BLS Main Report Final 25June2013 Copy
112
MAIN REPORT: PARTICIPATORY CITIZENS' SATISFACTION BASELINE SURVEY IN EIGHT UGDP PARTNER CITY ADMINISTRATIONS 2013 Urban Governance and Decentralization Programme (UGDP) Ministry of Urban Development and Construction German International Cooperation (GIZ) Ministry of Urban Development and Construction Deutsche Gesellschaft für Internationale Zusammenarbeit (GIZ) GmbH Urban Governance and Decentralization Programme (UGDP) Participatory Citizen Satisfaction Baseline Survey Main Report (Final) MEGEN Power Consultancy P.O. Box: 46121, Addis Ababa Ethiopia T: +251 - 11 -6296154, (0)911 -203097 E: [email protected], [email protected] www: Megenpower.com Addis Ababa, Ethiopia May, 2013
-
Upload
independent -
Category
Documents
-
view
0 -
download
0
Transcript of BLS Main Report Final 25June2013 Copy

MAIN REPORT: PARTICIPATORY CITIZENS' SATISFACTION B ASELINE SURVEY IN EIGHT UGDP PARTNER CITY ADMINISTRATIONS
2013
Urban Governance and Decentralization
Programme (UGDP) Ministry of Urban Development and Construction
German International Cooperation (GIZ)
Ministry of Urban Development and Construction
Deutsche Gesellschaft für Internationale Zusammenarbeit (GIZ) GmbH Urban Governance and Decentralization Programme (UGDP)
Participatory Citizen Satisfaction
Baseline Survey
Main Report (Final)
MEGEN Power Consultancy
P.O. Box: 46121, Addis Ababa Ethiopia
T: +251 - 11 -6296154, (0)911 -203097
E: [email protected], [email protected]
www: Megenpower.com
Addis Ababa, Ethiopia
May, 2013

MAIN REPORT: PARTICIPATORY CITIZENS' SATISFACTION B ASELINE SURVEY IN EIGHT UGDP PARTNER CITY ADMINISTRATIONS
2013
Contents 1. Introduction , Background and Objectives 5
1.1 Introduction 5 1.2 Overview of the UGDP 5 1.3 Survey Objectives 7 1.4 Scope and Limitations of the Survey 8
2. Survey Methodology 10
2.1 Identification of Services and Service Dimensions 10 2.2 Design of Questionnaires 10 2.3 Sampling Design and Sample Sizes 12 2.4 Execution of Survey 13 2.5 Data Analysis and Interpretation 14
3. Innovations: Participation, Training and Local Institutional Development 15
3.1 Innovative Approaches: Objectives, Accomplishments and Outputs 15 3.2 Lessons Learned, Challenges and Pending Issues 19
4. Analysis of Main Findings 23
4.1 Description of Findings on Access and Satisfaction Ratings 23 4.2 Satisfaction with the Delivery of Public Services 24
Households Business Enterprises
4.3 Participation, Access to Public-domain Information and Tax Literacy 32 Households Business Enterprises Civil Society Organizations
4.4 Vulnerable Groups 41
5. Summary Conclusions and Recommendations 44 5.1 Key Baseline Indicators 44 5.2 Summary of Main Findings and Recommendations 44 Appendices 50 Annex 1: Summary of Findings and Recommendations: Access and Satisfaction
50
Annex 2: Summary of Findings and Recommendations: Public Participation and Access to Public-domain Information
51
Annex 3: Statistical Tables: Survey Questions and Responses 53

MAIN REPORT: PARTICIPATORY CITIZENS' SATISFACTION B ASELINE SURVEY IN EIGHT UGDP PARTNER CITY ADMINISTRATIONS
2013
LIST OF TABLES AND FIGURES
List of Tables Table 1.1 Selected Services and Service Dimensions for Household Survey 11 Table 1.2 Distribution of the Sample by Target Groups and Cities 13 Table 5.1 Summary of Key Baseline Indicators 44
List of Figures
Figure 1.1 Summary of Survey Objectives, Methods and Goals 8 Figure 1.2 General Approach for Sample Selection for Baseline Survey 12 Figure 3.1 The 2012 participatory Citizens satisfaction Baseline Survey Team Organization 17 Figure 4.1 Percentage Distribution of 'User' and 'Non-user' Households 24 Figure 4.2 Proportions of Service Users by Socio-economic Status 25 Figure 4.3 Rankings of Level of Satisfaction of Households Which have Access to Services 26 Figure 4.4 Level of Satisfaction with Selected services Among Poor and Non-poor Groups 27 Figure 4.5 Level of Satisfaction with Selected Social Services by Study Cities 28 Figure 4.6 Level of Satisfaction with Selected Infrastructure Services Among Cities 29 Figure 4.7 Level of Satisfaction of those who Have Access to SMEs Support by Study Cities 30 Figure 4.8 Rankings of Satisfaction of Business Enterprises who have Access to services 31 Figure 4.9 Satisfaction of Businesses withAccess to Services by Types of Services and City 32 Figure 4.10 Percent Households Participating in Urban Development by BLS Cities 33 Figure 4.11 Proportions of Citizens Participation by Aspects of Participation in All Cities 33 Figure 4.12 Proportions of Poor and Non-poor Households Participation by BLS Cities 34 Figure 4.13 Comparison of Prportions of Poor and Non-poor Households' Satisfaction with
Participation Outcome Indicators in All BLS Cities
34 Figure 4.14 Proportions of Poor and Non-poor Households' Satisfaction with Accessibility of Public-
domain Information by BLS Cities
35 Figure 4.15 Proportions of Poor and Non-poor Households with Accessibility of Public-domain
Information in All BLS Cities by Type of Public-domain Information
35 Figure 4.16 Proportions of Citizens' tax Awareness by Aspects of Awareness and BLS Cities 36 Figure 4.17 Proportions of Business Enterprises Participating in Urban Development by BLS Cities 37 Figure 4.18 Proportions of Business Enterprises Reporting Public Participation in All BLS Cities by
Aspects of Participation
37 Figure 4.19 Proportions of Business Enterprises Reporting Satisfaction with Quality and Effectiveness
of Participation by BLS Cities
37 Figure 4.20 Proportions of Businesses Satisfied with Accessibility of Public-domain Information 38 Figure 4.21 Proportions of Businesses Satisfied with Accessibility of Public-domain Information by
Type of Public-domain Information
38 Figure 4.22 Distribution of Businesses by Indicators of tax Literacy and BLS Cities 39 Figure 4.23 Proportion of CSOs Reporting Participation in Public Affairs by BLS Cities 40 Figure 4.24 Proportions of Public Participation Among CSOs by Aspects of Participation 40 Figure 4.25 Proportions of CSOs Satisfied with Transparency & Accountability of Local Public Officials 40 Figure 4.26 Proportions of CSOs satisfied with Access to Public-domain Information by BLS Cities 41 Figure 4.27 Proportions of CSOs Satisfied with Access to Public-domain Information by Type of
Information
41 Figure 4.28 Proportions of Vulnerable Groups who Went Hungry by BLS Cities 42 Figure 4.29 Proportions of Vulnerable Groups with No Access to basic Needs other than Food 42 Figure 4.30 Proportions of Vulnerble Groups' Public participation 43 Figure 4.31 Overall proportion of Public Participation Among Vulnerable Groups by Aspects of
Participation 43

MAIN REPORT: PARTICIPATORY CITIZENS' SATISFACTION B ASELINE SURVEY IN EIGHT UGDP PARTNER CITY ADMINISTRATIONS
2013
ABBREVIATIONS AND ACRONYMS
AMP Asset Management Plan BLS Base-Line Survey BMGF Bill and Malinda Gates Foundation CA City Administration CBOs Community-Based Organizations CIM Centre for International Migration and Development CIP Capital Investment Plan CSOs Civil Society Organization(s) ECA Ethiopian Cities Association ECSU Ethiopian Civil Service University GIZ Deutsche Gesellschaft für Internationale Zusammenarbeit (GIZ) GmbH KfW Kreditanstalt fuer wiederaufbau LICS Labour-Intensive Construction Sector MFIs Micro Finance Institution(s) MUDC Ministry of Urban Development and Construction NGOs Non-Governmental Organization(s) PLA Poverty and Livelihood Assessment PLWHAs People Living With HIV/AIDS PMT Project Management Team (of the UGDP) PWPDs People With Physical Disability(ies) REP Revenue Enhancement Plan SMEs Small and Micro Enterprise(s) SNNP Southern National, Nationalities and Peoples TVET Technical and Vocational Education and Training UGDP Urban Governance and Decentralization Programme

MAIN REPORT: PARTICIPATORY CITIZENS' SATISFACTION B ASELINE SURVEY IN EIGHT UGDP PARTNER CITY ADMINISTRATIONS
2013
5
1. Introduction, Background and Objectives
1.1 Introduction This Citizen Satisfaction Baseline Survey was commissioned by the Deutsche Gesellschaft für Internationale Zusammenarbeit (GIZ) GmbH - Urban - Governance and Decentralization Programme (UGDP). The Survey covers eight cities: Adwa, Debre Markos, Nekemte, Yirgalem, Gambella, Assosa, Jigjiga, and Semera. The overall objective of the Survey was to establish baseline data on citizens’ satisfaction with public services as well as on citizens’ participation in the development of their cities. The Survey was undertaken by MEGEN Power (MGP) Consultancy under a service agreement with the GIZ-UGDP. The Survey was conducted between mid December 2012 and early January 2013. The report is structured as follows. This Chapter provides a brief description of the UGDP's objectives, programme components and objectives, scope and limitations of the baseline survey. Chapter 2 provides methodology adopted including target groups, sampling design and sample sizes. Chapter 3 provides additional methodological details discussing innovative approaches adopted in the current survey, achievements, lessons learned, challenges faced and issues pending for future action. Chapter 4 presents a high-level analysis and discussion of findings. The discussion includes measures of citizens’ satisfaction, areas of satisfaction and dissatisfaction, citizens’ participation in processes and activities related to development of their cities, citizens' access to public-domain information as well as tax literacy. Finally, a brief summary of the main findings of the study along with conclusions and recommendations are presented in Chapter 5. Survey questionnaires and more detailed outputs of the study are presented in the Appendices in the form of statistical tables. 1.2 Overview of the Urban Governance and Decentrali zation Programme Program Objectives The “Urban Governance and Decentralization Programme” (UGDP), an Ethio-German, bilateral cooperation programme and implemented jointly by the Ethiopian Ministry of Urban Development and Construction, together with Regional States of the partner cities. The overall aim of GIZ-UGDP is to support the Ethiopian Government and selected partner cities in the implementation of Ethiopia’s comprehensive decentralization and urban governance development plan. The programme adheres to the basic principles of decentralization, power and responsibility sharing between the different levels of government, in order to assure local governments’ access to financial, legal, institutional and managerial resources to fulfil their powers and responsibilities. The overarching objective of the UGDP is to enable “urban areas and cities provide better services while applying principles of good governance”. Currently UGDP is in its 3rd phase. During this phase the Programme focuses on ensuring sustainability of commenced urban reforms in its eight partner cities, as well as on laying foundation for a nationwide scaling-up of reforms. Areas of support include: Urban financial management, urban infrastructure planning and management, public participation, and urban poverty alleviation.

MAIN REPORT: PARTICIPATORY CITIZENS' SATISFACTION B ASELINE SURVEY IN EIGHT UGDP PARTNER CITY ADMINISTRATIONS
2013
6
Program Components Component 1: Urban Service Delivery . This component seeks to strengthen the partner cities to develop and implement and firmly establish in their administrative processes procedures and instruments of participatory urban planning and service delivery. The expected outcomes of this component are:
• Partner cities administrations manage participatory budget in a transparent, accountable and efficient way;
• Partner adapt CIP preparation and implementation; • Gender and HIV/AIDS is mainstreamed in partner cities; • Partner cities introduce and apply AMP system; • Citizens actively participate in the planning, decision-making and implementation of
infrastructure projects in partner cities; • At least 30% citizen participating urban planning and service delivery are women; and • Partner cities implement Municipal pro-poor service delivery standards and performance
measurement system. Component 2: Urban Financial Management. Through this component the Programme supports partner cities to apply more efficient and more transparent procedures of urban financial administration and increase their annual investment budget. The expected outcomes include:
• Partner cities take appropriate decisions on utilisation of financial resources; • Partner cities make efficient use of assets; • Cities’ own contribution to the financing of capital budget has increased by 20% in the cities of
the emerging regions and by 30% in the partner cities of the main regions by December 2014 as compared to July 2012;
• In at least four cities, elements of performance based budgeting are introduced and institutionalised;
• In all eight cities procurement is economic, efficient, effective and transparent; and • Financial and revenue management reform is sustainable and scaled-up
Component 3: Knowledge Management. This component aims to strengthen the regional urban development and construction bureaus, the ECSU and the ECA effectively contribute to the sustainable consolidation and effective up-scaling of the core processes of urban self-administration.
• In the four main regions, capacity of non-partner cities has enhanced through Bureaus' support.
• In the 8 partner Cities institutional memory is enhanced. • ECSU urban institute provides courses in line with MUDC policies and the training demand of
ECA member cities & MUDC get policy input as a result of an enhanced MUDC-ECSU-ECA feedback cycle.
• ECSU's (especially the urban institute) quality of education and trainings has improved. • ECSU's outreach capacity increased. • ECA institutionally developed. • ECA provides demand-driven services • MUDC's management capacity has enhanced
Component 4: Poverty-oriented Urban Development. The component supports partner City administrations implement their investment funds strategically and effectively in order to reduce poverty.

MAIN REPORT: PARTICIPATORY CITIZENS' SATISFACTION B ASELINE SURVEY IN EIGHT UGDP PARTNER CITY ADMINISTRATIONS
2013
7
While doing this, the city administrations will stay in close dialogue with representatives of the local civil society. The expected outcomes of this component include:
• Labour intensive construction sector (LICS) is enhanced in partner cities; • Urban poor in the partner cities are capacitated to access job opportunities in labour intensive
construction sector and other related poverty reduction initiatives; • Capital investments in partner cities are geared towards the labour intensive construction
sector; and • Partner cities have pro-poor strategic plans cascaded from GTP (annual sector office plans,
Kebele plans, CIP, AMP, REP, spatial plans, network/utility plans). Implementation Arrangements The institutional arrangement for the implementation of the programme provides for a participatory development approach involving coordination and management entities and a number of individual agencies/institutions. The Programme is co-implemented by the GIZ and KfW in partnership with the Ministry of Urban Development and Construction (MUDC), eight regional bureaus and eight selected cities. The Program is financed by the German Federal Ministry for Economic Cooperation and Development (BMZ) and Bill and Malinda Gates Foundation (BMGF). 1.3 Objective of the Survey A citizen satisfaction survey provides governments with systematic feedback from actual service consumers on various aspects such as physical accessibility, quality, affordability and reliability of public services on the one hand and responsiveness of service providers on the other. Its primary goal is to obtain a detailed understanding of how citizens evaluate the services provided by their local governments in order to guide efforts to improve service delivery. It also provides a rigorous basis and a proactive agenda for communities, civil society organization to engage in a dialogue with governments to improve the delivery of public services. The expected outcomes from a Citizen Satisfaction Survey include:
• Help public service agencies assess their performance objectively, track their progress over-time in improving citizens’ satisfaction, and facilitate open and proactive discussions on their performances;
• Empower citizen groups to play a watch-dog role to monitor public service agencies and local governments;
• Enable governments to streamline and prioritize budget allocations and monitor implementation; and
• Deepen social capital by converging communities around issues of shared experiences and concerns.
The overall objective of this participatory citizen satisfaction baseline survey was to determine the level of citizens’ satisfaction with selected public services and level of citizens’ participation in the development of their cities. The immediate goals of the survey were to:
• Measure citizens’ level of satisfaction or dissatisfaction with key public services; • Determine citizens’ level of participation in the identification, prioritization, implementation and
monitoring and evaluation of infrastructure projects; • Measure citizens’ level of satisfaction with CA’s disclosure of public domain information; • Measures variations in the levels of satisfaction or dissatisfaction among different social groups
(poor and vulnerable households and ‘non-poor’ households); • Provide a basis for a comparison of service delivery among different public service providers; • Highlight areas that require improvement or attention;

MAIN REPORT: PARTICIPATORY CITIZENS' SATISFACTION B ASELINE SURVEY IN EIGHT UGDP PARTNER CITY ADMINISTRATIONS
2013
8
• To establish baseline data for performance monitoring and evaluation against which to measure the performance of the UGDP;
• To build in-house citizen satisfaction survey capacity within the City Administrations and ensure its long-term sustainability.
The long-term goals will be improved public services, participation and engagement of citizens, businesses and CSOs in city development, and transparency and accountability of City officials.
Figure 1.1: Summary of Survey Objectives, Methods, and Goals
1.4 Limitations of the Survey As the title of the survey speaks for itself, the focus of the present survey is on the demand side of public service delivery. By demand side we mean the perceptions, opinions and assessments of users of public services expressed in the form of levels of “satisfaction/dissatisfaction”. In other words, the survey did not include primary data collection on the “supply side” of service delivery (e.g. the views and opinions of service providers, or collection of secondary quantitative data for the purpose of formal comparison with the demand side satisfaction survey data and findings). Accordingly, for a well-informed understanding and interpretation of the findings of the baseline survey, it is important to take into account the following two important points:
(1) Since the survey was focused on the opinions and perceptions of citizens as service consumers, the findings can be viewed as subjective in nature and may or may not exactly match objectively verifiable indicators (for example, those well-known official indicators of access and quality of

MAIN REPORT: PARTICIPATORY CITIZENS' SATISFACTION B ASELINE SURVEY IN EIGHT UGDP PARTNER CITY ADMINISTRATIONS
2013
9
services such as health, education, etc or quantitative data on the amount of service and infrastructure supplied in a given period of time) and can diverge from the opinions and assessments of service providers. It is important to note that this problem is to a large extent inherent in the nature of “satisfaction” surveys.
(2) The perceptions and assessment of citizens, hence their level of satisfaction with service delivery
can be influenced by various factors. One important factor is timing: satisfaction surveys such as the present one tend to be cross-sectional in nature (conducted at a single point in time) while service delivery is a process occurring over a relatively long period of time. Accordingly, events such as serious breakdowns and interruptions of services (e.g. water supply, electric power supply, etc.) which sometimes coincide with the timing of satisfaction surveys can and do influence the perceptions of users. A related factor is expectations of citizens and service users: this means, for example, that service delivery may have improved compared to past conditions by measures of objective indicators (e.g. the amount of access to inner city roads, drainage, etc. constructed). However, if citizen’s expectations are higher or on the rise (which often are), if the services/infrastructure tend to concentrate in very few areas, if conditions of significant improvements are followed by periods of decline and deterioration, etc.; then the perceptions of citizens can be less objective and can diverge from the assessments of public service providers based on objective indicators.
However, all of the above cautionary notes do not imply that the results of the baseline survey are arbitrary and lack validity and reliability. It is only to point out the limited scope of the survey (its focus on the demand side) and the possibility that due to the very nature of satisfaction surveys (being reflections of the subjective perceptions of users which tend to be influenced by many factors), the findings may diverge from objectively verifiable indicators or from the opinions and assessments of service providers. More importantly, we have taken quality control measures to minimize chances of error and bias which can arise from some of the factors and problems mentioned above and to increase the reliability and validity of the findings. In addition to the general measures described in the methodology section above, we can mention two important and specific points here: first, we have ensured that only those households who have accessed or used the specific services (e.g. individually accessed/used/paid services such as piped water, electric power supply, health, education, etc.) in the past one year prior to the survey were asked about their status or level of satisfaction with the delivery of a given public service (using filter questions). The logic of this approach is obvious in that respondents who have not used and lack direct experience and knowledge about particular services (e.g. piped water) cannot be expected to provide fair judgment or assessment about the various aspects of the services concerned (e.g. quality, reliability of supply, affordability, etc.). Accordingly, percentages or proportions of satisfaction and dissatisfaction with public service delivery discussed in this report are based on actual users of services rather than the entire sample included in the study. Secondly, although as mentioned above primary data on supply side was not collected under the baseline survey to undertake formal comparison with and verification of the findings of the demand side (citizens satisfaction) we have made serious and systematic effort to check and verify the data and the findings. The main approach we employed is to provide explanations and clarifications when findings (e.g. levels of satisfaction) appear to be exceptionally high or low contrary to known conditions and trends of the delivery of specific services in specific cities including highlighting some of those factors which may influence the perceptions of respondents mentioned above using information derived from recent studies (e.g. the PLA study), secondary sources of information as well as the direct observations and knowledge of the survey teams about service delivery in the survey cities.

MAIN REPORT: PARTICIPATORY CITIZENS' SATISFACTION B ASELINE SURVEY IN EIGHT UGDP PARTNER CITY ADMINISTRATIONS
2013
10
2. Survey Methodology 2.1 Identification of Services and Service Dimensio ns 6. The types of services covered were identified principally through review of the performance indicators of the different components of the UGDP as well as priorities identified in the Poverty and Livelihood Assessments and Stakeholder Analyses studies conducted by the UGDP in each of the cities. The services included in the Survey were: potable water, public health, education, electric power, street light, inner city roads, storm drainage structures, solid waste collection, sanitation, vacuum truck, marketing facilities, recreation facilities, cemeteries, shelter/housing, selected non-physical services (issuance and renewal of ID cards, birth and marriage certificates, letters of support for free medication and employment) and safety/security or police services), and SMEs Development services. The indicators used for each service item are listed in Table 1. Similarly, the following indicators were identified on the level of citizen participation:
• Citizen participation in the identification, planning, decision-making and implementation of urban development projects;
• Whether participants were able to articulate and reflect their interests and make their voice heard in the meetings;
• Citizens’ participation in tax literacy trainings; • Annual budget disclosure; • Audit report disclosure; and • Public procurement (tender) information.
7. Ten service items were selected for business enterprises. These are potable water, electric power, street light, inner city roads, drainage structures, solid waste collection, sanitation, vacuum truck, business development services (licensing and registration of businesses, business premises, access to finance, market outlets, business and technical training, and market linkages),and abattoir services. The indicators in respect of participation, access to public domain information and tax literacy. 2.2 Design of Questionnaires 8. Four sets of questionnaires were administered. These are for households, business enterprises, membership-based civil society organization, and homeless citizens. The questionnaires are presented as Appendix A. 9. The questionnaires include different modules. Section 1 of the household questionnaire consisted of demographic statistics of the respondents (sex, age, family size, education, employment, etc.). Section 2, consisted of question requiring the respondent to state his/her level of satisfaction with public services (accessibility, use, quality, reliability and affordability etc.). This section covered sixteen service items and one question on overall level of satisfaction with city services. The format and content of the questionnaire on satisfaction questions takes the “Likert Scale” approach with responses ranging from “highly satisfied” to “highly dissatisfied”. Section 3 of the questionnaire focused on participation: citizens were asked how often they participated in the identification, prioritization, implementation and monitoring and evaluation of infrastructure projects and their views on these experiences. The section also contains questions requiring the respondent to state his/her satisfaction with the CA’s disclosure of public domain information as well as on tax literacy. 10. The Enterprise questionnaire contains similar question requiring the respondent to state his/her level of satisfaction with ten selected service items and questions on participation, satisfaction with disclosure of public domain information and on tax literacy. The CSOs’ questionnaire consisted of

MAIN REPORT: PARTICIPATORY CITIZENS' SATISFACTION B ASELINE SURVEY IN EIGHT UGDP PARTNER CITY ADMINISTRATIONS
2013
11
questions on participation. The homeless citizens’ questionnaire consisted of demographic statistics, and questions on their levels of satisfaction with selected services and their participation, engagement and influencing City decision-making. The questionnaires were drafted in English then translated into local languages.
Table 1.1: Selected Services and Service Dimension for Households Survey
Services Service Dimensions /Indicators Potable Water Quality of water
Reliability of supply Affordability/price of water
Public Health Waiting Time for treatment Care provided/behaviour of staff Affordability/Cost of treatment Availability of medicine Affordability of medicines
Public Education Distance/proximity of primary school Adequacy of number of class rooms Availability of Text Books Affordability/cost of Text Books Affordability of school contributions
Electric Power Supply Reliability of Electric Power Supply Affordability of electricity
Street Lighting Functionality of street lights Inner City Roads Timely maintenance of inner city roads Drainage Structures Maintenance of drainage structures
Storm/flow of water drains Solid Waste collection Siting of solid waste dumpsters
Regularity of collection Affordability of collection fee
Sanitation: Public Toilets Cleanness of public toilets in your neighbourhood Regular functionality of public toilets in your neighbourhood
Vacuum Truck Waiting time for vacuum truck services Affordability of vacuum truck service
Market Infrastructure Distance to/proximity of market place Space/Congestion of market price Availability of shades Availability of basic amenities – toilets and water
Recreation Facilities: Public parks
Availability of and suitability of parks Cleanness of parks Basic amenities in parks– toilets and water Playground, sports facilities for children/youth
Cemeteries
Distance to/proximity of market place Adequacy of Space
Public Housing CA’s Efforts in providing access to housing Equitable distribution of publicly constructed houses Affordability of publicly constructed houses
Non-physical Services Provision and renewal of ID Cards Provision of birth and marriage certificates Letter of support (free healthcare, employment) Safety and security services (Police)
SMEs Development Service
Targeting mechanism for inclusion in SMEs Organizing/formation of SMEs Technical skills training Business/entrepreneurship Access to Credit Provision of business/market premises Creating Marketing Linkage

MAIN REPORT: PARTICIPATORY CITIZENS' SATISFACTION B ASELINE SURVEY IN EIGHT UGDP PARTNER CITY ADMINISTRATIONS
2013
12
2.3 Sampling Design
Sample Size 11. One of the major objectives of this study was to ensure that statistically significant results could be obtained from each of the units of analysis: households, enterprises, CSOs and homeless citizens. The consultant’s terms of reference implied a sample size of 300 households per city. This was believed to be an adequate sample size.
Sampling procedures 12. A stratified-cluster sampling design was adopted to select samples urban poor and relatively non-poor households. The procedures adopted were to draw sample poor households and non-poor samples at random. The sampling procedure adopted is depicted in Figure 1.2 and described below.

MAIN REPORT: PARTICIPATORY CITIZENS' SATISFACTION B ASELINE SURVEY IN EIGHT UGDP PARTNER CITY ADMINISTRATIONS
2013
13
Step 1: Stratification of Kebeles by socioeconomic conditions to select poor and non-poor households: Step 2: Stratified Purposive Sampling of Ketenas from sample poor kebeles and random sampling of Ketenas from sample ‘non-poor’ kebeles: Stage 3: Random Sampling of households: 13. Sampling frames were prepared in the form of lists of households in sample Ketenas. Lists of the different types of poor and vulnerable households were compiled from records of the respective Kebeles Administration and CSOs and through the support of local informants. These were:
• Female-headed households • Persons with physical disabilities • Persons with HIV in their blood, and • Commercial Sex workers.
14. The sample size of poor households (150) was apportioned to the selected sample Kebeles on the basis of proportionality to the number of households. The samples from each sub-group were randomly selected from the lists of households. The sample size of ‘non-poor’ households (150) was allocated on the basis of proportionality to the number of households in each Ketena. Table 1.2: Distribution of the Sample by Target Gro ups and Cities
BLS Cities Households Businesses CSOs Vulnerable Groups Total
Adwa 300 33 24 32 389
Asossa 297 30 30 30 386
D. Markos 270 30 30 30 360
Gambella 308 30 20 30 388
Jijiga 280 30 30 20 360
Nekempte 300 30 30 30 390
S. Logia 300 30 9 34 373
Yirgalem 300 30 23 30 383
All Cities 2,355 243 196 236 3,030
15. Business Enterprises Sample: The sample size of business enterprises was determined based on the minimum sample sizes required to obtain reasonable level of significance. As the rule-of-thumb in statistics dictates, a minimum of 30 enterprises were as the sample size. The sample enterprises were randomly selected from different sectors and sub-sectors and business size. 16. Civil Society Organizations Sample: A list of organizations was compiled from the registrar of the social development offices. A total of 30 membership-based civil society organizations and non-governmental organizations were listed out of which 24 were included in the survey. Given the poverty and livelihood focus of the ongoing UGDP phase three, a sample of 236 most vulnerable groups (homeless destitute) was also included in the survey.
2.4 Execution of Survey 17. From the outset, a Core Team consisting of City Administration, sector offices, academic institutions, local CSOs and UGDP local expert was formed in each study city and received a three-days

MAIN REPORT: PARTICIPATORY CITIZENS' SATISFACTION B ASELINE SURVEY IN EIGHT UGDP PARTNER CITY ADMINISTRATIONS
2013
14
training in Addis Ababa. The Core Team, in addition to joint execution of the field work, was responsible for recruiting, training, and supervision of Survey Team. A survey team consisting of ten experts drawn from relevant City Administration offices were trained for three days. The team was informed about the purpose of the survey and were trained in questioning respondents. Mock interviews and one round of pilot testing was conducted to assess the survey team members’ understanding and to check the consistency of the questions. The survey team members were divided into two fieldwork teams. Each team comprised one supervisor (a member of the core team) and five survey team members of interviewers. The interviewers worked under close supervision of the field supervisors. In order to ensure that recording of a respondent’s information was done accurately, random spot checks of completed questionnaire were undertaken. 2.5 Data Analysis 18. Data coded on the questionnaires was inputted into the computer using the MS Excel. Most analytical work on the survey data was done using MS Excel spread sheets for flexibility and ease of updating. The SPSS package was used to clean the data using frequency tables and to analyse the data using descriptive statistics and cross-tabulations. 19. The basic procedure of analysis was to tabulate responses either as average values or (for the majority of coded responses) the percentage of respondents offering each response. Disaggregation was employed for all questions by poor and non-poor households.

MAIN REPORT: PARTICIPATORY CITIZENS' SATISFACTION B ASELINE SURVEY IN EIGHT UGDP PARTNER CITY ADMINISTRATIONS
2013
15
3. Innovations: Participation, Training and Local C apacity Building
3.1 Innovative Approaches: Objectives, Accomplishme nts and Outputs
3.1.1 Description of Innovations and Related Objec tives 20. The 2012 citizens' satisfaction baseline survey represents a remarkable departure - in a number of ways - from the conventional extractive approaches of conducting similar surveys in which a consultant or research team almost exclusively undertakes the whole process from methodology design and survey planning to field data collection, cleaning, entry, analysis and write-up with minimum interaction and participation of local stakeholders who constitute primary users of such data and information. Innovations adopted in the current baseline survey can be categorized into three key innovations or features as follows:
1) Introduction and adoption of the concept of citizens' satisfaction, 2) Local institutional capacity development through training and participation, 3) Focus on inclusive urban development through pro-poor lens. Each of the three fundamental
features of the current baseline survey are briefly described below. 21. A) Citizens' Satisfaction Survey - a Powerful Tool to Enhance Responsiveness: The concept of citizens' satisfaction survey is entirely new to Ethiopian political or public administration culture. By providing a unique opportunity to citizens to evaluate the performance of local governments in the delivery of public goods and services, the new concept of participatory citizens' satisfaction survey is expected not only to bring about badly needed new perspective and dynamism to Ethiopian local public administration systems but, by enhancing transparency and accountability of local public officials to their respective electorate, it would also promote responsiveness of local governments to the demands, priorities and aspirations of citizens. Besides, as challenging to local public officials as it might be at the beginning, improved voicing of citizens together with improved responsiveness of local governments (both outcomes of the new concept - citizens' satisfaction) would also lead to improved confidence among the public, hence trust in government as well as increased revenue collection, which is in dire supply at local level at the moment. 22. In addition, the concept of citizens' satisfaction, when adopted in a demand-driven and well coordinated manner, by avoiding duplication of efforts by sectoral offices, would provide useful data and information to several line offices in a very cost-effective way. It is this multi-sectoral and potentially powerful tool that the current baseline survey adopted; and therefore, both the UGDP and the Government of Ethiopia (GoE) should be commended and deserve credit for their bold and courageous measure they took when they respectively introduced and approved the adoption of the concept of Participatory Citizens' Satisfaction Survey in the current study. Thus, upon successful trial of the new concept, what logically follows is up-scaling and institutionalization of the new concept for wider application at a national scale. 23. B) Local institutional capacity development through training and participation: From the outset, local institutional capacity building including eight partner city administrations, relevant sector offices, CSOs and academic institutions was made an integral part of the entire survey processes and operations in each study city. The main objectives of local institutional capacity development efforts carried out as part of the current survey are:
• Firstly, to impart knowledge and skills to local partners and stakeholders so that they can conduct similar surveys more independently in a regular and self-sustaining manner in the future. In other

MAIN REPORT: PARTICIPATORY CITIZENS' SATISFACTION B ASELINE SURVEY IN EIGHT UGDP PARTNER CITY ADMINISTRATIONS
2013
16
words, the whole exercise of local institutional capacity building is to capacitate CAs to regularly and independently conduct similar surveys and use the results to improve the design and implementation process and make the necessary adjustment in a proactive way Such a local capacity building is also believed to be both cost-effective and capable of reflecting local realities, needs and priorities to solve local problems and,
• Secondly, to promote ownership of the programme, its processes and outputs by empowering local partners and stakeholders through transferring not only knowledge and skills, but also by setting up, establishing and running a fully operational and flexible, user-friendly database, which local partners could operate (process outputs and analyze data) according to their needs. The capacity building component was closely linked to the participatory approach which was chosen as the main methodological approach for conducting the survey and was incorporated in the whole methodology and process of implementing the survey from inception to submission of outputs.
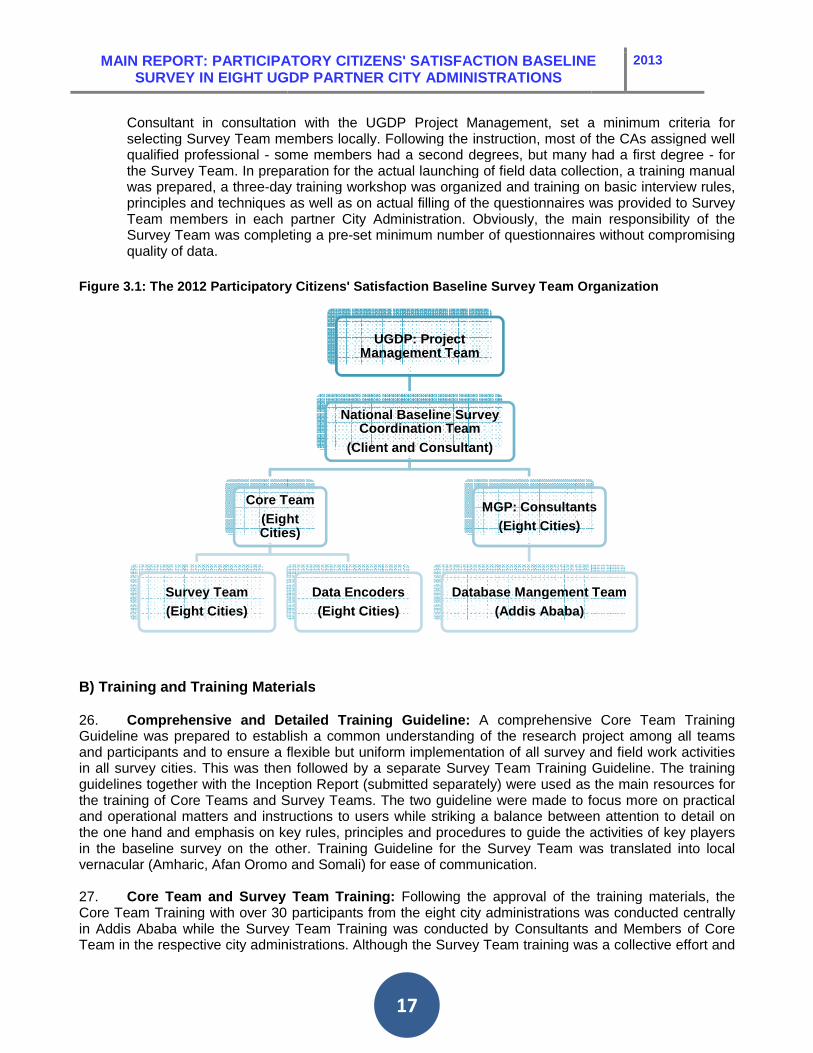
24. Given the limited financial resources of the city administrations to hire external consultants to undertake such surveys periodically, re-orienting the baseline survey in such a way that ensures transfer of survey knowledge and skills as part of local capacity building is challenging, but it is genuinely an innovative approach to any similar survey operation. 3.1.2 Accomplishments and Outputs A) BLS Team Organization, Composition and Allocatio n of Responsibilities 25. One of the unique design features of the 2012 Participatory Citizens' Satisfaction Baseline Survey was that it was designed and implemented with full participation and ownership by local stakeholders led by respective City Administrations. To facilitate local level participation and ownership of both the survey process as well as outputs, various teams entrusted with respective roles and responsibilities were organized at Federal and local levels. The following three teams were organized for the sole purpose of planning, organizing, and implementing the 2012 baseline survey.
a) National Baseline Survey Coordination Team : From the outset, at Federal level, a National Baseline Survey Coordination Team composed of members of the UGDP Project Management Team and Senior staff of the Consultancy (MGP), was formed. Among key responsibilities of the National Team were oversight and coordination of the survey activities, liaise with CAs to facilitate identification and selection of local team members, access to office space and computers for local level training and arranging logistics for the survey operation in each study city.
b) Core Team: A Core Team comprising five members and composed of CA staff, staff of other local stakeholders, UGDP local expert and a Consultant was set up in each City Administration during the Inception phase. Selection of local team members was done entirely by respective CAs following a set of criteria provided by the UGDP. A three-day training workshop was organized and provided centrally in Addis Ababa to members of Core Team from all eight partner City Administrations. Among Key responsibilities of the Core Team were identifying and selecting Survey Team members (based on criteria provided by UGDP and the Consultant), organizing, facilitating and conducting Survey Team training; oversee and supervise administration of the surveys, participate in sampling and sample identification processes, and Liaise with CAs to facilitate access to space and equipment for Survey Team and Database Team training and operation.
c) Survey Team: A Survey Team consisting ten members and comprised of various local stakeholders was set up and organized by respective CAs with the help of the Core Team in each partner city (see Figure 3.1). In the interest of quality and timely completion of the field work, the
MAIN REPORT: PARTICIPATORY CITIZENS' SATISFACTION B ASELINE SURVEY IN EIGHT UGDP
Consultant in consultation with the UGDP Project Management, seselecting Survey Team members locally. Following tqualified professional - some members had a second degrees, but many had a first degree the Survey Team. In preparation for the actual launching of field data collection, a training manual was prepared, a three-day training workshop was organized and trainprinciples and techniques as well as on actual filling of the questionnaires was provided to Survey Team members in each partner City Administration. Obviously, the main responsibility of the Survey Team was completing a prequality of data.
Figure 3.1: The 2012 Participatory Citizens' Satisfaction Basel ine Survey Team Organization
B) Training and Training Materials 26. Comprehensive and Detailed Training Guideline:Guideline was prepared to establish a common understanding of the research project among all teams and participants and to ensure a flexible but uniform implementation of all survey and field work activities in all survey cities. This was then followed by a separate Survey Team Training Guideline. The training guidelines together with the Inception Report (submitted separately) were used as the main resources for the training of Core Teams and Survey Teams. The two guideland operational matters and instructions to users while striking a balance between attention to detail on the one hand and emphasis on key rules, principles and procedures to guide the activities of key players in the baseline survey on the other. Training Guideline for the Survey Team was translated into local vernacular (Amharic, Afan Oromo and Somali) for ease of communication. 27. Core Team and Survey Team Training:Core Team Training with over 30 participants from the eight city administrations was conducted centrally in Addis Ababa while the Survey Team Training was conducted by Consultants and Members of Core Team in the respective city administrations. Althou
Core Team(Eight Cities)
Survey Team(Eight Cities)
MAIN REPORT: PARTICIPATORY CITIZENS' SATISFACTION B ASELINE SURVEY IN EIGHT UGDP PARTNER CITY ADMINISTRATIONS
17
Consultant in consultation with the UGDP Project Management, set a minimum criteria for selecting Survey Team members locally. Following the instruction, most of the CAs assigned well
some members had a second degrees, but many had a first degree the Survey Team. In preparation for the actual launching of field data collection, a training manual
day training workshop was organized and training on basic interviprinciples and techniques as well as on actual filling of the questionnaires was provided to Survey Team members in each partner City Administration. Obviously, the main responsibility of the
ompleting a pre-set minimum number of questionnaires without compromising
The 2012 Participatory Citizens' Satisfaction Basel ine Survey Team Organization
) Training and Training Materials
Comprehensive and Detailed Training Guideline: A comprehensive Core Team Training Guideline was prepared to establish a common understanding of the research project among all teams and participants and to ensure a flexible but uniform implementation of all survey and field work activities
y cities. This was then followed by a separate Survey Team Training Guideline. The training guidelines together with the Inception Report (submitted separately) were used as the main resources for the training of Core Teams and Survey Teams. The two guideline were made to focus more on practical and operational matters and instructions to users while striking a balance between attention to detail on the one hand and emphasis on key rules, principles and procedures to guide the activities of key players
he baseline survey on the other. Training Guideline for the Survey Team was translated into local vernacular (Amharic, Afan Oromo and Somali) for ease of communication.
Core Team and Survey Team Training: Following the approval of the training materials,Core Team Training with over 30 participants from the eight city administrations was conducted centrally in Addis Ababa while the Survey Team Training was conducted by Consultants and Members of Core Team in the respective city administrations. Although the Survey Team training was a collective effort and
UGDP: Project Management Team
National Baseline Survey Coordination Team
(Client and Consultant)
Core Team(Eight Cities)
Data Encoders(Eight Cities)
MGP: Consultants(Eight Cities)
Database Mangement Team(Addis Ababa)
MAIN REPORT: PARTICIPATORY CITIZENS' SATISFACTION B ASELINE 2013
a minimum criteria for he instruction, most of the CAs assigned well
some members had a second degrees, but many had a first degree - for the Survey Team. In preparation for the actual launching of field data collection, a training manual
ing on basic interview rules, principles and techniques as well as on actual filling of the questionnaires was provided to Survey Team members in each partner City Administration. Obviously, the main responsibility of the
questionnaires without compromising
The 2012 Participatory Citizens' Satisfaction Basel ine Survey Team Organization
A comprehensive Core Team Training Guideline was prepared to establish a common understanding of the research project among all teams and participants and to ensure a flexible but uniform implementation of all survey and field work activities
y cities. This was then followed by a separate Survey Team Training Guideline. The training guidelines together with the Inception Report (submitted separately) were used as the main resources for
ine were made to focus more on practical and operational matters and instructions to users while striking a balance between attention to detail on the one hand and emphasis on key rules, principles and procedures to guide the activities of key players
he baseline survey on the other. Training Guideline for the Survey Team was translated into local
Following the approval of the training materials, the Core Team Training with over 30 participants from the eight city administrations was conducted centrally in Addis Ababa while the Survey Team Training was conducted by Consultants and Members of Core
gh the Survey Team training was a collective effort and
MGP: Consultants
Database Mangement Team

MAIN REPORT: PARTICIPATORY CITIZENS' SATISFACTION B ASELINE SURVEY IN EIGHT UGDP PARTNER CITY ADMINISTRATIONS
2013
18
Box 3.1: Local Capacity Building Exercise: Was it a Success?
"I have attended training workshops organized by different
organizations. My engagement in Assosa baseline survey was completely different and an empowering exercise. The local capacity building and the entire participatory baseline survey process was really a practical learning by doing engagement. … I believe, with other Assosa team members, we can do similar surveys for Assosa in the future. I do not think we would need external Consultants anymore’’. An unofficial translation of a statement made by a Core Team Member in Asossa after the completion of the field work.
lion's share of the responsibility rests on staff of the Consultancy, it is important to note that the local members of the Core Team took the leading role in the whole training process, with advance preparation of training materials (power point presentations) and moderating the discussion process. In some of the study cities, keynote speeches were made by high-ranking officials of the city administrations (Mayors, Deputy Mayors) at the opening and or closing of the training sessions. In all partner cities the fieldwork started with an intensive three day training of the Survey Team. The training was systematic and participatory in nature: unlike the common approach in such trainings (which focus on technical aspects of questionnaire filling) the training included presentations and interactive discussions on the overall background, scope and objectives, target groups and methodology of the survey. We believe that this approach has broadened the perspective of the survey team members and impressed upon them the importance of the survey leading to greater sense of responsibility, motivation and interest in the survey. This was evident from the enthusiastic and active participation and debate during the whole training process. The training also included presentations and discussions on basic principles and techniques of conducting survey interviews, detailed review of the questionnaires, mock interviews, and finally field pilot testing with feed-back. 28. Database Design and Management: A robust, user-friendly database system consisting of both EXCEL and SPSS softwares was designed, tested and used for data entry, validation, analysis and preparation of outputs. Like all aspects of the survey design and methodology, the database was subjected to a rigorous review and improvement during the training sessions. As part of the participatory process and capacity building focus of the baseline survey, databases were set-up and maintained at central level (Addis Ababa) and at the local Level in each partner city administration. To ensure local ownership and sustained utilization, a database management expert was made part of the Core Team in each city. A speedy and efficient data editing and encoding system was established in each city to operate side by side with the daily data collection process. As part of the training workshop, hands-on training and demonstration was provided by Consultants - centrally assisted by a Senior Database Management Specialist - to local team members and data encoders in each city. Data entry was completed in all cities as it was originally scheduled - just one day later than field data collection. 29. Upon completion of data entry, cross-checking and editing, the first-cut analysis was conducted by members of the Core Team led by a Senior Consultant. Outputs of the data analysis were presented to and discussed with CA officials and members of Core Team and Survey team in each city. Following completion of the first-cut data analysis and presentations, the latest version of SPSS was loaded on to CAs' computers to convert the database from EXCEL to a more powerful software, SPSS, for data storage and further analysis. Thanks to unreserved support of respective CA officials and members of the Core Team, active and operational database was established in and a copy of the entire database was successfully handed-over to respective city administrations for further analysis and use as and when needed. Thus, we strongly believe that formation of Core Teams and Survey Teams comprising different local public institutions and CSOs, series of trainings provided, active engagement of key local stakeholders in the entire survey process - from inception to completion - establishment and ownership of a functional database locally by each partner city administration and a crew of local data encoders led by a Core Team member with database management skills does not only mean that the immediate baseline survey objectives are achieved, but also it means that the back-bone for a strong

MAIN REPORT: PARTICIPATORY CITIZENS' SATISFACTION B ASELINE SURVEY IN EIGHT UGDP PARTNER CITY ADMINISTRATIONS
2013
19
infrastructure (local institutional capacity), capable of delivering similar assignments in a cost-effective and localized, non-extractive manner, is laid down in the respective city administrations (see Box 3.1). However, this does not mean the institutional and technical capacity development needs of local stakeholders is over. In fact, it is incomplete and far from over as there are still important gaps that need to be filled-in to maintain the momentum and take the exercise few steps further in the future. C) Participation and Local Ownership: Survey Proces ses, Outputs & Database 30. Thanks to the highly participatory approaches adopted throughout the survey operations and devotion and commitment of local partners and team members in all eight partner cities, all of the main components of the field work (survey planning, preparation of training guidelines and survey instruments, Core Team training, Survey Team training, sample selection and identification, field data collection, data cleaning, entry and first-cut analysis, establishment and hand-over database along with the necessary software to respective partner CAs) were not only successfully completed within the timeframe allocated but also in a manner that ensures quality and reliability of outputs and deliverables. Members of the Core Team and Survey Team have worked hard and discharged their duties and responsibilities with diligence and enthusiasm and they have learned a great deal from the process which has laid a strong foundation for conducting similar studies locally in the future. All local stakeholders and partners (including respective City Administration and the UGDP Regional and City offices and experts) have provided unreserved support and immensely contributed to successful completion of the field work for the baseline survey. 3.2 Lessons Learned, Challenges Faced and Pending I ssues 31. As it was described above, the entire baseline survey process - from conception, inception and implementation through completion and submission of the outputs was a success and the dual objectives of participation local stakeholders and institutional capacity building were achieved despite variations in the extent of success across UGDP partner city administrations. However, such an overwhelming success should not camouflage the challenges that were faced and remaining gaps that need to be addressed in the future in all the participating cities. The experiences, challenges and gaps identified in the cities often vary from one city to the other and they are too many to describe all at a full length. Therefore, only the most important and commonest lessons and challenges along with identification of issues for future action are outlined below. Lessons Learned: 32. The real success of the capacity building effort will be tested whether and when local stakeholders are willing to and capable of replicating and adapting similar studies in the future. Moreover, putting local teams and their newly built capacities as part of the baseline survey exercise to effective use also largely depends on the willingness and capacity of the MUDC and UGDP in their further interventions in those cities. Hoping that lessons learned from the current local capacity building exercise could serve as useful inputs for future efforts we have identified the following as main lessons learned:
(1) Active Engagement of Local Leadership: Ensuring the participation, interest and commitment of the leadership of the City Administration, heads of sector offices and experts and all other key non-government stakeholders is critical for the institutionalization of the capacity building effort and for the regular and sustainable undertaking of similar surveys and studies at the local level independently and in a cost-effective manner in the future;
(2) Prior Strategy for Wider Sharing Survey Results: More systematic thinking and planning of the whole survey cycle and process is indispensable: For example, to maximize benefits of citizens'

MAIN REPORT: PARTICIPATORY CITIZENS' SATISFACTION B ASELINE SURVEY IN EIGHT UGDP PARTNER CITY ADMINISTRATIONS
2013
20
satisfaction surveys to wider consumers and the public, a clear strategy of wider dissemination of survey findings and how those findings can or should be incorporated into public service delivery reform should be an integral part of survey planning process. In this regard, it should be further noted that in most of the cities, local public officials attended validation workshops, provided comments on and endorsed the draft survey outputs. Having endorsed the findings and acknowledging gaps identified in the delivery of public services, local officials further displayed commitment to rectify the shortfalls. However, along with endorsement of findings often comes the question of responsibility to disseminate information and communicate results of the survey to wider citizens and all stakeholders - a responsibility there was no one to assume at the time of the field work. Therefore, the implication is that respective CAs should be encouraged and supported to widely disseminate and share findings of the survey with their citizens and other key stakeholders in each city.
(3) Proper Documentation and Archives at Local Level : The retention and active utilization of the knowledge, skill and experience transferred through the current survey and capacity building efforts requires a systematic documentation of all data bases, documents and training resources at the local level - at a minimum an integrated filing of all resources for future reference and use is necessary;
(4) Institutionalization of Local Capacity Building Eff orts: Genuinely and more broadly, the effective translation of the capacity building effort into a regular and sustainable system of knowledge management and local governance in public service delivery at the local level can only be ensured through institutionalization: at a minimum a core set of institutions within the CA (e.g. with a lead role by OFED and City Service) in partnership with other key stakeholders should assume more direct responsibility and play a proactive role in planning and implementing the system. This will pave the way for a transition to what we may call a full-fledged Community-Based Monitoring System (CBM).
(5) Local Knowledge and Local Institutions to Local Pro blems : Unlike the conventional and very often extractive approaches, where the consultant assumes full responsibility for recruitment and training of field work supervisors and data collectors, data encoding, analysis and write-up, Baseline Survey Teams comprising the client, partner city administrations, other local stakeholders and staff of the Consultancy were organized and assigned with corresponding duties and responsibilities at national and local levels. Such an innovative approach, which provided the study with a unique opportunity to capitalize on local knowledge (language, culture, confidence among respondents, selection and identification of sample groups, disaggregating Kebeles in to poor and non-poor, etc) did immensely contribute to the quality and reliability of data as well as smooth operation and timely completion of the field work. Moreover, it should also be mentioned that, despite the initial scepticism among some Consultant team members, recruited members of both Core Team and Survey Team recruited independently by local CA officials possessed the right qualifications, skills and orientation, all of which were instrumental to the actual survey operations. In effect, the role of the Consultant Team members was simply mentoring, providing guidance, setting up things, and facilitating the process.
(6) Inclusive Survey Might Serve a Precursor to Inclusi ve Urban Development: Covering an exceptional wider cross-section of communities (poor and non-poor households, business enterprises, local civil society organizations, and most important, vulnerable (destitute, homeless) groups, the current baseline survey, as commented by residents of some cities, is extraordinarily inclusive, which some members of vulnerable groups hoped that the survey might represent a "dawn of hope" to end their social exclusion and marginalization in their respective cities.

MAIN REPORT: PARTICIPATORY CITIZENS' SATISFACTION B ASELINE SURVEY IN EIGHT UGDP PARTNER CITY ADMINISTRATIONS
2013
21
Challenges and Pending Issues
33. Challenges faced during the actual implementation of the field work activities, and perhaps beyond (expected in the future) are as numerous, diverse, complex and overwhelming as the successes were. Some of the most important challenges and issues for further action are outlined below.
1. Lack of Complete and Up-to-date Sampling Frame : Lack of a complete set of data on residents (names of heads of households with their physical addresses) may not be unique to the current survey. But what adds to the already existing problem of absence of a sampling frame was that the current survey requires a sampling frame with socio-economically disaggregated data - an unattainable luxury in local contexts. Despite enormous time energy requirements, Core Team members closely working with Kebele Administrations managed to construct sampling frames (by registering all residents respective cities) in cities where such data did not exist. Lack of complete and up-to-date data on residents, which does not require huge amount of resources, or even may already exist, but lost due to poor archiving, is a recurring problem that respective CAs need to improve in the future;
2. Limited Resources - Time Money: The baseline survey was designed to accomplish a number of tasks (recruitment of Survey Team members and local data encoders, organizing and conduction the training, supervision and administration of field data collection, concurrent data entry followed by validation checks, preliminary analysis and presentation of draft outputs to local stakeholders, ... etc). Participatory surveys that heavily emphasize local participation, ownership and capacity building are also fairly expensive in terms of costs. The team worked under enormous time pressure. In effect, on-the-job type training on database management, data analysis and presentations of draft outputs, report writing and dissemination survey findings to rightful owners, local stakeholders was inadequate. Limited skill transfer due to time constraints was much more felt in cities with exceptionally low computer literacy and commercial availability (e.g., Gambella and Semara-Logia). We strongly believe that, despite the enormous momentum and dynamic that was created during the field work, the capacity building exercise in partner cities could be considered a modest success. It is modest, because it was incomplete, hence additional efforts would be required to equip local teams with such skills and achieve wider dissemination of survey findings. Therefore, it is proposed that a follow-up assessment should be conducted to determine the effectiveness the participatory approaches and local capacity building efforts in conducting similar surveys in the future and to identify existing gaps and take remedial actions
3. Inadequate Stakeholder and Gender Composition of Local Team Members : Selecting and assigning members of both Core Team and Survey Team was the responsibility of respective CAs. although members of both teams were qualified and experienced and have done a very good job, their stakeholder and gender composition was not satisfactory. For instance, in some cities, the Core Team was composed of only the City Administration and there were very few female Survey Team members. Obviously, such stakeholder and gender imbalances should not be tolerated in future engagements,
4. No or Limited Availability of Core Team Members with Statistical Background: In spite of the fact that efforts were made well in advance of the field work to embed a person with statistical or database management background into the Core Team, this proved difficult in some cities; and surprisingly, lack of such people was more serious in cities where one would not expect so, e.g., Adwa and Yirgalem.
5. Length of the Questionnaire: Length of questionnaire with multiple and graduated response options ("Highly Satisfied", "Satisfied", ... etc) coupled with relatively new and innovative approach

MAIN REPORT: PARTICIPATORY CITIZENS' SATISFACTION B ASELINE SURVEY IN EIGHT UGDP PARTNER CITY ADMINISTRATIONS
2013
22
adopted - asking ordinary citizens to evaluate service delivery of their local governments, which needed repeated probe and explanation to some respondents has been a demanding job on the part of Survey Team. The problem was significant when dealing with uni-lingual respondents in some cities, e.g., Jijiga and Gambella. Such a problem was foreseen and it was thought that the fact that the questionnaires were translated in to local vernacular and local interviewers were deployed would solve the problem. However, in cities where data collectors speak only one or the other language, say either Amharic or Somali only, which was the case in Jijiga, language barrier contribute to the problem. In order to address the language mismatch, data collectors who can speak one or the other language were paired to help each other during the interviews.
6. Other Less Frequent Challenges: These included resignation of Survey Team members without prior notice, absence from home of respondents for the interview, non-response to some personal-type questions (e.g., income, house number), electric power interruption - which affected the data entry process - and no or limited availability of office space and computers. However, unlike those outlined above, challenges mentioned under this section were infrequent, they apply to only few city administrations and above all, they are common to most surveys.
34. Finally, as repeatedly mentioned elsewhere in this Chapter, as far as local institutional capacity development and utilization issues are concerned, some of the major tasks requiring strategic thinking and closer attention by the UGDP and CAs alike are: i) how to maintain the momentum and dynamic that was created through capacity building efforts during the current survey, ii) conduct a review or a rapid assessment to identify gaps in effectiveness previous capacity building efforts (some are already mentioned in this report) and address them to take local capacities few more steps ahead and in a timely fashion, and iii) devise a strategy that would enable the UGDP and partner CAs to put such local capacities to effective use throughout the programme and beyond. Naturally, while the UGDP could assume a catalytic or enabling role, the Ministry of Urban Development and Construction and Bureaus of Urban Development and Construction could and should play a more direct facilitation as well as strategic role in the utilization of local teams and further strengthening of their capacities in the future.

MAIN REPORT: PARTICIPATORY CITIZENS' SATISFACTION B ASELINE SURVEY IN EIGHT UGDP PARTNER CITY ADMINISTRATIONS
2013
23
4. Analysis and Findings 4.1 Description of Findings on Access and Satisfact ion with Public Service 35. In order to properly grasp the nature of the detailed data and findings of the survey on public service delivery described below, it is important to distinguish between access to public services from satisfaction with service delivery. As intimately interrelated as the two aspects are; access and satisfaction have also distinct dimensions which can be highlighted in terms of the following points: On the one hand, some households can have access (defined both as the availability and actual use) to particular services but they may or may not be satisfied with the various aspects of services delivered (e.g. quality, affordability, reliability of supply, etc.), while on the other, public services could be available in the city, but some households may not be actually using some of those services (e.g. piped water supply, medical or public health services, education, electric power supply) for various reasons or the services/infrastructure may not be available in their locality (e.g. access roads, drainage, street light, etc.). 36. The baseline survey has collected both types of data - availability of or access to services and satisfaction with services delivered. The important point to note is that in this baseline survey only those households who have actually used the services (during a given reference period, which is 12 months prior to the survey in our case); or who said the services/infrastructure are available in their neighbourhoods (especially in the case of collectively used infrastructure facilities such as access or inner-city roads, drainage, street light, etc.) were asked how well satisfied they are with the delivery of those services. 37. The reasoning behind this approach is straightforward, i.e., it is intended to maximize the reliability and validity of the survey data and findings. Indisputably, respondents who have not used a particular service and hence have no recent direct experience and knowledge cannot be expected to provide objective assessment of the various aspects of the services (e.g. quality, affordability, reliability of services such as piped water, public health, education, etc.) being provided by their local governments. Both the level of access (measured in terms of the percentage of households who have actually used or accessed particular services) as well as level of satisfaction (as proportions of residents satisfied/dissatisfied out of only those who used the services) can and do vary from service to service and the two may or may not go together for the various types of service/infrastructure under investigation. For example, Figure 4.1 below indicates that citizens' access to electric power supply in all eight baseline survey cities is 90%. This simply means that out of a total of 2,354 households interviewed in the eight survey cities, 2,118 households used electric power supply during the reference period, which is 12 months prior to the survey. Unlike access, satisfaction is concerned only with those households that used the service (2,118 households in the case of electricity) during the reference period. Hence, proportions of satisfaction / dissatisfaction are computed based the number of actual service users and NOT the entire sample. Accordingly, it is possible that access to a particular service can be low (only a small number or proportion of households are actually using the service) but the level of satisfaction can be high (out of those using the service the majority can say they are satisfied with the service) and vice versa. 38. It is again important to note that it is out of those who reported use/availability (not out of the total sample) that the findings on satisfaction were derived from. Indeed, in some cases this base can be very small but still satisfaction data have to be collected and reported. Data and findings on both access and satisfaction are important and can be useful as baseline for tracking trends in public service delivery and as inputs for policy and strategy formulation. For this reason and although the focus of the baseline survey is mainly on the satisfaction aspects, we have presented the data on both aspects.

MAIN REPORT: PARTICIPATORY CITIZENS' SATISFACTION B ASELINE SURVEY IN EIGHT UGDP PARTNER CITY ADMINISTRATIONS
2013
24
4.2 Satisfaction with the Delivery of Public Servic es 4.2.1 Service Users and Non-users 39. The Survey attempted to obtain feedback from ‘actual users’ of services. A qualifier/filter question ‘whether someone in the household has used the servi ce of interest in the past 12 months’ was included to determine whether the respondent is qualified to answer further questions. Respondents who provided “no” response to this question because either the service of interest was not available in the city or was inaccessible, were not further asked about their satisfaction level with the service. 40. The aggregate percentage distribution of respondents in the eight survey cities who said didn’t use the service of interest are summarized in Figure 4.1. The availability and/or accessibility of services varied significantly across service types. Overall, a higher proportion of households (50% or more) used eight of the sixteen service items during the last 12 months prior to the survey. The service item used by the majority of the respondents (50% or more) were electricity (90%), cemeteries (89%), non-physical services (89%), potable water (87%), market infrastructure (84%), public health (83%), public education (77%), and inner city roads (58%). On the other hand, a higher proportion of the respondents (50% or more) reported ‘didn’t use’ eight of sixteen service items because the services were either unavailable or inaccessible. The service items with the highest proportion of non-users are public parks (92%), vacuum trucks (85%), public toilet (82%), and drainage (71%).
Figure 4.1: Percentage Distribution of ‘User’ and ‘Non-User’ Households
90%
89%
89%
87%
84%
83%
77%
58%
47%
45%
42%
31%
29%
18%
15%
8%
10%
11%
11%
13%
16%
17%
23%
42%
53%
55%
58%
69%
71%
82%
85%
92%
Electric Power
Cemeteries
Non-physical
Potable Water
Market Infrastructure
Public Health
Public Education
Inner City Roads
Street Lighting
Solid Waste
Housing/Shelter
SMEs Support
Drainage
Public Toilets
Vacuum Truck
Public Parks
Percent Reported "used' Service
Percent Reported "Not used' Service

MAIN REPORT: PARTICIPATORY CITIZENS' SATISFACTION B ASELINE SURVEY IN EIGHT UGDP PARTNER CITY ADMINISTRATIONS
2013
25
41. The distribution of ‘poor’ and ‘non-poor’ households across the survey cities, in terms of ‘use’ of service items was almost relatively closer (see Figure 4.2). Variations in ‘use’ and ‘non-use’ response rates can be seen for only a few service items. 42. A relatively higher proportion of ‘non-poor’ than ‘poor’ households used such services as potable water (91% ‘non-poor’ against 82% ‘poor’ households); electricity (93% against 86%); inner city roads (63% against 54%), and solid-waste (51% against 40%). On the other hand, relatively higher proportion of ‘poor’ than ‘non-poor’ households (24% against 11%, in their respective orders) used public toilets services.
Figure 4.2: Proportions of Service Users by Socio-e conomic Status
4.2.2 Households 43. This section reports the level of satisfaction with public services. Respondents were asked whether they were “highly satisfied”, “satisfied”, “dissatisfied”, or “highly dissatisfied” with an array of public services. For purposes of analysis, responses are grouped into two categories: “highly satisfied” and “satisfied”, and “dissatisfied” and “highly dissatisfied” and the combined responses of each service are reported. 44. Respondents who were not familiar enough with a service to respond (those who provided “no” response when asked whether they have used a service during the last 12 months prior to the Survey and those who reported “Don’t know” response to a given service item were not counted in either of the two categories. Responses from respondents who had an opinion about a specific item are analysed below. The following paragraphs discuss satisfaction ratings across services items, socioeconomic groups as well as survey cities. Although the proportion varies from one survey question to the other, the category of non-response (No Answer) is often within the range of 5% to 10% of respondents.
0%
20%
40%
60%
80%
100%
Po
tab
le W
ate
r
Pu
bli
c H
ea
lth
Pu
bli
c E
du
cati
on
Ele
ctri
c P
ow
er
Str
ee
t Li
gh
tin
g
Inn
er
Cit
y R
oa
ds
Dra
ina
ge
So
lid
Wa
ste
Pu
bli
c T
oil
ets
Va
cuu
m T
ruck
Ma
rke
t In
fra
stru
ctu
re
Pu
bli
c P
ark
s
Ce
me
teri
es
Ho
usi
ng
/Sh
elt
er
No
n-p
hy
sica
l
SM
Es
Su
pp
ort
Use
Se
rvic
e,
% o
f re
spo
nd
en
ts
Poor Non-poor

MAIN REPORT: PARTICIPATORY CITIZENS' SATISFACTION B ASELINE SURVEY IN EIGHT UGDP
a) Overall Satisfaction of respondents with access to 45. One question in the survey, inquires: “the City Administration?” Figure 4.3by satisfaction level - from those with the highest levels of satisfaction to those with the lowest. 46. The survey found that respondents in the survey cities services provided by their city administratiosatisfied” or “satisfied”; while the majority 62Cities’ services (see Figures 4.3).
Figure 4.3: Rankings of access to Services
Areas of satisfaction and dissatisfaction
47. The respondents who have access to the service of the sixteen service items. The highest rated satisfaction items based upon the combined percentage of
Overall satisfaction
Cemeteries
Potable Water
Electric Power
Public Education
Solid Waste
Non-physical Services
Public Health
SMEs Support
Public Toilets
Market Infrastructure
Street Lighting
Housing/Shelter
Public Parks
Inner City Roads
Vacuum Truck
Drainage
Highy Satisfied' and 'Satisfied'
MAIN REPORT: PARTICIPATORY CITIZENS' SATISFACTION B ASELINE SURVEY IN EIGHT UGDP PARTNER CITY ADMINISTRATIONS
26
of respondents with access to Services
question in the survey, inquires: “Overall, how satisfied are you with the services 4.3 provides the response to this question as well as
from those with the highest levels of satisfaction to those with the lowest.
respondents in the survey cities were generally dissatisfied with provided by their city administrations. Only 38% of the respondents reported
while the majority 62% were “dissatisfied” or “highly dissatisfied” with the overall
Rankings of Level of Satisfaction of Households which have
and dissatisfaction
who have access to the service expressed some degree of satisfaction with five of the sixteen service items. The highest rated satisfaction items based upon the combined percentage of
38%
65%
62%
59%
58%
53%
49%
44%
32%
31%
30%
28%
25%
23%
22%
21%
18%
62%
35%
38%
41%
42%
47%
51%
56%
68%
69%
70%
72%
75%
77%
78%
79%
82%
Overall satisfaction
Cemeteries
Potable Water
Electric Power
Public Education
Solid Waste
physical Services
Public Health
SMEs Support
Public Toilets
Market Infrastructure
Street Lighting
Housing/Shelter
Public Parks
Inner City Roads
Vacuum Truck
Drainage
Highy Satisfied' and 'Satisfied' Highy Dissatisfied' and 'Dissatisfied'
MAIN REPORT: PARTICIPATORY CITIZENS' SATISFACTION B ASELINE 2013
ow satisfied are you with the services provided by s well as service item ranked
from those with the highest levels of satisfaction to those with the lowest.
satisfied with the overall ns. Only 38% of the respondents reported were “highly
% were “dissatisfied” or “highly dissatisfied” with the overall
which have
expressed some degree of satisfaction with five of the sixteen service items. The highest rated satisfaction items based upon the combined percentage of
Highy Dissatisfied' and 'Dissatisfied'

MAIN REPORT: PARTICIPATORY CITIZENS' SATISFACTION B ASELINE SURVEY IN EIGHT UGDP PARTNER CITY ADMINISTRATIONS
2013
27
“highly satisfied” and “satisfied” responses related to cemeteries (65%), potable water supply (62%), electric power (59%), public education (53%), and solid waste (53%). 48. On the other hand, the cities’ residents who have access to services were dissatisfied in eleven of the sixteen service items. Services items that received highest levels of dissatisfaction, based upon the combined percentage of “dissatisfied” and “highly dissatisfied” responses, were: drainage (82%), vacuum truck services (79%), inner city roads (78%), public parks (77%), housing/shelter (75%), street lighting (72%), market infrastructure (70%), public toilets (69%), SME support services (68%), public health (56%), and non-physical services (51%). b) Levels of Satisfaction among poor and non-poor g roups who have access to services 49. The survey showed the levels of satisfaction with public services among ‘poor’ and ‘non-poor’ households who have access to services were very close. As can be observed from Figure 4.4, the ‘poor’ as a group didn’t differ significantly from those ‘non-poor’ in their satisfaction levels with respect to given items. However, the ‘non-poor’ respondents were somewhat more satisfied with such services as potable water, public education, electric power, housing and non-physical services. On the other hand, the ‘non-poor’ households who have access to services were more satisfied in street lighting, solid waste, and public parks.
Figure 4.4: Levels of Satisfaction with Selected Services among Poor and Non -poor Groups
c) Levels of Satisfaction with accessed Services Ac ross Survey Cities 50. The survey showed the levels of satisfaction with selected public services across the survey cities varied considerably (see Figure 4.5). Satisfaction ratings (based upon the combined percentage of “highly
-10%
0%
10%
20%
30%
40%
50%
60%
70%
Potable W
ater
Public Health
Public Education
Electric Power
Street Lighting
Inner City Roads
Drainage
Solid W
aste
Public Toilets
Vacuum Truck
Market Infrastructure
Public Parks
Cemeteries
Housing/Shelter
Non-physical
SMEs Support
Highly Satisied and Satisfied
Poor Non-poor

MAIN REPORT: PARTICIPATORY CITIZENS' SATISFACTION B ASELINE SURVEY IN EIGHT UGDP
satisfied” and “satisfied” responses) for potable water were high for Adwa (94.6%), Debre Markos (85.5%), and Semera (83%) compared to those of Gambella (36.4%), Jigjiga (36.7%) and Yirgalem (37.6%). Similar satisfaction ratings can be seen for public health and publevels of satisfaction for public health services were observed in Adwa, Jigjiga, and Debre Markos (63%, 57%, and 52%, in their respective orders) against those of Nekemte (29%), Gambella (32%), and Yirgalem (35%). High level of satisfaction with public education services were reported by respondents in Adwa (89.4%) and Debre Markos (88.6%) compared with those of Semera (32.5%), Gambella (39.7%), and Nekemte (44.9%).
Figure 4.5: Levels of Satisfaction with Selected Social Service s
51. As is the case with selected public services, satisfaction levels with infrastructural services across cities varied significantly. This can be observed from Figure satisfaction with street lighting in Acompared to those of Yirgalem (2.2%), Nekemte (16%), Debre Markos (17.1%), and Adwa (22.4%). The vast majority (50% or more) of the respondents in all surveyed cities were dissatisfied with inner city roads and drainage infrastructures. Respondents in Adwa and Debre Markos were found to be ‘highly satisfied’ or ‘satisfied’ with solid waste collection services while respondents in ‘dissatisfied’ or ‘highly dissatisfied’ with the same service item.
Potable Water
Adwa 94.6%
Assosa 54.6%
Debre Markos 85.5%
Gambella 36.4%
Jigjiga 36.7%
Nekemte 58.6%
Semera 83.0%
Yirgalem 37.6%
0%
10%
20%
30%
40%
50%
60%
70%
80%
90%
100%
Hig
hly
Sa
tisi
ed
an
d S
ati
sfie
d
MAIN REPORT: PARTICIPATORY CITIZENS' SATISFACTION B ASELINE SURVEY IN EIGHT UGDP PARTNER CITY ADMINISTRATIONS
28
and “satisfied” responses) for potable water were high for Adwa (94.6%), Debre Markos (85.5%), and Semera (83%) compared to those of Gambella (36.4%), Jigjiga (36.7%) and Yirgalem (37.6%). Similar satisfaction ratings can be seen for public health and public education services. High levels of satisfaction for public health services were observed in Adwa, Jigjiga, and Debre Markos (63%, 57%, and 52%, in their respective orders) against those of Nekemte (29%), Gambella (32%), and
f satisfaction with public education services were reported by respondents in Adwa (89.4%) and Debre Markos (88.6%) compared with those of Semera (32.5%), Gambella (39.7%),
Levels of Satisfaction with Selected Social Service s by Study Cities
As is the case with selected public services, satisfaction levels with infrastructural services across cities varied significantly. This can be observed from Figure 4.6. The respondents reported high levels of
ction with street lighting in Asossa (66%), Jigjiga (63.7%), Gambella (58.6%) and Semera (50%) compared to those of Yirgalem (2.2%), Nekemte (16%), Debre Markos (17.1%), and Adwa (22.4%). The
the respondents in all surveyed cities were dissatisfied with inner city roads and drainage infrastructures. Respondents in Adwa and Debre Markos were found to be ‘highly satisfied’ or ‘satisfied’ with solid waste collection services while respondents in the other six cities were somewhat ‘dissatisfied’ or ‘highly dissatisfied’ with the same service item.
Potable Water Public Health Public Education
63.0%
47.4%
52.1%
32.7%
57.0%
29.2%
40.8%
35.2%
MAIN REPORT: PARTICIPATORY CITIZENS' SATISFACTION B ASELINE 2013
and “satisfied” responses) for potable water were high for Adwa (94.6%), Debre Markos (85.5%), and Semera (83%) compared to those of Gambella (36.4%), Jigjiga (36.7%) and Yirgalem
lic education services. High levels of satisfaction for public health services were observed in Adwa, Jigjiga, and Debre Markos (63%, 57%, and 52%, in their respective orders) against those of Nekemte (29%), Gambella (32%), and
f satisfaction with public education services were reported by respondents in Adwa (89.4%) and Debre Markos (88.6%) compared with those of Semera (32.5%), Gambella (39.7%),
As is the case with selected public services, satisfaction levels with infrastructural services across ts reported high levels of
sossa (66%), Jigjiga (63.7%), Gambella (58.6%) and Semera (50%) compared to those of Yirgalem (2.2%), Nekemte (16%), Debre Markos (17.1%), and Adwa (22.4%). The
the respondents in all surveyed cities were dissatisfied with inner city roads and drainage infrastructures. Respondents in Adwa and Debre Markos were found to be ‘highly satisfied’
the other six cities were somewhat
Public Education
89.4%
57.0%
88.6%
39.7%
61.0%
44.9%
32.5%
51.6%

MAIN REPORT: PARTICIPATORY CITIZENS' SATISFACTION B ASELINE SURVEY IN EIGHT UGDP
Figure 4.6: Levels of Satisfaction with Selected
52. Respondent’s satisfaction levels with small and micro enterprises support (overall and service dimensions individually) in the survey Cities are shown in Figure respondents (53.8%) in Adwa expressed satisfactionthe other survey cities were dissatisfied or highly dissatisfied with the overall SME support services. As far as the individual service dimensions is concerned, the majority of the respondents (50% or moYirgalem (68.9%) and Adwa (61.5%) were satisfied with the targeting mechanisms (fairness of identification and inclusion in the SMEs’ membership) while the majority of the respondents in the remaining survey cities expressed dissatisfaction. The majthe process of organizing SMEs in five out of eight cities. A higher proportion of the respondents in two cities Adwa and Yirgalem expressed satisfaction with technical skill training and access to financiaservices. Market linkage received the lowest satisfaction rating where the majority of the respondents in all survey cities were dissatisfied or highly dissatisfied.
Street Lighting
Adwa 22.4%
Assosa 66.0%
Debre Markos 17.1%
Gambella 58.6%
Jigjiga 63.7%
Nekemte 16.0%
Semera 50.0%
Yirgalem 2.2%
0%
20%
40%
60%
80%
100%
120%H
igh
ly S
ati
sie
d a
nd
Sa
tisf
ied
MAIN REPORT: PARTICIPATORY CITIZENS' SATISFACTION B ASELINE SURVEY IN EIGHT UGDP PARTNER CITY ADMINISTRATIONS
29
Levels of Satisfaction with Selected Accessed Infrastructure Services among Cities
Respondent’s satisfaction levels with small and micro enterprises support (overall and service dimensions individually) in the survey Cities are shown in Figure 4.7. Overall, a little more than half of the respondents (53.8%) in Adwa expressed satisfaction while the majority of respondents (50% or more) in the other survey cities were dissatisfied or highly dissatisfied with the overall SME support services. As far as the individual service dimensions is concerned, the majority of the respondents (50% or moYirgalem (68.9%) and Adwa (61.5%) were satisfied with the targeting mechanisms (fairness of identification and inclusion in the SMEs’ membership) while the majority of the respondents in the remaining survey cities expressed dissatisfaction. The majority of respondents expressed satisfaction with the process of organizing SMEs in five out of eight cities. A higher proportion of the respondents in two cities Adwa and Yirgalem expressed satisfaction with technical skill training and access to financiaservices. Market linkage received the lowest satisfaction rating where the majority of the respondents in all survey cities were dissatisfied or highly dissatisfied.
Inner City Roads Drainage Solid Waste
27.8% 36.1% 93.5%
10.6% 50.0% 27.0%
16.3% 15.8% 97.3%
37.3% 30.0% 27.8%
40.7% 42.9% 41.1%
17.8% 11.3% 13.3%
21.6% 3.6% 49.5%
8.4% 4.0% 19.7%
MAIN REPORT: PARTICIPATORY CITIZENS' SATISFACTION B ASELINE 2013
Infrastructure Services among Cities
Respondent’s satisfaction levels with small and micro enterprises support (overall and service . Overall, a little more than half of the
while the majority of respondents (50% or more) in the other survey cities were dissatisfied or highly dissatisfied with the overall SME support services. As far as the individual service dimensions is concerned, the majority of the respondents (50% or more) in Yirgalem (68.9%) and Adwa (61.5%) were satisfied with the targeting mechanisms (fairness of identification and inclusion in the SMEs’ membership) while the majority of the respondents in the
ority of respondents expressed satisfaction with the process of organizing SMEs in five out of eight cities. A higher proportion of the respondents in two cities Adwa and Yirgalem expressed satisfaction with technical skill training and access to financial services. Market linkage received the lowest satisfaction rating where the majority of the respondents in all
Public Toilets
65.3%
60.0%
48.3%
85.7%
23.9%
10.0%
46.0%
9.6%

MAIN REPORT: PARTICIPATORY CITIZENS' SATISFACTION B ASELINE SURVEY IN EIGHT UGDP PARTNER CITY ADMINISTRATIONS
2013
30
Figure 4.7: Levels of Satisfaction of those who hav e access to Small and Micro Enterprise Support Services in Suvey Cities
4.2.3 Business Enterprises a) Overall Satisfaction of those who have access to Services 53. A summary of satisfaction ratings of services (overall and individually) by business enterprises are presented in Figure 4.8. The survey revealed that business enterprises that have access to services were generally dissatisfied with the overall City services. The majority of them (65%) were “dissatisfied” or “highly dissatisfied”. A majority of the Enterprises in the Survey cities (50% or more) expressed some degree of satisfaction with four of the ten service items included in the survey. These are: water supply (71.1%), drainage structures (68.9%), electric power (65.2%), and solid waste collection (62.5%). 54. On the other hand, the majority of the enterprises who have access to services expressed dissatisfaction with six of the ten services. The highest levels of dissatisfaction were expressed with
Targeting Organizing Skill TrainingBusiness Training
Access to Finance
Access to Market Stalls
Market Linkages
SME Support - Overall
All Cities 47.1 48.8 39.6 35.0 36.3 22.5 20.5 31.7
Adwa 61.5 52.6 66.0 62.2 60.9 28.8 28.2 53.8
Assosa 35.3 52.9 52.9 41.2 52.9 52.9 47.1 47.1
Debre Markos 43.9 56.1 29.2 13.6 28.8 16.7 12.1 33.8
Gambella 36.6 60.0 27.5 26.8 23.1 17.5 14.6 27.5
Jigjiga 33.8 42.6 36.8 32.4 29.4 23.5 26.5 30.9
Nekemte 27.4 31.3 24.1 22.2 24.0 15.7 13.8 17.4
Semera 20.0 17.5 10.0 10.0 7.5 15.0 12.5 12.5
Yirgalem 68.9 65.6 43.9 38.9 39.4 25.0 21.7 28.9
0
10
20
30
40
50
60
70
80
% of Respondents Highly Staisfied and Satisfied

MAIN REPORT: PARTICIPATORY CITIZENS' SATISFACTION B ASELINE SURVEY IN EIGHT UGDP PARTNER CITY ADMINISTRATIONS
2013
31
business development service (64.4%), vacuum truck services (65.8%), street lighting (69%), inner city roads (66.7%), slaughter house (67.1%), and public toilets (49.2%).
Figure 4.8: Rankings of Satisfaction of Business En terprises who have aceess to Services
b) Areas of satisfaction and Dissatisfaction 55. When the satisfaction ratings are disaggregated by city, the majority of enterprises of those who have access to services in only two (Yirgalem and Jigjiga ) out of eight survey cities expressed some degree of satisfaction with the overall services while the overwhelming majority were highly dissatisfied or dissatisfied with the overall services. 56. The high levels of satisfaction ratings (based upon the combined percentage of “highly satisfied” and “satisfied” responses) were expressed by the enterprises in majority of the cities in potable water supply (in seven of the eight cities), and solid waste collection (90.9%). The Enterprises expressed moderate levels of satisfaction with sanitary services (63.6%), and electric power (59.4%). 57. The businesses that could access the services were dissatisfied with six of the ten service items. The highest levels of dissatisfaction, based upon the combined percentage of “dissatisfied” and “highly dissatisfied” responses related to street lighting (85.2%), inner city roads (72.4.6%), abattoir services (50.0%), business development services (66.7.3%), vacuum truck services (67.3%), and drainage infrastructures (59.7%).
34.2
71.1
68.9
65.2
62.5
42.6
32.3
31.2
31.0
30.2
24.2
65.0
28.4
30.4
34.8
28.1
49.2
67.1
66.7
69.0
65.8
64.4
0.5
0.6
0.0
0.6
2.2
4.0
11.4
All Public Services
Potable Water Supply
Drainage Structures
Electricity
Solid Waste Collection
Public Toilets
Slaughterhouse
Inner City Roads
Stree Lighting
Vacuum Trucks
Business Development …
Highly Satisfied or Satisfied Dissatisfied or Highly dissatisfied No Answer/Do not know

MAIN REPORT: PARTICIPATORY CITIZENS' SATISFACTION B ASELINE SURVEY IN EIGHT UGDP PARTNER CITY ADMINISTRATIONS
2013
32
Figure 4.9: Satisfaction of Business with access to Services by Types of Public Services and Study Cit ies
4.3 Public Participation and Access to Public-domai n Information 58. The concept of public participation is complex and multi-dimensional in nature, and more often than not, it is defined and understood differently by different users. The semantic squabbling put aside, inarguably, public participation is both a means and an end by itself to decentralized and democratic local governance. As a means to an end, public participation requires that citizens should be effectively involved in the development of their cities so as to contribute to and benefit from local urban development efforts of their city administrations. In fact, public participation is essential tool for the expansion, management and effective delivery of public services. As an end by itself, citizens have an unalienable constitutional right to participate and be consulted in all matters (urban governance and service delivery in our case) that affect (directly or otherwise) their lives and livelihoods positively or negatively. Having internalized those principles and recognizing the pivotal role it plays in urban public service delivery, the current survey has attempted to capture information from various sample groups (households, businesses, CSOs and vulnerable destitute) on some key aspects of public participation using selected indicators on both the formal/procedural aspects as well as on aspects related to quality and effectiveness of public participation.
Overall
Services
Potable
Water Supply
ElectricitySlaughterh
ouse
Stree
Lighting
Inner City
Roads
Drainage
Structures
Solid
Waste Collection
Public
Toilets
Vacuum
Trucks
Business
Development Services
All Cities 34.2 71.1 65.2 32.3 31.0 31.2 68.9 62.5 42.6 30.2 24.2
Adwa 39.4 93.8 59.4 14.8 27.6 42.1 90.9 63.6 33.3 30.3 30.0
Assosa 30.0 58.3 60.7 30.4 17.2 27.3 25.0 - 10.7 6.3
Debre Markos 20.7 88.0 32.1 27.3 24.0 27.3 92.9 - 40.0 8.0 25.0
Gambella 10.7 37.0 72.4 41.2 71.4 - 41.7 100.0 100.0 10.3 5.3
Jigjiga 58.6 62.5 77.8 55.0 72.7 70.0 60.7 100.0 41.2 42.9 34.8
Nekemte 10.0 60.0 53.3 38.5 10.3 7.4 39.3 60.0 28.6 10.0 22.7
Semera-Logia 36.0 89.3 100.0 - 25.0 33.3 75.0 33.3 100.0 25.9
Yirgalem 66.7 70.0 66.7 30.0 34.5 43.3 96.7 71.4 63.6 27.6 71.4
0
10
20
30
40
50
60
70
80
90
100
% of Respondents: Highly Satisfied or Satisfied

MAIN REPORT: PARTICIPATORY CITIZENS' SATISFACTION B ASELINE SURVEY IN EIGHT UGDP PARTNER CITY ADMINISTRATIONS
2013
33
4.3.1 Households A) Participation in City Development: 59. With a little over half (53%) of the households reporting to have participated in city development activities either "Always", or "Sometimes" , or "Rarely" during the reference period ( 12 months prior to the survey), overall participation of residents in the development of their cities is modest, but encouraging. However, rates of households' participation vary widely from one city to the other. While higher (higher than the overall average of 53%) rates of participation were reported for Nekempte closely followed by Debre Markos and Yirgalem, lowest rate (as low as 28%) was reported for Semara-Logia City Administration (Fig. 4.10).
60. Variations in households' ratings with respect to various aspects of public participation are also remarkable in the study cities. While aspects such as making contributions to city development, invitation to and participation in public meetings were higher, citizens providing comments to city development plans, lodging grievances, receiving satisfactory responses to grievances, and incorporating citizens' comments in to city development plans on the part of the CAs were considerably lower than the overall average of 53% for all study cities (Fig. 4.11).
64
.1
59
.0
58
.4
46
.1
44
.1
43
.6
42
.7
27
.7
52
.9
-
10.0
20.0
30.0
40.0
50.0
60.0
70.0
Pe
rce
nt
pa
rtic
ipa
tin
g
BLS Cities
Fig. 4.10: Percent Households Participating
("Always" + "Sometimes" + "Rarely) in Urban
Development by BLS Cities
69
.9
61
.8
59
.7
57
.5
53
.1
50
.2
39
.4
36
.3
31
.0
22
.3
52
.9
-
10.0
20.0
30.0
40.0
50.0
60.0
70.0
80.0
Pe
rce
nt
(Alw
ay
s +
So
me
tim
es
+ R
are
ly)
Aspects of Participation
Fig. 4.11: Proportions of Citizens' Participation
("Always" + "Sometimes" + "Rarely") by Aspects of
Public Participation in All BLS Cities

MAIN REPORT: PARTICIPATORY CITIZENS' SATISFACTION B ASELINE SURVEY IN EIGHT UGDP PARTNER CITY ADMINISTRATIONS
2013
34
61. When the overall rate public participation in city development is disaggregated by socio-economic status of the households, on the whole, participation rates of non-poor (54%) was higher than those of the poor (52%). However, the differences remain small (Fig. 4.12), despite their consistency in most of the cities (other than Adwa, Semara-Logia and Yirgalem); and their ramifications to the UGDP's pro-poor focus. 62. The baseline survey has also attempted to collect information on the quality and effectiveness of public participation in addressing citizens' needs, interests and priorities. Overall, while only about 16% of poor households reported satisfaction, the proportion is nearly twice as much (27%) for non-poor households. As could be seen from Fig. 4.13, satisfaction rates for all three participation outcome indicators are consistently and significantly lower among poor households than their non-poor counterparts. Moreover, with only exception of Semara-Logia and Gambella, rates of satisfaction with outcomes of public participation were consistently and considerably lower among poor as opposed to non-poor households in all the remaining six City Administrations.
51.5 54.4
-
10.0
20.0
30.0
40.0
50.0
60.0
70.0
80.0
Po
or
No
n-p
oo
r
Po
or
No
n-p
oo
r
Po
or
No
n-p
oo
r
Po
or
No
n-p
oo
r
Po
or
No
n-p
oo
r
Po
or
No
n-p
oo
r
Po
or
No
n-p
oo
r
Po
or
No
n-p
oo
r
Po
or
No
n-p
oo
r
Adwa AssosaD. MarkosGambella Jigjiga NekemteS. Logia YirgalemAll Cities
Pe
rce
nt
Pa
rtic
ipa
tio
n
Fig. 4.12: Proportions of Poor and Non-poor Households' Public
Participation ("Always" + "Sometimes" + "Rarely") by BLS Cities
17.8
26.7
22.3
15.0
26.1
20.6
14.3
27.1
20.7
-
5.0
10.0
15.0
20.0
25.0
30.0
Po
or
No
n-p
oo
r
Bo
th G
rou
ps
Po
or
No
n-p
oo
r
Bo
th G
rou
ps
Po
or
No
n-p
oo
r
Bo
th G
rou
ps
Quality &
Effectiveness of
Participation
CA's Utilization of
Resources
Equitable
Distribution of
Benefits
Fig. 4.13: Comparison of Proportions of Poor and Non-
poor Households' Satisfaction with Participation
Outcome Indicators in All BLS Cities

MAIN REPORT: PARTICIPATORY CITIZENS' SATISFACTION B ASELINE SURVEY IN EIGHT UGDP PARTNER CITY ADMINISTRATIONS
2013
35
B) Satisfaction with Access to Public-domain Inform ation 63. From the outset, it should be noted that there has been a significant movement among local government s to make public-domain information as reasonably accessible to their electorate as possible - right move on the right direction. In line with this, the current survey attempted to assess how well citizens are satisfied with accessibility of public-domain information. As could be seen from Fig. 4.14, satisfaction rates are very low (seven percent) at the moment; and such information are slightly least accessible to the poor (six percent) as opposed to non-poor (eight percent). While citizens' satisfaction with accessibility of such information is above the overall average of seven percent in Jijiga, Adwa and Debre Markos City Administrations, it is lower in others and lowest for Yirgalem and Gambella. 64. With the exception access to annual audit information, with which citizens' satisfaction remains very low (less than five percent), there were no significant differences between satisfaction rates of the rest of public-domain information. Once again, results of the survey confirm that citizens' satisfaction rates with accessibility of public-domain information are consistently lower among poor households than in non-poor for all indicators (Fig. 4.15).
AdwaAssos
a
D.
Marko
s
Gamb
ellaJigjiga
Neke
mte
Semer
a
Yirgal
em
All
Cities
Poor 9.5 3.2 9.8 3.1 10.0 5.7 6.9 0.7 5.9
Non-poor 14.4 7.2 11.2 3.5 17.5 5.2 5.2 3.2 8.4
Both 11.9 5.2 10.6 3.3 14.1 5.4 6.0 1.9 7.2
-2.0 4.0 6.0 8.0
10.0 12.0 14.0 16.0 18.0 20.0
Pe
rce
nt
Sa
tisf
ied
Fig. 4.14: Proportions of Poor and Non-poor Households'
Satisfaction with Accessibility of Public-domain Information by
BLS Cities
Poor Non-poor Both
6.7
10.4 8.6
4.0 4.5 4.2 4.8
9.5
7.2 8.1
9.2 8.7
5.9
8.4 7.2
-2.0
4.0
6.0 8.0
10.0
12.0
Po
or
No
n-p
oo
r
Bo
th
Po
or
No
n-p
oo
r
Bo
th
Po
or
No
n-p
oo
r
Bo
th
Po
or
No
n-p
oo
r
Bo
th
Po
or
No
n-p
oo
r
Bo
th
Annual budget
information
Annual audit
information
Public
procurement
information
Information
on CA's dev't
plans, projects
All Information
Pe
rce
nt
Public-domain Information
Fig. 4.15: Proportions of Poor and Non-poor Households' Satisfaction
with Accessibility of Public-domain Information in All BLS Cities by Type
of Public-domain Information

MAIN REPORT: PARTICIPATORY CITIZENS' SATISFACTION B ASELINE SURVEY IN EIGHT UGDP PARTNER CITY ADMINISTRATIONS
2013
36
C) Tax Awareness and Literacy 65. With an overall 83% of citizens reporting that they believe paying taxes is important to improve the delivery of public services in their respective cities, it could be argued that citizens have understood that tax is a civic virtue among all residents. On the other hand, however, tax awareness raising efforts as well as their effectiveness in raising tax awareness among citizens are not as great as the tax awareness itself is. For example, despite massive efforts being made mainly by central government but also local governments in recent years, only less than half of the residents reported that they have received tax awareness raising information; and out of those who received such information only 45% believed that the information they received were useful in raising tax awareness. In terms of variations in tax awareness across cities, reportedly tax awareness among citizens is lower than the overall average (83%) in Adwa, Gambella and Semara-Logia, but higher in the remaining five study cities (Fig. 4.16).
4.3.2 Business Enterprises A) Participation in City Development 66. Surprisingly, trends and patterns of public participation among business enterprises are closely similar to those of the households. For instance, overall public participation rate which was 53% for households is 55% for business enterprises. Similarly, rates of participation of businesses for the more formal or procedural aspects such as cash contribution, invitation to and participation in public meetings are higher than the average (55%) than those less procedural aspects such lodging complaints, receiving
50
.7
23
.6
49
.3
29
.2
62
.4
60
.7
32
.0
63
.7
46
.2
47
.3
21
.9
45
.2
26
.3
61
.3
60
.0
36
.3
62
.0
44
.9
71
.7 8
6.2
95
.9
77
.3
81
.0
84
.7
80
.0
88
.3
83
.0
-
20.0
40.0
60.0
80.0
100.0
120.0
Adwa Assosa D. Markos Gambella Jigjiga Nekemte S. Logia Yirgalem All Cities
Pe
rce
nt
"Ye
s"
Fig. 4.16: Proportions of Citizens' Tax Awareness / Literacy by Aspects of Tax Awareness
and BLS Cities
Received tax awareness raising information
If received, was the information helpful in raising tax awareness
Do you now believe paying taxes is important to improve public service delivery in your city

MAIN REPORT: PARTICIPATORY CITIZENS' SATISFACTION B ASELINE SURVEY IN EIGHT UGDP PARTNER CITY ADMINISTRATIONS
2013
37
satisfactory responses (from local authorities) to complaints and incorporating citizens comments in to city development plans Fig. 4.18).
67. It is also interesting to note that with the exception Adwa that joined the group in the case of participation of business enterprises, the same three cities (Nekempte, Debre Markos and Yirgalem) for which higher citizens' participation was reported earlier, reported higher participation of business enterprises in city development activities. Participation of business enterprises in city development is also low in Gambella, Asossa and Semara-Logia cities, which was also the case with the households (Fig. 4.17). The fact that both satisfaction and participation are more or less consistently lower in Gambella, Asossa and Semara-Logia is reassuring that extra efforts would be needed to bring these citizens; satisfaction and participation to a more desirable level. 68. Three indicators - quality and effectiveness of public forums, CAs' resource utilization and equity in the distribution of benefits of public investments among social groups - were used assess satisfaction with outcomes of public participation. Accordingly, only a little over a quarter of (~27%) of owners of business enterprises reported that they were satisfied with outcomes of public participation (Fig. 4.19); and unexplainably, satisfaction was highest for Yirgalem - a City Administration that joined the UGDP only half way in the second phase of the programme.
67.7 67.0 65.8 58.7
55.0 47.7
43.7
33.7
55.0
-
10.0
20.0
30.0
40.0
50.0
60.0
70.0
80.0
Pe
rce
nt
Fig. 4.17: Proportions of Business
Enterprises Participating in Urban
Development by BLS Cities
79.0
64.2 63.0 58.0 57.2 56.4
49.8 46.5 40.7
35.4
55.0
-10.0 20.0 30.0 40.0 50.0 60.0 70.0 80.0 90.0
Pe
rce
nt
pa
rtic
ipa
tin
g
Fig. 4.18: Proportions of Businesses Reporting Public
Participation ("Always" +"Sometimes" + "Rarely") in
All BLS Cities by Aspects of Participation
58.9
33.3 33.3
21.2 21.1 20.0 14.4 12.2
26.7
-
10.0
20.0
30.0
40.0
50.0
60.0
70.0
Pe
rce
nt
sati
sfie
d
Fig. 4.19: Proportions of Businesses Reporting
Satisfaction with Quality and Effectiveness
Participation by BLS Cities

MAIN REPORT: PARTICIPATORY CITIZENS' SATISFACTION B ASELINE SURVEY IN EIGHT UGDP PARTNER CITY ADMINISTRATIONS
2013
38
B) Satisfaction with Accessibility of Public-domain In formation 69. Indicators used in the assessment of accessibility of public-domain information included annual budget, annual audit, public procurement and information about city development plans and projects. With an overall average of about 14% of business reporting satisfaction, access by business enterprises to public-domain information is very low. With the exception of Yirgalem and Semara-Logia, satisfaction of owners of business enterprises is lower than the overall average (14%) in all cities; and lowest in Asossa and Gambella (Fig. 4.20). In summary, results of the baseline survey clearly indicated that given the current rate of satisfaction among businesses (14%) and other citizens (7%) with accessibility of public-domain information, efforts launched in recent years by central and local governments to make public-domain information more widely accessible by business enterprises and the wider public are yet to come to fruition, and hence, such efforts need to be intensified in the future.
70. In terms of variations by types of public-domain information, businesses' satisfaction with accessibility of information about cities' development plans and projects and public procurement information was relatively higher than those of annual budget and audit information (Fig. 4.21).
12.9
5.0
12.5
6.7
14.2
11.7
16.7 17.5
13.8
-
2.0
4.0
6.0
8.0
10.0
12.0
14.0
16.0
18.0
20.0
Pe
rce
nt
sati
sfie
d
Fig. 4.20: Proportions of Businesses Satisfied
with Accessibility of Public-domain Information
by BLS Cities
10.79.1
16.5
18.9
13.8
0.0
2.0
4.0
6.0
8.0
10.0
12.0
14.0
16.0
18.0
20.0
Pe
rce
nt
Sa
tisf
ied
Fig. 4.21: Proportions of Businesses
Reporting Satisfaction with Accessibility of
Public-domain Information by Type of
Information

MAIN REPORT: PARTICIPATORY CITIZENS' SATISFACTION B ASELINE SURVEY IN EIGHT UGDP PARTNER CITY ADMINISTRATIONS
2013
39
C) Tax Awareness and Literacy 71. As important and closely associated with business operations as it has ever been, survey results showed that tax literacy among business enterprises is more than encouraging (85%, slightly higher than that of households' 83%). Moreover, unlike households that reported considerable lower rates (mid 40s), well over 60% of business enterprises reported that they had received tax awareness raising information and the information received were useful in raising tax awareness among members of the business community in the study cities. However, although tax awareness (those who believe that paying taxes is important for expanding public services in their cities) was one-hundred percent, only about a quarter of businesses reported that they had received tax awareness raising information and the information received was useful in raising tax awareness (Fig. 4.22). With regard to tax literacy, Semara-Logia is an exception where members of the business community responded to the first two questions ( tax awareness raising information and usefulness of such information) but not to the question that asks whether or not they believed that paying taxes is important for expanding access to public services. 4.3.3 Membership Based Civil Society Organizations A) Participation in City Development 72. With an overall rate of about 59%, the level of participation of Civil Society Organizations (CSOs) in processes and activities of urban development in their respective cities is relatively higher than that of households and business enterprises. As would be expected, rates of participation vary across cities as well as aspects of participation. CSOs' participation rates are higher than the average (59%) for Debre Markos, Nekempte, Adwa and Jijiga and lower for the rest of the cities. Lowest rate of CSOs participation was recorded for Asossa City Administration (Fig. 4.23). With respect to aspects of participation, invitation to and participation in public meetings, and provision of comments (by CSOs) is slightly higher than the overall average, while aspects of participation including incorporating CSOs' comments in to city development plans and CSOs' participation in citizens' awareness raising sessions are lower (Fig. 4.24).
62.167.1
84.8
0
20
40
60
80
100
120
Pe
rce
nt
Fig 4.22: Distribution of BEPs by Indicators of
Tax Literacy/Awarness and BLS Cities
Received tax awareness raising information
The information was useful in rasing awareness
Believe that paying tax is important for expanding public services

MAIN REPORT: PARTICIPATORY CITIZENS' SATISFACTION B ASELINE SURVEY IN EIGHT UGDP PARTNER CITY ADMINISTRATIONS
2013
40
73. The other important aspect of public participation and voicing on which the current survey sought information was transparency and accountability of local public officials. Accordingly, only about one-quarter of the CSOs reported that they are satisfied with transparency and accountability of local public officials in all study cities. As one would expect it, however, the rates of CSOs' satisfaction with transparency and accountability of local public officials vary widely from one city to the other. For example, while the rates are much higher than the overall average (25%) for Debre Markos, Jijiga and Semara-Logia, they are lower for the rest of City Administrations. The lowest satisfaction rates are reported for Gambella and Asossa City Administrations (Fig. 4.25).
76
.6
65
.9
65
.4
64
.0
55
.0
46
.7
45
.2
30
.7
58
.9
-
10.0
20.0
30.0
40.0
50.0
60.0
70.0
80.0
90.0
Pe
rce
nt
Pa
rtic
ipa
tio
n
Fig. 4.23: Proportions of CSOs' Reporting to
Have Participated in Public Affairs (Always +
Sometimes + Rarely) by BLS Cities
59
.2
72
.1
59
.3
52
.0
52
.0
58
.9
-
10.0
20.0
30.0
40.0
50.0
60.0
70.0
80.0
Pe
rce
nt
Aspects of Participation
Fig. 4.24: Proportions of Public Participation
Among CSOs by Aspects of Participation
56.7
40.0
33.3
16.7 16.7 13.0
10.0 6.7
24.5
-
10.0
20.0
30.0
40.0
50.0
60.0
Pe
rce
nt
Fig. 4.25: Proportions of CSOs Reporting Satisfaction (HS + S)
with Transparency & Accountability of Local Public Officials

MAIN REPORT: PARTICIPATORY CITIZENS' SATISFACTION B ASELINE SURVEY IN EIGHT UGDP PARTNER CITY ADMINISTRATIONS
2013
41
B) Satisfaction with Access to Public Domain Inform ation 74. CSOs were asked the same (same as households and businesses) set of questions that deal with the level of satisfaction with accessibility of public-domain information. As could be seen from Fig. 4.26 and Fig. 4.27 below, with only 17% reporting affirmative, CSOs' satisfaction with accessibility of public-domain information is awfully low in the study cities. However, there are significant differences between cities as well as aspects of public-domain information. For instance, satisfaction rate in Adwa is twice as much (35%) as the overall average (17%). Lowest satisfaction rates were recorded for Gambella, Yirgalem and Asossa City Administrations. With respect to indicators of public-domain information, accessibility of annual budget information and information about cities' development plans and projects by CSOs was slightly higher than the overall average (17%), while that of annual audit and public procurement information was significantly lower (Fig. 4.27).
4.4 Vulnerable Groups 75. Given all the more important poverty-focus of the ongoing UGDP phase-three, the current survey attempted to include vulnerable and destitute groups who are often ignored by many large scale surveys for the mere fact that the majority of such groups are either homeless or do not have permanent physical address. Recognizing the unique characteristics of such group (no or extremely limited access to public services, entirely different sets of needs, priorities and interests, etc), the survey instruments were modified to suit the circumstances of vulnerable groups, but applied uniformly across all study cities. The two main areas in which the survey sought information from vulnerable groups are: i) access to basic needs - food, shelter, clothing and healthcare and, ii) the level of participation in the mainstream societal life.
34.6
27.8 25.0 24.4
15.0
6.3 4.3 3.3
17.0
-
5.0
10.0
15.0
20.0
25.0
30.0
35.0
40.0
Pe
rce
nt
Fig. 4.26: Proportions of CSOs Reporting
Satisfaction (HS + S) with Accessibility of Public-
domain Information by BLS Cities
21.9
11.7 13.3
21.0
17.0
-
5.0
10.0
15.0
20.0
25.0
Pe
rce
nt
Sa
tisf
ied
Public-domain Information
Fig. 4.27: Proportions of CSOs Satisfaction
with Accessibility of Public-domain
Information by Types of Information

MAIN REPORT: PARTICIPATORY CITIZENS' SATISFACTION B ASELINE SURVEY IN EIGHT UGDP PARTNER CITY ADMINISTRATIONS
2013
42
4.4.1 Access to Basic Needs 76. With an overwhelming majority of about 88% reporting to have no access to food ("always", "sometimes" and "rarely" combined), the figure may not be surprising for such a group, but it is truly worrisome. Moreover, the proportions do not vary much by cities except Semera-Logia and Jigjiga where slightly lower proportions (about 70% of members of the group) reported that they very often face food shortages (Fig. 4.28). In spite of the fact that the proportions reporting lack of access are significantly lower (51%), the pattern is the same for other basic needs such as access to shelter, clothing, and healthcare in the study cities. Proportions reporting constrained access to basic needs other than food are higher than the average (51%) in Asossa, Adwa, Debre Markos and Gambella and it is lower in the rest of the City Administrations (Fig. 4.29). 77. In summary, results of the baseline survey suggest that there is a very high degree of deprivation of the most basic, physiological needs (food for instance) among members of vulnerable groups in all cities studied. Such an undesirable scenario needs to be reversed using an integrated and synergistic approach to firstly reduce suffering of such people from deprivation of some of the most basic needs and, secondly, to lay the foundation for the group to extricate themselves out of vicious cycle of poverty. Fortunately, the ongoing UGDP phase-three, provides a unique opportunity to adopt an integrated approach to urban poverty reduction that could lead to synergetic outcomes. That is, linking labour-intensive project activities taking place (by design and not by accident) in poverty neighbourhoods in all partner cities with introduction and or adoption of urban safety-nets.
4.4.2 Public Participation
78. Unsurprisingly, the level of participation of vulnerable and socially marginalized destitute groups in the mainstream societal or community life is extremely low (16%) in all cities except Debre Markos where 41% participation rate was reported. Lowest rates of public participation among vulnerable groups were
10
0.0
96
.9
96
.7
93
.3
90
.0
80
.0
70
.6
70
.0 8
7.7
-
20.0
40.0
60.0
80.0
100.0
120.0
Pe
rce
nt
Go
ing
Hu
ng
ry
Fig. 4.28: Proportions of Vulnerable Groups
that GO HUNGRY (Always + Sometimes +
Rarely) by BLS Cities6
3.3
57
.8
55
.0
51
.7
46
.7
45
.0
42
.8
37
.5 5
0.5
-
10.0
20.0
30.0
40.0
50.0
60.0
70.0
% w
ith
Acc
ess
to
ba
sic
Ne
ed
s
Fig. 4.29: Proportions of Vulnerable Groups
Reporting to Have Access to Basic Needs
Other than Food Always + Sometimes + Rarely
by BLS Cities

MAIN REPORT: PARTICIPATORY CITIZENS' SATISFACTION B ASELINE SURVEY IN EIGHT UGDP PARTNER CITY ADMINISTRATIONS
2013
43
reported for Yirgalem, Jijiga, Semara-Logia and Nekempte City Administrations (Fig. 4.30). Such an extremely low level of public participation by the group, which could also explain, at least partly, the underlying cause to their deprivation and vulnerability, would be appreciated more and understood well when a comparison is made with other survey groups. For example, as we have mentioned earlier in this Chapter, overall rate of public participation among households and business enterprises were respectively 53% and 55%; both of which are more than three times higher compared to the average participation rate of only 16% among vulnerable groups.
79. Viewed from the perspective of different aspects of public participation, one important issue that stands out is effort by members of vulnerable group to generate income to sustain their lives and those of their families. Unlike many other aspects of participation, nearly 34% of members of the groups reported that they are currently engaged in some sort of income generating activities. Moreover, about 14% of the group reported that they had received skills training in the past (Fig. 4.31) Although the scope of the current survey does not allow further investigations in to the kind of income generating activities from which the group is currently earning a living, the fact that sizeable number of members of the group are currently engaged in economic activities to earn their livelihood; and also some of them had participated in skills training in the past, are some of the things that need to be investigated further, given serious and systematic considerations for they could provide an entry point and serve as a solid stepping stone on which future interventions aimed at reducing urban poverty and vulnerability could be built upon in a more self-sustaining manner.
41
.3
20
.9
20
.0
11
.8
7.6
6.8
6.3
3.3
15
.6
-
5.0
10.0
15.0
20.0
25.0
30.0
35.0
40.0
45.0
De
bre
Ma
rko
s
Ad
wa
Ass
osa
Ga
mb
ell
a
Yir
ga
lem
Jig
jig
a
S.
Log
ia
Ne
ke
mte
All
Cit
ies
% P
art
icip
ati
ng
Fig. 4.30: Proportions of Vulnerable
Groups Reporting Public Participation
("Yes") by BLS Cities
33
.6
21
.5
18
.6
15
.7
15
.6
15
.5
13
.6
12
.8
11
.9
7.8
5.3
15
.6
-
5.0
10.0
15.0
20.0
25.0
30.0
35.0
40.0
Pe
rce
nt
Pu
bli
c P
art
icip
ati
on
Aspects of Participation
Fig. 4.31: Overall Proportions of Public Participation
Among Vulnerable Groups by Aspects of participation

MAIN REPORT: PARTICIPATORY CITIZENS' SATISFACTION B ASELINE SURVEY IN EIGHT UGDP PARTNER CITY ADMINISTRATIONS
2013
44
5. Summary, Conclusions and Recommendations
5.1 Key Baseline Indicators 80. A quantitative summary of key baseline indicators (for all survey themes and al target groups), which should be used to monitor progress and achievement of the programme targets at a later date are presented in Table 5.1 below. Table 5.1: Summary of Key Baseline Indicators
Themes Description
Households Other Target Groups
Poor Non-
poor Both
Business
Enterprises CSOs
Vulnerabl
e Groups
Public Services Access to Services 54.4 59.8 57.1 61.2 na na
Satisfaction with Services 37.9 39.5 38.7 34.2 na na
Public
Participation,
Access to
Information and
Tax Literacy
Level of Participation 51.5 54.4 52.9 55.0 58.9 15.6
Satisfaction with Participation Outcomes 15.7 26.6 21.2 26.7 na na
Satisfaction with Access to Public-domain
Information 5.9 8.4 7.2 13.8 17.0 na
Tax Literacy & Awareness 81 86.9 84.0 84.8 na na
Social Exclusion:
Access to Basic
Needs
No or Limited Access to Food na na na na na 87.7
No or Limited Access to Other Basic
Needs (clothing, shelter, healthcare) na na na na na 50.5
5.2 Summary of Main Findings and Recommendations 5.2.1 Innovations: Achievements and Remaining Issue s 81. A) Training and Local Capacity Development: With a strategic view of capacitating respective CAs and other local stakeholders to conduct similar surveys independently, survey training and local capacity development was deliberately made part of the current baseline survey planning, design and implementation processes. Accordingly, various local teams were organized in each city, received a series of formal and on-the-job trainings before and during the entire survey operation. The training included a range of survey related topics - survey planning, survey instruments, sampling design, administration of surveys, data quality control, data entry, analysis and interpretation and generation of preliminary survey outputs. While mobilization of the teams, the training and participatory operations of the survey were instrumental in building local capacities; and local teams were highly motivated, inspired and confident to undertake similar surveys in the future, two important issues remain pending. Firstly, time constraints did not allow a more detailed hands-on training on essential survey aspects such as rigorous data analysis and interpretation, database management and report writing. Secondly, we strongly believe that a strong socio-economic survey infrastructure or foundation has been put in place in all partner cities. However, a one-off training coupled with disengagement of the teams for any protracted period of time would mean no infrastructure; and everything has to start from the scratch again, hence, a unique opportunity foregone. 82. Recommendation : Therefore, in order to maximize benefits the investments already made on local capacity building, the dynamic created and momentum built should be not only maintained, but also taken more steps ahead by keeping them engaged with the project, i.e., providing opportunities (refresher training and additional survey work) to the teams to gain more experience and confidence which would be

MAIN REPORT: PARTICIPATORY CITIZENS' SATISFACTION B ASELINE SURVEY IN EIGHT UGDP PARTNER CITY ADMINISTRATIONS
2013
45
instrumental both for their own career development and the UGDP's upcoming mid-line and end-line surveys, and community-based monitoring and evaluation. 83. B) Participation and Local Ownership: Participation of local stakeholders may not be unique to the current baseline survey. But, what is quite unique about this survey is: first, the extent of participation of local stakeholders that went up to and including ownership of the entire survey processes and outputs (database for future use) and, second, the innovative approach adopted, i.e., a participatory, citizens' satisfaction survey, which, by allowing citizens to evaluate performances of local governments in public service delivery, promotes citizens' constitutional rights of holding local governments accountable (to their actions or inactions) to the electorate - a courageous move on the part of public officials at all levels. 84. Recommendation : Arising from qualitative nature of citizens' satisfaction surveys, results of such surveys may or may not tally with realities on the ground. It is important and also advisable to validate findings of the survey as an internal consistency check. But what is more important is: a) to widely share and disseminate findings of the survey with citizens and other stakeholders in each city - this could also serve as a platform for validation and reconciliation of survey findings with on-the-ground realities, b) to use findings of the current survey to prepare bench-marks for improvement of citizens' access to and satisfaction with the delivery of public services, and c) last but not least, to institutionalize participatory citizens' satisfaction surveys in to existing governance structures and processes.
5.2.2 Access to and Satisfaction with Public Servic es 85. Households: Access to and satisfaction with public services are intimately interrelated concepts in which any attempt to assess the latter presupposes the availability or use of the former. Accordingly, the current baseline survey used access both as an indicator on its own right and as a means or filter to assess citizens' satisfaction. As an indicator of availability or accessibility of public services, rates of citizens' access to services are consistently and significantly higher than those of satisfaction. Generally, disregarding remarkable variations that existed between cities, with 57% and 61% access rates for households and businesses respectively, accessibility of public services is relatively good, but it is not good enough to justify any celebration of achievements by CAs as there remains a long way to go; and all that is taking place in the face rapid and unabated growth of urban population in all cities and in cities in emerging regions in particular. 86. Main findings of the survey regarding citizens' access to and satisfaction with public services and corresponding recommendations can be summarized into four categories as follows:
a. High-Access-High-Satisfaction: This is the most desirable scenario of all and City Administrations of Adwa and Jijiga along with six public services (electricity, cemeteries, non-physical services, potable water, public health and education) fall under this scenario. One of the key implications of this finding is that Jijiga is no more an emerging city, rather it is a flourishing city which signifies the need for a different approach in future interventions. Recommendation : Therefore, it is recommended that the two CAs should go beyond maintaining the status quo improve citizens' access to and satisfaction with public services in quantity and quality that is commensurate to future demand and from growing urban population. In this regard, the two cities could be seen as a show case from which other peer cities could learn lessons and share best experiences in public service delivery.
b. High-Access-Low-Satisfaction: This is a mixed scenario with unsatisfactory satisfaction
with services, hence modestly desirable. Debre Markos, Nekempte and Yirgalem CAs and

MAIN REPORT: PARTICIPATORY CITIZENS' SATISFACTION B ASELINE SURVEY IN EIGHT UGDP PARTNER CITY ADMINISTRATIONS
2013
46
corresponding services such as market infrastructure and inner city roads fall under this category. Recommendation : Therefore, the three City Administrations are advised to improve citizens' satisfaction with the delivery of all public services and those two services in particular.
c. Low-Access-High-Satisfaction: This is also a mixed scenario with constrained access,
hence modestly desirable. This time around, the constraint is limited access to services. While the category of Low-Access and High-Satisfaction is applicable to all eight partner cities, it applies to only one type of service namely, solid waste collection. This means that, as relatively new to residents of the cities as the service is, citizens are tremendously satisfied (63%) with the service, but the service is not as widely accessible (11%) to citizens as they would have liked. In fact, judging from residents were happy with the introduction of the service, we believe that solid waste management is one of the key achievements of the ongoing national decentralization and local good governance programme. Recommendation : Therefore, all partner CAs are strongly advised to expand accessibility of the ongoing solid waste management services to wider citizens while keeping an eye on the quality of the service at the same time.
d. Low-Access-Low-Satisfaction: This is the most undesirable scenario with negative
tendencies on both sides. Capital cities of three emerging regions - Asossa, Gambella and Semara-Logia - fall under this category. Similarly, a wider range of public services including street lighting, public housing, MSE development services, drainage structures, public toilets, vacuum truck services and recreational facilities (public parks) are both low access and low satisfaction services. Obviously, a double-edged problem coupled with a wide range (seven types of services) services is a serious challenge that need to be overcome. On the other hand, as the old saying goes, "every challenge comes with an opportunity". The opportunity entailed in the challenge in this case is that most of the services with constrained access and limited citizens' satisfaction fall under LICS, which the UGDP aggressively promotes as a uniquely twin-track strategy to fight urban poverty through employment creation while improving citizens' access to and satisfaction with public service delivery in all partner City Administrations. Recommendation : Therefore, all CAs and those falling under this undesirable category should make sure that both sides of the equation (access and satisfaction) are addressed using the UGDP's twin-track strategy to city development. It is also recommended that special attention be given and additional support provided to the cities of Asossa, Gambella and Semara-Logia to accelerate their development and bring them to same level with other relatively well developed partner cities. On the part of the three City Administrations, it is important that they make efforts to forge partnerships with better performing sister cities (Adwa and Jijiga for example) to share best practices in service delivery and local good governance.
87. Business Enterprises: Following the same procedure adopted for households, key findings on access and satisfaction among business enterprises and corresponding recommendations are grouped into three categories as follows:
a. High-Access-High-Satisfaction: This category of findings applies for Yirgalem, Jijiga, Adwa and Nekempte CAs and services under the category included electricity, potable water and

MAIN REPORT: PARTICIPATORY CITIZENS' SATISFACTION B ASELINE SURVEY IN EIGHT UGDP PARTNER CITY ADMINISTRATIONS
2013
47
drainage structures. This is the most desirable scenario of all, and as such, the CAs deserve credit for. City Administrations of Nekempte and Yirgalem, which performed poorly in terms of access and satisfaction with households, performed very well with business enterprises. Therefore, it is recommended that the two cities should intensify their service delivery efforts to all citizens as much as they did with business enterprises. Recommendation : However, in the interest of continuous improvement of public service delivery and meeting rising demands in the future, CAs achieved "High-Access-High-Satisfaction" at the moment are strongly advise to leave no room for complacence.
b. High-Access-Low-Satisfaction: This is a scenario with mixed results - desirable on access, but undesirable on satisfaction aspects. While Asossa, Debre Markos and Semara-Logia are the three CAs that fall under this category, corresponding public services that also fall under the same category included vacuum trucks, street lighting and slaughterhouse. Recommendation : Therefore, it is recommended that the three CAs should work harder to improve satisfaction of business enterprises with the delivery of those services that fall short at the moment.
c. Low-Access-High-Satisfaction: Obviously, this is the most undesirable scenario that needs to be reversed on both aspects (access and satisfaction); and reversed with a sense of urgency. The scenario applies only for solid waste management and only for Gambella CA. Recommendation : Therefore, hand-in-hand with its efforts to improve the delivery of other public services, Gambella CA is strongly advised to introduce and popularize a systematic and efficient collection and management of solid waste collection in the city.
d. General Recommendation: Business enterprises are not only part and parcel of the wider citizenry in all cities, but they are also the back-bone of the local economy generating badly needed employment and providing a lion's share of internal revenues in their respective cities. As such, they should be considered as a "Golden Goose", a goose that lays golden eggs. No one, unless insane, would want to kill a goose that lays golden eggs. By the same metaphor, it is recommended that all partner city administrations should properly serve the 'goose', remove bottle-necks and barriers to its growth, address its needs, constraints and interests, and above all, effectively consult and genuinely engage in urban development dialogue, planning, design, implementation, monitoring and follow up of city development projects.
5.2.3 Public Participation, Access to Information a nd Tax Literacy A) Public Participation 88. Given the immediate as well as strategic significance of active participation of citizens and other stakeholders for an inclusive urban development agenda, the current rates of participation of citizens (53%), Business enterprises (55%) and CSOs (59%) could be considered as "moderately high', but leave much more to be desired. True, well over half of citizens and stakeholders participating (Always, Sometimes and Rarely) in city development activities and processes is an achievement to be cherished by City Administrations and the UGDP. But, there are important points that clearly justify actions for accelerating rates of public participation in some cities and much farther in others. These points are:

MAIN REPORT: PARTICIPATORY CITIZENS' SATISFACTION B ASELINE SURVEY IN EIGHT UGDP PARTNER CITY ADMINISTRATIONS
2013
48
(1) The overall participation rates indicated above imply that there is a huge room for improvement and a daunting task of achieving much higher rates is awaiting even those CAs that may have achieved rates over and above the overall averages at present;
(2) The overall average does not apply for all cities as there are City Administrations that fall on both sides (above and below) of the average. CAs that fall below the overall average are:
a. Adwa, Gambella, Asossa, Jijiga and Semara Logia in the case of households; b. Gambella, Semara-Logia and Asossa in the case of business enterprises; and c. Gambella, Semara-Logia, Yirgalem and Asossa in the case CSOs public participation;
(3) With the exception of Semara-Logia and Yirgalem CAs, public participation rates among poor
households are consistently lower than those of non-poor. Given the UGDP's pro-poor focus, implications of lower participation of the poor are much greater than the actual differences (a six percent lower participation rate among the poor) in participation rates of the poor and non-poor citizens;
(4) With an overall participation rate of about 16%, public participation among socially marginalized and vulnerable groups constitute a dooms-day scenario in all City Administrations; and the only exception with 41% participation rate is Debre Markos CA, which suggest that Debre Markos must have some innovative solutions that others would want to share and learn from.
89. Recommendations : Therefore, it is recommended that levels of participation of citizens and all other key stakeholders should be enhanced in all CAs further, but more so in CAs where public participation rates currently fall short of the overall average rates (see paragraphs above), through systematic and sustained efforts including:
1. Institutionalization of (some existing and other new ones) participatory mechanisms and processes by adopting agreed up-on guidelines, rules and procedures;
2. Advance planning of participatory forums and processes (instead of too formal, ad-hoc and arbitrary approaches) to clearly address the why, what who, when, etc of public participation;
3. Improve the quality, effectiveness and responsiveness of participatory processes and mechanisms by going beyond the traditional boundaries of the more formal and procedural approaches;
4. Greater and systematic efforts to promote the organization and level of participation of poor households & vulnerable & marginalized groups;
5. Support to CSOs & Associations/ Organizations of vulnerable groups (e.g. in the form of capacity building and networking) to enhance their participation in urban development in general and representation and advocacy of the interests and voices of poor, vulnerable and marginalized groups in particular.
B) Access to Public-domain Information 90. With overall respective rates of 7%, 14% and 17% for household, business enterprise and CSO sample groups, satisfaction of the target groups with accessibility of public-domain information is generally very low; and lowest in the case of households. Despite considerable efforts that are being made by local governments to improve transparency and accountability by making certain public-domain information widely available and accessible by the public in recent years, rates of satisfaction with accessibility of public-domain information (information about annual budget, annual audit, public procurement and city development plans and projects) remain persistently low in all

MAIN REPORT: PARTICIPATORY CITIZENS' SATISFACTION B ASELINE SURVEY IN EIGHT UGDP PARTNER CITY ADMINISTRATIONS
2013
49
partner cities; and they are lower than the respective group averages (Households, businesses and CSOs) in Asossa, Gambella, Nekempte, Yirgalem and Semara-Logia CAs, but also in Adwa and Debre Markos CAs - the latter two CAs only in the case of business enterprises. 91. Recommendation : All partner City Administrations, regional governments and development partners should conduct a rapid assessment of the on-going initiatives and reforms, buy-in and rally around the initiatives and provide resources and technical assistance including designing improved communication and dissemination strategies so as to enhance wider disseminations and improve accessibility of all the more important public-domain information to residents, the business community, CSOs, associations of vulnerable groups and the public at large
5.2.4 Vulnerable Groups: Social Exclusion and Margi nalization 92. Arising from the circumstances they live in, the most cruel forms of poverty, vulnerability and deprivation are witnessed among members of vulnerable and socially marginalized groups in all study cities. An overwhelming majority of 88% of the groups reported that they go without food - the most basic physiological need - either always, or sometimes or rarely. Similarly 51% of the group do not have access to other basic needs such as shelter, clothing and healthcare. In both cases, the proportions are not only appalling, but the entire situation is unacceptable socially as well as morally - hence needs to be reversed and reversed with a sense of urgency. Fortunately, the pro-poor focus of the ongoing UGDP provides ample opportunity to fight such a horrendous scenario of urban poverty and vulnerability in its partner City Administrations. 93. Recommendation : Therefore, it is recommended that partner CAs and the UGDP along with other key stakeholders should adopt and coordinate, a more inclusive, integrated, sustainable and synergistic approach in the implementation of the ongoing UGDP phase-three activities in partner CAs to firstly reduce the suffering of members of vulnerable and destitute groups from deprivation of some of the most basic needs (food and shelter for instance) and, secondly, to lay the foundation for the group to extricate themselves out of vicious cycle of poverty by supporting the organization and inclusion of members of such group in to MSEs so that they can contribute to and benefit from employment and other economic opportunities created by public investment. The ongoing UGDP phase-three, provides a unique opportunity to adopt such an innovative approach to urban poverty reduction that could lead to synergetic outcomes. That is, linking labour-intensive project activities taking place (by design and not by accident) in poverty neighbourhoods in all partner cities with an introduction and or supporting existing (if any) urban safety-net programmes. 94. Finally, a survey fatigue was evident in almost all partner City Administrations. Owing to recurring studies by the UGDP as well as other groups, citizens and some stakeholders appeared to be not so much enthusiastic, at best, about surveys and curious about what follows next. Surveys in general and citizens' satisfaction surveys in particular generate important information useful to planning and designing interventions, but they also cause expectation to rise. If surveys are not accompanied, or, at least followed by interventions, it is natural for respondents to become reluctant, if not against, because what matters more to them is actual implementation of interventions on the ground. Therefore, as it was strongly and loudly urged by survey respondents and many stakeholders including CA officials during the fieldwork, implementation of UGDP phase-three activities should take place in partner CAs with a sense of urgency. It is time to "walk the talk ".

MAIN REPORT: PARTICIPATORY CITIZENS' SATISFACTION B ASELINE SURVEY IN EIGHT UGDP PARTNER CITY ADMINISTRATIONS
2013
50
APPENDICES
ANNEX 1: SUMMARY OF FINDINGS AND RECOMMENDATIONS: ACCESS AND SATISFACTION
Key Findings
Findings Applicable
to BLS Cities
Findings Applicable to
Public Services Desirability
Actions Needed
(Recommendations)
A) Households (Citizens)
High-Access-High-
Satisfaction (2
Cities and 6
Services)
• Adwa
• Jijiga
• Electricity
• Cemeteries
• Non-physical
• Potable Water
• Public Health
• Education
Highly desirable, but should
not lead to complacence
Maintaining the status
quo is not enough,
improve further not to
be outpaced by
increasing public
demand and population
growth
High-Access-Low-
Satisfaction (3 Cities
and 2 Services)
• D. Markos
• Nekempte
• Yirgalem
• Market
Infrastructure
• Inner City Roads
Modest with poor
satisfaction
Improve both sides of
the equation, but more
on satisfaction
Low-Access-High-
Satisfaction (No
Cities and One
Service)
All CAs Solid Waste Collection
New service, liked most by
citizens, but suffers from
poor accessibility
More is needed to
improve access to solid
waste collection by
wider citizenry
Low-Access-Low-
Satisfaction (3 Cities
and 7 Services)
• Asossa
• Gambella
• S. Logia
• Street Lighting
• Public Housing
• MSE Dev't Support
• Drainage Structures
• Public Toilets
• Vacuum Trucks
• Recreation (Public
Parks)
Totally undesirable,
unacceptable
Needs reversal of status
quo on both sides of the
equation
B) Business Enterprises
High-Access-High-
Satisfaction
• Yirgalem
• Jijiga
• Adwa
• Nekempte
• Electricity
• Potable water
• Street lighting
• Drainages
Highly desirable, but should
not be taken for granted
Job well done! But
leave no room for
complacence so as to
keep pace with rising
demand
High-Access-Low-
Satisfaction
• Asossa
• D. Markos
• Vacuum trucks
• Street lighting
• Slaughterhouse
Desirable with qualification
signifying the importance
of both aspects for service
consumers
Improve citizens'
satisfaction with
vacuum truck, street
lighting & abattoir
services in Asossa & D.
Markos CAs.

MAIN REPORT: PARTICIPATORY CITIZENS' SATISFACTION B ASELINE SURVEY IN EIGHT UGDP PARTNER CITY ADMINISTRATIONS
2013
51
Key Findings
Findings Applicable
to BLS Cities
Findings Applicable to
Public Services Desirability
Actions Needed
(Recommendations)
Low-Access-High-
Satisfaction • Gambella
• Solid waste
management
Desirable with
qualification: SWM, only
service with low access but
high satisfaction
Improve accessibility of
SWM to the wider
business community in
Gambella CA
Low-Access-Low-
Satisfaction • Semara-Logia
• City roads
• Business
Development
Services
• Public toilets
Totally undesirable,
unacceptable.
NB: These findings are also
consistent with those of the
PLA
Reverse the status- quo
on both aspects (access
and satisfaction) in
Semara-Logia for ALL,
but city roads, BDS &
public toilets
ANNEX2: SUMMARY OF FINDINGS: PUBLIC PARTICIPATION AND ACCESS TO PUBLIC-DOMAIN INFORMATION
Target Group Public Participation (Overall Avg. = 52.9%) Access to PDI (Overall Avg. = 7.2%)
Above Average Below Average Above Average Below Average
Household Sample
• D. Markos
• Nekempte
• Yirgalem
• Adwa
• Asossa
• Gambella
• Jijiga
• S. Logia
• Adwa
• D. Markos
• Jijiga
• Asossa
• Gambella
• Nekempte
• Yirgalem
• S. Logia
Business Enterprises
Sample
Public Participation (Overall Avg. = 55.0%) Access to PDI (Overall Avg. = 13.8%)
Above Average Below Average Above Average Below Average
• Adwa
• D. Markos
• Jijiga
• Nekempte
• Yirgalem
• Asossa
• Gambella
• S. Logia
• Jijiga
• Nekempte
• Yirgalem
• S. Logia
• Adwa
• Asossa
• D. Markos
• Gambella
Civil Society
Organizations (CSOs)
Sample
Public Participation (Overall Avg. = 58.9%) Access to PDI (Overall Avg. = 17.0%)
Above Average Below Average Above Average Below Average
• Adwa
• D. Markos
• Jijiga
• Nekempte
• Asossa
• Gambella
• Yirgalem
• S. Logia
• Adwa
• D. Markos
• Jijiga
• S. Logia
• Asossa
• Gambella
• Yirgalem
• Nekempte

MAIN REPORT: PARTICIPATORY CITIZENS' SATISFACTION B ASELINE SURVEY IN EIGHT UGDP PARTNER CITY ADMINISTRATIONS
2013
52
ANNEX 3: STATISTICAL TABLES: SURVEY QUESTIONS AND RESPONSES, QUESTIONNAIRES AND TEAMS
Urban Governance and Decentralization Programme (UGDP)
Participatory Citizens' Satisfaction Baseline Survey
Contents (for Appendices)
Appendix A: 2012 BLS Sample Sizes, sample Groups and Sampling Distribution .............................. 53
Appendix B: Statistical tables: Survey Questions and Response ........................................................... 55
B1: Delivery of Public Services ..................................................................................................................................................... 55
B1.1: Households' Satisfaction with the Delivery of Public Services ............................................................................. 55
B1.2: Business Enterprises' Satisfaction with the Delivery of Public Services ............................................................. 72
B2: Public Participation and Access to Information ................................................................................................................ 76
B2.1: Households ........................................................................................................................................................................ 76
B2.2: Business Enterprises ........................................................................................................................................................ 83
B2.3: Civil Society Organizations ............................................................................................................................................ 90
B2.4: Vulnerable Groups ........................................................................................................................................................... 92
Appendix C: 2012 BLS Survey Questionnaires ....................................................................................... 95
Appendix C1: Household Survey Questionnaire .................................................................................................................... 95
Appendix C.2: Business Enterprises Survey Questionnaire ............................................................................................... 101
Appendix C.3: Civil Society Organizations Questionnaire ................................................................................................ 106
Appendix C.4: Vulnerable Groups Survey Questionnaire ................................................................................................ 108
Appendix D: 2012 BLS List of Core Team and Survey Team Members in Each City ....................... 110

MAIN REPORT: PARTICIPATORY CITIZENS' SATISFACTION B ASELINE SURVEY IN EIGHT UGDP PARTNER CITY ADMINISTRATIONS
2013
53
Appendix A: 2012 BLS Sample Sizes, sample Groups and Sampling Distribution
Table A1: Sample Sizes and Sample Distribution by Sample Groups and BLS City
BLS City Households Business
Enterprises
Civil Society
Organizations
Vulnerable
Groups
Total
Sample Poor Non-poor Both Groups
Adwa 150 150 300 33 24 32 389
Asossa 155 142 297 30 30 30 387
Debre-Markos 120 150 270 30 30 30 360
Gambella 152 156 308 30 20 30 388
Jijiga 130 150 280 30 30 20 360
Nekempte 150 150 300 30 30 30 390
Semara-Logia 150 150 300 30 9 34 373
Yirgalem 150 150 300 30 23 30 383
All Cities 1,157 1,198 2,355 243 196 236 3,030
Table A2: Distribution of Household Sample by BLS Cities and Kebeles of Residence
City Kebele Administration Poor Non-poor Both
Yirgalem
Aposto 50 - 50
Kidiste-Mariam 40 - 40
Mesincho Mewcha 60 - 60
Awada Stadium - 50 50
Mehal Ketema - 50 50
Wuha Limat - 50 50
Yirgalem Total 150 150 300
Jijiga
Kebele 2 - 50 50
Kebele 3 - 35 35
Kebele 4 50 15 65
Kebele 5 55 - 55
Kebele 6 25 - 25
Kebele 10 - 50 50
Jig-jiga Total 130 150 280
Adwa
Debrchi 75 - 75
Hayelom - 50 50
Alula - 50 50
Abinet 75 - 75
Mebale - 50 50
Adwa Total 150 150 300

MAIN REPORT: PARTICIPATORY CITIZENS' SATISFACTION B ASELINE SURVEY IN EIGHT UGDP PARTNER CITY ADMINISTRATIONS
2013
54
City Kebele Administration Poor Non-poor Both
Semara-Logia
Ketena 3 50 - 50
Ketena 4 35 - 35
Ketena 8 35 - 35
Ketena 9 (Semera Satera-sefer) 30 - 30
Ketena 2 - 40 40
Ketena 5 - 50 50
Ketena 6 - 30 30
Ketena 10 (Semera, Ke-Asphalt-betach) - 30 30
Semara-Logia Total 150 150 300
Asossa
Kebele 1 104 2 106
kebele 2 40 - 40
Kebele 3 10 77 87
Kebele 4 1 63 64
Asossa Total 155 142 297
Debre-Markos
Kebele 1 30 - 30
Kebele 2 - 50 50
Kebele 3 - 50 50
Kebele 4 - 50 50
Kebele 5 30 - 30
Kebele 6 30 - 30
Kebele 7 30 - 30
Debre-Markos Total 120 150 270
Gambella
Kebele 1 55 57 112
Kebele 2 11 12 23
Kebele 3 17 16 33
Kebele 4 22 22 44
Kebele 5 47 49 96
Gambella Total 152 156 308
Nekempte
Beke Kesse 57 - 57
Beke Jama 51 - 51
Keso 42 - 42
Beke Jato - 49 49
Cheleleke - 58 58
Derge - 43 43
Nekempte Total 150 150 300
Grand Total BLS Sample Households 1,157 1,198 2,355

MAIN REPORT: PARTICIPATORY CITIZENS' SATISFACTION B ASELINE SURVEY IN EIGHT UGDP PARTNER CITY ADMINISTRATIONS
2013
55
Appendix B: Statistical tables: Survey Questions and Response
B1: Delivery of Public Services
B1.1: Households' Satisfaction with the Delivery of Public Services
Table B1.1.1:- Potable Water
Responses All Cities Adwa Assosa Debre Markos Gambella Jigjiga Nekemte Semera Yirgalem
Poor + Non-poor
Sample size (n) 2354 300 297 270 308 279 300 300 300
Use Service 86.53 98.67 89.90 87.41 71.43 72.40 91.33 84.00 96.67
Don't Use Service 13.47 1.33 10.10 12.59 28.57 27.60 8.67 16.00 3.33
User and Non-User 100.00 100.00 100.00 100.00 100.00 100.00 100.00 100.00 100.00
Highly Satisfied 12.38 31.76 14.13 3.42 0.91 16.08 5.13 19.84 4.83
Satisfied 49.46 62.84 40.52 82.05 35.45 20.60 53.48 63.16 32.76
Dissatisfied 25.99 4.39 23.05 14.10 39.09 28.64 34.80 14.57 50.00
Highly Dissatisfied 12.08 1.01 21.93 0.43 24.55 34.67 6.59 2.02 12.41
No Answer 0.10 0.00 0.37 0.00 0.00 0.00 0.00 0.40 0.00
Total 100.00 100.00 100.00 100.00 100.00 100.00 100.00 100.00 100.00
Poor
Sample size (n) 1157 150 155 120 152 130 150 150 150
Use Service 82.20 99.33 89.03 85.00 53.95 72.31 84.67 79.33 93.33
Don't Use Service 17.80 0.67 10.97 15.00 46.05 27.69 15.33 20.67 6.67
User and Non-User 100.00 100.00 100.00 100.00 100.00 100.00 100.00 100.00 100.00
Highly Satisfied 10.64 28.86 7.86 2.00 2.44 15.96 3.94 18.80 0.71
Satisfied 46.05 64.43 38.57 75.00 34.15 14.89 47.24 63.25 25.71
Dissatisfied 26.55 6.04 18.57 22.00 24.39 37.23 34.65 13.68 57.14
Highly Dissatisfied 16.65 0.67 35.00 1.00 39.02 31.91 14.17 3.42 16.43
No Answer 0.11 0.00 0.00 0.00 0.00 0.00 0.00 0.85 0.00
Total 100.00 100.00 100.00 100.00 100.00 100.00 100.00 100.00 100.00
Noon-poor
Sample size (n) 1197 150 142 150 156 149 150 150 150
Use Service 90.73 98.00 90.85 89.33 88.46 72.48 98.00 88.67 100.00
Don't Use Service 9.27 2.00 9.15 10.67 11.54 27.52 2.00 11.33 0.00
User and Non-User 100.00 100.00 100.00 100.00 100.00 100.00 100.00 100.00 100.00
Highly Satisfied 13.90 34.69 20.93 4.48 0.00 16.19 6.16 20.77 8.67
Satisfied 52.46 61.22 42.64 87.31 36.23 25.71 58.90 63.08 39.33
Dissatisfied 25.49 2.72 27.91 8.21 47.83 20.95 34.93 15.38 43.33
Highly Dissatisfied 8.06 1.36 7.75 0.00 15.94 37.14 0.00 0.77 8.67
No Answer 0.09 0.00 0.78 0.00 0.00 0.00 0.00 0.00 0.00
Total 100.00 100.00 100.00 100.00 100.00 100.00 100.00 100.00 100.00

MAIN REPORT: PARTICIPATORY CITIZENS' SATISFACTION B ASELINE SURVEY IN EIGHT UGDP PARTNER CITY ADMINISTRATIONS
2013
56
Table B1.1.2 - Public Health
Responses All Cities Adwa Assosa Debre Markos Gambella Jigjiga Nekemte Semera Yirgalem
Poor + Non-poor
Sample size (n) 2348 300 291 270 308 279 300 300 300
Use Service 83.35 84.67 81.10 70.37 85.39 91.76 87.00 66.33 99.33
Don't Use Service 16.65 15.33 18.90 29.63 14.61 8.24 13.00 33.67 0.67
User and Non-User 100.00 100.00 100.00 100.00 100.00 100.00 100.00 100.00 100.00
Highly Satisfied 7.35 18.11 11.07 2.66 0.00 14.84 3.85 3.48 3.69
Satisfied 36.90 44.88 36.36 49.47 32.70 42.19 25.38 37.31 31.54
Dissatisfied 38.17 30.71 28.85 38.83 38.40 32.03 51.15 38.81 45.30
Highly Dissatisfied 16.02 4.33 22.92 7.98 28.52 7.81 19.23 14.43 19.46
No Answer 1.57 1.97 0.79 1.06 0.38 3.13 0.38 5.97 0.00
Total 100.00 100.00 100.00 100.00 100.00 100.00 100.00 100.00 100.00
Poor
Sample size (n) 1154 150 152 120 152 130 150 150 150
Use Service 83.45 86.00 88.82 71.67 76.97 88.46 89.33 64.67 100.00
Don't Use Service 16.55 14.00 11.18 28.33 23.03 11.54 10.67 35.33 0.00
User and Non-User 100.00 100.00 100.00 100.00 100.00 100.00 100.00 100.00 100.00
Highly Satisfied 8.16 18.60 12.68 4.76 0.00 13.91 5.30 3.03 4.67
Satisfied 34.81 41.09 35.92 46.43 29.06 41.74 19.70 33.33 35.33
Dissatisfied 36.26 35.66 24.65 34.52 34.19 34.78 47.73 39.39 39.33
Highly Dissatisfied 19.42 2.33 26.76 14.29 35.90 7.83 27.27 17.17 20.67
No Answer 1.34 2.33 0.00 0.00 0.85 1.74 0.00 7.07 0.00
Total 100.00 100.00 100.00 100.00 100.00 100.00 100.00 100.00 100.00
Non-poor
Sample size (n) 1194 150 139 150 156 149 150 150 150
Use Service 83.25 83.33 72.66 69.33 93.59 94.63 84.67 68.00 98.67
Don't Use Service 16.75 16.67 27.34 30.67 6.41 5.37 15.33 32.00 1.33
User and Non-User 100.00 100.00 100.00 100.00 100.00 100.00 100.00 100.00 100.00
Highly Satisfied 6.57 17.60 9.01 0.96 0.00 15.60 2.34 3.92 2.70
Satisfied 38.91 48.80 36.94 51.92 35.62 42.55 31.25 41.18 27.70
Dissatisfied 40.00 25.60 34.23 42.31 41.78 29.79 54.69 38.24 51.35
Highly Dissatisfied 12.74 6.40 18.02 2.88 22.60 7.80 10.94 11.76 18.24
No Answer 1.79 1.60 1.80 1.92 0.00 4.26 0.78 4.90 0.00
Total 100.00 100.00 100.00 100.00 100.00 100.00 100.00 100.00 100.00

MAIN REPORT: PARTICIPATORY CITIZENS' SATISFACTION B ASELINE SURVEY IN EIGHT UGDP PARTNER CITY ADMINISTRATIONS
2013
57
Table B1.1.3: Public Schools
Responses All Cities Adwa Assosa Debre Markos Gambella Jigjiga Nekemte Semera Yirgalem
Poor + Non-poor
Sample size (n) 2353 300 296 270 308 279 300 300 300
Use Service 77.05 78.67 64.53 71.48 78.25 76.34 87.67 64.33 94.33
Don't Use Service 22.95 21.33 35.47 28.52 21.75 23.66 12.33 35.67 5.67
User and Non-User 100.00 100.00 100.00 100.00 100.00 100.00 100.00 100.00 100.00
Highly Satisfied 7.87 20.76 7.50 3.11 0.00 21.13 5.70 4.71 1.41
Satisfied 49.72 68.64 49.50 85.49 39.75 39.91 39.16 27.75 50.18
Dissatisfied 27.50 6.78 25.00 9.33 35.98 22.54 38.40 38.22 38.16
Highly Dissatisfied 9.85 0.00 15.00 0.52 20.92 5.63 11.79 16.75 8.13
No Answer 5.06 3.81 3.00 1.55 3.35 10.80 4.94 12.57 2.12
Total 100.00 100.00 100.00 100.00 100.00 100.00 100.00 100.00 100.00
Poor
Sample size (n) 1157 150 155 120 152 130 150 150 150
Use Service 77.10 74.00 71.61 69.17 76.32 72.31 90.67 61.33 99.33
Don't Use Service 22.90 26.00 28.39 30.83 23.68 27.69 9.33 38.67 0.67
User and Non-User 100.00 100.00 100.00 100.00 100.00 100.00 100.00 100.00 100.00
Highly Satisfied 6.70 18.02 6.84 2.44 0.00 18.09 6.62 3.26 0.67
Satisfied 47.66 69.37 47.86 82.93 38.26 46.81 28.68 20.65 53.69
Dissatisfied 27.34 6.31 24.79 13.41 29.57 20.21 44.12 43.48 30.20
Highly Dissatisfied 12.95 0.00 15.38 1.22 26.96 5.32 16.91 20.65 12.75
No Answer 5.36 6.31 5.13 0.00 5.22 9.57 3.68 11.96 2.68
Total 100.00 100.00 100.00 100.00 100.00 100.00 100.00 100.00 100.00
Non-poor
Sample size (n) 1196 150 141 150 156 149 150 150 150
Use Service 77.01 83.33 56.74 73.33 80.13 79.87 84.67 67.33 89.33
Don't Use Service 22.99 16.67 43.26 26.67 19.87 20.13 15.33 32.67 10.67
User and Non-User 100.00 100.00 100.00 100.00 100.00 100.00 100.00 100.00 100.00
Highly Satisfied 9.00 23.20 8.43 3.60 0.00 23.53 4.72 6.06 2.24
Satisfied 51.74 68.00 51.81 87.39 41.13 34.45 50.39 34.34 46.27
Dissatisfied 27.66 7.20 25.30 6.31 41.94 24.37 32.28 33.33 47.01
Highly Dissatisfied 6.83 0.00 14.46 0.00 15.32 5.88 6.30 13.13 2.99
No Answer 4.77 1.60 0.00 2.70 1.61 11.76 6.30 13.13 1.49
Total 100.00 100.00 100.00 100.00 100.00 100.00 100.00 100.00 100.00

MAIN REPORT: PARTICIPATORY CITIZENS' SATISFACTION B ASELINE SURVEY IN EIGHT UGDP PARTNER CITY ADMINISTRATIONS
2013
58
Table B1.1.4: Power Supply Services
Responses All Cities Adwa Assosa Debre Markos Gambella Jigjiga Nekemte Semera Yirgalem
Poor + Non-poor
Sample size (n) 2352 300 297 270 308 277 300 300 300
Use Service 89.88 98.33 86.53 94.44 72.40 97.11 88.00 84.67 99.00
Don't Use Service 10.12 1.67 13.47 5.56 27.60 2.89 12.00 15.33 1.00
User and Non-User 100.00 100.00 100.00 100.00 100.00 100.00 100.00 100.00 100.00
Highly Satisfied 11.69 23.39 13.96 1.95 3.57 23.53 3.09 14.62 6.73
Satisfied 47.01 51.86 47.55 46.09 53.13 45.22 33.59 62.45 38.05
Dissatisfied 30.83 20.34 25.28 44.53 27.23 23.53 42.47 17.79 44.78
Highly Dissatisfied 9.95 4.07 12.08 7.42 13.84 7.72 20.85 4.35 10.44
No Answer 0.52 0.34 1.13 0.00 2.23 0.00 0.00 0.79 0.00
Total 100.00 100.00 100.00 100.00 100.00 100.00 100.00 100.00 100.00
Poor
Sample size (n) 1155 150 155 120 152 128 150 150 150
Use Service 86.32 97.33 82.58 93.33 60.53 95.31 77.33 88.00 99.33
Don't Use Service 13.68 2.67 17.42 6.67 39.47 4.69 22.67 12.00 0.67
User and Non-User 100.00 100.00 100.00 100.00 100.00 100.00 100.00 100.00 100.00
Highly Satisfied 11.19 27.40 11.45 1.79 4.30 20.80 4.39 12.98 2.01
Satisfied 43.06 43.15 45.04 42.86 46.24 46.40 29.82 61.07 30.87
Dissatisfied 33.07 23.97 29.01 46.43 30.11 24.80 34.21 21.37 53.69
Highly Dissatisfied 12.29 5.48 14.50 8.93 16.13 8.00 31.58 3.82 13.42
No Answer 0.40 0.00 0.00 0.00 3.23 0.00 0.00 0.76 0.00
Total 100.00 100.00 100.00 100.00 100.00 100.00 100.00 100.00 100.00
Non-poor
Sample size (n) 1197 150 142 150 156 149 150 150 150
Use Service 93.32 99.33 90.85 95.33 83.97 98.66 98.67 81.33 98.67
Don't Use Service 6.68 0.67 9.15 4.67 16.03 1.34 1.33 18.67 1.33
User and Non-User 100.00 100.00 100.00 100.00 100.00 100.00 100.00 100.00 100.00
Highly Satisfied 12.14 19.46 16.42 2.08 3.05 25.85 2.07 16.39 11.49
Satisfied 50.54 60.40 50.00 48.61 58.02 44.22 36.55 63.93 45.27
Dissatisfied 28.84 16.78 21.64 43.06 25.19 22.45 48.97 13.93 35.81
Highly Dissatisfied 7.86 2.68 9.70 6.25 12.21 7.48 12.41 4.92 7.43
No Answer 0.63 0.67 2.24 0.00 1.53 0.00 0.00 0.82 0.00
Total 100.00 100.00 100.00 100.00 100.00 100.00 100.00 100.00 100.00

MAIN REPORT: PARTICIPATORY CITIZENS' SATISFACTION B ASELINE SURVEY IN EIGHT UGDP PARTNER CITY ADMINISTRATIONS
2013
59
Table B1.1.5: Street Lighting
Responses All Cities Adwa Assosa Debre Markos Gambella Jigjiga Nekemte Semera Yirgalem
Poor + Non-poor
Sample size (n) 2345 300 296 270 308 279 300 292 300
Use Service 47.42 73.00 16.22 40.00 19.16 72.76 62.67 4.11 91.67
Don't Use Service 52.58 27.00 83.78 60.00 80.84 27.24 37.33 95.89 8.33
User and Non-User 100.00 100.00 100.00 100.00 100.00 100.00 100.00 100.00 100.00
Highly Satisfied 5.94 4.11 12.00 2.86 8.62 17.65 2.66 16.67 0.00
Satisfied 21.60 18.26 54.00 14.29 50.00 46.08 13.30 33.33 2.18
Dissatisfied 30.06 29.68 14.00 41.90 31.03 26.47 41.49 25.00 23.64
Highly Dissatisfied 41.76 46.12 20.00 40.00 10.34 9.80 42.02 16.67 74.18
No Answer 0.63 1.83 0.00 0.95 0.00 0.00 0.53 8.33 0.00
Total 100.00 100.00 100.00 100.00 100.00 100.00 100.00 100.00 100.00
Poor
Sample size (n) 1155 150 154 120 152 130 150 149 150
Use Service 44.42 67.33 19.48 36.67 17.11 75.38 45.33 0.67 96.67
Don't Use Service 55.58 32.67 80.52 63.33 82.89 24.62 54.67 99.33 3.33
User and Non-User 100.00 100.00 100.00 100.00 100.00 100.00 100.00 100.00 100.00
Highly Satisfied 6.21 3.96 11.76 4.76 8.00 18.18 2.94 0.00 0.00
Satisfied 24.47 12.87 58.82 14.29 60.00 58.59 16.18 0.00 2.07
Dissatisfied 25.83 24.75 8.82 28.57 20.00 20.20 41.18 0.00 27.59
Highly Dissatisfied 42.91 57.43 20.59 50.00 12.00 3.03 38.24 100.00 70.34
No Answer 0.58 0.99 0.00 2.38 0.00 0.00 1.47 0.00 0.00
Total 100.00 100.00 100.00 100.00 100.00 100.00 100.00 100.00 100.00
Non-poor
Sample size (n) 1190 150 142 150 156 149 150 143 150
Use Service 50.34 78.67 12.68 42.67 21.15 70.47 80.00 7.69 86.67
Don't Use Service 49.66 21.33 87.32 57.33 78.85 29.53 20.00 92.31 13.33
User and Non-User 100.00 100.00 100.00 100.00 100.00 100.00 100.00 100.00 100.00
Highly Satisfied 5.70 4.24 12.50 1.59 9.09 17.14 2.50 18.18 0.00
Satisfied 19.13 22.88 43.75 14.29 42.42 34.29 11.67 36.36 2.31
Dissatisfied 33.72 33.90 25.00 50.79 39.39 32.38 41.67 27.27 19.23
Highly Dissatisfied 40.77 36.44 18.75 33.33 9.09 16.19 44.17 9.09 78.46
No Answer 0.67 2.54 0.00 0.00 0.00 0.00 0.00 9.09 0.00
Total 100.00 100.00 100.00 100.00 100.00 100.00 100.00 100.00 100.00
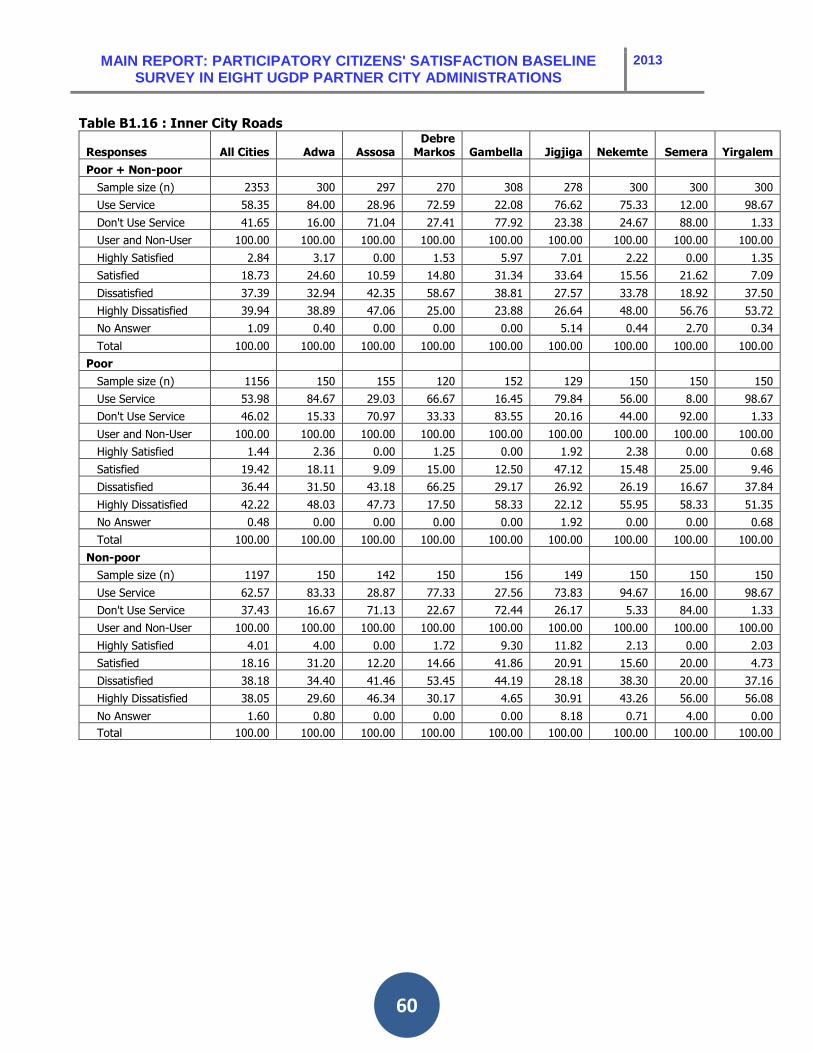
MAIN REPORT: PARTICIPATORY CITIZENS' SATISFACTION B ASELINE SURVEY IN EIGHT UGDP PARTNER CITY ADMINISTRATIONS
2013
60
Table B1.16 : Inner City Roads
Responses All Cities Adwa Assosa Debre Markos Gambella Jigjiga Nekemte Semera Yirgalem
Poor + Non-poor
Sample size (n) 2353 300 297 270 308 278 300 300 300
Use Service 58.35 84.00 28.96 72.59 22.08 76.62 75.33 12.00 98.67
Don't Use Service 41.65 16.00 71.04 27.41 77.92 23.38 24.67 88.00 1.33
User and Non-User 100.00 100.00 100.00 100.00 100.00 100.00 100.00 100.00 100.00
Highly Satisfied 2.84 3.17 0.00 1.53 5.97 7.01 2.22 0.00 1.35
Satisfied 18.73 24.60 10.59 14.80 31.34 33.64 15.56 21.62 7.09
Dissatisfied 37.39 32.94 42.35 58.67 38.81 27.57 33.78 18.92 37.50
Highly Dissatisfied 39.94 38.89 47.06 25.00 23.88 26.64 48.00 56.76 53.72
No Answer 1.09 0.40 0.00 0.00 0.00 5.14 0.44 2.70 0.34
Total 100.00 100.00 100.00 100.00 100.00 100.00 100.00 100.00 100.00
Poor
Sample size (n) 1156 150 155 120 152 129 150 150 150
Use Service 53.98 84.67 29.03 66.67 16.45 79.84 56.00 8.00 98.67
Don't Use Service 46.02 15.33 70.97 33.33 83.55 20.16 44.00 92.00 1.33
User and Non-User 100.00 100.00 100.00 100.00 100.00 100.00 100.00 100.00 100.00
Highly Satisfied 1.44 2.36 0.00 1.25 0.00 1.92 2.38 0.00 0.68
Satisfied 19.42 18.11 9.09 15.00 12.50 47.12 15.48 25.00 9.46
Dissatisfied 36.44 31.50 43.18 66.25 29.17 26.92 26.19 16.67 37.84
Highly Dissatisfied 42.22 48.03 47.73 17.50 58.33 22.12 55.95 58.33 51.35
No Answer 0.48 0.00 0.00 0.00 0.00 1.92 0.00 0.00 0.68
Total 100.00 100.00 100.00 100.00 100.00 100.00 100.00 100.00 100.00
Non-poor
Sample size (n) 1197 150 142 150 156 149 150 150 150
Use Service 62.57 83.33 28.87 77.33 27.56 73.83 94.67 16.00 98.67
Don't Use Service 37.43 16.67 71.13 22.67 72.44 26.17 5.33 84.00 1.33
User and Non-User 100.00 100.00 100.00 100.00 100.00 100.00 100.00 100.00 100.00
Highly Satisfied 4.01 4.00 0.00 1.72 9.30 11.82 2.13 0.00 2.03
Satisfied 18.16 31.20 12.20 14.66 41.86 20.91 15.60 20.00 4.73
Dissatisfied 38.18 34.40 41.46 53.45 44.19 28.18 38.30 20.00 37.16
Highly Dissatisfied 38.05 29.60 46.34 30.17 4.65 30.91 43.26 56.00 56.08
No Answer 1.60 0.80 0.00 0.00 0.00 8.18 0.71 4.00 0.00
Total 100.00 100.00 100.00 100.00 100.00 100.00 100.00 100.00 100.00

MAIN REPORT: PARTICIPATORY CITIZENS' SATISFACTION B ASELINE SURVEY IN EIGHT UGDP PARTNER CITY ADMINISTRATIONS
2013
61
Table B1.1.7 : Drainage Structures
Responses All Cities Adwa Assosa Debre Markos Gambella Jigjiga Nekemte Semera Yirgalem
Poor + Non-poor
Sample size (n) 2351 300 295 270 308 278 300 300 300
Use Service 29.48 43.00 2.71 29.26 3.25 30.22 38.67 6.33 82.67
Don't Use Service 70.52 57.00 97.29 70.74 96.75 69.78 61.33 93.67 17.33
User and Non-User 100.00 100.00 100.00 100.00 100.00 100.00 100.00 100.00 100.00
Highly Satisfied 3.47 8.20 12.50 1.32 0.00 13.10 0.00 0.00 0.40
Satisfied 14.33 27.87 37.50 14.47 30.00 29.76 11.30 3.57 3.63
Dissatisfied 35.02 26.23 25.00 64.47 20.00 29.76 41.74 10.71 32.66
Highly Dissatisfied 42.11 35.25 25.00 19.74 40.00 19.05 42.61 21.43 62.90
No Answer 5.07 2.46 0.00 0.00 10.00 8.33 4.35 64.29 0.40
Total 100.00 100.00 100.00 100.00 100.00 100.00 100.00 100.00 100.00
Poor
Sample size (n) 1154 150 153 120 152 129 150 150 150
Use Service 28.08 31.33 3.92 27.50 5.92 30.23 32.67 4.00 90.00
Don't Use Service 71.92 68.67 96.08 72.50 94.08 69.77 67.33 96.00 10.00
User and Non-User 100.00 100.00 100.00 100.00 100.00 100.00 100.00 100.00 100.00
Highly Satisfied 3.94 10.64 16.67 3.13 0.00 15.38 0.00 0.00 0.00
Satisfied 13.64 27.66 50.00 21.88 37.50 25.64 8.33 0.00 3.70
Dissatisfied 34.24 17.02 0.00 68.75 25.00 38.46 29.17 6.67 37.78
Highly Dissatisfied 42.12 44.68 33.33 6.25 37.50 15.38 52.08 13.33 57.78
No Answer 6.06 0.00 0.00 0.00 0.00 5.13 10.42 80.00 0.74
Total 100.00 100.00 100.00 100.00 100.00 100.00 100.00 100.00 100.00
Non-poor
Sample size (n) 1197 150 142 150 156 149 150 150 150
Use Service 30.83 54.67 1.41 30.67 0.64 30.20 44.67 8.67 75.33
Don't Use Service 69.17 45.33 98.59 69.33 99.36 69.80 55.33 91.33 24.67
User and Non-User 100.00 100.00 100.00 100.00 100.00 100.00 100.00 100.00 100.00
Highly Satisfied 3.05 6.67 0.00 0.00 0.00 11.11 0.00 0.00 0.88
Satisfied 14.96 28.00 0.00 9.09 0.00 33.33 13.43 7.69 3.54
Dissatisfied 35.73 32.00 100.00 61.36 0.00 22.22 50.75 15.38 26.55
Highly Dissatisfied 42.11 29.33 0.00 29.55 50.00 22.22 35.82 30.77 69.03
No Answer 4.16 4.00 0.00 0.00 50.00 11.11 0.00 46.15 0.00
Total 100.00 100.00 100.00 100.00 100.00 100.00 100.00 100.00 100.00

MAIN REPORT: PARTICIPATORY CITIZENS' SATISFACTION B ASELINE SURVEY IN EIGHT UGDP PARTNER CITY ADMINISTRATIONS
2013
62
Table B1.1.8 : Solid Waste Management
Responses All Cities Adwa Assosa Debre Markos Gambella Jigjiga Nekemte Semera Yirgalem
Poor + Non-poor
Sample size (n) 2353 300 297 270 308 279 300 299 300
Use Service 45.13 98.00 12.46 28.15 25.65 83.15 39.67 32.78 42.33
Don't Use Service 54.87 2.00 87.54 71.85 74.35 16.85 60.33 67.22 57.67
User and Non-User 100.00 100.00 100.00 100.00 100.00 100.00 100.00 100.00 100.00
Highly Satisfied 14.97 35.03 0.00 26.67 2.53 8.23 0.83 12.12 1.57
Satisfied 38.23 58.50 27.03 70.67 25.32 32.90 12.50 37.37 18.11
Dissatisfied 23.82 5.78 27.03 1.33 40.51 32.03 37.50 30.30 34.65
Highly Dissatisfied 20.72 0.34 45.95 0.00 26.58 25.97 43.33 16.16 41.73
No Answer 2.26 0.34 0.00 1.33 5.06 0.87 5.83 4.04 3.94
Total 100.00 100.00 100.00 100.00 100.00 100.00 100.00 100.00 100.00
Poor
Sample size (n) 1157 150 155 120 152 130 150 150 150
Use Service 39.59 99.33 0.65 13.33 13.82 90.00 31.33 22.67 48.67
Don't Use Service 60.41 0.67 99.35 86.67 86.18 10.00 68.67 77.33 51.33
User and Non-User 100.00 100.00 100.00 100.00 100.00 100.00 100.00 100.00 100.00
Highly Satisfied 16.09 38.93 0.00 31.25 0.00 8.55 0.00 2.78 0.00
Satisfied 39.57 57.05 0.00 62.50 38.10 41.88 4.26 33.33 21.92
Dissatisfied 17.39 3.36 0.00 0.00 28.57 19.66 21.28 30.56 34.25
Highly Dissatisfied 23.48 0.00 100.00 0.00 23.81 29.06 65.96 25.00 38.36
No Answer 3.48 0.67 0.00 6.25 9.52 0.85 8.51 8.33 5.48
Total 100.00 100.00 100.00 100.00 100.00 100.00 100.00 100.00 100.00
Non-poor
Sample size (n) 1197 150 142 150 156 149 150 150 150
Use Service 93.32 99.33 90.85 95.33 83.97 98.66 98.67 81.33 98.67
Don't Use Service 6.68 0.67 9.15 4.67 16.03 1.34 1.33 18.67 1.33
User and Non-User 100.00 100.00 100.00 100.00 100.00 100.00 100.00 100.00 100.00
Highly Satisfied 12.14 19.46 16.42 2.08 3.05 25.85 2.07 16.39 11.49
Satisfied 50.54 60.40 50.00 48.61 58.02 44.22 36.55 63.93 45.27
Dissatisfied 28.84 16.78 21.64 43.06 25.19 22.45 48.97 13.93 35.81
Highly Dissatisfied 7.86 2.68 9.70 6.25 12.21 7.48 12.41 4.92 7.43
No Answer 0.63 0.67 2.24 0.00 1.53 0.00 0.00 0.82 0.00
Total 100.00 100.00 100.00 100.00 100.00 100.00 100.00 100.00 100.00

MAIN REPORT: PARTICIPATORY CITIZENS' SATISFACTION B ASELINE SURVEY IN EIGHT UGDP PARTNER CITY ADMINISTRATIONS
2013
63
Table B1.1.9 : Public Toilets
Responses All Cities Adwa Assosa Debre Markos Gambella Jigjiga Nekemte Semera Yirgalem
Poor + Non-poor
Sample size (n) 2352 300 297 270 308 278 300 299 300
Use Service 17.56 25.00 1.68 10.74 2.27 25.54 4.33 15.72 55.33
Don't Use Service 82.44 75.00 98.32 89.26 97.73 74.46 95.67 84.28 44.67
User and Non-User 100.00 100.00 100.00 100.00 100.00 100.00 100.00 100.00 100.00
Highly Satisfied 10.87 34.67 40.00 10.34 0.00 5.63 0.00 16.00 1.20
Satisfied 20.29 30.67 20.00 37.93 85.71 18.31 10.00 30.00 8.38
Dissatisfied 35.99 22.67 20.00 41.38 0.00 33.80 10.00 20.00 50.30
Highly Dissatisfied 27.05 6.67 20.00 3.45 14.29 39.44 60.00 14.00 37.72
No Answer 5.80 5.33 0.00 6.90 0.00 2.82 20.00 20.00 2.40
Total 100.00 100.00 100.00 100.00 100.00 100.00 100.00 100.00 100.00
Poor
Sample size (n) 1157 150 155 120 152 130 150 150 150
Use Service 24.03 34.67 3.23 13.33 0.00 24.62 3.33 18.00 94.00
Don't Use Service 75.97 65.33 96.77 86.67 100.00 75.38 96.67 82.00 6.00
User and Non-User 100.00 100.00 100.00 100.00 100.00 100.00 100.00 100.00 100.00
Highly Satisfied 11.03 34.62 40.00 18.75 3.13 0.00 20.00 0.71
Satisfied 19.57 34.62 20.00 25.00 31.25 0.00 36.67 7.80
Dissatisfied 38.43 25.00 20.00 43.75 31.25 0.00 13.33 51.77
Highly Dissatisfied 26.69 1.92 20.00 6.25 34.38 60.00 20.00 36.88
No Answer 4.27 3.85 0.00 6.25 0.00 40.00 10.00 2.84
Total 100.00 100.00 100.00 100.00 0.00 100.00 100.00 100.00 100.00
Non-poor
Sample size (n) 1195 150 142 150 156 148 150 149 150
Use Service 11.30 15.33 0.00 8.67 4.49 26.35 5.33 13.42 16.67
Don't Use Service 88.70 84.67 100.00 91.33 95.51 73.65 94.67 86.58 83.33
User and Non-User 100.00 100.00 100.00 100.00 100.00 100.00 100.00 100.00 100.00
Highly Satisfied 10.53 34.78
0.00 0.00 7.69 0.00 10.00 3.85
Satisfied 21.80 21.74
53.85 85.71 7.69 20.00 20.00 11.54
Dissatisfied 30.83 17.39
38.46 0.00 35.90 20.00 30.00 42.31
Highly Dissatisfied 27.82 17.39
0.00 14.29 43.59 60.00 5.00 42.31
No Answer 9.02 8.70
7.69 0.00 5.13 0.00 35.00 0.00
Total 100.00 100.00 0.00 100.00 100.00 100.00 100.00 100.00 100.00

MAIN REPORT: PARTICIPATORY CITIZENS' SATISFACTION B ASELINE SURVEY IN EIGHT UGDP PARTNER CITY ADMINISTRATIONS
2013
64
Table B1.1.10 : Vacuum Truck Service
Responses All Cities Adwa Assosa Debre Markos Gambella Jigjiga Nekemte Semera Yirgalem
Poor + Non-poor
Sample size (n) 2351 300 297 269 308 278 300 299 300
Use Service 15.01 28.33 0.34 15.24 0.00 50.00 6.33 8.70 14.00
Don't Use Service 84.99 71.67 99.66 84.76 100.00 50.00 93.67 91.30 86.00
User and Non-User 100.00 100.00 100.00 100.00 100.00 100.00 100.00 100.00 100.00
Highly Satisfied 10.56 34.12 0.00 2.50
3.62 10.53 2.86 0.00
Satisfied 10.28 0.00 100.00 12.50
19.57 0.00 8.57 2.38
Dissatisfied 28.89 27.06 0.00 45.00
34.78 42.11 5.71 11.90
Highly Dissatisfied 25.28 12.94 0.00 32.50
28.26 42.11 20.00 30.95
No Answer 25.00 25.88 0.00 7.50
13.77 5.26 62.86 54.76
Total 100.00 100.00 100.00 100.00 0.00 100.00 100.00 100.00 100.00
Poor
Sample size (n) 1156 150 155 119 152 130 150 150 150
Use Service 13.24 21.33 0.65 11.76 0.00 45.38 2.67 7.33 21.33
Don't Use Service 86.76 78.67 99.35 88.24 100.00 54.62 97.33 92.67 78.67
User and Non-User 100.00 100.00 100.00 100.00 100.00 100.00 100.00 100.00 100.00
Highly Satisfied 10.49 40.63 0.00 7.14 3.39 0.00 5.00 0.00
Satisfied 9.88 0.00 100.00 14.29 20.34 0.00 0.00 3.13
Dissatisfied 29.01 15.63 0.00 57.14 42.37 50.00 10.00 15.63
Highly Dissatisfied 19.14 3.13 0.00 14.29 28.81 25.00 20.00 18.75
No Answer 31.48 40.63 0.00 7.14 5.08 25.00 65.00 62.50
Total 100.00 100.00 100.00 100.00 0.00 100.00 100.00 100.00 100.00
Non-poor
Sample size (n) 1195 150 142 150 156 148 150 149 150
Use Service 16.74 35.33 0.00 18.00 0.00 54.05 10.00 10.07 6.67
Don't Use Service 83.26 64.67 100.00 82.00 100.00 45.95 90.00 89.93 93.33
User and Non-User 100.00 100.00 100.00 100.00 100.00 100.00 100.00 100.00 100.00
Highly Satisfied 10.61 30.19
0.00
3.80 13.33 0.00 0.00
Satisfied 10.61 0.00
11.54
18.99 0.00 20.00 0.00
Dissatisfied 28.79 33.96
38.46
29.11 40.00 0.00 0.00
Highly Dissatisfied 30.30 18.87
42.31
27.85 46.67 20.00 70.00
No Answer 19.70 16.98
7.69
20.25 0.00 60.00 30.00
Total 100.00 100.00 0.00 100.00 0.00 100.00 100.00 100.00 100.00

MAIN REPORT: PARTICIPATORY CITIZENS' SATISFACTION B ASELINE SURVEY IN EIGHT UGDP PARTNER CITY ADMINISTRATIONS
2013
65
Table B1.1.11 : Market Infrastructure
Responses All Cities Adwa Assosa Debre Markos Gambella Jigjiga Nekemte Semera Yirgalem
Poor + Non-poor
Sample size (n) 2350 300 297 270 306 278 300 299 300
Don't Use Service 15.91 1.33 1.68 0.37 43.79 31.29 11.00 36.79 0.00
Use Service 84.09 98.67 98.32 99.63 56.21 68.71 89.00 63.21 100.00
User and Non-User 100.00 100.00 100.00 100.00 100.00 100.00 100.00 100.00 100.00
Highly Satisfied 3.69 7.43 3.42 1.85 0.00 8.90 0.00 9.04 0.67
Satisfied 26.61 46.96 27.74 38.89 9.83 25.65 14.61 28.19 14.33
Dissatisfied 43.65 36.15 30.48 45.19 35.26 52.36 53.56 32.98 59.67
Highly Dissatisfied 24.58 7.77 36.99 14.07 54.91 9.95 30.71 24.47 25.00
No Answer 1.47 1.69 1.37 0.00 0.00 3.14 1.12 5.32 0.33
Total 100.00 100.00 100.00 100.00 100.00 100.00 100.00 100.00 100.00
Poor
Sample size (n) 1155 150 155 120 150 130 150 150 150
Don't Use Service 17.23 1.33 0.65 0.83 58.67 13.85 20.00 39.33 0.00
Use Service 82.77 98.67 99.35 99.17 41.33 86.15 80.00 60.67 100.00
User and Non-User 100.00 100.00 100.00 100.00 100.00 100.00 100.00 100.00 100.00
Highly Satisfied 4.07 10.81 1.30 1.67 0.00 8.93 0.00 7.61 1.33
Satisfied 26.83 49.32 28.57 30.00 14.52 27.68 12.50 26.09 16.67
Dissatisfied 41.23 31.08 27.92 44.17 35.48 51.79 47.50 34.78 56.00
Highly Dissatisfied 26.10 6.76 41.56 24.17 50.00 8.93 38.33 23.91 25.33
No Answer 1.77 2.03 0.65 0.00 0.00 2.68 1.67 7.61 0.67
Total 100.00 100.00 100.00 100.00 100.00 100.00 100.00 100.00 100.00
Non-poor
Sample size (n) 1195 150 142 150 156 148 150 149 150
Don't Use Service 14.64 1.33 2.82 0.00 29.49 46.62 2.00 34.23 0.00
Use Service 85.36 98.67 97.18 100.00 70.51 53.38 98.00 65.77 100.00
User and Non-User 100.00 100.00 100.00 100.00 100.00 100.00 100.00 100.00 100.00
Highly Satisfied 3.34 4.05 5.80 2.00 0.00 8.86 0.00 10.42 0.00
Satisfied 26.40 44.59 26.81 46.00 7.21 22.78 16.33 30.21 12.00
Dissatisfied 45.93 41.22 33.33 46.00 35.14 53.16 58.50 31.25 63.33
Highly Dissatisfied 23.16 8.78 31.88 6.00 57.66 11.39 24.49 25.00 24.67
No Answer 1.18 1.35 2.17 0.00 0.00 3.80 0.68 3.13 0.00
Total 100.00 100.00 100.00 100.00 100.00 100.00 100.00 100.00 100.00

MAIN REPORT: PARTICIPATORY CITIZENS' SATISFACTION B ASELINE SURVEY IN EIGHT UGDP PARTNER CITY ADMINISTRATIONS
2013
66
Table B1.1.12 : Public Parks
Responses All Cities Adwa Assosa Debre Markos Gambella Jigjiga Nekemte Semera Yirgalem
Poor + Non-poor Sample size (n) 2353 300 297 270 308 279 300 299 300
Use Service 8.46 27.00 0.34 1.11 5.84 2.87 12.00 0.67 16.67
Don't Use Service 91.54 73.00 99.66 98.89 94.16 97.13 88.00 99.33 83.33
User and Non-User 100.00 100.00 100.00 100.00 100.00 100.00 100.00 100.00 100.00
Highly Satisfied 3.09 7.41 0.00
0.00 0.00 0.00 0.00 0.00
Satisfied 20.10 30.86 100.00
5.56 0.00 29.41 0.00 4.00
Dissatisfied 40.72 27.16 0.00
66.67 12.50 32.35 50.00 64.00
Highly Dissatisfied 23.20 17.28 0.00
27.78 75.00 23.53 50.00 22.00
No Answer 12.89 17.28 0.00
0.00 12.50 14.71 0.00 10.00
Total 100.00 100.00 100.00 0.00 100.00 100.00 100.00 100.00 100.00
Poor Sample size (n) 1157 150 155 120 152 130 150 150 150
Use Service 6.40 19.33 0.00 1.67 2.63 3.08 16.67 0.67 6.00
Don't Use Service 93.60 80.67 100.00 98.33 97.37 96.92 83.33 99.33 94.00
User and Non-User 100.00 100.00 100.00 100.00 100.00 100.00 100.00 100.00 100.00
Highly Satisfied 5.56 13.79
0.00 0.00 0.00 0.00 0.00
Satisfied 22.22 37.93
0.00 0.00 20.00 0.00 0.00
Dissatisfied 20.83 10.34
0.00 25.00 28.00 0.00 44.44
Highly Dissatisfied 27.78 10.34
100.00 75.00 32.00 100.00 11.11
No Answer 23.61 27.59
0.00 0.00 20.00 0.00 44.44
Total 100.00 100.00 0.00 0.00 100.00 100.00 100.00 100.00 100.00
Non-poor
Sample size (n) 1196 150 142 150 156 149 150 149 150
Use Service 10.45 34.67 0.70 0.67 8.97 2.68 7.33 0.67 27.33
Don't Use Service 89.55 65.33 99.30 99.33 91.03 97.32 92.67 99.33 72.67
User and Non-User 100.00 100.00 100.00 100.00 100.00 100.00 100.00 100.00 100.00
Highly Satisfied 1.64 3.85 0.00 0.00 0.00 0.00 0.00 0.00
Satisfied 18.85 26.92 100.00
7.14 0.00 55.56 0.00 4.88
Dissatisfied 52.46 36.54 0.00
85.71 0.00 44.44 100.00 68.29
Highly Dissatisfied 20.49 21.15 0.00
7.14 75.00 0.00 0.00 24.39
No Answer 6.56 11.54 0.00
0.00 25.00 0.00 0.00 2.44
Total 100.00 100.00 100.00 0.00 100.00 100.00 100.00 100.00 100.00

MAIN REPORT: PARTICIPATORY CITIZENS' SATISFACTION B ASELINE SURVEY IN EIGHT UGDP PARTNER CITY ADMINISTRATIONS
2013
67
Table B1.1.13 : Cemeteries
Responses All Cities Adwa Assosa Debre Markos Gambella Jigjiga Nekemte Semera Yirgalem
Poor + Non-poor Sample size (n) 2352 300 297 270 308 278 300 299 300
Use Service 88.61 93.67 75.42 94.81 78.57 89.57 99.33 78.93 99.33
Don't Use Service 11.39 6.33 24.58 5.19 21.43 10.43 0.67 21.07 0.67
User and Non-User 100.00 100.00 100.00 100.00 100.00 100.00 100.00 100.00 100.00
Highly Satisfied 19.60 35.94 8.11 5.86 6.61 20.97 37.92 15.61 18.79
Satisfied 45.34 46.98 40.54 58.59 29.34 29.03 46.31 56.96 52.35
Dissatisfied 23.29 13.52 25.68 29.69 38.02 32.26 12.75 16.03 22.15
Highly Dissatisfied 10.04 2.14 22.52 5.86 26.03 14.52 2.35 5.49 6.38
No Answer 1.73 1.42 3.15 0.00 0.00 3.23 0.67 5.91 0.34
Total 100.00 100.00 100.00 100.00 100.00 100.00 100.00 100.00 100.00
Poor Sample size (n) 1157 150 155 120 152 130 150 150 150
Use Service 90.06 93.33 88.39 99.17 76.97 87.69 99.33 78.67 98.67
Don't Use Service 9.94 6.67 11.61 0.83 23.03 12.31 0.67 21.33 1.33
User and Non-User 100.00 100.00 100.00 100.00 100.00 100.00 100.00 100.00 100.00
Highly Satisfied 20.21 37.14 8.03 3.36 7.69 14.04 42.95 18.33 22.30
Satisfied 45.98 45.71 43.07 58.82 28.21 30.70 46.98 56.67 54.73
Dissatisfied 22.13 15.71 24.09 27.73 37.61 39.47 8.05 16.67 14.86
Highly Dissatisfied 10.92 1.43 24.09 10.08 26.50 15.79 1.34 3.33 8.11
No Answer 0.77 0.00 0.73 0.00 0.00 0.00 0.67 5.00 0.00
Total 100.00 100.00 100.00 100.00 100.00 100.00 100.00 100.00 100.00
Non-poor
Sample size (n) 1195 150 142 150 156 148 150 149 150
Use Service 87.20 94.00 61.27 91.33 80.13 91.22 99.33 79.19 100.00
Don't Use Service 12.80 6.00 38.73 8.67 19.87 8.78 0.67 20.81 0.00
User and Non-User 100.00 100.00 100.00 100.00 100.00 100.00 100.00 100.00 100.00
Highly Satisfied 18.98 34.75 8.24 8.03 5.60 26.87 32.89 12.82 15.33
Satisfied 44.70 48.23 36.47 58.39 30.40 27.61 45.64 57.26 50.00
Dissatisfied 24.47 11.35 28.24 31.39 38.40 26.12 17.45 15.38 29.33
Highly Dissatisfied 9.15 2.84 20.00 2.19 25.60 13.43 3.36 7.69 4.67
No Answer 2.70 2.84 7.06 0.00 0.00 5.97 0.67 6.84 0.67
Total 100.00 100.00 100.00 100.00 100.00 100.00 100.00 100.00 100.00

MAIN REPORT: PARTICIPATORY CITIZENS' SATISFACTION B ASELINE SURVEY IN EIGHT UGDP PARTNER CITY ADMINISTRATIONS
2013
68
Table B1.1.14 : Affordable (Public) Housing
Responses All Cities Adwa Assosa Debre Markos Gambella Jigjiga Nekemte Semera Yirgalem
Poor + Non-poor Sample size (n) 2352 300 297 270 308 278 300 299 300
Use Service 41.96 52.00 4.04 83.33 25.32 18.71 55.00 3.34 96.33
Don't Use Service 58.04 48.00 95.96 16.67 74.68 81.29 45.00 96.66 3.67
User and Non-User 100.00 100.00 100.00 100.00 100.00 100.00 100.00 100.00 100.00
Highly Satisfied 2.33 6.41 0.00 0.88 0.00 1.92 2.42 20.00 1.39
Satisfied 22.29 19.23 33.33 38.94 6.41 21.15 20.00 30.00 15.97
Dissatisfied 36.47 19.87 25.00 41.59 26.92 32.69 32.73 10.00 48.26
Highly Dissatisfied 24.92 15.38 41.67 13.27 66.67 17.31 26.67 40.00 27.08
No Answer 13.98 39.10 0.00 5.31 0.00 26.92 18.18 0.00 7.29
Total 100.00 100.00 100.00 100.00 100.00 100.00 100.00 100.00 100.00
Poor Sample size (n) 1157 150 155 120 152 130 150 150 150
Use Service 39.59 48.00 1.29 90.00 11.18 7.69 60.67 5.33 100.00
Don't Use Service 60.41 52.00 98.71 10.00 88.82 92.31 39.33 94.67 0.00
User and Non-User 100.00 100.00 100.00 100.00 100.00 100.00 100.00 100.00 100.00
Highly Satisfied 3.27 9.72 0.00 0.92 0.00 0.00 4.40 22.22 0.67
Satisfied 16.99 13.89 0.00 31.19 0.00 20.00 18.68 22.22 8.67
Dissatisfied 33.99 12.50 0.00 41.28 5.88 60.00 24.18 11.11 48.00
Highly Dissatisfied 26.80 8.33 100.00 16.51 94.12 20.00 32.97 44.44 30.67
No Answer 18.95 55.56 0.00 10.09 0.00 0.00 19.78 0.00 12.00
Total 100.00 100.00 100.00 100.00 100.00 100.00 100.00 100.00 100.00
Non-poor
Sample size (n) 1195 150 142 150 156 148 150 149 150
Use Service 44.27 56.00 7.04 78.00 39.10 28.38 49.33 1.34 92.67
Don't Use Service 55.73 44.00 92.96 22.00 60.90 71.62 50.67 98.66 7.33
User and Non-User 100.00 100.00 100.00 100.00 100.00 100.00 100.00 100.00 100.00
Highly Satisfied 1.52 3.57 0.00 0.85 0.00 2.38 0.00 0.00 2.17
Satisfied 26.89 23.81 36.36 46.15 8.20 21.43 21.62 100.00 23.91
Dissatisfied 38.64 26.19 27.27 41.88 32.79 26.19 43.24 0.00 48.55
Highly Dissatisfied 23.30 21.43 36.36 10.26 59.02 16.67 18.92 0.00 23.19
No Answer 9.66 25.00 0.00 0.85 0.00 33.33 16.22 0.00 2.17
Total 100.00 100.00 100.00 100.00 100.00 100.00 100.00 100.00 100.00

MAIN REPORT: PARTICIPATORY CITIZENS' SATISFACTION B ASELINE SURVEY IN EIGHT UGDP PARTNER CITY ADMINISTRATIONS
2013
69
Table B1.1 15 : Non-physical Services
Responses All Cities Adwa Assosa Debre Markos Gambella Jigjiga Nekemte Semera Yirgalem
Poor + Non-poor
Sample size (n) 2352 300 297 269 308 278 300 300 300
Use Service 88.52 98.33 83.16 91.08 88.31 89.21 97.33 61.33 99.67
Don't Use Service 11.48 1.67 16.84 8.92 11.69 10.79 2.67 38.67 0.33
User and Non-User 100.00 100.00 100.00 100.00 100.00 100.00 100.00 100.00 100.00
Highly Satisfied 6.35 12.20 1.62 2.04 4.41 9.31 4.81 9.89 6.69
Satisfied 42.40 59.32 41.70 52.24 24.63 34.82 38.83 47.80 40.80
Dissatisfied 33.93 21.36 30.77 37.14 38.24 34.41 44.33 21.98 39.13
Highly Dissatisfied 15.64 5.08 23.08 8.16 31.62 19.03 11.68 15.38 12.71
No Answer 1.68 2.03 2.83 0.41 1.10 2.43 0.34 4.95 0.67
Total 100.00 100.00 100.00 100.00 100.00 100.00 100.00 100.00 100.00
Poor
Sample size (n) 1156 150 155 119 152 130 150 150 150
Use Service 88.41 98.67 87.10 88.24 87.50 86.92 99.33 59.33 100.00
Don't Use Service 11.59 1.33 12.90 11.76 12.50 13.08 0.67 40.67 0.00
User and Non-User 100.00 100.00 100.00 100.00 100.00 100.00 100.00 100.00 100.00
Highly Satisfied 5.68 12.84 1.48 3.77 3.76 5.31 3.38 12.36 4.00
Satisfied 38.85 58.11 41.48 41.51 22.56 29.20 27.70 48.31 42.67
Dissatisfied 36.69 21.62 34.81 37.74 37.59 38.94 54.05 20.22 42.67
Highly Dissatisfied 17.51 6.08 20.74 16.04 34.59 25.66 14.19 15.73 10.00
No Answer 1.27 1.35 1.48 0.94 1.50 0.88 0.68 3.37 0.67
Total 100.00 100.00 100.00 100.00 100.00 100.00 100.00 100.00 100.00
Non-poor
Sample size (n) 1196 150 142 150 156 148 150 150 150
Use Service 88.63 98.00 78.87 93.33 89.10 91.22 95.33 63.33 99.33
Don't Use Service 11.37 2.00 21.13 6.67 10.90 8.78 4.67 36.67 0.67
User and Non-User 100.00 100.00 100.00 100.00 100.00 100.00 100.00 100.00 100.00
Highly Satisfied 7.01 11.56 1.79 0.72 5.04 12.69 6.29 7.53 9.40
Satisfied 45.83 60.54 41.96 60.43 26.62 39.55 50.35 47.31 38.93
Dissatisfied 31.25 21.09 25.89 36.69 38.85 30.60 34.27 23.66 35.57
Highly Dissatisfied 13.83 4.08 25.89 2.16 28.78 13.43 9.09 15.05 15.44
No Answer 2.08 2.72 4.46 0.00 0.72 3.73 0.00 6.45 0.67
Total 100.00 100.00 100.00 100.00 100.00 100.00 100.00 100.00 100.00

MAIN REPORT: PARTICIPATORY CITIZENS' SATISFACTION B ASELINE SURVEY IN EIGHT UGDP PARTNER CITY ADMINISTRATIONS
2013
70
Table B1.1.16 : MSE Development Support
Responses All Cities Adwa Assosa Debre Markos Gambella Jigjiga Nekemte Semera Yirgalem
Poor + Non-poor
Sample size (n) 2349 300 297 267 308 277 300 300 300
Use Service 31.08 52.00 7.41 25.84 13.31 24.91 54.00 10.00 60.33
Don't Use Service 68.92 48.00 92.59 74.16 86.69 75.09 46.00 90.00 39.67
User and Non-User 100.00 100.00 100.00 100.00 100.00 100.00 100.00 100.00 100.00
Highly Satisfied 3.55 10.26 0.00 1.54 0.00 7.35 0.00 5.00 1.11
Satisfied 28.10 43.59 47.06 32.31 27.50 23.53 17.37 7.50 27.78
Dissatisfied 39.29 24.36 41.18 47.69 50.00 27.94 53.29 15.00 43.33
Highly Dissatisfied 16.92 4.49 11.76 12.31 22.50 25.00 18.56 15.00 24.44
No Answer 12.14 17.31 0.00 6.15 0.00 16.18 10.78 57.50 3.33
Total 100.00 100.00 100.00 100.00 100.00 100.00 100.00 100.00 100.00
Poor
Sample size (n) 1155 150 155 118 152 130 150 150 150
Use Service 31.08 52.00 2.58 31.36 9.87 16.92 50.00 8.00 77.33
Don't Use Service 68.92 48.00 97.42 68.64 90.13 83.08 50.00 92.00 22.67
User and Non-User 100.00 100.00 100.00 100.00 100.00 100.00 100.00 100.00 100.00
Highly Satisfied 4.40 14.10 0.00 2.94 0.00 9.09 0.00 4.55 0.86
Satisfied 26.10 43.59 50.00 35.29 20.00 36.36 12.00 0.00 24.14
Dissatisfied 37.36 19.23 0.00 50.00 53.33 18.18 53.33 13.64 42.24
Highly Dissatisfied 20.33 2.56 50.00 8.82 26.67 36.36 25.33 18.18 28.45
No Answer 11.81 20.51 0.00 2.94 0.00 0.00 9.33 63.64 4.31
Total 100.00 100.00 100.00 100.00 100.00 100.00 100.00 100.00 100.00
Non-poor
Sample size (n) 1194 150 142 149 156 147 150 150 150
Use Service 31.07 52.00 12.68 21.48 16.67 31.97 58.00 12.00 43.33
Don't Use Service 68.93 48.00 87.32 78.52 83.33 68.03 42.00 88.00 56.67
User and Non-User 100.00 100.00 100.00 100.00 100.00 100.00 100.00 100.00 100.00
Highly Satisfied 2.71 6.41 0.00 0.00 0.00 6.52 0.00 5.56 1.56
Satisfied 30.08 43.59 46.67 29.03 32.00 17.39 21.74 16.67 34.38
Dissatisfied 41.19 29.49 46.67 45.16 48.00 32.61 53.26 16.67 45.31
Highly Dissatisfied 13.55 6.41 6.67 16.13 20.00 19.57 13.04 11.11 17.19
No Answer 12.47 14.10 0.00 9.68 0.00 23.91 11.96 50.00 1.56
Total 100.00 100.00 100.00 100.00 100.00 100.00 100.00 100.00 100.00

MAIN REPORT: PARTICIPATORY CITIZENS' SATISFACTION B ASELINE SURVEY IN EIGHT UGDP PARTNER CITY ADMINISTRATIONS
2013
71
Table B1.1.17 : Overall Satisfaction with All Public Services
Responses All Cities Adwa Assosa Debre Markos Gambella Jigjiga Nekemte Semera Yirgalem
Poor + Non-poor
Highly Satisfied 4.57 8.33 7.41 0.38 0.00 15.83 0.00 4.41 0.67
Satisfied 33.25 59.67 40.74 34.96 24.10 32.01 25.00 35.59 14.33
Dissatisfied 43.15 27.00 29.97 59.02 41.37 34.89 58.33 31.86 63.67
Highly Dissatisfied 17.03 2.33 21.55 5.64 25.08 16.91 14.67 27.46 21.33
No Answer 2.01 2.67 0.34 0.00 9.45 0.36 2.00 0.68 0.00
Total 100.00 100.00 100.00 100.00 100.00 100.00 100.00 100.00 100.00
Poor
Highly Satisfied 5.21 11.33 12.90 0.00 0.00 11.54 0.00 5.41 0.00
Satisfied 29.89 60.00 33.55 23.93 17.22 33.08 25.33 37.16 8.00
Dissatisfied 40.49 24.00 23.87 67.52 35.10 30.00 50.67 31.08 66.67
Highly Dissatisfied 21.55 1.33 29.68 8.55 31.13 24.62 23.33 25.68 25.33
No Answer 2.87 3.33 0.00 0.00 16.56 0.77 0.67 0.68 0.00
Total 100.00 100.00 100.00 100.00 100.00 100.00 100.00 100.00 100.00
Non-poor
Highly Satisfied 3.94 5.33 1.41 0.67 0.00 19.59 0.00 3.40 1.33
Satisfied 36.49 59.33 48.59 43.62 30.77 31.08 24.67 34.01 20.67
Dissatisfied 45.72 30.00 36.62 52.35 47.44 39.19 66.00 32.65 60.67
Highly Dissatisfied 12.67 3.33 12.68 3.36 19.23 10.14 6.00 29.25 17.33
No Answer 1.17 2.00 0.70 0.00 2.56 0.00 3.33 0.68 0.00
Total 100.00 100.00 100.00 100.00 100.00 100.00 100.00 100.00 100.00

MAIN REPORT: PARTICIPATORY CITIZENS' SATISFACTION B ASELINE SURVEY IN EIGHT UGDP PARTNER CITY ADMINISTRATIONS
2013
72
B1.2: Business Enterprises' Satisfaction with the Delivery of Public Services
Table B1.2.1: Potable Water Supply
Responses All Cities Adwa Assosa Debre Markos
Gambella Jigjiga Nekemte Semera Yirgalem
Sample size (n) 243 33 30 30 30 30 30 30 30
Use Service 84.0 97.0 80.0 83.3 90.0 26.7 100.0 93.3 100.0
Don't Use Service 16.0 3.0 20.0 16.7 10.0 73.3 - 6.7 -
User and Non-User 100.0 100.0 100.0 100.0 100.0 100.0 100.0 100.0 100.0
Highly Satisfied 19.6 28.1 4.2 8.0 7.4 37.5 23.3 21.4 33.3
Satisfied 51.5 65.6 54.2 80.0 29.6 25.0 36.7 67.9 36.7
Dissatisfied 18.1 6.3 33.3 12.0 29.6 12.5 20.0 7.1 23.3
Highly Dissatisfied 10.3 - 8.3 - 33.3 12.5 20.0 3.6 6.7
No Answer 0.5 - - - - 12.5 - - -
Total 100.0 100.0 100.0 100.0 100.0 100.0 100.0 100.0 100.0
Table B1.2.2: Electric Power Supply
Responses All Cities Adwa Assosa Debre Markos
Gambella Jigjiga Nekempte Semera Yirgalem
Sample size (n) 243 33 30 30 30 30 30 30 30
Use Service 95.9 97.0 93.3 90.0 96.7 96.7 100.0 96.7 96.7
Don't Use Service 4.1 3.0 6.7 10.0 3.3 3.3 - 3.3 3.3
User and Non-User 100.0 100.0 100.0 100.0 100.0 100.0 100.0 100.0 100.0
Highly Satisfied 18.8 10.7 - 3.4 25.9 10.0 13.8 6.7 11.2
Satisfied 40.6 50.0 32.1 69.0 51.9 43.3 86.2 60.0 54.1
Dissatisfied 40.6 28.6 53.6 13.8 22.2 20.0 - 33.3 26.6
Highly Dissatisfied - 10.7 14.3 13.8 - 26.7 - - 8.2
No Answer - - - - - - - - -
Total 100.0 100.0 100.0 100.0 100.0 100.0 100.0 100.0 100.0

MAIN REPORT: PARTICIPATORY CITIZENS' SATISFACTION B ASELINE SURVEY IN EIGHT UGDP PARTNER CITY ADMINISTRATIONS
2013
73
Table B1.2.3: Street Lighting
Responses All Cities Adwa Assosa Debre Markos
Gambella Jigjiga Nekemte Semera Yirgalem
Sample size (n) 243 33 30 30 30 30 30 30 30
Use Service 67.9 81.8 76.7 73.3 56.7 66.7 83.3 6.7 96.7
Don't Use Service 32.1 18.2 23.3 26.7 43.3 33.3 16.7 93.3 3.3
User and Non-User 100.0 100.0 100.0 100.0 100.0 100.0 100.0 100.0 100.0
Highly Satisfied 6.9 3.4 - 42.9 22.7 3.4 - 6.9 8.0
Satisfied 20.7 13.8 24.0 28.6 50.0 6.9 25.0 27.6 23.0
Dissatisfied 41.4 20.7 52.0 28.6 4.5 41.4 50.0 51.7 36.2
Highly Dissatisfied 31.0 62.1 24.0 - 22.7 48.3 25.0 13.8 32.8
No Answer - - - - - - - - -
Total 100.0 100.0 100.0 100.0 100.0 100.0 100.0 100.0 100.0
Table B1.2.4: Inner City Roads
Responses All Cities Adwa Assosa Debre Markos
Gambella Jigjiga Nekemte Semera Yirgalem
Sample size (n) 243.0 33.0 30.0 30.0 30.0 30.0 30.0 30.0 30.0
Use Service 72.0 87.9 96.7 83.3 23.3 73.3 100.0 13.3 96.7
Don't Use Service 28.0 12.1 3.3 16.7 76.7 26.7 - 86.7 3.3
User and Non-User 100.0 100.0 100.0 100.0 100.0 100.0 100.0 100.0 100.0
Highly Satisfied 10.5 4.5 - - 30.0 - - 3.3 5.1
Satisfied 31.6 22.7 27.3 - 40.0 7.4 33.3 40.0 26.1
Dissatisfied 52.6 13.6 40.9 20.0 20.0 51.9 66.7 46.7 39.9
Highly Dissatisfied 5.3 54.5 31.8 80.0 - 37.0 - 10.0 26.8
No Answer - 4.5 - - 10.0 3.7 - - 2.2
Total 100.0 100.0 100.0 100.0 100.0 100.0 100.0 100.0 100.0
Table B1.2.5: Drainage Structures
Responses All Cities Adwa Assosa Debre Markos
Gambella Jigjiga Nekemte Semera Yirgalem
Sample size (n) 243 33 30 30 30 30 30 30 30
Use Service 56.4 57.6 73.3 73.3 16.7 33.3 86.7 10.0 100.0
Don't Use Service 43.6 42.4 26.7 26.7 83.3 66.7 13.3 90.0 -
User and Non-User 100.0 100.0 100.0 100.0 100.0 100.0 100.0 100.0 100.0
Highly Satisfied 5.1 10.5 4.5 - - 30.0 - - 3.3
Satisfied 26.1 31.6 22.7 27.3 - 40.0 7.4 33.3 40.0
Dissatisfied 39.9 52.6 13.6 40.9 20.0 20.0 51.9 66.7 46.7
Highly Dissatisfied 26.8 5.3 54.5 31.8 80.0 - 37.0 - 10.0
No Answer 2.2 - 4.5 - - 10.0 3.7 - -
Total 100.0 100.0 100.0 100.0 100.0 100.0 100.0 100.0 100.0

MAIN REPORT: PARTICIPATORY CITIZENS' SATISFACTION B ASELINE SURVEY IN EIGHT UGDP PARTNER CITY ADMINISTRATIONS
2013
74
Table B1.2.6: Solid Waste Collection
Responses All Cities Adwa Assosa Debre Markos
Gambella Jigjiga Nekemte Semera Yirgalem
Sample size (n) 242.0 33.0 30.0 29.0 30.0 30.0 30.0 30.0 30.0
Use Service 66.5 100.0 40.0 44.8 40.0 93.3 93.3 16.7 100.0
Don't Use Service 33.5 - 60.0 55.2 60.0 6.7 6.7 83.3 -
User and Non-User 100.0 100.0 100.0 100.0 100.0 100.0 100.0 100.0 100.0
Highly Satisfied 21.1 21.2 - 28.6 25.0 25.0 3.6 - 40.0
Satisfied 47.8 69.7 25.0 64.3 16.7 35.7 35.7 75.0 56.7
Dissatisfied 20.5 9.1 33.3 7.1 16.7 39.3 35.7 25.0 3.3
Highly Dissatisfied 9.9 - 33.3 - 41.7 - 25.0 - -
No Answer 0.6 - 8.3 - - - - - -
Total 100.0 100.0 100.0 100.0 100.0 100.0 100.0 100.0 100.0
Table B1.2.7: Public Toilets
Responses All Cities Adwa Assosa Debre Markos
Gambella Jigjiga Nekemte Semera Yirgalem
Sample size (n) 241 33 30 30 30 29 29 30 30
Use Service 11.2 33.3 3.3 10.0 3.3 10.3 3.4 - 23.3
Don't Use Service 88.8 66.7 96.7 90.0 96.7 89.7 96.6 100.0 76.7
User and Non-User 100.0 100.0 100.0 100.0 100.0 100.0 100.0 100.0 100.0
Highly Satisfied 21.9 18.2 - - - 50.0 20.0 - 28.6
Satisfied 40.6 45.5 - - 100.0 50.0 40.0 - 42.9
Dissatisfied 21.9 18.2 100.0 66.7 - - 20.0 - 14.3
Highly Dissatisfied 6.3 - - - - - 20.0 - 14.3
No Answer 9.4 18.2 - 33.3 - - - - -
Total 100.0 100.0 100.0 100.0 100.0 100.0 100.0 - 100.0
Table B1.2.8: Vacuum Truck Services
Responses All Cities Adwa Assosa Debre Markos
Gambella Jigjiga Nekemte Semera Yirgalem
Sample size (n) 240 33 30 30 30 30 27 30 30
Use Service 25.0 36.4 - 33.3 3.3 56.7 25.9 10.0 33.3
Don't Use Service 75.0 63.6 100.0 66.7 96.7 43.3 74.1 90.0 66.7
User and Non-User 100.0 100.0 100.0 100.0 100.0 100.0 100.0 100.0 100.0
Highly Satisfied 9.8 - - - 100.0 17.6 14.3 - 9.1
Satisfied 32.8 33.3 - 40.0 - 23.5 14.3 33.3 54.5
Dissatisfied 34.4 58.3 - 50.0 - 35.3 - 33.3 18.2
Highly Dissatisfied 14.8 8.3 - - - 17.6 42.9 33.3 9.1
No Answer 8.2 - - 10.0 - 5.9 28.6 - 9.1
Total 100.0 100.0 - 100.0 100.0 100.0 100.0 100.0 100.0

MAIN REPORT: PARTICIPATORY CITIZENS' SATISFACTION B ASELINE SURVEY IN EIGHT UGDP PARTNER CITY ADMINISTRATIONS
2013
75
Table B1.2.9: Business Development Services
Responses All Cities Adwa Assosa Debre Markos
Gambella Jigjiga Nekemte Semera Yirgalem
Sample size (n) 242 33 30 30 30 30 29 30 30
Use Service 88.8 100.0 90.0 83.3 96.7 70.0 100.0 0.0 100.0
Don't Use Service 11.2 - 10.0 16.7 3.3 30.0 - 100.0 -
User and Non-User 100.0 100.0 100.0 100.0 100.0 100.0 100.0 100.0 100.0
Highly Satisfied 5.3 6.1 - - 3.4 14.3 10.0 - 6.9
Satisfied 24.9 24.2 10.7 8.0 6.9 28.6 - - 20.7
Dissatisfied 36.4 54.5 28.6 56.0 20.7 28.6 50.0 - 51.7
Highly Dissatisfied 29.3 12.1 53.6 28.0 69.0 23.8 30.0 - 20.7
No Answer 4.0 3.0 7.1 8.0 - 4.8 10.0 - -
Total 100.0 100.0 100.0 100.0 100.0 100.0 100.0 - 100.0
Table B1.2.10: Abattoir services
Responses All Cities Adwa Assosa Debre Markos
Gambella Jigjiga Nekemte Semera Yirgalem
Sample size (n) 241 33 30 30 30 29 29 30 30
Use Service 44.0 30.3 53.3 30.0 63.3 79.3 75.9 - 23.3
Don't Use Service 56.0 69.7 46.7 70.0 36.7 20.7 24.1 100.0 76.7
User and Non-User 100.0 100.0 100.0 100.0 100.0 100.0 100.0 100.0 100.0
Highly Satisfied 3.8 10.0 6.3 - 5.3 4.3 - - -
Satisfied 20.0 20.0 - 25.0 - 30.4 22.7 - 71.4
Dissatisfied 33.3 30.0 12.5 62.5 42.1 26.1 45.5 - 14.3
Highly Dissatisfied 28.6 20.0 56.3 12.5 52.6 4.3 27.3 - 14.3
No Answer 14.3 20.0 25.0 - - 34.8 4.5 - -
Total 100.0 100.0 100.0 100.0 100.0 100.0 100.0 - 100.0
Table B1.2.11: Overall satisfaction with all public services
Responses All Cities Adwa Assosa Debre Markos
Gambella Jigjiga Nekemte Semera Yirgalem
Sample size (n) 234 33 30 29 28 29 30 25 30
Highly Satisfied 4.7 6.1 - - 7.1 10.3 - 12.0 3.3
Satisfied 29.5 33.3 30.0 20.7 3.6 48.3 10.0 24.0 63.3
Dissatisfied 43.6 54.5 36.7 72.4 46.4 31.0 56.7 16.0 30.0
Highly Dissatisfied 21.4 6.1 33.3 6.9 39.3 10.3 33.3 44.0 3.3
No Answer 0.9 - - - 3.6 - - 4.0 -
Total 100.0 100.0 100.0 100.0 100.0 100.0 100.0 100.0 100.0

MAIN REPORT: PARTICIPATORY CITIZENS' SATISFACTION B ASELINE SURVEY IN EIGHT UGDP PARTNER CITY ADMINISTRATIONS
2013
76
B2: Public Participation and Access to Information
B2.1: Households How often .......
Table B2.1.1: Invited to public meeting
Responses Adwa Assosa Debre
Markos Gambella Jigjiga Nekemte S. Logia Yirgalem All Cities
Sample size (n) 300 298 270 308 280 300 300 300 2,354
Valid Response % 100.0 99.3 100.0 99.7 99.3 99.7 87.7 100.0 98.3
Always 13.0 19.6 12.6 7.5 8.6 23.1 3.4 21.0 13.8
Sometimes 20.0 16.6 42.2 16.9 26.3 22.1 14.8 25.3 22.9
Rarely 23.3 21.6 31.1 30.3 19.8 37.8 15.2 29.3 26.2
Never 21.3 30.4 12.6 12.1 14.7 8.4 39.5 13.0 18.8
No Answer 22.3 11.8 1.5 33.2 30.6 8.7 27.0 11.3 18.3
Total 100.0 99.3 100.0 99.7 99.3 99.7 87.7 100.0 98.3
Table B2.1.2: Participated in public meeting
Responses Adwa Assosa Debre
Markos Gambella Jigjiga Nekemte S. Logia Yirgalem All Cities
Sample size (n) 300 298 270 308 280 300 300 300 2,354
Valid Response% 100.0 96.3 96.7 99.7 89.6 97.3 46.7 92.7 89.9
Always 10.3 25.4 4.2 12.7 8.8 18.5 8.6 19.8 14.0
Sometimes 13.7 14.6 38.3 23.5 26.7 19.5 22.9 25.9 22.8
Rarely 28.3 30.0 32.6 28.7 18.7 38.4 20.7 33.8 29.6
Never 32.3 24.7 22.2 25.4 8.4 20.9 20.7 16.2 21.7
No Answer 15.3 5.2 2.7 9.8 37.5 2.7 27.1 4.3 11.8
Total 100.0 100.0 100.0 100.0 100.0 100.0 100.0 100.0 100.0
Table B2.1.3: Public forums provided opportunity for participants to freely express views
Responses Adwa Assosa Debre
Markos Gambella Jigjiga Nekemte S. Logia Yirgalem All Cities
Sample size (n) 300 298 270 308 280 300 300 300 2,354
Valid Response% 52.00 71.48 74.44 75.65 52.86 85.33 28.67 73.67 64.23
Always 16.0 36.2 27.9 15.0 5.4 16.0 16.3 29.9 21.3
Sometimes 32.7 22.1 44.3 34.3 37.8 29.7 25.6 28.1 31.9
Rarely 32.7 25.8 20.4 29.6 33.8 33.2 26.7 31.7 29.4
Never 11.5 8.5 2.0 5.6 9.5 12.1 14.0 1.8 7.5
No Answer 7.1 7.0 5.5 15.5 12.8 9.0 17.4 8.6 9.9
Total 100.0 100.0 100.0 100.0 100.0 100.0 100.0 100.0 100.0

MAIN REPORT: PARTICIPATORY CITIZENS' SATISFACTION B ASELINE SURVEY IN EIGHT UGDP PARTNER CITY ADMINISTRATIONS
2013
77
Table B2.1.4: Provided comments, suggestions
Responses Adwa Assosa Debre
Markos Gambella Jigjiga Nekemte S. Logia Yirgalem All Cities
Sample size (n) 300 298 270 308 280 300 300 300 2,354
Valid Response% 52.00 72.82 74.81 75.32 52.50 84.67 29.00 73.33 64.36
Always 13.5 10.1 5.0 9.9 6.1 3.1 9.2 12.7 8.5
Sometimes 27.6 13.4 25.2 20.3 33.3 18.1 21.8 17.3 21.3
Rarely 29.5 20.3 35.1 26.3 29.3 44.5 18.4 37.7 31.5
Never 11.5 34.1 21.3 8.6 15.6 16.1 29.9 9.1 17.5
No Answer 17.9 22.1 13.4 34.9 15.6 18.1 20.7 23.2 21.3
Total 100.0 100.0 100.0 100.0 100.0 100.0 100.0 100.0 100.0
Table B2.1.5: Comments incorporated into CA's plans
Responses Adwa Assosa Debre
Markos Gambella Jigjiga Nekemte S. Logia Yirgalem All Cities
Sample size (n) 300 298 270 308 280 300 300 300 2,354
Valid Response% 52.00 71.81 72.96 72.08 52.86 81.33 27.00 59.67 61.21
Always 8.3 1.4 1.5 9.0 6.1 1.6 6.2 1.7 4.2
Sometimes 25.0 13.1 11.2 7.7 29.7 6.6 12.3 12.3 13.7
Rarely 31.4 34.1 28.9 20.3 26.4 46.3 21.0 43.6 32.7
Never 10.9 26.6 23.9 12.2 14.2 18.4 23.5 10.1 17.4
No Answer 24.4 24.8 34.5 50.9 23.6 27.0 37.0 32.4 32.0
Total 100.0 100.0 100.0 100.0 100.0 100.0 100.0 100.0 100.0
Tabl2 B2.1.6: CA's projects consistent with citizens' priorities
Responses Adwa Assosa Debre
Markos Gambella Jigjiga Nekemte S. Logia Yirgalem All Cities
Sample size (n) 300 298 270 308 280 300 300 300 2,354
Valid Response% 99.67 99.66 75.93 97.40 98.93 98.00 90.33 98.67 95.11
Always 5.7 8.8 2.4 2.7 4.0 3.1 7.4 0.7 4.4
Sometimes 17.1 13.5 23.9 10.7 20.9 16.3 18.5 11.1 16.1
Rarely 28.8 27.6 45.4 16.3 25.6 46.3 23.6 48.0 32.3
Never 10.7 23.9 14.6 13.3 14.1 15.6 19.9 13.5 15.7
No Answer 37.8 26.3 13.7 57.0 35.4 18.7 30.6 26.7 31.5
Total 100.0 100.0 100.0 100.0 100.0 100.0 100.0 100.0 100.0

MAIN REPORT: PARTICIPATORY CITIZENS' SATISFACTION B ASELINE SURVEY IN EIGHT UGDP PARTNER CITY ADMINISTRATIONS
2013
78
Table B2.1.7: Provided financial contributions
Responses Adwa Assosa Debre
Markos Gambella Jigjiga Nekemte S. Logia Yirgalem All Cities
Sample size (n) 300 298 270 308 280 300 300 300 2,354
Valid Response% 100.0 99.7 99.6 99.7 99.3 99.7 98.0 100.0 99.6
Always 29.3 17.5 15.2 25.7 4.0 14.7 10.5 20.7 17.4
Sometimes 23.0 17.8 33.5 18.9 23.4 37.5 25.9 31.3 26.3
Rarely 23.0 23.9 30.9 23.1 28.1 35.1 18.0 30.3 26.5
Never 8.0 29.0 16.7 5.9 19.8 6.4 20.4 7.0 14.0
No Answer 16.7 11.8 3.7 26.4 24.8 6.4 25.2 10.7 15.8
Total 100.0 100.0 100.0 100.0 100.0 100.0 100.0 100.0 100.0
Table B2.1.8: Provided in-kind contributions
Responses Adwa Assosa Debre
Markos Gambella Jigjiga Nekemte S. Logia Yirgalem All Cities
Sample size (n) 300 298 270 308 280 300 300 300 2,354
Valid Response% 100.0 99.7 100.0 99.7 99.3 99.3 98.7 100.0 99.7
Always 22.0 11.8 5.2 27.7 3.6 11.7 5.7 19.7 13.7
Sometimes 16.3 11.8 33.3 15.0 21.2 30.9 14.9 27.0 21.1
Rarely 18.0 18.9 32.6 20.2 18.3 33.9 15.2 26.7 22.9
Never 15.7 37.7 13.0 8.8 27.0 12.1 28.4 12.3 19.3
No Answer 28.0 19.9 15.9 28.3 29.9 11.4 35.8 14.3 23.0
Total 100.0 100.0 100.0 100.0 100.0 100.0 100.0 100.0 100.0
Table B2.1.9: Lodged complaints
Responses Adwa Assosa Debre
Markos Gambella Jigjiga Nekemte S. Logia Yirgalem All Cities
Sample size (n) 300 298 270 308 280 300 300 300 2,354
Valid Response% 100.0 98.3 100.0 99.4 99.3 99.7 98.3 100.0 99.4
Always 6.3 5.1 6.7 1.6 5.8 6.7 4.7 16.7 6.7
Sometimes 11.3 7.8 20.0 9.2 17.6 15.7 7.8 12.0 12.6
Rarely 14.3 10.6 25.2 10.8 12.9 31.4 14.6 18.3 17.2
Never 17.0 24.2 34.1 10.1 15.1 21.4 26.8 13.7 20.1
No Answer 51.0 52.2 14.1 68.3 48.6 24.7 46.1 39.3 43.4
Total 100.0 100.0 100.0 100.0 100.0 100.0 100.0 100.0 100.0

MAIN REPORT: PARTICIPATORY CITIZENS' SATISFACTION B ASELINE SURVEY IN EIGHT UGDP PARTNER CITY ADMINISTRATIONS
2013
79
Table B2.1.10: Received satisfactory responses to complaints
Responses Adwa Assosa Debre
Markos Gambella Jigjiga Nekemte S. Logia Yirgalem All Cities
Sample size (n) 300 298 270 308 280 300 300 300 2,354
Valid Response% 32.0 26.8 83.7 99.0 99.3 83.3 81.0 61.0 70.6
Always 4.2 5.0 1.8 0.7 - 1.2 1.2 - 1.2
Sometimes 22.9 11.3 11.9 3.9 15.1 9.2 7.8 6.0 9.9
Rarely 51.0 17.5 18.6 7.5 14.0 32.4 14.4 31.1 20.5
Never 6.3 17.5 36.3 10.8 13.3 8.4 25.1 12.6 16.7
No Answer 15.6 48.8 31.4 77.0 57.6 48.8 51.4 50.3 51.7
Total 100.0 100.0 100.0 100.0 100.0 100.0 100.0 100.0 100.0
Participation Outcomes
How satisfied / dissatisfied are you .....
Table B2.1.11: Effectiveness of public forums
Responses Adwa Assosa Debre
Markos Gambella Jigjiga Nekemte S. Logia Yirgalem All Cities
Sample size (n) 300 298 270 308 280 300 300 300 2,354
Valid Response% 100.0 99.7 95.6 100.0 99.3 99.0 98.3 100.0 99.1
Highly Satisfied 5.7 4.7 2.3 0.6 7.9 1.3 2.7 1.7 3.3
Satisfied 23.3 16.8 25.6 8.8 23.7 21.2 15.6 20.0 19.2
Dissatisfied 22.3 17.8 41.1 19.5 21.6 37.4 28.1 40.3 28.3
Highly
Dissatisfied 14.0 27.9 14.7 19.8 12.9 20.5 23.4 23.3 19.7
No Answer 34.7 32.7 16.3 51.3 33.8 19.5 30.2 14.7 29.4
Total 100.0 100.0 100.0 100.0 100.0 100.0 100.0 100.0 100.0
Table B2.1.12: CA's utilization of budget and resources
Responses Adwa Assosa Debre
Markos Gambella Jigjiga Nekemte S. Logia Yirgalem All Cities
Sample size (n) 300 298 270 308 280 300 300 300 2,354
Valid Response% 100.0 99.7 100.0 100.0 99.3 99.7 98.7 100.0 99.7
Highly Satisfied 4.0 4.4 0.7 0.3 3.6 1.7 1.7 2.7 2.4
Satisfied 17.3 16.2 25.2 9.1 37.4 14.4 13.5 15.7 18.3
Dissatisfied 27.3 21.2 47.8 15.3 18.7 40.1 30.7 47.3 30.9
Highly
Dissatisfied 16.0 35.4 16.7 26.9 12.9 24.4 28.4 28.3 23.8
No Answer 35.3 22.9 9.6 48.4 27.3 19.4 25.7 6.0 24.6
Total 100.0 100.0 100.0 100.0 100.0 100.0 100.0 100.0 100.0

MAIN REPORT: PARTICIPATORY CITIZENS' SATISFACTION B ASELINE SURVEY IN EIGHT UGDP PARTNER CITY ADMINISTRATIONS
2013
80
Table B2.1.13: Fair distribution of benefits & opportunities created by public investments
Responses Adwa Assosa Debre
Markos Gambella Jigjiga Nekemte S. Logia Yirgalem All Cities
Sample size (n) 300 298 270 308 280 300 300 300 2,354
Valid Response% 100.0 99.7 100.0 100.0 99.3 99.7 98.7 100.0 99.7
Highly Satisfied 5.7 5.4 1.1 0.3 5.4 2.0 1.4 1.7 2.9
Satisfied 25.0 16.2 28.9 8.4 24.8 14.7 13.5 14.3 18.0
Dissatisfied 24.7 17.8 48.1 14.9 23.0 39.8 31.1 39.7 29.7
Highly
Dissatisfied 12.3 28.6 14.8 26.3 14.4 23.7 26.4 32.7 22.6
No Answer 32.3 32.0 7.0 50.0 32.4 19.7 27.7 11.7 26.9
Total 100.0 100.0 100.0 100.0 100.0 100.0 100.0 100.0 100.0
Access to Public-domain Information
How satisfied / dissatisfied are you with accessibility of .....
Table B2.1.14: Annual budget information
Responses Adwa Assosa Debre
Markos Gambella Jigjiga Nekemte S. Logia Yirgalem All Cities
Sample size (n) 300 298 270 308 280 300 300 300 2,354
Valid Response% 99.7 99.7 100.0 100.0 99.3 99.7 98.7 100.0 99.7
Highly Satisfied 1.3 3.0 1.5 0.6 2.5 1.0 0.7 0.3 1.4
Satisfied 13.4 5.4 6.7 2.3 13.3 6.0 7.4 4.0 7.2
Dissatisfied 9.7 7.1 31.1 6.8 15.1 16.1 12.5 14.0 13.8
Highly
Dissatisfied 7.7 6.4 37.0 12.0 11.2 25.1 17.6 30.0 18.2
No Answer 67.9 78.1 23.7 78.2 57.9 51.8 61.8 51.7 59.4
Total Both
Groups 100.0 100.0 100.0 100.0 100.0 100.0 100.0 100.0 100.0
Table B2.1.15: Annual audit information
Responses Adwa Assosa Debre
Markos Gambella Jigjiga Nekemte S. Logia Yirgalem All Cities
Sample size (n) 300 298 270 308 280 300 300 300 2,354
Valid Response% 99.3 99.7 99.6 100.0 99.3 99.3 97.3 100.0 99.4
Highly Satisfied 1.0 - 0.7 0.3 1.4 - 0.3 - 0.5
Satisfied 6.0 3.7 1.9 2.9 6.8 2.0 6.2 1.0 3.8
Dissatisfied 11.4 3.7 29.0 6.2 16.9 15.1 11.6 11.0 12.9
Highly
Dissatisfied 7.7 10.1 43.9 9.4 7.9 27.5 18.5 38.3 20.2
No Answer 73.8 82.5 24.5 81.2 66.9 55.4 63.4 49.7 62.6
Total 100.0 100.0 100.0 100.0 100.0 100.0 100.0 100.0 100.0

MAIN REPORT: PARTICIPATORY CITIZENS' SATISFACTION B ASELINE SURVEY IN EIGHT UGDP PARTNER CITY ADMINISTRATIONS
2013
81
Table B2.1.16: Public procurement information
Responses Adwa Assosa Debre
Markos Gambella Jigjiga Nekemte S. Logia Yirgalem All Cities
Sample size (n) 300 298 270 308 280 300 300 300 2,354
Valid Response% 99.3 99.7 99.6 100.0 99.3 99.7 96.3 100.0 99.3
Highly Satisfied 1.3 0.7 1.9 0.3 1.4 0.3 0.7 - 0.8
Satisfied 9.4 2.7 20.4 3.6 8.6 4.0 3.5 1.0 6.5
Dissatisfied 8.1 4.0 23.4 5.2 14.7 18.1 11.4 12.7 12.0
Highly
Dissatisfied 9.7 9.8 17.8 9.1 9.7 24.4 20.8 34.3 17.0
No Answer 71.5 82.8 36.4 81.8 65.5 53.2 63.7 52.0 63.7
Total 100.0 100.0 100.0 100.0 100.0 100.0 100.0 100.0 100.0
Table B2.1.17: Information on CA's development plans & projects
Responses Adwa Assosa Debre
Markos Gambella Jigjiga Nekemte S. Logia Yirgalem All Cities
Sample size (n) 300 298 270 308 280 300 300 300 2,354
Valid Response% 98.7 99.3 100.0 100.0 99.3 99.0 97.3 100.0 99.3
Highly Satisfied 1.4 1.7 0.7 0.3 4.3 0.7 0.3 0.3 1.2
Satisfied 14.2 3.4 8.5 2.9 18.0 7.7 5.5 1.0 7.5
Dissatisfied 8.1 4.7 38.5 5.2 12.6 16.2 11.0 9.7 12.9
Highly
Dissatisfied 8.4 10.8 31.9 8.4 12.2 26.6 19.2 38.7 19.4
No Answer 67.9 79.4 20.4 83.1 52.9 48.8 64.0 50.3 58.9
Total 100.0 100.0 100.0 100.0 100.0 100.0 100.0 100.0 100.0
Tax Literacy
Have you / do you .....
Table B2.1.18: Received tax awareness raising information
Responses Adwa Assosa Debre
Markos Gambella Jigjiga Nekemte S. Logia Yirgalem All Cities
Sample size (n) 300 298 270 308 280 300 300 300 2,354
Valid Response% 99.3 99.0 100.0 100.0 99.3 99.3 98.0 100.0 99.4
Yes 51.0 23.7 49.3 29.2 62.6 61.1 32.7 63.7 46.5
No 11.4 1.4 37.4 17.5 8.3 15.8 21.8 1.0 14.1
No Answer 37.6 74.9 13.3 53.2 29.1 23.2 45.6 35.3 34.6
Total 100.0 100.0 100.0 100.0 100.0 100.0 100.0 100.0 100.0

MAIN REPORT: PARTICIPATORY CITIZENS' SATISFACTION B ASELINE SURVEY IN EIGHT UGDP PARTNER CITY ADMINISTRATIONS
2013
82
Table B2.1.19: If received, was the information helpful in raising tax awareness
Responses Adwa Assosa Debre
Markos Gambella Jigjiga Nekemte S. Logia Yirgalem All Cities
Sample size (n) 300 298 270 308 280 300 300 300 2,354
Valid Response% 70.7 27.2 63.7 48.4 92.9 65.0 67.3 68.0 62.7
Yes 67.0 80.2 70.9 54.4 65.8 92.3 54.0 91.2 71.6
No 7.5 3.7 13.4 4.7 10.8 4.6 6.9 2.5 7.1
No Answer 25.5 16.0 15.7 40.9 23.5 3.1 39.1 6.4 17.6
Total 100.0 100.0 100.0 100.0 100.0 100.0 100.0 100.0 100.0
Table B2.1.20: Do you now believe paying taxes is important improve public service delivery in your city?
Responses Adwa Assosa Debre
Markos Gambella Jigjiga Nekemte S. Logia Yirgalem All Cities
Sample size (n) 300 298 270 308 280 300 300 300 2,354
Valid Response% 98.0 99.3 100.0 100.0 98.9 94.7 98.7 100.0 98.8
Yes 73.1 86.5 95.9 77.3 81.6 89.4 81.1 88.3 84.0
No 5.1 0.7 1.9 3.6 7.9 6.0 3.7 1.0 3.7
No Answer 21.8 12.8 2.2 19.2 10.5 4.6 15.2 10.7 9.5
Total 100.0 100.0 100.0 100.0 100.0 100.0 100.0 100.0 100.0

MAIN REPORT: PARTICIPATORY CITIZENS' SATISFACTION B ASELINE SURVEY IN EIGHT UGDP PARTNER CITY ADMINISTRATIONS
2013
83
B2.2: Business Enterprises
How often .....
Table B2.2.1: Invited to public meeting
Responses Adwa Assosa Debre
Markos Gambella Jigjiga Nekemte S. Logia Yirgalem All Cities
Sample Size (n) 33 30 30 30 30 30 30 30 243
Valid (%) 100.0 100.0 100.0 100.0 100.0 96.7 43.3 100.0 92.6
Always 15.2 10.0 26.7 - 10.0 13.8 23.1 40.0 16.9
Sometimes 18.2 13.3 46.7 13.3 23.3 27.6 23.1 10.0 21.8
Rarely 45.5 30.0 10.0 36.7 23.3 41.4 30.8 16.7 29.3
Never 18.2 40.0 10.0 23.3 16.7 6.9 23.1 33.3 21.3
No Answer 3.0 6.7 6.7 26.7 26.7 10.3 - - 10.7
Total 100.0 100.0 100.0 100.0 100.0 100.0 100.0 100.0 100.0
Table B2.2.2: Participated in public meeting
Responses Adwa Assosa Debre
Markos Gambella Jigjiga Nekemte S. Logia Yirgalem All Cities
Sample Size (n) 33 30 30 30 30 30 30 30 243
Valid (%) 100.0 66.7 96.7 100.0 90.0 100.0 33.3 66.7 81.9
Always 9.1 15.0 20.7 6.7 18.5 16.7 10.0 65.0 19.1
Sometimes 21.2 15.0 55.2 20.0 37.0 20.0 10.0 25.0 27.1
Rarely 48.5 45.0 6.9 33.3 29.6 43.3 40.0 10.0 32.2
Never 21.2 10.0 17.2 30.0 - 13.3 10.0 - 14.1
No Answer - 15.0 - 10.0 14.8 6.7 30.0 - 7.5
Total 100.0 100.0 100.0 100.0 100.0 100.0 100.0 100.0 100.0
Table B2.2.3: Public forums provided opportunity for participants to freely express views
Responses Adwa Assosa Debre
Markos Gambella Jigjiga Nekemte S. Logia Yirgalem All Cities
Sample Size (n) 33 30 30 30 30 30 30 30 243
Valid (%) 84.8 46.7 80.0 73.3 80.0 96.7 43.3 66.7 71.6
Always 17.9 21.4 50.0 13.6 8.3 31.0 - 85.0 29.3
Sometimes 21.4 35.7 41.7 18.2 54.2 27.6 30.8 10.0 29.9
Rarely 50.0 21.4 8.3 31.8 8.3 17.2 15.4 5.0 20.7
Never 7.1 7.1 - 13.6 - 13.8 30.8 - 8.0
No Answer 3.6 14.3 - 22.7 29.2 10.3 23.1 - 12.1
Total 100.0 100.0 100.0 100.0 100.0 100.0 100.0 100.0 100.0

MAIN REPORT: PARTICIPATORY CITIZENS' SATISFACTION B ASELINE SURVEY IN EIGHT UGDP PARTNER CITY ADMINISTRATIONS
2013
84
Table B2.2.4: Provided comments, suggestions
Responses Adwa Assosa Debre
Markos Gambella Jigjiga Nekemte S. Logia Yirgalem All Cities
Sample Size (n) 33 30 30 30 30 30 30 30 243
Valid (%) 84.8 46.7 80.0 73.3 76.7 93.3 43.3 66.7 70.8
Always 14.3 14.3 20.8 - 21.7 21.4 - 45.0 18.0
Sometimes 32.1 14.3 25.0 22.7 26.1 21.4 15.4 20.0 23.3
Rarely 35.7 28.6 29.2 36.4 13.0 32.1 30.8 25.0 29.1
Never 10.7 21.4 20.8 13.6 4.3 7.1 23.1 10.0 12.8
No Answer 7.1 21.4 4.2 27.3 34.8 17.9 30.8 - 16.9
Total 100.0 100.0 100.0 100.0 100.0 100.0 100.0 100.0 100.0
Table B2.2.5: Comments incorporated into CA's plans
Responses Adwa Assosa Debre
Markos Gambella Jigjiga Nekemte S. Logia Yirgalem All Cities
Sample Size (n) 33 30 30 30 30 30 30 30 243
Valid (%) 84.8 40.0 70.0 73.3 80.0 93.3 93.3 63.3 74.9
Always 3.6 - - 4.5 8.3 3.6 - 15.8 4.4
Sometimes 17.9 16.7 19.0 9.1 25.0 17.9 32.1 26.3 20.9
Rarely 39.3 25.0 38.1 40.9 20.8 17.9 25.0 26.3 29.1
Never 17.9 16.7 38.1 18.2 8.3 21.4 21.4 21.1 20.3
No Answer 21.4 41.7 4.8 27.3 37.5 39.3 21.4 10.5 25.3
Total 100.0 100.0 100.0 100.0 100.0 100.0 100.0 100.0 100.0
Table B2.2.6: CA's projects consistent with citizens' priorities
Responses Adwa Assosa Debre
Markos Gambella Jigjiga Nekemte S. Logia Yirgalem All Cities
Sample Size (n) 33 30 30 30 30 30 30 30 243
Valid (%) 100.0 100.0 76.7 100.0 96.7 100.0 96.7 66.7 92.2
Always 3.0 - - - 6.9 13.3 17.2 10.0 6.3
Sometimes 18.2 6.7 21.7 6.7 34.5 23.3 24.1 45.0 21.4
Rarely 33.3 50.0 65.2 30.0 13.8 43.3 13.8 40.0 35.3
Never 15.2 10.0 13.0 20.0 13.8 13.3 24.1 - 14.3
No Answer 30.3 33.3 - 43.3 31.0 6.7 20.7 5.0 22.8
Total 100.0 100.0 100.0 100.0 100.0 100.0 100.0 100.0 100.0

MAIN REPORT: PARTICIPATORY CITIZENS' SATISFACTION B ASELINE SURVEY IN EIGHT UGDP PARTNER CITY ADMINISTRATIONS
2013
85
Table B2.2.7: Provided financial contributions
Responses Adwa Assosa Debre
Markos Gambella Jigjiga Nekemte S. Logia Yirgalem All Cities
Sample Size (n) 33 30 30 30 30 30 30 30 243
Valid (%) 100.0 100.0 100.0 100.0 100.0 100.0 96.7 100.0 99.6
Always 24.2 26.7 36.7 26.7 16.7 26.7 17.2 76.7 31.4
Sometimes 33.3 20.0 30.0 20.0 13.3 50.0 6.9 10.0 23.1
Rarely 27.3 33.3 26.7 30.0 43.3 13.3 20.7 3.3 24.8
Never 3.0 6.7 6.7 6.7 10.0 10.0 27.6 10.0 9.9
No Answer 12.1 13.3 - 16.7 16.7 - 27.6 - 10.7
Total 100.0 100.0 100.0 100.0 100.0 100.0 100.0 100.0 100.0
Table B2.2.8: Provided in-kind contributions
Responses Adwa Assosa Debre
Markos Gambella Jigjiga Nekemte S. Logia Yirgalem All Cities
Sample Size (n) 33 30 30 30 30 30 30 30 243
Valid (%) 100.0 100.0 100.0 100.0 100.0 100.0 96.7 100.0 99.6
Always 18.2 23.3 13.3 26.7 20.0 20.0 - 33.3 19.4
Sometimes 30.3 13.3 20.0 16.7 6.7 20.0 13.8 16.7 17.4
Rarely 6.1 20.0 20.0 26.7 43.3 26.7 13.8 3.3 19.8
Never 9.1 13.3 36.7 10.0 3.3 13.3 37.9 43.3 20.7
No Answer 36.4 30.0 10.0 20.0 26.7 20.0 34.5 3.3 22.7
Total 100.0 100.0 100.0 100.0 100.0 100.0 100.0 100.0 100.0
Table B2.2.9: Lodged complaints
Responses Adwa Assosa Debre
Markos Gambella Jigjiga Nekemte S. Logia Yirgalem All Cities
Sample Size (n) 33 30 30 30 30 30 30 30 243
Valid (%) 100.0 100.0 100.0 100.0 100.0 100.0 83.3 100.0 97.9
Always 15.2 16.7 20.0 6.7 13.3 23.3 - 20.0 14.7
Sometimes 33.3 10.0 46.7 13.3 20.0 20.0 8.0 16.7 21.4
Rarely 12.1 10.0 16.7 10.0 6.7 10.0 16.0 10.0 11.3
Never 18.2 - 13.3 10.0 3.3 30.0 36.0 43.3 18.9
No Answer 21.2 63.3 3.3 60.0 56.7 16.7 40.0 10.0 33.6
Total 100.0 100.0 100.0 100.0 100.0 100.0 100.0 100.0 100.0

MAIN REPORT: PARTICIPATORY CITIZENS' SATISFACTION B ASELINE SURVEY IN EIGHT UGDP PARTNER CITY ADMINISTRATIONS
2013
86
Table B2.2.10: Received satisfactory responses to complaints
Responses Adwa Assosa Debre
Markos Gambella Jigjiga Nekemte S. Logia Yirgalem All Cities
Sample Size (n) 33 30 30 30 30 30 30 30 243
Valid (%) 100.0 43.3 90.0 100.0 100.0 90.0 90.0 46.7 82.7
Always - 7.7 - 3.3 10.0 - - 14.3 3.5
Sometimes 15.2 7.7 14.8 6.7 16.7 14.8 18.5 14.3 13.9
Rarely 33.3 38.5 25.9 13.3 6.7 29.6 33.3 35.7 25.4
Never 12.1 7.7 48.1 16.7 6.7 33.3 29.6 35.7 23.4
No Answer 39.4 38.5 11.1 60.0 60.0 22.2 18.5 - 33.8
Total 100.0 100.0 100.0 100.0 100.0 100.0 100.0 100.0 100.0
Participation Outcomes
How satisfied / dissatisfied are you with .....
Table B2.2.11: Effectiveness of public forums
Responses Adwa Assosa Debre
Markos Gambella Jigjiga Nekemte S. Logia Yirgalem All Cities
Sample Size (n) 33 30 30 30 30 30 30 30 243
Valid (%) 100.0 100.0 90.0 100.0 100.0 96.7 90.0 100.0 97.1
Highly Satisfied - 3.3 - 6.7 3.3 - 7.4 23.3 5.5
Satisfied 21.2 23.3 11.1 13.3 26.7 34.5 3.7 30.0 20.8
Dissatisfied 51.5 26.7 70.4 10.0 20.0 27.6 37.0 10.0 31.4
Highly
Dissatisfied 21.2 16.7 7.4 30.0 13.3 24.1 29.6 16.7 19.9
No Answer 6.1 30.0 11.1 40.0 36.7 13.8 22.2 20.0 22.5
Total 100.0 100.0 100.0 100.0 100.0 100.0 100.0 100.0 100.0
Table B2.2.12: CA's utilization of budget and resources
Responses Adwa Assosa Debre
Markos Gambella Jigjiga Nekemte S. Logia Yirgalem All Cities
Sample Size (n) 33 30 30 30 30 30 30 30 243
Valid (%) 100.0 100.0 100.0 100.0 100.0 100.0 90.0 100.0 98.8
Highly Satisfied - 3.3 - 6.7 16.7 - 3.7 20.0 6.3
Satisfied 12.1 10.0 23.3 6.7 16.7 23.3 14.8 33.3 17.5
Dissatisfied 57.6 26.7 53.3 - 26.7 43.3 29.6 36.7 34.6
Highly Dissatisfied 24.2 53.3 13.3 46.7 10.0 23.3 33.3 6.7 26.3
No Answer 6.1 6.7 10.0 40.0 30.0 10.0 18.5 3.3 15.4
Total 100.0 100.0 100.0 100.0 100.0 100.0 100.0 100.0 100.0

MAIN REPORT: PARTICIPATORY CITIZENS' SATISFACTION B ASELINE SURVEY IN EIGHT UGDP PARTNER CITY ADMINISTRATIONS
2013
87
Table B2.2.13: Fair distribution of benefits & opportunities created by public investments
Responses Adwa Assosa Debre
Markos Gambella Jigjiga Nekemte S. Logia Yirgalem All Cities
Sample Size (n) 33 30 30 30 30 30 30 30 243
Valid (%) 100.0 100.0 100.0 100.0 100.0 100.0 90.0 100.0 98.8
Highly Satisfied 6.1 3.3 3.3 6.7 3.3 3.3 3.7 13.3 5.4
Satisfied 24.2 16.7 26.7 3.3 33.3 40.0 7.4 56.7 26.3
Dissatisfied 39.4 36.7 53.3 13.3 23.3 36.7 29.6 23.3 32.1
Highly
Dissatisfied 21.2 36.7 3.3 46.7 10.0 13.3 14.8 3.3 18.8
No Answer 9.1 6.7 13.3 30.0 30.0 6.7 44.4 3.3 17.5
Total 100.0 100.0 100.0 100.0 100.0 100.0 100.0 100.0 100.0
Access to Public-domain Information
How satisfied / dissatisfied are you with accessibility of .....
Table B2.2.14: Annual budget information
Responses Adwa Assosa Debre
Markos Gambella Jigjiga Nekemte S. Logia Yirgalem All Cities
Sample Size (n) 33 30 30 30 30 30 30 30 243
Valid (%) 100.0 100.0 100.0 100.0 100.0 100.0 90.0 100.0 98.8
Highly Satisfied - - - 3.3 - - 7.4 6.7 2.1
Satisfied 12.1 10.0 10.0 3.3 20.0 3.3 3.7 6.7 8.8
Dissatisfied 15.2 3.3 23.3 6.7 20.0 30.0 29.6 13.3 17.5
Highly
Dissatisfied 21.2 3.3 46.7 10.0 6.7 30.0 18.5 10.0 18.3
No Answer 51.5 83.3 20.0 76.7 53.3 36.7 40.7 63.3 53.3
Total 100.0 100.0 100.0 100.0 100.0 100.0 100.0 100.0 100.0
Table B2.2.15: Annual audit information
Responses Adwa Assosa Debre
Markos Gambella Jigjiga Nekemte S. Logia Yirgalem All Cities
Sample Size (n) 33 30 30 30 30 30 30 30 243
Valid (%) 100.0 100.0 100.0 100.0 100.0 100.0 90.0 100.0 98.8
Highly Satisfied - - - 3.3 - 3.3 11.1 3.3 2.5
Satisfied 9.1 3.3 - 3.3 13.3 3.3 11.1 10.0 6.7
Dissatisfied 15.2 6.7 36.7 6.7 16.7 20.0 22.2 10.0 16.7
Highly
Dissatisfied 24.2 - 40.0 10.0 6.7 33.3 14.8 6.7 17.1
No Answer 51.5 90.0 23.3 76.7 63.3 40.0 40.7 70.0 57.1
Total 100.0 100.0 100.0 100.0 100.0 100.0 100.0 100.0 100.0

MAIN REPORT: PARTICIPATORY CITIZENS' SATISFACTION B ASELINE SURVEY IN EIGHT UGDP PARTNER CITY ADMINISTRATIONS
2013
88
Table B2.2.16: Public procurement information
Responses Adwa Assosa Debre
Markos Gambella Jigjiga Nekemte S. Logia Yirgalem All Cities
Sample Size (n) 33 30 30 30 30 30 30 30 243
Valid (%) 100.0 100.0 100.0 100.0 100.0 100.0 90.0 100.0 98.8
Highly Satisfied - - - 6.7 - 3.3 3.7 3.3 2.1
Satisfied 12.1 3.3 33.3 - 10.0 20.0 14.8 23.3 14.6
Dissatisfied 12.1 6.7 20.0 3.3 20.0 16.7 18.5 16.7 14.2
Highly
Dissatisfied 24.2 3.3 26.7 13.3 6.7 23.3 22.2 10.0 16.3
No Answer 51.5 86.7 20.0 76.7 63.3 36.7 40.7 46.7 52.9
Total 100.0 100.0 100.0 100.0 100.0 100.0 100.0 100.0 100.0
Table B2.2.17: Information on CA's development plans & projects
Responses Adwa Assosa Debre
Markos Gambella Jigjiga Nekemte S. Logia Yirgalem All Cities
Sample Size (n) 33 30 30 30 30 30 30 30 243
Valid (%) 100.0 100.0 100.0 100.0 100.0 100.0 93.3 100.0 99.2
Highly Satisfied - 3.3 - 6.7 - 3.3 57.1 - 8.3
Satisfied 18.2 - 6.7 - 13.3 10.0 21.4 16.7 10.8
Dissatisfied 12.1 6.7 43.3 3.3 16.7 23.3 21.4 23.3 18.7
Highly
Dissatisfied 24.2 3.3 30.0 13.3 6.7 26.7 - 6.7 14.1
No Answer 45.5 86.7 20.0 76.7 63.3 36.7 - 53.3 48.1
Total 100.0 100.0 100.0 100.0 100.0 100.0 100.0 100.0 100.0
Tax Literacy
Have you / do you .....
Table B2.2.18: Received tax awareness raising information
Responses Adwa Assosa Debre
Markos Gambella Jigjiga Nekemte S. Logia Yirgalem All Cities
Sample Size (n) 33 30 30 30 30 30 30 30 243
Valid (%) 100.0 100.0 100.0 100.0 100.0 100.0 66.7 100.0 95.9
Yes 72.7 26.7 73.3 56.7 73.3 66.7 80.0 73.3 64.8
No 12.1 - 23.3 6.7 - 13.3 10.0 - 8.2
No Answer 15.2 73.3 3.3 36.7 26.7 20.0 10.0 26.7 27.0
Total 100.0 100.0 100.0 100.0 100.0 100.0 100.0 100.0 100.0

MAIN REPORT: PARTICIPATORY CITIZENS' SATISFACTION B ASELINE SURVEY IN EIGHT UGDP PARTNER CITY ADMINISTRATIONS
2013
89
Table B2.2.19: If received, was the information helpful in raising tax awareness
Responses Adwa Assosa Debre
Markos Gambella Jigjiga Nekemte S. Logia Yirgalem All Cities
Sample Size (n) 33 30 30 30 30 30 30 30 243
Valid (%) 84.8 26.7 76.7 70.0 100.0 80.0 93.3 73.3 75.7
Yes 82.1 100.0 87.0 76.2 93.3 79.2 96.4 100.0 88.6
No 3.6 - 8.7 - - 12.5 - - 3.3
No Answer 14.3 - 4.3 23.8 6.7 8.3 3.6 - 8.2
Total 100.0 100.0 100.0 100.0 100.0 100.0 100.0 100.0 100.0
Table B2.2.20: Do you now believe paying taxes is important improve public service delivery in your city?
Responses Adwa Assosa Debre
Markos Gambella Jigjiga Nekemte S. Logia Yirgalem All Cities
Sample Size (n) 33 30 30 30 30 30 30 30 243
Valid (%) 100.0 100.0 100.0 100.0 100.0 96.7 100.0 706.7 87.2
Yes 97.0 100.0 100.0 100.0 96.7 86.2 100.0 97.2 97.2
No - - - - - 10.3 - 1.4 1.4
No Answer 3.0 - - - 3.3 3.4 - 1.4 1.4
Total 100.0 100.0 100.0 100.0 100.0 100.0 100.0 100.0 100.0

MAIN REPORT: PARTICIPATORY CITIZENS' SATISFACTION B ASELINE SURVEY IN EIGHT UGDP PARTNER CITY ADMINISTRATIONS
2013
90
B2.3: Civil Society Organizations How often ....
Table B2.3.1: Public Participation
Aspects of
Participation Responses Adwa Assosa
Debre
Markos Gambella Jigjiga Nekemte S. Logia Yirgalem All Cities
Sample Size (n) 24 30 30 20 30 30 9 23 196
Valid (%) 100.0 100.0 100.0 100.0 100.0 100.0 100.0 100.0 100.0
Inv
ite
d t
o p
ub
lic
me
et
Always 33.3 3.3 33.3 10.0 16.7 6.7 11.1 17.4 16.8
Sometimes 25.0 6.7 33.3 20.0 23.3 36.7 33.3 8.7 23.0
Rarely 16.7 10.0 20.0 25.0 26.7 23.3 - 21.7 19.4
Never 4.2 76.7 13.3 15.0 20.0 26.7 22.2 - 24.0
Don't Know 20.8 3.3 - 30.0 13.3 6.7 33.3 52.2 16.8
Sample Size (n) 24 30 30 20 30 30 9 23 196
Valid (%) 95.8 43.3 90.0 100.0 100.0 90.0 100.0 100.0 87.8
Pa
rtic
ipa
ted
in
pu
bli
c m
ee
t
Always 26.1 7.7 33.3 10.0 13.3 14.8 11.1 8.7 16.9
Sometimes 34.8 15.4 40.7 30.0 40.0 44.4 33.3 17.4 33.7
Rarely 21.7 30.8 22.2 25.0 23.3 14.8 11.1 21.7 21.5
Never - 46.2 3.7 10.0 10.0 18.5 22.2 - 11.0
Don't Know 17.4 - - 25.0 13.3 7.4 22.2 52.2 16.9
Sample Size (n) 24 30 30 20 30 30 9 23 196
Valid (%) 95.8 43.3 90.0 100.0 100.0 90.0 100.0 100.0 87.8
Pro
vid
ed
com
me
nts
Always 26.1 23.1 25.9 30.0 10.0 22.2 22.2 26.1 22.7
Sometimes 26.1 - 29.6 15.0 13.3 37.0 22.2 4.3 19.8
Rarely 13.0 23.1 25.9 10.0 26.7 11.1 - 13.0 16.9
Never 4.3 46.2 11.1 5.0 20.0 22.2 - 4.3 14.0
Don't Know 30.4 7.7 7.4 40.0 30.0 7.4 55.6 52.2 26.7
Sample Size (n) 24 30 30 20 30 30 9 23 196
Valid (%) 95.8 40.0 90.0 100.0 100.0 90.0 100.0 100.0 87.2
Co
mm
en
ts t
ak
en
into
acc
ou
nt
Always 4.3 - 11.1 15.0 10.0 - - 13.0 7.6
Sometimes 26.1 - 25.9 20.0 30.0 37.0 22.2 17.4 24.6
Rarely 21.7 16.7 22.2 15.0 23.3 22.2 22.2 13.0 19.9
Never - 83.3 18.5 5.0 10.0 33.3 - - 16.4
Don't Know 47.8 - 22.2 45.0 26.7 7.4 55.6 56.5 31.6
Sample Size (n) 24 30 30 20 30 30 9 23 196
Valid (%) 100.0 100.0 93.3 100.0 100.0 90.0 100.0 100.0 97.4
Pa
rtic
ipa
ted
in
citi
zen
s'
aw
are
ne
ss r
ais
ing
sess
ion
s
Always 12.5 6.7 46.4 35.0 30.0 18.5 22.2 26.1 24.6
Sometimes 41.7 - 21.4 15.0 13.3 37.0 33.3 4.3 19.4
Rarely 16.7 10.0 7.1 5.0 23.3 22.2 11.1 17.4 14.7
Never 8.3 80.0 17.9 10.0 16.7 11.1 11.1 - 22.0
Don't Know 20.8 3.3 7.1 35.0 16.7 11.1 22.2 52.2 19.4

MAIN REPORT: PARTICIPATORY CITIZENS' SATISFACTION B ASELINE SURVEY IN EIGHT UGDP PARTNER CITY ADMINISTRATIONS
2013
91
Table B2.3.2: Accessibility of Public-domain Information
Public-
domain
Information
Responses Adwa Assosa Debre
Markos Gambella Jigjiga Nekemte S. Logia Yirgalem All Cities
Sample Size (n) 24 30 30 20 30 30 9 23 196
Valid Responses (%) 100.0 100.0 100.0 100.0 100.0 100.0 100.0 100.0 100.0
An
nu
al
bu
dg
et
info
rma
tio
n
Highly Satisfied 12.5 3.3 3.3 5.0 16.7 6.7 - - 6.6
Satisfied 33.3 3.3 30.0 - 16.7 10.0 22.2 8.7 15.3
Dissatisfied 16.7 3.3 30.0 5.0 23.3 23.3 22.2 13.0 17.3
Highly Dissatisfied 20.8 33.3 20.0 20.0 10.0 23.3 11.1 - 18.4
Don't Know 16.7 56.7 16.7 70.0 33.3 36.7 44.4 78.3 42.3
Sample Size (n) 24 30 30 20 30 30 9 23 196
Valid Responses (%) 100.0 100.0 100.0 100.0 100.0 100.0 100.0 100.0 100.0
An
nu
al
au
dit
info
rma
tio
n
Highly Satisfied 4.2 - - 5.0 - 3.3 - - 1.5
Satisfied 25.0 3.3 6.7 - 16.7 6.7 33.3 4.3 10.2
Dissatisfied 12.5 - 56.7 5.0 26.7 10.0 - 8.7 17.3
Highly Dissatisfied 29.2 36.7 20.0 15.0 10.0 23.3 - 4.3 19.4
Don't Know 29.2 60.0 16.7 75.0 46.7 56.7 66.7 82.6 51.5
Sample Size (n) 24 30 30 20 30 30 9 23 196
Valid Responses (%) 95.8 100.0 100.0 100.0 100.0 100.0 100.0 100.0 99.5
Pu
bli
c
pro
cure
me
nt
info
rma
tio
n
Highly Satisfied 4.3 - 3.3 5.0 3.3 6.7 - - 3.1
Satisfied 21.7 - 23.3 5.0 13.3 3.3 22.2 - 10.3
Dissatisfied 8.7 3.3 46.7 - 30.0 10.0 11.1 4.3 15.9
Highly Dissatisfied 8.7 36.7 6.7 15.0 13.3 26.7 - 8.7 16.4
Don't Know 56.5 60.0 20.0 75.0 40.0 53.3 66.7 87.0 54.4
Sample Size (n) 24 30 30 20 30 30 9 23 196
Valid Responses (%) 100.0 100.0 96.7 100.0 100.0 100.0 100.0 100.0 99.5
Cit
y's
de
ve
lop
me
nt
pla
ns,
pro
ject
s
Highly Satisfied 8.3 3.3 3.4 5.0 10.0 6.7 - - 5.1
Satisfied 29.2 - 27.6 - 23.3 16.7 33.3 4.3 15.9
Dissatisfied 8.3 10.0 51.7 5.0 40.0 30.0 - 13.0 23.1
Highly Dissatisfied 20.8 30.0 6.9 15.0 13.3 20.0 - 4.3 15.4
Don't Know 33.3 56.7 10.3 75.0 13.3 26.7 66.7 78.3 40.5
Sample Size (n) 24 30 30 20 30 30 9 23 196
Valid Responses (%) 100.0 100.0 100.0 100.0 100.0 100.0 100.0 100.0 100.0
Tra
nsp
are
ncy
&
acc
ou
nta
bil
ity
of
loca
l o
ffic
ials
Highly Satisfied 8.3 - - 5.0 13.3 3.3 - - 4.1
Satisfied 8.3 6.7 56.7 5.0 26.7 13.3 33.3 13.0 20.4
Dissatisfied 25.0 10.0 20.0 - 33.3 30.0 22.2 13.0 19.9
Highly Dissatisfied 20.8 50.0 23.3 25.0 16.7 33.3 11.1 8.7 25.5
Don't Know 37.5 33.3 - 65.0 10.0 20.0 33.3 65.2 30.1

MAIN REPORT: PARTICIPATORY CITIZENS' SATISFACTION B ASELINE SURVEY IN EIGHT UGDP PARTNER CITY ADMINISTRATIONS
2013
92
B2.4: Vulnerable Groups
Table B2.4.1: Access to Basic Needs
Survey
Questions Responses Adwa Assosa
Debre
Markos Gambella Jigjiga Nekemte S. Logia Yirgalem All Cities
Sample Size (n) 32 30 30 30 20 30 34 30 236
Valid Response (%) 100.0 100.0 100.0 100.0 100.0 100.0 100.0 100.0 100.0
Ho
w o
fte
n d
o y
ou
fa
ce
foo
d s
ho
rta
ge
Always 71.9 13.3 13.3 30.0 - 43.3 11.8 93.3 36.0
Sometimes 25.0 43.3 40.0 36.7 40.0 10.0 17.6 3.3 26.3
Rarely - 33.3 40.0 30.0 30.0 26.7 41.2 3.3 25.4
Never 3.1 3.3 6.7 3.3 10.0 20.0 26.5 - 9.3
Don't Know - 6.7 - - 20.0 - 2.9 - 3.0
Total 100.0 100.0 100.0 100.0 100.0 100.0 100.0 100.0 100.0
Valid Response (%) 100.0 100.0 100.0 100.0 100.0 100.0 100.0 100.0 100.0
Ho
w o
fte
n d
o y
ou
ha
ve
acc
ess
to
pro
pe
r
clo
thin
g?
Always 3.1 10.0 13.3 13.3 - 13.3 8.8 - 8.1
Sometimes 34.4 30.0 6.7 20.0 40.0 - 20.6 10.0 19.5
Rarely 21.9 33.3 40.0 33.3 30.0 30.0 14.7 26.7 28.4
Never 40.6 23.3 40.0 26.7 10.0 53.3 50.0 63.3 39.8
Don't Know - 3.3 - 6.7 20.0 3.3 5.9 - 4.2
Total 100.0 100.0 100.0 100.0 100.0 100.0 100.0 100.0 100.0
Valid Response (%) 100.0 100.0 100.0 100.0 100.0 100.0 97.1 100.0 99.6
Ho
w o
fte
n d
o y
ou
ha
ve
acc
ess
to
pro
pe
r
she
lte
r?
Always - 13.3 20.0 6.7 5.0 16.7 12.1 - 9.4
Sometimes 21.9 23.3 23.3 3.3 - 6.7 9.1 23.3 14.5
Rarely 37.5 23.3 20.0 23.3 30.0 26.7 3.0 23.3 23.0
Never 40.6 40.0 36.7 43.3 10.0 50.0 69.7 50.0 44.3
Don't Know - - - 23.3 55.0 - 6.1 3.3 8.9
Total 100.0 100.0 100.0 100.0 100.0 100.0 100.0 100.0 100.0
Valid Response (%) 100.0 100.0 100.0 100.0 100.0 100.0 97.1 100.0 99.6
Ho
w o
fte
n d
o y
ou
ha
ve
acc
ess
to
to
ile
t?
Always - 16.7 26.7 13.3 5.0 10.0 21.2 20.0 14.5
Sometimes 12.5 16.7 10.0 3.3 - 3.3 6.1 23.3 9.8
Rarely 40.6 16.7 3.3 36.7 20.0 40.0 24.2 33.3 27.2
Never 43.8 50.0 60.0 20.0 20.0 46.7 45.5 20.0 39.1
Don't Know 3.1 - - 26.7 55.0 - 3.0 3.3 9.4
Total 100.0 100.0 100.0 100.0 100.0 100.0 100.0 100.0 100.0
Valid Response (%) 100.0 100.0 100.0 100.0 100.0 100.0 97.1 100.0 99.6
Ho
w o
fte
n d
o y
ou
ge
t
me
dic
al
tre
atm
en
t
wh
en
sic
k?
Always - 20.0 13.3 3.3 - - 6.1 - 5.5
Sometimes 15.6 23.3 16.7 10.0 5.0 10.0 21.2 6.7 14.0
Rarely 43.8 26.7 26.7 40.0 15.0 23.3 24.2 20.0 28.1
Never 37.5 30.0 36.7 36.7 20.0 53.3 30.3 70.0 40.0
Don't Know 3.1 - 6.7 10.0 60.0 13.3 18.2 3.3 12.3
Total 100.0 100.0 100.0 100.0 100.0 100.0 100.0 100.0 100.0

MAIN REPORT: PARTICIPATORY CITIZENS' SATISFACTION B ASELINE SURVEY IN EIGHT UGDP PARTNER CITY ADMINISTRATIONS
2013
93
Table B2.4.2: Public Participation
Survey Questions Responses Adwa Assosa Debre
Markos Gambella Jigjiga Nekemte S. Logia Yirgalem All Cities
Sample Size (n) 32 30 30 30 20 30 34 30 236
Valid Response (%) 100.0 100.0 100.0 100.0 100.0 100.0 97.1 100.0 99.6
Are
yo
u a
t
pre
sen
t a
me
mb
er
of
an
y
ass
oci
ati
on
/org
a
niz
ati
on
of
vu
lne
rab
le/m
arg
i
na
lize
d g
rou
ps
in
the
cit
y?
Yes 3.1 20.0 50.0 10.0 - - 3.0 6.7 11.9
No 96.9 63.3 46.7 63.3 85.0 70.0 60.6 93.3 71.9
Don't Know - 16.7 3.3 26.7 15.0 30.0 36.4 - 16.2
Total 100.0 100.0 100.0 100.0 100.0 100.0 100.0 100.0 100.0
Valid Response (%) 100.0 100.0 96.7 100.0 100.0 100.0 100.0 100.0 99.6
Ha
ve
yo
u e
ve
r
be
en
in
vit
ed
to
att
en
de
d a
pu
bli
c
me
eti
ng
to
dis
cuss
th
e
pla
nn
ing
an
d
imp
lem
en
tati
on
of
de
ve
lop
me
nt
pro
ject
s in
th
e
city
?
Yes 28.1 20.0 58.6 13.3 - - 2.9 - 15.7
No 71.9 40.0 27.6 10.0 35.0 33.3 26.5 6.7 31.5
Don't Know - 40.0 13.8 76.7 65.0 66.7 70.6 93.3 52.8
Total 100.0 100.0 100.0 100.0 100.0 100.0 100.0 100.0 100.0
Valid Response (%) 100.0 83.3 93.3 90.0 100.0 90.0 85.3 - 79.7
Ha
ve
yo
u e
ve
r
pa
rtic
ipa
ted
in
pu
blic
me
eti
ng
s
of
the
typ
e
ind
ica
ted
in
nu
mb
er
"2"
ab
ove
?
Yes 25.0 24.0 60.7 14.8 - - - #DIV/0! 18.6
No 75.0 36.0 28.6 7.4 40.0 88.9 10.3 #DIV/0! 41.5
Don't Know - 40.0 10.7 77.8 60.0 11.1 89.7 #DIV/0! 39.9
Total 100.0 100.0 100.0 100.0 100.0 100.0 100.0 #DIV/0! 100.0
Valid Response (%) 25.0 56.7 83.3 90.0 100.0 - 70.6 - 51.3
If p
art
icip
ate
d,
did
th
e p
ub
lic
con
sult
ati
on
me
eti
ng
s p
rovid
e
op
po
rtu
nit
ies
for
all p
art
icip
an
ts t
o
exp
ress
th
eir
vie
ws,
co
nce
rns
an
d p
rio
riti
es?
Yes 37.5 23.5 60.0 3.7 15.0 #DIV/0! - #DIV/0! 21.5
No 62.5 17.6 20.0 11.1 35.0 #DIV/0! 8.3 #DIV/0! 20.7
Don't Know - 58.8 20.0 85.2 50.0 #DIV/0! 91.7 #DIV/0! 57.9
Total 100.0 100.0 100.0 100.0 100.0 #DIV/0! 100.0 #DIV/0! 100.0
Valid Response (%) 25.0 60.0 83.3 90.0 100.0 - 70.6 - 51.7
Ha
ve
yo
u
pro
vid
ed
com
me
nts
an
d
sug
ge
stio
ns
for
the
im
pro
ve
me
nt
of
urb
an
de
ve
lop
me
nt
pla
ns
an
d
pro
ject
s in
th
e
me
eti
ng
yo
u
att
en
de
d?
Yes 37.5 27.8 32.0 11.1 - #DIV/0! - #DIV/0! 15.6
No 62.5 5.6 28.0 7.4 15.0 #DIV/0! 8.3 #DIV/0! 16.4
Don't Know - 66.7 40.0 81.5 85.0 #DIV/0! 91.7 #DIV/0! 68.0
Total 100.0 100.0 100.0 100.0 100.0 #DIV/0! 100.0 #DIV/0! 100.0
Valid Response (%) 100.0 96.7 93.3 100.0 100.0 100.0 94.1 100.0 97.9
Do
yo
u t
hin
k
de
ve
lop
me
nt
pla
ns,
a
nd
pro
ject
s
imp
lem
en
ted
in
the
cit
y a
re
ad
dre
ssin
g t
he
ne
ed
s a
nd
pri
ori
tie
s o
f
vu
lne
rab
le
pe
op
le in
th
e
city
?
Yes 3.1 6.9 32.1 - - 10.0 9.4 - 7.8
No 96.9 69.0 50.0 20.0 80.0 50.0 28.1 73.3 57.6
Don't Know - 24.1 17.9 80.0 20.0 40.0 62.5 26.7 34.6
Total 100.0 100.0 100.0 100.0 100.0 100.0 100.0 100.0 100.0
Valid Response (%) 100.0 96.7 96.7 100.0 100.0 100.0 94.1 100.0 98.3
Ha
ve
yo
u e
ve
r
lod
ge
d
gri
eva
nce
s/co
mp
l
ain
ts o
r re
qu
est
for
sup
po
rt a
bo
ut
pro
ble
ms
yo
u a
re
faci
ng
to
re
leva
nt
au
tho
riti
es
or
off
icia
ls?
Yes 31.3 24.1 24.1 20.0 - 10.0 6.3 3.3 15.5
No 68.8 31.0 44.8 13.3 25.0 13.3 18.8 - 27.2
Don't Know - 44.8 31.0 66.7 75.0 76.7 75.0 96.7 57.3
Total 100.0 100.0 100.0 100.0 100.0 100.0 100.0 100.0 100.0
Valid Response (%) 31.3 73.3 80.0 90.0 100.0 70.0 76.5 3.3 64.0
tory
resp
on
s
es
to
yo
u
r com
pla
i
nts
or
req
ue
st
s
Yes 20.0 13.6 - 3.7 - 9.5 - - 5.3

MAIN REPORT: PARTICIPATORY CITIZENS' SATISFACTION B ASELINE SURVEY IN EIGHT UGDP PARTNER CITY ADMINISTRATIONS
2013
94
Survey Questions Responses Adwa Assosa Debre
Markos Gambella Jigjiga Nekemte S. Logia Yirgalem All Cities
Sample Size (n) 32 30 30 30 20 30 34 30 236
No 80.0 27.3 37.5 11.1 15.0 4.8 7.7 100.0 21.9
Don't Know - 59.1 62.5 85.2 85.0 85.7 92.3 - 72.8
Total 100.0 100.0 100.0 100.0 100.0 100.0 100.0 100.0 100.0
Valid Response (%) 100.0 100.0 100.0 100.0 100.0 100.0 97.1 100.0 99.6
Ha
ve
yo
ur
rece
ive
d a
ny k
ind
of
ass
ista
nce
or
sup
po
rt f
rom
go
ve
rnm
en
t,
NG
O o
r a
ny o
the
r
org
an
iza
tio
n i
n
the
pa
st 1
2
mo
nth
s?
Yes 9.4 20.0 33.3 16.7 - 6.7 12.1 - 12.8
No 90.6 36.7 53.3 16.7 30.0 16.7 24.2 - 34.0
Don't Know - 43.3 13.3 66.7 70.0 76.7 63.6 100.0 53.2
Total 100.0 100.0 100.0 100.0 100.0 100.0 100.0 100.0 100.0
Valid Response (%) 100.0 100.0 100.0 100.0 100.0 100.0 100.0 100.0 100.0
Ha
ve
yo
u e
ve
r
rece
ive
d s
kil
l
tra
inin
g?
Yes 15.6 16.7 46.7 16.7 - - 5.9 3.3 13.6
No 84.4 56.7 40.0 13.3 30.0 30.0 20.6 - 34.7
Don't Know - 26.7 13.3 70.0 70.0 70.0 73.5 96.7 51.7
Total 100.0 100.0 100.0 100.0 100.0 100.0 100.0 100.0 100.0
Valid Response (%) 100.0 100.0 100.0 100.0 100.0 96.7 100.0 100.0 99.6
Are
yo
u a
t
pre
sen
t e
ng
ag
ed
in a
ny in
com
e
ge
ne
rati
ng
act
ivit
y?
Yes 18.8 23.3 56.7 20.0 60.0 - 29.4 70.0 33.6
No 81.3 56.7 33.3 23.3 25.0 55.2 8.8 3.3 36.2
Don't Know - 20.0 10.0 56.7 15.0 44.8 61.8 26.7 30.2
Total 100.0 100.0 100.0 100.0 100.0 100.0 100.0 100.0 100.0

MAIN REPORT: PARTICIPATORY CITIZENS' SATISFACTION B ASELINE SURVEY IN EIGHT UGDP PARTNER CITY ADMINISTRATIONS
2013
95
Appendix C: 2012 BLS Survey Questionnaires
Appendix C1: Household Survey Questionnaire
Date:
Start Time:
End Time:
Enumerator's Name:
Supervisor's Name:
PART A. SAMPLE IDENTIFICATION AND HOUSEHOLD CHARACTERISTICS
Sample Target Group Urban Poor and Vulnerable Groups 1
Citizens (relatively non-poor Households) 2
1. Region
2. City
3. Kebele
4. Sub-Kebele/Zone
5. House Number
6. Details of Head of Household:
6.1 Sex Male 1
Female 2
6.2 Age:
Education: Yes 1
9.3 Do you read and write? No 2
9.4 If yes, and formal education Basic adult education 1
Elementary 2
High school 3
TVET 4
College/University 5
6.5 Main occupation (source of livelihood) Government employee (Salaried Employee) 1
Self-employed /Wage employee 2
House-wife 3
Student 4
Pensioner / Remittance 5
Casual worker 6
Unemployed 7
Other (specify) 8
6.6 Number of Household Members:

MAIN REPORT: PARTICIPATORY CITIZENS' SATISFACTION B ASELINE SURVEY IN EIGHT UGDP PARTNER CITY ADMINISTRATIONS
2013
96
PART B. LEVEL OF SATISFACTION WITH PUBLIC SERVICES DELIVERY
Major services provided by your City Administration and other service providers are listed below. Please
indicate the response that best describes your satisfaction/experience with the following aspects of those
services. Circle the ratings in for each item, choosing only one code.
Type and Aspect of Service
Has anyone in the HH
used the service in the
past 12 months?
1 = Yes (ask Level of
Satisfaction)
2 = No (skip to next
Question)
How satisfied were you with this
aspect of service?
1 = Highly Satisfied
2 = Satisfied
3 = Dissatisfied
4 = Highly Dissatisfied
0 = I Don't Know/No
information/Not Applicable
1. Potable Water Supply
1.1 Quality of water 1 2 1 2 3 4 0
1.2 Reliability of supply 1 2 1 2 3 4 0
1.3 Affordability/price of water 1 2 1 2 3 4 0
1.4 Overall, how satisfied were you with Water Supply 1 2 1 2 3 4 0
2. Public Health Care Services
2.1 Waiting Time 1 2 1 2 3 4 0
2.2 Care provided/behavior of staff 1 2 1 2 3 4 0
2.3 Affordability/Cost of treatment ( 1 2 1 2 3 4 0
2.4 Availability of medicine 1 2 1 2 3 4 0
2.5 Affordability of medicines 1 2 1 2 3 4 0
2.6 Overall, how satisfied were you with Public Health Care 1 2 1 2 3 4 0
3. Public Education Services
3.1 Distance/proximity of primary school 1 2 1 2 3 4 0
3.2 Adequacy of number of class rooms 1 2 1 2 3 4 0
3.3 Availability of Text Books 1 2 1 2 3 4 0
3.4 Affordability/cost of Text Books 1 2 1 2 3 4 0
3.5 Affordability of school contributions 1 2 1 2 3 4 0
3.6 Overall, how satisfied were you with Public Education 1 2 3 4 0
4. Electric Power Supply
4.1 Reliability of Electric Power Supply 1 2 1 2 3 4 0
4.2 Affordability of electricity 1 2 1 2 3 4 0
4.3 Overall, how satisfied were you with Electric Power supply 1 2 3 4 0
5. Street Lighting
5.1 Functionality of street lighting in neighborhood 1 2 1 2 3 4 0
5.2 Overall, how satisfied were you with Street Lighting Services 1 2 3 4 0
6. Inner City Roads
6.1 Timely maintenance of inner city roads 1 2 1 2 3 4 0
6.2 Overall, how satisfied were you with Inner City Roads 1 2 3 4 0

MAIN REPORT: PARTICIPATORY CITIZENS' SATISFACTION B ASELINE SURVEY IN EIGHT UGDP PARTNER CITY ADMINISTRATIONS
2013
97
Type and Aspect of Service
Has anyone in the HH
used the service in the
past 12 months?
1 = Yes (ask Level of
Satisfaction)
2 = No (skip to next
Question)
How satisfied were you with this
aspect of service?
1 = Highly Satisfied
2 = Satisfied
3 = Dissatisfied
4 = Highly Dissatisfied
0 = I Don't Know/No
information/Not Applicable
7. Drainage Structures
7.1 Maintenance of drainage structures 1 2 1 2 3 4 0
7.2 Storm/flow of water drains 1 2 1 2 3 4 0
7.3 Overall, how satisfied were you with Drainage Structure 1 2 3 4 0
8. Solid Waste Management (self-disposal or fee-based
collection)
8.1 Siting of solid waste dumpsters 1 2 1 2 3 4 0
8.2 Regularity of collection 1 2 1 2 3 4 0
8.3 Affordability of collection fee 1 2 1 2 3 4 0
8.4 Overall, how satisfied were you with Solid Waste Services 1 2 3 4 0
9. Sanitation Services
9.1 Cleanness of public toilets in your neighborhood 1 2 1 2 3 4 0
9.2 Regular functionality of public toilets in your neighborhood 1 2 1 2 3 4 0
9.3 Overall, how satisfied were you with Sanitation Services 1 2 3 4 0
10. Vacuum Truck Services
10.1 Waiting time for vacuum truck services 1 2 1 2 3 4 0
10.2 Affordability of vacuum truck service 1 2 1 2 3 4 0
10.3 Overall, how satisfied were you with Vacuum Truck Services 1 2 3 4 0
11. Market infrastructure/Facilities
11.1 Distance to/proximity of market place 1 2 1 2 3 4 0
11.2 Space/Congestion of market price 1 2 1 2 3 4 0
11.3 Availability of shades 1 2 1 2 3 4 0
11.4 Availability of basic amenities – toilets and water 1 2 1 2 3 4 0
11.5 Overall, how satisfied were you with market facilities 1 2 3 4 0
12. Recreation facilities
12.1 Availability of and suitability of parks 1 2 1 2 3 4 0
12.2 Cleanness of parks 1 2 1 2 3 4 0
12.3 Availability of basic amenities in parks– toilets and water 1 2 1 2 3 4 0
12.4 Availability of recreation facilities for children/youth
(playground, sports) 1 2 1 2 3 4 0
12.5 Overall, how satisfied were you with recreation facilities 1 2 3 4 0
13. Cemeteries
13.1 Distance to/proximity of market place 1 2 1 2 3 4 0
13.2 Adequacy of Space 1 2 1 2 3 4 0
13.3 Overall, how satisfied were you with cemeteries 1 2 3 4 0

MAIN REPORT: PARTICIPATORY CITIZENS' SATISFACTION B ASELINE SURVEY IN EIGHT UGDP PARTNER CITY ADMINISTRATIONS
2013
98
Type and Aspect of Service
Has anyone in the HH
used the service in the
past 12 months?
1 = Yes (ask Level of
Satisfaction)
2 = No (skip to next
Question)
How satisfied were you with this
aspect of service?
1 = Highly Satisfied
2 = Satisfied
3 = Dissatisfied
4 = Highly Dissatisfied
0 = I Don't Know/No
information/Not Applicable
14. Shelter/Housing
14.1 CA’s Efforts in providing access to housing (e.g., condominiums,
40/60) 1 2 1 2 3 4 0
14.2 Equitable distribution of publicly constructed houses 1 2 1 2 3 4 0
14.3 Affordability of publicly constructed houses 1 2 1 2 3 4 0
14.4 Overall, how satisfied were you with Shelter/housing 1 2 3 4 0
15. Non-physical Services
15.1 Provision and renewal of ID Cards 1 2 1 2 3 4 0
15.2 Provision of marriage and birth certificate 1 2 1 2 3 4 0
15.3 Letter of support (free healthcare, employment) 1 2 1 2 3 4 0
15.4 Safety and security services (Police) 1 2 1 2 3 4 0
15.5 Overall, how satisfied were you with non-physical services 1 2 3 4 0
16. SMEs Development Support
16.1 Targeting mechanism for inclusion in SMEs 1 2 1 2 3 4 0
16.2 Organizing/formation of SMEs 1 2 1 2 3 4 0
16.3 Technical skills training 1 2 1 2 3 4 0
16.4 Business/entrepreneurship 1 2 1 2 3 4 0
16.5 Access to Credit 1 2 1 2 3 4 0
16.6 Provision of business/market premises 1 2 1 2 3 4 0
16.7 Creating Marketing Linkage 1 2 1 2 3 4 0
16.8 Overall, how satisfied were you with SMEs Development 1 2 3 4 0
17. Overall, how satisfied were you with the services provided by
the City Administration? 1 2 3 4 0

MAIN REPORT: PARTICIPATORY CITIZENS' SATISFACTION B ASELINE SURVEY IN EIGHT UGDP PARTNER CITY ADMINISTRATIONS
2013
99
PART C. PUBLIC PARTICIPATION
C1. Please indicate the response that best describes your experience regarding participation in public
meetings and voicing your views in the planning, implementation and evaluation of development programs
and projects
No. Aspects of Participation and Voicing [Your experiences
during the past 12 Months]
Please indicate your response
to the following aspects of
participation?
1= Always
2= Sometimes
3= Rarely
4= Never
0= I don’t Know/No Answer
1 How often have you or a member of your household been invited
(public announcements, letter, public notice) to public meetings
for planning (identification of needs, setting priorities, etc.),
implementation and evaluation of development programs and
projects
1 2 3 4 0
2 How often have you or a member of your household participated
in public meetings? 1 2 3 4 0
If the answer
is “Never” skip
to Question
No. 6
3 To what extent (how often] the public consultation forums
provided opportunities for all participants/citizens to express
their views, concerns and priorities?
1 2 3 4 0
4 Have you provided comments and suggestions for the
improvement of urban development plans and projects in your
city?
1 2 3 4 0
5 If you have provided comments, how often were your
suggestions and priorities incorporated in the planning and
implementation of urban development projects in your city?
1 2 3 4 0
6 How often are infrastructure projects implemented by the CA
consistent with priorities identified and agreed upon in the public
consultation meeting you participated in?
1 2 3 4 0
7 How often have you or a member of your household contributed
money to infrastructure projects (such as health, education,
roads, water supply etc.)?
1 2 3 4 0
8 How often have you or a member of your household contributed
in-kind (labour, materials) to infrastructure projects (such as
health, education, roads, water supply etc.)?
1 2 3 4 0
9 How often have you or a member of your household lodged
grievances or complaints about problems of service delivery to
relevant authorities or officials?
1 2 3 4 0
10 If lodged complaints, how often have you received satisfactory
responses to your complaints from the relevant authorities? 1 2 3 4 0

MAIN REPORT: PARTICIPATORY CITIZENS' SATISFACTION B ASELINE SURVEY IN EIGHT UGDP PARTNER CITY ADMINISTRATIONS
2013
100
C2: Please indicate the response best describes your opinion about public participation and the distribution
of the benefits of urban development programs and projects in your city
No. Satisfaction with public participation
1 = Highly Satisfied
2 = Satisfied
3 = Dissatisfied
4 = Highly Dissatisfied
0 = I Don't Know/No
Information
11 Overall, how satisfied are you with the effectiveness of public participation in
the planning, implementation, and evaluation of development programs and
projects in your city?
1 2 3 4 0
12 How satisfied are your with the effective utilization of the available
resources/budget by the city Administration for urban development and
poverty reduction in your city?
1 2 3 4 0
13 How satisfied are your with the distribution of the benefits of public
investment on municipal public services and infrastructure among the various
sections of the population (poor and better-off) and different areas (Kebeles
and Neighbourhoods) in your city?
1 2 3 4 0
C3: Citizens Access to Public-Domain Information
No. Type of Public-Domain Information
How satisfied are you with
accessibility of the following
public domain information?
1 = Highly Satisfied
2 = Satisfied
3 = Dissatisfied
4 = Highly Dissatisfied
0 = I Don't Know/No Answer
14 Annual Budget information of the City Administration 1 2 3 4 0
15 Annual Audit Reports of the City Administration 1 2 3 4 0
16 Public Procurement (tender) information of the City Admin. 1 2 3 4 0
17 Information about urban development plans and projects 1 2 3 4 0
C4: Tax Awareness/Literacy
No. Tax Literacy Yes
(1)
No
(2)
I Don’t know
(3)
18 Have you or a member of your household ever received tax awareness-raising
information? 1 2 3
19 If the answer to Q1 above is "Yes", was the information useful in raising your
awareness about the importance of paying taxes for the development of your
city?
1 2 3
20 Do you think that citizens' tax payment is important for the delivery and
expansion of public services and infrastructure in your city? 1 2 3

MAIN REPORT: PARTICIPATORY CITIZENS' SATISFACTION B ASELINE SURVEY IN EIGHT UGDP PARTNER CITY ADMINISTRATIONS
2013
101
Appendix C.2: Business Enterprises Survey Questionnaire
Date:
Start Time:
End Time:
Enumerator's Name:
Supervisor's Name:
PART A. SAMPLE IDENTIFICATION AND ENTERPRISE PROFILE
1. Region
2. City
3. Kebele
4. House Number
5. Contact Telephone
6. Enterprise Details:
6.1 Year of Establishment:
6.2 Form of Organization: Private 1
Cooperatives (SMEs) 2
6.3 Type of Business Hotels, Bars, Restaurants, Cafes 1
Bakery/Food processing 2
Butchery 3
Metal/Wood Works 4
Garages 5
Other (Specify)
6.4 Number of Employees
6.5 Estimated Annual Sales Turn-over Birr

MAIN REPORT: PARTICIPATORY CITIZENS' SATISFACTION B ASELINE SURVEY IN EIGHT UGDP PARTNER CITY ADMINISTRATIONS
2013
102
PART B. LEVEL OF SATISFACTION WITH PUBLIC SERVICES DELIVERY
Major services provided by your City Administration and other service providers are listed below. Please
indicate the response that best describes your satisfaction/experience with the following aspects of those
services. Circle the ratings in for each item, choosing only one code.
Type and Aspect of Service
Has anyone in the HH
used the service in the
past 12 months?
1 = Yes (ask Level of
Satisfaction)
2 = No (skip to next
Question)
How satisfied were you with this
aspect of service?
1 = Highly Satisfied
2 = Satisfied
3 = Dissatisfied
4 = Highly Dissatisfied
0 = I Don't Know/No
information/Not Applicable
18. Potable Water Supply
18.1 Quality of water 1 2 1 2 3 4 0
18.2 Reliability of supply 1 2 1 2 3 4 0
18.3 Affordability/price of water 1 2 1 2 3 4 0
18.4 Overall, how satisfied were you with Water Supply 1 2 1 2 3 4 0
19. Electric Power Supply
19.1 Reliability of Electric Power Supply 1 2 1 2 3 4 0
19.2 Affordability of electricity 1 2 1 2 3 4 0
19.3 Overall, how satisfied were you with Electric Power supply 1 2 3 4 0
20. Street Lighting
20.1 Functionality of street lighting in neighborhood 1 2 1 2 3 4 0
20.2 Overall, how satisfied were you with Street Lighting Services 1 2 3 4 0
21. Inner City Roads
1.1 Timely maintenance of inner city roads 1 2 1 2 3 4 0
1.2 Overall, how satisfied were you with Inner City Roads 1 2 3 4 0
22. Drainage Structures
1.3 Maintenance of drainage structures 1 2 1 2 3 4 0
1.4 Storm/flow of water drains 1 2 1 2 3 4 0
1.5 Overall, how satisfied were you with Drainage Structure 1 2 3 4 0
23. Solid Waste Management (self-disposal or fee-based
collection)
1.6 Siting of solid waste dumpsters 1 2 1 2 3 4 0
1.7 Regularity of collection 1 2 1 2 3 4 0
1.8 Affordability of collection fee 1 2 1 2 3 4 0
1.9 Overall, how satisfied were you with Solid Waste Services 1 2 3 4 0
24. Sanitation Services
1.10 Cleanness of public toilets in your neighborhood 1 2 1 2 3 4 0
1.11 Regular functionality of public toilets in your neighborhood 1 2 1 2 3 4 0
1.12 Overall, how satisfied were you with Sanitation Services 1 2 3 4 0
25. Vacuum Truck Services

MAIN REPORT: PARTICIPATORY CITIZENS' SATISFACTION B ASELINE SURVEY IN EIGHT UGDP PARTNER CITY ADMINISTRATIONS
2013
103
Type and Aspect of Service
Has anyone in the HH
used the service in the
past 12 months?
1 = Yes (ask Level of
Satisfaction)
2 = No (skip to next
Question)
How satisfied were you with this
aspect of service?
1 = Highly Satisfied
2 = Satisfied
3 = Dissatisfied
4 = Highly Dissatisfied
0 = I Don't Know/No
information/Not Applicable
1.13 Waiting time for vacuum truck services 1 2 1 2 3 4 0
1.14 Affordability of vacuum truck service 1 2 1 2 3 4 0
1.15 Overall, how satisfied were you with Vacuum Truck Services 1 2 3 4 0
26. Business Development Services
1.16 Licensing and registration of business 1 2 1 2 3 4 0
1.17 Access to Land and Premises 1 2 1 2 3 4 0
1.18 Access to finance for business start-up/expansion 1 2 1 2 3 4 0
1.19 Market outlets for products (sales and display center, trade fair ) 1 2 1 2 3 4 0
1.20 Business Training 1 2 1 2 3 4 0
1.21 Technical Training 1 2 1 2 3 4 0
1.22 Creating Market Linkages 1 2 1 2 3 4 0
27. Abattoir services
27.1 Sanitary condition of Abattoir services 1 2 1 2 3 4 0
27.2 Availability/suitability of transport services 1 2 3 4 0
27.3 Price of Abattoir services 1 2 3 4 0
27.4 Overall, how satisfied were you with Street Lighting Services 1 2 3 4 0
28. Overall, how satisfied were you with the services provided by
the City Administration? 1 2 3 4 0

MAIN REPORT: PARTICIPATORY CITIZENS' SATISFACTION B ASELINE SURVEY IN EIGHT UGDP PARTNER CITY ADMINISTRATIONS
2013
104
PART C. PUBLIC PARTICIPATION
C1. Please indicate the response that best describes your experience regarding participation in public
meetings and voicing your views in the planning, implementation and evaluation of development programs
and projects
No
. Aspects of Participation and Voicing [Your experiences
during the past 12 Months]
Please indicate your response
to the following aspects of
participation?
1= Always
2= Sometimes
3= Rarely
4= Never
0= I don’t Know/No Answer
1 How often have your enterprise been invited (public
announcements, letter, public notice) to public meetings for
planning (identification of needs, setting priorities, etc.),
implementation and evaluation of development programs and
projects
1 2 3 4 0
2 How often have you or a member of your enterprise participated
in public meetings? 1 2 3 4 0
If the answer
is “Never” skip
to Question
No. 6
3 How often the public consultation forums provided opportunities
for all participants/citizens to express their views, concerns and
priorities?
1 2 3 4 0
4 Have you provided comments and suggestions for the
improvement of urban development plans and projects in your
city?
1 2 3 4 0
5 If you have provided comments, how often were your suggestions
and priorities incorporated in the planning and implementation of
urban development projects in your city?
1 2 3 4 0
6 How often are infrastructure projects implemented by the CA
consistent with priorities identified and agreed upon in the public
consultation meeting you participated in?
1 2 3 4 0
7 How often have you or contributed money to infrastructure
projects (such as health, education, roads, water supply etc.)? 1 2 3 4 0
8 How often have you or contributed in-kind (labour, materials) to
infrastructure projects (such as health, education, roads, water
supply etc.)?
1 2 3 4 0
9 How often have you lodged grievances or complaints about
problems of service delivery to relevant authorities or officials? 1 2 3 4 0
10 If lodged complaints, how often have you received satisfactory
responses to your complaints from the relevant authorities? 1 2 3 4 0

MAIN REPORT: PARTICIPATORY CITIZENS' SATISFACTION B ASELINE SURVEY IN EIGHT UGDP PARTNER CITY ADMINISTRATIONS
2013
105
C2: Please indicate the response best describes your opinion about public participation and the distribution
of the benefits of urban development programs and projects in your city
No Satisfaction with public participation
1 = Highly Satisfied
2 = Satisfied
3 = Dissatisfied
4 = Highly Dissatisfied
0 = I Don't Know/No
Information
11 Overall, how satisfied are you with the level, quality and effectiveness] of
public participation in the planning, implementation, and evaluation of
development programs and projects in your city?
1 2 3 4 0
12 How satisfied are you with the and effective utilization of the available
resources/budget by the city Administration for urban development and
poverty reduction in your city?
1 2 3 4 0
13 How satisfied are you with the distribution of the benefits of urban
development programs and projects among the various sections of the
population (poor and better-off) and different areas (Kebeles and
Neighbourhoods) in your city?
1 2 3 4 0
C3: Transparency/Citizens Access to Public-Domain Information
No
. Type of Public-Domain Information
How satisfied are you with
accessibility of the following
public domain information?
1 = Highly Satisfied
2 = Satisfied
3 = Dissatisfied
4 = Highly Dissatisfied
0 = I Don't Know/No Answer
14 Annual Budget information of the City Administration 1 2 3 4 0
15 Annual Audit Reports of the City Administration 1 2 3 4 0
16 Public Procurement (tender) information of the City Admin. 1 2 3 4 0
17 Information about urban development plans and projects 1 2 3 4 0
C4: Tax Awareness/Literacy
No. Tax Literacy Yes
(1)
No
(2)
I Don’t know
(3)
18 Have you or a member of your household ever received tax awareness-raising
information? 1 2 3
19 If the answer to Q1 above is "Yes", was the information useful in raising your
awareness about the importance of paying taxes for the development of your
city?
1 2 3
21 Do you think that the tax you pay is important for the delivery and expansion
of public services and infrastructure in your city? 1 2 3
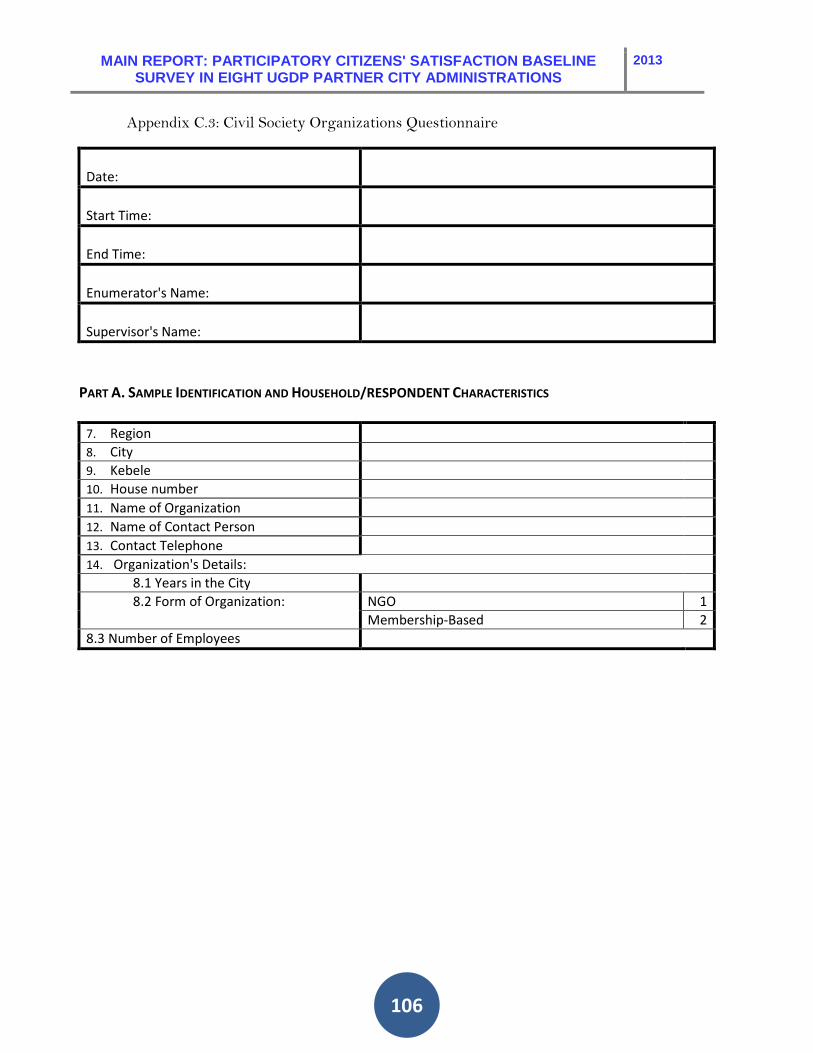
MAIN REPORT: PARTICIPATORY CITIZENS' SATISFACTION B ASELINE SURVEY IN EIGHT UGDP PARTNER CITY ADMINISTRATIONS
2013
106
Appendix C.3: Civil Society Organizations Questionnaire
Date:
Start Time:
End Time:
Enumerator's Name:
Supervisor's Name:
PART A. SAMPLE IDENTIFICATION AND HOUSEHOLD/RESPONDENT CHARACTERISTICS
7. Region
8. City
9. Kebele
10. House number
11. Name of Organization
12. Name of Contact Person
13. Contact Telephone
14. Organization's Details:
8.1 Years in the City
8.2 Form of Organization: NGO 1
Membership-Based 2
8.3 Number of Employees

MAIN REPORT: PARTICIPATORY CITIZENS' SATISFACTION B ASELINE SURVEY IN EIGHT UGDP PARTNER CITY ADMINISTRATIONS
2013
107
PART C. PARTICIPATION, EMPOWERMENT AND VOICING
1. Please indicate the response that best describes your experience regarding participation in public meetings and
voicing the concerns of your organization in forums organized by the City Administration.
Aspects of Participation and Voicing During 12 Months Preceding
this Survey
Please indicate your response to
the following aspects of
participation & voicing?
1 = Never
2 = Rarely
3 = Sometimes
4 = Always
0 = I Don't Know / No Information
1 How often have your organization been invited to public meetings in
the identification, planning, decision-making and implementation of
urban development projects during the last 12 months?
1 2 3 4 0
2 If invited, how often has your organization participated in public
meetings indicated in number "1" above? 1 2 3 4 0
3 If participated, have you provided comments and suggestions for
the improvement of urban development plans and projects in tour
city?
1 2 3 4 0
4 If you have provided comments, how often were your comments
and suggestions incorporated in the planning and implementation of
urban development projects in your city?
1 2 3 4 0
5 How often has your organization participated in sessions organized
to raise citizens' awareness on participatory urban development
processes and encourage them to exercise their Constitutional right
to effectively participate in matters that directly affect them?
1 2 3 4 0
2. Transparency and Accountability: Access to Public-Domain Information
Type of Public-Domain Information
How satisfied are you with
accessibility of the following public
information?
1 = Highly Satisfied
2 = Satisfied
3 = Dissatisfied
4 = Highly Dissatisfied
0 = I Don't Know
1 Accessibility of CA's Annual Budget information 1 2 3 4 0
2 Accessibility of CA's Annual Audit Reports 1 2 3 4 0
3 Accessibility of Public Procurement (tender) information 1 2 3 4 0
4 Information about urban development plans and projects 1 2 3 4 0
5 Transparency and accountability of local public officials in service
delivery

MAIN REPORT: PARTICIPATORY CITIZENS' SATISFACTION B ASELINE SURVEY IN EIGHT UGDP PARTNER CITY ADMINISTRATIONS
2013
108
Appendix C.4: Vulnerable Groups Survey Questionnaire
Date:
Start Time:
End Time:
Enumerator's Name:
Supervisor's Name:
PART A. SAMPLE IDENTIFICATION AND RESPONDENT CHARACTERISTICS
15. Region
16. City
17. Kebele
18. Sub-Kebele/Zone
19. Details of Respondent:
5.1 Sex Male 1
Female 2
5.2 Age:
Education: Yes 1
5.3 Do you read and write? No 2
5.4 If yes, formal education Basic adult education 1
Elementary 2
High school 3
TVET 4
College/University 5
5.5. Any Household/Family within the City: Yes 1
No 2
5.6 Vulnerability/Marginality Status of Respondent Beggar 1
Street Child 2
Commercial Sex Worker 3
Other (specify)

MAIN REPORT: PARTICIPATORY CITIZENS' SATISFACTION B ASELINE SURVEY IN EIGHT UGDP PARTNER CITY ADMINISTRATIONS
2013
109
PART B: ACCESS TO BASIC NEEDS AND SERVICES
No. Type of Basic Needs and Services
How often do you have access
to the following basic needs
and services?
Always = 1
Sometimes = 2
Rarely = 3
Never = 4
I Don't Know, or NA = 5
1 How often do you go hungry or face food shortage? 1 2 3 4 5
2 How often do you have access to proper day/night clothing? 1 2 3 4 5
3 How often do you have access to proper shelter? 1 2 3 4 5
4 How often do you have access to toilet? 1 2 3 4 5
5 How often do you get medical treatment when sick? 1 2 3 4 5
PART C: PARTICIPATION
No. Aspects of Participation
Please circle the number that
corresponds to the
respondents answer:
Yes = 1
No = 2
I Don't Know = 3
1
Are you at present a member of any association/organization of
vulnerable/marginalized groups in the city? 1 2 3
2 Have you ever been invited to attended a public meeting to discuss the planning
and implementation of development projects in the city? 1 2 3
3 Have you ever participated in public meetings of the type indicated in number
"3" above? 1 2 3
4 If participated, did the public consultation meetings provide opportunities for all
participants to express their views, concerns and priorities? 1 2 3
5 Have you provided comments and suggestions for the improvement of urban
development plans and projects in the meeting you attended? 1 2 3
6 In general, do you think that development plans, programs, and projects
implemented in the city are addressing the needs, problems and priorities of
poor, vulnerable and marginalized people in the city?
1 2 3
7 Have you ever lodged grievances/complaints or request for support about
problems you are facing to relevant authorities or officials? 1 2 3
8 If yes, have you received satisfactory responses to your complaints or requests
from the relevant authorities? 1 2 3
9 Have your received any kind of assistance or support from government, NGO or
any other organization in the past 12 months? 1 2 3
10 Have you ever received skill training? 1 2 3
11 Are you at present engaged in any income generating activity? 1 2 3

MAIN REPORT: PARTICIPATORY CITIZENS' SATISFACTION B ASELINE SURVEY IN EIGHT UGDP PARTNER CITY ADMINISTRATIONS
2013
110
Appendix D: 2012 BLS List of Core Team and Survey Team Members in Each City
Table D1: List of Baseline Survey Team and Core Team Members: Yirgalem City Administration
No. Name of Survey Team Member No Name of Core Team Member
1 Abinet Haile 1 Muluneh Nigusse
2 Asefa Bulbula 2 Tewodrose Kebede
3 Behailu Kedir 3 Gezahagh Barguda
4 Dawit Futara 4 Esayas Mulatu
5 Esayas Kayeso
6 Sisay Megersa
7 Tibebu Mamo
8 Zemach Hailu
Table D2: List of Baseline Survey Team and Core Team Members: Semara-Logia City Administration
No. Name of Survey Team Member No. Name of Core Team Member
1 Abubaker Hassen 1 Wondeye kebede
2 Anteneh Tedla 2 Misganew Abebewu
3 Freihiwot 3 Mahi Mohamed
4 Habtam 4 Zeleke Lerango
5 Medina
6 Mehbuba Seid
7 Meseret Sisay
8 Mulu
9 Wase
10 Zeineba
Table D3: List of Baseline Survey Team and Core Team Members: Nekempte City Administration
No. Name of Survey Team Member No. Name of Core Team Member
1 Abebe Etecha 1 Tefri Alemayehu
2 Dechasa Gudato 2 Urgesa Tilahun Bekabile
3 Feyisa Birhanu 3 Tesfaye Sirna Dissasa
4 Jiregna Asfaw 4 Tesfaye Dina
5 Kedanu Mulata
6 Muluneh Getachew
7 Oliyad Olana
8 Telile Dhugasa
9 Tesfaye Sirna
10 Teshome Teresa

MAIN REPORT: PARTICIPATORY CITIZENS' SATISFACTION B ASELINE SURVEY IN EIGHT UGDP PARTNER CITY ADMINISTRATIONS
2013
111
Table D4: List of Baseline Survey Team and Core Team Members: Jig-jiga City Administration
No. Name of Survey Team Member No. Name of Core Team Member
1 Abdifatha Mahad 1 Semeter Felek
2 Abdinasi Ali 2 Abdijbar Taha Yusuf
3 Aregash Tadesse 3 Alamayew Meshasha
4 Biniyam 4 Kahsay G/medhin
5 Farhan Mahadi
6 Mohammed Ibrahim
7 Ramadan
8 Sirak Benabru
9 Tirsit Solomon
Table D5: List of Baseline Survey Team and Core Team Members: Gambella City Administration
No. Name of Survey Team Member No. Name of Core Team Member
1 Adane Kaba 1 Eleni Brhane
2 Bidier Yiech 2 Bok Res
3 Daneil Wondimu 3 Tadele Jote
4 Domach Kuway 4 Demelash Yadete
5 Etaferahu Aguwa
6 Hawi
7 Minlargih Alemu
8 Ochan Obang
9 Okum Kode
10 Tigst Befikadu
Table D6: List of Baseline Survey Team and Core Team Members: Debre Markos City Administration
No. Name of Survey Team Member No. Name of Core Team Member
1 Abrham Tadesse 1 Endalkachew Emiru
2 Ashebir Melak 2 Kalkidane Tadesse
3 Israel Abatiyihun 3 Teruset Kebie
4 Esubalew Sentayehu 4 Moges Seifu
5 Habtamu Shimeles
6 Mamush Wondale
7 Maseresha Atnafu
8 Tegenu Dereje
9 Yayesh Kassa
10 Yohanes Abatiyihun
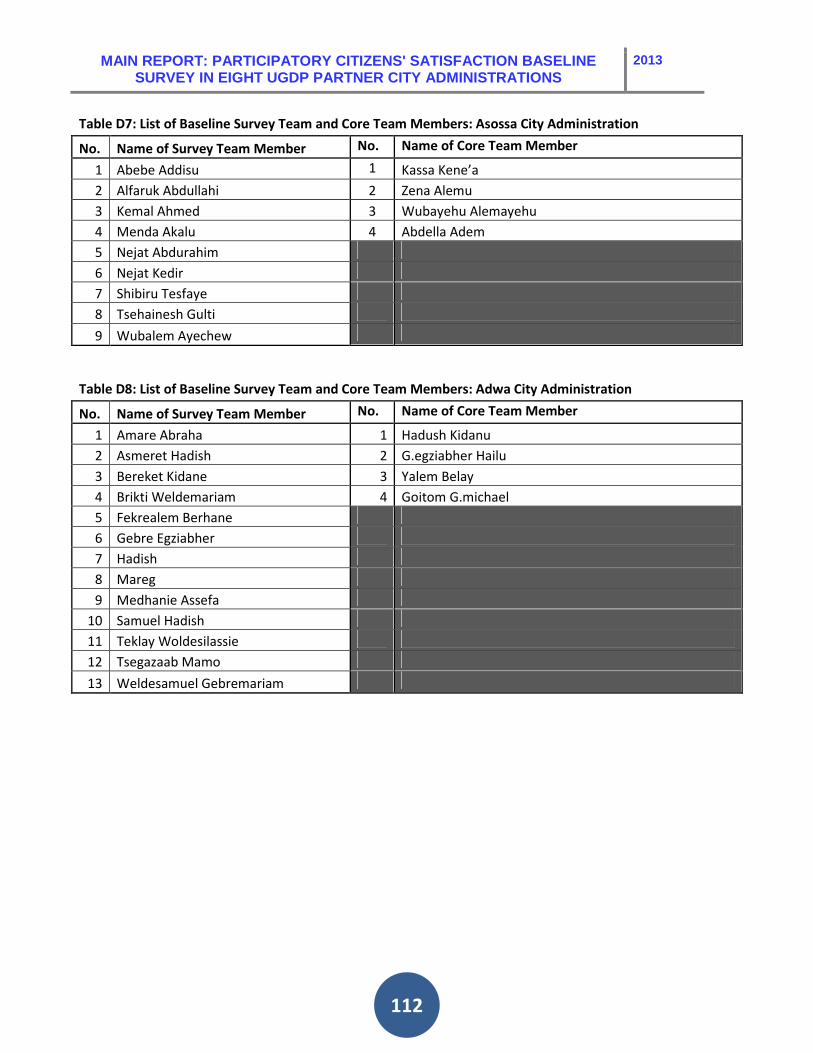
MAIN REPORT: PARTICIPATORY CITIZENS' SATISFACTION B ASELINE SURVEY IN EIGHT UGDP PARTNER CITY ADMINISTRATIONS
2013
112
Table D7: List of Baseline Survey Team and Core Team Members: Asossa City Administration
No. Name of Survey Team Member No. Name of Core Team Member
1 Abebe Addisu 1 Kassa Kene’a
2 Alfaruk Abdullahi 2 Zena Alemu
3 Kemal Ahmed 3 Wubayehu Alemayehu
4 Menda Akalu 4 Abdella Adem
5 Nejat Abdurahim
6 Nejat Kedir
7 Shibiru Tesfaye
8 Tsehainesh Gulti
9 Wubalem Ayechew
Table D8: List of Baseline Survey Team and Core Team Members: Adwa City Administration
No. Name of Survey Team Member No. Name of Core Team Member
1 Amare Abraha 1 Hadush Kidanu
2 Asmeret Hadish 2 G.egziabher Hailu
3 Bereket Kidane 3 Yalem Belay
4 Brikti Weldemariam 4 Goitom G.michael
5 Fekrealem Berhane
6 Gebre Egziabher
7 Hadish
8 Mareg
9 Medhanie Assefa
10 Samuel Hadish
11 Teklay Woldesilassie
12 Tsegazaab Mamo
13 Weldesamuel Gebremariam