Blood groups, serum proteins and enzymes of the faroe Islanders
14
D. Tills R. G. Harvey A. Warlow A. C. Kop& D. Suter British Museum (Natural History), Cromwell Road, London SW7 5BD, England M. Hauge H.J. Simonsen Odense University, Odense, Denmark A. Marin Autonoma University,Madrid, Spain Received 4January 1985 and accepted 23 February 1985 Keywords: Faroes, blood groups, proteins, enzymes, polymorphism, genetic distance. Blood Groups, Serum Proteins and Enzymes of the Faroe islanders Over 600 blood samples were obtained from the Faroe Islanders, with the help of the Department of Clinical Genetics, Odense University. They were tested for nineteen blood groups and seventeen red cell enzyme and protein systems. The data have been analysed in relation to the demographic history of the Faroes and information available on migration patterns. Comparisons have been made with other north-west European populations with particular reference to Iceland and its subdivisions. The Faroese show considerable differencesin their gene frequencies when compared with other populations of the region. Possible reasons for these findings are discussed. ,Journal of Human Evolution (1985) 14, 725-738 1. Introduction The Faroe Islands lie in the North Atlantic about 350 km north-west of the Shetlands and approximately 460 km from the south-eastern coast of Iceland. They form part of the basalt region which includes Iceland, Jan Mayen Island, parts of East and West Greenland, western Scotland and north-eastern Ireland. The fiords and long "U" shaped valleys of the Faroes, which run in a north-west to south-east direction, were shaped by glacial action. Weathering has produced spectacular cliffs and steep mountain slopes descending from peaks and ridges that rise to over 850 m in the nothern parts of the archipelago, which has a maximum length overall of about 113 kin. There are eighteen islands, seventeen of which are inhabited, with a total population of approximately 43,000. Virtually all the communities are coastal, their positions having been determined not only by their accessibility to the sea but also by their proximity to cultivable land, which represents a meagre 6% of the total land area of 1400 km 2. Until the mid-19th century the economy of the islands was heavily dependent upon sheep. Land was needed for the cultivation of winter fodder together with small quantities of cereals and potatoes. About 70,000 sheep live on the islands and wool products still comprise a significant export commodity but the economy is now dominated by the fishing industry which accounts for 95% of total exports. The expansion of the fishing industry to its present prosperous level has encouraged rapid growth in a number of Faroese towns, notably T6rshavn, the capital (pop. 13,000), Klaksvik (pop. 5000) and TvSroyri (pop. 2000). The redistribution of the population from smaller outlying communities, with poor communication links, to the larger towns and villages has been a notable recent 0047-2484/85/080725 + 14 $03.00/0 1985 Academic Press Inc. (I.ondon) Limited
-
Upload
independent -
Category
Documents
-
view
3 -
download
0
Transcript of Blood groups, serum proteins and enzymes of the faroe Islanders
D. Tills R. G. Harvey A. Warlow A. C. Kop& D. Suter
British Museum (Natural History), Cromwell Road, London SW7 5BD, England
M. Hauge H.J. Simonsen
Odense University, Odense, Denmark
A. Marin
Autonoma University, Madrid, Spain
Received 4January 1985 and accepted 23 February 1985
Keywords: Faroes, blood groups, proteins, enzymes, polymorphism, genetic distance.
Blood Groups, Serum Proteins and Enzymes of the Faroe islanders
Over 600 blood samples were obtained from the Faroe Islanders, with the help of the Department of Clinical Genetics, Odense University. They were tested for nineteen blood groups and seventeen red cell enzyme and protein systems. The data have been analysed in relation to the demographic history of the Faroes and information available on migration patterns. Comparisons have been made with other north-west European populations with particular reference to Iceland and its subdivisions.
The Faroese show considerable differences in their gene frequencies when compared with other populations of the region. Possible reasons for these findings are discussed.
,Journal of Human Evolution (1985) 14, 725-738
1. In troduc t ion
The Faroe Islands lie in the Nor th Atlantic about 350 km north-west of the Shetlands and approximately 460 km from the south-eastern coast of Iceland. They form part of the basalt region which includes Iceland, J a n Mayen Island, parts of East and West Greenland, western Scotland and north-eastern Ireland. The fiords and long "U" shaped valleys of the Faroes, which run in a north-west to south-east direction, were shaped by glacial action. Weather ing has produced spectacular cliffs and steep mountain slopes descending from peaks and ridges that rise to over 850 m in the nothern parts of the archipelago, which has a max imum length overall of about 113 kin.
There are eighteen islands, seventeen of which are inhabited, with a total population of approximately 43,000. Virtually all the communities are coastal, their positions having been determined not only by their accessibility to the sea but also by their proximity to cultivable land, which represents a meagre 6% of the total land area of 1400 km 2. Until the mid-19th century the economy of the islands was heavily dependent upon sheep. Land was needed for the cultivation of winter fodder together with small quantities of cereals and potatoes. About 70,000 sheep live on the islands and wool products still comprise a significant export commodi ty but the economy is now dominated by the fishing industry which accounts for 95% of total exports. The expansion of the fishing industry to its present prosperous level has encouraged rapid growth in a number of Faroese towns, notably T6rshavn, the capital (pop. 13,000), Klaksvik (pop. 5000) and TvSroyri (pop. 2000). The redistribution of the populat ion from smaller outlying communities, with poor communicat ion links, to the larger towns and villages has been a notable recent
0047-2484/85/080725 + 14 $03.00/0 �9 1985 Academic Press Inc. (I.ondon) Limited
726 D, T I L L S E T A L .
phenomenon. However, it is interesting to note that a period of intense demographic upheaval during the 1930s had a relativley small effect on traditional patterns of migration and that, in the aftermath of World War II, the level of immigration remained low (Harvey & Suter, 1984).
The earliest inhabitants of the Faroes are thought to have been of Celtic origin and, with the sheep, were probably in residence before A.D. 700. They are referred to as "hermits from Ireland" by the monk Dicuil, writing in A.D. 825. Life for these anchorites was severely disrupted, if not drastically curtailed, by the arrival of the Vikings, who were the first to establish sizeable settlements during the ninth century. Settling the Faroes about five decades before their kinsfolk colonized Iceland, the founders almost certainly brought with them Celtic slaves from established Viking communities in Scotland and Ireland. By A.D. 900 they had achieved a sufficiently stable society to institute a parliament on Tinganes, a small rocky peninsula, which is now a well-preserved feature of Tdrshavn harbour. The identity of their homelands remains conjectural, for no equivalent of the Icelandic "Book of the Settlements" (Landnamabdk) has survived. The important position of the Faroe Islands along Viking trade routes together with the established kinship between Faroese and Icelandic families probably encouraged gene flow between their populations during the Viking era. At its close the Faroese entered a period of economic stagnation and cultural isolation which lasted until the early 19th century. This was partly due to restrictions on trade through the Danish trading monopoly, which operated for over three hundred years, and to an impoverished agricultural economy which relied heavily on the importation of food and raw materials.
For almost a thousand years, before the closure of the Danish Trading Monopoly in 1856 and the coincident expansion of the fishing industry, the total Faroese population was probably no greater than about 5000 and may have been severely reduced at various times by epidemics of the Black Death, smallpox and measles (West, 1972). There are few historical records and no reliable census data until 1769 when the population stood at 4773. In 1801 a more detailed analysis, compiled by the Danish Department of Statistics, showed that 70% of the parishes enumerated had less than 150 residents. The population was by then 5265. Under these circumstances genetic "bottle-neck" effects and intergenerational gametic drift may have had a substantial influence on the genetic composition of the population. Recent studies have shown that there is a high degree of intra-population variation in dermatoglyphic and pigmentary traits, as well as colour vision anomalies (Harvey & Suter, 1982). In their dermatoglyphics and anthropometry the Faroese resemble the Icelanders (Surer et al., 1979; Harvey & Suter, 1983), and both populations show considerable divergence from the people of Scandinavia and north-western Europe.
2. Materials and Methods
The results concern 682 blood samples collected from secondary school pupils, student navigators, trainee teachers and residents of the northern islands during the period August 1977 to September 1979. The sampling localities: Klaksvfk, Fuglafjor~Sur, Oyrarbakki, Strendur, Runavfk, Toftir, T6rshavn, Vestmanna, Mi~Svfigur, Sorv{tgur, Skfivoy, Tv6royri and Vfigur were widely distributed across the archipelago and included ten locations used in a study of digital dermatoglyphics (Harvey & Suter, 1983). Sampling by place of residence was approximately in proportion to the distribution within the island communities, with the single exception of the capital T6rshavn, which was
FAROESE BLOOD GROUPS 727
under-represented. As T6rshavn has received migrants from all parts of the Faroes and represents a highly mobile population, the deficit of numbers does not seriously affect the proportional representation of the serological sample.
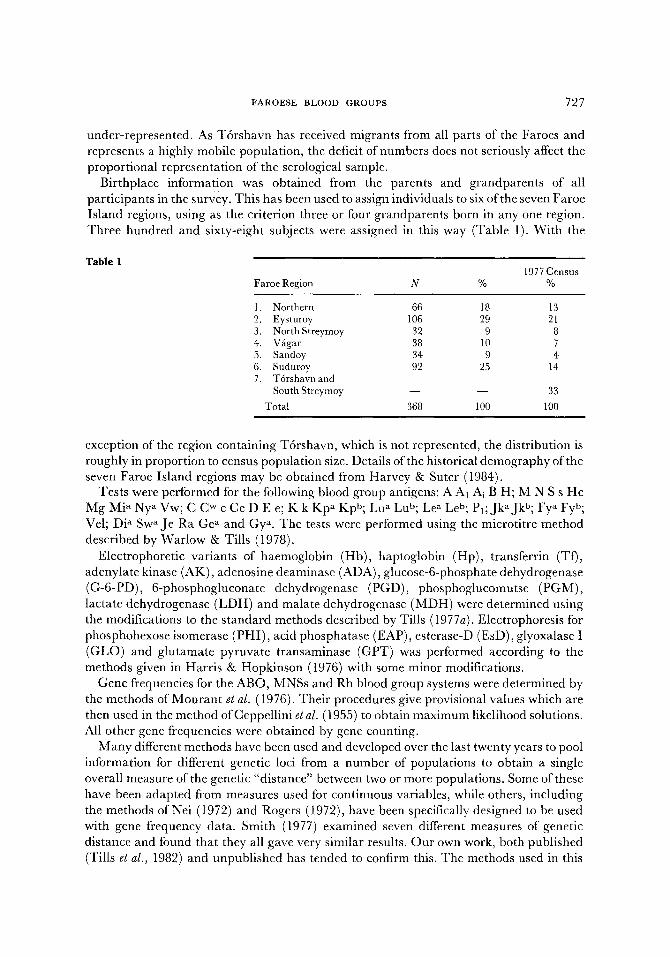
Birthplace information was obtained from the parents and grandparents of all participants in the survey. This has been used to assign individuals to six of the seven Faroe Island regions, using as the criterion three or four grandparents born in any one region. Three hundred and sixty-eight subjects were assigned in this way (Table 1). With the
Table 1 1977 Census
Faroe Region N % %
1. Northern 66 18 13 2. Eysturoy 106 29 21 3. North Streymoy 32 9 8 4. Vgtgar 38 10 7 5. Sandoy 34 9 4 6. Suduroy 92 25 14 7. T6rshavn and
South Streymoy - - - - 33 Total 368 100 100
exception of the region containing Tdrshavn, which is not represented, the distribution is roughly in proportion to census population size. Details of the historical demography of the seven Faroe Island regions may be obtained from Harvey & Surer (1984).
Tests were performed for the following blood group antigens: A A1 Ai B H; M N S s He Mg Mi a Ny a Vw; C C W c Ce D E e; K k Kp a Kpb; Lu a Lub; Le a Leb; P1;JkaJkU; Fya Fyb; Vel; Di~ Sw a Je Ra Ge a and Gy a. The tests were performed using the microtitre method described by Warlow & Tills (1978).
Electrophoretic variants of haemoglobin (Hb), haptoglobin (Hp), transferrin (TO, adenylate kinase (AK), adenosine deaminase (ADA), glucose-6-phosphate dehydrogenase (G-6-PD), 6-phosphogluconate dehydrogenase (PGD), phosphoglucomutse (PGM), lactate dehydrogenase (LDH) and malate dehydrogenase (MDH) were determined using the modifications to the standard methods described by Tills (1977a). Electrophoresis for phosphohexose isomerase (PHI) , acid phosphatase (EAP), esterase-D (EsD), glyoxalase I (GLO) and glutamate pyruvate transaminase (GPT) was performed according to the methods given in Harris & Hopkinson (1976) with some minor modifications.
Gene frequencies for the ABO, MNSs and Rh blood group systems were determined by the methods of Mourant et al. (1976). Their procedures give provisional values which are then used in the method ofCeppellini et al. (1955) to obtain maximum likelihood solutions. All other gene frequencies were obtained by gene counting.
Many different methods have been used and developed over the last twenty years to pool information for different genetic loci from a number of populations to obtain a single overall measure of the genetic "distance" between two or more populations. Some of these have been adapted from measures used for continuous variables, while others, including the methods of Nei (1972) and Rogers (1972), have been specifically designed to be used with gene frequency data. Smith (1977) examined seven different measures of genetic distance and found that they all gave very similar results. Our own work, both published (Tills et al., 1982) and unpublished has tended to confirm this. The methods used in this
728 D TILLS E T A L .
paper were chosen more for availability than for any theoretical consideration although wc are currently investigating several methods of analysis to determine their suitability for our type of data. For this study three matrices of genetic distance were computed and the results presented in two different ways:
(i) Nei's standard genetic distance. A genetic distance matrix was calculated using the method of Nei (1972).
(ii) Ordination procedure. A matrix of genetic distances was obtained by the method of Cavalli-Sforza & Edwards (1964). Principal co-ordinate analysis was then performed on this matrix to give a relationship between the populations in the form of an eigenvector plot diagram. A major problem with this form ofanalyis is that the data is in N-1 dimensions (N being the number of populations in the test data). For visualization the relationships between the populations are usually transformed in two dimensions and this can lead to considerable distortion. A measure of this distortion can be obtained by ranking the populations from a selected base population using both the calculated genetic distance and the measured distance on the plot (Till, 1980).
(iii) Standard phenetic clustering method. This was performed using the method of Sokal & Sneath (1973) on a genetic distance matrix produced by the procedure of Cavalli-Sforza & Edwards (1967). A phenogram was produced by a clustering (amalgamation) process. This method, which is discussed by Hartigan (1975); Dixon & Brown (1979), finds the two populations with the shortest distance between them and places them in a cluster. The next closest population is then added to the cluster. The algorithm is then repeated until all the populations are included in a single cluster.
The populations included in the genetic distance comparisons were selected either because of their probable ancestral relationship to the Faroese, or because it was thought that they had shared a common genetic heritage with the Faroese. For example the regions of Iceland (Tills et al., 1982) were included because the results of a dermatoglyphic study (Harvey & Suter, 1983) had suggested a possible relationship between the Faroese and West Iceland populations.
The majority of the data used in these comparisons were tested in the laboratory of the Biological Anthropolgy Section at the British Museum (Natural History); or in one of its two predecessors, the Medical Research Council's Serological Population Genetics Laboratory; or the Population Genetics Laboratory at St Bartholomew's Hospital. The populations include Eire, Iceland, Isle of Man, Lewis, Northern Ireland, Orkney and Wales. Other data used were obtained from Mourant et al. (1976), Tills et al. (1983) and Tills et al. 1985.
3. P r e v i o u s Studies
Four studies of blood group genetic markers have previously been performed on the Faroese, these are Olsen (1953), S. Tulinius (pers. comm. to A. E. Mourant and D. Tills, 1960), H. Gfirtler (cited in Mourant et al., 1976, pp. 216, 251,402) and B. Hojgard (pers. comm. to M. Hauge, 1974). The results obtained by these surveys are given in Table 2. These all agree well with the present study in showing high O and low cde gene frequencies. The study of Gfirtler included a larger set of genetic markers, the only major difference between his results and those of the present study was the higher value for the Hp 1 gene.
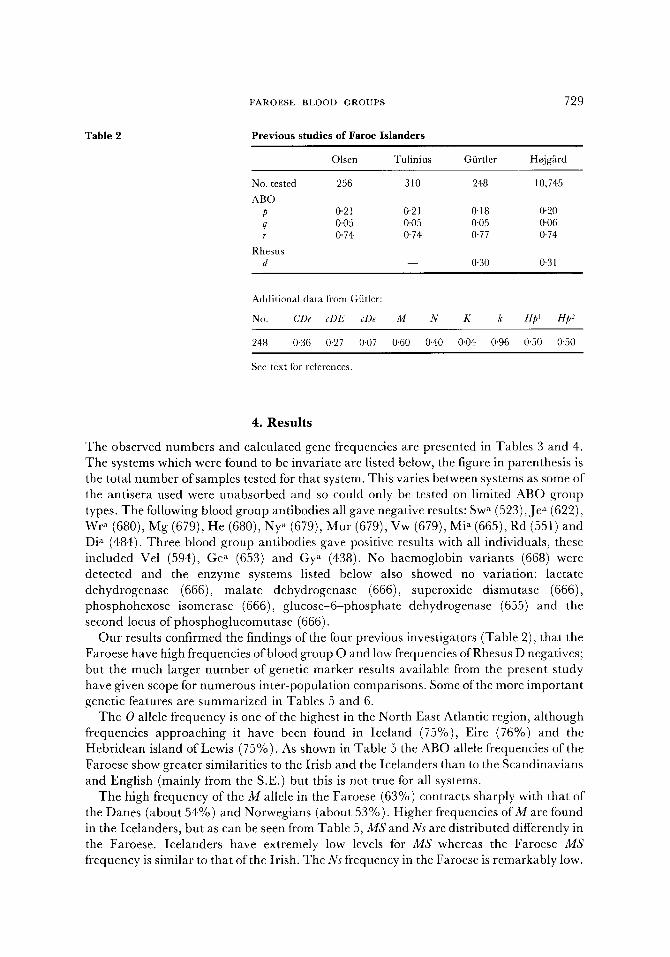
Table 2
FAROESE BLOOD GROUPS 729
Previous studies of Faroe Islanders
Olsen Tulinius Giirtler Hojg~rd
No. tested 256 310 248 10,745 ABO
p 0.21 0"21 0.18 0-20 q 0-05 0.05 0-05 0.06 r 0'74 0'74 0"77 0"74
Rhesus d -- 0"30 0"31
Additional data from Gilder:
No. CDe cDE cDe M N K k Hp I He 2
248 0"36 0"27 0"07 0"60 0 '40 0"04 0 '96 0 '50 0"50
See text for references.
4. R e s u l t s
The observed numbers and calculated gene frequencies are presented in Tables 3 and 4. The systems which were found to be invariate are listed below, the figure in parenthesis is the total number of samples tested for that system. This varies between systems as some of the antisera used were unabsorbed and so could only be tested on limited ABO group types. The following blood group antibodies all gave negative results: Sw" (523),Je ~1 (622), Wr a (680), Mg (679), He (680), Ny" (679), Mur (679), Vw (679), Mi a (665), Rd (551) and Di ~ (484). Three blood group antibodies gave positive results with all individuals, these included Vel (594), Ge a (653) and Gy a (438). No haemoglobin variants (668) were detected and the enzyme systems listed below also showed no variation: lactate dehydrogenase (666), malate dehydrogenase (666), superoxide dismutase (666), phosphohexose isomerase (666), glucose-6-phosphate dehydrogenase (655) and the second locus of phosphoglucomutase (666).
Our results confirmed the findings of the four previous investigators (Table 2), that the Faroese have high frequencies of blood group O and low frequencies of Rhesus D negatives; but the much larger number of genetic marker results available from the present study have given scope for numerous inter-population comparisons. Some of the more important genetic features are summarized in Tables 5 and 6.
The 0 allele frequency is one of the highest in the North East Atlantic region, although frequencies approaching it have been found in Iceland (75%), Eire (76%) and the Hebridean island of Lewis (75%). As shown in Table 5 the ABO allele frequencies of the Faroese show greater similarities to the Irish and the Icelanders than to the Scandinavians and English (mainly from the S.E.) but this is not true for all systems.
The high frequency of the M allele in the Faroese (63%) contracts sharply with that of the Danes (about 54%) and Norwegians (about 53%). Higher frequencies of M are found in the Icelanders, but as can be seen from Table 5, M S and Ns are distributed differently in the Faroese. Icelanders have extremely low levels for M S whereas the Faroese M S
frequency is similar to that of the Irish. The N s frequency in the Faroese is remarkably low.
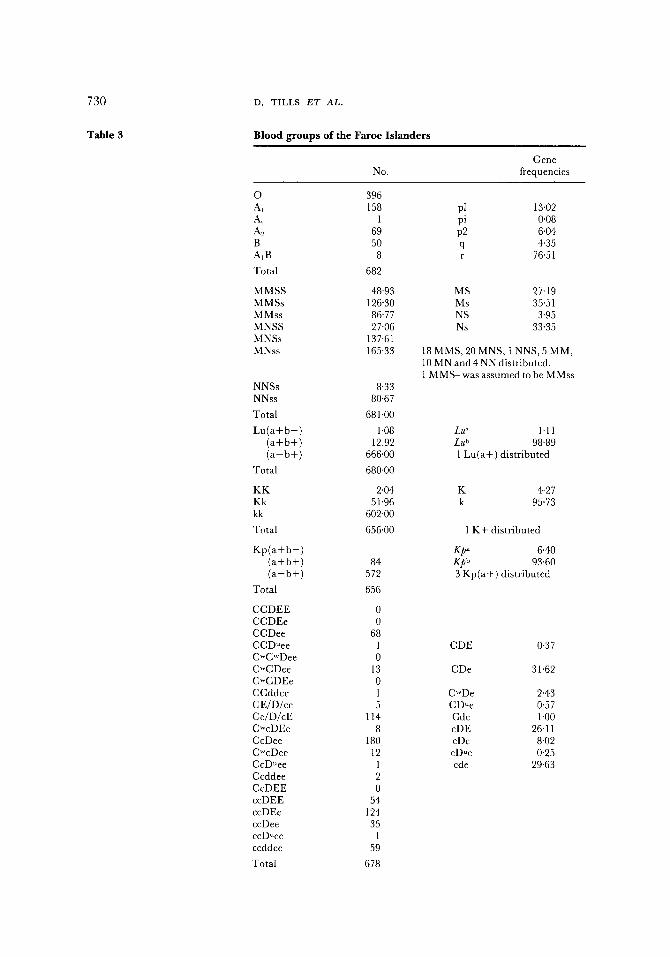
730
Table 3
D. TILLS E T A L .
Blood groups of the Faroe Is landers
Gene No. frequencies
O Al Ai A2 B AIB
Total
MMSS MMSs MMss MNSS MNSs MNss
NNSs NNss
Total
L u ( a + b - ) ( a + b + ) ( a - b + )
Total
KK Kk kk
Total
K p ( a + b - ) ( a+b+) ( a - b + )
Total
CCDEE CCDEe CCDee CCDuee CwCwDee CwCDee CwCDEe CCddee CE/D/ce Ce/D/cE CwcDEe CcDee CwcDee CcDuee Ccddee CcDEE ccDEE ccDEe ccDee ccDuee ccddee
Total
396 158 pl 13.02
1 pi 0.08 69 p2 6.04 50 q 4.35
8 r 76'51
682
48.93 MS 27-19 126'30 Ms 35.51 86.77 NS 3"95 27'06 Ns 33'35
137.61 165'33 18 MMS, 20 MNS, t NNS, 5 MM,
10 MN and 4 NN distributed. 1 MMS was assumed to be MMss
8-33 80.67
681.00
1.08 Lu a 1.11
12.92 Lu b 98.89 666.00 1 Lu(a+) distributed
680-00
2.04 K 4"27 51.96 k 95'73
602,00
656'00 1 K+ distributed
K p a 6'40 84 K p b 93"60
572 3 Kp(a+) distributed
656
0 0
68 1 CDE 0"37 0
13 CDe 31"62 0 1 CwDe 2'43 5 CD~ 0'57
114 Cde 1 '00 8 cDE 26" 11
180 cDe 8"02 12 cDue 0.25
1 cde 29.63 2 0
54 124 35
1 59
678
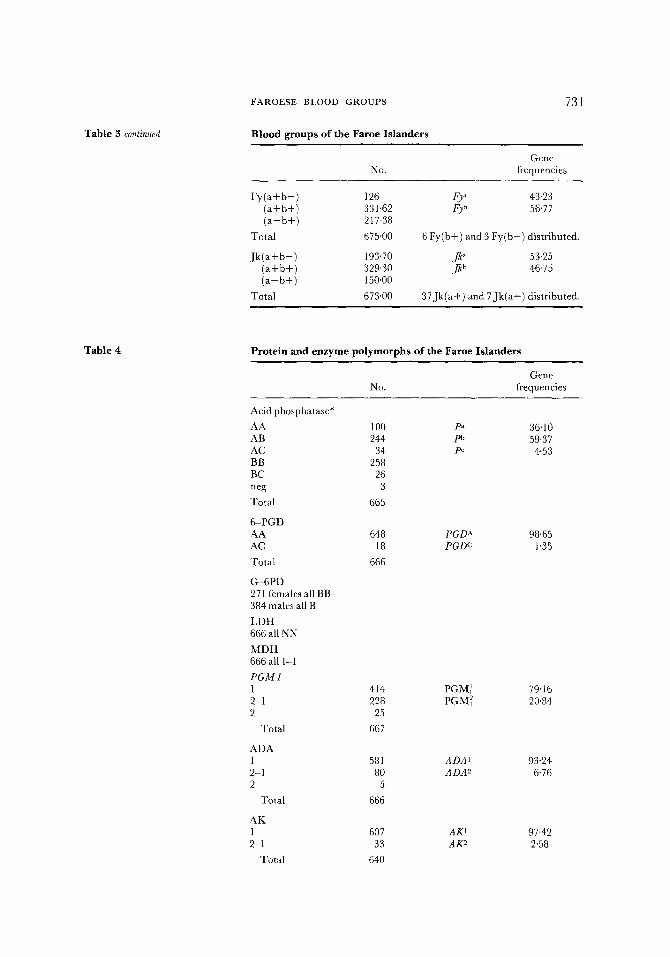
Table 3 continued
FAROESE BLOOD GROUPS
Blood groups of the Faroe Islanders
731
Gene No. frequencies
F y ( a + b - ) 126 Fy~ 43.23 ( a + b + ) 331.62 Fy b 56"77 ( a - b + ) 217"38
Total 675"00 6 Fy(b+) and 3 F y ( b - ) distributed.
J k ( a + b - ) 193.70 J k a 53-25 ( a + b + ) 329-30 J k b 46"75 ( a - b + ) 150"00
Total 673"00 37Jk(a+) and 7 J k ( a - ) distributed.
Protein and enzyme polymorphs of the Faroe Islanders
Gene No. frequencies
Table 4
Acid phosphatase*
AA 100 pa 36' 10 AB 244 pb 59"37 AC 34 pc 4"53 BB 258 BC 26 neg 3
Total 665
6 -PGD AA 648 P G D A 98.65 AC 18 PGDC 1"35
Total 666
G-6PD 271 females all BB 384 males all B
L DH 666 all NN
M D H 666 all 1-1
P G M 1 1 414 PGMI 79"16 2-1 228 PGM~ 20-84 2 25
Total 667
ADA 1 581 A D A l 93"24 2-1 80 ADA2 6"76 2 5
Total 666
AK 1 607 A K l 97-42 2-1 33 AK2 2.58
Total 640
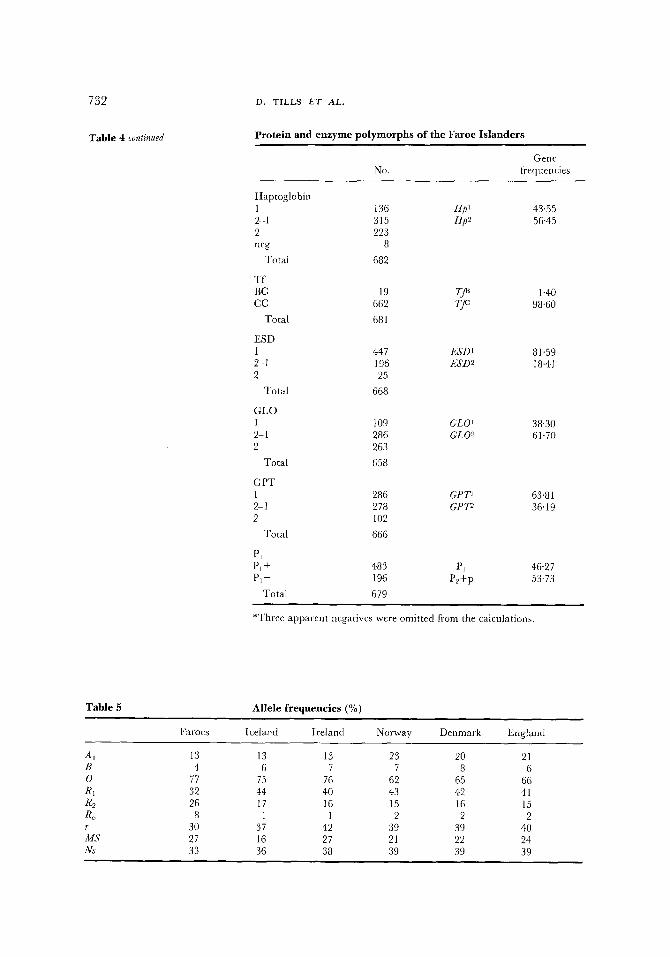
732
Table 4 continued
D. TILLS E T A L ,
Protein and enzyme polymorphs of the Faroe Islanders
Gene No. frequencies
Haptoglobin 1 136 H p ~ 43.55 2-1 315 H p 2 56-45 2 223 neg 8
Total 682
Tf BC 19 Tff 1.40 CC 662 Tff 98.60
Total 681
ESD 1 447 E S D l 81.59 2-1 196 E S D 2 18-41 2 25
Total 668
GLO 1 109 GLO 1 38"30 2-1 286 GLO 2 61"70 2 263
Total 658
GPT 1 286 G P T I 63.81 2-1 278 G P T 2 36.19 2 102
Total 666
PI PI+ 483 Pl 46.27 P I - 196 P~+p 53.73
Total 679
*Three apparent negatives were omitted from the calculations.
Table 5 Allele frequencies (%)
Faroes Iceland Ireland Norway Denmark England
Aj 13 13 13 23 20 21 B 4 6 7 7 8 6 O 77 75 76 62 65 66 RI 32 44 40 43 42 41 R2 26 17 16 15 16 15 Ro 8 i 1 2 2 2 r 30 37 42 39 39 40 M S 27 16 27 21 22 24 Ns 33 36 38 39 39 39
FAROESE BLOOD GROUPS
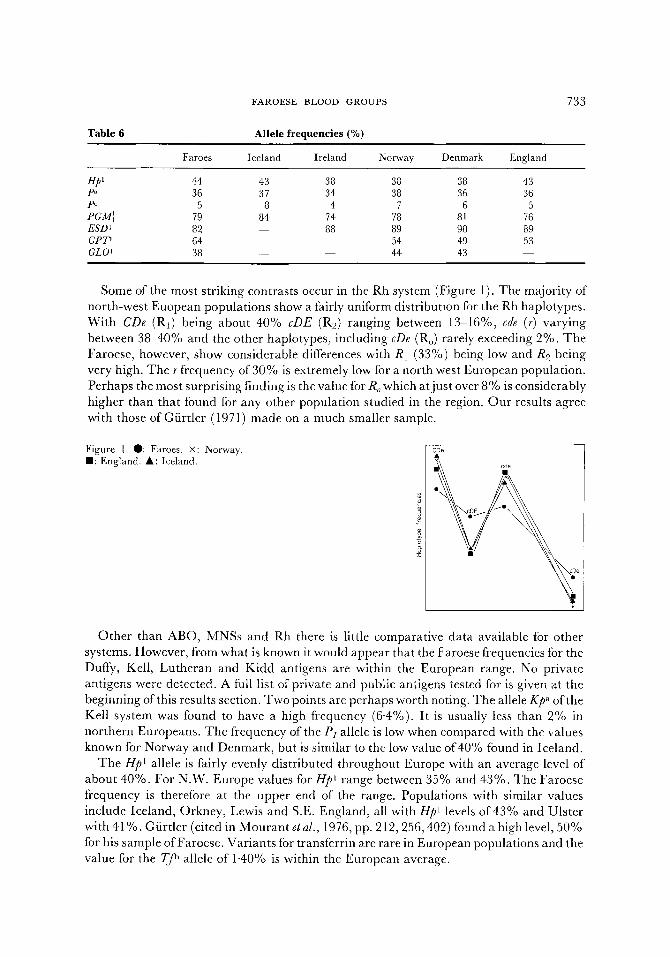
Table 6 A l l e l e f r e q u e n c i e s (%)
Faroes Iceland Ireland N o r w a y Denmark England
733
Hp I 44 43 38 38 38 43 P~ 36 37 34 38 36 36 pc 5 8 4 7 6 5 PGMI 79 84 74 78 81 76 ESD i 82 - - 88 89 90 89 GPT ~ 64 54 49 53 GLO~ 38 - - - - 44 43
Some of the most striking contrasts occur in the Rh system (Figure 1). The majority of north-west Euopean populations show a fairly uniform distribution for the Rh haplotypes. With CDe (R1) being about 40% cDE (R2) ranging between 13-16%, cde (r) varying between 38-40% and the other haplotypes, including cDe (Ro) rarely exceeding 2%. The Faroese, however, show considerable differences with R1 (33%) being low and R2 being very high. The r frequency of 30% is extremely low for a north west European population. Perhaps the most surprising finding is the value for Ro which at just over 8% is considerably higher than that found for any other population studied in the region. Our results agree with those of Gfirtler (1971) made on a much smaller sample.
Figure 1. 0: Faroes. X: Norway. I1: England. A: Iceland.
Other than ABO, MNSs and Rh there is little comparative data available for other systems. However, from what is known it would appear that the Faroese frequencies for the Duffy, Kell, Lutheran and Kidd antigens are within the European range. No private antigens were detected. A full list of private and public antigens tested for is given at the beginning of this results section. Two points are perhaps worth noting. The allele Kp~ of the Kell system was found to have a high frequency (6"4%). It is usually less than 2% in northern Europeans. The frequency of the PI allele is low when compared with the values known for Norway and Denmark, but is similar to the low value of 40% found in Iceland.
The Hp 1 allele is fairly evenly distributed throughout Europe with an average level of about 40%. For N.W. Europe values for Hp I range between 35% and 43%. The Faroese frequency is therefore at the upper end of the range. Populations with similar values include Iceland, Orkney, Lewis and S.E. England, all with Hp t levels of 43% and Ulster with 41%. Gfirtler (cited in Mourant et al., 1976, pp. 212, 256,402) found a high level, 50% for his sample of Faroese. Variants for transferrin are rare in European populations and the value for the T f ~ allele of 1'40% is within the European average.

7 3 4 D. TILLS E T A L .
Among the red-cell enzymes the majority of the frequencies are within the range for N.W. Europe. In the PGM system Mourant et al. (1976) suggested that there is an eastward and southward decrease in the frequency of the PGM~ allele, from a high level of 84% in Iceland to a low of 31-32% in Greece and Turkey. The Faroese value of 79% fits into this distribution pattern.
Four of the enzyme systems deserve special mention. For three of them, esterase-D, glyoxalase-I and glutamic-pyruvate transaminase, the amount of comparative data is not large. However, in the Faroes the frequencies appear to show considerable divergence from north west Europe. E S D 1 and GLO t are low and GP7 n is exceptionally high. The fourth enzyme, acid phosphatase (EAP), is of particular interest, because three samples totally lacking in any enzyme activity, on development after electrophoresis, were found. Unfortunately all attempts to obtain fresh samples failed so it has not been possible to confirm these results by quantitative analysis. Herbich et al. ( t970) described an Austrian family showing either reduced activity or a complete lack of the EAP enzyme. They suggested that these individuals were heterozygous for a rare null allele po. Since this first observation further examples have been found in Denmark (Dissing, t976) and in Poland (Koziuz & Bruszewska, 1978). The three Faroes examples are from apparently healthy unrelated individuals and would appear to be heterozygous. Homozygote possession of the po allele would probably result in a severe haemolytic anaemia as suggested by Herbich et
al. (1970).
5. Genetic Distance
In order to elucidate the genetic affinities of the Faroese with other north west Europeans, particularly those with close historical relationships with the Faroe Islands, a variety of genetic distance measures have been performed
It was known from our preliminary analysis of the uncompleted sample of the Faroese, that the genetic distances of other populations from the Faroese were very great. It was also known from a study of the finger dermatoglyphics of the Faroese (Harvey & Suter, 1983) that the very low total ridge counts and pattern intensity indices place them in an extreme position in relation to other Europeans. The probable exception being the Icelanders, particularly those from north-west Iceland studied by P~tlsson & Schwidetzky (1973).
In the genetic distance analysis a comparison was made between the results obtained from the Cavalli-Sforza & Edwards (1964) E~ distance and that of Nei (1972). It was found that for 10 loci the Faroese were closest to Ireland, England and Iceland, and most distant from Wales, Cumbria, Norway and south-west Scotland. The distances produced by the two methods were similar, though not identical, the position of Denmark, in particular, being somewhat ambiguous (Table 7).
Of particular interest was the possibility of genetic affinities between the Faroese and the regional subpopulations of Iceland. Tills et al. (1982) in their study of Iceland found considerable variation between these regional subpopulations. In view of the findings of the dermatoglyphic study, it was of special interest to look for evidence of relationship between the Faroes and western Iceland. On the basis of 12 loci the closest of the Icelandic regions are I and II in the West, followed at greater distances by regions VI, IV and III. Region V is by far the most remote (Table 8).
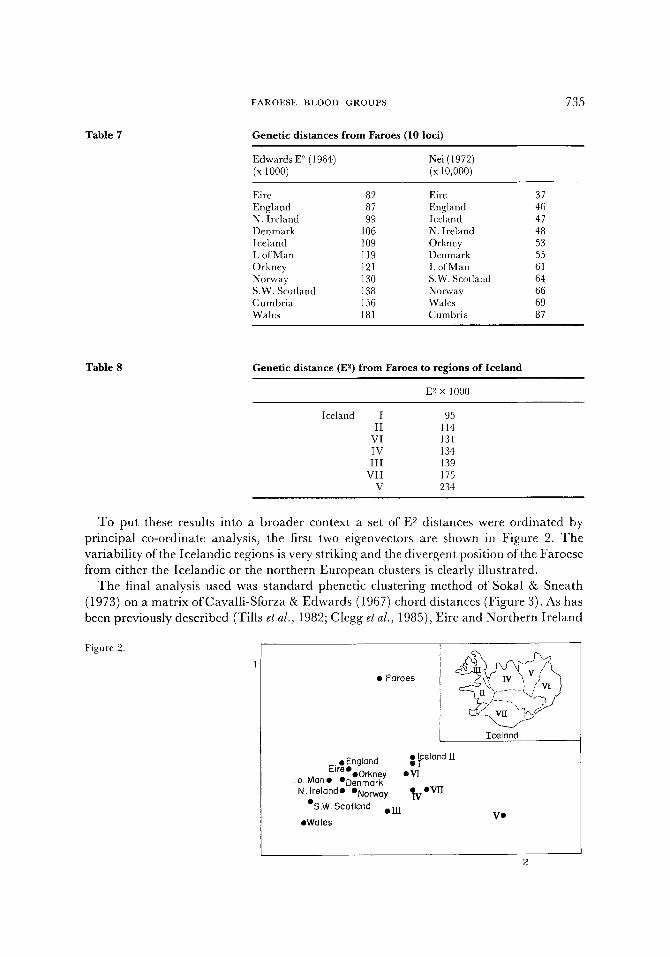
Table 7
FAROESE BLOOD GROUPS
Genetic distances from Faroes (20 loci)
Edwards E 2 (1964) Nei (1972) (x 1000) (x 10,000)
Eire 82 Eire 37 England 87 England 46 N. Ireland 99 Iceland 47 Denmark 106 N. Ireland 48 Iceland 109 Orkney 53 I. of Man 119 Denmark 55 Orkney 121 I. of Man 61 Norway 130 S.W. Scotland 64 S.W. Scotland 138 Norway 66 Cumbrla 156 Wales 69 Wales 181 Cumbria 87
735
Table 8 Genetic distance (E 2) from Faroes to regions of Iceland
E 2 x 1000
Iceland I 95 II 114
VI 131 IV 134 I I I 139
VII 175 V 234
To put these results into a broader context a set of E 2 distances were ordinated by principal co-ordinate analysis, the first two eigenvectors are shown in Figure 2. The variability of the Icelandic regions is very striking and the divergent position of the Faroese from either the Icelandic or the northern European clusters is clearly illustrated.
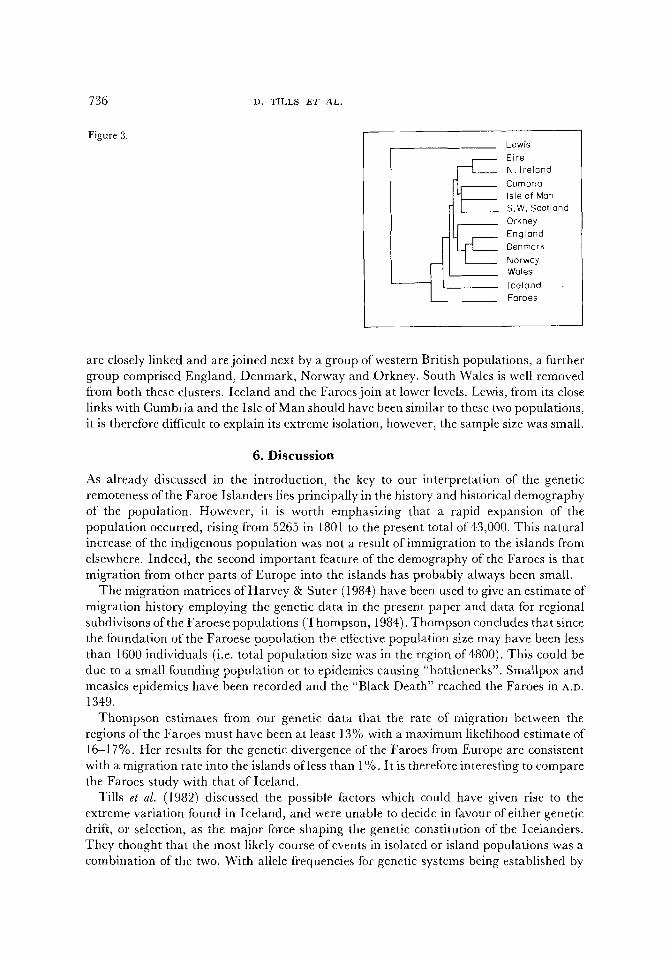
The final analysis used was standard phenetic clustering method of Sokal &Snea th (1973) on a matrix ofCavalli-Sforza & Edwards (1967) chord distances (Figure 3). As has been previously described (Tills et al., 1982; Clegg et al., 1985), Eire and Northern Ireland
Figure 2.
Iceland
V � 9
�9 Faroes
�9 Icela~d ]~ � 9 E �9 England
Ire�9 �9 �9 lOrkney I N I.o. ivlan I Denmark
N. Ireland�9 �9 ~rV I V [ [
IS.W. Scotland �9 ]TI
�9
736
Figure 3.
D. TILLS E T A L ,
-4
Lewis Eire N. ireland
Cumbrio Isle of Man S.W. Scotland Orkney England Denmark
Norway Wales
iceland Faroes
are closely linked and are joined next by a group of western British populations, a further group comprised England, Denmark, Norway and .Orkney. South Wales is well removed from both these clusters. Iceland and the Faroes join at lower levels. Lewis, from its close links with Cumbria and the Isle of Man should have been similar to these two populations, it is therefore difficult to explain its extreme isolation, however, the sample size was small.
6. Discussion
As already discussed in the introduction, the key to our interpretation of the genetic remoteness of the Faroe Islanders lies principally in the history and historical demography of the population. However, it is worth emphasizing that a rapid expansion of the population occurred, rising from 5265 in 1801 to the present total of 43,000. This natural increase of the indigenous population was not a result of immigration to the islands from elsewhere. Indeed, the second important feature of the demography of the Faroes is that migration from other parts of Europe into the islands has probably always been small.
The migration matrices of Harvey & Suter (1984) have been used to give an estimate of migration history employing the genetic data in the present paper and data for regional subdivisons of the Faroese populations (Thompson, 1984). Thompson concludes that since the foundation of the Faroese population the effective population size may have been less than 1600 individuals (i.e. total population size was in the region of 4800). This could be due to a small founding population or to epidemics causing "bottlenecks". Smallpox and measles epidemics have been recorded and the "Black Death" reached the Faroes in A.D. 1349.
Thompson estimates from our genetic data that the rate of migration between the regions of the Faroes must have been at least 13% with a maximum likelihood estimate of 16-17%. Her results for the genetic divergence of the Faroes from Europe are consistent with a migration rate into the islands of less than 1%. It is therefore interesting to compare the Faroes study with that of Iceland.
Tills et al. (1982) discussed the possible factors which could have given rise to the extreme variation found in Iceland, and were unable to decide in favour of either genetic drift, or selection, as the major force shaping the genetic constitution of the Icelanders. They thought that the most likely course of events in isolated or island populations was a combination of thc two. With allele frequencies for genetic systems being established by
F A R O E S E B L O O D G R O U P S 737
selection and if this is relaxed, the system would become adaptively neutral and the allele frequencies subject to the effects of drift. For random genetic drift to have any effect very low levels of external migrat ion would have to have been maintained because drift is probably counteracted by even low levels of hybridization (Tills, 1977b). As already discussed it seems probable that the level of external migration could have been below 1%. Because of this and of the small population size and the isolated nature of the subpopulations, it seems probable that genetic drift has been a major factor in the shaping of the Faroese gene frequencies, combined with the selective forces, for example disease, which have almost certainly affected other European populations in a similar way.
In conclusion, the Faroese populat ion represents one of the few genetic isolates in Europe, where a diverse spectrum of genetic marker frequencies have been established, by a combinat ion of natural selection and random genetic drift over the 40 or 50 generations since the Faroes were settled. In fact, it is one of the few existing populations where the evidence is in favour of r andom drift being the major factor. However, we know nothing of the original genetic constitution of the Viking founders. Unlike Iceland there are no records or oral traditions (sagas) to provide any information. Perhaps, like Iceland, a significant proport ion of the original settlers came from Ireland, Great Britain and the Northern Isles and that this accounts for the marginally closer genetic distance from the Faroes to the British Isles than to the present populations of Denmark and Norway. However much we may speculate on their origins, it is clear that the Faroese people have a unique contribution to make to our understanding of genetic variation and population structure in the Nor th Atlantic region.
We are grateful to the many colleagues who supplied us with antisera and to the Biotest Serum Institut, Frankfurt who also supplied antisera.
We gratefully acknowledge the assistance of Dr P. Hinderson and M. Hagens-Hansen during the field collection of blood samples in 1977. We are indebted to Dr Sanna Dahl Niclasen and Dr Erik Nordero for their generous help and advice. We thank the Principals of the Navigation School and Teacher ' s Training College, Tdrshavn, the Navigation School, Klakvik and the Head Teachers of secondary schools throughout the Faroes for their co-operation in this study, which was supported in part by a grant from the Danish Medical Research Council.
References
Cavalli-Sforza, L. L. & Edwards, A. W. F. (1964). Analysis of human evolution. Proceedings of the X1 International Congress of Genetics, 923-933.
Cavalli-Sforza, L. L. & Edwards, A. W. F. (1967). Phylogenetic analysis: models and estimation procedures. American Journal of Human Genetics 19, 233.
Ceppellini, R., Siniscalco, M. & Smith, C. A. B. (1955). The estimation of the gene fi'equencies in a random-mating population. Annals of Human Genetics 20, 97-115.
Clegg, E.J., Tills, D., Warlow, A., Kop~c, A. C., Wilkinson, J. & Marin, A. (1985). Blood group variation in the Isles of Lewis. (in press).
Dissing, J. & Svensmark, O (1976). Human red cell Acid phosphatase: Quantitative evidence of a silent gene P and a Danish population study. Human Heredity 26, 43-48.
Dixon, W. J., & Brown, M. B. (Eds) (1979). Biomedical Computer Programs P Series. Berkeley: University of California Press.
Harris, H. & Hopkinson, D. A. (1976). Handbook of Enzyme Electrophoresis in Human Genetics. Amsterdam: North-Holland.
Hartigan, J. A. (1975). Clustering Algorithms. New York: Wiley.
738 D. TILLS ET AL.
Harvey, R. G. & Surer, D. (1982). Intra-population Variability in the Faroe Islands. Anthropos (Brno) 22, 107-I 15.
Harvey, R. G. & Surer, D. (1983). Digital dermatoglyphics of the Faroe Islanders. American Journal of Physical Anthropology 61, 337-345.
Harvey, R. G. & Suter, D. (1984). Migration in the Faroe Islands. Journal of Human Evolution 13, 311-317. Herbich, J., Fisher, R. A. & Hopkinson, D. A. (1970). Atypical segregation of human red cell acid phosphatase
phenotypes: evidence for a rare "silent" allele P. Annals of Human Genetics 34, 145-152. Koziuz, P. & Bruzewska, W. (1978). A silent allele P of human red cell acid phosphatase; quantitative differences
of activity of enzyme. (in Polish.) Archiwum Medycyny Sad. 28, 293-297. Mourant, A. E., Kope6, A. C. & Domaniewska-Sobczak, K. (1976). The Distribution of the Human Blood Groups and
other Polymorphisms. London: Oxford University Press. Nei, M. (1972). Genetic distance between populations. American Naturalist 106, 283-292. Olsen, A. (1951). Bl6dflokkar i Foroyum. Vardin 29, 190-197. P~lsson, J. & Schwidetzky, I. (1973). Hautleistenmerkmale der Islander. I. Die Finserbeermuster. Homo 24,
162-170. Rogers, J. S. (t972). Measures of genetic similarity and genetic distance. Studies in Genetics VII. University of
Texas Publications 7213, pp. 145-153. Smith, C. A. B. (1977). A note on genetic distance. Annals of Human Genetics 40, 463-479. Suter, D., Harvey, R. G., Hauge, M., Hinderson, P. & Cohn, J. (1979). Anthropological and Genetic studies of
the Faroese. Fro6kkapparit (Annales Societatis Scientiarum Faeroensis) 27, 57-74. Sokal, R. R. &Sneath, P. H. A. (1963). Principles of Numerical Taxonomy. San Francisco: Freeman. Thompson, E. A. (1984). Estimation of migration history from current genetic data: Application to the Faroe
Islands. In (A. J. Boyce Ed.) Migration and Mobility. Symposia of the Society for the Study of Human Biology, Vol 23. pp. 123-142. London: Taylor and Francis.
Tills, D. (1977a). Red cell and serum proteins and enzymes of the Irish. Annals of Human Biology 4, 35-42. Tills, D. (1977b). The use of the FsT statistic of Wright for estimating the effects of genetic drift, selection and
migration with special reference to Ireland. Human Heredity 27, 153-159. Tills, D., (1980). Use of Genetic markers for Human studies. Biotest Bulletin 6, 60-69. Tills, D., Warlow, A., Kopek, A. C., Fridriksson, S. & Mourant, A. E. (1982). The blood groups and other
hereditary blood factors of the Icelanders. Annals of Human Biology 9, 507-520. Tills, D., Kope6, A. C. & Tills, R. E. (1983). The Distribution of the Human Blood Groups and other Polymorphisms.
Supplement 1. London: Oxford University Press. Tills, D,, Kopek, A. C. & Domaniewska-Sobczak, K.(1985). The Distribution of the Human Blood Groups and other
Polymorphisms, 3rd Edn. London: Oxford University Press (in press). Warlow, A. & Tills, D. (1978). Micromethods in blood group serology Vox Sanguinis 35, 354-356. West, J. F. (1972). Faroe: The Emergence of a Nation. London: C. Hurst.