Pacific Islanders and Amerindian relatedness according to ...
Upload
khangminh22Category
view
3download
0
HAL Id: hal-03322149https://hal.archives-ouvertes.fr/hal-03322149
Submitted on 16 Dec 2021
HAL is a multi-disciplinary open accessarchive for the deposit and dissemination of sci-entific research documents, whether they are pub-lished or not. The documents may come fromteaching and research institutions in France orabroad, or from public or private research centers.
L’archive ouverte pluridisciplinaire HAL, estdestinée au dépôt et à la diffusion de documentsscientifiques de niveau recherche, publiés ou non,émanant des établissements d’enseignement et derecherche français ou étrangers, des laboratoirespublics ou privés.
Distributed under a Creative Commons Attribution| 4.0 International License
Bone loss markers in the earliest Pacific IslandersJustyna Miszkiewicz, Frédérique Valentin, Christina Vrahnas, Natalie Sims,
Jitraporn Vongsvivut, Mark Tobin, Geoffrey Clark
To cite this version:Justyna Miszkiewicz, Frédérique Valentin, Christina Vrahnas, Natalie Sims, Jitraporn Vongsvivut, etal.. Bone loss markers in the earliest Pacific Islanders. Scientific Reports, Nature Publishing Group,2021, 11 (1), �10.1038/s41598-021-83264-3�. �hal-03322149�

1
Vol.:(0123456789)
Scientific Reports | (2021) 11:3981 | https://doi.org/10.1038/s41598-021-83264-3
www.nature.com/scientificreports
Bone loss markers in the earliest Pacific IslandersJustyna J. Miszkiewicz 1*, Frédérique Valentin2,3, Christina Vrahnas4,5,6, Natalie A. Sims5,6, Jitraporn Vongsvivut7, Mark J. Tobin7 & Geoffrey Clark3
Kingdom of Tonga in Polynesia is one of the most obese nations where metabolic conditions, sedentary lifestyles, and poor quality diet are widespread. These factors can lead to poor musculoskeletal health. However, whether metabolic abnormalities such as osteoporosis occurred in archaeological populations of Tonga is unknown. We employed a microscopic investigation of femur samples to establish whether bone loss afflicted humans in this Pacific region approximately 3000 years ago. Histology, laser confocal microscopy, and synchrotron Fourier-transform infrared microspectroscopy were used to measure bone vascular canal densities, bone porosity, and carbonate and phosphate content of bone composition in eight samples extracted from adult Talasiu males and females dated to 2650 BP. Compared to males, samples from females had fewer vascular canals, lower carbonate and phosphate content, and higher bone porosity. Although both sexes showed evidence of trabecularised cortical bone, it was more widespread in females (35.5%) than males (15.8%). Our data suggest experiences of advanced bone resorption, possibly as a result of osteoporosis. This provides first evidence for microscopic bone loss in a sample of archaeological humans from a Pacific population widely afflicted by metabolic conditions today.
The global obesity pandemic is increasing at an alarming rate posing growing health concerns and an economic burden for human generations today and in the future1. In 2019, the cost of treating obesity was estimated at USD $2 trillion (~ 2.8% of gross domestic product globally), with 9% of world population considered obese, and a further 392 million of youth predicted to become overweight or obese by 20251,2. Human populations in the Pacific Islands are consistently classified as some of the world’s most obese nations3. The Kingdom of Tonga in Polynesia, in particular, has one of the largest prevalence in type 2 diabetes4. The reasons behind such high prevalence of metabolic conditions across the Pacific are complex. Studies have identified hereditary factors3,5 and environmental constraints that interplay with genetics, individual lifestyle, and access to resources6,7. While modern sedentary lifestyle is understood to underlie many metabolic conditions8, shedding light on the roots of these conditions can be predominantly achieved by examining health and disease markers left on human remains in the archaeological record9,10. Prior research examining the surviving skeletons of archaeological Pacific Islanders reported possible evidence of diseases such as gout11 and Forestier’s disease (diffuse idiopathic skeletal hyperostosis—DISH)12 in ca. 3,000‐year‐old Vanuatu. Both diseases occur in the same populations today13, which suggests that the origins of these cannot be completely modern. Therefore, the study of archaeological human skeletal remains has the potential to fundamentally shift our understanding of the origins, or at least continuity in occurrence, of modern health problems14,15.
Obesity is typically associated with physical inactivity and nutrition of poor quality16. Both factors can have detrimental effects on bone physiology and structure because of a minimised mechanical loading regime17 and restricted dietary calcium and vitamin consumption18,19, which can lead to an increase in bone turnover where bone loss dominates bone gain18. This advances bone tissue age and can result in greater fragility, susceptibility to fractures, and a diagnosis of osteopenia or osteoporosis19. The deteriorating bone microarchitecture is caused by a shift in the activity balance between cells that normally renew the skeleton by bone remodelling such that osteoclast-mediated bone resorption exceeds bone deposition by osteoblasts20,21. Continuing bone loss in such
OPEN
1School of Archaeology and Anthropology, Australian National University, 44 Linnaeus Way, Canberra, ACT 2601, Australia. 2CNRS, UMR 7041, ArScAn, Ethnologie préhistorique, Maison René-Ginouvès, Archéologie et Ethnologie, 21 Allée de l’Université, 92023 Nanterre Cedex, France. 3Archaeology and Natural History, School of Culture History and Language, College of Asia and the Pacific, Australian National University, Canberra, ACT 2601, Australia. 4Bone Biology and Disease Unit, St. Vincent’s Institute of Medical Research, 9 Princes Street, Fitzroy, Melbourne, VIC 3065, Australia. 5Department of Medicine, St. Vincent’s Hospital, The University of Melbourne, Melbourne, VIC 3065, Australia. 6MRC Protein Phosphorylation and Ubiquitylation Unit, James Black Centre, University of Dundee, Dundee DD1 5EH, UK. 7Infrared Microspectroscopy Beamline, ANSTO - Australian Synchrotron, 800 Blackburn Road, Clayton, VIC 3168, Australia. *email: [email protected]
2
Vol:.(1234567890)
Scientific Reports | (2021) 11:3981 | https://doi.org/10.1038/s41598-021-83264-3
www.nature.com/scientificreports/
fragile bones of individuals, particularly the elderly, with untreated osteoporosis impairs lifestyle and mobility as fractures occur repeatedly or heal poorly. Osteoporosis is common in modern aging populations, and as such poses a large economic burden. The condition is known as the “silent disease” manifesting only once fracture has occurred22–24. The difficulty in completely preventing osteoporosis lies in its multi-factorial and inter-linked aetiology. Osteoporosis, meaning ‘porous bones’, can take different forms (e.g. primary or secondary) and as such develops as a result of various factors including ageing25, female biological sex26, lack of physical activity27, genetic predisposition28, hormone deficiencies29, dietary restrictions18,19, including those resulting from psychi-atric conditions such as anorexia nervosa30, and a combination of these and other variables that can relate to socio-economic status14,15. The effect of sex on bone health has been particularly well studied in post-menopausal women, where loss of oestrogen, a hormone essential in inhibiting bone resorption, is a causative factor31,32.
There has been much discussion about the relationship between obesity and osteoporosis33–36. Not only does a lack of exercise negatively impact bone density, a cell based link between fat and bone tissue has been proposed37. As bone loss increases with age, the number of bone marrow fat cells (adipocytes) rises37. Bone-forming osteoblasts and fat cells differentiate from the same bone-marrow precursor cells, yet whether bone loss is a precursor to fat infiltration or vice versa remains a point of contention37. To complicate matters further, a heavier frame can have a positive effect on bone formation due to the higher weight-bearing from increased body mass—a relationship which has been termed the “obesity paradox”35,36. The development of osteoporotic bone in obese patients has been demonstrated in clinical studies, though data have not been consistent38–40. For example, some sites of the skeleton, such as vertebrae, but not the hip, have been classified as osteoporotic in obese or overweight individuals39. Obesity incidence has been reported in Tonga4, but osteoporosis data are extremely limited. Reports from the past two decades paint a conflicting picture. In 2006, Tonga (included amongst other countries from the “Western Pacific”) was ranked second highest, after Europe, for prevalence of osteoporotic fractures41. In contrast, “the Polynesian bone phenotype” has been characterised as having higher bone density than that of European counterparts42. The International Osteoporosis Foundation is yet to map fracture inci-dence across the Pacific Islands comprehensively43. The efficiency of data collection there is possibly hindered by limited radiography infrastructure42.
Clinically, osteoporosis in modern populations is diagnosed from measures of bone mineral density (BMD) and occurrence of fractures44–46. Whether an individual suffers from abnormal bone fragility defined as osteo-penia or osteoporosis is diagnosed from BMD T-scores that are lower than those of healthy age-matched cohorts47. A gold standard methodology to collect BMD in living people is dual energy x-ray absorptiom-etry (bone densitometry, DXA)48. Diagnosis can be supplemented through bone turnover markers from bone histomorphometry49, or quantitative ultrasound techniques50, and various other types of microscopy that measure bone porosity two- (2D) or three- (3D) dimensionally51.
Similar means have been implemented to confirm the incidence of possible osteoporosis in various archaeo-logical European52–57, North American58, and African59–61 osteological collections (see reviews15,62–64). Where access to large and well-preserved specimens has been possible, DXA, cortical and/or trabecular bone volume, and bone turnover assessment methods have indicated significant bone loss52–55,60,65–67. Analyses of fracture types and their patterns (such as classic Colles’ fractures) have also provided insights into archaeological experiences of osteoporosis66–69. Microscopic methods reconstructing bone turnover, mineral composition, and trabecular and cortical bone microarchitecture in archaeological human remains have also been successful70–72. Non-invasive approaches such as 3D micro-computed tomography (micro-CT) can help in the calculation of trabecular or cortical bone thickness, separation, and the visualisation of porosity network73,74. Invasive methods such as histol-ogy rely on an extraction of samples to describe more localised bone changes72,75. Therefore, invasive techniques are less often applied to archaeological samples because of the irreplaceable nature of excavated remains76, and so typically rely on smaller sample sizes77. Additionally, preservation issues (such as degradation of bone micro-structure post-mortem78) can further limit the application of modern clinical osteoporosis diagnostic criteria to archaeological remains71,79. Therefore, while the examination of disease in archaeological remains can provide fruitful results, response of living bone to disease cannot be observed. However, a combination of different methods can provide multiple lines of data for differential diagnosis and interpretation.
To the best of our knowledge, bone loss as a result of possible osteoporosis has not yet been investigated in archaeological samples in the Pacific. Obesity specifically as a factor leading to osteoporosis cannot be directly reconstructed for archaeological specimens as the available methods of body mass estimation still provide large error80. However, given the widespread health issues in contemporary Pacific nations, bone loss markers in archaeological human remains in this region could be an indicator of musculoskeletal health and metabolic issues similar to those seen there today. The 2,650 BP archaeological site of Talasiu in the Kingdom of Tonga is one of the most significant sites ever uncovered in the Pacific81,82. This site has previously produced the first evidence for Early Polynesian mortuary behaviour81,82, archaeological Polynesian diet relying on marine resources83, and insights into the abandonment of ceramics by early Polynesian people84. We set out to test whether archaeologi-cal Tongan human bone would show evidence of abnormal bone loss marked by sex-specific differences. We employed an invasive microscopic examination to characterise bone metabolic fluctuations in eight samples extracted from femora in the Talasiu individuals, sub-divided into groups of estimated sex (four males, four females). All individuals were classified as ‘adults’ who likely lived beyond 30 years of age, which means their bone tissue had entered an age-driven degeneration phase following a peak bone mass accrual point of lifespan. One female (ID: Sk3.1) was possibly an elderly individual (Table S1), who might have survived into a sixth life decade and possibly beyond. We used several microscopic methods to provide multiple lines of data. We recorded sexually dimorphic femur size differences, and then combined 2D histology75,85, 3D laser scanning confocal microscopy51, and synchrotron particle accelerator methods (Fourier-transform infrared microspectroscopy, sFTIRM)86,87 (Fig. 1). This allowed us to examine compact femur bone Haversian canal densities as a proxy for remodelling (Fig. 2), abnormal porosity as a marker of prolonged bone resorption (Figs. 2, 3), and bone matrix
3
Vol.:(0123456789)
Scientific Reports | (2021) 11:3981 | https://doi.org/10.1038/s41598-021-83264-3
www.nature.com/scientificreports/
composition through carbonate and phosphate content (Fig. 1), averages of which we hypothesised to differ between the estimated female and male sex groups.
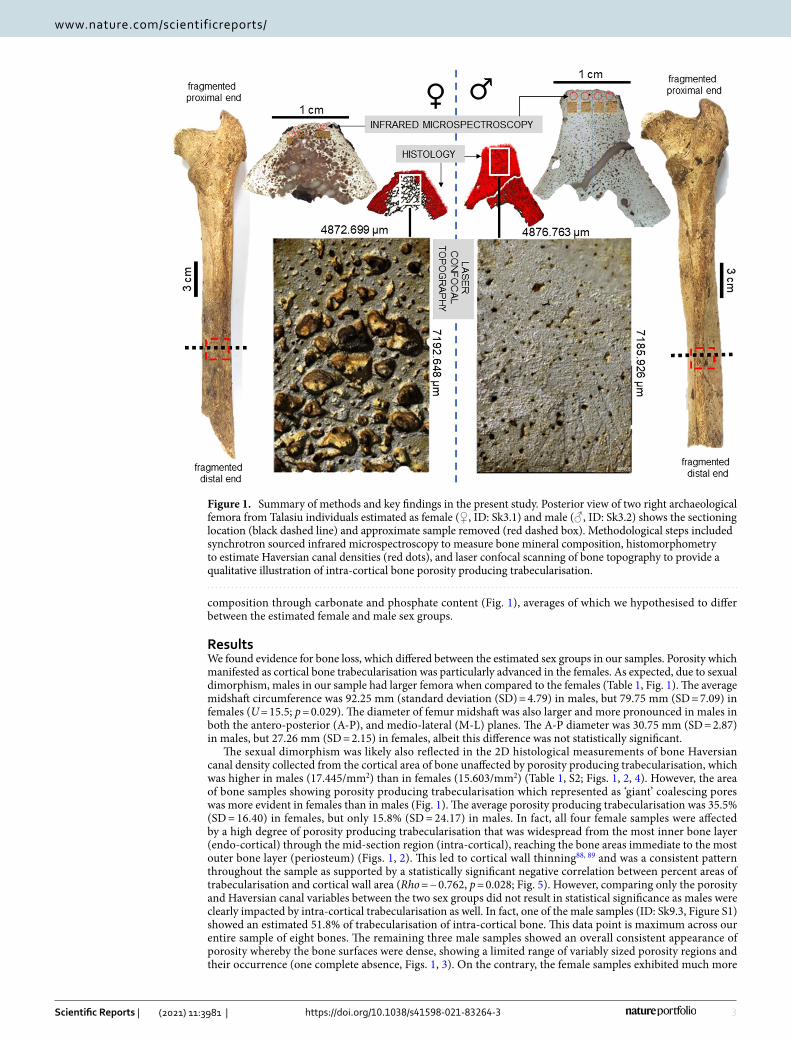
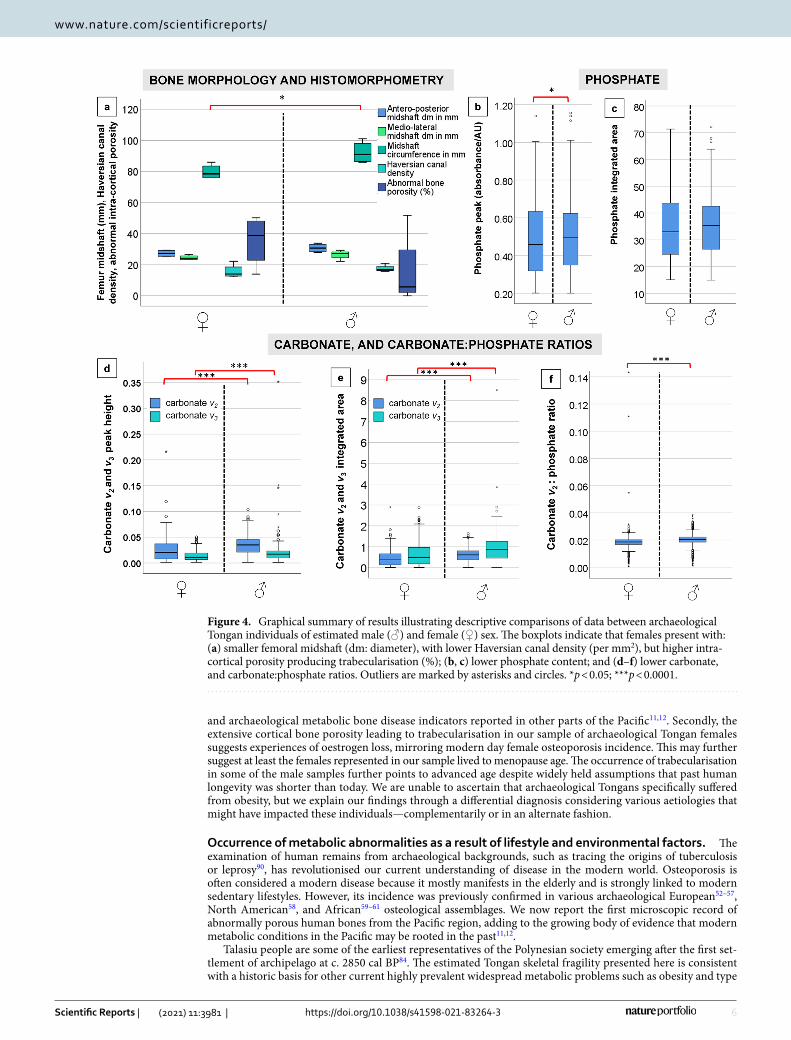
ResultsWe found evidence for bone loss, which differed between the estimated sex groups in our samples. Porosity which manifested as cortical bone trabecularisation was particularly advanced in the females. As expected, due to sexual dimorphism, males in our sample had larger femora when compared to the females (Table 1, Fig. 1). The average midshaft circumference was 92.25 mm (standard deviation (SD) = 4.79) in males, but 79.75 mm (SD = 7.09) in females (U = 15.5; p = 0.029). The diameter of femur midshaft was also larger and more pronounced in males in both the antero-posterior (A-P), and medio-lateral (M-L) planes. The A-P diameter was 30.75 mm (SD = 2.87) in males, but 27.26 mm (SD = 2.15) in females, albeit this difference was not statistically significant.
The sexual dimorphism was likely also reflected in the 2D histological measurements of bone Haversian canal density collected from the cortical area of bone unaffected by porosity producing trabecularisation, which was higher in males (17.445/mm2) than in females (15.603/mm2) (Table 1, S2; Figs. 1, 2, 4). However, the area of bone samples showing porosity producing trabecularisation which represented as ‘giant’ coalescing pores was more evident in females than in males (Fig. 1). The average porosity producing trabecularisation was 35.5% (SD = 16.40) in females, but only 15.8% (SD = 24.17) in males. In fact, all four female samples were affected by a high degree of porosity producing trabecularisation that was widespread from the most inner bone layer (endo-cortical) through the mid-section region (intra-cortical), reaching the bone areas immediate to the most outer bone layer (periosteum) (Figs. 1, 2). This led to cortical wall thinning88, 89 and was a consistent pattern throughout the sample as supported by a statistically significant negative correlation between percent areas of trabecularisation and cortical wall area (Rho = − 0.762, p = 0.028; Fig. 5). However, comparing only the porosity and Haversian canal variables between the two sex groups did not result in statistical significance as males were clearly impacted by intra-cortical trabecularisation as well. In fact, one of the male samples (ID: Sk9.3, Figure S1) showed an estimated 51.8% of trabecularisation of intra-cortical bone. This data point is maximum across our entire sample of eight bones. The remaining three male samples showed an overall consistent appearance of porosity whereby the bone surfaces were dense, showing a limited range of variably sized porosity regions and their occurrence (one complete absence, Figs. 1, 3). On the contrary, the female samples exhibited much more
Figure 1. Summary of methods and key findings in the present study. Posterior view of two right archaeological femora from Talasiu individuals estimated as female (♀, ID: Sk3.1) and male (♂, ID: Sk3.2) shows the sectioning location (black dashed line) and approximate sample removed (red dashed box). Methodological steps included synchrotron sourced infrared microspectroscopy to measure bone mineral composition, histomorphometry to estimate Haversian canal densities (red dots), and laser confocal scanning of bone topography to provide a qualitative illustration of intra-cortical bone porosity producing trabecularisation.

4
Vol:.(1234567890)
Scientific Reports | (2021) 11:3981 | https://doi.org/10.1038/s41598-021-83264-3
www.nature.com/scientificreports/
variability in porosity producing trabecularisation (Table 1, S2; Figs. 1, 2), ranging from 13.9% minimum to 50.2% maximum of cortical bone space. The 3D confocal laser scans of bone surfaces from two cases showing extremes in bone micro-organisation (one female Sk3.1, one male Sk3.2) (Figs. 1, 3, S10, S11) demonstrated an almost entirely limited topography in the male sample, but more variable topography in the female sample which was punctuated with relatively deep and ‘giant pores’ the bone cortex.
The bone carbonate and phosphate content measured through sFTIRM was consistently lower in females (Figs. 4, 5; Table 2, S3–S6) (p < 0.05 in all sFTIRM variables except for integrated phosphate area). The aver-age peak height of phosphate (from 848 spectra; U = 1,118,955.000; p < 0.013), and v2 (from 1676 spectra; U = 3,767,893.000; p < 0.0001) and v3 carbonates (from 2159 spectra; U = 4,978,269.000; p < 0.0001) were lower in females. While the phosphate difference of 2.6% in the means seems marginal, it was more substantial when considering v2 (30.3%) and v3 (32%) carbonates. We note that more spectra were successfully measured in the samples from males (2496 phosphate spectra, minimum 3329 v2 and 3264 v3 spectra) (Table 2, S3–S5). Com-pared to the male samples, the average integrated areas of phosphate and two carbonate peaks were also lower in females. The phosphate area in females was only lower by 1.1% (Table S3). However, the v2 (U = 3,765,291.500;
Figure 2. A summary of histomorphometric procedures for estimating densities of Haversian canals and abnormal intra-cortical bone porosity. (a, b): localised histology (60 ×) viewed under linearly polarised light showing secondary osteon lamellae (white arrows) surrounding Haversian canals (oval features), which were obscured by patches of diagenesis (grey arrows). Cement lines (black arrow in b) were inconsistently preserved (examples shown are from individuals BG2 (a) and Sk9.3 (b). Haversian canals were counted manually form thresholded images (c–f): (c) shows numbered canals, (d) shows manual segmentation of cortical wall from abnormal intra-cortical porosity (red dashed line), while the solid line marks whole section area in individual BG2; (e) illustrates final counts of Haversian canals, while (f) shows ‘extracted’ abnormal bone porosity.

5
Vol.:(0123456789)
Scientific Reports | (2021) 11:3981 | https://doi.org/10.1038/s41598-021-83264-3
www.nature.com/scientificreports/
p < 0.0001); and v3 (U = 4,847,614.000; p < 0.0001) carbonates were 35.3% and 44.12% greater in the samples from males (Table S4, S5). The carbonate v2:phosphate integrated area ratios from the female samples were lower by 5% when compared to males (U = 1,421,109.000; p < 0.0001; Table S6). This was despite females recording a maximum ratio spectrum of 0.143 contrasted with a much lower maximum spectrum of 0.038 in males, and the higher total number of spectra collected in males (2495) contrasted with 846 spectra in females.
DiscussionWe report the first microscopic record of bone loss characteristics in archaeological femora representing some of the earliest Pacific Islanders. On the basis of how commonplace contemporary metabolic issues, including obesity and diabetes, are in Tonga, we interpret our evidence to indicate that similar problems that might have led to osteoporosis occurred there ca. 3000 years ago. Two key implications are presented. Firstly, our small sample of archaeological humans from the Pacific appears to be afflicted by cortical bone porosity producing trabecu-larisation despite the notion that osteoporosis and related conditions are modern-day diseases. This confirms that the occurrence of widespread metabolic disease in this region today may have roots in the past. It agrees with bone loss experiences reported for archaeological collections from around the world (see reviews15,62–64),
Figure 3. Intra-cortical surfaces scanned using a three-dimensional laser confocal topography microscope Olympus OLS5000 with applied false-coloured heat map to illustrate extreme differences in porosity in archaeological posterior midshaft femur samples from Talasiu individuals estimated as female (♀, ID: Sk3.1) and male (♂, ID: Sk3.2). (a) shows topography viewed superiorly from the bone surface, whereas (b) is reverted upside down to show the inferior view of the same scan as (a).
Table 1. Sample details and raw gross morphometric data of the femora representing adult archaeological males and females from Talasiu, Tongatapu, Kingdom of Tonga. Cortical width and midshaft circumference are reported in mm. A-P: antero-posterior, M-L: medio-lateral, H.Dn: Haversian canal density per mm2, %Po.Ar: percent of sample impacted by porosity producing trabecularisation. *left femur, **probable sex.
Individual ID Estimated sex
Cortical width
Midshaft circumference
Quantitative histology
A–P M–L H.Dn %Po.Ar
BG2 Female 25.28 23.35 76 22.223 31.890
Sk3.1 Female 28.93 24.87 86 13.159 50.232
Sk3.2 Male 33.87 29.27 101 15.627 7.261
Sk5 Male 27.72 22.17 86 20.798 0.000
Sk9.2* Female** 29.30 26.54 81 14.815 46.001
Sk9.3 Male** 29.00 27.34 87 16.530 51.793
Sk12 Female** 25.54 23.26 76 12.216 13.908
Sk14 Male 32.41 26.92 95 16.826 4.197
6
Vol:.(1234567890)
Scientific Reports | (2021) 11:3981 | https://doi.org/10.1038/s41598-021-83264-3
www.nature.com/scientificreports/
and archaeological metabolic bone disease indicators reported in other parts of the Pacific11,12. Secondly, the extensive cortical bone porosity leading to trabecularisation in our sample of archaeological Tongan females suggests experiences of oestrogen loss, mirroring modern day female osteoporosis incidence. This may further suggest at least the females represented in our sample lived to menopause age. The occurrence of trabecularisation in some of the male samples further points to advanced age despite widely held assumptions that past human longevity was shorter than today. We are unable to ascertain that archaeological Tongans specifically suffered from obesity, but we explain our findings through a differential diagnosis considering various aetiologies that might have impacted these individuals—complementarily or in an alternate fashion.
Occurrence of metabolic abnormalities as a result of lifestyle and environmental factors. The examination of human remains from archaeological backgrounds, such as tracing the origins of tuberculosis or leprosy90, has revolutionised our current understanding of disease in the modern world. Osteoporosis is often considered a modern disease because it mostly manifests in the elderly and is strongly linked to modern sedentary lifestyles. However, its incidence was previously confirmed in various archaeological European52–57, North American58, and African59–61 osteological assemblages. We now report the first microscopic record of abnormally porous human bones from the Pacific region, adding to the growing body of evidence that modern metabolic conditions in the Pacific may be rooted in the past11,12.
Talasiu people are some of the earliest representatives of the Polynesian society emerging after the first set-tlement of archipelago at c. 2850 cal BP84. The estimated Tongan skeletal fragility presented here is consistent with a historic basis for other current highly prevalent widespread metabolic problems such as obesity and type
Figure 4. Graphical summary of results illustrating descriptive comparisons of data between archaeological Tongan individuals of estimated male (♂) and female (♀) sex. The boxplots indicate that females present with: (a) smaller femoral midshaft (dm: diameter), with lower Haversian canal density (per mm2), but higher intra-cortical porosity producing trabecularisation (%); (b, c) lower phosphate content; and (d–f) lower carbonate, and carbonate:phosphate ratios. Outliers are marked by asterisks and circles. *p < 0.05; ***p < 0.0001.

7
Vol.:(0123456789)
Scientific Reports | (2021) 11:3981 | https://doi.org/10.1038/s41598-021-83264-3
www.nature.com/scientificreports/
2 diabetes in the region3–5. Published evidence also exists for other types of skeletal abnormalities reported from different archaeological sites in Tonga91–94, and Vanuatu11,12,95. For example, scurvy and hypervitaminosis A, and iron-deficiency anaemia were discussed amongst several possible conditions arising in archaeological Tongan communities possibly as a result of poor nutrition91. This came from skeletal evidence in 17 children aged 6 months to 3 years old suggesting a combination of infections and metabolic bone disease at the ’Atele pre-European burial mounds dated to AD 1100–1250 from Western Tonga91. Further, poorly mineralised 21 archaeological deciduous teeth obtained from infant skeletons excavated at ‘Atele in Tonga also indicated devel-opmental disturbances in dental enamel linked to physiological stress arising from possible infections and nutri-tional deficiencies92. Stable isotope data extracted from archaeological human Tongan bone suggested diets to be predominantly based on starchy and marine food sources83,93. Selection of a wider variety of food sources would have been limited by the island size in addition to norms arising from social organisation83. Another site in Tonga, ca. 750–150 BP To-At-36 at Ha ‘ateiho, yielded examples of dental developmental disturbance and growth
Figure 5. Statistically significant Mann Whitney U ranking comparisons of the sFTIRM data for phosphate peaks (a), carbonate peaks and integrated area (b–e), and ratios computed using carbonate v2: phosphate area (f). A strong negative correlation between cortical area and trabecularised cortical bone in the whole sample is shown (g).

8
Vol:.(1234567890)
Scientific Reports | (2021) 11:3981 | https://doi.org/10.1038/s41598-021-83264-3
www.nature.com/scientificreports/
disruption indicators in 33 adult and 11 juveniles94. Lower spine degeneration (spondylosis) was also observed on archaeological Tongan lumbar vertebrae94. While spondylosis occurring as a result of bone degeneration due to age can be accelerated through weight bearing from active lifestyles94 (combat sports at archaeological Tonga mounds were previously also discussed96, and see our next discussion section about physical activity links to age-related bone loss), clinical studies have also linked it to increased body weight in obesity97. The experiences of degenerative bone conditions in our sample of the Tongan individuals can be inferred from joint lesions indicating osteoarthritis (Table S1).
In Vanuatu, an archipelago western to Tonga, previous reports of most likely diagnoses of scurvy due to vitamin C deficiencies95, gouty arthritis and DISH11,12, point to significant metabolic and nutritional issues afflicting Pacific Islanders thousands of years ago. While we cannot provide one aetiological explanation for the occurrence of bone metabolic conditions in our sample, we propose that a combination of lifestyle factors such as nutrition, and genetic predisposition played a role in the poor Tongan bone metabolism. Theoretical attempts to explain the high incidence of metabolic disease in the Pacific have predominantly focused on genetics (see98,99 for discussion). “The Thrifty Genotype” hypothesis proposes that thrifty genes, which would have been advanta-geous during famine events in the human past, drive diabetes and obesity in modern environments99. However, considering our data, and the aforementioned archaeological skeletal data from other sites in the region11,12,91–95, it is clear that genes alone cannot elucidate the human obesity trends in the Pacific. Additionally, as noted previ-ously by Gosling et al98, thrifty genes cannot alone account for a range of selective pressures that characterised the Pacific islands. Alternative, or complementary, interpretations to consider include early childhood exposure to other diseases91,92,100, compromising adult immunity which can equally result in altered bone turnover and poor skeletal mineralisation100,101. Ongoing macroscopic pathology examination of the Talasiu sample will pro-vide further data and help shed light on possible incidence of conditions such as DISH or gout, expanding our reported microscopic bone loss markers.
Table 2. Histomorphometry and synchrotron source Fourier-transform infrared microspectroscopy descriptive data per estimated sex (four males and four females). SD: standard deviation, min.: minimum data, max.: maximum data, A-P: antero–posterior, M-L: medio-lateral, H.Dn: Haversian canal density per mm2, %Po.Ar: percent area of sample impacted by porosity producing trabecularisation.
Estimated sex N Min Max Mean SD
Femur size and quantitative histology
Female
A-P midshaft diameter (mm) 4 25.28 29.30 27.26 2.15
M-L midshaft diameter (mm) 4 23.26 26.54 24.51 1.54
Midshaft circumference (mm) 4 76.00 86.00 79.75 4.79
H.Dn (/mm2) 4 12.216 22.223 15.60 4.54
%Po.Ar 4 13.908 50.232 35.508 16.397
Male
A-P midshaft diameter (mm) 4 27.72 33.87 30.75 2.87
M-L midshaft diameter (mm) 4 22.17 29.27 26.42 3.02
Midshaft circumference (mm) 4 86.00 101.00 92.25 7.09
H.Dn (/mm2) 4 15.63 20.80 17.45 2.295
%Po.Ar 4 0.000 51.793 15.813 24.171
Fourier-transform infrared microspectroscopy
Female
Peak phosphate height 848 0.201 1.139 0.481 0.189
Phosphate integrated area 848 15.087 71.381 34.518 11.673
Carbonate v2 height 1676 0.001 0.216 0.023 0.018
Carbonate v2 integrated area 2159 0.001 2.899 0.392 0.327
Carbonate v3 height 1676 0.001 0.050 0.011 0.008
Carbonate v3 integrated area 2071 0.001 2.873 0.475 0.498
Carbonate v2: phosphate ratio 846 0.001 0.143 0.019 0.007
Male
Peak phosphate height 2496 0.200 1.156 0.494 0.171
Phosphate integrated area 2496 14.937 72.184 34.899 10.346
Carbonate v2 height 3339 0.001 0.104 0.033 0.017
Carbonate v2 integrated area 3339 0.003 1.625 0.576 0.303
Carbonate v3 height 3329 0.001 0.352 0.017 0.011
Carbonate v3 integrated area 3264 0.001 8.510 0.850 0.526
Carbonate v2: phosphate ratio 2495 0.001 0.038 0.020 0.003

9
Vol.:(0123456789)
Scientific Reports | (2021) 11:3981 | https://doi.org/10.1038/s41598-021-83264-3
www.nature.com/scientificreports/
Sex-specific and ageing driven bone fragility. Osteoporosis has a long history of afflicting females more than males due to menopause-driven loss of estrogen31,32. Oestrogen plays a key role in inhibiting oste-oclast-mediated bone resorption, by regulating osteoclast apoptosis31. After menopause, prolonged bone loss occurs leading to increasingly porous and weak bones. Females are biologically disadvantaged because of this phenomenon, with modern postmenopausal women experiencing four times the level of osteoporosis than men102. Our data for a sample of archaeological Tongan females appear to match this sex-specific difference in bone fragility, providing another line of interpretation as an alternative or complementary aetiology. All our female samples showed a trabecularisation effect whereby the compact bone exhibited trabeculae-like architec-ture accompanied by cortical wall thinning (Figs. 1, 2). Female samples exhibiting higher cortical bone loss than male samples as a result of sex differences is consistent with prior archaeological58 and clinical reports103–105. The cortical wall bone not impacted by abnormal/trabecularised porosity in the female samples showed a lower den-sity of Haversian canals, which can be interpreted as a proxy for the amount of remodelled bone58,85. This can be explained by males possibly experiencing higher mechanically stimulated bone remodelling than females, body size differences, and/or within-sample age differences as noted in prior studies73,103,104,106.
Inter-woven with the sex-specific differences in bone microstructure is ageing65,72,103–105. It is well understood that the variability of age impacts on bone structure with sex manifests substantially in the femoral cross-section (and in other lower limb bones)107. Ageing of bone tissue results in a greater resorption on the endocortical surface, leading to modified long bone cross-sectional geometric properties107. In a classic study examining this in a sample of US human cadavers107, age-related endocortical resorption manifested both in males and females. However, males appeared to exhibit a simultaneous formation of bone sub-periosteally and resorp-tion endo-cortically, which did not drastically impact bone strength107. In females, while the medullary cavity expanded, there was no associated expansion of the sub-periosteal bone, meaning that their cross-sectional properties weakened with age107. When considering preindustrial humans such as the Pecos who undertook high levels of physical activity108, sex-differences in bone loss while present were not as extensive as those seen in the aforementioned cadavers107. In the Pecos, sub-periosteal bone and biomechanical properties of the femur (and tibia) followed a general pattern of increase with age in both sexes108. We were not able to undertake a biomechanical analysis of cross-sectional geometry, but the substantial thinning of cortical wall in the Tongan female samples, along with lower Haversian canal densities, could suggest not enough mechanically stimulated bone remodelling around the time of their peak bone mass accrual phase of the life-course (third life decade)109. Indeed, sedentary lifestyles are so widespread in Tonga today that several modern intervention efforts targeting adolescents have been unsuccessful110. This raises an important consideration for future studies of archaeological bone loss comparing populations from different parts of the world, whereby environmental and lifestyle factors impacting bone building in the early ontogeny will differ in accordance to genetic and cultural determinants109.
One of the negative repercussions of overall ‘improved’ longevity and mortality across contemporary human populations is the advanced age of soft and hard tissues that results in multiple degenerative diseases experienced by the elderly111. Bone fragility, increased fracture incidence, and hip-replacement surgeries, are some of the most common issues for the elderly of significantly deteriorated skeletal health. One of our female individuals (ID: Sk3.1) showed highly advanced skeletal deterioration characteristics (e.g. loss of all mandibular teeth ante-mortem, Figure S2) so she was classified as the oldest, and likely the only elderly, individual in our sample. This implies she might have survived into her sixth life decade (and possibly beyond). The combined age-at-death data and her abnormal intra-cortical porosity, are evidence that, at least some, archaeological Tongan females might have well surpassed the commonly assumed short longevity of humans in the distant past112,113. The trabecularisation of the cortical bone in our samples is remarkably similar to histology and microradiography images of midshafts examined in modern Australians aged 89 year old88, and 67, 78, 90 year old114. This encour-ages further research combining bone biology, skeletal anatomy, archaeology, and social structures of Tonga to elucidate aspects of care of elderly in past Polynesia115.
Archaeological context-specific and methodological limitations of our study mean we cannot provide a single diagnosis and aetiology of the bone loss characteristics reported. Access to hundreds of well-preserved skeletons, as has been the case in some prior archaeological osteoporosis studies54,55, is not possible at Talasiu as the site is on a remote island constrained by its land and population size. Given the archaeological age of the Talasiu samples, the preservation of bone is not comparable to modern or post-mortem tissue, and thus cannot be experimentally examined to the same level. Future microscopic research applied to archaeological human remains from the Pacific will hopefully generate more comparative data, ideally using complementary 3D and 2D methods where feasible. While our study is limited by the broad age-at-death ranges, this is an issue impossible to overcome in biological anthropology as a narrow and exact chronological age for archaeological individuals cannot be ascertained from gross osteological analysis alone116. The assignment of biological sex is also a prob-ability estimate based on well-established sexually dimorphic features of the human skeleton, which, without future aDNA validation, will be the best sex estimate possible.
ConclusionsOur results are the first microscopic record of cortical bone loss in a sample of archaeological humans from Tonga. Given the small sample size, we suggest caution in the generalisation of our results in regards to the wider archaeological Tongan societies. With larger archaeological samples from across the Pacific islands, a pattern in bone loss may be shown in the future. Nevertheless, our results are evidence that a possible occurrence of bone metabolic conditions in a sample of archaeological Pacific individuals can be detected microscopically. We think this is an important step forward for discussions about metabolic diseases in the past and present Pacific. We discussed several explanations for the observed bone loss markers including: sex-specific driven bone micro-architectural deterioration with the possibility of our sample of Tongan females experiencing hormonal changes

10
Vol:.(1234567890)
Scientific Reports | (2021) 11:3981 | https://doi.org/10.1038/s41598-021-83264-3
www.nature.com/scientificreports/
due to menopause; age-related bone loss similar to that seen in modern aging populations; and lifestyle factors such as poor physical activity and nutrition. Equally, other diseases in the region compromising immunity might have contributed to abnormal bone physiology in our sample. Given how commonplace contemporary metabolic issues, including obesity and diabetes, are in Tonga, our key interpretation is that similar problems might have led to osteoporosis in our sample there ca. 3,000 years ago.
MethodsWe implemented an invasive methodology and so were restricted to eight femora (seven right and one left) (Table 1). The choice of femur side was determined on the basis of macroscopic preservation and availability of midshaft bone for extraction. Brief summarises of gross anatomically visible skeletal lesions per individual are reported in Table S1, with several individuals (6/8) showing evidence for osteoarthritis. While limited, this sample size is comparable to previous research implementing microscopic methods of bone assessment in archaeological samples77,85. The biological sex of the individuals represented by the femora had been previously estimated82,83 following established methods117. Four males and four females (including one probable male and two probable females, Table 1) were estimated. The inclusion of ‘probable’ sexes is standard practice where archaeological human remains that do not show a directional consistency in sexually dimorphic skeletal features119. The adult age-at-death was assigned based on morphological features of the pelvic auricular surface118. The true chrono-logical age of these individuals cannot be ascertained from bone morphology alone.
The skeletal remains represented by the specimens reported here were excavated and analysed with the per-mission from the Lapaha Community and Nobles, and the Ministry of Internal Affairs (Government of Tonga). The samples are curated at the Australian National University, Canberra until further repatriation notice. Talasiu on Tongatapu in the Kingdom of Tonga is one of the most archaeologically significant sites in Asia–Pacific. It represents some of the earliest occupations of the Neolithic people migrating into the Pacific alongside the Lapita culture some 3200–2850 cal BP120. It is a shoreline site located to the north of Lapaha, and is mainly comprised of shell middens and ceramic deposits115. The first excavation of Talasiu had taken place in 1957 which was subsequently followed by dating of the recovered shellfish to 2800 + /− 70 BP120. Excavations from 2008 onwards revealed burials containing human remains, including burnt remains that provided an insight into early mortuary behaviours in the region81. At least 19 late-Lapita/ immediately post-Lapita single to multiple burials have been reported, detailing a possible total number of 45 individuals represented and complex mortuary practices81,82. Shell midden samples from Talasiu indicate a sedentary human occupation dated to approximately 2700–2650 cal BP120, with more recent calibrations of 2650 BP for the burials82. Twenty-one of these individuals were recently examined as part of a multi-isotopic analysis reconstructing the first Polynesian diet83. A sub-sample of these Talasiu human individuals with well-preserved femora was studied here to conduct the analysis of bone loss markers. Applying the microscopic methods reported here to bones previously sampled for isotopic analysis, and limiting sample extraction to a cortical quadrant (rather than a complete long bone cross-section) ensures minimal invasion of the archaeological human material as per ethical recommendations76.
Samples were collected from the midshaft femur due to its biomechanical versatility, and prior published data reporting abnormal porosity occurring there103,104. Prior to sampling, each femur was photographed and measured at midshaft using standard WorkZone calipers and a measure tape to obtain A-P and M-L diameters (in mm), and the midshaft circumference (in mm) (Table 1). As the femora were fragmented on the distal and proximal ends, we could not measure maximum femoral lengths (Fig. 1). However, the determination of the mid-shaft location was easily achieved by locating the linea aspera, which is also the region from which samples were extracted (Fig. 1). This followed prior methods examining femur bone histology in archaeological specimens75,85, and reports of increased porosity on the posterior aspect of the femur in modern cadavers103. Approximately 1 cm thick cortical quadrants were removed using a Dremel 200/2–30 Two-Speed Rotary Tool equipped with a rotary blade. Cutting was performed as per prior methodologies121. The samples detached loosely after the blade had reached the medullary cavity having made two parallel longitudinal and transverse cuts on the bone exterior.
The preparation for three different microscopic analyses (2D histology, 3D confocal laser topography scan-ning, sFTIRM, Fig. 1) included sequential partitioning of bone samples into slices. Using the Dremel blade, each sample was further cut in half to designate an approximately 0.5 cm thick bone section for confocal topography scanning. The remainder of the sample was embedded in Buehler epoxy resin to impregnate the internal bone structure for histology and sFTIRM. Using a Kemet MICRA CUT precision cutter equipped with a 150 mm dia-mond blade, a ~ 150 μm thin slice of bone was removed from the embedded block and designated for sFTIRM. The remaining portion of the sample was set aside for histological preparation.
The preparation of thin sections followed standard methods applicable to archaeological human bone75. The histology surface revealed by cutting on the low speed cutter was glued to a microscope glass slide using Stuk epoxy glue. It was further trimmed on the saw and ground using a series of silicon carbide pads until ~ 100 μm thickness was reached. The sections were then polished using Buehler MicroPolish alumina powder and cleared in an ultrasonic bath. This was followed by dehydration in ethanol, clearing using xylene, and mounting with cover slips. Imaging of the thin sections was undertaken using a high powered Olympus BX53 microscope, a DP74 camera, and associated Olympus cellSens Life Science Technology software. Images were scanned under a 40 × total magnification (17 mm working distance) and ‘auto-stitched’ using the “Multiple Image Alignment—MIA” tool available from the Olympus cellSens software. Each image was then imported into Adobe Photoshop CC 2014 (replicated recently in Photoshop CC 2020), greyscaled (Black & White), converted to type 16 bit, and thresholded so that Haversian canals throughout cortical bone were ‘enhanced’. This essentially converted cortical bone areas into black pixels and porous bone space into empty/white areas of the image (Fig. 2). Thresholding greyscale images for microscopic quantitative analysis is common practice122,123 and can be applied to threshold

11
Vol.:(0123456789)
Scientific Reports | (2021) 11:3981 | https://doi.org/10.1038/s41598-021-83264-3
www.nature.com/scientificreports/
out Haversian canals124. The images were imported into the open access ImageJ vol. 1.52 software for measure-ments of quantifiable components of the thin sections.
In order to differentiate between porosity producing trabecularisation and Haversian canal density the sec-tions had to be manually segmented. We followed descriptions in88,89 where a delimitation between ‘dense’ cortical bone and porosity producing trabecularisation cortical space can be estimated by visually separating the two bone matrices (see red dashed line in Fig. 2). As such, five variables as reported in previous bone porosity studies123–126 (some acronyms were modified following the nomenclature standards by Dempster et al127) were collected. Total Bone Area (T.B.Ar in mm2)123 was measured using the ImageJ vol. 1.52 “Polygon” tool by tracing the outer outline endosteal and periosteal borders of the section. Porosity Area (Po.Ar in mm2)124 was measured using the same tools, but by manually selecting intra-cortical bone regions characterised with abnormal ‘giant pores’ that originated from within the endo-cortical section areas, which we here define as porosity producing trabecularisation. Cortical area (Ct.Ar) was the cortical bone region comprising cortical walls where no porosity producing trabecularisation (Po.Ar) was noted (Ct.Ar = T.B.Ar – Po.Ar). From these measurements, we calculated porosity producing trabecularisation (%Po.Ar = P.Ar/T.B.Ar × 100). Therefore, if no trabecularised regions are consistently observed, this method allows for a null result of Po.Ar and %Po.Ar. From within the Ct.Ar, Haversian canal number (H.N) was counted manually125,126 (using the “Multi-Point” tool in ImageJ vol. 1.52 see red dots in Fig. 1). To estimate Haversian canal density (H.Dn)125,126, H.N was divided by Ct.Ar to obtain a value per mm2. Therefore, we took into consideration two types of bone porosity measures—H.Dn as a proxy for the amount of remodelled bone present in cortical bone, and %Po.Ar which estimates the area of intra-cortical bone affected by trabecularised cortex. Through H.Dn, we worked with an assumption that one Haversian canal represents one secondary osteon. Because cement lines of secondary osteons were not consistently preserved in these archaeo-logical samples, this technique does not account for fragmentary osteons (Fig. 2). The canals that were counted were identified as Haversian canals to the best of our expertise. This excluded micro-features that resembled other pores, which might have occurred as a result of diagenesis. That way, %Po.Ar is exclusively composed of ‘giant’ and coalescing pores, occurring consistently intra-cortically, originating on the endo-cortical part of the sample. These regions should otherwise be filled with dense cortical bone if the individual did not experience significant bone loss. Both measures can provide an insight into a Bone Multi Cellular unit (BMU) activity tun-nelling through cortical bone128, whereby H.Dn approximates the number of BMUs that once existed per mm2, and %Po.Ar indicates prolonged bone resorption through osteoclast-mediated activity.
To provide a qualitative illustration of bone surface topography in relation to the porosity producing trabecu-larisation, we scanned two contrasting male and female samples (IDs: Sk3.1 and Sk3.2) using an OLS5000 3D laser confocal microscope. Confocal laser scanning microscopy is a recommended technique for characteris-ing porous structures such as bones129. The associated OLS5000 2017 LEXT data acquisition and data analysis application software (Olympus LEXT, Japan) (Fig. 1) was then used to apply a heat map of false colours that ranged from red to blue indicating highest to lowest depth, respectively (Fig. 3, S10). This resulted in yellow to green colours indicating low topography (Fig. 3, S11) in the male, and red to blue marking high topography in the female (Fig. 3, S10). We used a 5 × LEXT short working distance objective (20 mm) with a 405 nm violet laser that scans 4,096 pixels along the x-axis, with the zoom as at 1.0x. We used the LEXT automated stitching tool to collectively scan six regions of bone located on the mid-line of the cortical area of the posterior bone quadrant. The scanned area of the female sample was 7192.648 μm long (y-axis) and 4872.699 μm wide (x-axis). The area scanned on the male sample was 7185.926 μm long (y-axis) and 4876.763 μm wide (x-axis). The z-plane depth (height of laser reaching the bone surface) was approximately 3741.925 μm.
Each sample was examined for phosphate and carbonate content using sFTIRM86,130–136. Phosphate was selected because it is necessary for bone metabolism, and occurs in skeletal tissue as part of hydroxyapatite crystals134. Carbonates (v2 and v3) substitute calcium apatite and influence the properties of crystal in bone, and thus influence bone function at the macroscopic scale133. Carbonate in bone is mainly A-type whereby it substi-tutes for phosphate, but it can also be naturally accompanied by B-type (substituting for hydroxide)133. Assessing total (A- and B-type combined) carbonate content, in addition to phosphate, and v2 carbonate and phosphate ratio of integrated areas under trace, can thus provide an insight into the extent to which calcium phosphate has been resorbed through osteoclast-mediated activity86,135,136.
The samples were scanned at the IRM beamline at the Australian Synchrotron facility in Melbourne (Victoria). The scanning technique followed settings reported by Vrahnas et al.86 with the exception that we used an attenu-ated total reflectance (ATR) attachment that allowed a direct contact with bone surface85,87. The synchrotron light source provides a highly intense infrared beam that was used to analyse mineral content of bone in situ and the ATR attachment allows the collection of infrared (IR) data from sample sections that are otherwise too thick for conventional IR transmission analysis87. The sFTIRM measurement was performed using a Bruker V80v FTIR spectrometer and a Hyperion 3000 IR microscope, which produced high quality spectra in terms of signal-to-noise ratios at 1–2 μm spatial resolution when the synchrotron IR beam coupled to the ATR crystal87.
Each sample had four regions of interest (ROIs) identified on the sub-periosteal area of bone, avoiding the endocortical surfaces particularly that they are so extensively affected by abnormal porosity in the Talasiu samples (Fig. 1). Before placing the samples on the microscope stage, the ROIs were identified from images captured at 2 × magnification under a basic dissecting microscope (Fig. 1). We measured carbonates v2 (890–850 cm−1) and v3 (1500–1400 cm−1), and phosphate (1180–916 cm−1), which were then used to calculate carbonate(v2):phosphate ratios (890–850 cm−1:1180–916 cm−1)85,86,132,133. Data analysis was undertaken in OPUS 7.2 and 8.0.19 (Bruker Optik, Germany) by creating integration files and extracting peak height (absorbance/AU) and area under the trace values in each spectrum. Each ROI was scanned for 220 spectra, which totalled 880 spectra per sample, totalling 6820 spectra in the entire sample (this excludes the second region of interest, which was unsuccessfully scanned, therefore deducting 220 spectra in data for individual Sk 3.1).

12
Vol:.(1234567890)
Scientific Reports | (2021) 11:3981 | https://doi.org/10.1038/s41598-021-83264-3
www.nature.com/scientificreports/
Once data were inspected, it became apparent that not all spectra were suitable for analysis. This might have occurred as a result of the ATR attachment not making contact with all scanned bone regions. Additionally, as our samples derive from an archaeological context, and are thus impacted by diagenetic processes, diagenetic calcite deposited post-mortem can contribute to carbonate sites of the spectra. To account for these issues, the spectra were inspected and those of poor quality were removed. Our supplemental file (Dataset S1) with raw data reports all spectra collected during the scanning, as well as the datasets following inspection. The inspec-tion involved removing phosphate peak values (and corresponding integrated areas under the peak) of < 0.2. All carbonate spectra values in the negative range to 0.001 were also removed. To further assess for possible diagenesis impacting the carbonate data (sites where calcite can occur), statistical correlations were performed to check how well carbonate v2 and v3 data aligned within each specimen (Table S6, S7). Where no strong correla-tions were identified, this was taken as an indication that diagenesis might have impacted the data as v3 and v2 values are scattered randomly. We also visually examined the sites of v3 for a strong peak at 1427 cm−1 indicating presence of calcite, which should otherwise be replaced by a trough in apatite spectra (creating a doublet)137 (Figure S3–S9). Overall, the inspection reduced the number of suitable phosphate spectra to 3344 in males and 844 in females. Carbonate spectra were minimum 1676 (v2) and 2159 (v3) in females, and 3339 (v2) and 3329 (v3) in males (Table 2). The carbonate v2:phosphate ratios calculated from integrated areas under the trace were possible to compute for 846 in females and 2495 in males. We note that all data for Sk12 appeared unsuitable, and so this specimen was excluded from data comparisons.
All data obtained in our study were firstly summarised descriptively. Descriptive comparisons were made within-sample by contrasting results between the sexes, and identifying whether either of the groups showed relatively higher or lower values of data. Next, as our sample size is small (n = 8), we were limited in the choice of statistical analyses to conduct inferential tests. On this basis, we applied non-parametric tests when compar-ing the sex groups (using a Mann Whitney U test138) and a Spearman’s Rho correlation to test if %Po.Ar was significantly associated with cortical thinning. All inferential statistical testing was conducted in IBM Statistical Package for Social Sciences 26 (SPSS) software. For the sFTIRM spectra inspection through correlations, data normality Kolmogorov–Smirnov tests were performed to check whether non-parametric or parametric correla-tions tests should be applied (Table S7). This step informed the use of Spearman’s Rho correlations as the spectra values were not normally distributed (Table S7, S8). Strong correlations (Rho = 0.68–1.00)139 were taken as an indication that data can be interpreted to draw conclusions for our research question.
Data availabilityAll data generated or analysed during this study are included in this published article (and its Supplementary Information files).
Received: 26 June 2020; Accepted: 25 January 2021
References 1. Swinburn, B. A. et al. The global syndemic of obesity, undernutrition, and climate change: the Lancet Commission report. The
Lancet 23, 791–846. https ://doi.org/10.1016/S0140 -6736(18)32822 -8 (2019). 2. NCD Risk Factor Collaboration (NCD-RisC),. Trends in adult body-mass index in 200 countries from 1975 to 2014: a pooled
analysis of 1698 population-based measurement studies with 19·2 million participants. The Lancet 387(1377–96), 2016. https ://doi.org/10.1016/S0140 -6736(16)30054 -X (2016).
3. Hawley, N. L. & McGarvey, S. T. Obesity and diabetes in Pacific Islanders: the current burden and the need for urgent action. Curr. Diab. Rep. 15, 29. https ://doi.org/10.1007/s1189 2-015-0594-5 (2015).
4. Lin, S. et al. Diabetes and obesity trends in Tonga over 40 years. Asia Pac. J. Public Health 28, 475–485. https ://doi.org/10.1177/10105 39516 64515 6 (2016).
5. Furusawa, T. et al. The Q223R polymorphism in LEPR is associated with obesity in Pacific Islanders. Hum. Genet. 127, 287–294. https ://doi.org/10.1007/s0043 9-009-0768-9 (2010).
6. Hetherington, M. M. & Cecil, J. E. Gene-environment interactions in obesity. In Frontiers in Eating and Weight Regulation (eds Langhans, W. & Geary, N.) 195–203 (Krager Publishers, Basel, 2010).
7. Snowdon, W., Lawrence, M., Schultz, J., Vivili, P. & Swinburn, B. Evidence-informed process to identify policies that will promote a healthy food environment in the Pacific Islands. Public Health Nutr. 13, 886–892. https ://doi.org/10.1017/S1368 98001 00001 1X (2010).
8. Freese, J., Klement, R. J., Ruiz-Núñez, B., Schwarz, S. & Lötzerich, H. The sedentary (r)evolution: Have we lost our metabolic flexibility. F1000Res. 6, 1787. https ://doi.org/10.12688 /f1000 resea rch.12724 .2 (2017).
9. Waldron, T. Palaeopathology (Cambridge University Press, Cambridge, 2008). 10. Brickley, M. & Ives, R. The Bioarchaeology of Metabolic Bone Disease (Elsevier Academic Press, Amsterdam, 2008). 11. Buckley, H. R. Possible gouty arthritis in Lapita-associated skeletons from Teouma, Efate Island, Central Vanuatu. Curr. Anthro-
pol. 48, 741–749. https ://doi.org/10.1086/52096 7 (2007). 12. Foster, A. et al. Possible diffuse idiopathic skeletal hyperostosis (DISH) in a 3000-year-old Pacific Island skeletal assemblage. J.
Archaeol. Sci. Rep. 18, 408–419. https ://doi.org/10.1016/j.jasre p.2018.01.002 (2018). 13. Bateman, M., Hapuarachchi, K., Pinto, C. & Doyle, A. J. Diffuse idiopathic skeletal hyperostosis (DISH): increased prevalence
in Pacific Islanders. J. Med. Imag. Rad. Oncol. 62, 188–193. https ://doi.org/10.1111/1754-9485.12679 (2018). 14. Miszkiewicz, J. J., Brennan-Olsen, S. & Riancho, J. A. Bone Health: A Reflection of the Social Mosaic (Springer Nature Medicine,
Singapore, 2019). 15. Miszkiewicz, J. J. & Cooke, K. M. Socio-economic determinants of bone health from past to present. Clin. Rev. Bone Miner.
Metab. 17, 109–122. https ://doi.org/10.1007/s1201 8-019-09263 -1 (2019). 16. Eaton, S. B. & Eaton, S. B. Physical inactivity, obesity, and type 2 diabetes: an evolutionary perspective. Res. Q. Exercise Sport
88, 1–8. https ://doi.org/10.1080/02701 367.2016.12685 19 (2017). 17. Pagnotti, G. M. et al. Combating osteoporosis and obesity with exercise: leveraging cell mechanosensitivity. Nat. Rev. Endocrinol
15, 339–355. https ://doi.org/10.1038/s4157 4-019-0170-1 (2019). 18. Patsch, J. M. et al. Increased bone resorption and impaired bone microarchitecture in short-term and extended high-fat diet–
induced obesity. Metabolism 60, 243–249. https ://doi.org/10.1016/j.metab ol.2009.11.023 (2011).

13
Vol.:(0123456789)
Scientific Reports | (2021) 11:3981 | https://doi.org/10.1038/s41598-021-83264-3
www.nature.com/scientificreports/
19. Cândido, F. G. & Bressan, J. Vitamin D: link between osteoporosis, obesity, and diabetes?. Int. J. Mol. Sci. 15, 6569–6591. https ://doi.org/10.3390/ijms1 50465 69 (2014).
20. Peel, N. Orthopaedics I: general principles. Bone remodelling and disorders of bone metabolism. Surgery (Oxford) 27, 70–74. https ://doi.org/10.1016/j.mpsur .2008.12.007 (2009).
21. Martin, T. J. & Sims, N. A. Osteoclast-derived activity in the coupling of bone formation to resorption. Trends Mol. Med. 11, 76–81. https ://doi.org/10.1016/j.molme d.2004.12.004 (2005).
22. Jepsen, K. J., Bigelow, E. M., Ramcharan, M., Schlecht, S. H. & Karvonen-Gutierrez, C. A. Moving toward a prevention strategy for osteoporosis by giving a voice to a silent disease. Women’s Midlife Health 2, 1–5. https ://doi.org/10.1186/s4069 5-016-0016-0 (2016).
23. Lewiecki, E. M. Osteoporotic fracture trends in a population of US managed care enrollees from 2007 to 2017. Osteoporos. Int. 31, 1299–1304. https ://doi.org/10.1007/s0019 8-020-05334 -y (2020).
24. Nguyen, T. V. Lifestyle factors and bone density in the elderly: implications for osteoporosis prevention. J. Bone Miner. Res. 9, 339–1346. https ://doi.org/10.1002/jbmr.56500 90904 (1994).
25. Hannan, M. T. Risk factors for longitudinal bone loss in elderly men and women: the Framingham Osteoporosis Study. J. Bone Miner. Res. 15, 710–720. https ://doi.org/10.1359/jbmr.2000.15.4.710 (2000).
26. Karasik, D. & Ferrari, S. L. Contribution of gender-specific genetic factors to osteoporosis risk. Ann. Hum. Genet. 72, 696–714. https ://doi.org/10.1016/S0140 -6736(02)08657 -9 (2008).
27. Harding, A. T. & Beck, B. R. Exercise, osteoporosis, and bone geometry. Sports https ://doi.org/10.3390/sport s5020 029 (2017). 28. Hsu, Y. H., Xu, X. & Jeong, S. Genetic determinants and pharmacogenetics of osteoporosis and osteoporotic fracture. In Osteopo-
rosis Pathophysiology and Clinical Management (eds Leder, B. Z. & Wein, M. N.) 485–506 (Cham, Springer Nature Switzerland, 2020). https ://doi.org/10.1007/978-3-319-69287 -6_25.
29. Bassett, J. D. et al. Thyroid hormone excess rather than thyrotropin deficiency induces osteoporosis in hyperthyroidism. Mol. Endocrinol. 21, 1095–1107. https ://doi.org/10.1210/me.2007-0033 (2007).
30. Anand, P. & Mehler, P. S. Osteoporosis recovery in severe anorexia nervosa: a case report. J. Eat. Disord. 7, 38. https ://doi.org/10.1186/s4033 7-019-0269-8 (2019).
31. Klein-Nulend, J., van Oers, R. F., Bakker, A. D. & Bacabac, R. G. Bone cell mechanosensitivity, estrogen deficiency, and osteo-porosis. J. Biomech. 48, 855–865. https ://doi.org/10.1016/j.jbiom ech.2014.12.007 (2015).
32. Shieh, A., Greendale, G. A., Cauley, J. A. & Karlamangla, A. S. The association between fast increase in bone turnover during the menopause transition and subsequent fracture. J. Clin. Endocrinol. Metab. 105, e1440–e1448. https ://doi.org/10.1210/cline m/dgz28 1 (2020).
33. Zhao, L. J. et al. Relationship of obesity with osteoporosis. J. Clin. Endocrinol. Metab. 92, 1640–1646. https ://doi.org/10.1210/jc.2006-0572 (2007).
34. Rosen, C. J. & Bouxsein, M. L. Mechanisms of disease: is osteoporosis the obesity of bone?. Nat. Clin. Pract. Rheumatol. 2, 35–43. https ://doi.org/10.1038/ncprh eum00 70 (2006).
35. Greco, E. A. et al. Is obesity protective for osteoporosis? Evaluation of bone mineral density in individuals with high body mass index. Int. J. Clin. Pract. 64, 817–820. https ://doi.org/10.1111/j.1742-1241.2009.02301 .x (2010).
36. Fassio, A. et al. The obesity paradox and osteoporosis. Eat. Weight Disord. St. 23, 293–302. https ://doi.org/10.1007/s4051 9-018-0505-2 (2018).
37. Muruganandan, S., Roman, A. A. & Sinal, C. J. Adipocyte differentiation of bone marrow-derived mesenchymal stem cells: cross talk with the osteoblastogenic program. Cell. Mol. Life Sci. 66, 236–253. https ://doi.org/10.1007/s0001 8-008-8429-z (2009).
38. Poiana, C., Carsote, M., Radoi, V., Mihai, A. & Capatina, C. Prevalent osteoporotic fractures in 622 obese and non-obese meno-pausal women. J. Med. Life 8, 462 (2015).
39. Sun, H. B. et al. Preliminary study of obese patients with chronic obstructive pulmonary disease suffering from painful osteo-porotic vertebral compression fracture treated by percutaneous vertebroplasty in improved prone position and right lateral position. World Neurosurg. 130, e933–e940. https ://doi.org/10.1016/j.wneu.2019.07.040 (2019).
40. Tanaka, S., Kuroda, T., Saito, M. & Shiraki, M. Overweight/obesity and underweight are both risk factors for osteoporotic fractures at different sites in Japanese postmenopausal women. Osteoporos. Int. 24, 69–76. https ://doi.org/10.1007/s0019 8-012-2209-1 (2013).
41. Johnell, O. & Kanis, J. A. An estimate of the worldwide prevalence and disability associated with osteoporotic fractures. Osteo-porosis Int. 17, 1726–1733. https ://doi.org/10.1007/s0019 8-006-0172-4 (2006).
42. Stride, P. Polynesian bones. J. Adv. Med. Med. Res. 16, 1–9. https ://doi.org/10.9734/BJMMR /2016/25651 (2016). 43. Ebeling, P. R. et al. Secondary prevention of fragility fractures in Asia Pacific: an educational initiative. Osteoporosis Int. 31,
805–826. https ://doi.org/10.1007/s0019 8-019-05197 -y (2019). 44. Elaine, W. Y. Osteoporosis screening and diagnosis. In Osteoporosis. Contemporary Endocrinology (eds Leder, B. & Wein, M.)
139–149 (Springer Nature Switzerland, Cham, 2020). https ://doi.org/10.1007/978-3-319-69287 -6_7. 45. Fuggle, N. R. et al. Fracture prediction, imaging and screening in osteoporosis. Nat. Rev. Endocrinol. 15, 535–547. https ://doi.
org/10.1038/s4157 4-019-0220-8 (2019). 46. Kanis, J. A. Diagnosis of osteoporosis and assessment of fracture risk. The Lancet 359, 1929–1936. https ://doi.org/10.1016/S0140
-6736(02)08761 -5 (2002). 47. Link, T. M. Metabolic bone disease. In Measurements in Musculoskeletal Radiology (eds Cassar-Pullicino, V. & Davies, A.)
785–807 (Springer, Berlin, 2020). https ://doi.org/10.1007/978-3-540-68897 -6_19. 48. Lorente-Ramos, R. et al. Dual-energy x-ray absorptiometry in the diagnosis of osteoporosis: a practical guide. Am. J. Roentgenol.
196, 897–904. https ://doi.org/10.2214/AJR.10.5416 (2011). 49. Kulak, C. A. M. & Dempster, D. W. Bone histomorphometry: a concise review for endocrinologists and clinicians. Arq. Bras.
Endocrinol. Metabol. 54, 87–98. https ://doi.org/10.1590/S0004 -27302 01000 02000 02 (2010). 50. dos Santos Floter, M., Bittar, C. K., Zabeu, J. L. A. & Carneiro, A. C. R. Review of comparative studies between bone densitometry
and quantitative ultrasound of the calcaneus in osteoporosis. Acta. Reumatol. Port. 36, 327–335. https ://doi.org/10.1590/S0004 -27302 01000 02000 02 (2011).
51. Cardoso, L., Fritton, S. P., Gailani, G., Benalla, M. & Cowin, S. C. Advances in assessment of bone porosity, permeability and interstitial fluid flow. J. Biomech. 46, 253–265. https ://doi.org/10.1016/j.jbiom ech.2012.10.025 (2013).
52. Mays, S., Turner-Walker, G. & Syversen, U. Osteoporosis in a population from medieval Norway. Am. J. Phys. Anthropol. 131, 343–351. https ://doi.org/10.1002/ajpa.20445 (2006).
53. Mays, S. Age-dependent cortical bone loss in women from 18th and early 19th century London. Am. J. Phys. Anthropol. 112, 349–361. https ://doi.org/10.1002/1096-8644(20000 7)112:3%3c349 ::AID-AJPA6 %3e3.0.CO;2-0 (2000).
54. Drusini, A. G., Bredariol, S., Carrara, N. & Rippa-Bonati, M. Cortical bone dynamics and age-related osteopenia in a Longobard archaeological sample from three graveyards of the Veneto region (northeast Italy). Int. J. Osteoarchaeol. 10, 268–279. https ://doi.org/10.1002/1099-1212(20000 7/08)10:4%3c268 ::AID-OA529 %3e3.0.CO;2-Q (2000).
55. Brickley, M. & Howell, P. G. T. Measurement of changes in trabecular bone structure with age in an archaeological population. J. Archaeol. Sci. 26, 151–157. https ://doi.org/10.1006/jasc.1998.0313 (1999).
56. Ekenman, I., Eriksson, S. A. V. & Lindgren, J. U. Bone density in medieval skeletons. Calcif. Tissue Int. 56, 355–358. https ://doi.org/10.1007/BF003 01601 (1995).

14
Vol:.(1234567890)
Scientific Reports | (2021) 11:3981 | https://doi.org/10.1038/s41598-021-83264-3
www.nature.com/scientificreports/
57. González-Reimers, E. et al. Double-energy X-ray absorptiometry in the diagnosis of osteopenia in ancient skeletal remains. Am. J. Phys. Anthropol. 118, 134–145. https ://doi.org/10.1002/ajpa.10076 (2002).
58. Ericksen, M. F. Cortical bone loss with age in three Native American populations. Am. J. Phys. Anthropol. 45, 443–452. https ://doi.org/10.1002/ajpa.13304 50306 (1976).
59. Dewey, J. R., Armelagos, G. J. & Bartley, M. H. Femoral cortical involution in three Nubian archaeological populations. Hum. Biol. 41, 13–28 (1969).
60. Martin, D. L. & Armelagos, G. J. Morphometrics of compact bone: an example from Sudanese Nubia. Am. J. Phys. Anthropol. 51, 571–577. https ://doi.org/10.1002/ajpa.13305 10409 (1979).
61. Zaki, M. E., Hussien, F. H. & El Banna, R. A. E. S. Osteoporosis among ancient Egyptians. Int. J. Osteoarchaeol. 19, 78–89. https ://doi.org/10.1002/oa.978 (2009).
62. Agarwal, S. C. & Stout, S. D. Bone Loss and Osteoporosis: An Anthropological Perspective (Springer, Boston, 2003). 63. Curate, F. Osteoporosis and paleopathology: a review. J. Anthropol. Sci. 92, 119–146. https ://doi.org/10.4436/jass.92003 (2014). 64. Agarwal, S. C. & Grynpas, M. D. Bone quantity and quality in past populations. Anat. Rec. 246, 423–432. https ://doi.org/10.1002/
(SICI)1097-0185(19961 2)246:4%3c423 ::AID-AR1%3e3.0.CO;2-W (1996). 65. Agarwal, S. C., Dumitriu, M., Tomlinson, G. A. & Grynpas, M. D. Medieval trabecular bone architecture: the influence of age,
sex, and lifestyle. Am. J. Phys. Anthropol. 124, 33–44. https ://doi.org/10.1002/ajpa.10335 (2004). 66. Curate, F. et al. A glimpse from the past: osteoporosis and osteoporotic fractures in a Portuguese identified skeletal sample. Acta
Reumatol. Port. 38, 20–27 (2013). 67. Brickley, M. An investigation of historical and archaeological evidence for age-related bone loss and osteoporosis. Int. J. Osteo-
archaeol. 12, 364–371. https ://doi.org/10.1002/oa.635 (2002). 68. Morgan, B., Mant, M., de la Cova, C. & Brickley, M. B. Osteoporosis, osteomalacia, and hip fracture: a case study from the Terry
collection. Int. J. Paleopathol. 30, 17–21. https ://doi.org/10.1016/j.ijpp.2020.03.004 (2020). 69. Curate, F., Lopes, C. & Cunha, E. A 14th–17th century osteoporotic hip fracture from the Santa Clara-a-Velha Convent in
Coimbra (Portugal). Int. J. Osteoarchaeol. 20, 591–596. https ://doi.org/10.1002/oa.1076 (2010). 70. Roberts, C. & Wakely, J. Microscopical findings associated with the diagnosis of osteoporosis in palaeopathology. Int. J. Osteo-
archaeol. 2, 23–30. https ://doi.org/10.1002/oa.13900 20105 (1992). 71. Brickley, M. B. & Agarwal, S. C. Techniques for the investigation of age-related bone loss and osteoporosis in archaeological
bone. In Bone Loss and Osteoporosis: An Anthropological Perspective (eds Agarwal, S. C. & Stout, S. D.) 157–172 (Springer, Boston, 2003). https ://doi.org/10.1007/978-1-4419-8891-1_10.
72. Cho, H. & Stout, S. D. Bone remodeling and age-associated bone loss in the past: a histomorphometric analysis of the Imperial Roman skeletal population of Isola Sacra. In Bone Loss and Osteoporosis: An Anthropological Perspective (eds Agarwal, S. C. & Stout, S. D.) 207–228 (Springer, Boston, 2003). https ://doi.org/10.1007/978-1-4419-8891-1_13.
73. Cooper, D. M. L., Matyas, J. R., Katzenberg, M. A. & Hallgrimsson, B. Comparison of microcomputed tomographic and micro-radiographic measurements of cortical bone porosity. Calcif. Tissue Int. 74, 437–447. https ://doi.org/10.1007/s0022 3-003-0071-z (2004).
74. Faccia, K. et al. Bone quality in prehistoric, cis-baikal forager femora: A micro-CT analysis of cortical canal microstructure. Am. J. Phys. Anthropol. 154, 486–497. https ://doi.org/10.1002/ajpa.22533 (2014).
75. Miszkiewicz, J. J. & Mahoney, P. Human bone and dental histology in an archaeological context. In Human Remains: Another Dimension (eds Thompson, T. & Errickson, D.) 29–43 (Elsevier Academic Press, London, The Application of Imaging to the Study of Human Remains, 2017). https ://doi.org/10.1016/B978-0-12-80460 2-9.00004 -7.
76. Mays, S., Elders, J., Humphrey, L., White, W., & Marshall, P. Science and the Dead: A Guideline for the Destructive Sampling of Archaeological Human Remains for Scientific Analysis (English Heritage Publishing with the Advisory Panel on the Archaeology of Burials in England, 2013).
77. Bennike, P., Bohr, H. & Toft, T. Determination of mineral content and organic matrix in bone samples using dual photon absorptiometry. Int. J. Anthropol. 8, 111–116. https ://doi.org/10.1007/BF024 47620 (1993).
78. Booth, T. The rot sets. In: low-powered microscopic investigation of taphonomic changes to bone microstructure and its applica-tion to funerary contexts. In Human Remains: Another Dimension. The Application of Imaging to the Study of Human Remains (eds Thompson, T. & Errickson, D.) 7–28 ( Elsevier Academic Press, London, 2017). https ://doi.org/10.1016/B978-0-12-80460 2-9.00003 -5.
79. Caruso, V. et al. Bone diagenesis in archaeological and contemporary human remains: an investigation of bone 3D microstructure and minero-chemical assessment. Archaeol. Anthropol. Sci. 12, 162. https ://doi.org/10.1007/s1252 0-020-01090 -6 (2020).
80. Jeanson, A. L. et al. Body mass estimation from the skeleton: an evaluation of 11 methods. Forensic Sci. Int. 281(183), e1-183.e8. https ://doi.org/10.1016/j.forsc iint.2017.10.026 (2017).
81. Valentin, F. & Clark, G. Early Polynesian mortuary behaviour at the Talasiu site, Kingdom of Tonga. J. Pac. Archaeol. 4, 1–14 (2013).
82. Valentin, F., Clark, G., Parton, P. & Reepmeyer, C. The oldest Polynesian burial site (Talasiu site, Kingdom of Tonga): Implica-tions for the reconstruction of the Ancestral Polynesian Society. Antiquity 94, 999–1014 (2020).
83. Herrscher, E. et al. Multi-isotopic analysis of first Polynesian diet (Talasiu, Tongatapu, Kingdom of Tonga). J. Archaeol. Sci. Rep. 18, 308–317. https ://doi.org/10.1016/j.jasre p.2018.01.012 (2018).
84. Burley, D. V., Connaughton, S. P. & Clark, G. Early cessation of ceramic production for ancestral Polynesian society in Tonga. PLoS ONE 13, e0193166. https ://doi.org/10.1371/journ al.pone.01931 66 (2018).
85. Miszkiewicz, J. J. et al. Asymmetric midshaft femur remodeling in an adult male with left sided hip joint ankylosis, Metal Period Nagsabaran, Philippines. Int. J. Paleopath. 31, 14–22. https ://doi.org/10.1016/j.ijpp.2020.07.003 (2020).
86. Vrahnas, C. et al. Anabolic action of parathyroid hormone (PTH) does not compromise bone matrix mineral composition or maturation. Bone 93, 146–154. https ://doi.org/10.1016/j.bone.2016.09.022 (2016).
87. Vongsvivut, J. et al. Synchrotron macro ATR-FTIR microspectroscopy for high-resolution chemical mapping of single cells. Analyst 144, 3226–3238. https ://doi.org/10.1039/C8AN0 1543K 3161-3452 (2019).
88. Lerebours, C., Buenzli, P. R., Scheiner, S. & Pivonka, P. A multiscale mechanobiological model of bone remodelling predicts site-specific bone loss in the femur during osteoporosis and mechanical disuse. Biomech. Model. Mechanobiol. 15, 43–67. https ://doi.org/10.1007/s1023 7-015-0705-x (2016).
89. Buenzli, P. R., Thomas, C. D. L., Clement, J. G. & Pivonka, P. Endocortical bone loss in osteoporosis: the role of bone surface availability. Int. J. Numer. Method. Biomed. Eng. 29, 1307–1322. https ://doi.org/10.1002/cnm.2567 (2013).
90. Expanding the dialogue between immunology and paleopathology. Crespo, F., White, J., & Roberts. C. Revisiting the tuberculosis and leprosy cross-immunity hypothesis. Int. J. Paleopath. 26, 37–47. https ://doi.org/10.1016/j.ijpp.2019.05.005 (2019).
91. Buckley, H. R. Subadult health and disease in prehistoric Tonga, Polynesia. Am. J. Phys. Anthropol. 113, 481–505. https ://doi.org/10.1002/1096-8644(20001 2)113:4%3c481 ::AID-AJPA4 %3e3.0.CO;2-1 (2000).
92. Farah, R. A. et al. Physiological insult or the burial environment: Differentiating developmental defects from post-mortem stained enamel in deciduous dentition from the Chiefdom Period of Tonga, Polynesia. Matters Sel. https ://doi.org/10.19185 /matte rs.20160 50000 05 (2016).
93. Stantis, C., Kinaston, R. L., Richards, M. P., Davidson, J. M. & Buckley, H. R. Assessing human diet and movement in the Tongan maritime chiefdom using isotopic analyses. PLoS ONE https ://doi.org/10.1371/journ al.pone.01231 56 (2015).

15
Vol.:(0123456789)
Scientific Reports | (2021) 11:3981 | https://doi.org/10.1038/s41598-021-83264-3
www.nature.com/scientificreports/
94. Pietrusewsky, M., Douglas, M. T., Ikehara-Quebral, R. M. & Kadohiro Lauer, K. Skeletal and dental health of early Tongans: The bioarchaeology of the human skeletons from the To-At-36 Site, Ha ‘ateiho, Tongatapu, Tonga. J. Isl. Coast. Archaeol. 15, 204–243. https ://doi.org/10.1080/15564 894.2018.15647 11 (2019).
95. Buckley, H. R. et al. Scurvy in a tropical paradise? Evaluating the possibility of infant and adult vitamin C deficiency in the Lapita skeletal sample of Teouma, Vanuatu, Pacific islands. Int. J. Paleopath. 5, 72–85. https ://doi.org/10.1016/j.ijpp.2014.03.001 (2014).
96. Scott, R. M. & Buckley, H. R. Exploring prehistoric violence in Tonga: Understanding skeletal trauma from a biocultural per-spective. Curr. Anthropol. 55, 335–347. https ://doi.org/10.1086/67647 7 (2014).
97. Sheng, B., Feng, C., Zhang, D., Spitler, H. & Shi, L. Associations between obesity and spinal diseases: a medical expenditure panel study analysis. Int. J. Environ. Res. Public Health 14, 183. https ://doi.org/10.3390/ijerp h1402 0183 (2017).
98. Gosling, A. L., Buckley, H. R., Matisoo-Smith, E. & Merriman, T. R. Pacific populations, metabolic disease and ‘Just-So Stories’: a critique of the ‘Thrifty Genotype’ hypothesis in Oceania. Ann. Hum. Genet. 79, 470–480. https ://doi.org/10.1111/ahg.12132 (2015).
99. Qasim, A. et al. On the origin of obesity: identifying the biological, environmental and cultural drivers of genetic risk among human populations. Obes. Rev. 19, 121–149. https ://doi.org/10.1111/obr.12625 (2018).
100. Buckley, H. R. & Tayles, N. G. The functional cost of tertiary yaws (Treponema pertenue) in a prehistoric Pacific Island skeletal sample. J. Archaeol. Sci. 30, 1301–1314. https ://doi.org/10.1016/S0305 -4403(03)00020 -7 (2003).
101. Weitzmann, M. N. The role of inflammatory cytokines, the RANKL/OPG axis, and the immunoskeletal interface in physiological bone turnover and osteoporosis. Scientifica https ://doi.org/10.1155/2013/12570 5 (2013).
102. Alswat, K. A. Gender disparities in osteoporosis. J. Clin. Med. Res. 9, 382–387. https ://doi.org/10.14740 /jocmr 2970w (2017). 103. Thomas, C. D. L., Feik, S. A. & Clement, J. G. Regional variation of intracortical porosity in the midshaft of the human femur:
age and sex differences. J. Anat. 206, 115–125. https ://doi.org/10.1111/j.1469-7580.2005.00384 .x (2005). 104. Bousson, V. et al. Distribution of intracortical porosity in human midfemoral cortex by age and gender. J. Bone Miner. Res. 16,
1308–1317. https ://doi.org/10.1359/jbmr.2001.16.7.1308 (2001). 105. Bjørnerem, Å. The clinical contribution of cortical porosity to fragility fractures. BoneKEy Rep. https ://doi.org/10.1038/bonek
ey.2016.77 (2016). 106. Cooper, D. M. et al. Age-dependent change in the 3D structure of cortical porosity at the human femoral midshaft. Bone 40,
957–965. https ://doi.org/10.1016/j.bone.2006.11.011 (2007). 107. Ruff, C. B. & Hayes, W. C. Sex differences in age-related remodeling of the femur and tibia. J. Orthop. Res. 6, 886–896. https ://
doi.org/10.1002/jor.11000 60613 (1988). 108. Ruff, C. B. & Hayes, W. C. Cross-sectional geometry of Pecos Pueblo femora and tibiae—a biomechanical investigation: II. Sex,
age, and side differences. Am. J. Phys. Anthropol. 60, 383–400. https ://doi.org/10.1002/ajpa.13306 00309 (1983). 109. Heaney, R. P. et al. Peak bone mass. Osteoporos. Int. 11, 985–1009. https ://doi.org/10.1007/s0019 80070 020 (2000). 110. Fotu, K. F. et al. Outcome results for the Ma’alahi Youth Project, a Tongan community-based obesity prevention programme for
adolescents. Obes. Rev. 12, 41–50. https ://doi.org/10.1111/j.1467-789X.2011.00923 .x (2011). 111. Chien, K. R. & Karsenty, G. Longevity and lineages: toward the integrative biology of degenerative diseases in heart, muscle,
and bone. Cell 120, 533–544. https ://doi.org/10.1016/j.cell.2005.02.006 (2005). 112. Appleby, J. E. Why we need an archaeology of old age, and a suggested approach. Nor. Archaeol. Rev. 43, 145–168. https ://doi.
org/10.1080/00293 652.2010.53158 2 (2010). 113. Crews, D. E. Biological anthropology and human aging: some current directions in aging research. Annu. Rev. Anthropol. 22,
395–423 (1993). 114. Zebaze, R. M. et al. Intracortical remodelling and porosity in the distal radius and post-mortem femurs of women: a cross-
sectional study. The Lancet 375, 1729–1736. https ://doi.org/10.1016/S0140 -6736(10)60320 -0 (2010). 115. Clark, G., Burley, D. & Murray, T. Monumentality and the development of the Tongan maritime chiefdom. Antiquity 82, 994–
1008. https ://doi.org/10.1017/S0003 598X0 00977 38 (2008). 116. Buikstra, J. E., & Ubelaker, D. H. Standards for Data Collection from Human Skeletal Remains (Arkansas Archaeological Survey
Research Series, 1994). 117. Bruzek, J. A method for visual determination of sex, using the human hip bone. Am. J. Phys. Anthropol. 117, 157–168. https ://
doi.org/10.1002/ajpa.10012 (2002). 118. Schmitt, A. Une nouvelle méthode pour estimer l’âge au décès des adultes à partir de la surface sacro-pelvienne iliaque. Bull.
Mem. Soc. Anthropol. Paris. 17, 89–101 (2005). 119. Sofaer, J. R. 10. Gender, bioarchaeology and human ontogeny. In The Social Archaeology of Funerary Remains (eds Gowland, E.
& Knüsel, C.) 155–167 (Alden Press, Oxford, 2006). 120. Clark, G., Grono, E., Ussher, E. & Reepmeyer, C. Early settlement and subsistence on Tongatapu, Kingdom of Tonga: Insights
from a 2700–2650 cal BP midden deposit. J. Archaeol. Sci. Rep. 3, 513–524. https ://doi.org/10.1016/j.jasre p.2015.08.005 (2015). 121. Miszkiewicz, J. J. & Mahoney, P. Ancient human bone microstructure in medieval England: comparisons between two socio-
economic groups. Anat. Rec. 299, 42–59. https ://doi.org/10.1002/ar.23285 (2016). 122. Kaczmarek, E., Gorna, A. & Majewski, P. Techniques of image analysis for quantitative immunohistochemistry. Rocz. Akad.
Med. Bialymst. Supl. 49, 155–158 (2004). 123. Ashique, A. M. et al. Lacunar-canalicular network in femoral cortical bone is reduced in aged women and is predominantly due
to a loss of canalicular porosity. Bone Rep. 7, 9–16. https ://doi.org/10.1016/j.bonr.2017.06.002 (2017). 124. Hunter, R. L. & Agnew, A. M. Intraskeletal variation in human cortical osteocyte lacunar density: implications for bone quality
assessment. Bone Rep. 5, 252–261. https ://doi.org/10.1016/j.bonr.2016.09.002 (2016). 125. Bell, K. L. et al. Regional differences in cortical porosity in the fractured femoral neck. Bone 24(57–64), 1999. https ://doi.
org/10.1016/S8756 -3282(98)00143 -457-64 (1999). 126. Thompson, D. D., Salter, E. M. & Laughlin, W. S. Bone core analysis of Baffin Island skeletons. Arctic Anthropol. 18, 87–96 (1981). 127. Dempster, D. W. et al. Standardized nomenclature, symbols, and units for bone histomorphometry: a 2012 update of the report
of the ASBMR Histomorphometry Nomenclature Committee. J. Bone Miner. Res. 28(1), 2–17. https ://doi.org/10.1002/jbmr.1805 (2013).
128. Lassen, N. E. et al. Coupling of bone resorption and formation in real time: new knowledge gained from human Haversian BMUs. J. Bone Miner. Res. 32, 1395–1405. https ://doi.org/10.1002/jbmr.3091 (2017).
129. Ren, F., Smith, I. O., Baumann, M. J. & Case, E. D. Three-dimensional microstructural characterization of porous hydroxyapa-tite using confocal laser scanning microscopy. Int. J. Appl. Ceram. Technol. 2(200–211), 2005. https ://doi.org/10.1111/j.1744-7402.2005.02022 .x (2005).
130. Heaney, R. P., Recker, R. R., Watson, P. & Lappe, J. M. Phosphate and carbonate salts of calcium support robust bone building in osteoporosis. Am. J. Clin. Nutr. 92, 101–105. https ://doi.org/10.3945/ajcn.2009.29085 (2010).
131. Bertrand, L. et al. Development and trends in synchrotron studies of ancient and historical materials. Phys. Rep. 519, 51–96. https ://doi.org/10.1016/j.physr ep.2012.03.003 (2012).
132. Ou-Yang, H., Paschalis, E. P., Mayo, W. E., Boskey, A. L. & Mendelsohn, R. Infrared microscopic imaging of bone: spatial dis-tribution of CO32−. J. Bone Miner Res. 16, 893–900. https ://doi.org/10.1359/jbmr.2001.16.5.893 (2001).

16
Vol:.(1234567890)
Scientific Reports | (2021) 11:3981 | https://doi.org/10.1038/s41598-021-83264-3
www.nature.com/scientificreports/
133. Madupalli, H., Pavan, B. & Tecklenburg, M. M. Carbonate substitution in the mineral component of bone: Discriminating the structural changes, simultaneously imposed by carbonate in A and B sites of apatite. J. Solid State Chem. https ://doi.org/10.1016/j.jssc.2017.07.02527 -35 (2017).
134. Penido, M. G. M. & Alon, U. S. Phosphate homeostasis and its role in bone health. Pediatr. Nephrol. 27(2039–2048), 2012. https ://doi.org/10.1007/s0046 7-012-2175-z2039 -2048 (2012).
135. Doi, Y., Iwanaga, H., Shibutani, T., Moriwaki, Y. & Iwayama, Y. Osteoclastic responses to various calcium phosphates in cell cultures. J. Biomed. Mater. Res. 47, 424–433. https ://doi.org/10.1002/(SICI)1097-4636(19991 205)47:3%3c424 ::AID-JBM19 %3e3.0.CO;2-0 (1999).
136. Paschalis, E. P. et al. FTIR microspectroscopic analysis of human osteonal bone. Calcif. Tissue Int. 59, 480–487. https ://doi.org/10.1007/BF003 69214 (1996).
137. Fleet, M. E. Infrared spectra of carbonate apatites: ν2-Region bands. Biomaterials 30, 1473–1481. https ://doi.org/10.1016/j.bioma teria ls.2008.12.007 (2009).
138. Nachar, N. The Mann-Whitney U: A test for assessing whether two independent samples come from the same distribution. Tutor. Quant. Methods Psychol. 4, 13–20. https ://doi.org/10.20982 /tqmp.04.1.p013 (2008).
139. Taylor, R. Interpretation of the correlation coefficient: a basic review. J. Diagn. Med. Sonogr. 6, 35–39. https ://doi.org/10.1177/87564 79390 00600 106 (1990).
AcknowledgmentsThe Lapaha Community and Nobles (His Serene Highness Prince Kalaniuvalu Fotofili, Her Serene Highness Prin-cess Marcella Taumoepeau Tupou Kalaniuvalu Fotofili, and Her Royal Highness Mele Siu’ilikutapu Kalaniuvalu Fotofili) and the Ministry of Internal Affairs (Government of Tonga) permitted the excavation and analysis of the skeletal material. This study was undertaken as part of projects funded by the Australian Research Council (ARC): “Ancient human bone metabolism change with lifestyle in Asia-Pacific populations” (DE190100068 to Miszkiewicz) and “The First Polynesians: Their Origins, Lifeways and Environmental Challenges” (DP200102872 to Valentin and Clark). Earlier associated archaeological excavations were supported by the MAEDI and CNRS funding allocated to Valentin and an ARC grant to Clark (FT0990591). The Research School of Humanities and the Arts at the Australian National University (ANU) funded stay on-site at the ANSTO – Australian Synchrotron facility (Clayton, Victoria), where the sFTIRM data were collected using the IRM beamline. The ANU College of Arts and Social Sciences, and the ANU Major Equipment Grant (18MEC26 to Miszkiewicz) funded microscopy equipment. David McGregor offered continuous technical assistance on the project.
Author contributionsJ.J.M. led the project, secured funding, carried out lab work, data analysis, wrote the draft of the manuscript; C.V., N.A.S., M.J.T., J.V. were part of the synchrotron lab work and data analysis; F.V., G.C. co-designed the study, excavated specimens, collected data in the field, secured funding. All edited the manuscript and gave approval for publication.
Competing interests The authors declare no competing interests.
Additional informationSupplementary Information The online version contains supplementary material available at https ://doi.org/10.1038/s4159 8-021-83264 -3.
Correspondence and requests for materials should be addressed to J.J.M.
Reprints and permissions information is available at www.nature.com/reprints.
Publisher’s note Springer Nature remains neutral with regard to jurisdictional claims in published maps and institutional affiliations.
Open Access This article is licensed under a Creative Commons Attribution 4.0 International License, which permits use, sharing, adaptation, distribution and reproduction in any medium or
format, as long as you give appropriate credit to the original author(s) and the source, provide a link to the Creative Commons licence, and indicate if changes were made. The images or other third party material in this article are included in the article’s Creative Commons licence, unless indicated otherwise in a credit line to the material. If material is not included in the article’s Creative Commons licence and your intended use is not permitted by statutory regulation or exceeds the permitted use, you will need to obtain permission directly from the copyright holder. To view a copy of this licence, visit http://creat iveco mmons .org/licen ses/by/4.0/.
© The Author(s) 2021
Copyright © 2022 FDOKUMEN