ANTINOCICEPTIVE AND ANTIPYRETIC ACTIVITY OF LEAF EXTRACT OF LASIANTHERA AFRICANA * 1
Bn
Sa
b
c
a
ARRAA
KBCELM
1
aahotsaonnh
anem
(
0d
Colloids and Surfaces B: Biointerfaces 80 (2010) 26–33
Contents lists available at ScienceDirect
Colloids and Surfaces B: Biointerfaces
journa l homepage: www.e lsev ier .com/ locate /co lsur fb
ioprospective of Sorbus aucuparia leaf extract in development of silver and goldanocolloids
hashi Prabha Dubeya,∗, Manu Lahtinenb, Heikki Särkkäa, Mika Sillanpääa,c
Laboratory of Applied Environmental Chemistry, Department of Environmental Sciences, University of Eastern Finland, Patteristonkatu 1, FI-50100 Mikkeli, FinlandUniversity of Jyväskylä, Department of Chemistry, P.O. Box 35, FI-40014 Jyväskylä, FinlandFaculty of Technology, Lappeenranta University of Technology, Patteristonkatu 1, FI-50100 Mikkeli, Finland
r t i c l e i n f o
rticle history:eceived 9 November 2009eceived in revised form 10 May 2010ccepted 11 May 2010vailable online 1 June 2010
eywords:iosynthesisharacterizations
a b s t r a c t
At the present time the bioprospective field is a dynamic area of research. The rapid biosynthesis of silverand gold nanoparticles without using toxic chemicals is reported here. Sorbus aucuparia is omnipresentin Europe. The aqueous leaves extract of the plant were used as reducing agent for the synthesis of silverand gold nanoparticles from their salt solutions. The synthesized nanoparticles were spherical, trian-gular and hexagonal in shape with an average size of 16 and 18 nm for silver and gold, respectively.Different extract quantities, metal concentrations, temperatures and contact times were investigated tofind their effect on nanoparticles synthesis. The resulting silver and gold nanoparticles were character-ized by transmission electron microscopy (TEM), UV–vis spectroscopy, X-ray diffraction (XRD), energy
uropean rowaneaf extractetal nanoparticles
dispersive X-ray (EDX) and Fourier transform infrared spectroscopy (FTIR). The concentration of residualsilver and gold ions was measured by Inductively Coupled Plasma (ICP) spectroscopy. Silver and goldnanoparticle suspensions gave maximum UV–vis absorbance at 446 and 560 nm, respectively. The XRDdata illustrated characteristic diffraction patterns of the elemental silver and gold phases and the averagesize of the crystallites were estimated from the peak profiles by Scherrer method. FTIR spectra of the leaf
the ds resp
extract before and afterpossible functional group
. Introduction
Bioprospective is the searching of innate properties of plants,nimals and microorganisms which is still a secret for humannd necessary to explore for the well being of animal as well asuman welfare. Natural products may be extracted from tissuesf terrestrial plants, marine organisms or microorganism fermen-ation broths. A crude (untreated) extract from any one of theseources contains novel, structurally diverse chemical compounds,nd it is now necessary to explore their properties. Developmentsf naturally inspired investigational practices for the synthesis ofanoparticles are a significant branch of nanotechnology. It will beot surfeit to say that nature is a natural nanofactory which canelp to synthesize a variety of nanoparticles [1].
The synthesis of metal nanoparticles is an expanding research
rea due to the potential applications for the development ofovel technologies. Metal nanoparticles have been of great inter-st due to their distinctive properties such as catalytic, optical,agnetic and electrical [2–4]. The development of silver nanopar-∗ Corresponding author. Tel.: +358 40 355 3410; fax: +358 15 336 013.E-mail addresses: [email protected], [email protected]
S.P. Dubey), [email protected] (M. Sillanpää).
927-7765/$ – see front matter © 2010 Elsevier B.V. All rights reserved.oi:10.1016/j.colsurfb.2010.05.024
evelopment of nanoparticles were determined to allow identification ofonsible for the conversion of metal ions to metal nanoparticles.
© 2010 Elsevier B.V. All rights reserved.
ticles increases due to its additional antibacterial properties [5,6].Bioapplications of gold nanoparticles are labeling, delivery, heat-ing and sensing [7,8]. Generally, nanoparticles are prepared bya variety of chemical and physical methods such as chemicalreduction [9–12], photochemical reduction [12–14], electrochem-ical reduction [15,16], heat evaporation [17,18], etc., which arenot environmental friendly. Recently some biomimetics way havealso been tried for the development of silver and nanoparticlesby several research groups using Parthenium leaf, Camellia sinen-sis, Natural rubber, Starch, Mushroom, Cinnamomum zeylanicumleaf, Magnolia kobus and Diopyros kaki leaf, Geranium leaf, Alfalfaplants, Tansy fruit, Rose leaf and other bacterial, viral materials[19–30] but so far there is no report on the development of sil-ver and gold nanoparticles by European rowan (Sorbus aucuparia).
rfaces
wtFwf
rrarhtspca
gmpetqti
F2
S.P. Dubey et al. / Colloids and Su
S. aucuparia can easily be found everywhere in Europe and theestern portions of Asia and it is well known for its phenolic con-
ent [31–34], antibacterial [35] and antioxidant activity [36–38].ew other species of genus Sorbus exhibit antioxidant activity asell [35]. Sorbic acid, known as food preservative was first isolated
rom S. aucuparia, hence its name.Silver micro- and nanoparticles are well known disinfectant
eported in several reports [39,40]. Microbes cannot build upesistance against silver, as they are doing against conventionalnd narrow-target antibiotics, because the metal attacks a broadange of targets in the organisms, which means that they wouldave to develop a host of mutations simultaneously to protecthemselves [41]. Gold nanoparticles can be utilized in biosen-or devices for the detection of viruses and bacteria [42]. Therogress development and application of nanocolloids in medi-al science provide an entirely new scope for detecting variousilments [43].
In this paper we present rapid, simple synthesis of silver andold nanoparticles by reducing aqueous salt solutions of both theetals using leaves extract. Silver and gold nanoparticles can be
repared in a size range of 10–40 nm with less amounts of leaf
xtract and without adding chemicals and physical steps like cen-rifugation, sonication, annealing, etc. The effect of leaf extractuantity, concentration of metal solution, temperature and contactime were also evaluated to optimize the synthesis route produc-ng the metal nanoparticles. The stability of particles was evaluatedig. 1. Effect of leaf extract (LE) quantity (a) In AS synthesis; (b) In AA synthesis (c) TEM imL LE; AS3:AS at 3 mL LE; AA1:AA at 1 mL LE; AA2:AA at 2 mL LE; AA3:AA at 3 mL LE.
B: Biointerfaces 80 (2010) 26–33 27
at different pH with zeta potentiometer without any additionalstabilizing chemicals.
2. Materials and methods
Silver nitrate and Auric acid were obtained from Sigma–AldrichChemicals. All glasswares were washed with lavolene and distilledwater and dried in oven. Fresh leaves of S. aucuparia were collectedfrom Mikkeli City, Finland.
2.1. Preparation of leaf extract
The fresh leaf extract used for the synthesis was prepared from45 g of thoroughly washed leaves in a 500 mL Erlenmayer flask andboiled in 180 mL ultrapure water for 15 min. Next the extract wasfiltered with Whatman 40 filter paper and stored at −15 ◦C andcould be used within 1 week.
2.2. Development of silver and gold nanoparticles
10−3 M aqueous solution of silver nitrate and auric acid were
reduced using 1 mL of leaf extract at room temperature for 15 min,resulting in a brown–yellow and pink–red solution indicating, theformation of silver (AS) and gold (AA) nanoparticles, respectively[44,45]. Each set of experiments was conducted in triplicate to cal-culate the standard deviation. ICP spectroscopy was carried out tomages of AS and AA at different leaf extract quantity, AS1:AS at 1 mL LE; AS2:AS at

28 S.P. Dubey et al. / Colloids and Surfaces B: Biointerfaces 80 (2010) 26–33
Table 1Effect of leaf extract quantity (temperature: 25 ◦C; contact time: 4 h; n = 3).
Leaf extract quantity (mL) Silver Gold
C0 (mg/L) Cf (mg/L) Q SD C0 (mg/L) Cf (mg/L) Q SD
0.5 110 94 15 0.91 205 62 70 0.491.0 110 66 39 0.52 205 31 85 0.561.5 110 42 61 1.39 205 22 89 0.282.0 110 38 65 0.52 205 20 90 0.492.5 110 35 69 1.05 205 13 94 0.563.0 110 32 71 0.69 205 11 95 0.49
F M imaA onc; A
den
Q
w(n
2
2
Lat
trum.
2.3.2. TEM analysis of silver nanoparticlesTransmission Electron Microscopic (TEM) analysis was done by
using a TEM, JEM-1200EX, JEOL Ltd., Japan. Copper grid were coated
Table 2Effect of metal concentration (temperature: 25 ◦C; contact time: 4 h; leaf extractquantity: 1 mL; volume of metal ion: 54 mL; n = 3).
Silver Gold
ig. 2. Effect of metal concentration (a) In AS synthesis; (b) In AA synthesis; (c) TES2:AS at 1 mM silver conc; AS3:AS at 10 mM silver conc; AA1:AA at 0.1 mM gold c
etermine remaining concentration of silver and gold ions afterquilibrium time. Percentage conversion of metal ion to metalanoparticles can be calculated by the following equation:
=(
C0 − Cf
C0
)× 100 (1)
here C0 and Cf are the intial and final concentration of metal ionmg/L), and Q is the percentage conversion of metal ion to metalanoparticles.
.3. Characterizations of the synthesized nanoparticles
.3.1. UV–vis spectra analysisUV–vis spectral analysis was done by using a PerkinElmer
amda-45 spectrophotometer. The development of nanoparticlest different leaf extract quantity, silver and gold solution concen-ration, temperature and contact time was observed by UV–vis
ges of AS and AA at different metal concentrations, AS1:AS at 0.1 mM silver conc;A2:AA at 1 mM gold conc; AA3: AA at 10 mM gold conc.
spectroscopy measurements of the reaction medium. Naturallysynthesized silver and gold nanoparticles of diameters (10–40 nm)gave sharp peaks in the visible region of the electromagnetic spec-
C0 (mg/L) Cf (mg/L) Q SD C0 (mg/L) Cf (mg/L) Q SD
14 6 60 4.12 19 12 38 0.03110 66 40 0.91 205 35 83 0.01
1117 892 20 0.18 2122 1734 18 0.01
S.P. Dubey et al. / Colloids and Surfaces B: Biointerfaces 80 (2010) 26–33 29
Table 3Effect of temperature (contact time: 15 min; leaf extract quantity: 1 mL; n = 3).
Temperature (◦C) Silver Gold
C0 (mg/L) Cf (mg/L) Q SD C0 (mg/L) Cf (mg/L) Q SD
25 110 71 36 0.53 205 66 68 0.5650 110 44 60 0.91 205 41 80 0.56
100 110 36 67 0.52 205 40 81 0.75150 110 21 81 0.90 205 27 87 0.49
Table 4Effect of contact time (temperature: 25 ◦C; leaf extract quantity: 1 mL; n = 3).
Contact time Silver Gold
C0 (mg/L) Cf (mg/L) Q SD C0 (mg/L) Cf (mg/L) Q SD
15 min 110 85 23 0.95 205 87 58 0.491 h 110 71 36 1.52 205 71 65 1.032 h 110 64 42 1.00 205 44 78 1.25
010
wcek
2
ew
2
i
◦
3 h 110 48 564 h 110 42 62
24 h 110 42 62
ith carbon then 3 �L of the sample was placed on the carbonoated copper grid, making a thin film of sample on the grid andxtra sample was removed using the cone of a blotting paper andept in grid box.
.3.3. Zeta potentiometerStability of gold and silver nanoparticles was analyzed at differ-
nt pH using Malvern Zetasizer (ZEN, 3600). The pH of the solution
as varied using 1N HCl and 1N NaOH, respectively..3.4. Powder X-ray diffractionThe X-ray powder diffraction data was measured with PANalyt-
cal X’Pert PRO diffractometer in Bragg–Brentano geometry using
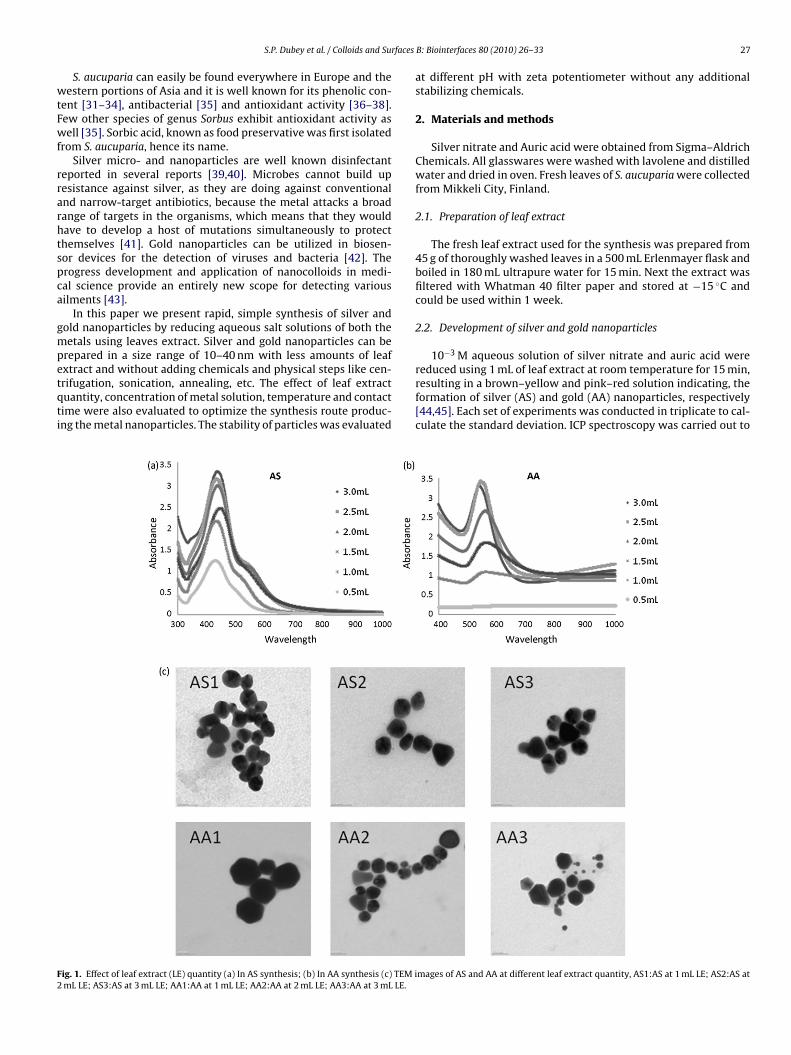
Fig. 3. Effect of temperature (a) In AS synthesis; (b) In AA synthesis.
.91 205 34 83 0.29
.04 205 31 85 1.03
.50 205 27 87 0.75
step-scan technique and Johansson monochromator to producepure Cu K�1 radiation (1.5406 Å; 45 kV, 30 mA). The data was col-lected by X’Celerator detector using continuous scanning mode in2� range of 8–120◦ with a step size of 0.033◦ and counting timesof 240 s per step. Programmable divergence slit (PDS) was usedin automatic mode to set irradiated length of sample to 10 mmtogether with fixed 10 mm incident beam mask. Soller slits of0.02◦ rad were used on incident and diffracted beam sides together
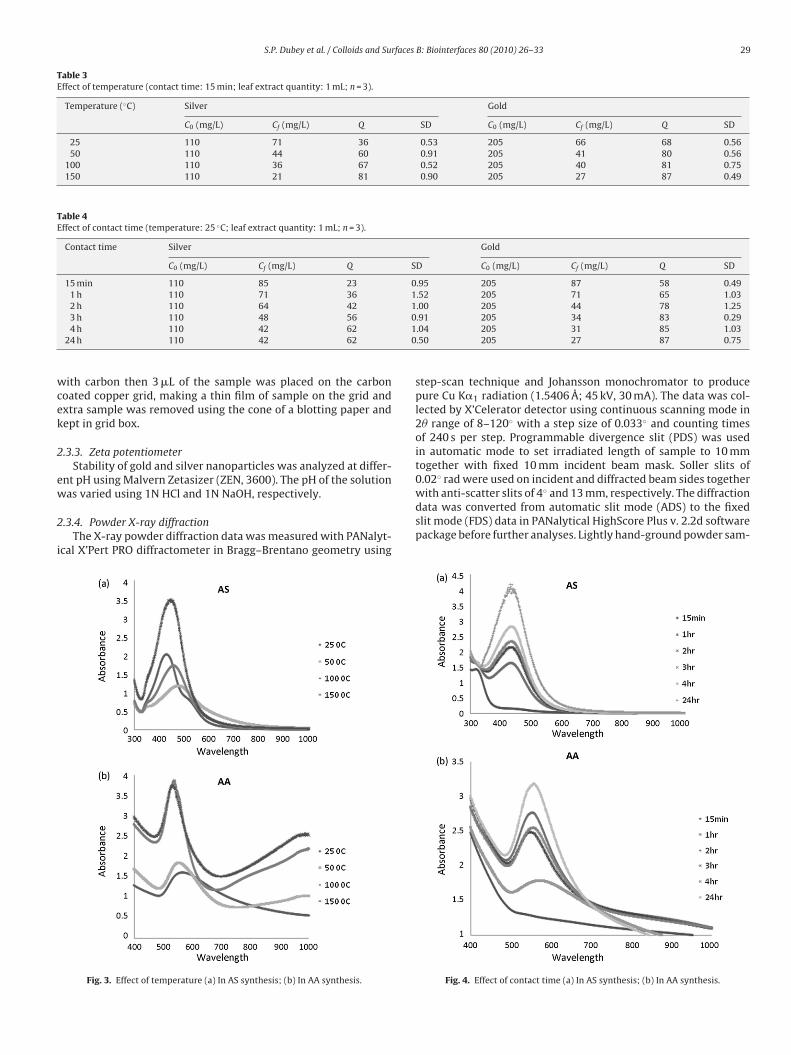
with anti-scatter slits of 4 and 13 mm, respectively. The diffractiondata was converted from automatic slit mode (ADS) to the fixedslit mode (FDS) data in PANalytical HighScore Plus v. 2.2d softwarepackage before further analyses. Lightly hand-ground powder sam-Fig. 4. Effect of contact time (a) In AS synthesis; (b) In AA synthesis.
3 faces
ppttfmewn
2
ut
2
Bmistawt
Fo
0 S.P. Dubey et al. / Colloids and Sur
le was prepared on a silicon-made zero-background holder usingetrolatum jelly as an adhesive. The ICDD PDF-2 powder diffrac-ion database [46] implemented in HighScore Plus was used forhe search-match phase identification analyses. The pseudo-Voigtunction was used in profile fitting to obtain the full-width at half-
aximum (FWHM) of the diffraction peaks needed for crystal sizevaluation by Scherrer equation. Powder samples for the analysisere prepared by drying the resulting solutions of the developedanoparticles of silver and gold at 80 ◦C.
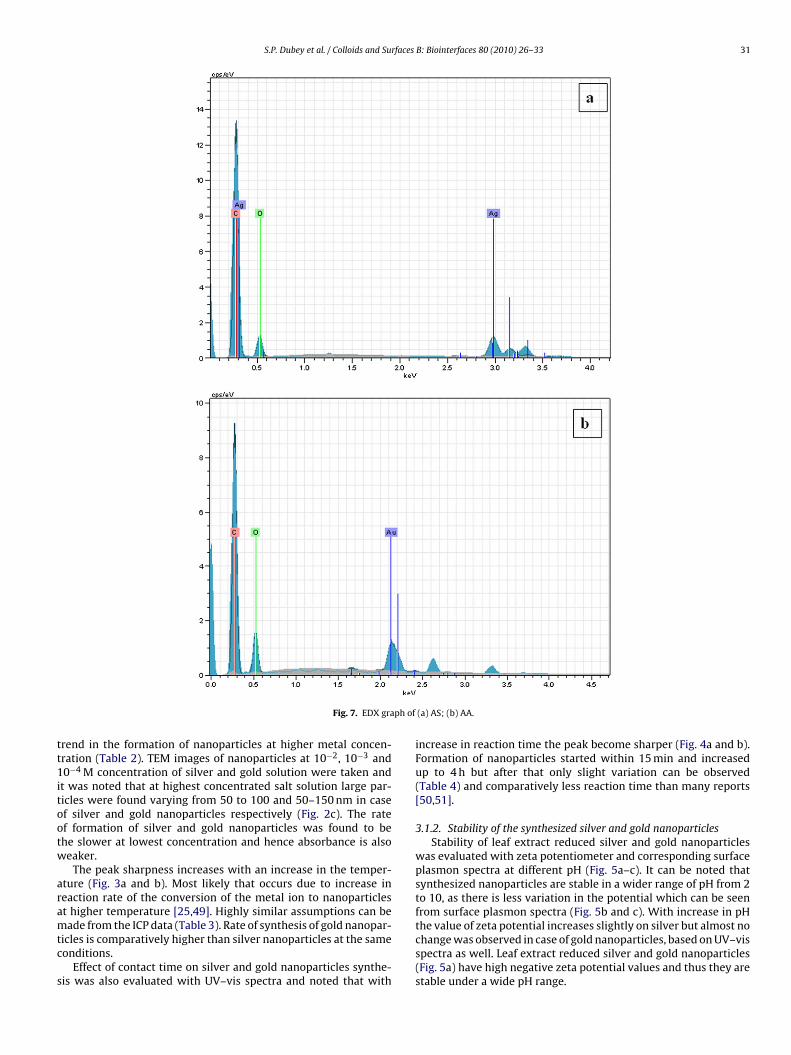
.3.5. EDX analysisThe presence of elemental silver and gold was determined by
sing EDX Zeiss Evo 50. The samples were dried at room tempera-ure and then analyzed for samples composition.
.3.6. FTIR spectroscopyFTIR spectra of hand-ground samples were measured using
ruker Tensor 27 FTIR spectrometer in attenuated total reflectionode (Pike Technologies, GladiaATR for FTIR with diamond crystal)
n the range of 4000–400 cm−1 with resolution of 4 cm−1. Powderamples for the FTIR was prepared similarly as for powder diffrac-
ion measurements. The FTIR spectra of leaf extracts taken beforend after synthesis of silver and gold nanoparticles were analyzedhich discussed for the possible functional groups for the forma-ion of silver and gold nanoparticles.
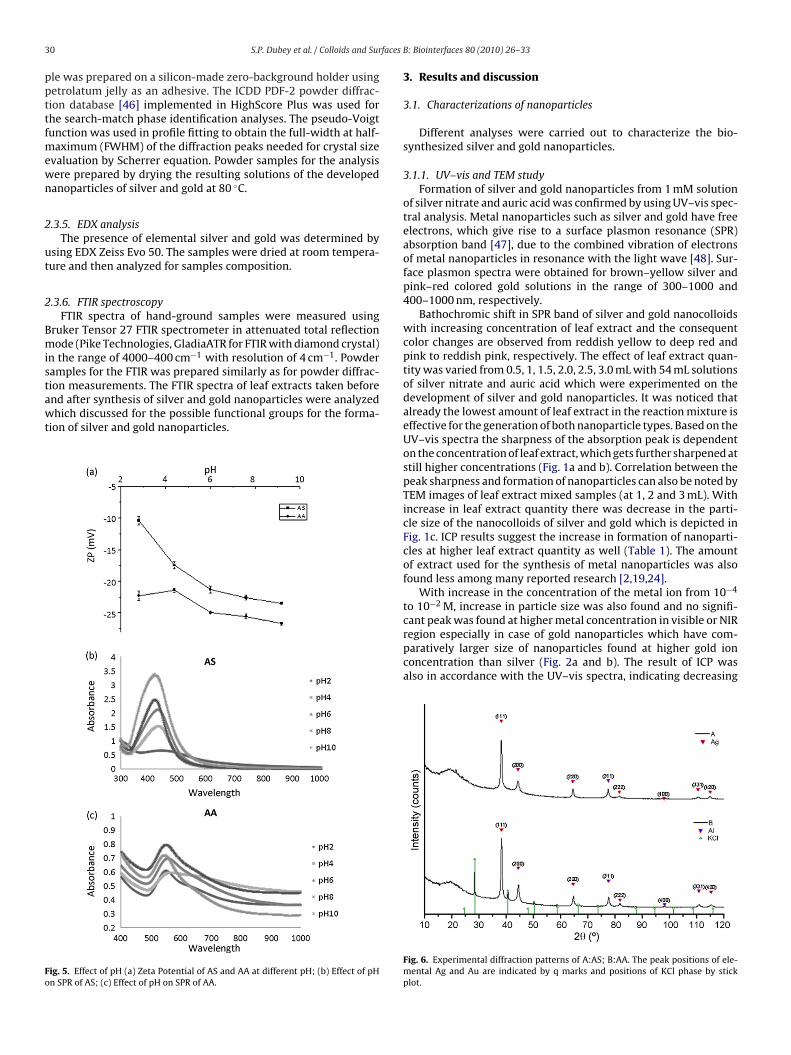
ig. 5. Effect of pH (a) Zeta Potential of AS and AA at different pH; (b) Effect of pHn SPR of AS; (c) Effect of pH on SPR of AA.
B: Biointerfaces 80 (2010) 26–33
3. Results and discussion
3.1. Characterizations of nanoparticles
Different analyses were carried out to characterize the bio-synthesized silver and gold nanoparticles.
3.1.1. UV–vis and TEM studyFormation of silver and gold nanoparticles from 1 mM solution
of silver nitrate and auric acid was confirmed by using UV–vis spec-tral analysis. Metal nanoparticles such as silver and gold have freeelectrons, which give rise to a surface plasmon resonance (SPR)absorption band [47], due to the combined vibration of electronsof metal nanoparticles in resonance with the light wave [48]. Sur-face plasmon spectra were obtained for brown–yellow silver andpink–red colored gold solutions in the range of 300–1000 and400–1000 nm, respectively.
Bathochromic shift in SPR band of silver and gold nanocolloidswith increasing concentration of leaf extract and the consequentcolor changes are observed from reddish yellow to deep red andpink to reddish pink, respectively. The effect of leaf extract quan-tity was varied from 0.5, 1, 1.5, 2.0, 2.5, 3.0 mL with 54 mL solutionsof silver nitrate and auric acid which were experimented on thedevelopment of silver and gold nanoparticles. It was noticed thatalready the lowest amount of leaf extract in the reaction mixture iseffective for the generation of both nanoparticle types. Based on theUV–vis spectra the sharpness of the absorption peak is dependenton the concentration of leaf extract, which gets further sharpened atstill higher concentrations (Fig. 1a and b). Correlation between thepeak sharpness and formation of nanoparticles can also be noted byTEM images of leaf extract mixed samples (at 1, 2 and 3 mL). Withincrease in leaf extract quantity there was decrease in the parti-cle size of the nanocolloids of silver and gold which is depicted inFig. 1c. ICP results suggest the increase in formation of nanoparti-cles at higher leaf extract quantity as well (Table 1). The amountof extract used for the synthesis of metal nanoparticles was alsofound less among many reported research [2,19,24].
With increase in the concentration of the metal ion from 10−4
to 10−2 M, increase in particle size was also found and no signifi-
cant peak was found at higher metal concentration in visible or NIRregion especially in case of gold nanoparticles which have com-paratively larger size of nanoparticles found at higher gold ionconcentration than silver (Fig. 2a and b). The result of ICP wasalso in accordance with the UV–vis spectra, indicating decreasingFig. 6. Experimental diffraction patterns of A:AS; B:AA. The peak positions of ele-mental Ag and Au are indicated by q marks and positions of KCl phase by stickplot.
S.P. Dubey et al. / Colloids and Surfaces B: Biointerfaces 80 (2010) 26–33 31
ph of
tt1itootw
aramtc
s
Fig. 7. EDX gra
rend in the formation of nanoparticles at higher metal concen-ration (Table 2). TEM images of nanoparticles at 10−2, 10−3 and0−4 M concentration of silver and gold solution were taken and
t was noted that at highest concentrated salt solution large par-icles were found varying from 50 to 100 and 50–150 nm in casef silver and gold nanoparticles respectively (Fig. 2c). The ratef formation of silver and gold nanoparticles was found to behe slower at lowest concentration and hence absorbance is alsoeaker.
The peak sharpness increases with an increase in the temper-ture (Fig. 3a and b). Most likely that occurs due to increase ineaction rate of the conversion of the metal ion to nanoparticlest higher temperature [25,49]. Highly similar assumptions can be
ade from the ICP data (Table 3). Rate of synthesis of gold nanopar-icles is comparatively higher than silver nanoparticles at the sameonditions.
Effect of contact time on silver and gold nanoparticles synthe-is was also evaluated with UV–vis spectra and noted that with
(a) AS; (b) AA.
increase in reaction time the peak become sharper (Fig. 4a and b).Formation of nanoparticles started within 15 min and increasedup to 4 h but after that only slight variation can be observed(Table 4) and comparatively less reaction time than many reports[50,51].
3.1.2. Stability of the synthesized silver and gold nanoparticlesStability of leaf extract reduced silver and gold nanoparticles
was evaluated with zeta potentiometer and corresponding surfaceplasmon spectra at different pH (Fig. 5a–c). It can be noted thatsynthesized nanoparticles are stable in a wider range of pH from 2to 10, as there is less variation in the potential which can be seenfrom surface plasmon spectra (Fig. 5b and c). With increase in pH
the value of zeta potential increases slightly on silver but almost nochange was observed in case of gold nanoparticles, based on UV–visspectra as well. Leaf extract reduced silver and gold nanoparticles(Fig. 5a) have high negative zeta potential values and thus they arestable under a wide pH range.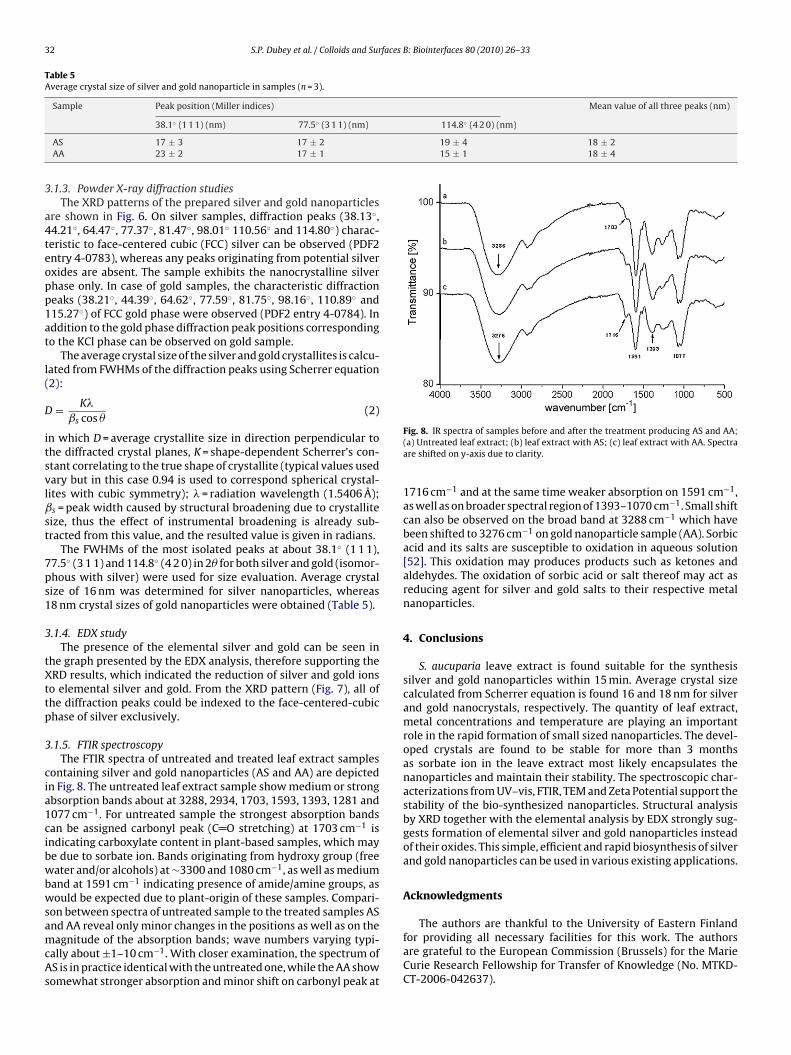
32 S.P. Dubey et al. / Colloids and Surfaces B: Biointerfaces 80 (2010) 26–33
Table 5Average crystal size of silver and gold nanoparticle in samples (n = 3).
Sample Peak position (Miller indices) Mean value of all three peaks (nm)
114.8◦ (4 2 0) (nm)
19 ± 4 18 ± 215 ± 1 18 ± 4
3
a4teopp1at
l(
D
itsvlˇst
7ps1
3
tXttp
3
cia1cibwbwsamcAs
38.1◦ (1 1 1) (nm) 77.5◦ (3 1 1) (nm)
AS 17 ± 3 17 ± 2AA 23 ± 2 17 ± 1
.1.3. Powder X-ray diffraction studiesThe XRD patterns of the prepared silver and gold nanoparticles
re shown in Fig. 6. On silver samples, diffraction peaks (38.13◦,4.21◦, 64.47◦, 77.37◦, 81.47◦, 98.01◦ 110.56◦ and 114.80◦) charac-eristic to face-centered cubic (FCC) silver can be observed (PDF2ntry 4-0783), whereas any peaks originating from potential silverxides are absent. The sample exhibits the nanocrystalline silverhase only. In case of gold samples, the characteristic diffractioneaks (38.21◦, 44.39◦, 64.62◦, 77.59◦, 81.75◦, 98.16◦, 110.89◦ and15.27◦) of FCC gold phase were observed (PDF2 entry 4-0784). Inddition to the gold phase diffraction peak positions correspondingo the KCl phase can be observed on gold sample.
The average crystal size of the silver and gold crystallites is calcu-ated from FWHMs of the diffraction peaks using Scherrer equation2):
= K�
ˇs cos �(2)
n which D = average crystallite size in direction perpendicular tohe diffracted crystal planes, K = shape-dependent Scherrer’s con-tant correlating to the true shape of crystallite (typical values usedary but in this case 0.94 is used to correspond spherical crystal-ites with cubic symmetry); � = radiation wavelength (1.5406 Å);s = peak width caused by structural broadening due to crystalliteize, thus the effect of instrumental broadening is already sub-racted from this value, and the resulted value is given in radians.
The FWHMs of the most isolated peaks at about 38.1◦ (1 1 1),7.5◦ (3 1 1) and 114.8◦ (4 2 0) in 2� for both silver and gold (isomor-hous with silver) were used for size evaluation. Average crystalize of 16 nm was determined for silver nanoparticles, whereas8 nm crystal sizes of gold nanoparticles were obtained (Table 5).
.1.4. EDX studyThe presence of the elemental silver and gold can be seen in
he graph presented by the EDX analysis, therefore supporting theRD results, which indicated the reduction of silver and gold ions
o elemental silver and gold. From the XRD pattern (Fig. 7), all ofhe diffraction peaks could be indexed to the face-centered-cubichase of silver exclusively.
.1.5. FTIR spectroscopyThe FTIR spectra of untreated and treated leaf extract samples
ontaining silver and gold nanoparticles (AS and AA) are depictedn Fig. 8. The untreated leaf extract sample show medium or strongbsorption bands about at 3288, 2934, 1703, 1593, 1393, 1281 and077 cm−1. For untreated sample the strongest absorption bandsan be assigned carbonyl peak (C O stretching) at 1703 cm−1 isndicating carboxylate content in plant-based samples, which maye due to sorbate ion. Bands originating from hydroxy group (freeater and/or alcohols) at ∼3300 and 1080 cm−1, as well as medium
and at 1591 cm−1 indicating presence of amide/amine groups, asould be expected due to plant-origin of these samples. Compari-
on between spectra of untreated sample to the treated samples AS
nd AA reveal only minor changes in the positions as well as on theagnitude of the absorption bands; wave numbers varying typi-ally about ±1–10 cm−1. With closer examination, the spectrum ofS is in practice identical with the untreated one, while the AA showomewhat stronger absorption and minor shift on carbonyl peak at
Fig. 8. IR spectra of samples before and after the treatment producing AS and AA;(a) Untreated leaf extract; (b) leaf extract with AS; (c) leaf extract with AA. Spectraare shifted on y-axis due to clarity.
1716 cm−1 and at the same time weaker absorption on 1591 cm−1,as well as on broader spectral region of 1393–1070 cm−1. Small shiftcan also be observed on the broad band at 3288 cm−1 which havebeen shifted to 3276 cm−1 on gold nanoparticle sample (AA). Sorbicacid and its salts are susceptible to oxidation in aqueous solution[52]. This oxidation may produces products such as ketones andaldehydes. The oxidation of sorbic acid or salt thereof may act asreducing agent for silver and gold salts to their respective metalnanoparticles.
4. Conclusions
S. aucuparia leave extract is found suitable for the synthesissilver and gold nanoparticles within 15 min. Average crystal sizecalculated from Scherrer equation is found 16 and 18 nm for silverand gold nanocrystals, respectively. The quantity of leaf extract,metal concentrations and temperature are playing an importantrole in the rapid formation of small sized nanoparticles. The devel-oped crystals are found to be stable for more than 3 monthsas sorbate ion in the leave extract most likely encapsulates thenanoparticles and maintain their stability. The spectroscopic char-acterizations from UV–vis, FTIR, TEM and Zeta Potential support thestability of the bio-synthesized nanoparticles. Structural analysisby XRD together with the elemental analysis by EDX strongly sug-gests formation of elemental silver and gold nanoparticles insteadof their oxides. This simple, efficient and rapid biosynthesis of silverand gold nanoparticles can be used in various existing applications.
Acknowledgments
The authors are thankful to the University of Eastern Finland
for providing all necessary facilities for this work. The authorsare grateful to the European Commission (Brussels) for the MarieCurie Research Fellowship for Transfer of Knowledge (No. MTKD-CT-2006-042637).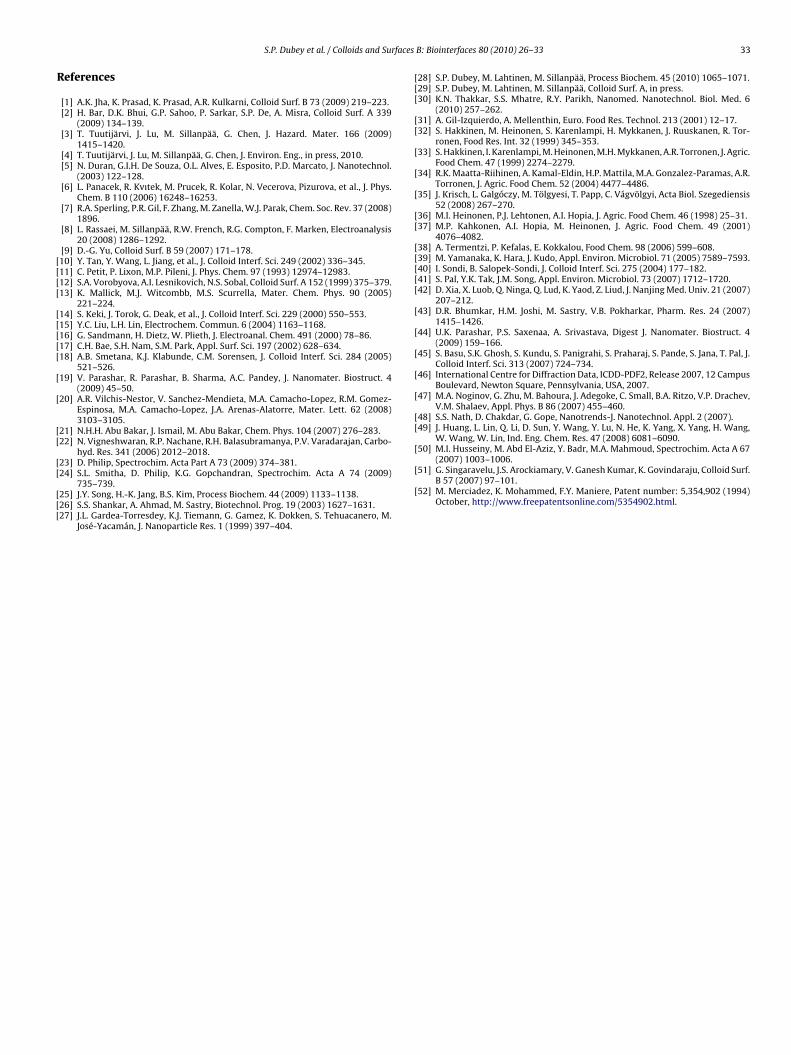
rfaces
R
[[[[
[[[[[
[
[
[[
[[
[[[
[[[
[[
[
[
[
[[
[[[[[
[
[
[
[
[
[[
[50] M.I. Husseiny, M. Abd El-Aziz, Y. Badr, M.A. Mahmoud, Spectrochim. Acta A 67(2007) 1003–1006.
S.P. Dubey et al. / Colloids and Su
eferences
[1] A.K. Jha, K. Prasad, K. Prasad, A.R. Kulkarni, Colloid Surf. B 73 (2009) 219–223.[2] H. Bar, D.K. Bhui, G.P. Sahoo, P. Sarkar, S.P. De, A. Misra, Colloid Surf. A 339
(2009) 134–139.[3] T. Tuutijärvi, J. Lu, M. Sillanpää, G. Chen, J. Hazard. Mater. 166 (2009)
1415–1420.[4] T. Tuutijärvi, J. Lu, M. Sillanpää, G. Chen, J. Environ. Eng., in press, 2010.[5] N. Duran, G.I.H. De Souza, O.L. Alves, E. Esposito, P.D. Marcato, J. Nanotechnol.
(2003) 122–128.[6] L. Panacek, R. Kvıtek, M. Prucek, R. Kolar, N. Vecerova, Pizurova, et al., J. Phys.
Chem. B 110 (2006) 16248–16253.[7] R.A. Sperling, P.R. Gil, F. Zhang, M. Zanella, W.J. Parak, Chem. Soc. Rev. 37 (2008)
1896.[8] L. Rassaei, M. Sillanpää, R.W. French, R.G. Compton, F. Marken, Electroanalysis
20 (2008) 1286–1292.[9] D.-G. Yu, Colloid Surf. B 59 (2007) 171–178.10] Y. Tan, Y. Wang, L. Jiang, et al., J. Colloid Interf. Sci. 249 (2002) 336–345.11] C. Petit, P. Lixon, M.P. Pileni, J. Phys. Chem. 97 (1993) 12974–12983.12] S.A. Vorobyova, A.I. Lesnikovich, N.S. Sobal, Colloid Surf. A 152 (1999) 375–379.13] K. Mallick, M.J. Witcombb, M.S. Scurrella, Mater. Chem. Phys. 90 (2005)
221–224.14] S. Keki, J. Torok, G. Deak, et al., J. Colloid Interf. Sci. 229 (2000) 550–553.15] Y.C. Liu, L.H. Lin, Electrochem. Commun. 6 (2004) 1163–1168.16] G. Sandmann, H. Dietz, W. Plieth, J. Electroanal. Chem. 491 (2000) 78–86.17] C.H. Bae, S.H. Nam, S.M. Park, Appl. Surf. Sci. 197 (2002) 628–634.18] A.B. Smetana, K.J. Klabunde, C.M. Sorensen, J. Colloid Interf. Sci. 284 (2005)
521–526.19] V. Parashar, R. Parashar, B. Sharma, A.C. Pandey, J. Nanomater. Biostruct. 4
(2009) 45–50.20] A.R. Vilchis-Nestor, V. Sanchez-Mendieta, M.A. Camacho-Lopez, R.M. Gomez-
Espinosa, M.A. Camacho-Lopez, J.A. Arenas-Alatorre, Mater. Lett. 62 (2008)3103–3105.
21] N.H.H. Abu Bakar, J. Ismail, M. Abu Bakar, Chem. Phys. 104 (2007) 276–283.22] N. Vigneshwaran, R.P. Nachane, R.H. Balasubramanya, P.V. Varadarajan, Carbo-
hyd. Res. 341 (2006) 2012–2018.23] D. Philip, Spectrochim. Acta Part A 73 (2009) 374–381.
24] S.L. Smitha, D. Philip, K.G. Gopchandran, Spectrochim. Acta A 74 (2009)735–739.25] J.Y. Song, H.-K. Jang, B.S. Kim, Process Biochem. 44 (2009) 1133–1138.26] S.S. Shankar, A. Ahmad, M. Sastry, Biotechnol. Prog. 19 (2003) 1627–1631.27] J.L. Gardea-Torresdey, K.J. Tiemann, G. Gamez, K. Dokken, S. Tehuacanero, M.
José-Yacamán, J. Nanoparticle Res. 1 (1999) 397–404.
[
[
B: Biointerfaces 80 (2010) 26–33 33
28] S.P. Dubey, M. Lahtinen, M. Sillanpää, Process Biochem. 45 (2010) 1065–1071.29] S.P. Dubey, M. Lahtinen, M. Sillanpää, Colloid Surf. A, in press.30] K.N. Thakkar, S.S. Mhatre, R.Y. Parikh, Nanomed. Nanotechnol. Biol. Med. 6
(2010) 257–262.31] A. Gil-Izquierdo, A. Mellenthin, Euro. Food Res. Technol. 213 (2001) 12–17.32] S. Hakkinen, M. Heinonen, S. Karenlampi, H. Mykkanen, J. Ruuskanen, R. Tor-
ronen, Food Res. Int. 32 (1999) 345–353.33] S. Hakkinen, I. Karenlampi, M. Heinonen, M.H. Mykkanen, A.R. Torronen, J. Agric.
Food Chem. 47 (1999) 2274–2279.34] R.K. Maatta-Riihinen, A. Kamal-Eldin, H.P. Mattila, M.A. Gonzalez-Paramas, A.R.
Torronen, J. Agric. Food Chem. 52 (2004) 4477–4486.35] J. Krisch, L. Galgóczy, M. Tölgyesi, T. Papp, C. Vágvölgyi, Acta Biol. Szegediensis
52 (2008) 267–270.36] M.I. Heinonen, P.J. Lehtonen, A.I. Hopia, J. Agric. Food Chem. 46 (1998) 25–31.37] M.P. Kahkonen, A.I. Hopia, M. Heinonen, J. Agric. Food Chem. 49 (2001)
4076–4082.38] A. Termentzi, P. Kefalas, E. Kokkalou, Food Chem. 98 (2006) 599–608.39] M. Yamanaka, K. Hara, J. Kudo, Appl. Environ. Microbiol. 71 (2005) 7589–7593.40] I. Sondi, B. Salopek-Sondi, J. Colloid Interf. Sci. 275 (2004) 177–182.41] S. Pal, Y.K. Tak, J.M. Song, Appl. Environ. Microbiol. 73 (2007) 1712–1720.42] D. Xia, X. Luob, Q. Ninga, Q. Lud, K. Yaod, Z. Liud, J. Nanjing Med. Univ. 21 (2007)
207–212.43] D.R. Bhumkar, H.M. Joshi, M. Sastry, V.B. Pokharkar, Pharm. Res. 24 (2007)
1415–1426.44] U.K. Parashar, P.S. Saxenaa, A. Srivastava, Digest J. Nanomater. Biostruct. 4
(2009) 159–166.45] S. Basu, S.K. Ghosh, S. Kundu, S. Panigrahi, S. Praharaj, S. Pande, S. Jana, T. Pal, J.
Colloid Interf. Sci. 313 (2007) 724–734.46] International Centre for Diffraction Data, ICDD-PDF2, Release 2007, 12 Campus
Boulevard, Newton Square, Pennsylvania, USA, 2007.47] M.A. Noginov, G. Zhu, M. Bahoura, J. Adegoke, C. Small, B.A. Ritzo, V.P. Drachev,
V.M. Shalaev, Appl. Phys. B 86 (2007) 455–460.48] S.S. Nath, D. Chakdar, G. Gope, Nanotrends-J. Nanotechnol. Appl. 2 (2007).49] J. Huang, L. Lin, Q. Li, D. Sun, Y. Wang, Y. Lu, N. He, K. Yang, X. Yang, H. Wang,
W. Wang, W. Lin, Ind. Eng. Chem. Res. 47 (2008) 6081–6090.
51] G. Singaravelu, J.S. Arockiamary, V. Ganesh Kumar, K. Govindaraju, Colloid Surf.B 57 (2007) 97–101.
52] M. Merciadez, K. Mohammed, F.Y. Maniere, Patent number: 5,354,902 (1994)October, http://www.freepatentsonline.com/5354902.html.
Copyright © 2022 FDOKUMEN