Treating spondyloarthritis, including ankylosing spondylitis ...
Bwi
CD
a
ARRA
KFPBSC
1
lyd2lsattesetp
c
h0
Ecological Engineering 70 (2014) 422–428
Contents lists available at ScienceDirect
Ecological Engineering
journa l h om epa ge: www.elsev ier .com/ locate /eco leng
iomass production and soil organic carbon accumulation in a freeater surface constructed wetland treating agricultural wastewater
n North Eastern Italy
armelo Maucieri ∗, Michela Salvato, Jessica Tamiazzo, Maurizio Borinepartment of Agronomy, Food, Natural Resources, Animals and the Environment, University of Padua, Viale dell’Università 16, 35020 Legnaro, PD, Italy
r t i c l e i n f o
rticle history:eceived 16 January 2014eceived in revised form 6 May 2014ccepted 23 June 2014
eywords:luctuating hydroperiodhragmites australis Cav. (Trin.)iomass partition
a b s t r a c t
Free water surface constructed wetlands (FWSs) play an important role in wastewater pollutants removaland, at the same time, vegetated wetlands can act as carbon sinks.
In this study we measured biomass production and soil carbon content variations over five years in aFWS with fluctuating hydroperiod treating agricultural drainage water to evaluate its role in the carbondioxide cycle.
During the study flooding occurred with a yearly average of 28 days. Annual dry matter production,from 2008 to 2011, ranged between 50 and 60 Mg ha−1. The highest C storage was concentrated in thebelowground biomass. 83% of total belowground biomass was measured in the 0–20 cm soil layer. During
oil bulk densityO2 sink
the 2007–2012 period the organic carbon (OC) concentration in the 0–20 cm soil layer slightly increasedfrom 12.3 to 13.1 g kg−1 and bulk density from 1.38 to 1.66 Mg m−3. In the 20–50 cm soil layer, monitoredonly in 2009 and 2012, OC concentration was lower and steady (8.8 g kg−1). The total soil C accumulationin the five years was 110.73 Mg ha−1 of equivalent CO2(eq). Given the positive C balance FWSs can beconsidered a CO2 sink.
© 2014 Elsevier B.V. All rights reserved.
am2
r2mfdrh2(t
. Introduction
Wetlands are complex ecosystems, characterized by water-ogged or standing water conditions during at least part of theear, found in all climatic zones ranging from the tropics to tun-ra and covering about 5% of the earth’s land area (Adhikari et al.,009). The anoxic wet conditions and high productivity of wet-
and ecosystems result in an optimum natural environment forequestering and storing carbon (C) from the atmosphere (Bernalnd Mitsch, 2012; Mitsch et al., 2013). Worldwide, these ecosys-ems have a total C stock amounting to about 20–25% of that inerrestrial soils, so play an important role in global C cycling (Zhangt al., 2008) associated with all aspects of the production and con-umption of both carbon dioxide (CO2) and methane (CH4) (Brix
t al., 2001). Therefore, due to their significant proportion of theerrestrial C pool (Trettin and Jurgensen, 2003; Lal, 2008), beingerhaps the largest sinks of C among the soil ecosystems (Choi∗ Corresponding author. Tel.: +39 0498272838; fax: +39 0498272839.E-mail addresses: [email protected],
[email protected] (C. Maucieri).
ibdi1gd1
ttp://dx.doi.org/10.1016/j.ecoleng.2014.06.020925-8574/© 2014 Elsevier B.V. All rights reserved.
nd Wang, 2004), wetlands are a key element to consider whenanaging and quantifying the earth’s C pool (Bernal and Mitsch,
008).Free water surface constructed wetlands (FWSs), capable of
emoving many contaminants from polluted waters (Maine et al.,007; O’Geen et al., 2010; Martín et al., 2013), are similar toany natural wetlands where plants are the most conspicuous
eature and where the development of complex ecosystems alsoepends on water conditions during the year. In FWSs, as in natu-al wetlands, C accumulation is influenced by many factors such asydrological regime, plant species, climatic conditions (Brix et al.,001; Davidson and Janssens, 2006), temperature, soil moistureAdhikari et al., 2009) and water nutrient content. Soil is one ofhe main elements affecting the processes in FWSs, since its chem-cal (e.g., organic carbon and total nitrogen) and physical (e.g.,ulk density) properties may influence pollutant fate to varyingegrees (Passoni et al., 2009). Nitrogen is often the most limit-
ng nutrient in natural or constructed wetlands (Downing et al.,
999), and organic matter dynamics are tightly coupled to the bio-eochemical cycle of nitrogen in wetland soils via the processes ofecomposition, mineralization and plant uptake (Chen and Twilley,999).
l Engineering 70 (2014) 422–428 423
nl
or(b
2
2
t1hoT−FwsTm1i
2
aT3otftcri4flpilba
mTdrsabs(
2
(Fm
m5sod
2
iEhb(tdd2eBo(b
wga
3
C. Maucieri et al. / Ecologica
Wetlands are therefore constructed or restored for removingutrients from surface water and at the same time vegetated wet-
ands can act as C sinks (de Klein and van der Werf, 2013).The purpose of this study was to evaluate in a fifteen years
ld FWS treating agriculture drainage with fluctuating hydrope-iod, the plant dry matter (DM) production and soil organic carbonOC) variations during the last five years of monitoring; the FWS Calance is also discussed.
. Materials and methods
.1. Site description
The FWS study began in the summer of 1996 at the Experimen-al Farm of Padua University at Legnaro, North-East Italy (458 21′ N;18 58′ E; 6 m a.s.l.) and is ongoing. The climate of the site is sub-umid (Köppen climate classification), with a mean annual rainfallf about 850 mm fairly uniformly distributed throughout the year.he temperature increases from January (average minimum value:1.5 ◦C) to July (average maximum: 27.2 ◦C). According to theAO-UNESCO classification, the soil is a fulvi-calcaric Cambisol,ith a loamy texture in the upper 80 cm; the percentage of
ilt gradually increases with depth, reaching 68–75% at 2–2.4 m.hroughout the study site, there is an upper layer of reduced per-eability (saturated hydraulic conductivity around 10−5 cm s−1) at
.5–1.8 m, and an impervious layer (saturated hydraulic conductiv-ty <10−6 cm s−1) at about 3 m.
.2. Wetland description and vegetation management
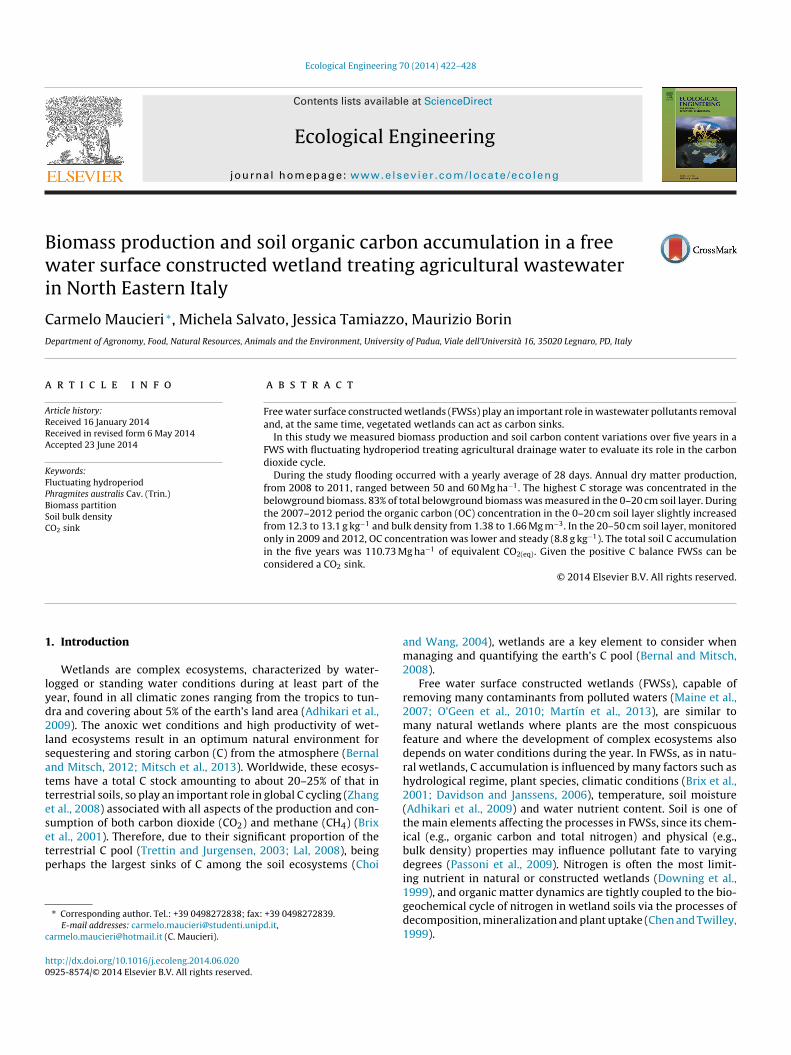
The FWS was excavated in 1996 as a single treatment cell forgricultural drainage water coming from 5.5 ha of cultivated land.he wetland is almost square in shape, with an area of about200 m2. The bottom is at 0.4 m below the field surface, with a slopef 3‰ from inlet point to outlet as a result of artificial removal ofhe upper soil profile and its surrounding embankment. The sur-ace and size of the FWS were calculated to guarantee a retentionime of at least 7 days, taking into account a 3-days cumulative dis-harge volume coming from the catchment area with a four-yearain return period. In 2007, before the beginning of the monitor-ng period referred to in this paper, three banks (0.25 m high and5 m long each) were erected in the wetland to direct the waterow from inlet to outlet (Fig. 1). At the outlet, an upward curvingipe, placed in a manhole, allows for a pipe of variable height to be
nserted to regulate the desired depth of water within the basin. Toimit lateral subsurface water flow to and from the FWS, geomem-rane waterproofing was installed vertically, to a depth of 1.5 mlong the cell perimeter.
The FWS was vegetated with cattail (Typha latifolia L.) and com-on reed (Phragmites australis (Cav.) Trin.ex Steud.) in spring 1997.
here was no vegetation harvest until 2007, so the biomass pro-uced remained in the wetland. Since January 2007, after FWSehabilitation, the vegetation has been composed almost exclu-ively of common reed; irrigation and nitrogen fertilization werepplied in summer 2008, 2009 and 2010 (Table 1) to study theiomass production with abundant nitrogen availability. Furtherpecifications are given in Borin et al. (2001), Borin and Tocchetto2007) and Passoni et al. (2009).
.3. Monitoring
During the study period (2007–2011) wetland water inflowfields drainage + rainfall + irrigation) and outflow were monitored.ields drainage was pumped into the FWS; two mechanical floweters recorded volumes at the wetland inlet and outlet. Flow
3
t
Fig. 1. Layout of the surface flow constructed wetland.
eter readings were taken daily. Rainfall was measured at about00 m distance from the FWS by the experimental farm weathertation. Irrigation volume was measured by the functioning timef the system and flow rate. Flooding days were also detected byaily monitoring.
.4. Vegetation and soil sampling and analysis
Eleven vegetation and soil sampling points were investigatedn the wetland at regular distances (18 m) from inflow to outflow.ach 0.25 m2 area was sampled to a depth of 0.5 m. P. australis wasarvested at the end of each vegetative season to determine plantiomass production separated in four fractions: (1) aerial; (2) litter;3) belowground 0–20 cm; (4) belowground 20–50 cm. To measurehe dry weight the biomass was dried to constant weight in a forcedraught oven at 65 ◦C. Soil data for 2007 were retrieved from aataset partially published in Passoni et al. (2009). In 2009 and012 soil samples were collected from each sampling point at thend of the vegetative season at two depths (0–20 and 20–50 cm).ulk density (Grossman and Reinsh, 2002) and OC by dichromatexidation (Walkley and Black, 1934) were determined in soil cores5 cm diameter). Total nitrogen content in biomass was determinedy Kjeldahl method (Arduino and Barberis, 2000).
Data of vegetation biomass as well as data of soil propertiesere compared with one-way ANOVA, and the differences between
roup means were tested using the Student–Newman–Keuls testt 5% significance level.
. Results and discussion
.1. Yearly water regime
During the monitoring period annual rainfall ranged from 601o 1150 mm with an average of 869 mm; the FWS received a yearly
424 C. Maucieri et al. / Ecological Engineering 70 (2014) 422–428
Table 1Inlet and outlet water depths (mm) in the wetland, flooding days and nitrogen added during the monitoring period.
2007 2008 2009 2010 2011 Average (±SD)
Rainfall (mm) 640 958 996 1150 601 869 ± 238Inlet (mm) 2831a 6435b 20,925b 11,194b 3690a 9015 ± 7414Total inlet (mm) 3471 7393 21,921 12,344 4291 9884 ± 7576Outlet (mm) 474 116 2680 2705 321 1259 ± 1315Drainage/rainfall 4.4 3.7 11.3 8.2 6.1 6.7 ± 3.1Flooding days 27 33 54 24 3 28 ± 18Nitrogen (Mg ha−1) 2.19 3.21 8.39 3.91 2.02 3.94 ± 2.60
ttad
2itdvdnts2
3
6iTtifi9chdpvtln
droot
pttatfot2mod
f(lapTs
dtbr2tias2aP
3
TW
a Only drainage.b Included irrigation.
otal average of 9884 mm, with values varying from 3471 (2007)o 21,921 mm (2009). Over the study period 8.8% of the aver-ge total FWS water supply came from rainfall and 91.2% fromrainage + irrigation.
The highest value of drainage–rainfall ratio was recorded in009 (11.3) while the lowest was in 2008 (3.7). Because of varying
nflow volumes the FWS water regime was discontinuous duringhe study period and flooding occurred on a variable number ofays per year with an average of 28. In 2011 field drainage wasery low due to little rainfall and the FWS was flooded on only 3ays. Although 2011 rainfall was comparable to 2007 the greaterumber of flooding days in the latter was due to rainfall distribu-ion, mainly the higher incidence of rainfall during winter and earlypring. The largest number of flooding days (54) was recorded in009, which had the highest total inlet (Table 1).
.2. Biomass production
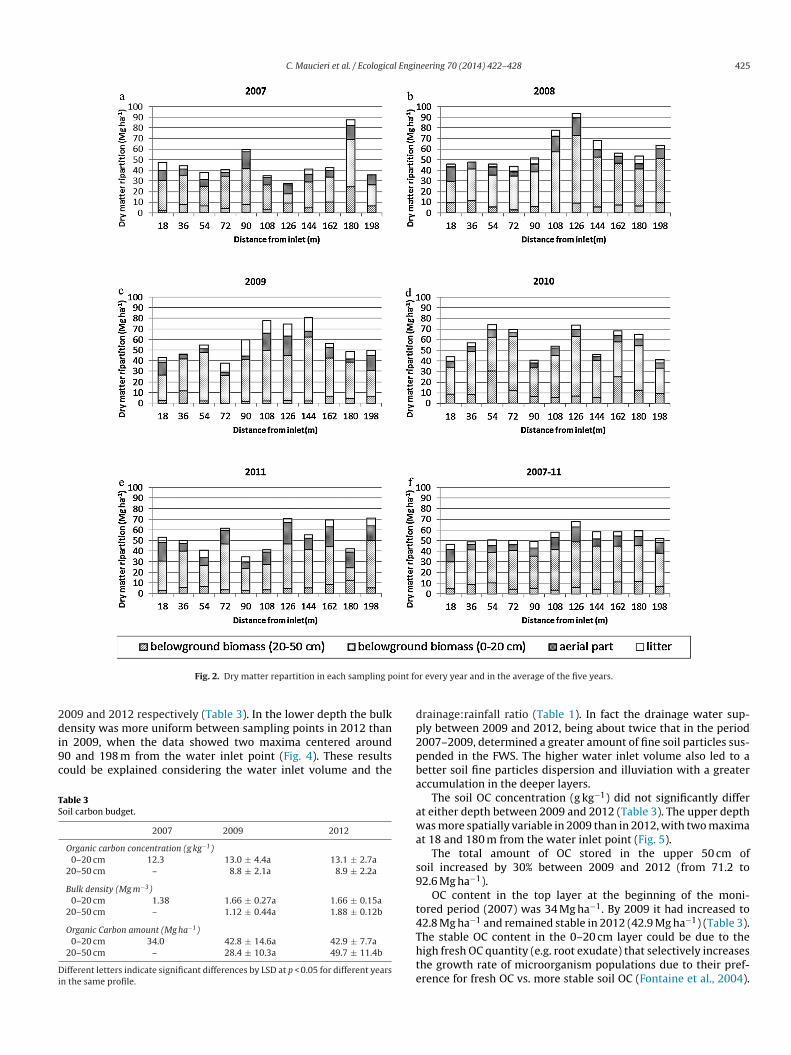
The yearly plant DM production ranged between 50 and0 Mg ha−1 from 2008 to 2011, being lower than 50 Mg ha−1 only
n 2007 (P. australis establishment phase after FWS rehabilitation).he DM production showed irregular annual variations in relationo the distance from the water inlet point (Fig. 2). On average dur-ng the study period the lowest DM production was recorded in therst half of the FWS, from the water inlet point up to a distance of0 m (≤50 Mg ha−1), except in 2007 and 2010 (Table 2). In the firstase the result is probably due to rehabilitation that determinedomogeneous vegetation conditions in the FWS area. In 2010 theifference between the two wetland sectors was not significantrobably because of the very high water and N inputs in the pre-ious year. In the other sampling years the differences may be dueo the FWS bottom slope that could have caused a greater accumu-ation of water and nutrients in the second half, with a higher totalitrogen uptake in the harvested biomass (Table 2).
The DM distribution among plant fractions showed significantifferences during the years, but was always mostly allocated in
hizomes and roots, which contained 75.3% of the total biomassn average (Fig. 3). The high N and water supply in 2009 (8.39 Mgf N ha−1 and almost 21,000 mm of total inlet water, both morehan twice the average yearly input of the wetland) did notn(t
able 2etland biomass production and nitrogen uptake.
Distance from inlet 2007 2008 2009
Biomass (Mg ha−1)0–90 m 45.8 ± 8.5 47.0 ± 3.0 48.4 ±108–198 m 44.8 ± 21.6 68.9 ± 14.9 64.7 ±Average 45.3 ± 16.2 59.0 ± 15.7 57.3 ±Nitrogen uptake (Mg ha−1)0–90 m 0.32 ± 0.06 0.34 ± 0.02 0.41 ±108–198 m 0.33 ± 0.17 0.51 ± 0.06 0.41 ±Average 0.33 ± 0.13 0.43 ± 0.10 0.41 ±
roduce a significant increase in DM aerial fraction at the end ofhe vegetative season with respect to previous years. On the con-rary, the litter fraction showed a significant increase (Fig. 3b), ingreement with Liu and Greaver (2010) who found that N addi-ion increased litter input. Litter increase can be explained by theact that higher N availability corresponds to a lower proportionf sclerenchyma, therefore reducing the bending strength of culmshat, due to mechanical effects, break down more easily (Engloner,009). The significantly highest aerial biomass recorded in 2011ay be related both to the greater root system biomass (devel-
ped in 2010) and the greater soil air availability (only 3 floodingays) which favors plant photosynthesis (Pezeshki, 2001).
During the five years, DM repartitioning was very dif-erent among the plant fractions. The highest average value41.2 Mg ha−1) was recorded for the belowground biomass, fol-owed by the aerial part (8.8 Mg ha−1) and litter (4.7 Mg ha−1), withn OC storage of 18.3 and 3.9 Mg ha−1 for belowground and aerialarts respectively, based upon a measured DM C content of 44.3%.he ratio of belowground to aboveground biomass was about 3.1,howing the rhizome to be the main organ for C storage.
Concerning the belowground biomass repartition in the twoepths (0–20 and 20–50 cm) the higher roots and rhizomes produc-ion was measured in the upper one with 83% of total belowgroundiomass. This is in agreement with Meuleman et al. (2002), whoeported that more than 75% of biomass was located in the top0 cm of soil. The high belowground biomass production is dueo: (1) the macrophyte present in the wetland, P. australis, whichs a summer green rhizomatous perennial plant in which thessimilates are allocated to belowground organs at the onset ofenescence, increasing the root and rhizome biomass (Borin et al.,001; Soetaert et al., 2004); (2) the high quantity of N supply, ingreement with Ravit et al. (2007) who reported more than doubledhragmites rhizome production under N enrichment.
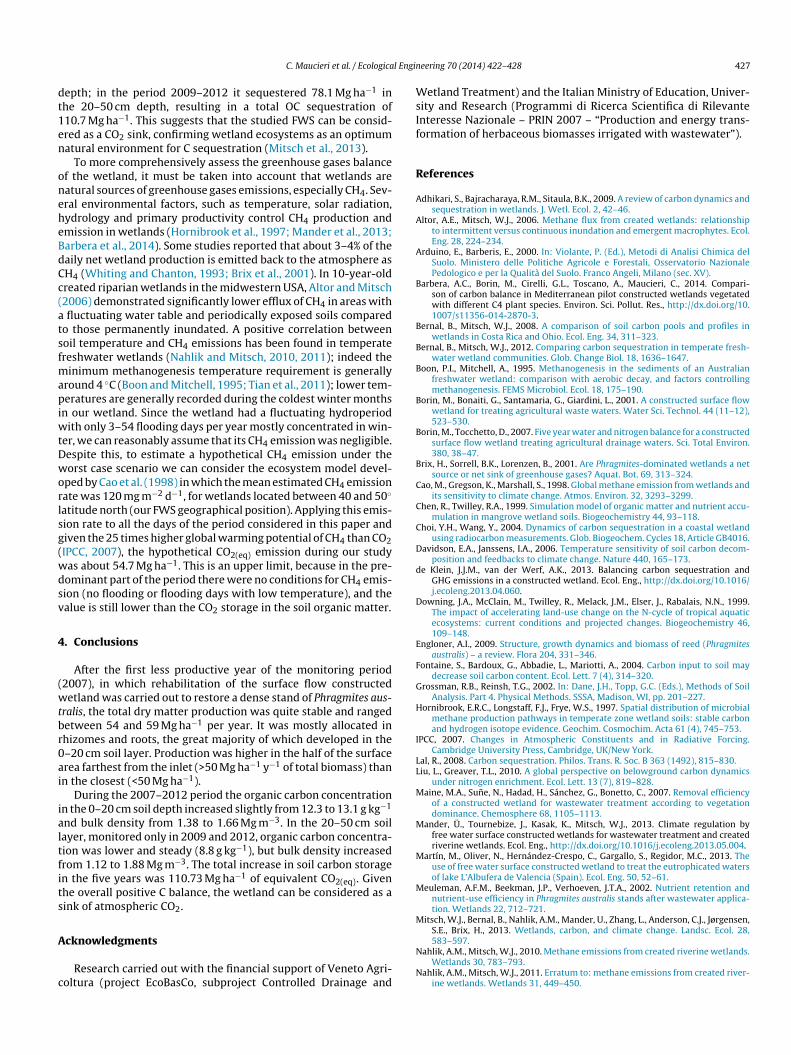
.3. Soil properties
The soil bulk density in the top layer (0–20 cm) showed no sig-ificant difference comparing 2009 (1.66 ± 0.27 Mg m−3) and 20121.66 ± 0.15 Mg m−3), while a significant increase was recorded inhe 20–50 cm layer, with 1.12 ± 0.44 and 1.88 ± 0.12 Mg m−3 in
2010 2011 Average
9.0 56.9 ± 14.8 48.1 ± 10.5 49.2 ± 4.4 14.7 57.8 ± 12.9 58.4 ± 14.1 58.9 ± 9.1 14.6 57.4 ± 13.1 53.7 ± 13.2 54.5 ± 5.5
0.08 0.42 ± 0.20 0.30 ± 0.09 0.36 ± 0.05 0.11 0.39 ± 0.13 0.40 ± 0.11 0.41 ± 0.06 0.09 0.41 ± 0.15 0.35 ± 0.11 0.39 ± 0.04
C. Maucieri et al. / Ecological Engineering 70 (2014) 422–428 425
oint fo
2di9c
TS
Di
dp
Fig. 2. Dry matter repartition in each sampling p
009 and 2012 respectively (Table 3). In the lower depth the bulkensity was more uniform between sampling points in 2012 than
n 2009, when the data showed two maxima centered around0 and 198 m from the water inlet point (Fig. 4). These resultsould be explained considering the water inlet volume and the
able 3oil carbon budget.
2007 2009 2012
Organic carbon concentration (g kg−1)0–20 cm 12.3 13.0 ± 4.4a 13.1 ± 2.7a
20–50 cm – 8.8 ± 2.1a 8.9 ± 2.2a
Bulk density (Mg m−3)0–20 cm 1.38 1.66 ± 0.27a 1.66 ± 0.15a
20–50 cm – 1.12 ± 0.44a 1.88 ± 0.12b
Organic Carbon amount (Mg ha−1)0–20 cm 34.0 42.8 ± 14.6a 42.9 ± 7.7a
20–50 cm – 28.4 ± 10.3a 49.7 ± 11.4b
ifferent letters indicate significant differences by LSD at p < 0.05 for different yearsn the same profile.
2pba
awa
s9
t4Thte
r every year and in the average of the five years.
rainage:rainfall ratio (Table 1). In fact the drainage water sup-ly between 2009 and 2012, being about twice that in the period007–2009, determined a greater amount of fine soil particles sus-ended in the FWS. The higher water inlet volume also led to aetter soil fine particles dispersion and illuviation with a greaterccumulation in the deeper layers.
The soil OC concentration (g kg−1) did not significantly differt either depth between 2009 and 2012 (Table 3). The upper depthas more spatially variable in 2009 than in 2012, with two maxima
t 18 and 180 m from the water inlet point (Fig. 5).The total amount of OC stored in the upper 50 cm of
oil increased by 30% between 2009 and 2012 (from 71.2 to2.6 Mg ha−1).
OC content in the top layer at the beginning of the moni-ored period (2007) was 34 Mg ha−1. By 2009 it had increased to2.8 Mg ha−1 and remained stable in 2012 (42.9 Mg ha−1) (Table 3).
he stable OC content in the 0–20 cm layer could be due to theigh fresh OC quantity (e.g. root exudate) that selectively increaseshe growth rate of microorganism populations due to their pref-rence for fresh OC vs. more stable soil OC (Fontaine et al., 2004).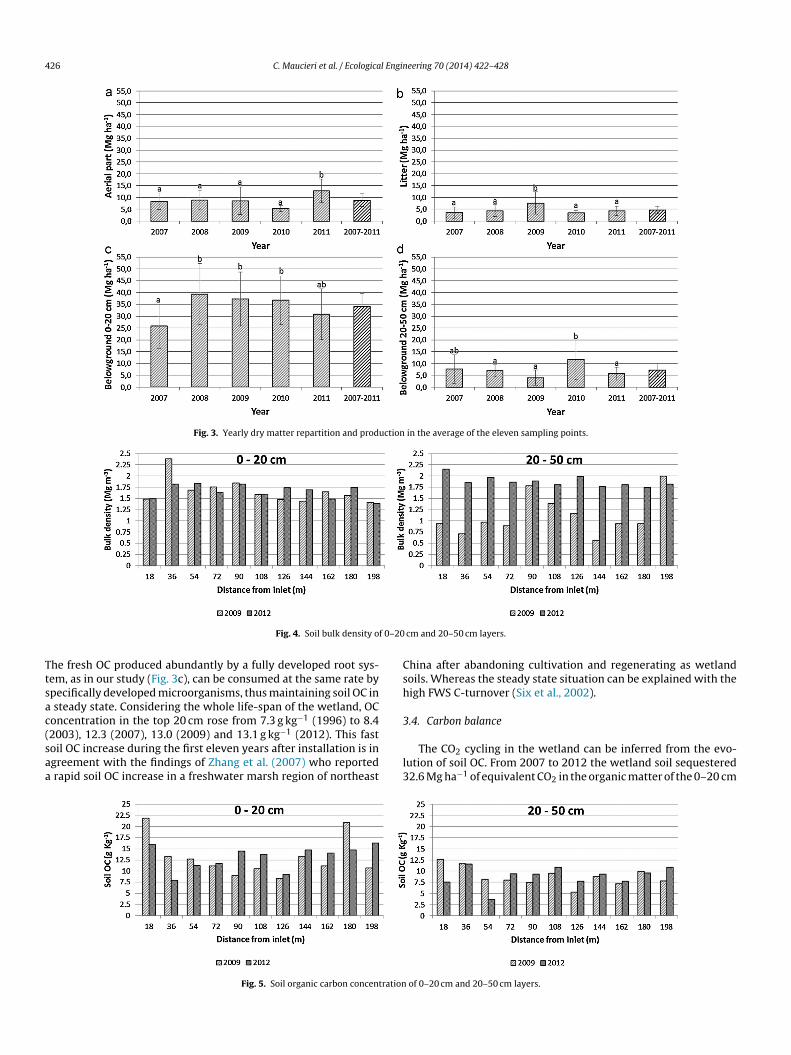
426 C. Maucieri et al. / Ecological Engineering 70 (2014) 422–428
Fig. 3. Yearly dry matter repartition and production in the average of the eleven sampling points.
f 0–20
Ttsac(saa
Csh
3
Fig. 4. Soil bulk density o
he fresh OC produced abundantly by a fully developed root sys-em, as in our study (Fig. 3c), can be consumed at the same rate bypecifically developed microorganisms, thus maintaining soil OC in
steady state. Considering the whole life-span of the wetland, OConcentration in the top 20 cm rose from 7.3 g kg−1 (1996) to 8.4
2003), 12.3 (2007), 13.0 (2009) and 13.1 g kg−1 (2012). This fastoil OC increase during the first eleven years after installation is ingreement with the findings of Zhang et al. (2007) who reportedrapid soil OC increase in a freshwater marsh region of northeastl3
Fig. 5. Soil organic carbon concentration
cm and 20–50 cm layers.
hina after abandoning cultivation and regenerating as wetlandoils. Whereas the steady state situation can be explained with theigh FWS C-turnover (Six et al., 2002).
.4. Carbon balance
The CO2 cycling in the wetland can be inferred from the evo-ution of soil OC. From 2007 to 2012 the wetland soil sequestered2.6 Mg ha−1 of equivalent CO2 in the organic matter of the 0–20 cm
of 0–20 cm and 20–50 cm layers.
l Engin
dt1en
oneheBdCc(atsfmapiwtDworlsg(wdsv
4
(wtbr0ai
ialtfits
A
c
WsIf
R
A
A
A
B
B
B
B
B
B
B
C
C
C
D
d
D
E
F
G
H
I
LL
M
M
M
M
M
C. Maucieri et al. / Ecologica
epth; in the period 2009–2012 it sequestered 78.1 Mg ha−1 inhe 20–50 cm depth, resulting in a total OC sequestration of10.7 Mg ha−1. This suggests that the studied FWS can be consid-red as a CO2 sink, confirming wetland ecosystems as an optimumatural environment for C sequestration (Mitsch et al., 2013).
To more comprehensively assess the greenhouse gases balancef the wetland, it must be taken into account that wetlands areatural sources of greenhouse gases emissions, especially CH4. Sev-ral environmental factors, such as temperature, solar radiation,ydrology and primary productivity control CH4 production andmission in wetlands (Hornibrook et al., 1997; Mander et al., 2013;arbera et al., 2014). Some studies reported that about 3–4% of theaily net wetland production is emitted back to the atmosphere asH4 (Whiting and Chanton, 1993; Brix et al., 2001). In 10-year-oldreated riparian wetlands in the midwestern USA, Altor and Mitsch2006) demonstrated significantly lower efflux of CH4 in areas with
fluctuating water table and periodically exposed soils comparedo those permanently inundated. A positive correlation betweenoil temperature and CH4 emissions has been found in temperatereshwater wetlands (Nahlik and Mitsch, 2010, 2011); indeed the
inimum methanogenesis temperature requirement is generallyround 4 ◦C (Boon and Mitchell, 1995; Tian et al., 2011); lower tem-eratures are generally recorded during the coldest winter months
n our wetland. Since the wetland had a fluctuating hydroperiodith only 3–54 flooding days per year mostly concentrated in win-
er, we can reasonably assume that its CH4 emission was negligible.espite this, to estimate a hypothetical CH4 emission under theorst case scenario we can consider the ecosystem model devel-
ped by Cao et al. (1998) in which the mean estimated CH4 emissionate was 120 mg m−2 d−1, for wetlands located between 40 and 50◦
atitude north (our FWS geographical position). Applying this emis-ion rate to all the days of the period considered in this paper andiven the 25 times higher global warming potential of CH4 than CO2IPCC, 2007), the hypothetical CO2(eq) emission during our studyas about 54.7 Mg ha−1. This is an upper limit, because in the pre-ominant part of the period there were no conditions for CH4 emis-ion (no flooding or flooding days with low temperature), and thealue is still lower than the CO2 storage in the soil organic matter.
. Conclusions
After the first less productive year of the monitoring period2007), in which rehabilitation of the surface flow constructedetland was carried out to restore a dense stand of Phragmites aus-
ralis, the total dry matter production was quite stable and rangedetween 54 and 59 Mg ha−1 per year. It was mostly allocated inhizomes and roots, the great majority of which developed in the–20 cm soil layer. Production was higher in the half of the surfacerea farthest from the inlet (>50 Mg ha−1 y−1 of total biomass) thann the closest (<50 Mg ha−1).
During the 2007–2012 period the organic carbon concentrationn the 0–20 cm soil depth increased slightly from 12.3 to 13.1 g kg−1
nd bulk density from 1.38 to 1.66 Mg m−3. In the 20–50 cm soilayer, monitored only in 2009 and 2012, organic carbon concentra-ion was lower and steady (8.8 g kg−1), but bulk density increasedrom 1.12 to 1.88 Mg m−3. The total increase in soil carbon storagen the five years was 110.73 Mg ha−1 of equivalent CO2(eq). Givenhe overall positive C balance, the wetland can be considered as aink of atmospheric CO2.
cknowledgments
Research carried out with the financial support of Veneto Agri-oltura (project EcoBasCo, subproject Controlled Drainage and
N
N
eering 70 (2014) 422–428 427
etland Treatment) and the Italian Ministry of Education, Univer-ity and Research (Programmi di Ricerca Scientifica di Rilevantenteresse Nazionale – PRIN 2007 – “Production and energy trans-ormation of herbaceous biomasses irrigated with wastewater”).
eferences
dhikari, S., Bajracharaya, R.M., Sitaula, B.K., 2009. A review of carbon dynamics andsequestration in wetlands. J. Wetl. Ecol. 2, 42–46.
ltor, A.E., Mitsch, W.J., 2006. Methane flux from created wetlands: relationshipto intermittent versus continuous inundation and emergent macrophytes. Ecol.Eng. 28, 224–234.
rduino, E., Barberis, E., 2000. In: Violante, P. (Ed.), Metodi di Analisi Chimica delSuolo. Ministero delle Politiche Agricole e Forestali, Osservatorio NazionalePedologico e per la Qualità del Suolo. Franco Angeli, Milano (sec. XV).
arbera, A.C., Borin, M., Cirelli, G.L., Toscano, A., Maucieri, C., 2014. Compari-son of carbon balance in Mediterranean pilot constructed wetlands vegetatedwith different C4 plant species. Environ. Sci. Pollut. Res., http://dx.doi.org/10.1007/s11356-014-2870-3.
ernal, B., Mitsch, W.J., 2008. A comparison of soil carbon pools and profiles inwetlands in Costa Rica and Ohio. Ecol. Eng. 34, 311–323.
ernal, B., Mitsch, W.J., 2012. Comparing carbon sequestration in temperate fresh-water wetland communities. Glob. Change Biol. 18, 1636–1647.
oon, P.I., Mitchell, A., 1995. Methanogenesis in the sediments of an Australianfreshwater wetland: comparison with aerobic decay, and factors controllingmethanogenesis. FEMS Microbiol. Ecol. 18, 175–190.
orin, M., Bonaiti, G., Santamaria, G., Giardini, L., 2001. A constructed surface flowwetland for treating agricultural waste waters. Water Sci. Technol. 44 (11–12),523–530.
orin, M., Tocchetto, D., 2007. Five year water and nitrogen balance for a constructedsurface flow wetland treating agricultural drainage waters. Sci. Total Environ.380, 38–47.
rix, H., Sorrell, B.K., Lorenzen, B., 2001. Are Phragmites-dominated wetlands a netsource or net sink of greenhouse gases? Aquat. Bot. 69, 313–324.
ao, M., Gregson, K., Marshall, S., 1998. Global methane emission from wetlands andits sensitivity to climate change. Atmos. Environ. 32, 3293–3299.
hen, R., Twilley, R.A., 1999. Simulation model of organic matter and nutrient accu-mulation in mangrove wetland soils. Biogeochemistry 44, 93–118.
hoi, Y.H., Wang, Y., 2004. Dynamics of carbon sequestration in a coastal wetlandusing radiocarbon measurements. Glob. Biogeochem. Cycles 18, Article GB4016.
avidson, E.A., Janssens, I.A., 2006. Temperature sensitivity of soil carbon decom-position and feedbacks to climate change. Nature 440, 165–173.
e Klein, J.J.M., van der Werf, A.K., 2013. Balancing carbon sequestration andGHG emissions in a constructed wetland. Ecol. Eng., http://dx.doi.org/10.1016/j.ecoleng.2013.04.060.
owning, J.A., McClain, M., Twilley, R., Melack, J.M., Elser, J., Rabalais, N.N., 1999.The impact of accelerating land-use change on the N-cycle of tropical aquaticecosystems: current conditions and projected changes. Biogeochemistry 46,109–148.
ngloner, A.I., 2009. Structure, growth dynamics and biomass of reed (Phragmitesaustralis) – a review. Flora 204, 331–346.
ontaine, S., Bardoux, G., Abbadie, L., Mariotti, A., 2004. Carbon input to soil maydecrease soil carbon content. Ecol. Lett. 7 (4), 314–320.
rossman, R.B., Reinsh, T.G., 2002. In: Dane, J.H., Topp, G.C. (Eds.), Methods of SoilAnalysis. Part 4. Physical Methods. SSSA, Madison, WI, pp. 201–227.
ornibrook, E.R.C., Longstaff, F.J., Frye, W.S., 1997. Spatial distribution of microbialmethane production pathways in temperate zone wetland soils: stable carbonand hydrogen isotope evidence. Geochim. Cosmochim. Acta 61 (4), 745–753.
PCC, 2007. Changes in Atmospheric Constituents and in Radiative Forcing.Cambridge University Press, Cambridge, UK/New York.
al, R., 2008. Carbon sequestration. Philos. Trans. R. Soc. B 363 (1492), 815–830.iu, L., Greaver, T.L., 2010. A global perspective on belowground carbon dynamics
under nitrogen enrichment. Ecol. Lett. 13 (7), 819–828.aine, M.A., Sune, N., Hadad, H., Sánchez, G., Bonetto, C., 2007. Removal efficiency
of a constructed wetland for wastewater treatment according to vegetationdominance. Chemosphere 68, 1105–1113.
ander, Ü., Tournebize, J., Kasak, K., Mitsch, W.J., 2013. Climate regulation byfree water surface constructed wetlands for wastewater treatment and createdriverine wetlands. Ecol. Eng., http://dx.doi.org/10.1016/j.ecoleng.2013.05.004.
artín, M., Oliver, N., Hernández-Crespo, C., Gargallo, S., Regidor, M.C., 2013. Theuse of free water surface constructed wetland to treat the eutrophicated watersof lake L’Albufera de Valencia (Spain). Ecol. Eng. 50, 52–61.
euleman, A.F.M., Beekman, J.P., Verhoeven, J.T.A., 2002. Nutrient retention andnutrient-use efficiency in Phragmites australis stands after wastewater applica-tion. Wetlands 22, 712–721.
itsch, W.J., Bernal, B., Nahlik, A.M., Mander, U., Zhang, L., Anderson, C.J., Jørgensen,S.E., Brix, H., 2013. Wetlands, carbon, and climate change. Landsc. Ecol. 28,
583–597.ahlik, A.M., Mitsch, W.J., 2010. Methane emissions from created riverine wetlands.Wetlands 30, 783–793.
ahlik, A.M., Mitsch, W.J., 2011. Erratum to: methane emissions from created river-ine wetlands. Wetlands 31, 449–450.

4 l Engin
O
P
P
S
R
S
T
T
W
W
Z
28 C. Maucieri et al. / Ecologica
’Geen, A.T., Budd, R., Gan, J., Maynard, J.J., Parikh, S.J., Dahlgren, R.A., 2010. Miti-gating nonpoint source pollution in agriculture with constructed and restoredwetlands. Adv. Agron. 108, 1–76 (chapter 1).
assoni, M., Morari, F., Salvato, M., Borin, M., 2009. Medium-term evolution of soilproperties in a constructed surface flow wetland with fluctuating hydroperiodin North Eastern Italy. Desalination 246, 215–225.
ezeshki, S.R., 2001. Wetland plant responses to soil flooding. Environ. Exp. Bot. 46,299–312.
oetaert, K., Hoffman, M., Meire, P., Starink, M., van Oevelen, D., Van Regen-mortel, S., Cox, T., 2004. Modeling growth and carbon allocation in tworeed beds (Phragmites australis) in the Scheldt estuary. Aquat. Bot. 79,211–234.
avit, B., Ehrenfeld, J.G., Häggblom, M.M., Bartels, M., 2007. The effects of drainage
and nitrogen enrichment on Phragmites australis, Spartina alterniflora, and theirroot-associated microbial communities. Wetlands 27, 915–927.ix, J., Conant, R.T., Paul, E.A., Paustian, K., 2002. Stabilization mechanisms ofsoil organic matter: implications for C-saturation of soils. Plant Soil 241,155–176.
Z
eering 70 (2014) 422–428
ian, J., Chen, H., Wang, Y., Zhou, X., 2011. Methane production in relation withtemperature, substrate and soil depth in Zoige wetlands on Tibetan Plateau.Acta Ecol. Sin. 31, 121–125.
rettin, C.C., Jurgensen, M.F., 2003. Carbon cycling in wetland forest soils. In: Kimble,J.M., Heath, L.S., Birdsey, R.A., Lal, R. (Eds.), The Potential of U.S. Forest Soils toSequester Carbon and Mitigate the Greenhouse Effect. CRC Press, Boca Raton,FL, pp. 311–331.
alkley, A., Black, I.A., 1934. An examination of the Degtjareff method for determin-ing soil organic matter and a proposed modification of the chromic acid titrationmethod. Soil Sci. 38, 29–37.
hiting, G.J., Chanton, J.P., 1993. Primary production control of methane emissionfrom wetlands. Nature 364, 794–795.
hang, J., Song, C., Yang, W., 2007. Dynamics of soil organic carbon and its fractions
after abandonment of cultivated wetlands in northeast China. Soil Tillage Res.97, 350–360.hang, W.J., Xiao, H.A., Tong, C.L., Su, Y.R., Xiang, W.S., Huang, D.Y., Syers, J.K., Wu,J.S., 2008. Estimating organic carbon storage in temperate wetland profiles innortheast China. Geoderma 146, 311–316.
Copyright © 2022 FDOKUMEN


![[Treating frostbite injuries]](https://static.fdokumen.com/doc/165x107/633ff39332b09e4bae09a1b5/treating-frostbite-injuries.jpg)