Biology,fisheriesandculture of tropicalgroupersandsnappers I
458
Biology, fisheriesandculture of tropicalgroupersandsnappers rr~ ~.,~ i I I Edited by ~~ Francisco Arreguin-Sanchez, John L. Munro Miriam C. Balgos and Daniet'Pauly II lL~~M =POMEX International Center for Living Aquatic Resources Management Universidad Autonoma de Campeche - - ~ - ----
-
Upload
khangminh22 -
Category
Documents
-
view
0 -
download
0
Transcript of Biology,fisheriesandculture of tropicalgroupersandsnappers I

Biology,fisheriesandculture
of tropicalgroupersandsnappers
rr~~.,~
i
I
I
Edited by ~~
Francisco Arreguin-Sanchez, John L. MunroMiriam C. Balgos and Daniet'Pauly
II lL~~M =POMEXInternational Center for Living AquaticResources Management
Universidad Autonoma
de Campeche
- - ~ - ----

18'
\ /
Jiilog\ firhtritr ond culture of tropic01 grouper! ond mopper!
)roceedings of an EPOMEXIICLARM lnternofional Workshop on Tropical Snappers and Groupers held at the University of Campeche
Campeche. Mexico 26-29 October 1993
Edited by
Francisco ypguin-Sanchez ~ohr f i . Munro
Miriam C. Balgos Daniel Pauly
--
EPOMEWUniversidad Autonoma de Campeche

Biology, fisheries and culture of tropical groupers and snappers L;,: J3
Edited by
Printed in Manila. Philippines
Published by the International Center For Living Aquatic Resources Management (ICLARM), MCPO Box 2631. 0718 Maltati City. Philippines and Prograrna de Ecologh, Pesquerias y OceanograRa del Golfo de Mexico (EPOMEX), Universidad Autdnoma de Campeche, Apdo. Postal 520 Campeche 24030. Mexico
Arreguln-SAnchez. F., J . L . Munro, M.C. Balgos and D. Pauly, Editors. 1996. Biology, fisheries and culture of tropical groupers and snappers. ICLARM Conf. Proc. 48, 449 p. +'
ICLARM Contribution No. 1323
Cover: Groupers and snappers of different species (From FishBase illustrations by Roberto Cada) Cover design by Alan Sigfried Esquillon
Copyediting: Casilda I. Guevarra and Leticia B. Dizon Indexing: Miriam C. Balgos and Audrey Banzon Layout: Audrey Banzon Graphs and artwork: Albert Conternprate and Roberto Cada

CONTENTS
Foreword M./. Wi/liams.. ................................................................................................................ vl Preface and Acknowledgements F. Arre~uin-SSnchez, /.L. Munro,
M. C Balgos and D. Pauly .............................................................................................. vii
Part I: Workshop Conclusions ' Biology. fisheries and culture of snappers and groupers: workshop
conclusions and updates to 1996 D. Pau/y, E Arregufn-Sanchez, j. L. Munro and M. C. Balgos ..................................................................................... 1
Part 11: Blology, Ecology and Dlstributlon Ecology and population dynamics of Lutjanus synagris on Campeche Bank
E. Nvera-Arriaga, A. L. Lara-Domhguez, /. Ramos-Miranda, P. Sincher-Gil and A. YrSiiz-Arancibia ................................................................... 1 1
Trophic role of the red grouper {Epinephelus morio) in the ecosystem of the northern continental shelf of Yucatan, Mexico F. Arreguin-Sanchezand E. Valero ........................................................................................................... 1 9
Biological research on the red grouper (Epinephelus morio) From the southern Gulf of Mexico T. Bru/& and C Dgniel ................................................................. 28
Seasonal patterns of distribution and abundance of snappers in the Mexican Caribbean S. Dk-Ruiz, A. Aguirre-Leon, C. Macuitl and 0. P&ra ...................... 43
Biological aspects of the yellow eye snapper (Luqanus vivanus) (Pisces: Lutjanidae) horn Los Herrnanos Islands, Eastern Venezuela
.......................................................... G./. Comez, R. A. Gumtin and L. A. Marcano 5 1 Species composition, distribution and trends in abundance OF snappers of the
southeasterh USA, based o n fishery-independent sampling N. Cuellar, ...................................................... G.R. Sedberq, D.]. MachowskiandM.R. Collins 59
The ecology of shallow-water groupers (Pisces: Serranidae) in the Upper Florida Keys, USA K.M. Sullivan andR Sluka ............................................. 74
A molecular approach to stock identification and recruitment patterns in red snapper (LuQanus campechanus) R. W. Chapman, S.A. Bortone
................................................................................................. and C. M. Woodley 8 5 Large catches O F red snappers by tuna purse seiners off the West
African continental shelf A. CaveriviPre ............................................................. 92 Uncommon mortality oFgroupers at the end of the warm season in the
coastal area of Senegal (West Africa) A. Caveriviere and D. Toure .................... 96 Groupers and snappers OF India: biology and exploitation P.S.B.R. james,
....................................................... V. Srirarnachanclra M u m and P. Nammalwar 1 06
Part 111: Age, Growth and Reproduction in the Wlld Reproduction, age and growth of the Caribbean red snapper (Lurjanuspurpureus)
in waters off Trinidad and Tobago S.C. Manickchand-Heileman and ....................................................................................................... D. A. 7: Pl~ilipll 1 3 7
Validation of ageing technique for Nassau grouper (Eph~ephelus striatus) in the Cayman Islands P.G. Bush, GC. Eanks and E.D. Lane ....................................... 150
Age validation, movements and growth rates of tagged gag (Mycteroperca microlepis), black sea bass (Centropristis striata) and red porgy (Pagrus pagrus) M. R. Collins, S. B. Van Sant and G. R. Sedberry.. ......................... 1 58

The validity of length-based methods for estimating growth and mortality of groupers, as illustrated by comparative assessment of the Creole Fish Paranthias furcifer (Pisces: Serranidae) /.M. Posada and R.S. Appeldoorn ................................................................................................... 1 63
Spawning and annual fecundity OF the red snapper (Lutjanus campechanus) from the northeastern Gulf ofMexico L.A. Collins. A.G./ohnson and C. P. Keim ......................................................................................................... 1 74
Reproductive biology of the gray snapper (Lufjanus~rjseus), with notes on spawning For other western Atlantic snappers (Lutjanidae)
M. 1. Domeiec C. KoenigandF. Coleman ............................................................ 189 Population dynamics and stoclc assessment of red grouper (Epinephelus morio)
fishery on Campeche Bank. Mexico F: Arreguin-Srinchez. M. Contreras, V. Moreno. R+ Burgos and R. Valdes ................................................. 202
FishBase and AUXlM as tools For comparing life-history patterns, growth and natural mortality of fish: applications to snappers and groupers D. Pauly and C. BinohIan ................................................................ 2 1 8
Part IV: Fisheries Assessments Effect oFgas bladder deflation on mortality of hook-and-line caught and
released red snappers: implications For management /. H. Renderand CA. Wilson .......................................................................... 244
Demersal fish stock assessment in Seychelles: an analysis OF a mothership/catcher boat fishery C.C. Mees ...................................................... 254
Abundance and distribution of snappers and groupers targeted by the artisanal medium range fishery off northeastern Venezuela ( 198 t - 1992)
/./. Mendoza and A. Ldrez ............................................................................... 266 Trends in commercial fishery landings OF groupers and snappers in
Bermuda From 1975 to 1992 and associated fishery management issues B.E. Luclchurst ................................................................................................... 277
Catch, effort and sustainable yield For Australia's northern trawl fishery D.C. Ramrnand Y: Xiao ................................................................................ 289
Reproduction in gag (Mycteroperca microlepis) (Pisces: Serranidae) in the eastern Gulf of Mexico and the consequences OF fishing spawning aggregations
........................ C C. Koen~g, F. C. Co!eman, L. A. Colhs, K Sadoly and P. L. Colin 307 Assessment of a snapper complex (Luqanus spp.) of the eastern tropical Pacific
M. Cruz-Romero, E.A. Chavez, E. Espjno andA. Carcfa ....................................... 324 Exploratory fishing with traps in oceanic islands off eastern Venezuela during I992
L A . Marcano. R Cuzmcin and G./. Gomez ......................................................... 33 1 Impact of variability in numbers and size at first recruitment on the
F, , rekrence point in the US red snapper fisheries of the Gulf of Mexico ........................................................................ N.M. Ehrhardtand C.M. Legault 337
Analyses of catch-per-effort data for red snapper on Campeche Bank in 1992 M. Re1 Carmen Monroy-Garcfa, R Burgos Rosas,
M, E. Gonzcilezy Re la Rosa and M. GardurSo-Andrade ........................................... 3 50 Time series analysis and multivariate methods applied to the red grouper fishery on
Campeche Bank, Mexico /, PolandS. Moreno ............................................... 355 Shrimp trawl bycatch research in the US Gulf oFMexico and southeastern Atlantic
E. Scott-Denton and/. Nance ....................................................................... 360
Part V: Aquaculture and Controlled Reproduction Nassau grouper aquaculture j. W Tucker, jr. and P.N. Woodward ..... .. . . . . . . . . . . . . . . . .. .. .. . . 363 Maturation and induced spawning ofthe mangrove red snapper
(Lutjanus argentimacu/atus) reared in a floating net cage in the Philippines A.C. Emata ................................................................................................. 378
Ultrastructural study of lymphocystis in kelp bass ( ~ ~ i n e ~ h e l u s moara; Serranidae) L Yongjia, W Zeyang and C. Kangrong . .. . . . . . . . . . . . . .. . . . . . . . . . . . . . . . . . . . . . . . . . . . . . . , , . . . . . . . . . . . 385
Development From egg to juvenile of the red grouper (Ephephelus morio) (Pisces: Serranidae) in the laboratory P. L. Colin. CC. Koenig and W.A. Laroche ...................................................................................................... 399
Appendices 1 . List of Participants ...................................................... ...... .......................... 4 15 2. Author lndex ........................................................................................................ 420 3. Geographic lndex .................................................................................................. 434 4. Species lndex ......................................................................................................... 44 1

T his volume of papers From the 1993 workshop on snappers and groupers presents important scientific findings and views on two important groups of fish.
Groupers, in the family Serranidae, and snappers, in the Family Lutjanidae, are amongst the most valuable components of catches in tropical and subtropical seas. The families are diverse but all species are highly valued as food fish and are actively sought by fishers wherever they are found. They are vulnerable to a wide range of fishing gears. Not only can they be caught in various nets but, being predators, they will also take baited hooks and enter baited traps. Many species are large, curious and unwary and easy prey for spearfishers. Many, particularly groupers, form spawning aggregations at clearly established times and places, where the aggregations can be relentlessly exploited. The unfortunate consequence of all this is that many stocks are overfished and, in some cases, threatened with extinction on a local scale.
Groupers are also protogynous hermaphrodites. This means that they first mature as females and later, at a large size, change into males. Such a life history raises the very real possibility that heavily exploited stoclcs, in which the average size has been drastically reduced, will suffer an acute shortage of males at spawning times, resulting in unfertilized eggs and, carried to an extreme, the collapse and extinction of the stock. In the past few years, since this conFerence was held, an additional threat has emerged in the form of great demand for live groupers in Southeast Asia, and at premium prices. This has prompted even greater onslaughts on the stocks in the Indo-Pacific Region.
All these features of the snappers and groupers alone justify the investment of considerable time and expense in research on the assessment and management of snappers and groupers and, in more recent years, on their artificial propagation for cultivation in cages or ponds, or for stock enhancement. The papers presented in this volume are evidence of the importance attached to these species by governments and research institutions and, ultimately, by the fishing communities who depend on the well-being of the stocks. They also attest to the advances in Itnowledge which have emerged in recent years through the support of well-planned research. However, they also show that the quest for knowledge is not over and that further effort is needed if these most vulnerable species are to be rationally managed and sustainably exploited.
Meryl 1. WPlliams Director General ICLARM

PREFACE AND ACKNOWLEDGEMENTS
G roupers and snappers are important fishery resources of the tropics and subtrop- ics, where their high values have caused most of their stocks to be heavily ex-
ploited, some even to the point of collapse.Trends towards heavy demand and decreasing natural supply, which are accelerating in several parts of the world, prompted various rnariculture ventures - but these have not yet generated sufficient supply to satisfy the soaring demand, especially for live fish.
Focused research on the biology and the population dynamics of groupers and snap- pers, and on their reproduction and growth under controlled condition - while no panacea- will remain essential for dealing with the questions on how to better manage their fisheries, and to farm them, and workshops where such research can be presented and evaluated are crucial if progress is to be made.
To date, three international workshops have been devoted to groupers and snappers: 1) one held in October 1975, in Pensacola Beach, Florida and documented in Bullis,
H. R. and A.C. Jones ( 1 976) Proceedings: colloquium on snapper-grouper &hey resources o f the Western Central A t h t i c Ocean. Florida Sea Grant College Program, University of Florida, Gainesville, 337 p.;
2) another held in May 1885, in Honolulu and documented in Polovina. J.J. and S. Ralston . 1 987. Tropical snappers and groupers: biology and fisheries manage- ment. Westview Press, Boulder, Colorado, 459 p.; and
3) a third, which led to this document, held in October 1993 in Campeche, Mexico, jointly organized by EPOMEX (Programs de Ec~logia, Pesquerias y OceanograRa del Golfo de Mexico) and ICLARM (International Center for Living Aquatic Re- sources Management).
This latest workshop resulted from a meeting in May 1992 of two of us (Francisco Arreguln-Sanchez and Daniel Pauly) at the First World Fisheries Congress.
The workshop proper was prepared by an organizing committee headed by Francisco Arreguin-Sanchez who, jointly with John Munro, also chaired the workshop sessions.
The objectives of the workshop were to: 1) assess the status of knowledge about groupers and snappers as tropical fishing
resources; 2) identify the gaps in knowledge; and 3) promote worldwide scientific collaboration. The workshop's strategy and linkages were: Experts were invited to attend the workshop. They were all chosen as recognized
scientists in their fields and balanced representation was sought from most of the tropical regions of the world: i.e., the South Pacific, Gulf of Thailand, Southeast Asia, Western Coast of Africa, Northeastern Coast of Australia, Caribbean Sea, and the Gulf of Mexico. Participants came with prepared manuscripts. Theme sessions were integrated through working groups. This initiative was under the framework of the Program OF Ocean Science and Living Resources (OSLR), specifically theTropid Demersal Recruitment Project (TRODERP) and the Subproject Coral Reef Demersal Recruitment Project (CORDERP) in the Caribbean and Adjacent Regions (IOCARIBE, IOCIFAO).

Altogether 60 scientists met on 26-29 October 1993 in Campeche, Mexico and presented papers, most of which are included here, along with a few contributions sent in later by authors who were not able to attend.
We thank these colleagues for their patience in waiting For the proceedings. And we are aware that the "update to 1996" tagged onto the workshop conclusions will not fully compensate For the anguish of some authors who feared that their paper would never come out.
It is our pleasure to conclude this by acl<nowledging those who made this workshop possible:
First our thanks go to the staff of EPOMEX who, under the dynamic leadership of Dr. A. Yaiiez-Arancibia, organized and hosted this workshop and its cultural program, including much appreciated visits to a Mayan temple, some fishing villages and several restaurants that proved Mexican food to be not "hot", but savoy.
We also acknowledge the crucial support provided by the Government O F Campeche State, and several of its agencies: Secretaria Particular del Gobierno del Estado de Campeche; Secretah de Educacion, Cultura y Deporte; Secretaria de Desarrollo Pesquero; Secretaria de Desarrollo Economico; Secretarla de Turismo. We also thank the (Federal) Secretaria de Educacion Pljblica, through the Subsecretaria de Educacion Superior e lnvestigacion Cientifica/Sep-Fomes; and the lnstituto Nacional de la Pesca, Mexico for their input and collaboration.
The Editors
viii

PART I: WORKSHOP CONCLUSIONS
Biology, Fisheries and Culture of Snappers and Groupers: Workshop Conclusions and Updates to 1996"
D. PAULYb Fisheries Centre, 2204 Main Mali
University of British Coiumbia, Vancouver, B. C. Canada V6T 124
F. ARREGU~N-SANCHEZ' Programa de Ecologfa, Pesquerhs
y Oceanografia cle/ Goifo cie Mexico U. A. C. Ap. Postal 520, Campeche 24030
Campeche, Mexico
J.L. MUNROd M.C. BALCOS
International Center for Living A qua tic Resources Management
MCPO Box 263 1 0718 Makati Ciw. Phi/i/7pines
PAULY, D., F. ARREGU~N-SANCHEZ, J.L. MUNRO and M.C. BALGOS. 1996. Biology, fisheries and culture o f snappers and groupers: workshop conclusions and updates to 1996 [Biologja, pesquerlas y cultlvo de pargos y rneros: conclusiones del taller de trahajo y actualizacidn a 199a, p. 1 - 10. In F . Arreguin- Sdnchez, J.L. Munro, M.C. Balgos and D. Pauly (eds.) Biology, fisheries and culture of tropical groupers and snappers. ICLARM Conf. Proc. 48, 449 p.
Abstract
A summary of the Findings of the three working groups (on population dynamics and ecology; fisher- ies management; and biology and aquaculture) of the International Workshop on Tropical Snappers and Groupers organized by EPOMEX (Programa de Ecologla, Pesquerias y Oceanografia del GolFo de Mexico) and ICLARM, and held 26-29 October 1993 in Campeche. Mexico. is presented. Recent references are included to update coverage to 1996. partlcularly concernlng Issues o f growth and integration OF groupers and snappers in ecosystems and models thereof.
ICLARM Contribution No. 131 2. "Also International Center for Living Aquatic Resources Management, MCPO Box 2631, 0718 Maltati
City. Philipplnes: e-mail: [email protected] ' Present address: Centro lnterdisciplinario de Ciencias Marinas. Institute Politecnico Nacional. A.P.
592, 23000 La Paz. Baja California Sur, Mexico; fax 52(1 12) 25322; tel. 52(1 12) 25344/25366: e-mall: [email protected] Present address: c/o Laboratoire de Blologle Marine et Malacologle. EPHE. UniversitC de Perpignan. Perpignan 66860 Cedex. France: fax (33) 68 50 36 86: tel. (33) 68 66 20 55: e-mail: [email protected]
Resumen
Se presenta una sslntesis de 10s prlncipales hal/azgos de 10s tres grupos de trahajo (sobre dinarnica de poblaciones y ecologla, manejo de pesquerlas, y blologia y acuacultura) del Taller hternacional sobre Pargos y Meros Tropicales organizado por EPOMEX e ICLARM, efectuado del 26 a1 29 de Octubre de /993 en Campeche, Mexico. Referencias recientes son incluidas para obtener una cobertura actualizada a 1966, part/cu/armente sobre aspect05 como crecirniento y la integracidn de pargos y meros en el context0 del ecosistema y rnodelos asoclados.
The Following is a summary of the find- ings of the three working groups which met on 28-29 October 1993 during the "lnternational Workshop on Tropical Snappers and Groupers" organized by EPOMEX and ICLARM, and documented in this volume. This is complemented, in areas where the authors are knowledgeable, by references to documents updating some earlier cita- tions, or recent research trends.
Population Dynamlcs and Ecology
The working group concentrated on the identification of the status of Imowledge, needs for further research and identification of priorities, where deemed appropriate. A summary of conclusions by topic are as foilows:
Age and growth studies
Age determination techniques based on the examination of skeletal structures (otoliths, scales, other bones) are reliable in areas where seasonal temperature fluctuations exceed 3-4°C (Williams 1 986; Longhurst and Pauly l 9 8 7 ) , though validation continues to be important (Beamish and McFarlane 1983).
O n the other hand, further research is needed in areas where seasonal tempera- ture differences are slight, i.e., where spawn- ing checks on skeletal parts may be mis- taken for seasonal checks. Here validation is crucial, whether based on the seasonal pattern of ring formation (Manickchand-Dass 1987) (see also Manickchand-Heileman and Phillip, this vol.), or on tetracycline or other otolith marks (Ferreira and Russ 1992, 1994) (see also Bush et al.; Collins et al., this vol.).
For estimation of von Bertalanffy growth parameters from size-at-age data, the use of nonlinear fitting techniques (see, e.g., Saila et al. 1988) is recommended over the use of linearizing transformation (e.g., Ford-Walford plots).
Estimation of growth parameters from length-frequency (L/F) data is problematic in long-lived organisms such as groupers and snappers, in which individual growth trajectories are highly variable, and which, moreover, may display "square" growth curves, wherein a steeply ascending ju- venile growth phase is followed by a long, flat adult phase (Newman et al. 1996). In- deed, such estimation should be under- taken only when L/F data are available which include small, Fast-growing specimens (Isaac 1990). Both ELEFAN I (Pauly 1987) and SLCA (Shepherd 1987) may be used in such casesc (see also Arreguln-SAnchez et al., this vol.).
" Since the workshop was held, the Shepherd's Length Composition Analysis (SLCA) method was considerably improved (see Pauly and Arreguin-Sanchez 1995). especially For application to long- lived organisms. Both ELEFAN and SLCA are available as routines of the FiSAT software (Gayanilo et al. 1995), and the improvement of SLCA is available as an update to FiSAT (contact ICLARMlcgnet.com for details).
Another rapid technique is the use of otolith weights as an indicator of age (Worthington et al. 1995).
Growth parameter estimates, particularly when based on unvalidated ages, or on length-kequency data, should be compared with previous estimates in the same, or closely related species. This can be done using the growth performance index @' defined as
$'= log,# + 2 log,, L-
where K is put on an annual basis, L_ is standardized, e.g., to total length in cm (Pauly and Munro 1984).
The coefficient of variation of $' within species tends to be less than 5% (Moreau et al. 1986), which provides a criterion for identifying outliers and thus, indirectly, to validate growth parameter estimates and their underlying age readings (see Pauly and Binohlan; Arreguin-Sanchez et al., this vol.).
Also, growth comparisons can be done using auximetric grids, as illustrated by Pauly and Binohlan (this vol.). Published growth parameters can be obtained from the FishBase 1996 CD-ROM (Froese and Pauly 1996) which contains 150 pairs of L_, IC values for snappers (for 42 of the 106 species of the family Lutjanidae in the world: Allen 1985), and 86 for groupers (for 47 of the 1 59 species of the subfamily Epinephelinae in the world; Heemstra and Randall 1993), with more to be included in the mid-1997 release of FishBase.
Total and natural mortillities
The standard techniques for estimation of total (2) and natural mortalities (M) (Ricker 1975) can be usually applied to groupers and snappers, though some methods may fail because of some particular behaviors (sex changes, spawning aggregations, etc.). Also, emphasis should be given to meth- ods for improving the estimation of M (see Pauly and Binohlan, this vol.).
to: 1.
2.
3.
4.
3
Particularly, emphasis should be given
estimation of M in marine protected areas (MPA); estimation of Z using length-converted catch curves which explicitly account for seasonal growth oscillations (Pauly et al. 1995) and individual growth variation, as discussed by Sainsbury (1 980) for growth estimation from tagging data; environmental effects on M (but see Pauly and Binohlan, this vol.), and hence on cohort strength (Arreguln- Sanchez et al., this vol.), including stock dislocations that may result from global climate changes; and using variable (age-specific or length- specific) estimates of M and/or es- timates changing with environmental forcing in models requiring inputs of natural mortality.
Finally, particular attention should be given to the interrelationships between estimates of mortality and of catchability, which are strongly affected by gregarious behavior (Arreguin-Sanchez 1996).
Reproduction and recruitment
It was considered that the reproductive strategies of groupers and snappers (batch spawning, sex reversal, spawning aggregations) are reasonably well known. However, further research is needed on the interrelationships among sex reversal, formation of spawning aggregations and population dynamics, as well as their im- pacts on the location of spawning aggregations and nursery grounds. As a priority, two aspects were mentioned: early life history in relation to habitat protection, and the effects of fishing on spawning aggregations.
On the other hand, spawning stock/re- cruitment relationships were given lower priority, because they usually fail to resolve uncertainties about effects of environmen- tal factors on recruitment and thus, even

when established, still leave unexplained most of the variability of recruitment lev- els.
Ecologkal, especia//y food web considera fions
The working group felt that the food and feeding habits of groupers and snappers are Imown in general terms (see also data in FishBase CD-ROM), and that further re- search on trophic interaction should be focused on:
food consumption estimates (for in- dividual fish and for age-structured populations); quantitative food webs, constructed using ECOPATH (Polovina 1984; Christensen and Pauly 1992: Pauly and Christensen 1 996)f (see also Arreguin-Sanchez and Valero, this vol.) or other approaches suitable for describing the trophic role of groupers and snappers; and models of diet selection (including opportunistic feeding) and prey switching.
Here, particular attention should be given to model validation, and to evaluation of the sensitivity of prediction to uncertainty in input parametersF.
Natural and arfificia/ habitats
The differential use of habitat space by early life stage, juvenile and adult groupers and snappers are generally well documented (see, e.g., Doherty and Williams 1988; Beets
and Hixon 1994) (see also Cuellar et al.; Diaz-Ruir et al.; Domeier et al.; and Rivera- Arriaga et al., this vol.), as is the use of artificial reefs.
Still, further research is required on: distinguishing the aggregative role from the habitat-enhancing role of artificial reefs (see also Polovina 1989 and contributions in Munro and Balgos 1995); economic aspects of artificial reefs, especially their cost/benefit ratios; potential effects of habitat degrada- tion and/or loss on stock size and structure: and the fractal nature of habitats, i.e., the availability of suitable crevices/holes for the successive life stages of co- horts, especially in groupers (Hixon and Beets 1993).
The general characterization of stocks is a priority subject for some regions. Tech- niques are well known, including rnolecu- lar genetic techniques (Chapman et dl., this vol.). Further research on stock identifica- tion .must be addressed using these and allozyme techniques to provide the infor- mation necessary to manage mixed or lo- cally discrete stocks, and to avoid stock collapse and losses of genetic diversity.
Fisheries Management
The working group dealing with fisher- ies management issues concentrated on issues specific to groupers and snappers, i.e., the recommendations below do not cover general issues of fisheries management, applicable to any type of fisheries resource
'Extensions of the ECOPATll software for construction of mass-balance models have recently become available which allow explicit consideration of uncertainty, using a semi-Bayesian approach (Christensen and Pauly 1995). This re-expresses these models in the form of simulations, enabling predictions in time of the effects of changing the fishing regime impacting the different elements of an exploited ecosystem. The latter approach will generally require, in the case of groupers and snappers, that the underlying mass-balance model includes separate boxes (each with its own parameter set and diet composition) for the juveniles and the adults (Walters et al. 1997).

(e.g., the need for effort controls). The resulting list of recommendations is as fol- lows:
Whenever possible, Fisheries man- agement plans concerned with demersal fish should deal with groupers and snappers as separate groups, i.e., acltnowledge their particular growth/mortality schedules and mode of reproduction. Continental and insular populations of groupers and snappers may re- quire different management advice due, e.g. , to differences in their seasonal patterns of reproduction. There is a need to identify and quantify sources of fishing mortality includ- ing cryptic mortality due to the passage of undersized Fish through the cod- end of trawls, and to bycatch in nondirected fisheries, e.g., in the Gulf of Mexico shrimp fisheries, which have an immense impact on red snappers and other demersal fish species (see also Ehrhardt and Legault; Scott-Denton and Nance, this vol .)s.
There is a need to statistically vali- date population parameters which have been estimated with inappro- priate models and/or with restricted data sets; this applies particularly to models which do not account for the peculiar mode of reproduction of groupers (Bannerot et al. 1987). There is an urgent need to define management strategies specifically adapted to groupers and snappers. Several options may be considered, depending on management effec- tiveness: (a) marine protected areas (i.e., reserves), which can ensure conservation of genetic diversity; (b) seasonally closed areas to reduce fishing pressure during critical stages;
(c) quotas to control fishing mortal- ity (but which, however, may lead to overcapitalization); (d) minimum size regulations to prevent growth overfishing (which however, may increase cryptic mortality); and ( e ) maximum size limitsg (to protect large fish). Risk analysis and bioeconomic con- siderations should be incorporated in management advice whenever possible, with the latter consider- ing the changes of price that gen- erally accompany changes in size. Most grouper and snapper fisheries are rnultispecies Fisheries. This as- pect must be explicitly considered in any management policy.
One item only briefly discussed at the workshop, but which has become very im- portant since, are marine protected areas (MPA) as Fisheries management tools. We cite a recent document to this effect:
'There is an emerging consensus among fisheries scientists and managers throughout the world that marine Fish- eries reserves (sanctuaries, no-take refuges) if well placed and of the ap- propriate size can achieve many of the goals that fishery management has failed to achieve using conventional meth- ods. Particularly, there is overwhelming evidence from both temperate and tropi- cal areas that exploited populations in protected areas will recover following cessation of fishing and that spawn- ing biomass will be rebuilt. Also there is widespread recognition throughout the world that loss of biodiversity is largely driven by ecosystem modifi- cations and the habitat loss that en- sues. Hence preserving biodiversity implies the maintenance or re-establishment of the natural ecosystems as in marine reserves in
g These points are perhaps more relevant to snappers, often caught as juveniles by trawling, than t o groupers, oFten caught with hook-and-lines that target the adults.

which no extractive anthropogenic effects are allowed or minimized" (Roberts et al. 1995). The possible effects of no-takeMPAs are
particularly marked for groupers and snappers (Ferreira and Russ 1995: Newman et al. 1996: Russ et al., in press), though populations may be slow to recover (Russ and Alcala 1996), due to their low turnover rates.
One reason for the positive effect of MPAs seems to be the high-site fidelity of snap- pers and especially groupers. Thus, in a recent study on the Great Barrier Reef, only 1 of over 100 tag returns of P/ectropomus leopardus performed between-reef move- ments, all other returns indicating within- reef movements, on a scale of 0.1 to 3 km, and especially during the spawning season (Davies 1995).
Biology and Aquaculture
Discussions within this working group attempted to identify the most important aspects to be addressed through further research, with particular emphasis on the
improvement of broodstock manage- ment and technology for growout to market size.
Early Life History
description of larval development (Masuma et al. 1993: Colin et al., this vol.); and description and experimental evalu- ation of processes controlling sexual differentiation.
Other Items
developing techniques to control or minimize environmental pollution resulting from aquaculture enterprises; increasing exchange of information among East Asian, American and European aquaculture groups, notably via translation of key documentsh; and discouraging aquaculture of non- native species, and hence the required introductions of exotics.
need, to develop biotechnology For pro- duction.
Bio/ow
Reproduction
Rearing
improvement of water quality for larval culture (mainly an engineering prob- lem); larval nutrition: studies of nutritional requirements of larval stages, Rnd- ins smaller prey for small-mouthed individuals, and development of formulated feeds; and
identifying proximate causes of adult sex change at multiple levels of cau- sation; behavioral, genetic, neuroendocrine and hormonal, with emphasis on collaboration wi th aquaculture environments; relating adult sex change to processes con- trolling initial sexual differentiation in juveniles (see also Sadovy and Figuerola 1992; Sadovy et al. 1992; Ferreira 1993, 1995; Sadovy et al.
The FishBase CD-ROM (see Pauly and Binohlan, this vol.) contains two tables (on cul ture systems and culture experiments) which oRer a standard format For reporting/standardizing aquaculture data, including reports on groupers and snappers (Agustin et al. 1996a, 1996b). However, these tables, containing hundreds of entries For freshwater Fishes, presently contain only one entry For groupers or snappers, describing experiments with Plectropomus leopardus in Indonesia (Lanjurnin 1982). The FishBase project seeks collaborators in this area: contact [email protected].

1994; Shapiro et al. 1994; and Sadovy and Colin 1995): evaluating hypotheses concerning the function of spawning aggregations, including measurement, at several scales, of physical oceanographic characteristics, rates of predation on adults and eggs, downcurrent tra- jectories of eggs,,and fertilization rates at aggregation sites (see Doherty et al. 1994): describing internal structure of aggregations, including mating struc- ture and sex ratio (Samoilys and Squire 1 994) ; identifying aggregation sex ratios at which sperm may become limiting; measuring fertilization rates of eggs; changing numbers of sperm released by males, and oocyte atresia and rejuvenilization under different sex ratios (Samoilys and Squire 1994): identiQing which species spawn in aggregations, with greater attention to snappers, for which this phenom- enon is not as well documented (nor probably as common) as for groupers; choosing species carefully for detailed studies to produce quick returns on research effort; using most accessi- ble species, which life history offers the greatest promise of providing answers to critical questions, including presently non-commercial species.
Policy Implications of Current Knowledge
some participants felt that, based on current knowledge, it would be best for the fish populations i f all forms of fishing were banned from spawning aggregation sites at least at spawning times. T h e dissenters felt that sustainable yields from aggregations
are possible, i.e., yields that would not marlvxily reduce population size. This remains one of the scientific questions to be addressed in further research efforts. set-aside reserves, both for conser- vation and as reference (i.e., con- trol) communities for comparison with impacted populations.
Larval Dispersal and Recruitment
addressing the large issue concern- ing what controls population size in unexploited populations: rates of settlement, predation, food availability and substrate limitation, i f any: addressing the second large ques- tion of whether, and to what extent, populations are self-recruiting: this includes many related issues, such as the ability of larvae to swim against residual currentsi, and by migrating vertically, to control position over substrates. Other issues are larval survivorship; transport mechanisms from the pelagic phase to reef set- tlement areas; and factors influenc- ing the timing and location of set- tlement (Doherty et al. 1994).
Life History Strategies
evaluating consequences of possi- ble fishing selection for genetically large individuals on size structure and genetic diversity of population. Com- pare heavily fished with underfished stocks; basic descriptions of age and growth rates, onset of maturity, and degree of plasticity of time of maturity and sex change. These descriptions should be made for species for which such
' We note that recent work in Australia has shown that beyond LO days, and especially during pre-
settlement (i.e., at about 1 cm), most reef fishes have phenomenal swimming abilities, with sustained speeds of around 30-40 cm per second (Stobutzkl and Bellwood 1994).

data d o not currently exist in formal literature. Complete FishBase coverage of species for which information is available, if only in the "grey litera- ture" (see Pauly and Binohlan, this vol.); evaluating predation mortality of all life stages, including identification of predators and predation rate: and evaluating feeding habits of differ- ent life history stages.
The latest threat
One issue that has become important since the workshop was held is the live trade to Hongkong (and China) of live groupers and snappers and similar high value fish (Johannes 1995; Johannes and Riepen 1995). The press has emphasized the use of sodium cyn- nide in this trade. The major threat, though, is overexploitation, with large areas of Southeast Asia and the South Pacific be- ing successively depleted (Erdmann and Pet-Soede 1996); a threat t o which an adequate response has yet to be found.
Acknowledgements
We thank the participants, who exhib- ited great interest and dynamism during the plenary worlrshop sessions. We are especially grateful to those who accepted to chair working group discussions, i.e., Tony j. Pitcher and Sherry Manickchand- Heileman, who led the discussions on Popu- lation Dynamics and Ecology: Douglas Shapiro and John Tucker, on Aquaculture and Bi- ology; and Brian E. Luckhurst and Jaime Gonzalez-Cano, on Fisheries Management. Finally, w e thank Carry Russ for reviewing the draft of this contribution, and suggesting we incorporate recent references from Australia; this added a flavor that had been missing a t the workshop.
References
J Agustin, L., R.S.V. Pullin and C. Casal. 1996a.
The CULEYS table, p. 129-1 32. fnR Froese and D, Pauly (eds.) FishBase 96: concepts, design and data sources. ICLARM, Ma-
J nila, Philippines. Agustin, L., R.S.V. Pullin and C. Casal. 199613.
The CULTSPEC table, p. 132-1 34. l n R Froese and D. Pauly (eds.) FishBase 96: concepts, design and data sources. ICLARM, Ma- mila, Philippines.
Allen, G.R. 1985. Snappers of the world: an annotated and illustrated catalogue of lutjanid species known to date. FA0 spe- cies catalogue. Vol. 6, 208 p. + 28 plates.
Arreguln-Sanchez, F. 1996. Catchability, a key parameter for fish stock assessment. Rev. Fish Biol. Fish. 6(2):221-242.
Bannerot, S., W.W. Fox, Jr. and 1.E. Powers. 1987. Reproductive strategies and the rnanage- rnent of snappers and groupers in the Gulf of Mexico and Caribbean, p. 561-603. fn 1.1. Polovina and S. Ralston (eds.) Tropi- cal groupers and snappers: biology and fisheries management. Westview Press. Boulder, Colorado.
Beamish, R.J. and G.A. McFarlane. 1983. The forgotten requirement For age validation in Fisheries biology. Trans. Am. Fish. Biol. 1 12:735-743.
Beets, 1. and M.A. Hixon. 1994. Distribution, persistence, and growth of groupers (Pisces: Serranidae) on artificial and natural patch reefs in the Virgin Islands. Bull. Mar. Sci. 55(2/3):470-483.
Christensen, V. and D. Pauly. 1992. The ECOPATH 11 - a software for balancing steady-state ecosystem models and calculating net- work characteristics. Ecol. Modelling 61:169-185.
Christensen, V. and D. Pauly. 1995. Fish pro- duction, catches and the carrying capac- ity of the world oceans. Naga, ICLARM Q. 18(3):34-40.
Davies, C.R. 1995. Movement studies of three species of coral reef Ash at Lizard Island, Great Barrier Reef, Australia. James Cook University of North Queensland, Australia. 212 p. Ph. D. thesis.

Doherty, P.J., A.J. Fowler, M.A. Samoilys and D.A. Harris. 1994. Monitoring the replen- ishment of coral trout (Pisces: Serranldae) populations. Bull. Mar. Sci. 54:343-355.
Doherty, P.J. and D.M. Williams. 1988. The re- plenishment of coral reef fish populations. Oceanogr. Mar. Biol. Annu. Rev. 26:487-
Irdrn:::: M.V. and L. Pet-Soede. 1996. How fresh is t o o fresh? The live reef food fish trade in Eastern Indonesia. Naga, ICLARM Q. 19(1):4-8.
Ferreira, B.P. 1993. Reproduction of the inshore coral t rout , P lec t ropomus rnacu/atus (Perclformes: Serranidae) from t h e cen- tral Great Barrier Reef, Australia. 1. Fish Biol. 42:83 1-844.
Ferreira, B.P. 1995. Reproduction of t h e corn- mon coral trout, Plectropornus leopardus (Serranidae: Epinephelinae) from the central and northern Great Bartier Reef, Australia. Bull. Mar. Sci. 56:653-669.
Ferreira, B.P. and G.R Russ. 1992. Age, growth a n d mortality of t h e inshore coral trout, Plectropomus macula tus (Pisces : Serranidae) from t h e central Great Bar- rier Reef, Australia. Fish. Bull. 92:46-57.
Ferreira, B.P. and G.R Russ. 1994. Age and growth of coral trout, Plectropomus leopardus (Pisces: Serranidae) from the northern Great Barrier Reef, Australia. Fish. Bull. 92:46-57.
Ferreira, B.P. and G.R. Russ. 1995. Population structure of t h e leopard coral grouper , Plectropomus leopardus, o n fished and unfished reefs offTownsville, central Great Barrier Reef, Australia. Fish. Bull. 93:629- 642 .
Froese, R, and D. Pauly, Editors. 1996. FishBase 96: concepts , design and d a t a sources. ICLARM, Manila, Philippines. 1 7 9 p.
Gayanilo. F.C., Jr., P. Sparre and 0. Pauly, 1995. The FAO-ICLARM stock assessment tools (FEAT) user's guide. FA0 Comp. Inf. Ser. (Fish.) No. 7, 1 2 6 p. Rome, Italy.
Heemstra, P.C. and J.E. Randall. 1993. Groupers o f the world (Family Serranidae, subfamily Ephinephellnae). An annotated and illus- trated catalogue of the grouper, rockcod, hind, coral grouper, and lyretail species known t o da te . FA0 species catalogue. Vol. 1 6 , 3 8 2 p. +31 plates.
Hixon, M.A. and 1.P. Beets. 1993. Predation, prey refuges, and t h e structure of coral
reef Fish assemblages . Ecol. Monogr. 6 3 ( l ) : 7 7 - l O l .
Isaac, V.]. 1990,. The accuracy o f s o m e length- based methods For fish population s tud- ies. ICLARMTech. Rep. 27, 8 1 p.
Johannes, R.E. 1995. Fishery for live reef food fish is spreading human death and envl- ronmental degradation. Coast. Manage. Trop. Asia. (September) (5):8-9.
Johannes, R.E. and M. Riepen. 1995. Environ- mental, economic, and social implications of t h e live reeF fish t rade in Asia and t h e Western Pacific. Nature Conservancy. Ja- karta Selatan, Indonesia. 81 p.
Lanjumin, L. 1982. Development of c a g e cul- ture for finfish in Riau Archipelago - Riau Province. Indonesia, p. 165-1 66 . In R.D. Guerrero and V. Soesanto (eds.) Report of the Training Course on Small-scale Pen and Cage Culture for Finfish. SCS/GEN/ 82/34. South China Sea Fisheries Devel- opment and Coordinating Programme, Manila, Philippines.
Longhurst, A.R. and D. Pauly. 1987. Ecology of tropical oceans. Academic Press, San Diego. 407 p.
Manickchand-Dass, S. 1987. Reproduction, age and growth of lane snapper Lu@nus synagris (Linnaeus) in Trinidad, West Indies. Bull. Mar. Sci. 40(1):22-28.
Masuma, S., N. Tezuka and K. Teruya. 1993. Embryonic and morphological develop- ment of larval and juvenile coral trout, Plectropomus /eopardus. lap. J. Ichthyol. 40(3):333-342.
Moreau, J., C. Bambino, and D. Pauly. 1986. A comparison OF four indices of overall fish growth perFormance. based on 1 0 0 tilapia populations (Farn. Cichlidae), p. 201 -206. 1nJ.L. Maclean, L.B. Dizon and L.V. Hoslllos (eds.) The First Asian Fisheries Forum. Asian Fisheries Society, Manila, Philippines.
Munro, J.L. and M. Balgos, Editors. 1395. Ar- tificial reefs in t h e Philippines. ICLARM Conf. Proc. 49, 56 p.
Newman. S.J., D. McB. Williams and G.R. Russ. 1996. Variability in t h e population struc- ture of Luuanus adet i i (Casteinnu, 1873) and L. quinquelineatus(Bloch, 1790) among r e e k in t h e central Great Barrier Reef, Australia. Fish. Bull. 94:313-329.
Pauly, D. 1987. A review of t h e ELEFAN sys- tem For analysis of length-frequency d a t a

in fish and aquatic invertebrates, p. 7-34. 117 D. Pauly and G.R. Morgan (eds.) Length- based methods i n fisheries research. ICLARM Conf. Proc. 13, 468 p.
Pauly, D. and F. Arreguin-SAnchez. 1995. Im- proving Shepherd's length composition analysis (SLCA) method for growth pa- rameter estimations. Naga, ICLARM Q. l8(4) :3 1-33.
Pauly. D. and J.L. Munro. 1994. Once more on the comparison o f growth in fish and in- vertebrates. Fishbyte 2(1):2 1.
Pauly, D., 1. Moreau and N. Abad. 1995. Com- parison of age-structured and length-con- verted catch curves OF brown trout Salrno truth i n two French rivers. Fish. Res. 22: 197-204.
Pauly, D. and V. Christensen. 1996. ECOPATH models o f coral reef ecosystems, p. 137- 144. In J.W. McManus and M.C. Ablan (eds.) ReefBase: a global database on coral r eek and their resources. ICLARM. Ma- nila.
Polovina, I . j. 1984. Model o f a coral reef eco- system. I. The ECOPATH model and its application to French Frigate Shoals. Coral Reefs3(1):1-1 I.
Polovina, J.J. 1989. Artificial reefs: nothing more than benthic fish aggregators. CaliF. Coop. Ocean. Fish. Invest. Rep. 30:37-39.
Riclter, W.E. 1975. Computation and interpre- tation of biological statistics of fish popula- tion. Bull. Fish. Res. Board Can. 19 1, 382 p.
Roberts, C., W.). Ballantine, C.D. Bwton, P. Dayton, . L.B. Crowder, W. Milon, M.K. Orbach, D. Pauly, j. Trexler and C.J. Walters. 1995. Review ofthe use OF marine fishery reserves in the U.S. Southeastern Atlantic. NOAA Tech. Mern. NMFS-SEFCS-376, 31 p.
Russ, G.R and A.C. Alcala. 1996. Marine reserves- rates and patterns of recovery and decline o f large predatory reef fish. Ecol. Appl. 6(3):947-96 1 .
Russ. G.R., D.C. Lou and B.P. Ferreira. Tracking
a strong cohort in the age structure of a coral reeFFish, the coral trout, Plectrapomus leapardus, on reek O F the central Great Barrier Reef, Australia. Can. J. Fish. Aquat. Sci. (In press).
Sadovy, Y. and P.L. Colin. 1995. Sexual
development and sexuality in the Nassau grouper. J. Fish Biol. 4696 1-976.
Sadovy, Y. and M. Figuerola. 1992. The status of the red hind Fishery in Puerto Rico and St.
Thomas as determined by yield-per-recruit analysis. PI-oc. CulfCaribb. Fish. Inst. 42:23-
38. Sadovy, Y., M. Figuerola and A. Roman. 1992.
Age and growth of red hind Lpine/~helus guttatus i n Puerto Rico and St. Thomas. US Fish. Bull. 90:5 16-528.
Sadovy, Y., A. Rosario and A. Roman. 1994. Reproduction in an aggregating grouper.
the red hind, Ephephe/usgumrus. Env. Biol. Fish. 4 1 :269-286.
Saila, S.B., C.W. Recltsielc and M.H. Praeei. 1988. Basic fishery science programming. Bev. Aquacult. Fish. Sci. 18: 230 p.
Sainsbury, L. 1980. Effect of individual variability
of the von Bertalanhjl growth equation. Can. j. Fish. Aquat. Sci. 37:241-247.
Sarnoilys, M.A, and L.C. Squire. 1994. Prelimi- n a y observations on the spawning behav- iour of coral trout, Pkctropomus leopardus (Pisces: Serranidae), on the Great Barrier ReeF. Bull. Mar, Sci. 54:332-342.
Shapiro, D.Y., G. Garcia-Moliner and Y. Sadovy.
1794. Social system OF an inshore stock o f the red h ind grouper , Epinephelus guttatus (Pisces: Serranidae). Env. Biol.
J Fish. 41 415-422. Shepherd, J.G. 1987. A weakly parametric
Stc
method for estimating growth parameters from length-composit ion data, p. 1 13- 1 19. In D. Pauly and G.R. Morgan (eds.) Length-based me thods En f isheries research. ICLARM Conf. Proc. 13,468 p.
~butz l t i , 1.C. and D.R. Bellwood. 1994. An analysis o f the sustained sw imming abilities o f pre-sett lement and post- settlement coral reef fishes. J. Exp. Mar. Biol. Ecol. 175:275-286.
Walters, C., V. Christensen and D. Pauly. 1997. Structuring dynamic models of exploited ecosystems from trophic mass-balance assessments. Rev. Fish Biol. Fish. 7: 139- 172.
Williams, T.P. 1986. Ageing manual For Kuwaiti fish. Kuwai t I ns t i t u te for Scient i f ic Research, Safat, Kuwait. 57 p.
Worthington, D.G., P.J. Doherty and A.J. Fowler. 1995. Variat ion i n t he re la t ionsh ip between o t o l i t h w e i g h t and age: implications For the estimation o f ase
of two tropical damselfish ( ~ o m a c e n t G moluccensis and P. w a r d . Can. J. Fish.
Aquat. Sci. 523233-242.

- . - ------I
PART 11: BIOLOGY, ECOLOGY AND DISTRIBUTION
Ecology and Population Dynamics of Luganus synagris on Campeche Bank
E. RIVERA-ARRIAGA A.L. LARA-DOM~NGULZ
J. RAMOS-MIRANDA P. SANCHEZ-CIL
A. YANEZ-ARANCIBIA Programa de Ecologia, Pesguerias
y Oceanografia cle/ Golfo de Mexico U. A. C. Ap. Postal 520, Campeche 24030
Campeche, Mgxico
RIVERA-ARRIAGA, E. , A.L. LAM-DOM~NGUEZ, J. RAMOS-MIRANDA. P. SANCHEZ-GIL and A. YANEZ- ARANCIBIA. 1996. Ecology and population dynamics of Lurjanussynagrison Carnpeche Bank [Ecologia y dindrnica poblacional de Lutjanus synagris en la Sonda de Campeche. Mexico], p. 1 1 - 18. /n F . Arreguin-Sanchez, J.L. Munro, M.C. Balgos a n d D. Pauly (eds . ) Biology, Fisheries a n d culture of tropical groupers and snappers. ICLARM Conf. Proc. 48, 449 p.
Abstract
Lut/anus synagris is a commercially Important member of t h e demersal Rsh community o n Campeche S o u n d , ad jacent t o Terminos Lagoon, sou thern Gulf of Mexico. Its life history a n d seasona l i ty a r e described, with emphasis o n its reproductive and trophic strategies.
L. synagris Is a s tenohal ine spec ies with preference for d e e p and clear w a t e r in t h e C a m p e c h e Sound. Reproduction takes place From May t o October on t h e Inner shelf.
The population near the Puerto Real of Terminos Lagoon was mainly composed of juveniles feeding over seagrass beds, and occurs in waters of less than 20 m depth .
The t rophic s p e c t r u m is w i d e with a t l eas t n ine impor tan t i t ems , with penae id shr imps (46%). carideans (40°/0), fishes (49%). and other crustaceans (33%) being dominant a t different periods of t h e year .
The von BertalanfFy growth parameters were est lmated, based on length-frequency d a t a a n d using ELEFAN I and SLCA, both parts of t h e FISAT s o h a r e . This led t o TL_ = 35.2 c m and K= 0.26-0.29 year-'. i.e.. values compatible with es t imates from earlier studies.
Resumen
Lutjanus synagris es una espede de importancia comerdal de la comunidad de peces dernersales de la Sonda de Campeche, adyacente a la Laguna de T&minos. Se descrlbe su ciclo de vida y estaclonalidad, con Cnhsls en sus estrategias reproductlva y trdflca.
L. synagris es una especie estenohallna con preferencia por aguas profundas y claras de la Sonda de Carnpeche. La reproduccidn tlene lugar de Mayo a Octubre sobre la parte interna de la plataforma continental. La poblacidn, cerca de Puerto Real, Laguna de T&rminos, estuvo compueita princ/palmente por /uveniles que se al/mentan en /as Areas de pastos marlnos, en profundldades menores a 20 m.
El espectro trdnco es amplio, con a1 rnenos nueve componentes de importancia: carnarones peneldos (46%), carldeos (40%)) peces (49%) y otros crustdceos (33%), slendo domlnantes en diferentes perl6dos del atio.

Los pardmetros de crecimiento de la ecuacl6n de von Bertalanfi fueron estimados con base en datos de riecuencia de longitudes utilizando 10s mdtodos ELEFAN 1 y SLCA, ambos contenidos en el paquete de programas FISAT. Las estimaciones fueron: LT_=35.2 cm y K=0.26-0.29 afio-', 10s cuales son compatibles con estucfios an teriores.
On the continental shelf of Campeche Sound, adjacent to Terminos Lagoon there are at least 350 fish species, of which 21 species are dominant. These include the commercially important snapper Lutjanus synagris.
The biology and ecology of L. synagris have been described by Reshetnikov and Claro ( 1 975) and Claro ( 1 983) (see Diaz- Ruiz et al.; and Cuellar et al., this vol.). Growth parameter analyses in the Yucatan shelf are given by Torres Lara and ChAvez ( 1 987), Torres Lara and Salas MArquez (1 988, 1 99O), Torres Lara et al. ( 199 1 ); and for Puerto Rico by Acosta and Appeldoom (1 992). The purpose of this paper is to add to this body O F knowledge, with emphasis on the ecology and growth of L. synagris.
Study Area
In the southern Gulf of Mexico, the Campeche Sound and Terminos Lagoon constitute a complex ecosystem involving transport and mixing processes, complex trophic webs and migratory processes, particularly near or through the two es- tuarine inlets of Terminos Lagoon (Y6iiez- Arancibia et al. 1991 ). The prevailing winds, littoral currents and river discharges cause a net inflow at the eastern inlet (Puerto Real), and a net outflow through the western inlet (El Carmen). There are three climatic seasons in t h e region, according to tem- perature, precipitation and wind patterns: the "Nortes" (Northern winds) season from October to February, the dry season from February to May, and the rainy season From J u n e to October. Detailed weather
descriptions for the area are provided by YStiiez-Arancibia and Day ( 1988) and YAfiez- Arancibia and Sanchez-Gil ( 1 984).
Campeche Sound has an area of 129 500 km2 within the 200 m isobath (Fig. 1 ) . Terminos Lagoon has an area of 1 662 kmz, and mean depth of 3.5 m. There are 933 km2 of wetlands and a number of associ- ated lagoons (YAiiez-Arancibia and Day 1 988).
Methods
Trawl-catches of lane snapper L, synagris were made from June 1976 to September 1985, at 18 sampling stations inside the lagoon, 81 in the Campeche Sound, and two in front of theTerminos Lagoon inlets (Fig. 1). These latter stations were sam- pled every four hours over 24-hour peri- ods during the "Nortes", rainy and dry seasons, and were used for trophic dynamics and gonadal maturity studies. The other sam- ples were used to determine distribution, abundance and growth parameters.
The gear used were shrimp trawls of 2.5- m opening and 1.90-cm mesh in the la- goon; and 9-m opening and 3.38-cm mesh in the Campeche Sound (Sanchez-Gil et al. 1981 : YAAez-Arancibia and Sanchez-Gil 1 986).
The trophic spectrum of L. synagris was analyzed following Hyslop (1 9803, De S y h ( 1985) and YAfiez-Arancibia et al. (1 986). The gonadal maturity was determined using the scale proposed by Hilge ( 1 977).
Length-frequency data were analyzed using SLCA (Shepherd 1987), ELEFAN 1 (Pauly 1987) and Extreme Value (Formacion et al. 1991) routines of the FiSAT soft- ware (Gayanilo et al. 1995). The growth parameter estimates were compared with

other estimates using the growth performance index ($') of Pauly a n d Munro (1984):
0' = 2Iog,,L-+ log,, I<.
Results and Discussion
The s a m p l e of 656 L. synagris t ha t was obta ined consisted of 88 spec imens from t h e C a m p e c h e Sound , 3 1 from Terminos Lagoon, 444 from Puerto Real a n d 93 from El Carmen. L. synagris is a dominan t spe- cies o n t h e C a m p e c h e Sound , a n d a n OC-
casional visitor to Terminos Lagoon. Abun- dances are highest over carbonate bot toms
and seag ras s b e d (YaAez-Arancibia a n d Sanchez-Gil 1 986).
In t h e inlet a reas . L. synagris is p resen t throughout t h e yea r but abundances w e r e higher dur ing d ry a n d rainy s e a s o n s (Fig. 1).
The range of lengths caugh t w a s 5 t o 31 c m , with t h e smaller s izes a t d e p t h s of abou t 10 m near t h e inlets, a n d t h e adul ts in 20-40 m (Fig. 2) .
Most juveniles w e r e found in El Carmen dur ing t h e rainy s e a s o n (Fig. 2), possibly because of t h e river d ischarge resulting in a high input of nutrients.
L. synagris is a second- o r third-order consumer , and feeds mainly o n organisms
I I 4
Compsche Sound 0 . ..
Fig. 1. Map of study area, 1.e.. the Camperhe Sound and Termlnos Lagoon. The dots repre- sent the sampling statlons of 13 trawl surveys from 1976 to 1985. The full dots are the sampllng statlons where Lutjanus synagrls occurred; the open dots represent the other stations. [Area de estudlo Incluyendo la Sonda de Campeche y la region de la Laguna de TPrmlnos. L os puntos corresponden a /as estaclones de muestreo de 13 cruceros efectuados de 1976 a 1985. Los puntos negros muestran /as estaclones donde In colecta de Lutjanus synagrls f u i positlva.]

0 Trawl hauls without L. synagris
of L. synagris L rynagrk catch (g)
Flg. 2. Dlstrlbutlon of Lut/anus synagrls In Carnpeche Sound (June 1978-March 1982); the depth (In m) in panel C also apply to panels A-B and D-F (rnodlfled from Sanchez-GI1 e t al. 1781). [Distrlbucldn de LutJanus synagris en la Sonda de Campeche l/unlo 1978 - Marzo 1982). La profundidad (m) en el dlagrama C se apilcd tambikn a 10s diagramas A-6 y D-F ladaptado de Sinchez-GII ef a/. 1981j.j

Table I. Comparlson of growth parameters of Lut,fanus synasris from different areas. [Comparaclbn de par&netror de creclmlento de Lutjanu s synagrls tfe dflerentes ireas.]
Area L_ (cm) K (year-') $'" Methods Authors
Florida Trinidad 8, Tobago
Cuba Cuba Yucatan Yucatan Yucatan Yucatan Yucatan Puerto Rico Campeche Sound
otoliths otoliths otoliths otoliths, scales and urohyal otoliths, scales and urohyal ELEFAN 1 , Ford-Walford -do- -do- -do- -do- -do- ELEFAN I , SLCA
Manooch and Mason ( 1 984) Manickchand-Dass (1 987)
Rodriguez-Pino ( 1962) Claro and Reshetnikov (1 9 8 1 ) Torres-Lara ( 1 984) Mexicnno-Cintora and Arreguin-Sanchez ( t 987) Torres-Lard and Salas-Marquez ( 1 990) Torres-Lara (1 987) Torres-Lara and Chkvez ( 1 987) Acosta and Appeldoorn ( 1992) This study
" 4' = log,,K + 21og,, L_(Pauly and Munro 1984)

which live in seagrass beds in Puerto Real. Its prey consists of at least nine items varying according to the availability of t h e prey, the season and size. Penaeid shrimps, fishes and other crustaceans predominate in terms of weight, with strong seasonal variations (Rivera-Arriaga 1990).
The sex ratio was close to 1 in both in- lets during the year. Juveniles were found in both inlets, while a few maturing adults were Found in Puerto Real during the rainy season. According to Torres-Lara and Salas- MArquez (1988), L. synagris matures in two or three years, at a size of 18 cm.
The growth parameters obtained were L_= 35.2 cm, I< = 0.29 year7' using SLCA
and LC*= 35.2 cm, K = 0.26 year2' using ELEFAN I , which is similar to reports from other areas of the Gulf of Mexico (Table 1).
Proposed m o m of the life history of Lutjanus synagris
The migratory strategy of L. synagris includes depth and distance from the coast. The population studied here includes ju- veniles which feed near the coast, while the adults migrate to depths exceeding 40 m and distances of more than 70 km from the coast. Fig. 3 summarizes the life cycle of L. synagris on Campeche Sound.
Flg. 3. Schematic repre- sentation of the llfe cycle of Luqanus synagrls on Campeche Sound. Arrows lndlcate stage and spatial transitions; circles lndlcate seasons of the year when most transitions occur, though some stages occur throughout the year. [ R e p r e s e n t a c l o n esquematica del ciclo de vida de Lutjanus synagrls en 1a Son& de Campeche. Las fiechas lndlcan 10s estadios y /as translciones espaclales; 10s circulos IndIcan /as estaclones tiel at50 cuando la mayoria de /as transiciones ocurren, aunque algunos estadios se presentan a lo largo rlel ado.]

References
Acosta, A. and R.S. Appeldoorn. 1992. Esti- mation of growth, mortality and yield per recruit for Lurpnus synagris (Linnaeus) in Puerto Rico. Bull. Mar. Sci. SO(2):282-291.
Claro, R. 1983. Ecologia y ciclo d e vida d e la biajaiba, Lutjanus synagris, en la Plataforma Cubana. V. Dinknica estacional d e algunos indicadores morfofisiologicos. Reporte d e Investigation, Inst. d e Oceanolog ia . Academia d e Ciencias d e Cuba 16, 3 8 p.
De Sylva, D.P. 1985. Nektonic food webs in estuaries, p. 35-56. In A. Yafiez-Arancibia (ed . ) Fish community ecology in estuar- ies and coastal lagoons: towards an eco- system integration. UNAM Press, Mexico. 6 4 5 p.
Formacion. S.P., J.M. Rongo and V.C. Sambilay. 199 1. Extreme value theory applied t o the statistical distribution of the largest lengths of fish. Asian Fish. Sci. 4: 123- 135.
/Gayanilo, F.C., Jr . , P. Sparre and D Pauly. 1995. The FAO-ICLARM stock assessment tools (FiSAT) user's guide. FA0 Cornp. Inf. Ser. (Fish.) 7, I 2 6 p.
Hilge. V. 1977. On the determination of the s tages O F gonad ripeness in female bony Fishes. MeeresForsch. Rep. Mar. Res. 25(3- 4) :149-155.
Hyslop, E.J. 1980. Stomach contents analysis; a review of methods and their applica- tion. 1. Fish Biol. 17: 41 1-429.
Manickchand-Dass, 5. 1987, Reproduction, a g e and growth of the lane snapper , Lutjanus synagris (Linnaeus), in Trinidad, West Indies. Bull. Mar. Sci. 40(1) : 22-28.
Manooch, C.S., I I I and D.L. Mason. 1984. Age, growth and mortality of lane snapper From Southern Florida. Northeast Gulf Sci. 7: 109-1 15.
Mexicano-Cintora, G. and F. Arreguin-Sanchez. 1987. Dinarnica d e las poblaciones d e rubia (L utjajanus s ~ n a g r i s ) y canane (Ocyurus chrysurus) d e las cos tas d e Yucatan. Congreso d e Ciencias del Mar. La Habana Cuba.
J Pauly, D. 1987. A review of t h e ELEFAN sys- tem for analysis of length-frequency data in fish and aquatic invertebrates. p. 7-34. In D. Pauly'and C. R. Morgan (eds.) Length- based m e t h o d s in fisheries research. ICLARM Conf. Proc. 1 3 , 4 6 8 p.
' Pauly, D. and J.L. Munm. 1 9 8 4 . Once more on t h e comparison of growth in Fish and invertebrates. Fishbyte 2 ( 1 ):2 1 .
Reshetniltov, Y.S. and R. Claro. 1975. Cycles of biological processes in tropical fishes with re fe rence t o Lutjanus synagris . S.N. Severtsov. lnstitute O F Evolutionary Mor- phology and Animal Ecology (IEMEZH). Moscow and lnstitute of Oceanology, Habana, Cuba.
Rivera-Arriaga, E. 1990. Ecologia trofica e n d o s poblaciones d e peces tropicales costeros (Po /ydac th /us octonemus y Lutjanus synagris) del sur del Colfo d e Mexico. Universidad Nacional Autonorna d e Mexico. Mexico, D.F. 60 p. M. thesis.
Rodriguez-Pino, Z. 1962. Estudios estadisticos -
y biologicos sobre la biajaiba Lu(ianus synagris . Cent ro d e Inves t igac iones Pesqueras. Nota sobre lnvestigaciones (4), 99 p.
Sanchez-Gil, P., A. YaAez-Arancibia and F. Amezcua Linares. 198 1. Diversidad, distribuci6n y abundancia d e las especies y poblaciones d e peces dernersales d e la Sonda d e Campeche (verano 1978). An. Inst. Cienc. del M a r y Lirnnol. Univ. Nal. Auton. Mexico 8( 1 ):209-240.
Secretaria d e Pesca. 1992. Estadisticas d e resumenes anuales por oficina, 199.2. Delegation Federal d e Pesca, Campeche,
J Mexico. Shepherd , J.G. 1987. A weakly parametric
method for estimating growth parameters from length composition da ta , p. 113- 1 19. 01 D. Pauly and G.R. Morgan (eds.). Length-based methods in fisheries research. ICLARM Conf. Proc. 13, 4 6 8 p.
Torres-Lara, R. 1984. Diagnosis.de la pesqueria d e la rubia (Lutjanus synagris, Linnaeus, 1758) e n las costas d e Yucatin. Escuela Nacional d e Estudios Profesionales IZTACALA, Universidad Nacional Autohoma d e Mexico, Mexico. 89 p. Tesis profesional.
Torres-Lara, R. 1987. An6lisis biologico-pesquero d e d o s temporadas d e pesca d e la rubia (Lutjanus synagris. L.. 1 758) en las costas d e Yucatan. CINVESTAV-IPN-Unidad Merida. Yucatan, Mexico. 154 p. Tesis d e maestria.
Torres-Lara, R. and E. ChAvez. 1987. Evaluation y diagnostic0 d e la pesqueria d e rubia

(Lut/anus synafls ( L ) ) en el Estado d e Yucatan. Cienc. Mar. 13( 1):7-29.
Torres-Lara, R. and S. Salas Mirquez. 1988. Fecundidad d e la rubia (Lutjanussynagris) en las costas d e Yucatan. Contribuciones d e Investigation Pesquera. Inst. Nac. Pesca (5) :21-31 .
Torres-Lara, R. and 5. Salas Marquez. 1990. Crecimiento y mortalidad d e la rubia Lutjanus synagris d e las costas cle Yucatan durante las temporadas d e pesca 1983- 1985. An. Inst. Cienc. del ~ a r Limnol., Univ. Nal. Auton. MCxico 17(2): 205-214.
Torres-Lara, R.. S. Salas Mkrquez, G. Mexicano- Cintora and M.A. Cabrera-Vascluez. 1991. Sinopsis d e la dinamica poblacional d e cinco especies d e la familia Lutjanidae e n la costa d e Yucatan. An. Inst. Cienc. del Mar y Limnol., Univ. Nal. Auton. MPxico 18(Z): 189- 198.
Yaiiez-Arancibia, A,, A.L. Lara-Dominguez and A. Aguirre-Leon. 1986. Feeding ecology of tropical estuarine fishes in relation t o recruitment processes, p. 73-94. In A. Yafiez-Arancibia and D. Pauly (eds.) Re- cruitment processes in tropical coastal demersal communities. Ocean Science in Relation t o Living Resources (OSRL),
International Recruitment Project (IREP). COI-FAO-UNESCO Workshop Press Series (44). Unesco, Paris.
Yaiiez-Arancibia, A. and J.W. Day, Jr. 1988. Caracterizacion ecologica d e la Laguna deTerminos, p. 1-26. In A. YAfiez-Arancibia and J.W. Day (eds.) Ecology of coastal ecosystems in the southern GulF of Mexico: The Terminos Lagoon region. lnstituto d e Ciencias del Mary Limnologia. Universidad Nacional Autonoma d e Mexico and Coastal Ecology Institute Louisiana State University, Ed. Universitaria. Mexico, D.F.
Yaiiez-Arancibia, A. and P. Sanchez-Gil. 1986. Los peces demersales d e la plataforma continental del sur del Golfo d e MCxico: caracterizacion ambiental , eco log ia y evaluaci6n d e las especies , poblaciones y comunidades. Inst. Cienc. del Mar y Limnol. Univ. Nal. Auton. (Mexico) Publ. Esp. 3 :230 p.
Yafiez-Arancibia. A , , P. Shchez-Gil and A.L. Lara-Dominguez. 1 9 9 1. lnteracciones eco log icas es tuar io -mar : es t ruc tura funcional d e bocas estuarinas y su eFecto en la productividad del ecosistema. Publ. ACIESP 7 1 (4):49-83.

--- d APR 1 4 1398
Trophic Role of the Red Grouper (Epinephelus morjo) in the Ecosystem of the Northern Continental Shelf
of Yucatan, Mexicoa
F. ARREGU~N-SANCHEZ~ Programa de Ecologia, Pesquerias
y Oceanografia del Golfo de M&x;co U. A. C. Ap. Postal 520, Campeche 24030
Campeche, Mexico
E. VALERO Centro de Investigacion y de Estudios A vanzados del IPN
Uniclad Merida, Ap. Postal 73-Cordemex. 97310 Merida, Yucatiin, Mexico
ARREGU~N-SANCHEZ. F. and E. VALERO. 1996. Trophic role of the red grouper (Epinephelus morio) in the ecosystem of the northern continental shelf of Yucatan, Mexico [Papel trofico del mero americano (Epinephelus rnorio) en el ecoslstema del norte de la plataforma contihenta/ de Yucatan, Mexico], p. 19-27. In F. Arreguin-Sanchez, J.L. Munro. M.C. Balgos and D. Pauly (eds.) Biology. fisheries and culture of tropical groupers and snappers. ICLARM Conf. Proc. 48. 449 p.
Abstract
The trophic role of. red grouper (Epinephelus morio) on the northern continental shelf of Yucatan, Mexico, is analyzed through simulated changes in its biomass, based on a previous study using the ECOPATH model and which emphasized the commercially important Fish resources. Red groupers occupy a high trophic level in the ecosystem, together with mojarras, lting mackerels, snappers, sharlts and octopuses. Except For the octopus, all others can be grouped as a single box in the model without loss OF structural information. When decreases in biomass of red groupers were simulated, the contrl- butions to detritus from primary producers and the sum of all exportations increased, along with other commercially important groups of fishes such as snappers, mojarras, lting mackerels and sharks. Net primary production, sum of Flows to respiration, the sum OF all consumptions and ascendencies de- creased, along with the biomasses OF sea trouts and sardines. In general terms, observed changes result in the ecosystem maintaining its thermodynamic equilibrium.
Resurnen
El papel trofico del mero americano (Epinephelus morio) de la plataforma continental a/ norte de /a Peninsula de Yucatin, Mexico cs analirado a traves de cambios simulados en su biomasa, con base en un estudio previo que utilizo el modelo ECOPATH, y hhae enfasis en 10s recursos pesqueros de mayor importancia comercial. El mero americano ocupa un alto nivel trofico en el ecosistema, junto con /as
" EPOMEX Contribution 240. " Present address: Centro lnterdisciplinario de Ciencias Marinas del IPN, Playa Conchalito s/n; Apartado
Postal 592. La Paz 23000. Baja California Sur. Mexico.

mojarras, el carito. 10s pargos, el tiburon y el pulpo. Con excepcidn del pulpo, /as otras especies pueden scr reunidas en un solo grupo sin pkrdida de inforrnau'on estructura/. Cuando los cambios en /a hiomasa dc 10s meros fucron sirnulados, /as contribuciones a detritus desde productores prirnarios y la suma de todas /as exportaciones lncrementaron, junto con otros grupos importantes como 10s pargos, rnojarras, carito y tiburdn: mientras que la producclbn primaria neta, la suma de flujos a respjracion, /a surna de rodos 10s consumos y /as ascendencias decrecieron, junto con /as biomasas de /a trucha de mar y sardinas. En terminos generales, 10s carnbios observados son resultado del rnantenirniento de/ equilibria
The northern continental shelf of Yucatan is an important fishing ground in the Gulf of Mexico, with a high diversity of resource species and fisheries. Most fishing is car- ried out by small- or middle-sized fleets which tend to operate close to the coast. Red grouper is the most important fish resource in this region after shrimp; an- nual yields reached more than 19 000 t in the early 1970s, but in the last years, they declined to about 1 1 000 t (see Arreguin- SAnchez et BI.; Brule and Deniel; Sullivan and Slulta, this vol.). The fishers use long- lines, or hand-lines, depending on the type of boats, and fishing areas. Fishing occurs throughout the year, and the fishery is a rnultispecies fishery (Fuentes 1991 ), although red grouper constitutes more than 80% of the total catch.
This fishery has been studied by sev- eral authors who determined its status at the time corresponding to their analysis. IWna ( 1 976), Muhlia (1 976), Moreno ( I 980), Doi et al. ( 1 98 1 ) and Stevenson ( 1 982), concluded that the fishery was still de- veloping and that higher yields could be obtained. Some years later, Seijo (1 986), Arreguin-Sanchez ( l987a, 1987b), Arreguin- Sanchez et al. (1987), noted a decline in relative abundance, i.e., catch/effort, while Contreras et al. (1 994) suggested that there had been a decrease in the average population size of around 30%.
Arreguin-Sanchez (1 992) undertook a study based on a detailed analysis of catchability patterns involving rime, age- length, fleet and density dependent effects
on the vulnerability OF fish and concluded that the population had remained reasonably stable during the last 15 years, with two peaks in abundance separated by a period of around eight years (Fig. 1 ). He also sug- gested that variations in population abun- dance were related to the amount of Rsh- ing, to annual reproductive success in re- lation to some environmental variables, such as temperature, and the primary produc- tion induced by the seasonal upwelling. Also, an oil spill occurred in the Southern Gulf of Mexico in 1980, For a nine-month period (Anon. 1980), but failed to have a significant long-term impact on population size (Fig. 1 ).
On the other hand, Gonzalez et al. (1 994) studied the population dynamics of the red snapper (Lutjanus campechanus) and indi- cated that the stock was underexploited in the early 1980s, and that annual yields were progressively increasing, reaching over 4 000 t at the end O F the period, in con- trast with the decreasing trend of the red grouper population. Moreover, ArreguIn- Sanchez ( 1 992) showed the life cycles of most fish populations on Campeche Bank to be in synchrony with the seasonal upwelling occurring on the central-eastern end of the continental shelfofYucatan. Such is the case for example with the porgies (Calamusspp.), grunts (Haemulon spp.) and some snap- pers (Luqanus spp. and Ocyurus ch/ysurus). ArreguIn-Sanchez and Chavez (in press) mentioned the specific case of the Icing mackerel (Scomberomorus cava//a), explaining its dynamics in the Campeche Bank by its relation to the pulses of primary produc- tion due to the seasonal upwelling men- tioned above, and that induced by outwelling from the Terminos\Lagoon system.

Year
Fig. 1. Dlfferences between observed and mean population size of red grouper on the Northern Shelf of Yucatan, 1975-1987. The solid line is a fourth order polynom fitted to the data so as to show trends (modified from Arreguin- Sanchez 1992). [Tendench osclliltork rlel tamafio de la po6Iacion del mero amerlcano (Eplnephelus morio) rlel Banco de Campeche, expresado como /a diferenda respecto a/ tamaiio promedlo de la po6lacldn para elperiodo 1975 a 1987 (adaptado de Arreguh-SAncher 1992.1
These characteristics suggest the hy- pothesis that fluctuations of the red grouper population could be explained by the trophic dynamic structure of an ecosystem domi- nated by pulses of primary production. Therefore, this contribution is focused on the understanding of the trophic dynam- ics of the ecosystem, with emphasis on the red grouper population.
Materials a n d M e t h o d s
Arreguin-S6nchez et al. (1 993) analyzed the trophic structure of a fish community on the North continental shelf of Yucatan, through the application of the ECOPATH model (Christensen and Pauly 1992-3, 1 W2b). Input data consisted of preylpredator matrix, biomasses, consumption rates, exports (in- cluding catches), and production/biomass
ratios, and produced a thermodynamically balanced model representing the flows of biomass/energy within the ecosystem, and also provided a number of parameters expressing ecosystem properties defined in Ulanowicr (1 986).
The basic assumption of the ECOPATH approach is that mass-balance occurs within th'e ecosystem and that the trophic rela- tionships between functional groups can be described by linear equations as fol- lows:
which can be re-expressed as
where Pi, B,, M2i, EE,, and EXi are the pro- duction, biomass, predation mortality, ecotrophic efficiency, and exportation of functional group (or species), while PB, is

the production/biomass ratio; QBj is the consumption/biomass ratio: and DC,, the fraction of prey i in the diet of predator j.
The system is then represented for n si- multaneous linear equations correspond- ing to n functional groups or species. For a full description see Christensen and Pauly ( 1 99Za).
To evaluate the trophic role of the red grouper, simulations were conducted by progressively reducing the biomass of the stock on successive ECOPATH models given the following considerations:
The catch rate, defined here as the catch/biomass ratio, was maintained constant. This implies that observed changes cannot be attributed to changes of fishing mortality; Because biomass was the major variable affected by changes, the production/biomass (PB) and consurnption/biomass (QB) ratios were assumed to change as well and re-estimated by the model (see equation 2): Ecotrophic efficiency, gross efficiency, and net efFiciency were assumed constant, and thus kept fixed for each run.
In general terms, the idea with this strategy was to evaluate the impact of changes of the red grouper biomass on the rest of the ecosystem. Each change required the model to be re-equilibrated. Differences between the new estimates relative to the original ones were then computed; from these we then identified various aspects of the trophic role of the red grouper in the ecosystem.
Results
Following the criteria mentioned above, gradual reductions of 20% of red grouper biomass were performed. Ecosystem re- sponses were analyzed both at the eco- system level, using indices by Ulanowicz
(1 986), and at the level of the various groups, by considering direct and indirect impacts.
Changes at the ecosystem level
The reduction in biomass has a propor- tional effect on total catch, total net pri- mary production, full ascendency, as well as on the sum of all respiratory flows and the sum of all consumptions. On the other hand, i t has an inverse relationship with the contribution of primary production to detritus, sum of all flows to the detritus and the sum of all exports. As the decreases of total biomass (TB) and total respiration (TR) were lower rhan the decreases in to- tal primary production (TPP), the quotients TB/TPP and TR/TPP increased with red grouper biomass (Table I I .
The reduction of the respiratory flows represents a loss of biomass/energy which cannot be used by other components: a compensatory mechanism tending to main- tain the thermodynamic equilibrium. These losses occurred through several ways:
Because the removed biomass is that of an important top predator, the sum of all consumption is strongly affected, and the respiratory flows decrease because ecosystem metabo- lism also decreases; The increase of exports (biomass moving out of the ecosystem) represents the excess of biomass which cannot be used by the ecosystem after it was thermodynamically re-equilibrated. The increase of the contribution of primary producers to the detritus represents another loss OF biomass at the ecosystem level; The losses of biomass/energy from the ecosystem are reflected in a decrease of Full ascendency sensu Ulanowicz ( 1986).

Table 1 . Effect of reducing the blomass of red grouper on various groups and system indlces of Northern Yucatan shelf ecosystem model of Arreguin-Sanchez et al. (1793). [Efecto de la reducclon de &iomasa de mero amerhno en varlos grupos e IndIcadores del ecosistema s e g h el modelo fie /a plataforma continental norte de Yucatrin de Arreguin-Sanchez et a/. (J993).]
Reduction OF red grouper biomass (%) Effect (%) on 20 40 60 80 100
Snappers 3 7 12 19 Sharks 8 9 Grunts King mackerel 8 9 17 Herrings - I2 -13 -2 1 -2 1 Porgies Mojarra 4 I I 2 1 Sea trout -3 -13 -28 -42 Jacks Total catch -38 Total biomass -18 -19 -28 -22 -33 Total Irriomassjfull ascendency -22 -8 -18 -13 - 18 Total primary production/ 26 14 3 7 3 0 42
Total biomass Total primary production/ 23 12 36 19 42
Total respiration Contribution to detritus from 20 14 28 2 2 3 6
primary production Total ne t primary production -1 7 -12 -24 -2 1 -3 1 Full ascendency -8 -4 - 12 - 10 - 12 Sum of all Flows to detritus 1 1 3 3 4 Sum of all respiratory flows -19 -12 -27 -22 - 3 1 Sum of all exports 3 9 23 5 6 46 62 Sum of all consumptions - 18 - I 1 -28 -22 - 3 1
Changes at the level of functional groups
To facilitate the understanding of the individual (group) interdependencies, and their responses to changes in the biomass of the red grouper, it is convenient to analyze the trophic levels of the main groups in t h e ecosys tem. Fig. 2 represents a dendrogram of the groups in the ecosys- tem with respect to their trophic level. It can be observed that some groups can be pooled without loss of ascendency: such is the case For the main predators; sharks, snappers, red groupers, king rnaclterels and jacks. This occurs because they occupy similar trophic levels and thus play a similar role
in the ecosystem (see also Exhibit 16.1 in Christensen and Pauly 1992a).
When the biomass of red grouper is re- duced, the impact on other predators is that their biomass is increased (Table 1) : this is because the trophic resources that the red grouper is no longer using become available to their competitors. Although the direction of the changes on other compo- nents of the same trophic level is similar, its impact on the ecosystem is different de- pending on individual abundances. This could partially explain why the yield of red snapper, which is abundant, increased in the 1980s while red grouper abundance decreased (Fig. 1 ) . Note that this is not observed in the case of rnojarras, because red snapper
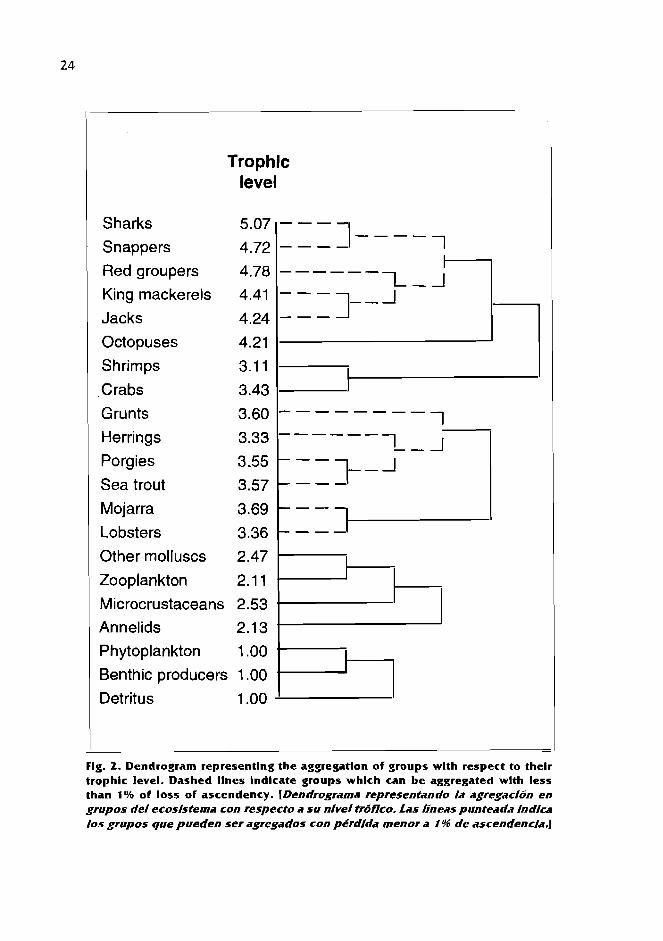
Trophic level
Sharks
Snappers
Red groupers
King mackerels
Jacks
Octopuses
Shrimps
Crabs
Grunts Herrings
Porgies
Sea trout
Mojarra Lobsters
Other molluscs
Zooplankton Microcrustaceans 2.53
Annelids 2.13
Phytoplankton 1 .OO
Benthic producers 1 .OO
Detritus 1 .OO
Flg. 2. Dendrogram representing the aggregation of groups wlth respect to thelr trophic level. Dashed llnes Indicate groups which can be aggregated wlth less than 1% of loss of ascendency. [Denrlragrama representando la agregacion en grupos del ecosistema con respecto a su nivel trdflco. Las lineas punteada indica ins grupos que puerlen ser agregatios con pdrdlda menor a I % tie ascendenck.1

Is a target species, while mojarras are con- sidered to be second or third class fishes, and are thus not targeted.
Some other groups or species exhibit a tendency to decrease, such as the sea trout and herrings (Table 1 ). Thls is easy to explain by the increased abundance of their main predator, king mackerel, as well as by the decrease of total primary production. The case OF sea trout is not so obvious, though it appears to compete with various groups For food resources, notably with mojarras (whose biomass increased) and invertebrates such as lobsters, crabs and molluscs (Table 2). The , .
i mojarra group is an interesting case; it
occupies an intermediate trophic level when the red grouper biomass decreased, this reduced its predation, and although red snapper biomass increased, and the fraction of mojarras in their diet is twice that for red grouper, the abundance of the latter species dominates, so that the total biomass of predators remains almost constant. Further, the mojarras benefit from the reduction of biomass of sea trout and herrings, because they are its main com- petitors. Thus, biomass increase of the mojarra group occurs because the loss of biomass due to predation is over- compensated for by a reduction of com- petition.
Table 2. Section of the predator-prey rnatrlx from the northern continental shelf of Yucatan (from Arreguln-Sanchez et al. 19931, emphaslzlng consumption by flshes. [Secc16n de la matriz predador-presa de la plataforma contimental node de Yucatiln, Mexico (rida por Arreguin-SAnchez et a/. 1993), enfatizanrlo el consumo por 10s peres.]
Predator Prey 1 Z 3 4 5 6 7 8 9 10
1. Red groupers 2. Snappers 0.10 3. Sharks 4. Grunts 0.08 5. King mackerels 0.02 6. Herrings 7. Porgles 8. Mojarras 0.22 9. Sea trout 10. Jacks 0.08 11. Shrimps 0.18 12. Lobsters 0.06 13. Crabs 0.10 14. Octopuses 0.15 15. Other molluscs 16. Microcrustaceans - 17. Zooplankton 18. Annelids 19. Phytoplankton 20. Benthic producers - 21. Detritus

Results d e r i v e d From simulat ions s u g g e s t t h a t t h e f luc tua t ions in t h e a b u n d a n c e of red g r o u p e r cou ld b e a r e s p o n s e t o c h a n g e s in t h e t r o p h i c d y n a m i c s of t h e e c o s y s t e m ; probably associated with medium-term fluc- t u a t i o n s in p r imary p r o d u c t i o n . This also m e a n s t h a t t h e ro le o f t h e f ishery is lim- i t e d to intra-annual c h a n g e s in b i o m a s s , a n d t h a t t h e losses c a u s e d by f ishing a r e r e c o v e r e d a f t e r e a c h r e p r o d u c t i v e cycle . This apparen t ly was w h a t occurred with t h e Fall in t h e 1980 y e a r class, in t h e s e n s e tha t it was n o t a se r ious impac t in t h e longer t e r m . T h e recogni t ion of th i s kind of e v e n t is o f i m p o r t a n c e in t e r m s o f m a n a g e m e n t of t h e Fishery. D e c r e a s e s in t h e p o p u l a - tion abundance observed through t h e s tudies of t h e c a t c h p e r un i t of effor t in t h e ea r ly 1980s s u g g e s t e d a trend toward overfishing. T h e resu l t s o f t h i s analysis , a n d t h e a d d i - tional avai lable e l e m e n t s , s u g g e s t t h a t t h e diagnosis was correct in t e r n s of a decrensing a b u n d a n c e , b u t Failed t o cor rec t ly ident i@ t h e c a u s e of t h e t r e n d .
Recent s t u d i e s (Arreguin-Sanchez et al., this vol.) s h o w t h a t f ishing mortal i ty m u s t b e l imi ted u s i n g s o m e kind of con t ro l . In M e x i c o , m o s t c o n t r o l s i n v o l v e l imitat ion of f ishing eFfort. It is also s h o w n t h a t t h e fish r e s o u r c e is fully e x p l o i t e d , a n d t h a t juveniles (one-year old recruits) a n d a d u l t s a r e s u b m i t t e d t o intensive exploitation. The juveni les a r e c a u g h t by small-scale f leet . whi le t h e commerc ia l fleets concent ra te o n t h e a r e a s w h e r e reproduc t ive a g g r e g a t i o n s occur . I F f ishing effort con t ro l s a r e i m p o s e d u n d e r t h e s e c o n d i t i o n s a t a t i m e w h e n a b u n d a n c e is h i g h , a f t e r s o m e few y e a r s ( s i n c e a b u n d a n c e c y c l e s a r e a r o u n d e i g h t y e a r s ) t h e a m o u n t of f i sh ing effort will b e - come excess ive , a n d a real overfishing situ- a t i o n c o u l d e m e r g e . This c o n c e p t is very i m p o r t a n t , especially as i n d i c a t i o n s o f
i n t e r f e r e n c e a m o n g f lee t s w e r e d e t e c t e d in t h e first y e a r s of t h e p r e s e n t d e c a d e (Gonzdlez-Cano et al. 1993). T h e conc lu- sion in t h i s case is t h a t Fishing effor t m u s t b e l imi ted b u t b a s e d o n a d y n a m i c s t ra t - egy in a c c o r d a n c e w i t h t h e c u r r e n t a b u n - d a n c e of t h e stoclc.
References
Anon. 1980. InForme d e 10s trabajos realizados para el control del pozo "lxtoc", el combate del derrarne d e petr6leo y deterrninacion d e sus efectos sobre el ambiente marino. Prograrna d e Coordinaci6n d e Estudios Ecologicos en la Sonda de Campeche. Sec. Marina, Departamento d e Pesca y PEMEX, Mexico. 242 p.
Arreguin-Sanchez, F. 1987a. Present s ta tus OF the red grouper fishery in t h e Campeche Bank. Proc. GulfCaribb. Fish. Inst. (38):498- 509.
Arreguin-Sdnchez, F. 1987b. Estado actual de la explotaci6n del mero (Epinephelus morio) del Banco d e Carnpeche. 25 Aniv. Inst. Nal. Pesca. Cent ro Keegional d e lnvestigaciones Pesqueras.Yucalpeten, lnstituto Nacional d e Pesca, Mexico. 23 p.
Arreguin-Sanchez, F. 1992. An approach t o t h e study of t h e catchability coefficient with application t o the red grouper (Ephephelus morio) fishery from t h e continental shelf of Yucatan, Mexico. Centro d e Invest. Estudios Avanzados del IPN, MCxico. 222 p. Ph.D. dissertation.
Arreguin-Sanchez, F. and E.A. Ch6vez. How marine shelf fisheries a re depending of mangrove ecosystems: the Campeche Bank. Mexico as a n example . In A. YaRez- Aranclbia and A.L. Lara-Dominguez (eds.). Valoracidn economics de 10s rnanglares. EPOMEX Ser. Cient. (In press).
Arreguln-Sdnchez, F., J.C. Seijo, D. Fuentes and M.J. Solis-Ramirez. 1987 . Estado dc l conocimiento d e 10s recursos pesqueros d e In peninsula d e Yucatan y region a d y a c e n t e . Cent ro Regional d e Investigaciones Pesqueras-YucalpetPn, lnstituto Nacional de Pesca, MCxico. Contr. Inv. Pesq. Dcto, TCcnico 4. 4 1 p.

Arreguin-Sinchez, F., 1.C. Seijo and E. Valero. 1993. An application of ECOPATH I I t o t h e north continental shelf of Yucatan, Mexlco, p. 269-278. InV. Christensen and D. Pauly (eds.) Trophic models of aquatic ecosystems. JCLARM Conf. Proc. 2 6 , 3 9 0 p.
'Christensen, V. and D Pauly. l 9 W a . A guide t o the ECOPATH I I software system (version 2.1). lCLARM Software 6, 7 2 p.
d ~ h r i s t e n s e n , V. and D. Pauly. 1992b. ECOPATH 11, a software for balancing steady-state ecosystem models and calculating network characteristics. Ecol. Modelling 61 : 169- 185 .
Contreras, M., F. Arreguin-Sdnchez, ].A. Sinchez, V. Moreno and M.A. Cabrera. 1994. Mor- tality and population size of the red grouper (Lpinephe lus morio) fishery From t h e Carnpeche Bank. Proc. Gulf Caribb. Fish. Inst. (43):309-410.
Doi, T., D. Mendizabal and M. Contreras. 1981. AnAlisis prelirninar d e la poblacion d e mero Epinephelus morio (Valenciennes) e n el Banco d e Carnpeche. Cienc. Pesq. (MCxico) l ( 1 ) : l - 1 6 .
Fuentes. D. 1991. La pesquerla d e mero e n el Banco d e Campeche. Mern. VII Congr. Nal. Oeanol. Ensenada. B.C., Mexico (1): 361- 374.
GonzAlez-Cano, I . , F. Arreguin-Sdnchez, M. Contreras, V. Moreno, R. Burgos, C. Zetina and V. Rios. 1993. Diagndstico del estado d e la pesqueria d e mero (Epinephelus morio) en el Banco d e Campeche. Grupo d e Trabajo sobre el recurso mero. lnstituto Nacional d e Pesca, MCxico. 26 p.
27
Gonzdlez, M.E., ].A. Sdnchez and F. Arreguin- Sdnchez. 1994. Population dynamics of the red snapper (Lutjanus campechanus) fishery Rorn the Campeche Bank, Mexico. Proc. GulFCaribb. Fish. lnst.(43):29-40.
Klima, E.F. 1976. Snapper and grouper resources of t h e Western Central Atlantic Ocean, p. 5-40. 117 H.R. Bullis, Jr. and A.C. Jones (eds.) Proceedings of a Colloquium on Snapper-Grouper Resources of the West- ern Atlantic Ocean. Florida Sea Grant Rep. 17, 333 p.
M o r e n o , V. 1 9 8 0 . La p e s q u e r l a d e m e r o (Eplnepheius morio) e n el Estado d e Yucatan. Univ. Auton. Edo. Morelos, MCxico. Tesis profesional.
Muhlia, A. 1976. Aspectos blologico-pesqueros d e Ephephelusmorio(Val.): rnero. lnstituto Nacional d e Pesca, Mexico. Mem. Primer Simp. al. Rec. Pesq. Mas. (MCxico) 2:223- 265.
5eij0,J.C. 1986. Comprehensive simulation model of the tropical demersal fishery: red grouper (Lpinephelus morio) of t h e Yucatan con- tinental shelf. Michigan State University. 21 0 p. Ph.D. dissertation.
Stevenson, D.K. 1982. Una revisi6n de 10s recursos marinos d e la region d e la Cornisi6n d e Pesca para el Atl6ntico Centro Occidental (COPACO). FA0 Doc. Tec. Pesca. 21 1 , 1 4 3 p.
Ulanowicz, RE. 1986. Growth and development: ecosystem phenomenology. Springer- Verlag, New York. 2 0 3 p.

Biological Research on the Red Grouper (Epfnephefus morio) from the Southern Gulf of Mexico
T. BRULE Centro de In vestigacidn y de Estudios A vanzados del IPN
Unidad Merida, Ap. Postal 73-Corclemex. 973 10 MtWda, Yucatdn, Mgxjco
c. DENIEL Labora toire de Biologie Animale-P oissons Marins
Universite cle Bretagne Occicfentale, B. P. 809 29275 Brest, Cedex, France
BRULE, 1'. and C. DCNlEL. 1996. Biological research on the red grouper (Lpinephelus morio) from the Southern Gulf OF Mexico [Investigaciones bioldgicas del mero americano (Epinephelus morio), del Sureste del Golfo de Mexico], p. 28-42. In F. Arreguin-Sinchez. J.L. Munro. M.C. Balgos and D. Pauly (eds.) Biology, fisheries and culture of tropical groupers and snappers. ICLARM Conf. Proc. 48. 449 p.
Abstract
Epinephelus morlo is one of the most common large serranids in the Gulf of Mexico. The Mexican red grouper fishery on Campeche Bank is a very important source OF food and revenue for the state OF Yucatan, but the fishery seems to be operating at a level of effort beyond that generating maximum sustainable yleld. Hence. management interventions are needed to protect this important fishery, but these can be developed only with a thorough knowledge OF the biology o f the species. Glven the paucity of data available on the life hlstory of E. morio from Campeche Bank, a joint research project involving Mexico and France was initiated in 1989 almed at improved understandlng and management of this tishery resource. The First results obtained on sexual maturatlon, spawning period, sex change and food and Feedlng habits are presented and discussed.
Resumen
Epinephelus morio es uno de 10s serrdnidos mAs grandes del Golh de M&xico. La pesquerla mexlcana del mero amerkano en el Banco de Campeche e5 una fuente muy lmportante de aliment0 e Ingreso economico para el Estado de Yucatdn. Sin embargo se ha observado que esta pesquerfa estd operando en un nivel de estiuerzo por enclma del que genera el rendimiento rnAximo sostenlble. En consecuencla, se requieten medidas de rnane/o para proteger este lmportante recurso, y &to solo puede ser hecho a traves del conocimiento de la biologla de /as especies. Dada la carencia de datos sobre el ciclo de vida de E. morio del Banco de Campeche, un proyecto de investlgacidn conjunto entre MCxIco y Francla fur2 iniclado en 1989 con el objeto de me/orar el conocimiento de este recurso pesquero. Los prlmeros resultados obtenidos sobre maduracldn sexual, perlodo de desove, cambio de sex0 y allrnentacldn son presentadus y discutidos.

Introduction
The family Serranidae, which includes some 300 species, is an important part of the marine shore fauna in tropical and subtropical ar- eas (Smith 1971). All serranid fishes are carnivorous, feeding mainly on fishes and invertebrates. Most are hermaphroditic, synchronous or protogynous (lortonese 1986). Some such as species of Serranus and Hypoplectrus are both male and female at the same time: others such as the genera Epinephelos, Cepha/opho/is and Myctempem start out mature life as females and change over to males when they are larger (Randall 1983). According to Manooch ( 1987), world- wide studies on the age and growth of serranids indicate that these fishes are long lived, slow growing, and have relatively low rates of natural mortality.
The red grouper (Epinephelus morio) is the most common and commercially im- portant grouper in the Gulf of Mexico, with two centers of abundance: off the west coast of Florida and off the north coast of the Yucatan Peninsula on Campeche Bank (Moe 1969; Sevilla 1987) (see Arreguin-Sanchez and Valero; Arreguin-Sanchez et al., this vol.). In 1969, Moe published the results of the first major investigation of the biology of this species from the eastern Gulf of Mexico, and established the format and standards for future research on this important group of fishes (see Colin et al., this vol.). In Yucatan, despite the commercial value of E. morio, studies on its life history, particularly those pertaining to fishery biology, have been few (Gonzdlex et al. 1974a, 197413; Zupanovic and GonzAlez 1975; Valdts and Padrdn 1980). Since 1988, a basic research program on the biology of red grouper from Campeche Bank has been conducted from the Centro de lnvestigacion y de Estudios Avanzados del IPN (CINVESTAV-IPN) Unidad MCrida, Yucatan. The purposes of this paper are to describe the background and objectives of this program and to present the results obtained to date.
Background and Objectives
The aim of this project was established bearing in mind the socioeconomic and geographical position of Yucatan. This is one of the poorest regions in Mexico, laclung in mineral and oil resources. The flat northern Yucatan Peninsula (350 000 kmz) is com- posed of extensive outcrops of limestone. However, the lack of upper clays and mark overlying the limestone causes the rainfall to infiltrate rapidly and prevents development of surface drainage. Areas OF soil cover are interspersed with bare limestone outcrops and seldom exceeds 30 un in thickness (Back and Hanshaw 1978). Consequently, intensive agriculture can- not be developed in this region. The only alternative source of development was the industrialization of marine fisheries. This has been clearly perceived by Mexico and, between 1975 and 1980, fish production in the Yucatan Peninsula increased From 40 000 to 85 000 t. However, increasing pressure on the marine environment has given rise to biological imbalances and it seems that the principal species landed in the Peninsula (shrimps in Campeche and groupers in Yucatan) have been heavily fished in recent years (Le Bail 1984).
The Campeche Bank red grouper fish- ery is very important for the economy of the state of Yucatan (Solis Ramlrez 1970: Klirna 1976). E. morio accounts for more than 87% of the Mexican grouper catch (Contreras, in Klima 1976). From 1969 to 1988, fluctuating landings of red grouper were observed with a maximum in 1972 (14 000 t) and a minimum in 1983 (6 700 t). In 1988, the catch of red grou,per ( I 1 887 t) was 49% of the total marine production for the state, equivalent to 34% of the annual revenue for Yucatan (Rihani Vales et al. 1989). Cuba's Gulf Fleet also fishes on the Campeche Shelf. When Mexico extended her Exclusive Economic Zone (EEZ) to 200 nautical miles offshore in 1976, a bilateral fisheries agreement between Cuba and
Mexico was ratified. This permitted Cuba Materials and Methods to continue fishing in waters that were under the jurisdiction of Mexico, but within the constraint of a catch quota. From 1976 to 1987, the Cuban catch quotas for groupers caught within the EEZ were reduced by Mexican authorities from 10 000 to 3 500 t (Tashiro and Coleman 1977; Arreguin-Sanchez et al. 198713). Although effort is higher than that required to generate maximum sus- tainable yield (MSY), the stock does not show typical signs of overfishing (Arreguin- Sanchez 1987; Arreguin-Sanchez et al. 1987a, 198713). However in 1993, leaders of the National Chamber of Fisheries of Yucatan petitioned the Fisheries Secretary for the establishment of a closed season For red grouper, during May and June (Diario de Yucatan, 27-28-29/05/ 1993; Por Esto, 28/ 051 1 993).
According to Sadovy ( 1 994) consider- able data are required to better understand and manage grouper stoclts. This author states that a number of biological ques- tions, particulary those regarding recruit- ment and reproduction, need to be ad- dressed. Only scanty published informa- tion was available concerning the basic biology o f the red grouper from Campeche Banlt. In 1989 a joint research project, sup- ported by the European Commission, was developed between the Laboratory ofMarine Biology from CINVESTAV-IPN-Unidad Merida, Mexico and the Laboratory of Animal Biology of the Universiti. de Bretagne Occidentale, Brest, France. The principal objective of this project was to provide essential knowledge on the biology of E. rnorio on Campeche Bank, for management O F this poorly known stock of tropical reef fish. Biological research, as related to fish- ery management requirements, Focused on reproduction (sexual maturation, spawn- ing period, sex change, fecundity), food and Feeding, and age and growth (rate of growth, longevity, age at sexual maturity).
Area in vesfigated
Campeche Bank is part O F the region covered by the Western Central Atlantic Fishery Commission (WECAFC), the inter- national body concerned with fisheries management for the Caribbean Sea, the Gulf of Mexico and their Atlantic approaches from Cape Hatteras (35"N latitude) to Recife, Brazil ( 1 0"s latitude). In the WECAFC area, the continental margins of the eastern US, the Gulf of Mexico, the Caribbean and the Guianas and Brazil contribute 80% of the total shelf area (0-200 m). Three locations with a wide continental shelF within the Gulf of Mexico are western Florida, the Texas and Louisiana coasts and Campeche Bank (Stevenson 1981 ). Campeche Bank (about 175 000 ItrnZ) includes the continental shelf from Terminos Lagoon to Cancun Island and extends to about 24"N latitude. Its maxi- mum dimension From North to South is 260 Itrn (Carranza 1957; Weidie et al. 1978).
Blo/og/cal sampling
On Campeche Bank, small red groupers are found in shallow waters and their size increases with depth (Gonzalez et al. 197413; Valdes and Padrbn 1980). Thus, red groupers were sampled through the commercial off- shore and inshore fisheries. Red groupers were obtained from the commercial long- line offshore Fishery based in Progreso, from May 1989 to April 199 1 . Offshore opera- tions were also conducted monthly between November 1991 and April 1992, near the time of full moon, from an offshore grouper vessel based at the harbor of Progreso. All Fish were captured in the northern region of Campeche Bank between 20" and 23"N latitudes at depths ranging From 30 to 90 m. Red groupers were also obtained From the commercial hook-and-line inshore fishery

based in CelestQn, Progreso. Telchac Puerto and Rio Lagartos, from August 1988 to November 1989. All specimens were caught in inshore areas of Campeche Bank near to these four ports, at depths ranging from 7 to 27 m (Fig. 1 ) .
The fish were examined either fresh a Few hours after Fishing, on arrival at the port (inshore collections), or after having been kept on ice aboard the fishing vessel for one or two days before landing (off- shore collections). For each specimen the Fork length (FL) , standard length (SL), to- tal weight (TW), eviscerated weight (EW), gonads weight (GW) and liver weight (LW) were recorded and stomachs and otoliths (sagittae) were removed.
Reproduction
Samples of gonads were fixed in Bouin's fluid For the histological study of oogenesis and spermatogenesis. The preserved gonads
were embedded in parafin, thin-sectioned at 6 p n , and stained as suggested in Gabe ( 1 968). Sections were examined to determine sex and gonad development. In sections, the shape of red groupers' oocytes was ellipsoidal. According to Colemanzs formula (Coleman 1 99 1 ) , an 'effective diameter' (dc = [abz]'f2, with a: major axis and b: minor axis) was calculated for 100 oocytes of each oocyte stage. The reproductive state of red grouper was futher examined by calculating a gonadosomatic index for each fish (GSI = GW. 100/EW). Data From the same months for the three years were combined and the results were presented as monthly means.
Food and feeding
Stomachs, including the contents, were preserved in 10% formalin. Each stomach was opened and analyzed individually, the contents were sorted by taxa, counted, drained, and weighed to the nearest 0.1 g.
Longitude P W 1
Fig. 1 . Map of the north coast of Yucatan Peninsula and of Campeche Bank. [Mapa de la costa Norte de la Peninsula r le Yucatiin y del Banco de Campeche.]

Fragments of pilchards (Harengula humea/is), used as bait in this fishery, were easily rec- ognized and discarded. In each stomach, all fragments attributed to the same taxon were scored as a single individual prey, unless two (or more) pieces obviously came from two (or more) different individuals. Stomach contents were analyzed by three parameters: frequency of occurrence (%F), percentage number (%N) and percentage weight (OhW), which partly overcame the disadvantage of using only one of these methods (Hyslop 1980).
Diet' overlaps between red groupers of different size classes and between individuals from the four different collection sites were estimated by calculating Schoener's index (Schoener 1970) which ranges from 0 (no overlap) to 1 (complete overlap). Follow- ing Zaret and Rand (1971) and Wallace (1 981 ), index values above 0.6 were con- sidered to represent a significant overlap. This index was calculated from percent- age number of the main prey categories.
Results
A total of 1 323 red groupers, ranging from 13.5 to 88.0 cm FL and 45 to 12 000 g TW were examined during this study. Inshore collections (N = 446) included specimens ranging from 13.5 to 55.5 cm FL and 45 to 2 475 g I W whereas offshore collec- tions (N = 877) included individuals rang- ing from 38.9 to 88.0 cm FL and 1 000 to 12 o o o g l w .
Reproduction
One hundred and thirteen red groupers (15.0 - 55.5 cm FL) caught in inshore waters and all specimens caught in offshore waters were sexed through histological prepa- rations. N o males were Found among the 1 13 specimens caught in inshore waters. All were juvenile females (immatures).
Offshore collections included juvenile and adult females, transitionals and adult males.
The principal cytologic changes observable during gametogenesis permitted the iden- tification of six stages to describe oogenesis (post-ovulatory follicles and atretic oocytes were not identified as stages) (Table I ) , and five stages to decribe spermatogenesis: spermatogonia, l o and 2" spermatocytes, spermatid and sperrnatozoan.
The seasonal and ontogenetic changes in gonad development were divided into nine classes (Table 2). Vitellogenesis started in September for the most precocious fe- males and high percentages of ripening and ripe females were observed in January, February and March. By April only primary, immature and atretic vitellogenic oocytes remained in the ovaries, indicating that fe- males entered the spent-resting period. Ripening males were observed from Sep- tember to March. Red grouper with ripe testes were more prevalent from January to April. By April-May, males entered the spent-resting period. Thus, peak spawn- ing seemed to occur from January to March. Transitional individuals were observed throughout the year (Fig. 2).
Changes on monthly mean gonadosomatic indices confirmed the histological obser- vations on spawning and resting periods. For both females and males, GSI values followed a similar pattern (Fig. 3). From October to December, the relative weight of gonads increased slowly. The GSls reached maximum values in January (Female: 0.90% and male: 0.28%) and in March (female: 1.15% and male: 0.24%), indicating rip- ening. Relative weight decreased in April to reach minimum values (female: 0.13- 0.24% and male: 0.13-0.14%) in spring and summer months, indicating that gametes had been shed.
Fig. 4 shows distribution of sex in 5 cm FL size groups. Female red groupers ranged from 14.5 to 84.5 cm FL and no male smaller than 39.5 cm FL was found. The percent- age of males in each size group where they
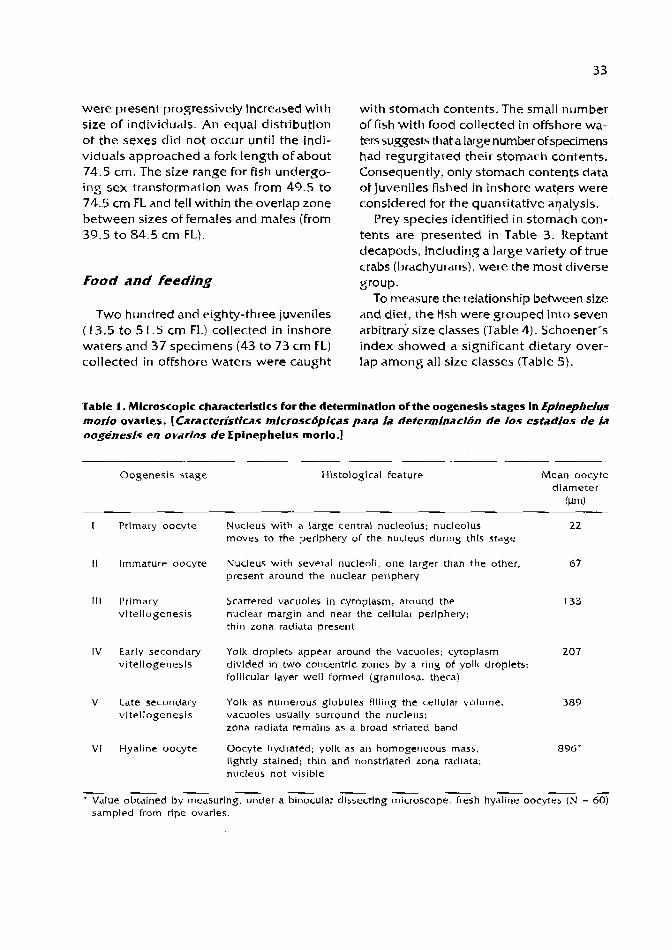
were present progressively increased with size of individuals. An equal distribution of the sexes did not occur until the indi- viduals approached a fork length of about 74.5 crn. The size range for fish undergo- ing sex transformation was from 49.5 to 74.5 cm FL and fell within the overlap zone between sizes of females and males (from 39.5 to 84.5 crn FL).
Food and feeding
Two hundred and eighty-three juveniles ( 1 3.5 to 51.5 cm FL) collected in inshore waters and 37 specimens (43 to 73 crn FL) collected in offshore waters were caught
with stomach contents. The small number of fish with food collected in offshore wa- ters suggests that a large number ofspecimens had regurgitated their stomach contents. Consequently, only stomach contents data of juveniles Fished in inshore waters were considered for the quantitative aqalysis.
Prey species identified in stomach con- tents are presented in Table 3. Reptant decapods, including a large variety of true crabs (brachyurans), were the most diverse group.
To measure the relationship between size and diet, the Ash were grouped into seven arbitrary size classes (Table 4). Schoener's index showed a significant dietary over- lap among all size classes (Table 5).
Table 1. Microscopic characteristics for the determination of the oogenesis stages In Epinephelus morio ovaries. [Caracteristicas microscdpicas para & determinacJbn de 10s estalllos de In oogeneds en ovarjos de Epinephelus morlo.]
Oogenesis stage Histological Feature Mean oocyte diameter
( ~ m )
Primary oocyte
Immature oocyte
Primary vitellogenesis
Early secondary vitellogenesis
Late secondary vitellogenesis
Hyaline oocyte
Nucleus with a large central nucleolus: nucleolus 22 moves to the periphery of the nucleus during this stage
Nucleus with several nucleoli, one larger than the other, 67 present around the nuclear periphery
Scattered vacuoles in cytoplasm, around the nuclear margin and near the cellular periphery; thin zona radiata present
Yolk droplets appear around the vacuoles; cytoplasm 207 divided in two concentric zones by a ring OF yolk droplets: folliculnr layer well formed (granulosa, theca)
Yolk as numerous globules filling the cellular volume; 389 vacuoles usually surround the nucleus: zona radiata remains as a broad striated band
Oocyte hydrated: yolk as an homogeneous mass. 896' lightly stained; thin and nonstriated zona radiata: nucleus not visible
* Value obtained by measuring, under a binocular dissecting microscope. Fresh hyaline oocytes (N = 60) sampled From ripe ovaries.

Table 2. Gonad development and correspondlng histologlcal condition stages of gonads of female, transitional and male red grouper. [Estadlos tie cfesarrollo gonadico y camcteristicas hisibldgicils corresponrllentes a hembras, inrllvtiuos en translcion y machos tie mero amerlcano.]
Gonad development Histological condition
Immature/resting female Stage I and stage I I oocytes
Ripening Female Stage I to stage V oocytes; stages 111, IV and V dominate
Ripe female Stage I to stage VI; stage VI dominates
Spent female
Transitional
Resting male*
Ripening male"
Ripe male*
Spent male*
Stage 1 and I1 oocytes; degenerating stage V; post- ovulatory Follicles
Stage I and I I oocytes; s tage I l l oocytes sometimes present: proliferation of small crypts of spermatogonia and spermatocytes; crypts of spermztozoa sometimes present
Spermatogonia; 1 " and Zo spermatocytes; spermatozoa occur rarely
Spermatogonia; 1 " and 2 O spermatocytes and spermatids dominate crypts; spermatozoa present
Spermatids and spermatozoa dominate and fill crypts; intralobular sinuses and vas deferens-like dorsal sinuses present
New crypts of spermatogonia and l o spermatocytes; old crypts empty with few residual spermatozoa
* Stages I. I I and rarely stage III oocytes have been observed in various testes.
Variations in food categories O F juveniles w e r e analyzed o n a regional basis (Table 6). The results s h o w e d a significant over- lap of p rey taken by red g r o u p e r a m o n g all t h e s t u d i e d a r eas (Table 7).
Discussion
Although s o m e grouper species are known to s p a w n o v e r 6-8 m o n t h s , m o s t s p a w n o v e r 1-5 m o n t h s a n d many s p a w n prima- rily d u r i n g 1-2 m o n t h s (Shapiro 1987). Consistent with these observations, t he study
of histological changes in gonad development and seasonal variation in mean GSI indicated a gonadal activity from September t o March with a peak spawning activity from January to March a n d a rest ing per iod from April to August. Zupanovic and Gonzalez ( 1975) a n d Valdes a n d Padron (1980) repor t ed tha t t h e s p a w n i n g period of red g r o u p e r population on Campeche Bank should occur during spring with a possible peak opspawn- ing activity in March or April. The p re sen t s tudy s h o w e d tha t E. m o r i o o n Campeche Bank s p a w n earlier than t h e red g r o u p e r population From t h e eastern Gulf of Mexico.

- 4::[ &?
1 - 0" m- C al s a- ?! IL 20-
O- J F M A M J J A
Month
Flg. 2. Percent Frequency distribution of gonad development classes by month. (A: Transltlonal and male; B: Female) [Distrihdon mensuai de freclrencfas en porcentaje de /as clases de desarro/io gonadico. (A: IndfvIduos en transiclbn y machos; B: Hembrasn
"'[, 0 , , e l , J F M A M J J A S O N D
Mont tl
Flg. 3. Seasonal varlatlons In mean gonadosomatlc Index o f female and male red grouper. Vertlcal bars represent confidence Interval of mean (95% confidence limits) (from BrulC et dl., In press). [ Variaciones esta clonales de/ indice gonaifosomitlco promedio de /as hembras y de los machos tie mero americano. LAS baras verticales representan el interval0 i fe conffanza de/ promedlo (95% Ihites de confianza) (tomarlo de Brul6 eta/., en prensa).] w
VI

Length (FL; cm)
Flg. 4. Percent frequency dlstrlbutlon of female, transltlonal (black sectlon of hlstograrns) and male red grouper by length. [Dlsfrlbucldn de fiecuencln en porcentaje rle hembras, IndIvIduos en estado de transicldn (seccfon negra del6Istogramaal y machos de mero amerlcano, por grupos de tallas de 5 cm de longitud furcaI.1
For E, moriofrom the west coast of Florida, Moe (1969) stated that gonadal activity occurs in January and February, while spawn- ing takes place from March to July with peak activity in April and May. The colder temperatures in the northern Gulf contrast with the warmer temperatures in the southern portion during late fall through spring. The southern and northern Gulf surFace tem- peratures extend to depths of a least 46 m in the winter (Rivas 1968). So, the marked fluctuation in sea surface temperature be- tween summer and winter in the northern Gulf could be the cause of the asynchronism observed between spawning periods of red grouper from the eastern and southern Gulf
oFMexico. But, according to Shapiro (1 987), no factor or combination of factors (water temperature, changes in water tempera- ture, day length, plankton abundance or latitude) clearly explains the variability in time of year at which groupers spawn.
Zupanovic and GonzAler (1 975) and Valci& and Padr6n (1980) did not provide infor- mation on multiple spawning by 15. morio during each reproductive period. Moe (1 969) did not find histological or analytical evi- dence to suggest that individual red grouper spawned more than once a season. How- ever, during this work we observed females with ovaries containing both post-ovulatoy follicles and numerous vitellogenic oocytes

Table 3. Prey specles grouped into nine rnaln categories recorded In stomach contents of red grouper from Carnpeche Bank (X: present. 0: absent). [Presas encontradas en 10s contenldos ertomacales del mero amerhno rle/ Banco de Campeche, claslflcadas en nueve categorlas (x=presente; o= ausente).]
Main prey groups Specific prey Inshore Offshore
Plant material Natant crustaceans
Reptant crustaceans
Stomatopods Unidentified crustaceans Molluscs
UnidentiFied echinoids Unidentified fishes Unidentified remains
Alga Penaeus duorarum notialisis Penaeus sp. Palaernonidae Alpheus armatus Alpheus sp. Synalpheus Lrevicarpus Synalpheus sp. Scyllaridae Ca//ida ctylus ssp . Stenorynch us seticornis Epialtus bituberculatu~ Macrocoeloma camptocerum Macrocoeloma eutheca Macrocoeloma sp. Mlthrax forceps Mlthrax acuticornis Mithrax hispldus Mithrax pleuracanthus Stenocionops furcata Parthenope agonus Solenolam Brus tenellus Callinectes s p. Portunus floridanus Portun us sayi Portunus spjnimanm Portunus sp. Actaea acantha Carpjlius corallin us Heteractea cera topus L obopilumn us agassirii Menippe mercenaria Panopeus americanus Pilumnus dasypohs Pllumnus say; Pilumnus s p. Gonodactylus bredini
Nassarius hinia Turridae Anadara notabjlis lfiognomon alatus Argopecten gibbus Laevlcardium mortoni, Octopus sp.

Table 4. Percentage number (%N) of main prey categories of Juvenile red grouper, according to size of predator (N: number of fish with stomach contents) (from Brule and Rodriguez I 993). [Porcentaje en n6mero I%N) de las prlnclpales cafegorias de presas de juveniles de mero americano de acuertfo a1 tamaiio del prerlirrlar (N: nlimero de peces con contenido esfomaca/) (tomado de Bru/e' y Rodrfguez 1993).1
Crustaceans Predator Natantia Reptantla Stomato- Uniden- Molluscs Fishes Uniden- N FL (cm) pods tified tified
food
Table 5. Dietary overlap between t h e size classes of juvenlle red grouper (from Brule and Rodriguez 1993). I Traslape de dietas entre clases de talla de juveniles de mero americano (tornado de Brule y RodHguez 1993)J
Size classes 12.1-16.0 16.1 -20.0 20.1-24.0 24.1-28.0 28.1-32.0 32.1-36.0 36.1-40.0 FL (cm)
Table 6. Percentage (YON) of main prey categories of Juvenlle red grouper, according to collection si te (N: number of fish with stomach contents) (from Brule and Rodriguez 1993). [Porcentaje en numero (%N) de /as princlpales categorias de p e a s de juveniles de mero arnerlcano, de acuerdo a1 sitlo de colecta (N: nfimero de ppeces con contenldo estomacal) (tomado de Brule' y Rodriguez 1773).1
--
Crustaceans Collection Natantia Keptantia Stomato- Uniden- Molluscs Fishes Uniden- N
site pods tified tified food
Celestun 3.2 53.2 21 -0 14.5 1.6 6 .5 0.0 29 Progreso 5.9 66.5 1.3 15.8 3.9 5.3 1.3 89 Telchac Puerto 0.0 65.1 0.0 18.6 4.7 9.3 2.3 Z 1 Rio lagartos 1.5 49.3 0.0 46.3 0.0 2.9 0.0 24

Table 7. Dietary ovelap between Juvenile red grouper from four collection sites (from Bruli and Rodriguez 1 993). [ Traslape tie dietas entre juveniles de mero amerlcano provenlentes de cuatro sltlos de colech (tornado rle Brule'y RodrSguez /993).]
Site Celestun Progreso Telchac Puerto Rio Lagartos
Celestun 0.79 0.76 0.68 Progreso 0.92 0.70 Telchac Puerto 0.7 1 Rio Lagartos
in stages 11, I l l or IV (January-March) and a high percentage of males with ripe testes during a long period (January-April), suggest- ing that individual Females and males may spawn repeatedly during each reproduc- tive period.
It is not generally known whether groupers spawn continually during the spawning period or at regular intervals, each lasting only a few days. Individuals of various grouper species aggregate at what seem to be traditional sites and spawn intensively For 1-2 weeks (Shapiro 1987). Spawning aggregations have been reported for E. striatus in the Bahamas, in the Vir- gin Islands, in Puerto Rico, in Honduras and Cayman Islands; for E. guttatusin the Virgin Islands and in Puerto Rico; for E. merra in Tahiti (Randall and Brock 1960: Smith 1972; Olsen and Laplace 1979; Colin etal. 1987; Fine 1990;Tuclceretnl. 1991). Aggregations of 15. striatus were observed around the ful l moon during two of the months between November and Febru- ary in the Virgin Islands, in January in Puerto Rico, and from late December to March in the Cayman lslands (Olsen and Laplace 1979; Colin et at. 1987; Tucker et al. 1991). In Tahiti, E. merra was found to spawn over a period of 3-4 days once each a month from January to April. The peak of
spawning occurred 2-3 days before full moon (Randall and Broclc 1860). To date, periodicity of spawning, spawning aggregations and relationship of migration and spawning to the full moon remain undescribed for E. morio. In our study, the final egg stage (hyaline oocyte) was only observed in ovaries of individuals caught after and near the time of full moon (8 days after Full moon in January 1990 and 2-3 days after full moon in March 1992). Dur- ing winter, GonzAlez et al. (1 974a), Zupanovic and Gonzalez (1 975) and ValdCs and Padron (1 980) reported movement of red groupers from west to east on Carnpeche Bank and stated that the eastern part of this area could be a site of reproduction for E. morio. But one of our collections from the western part of Campeche Bank (20°N; 91 OW) in March 1992, showed that 1 1 of the 19 Females caught in this area had ripe ovaries (stage VI oocyte). These observations suggest that red groupers spawn on various grounds distributed all over the Bank.
According to Shapiro (1987), one of the several difficulties with defining the time of sex change from the occurence of transitionals in monthly samples is the relatively small number of transitional gonads that are generally found. One reason for finding small numbers of transitionals is that

sex c h a n g e m a y b e c o m p l e t e d rapidly. M o e ( I 969) e x a m i n e d 790 sets of g o n a d s a n d f o u n d 1 1 t ransi t ional g o n a d s (1.4%). This a u t h o r r e p o r t e d t h a t sexua l transition t o o k p l a c e d u r i n g t h e m o n t h s of a c t i v e s e x u a l d e v e l o p m e n t a n d a l s o d u r i n g t h e r e s t i n g p e r i o d of t h e s p e c i e s . In o u r s t u d y , of t h e 877 g o n a d s his tological ly e x a m i n e d , on ly 16 w e r e t r a n s i t i o n a l g o n a d s ( 1 . 8 % ) . Transitional r e d g r o u p e r s w e r e found dur - i n g e i g h t m o n t h s of t h e y e a r , inc lud ing t h e t h r e e m o n t h s of p e a k s p a w n i n g . Trans- forming individuals general ly fall within t h e o v e r l a p z o n e b e t w e e n sizes of females a n d m a l e s (Shapi ro 1 9 8 9 ) . T h e o v e r l a p p i n g OF the sexes observed for E. morio o n Campeche Bank i n d i c a t e d t h a t sex c h a n g e c a n t a k e p l a c e o v e r a b r o a d r a n g e o f sizes (from 39.5 t o 84.5 c m FL).
Parrish ( 1987) pointed that various s tudies h a v e s h o w n t h a t t h e d o m i n a n t food For g r o u p e r s a r e fish a n d d e c a p o d crustaceans. Resul ts o b t a i n e d in th i s w o r k o n f o o d hab- its of juvenile red g r o u p e r a g r e e d with t h o s e r e p o r t e d b y Randall (1 967), M o e (1 969) a n d Vald& a n d P a d r b n ( 1 9 8 0 ) . T h e m a - jority of t h e p r e y o r g a n i s m s t a k e n w e r e reef-associated, indicat ing t h a t m o s t of t h e f e e d i n g was d o n e o v e r reefs. A l g a e f o u n d in r e d g r o u p e r s t o m a c h c o n t e n t s w e r e probably taken incidentally a n d n o t utilized as food. F i s h e s t h a t f e e d o n b e n t h i c inver tebra tes from rocky b o t t o m frequently i n g e s t algae a l o n g with their p rey ( H o b s o n 1 968).
T h e d i e t o f juveni le red g r o u p e r d i d n o t substantially c h a n g e with increasing predator s ize . O v e r t h e size r a n g e e x a m i n e d , t r u s - t a c e a n s w e r e a l w a y s t h e chieF i t e m s in t h e d i e t of E. morio. Parrish ( 1 987) r e p o r t e d that , independent of t h e size of t h e groupers , t h e s p e c t r u m o f m a j o r food i t e m s r e m a i n s essen t ia l ly t h e s a m e . This s t u d y s h o w e d a l so t h a t pr imary prey i t e m s in red g r o u p e r s w e r e c o m p a r a b l e o v e r m o s t of C a m p e c h e Bank. Crustaceans w e r e t h e most impor tan t food a n d of t h e s e , t r u e c r a b s (Brachyura:
Reptant ia) w e r e found a t all four s a m p l i n g sites (Bru l t a n d Rodriguez C a n c h e 1 9 9 3 ) . Randall (1 967) r e p o r t e d t h a t s t o m a c h s of two Caribbean red groupers contained 33.390 crabs, 50% unidentified crustaceans and 16.7% fishes. fmorio, like o t h e r commercially a n d recreat ional ly i m p o r t a n t g r o u p e r s p e c i e s , o c c u p i e s a ro le of t o p p r e d a t o r in m a r i n e f o o d w e b s a n d c a n b e charac te r ized as a g e n e r a l i z e d o p p o r t u n i s t i c carnivore.
Acknowledgements
This s t u d y was s u p p o r t e d b y G r a n t N o . CII* 0432.ME(JR) f r o m t h e E u r o p e a n C o m m i s s i o n , a n d by G r a n t No. P 65000 ME from t h e Science a n d Technology Council of t h e French Embassy (CST) a n d t h e For- e ign Office of France (DCST). W e a r e grateful t o Mrs. A.M. Pech de Quezada (Congeladora Pascual, P r o g r e s o ) For p r o v i d i n g t h e r e d g r o u p e r s for t h i s s t u d y .
References
Arreguin-Sdnchez, F. 1987. Present status of the red grouper fishery of the Campeche Bank. Proc. Gulf Carib. Fish. Inst. 37:498- 509.
Arreguin-Sdnchez. F. , M.A. Cabrera and G. Mexicano . 1 9 8 7 a . Dinarnica d e la pesclueria d e mero (Epinephehs morio) del Banco d e Campeche, p. 81 -87. In M. Ramirez Rodriguez (ed.) Memorias del sirnposium sobre investigacion en biologla y o c e a n o g r a n a pesquera e n Mexico. Consejo Nacional d e Ciencia y Tecnologia- lnstituto Politecnico Nacional, Mexico.
Arreguin-Shnchez, F.. J.C. Seijo Gutierrez, D. Fuentes Castellanos and M.I. Solis Ramirez. 1987b. Estado del conocimiento d e 10s recursos pesqueros d e la plataforrna con- tinental d e Yucatan y region adyacente. Contr. Inv. Pesq. CRIP-Yucalpeten-IPN, SEPESCA Doc.Tec. 4,41 p.
Back, W, a n d B.B. Hanshaw. 1978 . Hydrogeochemistry of the northern Yucatan Peninsula, Mexico with a section on Mayan

biology a n d f isheries m a n a g e m e n t . Westview Press, Boulder.
Shapi ro , D.Y. 1 9 8 9 . S e x reversal a n d sociodemographic processes in coral reef fishes, p. 103-1 18. 1nG.W. Potts and R.J. Wootton (eds.) Fish reproduction: strat- egies and tactics. Academic Press, Lon- don.
Smith, C.L. 1971. A revision of t h e American groupers; Epinephelusand allied genera. Bull. Am. Mus. Nat. Hist. 146:67-242.
Smith, C.L. 1972. A spawning aggregation o f Nassau grouper , Epinephelus sfr ia tus (Bloch). Trans. Am. Fish. Soc. 2:257-261.
Solis Ramirez. M. 1970. The red grouper fish- ery of Yucatan peninsula, Mexico. Proc. Gulf Carib. Fish. Inst. 22: 122-129.
Stevenson. D.K. 1981. A review of the marine resources of the Western Central Atlantic Fisheries Commission (WECAFC) region. FA0 Fish. Tech. Pap. 21 1 , 1 3 2 p.
Tashiro1.E. and S.E. Coleman. 1977. The Cuban grouper and snapper fishery in the Gulf of Mexico. Mar. Fish. Rev. 39(10): 1-6.
Tortonese, E. 1986. Serranidae, p, 780-792. In P.J.P. Whitehead, M.L. Bauchot, J.C. Hureau,
J. Nielsen and E. Tortonese (eds.) Fishes of t h e North-eastern Atlantic and t h e Mediterranean. Volume l l . UNESCO. Paris.
Tucker, ].We, J .E. Parsons. G.C. Ebanlts and P.G. Bush. 1991. Induced spawning of Nassau grouper Epinephelus striatus. J . World Aquacult. Soc. 22(3): 187- 19 1 .
Valdes, E. and G. Padron. 1980. Pesquerias d e palangre. Rev. Cub. Inv. Pesq. 5338-52.
Wallace, RK. 1981. An assessment of diet overlap indexes. Trans. Am. Fish. Soc. 1 10:72-76.
Weidie A.E., W.C. Ward and RH. Marshall. 1978. Geology ofYucatan platform, p. 3-29. In W.C. Ward and A.E. Weidie (eds.) Geology and hydrogeology of northeastern Yucatan. New Orleans Geological Society, New Orleans.
Zaret, T.M. and A.S. Rand. 1971. Competition in tropical stream fishes: support for t h e competitive exclusion principle. Ecology 52:336-342.
Zupanovic, S. and P. Gonzilez. 1975. lnvestigacion y p e s q u e r h d e la cherna e n el banco d e Campeche. Mar. Pesca Cuba. 1 12:22-27.

Seasonal Patterns of Distribution and Abundance of Snappers in the Mexican Caribbean
S. D~AZ-RU~Z' A. AGUIRRL- LEON^
C. MACUITL" o. PEREZ'
<'Depto. de Hidrobiologia UAM-1 Ap. Postal 55-535, Mexico 09340, D. F.
LDepto. El Hombre y su Ambiente UAM-X Ap. Postal 23- 181, Mexico 04960; D. F
D~AZ-RU~Z. S., A. AGUIRRE-LEON, C. MACUITL and 0. PEREZ. 1996. Seasonal patterns of distribution and abundance of snappers in the Mexican Caribbean [Patrones estacionales de distribucion yabundancia de lospargos del Carhe Mexicanol, p. 43-50. In F . Arreguln-Sdnchez, J.L. Munro, M.C. Balgos and D. Pauly (eds:) Biology, fisheries and culture OF tropical groupers and snappers. ICLARM Conf. Proc. 48. 449 p.
Abstract
A total of 1 022 snappers of eight species were collected in the Cozumel reefs, Quintana Roo (Mexico), between 1988 and 1991. The species are Lutjanus analis. L. apodus, L. cyanopterus, L. griseus, L. jocu, L. mahogan;. L. synagris and Ocyurus chrysurus. The biology and population ecology of the snappers are controlled by the seasons and reef habitat. Seasonal variations in density (0.02-0.13 individ~als.m-~), biomass (1.26- 15.1 g-m-') and average weight (58.7-1 28.4 g) are related to the popula- tion structure through the life histories and the environmental seasonal changes of the system.
L. apodus. L. griseus. I . jocu and 0. chysurus have wide distributions and high abundances. These species are typical inhabitants of the reef community, contributing 71% of weight and 85% of individual numbers. Biomass peaked during the rainy season. The juveniles and preadults undertook regular migrations from the barrier reeF to the protected seagrass (Thalassia te~tudinurn) areas for feeding, while the adults migrated to the barrier reefs for reproduction. More ecological studies of these potentially important Fishery resources are necessary in the Mexican Caribbean region.
Resumen
Un total de 1 022 peces de ocho especies de pargos fueron colectados en 10s arrecifes de Cozumel. Quintana Roo (Mexico), entre 1988y 1991. Estospargos fueron: Lutjanus analis, L. apodus, L. cyanopterus. L. griseus. L. jocu. L. rnahogani, L. synagris y Ocyurus chrysurus. La ecologia y biologia de 10s pargos estan controladas por /as estaciones clima'ticas y el habitat arrecifaL Las variacioncs cstacionales en densidad (0.02-0.13 ind-m-'), biornasa (1.26- 15.1 g . ~ " ~ ) ypeso prornedio (58.7- 128.4 g) esl'an asociadas a la estructura de la poblacion a traves de 10s ciclos de vida y el comportarniento ambiental del sisteina a lo largo del afio.
L. apodus, L. griseus, L. jocu y 0. chrysurus mostraron amplia distribucion y alta abundancia. Estas especies son habitantes tipicos de la cornunidad de arrecife con 71% del peso y 85% del nornero de iildividuos. La mayor biornasa (49%) de las poblaciones de pargos fueron encontradas dui-ante la estacion de lluvias. 10s juveniles y pre-adultos realizan migraciones regulares de 10s arrecifes de barrera a las dreas protegidas de Thalassia testudinum para alimentacidn, mientras que 10s adultos rnigran a la barrera arrecifal para reproduction. Por la importancia de estos recursos pesqueros potenciales se requieren mds estudios ecologicos en la region del Caribe Mexicano.

Introduction
The coastal region of Quintana Roo in the Mexican Caribbean is of high value for its fishery potential and is located in a zone of intense recreational activity.
Coral reef ecosystems are areas that support a great biotic diversity, with a high po- tential for Fishery resources such as gastro- pods, lobsters and fishes. Several fisheries depend on these systems and their habi- tats and resources are therefore important. The fishes play a significant role in the energy balance of these ecosystems (Ogdcn and Gladfelter 1983; Shulman et al. 1983: Meyer and Shultz 1985; Lewis 1986; Munro 1987; Sano 199 1 ; DTaz-Rulz and Aguirre-Leon 1991, 1993).
Species of snappers, Lutjanidae, play an ecologically important role in the coral reef ecosystem. Studies in the Caribbean have shown that the lutjanids belong to the ten most important families in the fisheries of the region (Munro 1983; Bannerot et al. 1987; Brusher and Pallto 1987: Polovina and Ralston 1987; Basurto-Origel 1988; Smith 1988; Dennis 1991 ). Owing to their economic value, systematic studies are needed on their taxonomy, biology and ecology to evaluate and manage these resources (see Chapman et al.; Gomez et al.; Rivera-Arriaga et al., this vol.). The principal objective of this work was to establish the patterns of distribution and abundance of the snap- per species and their relationship to tem- poral and spatial changes of enviromcntal parameters in the Cozurnel coral reef system (see Cuellar et al., this vol.).
Study Area
The Cozumel reef system is located in the Mexican Caribbean (20°28'N; 87" 01 'W) (Fig. 1 ), covering approximately 3 200 ltm2, including barrier reef and seagrass beds, with an average depth ranging from 2 to
15 m. The reef area consists of three habitats: a) Seagrass beds along the coastline; b) the barrier reef characterized by coralline formations; and c) a lagoon between these two habitats.
The seagrass (typically Thalassia testudinum) area is a shallow habitat with a mean depth of 1.2 m with strong tidal current. Salinity ranges from 32 ppt (June) to 34.9 ppt (May) and temperature from 26.8"C (November) to 31 .Z°C (May). The barrier reef has an average depth of 15 m on the inner side, with strong south-north currents and persistent winds from the south- east. The salinity varies from 32 ppt (July) to 34.9 ppt (May) and the temperature from 28°C (February) to 29.3"C (June). The coral reef communities include Agaricia agaricites, Acropora pdmata, A. cervicornis, Maclracis clecactis, Leptoseris cucu//ata, Diploria strigoa, Porites porites, Dendiogira cylindrus an d Millepora alcicornis.
The lagoon is characterized by isolated coral patches composed of the species previously cited. Salinity ranges from 32.5 ppt (March) to 33.3 ppt (November) and temperature from 25.2T (January) to 28.9"C (May).
The Cozumel reef system experiences three climatic seasons related to the rain- fall, frequency of winds and environmen- tal temperature. These are the dry season (February to May), the rainy season (June to September) and the winter storm sea- son ("Nortes") (October to February). De- tailed descriptions of the ecosystem are given in Garcia (1 987), Jordan (1 988), Fenner (1 988) and Diaz-Ruiz et al. ( 1993).
Methods
The fish catches were made in depths of 2-1 5 m using different fishing methods. In seagrass beds, samples were taken with a beach seine [chinchorro], 50 m in length, with mesh of 19 mm (314") in the bag and 38 mrn (1.5") in the wings. In the lagoon

Gulf o f
C a r i b b e a n S e a N b
+ - + + ?
------ __-*-
-_ -- . -- -. , --- / ----I-
Fig. 1. Cozumel coral reef system, showlng the dlstrlbutlon of the sampllng stations, the main habitats of the reef system and the main physlographlc and bathymetric characteristics In the area. (BA, barrler reef; LA, lagoon; and THT, seagrass beds). [Sistema arrecifal de Cozumelmostrando la distribucldn de la5 estaclones tie muestreo, asi como 10s prlnclpales habitats riel slstema arreclfal. Tamhien se muestran /as prhclpaies caracteristicas flsiogriincas y batim6tricas. BA, lrarrera arreclfal; LA, Iaguna; y THE paderas de pastos marlnos.]
and in the back reef area samples were taken by free diving using harpoons, and by traps. Additionally, visual census transects were made in the lagoon and back reef at four sampling stations, each 100 rn in length, and 4 m wide. The technique is a modifi- cation of the visual method of Sale and Sharp ( 1983). Two observers annotated plastic tables with the numbers of the identified fishes on the transects. Each diver counted the fishes in the 2-rn wide strip on each side of the transect. The two counts were added to obtain a total. The 100 m transect was completed in an average time of 30 minutes.
During each collection, salinity, tempera- ture, dissolved oxygen, depth and trans- parency of the water column were meas- ured. Observations of submerged vegetation, benthic rnacrafauna and meteorological conditions were also noted.
In the laboratory, fish were identified, counted, weighed and measured. The abundance of fishes was expressed as biomass (g wet we igh tad) and density (number of individual~m'~). Dominant fish populations were identified on the basis of frequency (percentage of occurrence), weight, nu- merical abundance and broad distribution in the system.

Results and Discussion
Forty-three fish Families were identified in the samples taken between 1988 and 199 1 in the Cozumel reef system, and the lutjanids were the fourth most important family by number, density and biomass.
This family group includes eight species: Lutjanus analis, L. apodus, L. cyanopterus, L. griseus, L. jocu, L. mahogani, L. synagris and Ocyurus chrysurus, jointly represeet- ing more than 7 1 O h by number and by weight, of the total catch.
Distributjon and habitat
Luganus apodus, L. jocu, L. griseus, L. mahogani, L. synagrisand 0. chiysurus have wide distributions in the system. Some of these species (L. apodus, L. jocu, L. grkeus and 0. chrysurus) reproduce on the bar- rier reef among mixed colonies of corals in depths of I5 m. Juveniles of these spe- cies are found in shallow waters on seayrass beds between 1 .O and 1.7 m. Other species, such as L. mahogani and L. synagris, uti- lize the habitats as feeding areas. Species with restricted distributions (L . analis and L. cyanopterus) are found mainly in the lagoon and seagrass beds.
Abundance
In general, the greatest abundance of lutjanids is on the barrier reef. Biomass, density and average weight are high on the reef during the rainy season whereas biomass and density are high in the seagrass habitat during the dry season. The great- est biomass (26.3 gvm-') was found on the reef during the rainy season and the low- est (1.59 g-m-') in the seagrass beds dur- i n g the dry season. The highest densities (0.19 individuals.m-" were found on the reef during the dry season and the least
(0.005 individuals-m-') on the seagrass beds during the "Nortes" season. These values suggest that the snappers are represented by larger individuals on the reef during the rainy season and by a few juveniles on the seagrass beds during the dry season. Fig. 2 summarizes our observations of density, biomass and mean weight in b u r I<ey species.
All species have pronounced seasonal variations in biomass and density through the year. This is a consequence of seasonal patterns of utilization in which the snap- pers optimize their use of food availabil- ity, environmental conditions and the struc- tural characteristics of the habitats. This behavior has been observed in other species of snappers in tropical ecosystems by Acero and Garzon 1985; Berrios et al. 1985; Alvarez- Guillen et al. 1986; Leis 1987; Diaz-Ruiz and Aguirre-Leon 1993.
Fig. 3 shows selected examples of utili- zation patterns in the coral reef system by lutjanids. In 0. chgmrus, immature individuals of small sizes are found in the lagoon and in the seagrass beds in March to April. The preadults migrate through the lagoon towards the barrier during the rainy season.
Similar behavior is observed in L. griseus, in which the seagrasses represent an im- portant habitat for feeding oFjuveniles and for the adults during the "Nortes" season. At the end of the "Nortes" and beginning of the dry season, preadults are recru,ited to the lagoon to feed, mature and later migrate toward the reef.
In contrast, juvenile L. analismigrate to the lagoon as preadult to grow, mature and spawn in this area during the rainy season. Adults have been collected in great abundance during July (Diaz-Ruiz et al. 1993).
Similar patterns observed by different authors show that, as in many species of fishes, juvenile lutjanids carry out wide migrations from the areas of reproduction toward the areas of seagrasses, with diur- nal and/or seasonal movements related to

Luljanus apodus
G- 012 -
21 r
O M
/ O0; & 0.34
0 F M A M J J * S O N D I F M A M I J A S O N D I
Lutjan us jocu 0 <6 1
Ocyurus chrysurus 1
riL 004 D F M A Y J J A S O N D J THT iJ"& F M A M J J A S O N D J + U
20
::A s o F M A M J J A s o N D I l t i r ig& F M A M J J A S O N D J u
L
Fig. 2. Seasonal abundance patterns of Llrtjanus apodus, 1. grfseus, L. jocu m d Ocyurus chrysurus In the Cozumel coral reef system: density (Ind.-m-I), biomass (g-m-') and mean welght of the population (g/ind). [Pafrones estaclonafes tfe fa abundancla deLutjanus apodus, L. griseus, 1. jocu y Ocy urus chrysurus en ef ststerna arreclfal tie Cozumel: tiensidad (fnd. om-'), blomasa (g*m-2) y peso promedh de la pobfaci6n (g/lnd.l.l
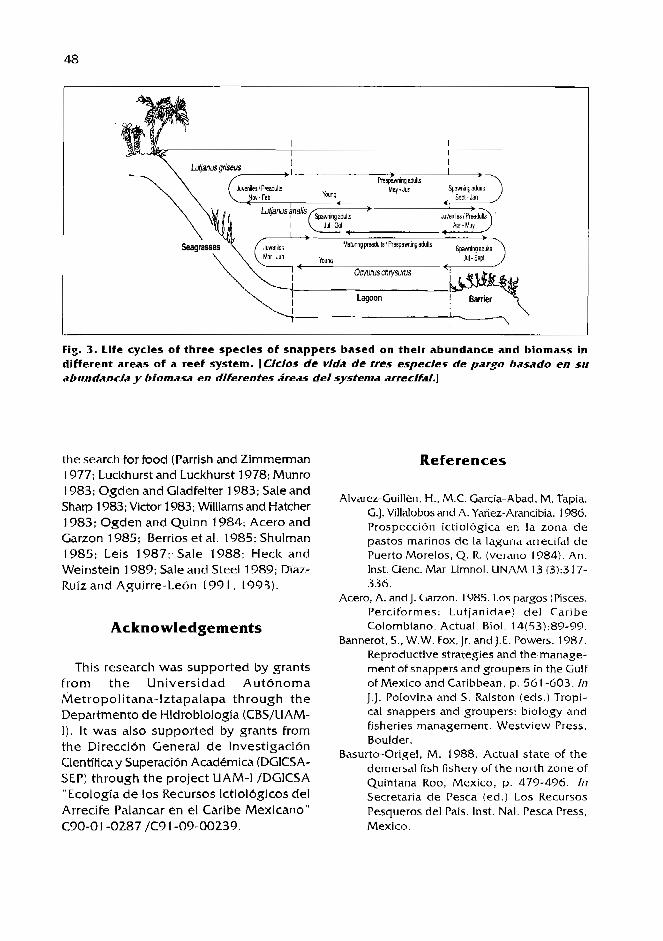
Fig. 3. Life cycles of three species of snappers based on thelr abundance and biomass in different areas of a reef system. [CMOS de v l h de tres especles de pargo Basado en su abundancja y biomasa en dlferentes areas clel systema arreclfal.]
the search for food (Parrish and Zimmerman 1977; Luckhurst and Luclthurst 1978; Munro 1983; Ogden and Gladfelter 1983; Sale and Sharp 1983; Victor 1983; Williams and Hatcher 1 983; Ogden and Qu inn 1 984; Acero and Garzon 1985; Berrios et al. 1985; Shulman 1985; Leis 1987: Sale 1988; Heck and Weinstein 1989; Sale and Steel 1989; Diaz- Ruiz and Aguirre-Le6n 1991, 1993).
Acknowledgements
This research was supported by grants from the Universidad Aut6noma Metropolitans-lztapalapa through the Departmento de Hidrobiologia (CBS/UAM- I). It was also supported by grants From the Direcci6n General de lnvestigacibn CientiRca y Superacion Academics (DGICSA- SEP) through t h e project UAM-I /DGICSA "Ecologia de 10s Recursos Ictiologicos del Arrecife Palancar e n el Caribe Mexicano" C90-01-0287 /C9 1 -09-00239.
References
Alvarez-GuillOln. H., M.C. Garcia-Abad. M. Tapia. 6.1. Villalobos and A. Yaiiez-Arancibia. 1986. Prospeccidn ictiologica en la zona de pastos marinos de la laguna arrecihl de Puerto Morelos, Q. R. (verano 1984). An . Inst. Cienc. Mar Limnol. UNAM 13 (3):3 17- 336.
Acero, A. and]. Garzon. 1985. Los pargos (Pisces: Perciformes: Lutjanidae) del Caribe Colombiano. Actual. Biol. 14(53):89-99.
Bannerot, S., W.W. Fox, jr. and J.E. Powers. 1987. Reproductive strategies and the-manage- rnent of snappers and groupers in the Gulf of Mexico and Caribbean. p. 561 -603.117 I.]. Polovina and S. Ralston (eds.) Tropi- cal snappers and groupers: biology and fisheries management. Westview Press. Boulder.
Basurto-Origel, M. 1988. Actual state of the demersal fish Fishery of the north zone of Quintana Roo, Mexico, p. 473-496. 117 Secretaria de Pesca (ed.) Los Recursos Pesclueros del Pais. Inst. Nal. Pesca Press, Mexico.

Berrios, J . , J.K. Gonzalez and I. Diaz. 1985. Fish population studies of the seagrass beds and coral reefs of Cayo Berberia and Cayo Ratones, Ponce. P.R. Puerto Rico Sport Fish. Res. Survey, 57 p.
Brusher, H.A. and 0.1. Palko. 1987. Results from the 1784 and 1985 charterboat surveys in southeastern U.S. waters and the U.S. Caribbean Sea. Mar. Fish. Rev. 49(2):109- 117.
Dennis, G.D. 1991. The validity OF length-fre- quency derived growth parameters from commercial catch data and their application to stock assessment of the yellowtail snapper (Ocyurus chrysurus). Proc. Gulf Carib. Fish. Inst. 40:126-138.
DCat-Ruiz, S. and A. Aguirre-Leon. 1991. Fish assemblages and patterns of Fish habitat utilization from the Cozumel coral reef system, Mexican Caribbean. Bull. Zool. Mus. Univ. Amst., 98 p.
Diaz-Ruiz, 5. and A. Aguirre-Lebn. 1793. Diversidad e ictioFauna de 10s arrecifes del sur de Cozumel, Quintana Roo, p, 81 7- 832.1nS.I. Salazar and N.E, Gonzalez (eds.) Biodiversidad Marina y Costera de Mexico. Com. Nal. Biodiversidad/ClQRO, Mexico.
Diaz-Ruiz, S. , C. Macuitl. A. Aguirre-Lebn, E. NORez, J.R. Ramos and 1. ChAvez. 1993. Ecologia de 10s peces arrecifales coralinos del Caribe Mexicano: Un perfi l de comunidad. Informe Final, Proyecto de Investigation: EcologIa y recursos lctiologicos del Arrecife Palancar en el Caribe Mexicano (C91-09-00239) Convenio UAM-I/DGICSA, 85 p.
Fenner, D.P. 1988. Some leeward reefs and corals of Cozumel. Mexico. Bull. Mar. Sci. 42(1):133-144.
Garcia, E. 1987. Modificacion al sistema de clasificacion climatica de Kappen, Inst. Geogr. Univ. Nal. Auton, MCxico. 346 p.
Heck, K.L. and M.P. Weinstein. 1989. Feeding habits of juvenile reef fishes associated with Panamanian seagrass meadows. Bull. Mar. Sci. 45(3):629-636.
Jord6n. D.E. 1988. Arrecifes profundos en la lsla Cozumel, Mexico. An. Cienc. Mar Limnol. Univ. Auton, MCxico 15(2):195- 208.
Leis, 1. M. 1987. Review of the early life history of tropical groupers (Serranidae) and snap- pers (Lutjanidae), p. 189-237.lnJ.J. Polovina
and 5. Ralston (eds.) Tropical snappers and groupers: biology and fisheries rnan- agernent. Westview Press, Boulder.
Lewis, S.M, 1986. The role of herbivorous fishes in the organization of a Caribbean reef community. Ecol. Monogr. 56(3): 183-200.
Luckhurst, B.E. and K. Luckhurst. 1978. Diurnal space utilization in coral reef Ash com- munities. Mar. Biol. 49:325-332.
Meyer, 1.L. and E.T. Shultz. 1985. Migrating haemulid Fishes as a source of nutrients and organic matter on coral reefs. Limnol. Oceanogr. 30( 1 ): 146- 156.
Munro, J.L., Editor. 1983. Caribbean coral reef fishery resources. ICLARM Stud. Rev. 7, 276 p.
Munro, J.L. 1987. Workshop synthesis and directions for future research, p. 639-659. In].]. Polovina and S. Ralston (eds.) Tropical snappers and groupers: biology and fish- eries management. Westview Press, Boulder.
Ogden, J.C. and E.H. Gladfelter. 1983. Coral reef, seagrass beds and mangroves: their interaction in the coast zones of the Car- ibbean. UNESCO Rep. Mar. Sci. (23): 1-1 33.
Ogden, J.C. and T.P. Quinn. 1984. Migration in coral reef fishes: ecological significance and orientation mechanisms, p. 293-308. In J.D. McCleave. G. P. Arnold, 1.). Dodson and W.H. Neill (eds.) Mechanisms of migration in fishes. Plenum Press. New York.
Parrish, J.D. and R.J. Zimmerman. 1977. Utili- zation by fishes of space and food resources on an offshore Puerto Rican coral reef and its surroundings. Proc. 3rd Int. Coral Reef Symp. 3:297-303.
Polovina, J.J. and 5. Ralston. Editors. 1987. Tropi- cal snappers and groupers: biology and fisheries management. Westview Press, Boulder. 659 p.
Sale, P.F. 1988. Perception, pattern, chance and the structure of the reeFfishes communi- ties. Env. Biol. Fish. 2 1 :3- 1 5.
Sale, P.F. and B.I. Sharp. 1983. Correction for bias in visual transect censuses of coral reef fishes. Coral ReeFs 2:37-42.
Sale, P.F. and W.J. Steel. 1789. Temporal vari- ability I n patterns of association among fish species on coral patch reefs. Mar. Ecol. Prog. Ser. 5 1 :35-47.
Sano, M . 1991. Patterns of habitat and food utilization in two coral-reef sandperches

(Mugi lo id idae) : c o m p e t i t i v e o r non- competitive coexistence? J. Exp. Mar. Biol. Ecol. 140:209-223.
Shulman, M.J. 1985. Recruitment of coral reef fishes: effects of distribution of predators and shelter. Ecology 66: 1056- 1066.
Shulman, M.J., J.C. Ogden , J.P. Ebersole. W.N. McFarland, S.L. Miller and N.C. Wolf. 1983. Priority effects in the recruitment of juvenile coral reef Fishes. Ecology 64: 1508-1 51 3.
Smith, G.B. 1988. Abundance and potential yield of g r o u p e r s (Ser ran idae) , s n a p p e r s
(Lutjanldae) and grunts (Haernulidae) on the Little and Great Bahama Banks. WCAFC Nat. Rep. COPACO 376:84- 105.
Victor, B.C. 1983. Recruitment and population dynamics of a coral reef fish. Science 2 19:419-420.
Williams, D.M. and A.I. Hatcher. 1983. Struc- ture of fish communities on the outer slopes of inshore, mid-shelfand outer-shelf reefs of the Great Barrier Reef. Mar. Ecol. Prog. Ser. 10:239-250.

Biological Aspects of the Yellow Eye Snapper (h@anus vivanus) (Pisces: Lutjanidae)
from the 10s Hermanos Islands, Eastern Venezuela
G.J. GOMEZ L A . GUZMAN
L A . MARCANO FONAIA P, Cen to In vest. Agrop. Pesq. Sucre
P. 0. Box. 236, Cuman 6101, Venezuela
COMEZ, G.J., R.A. CUZMAN and L.A. MARCANO. 1996. Biological aspects of the yellow eye snapper (Lutjanus vivanus) (Pisces: Lutjanidae) from Los Hermanos Islands. Eastern Venezuela [Aspectos biologicos del 'pargo ojo amarl//o" (Lutjanus vivanus) (Pisces: Luvanidae), de /as Islas Los Hermanos, Este de Venezuela], p. 51-58. In F. Arreguln-Sanchez. J.L. Munro. M.C. Balgos and D. Pauly (eds.) Biology, fisheries and culture of tropical groupers and snappers. ICLARM Cont Proc. 48. 449 p.
Abstract
Biometric and reproductive aspects of the yellow eye snapper, Lut/anus vivanus, a species of great commercial interest to the artisanal fishers OF the eastern region of Venezuela, are analyzed. A total of 592 fish were captured wlth Antillean fish traps between January and December 1992. in the vicinity of the Los Hermanos Islands, near Margarita Island, eastern Venezuela. Size structure showed that the most Frequent group was 350-510 mm. followed by the groups 250-330 mm and 530-790 mm. The length-weight relationship did not show a significant difference between males and females (p>0.05). thus a common equation was estimated (W = 1x10"-5 x TLA3.0Z18). The estimated sex ratio From the sample was 1.03:i (p>0.05). Mean length at first maturity for males and females was estimated at 565 and 540 mm. respectively. Reproductive activity was more intense during May and June, and August to November.
Resumen
Se analizan aspectos biomCtricos y reproductivos del "pargo ojo amarillo" Lutjanus vlvanus, una especie de gran inter& comerclal para pescadores artesanales de la reg/& oriental de Venezuela. Un total de 592 peces heron capturados con tramps para peces tipo Antillano entre Lnero y Didembre de 1992, en 10s alrededores de /as Islas 10s Hermanos, cerca de Isla Margarita, a1 este de Venezuela. La estructura por tamafios mostr6 que 10s grupos mas kecuentes estuvieron comprendidos enl're 10s 350 y 510 mm, seguidos por 10s grupos de 250 a 330 mm, y 530 a 790 mm. La relaci6n peso - Iongjtud no mostr6 diferencia significativa entre machos y hembras (p>0.05), por lo cual una ecuacion para arnbos sexos fuC estimada (W - /xlOA-5 x TLfi3.0218). La proporcldn de sexos en la muestra fu.5 de 1.03:1 (p~O.05). La longitud media de primera madurez para machos y hembras fu.5 estimada en 565 mrn y 540 mm, respectlvarnente. La actividad reproductiva fuc? mas lntensa durante Mayo y Junio, y Agosto a No viembre.

Introduction
The yellow eye snapper (Lu@mus vivanus) occurs over hard bottom (rocky, gravel, coralline or sandy), at depths between 90 and 170 m, from North Carolina and Ber- muda, to the southern Amazon river delta in Brazil, and is particularly abundant near the Antilles and Bahamas. In Venezuela it has been reported for the southwest and southeast of Los Hemanos Island (Cervigbn 1 966; Fisher 1 978; Gbmez et al. 1 992).
L. vivanus is one of the most important species of the genus Luqanus exploited by theVenezuelan offshore fishery and distant water fishery (off Surinam and French Guiana) (see Cuellar et al., this vol.). However, there are no studies on the biology and fishery of this species in Venezuela.
This study was undertaken in order to evaluate some important biological aspects of the species (biometry and reproduction). which may provide a basis for the future management of the fishery.
Materials and Methods
The Los Hermanos Islands are located to the northeast of Margarita lsland ( 1 1°40' N; 64O23' W; Fig. 1). The area is charac- terized by hard bottom, either rocky, coralline or sandy, which makes it an ideal habitat For fish. of the families Lutjanidae and Serranidae (Cines 1972).
Samples were obtained using Antillean traps during exploratory Fishing trips on board FONAIAP's /VV Golf0 de Cdriaco. Twelve trips of 8 days were executed during 1992. Twenty traps were placed at a depth of 20-70 fathoms, and baited with fresh sardine. The traps were baited every 24 hours between 0500 and 0600 hours, aFter removing the fish caught, for a period of five days.
Samples were kept iced during the trip and were thawed and processed in CurnanA. Total length (TL) and weight of each fish
were estimated using an ichthyometer ( I -mm accuracy) and a balance of 1 -g ac- curacy, respectively. The gonads were re- moved through a ventral incision in each fish, weighed and kept iced for further stud- les.
Size distribution was assessed using fre- quency histograms with 20-mm TL inter- vals. Size/weight relationships were esti- mated for males, females and both sexes combined, using log-transformed values of TL and W, and least square regressions (Sold and Rohlf 1981). The comparison between male and Female relationships was performed using covariance analyses (Snedecor and Cochran 197 1 ). The deviation of the slopes "b" from a value of 3.0 (which would imply that body weight increases as a cubic function of size), was estimated using a Student t- test (Sokal and Rohlf 1981).
Sex identification and sexual maturity were assessed by visual examination of the go- nads' external morphology. size and color, according to Holden and Raitt (1 975). The estimation of the monthly proportion of fish with mature gonads served as an index of reproductive activity for the species un- der study. The deviation of the sex ratio from a 1 : 1 proportion was estimated through a chi-square test (Soltal and Rohlf 198 1 ).
Size at maturity is defined as the small- est length at which 50% of the males or females sampled are reproductively active (stage IV). Size at maturity was estimated by plotting the relative cumulative frequency of mature fish against total length. The observed values were fitted to the logis- tic equation:
linearized by the function log,(a) + bX =
Ioge(l-Yfl). The constants "a" and "b" were estimated by regression analysis between the size classes and loge(l -Y/Y), where Y is the relative cumulative Frequency OF each size class. Replacing the values of these

C a r i b b e a n S e a
J Los Tes t ip
Venezuela
65 64 63 62 61
Longitude ( O W )
Fig. 1. Map showlng the study area, the 10s Hermanos Islands, eastern Venezuela. [ M a p mostrando el h e a de estudlo, Islas Los Hermanos, Este rle Venezuela.]
constants in equation ( 1 ) allowed the esti- mation of size at maturity of 50% of the population, according to the equation:
as suggested by Somerton (1 980) and by Gaertner and Laloe (1 986). The slopes and intercepts of the linearized logistic equa- tion, by sex, were compared by covariance analysis (Snedecor and Cochran 197 1).
Results
Biometry
Population Size Structure
A sample of 592 red eye snappers (Lu@anus vivanus) were obtained, consisting of 292 females (49.3%) and 300 males (50.7%). Females ranged From 260 to 750 rnrn TL,
with a mean value of 443 mm TL, while males ranged from 265 to 760 mm TL, with a mean of 442 mm TL (Fig. 2). No difer- ences in size were observed between males and females (Student t-test, p>0.05). The mode was located between 350 and 5 10 rnm TL (73% of the population). The smallest animals, fish between 250 and 330 mm TL, corresponded to 11% of the population, while the largest animals, with TL of 530 to 790 rnm, represented 16% of the popu- lation.
The monthly size structure analysis in- dicated several modal groups (Fig. 3), with most 250 and 400 mm TL.
Length-weight Relationship
The equations describing the relation- ship between weight (W) and TL was esti- mated for males and females (Fig. 4). The slopes and intercepts were not significantly

Length (TL; crn) I Fig. 2. Sixe structure of the sampled populatlon of Luganus vivanus from Los Hermanos Islands. Ven- ezuela, Januaq-December 1992. [Estrvcturapor~-os de la poblacion de Lutjanus vlvanus de /as Islas 10s Hennanos, Venezuela, de Enem a Dlclembre de 1992.1
26 32 38 44 50 56 62 60 74 80 86 92
Length (TL; cm)
Flg. 4. Length-welght relationship For Lut/hus vhanus from Los Hermanos Islands, Venezuela, January- December 1992. [Relacih peso longitz~dp.vaLutJanus vlvanus de Ins IsIas Los Hermanos, Venezuela, de Enero a Dlciembre de 1992.1
L 1 1 1 I I I I 0 D Z O J o 4 0 S o W i 0 L
Length (TL; cm)
Flg. 3. Monthly she structure of the sampled populatlon of lu@wus vhanus h m Los Hermanos Islands, Venezuela, January-December 1992. IEstructura menswipor tamaiias de la pobiacldn de LutJanus vlvanus de h s Islas Los Hermanos, Venezuela, de h e r o a DicIembre de 1792.1

different, hence a common equation was estimated for both sexes:
The slope of 3.02 was not significantly different from 3 which suggests isometric growth in weight for this species.
Reproduction
Sex Ratio
In the sample of 592 snappers, the sex ratio was 49.3% males and 50.7% females. which did not differ significantly from 1 : 1 (chi-square test, p0.05).
Sexual Maturity and Reproductive Season
Mature individuals were observed at the beginning of May, with two periods of increased gonadal activity, May-June and
August-November (Fig. 5). N o spent indi- viduals were observed.
The size at which 50% of the individuals are able to reproduce was estimated Far males at 565 rnm TL and the smallest ma- ture individual was 450 mm TL. For females, the size of 50% maturity was estimated at 540 mm TL, and the smallest mature female was 420 mm TL. The comparison of the equations for size at maturity of 50% of the population indicated that intercepts for males and females were significantly different (covariance analysis, p<0.05); thus separate equations are reported for males and fe- males (Fig. 6).
Discussion
Biometry
In this study the largest L. vivanus found was 790 mm TL, while the largest female was 760 mm TL. These sizes are larger than what have been reported by other authors
Month
Flg. 5. Monthly variation In maturity stages of Luf/nnus vivanus from Los Hermanos Islands. Venezuela, January-December 1992. 1 Variacih mensuai de 10s estadios de madurez de Lutjanus vlvanus de /as Islas Los Hermanos, Venezuela, tie h e r o a Diclemlrre de 1992.1

O.!
0.1
0.i 2 3 5 0.f
E c 0.1 0 .- - 0 0.4 E
0.3
0.2
0.1
0 40 44 48 52 56 60 64 68 72 76 80
Length (TL; cm)
Length (TL; cm)
Fig. 6. Slze at maturity of 50% of the popu; lation of (a) male and (b) female Lutjanus vlvanus from Los Hermanos Islands, Venezuela, January- December 1992. [ TamaAo tie prlmera madurez (50%) de la polrladbn de h)machos y (15) hembras de Lutjanus vlvanus de /as Idas Los Hermanos, Venezuela, tie Enero a Dlclembre tie //392.]

in the Caribbean area. Fischer (1978) re- ported a maximum size for L. vivanus of 690 mm total length, while Pozo and Espinou (1 982) found that the maximum size in Cuba was 560 mm forlc length. The latter authors, in their study on age and growth of L. vivanus, estimated an asymptotic size (L_) of 756 mm. Cervigon and Fischer (1979) indicated that specimens of this species in the region average around 450 mm to- tal length, which is slightly larger than that reported in the present study (443 mm and 442 rnm, for females and males, re- spectively).
There is evidence that, according to the fishing method adopted for the exploita- tion of a resource, its population can un- dergo changes in age or size structures, in growth rate, or in reproductive capac- ity (Csirlte 1980). One of the most notice- able changes is the reduction in the mean size of the fish in the population, as a re- sult ofa decrease in the proportion of older individuals. This situation was observed in the population studied. Analyzing its size structure, it was observed that 73% of the individuals were found in the range 350 to 5 10 mm TL, and only 16% were larger than 530 to 790 mm TL.
The presence of modal groups between 250 and 400 mm TL observed in the monthly distribution analysis (Fig. 3), suggests that recruitment to the fishing area is talting place at these sizes. However, a precise recruitment period for L, vivanuscould not be established without more detailed studies.
The similarity of the length-weight re- gression equations for male and female L. vivanus, and the proximity of the slope value to 3, suggest that both sexes have isometric growth. Other authors have re- ported near-isometric growth for snapper species. Rubio et al. (1985) reported for L. synagris in Cuba; Pozo and Guardiola (1983), and Gomez et al. (1991) for L. buccanella. However, Pozo (1 979) found in Cuba "b" values of 2.59 and 2.53, respectively, for male and female I . analis.
Reproductive aspects
Sex ratio can change considerably among species, or it can differ between populations, or even among different years for the same population. However, in most populations, the ratio is usually close to unity (Nikolsky 1963) as observed in this study.
Christiansen and Cousseau (1 971 ) indi- cated that sex ratios can show variations according to the reproductive period and to the size groups under consideration. Margalef (1 977) proposed that the opti- mal ratio between males and females is the result of selective pressure, which acts under different circumstances depending upon the distribution and the social organiza- tion of the species.
Reproduction of L. vivanusseerns to take place only during the second half of the year, since mature fish were only found during this period and no mature fish were found during the first four months of the year. Thompson and Munro (1 983) found that this species reproduces during a pro- longed period of the year in Jamaican wa- ters, with three main seasons: March/May, August/September and November. The absence of spent fish in the present study could suggest that the fishing area does not coincide with the reproductive area for this species, which would thus have to migrate elsewhere to spawn.
The size at 50% maturity of 50% of the L. vivanus population was established at 540 mm TL and 565 mm TL for females and males, respectively, suggesting that females mature before males do. Similar results were found by Thompson and Munro (1983) who reported that, in Jamaican waters, mean maturity size was 550-600 mm for males and 500-550 mm for females. These authors explained this difference in size at maturity, under the assumption that either growth rate is Faster in males, or that males mature later than Females.

Acknowledgements
We wish t o aclcnowledge R. Chacon, A. Urbaneja and G. Vizcaino For their enthu- siastic participation in the sampl ing pro- gram, ]. A l io and F. Arocha for the transla-
t ion and T. Ramlrez For the t yp ing o f the manuscript. W e also wish t o recognize the help provided by the crew o f the WVGolfo de Cariaco. Funds to support this work were p r o v i d e d by Fondo Nacional de lnvestigaciones Agropecuarias o f the Ven- ezuelan Government.
References
Cervigon, F. 1966. Los peces rnarinos de Ven- ezuela. Fundacion La Salle de Ciencias Naturales. Tomo 11. Caracas. Venezuela. 994 p.
Cervigon. F. and W. Fischer. 1979. Catalogo de especies marinas de inter& economico actual o potencial para America Latina. Parte I . Atlantico Centro y Sur Occidental. FAOfUNDP. Sic/79/1372 p.
Christiansen, H.E. and M.B. Cousseau. 1971. La reproduccion de la merluza y su relacion con otros aspectos biolbgicos de la especie. Bol. Inst. Biol. Mar. 20:44-73.
Csirlte, 5 . 1980. Introduccion a la dindmica de poblacion de peces. FA0 Doc. Tec. (Pesca) 192, 82 p.
Fischer, W.. Editor. 1978. FA0 species identi- fication sheets for Fishery purposes, Western Central Atlantic (Fishing Area 3 1 ) . FAO. Rome.
Gaertner. D. and F. Laloe. 1986. Etude biometrique de la taille a premiere maturite sexuelle de Geryon maritat?, Manning et Holthuis, 1981 du Senegal. Oceanol. Acta 9(4) :479-487.
Ginez, H., Editor. 1972. Carta pesquera de Ven- ezuela. I. Areas del nororiente y Guayana. Fund. La Salle de Cienc. Nat. Caracas. Monogr. 16, 3 19 p.
Gornez, G., A. Urbaneja, R Chacon and G. Viruino. 1991. Algunos aspectos biologicos del pargo aleta negra, Lurjanus buccanella
(Cuvier, 1828) (Pisces: Lutjanidae), de las lslas Los Hermanos, Venezuela. AsoVAC. XLI Conv. Anual. Acta Cient. 42(1):293.
Gomez, G.. A. Urbaneja, R Chacon and G. Vizuino. 1992. Aspectos prelirninares de la biologia del pargo ojo amarillo Lutjanus vivanus (Cuvier, 1828) (Pices: Lutjanidae), del sureste de las Mas Los Hermanos, Venezuela. AsoVAC. XLll Con, Anual. Acta Cient. vol. 43( 1 ):279.
Holden, M.]. and D.F.S. Raitt. 1975. Manual de ciencia pesquera. Parte 2. Metodos para investigar 10s recursos y su aplicacion. FA0 Doc. Tec. Pesca ( l 15) Rev. 1 :2 1 1 p.
MargaleF, R. 1977. Ecologia. Omega S.A., Bar- celona, EspaAa. 59 1 p.
Nikolsky, G. 1963. The ecology of fishes. Aca- demic Press, New York.
Pozo, E. 1979. Edad y crecimiento del pargo Lutjanus analis (Cuvier, 1828) en la plataforma nororiental de Cuba. Rev. Cub. Inv. Pesq. 4(2): I-24.
Pozo, E. and L. Espinoza. 1982. Estudio de la edad y crecimiento del pargo del alto Lutjanus vivanus (Cuvier, 1828) en la plataforma suroriental de Cuba. Rev. Cub. Invest. Pesq. 7(2): 1-24.
Pozo, E. and M. Guardiola. 1983. Aspectos preliminares de la biologia del sesi Lutjanus Doccanella (Cuvier, 1828) en la plataforma suroriental de Cuba. Rev. Cub. Invest. Pesq. 8(3): 1-28.
Rubio, R.. P. Salahange and M. Betancourt. 1985. Relaciones dela edad con el largo, el peso y la fecundidad de la biajaiba Lutjanus synagris de la plataforma suroriental de Cuba. Rev. Invest. Pescl. 10( 1 -4):78-90.
Snedecor, G. and W. Cochran. 197 1. Statisti- cal methods. The lowa State University Press, Ames, lowa. 593 p.
Sold, R. and F. Rohlf. 1981. Biometry. Free- man and Co., San Francisco. 859 p.
Sornerton, D.A. 1980. A computer technique for estimating the size of sexual maturity in crabs. Can. 1. Fish. Aquat. Sci. 47: 1488- 1 1494.
Thompson, R. and J.L. Munro. 1983. The biol- ogy, ecology and bioeconomics OF the snapper, Lutjanidae, p. 94- 109. In J.L. Munro (ed.) Caribbean coral reef Fisheries resources. ICLARM Stud. Rev. 7, 276 p.

Species Composition, Distribution and Trends in Abundance of Snappers of the Southeastern USA,
Based on Fishery-Independent Sampling
N. CUELLARa G.R. SEDBERRYb
D.J. MACHOWSKIb M.R. COLLINSb
.'Grice Marine Biological Labora t o y University of Charlesto17, South Carolina
205 Ft. johnson Rd. Charleston, South Carolina 294 12, USA
'Marine Resources Research /nstilute South Carolina Wildljfe and Marine Resources Management
P.O. Box I2559 Charleston, South Carolina 29412, USA
CUELLAR, N., G.R. SEDBERRY, D.J. MACHOWSKI and M.R. COLLINS. 1996. Species composition, distribution and trends in abundance of snappers of the southeastern USA, based on fishery-independent sampling [Composition por especies, distrilucion y tendencias en /a abundancia de parsos en /a ensenada del AtlAntico Sur, basado en muestreos independientes de la pesqueria], p. 59-73. 111 F. Arreguin- Sinchez. J.L. Munro. M.C. Balgos and D. Pauly (eds.) Biology. Fisheries and culture of tropical groupers and snappers. ICLARM Conf. Proc. 48, 449 p:
Abstract
Routine Marine Monitoring and Assessment Program (MARMAP) sampling (1073-1992) with trawls. traps and hook-and-llne between Cape Lookout, North Carolina and Cape Canaveral. Florida (9-366 m depths) collected 12 species of snappers (Etelis oculatus, Ocyurus chrysurus, Pristipomoides aquilonaris, P. freemani. Rhomboplites aurorubens; seven species of Lu+nus). Vermilion snapper (R. aurorubens) and red snapper (L . campechanus) were the most abundant and widely distributed species, and were collected over the continental shelf and shelf break throughout the region. Annual monitoring of abundance and length frequency indicated declines in vermilion snapper. Other species of Lurjanus were represented by occasional captures of juveniles in inshore waters (L. analis, L. purpureus, L. synagris) or rare occurrences at the shelF edge, under the influence of Gulf stream waters (L. buccanella. L. griseus. L. vivanus). Other snappers ( E . oculatus. 0. chrysurus, P. aquilonaris) were occasionally taken at the shelf edge.

Resumen
1 os rnnesireos de ruiina MARMAP (1973- 199) con redes de arrastre, trampas y palan~res, entre Cdbn Loolcout. Carolina del Norte y Caho CatTaveral, Florida (9-366 rn de profundidadj coleciaron 12 especies depargo(Etelis oculatus, Ocyurus chrysurus. Pristipomoides aquilonaris, P. Freetnani. Rhomboplites aurorubens; y s i d e especies de Lutjanusl. El pargo cunaro (R. aurorubens) y el parso del Golfo ( L . campechanus) heron /as especies ma5 arnpliamente distrlbuidas, y fueron colectadas sobre y a/ horde de la plataforma continental, a lo largo de la regidn mencionada. El rnonitoreo anual de abundancia y fiecuencia de longtudes indica/.on /a decllnacion del pargo cunaro. Otras especies de Lutjanus estuvieron representadas por capturas ocasionales de juveniles en agu;ls interiores (L. analis, L . purpureus. L. synagris) y ocurrencias raras en el horde de la plataforma, bajo la influencia de /as aguas de la corriente del Golfo (L. buccanella; L. griseus: L. vivanus). Otros pargos ( E . oculatus; 0. chrysurus; P. aquilonaris) heron ocasianalmente colectados en el borde de la plataforma.
Introduction
The continental shelf of the southeast- ern USA (Itnown in the USA as the South Atlantic Bight and extending from Cape Hatteras, North Carolina to Cape Canaveral, Florida) consists mainly of a sand bottom that gently slopes seaward to a series of ridges and scarps at the shelf edge. Scat- tered relatively infrequently throughout most areas of the shelf are rock outcrops, ledges, ridges and other exposed hard calcareous substrata. These areas, often referred to as hard bottom (Wenner et al. 1983; Sedberry and Van Dolah 1984: Wenner et al. 1984), live bottom (Struhsalter 1969), or sponge- coral habitat (Powles and Barans 1980; Wenner 1983) support dense populations of tropi- cal, subtropical and warm temperate or- ganisms including several species of snappers (Miller and Richards 1980; Wenner 1983; Sedberry and Van Dolah 1984).
Struhsalter ( 1 969) summarized existing data from exploratory trawling in the re- gion and divided the continental shelf and upper slope off the southeastern US into five habitat types, based on depth, bot- tom type, and catches of economically valuable fishes (Sedberry et al., in prep). These five regions consisted of: I ) coastal areas; 2) open shelf; 3) live bottom; 4) shelf edge; and 5) lower shelf. Coastal habitat in this area is shallow (<9 m) and is greatly affected by seasonal temperature changes
and terrestrial runoff. It has turbid, lower salinity water and is primarily a decapod shrimp and sciaenid habitat. Open shelf habitat (1 9-55 m) consists of a smooth, sandy bottom where occasional large catches of sparids (e.g. , Stenotomus chrysops), haemulids (e.g., Haemulon aurolineatum), and balistids (e.g., Momcanthus hispidus) are found (Sedberry et al., in prep.). Live bottom habitat (19-55 m) is interspersed with rocky outcroppings which support luxurious epifaunal growth. This habitat is ideal for lutjanids, serranids, sparids and haemulids (Sedberry and Van Dolah 1984). The shelf edge habitat (55-1 10 m) has smooth bottom to rocky high relief areas along the edge of continental shelf. Rocky reef habitats at the shelf edge have numerous warmwater invertebrates (Wenner et al. 1983) and reef fishes, including lutjanids (Struhsaker 1969; Sedberty and Van Dolah 1984). Lower shelf habitat (1 1 1-1 83 m) consists of a smooth. hard bottom with some areas OF rocky out- crops. Deep reef fishes such as some spe- cies of snappers and snowy grouper (Epinephelus niveatus) uti lite rugged habitat found at lower shelf depths.
Snappers (family Lutjanidae) of the Western Atlantic are percoid fishes most commonly found on coral reefs and adjacent tropical habitats (e.g., Sedberry and Carter 1993). However, some species are found in warm- temperate waters, such as those of the southeastern US (Robins and Ray 1986).

Most snappers are demersal; however, some are pelagic. f nappers are predators, usu- ally feeding at night on demersal organ- isms such as crustaceans and fishes (Parrish 1987; Sedberry and Cuellar 1993). Most species of snappers are highly prized for their flesh and are very important in many commercial fisheries around the world (Fischer 1978).
Snappers in the southeastern US, espe- cially the vermilion snapper (Rhomboplites aurorubens) and the red snapper (Lutjanus campechanus), are an important compo- nent of the commercial and recreational fisherles (see Chapman et al.; Collins et al.; Mendou and LArez, this vol.). In 1991, the South Carolina commercial landings for vermilion snapper were 227 t and the rec- reational headboat landings were about 50 t (Low 1992). An average vermilion snap- per captured in the commercial fishery was 31.1 cm long and weighed 0.29 k g (Low 1992). In South Carolina a vermilion snap- per sells for approximately US$ 1.13- 1.36 per 1%. Reported landings in the red snapper commercial fishery were 16.8 t and in the recreational fishery were 10 t in South Carolina in 1991 (Low 1 992). An average red snapper captured in the 1991 commercial fishery was 47.2 cm long and weighed 3.0 kg (Low 1992). Red snapper in the commercial fishery of South Carolina sell for approximately US$ 1.60 per kg.
Since 1973, the Marine Resources Moni- toring, Assessment and Prediction Program (MARMAP) has monitored offshore fish populations by conducting annual surveys of coastal, shelf and slope habitats between Cape Lookout and Cape Canaveral, Florida. MARMAP is a cooperative program ktween the National Marine Fisheries Service (NMFS) and the South Carolina Wildlife Marine Resources Department (SCWMRD). MARMAP has sampled all bottom habitats of the continental shelf with a variety of gears, including trawl nets, traps, and hook- and-line. Reef habitats have additionally been surveyed by divers, underwater video,
submersible and still cameras (e.g. , Powles and Barans 1980; Sedberry and Cuellar 1 993). During these surveys several species of snappers were collected. The purpose of this paper is to present data on the com- position, distribution and trends in abun- dance of snappers collected during MARMAP surveys over the past 20 years.
Methods
Several surveys were conducted during 1973-1 992, using a variety of vessels and types of gear. The first survey was the con- tinental shelf trawl survey using the 32 m WDoIphjn. Survey cruises were conducted at least once annually from Cape Fear, North Carolina to Cape Canaveral, Florida. A strati- fied random sampling design (Grosslein 1969: Wenner et dl. 19794 was used from 1973 to the winter of 1977; whereas from sum- mer 1977 to 1980, a systematic sampling design of 180 preselected stations along seven transects were trawled (Sedberry et al., in prep). At each station a 314 scale version of a #36 Yankee trawl was used in a standard trawl tow of 30 min at a speed of6.5 Icm hour-' (3.5 knots) (Wenner et al. 1983). Fishes from catches were sorted to species, counted, weighed and measured to the nearest cm (fork length, FL, for snap- pers).
A second survey, the coastal trawl sur- vey, was conducted from Cape Fear, North Carolina to Cape Canaveral, Florida, in 1980 to 1982 on the R/VAt/antic.Sun or the /VV Lady Lisa. These vessels were 20-m dou- ble-rigged trawlers formerly used in the commercial shrimp industry. The stratified random sampling design consisted of 13 latitudinal strata (7 486 to 3 1 66 1 ha) in a depth zone of 4.6-9.1 m within this area (Wenner and Sedberry 1989). At each station within a stratum, paired (one towed from each outrigger) four-seam Gulf of Mexico shrimp trawl nets were used for 20 min- utes at a speed O F 4.4 km hour-' (Wenner and Sedberry 1989). Contents of each net

were combined, with fishes being sorted to species, counted, weighed (g) and meas- ured to the nearest cm (Wenner and Sedberry 1 989).
A third survey, the reef fish survey, was conducted from Cape Fear, North Carolina to Jacksonville, Florida, beginning in 1978 and continuing through 1992. From 1978 to 1987, nine reef areas were selected for annual sampling, although each area was not sampled during each year. During this period, reefs were sampled with Florida snapper traps, trawls and hook-and-line. From 1987 through 1992, randomly cho- sen reef sites were sampled with fish traps and hook-and-line. Sampling was gener- ally conducted from late spring to mid- summer. Each station was surveyed and mapped with underwater television, fathometer and Loran-C. During mapping, a tethered underwater television camera was towed across the bottom. The area viewed, as well as fathometer traces, were continuously monitored by observers viewing a 46-cm monitor and white line depth re- corder or color video fathometer aboard the research vessel. Observations regard- ing bottom type (reefvs. nonreef) and the distribution and abundance of reef inver- tebrates and fishes were continuously re- corded. From these reconnaissance television transects, maps of the reef areas were drawn. All subsequent samplings were attempted over known reef areas.
From 1978 to 1988, the reef Fish survey cruises were conducted aboard the R/V Oregon using trawl nets (except 1 988), traps and hook-and-line gear. The R/VPalmetto was used from 1989 to 1992 using only traps and hook-and-line gear. Two designs of trawl gear were used in this survey, the 314 scale version of a #36 Yankee trawl (Wenner 1983) and the 40/54 High Rise
Net (Sedberry and Van Dolah 1984). Trawl sampling for fishes consisted of 1 -l<m tows with the trawl. Two types of fish traps used in the reef survey were used in the present analysis: a Florida snapper trap and a chevron trap (Collins 1990). Standard hook-and-line gear was also used in the reef survey (Collins and Sedberry 1991 ). Fishes collected in all gear types were sorted to species, counted, weighed (nearest gram) and measured to the nearest cm.
Snappers were ranked by abundance from the 1 680 MARMAP collections that col- lected snappers. Percent number was cal- culated as a percentage of the total number of snappers caught comprised by each species.
For each snapper species, a map was constructed showing the mean number of individuals per collection in the survey area. To calculate means, the survey area was divided by one-minute latitudinal, by one- minute longitudinal units, and the mean number per collection in each unit calcu- lated.
Additional data analysis was conducted on the vermilion snappers and the red snappers due to their high abundance and economic importance in the region. Abun- dance by depth, mean length by depth, and mean length by year were compared for those species.
Results and Discussion
Species composition, distribution and abundance
Twelve species of snappers were caught in the MARMAP surveys (Table 1 ). Ver- milion snappers and red snappers domi- nated the catches with the remaining species

being captured very rarely. The rare snapper species in descending order included: mutton snapper (LuQanusana/is), lane snap- per (Lutjanus synagris), wenchman (Pristipomoides aquilonaris), gray snapper (Lutjanus griseus) , Caribbean red snapper (Lutjanus purpureus), blacltfin snapper (Lutjanus buccanella), yelloweye wenchman (Pristipornoides Freeman/), yellow-tailed snapper (Ocyurus chrysurus), silk snapper (Lutjanus vivanus) and queen snapper (Etelis ocula tus) .
Vermilion snapper (Rhomboplites aurorubens) was the most abundant snap- per species in the MARMAP surveys (Ta- ble 1) . Vermilion snappers were quite com- mon across the continental shelf in the region, and also occur in the Gulf of Mexico south to southeastern Brazil (Bohlke and Chaplin 1968). Vermilion snapper captured in the MARMAP surveys occurred throughout the
region from 14 to 92 m (Fig. l ) , which is similar to Grimes' (1976) findings that vermilion snapper was associated with two distinct habitats on the southeastern shelf, the shelf-edge habitat (a- 183 rn) and inshore live bottom habitat (26-56 m). The size of vermilion snapper captured in MARMAP surveys ranged from 3 to 5 1 crn. Maximum size for avermilion snapper is approximately 60 cm TL (Grimes 1978). Vermilion snap- pers were caught with all gear types used in MARMAP surveys (Table 1 ).
k d snapper (Luqanus arnpechanus) were the second most abundant lutjanid cap- tured in MARMAP surveys. Although not as abundant as vermilion, red snappers occurred 124 times (322 individuals) from depths of 7-68 m (Table 1 , Fig. 1 ) . Red snappers were also broadly distributed across the shelfand are found throughout the re- gion to Key West and around the Gulf coast
Table 1. Rank by abundance of snappers In 1 680 MARMAP collectlons, Cape Lookout to Cape Canaveral. Percent number (%N) Is based on percentage of total snappers caught, and percent frequency (%F) Is based on percentage of the total number of stations where snap- pers occurred. [ Ordenamiento de pargo5 por su abundancla en / 680 colectas de MARMAP, dende Cabo Lookout a Calro Caiinveral. ElporcentaJe &I numero (%N) estd basado en el porcentaje de pargos totales capturados; y el porcentaJe de frecuench /SF) basado en porcentaje del numero total de estaclones donde 10s pargos estuvleron presentes.]
Species Number %N Freq. %F Depth range (m)
Rhomboplites aurorubens 20 254" Luljanus campechanus 32Zb LuQanus analis 1 3c L utjanus synagris 1 3 Pristipomoides aquilonaris 1 1 L uljanus griseus 5 Lutjanus purpureus 3 L uljanus buccanella 2 Pristipomoides keemani 1 Ocyurus chrysurus 1 Luljanus vivanus 1 Etelis ocula tus 1
- - - -
"Number caught by trawl: 7 767; by traps: 10 261; by hook-and-line: 2 201 "umber caught by trawl: 1 3 1 ; by traps: 1 1 1 ; by hook-and-line: 80 'All by trawl (also for all subsequent species).

'7 N.C. \ N.C.
1
I
\ Pristipomoides aquilonaris \ Mean number ~ s : col!ecl,m
@ <lOand>I
la. d
Luijanus campechanus Mean r,umkr per collecl~on
IlCOznd > I0 0 <loand> 1
= I
Luljanus purpureus
Lutjaflus griseus 05 IDar,d> l
Fla. , . = 1 e
Fig. 1 . Distribution o f snappers from Cape Fear, North Carolina to Cape Canaveral, FIorlda, in M vermlll on snapper (Rbombopfttes .wrurubens); b) red snapper (Luganus campecbanus); c) Lut/anus. rqdlonarjs; e) L. grlseus, L. purpureus and L. buccanella; f l Etelis ocuiatus, L. vfvanrrs, Ocyurus c [D/strl&uc/6n de pargos desde Cab0 Fear a Cabo Cafiaveral, FIorida; a partlr de muestreos experh pargo cunrro (Rhomboplltes aurorubens), b) pargo def Golfo (Lutjanus campechanus), cjpargo crio synagrls), d) panchito voraz (Pristlpomoldes aqullonarls), el pargo prleto (I.. grlseus), pargo cc bucanella), 4 pargo cachucho (Etells oculatus), piugo de lo alto (L. vivan us), rab/rrub/a (Ocyurus chrys~ freemanl) .I
!$lean number per cnllec'inn
Lutjanus synagris o s l O a n d > I . =1 Lutjanus anatis 0 5 10 and > 1 . = I C
N.C. yd
Etelis oculalus Luljanus vivanus Ocyurus chrysurus Prisl@omoides ireemani
f J ,
I A P surveys from 1973 to 1992: a) I s and L . synagr/s; d ) Prlstipom oiiies wrus and Prjsflpomojdes freeman/. tales MARMAP, de f 973 a 1992: a) Lutjanus anaits) ypargo blajajba (1. !do (L. purpureus) y pargo sesl(1. I ypmchito menudo (Pristipomoldes
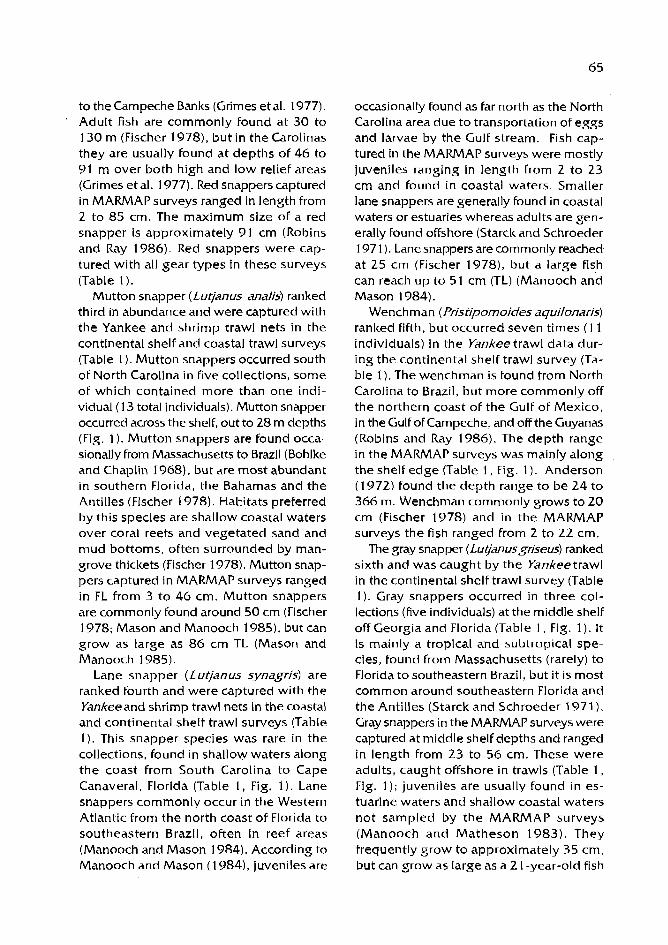
to the Carnpeche Banks (Grimes et al. 1977). Adult fish are commonly Found at 30 to 130 m (Fischer 1978), but in the Carolinas they are usually found at depths of 46 to 91 rn over both high and low relief areas (Grimes et al. 1977). Red snappers captured in MARMAP surveys ranged in length from 2 to 85 cm. The maximum size of a red snapper is approximately 91 cm (Robins and Ray 1986). Red snappers were cap- tured with all gear types in these surveys (Table 1).
Mutton snapper (Lutjanus analis) ranked third in abundance and were captured with the Yankee and shrimp trawl nets in the continental shelf and coastal trawl surveys (Table 1 ). Mutton snappers occurred south of North Carolina in five collections, some of which contained more than one indi- vidual (1 3 total individuals). Mutton snapper occurred across the shelf, out to 28 m depths (Fig. 1 ). Mutton snappers are found occa- sionally from Massachusetts to Brazil (Bohlke and Chaplin 1968), but are most abundant in southern Florida, the Bahamas and the Antilles (Fischer 1978). Habitats preferred by this species are shallow coastal waters over coral reefs and vegetated sand and mud bottoms, often surrounded by man- grove thickets (Fischer 1978). Mutton snap- pers captured in MARMAP surveys ranged in FL from 3 to 46 cm. Mutton snappers are commonly found around 50 cm (Fischer 1978; Mason and Manooch 1985), but can grow as large as 86 cm TL (Mason and Manooch I 985).
Lane snapper (Lutjanus synagris) are ranked fourth and were captured with the Yankee and shrimp trawl nets in the coastal and continental shelf trawl surveys (Table 1). This snapper species was rare in the collections, found in shallow waters along the coast from South Carolina to Cape Canaveral, Florida (Table I, Fig. 1). Lane snappers commonly occur in the Western Atlantic from the north coast of Florida to southeastern Brazil, often in reef areas (Manooch and Mason 1984). According to Manooch and Mason (1 984), juveniles are
occasionally found as far north as the North Carolina area due to transportation of eggs and larvae by the Gulf stream. Fish cap- tured in the MARMAP surveys were mostly juveniles ranging in length from 2 to 23 crn and found in coastal waters. Smaller lane snappers are generally found in coastal waters or estuaries whereas adults are gen- erally found offshore (Starck and Schroeder 1971 ). Lane snappers are commonly reached- at 25 cm (Fischer 1978), but a large fish can reach up to 5 1 cm (TL) (Manooch anb Mason 1984).
Wench man ( Pristipomoides aquilonaris) ranked fifth, but occurred seven times (1 I individuals) in the Yankee trawl data dur- ing the continental shelf trawl survey (Ta- ble 1). The wenchman is found From North Carolina to Brazil, but more commonly off the northern coast of the Gulf of Mexico, in the Gulf ofcampeche, and off the Guyanas (Robins and Ray 1986). The depth range in the MARMAP surveys was mainly along the shelf edge (Table 1, Fig. 1 ). Anderson (1972) found the depth range to be 24 to 366 m. Wenchman commonly grows to 20 cm (Fischer 1978) and in the MARMAP surveys the fish ranged From 2 to 22 cm.
The gray snapper (Lu$anusgriseus) ranked sixth and was caught by the Yankeetrawl in the continental shelf trawl survey (Table 1). Gray snappers occurred in three col- lections (five individuals) at the middle shelf off Georgia and Florida (Table 1, Fig. 1 ). It is mainly a tropical and subtropical spe- cies, found from Massachusetts (rarely) to Florida to southeastern Brazil, but it is most common around southeastern Florida and the Antilles (Starck and Schroeder 197 1 ). Gray snappers in the MARMAP surveys were captured at middle shelfdepths and ranged in length from 23 to 56 crn. These were adults, caught offshore in trawls (Table 1, Fig. 1 ) ; juveniles are usually found in es- tuarine waters and shallow coastal waters not sampled by the MARMAP surveys (Manooch and Matheson 1983). They frequently grow to approximately 35 crn, but can grow as large as a 2 1 -year-old fish

of 77 cm TL captured by Manooch and Matheson in 1983.
Caribbean red snappers (Lutjanus purpureus) ranked seventh and were caught by the Yankeetrawl in the continental shelf trawl survey (Table 1 ) . They occurred in three collections off Cape Lookout, North Carolina and near the Georgia/Florida bor- der, at inner and mickile shelf depths (Ta- ble 1 , Fig. 1 ). This species is very similar in morphology to the red snapper, but it has a more southerly distribution. It is Found around Cuba and from the Yucatan Penin- sula along continental shelves to northeastern Brazil, and is most common on the conti- nental shelf off Honduras and Cuyanas (Fischer 1978). Caribbean red snappers are commonly Found at depths between 70 and 120 m and at a sire up to 65 cm (Fischer 1978). In MARMAP surveys this species had a length range of3-32 cm.
Blacltfin snappers (Lutjanus buccanella) ranked eighth and occurred only twice in collections in the Yankeetrawl in the con- tinental shelf trawl survey (Table 1 ) . Blackfin snappers are found from North Carolina, Bermuda, and the Gulf of Mexico through the Antilles to northeast Brazil (Fischer 1978). According to Grimes et al. (1 977), explora- tory trawling in the 1960s found blackfin snapper to be very rare in the southeast- ern United States and only seven fish were reported from the headboat catches in the Carolinas From 1972 to 1975. Headboat fishers rarely recognized this species and this might explain the low catches for the blackfin snapper in the Carolinas during this pe- riod (Grimes et al. 1977). Blackfin snap- pers were found at the middle shelf off South Carolina during the MARMAP sur- vey (Fig. 1 ) . Usual habitat for the blackfin snapper is the shelf edge or live bottom areas from 9 to 2 1 9 m (Grimes et a]. 1 977). This species is common up to 50 cm, but is found up to 75 cm (Robins and Ray 1986).
Pristipomoides freernani (yelloweye wenchman) occurred only once, in the Ydnkee trawl in the continental shelf trawl survey
(Table 1 ). It was a small specimen ( 10-cm FL) and was found in deepwater off Florida (Table 1 , Fig. 1 ). Little is known about the life history of this fish. This species is found off Panama, Colombia, Venezuela, Barba- dos, Surinam, southern Brazil and Uruguay from 87 to 220-m water depths (Anderson 1972). This deepwater snapper reaches a maximum size of approximately 20 crn SL (Anderson 1972).
Ocyurus ch/ysurus (yellowtail snapper) occurred only once, in the Yankee trawl in the continental shelftrawl survey (Table 1 ) . Its fork length was 36 cm and it was found on the middle shelf off Florida (Fig. 1). Yellowtail snappers are commonly found in the Bahamas, off southern Florida, and throughout the Caribbean, but range From Massachusetts to southeastern Brazil (Fischer 1978). Their preferred habitat is coastal waters between 10 and 70 m around coral reefs (Fischer 1978). This species can reach ap- proximately 75 cm, but is common to 40 cm (Robins and Ray 1986).
Silk snapper (Lufjanus vivanus) also oc- curred only once, and was collected in the Yankee trawl in the continental shelf trawl survey (Table 1). The Fork length of this fish was 73 cm and it was captured at the shelf edge off South Carolina (Fig. 1 ) . Silk snappers have been quite common in the Carolinas, malting an important contribu- tion to the headboat catches (Grimes et al. 1977) and are distributed from North Carolina and Bermuda to Trinidad and to Brazil, but are most common around the Antilles and the Bahamas (Fischer 1978). Generally, the silk snapper is found in waters that are deeper than the red or vermillion snapper. Ideal habitat for the silk snapper is rough bottom at 55 to 128 rn (Grimes et al. 1977). An average silk snapper caught off the Carolinas is approximately 66 cm TL and 4.5 to 5 kg (Grimes et al. 1977).
Queen snapper (EteJis ocuJatus) occurred once, in the Yankee trawl in the continen- 81 shelftrawl survey (Table 1 ); it was captured at the shelf edge off Winyah Bay, South
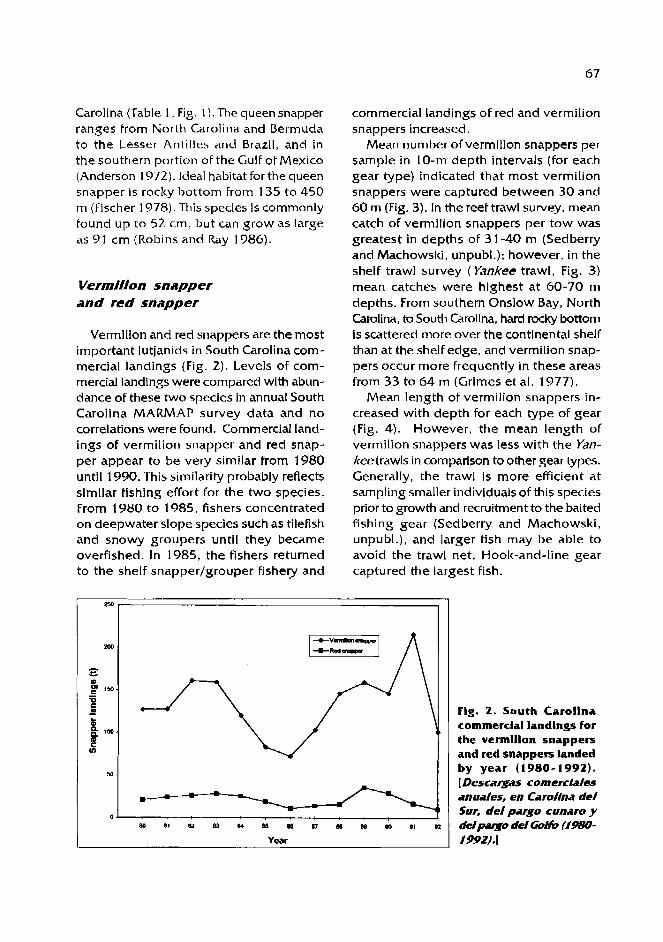
Carolina (Table 1, Fig. I ) . The queen snapper ranges from North Carolina and Bermuda to t h e Lesser Antilles and Brazil, and in the southern portion of the Gulf of Mexico (Anderson 1972). Ideal habitat forthe queen snapper is rocky bottom from 135 t o 450 rn (Fischer 1978). This species is commonly found u p to 52 cm, but can g row a s large as 91 cm (Robins and Ray 1986).
Verml/lon snapper and red snapper
Vermilion and red snappers are the most important lutjanids in South Carolina com- mercial landings (Fig. 2). Levels of com- mercial landings were compared with abun- dance of these two species in annual South Carolina MARMAP survey da ta and no correlations were found. Commercial land- ings of vermilion snapper and red snap- per appear t o b e very similar from 1980 until 1990. This similarity probably reflects similar fishing effort for the two species. From 1 9 8 0 t o 1985, fishers concentrated on deepwater slope species such a s tilefish and snowy groupers until they became overfished. In 1985, the fishers returned t o t h e shelf snapper/grouper fishery and
commercial landings of red and vermilion snappers increased.
Mean number ofvermilion snappers per sample in 10-m dep th intervals (for each gear type) indicated that most vermilion snappers were captured between 30 and 60 m (Fig. 3). In the reef trawl survey, mean catch of vermilion snappers per t o w was greatest in dep ths of 3 1-40 m (Sedberry and Machowski, unpubl.): however, in the shelf trawl survey (Yankee trawl, Fig. 3) mean catches were highest a t 60-70 rn depths. From southern Onslow Bay, North Carolina, to South Carolina, hard rocky bottom is scattered more over the continental shelf than a t the shelf edge , and vermilion snap- pers occur more frequently in these areas from 33 to 64 m (Grimes e t al. 1977).
Mean length of vermilion snappers in- creased with dep th for each type of gear (Fig. 4). However, the mean length o f vermilion snappers was less with t h e Yan- keetrawls in comparison to other gear types. Generally, the trawl is more efficient a t sampling smaller individuals of this species prior to growth and recruitment to the baited fishing gear (Sedberry and Machowski, unpubl.), and larger fish may b e able t o avoid the trawl net. Hook-and-line gear captured the largest fish.
Fig. 2. South Carollna commercial landlngs for the vermlllon snappers and red snappers landed by year (1980- 1982). [Descargas comerclales anuales, en CaroIlna del Sur, del pargo cunaro y de/-o del Go& / I W - /992).]

L PI n
Florida trap
E
zi
Depth (m)
Flg. 3. Mean catch per sample by depth of vermlllon snappers for the Yankee trawl, hook-and-line. Florlda trap and chevron trap In MARMAP surveys. [ Captura media par muestra porprofundidad delpargo cunaro para elarrastre Yankee, palangre, trampa tip0 Florlrla, y trampa tlpo chevron en 10s cruceros
-
MARMAP.]
I -
- Chevron trap -
Mean length and abundance ofvermilion snappers were compared by year for certain gear types used during a period of expansion in the fishery (Figs. 5 and 6). From 1983 to 1987 there was a decrease in mean FL and abundance ofvermilion snapper caught with fish traps and hook- and-line gear, and a decline in commercial landings (Fig. 2). Collins and Sedkny (1991) attributed the dedines in abun- dance and mean length in fishery-independent samples to overfishing. Collins and Pinclmey (1 988) found that vermilion snappers in the SAB became reproductively mature ear- lier in life, than was previously reported prior to the expansion in the fishery.
Greatest catches of red snappers occurred between 20 and 50 rn for all gear types (Fig. 7). Catches of red snappers were much lower than catches of vermilion snapper in the MARMAP surveys.
I I
I 1
I I
Mean FL of red snapper, compared by depth for all gear types (Fig. 8), indicated an increase in mean FL of red snapper with increasing depth in the Yankeetrawl. Other gear types that caught red snapper in suf- ficient numbers to examine depth trends did not cover a great enough depth range to show any relationship between depth and abundance. Generally, the trawl was not effective in capturing large snappers of the genus Lutjanus (Sedberry and Machowski, unpubl.).
In conclusion, MARMAP surveys over the past 20 years have captured 12 species of snappers of the family Lutjanidae. Vermil- ion snappers and red snappers were the most abundant species found in the SAB. Both of these species are economically im- portant to the commercial and recreational Fisheries of this region. Overfishing might be
I - 10 20 30 40 50 60 70 80 90 100 110
I I I I I I
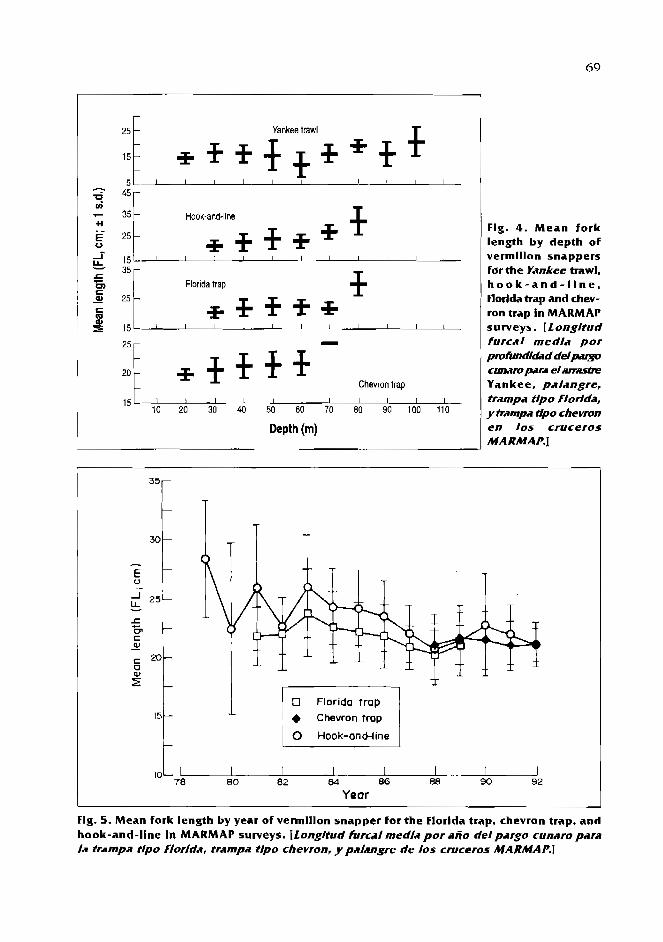
Yankee trawl T
Florida trap 4
* + H + Chevron trap
Depth (m)
Fig. 4. Mean fork length by depth of vermlllon snappers far the Yankee trawl, h o o k - a n d - l l n e , Florlda trap and chev- ron trap in MARMAP surveys. [Longitud furccai media por pro~ndlrad d e i p ~ ~ o cunarupwa elm- Yankee, paiangre, trampa tip0 Fiorlrln, y trampa ffpo chevron en 10s cruceros
J MARMAP.]
Florida trap Chevron trap
0 Hook-on6line r-- DL I I I I I 1 I I
78 00 82 84 86 88 90 92 Year
Flg. 5. Mean fork length by year of vermlllon snapper for the Florlda trap, chevron trap, and hook-and-line In MARMAP surveys. [Longkud furcaimedia por aAo deipargo cunaro para k tramp tlpo Florida, trampa tip0 chevron, y paiangre de 10s cruceros MARMAP.]

Fig. 6. Mean number per sample by year of vermllion snapper for the Florida trap and hook- and-line in MARMAP surveys. [Nsmem med/opormuestraporaiio delpargo cunrlro obtenldos con trampas y palangre en 10s muestreos MARMAP.]
Depth (m)
1 Yankee trawl
g 0 Hook-and-he
2 2l f " 5 r '1 Florida trap
B O A - -C
=
Fig. 7. Mean number per sample by depth of red snapper for the Y d e e trawl, hook-and-line, Florlda trap and chevron trap In MARMAP surveys. [Numero medfo por muestra por pro fundhiad de/ pargo rlel Golfo para el arrastre Yankee, palangre, frampa flpo Florida, y trampa tipo chevron en los cruceros MARMAP.]
- 0
I 1 I
II
Chevron trap
I I I i
10 20 30 40 50 60 70 60

Yankee trawl
3.1 ,A+
60 Florida trap
- OL - 1 I I I I
60 Chevron trap
30
O' ,b I I I_ I I I 1 20 30 40 50 60 70 80
Depth (m)
be affecting populations of vermilion snap-
pers in the SAB, as evidenced by decreasing the mean length of the fish and younger age at maturity.
Acknowledgements
We thank all past and present person- nel o f the Marine Resources Research In- stitute who participated in the MARMAP groundfish and reef fish surveys, for their assistance in the field and in data reduc- tion. We especially thank C.A. Barans and C.A. Wenner, who supervised the scientific
Flg. 8. Mean fork length by depth of red snap- per for the Yankeetrawl, hook-and-llne, Florlda trap and chevron trap In MARMAP surveys. [Longlfud furcal medla por pro fundidad del pargo del Golfo para el SIT-Yankee, pkngre, t ramp tip0 Frorlrln y trampa t p o chevron en 10s cruceros MARMAP.]
parties at sea on many cruises, and who were responsible for much of the data re- duction and quality control. We also thank the captains and crew members who skillfully manned the research vessels used in the MARMAP surveys. This work was supported through various MARMAP contracts between the South Carolina Wildlife and Marine Re- sources Department, and the U.S. National Marine Fisheries Service. This is Contribu- tion Number 385 from the South Carolina Marine Resources Center, and Contribution Number 136 from the Grice Marine Bio- logical Laboratory.

References
Anderson. W.D., Jr. 1972. Notes on western Atlantic lutjanid fishes of t h e g e n e r a P r i s t i p o m o i d e s and Etel is . C o p e i a 1972(2):359-362.
Bohllte, J . E . and C.C.G. Chaplin. 1968. Fishes of the Bahamas and adjacent tropical wa- ters. Livingstone Publ. Co., Wynnewood, Pennsylvania. 7 7 1 p.
Collins, M.R. 1990. A comparison of three fish trap designs. Fish. Res. 9:325-332.
Collins, M.R. and J .L . Pinclcney. 1988. Size and age a t maturity for vermilion snapper (Rho~nboplites aurorubens) (Lutjanidae) in t h e South Atlantic Bight. Northeast Gulf Sci.lO(1): 51-53.
Collins, M.R. and G.R. Sedberry. 1991. Status o f vermilion snapper and red porgy stocks off South Carolina. Trans. Am. Fish. Soc. 120: l 16-120.
Fischer, W. 1978. FA0 species identification sheets for fishery purposes. Western Central Atlantic (fishing area 31) . Vol. 3. Food and Agriculture Organization of the United Nations, Rome, pag. var.
Grimes. C.B. 1976. Certain aspects OF the life his tory of t h e vermil ion s n a p p e r Rhornboplites auroruLwns (Cuvier) From North and South Carolina. University of North Carolina. Chapel Hill, North Caro- lina. 2 4 0 p. Ph.D. dissertation.
Crimes, C.B. 1978. Age , growth, and length- weight relationships of vermilion snap- per. Xhomboplites aurorubens, From North and South Carolina. Trans. Am. Fish. Soc. 107(3): 454-456.
Grimes, C.B., C.S. Manooch, G.R. Huntsman and R.L. Dixon. 1977. Red snappers of the Carolina c o a s t . Mar. Fish. Rev. Pap. 1229(39) : 12-1 5.
Crosslein, M.D. 1969. Groundfish survey pro- gram of BCF Woods Hole. Comm. Fish. Rev. 3 1 (8-9):22-30.
Low, R.A. 1992. South Carolina Marine Fisher- ies, 199 1 . Marine Resources Divlsion, Office of Fisheries Management , Fisheries Sta- tistics Section. Data Keport 13 , 50 p.
Manooch, C.S. I l l and D.L. Mason. 1984. Age, growth, mortality of lane snapper From southern Florida. Northeast Gulf Sci. 7:109- 115.
Manooch, C.S. HI and R.H. Matheson 111. 1983. Age, growth, and mortality ofgray snap- per collected from Florida waters. Proc. Ann. Conf. S.E. Assoc. Fish 8. Wildl. Agencies 35:331-344.
Mason, D.L. and C.S. Manooch 111. 1 985. Age and growth of mutton snapper along the east coast o f Florida. Fish. Res. 3:93- 104.
Miller, G.C. and W.J. Richards. 1980. Reef fish habitat, faunal assemblages and factors determining distributions in t h e South Atlantic Bight. Proc. GulFCaribb. Fish Inst. 32: 1 14- 1 30.
Parrish, J.D. 1987. The trophic biology of snappers and groupers, p. 405-463. In J.]. Polovina and S. Ralston (eds.) Tropical snappers and groupers: biology and fisheries man- agement . Westview Press, Boulder.
Powles, H . and C.A. Barans. 1980. Groundfish monitoring in sponge-coral areas off the southeastern United States. Mar. Fish. Rev. 42:21-35.
Robins, C.R. and G.C. Ray. 1986. Peterson field guide: Atlantic Coast Fishes. Houghton Mifflin Company, Boston. 3 5 4 p.
Sedberry, G.R., J.C. McGovern, C.A. Barans and C.A. Wenner. The ichthyofauna of sandy bottom habitat on the continental shelf off the southeastern U.S. In prep.
Sedberry, G.R. and N. Cuellar. 1993. Planktonic and benthic feeding by the reef-associ- a ted vermilion snapper , Rhomboplites aurorubens. Fish. Bull. 91 (4):699-709.
Sedberry, G.R. and R.F. Van Dolah. 1 9 8 4 . Demersal fish assemblages associated with hard bottom habitat in the South Atlantic Bight of the USA. Env. Biol. Fish. 1 1 (4):24 1 - 258.
Sedberry, G.R. and H.J. Carter. 1993. The Fish community of shallow lagoon habitats in Belize, Central America. Estuaries l 6 ( 2 ) : 198-2 15.
Sedberry, G.R. and D.J. Machowski. 1987. Species composition, abundance, biomass and distribution of Fishes trawled From reef habitat on t h e southeastern continental shelf, 1878-1 987. South Carolina Wildlife and Marine Resources Department.
Starck, W.B. Ill and R.E. Schroeder. 1971. In- vestigations on the gray snapper, Lurjanus griseus. University OF Miami Stud. Trop. Oceanogr. .16. 2 2 4 p.

Struhsaker, P. 1969. Demersal fish resources: composition, distribution and commer- cia1 potential of the continental shelf stocks off t h e south-eastern United States. Fish. lnd. Res. 4:261-300.
Wenner, C.A. 1983. Species associations and day-night variability of trawl caught fishes from the inshore sponge-coral habitat, South Atlantic Bight. Fish. Bull. 81 :537-552.
Wenner, C.A. and G.R. Sedberry. 1989. Spe- cies composition, distribution, and rela- tive abundance of fishes in t h e coastal habitat off the southeastern Unites States. NOAA Tech. Rep. NMFS 7 9 . 4 9 p.
Wenner, C.A., C.A. Barans. B.W. Stender and F.H. Berry. 1979. Results of MARMAP otter
trawl investigations in t h e South Atlantic Bight. I: Fall 1973. S.C. Marine Resources Center. Tech. Rep. 33, 7 9 p.
Wenner, E.L., D.M. Knott. R.F. Van Dolah and V.C. Burrell. Jr. 1983. Invertebrate com- munities associated with hard bot tom habitats in t h e South Atlantic Bight. Es- tuarine Coastal Shelf Sci. 17: 143-1 58.
Wenner, E.L., P. Hinde. D.M. Knott and R.F. Van Dolah. 1984. A temporal and spatial study of invertebrate communities associated with hard-bottom habitats in t h e South Atlantic Bight. NOAA Tech. Rep. NMFS 18, lo4 p.

.- .. . .
- --*-- -,-..d APR 1 4 W8
The Ecology of Shallow-Water Groupers (Pisces: SerranPdae) in the Upper Florida Keys, USA
K.M. SULLIVAN'*b R. SLUKA'
" Universiq of Miami, Department of Biology Coral Gables, Florida 33 124, USA
The Nature Conservancy, Florida and Caribbean Marine Conservation Science Center
P, 0. Box 2491 18, Coral Gables, Florida 33 124, USA
SULLIVAN, K.M. and R. SLUKA. 1996. The ecology of shallow-water groupers (Pisces: Serranidae) in the upper Florida Keys, USA [La ecolugk d e meros d e baja profundidad (Pisces: Serranidae) en 10s Cayos Superiores d e Florida, USA], p. 74-84. In F . Arreguin-Sbnchez, J.L. Munro, M.C. Balgos and D. Pauly (eds.) Biology. fisheries and culture of tropical groupers and snappers. ICLARM Conf. Proc. 48, 449 p.
Abstract
The density, diversity and home range size of groupers were studied at different reefs in the upper Florida Keys, USA. Visual transects were used to estimate density and diversity on four different reef community classes: reef ridge, low-relief spur-and-groove, high-relief spur-and-groove. and channel patch reefs. Mean reef community class densities ranged from 0.52 to 0.63 groupers-100 m". There were significant differences between reefs in the eroded reef ridge and eroded spur-and-groove classes. There were also significant seasonal and/or season by reef interaction factors in these two reef classes. There were no significant differences among different reefs in the high-relief spur-and-groove and channel patch reef community classes. Seven different species of grouper were identified in the sur- veys: Nassau (Epinephelus striatus). red ( E . morio), coney ( E . fulvus), graysby ( E . cruentatus), red hind ( E . guttatus). black (Mycteroperca bonac~) , and yellowfin (M. venenosa). At three sites a transect was surveyed at different times of the day to determine whether or not grouper density varies diurnally. There were no significant differences in the numbers of groupers seen, based on time of day. At one site. Conch Reef, the home range size of graysby was examined by following individuals over ZO- minute intervals. The home range size of graysby was estimated as 23.7 mz For 5-1 5 cm individuals and 27.6 rnl for 15-25 cm individuals. These were not significantly different. The amount of area the graysby was observed to occupy was significantly correlated to the amount of time the individual was observed.
Resumen
La densidad, dlversidad y e l tamanr7 del sitio donde viven 10s meros fueron estudlados en diferentes arrecifes d e 10s Cayos superiores d e Florida, USA. Transectos visuales fueron usados para estimar la densidad y la diversidad en cuatro clases diferentes d e cornunidades de arrecife: arreclfe d e horde, salientes y surcos de bajo relieve; sallentes y surcos d e alto relieve; y manchones d e arrecife acanalados. Las densidades medias d e /as clases de cornunidad d e 10s arreciks variaron d e 0.52-0.13 meros por cada

100 m2. Huho diferencias significativas entre 10s arrecifes del horde erosionado y 10s arrecifes erosionados formados por salientes y surcos. Tarnbien hub0 estacionalidad y / o estacion significat/va por factores de interaccidn de arrecifes en estas dos clases de arrecife. N o hub0 diferencias significativas entre /as comunidades de arrecifes deformadas por salientes y surcos de alto relieve y 10s rnanchones de arrecifes acanalados. Siete especies diferentes de rneros fueron identificadas en 10s viajes de carnpo: /a cherna criolla (Epinephelus striatus), mero americano (E. rnorio), cherna cabrilla ( E . fulvus), cherna enjambre ( E . cruentatus), mero colorado ( E . guttatus). cuna bonaci (Mycteroperca bonaci) y el cuna de piedra (M. venenosa). En tres sitios diferentes un transecto fuP sujeto a o&servacion en tres mornentos del dia para deterniinarhasta donde o no la densidad de meros presenta variaciones diurnas. No huho diferencias significativas en el nljrnero de meros observados tomando como base la hora del did. En un sitio, Conch Reet el tamatio del sitio donde habita la cherna enjambre fue examinado siguiendo a 10s i l ld iv id~05 por periodos de 20 minutos. El tarnaiio del sitio donde habita /a cherna enjarnbte fue estimado en 23.7 rn2 para peces de 5-15 crn y de 27.6 rnz para individuos de I 5 a 25 crn. No hubo diferencias significativas. La magnitud del drea observada que ocupd la cherna enjambre Fue significativamente correlacionada con el period0 de tiernpo que 10s peces fueron observados.
Introduction
Fisheries scientists and managers recognize that grouper stocks throughout the tropi- cal Western Atlantic have been overfished and are declining (Beets and Freidlander 1992; Sadovy and Figuerola 1992; Beets et al. 1994; Sadovy 1994). The Florida Keys, USA, are situated at the northern edge of the distribution of many tropical groupers. The catch composition in Florida is more similar to the tropical Western Atlantic (or wider Caribbean) than northern subtropi- cal and temperate grouper fisheries in the Gulf of Mexico and the northeastern coast of Florida (see Arreguin-Sanchez and Valero; Brule and DCniel, this vol.). A commercial fishery for groupers has existed at least since the 1830s OR Key West, Florida (Allen and Tashiro 1976). Anecdotal evidence suggests that both the catch amount and composi- tion have changed dramatically over the past 30 years (Bohnsack unpubl.). Nassau grouper (Epinephelus striatus) were once abundant throughout the Florida Keys, being seen on almost every dive (Stark 1968). In the late 19505, the relative abundance of commercially caught Nassau grouper was almost equivalent to black grouper (Mycreropercd bonacl] (Springer and McErlean 1962).
US grouper landings were fairly consistent from 1949 (4 640 t) to 1974 (3 136 t) (Allen and Tashiro 1976). The majority of the US catch came from Florida (89% in 1973). Most of the catch in Florida originated off the western coast in the Gulf of Mexico (91%) (Allen and Tashiro 1976). The commercial catch off the eastern coast of Florida ranged from 272 tin 1969 to 341 tin 1971 to 238 t in 1973. Red grouper (E. morio) and black grouper were important components dur- ing these years (Allen and Tashiro 1976). Headboat catch-per-unit-effort (CPUE) OF Nassau grouper in the Florida Keys decreased from 0.175 fish per trip in 1981 to 0.025 in 1989 (Bohnsack, unpubl.). Black grouper CPUE decreased from 0.45 fish per trip in 1980 to 0.2 in 1989 (Bohnsack. unpubl.). There was an overall decrease of 48.6% in grouper landings in the Florida Keys and southwest Florida in 1989 over the 5-year mean (Brown et al. 1991).
Current information on the habitat require- ments of epinepheline groupers is sparse and mainly qualitative. This is especially true for juveniles. In general, groupers tend to be more abundant on wide shelf areas rather than narrow shelf areas (Bannerot et al. 1987). They tend to be secretive fish, occupying caves, crevices and ledges (Smith 1961 ).The juveniles tend to be more nearshore

than adults (Stewart 1989). Nassau grouper can be found in high-relief coral reef areas and over rocky bottoms (Bannerot et al. 1987; Stewart 1989). The larger fish tend to occupy deeper water (Thompson and Munro 1978). Red groupers are mainly caught over rocky bottoms with crevices, ledges and caverns (Moe 1969) (see ArreguIn- Sanchez et al.; Brule and Deniel, this vol.). The juveniles are found over hard bottoms (lory and lverson 1989). Red groupers under 50 crn tend to inhabit nearshore reefs (Beaurariage and Bullock 1976). Coneys (E. fulvus) and red hinds (E. guttatus) were found to be most abundant in Cura~ao on isolated patch reefs surrounded by sandy bottoms (Nagelkerlten 198 1 ). Graysbys (E. cruentatus) are most abundant on coral reefs with high vertical relief and numerous holes, crevices, and caves for shelter (Nagelkerken 1981) where they hide between and un- der the corals (Nagelkerlten 1979). The abundance ofgraysbys in Curacao was re- lated to the quantity of coral cover and more specifically associated with Montastrea annufaris and Asadcia spp. (Nagelkerlten 1979), although Thompson and Munro (1 978) caught graysbys in turtle grass beds.
The objectives of this investigation were three-fold:
1 ) to investigate what species of groupers co-occur on Florida reefs and their relative abundance;
2) to relate grouper diversity and abun- dance to definable reef community classes; and
3) to begin examining diurnal, seasonal and sampling biases for the moni- toring of groupers on shallow reefs.
This study examines the density and species composition among four reef com- munity classes: reef ridges, low-relief (eroded) spur-and-groove reek, high-relief spur-and- groove reefs and channel patch reefs. Seasonal and diurnal changes in the number and species of grouper recorded are re- ported. Home range size of the most abundant species, E. cruentatus, is estimated.
Methods
The study identified twelve reef sites that could be labeled as one of Four irnage- definable reeF community classes. The reef community classes had been both described in the literature and had unique geomorphological characteristics (Table 1 ). Geological surveys and reef research in the upper Florida Keys identified unique reef classes within the larger bankbarrier reef system (Shinn et al. 1989). The reef com- munity class have been described by Dustan and Halns (1987), Jaap et al. ( 1989) and Jaap (1 984).
A low-reliefspur-and-groove reeFis found seaward of high-relief spur-and-groove reefs or seaward of reef ridges. The low-relief spur-and-groove reefs represent "drowned" or relic reefs and are erosional features characterized by higher sediment accumu- lation, visual predominance of octocorals, and sparse coverage of algae. High-relief spur-and-groove reefs are found seaward of a reef flat or reef crest. High-relief spur- and-groove reefs are characterized by high surge and high relief (up to 4 m rise over 1 m run). All the spurs in these communi- ties are dominated by Acropora palmata or Montastrea annufaris. Reef ridge com- munities (sometimes referred to as "tran- sitional reefcommunities" inlaap 1984) were built by A. palmata and "drowned" with rapid rises in sea level. Reef ridges had previously been reef crests; they extend seaward to the low-relief spur-and-groove communities. Reef ridge communities occur at depths similar to high-relief spur-and- groove communities. There are over 8 000 channel patch reefs in the upper Florida Keys; the patch reefs are found in Hawk Channel, a seagrass-dominated channel (5- 7 rn depth) between the islands and outer bank reefs. Channel patch reefs can have large isolated coral heads of Montastrea s pp., Siderastred siderea, Colpophyllia natans and Diploria spp. Channel patch reek are typically dome-shaped and can have

Tablc 1. Summary of survey sltes and sampllng effort by comrnunlty class. IResumcn de MOS obsevados y esfuemo die muestreo por chse de comunldad.]
CLASS 1 CLASS 2
Reef class designation
Survey sites
Reef community class characteristics
Area surveyed (mZ) Number of species
recorded at all sites
Reef ridge
Conch Reef Ridge Davis Reef Ridge Alligator ReeF Ridge
- octocorals common - moderate relief - "drowned" reef crest 17 392
Low-relief spur- and-groove reef ~icklesReef The Elbow Reef Davis Reef
- low relief - sparse benthos - relic relief 16 240
CLASS 3 CLASS 4
Reef class designation High-relief spur- Channel patch reef and-groove reef
Survey sites Elbow Reef French Reef Pickles Reef
Hens-and-Chickens Three Sisters TS 1 Three Sisters TS2
Reef communlty class - high surge - large coral heads characteristics - high relief - high relief
- seaward of reef crest - high coral- cover Area surveyed (m2) 1 8 960 8 226 Number of species
recorded at all sltes 6 3
abundant soft coral coverage. These reefs are characterized by high relief and have the highest coral cover of all reef classes (Jones 1977; Jaap 1984).
Observers were trained to consistently and accurately estimate the lengths offish using a technique modified from Bell et al. (1985). The length, species and number of groupers observed was recorded within transects either 20 m or 50 m long and 12 m wide. Observers swam over each por- tion of the transect and examined all holes, caves and crevices. This tends to reveal smaller size classes and is recommended for surveying grouper density (Craik 1981 ).
Surveys were conducted throughout the day in the periods 1-1 8 April, 16-1 7 May. and 1 - 1 8 September 1 993 by two to six observers. A two-factor Analysis of Vari- ance (ANOVA) model was used to test for significant differences in the mean density of grouper between reefs and seasons.
At three sites (Conch Reef, Tennessee ReeF and Alligator Reef), transects were repeatedly sampled between dawn and dusk to examine the effects of time of day on survey results. Chi-square analysis tested the null hypothesis that there was no dif- ference in the number of groupers observed on the same transect among different times

of day. Two observers surveyed each transect. The maximum number observed between the observers at each time of day was used in the analysis.
In order to estimate the home range size of graysbys (E. cruentatus), a circular grid was marked out at Conch Reef (eroded reef ridge community; 24O57.21 N, 80D27.26W) using weights with flagging tape. Flags were positioned at 2.5-m intervals along the four main compass directions and centered around an area where a number of graysbys had been observed. This produced a circular grid 20 m in diameter within which the movement of individual graysbys could be tracked. Prior to the observations, four 20- minute intervals were chosen in each of two observation periods: 0600-0800 and 1540- 1800 hours. These periods were at dawn and dusk, the time periods that groupers would most likely be traveling the farthest in their foraging. Within each 20-minute observation, the position ofa graysby was plotted on a map of the grid at 30-sec in- tervals. The home range size of the graysby was estimated by connecting the outer- most observation points to form a poly- gon enclosing the movement patterns of the fish. The point method (Maling 1989) was used to determine the area of the polygon. If the grouper did not move over the duration of the observation period, the home range size was recorded as 1 m2 for statistical analyses.
Results
A summary of the sites surveyed and sampling effort within each reef commu- nity class is provided to illustrate overall experimental design (Table 1 ) . The mean number of grouper observed per 100 m2 was determined for each reef class (Table 2). There were significant differences in the density of groupers between reefs of moderate (reef ridges) and low relief
(low-relief spur-and-groove reefs) (Table 2). There were no significant differences between high relief reefs within the high- relief spur-and-groove and channel patch reef classes. Reek were combined within their respective reef classes and tested for differences between the two reef classes. There were no significant differences in the density of grouper between high-relief spur- and-groove reefs and channel patch reefs (t[O.O5(2),86] = 0.390, p>0.05),
There were significant seasonal effects and/or reef by season interactions in the low to moderate relief reef community classes (reef ridges and low-relief spur-and-groove reefs) (Table 3). The seasonal effects on reefs within the low-relief spur-and-groove reef class resulted from an unusually high den- sity value of 2.332 grouper 100 m-= on the deeper portion (13-17 m) of The Elbow Reef during the September sampling sea- son. The majority of these groupers ob- served were small (< 15 cm TL) graysby. The season by reef interaction effects oc- curred in the reef ridges due to the den- sity of grouper being higher at Davis Reef during the April sampling period than the September period and vice versa for Conch Reef. The interaction effect for reefs in the low-relief spur-and-groove rcefs occurred due to the density of grouper being higher on Pickles Reef during the April sampling period than the September period and vice versa for The Elbow Reef. There were no seasonal effects or season by reef interac- tion effects in the high-relief spur-and-groove and channel patch reef classes.
Seven species of groupers were observed at reek in the Florida Keys (Table 4). The high-relief spur-and-groove reefs had the most: six species were observed. Only three species were observed on channel patch reefs. Graysbys were observed on all reefs with the exception of Hens-and-Chickens channel patch reef site. Black groupers were not observed at all reef sites, but were observed on at least one site within each community class.

Table 2. Mean density of grouper (# 100 m-3 on four different reef classes In the Florlda Keys. Class I = reef rldge, Class 2 = low-rellef spur-and-groove reef, Class 3 = high-rellef spur-and-groove reef, Class 4 = channel patch reefs. [Densidadmedia de meros (# 100m-z) de cuatro clases de arreclfe dlferente en 10s Cayos de Florlda. Clase I: arreclfe de horde; Clase 2: arreclfe de salientes y surcos de bajo relleve; Chse 3: arrecjfe de sallenfes y surcos de alto relieve; Clase 4: manchones de arreclfes acanalados.]
Class 1 Class 2 Class 3 Class 4
n 7 1 mean density 0.603 s 0.6 1 1 95 % CI 0.145
Table 3. Summary of analysis of variance results comparing differences between reefs within classes and seasonal effects. Class 1 = reef rldge, Class 2 = low-relief spur-and- groove reef, Class 3 = high-relief spur-and-groove reef, Class 4 = channel patch reefs. * " =
pc0.01, ns = not signlficant, NA = not applicable, no Interaction term due to one way ANOVA. [Resumen de 10s resuhdos delani i / ls de varlanza cornparando dlferenclas e n t e arrecifes dentro de /as chses y efector estaclonales, CIase I= arecife de horde; Chse Z= arrecife de sallentes y surcos de bajo relieve; Chse 3= arreclfe de sallentes y surcos de alto relieve; Clase 4= manchones de arreclfes acanalados. ""p<O.Ol, ns.= no slgnlflcativa, na= no apllcable. No hay tkrmlno de fnferacclon debldo a1 ANOVA de una via.]
Factor Class I Class 2 Class 3 Class 4
Reef Season Reef x
Two transects were repeatedly sampled at Conch Reef at 0700-1800 hours on 3 April 1993 (Table 5 ) . There were no sig- nificant differences between the observed number of groupers at each time of day ( x ~ ~ , ~ ~ , ~ = 6.636 and x2 ,,,,,, = 2.66, p-0.05). At Tennessee Reef and Alligator Keef one transect was surveyed between 0730 and 2100 hours (Table 5). There were no significant differences among time of day (x2 0,,,,, = 2.00 for Tennessee Reef and x2 ,,,,, = 3 ,33 For Alligator Reef, p>0.05).
The home range size of graysby 5-15 cm in total length was estimated as 23.73 mZ + 5.51 and for 15-25 cm graysby as
27.57 m2 .- 12.24 (Table 5). There were no significant differences in the mean home range size of the two size classes (t0,,(2),63 = -0.592, p>0.05). The maximum area covered by a graysby in the 20-minute observation period was almost three times greater in the 15-25-cm size class when compared to the smaller size class. Most individual graysbys were not observed for the entire 20-minute observation period due to their cryptic appearance and behavior. The amount of area covered during an observation period was significantly cor- related with the duration of the observa- tion (r = 0.31 p<0.01).

Table 4. Specles of grouper observed on four different reef c lasses In t h e Florlda Keys. Class 1 - reef rldge, Class 2 = low-relief spur-and-groove reef, Class 3 = hlgh-relief spur- and-groove reef, Class 4 = channel patch reefs. [Especles de mero observadas en cuatro clases de arreclfe dlferentes de 10s Cayos de Florlda. CIase I= arrecife de horde; Clase Z= arreclfe de sallentes y surcos de bajo relleve: Clase 3= arrecife de salienfes y surcos de alto relleve; Ckse 4= manchones de arreclfes acanalados.]
Species - - -
Class 1 Class 2 Class 3 Class 4
Epinephelus cruenta tus + + + + E. fulvus + + 15, guttatus + E. morh + + + E. striatus + + Mycteroperca bonaci + + + + M. venenosa 4- +
Discussion
There a p p e a r e d t o b e s o m e significant differences in e i ther t h e dens i ty o r diver- sity of groupers observed o n all four classes of reef communi t ies , but communi ty class a lone is too coa r se for s eg rega t ing a n d defining grouper communities. Specific habitat r equ i r emen t s b e t w e e n s p e c i e s m a y b e partially related t o relief and reeFmorphology. The shallow-water reef communities in t h e Florida Keys a r e domina ted by graysbys. This species is found o n all reef classes and can occur in very high densities. These results a g r e e with previous s tudies relating abun- d a n c e to t h e availability of refuge (caves a n d crevices) available in high-relief reef s i tes (Smith 1961 ).
The fact t ha t graysbys w e r e found o n all reef communi ty classes, rather than just o n co ra l r e e k w i t h h i g h ver t ica l relief (Nagelkerken 1881, 1979) raises the question of w h a t biological constraints exis ted on g r o u p e r distribution prior t o t h e decl ine in popula t ions of certain spec ie s such a s Nassau, red a n d black groupers . Changes in g r o u p e r communi ty structure with ex- ploitation of certain species o r habitat deg - radation wou ld n e e d t o b e unders tood to effectively d e s i g n a n d m a n a g e mar ine fisheries reserves (Plan Development Team
1990) . The abundance a n d prevalence of graysbys in these surveys sugges t that there has been a c h a n g e in t h e g r o u p e r c o m - m u n i t i e s off Key L a r g o From e i t h e r ove rexp lo i t a t ion o r p o o r r ec ru i tmen t . Thompson a n d Munro (1978) found an abundance of graysbys in heavily fished areas. They s u g g e s t e d this migh t b e d u e t o a low catchability o r desirability t o fish- ers.
The objectives of this investigation w e r e to gain a bet ter unders tanding of habitat requi rements of g r o u p e r in addi t ion t o deFining relative abundance and co-occur- rence O F species in t h e uppe r Keys. Within t h e reef communi ty classes, the re w e r e significant differences within and between low t o m o d e r a t e relief communi t ies (reef ridges and low-relief spur-and-groove reefs). Clearly, t he re a r e o the r characteristics be- yond relief tha t a r e important t o groupers. These benthic parameters such a s coral, s p o n g e a n d algae cove rage m a y b e re- lated t o foraging base a n d food availabil- ity. The dens i ty a n d diversity of g roupe r s w e r e m o s t variable b e t w e e n t h e moder - a te- a n d low-relief reef sites. High-relief communities (high-relief spur-and-groove reefs a n d channel pa tch reefs) w e r e n o t significantly different in dens i ty , b u t had fewer o r different species . Channel pa tch .

Table 5. Number of groupers observed at each tlme of day at a trnsect repeatedly surveyed. Hours Indlcate the startlng tlme of surveys and (-) indicates no SUNeys durlng thls tlme Interval. Nfimero de meros observados n add bora tiel did en un transecto observado repetidas veces. la hora Indlca el momento en el cualse lnIcI6 k observacl6n y (- / India gue no bubo observaclones burante esas boras del dia.1
COMMUNITY Time (Hours) CLASS/Site 0700 0730 0800 0930 1000 1100 1230 1400 1530 1700 1800 2100
REEF RIDGE Conch Reef I 3 3 2 6 1 3 I 3
REEF RIDGE Conch Reef 2 3 2 2 2 5 4 3 3
REEF RIDGE Alligator Reef S 3 7 9
LOW-RELIEF SPUR-AND-GROOVE Tennessee Reef 2 0 3

reefs had the fewest number of species (3) seen in a given reef community class.
Seasonal changes in the numbers of groupers can be dramatic, particularly with recruitment events. An increase in the density of groupers was only noted for graysbys at one reef site. Most of the published ecological data on groupers in the Florida Keys are derived from catch data. Moe (1969) examined the biology of red grouper pri- marily in the Gulf of Mexico off western Florida. Moor and Labislcy ( 1 984) investi- gated snowy grouper (E. niveatus) in the Florida Keys and found that this species could not support an extensive and sus- tained fishery. A number OF studies have examined age and growth of certain spe- cies including snowy grouper (Moore and Labisky 1984), black grouper and Warsaw grouper (E. nigritk) (Manooch and Mason 1987), and Jewfish (E. itajara) (Bullock et al. 1992). Bullock et al. (1992) examined the spawning and sexual differences ofJewfish. lory and lverson (1 989) summarized eco- logical data available on black, red and Nassau groupers.
Sullivan ( 1 993) examined grouper physi- ology and home range size in an experi- mental tank at Long Key, Florida. Groupers were divided into dwarf (E. guttatus and E. cruentatus) and giant species (E. striatus, E. itajara and E, morio) based on differ- ences in life history strategies including maximum total length and age at sexual maturity. The development of an energy budget indicated a decreased potential For growth during the summer months. The effect of removing a congener on home range size was to increase activity and mean distance travelled and to decrease home range size. Although more active early in the morning and late in the day, groupers were accurately surveyed throughout the day by trained observers.
The combination of laboratory investiga- tions, catch records and ecological stud- ies will begin to provide some informa- tion on what species of groupers are liltely
to co-occur on specific reef community types and at what range of densities. This type of detailed data is critical for the rnanage- ment of grouper stocks as well as the de- sign and evaluation of marine fisheries re- serves.
Acknowledgements
The work was supported by funds from The Nature Conservancy's Florida and Car- ibbean Marine Conservation Science Center and by field logistical support hom the National Oceanic and Atmospheric Administration National Underseas Research Center Grant UNCW-93 16 to K.M. Sullivan. We wish to thank M. Chiappone, T. Potts and J. Levy for field assistance and thanks to Dr. J . Bohnsack, National Oceanic and Atmospheric Administration-National Marine Fisheries Service for discussions and information on grouper surveys.
References
Allen, D.M. and J . E . Tashiro. 1976. Status of the US commercial snapper-grouper fishery. p. 41-76.InH.R. Bullis, J r . and A.C. Jones (eds.) Proceedings: Colloquium on Snapper- Grouper Fishery Resources of the Western Central Atlantic Ocean. Florida Sea Grant Progr. Rep. 17, 333 p.
Bannerot, S., W.W. Fox, Jr. and J.E. Powers. 1987. Reproductive strategies and the rnanage- ment of snappers and groupers. p. 561 - 603. In].]. Polovina and S. Ralston (eds.) Tropical snappers and groupers: biology and fisheries management. Westview Press, Boulder, Colorado.
Beaumariage, D.S. and L.H. Bullock. 1976. Bio- logical research on snappers and groupers as related to Fishery management require- ments, p. 86-94. /n H.R. Bullis, Jr . and A.C. Jones (eds). Proceedings: Colloquium on Snapper-Grouper Fishery Resources of the Western Central Atlantic Ocean. Florida Sea Grant Progr. Rep. 1 7, 333 p.
Beets, j. and A. Friedlander. 1992. Stock analysis and management strategies For red hind, Epinephelus guttalus, in the U S Virgin

Islands. Proc. Gulf Caribb. Fish. Inst. 42:66- 79 .
Beets, J . , A. Friedlander and W. Tobias. 1994. Stock analysis of coney, Epinephelusfulvus, in St. Croix. US Virgin Islands. Proc. Gulf Caribb. Fish. Inst. 43:403-416.
Bell, J.D., C.1.S. Craik, D.A. Pollard and B.C. Russel. 1985. Estimating length-frequency distri- butions of large reef Fish underwater. Coral Reefs 4 : 4 1-44.
Brown, A.. Jr., ].A. Bohnsack and D. Harper. 1971. Automated landings assessment for responsive management (ALARM): Gulf of Mexico commercial reef Fish landings, September 199 1. Coastal Resources Di- vision, Contrib. No. MIA-90191 -80.
Bullock, L.H., M.D. Murphy, M.F. Codcharles and M.E. Mitchell. 1992. Age, growth and reproduction o f JewFish Epinephelusitajara in the eastern CulF of Mexico. Fish. Bull. 9 0 ( 2 ) :243-249.
Craik, G.J.S. 198 I . Underwater survey of coral trout Plectropomus leopardus (Serranidae) populations in t h e Capricorn section of the Great Barrier ReeF Marine Park. Proc. 4th Int. Coral Reef Symp. 4 ( 1):53-58.
Dustan, P. and J.C. Halas. 1987. Changes in the reef-coral community of CarysFort Reef. I<ey Largo, Florida. Coral Reek 2:9 1 - 106.
Jaap, W.C., W.G. Lyons, P. Dustan and 1.C. Halas. 1 9 8 9 . S t o n y coral (Scleractinia a n d Milleporina) community structure at Bird Key Reef, Fort Jefferson National Monu- ment , Dry Tortugas. Florida Marine Re- search Institute Publ. No. 4 6 , 3 1 p.
Jaap . W.C. 1984. The ecology O F south Florida coral reek : a community profile. United States Fish and Wildlife Service Rep. FWS/ OBS-82/08, 138 p.
Jones , J.A. 1977. Morphology and develop- ment of southeastern Florida patch reefs* Proc. 3rd lnt. Coral Reef Symp.3(2):231- 235.
lory, D.E. and E.S. Iverson. 1989. Special pro- files: liFe histories and environmental requirements of coastal fishes and inver- tebrates (south Florida) - black, red, Nassau groupers. U.S. Fish Wildl. Sew. Biol. Rep. 82(1 l - 1 10) and U.S. Army Corps of En- gineers, TR EL-82-4 21 p.
Maling, D.H. 1989. Measurements from maps: principles and methods O F cartography, Pergamon Press, Oxford, UK. 577 p.
Manooch, C.S. I l l and D.L. Mason. 1987. Age and growth of the Warsaw grouper and black grouper from the Southeast region of t h e United States. Northeast Gulf Sci. 9(2):65-75.
Moe, M.A., Jr. 1969. Biology of the red grouper (Elli/tephe/us morio Valenciennes) from the eastern Gulf of Mexico. Prof. Pap. Ser. Mar. Lab. Fla. No. 10. 9 5 p.
Moore, C.M. and R.F. Labisky. 1984. Popula- tion parameters o f a relatively unexploited stock of snowy grouper in the lower Florida Keys. Trans. Am. Fish. Soc. 1 13:322-329.
Nagelkerken, W.P. 1979. Biology of the graysby, Epinephelus cruentatus, of t h e coral reef ofcuraqao. Stud. Fauna Curaqao 60: 1 - 1 18.
Nagelkerlten, W.P. 1981. Distribution of t h e groupers and snappers of the Netherlands Antilles. Proc. 4th Int. Coral Reef Symp. 4 ( 2 ) :479-484.
Sadovy. Y. and M. Figuerola. 1992. The status of the red hind fishery in Puerto Rico and St. Thomas a s determined by yield-per- recruit analysis. Proc. Gulf Caribb. Fish. Inst. 42:23-38.
Sadovy, Y . 1994. Grouper stocks of t h e West- ern Central Atlantic: the need for man- agement and management needs. Proc. GulfCaribb. Fish. Inst. 43:43-64.
Shinn, E.A., B.H. Lidz, R.B. Hulley,].H. Hudson and J.L. Kindinger. 1989. Reefs of Florida and the D y Tortugas: Field trip guideT176. 28th lnternational Geological Congress, American Geophysical Union. Washing- ton, DC. 53 p.
Smith, C.L. 1961. Synopsis of biological data on groupers (Epinephefusand allied gen- era) of t h e Western North Atlantic. F A 0 Fish. Biol. Synop. 23 , 61 p.
Springer, V.G. and A.J. McErlean. 1962. A study of the behavior of some tagged South Florida coral reef fishes. Am. Mid. Nat. 67:386- 397.
Stark, W.A. 11. 1968. A list of fishes of Alliga- tor Reef, Florida with comments on t h e nature of t h e Florida reef fish fauna. Un- dersea Biology 1 :5-36.
Stewart, V.N. 1989. Grouper. Sea-Stats No.8. Fla. Dept. Nat. Res.. St. Petersburg, Florida. 13 p.
Sullivan, K.M. 1993. Animal welfare consid- erations in field and laboratory investi- gations of energetic strategies of tropical

reef fishes, p. 179-187, In D.O. Schaeffer, Thompson R. and J.L. Munro. 1978. Aspects O F K.M. Kleinow and L. Krulisch (eds.) The the biology and ecology of Caribbean reef care and use of amphibians, reptiles and fishes: Serranidae (hinds and groupers). fish in research. Scientists Center for Ani- j. Fish Biol. 12:l 15-146. ma1 Welfare, Bethesda, Maryland.

APR i 1998
A Molecular Approach to Stock Identification and Recruitment Pat&erns in Red Snapper
(Luqamus campechanus)
R.W. CHAPMAN Marine Resources Research Institute
South Carolina Wildi fe and Marine Resources Department Charleston, South Carolina 29412, USA
S.A. BORTONE Department o f Biology
Universiw of Wes t Florida 11000 Universiw Parkway
Pensacola, Florida 32504, USA
C.M. WOODLEY National Marine Fisheries Service
Charleston Labora toy 2 17/ohnson Road
Charleston, South Carolina, USA
CHAPMAN, R.W.. S.A. BORTONE and C.M. WOODLEY. 1996. A molecular approach to stock identification and recruitment patterns in red snapper, Luqanus campechanus [ U t ~ a aproximacion molecular a la idcntific7cion del stocky el patron de reclutamiento en el pargo del Golfo (Lutjanus campechanus)], p. 85-91. In F. Arreguin-Sanchez. ).I. Munro, M.C. Balgos and 0. Pauly (eds.) Biology, fisheries and culture of tropical groupers and snappers. ICLARM Conf. Proc. 48. 449 p.
Abstract
The genetic structure of red snapper has been investigated by amplifying several regions of the rnitochondrial DNA molecule via the polymerase chain reaction. The amplified regions were digested with four base restriction enzymes and the resulting fragments separated by polycrylamide gel electrophoresis. Two conserved regions of the molecule, cytochrome b and the 16 rRNA genes, exhibited only one variant in 40 surveyed individuals. The 0-loop reglon of the molecule which is known to be variable in some species was invariant in red snapper. Additional primer sets are being developed to amplify the NADH-I region which has been highly polymorphic in other species. Given the limited variation found to date in red snappers, i t is doubtful that sufficient variation wi l l be found in the NADH-I region to identlfy dlscrete stocks. An alternative approach using microsatellites is belng pursued in hopes of findlng more polymorphic markers.
Resumen
La estructura gemWca del pargo del Golh ha sldo investigada medlante /a arnplificacibn de varias reglones de la rnol&cula de DNA m/tocondrial a trav&s de /a reaccldn en cadena de la pol/rnerasa. Las regjones amplificadas heron digeridas con cuatro enzimas de restriccibn base y 10s Fragrnentos resultantes separados por e/ectroforesls en gel de po//cr/arnida. Dos reglones consernadas de la mo/@cu/a, citocromo b y 10s 16 genes de RNAr, rnostraron solarnente una varlante en 40 individuos anal/rados. La regidn con "glro a la derecha " de la rnol~cula, la cud1 se sabc que es variable en algunas especles, Fue invariable en el pargo del Go/fo. De manera adlcfonal estdn desarro1l;indose algunas pruebas para arnpllficar la regibn NADH-I la cual ha sido altarnente polirn6rfica en otras especies. Debido a /a poca variacidn encontrada hasta ahora en el pargo del Golfo, es dudoso gue suflciente variacidn sea encontrada en a/ regidn NADH-I corno para identiflcar stocks discretos. Una aproximacl6n alternativa usando rnlcrosat&/ites estA slendo /mp/ernentada con la esperanza de encontrar rnds marcadores genCticos polim6rcos.
Introduction
Conservation and management of living marine resources require in-depth Imowl- edge of the organisms' life history, including such parameters as mortality, fecundity, habitat preferences, population size, etc. In marine species, these parameters are often difficult to assess, because the or- ganisms are free to move over a wide geographic area and many of them pro- duce pelagic eggs permitting long distance dispersal. This complicates estimates of life history parameters as the data must be taken from a single population or stock in order to be reliable. To overcome this problem, genetic analyses of stock structure have become increasingly important tools for fisheries management (cf. Powers et al. 1 990).
Red snappers (Lutjanus campechanus) are found from the southeastern US, through- out the Gulf of Mexico and Caribbean and southward to Brazil (Bortone 1986) (see Collins et al.; Cuellar et al., this vol.). It is one of the most sought-after demersal fishes in the GulfoFMexico, for both commercial and recreational fisheries (Moran 1988). The alpha taxonomy of the species is relatively well known, except that some debate still exists over the status of southern populations, which have been considered as a distinct species, L. purpureus (cf. Bortone 1986; Allen 1987). In US waters in the subtropical Western Atlantic and Gulf of Mexico, L.
campechanus is currently managed as part of the reef fish management plans (SAFMC/ NMFS 1983; GMFMC 1990) due to declines in abundance over the past two decades. The larvae of this species are thought to be widely dispersed by oceanic currents, leading to the belief that a single stock exists within the Gulf of Mexico and perhaps throughout the US portion of the range.
Previous efforts to define stocks of red snapper within the Gulf of Mexico (Camper et al. 1993) found no evidence support- ing stock separation using traditional methods to assess genetic variation in mitochondria1 DNA (mtDNA). Camper et al. (1993) found 29 haplotypes in 86 specimens, but only two haplotypes were Found in more than two specimens and the remaining haplotypes were usually found only once. Camper et al. (1 993) reported levels of interpopulation diversity in this species as relatively low compared to other marine species. It is possible that the absence of stock struc- ture within the Gulf of Mexico reported by Camper et al. (1993) may result from the limited variation identified by their technical approach. In this report, we as- sess genetic variation in mtDNA from red snapper using the polymerase chain reac- tion to amplify four regions of the molecule and Four base restriction digests of the amplified product. Studies on four alosid species using this approach found much more variation than traditional methods using

six base digestion of the total mtDNA molecule (Chapman et al. 1994). Our goal is to identify the region(s) of the molecule that reveal sufficient variation to discriminate stocks, should they exist.
Materials and Methods
Samples were collected from the Gulf of Mexico near Panama City, Florida, Or- ange Beach, Alabama and Freeport, Texas, and by sampling commercial catches. Liver samples were preserved in 95% ethanol and blood in 1 O/O SDS and returned to the laboratory. Liver samples were dried, di- gested with Proteinase I< and phenol-chlo- roform extracted. Nucleic acids were then collected by ethanol precipitation. The samples were rehydrated in 100 ml of sterile water and 1 - 15 ml were used in PCR reac- tions depending upon the DNA content.
Amplification of the 12s-16s rRNA (bases 1 109-25 10 on the human genome), cytochrome b-D-loop ( 1 5560- l6498), 6- ATPase (8566-91 3 9 , NADH dehydrogenase 1 (2525-44 10) and 16s rRNA (2500-3058) regions followed the protocol of Kocher et al. (1 989). Oligonucleotide sequences for the primers are given in Meyer (1 993). Unincorporated nucleotides and Taq polymerase were removed from the am- plified products by either phenol chloro- form extraction and ethanol precipitation or by Magic PCR preps (Promega Biotechnology). The products were then digested by a battery of four base restric- tion enzymes and the resulting fragments separated on polyacrylarnide gels. The gels were stained with ethidium bromide and photographed under UV light following Chapman and Powers (1984). Molecular weight estimates of the restriction fragments were made using multiple regression pro- cedures in Lotus 1-2-3.
Restriction fragment patterns were as- signed a letter designation for each en- zyme. The first pattern encountered was assigned the letter and subsequent variants
were assigned B, C, etc. Composite haplotypes for each individual were com- posed of these letter designations arrang- ing the restriction enzymes in alphabeti: cal order. The frequency distributions of composite haplotypes in each population were then compared using the Roff and Bentzen (1 989) chi-square test.
Results
Of the five primer sets attempted in this survey only the ND 1 (2525-441 0) set failed to ampliFy L. cdmpechanus mtDNAs. This primer set has functioned well in partially purified mtDNAs from a variety of species. The remaining primer sets functioned well, generating consistent amplifications from either blood or liver derived DNA.
Molecular weight estimates for the re- striction fragments obtained by digesting the 12s-16s regions of L. campechanus mtDNA are presented in Table 1 . In gen- eral these estimates total about 1 600 bases and are consistent with the estimate of the total amplified region obtained from agarose gel electrophoresis. The exceptions to this are estimates obtained from Alu I and Hpa I I digests which were less than those ob- tained for the other restriction enzymes. In the Alu I digests, several low molecular weight bands were noted in the photo- graphs, but these bands were too Faint to score reliably. The single variant pattern seen in this region of the mtDNA was gen- erated by a Cfo I digest (Table t ) and this pattern was seen in only one individual. No variant haplotypes were seen in the forty individuals amplified for the cyt b- D-loop or 6 ATPasc regions (Table 2) .
Unlike the other regions amplified in this study the 16s rRNA segment revealed sub- stantial variation using four base digestions. Of the five restriction enzymes employed, four showed two variants each (Table 3). Composite haplotypes based upon these variants (Table 4) for 52 individuals revealed a total of ten dinstinct lineages. Five of these

Table I. Estimated molecular welghts of fragments obtalned by dlgestlon with the indicated endonuclease for the 1109-2500 (12s to 16s rKNA) region of L uqanus campechanus mtDNA. [Pesos mokculares estirnados de ios fragmentos obtenidos por digestion con la endonucleasa especificada para la 1 /09-2500 (12s a 16s rRNA) region tiel DNA mltocondrlal de Lutjanus campechanus.]
Alu CFo l Hae I l l M s p Rsa Hpa I1
Table 2. Composite haplotypes for three regions of the rntDNA molecule taken from 40 red snappers. [Haplotipos compuestospara tres regiones de /a mole'cuia de DNA-mitocondrlal tomada de 40 inrllvfduos de pargo del Golfo.]
Region N
AAAAAA ABAAAA
1 5560- 16498 (cyt b-0-loop)
AAAAAA
AAAAAA

Table 3. Molecular welght estimates for fragments obtained by digesting the 16s rRNA portlon of lut/imus campechanus mtDNA molecule wlth the indicated enzyme. All esti- mates a re accurate t o within 5%. [Pesos moleculares estlmadospara fragmentos obtenldos por la rllgestlon de la region Ids rRNA de la mole'cula de DNA-mlfoconrlrlal de Lutjanus campechanus, con /a enzjma lndlcarlir. Todas B s estlmaclones son preclsas a un nlvel 95%.1
Alu I Cfo I Hae I l l Rsa l Taq I A B A A B A 6 A I3
Table 4. Composite haplotypes found In t h e 165 rRNA portion (2 500-3 058) o f Luganus campechanus mtDNA. Cornposlte haplotypes are based upon pat- terns produced by the restrlction enzymes from Table 3 in alphabetical order. [Composjc/on de haplotjpos encontrados en la reglon 165 rRNA (2500-3058) de DNA mltocondrial d e h t j a n u s campechanus. La composlclon de haplotipos erta basada en 10s patrones producldos por /as enzlmas de restrlccion tie la tabla 3, en orden aIfabitlco.1
Haplotype Orange Beach Freeport Panama City Total Alabama Texas Florida
AAAAA AAAAB AABAA AABAB BAABC BAABB BAABA BABBB BAAAB BAAAA
haplotypes are common (i.e., found in more Panama City, Florida or Orange Beach, than two individuals), three haplotypes are Alabama populations. All five of the represented by two individuals and the rest Texas specimens shared a common were seen only once. haplotype that was not observed at the
Geographically the distribution o f other locations. The chi-square tests also mtDNA haplotypes clearly distinguish differentiated Orange Beach from Panama the Texas population as different from City (p<0.001).

Discussion
The results of this study are important to our understanding of mtDNA evolution and to the population structure of red snapper. These issues will be discussed in some detail. The data should, however, be viewed with some reservations as the sample sizes are somewhat restricted.
The vast majority of data on mtDNA vari- ation within and among species is based upon six base digestion O F the entire mol- ecule (cf. Meyer 1993). In most of these studies, restriction site losses and gains are not mapped to specific regions of the molecule and we cannot judge the rela- tive rates of change among various regions. Despite this limitation some generalities have emerged from sequencing studies of portions of this genome. Meyer (1993) compared mtDNA sequences of cod and frog and reported that the 16s rRNA por- tion was among the most conserved re- gions. In addition, it is generally accepted that the D-loop region is subject to higher rates of change than most other segments. In some species, the D-loop appears to be constrained and may evolve at a pace consistent with the rest of the mitochondrial genome (Shedlock et al. 1992). In the present study, our limited survey of variation in the D-loop indicates a rate of evolution very much slower than the 16s rRNA. In addi- tion, our results are not consistent with the conclusion that the 16s rRNA is one of the more conserved elements of L. campechanus mtDNAs. This should not be taken as a challenge to the general conclusion regarding rates oFevolution in this region. Meyer ( 1993) compared only 207 bases of this region in frog and cod, where our study surveyed variation in approxirnatly 610 bases. It is possible that we found variation in a part of the region that was not assessed by Meyer (1993). In addition, we have no doubts about the conservation of this region in some species. We found no restriction site diF- ferences in a comparison of clusky and
hammerhead sharks (two different families). This information was one of t h e reasons we did not examine the 16s rRNA region until recently. If the region is so highly con- served that one cannot differentiate families, there is little chance offinding intraspecific variation.
The geographic distribution of mtDNA haplotypes found in the 16s rRNA region clearly distinguishes populations of L. campechanusin the northern Gulf of Mexico. The data contrast markedly from those of Camper et al. ( I 993) where no evidence of population subdivision was observed. We believe that the difference is due to the distribution of mtDNA haplotypes in the two data bases. Most of the haplotypes reported by Camper et al. (1993) were represented by more than two individu- als, permitting greater statistical power. In addition, the geographic distribution of common haplotypes was highly structured. All Five of the BABBB haplotypes were found in the Texas specimens. These results should be viewed as provisional due to the lim- ited number of individuals in the Texas specimens. Should further analyses of Texas specimens support the data presented here, a substantial revision of current plans for this species are in order.
References
Allen, G.R. 1987. Synopsis of the circumtropical fish genus Luqajanus (Lutjanidae), p. 33- 88. I n ] . ] . Polovina and 5 . Ralston (eds.) Tropical snappers and groupers: biology and fisheries management. Westview Press, Boulder. Colorado.
Bortone, S.A. 1986 Skate/Federal management of red snapper and gag, p. 103- 1 1 I . 117
R.H. Shroud (ed.) Multi-jurisdictional management of marine fisheries. Marine Recreational Fisheries 1 1 . National Coalition for marine Conservation, Inc., Savannah, Georgia, USA.
Camper, J .D. , R.C. Barber, L.R. Richardson and J.R. Gold. 1993. Mitochondria1 DNA vari- ation among red snapper (Lutjanus

campechanus) from t h e Gulf of Mexico, Molec. Mar. Biol. Biotech. 2: 154-1 61.
Chapman. RW. and D.A. Powers. 1984. A method for the rapid isolation of mitochondrial DNA from Fishes. Maryland Sea Grant Tech. Rept. No. UM-SG-TS-84-5.
Chapman, R.W., J.C. Patton and B. Eleby. 1994. Comparisons of mitochondrial DNA vari- ation in four alosid species a s revealed by t h e total genome, t h e NADH dehy- drogenase I and cytochrome b regions, p . 249-262. In A. Beaumont (ed.) Genet- ics and evolution of aquatic organisms. Chapman and Hall, London.
GMFMC. 1990. Revised regulatory amendment of the reef fishery management plan. Gulf of Mexico Fishery Management Council, Tampa. Florida, USA.
Kocher, T.D., W.K. Thomas, A. Meyer, S.V. Edwards. 5 . Paabo, F.X. Villablanca and A.C. Wilson. 1989. Dynamics oFmitochon- drial DNA evolution in animals. Amplifi- cation and sequencing with conserved primers. Proceedings of the National Acad- e m y O F Science 86:6 196-6200.
Meyer, A. 1993. Evolution of rnitochondrial DNA in fishes, p. 1-38.117 P.W. Hochachlta and T.P. Mommsen (eds.) The biochemis- try and molecular biology of fishes. Vol. 2. Elsevier Science Publishers. Amsterdam.
Moran, D. 1988. Species profiles: life histories and environmental requirements of coastal fishes and invertebrates (Gulf of Mexico) red snapper. Biological Report 82( 1 1.83), 19 p. United States Army Corps of Engi- neers, TR EL-82-4.
Powers, D.A., F.W. Allendorf and T.T. Chen. 1990. Application of molecular techniques t o the study of marine recruitment problems, p. 104- 121. In L.M. Alexander and B.D. Gold (eds . ) Large marine ecosystems; patterns. processes, and trends. Ameri- can Association For Advancement of Sci- ence, Washington. DC.
Row, D.A. and P. Bentzen. 1989. The statistical analysis of mitochondrial polymorphisms; chi-square and the problem of small sam- ples. Mol. Biol. Evol. 6:539-545.
SAFMC/NMFS. 1983. Fishery management plan for the snapper-grouper Fishery of the South Atlantic Region. South Atlantic Fishery Management Council, Charleston, South Carolina and the National Marine Fisher- ies Service. Charleston, South Carolina.
Shedlock, A.M., J.D. Parker, D.A. Crispin, T.W. Pietsch and G.C. Burmer. 1992. Evolution of t h e salmonid mitochondrial control regions. Mole. Ptiylo. Evol. 1 : 179-1 92.

Large Catches of Red Snappers by Tuna Purse Seiners off the West African Continental Shelf
A. CAVERIVIERE Institut Francais de Recherche Scietifique Pour
le Developpement en Cooperation (OHTOM) B. P. 1386 Dakar, S&&ga/
CAVERIVIERE. A. 1996. Large catches o f red snappers by tuna purse seiners off the West African continental s hclf [ Gt-andes capturas del pargo colorado africano obtenidas por a tuneros c/e cerco tl~era de la plataforma continental del Oeste de Africa], p. 92-95 In F. Arreguin-Sanchez, J.L. Munro. M.C. Balgos and D. Pauly (eds.) Biology. Fisheries and culture of tropical groupers and snappers. lCLARM Conf . Proc . 48. 449 p.
Abstract
This note reports summer catches of large (84-1 16 cm fork length) red snappers (Lur/;?nus agennes), often associated w i th tunas, by tuna purse seiners o f Guinea Gulf coast (West Africa). Such high concentrations in surface schools beyond the continental shelf are surprising for a dernersal coastal species but may be related to reproductive behavior.
Resumen
Esta contrihucion reporta capturds de verano del gran pargo colorado africano (Lutjanus agennes), a menudo asociado con atunes, por barcos atuneros de cerco fuera de Ids Costas de Nueva Guinea (Oeste de Afiica). Esas altas concentraciones en cardljrnenes superficiales mas alla de la plataforma continental son sorprendentes para una especie costem demersal. Esto podria estar, a1 menos parcialmentr, relacionado a comportamiento reproductlvo.
On 27 October 1978, during daytime, the tuna purse seiner Bougainville caught 50 t of large red snappers (Lutjanus agennes) (Bleelter 1863). The catch location was GOSO'N- 13°10'W (Fig. 1 , location 1 ). Depth was more than 3 000 m and the nearest land (Cape St. Ann, Sherbro Island) was 45 nautical miles. As this refers to a demersal species known until then as littoral (Allen 1381 ), such a catch of about 2 500 speci- mens near the surface in open sea is
surprising. T h e purse seine also caught 2 or 3 t of yellowFin tuna (Thunnusa/hcares) weighing 30-40 kg each. The sea surface temperature was 27°C. Once landed in Abidjan, red snappers which were not deformed by freezing were measured (Fig. 2). All specimens were very large and ex- ceeded the maximum length of 80 cm maxi- mum suggested by Blache et at. ( 1 970). and S&et and Opic (1 981 ). Only three speci- mens were carried to the laboratory for

Sierra
Cot€ d'lvoire Ghono N lgeria
o f G u i n e a 0
Longitude (OE or W )
Gabon
Congo
Fig. 1. Locations of red snapper flshlng by tuna purse selners. [Localldades de pesca del p a r p co/orado africano por barcos atuneros de cerco.]
Length (FL; cm)
Flg. 2. Length-frequency distribution for a sample of red snapper {LutJanus agennes)landed by the tuna purse selner Bougalnvllle. [Dlstrllluclh de frecuencla de longitudes para una muestra de pargo colorado afrlcano (Lutjanus agennes) rlescargados por el barco atunero de cerco Bougainviile.l
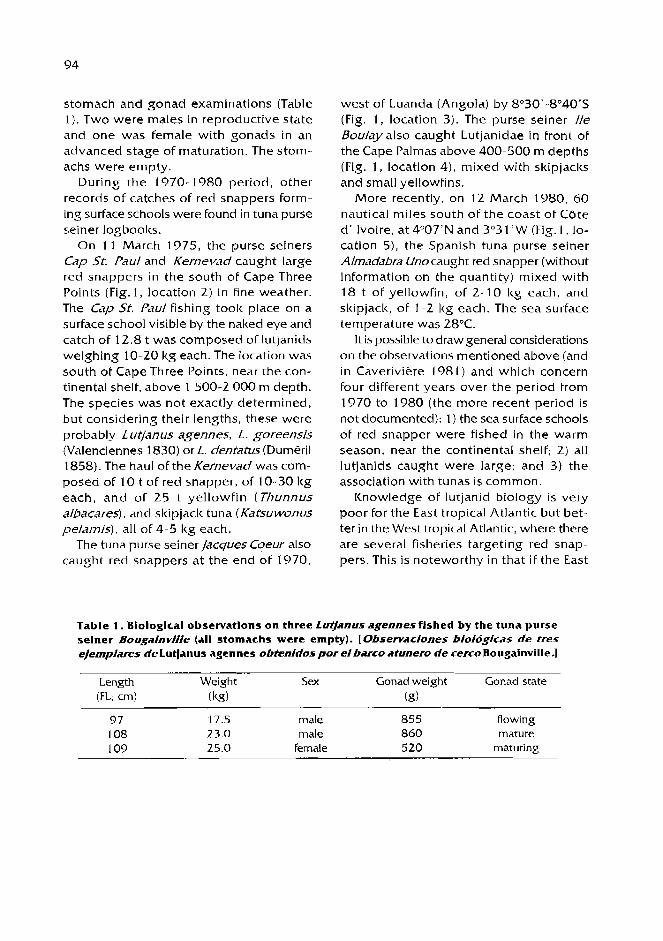
stomach and gonad examinations (Table 1 ) . Two were males in reproductive state and one was female with gonads in an advanced stage of maturation. The stom- achs were empty.
During the 1970- 1980 period, other records of catches of red snappers form- ing surface schools were found in tuna purse seiner logbooks.
On l l March 1975, the purse seiners Cap St. Paul and Kernevad caught large red snappers in the south of Cape Three Points (Fig.l, location 2) in fine weather. The Cap St Paul Fishing took place on a surface school visible by the naked eye and catch of 12.8 t was composed of lutjanids weighing 10-20 kg each. The location was south of Cape Three Points, near the con- tinental shelf, above 1 500-2 000 m depth. The species was not exactly determined, but considering their lengths, these were probably Lu+~nus agennes, L. goreensis (Valenciennes 1830) or L. dentatus (Dumeril 1858). The haul of the Kernevad was com- posed of 10 t of red snapper, of 10-30 kg each, and of 25 t yellowfin (Thunnus albacares), and skipjack tuna (Katsuwonus pelamis), all of 4-5 kg each.
The tuna purse seiner/acques Coeur also caught red snappers at the end of 1970,
west of Luanda (Angola) by B030'-B040'S (Fig. 1 , location 3). The purse seiner fie Boulay also caught Lutjanidae in front of the Cape Palmas above 400-500 m depths (Fig. 1, location 4), mixed with skipjaclts and small yellowfi ns.
More recently, on 12 March 1980, 60 nautical miles south of the coast of Cote d' Ivoire, at 4"07'N and 3"3 1 'W (Fig. I, lo- cation 5), the Spanish tuna purse seiner Alrnadabra Unocaught red snapper (without information on the quantity) mixed with 18 t of yellowfin, OF 2-10 kg each, and skipjack, of 1-2 kg each. The sea surface temperature was 28°C.
It is possible to draw general considerations on the observations mentioned above (and in Caveriviere 1981 ) and which concern four different years over the period from 1970 to 1980 (the more recent period is not documented): 1 ) the sea surface schools of red snapper were fished in the warm season, near the continental shelf; 2) all lutjanids caught were large; and 3) the association with tunas i s common.
Ihowledge of lutjanid biology is very poor for the East tropical Atlantic but bet- ter in the West tropical Atlantic, where there are several fisheries targeting red snap- pers. This is noteworthy in that iF the East
Table 1 . Biologlcal observations on three LuQanus agennes flshed by the tuna purse seiner BougainvMe (all stomachs were empty). [Olservaclones b/ologicas de tres e/emplares tie LutJanus agennes obtenidos por el harco atunero de cerco Bougainville .]
Length Weight Sex Gonad weight Gonad state (FL; crn) (kg) (S)
9 7 17.5 male 855 flowing 108 23.0 male 860 mature 109 25.0 Female 520 maturing

Atlan t ic r e d s n a p p e r s are littoral s p e c i e s o n rocky b o t t o m s , m o s t o f t h e W e s t At- l an t ic r e d s n a p p e r s p re fe r d e e p e r w a t e r s .
O n e h y p o t h e s i s t o explain s u c h concen- t r a t i o n s in s u r f a c e s c h o o l s of f ishes l iving usually near t h e bot tom a n d nearer t h e coasts in m o r e s c a t t e r e d g r o u p s is t h a t t h e s e con- c e n t r a t i o n s a r e r e l a t e d t o r e p r o d u c t i v e behavior . This h y p o t h e s i s is s u p p o r t e d by t h e fact t h a t t h e s c h o o l s f ished w e r e o n l y c o m p o s e d of a d u l t s a n d w e r e o n l y s e e n in t h e w a r m s e a s o n , w h i c h is t h e repro- d u c t i v e p e r i o d f o r t h e W e s t A t l a n t i c Lut jan idae ( t h e o n l y o n e s fo r w h i c h a re- p r o d u c t i v e s c h e d u l e is avai lable) . Further s u p p o r t fo r t h i s h y p o t h e s i s is t h e h i g h m a t u r a t i o n s t a t e of t h e g o n a d s a n d t h e e m p t i n e s s o f t h e s t o m a c h s (Table 1). T h e p h e n o m e n o n c o u l d d e n o t e a par t i cu la r r e p r o d u c t i v e s t r a t e g y , a l t h o u g h t h e sur - vival r a t e s for l a rvae a n d juveni les (which usual ly d e v e l o p n e a r t h e c o a s t ) w o u l d b e low so far f rom t h e c o a s t s . Also , w e c a n a s s u m e t h a t t h e old red s n a p p e r s f o r m i n g t h e s e s u r f a c e s c h o o l s d i e quickly.
References
Allen, G.R. 1981. Lutjanidae. In W. Fischer, G. Bianchi and W.B. Scott (eds) . Fiches FA0 d'identification des especes pour les besoins d e la p&che. Atlantique centre est; zones d e pCche 3 4 , 4 7 (en partie). Vol 11. Canada Fonds d e DCpbt, Ottawa, Ministere d e s Pecheries e t Oceans, Canada, pag , var.
Blache, I . , ] . Cadenat and A. Stauch. 1970. Cles d e dCtermination d e s poissons d e mer signal& dans I'Atlantique oriental (entre le 20" parallPle N. e t le 15" parallPle 5.) . Faune Tropicale, XVIII. ORSTOM, Paris. 480 P.
CaveriviCre, A. 1981. Note sur d e s peches d e bancs d e lu t jan id t s par d e s thonie rs senneurs au large d e s c8tes d e I'ARique d e I'ouest. Centre Rech. OcCanogr. Abidjan (CBte d'lvoire), Doc. Sci., XII(1):91-94.
S t re t , B. and P. Opic. 1981. Poissons d e mer d e I'ouest africain tropical. ORSTOM (Paris) Init. Doc. Tec. 49, 450 p.

Uncommon Mortality of Groupers at the End of the Warm Season
in the Coastal Area of Senegal (West Africa)
A. CAVERIVI~RE Institut Francais de Recherche Scietifique Pour
le Developpement en Cooperation (ORSTOM) 5. P. I386 Dakar, Senegal
D. TOURE Centre de Recherche5 Oceanographiques de Dal<ar-Thiaroye
B. P. 224 1 Dalcar, S&negal
CAVERIVIERE, A. and D. TOUR€. 1996. Uncommon mortality of groupers at the end of the warm season in the coastal area of Senegal (West Africa) [Mortalidadpoco cornun de meros a1 final de la temporada de calor en el area de /as costas de Senegal (Africa Occidental)l, p. 96-1 05. In F . ArreguTn-Sanchez. J . L . Munro. M.C. Balgos and D. Pauly (eds.) Biology, fisheries and culture of tropical groupers and snappers. ICLARM ConF. Proc. 48. 449 p -
Abstract
A large number of serranids. Epinephelus guaza, E. aeneus and Mycteropel-ca ruhra were found, dead or alive, on the sea surface above the Senegalese continental shelf, at the end of the warm season (October-November) in 1987 and, to a lesser extent, in 1988. Their abdomens were drastically distended. These events are probably related to exceptional hydrological conditions.
Resumen
Un gran nQrnero de peces serrinidos fueron encontrados, muertos y vivos, en la superficie del mar sobre la plataforrna continental de S&~@gal, a1 flnallzar la temporada de calor (Octubre-Noviernbre) en 1987; y en 1988 con una menor magnitud. El abdomen estaba drdsticamente distendido. Las especles observadas fueron Epinephelus guaza, E. aeneus y Mycteroperca rubra. Estos eventos podrian estar relacionados con condkiones hidro/6gicas excepcionales.

Introduction
In the beginning of October 1987, many very large demersal groupers (Serranidae) were found, dead and alive, above the Senegalese continental shelf between Dakar and Cape Roxo (Fig. 1) . Their abdomens were drastically distended. The concerned species were the dusky grouper (E,nephe/us guaza), the white grouper (Epinephelus aeneus) and the comb grouper (Mycteroperca ruhra). Later, it appeared that the Grande Cate of Stnigal and the southern shelf of Mauritania were also af- fected by this phenomenon. According to trawler captains, it also extended south- wards, to the shelves of the Republics of Guinea Bissau and Guinea Conakry. The mortality induced by the phenomenon was extensive and in October 1987 many artisanal canoes went to the sea only to collect groupers on the surface. This mortality can be termed as "natural" because it was not induced by fishing gears. The fish caught still alive by the fishers were eaten with- out causing any health problems. The phe- nomenon appeared to diminish in November and the last information is dated 10 De- cember, when a canoe landed 10 dusky groupers weighing about 100 kg, in Dakar. They had been collected alive, with their abdomens distended, near Joal.
At the end of the 1988 warm season, between September and the middle of November, new manifestations of this type of mortality were observed. They were a great deal less than those of the year 1987. According to old fishers, the phenomenon had been seen on occasions before 1987, always at the end of the warm season.
Scientific Observations of Groupers on the Sea Surface
During the two last weeks of October 1987, a trawl survey carried out on the entire Sh-kgalese continental shelf on the
R/VLouis Sauger permitted the observation of several groupers on the sea surface (Fig. 1).
The first grouper was located on 15 Oc- tober in the North Gambia area (1 3042.N) above 32 m depth (Fig. 1, spot 1 ) . It was a dead dusky grouper (E. guard) weigh- ing about 10 kg. The decomposed body prevented other observations. A bottom trawl tow carried out minutes before the discovery of the grouper caught a very small quantity of fish mainly composed of semipelagic species. The few specimens of dernersal species were small in size.
On 18 October, three dusky groupers (E . guaza) and a white grouper (E. deneus). apparently dead, were observed on the sea surface in front of the Sangomar pe- ninsula (1 3O50'-13"57'N), above 8-12 m depth (Fig. 1, spot 2 ) . The trawl tow underway prevented capturing them. Ac- cording to the benthic habitat and the com- position of the catch, these groupers had certainly drifted in from deeper waters.
On 22 October, a live white grouper was caught on the sea surface in front of the mouth of the Casamance river (1 2O37.N) above 35 m depth (Fig. 1 , spot 3). This grouper was still robust and only the drastically distended abdomen impeded its escape. Despite numerous attempts it was not able to dive below 2 rn. It was 61 cm in total length and weighed 2.9 kg. The gills were apparently in excellent condition, as was the the abdominal cavity. No parasite was seen by the naked eyes on and inside the fish. The stomach was empty. Only 16 kg of other fish were caught in the bottom trawl, mainly composed of semipelagic species. The few specimens of demersal species were very small in size. The water was very clear.
The last grouper observed on the sea surface was a white grouper, 57.5 cm in length and 2.1 kg in weight. caught alive to the north of Casamance (1 2 5 1 'N) above 50 m depth (Fig. 1, spot 4). Like the former, it was still very robust although its abdomen

Fig. 1. Locations of the groupers (squares 1-4) observed on the sea surface by the R/V Louis Sauger and locations of the hydrologlcal transects( ). [Local- Izacldn de 10s meros (cuadrantes I a 4) observados en la superflce por e/ R/V Louis Sauger y focalIzacl6n de 10s fransectos hIdro1dgIcos ( ).I
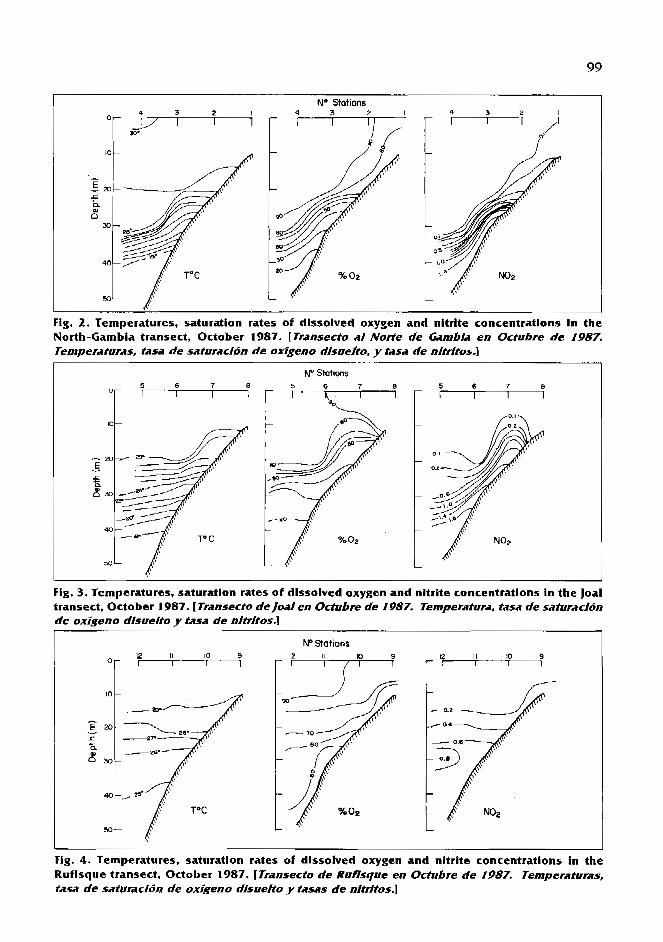
No Stotions 4 I
I 3
I 2
I
J
Fig. 2. Temperatures, saturation rates of dlssolved oxygen and nitrlte concentrations in the North-Gambia transect, October 1987. [Transecto a/ Norte de Gambla en Octulrre de 1987. Temperaturas, tasa de saturacldn de oxlgemo disuefto, y tasa de nltrltos.]
No Stations
Fig. 3. Temperatures, saturation rates of dissolved oxygen and nitrite concentrations in the Joal transect. October 1987. [Transecto de foalen Octubre de 1987. Temperatura, tasa de saturation de oxigeno dlsuelto y tasa de nltrltos.]
1
Flg. 4. Temperatures, saturation rates of dlssolved oxygen and nitrite concentrations in the Rufisque transect. October 1 987. [Transecto de Ruflsque en Octubre de 1987. Temperaturas, tasa de saturaclbn tie oxigeno dlsuelto y tasas de nitrites.]

was very distended. A rough examination showed that a gill arch was broken. Two trawl hauls near to this point in 38 m and 52 m depths yielded 36 kg and 72 kg, respectively, mainly composed of semi- pelagic species with a Few small-sized demersal specimens.
Between 27 and 3 1 October, the trawl survey along the Grande CBte (Dakar to Saint-Louis) showed no groupers o n the sea surface. The observations may have been impeded by the state of the sea which was rough, but probably the phe- nomenon had stopped in this area, at least temporarily.
The Environmental Condltlons
The two first days of the survey were used to determine the sea water condi- tions along three transects located in front of the Petite-CBte (RuFisque, Joal and North- Gambia transects) between the depths of 10 and 50 rn (Fig. 1 ) . The object was to compare the results with those obtained
during the sea water surveys carried out in the same area in the previous years (Caverivitre and Toure 1990).
The temperature, salinity, dissolved oxygen and two salts (nitrates and nitrites) were the main physical and chemical parameters analyzed. Phytoplankton and zooplankton were also sampled.
Temperature
During the transects, an important warming of the sea surface was observed and sometimes the temperature went beyond 30°C, reading 30.5"C at the 40 m station of the North-Cambia transect. With the lack of wind, this warming resulted in the for- mation of a strong thermocline separating a stratum of homogeneous warm water from the deep cold waters. The longitudinal sections drawn in Figs. 2-4 clearly show the exist- ence ofa strong thermal gradient between 30 and 40 m. This thermocline is more marked in the southern and intermediate transects (North-Gambia and Joal) than in
No Stations
Fig. 5. Temperatures, saturation rates of dissolved oxygen and nitrite concentrations In the North-Gambia transect, October 1986. [ Transecto a1 Node de Gambia en Octubre de 1986. Temperatura, tasa de saturacibn de oxigcno dlsuelto y tasas de nltrltos.]

the Rufisque transect. In the North-Gambia transecr the thermal gradient reached values of up to 1°C per meter. The intermediate sea water layer with a s t rong thermal gradient also had a strong density gradi- ent (pycnocline) which can form a barrier and reduce or impede exchanges between the homogeneous surface layer and the deep waters.
The standard situation in the warm sea- son was shown by the North-Gambia transect in September 1786 (Fig. 5). The thermocline
is less marked with more separated iso- therms. Exchanges by diffusion (molecular and turbulent) can occur more easily be- tween the deep and shallower waters.
A study of the sea surface temperatures collected daily at two beaches, Mbour (Petite CBte) and Yoff (suburbs north of Dakar), showed that the entire summer of 1987 was particularly warm. Tables 1 and 2 show the monthly mean temperatures from July to October, since 1752 for Mbour and since 1974 For YoR.
Table 1 . Sea surface temperatures ("C). Monthly means (July to October) and warm season means in the Mbour coastal station (1752 to 1988). Values equal to or above 1787 values are In bold type. [Temperaturas de la superficie del mar PC). Medias meosuales I/ullo a Octubre) y medias de la 6poca calurosa en la estacion costera Mbour (/352-/988), Valores iguales a mayores a 10s presentados en 1987 se muestran en negrlfas.]
M o n t h 1 [J I Y A u g u s t September O c t o b e r M E A N
Year 1952 28.4 28.1 28.4 27.8 28.2 1953 27.7 28.6 28.0 28.2 78 .3

Table 2. Sea surface temperatures ("C). Monthly means (July t o October) and warm s e a s o n means In the Yoff coastal station (1974 t o 1988). Values equal t o or above 1 987 values are in bold type. [ Temperatura de la superficle del mar PC). Medias mensuales //ulio a Octuhre) y medjas rle la epoca calwrosa en la estacj6n costera de Yoff (1974 a 1988). Valores jguales o mayores a 10s de 1987 se rnuestran en n egrltas.]
Month luly August September October MEAN Year 1974 26.8 27.3 27.8 25.9 27.0 1975 26.8 27.7 Z7.4 27.0 27.2 1976 26.9 27.6 27.9 26.9 27.3 1777 27.0 27.0 27.0 25.9 26.7 1778 26.9 27.7 27.7 27.1 27.4 1979 26.8 27.6 27.9 27.1 27.4 1980 27.0 27.1 27.3 25.8 26.8 1981 27.3 28.0 28.5 28.2 28.0 1982 27.8 27.7 28.7 27.4 27.9 1983 28.1 28.2 28.3 28.5 28.3 1984 26.9 . 27.2 27.5 26.0 26.9 1785 26.2 27.7 27.5 26.3 26.9 1986 27.0 27.6 27.7 26.8 27.3 1987 27.9 28.2 28.2 27.7 28.0 1988 26.9 27.9 27.6 25.7 27. 1
Dissolved oxygen
In October 1987 the saturation rates in dissolved oxygen For the homogeneous surface layer were similar to the rates ob- served in September 1986. In contrast, the rates were abnormally low on the grounds deeper than 30 m on the Joal and North- Gambia transects. In 1987 the absolute values (1.5 ml/l and sometimes I . 1 ml/l at 40 m) were much lower than those observed during the standard period.
This strong oxygen deficit could be ex- plained by the existence of an intermedi- ate sea water layer with a strong density gradient. This density barrier impedes all exchanges between the homogeneous surface layer rich in oxygen and the deeper layer. In this case the dissolved oxygen contained in the deep layer cannot be renewed. It would be slowly consumed by the organisms living in these waters and on the bottom, as well as by the decom- position of o-zanic matter.
Nitrites
At first, the degradation of the nitrog- enous organic products (ammonia elimi- nated by gills, excrement, plants, dead organisms) forms ammoniated compounds. These compounds are then transformed into nitrites (NO;) by bacteria, after which other bacteria transform the nitrites into nitrates (NO;). All these microorganisms are oxygen consumers and a strong oxy- gen deficit could slow the last step, the nitrate production by specialized bacte- ria, and consequently increase nitrite con- centrations. Nitrite toxicity in fish is a great deal higher than nitrate toxicity (Terver 1 985).
In October 1987 (Figs. 2-4) the nitrite concentrations in the homogeneous sur- face layer were normal. In contrast, the deeper waters showed concentrations of up to 1.73 pg.1.'. In the standard situa- tion (September 1986) the maximum reaches only 0.3 pg.1-' (Fig. 5).

Phfioplankton and zooplankton
The biomasses O F phytoplankton and zooplanl<ton sampled during the transects were low but showed the usual species composition. It is possible that the last windy pel-iods at the end of the rainy season enabled the release and/or an increase of inorganic salts into the euphotic area and consequently a phytoplankton bloom. Once a high wa- ter stability occurred, this phytoplankton could have been subject to a high mortal- ity and formed a deposit on the bottom. Then, the aerobic bacteria could have pro- liferated, leading to an increase in nitrite. In a new Fish tank, the concentration of toxic nitrites reaches a maximum 17 days after the tank has been put into service (Terver 1985); prior to that the bacteria transforming nitrites into nitrates are not sufficiently abundant. This lack may be OF the same magnitude in the open sea, where the bacterial counts are low under normal conditions.
Discussion
Two factors may be related to the pres- ence O F groupers occurring on the surface with abdomens distended by a gas which cannot be evacuated, and consequently impede diving and finally cause death. The first can be an exogenous Factor related to the environmental conditions, and the second an endogenous factor, e.g., a disease.
The exogenous factor could be related to the strong oxygen deficits and the strong nitrite concentrations observed on the 30- 40 m grounds, where groupers prefer to live. Respiratory dificulties could have forced the fish to rise too quickly. In this case, the gas contained in the swim bladder expands and if the fish cannot evacuate a part of this gas quicltly and/or slow down
its ascent, then it will necessarily be car- ried away to the surface. It is dangerous for fish that have no pneumatic duct con- necting the swim bladder to the alimen- tary canal (i.e., physoclists) to make sud- den upward movements (Bertin 1958). Then, the swim bladder can explode or a gen- eral hernia of viscera into the mouth can occur. This is often observed during the capture O F serranids by trawl or hooks, particularly for E guaza and E. aeneus.
Generally a decrease of dissolved oxy- gen in water below a certain level results in the escape of the fish, without mortal- ity, Troadec ( 1 97 1 ) showed that in Cote d'lvoire, where the Fish communities are similar to those in Senegal, the yields of some species decrease when the dissolved oxygen levels are below 2.0 mill. This phe- nomenon also must be true in Senegalese waters because, as indicated above, the trawl catches were low, and principally consisted of semipelagic species, when groupers were observed on the surface. The effect of the low oxygen concentra- tions on respiration could have been in- creased by the eFfect of nitrite concentra- tions Five times higher than normal: nitrites are toxic salts acting on the oxygen fixa- tion by haemoglobin (Terver 1985).
The bibliographic study of Person-Le Ruyet ( 1 986) o n the oxygen requirements of marine fish indicates that these requirements can be increased strongly by temperature in- creases. According to the adaptability of the species, a 10°C temperature variation could double, triple or even quadruple oxygen requirements.
In all instances there are Few species which can maintain normal metabolic activity under a very large thermal increase. Incidentally, it is worth noting that Senegalese groupers are subject to strong thermal variations between summer and winter, generally higher than 10°C. In 1987, the maximum amplitude of the sea surface temperatures

was 1 2.Z°C ( 1 7.9OC to 30.1 OC) in Mbour beach. Moreover, the critical threshold of respiratory dependence (oxygen concentration threshold below which there is a direct correspondence between con- sumption and oxygen availability) increases i f the other environmental conditions are not optimal; this must be the case in the warm season and particularly at the end of the 1987 summer. In contrast, the critical threshold is reduced if there is a progressive acclimation of the fish to low oxygen pressures. The critical threshold is high; for marine species it is always above 4-5 ppm (3.2 ml/l). The lethal threshold For the entire population (LD,,,) is a great deal lower when all other conditions are good: 0 .3 to 0.6 ml/l. No data exist For LD,, and LD,,.
I f the hypothesis on respiratory difficul- ties is correct, we can assume that the groupers will have stayed too long in unfavorable waters, which may be related to their territorial habits. It is well known that serranids, particularly the dusky grouper Epi17ephe/usguaza, choose a shelter in the middle of their hunting territory and are, with age, increasingly reluctant to move away from it. According to Neill (19671, E. guaza generally would not venture 5 m beyond its territory. When the environmental conditions became intolerable, probably first for the big groupers whose oxygen require- ments are considerable, it would have been too late to swim away Following the bot- tom and the Fishes had no choice but to swim towards the surface.
Alternatively the mortality may have been induced by an endogenous factor, e.g., a bacterial infection leading to release of gas into the visceral cavity or the swim bladder. This epidemic would, however, have to be narrowly linked to the hydrological conditions, because it occurred only in the
warm season, particularly towards the end: during the end of the R/V Louis Sauger survey in October 1987, groupers on the sea surface were not observed to the north of Senegal, between Dakar and Saint-Louis. At this time, the trade winds had already induced a return to a more normal hydrological situation by breaking the stratification.
Moreover, diseases and parasites pre- viously known among the groupers Epinephelus guaza and E, aeneus (Brusle 1985) do not seem related to the mortal- ity observed in Senegalese waters.
Conclusion
It is concluded that the high unusual mortality of groupers observed in Octo- ber 1987 resulted from abnormal environ- mental conditions. It seems likely that sig- nificant warming of the surface waters and the lack of wind had induced a strong vertical gradient (thermocline and pycnocline) sepa- rating the homogeneous warm water from the deep cold waters and that respiration and decomposition resulted in an oxygen deficit below 30-40 m. The large increase in nitrites was probably related to the oxygen deficit. It is believed that respiratory diffi- culties induced by low dissolved oxygen levels, aggravated by the abnormally high nitrite concentrations, led to the grouper mortality. The results of benthic trawl tows at 30-50 m showed that most of the fish species had moved, particularly the demersal fishes. However, the chain of events lead- ing to inflation of the grouper swim blad- ders is not clearly understood and the occurrence of an epidemic disease, almost surely related to the environmental con- ditions, cannot be dismissed.

References
Berth, L. 1958. Vessie gazeuse, p. 1342-1 362. In P.P. Grasse (ed.) Trait6 de zoologie. Tome XIII. Fasc. 11. Masson, Paris.
Brusle, 1. 1985. Expose, synoptique des donnees biologiques sur les rntrous Epinephelus aeneus (Geoffrey Saint Hilaire, 1809) et Epinephelus guaza (Linnaeus, 1758) de I'Octan Atlantique et de la Mtditerrnie. FA0 Synop. Peche 129,64 p.
\ Caveriviere, A. and 0. Tour&. 1990. Note sur les rnortalites de mtrou (Serranidae) observees en fin de saison chaude devant les cotes du Senegal, particuli&rement en 1987. Centre Oceanogr. (Dakar-Thiaroye) Doc. Sci. 1 16:43-63.
Neill, J.R. 1967. Observations on the behaviour of the grouper species Epnephelusguaza and E. a/exandr~nus(Serranidae). Undewat. Assoc. Rep. 1966-67: 101 -1 06.
Person-Le Ruyet, J. 1986. Les besoins en oxygene des poissons rnarins et leur comportement en condltions hypoxiques. Revue bibliographique. IFREMER (Brest, France) DRV-86-04, 24 p.
Terver, D. 1985. Manuel d'aquariologle. L'aquarium d'eau douce - eau de mer. Rtalisations Editoriales PCdagogiques, Paris. 303 p.
Troadec, J .P . 1971. Biologie et dynamlque d'un Sciaenidae ouest-africain, Pseudotofithus senegalensis(V.). Centre Rech. Octanogr. (Abidjan) Doc. Scient. 3, 225 p.

Groupers and Snappers of India: Biology and Exploitationa
P.S.B.R. JAMES V. SRIRAMACHANDRA MLIRTY
P. NAMMALWAR Central Marine Fisheries Research Institute
Cochin- 14, India
JAMES, P.S.B.R., V. SRIRAMACHANDRA M U R N and P. NAMMALWAR. 1996. Groupers and snappers o f India: biology and exploitation [Merosy pargos de /a India: biologia y explotacidn], p. 106-136. In F. Arregufn-SBnchez, J.L . Munro. M.C. Balgos and D. Pauly (eds.) Biology, Fisheries and culture o f tropical groupers and snappers. ICLARM Conf. Proc. 48. 449 p.
Abstract
The fishes of the families Serranidae (groupers) and Lutjanidae (snappers) are an important resource along the lndian coast. They are represented by 79 species in the lndian seas, reach up to 2 m and are abundant in and around rocky outgrowths and coral ridges at depths extending to about 360 m. Their exploitation presently yields an average annual landing of 8 000 t or about 3% of total lndian marine fish landings. This paper summarizes present Itnowledge on distribution, exploitation, culture and biology of groupers and snappers in India.
Los peces de la faml//a Serranldae (meros) y Lupnidae (pargos) representan un importante recurso a lo largo de las costas de la India. EstAn representados por 79 especies dentro de 10s mares de /a India, algunos alcanzan mas de 2 m de /ong/tud y son abundantes dentro y en 10s alrededores de fondos rocosos y bordes arrecifales a profundidades que se extienden a mas de 360 m. La explotacidn rinde actualmente un promedio anual de 8 000 t que equivalen a1 3% del total de peces marinos descargados en la India. Este trabajo sintetira el conocimiento actual sobre la distrlbucidn, explohcion, cultivo y biologfa de meros y pargos de 1.3 India.
"This contribution was assembled by the editors based on two submitted manuscripts: "Groupers and snappers of India: their distribution, exploitation and biology" by P.S.B.R. James and V. Sriramachandra Murty, and "Studies on the fishery, biology and cultivation of groupers and snappers along the lndian coast - exploitation and management'' by P. Nammalwar, and complemented by a FishBase list of the groupers and snappers of India, a150 used to update the scientific names of the originals.

Introduction
Groupers belonging to Epinephelusand other genera (Family Serranidae) are large- sized marine food fishes reaching up to 270 cm in length and weights of up to 455 kg. Thirty-eight species of groupers have been reported from the seas around lndia (Appendix I ) . Most species of groupers inhabit coral reefs and rocky habitats but some show a preference for seagrass beds and muddy or sandy bottoms. Juveniles of some species of groupers are also found in upper reaches of estuaries. Most spe- cies are solitary and all are predators on Fishes and invertebrates including crabs and lobsters. Usually, groupers are protogynous hermaphrodites, i.e., they first mature as females, then transform into males. Groupers are excellent food fishes and hence have assumed importance for commercial cul- ture in various countries, including India.
Snappers (Family Lutjanidae) are brightly colored, predatory marine fishes reaching 170 cm and weights of up to 57 kg. Forty- one species of lutjanids have been reported from the seas around lndia (Appendix 11). Most of them are demersal, and occur in shallow coastal waters and coral reefs; juveniles of some species of snappers are also Found in estuaries. Snappers are predators of Fishes and invertebrates, mainly crabs and prawns. Being excellent food fishes, snappers are gaining importance in mariculture.
Distribution
Exploratory and experimental fishing surveys by different agencies in lndia have generated valuable information on the dis- tribution of groupers and snappers around the country (Gopinath 1954; Menon and Joseph 1969; Silas 1969; Menon et al. 1977; Bapat et al. 1982; Ninan et al. 1984; Sornavanshi and Bhar 1984; Philip et al. 1984: Sivapraltasam 1 986; Joseph et al. 1987;
Sulochanan and John 1988; and Oornen 1989). The Indian coast is divided into four regions: 1 ) northwest consisting of Gujarat and Maharashtra states; 2) southwest con- sisting of Goa, Icarnataka and Kerala; 3) south- east consisting of Tamil Nadu, Pondicherry and Andhra Pradesh; and 4) northeast con- sisting of Orissa and West Bengal (Fig. 1 ).
Northwest. Bapat et al. ( 1982) conducted a survey in 1977 From 24ON (55-360 m depth) with a 70-m vessel using bottom and pelagic trawls. A total of six cruises were made during which 247 bottom trawl and 542 pelagic trawl hauls were taken.
The highest bottom trawl catch rate, of 88 Icg-hour-', was obtained at 1 7"N 126- 360 m during April-May followed by 69 kg-hour-' at 91 -1 25 rn at the same latitude, also in April-May. Among groupers, six species (Epinephelus areolatos, E, hsciatus, E. malabaricus, E. lanceolatus and E. la~faciatus) contributed to the catches. During the entire bottom trawl survey, the high- est catch rate of groupers, of 13.3 kg hour-' was obtained from 91 -125 rn, followed by 6.1 Icg hour-' in 126-360 rn and 1.93 kg in the 55-90 m depth zone. The highest catch rate OF pelagic trawls was 43.5 I<g hour2' in the 126-360 m depth zone, at 1 9"N dur- ing February-April, and next was 9.7 kg hour-' at 20°N, from 55-90 m during No- vember-December. In the pelagic trawl survey as a whole, the highest catch rate of 0.7 kg hour-' was obtained at 126-360 m depth followed by 0.3 kg hour-' at 55- 90 rn depth and zero in the 9 1 - 126 m depth range.
In this survey, the snappers also were represented by six species (Lutjanus argen timacu/a tus, L. johnii, L. vitta, L . malabarkus, L. sanguineus and L. fulvus) . For bottom trawling, the catch rate of snappers was 4.6 kg-hour-' in the 91 -1 25 m depth range followed by 1.89 kg*hour-' in the 126- 360 m and 1.5 kg-hour-' in the 55-90 m depth zones. The highest catch rate of 32.7 kg-hour-' was obtained in April-May in the

Fig. 1. Map of the Indlan coast showing the four regions surveyed and the locations mentioned in the text. [ M a p de /as costas de fa India mostrando cuatro reglanes exploradas y /as Areas mencionadas en el texto.]
9 1 - 1 25 rn dep th from 1 6 t o 17"N. Nearby, but in t h e 55-90 m d e p t h range, a catch rate of 1 4 . 3 kg-hour-' w a s obtained.
For t h e pe lagic trawl, only t h e a rea be- t w e e n 55-90 m d e p t h y ie lded ca tches of s n a p p e r s w i th a n a v e r a g e ca t ch r a t e of 3.3 kg-hour- ' : t h e a r e a b e t w e e n 22 a n d 23"N y ie lded t h e h i g h e s t ca t ch r a t e of 16.8 kg-hour- ' in April-May fo l lowed by 1 0 . 6 kg.hour-I in t h e a r e a b e t w e e n 18 a n d lQON.
The results o f a survey conducted a t 20 - 23"N and 68-7O0E dur ing 1985-88 using a trawl with a 32-m head rope (Vivelanandan e t al. 1990) showed that "perches" (of which g r o u p e r s a n d s n a p p e r s a r e a m a j o r component) formed 4.2% of the total catch, with a period of peak abundance extending frorn Oc tobe r t o February. The catch ra tes varied strongly between years, ranging frorn ze ro to about 3 kg*hour" ' , being highes t be tween 4 1 a n d 70 m.
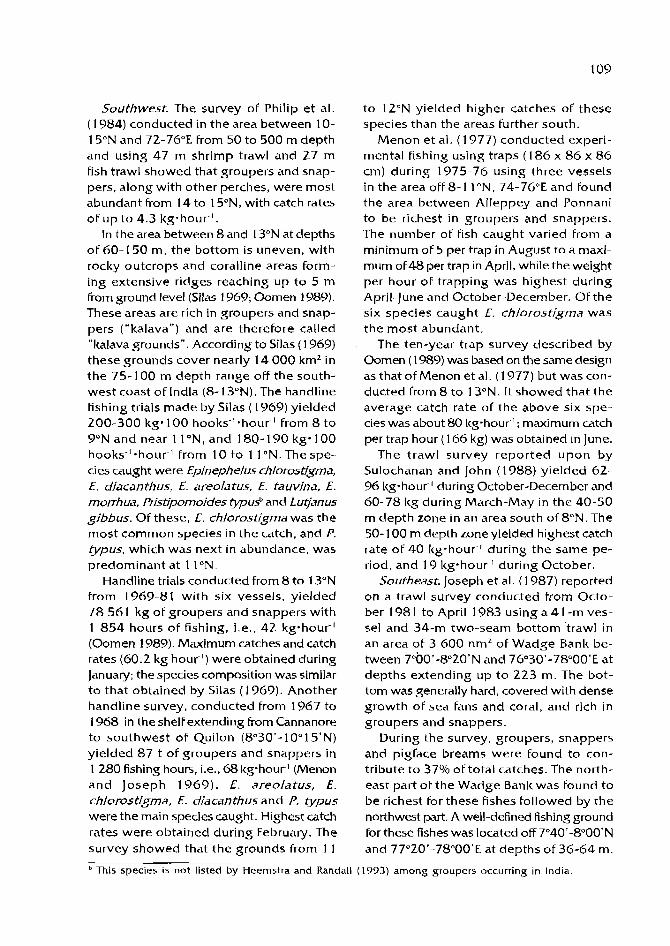
Southwest. T h e s u r v e y of Philip e t a l . ( 1 9 8 4 ) c o n d u c t e d in t h e a r e a b e t w e e n 1 0 - 15"N a n d 72-76"E from 50 to 500 m d e p t h a n d u s i n g 47 m s h r i m p t rawl a n d 27 m fish t rawl s h o w e d t h a t g r o u p e r s a n d s n a p - p e r s , a l o n g w i t h o t h e r perches , w e r e m o s t a b u n d a n t From 1 4 to 1 5"N, wi th catch rates o f u p to 4.3 k g - h o u r - ' .
In t h e a r e a b e t w e e n 8 a n d 13"N at d e p t h s o f 6 0 - 1 50 m , t h e b o t t o m is u n e v e n , w i t h rocky o u t c r o p s a n d coral l ine a r e a s form- i n g e x t e n s i v e r i d g e s r e a c h i n g u p to 5 m From ground level (Silas 1969; Oomen 1989). T h e s e a r e a s a r e rich in g r o u p e r s a n d s n a p - p e r s (" l<alavaW) a n d a r e t h e r e f o r e ca l led "l<alava grounds" . According to Silas ( I 9 6 9 ) t h e s e g r o u n d s c o v e r nearly 1 4 000 kmZ in t h e 75- 1 0 0 m d e p t h r a n g e off t h e s o u t h - west coast of India (8- 13"N). T h e handl ine f ishing trials m a d e by Silas (1 9 6 9 ) y i e l d e d 200-300 kg. 1 0 0 h o o k s - ' . h o u r - ' f r o m 8 to 9"N a n d n e a r 1 1 ON, a n d 1 8 0 - 1 9 0 kg. 100 h o o k s - ' . h o u r - ' f r o m 1 0 to 1 l 0 N . T h e s p e - cies c a u g h t w e r e Epinephelus chlorostigma, E. didcanthus, E. areolatus, E. tauvina, E. morrhua, Pristipomoides WpuY a n d Lo fjanus gibbus. O f t h e s e , E. chlorostigma w a s t h e m o s t c o m m o n s p e c i e s in t h e ca tch , a n d P. typus, w h i c h w a s n e x t in a b u n d a n c e , was p r e d o m i n a n t at 1 1 ON.
Handline trials c o n d u c t e d from 8 to 13"N f r o m 1 9 6 9 - 8 1 w i t h six vessels, y i e l d e d 7 8 561 k g o f g r o u p e r s a n d s n a p p e r s w i t h 1 854 h o u r s o f f ishing, i.e., 42 kgmhour-I ( O o m e n 1989). Maximum ca tches a n d catch ra tes (60.2 k g hour - ' ) w e r e ob ta ined dur ing January; t h e spec ies composi t ion was similar to t h a t o b t a i n e d b y Silas (1 969). A n o t h e r h a n d l i n e s u r v e y , c o n d u c t e d f rom 1 9 6 7 to 1 9 6 8 in t h e shelf ex tending from Cannanore to s o u t h w e s t o f Q u i l o n (8"3O'- 1 O"1 S 'N) y i e l d e d 87 t o f g r o u p e r s a n d s n a p p e r s in 1 280 fishing hours, i.e., 68 kg-hour1 (Menon a n d J o s e p h 1 9 6 9 ) . E. areolatus, E. chlorostigma, E. diacanthus a n d P. typus w e r e t h e main spec ies caught . Highest catch r a t e s w e r e o b t a i n e d d u r i n g February. T h e s u r v e y s h o w e d t h a t t h e g r o u n d s from 1 1
to 12"N y i e l d e d h i g h e r c a t c h e s of t h e s e s p e c i e s t h a n t h e a r e a s fur ther s o u t h .
M e n o n et al. (1 977) c o n d u c t e d exper i - m e n t a l f ishing u s i n g t r a p s ( 186 x 86 x 86 c m ) d u r i n g 1 9 7 5 - 7 6 u s i n g t h r e e v e s s e l s in t h e a r e a off 8- 1 1 ON, 74-76"E a n d f o u n d t h e a r e a b e t w e e n A l l e p p e y a n d Ponnani t o b e r ichest in g r o u p e r s a n d s n a p p e r s . The n u m b e r of fish c a u g h t v a r i e d f rom a min imum of 5 p e r t r a p in A u g u s t t o a maxi- m u m of48 per t rap in April, while t h e weigh t p e r h o u r O F t r a p p i n g w a s h i g h e s t d u r i n g Apri l -June a n d October -December . Of t h e s i x s p e c i e s c a u g h t E. chlorostigma w a s t h e m o s t a b u n d a n t .
T h e ten-year t r a p s u r v e y d e s c r i b e d by O o m e n (1 989) w a s based o n t h e s a m e design as t h a t of M e n o n et al. ( 1 9 7 7 ) b u t was con- d u c t e d from 8 to 13"N. It s h o w e d t h a t t h e a v e r a g e c a t c h r a t e of t h e a b o v e s i x s p e - cies w a s a b o u t 80 k g - h o u r ' ; maximum catch p e r t r a p hour (1 66 kg) was obta ined in June .
T h e t r a w l s u r v e y r e p o r t e d u p o n b y S u l o c h a n a n a n d J o h n ( 1 9 8 8 ) y i e l d e d 62- 96 kg-hour- ' dur ing October -December a n d 60-78 k g d u r i n g March-May in t h e 40-50 rn d e p t h z o n e in a n a r e a s o u t h of 8"N. T h e 50- 1 0 0 m d e p t h z o n e y ie lded h ighes t catch r a t e o f 40 k g - h o u r 1 d u r i n g t h e s a m e p e - r iod, a n d 1 9 kg.hour- ' d u r i n g O c t o b e r .
Southeast. J o s e p h et al. (1 987) r e p o r t e d o n a t rawl s u r v e y c o n d u c t e d f rom Octo- b e r 1 9 8 1 t o April 1 9 8 3 u s i n g a 4 1 - m v e s - sel a n d 3 4 - m t w o - s e a m b o t t o m t rawl in a n a r e a of 3 600 nm7- o f Wadge Bank b e - t w e e n 7 ' 0 0 ' - 8 0 2 0 ' ~ a n d 76°30'-78"00'E at d e p t h s e x t e n d i n g u p to 223 m . T h e b o t - t o m w a s generally hard, covered with d e n s e g r o w t h of s e a fans a n d coral , a n d rich in g r o u p e r s a n d s n a p p e r s .
Dur ing t h e s u r v e y , g r o u p e r s , s n a p p e r s a n d p igface b r e a m s w e r e f o u n d to c o n - t r ibu te to 3 7 % o f t o t a l c a t c h e s . T h e nor th- east p a r t of t h e W a d g e Bank was f o u n d to b e r ichest for t h e s e f ishes Followed b y t h e northwest part. A well-defined fishing ground for t h e s e fishes was located off 7"40'-B000'N a n d 77"20'-78"OO'E at d e p t h s of 36-64 m.
--
' This species is not listed by Heernstra and Randall (1993) among groupers occurring in India.

The catch rates at different depths showed that the abundance of these fishes decreased with increasing depth.
Well-defined variations in seasonal abun- dance occurred, with July-September hav- ing the greatest catch rates (up to 153.4 Icg-hour-') at depths of 18-45 m (7"N).
The species that contributed to the catches were: E. diacanthus, E. areolatus, E. rnalabdricus, E, longispinisand E, tauvina among groupers and L. argenfimaculatus, L. rnalabaricus, L. Iutjanus, L. vitta and L. rivulatus among snappers. The survey al- lowed the estimation of a standing stock of perches of 10 000 t, of which most (55%) occurred in the 18-45 m depth range.
The trawl survey by Sivaprakasam (1 986) on Wadge Bank and Gulf of Mannar at depths ranging from 250 to 500 m during Octo- ber-March 1985 revealed the dominant species of groupers and snappers in the area to be Epinephelus diacanfhus, E. Buvina, E. lanceolatus, L utjanus argenti~nacula tus, L . rnalabaricus, L. lutjanus, L. rivula tus, Pristipomoides @pusand Aprion virescens. The survey also confirmed that groupers and snappers were most abundant in the 20-50 m depth zone in the Wadge Bank area, their abundance decreasing with depth, as also described by Joseph et al. ( 1 987); there was no catch of these fishes in the 200-500 m depth zone. In the Gulf of Mannar as well, maximum catch rates were obtained at depths of 20-50 m, with very poor or no catches in deeper waters. On the Wadge Bank, the peak period of abundance of the fishes was observed to be January-February whereas the same was in May, July, October. and December in the Gulf of Mannar.
Somavanshi and Bhar (1 984) conducted a brief trawl survey (October 1983-March 1984) in the Gulf of Mannar (8-1O0N). Perches (E. diacanthus and other serranids, L. argentimaculafus and other lutjanids,
lethrinids, aunthurids and scolopsids) formed 2 1 O h of the catches. Of these, the snap- pers were found to be dominant, followed by groupers and pigface breams. Depths of up to 50 m were Found to be most pro- ductive for these fishes.
Northeast: Ninan et al. ( 1984) conducted a trawl survey during 1983-84 in the re- gion off 1 a004'- 1 7"30'N at depths of 45- 330 m. The perches (including groupers and snappers) formed 4.4% of the total catch of 176 t obtained during that survey.
Biology
Though groupers form an important com- ponent of the perch fisheries in the southwest coast of India, there is little information on the biology of commercially important species. Although many species of groupers have been reported from the seas around India (see Appendix I), only a few of them are represented in commercial catches. Among them, ,Epinephe/us tauvina, E. rnalabaricusand E. Meekeriare commonly found. Groupers are predatory Fishes feeding on crabs, prawns, polychaetes and other fishes such as Terapon and Ambassis (Devanesan and Chidambaram 1948). Most groupers are hermaphrodites, first matur- ing as females, then becoming males with advancing age and size.
Some ecological conditions of areas where groupers and snappers are abundant, i.e., along the east and west coasts of India, and their seasonal variations were studied in successive cr~ises of R/VSagarSampada (CMFRI 1985-1 992). Depthwise (1 0- 100 m), salinity ranged from 33.05 to 34.57 ppt, temperature from 26.85 to 23.15"C, and dissolved oxygen from 1.85 to 4.85 ml-I-' on the east coast and From 33.50-35.87 ppt, 26.25-29.1S0C and 3.63-4.35 ml-I-' in the west coast, respectively.

Only preliminary investigations on the biology of grouper and snapper species have been published, as follows:
1 . Pristipomoides &pu&: Oomen ( 1976) studied food and Feeding habits based on samples taken off the Kerala Coast. Fish, cumaceans, mysids, crabs, stornatopods and cephalopods formed the important food items, but 62% of Ash examined had everted stomachs. On the basis of 345 specimens of 21.5- 34.9 cm, the length-weight relationship was calculated as log W = -5.1002 + 3.0303 logL. Preliminary studies of supraoccipital crest in fishes O F 26.0- 27.4 cm revealed three growth rings and a fourth under formation in the 27.5-28.9 cm group.
Premalatha ( I 989) estimated the length-weight relationship using fe- males ranging from 35-60 cm as log W = -1.4959 + 2.7063 logL. The spawn- ing season was determined to be Feb- ruary-June.
2. E. diacanthus: Bapat et al. (1982) observed mature and spent adults in September. Silas ( 1969) collected juveniles of this species from 30-60 m and 100- 160 m depths. In June 1966, 10 kg of juveniles OF this species were collected from trawl catches frorn 160 m depth. Growth and mortality parameters were estimated as L_ =
45.5 cm, 1<=0.45 year-', M=0.76 year' and F=0.31 year-' (Anon. 1991). Premaiatha ( 1989) estimated a length- weight relationship for the female of this species (females) as log W =
- 1.3056 + 2.6 1 17 logL based on speci- mens ranging from 20 to 55 cm. The spawning period was determined as May-June.
3. E. areolatus: Off Kerala State, the spawn- ing season was determined as June- July and length-weight relationship log W = -1.2521 + 2.55772 logL for Females and log W = -0.8994 + 2.3287 logL for males were derived based on specimens ranging frorn 29 to 55 cm (Premalatha 1 989).
4. E. tauvina: Fish of 45-50 cm length mature as females while fish of more than 74 cm and weighing 1 1 kg be- come males having ripe testes. In specimens of 66-72 cm length, tran- sitional gonads contain male and fe- male tissues. Ameer Hamsa and Mohamad Kasim ( 1992) studied the growth of juveniles in cages ( 5 x 5 x 2 m) in the Gulf of Mannar starting with juveniles of 14-25 cm. The growth was studied for different periods ranging from about 160 to 334 days; this led to the growth parameter estimates L_=67.1 cm and 1<=0.462 year-'. Also, Selvaraj and Rajagopalan ( 1973) presented some observations on morphometric and meristic characteristics, and on fecundity and spawning habits of this species.
5. E. chlorostigma: length-weight re- lationsh-ips were estimated as log W = -2.71 15 + 3.0425 logL in females and log W = -1.7501 + 2.8497 logL in males, using fishes of the length range 32-65 cm. The spawning period is June-July (Premalatha 1989).
6. Lutjanus kasmira: This species appears to spawn only once during Novem- ber-March. Length at first maturity was estimated as 20 cm and fecun- dity as ranging from 42 100 to 332 620 (Rangarajan 1972b).

Fishery
The groupers and snappers, along with other "perches" are exploited by trawl, hoolc- and-line and traps. There is however, no targeted fishing for these resources except For hook-and-line fisheries along the Kerala and Tamil Nadu coasts.
During the period from 1985 to 1992, annual landings of groupers ranged from a minimum of about 2 500 t in 1982 to a maximum of about 6 300 t in 1991 (Table 1 ). Regionally, the highest landings occur off Tamil Nadu followed by Maharashtra, Kerala, Gujarat and I<arnatal<a @able 2). There were no landings of groupers along West Bengal and only negligible quantities were landed in Orissa.
In the case of snappers, annual landings ranged from about Z 200 t in 1982 to about 4 200 t in 1992 (Table 2). Maximum land- ings were recorded offTamil Nadu followed by Andhra Pradesh (Table 2). There were no landings of snappers along the West Bengal coast. In Orissa, landings of lutjanids were highest in 1986 (21 2 t), and were followed by a collapse in subsequent years.
Table 1. Nominal catch of groupers and snap- pers along the coasts of Indla, 1982-1992 (in tons)". [ Captura nominal tie meros y p q o s rle /as costas de /a India, 1982 - 1992 (toneladas).]
Year
1982 1983 1984 1985 1986 1987 1988 1989 1990 1991 1992
Groupers Snappers 2 511 2 202 4 415 3 340 Z 635 3 793 3 264 4 098 2611 2 623 4 807 (4 797) 3 808 (3 783) 5 104 4 136 5 553 3 705 4 718 2 746 6 287 (6 023) 2 257 5 340 (8 548) 4 150 (2 762)
'The figures in brackets document differences between the two manuscripts underlying this contribution.
Table 2 also shows that considerable sea- sonal changes in serranid and lutjanid catches occur in most states.
In Tamil Nadu there is an organized fishery for perches along the Gulf o f Mannar and Wadge Bank using hook-and-line, gill nets and traps. There, annual landings of groupers varied from 970 t to 3 124 t, with peak landings usually taken during first and third quarters (Table 2). As for snappers, the yearly catches varied from about 500 t to 1 400 t during 1985-92, with peak landings occurring during the first quarter of the year.
In the Gulf of Mannar, off Tuticorin (8- BON), the bottom is rocky and also rich in coral reefs. In this region about 250-300 country craHs with hook-and-line and gill nets operated over depths of 35-60 m, targeting perches. Serranids form 23% of that catch; the main species are E. tauvina (53% of the grouper catch), E. malabaricus ( 1 GOh), E. diacanthus ( 1 4%), E. chlorostigma ( 1 1 %) and E. undulosus (6%). Peak catches occur during July-October. Lutjanids form 14% of perch catch, and consist of Lul/anus rivulatus (42.5% of snappers), L. agentimaculatus (27%), L. malakicus (2 1 %) and Pristipomoides @pus ( 1 0%).
In the Gulf of Mannar, off Keelaltari (S.E. coast), there is a subsistence trap fishery exploiting groupers and snappers along with other coral reef fishes.
Fishers based in Tuticorin migrate to the Mandapam region during December-March to fish using plank-built boats and hook- and-line over 18-25 m depth off Dhanushlcodi (Jayasankar 1990). Lutjanids ranging from 15 to 70 cm and serranids ranging from 20 to 80 cm are targeted. From December 1988 to March 1989, 2 t of serranids, 6 t of lutjanids and 15 t of other fish were caught (Jayasankar 1 990).
Hand-lines for perches 30-40 Itm off the coast have been traditionally used along the southwest coast as well as on Wadge Bank. Hornell (1916) commented on the fishing grounds in the 25-40 fathom depths in Wadge Bank area, while John (1948)

Table 2. Reglonwlse and statewlse average annual landlng of groupers and snappers. (Values In parentheses are percentages In the total national catch of the group.) IDescargas anuales, regJonales y estat.lles, de meros y pargos {vaiorer entre parkmtesls son porcentajes del total anuai naclonal tie cada gmpo).]
Groupers Snappers Reglon State % by quarter Total % by quarter Total
1 I1 III IV
Northwest coast Gujarat 353 10.0 1.6 53.1 499 (9.7) 34.1 9.7 5.4 50.8 370 ( t 1.4) Maharashtra 28.8 12.8 4.9 53.5 1 416 (27.8) 17.1 9.1 15.8 58.0 658 (20.3)
Southwest coast Coa 94.3 0 3.7 0 27 (0.5) 0 36.4 9.1 54.5 10 (0.3) Karnataka 46.8 9.6 3.4 40.3 293 (5.8) 4.6 2.3 74.4 18.6 45 (1.4) Kerala 47.6 2.5 5.9 44.0 1 079 (21.2) 68.3 2.6 1.0 28.2 506 (1 5.6)
Southeast coast Tamil Nadu 36.2 18.1 33.3 12.4 1 704 (33.4) 40.4 16.4 25.8 17.4 825 (25.4) Pondicherry 16.7 50.0 33.3 0 6(0.l) 55.6 1 1 . 1 33.3 0 18 (0.6) Andhra Pradesh 38.5 16.9 24.6 20.0 65 (1.3) 33.2 24.5 19.8 22.5 779 (24.0)
Northeast coast Orissa 61.6 7. t 14.2 17.1 10 (0 .2) 56.4 28.7 4.2 10.6 37 (1.1) West Bengal

indicated that the depths between 60 and 70 fathoms off Anjengo and Chavara were good for line fishing. Gopinath (1 954) gave a preliminary account on perch fishery south of Alleppey and of the Wadge Bank.
Since October 1956, the Indo-Norwe- gian Project vessels, M.F. K Cochin (Re- christened M. 0, Kristensen) and other vessels were engaged in hand-line fishing off Cochin. The most successful vessel for this purpose was R/V Kalava which, in the course of about 200 fishing days (up to December 1966), landed approximately 75 t of perches, mainly horn the grouper grounds between Ponnani and Alleppey. The grouper grounds OH the Kerala coast are different from the perch fishing grounds on Wadge Bank, where trawling for perches is possible over large areas. Details of various species of groupers caught from 72 to 114 m during the ex- ploratory survey by R/V Varuna on the southwest coast of India were reported by Silas (1969). The species caught were Epinephe/us chlorostigma, Pristipomoides @pus, E. diacanthus, E. aridatus, E. morrhua, E. tauvina and Lovanus gibbus.
In Kerala, the estimated annual landings of serranids varied from 335 t in 1985 to 2 994 t in 1992. Peak catches were ob- tained during the first and last quarters. An estimated 120 t-1 200 t of lutjanids were landed in different years in Kerala during 1985-92 and the first quarter produced 6Wo of year's catch (Table 2).
Off Cochin, the hook-and-line fishery starts around December and continues till March (Mathew and Venugopalan 1990). Fishing is conducted by mechanized boats rang- ing from 7.6 to 9.4 rn. Maximum effort is expended during November-March but the highest landings occur in December and January. The estimated yield from these operations was 750 t in 1987 and 530 t in 1988, with perches forming over 90% of the catch (Mathew and Venugopalan 19W).
Among perches, serranids and lutjanids were dominant, and formed over 80% of the perch catch. Groupers and snappers were represented by E. diacanthus (range: 19-59 cm), E. chlorostigma (24-62 cm), E. tauvina (42-85 cm) , E. bleekeri (2 1 -64 cm), E. areolatus, E. episLkYus and Pristipomoides typus ( 1 9-69 cm).
OFF Quilon (8"20'40"N, 77"02'05"E) at depths ranging from 50 to 150 m, there is a regular fishery by country crafts using hook-and-line from January to April. Of an estimated 18 000 t of perches landed during 1980 and 198 1 , serranids formed 2 1 % and lutjanids 73% (Madan 1983). A total of 14 species of groupers were caught, among which E. areolatus and E. diacanthus were dominant. Among snappers, seven spe- cies contributed to the fishery. Here Aprion sp. and Aphareussp. were dominant, jointly forming 70% of perch catch. Off the coast of Karnatalca, the annual
landings of groupers varied from 21 to 839 t and those of snappers from 3 to 254 t during 1985-92, with the first quarter being most productive for groupers and the third quarter for snappers. In Maharashtra, the landings from 1985 to 1992 varied from 280 to 2 450 t for groupers and from 200 to 1 I00 t for snappers. In both cases, the peak period was the fourth quarter (Table 2). In 1988, an estimated 4 000 t of perches were landed at Bombay by small trawlers. E. diacanthusand E. tauvina were the domi- nant species (Anon. 1989).
In Lakshadweep (=Laccadives), there 1s no commercial fishery for groupers and snappers except on a sustenance basis. Of the several species occurring there (Jones and Kumaran 1980), Cephalopholis argus, Aethaloperca rogaa, Luqanus gihbus, L. kasmira, L. russe//iand L. bohar are corn- mon in the reef flats of the difterent islands (Kumaran et al. 1989). From 1975 to 1984 an average annual catch of 230 t of perches

were landed (Alagaraja 1987) in which groupers and snappers were dominant.
From the Andaman Islands, an estimated average of 330 Pyear' of perches were landed in 1 975- 1 984, forming 1 3% of total landings (Alagaraja 1987), with Lu+?nus kasmira as the dominant species.
Mariculture
The earliest attempts at culturing groupers (E . tauvina and 15, malabaricus), along with seabass and snappers, occurred in Malay- sia. Thailand, Singapore and Hongkong in the 1970s (Teng et al. 1977; Teng and Chua 1978; Chua and Teng 1978, 1979, 1 980). In the Philippines, six species of groupers, E. malabaricus, E. tauvina, E. sexfasciatus and E. bleekeri are farmed (Kohno et al. 1 988). E. suillus and E. ambfycephalus are farmed in Taiwan, E. akaara in HongKong and japan, and f tauvina in Malaysia, Indonesia, Thailand, Kuwait and India (Ukawa et a]. 1966; Moe 1969; Hussain et al. 1975; Lanjumin 1982; Rahim 1982; Ameer Hamsa and Mohamad Kasim 1 992).
Snappers such as Luqanus johnii, L. russelli, and L. sebaeare farmed in floating netcages in Singapore, Malaysia, Thailand and the Philippines, (Lee 1982; Rahirn 1982; Tanomkiat 1982; Anon. 1979).
In India, farming of groupers is in the initial stage of development and entirely supported by the supply oFseeds collected from the natural habitat, due to the ab- sence of technology for the mass produc- tion of seeds by induced breeding (Bensam 1993). Hence, projects on culture and seed production for these two species of groupers should be taken up on priority basis for implementation in India, as is already the case in Southeast Asia. With the growing interest in aquaculture, the need for seed is increasing. Seeds available from natural sources are usually seasonal, unreliable and not sufficient to meet the demand.
Experiments were carried out by the Central Marine Fisheries Research Institute at Mandapam (Palk Bay) to investigate the possibilities of culturing some economically important marine fishes in Fixed netcages made of palmyrah leaf stall= in coastal waters (Ameer Harnsa 1 982). Epinephelus tauvina, E. hexagonatus along with rabbit fishes (Siganus canaliculatus and S. jaws), and sand whiting (Siflago sihama) were cultured in cages (James et al. 198513). The mean monthly growth was 0.85 cm.3.1 g-' and 0.56-0.62 crn.2-3.05 g-' for E. tauvina. Other growth and production estimates for the grouper E, tauvinacultured in fixed netcages in Mandapam (Gulf ofMannar) coastal waters are reported by Ameer Hamsa and Mohamad Kasim (1992).
Discussion
The above review shows that the distri- bution and abundance in .space and time of Indian groupers and snappers are gen- erally understood. Rough and untrawlable grounds rich in these resources exist, par- ticularly along the northwest coast, south- west coast (particularly off Kerala), Wadge Bank and in the Gulf of Mannar. Where trawling is possible, groupers and snap- pers are exploited mainly as a bycatch. Groupers and snappers are abundant, as is clear from the results of different surveys, in rocky and coralline areas beyond 50 m depth and down to 360 m depth in certain areas presently not exploited by commercial fleets. The landing figures show that about 8 000 t only are landed annually whereas on Wadge Bank alone, the standing stock of groupers and snappers along with other perches was estimated to be around 9 400 t (Joseph et al. 1987). Joseph and John (1 987) and James et al. (1987) suggested that serranids and lutjanids offer a large scope for increased exploitation along both coasts of India, particularly along the southwest

coast a n d o n W a d g e Bank. Fishing by handlines (Silas 1969; O o m e n 1989) could yield considerably larger catches. Also, M e n o n et al. (1 977) a n d O o m e n (1 989) s h o w e d tha t t h e rocky a n d rough g rounds off t h e s o d t h w e s t coast c o u l d y i e ld c o n s i d e r a b l e c a t c h e s of g r o u p e r s a n d s n a p p e r s i f exploi ted us ing traps. Thus, increase in production of these fishes could b e achieved by introducing fish t raps a n d intensifying fishing wi th hook-and-line in t h e 75- 1 0 0 m d e p t h z o n e off sou thwes t coas t , at d e p t h s of 35-65 rn in t h e Gulf of Mannar a n d in t h e nor theas t region of t h e W a d g e Bank, a n d a t d e p t h s of 91 - 125 m a long t h e northwest coast where groupers a n d s n a p p e r s a r e known to b e abundant .
Planned exploratory fishing programs with FORVSagar Sampcla in addit ion t o t h e exploratory fishing vessels of FSI, INP, IFF a n d CIFNET, will enab le further m a p - p ing of t h e distribution of demersa l fish stocks. Moreover , t he re is a n urgent n e e d to utilize t h e p re sen t knowledge o n t h e distribution of t h e various demersa l fish- ery resources o n t h e continental shelf for simulated commercial fishing operations o n t h e s e stocks. Such operations will demon- strate t h e economic feasibility of fishing op- era t ions a n d provide e n o u g h d a t a for pri- v a t e ent repreneurs to initiate fishing ven- tures. The immedia t e objec t ive is to in- c r ease t h e product ion of perches , e spe - cially g roupe r s a n d snappe r s , by t app ing t h e underexploited fraction of conventional fish resources at d e p t h s of u p to I 0 0 rn by a d o p t i n g diversified fishing m e t h o d s in- s t ead of continuing trawling in shallow in- shore waters. Since most of the marine fishing g e a r cap tu re a multiplicity of fish spec ie s which have different growth, mortality and recruitment schedules, managemen t of the fisheries is difficult. Thus, t o solve this prob- lem, n e w approaches for modelling t h e dy- namics of resource species in a multispecics con tex t should b e deve loped . This will re- qu i re intensifying s tud ie s o n the growth , food a n d feeding habits, reproduction and
o the r aspects of t h e biology of s n a p p e r s and groupers. Also, in view of t h e existence of la rge numbers of spec ie s in t h e s e t w o g r o u p s a n d lack of a d e q u a t e knowledge o n t h e population differences a m o n g them, concer ted efforts should b e m a d e to im- p rove ou r knowledge of t h e t axonomy of Indian g roupe r s and snappers .
Alagaraja, K. 1987. An appraisal of the marine fisheries of Lakshadweep and Andarnan and Nicobar islands. CMFRl Spec. Pub. 39, 1 8 p.
Allen, G.R. 1984. Family Lutjanidae, var. p. In W. Fischer and G. Bianchi (eds). FA0 identification sheets for fishery purposes. Western Indian Ocean. Vol, IV. Food and Agriculture Organization. Rome.
Allen, G.R. 1985. FA0 species catalogue. Vol. 6. Snappers of the world. An annotated and illustrated catalogue of lutjanid spe- cies known t o date. FA0 Fish. Synop. 6(125):208 p.
Ameer Hamsa, K.M.S. 1982. Present status of pen and cage culture of finfishes in South- east Asia. Proc. Nat'l. Sem. Cage Pen Culture: 69-79.
Ameer Hamsa, K.M.S. and H. Moharnad Kasirn. 1992. Growth and production potential of young grouper Epinephelus tauvina (ForsskAl) reared in fixed netcages. 1. Mar. Biol. Assoc. lndia 34 ( 1&2):271-277.
Anon. 1979. International Workshop on Pen and Cage Culture of Fish, 1 1-1 2 February 1979, Tigbauan, Iloilo, Philippines.
Anon. 1989. Annual Report 1988. Central Marine Fisheries Institute, Cochin. 97 p.
Anon. 1991. Report of the working groups on revalidation of the potential marine fish- eries of exclusive economic zone of In- dia. Ministry of Agriculture, Government of India, New Delhi.
Bal, D.V. and K.V. Rao. 1984. Marine fisheries. Tata McGraw-Hill Publishing Co. Ltd., New Delhi. 470 p.
"This list includes all references originally included in the two manuscripts upon whlch this contribution was based, whether presently cited o r not.

Bapat, S.V.. V.M. Deshrnukh, B. Krishnamoorthi, C. Muth iah , P.V. Kagwade , C.P. Rarnamirtham, K.J. Mathew, S. Krishnapillai and C. Mukundan. 1982. Fisheries resources of t h e Exclusive Economic Zone of t h e northwest coast of India. Bull. Cent. Mar. Fish. Res. Inst. 33, 80 p.
Basheeruddin, S . and K.N. Nayar. 1962. A pre- limlnary study of the juvenile fishes of the coastal waters off Madras Clty. lndian J. Fish. 8(1):169-188.
Bensam, P. 1993. Prospects of farming groupers in India. Presented in t h e Business Ses- sion of India's First Aquaculture Show INDAQUA, 20-23 March 1993, Madras, Organized by t h e Marine Products Ex- por t Development Authority, Cochin, India. 1 6 p.
Chacko, P.I. 1949. Food and feeding habits of the fishes of the Gulf of Mannar. Proc. World. Maricult. Soc. 1 O:260-271.
Chua, T. and 5. Teng. 1978. Effects of feeding frequency on t h e growth of young estua- rine grouper Epinephelus tauvim (ForsskBI) cultured in floating cages. Aquaculture 14:31-47.
Chua, T. and S. Teng. 1979. Relative growth and production of t h e estuary grouper Epinephelus saltnoides under different stocking densities in floating net cages. Mar. Biol. 54:363-372.
Chua, T. and S. Teng. 1980. Economic produc- tion of es tuary g r o u p e r Lpinephelos salmoides Madwell reared in floating netcages. Aquaculture 20: 187-228.
CMFN. 1988. Annual Report 1988. Central Marine Fisheries Research Institute, Cochin, India. 9 7 p.
CMFRI. 1985- 1992. FORVSagarSampada Cruise reports. Central Marine Fisheries Research Institute, Cochin, India.
Devanesan, D.W. and K. Chidambaram. 1948. The common food fishes of the Madras Presidency, Madras. Government Press.
Fischer, W. and G. Bianchi, Editors. 1984. FA0 species identification shee t s for fishery purposes. Western lndian Ocean. Vol. 4. Food and Agriculture Organization. Rome.
Fischer, W. and P.1.P. Whitehead, Editors. 1974. FA0 species identification sheets for fishery purposes. Eastern lndian Ocean and Western Central Pacific. Vols. I I a IV. Food and Agriculture Organization, Rome.
Gopinath, K. 1954. A note on s o m e d e e p s e a fishing experiments off the south western
coast of India. lndian 1. Fish. l ( 1 L Z ) : 163- 216.
Heemstra. P., J.L.B. Smith and J.E. Randall. 1884. Family Serranidae, var. p. In W. Fischer and G. Bianchi (eds). FA0 species identi- fication sheets For fishery purposes. Western lndian Ocean. Vol. IV. Food and Agricul- ture Organization, Rome..
Heemstra, P.C. and J.E. Randall. 1993. FA0 species catalogue. Vol. 16. Groupers of the world. (Family Serranidae, Subfamily Epinephelinae). An annotated and illus- trated catalogue of the grouper, rockcod, hind, coral grouper and lyretail species known t o date. FA0 Fish. Synops. No. 125, Vol. 16.
Hornell, J. 191 6. Notes on two exploring cruises in search of trawl grounds OFF t h e lndian and Ceylon coasts. Madras Fish. Bull. 14:33- 70.
Huguenin, J.E. and F.J. Ansuini. 1978. A review of t h e technology and economics of ma- rine fish cage systems. Aquaculture 15:151- 170.
Hussain, N., M. Saif and M. Ukawa. 1975. On the culture of Einephelos tauvina (Forsskil). Kuwait Institute for Scientific Research MAB- IIIXXI, 1 2 p.
lames, P.S.B.R., K. Alagarswami, K.V. Narayana Rao, M S . Muthu, M . S . Rajagopalan, K. Alagaraja and C. Mukundan. 1987. Po- tential marine fishery resources of' India. CMFRI Spl. Pub. 30: 44-74.
James, P.S.B.R.. R Soundararajan and1.X. Rodrigo. 1985. Preliminary s tudies on culture of finfishes in cages in t h e coastal waters O F Pallc Bay at Mandapam. Proc. Symp. Coastal Aquaculture. Cochin 3:910-915.
Jayasankar, P. 1990. On the seasonal hooks and line fishery a t Parnban, near Mandapam. Mar. Fish. Inbr. Serv. Tech. Extn. Ser. 105: 13- 14.
Job, T.J. 1940. An investigation on t h e nutri- tion of the perches o f the Madras coast. Proc. Indian. Mus. 42:289-364.
Joel, J.J. and I.P. Ebenerer. 1991. Note on giant perch caught off Kanya-kumari. Mar. Fish. Infor. Serv. Tech. Extn. Ser. 108: 15.
John, C.C. 1948. Progress Report of t h e Fisher- ies Development Schemes-Central Research Institute. Travancore University, Division of Marine Biology and Fisheries, 8 p.
John, V.. P.I. Chacko, R. Venkatararnan and A.T. Sherriff. 1959. Report of fishing experi- ments in the offshore waters o f the Madras

State, p. 106-138. In DOF. Fish Station Rep. and Year Book, Department of Fish- eries. Madras.
Jones, S. and M. Icumaran. 1980. Fishes of the Laccadive Archipelago. Nature Conser- vation of Aquatic Sciences Service, Trivandrum. 760 p.
Joseph. K.M. and M.E. John. 1987. Potential marine fishery resources. CMFRI Spl. Pub. 30: 2 8-43.
Joseph, K.M., P, Sulochanan, M.E. john, V.S. Somavanshi, K.N.V. Nair and A. Joseph. 1987. Demersal Rshery resources of Wadge Bank. Bull. Fish. Surv. lndia 12: 1-52,
Kohno, H. , M. Duray and J. Juario. 1988. State of grouper (Lapu-lapu) culture in the Phil- ippines. SEAFDEC Asian Aquacult. 10(2):4- 9.
Kumaran, M., R.S. Lal Mohan and V.S. Murty 1989. Other fin fish resources, p. 65-72. In Marine living resources of the Union Territory of Lakshadweep - an indicative survey with suggestions for development. Bull. Cent. Mar. Fish. Res. Inst. 43, Cochin.
Landless, P.J. and A. Edwards. 1976. Econorni- cal ways ofassessing hydrography For Fish Farms. Aquaculture 8:29-43.
Lanjumin, L. 1982. Development of cage cul- ture of finfish in Riau Archipelago. Riau Province, Indonesia, p. 165-1 66. In Re- port of the Training Course on Small Scale Pen and Cage Culture for Finfish. South China Sea Fisheries Development and Co- ordinating Programme, Manila, Philippines.
Lee, E.S. 1982. Cage culture For marine finfish in Singapore, p. 197- 197. In Report of the Training Course on Small Scale Pen and Cage culture For Finfish. South China Sea Fisheries Development and Coordi- nating Programme. Manila, Philippines.
Madan. M. 1983. Kalava fisheries of Pulluvila Village. Indian J . Fish. 30:135-142.
Mathew, G. On the perch fishery of Tuticorin during 1978-80.1. Mar. Biol. Assoc. India. (In press).
Mathew, G. and K.M. Venugopal. 1990. Hooks and line fishery for Kalava at Cochin. In- dian ]. Fish. 37: 347-355.
Menon, M.D. and K.M. Joseph. 1969. Devel- opment of kalava (rock cod) Fishing off south west coast of lndia - a prospectus. Seafood Export 1. 1 (2):7-28.
Menon, M.D., C.P. Varghese and C. Haridas. 1977. Development oFtrap fishing for rock cod off south west coast of India. Sea- food Export ]. 9(I):5-14.
Moe. M.A. 1969. Biology of the red grouper Epinephelusmorio(Valenciennes) from the eastern Gulf of Mexico. Prof. Pap. Ser. Fla. Dep. Nat. Resour. Mar. Res. Lab. 10,95 p.
Ninan, T.V., S.P. Basu and P.K. Bhargava. 1984. Observations on the demersal fishery re- sources along Andhra Pradesh Coast. Bull. Fish. Surv. lndia 13: 18-22.
Oornen, V.P. 1976. An account of the fishery and biology of Velameen Pristipornoides argyrogrammicus (Valenciennes). j. Mar. Biol. Assoc. India, 18:469-475.
Oomen, V.P. 1789. A critical study on the ex- ploitation of fishery resources by the In- tegrated Fisheries Project. IFP Bull. 12,106 P.
Philip. K.P., 6. Premchand, G.K. Avadh and P.J. Joseph. 1984. A note on the deep sea demersal resources OFF I<arnataka- north Kerala coast. Bull. Fish. Surv. lndia 13~23- 32.
Prernalatha, P. 1989. Fishery and biology of rock cods (Order Perciformes) From the south west coast of India. Indian J. Fish. 36(4):285-29 1.
Rahim, 8. 1982. Cage of finfish in peninsular Malaysia, p. 173- 1 76. 117 Report of the Training Course on Small Scale Pen and Cage Culture for Finfish, South China Sea Fisheries Development and Coordinating Programme, Manila, Philippines.
Randall, J.E., G. R. Allen and W.D. Anderson, Jr. 1987. Revision of thelndo-Pacific lutjanid genus Pinjalo, with description of a new species. Indo-Pac. Fish. ( 14): 17.
Randall,J.E. and P.C. Heemstra. 1991. Revision of Indo-Pacific groupers (Perciformes: Serranidae: Epinephelinae), with descrip- tions of five new species. Indo-Pac. 20, 332 p.
Rangarajan, K. 1970. Food and feeding habits of the snapper, Lutjanus kasrnira (ForsskAl) from Andaman Sea. Indian 1. Fish. 17(1&2):1 14-121.
Rangarajan, K. 1972a. Food and Feeding habits of the snapper, Lutjanus kasmira (Forsslt61) From the Andaman Sea. Indian J. Fish. 1 7:43- 52.
Rangarajan, K. 1972b. Maturity and spawning of the snapper, Luqanus kasmira (Forsskbl) from t h e Andaman Sea. lndian 1. Fish. 18:114-125.
Rangarajan, K. 1973. Length-weight relation- sh ip in t h e snapper , Lutjanus kasmira (Forsskdl). lndian J . Fish. 20(2):205-208.
Rao, K.S. 1964. Food and feeding habits of fishes from trawl catches in the Bay of Bengal with observations on diurnal variations in the nature of food. lndian J. Fish. 1 1(1):277- 314 .
Rao, K.V. 1969. Distribution pattern of the major exploited marine Fishery resources in In- dia. Bull. Cent. Mar. Fish. Res. Inst. 6: 1 - 69.
Selvaraj, G.S.D. and M. Rajagopalan. 1973. Some observations on the fecundity and spawning habits of the rock cod Epinephelus tauvina (Forsskil). lndian J. Fish. 20 (2):668-67 1.
f ilas, E.G. 1969. Exploratory fishing lrry R I.: Varuna. Bull. Cent. Mar. Fish. Res. Inst. 12:53-66.
Sivapraltasam, T.E. 19%. A study ofthe demersal resources of the Wadge Bank and the Gulf of Mannar. Bull. Fish. Surv. lndla 15: 1-37.
Somavanshi, V.S. and P.K. Bhar. 1988. A note on demersal fishery resources survey of Gulf of Mannar. Bull. Fish. Surv. India 13: 12- 17.
Sulochanan, P. and M.E. john. 1988. Offshore, deepsea and oceanic Fishery resources of Kerala Coast. Bull. Fish. Surv. India 16:27- 48.
Tan, S.M. and 1C.S. Tan. 1974. Biology of tropi- cal grouper Epinephelus tauvina (Forsskdl). 1 . A preliminary study on hermaphroditism
in E. tauvina. Singapore 1 . Prim. Ind. 2(2): 123- 133.
Tanomkiat, T. 1982. Programme on c a g e cul- ture a t t h e Phang Nga Small Scale Fisher- ies Assisted Project, Phong Nga Province, Thailand, p. 21 3. In Report of t h e Train- ing Course on Small Scale Pen and Cage Culture for Finfish. South China Sea Fish- eries Development and Co-ordinating Pro- gramme, Manila, Philippines.
Teng, S. and T. Chua. 1978. Effects of stocking density on t h e growth of estuary grouper Epinephelus sa/rnoides Maxwell cultured in net cages. Aquaculture 15:272-287.
Teng, S.K., T.E. Chua and H.C. Lai. 1977. Con- struction and management of floating net cages for culturing t h e estuary grouper , Ephephelus tauvina (ForsslGd) in Penahg, Malaysia. SCSP/SEAFDEC. Philippines. Proc. Workshop on Aquaculture Engineering 2:359-37 1 .
Ukawa, M., M. Higuchi and S. Mito. 1966. Spawning habits and early life history of a se r ran id fish, &p/nephe/us akaara (Temminck and Schlegel). Japan. 1. Ichthyol. 13(4/6):156-161.
Venltataraman, G. 1960. Studies on the food and feeding relationships of t h e inshore fishes off Calicut on t h e Malabar coast. Indian]. Fish. 7:275-306.
Vivekanandan, E., C. Gopal, S. Shanmugam, H.K. Dhokia and B.P. Thumber. 1990. Industrial fisheries off Saurashtra Coast based on ex- ploratory survey during 1985-88. Mar. Fish. Infor. Sew. Tech. Extn. Ser. 103: 1-5.

Appendix I
FlshBase checklist of family Serranldae In Indla based rnalnly on Heemstra and Randall (1 993). [Llsta revisada de FishBasepara la bmilia Serzanidae de 1.a IndIa, basarl.1ptinc/pirlmente en Heemstra y Randall (19931.1
Perciformes (perch-llke) Serranidae Sea basses, groupers and fairy basslets
Aethaloperca rogaa (Forsskdl 1 775)
Cephalopholls rogaa Aethaloperca rogaa Perca lonaris Perca rogaa
Anyperodon leucogrammicus (Valenciennes 1828)
Serranus leucogrammicus Serranus micronota tus Serranus urophthalmus Anyperodon leucogrammicus
Cephalopholis argus Bloch b Schneider 1801
Serran us imrnunerur Serranus thyrsltes Cephalopholis argus Serranus myriaster Bodianus jacobevertsen Bodian us gutta tus
Cephalopholis boenak (Bloch 1790)
Serranus stigmapornus Serranus boenak Serranus nlg~ofasciatus Cephalopholis boenackj Serranus boelang Cephalopholis pachycentron Bodianus boenak Cephalopholis boenak Serranus pachycentron Cephalopholis boenack
Cephalopholls Formosa (Shaw B. Nodder 181 2)
Sciaena formosa Cephalopho//s formosa
Cephalopholis leopardus (Lacepede 1801 )
Labrus leopardus Serranus spilurus Serranus horn fray/ Epinephelus urodelops Cephalopholis leopardus
Redmouth grouper. (Fr M ) Max. 60 crn TL; SW (Forsskil 1775) new combination (ForsskAl 1775) new cornblnation ForsskAl 1775 lunior synonym Forsskdl 1775 original combination
Slender grouper, (Fr M) Max. 52 crn TL. Valenciennes 1828 orlginal combination Ruppell 1838 junior synonym Bleeker 1855 junior synonym (Valenciennes 1828) new combination
Peacock hind. Balufana, (Fr M Dan) Max. 55 cm TL. Museum: SMF 16354: SW Thiolliere 1856 questionable Saville-Kent 1893 other Bloch 8, Schneider 1801 orlginal cornblnation Valenciennes 1828 junior synonym LacepCde 1802 junior synonym Bloch 1790 junior synonym
Chocolate hind. (Fr MI, Ref. 5222 Max. 26 cm TL. Also ReE 4787. Museum: BPBM
27657; SMF 16351 (Nicobar). Richardson 1846 junior synonym (Bloch 1790) new combination Hombron and Jacquinot 1853 junior synonym (Bloch 1790) misspelling Valenciennes 1828 questionable Valenciennes 1828 junior synonym Bloch 1790 orlginal combination (Bloch 1790) new combination Valenciennes 1828 junlor synonym (Bloch 1790) misspelling
Bluelined hind, Bontoo, (Fr M) Max. 34 crn TL. Also Ref: 4787. Museum: ZMB 163: BMNH 1888.1 1.6.2.4; AMS 8.8215: MNHN 7423, 7424; BPBM 27656: NMW 39881. Shaw and Nodder 1812 original combination (Shaw & Nodder 1812) new combination
Leopard hind, (Fr M) Max. 20 crn TL. Lacepede 1801 original combination Valenciennes 1833 junior synonym Day 1870 junior synonym Schultz 1943 junior synonym (Lacepede 1801 ) new combination
(continued)

Appendix I (continued)
Perciformes (perch-like) Serranidae Sea basses, groupers and fairy basslets
Cephalopholis m/n/a ta (ForsskAl 1775)
Serranus cyanostjgma toides Cephalopholis cyanostigma Cephalopholis miniatus Cephalopholis bonjnius Cephalopholls formosanus Serranus perguttatus Cephalopholis rnlnjata Pomacentrus burdl Perm mlnia ta Cephalopholis maculatus
Cephalopholis sonnerati (Valenciennes 1828)
Cephalopholls purpureus Serranus zananella Epinephelus /an thinopterus Serranus unicoior Cephalopholis forrnosanus Cephalopholls sonnerati Serranus sonnera t i Cephalopholis a uran tius
Crom//eptes a/tive/is (Valenciennes 1828)
Serranus altivelis Chromileptes altivells Cromilep tis altivelis Cromileptes altivelis
Epinephelus areolatus (ForsskAI 1775)
Epinephelus craspedurus Serranus waanciersii Perca areola ta Epinephelus chlorostigma Bodjan us melanorus Serran us angularis Serranus celebicus Serranus glaucu5 Epinephelus areola tus Epinephelus angularis
Epinephelus bleekeri (Vaillant 1877)
Serran us variolosus
Coral hind. (Fr M) Max. 40 cm TL. Museum: SMF 16353 (Nicobar Is.). ,
Also Ref: 5222. Bleelter 1849 junior synonym (non Valenciennes 1828) misidentification (ForssltAl 1775) misspelling Jordan and Thompson 1914 junior synonym Tanalta 1911 junior synonym De Vis 1884 questionable (ForssltAI 1775) new combination Lacep6de 1802 junior synonym Forssltdl 1775 original combination Seale and Bean 1907 junior synonym
Tomato hind. Bontoo, (Fr M) Max. 57 cm TL. Museum: BPBM 20590: MNHN A.5774, A.7686 (paralectotypes of 5. sonnerati Valenciennes). A.7671 (lectotype): NMW 40813: SMF 22343: SU 41923. Fourmanoir 1966 junior synonym Valenciennes 1828 iunior synonym Bleeker 1874 junior synonym Lienard 1875 junior synonym (non Tanalta 101 1 ) misidentification (Valenciennes 1828) new combination Valenciennes 1828 original combination (non Valenciennes 1828) misidentification
Humpback grouper. (Fr M ) Max. 70 cm TL. Valenciennes 1828 original combination (Valenciennes 1828) misspelling (Valenciennes 1828) misspelling (Valenciennes 1828) new combination
Areolate grouper. Hontu. (Fr M), Max. 50 cm SL. NW; SW: SE Jordan a Richardson 1910 junior synonym Bleeker 1858 junior synonym Forsskil 1775 original combination (non Valenciennes 1828) misidentification Geoffroy St. Hilaire 1809 junior synonym Valenciennes 1828 junior synonym Bleeker 1851 junior synonym Day 1870 junior synonym (ForsskAl 1775) new combination (Valenciennes 1828) junior synonym
Duskytall grouper, (Fr M) Max. 76 cm TL. Museum: BMNH 1888.12.30.4; NMW 39248; BPBM 23749. 27479: RUSl 16297; SW (non Valenciennes 1828) misidentification
(continued)

Appendlx I (continued)
Perciformes (perch-like) Serranidae Sea basses, groupers and fairy basslets
Serranus bleekeri Serranus coromandelicus Epinephelus albimaculatus Epinephelus bleekeri Epi/lep/le/~S dayi
Epinephelus caeruleopuncta tus (Bloch 1790)
Holocentrus caeruleo-puncta tus Serranus alboguttatus Serranus fla voguttatus Serranus dermochirus Serranus hoevenii Epinephelus hoevenii Serranus Irunhardtii Epinephelus caeruleopunctatus
Epinephelus chabaudi (Castelnau 186 1 )
Epi~lep/le/us chabaudi Serranus chabaudi Epinephelus modestus Epinephelus clarkei
Epillephelus chlorostigma (Valenciennes 1828)
Epinephelus chlorostigma Serranus assabensis Serranus chlorostigma Serranus tauvina Serranus areolatus japonicus Serran us reevesii Serran us geoffroyi Serranus celebicus
var. multip~mcbtus Serranus geo ffroyi
Epinephelus coioides (Hamilton 1822)
Hornalogrystes guntheri Serranus suillus Bola coioides Epinepi~elus ta ~~v ina Epinephelus malabaricus Epin epll elus suillus Epin ep11 elus coioides Serranus nebulosus Serranus waandersi
Vaillant 1877 original combination Day 1878 junior synonym Seale 1909 junior synonym (Vaillant 1877) new combination (non Bleeker 1873) misidentification
Whitespotted grouper, (Fr M)
Max. 76 cm TL.Museum: SMF uncat. (Nicobar Islands); MNHN 7650 (Holotype of S. dermochlrus.Valenciennes); FMNH 98053. Bloch 1790 original combination Valenciennes 1828 junior synonym Peters 1855 junior synonym Valenciennes 1830 junior synonym Bleelter 1849 junior synonym (Bleelter 1849) junior synonym Bleelter 1851 junior synonym (Bloch 1790) new combination
Moustache grouper, (Fr M) Max. 137 crn TL. (Castelnau 1861 ) new combination Castelnau 1861 original combination Gilchrist 8, Thompson 1909 junior synonym Smith 1958 junior synonym
Brownspotted grouper, (Fr M) Max. 75 cm TL. Laltshadweep Islands and Nicobar Islands; SW: SE (Valenciennes 1828) new combination Giglioli 1888 junior synonym Valenciennes 1828 original combination (non Forsskil 1775) misidentification Temminclc and Schlegel 1842 junior synonym Richardson 1846 junior synonym Klunzinger 1870 junior synonym Kossman and R&uber 1877 questionable
(Klunzinger 1870) junior synonym
Orange-spotted grouper, (Fr Br M ) Max. 100 cm SL. Museum: MNHN 7289, 7288, A.7710: NMW 40924, 39457, 40923; RUSI 1 1413, 1 1407-8, 1 1410, 1 1379,26040; BPBM 27509. 30596,20591 : SU 41928; ZMB 171. Nicobar Islands. SMF 16349. Alleyne & Macleay 1877 junior synonym Valenciennes 1828 junior synonym Hamilton 1822 original combination (non Forrsltdl 1775) misidentification (non Bloch B, Schneider 1801 ) misidentification (Valenciennes 1828) junior synonym (Hamilton 1822) new combination Valenciennes 1828 junior synonym (non Bleelter 1858) misidentification
(continued)

Appendlx I (continued)
Perciformes (perch-like) Serranidae Sea basses, groupers and fairy basslets
Epinephelus diacanthus (Valenciennes 1828)
Epinephelus diacanthus Lpinephelus day/ Serranus diacanthus Serran us sexfascia tus
Epinephelus epistictus (Temminclc B, Schlegel 1842)
Epinephelus heniochus Epinephelus stigmogrammacus Epinephelus epistictus Epinephelus praeopercularis Epinephelus sp. Serran w praeopercularis Serran us epistictus Epinephelus rnagniscuttis
Epinephelus erythrurus (Valenciennes 1828)
Serran us erythrurus Epinephelus to wnsendi Epinephelus erythrurus
Epinephelm fascia tus (Forsskil 1775)
Serranus geometricus Serranus cruen tus Epinephalus alexat~drinus Epineph elus alexandrinus Epinephelus fasciatus Epit~epheius spiramen Epinephelus zapyrus Serranus subfasciatus Perca fasciata Cerna alexandrina Holocentrus marginatus Epinephelus marginalis Epinephelus goreensis Plectropoma fascia ta Perca maculata Epinephelus zasla vskii Holocentrus Forsbel
Spinycheek grouper. Heltaru. (Fr M) Max. 52 cm TL. Museum: SMF 605: CAS 29595; RUSl 11414. 11406: ANSP 145517. 145522. 145544: MNHN 7157. 7158. 1989-1018, 1981-1 118; BPBM 27494, 27537: CMFRl uncat: SW: SE (Valenciennes 1828) new combination Bleeker 1873 misidentification Valenciennes 1828 original combination (non Valenciennes 1828) misidentification
Dotted grouper. (Fr M) Max. 80 cm TL. Museum: I<erala. Cochin, BPBM 27483; SW (non Fowler 1904) misidentification Cheng 8. Yang 1983 junior synonym (Temminclc Schlegel 1842) new combination (Boulenger 1887) junior synonym (not applicable) misidentiFication Boulenger 1887 junior synonym Ternminclc 8. Schlegel 1842 original combination (non Postel. Fourmanoir Gueze 1963) misidentification
Cloudy grouper, (Fr Br M) Max. 43 cm TL.Museum: Gulf of I<utch. N side of Oltha PC.. ANSP 159277. Dwarlta, BMNH 181 2.5.2.1 1. Bombay. BPBM 3 1301. Malabar, MNHN 7545 (Holotype of S. erythrurus). Travancore, BMNH 1912.7.20.14. Valenciennes 1828 original combination Boulenger 1898 junior synonym (Valenciennes 1828) new combination
Blaclctip grouper. Teda. (Fr M) Max. 40 cm TL. Museum: Tuticorin, BPBM 20669 Also occurs in Laltshadweep Islands; NW De Vis 1885 junior synonym De Vis 1884 junior synonym (Valenciennes 1828) misspelling (Valenciennes 1828) junior synonym (ForssltRI 1775) new combination Whitley 1945 junior synonym Seale 1906 junior synonym De Vis 1885 junior synonym ForssltRl 1775 original combination (Valenciennes 1828) junior synonym Lacepede 1802 other Bloch 1793 junior synonym (non Valenciennes 1830) misidentification (ForssltRl 1775) new combination Forster 1844 junior synonym Poll 1949 junior synonym Lacepede 1802 other

Appcndlx I (continued)
Perciforrnes (perch-like) Ser ran ldae S e a basses, groupers and fairy basslets
Cerna chfysotaenia Holocentrus rosmarus Holocentrus oceanicus Serran us alexandrln us Epinephelus ernolyi Serran us variolosus Serran us tslrlm en -ara Holocen trus erythraeus
Epinephelus fa veatus (Valenciennes 1828)
Serran us fa vea tus Serranus bontoo Eplnephelus quoyanus Epinephelus fa veatus
Holocentrus gymnosus Bodianus macrocephalus Serranus borbonicus Perca ffava-purpurea Cynichthys fla va-purpura tus Eplnephelus flavocoeruleus Epinephelus f7avocaeruleu.s Holocen trus Ha vo-caeruleus
Ep/nephe/us fuscogutta tus (ForsskAl 1775) Epinephelus fuscogottatus Serranus taenioche/rus Perca summana var. fusco-guttata Serran us horridus Serranus lutra
Eplnephelus lanceolatus (Bloch 1790)
Holocentrus lanceolatus Serranus geographicus Serranus phaeostlgmaeus ~rom/crops lance&tus Stereolepoldes thompsoni Batrachus glgas OI/gorus terrae-reginae Ofigorus golia th
(non Doderlein 1882) rnisidentiflcation LacepCde 1802 junior synonym Laceptde 1802 iunior synonym . .
~ a l e n c i e n n e s l&8 junior synonym Schultz 1953 junior synonym Valenciennes 1828 junior synonym Temminck and Schlegel 1842 junior synonym Bloch and Schneider 1801 junior synonym
Barred-chest grouper, (Fr M) Max. 32 c m TL. Museum: Kerala, Trivandrurn. Travancore, BMNH 191 2.7.20.1 1- 1 3. Kovalarn. BPBM 27633, 30641 ; MNHN 1981 -1 185. Vizhinjam CMFRl uncat. Tuticorin, BPBM 20593: RUSl 1 1381. Mandapam. RUSl 1 1383. Madras, BMNH 1888.1 1.6.1. Valenciennes 1828 original combination Valenciennes 1828 Junior synonym (non Valenciennes 1830) mlsldentification (Valenciennes 1828) n e w combination
Blue and yellow grouper. (Fr M) Max. 80 c m TL. Laltshadweep Islands and t h e Andaman Islands. Museum: Madras?, BMNH 1803.1 1.26.14. Lacepede 1802 junior synonym Lacepede 1802 junior synonym Quoy and Gairnard 1824 junior synonym Bennett 1830 junior synonym Swainson 1839 other (Laceptde 1803) misspelling (LacepCde 1802) new combination Lacepede 1802 original combination
Brown-marbled grouper, (Fr M Dan) Max. 120 crn . Lakshadweep (Laccadive Islands). (Forsskal 1775) n e w combination Valenciennes 1830 junior synonym Forsskdl 1775 original combination Valenciennes 1828 Junlor synonym Valenciennes 1831 junior synonym
Giant grouper, (Fr Br M Dan) Max. 270 c m Museum: Vishakhapatnam. S U 41935; NW; SE Bloch 1790 original combination Valenciennes 1828 junior synonym Fowler 1907 junior synonym (Bloch 1790) new combination Fowler 1923 junior synonym Gunther 1869 junior synonym Ramsay 1880 junior synonym De Vis 1883 junior synonym
(continued)

Appendlx I (continued)
Perciformes (perch-like) Serranidae Sea basses, groupers and fairy basslets
Serranus abdorninalls Epinephelus lanceola tus
Epinephelus latifascia tus (Temminclc Schlegel 1842)
Priacan thich thys maderaspa tensis Epinephe/us /a tihscla tus Serranus grammicus Serran us la tlfascia tus
Epin eph elus longispinis ( Iher 1864)
Epinephelus galrnardi Epinephelus fario Epinephelus rnaculatus Epinephelus longispinis Serran us longispinis
Epinephelus rnacrospilos (Bleelter 1855)
Serran us cylindricus Epinephelus rnacrospilos Epinephelus quoyanus Epin eph elus h vea tus Epinephelus rnacrospilus Serran us ma crospllos Epln eph elus m egil chir
Epinephelus ma/abaricus (Bloch b Schneider 1801)
Serranus salrnonoides Serran us crapa o Epinephelus salmonoides Epinephelus rnalabaricus Epinephelus tauvina Holocen trus salrnoides Serranus polypodophilus Serranus semi-puncta tus Holocentrus rnalabaricus Epinephe/u5 abdomlnalis Epinephelus salmoides Epinephelus cylindricus Serranus estuarius Epinephelus salrno~des
Peters 1855 junior synonym (Bloch 1790) new combination
Striped grouper. (Fr M ) Max. 137 cm SL. Museum: NW of Bombay. CMFRl uncat. Quilon, CMFRl uncat. Cochin. BPBM 27566, 27585; RUSI 11380. SW of Cochin. RUSI 1141 1. Madras, ANSP 100153: BPBM 20515; NW Day 1868 junior synonym (Temminclc R Schlegel 1842) new combination Day 1867 junior synonym Temminclc and Schlegel 1842 original combination
Longspine grouper, (Fr M) Max. 55 cm. Museum: Kerala. Kovalam, BPBM 27682. Tuticorin, BPBM 20569. In Lalcshadweep Islands and Nicobars; SE (non Valenciennes 1830) misidentification (Thunberg 1793) other (non Bloch 1790) misidentification (Kner 1864) new combination Kner 1864 original combination
Snubnose grouper. (Fr M ) Max. 51 cm TL.Museum: Nicobar Is.. SMF 20433 Gunther 1859 junior synonym (Bleelter 1855) new combination (non Valenciennes 1830) misidentification (non Valenciennes 1828) misidentification (Bleelter 1855) misspelling Bleeker 1855 original combination (non Richardson 1846) misidentification
Malabar grouper, (Fr Br M) Max. 234 cm. Museum: BPBM 27497, 27993, 20592; CMFRl 143, 173; RUSI 11382: MNHN 743 (-Holotype of 5. semipunctatus): NW: SE Valenciennes 1828 other Cuvier 1829 junior synonym . (Lacepede 1802) junior synonym (Bloch & Schneider 180 1 ) new combination (non ForsskAI 1775) misidentification LacepCde 1802 junior synonym Bleeker 1849 junior synonym Valenciennes 18.28 junior synonym Schneider 1801 original combination (non Peters 1855) misidentification (Lacepede 1802) junior synonym Postel 1965 junior synonym Macleay 1884 questionable (Lacepede 1802) junior synonym
(continued)

Appendlx I (continued)
Perciformes (perch-like) Serranidae Sea basses, groupers and Fairy basslets
Epinephelus morrhua (Valenciennes 1833)
Epinephelus rnorrhua Epinephelus poecilonotus Serranus morrhua Epinephelus cornetae
Epinephelus octofasclatus Griffin 1926
Epinephelus cornpressus Epinephelus octofasciatus Eplnephelus mystacinus Epinephelus septemhsciatus
Epinephelus poecllonotus (Temminck & Schlegel 1842)
Serranus poecilonotus Epinephelus rnorrhua Epinephelus poecilonotus
Epinephelus polylepis Randall 8. Heemstra 1991
Epinephelus chlorostigma Epinephelus sp. Epinephelus polylepis
Epinephelus polyphekadlon (Bleeker 1849)
Serranus polyphekadion Epinephelus polyphekadion Eplnephelus microdon Ep/nephe/us goldmani Serranus dispar var. b Serranus microdon Serranus goldmanni
Epinephelus radiatus (Day 1867)
Epinephelus radiatus Serran us radia tus Serran us morrhua Serran us brunneus Epinephelus doderleinii Epinephelus rnorrhua
Epinephelus spilotoceps Schultz 1953
Eplnephelus spllotoceps Epinephelus salonotus
Comet grouper. (Fr M Dan) Max. 90 cm TL. In Lakshadweep Islands. (Valenciennes 1833) new combination: SW (non Temrninck a Schlegel 1842) misidentification Valenciennces 1833 original combination Tanalta 1927 junior synonym
Eightbar grouper. (Fr. M), Max. 130 cm TL. Lakshadweep (Laccadive) Is. Postel. Fourmanoir, a GuCze 1963 junior synonym Griffin 1926 original combinatlon (non Poey 1852) misidentification (non Thunberg 1783) misidentification
Dot-dash grouper, (Fr M). Max. 65 crn . Museum: Madras, AMS B.5342. Also Found in Lakshadweep Islands. Temminck 8, Schlegel 1842 original combination (non Valenciennes 1833) misidentification (Temminck a Schlegel 1842) new combination
Smallscaled grouper. (Fr M )
(non Valenciennes 1895) misidentification Not applicable misidentiflcatlon Randall Heemstra 199 1 original combination
Camouflage grouper. (Fr M Dan) Max. 90 crn SL. Museum: Mandapam. Kulak Karai, RUSl 16296. Bleeker 1849 original combination (Bleeker 1849) new combination (Bleeker 1856) junior synonym (Bleeker 1855) junior synonym Playhir 1867 junior synonym Bleeker 1856 junior synonym Bleeker 1855 junior synonym
Oblique-banded grouper, (Fr M ) Max. 70 crn SL. Museum: Vishakhapatnam, USNM 272429. (Day 1867) new combination Day 1867 original combination (non Valenciennes 1833) misidentification (non Bloch 1793) misidentiflcatlon Franz 1910 junior synonym (non Valenciennes 1833) misidentification
Foursaddle grouper. (Fr M) Max. 25 cm SL. Found in Lakshadweep (Laccadive) Islands. Schultz 1953 original cornblnatlon Smith and Smith 1963 junior synonym
(continued)
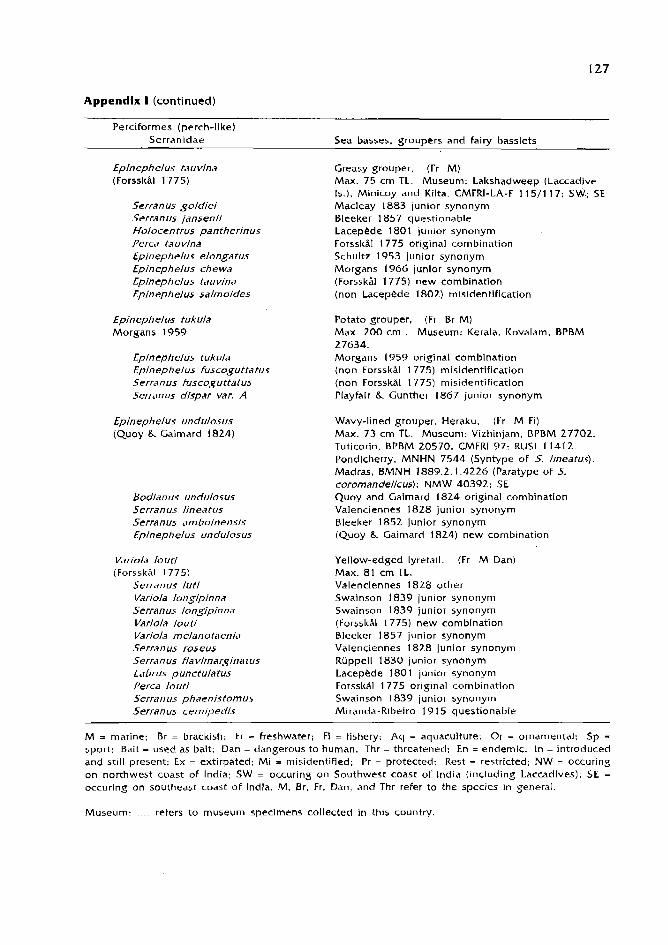
Appendix I (continued)
Perciformes (perch-like) Serranidae Sea basses, groupers and fairy basslets
Epinephelus tauvina (ForsskAl 1775)
Serranus goldiei Serranus jansenii Holocen trus pantherinus Perca tauvlna Epinephelus elonga tus Epinephelus chewa Epinephelus tauvina Epinephelus salrnoides
Epinephelus tukula Morgans 1959
Epinephelus tukula Epitiepheius fuscoguttatus Serranm fuscoguttatus Serranus dispar var. A
Epinephelus undulosus (Quoy R Gaimard 1824)
Bodianus undulosus Serranus lineatus Serranus arnboinensis Epin ep h elus un dulosus
Variola louti (ForssltAI 1775)
Serran us luti Variola longipinna Serranus longipinna Variola louti Variola m elanotaenia Serranus roseus Serranus fla Wmargina tus Labrus punctulatus Perca louti Serranus phaenistomus Sert-anus cernipedis
Greasy grouper, (Fr M ) Max. 75 cm TL. Museum: Laltshadweep (Laccadive Is.). Minicoy and Kilta, CMFRI-LA-F 115/1 17: SW; SE Macleay 1883 junior synonym Bleeker 1857 questionable Lacep*de 1801 junior synonym ForssItAl 1775 original combination Schultz 1953 junior synonym Morgans 1966 junior synonym (Forssltdl 1775) new combination (non Lacepede 1802) misidentification
Potato grouper, (Fr Br M) Max. 200 cm . Museum: Kerala, Kovalam, BPBM 27634. Morgans 1959 original combination (non ForsskAl 1775) misidentification (non ForsskAl 1775) misidentification Playfair & Gunther 1867 junior synonym
Wavy-lined grouper, Heraltu, (Fr M Fi) Max. 73 cm TL. Museum: Vizhinjam. BPBM 27702. Tuticorin, BPBM 20570. CMFRl 97; RUSl 1 141 2. Pondlcherry, MNHN 7544 (Syntype of S. lineatus). Madras, BMNH 1889.2.1.4226 (Paratype of 5. coromandelicus): NMW 40392; SE Quoy and Caimard 1824 original combination Valenciennes 1828 junior synonym Bleelter 1852 junior synonym (Quoy & Gaimard 1824) new combination
Yellow-edged lyretail. (Fr M Dan) Max. 81 cm TL. Valenciennes 1828 other Swainson 1839 junior synonym Swainson 1839 junior synonym (ForsskAl 1775) new combination Bleelter 1857 junior synonym Valenciennes 1828 junior synonym RIippell 1830 junior synonym LacepCde 1801 junior synonym Forssltdl 1775 original combination Swainson 1839 junior synonym Miranda-Ribeiro 191 5 questionable
M = marine: Br = bracltish; Fr = freshwater; Fi = fishery; Aq = aquaculture; Or = ornamental: Sp - sport: Bait = used as bait; Dan = dangerous to human; Thr = threatened: En = endemic: In = introduced and st i l l present; Ex = extirpated; M i = misidentified: Pr = protected; Rest = restricted; NW = occuring on northwest coast of India: SW = occuring on Southwest coast of India (including Laccadives); SE =
occuring on southeast coast of India. M. Br. Fr, Dan, and Thr refer to the species in general.
Museum: .... refers to museum specimens collected in this country.

Note: This list of species w a s assembled from country records For species entered in FishBase a s of 18 J u n e 1996. The scientific n a m e is fol lowed by t h e international FishBase n a m e a n d , if avallabie, a c o m m o n n a m e used in t h e country. Not all ex tan t spec ies of fishes a r e included in this version OF FishBase, nor have all species been assigned t o t h e countries in which they occur. Thus. this list is likely t o be incomplete. Conversely, this list may include fish that are very rare or extinct, o r reported only o n c e from a given country. Please check FlshBase 96 o r subsequent versions under t h e n a m e of t h e spec les In quest ion For additional information.

Appendix 11
FishBase checklist of famlly LutJanldae In lndla based malnly on Allen (1985). [Llsta revlsada de FlsbBase para la famllia luganldae de la Indla, basada prlnclpalmente en Allen /1985).]
PerciFormes (perch-like) Lutianidae S n a p p e r s
Aphareus furca (Lacepede 1 80 1 )
Aphareus Flavivultus Caranxomorus sacrestinus Labrus furca Aphareus furcatus Aphareus furca Aphareus caerulescens
Aphareus rutilans Cuvier 1830
Aphareus thompsoni Aphareus rutilans
Aprion virescens Valenciennes 1 8 3 0
Aprion konekonis Mesoprion rnicrochir Sparopsis elongatus Sparopsis la tifrons Aprion virescens
Etells carbunculus Cuvier 1 8 2 8
Etelis coruscans Etelis carbunculus Eteliscus rnarshi Etelis e vurus
Etelis coruscans Valenciennes 1 8 6 2
Etelis carbunculus Etelis coruscans Etelis evurus
Etelis radlosus Anderson 1 9 8 1
Etelis radiosus
Lipocheilus carnolabrum (Chan 1970)
Tangid carn olabrum Lipocheilus carnoiabrum
L utjanus argentimaculatus (Forsskal 1775)
Mesoprion roseigaster Mesoprion sexfasciatus Mesoprion taeniops Sciaena argentata
Small toothed jobfish, (Fr M) Max. 40 c m SL. Jenkins 1901 junior synonym LacepCde 1 8 0 3 junior synonym Lacepede 1801 original combination (Lacepede 1801) misspelling (Lacepede 1801 ) new combination Cuvier 1830 junior synonym
Rusty jobfish, (Fr M) Max. 80 c m SL. Fowler 1 9 2 3 junior synonym Cuvier 1 8 3 0 original combination
Green jobfish. (Fr M Dan) Max. 80 c m SL; SE Tanalca 1 9 1 4 junior synonym Bleeker 1 8 5 3 junior synonym Kner 1 8 6 8 junior synonym Kner 1 8 6 8 junior synonym Valenciennes 1 8 3 0 original combination
Ruby snapper. (Fr M) Max. 127 cm FL. (non Valenciennes 1862) misidentification Cuvier 1 8 2 8 original combinatlon Jenkins 1 9 0 3 junior synonym (non Jordan & Evermann 1903) misidentification
Flame snapper, (Fr M) Max. 85 cm SL. (non Cuvier 1828) misidentification Valenciennes 1 8 6 2 original combfnation Jordan & Evermann 1 9 0 3 junior synonym
Scarlet snapper, (Fr M) Max. 80 c m SL. Anderson 1981 original cornbinatlon
Tang's snapper. (Fr M) Max. 50 c m SL. Chan 1 9 7 0 original combination (Chan 1970) new combination
Mangrove red snapper. Banda. (Fr Br M) Max. 150 crn TL: NW: SE Macleay 1881 junior synonym Macleay 1 8 8 3 junior synonym Valenciennes 1 8 3 0 junior synonym Gmelin 1 7 8 9 junior synonym
(continued)
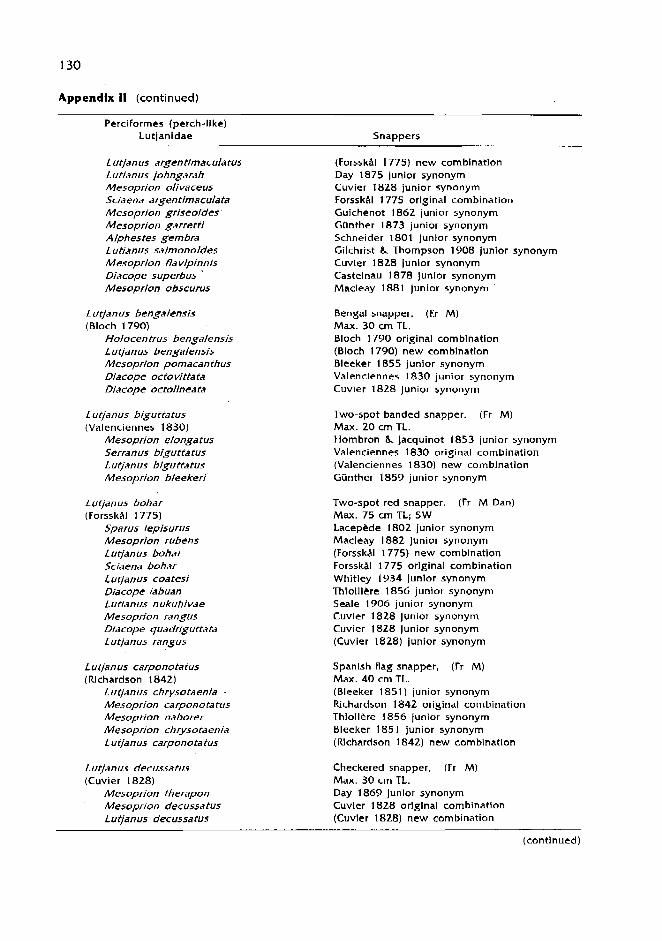
Appendlx ll (continued)
Perciforrnes (perch-like) Lutjanidae Snappers
L uvanus argent/maculatlr Lutjanus johngarah Mesoprion olivaceus Scia ena argentlmacula ta Mesoprion griseoldes Mesoprion garretti Alphestes gembra Lutlanus salmonoldes Mesoprion Ha vipinnis Diacope superbus ' Mesoprion obscurus
L ut/anus bengalensls (Bloch 1790)
Holocentrus bengalensis Lutjanus bengalensis Mesoprlon pornacanthus Diacope octovittata Dlacope octolineata
L utjanus biguttatus (Valenciennes 1830)
Mesoprion elongatus Serranus biguttatus L ut/anus blguttatus Mesoprion bleekeri
Lur/anus bohar (ForsskAl 1775)
Sparus lepisurus Mesoprion rubens L uvanus bohar Sciaena bohar Lu~anus coatesi Dlacope lahuan L utianus n ukuhivae Mesoprion rangus Diacope quadrigutta ta Lutjanus rangus
Lut/anus caponotatus (Rlchardson 1842)
Luvanus chrysotaenia -
Mesoprion carponotatus Mesoprion nahorer Mesoprion chrysotaenia Lutjanus carponotatus
L u t janu~ decussatus (Cuvier 1828)
Mesoprion therapon Mesoprjon decussatus
(ForsskAl 1775) new comblnatlon Day 1875 junior synonym Cuvier 1828 junior synonym ForsskAl 1775 original combination Guichenot 1862 junior synonym GOnther 1873 junior synonym Schneider 1801 junlor synonym Gilchrist a Thompson 1908 junior synonym Cuvler 1828 junior synonym Castelnau 1878 junlor synonym Macleay 1881 junior synonym
Bengal snapper. (F.r M ) Max. 30 cm TL. Bloch 1790 original comblnatlon (Bloch 1790) new combination Bleeker 1855 junior synonym Valenciennes 1830 junior synonym Cuvier 1828 Junior synonym
Two-spot banded snapper, (Fr M) Max. 20 cm TL. Hombron L Jacquinot 1853 junior synonym Valenciennes 1830 original combination (Valenciennes 1830) new comblnation Gijnther 1859 junior synonym
Two-spot red snapper, (Fr M Dan) Max. 75 cm TL: SW Lacepede 1802 junior synonym Macleay 1882 junior synonym (Forssld 1775) new comblnatlon Forssk$l 1775 orlglnal combination Whitley 1934 Junlor synonym ThiolliPre 1856 junior synonym Seale 1906 junior synonym Cuvler 1828 junior synonym Cuvier 1828 Junior synonym (Cuvier 1828) junior synonym
Spanlsh flag snapper, (Fr M) Max. 40 cm TL. (Bleeker 1851) junior synonym Richardson 1842 original combination Thiolltre 1856 junior synonym Bleeker 185 1 junior synonym (Richardson 1842) new combination
Checkered snapper. (Fr M) Max. 30 cm TL. Day 1869 Junlor synonym Cuvler 1828 orlglnal combination (Cuvier 1828) new combination
(continued)

Appendlx ll (continued)
Perciformes (perch-like) Lutjanidae Snappers
Lutjanus ehrenbergii (Peters 1869)
L utianus ehrenbergii L utjanus ehrenberg/l L utjan us oligolepls
L urjan us erythropterus Bloch 1790
L utjanus altlfrontalis L u t p u s Iongmani Mesoprion annularis Mesoprion chirtah Mesoprion rubellus Lutjanus malabaricus L utjanus annularis L utjanus erythropterus Genyoroge macleayana
L urjanus fulviFIamrna (ForsskAl 1775)
Mesoprion a ureovitta tus Lur/anus fulviflammus Sciaena fulviAamma L utjan us fulviflamma L utjanus unirnaculatus Centropomus hober Mesoprion terubuan Mesoprion a urolineatus
Lupnus fulvus (Schneider 1801)
Mesoprion argenteus L utJanus fulvus Lut/anus marginatus Mesoprion rnarginipinnis L utjanus vaigiensis Holocentrus fulvus Mesoprion rnaus Mesoprion gaimardi Lutjanus rnarginatoides Genyoroge nigricauda Diacope xanthopus Diacope vaigiensis Diacope rnarginata Diacope imrnaculata Diacope flavipes Diacope aurantiaca Diacope analis Mesoprion kagoshimna
Blackspot snapper, (Fr M ) Max. 35 cm TL. Peters 1869 original combination (Peters 1869) new combination Bleeker 1873 Junior synonym
Crimson snapper. (Fr M) Max. 60 cm TL. Chan 1970 junior synonym Whitley 1937 junior synonym Cuvier 1828 junior synonym Cuvier 1828 junior synonym Cuvier 1828 junior synonym (non Schneider) misidentification (Cuvier 1828) junior synonym Bloch 1790 original combination Ramsay 1883 junior synonym
Blackspot snapper. (Fr M) Max. 35 cm TL. Macleay 1879 Junior synonym (ForssltAl 1775) misspelling ForssltAl 1775 original combination (ForsskAl 1775) new combination Quoy .% Gaimard 1824 junior synonym Lacepeck 1802 junior synonym THiolliCre 1856 junior synonym Cuvier 1830 junior synonym
Blacktail snapper, (Fr M Dan) Max. 40 cm TL: NW Hombron R Jacquinot 1853 junior synonym (Schnelder 1801) new combination (Cuvier 1828) junior synonym Macleay 1883 junior synonym (Quoy R Gaimard 1824) junior synonym Schneider 1801 original combination Thiolliere 1856 junior synonym Bleelter 1859 junior synonym Kendall 8. Goldsborough 191 1 junior synonym De Vis 1885 Junior synonym Cuvier 1829 junior synonym Quoy 8, Gaimard 1824 junior synonym Cuvier 1828 junior synonym Cuvier 1828 junior synonym Valenciennes 1830 junior synonym Valenciennes 1830 junior synonym Valenciennes 1830 junior synonym Steindachner E. Doederleln 1883 junior synonym
(continued)

Appendlx I1 ( c o n t i n u e d )
Perciformes (perch-like) Lutjanidac Snappers
Lupnus gibbus (ForsskAl 1775)
Diacope lineata Diacope axillaris Diacope borensls Dlacope melanura Diacope coccinea Diacope striata Diacope tiea Genyoroge bidens L utianus tahitiensis L utjanus cornoriensis Mesoprion janthinurus Sciaena gibba L u p n u s gibbus Diacope rosea
L utjanus guilcheri Fourmanoir 1 9 5 9
Humpback snapper, (Fr M Dan) Max. SO c m TL; SW Quoy 8. Gaimard 1 8 2 4 junior synonym Valenclennes 1 8 3 0 junior synonym Cuvler 1 8 2 8 junior synonym Ruppell 1 8 3 8 junior synonym Cuvier 1 8 2 8 junior synonym Cuvier 1 8 2 8 junior synonym Lesson 1 8 3 0 junior synonym Macleay 1 8 8 3 junior synonym Seale 1 9 0 6 junior synonym Fourrnanoir 1957 junior synonym Bleeker 1 8 5 4 Junior synonym ForsskAl 1 7 7 5 origlnal combination (ForsskAl 1775) n e w combination Valenciennes 1 8 3 0 junior synonym
Yellowfin red snapper, (Fr M) Max. 6 0 cm TL.
L u(ianus gullcherl Fourmanoir 1 9 5 9 original combination
L utjanus johnii (Bloch 1792)
Mesoprlon yapilli Lutjanus johnii Lutjanus johni Anthias /ohnil Serranus pavoninus Diacope xan thozona Coius catus Sparus tranquebaricus
Lurjanus kasrnira (Forsskal 1775)
Diacope octolineata Mesoprbn etaape Mesoprion pornacan th us Sciaena kasrnira L uvan us kasrnjra
L ut/anus /ernniscatus (Valenciennes 1828)
L utjanus rangus Lutjanus janthlnurop term Lutianus lemniscatus Mesoprion janthinuropterus L ut/an us furvicauda tus Mesoprion irnrnaculatus Serranus lernniscatus
John's snapper, (Fr M) Max. 7 0 c m TL; NW Cuvier 1 8 2 8 junior synonym (Bloch 1792) new combination (Bloch 1792) misspelling Bloch 1792 original combination Valenciennes 1 8 3 1 junior synonym Bleeker 1 8 4 5 o ther Buchanan 1 8 2 2 junior synonym Shaw 1 8 0 3 junior synonym
Common bluestripe snapper, (Fr M) Max. 4 0 c m TL; SW (non Cuvier 1828) misidentification Lesson 1 8 3 0 junior synonym (non Bleeker 1855) misidentification ForsskAI 1 7 7 5 original combination (ForsskAl 1775) new combination
Yellowstreaked snapper, (Fr M) Max. 6 5 cm TL. (non Cuvier 1828) misidentification (Bleeker 1852) junior synonym (Valenciennes 1828) new combination Bleeker 1 8 5 2 junior synonym Fowler 1 9 0 4 junior synonym Cuvier 1 8 2 8 junior synonym Valenciennes 1 8 2 8 original combination
(continued)

Appendix il (continued)
PerciFormes (perch-like) Lutjanidae Snappers
Lutjanus lunulatus (Park 1797)
Mesoprion ca udalis Perca Iun ula ta Lopnus lunulatus
L urjanus madras (Valenciennes 183 1 )
Lut/anus madras Mesoprion madras
Lut/anus malabaricus (Bloch a Schneider 1801)
Lutjanus dodecacanthus Lurjanus malabaricus Lurjanus sanguineus Mesoprion dodecacanthus Sparus malabaricus
Lurjanus monostigma (Cuvier 1828)
Lotianus monostigma L utjanus rnmonostigmus L utjan us lioglossus Lut/anus monostigma Mesoprion monostigma
L utjanus quinquelineatus (Bloch 1790)
Holocentrus quinquelinearis L utjanus quinquelineatus L utjanus spilurus Genyoroge notata var. sublineata Genyoroge notata var. sexllneata Genyoroge grammica Diacope spirula Diacope decemlineata Holocentrus quinquelineatus
L utjan us rivulatus (Cuvier 1828)
Mesoprion parvidens Diacope rivulata L utjajanus rivulatus Mesoprion quadripunctatus Diacope sinal Diacope revulina Diacope albogutta ta Diacope coeruleo-punctata Mesoprion myriaster
Lunartall snapper, Chemara. (Fr M) Max. 35 cm TL. Valenciennes 1830 junior synonym Parlc 1797 orlginal combination (Parlc 1797) new combination
Indian snapper. (Fr M ) Max. 30 cm TL. (Valenciennes 183 1 ) new combination Valenciennes 183 1 original cornblnation
Malabar blood snapper. (Fr M) Max. 100 crn TL: NW: SE (Bleeker 1853) junior synonym (Bloch a Schneider 1801) new combination (non Cuvier 1828) misidentification Bleeker 1853 junior synonym Bloch Schneider 1801 original combination
One-spot snapper, (Fr M Dan) Max. 60 cm TL. (Cuvier 1828) misspelling (Cuvier 1828) misspelling (Bleeker 1873) junior synonym (Cuvier 1828) new combination Cuvier 1828 original combination
Five-lined snapper, (Fr M) Max. 38 crn TL. Bloch 1790 junior synonym (Bloch 1790) new combination (Bennett 1832) junior synonym De Vis 1885 junior synonym Kent 1893 junior synonym Day 1870 junior synonym Bennett 1832 junior synonym Valenciennes 1830 junior synonym Bloch 1790 original combination
Blubberlip snapper, (Fr M) Max. 65 cm TL; SE Macleay 1883 junior synonym Cuvler 1828 original combination (Cuvier 1828) new combination GIlnther 1859 junior synonym ThiolliCre 1857 junior synonym Cuvier 1828 misspelling Valenciennes 183 1 junior synonym Cuvier 1828 junior synonym Lienard 1839 junior synonym
(continued)
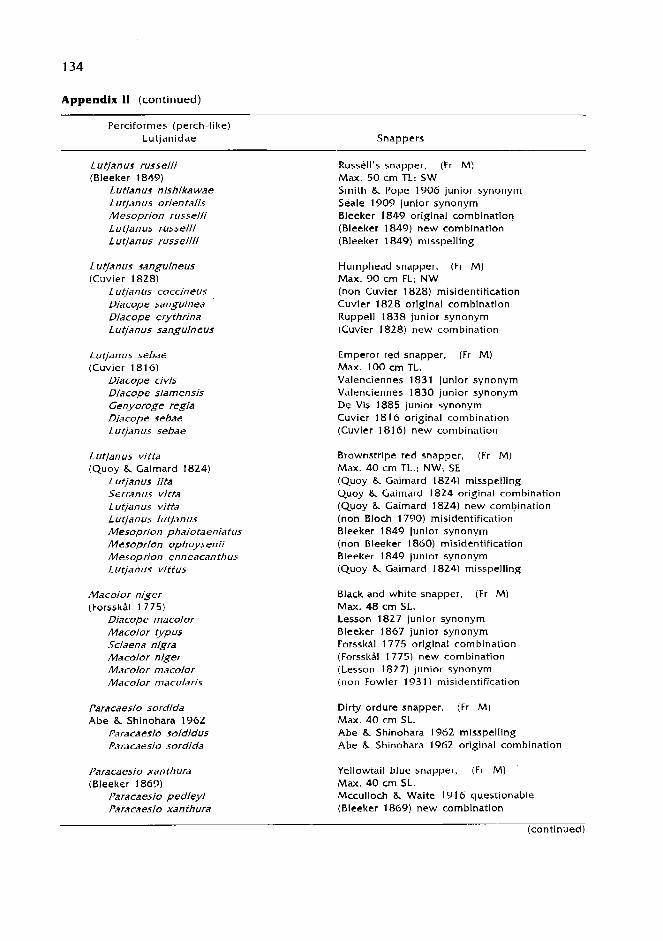
Appendix II (cont inued)
Perciformes (perch-like) Lutjanidae Snappers
Lupnus russelli (Bleelter 1849)
Lutianus nishihawae L utjan us orien talis Mesoprion russelli L utjanus russelli L utjanus russel///
L utjanus sanguineus (Cuvier 1828)
L utjanus coccineus Diacope sangulnea Diacope erythrina Lutjanus sanguineus
Lutjanus sebae (Cuvier 18 16)
Diacope civis Diacope sjamensis Cenyoroge regia Diacope sebae Lutjanus sebae
L urjanus vitta (Quoy B, Gairnard 1824)
1 utjanus iita Serran us vitta L utjanus vitta Lutjanus IutJanus Mesoprlon phaiotaeniatus Mesoprion ophuysenii Mesoprion enneacanthus L utjanus vittus
Macolor niger (ForssltBI 1775)
Diacope rnacolor Macolor typus Sciaena nigra Macolor niger Macolor rnacolor Macolor rnaculari5
Paraca esio sordida Abe B, Shinohara 1962
Paracaesio soldidus Paracaesio sordida
Russell's snapper. (Fr M) Max. 50 cm TL; SW Smith a Pope 1906 junior synonym Seale 1909 junior synonym Bleelter 1849 original combination (Bleelter 1849) new combination (Bleeker 1849) misspelling
Humphead snapper. (Fr M ) Max. '90 crn FL; NW (non Cuvier 1828) misidentification Cuvier 1828 original combination Ruppell 1838 junior synonym (Cuvier 1828) new combination
Emperor red snapper. (Fr M ) Max. 100 cm TL. Valenciennes 1831 junior synonym Valenciennes 1830 junior synonym De Vis 1885 junior synonym Cuvier 181 6 original combination (Cuvier 1816) new combination
Brownstripe red snapper, (Fr M ) Max. 40 cm TL.; NW; SE (Quoy & Gaimard 1824) misspelling Quoy B, Gairnard 1824 original combination (Quoy & Gaimard 1824) new combination (non Bloch 1790) misidentification Bleeker 1849 junior synonym (non Bleeker 1860) misidentification Bleelter 1849 junior synonym (Quoy & Gaimard 1824) misspelling
Black and white snapper, (Fr M) Max. 48 crn SL. Lesson 1827 junior synonym Bleeker 1867 junior synonym ForssltAl 1775 original combination (ForssltAl 1775) new combination (Lesson 1827) junior synonym (non Fowler 1931) misidentification
Dirty ordure snapper. (Fr M) Max. 40 cm SL. Abe 8, Shinohara 1962 rnlsspelling Abe B, Shinohara 1962 original combination
Paracaesio xan th ura Yellowtail blue snapper, (Fr M) (Bleelter 1869) Max. 40 cm SL.
Paracaesio pedleyi Mcculloch & Waite 191 6 questionable Paracaesio xanthura (Bleelter 1869) new combination
(continued)

Appendlx l l (continued)
Perciformes (perch-like) Lutjanidae
Paracaesio xan thurus Vegetich thys turnidus A etiasis can tharoides Caesio xan th urus
Pinjalo Ie wisi Randall, Allen, Anderson 1987
Pinjalo microph thalmus Pin jalo Ie wisi
Pinjalo sp
Macolor sp. Paracaesio s p. Pinjalo typus Pinjalo pinjalo
Pinjalo pinjalo (Bleelter 1850)
Mesoprion mitchelli Caesio pinjalo Pinjalo typus Odontonectes pinjalo Odontonectes erythrogaster Pinjalo pinjalo Pinjalo sp - Pinjalo microphthalmus
Pristipomoides Marnentosus (Valenciennes 1830)
Aphareus roseus Chaetopterus rnicrolepis Aprion Iranekonis Pristipomoides filamen tosus Pristipornoides rnicrolepis Etelis bre virostris Bo wersia violescens Aprion rnicrodon Serranus filamentosus
Pris tiporn oides m ultidens (Day 1870)
Pristipornoides rn ultidens Diacope sparus Mesoprion rn ultidens
Pris tiporn oides sieboldii (Bleelter 1857)
Pristiporn oides rnicrodon Bo wersia ula ula Chaetopterus dubius Pris tiporn oides sieboldii Cha etopterus sieboldii
Snappers
(Bleeker 1869) misspelling Tanalta 191 7 junior synonym Barnard 1737 junior synonym Bleelter 1869 original combination
Slender pinjalo. (Fr M ) Max. 36 cm SL. Lee 1987 questionable Randall, Allen. 8, Anderson 1987 original combination N.A. questionable N.A. misidentification Not applicable misidentification Not applicable rnisidentiflcatlon (non Bleelter) misidentification (non Bleeker 1850) misidentification
Pinjalo, (Fr M ) Max. 46 cm SL. Giinther 1867 Junior synonym Bleeker 1850 original combination Bleeker 1873 junior synonym (Bleelter 1850) new combination (non Cuvier 1830) misidentification (Bleeker 1850) new combination Not applicable rnisidentificatlon Lee 1987 questionable
Crimson jobfish. (Fr M) Max. 80 cm SL. Castelnau 1879 junior synonym Bleelter 1869 junior synonym Tanalta 1935 junior synonym (Valenciennes 1830) new combination (Bleeker 1868) junior synonym Vaillant 1873 junior synonym Jordan 8. Evermann 1903 junior synonym Steindachner 1876 junior synonym Valenciennes 1830 original combination
Goldbanded jobfish, (Fr M) Max. 70 cm SL. (Day 1870) new combination fernminclc 8. Schlegel 1842 junior synonym Day 1870 original combination
Lavender jobfish, (Fr M) Max. 50 cm SL. (Steindachner 1876) questionable Jordan b Evermann 1703 junior synonym GLjnther 1859 junior synonym (Bleeker 1857) new combination Bleelter 1857 original comblnatlon
(continued)

Appendlx I1 (continued)
Perciformes (perch-like) Lutjanidae
.
Snappers
Pristipomoides zona tus (Valenciennes 1830)
Serran us argyrogrammicus Rooseveltia aloha Serranus brighami Serranus telfairi Rooseveltia Mghami Tropjdinus zonatus Serranus zonatus Pr/stfpomoides zonatus
Obllque-banded snapper. (Fr M) , Ref. 55 Max. 40 cm SL. Valenciennes 183 1 questionable Jordan & Snyder 1907 junlor synonym Seale 1901 junior synonym Bennett 1831 junior synonym (Seale 1901) junior synonym (Valenciennes 1830) new combination Valenciennes 1830 original combination (Valenciennes 1830) new combination
M = marine: Br = brackish: Fr = freshwater; Fi = fishery: Aq = aquaculture; Or = ornamental; Sp =
sport: Bait = used as balt; Dan = dangerous to human; Thr = threatened: En = endemic; In = introduced and sti l l present; Ex = extirpated; M i = misidentified; Pr = protected: Rest = restricted: NW =
occurring on Northwest coast of India; SW - occurring on Southwest coast of India (including Laccadives); SE = occuring on Southeast of India. M, Br. Fr, Dan, and Thr refer to the species in general.
Museum: .... refers to museum specimens collected in this country
Note: This list of species was assembled from country records for species entered in FishBase as of 18 June 1996. The scientific name is Followed by the international FishBase name and, i f available, a common name used in the country. Not all extant species of fishes are included in this version of FishBase, nor have all species been assigned to the countries in which they occur. Thus, this list is likely to be incomplete. Conversely, this list may include fish that are very rare or extinct, or reported only once from a given country. Please check FlshBase 96 or subsequent version under the name of the species in questlon for addltlonal Information.

PART Ill: AGE, G R O W AND REPRODUCIlON IN THE WILD
Reproduction, Age and Growth of the Caribbean Red Snapper (L utjanus purpureus) in Waters off Trinidad and Tobago
S.C. MANICKCHAND-HEILEMAN' D.A.T. PHILLIP
Institute ofmarine Afhirs P.O. Box 3160
Carenage P. O., Carenage Trinidad, West In dies
MANICKCHAND-HEILEMAN. S.C. and D.A.T. PHILLIP. 1996. Reproduction, age and growth of the Caribbean red snapper (Lutjanus purpureus) in waters off Trinidad and Tobago [Reproducci&. edady crecimiento del pargo colorado (Lutjanus purpureus) en aguas de Trnidad y Tobago], p. 137- 149. In F. Arreguin- SBnchez, J.L. Munro. M.C. Balgos and D. Pauly (eds.) Biology, fisheries and culture of tropical groupers and snappers. ICLARM Conf. Proc. 48. 449 p.
Abstract
Size at maturity, time of spawning, growth and mortality parameters were estimated for the Carib- bean red snapper (Lutjanus purpureus) in Trinidad and Tobago. Size at maturity was 27 cm TL for males and 39 cm for females. Spawning occurred year-round with peak activity from September to February. The length-weight relationship was W, = 0.0141- TL'2.99 where W, is weight in g and TL is total length in cm. Age was determined from cross-sections of sagittae and opaque rings were deposited annually from December to April. Twenty age groups were found and the von Bertalanffy growth equation was: L, = 85 [1-exp-(0.13 (t+0.8G))], where L, is length (cm) at time t (years). Total mortality was 0.57, natural mortality 0.28 and fishing mortality 0.2Bayear-'. Yield-per-recruit analysis showed the snapper to be overfished at the present level of fishing mortality and age at first capture of 1.4 years (21.7 cm TL).
Resumen
La talla de rnadurez, epoca de desove, crecimiento y mortalidad heron deterrninados para el pargo colorado (Lutjanus purpureus) en Trinidad y Tobago. La talla de rnadurez fue de 27 crn de Iongitud total para machos y de 39 crn L Tpara hembras. N desove se presenta durante todo el an0 con una epoca de m2xirna actividad de septiembre a fehrero. La relacidn peso-longitud fu& W, = 0.0141 TLA2. 99 donde W, es el peso en grarnos y L T la longitud total en cen tirnetros. La edad h e deterrninada de secciones transversales de la sagita donde 10s anillos opacos fuer0t~ depositados anualmente de diciembre a abril. Veinte grupos de edad fueron encontrados, y la ecuacion de crecimiento de von BertalanfQ h e : L, - 85 [I-exp-(0.13 (t+O.86))], donde Lr es la longitud total (cm) a/ tiempo t (aiios). La mortalidad total FuP 0.57, la mortalidad natural de 0.28 y la mortalidad por pesca de 0.29-atio-'. El ana'lisis de rendimiento por recluta rnostrd que el pargo colorado estA sobrepescandose a1 nivel actual de mortalidad por pesca y edad de primera captura de 1.4 aiios (21.7 crn L T).
" Present address: lnstituto de Ciencias del Mar y Lirnnologia, Lab. Ecologia del Bentos Universidad Nacional Autonoma de' Mexico. Apartado Postal 70-305, Mexico 04510 D.F. Mexico: e-mail: [email protected]

Introduction
The Caribbean or southern red snapper (Lutjanus purpureus) is a large lutjanid, distributed along the southern coast of Cuba, t h e Yucatan Peninsula, and t h e shelves of Central and South America, down to northeast Brazil (Fischer 1978). This species is most abundant in dep ths between 30 and 160 m on the continental shelf off Honduras and the Guyanas. The Caribbean red snapper closely resembles the northern red snapper (Lutjanus campechanus), found in the Gulf of Mexico and the southern Atlantic coast of t h e United States (see Collins e t al., this vol.).
L. purpureus is of significant commer- cial value in this region, especially in north- eastern Brazil (Ivo and Hanson 1982) and in Venezuela (Gonzalez and Celaya 1986). This species is also one of the most important
species of finfish in Trinidad and Tobago, s u p p o r t i n g a lucrative e x p o r t marke t (Manickchand-Heilernan and Phillip 1996). It comprises about 76% of trap-caught fish, which consist mainly of other species of snappers, groupers and grunts (see Marcano et at., this vol.). Historically, this species has been fished by artisanal vessels, mainly using traps o n t h e continental shelf and shelf e d g e northwest of Tobago and along the north and northeastern coasts of Trini- dad (Fig. 1).
Due t o declining catches in t h e tradi- tional fishing areas, the trap Fishery has shifted south t o the offshore continental shelf and shelf e d g e t o the east of Trinidad. Several larger, me'chanized vessels have recently entered the fishery (Manickchand-Hellernan and Phillip 1996), posing a serious threat of overfishing. There is urgent need for management of t h e trap fishery, but lack
L--- ----+- -- 'x + --A A A - -
A N
C a r l b b e o n Sea II-
G u l f of P o r j o
62 61
Longitude (OW)
Flg. 1. Flshlng areas and locatlon of sampllng area for L uqanus purpureus In Trlnldad and Tobago. [Areas de pesca y Iocalldades de muestreo para LutJanus purpureus en T--hldady Tobago.]

of the necessary data is an impediment to the development of a management plan for this fishery in Trinidad and Tobago.
Because of its commercial significance, the biology and population dynamics of the snapper have been widely studied in north and northeastern Brazil. The repro- ductive biology has been investigated by several authors, for example, DeMoraes and Dos Santos (1 969), DeMoraes (1 97O), Fonteles-Filho (1 970;1972b), Alves (1 871). Gesteira and Ivo (1973) and Ivo (1973a, 197313, 1975. 1976). Age and growth studies have been conducted by Lima (1965). Menezes and Gesteira (1 974), Ivo and Hanson (1 982) and Ximenes and Fonteles-Filho ( I 988). Biology and population dynamics have been investigated by Ivo and Gesteira (1 974) and Ivo and Hanson (1982). Geographical distribution of this species with respect to oceanographic conditions has been reported by Fonteles-Filho and Kurisalta (1970). A synopsis of the biology of the southern red snapper has been prepared by Ivo and de Sousa (1 988).
Such studies have not been conducted in any detail for this species in Trinidad and Tobago, although preliminary studies on reproduction, age and growth were carried out by Manickchand-Heileman and Phillip (1 992). The main objectives of this study were to determine age, growth, spawn- ing season, age at sexual maturity and yield per recruit for this species in Trinidad and Tobago. This study formed part of a larger stock assessment project for snappers and groupers caught in the trap fishery in Trinidad and Tobago.
The Study Area
Trinidad and Tobago are the southernmost of the Caribbean chain of islands, lying between 1 0°35' and 1 1°1 5' north latitude and 61 "1 5' and 60°20' west longitude on the South American continental shelf (Fig. 1). Topographically, the shelf in this area is relatively featureless with a substratum
of fine mud interspersed with occasional patches of shell debris and fine sand (Kenny and Bacon 1981 ). The shelf edge lies along the 90-1 00 m contour (Gade 1989) which ranges from a distance of approximately 12 Itm from the coast of northwest Tobago to approximately 50 km from the coast of north Trinidad.
The islands experience a dry season from December to June and a wet season from July to November. During the wet season the area is influenced by freshwater runoff from local rivers and those From the mainland, especially the Orinoco and Amazon. This results in marked seasonal changes in salinity which have been found to vary from 35.5 ppt in the dry season to less than 27 ppt in the wet season (Gade 1989). Bottom temperatures at depths of about 100 m vary from a maximum of 25°C in the dry season to a minimum of 22°C in the rainy season (Gade 1989).
Samples were obtained from the tradi- tional fishing area on the continental shelf and slope to the northeast of Trinidad and northwest of Tobago (Fig. 1 ).
Methods
Field sampling
From January 1990 to December 199 1 , monthly samples of snappers were obtained from commercial fish landings at a wet fish processing plant in Tobago. These Fish were caught by Z-shaped Antillean fishtraps in the traditional fishing area in depths of 54- 150 m (Fig. I ) . The number of boats sup- plying fish to the plant varied between one to seven on any given day, and some of them landed fish that had been gutted at sea. Random samples of small- and me- dium-sized Ash were obtained, whereas all available fish above 600 mm total length were taken due to their scarcity in the catch. A total of 988 snappers were obtained during the study period.

The following were recorded for each fish: total length (TL) in centimeters, body weight and gonad weight in grams, sex and maturity s tage based on macroscopic examination of the gonads. Five maturity s tages were used: immature, active, ripe, spawning and spent . For most fish the left sagittal otolith w a s removed unless bro- ken or lost, in which case the right was obtained. Otoliths were stored dry in la- belled envelopes for use in a g e determi- nation.
Slze at maturjty and spawning seasonality
Size a t maturity was defined as the length at which 50% of the fish were sexually mature. The frequency of snapper in all maturity stages excluding immature was determined for each 4-cm length class and used to determine size a t maturity. Twne ofspawning was determined From monthly variations in t h e frequency of fish in each maturity s tage and in t h e mean gonosomatic index (GSI) which was gonad weight expressed as a percentage of total body weight. Time of spawning w a s determined using only females, a s was done in the Brazilian study of Gesteira and Ivo (1 973) .
Age and growth
Otoliths were embedded in polyester resin which was then allowed t o harden overnight. Two cross sections of each otolith w e r e taken through t h e focus a long a dorsoventral plane using a high speed circular saw. Sections were ground and polished using several grades of silicon carbide pa- per until they were thin enough t o trans- mit light (-0.2 rnrn). Sections were placed in glycerol and viewed against a black background using reflected light under a dissecting microscope a t a magnification oFx20. Alternating opaque and translucent
bands were visible and the former were counted a s annuli.
In order to validate that rings were formed annually, t h e frequency of occurrence of otoliths with an opaque e d g e was deter- mined for each month. Otolith radius and t h e distance from t h e core t o the e d g e of each opaque ring were measured using an ocular micrometer (1 micrometer unit = 0.125 mm). All measurements were taken along t h e ventral surface of t h e sulcus acousticus. Least squares linear regression of otolith radius (OR) on total length was carried ou t and t h e relationship used t o backcalculate lengths of Ash a t earlier ages. The von Bertalanffy growth function (Rlcker
1975) was used t o describe growth of t h e snapper:
where Lt is total length (cm) a t time t (years), L_ is the asymptotic length, K is the growth coefficient and to is theoretical a g e a t zero length. This was fitted t o observed and backcalculated lengths a t a g e using t h e FISHPARM program (Prager e t al. 1987). The resultant growth curve was compared with those from the literature using phi- prime ($'), where $'= logK + 21og L- (Pauly and Munro 1 984).
The length-weight relationship, W=aLb where W is body weight in g, L is total length (cm) and a and b are constants, was determined by least squares linear regression using log transformed data. W_ was obtained by substituting L_ into t h e above equation.
Natural mortality (M) was determined using the empirical equation of Pauly ( 1 980):
where L_ and K are the growth param- e t e r s and T is t h e m e a n environmental

temperature in "C. T was taken as 23.S°C in this study area (Gade 1989).
A second estimate of M was obtained from the equation oFAlagaraja ( 1 984):
where MI% is natural mortality correspond- ing to 1 ppt survival, and tmax represents longevity, which was taken as the oldest age Found in the catch.
Total mortality (2) was estimated from length-frequency distributions using the Wetherall plot (Wetherall 1986) as rnodi- fied by Pauly ( 1 986) in the ELEFAN suite of programs (Gayanilo et al. 1989). Fish- ing mortality (F) was determined as the difference between Z and M.
Yield per recruit
Equilibrium yield-per-recruit analyses following Beverton and Holt (1957) were carried out using the LFSA computer pro- gram (Sparre 1987). The input parameters were L-, K, to; a and b from the length-
weight relationship (for the Beverton and Holt model, b is assumed to be-3): M; age at first capture (tc); length at first capture LC; W_ and age at recruitment (t) which was assumed to be one year. Length at first capture was determined using the ELEFAN suite of programs (Gayanilo et al. 1989). and was converted to age by in- verting the growth equation.
Results
Slze at maturity and spawning seasonality
A total of 381 male and 408 female snap- pers, ranging in size from 24.7 to 84.9 cm TL were used to determine size at rnatu- rity. Males matured at a smaller size than females. The size at which 50% of the in- dividuals were mature was 27 cm TL for males and 39 crn TL for females (Table 1) .
Monthly frequency of females in each development stage showed the presence
Table 1 . Frequency of mature male and female LutJanuspurpureus by slze class. N- number In slze class. [Frecuencia, en porcenfaje, de hembras y machos madurns de Lutjanus purpureus por grupo de tal1a.l
Size class fTL:cm)
Females Males N O h mature N % mature
21-24 12 0 1 0 25-28 10 0 7 57 29-32 14 0 15 80 33-36 37 3 0 3 8 79 37-40 7 3 59 5 5 89 41 -44 68 9 1 58 95 45-48 5 2 90 46 100 49-52 43 93 37 9 7 53-56 2 7 100 3 9 100 57-60 2 1 96 2 1 100 6 1 -64 18 94 16 100 65-68 13 100 20 100 69-72 6 100 13 100 73-76 6 100 10 100 77-80 6 100 3 100 8 1 -84 2 100 2 100 Total 408 38 1

of all s t ages throughout the year (Fig. 2). The highest fre- quency of spawning females occurred from September to February. This is indicative o f a protracted spawning habit with peak spawning occur- ring from September to Feb- ruary. Monthly variation in m e a n g o n o s o m a t i c index showed elevated values in January a n d from J u n e t o October (Fig. 3).
Age and growth
Monthly variation in the fre- quency of otoliths with an opaque edge showed elevated values from December to April (Fig. 4), indicating the for- mation of opaque rings during this t ime. In o rder t o use otoliths for age determination, Flg. 2. Monthly frequency of female Luganus purpureus In
various stages of maturity. [Frecuencia mensuai tie hembras de Lutjanus purpureus en varios estados de madurez.]
-0.5 t I 1 - I I I 1 I I I I I I I 1
J F M A M J J A S O N D
Month
Flg. 3. Mean monthly gonosomatlc Index and standard deviation of female L.uvanus purpureus. Sample slzes are glven above data polnts. [Media mensuai dei indice gonadosomiit/co de hembras de Lutjanus purpureus. Los tamaiios de /as muestras se indican en /a parte superior de 10s dafos.]

1 1 I I I I I I I I I I M J J A S O N D J F M A
Month
Fig. 4. Monthly frequency of occurrence of otoliths with opaque margin for Luqanuspurpureus. Sample s izes are given next to data points. [Fecuencla mensual de la presencla de otolftos con margen opaco para Lutjanus purpureus. LOS tamafios de /as muestras estdn dados por 10s numeros asoclados a 10s puntos.]
growth of the otolith must be proportional to growth in length of the fish and number of rings must increase with body size (Van Oosten 1929). Analysis of covariance of otolith radius on total length (in mm) showed no significant difference between sexes (pz0.05) and data were pooled to give a single equation:
only in snappers with 1-12 rings. Mean backcalculated lengths at ages 1 - 12 years are given in Table 2. Close agreement was found between the observed and bacl<calculated growth curves (Fig. 5).
The von Bertalanffy growth equation fitted to observed lengths was:
Number of rings increased with fish length, with 1-20 age groups found in snappers between the lengths of 25-84 cm.
The relationship between total length and otolith radius was used to backcalculate lengths of fish at earlier ages. Due to overlapping of rings in older individuals and resultirig difficulty in making accurate measurements, ring radii were measured
The I$' value for the snapper was 2.97 which lies within the range Found for Brazilian snapper (Table 3).
The relationship between body weight (W,) and total length (TL) of the snapper was:
Asymptotic weight W_ was 8 690 g.

Table 2. Mean backcalculated length (mm) at ages 1 - 1 2 years for Lutjanus purpureus. [Longitudes. medas retro-calcuiadas a Ias edader I a I2 a- para Lutjanus purpureur.]
Annulus number
Age N I 2 3 4 5 6 7 8 9 10 11 12 1 21 200.9 2 9 168.3 243.9 3 30 154.7 240.1 295.3 4 39 177.0 271.3 354.4 394.8 5 59 165.6 264.3 349.8 406.7 438.2 6 18 167.1 259.9 352.8 415.9 455.5 483.4 7 11 157.1 250.3 322.2 388.0 437.6 480.2 504.5 8 6 156.6 266.1 347.8 420.2 468.5 511.2 546.5 576.2 9 3 162.2 251.3 333.0 407.2 455.5 492.6 518.6 548.3 568.8
10 2 145.5 251.3 318.1 429.5 485.2 518.6 557.6 591.1 624.5 652.3 11 4 134.3 273.3 365.5 446.2 507.5 560.4 593.8 630.0 657.9 691.3 709.4 12 5 L62.2 262.4 353.8 402.8 465.2 503.0 538.7 567.7 594.4 623.4 652.3 678.8
Number 207 207 186 177 147 i 08 49 3 1 20 14 10 9 5 Meanlength - 168.3 259.6 339.8 405.1 447.9 496.4 534.5 582.1 611.3 653.4 677.7 678.8 Increment - 168.3 91.3 80.3 65.2 42.8 48.5 38.1 47.6 29.2 42.1 24.3 1.1

Observed length
0 Back calc. length a
1 I 1 I I 5 10 15 M
Age (years)
Flg. S. Observed and hckcalculated length at age for Lu~anuspupureus. [Longitudes observndas ymt~vcalcuXadaspor eda4 paralutlanus purpureus.]
Table 3. von Bertalanffy growth parametea and 9' values for Lut$wuspurpureus. [Parifmetros de creclmlento tle la ecuacton de von Bertnlanffyylos vatores de #' para LutJanus purpureus.]
Source
Otoliths 97.7 0.1 17 3.05 Brazil Lima (1965) Scales 98.9 0.090 2.94 Brazil Menezes and Cesteira (1 974) Scales 92.9 0.103 2.95 Brazil Xirnenes and Fonteles-Filho ( 1988) Otoliths 85.1 0.130 2.97 Trinidad and This study
To bag0
4' = log K + 21og L_

Natural mortality determined by Pauly's and Alagaraja's equation was 0.32 and 0.23 year-', respectively. The average of these estimates was 0.28 year-! and was used in subsequent analyses. Total mortality was 0.57 resulting in an estimate of fishing mortality of 0.29 year-'.
Yield per recrult
Variations of Y/R and B/R with F for ages at first capture of 1.4, 3 and 4 years are shown in Fig. 6. Maximum yield per recruit (Ymnx/R) is obtained at low levels of F at all values of tc. The current level of F (0.29) exceeds Fmax (0.26), indicating that the snapper is overexploited at present. A higher tc is required to produce Ymw/Rat the present level of F. Increasing tc to 3 and 4 years results in an increase in yield by 21% and 249'0, respectively. F,,, levels are 0.15 and 0.21 for tc of 1.4 and 3 years, respectively. Y/R at these levels of F,,, is not much lower than Y,,,/R.
BIRdecreases sharply with increasing F at all values of tc and appears to be very low even at current Fmax. This is shown in Fig. 6 For tc of 1.4 years. At Fo-, B/R is not as severely reduced (Fig. 6). Maintaining F at F,, is therefore desirable since it ensures
a higher B/R than Fmax.
Dlscusslon
Reproduction in L. purpureus in Trini- dad and Tobago is consistent with what has been reported for snappers in general. Grimes (1 987) indicated that among snappers, males usually mature at smaller sizes than females, as was observed in this study and in a Brazilian study by Alves ( 197 1 ). In the latter study, which was based on histological data from 95 specimens, the size at maturity was 40 cm FL for males and 42 cm FL for females. Gesteira and Ivo (1973), using gonosomatic indices, obtained a size at maturity of 42 cm TL for female snapper in Brazil. The size at maturity observed in this study was 27 and 39 cm TL for males and
I Fishing mortality (F; year-1)
m-
- 400- - I L
5 z 300- + .- a L
m- L Q n
0 0 F loo-
0
Fig. 6. Variations in yield per recruit (Y/R) and blomass per recrult (B/R) with fishing mortality (F) and age at first capture (t) for Lutjanus purpureus. [ Variaciones en e/ rendidento por reduta (Y/R) y blomasa por recluta (B/R) con la mortalldad por pesca (F) y edad de primera captura (t) para Lutjanus purpureus.]
-

and females respectively, indicating ear- lier maturity than in Brazil.
In this study L. purpureuswas found to spawn year-round, with a peak from Sep- tember to February. This is consistent with the general year-round pattern OF spawning for lutjanids in the Caribbean (Munro et al. 1973; Grimes 1987). In Brazil, spawning is restricted to two periods from January to May and September to December (De Moraes and Dos Santos 1969; Fonteles-Filho 1970, 1972; Gesteira and Ivo 1973; Ivo 1973.3).
In reviewing the spawning seasonality of lutjanids, Grimes (1 987) found that spawn- ing in continental populations is more re- stricted than in their insular counterparts in which spawning is year-round. In the present study the snapper demonstrates a spawning pattern that is a combination of the two, showing year-round spawning with a six-month spawning peak begin- ning in the wet season. Grimes (1987) also re,ported that spawning in continental lutjanid populations along the east coast of North America, Venezuela and Campeche Bank coincides with high summer rainfall and perhaps local production cycles.
The formation of annual marks in hard parts has already been reported for this species in Brazil (Lima 1965; Ximenes and Fonteles-Filho 1988) and for other species of snappers in the region (Claro and Reshetniltov 1981 ; Manicltchand-Dass 1986; Palazon and Gonzalez 1986). The time of formation OF opaque rings in otoliths of snapper in Trinidad and Tobago is slightly out of phase with peak spawning, indicat- ing that the former may be related to other factors such as climatic or environmen'tal factors. Ximenes and Fonteles-Filho (1988) found that ring formation in scales of this species in Brazil is influenced by seasonal changes in food availability. Further vali- dation was obtained by the close agree- ment OF observed and backcalculated lengths at age, as well as similarity of$' value with those calculated for this species in Brazil
Previous estimates of L- and K for snap- per in Trinidad and Tobago were 90 cm
and 0.13 year', respectively, and were based on a preliminary study using only 90 otoliths and without validation (Manickchand- Heileman and Phillip 1992). The growth pattern of this species is similar to that re- ported for snappers in general (Manooch 1987), in that i t is long-lived (maximum observed age 20 years), has a high L_ (85.1 cm) and low I< (0.13 year-'). This is also similar to the growth pattern of this spe- cies in Brazil where Menezes and Gesteira (1974) observed 2-1 5 age groups and re- ported L_ of 99 cm and K of 0.09 year-', and Ximenes and Fonteles-Filho (1 988) found 23 age groups and reported L_ of 93 cm and I< of 0.103 year-'.
Estimates of L_ and I< for the closely re- lated northern red snapper Lutjanus campechanusare slightly higher than those obtained in this study. Nelson and Manooch (1 982) found L_ of 94.1 crn and I< of 0.17 year-' for northern red snapper in the Gulf of Mexico and L_ of 97.5 cm and I( of 0.16 year-' for this species in the southeastern United States. Nelson (1 988) estimated L_ to be 92.5 crn and I< to be 0.14 year-' in the Gulf of Mexico.
At the present age at first capture and fishing mortality, the stock is k i n g overtished. Increasing tc results in an increase in yield per recruit and is also desirable since the current tc is lower than the age at first maturity for females. I t is recommended that tc be increased to at least 3 years (33.6 cm TL) in order to protect immature fish. Increas- ing tc can be obtained by increasing the mesh size in traps.
Fishing effort should be kept low since long-lived fish wi th low I( may be overexploited by a large intensive fishery (Mason and Manooch 1985). As results of yield per recruit analyses have shown, the maximum yield per recruit of the snapper is obtained at low levels of F. lncreasing F results in a rapid decline in biomass per recruit which may reduce recruitment to the stock. I t may be desirable to maintain F at F,,, since B/R i s not as severely reduced and Y/R is not signiFicantly lower than Y,,,IR

Acknowledgements
The authors thank the Institute of Marine Affairs, t he Minlstry of Agriculture, Land and Marine Resources, FA0 and UNDP for support in carrying out this project; Maxwell Sturm for reviewing the manuscript; and the following fishers in Tobago for facilitating field sampling: Lincoln, Garnet, Rnoul, Robert (now deceased) and Clarence Yeates.
References
Alagaraja, K. 1984. Simple methods For esti- mation of parameters for assessing ex- ploited fish stocks. Indian ]. Fish. 31 : 177- 208.
Alves, M.I.M. 1971. Sobre a maturacao sexual do pargo, Lutjanus purpureus Poey, do nordeste braziliero. Arq. Cienc. Mar 11:153-158.
Beverton, R.J.H. and 5.1. Holt. 1957. On the dynamics of exploited fish populations. U.K. Min. Agric. Fish. Invest. Ser. (2) 19, 533 p.
Claro, R. and Reshetniltov, Y.S. 1981. EcologTa y ciclo de vida de la biajaiba, Lut/anus syn?gk(Linnaeus), en la platforma Cubana. Ser. Oceanol. Acad. Cienc. Cuba 174:l- 28.
De Moraes, N.U.A. 1970. Sobre a desova e a fecundidade do pargo, Lutjanuspurpureus Poey no nordeste Brazileiro. Bol. Estud. Pesca 10(1):7-20.
De Moraes, N.U.A. and E.P. Dos Santos. 1969. Sobre a curva de maturaqaodo pargo, Lutjanuspurpureus Poey. Bol. Estud. Pesca 9(3):50-57.
Fischer, W., Editor. 1978. FA0 species Identi- fication sheets for fishey purposes. Western Central Atlantic (Fishing area 31). Food and Agriculture Organization, Rome.
Fonteles-Filho, A.A. 1970. Estudo prelimlnar sobre a pesca do pargo, Lut/anuspurpureus Poey, no nordeste brazileiro. Arq. Cienc. Mar 9(1):83-88.
Fonteles-Filho, A.A. 1972. Estudo sobre a biologia da pescado pargo, Lut/Nluspurpureus Poey, no nordeste brazileiro - dados de 1970 e 1971. Arq. Cienc. Mar 12(1):21-26.
Fonteles-Fllho, A.A. and S. Kurisaka. 1970. Some oceanographlc conditions related to the
Caribbean red snapper fishey, offthe north- east Brazil. Arq. Cienc. Mar lO(2): 177- 180.
Gade, H . 1989. The environmental-ecological regimes, p. 8-41. In Report on surveys of the fish resources in the shelf areas be- tween Suriname and Columbia with the WVDr. FridqofNansen. institute of Ma-
J rine Research, Bergen. Gayanilo, F.C., Jr., M. Soriano and D. Pauly. 1988.
A draft guide to the Compleat ELEFAN. ICLARM Software 2, 70 p.
Gesteira, T.C.V. and C.T.C. Ivo. 1973. Estudo da reproducao e fecundidade do pargo, LutjanuspupureusPoey, do norte e nordeste do Brazil. Arq. Cienc. Mar 13(2): 109- 1 12.
Gonzalez, L.W. and J. Celaya. 1986. Diagnostic0 socio-economico de la pesquerii de me- dia altura pargo-mero del estado Nueva Esparta. Centro de lnvestigaciones Cientificas, Univ. Oriente, Venezuela, Contrib. Cientificas 8.
Grimes, C.B. 1987. Reproductive biology of the Lutjanidae: a review, p. 239-294. In J.J. Polovina and S. Ralston (eds.). Tropical snappers and groupers: biology and fish- eries management. Westview Press, Boulder.
Ivo, C.T.C. 1973.3. Estudo sobre a biologta cia pesca do pargo, Lutjanuspurpureus Poey, no nordeste Brasileiro-dados de 1972. Arq. Cienc. Mar 13(1): 39-43.
Ivo, C.T.C. 197313. Estudo sobre a biologia da pesca do pargo, Lutjanuspurpureus Poey, no nordeste Brasileiro-dados de 1973. Arq. Cienc. Mar 13(2): 1 13- 1 16.
Ivo, C.T.C. 1975. Estudo sobre a biologia da pesca do pargo, Lutjanuspurpureus Poey, no nordeste Brasileiro-dados de 1974, Arq. Cienc. Mar 1 S(2): 1 19- 123.
Ivo, C.T.C. 1976. Estudo sobre a biologia da pesca do pargo. Lu~anuspurpureus Poey, no nordeste Brasileiro-dados de 1975. Arq. Cienc. Mar 16(2): 87-91 .
Ivo, C.T.C. and de Sousa, M.J.B. 1988. Slnopse de informacoes sobre o pargo, Lutja~ius purpureus Poey (Pisces: Lutjanidae), no norte e nordeste do Brasil. Arq. Cienc. Mar 27:57-67.
Ivo, C.T.C. and T.C.V. Gestelra. 1974. Estimacao prellminar das medicas de rnortalidade do pargo, Lutjc7nus purpureus Poey, no norte e nordeste Brazileiros. Arq. Cienc. Mar 14(2): 123- 127.
Ivo, C.T.C. and A.1. Hanson. 1982. Aspectos d a biologia e dinamica populational d o pargo, t utjanuspurpureus Poey, n o Norte e Nordeste d o Brasil. Arq. Cienc. Mar 22(1/ 2): 1-41.
Kenny, 1.5. and P.R. Bacon. 1981. Aquatic re- sources, p. 1 12- 144. In S.G.C. Cooper and P.R. Bacon (eds). The natural resources of Trinidad and Tobago. Edward Arnold, London.
Lima, F.R 1965. Crescimento d o "pargo" (Lutjanus aya, Bloch, 1 795): aspect05 quantativos. Bol. Estud. Pesca 5: 33-42.
Manicltchand-Dass, 5 . 1986. Reproduction, a g e and growth of t h e lane snapper, Lut/anus synagrls (Linnaeus) in Trinidad, West Indies. Bull. Mar. Sci. 40(1):22-28.
Manickchand-Heileman, S. and D.A.T. Phillip. 1992. Preliminary stock assessment for t h e fishpot fishery of Tobago. Technical Report of the Project for the Establishment of Data Collection Systems and Assess- ment of the Fisheries Resources. FAO/UNDP: TR1/91/001 /TR12.
Manickchand-Heileman, S. and D.A.T. Phillip. 19%. Description and status ofthe snapper- grouper fishery of Trinidad and Tobago, Proc. Gulf and Carib. Fish.lnst. 45 (Section A): 189-204.
Manooch, C.S. 111. 1987. Age and growth of snappers and groupers, p. 329-373. In J.J. Polovina and 5 . Ralston (eds.) Tropi- cal snappers and groupers: biology and fisheries management . Westview Press, Boulder.
Mason, D.L. and C.S. Manooch 111. 1985. Age and growth of mutton snapper along t h e e a s t coas t of Florida. Flsh. Res. 3:93- 1 0 4 .
Menezes, M.F. d e and T.C.V. Gesteira. 1974. Age and growth of the Caribbean red snap- p e r Lutjanus purpureus Poey, from north and northeastern Brazil. Arq. Cienc. Mar 14(2):81-85.
Munro, J.L.. V.C. Gaut, R Thompson and P.H. b n . 1973. The spawning seasons of Caribbean reef fishes. 1. Fish Biol. 5:69-84.
Nelson, R.S. 1988. A study of t h e life history, ecology, and population dynamics of four sympatric reel predators (Rhomboplites aurorubens , L ut/anus ca rnpechanus , Lutjanidae; Haernulon melanurum, Haemulidae; and Pagruspagrus, Sparidae) on the east and west Flower Garden Banks,
Nor thwes te rn Gulf of Mexico. North Carolina State University, Raleigh, North Carolina. 197 p. Ph.D. thesis.
Nelson, RS. and C.S. Manooch 111. 1982. Growth and mortality OF red snappers, Lut/anus carnpechanus, in t h e West Central Atlan- tic Ocean and northern Gulf of Mexico. Trans. Am. Fish. Soc. 1 1 1 :465-475.
Palazon, J.L. and L.W. Gonzalez. 1986. Edad y crecimiento del pargo cebal, Lutjanusan&s (Cuvier, 1828) (Teleostei: Lutjanidae) e n la isla d e Margarita y alrededores, Ven- ezuela. Inv. Pesq. 5O(2): 1 5 1 - 165.
'Pnuly. D. 1980. On t h e interrelationships be- tween natural mortality, growth param- eters, and mean environmental tempera- ture .in 1 7 5 fish stocks. ]. Cons. ClEM 39(2): 175- 192.
J ~ a u l y , D. 1986. On improving operation and use of t h e ELEFAN programs. Part II. Im- proving t h e estimation of L_. Fishbyte 4(1):18-20.
J Pauly, D. and J.L. Munro. 1984. Once more on t h e comparison of growth in fish and In- vertebrates. Fishbyte 2(1):21.
Prager, M.H., S.B. Saila and C.W. Reckslek. 1987. FISHPARM: a mlcrocomputer program br parameter estimation o f nonlinear rnod- els in Fishery Science. Ocean. Tech. Rep., 1 8 p. Old Dominion University. Norfolk. Virginia.
Ricker. W.E. 1975. Computation and interpre- t a t ion of biological s ta t i s t i cs of fish populations. Fish. Res. Board Can. Bull. 191 , 3 8 2 p.
Sparre, P. 1987. Computer programs for fish stock assessment. Length-based Flsh Stock Assessment for Apple I1 Computers. FA0 Fish. Tech. Pap. (101) Suppl. 2 , 2 1 8 p.
Van Oosten, J. 1929. L i f e history of t h e lake herring (Leucichthys ar tedi Le Sueur) of Lake Huron a s revealed by its scales with a critique of t h e scale method. U S . Dep. Comm., Bull. U.S. Bur. Fish. 4 4 2 6 5 - 4 2 8 .
Wetherall, ].A. 1986. A new method for esti- mating growth and mortality parameters from iength-frequency da ta . Fishbyte 4(1):1Z-15.
Xlmenes, M.O.C. and A.A. Fonteles-Who. 1988. Estudo da idade e crescimento d o pargo, Lut janus p u r p u r e u s Poey (Pisces: Lutjanidae), n o norte e nordeste d o Brasil. Arq. Cienc. Mar 27:69-81.

Validation of Ageing Technique for Nassau Grouper (Epfnepbelus striatus) in the Cayman lslands
P.G. BUSH' G.C. EBANKS'
E.D. LANEb "Department o f the Environment, P. 0. Box 486 CT
Grand Cayman, Cayman Islands, B WI
bA quaculture and fisheries, Malaspjna College 900 Fifth Street, Nanaimo 6. C. V9R 555 Canada
BUSH. P.G., G.C. EBANKS and E.D. LANE. 1996. Validation of the ageing technique for the Nassau grouper (Epinephelus striatus) in the Cayman Islands 1 Validation de la tecnica para deterrninacion de edadde la cherna criolla (E. striatus) de Islas CaimJn], p. 150-158. In F. Arreguin-Sanchez. J.L. Munro, M.C. Balgos and D. Pauly (eds.) Biology, fisheries and culture OF tropical groupers and snappers. ICLARM Conf. Proc. 48. 449 p.
Abstract
During its ongoing study of the local Nassau grouper spawning population, the Cayman Islands Natural Resources Unit analyzed thin sections of sagittal otoliths to determine ages of fish in the spawning population. To validate this method of ageing, fish injected with oxytetracycline-HCL (OTC) were held in submerged cages for approximately 21 months after which the fish were sacrificed and their otoliths examined. Fish were injected either intramuscularly or intraperitoneally at 100 m g OTC/ kg body weight. Post-capture mortality was 36% and seemed related to various levels of trauma during capture and individual resilience. A total of 14 fish (size range 34-76 cm TL) were held captive and fed on squid and small fish. Sagittal otoliths were taken from six Fish and examined. Examination of otolith sections under ultraviolet light showed a distinct fluorescent band marking the time of injection with OTC. Further analysis of banding revealed that the rings were indeed annuli. Time of annuli Formation appears to be after spawning during the months of February through July.
Resumen
Durante el desarrollo del estudio sobre la poblacidn local de desovadores de la cherna criolla, la Unidad de Recursos Naturales de /as lslas Caimdn analizaron cortes del otolito (sagita) para determinar /as edades de 10s peces en la poblacidn de desovadores. Para validar el mCtudo para deterrntnacion de edad, 10s peces fueron inyectados con oxitetraciclina-HCL (OTC) y sumergidos en jaulas por aproximadamente 21 meses, despues de 10s cuales 10s peces fueron sacrihcddos y sus otolitos exarninados. lnyecciones intramusculares e intraperitoneales fueron colocadas a cada per en una proporcidn de 100 rng de 07C por cada kg de peso corporal. La mortalidad post-captura fue de 36% y se observo que estuvo relacionada con diferentes niveles de daiio y resistencia individual durante la captura. Un total de 14 pcces (en un intervalo de talla de 34 cm a 76 cm Ln fueron mantenidos en cautividad y alimentados con calarnares y pequefios peces. Las sagitas fueron tornadas de seis peces (10s ocho restantes escaparon durante una torrnenta) para so andlisis. El exhrnen de /as secciones de 10s otolitos bajo luz ultravioleta mostro una banda fluorecente distinta formada a/ rnomento de la inyeccidn con OTC. Posteriores andlisis de /as bandas revelaron que 10s anillos heron annuli reales. El tiempo de formacton de 10s annuli parece ocurrlr despu&s del desove, durante 10s rneses de febrero a julio.

Introduction
The Nassau grouper (Ephephelus striatus) aggregates en masse to spawn each winter at various sites around the Cayman Islands (see Tucker and Woodward, this vol.). There are five main aggregations which are regularly fished by the local people (Tucker et al. 1993) and these form the basis of a sea- sonal subsistence level fishery. In 1987, the Cayman Islands Natural Resources Labora- tory initiated a study to investigate the population structure of the spawning aggregations. Data such as catchleffort, total catch, size, sex and age offish were taken. The need to accurately determine the age composition of the aggregations and the validation of the ageing technique employed were critical to this study and i t is these two topics on which this paper will focus.
Manooch ( 1987) states that stable bio- logical and environmental conditions, es- pecially temperature, contribute to mak- ing age and growth determination in tropical fish dificult. Pannella (1974) suggested that age determination of tropical fish was dif- ficult due to the lack of clear annual rings. However, later research of bony structures revealed an abundance of markings, though interpreting their meaning is challenging (Pannella 1980). The analysis of regularly formed marks in bony structures such as otoliths is nevertheless the preferred method of age determination of tropical fish with the only disadvantage to this technique being that great care and extensive study are required to establish a true indication of elapsed time between consecutive marks (Manooch 1987). Scientists previously unable to explain the occurrence of periodic markings, based on seasonally changing water temperatures, have now turned their efforts to studying less obvious genetic, physiological and environmental phenomena that may influence patterns of growth in tropical species (Manooch 1987).
For this study, age determination was done by examination of growth ring structure in sagittal otoliths, these typically being the preferred of the three pairs of otoliths used for age analysis. As Beamish and Chilton ( 1 982) observe, failure by fisheries biologists to accurately validate age determination often leads to wasting and mismanagement of fisheries resources. Validation of the ageing technique in this study was carried out by injecting a number of fish with the marker antibiotic oxytetracycline (OTC), and holding them in captivity after which they were sacrificed and their otoliths taken for analysis (see Collin et al., this vol.).
Materials and Methods
Sagittal otoliths were taken from wild caught Fish by medially splitting the cranium to expose the inner ear cavities. They were then individually stored in a 1 : 1 solution of water and glycerol with a small amount of thymol added (Beamish and Chilton 1982), for later analysis of growth ring formation. The typical break and burn technique used for many temperate fish (Beamish and Chilton 1982) was found to be unsuitable for E. striatusotoliths which are characteristically thick, dense, highly crystalline and irregularly shaped. Thus, these otoliths were embedded in epoxy and serially sectioned with a high speed microtome to 0.5-mm thicknesses. The sections were mounted and analyzed independently by three persons using trans- mitted light microscopy. Each reader aged the fish twice.
For the validation of the technique, three cages were constructed on land and de- ployed in a 9-m deep trench within the Marine Park on the lee side of Grand Cayman. One large oblong cage (24.57 m3), and two smaller, circular cages (7.84 m3 each) were constructed of 2.54-cm diameter stain- less steel tubing for framing, and 5.1 -cm

and 2.54-cm Vexar polypropylene mesh- ing for enclosure. The cages were teth- e red d o w n with stainless steel cable at- tached t o pins embedded in the substrate t o prevent movement by wave action. In each cage , artificial shelter was provided by lashing together a number of 45.7-cm and 20.3-cm diameter clay sewer pipes.
A total of 2 2 fish ranging in length from 36.5 cm t o 76 c m were caught using large, baited, antillean Rsh traps. Soak time varied from 1 2 t o 7 2 hours and trapping dep ths varied From 9 to 24 rn. Each Nassau grouper was anesthetized in a 5-ppm metomidate - HCL (Marinil) seawater solution, afterwhich they were weighed, measured, tagged with numbered plastic disc tags (secured by pins inserted through the dorsal pterygiophores) and injected with oxytetracycline HCL anti biotic (Terra-Vet 100 rng/rnl) a t dosages of 100 mg OTC/kg bodyweight (Sadovy, pers. comm.). Individuals were either injected intramuscularly o r intraperitoneally, using 25 g a and 2 0 ga hypodermic needles for small and large fish, respectively. The fish were then allowed t o recover from t h e anesthetic before being transferred to their allocated cages. The captive fish were fed on a die t predominantly of squid and oc- casionally small reef fish. Dates of capture extended from 9 May t o 8 August 1990 and the fish were sacrificed on 1 0 Febru- ary 1992.
The sagittal otoliths from these fish were extracted and prepared (as described pre- viously) and then microscopically analyzed using transmitted light in combination with an ultraviolet light source.
Results and Discussion
Total post-processing mortality was 36% (8 fish died) and varied individually within 12-1 2 0 hours. Mortality was attributed t o
trauma during capture and processing. Physical damage during trapping varied greatly and was related to length of residence time in traps. Barotrauma was also an added complication in fish caught a t dep ths of 18 m or more. Fish with distended air bladders were vented of g a s by insertion of a 2 0 ga hypodermic needle into t h e air bladder.
Although employed t o minimize physi- cal trauma t o fish during processing, the anesthetic itself may also possibly cause some degree of trauma. The recommended dosage for the product used resulted in an average "roll-over" (complete anesthesia) t ime of 1 minute with "righting" (recov- ery) t ime of 2-5 minutes. There was n o appreciable difference in these t imes be- tween larger and smaller fish. Upon being introduced t o t h e anesthetic bath, many of the fish exhjbited drastic color loss (an estimated 90% in some cases). Some color loss was still evident even after apparent recovery. Given the relatively rapid knockout t imes observed, it may b e possible that the recommended dosage of this muscle relaxant may b e t o o high, possibly result- ing in s o m e level of physiological shock especially if combined with other trauma. At t h e time, Marinil was being offered a s a new experimental drug for t h e sedation of fish. Another source o f t rauma was t h e actual tagging of fish. This was especially so in large fish a s it was often difficult t o inser t t h e pin th rough t h e dorsal pterygiophores even with the aid of a pli- ers. This process often triggered a violent muscular reaction in fish although they were anesthetized.
Injection of high concentrations of OTC is known t o cause tissue necrosis (Beamish e t al. 1983). A major factor in the mortality of three larger fish was that the injection o f proportionally high volumes of 100 mg/ ml OTC solution into the dorsal musculature p roduced s u b s e q u e n t t issue necrosis. Dissection oftissue surrounding the injection sites of these fish revealed conspicuously hard, yellow, dry and flaky tissue. This was

subsequently avoided by injecting the prescribed dosage for large individuals into a number of sites rather than a single one.
An initial dosage of 50 rng OTC/kg body weight was increased to 100 mg/kg body weight after preliminary microscopic inspection of otoliths From these fish showed weak fluorescence under ultraviolet light. Otoliths from dead fish which had been injected with the higher dosage showed stronger fluorescence.
The Nassau grouper seems to exhibit a high individual variability of resilience to trauma. Some fish showing high levels of physical and behavioral stress from trapping and processing survived, while others show- ing considerably lower levels of stress did not. Indeed one fish survived after being badly damaged in the trap, having its stomach everted in order to surgically remove a hook which had pierced the posterior end of the stomach wall, and having the same pushed back in with a broomstick.
Adaptation to captivity
The 14 surviving fish constituted the stable captive population within the cages for the duration of the experiment. Total lengths of these fish ranged within 36.5-57.5 cm (Table 1 ) . The fish adapted well to captiv- ity, utilizing the pipes for shelter, feeding on provided squid and small reef Ash within
the cages, and conducting spawning activity during the weeks of the two January full moons following capture.
The disc tags did not prove to be corn- patible with the cryptic and demersal life style of the captive fish. The retaining pins tended to bend and break with time after being caught or rubbed against the mesh- ing or pipes. As each fish in a cage lost its tag, it was caught and a designated dor- sal spine clipped half way down in order to ensure later identification. On 8-9 Feb- ruary 1992, a heavy storm destroyed the large cage and one small one. The eight fish in these cages (4 very large and 4 smaller individuals) escaped and were not recovered despite trapping attempts in the area during the following weeks.
The six remaining fish of intermediate sizes (Table 1 ) were sacrificed and their otoliths taken on 10 February 1992. The fish had grown considerably and even though there was a feeding hierarchy dominated by the largest fish, percentage increase in length was greatest for the smaller fish.
Analysis of oto/iths
Appearance of Sections
We have examined hundreds of sectioned E. striatusotoliths taken from fish ranging in length from 34 to 84 cm, and there was
Table 1. Project data for captive flsh (IM=intramuscular; IP=intraperitoneal Injections). [Datos delproyecto de peces cautlvos (inyecclones: fM=lntramuscu/ar, IP=intraper/toneat).]
Date IM/IP Length at Final Increase Sex As e injected injection length ( O h ) (years)
( 1 990) (cm) (cm)
9 May I M 57.5 70.0 21.74 Male 6+ 8 August I P 51 -5 61 .O 18.45 Female 6 + 8 August IP 42.5 59.0 38.82 Female 5+ 3 August IP 42.5 56.5 32.94 Female 5+ 7 WY IM 41.0 56.0 36.58 Female 5 +
5 May I M 36.5 50.25 37.67 Female 4+

95% agreement between readings and readers, indicating a high level of precision. Most sections revealed a distinct banding pattern of alternating light and dark bands lying perpendicular to the axis of the otolith's aragonitic crystalline structure. Usually, otoliths which were not readable were those of smaller fish. In these cases cracks and Fractures caused optical refractive anomalies in the banding pattern too frequently to allow a reliable reading. The cracks were probably caused by vibratory shattering during sectioning, as smaller otoliths are generally thinner and more brittle than those of larger fish.
In this paper we define a growth zone as one pair of constituent light (hyaline) and dark (opaque) bands representing periods of slow and rapid somatic growth, respectively (Pannella 1974; Beamish and Chilton 1982). For convenience, we define the assumed annuli to be opaque zones. These zones have a higher optical density (due to an organic-rich matrix) and are more visually and structurally distinct than the amorphous hyaline zones.
The spatial distribution and progressive width of growth zones observed in E. strjatus otoliths are consistent with those described for other tropical fish. The position of the first annulus can be difficult to locate as the central area, or nucleus, often appears similar to the organic matrix of individual annuli. However, thinner sections, and therefore increased transparency, allowed observation of an obvious band of crowded rings within this area. Many otoliths sectioned at the usual 0.5-mm thickness showed a more distinct band in this same location. We therefore conclude that this is the first annulus. The organic appearance of the nucleus area may be attributed to the likelihood that young fish experience continuous and rapid growth in the first year. The observed distance between the center of the nucleus and the first annulus is also the widest growth zone. In all otoliths there are many opaque striations distributed
between the first four annuli that are generally lacking between later ones. This also suggests continuous and rapid growth prior to sexual maturity.
Band thickness and spacing of the first three or four growth zones are much greater than in subsequent zones, which become more evenly spaced and progressively narrower towards the edge of the otolith (Table 2). This indicates fast growth which tapers off after the early years, and reflects what is known of the growth of tropical fish (Scholander 1953; Edwards et al. 1971 : Pannella 1974). As tropical Ash tend to grow faster than temperate ones until they reach sexual maturity (Pannella 1974), the pat- tern seen in E. striatus otoliths may sug- gest that sexual maturity occurs after the third or fourth year (J.W. Tucker, pers. comm.). However, more detailed study of otoliths from fish of known age is necessary to verify this.
The vast majority of otoliths analyzed in this study were taken in the spawning season in January. Otoliths of the captive fish were talten in early February. Presumed ages of fish from the spawning aggregation before validation ranged from 4+ years to 26+ years. Ages of captive Fish ranged from 4+ years to 6+ years (Table 1 ) .
Examination of the edges of otoliths talten from the January spawning individuals revealed an almost complete hyaline band
fable 2. Distances between dlstal edges of annuli of 6+ year old Rsh. [Dlsl'imcias entre hordes dlstales de 10s annul1 de peces de edad 6+ an"os.1
Annuli Interannuli distance (em)
1 a2 34.5 2 & 3 32.2 3 b 4 18.4 4 a 5 11.5 5 6 6 11.5 6 &. Edge 9.2

following the last visible annulus. Similar examination in otoliths from the captive fish showed what appears to be a complete hyaline band followed by visible striations reminiscent of those found in material laid down at the beginning of annulus formation. I t is important to remember these observations of otolith formation in both wild and captive fish when discussing the validation itself.
Position of the OTC Marker
Analyses of sectioned otoliths from the captive fish showed a distinct fluorescent band marking the exact time of injection with OTC (Fig. 1 and Table 1 ). OTC marks OF the two fish injected in early May lay nearly half way in from the distal edge of an opaque band (Fig. 2). This indicates that approximately half of the annulus was laid down during the months immediately prior to injection. Otoliths of fish injected in the subsequent months of July and August, respectively, displayed marl6 slightly within, and a short distance outwards from, the distal edge of the opaque band.
In each otolith, following the OTC mark, there occurred one complete growth zone
(hyaline/opaque), then a second full hyaline band, and finally the First striations of opaque material at the otolith's periphery. This opaque material would represent the beginning of the second annulus after the t ime of injection. The fact that the second annulus is just beginning to form at the time of harvest in early February indicates that it is not laid down during the period prior to spawn- ing or during spawning itself. Thus the annulus must be laid down after spawning, during the months of February through July.
Pre- and post-injection growth zones (in the largest captive fish) were approximately equal in width. When the above is con- sidered in combination with the knowledge that almost two years (2 1 months 10 days, and 18 months 10 days) had elapsed be- tween injection and harvesting, i t is obvi- ous that almost two complete growth zones were Formed within this period of time. This signifies the formation of o n e growth zone per year. The growth in otoliths of wild fish mentioned earlier further supports this. As wild Fish were taken during spawning (no active growth), no annulus formation would have been occurring. This growth of hyaline material would therefore represent a period of approximately six months.
10 February 1992 I + (New annulus fwming)
" -vista1 edge of otolith
1991 annulus
8 August 1990 OTC label
1990 annulus
Annulus (dark opaque band)
Flg. 1. Detall of otolith section showing oxytetmcycline-HCI (OK) label (drawlng adapted from actual photo) . [Detalle de la seccidn de un otollto mostrando /a marca dejarlil por /a 0TC (dlbu/o tomado tie una fotografia actual).]

Jan-Aug Jan-Aug Jan- Aug Jon- Birth day
Feb-Aug
10 Feb 1992 New annulus formin
OTC label 19 May l W
Fig. 2 Drawlng of conventionallzed otollth section showing sequence of growth. [Esguema de m a seccibn convenclonal ifel otollto mostrando la secuanch del creclmlento.]
OTC labels applied in August are logi- cally only a short distance from the previ- ously established annulus. One would ex- pect this as the hyaline band representing reduced somatic growth spans a period of six months from August to January.
The measured bands of the clearest sections from the 6+ year old fish show hyaline and opaque bands to be almost equal in width (average width of hyaline = 6.9 pm; aver- age width of opaque = 4.8 um) - a differ- ence of only 2.1 pm. When compared to the amount of time allocated for each type of band to be formed (6 months each) this difference is negligible.
Spacing and incremental widths in the other otoliths from fish of similar age show a similar pattern. In younger fish the com- parative widths of hyaline and opaque bands are more equal, while in apparently older fish, they are more disproportionate.
As two almost complete growth zones were laid down after OTC labeling, this would mean that the smallest fish, aged at 4+ years, would have actually been 2+ years of age when injected. This is because each hyaline/opaque growth zone is com- pleted during August through July (Fig. 2). Similarly, sacrificed fish aged at 5+ years and 6+ years would have, respectively, been 3+ years and 4+ years old at injection.
Conclusions
The number of hyaline and opaque bands beyond the O K lakl in the otoliths of captive E. stfiatuswas consistent with the amount of time spent in captivity. We therefore conclude that the opaque (dark) organic bands which represent peak periods of active (somatic) growth, are indeed annuli, and

t h a t t h e s e depos i t ions a r e laid d o w n dur ing t h e m o n t h s of February through July. Though t i m e of a n n u l u s formation is n o t re la ted t o s p a w n i n g ( o b v i o u s l y n o t f o r s e x u a l l y i m m a t u r e fish) it does a p p e a r as if it is a r e g u l a r l y s c h e d u l e d o c c u r r e n c e w i t h unknown causal factors (but possibly related t o s o m a t i c g r o w t h ) . N o o b v i o u s s p a w n i n g c h e c k s w e r e o b s e r v e d in a n y o to l i ths of fish expected t o b e s e x u a l l y m a t u r e . Incidentally, timing of injection w a s somewhat fo r tu i tous in t h a t it m a d e t h e p r o c e s s o f extrapolatory deduct ion s imple with respect to t h e t i m e a n d f r e q u e n c y o f g r o w t h r ing formation.
We c a n n o w s a y wi th cons iderab le con- f i d e n c e t h a t t h e a g e i n g t e c h n i q u e u s e d h e r e f o r t h e Nassau g r o u p e r s t u d y is valid a n d a c c u r a t e for Ash in t h e 3-7 y e a r age classes. Examina t ion of o to l i ths f rom t h e l a r g e r ( a n d p r e s u m a b l y o l d e r ) fish w h i c h escaped would have revealed a n y difference in a n n u a l g r o w t h z o n e f requency p a s t t h e age o f 7. H o w e v e r th i s was n o t p o s s i b l e for obvious reasons. W e c a n s a y wi th s o m e d e g r e e o f c e r t a i n t y t h a t g r o w t h z o n e f r e q u e n c y does n o t c h a n g e in t h e o l d e r fish as w e see n o real c h a n g e in o to l i th b a n d i n g a n d g r o w t h p a t t e r n af ter age 7+.
A s m i n i m a l g r o w t h r a t e v a r i a t i o n is e x p e c t e d of s e x u a l l y m a t u r e fish ( g i v e n t h e s e a s o n a l i t y of t h e t rop ics ) , t h e o n l y expected di f fe rence in t h e g r o w t h z o n e s ofotoliths in older fish would b e a decreasing w i d t h of the i r c o n s t i t u e n t b a n d s . This is c o n s i s t e n t w i t h t h e fact t h a t as fish age, s o m a t i c g r o w t h d e c r e a s e s asympto t ica l ly - a p h e n o m e n o n w h i c h we e x p e c t t o b e cor responding ly reflected in depos i t ion of mate r ia l in t h e o to l i ths . Both d e c r e a s i n g w i d t h s o f ser ial g r o w t h z o n e s , as well as proportionally narrower annuli in t h e otoliths of o l d e r N a s s a u g r o u p e r , a r e o b v i o u s .
The a b o v e reasonably s u g g e s t s tha t t h e r e is little reason for, o r probability of, c h a n g e in t h e annua l life history of o l d e r E. striatus. O b v i o u s l y , prooF O F th i s w o u l d lie in t h e a c t u a l va l ida t ion O F t h e s e age g r o u p s .
Acknowledgements
W e t h a n k Mr. G e n e Parsons for h i s h e l p and advice in p r e p a r i n g t h i s p a p e r , as wel l as Mr . S . S l a y b a u g h , M r . M . G r u n d y , M r . I . Y o u n g , a n d M r . M . G u d e r i a n for t h e i r a s s i s t a n c e a t v a r i o u s p o i n t s in t h e p r o j e c t .
References
Beamish, R.J. and D.E. Chilton. 1982. Age de- termination methods for fishes studied by the Ground Fish Program a t t h e Pacific Biological Station. Can. Spec. Publ. oFFish. &. Aquat. Sci. 6 0 , 107 p. Department of Fisheries and Oceans. Ottawa, Canada.
Beamish, R.J., G.A. McFarlane and D.E. Chilton. 1983. Use of oxytetracycline and other methods t o validate a method of a g e determination for sablefish, p. 95-1 18. In Proceedings of the International Sablefish Symposium. Alaska Sea Grant Program, Alaska University, Alaska.
Edwards, RR.C., J.H.S. Baxter, V.K. Gopalan, C.V. M a t h e w s a n d D.M. Finlayson. 1971. Feeding. metabolism, and growth of tropical flatfish. 1. Exp. Mar. Biol. Ecol. 6:279-300.
Manooch, C.S. 1987. Age and growth of snapper and groupers, p. 329-373. In 1.1. Polovina and 5 . Ralston (eds) . Tropical snappers and groupers: biologjr and management . Westview Press. Boulder.
Pannella, G. 1974. Otolith growth patterns: an aid in a g e determination in temperate and tropical fish, p. 28-39.lnT.B. Bagenal (ed.) Proceedings of an International Symposium on t h e Ageing of Fish. Unwin Brothers, Surrey. England.
Pannella, G . 1980. Growth pat terns in fish sagittae, p. 5 19-560. In D.C. Rhoads and R.A. Lutz (eds). Skeletal growth o f aquatic o rgan isms: biological records o f environmental change. Plenum Press, New York, USA.
Scholander, P.F. 1953. Climatic adaptation in arctic and tropical poikilotherms. Physiol. Zool. 26:67-92.
Tucker, I.W., P.G. Bush and S. Slaybaugh. 1993. Reproductive patterns of Cayman lslands Nassau grouper (E. striatus) populations. Bull. Mar. Sci. 52(3):96 1-968.
Age Validation, Movements and Growth Rates of Tagged G a g (Mycteroperca microIepis), Black Sea Bass
( Centropristis stdata) and Red Porgy (Pagrus pagrus)
M.R. COLLINS S.B. VAN SANT G.R. SEDBERRY
Marine Resources Research Institute South Carolina Wildlife and Marine Resources Department
P. 0. Box 12559 Charleston, Sooth Carolina USA 29422-2559
COLLINS. M.R., S.B. VAN SANT and G.R. SEDBERRY. 1996. Age validation. movements and growth rates of tagged gag (Mycteroperca microlepis) , black sea bass (Centropristis stria ta) and red porgy (Pagrus pagrus) [Movlrnientos y tasa de crecimiento a partir de clatos de marcado del cuna asuaji (Mycteroperca rnicrolepls), del Serrano Estriado (Centropristis striata), y del Pargo (Pagrus pagrus)], p. 158-162. In F. ArreguTn-Sbnchez, J.L. Munro. M.C. Balgos and D. Pauly (eds.) Biology, fisheries and culture of tropical groupers and snappers. ICLARM Conf. Proc. 48, 449 p.
Abstract
Ages o f fishes are commonly estimated by counting opaque bands in the otoliths, but direct evi- dence to validate the annual nature of these bands Is lacklng for most specles. Therefore, gag (Mycteroperca mlcrolepis), black sea bass (Centroprlstk striata), and red porgy ( P a p s p a p s ) were tagged, injected intramuscularly with oxytetracycline (OTC) and released. Otoliths were acquired from eleven gag at large for 225-603 days. Five black sea bass at large For 206-355 days. and one red porgy at large for 341 days. Transverse sections of the otoliths were examined microscopically under white and ultraviolet light. Numbers of opaque bands distal to the fluorescent OTC mark were conslstent with the hypothesls that these opaque bands are produced annually. Most individuals were recaptured at or near the two study sites. Growth rates were calculated For comparison with previous estimates.
La edad de 10s peces es cornunrnente estimada por conteo de bandas opacas en 10s otolitos, pero se carece de evldencias directas para validar la naturaleza anual de estas bandas para la mayor parte de /as especies. En consecuencia el cuna agua/f (Mycteroperca microlepis), el serrano estriado (Centropristis striata) y el pargo (Pagrus pagrus) fueron rnarcados, inyectados intrarnuscularrnente con oxltetraciclina (OTC), y liberados. Despues de 225-603 dfas 10s otolitos de once cuna aguaji fueron obtenidos, cinco del serrano estriado despu& de 206-355 dfas, y uno del pargo despues de 3-21 dfas. Secclones transversales de 10s otolitos fueron analizadas a1 rnicroscopio bajo luz blanca y luz ultravioleta. El nrimero de bandas opacas dlstales de la marca fluorescente de OTC fueron conslrtentes con la hlpdtesis de que estas bandas opacas son producidas anualrnente. La mayorla ck 10s peces fueron recapturados dentro o cerca de 10s sitios de estudio. Las tasas de crecimiento fueron calculadas para comparaci6n con estlmaclones previas.

Introduction
Validation of the annual nature of marks (annuli) in hard parts of Fishes ensures the accuracy of age estimates generated by counting the marks (Bearnish and McFarlane 1983). Validation is usually based on indi- rect evidence, most commonly on marginal increment analyses of monthly samples of fish (e.g., Wenner et al. 1986; Collins et al. 1987) (see also Manickhand-Heileman and Philipp, this vol.). Direct evidence can be produced by examination of hard parts of known-age fish or by marking hard parts and examining them after a known period OF time. One common method of marking hard parts is by injecting, feeding or im- mersing fish in the antibiotic oxytetracycline (OTC), which is incorporated into bony parts and fluoresces when the structure is ex- amined under ultraviolet light (Hettler 1984; Foreman 1987; Marking et al. 1988) (see also Bush et al., this vol.);.
Age and growth of most species of eco- nomically important reef fishes from the Atlantic coast of the southeastern United States have been described, but evidence for validation has been indirect. The primary objective OF this study was to directly validate ages for several species of reef Fishes. Secondary objectives were to gather information on growth rates and movements.
Methods
Reef fishes were captured by angling and trapping during 1987- 1990 at two natural reef sites in 22-m and 27-m depths near Charleston, South Carolina, USA. Prior to tag application, the swim bladder was deflated with a hypodermic needle, total lengths (TL) were measured to the nearest mm, and a weight-dependent dosage of OTC was injected intramuscularly (McFarlane and Beamish 1987). Weights were estimated from length-weight relationships [(gag Mycteroperca microlepis) Manooch and
Haimovici 1 978: red porgy (Pagruspagrus) Dias et al. 1972; black sea bass (Ceniropristis striata) Wenner et al. 1986)]. During 1987, Petersen disk tags were attached below the dorsal Fin and approximately 70 mg OTC per Icg body weight of Liquamycin LA-200 was injected into the dorsal mus- culature. During 1988- 1990, internal an- chor tags were inserted into the abdomen and approximately 50 mg OTC per kg body weight of Anchor Oxy-Tet 100 was injected into the dorsal musculature. The address of our laboratory and instructions to save the tag and head were printed on all tags.
When recaptures of tagged fish were reported by commercial or recreational fishers we asked for the Fish's length and the re- capture date and loation, and we attempted to acquire the head or sagittal otoliths. In most cases, however, only the date and location were provided. When fish were recaptured by project personnel during tagging operations, those that had been at large for less than six months were gen- erally measured and released. Some fish that were at large For more than six months and all that were at large for more than 12 months were sacrificed, measured and the otoliths removed and stored dry. Further processing was restricted to otoliths From Fish recaptured after at least 200 days at large. Only fish at large for at least 90 days with lengths measured by project person- nel were used in calculations of growth rates (recapture length - tagging length) /days at large).
Otoliths were embedded in paraffin, and transverse sections (ca. 0.5-mm thick) through the core of one otolith per fish were cut with a Buehler Isomet low speed saw. Sections were placed in nonfluorescing immersion oil and examined under white light and ultraviolet light at 40x and I OOx using a Nilton Labophot microscope with an epifluorescence attachment. Age estimates were based on the number of opaque zones visible on the otolith section.

Results and Discussion
The brand and/or dosage of OTC used during the first year of this study caused lesions to form in the vicinity of the injec- tion site, at least for gag. In addition, sev- eral Fish were recaptured with the Peterscn disk tags deflected posteriorly and torn partially through the musculature, and a few recaptured fish had evidence of OTC injection but only a scar or wound at the site of tag insertion (Van Sant et al. 1994). These problems were apparently eliminated in subsequent years by changing the tag type and the brand and dosage of OTC.
Validation analyses were restricted to otoliths of 1 1 gag, five blaclc sea bass and one red porgy since otoliths were not ac- quired or the time at large was less than 200 days for most OF the recaptured Ash. Gag, blaclc sea bass, and red porgy used in analyses were at large for 225-603 days, 206-355 days, and 341 days, and their otoliths displayed 2-7,4-7, and 4 opaque zones, respectively. A fluorescent OTC mark was visible in all otoliths examined, and all otoliths showed growth beyond the O K mark. Six gag, four black sea bass, and the red porgy had formed one opaque zone distal to the OTC mark.
Our results agreed with the periods of pealc annulus formation, as determined from marginal increment analyses, reported in previous studies from this geographic area (May-August For gag, Collins et al. 1987; April-June for blaclc sea bass, Wenner et al. 1986; and March-April for red porgy, Manooch and Huntsman 1977). Because our fish were tagged and recaptured dur- ing various months, including months of pealc annulus formation, comparing the number of observed opaque zones distal to the OTC mark with the number to be expected if they were deposited annually is not straightforward. For all gag, two black sea bass, and the red porgy, the expected number is a range of two (e.g., 0-1 ).
However, in no case does the observed number of opaque zones disagree with the expected number or range, supporting the hypothesis that the zones are annual marks in the age groups examined (Fig. 1 ).
The scarcity of tag returns from locations other than the study sites suggests that most gag, red porgy, and black sea bass moved little. Most tag returns were From within 7 Itrn of the tagging site, confirming results from previous tagging studies that reported little movement by reef fish in this region (Parker et al. 1979: Ansley and Davis 1981 ; Parker 1990). However, a few fish moved substantial distances. One red porgy at large For 62 days moved 17 krn northwest, and another at large For 24 days moved 54 km northwest. A black sea bass at large 290 days was recaptured at an artificial reef 22 Itrn northeast of the study site. One small gag at large for 1 021 days moved 54 Itrn southwest, and another that was at large for 646 days moved 93 I<m northeast. The greatest movements were by large (>75 cm TL) gag. Long distance movements of three large individuals sug- gested a possible spawning migration to southern Florida (Van Sant et al. 1994).
To minimize the effects of handling stress and possible measurement error on mean growth rate estimates, only fish that were at large 290 days and that. were measured upon recapture by project personnel were utilized in calculations of mean growth rates. Mean growth rates (*SD) in terms OF TL were 0.15 (0.08) mrnlday for gag, 0.17 (0.08) mrn/day for blaclc sea bass, and 0.17 (0.05) mmlday for red porgy (Table 1). Our growth rates for gag and red porgy are similar to daily growth increments estimated From mean back-calculated (Manooch and Haimovici 1978) and mean observed (Collins et al. 1987) lengths for gag, and from mean back-calculated lengths for red porgy (Manooch and Huntsman 1977). However, our growth rate For black sea bass appears to be substantially greater than daily growth

No. of annuli Expected Observed
I --,. ~ - " Black sea boss
0
I I I I I I I I I ! 1 ~ . L J . . I I I I I I l S O N D J F M A M J J A S O N D J F M A M J J A
Month
annulus formation (from the literature) indlcated by bold line segments. [Meses (afiopromedo) y numero esperado y olrservado de annull rllsfales de la marca de tetrackllna para cada pez
I
utilizado en elanBlIsIs de vaiidacion, con meses plco de formaclon de annuli (tomado de la Ilteratura) indkado por la lhea gruesa.]
I
Table 1. Number of lndlvlduals, and mean (&D) total length (TL, In mm), days of freedom, and growth rate (mm/day), of gag (Mycteroperca microlepls), black sea bass (Centropristls striata), and red porgy (Pagruspagrus) tagged off South Carollna. Only individuals measured by project personnel at recapture and at large for at least 70 days were used In growth rate analyses. INdmero de IndMuos, longitud total (LT, en mm) media (2 D.S.), dias de iibertad, y tasa de crecimiento (mm/&a) del cuna aguaji(Mlcteroperca ml~rolepls), serrano estriado (Centropristls strlata), y pargo (Pagrus pagrus) marcados en aguas afuera de Carollna del Sur. 5610 lndlvlrluos medidos par personal tiel proyecto a1 momento de la recaptura, y con el tiempo de iiberacldn >90 dins fueron usados en la estimacibn de la tasa de crecimiento.]
Fig. 1 . Months at large (years pooled) and numbers of expected and observed annuli dlstal to the tetracycline mark for each fish used i n validation analyses, wlth months of peak
N o . tagged N o . recaptured N o . For analysis TL at release TL at recapture Days Free Growth rate
Black sea bass Red porgy 270 121 45 8 15 2
349k40 3502 12 381 *35 3 9 5 ~ 1 1 197k72 2 8 4 4 1
0.1 720.08 0.17+0.05

inc rements calculated from m e a n back-cal- c u l a t e d l e n g t h s ( W e n n e r et al. 1986).
W e s u g g e s t two modi f ica t ions to o u r m e t h o d o l o g y f o r fu ture val idat ion s tud ies . Grea te r e m p h a s i s o n public relat ions (e .g. , n e w s r e l e a s e s , p r e s e n t a t i o n s to Fishing g r o u p s ) m i g h t i n c r e a s e t h e n u m b e r o f r e c a p t u r e d fish f r o m w h i c h o t o l i t h s a r e ob ta ined , as t h e necessity of retaining h e a d s w o u l d b e b e t t e r u n d e r s t o o d by t h e public. C o n c e n t r a t i n g m a r k a n d r e c a p t u r e effor ts at t i m e s o t h e r t h a n p e a k annulus formation would allow t h e e x p e c t e d number of o p a q u e z o n e s distal to t h e OTC m a r k to b e a s ing le n u m b e r r a t h e r t h a n a r a n g e . This w o u l d s i m p l i f y c o m p a r i s o n s o f o b s e r v e d a n d e x p e c t e d n u m b e r s .
Acknowledgements
W e appreciate t h e assistance in our tagging o p e r a t i o n s p r o v i d e d by t h e c r e w m e m b e r s o f t h e R/VPa/metto a n d R/VLacly Lisa a n d by n u m e r o u s MARMAP personne l . Charles A. Barans a n d Charles A. W e n n e r p rov ided valuable c o m m e n t s o n t h e manuscript . This s t u d y was f u n d e d b y t h e National M a r i n e Fisheries Service (Southeast Fisheries Center) a n d t h e S o u t h Carolina Wildlife a n d Mar ine Resources Department through t h e MARMAP cont rac t . This is Contr ibut ion No. 3 1 1 from t h e South Carolina Marine Resources Center.
References
Ansley, H.L.H. and C. D. Davis. 1981. Migration and s tanding stock of Fishes associated with artificial and natural reek on Georgia's outer continental shelF. Georgia Department of Natural Resources. Brunswick. 38 p.
Beamish, R.], and G.A. McFarlane. 1983. The forgotten requirement For a g e validation in fisheries biology. Trans. Am. Fish. Soc. 1 12:735-743.
Collins, M.R., C.W. Waltz, W.A. Roumillat and D.L. Stubbs. 1987. Contribution t o the life history and reproductive biology of gag, Mycteroperca microlepis (Se rran i dae) , In
t h e South Atlantic Bight. Fish. Bull. U.S. 85:648-653.
Dias, RK., J.K. Dias and W.D. Anderson, Jr. 1972. Relationships of lengths (standard, fork, and total) and lengths t o weight in t h e red porgy, Pagrus sedecim (Perciformes, Sparidae), caught off South Carolina. Trans. Am. Flsh. Soc. 101 3 0 3 - 5 0 6 .
Foreman, T. 1987. A method of simultaneously tagging large oceanic fish and injecting them with tetracycline. Fish. Bull. U.S. 85:645-647.
Hettler, W.F. 1984. Markingotoliths by immersion of marine fish larvae in tetracycline. Trans. Am. Fish. Soc. 113:370-373.
Manooch, C.S., I l l and M. Hairnovici. 1978. Age and growth of t h e g a g , Mycteroperca rnicrolepis, and size-age composition of the recreational catch off the southeastern United S ta tes . Trans. Am. Fish. Soc. 1 0 7 ~ 2 3 4 - 2 4 0 .
Manooch, C.S., H I and G.R. Huntsman. 1977. Age, growth, and mortality OF t h e red porgy, Pagruspagrus. Trans. Am. Fish. Soc. 106:26-33.
Marking, L.L., G.E. Howe and J.R Crowther. 1988. Toxicity of erythromycin, oxytetracycline, and tetracycline administered t o lake trout in water baths, by injection, or by feeding. Prog. Fish-Cult. 50: 197-201.
McFarlane, L A . and R]. Beamish. 1987. Selection of d o s a g e s of oxytetracycline for a g e validation studies. Can.]. Fish. Aquat. Sci. 44:905-909.
Parker, KO., Jr. 1990. Tagging studies and diver observations of fish populations on live- bottom reek of the U.S. southeastern coast. Bull. Mar. Sci. 46:749-760.
Parker, R.O., Jr., R.B. Stone and C.C. Buchanan. 1979. Artificial reek off Murrells Inlet, South Carolina. Mar. Fish. Rev. 8( 1):3 1-49.
Van Sant, S.B., M.R. Collins and G.R. Sedberry. 1994. Preliminary evidence from a tagging study for a g a g (Mycteroperca microlepis) spawning mlgration with notes on the use of oxytetracycline for chemical tagging. Proc. Gulf Carib. Fish. Inst. 43 :4 17-428.
Wenner, C.A., W.A. Roumillat and C.W. Waltz. 1986. Contributions t o t h e life history of black s e a bass, Centropristis striata, off the southeastern United States. Fish. Bull. U.S. 84:723-741.

The Validity of Length-based Methods for Estimating Growth and Morhllty of Groupers,
as Illustrated by Comparative Assessment of the Creole Fish (ParmthIas furcifed (Pisces: Serranidae)
J.M. POSADA R.S. APPELDOORN
Departm en f ofMarin e Sciences University of Puerto Rico
Mayagiiez 00681-5000, Puerto Rico *
POSADA, J.M. and R.S. APPELDOORN. 1996. The validity of length-based methods for estimating growth and mortality o f groupers, as illustrated by comparative assessment of the creole Fish, (Paranthlas furcifer) (Pisces: Serran idae) [ Valldez de /as rnetodos para estimar crecimiento y mortalidad en meros basados en h-ecuencia de longitudes, a partlr de la evaluacidn cornparativa de la cuna Iucero (Paranthias furcifer) (Pisces: Serranidae)], p. 163-173. In F. Arreguin-Shchez. J.L. Munro, M.C. Balgos and D. Pauly (eds.) Biology. fisheries and culture of tropical groupers and snappers. ICLARM Conf. Proc. 48. 449 p.
Abstract
Several length-based methods for the analysis of growth and mortality of the creole fish (Paranthias furcifer) (Valenciennes) were used and results compared to see how they were affected by distortion of the length-frequency distribution due to ontogenic offshore migration. Data were from fish caught using pole spears (=40 ind/month. 10 months) at the edge of the insular shelf off southwestern Puerto Rico. Two methods were used to estimate growth parameters (K, L_): ELEFAN I, and Wetherall's method (L_) coupled with a $'-value to estimate K. Four methods were used to estimate mortality (Z-M): Z/K, Ralston's and Pauly's equations, and length-converted catch curve. Only the ELEFAN I method gave realistic results for growth parameters ( I _ = 31.4 cm and K = 0.282 year-'), and these gave reasonable estimates for mortality using Ralston's equation (0.647 year-') and Z/K (0.637 year-'). Wetherall's method underestimated L_, and hence led to an overestimate of K. Al l subsequently derived mortality esti- mates were biased upwards by a factor of 2. Catch-curve analyses also resulted in overestimations of mortality. These results are all consistent with those expected under the scenario of ontogenic migra- tion out o f the sampling area.
Resumen
Diferentes rnetodos basados en longitud fueron utilizados para estirnar 10s parametros de crecimiento y rnortalidad de la cuna lucero (Paranthias furcifer) (Valenciennes) y 10s resultados fueron cornparados para deterrnlnar como la rnigracibn ontogenetica fuera de la costa distorsiona la distr ihcidn de fiecuencia de tallas. Los datos provenian de peces capturados mediante el uso de arpones (=40 ind/mes, 2 0 meses) a1 horde de la plataforrna insular en el suroeste de Puerto Rico. Dos mCtodos fueron utilizados para estimar 10s pardmetros de crecirniento (K, L-1; ELEFAN I, y Wetherall (L,,,) conjuntamente con el valor de $' para estimar K. Cuatro mCtodos fueron utilizados para estimar mortalidad (Z=M): Z/K, Ids ecuaciones empliicas de Ralston y Pauly, y c u m de captura. Unicarnente el rnetodo ELEFAN I estirnd realisticarnente

10s parJmetros de crecimiento (L_ = 31.4 cm y K = 0.282 afio-'1, y &tos condujeron a estimados razonables de mortalldad utilizando la ecuac/dn de Ralston (0.647 afio-'1 y la relacibn Z/K (0.637 at70-I). El metodo de Wetherall subestlma L-, ypor tanto induce a una sobrestimacidn de K. Todos /as derivaciones subsecuentes de mortalidad resultaron sesgados por on factor de 2. El anii/isis de curva de captura tarnLiCn result6 en sobrestimaclones de mortalidad. Todos 10s resultados son consistentes con lo esperado bajo el escenario de mlgracion ontogenftica fuera del drea de rnuestreo.
Groupers (Subfamily: Epinephelinae) are very important components of commercial fisheries in tropical reef environments. Despite their importance, few quantitative stock assessments have been conducted (see compilation in Munro and Williams 1985. and see also Arreguin-Sanchez et al., this vol.). This results From a combination of the nature of the Fishery (usually multispecies and artisanal with a high diversity of gear and landing sites) and the limited resources available on the part of management agen- cies. Length-frequency analysis has been suggested as a potentially valuable tool for the stock assessment of tropical fishes (Munro 1983), and recent interest in this approach has led to considerable devel- opment and testing of length-based tech- niques (see, e.g., Pauly and Morgan 1987).
Length-frequency analysis (LFA) has two general constraints when applied to groupers. First, discrete modes in the length- frequency distribution must be detectable i f growth rate is to be determined. Detec- tion of modes is favored where growth is rapid (usually correlated with short lifespan) and spawning is restricted to a short sea- son. While groupers often show a quite restricted spawning season (Shapiro 19571, they are slow growing and long lived. Nevertheless, LFA has been successfully applied to some important species of groupers where a clear modal progression of size classes can be followed over time (Manooch
1987). Second, in general, large sample sizes are required to adequately represent the location of modes in the length-fre- quency distribution (Erzini 1990). Consid- ering the nature of these fisheries, large sample sizes are often difficult to obtain during a restricted period of time, although sampling strategies can be adjusted to maximize the quality of these limited data with respect to LFA (Dennis 1988; Acosta and Appeldoorn 1992).
If growth rate determination is the goal of LFA, sampling need not be random relative to the underlying population (Hoenig et al. 1987). All that is required is that modes be detectable and their location be rela- tively unbiased; the relative size of the modes is unimportant. A variety of techniques, e.g., polymodal breakdown (Cassie 1954; Bhattacharya 1967; Macdonald and Pitcher 1979; Schnute and Fournier 1980; Akamine 1985) and ELEFAN I (Pauly and David 1981 ) can be used to determine growth under these conditions.
More restrictive assumptions of a steady- state population and an unbiased sample of the population are necessary when us- ing techniques dependent upon the shape of the distribution (Hoenig et al. 1987). These include techniques for estimating mortality, such as Beverton and Holt's (1 956) method and length-converted catch curves (Pauly 1984) and some methods for esti- mating growth parameters (Wetherall et al. 1987). These assumptions are rarely assessed when applying length-based tech- niques, yet there is good evidence that

these assumptions are, at times, poorly met with respect to groupers. Two sources of deviation from these assumptions are of particular concern: recruitment variations, and nonrandom spatial distribution with respect to size.
Marked, nonrandom changes in the re- cruitment of two species of grouper were found by Appeldoorn et al. (1992), and these caused considerable interannual vari- ation in the shape of their respective length- frequency distributions. These changes were detected only after long time-series of length- frequency distributions had been obtained and growth rate via otolith analysis had been determined: this is an infrequent sltu- ation in most tropical fisheries.
Shifts in length-frequency distributions toward larger sizes in deeper, offshore habitats are known for many reef species (see Parrish 1987: Williams 1991 ), reflecting ontogenetic migrations from shallow/inshore areas to deeper/offshore areas. Similar behavior is Imown for groupers (Bullock and Smith 1991). This can lead to two problems. First, it is much more difficult to obtain an unbiased population length-frequency distribution. While a wide depth range can be easily stratified and sampled, such sampling is costly and time-consuming, and the pooling of samples among strata is made difficult because differences in habitat abundance among strata will affect fish abundance within strata. This problem can be ameliorated somewhat if sampling is limited to the deeper strata where larger fish are found. How- ever, this leads to the second problem, which is a reduction in the number of size classes available for estimating parameters. Also, because size is a poor indicator of age in large Ash, these data will be of lesser quality.
The purpose of this study is to compare the results of different length-based methods to see if they are subject to invalid assump- tions. This is illustrated with an analysis of
the creole fish (Paranthias furcifer) (Valenciennes) off the southwest coast of Puerto Rico. Since o u r orientation is pri- marily methodological, we will restrict our analyses and comparisons to mean estjrnates of parameters. A more detailed analysis of this species, including estimation of pa- rameter variances, is currently being con- ducted using otolith analysis.
The creole fish is a small grouper and one of the few species of fishes found at both sides of the Atlantic and in the east- em Pacific (Snodgrass and Heller 1905: Meek and Hildebrand 1925; Fowler 1936, 1945; Briggs 1967; Randall 1 9GS: Hoese and Moore 1977: Thornson et al. 1979; Quero et al. 1990). It is reported to occur in the open waters over reefs 20 m and deeper, be- yond outer emergent reefs (Smith 1971 ; Davis and Birdsong 1973; Kimmel 1985).
At the moment, P. furcifer lacks signifi- cant commercial importance due to its small size (30-cm maximum size, according to Smith 1971). However, it is occasionally found in party-boat catches from the Florida Middle Grounds (Bulloclc and Smith 1991) and is gaining value in Bermuda as the catch of larger groupers declines (Butler et al. 1993). Given this, and its wide geo- graphic distribution, we consider that P. furciferrepresents a potentially important fisheries resource. Age, growth and mor- tality have been estimated by Nelson et al. (1 986) at the Flower Gardens Bank (Gulf of Mexico) using scales and otoliths. Sig- nificantly, using remote video transects at depths beyond the reach of scuba divers, the maximum size they observed was in excess of 34.0 cm fork length (FL) , while the largest size sampled by divers was 28.0 cm FL. Similarly, one of us (J.M. Posada) has observed small individuals of P. furcifer to recruit to a shallow water/inshore habi- tat in Bermuda. Although limited, these observations indicate that creole Fish un- dergo an ontogenic offshore migration.

Methods
The study area was located in depths of 16-34 m at the edge of the Insular shelf off southwestern Puerto Rico, at approxi- mately 17"53'86"N, 66O57'35"W. This is southwest of Guanica with the nearest land being Punta Jorobada, 4 km to the north (Fig. 1 ) .
Collections, oriented to reproduction studies, were made using SCUBA diving. Fish were caught (approx. 40 ind.) monthly between March 1992 and October 1993 with a pole spear fitted with a three-pronged tip; extreme care was taken to collect all fish encountered so as not to bias the sample towards particular size classes. Divers felt that it was equally difficult to catch a 13- crn TL Fish as one 27-cm TL, although the Former was more scarce. For all individu- als, total length (TL) was measured to the nearest 0.1 cm.
To increase modal definition for LFA, samples were pooled bimonthly without weighting and assigned a single collec- tion date. Sample size varied from 62 to 92 individuals and the total number of fish sampled was 842. Our analysis assumes von Bertalanffy growth:
where L, = length at time t (years), L_ =
asymptotic length, I< = growth coefficient, and to = hypothetical age when length would be zero. To obtain an idea of the range of growth parameters that could be expected, a literature search was made on the growth of small groupers.
Estimates of K and L_ were made using two different techniques. The first technique was the ELEFAN I method as implemented in the Compleat ELEFAN (Gayanilo et al. 1989). ELEFAN I does not assume a
~ d " ' ' ' 5 km Puerto Rico I La Porguem
C a r i b b e a n Sea
A Study area
N mm
Flg. 1. Map showlng study area on the shelf edge offsouthwestern Puerto R k o (from Colln and ClavlJo 1988). [Mapa mostrando el Srea de estudio sobre el borde de L plataforma continental a1 suroeste rle Puerto Rlco.]

steady-state population and only requires an unbiased sample of the catch. Using ELEFAN I . L_ and I( were first allowed to vary, and a response surface of 3, (goodness- of-fit) values was generated. The logic of ELEFAN I implies that one should pick the value of L- and I< associated with the highest Rn-value, however some constraints were imposed considering the b i o l o ~ of groupers in general. Over a narrow range defined by the response surface (subject to the above constraints), all parameters (I<, L_, starting point and sample) were allowed to vary, and optimum values were obtained.
The second technique used Wetherall's method (also implemented using the Compleat ELEFAN) to estimate L- and Z/I<, where Z is instantaneous total mortality. Wetherall's method assumes a steady-state population and unbiased sample. To smooth out possible recruitment variations, all data (over two years) were pooled, without weighting, into a single length-frequency analysis. The growth parameters for /? hrcikr presented by Nelson et al. (1986) were used to estimate 4' (Pauly and Munro 1984), where $' = log,#) + 2 log,,(L_). The value of L_ obtained From Wetherall's method was then substituted into the I$' equation for P. furciferto estimate K , and hence 2. In addition, the estimate of Z/K was com- bined with the estimate of I( derived from ELEFAN I to estimate Z. The difference between these two estimates of Z is that the former is done while attempting to maintain a known relationship between the growth parameters (i.e., @') while the lat- ter does not.
Estimation of instantaneous natural mor- tality (M) was done by substituting the es- timated values of L_ and K values derived from the ELEFAN method into the equations:
Log(M) = -0.0066 -t 0.6543 Log(K) - 0.279 Log(L-) -t 0.4634 Log(T) (Pauly 1980). and
M = -0.0666 + 2.53 K (Ralston 1987)
where T = annual mean water tempera- ture at the sampling site (27.9OC). Instan- taneous total mortality (Z) was calculated using a length-converted catch curve (Pauly 19841, again implemented using the Compleat ELEFAN. For this analysis, all data were pooled, without weighting, into a single length-frequency sample. A regression line was fitted to points immediately to the right of the highest point on the catch curve. The slope of the regression line is an esti- mate of 2. The L_ and K values used for the catch curve were those determined using the ELEFAN method. Since the creole fish is not commercially or recreationally ex- ploited in the study area, the estimates of total mortality should reflect only natural mortality.
Results
Length-frequency distributions used for the estimation of growth parameters for Paranthias furcifer are presented in Table 1. Table 2 presents the results of the analyses. The estimate of 4' for P, furciferfrom Nel- son et al. (1 986) was 2.60. Wetherall's method (Fig. 2) resulted in an estimate of L_ of 25.9 cm and a value of 2.261 for Z/K. Using the former with the estimated value of 4' resulted in an estimate of K of 0.593 year-' and a high estimate for Z of 1.34 year2'. Fig. 3 shows the ELEFAN-derived growth curve superimposed on the length-frequency data. The estimated parameters were L_ =
3 1.4 cm and I< = 0.282 year*'. Using this K-value with the Z/K estimate From Wetherall's method resulted in a markedly lower Z-value of 0.637 year-'.
Natural mortality (M) estimates derived from the Pauly and Ralston equations and the ELEFAN parameters were 0.769 and 0.647 year-!, respectively. Natural mortal- ity estimates derived from the Pauly and Ralston equations and the Wetherall pa- rameters were l .320 and 1.435 year-',
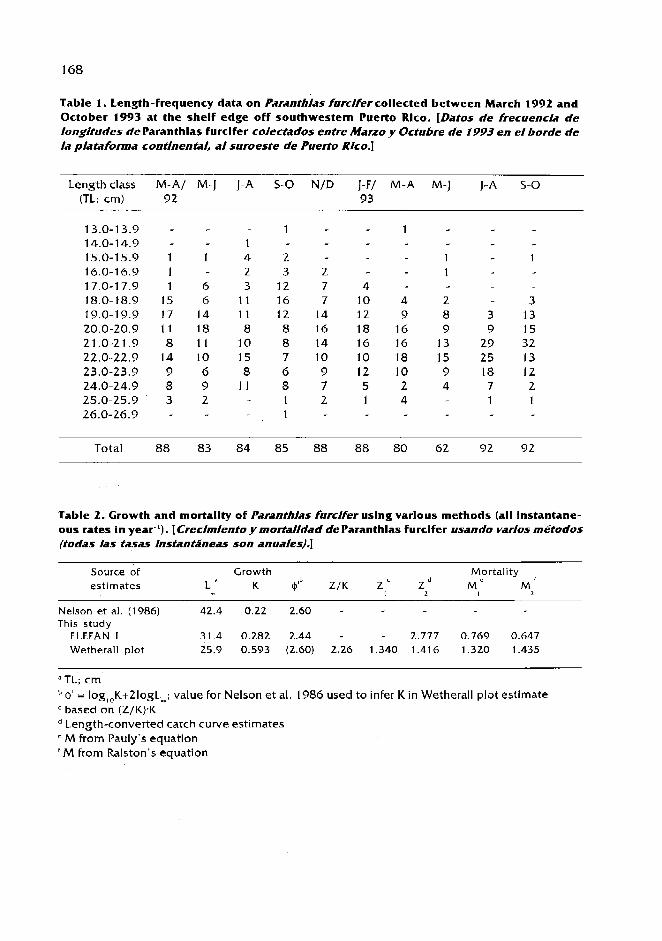
Table 1 . Length-frequency data on Paranthias furclfer collected between March 1992 and October 1993 at the shelf edge off southwestern Puerto Rlco. [Datos de frecuencla de longit~des deParanthlas furclfer colectados entre Marxo y Octubre de 1973 en el horde de /a piataforma continents/, a/ suroeste tie Puerto Rlco.]
Length class M-A/ M-J J-A 5-0 N/D J-F/ M-A M-] J-A 5-0 (TL; cm) 9 2 93
Total 88 83 84 85 88 88 80 62 9 2 92
Table 2 , Growth and mortality of Paranthlas furclfer uslng varlous methods (all instantane- ous rates in yearF'). [Crecimiento y mortalidad deParanthlas furcifer usado varios rnktodos (todas L s tasas lnstanthneas son anuafes).]
Source of Growth Mortality estimates L ' K qib Z/I< z C z M C M
Nelson e t al. (1986) 42.4 0.22 2.60 - This study
ELEFAN I 31.4 0.282 2.44 - - 2.777 0.769 0.647 Wetherall plot 25.9 0.593 (2.60) 2,26 1.340 1.416 1.320 1.435
a TL; cm "' = log,,K+ZlogL_; value for Nelson e t al. 1986 used t o infer Kin Wetherall plot estimate ' based on (Z/K).K
Length-converted catch curve estimates ' M from Pauly's equation M from Ralston's equation
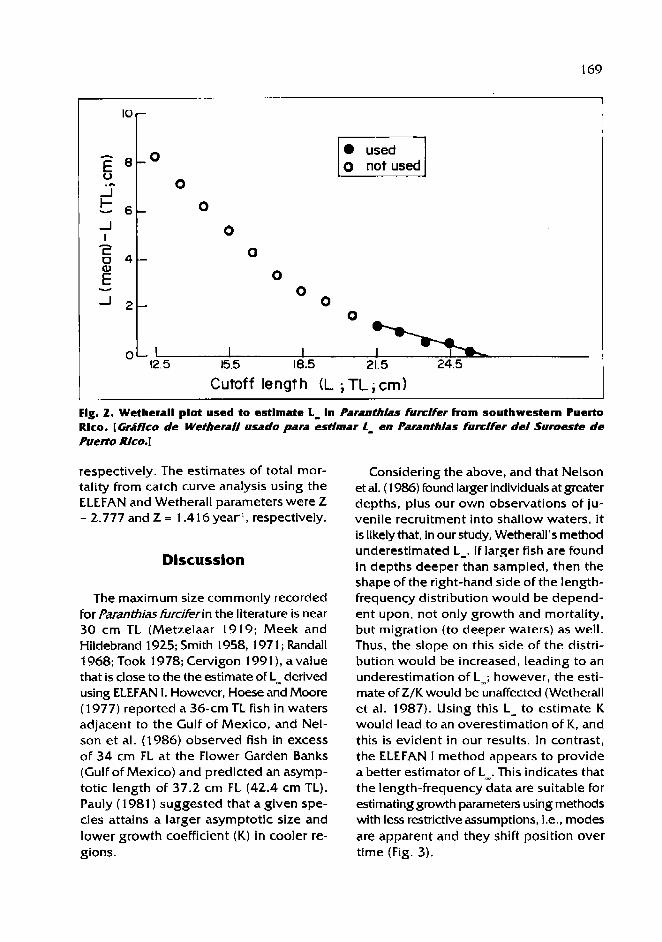
used
Cutoff length (L ; TL; cm)
Flg. 2. Wetherall plot used to estlmate I_ In Paranthias fircifer from southwestern Puerto Rlco. [GrilJco de Wetherall usado para estlmar L_ en Paranthias furcifer del Suroeste de Puerto Rlc0.1
respectively. The estimates of total mor- tality from catch curve analysis using the ELEFAN and Wetherall parameters were Z = 2.777 and Z = 1.416 year2', respectively.
Discussion
The maximum size commonly recorded for Paranthiasfurciferin the literature is near 30 cm TL (Metzelaar 191 9: Meek and Hildebrand 1925; Smith 1958, 197 1 ; Randall 1968; Took 1978; Cervigon 1991 ), a value that is close to the the estimate of L_ derived using ELEFAN I. However, Hoese and Moore ( 1 977) reported a 36-cm TL fish in waters adjacent to the Gulf of Mexico, and Nel- son et al. (1986) observed fish in excess of 34 cm FL at the Flower Garden Banks (Gulf of Mexico) and predicted an asymp- totic length of 37.2 crn FL (42.4 cm TL). Pauly ( 1981 ) suggested that a given spe- cies attains a larger asymptotic size and lower growth coefficient (K) in cooler re- gions.
Considering the above, and that Nelson et al. (1 986) found larger individuals at greater depths, plus our own observations of ju- venile recruitment into shallow waters, i t is likely that, in our study, Wetherall's method underestimated L-. If larger fish are found in depths deeper than sampled, then the shape of the right-hand side of the length- frequency distribution would be depend- ent upon, not only growth and mortality, but migration (to deeper waters) as well. Thus, the slope on this side of the distri- bution would be increased, leading to an underestimation of L_; however, the esti- mate of Z/K would be unaffected (Wetherall et al. 1987). Using this L_ to estimate K would lead to an overestimation of I<, and this is evident in our results. In contrast, the ELEFAN I method appears to provide a better estimator of L_. This indicates that the length-frequency data are suitable for estimating growth parameters using methods with less restrictive assumptions, i.e., modes are apparent and they shift position over time (Fig. 3).

- F M A M J J A S O N D J F M A M J J A S O
Flg. 3. Growth curve obtalned using ELEFAN I for Pilranthhs furclfercaught at the shelf edge off southwestern Puerto Rlco superimposed on length- frequency data. [ C u m de crecldento obtenlda usando IfEFAN I, para Paranthlas furclfer capturado en el bode de Ja platafoma continental al suroeste de Puerio Rlco, superpuesta a Jos datos de frecuencla de iong1ti1des.l
Four methods were used for mortality (Z=M) estimation: length-converted catch curve, Z/K ratio, and the Pauly and Ralston equations. The latter two gave similar results when used with the ELEFAN I growth pa- rameters, with the results from the Pauly equation being slightly higher. Nelson and Manooch (1 982), Brouard and Grandperrin (1 984) and Ralston (1 987) indicate that Pauly's equation tends toward overestimation o f M for slow-growing species. This is con- sistent with our results and the estimate of mortality reported by Nelson et al. (1 986) (M = 0.61 year*'). If our length-frequency distribution was affected by ontogenic migration of larger individuals into deeper water, then we would also expect that mortality rates derived from the catch-cuwe would be overestimated (Pinto 1986). and this was clearly evident in our results. The amount of bias is dependent upon the magnitude of the K and L_ values and wil l be greater when I< is low and Lw is high, i.e., t o account for a given shape of the right-hand side o f the length-frequency distribution, continued growth must be offset by greater mortality. For this reason, the results using the ELEFAN I parameters show greater overestimation of mortality.
The underestimation of L_ and subse- quent overestimation of I< using Wetherall's method resulted in extreme overestima- tions o f mortality for all methods. The re- sults with Pauly's equation were surpris- ing, as it was thought that, with the in- verse linear log-log relationship between I< and L_, overestimation in one param- eter would be offset by underestimation of the other. However, a closer exarnina- tion reveals that i f L_ is underestimated, and K thus overestimated, then M will be overestimated without compensatory ef- fect.
I t has been suggested that Wetherall's method could be used to first estimate L_ and that a different method (e.g., ELEFAN I) be used to estimate I< (e.g.. Pauly 1986);
this suggestion is based on the good sta- tistical properties of the method (Wetherall et al. 1987) and its ease of use. However, we believe its application to reef fish must be done with caution and the validity of its assumptions ascertained. In a similar man- ner, Ralston's (1 987) equation has been recommended to predict natural mortal- ity for snappers and groupers. We agree with this recommendation; however, in relying only on a single parameter, this method is more sensitive than Pauly's equa- tion to biases in growth-parameter estima- tion.
Acknowledgements
We are indebted to G. Lopez. M. Rosado and A. Nazario for assistance in collecting specimens; M. Reigle kindly facilitated the use of boats and personnel. This research was supported by the Department of Ma- rine Sciences, University of Puerto Rico and by a fellowship to J.M. Posada from the National Council for Scientif ic and Technological Research (CONICIT, by its Spanish abbreviation). Venezuela.
References
Acosta, A. and R.S. Appeldoor~~. 1992. Esti- mation of growth, mortality and yield per recruit for Luljanus synagris (Linnaeus) in Puerto Rico. Bull. Mar. Sci. 50:282-291.
Akamine, T. 1985. Considerations of the BA- SIC programs to analyse the polymodal Frequency distributions into normal dis- tributions. Bull. Japan Sea Reg. Fish. Res. Lab. 35:129-160.
Appeldoorn, RS.,]. Beets, 1. Bohnsack, S. Bolden, D. Matos, S. Meyers, A. Rosario, Y. Sadovy and W. Tobias. 1992. Shallow water reef fish stock assessment for the US. Carib- bean. NOAA Tech. Mem. NMFS-SEFSC- 304, 70 p.
Bhattacharya, C.G. 1967. A simple method of resolution of a distribution into Gaussian tomponents. Biornetrlcs 23: 1 15- 135.

Beverton. R.J . H . and S. J. Holt. 1956. A review of methods for estimating mortality rates in fish populations wlth special reference to sources of bias in catch sampling. Rapp. P.-v. Rbun. ClEM 140:67-83.
Briggs, J.C. 1967. The relationship of t h e tropi- cal shelf reglons. Stud. Trop. Oceanogr. Miaml 5:569-578.
Brouard, F, and R Grandperrin. 1984. Les poissons profonds d e la pente rbcifale extCrne a Vanuatu. N o t e s e t d o c u m e n t s d'ocCanographie, Mission ONTOM, Port- Vila, Vanuatu, No. 1 1 , 1 3 1 p.
Bullock, L.H. and G.B. Smith. 1991. Memoirs of the Hourglass cruises: seabasses (Pisces: Serranidae) . Florida Marlne Research Ins t i tu te , D e p t . Nat. Resources, St . Petersburg, Florida. 3(2): 1-243.
Butler, J.N., J. Burnett-Herkes, ].A. Barnes and J. Ward. 1993. The Bermuda Rsheries: a t r a g e d y o f t h e c o m m o n s a v e r t e d ? Environment 35(1):7-33.
Cassie, R.M. 1954. S o m e uses of probability paper in the analysis of size Frequency distributions. Aust. J . Mar. Freshwat. Res. 5 13-522.
Cervigon, F. 1 9 9 1 . Los p e c e s rnarlnos d e Venezuela, Vol. I, 2da. edici4n. Fund. Cient. Los Roques. Caracas. 4 2 5 p.
Colin, P.L. and I.E. Clavijo. 1 9 8 8 . S p a w n i n g activity of fishes producing pelagic eggs o n a shelf e d g e coral reef. Southwestern Puerto Rico. Bull. Mar. Sci. 43(2):249-279.
Davis, W.P. and KS. Birdsong. 1973. Coral reef fishes which forage i n t h e water column. Helgolander wiss. Meeresunters 24292- 306 .
Dennis, G.D. 1988. Commercial catch length- Frequency d a t a a s a tool for fisheries management with an application t o t h e
-
Puerto Rico trap fishery. Mern. Soc. Cienc. Nat. La Salle 48(suppl. 3):289-310.
Erzini, K. 1990. Sample size and grouping of d a t a for length-frequency analysis. Fish. Res. 83355-366.
Fowler. H.W. 1936. The marlne fishes of west Africa, part 11. Bull. Am. Mus. Nat. Hist. TO(2): 1 4 9 3 p.
Fowler, H.W. 1945. Los peces del Peru. Mus. Hist. Nat. Javier Prado, Univ. Nac. Mayor d e San Marcos, Lima. 298 p.
J Gayanilo, F.C., Jr., M. Soriano and D. Pauly. 1989.
A draft gu ide t o t h e Compleat ELEFAN. ICLARM Software 2 , 6 7 p.
' ~ o e n i ~ , J.M., 1. Cslrke, M.). Sanders, A. Abella. M.G. Andreoli, D. Levi, S. Ragonese, M. AI-Shoushani and M.M. El-Musa. 1987. Data acquisition For length-based stock assessment: Report of Working Group I, p. 343-352. In D. Pauly and G. Morgan (eds.) Length-based methods in fisheries research. ICLARM Conf. Proc. 1 3 , 4 6 8 p.
Hoese, H.D. and R.H. Moore. 1977. Fishes of t h e Gulf of Mexico. Texas, Louisiana and adjacent waters. Texas A E. M University Press, College Station. 3 2 7 p.
Kimmel, 1.). 1985. A characterization of Puerto Ricnn Rsh assemblages. University of Puerto Rico, Mayaguez, Puerto Rico. 106 p. Ph.D. dissertation.
Manooch, C.S. 111.. 1987. A g e and growth of snappers and groupers, p. 329-374. In J.J. Polovina and S. Ralston (eds) Tropical snappers and groupers: biology and fisheries management. Westview Press, Boulder.
Macdonald, P.D.M. and T.J. Pitcher. 1979. Age g r o u p s from s ize- f requency d a t a : a versatile and efficient method OF analyzing distribution mixtures. J. Fish. Res. Board Can. 36:987-101.
Meek, S.F. and S.F. Hildebrand. 1925 . The marine fishes of Panama, part 11. Field Mus. Natur. Hist. Pub. 2 2 6 , Zool. Ser. 15:33 1-707.
Metzelaar, J. 191 9. Fishes of t h e Dutch West Indies. Report on t h e fishes collected by Dr. J . Boeke in t h e Dutch West lndies 1904-1 905, wlth comparative notes on marine Fishes of Tropical West Africa by Dr. J . Metze laar . A. Asher and Co. ,
J Amsterdam. M u n r o , 1.1. 1983. A cos t -e f fec t ive d a t a
acqulsltlon system for assessment and management of tropical multispecies,
1 multi-gear fisheries. Flshbyte 1 (1):7-12. Munro. J.L. and D.McB. Williams. 1985. As-
sessment and management O F coral reef fisheries: biological, environmental and socio-economic aspects, p. 545-578. In C. Gabrie and B. Salvat (eds.) Proceed- ings of t h e Fifth International Coral Reef Congress, 27 May-1 June 1985. Tahiti. Vol.

4. Antenne Museum-EPHE, Moorea, French Polynesia.
Nelson, R.S. and C.S. Manooch I l l . 1982 . Growth and mortality of red snappers in t h e west-central Atlantic Ocean and northern Gulf of Mexico. Trans. Am. Fish. SOC. 1 1 1 :465-475.
Nelson, R.S., C.S. Manooch I l l and D.L. Mason. 1986. Ecological effects OF energy devel- opment on reef fish of the Flower Garden Banks: Reef fish bioprofiles. Final report. Southeast Fish. Cent. Beaufort Lab., Natl. Mar. Fish. Serv., NOAA, Beaufort, North Carolina. 25 1 p.
Parrish, J.D. 1787. The trophic biology ofsnappers and groupers, p. 405-463. In J.J. Polovina and S. Ralston (eds.) Tropical snappers and groupers: biology and fisheries man-
J agement . j. Westview Press, Boulder. Pauly, D. 1980. On t h e interrelationships be-
tween natural mortality, growth param- eters and the mean environmental tem- perature in 175 fish stocks. J . Cons. ClEM 39(3): 1 75- 192.
jPauly, D. 1981. The relationships between gill surface area and growth performance in fish: a generalization of von Bertalanfv's theory of growth. Meeresforsch. 28:251-
j 282. Pauly, D. 1984. Fish population dynamics in
tropical waters: a manual For use with programmable calculators. ICLARM Stud.
J Rev. 8, 3 2 5 p. Pauly, D. 1986. Improving operation and use
oFthe ELEFAN programs. Part 11. Improv- ing the estimation of L_. Fishbyte 4(1): 18- 20.
J ~ a u l y , D. and N. David. 1981. ELEFAN 1, a BA- SIC program for the objective extraction
-
of growth parameters from length-fre-
j quency data. Meeresforsch. 28:205-21 1. Pauly, D. and C.R Morgan, Editors. 1987. Length-
based m e t h o d s in fisheries research.
J ICLARM ConF. Proc. 13. 4 6 8 p. Pauly, D. and1.L. Munro. 1984. Once more on
growth comparison in Fish and inverte- brates. Fishbyte 2 ( 1 ):21.
Pinto, L. 1986. Use o f ELEFAN programs for emigrating species. Fishbyte 4(1): 14-1 5.
Quero, J.C.. J.C. Hureau, C. Karrer, A. Post and L. Saldanha. 1790. Check-list of the fishes
of t h e eastern tropical Atlantic. Vols. I - I l l . UNESCO, Paris. 1492 p.
Ralston, S. 1987. Mortality rates of snappers and groupers, p. 375-404. In 1.1. Polovina and S. Ralston (eds.) Tropical snappers and groupers: biology and fisheries man- agement . Westview Press, Boulder.
Randall, J.E. 1968. Caribbean reef fishes. T.F.H. Publications, Neptune City, New Jersey. 3 1 8 p.
Schnute, j. and D. Fournier. 1980. A new ap- proach to length-frequency analysis: growth structure. Can. J. Fish. Aquat. Sci. 37: 1337- 1 3 5 1 .
Shapiro, D.Y. 1987. Reproduction in groupers, p. 295-327. In J.J. Polovina and S. Ralston (eds.) Tropical snappers and groupers: biology a n d Fisheries m a n a g e m e n t . Westview Press, Boulder.
Smith, C.L. 1758. The groupers of Bermuda, p. 4- 17 , 37-59. In J . E. Bardach, C. L. Smith and D.W. Menzel (eds.) Final report of the Bermuda Fisheries Research Program. Bermuda Trade Development Board, Ham- ilton, Bermuda.
Smith, C.L. 1971. A revision of the American groupers: Epinephelus and allied genera. Bull. Am. Mus. Natur. Hist. 146(2):67- 242.
Snodgrass, R.E. and E. Heller. 1905. Shore fishes of the Revillagigedo, Clipperton, Cocos and Galapagos Islands. Proc. Wash. Acad. Sciences, 6:33-427.
Thornson, D.A., L.T. Findley and A.N. Kerstitch. 1979. Reef Ashes of t h e Sea Cortez. John Wiley and Sons, New York. 302 p.
Took, I. F. 1978. Fishes o f t h e Caribbean Reef.
J Macmillan Publishers Ltd., London. 9 2 p.
Wetherall, J.A., J.J. Polovina and S. Ralston. 1987. Estimating growth and mortality in steady- state fish stocks from length-kequency data. p . 53-74. In D. Pauly and G. Morgan (eds.) Length-based methods in fisheries research. ICLARM Conf. Proc. 1 3 , 4 6 8 p.
Williams, D.McB. 1991. Patterns and processes in t h e distribution o f coral reef fishes, p. 437-474. In P.F. Sale (ed.) The ecology of fishes on coral reefs. Academic Press, New York.

Spawning and Annual Fecundity of the Red Snapper (Luflanus citmpechanus)
from the Northeastern Gulf of Mexico
L A . COLLINS A.G. JOHNSON
C.P. KElM National Oceanic and Atmospheric Adm/nistation
National Marine Fisheries Service Southeast Fisheries Science Center
Panama City Laboratory 3500 Delwood Beach Road
Panama Cilfy, Florici'a 32408, USA
COLLINS, L.A., A.G. JOHNSON and C.P. KEIM. 1996. Spawning and annual fecundity of the red snapper (Lutjanus campechanus) from the northeastern Gulf of Mexico [Desove y fecundidad anual del pargo del Golfo (~ut/anus campechanus) del noreste del Golfo de M&xico], p. 1 74- 1 88. In F. Arreguin- ~ i n c h e z , J.L. Munro, M.C. Balgos and D. Pauly (eds.) Biology, fisheries and culture of tropical groupers and snappers. ICLARM Conf. Proc. 48, 449 p.
Abstract
We used batch fecundity and spawning frequency methods to provide information on spawning and annual fecundity for the red snapper (Lutjanus campechanus), an indeterminate spawner. These esti- mates were based on 923 females sampled during February 1991 through November 1993, from north- west Florida landings. Spawning occurred from May through September or early October. Oocytes >0.16 m m in diameter were homogeneously distributed in hydrated ovaries. The smallest (349 m m total length (TL) and 0.60 k g total weight (TW)) female contained 458 hydrated oocytes. while the largest (820 rnrn TL and 9.00 kg TW) and oldest (age 12 years) female contained 1 704 736 hydrated oocytes. Batch fecundity was predicted well by age (r2=0.642) and TL (r2-0.584). Estimates of the spawning frequency were 26 in 1991, 21 in 1992. and 35 in 1993. Estimates of annual fecundity ranged From 0.012 to 59.666 million per female, assuming that spawning frequency was constant for all sizes/ ages. However, estimates o f spawning frequency by age for n> l I suggested that age 8 females spawn more often than age 3, 4. 5 and 6 females. Previous estimates of annual fecundity (based on number of oocytes 20.20 rnm in diameter) were strongly correlated with improved estimates incorporating batch fecundity and spawning frequency methods (based on number of hydrated oocytes). This relationship was described by the equation: improved annual fecundity estimate = (5.401 .previous annual fecundity estimate)+ 2.054.105 (rZ = 0.956: n = 21: TL range from 349 to 810 mm). This equation will allow adjustment of previous fecundlty estimates, malting previous spawning potential ratios more accurate and useful.
Resumen
El presente trabajo tlene por objeto proporcionar inhrmaci6n sobre desove y fecundidad anual del pargo del Golfo (Lutjanus carnpechanus) utilizando un metodo de pulsos de fecundidad y un metodo de frecuencia de desove. Estas estirnacioner fueron basadas en 923 hembras rnuestreadas en el period0 de Febrero 1991 hasta Noviembre de 1993, de desernbarques a1 noroeste de florh'a. Los desoves ocurrieron

preservation. Preliminary sex and maturation stage were assigned, and a maximum oocyte diameter recorded for females in order to compare these data with those from his- tology. Gonad weight was recorded to the nearest 0.1 g before selected gonads were preserved in a plastic bag with 5-1 0 times the gonad's volume of 10% buffered his- tological grade formalin. Large gonads were usually cut longitudinally to promote pres- ervation.
We tested for homogeneity of oocyte diameter distributions throughout the ovary with the I~olmogorov-Smirnov test (Soltal and Rohlf 1981). This was done to allow selection of a single sample within an ovary for accurate determination of maturation stage and batch fecundity. Three late-stage ovaries were divided into 6 regions and a wedge- shaped sample was cut out in cross sec- tion to represent the periphery and center of each region. We teased apart all oocytes in each sample and measured the diam- eter of 300-t randomly selected oocytes in each region.
We also tested for differences in hydrated oocyte counts among regions and between lobes with an analysis ofvariance (SAS 1988). Six hydrated ovaries were divided into 6 regions and wedge-shaped samples taken, as above.
A simple gonadosomatic index (GSI = (gonad weight/total weight) x 100) was used to generally delineate the spawning season by month. We also loolted for rela- tionships between length and GSI, since they are usually related allornetrically (devlaming et al. 1982).
Late-stage ovaries selected from the rni- croscopic examination of Fresh, whole oocyte samples were prepared for final sexing and staging through histology. Histological prepa- ration (after the selected ovaries had been fixed in fornialin for at least 2 weeks) was identical to that described by Fitzhugh et al. ( 1993). Ovarian stage judged from the most advanced stage of oocytes recorded from both the fresh material and histological
slides was: 1 -primary growth, 2-cortical alveolar, 3-vitellogenic, and 4-hydrated (Wallace and Selman 1981) and 5-spent (West 1990). Only Stage 4 ovaries, with no postovulatory follicles, were selected for fecundity estimation.
Ovaries selected for fecundity estima- tion were randomly sampled as follows. A wedge-shaped sample representing the periphery and center of each ovary in cross sections was weighed to the nearest 0.001 g and placed in a 2 dram vial with 33% glycerol. Sample size was usually 0.1 - 0.3 g. After at least 2 hours, the hydrated oocytes within the sample were carefully separated with teasing needles. We made at least two independent counts of all hy- drated oocytes on each selected sample and used the mean as the final estimate. The batch fecundity estimate (BFE) was calculated gravimetrically, by multiplying the final estimate of the number of hydrated oocytes by the weight of the whole ovary, then dividing this product by the sample weight. Batch fecundity was regressed on TL, TW and age for all hydrated ovaries (SAS 1 988).
The spawning frequency estimate (SFE), required for calculating annual fecundity (Hunter and Macewicz 1985), was found by dividing the duration of the spawning season (DOSS) in days by the number of days between spawning for all females. DOSS was the number of days between the first and last occurrence of hydrated oocytes or postovulatory follicles each year. The number of days between spawning for all females (2TL of the smallest hydrated fish) was 100% divided by the percentage of hydrated females. SFE is the number of times that the species spawned each year.
Age was determined from sections of sagittal otoliths following the method of johnson (1 983). Nelson (1 980) validated rings on red snapper otoliths as annular marks.
Spawning frequency by age was esti- mated using 1993 females X L of the smallest

hydrated female. As with the SFE, only females collected during the spawning season were included for this estimate.
The relationship between previous and improved annual fecundity estimates was determined. Previous estimates were rep- resented by counts of all yolked oocytcs (20.20 mm) from some of the same ovaries from which improved estimates were made. The previous method's formula was annual fecundity = (number of oocytes 20.20 rnrn x ovary weight)/sarnple weight. To deter- mine the relationship between the two estimates of fecundity, we regressed the improved estimate on the previous esti- mate using SAS ( 1988).
Results
A total of 1 475 red snapper gonads were sampled from northwest Florida waters during February 1991 through November 1993. Most fish came from charterbats during the summer months. The largest portion of Ash (629, or 43%) was collected in 1993 when we sampled almost daily most of the summer, while 484.(33%) were sampled in 1992, and 362 (24%) in 199 1. Sampling in 1931 was biased toward females, but
unbiased sampling in 1992 and 1993 showed 59% and SO% females, respectively.
Most fish were caught, iced, landed and sampled the same day, which allowed adequate preservation of gonads. Preser- vation of gonads in formalin usually occurred within 12 to 48 hours o f the fish's death.
Red snapper spawned serially from May- June through September-early October, ac- cording to GSls (Fig. 1 and Tables 1 and 2). Peaks of spawning apparently occurred in June, July and August. Monthly moan- GSls were similar in each of the 3 years. except for females in ]un-e 1993, when the estimate was much higher than the 1991 and 1992 values. The greater mean GSI in June 1993 was explained by the fact that significantly larger females were sampled in June 1993 (mean TL = 528 rnm) than in June 1991 (mean TL = 389 mrn) and June 1992 (mean TL = 433 rnrn).
Examinations of gonads revealed that red snappers are gonochorists. The lobes of the ovaries and testes were symmetrical. Large amounts o f adipose tissue were usually attached to both ovaries and testes.
The test for homogeneity o f oocyte di- ameter distributions throughout each of 3 hydrated ovaries showed no significant differences for oocytes >0.16 mrn in di- ameter (Tables 3 and 4). This result allowed
Flg. 1. Mean GSI of fe- male red snapper from the NE Gulf of Mexlco. 1991-1993. N = 646 (months wlth n > 10). [ h d k e g o ~ d o s o ~ c o (GSI,, medlo de hembras de pargo del Golf0 del noreste del GoMo de M&xlco, $991- 1993. N = 646; meses con n >

Table 1. Gonosomatic index (CSI) and total length (TL in mm) for female red snapper by month, 1991 -1993; s.d. = standard deviation, C.V. = - coefficient of variation, N = number of individuals. [fndicegonadosomafico (GSIJ ylongjtudtotal (TL, en mm)para hembras depargo delGolfo, 03 por mes, durante 199f- 1993; s. d. = deviation estandar; c. v. = coeficlente de variacjon, N = numero de individuos.]
Month
Year ]an ' Fe b M a r A P ~ May j u n l u l *US S ~ P Oct N ov N 1991
n Min GSI Max GS1 Mean GS1 s.d: C.V.
Min TL Max TL Mean TL s.d. C.V.
1992 n
Min GSI Max GS1 Mean CS1 s.d. C.V.
Min TL Max TL Mean TL s.d. C.V.
1993 n
Min GSI Max GS1 Mean G51 5.d. C.V.
Min TL Max TL Mean TL s.d. C.V. - 30.96 14.27 24.64 15.81 26.78 29.40 20.10 20.33 20.2 I 84.73 1991-93N 2 I 1 28 58 94 82 106 9 7 98 49 50 675

us to sample just one location on each ovary to determine maturation stages and maxi- mum oocyte diameter.
Hydrated oocyte counts per unit of weight did not differ significantly by region or lobe (Table 5). The 6 ovaries selected for this ANOVA represented June through Octo- ber, 1 993.
Percentage frequencies of 588 Stage 1 - 4 ovaries (unpreserved, examined micro- scopically) varied by month (Fig. 2 and Table 6) and basically showed the same spawn- ing peaks as had GSI. Stage 1-2 ovaries were prominent in January through May, and November. Stage 3 ovaries were found from May through November. Stage 4 ovaries occurred from May through September or October, but were most prominent in June through September.
Means of maximum oocyte diameter for 576 ovaries indicated that spawning oc- curred from June through October (Fig. 3 and Table 6). Greatest means of maximum oocyte diameter were 0.51, 0.67 and 0.55 in June, July and August of 1992, respec- tively.
A total of 237 Stage 3-4 ovaries was ex- amined histologically from red snapper col- lected during the period May 1991 through October 1993. Physical appearance of Stage 1-4 oocytes was identical to those of sheepshead described and illustrated by Render and Wilson (1 992). Only one ovary with fresh postovulatory follicles was found. in June 1992. Sixty-six ovaries weighing 1.2 to 908 g were hydrated and intact, and thus were used for BFEs (Table 7). These BFE fish were 349 to 820 mm TL, 0.60 to 9.10 kg TW and, age 3 to 12 years old. Early stage hydrated (including yolk coa- lescence) and late stage hydrated oocytes were included in Stage 4 ovaries used for BFEs. Atresia of yolked oocyres occurred in many Stage 4 ovaries; this may have been an effect of delayed preservation.
Batch fecundity estimates (BFEs) ranged from 458 to 1 704 736, for the smallest and largest fish, respectively (Table 7). BFEs
by year were not significantly different (F = 1.43, p = 0.237), therefore data for all years were combined for analysis. TL, TW and age all proved to be useful predictors of batch fecundity, with simple linear models providing the best fits. These relationships were described by the following equations:
BFE = ( 1 -849 x 103(TL)) - 8.055 x 10' (rZ = 0.584);
BFE= ( 1 . 3 6 3 ~ 105(TW))- 1 . 3 1 5 ~ 105 (rZ = 0.741); and
BFE = (1.278 x 1 OS(AGE)) - 4.375 x 10⁵ (rZ = 0 .642) :
with TL in mm, TW in kg and age in years. SFEs per year ranged from 21 to 35 (Ta-
ble 7). The smallest hydrated females were 400, 362 and 344 mm TL in 1 99 1 , 1992 and 1993, respectively. Percentage of hydrated females was 25.2, 16.8 and 22.7 in 1991, 1992 and 1993, respectively. Days between spawning were 3.97, 5.95 and 4.41 in 1991 , 1992 and 1993, respectively. DOSSwas 102, 119and 154in 1991, 1992 and 1993, respectively. All estimates for 1993 are probably the most accurate be- cause of the greater sampling intensity during that year.
Annual Fecundity estimates ranged from 1 l 61 3 to 5 9 665 760 assuming that SFE was the same for all females by year (Ta- ble 7). Again, 1993 estimates are prob- ably the most accurate.
We aged 502 of 526 red snapper of both sexes collected in 1993. The remaining fish had confusing marks.
Estimates of SFE by age were made with all aged females 2344 mm TL collected from 2 May through 3 October 1993 (Table 8). A comparison of samples with n r 10 was possible for only ages 3, 4, 5, 6, and 8. The SFE for ages 3, 4, 5, and 6 were 28, 30, 41 and 14, respectively. The SFE for age 8 was 1 12. Sample size was much greater for ages 3-5 (n>43) than for age 6 and 8 (n = 1 1 ) . however.
The relationship between AFEs using pre- vious (Collins et al., unpubl.) and improved (Hunter et al. 1985) methods was determined

Table 3. Oocyte diameter frequency dlstrlbutlons by reglon of red snapper for two fully hydrated ovaries (I and I[) and one partially hydrated ovary (111). Oocyte dlameter glven as ocular micrometer unlts (OMU = 0.04 mm). [Dlstrlbuclh~ de frecuenda def d lhe t ro & lor oocltos por resI6n de ovarlos de pargo del Golfo para dos ovarlos tohlmente hldratados If y If), y un ovarlo parclalmente hldratado {Mfl. El dtimetro de 10s oocltos esti dado en unlhdes de mfcrometro ocular (OMUI. (Un OMU=0.04 rnml.1
I II Ill OMU A" 0 C D E F A B C D E F A 0 C D E F
t 69 73 79 65 82 69 82 72 73 59 102 67 51 93 93 101 105 57 2 t27 I04 99 117 101 97 83 100 101 98 102 78 66 51 66 97 64 9i 3 43 45 43 61 60 40 36 22 31 34 22 25 81 64 60 53 60 24 4 10 21 21 21 18 12 17 8 14 I4 9 16 30 50 32 16 19 9 5 14 10 9 8 14 17 16 9 15 I6 9 10 31 15 5 10 7 4 6 5 10 5 I2 7 10 14 10 18 9 8 10 8 5 3 6 6 5 7 12 8 2 2 13 6 I2 14 12 I 1 8 17 9 4 4 2 2 9 8 9 2 3 1 6 7 22 28 17 1 1 13 2I 4 4 4 3 2 14 9 12 2 9 8 2 6 12 17 8 14 14 14 5 1 4 5 4 12 10 12 4 12 2 6 17 4 16 16 3 10 1 1 I2 1 7 3 7 21 1 1 9 6 5 3 7 6 9 4 8 5 4 1 8 4 7 8 3 9 25 12 3 1 3 2 3 1 4 8 4 3 3 3 1 0 1 8 3 10 21 13 1 0 1 1 0 1 4 5 0 0 1 3 3 2 3 0 2 6 14 0 0 1 0 0 1 4 5 5 3 1 2 0 0 0 0 1 2 15 0 0 1 0 1 0 1 2 1 1 1 4 8 9 1 6 0 0 0 0 0 0 16 0 0 2 0 1 0 0 0 0 0 0 0 4 1 0 i O 7 4 9 17 1 3 2 0 0 2 6 1 3 7 9 9 9 0 1 0 0 0 0 18 3 1 0 2 2 1 2 4 2 9 8 2 0 0 0 0 0 0 19 4 3 3 5 3 3 1 3 5 I 2 2 0 0 0 0 0 0 20 5 2 2 6 7 2 0 0 0 0 0 2 0 0 0 0 0 0 2 1 6 2 1 1 3 1 0 0 0 0 0 0 0 0 0 0 0 0 22 2 2 I 1 0 0 0 0 0 0 0 0 0 0 0 0 0 0 23 0 1 0 0 0 0 0 0 0 0 0 0 0 0 0 0 0 0 24 0 1 0 0 0 0 0 0 0 0 0 0 0 0 0 0 0 0 25 0 0 0 0 0 0 0 0 0 0 0 0 0 0 0 0 0 0 26 0 0 1 0 0 0 0 0 0 0 0 0 0 0 0 0 0 0 27 0 0 0 0 0 1 0 0 0 0 0 0 0 0 0 0 0 0
~ o t a l ~ 347 301 305 318 336 300 344 359 360 314 338 335 309 300 300 301 300 300
Ovary regions: A = right lobe, anterior one-third D = left lobe, anterior one-third B = right lobe, middle one-third E = left lobe, middle one-third C = right lobe, posterior one-third F = left lobe, posterior one-third
b~urnber of oocytes sampled.
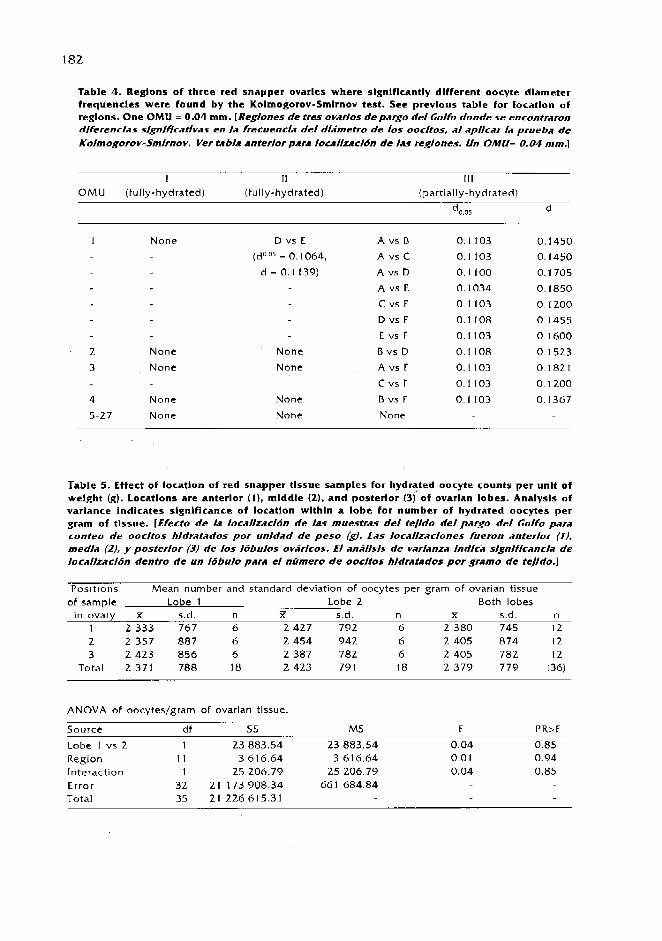
Table 4. Regions of three red snapper ovaries where slgnlflcantly dlfferent oocyte dlameter frequencies were found by the Kolmogorov-Smlrnov test . See prevlous table for locatlon of reglons. One OMU = 0.04 mm. [Regiones de tres ovarlos tie pargo del Golfo donde se encontraron dlferencias significativas en la frecuencla del dia'metro de 10s oocltos, a1 apllcar la prueba de Kolmogorov-Smlrnov. Ver tabla anterior para Iocallzaclon de las reglones. Un OMU= 0.04 mm.]
OMU (fully-hydrated) (fully-hydrated) (partially-hydrated)
1 None D vs E A vs B 0.1 103 0.1450
(d0.05 = 0.1064, A vs C 0.1 103 0.1450
d = 0.1 139) A vs D 0.1 100 0.1 705
A vs E 0.1034 0.1850
C vs F 0.1 103 0.1 200
D vs F 0.1 108 0.1455
E vs F 0.1 103 0.1600
2 None None B vs D 0.1 108 0.1523
3 None None A vs F 0.1 103 0.182 1
C vs F 0.1 103 0.1200
4 None None B vs F 0.1 103 0.1367
5-27 None None None
Table 5. Effect of locatlon of red snapper t lssue samples for hydrated oocyte counts per unlt of welght (g). Locations are anterior (11, mlddle (21, and posterlor ( 3 ) of ovarlan lobes . Analysls of variance Indicates slgnlficance of lotatlon wlthln a lobe for number of hydrated oocytes per gram o f t lssue. [Efecto de la locallzacl6n de Ias muestras del te/ldo del pargo del Golfo para conteo tie oocltos hldratados por unldad de peso (g). Las locallzaclones fueron anterior ( I ) , media (21, y posterlor (3) de 10s Iiibulos oviir/cos. El anallsls de varianza Indlca signlflcanch de l o c a l h c l ~ n dentro de un Iobulo para el numero de oocltos hldratados por gramo de teJldo.1
Positions Mean number and standard deviation of oocytes per gram of ovarian tissue of sample Lobe 1 Lobe 2 Both lobes
in ovary K s.d. n x 5.d. n X s.d. n - 1 2 333 767 6 2 427 792 6 2 380 745 12 2 Z 357 887 6 2 454 942 6 2 405 874 12 3 2 423 856 6 2 387 782 6 2 405 782 12
Total 2 371 788 18 2 423 791 18 2 379 779 (36)
ANOVA of oocytes/gram of ovarian tissue.
Source df 5 5 MS F PR>F
Lobe 1 vs 2 1 23 883.54 23 883.54 Region 1 1 3 616.64 3 616.64 Interaction 1 25 206.79 25 206.79 Error 32 21 173 908.34 66 1 684.84 Total 35 Z 1 226 615.31


o L j ; 1 I I 1 I 1 I I I ._I M A M J J A S 0 N D
Month
Flg. 3. Mean maximum oocyte diameter of red snapper. 1992 (N=265) and 1993 ( N = 3 1 1). [DiAmetro mAximo promedlo /en mm) de 10s oocltos del pargo de1 Golfo, 1992 (N=Z65) y
From 21 fish from 349 to 81 0 mm TL (Table 9) . This relationship was: Improved AFE = (5.401 .previous AFE)+ 2.054.1 O5 (r2 = 0.956). Since previous AFEs are strongly correlated to improved AFEs, adjustments can now be made on previous AFEs to improve stock assessments. However, an assumption of no significant difference in AFE between years would have to be made in order to make these adjustments to previous years' AFEs.
Discussion and Recommendations
Dockside sampling of charterboat catches provided an adequate first measurement OF red snapper spawning and annual fe- cundity off northwest Florida. The delay in preserving gonads was necessary because of the need to examine unpreserved ma- terial (to inspect and measure the oocytes beforethey were affected by formalin), and the fact that periodic backups in process- ing occurred with our intensive sampling.
Intensive sampling at sea with rapid ex- amination and preservation of ovaries is needed
to identify spawning time and better define rates of ovarian development and atresia for red snapper. This species probably spawns at night (Grimes 1987; B. Thompson, pers. comm.), which could explain why ovaries in our collections used For BFE had both early and late hydration. The charterboats usually fished throughout the day and landed their catch in the late afternoon. Spawning of red snapper may occur In the early evening off northwest Florida, since more than half ofthe ovaries used For BFE were late-stage hydrated. Post-ovulatory follicles apparently deterio- rated rapidly after spawning.
Studies are also needed on large num- bers of large, old snappers to better esti- mate annual fecundity and frequency of spawn- Ing. Fish of this greater size are not common offnorthwest Florida, but are relatively common off Louisiana.
Acknowledgements
We thank many individuals in the Panama City, Florida, area for allowing us to sam- ple their catch, in particular commercial Captains Sigurd Srneby, Mark Rafield, Mike


Table 8. Spawnlng frequency estlmates by age of female red snapper wlth hydrated oocytes from 2 May 1773 to 3 October 1993. [t"stimacidn de L liecuencia de desove por edad Ile /as hembras mas pequeiiils de pargo Ile/ Goifo con oocitos hidratados, de Mayo 2 de 1993 a Octubre 3 de 1993.1
Length n n with Spawning (TL; mm) hydrated frequency
oocytes
Table 9. Data used for analyzing relationships of prevlous and Improved annual fecundity estlmates (AFEs) for red snapper. [Datos usadospara anaiizarlas relac/ones de /as estimaciones de fecundidad anual, prevja y mejorada (AFEs)para elpargo tie1 Golfo.]
Mean Mean count OF count of:
Date Length Weight Age oocytes Previous hydrated Improved (dd/mm/yy) (TL; rnrn) (kg) (years) 20.20 mm AFE oocytes AFE
654 919 486 ZOO 453 564
2 147 371 1 073 090 4 332 428
60 347 1 465 290
27 898 8 166 356 2 519 145 7 914 966 691 333 242 560
17 035 340 814
1 742 I58 82 578 37 181
397 109 250 052
Raffield, and Ray Ward. Jerry and Carl Anderson al lowed us t o routinely sample their seafood markets at Panama City Beach. Charterboat captains Bill Archer and Charles Paprocki also participated in our sampling. Special thanks are extended t o National Marine Fisheries Service Fishery Reporting Specialist Debbie Fable, w h o routinely in- terrupted her schedule t o assist our sam- pl ing.
Bruce Thompson, Cheryl Crowder and Jeff Render o f Louisiana State University in Baton Rouge provided valuable advice on ovarian histology. Lew Bullock, Ron Taylor and Ruth Reece o f the Florida Marine Re- search Institute in St. Petersburg helped w i th sampling methodology and histology.
Marc Remy, Sean Murray and James McClain processed gonads and participated i n batch fecundity estimation. John Dahl assisted wi th efficient processing ofotoliths.
This research was Funded by the MARFIN (Marine Fisheries Initiative) Program o f the NMFS, Southeast Region.
References
Bennett. J. 1993. Automated landings assess- ment for responsive management (ALARM) report. October 1993. NOAA. NMFS, SEFSC, Res. Manage. Div. Contrib. MIA- 93/94- 18, 49 p.
Briggs, 1.C. 1958. A list of Florida fishes and their distribution. Bull. Fla. State Mus. (Biol. Sci.) 2:223-3 18.
Collins, L.A., J . H . Finucane and H.A. Brusher. Reproductive biology of red snapper, Lutjanus campechanus (Poey), from three areas along the southeastern coast of the United States. 2 1 p.
devlaming, V.L., G. Grossman and F. Chapman. 1982. On the use of the gonadosomatic index. Comp. Blochem. Physiol. 73A:31- 39.
Fitzhugh, G.R., B.A. Thompson and T.G. Snider 111. 1993. Ovarlan development. fecundity, and spawning frequency of black drum, Pogonias cromis, in Louisiana. Fish. Bull. US 91 :244-253.
Goodyear, C.P. and P. Phares. 1990. Status of red snapper stocks of the Gulf of Mexico Report for 1990. NOAA, NMFS. SEFSC, Coast. Res. Div.. Contrib. 89/90-05.
Grimes, C.B. 1987. Reproductive biology of the Lutjanidae: a review, p. 239-294. In 1.1. Polovina and S. Ralston (eds.) Tropical snappers and groupers: biology and Rsh- eries management. Westview Press, Boulder.
GMFMC. 1989. Amendment Number I to the reef fish fishery management plan. Gulf OF Mexico Fishery Management Council, Tampa, Florida. 356 p.
Hunter, J.R., N.C.H. Lo and R.J.H. Leong. 1985. Batch fecundity in multiple spawning fishes, p. 67-77. In R. Lasker (ed.) An egg pro- duction method for estimating spawning biomass of pelagic fish: application to the northern anchovy, Engraulis mordax. NOAAINMFS Tech. Rep. 36.
Hunter, J.R. and B.J. Macewicz. 1985. Meas- urement OF spawning frequency in multi- ple spawning Fishes, p. 79-94. In R. Laslter (ed.) An egg production method for es- timating spawning biomass of pelagic fish: application to the northern anchovy, Engrauiis morclax. NOAA/NMFS Tech. Rep. 36.
Hunter, J.R., B.]. Macewicz, N.C.H. Lo and C.A. Kimbrell. 1992. Fecundity, spawning, and maturity of female dover sole, Microstomus pacificus, with an evaluation of assump- tions and precision. Fish. Bull. US 90: 101 - 128.
Johnson, A.C. 1983. Age and growth of yellowtail snapper from south Florida. Trans. Am. Fish. Soc. 1 12: 173- 177.
Nelson. R.S. 1980. Growth and mortality as- pects of natural populations of the red snapper Lutjanus campechanus, in the West Central Atlantic and GulF OF Mexico. North Carolina State University. 73 p. M.S. the- sis.
Nelson, R.S. 1988. A study of the life history, ecology, and population dynamics of four syrnpatric reef predators (Rhomboplites aurorubens, Lotjanus campechanus, Lutjanidae; Haernulon melanurum. Haemulidae; and Pagruspagrus, Sparidae) on the East and West Flower Garden Banks. northwestern Gulf of Mexico. North Carolina State University. 163 p. Ph.D. thesis.

Render, J.H. and C.A. Wilson. 1992. Reproduc- Wallace, R.A. and K. Selman. 1981. Cellular tive biology of sheepshead in the northern and dynamic aspects of oocyte growth Gulf of Mexico. Trans. Am. Fish. Soc. in teleo5ts. Am. Zool. 21 1325-343. 1 2 1 :757-764. West, G. 1990. Methods of assessing ovarian
SAS. 1988. Release 6.03. SAS Institute, Inc., development in fishes: a review. Aust. J. Cary, North Carolina. Mar. Freshwat. Res. 41 : 199-222.
Soltal, R.R. and F.J. Rohlf. 198 1 . Biometry. W.H. Freeman and Co., New York. 859 p.
Reproductive Biology of the Gray Snapper (Lu#wws griseus), with Notes on Spawning
for other Western Atlantic Snappers (Lutjanidae)
M.L. DOMEIERa California Department offish and Game
Marine Resources Division 330 Golden Shore, Suite SO, Long Beach, CaliForn/a 92648, USA
C. KOENIG F . COLEMAN
Florida State Universi&, Department of Biological Sciences Conracli Building, Tallahassee, Florida 32306, USA
DOMEIER. M.L., C. KOENIG and F. COLEMAN. 1996. Reproductive biology of the gray snapper (Lutjanus griseus), with notes on spawning for other Western Atlantic snappers (Lutjanidae) [Biologia reproductiva del pargo prieto (Lutjanus griseus), con notas sobre el desove de otros pargos (Luqanidae) del Atlantic0 Occidenta/l, p. 189-201. In F. Arreguin-Sbnchez, J.L. Munro, M.C. Balgos and D. Pauly (eds.) Biology and culture OF tropical groupers and snappers. ICLARM Conf. Proc. 48, 449 p.
Abstract
Specimens of Luganus griseus were collected from Four sites off Key West, Florida, From May 1991 to January 1992. Two sites were in shallow inshore waters and two were offshore reef sites. Gonads from all specimens were macroscopically examined, and a subset was examined microscopically. A few sexually actlve males were found as early as late March, but females were not observed with active ovaries until mid-June. Spawning peaked in July and August and tapered off in September. The minimum size at maturity was found to be 182 mm SL for males and 198 mm SL for females. Examination of otoliths From newly settled L. griseus revealed that actual spawning was occurring during the new moon phases, Adult fish were observed to migrate from inshore to offshore waters during the peak of the spawnlng season. Observations of other species OF Lutjanus suggest that some spawn in annual aggregations at specific sites, while others have protracted spawning seasons with no apparent spawning migration.
Resumen
Espechenes de Lutjanus griseus fueron colectados de cuatro sitios fuera de Key West, Florida. de Mayo de 1991 a Enero de 1992. Dos sltlos fueron en aguas interiores de baja profundidad y dos Fueron en arrecifes de aguas marinas. Las gdnadas de todm lospeces fueron examinadas rnacroscopicamente y una submuestra FuC examlnada microscdplcamente. Unos pocos machos sexualrnente activos fueron encontrados a1 inicio y a1 final de Marzo, pero no fueron observadas hembras con ovarios activos hasta
"Present address: Hubbs-Seaworld Research Institute. 2595 lngraham Street, San Diego, California 92109. USA: e-mail 1037Z7.35301compuserve.com

la mitad de /unio. El desove present6 su mdrimo en /u/lo y Agosto, culrnlnando en Septiembre. N tamafio mlnimo de rnadurez fuC de 182 mm de longltud estandar (SL) para machos y 198 mrn SL para hembras. El exiirnen de 10s otolltos de L. griseus recientemente reclutados revel6 que el desove actual ocurri6 durante /as hses de luna nueva. Se observd que 10s peces adultos presentan una migracidn de aguas costeras a aguas m a h a s durante elp/co de /a e p o a de desove. La ohsemcidn de otras especies de Lutjanus sugiere que algunas desovan en agregaciones anuales en sitios especlflcos, mientras que otros presentan una kpoca de desove protrdctil sin mlgracidn aparente para desovar.
Introduction
Snappers are a major component OF the commercial, sport and subsistence fisher- ies in the tropical Western Atlantic and Gulf of Mexico. Although gray snapper (Lutjanus griseus) (Domeier and Clarke, unpubl.), red snapper (L. campechanus) (Arnold et al. 1978: Minton et al. 1983) (see also Collins et al., this vol.), lane snapper (L. synagr/s) (Domeier and Clarke 1992: Clarke et al. in prep.) (see also Rivera-Arriaga et al., this vol.), yellowtail snapper (L. chrysurus) (Soletchnik et al. 1989: Domeier and Clarke 1992; Clarke et al. in prep), and mutton snapper (L. analis) (Clarke et al. in prep) have been spawned in captivity, little is known of the reproductive biology and spawning habits of this group (see also Manickchand-Heileman and Philipp, this vol.). Details of reproduction and early life history are critical to effective fisheries man- agement. Here we present new data re- garding the reproductive biology of the gray snapper and report observations on the spawning habits of several other spe- cies of Western Atlantic snapper.
The gray snapper is of considerable corn- rnercial importance in Florida, where hook- and-line landings for 1978 amounted to 337 t worth an estimated US $426 000 (Bortone and Williams 1986). Catches dropped to 230 t by 1990 but the eco- nomic value remained high at $73 1 000 (preliminary data: O'Hop, pers. comm.). The economic value of the sport fishery
probably far exceeds that of the commer- cial fishery (Starck 197 1 ). Peak commer- cial landings occur during the summer months in Florida, with the Florida Keys taking 25% of the annual catch in July alone (Burton 1992). This peak of commercial activity coincides with the peak of gray snapper spawning activity reported by Jordan and Everrnann ( 1 923) to occur in July and Au- gust, and Starck (1 97 1 ) (working in south Florida) from June to September with peak spawning in June and July.
Actual spawning has not been observed but the evidence suggests that it takes place at offshore reefs and wrecks (Springer and woodburn 1 960; Starck 1 97 1 ) . Starck (1 87 1 ) suggested that spawning periods followed a lunar cycle, occurring around the full moon. Eggs and larvae are planktonic (Barans and Powles 1977). Larvae remain in the plank- ton for three weeks (Dorneier and Clarke, unpubl.) and settle as, early juveniles in estuaries (Bortone and Williams 1986), primarily in shallow seagrass beds in Florida (Starck 1971). Gray snapper larvae have been described From laboratory-reared in- dividuals (Richards and Saksena 1980: Clarke et al. in prep.).
Starck's ( 197 1 ) comprehensive study of gray snapper covered many aspects of the life history. However, important details regarding spawning were left unanswered. This study investigates spawning season, spawning periodicity, spawning behavior, and sexual pattern of gray snapper. Data were also collected regarding certain as- pects of early juvenile biology.
Materials and Methods
Site selections
Gray snapper were collected from four sites near Key West, Florida, two shallow inshore sites and two offshore reef sites representative of the wide range of habi- tat types known for this species. Specific sites ware chosen after visually identitj- ing areas (using SCUBA) with large num- bers of gray snapper. The following are site descriptions.
lnshore Site 1 (IS1 ) - A large patch reef (20 rn long, 7 m wide, and 3 m high in a depth of 5 m) consisting of living boulder, brain, and star coral, surrounded by sand and seagrass beds. Visibility varied greatly from poor to good (2- I 2 m) .
lnshore Site 2 (IS2) - Boca Grande Channel between Boca Grande Keys (west of Key West in a depth of 6 m) with soft corals, sponges and one small isolated coral head. This site was subject to strong tidal cur- rents restricting sampling to slack tides. Visibility was poor ( I -6 m).
Offshore Site 1 ( 0 s 1 ) - A large area of reef with overhanging ledges and sand channels at a depth of 9 rn, adjacent to a sloping dropoff into deepwater. The top of the reef was covered with soft corals. Visibility ranged from 10 to 20 m. Although this site produced relatively few gray snap- pers during initial surveys, i t was selected because it was known by fishers to be a spawning ground for these fish.
Offshore Site 2 (052) - A large area of spur and groove reef, locally referred to as Boca Grande Bar at a depth of 15 m). Visibility ranged from 10 to 30 m.
Miscellaneous Sites - The data set was supplemented by specimens opportunistically collected at a variety of locations in south- ern and western Florida. Many of these collections were made by fishers unwill- ing to reveal the exact location of the site.
Snmpllng of adults
Ten gray snappers were collected by spearfishing at each of the four sites at regular intervals between 14 May 1991 and 12 September 1991, the extent of the spawning season. Collections were made at one-week intervals during the peak of spawning ac- tivity, and at two-week intervals at all other times. These sites were periodically sam- pled outside the spawning season until January 1992. All specimens were sexed, measured to the nearest mrn standard length (SL), and gonads were removed for sub- sequent analysis. Most of the specimens were also weighed to the nearest gram. A subset of fish were not weighed due to faulty equipment; weights were calculated for these specimens using a derived length (cm)-weight (g) relationship (weight= 0.0281(SL2.998); n = l 026).
The largevariability in visibility between sites and between sampling periods pre- cluded reliable density comparisons be- tween sites and sampling periods. Densi- ties of gray snapper changed over time on a magnitude that could not be explained by repeated sampling.
Gonad analysis
Gonads removed in the field were rnac- roscopically examined to determine sex, i f possible, and either placed on ice for transport to the laboratory, or placed in Davidson's solution for subsequent histo- logical work (n= 122). In the laboratory, gonads were weighed to the nearest 0.1 g and frozen.
Squashes of thawed gonad tissue were microscopically examined to determine sex, identify stages of oocyte development (Moe 1969), range of oocyte size per stage, and presence or absence of atresia. Quick hematoxylin and eosin stains of new squashes

were made (see Link (1 980)) when sex could not be determined from unstained squashes.
Histological preparations of gonads were made following the procedures of Moe ( 1 969) to determine gonadal development. Preserved tissue was sectioned at 10 m, mounted on slides, and stained with hematoxylin and eosin. Such preparations were required for identification of pre- or post-spawning individuals and early atritic stages. Gonads were evaluated histologically for the following:
1. Minimum size of sexual maturation and sexual differentiation;
2. Sexual pattern; 3. Description OF' stages of gonadal
maturation; and 4. Timing of annual spawning activity.
Spawning season and per/oditity
The extent and peaks of spawning ac- tivity. were determined by calculating a gonosomatic index (GSI) for all specimens, and plotting them against capture dates. Spawning dates were also back-calculated by counting daily increments of otoliths from juvenile gray snapper (n=68) collected from seagrass beds by otter trawl, benthic scrape and roller frame trawl. Collections were made in 1992 between late July and mid-Sep- tember. The specimens were measured to the nearest mm (SL) and either frozen or Fixed in 95% ethanol to ensure preserva- tion OF otoliths. Otoliths were subsequently removed and stored in 95% ethanol. Lapilli were ground and polished, then viewed under oil immersion at 1000x. Daily in- crement counts (following Brothers and McFarland 1981 ) were made using a video- enhanced microscope.
Daily growth increments of juvenile otoliths were validated by comparing our counts with the known age of juveniles reared from the egg by Richards and Saksena (1980).
A subset of 10 otoliths were read and counts confirmed by Dr. Ed Brothers.
Spa wnfng Behavior
Many dive trips were made during the summers of 199 1 and 1992 in an attempt to observe courtship and spawning. Dives were made between first light and dark. These dives were made primarily during the days before and after the full moon, since Starck (1 971 ) stated that gray snap- per spawn at this time.
Observations on spawning behavior of several other Western Atlantic snappers were opportunistically made by one of us (MLD). Although this inFormation is not quantita- tive, it is a valuable contribution to our Itnowledge of these little known species. Observations on L. analis, L. synagris, L. chrysurus, L. jocu, L , apodus, and I . cyanopterus were made on SCUBA, and additional information was gained through collecting (hook and line, spearfishing, fish trapping) and through interviewing fish- ers.
Results
Gonad analysis
Gonad developmental stages of gray snapper were described by histological examination of gonads. All oocyte and spermatocyte stages fol,low those described by Moe ( 1969).
Sexually undifferentiated - Gonad is small, compact and contains undifferentiated stroma. No oocytes. seminiferous tubules, spermatogenic tissue or lumen are visible. All go- nads have attached fat.

Immature female - Gonads are small and compact with a distinct lumen. The gonads contain much stroma and scattered small previtellogenic oocytes, or many small previtellogenic oocytes. The ovarian wall is gener- ally thin. All gonads have attached fat.
Immature male - Gonads are small and compact with no lumen. The go- nads contain developing seminiferous tubules and scattered early stages of spermatogenesis, interspersed with stroma. Mature inactive female - In addition to a lumen and previtellogenic oocytes, the ovaries contain a number of stage 3 oocytes (early vitellogenic) and/or indications of prior spawn- ing. Prior spawning is indicated by a thickened ovarian wall, degener- ating oocytes, or internal muscle bundles that contract the expanded ovary aRer spawning.
Mature inactive male - The testes predominantly consist of the early stages of spermatogenesis, which are particularly evident at the gonad margins. A few scattered cysts of later spermatogenic stages may be present.
Mature active female - Ovaries have a lumen and a mixture of previtellogenic oocytes and vitellogenic oocytes of stages 3,4 and 5 in varying proportions. The diameter of the gonad is relatively thin and stretched.
Mature active male -The testes consist predominantly of later stages of spermatogenesis (stage 2 spermatocytes, spermatocids and spermatozoa). The gonad is enlarged and may contain large areas of sperm.
If spawning has occurred, empty lobules may be visible and the tes- tes will appear to be disrupted in areas.
Gonads were generally undifferentiated in fish smaller than 140 mm SL. The small- est sexually differentiated male was 120 mm SL, and the smallest sexually differ- entiated female was 140 mm SL. The size of first maturity was 182 mm SL for males and 198 mm SL for females. Although small sample size precluded separate analyses of maturation by sex, we calculated a com- bined maturity curve for both sexes for size classes 100-300 mm SL (n=80) because both sexes mature at about the same sire. Ninety percent of gray snappers mature by the time they reach 200 mm SL and 100% are mature at 240 mm SL.
All gray snapper gonads have stored, Fat attached to the gonads during the non- reproductive season; during the spawn- ing season sexually mature fish lose this fat as it is mobilized for gametogenesis and spawning.
Sexual pattern
Gray snapper are clearly gonochorists, based on the similarity in size of sexual maturation of the sexes, the overlap be- tween the sexes in size-frequency distri- butions, and the absence of individuals undergoing sexual transition. Testes had a typical gonochore structure lacking the ovarian-type lumen characteristic of many hermaphroditic (protogynous) species. One adult male exhibited a few, very small previtellogenic oocytes within the testes, but this characteristic is found in many gonochoristic species (Sadovy and Shapiro 1987), and is assumed to be unrelated to sexual pattern in the absence of any other indications of sex change.

The sex ratio of gray snapper was slightly s k e w e d towards Females a t 1 .Z females: 1 ma le ( n = 8 8 9 , s i ze r ange 145-497 m m ) . A subse t of all fish grea ter than 350 m m also had a s e x ratio of 1.2: 1 .
Spa wnhg season
S p a w n i n g began in la te May a n d con- tinued into early September (Fig. 1 ; n=664). A few ripe ma le s w e r e found a s early a s late May, but m o s t males w e r e ripe by late June . Females w e r e neve r collected run- n ing r ipe, a l though microscopic examina- t ion of ovar ies revealed a f ew hydra ted eggs in several specimens during the months
of July a n d August . Clear peaks in GSI a p - p e a r to b e related t o t h e lunar cyc le for fish collected at t h e offshore sites. The first peak coincides with t h e n e w m o o n in mid- June , a s e c o n d peak occurs o n t h e follow- ing full m o o n late in June , a n d a third peak with t h e n e w m o o n in July. Each of t h e s e t h ree peaks is successively larger than t h e previous one . The fourth a n d largest peak occurs o n t h e last quar ter m o o n in early August . The m e a n GSI of inshore spec i - mens are lower than those of ofFshore speci- m e n s collected a t t h e s a m e t i m e a n d d o no t s h o w a n y p ronounced peaks until t h e last quarter m o o n in August , a l though GSI gradually increases from J u n e through Au- gus t .
e'o 0 0 l 0 -a 0 Lunar phase
Flg. 1. Mean gonosomatlc Index (GSI) of Lut/anus grlseus in inshore and offshore waters of Florida. [Indlce gonadosomaHco medfo (GSJ deLutJanus grlseus en aguas fntedores y aguas
I marinas de Florfda.]
Flg. 2. Back-calculated spawning dates of
Lutjanus grlseus relative to date and lunar phases. [Fechas de desove retrocalcufadas & LutJanus gtlseus dsocL& a fe& y fases lunares.]
Lunar ohase

Spawning dates hclc-calculated by reading daily increments of juvenile gray snapper otoliths (Fig. 2) corroborated spawning periods delimited by GSls. Spawning takes place in June, July and August, with peaks of spawning around the new moon and a decline in spawning activity around the full moon ofeach month. The relatively small number of samples from spawnings in July and August is due to decreased sampling effort. Since sampling was discontinued in mid-September, representative specimens from the new moon spawning in August were not obtained.
Spa wnhg migra fjon
During the course of this study, move- ment of adult gray snapper from inshore to ohkhore sites was observed. Initially, large
fish were especially numerous at IS2 while very few gray snappers were present at 051. As the spawning season progressed large specimens disappeared from the inshore sites and began to appear at the offshore sites. Movement of gray snappers from inshore areas to offshore areas became clear as the time required to attain our weekly samples increased at the inshore sites and decreased at the offshore sites. Fig. 3 plots the mean standard length for each sam- pling period at inshore and offshore sites (two inshore sites were combined and two offshore sites were combined; n=664). Prior to the onset of the spawning season, the mean SL of inshore samples was actually higher than that of offshore samples; as the spawning season progressed the mean stand- ard length of the samples increased at off- shore sites. At the end of the spawning season, the means are again similar. This
32 -
30 - - E 28- 0 .- ffshore speclrnens
1 26- (n - Inshore s p e c i m s r 24- t
CT & 22- -I
20-
18 -
l6 - 14 May 05 Jun 19 Jun 05 Jul 18 Jul Aug 17 Aug 01 Sep 20 Oct
.0.0.0.0. Lunar phase
Fig. 3. Average standard length of Lut/lnusgrlseuscaptured In Inshore and offshore waters In Florlda relative to date and lunar phases. [Long/tud estiindarpromedlo deLutJanus griseus captufado en aguas interiores y aguas marinas en Florida, asoclarlil a fechas y fases 1unares.I

supports our observation that many adult gray snappers migrate to offshore reefs to spawn.
Despite repeated diving, actual spawning behavior was never observed.
Reproductive strategies of other western Atlantic snappers
As discussed in the methods section, observations of spawning strategies for several Western Atlantic lutjanids were made over the last several years (by MLD). Each species for which we have information to add is reviewed and updated relevant to its specific reproductive biology.
Mutton Snapper (Lutjanus analis)
Adult L. analls are found in a variety of habitats, from shallow grass beds and patch reek to deep barrier reek. They are a solitary fish, rarely found in groups or schools outside the spawning season. However, during the spawning season, they form dramatic spawning aggregations that may persist for several weeks. They exhibit high site-fi- delity, spawning at exactly the same lo- cation and on the same days of the lunar calendar year after year. Aggregations may form and dissipate at a particular site dur- ing two consecutive months oFthe late spring. Three such aggregations were observed: one at Riley's Hump in the Dry Tortugas near the time of the full moon in May and June: one off West Caicos, Turks and Caicos, during the full moons of April and May; and the third off English Cay, Belize, be- tween the full and last quarter moons of April and May. All three sites are located on the edge of a steep drop-off.
Many mutton snappers were collected by spearfishing and a single female with expressable hydrated eggs was collected at dusk near Riley's Hump, suggesting that
spawning occurs near this time. Several evening dives made at West Caicos and the Dry Tortugas to observe spawning were unsuccessful. Thousands of snappers were observed milling around the bottom and in the water column but none spawned. It may be that mutton snapper spawn after dark.
Several fish were collected by hook-and- line at West Caicos and brought back to the laboratory where they were induced to spawn via hormone injection, confirming that the fish observed in the aggregation were in spawning condition.
Dog Snapper (Lutjanus jocu)
Dog snappers are solitary reef fish that appear to occupy a home range; individual specimens of dog snappers inhabited the same ledge or crevice of a reef over extended periods of time. Based on a single observation of a spawning aggregation off English Cay, Belize, on 19 July 1992 (between full and last quarter moon), it appears that dog snappers spawn in large aggregations. The site consisted of a spur of reef that began in 5 m of water and sloped down to over 35 m.
During two dives at this site in the early afternoon, several large groups of fish, to- talling over a thousand individuals, were observed schooling on the bottom and occasionally forming tight balls that rose up into the water column approaching the surface. Ten fish were collected by spear, 6 males and 4 Females. All the males were running ripe and the females had large, well developed ovaries but no observable hydrated eggs. The lack of a laboratory and a means of refrigeration precluded a more detailed study of the ovaries. Experience in collecting ovaries and inducing spawn- ing in other species of snapper allow the conclusion that females present in this ag- gregation were ready to spawn.

Cubera Snapper (Lutjanus cyanopterus)
This is the largest species of Western Atlantic snapper, attaining weights in ex- cess of 57 kg (Robins et al. 1986). Despite its size, it is perhaps the least studied species of this region. It is one of the few snap- pers that enters water that is nearly fresh (e.g., the intra-coastal waterway on the east coast of Costa Rica). Cubera snappers are also found on both shallow and deep reefs, and in mangroves.
According to anecdotal accounts by fishers and divers, this species also spawns in aggregations. Three aggregation sites have been found by fishers off the coast of south Florida. Two of these sites (Key West and Dry Tortugas) are wrecks located in 67-85 m of water. The third is a deep reef in the Miami area. D. DeMaria (pers. comm.) has observed and collected Cubera snapper from these wrecks during spawning aggregations. The aggregations of Cubera snapper in Florida have far fewer fish, less than 100 to a few hundred, than aggregations of other snapper species reported here.
Similar aggregations occur in Belize off Buttonwood Cay and Cay Boltel (Cabral, pers. comm.). The Belizean sites are in much shallower water (1 0-30 m) than the Florida sites and may contain greater numbers of individuals. Both the Florida and Belizean aggregations occur during the months of June and July (full moon to last quarter).
Extensive year-round collecting of this species shows a protracted spawning season lasting from March through September in south Florida. Other investigators have found this species to have a protracted, if not year-round spawning season in other parts of the Caribbean (Piedra 1965: Munro et al. 1973; Thompson and Munro 1974/ 1983; Erdman 1976; Soletchnik et al. 1989).
Yellowtail snappers do not exhibit any migration or aggregation related to spawning.
Lane Snapper (Lutjanus synagris)
This is a small, reef-dwelling species that occurs in tight schools close to the bottom.
Extensive collecting of this species at all times of the year reveals a similar spawning pattern to that of the L. ch/ysurussnapper. In south Florida, L. synagrris have been found in spawning condition From March through August. Other investigators have found this species to have a protracted and/or continuous spawning season (Rodriguez- Pino 1962; Erdman 1976: Reshetnikov and Claro 1976; Erhardt 1977).
Lane snappers show an interesting pat- tern of distribution in that they can k common at a particular location year after year, but can be rare at other locations in the vicin- ity. This suggests that individual schools of lane snappers have strict home ranges and do not migrate or aggregate for the purpose of spawning.
Yellowtail Snapper (Lutjanus ocyurus)
Discussion This is a small planktophagous species
of Lutjanus (=Ocyurus, see Dorneier and Clarke 1992), abundant throughout the tropi- cal western Atlantic. Although juvenile yellowtail snapper can be found over sandy bottom inshore, adults occur primarily over coral reefs. This species can be found feeding well off the bottom in large schools, or seen swimming over the reef as a solitary fish.
Our study of the gray snapper was con- sistent with previous work for first size of maturity (Crolter 1962) and time of spawning season (Jordan and Evermann 1922: Starck and Schroeder 1971 ). Our finding that they spawn around the new moon is contrary to the findings of Starclc and Schroeder (1 97 1 ) who reported gray snapper spawning on

the full moon. Their conclusions were based upon the presence of spent ovaries in speci- mens collected shortly after a full moon in early September. Our study suggests that these fish had spawned a few weeks prior to their collection and were finished spawning for the year.
Many dives were made at all times OF the daylight hours during the spawning season to observe spawning. Although dives were concentrated around the full moon due to Starck's ( 1 97 1 ) report of spawning activity at this time, some diving was ac- complished at all phases of the lunar cal- endar. Our failure to witness spawning may be a result of our concentrated effort around the full moon, or i t may suggest that gray snappers spawn at night. The lack of speci- mens with hydrated eggs supports the suggestion that they spawn at night, since all specimens were collected during the day.
Grimes ( 1 987) concluded that snappers exhibit two basic spawning strategies that are directly related to whether the popu- lation occurs over a continental or insular habitat. Continental populations exhibit extended summer spawning seasons, while insular species reproduce year-round with spring and Fall peaks (Grimes 1987). This study found a new snapper spawning strat- egy, the spawning aggregation, that oc- curs over both insular and continental habitats. It is true that habitat differences can cause variation of occurrence and length of spawn- ing season between populations of the same species, but we suggest that spawning strategies are species specific rather than habitat dependent.
Two spawning strategies seem evident among Western Atlantic lutjanids:
1. Schooling species that have pro- tracted spawning seasons and do not migrate or aggregate for the pur- poses of spawning (e.g., L. chysurus (Piedra 1965; Munro et al. 1973; Thompson and Munro 19741 1983:
Erdman 1976; Soletchnik et al. 1989), L. synagris (Rodriguez-Pino 1962; Erdman 1976; Reshetnikov and Claro 1976; Erhardt 1977), L. apodus (Munro et al. 1973; Thompson and Munro 197411 983).
2. Solitary species that migrate and aggregate for the purpose of spawning over a very short time period (i.e., a few days or weeks) (e.g., L. analis, L. jocu, L. cyanopkrus).
Mahogany snapper ( L . mahogan/) may be found to be a Strategy 1 spawner due to its similarity in behavior and habitat uti- lization to L. synagris.
Spawning aggregations have been well documented for many species of grouper (Serranidae) (see Sadovy et al., in press), but have not been previously reported for lutjanids. The nature of snapper spawning aggregations is extremely similar to that of groupers. In fact, many sites that are used by groupers for spawning are used by snappers but at difFerent times of the year. For example, the Belize site used by mutton snapper is also used by Nassau grouper (Ephephelus striatus), yellowfin grouper (M. venosum), and Jewfish (E. itajara) (Cabral, pers. comm.). As with groupers, snappers begin to arrive at the spawning site approximately one week prior to the peak spawning activity (deduced from peak density of fish at site) and linger at the site after spawning For another week. Also similar to groupers, an aggregation may occur during two consecutive months of the year, although one month usually has a greater number of fish participating in the aggregation.
In both the Lutjanidae and the Serranidae it is the larger species that aggregate to spawn. These large predators require more spatial and nutritional resources to survive than smaller fish. Increased space between individuals creates difficulty in finding mates during the spawning season. Formation of annual spawning aggregations at permanent

sites provides an efficient mechanism for overcoming this problem. The brevity of the spawning may limit periods of intense cospecific competition for food.
Smaller species of lutjanids require fewer resources per individual and can form schools year-round. Membership in a school en- hances reproductive success. Schooling species are limited in the duration of the spawning season only by the availability of food and the physiological constraints of the eggs and larvae.
The gray snapper does not fit well into either of the described spawning strate- gies. This species has adapted to a vari- ety of habitats, including inshore areas that can vary widely in temperature and salin- ity. It is possible that the adult stage has evolved to tolerate a wide range of physical conditions, but the larval stage remains intolerant. The spawning migration of this species from inshore to offshore would thereby increase the survival of the offspring. This scenario would make the L. griseus snapper a modified Strategy 1 spawner. Another possibility is that the intermedi- ate size of this species has allowed an in- termediate spawning strategy. The L. apodus is a closely related species that needs fur- ther study: it too may exhibit an interme- diate spawning strategy.
Spawning behavior has only been re- ported for two species of snappers world- wide: L. synagriswhich were observed to spawn at dusk in Florida (Wicltlund 1969) and L. kasmirawhich were reported to spawn at night in captivity (Suzulci and Hiolti 1979). Both species were group spawners. Although L. ch/ysurus (Soletchnilc et al. 1989) and L. campeehanus (Arnold et al. 1 978) have been spawned in captivity without the aid of hormone injection, the time of spawn- ing and spawning behavior were not re- ported. Davis and West (1 993) report that L, vittus (Australia) spawns during the early afternoon. This conclusion was based on the presence of hydrated eggs between 1 I00 and 1500 hours, and a peak in the
presence of early post-ovulatory Follicles by 1700 hours. Lu@anus vittusis probably an unusual example of daytime spawning among a group of primarily dusk or nocturnal spawners.
Both snapper species observed spawn- ing are group- rather than pair-spawners (Wiclclund 1969; Suzulti and Hioki 1979). The behavior of L. jocuwithin a spawning aggregation reported here may also indi- cate group spawning. Some species of ag- gregating groupers are pair spawners (i.e., Mycteroperm tigris: Sadovy et al., in press) while at least one species is a group spawner ( E . sstriatus: Colin 1992). It is possible that future studies will find that the lutjanids also have representative group and pair spawning species. The presence of group spawning among lutjanids may also play a role in the formation of spawning aggregations. It is not known whether or not group spawning species can success- fully reproduce when populations are se- verely depleted.
Spawning aggregations of both lutjanids and serranids are often fished out of exist- ence upon discovery by fishers. Although the United States is taking measures to protect the mutton snapper at Riley's Hump, Florida, the annual aggregation is already a tiny fraction of what it once was. Proactive rather than reactive management is called for where aggregation sites exist. As we have seen, specific aggregation sites are often used by more than one species of fish; protect- ing an aggregation site would serve to protect multiple species in many cases.
Acknowledgements
Captain Don DeMaria and Carl Cabral provided valuable information regarding the locations and habits of snappers that made this study possible. Chris Ninnis and the Fisheries Department of the Turks and Caicos provided their assistance and resources while studying mutton snapper at West Caicos. Grant money from the Florida

Department of Natural Resources and the Caribbean Marine Research Center supported various aspects of this research. Scott Harris provided valuable technical support regard- ing the manipulation of the large database.
References
Arnold, C.R., J.M. Walteman, T.D. Williams and G.D. Treece. 1978. Spawning of red snapper (Lutjanus campechanus) in captivity. Aquaculture 15:301-302.
Barans, C.A. and H.W. Powles. 1977. South Carolina MARMAP program: present and future, p. 6- 12. In D.M. Cupka, P.J. Eldridge and G.R. Huntsman (eds.) Proceedings of Workshop on the Snapper/Grouper Re- sources of the South Atlantic Bight. South Carolina Marine Resources Center Tech. Rep. 27.
Bortone. S.A. and J.L. Williams. 1986. Gray, lane, mutton, and yellowtail snappers. Species profiles: life histories and envi- ronmental requirements of coastal fishes and invertebrates (South Florida). Fish Wildl. Serv. Biol. Rep. 82(1 1.52) TR EL-82-4: l - 18.
Brothers, E.B. and W.N. McFarland. 1981, Cor- relations between otolith microstructure, growth, and life history transitions in newly recruited French grunts (Haemdon flavo/lneatum (Desrnarest), Haemulidae). Rapp. P.-v. Reun. ClEMl78:369-374.
Burton, M. 1992. The relationship between spawning season and landings of selected reef fishes. Beaufort Laboratoy, Southeast Fisheries Science Center, National Marine Fisheries Service, National Oceanic and Atmospheric Administration.
Clarke, M.E.. M.L. Domeier and W.A. Laroche. Development of the larvae and juveniles of mutton snapper (Lutjanus analis), lane snapper (L. synagris)and yellowtail snapper (L. ocyurus). Bull. Mar. Sci. (In press).
Colin, P.L. 1992. Reproduction of the Nassau grouper, Epinephelus striatus (Pisces: Serranidae) and its relationship to envi- ronmental conditions. Env. Biol. Fish. 34:357-377.
Croker, R.A. 1962. Growth and food ofthe gray snapper, Lutjanus griseus, in Everglades
National Park. Trans. Am. Fish. Soc. 91 :379- 383.
Davis. T.L.O. and G.]. West. 1993. Maturation, reproductive seasonality, fecundity, and spawning frequency in 1urj;mus vittus(Quoy and Gaimard) from the North West Shelf of Australia. Fish. Bull. 9 1 :224-236.
Domeier. M.L. and M.E. Clarke. 1992. A labo- ratory produced hybrid between Lutjanus synagris and Ocyurus chlysurus and a prob- able hybrid between L . griseus and 0. chrysurus(Perciformes: Lutjanidae). t3ulI. Mar. Sci. 50(3):501-507.
Erdman. D.S. 1976. Spawning patterns of fishes From the northeastern Caribbean. Puerto Rico Dept. Agric., Commer. Fish. Lab., Agric. Fish. Contrib. 8(2): 1-36.
Erhardt, H. 1977. Beitrage zur Biologie von Lu&?nussynagris (Linnaeus 1758) an der Kolumbianischen Atlantiltltuste. Zool. Beitr. 23(2):235-265.
Grimes, C.B. 1987. Reproductive biology of the Lutjanidae: a review, p. 239-294. In J.J. Polovina and S. Ralston (eds). Tropical snappers and groupers: biology and fish- eries management. Westview Press, Boulder.
Jordan, D.S. and W. Evermann. 1923. Ameri- can food and game Fishes. Doubleday, Page and Co.. New Jersey.
Link, G.W., Jr. 1980. Age, growth, reproduc- tion, feeding, and ecological observations on the three species of Centropristis (Pisces: Serranidae) in North Carolina waters. The University of North Carolina, Chapel Hill. 277 p. Ph.D. Dissertation.
Minton, R.V., J.P. Hawlte and W.M. Tatum. 1983. Hormone induced spawning O F red snap- per, Luqajanus campechanus. Aquaculture 30:363-368.
Moe, M. A,, Jr . 1969. Biology ofthe red grouper (Epinephehs rnorio Valenciennes) from the eastern Gulf of Mexico. Prof. Pap. Ser., Fla. Mar. Lab. 10, 95 p.
Munro. J .L. , V.C. Caut, R. Thompson and P.H. Reeson. 1973. The spawning seasons of Caribbean reef fishes. ) . Fish Biol. 5:69- 84.
Piedra, 6. 1965. Materials on the biology of the yellowtail snapper (Ocyurus chrysurus Bloch), p. 251 -269. In A.S. Bogdanov (ed.) Soviet-Cuban fishery research. All-Union Sci. Res. Inst. Mar. Fish. Oceanogr., Fish. Res. Cent. Nat. Pisc. Inst. Rep. Cuba.

Reshetnikov, Y.S. and RM. Claro. 1976. Cycles of biological processes in tropical fishes with reference to Lutjanus synagris. J. Ichthyol. 16:711-723.
Richards, W.J. and V.P. Saksena. 1980. Descrip- tion of larvae and early juvenlles of labo- ratory-reared gray snapper, Lu~anusgtiseus (Linnaeus) (Pisces, Lutjanidae). Bull. Mar. Sci. 30:5 15-521.
Robins, C.R., G.C. Ray and j, Douglas. 1986. A Held guide to Atlantic Coast fishes of North America. Houghton Mifflin Co., Boston, Massachusettes. 354 p.
Rodriquez-Pino, 2. 1962. Estudios estadisticos y biologicos sobre la biajaiba (Lutjanus synagris). Cent. Invest. Pesq., Notas Sobre Invest. 4.91 p.
Sadovy, Y. and D.Y. Shapiro. 1987. Criteria for the diagnosis of hermaphroditism in fishes. Copeia 1 : 136- 156.
Sadovy, Y., P.L. Colin and M.L. Dorneier. Ag- gregation and spawning in the tiger grouper, Mycteroperca tigris (Plsces: Serranidae) . Copeia (1994 (2)). (In press).
Soletchnik, P., M. Suquet, E. Thouard and J.P. Mesdouze. 1989. Spawning of yellowtail snapper (Ocyurus ch/ysurus Bloch 1791 ) in captivity. Aquaculture 77:287-289.
Springer, V.G. and K.D. Woodburn. 1960. An ecological study of the fishes OF Tampa Bay area. Fla. Dept. Nat. Resour. Prof. Pap. Ser. 1:l-104.
Starck, W.A. 197 1. Biology of the gray snap- per, Luganusgdseus (Linnaeus), in the Florida Keys. In W.A. Starck and R.E. Shroeder (eds.) Investigations on the gray snapper, Lutjanusgriseus. Studies in Tropical Ocea- nography 10, 224 p.
Starck, W.A., I I and R.E. Schroeder. 1971. Bi- ology of the gray snapper, Lu~anusgr/seus. Studies in tropical oceanography ( 10). University of Miami Press, Coral Gables, Florida. 224 p.
Suzulti, K. and S. Hioki. 1979. Spawning behavior, eggs and larvae ofthe lutjanid fish, Lufjanus kasmira, in an aquarium. lap. j. Ichthyol. 26:161-166.
'~hornpson, R. and 1.L. Munro. 1974. The biol- ogy, ecology, exploitation and rnanage- rnent OF Caribbean reeF fishes. Part V.d. The biology, ecology and bionornics of Caribbean reeF Fishes: Lutjanidae (Snap- pers). Res. Rept. Zool. Dept. Univ. West lndies 3(V.d):69 p. reprinted as Thompson, R and J.L. Munro. 1983. The biology, ecol- ogy, and bionomics of snappers, Lutjanidae, p. 94-109. In J.L. Munro (ed.) Caribbean coral reef fishery resources. ICLARM Stud. Rev. 7, 276 p.
Wlcklund, R. 1969. Observations on spawning of lane snapper. Underwater Nat. 6(2):40.
Population Dynamics and Stock Assessment of Red Grouper (Ephephehs modo) Fishery
on Campeche Bank, Mexicoa
F. ARREGU~N-SANCHEZ~ Programa de Ecologia, Pesquerias
y Oceanograh del Golfo de Mexico U. A* C+ Ap. Postal 520, Campeche 24030
Campeche, Mexico
M. CONTRERAS V. MORENO R. BURGOS
Centro Regional cle Investigacidn Pesquera de Yucalpeten Institute Nacional de la Pesca
Ap. Postal 73, Progreso, Yucatiin, Mexico
R. VALDES Centro de lnvestigaciones Pesqueras de Cuba
5a A ve. y 242, EdiAcio 2 Barloven to Playa C Habana, Cuba
ARREGU~N-SANCHEZ. F.. M. CONTRERAS. V. MORENO, R. BURGOS and R. VALDES. 1996. Population dynamics and stock assessment of red grouper (Epinephelus morio) fishery on Campeche Bank. Mexico [DinAmica poblacional y evaluaci6n de la pesqueria r iel mero Arnericano (Epinephelus morio) de1Banco de Campeche, Mexico], p. 202-217. In F. Arreguin-SBnchez, J.L. Munro, M.C. Balgos and D. Pauly (eds.) Biology, Fisheries and culture of tropical groupers and snappers. ICLARM Conf. Proc. 48, 449 p.
Abstract
An analysis of information is presented on the current status of the population dynamics and stock assessment of the red grouper (Epinephelus morlo) fishery from Campeche Bank, Gulf of Mexico. Three fleets participate in the fishery, two From Mexico, and a third one from Cuba. Because of their charac- teristics, the operations of these fleets constitute a sequentlal Fishery, in which the small-scale fleet mainly exploits juveniles, the mid-sized Mexican vessels target both juveniles and adults: and the technically advanced Cuban fleet mainly captures adult fish. Catch-per-unit-effort indicates a declining population abundance in recent years. Although some authors suggest that overexploitation is the cause, the population decline appears initially to have been related to an important fall in recruitment on the 1980 year class, which was probably combined with changes in suitable habitat which occurred some years later. Results of an age-based VPA analysis indicate a decrease of the population size by 30% after 1980. However. despite this estimate, more detailed studies based on catchability estimates and catch structured data show that population size remained reasonably stable over a period of 17 years. Catchability studies suggest reproductive behavior (maturation and spatial distribution) to be the most important factor affecting yields and fishing strategies.
" EPOMEX Contribution No. 239.
"resent address: Centro lnterdisciplinario de Ciencias Marinas del IPN, Playa El Conchalito, s/n: Apartado Postal 592, La Paz, 23000, Baja California Sur, Mexico.

Resumen
N presente documento analiza el estado actual del conocimiento de la dindmica poblacional y de h evaluacidn del recurso mero (Epinephelus morio) del Banco de Carnpeche, M6xico. En la pesqueria participan tres Iotas, dos de Mkxjco y una de Cuba. Debldo a sus caracterfsticas, la operation de estas flotas constituye una pesqueria secuencial, donde la flota artesanal explota principalmente juveniles, la ffota mediana de Mbxico captura juveniles y adultos, y la flota tecnificada de Cuba es orientada hacia 10s adultos. Los datos de captura por unidad de esfuerzo indican gue la abulldancia del recurso ha ciecrecido en 10s Ijltimos afios. Aun cuando algunos autores han sugerido una tendencia a la sobrepesca, 10s decrementos de la poblacidn parecen estar asociados a una importante Falla del reclutamiento en la clase anual de 1980, lo cual parece estar inicialmente asociado con carnbios en la calidad del habitat ocurrido algunos affos mas adelante. Los resultados obtenidos utilizando VPA con edades inciican un decrement0 de 30% del tamaiio de la poblacidn despu&s dde 1980. Sin embargo, a pesar de estas estimaciones, estudios detallados sobre la estructura de /as capturas indican que la poblacion se ha rnanteniclo rasonablemente estable por un period0 de 17 afios. En relacidn con el 6xito de pesca, 10s estudios de capturabilidad sugieren que el cornportamiento reproductive (maduracion y distribucidn espacial) cs un factor de suma importanda que afecta /os rendimientos y /as cstrategias de pesca.
Introduction
The fishery
Red grouper (Epinephehs morio) is a demersal fish constituting the most important fishery resource on the continental shelf of Yucatan, and the second in the Gulf of Mexico, after shrimp. Exploitation is carried out by three fleets (Arreguin-Sanchez et al. 1987a): an artisanal fleet from Mexico and a mid- sized fleet and a fleet of technically-ad- vanced vessels from Cuba. These fleets exhibit important differences in their technical char- acteristics as well as in their impact on the population. This fishery captures a number of demersal species of which the red grouper amounts to 89% on average from 1980 to 1985. The remaining 1 1% is composed of about 46 species (Fuentes 1991 ).
The artisanal fleet consists of about 900 small boats about 10 m long, each carrying two "alijos" and 3-4 fishers (Saenz et al. 1987). I t operates to a depth of 22 m (1 2 fathoms) with long-lines of 50 to 100 hooks, and hand-lines, fishing mostly juveniles and young adults. Catch is landed on the beach and is used mostly for local consumption and also For national and foreign markets. Usually the Fishing operation lasts one or two days. This fleet takes 23% of the whole catch.
The mid-sized Mexican fleet is composed of 222 boats (Burgos 1987), 14-22 m long. Each vessel acts as a mother boat with 9- 12 fishers and 7-1 0 small boats, without engines which are locally named "alijos". Each "alijo" fishes with a long-line of 25 to 50 hooks, and two or more hand-lines. The fleet operates mainly between 9 and 109 m (5-60 fathoms) most of the time on 55 rn (30 fathoms) or less. The fishing trips last about I5 days (Arceo et al. 1987). Catch is landed as whole fresh fish or fillets, and part of the production is exported. This fleet takes about 52% of the total catch.
The Cuban fleet consists of about 40 mother boats each 22 m long and carrying 18 crew members. Each vessel carries six 5-m boats with an in-board engine. They operate in 27- 1 10 m ( 15-60 fathoms) with long-lines of 350 hooks (which are checked six or seven times per day). Trips last about 20 to 30 days and the catches, composed mostly of adult fishes, are landed in Havana, Cuba. This fleet takes around 25% of the total catch.
Resource access by the Mexican fleets is unrestricted, while Cuba has a catch quota which was gradually reduced from 10 000 t in 1975 to 3 900 t of demersal fish in 1987. The highest yield was recorded in 1972 with nearly 20 000 t but in recent years it declined to around 1 1 000 t. Catch trends follow similar annual patterns for both countries.

Red grouper ranges from Katama Bay, Massachusetts, USA, to Rio de Janeiro, Brazil, including Bermuda, and the West Indies, and found in high densities in Florida and the Gulf of Mexico. Adult fishes are gre- garious with a high tendency toward territorialism, and live in caves and on rocky and hard bottoms, to about 275 m (150 fathoms) (Bijhlke and Chaplin 19%; Smith 197 1 ; Shapiro 1987). Young fishes live close to the coast and are associated with seagrass beds and reek. Spawning occurs in aggregations in deepwaters, and in the Gulf of Mexico, usually from December to May, with a peak in januay- February in the Campeche Bank (Mexicano- Cintora 1990); and in March-April in Florida waters (Moe 1969). Fecundity has been esti- mated to range horn 3.1 O5 to over 5- 106 eggs, with a mean value around 1.5.106 eggs. Gonad development was described by Moe (1 969) for Florida waters, and by Mexicano-Clntora ( 1 990) for Carnpeche Bank (see Arreguin- Sanchez and Valero; Brul.5 and DPniel; Colin et al., this vol.). This species is protogynous hermaphrodite, reaching female sexual maturity at about 4 years, while the tran- sition to males occurs at 7 to 10 years.
Spatial distribution in the Campeche Bank
Ked grouper inhabits the broad conti- nental shelf of Yucatan, also known as Carnpeche Bank ( I 00 000 krn2). Bottom characteristics and type of sediments are typical of reef environments. Some sea- sonal upwelling (Ruiz and Merino 1989) takes place during late spring and early summer affecting life history and behavior. Oleachea (1 975) shows general patterns of abundance and distribution of several demersal fishes on the Carnpeche Bank; For red grouper there is some evidence of spatial changes in the abundance. Burgos ( 1 987)
established a sampling system for commercial catches which producesvaluable data on yields, catch composition (by species), geographic position and other relevant data. This information is continuously reported and displayed on trimonthly charts. Currently, charts are available for seven years showing the spatial distribution of catch-per-unit-effort (Fig. 1).
Shapiro (1987) compiled information concerning the reproductive behavior of serranid fishes, particularly of the genus Epinepbelus. The usual behavior of this species is a reproductive aggregation during a specific season of the year. As for E. morio, there is no direct evidence of population movements, but its reproductive behavior and seasonal spatial distribution of biomass suggest the existence of seasonal popula- tion displacements.
Materials and Methods
This document represents a review of the state of knowledge of the population dynamics and stock assessment for the red grouper in the Campeche Bank, Mexico. Most of this literature origirrates from Mexican and Cuban investigations on this shared fish resource, and it is complemented by other studies on the environmental factors affecting fish populations in this region.
Results
Population r/ynam/cs
Age and Growth
Growth largely conforms to the von Bertalanffy (1938) equation, the age be- ing recorded mostly on hard parts (mainly otoliths and urohyal bones). Ageing tech- niques vary from simple counting of rings to backcalculations. Works on length composition data are scarce (see Posada and

Flg.1. Spatlal distribution of the relative abundance (tons-per-trlp) of the red grouper (Eplnephelus morio), on the continental shelf of Yucatan, Mexico. durlng the period of January to March of 1986 (From Burgos 1987). [Dlstrihucldn espcln/ tie la abundanch relath (tons-por-viaje) delmero amerlcano (Epinephelus morio) de fa plataforma cont/nental de Yucatan, M&/co, durante elperiodo de Enero a Marxo de 1986 (tornado de Burgos 1987).]
Appeldoorn, this vol.). Table 1 summarizes information on age and growth for E. morio.
Rodriguez ( 1986) analyzed both otoliths and mesopterigoids of E. morio, and found that an annulus is laid down in the otolith For every two rings deposited in the mesopterigoids. This relationship has been reported for other species inhabiting the same ecosystem such as the red snapper (Luqanus carnpechanus) Cronz;ilez (1 983); and by Orciaz ( 1 W3) for rnojarra (Ca/amus noCjOSus). For red grouper, the averqetime period between two successive otolith rings is oneyear. However, an imprtant point made by Moe ( 1 969), Clam ( 1985), Rdriguez ( 19%) and Arreguin-Sanchez ( I 989) is that the time between rings may vary ktween
cohorts (age groups), which can lead to errors in the estimation of the age structure.
Most studies have assumed a normal distribution of age groups with similar variances and a stable growth pattern. However, the possibility of serious errors in mortality estimations has been re.ported (ArreguCn-Sanchez et al. 1987b), particu- larly because the variance of size increases with age (Zetina 1990; Cabrera 1991; Contreras et dl. 1994). A detailed description of the statistical distribution of age groups from hcI~calculated data providecl by Wriguez (1 986) shows normal distributions for age groups, but changingvariances between them suggesting that, while growth patterns are

Table 1. Parameters of the von Bertalanffy growth equatlon estlrnated for the red grouper (Eplnephelus morlo) from the Campeche Bank, Mexlco, by several authors and methods. 1 Parametros de Ia ecuaclon de creclmlento de von Bertalanffy estlmados para elmero amerlcamo (EpIneplieIus morW deI Banco de Campeche, por varlos aufores y mktodos.]
Otolith (ml) Urohyal bones Otolith (rnl) Otolith (ml) Urohyal bones (bc) Otolith (ml) Otolith (bc) Mesopterigoids (bc) ELEFAN I Otolith (rnl) Oto l i th S LCA S LCA S L C A SLCA S L C A SLCA SLCA S LCA SLCA SLCA SLCA SLCA SLCA SLCA SLCA SLCA
~ e t h o d * L_ (TL. crn) K (yea<1) Q ' ~ Reference
79.2 0.179 3.05 Moe (1969) GonzAles et al. (1 974) Muhlia (1976) Valdis and Padr6n (1 980) ValdCs and Padr6n (1 980) Doi et al. (1981) Rodriguez (1 986) Rodrlguez (1 986) Arregufn-Sanchez et al. (1 98713) Salazar ( 1 988) Guzmin ( 1986) Arreguin-Sdnchez ( 1992) -do- -do- -do- -do- -do- -do- -do- -do- -do- -do- -do- -do- -do- -do- -do-
> rnl = using mean !ength of age-class; bc = using bacltcalculated lengths: SLCA = Shepherd's Length Composition Analysis (Shepherd 1987).
b$' = log K +-210g L- (Pauly and Munro 1984). I 0
stable, the variability associated with each cohort has an important influence for the identification of population age structure. Moe ( 1 969), Arreguin-Sdnchez et al. ( 1990) and Mexicano-Cintora (1 990) reported variation in spawning season of 4-6 months, another important source of variation.
These difficulties in clearly defining the age structure of the E. morio stock are due to its being a long-lived species with lon- gevity of 25-30 years (Manooch 1987) and a relatively slow growth rate. These char- acteristics, combined with a long spawn- ing season, produce length distributions with great overlap between age groups, and usually showing few modes (Type 4 according to Shepherd et al. 1987). This.
explains part of the high variation in growth estimates in Table 1.
Length-based growth studies were un- dertaken by Arreguin-Sanchez ( 1992), using several methods, on a comparative basis, including Shepherd's Length Composition Analysis, SLCA (Shepherd 198713); Projection Matrix method, PROJMAT (Shepherd 1987a; Rosenberg and Beddington 1987: Basson et al. 1988) and the method proposed by MacDonald and Pitcher ( 1979) for analysis of distribution mixtures, MIX, to obtain age- groups from size-frequency data. Of these methods, only the SLCA offered accept- able results (Table 1 ) ; it can thus be expected that the recent improvements pro- posed by Pauly and Arreguin-Sanchez (1 995)

should make it a method of choice for study- ing the growth of E. rnorio.
Mortality
Few studies on mortality and exploita- tion rates have been made, most of them assuming constant patterns with a g e and time, and providing general estimations without a description of their variance or uncertainty. Table 2 shows values obtained by several authors. Moreover, most mor- tality estimates are based o n the catches of t h e mid-sized Mexican fleet, while only o n e considers all Fleets.
Contreras e t al. (1 994) used virtual popu- lation analysis and found similar exploita- tion patterns for all t h e cohorts identifled within t h e period 1973 t o 1987 , but dif- ferent values of fishing mortality. Accord- ing to them, fishing intensity, cohort strength and reproductive behavior have important influences on these patterns.
Arreguln-Sanchez (1 992) developed an integrated model of catchability through which fishing mortality can be estimated. For juvenile fish, catchability and its vari- ance can be considered to be constants, up
t o age of maturity at four years, but thereaf- ter they increase with age (Fig. 2). This means that fishing mortality is proportional to fishing effort only for immature Ftshes. As indicated by this author, the importance of the catchability pattern is that young fish are more accessible t o fishing because they remain close t o the coast, while adult fish catchability increases, because the spawning stock is highly vul- nerable t o fishing.
Recruitment
There are s o m e isolated reports of re- cruitment. Arreguln-Sanchez (1 987) esti- mated a recruitment index (r) with the form: r=ln{(R/A)+l], with R=number of recruits and A=nurnber of adults, for incorporation within the Schaefer (1 9 5 4 , 1957) model according to Walters (1 978). In general terms, he found that recruitment fluctuations pro- duced variations of Maximum Sustainable Yield (MSY) of 3 000 t (around 20% of t h e average value of MSY level). ArreguTn- Sdnchez (1 985) obtained a first estimate of t h e stock-recruitment relationship by fitting the Ricker (1 954) model, and Found that density-dependence could be reasonably
Table 2. Estlmates of the Instantaneous rates of mortality of the red grouper (Eplnephelus modo) flshery from the Campeche Bank. ILstlmacloaes de Ias tasas Instantheas de moHalIdad para b pesquerh del mero amerlcano (Eplnephelus morw del Banco de Campecbe.1
Total Natural Fishlng mortality mortality mortality Z M (year.') F
References and remarks
Muhlia (1 976) Valdes and Padrdn ( 1 980) Moreno (1 980): mean For 1974 to 1979 Doi et al. (1981); mean for 1972 to 1976 ChAvez and ArreguTn-Sdnchez (1 986) Chavez and Arreguln-Sanchez (1986) GuzrnAn ( 1 986) Arreguln-Sanchez et al. ( 1 987a. 198713) Salazar (1 988) Zetina (1990); estimates vary 26% on both sides Contreras et al. (1994); range from age-based VPA Arregufn-Sanchez (1992); range from a length-
catchability pattern and fishing effort

Length (TL; cm)
Fig. 2. Catchablllty-at-length pattern for the red grouper (Eplnephelus morio) from the Campeche Bank, Mexlco. Solld weighted llne represents the average pattern over a perlod of 17 years; solld narrow llnes indlcate 2 one standard devlatlon; vertical llnes represent the minimum and maximum values for each length class. Note that variance Increases signlflcantly from a fish length of 50 cm, whlch corresponds to the slze at first maturlty (from Arreguin- Sahchez 1 992). [Patfin de cambia de la capturaIrIlIdad con /a 1ongifudpar.1 elmero ameriano (Epinephelus morlo) Ile/ Banco de Campeche, Mkxico. Llnea solida gruesa represent2 la tendencia promedio para un perlodo de 17 afios; /as lineas sdlidas delgarlils lndican 10s limites definidos por * una desviaclcin estandar: /as lineas vertlcafes representan 10s vaiores minimos y mtixlmos para cada clnse de longlud. Nbtese que la vahnza aumena signiflcatharnente a partir de peces con una longitud de 50 cm, la cual corresponde a /a talla de primera matfurex (tornado de Arreguin-Sanchez 19921.1
explained by the species' habits (i.e., gregarious behavior, territoriality and active predatory behavior). On the other hand, seasonal recruitment patterns obtained by Arreguin- Sanchez et al. ( 1 98713) through the procedure suggested by Pauly (1 982), and by simulation experiments (Seijo 1986). show a recruitment timed with spawning during winter and early spring.
A comparative recruitment index ( Arreguin-SAnchez 1992) of relative annual abundance of recruits (one-year old fish)
with respect to the average recruitment abundance, showed that during the 17 years analyzed there had been an important fall in recruitment, for the year class of 1980. Also the recruitment index tended to decrease after 1980 with respect to the level ob- served for the previous years. Because relative abundances are measured as catch-per-unit- effort, i t is not possible to define whether this decrexe of recruitment (Fig. 3) corresponds to a real decreaing population size, orto another factor affecting fish vulnerability. The most

important point here is that the recruitment fall in 1980 had important consequence for yields. The fall in recruitment during 1980 might have been associated with an oil spill on Campeche Bank which occurred over a period of nine months that included the spawning season of red grouper (and other aquatic organisms).
Stock Assessment
Assessments of the red grouper stocks are not done routinely; however, reports on the state of exploitation at certain times
have agreed with historical catch trends. Fig. 4 shows the trends corresponding to the development stage of the fishery, fol- lowed by a level close to the MSY, fol- lowed by a decline in catches, suggest- ing that the resource is being exploited at or beyond its maximum biological capacity (Arreguin-Sanchez 1985, 1987a, 198713; Fuentes and Contreras 1986; GarcIa et al. 1986: Seijo 1986), particularly because fishing intensity has remained fairly constant over the last ten years.
Seijo (1 986) developed a simulation model which incorporated biological, economic
Year
Fig. 3. Recrultment fluctuations of the red grouper stock from the Campeche Bank, as estlmated from departure of the annual abundance of juvenlle flsh, relative to the average population, over a perlod of 17 years (following Arreguln-SBnchez 1992). Solld llne represents recrults to the mid-sized Mexlcan fleet (one-year old), while dashed llne indicates recrults to the Cuban fleet (flve-year old). For explanation, see text. [Fiuctuaciones deireciutamiento de la poblacibn de mero americano dei Banco de Camperhe, expresado como /a diferencia de /a abundanch relativa anuai de juveniles, con respecto a la estructura promedlo de la poblacion obtenirlil para un period0 de 17 aiios fde acuerdo con Arregufn-Sdnchez 1992). La linen confnua represents 10s reciutas a la flora mediana de Mexico (peces de un aRo de eciati), y la linea discontfnua represents ei reciutamiento a ia nota cubana fpeces de cinco anlos de ehd).]

Year
Fig. 4. Hlstorlcal trends of ylelds for the red grouper (Eplnephelus morlo) fishery from the Campeche Bank, Gulf of Mexico; 1956- 1987. [Tendencla hlstorlca de las capturas tfe la pesqueria del mero americano (Epinephelus morlo) del Banco de Campeche, Golfo de M6xJto; 1956-1987.1
L O A
I I I I I I I I I I I I I 30 40 50 60 im 80 90
Length (TL; cm) C
Fig. 5. Annual flshing mortality-at-length wlthin the perlod of 1973 to 1987, for the mlddle-sized fleet of Mexlco, for the red grouper flshery from the Campeche Bank (from Arreguin-Sanchez 1992). [Patron tie camliio de la mortalidad por pesca anual con la longitudpara el period0 1973 a 1987, para la ffota mediana de Mexico tfe la pesqueria de mero americano ifel Banco de Campeche (tornado de Arreguin-Sanchez 1792).1

and institutional aspects, taking into account the three fleets participating in this fish- ery. His conclusions show a clear trend towards overfishing, probably caused by a high pressure on juveniles by the artisanal fleet. (Note that the simulation was started with the estimated age structure of De- cember 1 985.) On the other hand, Arreguin- Sanchez ( 1 992) calculated from the logis- tic model the time of recovery of the ex- ploited population under different fishing intensities. His estimations based o n catch and effort data, indicate that in the absence of fishing and at average recruitment levels, the population would need five years to attain a size equivalent to 0.5 of the maximum population which can be sustained by the ecosystem (carrying capacity) 14 years at the exploitation rate prevailing in 1986.
Contrerx et d. ( 1994) using cohort analysis and VPA have shown a decrease of nearly 30% in population size since 1980, at lev- els of exploitation similar to those estimated for the previous decade. These results do not completely agree with other studies, because the effect of Fishing intensity as the cause for the decrease of the popula- tion size is not clearly shown.
The integrated catchability model sug- gested by Arreguin-Sanchez ( 1 992) (involving size, time, density dependence and be- tween-fleet effects) enabled estimation of fishing mortality and population size independ- ently of VPA. The complete model is expressed by the relationship
L 0.03 & I I I 1 40 60 80 100
Length (TLi cm)
Fig. 6. Monthly flshlng mortality-at-length during 1978, for the rniddle- sized fleet of Mexlco. for the red grouper (Epinephelus morlo) flshery from the Campeche Bank (from Arreguln-Sanchez 1992). [Patron de cambio mensual tie la mortalfdad por pesca con la Iongltud, durante 1978, p r a la flotil metilam de M&ko de fa pesqueria tie mem amerluno (Eplnephelus morio) del Banco de Campeche (tornado de Arreguin- Siinchex 1992j.1

where I is the length-class, t is the year (y) or month (m) times, f is a fleet index, and E is the amount of fishing, expressed by the fishing effort as the main factor af- fecting population abundance. Fig. 5 ex- hibits the annual fishing mortality from 1973 to 1987 for the MCS fleet of Mexico. Fig. 6 shows the pattern of monthly fishing mor- tality for 1978 for the MDS fleet, while Flg. 7 depicts the monthly fishing mortality rates for ART fleet during 1987.
The size of the fishable stoclc was esti- mated by Arreguin-Sanchez ( 1992) based on the catchability patterns described above, and the fishing effort exerted by each fleet to obtain an estimate for population size per year. Results (Table 3; Fig. 8) indicate that population size varies, but suggest a stable situation of the resource.
Discussion
The growth studies performed to date suggest that more emphasis should be placed on the analysis of hard parts to estimate age and to validate growth estimations. Some otolith-based estimates appear to be outside the region where most values were observed. This could mean that techniques for the analysis of otoliths must be reviewed and improved, to permit adequate defi- nition of the age structure of catches and other population parameters. Length-based methods appear to be an alternative to estimate growth. However, the length-struc- tured data will reflect selection during fishing operations, and the length-frequency dis- tributions will not accurately represent the population structure (Arreguin-Sanchez 1 W2).
J I 1 I I I 20 40 60 80 100
Total length (cm)
Flg. 7. Monthly flshlng mortality-at-length durlng 1987, for the artlsanal fleet of Mexlco, for the red grouper (Eplnephelus morlo)flshery from the Campeche Bank (from Arreguin-SAnchez 1992). [Pathn de camblo mensual de B mottalidad por pesca con la longltud, durante 1'887, para la flota artesanal de Mdxico tie la pesqueria tile mero americano (Epinephelus morio) del Banco de Campeche (tomado de Arreguh-SAnchex 1792).1

Table 3. Population size estimated from data of the mid-sized Mexican fleet and the Cuban fleet. [Taman'o de la poblaclbn estlmada a
tamaiio de M6xlco y la flota Cubana.1
Numbers of fish (x 1 o*) Year Without densi ty- With densi ty-
d e p e n d e n t d e p e n d e n t effects effects
This could be of particular importance for those species caught while part ofspawn- ing aggregations.
Estimates of natural mortality are scarce. In fact, values reported in the literature come from empirical equations or were assumed (Muhlia 1976). This aspect must be em- phasized in further population dynamics studies because the estimated range is 0.20 2 M I 0.44 year-', or, over 200% of the lowest value.
Estimates of fishing mortality, F, have been obtained by diFferent methods. However, detailed analysis has been presented only
'
by Contreras et al. (1994), who used an age-based VPA method, and by Arreguin- Sanchez ( 1 992), who used the catchability method described above. Both studies were applied approximately to the same years and both show that the stocks are exploited and
- I I I I I 1 R 76 78 80 82 84 86
Year
Flg. 8. Fluctuations In populatlon slze estlmated for the red grouper (Epinephelus morlo) stock from the Campeche Bank. Notlce that cycles tend to be completed In an 8-year perlod. [Fluctuaclones en el tamaiio de la poblacldn estlmda para el mero amerlcano (Epinephelus morlo) del Banco de Campeche. ObscWese que 10s CMOS fienden a ser completados en un period0 tie ocho afios.]

that fishing mortality must be controlled. However, the age-based VPA suggests that the average population decreased by around 30%. while the other study indicates that the population has remained reasonably stable. This matter remains to be resolved.
There is still a lack of quantitative data concerning the sizes of cohorts. This is a serious constraint for a fully exploited resource where the juveniles and sub-adults are subjected to intense exploitation. In terms of management, the Spawning Stock: Re- cruitment relationship (SSRr) is a very im- portant aspect to be addressed by rresearch-
ers. Controls on fishing mortality of juve- niles (as generated by the artisanal fleet) and on adults (as generated by the mid- sized and Cuban fleets during aggrega- tion) must be established. However they should be based on quantitative informa- tion provided by the SSRr.
Red grouper is a gregarious species which has seasonal reproductive aggregations. According to Shapiro ( 1 987), the mecha- nism which initiates sexual maturity is not well known, but i t seems related to envi- ronmental changes affecting metabolic proc- esses. Adult fishes mature in response to environmental stimuli, probably more re- lated to spatial distribution than to a spe- cific size. Arreguin-Sanchez ( 1 992) has suggested a probable synchrony with the seasonal upwelling on the eastern end of the continental shelf reported by Rulz and Merino (1 989). Because an important part of the fishing operations are related to the fish aggregation, the SSRr, combined with environmental data and information on vulnerability, might provide information on possible controls and critical times, to de- termine the number of adults which must
escape from fishing to guarantee the sta-
bility of the stock. The lack of knowledge on the processes behind the SSRr suggests that they must be included in further
research efforts to support management de- cisions.
Population size estimates suggest that stock abundances fluctuate with an 8-year periodicity. Although there is presently no explanation for these cycles, they are very important in terms of management: most of the studies undertaken during the early 1980s mentioned a declining population abundance, interpreted as evidence of
excessive fishing effort. In this case, although the diagnosis was right, the assigned causes were erroneous. However, the most important point here is the management process, because i t must consider these variations i f restrictions on catch and fish- ing effort are to be used as main manage- ment measures. How these measures will impact the fishery; either positively and encouraging stability or negatively and promoting decline, will depend on the relative situation of the stock. Our recom- mendation is that a proper fishing man- agement regime must be revisited every year.
References
Arceo, P., D. Fuentes, R. Puerto, M. Contreras, V. Moreno and I. Judrez. 1987. Sinopsis de datos biol6gicos del rnero (Epinephelus maHo, Valenciennes). Dcto. Tecnico. Centro Regional de lnvestigaciones Pesqueras, Yucalpeten, lnstituto Nacional de Pesca, Mexico.
Arreguin-SAnchez, F . 1987a. Present status OF the red grouper fishery in the Campeche Bank. Proc. GulFCaribb. Fish. Inst. 381498- 509.
Arreguin-Sanchez, F . 198713. Estado actual de la explotacion del rnero (Epinephelus morio) del Banco de Campeche. 25 Aniv. lnstituto Nacional de Pesca, Centro Regional de lnvestigaciones Pesqueras, Yucalpeten, lnstituto Nacional de Pesca. Mexico. 23 p.
Arreguin-Sbnchez, F. 1989. lnvestigaciones para el manejo y adrninistracion racional de pesquerias tropicales. Avance y Perspectiva. CINVESTAV-IPN (Mexico) 37(8)13 1 -4 1 .
Arreguin-Sdnchez, F. 1992. An approach to the study OF the catchability coeficient with

application to the red grouper (Epinephelus morio) Fishery from the continetal shelf o f Yucatan, Mexico. Centro de Invest. Estudios Avanzados de l lns t i tu to Politecnico Nacional, Mexico. 222 p. Ph.D. dissertation.
Arreguin-Sanchez, F. and E.A. Chavez. How marine shelF Fisheries are depending on mangrove ecosystems: the Campeche Bank, Mex ico as an example. /n A . Yafiez- Arancibia and A.L. Lara-Dominguez (eds.) Valoracion economica de 10s manglares. EPOMEX Serie Cientifica 6. (In press).
Arreguin-Sanchez, F., J.C. Seijo, D. Fuentes and M.J. Solis-Ramirez. 1987a. Estado del conocimiento delos recursos pesqueros de la peninsula de Yucatiin y regibn adyacente. Contr. Inv. Pesq. Dcto. TPcnico 4. Centro Regional de lnvestigaciones Pesqueras, Yucalpeten, lnstituto Nacional de Pesca, Mexico. 41 p.
Arreguin-Sanchez, F., M.A. Cabrera and G. Mexicano-Cintora. 198713. Dinamica de la pesqueria de mero (Epinephelusmorio) del Banco de Campeche, p. 81 -87. In E.M. Ramirez (ed.) Mem. Simp. Biol. Ocean. Pesq. Mexico. La Paz, B.C.S.. Mexico. I83 p.
Arreguin-Sanchez, F.. M. Contreras, V. Moreno, M.A. Cabrera and R. Burgos. 1990. Dindmica de la poblacion y evaluation de la pesqueria d e mero (Epinephelus mor io ) de la plataforma continental de Yucatdn. Inf. TCc. Invest. Centro de lnvestigacion y de Estudios Avanzados de l lnst i tuto Po l i t i cn ico National-Merida, Centro Regional de lnvestigaciones Pesqueras, Yucalpeten lnstituto Nacional de Pesca, Mexico. 62 p.
Arreguin-Sinchez, F.. J.C. Seijo and E. Valero. 1993. An application o f ECOPATH I1 to the north continental shelf ecosystem of Yucatan, Mex ico . p. 269-278. In V. Christensen and D. Pauly (eds.) Trophic models of aquatic ecosystems. ICLARM Conf. Proc. 26, 390 p.
Basson, M., A.A. Rosenberg and J.R Beddington. 1988. The accuracy and reliability of two new methods for est imat ing g row th parameters from length frequency data. 1. ClEM 44:227-285.
Bohllte, 1.E. and C.C.G. Chaplin. 1968. Fishes of the Bahamas and adjacent tropical waters. Acad. Nat. Sci. (Philadelphia) MI, 771 p.
Burgos, R. 1987. Operaciones y rendimientos de la flota pesquera mayor de Yucatan durante 1985. Contr. Invest. Pesq. Dcto. Tec. 3. Centro Regional de lnvestigaciones Pesqueras, Yucalpeten, lnstituto Nacional de Pesca, Mexico.
Cabrera, M.A. 199 1 . Efectos de cambios en la varianza y tamafio del interval0 en la estimacion d e 10s par6metros d e crecimiento del mero Epinephelusmur/o. Centro de lnvestigacion y de Estudios Avanzados de l lns t i tu to Poli tecnico Nacional, Merida. Mexico. 97 p. Tesis maestria en ciencias.
Chavez, E.A. and F. Arreguin-Sanchez. 1986. Evaluation de 10s recursos pesqueros de la peninsula de Yucatdn, Mexico. Inf. TPc. Invest. Centro de lnvestigacion y de Estudios Avanzados de l lns t i tu to Poli tecnico Nacional. Merida. Mexico.
Claro, R 1985. Ecologla de 10s peces rnarinos de Cuba. Simp. Cienc. Mar. y VII Jornada Cient. Inst. Oceanologia. XX Aniv. Acad. Cienc. (Cuba) 1 : 19-65.
Contreras, M.. F. Arreguin-Sanchez, J.A. Sanchez, V. Moreno and M.A. Cabrera. 1994. Mor- tality and population size of the red grouper (Epinephelus mor io) fishery from the Carnpeche Bank Proc. Gulf Caribb. Fish. Inst. 43:309-410.
Doi, T., D. Mendizabal and M. Contreras. 1981. Andlisis preliminar de la poblacion de mero Epinephelus mor io (Valenciennes) en el Banco de Campeche. Cienc. Pesq. (MCxico) l ( 1 ) : l - 1 6 .
Fuentes, D. 1991. La pesqueria de mero en el Banco de Campeche. Mem. VII Congr. Nal. Oeanol. Ensenada, B.C. (Mexico) 1 :361- 374.
Fuentes, D. and M. Contreras. 1986. Situacibn de la pesqueria de mero (Fpinephelus morio) en Yucatan: Analisis 1985. Inf. TCc. Centro Regional d e lnvestigaciones Pesqueras, Yucalpeten, lnstituto Nacional de Pesca, Mexico.
Garcia, F., P. Arceo and R. Puerto. 1986. Analisis de a pesqueria de mero (Epi~~ephelusmorio) del Banco de Campeche durante el period0 1982- 1984 seglin 10s modelos de Schaefer y Fox. Inf. Tec. Centro Regional d e lnvestigaciones Pesqueras, Yucalpeten, lnstituto Nacional de Pesca, Mexico.

Gonzalez, M.E. 1988. Analisis de la pesqueria de huachinango (Lutjanus carnpechanus) del Banco de Campeche, Mexico. Centro de lnvestigacion y de Estudios Avanzados del lnstituto Politecnico Nacional, MPrida, Mexico. Tesis maestria en ciencias.
Gonzales, P.D., S. Zupanovic and H.E. Ramis. 1974. Biologia pesquera de la cherna americana del Banco de Campeche. Centro de lnvestigaciones Pesqueras, Cuba. Res. Invest. 1 : 107- 1 l I.
Guzman, E. 1986. Contribucion al conocimiento de la pesqueria de mero (Epinephelus morio, Valenciennes) de las costas de Yucatan. Escuela Nacional de Estudios Profesionales-lztacala, Universidad Nacional Autonoma de MCxico. Tesis profesional.
MacDonald, P.D.M. and T.J. Pitcher. 1979. Age- groups From size-frequency data: a ver- satile and efficient method of analyzing distribution mixtures. j. Fish. Res. Board Can. 36(8):987- 100 1 .
Manooch, C.S., 111. 1987. Age and growth of snappers and groupers, p. 329-374. In J.J. Polovina and 5. Ralston (eds.) Tropi- cal snappers and groupers: biology and Fisheries management. Westview Press, Boulder.
Mexicano-Cintora, 6. 1990. Analisis prelirninar de algunos aspectos reproductivos del mero (Epinephelus rnorio) de las costas de Yucatan. Rep, Espec. Acad. Centro de lnvestigacion y de Estudios Avanzados del lnstituto Politecnico Nacional, Merida, Mexico. 42 p.
Moe, M.A., Jr. 1968. Biology of the red grouper Epinephelus morio (Valenciennes) from the eastern Gulf o f Mexico. Florida Dept. Nat. Res. ProF. Pap. Ser. 10:95 p.
Moreno, V. 1980. La pesquerla d e rnero (Epinephefus rnorio) en e l Estado de Yucatan. Univ. Auton. Edo. Morelos, MCxico. Tesis profesional.
Muhlia, A. 1976. Aspectos biologico-pesqueros de Ephinephelus morio (Val.): mero. Mern. Primer Simp. al. Rec. Pesq. Mas. Mexico 2:223-265. lnstituto Nacional de Pesca, Mexico.
Oleachea, A. 1975. Distribution y abundancia de peces demersales y su relacion con la temperatura de aguas de Fondo. Centro
de lnvestigaciones Pesquera, Cuba. Resurn. Invest. Z: 16 1.
Ordaz. D. 1993. Estudo sobre la mojarra (Ca- lamus nodosus) de las costas de Yucatan. Inst. Tecnol. Mar., Veracruz, Mexico. Tesis
J profesional. Pauly, D. and J.L. Munro. 1984. Once more on
the comparison of growth in fish and in- I vertebrates. Fishbyte 2(1):21. Pauly, D. 1982. Studying single species on a
rnultispecies context, p. 33-70. In D. Pauly and G.T. Murphy (eds.) Theory and man- agement of tropical fisheries. ICLANVl Conf. Proc. 9, 360 p.
Pauly, D. and F. Arreguin-Sanchez. 1995. Irn- proving Shepherd's length composition analysis (SLCA) method for growth pa- rameter estimation. Naga, ICLARM Q. 18(4):31-33.
Ricker, W.E. 1954. Stock and recruitment. 1. Fish. Res. Board Can. 303409-434.
Rodriguez, H. 1986. Estudio cornparativo de dos estructuras rigidas (otol i to y hueso mesopterigoide) para la estimacion de edad y crecimiento del mero (Epinephelus morio) del Banco de Carnpeche. Univ. Auton., Nuevo Leon, Mex ico . Tesis
J profesional. Rosenberg, A.A. and J.R. Beddington. 1987.
Monte-Carlo testing of two methods for estimating growth from length-Frequency data w i th general conditions for their applicability, p. 283-298. In D. Pauly and G.R. Morgan (eds.) Length-based meth- ods in fisheries research. lCLARM Conf. Proc. 13, 468 p.
Ruiz, F. and M. Merino. 1989. Upwelling off the north coast OF the Yucatan Peninsula, p. 149-160. In E.A. Chavez (ed.) Australia- Mexico Workshop in Marine Science. Centro de Investigacion y de Estudios Avanzados de l lns t i tu to Poli tecnico Nacional, Merida, Mexico and CSIRO, Aus- tralia.
Saenz, M. , F. Mendoza and J.C. Piste. 1987. Diagnosis de la pesqueria artesanal del estado de YucatAn. Centro Regional de lnvestigaciones Pesqueras, Yucalpeten. lnstituto Nacional de Pesca, MCxico. Contr. Inv. Pesq. Dcto. Tec. 5, 43 p.
Salazar, A.R. 1988. Contribucion al conocimiento de la pesqueria de mero (Epinephelus

morio) de la flota menor de las costas de Yucatan. Escuela Nacional de Estudios Profesionales, I t tacala, Universidad Nacional Autdnoma de Mexico. Tesis profesional.
Schaefer, M.B. 1954. G m e aspects o f the dy- namics o f populations important to the management o f the commercial marine fisheries. Inter-Am. Trop. Tuna Comm. Bull. 1 :27-56.
Shaefer, M.B. 1957. A study of the dynamics of the fishery for the yellowfin tuna in the eastern tropical Pacific Ocean. Inter-Am. Trop. Tuna Comm. Bull. 2:247-268.
Seijo, J.C. 1986. Comprehensive simulation model of the tropical demersal fishery: red grouper (Epinephelus morio) of the Yucatan con- tinental shelf. Michigan State University, East Lansing, Michigan. 210 p. Ph.D. dis- sertation.
Shapiro, D.Y. 1987. Reproduction in groupers, p. 295-328. In].]. Polovina and S, Ralston (eds.) Tropical snappers and groupers: b io logy and fisheries management. / Westview Press, Boulder.
Shepherd, J.G. 1987a. Towards a method for short term forecasting of catch rates based on length compositions, p. 167- 176. In
D. Pauly and G.R. Morgan (eds.) Length- based methods i n fisheries research.
f ICLARM Conf. Proc. 13, 468 p. Shepherd, J.G. 1987b. A weakly parametric
method for estimating growth parameters
From length composition data. p. 1 13- 119. In D. Pauly and G.R. Morgan (eds.) Length-based methods in fisheries research. ICLARM Conf. Proc. 13. 468 p.
Shepherd, J.C., C.R. Morgan, J.A. Gulland and C.P. Mathews. 1987. Methods of analy- sis and assessment; report of working group 11, p. 353-362. h D. Pauly and G.R. Morgan (eds.) Length-based methods i n fisheries research. ICLARM Conf. Proc. 13. 468 p.
Smith, C.L. 1971. Synopsis of biological data on groupers (Epinephelus rnorio and al- l ied genera) o f the western north Atlan- tic. Bull. Am. Mus. Nat. Hist. 146(2):67- 242.
Valdes. E. and G. Padron. 1980. Pesquerias de palangre. Rev:Cub. Invest. Pesq. 5(2):38- 52.
von BertalanfFy. L. 1938. A quantitative theory o f organic growth (inquiries on growth laws 11). Hum. Biol. l O ( Z ) : l 8 l - 2 l 3 .
Walters, G.G. 1978. A surplus yield model in- corporating recruitment and applied to a stock o f Atlantic mackerel. J . Fish. Res. Board Can. 35:229-234.
Zetina, C. 1990. Estudio de la mortalidad del mero (Epinephelus morio) en el Banco de Campeche. Centro de lnvestigacion y de Estudios Avanzados del lnstituto PolitCcnico Nacional, MCrida, Mexico. 126 p. Tesis maestria en ciencias.

FishBase and AUXIM as Tools for Comparing Life-history Patterns, Growth and Natural Mortality
of Fish: Applications to Snappers and Groupersa
D. PAULY In terna tional Center For Living A qua tic Resources Managemen t
MCPO Box 263 1 0718 Makati City, Metro Manila, Philippines
Fisheries Centre, 2204 Main Mall University of British Columbia, Vancouver, B, C
Canada V6T 124.
C. BINOHLAN /n t e r m tional Center For Living Aquatic Xesources Management
MCPO Box 263 1 071 8 Malrd ti City, Metro Manila, Philippines
PAULY, D. and C. BINOHLAN. 1996. FishBase and AUXIM as tools for comparing the life-history patterns. growth and natural mortality of fish: applications to snappers and groupers [FishBase y AUXIM como herramlentas para cornparacidn d e patrones de estrategias de vida, crecirniento y morta//dad natural d e peces: ap/icac/dn a pargos y meros], p. 21 8-243. In F. Arreguin-SBnchez. J.L. Munro, M.C. Balgos and D. Pauly (eds.) Biology, fisheries and culture of tropical groupers and snappers. ICLARM Conf. Proc. 48, 449 p.
Abstract
The FishBase 96 CD-ROM, the computerized encyclopedia of fishes, contains, among other things. 4 434 fully documented sets of growth parameters f0.r 1 1 1 5 species, and 170 families of fish. This allows definition of the growth patterns typical of various taxa, and the prediction of liltely growth parameters in l itt le studied groups, as well as the identification of outliers in well studied ones. A software tool called AUXIM is presented which, based on growth parameters, facilitates definition and quantification of the growth space" inhabited by various taxa, here the Lutjanidae ( 1 17 cases; I5 spp.) and the Epinephelinae (34 cases: 6 spp.).
It is shown that AUXIM and its underlying concept, the growth performance index $', can be used to verify ages and/or growth parameter estimates in species for which previous growth parameter estimates exist, and to infer liltely growth parameters in unstudied species.
Various predictors of natural mortality (MI in groupers and snappers are examined, and earlier work by S. Ralston is confirmed which suggested that the von Bertalanffy parameter K is a good predictor of M for this very homogenous group of fishes.
FishBase graphs on the longevity of lutjanids and the brain size o f serranids are finally used to illustrate the power of FishBase for presenting in fishes previously unconnected aspects of their life- history, and morphology, respectively.
" ICLARM Contribution No. 1334

Resumen
El CD-ROM de FishBase 96, la enciclopedia computarizada de peces contiene, entre otras cosas, 4 434 conjunto de datos sobre pardmetros de crecimiento totalmente documentados para I I I5 especies, y 170 Familias de peces. Esto permite la definicidn de parametros de crecimiento tipicos de varios taxa, y la prediction de valores aproximados para pequeiios grupos poco estudiados, as[ como la identificacidn de estimaciones errdneas en aquellos bi&n conocidos. Tarnhi& se presenta un programa llamado AUXlM el cual, con base en 10s pardmetros de crecimlento, facilita la definicldn y cuantificacidn del "espacio de crecimiento" en el cual se ubican 10s diferentes taxa, en este caso 10s Lutjanidos ( 1 17 casos; /5 especies) y 10s Epinephelidos (34 casos; 6 especies).
Se muestra AUXIM, y el concept0 que lo sostiene, el hd ice de crecimiento 9'. puede ser usado para verificar edades y /o estimaciones de pardmetros cle crecimiento en especies n o estudiaclas.
Se examinan varios predictores de rnortdidad natural IMJ para pargos y meros y el trabajo initial de 5. Ralston es confirmado, el cual sugiere que el pardmetro K de la ecuacion de von BertalanF& es un bu&n predictor de M para este muy homoggneo grupo de peces.
Finahente se ut//izan algunas grdficas de FishBase sobre longevidad de IuTjanidos y el tamaiio del cerebro de serranidos para ilustrar el poder de FishBase para presentar aspectos sobre ciclos de vida y morhlogla de peces que anteriormente apareclan desconectados entre si.
Introduction
Growth and mortality studies of fish have been crucial to the emergence of fisheries biology as a discipline of its own (Petersen 1891 ; Baranov 1 9 18; Mohr 1927, 1930,1943, 1994; Beverton and Holt 1959; Smith 1994). This has resulted in large amounts of size- at-age data, growth curves and growth parameters, and of estimates of natural mortality having been published in a widely scattered literature. However, attempts to derive theories from these data have been Few and generally marred by ad hoc ex- planations, suited for only a small subset of the data at hand (e.g., Weatherley and Gill 1987). One reason for this may be that the regularity among species, genera, and families of fish growth and mortality pat- terns had not been made visible to the prac- titioners, who are thus left to deal with what they believe are peculiar features of their favorite taxa.
The need to overcome parochialism O F this sort, and related considerations led, in the late 1980s to the launching by ICLARM of the FishBase Project, devoted to the crea- tion of a database on fish, which would maice available to fishery biologists and other scientists key data on all fish species of the
world, among other things, to provide a basis for new insights and generalizations, e.g., on growth and mortality patterns.
An early version of FishBase was pre- sented at the workshop ofwhich this vol- ume is the proceedings, but the following account is based on the data in FishBase 96, whose CD-ROM was released in June 1996 (Froese and Pauly 1 996), and on material extracted from the other contributions in this volume (to be included in the 1997 release of FishBase).
Materials and Methods
Comparing vectors of sizes-at-age is pos- sible, but is not a straightforward way of comparing the growth parameters of fish, especially when they widely differ in their longevity.
Rather, parameters expressing the shape of a growth curve can be compared, e.g., the parameters L_ and K ofthe von Bertalanffy growth function (VBGF), viz
where Lf is the mean predicted length at age t, L- is t h e mean length the Fish would

reach if they were to grow forever, K ex- presses the rate (here always with unit year-') at which L_ is approached, and to is the theoretical age the Fish would have at length zero, were they to grow accord- ing to the VBGF from the onset on (Bertalanffy 1938; Beverton and Holt 1959: Pauly 1980). Note that t,is of no importance to the con- siderations which follow.
The data for this contribution were all taken from the POPGROWTH table of FishBase, whose layout is detailed in Binohlan and Pauly ( 1 996a). Overall, 250 sets of growth parameters were extracted, pertaining to 4 1 species of Serranidae (subfamily Epinephelinae, i.e., groupers) and to 43 species of Lutjanidae, i.e., snappers (Ta- ble 1 ). These species' taxonomic status is as defined in the recent revision of Heemstra and Randall (1993) and Allen (1985), re- spectively.
Also, 29 independent estimates of natural mortality (M; year-') were extracted from the relevant fields of the POPGROWH Table (Table 2).
To ensure comparability of the growth and mortality parameter sets, estimates of asymptotic size initially expressed as fork (FL) or standard length (SL) were re-expressed as total length (TL), based on the taxonomically correct graphs in the above- cited species catalogues. Estimates of W_, the weights corresponding to L-,, were ob- tained by using appropriate length-weight relationships in the LENGTH WEIGHT Ta- ble of FishBase 96 (Binohlan and Pauly 199613).
Methods for growth comparisons
Our first approach for demonstrating the presence of strong patterns among growth parameters uses the plotting routine of FishBase 96, i.e., to output its growth-re- lated graphs, showing all relevant entries in the database (lighter dots), with the entries
for Epinephelinae and Lutjanidae super- imposed as black dots.
Our second approach is to compute for each set of growth parameters the corresponding value of the growth per- formance index +', defined by
where I< i s year-' and L_(TL) is expressed in cm.
Our third method to document patterns of growth performance in groupers and snap- pers is to analyze the available growth pa- rameters using AUXIM, a software pack- age documented in Pauly et al. (1996), based on the theory of fish growth of Pauly ( 1979) and further developed in Pauly ( 1994) and in Longhurst and Pauly (1 987).
This software is built on the observation that in closely related groups (e.g., in population of the same species, and usu- ally in species of the same genus), L*, and I< not only tend to vary inversely (as has been widely reported in the literature), but that their interrelationship can be more pre- cisely captured by
i.e., the inverse of equation (Z), and wherein the slope (2) is the mean of a large number of plots of the same forms as equation (3) (Pauly 1979).
In reality, however, observed pairs of L_, I<, pertaining, e.g., to different populations of the same species are not aligned as sug- gested by equation (3), but form ellipsoid clouds, whose main axis has a mean slope of -2 (Pauly 1979; Moreau et al. 1986; Pauly 1991). Such ellipses can be designed to define the 95% confidence perimeter around the data points representing sets of growth parameters From a given species (Pauly et al. 1996), which can be taken as defining

Table 1. Growth parameters of groupers and snappers In FlshBase. [Parametros de creclmiento de meros y pargos en FlshBase.1
Family Serranidae Subfamily Epinephellnae Cephalopholis cruentah Curacao I. Jamaica Jamaica Cephalopholis fulva Jamaica Virgin Is. US Cephalopholis hemistiktos Kuwait Lplnephelus adscenslonis Virgin Is. US Epinephelus aeneus ESY pt Morocco Morocco SPnigal Epinephelus areolatus Uuwait New Caledonia Epinephelus chlorostigma Seychelles Seychelles Eplnephelus co/o/des Kuwait Epinephelus costae
E ~ Y ~t EgY pt Epinephelus cyanopodus New Caledonia Epinephelus diacanthus Yemen Epinephelus llnrmmondhayl USA Epinephelus fasciatus Egy I't New Caledonia Epinephelus fuscoguf@tus Papua New Guinea Papua New Guinea Eplnephelus guttatus Bermuda Jamaica Virgin Is. US Eplnephelus itajara
w, L, K Sex Data type/ References" (g) (TL. cm) (year-') Method
USA 143166 201 0.126 Eplnephelus Iabriformls Mexico 1150 36.4 0.247 Epinephelus latifasciatus Kuwait 7870 82.1 0.328 E$jnephelus maculatus New Caledonia 1817 47.2 0.28
unsexed unsexed unsexed
unsexed unsexed
unsexed
unsexed
unsexed male female unsexed
unsexed unsexed
unsexed unsexed
unsexed
unsexed unsexed
unsexed
unsexed
unsexed
unsexed unsexed
unsexed unsexed
unsexed unsexed unsexed
unsexed
unsexed
unsexed
unsexed
(continued)


Table 1 (cont inued)
W- L_ I< Sex Data type/
(g) '(TL.c~) (year.') Method
Mycteroperca olfax Galapagos Is. Mycteroperca phenax USA USA Mycteroperca tigris Cuba Mycteroperca venenosa jamaica Virgin Is. US Paranthias furcifer Puerto Nco USA Plectropomus leopanlus Australia Australia Australia New Caledonia Plectropomus maculatus Australia Variola lout/ Papua New Guinea
Family Lutjanidae Subfamily Apslllnae Apsilus dentatus jamaica Jamaica Subfamily Etelinae Aphareus rutilans N. Marianas Aprion virescens New Caledonia Seychelles Seychelles Seychelles Etelis carbunculus Hawaii Hawaii N . Marianas N. Marianas French Polynesia Vanuatu Etelis caruscans N. Marianas Vanuatu Etells oculatus Saint Lucia Saint Lucia Pristipomoides auricilla N. Marianas
unsexed
unsexed unsexed
unsexed
unsexed unsexed
unsexed unsexed
unsexed unsexed unsexed unsexed
unsexed
unsexed
female male
unsexed
unsexed female unsexed male
unsexed unsexed unsexed unsexed unsexed unsexed
unsexed unsexed
unsexed unsexed
unsexed
(continued)

Table 1 (cont inued) - --
w_ LM K Sex Data type/ References" (g) (TL. cm) (year-') Method
Hawaii Hawaii Hawaii N. Marianas Seychelles Seychelles Vanuatu Pristipomoides flavipinnis N. Marianas Vanuatu Pristipomoides rnult/dens Tunisia Australia Pristipomoides slet5oldii N. Marianas
Australia Pristiporno/des zonatus Hawaii N . Marianas Subfamily Lutjaninae Lu$wus adetii New Caledonia New Caledonia Lut/anus analis Cuba Cuba Cuba Cuba Cuba Cuba USA Venezuela Lu$anus apodus Virgin Is. US Lutbnus argentimaculatus Malaysia Lutjanus bohar Uenya New Caledonia Papua New Guinea Seychelles Lutjanus buccanella Cuba Cuba Jamaica Jamaica L ut/anus campechanus Mexico Mexico Mexico USA
unsexed unsexecl unsexed unsexed male female unsexed
unsexed unsexed
unsexed unsexed
unsexed
unsexed
unsexed unsexed
unsexed unsexed
unsexed unsexed unsexed unsexed unsexed unsexed unsexed unsexed
unsexed
unsexed
unsexed unsexed unsexed unsexed
unsexed unsexed female male
unsexed unsexed unsexed unsexed
~ -
(continued)

Table 1 (continued)
w_ L_ K Sex Data type/ ReferencesA (g) (TL. cm) (year-') Method
USA USA USA USA USA USA USA L ucjirnus carpanotatus Papua New Guinea Lut)knus cyanopterus Cuba Lutpnus e~ythropterus Australia Australia Australia Lut+us fulvlflamma New Caledonia L ut$wus gibbus Palau Papua New Guinea Lut/;mus grlseus Cuba Cuba Cuba Cuba USA Lutpnus jocu Cuba lut$wws johnii India Indonesia Philippines Lutpnus kasmira American Samoa American Samoa N. Marianas New Caledonia Lutpnus Iutbnus Malaysia Philippines Lutfinus malabaricus Australia Australia Australia Australia Australia Australia Australia Australia Australia China China
unsexed unsexed unsexed unsexed unsexed unsexed unsexed
unsexed
unsexed
male unsexed female
unsexed
unsexed unsexed
unsexed unsexed unsexed unsexed unsexed
unsexed
unsexed unsexed unsexed
unsexed unsexed unsexed unsexed
unsexed unsexed
male unsexed unsexed unsexed unsexed female female unsexed male unsexed unsexed
(continued)

226
Table l ( con t inued)
Taiwan Vanuatu Lut/;mus monostlrgma Papua New Guinea L ut/;mus puqxtreus Brazil Brazil Brazil Trinidad Tobago Lurjanus quinquelineatus New Caledonia Lut/;mus rivulatus Papua New Guinea Lut/;nus sanguineus Djibouti L uthnus s e h e Australia Australia Australia Australia Australia Seychelles Seychelles Seychelles Seychelles Yemen Lut$wws synagris Brazil Cuba Cuba Cuba Cuba Cuba Cuba Cuba Cuba Cuba Mexico Mexico Mexico Puerto Rico Trinidad and Tobago Trinidad and Tobago Trinidad and Tobago Trinidad and Tobago USA Luljanus vitta Australia Australia Malaysia New Caledonia New Caledonia Philippines
L- K Sex Data type/ Referencesa (g) (TL, cm) (year-') Method -
unsexed unsexed
unsexed
unsexed unsexed unsexed unsexed
unsexed
unsexed
unsexed
Female male male female unsexed male unsexed unsexed female unsexed
unsexed unsexed unsexed unsexed unsexed unsexed unsexed unsexed unsexed unsexed unsexed unsexed unsexed unsexed female female male male unsexed
female male unsexed female male unsexed
(continued)

Table 1 (cont inued)
'% L,-, K Sex Data type/ References* ( g ) (TL.cm) (year-') Method
L ut/;lnus vivanus Cuba Cuba Ocyurus chtysurus Cuba Cuba Cuba Cuba Cuba Cuba Cuba Cuba Cuba Jamaica Mexico Mexico Puerto Rico USA Rhomboplites aurom6ens USA Subfamily Paradicichthyinae Symphorus nematophorus Papua New Guinea
unsexed unsexed
unsexed unsexed unsexed unsexed unsexed unsexed unsexed unsexed unsexed unsexed unsexed unsexed unsexed unsexed
unsexed
unsexed
Total: 250
1 - otolith annuli; 2 - scale annuli: 3 - other annual rings; 4 - daily otolith rings; 5 - tagging/recaptures: 6 - length frequencies; a - Ford/Walford plot: b - v. Bertalanffy/Beverton plot; c - Lulland plot: d - non- linear regression; e - ELEFAN I: f - other methods.
"The first reference for growth is that from which the parameters were obtained. The second reference, if present, indicates the source of data.
Table 2. Estimates of natural rnortallty of groupers and snappers In FlshBase. [Estimaciones tie mortaiidad natural de meros y pargos en FIshBase.1
M I< L- Sex T References" ( I /Y) (year-')(TL, cm) PC) M Growth
Jamaica 1.95 34 0.63 unsexed 27 1784 29 784 Epinephelus clrummondhayi USA 0.2 97 0.13 unsexed 21 3094 3094 Eplnephelus guttatus Jamaica 0.68 52 0.24 unsexed 27 29 29 Ephephelus rnarglnatus Tunisia 0.1 115 0.W unsexed 17.6 5533 5533 5550 Tunisia 0.05 198 0.03 unsexed 17.6 5533 5533 5545 Epl'nephelus niveatus USA 0.18 132 0.09 unsexed 25 3083 3083 Epinephelus striatus Jamaica 0.24 90 0.0'3 unsexed 27 1784 29 716 Mycteroperca venenosa Jamaica 0.42 &6 0.17 unsexed 27 1784 29 1784
(continued)

Table 2 (continued)
M K L_ Sex T References' (l/y) (year2')(TL. un) PC) M Growth
Plectropomus leoprrlud Australia Apsilus dentatus Jamaica Jamaica Etelis carbunculus Vanuatu Etells coruscans N. Marianas Vanuatu Lut/anus bucenella Jamaica Jamaica L uthnus campechanus USA L utmus malabarlcus Vanuatu Lut@nus purpureus Brazil Brazil Ocyums chtysunrs Jamaica USA Pristipomoides auric/lla N. Marianas Ptis~pomoides ~lamentosus Hawaii N . Marlanas Vanuatu Pristlpomoides flavlpinnis Vanuatu Pdsttpomoides zonatus N. Marianas Rhombopllres aunarubens USA
unsexed
male female
unsexed
unsexed unsexed
male Female
unsexed
unsexed
unsexed unsexed
unsexed unsexed
unsexed
unsexed unsexed unsexed
unsexed
unsexed
unsexed
*The first reference for growth is that from which the parameters were obtained. The second reference, if present, indicates the source of $at&
% iis the mean survival of 2-4 y6ar olds in refs. 2884 and 3081.
the "growth space" occupied by that spe- cies.
Also, the overlap between ellipses rep- resenting different species (i.e., between the growth space they inhabit) can be com- puted, as can the distances between the centers of a number o f ellipses. Finally, the latter can, in form o f a dendrogram, ex- press the similarity in growth between a number o f species (Pauly et al. 1996).
Methods for preiifctfng natural mortnlfty
Beverton and Holt ( 1 959) were the First t o investigate the strong relationship, i n fishes between growth parameters (es- pecially K) and natural mortality (M), and to derive empirical relationships allowing- the prediction o f M from K in selected Fish groups.

Their work was carried on by Pauly (1 980) who extended both the database and the parameter set for prediction of M, and who proposed the widely used empirical model
log,, M = -0.0066 - 0.279 log,, L_ + 0.6543 log,,K + 0.4634
log, ,T. ... 4)
based on 175 independent sets of M, L_ (TL: cm). K and T ("C) values (of which only 5 pertained to groupers, and 6 to snap- pers). We shall call this model "Pauly I " .
Ralston (1 987), based on a set of 18 es- timates of M and K pertaining to groupers and snappers, showed that the linear regression
(which we shall call "Ralston I" ) , led to bet- ter predictions of M than equation (4) for the data set in question.
We derived two improved models from the data in Table 2. The Rrst of these is a version of equation (4) whose intercept was adjusted such as to provide a mean residual of zero when applied to the data ofTable 2. We call the resulting model "Pauly I t " , and it has the form
loglo M = -0.0636 - 0.279 log,o L_+ 0.6543 log,, K + 0.4634 log,, T
... 6)
The second improved model is a linear regression of the M on the K values ofTable 2, which we call "klston 11". and which has the form
Thevalues of M predicted by these models were subtracted from the observed values, and the deviation squared and summed, providing residual sums of squares (RSS) that could be used to compare the fit of equa- tions 4-7 to the data of Table 2.
Results and Dlscusslon
Table 1 presents the growth parameters upon which much of this contribution is based, as extracted From FishBase 96. Observed asymptotic size range over one order of magnitude, from 20.5 cm TL in Lutjanus quinquelinea fus (Family Lutjanidae) to 20 1 cm TL in Epinephelus itajara (Family Serranidae). This is much less than for Ashes as a whole, whose asymptotic lengths range over three orders of magnitude From 1.5 cm (in foecilia reticulata) to well over 10 m (in Cethorinus maximus).
Figs. 1 and 2 show some of the ob- served patterns between L_ and K in fish in general (grey dots) and in groupers and snappers, respectively (black dots), based on the auximetric plot concept (from the Greek metreos, measure, and auxein, to grow).
As might be seen, groupers a n d snap- pers occupy, indeed, a small fraction of the growth space where Fish occur, due to their relatively narrow range of sizes, and of growth patterns.
The narrowness of growth patterns is also expressed by the low standard error ofthe mean values of 4' for species in which enough L_, K data pairs were available (Table 3). This implies that estimates of K can be obtained From equation (3) when reason- able estimates of L_ are available (e.g., from a Wetherall Plot, see Pauly 1986; Wetherall 1986: Wetherall et al. 1987: Gayanilo et al. 1996), along with a value of $' with a low standard error.
This approach can also be used to se- lect among various options for interpret- ing structure on otoliths and other hard parts.
Thus, microscopic rings on otoliths will produce estimates of K and q?' that will have certain values i f the rings are assumed to be laid daily, different from those that would result i f the rings are assumed to be laid, say only during high tides or subdaily.
Similarly, mean values of @' can be used when using length-frequency data to select

aa all other records (n = 887)
Serranidae
0 L 1 I I I I I I 0 0.5 1 1.5 2 2.5 3
Asymptotic length (log Lm; cm)
r all other records (n = 886)
Serranidae in = 1641
Asymptotic length (log; cm)
Flg. 1 . Auxirndc plot of the von Bertalanffy parameters K vs L_ for the flsh of the world (grey dots, showing 20% of the records i n FlshBase 9G) , with emphasis on groupers (black dots). Based on a FishBase 96 graph (see text). [Rejilla a u x h i t r i c a de 10s parametros de von BertaIanfIj. K vs L _ para peces del mundo (puntos grises mostrando 20% tie 10s reglstros en FIshBase 961, con &nfasls en meros fpuntos negros), Basirno en un graRco de FIshBase 96 (ver texto).]
Fig. 2. Auxirnetric plot of the von Bertalanffy parameters K vs L_ for the flsh of the world (grey dots, showlng 20% of the records In FlshBase 96), wlth emphasls on snappers (black dots). Based on a FlshBase 96 graph (see text). 1 Rejllla auxlmitrlca de 10s parametros de von BertaIanm Kvs L _ para peces tiel mundo (puntos srlses mostrando 20% de 10s reglstros en FIshBase 96), con knfasls en pargos (puntos negros). Basado en un grifTco tie nshhse 96 (ver texto).]

Table 3. Mean value of 4' (In ascending order) In 12 snappers with sufficient records (nS 5 In Table I), documenting low standard errors and coeffclen& of varlatIon. I Valor medlo de QS (en oden ascendente) de IZpargos con suMentes redstms In2 5 en Tabla I ) documenhnrlo bajos valores para e/ error estilndar y el coeflclente de varlacldn.1
Species n mean $' S E CV L u p u s lcasrnira 5 2.530 0.036 3.2 Lur/anus vitta 6 2.674 0.085 7.8 Lutjanus synagris 19 2.755 0.040 6.4 Ocyurus chrysurus 12 2.823 0.047 5.7 Luvanus griseus 6 2.825 0.048 4.2 Lut/anus purpureus 5 2.974 0.019 1.4 Etelis carbunculus 7 3.058 0.082 7.1. Lutjanus rnalabaricus 15 3.167 0.029 3.5 Lutjanus analis 8 3.185 0.038 3.4 Lutjanus campechanus 11 3.188 0.033 3.5 Lutjanus sebae 10 3.254 0.048 4.7 Pr/st/pornoides flarnentosus 7 3.273 0.081 6.5
among competing solutions, correspond- ing to different (local) peak of a score function (Pauly and Morgan 1987). The extent to which these procedures can be considered "validations" (sensuBeamish and McFarlane 1983) may be open for debate. However, we believe that an interpretation of growth patterns compatible with a previously com- puted value of $' is more credible than one that is incompatible with such value.
Fig. 3 shows a detailed analysis of the growth patterns of snappers, using the auximetric plot concept and its irnplernen- tation as a software (AUXIM, Pauly et al. 1996), applied to 12 species with an ap- propriate number of growth parameter sets. As might be seen, this approach enables:
i) the definition, in quantitative terms, of the "growth space" covered by a single species (Fig. 3a):
i i ) the comparison of a pair of species, and the definition of the fishes' overlap in terms of growth (i.e., their niches?) (Fig. 3b);
ii i ) the simultaneous plotting of ellip- soids representing a number ofspecies (Fig. 3c): and thence
iv) the identification of similarities of growth patterns, and their
quantification and display through cluster analysis (Fig. 3d).
Pauly et al. (1 996) presented a similar analysis for tilapia (family Cichlidae), and related the position in growth space ofvarious species (groups) to their ecology. We shall abstain from doing this here, but point out for interested readers that this tool will soon become widely available, through the in- corporation of AUXIM as a subroutine of FishBase 97.
Fig. 4 shows a FishBase plot of log K vs log M, showing the close relationships between these two parameters in fish in general, and in Lutjanidae.
Fig. 5, illustrating a FishBase plot of log M on log L_ shows, however, that K is not the only attribute of fish that is related to M. The plot confirms that both Lw and water temperature also relate to M, as shown earlier by Pauly ( 1 980).
However, because the values of M available for groupers and snappers stem from warm water (Fig. 5, Table 2), and because these fishes occupy a rather narrow range of asymptotic sizes (see above), relatively accurate predictions of M can be derived from K alone, as suggested by Ralston (1 987). We recommend, however the use

-21) I I I I I J 2.0 2.5 3.0 3.5 4.0 4.5 5.0
Asymptotic weight (log,,W_: g j
- P . O L L I I 1 I I A 2.0 2.5 3.0 3.5 4.0 4.5 5.0
Asymptotic weight (log,,Wm; g)
(1.000 log unllc2)
Overiap area
Overlap index : 0.227
- 2 . 0 L ' 1 1 I I I I 2 . 0 2.5 3.0 3.5 4.0 4.5 5.0
Asymptotic weight (log,,Wm; g)
Species
L. bohar
L. buccenella
P filamentusus
L. campechanus
L, malabaricus L. analis
E carbunculus
L, griseus
Distance (log units)
Fig. 3. Sequence of steps lnvolved in a detailed analysis using AUXIM: a: An ellipse Is defined by the growth parameters (W_, K) of each species (here: &tells carbunculus; n = 7); b: The overlap (In growth space) between the elllpses of pairs of species can also be defined (here for E. carbuncu/us and Lut/.nus vltta); C: The growth space occupied by a number of related species (here for 12 snapper species, each with a sufficient number of growth parameter pairs is then deflned); and d: The dendrograrn resulting from the distances among specks In (c) is drawn; i t shows the closeness In growth space of 12 species of Lutjanidae. [Secuencla de procesos Involucrados en un andllsls detallado usando AUXIM. a) Una elipse es tiefinIda por 10s parrimetros tle creclmlento (K y WJ tie carfa especie (a@ Eteiis carbunculus; n=q; b) La superposlcldn (espaclo de creclmlento) entre /as ellpses de pares de especies tambien puetien ser tleflnlras (aquipara E. carbunculus y Lutjanus vitta); C) El espacio de crechntento ocupado por varlas especles asociadas (a@ 12 especies de pargos, cada una con un ndmero suMente tie pares tie parsmetros tle creclm/ento); d) Se construye el tlendrograma resultante de la dlstanch entre especles en (c), el cual muestra la cercania de 10s espaclos de creclmlento tie 12 especles de LutJanidos.]
of the "Rnlston [I" model, which gives a better fit to the data of Table 2 than the original version (Table 4).
1t will be noted that the Pauly 11 model, due to its intercept having been adjusted to the data in Table 2, also provides irn- proved predictions of M in groupers and snappers (Table 4).
Having illustrated the utility of FishBase (and of AUXIM) for analyzing the growth and mortality of fishes, we conclude this contribution with two graphs, sirnultane- ously illustrating an aspect of the life his-
tory of snappers and anatomical Feature of groupers, and the ease with which a relational database such as FishBase, can generate patterns From previously uncon- nected facts.
Fig. 6 shows a plot of reported longev- ity vs maximum reported length in fishes, and on 21 species of Lutjanidae. As might be seen, snappers are well within the scattergram.
Fig. 7 shows that groupers have aver- age brain sizes relative to all other fishes (Froese 1996). However, they have below
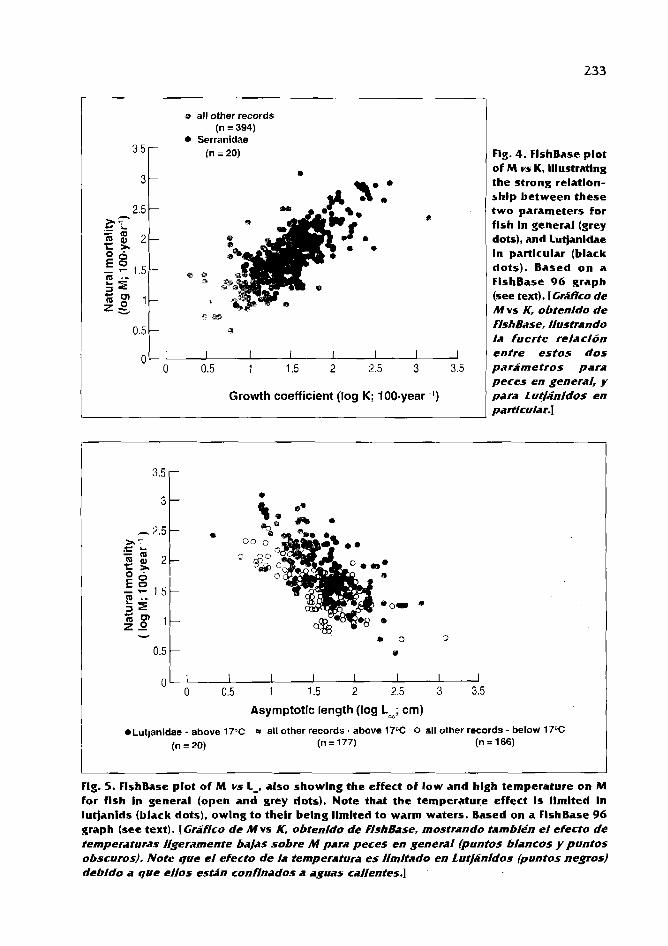
r all other records (n = 394)
Serranidae
3,5 r (n = 20)
Growth coefficient (log K; 100.year -')
Flg. 4. FlshBase plot of M vs K. lllustratlng the strong relatlon- shlp between these two parameters for flsh In general (grey dots), and LutJanldae In particular (black dots). Based on a
FlshBase 96 graph (see text). [Grhflco de M vs K, ohtenido de FishBase, ilustrando /a fuerte relacion entre estos dos pariimetros para peces en general, y para LuQanidos en particuiar.]
Asymptotic length (log Lm; cm)
eLutjanidae - above 17% @ all other records - above 17°C 0 all other records - below 17°C
(n = 20) (n = 177) (n = 166)
Flg. 5. FlshBase plot of M vs L_, also showlng the effect of low and high temperature on M for flsh i n general (open and grey dots). Note that the temperature effect Is llmlted In lutjanlds (black dots), owlng to their belng llmlted to warm waters. Based on a FlshBase 96 graph (see text). [Graflco de M vs K, obtenldo de Fishhse, mostrando tambikn el efecto de temperaturas Iigeramente hajas sobre M para peces en general (puntos biancos y puntos obscuros). Note que el efecto de la temperatura es limitado en LutJAnidos (punros negros) debido a que ellos esthn con/mildos a aguas caiientes.]
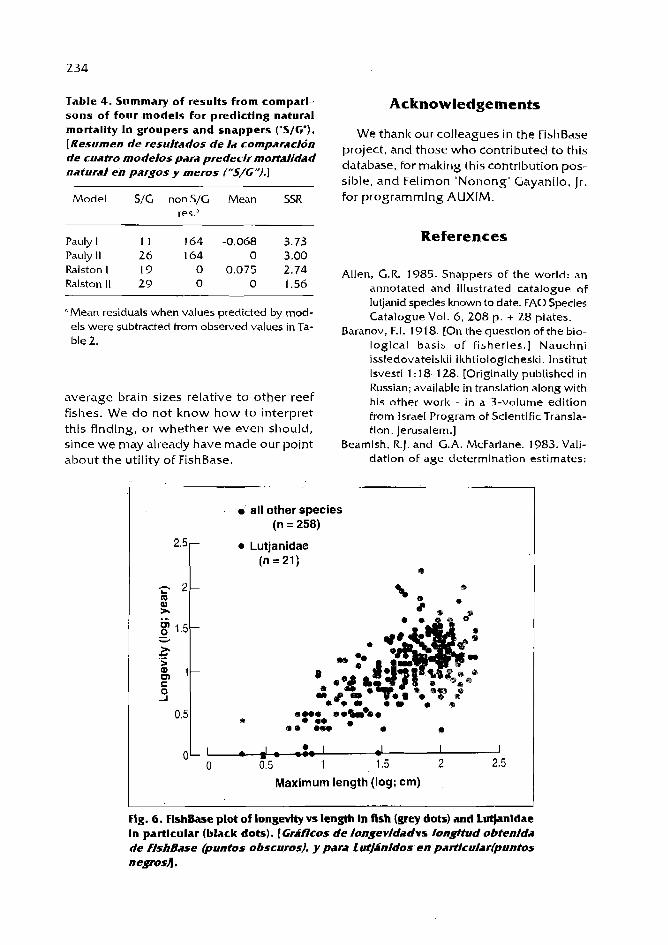
Table 4. Summary of results from comparl- sons of four models for predicting natural mortality In groupers and snappers ("S/GM). [Resumen de resultados tie la comparaclbn de cuatro moifelos para predecir mortalidad natural en pargos y meros ("S/G").]
Model S/C nonS/G Mean SSR re^.^
Pauly I 1 1 164 -0.068 3.73 Pauly I I 26 164 0 3.00 Ralston I 19 0 0.075 2.74 Ralston 11 29 0 0 1.56
"Mean residuals when values predicted by mod- els were subtracted From observed values in Ta- ble 2.
average brain sizes relat ive t o o t h e r reef f ishes. We d o n o t k n o w h o w to in te rpre t th i s f ind ing , o r w h e t h e r we even s h o u l d , s ince we may a l ready h a v e m a d e o u r po in t a b o u t t h e utility of FishBase.
Acknowledgements
We thank o u r co l leagues in t h e FishBase project , a n d t h o s e w h o cont r ibu ted to th i s d a t a b a s e , for malting this contribution p o s - s ib le , a n d Felirnon " N o n o n g ' Gayanilo, Jr.
fo r p r o g r a m m i n g AUXIM.
References
Allen, G.R. 1985. Snappers OF the world: an annotated and illustrated catalogue of lutjanid species known to date. FA0 Species Catalogue Vol. 6, 2 0 8 p. + 28 plates.
Baranov, F.I. 1918. [On the question of the bio- logical basis of Fisheries.] Nauchni issledovatelsltii ilthtiologicheslti. lnstitut lsvesti 1 : 18- 128. [Originally published in Russian; available in translation along with his other work - in a 3-volume edition From Israel Program of Scientific Transla- tion, Jerusalem.]
Beamish, R.J. and G.A. McFarlane. 1983. Vali- dation of a g e determination estimates:
all other species (n = 258)
rn Lutjanidae (n =21)
Maximum length (log; cm)
Fig. 6. F l s h h e plot of longevity vs length In fish (grey dots) and Lut)anldae In particular (black dots). [GriWcos de Iongevldadvs Iongftud abtenlda de FishBase huntos obscuros), y para f wt/Anidos en partlcular(puntos negrosA .

0 all other records (n = 2 819)
Serranidae
Body weight (log; mg)
Flg. 7. FlshBase plot of the relationship between relatlve brain slze and the body weight of fish In general (grey dots), and Serranldae in particular (black dots), based on a FlshBase 96 graph constructed uslng the data of R. Bauchot and colleagues at the University Paris VII (see Froese iund Pauly 1776). 1 Griinco tie FishBase mostrando la relaclon entre tamaiio relativo del cerebro y el peso dei cuerpo para 10s peces en general lpuntos grlses), y ios Serranidos en partlcuiar (puntos negros), basados en un griiflco general construido en FishBase 96, usando datos de R. Bauchot y colegas de la Unlversidad de Paris Vfi (ver froese and Pauly 1996).1
t h e forgotten requirement. p. 26-34. In E.D. Prince and L.M. Pulos (eds.) Proceedings of t h e International Workshop on A g e Determination of Oceanic Pelagic Fishes: Tunas, Billf~shes and Sharks, 15-18 Febru- ary 1982, Miami, Florida. NOAA Tech. Rep. NMFS 8, 21 1 p.
BertalanfFy, L. von. 1938. A quantitative theory of organic growth (Inquiries on growth Laws 11). Human Biol. 10(2): 181-21 3.
Beverton, R.J.H. and 5.1. Holt. 1959. A review OF t h e lifespans and mortality rates of fish in nature, and their relation t o growth and other physiological characteristics, p. 142- 180. In G.E.W. Wolstenholme and M. O'Connor (eds.) ClBA Foundation Colloquia on Ageing. Vol. 5. The lifespan of animals. 1. g A. Churchhill, London.
Binohlan, C. a n d D . Pauly. 1 9 9 6 a . The POPGROWH Table, p. 68-72. In R. Froese and D. Pauly (eds.) FishBase 96: concepts,
design and data sources. ICLARM, Ma- nila.
Binohlan, C. a n d D. Pauly. 1996b. The LENGTHWEIGHT Table, p. 72-74. In R. Froese and 0. Pauly (eds.) FishBase 96 : c o n c e p t s , d e s i g n a n d d a t a sources .
J ICLARM, Manila. Froese, R. 1996. FishBase: a database with key
information on coral reeF fishes. Paper presented a t the the 8 t h International Coral Reef Symposium. 23-28June 1996, Panama City.
Froese, R. and D. Pauly, Editors. 1996. FishBase 96: concepts. design and da ta sources. ICLARM, Manila. 179 p.
Gayanilo, F.C., Jr., P. Sparre and D. Pauly. 1996. The FAO-ICLARM Stock Assessment Tools (FiSAT) User's Guide. FA0 Comp. Inf. Ser. Fish. 7, 126 p.
Heernstra, P.C. and J.E. Randall. 1993. Groupers of the world (Family Serranidae, subfamily

Ephinephelinae). An annotated and illus- trated catalogue of the grouper, rockcod, hind, coral grouper , and lyretail species known t o date . FA0 Species Catalogue Vol. 16 , 3 8 2 p. +3 1 plates.
Longhurst. A. and D. Pauly. 1987. Ecology of tropical oceans. Academic Press, San Diego. 4 0 7 p.
Mohr, E. 1927. Bibliographie d e r Alters- und Wachstums-Bestirnmung hi Flschen. 1. Cons. ClEM 2(2):236-258.
Mohr, E. 1930. Bibliographic d e r Alters- und Wachstums-Bestirnmung bei Fischen. I1 Nachtrage und Fortsetzung. J. Cons. ClEM 5( 1 ):88-100.
Mohr, E. 1943. Bibliographie d e r Alters- und Wachstums-Bestimmung bei Fischen. 111 NachtAge und Fortsetzung. 1. Cons. ClEM 9(2):397-391.
JMohr, E. 1994. A g e determination in tropical fish. Naga, ICLARM Q. 17(2):27-30. urans- lated by D. Pauly from original German version published in Zoologischer Anzeiger 53:87-95;29].
Moreau, J., C. Bambino and D. Pauly. 1986. In- dices of overall growth performance of 1 0 0 tilapia (Cichlidae) populations, 201 - 206. In J.L. Maclean, L.B. Dizon and L.V. Hosillos (eds.) The First Asian Fisheries Forum. Asian Fisheries Society, Manila, Philippines.
Pauly, D. 1979. Gill size and temperature as governing factors in fish growth: a gener- alization of von Ber ta lane ' s growth for- mula. Berichte des lnstituts Fijr Meereskunde a n d e r Universitat Kiel. No. 63, x v t 1 5 6 p. (Doctoral thesis).
Pauly, D. 1986. O n improving operation and use O F the ELEFAN program. Part 11: im- proving t h e estimation of L_. Fishbyte 4( 1 ): 18-20.
Pauly, D. 1980. O n t h e interrelationships be- tween natural mortality, growth pararn- eters, and mean environmental tempera- ture in 175 fish stocks. J. CIEM 39(3): 175- 192.
Pauly, D. 1991. Growth performance of fishes: rigorous description OF patterns as a ba- sis For understanding causal mechanism. Aquabyte (ICLARM) 4(3):3-6. [Reprinted as Essay 7 in Pauly 19941.
Pauly, D. 1994. On the sex of fish and the gen- der ofscientists: a collection of essays in
fisheries sclence. Chapman and Hall, Lon- don , 250 p.
Pauly, D., 1. Moreau and F. Gayanilo, Jr. 1996. A new method for comparing the growth performance of fishes, applied t o wild and Farmed tilapias, p. 433-441.InRS.V. Pullin, J. Lamrd, M. Legendre, 1.8. Amon Kothias and 0. Pauly (eds.) The Third International Symposium o n Tilapia and Aquaculture. ICLARM Conf. Proc. 41 . 5 7 5 p.
Pauly, D. and G.R Morgan, Editors. 1987. Length- based m e t h o d s in fisheries research. ICLARM Conf. Proc. 1 3 , 4 6 8 p.
Pe te rsen , C.G.J. 1 8 9 1 . Eine M e t h o d e z u r Bestimmung d e s Alters und Wuchses d e r Fische. Mit tei lungen d e s Deutschen Fischerei-Vereins 1 1 :226-235.
Ralston, S. 1987. Mortality rates of snappers and groupers, p. 375-404. /nJ.]. Polovina and 5. Ralston (eds.) Tropical snappers a n d groupers : biology a n d f isheries management. Ocean Resour. Mar. Policy Ser. Westview Press, Boulder.
Smith, T.D. 1994. Scaling fisheries: the science of measuring the effects of fishing, 1855- 1955. Cambridge University Press, Cam- bridge. 3 9 2 p. ' Wetherall. J.A. 1986. A new method For esti- mating growth and mortality parameters from length-Frequency da ta . Fishbyte
1 4(1):12-14. Wetherall, J.A., J.J. Polovina and S. Ralston. 1987.
Estimating growth and mortality in steady- state fish stocks from length-frequenq data, p. 53-74. /n D. Pauly and G.R. Morgan (eds.) Length-based methods in fisheries research. ICLARM Conf. Proc. 1 3 , 4 6 8 p.
Weatherley, A.H. and H.S. Gill. 1987. The biol- ogy of fish growth. Academic Press, Lon- don. 4 4 3 p.
Numbered Referencesa
000029 Thompson. R. and J.L. Munro. 1983. The biology, ecology and bionomics of the hinds and groupers. Serranidae, p. 59- 81. In J.L. Munro (ed.) Caribbean coral reef fishery resources. KLARM Stud. Rev. 7, 276 p.
0001 60 Brouard, F. and R. Grandperrin. 1 984. Les poissons profonds de la pente recifale
" As listed in Tables 1 and 2.

externe. Notes Doc. OcCanogr. Mission ORSTOM, Port-Villa 11. 131 p. Pauly, D. 1978. A preliminary compila- tion of fish length growth. Berichte des lnstituts fiir Meereskunde an der Chris- tian-Albrechts Universitat Kiel (55). 200
P. Randall. J.E. 1962. Tagging reef fishes in the Virgin Islands. Proc. Gulf Caribb. Fish. Inst. 14:201-241. Gundermann, N. and D. Popper. 1975. Some aspects of recolonization of coral rocks. Mar. Biol. 33: 109-1 17. Croclter. R.A. 1962. Growth and food of the gray snapper, Lutjanus griseus, in Everglades National Park. Trans. Am. Fish. SOC. 91 :379-383. Fonteles-Filho, A.A. 1970. Estudio sobre a biologia da pesca do parjo. Luqanus purpureus Poey, no Nordeste Brasileiro. - Dado de 1969. Arq. Cien. Mar. 1 O(l):73- 78. Rodriguez-Pino, Z. 1962. Estudios estadisticos y biologicos sobre la biajaiba Lutjanus synagris. Centro de lnvestigaciones Pesqueras. Nota sobre lnvestigaciones (4). 99 p. Alegria, J. and M. Ferreira de. 1970. Edad y crecimento del ariac6 Luljanussynagris en el Nordeste dc Brasii. Arq. Cien. Mar. 10(1):65-68. Pauiy. D. 1980. On the interrelationships between natural mortality, growth pa- rameters, and mean environmental tem- perature in 175 fish stoclts. J . ClEM 39(2): 175-1 92. Cadenat, 1. 1935. Les Serranidts de la CBte occidentale dqAfrique (du Cap Spartel au Cap Vert.). Rev. Trav. Off. 5cient. Tech. P&h. Marit. 8(4):377-422. McErlan, A. 1963. A study of the age and growth of the gag Mycteroperca microlepis Goode and Bean (Pisces, Serranidae) on the West Coast of Florida. Fla. Board Conserv. Tech. Ser. 41:l-35. Rafail, 5.2. 1972. A statistical study of length-weight relationship of eight Egyp- tian fishes. Bull. Inst. Oceanogr. Fish. (Cairo) 2 : 136- 156. Bortone. S.A. 1971. Studies on the bi- ology o f the sand perch. Diplectum formosus (Perciformes. Serranidae). Tech. Ser. Fla. Dep. Nat. Res. (65):l-27. Young, P. 1963. The kelp bass (Paralabfax clathrus) and its fishery 1947-1 958. Calif. Fish Game. Fish. Bull. (122). 67 p. Ingles. J . and D. Pauly. 1984. An atlas OF the growth, mortality and recruitment of Philippine fishes. ICLARM Tech. Rep.
Wheeler, J. and F. Ommanney. 1953. Re- port on the Mauritius-Seychelles fish- eries survey 1948-1 949. part 4. Fish. Publ., Lond. l (3): 120-140. Lablache. G. and G. Carrara. 1988. Popu- lation dynamics of emperor red snapper Lutjanus sebae wi th notes on the demersal fishery of the Mahe Plateau, Seychelles, p. 17 1-1 92. In S.C. Venema. J.M. Christensen and D. Pauly (eds.) Con- tributions to tropical fisheries biology. FAO/DANIDA Follow-up Training Course on Fish Stock Assessment in the Trop- ics, Denmark, 1986 and Philippines, 1987. FA0 Fish. Rep. (389). De Menezes, M.F. and T.C.V. Gesteira. 1974. ldade e crescimento do pargo, Lutjanus purpureus Poey, do norte e nordeste do Brasil. Arq. Cien. Mar. 14(2):81- 85. Corpuz, A,. I . Saeger and V. Sambilay. 1985. Population parameters of commer- cially important fishes in Philippine waters. Tech. Rep. Univ. Philipp. Visayas, Dept. Mar. Fish. (6), 99 p. McPherson. G.R. et al. 1985. Great Bar- rier Reef demersal fish research. South Pacific Commission, 17th Regional Tech- nical Meeting on Fisheries, Noumea. New Caledonia. August 1985. SPC/Fisheries 17/WP 23. Edwards, R.R.C. 1985. Growth rates of Lutjanidae (snappers) in tropical Aus- tralian waters. J . Fish Biol. 26:l-4. Munro, J.L. and D. McB. Williams. 1985. Assessment and management of coral reef fisheries: biological, environmen- tal and socio-cconornic aspects. p. 543- 578. In Proceedings of the Fifth interna- tional Coral Reef Congress, Tahiti. 27 May-l June 1985. Vol. 4. Antenne Mu- seum-EPHE. Moorea, French Polynesia. Sanders, M.J. and G.R. Morgan. 1989. Review of the fisheries resources of the Red Sea and Gulf of Aden. F A 0 Fish. Tech. Rep. (304). 138 p. Edwards, R.R.C.. A. Bakhader and 5. Shahcr. 1985. Growth, mortaliQ,age com- position and fishery yields of fish from the Gulf of Aden. J . Fish Biol. 27:13-21. Kedidi, S.M. and M. Bouhlel. 1985. Stock assessment for the blood snapper Lurjanus sanguineus From the Djiboutian waters Red Sea - Gulf of Aden. Project for the Development of Fisheries in the Red Sea areas of the Gulf of Aden, FAO/UNDP RAB/83/023/1 1. Cairo. 20 p. (mimeo). Thompson. R. and J.L. Munro. 1977. As- pects o f the biology and ecology of

Caribbean reef fishes: Serranidae (hinds and groupers). J. Fish Biol. 12: 1 15-146.
001786 Munro, J . L . 1974. The biology, ecology, exploitation and management of Carib- bean reef fishes. Scientific Report of the ODA/UWI Fisheries Research Project: 1969-1973. Part V.m. Summary of blo- logical and ecological data pertaining to Carribean reef fishes, Res. Rep. Zool. Dep. Univ. West lndie; (3):24 p.
001789 Ivo, C.T.C. and T.C.V. Gestira. 1974. Estimacao prel iminar das medida de mortalidad do pargo, Lutjanuspurpureus Poey, no norte e norteste brasiliero. Arq. Cient. Mar. 14: 123-1 27.
001 91 2 Pauly, D. and I . Ingles. 1981. Aspects of the growth and natural mortality of ex- ploited coral reef fishes. p. 89-98. In E. Gomez. C.E. Birlteland. R.W. Buddemeyer, R.E. Johannes. ].A. Marsh, Jr. and R.T. Tsuda (eds.) Proceedings of the Fourth Internat ional Coral Reef Symposium, Manila. Philippines. Vol. 1.
0020 10 Mathews, C.P. and M. Samuel. 1985. Stock assessment and management of newaiby, hamoor and hamra in Kuwait. p. 67-1 15. In C.P. Mathews (ed.) Proceedings o f the 1984 Shrimp and Fin Fisheries Man- agement Workshop. Kuwait Institute for Scientific Research. Kuwait.
3 Cu y. P. and 1. Worms. 1982. Peche, biologie et dynamique du thiof (Lpinephelusaeneus E. Geoffroy Saint-Hilaire, 181 7) sur les cbtes scnegalaises. Doc. Sci. Cent. Rech. Oceanogr. Dakar-Tiaroye (82). 88 p .
5 Smith. M.K. and E. Kostlan. 1991. Esti- mates of age and growth of ehu Etelis carfwnculus in four regions of the Pa- cific from density of daily increments in otoliths. Fish. Bull. 89:461-472.
002087 Han-lin. L. and L. Hsi-Chiang. 1974. Age determination and growth of Lurjanus sanguineus (C. a V.) in the South China Sea. 1. Fish. Soc. Taiwan 3(1):39-57.
002 160 Coeden. G.B. 1978. A monograph of the coral t rout , Plectropomus leopardus (Lacepede). Queensland Fish. Serv. Res. Bull. 1 : 1-42.
002290 Loubens,.L. 1980. Biologie de quelques especes de poissons d u lagon NCo- Caledonien. I l l . Croissance. Cah. Indo- Pac. 2:101-153.
002299 Ambak. M.A. . A.K.M. Mohsin and M.Z.M. Said. 1985. Growth characteristics o f Lutjanidae off the east coast of Penin- sular Malaysia. p . 165-174. In A.K.M. Mohsin, M.I.H. Mohamed and M.A. Ambalc (eds.) Elrspedisi Matahari '85: a study on the (-iffshore waters of the Malaysian EEZ. Occas. Publ. Fac. Fish. Mar. Sci. Univ. Pertanian Malays. No. 3.
002300 Ralston, S . and H.A. Williams. 1988. Depth distributions, growth, and mortality o f deep slope fishes from the Mariana Ar- chipelago. NOAA Technical Mernoran- dum NMFS. NOAA-TM-NMFS-SWFC- 1 1 3. 4 7 p.
002315 Wright, A., P.]. Dalzell and A.H. Richards. 1986. Some aspects of the biology o f the red bass, Lu+mus bohar (Forsskdl), from the Tigak Islands, Papua New Guinea. J. Fish Biol. 28:533-544.
002316 Talbot, F.H. 1957. The fishes of the ge- nus Lurjanus of the east African coast. Ann. Mag. Nat. Hist. 12:241-267.
002318 Ju. D.R., S.Y. Yeh and H.C. Liu. 1988. Age and growth of Lurjanus altifiontalis in the waters off northwest Australia. Acta. Oceanogr. Taiwanica 20: 1 - 12.
002320 Druzhinin, A.D. 1970. The range and bi- ology of snapper (family ~ut janidae). J. Ichthyol. 10:715-735.
002322 Ralston, 5. and H.A. Williams. 1988. Age and growth of Lutjanus lrasrnira, ~ethrinus rubrloperculatus. Acanthurus lineatus and Ctenochaetus striatus in American Sa- moa. Adminstrative Report 1 1 - 1 8-1 8 , Southwest Fisheries Center: NMFS (Honolulu Laboratory), I I p.
002326 Lai. H.L. and H.C. Liu. 1979. Age and growth o f Lutjanus sanguineus in the Arafura Sea and north west shelf. Acta Oceanogr. Taiwanica 10: 164- 175.
002328 Druzhinin, A.D. and N.A. Filatova. 1980. Some data on Lutjanidae from the GulF of Aden area. J . Ichthyol. 20(1):8-14.
002327 Yeh, S.Y.. C.Y. Chen and H.C. Liu. 1786. Age and growth of Lurjanus sebae In the waters off northwestern Australia. Acta. Oceanogr. Taiwan. Sci. Rep. 16:90- 102.
00281 1 Sanchez-Gil, P. , J.R. Miranda and D.F. Hernandez. 199 1 . Avances en el atlas ecologico pesquero del sur del Golfo de Mexico. Jaina Z(4): 16.
003083 Moore. C.M. and R.F. Labisky. 1984. Popu- lat ion parameters o f a relat ively unexploited stock of snowy groupers in the lower Florida Keys. Trans. Am. Fish. SOC. 1 13:322-329.
003090 Manooch. C.S.. 111. 1987. Age and growth of snappers and groupers. p. 327-373. 1nJ.J. Polovina and 5. Ralston (eds.) Tropi- cal snappers and groupers: biology and Fisheries management. Ocean Resour. Mar. Policy Ser. Westview Press. Boul- der.
003092 Nagellterken, W.P. 1979. Biology of the graysby. Epinephelus cruentatus, o f the coral reef oFCuragao. Stud. Fauna Curacao Other Caribb. 151. 60: 1 - 1 18.


240
003 125 Grimes. C.B. 1978. Age, growth and length- weight relationships of vermilion snap- per. Rhombop//tes aurorubens from North Carolina and Sourh Carolina waters. Trans. Am. Fish. Soc. 107:454-456.
27 Ralston, S. 1987. Mortality rates of snap- pers and groupers. p. 375-404. In J.J. Polovina and S. Ralston (eds.) Tropical snappers and groupers: biology and fish- eries management. Ocean Resour. Mar. Policy Ser. Westview Press, Boulder.
96 Saloman, C.H. and W.A. Fable, Jr. 1981. Length-frequency distr ibut ion o f recreationally caught fishes from Panama City. Florida in 1978 and 1979. NOAA Tech. Memo. NMFS-SEFC-61. Futch, R.B. and G.E. Bruger. 1976. Age, growth and reproduction of red snap- per in Florida waters. p. 165-184. In H.R. Bullis and A.C. Jones (eds.) Proc. Colloqium on Snapper-Grouper Fishery Resources of the Western Central Atlantic Ocean. Florida Sea Grant Program Report 17. Manickchand-Dass, S. 1987. Reproduc- tion, age and growth of the lane snap- per, Lurjanus synagris (Linnaeus), in Trini- dad, West Indies. Bull. Mar. Sci. 40(1): 22-28. Baisre. ].A. and 1. Paez. 198 1. Los recursos pesqueros del archipelago Cubano. WECAF Stud. 8:79. Espinosa, L. and E. Pozo. 1982. Edad y crecimiento del sesi (Lutjanus buccanella Cuvier, 1928) en la plataforma suroriental de Cuba. Rev. Cuba. Invest. Pesq., 7(1): 80- 100. Edwards, R.R.C. and S. Shaher. 1991. The biornetrics of marine fishes from the Gulf of Aden. Fishbyte 9(2):27-29. Mathews, C.P. and M . Samuel. 1991 Growth, mortality and length-weight pa- rameters For some Kuwaiti fish and shrimp. Fishbyte 9(2):30-33. Mathews, C.P. and M . Samuel. 1987. Growth, mortal i ty and assessment for groupers from Kuwait. Kuwait Bull. Mar. Sci. 9:173-191 Pinto. L. 1986. Use of ELEFAN programs for emigrating species. Fishbyte 4(1):14- 15. Uchida. R.N. 1986. Berycidae. p . 78-79. In R.N. Uchida and J.H. Uchiyama (eds.) Fishery Atlas of the Northwestern Ha- waiian Islands. NOAA Tech. Rep. NMFS 38 . Uchiyarna, J.H. and D.T. Tagami. 1984. Lifc history, distribution, and abundance of bottomfishes in the Northwestern Ha- waiian Islands. p. 229-247. /nR.W. Grigg and K.Y. ~ a n o u e (eds.) Proceedings o f
the Second Symposium on Resource Investigations in the Northwestern Ha- waiian Islands. Ralston. 5. and G.T. Miyamoto. 1983. Analyzing the width of daily otolith in- crements to age the Hawaiian snapper, Pr/st/pomoides filarnentosus. Fish. Bull., US 81 :523-535. Sherman, K.. L.M. Alexander and B.D. Gold. 1991. Food chains, yields, mod- els, and management of large marine eco- systems. Westview Press. Inc.. Boulder, Colorado. 320 p. Acosta, A . and R.S. Appeldoorn. 1992. Estimation of growth, mortality and yield per recruit for Lutjanussynagris (Linnaeus) in Puerto Rico. Bull. Mar. Sci. 50(2):282- 291. Davis. T.L.O. and G.J. West. 1992. Growth and mortality of Lurjanus vittus (Quoy and Gaimard) from the North West Shelf of Australia. Fish. Bull. 90:395-404. Bullock, L.H., M.D. Murphy. M.F. Godcharles and M.E. Mitchell. 1992. Age, g rowth , and reproduct ion o f jewfish Lpinephelus itajara in the eastern Gulf of Mexico. Fish. Bull. 90:243-249. Kitalong. A.H. and P. Dalzell. 1994. A preliminary assessment of the status of inshore coral reef fish stocks in Palau. Inshore Fish. Res. Tech. Doc. No. 6. South Pacific Commission, Noumea, New Cal- edonia. Manooch. C.S.. III and C.L. Drennon. 1987. Age and growth of yellowtail snapper and queen triggerfish collected from the U.S. Virgin Islands and Puerto Rico. Fish. Res. 6:53-68. Djabali. F.. A. Mehailia. M. IKoudil and B. Brahmi. 1993. Empirical equations for the estimation of natural mortal i ty in Mediterranean teleosts. Naga, ICLARM Q. 16(1):35-37. Bouain, A. 1985. Croissance lineaire des rnCrous du Golfe de Gabts (Tunisie). Rapp. P.-v. Rtun. CIEM 29(8):99-100. Chauvet, C. 1988. Etude de la croissance du mCrou Epinephelusguaza (LinnC 1758) des cotes Tunisiennes. Aquat. L iv ing Resour. 1 :277-288. McPherson, G.R. and L. Squire. 1990. Age and g rowth o f three dominant Lurjanus species of the Great Barrier Reef inter-reef fishery. Asian Fish. Sci. 5(1):25- 36. Chen. C.Y., S.Y. Yeti and H.C. Liu. 1984. Age and growth of Lutjanus malaLwricus in the northwestern shelf off Australia. Acta Oceanogr. Taiwan 1 5: 154- 164.

Erzini, K. 1991. A cornpllation of data on variabil i ty in length-age i n rnarlne fishes. Working paper 77. Fisheries Stock Assessment, Ti t le XII. Collaborative Research Support Program, University of Rhode Island. (unpaged). Brlggs, P.T. 1978. Black sea bass in New Yorlc waters. N.Y. Fish Game J . 25:45- 58. '
Ezzat, A.A., W.F. Wadie. M.Y. Miltail and M.T. Hashem. 198 1 . Age and growth of Epinephelus aeneus in the Egyptian Medi- terranean waters. Bull. Inst. Oceanogr. (ARE) 7:395-406. Hastings. P.A. and S.A. Bortone. 1980. Observations on the life history of the be l ted sandfish Serranus subl igar ius (Serranidae). Env. Biol. Fish. 5:365-374. Morales-Nin. B. 1989. Growth deterrni- nation of tropical marine fishes by means of otolith interpretation and length analy- sis. Aquat. Living Resour. 22:241-253. Wadie, W.F., M.T. Hashern, M.Y. Miltail and A.A. Ezzat. 1981. Age and growth of Epinephelus alexandrinus in the Egyp- t ian Mediterranean waters. Bull. Inst. Oceanogr. ARE 7:559-574. Pozo, E. and L. Espinosa. 1982. Estudios de la edad el crecirniento del pargo del alto (LuTjanus vivanus Cuvier. 1828) en la plataforma suroriental de Cuba. Rev. Cub. Inv. Pesq. 7: 1-23. Lee, J.U. and A.F. Al-Baz. 1989. Assess- ment of fish stocks exploited by fish traps in the Arabian Gulf area. Asian Fish. Sci. 2:213-231. Mees. C.C. 1993. Population biology and stock assessment o f Pristipornoides filamentosus on the Mahe Plateau. Sey- chelles. J . Fish Biol. 43:695-708. Hostetter, E.B. and T.A. Munroe. 1993. Age, growth, and reproduction of tautog. Tautosa onitis(Labridae: Perciformes) from coastal waters of Virginia. Fish. Bull. US 9 1 :45-64. Wenner. C.A., W.A. Roumillat and C.W. Waltz. 1986. Contributions to t h e l i fe history of black sea bass, Centroprjstis striata, off the southeastern United States. Fish. Bull. 89:723-741. Matheson. R.H., I l l , G.R. Huntsman and C.S. Manooch 111. 1986. Age, growth. mortality, Food and reproduction ofscarnp. Myctoperca phenax, collected off North Carolina and South Carolina. Bull. Mar. Sci. 38:300-3 12. Murray. P.A.. L.E. Chinnery and f . A . Moore. 1992. The recruitment of the queen snapper, Etelis oculatus Val., into the St. Lucian fishery: recruitment of fish
and recruitment of fishermen. Proc. Gulf Caribb. Fish. Inst. 41 :297-303. Murray, P.A. and E.A. Moore. 1992. Re- cruitment and exploitation rate of Etelis oculatus Val. in the St. Lucian fishery. Proc. Gulf Caribb. Fish. Inst. 42:262. (ab- stract). Rodriguez. W.T. 1984. Estudio prelirninar para evaluar las caracteristicas biologicas pesqueras de Mycteroperca olfax en las islas Galapagos (Ecuador). Bol. Cient. Tec., Inst. Nac. de Pesca, Guayaquil-Ecuador 6(3):3-66. Sanders, M.I., G. Carrara and G. Lablache. 1988. Preliminary assessment for the brownspot ted grouper Epinephelus c/~/orostigma occurring on the Mahe Pla- teau (Seychelles), p . 268-277. In M.J. Sanders, P. Sparre and S.C. Venema (eds.) Proceedings of the workshop on the assessment of the fishery resources In the Southwest Indian Ocean. FAOIUNDP: RAF/79/065/WP/41/88/E. Ferreira, B.P. and G.R. Russ. 1992. Age. growth and mortality of the inshore coral t routP/ectropomus maculatus (Pisces: Serranidae) from the central Great Bar- rier Reef. Australia. Aust. j. Mar. Freshwat. Res. 43:1301-1312. Abde l -A i r . S.H. 1991. Sexual differences in growth OF the painted comber, Serrat~us sciba (Linnaeus. 1758) (Teleostel, Serranidae) from the southeastern Medl- terranean. Cybium 15(3):ZZ 1-228. Ferreira. B.P. and G.R. RUSS. 1993. Age validation and estimation of growth rate of the coral trout, Plectropomus leopardus (Lacepede 1802) from Lizard Island, northern Great Barrier Reef. Fish. Bull. 92:46-57. Romero. M.C.. E.E. Barr and A.G. Boa. 1987. Algunos aspectos b io log ico- pesqueros de la cabril la Epinephelus labriform~s (jenyns, 1840). Acta Cientifica Potosina 9(2): 165-1 76. Mees. C. 1992. Seychelles demersal fish- ery: an analysis of data relating to four key dernersal species. Seychelles Flsh- ing Authority. SFA/RE.D/019. 142 p. Moussac. G . de. 1988. Synthese des donnees sur la pCche artisanale aux Sey- chelles, biologie-resources-exploitation. SFAlRLDl006. 64 p. Van der Knapp. M.. Z. Waheed, H. Shareef and M . Rasheed. 1991. Reef fish resources survey in the Maldives. Bay o f Bengal Program/WP/64/MDV/88/007. 6 1 p. Valle. S.V. and 1.P. Garcia-Arteaga. Growth parameters of marine fishes in Cuban waters. (MS)

Artiles. M. 1985. Estudios sobre 10s efectos de 10s otolitos. la edad y el crecimiento de la biajaiba. (Lutjanus synasris. 1758). Trab. Dipl. Cent. Inv. Mar.. Univ., Hab. 29 p. Carrillo de Albornoz. C. and M.E. Rarniro. 1988. Estudio biolegico de la rabirrubia (Ocyurus chrysurus) en el W. de la plaraforma SE de Cuba. I. Edad y crecimiento. Rev. Invest. Mar. 9(1):9-24. Claro. R.. A. Garcia-Cagide, L.M. Sierra and J . P . Garcia-Arteaga. 1991. Caracteristicas biol6gicas-pesqueras de la cherna criolla Epinephelus stfiatus (Bloch) (Pisces:Serranidae) en la plataforma Cubana. Cienc. Biol. 23:23-43. Garcia-Arteaga, J.P., A. Garcia-Cagide, L.M. Sierra and R. Claro. Caracteristicas bioldgicas del bonaci gato, Mycteroperca tigrjs(Pisces: Serranidae) en la plataforrna suroccidental de Cuba. Scientia Marina. (In press). Olaechea, A. and M . Quintana. 1970. Preevaluacion sobre la deterrninacion de la edad en la biajaiba, Lutjanus synagris (Linne). 11. Reun. Balance Trabajo. Cent. Invest. Pesq. La Habana, Cuba. Perez, A. and R. Rubio. 1986. Analisis electronico de frequencias de largo en poblaciones de peces cubanos. 5to. Foro Cient. Cip. Cent. Invest. Pesq. Cuba. En. 1986. Piedra, G. 1965. Materiales sobre la biologia de la rabirrubia. Ocyurus chrysurus (Bloch), p. 267-283. 1nA.S. Bogdanov (ed.) Invest. Pesq. Soviet-Cubanas Pischevaia Promishlennost, Moscu, Vol. 1. Salahange, P. 1984. Edad y crecimiento del caballerote (Lutjanus griseus, Linne 1758) en la plataforrna suroccidental de Cuba. Resum. Biol. IV Conf. Cient. Cienc. Nat. Exactas., II. Congr. Cienc. Biol. 82 p. Espinosa, L., E. Pozo and R. Quevedo. 1984. Edad y crecimiento del sesi (Luganus bucanella Cuvier, 1828) en la plataforma nororiental de Cuba. Rev. Cub. Inv. Pesq. 9( t ):9-20. Claro. R.. J. Baisre and J.P. Garcia-Arteaga. 1994. Pesquerias. In R. Claro (ed.) Ecologia de 10s peces rnarinos de Cuba. Inst. Oceanol. Acad. Cienc. Cuba and Cen. Invest. Quintana Roo (CIQRO) Mexico. Pozo. E.. L. Espinosa and M. Guardiola. 1984. Caracteristticas biologicos de 10s especies pelagico-oceinicas en la plataforrna SW de Cuba. Resurn. I Jor. Cient. BTJ., Cent. Inv. Pesq. La Habana. 8 p. Rubio, R., P. Salahange and M. Betancourt. 1985. Relaciones de la edad con ell largo, el peso y la fecundidad de la diajaiba (Lutjanus synagris) de la plataforma suroccidental de Cuba. Rev. Cub. Invest. Pesq. lO(3-4):77-90.
Rubio. R. 1986. Estudio sobre la edad y el crecimiento de la biajaiba (Lutjanus synagris Linnaeus 1758) (Pisces: Lutjanidae), en la plataforma noroccidental de Cuba. Sto. Foro Cicnt. Cip.. Centr. Invest. Pesq., La Habana. Algunas consideraciones sobre la forkacion e interpretaci6n del patr6n de rnarcas de crecimiento de 10s otolitos de la biajaiba (Lutjanussytiagris, Linnaeus 1758) y su uso en 10s estudios de edad y crecirniento. 5to. Foro Cient. Cip.. Centr. Invest. Pesq., La Habana. Salahange. P. 198 1 . Edad y crecimiento de la biajaiba (Lutjanus synagris, Linnaeus). Resum. I. Congr. Nac. Cienc. Biol.. La Habana. Buesa. R.]. and A. Olaechea. 1970. Estudios sobre la biajaiba: zona 6 y area de Diego Perez. Cent. Inv. Pesq., Archivo (01 20). 9 p. Badrudin, M. 1985. Untitled. Manuscript, Res. Inst. Mar. Fish.. Jakarta. Arreguin-Sanchez, F. 1987. Estado ac- tual de la exploitation del mero (Epincphelus morio) de l Banco de Campeche. 25 Aniv. Inst. Nal. Pesca. CRIP, Yucalpeten. INP, Mexico. Arreguin-Sdnchez. F . , M. Contrcras. V. Moreno. R. Burgos and R. Valdes. 1996. Population dynamics and stock assess- ment of red grouper (Epinephelus morio) fishery on Campeche Bank, Mexico, p. 202-2 17. In F. Arreguin-Sdnchez, J.L. Munro, M.C. Balgos and D. Pauly (eds.) Biology, fisheries and culture of tropical groupers and snappers. ICLARM Conf. Proc. 48. 449 p. Arreguln-Shnchez, F. 1992. An approach to the study of the catchability coeffi- cient with application to the red grouper (Epinephelus morio) fishery from the continental shelf of Yucatan. Mexico. Centro de Invest. Estudios Avanzad0.s del IPN, Mexico. 222 p. Doctoral thesis. Doi, T.. D. Mendizabal and M. Contreras. 1981. Andlisis prel iminar de la poblacidn de rnero Epinephelus mor io (Valenciennes) en el Banco de Carnpeche. Cienc. Pesq., MPxico (1 ): 1 - 16. Gonzilez, P.D.. 5. Zupanovic and H.E. Ramis. 1974. Biologia pesquera de la cherna americana del Banco de Campeche. INP/CIP Cuba. Res. Invest. 1:107-1 11. Guzmin. E. 1986. Contribuci6n al conocimiento de la pesqueria de mero (Epinephelus morio. Valenciennes) de las costas de Yucatan. ENEP-lztacala, UNAM, Mexico. Tesis profesional.

Muhlia. A. 1976. Aspectos biolbgico- pesqueros de Epinephelus morjo (Val.): mero. Mem. Primer Simp. al. Rec. Pesq. Mas. MCxico. Inst. Nal. Pesca, MCxico. 2:223-265. Rodrlguez. H. 1986. Estudio comparative de dos estructuras rigidas (otolito y hueso mesopterlgoide) para la estimacidn de edad crecimiento del mero (Epinephelus morio) del Banco de Campeche. Univ. Autbn.. Nuevo Leon, MCxico. Tesis profesional. Salazar, A.R. 1988. C o n t r i b u c i 6 n a l conoclmiento de la pesquerla de mero (Eplnephejus rnorio) de la flota menor de las costas de YucatAn. ENEP-lztacala, UNAM. Mexico. Tesis profesional. Valdes. E. and G. Padron. 1980. Pesquerlas de palangre. Rev. Cub. Invest. Pesq. 5(2):38-52. Manicltchand-Heileman, S.C. and D.A.T. Phillip. 1896. Reproduction, age and growth of the Caribbean red snapper Lut/anus purpureus in waters off Trini- dad and Tobago, p. 137-149. In F. Arreguin- SAnchez, J.L. Munro. M.C. Balgos and D. Pauly (eds.) Biology, flsheries and culture of tropical groupers and snappers. ICLAW Conf. Proc. 48. 449 p. Ximenes, M.O.C. and A.A. Fonteles-Filho. 1988. Estudo da idade e crescimento do pargo, Luganus purpureus Poey (Pisces: Lutjanidae), no norte e nordeste do Brasil. Arq. Cienc. Mar. 27~69-81. Posada, J.M. and R.S. Appeldoorn. 1996. The validity of length-based methods for estimating growth and mortality of groupers, as illustrated by comparative assessment of the creole Fish. Paranthias furcjfer (Pisces. Serranidae). p 163-1 73. I n F. Arreguin-Sanchez. J.L. Munro. M.C. Balgos and D. Pauly (eds.) Biology, fisheries and culture of tropical groupers and snap- pers. ICLARM Conf. Proc. 48. 449 p. Nelson, R.S.. C.S. Manooch Ill and D.L. Mason. 1986. Ecological effects of en- ergy development on reef fish of the Flower Garden Banks: reef fish bloprofiles. Final Report. Southeast Fish. Cent. Beau- fort Lab.. Natl. Mar. Fish. Sew. NOAA, Beaufort. North Carolina. 251 p. Leonce-Valencia. C.O. and C. Monroy. 1993. Growth parameter estimation based on length frequency data of red snapper (Lupnus campechanus) on Campeche Bank. Paper pbesented at the International Workshop on Tropical Groupers and Snappers. 28-29 October 1993, Campeche, Mexico Gonzalez. M.E. 1988. Estudio de la pesqueria de huachlnango (Lutjanus
carnpechanus Poey) de l Banco de Campeche. CINVESTAV Unidad Mkrida.. Tesis maestria. Rodriguez Castro, 1. 1992. Contribucion al conocimiento de la biologia pesqueria del huachinango Luvanus campechanus (Poey 1860) en las costas del sur de Tamaullpas, Mexico. Tec. de Ciudad Victoria, Tamaulipas, Mexico. Tesis de licenciatura. Claro. R. and J.P. Garcia-Arteaga. 1994. Crecimiento. p. 321 -402. In R. Claro (ed.) Ecologla de 10s peces rnarinos de Cuba. Inst. Oceanol. Acad. Cienc. Cuba. and Cen. Invest. Quintana Roo (CIQRO) MCxico. Ayala. D.L. 1984. Determinacion de algunos parametros poblacionales y de la biologh pesquera de la biajaiba Lurjanus synqris(Linneo), 1758 (Pisces: Lutjanidae). E.N.EP.I., UNAM, Mexico. Tesis de licenciatura. Torres-Lara. k. and E. Chavez. 1987. Evaluaci6n y dlagnostico de la pesqueria de rubia (Lutjanus synagris) en el estado de YucatAn. Cienc. Mar. 13(1):7-29. Mexicano-Cintora, G. and F. Arreguin- SAnchez. 1989. Dinhica de las poblaciones de rubia (Lutjanus synagris) y canane (Ocyurus chrysurus) de las costas de Yucatan, Mexico. Centro de lnvestigacibn y Estudios Avanzados del lnst i tuto PolitCcnico Nacional. Unida Merida, M6xIco. 12 p., 3 tabs, 1 fig. Cantarell. E. 1982. Determinacion de la edad y e l ritmo de crecimiento del pargo canank (Ocyurus chrysurus). Bloch 1871 ). en el estado de Yucatdn. E.N.E.P.I.. UNAM, Mexico. Tesis de licenciatura. Mexicano-Cintora. G. and F. Arreguln- Sanchez. 1989. Estimacion de edad y crecimiento del pargo canane (Ocyurus chysurus) del litoral de Yucatan, MCxico. Centro de lnvestigacion y Estudios Avanzados del lnst i tuto PolitCcnico Nacional, Unida MCrida. MCxico. 12 p., 3 tabs, 1 fig. Valdes-Alonso, R. and D. Fuentes- Castellanos. 1987. lnforme anual del programa de cruceros de investigaciones sobre el mero, Epjnephejus morio (Valenciennes) en el Banco de Carnpeche. Centro de lnvestigaciones Pesqueras, La Habana. Cuba. (manuscript). 10 p. Manooch, C.S.. Ill and D.L. Mason. 1987. Age and growth of Warsaw grouper from the southeast region of the United States. Northeast Gulf Sci. 9(2):65-75.
FishBase, 12 September 1996
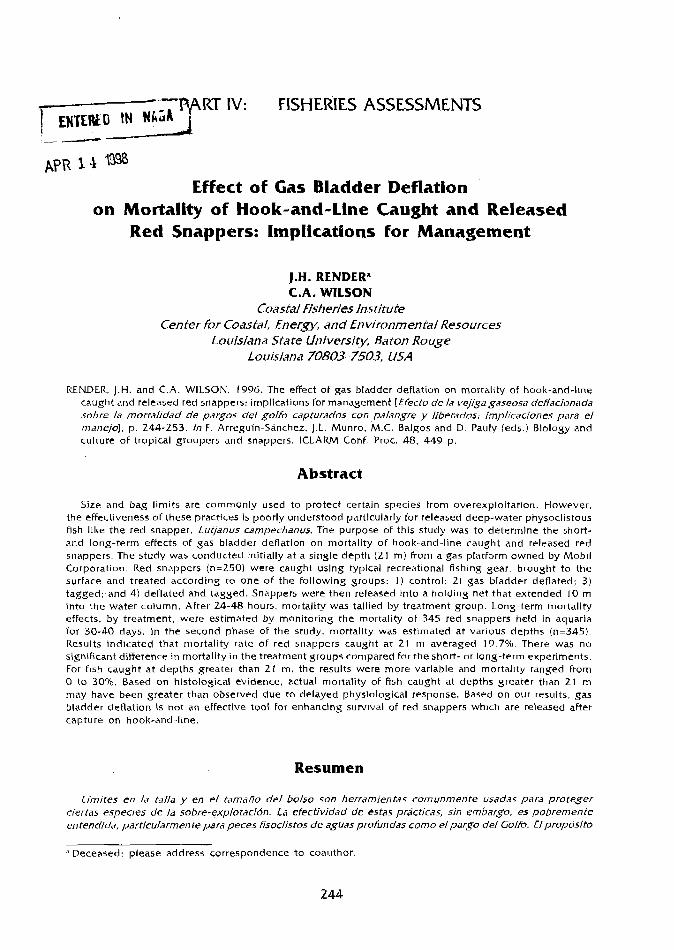
-DfiRT 1V: FISHERIES ASSESSMENTS piiiiiz* -_ - APR 1 4 m8
Effect of Gas Bladder Deflation on Mortality of Hook-and-Line Caught and Released
Red Snappers: Implications for Management
J.H. RENDER" C.A. WILSON
Coastal fisheries Institute Center for Coastal, Energy, and Environmental Resources
Louisiana State University, Baton Rouge Louisiana 70803-7503, USA
RENDER, J.H. and C.A. WILSON. 1996. The effect of gas bladder deflation on mortality of hook-and-line caught and released red snappers: implications for management [Efecto d e b vejiga gaseosa deh'acionada sobre 1.7 mortalidad de pargos del golf0 capturados con palangre y liberados; implicaciones para el manejo], p. 244-253. In F. Arreguin-Sanchez, J.L. Munro. M.C. Balgos and D. Pauly (eds.) Biology and culture of tropical groupers and snappers. ICLARM Conf. Proc. 48, 449 p.
Abstract
Size and bag limits are commonly used to protect certain species from overexploitation. However. the effectiveness of these practices is poorly understood particularly for released deep-water physoclistous fish liltc the red snapper, Lutjanus campechanus. The purpose of this study was to determine the short- and long-term effects of gas bladder deflation on mortality of hook-and-line caught and released red snappers. The study was conducted initially at a single depth (21 m) from a gas platfarm owned by Mobil Corporation. Red snappers (n=250) were caught using typical recreational fishing gear, brought to the surface and treated according to one of the Following groups: 1 ) control; 2) gas bladder deflated: 3) tagged; and 4) deflated and tagged. Snappers were then released into a holding net that extended 10 m into the water column. After 24-48 hours, mortality was tallied by treatment group. Long-term mortality effects, by treatment, were estimated by monitoring the mortality of 345 red snappers held in aquaria for 30-40 days. In the second phase of the study. mortality was estimated at various depths (n=345). Results indicated that mortality rate of red snappers caught at 21 m averaged 19.7%. There was no significant difference in mortality in the treatment groups compared For the short- or long-term experiments. For Fish caught at depths greater than 21 m, the results were more variable and mortality ranged from 0 to 30%. Based on histological evidence, actual mortality OF Fish caught at depths greater than 21 rn
may have been greater than observed due to delayed physlological response. Based on our results, gas bladder deflation is not an effective tool for enhancing survival of red snappers which are released after capture on hook-and-line.
Resumen
Limites en la talla y en el tamatio del bolso son herramientas cornunrnente usadas para proteger ciertas especies de la sobre-explotacidn. La efectividad cle estas practicas, sin embargo, es pobremente entendida, pnrticularmente para peces fisoclistos de aguas profundas como el pargo del Golfo. El proposito
.' Deceased: please address correspondence to coauthor
244

de este estudlo fue determinar 10s ekctos a corto y largo plazo de la deflaclbn de la vejiga gaseosa sobre /a mortalldad de pargos del Golfo capturados y liberados utiljzando palangres. El estudio se efectud lnicialmente a solo un nivel de profundldad (21 m) desde una plataforma de gas perteneciente a Mobil Corporation. Los pargos del Golfo (n=250) fueron capturados usando artes para pesca deportiva, traido a la superficie y colocado de acuerdo a alguno de 10s siguientes grupos: ( I ) control, (2) vejiga gdseosa desinflada, (3) marcados, y (4) marcados/deflacionados. Los pargos fueron entonces liberados en una red colgante que se extend16 I0 rn en la colurnna de agua. Despuks de 24 a 48 horas, la mortalidad fuk registrada para cada grupo/tratamiento. El efecto a largo plazo, por tratamiento, fuP estirnado por monltoreo de la mortalidad de 345 pargos mantenldos en acuarios por 30-40 dias. En la segunda etapa del estudlo, la mortalidad fu6 estlmada a varlas profundldades (n=345). Los resultados indican que la tasa de mortalidad del pargo del Golfo capturado a 21 m promedid 19.7%. No hub0 diferenclas slgnificativas en mortalidad entre grupos de tratamiento comparando cada experimento, a corto y largo plazo. Los resultados de 10s peces capturados a profundiclades mayores a 21 m fueron mds variables y /as mortal/dades observadas fluctuaron de 0% a 30%. Con base en evjdencjas histoldgicas, la mortalidad actual de peces capturados a profundidndes mayores de 21 rn pudieron haber sido mAs altas que /as observadas debido a un retraso en la respuesta flsloldgica. Los resultados aqui obtenidos sugieren que la deflacidn de la vejiga gaseosa no es una herramlenta efectiva para obtener estimados de supervivencia en el pargo del Golfo capturado con palangre y posteriormente liberado.
Introduction
The red snapper (Lul"janus campechanus) is an important commercial and recreational species in the northern Gulf of Mexico (GOM) (see Cuellar et al.; Ehrhardt and Legault; Monroy-Garcia et al., this vol.). Off Louisi- ana, red snappers comprise a significant portion of the communities that are associated with offshore oil and gas production platforms. These platforms serve as 'de facto' reefs since natu- ral hard substrate is limited and far from shore.
The red snapper population in the north- ern GOM was recently characterized by the Gulf of Mexico Fisheries Management Coun- cil's (GMFMC) Reef Fish Assessment Panel as being in a state of "severe overfishing" (Muller 1990). Much of the current problem has been attributed to high mortality rates in young fish. Highest fishing mortality is on age 1 (juve- nile) snappers taken in the shrimp fishery bycatch, followed by age 3 fish from the commercial and recreational fisheries (Muller 1990). Age 1 and 2 fish are also common in commercial and recreational catches (Wilson et al. 1993). Undersized fish caught in the directed com- mercial and recreational fisheries are returned to the water, presumably to recover and grow larger. Although the question of survival of released red snapper has been raised, it has not been adequately addressed particularly
off Louisiana where extremely large numbers of undersized fish are caught and released (Capt. Steve Tomeny, pers. comm.). Lit- t le is known about the success of release practices since contact with an individual fish Is lost at time of release and return rates in most tagging studies have been low.
There has been considerable debate and interest on the question of whether gas bladders in certain fishes should be deflated by recreational anglers to increase a fish's ability t o descend rapidly (Sport Fishing Institute 1991). The question has merit since vertical movements of physoclistous species are limited in either upward or downward directions due to positive or negative buoyancy effects as explained by Boyle's Law (Alexander 1967). A central question exists, however, as to whether deflation techniques increase the survival of released fish or simply enable the fish t o submerge where they experience delayed mortality. Gotshall (1 964) studied the effect of deflating gas bladders on the survival o f tagged rockfish (Genus Sebastodes). He concluded that deflated rockfish may have suffered greater mortality than non-deflated ones and suggested that more detailed studieswere needed on the survival of deflated and non-deflated rockfish.

The goal of this study was to estimate mortality rates of red snapper which have been caught on hook-and-line and released in order to determine whether gas bladder deflation techniques could be used to increase survival. Specific objectives were to: a) determine short-term effects of air bladder deflation on mortality rates and b) determine long-term effects of gas blad- der deflation on mortality rates.
Materials and Methods
Initially, the study was conducted on a gas production platform (Mobil West Cameron 352) approximately 90 I<m south ofcameron, Louisiana, from October 1990 to September 199 1 , with water depth of 2 1 m. Red snappers (n=250) were caught near the bottom by hook-and-line with typical bottom fishing gear (Penn 309 reels, 6 R medium action rods, 5" stainless hooks). Bait was usually cut blue runner (Caranx crysos), bluefish (Pornatomus saltatrix) or little tunny (Euthynnus alletteratus) . Following hooking, the fish were brought quickly to the surface, treated, and released into a holding net. Out-of-water handling time was usually less than 1 min and never more than 2 min, otherwise the specimen was rejected from testing due to excessive handling time. The holding net consisted of a modified commercial hoop net (#IS twine, 2.5 cm square mesh) (Fig. 1 ) that was extended to 1 1 m length with a 1.8 m diameter hoop at the mouth. The nets were moored vertically within the platform structure by pulling a rope attached to the bottom of the net through a shackle that was attached to the platform 8.5 m below the surface. After their release into the net, the fish were held from 24 to 48 hours. Mortality was tallied at the end of each experiment for each treatment group.
Fig. 1. Modlfled hoop net deslgn used for holdlng hook-and-llne caught and released red snappers. [Diseiio modificado de /a red rle.aro usada para contenerpargos del Golfo capturados y liherados con paiangre.]
Experimental design included the fol- lowing treatments: a) control; b) air blad- der deflation; c) tagging; and d ) air blad- der deflation and tagging. Control here refers to the release O F fish into a net with no treatment. Air bladders were deflated by inserting a sterile disposable needle tip (Becton Dicinson 8, Co., Precision Glide #20, 4 cm) through the side of the fish under the fourth dorsal spine and directly behind the opercular spine. This site was preselected based on our determination that no other organs would be damaged
by insertion at this site. Tags (Hallprint dart tags) were inserted below the first dorsal fin to hook between the pterygiophores of that fin. Treatments were designed to test the effects O F tagging and air bladder deflation relative to a control through the following comparisons: a) tagging versus not tagging; b) air bladder deflation versus no deflation; and c) tagging with air bladder deflation versus tagging without deflation.
The effects of tagging and tagging with deflation were investigated since all of the specimens in the long-term studies would be tagged as described below.
Long-term effects of catch on survival were tracked by transferring specimens to the Aquarium of the Americas in New Or- leans, Louisiana. The aquarium specimens were transported via ship in an oxygen- ated tanlc to Cameron, Louisiana, where they were received by Aquarium person- nel for final transport via truck to New Or- leans. The fish were held for 30-40 days in a 6.25 m diameter tanlc with a volume O F approximately 34 m3 water capacity. Salinity and temperature were maintained at 32 ppt and 25°C. All fish were tagged for identification. Thirty-five ofthe red snap- pers had deflated air bladders, while 72 were tagged without gas bladder defla- tion. Mortality rates between the treatment groups (tagged, and tagged and deflated) were monitored by Aquarium personnel.
The effects of treatment on mortality rates were investigated using analysis of vari- ance (ANOVA). Type I l l sums of squares were used for the analysis due to the un- equal number of observations in each sub- class.
In the second phase of the study, rnor- tality effects were tested at variable depths by modifying the net system. From our work during the First phase of the study, we observed that most of the fish released into the closed net system were unable to sub- merge more than several feet, or For more than a few minutes, and then floated to
the surface. We hypothesized, therefore, that a conservative estimate of mortality could be obtained by releasing red snap- pers into an open net system and tallying the number of red snappers that were un- successFul in submerging. Further, this es- timate of submergence rate would allow us to evaluate the necessity of air bladder deflation ( i .e., at what depth red snappers were unable to compensate for positive buoyancy).
To test whether the open net system could be used, we deployed closed and open net systems at 2 1 m water depth. Twenty red snappers were caught and released into each net. There was no significant differ- ence in our mortality estimates (p<0.05) between the two systems.
Six cruises were conducted aboard the F/V Southerner from September 1992 to March 1993. The original net design was modified by placing floats at the mouth of the net and opening the bottom of the net to allow the fish to swim out. The net was deployed From the rear of the vessel and the tail was weighted with two 4.5 kg mushroom anchors to keep the net suspended vertically. As in the first phase, Ash were caught near the bottom, brought to the surface, and released after one of the following treat- ments: control or air bladder deflation. Red snappers were tested at five depth inter- vals (Table 1 ) .
The effect of depth interval on mortality was investigated using ANOVA. Type I l l sums of squares were used for analysis due to unequal number of observations in each subclass.
A subsample of six fish collectedat two depths (28 and 44 m, three from each) during the 4 March 1993 cruise were taken to com- pare physiological damage by depth. The specimens were preserved on ice, and trans- ported back to the laboratory For gross necropsy analysis. Internal organs were examined, and condition or damage of organs and tissues were noted.

Table 1. Numbers of red snapper tested at varlous depth Intervals during varlable depth mortality experiments. [Numero de pargos rojos a varjos lntervalos tie profundldad durante 10s experlmentos de mortalidad a profundidades varln6les.l
FALL SPRING Depth Interval Treatment
(m) Control Deflated Control Deflated
Results
The length-frequency distribution of red snappers tested during this study is shown in Fig. 2. The minimum size limit for red snapper legally retained by the commer- cia1 and recreational fisheries is indicated on the chart. Overall mortality during the study averaged 19.7%. We observed no
significant differences among treatments (Table 2).
Red snappers that were transferred to the Aquarium of the Americas allowed us to examine long-term mortality. Twenty of the 107 specimens died within 2 to 37 days (average 1 1.4 days) from the time of transfer. Sixty percent of deaths occurred within the first week of captivity. Mortality rates be- tween the tagged ( 1 8.0°/o), and tagged and
Length (FL; em)
Fig. 2. Length-frequency dlstrlbution of red snappers used in mortality tests at 21 m depth. The minimum size llmlt for the commercial and recreational fisheries Is Indicated. [Distribution de frecuencia de longitudes d e l p a ~ o del Golh usados en las pmebas de morkalidad a 21 m de profundidad. Los Iiinltes minjmos de tamanlo para la pesca comerc/al y deportha son sefi1ados.l

Table 2. Analysls of varlance table testlng the effects of treatment on mortality rates of hook-and-llne caught and released red snapper. [Tabia tiel anaiisls de varianza probando 10s efectos de tratamlento sobre /as tasas de motcaiidad de pargos tie1 Goifo capturados y /Iberados ufllizando paiangres.1
Model Source dF s s F-ratio P > F
Model 3 0.0221 0.49 0.6952
Error 13 0.1950 -- ..
Table 3. Mortality rate (%) of red snapper by treatment and season during varlable depth mortallty experiments. [ Tasas tie mortalidad (%) tie pargo del Goifo por trafamiento y estaclon duranfe 10s experimentos tie mortaiidad a profundidad variable.]
FALL SPRING Depth Interval Treatment
(m) Control Deflated Control Deflated
deflated (20.1 Oh) treatment groups were not significantly different (p>0.05).
Results from the depth tests are sum- marized in Table 3 by treatment, season and depth interval. A total of 345 red snap- pers were tested. Results from the fall cruises suggested increasing mortality with depth for the control group (Fig. 3); however, the numbers of fish tested at the two greatest dep ths tested were low, 6 and 4, respec- tively, and the relationship was not sig- nificant a t p=0.05 (Table 4). Sample size was low in the deeper stations owing t o our inability t o catch sufficient numbers of
red snappers at a particular station, o r be- cause of current conditions that were suf- ficiently strong t o prohibit deployment of the net system. During the spring cruises there was again a general trend of increasing mortality with depth for the control treat- ment (Fig. 3) , but it was not significant a t p<0.05.
Data from the deflated treatment group in t h e variable dep th experiments exhib- ited considerably more variation for both the fall and spring cruises. Mortality was not significantly related to dep th for ei- ther seasonal period. Greatest mortality in

Controls Oeflated -- Fa 1 1 0 0
Spring II
I I 1 I I 1 I 20 25 X ) 35 ' 40 45 50 -
Depth (m)
Fig. 3. Mortality rate, by treatment, of red snapper tested in the variable depth experiments during Fall 1992. [Tasa de mortalidad, por tratamiento, de /as pruebas con pargo dei Goifo en 10s experimentos con profundidad variable durante /a 6poca de Iiuvjas en 1992.1
Table 4. Analysis of variance table testing the effects of depth, treatment, and the Interaction between treatment and depth on rnortallty rates of hook-and-line caught and released red snapper. [Tabla de andiids de varianza probando 10s efectos de profundidad, tratamiento, y la Interacdon entre tratamiento yprofundidad sobre /as tasas de mortai/dad delpargo dei Goifo capturado y iiberado usando palangres.]
Model Source d f 5.5 F-ratio P>F Model 26 0.2056 0.74 0.7283 Error 5 0.0537
Type Ill - . Variable df 5 s F-ratio P > F
Depth 15 0.1 193 0.74 0.7035 Treatment 1 0.0126 1.17 0.3290 Depth'Trt 10 0.0698 0.65 0.7378
this group was 20°/0 at >55 m during the spring cruises.
During the necropsy analyses we examined each specimen and noted whether: a) the gas bladder had ruptured; b) the stomach was everted; c) there was hemorrhaging of muscle tissue; d) there was hemorrhaging of the liver: and e) whether there was an
intusseption (i.e., blockage) of the gut caused by the stomach eversion. For the three specimens examined from 28 rn, there were no cases in which the stomach was everted and therefore no intusseption of the gut. One of the three specimens had a rup- tured gas bladder. Liver hemorrhage was noted in two specimens, and light muscle
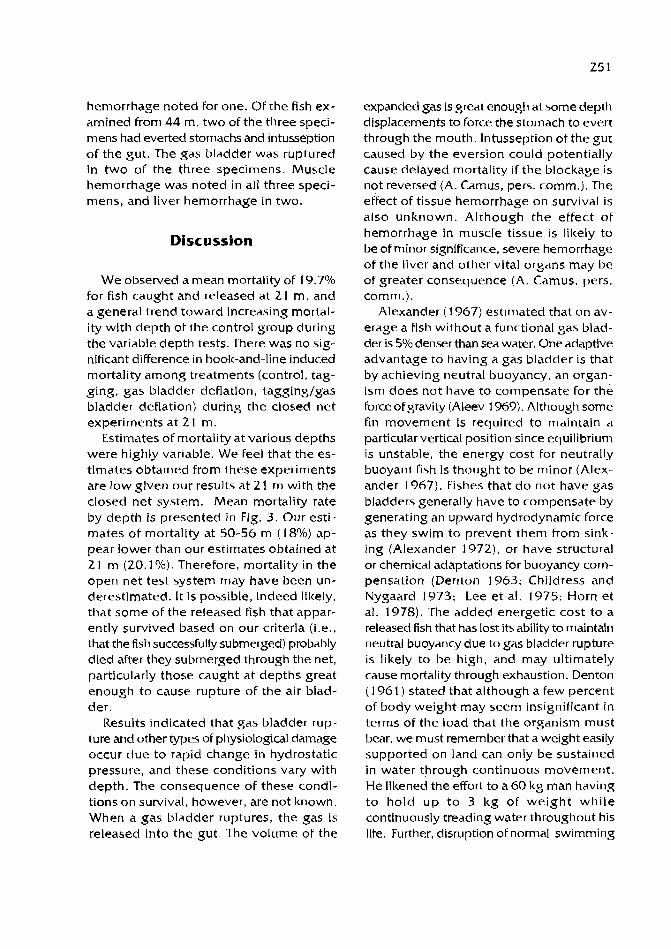
hemorrhage noted for one. Of the fish ex- amined from 44 m, two of the three speci- mens had everted stomachs and intusseption of the gut. The gas bladder was ruptured in two of the three specimens. Muscle hemorrhage was noted in all three speci- mens, and liver hemorrhage in two.
Discussion
We observed a mean mortality of 19.7% for fish caught and released at 21 m, and a general trend toward increasing mortal- ity with depth of the control group during the variable depth tests. There was no sig- nificant difference in hook-and-line induced mortality among treatments (control, tag- ging, gas bladder deflation, tagginglgas bladder deflation) during the closed net experiments at 2 1 m.
Estimates of mortality at various depths were highly variable. We feel that the es- timates obtained from these experiments are low given our results at 21 m with the closed net system. Mean mortality rate by depth is presented in Fig. 3. Our esti- mates of mortality at 50-56 m (18%) ap- pear lower than our estimates obtained at 21 m (20.1 O/O). Therefore, mortality in the open net test system may have been un- derestimated. It is possible, indeed likely, that some of the released fish that appar- ently survived based on our criteria (i.e., that the fish successfully submerged) probably died after they submerged through the net, particularly those caught at depths great enough to cause rupture of the air blad- der.
Results indicated that gas bladder rup- ture and other types of physiological damage occur due to rapid change in hydrostatic pressure, and these conditions vary with depth. The consequence of these condi- tions on survival, however, are not known. When a gas bladder ruptures, the gas is released into the gut. The volume of the
expanded gas is great enough at some depth displacements to force the stomach to evert through the mouth. Intusseption of the gut caused by the eversion could potentially cause delayed mortality i f the blockage is not reversed (A. Camus, pers. comm.). The effect of tissue hemorrhage on survival is also unknown. Although the effect of hemorrhage in muscre tissue is likely to be of minor significance, severe hemorrhage of the liver and other vital organs may be of greater consequence (A. Camus, pers. comm.).
Alexander ( 1 '967) estimated that on av- erage a fish without a functional gas blad- der is 5% denser than sea water. One adaptive advantage to having a gas bladder is that by achieving neutral buoyancy, an organ- ism does not have to compensate for the force of gravity (Aleev 1969). Although some fin movement is required to maintain a particular vertical position since equilibrium is unstable, the energy cost for neutrally buoyant Fish is thought to be minor (Alex- ander 1967). Fishes that do not have gas bladders generally have to compensate by generating an upward hydrodynamic force as they swim to prevent them from sink- ing (Alexander 1972), or have structural or chemical adaptations for buoyancy com- pensation (Denton 1963; Childress and Nygaard 1973; Lee et al. 1975; Horn et al. 1978). The added energetic cost to a released fish that has lost its ability to maintain neutral buoyancy due to gas bladder rupture is likely to be high, and may ultimately cause mortality through exhaustion. Denton (1961) stated that although a few percent of body weight may seem insignificant in terms of the load that the organism must bear, we must remember that a weight easily supported on land can only be sustained in water through continuous movement. He likened the effort to a 60 kg man having to hold up to 3 kg of weight while continuously treading water throughout his life. Further, disruption of normal swimming

behavior may increase the rislcof mortality since odd or conspicuous individuals are often targeted by predators (Curio 1976).
Air bladder deflation did not significantly affect survival of red snappers caught at 21 m depth for either the short- or long- term comparisons. Several factors should be considered when interpreting these results, particularly for fish that were transferred to the aquarium for the long- term experi- ments. These fish were held in the net at 9 rn for at least 24 hours. This acclimation period allowed some adjustment in buoy- ancy prior to transfer to the tank for trans- port. Sreen ( 1 970) modeled the rate at which fish could maintain neutral buoyancy with vertical displacement. Although his model calculated a rate of 5 hours for a vertical displacement of 150 m, he concluded that direct observations of gas deposition rates (Fange 1953) indicate that appreciably longer time would be needed for an adjustment of this magnitude. Second, the tank was highly oxygenated and was without cur- rent, therefore the necessity of neutral buoyancy for position maintenance was removed. There is evidence based on ob- servation of the fish transferred to the aquarium and ancillary data, that small puncture holes (#20 hyperdermic needle tips) in the gas bladder apparently reseal or repair rapidly. The tissue composition of the gas bladder as described by Fange (1 958) indicate elastic properties.
Although deflation techniques may have some significance in enhancing our ability to obtain physoclistous species for aquaria and experimental collections, the fate of deflated specimens released in situ is less certain given the harsher environmental conditions that the Ash is released into and the fact that return to capture depth would imply negative buoyancy. It is predictable based on' Boyle's law that i f only a partial amount of the total gas in the bladder is vented (as was usually the case), that a released fish could find neutral buoyancy
at some depth between surface and initial capture depth assuming that the gas bladder reseals effectively. The effect of a "com- pensatory return depth" is unknown. We suspect that For red snappers caught and released around an oil or gas platform, the effect would be less significant than for snappers caught and released around sub- merged natural or artificial substrate. Plat- form structure extends through the entire water column and red snappers at various depths from near surface to bottom were observed when in association with these structures. The effect on red snapper caught near-bottom around submerged natural or artificial hard substrate is less predictable since the structure provided by the substrate may k important for predation shelter (Parish 1987), and the "compensatory return depth" may not be sufficient to adequately pro- tect these fish from predation.
Results from the variable depth tests did not show evident differences in apparent survival due to deflation until depths of approximately 30-40 m were reached. Based on these results i t does not appear that air bladder deflation is an effective tool for enhancing survival of released red snap- per. For fish caught at depths not great enough to rupture the gas bladder (approx. >30 m), most of the fish (93%) were able to submerge. Since the gas in the bladder compresses as the Fish descends, neutral buoyancy can be reachieved by the fish as it returns to capture depth. Negative buoyancy resulting from the venting of gas as previously described or "compensatory return depth" may adversely affect survival. When capture depth is great enough to cause air bladder rupture, survival of the released individual becomes increasingly unlikely, for reasons previously described.
A further argument for not encouraging deflation techniques is that deflation tech- niques need to be rather precise and the tools used should be sterile. One of the authors has observed a well meaning angler

venting gas f r o m a n e v e r t e d s t o m a c h ( a c o m m o n m i s c o n c e p t i o n exists t h a t th i s is t h e gas b l a d d e r ) b y ItniFe p u n c t u r e . A s stated earlier in t h e discussion, s tomach e v e r s i o n g e n e r a l l y o c c u r s as a resu l t of gas b l a d d e r rup ture . A l t h o u g h venting gas t h r o u g h t h e s t o m a c h m a y i n c r e a s e a fish's ability to s u b m e r g e , o u r resul ts ind ica te t h a t long- te rm survival o f t h e s e Ash is unlikely. Further t h e effect of stomach p u n c t u r e o n survival is n o t k n o w n , par- ticularly g i v e n t h e s t r e s s a l ready p r e s e n t f rom h y d r o s t a t i c p r e s s u r e damage. Al- t h o u g h all deflation efforts by angle rs a r e not as c r u d e as t h o s e d e s c r i b e d a b o v e , i t d e m o n s t r a t e s t h a t s ignif icant a n g l e r educa t ion w o u l d b e necessary For p r o p e r utilization of t h e s e techniques, if it is found t h a t def la t ion t e c h n i q u e s e n h a n c e sur- vival for a g i v e n s p e c i e s .
References
Aleev , Y.C. 1 9 6 9 . Adapta t ions toward neutralizing the force of gravity, p. 31- 89. /nV.A. Vodyanitskii (ed.) Function and gross morphology in flsh. Keter Press, Jerusalem.
Alexander, R.McN. 1967. Functional design in fishes. Hutchinson University Library, London.
Alexander. RMcN. 1972. The energetics of vertical migration by fishes. Syrnp. Soc. Exp. Biol. 2 6 2 7 3 - 2 9 4 .
Chlldress, 1.). and M.H. Nygaard. 1973. The chemicd composition of midwater fishes a s a function of depth of occupance off sou thern California. Deep-sea Res. 20 : 1093-1 109.
Curio. E. 1976. The ethology of predation. Springer-Verlag, Berlin. 2 5 0 p.
Denton, E.]. 1961. The buoyancy of Ash and cephalopods. Progr. Biophys. 1 1 : 1 17- 234.
Denton E.J. 1963. Buoyancy mechanisms of sea creatures. Endeavor 22:3-8.
Fange, R. 1953. The mechanism of g a s transport in the euphysoclist swimbladder. Acta Physiol. Scand. 23 , Suppl. 110, 1-133.
Fange, R. 1958. The structure and Function of the g a s bladder in Argentina silus. Q. J . Micro- scope Sci. 9995- 102.
Gotshall, D.W. 1964. Increasing tagged rockfish (Genus Sebastodes) survival by deflating the swimbladder . California Fish a n d C a m e 50(4):253-260.
Horn, M.H.. P.W. Grimes, C.F. Phleger and H. McClanahan. 1978. Buoyancy function of the enlarged fluid-filled cranium in the d e e p sea ophidiid fish Acanthus armatus. Mar. Biol. 46:335-339.
Lee, R.F., C.F. Phleger and M.W. Horn. 1975. Composition of oil in Fish bones: possible function in neutral buoyancy. Comp. Biophys. Physlol. 50B: 13- 16.
Muller. R 1990. Report of the reef Fish assessment pane l , March 1 9 9 0 . Miami Laboratory, Southeast Fisheries Center. National Marine Fisheries Service, Miami, Florida. 15 p.
Parrish, J.D. 1987. The trophic biology of snappers and groupers, p. 405-439. In J.J. Polovina and 5 . Ralston (eds.) Tropical snappers and groupers: biology and Fisheries management. Westview Press, Boulder.
Sport Fishing Institute. 1991 . Puncturing air bladders: successful release method? Sport Fishing Inst. Bull. 426:3.
Steen, J.B. 1970. The swim bladder a s a hydrostatic organ, p. 41 3-443. In W.S. Hoar and D.J. Randall (eds . ) Fish physiology, vol . IV. Academic Press, New York.
Wllson, C.A., J.H. Render and D.L. Nieland. 1993. Life history g a p s in red snapper (Lutjanus campechanus) , swordfish (Xiphias gladius) and red drum (Sciaenops oce//atus) in t h e northern Gulf of Mexico; a g e determination, growth, and s o m e reproductive biology. Interim report. U.S. Department of Commerce, MARFIN., 44 p.

APR 1 4 1998
Demersal Fish Stock Assessment in Seychelles: An Analysis of a Mothership/Catcher Boat Fishery
C.C. MEES Marine Resources Assessment Group
4 7 Prince 's Gate London S W7ZQA, UK
MEES, C.C. 1996. Demersal fish stock assessment in Seychelles: An analysis of a mothership/catcher boat Fishery [Evaluation de peces dernersales en Seyc/dles: Un analisis de una pescperia basada en un bote nodriza], p. 254-265. In F. Arreguin-Sinchez, J . L . Munro. M.C. Balgos and D. Pauly (eds.) Biology. Fisheries and culture OF tropical groupers and snappers. ILLARM Conf. Proc. 48. 443 p.
Abstract
Stock assessments For certain important tropical demersal species are presented, based on the analysis OF commercial line fishing data collected from a mothership/catcher boat operation targeting snappers, groupers and emperors in Seychelles waters. Six Fishing trips were conducted over the period March 1991 - March 1333 at a number OF unexploited or lightly fished banks and sea mounts of varying sizes Far horn the main centers OF population.
Depletion estimates of initial population size (biomass. 8,) are derived from daily information within single Fishing voyages at speciFic locations. An attempt to determine production is presented using biomass estimates From subsequent voyages to the same locations. The limited time spent at any one Fishing location and variability in catch rates resulting from changes in Fishing depths and target species restrict the number of comparisons of sit'e-specific analyses From the present data, but the method will bc of increasing value as more information becomes available. The implications For management purposes are great: inferences may be made regarding the rate of recovery of depleted areas, which is useful in what is essentially a 'hit and run' Fishery.
It is suggested that i f adequate care is taken to account for variability in catch rates not directly attributable to Fishing pressure, the application of this type of analysis to commercial data offers a cheap alternative to intensive Fishing experiments during research cruises.
Resumen
La evaluation de recursos de ciertas especies dernersales tropicales importantes son presentadas en base a/ analisis de datos de la pesca comercial con lfnea colectados de la opcracion dc ut7 bote nodriza orientado a la pesca de pargos, meros, y emperadores en aguas de Seychelles. Seis viajes de pesca fueron efectuados en el period0 comprendido entre Marzo de I 9 9 1 y Marzo dc 1993, hacia varios bancos no explotados o Iigeramente explotados y varias montafias marinas de tamafio variable, alejadas de 10s principales centros de poblacion.
Las estimaciones de descuento en el tamatio Inicial de la poblacion (biomasa, BJ fueron derivadas de inforrnacidn diaria dentro de viajes de pesca sencillos a /oca/idades especificas. Se presenta un intento para determinar la production usando estirnaciones de biomasa de viajes subsecuentes a /as misrnas localidades. La lirnitada duracion de /as operaciones de pesca en cualquiera cle /as Iocalidades, y la variabilidad en /as tasas de captura resultantes de 10s carnbios en /as profundidades de pesca (especies objetivo) lirnitarnn el nljmero de comparaciones para el analisis de sitios especificos de/ presente conjunto de datos, per0 el metodo tendra mayor valor conforme mas cantidad de information vaya

siendo disponible. Las irnplicaciones para propositos de mane/o son grandes: algunas inferencias pueden ser hechas sobre la tam de recuperation de /as areas que rnostraron decrementos, aspect0 que es esencial en una pesqueria basada en el exito de cada operation de pesca.
Se sugiere que si se toma cuidadosamente en cuenta /a variabiiidad en /as tasas de captura que no son atribuibles directarnente a /a intensidad de pesca, /a aplicacion de este tip0 de at~alisis de d a t a comerciaies puede oh-ecer una alternativa de bajo costo para intensificar experimentos de pesca durante 105 cruceros de investigacion.
Introduction
The. large number of fish species and information-intensive requirements of most multi-species stoclc assessment models (for reviews, see Gulland and Garcia 1984; Kerr and Ryder 1989; Polovina 1992) means that data-collection requirements for adequate stoclc assessment are beyond the means of many small fishery departments in tropical countries. Depletion methods of stock as- sessment, however, can be substantially cheaper and more effective than others (Hil born and Walters 1992). Polovina ( 1986) applied this approach to data collected during an intensive fishing experiment in the Marianas. Where commercial data can be utilized, substantial cost savings may be gained over the application of experi- mental fishing during planned research cruises, although at the expense of experi- mental design.
In this paper stock assessments are based on the analysis of commercial line fishing data collected from a mothershiplcatcher boat operation targeting snappers, groupers and emperors in Seychelles waters. Mees (1993) estimated the biomass of Pristipomoides filamentosus (Valenciennes 1830) from data collected during a single voyage of this vessel. Here, subsequent voyages to a number of locations are presented, and enable estimates of stock production.
The study area
Seychelles consists of four island groups in the western Indian Ocean between 5" and 10°S and and 56OE (Fig. 1). The
majority of the population live on the gra- nitic islands Mahe, Praslin and La Digue within the Mahe Plateau, whilst the coralline Amirantes, ProvidenceIFarquhar and Aldabral Cosmoledo groups are sparsely inhabited.
Demersal fishing effort by the artisanal fleet (mostly wooden vessels, 12 m length or smaller) is largely confined to the Mahe Plateau and its periphery, but in periods of good weather a Few vessels may venture to the Amirantes group. The Providence1 Farquhar and Aldabra/Cosmoledo groups may be regarded as unfished excepting some exploitation during the 1970s by mothershiplcatcher boat ventures at the former group. Fishing activity at these locations and at lightly fished banks and sea mounts south of the Mahe Plateau is examined.
Climatic conditions during the southeast trade winds, which average 12 knots, frequently limit fishing activity from the end of May to October. It may also be affected by the northwest monsoon between mid- November and mid-March. During the two inter-monsoon periods light variable winds and frequent calms occur.
Materials and Methods
Between March 199 1 and March 1993 an 88.4 m refrigerated cargo ship deployed up to twelve 7 m fiberglass catcher boats during six fishing voyages to remote banks and island groups in the Seychelles. Each voyage lasted between 46 and 7 1 fishing days (Table 1 ) .
Catcher boats were equipped with echo sounder and compass and usually fished within 10 miles of the mothership. Handlines were used during the first voyage. Electric fishing reels were fitted subsequently although

J"
Longitude (OE)
Fig. 1. Seychelles EEZ indicating the fishing locations vislted by the mothership catcher vessel: Mahi Plateau, and Banks South of the Plateau, the Arnlrantes group, Provldence/Farquhar group, and Aldabra/Cosmoledo group. [ZEE ile Seychelles indicando /as Iocalldades de pesca visitadas por el barco nodrlza: Planicie tie Mahe, y Bancos rle/ Sur de la Planicie, el grupo Amlrantes; el grupo Provldence/Farquar y el grupo Alrlilbra/Cosmoledo.l
Table 1 . Detalls of the flshlng voyages undertaken between March 1991 and March 1993. [Detalle tie 10s vwes de pesca efectuados entre Marzo ile 1991 y Marzo de f993.l
Voyage Fishing dates Days Fishing locations Boat-days
1 03/03/91 -02/05/9 1 70 MahC Plateau (MP) 169 Banks south O F MP 547
2 23/10/91-16/12/91 54 Maht Plateau 297 Banks south of MP 142 Platte Plateau 4 Amirantes group 58 Providence/Farquhar 137
3 0810 1/92- 12/03/92 64 Maht Plateau 73 Banks south of MP 252 Arnirantes group 325
4 1 1 /04/92-27/05/92 46 Providence/Farquhar 50 1 5 261 10/92-20/ 12/92 55 Amirantes group 13
Providence/Farquhar 443 Aldabra/Cosrnoledo 79
6 1010 1193-22/03/93 71 Mahc Plateau 12 Banks south of MP 60 Platte Plateau 12 Saya de Mahla bank 59 1
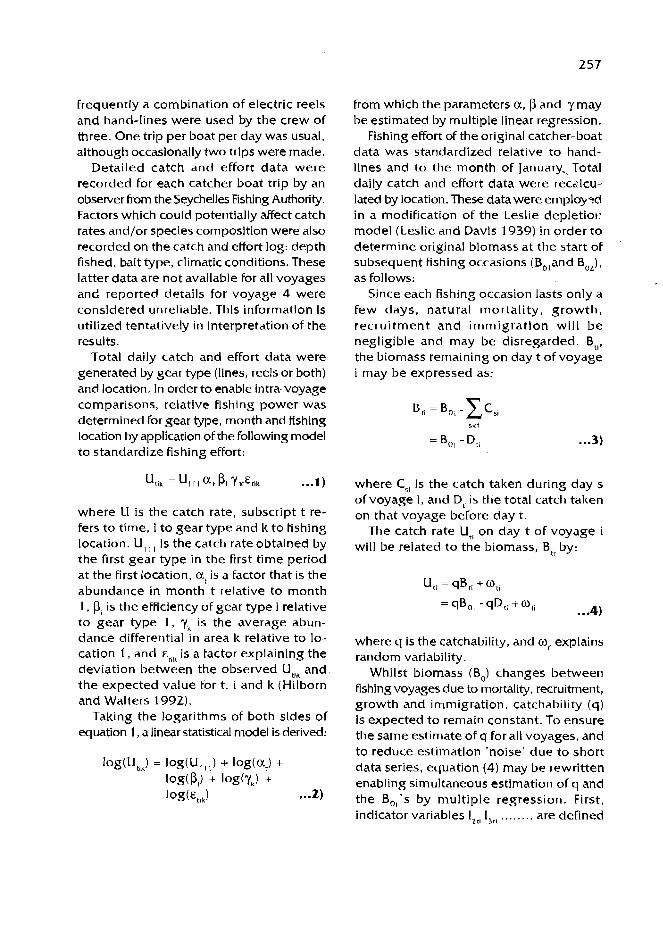
frequently a combination of electric reels and hand-lines were used by the crew of three. One trip per boat per day was usual, although occasionally two trips were made.
Detailed catch and effort data were recorded for each catcher boat trip by an observer from the Seychelles Fishing Authority. Factors which could potentially affect catch rates and/or species composition were also recorded on the catch and effort log: depth fished, bait type, climatic conditions. These latter data are not available for all voyages and reported details for voyage 4 were considered unreliable. This information is utilized tentatively in interpretation of the results.
Total daily catch and effort data were generated by gear type (lines, reels or both) and location. In order to enable intra-voyage comparisons, relative fishing power was determined for gear type, month and fishing location by application of the following model to standardize fishing effort:
where U is the catch rate, subscript t re- fers to time, i to gear type and k to fishing location. U , , , is the catch rate obtained by the first gear type in the first time period at the first location, at is a factor that is the abundance in month t relative to month 1 , pi is the efficiency of gear type i relative to gear type 1 , y, is the average abun- dance differential in area k relative to lo- cation I , and E ~ , , is a factor explaining the deviation between the observed Utik and the expected value for t, i and k (Hilborn and Walters 1992).
Taking the logarithms of both sides of equation 1, a linear statistical model is derived:
from which the parameters a, P and y may be estimated by multiple linear regression.
Fishing effort of the original catcher-boat data was standardized relative to hand- lines and to the month of January, Total
c, CU- daily catch and effort data were rec . I lated by location. These data were ernployd in a modification of the Leslie depletiot: model (Leslie and Davis 1939) in order to determine original biomass at the start of subsequent fishing occasions (B,,and B,,), as follows:
Since each fishing occasion lasts only a few days, natural mortality, growth, recruitment and immigration will be negligible and may be disregarded. Bti, the biomass remaining on day t ofvoyage i may be expressed as:
where Cgi is the catch taken during day s ofvoyage i , and Dti is the total catch taken on that voyage before day t.
The catch rate Uti on day t of voyage i will be related to the biomass, Bti by:
where q is the catchability, and o, explains random variability.
Whilst biomass (B,) changes between fishing voyages due to mortality, recruitment, growth and immigration, catchability (q) is expected to remain constant. To ensure the same estimate of q for all voyages, and to reduce estimation 'noise' due to short data series, equation (4) may be rewritten enabling simultaneous estimation of q and the BOi's by multiple regression. First, indicator variables lai I,, ..... . .. are defined

for all voyages except the first, so that I,,,= 1 for all data From Voyage 2 and 0 for all other data, I,,,= 1 for all data from Voyage 3 and 0 for all other data, and so on.
Consider the example of three voyages to one location. Using equation (4) we set for Voyage 1 :
noting that for all observations in Voyage 1 , I z r 1 = = 0. For Voyage 2, (1,,,=1, I,,,=O):
and Voyage 3 ( I z t3 = 0, 13 t3 = 1):
This may be written in general form as:
where v is the total number of voyages undertaken,
a = clB,, ... 9)
P, = !clB,,-W ... 1 0 )
For j = 1 to v. The variables q , a and Pi may be estimated by multiple linear re- gression. The biomass at the start of the first voyage may then be estimated from equation (9): - M
Bo, =, cl ... 1 1)
and subsequent voyages For j = 1 to v from equation ( 1 0 )
Production (P) between voyages i and (i+ 1 ) to the same location can be estimated from:
where C, is the total catch removed at the end of voyage i , and d ,,(,+,, is the time interval, in days, between fishing occasions. Production is equivalent to all gains due to growth, recruitment and immigration, less losses due to natural mortality.
Results
Factors applied to standardize the original data by month and gear type are indicated in Table 2. Throughout the six voyages, Fishing took place at a total of 3 1 different banks, sea mounts or islands. At any one location fishing duration varied between 1 and 8 days and the prevalent pattern observed was that of decreasing daily catch rates. Results relate to those locations fished during two or more voyages for greater than one day (Table 3 and Figs. Za and 2b).
In general, mean catch rates were ob- served to decrease from one voyage to the next. This was true for small banks and sea mounts, but not for the large banks (Constant Bank). Daily catch rates at For- tune Bank, like Constant Bank, indicated no evidence of depletion between voy- ages (Fig. 2c). For small banks, exceptions were Bulldog Bank and Sea Mount '25' in the Providence/Farquhar group. During Voyage 4 , strong currents depressed catch rates but this was not the case during Voyage 5 to these locations.
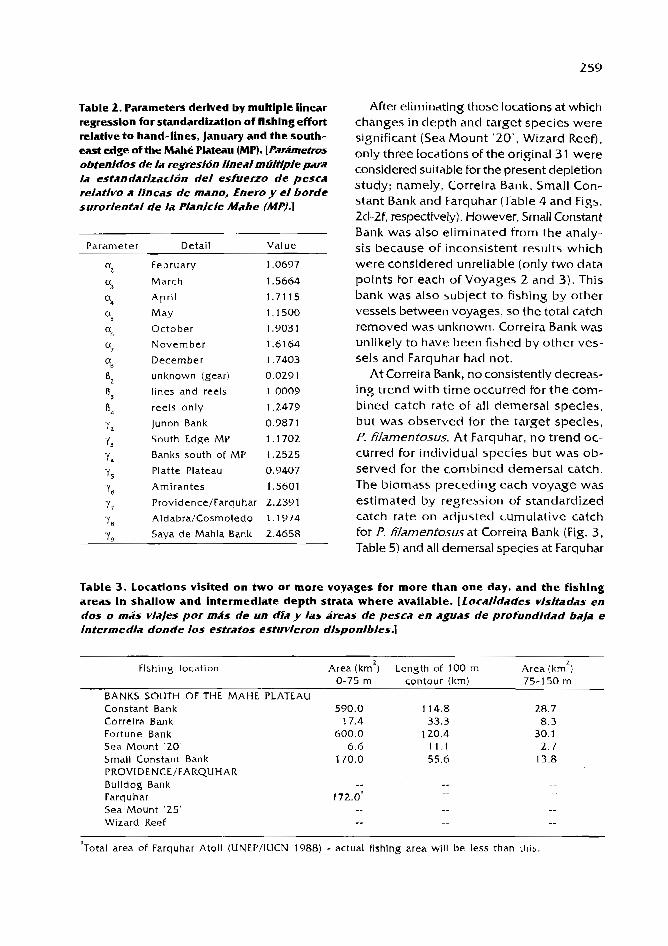
Table 2. Parameters derived by multiple h e a r regression for standardiutlon of flshlng effort relative to hand-lines, January and the south- east edge of the Mahi Plateau (MP). [Parherkos obtenidos de /a regresibn IineaImuitipIe para la estanrlilrixaclon dei esfuerzo de pesca relatlvo a linear de mano, Enero y el horde suroriental de la Planicle Mahe IMP).]
Parameter Detail Value
February
March
Ap r i l
M a y October
November
December
unknown (gear)
lines and reels
reels only
Junon Banlc
South Edge MP
Banks south of MP
Platte Plateau
Arnirantes
y, Providence/Farquhar 2.2391
Y, Aldabra/Cosmoledo 1.1974
Y, Saya de Mahla Bank 2.4658
After eliminating those locations at which changes in depth and target species were significant (Sea Mount ' 207 , Wizard Reef), only three locations of the original 31 were considered suitable for the present depletion study; namely, Correira Bank. Small Con- stant Banlc and Farquhar (Table 4 and Figs. 2d-2f, respectively). However, Small Constant Bank was also eliminated from the analy- sis because of inconsistent results which were considered unreliable (only two data points for each of Voyages 2 and 3). This bank was also subject to fishing by other vessels between voyages, so the total catch removed was unknown. Correira Banlc was unlikely to have been fished by other ves- sels and Farquhar had not.
At Correira Banlc, no consistently decreas- ing trend with time occurred For the com- bined catch rate of all demersal species, but was observed for the target species, P. tWamentosus. At Farquhar, no trend oc- curred for individual species but was ob- served for the combined demersal catch. The biomass preceding each voyage was estimated by regression of standardized catch rate on adjusted cumulative catch for P. I%ldmentosus at Correira Bank (Fig. 3, Table 5) and all demersal species at Farquhar
Table 3. Locations visited on two or more voyages for more than one day, and the fishlng - areas In shallow and intermediate depth strata where available. [Localidarles visitadas en dos o mas vwes por mas tie un dia y las Areas de pesca en aguas de profundldad baja e Intermedia donde 10s estrntos estuvieron rl/sponIb/es.]
Fishing location Area (ltmL) Length of 100 rn Area (krnz) 0-75 rn contour (Itrn) 75- 150 rn
BANKS SOUTH OF THE MAHE PLATEAU Constant Bank 590.0 1 14.8 28.7 Correira Bank 17.4 33.3 8.3 Fortune Bank 600.0 120.4 30.1 Sea Mount '20 ' 6.6 11.1 2.7 Small Constant Bank 170.0 55.6 13.8 PROVIDENCE/FARQUHAR Bulldog Bank -- ..
Farquhar 172.0' ..
Sea Mount '25' -- .. 2 2
Wizard Reef -- .. .-
" ~ o t a l area of Farquhar Atol l (UNEPfIUCN 1988) - actual fishing area wi l l be less than this.

Mrms Bank
Sea Mounl'm a
Fanuna Small Canslanl Bank
Voyage number
Fsquhar Ses Mount '25'
. * voyage number
z a ~ p r - e ~ Oi-Maij"j"lMaY-u, 27-F&O2 02-Mar-02 08-Mar-82 iz.jan.nl
so-npr-81 28-Feb-82 04-kr-82 07.Mar.92
01-Mar42 05.Mlr.92
Flshlng day d 1 Jan lB9l
Flg. 2. Mean standardized CPUE (kg/person per hour) by voyage to: a) south of the Mahi Plateau; b) Provldence/Farquhar group; c) standardlzed dally catch rates at Fortune Bank [CPUE medk estandarlrada (k&persona por hora) por vlaje en: J sur de /a PIanicIe Mabk; b) grupo Provldence/Farquhar; cj tasas de capfura dlarla estandarlzadas en el Banco fortuna] (contlnued)

02.Apr.91 04.Apr-91 OB-Apr-91 08-Nov-91 21-Feb-82
Fishing day
Fishing day
Fig. 2. (continued) d) Correlra Bank; e) Small Constant Bank; and fl Farquhar. For Flgs. c-f, the x-axls does not represent a h e a r scale. A break In the llne lndlcates that the mothershlp moved locatlon (wlthln any voyage) or that the data relate to dlfferent voyages. Id) Banco Correlra; e) Banco Small Constant; y fl Farquhar, Para /as Ilguras c-I; el eJe-X no represents una escala lineal.* Un code en la linea lndlca que el bate nodrlza se movl6 de lugar (dentro de un vlar/e) o que 10s datos se refleren a dlferentes vhJes.]
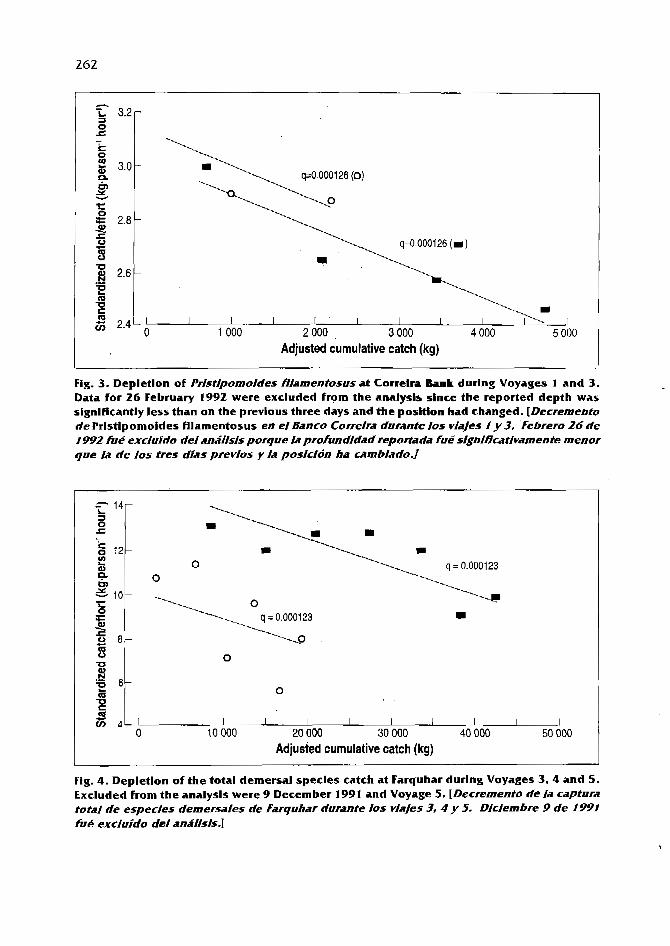
Adjusted cumulative catch (kg)
Fig. 3. Depletlon of Pristipomoides fllamentosus at Correlra Bank during Voyages i and 3. Data for 26 February 1992 were excluded from the analysls slnce the reported depth was signlflcantly less than on the previous three days and the poskion had changed. [Decremento de Prlstlpomoides fllamentosus en el Banco Correira durante 10s via/es 1 y 3. Febrero 24 de 1992 f u i exclufdo tfel analisis porque la profundidad reportada fue slgnlncirtIvamente menor que la de 10s tres dias previos y la posicjon ha cambiadoJ
Adjusted cumulative catch (kg)
Fig. 4. Depletlon of the total demersal specles catch at Farquhar durlng Voyages 3, 4 and 5. Excluded from the analysls were 9 December 1991 and Voyage 5. [Decremento de la captura total de especies demersales de Farquhar durante ios vlajes 3, 4 y 5. Diciembre 9 de 1991 fub excluido d d anii/lsis.l

Table 4. Anchoring position of the mothershlp each day at each of the locations studled showlng (') the days used In the analyses. [Posicidn geogriiflca del barco nodrlza cada dia de cada una de las localldades estudiadas mostrando 10s dias usados en el andIIsIs (').I
Location
Correira Bank Correira Bank Correira Bank Correira Bank Correira Bank Small Constant Small Constant Small Constant Farquhar Farquhar Farquhar Farquhar Farquhar
Voyage
1
Dates
24/04/9 1 25-27/04/9 1 10/05/9 1 23-25/02/92 26/02/92 0 1 -07/04/9 1 07-08/ 1 1 /9 1 2 1 -22/02/92 09-16/IZ/91 09-1 3/05/92 1 7/05/9 1 17-1 8/12/92 19/ 12/92
Position
06O 29' 5 57O 10' E *
06" ZZ ' S 57O 05' E "
0 6 ~ 22' S 57O 05' E 0 6 ~ 2 l ' S 57'06'E ' 06O 30' S 57" 16' E 0 6 ~ 03' 5 56O 18' E * 06O 04' S 56O 18' E * 0 6 ~ 03' 5 56O 17' E "
1 0 ' 0 8 ' ~ 51"09' E * 10°08'S 51°01' E * 1 0 ~ 0 5 ' 5 51" I O ' E 1 0 ' 0 8 ' ~ 51°59'E l o o 1 l ' S 5 l 0 1 I ' E
Table 5. Regression parameters derived for Pristipomoldes fllamentosus at Correlra Bank, and estimates of catchablllty, biomass, and production between Voyages 1 and 3; a11 demersal species at Farquhar, and estimated values between Voyages 2 and 4. [Parimetms de regreslon obtenldos para: Prlstlpomoides filamentosus en el Banco de Correira, y estimaciones de capturabllidad, biomasa y producclon entre vla/es 1 y 3; fodas /as especles demersales en Farquhar, y valores est/mados entre 10s v/a/es 2 y 4.1
Parameter Correira Bank Farquhar
N o . obs 7 13
R' 0.9066 0.6724
C1 3.01 7958 14.90345
&, 0.108966 -4.73422
cl 0.0001 26 0.0001 23
cI (kg) 5426 44788
Bo, (kg) 23903 121177
B,, (kg) 24766 82684
'='la 302 145 PI+, (kg~day-') 20.8 43.4
(kgvhy.' km.'.) 2.5 0.25
(Fig. 4, Table 5). No attempt was made to partition effort directed at P. filamentosus in the case of Correira Bank. This species formed approximately 50% of the catch and at the depth range fished (>70 m) it was the target species. Thus the total effort was assumed to be directed at this species.
In Seychelles, P. filamentosus is caught in the depth range 75- 150 m (Mees 1993). The net rate of production for P. filamentosusat Correira Bank was 2.5 kg day-' Itm-z of the intermediate depth range (Table 5) or 0.6 kg day-' Itm-' of the 100 m isobath. For all dernersal species at Farquhar, where fishing occurred in the shallow stratum, it was 0.25 kg day-' km-'.
Dlscusslon
Mothership/catcher boat operations exert significant Fishing pressure at localized ar- eas over a short time period. At large banks, local depletion may occur during any one voyage (as appeared to be the case during Voyage 3 at Fortune Bank, Fig. Zc) but dif- ferences in precise Fishing location and the relatively larger standing stock at these locations mean depressed catch rates are not observed between voyages. However,

it is apparent that depletion of small iso- lated areas can be significant, and that catch rates remain depressed from one fishing occasion to the next indicating that insuf- ficient time has elapsed to allow complete recovery.
The rate of recovery, or production, was estimated. At Correira Bank the stock of P. filarnentosus had fully recovered between Voyages 1 and 3. The production estimate O F 2.5 kg I<mTZ day-' equates to 914.6 kg Itm-zyear' (228.0 Itg km-' of the I00 m isohth). Mees ( 1 993) estimated the sustainable yield of this species to be 7 17 1% I<m-2year'. Polovina and Ralston (1 986) estimated the total yield of all snappers and groupers within the 200- rn isobath in the Marianas to be 300 kg I<m-2 year' whilst Polovina et al. (1 990) gave mean estimates of 380 kg Icm-' of the 200 m isobath on reefs and 1 460 kg I<m-' of the 200 m isobath at sea mounts for all species. Given the differences in depth, and the fact that P filamentosus represented approximately 50% of the catch, the esti- mate of production is of the right order and sufficient to generate the estimated yield for this resource.
Incomplete recovery had occurred at Farquhar between Voyages 2 and 4. Production was estimated to be 0.25 kg day7' l<m-2 in the shallow stratum, which is a rather low value. However, the total area of Farquhar Atoll is an inapropriate value to apply because it is unlilcely that fishing actually took place inside the lagoon: this is not permitted, and the maximum depth of the lagoon is 14.6 m, whilst the mean fishing depth was around 50 m. It is most likely that localized depletion of a smaller area occurred. At Farquhar the anchoring positions for Voyages 2 and 4 were 8 nautical miles (nmi) apart. However, the catcher boats fish within a radius of approximately 10 nmi of the mothership and so the same area would have been exploited. Assuming a fished reef area of 10-20 nmi by 0.5-1 nmi (1 7-69 kmm2) the production estimate becomes 2.5-0.62 k g day-' km-'.
Polovina ( 1986) indicated that the catchability of subordinate species in a multispecies assemblage is inversely re- lated to the abundance of a more dorni- nant species, although this change in catchability may have a time lag associ- ated with it. H e also showed that the pooled estimate of abundance for three species representing 90% of the exploitable popu- lation was 71 O h of the estimate derived for these species individually. From this we may conclude the biomass derived for all species at Farquhar may be underestimated on each voyage, but not necessarily the production. At Correira, P. filamentosuswas dominant in the catch.
Whilst the results presented for P. filarnentosus are of the correct order and support previous estimates of yield, there are potential sources of bias and error. During each period of fishing the model assumed a 'closed' study population, due to the short time frame involved. Between fish- ing it was 'open'. Hilborn and Walters (1 992) discuss sources of error in estimates based on closed population depletion assessments and suggest that over a short time frame catchability may decline with the removal of the more stupid and/or aggressive fish, increasing q and depressing estimates of Bo. Catchability was assumed to be con- stant for each fishing occasion although its real value may change within each fishing period in this manner. The time interval between fishing occasions (145 days at Farquhar: 302 at Correira Bank) was con- sidered sufficiently long to negate such a change by the start of the second fishing period. In contrast to this potential bias, q may be underestimated and 0, overesti- mated if errors occur in the measurement of the cumulative catch or effort. These are considered to be reliable.
It has been demonstrated that commer- cial data may be used for depletion estimates of stock size and production. The possible analyses were constrained by lack o f replicates which under research

conditions would have been contained in the experimental design: particularly depth fished, duplicate fishing trials at certain locations despite low catch rates, longer time series at each location. Nevertheless, for single voyages depletion estimates of stock size were frequently possible (see Mees 1993, for P. filamentosus and Mees 1 992, for P. filamentosus and L. nebulosus) . For estimating production between voy- ages it was seen that the number of site specific comparisons was limited. Addition- ally, depletion estimates of abundance are subject t o the bias discussed. Neverthe- less, it is argued that despite these limita- tions, valuable information has been gained at minimal cost, and that this method will be of increasing value as more data become available from future voyages.
Acknowledgements
The author is grateful to MahC P&he Ltd. and Seychelles Fishing Authority (SFA) for permission to publish these data, collected and compiled by SFA observers and computer staff under an SFA-funded demersal fisheries project. The author was financed through the British Overseas Development Administration Fish Management Science Programme. Marlc Bravington of MRAG Ltd. helped significantly with the statistical treatment of data and development of the biomass model. Professor John Beddington and Julie Rossouw critically reviewed the text.
References
Gulland, J.A. and S. Garcia. 1984. Observed patterns In multispecies Fisheries, p. 155- 190. InRM. May (ed.) Exploitation of marine communities: report of the Dahlern workshop on exploitation of marine corn- munities, 1-6 April 1984 Berlin. Life Sci. Res. Rep. 32. Springer-Verlag, Berlin.
Hjlborn, R.Y. and C.J. Walters. 1992. Quantita- tive Fisheries stock assessment: choice.
dynamics and uncertainty. Chapman and Hall, New Yorlc and London. 570 p.
Kerr, S.R. and R.A. Ryder. 1989. Current ap- proaches to multispecies analyses of marine fisheries. Can. 1. Fish. Aquat. Sci. 46:528- 534.
Leslie, P.H. and D.H.S. Davis. 1939. An attempt to determine the absolute number of rats on a given area. 1. Anim. Ecol. 8:94-1 13.
Mees, C.C. 1992. PCcheur Breton: an analysis of data relating to a mothership-dory fishing operation in Seychelles waters from March 199 1 -June 1992. Seychelles Fishing Authority, SFA/RLD/023, October 1992.
Mees, C.C. 1993. Population biology and stock assessment of Pristipomoicies filarnentosus on the Maht Plateau, Seychelles. J . Fish Biol. 43(5):695-708.
Polovina, J.J. 1986. A variable catchability version of the Leslie model with application to an intensive fishing experiment on a multispecies stock, Fish. Bull. 84(2):423- 428.
Polovina, 1.1. 1992. Modeling Fish stocks: applicability, problems and requirements For multispecies and multigear fisheries in the tropics, p. 28-54. In Proceedings O F the Sixth Session of the Standing Committee on Resources Research and Development, 18-21 May 1990, Colombo, Sri Lanka. FA0 Fish. Rep. (Suppl.) 463,
Polovina, I.], and 5. Ralston. 1986. An approach to yield assessment for unexploited resources with application to the deep slope fishes of the Marianas. Fish. Bull. 84(4):759-770.
Polovina, J.J . , R. Benco, A. Carlot, E. Cillauren. P. Dalzell, N . Howard, D. Kobayashi, T. Latu, P. Lokani, G. Nath, H. Pili. A. Sesewa, R. Shomura, T. Sua, 6. Tiroba and S. Tulua. 1930. Summary of the methods and results from the tropical stock assessment workshop, p. 1-6. In 1.). Polovina and RS. Shornura (eds.) United States Agency for International Development and National Marine Fisheries Service Workshop on Tropical Fish Stock Assessment. Hono- lulu, Hawaii.
UNEPIIUCN. 1988. Coral reefs of the world. Volume 2: Indian Ocean, Red Sea and Gulf. U N E P regional seas directories and bibliographies. IUCN, Gland.

Abundance and Distribution of Snappers and Groupers Targeted by the Artisanal Medium Range Fishery
off Northeastern Venezuela (1 981 - 1992)
1.J. M E N D O Z A Dpto. d e Biofogia Pesquera, Instituto Oceanografico
Univcrsidad cie Oriente, Apdo. 245, Cumana, Venezuela
A. LAREZ Fstacion Nueva Esparta, CIAPES-FONAIAP
Isla de Margarita, Venezuela
MENDOZA, 1.1. and A. LAREZ. 1996. Abundance and distribution of snappers and groupers targeted by the artisanal medium range Fishery off northeastern Venezuela ( 1981 to 1992) [Abundat~cia y distrjhucion, pargas y rneros par la pesgueria artesanal de media altura del noreste de Venezuela de I981 a 199J. p. 266-276. In F. Arreguin-Sanchez. J.L. Munro, M.C. Balgos and D. Pauly (eds.) Biology. Rsheries and culture of tropical groupers and snappers. ICLARM Conf. Proc. 48, 449 p.
Abstract
Changes in catch-per-unit effort ( C P U E ) For the main species (red snapper [Lutjanus purpureus], yellowedge grouper [Epinephelus FlavolimbatusJ, and vermilion snapper [Rhomboplites aurorubens]) exploited by the medium-range artisanal Fishery in northeastern Venezuela are analyzed for 1981 to 1992. The study is based on data obtained From interviews and landing controls. Vessels operate within t h e area between 7"N 58"W and 1 Z " N 67"W, in the waters of Venezuela and Guyana and those of neighboring island countries. Fishing gears used are manually operated hooks-and-lines and longlines. The analysis is presented For the aforementioned area and three subareas: the Atlantic (east of Trinidad and Orinoco Delta), eastern Margarita (including northern Trinidad) and wcstern Margarita. Handline effort i s directed mainly to red snapper (45% of total handline catches) while longline effort is directed to grouper (59% of total longline catches). Species abundance varies from one subarea to another: red snappers are dominant in the Atlantic subarea, groupers in the east and west OF Margarita Island and vermilion snappers are present mainly East of Margarita. For the general area, red snapper handline CPUE (kg/handline per Fishing day) shows a 40% reduction For the study period. However, this decrease is particularly pronounced in the Atlantic subarea (approx. 60%). Grouper longline CPUE (kg/hoolt per fishing day) shows a stronger reduction (50%) For the whole area, the decline in abundance being stronger east of Margarita. Vermilion snapper handline CPUE shows the strongest reduction East of Margarita. Finally the strong seasonality of CPUE is discussed, as well as possible implications of overall results regarding stock structure in the study area.

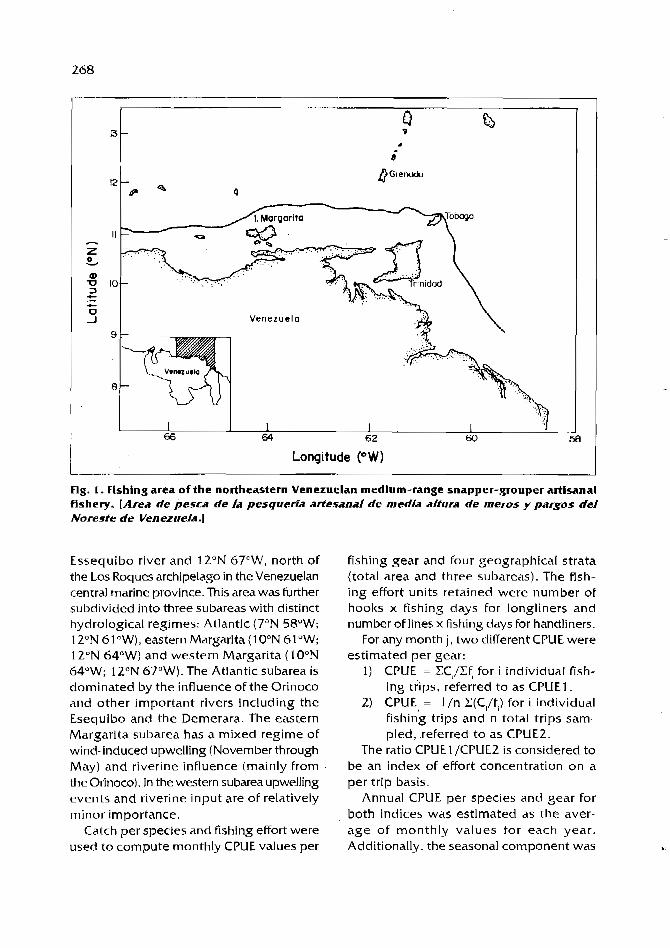
II
10
Venezuela
9
8
62
Longitude ( O W )
Flg. 1. Fishing area of the northeastern Venezuelan medlum-range snapper-grouper artisanal fishery . [Area de pesca de fa pesqueria arfesanal de medh altura de meros y pargos del Noreste de Venezuela.]
Essequi b o river a n d 12"N 67"W, north of the Los Roques archipelago in the Venezuelan central marine province. This a r eawas further subdivided into three subareas with distinct hydrological regimes: Atlantic (7ON 5S0W; 1 ZON 6 l o w ) , eastern Margarita ( I OON 61 "W; 12"N 64OW) a n d wes t e rn Margari ta (lOON 64"W; 1 ZON 67"W). The Atlantic subarea is domina ted by t h e influence of t h e Orinoco a n d o t h e r impor t an t rivers including t h e Esequibo a n d t h e Demerara. The eas tern Margari ta suba rea has a mixed r eg ime of wind-induced upwelling (November through May) a n d riverine influence (mainly from the Orinoco). In the western subarea upwelling e v e n t s a n d riverine input a r e of relatively minor importance.
Catch p e r spec ies and fishing effort we re used t o c o m p u t e monthly CPUE values per
fishing g e a r a n d four geographica l s t ra ta ( total a r e a a n d th ree subareas) . The fish- i ng effort units retained w e r e n u m b e r of hooks x fishing d a y s for longliners a n d number of lines x fishing days for handliners.
For any month j , t w o different CPUE w e r e e s t ima ted p e r gea r :
1 ) CPUE, = CCi/Zfi for i individual fish- ing tr ips, referred t o a s CPUE1.
2) CPUEi = l / n C(C,/f,) for i individual fishing tr ips a n d n total t r ips s a m - p l ed , referred t o a s CPUEZ.
The ratio CPUE 1 /CPUEZ is considered t o b e a n index O F effort concent ra t ion o n a pe r trip basis.
Annual CPUE p e r spec i e s a n d g e a r for both indices was es t ima ted a s t h e aver- a g e of m o n t h l y v a l u e s for e a c h year. Additionally, t h e seasonal componen t w a s

determined from the average CPUE for each month over the 12-year study period for red snappers and yellowedge groupers for both gears.
Results
The analysis of relative catch composi- tion per gear allowed us to establish that handline fishing effort is mainly directed towards red snapper (45% of total catches sampled) and that yellowedge grouper is the target species in the longline fishery (approximately 59% of total catches sam- pled). Vermilion snapper is also caught by both gears but in a higher proportion by handlines (about 17% of total catches sampled).
Figs. 2-4 show the yearly trend for handline CPUEs per species in the total area. I t is clear that red snapper CPUE is significantly higher than for other species. All species show a marked decline in abundance during the period. especially red snapper and yellowedge grouper. Vermilion snapper CPUE has apparently stabilized at about 2.5 I<g/hook per fishing day in recent years. Both indices (CPUE1 and CPUEZ) show similar trends for all species.
Figs. 2 and 3 show, for the whole area, yearly changes in longline CPUE for red snappers and yellowedge groupers. CPUE values are significantly higher in the case of yellowedge groupers. The decreasing trend over the period is especially marked in the case of this species. Red snappers show a strong reduction in apparent abundance between 1981 and 1982, but afterwards the declining trend is relatively moderate. Curiously, CPUEZ values for groupers are almost always higher than CPUEl estimates, as opposed to red snappers, which do not present any significant difference regarding both indices. It would thus appear that longline effort is not well concentrated on yellowedge grouper.
The analysis of red snapper handline CPUE per subarea (Fig. 5) indicates that overall abundance is much higher in the Atlantic subarea, despite a continuously decreasing trend in apparent abundance. The subareas east and west of Margarita island show relative stability at similar levels of CPUE for this species between 1985 and 1992. Yellowedge grouper handline abundance is higher in the subareas east and, especially, west of Margarita (Fig. 6). Notwithstanding large interannual fluctuations in the western sector, i t would appear that trends in abundance differ between the Atlantic subarea and the subareas east and west of Margarita. Vermilion snapper (Fig. 4) abundance is higher in the eastern Margarita sector, though this subarea shows a strong reduction in CPUE from 1983 onwards. Although strong variations occur. the other subareas show relative stability of CPUE over the study period.
Longline red snapper CPUE (Fig. 5) shows a marked decrease in the Atlantic sector and l o a lesser degree west of Margarita, while apparent abundance east of Margarita has remained stable over the last six years of the series. Overall abundance was much higher in the Atlantic subarea at the beginning of the period, though present levels are similar for the three subareas considered. If we exempt the last four years of the study period in the subarea east of Margarita, yellowedge grouper longline CPUE (Fig. 6) does not show a sharp declining trend over the study period for the different sectors.
Figs. 2 and 3 show average monthly handline CPUE per subarea for red snap- pers and groupers from 1981 through 1992. Apparent abundance of red snapper tends to be low at the beginning and end of the average year, especially in the Atlantic and eastern Margarita subareas. On the other hand, yellowedge grouper shows a clear trend towards higher CPUE values in the first and last months. Average monthly longline red snapper CPUE (Fig. 2) differs from handline observations, except for the

Total area C/f, by year
1 Longlines
Year
Monthly C/f, by area
Atlantic East&West Margarrta
J F M A M J J A S O N D
Month
Fig. 2. Average annual red snapper (Lutjanrrs purpureus) CPUE (CPUE1 = Z C i / Z f i and CPUEZ = l/nE(C,/fi) for I individual flshlng trips and n total trlps sampled) by handllnes (kg/line per day) and longlines Ikg/hook per day) in all areas, and average monthly ( 1 981 - 1992) red snapper CPUE by subarea. IPromerllo anual de la CPUE (CPUEI = EC,LE< d ~ d CPUE2 =
I/nE{C/f) para I viajes de pesca y n n h e r o fofal de viajesl delpargo colorado {Lutjanus purpureus) por lineas de mano (kg/linea por dia) y palansres (kg/anzuelo por dial en todo el area y promedjo mensual(1981- 19921 de /a CPUE del pargo colorado por subdreas.]

Total area C l f , by year Monthly Clf, by area
Handlines ---?
Longlines
Year
Handlines
J F M A M J J A S O N D
r Longlines
EL^^^^^^ 1 2 1 1 1 1
J F M A M J J A S O N D
Month
Fig. 3. Average annual yelloweflge grouper (Epjnephelus flavolfmbrtus) CPUE (CPULI = ZC,/Zfi and CPUEZ = l/nZ(Ci/fi) for I individual fishing trips and n total trips sampled) by handllnes (kg/llne per day) and longllnes (kg/hook per day) In all areas, and average monthly (1981-1992) yellowedge grouper CPUE by subarea. [Promedlo anlralde la CPUE (CPUEf=SCI/Sf/y CPUE2= I/n 5 CI/ fl] para i vhjes de pesca y n nlimero total de vlajesl del mero fralle (Eplnep helus flavolim batus) por lineas de mano (kg/linea por dial y palangres (kg/anzuelo por dja) en todo e l area y promedlo mensual (I981 - IWZ) Ire la Cf UE 'riel mero fralle colorado por subareas.] t,
2

81 82 83 84 85 86 87 88 89 90 91 92
Year
Atlantic
81 82 83 84 85 6 6 87 8 8 8 9 90 91 92
Year
7 -
6 -
5 -
4 - CPUE
3 -
2 -
1 81 82 83 84 85 86 87 BB 89 90 91 92
Year
81 82 83 a4 BS a6 87 eB as so 9 1 92
Year
J Fig. 4. Average annuaI vermilion snapper (Rhomboplites aurorubens) CPUL (CPUEI = ZC,/Zfi and CPUEZ =
l/nZ(C,/f,) for I lndlvidual fishing trips and n total trips sampled) by handllne (kg/line per day) In all areas. [ Promedio anual tfe /a CPUE (CPUEI=SCI/51'1 y CPUE2= I/n (5 Cl/ff l para I vIajes de pesca y n numero total de v i a w tiel ccunaro (Rhomboplites aurorubens) porlineas de mano (kg///inea por did) en todas /as areas.]

Longlines Handlines
I Atlantic I
m a m e d m f f i m m m m m ~ U ~ ~ ~ L E B ~ ~ W ~ ~ I ~
Year Year
East Margarita
Year
West Margarita
I
Fig. 5. Average annual red snapper ( L u w u s purpureus) CPUE by handllnes (kg/line per day) and longllnes (kg/hook per day) by subarea (CPUEl = ZC,/Zf, and CPUEZ = l/nZ(C,/f,) for I Individual fishing trlps and n total trlps sampled). [Promedlo anual de la CPUE de1 pargo colorado (Lutjanus purpureus) por lineas de mano (kg/lnea por dia) y palangres (kg/ anzuelo por dia) por subiireas (CPUEI =SCI/Sfl y CPUE2= I/n (5 CI/fl) para I vIaJes de pesca y n nhmero total de vla/es).l
- -
-
-
-
- -
-
2 - " " 1 " ' 1 1 1 '
0,ii
0.1
0.03
0.08
0.07
O,m
0,m
0.W
o.m o.m
0 l @ f f l b E & W I P B 9 l l 0 1 & ? f f l M P 6 f f i 0 7 M ~ 9 l 9 1 9
Year Year
- 10
- 9 -
8 - 7 -
- 6
- 5
- 4 -
3 - 0 . 0 1 - " " " " " "

Handlines
81 82 83 84 85 b6 87 88 89 90 91 92
Year
Longlines
Atlantic
East Margarita
Year West
Year
I I I I I I I 3 I I
81 82 83 84 85 86 87 88 89 90 91 92
Year
Year Margarita
- t 1 1 1 1 1 i i , l l i
81 82 83 84 85 86 87 88 80 90 01 92
Year
Fig. 6. Average annual yellowedge grouper (Epinephelus ffavolimbatus) CPUE by handlines (kgl l ine per day) and longlines (kglhook per day) by subarea (CPUE1 = CC,/Cf, and CPUEZ =
l /nZ(C,/ f , ) for I lndlvldual flshing tr ips and n total trlps sampled). [Promedlo anual de la CPUE del mero fraile (Eplnephelus flavolimbatus) por lineas de mano (kg/linea po r dia) y palangres (kg/anzueIo por dia) por subAreas CPLTrI=SCi/Sff y CPU€2= I /n (S CI/fl) para I viajes de pesca y n nhnero total de vkjes).]

Atlantic sector. In east and west Margarita, higher values are observed in the first and second semesters, respectively. For yellowedge grouper longline CPUE (Fig. 3) only the Atlantic subarea presents monthly variations similar to the ones observed for handlines, and monthly fluctuations east and west of Margarita are much less pronounced.
Dlscusslon
Economic policies developed by the Venezuelan government during the period 1983- 1988 favored a large increase in number of boats and consequently fishing effort in several national fisheries. The north- eastern Venezuelan snapper-grouper fleet increased from an estimated 341 boats in 1983 to 961 boats in 1989, o f which approximately 50% participated in the medium range fishery (Anon. 1 990).
Estimates oftotal catch for the latter fishery were only available for the years 1988 and 1989, in which a reduction from 6 33 1 t to 3 659 t was observed (Anon. 1990). Cur- rent work will try to reconstruct longer catch series in order to obtain a more precise picture of the response of these resources to exploitation. In any case, the analysis of CPUE data for the period 1981-1992 indicates that overall apparent abundance has decreased markedly for the main exploited species. This is particularly evi- dent in the case of red snapper, yellowedge grouper and vermilion snapper handline CPUE for the total area, in which relative declines over the study period have been greater than 50%. Longline yellowedge grouper CPUE and, to a lesser degree, red snapper longline CPUE, present a similar trend. The image obtained from this analysis suggests that these resources are heavily exploited and that measures should be adopted to reduce fishing effort.
However, the additional information obtained from the geographical stratifica- tion of catch and effort data may imply that
more than one unit stock exists for each species in the fishing area. Red snappers are more abundant in the Atlantic subarea where reduction of CPUE for both gears shows a pronounced and continous trend, as opposed to the western subareas where abundance is lower and CPUE estimates have remained relatively stable in the last seven years of the series. In this case we may be dealing with at least two separate stocks: an Atlantic stock associated with the Guianas Plateau and what may be called a southeastern Caribbean stoclc (northeast- ern Venezuela and northern Trinidad). A similar situation may exist for yellowedge grouper: the species is more abundant in the west- ern subareas and its CPUE series resemble each other more than those from the Atlan- ticsubarea. Following the same line ofthought, trends in abundance of vermilion snapper would indicate that three different unit stocks may be present (Fig. 4). However, this spe- cies is a secondary target in the handline fishery and trends in CPUE may not adequately reflect changes in population abundance.
The relation between the two CPUE es- timates indicates that handline effort is somewhat concentrated on red snapper, relative to longline effort, which is more dispersed. Snappers and groupers are gen- erally more abundant on "hard bottoms" and rocky outcrops over the continental shelf and slope edge (Kawaguchi 1974). Expe- rienced medium-range artisanal fishers use visual reFerence points to locate hard bottom grounds and, once within them, they em- ploy a leaded wire or a fishfinder to de- termine the nature ofthe substrate. A pre- liminary assessment of our data showed that fishing occurs mainly in 60-240 m depth with higher red snapper catches obtained in less than 160 m, while yellowedge groupers were more abundant in deeper waters. This difference in depth distribu- tion and higher mobility to avoid ground where "strikes" are not satisfactory, may explain why handliners are able to concentrate fishing effort on red snappers.

Seasonal c h a n g e s in a p p a r e n t a b u n d a n c e a r e n o t easily i n t e r p r e t e d in t h i s fishery. Red s n a p p e r h a n d l i n e CPUE p e a k s d u r i n g t h e m o n t h s from April to S e p t e m b e r , which c o r r e s p o n d s w i t h low a p p a r e n t a b u n d a n c e for y e l l o w e d g e g r o u p e r . This p a t t e r n is presen t in longline CPUE only in t h e Atlantic s e c t o r . Longl ine CPUE in o t h e r s u b a r e a s does n o t p r e s e n t a wel l -def ined s e a s o n a l p a t t e r n . N u m e r o u s fac tors re la ted to fish b e h a v i o r , e n v i r o n m e n t , r e c r u i t m e n t a n d fishing s t r a t e g y a n d tactics may d e t e r m i n e t h e observed changes in t h e handline fishery. We t h i n k , h o w e v e r , t h a t c h a n g e s in local d e n s i t i e s associated w i t h r e p r o d u c t i v e b e h a v i o r m a y b e a m a j o r d e t e r m i n a n t Fac- tor. S n a p p e r s (Thompson a n d M u n r o 1 9 8 3 4 a n d g r o u p e r s (Thompson a n d Munro 1983b; Robertson 1 99 1 ) have been reported to form s p a w n i n g aggrega t ions . Lutjanuspurpureus is k n o w n to h a v e a p r o t r a c t e d s p a w n i n g per iod e x t e n d i n g from April to S e p t e m b e r . Even t h o u g h we a r e n o t a w a r e of specific s t u d i e s o n Epinephelus Fla volimbatus, in format ion p r e s e n t e d for t h e Car ibbean ( T h o m p s o n a n d M u n r o 1 9 8 3 b ; Rober t son 199 1) indicates t h a t several serranid species s p a w n in t h e first a n d last m o n t h s o f t h e year. These observat ions a r e consis tent with o u r results regarding handline CPUE for bo th s p e c i e s a n d , to a l e s s e r d e g r e e , For t h a t o n longl ines .
Acknowledgements
W e w i s h to t h a n k M r . Jose Silva from t h e D e p a r t a m e n t o de Biologla P e s q u e r a , lns t i tu to O c e a n o g r a f i c o , Univers idad de O r i e n t e , for his a s s i s t a n c e in data process - ing .
References
Anon. 1990. Resultados d e talleres sobre la p e s c a e n Venezuela . Minister io d e Agricultura y Cria, Direcci6n General Sectorial d e Pesca y Acuicultura, Caracas, 1 2 6 p .
Celaya, J. and L. Gonzalez. 1988. Descripci6n d e la pesqueria d e altura del pargo del Estado Nueva Esparta, Venezuela. Contrib. Cient. Centro d e lnvestigaciones Cientificas, Universidad d e Oriente. 17, 7 2 p.
Gonzklez, L. 1990. Edad y crecimiento del pargo colorado Lutjanuspurpureus e indice d e abundancia d e la pesquerh d e media altura pargo-mero e n la Region Oriental de Venezuela. Trabajo de Ascenso, Universidad d e Oriente, Boca d e Rio, Edo. Nva. Esparta. 7 3 p.
Kawaguchi, K. 1974. Handline and longline fishing explorations For snapper and related species in the Caribbean and adjacent waters. Mar. Fish. Rev. 36(9):8-3 1 .
Lugo, T. 1986. Aspectos d e la reproducci6n del pargo colorado, Lutjanuspurpureus, (Poey, 1875) (Pisces : Lutjanidae) d e la regi6n oriental d e Venezuela. Universidad d e Oriente, Cumana. 96 p. Thesis.
Robertson, D.R. 199 1 . The role of adult biology in t h e timing of spawning of tropical reef fishes, p. 356-386. In P.F. Sale (ed.) The ecology of fishes on coral reefs. Academic
1 Press, New York. Thompson, R and J.L. Munro. 1983a. The biology,
ecology and bionomics of t h e snappers , Lutjanidae, p. 94-109. In1.L. Munro (ed.) Caribbean coral reef fishery resources.
] ICLARM Stud. and Rev. 7, 2 7 6 p. Thompson, R and J.L. Munro. 198313. The biology,
ecology and bionomics OF t h e hinds and groupers, Serranidae, p. 59-81.Inj.L. Munro (ed.) Caribbean coral reef fishery resources. ICLARM Stud. and Rev. 7 , 276 p.

Trends in Commercial Fishery Landings of Groupers and Snappers In Bermuda from 1975 to 1992 and Associated Fishery Management Issues
B.L. LUCKHURST Division of isheries
P. 0. Box CR 52 Crawl CRBX. Bermuda
LUCKHURST, B.E. 1996. Trends in commercial fishery landings of groupers and snappers in Bermuda from 1975 to 1992 and associated fishery management issues [ Tendencias en 10s desernbarques de la pesqueria comercial de meros y pargos en Bermuda, de 1975 a 1992 y aspectos asociados a1 manejo de la pesqueria], p . 277-288. /n F. Arreguin-Sinchez, 1.L. Munro, M.C. Balgos and D. Pauly (eds.) Biology, fisheries and culture of tropical groupers and snappers. ICLARM Conf. Proc. 48, 449 p.
Abstract
From 1975 to 1981, the reported landings of six commercially important species of grouper (four Mycteroperca spp.. two Epjncphelus spp.) declined between 68% and 95%. The largest percentage decline (representing approximately 32 t) was in fishing for the Nassau grouper. Epinephelus striatus, whose spawning aggregations were heavily fished during these years. The only species which exhibited signs of a significant recovery in subsequent years was the black grouper (M. bonac~). Landings of two smaller species of grouper, the coney (Cephalopholis fulva) and the creole-fish (Paranthias furcifer) increased markedly from 1984-1985 to April 1990 when a ban on the use of fish pots was implemented. As a consequence of this ban, line fishing effort for these and other species has increased in an effort to maintain catch levels.
Of the species of snapper taken by the commercial fishery, the yellowtail snapper (Ocyurui chrysurus) has dominated catches with landings varying over time from 10 t to over 35 t. Gray snapper (Lurjanus griseus) and lane snapper (LuTjanus synagris) landings have shown a general increase over time with a significant increase in Fishing effort for lane snapper after the fish pot ban. Landings from line fishing effort directed at lane snapper doubled to 20 t between 1990 (the year of the fish pot ban) and 1992. A deepwater snapper Fishery which developed in 1981 as a result of a fishing gear innovation lasted !ess than two years due to overfishing of a limited bathymetric zone around the Bermuda seamount.
Resumen
Durante el perlodo de 1975 a 1981, 10s desernbarques reportados de seis especies de mero de importancia comercial (cuatro Mycteroperca spp., dos Epine phelus spp.) decrecieron entre 68% y 95%. El mayor porcentaje de decrement0 (representado por aproximadarnente 32 000 kg) ocurrio en la cherna criolla ( E pinep he1 us striatus) cuyas agregaciones reproductivas fueron fuertemente explotadas durante esos afios. La ljnica especie que present6 signos de una recuperation significativa en aAos suhsecuentes fue el cuna bonacl (M. bonaci). Los desembarques de dos especies mas pequetias de meros, la cherna cabrilla (Cephalopholis fulva) y el cum lucero (Paranthias furcifer) aumento en forma marcada de 1984- 1985 a Ahril de 1990, cuando una prohibicion en el uso de eenierros fue implernentada. Como una consecuencia de esta prohibicion, el esfuerzo cle pesca con lined para estas y otras especies ha incrementado en un intento por mantener 10s niveles de captura.

De /as especies de pargo tomadas por la pesca comercial, la rabirrubia (Ocyurus chrysurus) ha dominado /as capturas con descargas variando en el tiempo de 10 a mas de 35 toneladas. Los desenihrques cle pargo prieto (L. griseus) y pargo biajaiba (L. synagris) han rnostrado un incremenln marginal en el tienlpo, con un increment0 significative en el esfuerzo de pesca para el pargo biajaih despues de la irnplernentacidn de la prohibition del us0 de 10s encierros para peces. Los deseinbarques del esfuerzo de pesca con llnea, dirigido alpargo biajaih, duplico a 20 toneladas entre f 990 felaiio de la implementation de la prohibicidn) y 1992. Una pesqueria de pargos de aguas profundas que se desarroll6 en 1981 como resultado de una innovacidn a /as artes de pesca cluro menos de dos aAos debido a la sobrepesca de una area batimCtrica alrededor de la montat7a marina de /as Bertnudas.
Introduction
Xn an historical context, Bermuda's fish- ery has been dominated by groupers. Bardach et al. ( 1 958) discussed the abun- dance and importance of groupers to the island while providing information on as- pects oftheir biology. They estimated that groupers comprised approximately 70% of total food fish landings during the period OF their study (middle 1950s), with snap- pers contributing 20°/0 to the total. In 1975, a fisheries statistics program became fully operational providing catch and effort data from the industry on a compulsory basis. In this first year of the program, groupers comprised 47.6% of the total landed weight of food fish (431 t) while snappers con- tributed 9.8% (Luckhurst and Ward 1996). By 1989, total food Fish catch had increased to 623 t but the species composition of the catch had changed significantly with the grouper landings being reduced to 18.7% of the total, while snappers were largely unchanged at 10.1 %. The well-documented decline of Bermuda's grouper stocks from 1975 to 1981 was used by Bannerot et al. (1987) as an empirical data set to com- pare against simulated yield curves gen- erated by various computer models ex- amining the resiliency of protogynous and gonochoristic populations to exploitation. In general, protogynous populations such as groupers should be favored provided that males are not limiting. However, as mortality reduces the frequency of contact
between males and females, relative re- productive success of groupers is expected to decline. Russ ( 1 991) discussed several studies in which large declines occurred in both grouper and snapper populations as a result of intense fishing pressure (see also Cuellar et al.: Diaz-Ruiz et al.; Sullivan and Sluka, this vol.).
Methods
The data used in these analyses are de- rived from the fishery statistical database established by the Division of Fisheries in 1975. They have subsequently been modified and refined over the past 18 years in re- sponse to changes in the fishery. Changes in reporting categories over time can com- promise the interpretation of landing fig- ures, but this is considered primarily a prob- lem with smaller species which may often be filleted for marketing purposes. As re- porting practices vary in the Fishery in re- sponse to different factors, i t is not possi- ble to quantify this effect when using re- ported landings. However, Itnowledge of the operation of the fishery and the mar- ket has been used in the interpretation of the Figures in an attempt to reduce this possible error. The various fishery manage- ment plans and issues referred to in this paper and an analysis of trends in land- ings in the commercial fishery, up to and including 1990, is given in Luclthurst and Ward ( 1996).

Results and
Total landings
Discussion
The overall pattern in landings of groupers is a sharp decline from over 200 t in 1975 to approximately 58 t in 1981 (Fig. la) , followed by an increasing trend until 1989. However, the species composition of the grouper catch changed markedly during the 1980s with two smaller species com- prising almost 50% of total landings in 1989 (Luckhurst and Ward 1996). A fish pot ban was put into effect in April 1990 in an ef- Fort to allow the recovery of coral reef fish stocks which had been subjected to heavy fishing pressure with fish pots. As a result of the fish pot ban, the total grouper land- ings level declined by 58% and has re- mained stable through 1992. An analysis of the trends in individual grouper spe- cies (next section) indicates the relative contribution of each species to this gen- eral pattern.
In contrast, the pattern of landings in all the snapper species combined shows a more stable trend over the 18-year period, ranging from under 25 t to 70 t (Fig. la) . As the yellowtail snapper (Ocyurus ch~ysurus) often comprised 50% or more of the total snap- per landings, it is clear that variations in the landing Figures of this species have a significant effect on the overall snapper pattern.
In the past three years, the total land- ings of groupers and snappers have been very similar with little variation between them.
Grouper landings by species
The pattern of landings for the larger grouper species (Mycteroperca spp.) shows a similar trend in the four species with large declines from 1975 to 1981 (Fig. I b). The landings of the blaclc grouper (M. bonac17 declined 78.4OIo during this period while the next most abundant species, the tiger
grouper (M. tigris) dropped 91.7%. From 1982 to 1984, the blaclc grouper and the yellowmouth grouper (M. interstitialis) showed parallel increasing trends but these trends diverged in 1985 with the black grouper continuing to increase while the yellowmouth grouper steadily declined again. The fish pot ban in April 1990 brought a dramatic drop in the landings of black grouper (Fig. I b) while having little im- pact on the remaining three species whose landings had already declined to little more than incidental catch levels.
The landings of groupers of the genus Epinephe/us(Fig. 1 c) show the same steep decline from 1975 to 1981 but with only two species of commercial significance. The red hind (f guttatus) had the largest landing figures of all the grouper species starting at just under 70 t in 1975. Landings of this species declined by 67.8% over the seven- year period. This was followed by a sig- nificant increase in 1983 and apparent stabilization before a large drop in 1990. In contrast, the Nassau grouper (E. striatus) underwent a precipitous decline from over 33 t in 1975 to less than 2 t i n 1981 (Fig. Ic), a drop of 95.0% in landings. The spe- cies has not shown any evidence of a sub- sequent recovery. The spawning aggre- gation sites on the Bermuda platform and on the offshore banks were intensively fished with fish pots during this period and it appears that the spawning stock biomass was re- duced below a critical but unknown level so that the population has apparently been unable to recover (see Sadovy 1996).
Red hind spawning aggregation sites have been afforded a measure of protection since 1974 when these sites and surrounding areas were seasonally closed to all fishing dur- ing the summer spawning period. The enforcement of these area closures has been continuous since their inception, but with varying effectiveness, which probably in- creased in recent years. This may have helped to maintain spawning stock biomass and will possibly allow a partial recovery of the

stock now that it is subject only to line fishing pressure. Some of the Nassau grouper aggregation sites were relatively close to the red hind sites (24-28 m depth) but on the seaward side in deeper water (36-40 m). These deeper sites were not included in the area closures and were therefore intensively fished. Anecdotal information from fishers indicates that the density of fish pots set for Nassau groupers in these small areas during the aggregation period (May-June) was so high that the buoy ropes of adjacent fish pots often became tangled as fishers attempted to maximize catch during this brief period of high catchability.
The misty grouper (E. mystacinus) at- tained a peak in landings in 1979 at over 7.4 t but declined after 1981 to a negligi- ble level. The "Other" category is comprised primarily of the red grouper (E. morio), the rock hind (E. adscensionis) and the graysby (E. cruentatus). This group reached'a peak in 1985 at almost 6 t but as these species were lumped in the original statistical re- porting form, i t is not possible to deter- mine what proportional contribution each species has made to the overall figure. It is thought that the 1981 figure was increased significantly by the inclusion of wreckfish (Polyprion americanus) in the "Other" cat- egory as a result of an intense but short- lived vertical longline fishery which tar- geted primarily snappers. The wreckfish were taken in deeper water than the snappers but using the same gear. Wreckfish were included as a separate entry in the reporting Form as of 1982.
The landings of two smaller grouper species, the coney (C. fuJva) and the cre- ole-fish (Paranthias furcifer) increased dra- matically from 1984 to 1989 reaching lev- els of 25 t and almost 33 t, respectively (Fig. 1 d). Most of this catch can be attrib- uted to the increased fishing power of fish pots which came about as a result of tech- nological innovations in the fish pot Fish- ery. Despite the irnplementatlon of a full
limited entry fish pot fishery in 1986 with reductions in numbers of fish pots, effec- tive fishing effort with fish pots did not appear to decline and these smaller grouper species became increasingly important for the established local fresh fillet market. The fish pot ban in 1990 witnessed steep de- clines in both species but the landings level of the coney returned to its previous level the next year, while the creole-fish con- tinued to decline (see section on analysis by gear type).
Snapper kndjngs by species
The dominant snapper species landed in Bermuda is the yellowtail snapper (Oqmrus chlysurus). The landings have fluctuated over the 1 &year period of this analysis From 10 t to 36 t (Fig. 1 e). This large range is probably the result of a combination of natural variability and changes in fishing effort over time. However, the highest sustained catch levels occurred from 1984 to 1989 during which period fish potting effort was high. The decline in 1990 and the two subse- quent years is probably the combined re- sult of the fish pot ban and the seasonal closure of portions of the Bermuda plat- form to all fishing activities (Luckhurst and Ward 1996). These closed areas are con- sidered to be very productive, particularly for yellowtail snappers and other species which are fished along the edge of the platform during the summer months. Gray snapper (Lutjanusgnseus) landings increased through the 1980s reaching a peak in 1 987 at just over 23 t (Fig. l e) before plunging to approximately 7 t in 1990 mainly in response to the fish pot ban. It has remained at a similar level for the past two years.
The lane snapper. (L. synagris) has shown a slower but steady climb over the years, peaking in 1987 but, unlike the gray snapper. landings did not decline in 1990 (Fig. 1 e). In the past two years, landings have

2mr Bermuda comrnerciol fishery bndings
s ~ o t a groupers
6 Total snappers
Groupers - Myctemperm spp. -T
4 Yellawfin
Year
Flg. 1. Grouper and snapper landings reported from the Bermuda com- mercial fishery from 1975 to 1992: [Descargas comercla/es de meros y pargos reporfadas en la pesquerh de Bermuda de 1975 a 1992:l
a) Total grouper (Sermnldae) and snapper (Lutjanidae) landlngs [Total de meros (Serranldae) y pargos (lut/nnldae).]
b) Groupers of the genus Mycteroperc;l: black (M. bonacl); yellowmouth (M. /nterst/tla/ls); tlger (M. t lg r ls ) ; and yellow fin (M. venenosa) [Meros Mgenero Mycteroperca: cuna IronacS(M. bonacl); cuna amarllla (M. Interstltlalis); cuna gata (M. tlgrls); y cuna de pledra (M. venenosa).]
C) Groupers of the genus Eplnephelus: Nassau (E. striatus); red hind (E. guttatus); misty (E. mystacinus); other species [Meros del gknero Eplnep helus: cherna crlolln (E. strlatus); mero colorado (L. guttatus); mero listado (P. mystaclnus); y otras especles.]

35 -
30- Groupers
15 -
10 -
1975 1977 W9 1981 t X 3 1985 1907 089 1-1
40r Snappers
Year
Fig. 1 . (cont.) d) Other grouper species: coney (Cephdopholl$ hIv& creole-Ash (Pivilllthk
furclferrl; w teckf Is h Polyprion amerlcimus) [ Otras especles tie meros: chema cabrilh (Cephalopholis fulva); cuna iucero (Paranthias furclfer); cherna (Polyprion americanus)]
e) Snappers: yellowtall (Ocyurus chqsurush grey (Lut/rmusgrlseus); lane (L. synagrlsh red (L. vlvanus) [a) Pargos: rabirrubla (Ocyurus chrysurus); pargo prieto (Lutjanus griseus);pargo bla/alba (L. synagris);pargo de 10 alto (L. vivanus)]
f) Deepwater snappers: "wenchman" (Pristlpomoldes macrophthalmus); queen (Eteiis ocuiatusrl; other specles [Pargos de aguas profundas: panchlto o/dn (Prlstlpomoldes macrophthalmus);pargogo cachucho(Etelis oculatus); y otras especiesn

increased by over 8 t in response to in- creased line fishing effort.
The red snapper category was comprised primarily of the silk snapper (L, vivanus) from 1975 to 1980, although vermilion snapper (Rhornboplites aurorubens) was also caught. The dramatic peak in 1981 (Fig. 1 e) is an artifact of the statistical reporting system. A vertical longline Fishery for queen snapper (Etelis oculatus) and the "wenchman"" snapper (Pristipomoides macrophthalmus) rapidly developed in 1981 and fishers re- ported the catches of these two species under the red snapper category in that year. By 1982, these two species were included on the reporting Form and their landings were reported separately from that year onward (Fig. 1 fl. Landings of red snapper For the last 1 1 years have been at a low level showing no sign of a recovery.
The vertical longline fishery for deepwater snappers (queen and "wenchman") lasted less than two years due to overfishing of the narrow shelfedge around the Bermuda platform (Luclthurst and Ward 1996). The combined catch O F these two species in 1981 is estimated at approximately 22 t and, by 1983, the reported landings of both species were negligible. It appears that these two species have been subjected to pulse fishing over the years with concurrent land- ings pealts in 1986 and 1991 (Fig. 10. These pealts in landings are almost certainly ef- fort-related and probably reflect fishery responses to management actions in ef- fect at the time. In 1986, the limited entry fish pot fishery (for full-time fishers only) was implemented, displacing many part- time pot fishers who turned to various forms of line fishing in an attempt to maintain their catch levels. The larger peak in 1990- 1991 is probably a direct result of the fish pot ban because former fish pot fishers were forced to shift their efforts into line and net Fishing. AnecdotAl evidence suggests
that a number of fishers decided to fish For deepwater snappers again because they felt that the stocks had probably an opportunity to recover after being largely unfished for several years. Catches did in- crease in 1991 with queen snapper reach- ing over 3.8 t but landings plummeted again in 1992.
Analysis of fanrllmgs by gear Qpe for groupers
In order to assess the full impact of the I990 fish pot ban on catches of groupers and snappers, it is necessary to determine the proportion of the catch taken by fish pots for each species in the years leading up to the h. It is also desirable to determine whether apparent increased line Fishing effort for a given species following the fish pot ban has resulted in the maintenance of landing levels.
On the basis of landing statistics, four grouper species were chosen for this analysis. The reported landings by fish pots and by various forms of line fishing were deter- mined from the fishery statistical database (Luckhurst and Ward 1996) for the three years prior to the fish pot ban and then extended through 1992, two years after the ban had been in effect.
The black grouper (M. bonacfl was cho- sen from amongst the four species of Mycteroperca because it was the only large grouper with a significant landing level before the fish pot ban. The analysis showed that the catch by fish pots completely domi- nated the landings in 1987- 1989, comprising over 95% of the landed weight in each of the three years (Fig. 2.3). The same analy- sis of the other three species of Mycteroperca (see Fig. 1 b) revealed a similar trend. This clearly demonstrates the dependence of the fishery on fish pots to efficiently harvest
" P macrophthalamus is designated as the cardinal snapper by both the Food and Agriculture Organization and t h e American Fisheries Society in their list o f official common names. Hence, wenchman in quotes as this is the official common name of P. aquilonaris.

25r Black Grouper
* line fishing 20L A = Red Hind 30'-
- 25 - b 20 2 t Is- m m t .- 10- 2
5 -
0-
Coney C
0
0
-
-
0 1 I I 1 - 1 1907 1980 1989 1990 19% 1992
Year
Flg. 2. Grouper and snapper landlngs by gear type from 1987 to 1992. The fish pot ban came into efect In April 1990. [Descargas comerclales tie meros y pargos por tip0 de arte de 1987 a 1992. La prohi6iclon rlei uso de encierros f u i implementah en Abril cle 1990.] a) Black grouper (M. bonaci) [cum bonaci (M. bonacl)]
b) Red hlnd (E. guttatus) [mero colorado (E. guttatus)]
C) Coney (C. fulva) [cherna cabrMa (C. fulva)]
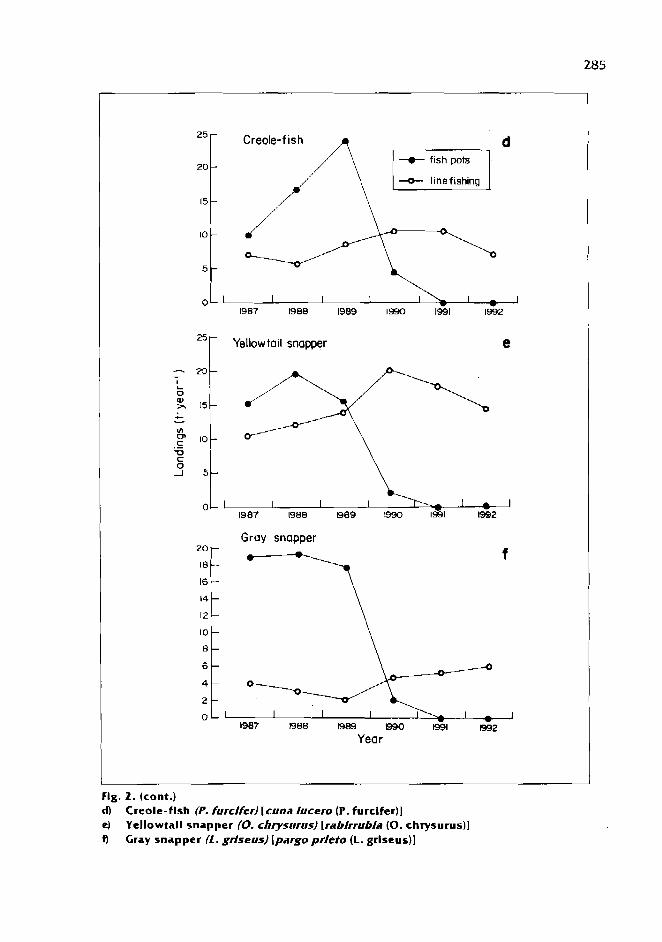
+ linefishing
15
25r Yellowtail snapper e
Gray snapper
14
I2
6
2
o 1 Year 1992
Flg. 2. (cont.) rl) Creole-flsh (P. furclfer) [cuna lucero (P. furcifer)] e) Yellowtall snapper (0. chlysurus) [ralrlrrulrla (0. chrysurus)l 4 Gray snapper (1. grlseus) [pargo prleto (L. grlseus)]

I t fish pots
4 line fishing
-7,'
Year I
Fig. 2. (cont.) @ Lane snapper (1. syrtagrjs) Ipargo bla]alba (I. synagrls)]
large groupers. Anecdotal evidence indi- cates that greater fishing effort has been directed at black groupers by handline fishers since the fish pot ban, but i t is considered to be a specialized fishery and the landings from line fishing have remained at the same low level since 1990 as they were before the fish pot ban.
The red hind figures indicate that the catch by fish pots ranged from 79 to 89% of the total landings before the fish pot ban, while line Fishing landings increased substantially in 199 1 before falling back to a lower level in 1992 (Fig. 2b). The effec- tiveness of increased line fishing effort for red hinds was probably limited by the closure of the expanded seasonally protected ar- eas which went into effect as part of the 1990 Fisheries Management Plan. These areas include known red hind spawning aggre- gation sites, as well as a considerable area of prime fishing bottom.
The coney landing figures provide evi- dence of a major shift in fishing effort with the advent OF the fish pot ban in April 1990 (Fig. 2c). From 1987 to 1989, fish pot landings comprised 75-78% of the total, but by 1991 landings from line Fishing alone equaled the total landings achieved when fish pots were in use. This level was sustained in 1992 indicating that the high catchability of conies on handlines and their ubiqui- tous distribution have made the coney one of the principal species of the commercial fishery.
The other small grouper species, the creole- fish, provides a dramatic contrast to the coney. Although landings by fish pots in- creased from 10 t in 1987 to over 24 t in 1989, comprising 74% of creole-fish land- ings in that year, line fishing landings in- creased only marginally in 1990 and then declined significantly in 1992 (Fig. 2d). As catch-per-unit-effort of the creole-fish by

line fishing is generally not as high as the coney, many fishers have moved to tar- get other species where the landed weight per unit of fishing time is higher.
Analysis of landings by gear qpe for snappers
The three most commercially important species of snapper provide interesting con- trasts in landing patterns in relation to the fish pot ban. The yellowtail snapper was taken in larger quantities by fish pots than by lines in 1987-1 988 but line fishing landings were still very significant and increased steadily from 1987 to 1990 (Fig. Ze). From 1989 to 1991,0.4-0.5 t were reported landed with seine nets but this netting effort is generally sporadic and opportunistic in nature. Landings declined in the two years Following the fish pot ban but still achieved the levels of Fish pot landings alone confirming high catchability by the line Fishery. Thus, the fishery was able to compensate for the loss of fish pots and catch levels have generally been maintained during this largely seasonal summer Fishery.
The gray snapper landing pattern indi- cates a strong dependence on fish pots, with this gear providing 83-90% of total landings in the three years before the Fish pot ban (Fig. 2Q. Netting of gray snappers with seine nets traditionally occurred in inshore waters but was banned in 1983. Although the line fishing catch increased in 1990 to over 4.8 t , it remained almost level for the next two years. Gray snap- pers are notoriously difficult to catch in quantity by line fishing and the fishery has, to date, been unable to surpass the 6 t landing level. This is approximately one- third of the landing levels achieved with fish pots before the fish pot ban.
Although the catch of lane snappers by fish pots (78-89%) was at a similar level to gray snappers, the line fishing catch rose steeply in 1990 to 10 t (a five-fold increase
from the year before) as the fishery ex- ploited the vulnerability of lane snappers to line fishing effort, particularly by night fishing (Fig. Zg). Anecdotal evidence in- dicates that line fishing effort continued to increase in 1991 -92 reaching a catch level of almost 20 t, the highest recorded land- ings of lane snapper in the statistical data- base. Recreational fishing effort has also increased markedly in the past few years but no landings figures are available.
Summary and Conclusions
The dominance of groupers in the Ber- muda commercial fishery in 1975 is indi- cated by total landings of over 200 t vs. 42 t for snappers. By 1981, grouper landings had declined to 58 t while snappers had increased to almost this same level. Despite an increasing trend in total grouper landings during 1983-1 989, which was largely the result of the contribution of two smaller species, the landing level only reached about 1 16 t before the fish pot ban was imposed in April 1990. The majority of the grouper species stocks had not effected any recovery over this period: in fact, several species had become commercially extinct e . g . , Nassau grouper. The fishing industry's strong dependence on fish pots to catch groupers was dramatically illustrated when total landings plunged to under 50 t the year that the fish pot ban took effect. Additional line fishing effort in 1991 -1 992 was unable to increase landings to compensate for the loss of fish pot catches.
Total snapper landings have oscillated in a smaller range than groupers with an overall increasing trend up to the fish pot ban. The yellowtail snapper has been the dominant species in the commercial fish- ery with landings ranging up to 36 t. How- ever, there has been a significant decline in landings since 1989 with the 1992 fig- ure standing at under 15 t. Since the fish

pot ban, the landings of lane snapper have almost doubled surpassing the figure for yel lowtai l snapper for the first t ime. An- ecdotal evidence suggests that there has been a significant increase i n directed line fishing effort for this species by both com- mercial and recreational fishers due t o its high catchability by l ine fishing and ready access t o the fishing grounds o n the Ber- muda platform by smaller fishing vessels.
I t appears that most o f the larger grouper species suffered high levels of fishing mortality when subjected to heavy fishing pressure with fish pots. The species which form discrete spawning aggregations, such as Nassau grouper and t iger grouper, seem t o be particularly vulnerable t o exploitation. When these spawning aggregations are heavily fished, spawning stock biomass is signifi- cantly reduced. When population size Falls be low some min imum level, disrupting reproductive behavior patterns, it is probable that the stock wil l suffer a spawning collapse. In protogynous hermaphroditic species such as groupers, where there is typically a female-biased sex ratio, the number of males available t o spawn may become the limiting factor. The min imum or threshold size o f a spawning aggregat ion for reproductive success is largely unknown. Several o f Ber- muda's grouper stocks appear to have suffered such a collapse and have not recovered.
The gonochoristic snappers have been more resilient under the high fishing effort imposed o n Bermuda's stoclts. Al though vulnerable to fish potting pressure, the different reproduct ive ecology and behavior o f snappers seems t6 have al lowed these species t o maintain stock levels under the Bermuda fishing regime without suffering the dramatic declines witnessed in many of the grouper species.
Acknowledgements
I thank Norbert Simmons For reviewing the manuscript and providing an histori- cal perspective o n aspects of the fisheries stat ist ics p rogram. Fishers L i n w o o d Outerbridge and john P. lngham shared their Imowledge from years o f fishing ex- perience w i t h fish pots and helped m e interpret some o f the landing patterns. Nevil le Trott wi l l ingly produced slides for m y presentation o n short notice.
References
Bannerot, S., W.W. Fox, jr. and J.E. Powers. 1987. Reproductive strategies and the management of snappers and groupers in the Gulf of Mexico and Caribbean, p. 56 1-603. In J.]. Polovina and S. Ralston (eds.) Tropical snappers and groupers: biology and fisheries management. Westview Press, Boulder.
Barclach, J.E., C.L. Smith and D.W. Menzel. 1858. Bermuda Fisheries Research Program. Final Report. BermudaTrade Development Board, Hamilton, Bermuda. 59 p.
Luckhurst, B.E. and J.A. Ward. 1996. Analysis of trends in Bermuda's fishery statistical database from 1975- I990 with reference to fishery management measures implemented during this period. Proc. Gulf Caribb. Fish. Inst. 44:306-324.
Russ. G.R. 1991. Coral reeffisheries: effects and yields, p. 601-635. In P.F. Sale (ed.) The ecology of fishes on coral reefs. Academic Press, San Diego, California.
Sadovy, Y. 1996. The case of the disappearing grouper, Epinephelus striatus, the Nassau grouper, in the Caribbean and western Atlantic. Proc. GulFCaribb. Fish. Inst. 4 5 5 22.

Catch, Effort and Sustainable Yield for Australia's Northern Trawl FSshery
DL, RAMM Y. XlAO
Fisheries Division Department of Primaly Industry and Fisher/es
GPO Box 990, Darwin NT0801 A ustrah
RAMM, D.C. and Y. XIAO. 1996. Catch, eFfort and sustainable yield for Australla's northern trawl fishery [Captura, esfuerzo y rendimiento sostenille para la pesqueria de arrastre del norte de Austral/al, p. 289-306. In F. Arreguln-Sanchez, J .L. Munro. M.C. Balgos and D. Pauly (eds.) Biology. fisheries and culture of tropical groupers and snappers. ICLARM Conf. Proc. 48. 449 p.
Abstract
Australia's northern trawl fishery is a multlspecies, rnultifleet shelf fishery operating on the North- west Shelf (1 14-1 23"E), and in the Timor (123-129"E) and Arafura (1 31-14Z0E) Seas. Groundfish resources have been fished continuously since 1971, and total annual retained catches reached 37 100 t on the Northwest Shelf in 1973: 9 100 t in the Timor Sea in 1974: and 9 000 t in the Arafura Sea in 1983. Red Lutjanidae, mainly Lu@nus malalarkus, dornlnated catches in the Arafura (54 191 t-year-') and Timor Seas (51 091 t-year-'), and were a major catch component on the Northwest Shelf (22 182 t.yearrl). Other major commercial categories included Nemlptems spp. (28 377 tayear"). Saurlda spp. (S4.276 t-year-') and Lethrinus spp. (24 074 t-year.') on the Northwest Shelf, and Ariomma indica and Psenopsls humerosa (S3 057 t.yearl) and Nemipterus spp. (52 81 1 t *year l ) in the AraFura Sea. Catch-per-unit effort data were standardized and maximum sustainable yields estimated, where possible, using the surplus production model.
Resumen
La pesqueria de arrastre del Norte de Australia es una pesqueria multlespecffica multiflota que opera sobre la p/ataforma continental noroe~te ( I 14-123°E) y en el mar de Timor (123-1Za'E) y Arafura (131- 14Z0E). Los recursos de 10s campos pesqueros han sido explotados continuamente desde 1971 y /as capturas totales por aiio alcanzaron 3 7 I 0 0 t en la plataforma nororiental en 1973: 9 I 0 0 t en el mar de Timor en 1974; y 9 000 t en el mar Arafura en 1983. Los pargas Lutjanus rnalabaricus dominaron Ids capturas en el mar Arafura (54 J91 tw io - ' ) y en el mar de Timor (5 1 091 t'afio.'), y fueron el componente mayor de la captura en la plataforma nororiental (52 182 t -a~io ' / / . Otras categorlas comerciales mayores incluyeron Nemipterus spp., (58 377 t-afio-'1; Saurlda spp. (54 276 taaAo,') y Lethrlnus spp. (54 076 t-afio-') sobre la plataforma nororiental; y Ariomma indica. Psenopsis hurnerosa (53 057 t-aiio-') y Nernipterus spp (22 811 t-aiio-') en el mar Arafura. Los datos de captura por unidad de esfuerzo fueron estandarizados y 10s rendimientos rnAximos sostenildes estimados, cuando fu.6 posihle, usando mode10 de produccidn exceden te.

Introduction
Groundfish resources of the Northwest Shelf and Timor and Arafura Seas, on Aus- tralia's northern continental shelf, were fished extensively by Japanese stern trawlers during 1959-1 963 (Sainsbury 1987), Taiwanese pair trawlers during 197 1 - 1990, and Thai stern trawlers during 1985- 1990. The Japanese fleet targeted Lethrinidae on the North- west Shelf (Sainsbury I987), while Taiwanese trawlers retained predominantly Carangidae, Lutjanidae, Nemipteridae and Synodontidae (e.g., Liu 1976; Liu et al. 1878; Chen et al. 1979; Edwards 1983; Sainsbury 1987, 1988, 1991 ). The Fishery developed rap- idly and total annual catch reached 49 200 t in 1974 (Sainsbury 1991 ; Sainsbury, unpubl.), representing about 30% of the then total catch from Australian waters, and 60% of the catch taken by Taiwanese distant-wa- ter pair trawlers (Liu 1976). Early estimates of maximum sustainable yield (MSY) for groundfish were based on Gulland's ap- proximation of MSY=0.5MBo where M is natural mortality rate, and Bo is unexploited biomass estimated using swept area method with net width as effective trawl path width. These estimates varied considerably de- pending on values of M, and area of trawl grounds. Liu ( 1 976) and Liu et al. (1 978) estimated MSYs of 336 000 t-year- ' , 250 000 t-year-' and 447 000 tbyear-I for all commercial groundfish species on the Northwest Shelf, Tirnor Sea and Arafura Sea (Australian and Indonesian sectors), respec- tively, assuming M= 1 .O year-' and that the total shelf area was exploited. Sainsbury ( 1 982) estimatecia MSY of 87 000 t-year-' for all commercial groundfish species on the Northwest Shelf using M=0.5 year-' and actual area trawled in 1973. Edwards ( 1983) assumed M=0.3 year-' and 'areas of con- centration of effort' in estimating MSYs of 36 000 tmyear.', 20 000 t-year-' and 30 000 tayear-' for all commercial groundfish spe- cies on the Northwest Shelf, Tirnor Sea and Arafura Sea (Australian sector only),
respectively. Sainsbury (1 982. 1984) also estimated sustainable yields for major com- mercial categories by fitting data from the Northwest Shelf to surplus production models.
Sainsbury (1991) developed an adap- tive management strategy for groundfish on the Northwest Shelf based on observed changes in community structure during 1960- 1983, where relative abundances of Lethrinidae, Lutjanidae and Serranidae, and incidentally caught sponges, decreased sig- nificantly over time, while those of Nernipteridae and Synodontidae increased significantly, while those of Carangidae, Haemulidae and Sparidae did not change. Further, Sainsbury ( 199 1 ) established that Lethrinidae and Lutjanidae had a higher probability of occurring in habitat with large epibenthos than in open sand habitat, while Nemipteridae and Synodontidae preferred open sand habitat. Sainsbury ( 1 987) concluded that trawling on the Northwest Shelf may have modified benthic habitats and caused long-term changes in community structure.
Major changes in fishing practice occurred Following the ratification of Australia's Fishing Zone (AFZ) in 1979. Groundfish trawling, now managed by the Federal Department of Primary Industries and Energy, was con- fined to management zones on the North- west Shelf, and in the Tirnor and Arafura Seas. User conflicts with the domestic shrimp fishery were minimized by excluding fish trawlers from shallow, shrimp-rich waters, including the Gulf of Carpentaria. Fishing by foreign trawlers continued, under license, and effort shifted from the Northwest Shelf to the Arafura Sea to target Lutjanus ma/abaricus. Concerns were raised about the inadequacy of fishery data from the Timor and Arafura Seas (e.g., JernalcoR and Sainsbury 1990). Here, we report catch and effort data for the entire trawl fishery in northern Australia during 1972- 1990, and discuss implications of our findings for rnan- agement of, and future research into, that Fishery.

Method
Our study covered groundfish trawl data from the Northwest Shelf (1 15-1 23OE) and the Australian sectors of the Timor (1 23- 131°E) and Arafura (131-14l0E) Seas from 1971 when fishing began in the Arafura Sea, to 1990 when foreign license arrange- ments were discontinued (Fig. 1 ). Annual retained catch and effort data to 1979 were based on Edwards (1983) and Sainsbury ( 1 99 1 ; Sainsbury, unpubl.) (Appendix 1 ). The Federal Department of Primary Indus- tries and Energy supplied tow-by-tow log- book data for 1980- 1990 and observer data for box weights and species composition for commercial categories from 1 192 tows (3700h) on the Northwest Shelf and in the Arafura Sea during 1985-1 987. Logbook catch data (number of boxes.tow-' by cat- egory) were converted to weight using box weights declared in logbooks or measured by observers. Distant-water fleets operating in the AFZ were also monitored by sur- veillance and weekly radio reports. There was a good correspondence between these sources of information and fishing activi- ties reported by observers and logbooks
(Rarnrn, unpubl.), and all logbooks were assumed to be recovered. Further, logbook data quality were good, with only 0.2% of effort data missing, and 93.5% of catch data reported by commercial categories. Thus no corrections were applied to the data.
Catch-per-unit-effort (CPUE) for each commercial category was standardized by fleet, zone and year using annual catch- and-effort data ( 1972- 1990) fitted to the multiple linear regression model
where Uiit is CPUE for fleet i in zone j du r - ing year t , U,, , is CPUE for fleet 1 in zone 1 during year 1, ai is relative fishing power of fleet i,p, is relative abundance in zone j , ytis relative abundance in year t, and E, ,~ is an error term with a mean of zero and a constant variance (e.g., Hilborn and Walters 1992). Standardized CPUE and effort for each zone were fitted, by multiple linear regression, into Walters and Hilborn's (1 976)
2 1 6 1 -, Northwest 1 t - Shelf
Australia
Longitude ("El
Fig. 1 . Fishery management zones (shaded) In Australla's northern trawl flshery: Northwest Shelf ( 1 15-123"E), Tlmor Sea (123-131°E) and Arafura Sea (131-141°E). [Zonas tie manejo (area sombreada) de Id pesquerh de arrastre tiel node tie Australia: Plataforma Nororiental (1 l 5 - lZ .PE) , Mar rle Tlmor (123- lJlO&) y Mar Arafura (131 -141°E).]

where U, and U,+, are standardized CPUE during years t and t+ 1 , respectively, Et is standardized effort during year t, r is in- trinsic population growth rate, q is catchability, and k is carrying capacity. Alternative fits using Polovina's (1989) extension of this model, assuming an identical intrinsic popu- lation growth rate r among zones and a time-series method (Hilborn and Waiters 1992) resulted In little improvement in good- ness-of-fit.
Results
Taiwanese distant-water pair trawlers (length: 36-42 rn, gross tonnage: 280- 350 t) dominated the Fishery with effort >30 000 h-year-' during 1973-1 986 (Table
T a i w s e Flmt 1980-90
1 ; Edwards 1983; Sainsbury 1991 ) mostly on the Northwest Shelf between 1 16- 1 19"E and 19-21 "5, and Arahra Sea between 1 36- 1 38"E and 9- 1 1 "S (Fig. Za). Thai stern trawlers (26-42 m, 1 15-350 t) fished in the Arafura Sea during 1985-1 990 with effort >30 000 h*yearl during 1988- 1990, mostly between 133-1 37"E and 10- 1 1 "S (Table 1, Fig. 2b). Another Chinese pair trawler fleet, from Zhejiang Province, fished on the North- west Shelf and in the Tirnor Sea during 1989 with a total effort of 6 251 hours, and a fledgling Australian stern trawl fleet has op- erated sporadically in the Arafura Sea for a total of 2 793 hours during 1887- 1990 (Table 1 ).
Taiwanese trawlers generally fished o n the Northwest Shelf (depth fished: 50-80 m)
Thai Fleet (1985-90) b
Longitude ("E)
Flg. 2. Total flshlng effort, by degree grld, for (a) Taiwanese and (b) Thal fleets In Australla's northern trawl flshery during 1980-1990. [Esfueno de pesca total, por cuadrante de un gratfo, para /as ffotas de (a) Taiwan y (b) Thailandia, de la pesqueria de arrastre rle/ norte tie Australla durante 19800-1990.1

Table I. Total number of Hcensed trawlers and flshlng effort (h) in Australia's northern trawl fishery during 1980-1990. INumero total tie arrasfreros con IIcencIa y esfuerzo de pesca (h) de la pesgrreria de arrastre del node de Australh durante 1980- 1990.1
Fleet 1980 I981 1982 1983 1984 1985 1986 1987 1988 1989 1990
Number of licensed trawlers Australian 0 0 0 0 0 0 0 2 2 8 3 Thai 0 0 0 0 0 3 7 7 13 14 1 1 Taiwanese 104 72 72 72 80 64 44 22 18 12 4 Lhej iang 0 0 0 0 0 0 0 0 0 8 0
Effort on Northwest Shelf Australian 0 0 0 0 0 0 0 0 0 0 0 Thai 0 0 0 0 0 0 0 0 0 0 0 Taiwanese 36448 31 379 38996 29891 38546 38022 12203 4960 7 153 10 139 665 Zhejiang 0 0 0 0 0 0 0 0 0 1 974 0
Effort in Tirnor Sea Australian Thai Taiwanese Zhejiang
Effort in AraFura Sea Australian 0 0 ' 0 0 0 0 0 58 1 399 0 f 336 Thai 0 0 0 0 0 2597 17924 25672 31413 61317 41739 Taiwanese 17959 9881 13948 28219 29935 7173 16862 3941 2610 22 1 470 Zhejiang 0 0 0 0 0 0 0 0 0 0 0

during April-August and in the Timor (60- 90 m) and Arafura (40-75 rn) Seas during October-March (Fig. 3). Trip and tow du- ration averaged 59.1 days (SE= 1.3 day, n=447) and 2.2 h (SE<O.Ol hours, n=186 278), respectively. Interestingly, fishing was conducted throughout the day on the North- west Shelf and Tirnor Sea (7 tows-day7'), and from dawn to dusk in the Arafura Sea (0530- 1930 hours, 5 tows-day-'). In con- trast, Thai trawlers fished throughout the day (6 tows-day-I) and year in the Arafura Sea (50-75 m), with a mean trip and tow duration of 27.6 days (SE=O.8 day, n=3 19) and 4.0 hours (SE<O.Ol hours, n=45,709), respectively.
Twenty-four commercial categories, rep- resenting at least 69 species of fish, squid and cuttlefish, were identiFied from observer data (Appendix 2). Most categories were dominated by single species such as Lethrinus Ientjan (Lethrinidae), Lutjanus ma/abaricus (red Lutjanidae) , Lutjanus vittus (small Lutjanidae), Nemipterus furcosus
(N em ipteri d ae) , Pristipmoides multidens (goldband Lutjanidae), Psenopsishumerosa (butterfish), Saurida undosquamis (Syno- dontidae) and Trichiurus Iepturus (Trichiuridae). Total retained catch For all fleets during 1972- 1990 was approximately 229 000 t on the Northwest Shelf, 47 000 t in the Tirnor Sea and 126 000 t in the AraFura Sea (Table 2.3-c, Appendix 1 ) . Nemipteridae was the dominant category on the North- west Shelf (8 3 7 7 t-year.'), while red Lutjanidae dominated catches in the Tirnor (1 091 t-year-') and Arafura Seas (4 191 t*yearq. Other important categories included Lethrinidae (4 076 t-years') and Synodontidae (4 276 t-year2') on the Northwest Shelf, Carangidae (1 528 t-year - ' ) in the Timor Sea, and butterfish (3 057 t-year-') and Nemipteridae (Z 8 1 1 t-year7') in the Arafura Sea.
Observer data indicated that the pro- portion of the total catch retained by trawlers varied little between fleets and zones, with Taiwanese vessels retaining 67% by weight,
Year
Flg. 3. Monthly effort for Talwanese and Thal fleets In Australla's northern trawl fishery during 1980- 1 770. Talwanese -fleet on the Northwest Shelf (cross hatch), and In the Tlmor (whlte) and Arafura Seas (black); Thal fleet In the Arafura Sea (stipple). [Esfuerzo rnensual para las notas tie Talwan y Thal de la pesqueria de armstre del node de Austraila durante 1980- 1990. la nota de Taiwan de la platafonna nodental /acliurada), y en 10s mares de Timor /blanco) y Arafura (negro); y la flota de Thai en el mar Arafura (st//pie).]
of the catch (SE= 12010, n=61) on the Northwest Shelf and 53% (SE=14%, n= 101) in the Arafura Sea, and Thai trawlers retaining 63% (SE= 1 G0/0, n= 109) in the Arafura Sea. However, marked differences existed in discard practices, at the category level, be- tween fleets particularly in the Arafura Sea where butterfish, Trichiuridae and Rachycentridae were re- tained by Taiwanese trawl- ers but discarded by Thai vcs- sels, while Ariidae were re- tained by Thai vessels but discarded by Taiwanese vessels (Table Za-c, Fig.4).
Standardization of CPUE revealed marked variation in fishing power between fleets, zones and years (Table 3). The fishing power of Thai
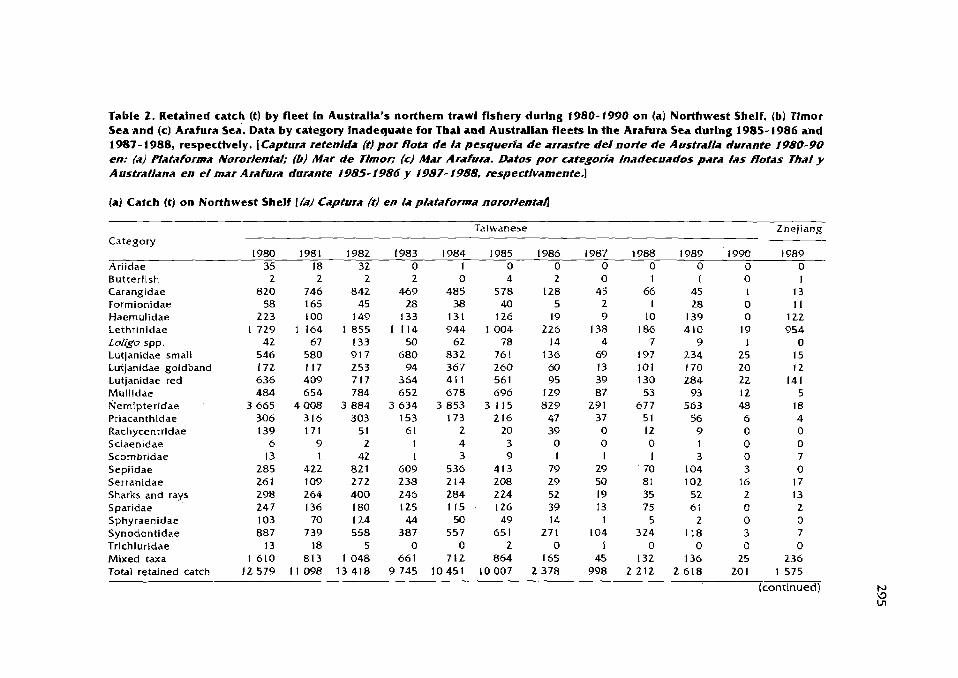
Table 2. Retained catch (t) by fleet In Australia's northern trawl flshery during 1980-1990 on (a) Northwest Shelf, (b) Tirnor Sea and (c) Arafura Sea. Data by category Inadequate for Thai and AustralIan fleets In the Arafura Sea durlng 1985-1986 and 1 987 - 1 988, respectlvel y . [ Captura retenlda (t} por flora tie k pesqueria de arrastre del notie de A ustrah durante 1980- 90 em- {a) Plataforma Noror/ent?d; (b} Mar de Tlmor). (c) Mar Arafum. Datos por categoria lnadecuados para la5 floras Thai y Australlam en el mar Arafura durante 1988- 1986 y 1987- 1988, respectlvamente.]
(a) Catch it) on Northwest Shelf [/a/ Captura /d en k pktafonna norodental)
- -
Taiwanese ~ h e j i a n g Catenorv - +
1980 1981 1982 1983 1984 1985 1986 1987 1988 1989 1990 1989 Ariidae 35 18 32 0 1 0 0 0 0 Butterfish Carangidae Formionidae Haernulidae Lethrinidae Lo/igo spp. Lutjanidae small Lutjanidae goldband Lutjanidae red Mullidae Nemipteridae Priacanthidae Rachycentridae Sciaenidae Scombridae Sepiidae Serranidae Sharks and rays Sparidae Sphyraenidae Synodontidae Trichiuridae Mixed taxa Total retained catch
(continued) N S

Table 2. (continued) (b) Catch (t) in Tirnor Sea [/b) Captufa (t) en el mar de Tlmod
Category
Ar i idae Butterfish Carangidae Forrnionidae Haemulidae Lethrinidae Loljgo spp. Lutjanidae small Lutjanidae goldband Lutjanidae red Mul l idae Nernipteridae Priacanthidae Rachycentridae Sciaenidae Scombridae Sepi idae Serranidae Sharks and rays Sparidae Sphyraenidae Synodontidae Trichiuridae Mixed t a m Total retained catch
Taiwanese Zhejiang Thai --

Table 2. (continued)
(c) Catch (t) In Arafura Seaa [ (c) Captura (t) en el Mar Arafura]
Taiwanese Thai Australian Caregory
- Ariidae
Butterfish
Carangidae
Formionidae
Haem ulidae
Lethrinidae Loiigo spp.
Lutjanldae small
Lutjanidae goldband
Lutjanidae red Muliidae
Nemipteridae
Priacanthidae Rachycentridae
Sciaenidae
Scombridae
Sepiidae Serranidae
Sharks and rays
Sparidae Sphyraenidae
Synodontidae
Trichiuridae
Mixed taxa
Total retained catch 6 392 3 782 5 464 9 004 7 8 4 8 2 299 4 293 1 126 7 10
a Data by category inadequate For Thai f leet during 1985-1 986, and Australian fleet during 1987- 1988.

Retained 'catch (%)
Lutjanidae small Lutjanidae goldband
Priacanthidae
Sciaenidae - Scombridae - 2
5 9,
Sepiidae - 2 3 (D
Serranidae - &!?. LO (D
Sharksandrays - 9 (D
71
2 5 Sparidae - -. 2 2 -.
3 Sphyraenidae - ? Synodontidae S 2
Ph
Trichiuridae 5 cn 5 Mixed taxa m pl CD
(II
w
IU 0 8 0 8 P 8 P
0 0 0 0 0 0
Ariidae I I 1


trawlers, relative toTaiwanese trawlers, ranged from 0.10 for Lol~gospp. to 5.63 for Ariidae, with an overall value of 0.56. Geographic variations in relative abundances were also marked, with categories such as Ariidae, Carangidae and Sphyraenidae occurring throughout the fishery, Mullidae and Nemipteridae being predominant on the Northwest Shelf, Haemulidae and goldband Lutjanidae occurring mostly in the Timor Sea, and butterfish and Trichiuridae being predominant in the Arafura Sea. Coefficients of relative annual abundance varied widely for many categories during 1980- 1982. Estimation of MSY from annual catch and effort data fitted to Walters and Hilborn's (1 976) difference equation was attempted For all categories and zones, but was ob- tained only for about 24 of the possible 75 combinations of category and zone (Table 4). MSY was estimated for 9 commercial categories (e.g., Lethrinidae 5 288 t-year-', red Lutjanidae 1 528 t*year-', Nemipteridae 4 520 t-year2') on the Northwest Shelf, 12 categories (e.g., Lethrinidae 1 168 t*year-', red Lutjanidae 750 t-year-', Nemipteridae 377 t-year-') in the Tirnor Sea, and butterfish (3 018 t-year-') in the Arafura Sea.
Discussion
Although only 69 species of fish were identified from observer data, many more species are taken in Australia's northern trawl Fishery. Sainsbury et al. (1 984) reported 53 1 species commonly taken in trawls be- tween 30 and 150 m on the Northwest Shelf and Tirnor and Arafura Seas. Russell and Houston ( 1989) concluded that 23 1 spe- cies of fish were caught by groundfish trawl- ers in the Arafura Sea, of which about 100 species were retained, with 23 species accounting for 70% of total catch by weight. While most species are widespread within the Indo-Pacific, distinct changes in fish fauna occur near 123OE (Sainsbury 1991 ) and 1 3Z0E (Ramm et al. 1990). Thus Nemipteridae was
the dominant catch component on the Northwest Shelf and a major commercial category at other grounds, while Lethrinidae and Synodontidae were important on the Northwest Shelf, red Lutjanidae dominated catches in the Timor and Arafura Seas, Carangidae was important in the Timor Sea, and butterfish occurred predominantly in the Arafura Sea.
MSY estimates For Lethrinidae, red Lutjanidae and Nemipteridae on the North- west Shelf are within the range of values determined by Sainsbury ( 1 987, 1991 ) for various model scenarios. Whilst there are previous estimates of sustainable yield for groundfish in the Timor and Arafcra Seas (e.g., Edwards 1983; Dalzell and Pauly 1989), none have previously been attempted for individual species or species groups. Our analyses indicated that the majority of avail- able fishery data was inadequate for use in stock assessment, particularly in the Arafura Sea. Many factors contributed to this prob- lem, including long-term changes in dis- card practice, targeting and management regimes. Edwards ( 1983) reported low logboolc recovery rates prior to the decla- ration of the AFZ, and complete recovery thereafter. He also reported that effort in- creased in the Arafura Sea during 1978- 1979 due to targeting of Loligospp. Other operational changes included an increase in minimum codend mesh size, from about 45 rnm (stretched mesh) prior to 1979, through 60 mm during 1979- 1989, to 90 mm thereafter (Jernakoffand Sainsbury 1990). Sainsbury and Ramm (1 988 in Jernakoff and Sainsbury 1990) identified limitations in the observer data and concluded that avail- able data were insufficient to interpret log- book data and estimate sustainable yields. They recommended that quality of data on fishing operations, retained catch and total catch, species composition of retained and discarded catch and length-frequency distributions of key species be improved for viable stock assessment. Finally, assess- ments for the AraFura Sea also require fishery
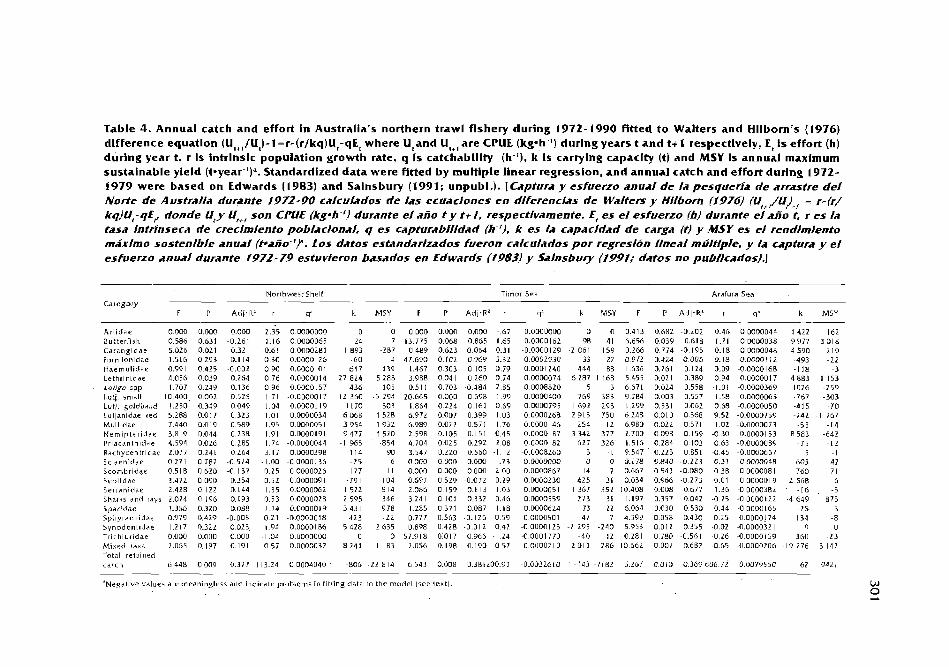
Table 4. Annual catch and effort in Australia's northern trawl flshery during 1972-1990 fitted to Walters and Hllborn's (1976) difference equatlon (U,+,/Ut)-l =r-(r/kq)U,-qEt where Utand Ut+, are CPUE ( k r h - ' ) durlng years t and t+d respectively, It Is effort (h) durlng year t, r Is intrlnslc population growth rate, q 1s catchablllty (h-'1, k Is carrying capaclty It) and M S Y Is annual maximum sustainable yleld (t-year-')". Standardized data were fitted by multiple linear regresslon, and annual catch and effort during 1972- 1979 were based on Edwards (1983) and Salnsbury (1991; unpubl.). ICaptura y esfuerzo anual de h pesgueria tie arrastre del Node de Australfa durante 1972-90 calculados de /as ecuaciones en dlferencjas de Walters y if//born (1976) (U,+,/U)_, = r- (r/ kg)U,-gE, donde Uty Y+, son CPUE (kg.6-'1 durante el ar70 f y t+ I, respectlvamente. E, es el esfuerzo (b) durante el aiio t, r es k tasa intrinseca de crecimlento pob/acional, q es capturaIrMdad (h-% k es k capacldad de carga {t) y MSY es el rendlmjento mixlmo sostenfble anual (twfio-%. Los datos esDndar/zados fueron ca/cuiados pur regreslon lineal mu/rlple, y la captura y el esfuerzo anual durante 1972-79 estuvleron basados en Edwards 11983) y 5almsbu1-y (1 991; datos no pulr//cados).J
NorthwestShelf Category
F P Ad1.R' r 4'
Ari idae 0.0M 0,000 0.000 2.35 0.0000000 autterrish 0.586 0 631 -0.261 I. 16 0.0000065 Carangidae 5.026 0 021 0.32 I -0.61 0.0000281 Formionidae 1.516 0 293 0.1 [ 4 0.30 -0.0000126 Haemulidae 0.991 0.425 -0.002 0.90 0.0[100101 Lethrinidae 4.056 0.039 0.264 0.76 0.0000014
. Loligo spp 1.707 0.249 0.136 0.96 0.0000157 Luti, small L0.400 0.002 0.525 1 7 1 -0.000001 7 Lutj. goldband 1.230 0.359 0.049 1.04 0.00001 19 Lutjanidae re6 5.288 0.017 0.323 1 01 0.0000034 hlullidae 7.440 0.019 0.589 1.95 0 0000051 Kemipler idae 3.819 0.044 0.238 1.91 0.0000191 Pr ia~anlh ldne 4.594 0.026 0.205 1.74 -0.0000044 Rachycentridae 2.077 0 241 0.264 3.17 0 OW0398 Scia~nidae 0.271 0.787 -0.574 -1.00 -0 0000136 Scombridae 0.5 18 0.620 -0.137 0.25 0.0000026 Sep i i d~e 3.472 0.090 0.354 0.52 -0.0000091 Serranidae 2.428 0. I22 0 144 1.35 0.0000062 Sharks and rays 2.074 0. 196 0. [93 0.53 0.0000028 Sparidae 1.386 0.320 0083 114 0.0000019 Sphyraenidae 0.979 0.429 -0.005 0.21 -0.0000018 Synodonlldde 1.217 0.322 0.023 1-94 0.0000186 Tr~chiuridae 0.000 0.000 O.OC0 -1.04 0.0300000 Mixed (axa 2.065 0.197 0.191 0 57 0.0000032 Total retained catch 6.448 0.009 0.377 1 13.24 0.0004040
Timor Sea Arafura Sea
P Adj.RL r q' k MSY F P Adj.RL r q*
0.000 0,000 -.67 0.0000000 0 0 0.413 0.682 -0.202 0.46 0.0000044 0.068 0.865 1.65 0.0000162 98 41 6.656 0.039 0.618 i.21 0.0000038 0.623 -0.064 0.31 -0.0000129 -2 061 -159 0.266 0.774 -0.195 0.18 0 0000048 0.102 0.969 3.32 0.0002930 33 27 0.972 0.424 -0.006 0.18 -0.00001 12 0.303 0.105 0.79 0.0001240 444 BB 1 636 0.261 0 114 0.09 -0.0000168 0.04 1 0 260 0.74 0.0000074 6 287 1 168 5.455 0.02 I 0.389 0.94 0.000001 7 0.703 -0.484 2.85 0.0008820 5 3 6.671 0024 0.558 -1.01 -0.0000369 0.000 0.698 1.99 0.0000400 769 383 9.784 0.003 0.557 1.58 -0.0000063 0.224 0.161 0.69 0.0000795 1 692 293 1.299 0.331 0 062 0.68 -0.0000050 0.007 0.399 1.03 0.0000268 2915 750 6248 0.010 0.368 9.52 -0.0000759 0.022 0.571 1 76 0.0000 146 254 112 6.980 0.022 0.571 I .02 -0.0000073 0.105 0.151 0.45 0.0000187 3 342 377 2.700 0.098 0 159 -0 30 0.00001 53 0.025 0.292 2 08 0 0800182 627 326 1.5 16 0.284 0 103 0 63 -0.0000089 0.220 0 560 -1.12 -0.0008260 3 - 1 9.547 0.223 0.85 1 -0 45 -0 0000667 0.000 o wo -.73 O.MOOOOO o o o . i m 0.840 -0.223 0.31 o.ooooo48 0.000 0.000 200 0.0000867 I4 7 0.667 0.543 -0.080 0 3 8 0.0000081 0.529 -0.072 0.29 0 0000230 425 31 0.034 0.966 -0 273 -0.01 0.000001 9 0.159 0.1 13 1 03 0.0000051 1 367 352 10.408 0.008 0.677 1.36 -0.0000382 0.101 0.332 0.46 0.0000559 273 31 1.197 0.357 0.042 -0 75 -0.0000t22 0.371 0.087 1.18 0 0000624 73 22 6.064 0.030 0.530 0.44 -0.0000165 0.563 -0.126 0.59 0.000~501 47 7 4.399 0.058 0430 -0.25 -0.0000!74 0 428 -0.0 12 0.42 -0 0000125 -2 295 -240 5.953 0.012 0 355 .0.02 -O.OOOO32 I 0.017 0966 .1.2'3 -0.0001770 -40 I 2 0.281 0.780 0.561 -0.26 -0.0OOOlj9 0 198 0.190 0.57 0 00002l0 2 Ol 1 286 10 662 0.007 0682 -0.65 -0 0000206
MSY
"Negative values are meaningless and indicate problems in fltting data to the model [see text)

data for the Indonesian sector,, which are presently lacking.
Although the results from this study are generally inconclusive, the analyses have directed recent research on groundfish in the Timor and Arafura Seas (e.g., Blaber e t al. 1992). Identification of large uncer- tainties in interpreting logbook data had led to fishery-independent trawl surveys in the Timor and Arafura Seas between 127 and 137"E (D.C. Ramm, unpubl.) and G I I I ~ of Carpentaria (S.J.M. Blaber, unpubl.), and the development of a project aimed at collating fishery catch and operational data For groundfish fisheries in both Australian and Indonesian sectors of the Arafura Sea (D.C. Ramm and D.J. Staples, unpubl.). Alternative assessments of groundfish stocks are now underway using biomass data from trawl surveys.
Acknowledgements
We gratefully acknowledge AFZ observers, especially Messrs. Bill Anderson, Jeff Wessel, Mick Baron and Phil Schubert, and AFZ fish- ery manager Dr. Rusty Branford, of the Federal Department of Primary Industries and En- ergy, for logbook and observer data dur- ing 1980-1 990. We also thank masters and crew members of trawlers and observer plat- forms, including Capt. David Tomlinson of XVFIamingo Bay (observer platform 1885- 1988), for their collaboration in acquiring data. This study was partly funded by grant 86/049 from the Federal Fishing Industry Research and Development Council.
References
Blaber, S., D. Staples, I(. McLoughlin, 6. New- ton. R. Campbell, D. Brewer, J . Stevens, D. Ramm, R. Bucltworth. R. Slack-Smith, N. Hall, G. Johnson, S. Adisultresno, N. Naarnin, M. Badrudin and 1. Muchsin. 1992. Stock Assessment Working Group Report, Aus- tralia-Indonesia Workshop on Arafura Sea Fisheries, 9-1 3 November 1992, Darwin.
Chen, S.C., C.H. Chen,T.H. Chi, K.C. Fan, D.C. Liu and R.Y. Tsay. 1979. Demersal fish tzsources investigation on trawl grounds off the northwest coast of Australia. Bull. Taiwan Fish. Res. Inst. 93 p.
Dalzell, P. and D. Pauly. 1989. Assessment of the fish resources ofsoutheast Asia, with emphasis on the Banda and Arafura Seas. Neth. J. Sea Res. 24:64 1-50.
Edwards. R.R.C. 1983. The Taiwanese pair trawler fishery in tropical Australian waters. Fish. Res. 2:47-60.
Hilborn, R. and C.J. Walters. 1992. Quantita- tive fisheries stock assessment: choice, dynamics and uncertainty. Chapman and Hall, New York.
Jernakoff, P. and K.]. Sainsbury. 1990. CSIRO's northern dernersal finfish stock assessments: 1980-89. Bureau of Rural Resources, Can- berra. Information Paper IP/6/90, 169 p.
Liu, H..-C. 1976. The demersal Fish stoclts of the waters of north and northwest Aus- tralia. Acta Oceanogr. Taiwan 6: 128- 134.
Liu, H.-C., H.-L. Lai and S.-Y. Yeh. 1978. Gen- eral review of demersal fish resources in the Sunda Shelf and the Australian wa- ters. Acta Oceanogr. Taiwan 8: 109- 140.
Polovina, I.]. 1989. A system of simultaneous dynamic production and forecast mod- els for multispecies or rnultiarea applica- tions. Can. j. Fish. Aquat. Sci. 46:961-963.
Ramm, D.C., P.J. Pender, R.S. Willing and R.C. Bucltworth. 1 990. Large-scale spatial patterns of abundance within the assem- blage of fish caught by prawn trawlers in northern Australian waters. Aust. 1. Mar. Freshwat. Res. 41 :79-95.
Russell, B.C. and W. Houston. 1989. OMhore fishes of the Arafura Sea. The Beagle, Records of the Northern Territory Museum of Arts and Sciences 6:69-84.
Sainsbury, I<.]. 1982. The biological manage- ment of Australia's multispecies tropical demersal fisheries: a review of problems and some approaches. Aust. CSlRO Mar. Lab. Rep. 147. I 6 p.
Sainsbuty, I(.]. 1984. Optimal mesh size for tropi- cal rnultispecies trawl fisheries. j . Cons. ClEM 41 : 129-39.
Sainsbury, K.J. 1987. Assessment and manage- ment ofthe dernersal fishery on the con- tinental shelf of northwestern Australia, p. 465-503. In 1.1. Polovina and S. Ralston ( 4 s . ) Tropical snappers and groupers:

b io logy and Fisheries management.
Westview Press, Boulder. Sainsbury, I<.]. 1988. The ecological basis o f
multispecies fisheries, and the management of a demersal Fishery in tropical Australia,
p. 349-82. In J.A. Gulland (ed.) Fish popu- lation dynamics: the implications for man- agement (second edition). John Wiley 8,
Sons, Chichester. Sainsbury, I(.]. 1331 . Application oFan experimen-
tal approach to management o f a tropical
multispecies Fishery with highly uncertain
dynamics. ICES Mar. Sci. Symp. 193:30 1 - 20.
Sainsbury, I<.]., P.S. IMlo la and G.C. Leyland. 1984. Continental shelf Fishes OF Northern and North Western Australia. Clouston 8. Hall and Peter Pownall Fisheries Inforrna- tion Service, Canberra.
Walters, C.J. and R. Hilborn. 1976. Adaptive control of fishing systems. 1. Fish. Res. Board
Can. 33: 145 159.
Appendix 1
Effort (h) for the Taiwanese fleet in Australla's northern trawl fishery during 1772- i 777 on (a) Northwest Shelf. (b) Timor Sea and (c) Arafura Sea based on Edwards (1983) and Sainsbury (1991; unpubl.). [Esfuerzo (h) para /a flota de Taiwan en la pesqueria dei node de Australia .4FI~rante 1972- 1979 sobre (a) piataforma noroeste, (6) Mar de Timor, (c) Mar Arafura, basados en Edwards (1983) y Sainsbuty (1991); datos no pubiicados).]
Ground 1972 1973 1974 1975 1976 1977 1978 1979
Northwest Shelf 500 64545 79860 57 767 46 592 56413 40998 33 500
Tirnor Sea 2 017 1 5 1 2 8 6 7 3 6 6 6 4 5 9 1 1 7 0 6 3 8 3 2 4 8 3 5 7
Arafura Sea 17 425 19 334 19 083 14412 18 208 25 951 29 250 23 544
Retained catch (t) for the Taiwanese fleet In Australia's northern trawl flshery durlng 1972- 1979 on (a) Northwest Shelf, (b) Tlmor Sea and (c) Arafura Sea based on Edwards (1 783) and Sainsbury (1991 ; unpubl.). Zeros may be mlssing values. [Captura (ton) ohtenitfa porla flota de Taiwan en la pesqueria de nrrastre rle/ Norte tie Austraiia durante 1972-1979 sobre (a) piataform nororiental; (b) Mar de Timor; (c) Mar Arafura, basado en Edwards (1983) y 5alnsbury (1991; datos no pubiicados). Los vaiores cero pueden ser vaiores perrl/dos.l
(a) Catch (t) on Northwest Shelf [ (a) Captura (ton) de /a plataforma node]
Category 1972 1973 1974 1975 1976 1977 1978 1979 Ariidae 0 0 0 0 0 0 0 0 Butterfish 0 0 0 0 0 0 0 0 Carangldae 34 866 1462 685 1 168 l 060 885, 595 Forrnionidae 0 0 0 0 0 0 0 0 Haernulldae 0 0 0 0 0 0 0 0 Lethrinidae 33 4 0 7 6 2 653 2 8 6 6 1 841 2 000 1 701 754 Loligo spp. 0 0 0 0 0 0 0 0 Lutjanidae small 13 1762 1281 1148 4.5'3 777 755 411 Lutjanidae goldband 0 0 0 0 0 0 0 0 Lutjanidae red 21 2 182 1 487 I 107 336 557 5 297 Mullidae 0 0 0 0 0 0 0 0 Nemipccridae 33 8 3 7 7 7 9 3 5 5 0 3 4 4531 4 5 1 8 3 4 3 2 2 169 Priacanthidae 12 70 61 8 369 327 318 392 2EJ Rachycentridae 0 0 0 0 0 0 0 0 Sciaenidae 0 0 0 0 0 0 0 0 Scornbridae 0 0 0 0 0 0 0 0 Sepiidae 0 0 0 0 0 0 0 0 Serranidae 3 374 226 275 168 193 I21 1 56
Sharks and rays 0 0 0 0 0 0 0 0 Sparidae 0 0 0 0 0 0 0 0 Sphyraenidae 0 0 0 0 0 0 0 0 Synodontidae 16 2711 4 2 7 6 3 3 5 6 3 0 6 2 3 1 9 9 1952 1037 Trichiurldae 0 0 0 0 0 0 0 0
Total retained catch 273 37143 31256 21289 18929 19080 14488 10764
(continued)

Appendix l (continued)
(b) Catch (t) In Tlmor Sea I (b) Captura (ton) de1 Mar de T'lmol]
Category 1972 1973 1974 1975 1976 1977 1978 1979 Ariidae 0 0 0 0 0 0 0 0 Butterfish Carangidae Formionidae Haemulidae Lethrinidae Loligo spp. Lutjanidae small Lutjanidae goldband Lutjanidae red Mullidae Nemipteridae Priacanthidae Rachycentridae Sciaenidae Scombridae Sepiidae Serranidae Sharks and rays Sparidae Sphyraenidae Synodontidae Trichiuridae Total retained catch 87 1 785 9121 5 5 5 0 4 4 9 6 6 3 3 3 7 3 8 1 2 5 9 7
(c) Catch (t) In Arafura Sea [fcl Captura (ton) del Mar Arafural
C a t e ~ o r y 1972 1973 1974 1975 1976 1977 1978 1979 Ariidae 0 0 0 0 0 0 0 0 Ariidae Butterfish Carangidae Formionidae Haemulidae Lethrinidae Loligo spp. Lutjanidae small Lutjanidae goldband Lutjanidae red Mullidne Nemipteridae Priacanthidae Rachycentridae Sciaenidae Scornbridae Sepiidae Serranidne Sharks and rays Sparidae Sphyraenidae Synodontidae Trichiuridae Total retained catch

Appendix 2
Species composition of cornmerclal categories in Australla's northern trawl flshery based on observer data for Taiwanese and Thal fleets durlng 1985-1987. [Composlcldnpor especles de categoriirs comerciales de la pesqueria de arrasfre del Node de Australla hasado en datos observados de /as notas de Taiwan y Thal durante 1985-1987.1
Category/Family Species Relative abundance ( O h weixht of catexory)
Ariidae A rius thafassinus 100
Butterfish Ariornmatidae Centrolophidae
Carangidae
Formionidae
Haernulidae
Lethrinidae
Loligo spp.
Lutjanidae small
Lutjanidae goldband
Lutjanidae red
Mullidae
Nemipteridae
Ariomrna indica Psenopsis humerosa
Alepes sp. Carangoides uii Carangoides chrysophrys Carangoides gymnostethus Carangoides h urnerosus Carangoides ma/G?baricus Caranx bucculentus Gnathanodon speciosus Megalaspis cordyla Selar boops Selaroides Iep tolepis
Apolectus niger
Diagramma picturn
L ethrinus choerorynchus Lethrinus fraena tus Lethrinus Ientjan Lethrinus nebulosus Lethrlnus nernatacanthus
Loligo spp.
Lurjanus russelli Lutjanus vittus
Prlst/pomoides m ultidens Pristipornoides typos
L utjanus argentimacu/atus L utjan u5 erythropterus Lurjanus johni Lutjanus rnalabaricus Lutjanus sebae
Parupeneus pleurospilus
Nemipterus celebicus
(continued)

Appendix 2 (continued)
Category/Family Species Relative abundance
(% weight OF category) Nemipterus furcosus 69
Priacanthidae
Rachycentridae
Sciaenidae
Scornbridae
Sepiidae
Serranidae
Sharks and rays Carcharhinidae
Hernigaleidae Dasyatididae Rhynchohtidae
Sparidae
Sphyraenidae
Synodontidae
Trichiuridae
Mixed taxa Labridae
Haemulidae Glaucosomatidae Lethrinidae Ephippididae Scaridae Carangidae Siganidae Teraponidae
Nemlpterus hexodon Nemipterus vifga tus Sco/opsis monogramma
Priacanthus hamrur Priacanthus tayenus
Rachycentron canadus
Protonlhea diacanthus A rgyfos om us s p .
Rastrelliger kanagurta
Sepia spp.
Epinephelus areolatus Epinephelus coiodes P/ectfopomus maculatus
Carcharhinus dmsurnieri Rhiroprionodon acutus Rhizopr/onodon taylori Hemipris tls elonga tus Himantura uarnak Rhynchobatus d/iddensis
Argyrops spinifer
Sphyraena putnamiae
Sa urida m/cropectoralis Saurida sp. 1 Saurida undosquam/s
Trichiurus lep turus
Choerodon cephalotes Choerodon schoen/ein// Choerodon s p. Hapalogenys kishinouyei Glaucosoma burgeri Gyrnnocranius elongatus Pla tax Lata vian us Scarus gholban Seriolina nigro fasciata Siganus fuscescens Terapon jarbua

Reproduction in Gag (Mycteroperca rnicrolepis) (Pisces: Serranidae) in the Eastern Gulf of Mexico
and the Consequences of Fishing Spawning Aggregations
C.C. KOENIG F.C. COLEMAN
Florida State University Department o f Biological Sciences
Tallahassee, Florida 32306-2043, USA
L.A. COLLINS National Oceanic and A trnospheric Administration
National Marine Esheries Service Southeast Fisheries Science Center
Panama City Laboratory 3500 Delwood Beach Road
Panama City, Florida 32408, USA
Y. SADOVY Department oFZoology University o f Hong Kong
Polcfulam Rd.. Hong Kong
P.L. COLIN Chuulc Atoll Research Laboratoy PO Box 70, Weno, Chuuk State
Federated States of Micronesia 96942
KOENIG. C.C.. F.C. COLEMAN, L.A. COLLINS, Y. SADOVY and P.L. COLIN. 1996. Reproduction in gag (Mycteroperca microlepis) (Pisces: Serranidae) in the eastern Gulf of Mexico and the consequences o f Fishing spawning aggregations [Reproduction del cum aguaji (Mycteroperca microlepis) (Pisces: Serranidae) en el este del Golfo de Mexico y /as consecuenciar de la pesca de las agregaciones de desovadores], p . 307-323. In F. Arreguin-Sanchez. J .L . Munro. M.C. Balgos and D. Pauly (eds.) Biology, fisheries and culture of tropical groupers and snappers. ICLARM Conf. Proc. 48. 449 p.
Abstract
Spatial and temporal spawning patterns of gag (Mycteroperca rnicrolepis) in the eastern Gulf o f Mex ico were investigated by: ( I ) offshore cruises t o suspected spawning sites; (2) interviews wi th grouper fishers: (3) the analysis of gag gonads: and (4) the analysis of daily incremental g rowth in juvenile gag otoliths. The gag spawning season extends from early February t o late Apr i l , bu t the major i ty o f spawning occurs in March. Spawning aggregations in the eastern Gulf are concentrated along the 80-m isobath in the area south of Apalachicola t o west of Tampa. Florida. Sex-size-frequency data from gag collection in 179 1 , 1992 and 1993 indicated several changes in population structure
compared with -sex-size data collected by other investigators before the 1980s. The comparisons indicated that the present population shows a reduction in: (1 ) the average size OF Females; (2) the average size of males; and (3) the proportion of males (from about 17% to ~ 2 % ) . An increase in fishing pressure on gag spawning aggregations during the 1980s and observations by other investigators strongly suggest that a Fishing selection for males during the spawning season is in large part respon- sible for the observed changes in the gag population. Probable mechanisms are discussed to explain the fishing-induced suppression of compensatory sex-change in these protogynous hermaphrodites.
Resumen
Patrones de desove espacial y temporal del cuna aguaji (Mycteroperca microlepis) en el este de/ Golfo dc Mexico fueron investigacfas por: [ I ) cruceros mar afuera y sitios donde sc sospechaba que ocurrian desoves; (2) entrevistas con pescadores de mero; (3) anSlisis de gonadas del cuna aguaji; (4) an6lisi5 cfe crecirniento usando incrementos cfiarios en otolitos de juveniles. La temporada de desove se extiende cfe inicios d@ Febrero a fines de Abril, pero la mayoria de 10s desoves ocurren en Marzo. Agregaciones de desovadores en el este del Golfo se concentran a 10 largo de /a isobata de 80 m en el area sur de Apalachicola, a1 oeste de Tampa, Florida. Los datos de fiecuencia de ta/las por sexo del cuna aguaji fueron colectados en 1991, 1992 y 1993, indicando varios carnbios en la estructura de la poblacidn cuando fueron comparados con datos de talla por sexo colectados por otros investigadores antes de 10s 1980s. Las comparaciones indicaron que la poblacidn actual muestra una reduction en; [I) el tamafio prome@o de /as hembras; (2) el tarnaiio promedio de machos; y (3) la proportion de machos [de cerca de 17% a <2%). Un increrncnto en la presion de pesca sobre /as agregaciones de desovadores del cuna aguaji en 10s 1980s y observaciones efectuadas por otros investigadores sugieren fuertemente que la selercldn de pesca sobre 10s machos durante la estacion de desove es en gran parte responsable de 10s cambios observados en la poblacion. Se discuten probables rnecanismos para explicar la supresion inducida -por la pesca del cambio de sex0 compensatorio en estos hernafroditas protogineos.
Introduction
The shallow water groupers (Family Serranidae), including gag (Mycteroperca microlepis), black grouper (M. hnac~ ) , scamp (M. phenax), and red grouper (Epinephelus morio), support major commercial and rec- reational fisheries in the southeastern United States (Huntsman and Waters 1987; Bul- lock and Smith 199 1 ) (see also Collins et al., this vol.). In the Gulf of Mexico, red groupers rank first among reef fish species in mean annual harvest (4.5 million kg). Gag are ranlted seventh, at 1.15 million kg, but should probably be ranked sec- ond, with annual landings of about 2 rnil- lion Icg because fishers often misidentify gag as blaclc grouper, resulting in landing reports that grossly underestimate catches of gag (Eltlund 1993: Koenig, pers. comm.).
All species of groupers examined have proven to be protogynous hermaphrodites (Shapiro 1987), in which males result from sex change of mature Females. The repro- ductive mode that a species exhibits may
have significant population-level conse- quences when that species is subject to exploitation. For instance, Bannerot (1 984) and Bannerot et al. (1 987), using Fishery simulation models, concluded that protogynous hermaphrodites may be more susceptible to overexploitation than gonochorists (separate sexes) i f fishing pressure served to reduce the normal pro- portion of males in the population. A sig- nificantly depressed male:female ratio could potentially restrict reproductive capacity and ultimately result in population declines.
The primary objective of this study was to define precisely the timing and loca- tion of gag spawning in the Gulf of Mexico and to gain insight into the nature of the gag mating system. Because we noted a significant decline in the number of males occurring in our samples relative to sam- ples taken by other investigators over a decade ago, we compare historical and recent sex-ratio and size-frequency data for Gulf and Atlantic populations of gag against a background of information on temporal and

spatial reproductive patterns. W e explain observed sex and size changes in gag populations in the context of known pat- terns and mechanisms of sex change in other species and OF recent documented increases in fishing effort and landings, particularly on spawning aggregations.
Materials and Methods
Spatial and temporal spawning patterns of gag were investigated by the analysis of gonads collected by Florida State Uni- versity (FSU) researchers over a two-year period (1 991 through 1992). Data obtained for each gonad included size of fish (mm total length, TL) and collection date, loca- tion and depth (m). Cooperation from com- mercial Fishers O F northwest Florida was essential to this study. Data collected in- dependently by the National Marine Fish- eries Service (NMFS), Panama City Labo- ratory, in 199 1, 1992 and 1393 were used For comparisons of sex ratio and size-frequency distributions.
Samples were collected year-round in 1991 (N = 99 1 ) before we were aware of the location of spawning aggregations. We obtained gonads from fish houses and from recreational and commercial fishers oper- ating in relatively shallow waters (< 40 rn) primarily in the area between and south of Apalachicola and St. Marks, Florida.
Samples were collected in 1992 ( N =
536) from January through August in both shallow water sites (<40 m, 30% of sarn- ples) and offshore spawning sites (50 - 120 m, 70% of samples). The shallow-water samples collected in 1992 were from the same general area as those collected in 1991.
Samples from spawning aggregations were collected by hook-and-line, mostly in the area to the north and west of the Middle Grounds (southeast of Apalachicola) between the 40 and 120 m isobaths, but
some samples were taken from the same depth range to the southwest of the Mid- dle Grounds. These gonads came from catches taken by five commercial fishers who, be- cause they derive a significant portion of their annual income From fishing the gag spawning aggregations, would give gen- eral locations of capture, including depth, but would not release exact locations. We chartered four trips with commercial fish- ers to spawning sites during the peak spawn- ing period (discussed below).
Both historical and recent data sets are comparable in terms of fishing method and the geographical areas of coverage. The historical Gulf data (Hood and Schlieder 1992) were collected primarily from hook- and-line commercial fishers operating in the area ofthe Middle Grounds (R. Schlieder, pers. comm.), but also from recreational fishers. The historical Atlantic data (Collins et al. 1987) was collected by the same meth- ods in various depths of water off South Carolina.
Gonad analysis
Gonads collected both years were used to determine spawning season, depth and location and to determine size-frequency distributions. Only gonads from 1992 were used to determine sex, size at sexual ma- turity, spawning patterns and sex ratios. Gonads were removed From Freshly killed fish and either immediately placed on ice and brought back to the laboratory where they were frozen or they were preserved in Davidson's solution. All frozen gonads were thawed and weighed to the nearest 0.1 g.
Gonadosomatic indices (GSI), used to identify spatial and temporal variation in reproductive states, were calculated us- ing the following equation:
GS1 = 100(ovary weightltotal body weight)

Conversions of lengths to weights were made using the following equation from Bullock and Smith (1 991):
where W = weight in kg and SL = stand- ard length in mm.
Sex was determined microscopically for both the FSU- and NMFS-collected speci- mens because gross examination was un- reliable. Freshly frozen ripe gonads were adequate for identifying sex and for stag- ing oocyte development, whereas histo- logical sections were required for identi- fying pre- or postspawning individuals and staging.
Frozen gonads were examined by pre- paring squashes, in which a bit of thawed tissue was squashed between two micro- scope slides and then covered with a cover slip. Each squash was examined under a compound microscope for sex, stages of oocyte development (see Moe 1969), range of oocyte size per stage, and presence or absence of late-stage atresia, i f possible. Whenever sex was questionable, quick hernatoxylin and eosin stains of new squashes were made, following Link (1980). This method also facilitated identification of transitionals (= individuals in the process of changing sex from female to male). The presence of live sperm in thawed testes confirmed reproductive activity.
Preserved gonads were sectioned at 10 pm, mounted on slides, and stained with hernatoxylin and eosin. Oocytes were examined for stage and degree of devel- opment following Moe (1 969). Fish were considered immature i f the gonads-were small, extremely compact, and contained oogonia, stage 1 and small stage 2 oocytes. Gonads were considered ripe i f they con- tained stage 3 or more advanced oocytes.
Inactive Fish (mature, nonteproductive), which could be identified reliably only by histological examination, contained stages I and 2 oocytes which were loosely held
in a stroma or showed evidence of the early stages of oocyte degeneration; the gonadal wall (tunica) was typically thick, indicat- ing, but not confirming, prior spawning activity. Individuals so classified may or may not have spawned before in their lifetime. Postspawning individuals could be iden- tified histologically by the presence of early stage degeneration of vitellogenic oocytes or postovulatory Follicles.
Landings data
Gag landings data for the Gulf coast of Florida were obtained from the Marine Fish- eries Information System ofthe Florida Marine Research Institute, Department of Environ- mental Protection, St. Petersburg, Florida. A problem with the gag landings data is that gag catches are commonly recorded as black grouper. It is well known, how- ever, that blaclc groupers (M. Donac11 are rare on the west coast of Florida north of the Florida Keys (Bulldck and Smith 199 1 ) .
Therefore, to estimate the actual gag landings, we combined gag with black grouper land- ings data, but excluded Monroe County (Florida Keys) landings from our estimates.
Results
Spa wning season, depth, location and pattern
GSls of gonads collected in 199 1 were low throughout the year, but suggested that gags were reproductively active from December through mid-May (Fig. 1 a). GSls of gonads collected in 1992 (most from spawning aggregations) clearly indicated that gags were reproductively active from February through April, with peak spawn- ing from mid-February through March, fol- lowed by a gradual decline from late March through April (Fig. 1 b). These spawning times were corroborated by the analysis of juvenile otolith daily increments from

#
-0 C
Jon Feb Mor Apr May Jun Jul Aug Sep Oct Nov Dec .-
Jon1 K) 20 30 Feb 9 19 29 MarD 20 30 AprS 19 29 May9 19
Fig. 1. Seasonal pattern of gonadosornatlc indlces of gag (Mycteroperca mlcrolepls) (a) 1991 data collected year-round In depths less than 50 rn; (b) 1992 data collected durlng spawnlng season mostly from aggregation sltes. 1 Patrdn estaclonal de 10s indlces gonadosom~tlcos dei cuna aguaji Wycteroperca mlcrolepls) (a) datos colectados a lo largo del anlo 1991 en profundldades menores a 50 m; (I! Datos colectados durante la estacjon de desove en 1792, mayormente de sltlos de agregacion.]
fish collected over a broad geographic and temporal range (Koenig, unpubl.).
Spawning occurs on offshore reefs from southeast of Apalachicola to west ofTampa (and possibly further to the south) (Fig. 2). Spawning aggregations were concentrated at depths of about 80 m (range: 50 m to 120 m). GSls of Ash caught in shallow wa- ter ( 1 992) were higher in February than in March, but GSls of both groups (February
and March) were much smaller than those recorded for gags captured at depths greater than 50 m (Fig. 3). During peak spawn- ing, most mature females (i.e., >5SO mm SL) caught at depths >50 m (Fig. 1 b) had large, active gonads whereas those caught at the same time in shallower waters (<TO m) had relatively small gonads (Fig. la) . Fish collected from spawning aggregations in March tended to be larger than fish collected

Flg. 2. Dominant spawnlng grounds for gag (Myctero- perca mlcro/epls) off the Gulf coast of Florida. ICampos de desove domlnmtes para el cuna agua/i ( M y c t e r o p e r c a mlcrolepls) fiuera de 1.1s Costas tfel Golfo de Florida.]
I I I I I I 1 87 86 R5 84 83 82
Longirude (OW 1
Depth (rn)
Fig. 3. Dlstributlon of gonadosomatic indices relative to depth of capture for gag (Mycteroperca mlcrolepis) during peak spawning (February = open clrcles; March = closed clrcles) In 1992. [Dlstrlbuclon tfe 10s indlces gona dosomitlcos en relacldn a la profundlrlird de captura del cuna aguaJi (Mycteroperca mlcroleplsl durante el plco de desove (Febrero = ctrculos claros; Marzo = circulos obscures) en 1792.1

0 a a 0 0 0 (D a . 0 0 m a e m 0 0 0 0 0 8 . 0 0 . 0 0 0 o * ( a . 0 a 0 0 0 0 .a 0 0. m o o o + m o
0 . 0 0 a 0 0 0
0 a 0 m m O a 0
L f)
I I I 1 I I I I I I 1 0 2 0 ~ 4 0 5 0 6 0 7 0 8 0 9 0 1 0 0
Depth (m)
Fig. 4. Distributlon of total length (cm) relative t o depth of capture for -gag (Mycteroperca mlcroIep/s)during peak spawning (February = open clrcles; March = closed clrcles). [Dlst~lbucldn tie la longltud total (cm) en relacion a l a profundidad de l a captura del c u m aguajI(Mycteroperu microie pis) tiurante e l plco d e deso ve (FeIrero= cIrculos claros; Marzo=circulos obscures).]
in shallow (150 m) water (Fig. 4), but this pattern appeared reversed in February.
Gonads examined histologically ( N = 1 12) included 110 females, no males, and 2 transitionals. Nineteen of the fish were immature, 67 were inactive (47 mature, 20 uncertain), and 24 were mature and ripe. The inactive category includes fish that are clearly sexually mature but are not in spawning condition ( N = 43) and fish for which level of maturity could not be determined. The smallest mature fish examined was 400 mm SL, 50% of the fish between 500 and 550 mm SL had matured, and 100% of the fish larger than 550 mm SL were mature.
The inactive gonads, most of which were collected From mature fish ( N = 47) in shallow water (<50 m) during peak spawning periods, provide limited but highly suggestive
information about the spawning condition of females in shallow water. Spawning con- dition could be determined clearly in 15 of these fish: 10 (67%) showed no indica- tion of either imminent or past spawning activity, 3 (20%) collected in February had developing oocytes suggesting a prespawning condition, and the remaining 2 (13%) collected in March were in postspawning condition. These data , combined with the data presented in Figs. 3 and 4, suggest that gags found in February in relatively shallow water consist of two types of mature females, those that will not spawn and those that will migrate to the spawning sites. In March, mature females in shallow waters consist of both nonspawners and those that have spawned and left the spawning sites.

Sex ratio and size frequency
The two data sets, historical and recent, show marked differences in both sex ratio and size frequency (Table 1 ) . In both his- torical data sets the percentage of males among mature fish was 17%. The 95% con- fidence interval (binomial) for the histori- cal Gulf data ( 1 3% to 2 1 %) was narrower than the historical Atlantic data (1 1% to 23%) because of the smaller sample size of the latter. In the recent data sets, the percent males among mature fish was much lower, ranging from 2.7% to 1.3% (Table I ) . The 95% confidence interval about the mean (2.2%) of the recent data sets was about 0.9% to 3.5%.
A comparison of the FSU-1991 size- Frequency distribution and the FSU-1992 size-by-sex-frequency distributions with those of Hood and Schlieder ( 1 992) (Fig. 5a and 5b, respectively) shows that a distinct loss of large fish has occurred over the 1980s (along with a reduction in the proportion and average site of males).
Fig. 6 shows size-by-sex-frequency distributions of data collected by NMFS (Panama City Laboratory) in 1991, 1992 and 1993. It shows a distinct reduction in average size compared with the historical data.
Transitionals were rare in all samples, historical and recent (Table 1 ). The size (mm TL) range of transitionals in the historical samples were: Gulf, 850 - 1 1 SO and At- lantic, 857 - 904. In the recent samples the size ranges of transitionals were: FSU- 1992,660 - 864; NMFS- 1991,725; NMFS- 1992, 1 025 - 1 149; NMFS- 1993, 525 - 1 175.
Gags have sexually dimorphic color pat- terns a t least during the spawning season (Gilmore and Jones 1992). All of the large males we examined exhibited this pattern, which Fishers have variously called "copperbelly', "charcoalbelly", or "rustybelly". Such pigment patterns persist even after capture. The smallest males in our sample apparently did not exhibit this pattern because they were not recognized as males until the gonads were examined microscopically. Only one male in the FSU-1992 collection (607 mm TL), was collected shallower than 50 m (29 m). In addition, the two smaller of the three FSU- 1992 transitionals were collected shallower than 50 m.
We examined monthly variation in the average catch data for the Florida Gulf coast landings (1 986-1 992) and found that the highest catches occurred during the period immediately prior to, during and after peak
Table 1 . Historical and recent sex ratio and size frequency of gag (Mycteroperca microlepis) (Pisces: Serranidae) in the eastern Gulf of Mexico. [Proportion de sexos Mstdrica y reciente, y frecuencia de tallas del cuna aguaji (Mycteroperca mlcrolepls) (Pisces: Serranidae) en el este rle/ GolFo de M6xico.l
Study Col lect ion Col lect ion Males Transitionals Ma tu re dates areas Females
No. % No. % No. % Median sz
Hood and Schlicder 1977.1 980 N.E. Gulf 134 17 6 0.8 659 82 850-900 ( 1992) Collins et al. 1977-1982 off South 51 17 4 1.3 253 82 800-850 (1987) Carolina Panama City 1991 N.E.Gulf 12 2.7 1 0.2 427 97 800-849 Laboratory 1992 8 2.5 2 0.6 309 97 750-799
1993 8 1.3 2 0.3 613 78 700-749 FSU Laboratory 1992 N.E. Gulf 9 1.9 3 0.6 457 98 750-799

R \ female, hisfmical
/ '? /
Length (TLi cm)
L Flg. 5. (a) Size-frequency dlstrlbutlons for gag (Mycteroperca microiepis) collected by FSU in 1991 (<50 m) and 1992 (>SO m) and by Hood and Schlieder (1992) in 1977- 1980; (b) Size-frequency dlstrlbutions by sex for gag (Mycteroperca microiepls) collected by FSU in 1792 ( ~ 5 0 rn) and by Hood and Schlleder (1992) in 1977-1980. [(a) Distribucion de frecuencia tie taiias riel cuna aguaji (Mycteroperca microlepls) colectada por FSU en I991 (<SO m) y 1992 6 5 0 m) y por Hood y Schlieder (1992) en 1977- 1780; (15) Distribucion de frecuencia par sexo para ei cuna aguaji (Mycteroperca microlepis) coiectadas por FSV en 1772 1550 m) y por Hood y Schiieder (1992) en 1977- 1980.1

120 C
100
40
I 120 I30
Length (TL; cm)
Fig. 6. Slze-frequency distributions by sex for gag (Mycteroperca mlcrolepis), NMFS, Panama City ~ a b o r a t o r ~ data: (a) 1931, (b) 1932, (c ) 1993. [Dlstrlbuclon de frecuencla par tallas por sexo para el cum aguaji flycteroperca mlcrolepls), NMFS, datos tie hboratorlo tie Panama City: (a) 1991, (b) 1992, (c) 1993.1

spawning (Fig. 7a). The mean number of trips was lowest during February and March, probably due to the high incidence of storms and danger associated with fishing these areas during that time of year (Fig. 7b). But clearly, the catch-per-unit effort (Fig. 7c) is highest exactly during pealc spawn- ing, indicating a high vulnerability of gags during this time.
Discussion
The pealc spawning season in the Gulf population of gag is February through March and spawning aggregations occur in wa- ter depths from 50 to 120 rn. Keener et al. ( 1 988) showed similar spawning times for the Atlantic population of gags through the back-calculation of daily increments of juvenile otoliths, and Gilmore and Jones ( 1992) observed putative spawning aggregations within the same depth range as those in the Gulf off the east coast of Florida. Mitochondria1 DNA analyses (Koenig and Ptaceli, unpubl.) of Atlantic and Gulf populations OF gags demonstrated a lack of genetic differentiation within and be- tween populations. Thus, it appears that Atlantic and Gulf gag comprise a single genetic population with similar patterns of spawning and probably similar responses to exploitation. Burton (NMFS, Beaufort, unpubl.) showed that fishery landings of gag peaked during the time of gag spawning off the east coast of Florida. Although there are no recent studies of sex ratios of At- lantic gag, we found neither males nor transitionals in a sample (collected during the spawning season, 1993) supplied by commercial fishers ( N = 170, Koenig, Coleman and Carr, unpubl.).
Several species of groupers have been shown to undergo annual migrations to well- defined spawning sites (Colin et al. 1987; Shapiro 1987; Waschltewitz and Widr 1990; Sadovy, in press). Van Sant et al. (1990) described a gag spawning migration
southwards to the east coast of Florida, based on tagging studies. Although no spawning migrations have been described for gag in the Gulf. they are implied from the consistent annual timing and location of the aggregations.
Gilmore and Jones ( 1 992: pers. comm.) observed individual scamp returning to the same aggregation site in consecutive years. These investigators did not present direct observations of individual gag returning annually to the same sites, although they did observe consistent annual site-specific aggregations.
The occurrence of prespawning groups in gag has been observed and videotaped (D. DeMaria and W. Parks, commercial fishers, pers. cornrn.). Prespawning sites were observed by Parks to occur in shallow (20- 40 m) water at annually consistent sites OR the south Atlantic coast of Florida typically during late December or early January. The function of the prespawning groups is un- known.
Anecdotal accounts by commercial fish- ers indicate that gag spawning aggregations once exceeded the present range north- ward to more accessible locations south- east of Pensacola and throughout the Middle- Grounds. Spawning sites are now restricted to the range depicted in Fig. 2. I f gag aggregation sites are traditional and the northern aggregation sites have been de- pleted by fishing, then it is likely that con- tinued aggregation fishing will eliminate other aggregation sites. Such a process may lead to fishery extinction, and this proc- ess is often cited as the cause for the col- lapses of other grouper fisheries (Olsen and Laplace 1977; Sadovy 1974).
Spawning has not been directly observed in gag; however, evidence presented by Gilmore and Jones ( 1 992) suggests that gag form hierarchical spawning groups with single- male, multiple-female spawning events. Our data support his observation. Ripe testes From gag are relatively small and contain small amounts of milt which indicates single

Months
Flg. 7. Florlda Gulf coast landlngs of gag (Mycrkmpem mlcroiepls) from 1986 to 1992. (a) Mean monthly landings; Ib) Mean monthly commercial grouper flshlng trlps; (c) Mean monthly catch per trlp. [Descargas en /as costas del Goffo de Florida de1 cuna agua/s(Mycteroperca mlcrolepls) tie 1986-1992. (a) Descarga medk menruak (b) Media mensual de via/es de pesca comerclai tielmem; (c) Medla mensual de /a captura por vWe.1

male spawning (i.e., no sperm competi- tion). Red hind (Epinephelusguttatus), also has single male spawning and males have small testes (Sadovy et al. 1 994). In contrast, Nassau grouper (Epinephelus striatus) males, when ripe, have large, milt-filled testes and are multiple-male spawners (Colin 1992).
The proximal causes of sex change in groupers have important implications for fisheries management (Munro 1 987). Man- agement will be quite different for spe- cies in which sex change is age- or size- mediated (endogenous control, as suggested for gag by McErlean and Smith 1964) than For those exhibiting sociodemographic control (exogenous control, e.g., Shapiro 1987). To date, the only mechanism described for sex-changing reef fish species is sociodemographic control (Shapiro et al., in press).
The conditions of sex change (i.e., which fish changes sex and when) are determined in Anthias squamipinnis, a protogynous serranid (iubfamily Anthiinae), by hierar- chical associations within the social group (Shapiro 198 i a). For example, removal of a territorial male From the group causes the dominant (= largest) female to change sex. I t is possible that a similar process of sex change occurs in gag. Our size-by-sex- frequency data (Fig. 5b) support this con- tention, as no small males (<SO0 mm) occurred in historical sarnpies, but-were present in. ours. That is, if the yechanism of sex change in gag is mediated by social o'r demographic Factors, then smaller males and transitionals would be expected in the population as exploitation,elimihated ttie larger size classes. Hdwever, our data do not support a hy- pothesis of sex change in gag which . - is determined by size alone.
The declines- in average .size and male:female sex ratios in the eastern Gulf of Mexico population of gag over the 1980s was coincident with increased fishing pressure (Ecltlund 1993). Landings data for the Florida Gulf coast indicate that fishing pressure was most intense during the time
of gag spawning aggregation formation (Gilmore and Jones 1992 and anecdotal information from fishers) and that the highest catch-per-effort occurs at the time of peak spawning (Fig. 7c). In addition, northwest Florida grouper fishers report that they have experienced a steady decline in gag landings over the last 12 years. Unfortunately, stock declines cannot be verified because be- fore 1986 all Gulf groupers were lumped in the landings data. I t appears likely that. in addition to general stock declines due to heavy Fishing pressure, population-level size- and sex-ratio changes are the direct result of fishing activities on the spawning aggregations. This contention is supported by the observations of Gilmore and *Jones (1 992 and pers. comm.), who reported that hook-and-line fishing on gag (and scamp) spawning aggregations tended to select males before females. If fishing selection for males occurs, then hook-and-line esti- mates of sex ratio (Table 1) actually overstimate the actual (absolute) propor- tion of males.
Although males may be selected by hook- and-line fishing, this observation alone does not explain how aggregation fishing could override compensatory sex-change mecha- nisms and reduce the proportion of male gags. If compensatory sex change mecha- nisms were operational in the male-defi- cient an increase in the pro- portion of transitionals would be expected. However, the proportion of transitionals is about the same in both historical and con- temporary samples (Table 1 ) . This obser- vation could be explained if transitionals were also selected by fishing. Shapiro (1 981 b) and others have shown- that among protogynous species individuals induced to undergo sex change rapidly adopt stere- otypic male behaviors before they become functional males. The time necessary to complete transition in gag is unknown;
'
however, data from artificial induction of sex change (Roberts and Schlieder 1983) suggest that it may take months.

Nevertheless, i f fishing selection of males is based on male behavior, as Gilmore and Jones (1 993) suggest, then transitionals, once they adopt male behaviors, will also be selected by fishing.
Selection o f male and transitional gags in spawning aggregations should cause a depression of the male:female ratio, but when aggregations disperse and fishing pressure is lessened at nonspawning times of the year i t would seem that the oppor- tunities for sex change would increase. Therefore, i f sex change could be induced at all times of the year, a higher frequency of males and/or transitionals would be ex- pected in the population during nonspawning times. This increase in males (and/or transitionals) should be reflected in the catch at the beginning of the spawning season. However, no such increases in males nor transitionals were observed. If, on the other hand, males and females were segregated during nonspawning times of the year, the only opportunity for female "assessment" OF the altered sex ratio would occur when the two sexes reunited at the time ofspawn- ing. Shapiro et al. (in press) described a
similar system of sex segregation in the red hind and discussed possible mecha- nisms which could account for the lack of sex change among all-female groups dur- ing nonspawning times. Anecdotal evidence suggests that large male gags remain offshore; commercial fishers say that it is rare to catch large males that are distinctively colored ("copperbellies") in water shallower than 40 m. Our data support this contention, but the possibility of males lacking characteristic color patterns exists in our data set. Clearly, the temporal and spatial distribution of males needs further investigation. Assuming that males remain offshore throughout the year and females disperse after spawning to inshore sites (and sex change is socially mediated), then sex change would likely be initiated only at the time of spawning. It is possible that prespawning aggregations play a role
in sex change, but these ephemeral aggregations are completely unstudied.
Selection of males and transitionals from spawning aggregations could explaln the relatively rapid depletion of large adults from the Gulf population of gag. The larg- est fish in the population are in the spawning aggregations and the largest individuals of each spawning aggregation are males, transitionals and dominant females. Removal by fishing of the males and transitionals presumably induces sex change in the dominant females, then these too are se- lected. Although size reduction in exploited fish populations is a general phenomenon (Bohnsack 1989) based on increased prob- ability of capture with age (size), it would probably not act as rapidly as the direct removal of the largest individuals.
Several points are important to consider in relation to the comparison of historical and recent data sets. Although random sampling cannot be assumed for the over- all data sets, bias would be minimized if the data were stratified by season and depth because large gag and males tend to oc- cupy deeper water, especially during the spawning season. Thus, our 199 1 size-class data are biased towards the smaller sizes of adult gags because samples were taken from shallow water. By contrast, our 1992 size-class data are biased towards larger sizes (and probably a high male:fernale sex ratio) because most of the samples came from deepwater during the spawning season. I t is likely that historical samples were not taken from spawning aggregations because the GSls were relatively small during the spawning season (Hood and Schlieder's mean peak GSI value was less than 2.0). Thus, our 1991 and 1992 data sets bracket the 'true' population size frequency (Fig. 5a) and the 1992 data set is biased in favor of a higher rnale:female sex ratio. In addi- tion, the data set collected by the NMFS Panama City Laboratory had an additional bias toward more males because

"copperbellies" were selected from the catch (at the fish house) before the catch was sampled. Thus, males are probably even rarer in the population than our data indi- cate.
The question remains: What does a re- duced proportion of males in the gag popula- tion mean in terms of reproductive capacity and ultimately recruitment? Intuitively, fewer males than is evolutionarily adaptive for a particular mating system would seem to restrict spawning opportunities for females in that system. As far as we Itnow, there is a complete lack of information on this subject, except for the simulation models of Bannerot (1 984) which compared the response, in terms of reproductive capacity, of the gonochorist and protogynist reproductive modes at various levels of exploitation. Bannerot Found protogynists generally superior to gonochorists in reproductive capacity; however, under reduced male:female sex ratios the reproductive capacity o f the protogynists dropped precipitously. Clearly, the relationship of sex ratio to reproductive capacity (and/or recruitment) needs to be examined in de- tail.
The response of gag to fishing pressure serves as an example of the importance to fishery management of Itnowledge of the details of reproductive strategies of exploited species. Even within the protogynous hermaphroditic mode of re- production there may be widely diFferent responses to fishing pressure, especially i f that pressure is applied to the spawning fish. For example, we compared red grouper size-by-sex ratios of fish collected in the early 1960s ( N = 594, Moe 1969) with our red grouper collections of 1991 and 1992 ( N = 450, unpublished data). Both data sets were collected in a similar manner and in overlapping areas. We found no signifi- cant difference in size distribution or in sex ratios (22% males [plus transitionalsl in Moe's sample and 24% males [plus transitionalsl
in ours) even though red groupers are subject to exploitation rates at least as great as those of gags and at all times of the year (Goodyear and Schirripa 1993).
Effective management depends on cle- tailed information concerning the complex life histories of exploited species at many levels of biological organization. Such de- tailed information is difficult, time consuming, and expensive to gain. An immediate management measure for gag. given the evidence presented in this paper on the effects of fishing spawning aggregations, should involve closure of either the spawning areas or season. Before, during and after the closure, gag should be monitored for sex ratio, gonad condition (e.g., rates of atresia) and recruitment success (Koenig and Colin, in press). I F our hypotheses are correct about the timing and nature of gag sex change induction and fishing selec- tion then the proportion of males should rise the second year after fishing of spawning aggregations stops.
Acknowledgements
We thank the following people for their participation in this work. M.P. Chasar was indispensable in all phases of the field work. Ann Kiefert, Shawna Stewart, Lou Spataro and Shannon Owens provided technical support. Sandy Handy (FSU) and Dan Marciewicz volunteered many hours. Peter Hood (FMRI, St. Petersburg) supplied unpublished data on gag. Lew Bullock (FMRI, St. Petersburg) provided Field support on offshore trips to identify spawning aggregations. Jim Bohnsack (NMFS, Miami) provided advice and support during vari- ous phases of this project. The following commercial fishers were invaluable in pro- viding gonads and leading us to the spawning grounds of gag: Clay Bailey (Apalachicola), Brian Garrity (Crawfordville), Bob Dickey and Phil Mathis (Panacea), Steve Smeby

(Panama City) and Don DeMaria (Key West). This research project was funded by MARFIN ( N A 9 0 A A - H - M F 7 4 8 ) a n d t h e F lor ida Department o f Natural Resources (now De- partment o f Environmental Regulation).
References
Bannerot, S.P. 1984. The dynamics of exploited groupers (Serranidae): an investigation of the protogynous hermaphroditic repro- ductive strategy. University of Miami. Coral Cables, Florida. 392 p. Ph.D. dissertation.
Bannerot, S.P., W.W. Fox and J.E. Powers. 1987, Reproductive strategies and the manage- ment of snappers and groupers in the Gulf of Mexico and Caribbean, p. 295-327. In
J.J. Polovina and S. Ralston (eds.) Tropi- cal snappers and groupers: biology and fisheries management. Westview Press, Boulder.
Bohnsack, ].A, 1989. The potential OF marine Fishery reserves for reef fish management in the US Southern Atlantic. NOAA Tech. Mem. NMFS-SEFC-26 1, 40 p.
Bullock. L.H. and G.B. Smith. 199 I. Seabasses (Pisces: Serranidae). Memoirs of the Hour- glass Cruises Vlll (11). 243 p.
Colin, P.L. 1992. Reproduction of the Nassau grouper, Epinephelus striatus (Pisces: Serranidae) and its relationship to envi- ronmental conditions. Env. Biol. Fish. 34:357-377.
Colin. P.L., D.Y. Shapiro and D. Weiler. 1987. Aspects o f the reproduction of two groupers, Epinephelus guttatus and 1F. striatus, in t'he West Indies. Bull. Mar. Sci. 40:220-230.
Collins. M.R., C.W. Waltz, W.A. Roumillat and D.L. Stubbs. 1987. Contribution to the life history and reproductive biology of gag, Mycteroperca rnicrolepis (Serranidae) in the South Atlantic Bight. US Fish. Bull. 85:648-653.
Ecldund, A.M. 1993. A literature review of the gag grouper, Mycteroperca rnicrolepis. National Marine Fisheries Service, SE Fisheries Science Center. Miami. Contri- bution MIA 92/93-72.
Gilmore, R. G. and R. J. Jones. 1992. Color vari- ation and associated behavior in the
epinepheline groupers. Mycteroperca rnicro/epis(Goode and Bean) and M. phenax Jordan and Swain. Bull. Mar. Sci. 5 1 (1 ):83- 103.
Goodyear, C.P. and M.J. Schirripa. 1993. The red grouper fishery of the Gulf of Mexico. National Marine Fisheries Service, SE Fisheries Science Center, Miami Contribution MIA-90/9 1-86.
Hood, P.B. and RA. Schlieder. 1992. Age. growth and reproduction OF gag Mycteroperca microlepis (Pisces: Serranidae), in the eastern Gulf of Mexico. Bull. Mar. Sci. 5 1 (3):337-352.
Huntsman. G.R. and J.R. Waters. 1987. Devel- opment of management plans for reef fishes- Gulf of Mexico and US South Atlantic, p. 533-560. In I .) . Polovina and S. Ralston (eds.) Tropical snappers and groupers: biology and fisheries management. Westview Press. Boulder.
Keener, P., C.D. Johnson, B.W. Stender. E.B. Brothers and H.R. Beatty. 1988. Ingress of post larval gag, Mycteroperca rnicrolepis (Pisces: Serranidae) through a South Caro- lina barrier island inlet. Bull. Mar. Sci. 42(3):376-396.
Koenig, C.C. and P.L. Colin. Absolute abundance. and survival of juvenile gag grouper. Mycteroperca microlepis, in seagrass beds of the northeastern GulF of Mexico. Proc. Gulf Caribb. Fish. Inst. 45. (In press).
Link, G.W., Jr. 1980. Age, growth, reproduc- tion, feeding, and ecological,observations on the three species of Centropristis(Pisces: Serranidae) in North Carolina waters. The University of North Carolina, Chapel Hill. 277 p. Ph. D. dissertation.
McErlean, A.J. and C.L. Smith. 1964. The age of sexual succession in the protogynous hermaphrod i te Mycteroperca microlepis. Trans. Am. Fish. Soc. 93(3):301-302.
Moe, M.A., Jr. 1869. Biology of the red grouper (Epinephelus morio Valenciennes) from the eastern Gulf of Mexico. Prof. Pap. Ser.. Fla. Mar. Lab, 10. 95 p.
Munro, J.L. 1987. Workshop synthesis and di- rections For future research. p. 639-659. In 1.1. Polovina and S. Ralston (eds.) Tropical snappers and groupers: biology and fish- eries management. Westview Press, Boulder.
Olsen, D.A. and ].A. Laplace. 1979. A study of a Virgin Islands grouper fishery based on

a breeding aggregation. Proc. Gulf Carib. Fish. Inst. 31: 130-144.
Roberts, D.E., ]r. and R.A. Schlieder. 1983. In- duced sex inversion, maturation, spawning, and embryogeny of the protogynous grouper, Mycteroperca microlepis. ] ). World Maricult. Soc. 14439- 649.
Sadovy, Y. 1994. Grouper stocks of the Western central Atlantic: the need for managment and management needs. Proc. Gulf Caribb. Fish. Inst. 43:43-64.
Sadovy. Y. The case of the disappearing grouper: Epinepheius striatus, the Nassau grouper, in the Caribbean and Western Atlantic. Proc. GulfCarlbb. Fish. Inst. 45. (In press).
Sadovy, Y., P.L. Colin and M.L. Domeier. 1994. Aggregation and spawning in the tiger grouper, Mycteroperca tigris (Pisces: Serranidae). Copeia: 5 1 1-5 16.
Shapiro, D.Y. 1981a. Size, maturation and the social control of sex reversal in the coral reef fish Anthias squamipinnis. J. Zool. Lond. 193: 105-1 28.
Shapiro, D.Y. 1981 b. Behavioural changes of protogynous sex reversal in a coral reef
fish in the laboratory. Anim. Behav. 29: 1 185-1 198.
Shapiro, D.Y. 1987. Reproduction in groupers. p. 295-327. In].]. Polovinaand S. Ralston (eds.). Tropical snappers and groupers: biology and fisheries management. Westview Press, Boulder.
Shapiro, D.Y., G. Garcia-Moliner and Y. Sadovy, Social system of an inshore sub-popula- tion of the red hind grouper. Epinephelus guttatus (Pisces: Serranidae). Env. Biol. Fish. (In press).
Van Sant, S.B., M.R. Collins and G. Sedberry. 1990. Preliminary evidence from a tag- ging study for a gag (Mycteroperca microkpis) spawning migration with notes on the use of oxytetracycline for chemi- cal tagging. Proc. Gulf Caribb. Fish. Inst. 43:417-428.
Waschkewitz. R. atid P. Wirtz. 1990. Annual migration and return to the same site by an individual grouper. Epinephelus alexandrinus (Pisces: Serranidae). 1. Fish Biol. 36(5):781-782.

Assessment of a Snapper Complex (Lufjimus spp.) of the Eastern Tropical Pacific
M. CRUZ-ROMERO* E.A. CHAVEP
E. ESPINO" A. GARCIA"
dIn~titutu Nacional de la Pesca, Centro Regional de Investigacidn Pesquera, A. P. 591, Manzanillo, Colima Mexico
Cen tro In terdisciplinario de Ciencias Marinas Institutu Politecnicu Nacional
A. P. 592, 23000 La Par, Baja California Sur, Mexico
CRUZ-ROMERO, M., €.A. C H ~ V E Z , E. ESPINO and A. CARC~A. 1996. Assessment of a snapper complex (Lutjanus spp.) of the eastern tropical Pacific [Evaluation del recurso de un complejo de pargos (Lutjanus spp.) del Pacifico occidental tropical], p. 324-330. In F. Arreguin-S*nchez, J . L . Munro, M.C. Balgos and D. Pauly (eds.) Biology, Fisheries and culture of tropical groupers and snappers. ICLARM Conf. Proc. 48, 449 p.
Abstract
Three stocks (Lutjanus peru, L. guttatus and L. argentiventris) from a ten-snapper species complex were assessed after a year of weekly samplings OF commercial landings. The length-weight relationship parameters, von Bertalanffy growth parameters, ages, stages of gonad maturity. fecundities, seasonal spawning patterns, natural mortalities and stoclc sizes were estimated. Population sizes, Fishing mortality and exploitation rates were estimated for each stock. An age-structured simulation model For each stoclc was created such that fishing mortality strategies could be proposed to ensure a sustainable yield in the long term. In one case, changes In observed yields through time could not be explained to be a result of changes in recruitment or fishing mortality. However, the three stocks analyzed were found to be underexploited and yields can be expanded to about 70 t above current levels. Thus, further annual increases in fishing intensity at a rate equivalent to that of human population growth are recommended until the maximirm sustainable yield level is reached to ensure the cr-eation of new jobs at the same rate as they are required by new generations of fishers.
Resumen
Trespoblac/ones de un complejo de diez especies depargos (Lutjanus peru, L. guttatus y L. argentiventris) fueron analjzadas a partir de muestras sernanales de descargas cornerciales tornadas a lo largo del atio. Parametros de la relacion peso-longitud, pardmetros de crecirniento de von Bertalanfw, eedad, estadios de madurez, fecundidad patrones estacionales de desove, mortalidad naturaly tamanos de las poblaciones fueron e.rt/mados para cada poblacion. Un mode10 de simulation basado en la estructura por edades de

la poblacion fu6 creado, tal que /as estrategias de pesca pudieran ser propuestas con el objeto de asegurar un rendimiento sostenible a largo plazo. En un caso, carnbios observados a traves del tiempo no pudieron ser explicados rjnicamente como resultado de cambios en el rec/utamiento y mortalidad por pesca. Sin embargo, las tres poblaciones analizadas se consideran subexplotadas de tal forma que 105 rendimientos pudieran ser aurnentados en cerca de 70 t sobre el nivel actual. De esta forma, incrernentos futuros en la intensidad de pesca anual equivalente a la tasa de crecimiento de la poblacih hurnana es recomendada hasta que el nivel de rendimiento mliximo sostenible sea alcanzado, con el objeto de asegurar /a creacion de nuevos empleos en la misrna proporcidn conforme sea requerido por /as nuevas generaciones de pescadores.
Tropical artisanal fisheries are typically multispecific and often yield relatively low catches on a per-species basis. The snap- per fishery on the coast of Colima, west- central Mexico, is just a portion of a com- plex that includes 109 species, and whose total yearly catches exceed 2 000 t in some years (see Cuellar at al.; Diaz-Ruiz et al., this vol.). Amongst these, red snapper (Luvanusperu) is the most important for its commercial value, as well as its yields (Cruz-Romero et al. 1988). The snapper com- plex comprises nine species of Luqanusand one belonging to the genus Hoplopagrus. The three species discussed here are the red snapper or "huachinango" (Luqanusperu), the "alazan" snapper (Lutjdnusargentiventris) and the "lunarejo" or "flamenco" snapper (Lutjanus guttatus). They have a Panamic distribution, from the west coast of Baja California, in the vicinity of Bahia Magdalena, to Peru. The role of fisheries management is the conservation of exploited resources based upon monitoring of stocks and through a continuous reorientation of management policies (Holling 1978; Gulland 1982). Thus, the goal of the present paper is to con- tribute to the management of snapper re- sources based upon the principles of popu- lation dynamics integrated in a simulation model For each species.
The fishefy
The shoreline of the State of Colima is characterized by a mixture of rocky coast and sandy beaches and a narrow continental
shelf. Mean sea surface temperatures range from 27.4 to 28.7%. The continental shelf is narrow and fishing activities here began only recently. There are about 360 fishers mostly using hook-and-line, although gill nets, longlines and fish traps are also used. Most of the fishing boats used are 7.3 m (24 feet long) with outboard motors. Fishing trips talce only a few hours every day and fishing grounds are spread over most of the rocky coastline of the State. Catch of the full species complex ranged from 3 686 t in 1980 to 1 177 t in 1986, with the number of fishing trips ranging from 1 246 in 1984 to 10 772 in 1980. Snappers represent 40- 60% of total catch, and the red snapper represents more than 90% of all snappers (Cruz-Romero et al. 1988). The latter authors mention that there was a decline in catches from 1980 to 1985, with a partial recovery in 1986; fishing effort also showed a similar trend. Estimates of maximum sustainable yield (MSY) for the red snapper and other species of snappers have been presented previously (Cruz-Romero et al. 1988) as obtained by the application of the models of Schaefer and Fox (Doi 1973; Riclcer 1975; Pauly 1988). These estimates gave MSY values ranging from 333 to 382 for the red snapper, with optimum effort ranging from 1 761 to 2 214 one-day trips. In the case of other snappers, considered as a single stock, maximum yield was estimated as 26 to 48, with optimum effort ranging from 170 to 173 trips. They concluded that the current catches are near-MSY levels, and that the declining catches were not the result of low stock biomass but rather that administrative problems constrain the development of the fishery.

Matealals and Methods
Data on commercial landings were used in addition to one year of weekly samplings of the length-frequencies of the total catch at Manzapillo harbor and twice monthly at B Q G ~ de Apiza. Length-we!ght data and s t a p sf gonad maturity were also recorded for subsamples. Sex composition was de- termined at the sampling time, as well as confirmed in the laboratory with specimens whose gonads were also collected. Qvarles were analyzed using the maturity scale of Soltolov and Wong ( 1373). Fecundity was evaluated by the gravimetrlc method, based on the countixlgs of 0.3 g subsamples of mature ova taken from the fore, medium and posterior ends of the right ovaries. Resulting values were raised to the total weight of the ovary and logarithmic regressions establishing the relationship between fecundity and body weight were derived for each species.
The growth parameters of the von Bertalanffy growth were estimated from the length-frequency data using ELEFAN I (Pauly 1987). After growth rates had been estimated, an age-length key was used to estimate the age structure of each stock. Then, natural mortality was determined by the equation of Pauly (1 983). Length-weight relationships were established by means of logarithmic regressions.
Once the growth parameters (L-, I() and natural mortality (M) were estimated, the catch data for eight years were used to run an age-structured simulation model implemented on a spreadsheet, which reconstructed the population throughout the tlme period covered by the catch records. The model is based upon the estimated age structure of the stock in the year when the records showed the greatest catch. For this year, an estimate was made of the population size of each age class per age class (P,). The exploitation rate (E, in this case the proportion of the unexploited stock
that Is exploited each year), the fishing mortality (F) and its correspondence with the most likely catch value (C) were es- tablished, uslng the equations:
C = P,. E, P, - Z;T2 n,. w, and E = (F/M+F)I1 -exp-(F/M+F)].
Then, an lteratlve process involvlng different Fvalues was implemented until the maximum likehood was found between recorded and estlrnated catches; thls also led to Fishing mortality estimates for each year, as well as to the most likely number of one-year old recruits. The latter values were used to flt the Rlcker (1954) recruitment model, us& to simulate the affects of exploitation after the last catch records, and to identiFy the most appropriate exploitation strategy.
To establish the relationship among co- horts through time, it was necessary to define a relationship of dependence between the number of parents in one year (P) and the number of one-year old recruits (R) the Following year. In order to accomplish this task, the number OF one-year old recruits was determined empirically through the iterative process used also to obtain the best estlmnte of catch and fishing mortalities throughout the time period when catch data werc available, as explained previously. Then the number of one-year old fish was fitted to the recruitment model by Ricker (1 954)
where a expresses density-independent mortallty and P expresses density-dependent mortality. Cushing (1 977) has discussed the meaning of the parameters OF this model. Once parameter values werc found, the alpha parameter of each stock was transbrmed by multiplication by a normally distributed random variable. The amplitude of varia- tion used was +30°/o around the mean

parameter value, equivalent to the average number of recruits at that adult number the year before.
Parameter values for each stock were used to simulate the most likely development of exploitation of each stock twelve years after the last year of catch records.
Results and Dlscusslon
Male:female ratios showed non-signincant differences from unity in two of the three stocks analyzed, being of 1 : 1.05 for L. guttatus, and 1 :0.9 for 1. argentiventris. However, in L. peru it was 1 :0.68. Minor seasonal differences were observed; For instance, in L. guttatus females are sllghtly more abundant than males during the spawning period from July through October.
L. guttatusspawns throughout the year, while in the case of L. argentiventris, spawning was observed to occur in April- May and from September through November. No mature females of L. peru were recorded from samples and spawning apparently occurs in deeper waters where females are not accessible to fishing gears. Ruiz et al. ( 1 985) found that males of this species were more abundant during the spawning season, but our findings showed these differences to be more frequent throughout the year. The species is apparently iteroparous and a spawning period probably occurs in April and another one in September.
Although it is known that there is an exponential relationship between the size of females and their fecundity, and the snappers here studied may spawn several times throughout the year, an accurate estimate of the reproductive contribution of different age classes is still unknown.
Mean sizes observed in commercial catches range between 200 and 280 mm, corresponding to ages of 2.5-3 years. Minimum sizes of maturity were 170- 180 mm in L. guttatus, 190-200 mm in L.
drgentiventrisand 220 mm in L. peru. Growth patterns are similar in the three stocks. In addition, It was found that 62% of the catch OF L. pem are immature, which should be carefully examined in order to avoid the risk of premature overexploitation O F ]U;
venlle Ash. In contrast, in L: argenrherltfh and L , guttarusonly 6 and 7% of t h e catch are Immature.
In the case of L. argentiventris fecun- dity ranged from 0.759-10' to 3.56.1 O5 in females whose standard lengths were 240 and 565 mm, repectively. In L. guttatus it was an order OF magnitude larger and it ranged From 0,0664.1 0"o 2. i 7 b l Oti lh
specimen$ whose standard lengths were from 200 to 490 mm. No data are avail- able Far L. Peru. Tables 1 and 2 presetif our growth parameters and related esti- mates.
The estimates of fishing mortality (F) obtalned independently for each stock throughout each of the years when catch records were available, i.e., From 1980 to 1988, and through a 12-year prijjectibni are shown in Table 3 , Fig. 1. They ranged From 0.0 1. to 0.32 year-' for L. argentiventrk; from F= 0.1 1 to 0.4 year" for L. guttatus and from F= 0,3 to 0.36 year ' For L, perb.
These values lead us to Interpret that the last mentioned specks probably is the main
Table 1. Parameter values of the Rlcker marlel for stock and recruitment [R= [email protected])], establlshlng the relationship between ~ d l l l t numbers (A) and one-year old recruits (R) of three Lutjanus spp. from the west coast of Mexlco. [ Valores de 10s pardmetros del mode10 de Rlcker para el stock y el reclutamiento (fR=cr. *A #ex/) -0 *A)/, estable- clendo /as relaclones entre el ndmero de adu/ios (A) y reclutas de un afio de erlad (R) de tres especies de LutJanus spp. de /a costa occidental de M15xlco.l
Species 01 P L, argentiventris 1.184 0.00009 L. guttatus 6.08 0.0000 1 L, peru 0.8 0.00008

Table 2. Asymptotic slzes (L_,W_), K, length-welght relatlonshlp (a:b) and natural mortality (M) In three Important specles of Lw/anus from the west coast of Mexlco. [Tallas asintbticas (L-, WJ, K, reIacibn peso-longkud la:&) y mortaIIdad natural (M) en tres especles de LutJanus spp. de ImpodancIa en /a cosh occidental de M&xlco.]
Species L_ w, K a b M
(SL; cm) (g) (year-') (year")
L . argentiventris 68.5 6 676 0.155 0.070 2.75 0.33 L. guttatus 64.2 4 577 0.192 0.064 2.73 0.39 L. peru 64.0 5 536 0.156 0.061 2.75 0.33
target of the fishery, not only because of the fishing mortality values, but also be- cause of its high catches and market value.
Values of the exploitation rates (E= F/Z) ranged from E= 0.0084 to 0.23 in the case of L. argentiventris, from E= 0.09 to 0.28 in I . guttatusand From E= 0.22 to 0.26 For L. peru, showing that the latter stock has been exploited more intensely than the others. However, the three stocks are still
underexploited. It was found that in the case of L. argentiventris the MSY is 6.2 and 10.9 t if F= 0.7, as compared to 2.06 and 3.5 if a value of F= 0.1 is applied in both cases, representing only 32 and 33% of the MSY value. For E. guttatus, the stock would be exploited to about 80°/o under the MSY values which would be 2.1 and 2.3 t for the same years. Finally, the MSY values for L. peru would be 41 7 and 444
Table 3.Observed/slmulated catches of I . argentlvenfrls, L. peru and L. guttatus. Catch data for the years after I988 ate a 12-year simulated proJection. [Capturns observ~das/slmuIadas de L. argentlventrls, L. peru y L. guttatus. Dafos de captura para los aios posteriores a 1988 son una proyeccl6n de 12 aiios mediante slmulac1~n.l
L . argentiven tris L . peru L. guttatus Year Catch (t) F Catch (t) F Catch (t) F

4 ~ r L. peru
Fishing mortality (year-I)
Observed catch (1980- 1988)
S 10
,-Estimated serles
Fishing mortality (year-')
1. -Observed mtch (1980- 1988)
Estimated serles
O 0.4 012 0.39 035 03% 0.368 0.377
Fihing rnorfalify (year-1)
Fig. 1 . Observed and simulated catch of I , argentfventds, f. gutyahrs andf. peru In West Mexlco from 1980 to 1988 and In a 12-year projection. [ Capturas observarlirs y slmuladas de L. argenti- ventrls, L. guttatus y L. peru en el occldente de M&lco, de 1980 a 1988, y a lo largo de una proyeccldn de I 2 ati0s.l

t, w h i c h w o u l d m e a n t h a t t h e cur ren t fish- e r y exploits o n l y a b o u t 84% of t h e p o t e n - tial MSY.
A v e r y c o m m o n goal o r s t ra tegy of man- a g e m e n t is t h e a s s e s s m e n t of t h e F v a l u e tha t will p r o d u c e m a x i m u m sustainable yield (MSY). In t h e case of L. peru, w h o s e c a t c h v o l u m e s represen t a b o u t 99% of total catch, t h i s can b e e x p a n d e d to a b o u t 70 t a b o v e t h e c u r r e n t level.
O n t h e bas i s of t h e c u r r e n t resu l t s it is r e c o m m e n d e d t h a t a n i n c r e a s e of f ishing effor t n o t l a r g e r t h a n t h e c u r r e n t p o p u l a - tion growth rate (about 2% per annurn) should b e m a i n t a i n e d until t h e v a l u e of F ~ 0 . 7 is r e a c h e d . This policy w o u l d allow t h e pos- sibility of c r e a t i n g jobs for n e w Fishers at a b o u t t h e s a m e r a t e e v e r y y e a r . In addi- t i o n , t h e m a n a g e m e n t .op t ion c h o s e n for th i s f ishery s h o u l d b e d e f i n e d e v e r y y e a r after a n a s s e s s m e n t of t h e current s tock size.
S o u n d s t u d i e s on t h e f isheries b io logy O F s n a p p e r s m u s t b e m a d e in o t h e r p a r t s of the i r r a n g e in o r d e r to confirm t h e evi- d e n c e p r e s e n t e d h e r e .
References
Cruz-Romero, M., E. Espino and A. Garcia. 1388. Estimacion prel iminar de l ind ice d e rendimiento maximo sostenible para la captura d e escama ribereiia. Universidad Autonoma d e San Luis Potosi 1 O(2): 109- 123.
Cushing, D.H. 1977. The problems ofstock and recruitment, p . 1 16-1 33. fn ).A. Gulland (ed.) Fish population dynamics. john Wiley B Sons. London.
Doi, T. 1973. Analisis rnaternatico d e poblaciones pesqueras. Complendio para uso practico. lnstituto Nacional d e la Pesca, Mexico.
Gulland, J.A. 1982. Fish stock assessment-a manual of basic methods. FAO/Wiley Series o n Food and Agriculture. Vol. I. john Wiley b Sons, New York.
Holling, C.S . . Editor. 1978. Adaptive environ- mental assessment and management. John Wiley 8, Sons, New York.
Pauly, D. 1983. S o m e simple methods For t h e assessment of tropical fish stocks. FA0
J Fish. Tech. Pap. No. 234. 52 p.
Pauly, D. 1987. A review of t h e ELEFAN system for analysis of length-Frequency data in Fish and aquatic invertebrates, p. 7-34. fn D. Pauly and G.R. Morgan (f!ds.) Length- based m e t h o d s in Fisheries research.
/ ICLARM Conf. Proc. 13, 468 p: Pauly. D. 1988. Towards appropriate concepts
a n d m e t h o d o l o g i e s for t h e s t u d y of rec ru i tment in t ropical dernersal communities, p. 3- 14. 117 A. Yahez-Arancibia and D. Pauly (eds.) Proceedings of the IREP/ OSLR Workshop on t h e Recruitment of Coastal Demersal Communities, Campeche, Mexico, 2 1-25 April 1986. IOC (UNESCO) Workshop Rep. No. 44.
Ricker, W.E. 1954. Stock and recruitment. J. Fish. Res.Board Can. 1 1 (5):559-623.
Riclter, W.E. 1 9 7 5 . Computa t ion a n d interpretation of biological statistics O F Fish populations. Bull. Fish. Res. Board Can. 191: i -382 .
Ruiz, A*, E. Giron, ). Madrid and A. Gonzalez. 1985. Deterrninacion d e edad, crecimiento y a l g u n a s c o n s t a n t e s biologicas d e l huachinango del PaciRco, Lutjanusperu (Nichols and Murphy, 1922), p . 188-197. fn Memorias del Vlll Congreso Nacional d e Zoologia. Saltillo, Coahuila, Mexico.
Solokov, V. and M. Wong. 1973. Programa general para la investigacidn d e 10s peces pelagicos del Golfo d e California. Frog. d e Invest. y Fomento Pesqueros. PNUDIFAO. Mexico, CEPM, 51 p.

Exploratory Fishing with Traps in Oceanic Islands off Eastern Venezuela during 1992
L.A. MARCANO R. GUEMAN G.J . GOMEZ
FONAIAP, Ctro. Inv. Agrop. Pesq. Sucre P. 0. Box 236, Cumana 61 01
Venezuela
MARCANO. L.A., R. GUZMAN and G.]. G6MEZ. 1996. Exploratory fishing wi th traps in oceanic islands off eastern Venezuela during 1992 [Pesra exploratoria con trampas en una isla oceanica del este de Venezuela durante 1991, p. 331-336. In F . Arrcguin-Sanchez, 1.L. Munro. M.C. Balgos and D. Pauly (eds.) Biology, fisheries and culture of tropical groupers and snappers. ICLARM Conf.. Proc. 48, 449 p .
Abstract
Preliminary results are presented from an exploratory fishing program wi th traps undertaken at La Blanquil la and Los Hermanos Islands, northwest o f Margarita Island in eastern Venezuela. Twelve monthly surveys were made between January and December 1992, with Antillean traps, at a depth of 37-128 rn. Mean fishing effort was 154 trap-daynmonth-I, and the total catch was 10 t, w i th a mean catch/efFort o f 5.6 lcg trap-'.day-'. Catches were composed o f 18 fish species. Snappers (Lutjanidae) were most abundant dur ing the second half o f the year, w i th an average yield of 5 kg trap- ' .day- ' , whi le groupers and hinds (Serranidae) and grunts (Haernulidae) produced l ow catches - d u r i n ~ the entire pc - r iod .
Resumen
Lc7 presente rontrjbucion reporta 10s resultados preliminares de un programa de pcsca cxploratoria con t r a m p s de peces antillanos alrededor de /as islas La Blanquilla y Los Hermanos, a1 noroeste de /sl=~ Margarita, este de Venezuela. Se efectuaron doce campmias entre Enero y Diciernbre de 1991, con trampas antjllanas co1oc;ldas a profundidades de 36.6-128.0 m. El esfuerzo de pesca promedio fue de /54 trampas-n'ia mes-'. La captura total fue de 10 t con un rendimiento medio de 5.65 kg trarnpa '-did.'. Las capturas estuvieron cornpuestas por 18 especies de peces, entre Ids cuales un Srupo dc tres renian interes cornercial. Los meses de Enero, Agosto, Octubre y Noviembre, contribuyeron con el 47% rle Id
captura total. Los pargos (Lutjanidae) fueron 10s mas ab~nd~wi tes d ~ ~ r a n t e /a segundd m i t d del atio. con ur7 rendimiento promedjo de 5 kg trarnpa' -did-'. Los meros y cabrillas (Serranidae) y roncos (Haern ciiid;le) produjemn bajos rcndiniienros durante todo el perfodo de estudio. sin picos de importancia en su abundancia.

lntroductlon
Venezuela, as a coastal country in the West Central Atlantic Ocean, has rich fish- eries resources, owing to the North Equa- torial Current and upwellings along the coast, which induce a high primary productiv- ity, itself supporting important fish, crus- tacean and molluscan communities (Anon. 1989). Some of these communities have been intensively fished, but others have scarcely been exploited despite their po- tential importance.
La Blanquilla and Los Herrnanos Islands, in eastern Venezuela, hold some of these latter communities. The rocky, coralline or sandy seabeds around these islands make them ideal habitats for commercial fish species. Among the most important fish families found in this area are Lutjanidae, Serranidae and Haemulidae (Gin& 1972). However, their fishing potential has not been properly evaluated.
The aforementioned arguments form the basis for the present study: an exploratory fishing program with traps, with the pur- pose of describing the dernersal fish spe- cies of the area, as well as their distribu- tion in space and time and their potential yield.
Study Area
The study area was located around La Blanquilla and Los Hermanos Islands, northwest of Margarita Island, between 1 1 "4O'N: 64O23.W and 1 1 OSO'N: 64O40'W (Fig. I ) .
Materials and Methods
The fishing program was conducted be- tween January and December 1992, through 12 monthly cruises on board the FONAIAP's R/VGo/fi de Cariaco. The fishing gear was the Antillean 2-trap (Munro 1974: Fig. 2).
Ls 5 Los Testigos k Los Frailes Is.
La Tortuga @Mwgarim Is. II - a TOBAGO
Cubaqua l s h c o c h e Is.
-
10 - VENEZUELA
-
EL I I I I I
65 64 63 62 6 1 60
Longitude ( O W )
Fig. 1. Location of the sampling areas, showlng the posltlon of La Blanqullla and Los Testlgos Islands In eastern Venezuela. [Localizacl6n de ireas de muestreo indicando la poslcion de k s islas La B/rmqu///n y Los festlgos, a1 este de Venezud.a.1

Flg. 2. Dlagram of Antlllean trap of the Jamalcan type (after Munro 1974). [Dlagrama de la trampa AnflIIana del tlpo /ama/qulno (adaptada de Munro
This type of trap is considered to be one of the most efficient of its kind, and better than the ones with a single entrance (Buesa- Mas 1 962).
Some 20 to 25 traps were used in every cruise. The traps were placed in groups of 4-5 traps, joined together with polyethylene rope, with an intertrap distance of 64.0- 82.3 m, according to depth. The depth of the working area varied between 37 and 128 m. The traps were baited with Fresh sardine (Sarclinella aurita) and were checked every 24 hours. On some occasions, no bait was placed in the traps.
Lifting O F the traps started at 0600-0700 hours; groups of traps were taken on board, the fish were removed and the traps rebaited and reset. Species identification, as well as measurements of the fish and evalua- tion of the sex and sexual maturity stage were then performed.
The data on capture of the main com- mercial fish species and the fishing effort (no. trap-days-month-') were used to derive an index of relative abundance, Icg trap-'. day-', by strata of time and space.
Results
Fishing effort varied from I00 to 178 trap- days-month ' , with an average of 154 trap- days.month-', for a total O F 1 848 trap-days during the study period (Table I ) . Total catch was 10.4 t, with an average annual yield of 5.63 Icg*trap-day-'. The catch consisted of 18 fish species, among which there were two groups of major economic interest, the snappers (family Lutjanidae), and the groupers (family Serranidae), which accounted for 80% of total catch. There was a third group, of less commercial value but with substan- tial catches, formed by species ofthe family

Table 1. Dlstributlon of the catch (kg) by specles and effort (no. trap-days-month-'), from the exploratory fishlng wlth traps In La Blanqullla and Los Testlgos Islands In January-December 1992. [Dlstrlbucion tie fa captura (kgl por especles y esfuerzo (no. de trampar-dia*mes), de la pesca expioratorla con trampas en la+ Islas La Blanguilla y Los Testlgos, tie Enero-DIcIembre de 1992.1
Month
I F M A M I 1 A 5 0 N D Tot a1 Species caught Catch (kg)
Epinephelus guffah
EpinepheIus mono Mycteropem u'di Haernulon mdanumm Hofoce~tius -ensionis C;lranxsp. Rhiropnonudon prosus Gymnothorarsp. Lycodon$~ ssp. Ca ulolati/us sp . &lamus sp. Baiistess p. Sphyraena h d c u d a
Prionotus s p.
- ->
Total catch 1 3 7 4 471 793 642 894 840 804 1 0 3 7 629 1 2 0 4 1 2 3 1 479 10398 ~ r a ~ - d a y s . m o n t h - ' 198 178 175 12 1 190 169 136 121 100 155 178 127 1 8 4 8 Fishing days 9 8 8 5 8 8 6 6 4 7 7 7 83 D e ~ t h Irn) 80-102 86-113 66-1 10 51-1 10 37-115 73-1 15 68-104 62-1 15 82-101 62-121 68-113 49-128

Haemulidae, which accounted for 13% of the total catch (Table 1 ) .
The snapper catch, the most important group of fish in the sample, consisted of Rhomboplites aurorubens (5 1 %) , Luqanus buccanella (29%) and L. vivanus (20°/0) and their monthly catch varied from 47 1 kg to 1 374 kg, wlth January, August, October and November producing 47Oh of the to- tal catch (see Cuellar et al., thls vol.).
Snappers were more abundant during the second half of the year, with an aver- age yield of 4.96 kg trap2'.day-'. Groupers, on the other hand, varied little from 0.1 to 1.0 kg trap-'day-'. In the case of the grunts, there were important variations in catch/effort, with a short period (October- November) in which the greatest values were observed.
Among the Lutjanidae, R aurorubenswas the most abundant species with an average
annual cntchleffort of 2.1 kg-trap-'*day-', with a maximum from May to November. The average catch/effort for L. buccanella and L. vivanus were 1.2 and 0.8 kg-I-trap7'-day-', respectively, with the greatest abundance during the period July-December for both of these species.
The bathymetric distribution of abundances (Fig. 3) showed that the Lutjanidae were most abundant at depths between 66 m and 6 1 m, while the Serranidae were most abundant in deeper waters (102-1 10 m).
Discussion
The number of fish species encountered during the exploratory survey in the La Blanquilla and Los Hermanos Islands was low in comparison with other, similar eco- systems in the Venezuelan Caribbean. Thus,
Depth (m)
Flg. 3. Bathymetrlc dlstrlbutlon of the ylelds (kgtrap-'=day-'), by group of specles (famllles Lutjanldae and Serranldae), from the exploratory flshlng wlth traps In the La Blanqullla and Los Testlgos Islands In January-December 1992. [Dlstrlbucion batlm6trlca de 10s rendlmlentos (kg trampa-'*dSa-'), par grupo de especles (famlllns LutJanldae y Serranldae) de /a pesca exploratoria con trampas en /as lslas La BIanqu//ln y Los Yestlgos, de Enero-Diclembre de 1992.1

Cervigdn (1 982) reported that 76 Rsh species w e r e cap tured with t raps placed o n coralline b o t t o m , a t d e p t h s f r o m 7 .3 m to 64 m in t h e L o s R o q u e s Arch ipe lago .
C i n e s (1 982) s u g g e s t e d for Los R o q u e s A r c h i p e l a g o , and t h e La Orchi la a n d A v e s Is lands, t h a t t h e o b s e r v e d h i g h fish spe- cies d i v e r s i t y was d u e t o h i g h n u t r i e n t c o n c e n t r a t i o n , as a resu l t o f upwel l ings .
T h e ana lys i s of t h e to ta l c a t c h r e v e a l e d t h a t s n a p p e r s w e r e t h e d o m i n a n t g r o u p of fish species c a u g h t in o u r s u r v e y c o n - tributing 72% in weigh t . This result m a t c h e s ea r l i e r resu l t s of B a e z a n d Plaut ( 1 9 7 8 ) , c o n d u c t e d in t h e s a m e a r e a , a n d w h o re- p o r t e d t h a t t h i s g r o u p of fish c o n t r i b u t e d 65% o f t h e i r total c a t c h .
T h e s n a p p e r s s h o w a definite seasonality, w i t h a g r e a t e r a b u n d a n c e d u r i n g t h e sec- o n d half o f t h e y e a r , a t d e p t h s b e t w e e n 65.8 rn a n d 9 1 . 4 m . Cerv igon ( 1 9 8 2 ) also Found t h a t s n a p p e r s w e r e m o r e f r e q u e n t in ca tches from M a y to November e l sewhere in t h e Venezuelan Caribbean. Cervigon (1 982) also found a definite bathymetr ic preference in s o m e species o f g r o u p e r s , s o m e b e i n g m o r e a b u n d a n t b e t w e e n 7.3 m a n d 64 m. This Fact w o u l d explain t h e low yields found for t h e s e two famil ies in o u r s t u d y , s i n c e m o s t - of o u r s a m p l e s w e r e taken at a g r e a t e r d e p t h .
Cansidering that t h e s tudy area is important for its commercial fishing potential, a n d that t h e exp lo i ta t ion of its resources h a s b e g u n only recently, it is r e c o m m e n d e d that s tudies o n t h e b io logy , p o p u l a t i o n d y n a m i c s a n d Fishery o f t h e m a j o r fish s p e c i e s s h o u l d b e p r o m p t l y u n d e r t a k e n .
Acknowledgements
A l s o , we a c k n o w l e d g e t h e c r e w o f t h e R/V Golf0 De Cariaco, w h o s e will a n d d i sc ip l ine m a d e t h i s w o r k poss ib le .
References
Anon. 1989. Prospecciones d e recursos de las Areas de la plataforma en t re Suriname y Colombia. NORAD/UNDP/FAO Program. Report on surveys with RfVFr~d~oFNansen, Institute of Marine Research, Bergen, Norway. 143 p.
Baez, C. and P. Plaut. 1978. Pesca exploratoria costera. Ensayos d e pesca mecanizada aplicable a la pesca artesanal. Prog. CIP- MAC-CONICIT. 18 p.
Buesa-Mas. R.J. 1962. La nasa antillana. Contrib. Cent. Invest. Pesq., La Habana ( 1 5):5-26.
Cervigbn, F. 1982. Especies y rendirniento d e peces cornerciales capturados con nasas en un area del archipielago d e Los Roques. Inf. MAC, Caracas. 2 6 p.
GinCs, H.. Editor. 1972. Carta pesquera d e Venezuela. I. Areas de l noror ien te y Guayana. Fund. La Salle d e Cienc. Nat.. Caracas. Monografia No. 16, 3 16 p.
Gines, H., Editor. 1982 . Carta pesquera d e Venezuela. 11. Areas central y occidental. Fund. La Salle d e Cienc. Nat., Caracas. Monografia N o . 27, 226 p.
Munro, J.L. 1974. The m o d e of operation of Antillean fish traps and t h e relationship between ingress, escapement , catch and soak. J. Cons. ClEM 35(3):337-350.
W e thank FONAIAP technicians R Chacdn, R. M a r c a n o , M. M d r q u e z , A. Urbaneja a n d G. Vizcaino For t h e i r par t i c ipa t ion in t h e field a n d labora tory w o r k ; C a c h a n Gil for the p r o c e s s i n g o f t h e d a t a , a n d J . Al io for t h e revision a n d translation o f t h e manuscript.

Impact of Variability in Numbers and Size at First Recruitment on the F,,, Reference Point in the US Red Snapper Fisheries of the Gulf of Mexico
N.M. EHRHARDT C.M. LEGAULT
Division o f Marine Biology and Fisheries Rosenstiel School ofMarine and A tmospheric Science
University of Miami 4600 Rickenbacker Cause way
Miami. Florida 33 149- 1098 USA
EHRHARDT, N.M. and C.M. LEGAULT. 1996. Impact of variability in numbers and size at first recruitment on the F,,, reference po in t in the US red snapper fisheries o f the Gulf o f Mex ico [ lmpacto de la variabilidad en nrjmero y tarnanlo de primer redutarniento sobre el parametro de referencia F,, en las pesquerias depargo del Golfo cfe Mexico de US], p. 337-349. In F. Arreguin-Sanchez. J.L. Munro. M.C. Balgos and D. Pauly (eds.) Biology, Fisheries and culture o f tropical groupers and snappers. ICLARM ConF. Proc. 48, 449 p .
Abstract
Red snapper (Lutjanus campechanus) is heavily exploited by commercial and recreational fisheries in the US Gulf o f Mexico. Additionally, a large number of red snappers are caught as bycatch in the shrimp trawler fishery. The directed fisheries are managed under strict catch quotas, min imum size restric- tions, area closures and gear restrictions. However. the ability o f these measures t o recover the stoclc may be compromised by the large, and uncertain, nondirected catch. The annual uncertainty in the shrimp trawl bycatch was estimated through a bootstrap procedure and this uncertainty was propa- gated t o the stoclc assessments. To examine the relationship between the shrimp trawl bycatch and the directed fishery management, stoclc assessments were carried out under three scenarios: 1 ) manage- men t o f d i rected fisheries considering nondirected catch: 2) management o f directed fisheries not considering nondirected catch: and 3) management of directed fisheries under zero discards. Resulting allowable biological catches computed under the biological reference point F,, show that the shrimp trawl bycatch reduces significantly the amount of biomass available to the directed fishery. The shrimp trawl bycatch also smooths the recruitment of red snapper into the directed fishery thus reducing the variability o f the directed catch.
Resumen
Ll pargo del Golfo, Lutjan us carnpechanus, es fuertemente explotado por pesquerias comerciales y recreativas en aguas de US del Golfo de Mexico. Adidonalrnente, un nurnero importante de pargos del Golfo son capturados corno fauna acornpatiante en la pesqueria de arrastre de carnaron. Las pesquerias dirigidas sot^ rnal~ejadas bajo un sisterna estrjcto de cuotas, restricciones =? tarnafio rn fnirno, areas vedadas y restricciones a las artes de pesca. Sin embargo. la habilidad de estas medidas para lograr Ih recuperacidn del stock puede ser cornprornetida por /a gran cantidad, e incertidurnbre, de captura no dirigida. La incertidumbre anual de la captura acornpatiante de 10s arrastres de carnaron fuC cstirnada a
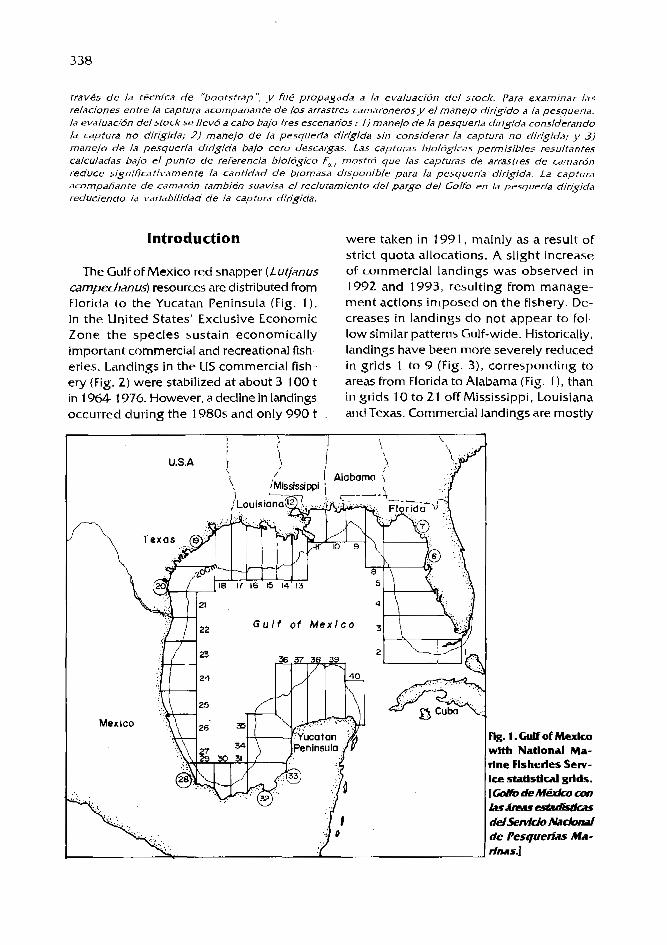
traves de la tecnica de "bootstrap': y fue propagada a la evaluacidn del stock. Para examinar /as relaciones entre la captura acornpaiiante de 10s arrastres carnaroneros y el manejo dirigido a /=I pesqueria, la evaluacidn delstock se llevd a cabo bajo tres escenarios : I ) rnanejo de la pesqueria dirigida consikerando /a cdptura no dirigida; 2) rnanejo de la pesquerfa dirigida sin considerar la captura no dirigida; y 3) rnanejo de la pesquerk dirigida bajo cero descargas. Las capturas biologicas perrnisibles resultantes calculadas bajo el punto de referencia biologico F,, mostr6 que /as capturas de arrastres de camardn reduce significativamente la cantidad de biornasa disponihle para la pesqueria dirisidc7. La captura acornpahnte cfe camardn tarnhen suavjsa d reclutamienta del pargo del Go/fo ED /a pesqueria dir igda reduciendo la varidbilidad de /a cap tura dirigida.
Introduction
The Gulf of Mexico red snapper (Luqanus campechmus) resources are distributed from Florida t o the Yucatan Peninsula (Fig. 1) . In t h e United States' Exclusive Economic Zone t h e species sustain economically important commercial and recreational fish- eries. Landings in the US commercial fish- ery (Fig. 2) were stabilized a t about 3 100 t in 1964- 1976. However, a decline in landings occurred during the 1980s and only 990 t
were taken in 1991, mainly a s a result OF strict quota allocations. A slight increase of commercial landings was observed in 1992 and 1993, resulting from manage- ment actions imposed on the fishery. De- creases in landings d o not appear to fol- low similar patterns Gulf-wide. Historically, landings have been more severely reduced in grids 1 to 9 (Fig. 3) , corresponding t o areas from Florida to Alabama (Fig. 1 ), than in grids 1 0 t o 21 off Mississippi, Louisiana and Texas. Commercial landings are mostly
Fig. 1. Gulf of Mexlco wlth Natlonal Ma- rlne Flsherles Serv- Ice stat lst ld grids. [t%&&Mt%hcan krh?asesdl- delServWo Mclonal de Pesquetias Ma- rfnas.1

Year
Flg. 2. Red snapper commercial landlngs by gear and year of the US fleet. [Desurgar comercIaIes tiel pargo del GoIfo par arie ife pesca y aiio de Ia f l oh ife EU.]
Other Louisiana Florida Texas Alabama &
Mississipi - 5OOr
Grid area
Hg. 3. Commercial land- lngs of red snapper for three years by NMFS statlstlcal grld. [Des- comexklts delpago del GI& para tres a io s por irea estadistlca del NMFSJ

from fishing operations with handlines, with some catches taken by bottom longlining in the 1980s (Fig. 2).
The US recreational fishery landed about 5 000 t-year-' during 1979-1981 (Fig. 4). However, a steady decline in recreational landings occurred in the early 1980s which stabilized at an average of 935 t during 1986- 1992. The decrease in recreational landings in 1990 was the result of a sig- nificant increase in the number of under- sized fish released as a consequence of adopting a 33.0 cm (1 3 inch) minimum size (Fig. 5) and a bag limit of 7 red snappers per person per day. Release mortality in the recreational fishery is unknown: however, a release mortality of33% per year has been used in stock assessment work (Goodyear 1 993).
The red snapper fisheries in the US sec- tor of the Gulf of Mexico are intensively managed as a consequence of increased fishing pressures exerted on the stocl~. Man- agement actions include strict catch quo- tas, minimum size restrictions, area closures and gear restrictions. In spite of these management actions, the stocks have re- mained at low levels of abundance, with spawning potential ratios at slightly above one percent (Goodyear 1993). However. these extremely low levels of spawning stock biomass are not the consequence of the directed fisheries alone but, more sig- nificantly, a result of very high mortalities inflicted indirectly on ages 0 and 1 by the shrimp trawl fishery.
A "Reef Fish Fishery Management Plan" developed by the Gulf of Mexico Fishery Management Council (GMFMC) mandates that a spawning potential ratio for the specks should be at least 20% by the year 2007. This goal, however, may not be attainable unless considerable reductions in the dis- carded shrimp bycatch are considered (GMFMC 1993). In this paper we analyze the effect of discards of red snapper in the shrimp fishery on the traditional biological reference point of F,,, (Gulland and Boerema
1973), commonly used to estimate allowable biological catches (ABCs) (see Scott Denton and Nance, this vol.).
Materials and Methods
Red snappers discarded in the shrimp trawl fishery were estimated by multiply- ing catch of red snappers per unit of shrimp fishing effort and the total amount of shrimp fishing effort exerted in the different areas of the US sector of the Gulf OF Mexico. For this purpose red snapper catch per unit of effort was estimated by a general linear model (GLM) developed by Nichols et al. ( 1 987) and used in a bootstrap algorithm developed by Ehrhardt and Legault (in press). The algorithm applies to a shrimp bycatch database which consists OF several data sources collected since 197 1 by the National Ma- rine Fisheries Service in the Gulf of Mexico (Nichols et al. 1987, 1990; Nichols and Pellegrin 1992). These data sources were generated during sea turtle excluder de- vice evaluations, a sea turtle incidental catch project, a shrimp bycatch evaluation project and the National Marine Fisheries Service resource survey cruise program in the GulF of Mexico. Each record in the database corresponds to a single bottom trawl tow and the information consists of date, loca- tion, depth, length of tow, catch by spe- cies and ancillary inFormation on sea con- ditions.
The GLM used in the bootstrap algo- rithm is given as
log(CPUE+ I mean + data seti + year, + season, + area, + depthm +
where "CPUE" is the red snapper catch rate in numbers per hour fishing, "mean" is the overall red snapper relative abun- dance and "data set" is an effect term dis- criminating shrimp fishing efFort from re- search survey fishing effort in the database. The terms "year", "season", "area" and
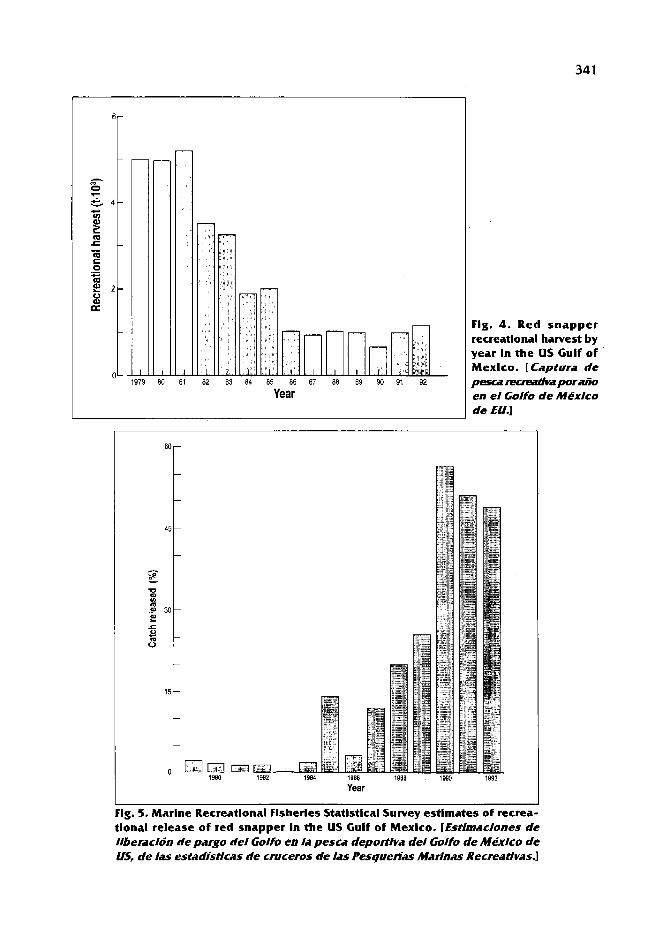
81 82 83 84 85 86 87 88 89 90 91 92
Year
Fig. 4. Red snapper recreational harvest by year In the US Gulf of Mexlco. [Captura tie pesca nxmdvaporniio en el Golfo de M&xlco de EU.]
Year
Flg. 5. Marine Recreational Flsherles Statistical Survey estimates of recrea- tlonal release of red snapper in the US Gulf of Mexlco. [Etlmaclones de Ilberaclon tie pargo def Golfo en fa pesca deportlva del Golfo de Mkxlco de US, de fas estadisrlcas de cruceros de fas Pesquerfas Marinas RecreatIvas.1
"depth" are effects terms for the spatial and temporal breakdown and "E" are er- ror terms assumed to be independently and normally distributed.
Discard estimates are subjected to sig- nificant levels of uncertainty derived from the estimation procedure. Therefore, a variance for the annual estimates was ob- tained by resampling, with replacement, tow records at random from the database. A total of 250 bootstrap samples were generated through this procedure and estimates of red snapper catch-per-unit- of-fishing-effort were obtained for each sam- ple using the GLM.
Shrimp fishing effort estimates were derived from data-collected by the dealer canvas/ vessel interview system conducted by port agents for the National Marine Fisheries Serv- ice, Southeast Fisheries Center. Effort esti- mates for each month/area/depth cell were calculated by dividing total reported shrimp catch (ignoring species) by average shrimp catch per effort from the interview data (Nichols e t al. 1987).
Discard estimates were distributed among ages 0 and 1 in a 58:42 ratio according to red snapper catch-at-age information available at the National Marine Fisheries Service, Miami Laboratory.
Values of F,,, were estimated as those values of instantaneous fishing mortality rate, F, corresponding to a point in the catch curve where the slope of the curve is 10% ofthat in the origin. The Beverton and Holt ( 1 957) equilibrium catch curve equations were not used to estimate F,,,; rather, nonequilibrium catch curves were gener- ated for a range of fishing mortality rates based on the estimated population age struc- ture present in the fishery and a gear se- lectivity at age vector as
Catch = C(slF/(slF+M)) ( 1 -e-('lF+M))NIWI
where si is selectivity at age j , M is the instantaneous natural mortality rate, Ni and
W, correspond to numbers and average weight at age, respectively, and the sum is over all ages.
Cohort abundances, Ni, in a given year were estimated by the traditional sequential population analysis (SPA) technique of Gulland (1 965). Initial fishing mortality rates used as a parameter required in SPA were obtained from separable SPA techniques developed by Pope and Shepherd (1 982) and then used as input in a CPUE-calibrated SPA which adjusted the initial F values to minimize the difference between expected and observed CPUEs. The calibration tech- nique consists of a nonlinear least squares procedure developed by Gavaris (1 988) and included -in an expanded FORTRAN algorithm developed by V. Restrepo (Uni- versity of Miami, pers. comm.).
A catch-at-age matrix required for SPA was obtained from Goodyear ( 1 993) and integrated with discard estimates for ages 0 and 1 obtained by the GLM algorithm. Because discards were estimated by a bootstrap GLM procedure (Ehrhardt and Legault, in press), several discard estimates were thus available for each year in the matrix. Consequently, SPAS were run as many times as matrices were available to estimate Nls.
Natural mortality rates required in the SPA procedure are not well Imown for red snapper. However, Nelson and Manooch ( 1982) have estimated natural mortality rates of 0.18-0.20 year-' for the species using the approximation of Pauly (1 980). Standard red snapper stock assessment work performed by the US National Marine Fisheries Service (Goodyear 1993) currently use a natural mortality rate of 0.20 year-'. Therefore, a similar rate was adopted in this study.
ABCs for any year i were estimated from Baranov's catch equation corresponding to a given F,,, and exploited population biomass, Bi, according to

where: Bi = NiiWi Nii = numbers O F age j in year i estimated
from SPA Wi = average weight of a fish of age j .
Analyses of the fishery under the assump- tion of zero discards in the shrimp fishery were accomplished by adding the discard estimates to the recruitment in the directed fishery, discounted by the natural mortal- ity rate that might have acted upon the individuals if they had not been discarded. With these values, a matrlx of expected catch at age was constructed using the fishing mortality rates previously estimated by SPA applied to the directed fishery only. The resulting matrices were used in other SPAS to calculate abundance matrices and the values of abundance at age were used to estimate new F,,,s and ABCs in year i.
Results and Discussion
A total of 250 bootstrapped GLMs were run with the discard database corresponding to the period 1972 to 1991. The resulting values for 1982 to 199 1 are given in Fig. 6. Two facts are immediately evident from the Figure: 1 ) red snapper discards in the shrimp fishery are extremely large and 2) annual discard estimates have very different levels of variability. Years with the highest number of discards are 1990 and 1991 when on average between 40 and 50 million fish were discarded. There are six other years when discards are the lowest, ranging from 15 to 25 million fish, although the shrimp fishing effort varied from 17 to 25 thou- sand days fished during these years (Fig. 7).
The catch-at-age matrix resulting from the directed and nondirected Fisheries cor- responded to the period 1984 to 1991. Therefore, results of SPA are estimated 1992 numbers-at-age. Cohort abundances for this year and their corresponding confidence intervals are given in Fig. 8. It is evident
from this figure that the effect of discards in the shrimp fishery overwhelms the popu- lation to the point that population abun- dance available for the directed fisheries is so low that any management restriction imposed on the directed fisheries would not generate any meaningful result in terms of recuperation of this fishery from severe overexploitation. This situation contr%ts dra- matically with cohort abundances obtained under the condition of zero bycatch in the shrimp fishery (Fig. 8). This situation is in agreement with the findings of the GMFMC (1991) when it concluded that unless the shrimp fishery reduces the shrimp bycatch, the red snapper fishery would not recu- perate from overexploitation by the 2007 target date.
The comparison of bycatch and no bycatch cases in Fig. 8 also shows the effect of bycatch smoothing recruitment to the directed fishery. The no bycatch population abundance at age 2 has a much larger confidence inter- val than the bycatch case, thus another source of uncertainty arises when the variability in bycatch is removed. The high level of discard mortality in the shrimp fishery ap- pears to act as a smoothing process whereby both high and low biological recruitment years will result in similar recruitment to the directed fishery. The relative impor- tance of these two sources of uncertainty in recruitment to the directed fishery deserves more attention in the future.
In order to measure the effect of dis- cards variability on F,,, and the resulting effect on ABCs, SPAS were run with all other parameters constant (i.e., point estimates of natural mortality, CPUE series used in calibrations and catch at age matrix of di- rected fishely were assumed with no er- ror). Three scenarios were prepared with the results: 1 ) management of directed fish- eries considering nondirected catch in ABC estimates; 2) management of directed Rsh- eries not considering nondirected catch in ABC estimates; and 3) management of di- rected fisheries under zero bycatch.

Year
. ,
I I I I I I 60 50 40 30 20 10
Red snapper bycatch (fish.108)
Flg. 6. Annual bycatch of red snappers In the shrlmp flshery for years 1982 to 1991. The histograms are the results of 250 bootstraps of the orlglnal data as described In the text. The solld llne connecting the histograms denotes the mean estlmate of annual bycatch from Nlchols and Pellegrln (1992) and the ticks below the histograms are the 30% confi- dence Intervals estimated by Nlchols and Pellegrln (1992) using the delta method. Note the bycatch axis Increases to the left. [Captura Incldentalanual delpargo riel Golfo en la pesqueria de camahn para 10s aiios I982 a 1991. L us hlstogramas son el resultado rle 250 iteraclones slgulendo la tecnlca "bootstrap" de 10s datos or/gnales como es descrito en el texto. La linea contlnua que conecta 10s hlstogramas lndlca la estlmacldn media anual de la pesca Inclrlental segtin Nichols y Pellegrln (1992), y k s /heas apuntando abajo riel hlstograma corresponden a1 90% del Intervalo de conflanza estimado por Nlchols y Pellegrln /1992) usando el mitodo delta. Note que el eje de pesca Incldenfal aumenta hacia la izqulerda.]

10 82 E
Year
Fig. 7. Estlmated number of days fished annually In the shrlmp fishery of the US Gulf of Mexico. [Nhnem edmado de dias de pesca a1 aiio en la pesquerla de camarbn del Golfo de M6xlco de EU.]
Age (years)
Flg. 8. Estlmated 1992 population abundance at age for bycatch and no bycatch cases described In the text. each with 95% confldence Intervals. [Abundancla por edad edlllrlikpma Ipobkfldn de 1992 por pesca Incidental o sln ella descritos en /as pruebas, cada uno con Intervaios de conflanxa a1 95%.1

Fig. 9 gives the mean yield curve for scenario 1 , bycatch considered as part of the ABC, with the 250 F, , and associated yield points superimposed on the curve. Each of the 250 annual bycatch bootstraps would have its own yield curve, but all the curves are not presented for the sake of clarity. The mean bycatch vector pro- duced an F, , of 2.2 year-' with an associ- ated yield of 9 290 t. The uncertainty in the bycatch produced a range in F,, of approximately 2.1 to 2.4.year-' for the 250 bootstraps, as shown in the lower histo- %ram of Fig. 9. This small range in the rnan- agement parameter F,,, produced a very large range in the associated yield though,
From 7 500 t to 12 000 t (Fig. 9 upper his- togram). Managers in this situation would be faced with the problem of a small change in the biological reference point causing a major change in ABC, especially since each of the bootstrapped points on the curve are equally likely but the risk of overfishing or foregoing yield varies greatly over the range of ABCs.
If only the directed fishery is managed, even-though the shrimp fishery is causing discard mortality (scenario 2). the total yield decreases and the F,,, values increase relative to scenario 1 (Fig. 10). The mean bycatch increases the F, , to 3.29-year-' with an as- sociated yield of 6 790 t. This shift down
10.5 9.0 7.5 "
1 Yield (1034.yearJ-0-
OIL- 0 0 ' I ! O ' 2.0 ~- \ 3.0 5.0
Fishing mortality
Fishing &ality (yew1)
Fig. 9. Red snapper yield curve with F,,, and associated yield for the 250 bootstrapped annual bycatch estimates for scenario one. The yield curve Is for the mean bycatch val- ues given by Nlchols and Pellegrln (1792). The dlstrlbutlons of the F,,, and associated yields are shown in the lower and upper histograms, respectively. [ C u m de renrl/mlento del pargo def Golfo con 5,) y rendlmiento asociado para k s capturas lncldentales estlmadnr para el escenario uno a parflr tie 250 iteraciones rlel metodo Bootstrap. La cuwa de renrl/m/ento es para 10s vafores medios tie captura in- cldentt/ rlltdos por Nlchols y Pel/e@n (1992). Las dlsfrllruclones de Fo,, y renrlJmientos asoclados son mostrallils en 10s histogramas Inferlores y superlores, respectl- vamente.]

and t o t h e right in t h e yield vs. fishing mortality plots is d u e t o fewer available a g e classes in the fishery requiring a higher effort to reach F,,, while producing a lower yield. As in scenario 1 , a small range in the biological reference point F,,, causes a large range of ABCs (Fig. 10 histograms). The approximate 3 000 t difference be- tween scenarios 1 and 2 for fishing mortalities a t either biological reference point corre- sponds to the biomass of red snapper that is caught by the shrimp fishery and never landed.
IFthe red snapper discarded by the shrimp fishery had only experienced natural mortality (scenario 3), the expected yield t o t h e di- rected fishery would b e an order of mag- nitude greater (Fig. 1 1 ) . The yield curve shown in Fig. 1 I corresponds t o the mean bycatch being introduced into t h e num- bers-at-age matrix and t h e 250 F,,, and associated yield points correspond t o the 250 bycatch bootstraps being introduced into t h e numbers a t age matrix. The mean F,,, of 3.2 1 -year2' is similar t o scenario 2 because the directed fishery does not catch
4 B 7.5 Yield (1 03.t.year ")
1
/
/- /'
F,, = 3.29 year1 Yield = 6 790 t
0.0 1 .O 2.0 3.0 4.0 5 0 Fishing mortality \
/ \ \
Fishing mortality (year1)
Flg. 10. Red snapper yleld cuwe wlth F , , and assoclated yleld for the 250 bootstrapped annual bycatch e s - tlmates for scenarlo two. The yleld curve Is for the mean bycatch val- ues glven by Nlchols and Pellegrln ( 1 992). The dlstrlbutlons of the F,,, and assoclated ylelds are shown In the lower and upper hlstograms, respectively. [ C u m tie rendlmlento del pargo del Golfo con For, y el rendhiento asocIado para /as capturas IncIdenWes esHm&pra el escenarlo dos a partlr de 250 Iteraclones del mitodo bootstrap. La curva de rendmlento es para 10s valores medjos de cptura In- cidenW &dospor NlchoIs y PeIiegin (199.2). las d/strlbuclones de Fo,, y reniflmlentos asoclados son mostrados en 10s histogramas jnferiores y superjores, respectl- vamente.1

F,,= 3.21 year1 Yield = 50 600 t
1 I I I 1 1 1 I I J 1 0 2.0 3 0 ' 4.0 5.0
Fishing morthy\\ / \
Fishing mortality (year1)
age 0 and age 1 fish, but the associated yield is much higher because much more biomass is available to the directed fish- ery. Even though the numbers-at-age vectors used to compute the yield curves are much more uncertain than those used for sce- narios 1 and 2 (see Fig. 8), the range of F,,, for scenario 3 is still quite small, 3.1 to 3.3-year-'. As before, this small range in F,,, produces a large range in the associ- ated yield, 45 000-57 000 t. Comparison of scenarios 1 and 3 shows the increase in yield from the red snapper population that could occur if mortality created by shrimp fishing was prevented.
Flg 11. Red snapper yield curve with F,,, and associated yield for the 250 bootstrapped annual bycatch estimates for scenarlo three. The yleld curve is for the mean bycatch values gven by Nichols and Pellegrln (1932). The distrlbutions of the F,,, and associated yields are shown in the lower and upper histograms. respectively. Note the change In scale for the yleld axis relatlve to Figs. 9 and 1 0. [Curva de rendlmienm Ile/ pargo del Golfo con fo,, y ei rentlimlento asociado para /as captur- incldent=~les esH~idhspara ei escenarlo tres a partir de 250 iteraclones dei metodo bootstrap. La curva de rendimiento es para 10s valores medios de captura ln- cidental dados port Nichols y Pellegrin (199.7). Las rllstdbuclones de F0,, y rendlmienfos asoclaiios son mostrados en ios histop-amas inferiores y superiores, respecti- vamente. Note el cam6Io en la escah para el eje de rendlmiento en relacion a /as Figs. 9 y 10.1
Conclusions
The management of the directed red snap- per fishery in the US Gulf of Mexico is re- duced in importance due to the nondirected effects of the shrimp fishery. Similar to the discard problem caused by the shrimp in- dustry, release mortality also occurs in the recreational fishery for red snapper; espe- cially since there are minimum size and bag limit regulations in effect and the red snapper is only one part of a multlspecies complex targeted by recreational fishers. Discard uncertainty causes some variability in the management parameter F,,,, but this

small r a n g e c a u s e s h igh variability in t h e associated yield, which is t h e ABC that man- a g e m e n t m u s t s e t . This relat ionship in t h e variability of F,,, a n d a s s o c i a t e d y ie ld is a d i r e c t c o n s e q u e n c e of t h e curva ture of t h e c a t c h model at t h e r e f e r e n c e po in t . Man- a g e r s p r e s e n t e d wi th a r a n g e of ABCs s u c h as t h e s e m u s t w e i g h t h e risks of overfishing a n d f o r e g o i n g y i e l d a l o n g w i t h t h e socioeconomic impacts to determine a quota.
T h e e f fec t s of d i s c a r d s O F r ed s n a p p e r s in t h e US sec tor of t h e Gulf of Mexico shr imp f ishery o n m a n a g i n g t h e red s n a p p e r di- r e c t e d f ishery m a y be c o m m o n to o t h e r s n a p p e r f isheries of t h e wor ld . As s u c h , research lead ing to s o u n d scientific a d v i c e for managing this resource should emphas ize t h e s ign i f icance of u n d e r s t a n d i n g c r y p t i c mortality s o u r c e s in nondi rec ted fisheries.
References
Beverton, R.J.H. and 5.1. Holt. 1957. On t h e dynamics of exploited Fish populations. Fish. Invest. Ser. 2, Vol. 19. U K Ministry of Agriculture and Fisheries, London.
Ehrhardt, N.M. and C.M. Legault. The role of uncertainty in fish stock assessment and management: a case study of the Spanish mackerel, Scomberomorus maculatus, in the U.S. GulfofMexico. Fish. Res. (In press).
Cavaris, 5 . 1988. An adaptive framework for t h e estimation of population size. Cana- dian Atlantic Fishery Scientific Advisory Commission. Research Document 88/29,
Goodyear, C.P. 1993. Red snapper in US wa- ters of the Gulf of Mexico: 1992 assessment update. Contribution MIA 92/93-76. Na- tional Marine Fisheries Service, Southeast Fisheries Center, Miami Laboratory. 125 p.
GMFMC. 1991. Reef Fish Stock Assessment Panel Report, 1991. Gulf of Mexico Fisheries Management Council. Sarasota, Florida. 10 p.
GMFMC. 1993. Reef Fish Stock Assessment Panel Report. 1993. Gulf of Mexico Fisheries Management Council, Sarasota, Florida. 7 P*
Gulland, ].A. 1965. Estimation of mortality rates. Annex to Arctic Fisheries Working Group Report. ICES CM 1965 , Doc No. 3, 9 p. (mimeo).
Gulland, ].A. and L.K. Boerema. 1973. Scien- tific advice on catch levels. Fish. Bull. 71 (2):325-335.
Nelson, R.S. and C.S. Manooch 111. 1982. Growth and mortality of red snappers in the West- Central Atlantlc Ocean and northern Gulf oFMexico. Trans. Am. Fish. Soc. 1 1 1 :465- 475.
Nichols, S., A. Shah, 6.1. Pellegrin, jr. and K. Mullin. 1987. Estimates of annual shrimp fleet bycatch for thirteen finfish species in the offshore waters of the Gulf of Mexico. Report t o the GulF of Mexico Fishery Man- agement Council.
Nichols, S., A. Shah, C.]. Pellegrin, Jr. and K. Mullin. 1990. Updated estimates of shrimp bycatch in t h e offshore waters of t h e Gulf of Mexico, 1972- 1988. Report to the Gulf of Mexico Fishery Management Council.
Nichols, 5 , and G.J. Pellegrin, Jr. 1972. Revision and update of est imates of shrimp fleet bycatch, 1972-1 991. Report t o t h e Gulf of Mexico Fishery Management Council.
Pauly, D. 1980. On t h e interrelationships be- tween natural mortality, growth pararn- eters and mean environmental tempera- ture in 175 fish stocks. ]. ClEM 39(3): 175- 192 .
Pope, 1.G. and J.G. Shepherd. 1982. Simple method For the consistent interpretation O F catch- at-age data. ]. ClEM 40: 1 76- 184.

Analyses of Catch-per-Effort Data for Red Snapper on Campeche Bank in 1992
M. DEL CARMEN MONROY-GARC~A" R. BURGOS ROSAS"
M.E. GONZALEZ Y RE LA ROSA" M. GARDUNO-ANDRADE*
"Centro Regional de lnvestigacianes Pesqueras de Yucalpeten Apdo. Postal 73, Progreso
97320 Yucatan, Mexico
'Centre Regional de Investigaciones Pesqueras de Lerrna Km 5 carretera Campeche-Lerma
24000, Campeche, Mexico
MONROY-GARCIA, M.D.C., R. BURGOS ROSAS, M.E. GONZALEZ DELA ROSA and M. GARDuQO-ANDRADE. 1996. Analyses of catch-per-effort data for red snapper on Campeche Bank in 1992 [Analisis de la captura-par-unidad de esfuerro de la pesqueria del huachinango del golf0 en el Banco de Carnpeche en 1 9 9 4 , p. 350-354. In F. Arreguin-SAnchez. J.L. Munro. M.C. Balgos and D. Pauly (eds.)] Biology, Fisheries and culture of tropical groupers and snappers. ICLARM Conf. Proc. 48, 449 p.
Abstract
This paper analyzes the catch, effort, and catch-per-unit-effort (CPUE) o f red snappers in the Complejo Industrial Pesquero del Mayab fleet (CPI fleet). There are three different areas: Area I (western side o f the Campeche Bank) gave the highest average CPUE, w i th 82.7 kg-day- ' ( *37.2 ; CV=0.44). Area II (northeastern part between the Arenas Key, Alacranes Reef and the North Keys) gave an average CPUE of 57.1 kg-day-' ( ~ 5 9 . 4 ; CV= 1.04). Area 111 (eastern part of the Bank) had the lowest average wi th 22.4 Ikg.day-I (?2Z.O: CV=0.98). Effort varied monthly between 10 and 47 Fishing trips-month-'. Area I and Area II yielded a high CPUE in January t o May and in November-December.
Resumen
El7 este trabajo se analiza la inforrnacion de la captura, el esfuerzo y la captura por unidad de esfuerzo (CPUE) del pargo del Golfo proveniente de la flota [CPI) del complejo industrial pesquero del Mayab. Se tiefinen tres areas diferentes: Area I [a/ oeste del Banco de Carnpeche) donde se registro la CPUE prornedio mas alta, con 82.7 k g did-' [_c37.2, CV-0.44). Area I1 (regidn noreste, entre Cayo Arenas, Arrecife Alacranes y 10s Cayos del Norte). con valores promedio de CPUE de 57. / lrg dia-' (_c59.4, CV=1.04). Area Ill (regidn orjental del Banco) que present0 10s menores valores promedio de CPUE con 22.4 kg dia-' [ ~ 2 2 . O , CV=0.98). El esfuerzo varlo rnensualmente entre 10 y 4 7 viajes de pesca por mes. En la5 Areas I y I1 se registraron altos valores de CPUE de Enero a Mayo y en Noviernbre-Diciembre.

lntroductlon
Red snapper (Luqanus carnpechanus) Fish- eries are important in Yucatan State, Mexico, this species being of high quality (see Render and Wilson; Ehrhardt and Legault, this vol.). It is exported to the USA, providing for- eign exchange while also generating em- ployment. Between 1990 and 1992, red snappers contributed from 2.2% to 19.4% of the total monthly catch recorded by the Progreso Fisheries Office (Secretaria de Pesca), which covers 90% of Yucatan State.
In fisheries stock assessment, two important factors are the spatial distribution and sea- sonal changes (Hilborn and Walters 1992).
The objective of this study was to analyze the effort, catch and catch-per-unit-effort (CPUE) applied to red snapper for different areas of Carnpeche Bank, for a standard fleet.
Materials and Methods
Data were collected from the Complejo lndustial Pesquero del Mayab (CPI fleet), whose target species is red snapper. This fleet is quite standardized: the vessels are 12.2 m (40 H) long, each equipped with three line haulers with a pulley and 4 or 5 #7 or #8 hooks. There are three fishers per vessel. Fishing depth is 36- 146 m (20-80 fathoms).
Effort and catch data for each fishing trip were recorded in a logbook by the vessel's captain. Records cover the effective catch days, fishing grid number, red snapper catch and total catch by weight. Campeche Bank is divided by a grid of one degree longi- tude by latitude.
The logbook catches were matched with the catch records From the Progreso Fish- eries Office (Secretaria de Pesca). Logbooks without matching records were not con- sidered.
Effective catch days are the total time less the travel time. The t-student statistic
was used to compare spatial (grids) and monthly differences in effort and CPUE. Averages, standard deviations and the coefficients of variation (CV=y/s.d.) were calculated.
Results
Data from 379 fishing trips were used, corresponding to 3 91 1 effective fishing days by the CIP fleet during 1992. Table 1 shows the effort and its distribution on the Campeche Bank grid.
The red snapper catch rates show that there are three different areas (t-student <0.05):
Area I , corresponding to grid squares 8, 14 and 15 gave the highest average CPUE, with 82.7 kg-day-' (e37.2; CV=0.44); this area is on the western side of the Campeche Bank off Celestun (between 20- 24"N and 91 -93"W) (Fig. 1 ) .
Table 1. Number of flshing trlps and effec- tive catch days by grld square, for t h e c ~ l fleet on CNnpeche Bank during 1992. [Numen, de vvlrjes de pesca y dhs efectfvos de pesca ap/icados a 10s dlferentes cuadrantes en el Banco tie Campeche durante 1992.1
~p
Grid Fishing Effective square trips davs
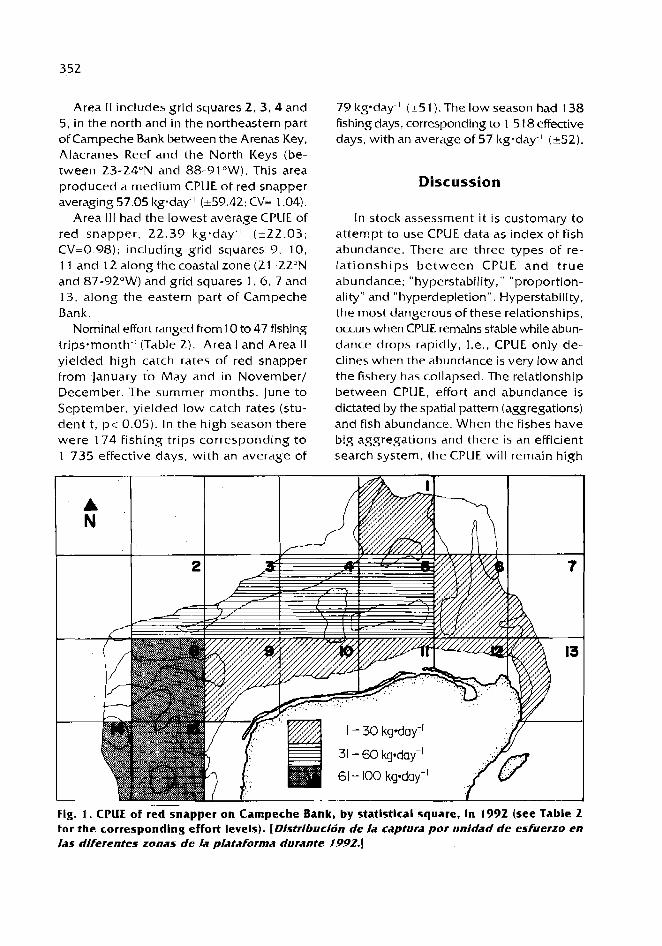
Area I1 includes grid squares 2, 3 ,4 and 5, in the north and in the northeastern part of Campeche Bank between the Arenas Key, Alacranes Reef and the North Keys (be- tween 23-24"N and 88-91 OW). This area produced a medium CPUE of red snapper averaging 57.05 kgday-' (k59.42; CV= 1.04).
Area I l l had the lowest average CPUE of red snapper. 22.39 kg.day" (222.03; CV=0.98); including grid squares 9, 10, 1 1 and 12 along the coastal zone (21 -2Z0N and 87-92"W) and grid squares 1 , 6, 7 and 13, along the eastern part of Campeche Bank.
~omina l effort ranged from 10 to 47 fishing trips-month-' (Table 2). Area I and Area 11 yielded high catch rates of red snapper from January to May and in November/ December. The summer months, June to September, yielded low catch rates (stu- dent t, p i 0.05). In the high season there were 174 Fishing trips corresponding to 1 735 effective days, with an average OF
79 I<g*day-' (k51). The low season had 138 fishing days, corresponding to 1 5 18 effective days, with an average of 57 kg-day-' (+52).
Discussion
In stock assessment i t is customary to attempt to use CPUE data as index OF Fish abundance. There are three types of re- lationships between CPUE and true abundance; "hyperstability," "proportion- ality" and "hyperdepletion". Hyperstability. the most dangerous of these relationships, occurs when CPUE remains stable while abun- dance drops rapidly, i.e., CPUE only de- clines when the abundance is very low and the fishery has collapsed. The relationship between CPUE, effort and abundance is dictated by the spatial pattern (aggregations) and fish abundance. When the Fishes have big aggregations and there is an efficient search system, the CPUE will remain high
.. -
Fig. I . CPUE of red snapper on Campeche Bank, by statistical square. In 1992 (see Table 2 for the corresponding effort levels). [Distribution de /a captura por unidad de esfuerzo en /as diferentes zonas de la plataforma durante 1972.1
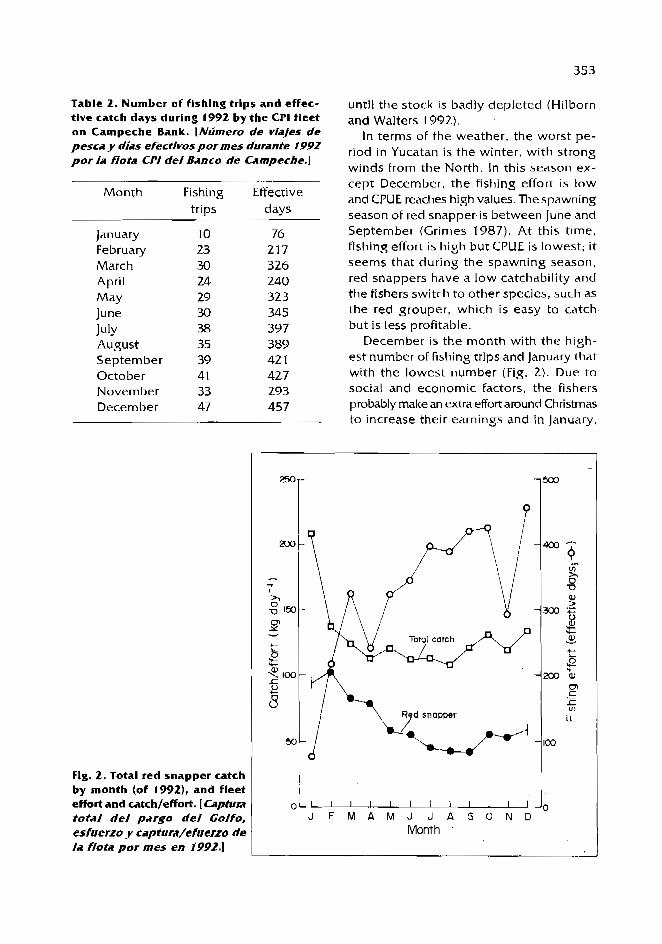
Table 2. Number of fishlng trlps and effec- t lve catch days during 1992 by the CPI fleet on Campeche Bank. [Ndmero de viajes rle pesca y dias efecfivos por mes durante 1992 por /a flota CPI del Banco de Campeche.]
Month Fishing Effective trips days
January 10 76 February 23 21 7 March 30 326 April 2.4 240 May 29 323 June 30 345 July 38 397 August 35 389 September 39 42 1 October 41 427 November 33 293 December 47 45 7
Fig. 2. Total red snapper catch by month (of 1992), and fleet effort and catchleffort. [Captwra total del pargo del Golfo, esfuerzo y captura/efuerzo de la flora por mes en 1992.1
until the stock is badly depleted (Hilborn and Walters 1992).
In terms of the weather, the worst pe- riod in Yucatan is the winter, with strong winds horn the North. In this season ex- cept December, the fishing effort is low and CPUE reaches high values. The spawning season of red snapper is between June and September (Grimes 1987). At this time, fishing effort is high but CPUE is lowest; it seems that during the spawning season, red snappers have a low catchability and the fishers switch to other species, such as the red grouper, which is easy to catch but is less profitable.
December is the month with the high- est number of fishing trips and January that with the lowest number (Fig. 2). Due to social and economic factors, the fishers probably make an extra effort around Christmas to increase their earnings and in January,
I l l l l l l l l l l l
J F M A M J J A S O N D
Month

when climatic conditions are poor, they replant their crops and dry dock the vessels.
The grid squares with the highest CPUE and the lowest CV are t h e grid squares with the highest number of fishing trips. A major problem with using commercial catch-and-effort data to estimate stock dis- tribution and abundance is that fishers go where the fish are. Fishlng effort is nor- mally concentrated on the highest den- sity fish and attempts to assess the range, or total abundance of fish From commercial catch-and-effort data can be expected to be biased.
References
Grimes, C.B. 1987. Reproductive biology of the Lutjanidae: a review, p. 239-294. In J.J . Polovina and S. Ralston (eds.) Tropical snappers and groupers: biology and Ash- eries management. Westview Press, Boulder.
Hilborn, R.Y and C.J. Walters. 1992. Quantita- tive fisheries stock assesrnent. Choice, dy- namics and uncertainty. Chapman 8, Hall, New York.

Time Series Analysis and Multivariate Methods Applied to the Red Grouper Fishery on Carnpeche Bank, Mexico
J . POL S. MORENO
Flota del Golfo C. Garcia 11 1, Regla, C. Habana, Cuba
POL. I . and S. MORENO. 1896. Time series analysis and multivariate methods appl ied t o the red grouper fishery on Campeche Bank. Mexico [Series de tiernpo y metodos rnultivariados aplicados a la pesqueria de mero arnericano del Banco de Carnpeche, Mc?xico], p. 355-359. In F. Arreguin-SBnchez, 1.L. Munro. M.C. Balgos and D. Pauly (eds.). Biology, fisheries and culture of tropical groupers and snappers. ICLARM Conf. Proc. 48. 449 p.
Abstract
Time series analysis was appl ied to monthly y ield data OF the red grouper (Epinephelus rnorio) commercial fishery from the Campeche Bank, in the Gulf of Mexico, during 1973 to 1991. A single exponential smoothing technique was used to fit the data, resulting in a series characterized by small changes of individual values with respect to the mean, without a specific trend. The forecast mean value was 3.56 kg/i00 hooks. Principal component analyses showed that total abundance of fish is signifi- cantly related to variables such as depth. fishing ground and red grouper abundance.
Resumen
Se presentan 10s resultados del andlisis de series de tiernpo aplicado a 10s valores mensuales de CPUE total de la pesqueria cornercial con palangre de fondo del mero arnericano (Epinephelus morio) en el Banco rle Carnpeche de 1973- 1991. El rnejor ajuste se Iogra con e l rnetodo de suavizamiento exponential simple con un error del 18.6%. La serie se caracteriza por pequerios cambios en 10s valores respecto a la media, sin tendencia definida. E l valor rnedio del pronostico fuC de 3.56 kg/100 anz. El analisis de componentes principales sugiere que la abundancia total cie peces est i relacionada de forrna significativa con otra5 variables corn0 son la profundidad, zona de pesca y /as variaciones de la abunclancla de rnero arnericano.
Introduction
The structure of demersal fish commu- nities in a given area is related to the type and characteristics of the sea bed, the depth and the local oceanographic dynamics (Caddy and Sharp 1988). Thus, environmental changes promote fluctuations in abundance of Fish populations. Fishing grounds of the Campeche Bank visited by the Cuban fleet
are characterized by a coralline sea floor where serranids and lutjanids dominate commercial catches (see ArreguIn-Sanchez et al., this vol.). This region is also charac- terized by east-west currents and a sea- sonal upwelling on the northeastern con- tinental shelf of the Peninsula of Yucatan (Elizarov and Machado 197 1 ).
Sharp and Csirke ( 1 983) emphasize that prognoses must not ignore environmental

influence. For the Campeche Bank, Garcia et al. ( 1980) developed a prognostic based on a system of equations which relate the effect of atmospheric pressure, Gulf Stream flow and upwelling, the last effect being related to low temperatures. These changes also promote high abundance of some spe- cies such as grunts (Haemulidae) (Oleachea 1975) . However, the red grouper (Epi17ephelus morio) tends to move away from low temperatures, which have therefore been interpreted as a major cause of the east-west red grouper population move- ments.
Currently, studies developed in the Campeche Bank relate temperature and fish density. This contribution aims to analyze relationships among some environmental variables and the abundance of the fish populations for forecasting purposes.
Materials and Methods
Time series O F catch/effort data (U, kg/ I00 hoolts) were used to analyze changes in population abundance for the most im- portant species caught by the red grouper hoolc-and-line fishery of the Campeche Bank, Mexico. For the analysis, 161 samples were used, taken From 15 surveys undertaken from 1986 to 1991. An exponential smooth- ing procedure was used to derive a main trend through the equation:
where U = observed value of catch/efFort ( k g /
100 hoolts), as a measure of abun- dance:
U, = forecast abundance: t = time, in months; a = smoothing constant, with 0 5 o: 5 1 . The variables usedfor environmental
characterization were: time, fishing ground, mean depth, population abundance for the main species (red grouper [Epinephelus morio] , black grouper [Myctwoperca bonac~l,
snappers [ Lutjanus campechanus] , L. analis, porgies [Calnmus spp.], yellowtail snap- per [Ocyurus chrysurus]) and total abun- dance (U,).
Factorial analysis of these variables was developed through the Principal Component Analysis (PCA) technique in order to identib main interrelationships with a minimum loss of information (Linares 1970).
Results and Discussion
The monthly trends of catchleffort shown in Fig. 1 do not exhibit a clear pattern. The percentage of error estimated after single exponential smoothing (SES), with a value for a = 0. I was 18.6%. This analysis was considered adequate for time series where changes are small with respect to the mean value.
The monthly trend exhibits two periods of low yields, 1980- 1782 and 1970- 199 1 , which coincide with low temperatures. These conditions occur more frequently during summer (Garcia 1980), but their intensity and duration remain ill-defined. High val- ues of fish abundance during October -
December 1988 were an effect of hurri- cane Gilbert, which occurred the previous September.
The SES permits a prognosis of the weighted average (3.56 kg/ 100 hooks), which, unfortunately is strongly afFected by values at the beginning of the time series (Zerguera 1988). However, the prognosis is not dependent on the older values; rather, it depends on the most recent abundance records.
Cansado ( 1970) suggests that adequate predictions are given by the average val- ues in time series such as used in this analysis, where no cyclical processes are involved. In practice, this average value did vary as a consequence of environmental variables such as temperature, which has a very important eEFect on many species and their fisheries in the Campeche Bank.

Fig. 1. Tlme serles of monthly ylelds by the Cuban fleet on Campeche Bank. [Serie de t/empo de 10s rendlmientos mensuaies de la flota Cubana en el Banco tie Campeche.]
Garcia ( 1 974) indicates that 43% o f the variance of red grouper abundance is ex- p la ined by t e m p e r a t u r e . Conversely , Cewigon ( 1 972) suggested that complexity o f coral reef ecosystems is a result of their environmental stability; notably their sta- ble temperatures.
Although the red grouper constitutes 80% of the total fish caught, o ther species ap- pear t o be of importance for forecasting purposes. The most important a re other species of serranids (1 3.4%). lutjanids (5.3O/o) and sparids (1.3%).
To analyze the results from the PCA, those values for correlation coeficients higher than 0.4 were taken t o b e significant. This cri- terion w a s applied t o the first t o fourth components because they explain 7 1 % of t h e total variance (Table 1 ) . A high asso- ciation was observed between population abundance and depth (Table 2). Differences a m o n g species related with their dep th distribution indicate that higher total abun- dance w a s found in the range of 2 7 rn t o 45 m.
The second component of the PCA sug- ges t s a relationship between s o m e spatial variables, such a s fishing ground and depth, with total abundance; and specifically that
of red and black groupers. This association is clearly observed o n t h e eastern region of the Campeche Bank, where t h e Cuban fleet operates most frequently. This par- ticular result is a consequence of t h e fish- ing strategy, because the Cuban fleet op- erates on targeted fishing grounds where , in this particular case , the black grouper
Table 1. PCA analysls of catch/effort data by the Cuban fleet on Campeche Bank; eigenvalues and variation for each compo- nent. [ Vaiares proplos y vatiabiiidadapllcnda para cada componente.]
Eigenvalues Explained Curnrnulated variance (%) variance (%)

Table 2. Correlatlon coefficients for significant variables within each component, U = catch/effort. [ CoeFkIenfes tie corre/acldn para /as varlnbles prlmarlas en cada
componente. U= captura por unldad de esfuerzo.] .
l tem Factor 1 Factor 2 Factor 3 Factor 4
month fishing ground 0.53 -0.53 mean depth -0.47 -0.49 Fishing effort 0.44 0.48
U ,oral -0.73 0.53 -0.45 0.75
red grouper
-0.74 -0.42 black grouper
-0.58 smppcrs
-0.59 LI porgies 0.61 ycllowtail mapper, 0.58 -0.45 0.55
have larger sizes and weights than the other species with a significant influence on the total abundance.
Yellowtail snapper is a schooling demersal fish most frequently found at a depth of about 27 rn in exploited areas of the western part of Campeche Bank. However, the economic value of this species is relatively low, and is not a primary target species. This species was considered significant for the third component of the PCA.
There is little difference among the dif- ferent seasonal indices of abundance for
each month; all tend to have lower values during early summer, just when the upwelling impact occurs (Fig. 2 ) ; however, during winter and early spring, relative abundance is much higher, probably be- cause of the reproductive aggregation of the red grouper, which is well known to fishers (Arreguin-Sanchez 1992; Arreguln- Sanchez et al., this vol.).
We conclude by noting that the best representation of our catch/eFfort time se- ries was obtained by the single exponen- tial smoothing, with an error of l8.6%, and
-0.6' I I I I I I I I J F M A M J J A S 0 N D
Year
Flg. 2. Monthly flsh abun- dance Indices. [Inrllces mensuales tie anbundancln tie peces.]

characterized by small changes with re- spect to the mean value.
For the red grouper fishery it is not rec- ommended to use time series analysis without consideration of interacting factors, such as fishing ground, depth and species-specific abundances.
References
Arreguin-Sanchez, F. 1992. An approach to the study of the catchability coefficient with application to the red grouper (Ephephelus morio) fishery from the continental shelf of Yucatan, Mexico. Centro de Investigation y de Estudios Avanzados del IPN. Unidad Merida, Mexico. Doctoral thesis.
Caddy, J.E. and G.D. Sharp. 1988. Un marco ecologico para la investigacion pesquera. FA0 Doc. Tic. Pesca (283). 153 p.
Cansado, E. 1970. Curso de estadistica gen- eral. Inst. del Libro. 662 p.
Cervigon, F. 1972. Los peces, p. 308-355. En H . Ginis y R. Margalef (eds.) Ecologia marina. Fund. La Salle de Cienc. Nat., Dossat S.A. Caracas.
Elizarov, A.A. and I . Machado. 1971. Variabilidad de la corriente de Yucatan y
tipos de circulacion en dicho estrecho en relacion a la concentracibn de organismos comerciales en el Banco de Campeche. Invest. Pesq. Sov. Cub. Fasciculo 3: 130- 141.
Garcia, C. 1974. Influencia de la temperatura en el cornportamiento de la cherna americana (E. morio) en el 8. de Campeche. ler Simp. Cienc. Pesq. 4 p.
Garcia, C. 1980. Caracterizacion general del Banco de Carnpeche. Rev. Cub. Invest. Pesq. 5(2):1-10.
Garcia. C., M.H. Obregon and M.E. de Leon. 1980. Relaciones oceanogrMco-pesqueras. Rev. Cub. Invest. Pesq. 5(3):22-31.
Linares, G. 1990. Analisis de datos. Universidad de la Habana. ENPES. 590 p.
Oleachea, A. 1975. Distribucidn y abundancia de peces demersales y su relacion con las temperaturas de las aguas de fondo. Rev. Invest. Pesq.(2): 161.
Sharp, C. and 1. Csirke, Editors. 1983. Proceedings of the Expert Consultation to Examine Changes in Abundance and Species of Neritic Fish Resources. FA0 Fish. Rep. (291) Vol. 2:55Z- 1224.
Zerguera, P. 1.988. lntroduccion a la direccion cientlfica de 10s inventarios. CEDISATEMA. 174 p.

Shrimp Trawl Bycatch Research In the US Gulf of Mexico and Southeastern Atlantic
E. SCOTT-DENTON I . NANCE
National Marine Fisheries Service Southeast Fisheries Science Center
Galveston Laboratory 4700 Avenue l/
Gal veston, Texas 7755 I , USA
SCOTT-DENTON. E. and J . NANCE. 1996. Shrimp trawl bycatch research in the US Gulf of Mexico and sou theastern Atlantic [lnvestigaciones sobre captura acomparlante de arrastres carnaroneros en aguas de US del Golfo de Mexico y Atknt ico Surorientad, p. 360-362. In F. Arregul'n-SAnchez, J .L . Munro, M.C. Balgos and D. Pauly (eds.) Biology, Fisheries and culture of tropical groupers and snappers. ICLARM Conf. Proc. 48. 449 p.
Abstract
A brief description is given of a project initiated in 1982 by the National Marine Fisheries Service, designed to assess the status OF fish caught as bycatch in the shrimp fishery of southeastern Atlantic and Gulf of Mexico coast of the USA. Some preliminary results are presented.
Resumen
5e presenta una breve description de un proyecto de investigacidn in/ciado en 1992 por e/ Servicio Naciona/ de Pesqucrias Marinas y disefiado para evaluar el estado de 10s peces capturados como fauna acornpaiiante de /a pesqueria de camaron del Atldntlco surorienta/ y en aguas de USA en e/ Golfo de Mexico. Se presentan algunos resultados pre//minares.
Introduction
As elsewhere in the world, shrimp trawling in the US Gulf of Mexico and southeastern Atlantic has been identified a s a contrib- uting factor for t h e declining stocks of demersal finfishes (Alverson e t al. 1994). A reduction in red snapper landings in the 1980s brought considerable attention t o shrimp trawl bycatch as being the primary cause of juvenile red snapper mortaliSy (see also Ehrhardt and Legault; Monroy-Garcia e t al., this vol.). A s a result of the 1990
amendments to the Magnuson Act, a three- year research plan was established t o as- sess bycatch from t h e commercial shrimp Fishery operating in the southeast region. Since April 1992, scientists a t the South- east Fisheries Science Center Galveston Laboratory of the National Marine Fisher- ies Service (NMFS) have been collecting bycatch data onboard shrimp vessels in the US Gulf of Mexico and southeastern At- lantic, in the context of a project that is briefly presented below, along with s o m e preliminary results.

Goals and Objectives
The goals of this project were t o update and e x p m d bycatch estimates temporally and spatially in the offshore, nearshore and inshore waters of the Gulf of Mexico and the southeastern US Atlantic and to evaluate various devices t o reduce shrimp trawl byca tch . Bycatch d a t a w e r e u s e d t o determine what species are impacted during shrimping activity. Catch-per-unit effort estimates for various species were avail- able for inclusion into stock assessment models.
Materials and Methods
This research project follows the guide- lines in the Research Plan AddressingFinflsh Bycatch in the Gulf ofMexico and South Atlantic Shrimp Fisheries, prepared by the Gulf and South Atlantic Fishery Develop- ment Foundation under the direction of a Steering Committee composed of individuals representing industry, environmental, State and Federal interests in the United States. The intent of the sampling design is to survey t h e commercial shrimp fishery in opera- tion and not to simply establish a research survey s tudy O F the bycatch or t h e finfish populations. The sampling universe in this case consists of all tows From all vessels shrimping in the Gulf of Mexico and along the Atlantic coast of the southeastern United States. Parameters of interest are the catch totals and size distributions of species of finfish and invertebrates incidentally taken by t h e shrimp fleet.
The quantity and type of bycatch change with fishing location, season and depth. Stratification by these variables will help to minimize thevariances of catch estimates. Forty-five analysis strata were identified using season (January through April, May through August, and September through Decern- ber), location (Statistical zones 1-9, 10-1 2, 13-1 7, 18-21, and the US Atlantic coast) ,
and depth (inshore, nearshore and ofkhore). The statistical sample unit within each stratum consists of a single subsample from a trawl haul.
NMFS-tralned observers collect the trawl haul subsamples and record the da ta fol- lowing the established NMFSBycatch Char- acterization Protocol published with t h e Bycatch Research Plan. A 13-kg p e r tow hour subsample is obtained from o n e ran- domly selected net after each tow. The data collected consist of total tow weight, subsample weight, species composition, abundance, weight and miscellaneous data from which life history information can b e derived.
The actual number of sea days a t the end of t h e project will greatly depend o n co- operating shrimp vessels. Since t h e pur- pose of t h e research is t o characterize to- tal bycatch by t h e shrimp fleet, allocation of samples is based only on intensity of shrimping effort and not on abundance levels of selected finfish species.
Preliminary Results
A total of 750 s e a days of observations on shrimp vessels has been conducted in the Gulf of Mexico and along the east coast of t h e United States between May 1 9 9 2 and September 1993. However, only data through April 1 8 9 3 for the Gulf of Mexico were available for summary analysis. All other data are in various s tages of analy- sis.
As of late 1993, a total of 2 8 2 species of finfish, 72 species of crustaceans, and 47 species of invertebrates were identified From the 440 trawl samples (401 different spe- cies). Most of the species were taken only on rare occasion, with about sixteen spe- cies being found in more than 50% of t h e sampled trawls. Overall, Atlantic croaker (Micropogonias undu/atus) and longspine porgy (Stenotomus caprinus) were t h e dominant bycatch species in terms of both biomass (38%) and numbers (37%). The other

eight biomass dominant bycatch were hardhead catfish (Arius klis), Gulf menhaden (Brevoortia patronus), inshore lizardfish (Synodus foetens), Gulf butterfish (Peprihs burti), spot (Leiostomus xanthurus), sand seatrout (Cynoscion arenarius), cutlass fish (Trichiurus lepturus) and lesser blue crab (Callinectes sim/lis), while the other eight numerical dominants included seabob shrimp (Xiphopenaeus kroyeri), sugar shrimp (Trachypenaeusspp.), longspine swimming crab (fortunus spinicarpus), lesser blue crab, iridescent swimming crab (Portunusgibbesii), mantis shrimp (Squillaspp.), Gulf butterfish, and hardhead catfish. On a seasonal ba- sis, Atlantic croaker and longspine porgy were the biomass and numerical dominants during the May 1 992 through December 1992 period, while during the January 1993 through April 1993 period the biomass dominants were the inshore lizardfish and the longspine porgy, and the numerical dominants were the sugar shrimp and the Gulf butterfish. With regard to the Florida area, pinfish and inshore lizardfish were the biomass dominants, while sugar shrimp and mantis shrimp were the dominant bycatch by number. In the Mississippi/Ala~ma area, Atlantic croaker and sand seatrout were
dominant by biomass, and Atlantic croaker and mantis shrimp were the numerical dominant bycatch. In the Louisiana and Texas areas, Atlantic croaker and longspine porgy were the biomass and numerical dominant bycatch. Red sqapper (Lufjanus campechanus) accounted for less than 1 % in terms of biomass for th-a entire Northern Gulf of Mexico cgash The highest percent biomass (2.7%) of red snapper occurred off the Texas coast in offshore waters during September 1992 through December 1992 (based on 25 trawl samples). Numerical abundance (number/hour) of red snapper ranged from zero off the Florida coast t~ 16 off the Texas coast from May 1992 though April 1 W3, while biomasses (1%-hour') ranged from zero to 0.5 kg*hour2' for these same areas. Median length (FL) of red snapper for the same time period ranged From 7.5 cm to 17.4 cm.
Reference
Alverson, D.L., M.H. Freeberg, S.A. Murawski and J.G. Pope. 1994. A global assessment OF fishery bycatch and discards. FA0 Fish. Tech. Pap. 339, 233 p.

PART V: AQUACULTURE AND CONTROLLED REPRODUCTION
-+ APR a 4 1598 Nassau Grouper Aquaculture
J.W. TUCKER, JR. P.N. W O O D W A R D
Harbor Branch Oceanographic Institution 5600 North U. 5. High way 1 Fort Pierce, Florida 34946
USA
TUCKER, J.W., Jr. and P.N. WOODWARD. 1996. Nassau grouper aquaculture [Acuacultura de la cherna criolla], p. 363-377. In F. Arreguln-Sanchez, J.L. Munro, M.C. Balgos and D. Pauly (eds.) Biology, fisheries and culture of tropical groupers and snappers. ICLARM Conf. Proc. 48. 449 p.
Abstract
Nassau grouper (Epinephelus striatus), which ranges throughout the tropical western Atlantic, is highly valued commercially and has been severely depleted in many areas. We have studied the reproduction and culture of this species since 1987. Short-term captive wi ld fish produced eggs in four ways: (1 ) induced ovulation with human chorionic gonadotropin followed by artificial fertilization: (2 ) induced ovulation followed by fertilization by males in the holding tank; (3) natural ovulation Followed by artificial fertilization: and (4 ) natural ovulation followed by fertilization in the holding tank. Long- term captive fish also have spawned: ( 5 ) unexpected voluntary spawning in a cage in a related project: and (6) planned voluntary spawning In a concrete raceway. In 1990, larvae were fed mainly enriched rotifers and Artemia metanauplii, with some Artemia nauplii. In 1994, oyster trochophores and copepods were also used. The best survival rates in three trials were 25% from fertilization to 15 days, 59% during 10-75 days, and 5% from fertllization to 98 days. After weaning at transformation, the groupers were fed a series of dry pelleted feeds developed at Harbor Branch Oceanographi~ Institution For marine fish. Under less than optlmal conditions, medium-sized groupers reached a mean weight of 1.5 k g at 23 months after Fertilization (with feed conversion ratlo (FCR) rising from 0.9 to 1 .3) , and 2.0 kg in 28 months (FCR up to 1 .8). When the pelleted diet was supplemented with live and Frozen food, growth rate was slightly better. Improved water systems with temperature control (22-30°C) would allow productlon OF 600-g groupers withln 12 months, one-kg groupers withln 18 months, and two-kg groupers within 24 months.
Resumen
La cherna criolla (Epinephelus striatus), la cual se distrlbuye a lo largo del Atldntico occidental tropical. tiene un alto valor comercial y su abundancia ha decrecido spveramente en muchas Areas. Peces s/lvestres en cautiverio produjeron huevos por cinco vfas dikrentes: ( I ) ovulacion inducida con gonadotropins corionica hurnana seguida por fertilizacidn artificial; (2) ovulacion /nducida seguida por desoves en estanques; (3) ovulacldn natural seguida por fert/lizacidn artificial. Peces cautivos por perlodos de tiempo largos tarnbien desovaron; (4) ovulacibn natural seguida por desove en estanques: (5) desove voluntario en una jaula; y (6) Desoves vo/untar/as planeados en un canal de concteto. Las larvas fueron alimentadas con metanauplios de Artemia enriquecido con rotfferos y algunas naup//o de Artemia. Despues de completada la transformation de 1a.s larvas, 10s peces heron alirnentados con una serie de alimento artificial ('pellets") desarrollados en HBOl, para peces marinos. Bajo poco menus que

/as condiclones eptimas, /as chernas criollas medianas alcanzaron on peso prornedio de 1.5 kg en 23 meses, despds de la Fertilizacidn (con una conversi6n alimentlcia de 0.9 a 1.31, y 2.0 kg en 28 meses. Cuando la dieta artificial fu6 cornplementada con alimento vivo y congelado, la tasa de crecimiento fuC ligeramente mejoraiia. Los sistemas de agua implementados con control de temperatura (22-3BC) podrian permitir la produccih de cherna criolla de 600s dentro de 10s primer05 12 meses; meros de 1 kg dentro de 10s 18 meses y chernas de 2 kg dentro de 10s 24 meses.
Introduction
The Nassau grouper (Epinephelus stdatus. family Serranidae) ranges from Brazil to South Carolina and Bermuda, including the Car- ibbean Sea and Gulf of Mexico (see also Sullivan and Sluka, this vol.). It is an im- portant food fish and has been severely depleted in many areas, usually as a re- sult of overfishing of spawning aggregations (Bohnsaclc 1989; Carter 1989; Fine 1990; Butler et al. 1993; Sadovy 1993; Sadovy, in press.). In January 1987, we began a re- search program to investigate aspects of the biology and culture of this species (see Bush et al., this vol.), and to evaluate the feasibility of its culture for commercial farming or for stock enhancement. This paper re- views the work completed through early 1 994.
Methods
Spa wning
Nassau grouper eggs were routinely obtained by inducing ovulation in wild fish with injections of human chorionic gonadotropin, or HCG (Tucker et al. 1991 ). Spawning normally occurs at about 26°C (Tucker e t al. 1993). Four types of spawn- ing by short-term (days to weeks) captive fish have occurred: ( 1 ) hormone-induced ovulation followed by artificial fertilization: (2) hormone-induced ovulation followed by fertilization by males in the holding tank; (3) natural ovulation followed by artificial fertilization; (4) natural ovulation followed by fertilization in the tank. Voluntary spawning of long-term (months) captive Ash occurred (5) in a cage and (6) in a concrete raceway.
Culture conditions
Several preliminary larval rearing trials were conducted. Adult groupers were raised From five spawns to the juvenile stage at Harbor Branch Oceanographic Institution (HBOI). The first and the most recent trials are described here.
I 2 Februay 1990 spawn (4.9-kg krnale): These were HCG-induced, artificially spawned eggs from a pair of wild adults caught at Grand Cayman. Larvae and early juveniles were raised in 3.5-rn3 fiberglass tanks. At 4 8 days after hatching (dah), a white polyethylene milk crate (34.5 cm x 38 cm x 28 cm) was anchored (opening sideways) just below the water surface in each tank to provide cover for newly transformed juveniles. Older juveniles were raised in the 3.5-m3 tanks, a pair of 10-rn3 (3.3 m x 2.6 m x 1.2 m deep) concrete tanks, and a 37-117' (12.2 m x 3.4 m x 0.9 m deep) concrete raceway. Seawater at 27-38 ppt and 23-30°C was provided by a flow-through system with slow gravel filter and rapid sand filter (plus 5 pm polyester cartridge filters for 3.5-m3 tank). In the hatchery phase, water exchange rate was gradually increased to 300%/day during 5-70 dah. For older fish inthe 3.5-rn3 tanks, exchange rate was 300-500%/day. In the 37-m3 tank, it was 5-1 OO/o/day. The 1 0-m3 tanks had water recirculated through a biofilter, with 5-1 0%/ day exchange.
26/anuary 1994 spawn (2.8-kg Female): These were naturally ovulated, artificially- spawned eggs from a pair of wild adults caught in the Berry Islands, Bahamas. Lar- vae were reared in a 7-m3 Fiberglass tank supplied with biofiltered well water at 30- 31 ppt and 22-26°C. Greenwater

conditions (static until 12 dah) were maintained throughout larval rearing to 75 dah. During 13-41 dah, water exchange averaged 6.8% per day, and during 42- 75 dah it was 1 5 O / 0 per day.
Growth studies
1990. About 1 000 eggs were stocked in each of four 3.5-m3 round fiberglass tanks. At 98 dah, juveniles were removed, counted, measured (total length, TL), and weighed. In growth trials with older fish, survival, TL, weight, feed conversion ratio and daily ration were determined.
1994. About 9 000 eggs were stocked in a 7-m3 round fiberglass tank. At 75 dah, the fish were removed, counted, measured and weighed.
1990. Reared groupers were fed rotifers (Brachionus plicatilis) , Artemia sp . , minced penaeid shrimp, an experimental starter feed, two experimental grower feeds, and two experimental broodstock feeds. Rotifers and Artemia in continuous cultures were fed Nannochloropsis oculata and Tahitian /soch/yss. These were chosen because they contain significant amounts of fatty acids that are essential in the diet O F marine fish (EPA and DHA, see review in Tucker 1992a). During 0-25 dah, 1-2 1 of each alga from mature cultures (i.e., nutrients mostly used up) were added to larval rearing tanks each day to feed rotifers and Artemia and to take up ammonia. Grouper larvae were fed rotifers and 1-5 day-old brine shrimp en- riched for 2-3 hours with Frippak Booster microcapsules, and occasional!y with Roti- Rich, a yeast- and algae-based rotifer food. Newly hatched Artemiawere given to larvae during 1 1-60 dah in decreasing amounts
but were not digested well, at least ini- tially. Crumbled starter pellets were offered to the fish once a day during 42-60 dah and twice a day during 6 1-66 dah; older fish received one meal a day. Weaning from live food to pellets was accomplished, using minced penaeid shrimp as an appetizer, during 56-61 dah when most larvae were transforming (range 46-70 dah, 32-50 mm TL). After weaning, the only food given (except for tagged and released fish) was a series of dry pelleted feeds developed at HBOl for marine fish.
For a 128-day tagging study (Roberts e t al. 1995) the pelleted feed was partly re- placed with live and frozen food to accus- tom the fish to a more natural diet. During the study, pellets were fed 8 4 times. Live food consisted of 1 21 8 goldfish (Carassius auratus, 12 times), 50 minnows (Cyprinidae, once), 7 18 live pink shrimp (Penaeus duorarum, 6 times), and 160 fiddler crabs (Uca sp., twice). Frozen food consisted of fish (tuna, tilefish, Spanish mackerel, dol- phin, gag, 16 times), queen conch (Stombus gigas, 12 times), penaeid shrimp (9 times), and scallops (twice).
1994, During the entire period (0-75 dah), 0.4- 1 1 each of Nannochloropsis, lsoch/ysis, and Tetraselmis suecica was added to the tank each day. Both small strain rotifers and large strain rotifers were used. Cryopreserved Pacific oyster (Crassostreagigas) trochophore larvae (50 pm width) were given as a sup- plemental food, initially to ensure enough small prey, then up to 18 dah to help slow- growing larvae and as an,extra source of essential fatty acids. Copepods (Tigriopus japonicus) also were fed. Rotifers and Artemia were enriched with Microfeast Booster (Provesta Corporation). To delay buildup of an oil film, rotifer enrichment was started late ( 1 1 dah). Minced shrimp was offered during 41-74 dah and crumbled pellets during 44-75 dah. Weaning was accom- plished during 54-75 dah.

Results and Discussion
Spa wnhg
Wild females containing Fully-yolked oocytes were induced to ovulate with two injections of 700 IU HCG/kg body weight spaced 24 hours apart, with ovulation oc- curring about 2 days after the first injec- tion (Tucker et al. 1991 ). Females whose oocytes had begun to hydrate required only one injection, and ovulation occurred sooner. Despite some problems with the broodstock holding systems, eggs were obtained from seven of 12 females injected with HCG at Grand Cayman (Tucker et al. 199 1 ) during four seasons ( 1987- 1990). Broodstock treat- ment was then standardized as follows. Immediately after capture, fish that are overinflated from gas bladder expansion are deflated with a large bore (1 8-20 gauge) hypodermic needle, or equivalent (see Render and Wilson, this vol.). They are han- dled gently but decisively with wet hands, soft nylon nets, or clear polyethylene bags. ~nesthesia with tricaine methanesulfonate is used for weighing and measuring reared Fish, but has never been necessary when processing, injecting or spawning broodfish, if they are handled without hesitation. Fe- males are injected soon after they reach the laboratory, but this has been as long as 4 days (once > 14 days) after capture. Running ripe males will stay that way for several days and have never needed in- jections. Two 4.4 kg males transported from Nassau to Florida in December 1992 and held in a 6 m3 nylon net cage remained running ripe at least until April 1993. In a limited trial with two other running ripe males, milt volume was increased 24 hours a fer a single half dose of 350 IUIkg BW. As in many groupers, hydration OF oocytes is indicated by swelling of the abdomen, and ovulation by protrusion of the egg mass through the genital opening. The female does not swim smoothly, rests on the
bottom more often, and sometimes turns pale relative to its tankmates. Bicoloration (top dark, bottom pale) occurs more often in both males and females as spawning be- comes imminent. When the eggs are pro- truding, the membrane holding them in is stretched thinly, and biopsies are very easy to take with 1 140 Um inside diameter polyethylene tubing. Before that time, bi- opsies tend to injure the Fish and should be avoided.
Wet fertilization was used during 1987- 1990, but in 1992- 1994 the dry method was Found to be more convenient and just as reliable. One milliliter of milt was more than enough to fertilize 300 000 eggs. High quality eggs were consistently obtained during the 1992- 1993 and 1993- 1994 sea- sons (Table l ) . Eggs were obtained from 1 1 wild females that naturally ovulated and 19 that were induced to ovulate with in- jections of 700 111 HCGIkg (Table 2). Dur- ing December, January and February 1992- 1994, we observed that many wild females held in cages and tanks in Nassau ovulated naturally from two days before until seven days after the full moon. In a few cases, eggs were released in the holding tank before the female was removed for strip- ping. Each time, fertilization in the tank was near 100%. Intentional fertilization was not observed, but the males were very ripe and probably were constantly leaking enough milt. Only stripped eggs were used for culture purposes, because they are cleaner and already concentrated. Also, when under stress, females sometimes retain ovulated eggs until they overripen. Voluntary spawning of long-term captive groupers in ponds, cages or tanks has occurred with at least 22 species (Tucker 1994), including Nas- sau groupers in a large aquarium (Guitart Manday and Juarez Fernandez 1966), in a 26-m3 cage (P.G. Bush, personal observa- tion, in Tucker et al. 1993). and in a 37-m3 concrete raceway (Tucker and Woodward 1 996).
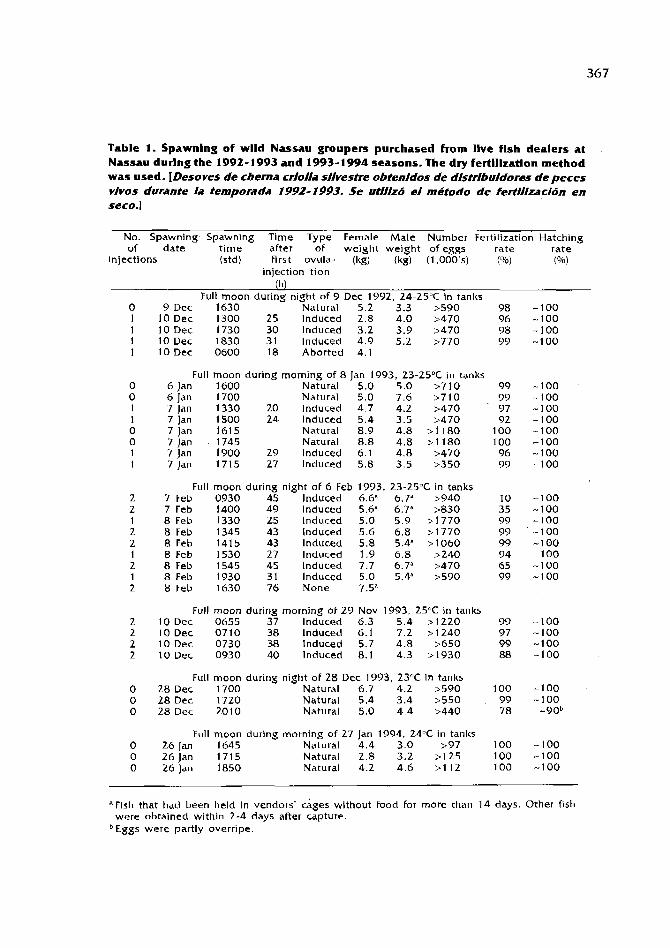
Table 1. Spawnlng of wlld Nassau groupers purchased from llve flsh dealers at Nassau durlng the 199% 1993 and 1993-1 994 seasons. The dry fertlllzatlon method was used. [Desoves de cherna crlolla sllvestre obtenldos de rllstrIbuldores de peces vlvos durante la temporada 1992-1993. Se utlllz6 el metodo de fertIIIzacI6n en seco.]
No. Spawning Spawning Time Type Female Male Number Fertilization Hatching of d a t e t i m e a f te r OF weight weight oFe&gs ra te r a t e
injections (std) First ovula- (kg) (kg) (1,000's) (%) (W injection t ion
(h) Full moon during night o f 9 Dec 1992, 24-25°C in tanks
9 Dec 1630 Natural 5.2 3.3 >590 10 Dec 1300 25 lnduced 2.8 4.0 >470 10 Dec 1730 30 lnduced 3.2 3.9 >470 10Dec 1830 31 lnduced 4.9 5.2 >770 10 Dec 0600 18 Aborted 4.1
Full moon during morning OF 8 Jan 1993, 23-25°C in tanlts 6 Jan 1600 Natural 5.0 5.0 >710 6 Jan 1700 Natural 5.0 7.6 >710 7 Jan 1330 20 lnduced 4.7 4.2 >470 7 Jan 1500 24 lnduced 5.4 3.5 >470 7 J a n 1615 Natural 8.9 4.8 > 1 180 7 Jan 1745 Natural 8.8 4.8 > I 180 7 Jan 1900 29 lnduced 6.1 4.8 >470 7 Jan 1715 27 Induced 5.8 3.5 >350
Full moon during night of 6 Feb 1993, 23-25T in tanlts 7 Feb 0930 45 lnduced 6.6* 6.7* >940 7 Feb 1400 49 lnduced 5.6" 6.7' A 3 0 8 Feb 1330 25 Induced 5.0 5.9 >I770 8 Feb 1345 43 lnduced 5.6 6.8 >I770 8 Feb 1415 43 lnduced 5.8 5Aa >I060 8 Feb 1530 27 lnduced 1.9 6.8 >240 8 Feb 1545 45 lnduced 7.7 6.7" >470 8 Feb 1930 31 lnduced 5.0 5.4" >590 8 Feb 1630 76 N o n e 7.5"
Full moon during morning of 29 Nov 1993. 25OC in tanks 10 Dec 0655 37 lnduced 6.3 5.4 >I220 10 Dec 0710 38 lnduced 6.1 7.2 >I240 10 Dec 0730 38 lnduced 5.7 4.8 >650 10 Dec 0930 40 lnduced 8.1 4.3 >I930
Full moon during night of 28 Dec 1993, 23°C in tanlts 28 Dec 1700 Natural 6.7 4.2 >590 28 Dec 1720 Natural 5.4 3.4 >550 28 Dec 2010 Natural 5.0 4.4 >440
Full moon during morning of 27 Jan 1994. 24°C in tanlts 26 Jan 1645 Natural 4.4 3.0 >97 2 6 J a n 1715 Natural 2.8 3.2 >I25 26 Jan 1850 Natural 4.2 4.6 > I 12
98 96 98 99
99 99 97 92
100 100 96 99
10 35 99 99 99 94 65 99
99 97 99 88
100 99 78
100 100 1 oil
aFish that had been held in vendors' cages without food for more than 14 days. Other fish w e r e obtained within 2-4 days after capture. Eggs w e r e partly overripe.

Table 3. Development of Nassau groupers to early juvenlles at about 26°C and t o adults at varlable temperatures. Slzes correspond wlth events, and not necessarily wlth ages. [Desnrrollo de la cherna criolla a juvenlles tempranos a cerca de 2G°C, y a arlu/tos a temperaturas variables. Las tallas corresponden a eventos y no necesariamente a edades.1
Event Days after hatching
Total length (mm)
Hatching 0 First feeding 2.5-3.5 Exhaustion of yolk a oil 5-6 First feeding on Artemla nauplii 10-12 Transformation 46-75 First Feeding on dry Feed 56-59 Maturat ion 4-5 (0365)
occurred over a longer period in 1994, partly because of lower temperatures. Many of the juveniles used openings of the milk crates as perches until they outgrew the spaces. Egg and larval development is described in Powell and Tucker ( 1992).
Culture conditions
Table 4 summarizes details of culture conditions.
Temperature. The range tolerated by eggs and larvae was 1928°C. Sudden temperature changes (e.g., from thermal stratification or too much sunlight) can result in sudden high mortality of early larvae. Older fish survived in a temperature range of 1 1-33°C. but food intake was minimal below 18°C and growth was best at 22-30°C.
Water quality. Bacterial counts indicated zero Vibrio in incoming hatchery water and rotifer cultures.
In 1994, ammonia peaked at about 13 dah when rotifer density was high (1 50 ppb total ammonia nitrogen (TAN)) and nitrite at about 20 dah (300 ppb NO,-nitrogen, zero ammonia). At 35 dah, ammonia was zero, nitrite 20 ppb and nitrate (NO,-ni- trogen) 1 .1 ppm. Dissolved oxygen was relatively constant at 4.9-5.2 ppm.
In early trials, when TAN reached 100 ppb, weak larvae died within 12 hours. In
1994, strong larvae ( 13 dah) tolerated 150 ppb TAN for 12 hours. At 100-300 ppb TAN, juveniles and adults were stressed and some died within 48 hours. When in- coming water from pipelines was contarni- nated with ammonia, low but possibly toxic levels of hydrogen sulfide might also have been present, but H,S analysis was not pos- sible.
Larvae seemed to be alternately slug- gish and agitated when nitrite nitrogen reached 300 ppb, and these signs stopped when it dropped to 1 SO ppb; however. no cause and effect were proven.
Although juveniles tolerated salinity as low as 15 ppt For a few days, they seemed stressed and ate less.
Surhce Fims. In some cases, naturally occurring sticky substances (probably from decaying seaweeds) in the water supply formed a surface film that trapped early larvae like flypaper, usually killing all the fish in a tank. Sticky films must be avoided by reliable water treatment. Inevitably, surface oil films will occur in the rearing tanks and these must be kept thin. Sources of the oil are the oil globules of dead eggs and early larvae, added phytoplankton and zooplanl~ton, and enrichment mixtures added with zooplankton, either stuck to it or in the water added with it. With grouper larvae, compressed-air skimmers could not be used

Table 4. Environmental ranges and constralnts for rearing Nassau groupers. Ilntervalos ambientales y restrlcciones para la crianza de L cherna crlolla.]
Factor Comments
Larvae
Temperature
Salinity
Total ammonia nitrogen
Nitrite nitrogen
PVC cement
Sticky surface film
Oily surface film
Light
Juveniles and adults
Temperature
Salinity
Total ammonia nitrogen
Light
19-28°C was tolerated 24-27°C probably is best
27-38 ppt was tolerated 30-37 ppt probably i s best
100 ppb was lethal to weak larvae within 1 2 h 150 ppb was tolerated by strong larvae For 12 h 0 ppb is best
300 ppb apparently stressed strong larvae 150 ppb apparently was tolerated by strong larvae
Contamination oFwater-from mild stress to total mortality
Possible complete mortality of early larvae
I f thin, tolerated by strong larvae, no gas bladder problem
5% natural light increases Food and water quality by supporting algal growth (avoid radiant heat)
1 1-33°C was tolerated 22-30°C probably is best
15-37 ppt was tolerated 25-37 ppt probably is best
100-300 ppb was lethal within 48 h 0 ppb is best
Some natural light helps water quality
t o r e m o v e s t i c ky f i lms because t h e turbulence usually caused high mortality. When larvae are strong enough t o avoid being trapped, such devices could be used for oil/algae/debris films that wil l move but
are less effective w i th thick or very viscous films. Even late larvae are relatively pas- sive drifters and can be carried into a skimmer
or down the drain by a weak current. For small tanks, we have at times used a peristaltic vacuum pump with Pasteur pipette attached t o manually remove the oi l film. Distur- bance t o larvae is minimal with this method,
but it is laborious and slow and thus im- practical. When larvae are no t at the sur- face, clean, non-shredding, paper towels

have been used to blot up sections of the film. The towels must be free of toxicants and they must be removed promptly be- fore they trap larvae or sink.
Light. About 5% natural sunlight trans- mitted through the hatchery roof supported a light bloom of microalgae a t first, then macroalgae on tank walls beginning within 10 days after stocking. Because Nassau grouper larvae are very sensitive to am- monia and early larvae are very sensitive to water changes, removal of ammonia by algae was considered a critical factor in larval survival. A very reliable recirculating sys- tem is an alternative; however, algae in the tank take up ammonia very quicltly. Unevenly distributed intense light caused larvae to bunch up, sometimes interfering with feeding or causing localized oxygen depletion.
Aeration. Water movement is important t o ensure oxygenation, to prevent ther- mal stratification and to disperse food. Too much movement might keep larvae from Feeding, make them struggle and waste energy, or cause gas bladder overexpansion by a rapid upward excursion. Early Nas- sau grouper larvae are very sensitive to turbulence. At first, very light or no aera- tion is best. Circulation can be improved by directing water flow from diffuser pipes, by having constant air currents blow across the water surface or sprinkling water on the surface. Added water must be well- aerated before it enters the hatchery tanlts. In 1994, aeration was provided by one airstone inside a screened airlift tube dur- ing 0-39 dah, one uncovered airstone on the tank bottom beginning 38 dah, and two on the bottom from 60 dah onward.
Feeding
Idealized feeding and weaning sched- ules for groupers are given in Tucker (1 992a). Table 5 summarizes actual Feeding sched- ules. Although Nannochloropsis oculata
provides EPA and Tahitian /sochrysis pro- v ides D H A t o t h e food o rgan i sms , enrichment was done mainly as a precau- tion against essential fatty acid deficien- cies. Although weaning was accomplished during 56-6 1 dah in 1990, minced shrimp was given three more times to help the slow learners.
The tagged juvenile groupers showed no hesitation in eating any of the new foods when first presented, except for live shrimp, which in the beginning were eaten gradually over several hours, and later as fast as they were added to the tank. Live fish and crabs were easier for the groupers to handle and, from the beginning, were usually eaten within 20 minutes.
Nassau groupers are more flexible than some other fish in their feeding habits. Reared groupers will eat pellets and frozen food either combined or alternately. Wild ju- veniles (averaging about 250 mrn TL) ate pellets in 1-m3 fiberglass tanlts within 2 hours after being captured in a trap. We also have trained several small to medium wild adults (500-700 mm TL) to eat pellets, as well as frozen Food. Reared juvenile and adult Nassau groupers often ate well within 3 hours after being transferred to different tanks, if handled gently.
Survival
1990. Mortality peaks occurred during three phases. At first feeding (2.5-3.0 dah) some larvae apparently were too weak to continue or were adversely affected by temperature changes. At EYS (end of yolk sac, 5 dah), a larger number died, prob- ably because they were not feeding ef- fectively. Most mortality occurred over sev- eral days when larvae were mainly eating newly hatched Artemia nauplii, especially near 20 dah. Survival from eggs to 98-day old juveniles (129 Fish) in the four 3.5-m3 tanlts was 1 O/O, 2.4%, 4.5%. and 5.0%. After weaning, mortality was negligible. Between 98 dah and 1 year, only two runts were lost.

Table 5. Feeding schedule used for Nassau groupers. [Calendario de aiimentacion usado para ia cherna criolla.]
Days Total Food after length
hatching (mm)
Larvae (in 1990) 0-25 1.9-8 Nannochloropsis Isochrysis to feed prey 3-22 2.6-6 Enriched rotifers (40-200 pm)
1 1 -60 5-60 Artemia nauplii (just hatched)" 21 -60 6-60 Enriched Arternia (1 -5 dah) 23-49 7-40 Enriched rotifers (1 18-200 pm)
Transforming (in 1990) 56-6 1,63,66,69 Minced penaeid shrimp
Larvae (in 1994) Nannochloropsis, Isochrysis, Tetraselmis to feed prey Oyster trochophores Small strain rotifers (fed Nannochloropsis 8. Isoch~vsis) Large strain rotifers (fed Nannochloropsis 8 lsochrysis) Small strain rotifers (enriched) Large strain rotiFers (enriched) Artemia ( 1-5 dah, enriched) Artemia ( 1-5 dah, fed Nannochloropsis b lsochrysis) Copepods Artemia nauplii
Transforming (in 1994) Minced penaeid shrimp
Juvenile to adult (all years) 40-90 1.6 mm pellets (HE391 10) 80-140 2.4 mm pellets (HB9120 or HB92ZO) 140-250 4.0 mm pellets (HE91 20 or HB9220) 250-600 9.5 mm pellets (HWI 20, HB9220, HB9261, or HB9262)
600- 12.7 mm pellets (HB9120, HB9220, HB9261, or HB9262) " Artemiaare probably more digestible after their own digestive systems are open (about 12 hours after hatching).
Later, some fish were lost from ammonia con- tamination of the water supply.
1994. Only the second mortality peak was important. High egg quality and bet-
ter temperature control helped eliminate the first peak, and the diverse diet helped eliminate the third. During 0-5 dah, sur-
vival was near 1000/0. Because of high mortality
during 7-9 dah, survival at 10 dah was only 1.2%. During 10-75 dah, survival was 59%.
Overall survival was 0.71 %, mainly because o f the 7-9 dah losses.
In a preliminary trial, survival at I5 dah
was 25% (2001800) in a 120-1 glass aquarium.
Based on that result and 5'30 survival during 10-75 dah in 1994, 15% overall survival

seems possible. Earlier enrichment of rotifers (beFore I I dah) and earlier feeding o f copepods (before 18 dah) might improve early survival.
Gro wth and feed conversion
1990. Medium-sized groupers grew and utilized food well (Tables 6 and 7). Mean weight was 0.5 kg in 12 months, 1.5 kg in 23 months and 2.0 kg in 28 months (Fig. 1 ) . Feed costs would be low for commer- cially raising Nassau groupers to a market size o f 2 kg. In trials 3. 4 and 6, feeding and growth were reduced during periods of low temperature (<2Z°C). Improvement OF early growth rates (particularly by diet and temperature control) wi l l allow pro- duction of 2 kg groupers within 24 months.
Rearing units
Round fiberglass tanks. Larvae, juveniles and adults grew well and remained healthy in fiberglass tanks as long as water quality was maintained. Based on rearing experi- ence with 35 marine species, a tank con- taining 1 m3 of water probably is the mini- mum practical size required For grouper larval rearing. A 3.5-m3 tank is better and is convenient to manage. The 7-m3 tank worked very well, except the bottom was hard to clean. Increasing tank size (mov- ing toward extensive rearing with lower fish density) has a moderating effect on water quality fluctuations and allows more larvae to be reared in each tank, but some- times increases management difficulties.
Rectangular concrete tanks. Nassau groupers can be grown out in smooth concrete tanks. Slight fin and body abrasion was caused by bare concrete walls and concrete bloclts bu t no t by concrete covered w i th macroalgae.
Rectangular cages. Plastic or plastic-coated wire cages probably are suitable for growing out Nassau groupers. Wild Nassau groupers usually do not live long (< I day) i f left in wire traps after capture, but survive For weelts on boats in live-wells lined wi th plastic- coated wire if motion is minimal. Some Asian groupers are raised in flexible polyethylene net cages. Nassau groupers might be more aggressive than some other species, but probably would do reasonably well in such cages. When 27 tagged, reared groupers (never before kept in a cage) fish were sud- denly transferred to a chicken wire cage (4 m x 1.2 m x 1.2 m high) and held there for 2 weelts, eight developed eye injuries from early escape attempts. Adult groupers kept in a rigid polyethylene cage (2.4 m dia. x 1.8 m deep) in Grand Cayman for a year remained healthy (P.G. Bush, pers. comm.).
Tagging and release study
Thirty-two medium-sized groupers were tagged with 76-mm orange dart tags, held in a raceway and alternately fed pellets, frozen seafood, and live fish, shrimp or crabs for three months (Roberts et al. 1995). Despite their benthic habits, at the end of this evalu- ation period, 22 of the groupers had re- tained their tags. The others were retagged and 27 of them (0.6- 1.1 kg) were held in a transitional cage for two weeks at a small reef-fringed island off St. Thomas (U.S. Virgin Islands) and then were released. The fish immediately began instinctive wild behavior, such as allowing gobies and shrimp to clean them and hunting with an octopus. Div- ing teams monitored behavior and dispersal of the tagged fish for several months. Most of them remained near the release area for at least a month. A t least two of the fish stayed in the area for 200-297 days. One of the fish was seen in the area I6 months after release.

Table 6. Compositions of six experimental diets (dry pellets) developed at Harbor Branch Oceanographic hstitutioh for Nassau groupers. All values except protelmenergy are In percent. Except for moisture, proximate analysis values are moisture free. [ ComposiciBn de seis dietas experimentales C"pe1lets" secos} riesarrollados por Harbor Branch Oceanographic Instltut/on para la cherna criolla Todos 10s valores except0 protehwenergia estan dados en porcentaje. Excepto la proporcion para mezcla, torlos 10s anajisjs proximales son IJbres de mercla.]
Component Feed Feed Feed Feed Feed Feed Feed HB9O1 0 HB9020 HB9l2O HB9261 HB9llO HB922O HB9262
T y p e Status
Star ter C r o w e r G r o w e r Broodfish Star ter C r o w e r Broodf ish used used used used rev ised rev ised rev ised a
M o i s t u r e (% o f air d ry we igh t ) 8.0 7.6
Formu la t ion L o w t e r n ~ e r a t u r e
her r ing 'meal Shr imp mea l Kr i l l m e a l Pou l t r y mea l M e a t meal B lood meal Feather m e a l Tex tu red v e g e t a b l e
prote in Corn g lu ten mea l H i g h g l u t e n wheat f lour Brewer ' s yeas t Bone meal M e n h a d e n o i l L e c i t h i n M i c r o i n g r e d i e n t s "
Prox imate analysis (vacuum dry) Crude p ro te in (Kje ldahl ) 60.1 Crude fat (ether ext ract ) 16.2 Carbohydrate (d i f ference) 9.6 Fiber (ac id de te rgen t ) 0 . 3 Ash (600°C for 4 h) 13.8 Total Fish o i l 13.4 Tota l crustacean o i l - EPA 1.3 D H A ~ 1.4 Pro te in :energy (mg P/ltcal DE) 151 Pro te in :energy
( m g P/kJ DE) 36.0
' Microingredients in the Formulas are given below. Feeds HE9010 and Hi39020 contained. in mg/kg diet: iodine (potassium iodide) 4, zinc (oxide) 60. iron (Ferrous sulfate) SO, manganese (oxide) 5. chromium (chromium potassium sulfate) 1 . thiamin (mononitrate) 40. r~boFlavin 60. pyridoxine 40, pantothenic acid Id-calcium pantothenate) ZOO, niacin 300, biotin 2, folacin 20, cyanocobalamin 0.2, choline 4 800, inosltol 900, APP (L-ascorbyl-2-polyphosphate) 300 mg/kg ascorbic acid equivalent. ethoxyquin 150; in IU/kg diet: retinol ZO 000, cholecalciferol 3 000. tocopherol 500, menadione 50. Feeds HB9 I I 0 and HB9120 contained the same as A except: ( I ) zinc was increased ro 90 mg/l<g. (2) iron was deleted. (3 ) manganese was increased to 40 mg l l~g , (4) copper (sulfate) was added at 3 rnglkg. (5) L-ascorbyl- 2-polyphosphate was increased to 400 mg/ky AAE. Feeds HB9220, HB926I, and HB9Z62 contained the same as B except: ( I ) copper was deleted.
1' Contents of eicosapentaenolc and docosahexaenoic acids were calculated uslng average values for herring. menhaden and shrimp oils From Lovell (1989) and krill oil from Sargent et al. (1989) For comparison, digestible energy was estimated using the values 4 kcal/g protein, 8 ltcal/g Fat. 3 Itcal/g carbohydrate.


Pellets only Rllets t fresh and frozen food
Age (month)
Flg. 1. Growth curve and feed conversion ratlos of Nassau groupers (Eplnephelus strhtus). Solld Ilne: pellets only; dashed line: tagged Ash fed both pellets and whole foods In trlal5. [Curvns de creclmlento ypropoMn tie converd& dmentfckrpara /a hema cdolh Eplnephelus strlatus) dlmentada sdlo con '.Pel%?&" fin= con&nua). La fin= dhcontinlm represents 10s peces marcarlos y allmentados con ambos, "pellets" y allmento entero en el experiment0 5.1
Conclusions
Nassau grouper aquaculture is not yet close to commercialization; however, the species has potential. Obtaining large num- bers of viable eggs is relatively easy. Al- though Nassau groupers endure a long and sensitive larval period, we believe that survival from egg to juvenile can be im- proved from 5% to 15% or more by better management of temperature, water quality and food. Juveniles and adults are robust. Barring accidents, nearly 100% survival after transformation can k expected. Temperature control and improved early diets can re- sult in growth to 2 kg within 24 months. Hatchery-reared Nassau groupers have the potential to survive i f carefully released in
suitable habitats. In special cases, depleted spawning populations could be replenished with large juveniles or adults (as long as genetic diversity is maintained).
Acknowledgements
We thank the personnel of the Bahamas Department of Fisheries, Cayman Islands Natural Resources Laboratory, Cayman Is- lands Turtle Farm, and HBOl Aquaculture Division for providing technical assistance; and Allen Johnson, HBOI, the U.S. Depart- ment of the Interior in cooperation with the National Sea Grant Office, and the Uni- versity of Puerto Rico Sea Grant College Program for funding. This is HBOl Contri- bution No. 1030.


Maturation and Induced Spawning of the Mangrove Red Snapper @u@anus argentJmacuktus)
Reared in a Floating Net Cage in the Philippines
A.C. E M A T A Aquaculture Department
Southeast Asian Fisheries Development Center (SEAFDEC/A QD) Tigbauan, //oilo, Philippines
EMATA. A.C. 1996. Maturation and induced spawning of the mangrove red snapper, Lu~anusargentlmaculatus. reared in a floating net cage in the Philippines [Maduracion y desove inducldo ddpargo de manglar, Lutjanus argentlmaculatus, criado en cajas de red flatantes en Fi/pinas], p. 378-384. In F. Arregutn- Sanchez, J.L. Munro, M.C. Balgos and 0. Pauly (eds.) Biology. Fisheries and culture of tropical groupers and snappers. KLARM Conf. Proc. 48, 449 p.
Abstract
Wild-caught mangrove red snapper (Luvanus argentimaculatus) were reared in a floating net cage at SEAFDEC/AQDrs lgang Marine Substation at Guimaras Island. Central Philippines. In 1993, monthly samplings and induced spawning trials were conducted as part of a project on seed production. Gonadal development began in February for males and April for females, reached a peak in September and declined in December. Males and females had ripe gonads for u p to 5-6 consecutive months. Spawning occurred in the evening (2000-2300 hours), 32-36 hours after a single intramuscular injection of 1 500 lU human chorionic gonadotropin kg-I body weight (BW). About 0.53-2.14 million eggs were collected per female (2.5-4.4 kg BW) with Fertilization rates of 21-97% and hatching rates of 42.80% resulting in 30-85% normal larva; (straight and without deformities). The results strongly suggest the feasibility of breeding mangrove red snapper in floating net cages.
Resumen
Pargos de manglar silvestres (Lutjanus argentimaculatus) fueron capturados y criados en cajas de red Hotantes en SEAFDEC/AQD de la Subestacion Marina de /gang en la Isla Guimaras, a1 centro de Filipinas. En 1993. muestras rnensuales y experimentos de desoves inducidos fueron efectuados como parte de un proyecto sobre produccion de semi//,? de pargo de manglar. El desarrollo de /as gonadas emperd en Febrero para 10s machos, y en Abril para /as hembras, alcanzando un miximo en Septiembre y declinando en Diciembre. Machos y hembras estuvieron sexualmente maduros por 5-6 meses consecutivos. El h o v e ocurrio durante la noche (2000-Z300), 32-36 horas despuis de una simple inyeccion intrarnus- cular de 1 500 IU de gonadotropins cori6nica humana por cada kg de peso corporal hljrnedo. Cerca de 0.53 a 2.14 millones de huevos fueron colectados por cada hembra (2.5-4.4 k g peso hljmedo), con tasas de fertilization de 21-97%, tasa de incubacidn de 42-80%, y 30-8546 de larvas normales (derechas y sin deformaciones). Los resultados sugieren fuertemente la Factihilidad de criar pargos de manglar en cajas de red flotantes.

Introduction
Many snappers belonging to the family Lutjanidae have long been recognized to have mariculture potential. In Southeast Asia, the mangrove red snapper (Lutjanus argentimaculatus) command a relatively high market price (FA0 1990) and are cultured in cages and brackishwater ponds (Cheong 1988; A. Maravilla, pers. comm.; N.J . Ogburn, pers. comm.). However, in the Philippines, the fry (2-3 crn total length, TL) needed to stock ponds still come exclusively from the wild where they are mostly collected near river mouths together with grouper fry. Thus, broodstock development was initiated at the Aquaculture Department of the Southeast Asian Fisheries Development Center (SEAFDECIAQD) as part of a project on seed production to supplement the natural fry supply.
Materials and Methods
Mangrove red snappers were collected in 1991 and 1992 from fish corrals along the southwestern coast of Guirnaras Island, Central Philippines. These were kept in a 5 x 5 x 3 m deep floating net cage located at SEAFDEC/AQD's lgang Marine Substation at Guirnaras Island. Fish were fed trxh fish every other day at 5% body weight (BW). Seawater temperature and salinity ranges were 27- 32°C and 30-36 ppt respectively, during 1 99 1 - 1 993.
Fish were sampled monthly, beginning on 1 7 February 1993 to assess their gonadal development based on biopsied material. During sampling, fish were anesthetized in 250 ppm 2-phenoxy-ethanol (Merck, Germany) and BW and TL of each fish was measured. Gonadal biopsy for females was conducted by inserting polyethylene tubing (PE 100, Clay Adams, New Jersey) into the genital pore followed by gentle aspiration of ovarian oocytes. The oocytes were fixed in 5% buffered formalin. Diameters of 20 oocytes were measured to the nearest
0.05 rnrn using an ocular micrometer. The mean oocyte diameter was later used to select females for induced spawning trials. Mature males were identified by the presence of milt following gentle massage to the abdomen. Fish with no cannulated oocytes or milt were considered unidentified (UD). Each fish was then marked with a numbered opercular tag as described by Garcia and Gapasin ( 1988).
Induced spawning trials were conducted as soon as adequate number of females possessing vitellogenic oocytes and males with copious amount of milt were obtained during sampling. Females and males were then given a single intramuscular injection of 1 500 IU human chorionic gonadotropin (hCG, Argent Chemicals, Philippines) kg-' BW or 100 mg des GlylO(D-Ala6)-luteinizing hormone-releasing hormone ethylamide (LHRHa, Lam Hua Dragon Trading Co., Hongkong) kg-( BW. Injected Fish were then placed in 2 x 2 x 2 m deep fine mesh (0.6-0.8 mm) net cage at 1: 1 to 1 :3 female to male ratio and allowed to spawn spontaneously.
Spawning, which occurred during the night, was monitored by checking for the presence of eggs in the water column of the spawning cages each morning. As soon as spawning was confirmed, the spawners were removed from the spawning cage. By lifting the cage and splashing the sides of the net with seawater, eggs were concentrated at the cage bottom and collected and incubated in 500-1 fiberglass tanks containing gently aerated filtered seawater o f ambient temperature and salinity. Eggs were transported to the hatchery in double-lined plastic bags containing 300 000 eggs in 12 1 of filtered seawater saturated with oxygen. The total number of eggs and fertilization rate were determined from three 700 ml aliquots. Likewise, hatching rates and percent of normal larvae were determined from three 700 ml aliquots obtained the day aFter spawning.

W m
Table 1. Gonadat development of mangrove red snapper (Lutjanus afgentfmacrrfafus) broodstock reared in floating net cages in the o Phlllpplnes In 1993. Zero (0) or plus (+) Indicates presence or absence of cannulated oocytes or free-runnlng mllt. Oocyte diameters are means 2 S.E.M. (mm). Desarrollo gonidko &/pargo de manfir (Lutjanus argentlmacu tatus) criado en alas de red flotantes en Fiijplnas en 1993. Cero (0) o mas /+) Intilcan ausencla o prescencfa de oocftos c . Z R U ~ ~ ~ O S o fecundadus lihemente. El dlrimetro de los oocttos fueron metildos z s.e.m. (&.I
Fish No. Body Total 17 Feb 21 Apr 18 May 7 Jul 17 Aug 29 Sep 27 Oct 7 Dec we igh t length
( ke) (crnl Females
Males
" Mortality Presence of viscous milt

Results
Monthly samplings conducted between 17 February and 7 December 1993 showed that the L. argentimaculatus broodstock consisted of seven females (2.5-4.4 kg BW, 5 1 .O-62.0 cm TL), 1 1 males (1.8-4.5 k g BW, 44.5-61.5 cm TL), and four UD (3.3- 4.0 kg BW. 55.5-58.0 cm TL) (Table 1). Ripe Females were observed from April to October, with a peak of ripeness in Sep- tember, and were sexually inactive in Feb- ruary and December (Fig. 1 ) . A single fe- male (fish no. 4851) possessed mature oocyfes for up to Five consecutive months even when induced to spawn in the pre- vious months. Spermiating males were observed from February to December. But, as in females, sexual activity reached a peak in September when almost all fish were
ripe. Males (fish no. 2683 and 4896) were spermiating For up to 6 consecutive months even when used for induced s~awning trials. None of the unidentified fish matured during 1993.
Preliminary results of induced spawning trials are shown in Table 2. A single intra- muscular injection of 1 000 IU hCG kg-' BW resulted in successful spawning 32-36 hours post-injection in six out of eight trials. In one instance of unsuccessful spawning, a female ovulated but died at 48 hours post- injection with a bulging abdomen as overripe eggs could not be released. Females that spawned had initial mean oocyte diam- eters of 0.35 -0.46 mm. About 0.53-2.14 million eggs were collected per female, with fertilization rates of 2 1-97%. Hatch- ing rates and percentages of normal lar- vae were From 42-80% and 30-85%,
Month
F 3 C
Em- s
0
Fig. 1 . Reproductive state of mangrove red snapper /Lut/lmus argent/maculatus) reared In a floating cage In the Philippines In 1993. [Tasa de reproducclbn delpargo de manglar, LutJanus argentlmaculatus, crhrlos en cajas de red flotantes en Filipnas en 1993.1
-
.-
.-
-
- 1
-
"u n
Feb A p May d -
JuI

Table 2. Summary of induced spawnlng trials on mangrove red snapper (Lur/Anus argentimaculatrrs) reared In floating net cages In the Philippines In 1 993. IResumen de desoves lnducldos experlmentalmenfe en pargos de manglar (Lutjanus argentlmaculatus) crhdos en caps de red flotantes en Fii~plnas en 1993.1
Date Fish no. Body OD Hormone Dosage Ratio Latency Total number Fertilization Hatch %Normal weight (mm) [mg/l(g) (F:M) (h) of eggs rate rate larvae
(kg)
18 May 2 960 4 851 4 469
17 Aug 4 890 2 960 4 895 4 898 4 851
29 Sep 4 895 4 890 4 892 4 898 4 851
27 Oct 4 851 4 898 4 890
LHRHa LHRHa L H R H a
hCG hCG None hCG hCG
LH RHa hCG LHRHa hCG hCG
hCG LHRHa LH RHa
No spawning No spawning No spawning
32 Fish died None 36 36
No spawning 32 No spawning No spawning 36
34 No spawning No spawning
528 800
None 2 137 950
628 816
1 162 240
992 000
1 413 920

respectively. A single intramuscular in- jection of 100 ug LHRHa kg-' BW failed to induce spawning in seven trials. An uninjected Female failed to spawn dur- ing the trial on 1 7 August 1993.
Discussion
Wild-caught L. argentimaculatus reared in a floating net cage spontaneously ma- tured and rematured for up to 5 consecutive months. These results strongly support the feasibility of breeding these snappers in floating net cages in the Philippines as observed in Thailand (Singhagraiwan and Doi 1993), Malaysia (Ostrowski, pers. cornm.) and Singapore (Chao Tien Mee, pers. comm.).
Captive L. argentimaculatus exhibited a defined seasonal cycle of reproductive activity in the Philippines. Spermiating males were observed as early as Febru- ary and females possessed vitellogenic oocytes by April. Sexual maturation reached a peak in September. Although sperrniating males were still obtained in December no females with vitellogenic oocytes were sampled indicating the end of the spawning season. A similar pat- tern of seasonal reproductive activiw was observed for this species, cage-reared in Thailand (Singhagraiwan and Doi 1993). Lutjanids exhibit a seasonal reproductive cycle although the season varied depend- ing on geographic location (review in Grimes 1987).
Seed production of L, argentimaculatus entails a reliable breeding program that must be adaptable to the fish farmers. The availability of mature male and fe- male mangrove red snapper for up to 5- 6 consecutive months provide spawners for induced spawning. Furthermore, the use of hCG is a reliable protocol for pro- duction of quality eggs. The results from induced spawning trials using hCG in this paper are similar to those reported by
Singhagrawan and Doi (1 993) for this spe- cies. The authors reported about a million eggs spawned per female with fertilization rates of 0 to 86.4%, although a lower hCG dose (300-600 IU/fish) was used. Other species of lutjanids have successfully spawned fol- lowing injection of hCG (Minton et al. 1983: Lim et al. 1985) using lower doses. Thus, the minimum effective dose of hCG will have to be determined in the future. Furthermore, spawning trials using LHRHa at lower doses also will be continued as LHRHa is cheaper than hCG. These studies, together with those that will determine the relationships of fertilization rates and egg production to initial oocyte diameters are needed to fully attain a reliable spawning technique that can provide eggs when required by the industry.
A number of lutjanids have been reported to spawn serially or in batches (Grimes 1987), including cage-reared L. argentimaculatus in Thailand (Singhagrawan and Doi 1993). In all successful trials conducted in the present paper, serial spawning of individual L. argentimaculatus was never observed even though spawners were returned to the spawning cage following egg collection. Optimum conditions for serial spawning will be determined further, as well as those of natural spawning which was only observed once in 1993.
Acknowledgements
I am extremely grateful to B. Eullaran and the staff of [gang Marine Substation for the assistance in sampling and egg collection and transport.
References
Cheong, L. 1988. Aquaculture development in Singapore, p. 1 17- 128. In 1.V. Juario and L.V. Benitez (eds.) Perspectives in aquaculture development in Southeast Asia and Japan. SEAFDEC Aquaculture Department, Tigbauan, Iloilo, Philippines.

FAO. 1990. Regional seafarming resource atlas. RAS/ 86/024,60 p. FAO/UNDP Regional Seafarming Development and Demonstration Project, Network of Aquaculture Centres in Asia and the Pacific c]o ~ational Inland Fisheries Institute, lhsetsart University Campus, Bangkhen, Bangkok, Thailand.
Garcia, L.M.B. and R.S.]. Gapasin. 1988. An inexpensive tag for short-term studies in milkfish (Chanos chanosForsskA) and in sea bass (Lates ca/cariferBloch). j. Appl. Ichthyol. 4: 101 -1 04.
Grimes, C.B. 1987. Reproductive biology o f the Lutjanidae: a review, p. 239-294. In 1.). Polovina and S. Ralston (eds.) Tropical snappers and groupers: biology and fisheries management. Westview Press, Boulder.
Lim, L.C.. L. Cheong, H.B. Lee and H.H. Heng. 1985. Induced breeding stud- ies of the john's snapper, Lurjanus johni (Bloch), in Singapore. Singapore j. Pri. Ind. 13:70-83.
Minton, R.V.. J.P. Hawke and W.M. Tatum. 1983. Hormone-induced spawning of red snapper, Lutjanus campechanus. Aquaculture 30:363-368.
Singhagraiwan. T. and M. Doi. 1993. In- duced spawning and larval rearing of red snapper, LuQanus argentimaculatus at the Eastern Marine Fisheries Devel- opment Center. Thai Mar. Fish. Res. Bull. 4:45-57.

APR 1 4 llgd
Ultrastructural Study of kymphocystis in Kelp Bass (Epinephelus moara; Serranidae)
2. YONGJIA W. ZEYANG
(1. KANGRONG Department of Agriculture Zhanjiang Fisheries College
China 524025
YONGJIA, Z., W . ZEYANG and C. KANGRONG. 1996. Ultrastructural study of lymphocystis in ltelp bass (Epinephelus moara: Serranidae)[Estudio ultraestructural en lonfocitos d e la cabrilla alguera (Epinephelus moara; Serranidae)], p. 385-398. In F . Arreguin-Sanchez, J.L. Munro, M.C. Balgos and D. Pauly (eds.) B i o l o ~ y , fisheries and culture of tropical groupers and snappers. ICLARM Conf. Proc. 48, 449 p.
Abstract
Spontaneous and experimentally infected lymphocystis disease of ltelp bass (Epinephelus moara. Temminclc et Schlegel) cultured in marine net cages in Huanan Farm. Guandong. China, was studied under an electron microscope. Examination of the lymphocystis cells revealed no difference between spontaneous and experimentally infected lyrnphocystis of kelp bass. In the derma of the lymphocystis fish subcutaneously injected w i th nodule hornogenate, the Fibroblast cells changed morphologically, attesting t o their transformation into lymphocystis cells. An immunological response occurred which involved macrophage lymphocyte associations before the rupture stage of the nodules. Pathological lesions of the heart, liver, spleen, ltidney and intestine suggested that lymphocystis virus infection can damage several types of susceptible cells. The significance of the cellular responses is discussed.
Resumen
Se estudiaron bajo microscopio electronico infecciones espontsneas y experimentales causadas por linfocistis en /a cabrilla aiguera (Zpinephelus moara, Temrninck e t Schle$el) cultivados en rajas d e red, en la granja Huanan, Guandong, China. N exiimen d e /as celulas que presentan linfocistis muestran que n o hay diferencias entre infecciones espontineas e inducidas experimentalmente. En la p ie l de l pez inyectado a nivel subcutaneo con un nodulo hornogenado, 10s fibroblastos rnosrraron cambios morfoldgicos hacia su transformacion a celulas con linfocistis. Una respuesta inmunologica se present6 asociada a lonfocitos macrofasos antes d e la ruptura d e 10s nodulos. Lesiones patologicas en cofazon, hjgado, bazo, rif ion e intestino sugiercn que la infection viral causante d e linfocistis puede dafiar varios tip05 cfe celulas suceptibles. Se discute /a significancia de la respuesta celular.

Introduction
Fish lymphocystis disease (FLD) with proven viral etiology occurs in groupers ( Epinephelus moara, E, malabaricus, E. chloroshgma) , and snappers (Luganus russelli, L. argentirnaculatus) cultured in marine net cages in China (Yongjia 1992) and South- east Asia (Chong and Chao 1986). The fish lymphocystis disease virus (FLDV) belongs to the lridovidae family and has been clas- sified by D.B. Williams as a separate ge- nus of this family with the name of Cystivirus (Flugel 1985). The infection is a common, chronic, worldwide disease, and causes high mortality rate of fingerlings. The research works of many authors usually concentrate on the morphology and classification of the virus, and many have reported cases of wild and cultured fish infected with FLD. Experimental transmission has been suc- cessful using implantation, injection and application to traumatized skin. Also it was found that the disease could be transmit- ted by feeding, injection, application of traumatized sltin and cohabitation among groupers (E. moara, E. malabaricus, .E. chlorostigma) and also from kelp bass to snappers ( I . russelliand L, argentimaculatus) but not to seabass (Lates calcalifer) (Yongjia and Zeyang 1993). The present study de- scribes our ultrastructural observations on the cellular response of kelp bass to FLDV.
Materials and Methods
Source o f fish and experimental transmission
The fish used for the present work were ltelp bass cultured in floating net cages at Huanan Farm, Guangdong. China. The in- fection was caused by subcutaneous injection of a 20°h homogenate of black nodules in
a balanced salt solution buffered to main- tain pH 7.2. Ten injected fishes, with a mean length of 13 cm and a mean weight of 32 g, were cultured in a net cage to observe the process of the disease. The experiment was conducted from 20 October 1989 to 20 July 1990. Spontaneously infected Fish were obtained from Techeng Farms, Zhanjiang, China.
Preparation for EM
Fish were killed by decapitation on day 1, 3, 7, 14, 21, and month I , 2 and 5 after injection. Blocks oftissue, namely skin with nodules (if present), heart, liver, spleen, kidney and intestine were dissected, and fixed wi th 2.5% glutaraldehyde-2% paraformaldehyde mixture in cacodylate buffer before being fixed with 1 O/o osmium tetraoxide (050,) for 1 hour at 4°C. After fixation, the specimens were rinsed with cacodylate buffer again and treated with uranyl acetate and dehydrated through progressive grades OF ethyl alcohols end- ing with dry, absolute alcohol. The speci- mens were then infiltrated with Epox 618, and transferred to a gelatin capsule con- taining fresh resin. The resin with the speci- mens was then allowed to polymerize for 48 hours at 60°C. The sections were cut by LKB-V ultratome and finally stained on grids with lead acetate and examined un- der a ]EM 100-CXlI electron microscope (working voltage 80 kv).
Results
Skin with nodules (if present)
After one month, the thin sections of the fish injected with the homogenate showed the epithelial cells of the sltin with a nor- mal structure containing usually a few tonofibrils and microtubules, mitochondria and free ribosomes, and were surrounded

by a small intercellular space. The nuclei were dense with heterochromatin, espe- cially in the peripheral areas. Indentations of the nuclei were occasionally seen (Fig. 1 a).
Beneath the epidermis, the subcutane- ous tissue is made up of loose connective tissue, containing collagenous fibers and many fibroblasts which are susceptible to FLDV. Within a few days of the initial in- fection, the fibroblasts had a varied mor- phology, depending on the cellular response to FLDV. This response was a progressive process, and three types of fibroblasts-- besides normal fibroblasts--were observed. Virus particles were occasionally seen at- tached to the First type of fibroblast. The membrane of the Fibroblast to which the virus particle had attached appeared on 1 to 3 electron-dense plates or plaques. One of these was incorporated by a virus parti- cle (Fig. 1 b). These cells were similar to other normal fibroblasts in ultrastructure and with the exception ofthe plates, they were characterized by possessing an ovoid nu- cleus with fine chromatin and evident nu- cleus, abundant granular endoplasmic reticulum, mitochondria and Golgi appa- ratus. The second type of fibroblast was not changed in size, but in structure. The fibroblasts were characterized by a larger spongy nucleus with dense chromatin, and indentations of the nucleus were usually seen. A target-like lamellar body or paranucleus was occasionally observed in their cytoplasm. Otherwise there were few cellular inclusions, such as vacuoles, mitochondria and granular endoplasmic reticulum. The third type of fibroblast exhibited a swollen and round shape, with a spongy rounded nucleus containing dense chromatin, especially in peripheral areas; also, indentations of the nucleus were found. The cytoplasm of the fibroblast was usu- ally separated by a channeled vesicle into perinuclear and outer areas. In the former, cellular inclusions consisted of no more than a few vesicles; but in the latter microfilaments, numerous vesicles or transversely cut
tubules, measuring approximately 20 nanometers (nm) in diameter, and a few mitochondria were seen. The cytomembrane was not clear. Virus particle inclusion bodies were not seen in the cytoplasm except in the above three types of fibroblasts (Fig. I c).
After two weeks, the infected Fish ex- hibited the characteristic sign of lymphocystis on fin and skin areas. The nodule consisted of masses of tremendously hypertrophied cells, so-called lymphocystis cells (approxi- mately 20-600 mm in diameter), which were apparently terminal cells. Some fibroblasts were also present. These lymphocystis cells were enclosed in a collagenous sheath of the surrounding dermal connective tissue. No distinct plasma membrane between the sheath and the cytoplasm of lymphocystis cell was visible under the light microscope, but a 8- 15 mm thick hyaline and homog- enous wall could be seen, consisting of two layers: a hyaline wall with a fine granular consistency and an outer area consisting of collagenous fibers and few fibrocytes (Fig. 2a). The nucleus was large with nucleoli containing mainly nucleolar filaments and granules. The chromatin appeared in the form ofgranules, or flakes, irregularly dis- persed within the nucleoplasm. The nu- clear envelope had a double-layered tex- ture, with distinct nuclear pores (Fig. 2b). Within the cytoplasm of the lymphocystis cell, many inclusion bodies, distributed in the Form of a network, were usually ob- served. The network showed an aggrega- tion of electron-dense granules. The cyto- plasm outside the network was densely packed with virus particles; inside the meshes of the network, virus particles were occa- sionally seen (Fig. Zc). The virus particles were mainly hexagonal in profile and oc- casionally, pentagonal or decagonal in shape. The diameters, measured from 20 rectan- gular hexagonal size virus particles, were 190 nm between opposite sides and 235 nm between opposite vertices. The capsid of the virus measured about 15 nm in thickness and was a double-layered

Fig. 1. (a) Enlarged eplthellal cells of the kelp bass skln, covering the nodules. x 6 000. (b) Flbroblast in dermal connective tissue. Arrow shows a virus particle In the membrane which appears as a thickened plate. x20 000. (c) After one week of infection, three transformlng fibroblasts in dermal connectlve tlssue show various stages of meta- morphoses. Arrow shows a target-like lamellar body. x i 0 600. [(a) Ciiuias riel epltello getminativo de k pi/ de la crlbtilla alguera c u ~ ~ e n d o 10s noduios. x 6 000; (6) Fibroblastos en teJido conectivo derrnico. Las ffechas muestran una partScula de virus en la membrana, el cual aparece como una piaca e s p e ~ . x 20 000; (c) Despuks tie u m semana de infeccldn, tres flbrobiastos transformados, en el tejlrlo conectlvo d&mlco, muestran vaHos es*tdos de rnetivnorfosls. Lils ffechas muesiran un cuerpo lamelar. x 10 600.1

structure. Outside the capsid there was a fuzzy halo of electron-dense filaments, 50- 75 nm in thickness. Within the peripheral area of the cytoplasm, virus particles were only few; there were usually no more than a few vacuoles, mitochondria and endoplasmic reticulum. In mature lymphocystis cells (usually within 1 or 2 months after infection), mitochondria showed degrees of collapse and degradation and some of them had already lost their char- acteristic cristae. AFtcr two or three months O F infection, their cytoplasm contained numerous spherical or oval electron-dense myelinated particulate features, measuring 50-70 nm in diameter, and frequently forming an aggregation enclosed in a membranous vesicle (Fig. Zd). In the superficial layer of the cytoplasm, representing the hyaline wall under LM, no mitochondria or defined endoplasmic reticulum was usually observed, but numerous small vesicles were common (Fig. Za). In the dermal tissue, there were a few macrophages and lymphocytes ad- jacent to the lymphocystis cells. Macrophages contained abundant mitochondria and lysosomes. Lymphocyte and macrophage were occasionally observed establishing cy- toplasmic contact; this took the form of a complete fusion O F the membranes of the two cells, which acquired a finely granu- lar consistency (Fig. 3 4 .
Heart
In most specimens, the heart was grossly edematous and necrotic. Examination of the histopathological specimens revealed the appearance of rnyocarditis. Muscle fibers showed loss O F striation and granulation. The I , A bands and M line of the fibers were difficult to distinguish, and mitochondria
had also lost their cristae or were in vari- ous stages OF degeneration (Fig. 3b).
Within three days of inFection, hepatocytes showed predominating smooth endoplasmic reticulum with content of medium elec- tron-dense granules and virus-like figures. Giant mitochondria with loss ofcristae were generally observed to be surrounded by multilamellate endoplasmic reticulum (Fig. 3c). The nuclear envelope with pores re- vealed extended into internuclear spaces. There was abundant heterochromatin within the nucleoplasm. lnterchromatin granules were usually observed (Fig. 3d) . Plasma cell infiltration was pronounced. The plasma cells were characterized by a typically ec- centric nucleus and a well-developed reticular system with vesicular cisternae fringed with ribosomes. The cisternae displayed a di- lated appearance. The nucleus assumed compact, coarse, Flaky chromatin, which showed an expanded perinuclear space connected to the endoplasmic reticulum outside the nucleus (Fig. 4a).
In the stage of late infection, the cyto- plasm of the hepatocytes usually showed appearance of necrosis and was reduced to an electron-lucent matrix with degen- erated mitochondria and membranous residues (Fig. 4b). A Few Kupffer cells exhibited abundant vacuoles and peroxisomes, but few lysosomes (Fig. Sa). Some of these contained protrusions and showed signs of activity. Small lymphocytes were usually seen; they are always smaller (4 - 5 pm in diameter) than neighboring cells and though of varying shape, were characterized by a large nucleus and only a small cytoplasmic rim, with many protrusions of macrophages. A fusion of

Fig. 2. (a) Hyaline wall of the lymphocystis cell shows a flnely granular consistency of medium electron-denslty Inner a rea and a collagenous outer a rea with flbrocyte. x 4 000; (b) Within two weeks, a part of nucleus of lymphocystls cell. 1: vlrus pael- c les In t h e cytoplasm; 2: nucleoli; 3: euchromatln. x 7 000; (c) An Inclusion body In the cytoplasm of lymphocystls cell. x8 000; ( d ) Lyrnphocystis vlrus particles In the cytoplasm of lymphocystls cell. x20 000. I/al Paredhidlna de /as c~lulas conllnfoclsfls mostrando una conslstencla granular tie densirfad electrdnlca metila dentro rlel drea, y un Area externa colAgena con fi6roclto. x 4 000: (b) Dentto de las dos semanas, uuna parte rle/ n12cIeo de la c6lula con l/nfoc/stls: I:.partfcu/ir tie vlrus en cltopIasma; ;Z;
nucleoh, y 3: eucromatha. x 7 000; /c) Uncuerpo inciuldo en el c l t o p l ~ s ~ ~ a de una c&Iula con iinfoclstis. x 8 000; (d) Particulas tfe virus de l/nfoclstls en el cltoplnsma de una c&~fa Infecfada. x 20 000.1

Flg. 3. (a) Lymphocyte-macrophyte assoclatlon In dermal connectlve tissue. Observe a cyto- plasmlc contact between macrophage and lymphocyte on their protrusions. 1: lymphocyte protrusion; 2: macrophage. x 20 000; (b) Myocardial flbers show loss of strlation and granulation. Arrow indicates that mltochondrla had lost its crlstae. x 10 000; (c) Part of cytoplasm of lymphocystis cell withln three days of infectlon. Arrow shows vlrus-like figure. x 16 000; (d) Part nucleus of lymphocystis cell wlthin three days of infection. O b - serve that nucleus contains interchromatln and that multendoplasmlc appear In t h e cyto- plasm. x 16 000. [(a) AsorLclbn /infoclto-macrofito en tejldn conectivo dermlco. 5e oolrserva un contact0 c/topiasmico entre macrofago y IlnfocIto sobre sus protuheranclas. 1: protrusln rle//fnfocito, 2: macrofago. x 20 000; (Ir/ Fibras m/ocamdiales mostrando pPrdlda de estriacldn y granulation. Las ffechas Indlcan que la mitocondrfa tuvo perdfda de sus crestas. x l 0 000; (c) Parte del cltopksma de una c&da con linfocl~tls de tres diar Ae hfeccldn. Las fhchas muestran una flgura pareclda a1 virus. x I 6 000; (fl Parte del nucleo de una cPlula con /Infoclstis de tres d h s tie imfeccl6n. Observe que el pficleo contfene lntercfomatlna y que el mu/rlendop/asma aparece en eJ c/topJasma, x I 6 000.1

Fig. 4. (a) Plasma cell In the liver assumes a well-developed reticular system wlth veslcular clsternae fringed ribosomes. Arrow Indicates a glant mitochondria In the cytoplasm of hepatocyte. x 10 000; (b) In the stage of late Infection, the cytoplasm of hepatocyte shows an electron-lucent matrix wlth degenerated mltochondrla and mem- branous residues. x 10 000. [fa) Plasma de una celula de hjgado que supone un sistema reticular bien desarrollado con vesfculas en elbode de la avldad delrlbosoma. Lts Ilechas 1ndlc.m una mbcondda gigante en el cltopiasma tiel hepatocito. x 10000; (15) En el estadfo rle infeccldn tardia, el citoplasma del hepatocito muestra una matrlz eleciro-iluminada con reslduos de mhoc~ndda y membrma degenerad.u..l

Fig. 5. (a) Kupffer cell with abundant vacuoles and peroxisomes in the liver. x 10 000. (b) Lymphocyte-macrophage association In the liver within two months of infection. Observe that the lymphocyte protrusion comes into contact with the protrusion of macrophage. At that point a complete cytoplasmic fusion occurs. x 16 000. [(a) Cuerpo tie Kupffer con abundantes vacuolas y peroxlsomas en el higado; (b) Asociacldn ihfocito-macr6fago en hl'gado con dos meses de infeccldn. Observe que la protuberancla del Ilnfoclto vlene hacia un contact0 con la protuberancla del macrofago. En este punto, ocurre una completa fusibn citoplasmlca. x I6 000.1
cytoplasm was observed where material was being exchanged (Fig. 5b).
Spleen
In thin sections of the spleen, the fol- lowing types of cells were distinguished: lymphocytes, blast type cells, reticulum cells, macrophages, granulocytes, and mature and immature erythrocytes. Macrophages were common both within ellipsoids and within the pulp. Some cells contained various Icinds of inclusions, which usually could be iden- tified as the debris of disintegrated eryth- rocytes at various stages of digestion. Some cells contained numerous indistinct mitochondria, minute vesicles and lysosomes. Where the lymphocyte came Into contact with macrophages, it was observed to es- tablish cytoplasmic contacts which took the Form of an incomplete fusion at the point of contact of the protrusions of the mem- branes, obvious cell membrane bounda- ries still being present, however. Lymphocytes were one of the significant cell types associared with immunological processes in the spleen. They were read- ily seen there, with a characteristic elec- tron-dense nucleus surrounded by a thin rim of cytoplasm containing Few ribosomes and mitochondria. Other cell types related to immunological processes were macrophages, both sessile and Free. The sessile rnacrophages within the spleen connected with adjoining cells by their cytoplasmic extensions, and free macrophages were usually observed to establish a cytoplasmic contact with lymphocytes (Fig. 6a). Few granulocytes were identified in the spleen.
The kidney was, to various degrees, hyperplastic and necrotic; moreover, the severity of the condition increased progres- sively from posterior to anterior. The
posterior kidneys were prominently altered, and showed necrosis of tubular tissue. The tubular lumens had collapsed. The microvilli on the apical cytoplasm of the epithelial cells were in disorder or had separated. The cytoplasm contained numerous vacuoles and membrane-bound electron-lucent lysosomes, free ribosomes, mitochondria with indistinct cristae and endoplasmic reticulum. Some of the mitochondria were very large and contained vacuole-like in- clusions (Fig. 6b). Glomeruli were slightly edematous. The main cellular component of the haematopoietic tissue in the kidney was lymphocyte-like cells. These cells con- stituted many zones of very active lymphocyte production. Various stages of development of lymphocytes were noted, characterized by a large nucleus and a small cytoplasmicvolume. Nuclear chromatin was dense, and indentations of the nucleus were generally seen. The cytoplasm contained numerous ribosomes and small vesicles and a few mitochondria. N o cytoplasmic protrusion was found (Fig. 6c).
Intestine
The intestine showed sloughing of mu- cus into the lumen. Ultrastructurally, the mucus epithelial cells presented irregular profiles and short microvilli. Numerous membrane-bound vesicles with many myelinated figures and vacuoles filled the apical cytoplasm. The cells appeared as an electron-lucent matrix on the background (Fig. 6d).
Lymphocystis disease has been noted to associate with lymphocystis virus infec- tion of the host connective tissue cells, and its agent has been propagated under labo- ratory conditions (Wolf 1962; Chao 1984). The literature concerning the pathological changes in the vital organs of fish with
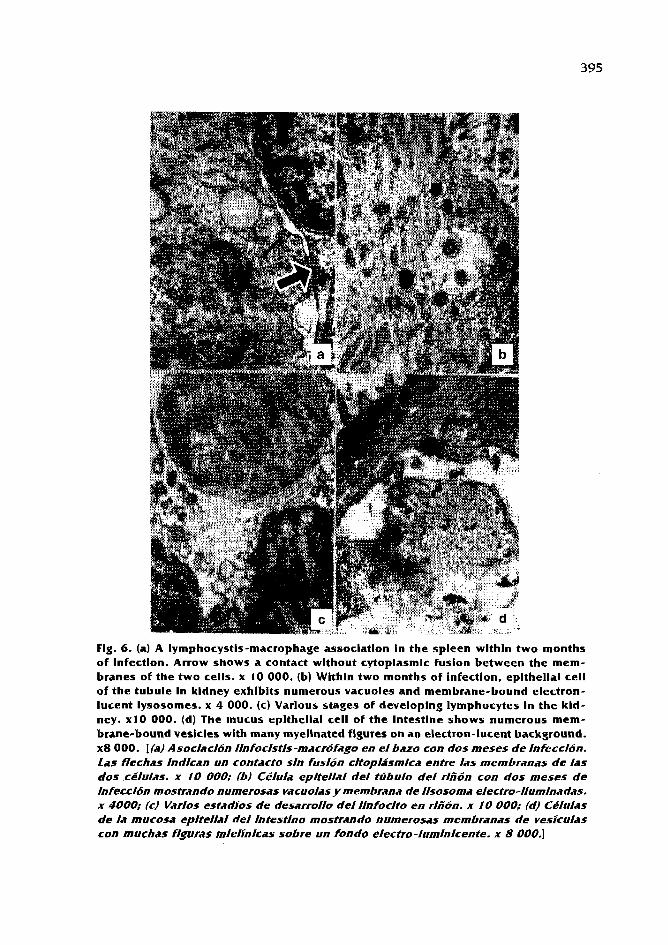
Flg. 6. (a) A lymphocystis-macrophage assoclatlon in the spleen wlthln two months of Infectlon. Arrow shows a contact wlthout cytoplasmic fuslon between the mem- branes of the two cells. x 10 000. (b) Withln two months of infection, eplthellal cell of the tubule In kidney exhibits numerous vacuoles and membrane-bound electron- lucent lysosornes. x 4 000. (c) Varlous stages of developing lymphocytes In the kid- ney. x10 000. (d) The mucus eplthellal cell of the Intestine shows numerous mem- brane-bound veslcles with many myelinated flgures on an electron-lucent background. x8 000. [la) Asociacion iinfocistis-macrofago en el bazo con dos meses de infetxlon. Las flechas indlcan un contact0 sin fusion citoplasmica entre las membranas de /as cios celulas. x 10 000; fb) CtYuia epitellal tiel tubuio dei rifidn con dos meses de Infecclon mostrando numerosas vacuoias y membrana de llsosoma electro-liumlnadas. x 4000; (c) Varhs estadlos de desarroiio del IInfoclto en rlnlbn. x 10 000; fd) Celulas de la mucosa epltellai del Intestlno mostrando numerosas memlrranas de vesiculas con muchas flguras mielfnicas sobre un fondo eiectro-lumlnicente. x 8 000.1

lymphocystis is sparse. Certain authors do not mention the cellular response to the FLDV. The present study has shown the transformation process of the lymphocystis cells. Ultrastructurally, the observations re- vealed a virus particle that attached to the membrane of fibroblast. The virus particle, which had decapsulated, merged into the membrane whose thickened plates may constitute the receptors for the FLDV. The genome of the FLDV would have existed in the host cell for a period of time, before the host cell exhibited a series of metamorphosis. The three types of fibroblasts in the present study are considered to be the transitional stages from a fibroblast to a lyrnphocystis cell. The following changes take place during this process: heterochromatin concentration, nucleolus metamorphosis, nucleus enlargement, target- like texture appearance, cytoplasmic layer- separation, tonofibrils' abnormal distribu- tion, plasma membrane disappearance, and cellular enlargement. These changes are considered to be neoplastic features in cells (King et al. 1983). The virus infection alone would not destroy the susceptible cells, at least not during early infection. With the insertion of the FLDV DNA fragments into the genomes of the host cell, the DNA/ RNA metabolism of the host cell lost its regulation, which resulted in a series of metamorphosis occurring in the host cell. After a period of time of at least one week, virus particles appeared in the cytoplasm of the susceptible cell and cellular organelles were progressively damaged. The mem- brane of the host cell was separated into inner and outer layers in the transforma- tion process, the former probably a meta- morphosis of the plasma membrane and the latter formed by surrounding connec- tive tissue. It is difficult to escape the conclusion that the texture of these two layers prevented other virus particles from gaining access to the host cell again, and hence the new virus particles in the cell are duplicated by a single virus source.
After the mature lymphocystis cells col- lapse, the virus particles are released into the surrounding tissue or water environ- ment. In the surrounding tissue, they can affect other fibroblasts and in water, they can initiate horizontal transmission among the cohabiting groupers. A similar opinion has been expressed concerning snake-skin gourami (Paperna et al. 1987) and seabass (Chao 1984).
It has been reported that affected fish develop small, pearl-like tumefactions ei- ther singly or in groups, on the skin of body, Fins and tail and, less commonly, gill Fila- ment, pharynx, intestinal wall, mesenteries, liver, spleen and ovary (Roberts 1978). Paperna et al. (1 987) have mentioned that pathological changes took place in the spleen and kidney. We have previously reported severe damage on the liver, kidney and heart with light microscopic observation (Yongjia 1992). The above-mentioned sug- gested that the lymphocystis virus may affect the cells in these organs although no virus particle has been found in these organs so far. The ultrastructural observations on the liver, spleen, heart, intestine of the infected kelp bass described in the present study agree with our previous descriptions. Al- though virus-like granules have been found in hepatocytes, virus particles, however, have not been confirmed in these organs, either in natural or in experimentally lymphocystis-infected fish. Cellular lesions on these organs suggested that potential susceptible cells may be affected by FLDV. A further possible hypothesis is that the mechanism of the damage may well be a neoplastic process. After having entered into potential susceptible cells, the virus is not duplicated (nonproductive infection), and causes only cell damage. The evidence presented strongly suggests that this vi- rus may disturb the normal DNA/RNA metabolism in the infected cells, followed by a series of pathological changes; for example, giant mitochondria in hepatocytes and in epithelial cells of the Itidney,

endaplasmic reticulum hyperplasia and an abnormal texture, abnormal nuclear chro- matin concentration, and appearance of interchromatin granules and enlarged perinuclear spaces. Cellular synthetic and oxidative processes are bound to be re- flected in the morphology of the endoplasmic reticulum and mitochondria associated with pathological changes of the nuclei. Other examples are the epithelial lesions in the intestine; in this case where the virus must pass through the intestine wall in order to infect dermal connective tissue cells (Yongjia et al. in press). The lesions resemble those described in the present study, i.e., within the apical cytoplasm, there were no more than a few inclusions containing myelinated figures of multivesicular bodies, with an empty background. This phenomenon can be explained by the fact that virus disturbed the stability of the lysosomic membrane, which resulted in intercellular lysis. The FLDV genome must exist or be transmitted ei- ther in the form of merging with the chromosomes or in a non-merging form in the host cells, because no virion could be observed within the cytoplasm of the host cells (King et al. 1983).
In the present study, there were abun- dant lymphocytes within the liver, spleen and dermal connective tissue in natural and experimental late infections of kelp bass, which caused immunological activity. Their cytoplasmic protrusions came into contact with those of the macrophages. Plasma cells also occurred in the tissue of the liver and spleen; they are one of the principal cell types in the immunological processes. The frequency of above-mentioned cells var- ies with the immunological activities of the fish. The significance of the macrophage- lymphocyte association in the liver and in the spleen is that some kind of immunological interchange may be taking place, since a complete fusion of the cytoplasm of the cells was noted. Rosenthal et al. (1975) suggested from in vitro studies that such
an association could serve to facilitate the presentation of antigen by macrophages to immune T lymphocytes. Although B and T lymphocytes were not morphologically identified in kelp bass, i t is possible to speculate that the function of these asso- ciations is the macrophage presenting proc- essed antigen to lymphocyte. The present study has shown that plasma cells in the liver and in the spleen during late infection carry out an active synthetic process. Therefore, we may conclude that it is possible to find a suitable vaccine for prevention of FLD. Experimental protection against FLD of groupers for at least six months has been conferred by injecting inactivated nodule hornogenate (Yongjia et al. in press). This experiment provides proof of the cellular response and does not agree with the work of Wolf (1962), in which he established second infection of bluegill. Further work on antibody detection and immunological response is needed.
Acknowledgements
I thank Dr. Supranee Chinabut of the Aquatic Animal Health Research Institute of Thailand for comments on the draft of this contribution.
References
Chao, T.M. 1984. Studies on the transmissibil- ity of lymphocystis disease occurring in seabass (Lates calcarifer, Bloch). Singa- pore]. Prim. Ind. 12(1):I 1-16.
Chong, Y.C. and T.M. Chao. 1984. Common dis- eases of marine foodfish. Prim. Prod. Dept.. Rep. ofsingapore, Fisheries Handbook No.2, 34 p.
Flugel, R.M. 1985. Lymphocystis disease vi- rus. Curr. Topics Microbiol. Immunol. 116:133-150.
King, D.W., C.M. Fenoglio and J.H. Leflcowitch. 1983. General pathology: principles and dynamics. Lee 8, Febiger, Philadelphia.


Development from Egg to Juvenile of the Red Grouper (Ephephe/us morlo) (Pisces: Serranidae) in the Laboratory
P.L. COLIN Coral ReefResearch Foundation
P. 0. Box 1785 Koror, Palau 96940
C.C. KOENlG Department of Bio/ogicai Sciences
Florida State University, Tallahassee, Florida 32308-2043, USA
W.A. LAROCHE Stonefish Environmental Consulting
P. 0. Box 216, Enosburg Falls, Vermont 05450, USA
COLIN. P.L., C.C. KOENlG and W.A. LAROCHE. 1996. Development from egg to juvenile of t h e red grouper (Epinephelus morio) (Pisces: Serranidae) in the laboratory IDesarollo de huevo a juvenil del mero americano (Epinephelus rnorio) (Pisces: Serranidae) en laboratorio], p. 399-414. In F. Arreguin- Sanchez. J.L. Munro, M.C. Balgos and D. Pauly (eds.) Biology, fisheries and culture of tropical groupers and snappers. ICLARM Conf. Proc. 48, 449 p.
Abstract
Red groupers were reared from artificially spawned eggs, which hatched In 30 hours at 24°C. Eggs requlred salinities of at least 32 ppt to float. Yolk absorption was completed by about 30 hours. eye pigmentation and first feeding observed at 72 hours post-hatch. Dorsal and pelvic splne development was First noted at nine days post-hatch wlth rapid length Increase over the,next seven days. Flexion occurred startlng at 16 days post-hatch at a stage w i th well developed dorsal and pelvic spines. Behavior of larvae was closely examined and at all stages larvae were active predators on small zooplankton. Metamorphosls occurred at a minimum of 35 days post-hatch at 20 rnrn SL. Juveniles grew at a rate between 0.26 and 0.61 mm-day-' reachlng a mean of about 55 rnrn SL at 130 days post-hatch and were aggressive and territorial. Reared Juveniles tagged and released on an artlficial reef off the Florida Panhandle survived and continue to be rnonltored.
Resumen
El mero amerlcano fu t crlado de huevos desovados artlnclalmente, Lo5 huevos requlrleron salinidades de a1 rnenos 32 ppt para notary fueron incubados durante 30 horas a 24°C. La absorcI6n del saco vitelino se cornpletd a /as 30 horas, la plgmentad6n y primera allmentaci6n se observd a /as 72 horas despu4s de la incubacidn. El desarrollo de /as espinas dorsal y pClvica fur2 observado primero a 10s 9 dlas despues de la incubacl6n con un rdpldo Increment0 en Iongitud durante 10s 7 dlas siguientes. La ffexl6n ocurrld a1 inicio, 16 dfas despuks de la lncubacidn con Ins esplnas dorsal y p&lvlca bien desarrollada. E l comportamlento de /as larvas fuC exarnlnado estrechamente y durante todos 10s estados larvarlos fueron predadores activos sobre pequefio zooplancton. La rnetarnorfosl5 ocurri6 a un mlnimo de 35 &as despu& de la incubacldn a 20 rnrn de Iongitud estandar (SL). Los juveniles crecieron a una tasa entre

0.26-0.61 mm por did, alcanrando un promeclio de 55 mm SL a I30 dfas despues de la incubation; y tueron asresivos y territoriales. Los juveniles criados heron marcados y liberado5 en un arrecife artificial en aguas fuera de Florida donde 10s supervivientes continlian siendo monitoreados.
Introduction
The red grouper (Epinephelus morio) is the most common grouper captured in both commercial and recreational fisheries in US and Mexican waters of the Gulf of Mexico (Goodyear and Schirripa 199 1 ). In the Ex- clusive Economic Zone of the US Gulf of Mexico, it accounts for two-thirds of the total commercial grouper catch, some 3 400 t in 1989 (Goodyear and Schirripa 1991). Despite its commercial and recreational importance, relatively little has been published on its biology since the study of Moe ( 1 969) (see Brule and DPniel, this vol.).
Although the larvae of epinepheline serranids have been recognized for more than a century (Kendall 1984), largely due to their elongate dorsal and pelvic fin spines. few identifiable to a particular species have been described in detail. Virtually noth- ing is known of the specific larval devel- opment of E. morio (Moe 1969) and the wild-captured larvae could not be sepa- rated from E. guttdus and f drummondhayi based on ray counts (Johnson and Keener 1 984).
As part of a study to delineate life his- tories of Gulf of Mexico groupers, we were able to rear red groupers in the laboratory from artificially fertilized eggs through the juvenile stage. These laboratory-reared juveniles were released in the field suc- cessfully and have survived.
Materials and Methods
Live adult E, morio females were ob- tained by fishing from commercial hook- and-line Fishing boats during the spawn- ing season in the northern Gulf of Mexico.
Fish captured at depths between 20 and 40 m had their swim bladders deflated immediately upon surfacing and were placed in flowing seawater tanks. Survival rates were high unless the fish had been gill- hooked or otherwise injured. Individual fish were returned to the Florida State Univer- sity Marine Laboratory and maintained in 2 000-1 tanks in a closed-circuit seawater system.
Freshly caught ripe E. morio males were obtained From commercial fishers at the dock. Testes were removed From the body cav- ity within a few hours of capture and stored in plastic bags on ice (not frozen). Sperm remained capable of fertilizing eggs for a number of days afterwards.
In the aquarium facility at Florida State University Marine Laboratory (FSU), live fish were catheterized to determine sex and stage of gonad development. Females were injected with 1 000 units human chorionic gonadotropin (HCG) per kg body weight, followed, i f necessary, by a second injec- tion of 500 units HCG 18-24 hours later.
Adult fish were maintained in recirculating , seawater of approximately 25 ppt (the salinities of inshore areas of North Florida during spring) until eggs were fully hy- drated. Once hydrated, eggs were stripped from Females, into plastic containers, with gentle pressure on the body cavity. A sperm and water mixture was added immediately. Sperm were obtained either by stripping live male fish or macerating a piece of Fresh or chilled testes. An additional few milliliters of sea water (36 ppt) were added to the sperm and egg mixture, which caused the eggs to become buoyant.
Initiation of development was confirmed microscopically by the onset of first cleav- age and occurred within an hour of addi- tion of sperm. Eggs were then transferred

to 20-1 aerated buckets of 36 ppt seawater at 2Z°C, and then moved to the rearing aquariums (36 ppt seawater) within 3-4 hours.
The absolute density of eggs and newly hatched larvae was determined by pipetting eggs and larvae into small beakers with seawater of different salinities (between 27 and 35 ppt): eggs and larvae were either negatively buoyant, positively buoyant or neutrally buoyant.
Larvae were reared largely using the methods of Houde and Taniguchi ( 1977). Floating fertile eggs were transferred to 80-1 aerated rearing aquariums with twin 20-W flourescent lights. Larvae were fed zooplankton collected offshore of the FSU Marine Laboratory starting approximately 72 hours after hatching (depending on water temperature). Zooplankton was maintained on various species of cultured microalgae, which also served to absorb toxins gener- ated in the rearing tanks. Initially, plank- ton 53-88 p in size were offered, followed a few days later by plankton in the 53-1 25 u size fraction.
Larvae were preserved every few days in order to obtain a representative size series for describing developmental stages. Pres- ervation was initially in 5% forrnalin and later in 70% ethanol. The specimens se- lected for preservation at any one time were generally among the larger, more advanced individuals in the rearing tanks. Specimens were measured either with dial calipers or by ocular micrometer in a dissecting mi- croscope. Preflexion larvae were measured f roh the tip of the snout to the end of the notochord (NL) whereas post-flexion lar- vae and juveniles were measured to standard length (SL). All development times given in this paper (e.g., 24 hours, 5 days) are times post-hatching.
Several hours of excellent video recordings of live larvae were obtained using a dis- secting scope with attached color video camera. Larvae were chilled to make them quiescent. Additional recordings were made of larvae remaining in rearing tanks by
using additional closeup diopters and ex- treme telephoto settings on the video camera lens. Drawings of larvae were made by one of us (WAL) using a camera lucida attach- ment on a stereo microscope. Color illus- trations were prepared from fresh speci- mens.
The series of larval specimens are de- posited in the US National Museum as lot number USNM 326839.
Results
Eggs were almost spherical, approximately 0.95 mm in diameter. They contained a single oil globule and were unpigmented. The germinal disk of the eggs was visible 25 minutes after addition of sperm; first cleavage occurred 54-59 minutes post-fer- tilization. Hatching occurred 30-38 hours post-fertilization, although the exact time of hatching was not observed.
Fertilized eggs and newly hatched red grouper larvae were positively buoyant in full-strength seawater (36 ppt); fertilized egg5 were negatively buoyant in 25 ppt seawater. Eggs at 4 hours post-fertiliza- tion were neutrally buoyant in seawater be- tween 28 and 30 ppt. Eggs at over 20 hours post-fertilization were slightly more dense; they were neutrally buoyant in 32 ppt. Newly hatched larvae were more positively buoyant at 27 ppt, with some floating and some sinking. Eggs in 25 ppt seawater under- went limited embryonic development while on the bottom of the container. Very few of these eggs hatched. None of the larvae that hatched at this salinity was reared.
Larval and pelagic juvenlle development
Meristic5 and morphometrics. Meristic and morphometric data on larvae and ju- veniles were based on a series of 44 specimens (Tables 1 and 2). The larval and early
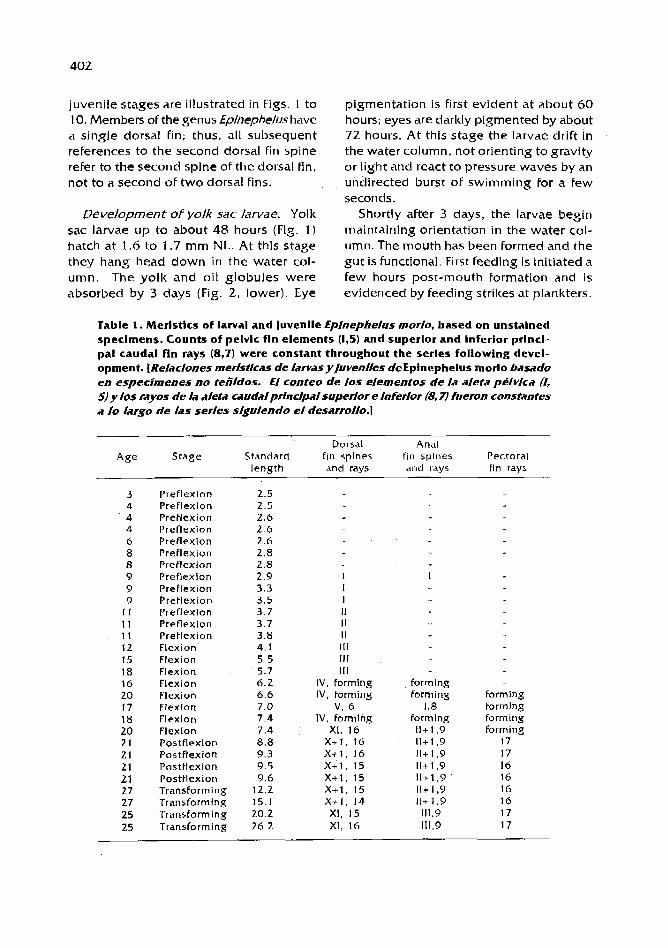
juvenile stages are illustrated in Figs. 1 to 10. Members of the genus Epinephelus have a single dorsal fin: thus, all subsequent references to the second dorsal fin spine refer to the second spine of the dorsal An, not to a second of two dorsal fins.
Development ofyolk sac larvae. Yolk sac larvae up to about 48 hours (Fig. 1) hatch at 1.6 to 1.7 mrn NL. At this stage they hang head down in the water col- umn. T h e yolk and oi l globules were absorbed by 3 days (Fig. 2, lower). Eye
pigmentation is first evident at about 60 hours; eyes are darkly pigmented by about 72 hours. At this stage the larvae drift in the water column, not orienting to gravity or light and react to pressure waves by an undirected burst of swimming for a few seconds.
Shortly after 3 days, the larvae begin maintaining orientation in the water col- umn. The mouth has been formed and the gut is functional. First feeding is initiated a few hours post-mouth formation and is evidenced by feeding strikes at plankters.
Table 1. Merlstics of larval and juvenlle Eplnephelus morlo. based on unstained specimens. Counts of pelvlc fln elements (1,s) and superior and Inferior prlncl- pal caudal fln rays (8,7) were constant throughout the serles following devel- opment. [Relaclones merlstlcas de iarvas y/uvenlles deEpinephelus morlo basado en especimenes no tefildos. El conteo de 10s elementos de la aleta pdvlca (f, 5) y 10s rayos de la alefa cauda/prindp~/superior e inferlor (8,a fueron constantes a 10 largo de Ins serles slgulendo el desarrollo.]
Dorsal Anal *ge S t a g e S tandard fin s p i n e s fin s p i n e s Pectoral
l e n g t h a n d rays a n d rays fin rays
Pref lexion Pref lexion PreRexion Pref lexion Pref lexion Pref lexion Pref lexion Pref lexion Pref lexion Pref lexion Pref lexion Pref lexion Pref lexion Flexion Flexion Flexion Flexion Flexion Flexion Flexion Flexion Postf lexion Postf lexion Postf lexion Postf lexion TransForming Transforming Transforming Transforming
I I I I1 II I I
I l l 111 I l l
IV. Formlng IV, forming
v, 6 IV, forming
XI. 1 6 X+1, 1 6 X+1, 16 X+1, 1 5 X+1. 1 5 X+1, 15 X+1. 1 4
XI, 1 5 XI, 1 6
forming forming
1,s forming
1 1 + 1 , 9 II+ 1 , 9 11+1,9 11+ 1 . 9 11+1.9 11+ 1 , 9 11+1.9
111,9 111.9
forming Forming forming forming
17 17 16 16 16 16 17 17

Table 2. Body proportion of larvae and juveniles of Epinepheius morio. Values glven are percent of standard length (SL) and head length (HL) lncludlng mean, standard deviation and range in parentheses. Number of specimens measured indicated In parentheses, listed by stage. [Proportion corporal de iarvas yjuveniles delepinephelus morlo. Los vaiores dados son porcentajes de /a longltud estandar (SL) y iongitud de la cabeza IHL) inciuyendo media, desviacion estandar e intervaio entre parentesis. El numero de especimenes medidos es indicado en te parkntesis, Iistado por estado.]
Body depth at Body depth at Caudal peduncle cleithrurn (SL) anus (SL) depth (SL)
Yolk sac (1 5) Preflexion (1 3) Flexion (8) Postflexion (4) Transforming (2) Juvenile (2)
Yolk sac ( 1 5) Preflexion (1 3) Flexion (8) Postflexion (4) Transforming(2) Juvenile (2)
Yolk sac ( 15) Preflexion (1 3) Flexion (8) Postflexion (4) Transforrning(2) Juvenile (2)
Head length/ Eye diameter/ Upper jaw length/. S L Head length Head length
Snout length/ Longest anal spine Pectoral Fin Head length length/SL length/SL
Fin formation. The sequence o f Fin de- velopment is pectoral, spinous dorsal and spinous pelvic simultaneously, caudal, soft dorsal and soft anal simultaneously, and finally the spinous anal. Elements of the caudal, the soft dorsal and anal, and spinous anal develop from the center of each Fin outwards in both directions. Development begins anteriorly and progresses posteriorly in t h e spinous-dorsal-fin elements; it progresses from dorsal to ventral in the pectoral fin.
Pectoral fin development begins in lar- vae 2.6 mm NL. Pectoral fin length in- creases from 5.4 t o 25.6% of N L or SL
between preflexion and transformation stages. Fin elements begin to develop a t 6.6 mm, attaining the Full adult complement of fin rays by 9.5 mm.
Dorsal and pelvic fin spines begin to develop simultaneously a t 7 days (Fig. 2, center). The anlagen of the second dorsal spine first appears at 2.8 mm, initially vis- ible only as nubs, protruding from the myomeres into the finfold, but subsequently protrude beyond the fin fold at 8-9 days (Fig. 2, upper). The second dorsal spine and pelvic spine are the longest elements in their respective fins throughout the larval development.

Flg. 1. Yolk sac larvae of Epinephelus m o m laboratory-reared. Upper: At hatch, 1.7 mm NL; Middle: 24 hours, 2.3 mm NL; Lower: 48 hours, 2.4 mm NL. [Larva de Epinephelus morio con sac0 viteho, crfirdo en laboratorio. Arriba: A1 hcubarse 1.7, mm NL; en el medio, a /as 24 horas, 2.3 mm NL; Abajo: a /as 48 horas con 2.4 mm NL.]
Fig. 2. Early stage Iaboratory- reared larvae of Ephepheius morio. Lower: 3 days, 2.7 mm NL, at t h e of first feeding; Mlddle: 8 days, 3.0 mm NL. with dorsal fin splne bud vls- ible; Upper: 9 days, 3.5 mm NL, developing second dorsal f ln and pelvlc fln splnes; the ventral melanophore spot Is well-developed. [Estadio temprano de larva de Epinephelus morio crladas en Iaboratotfo. Abajo; 3 dias con 2.7 mm. NL, a1 tiempo de prlmera alimentacldn; En el merllo, 8 dias con 3.0 mm NL, con el brote tie la esplna de la aleta dorsal vJslbIe. Arrlba: 9 dhs con 3.5 mm NL, con Ias espinas de la segunda aleta dorsal en desarrolh, e l melandforo venbdea blen deswrolhdo.]

1 Fig. 3. Twelve-day larvae of Eplnephelus morio, 4.1 mm NL. Initial ossiflcatlon of the caudal f ln supporting elements can be seen. Dark ends of the dorsal and pelvic f in spines are evident. [Larvas de 12 dias deEplnephelus morio, 4.1 mm NL. Puede olrservarse una oslficacldn Inlclal de la aieta caudal soportando ios elementos. L 0s extremos opacos de /as espinas tie /as aietas dorsal y pelvlcas son evldentes.]
Development of the second dorsal and pelvic fin spine is extremely rapid over the next 7- 1 0 days (Figs. 3 and 4). For larvae 4- 10 mm SL pelvic fin spine length was 72-88% of second dorsal fin spine length. The spines reach their longest length relative to SL when larvae are 5.5-7.5 rnrn SL (1 5-20 days post-hatch) (Figs. 4-6). Some of the largest specimens ( r 15 rnrn SL) had the pelvic fin spine somewhat longer than the second dorsal fin spine.
Development of the first dorsal spine is next, in larvae a t about 3.7 to 3.8 m m SL ( 1 1 days) (Fig. 3). It develops a few small spinelets. It is followed by development of the third dorsal spine, forming at about 4.1 rnrn SL ( 1 2 days ) (Fig 4).
Soft dorsal, soft anal, and caudal fin rays begin development a t 5.5 mrn. The adult complement of eight superior and seven inferior principal rays develops by
Fig. 4. Thirteen-day larvae of Eplnephelus morio, 5.8 mm NL, showlng further development of spination, lncludlng elongation of the second dorsal and pelvic f in splnes, appearance of the first and third dorsal f in splnes and appearance of the preopercular spines. This stage is at the greatest relative development of the elongate spines. Flexlon Is just beglnning to occur. [Larva de 13 dias deEplnephelus rnorlo de 5.8 mm NL mostrando el futuro desarrollo de /as esplnas, inchyendo el alargamlento tie las espinas de la segunda aleta dorsaly de la aieta p6ivlca, aparlcldn de /as espinas de la primera y tercera aleta dorsal, y aparicibn de /as espinas preopercuiares. En este estado se observa ei miisgrande des~ml io re/irtivo deiaihgmmlento de /as espinas. La flexion asta a punto de ocurrlr.]

Fig. 5. Sixteen-day flexion larvae of Epinephelus morio, 6.5 mm NL. [Larva ffexionada tie 16 dins de Eplnephelus morio, de 6.5 mm NU
7.4 mm. The adul t complement of soft dorsal ( 1 5 or 16) and anal Fin (9) rays develops by 9.3 mm. The spinous anal fin is the last fin to begin development at 7.4 mm. The third anal fin spine is the last fin element to ossify at 20 mm.
The dorsal and pelvic spines are sheathed with tissue and have heavily pigmented fleshy lobes at their tips from the time of their first appearance through the juvenile stage (Figs. 3 to 10). The mobility of the dorsal and pelvic spines are described in Colin and Koenig (in press).
Spination of the head. Spines on the head begin to develop at 4 mrn. The
I
Flg. 6. Elghteen-day post-flexlon larvae of Epinepheiars morio, 7.4 mm SL. [Larva de 18 dins en etapa de post-flexibn de Eplnephelus morlo, tie 7.4 mm SL.]

Fig. 7. Twenty-one-day post-flexlon larvae of Epinephelus morio, 9.8 rnm SL. [Larva de 21 dhs en etapa rle post-flexion de Lplnephelus morlo, de 3.8 mm SL .I
L
Fig. 8. Twenty-seven-day pelaglc Juvenlle of Eplnepheius morio, 12.6 mm SL. ~uvenilpe/ilglco tie Epinephelus morlo de 27 dias, tie 12.6 mm Sf.]

Flg. 9. Twenty-seven-day pelagic Juvenile of Eplnephehs morlo, 13.9 mrn SL. [/uvenllpel.co de Epinephelus morlo de 27 dfas, de 13.9 mm SL.]
Fig. 10. Sixty-day laboratory-reared benthic juvenlle Eplnephelus rnorjo. [/uvenl/ benfdnlco de Eplnephelus morio crlado en la6oraforIo de 60 diils.1
angle spine of the posterior preopercular series forms first. Subsequent preopercular spines form from dorsal to ventral along the posterior margin away from the angle spine. Single spines develop on each side of the angle spine, at the angle of the anterior margin of the preopercle, on the frontal bone over the eye (supraocular spine), and on the supracleithral bone by 5.3 mm. Two or three preopercular spines appear dorsal
to the angle spine and one spine remains ventral to the angle spine from post-flexion (6.8 mrn) through transformation (20 rnrn). A second supracleithral spine develops by 7.4 rnrn. The single supraocular spine is reduced in size and becomes part of a ser- rated supraocular ridge on the frontal bone by 9.6 rnrn. A subopercular and an interopercular spine begin to develop by 9.6 mm. During the transformation stage

several spines become overgrown with tissue and/or bone: the spine ventral to the an- gle spine, the angle spine of the anterior peropercular margin, and the supracleithral spines. Posterior preopercular spines on the dorsal margin rapidly increase in number, with 12 small spines giving a serrated ap- pearance in small juveniles.
Lateral line and scale formation. Lateral line organs (indicated by a row of light colored spots on the flesh and caudal fin membrane) are visible on transforming specimens (1 5.1 mm). Scale development also appears to begin on the dorsal sur- face of the body and proceed from ante- rior to posterior (15.1 mm). The body is fully-scaled by the beginning of the juve- nile period (20 mm).
Pigmentation: general. Larvae lack pig- mentation at hatching. pigmentation is first observed on 2.4 rnm larvae as two small melanophores on the tip of the snout, two small melanophores over the forebrain and three small melanophores at the anterior to the yolk sac. The eyes become pigmented by day 3, with a scattering of melanophores over the gut and along the ventral area of the tail.
As the larvae grows, the caudal pigment spot moves slightly to the posterior onto the caudal peduncle and dorsally to the level ofthe centra. When the elongate dorsal and pelvic spines are folded back their dark tips are located very close to the caudal spot. In live larvae, the caudal end of the body is nearly transparent and i t is some- times difficult to distinguish the caudal spot from the dark tips of the spines.
From the earliest stages of dorsal and pelvic fin spine formation, the spines have fleshy tips with dense rnelanophores. As these spines lengthen greatly, the dark markings on their tips become more promi- nent, covering the outer one-third to one- half, making the spines readily apparent
(Colin and Koenig, in press). The tips of other spines of the dorsal Fin and the anal fin are not pigmented in larvae. Late stage larvae acquire melanophores on the up- per surFace of the head and a line along the base of the dorsal fin.
Pigmentation: head region. Head pig- mentation is lacking on most preflexion larvae (2.5-3.8 mm). Two preflexion larvae were observed with a melanophore located on each side of the ventral midline near the tip of the lower jaw while one specimen had only one of the two melanophores. This pair of melanophores near the tip of the lower jaw is present on all flexion lar- vae (5.5-7.4 mm). Flexion larvae >5 mm have a melanophore on the upper jaw on the anterior margin of the maxillary. Melanophores generally increase in number over the dorsal surface of the midbrain and forebrain during the flexion stage. By 7.4 mm, a cap of melanistic pigmentation covers the dorsal surface of the midbrain. In lar- vae >5 mm, internal melanophores appear over the hind brain and extend anteriorly from the anterior end of the notochord onto the perineural sheath in the nape region. Melanophores first appear on the opercle and color first appears on the head during post-flexion (9 mm).
Yellow (xanthophoric) pigmentation is present on the dorsal surface of the head and extends ventrolaterally to the eye which appears silvery for the first time. Silvery color (guanine crystals) appears on the preoperculum and operculum posterior to the eye during transformation ( 13 mm) with lavender pigmentation on the eye and a few orange chromatophores around the opercular spines. During the transforma- tion stage, melanophores rapidly increase in number and spread over all surfaces of the head until the entire head is covered with melanophores obscuring color pigmen- tation by the beginning ofthe juvenile stage (20 mm).

Pigmentation: preanal region. Three to five rnelanophores appear over the dorsal surface of the gut at the beginning of the preflexion stage (2.5 rnrn). Melanophores over the gut increase in number and fuse to form an internal melanistic shield by 3 mm in preflexion larvae. This shield extends anteroventrally and ventrolaterally with development and is clearly visible until external rnelanistic pigmentation obscures i t early in the juvenile stage. Internal melanophores appear dorsal and ventral to the notochord above the anterior of the gut at 2.6 mm and appear to extend anteriorly to the perineural sheath and hind brain b i 5.0 rnrn. Internal pigmentation may extend from the. notochord nearly to the dorsal margin of the body in 3.6 rnrn preflexion larvae and flexion larvae. Increasing body musculature and external pigmentation during transformation obscures this pigmen- tation in later stages. Melanophores ap- pear along the dorsal margin of the body early in the transformation stage. Melanistic pigmentation rapidly increases over the surface of the body during transformation and completely covers the body of small juvenile specimens.
Color first appears on late preflexion larvae (7.4 rnrn). Yellow pigmentation and silvery color appear along the ventral margin of the melanistic shield lining the peritoneum. Xanthophoric pigmentation spreads anteriodorsally and appears as a wash of color covering the gut region and nape: silvery color covers the ventrolateral re- gion of the peritoneal shield in post-flexion and transformation Fish. Color pigmentation in the preanal region becomes obscured by melanistic pigmentation on transformation to the juvenile stage.
Pigmentation: post-anal region. In the post-anal region, melanophores first ap- pear along the ventral midline of the body about one-third post-anal length anterior horn the notochord tip at 2.4 mm and increase in number to seven to nine by 2.6 mm.
One of the anteriormost melanophores in this series usually appears notably larger than the others. This melanophore appears to be expanded in larvae of 2.8 mm and appears to form what Powell and Tucker (1 992) have described as an inverted saddle on the ventrolateral surface of the body in the vicinity of myomeres 17-20. Three to five internal melanophores appear along the dorsal surface of the notochord in the region dorsal to the inverted saddle at 6 mm. Late in the flexion stage (7.4 mm), internal and external pigmentation asso- ciated with this saddle begins to move dorsally towards the notochord and lateral midline of the body. By the end of the flexion at 9.6 mm, internal melanophores extend along the dorsal surface of the notochord from the caudal peduncle to midbody and a patch of external pigmentation has moved to the lateral midline of the body on the caudal peduncle.
Color first appears in 9 mm larvae in the post-anal region. A wash of yellow pig- mentation surrounds the melanistic pigment patch on the caudal peduncle and a Few orange chrornatophores appear along the lateral midline near the caudal peduncle patch. This yellow wash of pigmentation persists through the larval and transformation stages. Orange chromatophores increase in number and by the beginning of trans- formation (1 2 rnrn) extend anteriorly along the lateral midline from the caudal peduncle patch to a position under the origin of the soft dorsal fin. Internal pigmentation, color pigmentation and the caudal peduncle patch are obscured by musculature and external pigmentation by the beginning of the ju- venile period at 20 rnrn.
Pigmentation: fins. Fin pigmentation first appears in the caudal fin membrane, ven- tral to the notochord tip at 2.6 mm. Two to twelve rnelanophores generally appear as a line of pigment extending away from the ventral tip of the notochord prior to flexion. As the caudal fin develops, these

melanophores become fewer in number through post-flexion and appear on the fin membrane between the developing cau- dal rays. During transformation, a few orange chromatophores and a "crescent" area in the anterior third of the fin becomes covered with leucocytes. Towards the end of transformation stage small melanophores appear, except for a crescent-shaped area in the anterior third of the fin, which re- mains lightly pigmented and appears white due to presence of leucocytes. Melanophores appear flag-like on the fin membrane at the distal tips of the second dorsal and the pelvic fin spines immediately after they begin to develop at 2.9 mm. Melanistic pigmen- tation over the second dorsal fin spine extends proximally and covers the distal one-third of the spines and is the only melanistic pigmentation present on the spinous and soft dorsal fin until rnelanistic pigmenta- tion rapidly develops and obscures larval pigmentation during transformation.
Orange pigmentation appears around the flag only during the transformation stage at 12 rnrn. The spinous dorsal fin rnem- brane OF juveniles is densely covered by small melanophores except for the distal fringes between the spines, which lack melanophores and appear as white "flags". Melanistic pigmentation extends proximally over the pelvic An spine to the pelvic fin base by 5 mm. Melanophores appear on the pelvic fin membrane coinciding with initiation of pelvic fin development (6.5 mm), and persist through larval develop- ment. The pelvic fin spine is covered by an orange wash of chromatophores during the post-flexion stage (9.5 rnm). Orange chromatophores extend posteriorly onto the pelvic fin membrane and cover the entire pelvic membrane during the transforma- tion stage. Rapid development of melanistic pigmentation on the pelvic fin late in trans- formation obscures all larval pigmentation in juveniles.
Orange chromatophores appear over the distal tip of the second anal fin spine early
in the transformation stage ( 1 2.5 mm). By 14 mrn, a row of orange chromatophores appear at the insertion of the anal rays and a crescent-shaped band of leucocytes ex- tends across the middle of the anal fin. Larval pigmentation is obscured by melanistic pigmentation by the beginning of the ju- venile stage (20 mm), except for the crescent- shaped band of white pigmentation.
juveniles in rearing aquariums did not quickly acquire the dark juvenile color pattern, which is similar to the adult. Rather, the barred pattern found on large juvenile and adults was first faintly acquired.
Swim Madder. Swim bladder inflation was first noted at day 12 when the silvery- sheen of the swim bladder was noted,in- side the gut of the larger larvae in the rearing tank.
Lan4growth rate. Data for growth rate (Fig. 1 1 ) were taken from preserved speci- mens which show shrinkage averaging 7% after preservation and are indicative of the growth rate of the more advanced larvae in the rearing tanks.
/uveni/egrowth. Six red grouper juve- niles were individually maintained in 80-1 aquaria and fed to satiation with juvenile pinfish (Lagodon rhomhides). From days 66 to 1 34, these juveniles grew at rates from 0.26 to 0.6 1 mmday-' (mean =.0.41 mm-day7') (Fig 12). From 134 to 557 days, growth rates were 0.20 to 0.29 mmday-' (mean = 0.27). All six juveniles were released in October 1992 on an artificial reef offshore OF Cedar Key, Florida, in water 15 m deep. They were freeze-branded (Colin and Koenig, in press) and dart-tagged and their survival is being monitored.
Discussion
The eggs of red grouper would be in- distinguishable, in the field, from the eggs of most other species of Epinephelus. The

I I I I 15 L 1 I I I I
w m so so too Iro 120 1 3 140 Days after
Fig 11. a) Growth of larval and pelagic juvenile Epinephefus morio ln the laboratory. I Crecimlento de I m a s y juveniles peliglcos de Eplnephelus morlo en el laboratorio.] b) Growth of benthic juvenile Epinephelus moriu In the laboratory. [ CrecJmlento de juveniles bentbnko de Ep l nephelus
Pelvic spine , -0
Notochord or standard length (mm) Age in days post hatching
_1
Flg 12. The relattonshlp of the absolute and relative lengths o f the second dorsal and pelvlc fLn splnes of larval Epinephelus morio with the length (notochord length In preflexlon larvae and standard length In postflexlon larvae) and post-hatch age In days. [Relacion entre Ias fongltudes absofuta y refatfva de Ia segunda esplna iie la afeta dorsaf y la espina de la aleta pc5lvica de lamas de Eplnep helus morio con h longitud y edad post-crianza, en dias (iongitud del notocordlo en larvas en estado de preffexion, y longitud estandar en / m a s en estado de posfnexion).]

density of eggs indicates that they must be spawned intially in water of 28 ppt or greater to be positively buoyant and late stage eggs require about 32 ppt for neu- tral buoyancy. Almost certainly, eggs which are not floating have little chance of suc- cessful development, although embryonic development can proceed. Such eggs would come into contact with the bottom fairly soon after spawning and the conditions would not favor survival of the egg or early lar- vae.
A5 salinities lower than the 32 ppt which are necessary for positive buoyancy are common in inshore areas of the coast of Florida of the Gulf of Mexico, this is one factor which would limit the areas where E. morio could spawn. There are also of- ten haloclines occurring in this area, and i t is probable that eggs would rise to the upper limit of high salinity water and remain there, probably developing successfully.
Spine de velopmen f
Relative to standard length, the second dorsal fin spine reached its maximum of about 50% and the pelvic spine its peak of 40% of SL at 5.5-7.4 mm SL (Fig. 12). The longest absolute spine lengths were obtained at these same stages. Powell and Tucker (1 992) reported slightly smaller relative spines lengths (maxima of 48% and 32%) for laboratory-reared E striatus. For larvae smaller than 6.0 mm SL, they did not report any relative dorsal spine lengths over about 36% and pelvic spine lengths over 27%. For E. morio, larvae as small as 4.0 mm SL exceeded these relative values for spine length.
Colin and Koenig (in press) argued that the major function of the elongate dorsal and pelvic spines of planktonic epinephelines was antipredator. The early and rapid de- velopment of spines, plus their orientation, resulted in a larvae representing a con- siderably larger and more difficult prey item
to a potential predator. The melanophore- rich fleshy tabs at the tips of the spines were very apparent in live larvae and are thought to mark clearly to potential predators the tips of the spines and the effective size of the larvae. When seen in living larvae the location of the caudal pigment spot tends to enhance the pattern produced by the three outward projecting spines with their dark tips. It is seen as a fourth dark spot centered within the triangle produced by the spine tips.
Larval growth rate
We feel that the growth rates of larvae and pelagic juveniles, shown in Figs. 11 and 12 are relatively similar to those which would occur in nature. Given the rates shown and the timing observed in our rearing aquaria where transformation from pelagic juvenile to benthic juveniles occurred at about 20 mm SL and 35-50 days post-hatch, this agrees reasonably well with ages deter- mined for recruiting grouper juveniles in the field. Unfortunately there are no such data available for E. morio, but pretransition ages determined from otolith increments were found to be 37-45 days (mean 41.6) for E. striatus and 34-42 days (mean 38.6) for E. fulvus in the Bahamas (Colin et al., in press). For other Western Atlantic groupers, Mycteroperca rnicrolepis had m ean pretransition ages of approximately 42 days and SL of 15 mm and M. bonaciof 41 days (Keener et al. 1988). The data presented by Powell and Tucker ( 1992) for labora- tory reared E. striatusindicate a slower growth rate for that species. For example, their 17-20 days post-hatch larvae were 5.5-6.5 mm SL, while the present E. rnorio were 5.7- 7.4 mm SL: and at 26-30 days lengths were 8.5-9.4 mm SL vs. 12.1-1 5.1 mrn SL, respectively. Their largest larvae at 13.2 mrn SL was of an age (40 days) at which transition of E. striatus to benthic existence would be expected, normally at 20 rnm

SL o r m o r e (Colin e t a l . , in p ress ) . W h e t h e r t h e i r s l o w e r larval g r o w t h r a t e was d u e to rearing condi t ions n e e d s to be de te rmined .
Keener e t al. (1 988) also collected a small n u m b e r of recru i t ing E. morio in n e t s a n - c h o r e d in a c h a n n e l l e a d i n g t o a n e s t u a - r ine a r e a off C h a r l e s t o n , S o u t h Carol ina. C o m p a r e d to t h e g a g , Mycferoperca microlepis a n d o t h e r g r o u p e r p e l a g i c ju- v e n i l e s , t h e s e c o m p r i s e d less t h a n 1 O/o of t h e e p i n e p h e l i n e c a t c h , b u t w e r e g e n e r - ally col lected dur ing mid-April to mid-May, at a time consistent with t h e known spawning s e a s o n o f E. morio a n d t h e time be l ieved r e q u i r e d for d e v e l o p m e n t to t h e b e n t h i c juveni le stage.
juvenile growth
The g r o w t h rates of t h e juveniles in aquaria i n d i c a t e c o n s i d e r a b l e individual variation. H o w e v e r , t h e m e a n r a t e o b s e r v e d , 0.41 m m - d a y 7 ' is similar to t h a t reported by Colin et a l . (in p r e s s ) for Epinephelus stridtus in t h e B a h a m a s .
T h e r e l e a s e of t h e labora tory- reared ju- veni les o n a Florida artificial reef represents , w e b e l i e v e , t h e first r e l e a s e of cu l tu red g r o u p e r s i n t o t h e wild.
Acknowledgements
N u m e r o u s individuals ass i s ted wi th field and laboratory work. Local commercial fishers, particularly Clay Bailey, p rov ided a d u l t fish fo r s p a w n i n g w o r k . M i k e C h a s a r was in- v o l v e d in all a s p e c t s of t h e field a n d l a b o r a t o r y w o r k . Lori 1. Bell a n d Felicia C o l e m a n assisted in m a n y w a y s .
This w o r k was s u p p o r t e d by t h e MARFIN p r o g r a m of t h e National M a r i n e Fisheries S e r v i c e a n d t h e Florida S t a t e D e p a r t m e n t of Natural R e s o u r c e s f ishing l i c e n s e rev- e n u e r e s e a r c h p r o g r a m .
References
Colin, P.L., W.A. Laroche and ED. Brothers. Timing o f ingress and set t lement in the Nassau grouper , Epinephelus s t r ia tus (Pisces: Serranidae). with relationship to spawning occurence. Bull. Mar. Sci. (In press).
Colin, P.L. and C.C. Koenig. Spines in larval red grouper, Epinephelusmorio: development and Function. Proc. GulFCaribb. Fish. Inst. (In press).
Goodyear, C.P. and M.J. Schirripa. 1991. The red grouper fishery of the Gulf of Mexico. Miami Lab. Contrib. No. MIA-90/91-86, Southeast Fisheries Center, U.S. Natl. Mar. Fish. Serv. 80 p.
Johnson, G.D. and P. Keener. 1984. Aid t o iden- tification of American grouper larvae. Bull. Mar. Sci. 34: 106- 134.
Houde, E.D. and A.K. Taniguchi. 1977. Proce- dures used to culture larvae of marine fishes a t the Rosenstiel School of Marine and A t m o s p h e r i c Sc ience . Report t o Environmental Prot. Agency. 1 7 p.
Keener, P., G.D. Johnson, B.W. Stender and E.B. Brothers. 1988. Ingress of postlarval gag , Mycte roperca micro lep is (Pisces: Serranidae) through a South Carolina barrier island inlet. Bull. Mar. Sci. 42(3):376-396.
Kendall, A.W., Jr. 1984. Serranidae: develop- ment and relationships, p. 499-51 O.lnH.G. Moser, W.J. Richards, D.M. Cohen, M.P. Fahay, A.W. Kendall, Jr. and S.L. Richardson (eds.) Ontogeny and systematics o f Fishes. Amer. Soc. Icht. Herp. Spec. Publ. No. 1 .
Moe, M.A. 1969. Biology of t h e red grouper , Epjnephelus morio (Valenciennes) From the eastern Gulf of Mexico. Florida Dept. Nat. Res.. Mar. Res. Lab. Prof. Pap. Ser. 10: 1 - 95.
Powell, A.B. and J.W. Tucker, Jr. 1992. Egg and larval development O F laboratory-reared Nassau grouper, Epinephelus striatus(Pixes: Serranidae). Bull. Mar. Sci. 50(1): 171 -1 85.

APPENDIX 1
List of Partlclpants
Arreguin-Sanchez, Francisco Centro lnterdisciplinario d e Ciencias
Marinas, lnstituto Polit6cnico Nacional A.P. 592, 23000 La Paz Baja California Sur, Mexico
Fax 52(1 12) 25322 Phone 52( 1 12) 25344/25366 E-mail [email protected]
Auil, Stephanie Fisheries Department Princes Margaret Drive P.O. BOX 148 Belize City, Belize
Fax (50 1 ) 2 32983
Ault, Jerald Marine Biology and Fisheries Division University of Miami RSMAS Campus 4600 Rickenbacker Causeway Miami, Florida, 33 149- 1098
Fax (305) 361 4600
Bush, Phlllipe G. Natural Resources Unit Department of the Environment Grand Cayman, Cayman Islands, BWI
Fax (809) 9497544 E-mail [email protected]<g
Campos, Jose Luis Department of Natural and
Environmental Resources P.O. Box BO666OO Puer ta de Tierra Station San Juan, Puerto Rico 00906-6600
Fax (787) 724 7335 Phone (787) 722 4204 E-mail CARIBEFISH@UPRI .UPRCLU.EDU
Caveriviere, Alain lnstitut Francais de Recherche Scietifique
Pour le Developpement en Cooperation (ORSTOM)
B.P. 1386, Dakar, Senegal Fax (22 1 ) 32 43 07 Phone (22 1 ) 34 75 95 E-mail [email protected]
Chapman, Robert W. Marine Resources Research Institute South Carolina Wildlife & Marine
Resources Department Charleston, South Carolina 294 12, USA Fax (803) 762 5 1 10 Phone (803) 762 5402 E-mail [email protected]
Chavez, Ernesto A. Centro lnterdisciplinario d e Ciencias
Marinas, lnstituto Politecnico Nacional A.P. 592, 23000 La Par Baja California Sur, Mexico
Fax ( 1 12) 25366 Phone ( 1 12) 2$322/25344
Colllns, L. Alan National Oceanic and Atmospheric
Administration National Marine Fisheries Service Southeast Fisheries Science Center Panama City Laboratory 3500 Delwood Beach Road Panama City, Florida 32408, USA
Fax (904) 235 3559 E-mail [email protected]

Collins, Mark R. Marine Resources Research Institute South Carolina Wildlife a Marine
Resources Department P.O. Box 12559 Charleston South Carolina 29422-2559 USA
Fax (803) 762 5 1 10 Phone (803) 762 5008 E-mail [email protected]
Cotte, Ricardo Caribbean Fishery Management Council 268 Avenue Mu1702 Rivera, Suite 1 108 San Juan, Puerto Rico 009 18-2577
Fax (787) 766 6239 Phone (787) 766 5926/766 5927/
766 5928 E-mail CARIBEFISH@UPRl .UPRCLU.EDU
Domeier, Michael L. California Depatment of Fish and Game Marine Resources Division 330 Golden Shore, Suite 50 Long Beach, California 92648, USA
Fax (3 10) 590 5 193 E-mail 103727.353~compuserve.com
Ehrhardt, Nelson M. Division of Marine Bio10,gy and Fisheries Rosentiel School of Marine and
Atmospheric Science University of Miami 4600 Rickenbacker Causeway Miami, Florida 33 149-1 098, USA
Fax (305) 361 4902 Phone (305) 361 4741 E-mail [email protected]
Estrada Garcia, Jaime Centro Regional de Investigacion
Pesquera Veracruz Av. Manuel Avila Camacho # 195 Col. Centro, Veracruz, Veracruz, Mexico
Phone (52-28) 1 5 6 1 18
Flores-Hernandez, Dorningo Programa de Ecologia, Pesquerias y
Oceanografia del Golfo de Mexico (EPOMEX)
U.A.C. Apartado Postal 520 Campeche 24030, Campeche, Mexico
Fax (98 1 ) 65 954
Garcia Moliner, Graclela Caribbean Fishery Management Council 268 Avenue Mufioz Rivera, Suite I I08 San Juan, Puerto Rico 0091 8-2577
Fax (787) 766 6239 Phone (787) 766 5926/766 59271
766 5928 E-mail CARIBEFISHBUPRI .UPRCLU.EDU
Gomez, Gabriel I . FONAIAP Centro Invest. Agrop. Pesq. Sucre P.O. Box 236, Curnand 61 0 1 , Venezuela
Fax 58 (93) 3 18 454 E-mail ciapes@sucre,udo.edu.ve
Gonzales Cano, Jaime lnstituto Nacional de la Pesca Chilpancingo # 70 Colonia Hipodromo Condesa 06100 Mexico, D.F.
Fax (5) 286- 1 149
Jacobs, Noel Fisheries Department Princes Margaret Drive P.O. Box 148 Belize City, Belize
Fax (50 1 ) 2 32983
Koenig, Christopher C. Department O F Biological Sciences Florida State University Tallahassee, Florida 32306-2043, USA
Fax (904) 6449829 E-mail I<[email protected]

Lara-Dorninguez, Ana L. Programa de Ecologia, Pesquerias y
Oceanografia del Golfo de Mexico (EPOMEX)
U.A.C. Apartado Postal 520 Campeche 24030, Campeche, Mexico
Legault, Christopher M. Rosentiel School of Marine and
Atmospheric Science University of Miami 4600 Rickenbacker Causeway Miami, FL 33 149- 1098 USA
Leonce-Valencia, Claudia 0. Centro de Investigation y de Estudios
Avanzados del IPN Apartado Postal 73 Cordemex C.P. 973 10 Merida, YucatAn, Mexico
Fax (99) 8 1 29 1 7
Luckhurst, Brian E. Division of Fisheries P.O. Box CR 52, Crawl CRBX, Bermuda
Fax (808) 2932716 E-mail [email protected]
Manickchand-Heilernan, Sherry lnstituto de Ciencias del Mary
Limnologia, Lab. Ecologia del Bentos Universidad Nacional Autonoma de Mexico, Apartado Postal 70-305, Mexico 045 10 D.F. Mexico
E-mail [email protected]
Medina, Miguel Secretaria de Medio Ambiente Recursos
Naturales y Desarrollo (SEMARNYD) Gobierno del Estado de Campeche Calle 10 $338, Barrio San Roman C.P. 24040, Campeche, Campeche Mexico
Phone (52-98 1 ) 1 29 20
Mees, Christopher C. Marine Resources Assessment Group 47 Prince's Gate, London SW7 2QA, UK Fax (+44) 1 7 1 823 79 16 Phone (+44) 1 7 1 594 9888 E-mail [email protected]
Mendoza, Jeremy J . Dpto. de Biologia Pesquera lnstituto Oceanografico Universidad de Oriente Apartado Postal 245, Cumana, Venezuela
Fax (58-93) 653 606 E-mail [email protected]
Monroy-Garcia, M. del Carmen Centro Regional de lnvestigaciones
Pesqueras de Yucalpeth Apartado Postal 73, Progreso 97320 YucatAn, Mexico
Fax (993) 54028
Munro, John L. ICLARM MCPO Box 263 1 071 8 Makati, Metro Manila, Philippines
Fax (63-2) 81 6 3 183 Phone ( 1 -809) 973 2241 E-mail [email protected]
Laboratoire de Biologie Marine et Malacologie
EPHE, Universite de Perpignan Perpignan 66860 Cedex, France
Fax (33) 68 50 36 86 Phone (33) 68 66 20 55
Caribbean Marine Protected Areas Project
Discovery Bay Marine Laboratory P.O. Box 35, Discovery Bay, Jamaica
Fax ( 1 -809) 073 309 1 Phone ( 1 -809) 073 2241

Pauly, Daniel ICLARM MCPO Box 263 1 071 8 Makati City, Metro Manila, Philippines
Fax (63-2)s 16 3 183 and Fisheries Centre, 2204 Main Mall University of British Columbia Vancouver, B.C. Canada V6T 124.
E-mail [email protected]
Perez Mellado, Joaquin lnstituto Tecnolbgico del Mar de
Cuaymas Secretarla de Educacibn PGblica Apartado Postal 742, Cuaymas, Sonora 85400, Mgxico
Pitcher, Tony Fisheries Centre University of British Columbia 2204 Main Mall, Vancouver, B.C. Canada V6T 124
Fax (604) 822 8934 E-mail [email protected]
Posada, Juan M. Department of Marine Sciences University of Puerto Rico Mayagiiez 00681 -5000, Puerto Rico
Fax (787) 899 5500 Phone (787) 899 2048
Ramm, David C. Commission for the Conservation of
Antarctic Marine Living Resources 23 Old Wharf, Hobart Tasmania 7000 Australia
Fax (6 1 -3) 62349965 Phone (6 1-3) 623 19556 E-mail [email protected]
Ramos-Miranda, Julla Programa de EcologCa, Pesquerias
y Oceanografia del Golfo de Mexico U.A.C. Apartado Postal 520 Campeche 24030, Campeche, Mexico
Render, Jeffrey H . Coastal Fisheries Institute, Center for
Coastal Energy and Environmental Resources
Louisiana State University Baton Rouge, Louisiana 70803-7503, USA
Fax (504) 38865 13
Rivera-Arriaga, Evella Programa de Ecologia, Pesquerias
y Oceanografia del Golfo de Mexico U.A.C. Apartado Postal 520 Carnpeche 24030, Campeche, Mixico
Rodrigues Cunha, Luis Paulo Universidade do Rio Grande Depto. de Oceanografia Cp 474,9620 1 400 Rio Grande (RS), Brazil
Rolon, Miguel Angel Caribbean Fishery Management Council 268 Av. Mufioz Rivera Suite 1 108 San Juan, Puerto Rico, 009 18
Fax (809) 766 6239
Sadovy, Yvonne Department of Zoology University of Hong Kong Pokfulam Road, Hong Kong
Fax (852) 55991 14
Siincher Chiivez, Julio A. Universidad Aut6noma de Campeche Direcci6n General de Estudios de
Posgrado e lnvestigacion Torre de Rectoria, Ciudad Universitaria, Av. Universidad y Agustin Melgar s/n Campeche 24030 Carnpeche, MGxico
Fax/Phone (52) (981) 1 29 67 Phone (52) (981) 6 26 18 ext. 1 13 E-mail dgpiQbecan.uacam.mx
Sanchez-CII, Patricia Program of Ecology, Fisheries and
Oceanography of the Gulf of Mexico (EPOMEX)
University of Campeche Apartado Postal 520 Campeche 24030, Carnpeche, Mexico

Salas, Sllvia Fisheries Centre, 2204 Main Mall University of British Columbia Vancouver, B.C. Canada V6T 1 24.
Scott-Denton, Elizabeth National Marine Fisheries Service Southeast Fisheries Science Center Galveston Laboratory 4700 Avenue U , Galveston Texas 7755 1 , USA
Fax (409) 766 3508 Phone (409) 766 3500
Shapiro, Douglas Department of Biology Eastern Michigan University Ypsilauti, Michigan, 481 97, USA
Fax (3 13) 487 9235
Skov, Patricia Caribbean Fishery Management Council 268 Avenue Muiioz Rivera, Suite 1 108 San Juan, Puerto Rico 0091 8-2577
fax (787) 766 6239 Phone (787) 766 59261766 59271
766 5928 E-mail CARIBEFISHBUPRl .UPRCLU.EDU
Sluka, Robert University of Miami Department of Biology Coral Gables, Florida 33 124 USA
Fax (305) 284 30 1 3 E-mail [email protected]
Sullivan, K.M. University of Miami Department of Biology Coral Gables, Florida 33 124 USA
Fax (305) 284 3039
The Nature Conse~ancy, Florida and Caribbean Marine Conservation Science Center
P.O. Box 2491 18, Coral Gabies, Florida 33 124, USA
Fax (305) 284 3002
Szedlmayer, Stephen T. Auburn University Marine Extension and
Research Centre Department of Fisheries and Allied
Aquacultures 4 1 70 Commanders Drive, Mobile AL36615-1413 USA
Fax (205) 438 5670
Thompson, Bruce A. Coastal Fisheries Institute, Center for
Coastal Energy and Environmental Resources
Louisiana State University Baton Rouge, Louisiana 70803-7503 USA
Fax (504) 38865 1 3
Tucker, John W., Jr. Harbor Branch Oceanographic Institution 5600 North U.S. Highway 1 , Fort Pierce Florida 34946, USA
Fax (407) 465 2446
Woodley, Cheryl M. National Marine Fisheries Service
Charleston Laboratory 2 1 7 Johnson Road Charleston, South Carolina, USA
Xiao, Yongshun Fisheries Division Department of Primary Industry and
Fisheries GPO Box 990, Darwin NT 080 1 , Australia
Yaiiex-Amncibia, Alejandro Programa de Ecologia, Pesquerias
y Oceanografia del Golfo cie Mexico U.A.C. Apartado Postal 520 Campeche 24030, Campeche, Mexico
Zetina-Moguel, Carlos Centro Regional de Investigaciones
Pesqueras de Yucalpeten Apartado Postal 73, Progreso, 97320 Yucatan, Mexico
Fax (993) 54028
APPENDIX 2
Author Index
Abaci, N. 3, 10 Abdel-Aziz, S.H. 241 Abella, A. 164, 172 Ablan, M.C. 10 Acero, A. 46,48 Acosta,A. 12, 15, 17, 164, 171,240 Adisukresno, 5. 302 Aguirre-Leon,A. 4, 12, 18,43,44,46,48,
49,278,325 Agustin, L. 6, 8 Altamine, T. 164, 17 1 Al-Shoushani, M. 164, 172 A1agaraja.K. 115, 116,117, 141, 146,148 Alagarswami, I<. 1 15, 1 17 AI-Baz, A.F. 241 Alcala, A.C. 6, 10 Aleev, Y.G. 251, 253 Alegria, j. 237 Alexander, L.M. 91,240 Alexander, R.McN. 245,251,253 Alio, J. 58, 336 Allan, G.L. 377 Allen, D.M. 75,82 Allen,G.R, 3,8,86,90,92,95, 116, 118,
129, 130, 131, 132, 133, 134, 135, 136,220,234
Allendorf, F.W. 86, 91 Alvarez-Guillh, H. 46.48 Alvarez-Lajonchere, L. 239 Alverson, D.L. 360, 362 Alves, M.I.M. 139, 146, 148 Ambak, M.A. 238 Ameer Hamsa, K.M.S. 1 1 1, 1 15, 1 16 Arnezcua Linares, F. 12, 14, 17 Amon Kothias, J.B. 236 Anderson, B. 302 Anderson, C. 187 Anderson, J. 187 Anderson, W.D., Jr. 65-67, 72, 1 18, 1 62 Andreoli, M.G. 164, 172 Anon. 20.26, 1 1 1 , 1 14,
276,332,336 Ansley, H.L.H. 160, 162
Ansuini, F.J. 1 1 7 Appeldoorn, R.S. 12, 15, 1 7, 163- 165,
1 71 ,205,240,243 Arceo,P. 203,211,214, 215 Archer, B. 187 Arnold. C.R. 190, 199. 200 Arnold, G.P. 49 Arocha, F. 58 Arreguin- SAnchet, F. 1-4,8, 10, 11 , 1 5,
17, 19, 20, 21,23, 25-30,40,43, 51, 59, 74-76,85,92,96, 106, 1 37, 150, 158, 163, 164, 174, 189,202-21 6, 218,242-244,254,266,277,289, 307,324,331, 337, 350,355, 358, 359,360,363,378,385,399
Artiles, M. 241 Avadh, G.K. 107, 109, 118
Back, W. 29,40 Bacon, P.R. 139, 149 Badrudin, M. 242, 302 Baez, C. 336 Baez Hidalgo, M. 239 Bagenal, T.B. 1 57 Bailey, C. 321,414 Baisre, J. 242 Baisre, ].A. 240 Bakhader, A. 237 Bal, D.V. 1 16 Balgos,M.C. 1,4, 9, 11, 19, 28, 43, 51,
59, 74,85,92, 106, 137, 150, 158, 163, 174, 189,202,2 18,242-244, 254,266,277,289,307,324,331. 337,350, 355,360,363,378, 385, 399
Ballantine, W.]. 6, 10 Bambino, C. 3, 9. 220, 236 Bannerot, S.P. 5, 8, 44, 48, 75, 76, 82,
278,288,308,321,322 Bapat, S.V. 107, 1 1 1, 1 17 Baranov, F.I. 219,234 Barans,C.A. 60,61, 71, 72, 73, 162, 190,
200

Barber, R.C. 86. 90 Bardach, J.E. 1 73, 278, 288 Barnes, ].A. 165, 172, 364, 377 Baron, M. 302 Barr, E.E. 241 Basheeruddin, S. 1 17 Basson, M. 206, 215 Basu. S.P. 107, 1 10, 1 18 Basurto-Origel, M. 44,48 Bauchot, M.L. 42 Baxter, J.H.S. 154, 157 Beamish.R.1. 2 .8 . 151, 152. 154, 157,
159, 162,231,234 Beatty, H.R. 317, 322,413,414 Beaurnariage, B.S. 76, 82 Beaumont, A. 91 Beddington, 1.R. 206, 2 15, 2 16, 265 Beets. 1. 4, 8, 9, 75, 82, 83, 165, 171 Bell, J .D. 77, 83 Bell, L.J. 414 Bellwood, D.R. 7, 10 Benco. R. 264, 265 Benitez. L.V. 383 Bennett, J. 175, I87 Bensarn, P. 115, 117 Bentzen, P. 87, 9 1 Berrios. j. 46, 48. 49 Berry, F.H. 6 1 , 73 Bertin, L. 103, 105 Betancourt, M. 57, 58, 242 Beverton, R.J.H. 141, 148, 164, 172, 219,
220,228,235,342,349 Bhar, P.K. 107, 1 10, 1 19 Bhargava. P.I<. 107. 1 10. 1 18 Bhattacharya, C.G. 164, 17 1 Bianchi, G. 95, I 16, 1 17 Binohlan. C. 3, 6. 8. 218, 220, 235 Birdsong. R.S. 165, 172 Birkeland, C.E. 238 Blaber, S. 302 Blaber. S.J.M. 302 Blache, J. 92, 95 Boa, A.G. 241 Boerema, L.K. 340, 349 Bogdanov, A.S. 200, 239 Bohllte, J.E. 63, 65. 72, 204, 2 15 Bohnsaclc 75 Bohnsack, ].A. 75,82, 83, 165, 17 1 , 320-
322,364,377 Bolden, S. 165, 17 1 Bortone, S.A 4,44, 61, 85, 86, 90, 190,
200,237,241 Bouain, A. 240 Bouhlel, M. 237 Brahrni, B. 240 Branford, R. 302 Bravington, M. 265 Brewer, D. 302 Briggs, J.C. 165, 172, 175, 187 Briggs, P.T. 241 Brock, V.E. 39, 41 Brothers, E.B. 192, 200, 3 17, 322.4 13,
414 Brouard, F. 17 1 , 172, 236 Brown, A,, Jr. 75, 83 Bruger, G.E. 240 Brule, T. 20, 28, 35, 38-41, 75. 76, 204,
400 Brusher, H.A 44,49, 175, 180, 187 Brusle, J. I05 Buchanan, C.C. 160, 162 Buckworth, R.C. 300, 302 Buddemeyer, R.W. 238 Buesa-Mas, R,J, 333, 336 Buesa, R.J. 242 Bullis, H.R., Jr. 27, 82, 240 Bullock, L.H. 76, 82, 83, 165, 172, 187,
240,308,3 10,32 1.322 Burgos, R. 2, 3, 20, 26, 27, 29, 76, 164,
202-205,206,215,242, 355,358 Burgos Rosas, R. 245,350,360 Burrner, G.C. 90, 91 Burnett-Herkes, J. 165, 172, 239, 364, 377 Burrell. V.G., jr. 60, 61, 73 Burton, M. 190.200 Bush, P.G. 2, 39,42, 150, 151, 157. 159,
364,366,368,373,377 Butler, J.N. 165, 172, 364, 377 Buxton, C.D. 6. 10
Cabral, C. 197- 199 Cabrera, M.A. 20, 27, 30, 40, 205-208.
21 1,214,215 Cabrera-Vasquez, M.A. 12. 18 Caddy, J.E. 355, 359 Cadenat. j. 92, 95. 237

42 2
Campbell, R. 302 Camper, J.D. 86, 90 Camus, A. 25 I Cansado, E. 359 Cantarell, E. 243 Carlot, A. 264, 265 Carr 31 7 Carranza, j. 30, 41 Carrara, G. 237, 241 Carrillo de Albornoz, C. 242 Carter, H.J. 60, 72 Carter, J . 364, 377 Casal, C. 6, 8 Cassie, R.M. 164, 1 72 Caveriviere, A. 92, 94, 95, 96, 100, 105 Celaya, 1. 138, 148, 267, 276 Cervigon, F. 52, 57, 58, 169, 172, 336,
357,359 Chaclto, P.1 1 1 7, 118 Chacon, R. 52, 57, 58,336 Chao, T.M. 383,386,394,396,397 Chaplin, C.C.G. 63, 65, 204, 215 Chapman, F. 176, 187 Chapman, R.W 4, 44, 61, 85, 87, 91 Chasar, M.P. 321 Chasar, M. 414 Chauvet, C. 240 Chavez, E. 12, 15, 17, 243 ChAvez, E.A. 20,26,207,215,216, 324 Chavez, j. 49 Chen 115, 117 Chen, C.H. 290,302 Chen, C.Y. 238, 240 Chen, S.C. 290, 302 Chen, T.T. 86, 91 Cheong, L. 379,383, 384 Chi, T.H. 290, 302 Chiappone, M. 82 Chidambaram. I<. 110, 1 1 7 Childress, J.J. 251, 253 Chilton, D.E. 151, 152, 154, 157 Chinnery, L.E. 241 Chong, Y.C. 386, 397 Christensen, J.M. 237 Christensen, V. 4, 8, 10, 21-23, 27 Christiansen, H.E. .57, 58 Chua, T.E. 1 15, 1 17, 1 19 Cillauren, E. 264, 265
Clarke, M.E. 190, 197, 200 Claro, R 12, 17, 147, 148, 205, 215,
239, 242, 243 Claro, R.M. 197, 198, 201 Clavijo, I.E. 166, 172 CMFRl (Central Marine Fisheries Research
Institute) 1 10, 1 1 7 Cochran, W. 52, 53, 58 Cohen, D.M. 414 Coleman 3 1 7 Coleman, F. 4, 189, 414 Coleman, F.C. 307 Coleman, R.M. 3 1, 4 1 Coleman, S.E. 30, 42 Colin, P.L. 6, 7, 10, 29, 39, 41, 166, 172,
198-201,204,307,317,319,321, 322,323,377,399,406,409,41 1, 41 3,414
Collins etal. 1977-1982 oKSC 51 17 41.3 253 8 2 3 1 4
Collins, L.A. 1 38, 1 74, 175, 180, 187, 190, 307
Collins, M.R 2, 4, 12, 44, 52, 59, 61, 62, 68, 72,86, 1 5 1, 1 58- 160, 1 62,245, 267,278, 308,309, 31 7,322,323, 335
Contreras, M. 2, 3, 20, 26, 27, 29, 76, 164, 202,205-207,211,214,215,242, 355,358
Cooper, S.G.C. 149 Corpuz, A. 237 Cousseau, M.B. 57, 58 Craik, G.J.5 77, 83 Crispin, D.A. 90, 91 Crocker, R.A. 197, 200, 237 Crowder, C. 187 Crowder, L.B. 6, 10 Crowther, J.R. 162 Cruz-Rornero, M, 324, 325, 330 Csirlte, J. 164, 172, 355, 359 Csirke, 5. 57, 58 CSlRO (Commonwealth Scientific and
Industrial Research Organisation) 299 Cuellar, N. 4, 12,44, 52, 59, 61, 72, 86,
245,267,278,335 Cuplta, D.M. 200 Curio, E. 252, 253 Cury, P. 238

Cushing, D.H. 326, 330
Davis, C.D. 162 Day, J.W., J r . 18 Dahl, 1. 187 Dall. W. 377 Dalzell, P. 240, 264, 265, 300, 302 Dalzell, P.J. 238 David. N. 164, 173 Davies, C.R. 6, 8 Davis, C.D. 162 Davis, D.H.S. 257, 265 Davis, T.L.O. 199, 200, 240 Davis, W.P. 165, 172 Day, J.W., J r . 12, 18 Dayton, P. 6, 10 de Leon , M.E. 356, 359 DeMaria, D. 197, 199, 31 7, 322 de Matos, A.P. 396, 398 De Menezes, M.F. 237 De Moraes, N.U.A. 139, 147, 148 de Sousa, M.J.B. 139, 148 De Sylva, D.P. 12, 17 Deniel, C. 20, 28, 75, 76, 204, 400 Dennis, G.D. 44, 49, 172 Denton. E.I. 251, 253 Deshmulth. V.M. 107, I 1 1 , 1 17 Devanesan, D.W. 110, 117 devlaming, V.L. 176, 187 Dholtia, H.I<. 1 19 Dias, ].I(. 159, 162 Dias, R.K. I62 Diar, 1. 46, 48, 49 Diaz-Ruiz, S. 4, 12, 43, 44, 46, 48, 49,
278.325 Dickey, B. 321 Dixon, R.L. 63, 65-67, 72 Dizon, L.B. 9, 236 Djabali, F. 240 Dodson, 1.1. 49 Doherty, P.J. 3, 4, 7, 9, 10 Doi, M. 383, 384 Doi, T. 20, 27, 206, 207, 21 5, 242, 325,
330 Domeier, M.L. 4, 189, 190, 197-201, 31 9,
323 Dominguez Rivas, F. 29,41 Dos Santos, E.P. 139, 147, 148
Douglas, J . 197, 20 1 Drennon, C.L. 240 Druzhinin, A.D. 238 Duray, M. 1 15, 1 18 Dustan, P. 76, 83
Ebanks, G.C. 2, 39,42, 150,159, 364, 366, 368,377
Ebenezer, I.P. 1 18 Ebersole, J.P. 44, 50 Ecldund, A.M. 31 9, 322 Edwards, A. 1 18 Edwards, R.R.C. 154, 157, 237, 240, 290-
292,299-303 Edwards, S.V. 87, 9 1 Ehrhardt, N.M. 5, 337, 340, 342, 349, 360 Eltlund, A.M. 308, 322 El-Musa, M.M. 164, 1 72 Eldridge, P.J. 200 Eleby, B. 91 Elizarov, A.A. 355, 359 Emata. A.C. 378 Erdrnan, D.S. 197, 198, 200 Erdrnann, M.V. 8, 9 Erhardt, H. 197, 198, 200 Erhardt, N.M. 245, 351 Erzini, I<. 1 64, 1 72, 24 1 Espino, E. 324. 325. 330 Espinoza, L. 57, 58, 240-242 Eullaran, B. 383 Everrnann, W. 190, 197,200 Ezzat, A.A. 241
Fable, Jr., W.A. 240 Fahay, M.P. 414 Fan, KC. 290, 302 Fange, R. 252, 253 FA0 (Food and Agriculture Organization)
379,384 Fenner, D.P. 44, 49 Fenoglio, C.M. 397 Ferreira, B.P. 2, 6, 9, 10, 241 Ferreira de, M. 237 Figuerola, M. 6, 10, 74, 83 Filatova, N.A. 238 Findley, L.T. 165, 173 Fine, J.C 39,41, 364, 377 Finlayson, D.M. 154, 157


Guzman, R. 33 1 Guzman. R.A. 51
Hairnovici, M. 159, 160, 162, 239 Halas, j.C. 76, 83 Hall, N . 302 Halver, J.E. 374, 377 Handy, S. 321 Han-[in, L. 238 Hanshaw, B.B. 29,40 Hanson, A.J. 139, 149 Haridas, C. 1 18 Harper, D. 75, 83 Harris, D.A. 7, 9 Harris, S. 200 Hashern, M.T. 241 Hastings, P.A. 241 Hatcher, A.I. 48, 50 Hawk, J.P. 190, 200, 383, 384 Heck, K.L. 48, 49 Heemstra, P.C. 3, 9, 1 1 1 , 1 1 7, 1 18, 1 ZO-
127,220,235 Heller, E. 165, 173 Henderson, R.J. 374,377 Heng, H.H. 384 Hernandez, D.F. 238 Hettler, W.F. 159, 162 Hilge, V. 12, 17 Higuchi, M. 115, 1 19 Hilborn, R.Y. 255,257, 264, 265,291, 292.
300-303,35 1,353,354 Hildebrand, S.F. 165, 169, 172 Hinde, P. 60, 73 Hiolti, S. 199, 201 Hixon, M.A. 4. 8, 9 Hoar, W.S. 253 Hobson, E.S. 40, 41 Hochachka, P.W. 9 1 Hoenig, J.M. 164, 172 Hoese. H.D. 165, 169, 172 Holden, M.J. 52, 58 Holling, C.S. 325, 330 HolC5.j. 141, 148. 164, 172,219,220,
228,235,342,349 Hood, P.B. 309,314, 315, 321, 322 Horn, M.H. 251, 253 Horn, M.W. 251,253 Hornell, J . 1 12, 1 17
Hosillos, L.V. 9, 236 Hostetter, E.B. 241 Houde, E.D. 401,414 Houston, W. 300.302 Howard, N. 264,265 Mowe, G.E. 162 Hsi-Chiang, L. 238 Hudson, J.H. 76,83 Huguenin, J.E 1 17 Hulley, R.B. 76, 83 Hunter, J.R. 175, 176, 180, 187 Huntsman, G.R. 63,65-67, 72, 160, 162,
200,239, 241,308,322 Hureau, j.C. 42, 165, 173 Hussain, N. 1 15, 1 17 Hyslop, E.J. 12, 17, 32, 4 1
Ingham, J.P. 288 Ingles, J , 237, 238 Isaac, V.j. 2, 9 lverson, E.S. 76, 82, 83 I V O , C.T.C. 138, 139, 140, 146- 149, 238
Jaap, W.C. 76, 77, 83 James, P.S.B.R. 106, 115, 117 jayasankar, P. 1 12, 1 1 7 Jernaltoff, P. 290, 300, 302 Job, T.J. 117 Joel, 1.1, I I8 johannes, R.E. 8, 9, 238 john, C.C. 1 14, 1 18 John, M.E. 109, 115, 118, 119 John, V. 1 18 Johnson,A.G. 138, 174, 176, 187, 190,
239 johnson, G. 302 johnson,G.D. 317, 322,400,413,414 Jones, A.C. 27, 82, 240 Jones, ].A 77,83 Jones,R.j. 314,317, 319, 320, 322 Jones, S. 114, 118 Jordan, D.E. 44, 49 Jordan, D.S. 1 90, 197, 200 Jory, D.E. 76, 82, 83 Joseph, A. 1 18 Joseph, K.M. 107, 109, 110, 115, 118 Joseph, P.J. 107, 109, 1 18 ju, D.R. 238

Juarez, L. 214 Juarez Fernandet, M. 366, 377 Juario, J.V. 1 15, 1 18, 383
I<agwade, P.V. 107, 1 1 1 , 1 17 I(ailola, P.S. 300, 303 Ihngrong, C. 368, 385 Icarrer, C. 165, 1 73 Icasirn, H.M. 1 17 Kawaguchi, K. 267, 275, 276 I<edidi, S.M. 237 Keener, P. 3 17, 322,400,413,414 Keim, C.P. 138, 1 74, 190 Kendall, A.W., Jr. 400, 414 Kenny, J.S. 139, 149 [<err, S.R. 255, 265 Kerstitch, A.N. 165, 173 Kiefert, A. 321 I<irnbrell, C.A. 175, 187 Kimmel, 1.1. 165, 172 Kindinger, J.L. 76, 83 King, D.W. 396, 397 Kitalong, A.H. 240 Icleinow, I<.M. 84 I<lima, E.F. 20, 27, 29, 41 I<nott, D.M. 60,61. 73 Kobayashi, D. 264,265 Icocher, T.D. 87, 91 Koenig, C.C, 4, 6, 29, 189, 204, 307, 308,
317,321,322,399, 106,409,41 1 , 413,414
Kohno, H. I 15, 118 Kostlan, E. 238 Koudil, M. 240 Krishnamoorthi, B. 107, 1 1 1 , 1 17 I<rishnapillai, S. 107, l 1 1 , 1 17 I<rulisch, L. 84 Kumaran, M. 1 14, 1 18 I<urisalta, S. 139, 148
Labisky, R.F. 82, 83, 238 Lablache, G. 237, 241 Lai, H.L. 238, 290, 302 Lai, H.C. 1 15, 1 19 Lal Mohan, R.S. 1 14, 1 18 Laloe, F. 53, 58 Landless, P.J 1 18 Lane, E.D. 2, 150, 159, 364
Lanjumin, L. 6, 9, 115, 118 Laplace, J.A. 39,41, 239, 3 1 7, 322 Lara-Dominguez, A.L. 1 1 , 12, 18, 26,44,
180,215 Larez, A. 6 1 , 266 Laroche, W.A. 6, 29, 190, 200, 204,
399, 413,214 Lasker, R. 187 Latu, T. 264, 265 Lazard, J. 236 Le Bail, J . 29, 41 Lee, E.S. 1 15, 1 18 Lee, H.B. 384 Lee, J.U. 241 Lee, R.F. 25 1 , 253 Lefltowltch, J.H. 397 Legault, C.M. 5, 245, 337, 340, 342, 349,
351,360 Legendre, M. 236 Leis, J.M. 46, 48, 49 Leonce-Valencia, C.O. 243 Leong, RJ.H. 175, 180, 187 Leslie, P.H. 257, 265 Levi, D. 164, 172 Levy, j. 82 Lewis, S.M. 44, 49 Leyland, G.G. 300, 303 Lidz, B.H. 76, 83 Lim, L.C. 383, 384 Lima,F.R. 139, 145, 147, 149,239 Linares, G. 359 Lincoln 148 Link, G.W., Jr. 192, 200, 3 10, 322 Lipsky, P.E. 397, 398 Liu, D.C. 290, 302 Liu, H.C. 238, 240, 290, 302 Lo, N.C.H. 175, 180, I87 Loltani, P. 264, 265 Longhurst, A.R. 2, 9, 220, 236 Lbpez, G. 17 1 Lou, D.C. 6, 10 Loubens, G. 238 Lovell, T. 374, 377 Low, R.A. 61, 72 Luckhurst, B.E. 8,48, 49, 277, 278, 279,
280,283,288 Lutz, R.A. 157 Lyons, W.G. 76, 83

MacDonald, P.D.M. 1 64, 1 72 ,206,2 16 McErlan, A. 237 Macewicz, B.J. 175, 176, 187 Machado, 1. 355,359 Machowski, D.J. 4, 12,44, 52, 59, 72,86,
245,267,278,335 Maclean, J.L. 9, 236 McPherson, G.R. 237, 240 Macuitl, C. 4, 12, 43,49, 278, 325 Madan, M . 1 14, 1 18 Madrid, J. 327, 330 Maldonado Montiel, T. 35, 4 1 Maling, D.H. 78, 83 Manickchand-Dass. S. 2, 9, 1 5, 1 7, 147,
1 49,240 Manicltchand-Heilernan, S.C. I , 8, 137-
139, 147, 149, 159, 190,243 Manooch, C.S., 111 15, 17, 29, 41, 63, 65-
67, 72,82,83, 147, 149, 15 1 , 157, 159, 160, 162, 164, 165, 167-169, 171, 172, 173, 206,216,238-240, 24 1,243,342,349
Maravilla, A. 379 Marcano, L.A. 44, 5 I , 138, 33 1 Marcano, R. 336 Marciewicz, D. 321 Margalef, R. 57, 58, 359 Marking, L.L. 159, 162 Marquez, M. 336 Marsh, Jr., J.A. 238 Marshall, R.H. 30, 42 Mason, D.L. 15, 17, 65, 72, 82, 83, 149,
165, 167-169, 171, 173,239,243 Masuma, S. 6, 9 Matheson, R.H.', 111 65, 66, 72, 239, 241 Mathew, G. 1 14, 1 18 Mathew, I<.]. 107, 1 1 1 , 1 17 Mathews, C.P. 206, 2 17, 238, 240 Mathews, C.V. 154, 157 Mathis, P. 321 Matos, D. 165, 171 May, R.M. 265 McClain, J . 187 McClanahan 25 1,253 McCleave, J.D. 49 McErlean, A.j. 75,83, 3 19, 322 McFarland, W.N. 44, 50, 192, 200
McFarlane, G.A. 2, 8, 152, 157, 159, 162, 23 1,234
McGovern, J.C. 60, 6 1 , 72 McLoughlin, I<. 302 McManus, J.W. 10 Meek, S.F. 165, 169, 1 72 Mees, C.C. 241, 254, 255, 264. 265 Mehailia, A. 240 Melo, A.M. 239 Mendizabal, D. 20, 27, 206. 207, 21 5, 242 Mendoza, F. 203,2 16 Mendoza Rodriguez, 1. 29,41 Mendoza, J.J. 61, 266 Menezes, M.F. de 139, 145, 147, 149 Menon, M.D. 107, 109, 116. 118 Menzel, D.W. 173, 278,288 Merino, M. 204. 214, 21 6 Mesdouze, J.P. 190, 187, 198. 199, 201 Metzelaar, 1. 169, 172 Mexicano-Cintora, G. 12, 15, 17, 18. 30,
35,40,41, 204-$06,208,215,216, 243
Meyer, A. 87, 90, 91 Meyer, 1.L. 44, 47 Meyers, S. 165, 17 1 Mikail. M.Y. 241 Miller, L C . 60. 72 Miller. S.L. 44, 50 Milon, W. 6, 10 Minton, R.V. 190, 200, 383. 384 Miranda, 1.R. 238 Mitchell, M.E. 82, 83, 240 Mito. S. 1 15, 1 19 Miyamoto, G.T. 240 Moe, M.A., Jr. 29, 36, 40, 41, 76, 82, 83,
191, 192, 1 15, 1 18, 200,204-206, 216,239,310,321,322,400,414
MohamedI<asim. H. I l l , 115, 116 Mohamed, M.I.H. 238 Mohr, E. 219, 236 Mohsin, A.K.M. 238 Mommsen, T.P. 9 1 Monroy, C. 243 Monroy-Garcia, M.D.C. 245, 350, 360 Moore, C.M. 82, 83, 238 Moore, E.A. 241 Moore, R.H. 165, 169. 172 Morales-Nin, B. 24 1

Moran, D. 86, 91 Moreau, 1. 3, 9, 10, 220, 228, 231, 236 Moreno, S. 355 Moreno, V. 2, 3, 20, 26, 27, 29, 76, 164,
202.205-207,211,214,215,216, 242,355,358
Morgan, G.R. 10, 17, 164, 172, 173, 206, 216,217,231,236,237,330
Moser, H.G. 414 Moussac, G, de 241 Muchsin, 1. 302 Muhlia,A. 20,27,207,207,213,216,242 Mukundan, C. 107, 1 1 1 , 1 15, 1 17 Muller, R. 245, 253 Mullin, I<. 349 Munro, J.L. 1 , 3 ,4 , 9, 10, 1 1 , 13, 15, 17,
19, 28,43,44,48,49, 51, 57-59, 74, 76, 80, 84.85.92, 96, 106, 1 37, 140, 147, 149, 150, 158, 163, 164, 167, 1 72, 1 73, 1 74, 189, 197, 1 98,200, 201,202,206,216,218,236-239, 242-244,254,266,276,277,289, 307,319,322,324.33 1-333,336, 337, 350, 355, 360,363,378, 385, 3 9
Munroe, T.A. 241 Murawski, S.A. 362 Murphy, M.D. 82, 83, 240 Murray, P.A. 241 Murray, S. I87 Murty, V.S. 1 14. 1 18 Muthiah, C, 107, 1 1 1 , 1 17 Muthu, M.S. 1 15, 1 17
Naamin, N. 302 Nagelkerken, W.P. 76, 80, 83, 238 Nair, K.N.V. 1 18 Namrnalwar, P. 106 Nance, J . 5, 340, 360 Narayana Rao, I<.V. 1 15, 1 17 Nath, G. 264, 265 Nayar, K.N. 1 1 7 Nazario, A. 1 7 1 Neill, J . R . 104, 105 Neill, W.H. 49 Nelson, R.S. 147, 149, 165, 167-169, 171,
1 73, 1 75, 176, 187,239,243,342, 349
Newrnan, S.J. 2, 6, 9 Newton, G. 302 Nichols, S. 340,342, 344, 346-349 Nieland, D.L. 245, 253 Nielsen, J. 42 Niltolslty, G. 57, 58 Ninan, T.V. 107, 1 10, 1 18 Ninnis, C. 199 NMFS (National Marine Fisheries Service)
317 Nunez, E. 49 Nygaard, M.H. 251,253
Obregon, M.H. 356,359 O'Connor, M. 235 Ogburn, N.J. 379 Ogden, J.C. 44, 48-50 O'Hop 190 Oleachea, A. 204,216,242,356,359 Olsen, D.A. 39,4 1 ,242,3 1 7, 322 Ommanney, F. 237 Oomen,V.P. 107, 109, 1 1 1 , 116, 118 Opic, P. 92, 95 Orbach, M.K. 6 , 10 Ordaz, D. 205, 21 6 Ostrowski 383 Outerbridge, L. 288 Owens. S. 321
Paabo, S. 87,91 Padron, G. 34, 36, 39, 40,42, 206, 207,
21 7.243 Paez, j. 240 Palazon, J.L. 147, 149 Palko, B.J. 44, 49 Pannella, G. 151, 154, 157 Paperna, 1. 396, 398 Paproclti, C. 187 Parker, J.D. 90, 91 Parker, R.O., jr. 160, 162 Parlts, W. 31 7 Parrish, J.D. 40,41,48, 49, 6 1 , 72, 165,
173,252,253 Parsons, G. 157 Parsons, J.E. 39,42, 364, 366, 368, 377 Patton, J.C. 91 Pauly, D. 1-4, 68-13, 15, 17-19, 21-23,
27, 28,43, 51, 59, 74, 85, 92, 96,

106, 137, 140, 141, 148-150, 158, 163, 164, 166, 167, 171-173, 174, 189,202,206-208,216,217,218, 220,228,229,23 1,235,236-238, 242-244,254,266,277,289,300, 302,307,324-326,330,331,337, 342,349, 350, 355,360,363,378, 385,399
Pech de Quezada, A.M. 40 Pedrosa Tabio, B. 239 Pellegrin, G.J., Jr. 340, 342, 344, 346-349 Pender, P.J. 300, 302 Peraza Menendez, j. 29,41 Perez, A. 242 Perez, 0. 4, 12, 43, 278, 325 Person-Le Ruyet, J . 103, 105 Pet-Soede, L. 8, 9 Petersen, C.G.J. 219, 2 6 Pfund, R. 239 Phares, P. 175, 187
4 Philip. K.P. 107, 109, 1 18 Phillip, D.A.T. 2, 137, 138, 149, 159, 190,
243 Phleger, C.F. 251, 253 Piedra, G, 197, 198, 200, 239, 242 Pietsch, T.W. 90, 91 Pili, H. 264, 265 Pinckney, J.L. 68, 72 Pinto, L. 17 1 , 173, 240 Piste. J.C. 203, 21 6 Pitcher, T.J. 8, 164, 172, 206, 216 Plan Development Team 80 Plaut, P. 336 Pol, j. 355 Pollard, D.A. 83 Polovina, J.J. 4, 8 , 10, 41, 44,48, 49, 72,
82,90, 148, 149, 157, 164, 169, 171- 173, 187, 200,216,217,229,236, 240,253,255,264,265,288,292, 302,322,323,354,384
Pope, J.G. 342, 349, 362 Popper, D. 237 Posada, J.M. 1 63, 1 64, 1 7 1 ,205,243 Post, A. 173 Potts, G.W. 42 Potts, T. 82 Powell, A.B. 369, 377,410, 41 3,414 Powers, D.A. 5,86,87,91
Powers, J.E. 5 , 8, 44, 48, 75, 76, 82, 278, 288,308,322
Powles, H. 60,6 1 , 72 Powles, H.W. 200 Pozo, E. 57, 58, 243 Prager, M.H. 2, 10, 140, 149 Prernalatha, P. l 1 1 , 1 18 Prernchand, 6. 107, 109, 1 18 Prince, E.D. 235 Puerto, R. 21 1 , 214, 215 Pullin, R.S.V. 6, 8, 236 Pulos, L.M. 235
Quero, J.C. 165, 173 Quevedo, R. 242 Quinn, N. 365, 373, 377 Quinn, T.P. 48, 49 Quintana, M. 242
Rafail, S.Z. 237 RaKield, Mark I84 Raffield, Mike 184, 187 Ragonese, 5. 164, 1 72 Rahirn, 0. 1 15, 1 18 Raitt, D.F.S. 52, 58 Rajagopalan, M. 1 1 1 , 1 1 9 Rajagopalan, M.S. 1 15, 1 1 7 Ralston, 5. 8, 41,44,48,49, 72, 82, 90,
148, 149, 157, 164, 167, 169, 171- 173, 187,200, 216,217,229, 231, 236,238-240,253,264,265,288, 302,322,323,354,384
Rarnamirtham, C.P. 107, l 1 I , 1 17 Rarnirez, E.M. 21 5 Rarnirez Rodriguez, M. 40 Rarnirez, Solis, M . 42 Rarnirez, T. 58 Rarniro, M.E. 242 Rarnis, H.E. 29, 30,41, 206, 2 16, 242 Rarnrn, D.C. 289-291,300,302 Ramos, J.R. 49 Rarnos-Miranda, J. 1 1 ,44, 190 Rand, A.S. 32, 42 Randall, D.J. 253 Randall, J .E. 9, 29, 39-41, 117, 118, 173,
165, 169,235,237 Rangarajan, I(. 1 1 1 . 1 18, 1 19 Rao, K.S. 1 19

Rao, K.V. 1 16, 1 19 Rasheed, M. 241 Raoul 148 Ray, G.C. 60, 65-67, 72, 197, 201 Recksiek, C.W. 2, 10, 140, 149 Reece, R. 187 Reeson, P.H. 147, 149, 197, 198,200 Reigle, M. 1 7 1 Remy, M. 187 Render, J.H. 180, 188,244,245,253,351,
366 Render, J. 187 Reshetnikov,Y.S. 12, 15, 17, 147, 148,
197, 198,201, 239 Restrepo. V. 342 Rhoads, D.C. 157 Richards, A.H. 238 Richards, W.J. 60, 72, 190, 192,201,414 Richardson, L.R. 86, 90 Richardson, S.L. 414 Ricker, W.E. 10, 140, 149, 208, 21 6, 325,
326,330 Riepen, M. 8, 9 Rihani Vales, C. 29, 41 Rios, V. 27 Rivas, L.R 36,41 Rivera-Arriaga, E. 1 1, 16, 17,44, 190 Robert 148 Roberts, C. 6, 10 Roberts, C.M. 365, 373, 377 Roberts, D.E., Jr. 319, 323 Roberts, R.J. 396, 398 Robertson, D.R. 276 Robins, C.R. 60,65-67, 72, 197, 201 Rodrigo, J.X. 1 15, 1 17 Rodriguez, H. 205,206,Z 16,243 Rodriguez, W.T. 241 Rodriguez Canchi., L.G. 35, 38-41 Rodriguez Castro, J. 243 Rodriguez-Pino, Z. 1 5, 1 7, 197, 198, 201,
237 Roff, D.A. 87,91 Rohlf, F. 52, 58 Rohlf, F.J. 176, 188 Roman, A. 6, 10 Romero, M.C. 241 Rongo, J.M. 17 Rosado, M. 1 7 1
Rosario, A. 6, 10, 165, 17 1 Rosenberg, A.A. 206,2 15,216 Rosenthal, A.S. 397. 398 Rossouw, J. 265 Rournillat, W.A. 159, 160, 162,241,309,
322 Rubio, R. 57, 58, 242 Ruiz, A. 327, 330 Rulz, F. 204, 214, 216 Russ, G. 8 Russ,G.R. 2,6,9, 10,241,278,288 Russel, B.C. 83, 300, 302 Ryder, R.A. 255, 265
Sadovy, Y. 6, 7, 10, 30, 41, 75,83, 152, 165, 171, 193, 198, 199,201,279, 288,307,317,3 19,323,364,377
Saeger, J. 237 Saenx, M. 203,2 1 6 SAFMC (South Atlantic Fishery Management
Council)/NMFS 86,9 1 Said, M.Z.M. 238 Saif,M. 115, 117 Saila, S.B. 2, 10, 140, 149 Sainsbury, K.J. 290,291, 292, 299, 300-
303 Sainsbury, L. 3. 10. 300 Saksena, V.P. 190, 1 92, 20 1 Salahange, P. 57, 58, 242 Salas Marquez, S. 12, 15- 18 Salazar, A.R 206,207,2 17, 243 Saldanha, L. 173 Sale, P.F. 45,48, 49, 173, 276, 288 Salornan, C.H. 240 Salvat, B. 172 Sarnbilay, V. 237 Sarnbilay. V.C. 17 Samoilys, M.A. 7, 9, 10 Samuel, M. 238, 240 SAnchez, J.A. 20,27,205,207,2 1 1,2 14,
21 5 Sanchez-Gil, P. 1 1 - 14, 17, 18,44. 190,
238 Sanders, M.J. 164, 172, 237, 241 Sano, M. 44,49 Sargent, J. 374.377 SAS '176, 177, 188 Schaefer, M.B. 21 7

Schaeffer, D.O. 84 Schirripa, M.J. 322, 414 Schlieder, R.A. 309, 314, 315, 319, 322,
323 Schnute, 1. 164, 173 Schoener, T.W. 32,41 Scholander, P.F 154, 157 Schroeder, R.E. 65, 72, 197, 201 Schubert, P. 302 Scott, W.B. 95 Scott-Denton, E. 5, 340, 360 Secretaria de Pesca 17 Sedberry, G. 3 1 7, 323 Sedberry, G.R. 2. 4, l2 ,44, 52, 59, 60-62,
67, 68, 72, 73,86, 151, 158, 160, 162, 245,267,278,308,317,323,335
Seij0,J.C. 20,26,27,208,211,215,217 Seijo Gutierrez, J.C. 20, 30, 40 Selman, K. 1 76, 188 Selvaraj, G.S.D. 1 1 1 , 1 19 Seret 8. 92, 95 Sesewa, A. 264, 265 Sevilla, M.1 29, 41 Shah, A. 340,342,344) Shaher, S. 237, 240 Shanmugam, S. 119 Shapiro, D.Y. 7, 10, 34, 36, 39, 40-42,
164, 173, 193, 201,204,214,217, 308,3 17.3 19,322,323,377
Shapiro, D. 8 Shareef, H. 24 1 Sharp, B.I. 45, 48, 49 Sharp, G.D. 355, 359 Shedlock, A.M. 90, 91 Shedlock et al. 1 992 90 Shepherd, J.G. 2, 10, 12, 17, 206, 217,
342,349 Sherman, I<. 240 Sherriff, A.T. 1 18 Shevach, E.M. 397,398 Shinn, E.A. 76, 83 Shomura, R.S. 264, 265 Shroeder, R.E. 201 Shroud, R.H. 90 Shulman, M.J. 44,48, 50 Shultz, E.T. 44, 49 Sierra, L.M. 242 Silas, E.G. 107, 109, 1 1 1 , 114, 116, 119
Silva, J. 276 Simmons, N. 288 Singhagraiwan, T. 383, 384 Sivaprakasam, T.E. 107, 1 10, 1 19 Slack-Smith, R. 302 Slaybaugh, S. 157 Slaybaugh, S.T. 15 1 , 157, 364, 377 Sluka, R. 20, 74, 278, 364 Smeby, Sigurd 184 Smeby, Steve 37 1 Smith, C.L. 29, 39, 42, 75, 80, 83, 165,
169, 173,204,217,278,288,319, 322
Smith, G.B. 44, 50, 165, 172, 308, 310, 322
Smith, J.L.B. 1 17 Smith, M.K. 238 Smith, T.D. 21 9, 236 Snedecor, G. 52, 53 ,58 Snider, T.G. 111 176, 187 Snodgrass, R.E. 165, 173 Soesanto, V. 9 Sold, R.R. 52, 58, 176, 188 Soletchnik, P. 190, 197, 198, 199,201 Solis-Ramirez, M.]. 20, 26, 30.40, 203,
206,215 Solokov, V. 326, 330 Somavanshi, V.S. 107, 1 10, 1 18, 1 19 Somerton, D.A. 53, 58 Soriano, M. 148, 141, 1 72 Soundararajan, R. 1 15, 1 17 Sparre, P. 2, 9, 1 2, 1 7, 149, 1 66, 229, 235,
24 1 Spataro, L. 321 Sport Fishing Institute 245, 253 Springer, V.G. 75, 83, 190, 201 Squire, L. 240 Squire, L.C. 7, 10 Srirarnachandra Murty, V. 106 Staples, D. 302 Starck, W.A. 190, 192, 198, 201 Starck, W.A. 11 75, 83, 197, 201 Starck, W.B. 111 65, 72 Stauch, A. 92, 95 Steel, W.J. 48, 49 Steen, J.B. 252, 253 Stender, B.W. 61, 73, 317, 322,413,414 Stevens, J . 302


von Bertalanffy, L. 204,Z
Wadie, W.F. 241 Waheed, 2. 241 Wakeman, J.M. 1 90, 1 99,200 Wallace, L A . 176, 188 Wallace, R.K. 32, 42 Walters, C.J. 4,6, 10, 265, 291,300-303,
255,257,264,291,292,351,353, 3%
Walters, G.G. 21 7 Waltz, C.W. 1 59, 1 60, 162, 24 1 ,309, 322 Ward, J. 165, 172, 364, 377 Ward, J.A. 278-280,283,288 Ward, R. 187 Ward, W.C. 30, 41, 42 Waschkewitz, R 3 1 7, 323 Waters, J.R. 308, 322 Weatherley, A.H. 219,236 Weidie, A.E. 30, 41, 42 Weiler, D. 41, 39, 31 7, 322, 377 Weinstein, M.P. 48, 49 Wenner, C.A. 60-62, 71 -73, 159, 1 GO,
162,241 Wenner, E.L. 60, 61, 73 Wessel, J. 302 West, G. 176, 188 West, G.J. 199, 200,240 Wetherall, J.A. 141, 149, 164, 169, 171,
173,229,236 Wheeler, J. 237 Whitehead, P.J.P. 42, 1 17 Wicklund, R. 199, 201 Williams, D.B. 386 Williams, D.M. 4, 9, 48, 50 Williams, D.McB. 2.6.9, 164, 165, 172,
173,237 Williams, J.L. 190, 200
Williams, H.A. 238 Williams, T.D. 190, 199, 200 Williams, T.P. 2, 10 Willing, R.S. 300, 302 Wilson, A.C. 87, 91 Wilson, C.A. 188,244,245, 253, 351,366 Wirtz, P. 3 17, 323 Wolf, K. 394, 397, 398 Wolf, N.G. 44, 50 Wolstenholme, G.E.W. 235 Wong, M. 326,330 Woodburn, K.D. 190, 201 Woodley, C.M. 4, 44, 61, 85 Woodward, P.N. 151, 363,368,377 Wootton, R.]. 42 Worms, J. 238 Worthington, D.G. 3, 10 Wright, A. 238
Xiao, Y. 289 Ximenes, M.0.C 139, 145, 147, 149, 243
Yafiez-Arancibia, A. 1 1 - 14, 17, 18, 26,44, 46,48, 190,215,330
Yeates, C. 148 Yeh, S.Y. 238, 240, 290, 302 Yongjia, Z. 368, 385, 386, 396, 398 Young, I. 157 Young, P. 237
Zaret, T.M. 32, 42 Zerguera, P. 359 Zetina, C. 27, 205, 207, 21 7 Zeyang, W. 368, 385, 386,398 Zimmerman, R.J. 48,49 Zupanovic, S. 29, 30, 34, 36, 39, 41, 42,
206,216,242

APPENDIX 3
Geographic Index
Abidjan (Cbte d'lvoire, West Africa) 92 Africa 93
West 92 African Continental Shelf 92 Agolega Islands 256 Alabama (USA) 87,89,338,362 Alacranes Reef (Campeche Bank, Yucdtan,
Mexico) 31,350,352 Aldabra Group (Seychelles) 255,256 Aldabra Islands (Seychelles) 256 Alleppey (Kerala, India) 108, 109, 1 14 Alligator Reef (Ridge) (Florida, USA) 77, 79,
81 Amazon (South America) 139
River delta (Brazil) 52 American Samoa (Pacific Ocean) 225 Amirante(s) (Seychelles) 255
Group 255,256 Plateau 256
Andaman Islands (lndia) 108, 1 15, 124 Andhra Pradesh (lndia) 107, 108, 1 12, 1 1 3 Angola (Africa) 93 Anjengo (Kerala, India) 1 14 Antilles (West lndies) 52, 65,66
Lesser Antilles 67 Apalachicola (Northwest Florida, USA)
South oF307,309 Southeast of 309.3 1 1
Asia Southeast 8, 1 15,386
Arabian Sea (Indian Ocean) 108 Arafura Sea 289,290-295,297,299-304 Arenas Key (Campeche Bank, Yucdtan,
Mexico) 350,352
Atlantic (Atlantico) 165, 268,270-274,308, 309,314,317 Coast 36 1
East 94,95 East ofTrinidad and Orinoco delta 266,267 East tropical 94 Sector 269,275,276
Southeastern 360 Southeastern US 36 1 Subarea 266-269,275 US coast 36 1 West(ern) Atlantic 60,65, 75,86, 95, 196-1 98,363 Western Atlantic, tropical 75, 190 West tropical 94
Atlantic Ocean 138 West central 332
Australia 223-227,291 Australian Fishing Zone (AFZ) 290, 300 Northern 290 Northern continental shelf 290 Northern trawl fishery 289,291 - 295,298-301 ,303,305 Sector 290 Waters 290
Aves Islands [Bird Islands] (Venezuela) 336
Bahamas [Bahama Islands/ The Commonwealth ofthe Bahamas] 39, 52,65,66,365
Bahia Magdalena 325 'Baja California (Mexico)
West coast of 325 Banjul (Gambia, West Africa) 98 Bangladesh 108 ~ a r b a d b s (Lesser Antilles, West Indies) 66 Barcelona (Venezuela) 53 Belize 198 Bengal , Bay of 1 08 Bengal, West (India) 107, 1 08, 1 1 2, 1 1 3
Coast 1 12 Bermuda(s) [Bermuda Islands] 52,66,67,
165,204,221,277,278,280,281, 287,288,364
Narrow shelf edge 283 Platform 279,280,283,288 Seamount [Marina] 277,278
Berry Islands (Bahamas) 365 Blanquilla Island, La (Venezuela) 53, 33 1 ,
332,334,335 Boca de Apiza 326 Boca Grande [South Channel]
Bar 191 Channel 191 Keys 191
Bombay (India) 108, 123, 125 Brazil 30, 52,65-67,86, 145-147,226,
228,267,364 Northeast(ern) 66, 138, 139 South(ern) 63,66 Southeastern 63,65,66
Brest (France) 30 Broome (Australia) 29 1 Bulldog Banlc 258, 259 Buttonwood Cay (Belize) 197
Caicos [Islands], West 196 Cameron (Louisiana, USA) 247
South of Cameron 246 Coast 30
Cameroon (West Africa) 93 Campeche (Mexico) 205
Shelf 29 Campeche Bank [Banco de Campeche]
(Yucatan, Mexico) 1 1 , 20, 28-3 1 , 34, 37,40,63, 147,202-204,206-213, 350-353,355-358
East 39 Eastern part 350, 352 North 352 Northeastern part 350 West 39 Western side 350, 35 1
Campeche, Gulf of 65 Campeche Sound [Sonda de Campeche]
11-16 Continental Shelf 12 Canaveral, Cape [Caiidveral, Cabo] (Florida)
59-6 1,63-65 Cancun lsland 30 Cannanore (lndia) 108, 109 Cape Fear (North Carolina, USA) 61,62,64 Cape Hatteras (North Carolina, USA) 30,60 Cape San Blas 3 1 2 Caribbean 30,40,44, 57, 66,86, 138, 147,
197,276 Caribbean Sea (Atlantic Ocean) 30,45,53,
138,166,332,364 Carolina(s) (USA) 46, 66
North 52,59,60-62,64-67 South 61, 65, 67, 309, 364 Middle shelf off 66 Shelf edge off 66
Carpentaria, Gulf of 290, 28 1 , 302 Casarnance River [Kasamansal (Senegal,
Africa) 97, 98 North 97
Cay Boltel 197 Cayman Islands [Islas Caiman] (Caribbean
Sea) 39, 150, 15 1 CelestOn (Yucatan, Mexico) 3 1 , 38, 35 1 Central America
Shelves 138 Channel Patch Reef 77,80 Charleston (South Carolina, USA) 159 Chavara 1 14 China 8, 225, 385, 386 Coche Island (Venezuela) 53, 332 Cochin (India) 108, 1 14, 123, 125 Coetivy lsland (Seychelles) 256 Colima (West Central Mexico)
Coast 325 State of 325
Colombia (South America) 66 Colombia Lagoon (Cozumel, Quintana Roo,
Mexico) 45 Columbus Channel 138 Comoros [Comoro Islands] (Mozambique
Channel) 256 Conch Reef (Ridge) (Florida, USA) 74, 77-
79,81 Congo (Central Africa) 93 Constant Banlc (Mahe Plateau, Seychelles)
258,259 Continental 1 98 Continental habitats 198
Coral Sea (Pacific Ocean) 291 Correira 264 Correi ra Banlc [Banco Correira] (Mahe
Plateau, Seychelles) 259.26 1-264 Cosmoledo Group (Seychelles) 255,256 Costa Rica (South Central America)
East coast 197 CBte d'lvoire [Ivory Coast] (West Africa) 93,
103

South of the coast of 94 Cozumel (Quintana Roo, Mexico) 45
Coral reef system 44-47 Reefis) 43 System 44
Cuba 15,29,30,57,66,203,222-227,338 Southern coast 138
Cubagua Island (Venezuela) 53,332 Cumana (Venezuela) 52,53,332 Curaqao (Island) [Netherlands Antilles] 76,
22 1
Dakar (SBni:gal) 97,98, 100, lG1, 104 Darwin (Australia) 291 Davis Reef (Ridge) (Florida, USA) 77, 78 Demerara (Guyana) 268 Dhanushkodi (Tamil Nadu, India) 1 12 Djibouti [Jibuti] (East Africa) 226 DryTortugas 196, 197 Dwarka (Gujarat, India) 123
Eastern Tropical Pacific [Pacifico Occidenta/ 7ropica4 324
Egypt 22 1 Elbow Reef (Florida, USA) 77, 78 El Carmen (Terrninos Lagoon, Mexico) 12,
13 English Cay (off Belize) 196 Esequibo [Guyana] 268
River 268
Farquhar (Seychelles) 259, 261 -264 Atoll 259,264 Group 255,256,260
Florida (USA) 15, 59-62,64,65,69-71, 75, 76, 82,87,89, 190, 197, 198,204, 307-3 1 0 , 3 1 2,338,362,367,414
Coast 362,413 Deep water off 66 Gulfcoastof 310,312, 314, 318 Inshore waters 194, 195 Middle shelf off 66 North 400 North coast 65 Northeastern coast 75 Northwest 174, 177, 184,309 Offshore waters 194, 195 Panhandle 399
South Atlantic coast of 3 1 7 South(ern) 65,66, 160, 190, 191, 197 Southwest 75 Waters 204 West coast 29, 36, 3 1 0 Western 30,82, 191
Florida Keys (USA) 75, 76, 79, 80,82, 190, 310
North 31 0 Upper 74
Florida Middle Grounds 165, 3 12 Flower Banks (Gulf of Mexico) 165, 169 Fortune Bank (Mahi: Plateau, Seychelles)
256,258,260,263 Freeport (Texas, USA) 87, 89 French Guiana (South America) 52, 267 French Polynesia (South Pacific) 223 French Reef (Florida, USA) 77
Gabon (West Africa) 93 Galapagos Islands [Tortoise Islands]
(Ecuador; Pacific Ocean) 223 Gambia (West Africa) 98
North 97,99-102 River 98
Georgia (USA) Middle shelf off 65
Georgia/Florida Border 66 Inner shelf depths 66 Middle shelf depths 66
Ghana (West Africa) 93 Coa (India) 107, 1 13 Grand Cayman (Cayman Islands) 151,365,
366 Grande Cbte (Senegal) 97, 98, 100 Great Barrier Reef (Queensland, Australia) 6 Grenada 267,268 Guangdong (China) 385,386 Guanica (Puerto Rico) 166
Southwest 166 Guianas [Guyana] 30 Guianas Plateau 267, 275 Guimaras Island (Central Philippines) 378,
379 Southwestern coast 379
Guinea-Bissau, Republic of 97

Guinea Conakry, Republic of 97 Guinea, Gulf coast of [Costas de Nueva
Guinea] (Atlantic Ocean) 92 Guinea, Gulf of (Atlantic Ocean) 93 Guiria (Venezuela) 332 Gujarat (India) 107. 1 12, 1 13 Gulf 308, 309, 3 14, 3 17, 320
Coast 63 Stream 65 Stream waters 59
Guyana [British Guiana] (South America) 65,66, 138,266,267
Waters 266 Havana (Cuba) 203 Hawaii [Hawaiian Islands] (USA) 223, 224,
228 Hawk Channel 76 Hens-and-Chickens (Florida, USA) 77, 78 Honduras (Central America) 39
Continental shelf off Honduras 66, 138
Hongltong [Hong Kong] (China) 8, 1 15, 380
lles Glorieuses 256 lndia 106-108, 1 1 1 , 115, 120-136,225
East coast 1 10 West coast 1 10
Indian Coast [Costasdela/17dial 106-108, 112
Northeast 107 Northwest 107, 1 15, 1 16, 127, I36 Southeast 107, 1 15- 1 16, 127, 136 Southwest 107, 1 10, 1 14- 1 16, 127, 136
Indian Ocean 1 08 Western 255
Indonesia 1 15,225,291 Indo-Pacific 300 Insular 198
Jacl<sonville (Florida) 62 Jamaica (West Indies) 221 -224, 227, 228 Japan 1 15 Joal (Senegal) 97- 100, 102
I(arnatalta (lndia) 107, 108, 1 12- 1 14
Karumba (Australia) 29 1 ICatama Bay (Massachusettes, USA) 204 Kayar (Senegal) 98 Keelaltari 1 12 Kenya [Kenia] (East Ahica) 224 Kerala (Southwest India) 107, 108, 1 12,
113, 115, 123-125, 127 Coast 1 1 1 , 112, 114
Key Largo (Florida, USA) 80 Key West (Florida, USA) 63, 75, 189, 191,
197 Shallow inshore waters 189 Offshore reef sites 189 West 19 1
I<ilaltl<aroi (India) 108 ICovalam 124, 125, 127 I(ulalc I(arai 126 Ihtch, Gulfof [Cutch, Gulf ofl (India) 123 Kuwait 1 15, 22 1,222
Laccadives: see Lakshadweep Islands Laltshadweep Islands 108, 1 14, 1 22- 1 27 La Digue (Mahe Plateau, Seychelles) 255 LaTortuga (Venezuela) 53, 332 Long Key (Florida, USA) 82 Lookout, Cape [Lookout, Cabo] (North
Carolina) 59-61,63,65 Los Frailes lsland (Venezuela) 53, 332 Los Hermanos Island [/s/as Los Hermanos]
(Eastern Venezuela) 5 I , 53-56, 33 I , 332,335
Southwest 52 Southeast 52
La Parguera (Puerto Rico) 166 Los Roques Archipelago (Venezuela) 168,
336 Los Testigos Island (Venezuela) 53, 332,
334,335 Louisiana (USA) 245-247,338,362 Luanda [Loanda] (Angola, Africa) 94
Madagascar [Malagasy Republic] 256 Madras [Tamil Nadu] (India) 108, 124, 125,
127 Maharashtra (India) 107, 108, 1 12- 1 14 Mahe 255 Mahe Plateau (~e~che l les) 255, 256, 259
Banks south of 256,259

South 260 Southeast edge 259
Malabar (Kerala, India) 123 Malaysia 1 15,224-226,383 Mandapam (lndia) 108, 1 12, 1 1 5, 1 24, 126 Mannar, Gulf of (Indian Ocean) 108, 1 1 O-
112, 115, 1 I6 Manzanillo 326 Margarita Island [Ida Margarita] (Venezuela)
5 1-53,268,332 East(ern) (including Northern Trinidad) 266 East(ern) 266-275 Northwest 33 1 West(ern) 266,268-275
Marianas [Mariana Islands] 255, 264 Massachusettes (USA) 65,66 Mauritania (West Africa) 97 Mbour (Senegal) 98, 101, 104
Coastal station 10 1 Merida (Yucatan, Mexico) 29, 30, 31, 205 Mexican Caribbean [Caribe Mexicano]
(Yucatan,MPxico) 43,44 Mexico (Mexico) 19, 26, 29, 30, 43, 21 1 ,
2 12,22 1,222, 224-227,338, 350,355, 356
West 329 West Central 325 West Coast 327, 328
Mexico, Gulf of [Colfo de Mexico] 5, 19, 20, 28-30,45, 63, 65, 66, 75, 82,86, 87, 138, 147, 169, 175, 190,202-204, 308,3 12,337, 338,340, 355,361, 364,400,413
Eastern 29, 34, 36.307, 308, 314, 319 Northeast(ern) 174, 177 Northern 90,245,400 Northern Coast 362 Southern 1 1 , 12, 20, 28, 36 Mexican waters 400 Portion 67 US Gulf of Mexico 337, 340, 341, 345,348,349,360,400 US waters 400 Western coast 75
Miami (USA) 197 Middle Grounds 3 1 7
North and West of 309 Southwest 309
Minicoy and Kilta (lndla) 127 Mississippi (USA) 338, 362 Monroe County (Florida, USA) 3 10 Morocco (Africa) 22 1
Nassau 366,367 New Cnledonia (South PaciFic) 22 1 -226 New Orleans (Louisiana, USA) 247 Nicobar Islands (Bay of Bengal, India) 120,-
122,125 Nigeria (West Africa) 93 N. Marianas 223-225, 228 North America
East Coast 147 North Keys 350, 352 Northwest Shelf (Australia) 289-295, 299,
300,301,303
Obslow Bay (North Carolina, USA) 67 Okha Pt. (Salthalin Oblast, Siberia, Russian
Federation) 123 Orange Beach (Alabama, USA) 87,89 Orchila Island, La (Venezuela) 336 Orinoco (Venezuela) 139,268
Delta 266 Orissa (lndia) 107, 108, 1 12, 1 13
Pacific Eastern 165 South 8
Pakistan 108 Palau (Pacific Ocean) 225 Pallc Bay (India) 108 Palmas, Cape 94 Panama 66 Panama City, Florida 87,89, 175 Papua New Guinea 22 1 -227 Paria, Gulf of [Paria, golf^ del (Atlantic
Ocean) 53, 138, 332 Peninsula 138
Pensacola (Florida, USA) Southeast of 3 1 7
Peru (South America) 325 Petite Cate (Senegal) 98, 100, 101 Philippines [filipinas] I 1 5, 222,225, 226,
378-382,383

Central 378, 379 Pickles Reef (Florida. USA) 77, 78 Pigeon Point 138 Platte lsland (Seychelles) 256 Platte Plateau (Seychelles) 256 Pondicherry (lndia) 107, 108, 1 13, 127 Ponnani (India) 108, 109, 1 14 Port Hedland (Western Australia) 291 Praslin (Seychelles) 255 Progreso (Yucatan, Mexlco) 30, 31,38 Providence (Seychelles) 259
Group 255,256, 260 lsland 256
Puerto Real (Terminos Lagoon, Mexico) 11, 1 3 , l S
Inlet 13 Puerto Rico (West Indies) 1 5, 39, 166, 223,
226,227 Southwest coast 165 Southwestern 164, 166, 168 Shelf edge off 168, 170
Punta jorobada 166
Quilon (Kerala, India) 108, 1 14, 125 Southwest of 109
Quintana Roo (Yucatan, Mexico) 43 Coastal region 44
Recife, Brazil 30 Riley's Hump (Dry Tortugas, Florida) 196,
199 Rio de Janeiro [Guanabara Bay] (Brazil) 204 Rio Lagartos 3 1 , 38 Roxo, Cape 97 RuGsque (Senegal) 98- 100
Sable, Cape 3 12 Saint Lucia (West Indies) 223 Sangomar Peninsula 97 Saya de Mahla Bank 256 Sea Mount '20' (Mahe Plateau, Seychelles)
259 Sea Mount '25' (Providence/Farquhar,
Seychelles) 258, 259 Senegal (West Africa) 96, 98, 103, 104,
ZZ 1 Senegalese 103
Continental shelf 96.97
Waters 103 Seychelles 221,223,224,226,254-256,
263 Remote banks 255 lsland groups 255 Waters 254,255
Sherbro lsland (Sierra Leone, West Africa) '32
Sierra Leone (West Africa) 93 Singapore 1 1 5, 383 Small Constant Bank (Mahe Plateau,
Seychelles) 259,26 1 ,263 Sola Island (Venezuela) 53, 332 Southern America
Continental shelf 139 Shelves 138
South Atlantic Bight (USA) 60 Sri Lanlta (Indian Ocean) 108 Sta. Fe (Venezuela) 53, 332 St. Ann, Cape 92 St. Louis (Senegal) 98, 1 00, 1 04 St. Marks (Florida, USA) 309 St. Petersburg (Florida, USA) 31 0 St. Thomas (U.S. Virgin Islands) 373 Surinam [Suriname] 52, 66, 267
Taiwan [Formosa] 1 15,226 Tamil Nadu (lndia) 107, 108, 1 12, 1 13
Coast 1 12 Tampa (Florida, USA)
West 307, 308,3 1 1 Telchac Puerto 3 1 , 3 8 Tennessee Reef (Florida, USA) 77, 79 Terminos Lagoon [Laguna de Termin051
(Southern Gulf of Mexico) 1 1-1 3, 16, 20,30
Eastern inlet 12 Western inlet (El Carmen) 12
Texas (USA) 87,89,90, 338, 362 Coast 30, 362
Thailand (Southeast Asia) 1 15, 383 Three Points, Cape (West Africa) 94 Three Sisters (Florida, USA) 77 Timor Sea (Atlantic Ocean) 289-296,299-
304 Tobago 1 39,268
Northwest Coast 139

Continental shelf and slope 139 Travancore (Kerala, India) 123, 124 Trinidad 53,66, 1 38, 268, 332
East 138 Continental shelf 138 Shelf edge 1 38 North coast 138, 139 Northeast continental shelf and slope 139 Northeastern coast 138 Northern 266,275
Trinidad and Tobago (Atlantic Ocean) 15, 137- 139, 145-147,226,267
Trivandrurn (Kerala, India) 124 Tunisia (North Africa) 222, 224,227 Turks and Caicos 196 Tuticorin (Tamil Nadu, India) 108, 1 12, 124,
125,127
United States (of America) 74, 75,86, 175, 198,221-228,338,351,361
Atlantic coast of the US 175 Continental shelf 175 Eastern 30 East coast 361 Exclusive Economic Zone (EEZ) 338 Southeastern 59, 61,06, 147, 175, 308,361 Coastal areas 60 Continental shelf 60 Live bottom 60 Lower shelf 60 Open shelf 60 Shelf edge 60 Upper slope 60 Southern 86 Southern Atlantic coast 138, 1 59
Uruguay (South America) 66
Vanuatu (Pacific Ocean) 223-225,228 Venezuela (South America) 52-56,66, 138,
147,224,268,332 Central marine province 268 Eastern 5 1 , 33 1 , 332 Northeastern 266,267,275
Venezuelan Caribbean 336 Virgin Islands (US) 39,221 -224,373 Vishakhapatnam (Andhra Pradesh, India)
124, I26 Vizhinjam (India) 1 24, 1 27
Wadge Bank (India) 108-1 10, 1 12, 1 14- 1 I6
Northeast region 1 16 West Central Atlantic Ocean 332 West lndies 204 Winyah Bay (South Carolina, USA) 67 Wizard Reef (Providence/Farquhar) 259
Yemen 221,222,226 YoR (Senegal) 1 0 1
Coastal station 102 Yucdtan Peninsula (Mexico) 15,28-3 1 ,45,
138,353 Continental shelf 66, 203-205 Central-Eastern End 20 North coast 29 Northern 29 North(ern) continental shelf 19-21, 25 Northern shelf 2 1 , 23 Shelf 12 Peninsula 338 Northeastern continental shelf 355 State 350
Zhanjiang (China) 386 Zhejiang Province (China) 292

APPENDIX 4
Acropora cervicornis 44 Acanthurids 1 10 Acanthurus lineatus 238 Acanthusarmatus 253 Acropora palma ta 44, 76 Actaea acantha 37 Aethaloperca rogaa 1 1 4 Agaricia spp. 76
Agaricia agaricites 44 Alazan 325 Alepes sp. 305 Algae 76,80 Alpheussp. 37
Alpheus armatus 37 Amhissis 1 10 Amphibians 84 Anadara notalilis 3 7 Anchovy 187 Annelids 25 Anthias squamipinis 3 1 9,3 23 Anthiinae 3 19 Aphareus rutihns 223 Aphareus sp. 1 1 4 Apolectus niger 30 5 Aprion sp. 1 14
Aprion virescens 1 1 0, 223 Apsilinae 223 Apsilus dentatus 223,228 Argentina silus 25 3 Argopecten gibbus 3 7 A rarops spinifer 306 Arsyrosomwsp. 306 Ariidae 294-297,299-30 1,303-306 Ariomma indica 289, 305 Ariornrnatidae 305 Arius thalassinus 305 Arius felis 362 Artemiasp. 363, 365, 369, 371, 372,
375 Atlantic croaker 36 1 , 362
Balistes sp. 334 Balistids 60
"Excludes the species in the list From p. 120- 136
Biajaiba 1 7, 58, 148, 20 1, 237, 239, 242, 243 see Luqanus synagris
Blue runner 246 Bluefish 246 Bluegill 397 Bonaci g a t o 242 see Mycteroperca tigris Brachionus pkatilis 365 Brachyura 40 Brachyurans 33,40 Brine shrimp 365 see Artemia sp . Brevoortia patronus 362 Butterfish 294-297,299-30 1 ,303-305 see
Trichiuridae Gulf 362
Caballerote 239,242 see Lutjanusgriseus Cabri l la 24 1 see Epinephelus lalriformis Calamussp. 20,334 see Porgies
Calamus nodosus 205,206 Callidac@lus sp. 3 7 Callinectes s p. 3 7
Callinectes sirnilis 362 Carangidae 290,294-297,299-30 I , 303-
306 Carangoides chysophys 305 Carangoides gymnosteth us 3 0 5 Carangoides humerosus 305 Carangoides malaOaricus 305 Carangoides uii 30 5 Caranx sp. 3 34
Caranx bucculentus 305 Caranx c p w 246
Carassius auratus 365 Carcharinidae 306 Carcharinus dussurnieri 306 Carideans 1 1 Carpilius corallinus 3 7 Catfish, hardhead 362 Caulolatilus sp. 3 34 Centrolophidae 305 Centropristis 200, 322
Centropdstis stria ta 1 58- 1 62,24 1 Cephalopholis 29

Cephalopholis argus 1 1 4 Cephalopholis cruentata 22 1 Cephalopholis fulva 22 1 ,227,277 Cephalopholis hemistiktos 22 1
Cephalopods 1 1 1,253 Cethorinus maximus 229 Chanos chanos 384 Cherna americana 242,359 see
Epinephelus rnorio Cherna criolla 242, 377 see Epinephelus
sMatus Choerodon sp . 306
Choerodon cephalotes 306 Choerodon schoenleinii 306
Cichlidae 9, 23 1 , 236 Cod 90
Rock 9, 1 1 7- 1 19,236 see Epinephelus ta uvina
Colpophyllia natans 76 Comber, painted 241 Coney 74,76,83,280,282,284,286 see
Cephalopholis Wva; Epinephelus hlvus Copepods 363,365,372,373 see
Tigriopus japonicus Copperbellies 320,321 Coral 80, 109
Soft 191 Crabs 25, 58, 107, 1 10, 1 1 1, 371, 373
Fiddler 365 Iridescent swimming 362 Lesser blue 362 Longspine swimming 362 True 33,40 see Brachyurans
Crassostrea gigas 365 Creole fish 163, 165, 167,243,277,280,
282,285,286 see Paranthias furcikr Crustaceans 1 1, 16, 37, 38,40,61, 361
Decapod 33,40 Natant 37 Reptant 33.37
Ctenochaetus striatus 238 Cumaceans 1 1 1 Cutlass fish 362 Cuttlefish 294 Cynoscion arenarius 362 Cyprinidae 365 Cystivirus 386
Damselfish 10 Dasyatididae 306 Dendrogira cylindrus 44 Diagramma picturn 305 D~plectum forrnosus 23 7 Diploria spp. 76
D~ploria strigosa 44 Dolphin 365 Dover sole 187
Echinoids 37 Ehu 238 see Etelis carbuncu/us Engraulis mordrru 1 87 Ephippididae 306 Epialtus Litubercula tus 3 7 Epinephelinae 9, 1 17, 1 18, 164, 218,220,
221,236 Epinepheline 41
Groupers 75 Serranids 400
Epinephelus 29,42, 107,204, 277, 279, 306,402,411
Epinephelus adscensionis 22 1 Epinephelus aeneus 96,97, 1 03-
105,221,238,241 Epinephelus alcaara 1 1 5 , 1 1 9 Epinephelus alexandrinus 1 05,
241,323 Epinephelus amb/ycepha/us 1 1 5 Epinephelus areolatus 1 07, 1 09-
111,114,221 Epinephelus bleekeri 1 1 0, 1 1 4,
115 Epinephelus chlorostigrna 1 09,
111, 112, 114,221,386 Epinephelus coioides 22 1 , 306 Epinephelus costae 22 1 Epinephelus cruentatus 80.82 Epinephelus cyanopodus 22 1 Epinephelus diacanthus 1 09- 1 1 2,
114,221 Epinephelus drumrnondhayi 22 1 ,
227,400 Epinephelus epistictus 1 1 4 Epinephelus I'asuXus 1 07,22 1 Epjnephelus flavolimbatus 276 Epjnephe/us ~ l v u s 8O,4 1 3

Epinephelus fuscog~ttat~s 22 1 Epinephelusguc71a 96, 1 03, 105 Epinephelus guttatus 1 0, 39,4 1 ,
80,82,221,227,322.328, 334,377,400
Epinephelus hexagonatus 1 1 5 Epinephelus itajara 82,221 ,229 Epinephelus labrihrmis 221 ,241 Epinephelus lanceolatus 1 07, 1 1 0 Epinephelus Iatihsciatus 1 07.22 1 Epinephelus longispinis 1 1 0 Epinephelus maculatus 22 1 Epinephelus mala~aricus 1 07, 1 1 0,
112,115,386 Epinephelus marginatus 222,227 Epinephelus rnerra 39, 222 Epinephelus moara 386 Epinephelus rnorio 28, 34, 36,39,
40,80,82,204,206,207, 21 7,222,239,242,243,334, 359,402-408.41 2-41 4 see Red grouper
Epinephelus rnorrhua 1 09, 1 1 4 Epinephelus multinota tus 222 Epinephelus mystacinus 280,28 1 Epinephelus nisr/tus 222 Epinephelus niveatus 222,227 Epinephelus ongus 222 Epinephelus polylepis 222 Epinephelus rivulatus 222 Epinephelus salmoides 1 1 7, 1 1 9 Epinephelus sexl'asciatus 1 1 5,222 Epinephelus striatus 39,41,80,
82, 151, 154, 156, 157, 199, 200,222,227,242,281,288, 322,323,377,413,414see Nassau grouper
Epinephelus suillus 1 1 5 Epinephelus tauvina 1 09- 1 1 2,
114-1 17, 119,222 Epinephelus undulosus 1 12
Etelinae 223 Etelis 72
Etelis carbunculus 223,228,23 1 , 232,238 see Ehu
Etelis coruscam 223,228 Etelis oculatus 59, 63,64,223,
241
Formionidae 295-297,301,303-305 Frog 90
Gag 158- 162,237,239,307,308, 3 10- 319,321 -323,365,414 see Mycteroperca microlepis
Gastropods 44 Getyon maritae 58 Glaucosoma buxgeri 306 Glaucosomatidae 306 Gnathanodon speciosus 305 Gobies 373 Goldfish 365 Gonodac@lus bredin; 3 7 Gourami, snakesltin 398 Graysby 74, 76, 78,80,82,83,239, 280 Groundfish 72,290 Groupers 83,84 see Epinephelus
American 42, 173,414see Epinephelus
Black 74, 75, 78, 80, 82, 83, 277, 279,283,284,308,3 10, 356, 357 see Mycteroperca bonaci 74
Brownspotted 24 1 see Epinephelus chlorostigma
Corn b 97 see Mycteroperca r u h Coral 9, 1 1 7, 236 Coral, leopard 9 Dusky 90, 97, 104 see
Epinephelus guaza Estuary 1 17, 1 19 see Epinephelus
salmoides: Epinephelus tauvina
Nassau 41.42, 74-76,80,82,83, 150-1 52, 157, 198,200,277, 279,280,287, 288,3 19,322, 363,364,367-377,414 see Epinephelus striatus
Red 20-23, 25-30, 32, 34, 36, 38- 42, 74-76,80,82,83, 200, 202-21 6,239,242,280,308, 321,322,353,355-359,399- 4Ol,4l l ,4l4see Epinephelus morio
Snowy 67,82,83,238 see

Epinephelus nivea tus Tiger 20 1 ,279, 28 1 ,288,323 see
Mycteroperca tigrts Warsaw 82,83,243 see
Epinepbelus nigritis White 97 see Epinepbelus aeneus Yellowfin 74, 198,281 see
Mycteroperca venenosa: M, venosum
Yellowedge 266,267,269,271, 274-276 see Epinephelus ffavoLimhtus
Yellowmouth 279,281 see Mycteroperca interstitialis
Grunts 20,23, 25, 50, 138, 331, 356 see Haemulidae; Haemulonspp.
French 200 Gulf menhaden 362 Gymnocranius elonga tus 306 Gymnothoraxsp. 334
Haemulids 49,60 Haernulidae 148,200,290, 295-297,299-
301,303-306,332,335 Haemulon aurolineatum 60 Haemulon melanurum 149, 1 87,334 see
Haernulidae Haemulon Aavolineatum 200 Hamoor 238 Hamra 238 Hapalogenys kishinouyei 306 Harengula humeralis 32 Hemigaleidae 306 Hemipristis elongatus 306 Herring 23, 25,374
Lake 149 Heteractea ceratopus 3 7 Himantufa uarnak 306 Hinds 9, 84, 11 7, 236,276 see Serranidae
Red 10, 74, 76.83, 238, 239,279, 281,284,286,319,323 see Epinephelusguttatus
Rock 280 see Epinephelus adscensionis
Speckled 239 Holocentrus ascensionis 334 Hoplopagrus 325 Huachinango 330 see Luqanus
Ichthyofauna 72 invertebrates 36 1 Isoch/yss 365,372
Tahitian 365,371 /sognomon alatus 37
Jacks 23, 25 Jewfish 82,83, 1 98,240,33 1 see
Epinephelus itajara
Kalava 1 09, 1 1 8 see Rock cod Katsuwonuspelamis 94 Kelp bass 237,385,386,397, 398
Labridae 306 Laeviardium mortoni 37 Lagodon rhomboides 4 1 1 Lane snapper 9, 1 2, 17,63,65, 72, 149,
190, 197,200,201,239,240,277, 280,282,286,287,288 see Lufianus synagris
Lates calcalifer 386,397 Leptoseris cucullata 44 Lethrinidae 290,294-297,299-301,303-
306 Lethrinids 1 10
Lethrinus spp. 289 Lethrnus choeroryllchus 305 Lethrinus henatus 305 Lethrinus Iengan 294,305 Lethrinus nebulosus 305 Lethrinus nernatacanthus 305 Lethrinus rubrioperculatus 238
Leucichtbys artedj 1 49 Lizardfish 362 Lobopilumnus agassizii 37 Lobsters 25,44, 107 Loligospp. 295-297,299-301,304,305 Lutjanids 41,44,46,60,63,94, 107, 110,
112,114-116,138,147,196,198,199, 218,355,357,383
Lutjanidae 44, 48, 50, 52, 60, 68, 72, 90, 94,95, 106, 107, 116. 149, 187, 189, 1 98,20 1 , 2 1 8,220,223,224,229, 231,232-234,237-238,276,281,290,

295-297,300,301,303,304,332,333, 335,354,379,384
Goldband 295-297,299-301,303- 305
Red 289,295-297,299,301,303- 305
Small 296,297,305 LutjanusZO, 52, 59,68,90, 189, 197,238,
241,324,325 see Ocyurus Snappers Lutjanus adetii 9,224 Lutjanus agennes 92-94 Luganus altifiontalis 238 Luljanusanalis 43,46, 57,59,63,
64, 192,198,224,23 1,356 Lutjanus apodus 43,46,47, 192,
198-1 10, 112,224,381,383, 386
Lutjanus argentimaculatus 1 07, 1 10, 1 12,224,305,378-384, 3%
Lutjanus argentiventris 324,325, 327-329
Lutjanus aya 239 Luljanus bohar 1 1 4,224 Lutjanus buccdnella 57, 58, 59,63,
64,224,228,334,335 Lutjanus carnpechanus 20,27,6 1 ,
63,64,85,86-91, 138, 149, 159, 174, 175, 187, 190, 199, , 200, 205,216,224,228.23 1, 239, 243,244,245,253,337, 338,35 1,356,362,384
Lutjanus cc7rponotatus 225 Luganus ch/ysurus 192, 197- 199 Lutjanus cyanopterus 43,46, 1 92,
198,225 Lu&-inus dentatus 94 Lutjanus eythropterus 225,305 Lutjmus hlv ihmma 225 Lutjanus hlvus 1 07 Lutjanusgibbus 109, 1 14,225 Luljanusgriseus 43,46,47,59,
63,64,194,195,199,200, 225,231,239,242
Lu@anusguttatus 324,327-329 Lutjanus goreensis 94 Luqanus jocu 43,46,47, 192, 198,
199,225
Lutjanus johnii 107, 1 15,225, 305 Lutjanuskasrnira 11 1 , 114, 115,
119, 199,201,225,231,438 Luljanus Iuljanus 1 1 0,225 Lutjanus rnahogani 43.46 Luljanus malabaricus 1 07, 1 1 0,
112,225,228,231,241,289, 290,294,305 see Red Lutjanidae
Luljanus monostigma 226 Luljanus nebulosus 265 Lutjanusperu 324,325,327-330
see Huachinango Lutjanuspurpureus 59, 63,64,86,
137, 138, 141-147,226,228, 23 1,243,266,267,270,273, 276
Lutjdnus quinquelineatus 9,226, 229
Lutjanus rivulatus 1 1 0, 1 1 2,226 Luqanus russelli 1 14, 1 1 5,305,
386 Luljanus sanguineus 1 07,226,238 Lutjanussehe 1 15,226.23 1,
238,305 Lutjanussynagris 9, 11-13, 15-18,
57, 58,63, 148, 171, 200, 201,226,231,237,239,240, 242,243
Lutjanus vitta 1 07, 1 1 O,226,23 1 , 232
Lutjanus vittus 1 99, 200,240, 294, 305 see Small Lutjanidae
Lutjc7nus vivanus 54,55, 56, 57, 59,63,64, 227,241', 282, 334,335
Lycodon&ssp. 334 Lyrnphocystis 385, 390,397 Lyretail 9, 1 17, 236
Mackerel 2 1 7 King 20, 23, 25 Spanish 349,365
Macroalgae 373 '
Macrofauna, benthic 45 Macrocoeloma sp. 3 7
Macrocoeloma cmptocerurn 37 Macrocoeloma eutheca 3 7

Madracis clecactis 44 Mahogany snapper 198 see Lutjanus
mahogmi ~ a h s shrimp 362 Megalaspis cordyla 305 Menhaden 374 Menippe rnercenaria 3 7 Mero 26,27,40,41,2 14-21 7,242,243
see Epinephelus rnorio Merou 240 see Epinephelusguaza Microalgae 37 1 Microcrustaceans 25 Micropogonias unndu/atus 36 1 ,362 Microstomus pacificus 1 87 Milltfish 384 Millepora alcicornis 44 Minnows 365 Misty grouper 280,28 1 Mithrax acuticornis 3 7 Mithrax hrceps 3 7 Mithrax hispidus 3 7 Mithrax pleuracan thus 3 7 Mojarras 23,25,205,2 16 Molluscs 25, 37, 38 Monacanthus hispidus 60 Montastreaspp. 76
Montastrea annularis 76 Mugiloididae 50 Mullidae 295-297,299-301,303-305 Mutton snapper 63,65, 72, 149, 190, 196,
198, 199,200,239 see Lu+wus analis Mycteroperca spp. 29,277,279,283
Mycteroperca bonaci 80, 222, 281,284,310,413
Mycteroperca cidi 334 Mycteroperca microlepis 222,322,
323,413,414 Mycteroperca 01.6~ 223,24 1 Mycteroperca phenax 223,24 1 ,
308 Mycteroperca rubra 96,97 Mycteroperca tigris 1 99,223,242 Mycteroperca venenosa 80,223,
227 Mysids 1 1 1
Nannoch/oropsis 365,3 72 Nannochloropsis oculata 365,37 1
Nassarius hinia 3 7 Natantia 38 Nernipteridac 290,294-297,299-301,
303-305 Nemipterus spp. 289 Nemipterus celebicus 305 Nemipterus hrcosus 294,306 Nemipterus hexodon 306 Nemipterus virgatus 306
Newaiby 238
Octocorals 76 Octopus sp . 3 7 Octopuses 25,373 Ocyurus chgeiurus 17,20,43,46,47, 59,
63,64,66,200, 227,228,23 1 see Yellowtail snapper
Ophidiid fish 253 Oyster 363
Pacific 365
Pagruspagrus 149, 187 see Sparidae Pagrus seclecim 1 62 Palaernonidae 37 Panopeus arnericanus 3 7 Paradicichthyinae 227 Paralabrax clathrus 23 7 Paranthias Furu'Fer 1 67- 1 70.223 Parasitic trematodes 368 Pargo 48, 58, 148, 149, 237, 238,243,
239 see Luyanus analis; Lutjanus purpureus
Aleta negra 58 see Lutjanus buccanella
Canane 1 7,243 see Ocyurus chrysurus
Cebal 149 see Luqanus analis Colorado 276 see Lutjanus
purpureus Criollo 239 see Luqanus analis Del alto 58 see Luqanus vivanus Ojo arnarillo 58 see Lutjanus
vivanus Parthenope agonus 3 7 Parupenaew pleurospilus 305 Penaeid shrimps 1 1 , 16,365,372 Penaeus sp. 3 7
Penaeus duorarum 365

Penaeus duorarum notialisis 3 7 PelJrius burti 362 Perches 108, 110, 112, 114, 115, 118see
Epinephelus diacanthus Giant 118 Sand 237
Percoid fishes 60 Phytoplankton 25, 103, 369 Pigface breams 109, 1 10 Pilchards 32 Pilumnus sp . 3 7
Pilumnus dasypodus 3 7 Pifunnus sayi 3 7
Pinfish 362.41 1 Pink shrimp 365 Platax bata vianus 306 Plectropomus leopardus 6,9 , 1 0,223,228 Plectropomus maculatus 9, 223, 306 Poecilja reticulata 229 Pogonias cromis 1 87 Polychaetes 1 10 Po/ydacthlus octonemus 1 7 Polyprion americanus 280,282 Pornacentrus mo1uccens;s 1 0 Pomacentrus ward; I0 Pornatomus saltatfix 246 Porgies 20, 23, 25, 356 see Calamusspp.
Longspine 36 1,362 Red 72, 158, 159, 161, 162see
Pagruspagrus; Sparidae Porites porites 44 Portunus s p . 3 7
Portunus floridanus 3 7 Portunus gibbesii 362 Portunus sayi 3 7 Portunus spinjcarpus 362 Portunus spinimanus 37
Prawns 107, 1 10 Priacanthidae 295-297,299,30 1,303,304,
306 Priacanthus hamrur 306 Priacanthus tayenus 306 Pristipomoides 72 Pristipomoides aqui/onaris 59,63,64 Pristipomoides argyrogrammicus 1 1 8 Pk!stlpomoides auricilla 223,228 Prist@omoides filamentosus 224,228,23 1 ,
241,255,259,262-265
Pristipomoides Aavipinnir 224,228 Pristipomoides/creemani 59,63,64,66 Pristimmoides mauophtha/amus 283 Pristipomoidesmultidens 224,294,305
see Goldband Lutjanidae Pristipomoides sieboldi 224 Pristipomoides @pus 1 09- 1 14,224,305 Pristipomoidesronatus 224,228 Protonibea diacanthus 306 Psenopsis humerosa 289,305 Psenopsis humerosa 294 see Butterfish Pseuclotolithus senegalensis 1 05
Queen conch 365 Queen triggerfish 240
Rabirrubia 239,242 see Ocyurus chysurus Rachycentridae 294-297,299,301,303,
304,306 Rtchycentron canadus 306 &strelliger kanagu/-ra 306 Rays 295-297,299,301,303,304,306 Red bass 238 see Lutjanus bohar Red drum 253 Reptantia 38 Reptiles 84 Rhizoprionodon dcutus 306 Rhizoprionodon porosus 334 Rhizoprionodon taylori 306 Rhom.hopIites aurorubens 59,63, 149, 1 87,
227,228,334,335 Rhyncobatidae 306 Rhynchoktus @iddensis 306 RocMish 245,253 Rotifers 363,365,372,373,375 Rubia 1 7, 18 see Lutjanus synagris
Sablefish 157 Salrno trutta 1 0 Sandfish, belted 241 Sardine 52, 333 Sardinella aurita 333 Sauridaspp. 289, 306
Saurida micropectoralis 306 Saurida undosquamis 294,306 see
Synodontidae Scallops 365 Scamp 308,319,241

Scaridae 306 Scarusghobban 306 Sciaenidae 105,295-297,299,301,303,
304,306 Sciaenops oce//atus 253 Scolopsids 1 10 Scolopsis monogramma 306 Scomberomorus avalla 20 Scomberomorus maculatus 349 Swmbridae 295-297,299,301,303,304,
306 Scyllaridae 37 Sea fans 109 Seabass 1 72,322,384,386,397
Black 1 58- l62 ,U 1 see Cen froprktis
Seagrass 44 Seaweeds 369 Sebastodes 245,253 Selar boops 305 Selaroides Iep tolepis 305 Sepiidae 295,296,297,299,301,303,
304,306 Sepia spp. 306
Seriolina n~grohsciata 306 Serranid 60, 104, 1 12, 1 14, 1 15, 199,204,
2l8,306,3 19,355,357,368,377 ~eFranidae 9, 29,48, 50, 52,83,&4,37,
105, 106, 117, 198,ZOl,220,221, 227,229,235-237,241,243,276,281, 280,295-297,299,301,303,304,308, 322,33 1-333,335,364,385,399,414 see Hinds
Serranus 29 Serranus S C I ~ 24 1 Serranus sub/igrius 24 1
Sesi 240,242 see Lutjanus bucanella Sharks 23,25,295,296,297,299,301, .
303,304,306 Hammerhead 90
Shrimps 5,25,360,373 Seabob 362 Sugar 362
Siderastrea siderea 76 Sigani'dae 306 Siganus canallcu/afu~ 1 1 5 Siganus hscescens 306 Siganus jaws 1 1 5
Sillago sihama 1 1 5 Snapper(s) 58 see Lutjanidae
Black 28 1 Blackfin 63,66 see Lutjanus
buccane//a Blood 237 see Luqanussanguineus Brazilian 143 Caribbean red 63.66, 1 38, 149
see Lutjanus purpureus Cubera 197 see Lutjanus
cyanopterus Dog 1 96 see Lufjanus jocu Emperor red 237, 254 see
Lutjanus sebae Flamenco 325 see Lrstjanus
guttatus Gray 63,65, 72, 189- 196, 198-
201,237,239,277,280,287 see Lutjanusgriseus
Grey 282,285 see Lutjanusgriseus Hawaiian 240 see Pristfpomoides
filamentosus John's 384 see Luqanusjohni Lunarejo 325 see Lutjanusgutkatus Lane 200 Mutton 200 Queen 63,66,67,241,282,283
see Etelis ocula fus Red 5,23,25-27,59,61-68, 70-
72,85,86,88,90,92-95, 137, 138, 147-149, 173, 174, 187, 176-186, 190,200,205, 239,240,243-250,252,253, 266,267,269,270,273,275, 282,325,337-342,344,346- 353,360,362,378-384 see Lutjanus
Red eye 53 see Lutjajanus vivanus Silk 63,66,283 see Lutjanus
vivanus Southern 138 Vermilion 59,61-63,64,67-70,
72,240,266,267,269,272, 275,283 see Rhomboplites aurorubens
Wenchman 283 Yellow eye 5 1 ,52 see Lutjanus
vivanus

Yellowtail 49,63.66, 187, 190, 177,200,20 1,239,240,277, 279,280,282, 285,287,356, 358 see Ocyurus chlysurus; Lutjanus ocyurus
Sok~~olamDrus ten ellus 37 Sparidae 290,295-297,299, 301,303,
304,306 Sparids 60, 357 Sphyraena barracuda 3 34 Sphyracna puhatniae 306 Sphyraenid 297 Sphyraenidae 295-237,299-301,303,304,
306 Sponges 60,80, 1 9 1,290 Spot 362 Leiosfomus xanthurus 362 Squid 150, 152. 153, 274 SquiJJa s p p . 3 62 Stenocio170ps furcat.. 3 7 Stenotom~rs cap1-i/7us 36 1 Stenotorn~~s chrysops 60 Stenoynchus seticornis 3 7 Stomatopods 37, 38, 1 I I Strombus gigas 36 5 Swordfish 253 Symphorus 17etna tophorus 227 Sy~~alpheus sp. 3 7
Synadjheus brevicarpus 37 Synodontid 297 Synodontidae 270,294,295,296,297,
300,301,303,304,306 SYI~O~LJS Poetem 362
Tautog Tautoga onitis 24 1 Teleosts 188 Teraponidae 306 Terapon 1 I0
Terapon jarbua 306 Tetrdse/mis 3 7 2 Tetraselmis suecica 365
Thaiassia testudinum 43,44 Thun17us albacares 94 Tilapia 9, 23 1 . 236 Tilefish 67,365 Tracbypenaeus spp. 362 Trichiuridae 295-277.300, 30 1,303,304,
306 Trichiurus Iepturus 294, 306, 362 see
Trichiuridae ~~chogasterpectora/is 398 Trout 9, 10, 23, 25,83 , 238, 241, 362
Brown 10 Coral 9, 10,83, 238, 241 see
Plectropom LIS leopardus Sea 23, 25 Sand 362
Tuna 92,365 Skipjack 94 Yellowfin 92.94. 2 17
Tunny 246 Turridae 37
Llca sp. 365
Variola /out! 223 Vibrio 369 Virus 377
Wenchman 63,65,282,283 see Pristipomoides aquilonaris; Prisi~pomoidrs macro@ thalrn us
Yelloweye 63 see Pristipomoides fieemani
Whiting, sand 1 15 Wreckfish 280, 282
Zooplankton 25, 103, 369

."..-
Biology, fisheries and culture of tropical groupers and snappers.F. Arreguin-Sanchez, J.L. Munro, M.c. Balgos and D. Pauly, Editors.t 996. ICLARMConf. Proc. 48, 449 p. ,
TITLES OF RELATED INTEREST \t'.FishBase96: concepts, design and data sources. R. Froese and D. Pauly,Editors. 1996. ICLARM. 179 p. Distributed with one CD-ROM disk for US$95(airmail). Available free of cost for all collaborators of the FishBase Project.Available only from the FishBase Project, ICLARM.
Caribbean coral reef fishery resources. J.L. Munro, Editor. 1983. ICLARMStud. Rev. 7, 276 p.
Baseline studies of biodiversity: the fish resources of Western Indonesia.D. Pauly and P. Martosubroto, Editors. 1996. ICLARM Stud. Rev. 23, 321 p.
Quantitative models of trophic interactions in Caribbean coral reefs.S. Opitz. 1996. ICLARM Tech. Rep. 43, 350 p.
Note on observations of daily rings on otoliths of deepwater snappers.F. Brouard, R. Grandperrin, M. Kulbicki and J. Rivaton. 1984. ICLARM Transl.3,8 p.
HOW TO ORDER
For book prices and more publication information, contact:
The EditorICLARM
MCPO Box 2631, 0718 Makati City, PhilippinesTel. nos. (63-2) 812-8641 , 818-0466 ext. 1 10Fax no. (63-2) 816-3183E-mail: [email protected]
Payment should be in US dollars by bankdraft or check (payable toICLARM) from a US-based bank. We also accept payment throughthe American Express card.
Visit our homepage: http://www.cgiar.org/iclarm/
- ; - "...,