
Auditor-general reports significant faults in procurement and ...
Upload
independentCategory
view
0download
0
Int. J. Biol. Sci. 2008, 4
368
International Journal of Biological Sciences ISSN 1449-2288 www.biolsci.org 2008 4(6):368-378
© Ivyspring International Publisher. All rights reserved Research Paper
Biological and functional analysis of statistically significant pathways de-regulated in colon cancer by using gene expression profiles Angela Distaso1, Luca Abatangelo1, Rosalia Maglietta1, Teresa Maria Creanza1, Ada Piepoli2, Massimo Carella3, Annarita D’Addabbo1 and Nicola Ancona1 1. Istituto di Studi sui Sistemi Intelligenti per l’Automazione, CNR, Via Amendola 122/D-I, 70126 Bari, Italy 2. Unità Operativa di Gastroenterologia, IRCCS, “Casa Sollievo della Sofferenza”-Ospedale, 71013 San Giovanni Rotondo
(FG), Italy 3. Servizio di Genetica Medica, IRCCS, “Casa Sollievo della Sofferenza”-Ospedale, 71013 San Giovanni Rotondo (FG), Italy
Correspondence to: Nicola Ancona - [email protected]
Received: 2008.07.08; Accepted: 2008.10.07; Published: 2008.10.14
Gene expression profiling offers a great opportunity for studying multi-factor diseases and for understanding the key role of genes in mechanisms which drive a normal cell to a cancer state. Single gene analysis is insufficient to describe the complex perturbations responsible for cancer onset, progression and invasion. A deeper under-standing of the mechanisms of tumorigenesis can be reached focusing on deregulation of gene sets or pathways rather than on individual genes. We apply two known and statistically well founded methods for finding path-ways and biological processes deregulated in pathological conditions by analyzing gene expression profiles. In particular, we measure the amount of deregulation and assess the statistical significance of predefined pathways belonging to a curated collection (Molecular Signature Database) in a colon cancer data set. We find that path-ways strongly involved in different tumors are strictly connected with colon cancer. Moreover, our experimental results show that the study of complex diseases through pathway analysis is able to highlight genes weakly connected to the phenotype which may be difficult to detect by using classical univariate statistics. Our study shows the importance of using gene sets rather than single genes for understanding the main biological processes and pathways involved in colorectal cancer. Our analysis evidences that many of the genes involved in these pathways are strongly associated to colorectal tumorigenesis. In this new perspective, the focus shifts from finding differentially expressed genes to identifying biological processes, cellular functions and pathways per-turbed in the phenotypic conditions by analyzing genes co-expressed in a given pathway as a whole, taking into account the possible interactions among them and, more importantly, the correlation of their expression with the phenotypical conditions.
Key words: Microarray, pathway analysis, prediction accuracy, machine learning, gene expression, colon cancer.
Introduction Gene expression profiling has become a mainstay
of the current research in applied genomics [1]. In on-cology, in particular, the advent of DNA microarray technology has allowed a deeper understanding of the role that many genes play in onset, progression and treatment of tumors [2,3]. Typically, specimens of tis-sues in two different phenotypical conditions (e.g dis-eased patients vs. healthy controls, or patients in two different stages of the same pathology) are collected and genes which are differentially expressed (DE) in the two conditions analyzed are determined. To this end, appropriate univariate statistical tests are applied to the gene expression profiles of the specimens and genes with high statistical significance levels (p-value)
are considered associated with the trait of interest. Due to the huge number of hypotheses tested simultane-ously, suitable statistical strategies are applied to con-trol false positive findings [4]. Finally, the list of DE genes statistically associated to the phenotype is used to find the main pathways or biological processes in-volved in the analyzed pathology. Such processes are coded through lists of genes defined on the basis of a-priori biological knowledge or experimentally. In the first case, such lists are composed of those genes which cooperate or are co-expressed in a particular cellular mechanism or function [5–7]. In the second case, the gene set represents the signature (response) of cells (system) to a given stimulus [8]. Many tools have been proposed for measuring deregulation of pathways and for assessing their statistical significance [9].
Int. J. Biol. Sci. 2008, 4
369
This approach has a few major limitations. a) The results obtained with this method are not always con-firmed by studies carried out on independent cohorts of subjects [10]. This means that studies performed by different groups on the same trait or pathology may produce lists of DE genes with little overlap. b) The information embedded in genes weakly connected with the phenotype may be lost due to both the statis-tic adopted and the correction for multiple hypothesis testing. c) Single gene analysis provides a limited view of the phenomena under examination since it does not take into account interactions among genes and is un-able to uncover the correlation between groups of genes and phenotype. Many different genes contribute to a given disorder, with no particular gene having a remarkably large effect [11]. Thus, a specific pheno-type may result from the combination of effects by a large number of moderately contributing genes.
To overcome these drawbacks, a new approach is emerging in genomics research in which instead of inferring pathways involved in a given disorder start-ing from the analysis of DE genes, it aims to measure pathway deregulation by considering simultaneously all the genes co-operating in the pathway [12–14]. In this new perspective, the focus shifts from finding DE genes to identifying biological processes, cellular functions and pathways perturbed in the phenotypic conditions by analyzing genes co-expressed in a given pathway as a whole, taking into account the possible interactions among them and, more importantly, the correlation of their expression with the phenotypical conditions [8,15].
In this paper we describe the results obtained by applying this new approach to a data set composed of gene expression profiles relative to patients affected by colon cancer, collected in Casa Sollievo della Soffer-enza Hospital, Foggia -Italy [16]. Two well known methods recently proposed for finding deregulated pathways were applied. GSEA (Gene Set Enrichment Analysis) [12] finds perturbed pathways comparing the rank distribution of genes belonging to a given gene set with the rank distribution of the remaining genes. To this end a Kolmogorov-Smirnov like statistic is used for assessing the statistical significance of the deregulation. GLAPA (Gene List Analysis with Pre-diction Accuracy) [14] uses the prediction accuracy of the phenotypic status of specimens to find the path-ways involved in the pathology. Both use non para-metric permutation tests [17] and false discovery rate (FDR) [4] for assessing the statistical significance of the estimates. The database of gene sets we use in this study is the Molecular Signatures Database (MSigDB) [12]. This is a collection of 1687 curated gene sets with sizes ranging from 2 to 1594 genes, obtained from
online pathway databases, publications in PubMed and expert knowledge.
Our study highlights two relevant and different aspects of the application of pathway analysis in on-cology. In fact it shows that specific pathways de-regulated in different types of tumors are found per-turbed in colon cancer with high statistical signifi-cance. Moreover, such an approach provides a more complete portrait of complex diseases like tumors be-cause it points out genes moderately associated to the trait which would not be detected by using classical univariate statistics.
Material and methods Data set description Study population
Twenty-five patients (14 males; mean age: 60 ± 14 years), who underwent colonic resection for colorectal cancer (CRC) at CSS hospital, were prospectively re-cruited into this study. Two samples from each patient were available, one from colon cancer tissue and one from normal colonic mucosa tissue. The samples had been obtained during the surgery, immediately frozen in liquid nitrogen and then stored at −80°C. All of them were reviewed by the same experienced pa-thologist to confirm the histological diagnosis. None of the patients suffered from hereditary CRC or had re-ceived preoperative chemo-radiotherapy. Informed consent to take part in this study was obtained from all the patients. The study was approved by the Hospital’s Ethics Committee.
RNA extraction from fresh frozen tissue Total RNA from 150-200 mg of fresh frozen tissue
was isolated by phenol-chloroform extraction (TRIzol Reagent, Invitrogen, Carlsbad, CA) and subsequently purified through column chromatography (RNeasy Mini Kit, Qiagen, Valencia, CA) according to the manufacturer’s instructions. RNA integrity was monitored using denaturing agarose gel electrophore-sis in 1X MOPS. Three neoplastic samples were dis-carded from the final analysis since their RNA prepa-ration was suboptimal.
Microarray assays Biotinylated target cRNA was generated from 12
mg as described by the Affymetrix Expression Analy-sis GeneChip Technical Manual (Affymetrix, Santa Clara, California). Briefly, double-stranded cDNA was synthesized from total RNA using the SuperScript Choice System (Invitrogen, Carlsbad, California), a primer containing poly(dT) and a T7 RNA polymerase promoter sequence. In vitro transcription using dou-ble-stranded cDNA as a template in the presence of
Int. J. Biol. Sci. 2008, 4
370
biotinylated UTP and CTP was carried out using BioArray High Yield RNA Transcript Labeling Kit (Enzo Diagnostics, Farmingdale, New York). The re-sulting biotynilated-cRNA ”target” was purified and quantified. Fifteen micrograms of biotinylated cRNA were randomly fragmented to an average size of 50 nucleotides by incubating in 40mM TRIS-acetate, pH 8.1, 100 mM potassium acetate, and 30 mM magne-sium acetate at 94°C for 35 minutes. The fragmented cRNA was hybridized for 16 hours at 45°C on Human Genome U133A GeneChips containing a total of 22,283 probe sets and after stained in a Fluidics station with streptavidin/phycoerythrin, followed by staining through a streptavidin antibody and strepta-vidin/phycoerythrin. Arrays were scanned on a Ge-nearray scanner G2500A by using standard Affymetrix protocols. Absolute data analysis was performed using the Affymetrix Microarray Suite 5.0 software.
GSEA This method provides an enrichment score of
pre-defined gene sets whose magnitude is propor-tional to the association of the gene set to the particular phenotype [12]. Given a gene expression dataset, the genes are ordered in a ranked list S according to their differential expression between the two classes. GSEA provides a score which measures the degree of en-richment of a given gene set L at the extremes (top or bottom) of the rank-ordered list S. The method is based on a maximum deviation statistic of two distribution functions, similarly to the Kolmogorov-Smirnov test that is used to estimate the difference between two distributions. In fact, the score is calculated by walking down the list S, increasing a running-sum statistic when a gene in the gene set is encountered, and de-creasing it when genes not belonging to the gene set are encountered. The magnitude of the increment de-pends on the correlation of the gene with the pheno-type. The enrichment score (ES) is the maximum de-viation from zero in the walk. These ES are then nor-malized to take into account the size of the gene sets resulting in a normalized enrichment score (NES). The gene sets related to the phenotypic distinction will tend to show high values of NES. The significance of NES is assessed by permutation testing: the observed NES is compared with the distribution of enrichment scores under the null hypothesis that the gene expres-sion levels and the phenotype are independent ran-dom variables. The nominal p-value (py) is given by the percentage of random normalized enrichment scores greater than the observed value of NES.
GLAPA This method uses an estimate of the generaliza-
tion error of predictors trained by using raw expres-
sion levels of the genes belonging to a gene set L as a measure of enrichment of L [14]. The rationale is that a functional category coded through a list of genes is perturbed in a particular disease if it is possible to correctly predict the occurrence of the pathology in new subjects on the basis of the expression levels of those genes only. In other words, a functional category is informative for or is deregulated in a disease if the expression levels of the genes involved in the category are useful for training classifiers able to generalize, that is, able to correctly predict the status of new subjects [18]. So, the generalization ability of predictors trained by using the expression levels of the genes co-operating in a given cellular mechanism or function can be seen as a measure of the relevance of the func-tion in the pathology at hand. The phenotype is pre-dicted through regularized least squares (RLS) classi-fiers with linear kernel [16, 19–21]. The error rate of the phenotype eL is estimated by using a multiple random validation strategy which provides a statistically sig-nificant estimate of the generalization error of outcome cancer predictors [22, 23]. The statistical significance of the measured accuracy is assessed against a couple of null hypothesis by using two independent permuta-tion tests [17]. The first one (T1) controls for how likely the error rate eL was due to chance. The statistical sig-nificance py, power πy and false discovery rate FDRy
were estimated by phenotypic permutations. The sec-ond one (T2) controls for the effect of the gene set size in the error rate eL. The statistical significance pn, power πn and false discovery rate FDRn were estimated by randomly selecting gene sets of the same size as L.
Results and discussion Statistical analysis
The deregulation of the whole collection of gene sets belonging to MSigDB was measured applying GSEA and GLAPA tools on our colon cancer data set independently. The GSEA software parameters were set to their default values. The statistical significance of the normalized enrichment score (NES) associated to each gene set was assessed through a non parametric permutation test in which 1000 random permutations of the phenotypic labels were carried out. GSEA found 915 gene sets up-regulated in tumor and 769 up-regulated in normal specimens. Among these, only 399 gene sets up-regulated in tumor and 3 up-regulated in normal were found statistically sig-nificant with FDRy ≤ 25%. For measuring the deregu-lation of each gene set L with GLAPA, we measured the prediction error of the phenotype eL associated to L. To this end, for each gene set, 1000 cross validations of the data set were carried out. In each cross valida-tion, we used 30 examples for training and the re-
Int. J. Biol. Sci. 2008, 4
371
maining 17 for testing RLS classifiers with linear ker-nel. We found 1381 pathways with an error rate eL ≤ 25%. To assess the statistical significance of eL, 1000 random permutations of the phenotypic labels were performed. This permutation test revealed 690 statis-tically significant gene sets (py ≤ 0.01, FDRy ≤ 0.024) having error rates eL ≤ 17%. In order to determine if the deregulation of a particular pathway was due to the identity of the genes cooperating in the given pathway, or simply to the number of genes present in the gene set, a second permutation test was carried out. Spe-
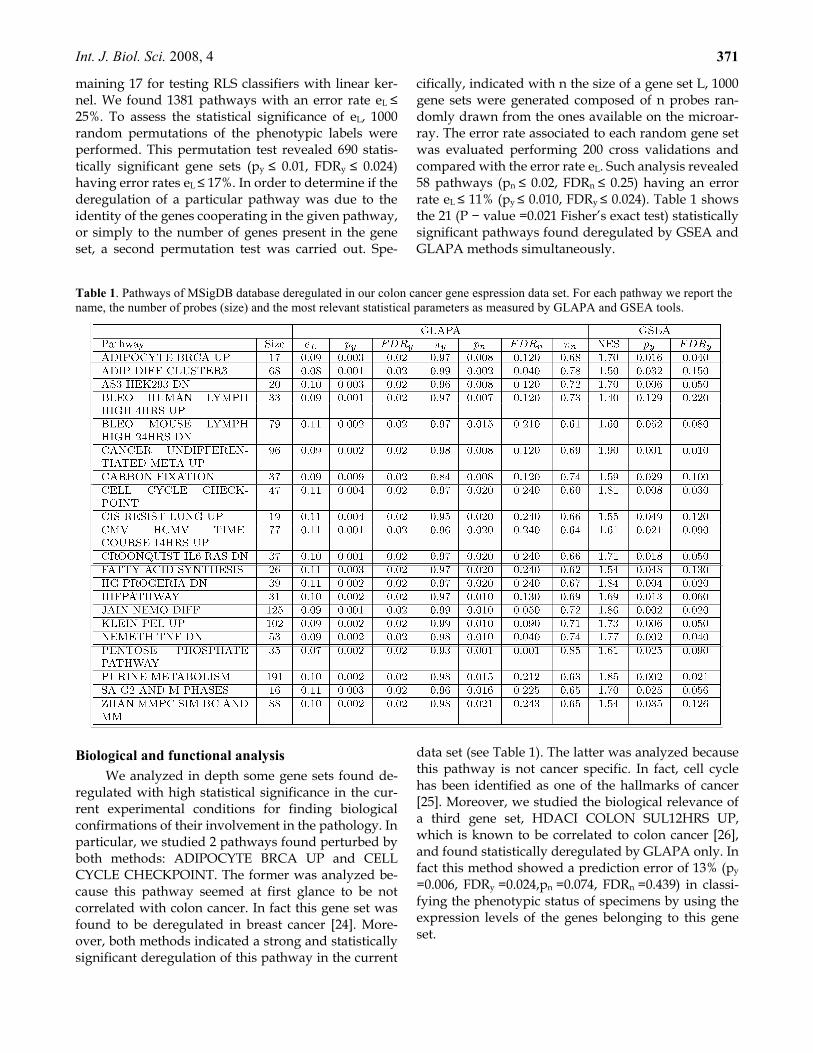
cifically, indicated with n the size of a gene set L, 1000 gene sets were generated composed of n probes ran-domly drawn from the ones available on the microar-ray. The error rate associated to each random gene set was evaluated performing 200 cross validations and compared with the error rate eL. Such analysis revealed 58 pathways (pn ≤ 0.02, FDRn ≤ 0.25) having an error rate eL ≤ 11% (py ≤ 0.010, FDRy ≤ 0.024). Table 1 shows the 21 (P − value =0.021 Fisher’s exact test) statistically significant pathways found deregulated by GSEA and GLAPA methods simultaneously.
Table 1. Pathways of MSigDB database deregulated in our colon cancer gene espression data set. For each pathway we report the name, the number of probes (size) and the most relevant statistical parameters as measured by GLAPA and GSEA tools.
Biological and functional analysis We analyzed in depth some gene sets found de-
regulated with high statistical significance in the cur-rent experimental conditions for finding biological confirmations of their involvement in the pathology. In particular, we studied 2 pathways found perturbed by both methods: ADIPOCYTE BRCA UP and CELL CYCLE CHECKPOINT. The former was analyzed be-cause this pathway seemed at first glance to be not correlated with colon cancer. In fact this gene set was found to be deregulated in breast cancer [24]. More-over, both methods indicated a strong and statistically significant deregulation of this pathway in the current
data set (see Table 1). The latter was analyzed because this pathway is not cancer specific. In fact, cell cycle has been identified as one of the hallmarks of cancer [25]. Moreover, we studied the biological relevance of a third gene set, HDACI COLON SUL12HRS UP, which is known to be correlated to colon cancer [26], and found statistically deregulated by GLAPA only. In fact this method showed a prediction error of 13% (py
=0.006, FDRy =0.024,pn =0.074, FDRn =0.439) in classi-fying the phenotypic status of specimens by using the expression levels of the genes belonging to this gene set.
Int. J. Biol. Sci. 2008, 4
372
ADIPOCYTE BRCA UP This gene set, composed of ten genes, was ex-
perimentally determined and found upregulated in breast cancer cells (MCF-7) treated with adipo-cyte-conditioned growth media [24]. However, an analysis in detail of the genes co-expressed shows a strong correlation of this pathway with colon cancer. ATF3 (activating transcription factor 3; Location: 1q32.3), a member of the ATF/CREB family, is a eu-karyotic transcription factor that is upregulated tran-scriptionally during the cellular response to a variety of stresses, in particular the DNA damage [27]. Dys-function of ATF3 impairs the p53-mediated cellular response to DNA damage, allowing cells to be readily transformed by oncogenes. Consistent with this notion is the observation of downregulated ATF3 expression in most human cancers [28,29]. Furthermore, ATF3 may play a pivotal role in DIM(3,3’-diindolylmethane)-induced NAG-1(Non-steroidal anti-inflammatory drug-activated gene-1) expression in human colorectal cancer cells [30]. The second gene analyzed was IGF2 (insulin-like growth factor 2; Location: 11p15.5) that plays a critical role in the regulation of cell growth and transformation. IGF-I and IGF-II inhibit apoptosis, promote tumor growth, and induce transformation and metastasis in many types of malignancies. The gastrointestinal system may be one of the major targets of the IGF action and there is increasing evidence that alterations in IGF signaling are involved in the neoplastic transformation and progression of the colorectal carcinoma. A significant overexpression of IGF-II mRNA and protein levels have been reported in 30-40% of colorectal carcinoma patients [31]. It has also been suggested that IGF-II plays a role in the development of liver metastasis from colorectal cancer and that 44% of colorectal can-cer patients showed loss of imprinting of IGF-II [32]. For this reason, it may be a valuable predictive marker of colorectal cancer [33]. Another gene analyzed was MMP1 (matrix metallopeptidase 1; Location: 11q22.3). It is a component of matrix metalloproteinases (MMPs) that collectively degrade most of the components of the extracellular matrix (ECM), contributing to the proliferation, invasion and metastasis of tumor cells by eliminating the surrounding ECM barrier [34,35]. Numerous MMPs, including MMP1, MMP3 and MMP7, have been associated also with the develop-ment of colorectal cancer [35, 36]. Another gene be-longing to ADIPOCYTE BRCA UP gene set was NFkB (nuclear factor of kappa light polypeptide gene en-hancer in B-cells 1; Location: 4q24) that is a generic name for a transcription-factor system that is involved in the regulation of cell proliferation, development, and apoptosis. The analysis of the expression of NFkB
in various colorectal carcinoma cell lines shows that the inactive cytoplasmic NFkB form is evidently up-regulated in the tumor epithelium, especially in the metastatic cases, as compared to normal tissue. The transcription factor SOX9 (sex determining region Y-box 9; Location: 17q24.3-q25.1) is another gene co-expressed in this pathway. A study carried out on a human colon carcinoma cell line showed that this gene down-regulates the human carcinoembryonic antigen (CEA) gene expression which contributes to the car-cinogenesis, and induces apoptosis [37]. Altered pat-terns of STC1 (stanniocalcin 1; Location: 8p21-p11.2) expression have a role in human cancer development. Hypoxia can stimulate STC1 gene expression in vari-ous human cancer cell lines, including those derived from colon carcinomas [38].
CELL CYCLE CHECKPOINT This gene set belongs to the Gene Ontology (GO)
data base and is composed of twenty six genes. Cell cycle checkpoints are essential in eukaryotes for en-suring high fidelity transmission of genetic informa-tion from one generation to the next. They include DNA damage checkpoints, DNA replication check-points, spindle assembly checkpoints, and cytokinesis checkpoints. Also in this case we give a short descrip-tion of the single genes belonging to this gene set, un-derlining their importance in oncogenesis. ABL1 (v-abl Abelson murine leukemia viral oncogene homolog 1; Location:9q34.1) proto-oncogene has been implicated in processes of cell differentiation, cell division, cell adhesion, death, and stress response. Several findings suggest that the 9q34 region was altered in some cases of sporadic colorectal carcinomas [39]. The protein encoded by ATM (ataxia telangiectasia mutated; Loca-tion:11q22-q23) gene is an important cell cycle check-point kinase which functions as a regulator of a wide variety of downstream proteins. ATM and the closely related kinase ATR are thought to be master control-lers of cell cycle checkpoint signaling pathways which are involved in the cell response to DNA damage and for genome stability. The ATM gene could be valuable in the cancer’s gene therapy. Frequent allelic imbal-ances at the ATM locus have been reported in colo-rectal cancer and some findings led us to hypothesize that loss of expression of this gene may have a role in the early stage of colorectal cancer development and it may be related to advanced tumor stage and poorer patient survival [40]. Another interesting gene ana-lyzed was BRCA1 (breast cancer 1; Location: 17q21) which plays a role in maintaining genomic stability and acts as a tumor suppressor.
Defects in BRCA1 are a cause of genetic suscepti-bility to breast cancer, and BRCA1 mutation carriers have a 4-fold increased risk of colon cancer. Recent
Int. J. Biol. Sci. 2008, 4
373
evidence shows that the expression of ATM and BRCA1 is a prognostic marker in colorectal cancer [40]. CHEK1 (checkpoint homolog; Location: 11q24-q24) gene is essential in human cells for cell cycle arrest in response to DNA damage, and has been shown to play an important role in the G2/M checkpoint. Some re-sults suggest that the CHEK1 gene is a target of ge-nomic instability in microsatellite instability (MSI)-positive colorectal cancers and that mutations of this gene might be involved in colorectal tumorigene-sis [41]. Also CHEK2 (checkpoint homolog; Location: 22q12.1) is a cell cycle checkpoint regulator and it was considered a putative tumor suppressor. Recently, a functionally defective CHEK2 variant I157T has been proposed to associate with an increased risk of colo-rectal cancer in a large population based study in-cluding a significant number of familial and sporadic colorectal cancer cases [42]. Also analysis of GADD45 (growth arrest and DNA-damage-inducible, alpha; Location: 1p31.2-p31.1) was interesting. It is a growth arrest-associated gene that is induced in response to DNA damage. This gene is a target for coordinated regulation by both ZBRK1 and BRCA1. Analyzing the relationships between GADD45, ZBRK1, and BRCA1 expression in colon carcinomas, it was reported that this pathway is deregulated in colon carcinomas [43].
Another important finding was MAD2L1 gene (MAD2 mitotic arrest deficient-like 1; Location: 4q27) which expression was found higher in colorectal can-cer than in the corresponding normal tissue. The ex-pression of Mad2 in colorectal cancer was related with histological differentiation and lymph node metastasis. Overexpression of Mad2 protein in cancer tissue might be a marker for the prognosis of colorectal cancer [44].
MRE11A (MRE11 meiotic recombination 11 ho-molog A Location: 11q21) encodes a nuclear protein involved in homologous recombination, telomere length maintenance, and DNA double-strand break repair. MRE11 may be considered as a new common target in the mismatch repair deficient tumorigenesis with a role in colorectal carcinogenesis [45]. Also mu-tations of the mismatch repair gene, MSH3 (mutS ho-molog 3 ; Location: 5q11-q12) might play a role in the progression of tumors by increasing instability. Common polymorphisms in MSH3 may increase the risk of colorectal cancer, especially proximal colon cancer [46]. NBS1 (nibrin; Location: 8q21) is a member of the MRE11/RAD50/NBN complex which plays a critical role in the cellular response to DNA damage and the maintenance of chromosome integrity. Also NBS1 could be a tumor suppressor gene involved in proximal colorectal cancer [47]. Another important gene analyzed was RAD17 (RAD17 homolog; Loca-tion: 5q13) which is a cell cycle checkpoint gene re-
quired for cell cycle arrest and DNA damage repair. It is overexpressed in various cancer cell lines and in colon carcinoma. Its chromosomal localization sug-gests that a variety of human cancers shows a deletion of this gene [48].
RPA1 (replication protein A1; Location: 17p13.3) and RPA2 (replication protein A2; Location: 1p35) are required for the stabilization of single-stranded DNA during the DNA replication. Experimental studies in colon cancer cell lines have shown that the RPA pro-tein may be the target of cytotoxins designed to inhibit cellular proliferation. So RPA1 and RPA2 proteins appear to be useful prognostic indicators in colon cancer patients and attractive therapeutic targets [49].
Finally we have analyzed TP53 (tumor protein p53; Location: 17p13.1) which plays an essential role in the regulation of cell cycle, specifically in the transition from G0 to G1. p53 is a tumor suppressor which acti-vates the expression of downstream genes which in-hibit growth and/or invasion, and induces apoptosis. Over 8000 mutations of this gene have been identified, and the spectrum of p53 mutations varies among tu-mor types. The G→A transition in codon 175 of p53 gene may be useful as a potential marker of colorectal cancer progression and in evaluating the margins of surgical resection [50].
HDACI COLON SUL12HRS UP This gene set, composed of twenty six genes,
seems to be specific for colorectal cancer. It was ob-tained experimentally by SW620 colonic epithelial cells as described in [26]. This gene set was found deregu-lated by GLAPA software only. ANXA2 (annexin A2; Location: 15q21-q22) gene encodes a member of the annexin family which plays a role in the regulation of cellular growth and in signal transduction pathways. In addition to these functions, it has been suggested that annexin II is involved in cell prolifera-tion/differentiation and in the pathogenesis of carci-noma. Overexpression of annexin II has been reported in various carcinomas including colon malignant tu-mors and it may be related to the progression and metastatic spread of colorectal carcinoma [51]. Also up-regulation of ANXA5 (annexin A5; Location: 4q28-q32) is associated with human colon adenocar-cinoma cell differentiation [52]. Another gene belong-ing to this list is CD55 gene (decay accelerating factor (DAF) for complement; Location: 1q32), a membrane glycoprotein which regulates the activation of the complement. The expression of DAF is enhanced in colorectal cancer cells and in the colonic epithelium of ulcerative colitis in relation to the degree of mucosal inflammation [53, 54]. The expression of DAF is de-tected in stool specimens of patients with colorectal cancer and its presence may be a valuable test for the
Int. J. Biol. Sci. 2008, 4
374
detection of colorectal cancer [55–57]. The CDH1 (cadherin 1, type 1, E-cadherin (epithelial); Location: 16q22.1) gene belongs to the cadherin superfamily. Mutations in this gene are correlated with gastric, breast, colorectal, thyroid and ovarian cancer. Loss of function is thought to contribute to progression in cancer by increasing proliferation, invasion, and/or metastasis. The examination of E-cadherin expression and distribution in colorectal tumors can be extremely valuable in predicting disease recurrence [58]. More-over, some findings suggest that E-cadherin may play an important role in tumor metastasis in colorectal cancer [59]. Another important gene analyzed was GSR (glutathione reductase; Location: 8p21.1). The gastrointestinal tract is particularly susceptible to re-active oxygen species attacks which lead to carcino-genesis, and an important role in the defense strategy against these reactive oxygen species is played by an-tioxidants. The activity of glutathione reductase results increased in colorectal tumor [60]. HSP90AA1 (heat shock protein 90kDa alpha (cytosolic), class A member 1; Location: 14q32.33) gene is a member of molecular chaperones and it was thought to promote tumor cell survival. HSP90 was low or non-detectable in normal colon tissues while high levels of HSP90 expression were observed in human colon cancer tissues, sug-gesting that HSP90 expression is a promising marker for malignant colon cancer [61]. Furthermore HSP90 are marker genes for the stress signaling pathway, so the induction of these genes in colorectal cancer tissue indicate the activation of stress signaling pathway in cancer tissue [62]. The protein encoded by MYC (v-myc myelocytomatosis viral oncogene homolog (avian); Location: 8q24.21) gene is a multifunctional, nuclear phosphoprotein that plays a role in cell cycle progression, apoptosis and cellular transformation. It functions as a transcription factor that regulates tran-scription of specific target genes. Some findings indi-cate that failure of the normal apoptotic process to-gether with de-regulation of c-MYC proto-oncogene might promote the development of colorectal tumors and its overexpression is observed in most colorectal cancers [63, 64].
An essential requirement for the development, progression and metastasis of malignant tumors is angiogenesis. VEGF (vascular endothelial growth fac-tor; Location: 6p12), a member of the PDGF/VEGF
growth factor family, plays an essential role in the de-velopment of angiogenesis of numerous solid malig-nancies including colon cancer. VEGF is associated with the development and prognosis of colorectal cancer, but its relation with degree of differentiation remains to be studied [65]. Some data suggested that VEGF functions as regulator of colon cancer cell inva-sion.
A key regulator of the expression of VEGF is the Sodium butyrate (NaB), a short-chain fatty acid natu-rally present in the human colon. NaB is able to induce cell cycle arrest, differentiation and apoptosis in colon cancer cells suggesting a possible clinical application of this fatty acid as an anti-angiogenic compound in as-sociation with conventional chemotherapeutic agents [66]. Other factors which may induce alterations of VEGF expression in colon cancer are hypoxia, muta-tions of p53 and activation of the Ras/MAPK pathway [67, 68].
Conclusions In this paper we have described the biological
and functional relevance in colon cancer of some pathways found deregulated in a gene expression profile data set composed of normal and tumor specimens of patients affected by this pathology [16]. Other studies have pointed out the fundamental role of pathways in studying onset and progression of tu-mors. In [8], human primary mammary epithelial cell cultures (HMECs) were used for studying in vitro pathways associated to the activation of Myc, Ras, E2F3, Src and β-catenin oncogenes. To this end, re-combinant adenoviruses were used to express the ac-tivities of these oncogenes in an otherwise quiescent cell and RNA from multiple independent infections were collected for DNA microarray analysis using Affymetrix Human Genome U133 Plus 2.0 Array. For each oncogene, a microarray data set was used to identify a gene set (signature) associated to the activity of the oncogene. This unique signature was used to assess the activity of the oncogene in lung and breast cancer. In [69], a pathway approach was used to study the genetic perturbations implicated in initiation and progression of prostate cancer and melanoma. In par-ticular, pathways interaction networks were inferred for relevant pathways over the steps in progression.
Int. J. Biol. Sci. 2008, 4
375
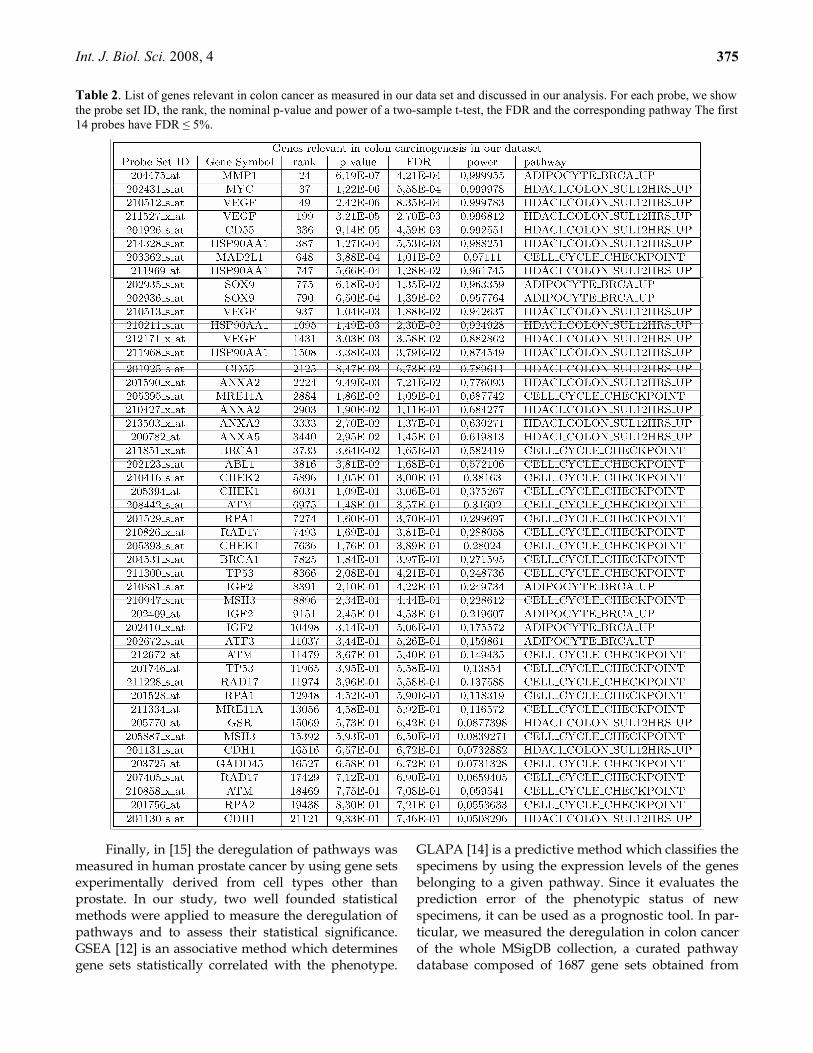
Table 2. List of genes relevant in colon cancer as measured in our data set and discussed in our analysis. For each probe, we show the probe set ID, the rank, the nominal p-value and power of a two-sample t-test, the FDR and the corresponding pathway The first 14 probes have FDR ≤ 5%.
Finally, in [15] the deregulation of pathways was
measured in human prostate cancer by using gene sets experimentally derived from cell types other than prostate. In our study, two well founded statistical methods were applied to measure the deregulation of pathways and to assess their statistical significance. GSEA [12] is an associative method which determines gene sets statistically correlated with the phenotype.
GLAPA [14] is a predictive method which classifies the specimens by using the expression levels of the genes belonging to a given pathway. Since it evaluates the prediction error of the phenotypic status of new specimens, it can be used as a prognostic tool. In par-ticular, we measured the deregulation in colon cancer of the whole MSigDB collection, a curated pathway database composed of 1687 gene sets obtained from
Int. J. Biol. Sci. 2008, 4
376
different sources [12]. In our analysis, we have shown the relevance in colon cancer of two pathways found statistically altered by both methods. The former was a gene set which seemed to be not associated to colon cancer. In fact it was found implicated in breast cancer [24]. The latter was a pathway usually altered in can-cer. In fact, cell cycle has been identified as one of the hallmarks of cancer [25]. Moreover, we have studied the biological relevance of a third gene set, which is known to be correlated to colon cancer and that was found implicated in the pathology at hand by GLAPA only.
Our study highlights the importance of using gene sets rather than single genes for understanding the main biological processes and pathways involved in colorectal cancer. Our analysis shows that many of the genes involved in pathways found deregulated are strongly associated to colorectal tumorigenesis. Many of the genes that we have discussed in this work, and found involved in the pathology at hand, would not have been detected by the classical single gene ap-proach. In fact, by applying a two-sample t-test statis-tics to the expression levels of each of 22283 probes in our data set, we found 1743 statistically significant DE probes with FDR ≤ 5%. Among these, only 14 belong to the set of probes determined by using the pathway approach and found strongly implicated in colon can-cer as demonstrated by our analysis (see Table 2). Note that, 34 out of 48 probes showed associated to the pa-thology, having rank in the range [2125,21121], would not have been analyzed by adopting classical single gene approach. This highlights the importance of pathway approach to the study of complex diseases because it allows detection of genes weakly correlated to the phenotype of interest which would be difficult to find using classical univariate statistics. So individ-ual gene analysis could give a limited interpretation of the processes involved in the tumorigenesis and could not be able to provide a full description of the complex interactions among genes. Unlike single gene analysis, pathways analysis allows to get a more complete pic-ture of altered biological processes in cancer patholo-gies.
Conflict of interests The author(s) declare that they have no compet-
ing interests.
Acknowledgements R.M. and A.D’A. are PhD students of Diparti-
mento Interateneo di Fisica, Bari, associated to Istituto Nazionale di Fisica Nucleare, sez. di Bari, and to Cen-ter of Innovative Technologies for Signal Detection and Processing (TIRES), Università degli Studi di Bari, It-
aly. This work was supported by grants from Regione Puglia, Progetto Strategico PS 012.
References 1. Schena M, Shalon D, Davis RW, Brown PO: Quantitative moni-
toring of gene-expression patterns with a complementary-DNA microarray. Science 1995, 270:467–470.
2. Golub TR, Slonim DK, Tamayo P, Huard C, Gaasenbeek M, Mesirov JP, Coller H, Loh ML, Downing JR, Caligiuri MA, Bloomfield CD, Lander ES: Molecular Classification of Cancer: Class Discovery and Class Prediction by Gene Expression Monitoring. Science 1999, 286:531–537.
3. Barrier A, Boelle PY, Roser F, Gregg J, Tse C, Brault D, Lacaine F, Houry S, Huguier M, Franc B, Flahault A, Lemoine A, Dudoit S: Stage II Colon Cancer Prognosis Prediction by Tumor Gene Ex-pression Profiling. J Clin Oncol 2006, 24(29):4685–4691.
4. Storey J, Tibshirani R: Statistical significance for genomwide studies. Proc Natl Acad Sci 2003, 100:9440–9445.
5. Ashburner M, Ball C, Blake J, Botstein D, Butler H, Cherry J, Davis A, Dolinski K, Dwight S, Eppig J, Harris M, Hill D, Is-sel-Tarver L, Kasarskis A, Lewis S, Matese J, Richardson J, Ringwald M, Rubin G, Sherlock G: Gene ontology: tool for the unification of biology. The Gene Ontology Consortium. Nat Genet 2000, 25:25–29.
6. Kanehisa M, Goto S, Kawashima S, Nakaya A: The KEGG data-bases at GenomeNet. Nucleic Acids Res 2002, 30:42–46.
7. Khatri P, Draghici S, Ostermeier G, Krawetz S: Profiling Gene Expression Using Onto-Express. Genomics 2002, 79(2):266–270.
8. Bild A, Yao G, Chang J, Wang Q, Potti A, Chasse D, Joshi M, Harpole D, Lancaster J, Berchuck A, Olson J, Marks J, Dressman H, West J M Nevins: Oncogenic pathway signatures in human cancers as a guide to targeted therapies. Nature 2006, 439(19):353–357.
9. Khatri P, Draghici S: Ontological analysis of gene expression data: current tools, limitations, and open problems. Bioinfor-matics 2005, 21:3587–3595.
10. Fortunel NO, Otu HH, Ng HH, Chen J, Mu X, Chevassut T, Li X, Joseph M, Bailey C, Hatzfeld JA, et al: author reply 393. Science 2003, 302:393.
11. NJ R: Searching for genetic determinants in the new millennium. Nature 2000, 405:847–856.
12. Subramanian A, Tamayo P, Mootha VK, Mukherjee S, Ebert BL, Gillette MA, Paulovich A, Pomeroy SL, Golub TR, Lander ES, Mesirov JP: Gene set enrichment analysis: A knowledge-based approach for interpreting genome-wide expression profiles. Proc Natl Acad Sci 2005, 102:15545–15550.
13. Tian L, Greenberg S, Kong S, Altschuler J, Kohane I, Park P: Discovering statistically significant pathways in expression pro-filing studies. Proc Natl Acad Sci 2005, 102:13544–13549.
14. Maglietta R, Piepoli A, Catalano D, Licciulli F, Carella M, Liuni S, Pesole G, Perri F, Ancona N: Statistical assessment of func-tional categories of genes deregulated in pathological conditions by using microarray data. Bioinformatics 2007, 23(16):2063–2072.
15. Creighton CJ: Multiple oncogenis Pathway Signatures Show Coordinate Expression Patterns in Human Prostate Tumors. PLoS ONE 2008, 3(3):e1816.
16. Ancona N, Maglietta R, Piepoli A, D’Addabbo A, Cotugno R, Savino M, Liuni S, Carella M, Pesole G, Perri F: On the statistical assessment of classifiers using DNA microarray data. BMC Bio-informatics 2006, 7:387.
17. Good P: Permutation tests: a practical guide to resampling methods for testing hypotheses. New York: Springer Verlag, New York, Inc 1994.
18. Vapnik V. The Nature of Statistical Learning Theory. New York: Springer Verlag; 1995.
Int. J. Biol. Sci. 2008, 4
377
19. Rifkin R, Yeo G, Poggio T. Regularized least squares classifica-tion. In: Suykens J, et al, eds. Advances in Learning Theory: Methods, Model and Applications, NATO Science Series III: Computer and Systems Sciences. Amsterdam: IOS Press. 2003:131–153.
20. Ancona N, Maglietta R, D’Addabbo A, Liuni S, Pesole G: Regu-larized least squares cancer classifiers from DNA microarray data. BMC-Bioinformatics 2005, 6(Suppl 4):S2.
21. Maglietta R, D’Addabbo A, Piepoli A, Perri F, Liuni S, Pesole G, Ancona N: Selection of relevant genes in cancer diagnosis based on their prediction accuracy. Artif Intell Med 2007, 40:29–44.
22. Mukherjee S, Tamayo P, Rogers S, Rifkin R, Engle A, Campbell C, Golub TR, Mesirov JP: Estimating dataset size requirements for classifying DNA microarray data. J Comp Biol 2003, 10:119–142.
23. Michiels S, Koscielny S, Hill C: Predictor of cancer outcome with microarrays: a multiple random validation strategy. Lancet 2005, 365:488–492.
24. Iyengar P, Combs TP, Shah SJ, Gouon-Evans V, Pollard JW, Albanese C, Flanagan L, Tenniswood MP, Guha C, Lisanti MP, Pestell RG, Scherer PE: Adipocyte-secreted factors synergisti-cally promote mammary tumorigenesis through induction of anti-apoptotic transcriptional programs and proto-oncogene stabilization. Oncogene 2003, 22(41):6408–6423.
25. Hanahan D, Weinberg RA: The Hallmarks of Cancer. Cell 2000, 100:57–70.
26. Mariadason JM, Corner GA, Augenlicht LH: Genetic repro-gramming in pathways of colonic cell maturation induced by short chain fatty acids: comparison with trichostatin A, sulindac, and curcumin and implications for chemoprevention of colon cancer. Cancer Res 2000, 60(16):4561–4572.
27. Wang A, Arantes S, Conti C, McArthur M, Aldaz CM, MacLeod MC: Epidermal hyperplasia and oral carcinoma in mice overex-pressing the transcription factor ATF3 in basal epithelial cells. Md Carcinog 2007, 46(6):476–487.
28. Yan C, Boyd DD: ATF3 regulates the stability of p53: a link to cancer. Cell Cycle 2006, 5(9):926–929.
29. Zhang C, Gao C, Kawauchi J, Hashimoto Y, Tsuchida N, Kita-jima S: Transcriptional activation of the human stress-inducible transcriptional repressor ATF3 gene promoter by p53. Bio-chemical and Biophysical Research Communications 2002, 297:1302–1310.
30. Lee SH, Kim JS, Yamaguchi K, Eling TE, Baek SJ: In-dole-3-carbinol and 3,3’-diindolylmethane induce expression of NAG-1 in a p53-independent manner. Biochem Biophys Res Commun 2005, 328(1):63–69.
31. Weber MM, Fottner C, Liu SB, Jung MC, Engelhardt D, Baretton GB: Overexpression of the Insulin-Like Growth Factor I Receptor in Human Colon Carcinomas. CANCER 2002, 95(10):2086–2095.
32. Nosho K, Yamamoto H, Taniguchi H, Adachi Y, Yoshida Y, Arimura Y, Endo T, Hinoda Y, Imai K: Interplay of Insulin-Like Growth Factor-II, Insulin-Like Growth Factor-I, Insulin-Like Growth Factor-I Receptor, COX-2, and Matrix Metallopro-teinase-7, Play Key Roles in the Early Stage of Colorectal Car-cinogenesis. Clinical Cancer Research 2004, 10:7950–7957.
33. Woodson W, Flood A, Green L, Tangrea JA, Hanson J, Cash B, Schatzkin A, Schoenfeld P: Loss of Insulin-Like Growth Factor-II Imprinting and the Presence of Screen-Detected Colorectal Adenomas in Women. Journal of the National Cancer Institute 2004, 96(5):407–410.
34. Seiki M. Membrane-type 1 matrix metalloproteinase: a key en-zyme for tumor invasion. Cancer Letters. 2003; 194:1-11.
35. Ye S: Polymorphism in matrix metalloproteinase gene promot-ers: implication in regulation of gene expression and suscepti-bility of various diseases. Matrix Biol 2000, 19:623–629.
36. Hewitt RE, Leach IH, Powe DG, Clark IM, Cawston TE, Turner DR: Distribution of collagenase and tissue inhibitor of metallo-
proteinases (TIMP) in colorectal tumours. Int J Cancer 1991, 49:666–672.
37. Jay P, Berta P, Blache P: Expression of the Carcinoembryonic Antigen Gene Is Inhibited by SOX9 in Human Colon Carcinoma Cells. Cancer Res 2005, 65(6):2193–2198.
38. Yeung HY, Lai KP, Chan HY, Mak NK, Wagner GF, Wong CKC: Hypoxia-Inducible Factor-1-Mediated Activation of Stanniocal-cin-1 in Human Cancer Cells. Endocrinology 2005, 146(11):4951–4960.
39. Bartos JD, Gaile DP, McQuaidb DE, Conroy JM, Darbary H, Nowak NJ, Block A, Petrelli NJ, Mittelman A, Stoler DL, Anderson GR: aCGH local copy number aberrations associated with overall copy number genomic instability in colorectal can-cer: Coordinate involvement of the regions including BCR and ABL. Mutation Research 2007, 615:1–11.
40. Grabsch H, Dattani M, Barker L, Maughan N, Maude K, Hansen O, Gabbert HE, Quirke P, Mueller W: Expression of DNA Dou-ble-Strand Break Repair Proteins ATM and BRCA1 Predicts Survival in Colorectal Cancer. Clin Cancer Res 2006, 12(5):1494–1500.
41. Kim CJ, Lee JH, Song JW, Cho YG, Kim SY, Nam SW, Yoo NJ, Park WS, Lee JY: Chk1 frameshift mutation in sporadic and he-reditary non-polyposis colorectal cancers with microsatellite in-stability. EJSO 2007, 33:580–585.
42. Kilpivaara O, Alhopuro P, Vahteristo P, Aaltonen LA, Nevanlinna HJ: CHEK2 I157T associates with familial and spo-radic colorectal cancer. Med Genet 2006, 43(7):e34.
43. Garcia V, Garcia JM, Pena C, Silva J, Dominguez G, Rodriguez R, Maximiano C, Espinosa R, Espana P: The GADD45, ZBRK1 and BRCA1 pathway: quantitative analysis of mRNA expression in colon carcinomas. J Pathol 2005, 206(1):92–99.
44. Li GQ, Zhang HF. Mad2 and p27 expression profiles in colorec-tal cancer and its clinical significance. World J Gastroenterol. 2004;10(21):3218-3220.
45. Giannini G, Rinaldi C, Ristori E, Ambrosini MI, Cerignoli F, Viel A, Bidoli E, Berni S, D’Amati G, Scambia G, Frati L, Screpanti I, Gulino A: Mutations of an intronic repeat induce impaired MRE11 expression in primary human cancer with microsatellite instability. Oncogene 2004, 23(15):2640–2647.
46. Berndt SI, Platz EA, Fallin MD, Thuita LW, Hoffman SC, Helzlsouer KJ: Mismatch repair polymorphisms and the risk of colorectal cancer. Int J Cancer 2007, 120(7):1548–1554.
47. Uhrhammer N, Bay JO, Gosse-Brun S, Kwiatkowski F, Rio P, Daver A, Bignon YJ: Allelic imbalance at NBS1 is frequent in both proximal and distal colorectal carcinoma. Oncol Rep 2000, 7(2):427–431.
48. Bao S, Chang MS, Auclair D, Sun Y, Wang Y, Wong WK, Zhang J, Liu Y, Qian X, Sutherland R, Magi-Galluzi C, Weisberg E, Cheng EYS, Hao L, Sasaki H, Campbell MS, Kraeft SK, Loda M, Lo KM, Chen LB: HRad17, a Human Homologue of the Schizosaccharomyces pombe Checkpoint Gene rad17, Is Over-expressed in Colon Carcinoma. CANCER RESEARCH 1999, 59:2023–2028.
49. Givalos N, Gakiopoulou H, Skliri M, Bousboukea K, Konstanti-nidou AE, Korkolopoulou P, Lelouda M, Kouraklis G, Patsouris E, Karatzas G: Replication protein A is an independent prog-nostic indicator with potential therapeutic implications in colon cancer. Modern Pathology 2007, 20:159–166.
50. Krajewska WM, Stawinska M, Brys M, Mlynarski W, Witas H, Okruszek A, Kilianska ZM: Genotyping of p53 codon 175 in co-lorectal cancer. Med Sci Monit 2003, 9(5):228–231.
51. Emoto K, Yamada Y, Sawada H, Fujimoto H, Ueno M, Takayama T, Kamada K, Naito A, Hirao S, Nakajima S: Annexin II Over-expression Correlates with Stromal Tenascin-C Overexpression. A Prognostic Marker in Colorectal Carcinoma. Cancer 2001, 92:1419–1426.
Int. J. Biol. Sci. 2008, 4
378
52. Guzman-Aranguez A, Olmo N, Turnay J, Lecona E, Perez-Ramos P, Lopez de Silanes I, Lizarbe MA: Differentiation of human colon adenocarcinoma cells alters the expression and intracellular localization of annexins A1, A2, and A5. J Cell Bio-chem 2005, 94(1):178–193.
53. OKAZAKI H, MIZUNO M, NASU J, MAKIDONO C, HIRAOKA S, YAMAMOTO K, OKADA H, FUJITA T, TSUJI T, SHIRATORI Y: Difference in Ulex europaeus agglutinin I-binding activity of decay-accelerating factor detected in the stools of patients with colorectal cancer and ulcerative colitis. J Lab Clin Med 2004, 143(3):169–174.
54. Durrant LG, Chapman MA, Buckley DJ, Spendlove I, Robins RA, Armitage NC: Enhanced expression of the complement regula-tory protein CD55 predicts a poor prognosis in colorectal cancer patients. Cancer Immunol Immunother 2003, 52:638–642.
55. Iwagaki N, Mizuno M, Nasu J, Mizuno M, Okazaki H, Hori S, Yamamoto K, Okada H, Tsuji T, Fujita T, Shiratori Y: Advances in the development of a reliable assay for the measurement of stool decay-accelerating factor in the detection of colorectal cancer. J Immunoassay Immunochem 2002, 23(4):497–507.
56. Mizuno M, Mizuno M, Iwagaki N, Nasu J, Okazaki H, Yama-moto K, Okada H, Tsuji T, Fujita T, Shiratori Y: Testing of mul-tiple samples increases the sensitivity of stool decay-accelerating factor test for the detection of colorectal cancer. Am J Gastroen-terol 2003, 98(11):2550–2555.
57. Nakagawa M, Mizuno M, Kawada M, Uesu T, Nasu J, Takeuchi K, Okada H, Endo Y, Fujita T, Tsuji T: Polymorphic expression of decay-accelerating factor in human colorectal cancer. J Gastro-enterol Hepatol 2001, 16(2):184–189.
58. Elzagheid A, Algars A, Bendardaf R, Lamlum H, Ristamaki R, Collan Y, Syrjanen K, Pyrhonen S: E-cadherin expression pattern in primary colorectal carcinomas and their metastases reflects disease outcome. World J Gastroenterol 2006, 12(27):4304–4309.
59. Furuta K, Yoshioka S, Okabe S, Ikeda M, Oginosawa M, Ikeda S, Nakayama Y, Kikuchi M, Hamilton SR: Expressions of two adenomatous polyposis coli and E-cadherin proteins on human colorectal cancers. Virchows Arch 2003, 442(3):266–270.
60. Skrzydlewska E, Kozuszko B, Sulkowska M, Bogdan Z, Kozlowski M, Snarska J, Puchalski Z, Sulkowski S, Skrzydlewski Z: Antioxidant potential in esophageal, stomach and colorectal cancers. Hepatogastroenterology 2003, 50(49):126–131.
61. Park KA, Byun HS, Won M, Yang KJ, Shin S, Piao L, Kim JM, Yoon WH, Junn E, Park J, H SJ, Hur GM: Sustained activation of protein kinase C downregulates nuclear factor-kB signaling by dissociation of IKK-g and Hsp90 complex in human colonic epithelial cells. Carcinogenesis 2007, 28(1):71–80.
62. Cen H, Zheng S, Fang YM, Tang XP, Dong Q: Induction of HSF1 expression is associated with sporadic colorectal cancer. World J Gastroenterol 2004, 10(21):3122–3126.
63. Greco C, Alvino S, Buglioni S, Assisi D, Lapenta R, Grassi A, Stigliano V, Mottolese M, Casale V: Activation of c-MYC and c-MYB proto-oncogenes is associated with decreased apoptosis in tumor colon progression. Anticancer Res 2001, 21(5):3185–3192.
64. Seidler HBK, Utsuyama M, Nagaoka S, Takemura T, Kitagawa M, Hirokawa K: Expression level of Wnt signaling components possibly influences the biological behavior of colorectal cancer in different age groups. Experimental and Molecular Pathology 2004, 76:224–233.
65. Han J, Xia C, Gao J, Xing C, Yang X, Tang X, Qiu F, Du Y: Ex-pression of vascular endothelial growth factor in colorectal can-cer and its clinical significance. Zhonghua Yi Xue Za Zhi 2002, 82(7):481–483.
66. Pellizzaro C, Coradini D, Dandone MG: Modulation of angio-genesis-related proteins synthesis by sodium butyrate in colon cancer cell line HT29. Carcinogenesis 2002, 23(5):735–740.
67. Faviana P, Boldrini L, Spisni R, Berti P, Galleri D, Biondi R, Camacci T, Materazzi G, Pingitore R, Miccoli P, Fontanini G: Neoangiogenesis in colon cancer: correlation between vascular density, vascular endothelial growth factor (VEGF) and p53 protein expression. Oncol Rep 2002, 9(3):617–620.
68. Cassano A, Bagala C, Battelli C, Schinzari G, Quirino M, Ratto C, Landriscina M, Barone C: Expression of vascular endothelial growth factor, mitogen-activated protein kinase and p53 in hu-man colorectal cancer. Anticancer Res 2002, 22(4):2179–2184.
69. Edelman E, Guinney J, Chi J, Febbo P, S M: Modeling cancer progression via pathway dependencies. PLoS Comput Biol 2008, 4(2):e28.
Copyright © 2022 FDOKUMEN