Biofiltration of trichloroethylene using diazotrophic bacterial community
8
Bio-filtration of trichloroethylene using diazotrophic bacterial community Awadhesh K. Shukla a , Pranjali Vishwakarma a , R.S. Singh b , S.N. Upadhyay b, * , Suresh K. Dubey a, * a Department of Botany, Banaras Hindu University, Varanasi 221005, India b Department of Chemical Engineering and Technology, Institute of Technology, Banaras Hindu University, Varanasi 221005, India article info Article history: Received 2 September 2009 Received in revised form 22 October 2009 Accepted 23 October 2009 Available online 3 December 2009 Keywords: TCE degradation Bio-filtration Removal efficiency Diazotroph Azospirillum abstract Biodegradation of TCE was studied in a biofilter packed with wood charcoal and inoculated with diazo- trophic bacterial community isolated from local soil. Steady state TCE removal efficiencies higher than 85% were observed up to inlet load of 2.866 g m 3 h 1 . The maximum elimination capacity of 5.31 gm 3 h 1 was observed at an inlet load of more than 7.90 g m 3 h 1 . The biofilter was sensitive to fluc- tuations in the process conditions but could easily recover its performance after 10 days shutdown. Almost constant and small pressure drop per unit length and very negligible compaction was observed during the whole experimental period. The molecular analyses such as RT–PCR and gene sequencing revealed the presence of functionally active Azospirillum species in the biofilm. Ó 2009 Elsevier Ltd. All rights reserved. 1. Introduction Trichloroethylene (TCE) is a volatile halogenated hydrocarbon. It possesses unique solvent properties which make it suitable for wide use for various purposes such as degreasing of metals, in tex- tile industries, etc. (Ohlen et al., 2005). It is a toxic environmental pollutant which enters into ground water and soil due to spillage, discharge and leakage from various sources including industries (Shen et al., 2008). Several physical and chemical methods have been developed and used by researchers to remediate TCE from the environment, but such processes are time taking and costly (Lin et al., 2009; Shukla et al., 2009; Wang and Tseng, 2009). There- fore, attention has been focused on bioremediation of TCE due to its cost effectiveness and ability for complete mineralization of toxic pollutants. Bio-filtration is one of the most promising tech- niques of biodegradation of volatile organic compounds (VOCs), in which pollutants are decomposed by indigenous microbial com- munity adhered to the surface of a suitable filter medium (Langolf and Kleinheinz, 2006). TCE is resistant to biodegradation because it cannot be directly utilized by bacteria for their growth, however, it can be co-metabolised by aerobic or anaerobic processes (Kocam- emi and Cecen, 2005). It has been reported earlier that for bioreme- diation of TCE, nitrogen acts as the limiting factor (Connon et al., 2005), hence, bacterial community capable of fixing molecular nitrogen are advantageous for bioremediation of TCE. Diazotrophs may be capable of promoting in situ bioremediation of TCE because they have the capacity to fix molecular nitrogen under micro-aer- ophilic conditions as a growth promoting substrate in nitrogen deficient environment. Therefore, a better understanding about diazotrophic community structure and function is equally essential for long term stability and further optimization of biofilter efficacy. In the present study TCE degradation potential of diazotrophic bacterial community was first evaluated in batch mode. Encour- aged by the high degradation capacity, it was planned to test the efficacy of their potential in a large size continuous unit such as a biofilter for the bio-filtration of TCE contaminated air. Thus the performance of a biofilter packed with charcoal was evaluated un- der varying process conditions, and the bacterial consortia in the biofilm was analysed by PCR based approach to know the potential groups present in the system. 2. Methods 2.1. Enrichment and isolation of diazotrophs Soil samples were collected from the agricultural fields of Banaras Hindu University, Varanasi, India (25°18 0 N, 83°03 0 E and 129 m above mean sea level). The enrichment of diazotrophs from soil was done into a semisolid nitrogen free medium NFb (Döbere- iner and Day, 1976). The composition of NFb-medium (g/L) was: malic acid 5.0; K 2 HPO 4 0.5; MgSO 4 7H 2 O 0.2; NaCl 0.1; CaCl 2 0.02; bromothymol blue 0.5% in 0.2 N KOH (2 ml); 1 ml of vitamin solution (biotin: 10 mg 100 ml 1 and pyridoxol–HCl: 20 mg 100 ml 1 ); 2 ml of micronutrient solution (g/L): CuSO 4 0.4; ZnSO 4 7H 2 O 0.12; H 3 BO 3 1.4; Na 2 MoO 4 2H 2 O 1.0; MnSO 4 H 2 O 0960-8524/$ - see front matter Ó 2009 Elsevier Ltd. All rights reserved. doi:10.1016/j.biortech.2009.10.094 * Corresponding authors. Tel.: +91 0542 2307147; fax: +91 0542 2368174. E-mail addresses: [email protected] (S.N. Upadhyay), dskbot@ rediffmail.com (S.K. Dubey). Bioresource Technology 101 (2010) 2126–2133 Contents lists available at ScienceDirect Bioresource Technology journal homepage: www.elsevier.com/locate/biortech
-
Upload
independent -
Category
Documents
-
view
0 -
download
0
Transcript of Biofiltration of trichloroethylene using diazotrophic bacterial community
Bioresource Technology 101 (2010) 2126–2133
Contents lists available at ScienceDirect
Bioresource Technology
journal homepage: www.elsevier .com/locate /bior tech
Bio-filtration of trichloroethylene using diazotrophic bacterial community
Awadhesh K. Shukla a, Pranjali Vishwakarma a, R.S. Singh b, S.N. Upadhyay b,*, Suresh K. Dubey a,*
a Department of Botany, Banaras Hindu University, Varanasi 221005, Indiab Department of Chemical Engineering and Technology, Institute of Technology, Banaras Hindu University, Varanasi 221005, India
a r t i c l e i n f o a b s t r a c t
Article history:Received 2 September 2009Received in revised form 22 October 2009Accepted 23 October 2009Available online 3 December 2009
Keywords:TCE degradationBio-filtrationRemoval efficiencyDiazotrophAzospirillum
0960-8524/$ - see front matter � 2009 Elsevier Ltd. Adoi:10.1016/j.biortech.2009.10.094
* Corresponding authors. Tel.: +91 0542 2307147;E-mail addresses: [email protected]
rediffmail.com (S.K. Dubey).
Biodegradation of TCE was studied in a biofilter packed with wood charcoal and inoculated with diazo-trophic bacterial community isolated from local soil. Steady state TCE removal efficiencies higher than85% were observed up to inlet load of 2.866 g m�3 h�1. The maximum elimination capacity of 5.31g m�3 h�1 was observed at an inlet load of more than 7.90 g m�3 h�1. The biofilter was sensitive to fluc-tuations in the process conditions but could easily recover its performance after 10 days shutdown.Almost constant and small pressure drop per unit length and very negligible compaction was observedduring the whole experimental period. The molecular analyses such as RT–PCR and gene sequencingrevealed the presence of functionally active Azospirillum species in the biofilm.
� 2009 Elsevier Ltd. All rights reserved.
1. Introduction
Trichloroethylene (TCE) is a volatile halogenated hydrocarbon.It possesses unique solvent properties which make it suitable forwide use for various purposes such as degreasing of metals, in tex-tile industries, etc. (Ohlen et al., 2005). It is a toxic environmentalpollutant which enters into ground water and soil due to spillage,discharge and leakage from various sources including industries(Shen et al., 2008). Several physical and chemical methods havebeen developed and used by researchers to remediate TCE fromthe environment, but such processes are time taking and costly(Lin et al., 2009; Shukla et al., 2009; Wang and Tseng, 2009). There-fore, attention has been focused on bioremediation of TCE due toits cost effectiveness and ability for complete mineralization oftoxic pollutants. Bio-filtration is one of the most promising tech-niques of biodegradation of volatile organic compounds (VOCs),in which pollutants are decomposed by indigenous microbial com-munity adhered to the surface of a suitable filter medium (Langolfand Kleinheinz, 2006). TCE is resistant to biodegradation because itcannot be directly utilized by bacteria for their growth, however, itcan be co-metabolised by aerobic or anaerobic processes (Kocam-emi and Cecen, 2005). It has been reported earlier that for bioreme-diation of TCE, nitrogen acts as the limiting factor (Connon et al.,2005), hence, bacterial community capable of fixing molecularnitrogen are advantageous for bioremediation of TCE. Diazotrophsmay be capable of promoting in situ bioremediation of TCE because
ll rights reserved.
fax: +91 0542 2368174.(S.N. Upadhyay), dskbot@
they have the capacity to fix molecular nitrogen under micro-aer-ophilic conditions as a growth promoting substrate in nitrogendeficient environment. Therefore, a better understanding aboutdiazotrophic community structure and function is equally essentialfor long term stability and further optimization of biofilter efficacy.
In the present study TCE degradation potential of diazotrophicbacterial community was first evaluated in batch mode. Encour-aged by the high degradation capacity, it was planned to test theefficacy of their potential in a large size continuous unit such asa biofilter for the bio-filtration of TCE contaminated air. Thus theperformance of a biofilter packed with charcoal was evaluated un-der varying process conditions, and the bacterial consortia in thebiofilm was analysed by PCR based approach to know the potentialgroups present in the system.
2. Methods
2.1. Enrichment and isolation of diazotrophs
Soil samples were collected from the agricultural fields ofBanaras Hindu University, Varanasi, India (25�18
0N, 83�03
0E and
129 m above mean sea level). The enrichment of diazotrophs fromsoil was done into a semisolid nitrogen free medium NFb (Döbere-iner and Day, 1976). The composition of NFb-medium (g/L) was:malic acid 5.0; K2HPO4 0.5; MgSO4�7H2O 0.2; NaCl 0.1; CaCl2
0.02; bromothymol blue 0.5% in 0.2 N KOH (2 ml); 1 ml of vitaminsolution (biotin: 10 mg 100 ml�1 and pyridoxol–HCl: 20 mg100 ml�1); 2 ml of micronutrient solution (g/L): CuSO4 0.4;ZnSO4�7H2O 0.12; H3BO3 1.4; Na2MoO4�2H2O 1.0; MnSO4�H2O
A.K. Shukla et al. / Bioresource Technology 101 (2010) 2126–2133 2127
1.5; 1.64 w/v Fe-EDTA solution (4 ml); KOH (4.5 g). The pH was ad-justed to 6.8. For enrichment of diazotrophs, 5 g of soil sampleswere inoculated into 100 ml Erlenmeyer flasks containing 45 mlNFb media and then these were put on incubator shaker main-tained at 30 �C for overnight. The whole suspension was serially di-luted from 10�1 to 10�9. From each dilution 100 ll of the inoculumwas inoculated into different sets of test tubes containing 5 ml ofNFb semisolid media and incubated at 30 �C for the growth obser-vation. Hundred microliters of the culture was transferred on NFbagar plates. The bacterial colonies were observed on the plates andused for further analyses.
2.2. TCE degradation potential of bacterial culture using batchexperiments
Three sets of batch experiments were performed in selected TCEconcentration range from 100 to 1000 ppm to assess the inhibitoryeffect of TCE on diazotrophic bacteria. Maximum bacterial growthwas observed at 100 ppm TCE concentration while beyond500 ppm no growth was observed. Therefore, bacterial culture accli-mated with 100 ppm TCE concentration was screened for furtheranalysis. Hundred microliters of well grown mixed diazotrophicculture (OD600; 1.0) was inoculated into 25 ml serum vials contain-ing 5 ml fresh NFb medium and 100 ppm of TCE. After that the ser-um vials were sealed with butyl rubber stopper and aluminiumcaps, and were incubated at 37 �C for further analysis. Another setof experiments was conducted to ascertain TCE volatilization ratein order to investigate transfer rate of TCE from the liquid phaseto gaseous phase of headspace. For control, serum vials wereprepared without bacterial culture. TCE degradation rate in all thesamples was studied during 0–9 days of incubation. The TCE con-centration was analysed using a gas chromatograph (Model 3800GC, Varian, BV, and The Netherlands) equipped with electron cap-ture detector (ECD) and capillary CP SIL 5CB column (15 m �0.25 mm) packed with silica. The column temperature was 70 �Cand injector and detector temperatures were set at 250 �C and350 �C, respectively. Nitrogen gas (flow rate: 15 ml min�1) servedas the carrier. The GC calibration standards were prepared withTCE solution (146 lg ml�1) supplied by Merck Company, Germany.The degradation rate was calculated using the first order reactionkinetics. Each experiment was performed in triplicate.
2.3. Rate of TCE degradation from batch culture experiments
Rate of TCE volatilization into the headspace and specific TCEdegradation were calculated by using the first order kinetics equa-tion. Decrease in the TCE concentration was corrected for volatili-zation rate using relation: TCEC = TCEM + rvol. TCE � t (Kocamemiand Cecen, 2005) where TCEC, TCEM, rvol. TCE and t are correctedTCE concentration (ppm), measured TCE concentration (ppm),TCE volatilization rate (ppm h�1) and time in hours, respectively.Co-metabolic degradation rate (qTCE) was also calculated from cor-rected concentration (TCEC) for a definite time (Dt in hours) byusing equation: qTCE = DTCEC/Dt (Kocamemi and Cecen, 2005).
2.4. Biofilter setup
The schematic diagram of the experimental set-up (biofilter)used for continuous biodegradation experiments is shown in(Fig. 1). The biofilter was made of a 5.0 cm inner diameter cylindri-cal glass column having an overall height of 80 cm. It was providedwith four sampling ports placed at a distance of 12.5 cm each. Avalve was provided at the bottom of the column to collect theleachate. The biofilter was operated in upflow mode. The air wassupplied by an oil free compressor (Elgi Equipments Ltd., Coimba-tore, India) and passed through a filter having pore size less than
0.01 lm (AOF Filtration System, Hyderabad, India) to avoid thecontamination in the bed. The compressed and filtered air streamwas divided into two parts. One part of the air stream was passedthrough the humidifier and the outlet air stream was monitoredregularly to assure a relative humidity of more than 90%. The sec-ond part of the air stream was allowed to bubble through a 250 mlbubbler containing TCE for producing TCE loaded air stream of de-sired concentration. For getting the desired level of inlet TCE con-centration into air stream the flow of air stream into bubbler wascontrolled with a Swagelock needle valve and was measured witha rotameter. Both the air streams were mixed in a rectangular mix-ing chamber made of perspex and fed to the biofilter column. Thenutrient solution was supplied occasionally and its compositionwas the same as that of the solution used for enrichment ofdiazotrophs.
2.5. Filter media
Wood charcoal was obtained from the domestic fuel market ofVaranasi and cut into cubes of approximate 1 cm size using hexablade. Wood charcoal cubes were dried in oven at 60 �C for 2 daysand then cooled in a desiccator. Dry weight, bed porosity, pH andmoisture content of the filter media were determined and foundto be 0.65 g cm�3, 68, 8.2, 65%, respectively. Chemical resistancestudies were carried out by placing the wood charcoal samples inglass bottles containing pure TCE, tap water, distilled water, acidicsolution (pH 4.0) and basic solution (pH 9.2) for 2 days. Slight col-our change was observed while media was placed in pure TCEwhere as no such change was visualized in other cases. Weightlosses of 2.2 and 2.88% were observed when kept in acidic and ba-sic solutions, respectively. Specific surface area was measured byBET surface area and porosity analyzer (Micromeritics) and foundto be 212 m2 g�1. To characterize the filter media C, H, and N con-tents of the wood charcoal were measured with the help of C H Nanalyzer (Perkin Elmer 2400, USA). The values of C, H, N contentswere 68.63, 3.65 and 2.297%, respectively. Then column waspacked with previously humidified, autoclaved, equal size, smallcubical pieces (1 cm size) of wood charcoal above a separate2 cm layer of 6 mm glass beads to ensure homogenous gas distri-bution while a space of 15 cm was provided at the bottom andtop of the column for leachate collection and nutrient supply,respectively. The glass beads were placed over a stainless steelsieve plate which had uniform holes of 3 mm on a square pitch.In order to improve the absorption of TCE in the biofilm, siliconoil (10–15% by volume) was also added along with nutrient solu-tion (Koutinas et al., 2006).
2.6. Performance evaluation of biofilter
Biofilter was operated for 156 days including 40 days acclima-tion period. The inlet and outlet TCE concentrations from bio-filtra-tion unit were measured periodically using GC. The conditions forGC analysis were similar to those for batch culture experiments.Operation and performance of a biofilter are expressed in termsof percentage removal efficiency (RE) and pollutant eliminationcapacity (EC) as a function of pollutant loading (L) of gases at dif-ferent EBRT (Empty Bed Residence Time). Experimental data wereused to calculate these parameters.
2.7. DNA extraction
Diazotrophic bacteria from batch culture and biofilm of contin-uous culture were centrifuged at 10 min (15,000g; 4 �C) and cellswere lysed by the addition of 500 ll of lysozyme buffer containing5 mg ml�1 lysozyme and 250 ll of sodium dodecyl sulfate (2%),
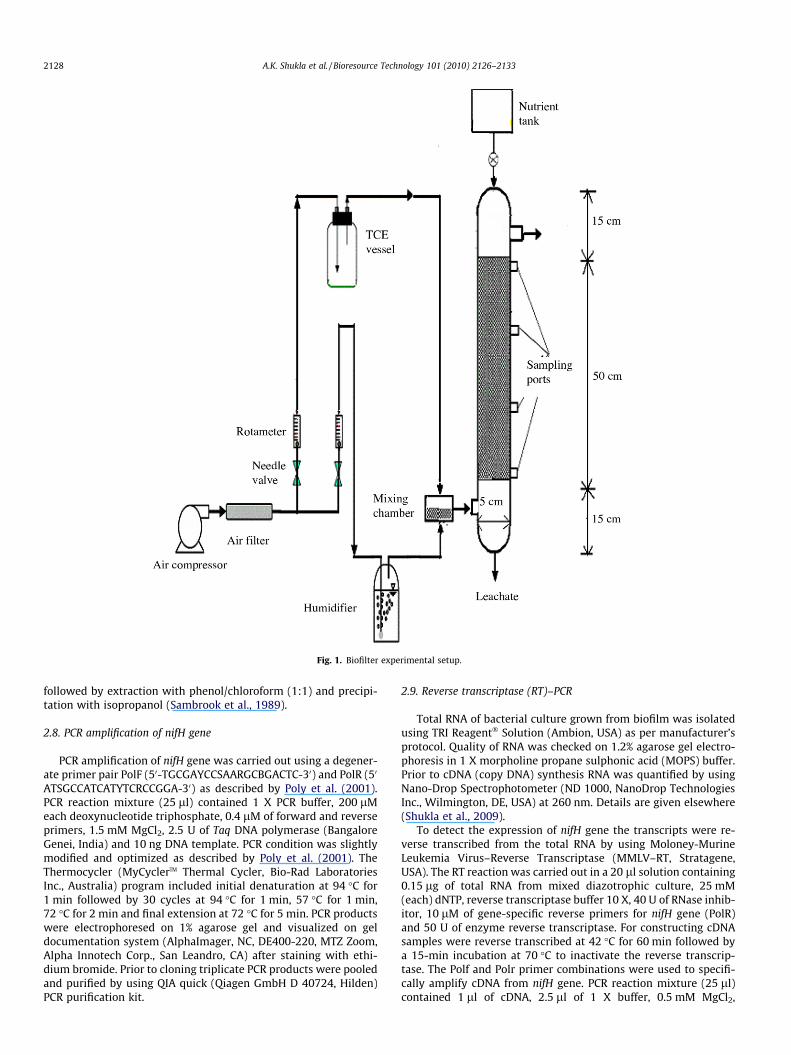
Fig. 1. Biofilter experimental setup.
2128 A.K. Shukla et al. / Bioresource Technology 101 (2010) 2126–2133
followed by extraction with phenol/chloroform (1:1) and precipi-tation with isopropanol (Sambrook et al., 1989).
2.8. PCR amplification of nifH gene
PCR amplification of nifH gene was carried out using a degener-ate primer pair PolF (50-TGCGAYCCSAARGCBGACTC-30) and PolR (50
ATSGCCATCATYTCRCCGGA-30) as described by Poly et al. (2001).PCR reaction mixture (25 ll) contained 1 X PCR buffer, 200 lMeach deoxynucleotide triphosphate, 0.4 lM of forward and reverseprimers, 1.5 mM MgCl2, 2.5 U of Taq DNA polymerase (BangaloreGenei, India) and 10 ng DNA template. PCR condition was slightlymodified and optimized as described by Poly et al. (2001). TheThermocycler (MyCyclerTM Thermal Cycler, Bio-Rad LaboratoriesInc., Australia) program included initial denaturation at 94 �C for1 min followed by 30 cycles at 94 �C for 1 min, 57 �C for 1 min,72 �C for 2 min and final extension at 72 �C for 5 min. PCR productswere electrophoresed on 1% agarose gel and visualized on geldocumentation system (AlphaImager, NC, DE400-220, MTZ Zoom,Alpha Innotech Corp., San Leandro, CA) after staining with ethi-dium bromide. Prior to cloning triplicate PCR products were pooledand purified by using QIA quick (Qiagen GmbH D 40724, Hilden)PCR purification kit.
2.9. Reverse transcriptase (RT)–PCR
Total RNA of bacterial culture grown from biofilm was isolatedusing TRI Reagent� Solution (Ambion, USA) as per manufacturer’sprotocol. Quality of RNA was checked on 1.2% agarose gel electro-phoresis in 1 X morpholine propane sulphonic acid (MOPS) buffer.Prior to cDNA (copy DNA) synthesis RNA was quantified by usingNano-Drop Spectrophotometer (ND 1000, NanoDrop TechnologiesInc., Wilmington, DE, USA) at 260 nm. Details are given elsewhere(Shukla et al., 2009).
To detect the expression of nifH gene the transcripts were re-verse transcribed from the total RNA by using Moloney-MurineLeukemia Virus–Reverse Transcriptase (MMLV–RT, Stratagene,USA). The RT reaction was carried out in a 20 ll solution containing0.15 lg of total RNA from mixed diazotrophic culture, 25 mM(each) dNTP, reverse transcriptase buffer 10 X, 40 U of RNase inhib-itor, 10 lM of gene-specific reverse primers for nifH gene (PolR)and 50 U of enzyme reverse transcriptase. For constructing cDNAsamples were reverse transcribed at 42 �C for 60 min followed bya 15-min incubation at 70 �C to inactivate the reverse transcrip-tase. The Polf and Polr primer combinations were used to specifi-cally amplify cDNA from nifH gene. PCR reaction mixture (25 ll)contained 1 ll of cDNA, 2.5 ll of 1 X buffer, 0.5 mM MgCl2,
A.K. Shukla et al. / Bioresource Technology 101 (2010) 2126–2133 2129
10 lM each primer, and 2.5 U of Taq DNA polymerase (BangaloreGenei, Bangalore, India). Amplification was carried out with an ini-tial denaturation at 94 �C for 1 min followed by 30 cycles at 94 �Cfor 1 min, 57 �C for 1 min, 72 �C for 2 min and final extension at72 �C for 5 min. For positive control cDNA was isolated from thediazotrophic culture grown in absence of TCE and for negative con-trol reactions without reverse transcriptase were run in parallel toensure that there was no contamination of DNA. PCR productswere run on a 1% agarose gel and visualized on gel documentationsystem.
2.10. Amplicon cloning and screening by RFLP analysis
Purified PCR amplicons of nifH gene of DNA from batch cultureand biofilm were cloned using p-GEM� T Easy Vector (Promega,USA) and transformed into DH5a strain of Escherichia coli. Theclone containing inserts were checked by PCR amplification usingM13 f (50-GTAAAACGACGGCCAG-30) and M13 r (50-CAGGAAA-CAGCTATGAC-30) primer pairs. The clones with inserts were di-gested with 0.4 U of each tetrameric restriction enzymes HaeIIIand AluI (New England, Biolabs Beverly, MA) in 1 X buffer B(New England, Biolabs), and BSA (bovine serum albumin;10 mg ml�1) in a total volume of 20 ll. Digestion was performedovernight at 37 �C. The restriction patterns were analysed using3% metaphor agarose gel stained with ethidium bromide andvisualized on gel documentation system. On the basis of bandingpattern operational taxanomic units (OTUs) were prepared bypresence (1)/absence (0) of bands on the gel and dendogram wasprepared using NTSYS program (Version 2.2 Windows� 2002, Ap-plied Biostatistics Inc., Australia).
2.11. Sequencing and sequence analysis
DNA sequencing was performed on both strands in an ABIPrism� 3100 Genetic Analyzer (ABI, USA) using Big Dye Terminator
Fig. 2. Activity of diazotrophic mix
Kit (Version 3.1). The nifH gene sequences were analysed withBLAST (http://www.ncbi.nlm.nih.gov/) and were aligned againstknown sequences in the GenBank database. Multiple and pair wisesequences were performed with CLUSTAL W software (Higginset al., 1994). The phylogenetic distances were computed usingthe maximum likelihood method (Tamura et al., 2004). Phyloge-netic analyses were done using MEGA 4.0 software (Tamuraet al., 2007).
2.12. Nucleotide sequence accession numbers
The nucleotide sequences of the 24 nifH clones presented inthis study have been deposited with GenBank database underaccession number GQ161220–GQ161243.
3. Results and discussion
3.1. Degradation of TCE by mixed diazotrophic culture in batchexperiments
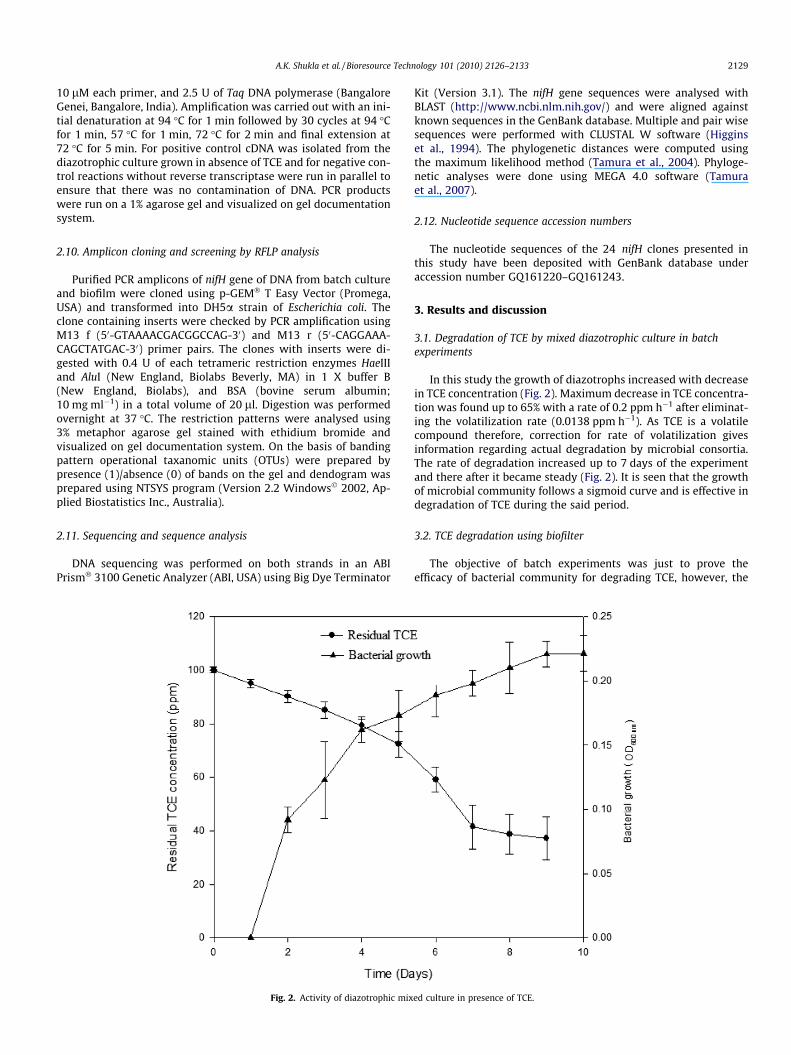
In this study the growth of diazotrophs increased with decreasein TCE concentration (Fig. 2). Maximum decrease in TCE concentra-tion was found up to 65% with a rate of 0.2 ppm h�1 after eliminat-ing the volatilization rate (0.0138 ppm h�1). As TCE is a volatilecompound therefore, correction for rate of volatilization givesinformation regarding actual degradation by microbial consortia.The rate of degradation increased up to 7 days of the experimentand there after it became steady (Fig. 2). It is seen that the growthof microbial community follows a sigmoid curve and is effective indegradation of TCE during the said period.
3.2. TCE degradation using biofilter
The objective of batch experiments was just to prove theefficacy of bacterial community for degrading TCE, however, the
ed culture in presence of TCE.
2130 A.K. Shukla et al. / Bioresource Technology 101 (2010) 2126–2133
information generated using batch experiments are not sufficientfor designing a continuous process for the removal of TCE at indus-trial scale. Keeping the above fact in mind continuous biodegrada-tion experiments were conducted in a biofilter.
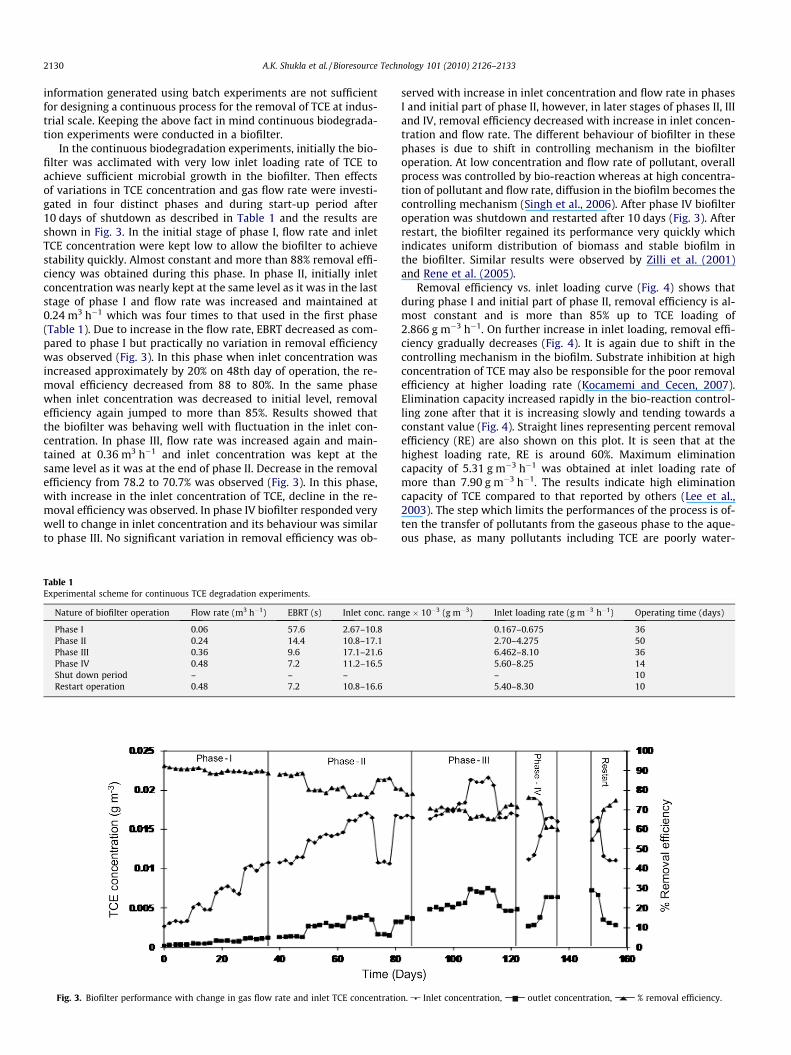
In the continuous biodegradation experiments, initially the bio-filter was acclimated with very low inlet loading rate of TCE toachieve sufficient microbial growth in the biofilter. Then effectsof variations in TCE concentration and gas flow rate were investi-gated in four distinct phases and during start-up period after10 days of shutdown as described in Table 1 and the results areshown in Fig. 3. In the initial stage of phase I, flow rate and inletTCE concentration were kept low to allow the biofilter to achievestability quickly. Almost constant and more than 88% removal effi-ciency was obtained during this phase. In phase II, initially inletconcentration was nearly kept at the same level as it was in the laststage of phase I and flow rate was increased and maintained at0.24 m3 h�1 which was four times to that used in the first phase(Table 1). Due to increase in the flow rate, EBRT decreased as com-pared to phase I but practically no variation in removal efficiencywas observed (Fig. 3). In this phase when inlet concentration wasincreased approximately by 20% on 48th day of operation, the re-moval efficiency decreased from 88 to 80%. In the same phasewhen inlet concentration was decreased to initial level, removalefficiency again jumped to more than 85%. Results showed thatthe biofilter was behaving well with fluctuation in the inlet con-centration. In phase III, flow rate was increased again and main-tained at 0.36 m3 h�1 and inlet concentration was kept at thesame level as it was at the end of phase II. Decrease in the removalefficiency from 78.2 to 70.7% was observed (Fig. 3). In this phase,with increase in the inlet concentration of TCE, decline in the re-moval efficiency was observed. In phase IV biofilter responded verywell to change in inlet concentration and its behaviour was similarto phase III. No significant variation in removal efficiency was ob-
Table 1Experimental scheme for continuous TCE degradation experiments.
Nature of biofilter operation Flow rate (m3 h�1) EBRT (s) Inlet conc. ran
Phase I 0.06 57.6 2.67–10.8Phase II 0.24 14.4 10.8–17.1Phase III 0.36 9.6 17.1–21.6Phase IV 0.48 7.2 11.2–16.5Shut down period – – –Restart operation 0.48 7.2 10.8–16.6
Fig. 3. Biofilter performance with change in gas flow rate and inlet TCE concentratio
served with increase in inlet concentration and flow rate in phasesI and initial part of phase II, however, in later stages of phases II, IIIand IV, removal efficiency decreased with increase in inlet concen-tration and flow rate. The different behaviour of biofilter in thesephases is due to shift in controlling mechanism in the biofilteroperation. At low concentration and flow rate of pollutant, overallprocess was controlled by bio-reaction whereas at high concentra-tion of pollutant and flow rate, diffusion in the biofilm becomes thecontrolling mechanism (Singh et al., 2006). After phase IV biofilteroperation was shutdown and restarted after 10 days (Fig. 3). Afterrestart, the biofilter regained its performance very quickly whichindicates uniform distribution of biomass and stable biofilm inthe biofilter. Similar results were observed by Zilli et al. (2001)and Rene et al. (2005).
Removal efficiency vs. inlet loading curve (Fig. 4) shows thatduring phase I and initial part of phase II, removal efficiency is al-most constant and is more than 85% up to TCE loading of2.866 g m�3 h�1. On further increase in inlet loading, removal effi-ciency gradually decreases (Fig. 4). It is again due to shift in thecontrolling mechanism in the biofilm. Substrate inhibition at highconcentration of TCE may also be responsible for the poor removalefficiency at higher loading rate (Kocamemi and Cecen, 2007).Elimination capacity increased rapidly in the bio-reaction control-ling zone after that it is increasing slowly and tending towards aconstant value (Fig. 4). Straight lines representing percent removalefficiency (RE) are also shown on this plot. It is seen that at thehighest loading rate, RE is around 60%. Maximum eliminationcapacity of 5.31 g m�3 h�1 was obtained at inlet loading rate ofmore than 7.90 g m�3 h�1. The results indicate high eliminationcapacity of TCE compared to that reported by others (Lee et al.,2003). The step which limits the performances of the process is of-ten the transfer of pollutants from the gaseous phase to the aque-ous phase, as many pollutants including TCE are poorly water-
ge � 10�3 (g m�3) Inlet loading rate (g m�3 h�1) Operating time (days)
0.167–0.675 362.70–4.275 506.462–8.10 365.60–8.25 14– 105.40–8.30 10
n. Inlet concentration, outlet concentration, % removal efficiency.
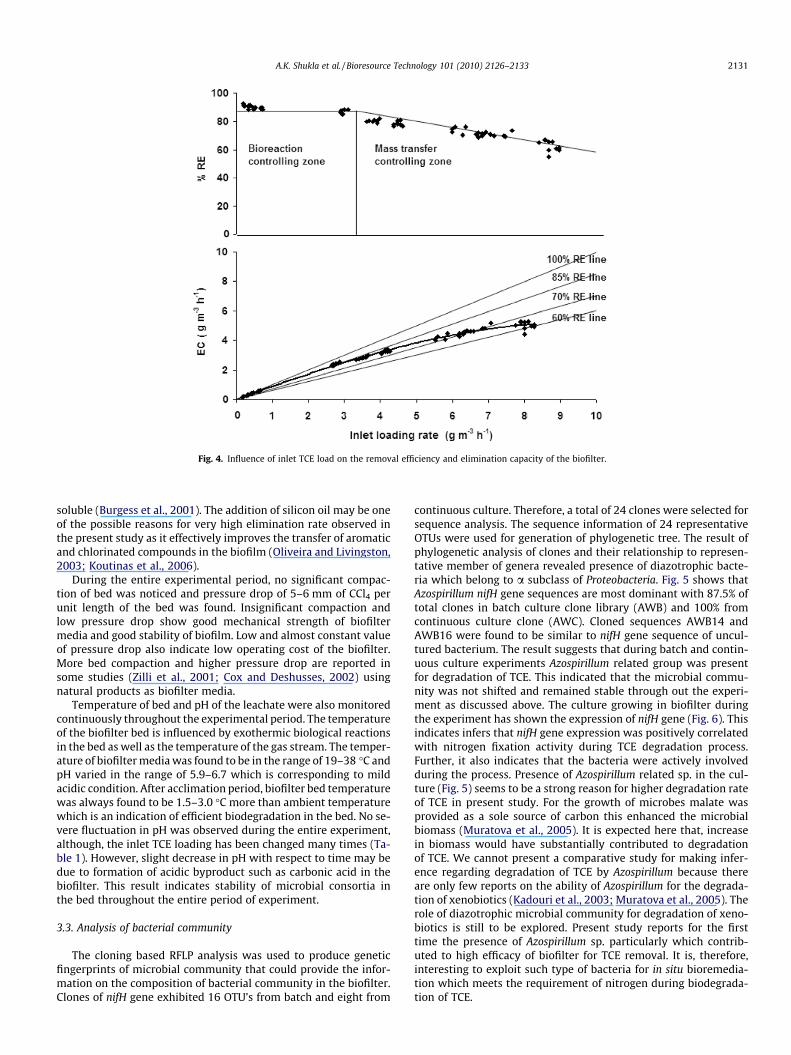
Fig. 4. Influence of inlet TCE load on the removal efficiency and elimination capacity of the biofilter.
A.K. Shukla et al. / Bioresource Technology 101 (2010) 2126–2133 2131
soluble (Burgess et al., 2001). The addition of silicon oil may be oneof the possible reasons for very high elimination rate observed inthe present study as it effectively improves the transfer of aromaticand chlorinated compounds in the biofilm (Oliveira and Livingston,2003; Koutinas et al., 2006).
During the entire experimental period, no significant compac-tion of bed was noticed and pressure drop of 5–6 mm of CCl4 perunit length of the bed was found. Insignificant compaction andlow pressure drop show good mechanical strength of biofiltermedia and good stability of biofilm. Low and almost constant valueof pressure drop also indicate low operating cost of the biofilter.More bed compaction and higher pressure drop are reported insome studies (Zilli et al., 2001; Cox and Deshusses, 2002) usingnatural products as biofilter media.
Temperature of bed and pH of the leachate were also monitoredcontinuously throughout the experimental period. The temperatureof the biofilter bed is influenced by exothermic biological reactionsin the bed as well as the temperature of the gas stream. The temper-ature of biofilter media was found to be in the range of 19–38 �C andpH varied in the range of 5.9–6.7 which is corresponding to mildacidic condition. After acclimation period, biofilter bed temperaturewas always found to be 1.5–3.0 �C more than ambient temperaturewhich is an indication of efficient biodegradation in the bed. No se-vere fluctuation in pH was observed during the entire experiment,although, the inlet TCE loading has been changed many times (Ta-ble 1). However, slight decrease in pH with respect to time may bedue to formation of acidic byproduct such as carbonic acid in thebiofilter. This result indicates stability of microbial consortia inthe bed throughout the entire period of experiment.
3.3. Analysis of bacterial community
The cloning based RFLP analysis was used to produce geneticfingerprints of microbial community that could provide the infor-mation on the composition of bacterial community in the biofilter.Clones of nifH gene exhibited 16 OTU’s from batch and eight from
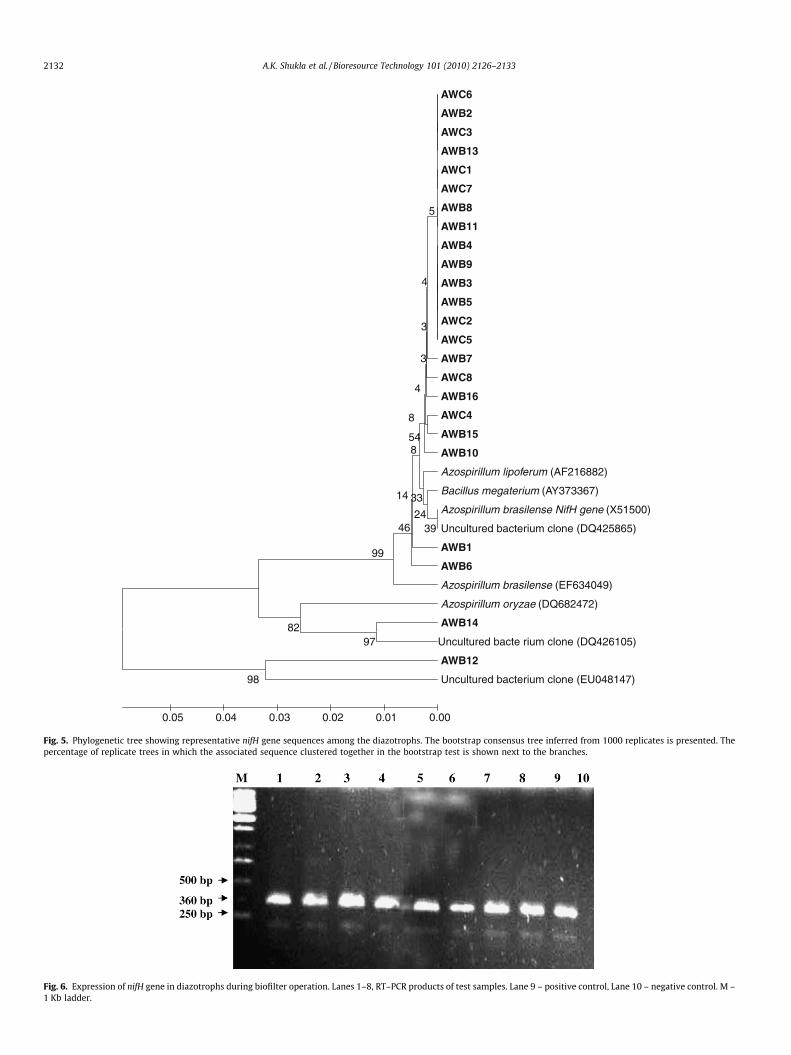
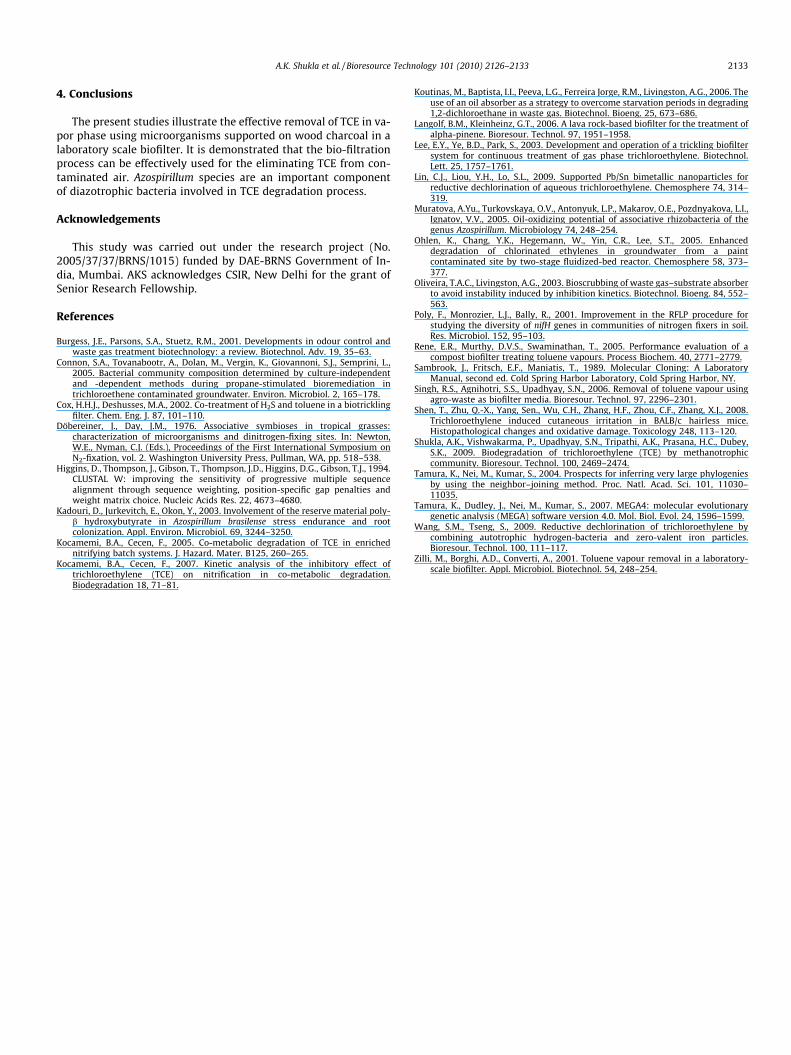
continuous culture. Therefore, a total of 24 clones were selected forsequence analysis. The sequence information of 24 representativeOTUs were used for generation of phylogenetic tree. The result ofphylogenetic analysis of clones and their relationship to represen-tative member of genera revealed presence of diazotrophic bacte-ria which belong to a subclass of Proteobacteria. Fig. 5 shows thatAzospirillum nifH gene sequences are most dominant with 87.5% oftotal clones in batch culture clone library (AWB) and 100% fromcontinuous culture clone (AWC). Cloned sequences AWB14 andAWB16 were found to be similar to nifH gene sequence of uncul-tured bacterium. The result suggests that during batch and contin-uous culture experiments Azospirillum related group was presentfor degradation of TCE. This indicated that the microbial commu-nity was not shifted and remained stable through out the experi-ment as discussed above. The culture growing in biofilter duringthe experiment has shown the expression of nifH gene (Fig. 6). Thisindicates infers that nifH gene expression was positively correlatedwith nitrogen fixation activity during TCE degradation process.Further, it also indicates that the bacteria were actively involvedduring the process. Presence of Azospirillum related sp. in the cul-ture (Fig. 5) seems to be a strong reason for higher degradation rateof TCE in present study. For the growth of microbes malate wasprovided as a sole source of carbon this enhanced the microbialbiomass (Muratova et al., 2005). It is expected here that, increasein biomass would have substantially contributed to degradationof TCE. We cannot present a comparative study for making infer-ence regarding degradation of TCE by Azospirillum because thereare only few reports on the ability of Azospirillum for the degrada-tion of xenobiotics (Kadouri et al., 2003; Muratova et al., 2005). Therole of diazotrophic microbial community for degradation of xeno-biotics is still to be explored. Present study reports for the firsttime the presence of Azospirillum sp. particularly which contrib-uted to high efficacy of biofilter for TCE removal. It is, therefore,interesting to exploit such type of bacteria for in situ bioremedia-tion which meets the requirement of nitrogen during biodegrada-tion of TCE.
AWC6
AWB2
AWC3
AWB13
AWC1
AWC7
AWB8
AWB11
AWB4
AWB9
AWB3
AWB5
AWC2
AWC5
AWB7
AWC8
AWB16
AWC4
AWB15
AWB10
Azospirillum lipoferum (AF216882)
Bacillus megaterium (AY373367)
Azospirillum brasilense NifH gene (X51500)
Uncultured bacterium clone (DQ425865)
AWB1
AWB6
Azospirillum brasilense (EF634049)
Azospirillum oryzae (DQ682472)
AWB14
Uncultured bacte rium clone (DQ426105)
AWB12
Uncultured bacterium clone (EU048147)
39
5
4
54
24
3
3
4
8
33
8
14
46
99
9782
98
0.000.010.020.030.040.05
Fig. 5. Phylogenetic tree showing representative nifH gene sequences among the diazotrophs. The bootstrap consensus tree inferred from 1000 replicates is presented. Thepercentage of replicate trees in which the associated sequence clustered together in the bootstrap test is shown next to the branches.
Fig. 6. Expression of nifH gene in diazotrophs during biofilter operation. Lanes 1–8, RT–PCR products of test samples. Lane 9 – positive control, Lane 10 – negative control. M –1 Kb ladder.
2132 A.K. Shukla et al. / Bioresource Technology 101 (2010) 2126–2133
A.K. Shukla et al. / Bioresource Technology 101 (2010) 2126–2133 2133
4. Conclusions
The present studies illustrate the effective removal of TCE in va-por phase using microorganisms supported on wood charcoal in alaboratory scale biofilter. It is demonstrated that the bio-filtrationprocess can be effectively used for the eliminating TCE from con-taminated air. Azospirillum species are an important componentof diazotrophic bacteria involved in TCE degradation process.
Acknowledgements
This study was carried out under the research project (No.2005/37/37/BRNS/1015) funded by DAE-BRNS Government of In-dia, Mumbai. AKS acknowledges CSIR, New Delhi for the grant ofSenior Research Fellowship.
References
Burgess, J.E., Parsons, S.A., Stuetz, R.M., 2001. Developments in odour control andwaste gas treatment biotechnology: a review. Biotechnol. Adv. 19, 35–63.
Connon, S.A., Tovanabootr, A., Dolan, M., Vergin, K., Giovannoni, S.J., Semprini, L.,2005. Bacterial community composition determined by culture-independentand -dependent methods during propane-stimulated bioremediation intrichloroethene contaminated groundwater. Environ. Microbiol. 2, 165–178.
Cox, H.H.J., Deshusses, M.A., 2002. Co-treatment of H2S and toluene in a biotricklingfilter. Chem. Eng. J. 87, 101–110.
Döbereiner, J., Day, J.M., 1976. Associative symbioses in tropical grasses:characterization of microorganisms and dinitrogen-fixing sites. In: Newton,W.E., Nyman, C.J. (Eds.), Proceedings of the First International Symposium onN2-fixation, vol. 2. Washington University Press, Pullman, WA, pp. 518–538.
Higgins, D., Thompson, J., Gibson, T., Thompson, J.D., Higgins, D.G., Gibson, T.J., 1994.CLUSTAL W: improving the sensitivity of progressive multiple sequencealignment through sequence weighting, position-specific gap penalties andweight matrix choice. Nucleic Acids Res. 22, 4673–4680.
Kadouri, D., Jurkevitch, E., Okon, Y., 2003. Involvement of the reserve material poly-b hydroxybutyrate in Azospirillum brasilense stress endurance and rootcolonization. Appl. Environ. Microbiol. 69, 3244–3250.
Kocamemi, B.A., Cecen, F., 2005. Co-metabolic degradation of TCE in enrichednitrifying batch systems. J. Hazard. Mater. B125, 260–265.
Kocamemi, B.A., Cecen, F., 2007. Kinetic analysis of the inhibitory effect oftrichloroethylene (TCE) on nitrification in co-metabolic degradation.Biodegradation 18, 71–81.
Koutinas, M., Baptista, I.I., Peeva, L.G., Ferreira Jorge, R.M., Livingston, A.G., 2006. Theuse of an oil absorber as a strategy to overcome starvation periods in degrading1,2-dichloroethane in waste gas. Biotechnol. Bioeng. 25, 673–686.
Langolf, B.M., Kleinheinz, G.T., 2006. A lava rock-based biofilter for the treatment ofalpha-pinene. Bioresour. Technol. 97, 1951–1958.
Lee, E.Y., Ye, B.D., Park, S., 2003. Development and operation of a trickling biofiltersystem for continuous treatment of gas phase trichloroethylene. Biotechnol.Lett. 25, 1757–1761.
Lin, C.J., Liou, Y.H., Lo, S.L., 2009. Supported Pb/Sn bimetallic nanoparticles forreductive dechlorination of aqueous trichloroethylene. Chemosphere 74, 314–319.
Muratova, A.Yu., Turkovskaya, O.V., Antonyuk, L.P., Makarov, O.E., Pozdnyakova, L.I.,Ignatov, V.V., 2005. Oil-oxidizing potential of associative rhizobacteria of thegenus Azospirillum. Microbiology 74, 248–254.
Ohlen, K., Chang, Y.K., Hegemann, W., Yin, C.R., Lee, S.T., 2005. Enhanceddegradation of chlorinated ethylenes in groundwater from a paintcontaminated site by two-stage fluidized-bed reactor. Chemosphere 58, 373–377.
Oliveira, T.A.C., Livingston, A.G., 2003. Bioscrubbing of waste gas–substrate absorberto avoid instability induced by inhibition kinetics. Biotechnol. Bioeng. 84, 552–563.
Poly, F., Monrozier, L.J., Bally, R., 2001. Improvement in the RFLP procedure forstudying the diversity of nifH genes in communities of nitrogen fixers in soil.Res. Microbiol. 152, 95–103.
Rene, E.R., Murthy, D.V.S., Swaminathan, T., 2005. Performance evaluation of acompost biofilter treating toluene vapours. Process Biochem. 40, 2771–2779.
Sambrook, J., Fritsch, E.F., Maniatis, T., 1989. Molecular Cloning: A LaboratoryManual, second ed. Cold Spring Harbor Laboratory, Cold Spring Harbor, NY.
Singh, R.S., Agnihotri, S.S., Upadhyay, S.N., 2006. Removal of toluene vapour usingagro-waste as biofilter media. Bioresour. Technol. 97, 2296–2301.
Shen, T., Zhu, Q.-X., Yang, Sen., Wu, C.H., Zhang, H.F., Zhou, C.F., Zhang, X.J., 2008.Trichloroethylene induced cutaneous irritation in BALB/c hairless mice.Histopathological changes and oxidative damage. Toxicology 248, 113–120.
Shukla, A.K., Vishwakarma, P., Upadhyay, S.N., Tripathi, A.K., Prasana, H.C., Dubey,S.K., 2009. Biodegradation of trichloroethylene (TCE) by methanotrophiccommunity. Bioresour. Technol. 100, 2469–2474.
Tamura, K., Nei, M., Kumar, S., 2004. Prospects for inferring very large phylogeniesby using the neighbor–joining method. Proc. Natl. Acad. Sci. 101, 11030–11035.
Tamura, K., Dudley, J., Nei, M., Kumar, S., 2007. MEGA4: molecular evolutionarygenetic analysis (MEGA) software version 4.0. Mol. Biol. Evol. 24, 1596–1599.
Wang, S.M., Tseng, S., 2009. Reductive dechlorination of trichloroethylene bycombining autotrophic hydrogen-bacteria and zero-valent iron particles.Bioresour. Technol. 100, 111–117.
Zilli, M., Borghi, A.D., Converti, A., 2001. Toluene vapour removal in a laboratory-scale biofilter. Appl. Microbiol. Biotechnol. 54, 248–254.