biodiversity strategy and action plan (bsap) for himachal - NIPFP
203
BIODIVERSITY STRATEGY AND ACTION PLAN (BSAP) FOR HIMACHAL PRADESH AND THE RESOURCE MOBILISATION STRATEGY FOR IMPLEMENTING THE BSAP WITH SPECIAL FOCUS ON LAHAUL-PANGI AND KINNAUR LANDSCAPES Final Report MARCH 2021
-
Upload
khangminh22 -
Category
Documents
-
view
4 -
download
0
Transcript of biodiversity strategy and action plan (bsap) for himachal - NIPFP

BIODIVERSITY STRATEGY AND ACTION PLAN (BSAP) FOR HIMACHAL
PRADESH AND THE RESOURCE MOBILISATION STRATEGY FOR
IMPLEMENTING THE BSAP WITH SPECIAL FOCUS ON LAHAUL-PANGI
AND KINNAUR LANDSCAPES
Final Report
MARCH 2021

This publication has been developed by the National Institute of Public Finance and Policy, New Delhi, under the assignment, Biodiversity Strategy and Action Plan (BSAP) for Himachal Pradesh and the Resource Mobilisation Strategy for Implementing the BSAP with Special Focus on Lahaul-Pangi and Kinnaur Landscapes in Himachal Pradesh under the GEF-GoI-UNDP SECURE Himalaya Project.
Disclaimer: The designation of geographical entities in this book, and the presentation of the material, do not imply the expression of any opinion whatsoever on the part of United Nations Development Programme (UNDP) or Government of India concerning the legal status of any country, territory, or area, or its authorities, or concerning the delimitation of its frontiers or boundaries. The views expressed in this publication do not necessarily reflect those of the United Nations, including UNDP or the UN Member States, nor do citing of trade names or commercial processes constitute an endorsement. UNDP must be acknowledged as the source when content is extracted from this publication.

BIODIVERSITY STRATEGY AND ACTION PLAN (BSAP) FOR HIMACHAL
PRADESH AND THE RESOURCE MOBILISATION STRATEGY FOR
IMPLEMENTING THE BSAP WITH SPECIAL FOCUS ON LAHAUL-PANGI
AND KINNAUR LANDSCAPES
Rita Pandey Priya
Anuja Malhotra Garima Jasuja
Supported by:
United Nations Development Program, New Delhi, India
Suggested citation: Pandey, Rita., et al, Biodiversity Strategy and Action Plan (BSAP) for Himachal Pradesh and the Resource Mobilisation Strategy for Implementing the BSAP with Special Focus on Lahaul-Pangi and Kinnaur Landscapes, National Institute of Public Finance and Policy, March, 2021, New Delhi, India.
Contact information: Rita Pandey, [email protected]; [email protected]
Final Report
March 2021
National Institute of Public Finance and Policy
New Delhi

iii
Contents
Preface
Acknowledgement
Executive Summary
Chapter 1: Overview of International Conventions and Legislative and Policy
Actions for Biodiversity Conservation in India 1.1 Background
1.2 The Convention on Biological Diversity (CBD), Biological Diversity Act 2002 and
National Biodiversity Action Plan (NBAP), 2008
1.3 Linkages of NBTs with Sustainable Development Goal
1.4 Linkages and Synergies between NBTs and NDCs
1.5 Rationale for and Scope of Himachal Pradesh Biodiversity Strategy and Action Plan
(SBSAP)
1.6 Key Objectives of the Study
Chapter 2: Overview and Process Documentation 2.1 Vision and Guiding Principles
2.2 Methodology and Process
2.2.1 Key Process Details
Chapter 3: State Profile, Drivers of Change and Gaps in Biodiversity
Conservation 3.1 State Profile
3.1.1 General Profile Physiological Features
3.1.2 Other Physiological Features
3.1.3 Biodiversity Profile including Threatened Ecosystems and Species
3.1.4 Administrative set up and Natural Resource Governance
3.2 Drivers of Change: Key Factors Impacting Biodiversity
3.2.1 Direct Threats to Biodiversity in Himachal Pradesh
3.2.2 Indirect Threats to Biodiversity in Himachal Pradesh
3.3 Gaps in Conservation and Management of Biodiversity
Chapter 4: Biodiversity Strategy and Action Plan
4.1 Theme-wise Recommendations and Action Plan

iv
Chapter 5: Biodiversity Expenditure Review
5.1 What is a Biodiversity Expenditure Review?
5.2 Mapping Public Expenditure for Biodiversity in Himachal Pradesh
5.3 Methodology for Determining Expenditure Attributable to Biodiversity Conservation
in Himachal Pradesh
5.4 Analysis of Findings and Results
5.5 BER for Landscapes under SECURE Project
5.5.1 Fund Flow Arrangements to the Landscapes
5.5.2 A Snapshot of Number of Biodiversity Relevant Schemes Implemented
5.6 Projections
5.7 Conclusion
Chapter 6: Mapping Revenue from Biodiversity in Himachal Pradesh
6.1 Objectives and Scope
6.2 Guidance from Literature
6.3 Framework and Methodology
6.4 Revenue Receipts: Sectoral Analysis
6.4.1 Tourism
6.4.2 Forest and Wildlife
6.4.3 Fisheries
6.4.4 Mining
6.4.5 Hydropower
6.5 Way Forward
Chapter 7: Financial Needs Assessment 7.1 Financial Needs Assessment
7.2 Mobilizing Conservation Finance
7.2.1 Leverage Existing Sources like MNREGA, CAMPA, and Agriculture and
Horticulture Sector Schemes
7.2.2 Levy a Charge on Identified Sectors
7.2.3 Augment Environment Fund, Local Trust Fund through Rationalising User
Charges, Environment Tax/Cess, CSR
7.2.4 Focussed Efforts for Realising the Full Potential of ABS
7.3 Other Sources
7.3.1 Payment for Ecosystem Services (PES)
7.3.2 Fintech
References
Annexures Annexure 1
Annexure 2 Annexure 3
Annexure 4

v
Annexure 5
List of Tables, Figures, Boxes and Annexures
Chapter – 1
Tables
Table 1.1 CBD Strategic Goals, AICHI Targets and India’s NBTs
Table 1.2 Linkages of NBTs with ABTs and SDGs
Figure
Figure 1.1 Legislative and Policy Actions for Biodiversity Conservation
Box
Box 1.1 Biodiversity focus in NDCs Committed and Ratified by India
Chapter – 2
Table
Table 2.1 Snapshot of Meeting and Consultative Workshops in HP
Figure
Figure 2.1 Linkages between Ecosystem Services & Human Well-being
Box
Box 2.1 Key Steps
Chapter – 3
Tables
Table 3.1 Land-Use Pattern in Himachal Pradesh
Table 3.2 Land Capability Classes of Himachal Pradesh
Table 3.3 Catchment Area of Major Rivers in Himachal Pradesh
Table 3.4 Lakes and man-made Reservoirs in Himachal Pradesh
Table 3.5 Agro-Climatic Zones in Himachal Pradesh
Table 3.6 State Symbols of Himachal Pradesh
Table 3.7 Snapshot of the Biodiversity in Himachal Pradesh
Table 3.8 Threatened Species in Himachal Pradesh as per IUCN Red list
Table 3.9 Forest Cover in Himachal Pradesh
Table 3.10 Classification of Forest on the basis of Agro-ecological Zone
Table 3.11 Administrative Set-up of Department of Forest, Himachal Pradesh
Table 3.12 Distribution of Land Holding in Himachal Pradesh
Table 3.13 Agro-ecological Zone-wise Important Crops
Table 3.14 Yield gap in Agricultural Crops in Himachal Pradesh
Table 3.15 Progress in Respect of Programmes of Department of Agriculture during
2017-18
Table 3.16 Administrative Set-up of Department of Agriculture, Himachal Pradesh
Table 3.17 Status of Horticulture in Himachal Pradesh
Table 3.18 Suitable Fruit Crops Across different Agro-Climatic Zones in Himachal
Pradesh
Table 3.19 Livestock Population (in thousands)

vi
Table 3.20 Year-wise Production by Livestock in Himachal Pradesh
Table 3.21 Administrative Set-up of Department of Animal Husbandry, Himachal
Pradesh
Table 3.22 Fish Cooperative Societies across different Reservoirs in Himachal Pradesh
Table 3.23 Fish Fauna of Himachal Pradesh
Table 3.24 Fish Yield
Table 3.25 Administrative Set-up of Department of Environment, Science and
Technology
Table 3.26 Other relevant Institutions in Himachal Pradesh
Table 3.27 Identified Monkey Hotspots in Himachal Pradesh
Table 3.28 Human-Wildlife Conflict: Threats, Drivers & Impact
Table 3.29 Unscientific Extraction of Medicinal Plants: Threats, Drivers & Impact
Table 3.30 Climate Change as a Direct Threat: Threats, Drivers & Impact
Table 3.31 Forest Fires: Threats, Drivers and Impact
Table 3.32 Illegal Hunting and Wildlife Trade: Threats, Drivers and Impact
Table 3.33 Gaps in Conservation and Management of Biodiversity
Figures
Figure 3.1 Elevation map of Himachal Pradesh
Figure 3.2 Seasons in Himachal Pradesh
Figure 3.3 Superimposition of socio-cultural system on relationship of ecological and
economic system
Figure 3.4 Millennium Ecosystem Assessment Conceptual Framework
Figure 3.5 Indirect Impacts of Climate Change
Figure 3.6 Indirect Effects of Climate Change on Animal Diseases
Figure 3.7 Action Points for Carrying Capacity in Himachal Pradesh
Boxes
Box 3.1 Himachal Pradesh: Key Features
Box 3.2 Administrative structure
Chapter – 4
Tables
Table 4.1 Recommendations, Action Points, Time Frame, Indicators and relevant
Agencies for Himachal Pradesh
Chapter – 5
Tables
Table 5.1 Framework Used in Analysis of BER
Table 5.2 Determining Attribution for Biodiversity Expenditure
Table 5.3 Biodiversity Related Expenditure in Himachal Pradesh (Summary)
Table 5.4 Attributable Expenditure under CBD (BIOFIN) Classification (Rs. Crore)
Table 5.5 Department-wise Expenditure on Biodiversity (Rs. Crore)
Table 5.6 Number of Biodiversity Relevant Scheme by Type of Impact
Table 5.7 Biodiversity Attributable Expenditure

vii
Table 5.8 Expenditure of Biodiversity Relevant Scheme by Type of Impact (Rs. Lakh)
Table 5.9 Department-wise Biodiversity Attributable Expenditure (Rs. Lakh)
Table 5.10 Biodiversity Attributable Expenditure in Lahaul
Table 5.11 Direct and Indirect Impact-wise Biodiversity Attributable Expenditure (Rs.
Lakh)
Table 5.12 Department-wise Biodiversity Attributable Expenditure (Rs. Lakh)
Table 5.13 Biodiversity Attributable Expenditure
Table 5.14 Expenditure of Biodiversity Relevant Scheme by Type of Impact (Rs. Lakh)
Table 5.15 Department-wise Biodiversity Attributable Expenditure (Rs. Lakh)
Table 5.16
Figures
Figure 5.1 Total Biodiversity Attributable Expenditure
Figure 5.2 Attributable Expenditure to Biodiversity by key departments
Figure 5.3 Biodiversity Related Expenditure (CBD Classification)
Figure 5.4 Biodiversity Related Expenditure (CBD Classification)
Figure 5.5 Biodiversity Related Expenditure (CBD Classification)
Figure 5.6 Projections of Biodiversity Attributable Expenditure
Chapter – 6
Tables
Table 6.1 Economic Instruments for Biodiversity Conservation and Addressing
Specific Externalities
Table 6.2 Sectoral Categorization of Environmentally related Tax Revenues in OECD
Dataset
Table 6.3 Sectors Related to Biodiversity
Table 6.4 Economic Instruments Levied in Tourism Sector Related to Biodiversity
Table 6.5 Revenue Earned from Tourism (Rs. Lakh)
Table 6.6 Economic Instruments Levied on Forest Produce
Table 6.7 Revenue Earned from Forestry and Wildlife (Rs. Crore)
Table 6.8 Economic Instruments Related to Biodiversity levied in Fisheries Sector
Table 6.9 Revenue Earned from Fisheries (Rs. In Thousands)
Table 6.10 Receipts of District Mineral Foundation
Table 6.11 Economic Instruments related to Biodiversity in Mining Sector
Table 6.12 Revenues Earned from Mining
Table 6.13 Revenue Earned from Power
Figures
Figure 6.1 Impact of Hydropower Projects on Biodiversity
Figure 6.2 Categories of Revenue Generated from Biodiversity
Boxes
Box 6.1 District Mineral Foundation
Box 6.2 Surface Rent, Royalty and Dead Rent
Box 6.3 Local Area Development Fund
Chapter – 7

viii
Table 7.1 Financial Needs Assessment for Implementation of SBSAP
Table 7.2 Economic Instruments levied across economic sectors in Himachal Pradesh
Table 7.3 Economic Sectors for Mainstreaming Biodiversity
Annexure – 1
Table A1.1 A Snapshot of Consultative Workshops and Meetings in HP
Table A1.2 List of Participants in Consultative workshop in Kilar, Pangi
Annexure - 2
Table A2.1 Threatened Medicinal and Aromatic plants in Himachal Pradesh
Table A2.2 Threatened Species of Animals Notified by the Himachal Pradesh State
Biodiversity Board
Table A2.3 Forest cover across districts of Himachal Pradesh
Table A2.4 Classification of forests in Himachal Pradesh
Table A2.5 Crop Diversity in Himachal Pradesh
Table A2.6 Crop Production of major food crops (2010-11 to 2018-19)
Table A2.7 Monsoon season rainfall (June-September, 2018)
Table A2.8 Post Monsoon Seasons Rainfall Data (October-December, 2018)
Table A2.9 Consumption of fertilizers (in M.T.)
Table A2.10 Species of honey bees in Himachal Pradesh
Table A2.11 District-Wise Livestock in Himachal Pradesh
Table A2.12 Government Poultry Farms/Extension Centres in Himachal Pradesh
Table A2.13 Mahseer Major River Stretch in Himachal Pradesh
Table A2.14 Trout Major River Stretch in Himachal Pradesh
Table A2.15 Recreational fisheries zone for Trout water
Table A2.16 Recreational fisheries zone for Mahseer water
Annexure - 3
Table A3.1 Sectoral Policy Analysis
Annexure - 4
Table A4.1 Transit Fees in Himachal Pradesh
Table A4.2 Potential Bioresources of Himachal Pradesh

ix
List of Abbreviations
ABS Access and Benefit Sharing
ABT Aichi Biodiversity Targets
ACF Adaptation Coalition Framework
ADB Asian Development Bank
APCCF Additional Principal Chief Conservator of Forests
BBMB Bhakra Beas Management Board
BDA Biological Diversity Act
BER Biodiversity Expenditure Review
BFP Biodiversity Finance Plan
BHS Biodiversity Heritage Sites
BIOFIN Biodiversity Finance Initiative
BMC Biodiversity Management Committees
BSAP Biodiversity Strategy and Action Plan
BSI Botanical Survey of India
CA Compensatory Afforestation
CAMPA Compensatory Afforestation Fund Management and Planning Authority
CAT Catchment Area Treatment
CBD Convention on Biological Diversity
CFC Chlorofluorocarbons
CoP Conference of Parties
CPCB Central Pollution Control Board
CR Critically Endangered
CRGGS Climate Resilient Green Growth Strategies
CSKHPKV Chaudhary Sarwan Kumar Himachal Pradesh Krishi Vishvavidyalaya
CSR Corporate Social Responsibility
CSS Centrally Sponsored Scheme
DFO District Forest Officer
DMF District Mineral Foundation
DoA Department of Agriculture
DoAH Department of Animal Husbandry
DoEE Department of Elementary Education
DoEST Department of Environment, Science and Technology
DoF Department of Fisheries
DoH Department of Horticulture
DoI Department of Industries
DoTD Department of Tribal Development

x
EEA European Environment Agency
EN Endangered
ENVIS Environmental Information System
FSI Forest Survey of India
FTC Forest and Tree Cover
GBPIHED GB Pant Institute of Himalayan Environment & Development
GCF Green Climate Fund
GDP Gross Domestic Product
GEF Global Environment Facility
GHG Greenhouse Gas
GoHP Government of Himachal Pradesh
GSB Govansh Samverdhan Board
GSDP Gross State Domestic Product
HCFC Hydro chlorofluorocarbon
HEP Hydro Electric Projects
HIMCOSTE Himachal Pradesh Council for Science Technology and Environment
HP Himachal Pradesh
HPAB Himachal Pradesh Ayush Board
HPAU Himachal Pradesh Agriculture University
HPBOSE Himachal Pradesh Board of School Education
HPFD Himachal Pradesh Forest Department
HPKCCC Himachal Pradesh Knowledge Cell on Climate Change
HPPCL Himachal Pradesh Power Corporation Ltd.
HPSAMB Himachal Pradesh State Agriculture Marketing Board
HPSBB Himachal Pradesh State Biodiversity Board
HPSBSAP Himachal Pradesh State Biodiversity Strategy and Action Plan
HPSMPB Himachal Pradesh State medicinal Plant Board
HPSPCB Himachal Pradesh State Pollution Control Board
HPSSAPCC Himachal Pradesh State Strategy and Action Plan on Climate Change
HPSVC Himachal Pradesh State Veterinary Council
HWC Human-Wildlife Conflict
HYV High Yielding Variety
IA Implementation Agreement
IBBI India Business and Biodiversity Initiative
ICAR Indian Council of Agricultural Research
IHBT Institute of Himalayan Bio-resource Technology
IGFRI Indian Grassland and Fodder Research Institute
INDC Intended Nationally Determined Contributions
IUCN International Union for Conservation of Nature
JFMC Joint Forest Management Committee

xi
KUSUM Pradhan Mantri Kisan Urja Suraksha Utthan Mahabhiyan
LADF Local Area Development Fund
MAP Medicinal and Aromatic Plants
MGNREGA Mahatma Gandhi National Rural Employment Guarantee Act
MoEF&CC Ministry of Environment and Climate Change
MT Metric Tonne
MW Mega Watt
NAP National Afforestation Programme
NAPCC National Action Plan on Climate Change
NBA National Biodiversity Authority
NBAGR National Bureau of Animal Genetic Resources
NBAP National Biodiversity Action Plan
NBT National Biodiversity Targets
NDC Nationally Determined Contributions
NEP National Environment Policy
NIPFP National Institute of Public Finance and Policy
NITI National Institute for Transforming India
NLM National Livestock Mission
NMAET National Mission on Agricultural Extension and Technology
NMSA National Mission on Sustainable Agriculture
NPV Net Present Value
NRSC National Remote Sensing Centre
NT Near Threat
NTFP Non-timber Forest Produce
OBC Other Backward Classes
OECD The Organisation for Economic Cooperation and Development
PA Protected Area
PBR People’s Biodiversity Register
PES Payment to Ecosystem Services
PGP< Plant Growth Promoting Microbes
PKVY Paramparagat Krishi Vikas Yojana
PMKKKY Pradhan Mantri Khanij Kshetra Kalyan Yojana
PRI Panchayati Raj Institutions
RKVY Rashtriya Krishi Vikas Yojana
RO Range Officer
ROAM Restoration Opportunities Assessment Methodology
SADA Special Area Development Authority
SAWB State Animal Welfare Board
SBB State Biodiversity Board
SBSAP State Biodiversity Strategy and Action Plan
SC Scheduled Classes
SDG Sustainable Development Goals

xii
SECURE Securing Livelihoods, Conservation, Sustainable Use and Restoration of High Range Himalayan Ecosystems
SHM Soil Health Mission
STP Sewage Treatment Plant
SVSY Samudaik Van Samvardhan Yojana
SVY Sanjhi Van Yojana
TCAD Tourism and Civil Aviation Department
TDC Tourism Development Council
TERI The Energy and Resource Institue
UNDP United Nations Development Programme
UNEP United Nations Environment Programme
UNFCCC United Nations Framework Convention on Climate Change
USD US Dollars
VFDC Village Forest Development Committee
VU Vulnerable
WCCB Wildlife Crime Control Bureau
WRI World Resource Institute
WWF World Wide Fund for Nature
YSSD Youth Services and Sports Department
ZSI Zoological Survey of India

xiii
Preface
SECURE Himalaya (Securing livelihoods, conservation, sustainable use and restoration of high range Himalayan ecosystems) is a GEF funded project being implemented by the Ministry of Environment, Forest and Climate Change, Government of India along with the UNDP, in the states of Himachal Pradesh, Uttarakhand, and Sikkim and Union Territories of Jammu and Kashmir and Ladakh. The project aims to support the Government of India to effectively promote sustainable land and forest management in alpine pastures and forests in high range Indian Himalayan ecosystems that secure sustainable livelihoods and community resilience and ensures conservation of globally significant biodiversity and threatened species.
The National Institute of Public Finance and Policy was commissioned to undertake this study as part of the SECURE Himalaya Project by the United Nations Development Program, New Delhi at the behest of the Ministry of Environment and Forest & Climate Change, Government of India. The present report “Biodiversity Strategy and Action Plan (BSAP) for Himachal Pradesh and the Resource Mobilisation Strategy for Implementing the BSAP with Special Focus on Lahaul-Pangi and Kinnaur Landscapes” covers important issues around conservation of biodiversity in Himachal Pradesh and India on which the authors have done exhaustive research through field visits and stakeholder consultations. The empirical analysis and investigations have enabled authors to make a number of policy recommendations which I am confident will be extremely useful to the central government and the government of Himachal Pradesh in their efforts to improve the status of biodiversity, natural resources and ecosystem services in the state and the identified landscapes.
This study was designed, managed and carried out by a team led by Professor Rita Pandey. Other key members of the team are Priya, Anuja Malhotra, and Garima Jasuja. The views expressed in the report are that of the authors and the Governing Body of the institute are in no way responsible for them.
(Pinaki Chakraborty)
Director

xiv
Acknowledgement This study has benefitted from the valuable suggestions received from experts in government, academia, industry, civil society organisations and communities. We acknowledge the guidance and valuable inputs from the Review Committee of MoEFCC, chaired by Mr. Rakesh Jagenia, Deputy Inspector General (DIG-WL), MoEF&CC, government of India and also the State Level Technical Committee, chaired by Dr. Savita, IFS, former PCCF (WL)-cum State Project Director of SECURE Himalaya Project & Chief Wildlife Warden, Himachal Pradesh.
Acknowledgement is also due to the Department of Forest, HP, especially to Dr. Archna Sharma, IFS, PCCF (WL), Shri Anil Thakur, IFS, CCF and Shri Ajay Srivastav, IFS, Addl. PCCF (WL) cum State Nodal Officer of the SECURE Himalaya Project in Himachal Pradesh for their guidance, technical support and insights. The support received during the initial Stage of the study from Shri G. S. Goraya, former PCCF (HoFF), Shri Kunal Satyarthi, IFS and former Member Secretary, HP State Biodiversity Board, and Shri N.P.S. Dhaulta, DFO (WL), Shimla is gratefully acknowledged.
We acknowledge the guidance, and technical and financial support received from Dr. Ruchi Pant, Head, Natural Resource Management and Biodiversity during the project cycle. In particular, we are grateful to Manoj Thakur, State Project Officer in Project Management Unit in Himachal Pradesh for his support in facilitating the communication with the line departments and members of the communities, and field visits to the landcsapes.
We wish to put on record the excellent support extended by Gayatri Mahar, State Coordination Officer at UNDP Delhi, and Parth Joshi, National Livelihoods Specialist, SECURE Himalaya at UNDP Delhi, Amit Mehta, Socioeconomic and Livelihoods Associate, Abhishek Kumar, Project Associate, UNDP and Ms. Neha Tomar, Administrative and Finance Assistant, UNDP.
The authors received support from Shri Nishant Thakur, HPAS, Joint Member Secretary, Himachal Pradesh State Biodiversity Board (HPSBB), also sought considerable inputs from Dr. M. L. Thakur, State Project Coordinator, Ms. Shubra Banerjee, Senior Scientific Officer, HPSBB. The inputs and insights received from various line departments of Government of Himachal Pradesh is highly appreciated. The authors sought considerable amount of information from Gram Pradhans, members of Praja, Mahila Mandal and other members of communities through field visits and in-person meetings. We appreciate and acknowledge their time and efforts. Our heartfelt thanks to all individuals and their institutions who contributed their time and expertise in various consultation meetings organized as part of the study.
During the course of the study, the team has received overall guidance and immense support from Dr. Rathin Roy, former Director, NIPFP for which we are grateful to him. Prof. Pinaki Chakravorty, Director, NIPFP provided useful support during the last ohase of the study. Wasim Ahmad and Promila Rajvanshi provided excellent secretarial support during the project cycle.
This report would not be possible without the financial support from UNDP, New Delhi which is immensely appreciated.
Authors

xv
Executive Summary
India is a mega diverse country, harbouring 7-8 per cent of all recorded species in the world with
only 2.4 per cent of the world’s land. Of the 34 global biodiversity hotspots, four are present in
India, represented by the Himalaya, the Western Ghats, the North-east, and the Nicobar Islands.
The threats to biodiversity – not only in India, but throughout the world has culminated into The
Convention on Biological Diversity (CBD) – which was one of the three Conventions of the Rio
Earth Summit in 1992.
It has been increasingly recognised by both the member countries and the CBD that the Sub-
national BSAPs are necessary for effective conservation and management of biodiversity as each
state may have a different connect of biodiversity with human well-being as well as states’
developmental priorities. Further, unique features of the state, land use patterns and practices, and
institutional and policy arrangements for governance of biodiversity and natural resources may
require a state specific BSAP.
In HP, the BSAP was prepared in 2002. However, with the introduction of new guidelines for
National and sub-national BSAPs at Nagoya 10th CoP Summit, and India’s commitment to CBD
during 2011-20; the need to refine and update the BSAP, 2002 has been felt.
In this context, the National Institute of Public Finance and Policy (NIPFP) was commissioned to
undertake the study “Updating the Biodiversity Strategy and Action Plan (BSAP) of Himachal
Pradesh and a Resource Mobilisation Strategy for Implementing the BSAP with special focus on
Lahaul-Pangi and Kinnaur Landscapes”.
The key objectives of the study are:
1. To update the existing Biodiversity Strategy and Action Plan (BSAP) of Himachal Pradesh
based on current state priorities and in alignment with national and global priorities of
biodiversity conservation and wildlife protection.
2. To develop a resource mobilization strategy for implementing BSAP in Himachal Pradesh.
3. Prepare process document for implementation of two financial solutions for conservation
of snow leopard landscape; namely Lahaul – Pangi and Kinnaur Landscape1.
The present report focuses on identifying the threats to biodiversity in the State and makes policy
recommendations for improving the status of biodiversity, natural resources and ecosystem
services in the state. The preparation of this document has undertaken an exhaustive research
through field visits and stakeholders’ consultations. A review of the existing SBSAP and rapid
assessment of the gaps in implementation was done. In addition, a review was carried out for:
Status and trends of biodiversity and biological resources in the state.
Threats to biodiversity.
1 Analysis and results pertaining to this objective and a BSAP for Lahaul – Pangi and Kinnaur Landscapes are put
together in a separate report (Pandey Rita et al, 2021) as per the advice of the Project Management Unit.

xvi
Review of the biodiversity relevant schemes and expenditure in the landscape.
Literature and statistical surveys through secondary literature.
Consultative meetings were conducted with the officials of HP Forest Department, State
Biodiversity Board, key line departments in Shimla as well as the district level officials in the
landscape. Field trips were organised for holding public meetings, discussions were carried out
with local experts and subject experts.
Himachal Pradesh is a mountainous state that lies in the Western Himalayas, extending over a
geographical area of 55, 673 sq. km (FSI, 2019). The state is characterised by fragile landscapes,
rich biodiversity and ecosystems supporting livelihood of local communities and providing a
source of revenue to the State Government. The state has elevation ranges from 350 m to 6816 m
(Jaswal and Bhan, 2015) and is divided in three regions, topographically, namely Shiwalik (outer
Himalayas), the lesser Himalayas (middle Himalayas) and the greater Himalayas. Due to
altitudinal variations, the State is divided into 4 agro-ecological zones which differ in terms of
their area, temperature, elevation, rainfall as well as important crops sown. These are: Sub-tropical,
low hill zone, sub-tropical mid-hill zone, temperate wet high hill zone, and temperate dry high hill
zone (Table 3.10). Due to varied geological formations, topography, climatic conditions and
altitudinal changes, Himachal Pradesh has a vast repository of floral and faunal species. As many
as 3,256 floral species are found in Himachal Pradesh, consisting of ferns, higher plants, fungi,
mosses and lichens (out of the total of 47,000 species found in India). In addition, the State also
harbours rich and unique fauna with 5,721 species of fauna (out of a total of 89,451 species found
in India). The state has the largest population of Chir pheasants in the world. (Table 3.7).
The state is endowed with a variety of medicinal and aromatic plants (MAPs) which are used by
local communities, and in other parts and regions in many ways. There are approximately 187
species of MAPs in Himachal Pradesh. The altitudinal variations also influence the agricultural
and horticultural crops found in the State (Table 3.13 and Table 3.18). The State also has an
abundance of fish (Table 3.24).
The biodiversity of the State faces a number of direct and indirect threats. According to the
Himachal Pradesh Forest Department, 57 species of MAPs have gone threatened due to
unscientific extraction.2. In addition, HPSBB has also released a list of 16 threatened faunal
species3. A number of floral and faunal species have been included in IUCN Red List (Table 3.8).
Key direct threats faced by the biodiversity in the State:
i. Human-wildlife conflict: In Himachal Pradesh, the threats due to HWC revolve around
livestock predation, crop raiding, attack on humans, and wildlife strolling in human
settlements. There have been reported attacks by monkeys, wild bears and leopards on
agro-pastoralists, agricultural fields, and livestock (Table 3.28).
ii. Unscientific extraction of medicinal and aromatic plants: Illegal and unsustainable
collection and marketing have been seen as a major threat to MAPs in Himachal Pradesh.
The unscientific extraction of medicinal plants has led to failure of regeneration of plants
2 https://hpforest.nic.in/files/ANNEXURE%20-%20I.pdf 3 http://www.hpbiodiversity.gov.in/BMC/Proceeding%20Threatened%20Animal.pdf

xvii
in their natural habitat. Over-extraction of plants also leads to soil erosion and landslides
(Table 3.29).
iii. Climate Change: According to CRGGS (2015), there has been an increase in annual mean
temperature in HP by 0.02 °C/year and a decrease in annual average rainfall by 3.26
mm/year. There has also been a decrease in snowfall received in the State. These
fluctuations in temperature and precipitation have had an impact on agricultural
productivity, flowering period and decline in the area of traditional crops (Table 3.30).
iv. Forest Fires: The peak fire season in the State is in the months of March to June.
MoEF&CC and the World Bank (2018) estimated that reported monetary losses due to
forest fires in the state was Rs. 134.78 lakhs in the year 2016 and Rs. 113.27 lakhs in 2015.
Forest fires result in reduced density as well as basal area of Chir Pine trees in fire affected
areas. The fires are also a major source of carbon emissions leading to changes such as
reduced photosynthesis activities (Table 3.31).
v. Illegal Hunting and Wildlife Trade: There are several routes for illegal wildlife trade
which are reported to be operating in HP, the main exit points of which are: Border areas
of Leh-Ladakh, Chamba and Pathankot as well as Tiuni-Vikasnagar in Uttarakhand
(Chauhan, 2018). Poaching disrupts the population of species which further disturbs the
food chain as the population of immediate next wild animal would increase. Hunting of
animals impacts nature-based tourism negatively. This impacts livelihood of locals (Table
3.32).
Key indirect threats to biodiversity in Himachal Pradesh:
i. Climate Change: The Himachal Pradesh Strategy and Action Plan on Climate Change
(2012) notes that the State is highly vulnerable to climate change. Climate change leaves
farmers vulnerable to crop losses due to fluctuations in temperature and precipitation.
Similarly, change in climate encourages growth of invasive species which ultimately
affects the biodiversity composition of an area. Climate change and forest fires also have a
vicious circle which is difficult to disrupt. Climate change causes forest fires; forest fires
increase carbon emissions and reduce the carbon storage capacity of an area, thereby
worsening the climate change (WWF, 2020).
ii. Pressure on Pastureland due to overgrazing: Overgrazing is not only impacting the
native grass species but also habitat of wild animal species in HP: ibex (Capra ibex
sibirica), brown bear (Ursus arctos), himalayan tahr (Hemitragus jemlabicus), and musk
deer (Moschus moschiferus) (Greentumble, 2017; Saberwal, 1996). Continuous grazing
has also given rise to a number of invasive species such as Rumex nepalensis is found in
Dharampur area due to overgrazing by sheep and goat (Saberwal, 1996). The Restoration
Opportunities Atlas by WRI (2018) has identified grazing as one of the potential risks to
land degradation in HP.
iii. Mass Tourism: Tourism sector provides more than 4 lakh jobs and generates 8 to 10 per
cent of the GSDP in HP (Shukla, 2017). The high dependence on tourism has led to issues
like water scarcity and traffic congestion in the State. Apart from this, there are negative

xviii
impacts on biodiversity due to improper disposal of waste, increased construction in the
fragile landscapes, land clearing for construction, excessive fuel wood collection.
Keeping in view the status, trends and threats to biodiversity in the landscape, the Biodiversity
Strategy and Action Plan (BSAP) has been presented in nine themes (Table 4.1):
1. Wild Flora and Fauna
2. Agriculture and Biodiversity
3. Animal Husbandry
4. Aquatic Biodiversity
5. Microbial Diversity
6. Tourism
7. Economic valuation and Natural Capital Accounting
8. Education, Awareness, and Training
9. Policies, Laws, and Institutions
A thematic summary of recommendations and action points:
1. Wild Flora and Fauna:
i. Protected Areas: There is a need for re-strategizing of PAs through spatial analysis
for determining changes in forest cover of PAs using remote sensing applications.
There is also a need to adopt participatory resource management strategy across all the
PAs within the state. For this, the state needs to undertake training and awareness
campaigns for the local governance bodies and community members to identify the
opportunities for networking in the context of biodiversity conservation.
ii. Human-wildlife conflict: Developing a comprehensive database for HWC along with
the nature and extent of conflicts in the State is crucial. This will involve conducting
district-wise scientific investigation on richness of wild animals in relation to habitat
characteristics, land-use pattern and availability of prey species. Other key
interventions would be: to plant more fruiting trees in forests to avoid raiding by
animals in agricultural lands in search of food, identify zones and mark them as grazing,
revive degraded pasturelands in uphill to provide grazing lands for wild animals such
as Ibex and blue sheep, periodic clearing of shrubs to provide free movements of
animals.
iii. Forest Fires: There is a need to strengthen data on forest fire, especially to document
causes of increasing incidents of forest fires. The State also needs to conduct the gap
analysis of current capacity of forest fire management in terms of fire stations,
improved fire equipment and manpower, explore devising a Fire Danger Rating System
to assess the effect of factors such as fuel, weather, topography, etc. on daily fire
potential of an area, and provide training to local communities for prescribed burning.
iv. Restoration Potential: To achieve the restoration potential of the State, it should
explore the suitability of ROAM methodology developed by WRI, as well as identify

xix
native tree species and associated value chain of key tree species for livelihood
diversification and income generation of local communities.
v. Preparation of PBRs: Preparation of PBRs should be expedited as per the mandate of
Biological Diversity Act, 2002 and supplement PBRs with regular scientific surveys to
timely update key threatened, critical, endangered, vulnerable and rare species.
vi. Wildlife Crime: To tackle the issue of wildlife crime, there is a need to identify gap in
staff training and funding based on security audits, and design training modules for the
enforcement agencies.
vii. Invasive Alien Species: There is a need to involve cottage industries and incentivize
them to utilize invasive species. For example, Lantana Camara can be used as
bioethanol fuel, fresh root of Ageratina Adenophora have antibacterial qualities.
viii. Biodiversity Heritage Sites: Biodiversity Heritage Sites (BHS) should be identified
in the state with active involvement of local institutions and communities. For this, use
GIS mapping to delineate the boundaries of such sites.
ix. Database: Database on ENVIS HP portal should be strengthened to make it a
repository of credible data and knowledge on biodiversity to include endangered,
extinct, rare, threatened, vulnerable species along with trends in species composition.
x. In-situ Conservation: The state needs to identify sites for restoration in light of
conservation of native species and plan for long-term environmental monitoring. The
traditional knowledge regarding crop breeding, especially for the crops of economic
importance to help farmers.
xi. Ex-situ Conservation: The State should conserve genetic diversity of threatened flora
and fauna in the State by strengthening seed banks for seed and germplasm collection.
xii. Cultivation of MAPs: A comprehensive focused program should be introduced to
create value chain through partnership between industry and local communities for
commercially viable species of (MAPs) which are on the verge of extinction due to
unscientific extraction.
2. Agriculture and Biodiversity:
i. Organic Farming: There is a need to introduce a program to provide support to identified
niche organic products such as peas, kala jeera, wild garlic, kuth, kutki in terms of branding,
labelling and marketing.
ii. Community Seed Banks: There is a need to establish community seed banks to make
local variety of seeds available to farmers and monitor quality seed production response to
threats posed to plant genetic resources due to climate change.
iii. Fodder Management: There is a need to revive degraded pasturelands on regular basis
with native species. It is recommended that the State establish fodder banks in alpine areas
to help local communities in winter months and reduce pressure on grazing lands.
iv. Irrigation: The State must promote khuls (a traditional irrigation practice), rainwater
harvesting, solar energy and pumps. The State should also revise small Hydro power policy
to consider the issue of divergence of water from micro irrigation systems such as Kuhls.

xx
v. Agro-forestry: The State can explore rehabilitation of degraded land via agro-forestry
system in lines with existing crops and livestock needs. For this, the State will need to set-
up high-tech nurseries in higher altitude regions to provide viable varieties of planting
material for agro-forestry.
vi. Bio-control agents: Use of bio-control agents should be promoted and on-farm training
should be provided to the farmers to ensure proper adoption of Pesticide Application
Technology for minimum residue and reduced pesticide risk.
vii. Adaptation towards climate change: The State should explore the option of mapping
fragile ecosystems and demarcating them as “No-go zones”. Provisions should also be
made for ensuring availability of drought resilient seeds, public health measures for heat-
waves, cold-waves, vector-borne diseases, disaster risk reduction, water management as
well as climate smart agriculture.
3. Animal Husbandry and Biodiversity
i. Promoting genetic diversity: Conservation and promotion of genetic diversity of
indigenous animal species should be strengthened.
ii. Stray Cattle Management: There is a need to involve local level institutions and
communities to ensure effective stray cattle management, as well as designing a
mechanism to identify and punish defaulters who abandon their unproductive cattle.
iii. Diseases among livestock: The State needs to conduct studies to identify diseases, causes,
as well as etiological agents of diseases including the impact of these diseases on bovines
across all the districts.
iv. Diseases among migratory livestock: The State needs to make provisions for compulsory
vaccination of cattle before they are taken for grazing uphill by nomadic/semi-nomadic
community to avoid the spread of diseases like Foot and Mouth Disease.
v. Yak Population: Provisions should be made for facilitating artificial insemination using
yak semen in the remote regions of the State to increase yak population.
vi. Fodder Management: The farmers should be trained in the process of improving nutritive
value and taste of crop residues as feedstock. A 21-day treatment process organized by
ICRISAT in Karnataka is a success story in this context.
vii. Grazing Policy: Formulation of a Grazing Policy is critical for outlining the guidelines for
management and development of pastureland in the State.
4. Aquatic Biodiversity
i. Wetlands: There is a need to identify wetlands facing environmental degradation and
develop site-specific action plan for restoration.
ii. Revival of fish species: There is a need to strengthen fish brood bank, especially for native
species such as mahseer. The State should also explore the option of designating deep pools
in rivers as fish sanctuaries in consultation with Fisheries Department.
iii. Construction of dams: The report recommends E-flows assessment to determine river
health regime, periodic check on hydropower projects for compliance with lean season

xxi
water flow mandate downstream, and small adjustments in flow regime in hydel project
during hydro peaking to conserve shoreline river bed habitat.
iv. Fish Movement: The State should mandate appropriate channels to check obstruction of
fish movement and facilitate easy fish movement through dams.
v. Pollution: CPCB has identified 7 polluted river stretches in HP. To address this, there is a
need to conduct the study to estimate the gap between total sewage generation and
treatment capacity of STPs in the state to plan effective sewage management, identify
locations to lay down additional pipeline to treat effluents before disposal in river and
involve public in reporting discharges by default industries.
5. Microbial Diversity
i. Microbial diversity database: There is a need to document microbial diversity (in both
aquatic and terrestrial ecosystem) across the State by preparing web-based curated
microbial diversity database.
ii. Application of microbes in farming: There is a need to identify and strengthen measures
for utilization of plant growth promoting microbes (PGPM) which can be used as a
substitute to agri-xenobiotics.
iii. Conservation of aquatic microbial diversity: Microbial biodiversity should be included
in the impact assessment of projects and indicators should be developed to monitor
microbial diversity of the State.
iv. Direct-fed microbes: The State should explore the application of microbes (called Direct-
fed Microbes) to augment indigenous cattle performance.
6. Tourism
i. Ecotourism: The State should undertake capacity building programme for local
communities for “high-value-low impact” tourism. There is also a need to converge
‘Ecotourism Policy’ of the Forest Department and ‘Tourism Policy’ of the Tourism
Department.
ii. Carrying Capacity: The State should undertake carrying capacity studies to limit the
maximum number of tourists in the ecological fragile areas of the State.
iii. Payment for ecosystem services: The state can also explore the PES model of tourism
which provides a fair and equitable mechanism to incentivize communities for biodiversity
conservation.
iv. Impact Assessment: There should be a study regarding the impact of activities like
trekking and camping on habitat disturbances, solid waste accumulation, water pollution
and air pollution.
7. Economic Valuation and Natural Capital Accounting:
i. Economic Valuation of Biodiversity: There is a need to focus on economic valuation of
bio-resources for ABS mechanism. The state should support studies for measurement of
economic valuation of bio-resources of the State for appropriate benefit-sharing.

xxii
ii. Natural Capital Accounting: The State should explore the application of Natural Capital
Accounting to all the sectors in HP.
8. Education, Awareness and Training:
i. Environmental Education: The State should mainstream environmental studies in
education to increase awareness about biodiversity conservation.
ii. Awareness through communication media: The State should promote awareness
regarding topics related to biodiversity using short films, documentaries, besides stories in
print media.
iii. Community Based Natural Resource Management: There is a need to promote
collaboration between institutions such as self-governing bodies such as Praja Mandals,
Panchayat, VDFCs, JFMCs, local administration, research institutes and NGOs.
iv. Development of Portal: A portal for documenting and sharing national and international
best practices to relevant functionaries and stakeholders should be developed.
9. Policies, Laws and Institutions
i. Procurement of green products: The State should develop sustainable public
procurement manuals for line departments to encourage procurement of green products
based upon life-cycle costing.
ii. Community Participation: The State should explore the suitability of Adaptation
Coalition Framework (ACF) to create community institutions with the mandate of
increasing resilience to climate change over the long-term. This can be done by facilitating
coalitions/alliances of local communities and mobilising local assets including human,
social and financial.
iii. Investment in Agricultural Research: There is a need to increase investment in
agricultural research, infrastructure and technology development as well as plant gene
banks.
iv. Regional Cooperation: There is a need to promote regional cooperation between
Himalayan States by strengthening existing mechanisms and explore possibility of new
agreements.
The second objective of the study was to develop a resource mobilisation strategy for
implementation of SBSAP in HP. The following figure gives a brief description of the elements
of resource mobilisation strategy:

xxiii
Source: Author’s Construct
Biodiversity Expenditure Review (BER) is a standard tool used to map the sources and amount of
funds flow towards biodiversity and ecosystem conservation and protection. Biodiversity
expenditure can be direct (restoration, tree planting and other conservation and protection
activities) or indirect (training awareness building of stakeholders, research, measuring and
mapping of biodiversity etc.). Similarly, expenditure on biodiversity can be to achieve one or more
goals of CBD or achieve one or more NBTs (Table 5.1).
Key results of BER (Table 5.3 to 5.5):
i. The BER analysis shows that in HP, while the number of biodiversity relevant schemes
has increased from 77 in 2011-12 to 189 in 2016-17; biodiversity relevant expenditure has
increased from Rs. 159.33 crore in 2011-12 to Rs. 457.35 crore in 2016-17 and is projected
to increase to Rs. 741.87 crore in 2020-21.
ii. The detailed analysis shows that while some aspects of conservation have received the
required policy and programmatic focus along with adequate funding, in some areas
increase in both the policy focus and funding is necessary. For instance, while a significant
share (over 31-68%) of the total biodiversity attributable expenditure is on ‘protection’ of
biodiversity in the state; expenditure on restoration has been low (3.16-5.17%) especially
when compared with restoration needs in the state. This calls for a greater policy focus and
additional funding on restoration. Similarly, additional funding will be required in other
key areas such as management of HWC, livelihood support, adequate compensation of
farmers as an incentive for wild biodiversity conservation, training and awareness etc.
Mapping of current sources of revenues from biodiversity shows a lot of untapped potential. In
this context the following suggestions are made:
i. Effective Implementation of ABS: Corporations utilizing bio resources of the State
should be persuaded to share the benefits accrued with the State. There should also be a
detailed assessment of ABS potential and the challenges in its implementation with the
help of subject experts. State should encourage Bio prospecting proactively.

xxiv
ii. Environment Fund: It was established in 2008 to be serviced mainly with donations. This
fund needs to be revived and strengthened through mobilization of steady flow of funds.
The following may be explored in this context.
a. Specific share of Compensatory Afforestation Fund: The State should explore
the possibility of earmarking a specific amount of CAMPA for conservation and
restoration of biodiversity, specifically for restoration of endangered and threatened
species. Earmarked amount could be transferred to the Environment Fund
b. Utilizing District Mineral Foundation Fund: Currently the State has Rs 96.49
crore in DMF which, among others, can be used for control of pollution. The State
should also explore the possibility of earmarking a part of DMF which could be
transferred to the Environment Fund, to be utilized for conservation and restoration
purposes.
c. Entry Fees: The State already collects entry fees for ecologically fragile areas. Part
of this fees could be earmarked for maintenance of biodiversity in the area.
iii. Increasing the Involvement of Traditional Governance Systems: Traditional systems
like Praja Mahila Mandal should be encouraged and empowered to take actions for
conservation of biodiversity like imposing ban on environmentally harmful activities,
implementing fees and fines for behavioural changes among people towards sustainable
practices.
Resource mobilisation: Details of finance needs assessment are outlined in Table 7.1. The total
additional funds required for implementation of SBSAP in the state is estimated to be Rs. 51.795
crore per annum.
We suggest the following seven strategies in mobilising these additional funds:
1. Leveraging Existing Sources: The State should focus on mobilising resources through
CAMPA, MGNREGA, PKVY, RKVY, KUSUM, NMSA and others (details in Chapter 7 of the
report). SBB should build on the identified linkages and synergies between SBSAP and several
programs and schemes currently being implemented in the state. Accordingly, the relevant line
departments should be convinced to incorporate identified action points in their annual programs.
An inter-departmental group set up for this purpose will be necessary in drawing up an annual or
multi-year plan before the budgets of the line departments are finalised.
2. Rationalisation of User Charges of Protected Areas and CSR: There is a need to revise the
entry fees commensurate with the demand for the PA and the pristine nature and services it offers
and establish a Local Trust Fund for each PA. The state should explore levying a conservation cess
on tourism activities in 4 to 5 sq km area around PAs for augmenting the receipts of the Local
Trust Fund.
Long gestational period, poor awareness, and intangible results are reported to be partly
responsible for poor mobilisation of CSR funds for conservation of biodiversity. SBB needs to
strengthen awareness strategies and also develop a pipeline of projects in priority areas in
collaboration with IBBI and other such associations and federations.
3. Levy a Charge on Identified Sectors: It is recommended that upto 50 per cent of the annual
accruals in LADF and DMF be earmarked for biodiversity conservation which could be routed

xxv
through the existing Environment Fund. The State should also explore the option of levying a
biodiversity cess @ 5 – 8 per cent on revenue from tourism activities (irrespective of the
department involved).
4. ABS: This is a highly underutilised source of revenue in the country and HP is no different.
There is a need for a detailed study on potential of ABS and challenges in implementing ABS in
HP. It is an important tool for mobilising conservation funds at the same time ensuring its equitable
distribution of benefits of conservation and sustainable use of resources. State should encourage
Bio prospecting proactively.
5. Payment for Ecosystem Services: It is a market-based mechanism which has the potential to
link up geographically disparate providers and beneficiaries as some ecosystem may be generated
at one place, and benefits may be felt at considerable distances from their point of origin.
It provides an opportunity to put a price on un-priced ecosystem services like climate regulation,
water quality regulation and the provision of habitat for wildlife and, in doing so, brings them into
the wider economy.
In HP, under ‘Policy to institutionalize Payments for Ecosystem Services’ 2013, the ecosystem
services eligible for PES include soil erosion control, sediment load reduction, fire control,
discharge of water in streams and springs especially potable water, carbon sequestration,
rehabilitation of weed infested areas, organic and conservation agriculture, conservation
horticulture, pollination and biodiversity conservation.
Potential funders for PES: International donors, impact investment funds, private donors.
6. Carbon Credits: Carbon credits create a market for reducing greenhouse emissions by giving
a monetary value to the cost of polluting the air. NITI Aayog has estimated that India can access
USD 50 60 billion worth of carbon credits if it propagates natural farming and agroecology. Pangi
in Chamba and part of SECURE Landscape practices natural farming, State may look for such
environment friendly practices and initiatives register them. The restoration programme for
landscape is potentially a good source for earning carbon credits for the State.
7. Fintech: These instruments have the potential to increase the breadth and depth of conservation
finance. Fintech reduce transaction cost and improve economic efficiency. The use of technology
reduces the cost of transaction, credit investigation, resources matching and help overcome the
scale issues. These work well at the retail level and bring overall efficiency. There are several
success stories available around these. SBB should explore this in addressing man-animal
conflicts.

1
Chapter 1: Overview of International Conventions and Legislative and
Policy Actions for Biodiversity Conservation in India
1.1 Background
India, a mega diverse country with only 2.4 percent of the world's land area, harbors 7-8
percent of all recorded species, including over 47,000 species of plants and 96,000 species of
animals. Of the 34 global biodiversity hotspots, four are present in India, represented by the
Himalaya, the Western Ghats, the North-east, and the Nicobar Islands.
India recognizes that human survival and well-being and millions of livelihoods in the country
depend upon biodiversity and healthy ecosystems and the goods and services they provide.
Therefore, protection, and conservation of biodiversity and ecosystems is of paramount
importance in India.
However, the country's biodiversity faces a variety of threats — caused by various
anthropogenic activities — ranging from land use changes in natural habitats to
overexploitation of natural resources, proliferation of invasive species, and climate change.
This calls for effective and urgent action to halt the loss of biodiversity in order to ensure that
ecosystems are resilient and continue to provide essential services.
Threats to species and ecosystems are not unique to India but are prevalent in countries all
over the world. This recognition culminated into The Convention on Biological Diversity
(CBD) — which was one of the three Conventions of the Rio Earth Summit in 1992.
1.2 The Convention on Biological Diversity (CBD), Biological Diversity Act
2002 and National Biodiversity Action Plan (NBAP), 2008
The CBD is a multilateral treaty, entered into force on 29 December 1993. Its objective is to
develop national strategies for the conservation and sustainable use of biological diversity.
The 2050 Vision for Biodiversity was adopted as part of the Strategic Plan for Biodiversity
2011- 2020. The Strategic Plan for Biodiversity 2011-2020 consists of five strategic goals and
twenty Aichi Biodiversity Targets (ABTs).
India, as a signatory party to the CBD, has proactively taken a range of legislative, policy, and
institutional measures to fulfill its mandate and go beyond it in order to tackle the existing and
emerging threats to biodiversity and the environment -- of which the following measures need
to be emphasized:
i. India developed a ‘National Policy and Macro level Action Strategy on
Biodiversity’ in the year 1999. Subsequent to this, The National Environment
Policy (NEP), 2006 which has been put in place to mainstream environment --
including biodiversity -- in development planning processes.
ii. India was one of the first countries to enact a comprehensive Biological Diversity
Act in 2002 (BDA, 2002), to implement the provisions of the CBD. This is being
implemented through a three-tier structure, National Biodiversity Authority (NBA)
at the national level, State Biodiversity Boards (SBBs) at the provincial level, and
Biodiversity Management Committees (BMCs) at the local level.

2
iii. India's NBAP, 2008, was developed prior to the formal release of CBD Strategic
Plan for Biodiversity 2011-2020 and associated Aichi Biodiversity Targets. The
NBAP was formulated through a comprehensive inter- ministerial process and
approved by the Government of India in 2008. Subsequently, as part of the
preparation of India’s Fifth National Report to the CBD (NR5) and updating of
NBAP 2008, India developed 12 National Biodiversity Targets (NBTs) in harmony
with the Aichi Targets (Addendum 2014 to NBAP, 2008).
Table 1.1: CBD Strategic Goals, Aichi Targets and India’s NBTs
Strategic Goal A B C D E
CBD
Strategic
Goal
Address underlying
causes of
biodiversity loss by
mainstreaming
biodiversity across
government and
society
Reduce direct
pressures on
biodiversity and
promote
sustainable use
Improve the
status of
biodiversity by
safeguarding
ecosystems
species and
genetic
diversity
Enhance the
benefits to all
from biodiversity
and ecosystem
services
Enhance
implementation
through
participatory
Planning,
knowledge
management and
capacity building
NBTs (1,2,10) (3,4,5,6) (6 & 7) (3,8,9) (10,11,12)
Aichi
Targets 1,2,3&4 5,6,7,8,9 & 10 11,12 & 13 14,15 & 16 17,18,19 & 20
Figure 1.1: Legislative and Policy Actions for Biodiversity Conservation
1.3 Linkages of NBTs with Sustainable Development Goals
Under the 2030 Agenda, a series of 17 global Sustainable Development Goals (SDGs) have
been agreed that are to be universally achieved. Although both NBTs and SDGs are not legally
binding, governments are expected to establish national frameworks to achieve the goals and
observe a reporting requirement. Biodiversity and ecosystems feature prominently in the 2030
agenda.
Almost all of the SDGs are relevant to biodiversity conservation although SDGs 13 (combating
climate change) and 14 and 15 (marine and terrestrial biodiversity and ecosystems) have
(1999) (2004) (2008) (2014)

3
stronger biodiversity conservation linkages. Linkages between NBTs, ABTs and SDGs are
depicted in Table 1.2
A coordinated implementation of SDGs and NBAP and state level BSAPs will provide a
tremendous opportunity to mainstream biodiversity in key national and sub-national
development policies thereby setting up a robust policy, institutional and financial
environment in achieving these interdependent goals and targets.
Table 1.2: Linkage of NBTs with ABTs and SDGs
India’s National
Biodiversity Targets
Aichi Biodiversity Targets SDGs
Source: India’s 6th National Report to the CBD (2018)
1.4 Linkages and Synergies between NBTs and NDCs
In 2015, 196 countries came together to sign the historic Paris Agreement, guided by the
United Nations Framework Convention on Climate Change (UNFCCC), in order to deal with
global warming impacts. Countries submitted their Intended Nationally Determined
Contribution (INDC) to the UNFCCC which outlines their commitments to reduce greenhouse
gas emissions and strengthen resilience to climate change.

4
India too signed the agreement and ratified through approval from the Union Cabinet on 2nd
October 2016. NDCs committed and ratified by India are in Box 1.1. Almost all of the NDCs
are relevant to biodiversity conservation although NDC 5, 6 and 7 have stronger biodiversity
conservation linkages. Also, the National Action Plan on Climate Change (NAPCC) in India
which is implemented through eight National Missions has strong focus on Biodiversity
conservation. Box 1.1: Biodiversity focus in NDCs Committed and Ratified by India
1. To put forward and further propagate a healthy and sustainable way of living based on traditions
and values of conservation and moderation.
2. To adopt a climate friendly and a cleaner path than the one followed hitherto by others at
corresponding level of economic development.
3. To reduce the emissions intensity of its GDP by 33 to 35 percent by 2030 from 2005 level.
4. To achieve about 40 percent cumulative electric power installed capacity from non-fossil fuel-
based energy resources by 2030 with the help of transfer of technology and low-cost international
finance including from Green Climate Fund (GCF).
5. To create an additional carbon sink of 2.5 to 3 billion tons of CO2 equivalent through
additional forest and tree cover by 2030.
6. To better adapt to climate change by enhancing investments in development programs in
sectors vulnerable to climate change, particularly agriculture, water resources, Himalayan
region, coastal regions, health and disaster management
7. To mobilize domestic and new & additional funds from developed countries to implement
the above mitigation and adaptation actions in view of the resource required and the
resource gap.
8. To build capacities, create domestic framework and international architecture for quick diffusion
of cutting-edge climate technology in India and for joint collaborative R&D for such future
technologies
1.5 Rationale for and Scope of Himachal Pradesh State Biodiversity Strategy
and Action Plan (SBSAP)
It has been increasingly recognized by both the member countries and the CBD that the Sub-
national BSAPs are necessary for effective conservation and management of biodiversity as
each state may have a different connect of biodiversity with human well-being as well as
states’ developmental priorities. Further, unique features of the state, land use patterns and
practices, and institutional and policy arrangements for governance of biodiversity and natural
resources may require a state specific BSAP.
Thus HP BSAP (SBSAP) will ideally have elements of NBAP relevant for the Himachal
Pradesh; and strategies and action plan necessary to address the pressures and resulting decline
and loss of biodiversity unique to the state.
In HP, its first BSAP was prepared in 2002. This report had at least three key achievements:
(i) it carried out extensive mapping of biological diversity in the state, both wild and
cultivated/domesticated, found in the different eco-regions of the state, based on available
scientific studies and knowledge, (ii) a thorough grass-root consultative process was followed
in the form of meetings and interactions with different stakeholders, and (iii) it outlined
strategies and an action plan for biodiversity conservation.
In 2010, new guidelines for regional and National BSAPs were framed at the Nagoya 10th
CoP Summit. For achieving this, it was decided by the central Ministry of Environment and
Climate Change (MoEF&CC) to prepare an addendum to India’s NBAP and various states
(state biodiversity boards) were asked to prepare state BSAPs to include the concerns of

5
various CBD CoP meetings, and to align the BSAP of the state according to the 2011-20
commitment of the country towards CBD.
Keeping in view recent data, knowledge, and experience, this study has been launched for
refining and updating BSAP, 2002 under the GEF funded and UNDP managed SECURE
Himalaya Project in the state.
The updated SBSAP will have the following new elements and components:
Identification of regulatory, institutional, and finance gaps in implementation of
existing SBSAPs
Periodic monitoring and evaluation framework
Suggestions for mainstreaming and coordination with other flagship programs
Resource mobilization strategy for implementation of SBSAP
1.6 Key Objectives of the Study
1. To update the existing Biodiversity Strategy and Action Plan (BSAP) of Himachal
Pradesh based on current state priorities and in alignment with national and global
priorities of biodiversity conservation and wildlife protection.
2. To develop a resource mobilization strategy for implementing BSAP in Himachal
Pradesh.
3. Prepare process document for implementation of two financial solutions for
conservation of snow leopard landscape; namely Lahaul – Pangi and Kinnaur
Landscape4.
4 Analysis and results pertaining to this objective and a BSAP for Lahaul – Pangi and Kinnaur Landscapes are put
together in a separate report (Pandey Rita et al, 2021) as per the advice of the Project Management Unit.

6
Chapter 2: Overview and Process Documentation
2.1 Vision and Guiding Principles
The vision of SBSAP is same as the CBD strategic vision -- “Living in harmony with nature”
where “By 2050, biodiversity is valued, conserved, restored and wisely used, maintaining
ecosystem services, sustaining a healthy planet and delivering benefits essential for all
people.”
i. The SBSAP should address all three objectives of the Convention on Biodiversity
(CBD) and the NBAP, namely:
Conservation of biodiversity
Sustainable use of the components of biodiversity
Fair and equitable sharing of the benefits deriving from the utilization of genetic
resources.
ii. SBSAP should recognize the contribution of biodiversity and ecosystem services for
human well-being and poverty eradication, besides their valuable contribution to
economic, social, and cultural development of people dependent on them. Therefore,
BSAP should seek to maintain this fundamental connect with biodiversity and
ecosystems (see Figure 2.1).
iii. Only a participatory approach, where all stakeholders work together to support and
conserve the wealth of biodiversity, can bring the desired success. In order to be
effective, it is important that the SBSAP be jointly developed, adopted, and owned by
the key stakeholders including those who may have stakes or rights with regard to
biodiversity.
iv. SBSAP should emphasize the need for biodiversity conservation to be a significant
consideration in socio-economic development strategy of the state and thus
mainstreaming of biodiversity into sectoral and cross-sectoral decision-making at the
policy and programmatic planning and budgeting level especially in the context of
achieving the SDGs and NDCs.
v. The strategy should suggest and construct appropriate coordination and reporting
arrangements as well as monitoring and evaluation frameworks.
Figure 2.1: Linkages between Ecosystem Services & Human Well-being*
Source: Millennium Ecosystem Assessment, 2005.5
* It depicts the strength of linkages between categories of ecosystem services (supporting, provisioning,
regulating, and cultural) and components of well-being (security, basic material for good life, health, good social
5 Millennium Ecosystem Assessment, 2005. Ecosystems and Human Well-being: Synthesis. Island Press,
Washington, DC.

7
relations, freedom of choice and action). In addition to the influence of ecosystem services on human well-being,
it also shows how ecosystems are in turn affected by changes in human well-being.
2.2 Methodology and Process
In fulfilling the objectives of the study outlined in Chapter 1, and to encompass the vision and
guiding principles of BSAP as above (Section 2.1), the following methodology and approaches
have been adopted by the team.
2.2.1 Key process details
While detailed methodology for different components and themes of the study has been
discussed in relevant chapters in the report, a snapshot of the process is given below:
1. Review of existing SBSAPs and rapid assessment of the gaps in implementation
Rapid assessment of BSAP, 2002 was undertaken with the following key objectives:
Understanding the institutional, financial and
programmatic arrangements put in place for
implementation of the BSAPs and the barriers
therein, and;
The progress made so far with respect to
achieving the listed actions/targets.
Any gaps in coverage of issues, threats and
practical solutions.
Information has also been elicited through
questionnaires and detailed one-on-one and group
discussions with the Himachal Pradesh State
Biodiversity Board (HPSBB), relevant line
departments, subject experts, research organizations,
district and Panchayat level officials, civil society
organizations and communities. Comparison of the
existing BSAP action plans with the programs and
schemes implemented in the state for biodiversity
conservation and preservation in assessing the status of
implementation of the same has also been carried out.
2. Linking existing BSAP with NBTs, NDCs and SDGs
These linkages were mapped in order to identify the synergies and potential entry points for
coordination and mainstreaming.
3. Desk-based assessments
We have also collected, compiled & reviewed state budgets of various years, annual reports,
policies, peer-reviewed scientific publications and other literature relevant and important in
this context. Desk assessments included the following:
i. A review of the status and trends of biodiversity and biological resources in the
state;
ii. A review of the drivers of biodiversity loss. Both direct drivers (such as land use
change, invasive species, over-exploitation of resources, pollution) and indirect
drivers (such as changes in human population, livestock population, and climate
change);
Box 2.1: Key Steps
1. Review of existing SBSAPs
2. Rapid assessment of gaps in existing SBSAPs
3. Review of key policies and programs relevant
for the study
4. Identification of key stakeholders
(government, private, research, specialized
institutions, communities)
5. Mapping linkages with SDGs and NDCs
6. Review of existing literature relevant for the
study
7. Field level one-on-one and group
consultations with key stakeholders
8. Mapping budgetary fund flows for
biodiversity
9. Mapping budgetary revenue receipts from
biodiversity
10. Estimating gaps in funding
11. Resource mobilization strategies

8
iii. A review of the framework of biodiversity relevant laws, policies, programs, and
expenditures in the state and an assessment of any gaps;
iv. The relevant public institutions;
v. Literature and statistical surveys through secondary literature
4. Field level consultations and other assessments
i. Consultative meetings with representatives of Forest Departments, State
Biodiversity Board, key government departments relevant for conservation of
biodiversity, institutions associated with implementation of BSAP, state level
institutions, universities, district and village level institutions and officials, and
other stakeholders to get insights into any policy, institutional, capacity or technical
gaps in current BSAP due to changing development and other priorities of the state
as well as any new challenges and threats to biodiversity;
ii. Field trips for holding of public meetings;
iii. Discussions with local experts and knowledgeable individuals;
iv. The status, sources and potential sources of biodiversity financing in the country;
v. Gaps and unmet needs, and resource mobilization strategies.
A snapshot of the meetings held is given in Table 2.1. For details, see Annexure 1.
Table 2.1: Snapshot of meeting and consultative workshop in HP
S.
No.
Particulars Date Participation
1. Roundtable and
small group
meetings
December 2018 Department of Forest, HP State Biodiversity Board
Department of Animal Husbandry, Department of Agriculture,
Department of Horticulture, Himalayan Forest Research
Institute
2. Questionnaires
sent to line
departments via
email, post and
fax
Sent – April – May
2019
First round of follow-
ups – May – July,
2019
Second round of
follow-ups – August
2019
Department of Horticulture, Department of Agriculture,
Department of Forest, Department of Health and Family
Welfare, Department of Irrigation, Department of Rural
Development, Department of Tribal Development,
Department of Urban Development, Department of Tourism,
HP State Biodiversity Board, Department of Animal
Husbandry, Police, Department of Education, Directorate for
empowerment of SCs, OBCs, Minorities Affairs and Specially
Abled
3. Six One on one
meetings with
Department
Officials
16th May 2019 Department of Forest, SBB, Department of Irrigation and
Public Health, Department of Agriculture, Department of
Tribal Development, Department of Rural Management and
Development
4. Consultation
Workshop at
Kilar, Pangi
25th September 2019 53 participants from community, Representatives from local
bodies like Panchayat, Mahila Mandal, Praja and line
departments BMCs, Department of Animal Husbandry, Tribes
Advisory Council
5. Nine one to one
meetings with
Department
officials and
representatives
from local bodies
24th September, 2019
and 26th September,
2019
Department of Forest, BMC Mindhal, Agriculture
Development Officer, Block Development Officer, Panchayat
Pradhan of Pangi, Karyas, Lujh, Naib Tehsildar, Kilar, Mahila
Mandal Pradhan, Pangi.

9
Consultation workshop organized by NIPFP at Kilar, Pangi
(25th September, 2019)

10
Chapter 3: State Profile, Drivers of Change and Gaps in Biodiversity
Conservation
3.1 State Profile
3.1.1 General Profile and Physiological Features
Himachal Pradesh is a mountainous state that lies in the Western Himalayas, extending over a
geographical area of 55, 673 sq. km (FSI, 2019). The state is characterised by fragile
landscapes, rich biodiversity and ecosystems supporting livelihood of local communities and
providing a source of revenue to the State Government.
The state has elevation ranges from 350 m to 6816 m
(Jaswal and Bhan, 2015) and is divided in three regions,
topographically, namely Shiwalik (outer Himalayas),
the lesser Himalayas (middle Himalayas) and the
greater Himalayas. The elevation of the range is about
1000 m and stretches for about 70 Km. The middle or
lesser Himalaya covers major part of the state and has
high-altitude board-leaved and conifer forests, alpine
meadows, major hill stations and covers major part of
the state’s land under horticulture. The Greater
Himalaya constitutes trans-Himalayan cold desert areas
of Himachal Pradesh and lies further north of the lesser
Himalayas. This range has thin vegetation as well as
human population density due to glaciated landscape.
A glance of the state is presented in Box 3.1.
Figure 3.1: Elevation Map of Himachal Pradesh
Source: Jaswal & Bhan (2015).
Box 3.1: Himachal Pradesh - Key Features
Geographical location: 3022’40” N to 3312’40”
N Latitude and 7547’55” to 7902’20” E Longitude
Human population: 6,864,602 (89.97 Rural; 2011
Census)
Population Density: 123 per km2
Sex Ratio: 972
Literacy Rate: 82.80 %
Livestock population: 48.44 Lakh
BPL households (rural): 25% of total rural
households
Source: Compiled by NIPFP from various sources

11
3.1.2 Other Physiological Features
1. Land Use
The total geographical area in the state is 5.5673 mha with 3.70 mha of land under forest. Of
the total 6,20,700 ha of cultivable area, 5,38,412 ha is net sown area. Net irrigated area in the
state is 1,09,452 ha (Table 3.1). Table 3.1: Land-Use Pattern in Himachal Pradesh
Content Area (ha.)
Total Geographical Area 55,67,300
Barren and Uncultivable Lands 7,83,404
Land Put to Non-Agriculture Use 3,48,649
Permanent Pastures and Other Grazing Lands 15,03,833
Land under Misc. Trees Crops not Included in Area Sown 68,391
Cultivable Waste Lands 1,28,224
Other Fallow Lands 22,109
Current Fallows 59,991
Net Area Sown 5,38,412
Total Cropped Area 9,40,597
Source: Department of Agriculture, Himachal Pradesh
2. Soil
In a mountainous state like Himachal Pradesh, soil type varies across different altitudes with
different climatic conditions. The classification of soil in the state is done in two categories:
Brown Hill soil and Sub-Montane soil. The brown soil is found in Shiwalik and the lesser
Himalayan region covering 42.16% of the state’s area. The sub-montane soil characterizes the
Middle and Greater Himalayan zone covering 46.07% of the state’s area whereas eternal snow
and glacial types of snow cover an area of 11.77%.
The soil resource mapping has been done by NBSS & LUP in the Northern Region where 8
land capability classes have been developed with guiding principle as follows: cultivation
should be restricted between capability classes I to IV, horticulture as well as grazing between
V to VII, forestry to class VII whereas class VIII should be utilized for conservation and
restoration. The soil in Himachal Pradesh is interpreted across 5 Land Capability Classes out
of the 8 outlined (Table 3.2).
Table 3.2: Land Capability Classes of Himachal Pradesh
Land Capability
Class
% of Total
Geographical Area
covered
Suitability of land
III 6.7 Fairly good land for cultivation of climatically
suited crops
IV 14.7 Moderately good land for cultivation of
climatically suited crops
VI 23.1 Grazing, Forestry plantation and limited
cultivation
VII 14.7 Grazing and Forestry
VIII 40.6 Wildlife, Recreation and Permanent Snow Cover Source: State of Environment Report, Himachal Pradesh (2009)

12
However, unscientific cultivation on the slope and deforestation is putting strain on the soil and
is resulting in sheet6 and gully erosion7. The soil erosion status of northern states has been
prepared by NBSS & LUP. The study shows that around 7% of the total geographical area in
the state is experiencing an annual soil loss within the range of 5-10 tonne per ha., around 5%
area is recorded with soil loss ranging between 10-15 tonne per hectare and 27% area has soil
loss in >15 tonne per ha. which is further categorized into severe, very severe and extremely
severe.
3. Lakes and Rivers
Due to good precipitation during summer as well as winter season, Himachal Pradesh has rich
water resources in the form of perennial streams draining into rivers, glaciers, man-made
reservoirs, lakes, water springs as well as sub-soil.
There are nine major river systems in the state (Table 3.3), however five river systems i.e.,
Sutlej, Yamuna, Beas, Ravi and Chenab drain more than 95% of the total catchment area in the
state.
Picture 1 and 2: Chenab River on way from Manali to Pangi
Table 3.3: Catchment Area of Major Rivers in Himachal Pradesh
S.
No.
Name of the River System Area of Catchment (in Km2) Area (in %)
1 Sutlej 20,398 30.69
2 Beas 13,663 24.50
3 Chenab 7,850 14.20
4 Yamuna 5,872 10.60
5 Ravi 5,528 09.90
6 Indus 1,450 02.60
7 Markanda 360 00.60
8 Ganga 290 00.50
9 Ghaggar 262 00.50
Total 55,673 100.00 Source: State of Environment Report, Himachal Pradesh (2009)
Besides the river systems, there are numerous man-made reservoirs as well as natural lakes.
Some of them are presented in the Table 3.4.
6 Sheet erosion is uniform removal of soil in thin layers by the forces of raindrops and overland flow. It can go
unnoticed covering large areas of sloping land. 7 Gully erosion is the removal of soil along drainage lines by surface water runoff.

13
Table 3.4: Lakes and man-made Reservoirs in Himachal Pradesh
Water Body Name
Lakes
Suketi (Sirmour), Ghadasaru, Renuka, Khajjiar, Nako(Kinnaur), Lama,
Bradasar (Shimla), Manimahesh, Karali, Kalasar, Chandranahan, Mahakali
(Chamba), Surajtal (Lahaul & Spiti), Chandertal, Dal, Kumservali, Kaveri
(Kangra), Prashar, Sukhasar (Mandi), Rewalsar, Bharigu, Kuntbhyo, Sareolsar
and Mantalai (Kullu)
Man-Made
Reservoirs Pongdam (Kangra), Pandoh (Mandi) and Govindsagar (Bilaspur) Source: State of Environment Report, Himachal Pradesh (2009)
4. Climate
Due to altitudes varying between 350 m to 6816 m, there is a considerable variation in
distribution of temperature as well as rainfall in the state. The precipitation in the form of
rainfall (70% of the precipitation) is received during July to September. At elevations above
1800 m, precipitation is received in the form of snowfall. The areas above the elevations of
3000 m receive an average of 3 m of snowfall during December to March and the reaches
which are above an elevation of 4500 m remain under perpetual snow.
Temperature decreases from West to East. The hottest month is June, whereas January records
the lowest temperature in a year. Humidity is high during monsoon months of July to
September (76-95%). Three marked seasons of the year are:
Figure 3.2: Seasons in Himachal Pradesh
Source: State of Environment Report, Himachal Pradesh (2009).
The state is divided into 4 agro-climatic zones. The elevation ranges between 350-2200 m and
above are detailed in Table 3.5. Besides, agro-climatic Zone-I covers High Hill Temperate Sub-
zone which is Western Himalayan region under which Himachal Pradesh falls. There are two
distinct regions: The High Hill Temperate region comprises of Lahaul and Spiti and Kinnaur
districts and the Hill Temperate region comprises of Chamba, Bilaspur, Kullu, Kangra,
Hamirpur, Sirmaur, Shimla, Una and Solan districts.
Table 3.5: Agro-Climatic Zones in Himachal Pradesh
Zone
Elevation
(in
meters)
% of total
geographical
area
% of total
cultivable
area Major crops
Shivalik
Hill Zone 350-650 35 40
Wheat, maize, paddy, gram, sugarcane,
mustard, potato vegetables
Mid Hill
Zone 651-1800 32 37
Wheat, maize, barley, black gram, beans,
paddy, cash crops like off-season
vegetables, ginger, seeds of temperate
vegetables like root crops, cauliflower

14
Zone
Elevation
(in
meters)
% of total
geographical
area
% of total
cultivable
area Major crops
High Hill
Zone
1801-
2200 35 21
Wheat, barley, lesser millets, pseudo-
cereals like amaranthus and buckwheat,
potato, maize, seeds of temperate
vegetables like root crops, cauliflower
Cold Dry
Zone
Above
2200 8 2
Wheat, barley, pseudo-cereals like
amaranthus, buck wheat, seed potato, peas
as green as well as seed purposes Source: ENVIS, Himachal Pradesh (2016)
According to the report State Level Climate Change Trends in India (2013) by India
Meteorological Department, HP has recorded the highest increase in summer mean maximum
temperature (+0.06% C/year) as well as winter mean maximum temperature (+0.06% C/year)
during 1951-2010 due to climate change.
With increase in temperature, apple production has been declining at the rate of 9.1 units per
year in the last 23 years. Besides, a damage of Rs. 366 crore was inflicted due to drought in the
state; the damage was also inflicted on agrobiodiversity and livestock.
3.1.3 Biodiversity Profile including Threatened Ecosystems and Species
1. Range of biodiversity
Due to varied geological formations, topography, climatic conditions and altitudinal changes,
Himachal Pradesh has a vast repository of floral and faunal species. The range of biodiversity
in the state is extensive, as it ranges from Sub-tropical, temperate, dry temperate to alpine
region, where 95 percent of species are endemic and rest 5% are exotic species. Table 3.6
shows the state symbols of Himachal Pradesh.
Table 3.6: State Symbols of Himachal Pradesh
Western Tragopan Snow Leopard Pink Rhododendron
Source: Himachal Pradesh State Biodiversity Board
A snapshot of biodiversity has been outlined in the Table 3.7 below. Floral biodiversity in the
state constitutes of Medicinal and Aromatic Plants (MAPs), forest vegetation, agricultural
crops as well as wild fruits and wild ornamental plants. As many as 3,256 floral species are
found in Himachal Pradesh, consisting of ferns, higher plants, fungi, mosses and lichens (out
of the total of 47,000 species found in India). The vegetation consists of Moist Temperate
Deciduous Forest, Ban Oak Forest, Rhododendron Scrub Forest and Himalayan Alpine
Pastures. The mid and high hills are dominated by coniferous forest with Sal and Chir Pine as
predominant species in dry deciduous.
The state harbours rich and unique fauna with 5,721 species of fauna (out of a total of 89,451
species found in India). The state has the largest population of Chir pheasants in the world.
Mammals mostly include long tailed Himalayan Marmots, Himalayan voles and squirrels
whereas herbivores include blue sheep, ibex, serow, musk deer, tahr, the barking deer, ghoral.
Carnivores are rare and include brown bear, black bear, yellow throated martin, himalayan

15
weasel, wolf and stone martin whereas the snow leopard and common leopard are
representative of larger cats in the state.
(Floral and Faunal diversity of Pangi, Chamba)
Table 3.7: Snapshot of the Biodiversity in Himachal Pradesh
Species Number Species Number
Angiosperms 3120 Crustaceans 73
Gymnosperms
(Conifers)
12 Annelids 60
Pteridophytes (Ferns) 124 Molluscs 73
Mammals 77 Acanthocephala 2
Birds 447 Nematodes 132
Amphibians 44 Rotifers 16
Fishes 83 Platyhelminthes 90
Bryozoa 2 Cnidaria 2
Insects 4362 Porifera 3
Arachnids 195 Protozoans 34
Myriopods 11
Source: HPSBB; Himachal Pradesh Forest Sector Review (2000)
The state is endowed with a variety of medicinal and aromatic plants (MAPs) which are used
by local communities in many ways. There are approximately 187 species of MAPs in
Himachal Pradesh. According to the Himachal Pradesh Forest Department, 57 species of MAPs
have gone threatened due to unscientific extraction.8 (Table A2.1 in Annexure 2). In addition,
HPSBB has also released a list of 16 threatened faunal species9 (Table A2.2 in Annexure 2). A
number of floral and faunal species have been included in IUCN Red List (Table 3.8).
Table 3.8: Threatened Species in Himachal Pradesh as per IUCN Red list
IUCN
Category
Name of Faunal Species Name of Floral Species
Critically
Endangered Kashmir Catfish (Glyptothorax
kashmirensis)
Indian Gentian (Gentiana kurroo Royle), Spikenard
(Nardostachys jatamansi (D. Don) DC, Costus/
Kuth (Saussurea costus (Falc.) Lipsch), Indian
Napellus/ Mori (Aconitum chasmanthum Stapf ex
Holmes), White Himalayan lily (Lilium
polyphyllum D.Don) (5) Endangered Himalayan Mahseer (Tor putitora),
Kashmir Gray Langur (Semnopithecus
ajax), Wagur
Liverwort (Aitchisoniella himalayensis), Doon
Cheesewood (Pittosporum eriocarpum Royle),
Stephensoniella brevipedunculata, Dalbergia
congesta, Smooth Angelica/ Dogri (Angelica
glauca), Atish (Aconitum heterophyllum Wall. ex
Royle) (6)
8 https://hpforest.nic.in/files/ANNEXURE%20-%20I.pdf 9 http://www.hpbiodiversity.gov.in/BMC/Proceeding%20Threatened%20Animal.pdf

16
IUCN
Category
Name of Faunal Species Name of Floral Species
Vulnerable Snow leopard (Panthera uncia), Asla,
Asian small clawed otter (Aonyx
cinereus)
Sewardiella tuberifera, Eleiotis rottlerin,
Snoutbean (Rhynchosia heynei), Heart-shaped
Slipper Orchid (Cypripedium cordigerum D.Don),
Violet Monkshood (Aconitum violaceum Jacquem.
ex Stapf) (5) Near
Threatened
Tarai grey langur (Semnopithecus
hector), Neallogaster ornata,
Gangetic ailia, Siberian Ibex (Capra
sibirica)
Carex kashmirensis, Santapau/Ranmung (Vigna
khandalensis), Haines/Maesen Cajanus
cajanifolius, Webb Fir (Abies spectabilis) ,
Jungli pyaz (5) Source: IUCN Red list (accessed in March 2021)
Note: The figures in the bracket indicate the total number of species in each IUCN category.
In addition to this, a list of threatened animal species as notified by Himachal Pradesh State Biodiversity
Board has been presented in Table A2.1 in Annexure 2.
2. Cultural/Social Linkages with Biodiversity
Local-level systems which are based upon traditional knowledge for managing natural
resources have potential to improve the status of mountain ecosystems given that a considerable
amount of ecologically sensible indigenous practices exist (Berkes & Folke, 1994). Linkages
develop due to existence of resource dependency which relates local communities to the
environment (Adger, 2000). Such linkages give rise to problems which are complex in nature
and therefore, cannot be addressed in isolation. Hence, both social as well as ecological systems
are combined to ensure sustainable development keeping in view biodiversity conservation as
shown in the Figure 3.3.
Figure 3.3: Superimposition of Socio-cultural System on Relationship of Ecological and
Economic System
Source: Singh (2006).
There is a close linkage between local communities and biodiversity surrounding them. Forests
are rich in native as well as exotic species and provide not only fuel wood but also wood for
making houses, furniture, agricultural implements, fibre, fodder, MAPs as well as a variety of
other food crops and aromatic plants such as Dhoop and Juniper. Therefore, acknowledgment
of such multiple values of biodiversity need to be accounted for in the state policies such that
actions necessary for biodiversity conservation can be identified.

17
3.1.4 Administrative set-up and Natural Resource
Governance
The state consists of 12 Districts, 3 Divisions, 71 Sub-
Divisions and 109 Tehsils. From the point of view of
development, the state is divided into 59 Towns, 78 Blocks,
3,226 Gram Panchayats as well as 129 Police Stations10.
1. Forestry
Forests and other natural ecosystems constitute approximately
two-third of the state’s geographical area and therefore,
recognizing these natural resources becomes important not
only for ecological well-being but also for social well-being.
Forests play an important role in preserving Himalayan
ecosystem and is an important source of livelihood for local
communities. The forest cover in HP is 15,433.52 sq. km
constituting 27.72 percent of the total geographical area
(Table 3.9). For a detailed district-wise assessment for forest
cover see Table A2.3 in Annexure 2.
Table 3.9: Forest Cover in Himachal Pradesh
Category Area (sq. km) % of area
1) Geographical Area 55673 100
2) Recorded Forest Area (RFA) 37,033 66.51
3) Area under Tree Cover 15,433.52 27.72
i) Very Dense Forest 3,112.71 5.59
ii) Moderate Dense Forest 7,125.93 12.80
iii) Open Forest 5,194.88 9.33 Source: State of Forest Report, Forest Survey of India (2019).
Himachal Pradesh is divided into four agro-ecological zones which differ in terms of their area,
temperature, elevation, rainfall as well as important crops sown. All the zones are associated
with different herbs, scrubs and tress species as presented in Table 3.10.
Table 3.10: Classification of Forest on the basis of Agro-ecological Zone
Zone Forest type Tree Species
Sub-tropical
zone, low hill (up
to 1000m)
Tropical mixed
deciduous and thorn
scrub
Tree: Acacia catechu (Black Cutch), Embelica
officinalis (Amla), Dalbargia sissoo (North Indian
Rosewood), Terminalia chebula (Black Myrobalan),
Cassia fistula (Golden Shower Tree), Anogeissus
latifolia (Bakli), Zizyphus jujube (Jujube).
Scrub: Euphorbia royaleana (Sullu spurge),
Adhatoda vasica (Malabar nut), Vitex negundo
(Chaste Tree), Woodfordia fruticose (Fire Flame
Bush).
Sub-tropical
zone, mid hill
(1000m-1500m)
Sub-tropical pine forest Tree: Pinus roxburghii (Chir Pine), Quercus incana
(Upland Willow Oak), Lannea sp., Lyonia ovalifolia
(Fetterbush), Rhododendron arboreum
10 https://himachal.nic.in/en-IN/at-a-glance.html#admst
Box 3.2: Administrative Structure
State Capital: Shimla
Districts: 12
Tehsil: 169
Divisions: 3
Sub-divisions: 71
Police Stations: 129
Blocks: 78
Urban Local Bodies*: 54
Gram Panchayats: 3226
Villages: 20690
Towns: 59
Parliamentary Constituencies
Lok Sabha: 4
Rajya Sabha: 3
Assembly constituencies: 68
Source: Government of Himachal Pradesh, 2020
*Urban Local Bodies include Municipal
Corporation, Municipal Councils, Nagar
Panchayat and Cantonment Boards

18
Zone Forest type Tree Species
(Rhododendron), Indigofera sp. (Indigo), Myrsine sp.
(Colicwood), Rubus sp.
Scrub: Diospyros melanoxylon (Black Ebony),
Embelica officinalis (Amla), Carrissa sp., Dodonea
viscosa (Hop Bush), Acacia catechu (Black Cutch),
anogeissus sp., Lannea sp., Cassia Fistula (Golden
Shower Tree), Olea cuspidata (Wild Olive), Punica
granatum (Pomegranate)
Temperate wet
zone (1500m-
3000m)
Himalayan moist
temperate forest
Tree: Quercus incana (Bluejack oak), Q. dilata,
Cedrus deodara (Deodar), Picea smithiana (Morinda
Spruce), Pinus wallichiana (Himalayan Pine), Abies
pindrow (West Himalayan Fir), Quercus
semicarpifolia (Brown Oak), Aesculus indica (Indian
Horse-chestnut), Acer caesium (Bluish Grey Maple),
Prunus padus (Bird Cherry), Populus ciliata
(Himalayan Poplar), Corylus colurna (Chinese
Hazelnut), Ulmus wallichiana (Himalayan Elm),
Juglans regia (Walnut), Pyrus lanata (Hairy Rowan),
Betula alnoides (Himalayan Birch), Fraxinus sp.
Carpinus sp.
Temperate dry
zone (above
3000m)
Scrub: Juniperus wallichiana (Black Juniper), J.
communis (Juniper) and cargana sp., Alpine steppe
Source: State of Environment Report, Himachal Pradesh (2009)
Forests in HP have also been classified on the basis of criteria laid down by Champion and
Seth (Table A2.4, Annexure 2). The Forest Department of Himachal Pradesh has been pro-
active in conserving forests in the state. It also manages eco-tourism. Key institutions of
Governance of Forest Department and their key functions are in (Table 3.11).
Table 3.11: Administrative Set-up of Department of Forest, Himachal Pradesh
Name of Institution Functions and Focus Areas
HP State Forest
Development Corporation
Limited
Set up as an undertaking of the Government of HP in 1974. The
Corporation deals primarily with sales & marketing of timber,
fuel wood, pulp wood, bamboo, khair and resin.
H.P. Ecotourism Society It is an autonomous and independent body. It aims to preserve
and protect natural, historical and cultural heritage of Himachal
Pradesh and provides opportunities to promote Community
Based Ecotourism (CBET) using Participatory Forestry
Management.
Forest Training Institute
and Ranger’s College
Set up in Sundernagar and Chail, the FTI conducts induction
training as well as in-service training of forest personnel. The
institute also conducts refresher courses for frontline staff Tailor
made training courses for other departments/ projects/
HPSFDC/ agencies/ community members/ eco-tourism are also
conducted in this Institute.
Natural Resource
Management and Training
& Development Society
The Society was set up in 2006 with the primary objective to
organize capacity building trainings, study courses, exposure
visits, conferences, workshops, seminars and lectures and all
level trainings/activities of line departments over and above the
mandate of Forest Training Centres/School at Sundernagar,

19
Source: Compiled by Authors
2. Agriculture
Agriculture and its allied sectors contribute approximately 9% to the GSDP (Gross State
Domestic Product) and provide direct employment to approximately 62% of the total
workforce of the state (Economic Survey of HP, 2018-19). Operational holdings constitute of
approximately 9.55 lakh ha area, operated by 9.61 lakh farmers. It is important to note that the
agricultural land is highly fragmented in HP with 69.78 percent marginal and 18.17 percent
small land holdings (Table 3.12) which has implications for implementation and desired impact
of a number of programs and schemes in this sector.
Table 3.12: Distribution of Land Holding in Himachal Pradesh
Size holdings
(hect.)
Category
(Farmers)
No. of holdings
(lakh)
Area (lakh hect.) Avg. size of
holdings (hect.)
Below 1.0 Marginal 6.70
(69.78%)
2.73
(28.63%)
0.41
1.0-2.0 Small 1.75
(18.17%)
2.44
(25.55%)
1.39
2.0-4.0 Semi medium 0.85
(8.84%)
2.31
(24.14%)
2.72
4.0-10.0 Medium 0.28
(2.87%)
1.57
(16.39%)
5.61
10.0-Above Large 0.03
(0.34%)
0.51
(5.29%)
17.00
Total 9.61 9.55 1.00 Source: Economic Survey of Himachal Pradesh (2018-19)
The state is a repository of rich and wide variety of agricultural crop (For details see Tables
A2.5 and A2.6, Annexure 2). The altitudinal variation in the state also impacts the diversity of
the crops as the mean annual temperature, soil type and rainfall received differ across the zones.
The different agro-ecological zones of Himachal Pradesh are associated with varied
agricultural crops.
Table 3.13: Agro-ecological Zone-wise Important Crops Zone Area (in sq.
km)
% of total
area
Elevation
(M)
Mean
Annual
Temperat
ure (C)
Soil type Rainfall
(mm)
Important crops
Sub-
Tropical
Sub
Montane
& Low
Hills
Zone
1.1
8201
(14.73%)
240-1000 15 to 23 Sandy
loams
(Light
textured,
shallow)
1500 Wheat, maize, paddy,
Pulses, Oilseeds,
barley, Sugarcane,
Potato, watermelon
and vegetables
Zone
1.2
2059
(3.70%)
240-1000 18.6-21.9 Loamy sand
(medium in
depth)
>1500 Wheat, Paddy, Maize,
Seed pot, Pulses, oil
seeds.
Chail and Kuther and to assist and organize research
programmes in ‘Natural Resource Management’.
Joint Forest Management
Committee (JFM) / Village
Forest Development
Committee (VFDCs)
These are village-level institutions involve people to participate
for the protection, conservation and rehabilitation of forests
whilst safeguarding the rights of forest dwellers.

20
Zone Area (in sq.
km)
% of total
area
Elevation
(M)
Mean
Annual
Temperat
ure (C)
Soil type Rainfall
(mm)
Important crops
Sub
humid
Mid Hills
Zone
2.1
3770
(6.77%)
1001-1500 14.2-22.1 Sandy
Loam-Clay
Loam
(Acidic)
1500 Wheat, Paddy,
Barley, Pulses, Oil
seed, Off season
vegetables.
Zone
2.2
894
(1.60%)
1001-1500 16.53-
21.25
Silt Loam-
Loam
> 1500 Wheat, Paddy,
Barley, Pulses, Oil
seed, Off season
vegetables in some
parts
Wet
temperate
high hills
Zone
3.1
8207
[14.74%]
1501-2500 9.1 - 20.6 Mainly
Loamy
shallow,
acidic
≤ 1500 Wheat, Barley,
Maize, Millets,
Pulses, Oilseeds
Zone
3.2
1010
[1.81%]
1501-3250 15.4 - 20.5 Sandy
Loams
shallow to
Medium
depth.
> 1500 Maize, Wheat, Pulses,
Oilseeds
Dry
temperate
high hills
Zone
4.1
4616
[8.29%]
2501- 3250
9 - 20 Sandy
Loams
(Shallow in
depth)
< 700
(Dry)
Wheat, Potato,
Barley, Buckwheat,
Peas Minor Millets,
Kuth & Temperate
Vegetables, Hops,
Cumin & Saffron.
Zone
4.2
7003 [12.58
%]
3251- 4250
8.8 – 19.9 Sandy
Loams
(Shallow)
Dry/
snow
Quality Potato seeds,
Temperate &
European type
vegetables, Barley,
Buckwheat.
Zone
4.3
19890
[35.74%]
> 4250
8.7- 19.7 Sands &
Pebbles
(Loose
Textured)
Dry/
Snow
Buck wheat, Barley,
Minor millets & Kala
Zeera.
Source: ENVIS, Himachal Pradesh, 2016
Food grain production in the state has increased from 200 thousand tonnes in year 1951-52 to
1745.1 thousand tonnes in year 2017-18. Maize is the major crop produced in the state the
production of which has increased from 67.3 thousand tonnes in year 1951-52 to 644.44
thousand tonnes in year2017-1811. It is important to note two things here:
1. Even though there has been a significant increase in food grain production, the farmers
are not able to get maximum yield from their fields. A study by TERI (2015) found a
yield gap in farmer’s field and their experimental research plot. (Table 3.14).
2. There has been a shift away from traditional crops Setaria italica (Koni), Paspalum
scrobiculatum (Kodo), Eleusine coracana (Ragi), Panicum miliaceum (cheena),
pseudocereals like grain amaranth, green chenopod and buckwheat. The reason for
decline varies from the increased focus on HYV seeds to lower productivity of
traditional variety as compared to high yielding seeds. There has been a deterioration
11 http://www.hpagriculture.com/achivements.htm

21
of natural habitats due to man induced environmental changes and lack of scientific
interests in the traditional crops, further leading to a decline in production of traditional
crops (Maikhuri and Nautiyal, 1991).
Table 3.14: Yield gap in Agricultural Crops in Himachal Pradesh
Crop Yield (in quintals)
Research Plots Farmer’s Plot State Average
Maize 53.6 35.3 20.5
Wheat 35.9 33 14.7
Paddy 56.2 51 12.5
Black gram 10.5 7.8 3.7
Sesame 7.5 6.4 1.2
Rapeseed & Mustard 13 9.3 2.7
Linseed 11 9.5 3.2 Source: TERI (2015)
The state has taken steps to close the yield gap by providing improved seeds, fertilizers, and
analysing soil samples to help the farmers maintain soil fertility (Table 3.15). There is a need
to provide focused attention towards increasing area under traditional crops as these crops are
adapted to high tolerance to the poorer soils, insects, pests, changing climate and require lesser
fallow periods (Maikhuri et al, 1996).
Table 3.15: Progress in Respect of Programmes of Department of Agriculture during 2017-18
Development Programme Unit Quantity
Distribution of Improved Seeds M.T. 10,210
i) Distribution of Plant Protection Material
ii) Area Treated
M.T.
000’ ha
135.00
2.80
Distribution of Fertilizers
(In Nutrients)
i) Nitrogen (N)
ii) Phosphorous (P)
iii) Potassium (K)
iv) TOTAL (N+P+K)
M.T.
M.T.
M.T.
M.T.
35,000
8,000
8,000
51,000
Improved Agricultural Implements Distributed including
Plant Protection Equipment
No. 1,20,000
Area covered under H.Y.V. Programme
i) Wheat
ii) Rice
iii) Maize
000' ha
000' ha
000' ha
360.00
76.10
294.00
No. of Biogas Plants Installed No. 100
Area to be Covered under Soil and Water Conservation
Measures
ha 3,600
Number of Soil Samples Analysed No. 50,000 Source: Department of Agriculture, Himachal Pradesh (2017-18)
There has been an increase in the use of pesticides with a progressive decrease in organic
compost manures. Sub-standard pesticides sometimes act as a booster rather than killer where
toxic residual effects are not paid attention to. The consumption of fertilizers is given in the
Table A2.9 in Annexure 2.
The agricultural sector is governed by the Department of Agriculture. Agriculture research
support if provided by Agriculture University, Palampur. Key institutions and features of
Governance of Agriculture Department are given in Table 3.16.

22
Table 3.16: Administrative Set-up of Department of Agriculture, Himachal Pradesh
Source: Compiled by NIPFP
3. Horticulture
Himachal Pradesh is not only diverse in its agro-climatic conditions but also has variations in
its topography and difference in its altitude with deep, well drained and fertile soil. Such
climatic conditions are favourable for the cultivation of temperate to sub-tropical fruits in the
state. In addition to this, the region is highly suitable for cultivating horticulture produce such
as mushroom, honey, and flowers. Horti-forestry helps not only in providing inter-crops such
as potato, sunflower, mango, peas, urad, etc. but also fodder, fuel, timber, etc. boosting the
economy while maintaining the ecosystem. However, in Himachal Pradesh, farmers find it less
paying to plant orchards than to cultivate cereal and other cash crops which is resulting in
declining area under traditional crops. The varied climatic conditions offer scope for cultivation
of off-season vegetables: tomato, capsicum, cabbage cauliflower, and pea. With the average
productivity of 17 tonnes/ha which is low, there is a scope to bring more area under cultivation
of off-season vegetables12. For a snapshot of status of horticulture in the state in the year 2017-
19 and suitable fruit crops across different agro-climatic zones see Tables 3.17 and 3.18
respectively13:
Table 3.17: Status of Horticulture in Himachal Pradesh
Category 2017-18 2018-19 % change
Area under Horticulture 2,30,852 ha 2,30,852 ha -
Total fruit production 5,65,307 M.T. 4,953,62 M.T. (-) 14%
Gross value of the fruit production Rs. 2,517.99 Rs. 3,313.68 Crore 24%
Area under floriculture 642.48 ha 705.77 ha 8%
Total production of mushroom 13,899 M.T. 14,206.70 M.T. 21%
Total production of honey 1,039.23 M.T. 1,591.3 M.T. 34%
Source: Department of Horticulture, Himachal Pradesh (2018-19)
12 https://icar.org.in/files/state-specific/chapter/58.htm 13 http://www.hpagrisnet.gov.in/hpagris/Horticulture/Default.aspx?SiteID=5&PageID=1219
Name of the Institution Functions and Focus Areas
HP State Agricultural
Marketing Board
To facilitate the, Himachal Pradesh Agricultural Marketing Board
overseas implementation of Himachal Pradesh Agricultural &
Horticultural Produce Marketing (Development & Regulation) Act,
2005. The state has notified 10 marketing areas in the state
H.P. State Seed and
Organic Produce
Certification Agency
The main objective is to maintain, provide and make available to the
public high-quality seeds of notified varieties and propagating
materials and to ensure their genetic identity, known pedigree, high
varietal purity and good seedling value.
State Agricultural
Management and
Extension Training
Agency (SAMETI)
Capacity building and training at the State level

23
Table 3.18: Suitable Fruit Crops Across different Agro-Climatic Zones in Himachal Pradesh
Description of
Zone
Elevation
range (m)
Rainfall
(cm)
Suitable fruit crops
Low hill and valley
areas near the
plains
365-914 60-100 Mango, litchi, guava, loquat, citrus, fig,
papaya, grapes, jackfruit, banana, low chilling
varieties of plum, peach and pear and
strawberry.
Mid hills (Sub-
Temperate)
915-1523 90-100 Stone fruits (peach, plum, apricot, almond),
persimmon, pear, pomegranate, pecan nut,
walnut, kiwi fruit, strawberry.
High Hills and
Valleys in the
interiors
(Temperate)
1524-2742 90-100 Apple, pear, cherry, almond, walnut, chestnut,
hazelnut, strawberry.
Cold and dry zone
(Dry Temperate)
2743-3656 24-40 Apple, grapes, prunes, drying type of apricot,
almond, chilgoza, pistachio, walnut, hazelnut.
Source: State of Environment Report, Himachal Pradesh (2009)
The state is also endowed with a variety of honey bee species. There are four species of honey
bees found in different agro-climatic zones as has been outlined in Table A2.10 in Annexure
2.
The sector of horticulture is governed by Department of Horticulture. The Department
functions with the objective of building a prosperous Himachal through scientific development
of horticulture by harnessing the natural resources for the development of a sustainable system
of agriculture in the hilly areas.
4. Animal Husbandry
Rearing of livestock is an important component for a state where a large proportion of
population is dependent on agriculture. Livestock not only provides material such as wool,
milk, meat, etc. but is also a major source in agricultural operations on the hill slopes. There is
a wide variety of domesticated animals in Himachal Pradesh consisting of cattle, buffaloes,
yak, sheep and goats as well as a small proportion of ponies, horses, donkeys and pigs.
Livestock population has been detailed in the Table 3.19. District-wise livestock population
has been outlined in Table A2.11 in Annexure 2.
Table 3.19: Livestock Population (in thousands)
Category 1997 2003 2007 2012
Livestock:
1. Cattle
2. Buffaloes
3. Sheep
4. Goats
5. Horses and ponies
6. Mules and donkeys
7. Pigs
8. Other livestock
Total
2002
652
909
947
22
31
5
3
4571
2196
773
906
1116
17
33
3
2
5046
2269
762
901
1241
13
26
2
2
5216
2149
716
805
1119
15
31
5
4
4844 Source: Statistical tables, Economic Survey (2018-19)

24
Livestock rearing is a profitable business if undertaken with utmost attention and care towards
livestock. Therefore, data has been complied to outline the production of major livestock
products in terms of milk, egg, meat and wool in Table 3.20.
Table 3.20: Year-wise Production by Livestock in Himachal Pradesh
2010-11 2011-12 2012-13 2013-14 2014-15 2015-16 2016-17 2017-18
Milk
Production
(‘000 tonnes) 1102 1120 1139 1151 1172 1283 1329 1392
Egg
production
(in lakhs) 1020.62 1049.66 1069.39 1075.48 1084.34 811.67 958.99 981.40
Meat
Production
(‘000 tonnes) 3.45 3.97 4.00 3.99 4 4.01 4.4 4.49
Wool
Production
(000’ kg) 1642.15 1648.01 1649.33 1654.99 1663.07 1408.87 1475 1481.87 Source: Adapted from Ministry of Agriculture and Farmers Welfare.
In order to develop poultry sector in Himachal Pradesh and to minimize the difficulties of
farmers, Department of Agriculture has taken a few initiatives to increase poultry production
in the state as shown in Table A2.12 in Annexure 2.
For governance of this sector, Department of Animal Husbandry has been set up. The
department works on the mandate to bring improvement of nutritional status of animals,
training and demonstration in scientific livestock rearing, and extension and transfer of
technology. Key institutions of Governance of Animal Husbandry Department are given in
Table 3.21.

25
Table 3.21: Administrative Set-up of Department of Animal Husbandry
Source: Compiled by Authors
5. Fisheries
Himachal Pradesh has been endowed with enormous rivers which are emanating from glaciers
and traversing through hilly terrain. Major water bodies that have been created in Himachal
include Pong, Gobind Sagar, Chamera including some parts of Ranjit Sagar Dam. Additionally,
1300 hectare of water body has emerged after the construction of Kol Dam on river Satluj.
These reservoirs have resulted in the production of 1562.12 tonnes of fish valuing Rs.1449.65
lakhs during 2013-1418. Fish cooperative societies have been detailed in the Table 3.22.19
14 http://www.hpagrisnet.gov.in/Agrisnet/AnimalHusbandry/pdf%20files/re-con.pdf 15 http://hpagrisnet.gov.in/Agrisnet/AnimalHusbandry/pdf%20files/HPPVC%20ACT%202010.pdf 16 http://www.hpagrisnet.gov.in/Agrisnet/AnimalHusbandry/pdf%20files/re-con.pdf 17 http://hpagrisnet.gov.in/Agrisnet/AnimalHusbandry/pdf%20files/HPPVC%20ACT%202010.pdf 18 https://himachal.nic.in/showfile.php?lang=1&dpt_id=4&level=1&sublinkid=6668&lid=6880 19 https://himachal.nic.in/showfile.php?lang=1&dpt_id=4&level=1&sublinkid=128&lid=155
Name of the Institution Functions and Focus Areas
Himachal Pradesh Govansh
Samvardhan Board
The board was constituted for the purpose of the preservation,
welfare and development of cow species in the state in 2016.14
State Animal Welfare Board The board was constituted in 2015 to prevent infliction to cruelty
to the animals. The Additional Chief Secretary -in-Charge of
Animal Husbandry Department acts as the chairman of the board.
Himachal Pradesh Para
Veterinary Council
The council was set up in 2011 with an objective to promote
innovations, research and development in establishment of new
Para veterinary subjects.15
HP Milk Producers’ federation Milk Fed was registered in 1980 with an objective to organise Milk
Producers Cooperative Societies and provide remunerative market
to milk producers.
Himachal Pradesh Govansh
Samvardhan Board
The board was constituted for the purpose of the preservation,
welfare and development of cow species in the state in 2016.16
State Animal Welfare Board The board was constituted in 2015 to prevent infliction to cruelty
to the animals. The Additional Chief Secretary -in-Charge of
Animal Husbandry Department acts as the chairman of the board.
Himachal Pradesh Para
Veterinary Council
The council was set up in 2011 with an objective to promote
innovations, research and development in establishment of new
Para veterinary subjects.17
HP Milk Producers’ federation Milk Fed was registered in 1980 with an objective to organise Milk
Producers Cooperative Societies and provide remunerative market
to milk producers.

26
Table 3.22: Fish Cooperative Societies across different Reservoirs in Himachal Pradesh
Reservoir
No. of
Fishermen
Active
Fishermen
Participation
of women
Participation
of men
Total catch up
to March 2019
Pong Reservoir 2674 2674 307 2367 2,65,703.9
Gobind Sagar
Reservoir 2332 1799 581 1244 2,95,615.3
Chamera and
Ranjeet Sagar
Reservoir 173 110 10 100 32,539 Source: Department of Fisheries, Himachal Pradesh (2019).
There is a diversity of fish species in the state. The fish fauna of Himachal Pradesh principally
belongs to 12 families (Table 3.23).
Table 3.23: Fish Fauna of Himachal Pradesh20
S.
No Family Fish Species
1. FAMILY
NOTOPTERIDAE
Notopterus chitala (Hamilton), N. notopterus (Pallas), Oxygaster bacailia
(Hamilton), Oclupeoides (Bloch), O. gora (Hamilton), Barilius barila
(Hamilton), B.bendelisis chedra. (Hamilton), B.modestus(Day),
B.vagra(Hamilton), B.shacra (Hamilton), Danio (danio) devario
(Hamilton), D.(Brachydanio) rerio (Hamilton), Esomus danricus
(Hamilton), Rasbora daniconius (Hamilton), Amblypharyngodon
mola(Hamilton), Aspidoparia morar (Hamilton), Tor putitora (Hamilton) ,
Puntius chola (Hamilton), P.chrysopterus(MeClelland), P.chonchonius
(Hamilton), P.sarana (Hamilton), P.tetrarupagus (MeClelland),
P.terio(Hamilton), Catla catla (Hamilton), Cirrhina mrigala (Hamilton),
C.reba (Hamilton), Garra gotyla (Gray), P.stigma(Hamilton), Labeo boga
(Hamilton), L.calbasu(Hamilton), L.dero (Hamilton),
L.dyocheilus(MeClelland), L.gonius (Hamilton), L.rohita (Hamilton),
Oreinus plagiostomus(Heckel), O.sinuatus (Heckel), Crossocheilus latius
punjabensis (Hamilton)
2. FAMILY COBITIDAE Noemacheilus botia (Hamilton), N. botia aeurus (Hamilton), N. corica
(Hamilton), N. kangrae (Menon), Botia birdi (Chaudhuri),
Lepidocephalus guntea balgara (Hamilton)
3. FAMILY SILURIDAE Ompak bimaculatus (Bloch), Wallago attu (Hamilton)
4. FAMILY BAGRIDAE Mystus (Mystus) bleekri (Day), M. (Mystus) vittatus (Bloch), M.
(Osteobagrus) seenghala (Sykes), Rita rita (Hamilton)
5. FAMILY
AMBLYCIPITIDAE Amblyceps mangois (Hamilton)
20 https://himachal.nic.in/index1.php?lang=1&dpt_id=4&level=1&sublinkid=127&lid=149

27
S.
No Family Fish Species
6. FAMILY SISORIDAE Glyptothorax conirostris (Steind), G. pectinopterus (Hamilton), G.
stoliczkae (Steind)
7. FAMILY SCHILBEIDAE Clupisoma garua (Hamilton)
8. FAMILY BELONIDAE Xenentodon cancila (Hamilton)
9. FAMILY MUGLIDAE Mugil cascasia (Hamilton)
10. FAMILY CHANNIDAE Channa gachau (Hamilton), C. marulius (Hamilton), C. punctatus (Bloch)
11. FAMILY
ANABANTIDAE Colisa fasciata (Bloch)
12. FAMILY
MASTOCEMBELIDAE Mastacembalus armatus (Lacepede) Source: Department of Fisheries, Himachal Pradesh (2014)
In addition to this, fish yield from the year 2012-13 to 2017-18 has been outlined in Table 3.24.
Table 3.24: Fish Yield
Fish Production (in 000 tonnes) 2012-13 2014-15 2016-17 2017-18
Marine 0 0 0 0
Inland 8.561 10.736 12.48 11.87
Total 8.561 10.736 12.48 11.87
Fish Seed Production (in Million Fry) 22.02 25.70 62.50 4.70
Source: Basic Animal Husbandry and Fishery Statistics, 2018.
5.1 Mahseer and Trout
In the uplands along the Himalayan belt, Tor Putitora or Golden Mahseer is the most sought-
after species extending from north-west to north-east. Due to human interventions such as dam
construction, barrages and over-extraction has resulted in threatening this species. Moreover,
regardless of the height, dams act like barrier to breeding of the fish along with negative
impacts of river valley projects such as morphological modifications. Indiscrimination
dynamiting, hooking, and netting have also affected state’s rivers as well as streams.
Trouts, which were introduced to encourage sport fisheries, are now being identified as a
commercial venture for table fish production. Two major species available in Himachal
Pradesh are rainbow trout (Salmo Gairdneri) and brown trout (Salmo Trutta fario). There has
been a sharp decline in catches due to destruction of breeding grounds, illegal and destructive
fishing, rapid urbanization, river-valley projects. However, the matter has received attention of
the State Government21. Mahseer and Trout Major River stretches have been outlined in Table
A2.13 and Table A2.14 in Annexure 2.
Streams in the state are categorized as either trout waters or general waters with approximately
600 kms and 2400 kms of length respectively. Fishes such as Nemacheilus spp, Mahseer, Trout,
Schizothoraacids Crossocheilus sp. Glyptothorax spp., Barilus sp, etc. are found in the major
streams flowing across the state such as Sutlej, Beas, Ravi, Tirthan, Giri, Nugal Gai, Sainj,
21 https://himachal.nic.in/index1.php?lang=1&dpt_id=4&level=1&sublinkid=132&lid=153

28
rana, Uhl, Baspa, Lambadug, Pabar, Bata, etc22. Fishing across these streams is regulated by
the state under Fisheries Act, 1976. For general water license rod, line as well as cast netting
is allowed whereas for trout water only line and rod are allowed. Fishery Department has
identified the fishing spots for trout and mahseer which are listed in Tables A2.15 and A2.16
in Annexure 2 respectively.
Department of Fisheries has been set up for conservation of riverine fisheries, production and
protection of sport fisheries, issuing of licenses, breeding and production of trout seed, their
plantation in rivers and streams for augmentation of riverine stocks. To acheive maximum
sustainable fish production from state’s reservoirs as well as fish farms by applying latest
scientific technologies, HP Aqualculture, Fishing and Marketing Society was set up in 2001.
6. Environment, Science and Technology
The Department of Environment, Science and Technology works towards improving the
effectiveness of environmental management, protection of vulnerable ecosystems and
enhancement of sustainability of development.23 Key institutions and features of Governance
of Environment, Science and Technology Department are given in Table 3.25.
Table 3.25: Administrative Set-up of Department of Environment, Science and Technology
Name of the Institution Functions and Focus Areas
Himachal Pradesh Council for
Science, Technology &
Environment
The council was set up on January 3, 1986 with an objective to
advise the state on the issues and intervention related to science,
technology & environment.
State Centre on Climate
Change
It was set up under the aegis of the State Council for Science
Technology & Environment to the objectives to coordinate
amongst scientific, academic, NGOs and other research
institutions in and outside the state for pursuing research in the
field of climate change and its impact on the Himalayan
Ecosystem
Himachal Pradesh State
Biodiersity Board Himachal Pradesh State Biodiversity Board has been
constituted with an aim to conserve diversity, sustainable use of
its components with fair and equitable distribution of benefits
arising out of the use of biological resources knowledge and for
matters connected herewith and incidental thereto in the State.
HP State Knowledge Cell on
Climate Change
HP State Knowledge Cell on Climate Change (HPKCCC) under
National Mission for Sustaining the Himalayan Ecosystem
(NMSHE) has been setup in the Department of Environment,
Science & Technology, Government of Himachal Pradesh after
the approval of The Ministry of Science & Technology, Govt. of
India. The objective of setting up this cell is to fill the knowledge
gaps related to climate change.
Himachal Pradesh State
Wetland Authority
The Himachal Pradesh State Wetland Authority (HPSWA)
constituted in the year 2017 under the aegis of H.P. Council for
Science, Technology & Environment (HIMCOSTE) is acting as a
nodal agency to coordinate the Wetland Conservation Programme
22 http://himachal.nic.in/index1.php?lang=1&dpt_id=4&level=1&lid=168&sublinkid=146 23 https://desthp.nic.in/setup.html

29
Name of the Institution Functions and Focus Areas
with the active participation of all the stakeholders. The core
objective is to conserve and restore wetlands with the active
participation of the local community at the planning,
implementation and monitoring level.24 Source: Compiled by NIPFP.
7. Other Agencies/Boards/Institutions/Committees
There are a number of Boards, Agencies, Institutions and local community groups, which are
relevant in the context of biodiversity management and conservation, some of them have been
identified below in Table 3.26.
Table 3.26: Other relevant Institutions in Himachal Pradesh Name of the Institution Functions and Focus Areas
HP State Board of Ayurvedic & Unani
Systems of Medicine
The Board was formed in 1971 and is governed by Himachal
Pradesh Ayurvedic and Unani Practitioners Act, 1968. The Board
registers Ayurvedic and Unani Practitioners in the state and regulate
the practice in such systems.
HP Khadi and Village Industries Board This is a statutory body that came into existence in 1968. The Board
functions to fulfil the objective of providing employment, producing
saleable items with the help of local communities and building the
strong rural community spirit.
HP State Pollution Control Board It is a nodal agency in the administrative structure of the State
Government, for the planning, promotion, co- ordination and
overseeing the implementation of environmental programs.
HP Tourism Development Board The Board was formed in 2003 for the promotion and development
of tourism in the state.
HP State Council of Educational
Research and Training
The Council is an apex body on school education which was formed
in pursuance of the recommendations of National Policy on
Education with an objective to improve quality of education in the
state.
HP Panchayati Raj Training Institute The Panchayati Raj Training Institute, Mashobra was established as
a government institute, under the Panchayati Raj Department in the
year 1978 and is recognised as an Extension Training Centre (E.T.C)
under the Ministry of Rural Development.
HP State Wool Federation The H.P. State Wool Procurement and Marketing Federation Ltd.
commonly known as "Woolfed" was established on 7th November
1988 and registered with Registrar Cooperative Societies,
Government of Himachal Pradesh for the upliftment of sheep
breeders of the state by promoting the growth and development of
wool industry in the state
Source: Compiled by NIPFP
3.2 Drivers of Change: Key Factors Impacting Biodiversity
A conceptual framework for recognizing relationship between interaction of Biodiversity,
Ecosystem Services, Human Well-Being and Drivers of Change25 is important to put this in
context. The framework assumes a dynamic interaction between human system and ecosystem
due to direct and indirect drivers of change established by human actions (Figure 3.4), which,
in turn, change ecosystems in different ways with profound impacts on human well-being26.
24 http://www.himcoste.hp.gov.in/Wetland%20Authority/Wetland_Home.aspx 25 https://www.millenniumassessment.org/documents/document.356.aspx.pdf 26 https://www.millenniumassessment.org/documents/document.765.aspx.pdf

30
Figure 3.4: Millennium Ecosystem Assessment Conceptual Framework
Source: Millennium Ecosystem Assessment (2005)
3.2.1 Direct Threats to Biodiversity in Himachal Pradesh
1. Human-Wildlife Conflict (HWC)
HWC has been on a rising trend in Himalayan region both due to anthropogenic pressure and
due to climate change. In the notification dated May 20, 2020, the Ministry of Environment,
Forest and Climate Change has declared the following areas in HP as monkey hotspots (Table
3.27):
Table 3.27: Identified Monkey Hotspots in Himachal Pradesh
S.
No.
Name of
District
No. of Tehsil/
Sub-tehsils
Name of Area/Tehsil/Sub-Tehsil
1. Chamba 06 Churah, Bharmour, Dalhousie, Bhatiyat, Sihunta and Chamba
2. Kangra 15 Kasba-Kotla, jaswan, DehrA-Gopipur, Khundiyan, Jaisinghpur,
Baijnath, Dharamshala, Shahpur, Nurpur, Indora, Fatehpur,
Jawali, Kangra, Palampur, and Baroh
3. Bilaspur 06 Jhandutta, Bharari, Ghumarwin, Nainadevi, Bilaspur Sadar and
Namhol
4. Una 05 Bharwain, Amb, Una, Haroli, and Bangana
5. Shimla 16 Sunni, Theog, Kotkhai, Kumarsain, Chopla, Rohroo, Jubbal,
Chirgaon, Kupvi, Nankhari, Tikkar, Junga, Shimla Rural,
Rampur, Nerwa and Shimla Municipal Corporation limits
6. Sirmour 10 Paonta Sahib, Dadahu, Panjhota, Nohra, Pachhad, Rajgarh,
Renuka, Shillai, Kamrau, Nahan Municipal Committee Area
7. Solan 08 Arki, Kandaghat, Pamshahar, Krishangarh, Nalagarh, Kasauli,
Solan and Daralaghat
8. Mandi 10 Mandi, Chachiot, Thunag Karsog, Jagindernagar, Padhar,
Ladbhadol, Sarkaghat, Dharampur, and Sundarnagar
9. Kullu 06 Nirmand, Banjar, Ani, Manali, Kullu and Sainj
10. Hamirpur 06 Hamirpur, Bhoranj, Nadaun, Sujanpur, Badsar and Bijhari
11. Kinnaur 05 Nichar, Pooh, Kalpa, Sangla and Moorang Source: MoEFCC, 2020.27
27 https://hpforest.nic.in/files/WL%20notifiication.pdf

31
While more scientific data is needed, a review of available literature is in Table 3.28.
Table 3.28: Human-Wildlife Conflict: Threats, Drivers & Impact Type of Threat Drivers Impact on environment,
biodiversity and economic losses
In Himachal Pradesh, the
threats due to HWC revolve
around the following:
Livestock predation
Crop raiding
Attack on humans
Wildlife strolling in
human settlements
188 cases of leopard attacks killing more than 26 people
have been recorded in HP
during 2008-09 (Rattan, 2015)
Conflict among wildlife and
agro-pastoralists has been a
major threat to livestock. Nearly
18% of the total livestock
holding were killed by wild
carnivores in HP in 1995
(Mardaraj & Sethy, 2015)
Monkey menace- In 11
districts, 93 tehsils and sub-
tehsils have been declared as
monkey hotspots (Table 3.29).
A total of 513 attacks by
monkeys have been reported on
humans in 2013-14 in HP.
Attacks by wild bears on
humans has been reported in
Bharmaur and Jummhar regions
of Chamba district and by
leopard in Kinnaur and Una
district (Bodh, 2017)
Crop depredation by
Monkeys and wild pigs has
created a menace across five
villages in Bilaspur District
(Saraswat, Sinha, &
Radhakrishna, 2015).
Interface of man and animal has
escalated due to the following
key drivers in HP:
Increasing human
settlements
Degradation of wildlife
habitat
Degradation of pasture lands
impacting wild animal habitat
due to uphill movement of semi-
nomadic communities like
Gaddis for grazing their cattle
Climate induced changes have
impacted the habitat and food
availability for wild animals in
Himalayan region, causing them
to wander around human
habitations, leading to conflicts.
Climate Change has also led to
a dramatic increase in direct
encounter incidents involving
Himalayan black bears with
stray incidents of leopards in
HP.
Depletion of natural prey base
of wild animals has been
shifting carnivores towards
killing of livestock (Mardaraj &
Sethy, 2015)
In HP, there has been an
increase in human settlement in
urban, semi-urban and rural
areas which is resulting in
shrinking of wildlife habitat
(Bodh, 2017)
The following impacts of HWC
have been identified widely:
A survey of crop damage by
monkeys and langur in HP
estimates the highest crop
damage in Sirmor district (30%),
followed by Bilaspur (25%),
Mandi (18.8%), Solan (15.3%),
Shimla (14.9%) and Chamba
(11.4%) (Sahoo and Mohnot
2004).
Crop damage by monkey raids
left farmers grappling with an
estimated loss of Rs. 19.16 crore
in 2016, since farmers did not
grow crops over 2864 ha land in
Solan district (Sharma 2016).
An annual estimated loss of Rs.
150.10 crore of horticulture crops
has been reported in HP due to
raiding of farmlands by monkeys
and birds (Thakur 2019)
Farmers are shifting away from
growing sugarcane, maize, pulses
and wheat in Una district due to
crop destruction by nilgais
(Narayanan 2015)
During consultation workshop in
Kilar, Pangi, local communities
reported that crops (food and
commercial) are damaged by
monkeys and black bear28.
An analysis of data collected
from 26 migratory pastoralists
from Kangra district reveals that
8-10% of their flocks were killed
by wild animals impacting their
only source of livelihood (Singh,
Kaul, & Sivaramane, 2006)
28 Consultation workshop organized by NIPFP on 25th September, 2019 in Kilar, Pangi Valley

32
2. Unscientific extraction of medicinal and aromatic plants (MAPs)
Illegal, and unsustainable and unscientific collection and marketing have been seen as a major
threat to MAPs in Himachal Pradesh. A number of MAP species have already been listed as
threatened in the state (Table A 2.1 in Annexure 2).
Table 3.29: Unscientific Extraction of Medicinal Plants: Threats, Drivers & Impact Type of Threat Drivers Impact on MAPs
HP is rich in MAP species. With
rising demand, MAPs are facing
the following threats:
Unscientific methods
of MAP extraction
Over-extraction of
medicinal plants
before maturation
Local communities have less
knowledge about biochemical,
molecular and genetic
characterization of existing
medicinal plants which is
resulting in unsustainable
extraction of MAPs (Parkash &
Aggarwal, 2010).
Over-extraction of decoction of
plants like Crotolaria juncea
(Pataku) and Eclipta alba
(Bringraj) by local communities
to cure diseases as well as for
livestock has been done by local
communities (Parkash &
Aggarwal, 2010)
Tubers/rhizomes of Picrorrhiza
kurrooa, Saussurea lappa,
Aconitum heterophyllum and
Jurinea macrocephala are
harvested every year as against
the suggested optimal harvesting
rate of 2-3 years (Singh G. S.,
2011)
Owing to over-extraction, Paris
polyphylla has been listed as
endangered in HP and other
Himalayan regions (Paul,
Gajurel, & Das, 2015)
The following drivers have
been identified:
Unregulated use of permits
for MAP collection
Illegal trading channels
providing ready cash
Unemployment among
youth
Communities have been
reported to dig 5 feet deep pits
for illegal extraction of
Kashmal in Kangra and Mandi
districts fetching a price of Rs
100-500 per kg (Mohan, 2018)
Collection of medicinal plants
is done on right-holding basis.
In this way, local people get
free access to forest produce
through license (Vinayak,
2012)
Local communities reported in
consultation workshop in Kilar,
Pangi that illegal extraction is
mostly done by the foreign
intruders (mainly from Nepal)
and Gaddis. In addition, the
locals sell their permits (given
to them by forest department
for collection of NTFPs) to the
traders, leading to over-
extraction of MAPs through
illegal channels
According to HP Forests for
Prosperity Project Report
(2018), productivity of MAP
species is harmed since little or
no grading is carried out by
communities due to incorrect
picking of plants.
Regeneration failure of plants
in their natural habitat is caused
due to unscientific extraction
such as removing of whole
plant (without leaving any part
of rhizome) (Paul, Gajurel, &
Das, 2015)
The extraction of species like
A. heterophyllum, A. glauca, H.
spicatum in HP at the flowering
stage or before ripening of
seeds has affected their high
germination potential which is
a constraint in their propagation
(Butola and Badola 2008)
Study conducted in Kullu
district reveals that due to
premature and frequent
harvesting, the size of roots of
Jurinea macrocephala has
become smaller (Singh G. S.,
2011)
Over-extraction of plants leads
to soil erosion which not only
results in landslide but also
declines productivity of MAPs
(Bodh, 2016)

33
3. Climate Change
Climate change has emerged as a global issue which is not only impacting ecosystems but also
human life. The phenomenon is much more complex than it looks since it alters the
composition of atmosphere due to unsustainable extraction of natural resources. The threat has
both direct (Table 3.30) as well as indirect impact on biodiversity.
Table 3.30: Climate Change as a Direct Threat: Threats, Drivers & Impact Type of Threat Drivers Impact on environment, biodiversity and
livelihood
According to a 2015 report
“Climate Resilient Green
Growth Strategies for
Himachal Pradesh”, changes
in climate parameters have
been observed in HP during
1951-2010:
Increase in annual
mean temperature by
0.02 °C/year
Decrease in annual
average rainfall by
3.26 mm/year
There has been a decrease in
the snowfall received in
Shimla and Solan from 78 cm
in 1986-1900 to mere 15 cm in
200929.
There has been an increased
water stress for rain-fed crops
in HP due to increasing
temperature (1.7 °C to 2.2 °C)
posing a threat to traditional
crops (HPSSAPCC, 2012).
HP has 98 IBIS grids for four-
eco-sensitive regions, out of
which 56% are projected to
undergo change in vegetation
type by 2030 due to climate
change (HPSSAPCC, 2012).
The districts Una, Solan,
Hamirpur, Sirmour and
Bilaspur have been
categorized as ‘highly
vulnerable’ and exposed to
climate change whereas
districts Shimla and Kullu
are ‘moderately vulnerable’
(HPSSAPCC, 2012). The
stressors for climate change
in HP are:
Anthropogenic
pressure due to
increasing population,
mass tourism-based
activities, and land
degradation.
Inadequate
infrastructure for solid
waste management,
and sewage treatment.
Diversion of water
resources for
hydropower.
Sen, et al. 2015 shows that apple
productivity has decreased at the rate of
0.02 tonnes/ha per year in Kullu valley
during 1985-2009.
A declining apple productivity in other
parts of HP has also been reported, due to
erratic precipitaion and reduction in days of
availability of effective chilling units
adversely impacting the livelihood of
farmers (CRGGS, 2015).
Reduced annual snowfall and fluctuating
temperatures during flowering period in
Kullu has resulted in consistent decline in
dry fruit production. A net decrease in
productivity by 0.005 t/ha/yr has been
recorded (HIMCOSTE, 2018)
There has been an overall reduction in
glacier area from 2,077 sq. km. to 1,628 sq.
km. during 1962-2001 in Chenab, Parbati &
Baspa Basins of HP (HPSSAPCC, 2012).
Population of species like Dalbergia sisoo,
commonly known as rosewood, has been
declining in HP due to the prevalence of
cold waves as well as non-availability of
adequate light during winter, when new
leaves emerge in the plant30, 31.
The area under traditional crops like
Bunium persicum bioss. (Kala zeera),
Fagopyrum esculentum Moench.
(Buckwheat), Amranthus candatus L.
(amaranth), Saussurea costus Falc. (Kuth)
and Crocus sativus L. (saffron) has
decreased significantly in Lahaul valley
(Rana et. al, 2013).
29 http://www.hpenvis.nic.in/Database/Climate_Change_Scenario_4310.aspx 30 http://www.hpenvis.nic.in/Database/Climate_Change_Scenario_4310.aspx 31 https://hpforest.nic.in/files/20-11-2018%20EMF%20HPFPP%20FINAL.PDF

34
Type of Threat Drivers Impact on environment, biodiversity and
livelihood
Previously unknown pests are reported, for
instance hopper burn in rice was reported in
the Kangra valley in 2008 (ADB, 2010).
Due to change in climatic factors, there has
been an increase in invasive species which
poses a threat to native biodiversity (Parikh
et al, n.d.). The extent of major invasive
species are as follows (FSI, 2019):
Lantana Camara: 654 sq. km
Ageratina adenophora: 39 sq. km
Ageratum conyzoides: 36 sq. km
Melochia corchorifolia: 30 sq. km
Dioscorea deltoidea: 29 sq. km
4. Forest Fire
Forest fire incidents cause economic losses as well as loss of non-monetised flora and fauna.
Of the identified 14 major forest fire incidents during 1990-2011, two have been recorded in
Himachal Pradesh (June 2007 in Shimla where 2000 ha of Reserve area was affected; and June
2010 in Solan which affected 19,109 ha of area) (Satendra & Kaushik, 2014). The report has
outlined that the peak forest fire season in the state is March to June. A joint report by
MoEF&CC and the World Bank (2018) estimated that reported monetary losses due to forest
fires in the state was Rs. 134.78 lakhs in the year 2016 and Rs. 113.27 lakhs in 2015. Due to
efforts by the State Government to fight the issue of forest fire, such as, satellite-based fire
alerts there is improvement in situation. Besides, community participation in traditional forest
fire management via forest line clearance, burning debris has proven useful. The impacts of
forest fires have been summarized in the Table 3.31.
Table 3.31: Forest Fires: Threats, Drivers and Impact Type of Threat Drivers Impact on environment and
biodiversity
Districts like Bilaspur in HP
consist of pine and broad-leaved
forests which are highly
inflammable in nature and are
prone to forest fires. A Forest
Fire Risk Map has been
developed for Bilaspur district
which depicts that the high
terrain is more prone to forest
fires given the unfavourable
climatic conditions (Kanga,
Kumar, & Singh, 2017).
Forest fires cause indispensable
loss to timber species like chir,
teak, deodar, sal, sheesam,
rosewood. The periodicity of
forest fire in pine forest in
Himalayas is 2 to 5 years which
usually takes the form of crown
Drivers of forest fires in HP:
Natural drivers
Natural factors such as
extreme summer heat due to
climate change (Parkash &
Sharma, 2008).
Lightning, friction caused due
to rolling stone from the slope,
natural deposition of highly
flammable forest produces
such as Chir Pine cones
(Satendra and Kaushik, 2014).
Ban on grazing leads to
unchecked growth of shrubs
which causes forest fires due
to heat during summer season.
Man-made drivers
Accidental fires due to
unextinguished cigarette butts,
matchsticks by local people
who intrude forest area for fuel
Forest fires result in reduction
of density as well as basal area
of Chir Pine trees in fire
affected forest areas (Kumar &
Thakur, 2008)
Forest fires are a major source
of carbon emissions leading to
biodiversity changes (such as
reduced photosynthesis
activities) and contributing to
global warming.
Burning of vegetation results in
release of CO2 stored in them.
This increases global warming
and contribute to climate
change.

35
Type of Threat Drivers Impact on environment and
biodiversity
fire when moving upward from
the bottom of the hills.
Most of the forests between the
elevations of 1000-1800 m are
dominated by oak and chir. The
repeated fires in this region has
resulted in spreading of chir pine
forest (due to remaining
seedlings after repeated forest
fires) at the cost of indigenous
oak forest causing an ecological
imbalance (MoEF&CC and The
World Bank, 2018)
Wildlife habitat and species
composition are disrupted by
forest fires. Additionally,
residual soot and charcoal
increases insulation which
results in rise in temperature
making the habitat unfit for wild
animals as well as microbes
(Satendra and Kaushik, 2014).
wood collection (Kumar &
Thakur, 2008).
Setting grasslands on fire by
graziers for good pasture
growth.
Collection of NTFP, shifting
cultivation, burning farm
residues, camp fires,
uncontrolled prescribed
burning (Satendra & Kaushik,
2014).
According to Satendra and Kaushik
(2014), one of the chief causes of
forest fire in HP is ‘negligence in use
of fire’, for instance: poor control of
burning on adjacent croplands; and
the second major cause is
‘restriction on grazing in the
forests.’
5. Illegal Hunting and Wildlife Trade
India has been deeply impacted because of the trafficking operations in China and South East
Asia. There are several trade routes operating in India that facilitate the successful trafficking;
reported to be operating across Uttarakhand, Himachal Pradesh, Sikkim and into Tibet, and
then China (Basu, 2018). Despite a ban on wildlife trade and NTFP collection, illegal collection
and poaching is a serious threat to the biodiversity of HP. Based on a review of available studies
a snapshot of key threats is in Table 3.32.
Table 3.32: Illegal Hunting and Wildlife Trade: Threats, Drivers and Impact
Type of Threat Drivers Impact on Environment,
Biodiversity and livelihood
There are several routes for illegal
wildlife trade which are reported to
be operating in HP, the main exit
points of which are:
Border areas of Leh-Ladakh,
Chamba and Pathankot as well as
Tiuni-Vikasnagar in Uttarakhand
(Chauhan, 2018).
A trend analysis for Hamirpur
district has found that during 2001-
13, 58 out of 123 leopards were
found dead due to illegal hunting
(Kumar, Chandel, Kumar, &
Sankhyan, 2015).
The following have been outlined
as major drivers of illegal wildlife
trade and poaching:
The illegal animal parts are
not restricted to illegal
markets, but also end up in
legal markets.
These items fetch a huge
amount of money in cash.
Steep prices incentivize
poachers to hunt more
animals.
Diverse usage of animal
parts such as making rug and
carpet as well as traditional
medicines implies various
Poaching disrupts the
population of species which, in
turn, disturbs the food chain as
the population of immediate
next wild animal would
increase.
Hunting of animals impacts
nature-based tourism
negatively. This impacts
livelihood of locals.
(Estrada, 2019)

36
Type of Threat Drivers Impact on Environment,
Biodiversity and livelihood
Police arrested 2 locals and 2
Nepalese who were caught with
leopard skin in Jabli area of HP.
Meat filled with poison has become
a trap for leopards for their skin
which does not have bullet marks
(Bisht, 2018).
Panthers are killed for their jaws,
claws and other body parts and
traded in China and other South
East Asian countries (Puri, 2018).
sources of demand fueling
the wildlife trade (Ashwini,
2018).
During the consultation workshop
organised by NIPFP in Kilar,
Pangi, local communities have
reported that the existing frontline
staff is inadequate in the forest
area. It is easy for intruders to
locate the forest guards and get
away with the crime.
3.2.2 Indirect Threats to Biodiversity in Himachal Pradesh
1. Climate Change
According to Himachal Pradesh Strategy and Action Plan on Climate Change (2012), the state
is highly vulnerable to climate change. There are some indirect threats to biodiversity due to
climate change such as increase in temperature which further increases the need for water and
reduces agricultural productivity of traditional crops. Climate change leaves farmers vulnerable
to crop losses due to two reasons: increasing temperatures, and excessive precipitation..
Similarly, changes in climatic parameters provide suitable conditions for invasive species to
grow which affects the biodiversity composition. Besides, changing patterns of precipitation
has resulted in shifting of apple line upwards.
In addition to this, an agro-climatic zone-wise study conducted on farmer’s perception of
climate change regarding shift in crops outlines that there has been a decline in basmati rice
and maize crop production by 37% and 26% where the crop area has been diverted to paddy
rice in Fatehpur Valley. There has been a shift in cultivation in Theog region from cereals and
pulses to off-season and seasonal vegetables due to unfavourable weather conditions (Rana et.
al, 2013).
Bajaura valley has also reported a shift in cultivation away from fruits like apples and plums
to vegetables. A significant decline has been reported in area under sarson (mustard) oilseeds
by 76 percent.
Also, the area under traditional crops like Bunium persicum bioss. (Kala zeera), Fagopyrum
esculentum Moench. (buckwheat), Amranthus candatus L. (amaranth), Saussurea costus
Falc.(Kuth) and Crocus sativus L. (saffron) has decreased significantly in Lahaul valley (Rana
et. al, 2013)

37
Figure 3.5: Indirect Impacts of Climate Change
Source: Compiled by Authors
There are indirect impacts of climate change on diseases among animals as has been identified
by State Centre on Climate Change in its report on ‘Animal Diseases Influenced by Climate
Variation in Himachal Pradesh’.
The complexity of indirect impacts of climate change on diseases among animals has been
depicted in the Figure 3.6.
Figure 3.6: Indirect Effects of Climate Change on Animal Diseases
Source: State Centre on Climate Change
Climate change and forest fires also have a vicious circle that is difficult to disrupt. Fires
release carbon trapped in vegetation and soils, and as their severity increases, they begin to
damage deeper layers of soil, releasing centuries-old ‘legacy carbon’. Moreover, when a forest
regrows after burning, they are smaller, younger and drier than before, and, in some
ecosystems, their carbon storage capacity is reduced. This results in a net increase in carbon
emissions, thereby worsening climate change. Climate change causes forest fires, which further
worsens climate change (WWF, 2020)

38
2. Pressure on pasture land due to overgrazing and shortage of fodder
According to Himachal Pradesh State of Environment Report (2009), cultivation of green
fodder in the agricultural fields is virtually non-existent, leading to open grazing throughout
the year. In addition, it is estimated that approximately 35-40% of the geographical area in HP
is degraded. According to Desertification and Land Degradation Atlas of India (2016), there
has been an increase in vegetation degradation on land with scrub by 1,12,990 ha during 2003-
05 to 2011-13. WWF has also recognized overgrazing as a threat to the ecology of important
wetlands such as Chandertal32.
Gupta et al (1998) has estimated that in HP, there was an overall deficit of 32% of fodder
requirement of which deficit was 13% in case of grasses, 14% in cases of tree fodder and 55%
in case of straw. Some of the important species of fodder are: Beul (Grewia oppositifolia),
Grewia Optiva, Poplar tree (Populus spp.), Willow (Salix spp.), Himalayan Birch (Betula
utilis), Sea-buckthorn (Hippophae), Bichhu Booti (Urtica dioica).
There exists traditional agro pastoral Gaddi community in the state (approximately 100,000
Gaddis), who migrate the livestock semi-annually between the scrub forests of Shivalliks and
the alpine meadows. The migration involves approximately 300 km each way over an elevation
gradient of 13,000 feet. The shrinking pasturelands due to overgrazing as well as climate
change have induced these communities to move upward in the wild animal habitat (Saberwal,
1996).
Overgrazing is not only impacting the native grass species but also habitat of wild animal
species in HP: ibex (Capra ibex sibirica), brown bear (Ursus arctos), himalayan tahr
(Hemitragus jemlabicus), and musk deer (Moschus moschiferus) (Greentumble, 2017;
Saberwal, 1996).
Continuous grazing has also given rise to a number of invasive species such as Rumex
nepalensis is found in Dharampur area due to overgrazing by sheep and goat (Saberwal, 1996).
The Restoration Opportunities Atlas by WRI (2018) has identified grazing as one of the
potential risks to land degradation in HP and has recorded the landscape restoration potential
of 1.58 Mha in the state across three categories: Area of Protection33 (0.52 Mha), Area of Wild-
scale Restoration34 (0.63 million ha), and Area of Mosaic Restoration35 (0.43 million ha). Of
the total restoration potential, 0.23 Mha potential has been calculated for Chamba and Lahaul
& Spiti.
3. Mass Tourism
Being a popular tourist destination, the numbers of tourists in Himachal Pradesh have increased
from 161.45 lakh tourists in 2012-2013, to 196.02 lakh in 2017-2018. Tourists enjoy a plethora
of activities ranging from trekking and camping to adventure sports, visit to wildlife
sanctuaries, lakes as well as fairs and festivals. The tourism sector provides more than 4 lakh
jobs, and generating 8-10% of the GDP (Shukla, 2017). However, the implications of
expansionary model of tourism on environment and biodiversity cannot be overlooked.
32Chandertal is a ‘Wetland of International Importance’ under the Ramsar Convention, due to the presence of rare
plants and a wide variety of unique animal species. 33 Atlas has defined forest cover with a density of more than 40% as protection areas which can be maintained
through protection from risks such as fire, land diversion and fragmentation 34 Existing forest and tree cover in this category of area is less than 40 % and population density is less than 200
persons per sq. km. This area also includes all plantations irrespective of tree cover density 35 This area has a tree cover density of less than 40 % and population density of less than 400 Persons per sq.km.
The area includes agroforestry interventions, such as trees on boundaries, agri-horti-forestry, and farm forestry.

39
Problem related to water is often reported from the popular tourist places like Shimla and Kullu.
A survey of 109 tourists conducted in Shimla reveals that scarcity of water is the major issue
followed by traffic congestion during peak season (Das, 2012). Apart from this, negative
impacts of nature and biodiversity are often subjected to tourism activities in HP such as waste
generation in bulk and its improper disposal, increased construction in the fragile landscapes,
land clearing for construction, excessive fuel wood collection.
Given that the state provides a wide scope for recreational activities-- promotion of community-
based eco-tourism can be beneficial. With a participatory approach, the idea of promoting eco-
tourism is not only restricted to ample employment opportunities for the locals but also
contributes towards conserving the nature and biodiversity (Raj, 2017). Active participation of
local communities along with building their capacities needs to be done especially in the remote
tribal areas such as Pangi valley, Lahaul & Spiti. These places are emerging as a spot for bikers
and trekkers.
This can be done in lines with restricting the number of tourists that can visit a destination at
the same time based upon carrying capacity (Figure 3.7). An active participation from local
communities can help meet the objectives of eco-tourism. Home stays need to be promoted in
the remote regions of Chamba, Lahaul & Spiti districts. Home stay units (up to three rooms)
are exempted from tax (Himachal Pradesh Home Stay Scheme, 2008). In addition to this,
replacement of packed food with locally cooked food is an effective way to reduce solid waste
generated during peak season. This along with defining the carrying capacity can help meet
the objectives of eco-tourism in the state.
Figure 3.7: Action points for carrying capacity in Himachal Pradesh
Source: Himachal Pradesh Tourism Policy, 2019.
3.3 Gaps in Conservation and Management of Biodiversity
Himachal Pradesh scored 6936 in SDG India Index 2.0 (NITI Aayog, 2019-20), which is the
second highest score in ranking of all states. However, there exists scope for further
improvements. Besides, there is a huge scope to strengthen research on microbial diversity to
explore the unexplored habitats, specialized ecological niches, rhizospheres and phyllospheres
of the plants, animals, traditional fermented foods and beverages of HP, as well as to
characterize and report microbial diversity.
36 This score doesn’t include SDG target 13 which is Climate Action due to lack of data.

40
While a detailed sector-wise analysis is given in the Table A3.1 in Annexure 3 (which includes
threats, components of policy, objectives, issues addressed, NBTs and SDGs achieved), a
snapshot of gaps is in Table 3.33.
This has been accompanied with consulting Annual Action Plans, Schemes and other
programmes, consultation workshops, as well as one-on-one interactions with line
departments.
There are some gaps that prevail in conservation and management of biodiversity in the state
which have been outlined in Table 3.33 below.
Table 3.33: Gaps in Conservation and Management of Biodiversity
S.
No. Theme Gaps in current SBSAP and Conservation and Management of Biodiversity
1. SBSAP 2002 Harmonization of SBSAP with international conventions has not been
made explicit.
A detailed Finance Plan for mobilization of resources has not been
outlined.
Monitoring framework and indicators have not been developed.
2. Implementation of
SBSAP
Implementation is fragmented with no systematic institutional mechanism for
tracking the progress on action points and targets outlined. No clear finance plan
for implementation of BSAP.
3. Synergy and
Coordination
among Line
Departments
Multiple agencies are involved with often overlapping functions.
Currently, there are two tourism policies (Sustainable Tourism Policy, and
Eco-tourism Policy) implemented by Tourism Department and
Department of Forest respectively.
Convergence is needed between HP SSAPCC (Himachal Pradesh State
Strategy and Action Plan on Climate Change) and HP SBSAP (State
Biodiversity Strategy and Action Plan) by way of collaboration between
HPFD and DoEST
A forum should be made for all the Himalayan States to exchange ideas,
learn from each other and explore opportunities for cooperation.
Support should be provided to research centers/institutions to ensure
coordination between Departments and researchers to share inputs.
4. Priority Areas Prioritisation of actions on critical threats is lacking
Human-wildlife conflict
Forest Fires
Climate Change
Unscientific extraction of medicinal plants
Shortage of fodder
Mass tourism
5. Information and
Research Gap Lack of periodic scientific mapping and monitoring of key resources.
Lack of alternatives to fuel wood to reduce dependence on forests.
Awareness building and training of local communities for sustainable
extraction of medicinal plants.
Economic Valuation of ecosystem services to facilitate implementation of
ABS and PES mechanism is required.
6. Capacity Building
and Strengthening
of Institutions
BMCs lack capacity for preparation of PBRs and implementation of ABS.
Recruit more Forest Guards, provide them training and equipment37
37 Kilar, Pangi Valley Workshop Discussion

41
Chapter 4: Biodiversity Strategy and Action Plan
4.1 Theme-wise Recommendations and Action Plan
This chapter presents the Biodiversity Strategy and Action Plan for Himachal Pradesh.
Table 4.1 presents BSAP for the whole state. The BSAP is organised under the following eight
themes. Each theme is divided into key sub-themes which in our assessment would require
focussed attention. The BSAP covers the Issues, Recommendations, Action Points, Time Frame,
Indicators and relevant Agencies.
BSAP Themes
1. Wild Flora and Fauna
2. Agriculture and Biodiversity
3. Animal Husbandry
4. Aquatic Biodiversity
5. Microbial Diversity
6. Tourism
7. Economic valuation and Natural Capital Accounting
8. Education, Awareness, and Training
9. Policies, Laws, and Institutions

42
Table 4.1: Recommendations, Action Points, Time Frame, Indicators and relevant Agencies for Himachal Pradesh
S.
No
Recommendations/Strat
egies
Action Points Time
Frame
Indicators Agencies Remarks
1. WILD FLORA AND FAUNA
1.1 Protected Areas
1. PAs as a conservation
strategy should be re-
strategized for effective
biodiversity conservation.
Re-strategizing does not
necessarily mean an
increase in net area under
PAs, or significant impact
on tenurial or access rights
of communities or forest
resources.
Conduct spatial analysis for
determining changes in forest cover
of PAs using remote sensing
applications.
M
Scientific
investigations
conducted
PA boundaries
assessed
Grazing zones
identified within PAs
HPFD
DoEST
SBB
NRSC
GBPIHED
Reddy et al, 2017 reveals a reduction of
7.3% in large core forests from 1930 to
2013 across 175 protected areas of India. It
suggests application of high-resolution
satellite data to analyse degradation in PAs
including grazing pressure, forest fires,
invasive species as well as encroachments for
better monitoring
An assessment of status of biodiversity in
relation to livestock grazing in The Great
Himalayan National Park Conservation Area,
Himachal Pradesh using GIS and remote
sensing and have suggested the following
(Mehra and Mathur, 2001):
A careful delineation of PA boundaries in
the state
Allowing grazing in PAs based upon
sound spatio-temporal use of grazing
resources (pasture lands) instead of
overburdening the landscape at a given
point of time
Appropriate distribution of grazing
pressure across the landscape
This requires identifying pastureland
and different migratory routes taken
by herders within PAs to ensure
appropriate distribution of livestock
pressure in the landscape.
Delineate boundaries of PAs in the
state to create a systematic
understanding of social, biological
and physical components of the
landscape
2. Participatory resource
management should be
adopted across all 5
Identify the training needs of
institutions (such as JFMCs,
VFDCs, Yuvak Mandals, Mahila
S Training modules
designed
HPFD In light of protected area management, Pretty
& Pimbert (2009) have highlighted the idea of

43
S.
No
Recommendations/Strat
egies
Action Points Time
Frame
Indicators Agencies Remarks
National Parks, 26
Wildlife Sanctuaries and 3
Conservation Reserves in
the state to involve local
level institutions as well as
communities dependent on
PAs
Mandals, Praja Mandals) to create
opportunities for networking in the
context of biodiversity conservation
in PAs
Trainings conducted
for institutions at the
block level
Awareness
campaigns designed
and conducted
DoEST
SBB
JFM and other
local level
institutions
community-based action through local
institutions and user groups.
The key premise here is that joint or co-
management of protected areas will result in
greater conservation. This would establish
mutually agreed processes to achieve long-
term conservation.
Conduct awareness to educate
communities about the impacts of
anthropogenic pressures on
biodiversity like illicit felling,
unsustainable extraction of
medicinal plants, overgrazing, etc.
1.2 Human-Wildlife Conflict
3. Comprehensive database
for Human-wildlife
conflict along with nature
and extent of conflicts in
H.P should be prepared
Conduct district-wise scientific
investigation on abundance of wild
animals in relation to habitat
characteristics, land-use pattern, and
availability of prey species
M Number of Human
wildlife conflict
related cases
registered
District-wise studies
for scientific
investigation on
HWC conducted
HPFD
SBB
JFM
PRI
VFDC
188 cases of leopard attacks killing more than
26 people have been recorded in HP during
2008-09 (Rattan, 2015)
Out of a total of 75 Tehsils, 39 Tehsils have
been marked as monkey hotspots38
Attacks by wild bears on humans has been
reported in Bharmaur and Jummhar regions of
Chamba district and by leopard in Kinnaur and
Una district (Bodh, 2017)
An annual estimated loss of Rs. 150.10 crore
of horticulture crops has been reported in HP
Establish a complete protocol of
wild animals with types of species,
sex, and individual identity of
animals which may be involved in
the human-wildlife conflict
38 https://hpforest.nic.in/files/Proposal%20under%20Sec%2062%20for%20declaring%20Macaque%20as%20Vermin%20in.pdf

44
S.
No
Recommendations/Strat
egies
Action Points Time
Frame
Indicators Agencies Remarks
Evaluate the experience of ongoing
projects/programs such as Insurance
Scheme by National Conservation
Foundation in Spiti (Bijoor, et al, nd)
and identify effective approaches to
strengthen such programs
A complete protocol
of wild animals in
conflict prone area
established
due to raiding of farmlands by monkeys and
birds (Thakur 2019)
Pandey, et al. (2016) explains the importance
of wildlife forensic genetics to provide
significant information for the management of
human-wildlife conflicts.
4. Conduct studies to
identify effective
compensation and risk
mitigation measures based
upon extensive
consultations with state
officials, local-level
institutions, local
communities, and experts
to reduce interface of man
and animal
Ensure availability of food for
animals in their habitat. Some of the
suggestions39 are listed below:
1. Plant more fruiting trees in
forests to avoid raiding by animals
in agricultural lands in search of
food
2. Identify zones and mark them as
grazing/ pasture lands
3. Revive degraded pasturelands in
uphill to provide grazing lands for
wild animals such as Ibex & blue
sheep
4. Periodic cleaning of shrubs to
provide free movement of animals
5. Improving prey base for wild
animals
M-L Revival and
demarcation of
zones for grazing is
done
Convergence of
economic
instruments for
compensation done
More frontline staff
deployed
HPFD
SBB
JFM
PRI
VFDC
Area specific measures such as identification
of wild animals, plantation of fruiting trees,
fencing should be explored and an effective
compensation programme should be designed
covering human, livestock as well as crop
damage due to such conflicts
Some of the reasons for HWC, based upon
consultation workshop in Kilar, Pangi40 are:
Depletion of natural prey base of wild
animals (mainly due to shrinking of
grazing pastures) is resulting in attacks on
livestock by wild animals such as snow
leopards
Encroaching habitat of wild animals
Uphill movement of semi-nomadic
communities like Gaddis in search of
pastures for grazing their cattle
39 Consultation Workshop organized by NIPFP on 25th September 2019, Kilar, Pangi Valley 40 Consultation Workshop organized by NIPFP on 25th September 2019, Kilar, Pangi Valley

45
S.
No
Recommendations/Strat
egies
Action Points Time
Frame
Indicators Agencies Remarks
6. Sterilization of animals like
Monkeys
Explore gainful alternate livelihood
for herders like Gaddis in uphill
such as wool products as well as
provide training to herders for
sustainable pastoral practices
Explore implementation of
insurance scheme and link it with
already existing Rates of Relief (HP
Forest Department, 2014) and
Mukhya Mantri Khet Sanrakshan
Yojana (Himachal Watcher, 2019)
Prevent poaching and illegal trade
of wild animals by deploying more
frontline staff and wildlife
personnel and provide them
adequate equipment
1.3 Forest Fires
5. Data on forest fire should
be strengthened to
document causes of
increasing incidents of
forest fires (ANI, 2019)
Conduct a comprehensive study to
document the causes as well as
ecological, economic and social
impacts of forest fire in the state
S A detailed socio-
economic analysis
on impact of forest
fire being conducted
HPFD
DoEST
SBB
Some of the causes that have been identified
for forest fires are:
1. According to State Level Climate Change
Trends in India report (2013) by India
Meteorological Department, highest increase
in both: summer mean maximum temperature

46
S.
No
Recommendations/Strat
egies
Action Points Time
Frame
Indicators Agencies Remarks
Regularly update
information such as area
burnt, economic loss,
vegetation and wildlife
affected due to forest fires
Conduct the gap analysis of current
capacity of forest fire management
in terms of forest fire stations,
improved fire equipment,
manpower, etc. and strengthen the
same in the light of increasing forest
fire incidents (MoEFCC & The
World Bank, 2018).
Gap analysis to
enhance forest fire
management
conducted
(+0.06% °C/year) and winter mean maximum
temperature (+0.06% °C/year) in Himachal
Pradesh has been noted during 1951-2010 due
to climate change (Rathore, Attri and Jaiswal,
2013).
2. Setting grasslands afire by local
communities to get softer grass after the rains
in forest area vicinity (IANS, 2019 (i)).
3.Heaps of dry pine needle which are highly
inflammable in nature (Goswami, 2018)
6. Advanced technologies as
well as suitable measures
should be adopted to help
detect, prevent and
monitor the impact of
forest fire
Develop an active
prevention strategy for the
state. Shift the focus from
suppression strategies to
prevention strategies.
Develop strategy to bring
businesses on board by
mobilising CSR activities
to support local
communities and create
partnerships for fire
Explore devising a Fire Danger
Rating System to assess the effect
of factors such as fuel, weather,
topography, etc. on daily fire
potential of an area and consider
local knowledge to identify
solutions
S-M Fire Danger Rating
System devised
Percentage of
households using
clean cooking fuel
HPFD
DoEST
SBB
Fire Dander Rating System helps in assessing
fire potential of an area. One Fire Danger
Rating System has been designed by U.S.
Department of Agriculture in collaboration
with Pacific Southwest Forest and Range
Experiment Station (NWCG (2002) & Cohen
& Deeming (1985))
Explore the idea of cool burning, often
referred to as prescribed burning, where
intentional forest-fires are expected to reduce
the risk of serious fires (Fernandes and
Botelho, 2003). This has been emphasised by
scientists worldwide as they have called for
prevention-based action rather than
suppression-based efforts.
Explore the method of “prescribed
burning” or “cool burn” and provide
training for the same to local
communities, where controlled,
early dry-season burning is done
intentionally to reduce the risk of
serious fires
Provision of LPG to reduce
dependency on biomass-based
stoves often used in open areas
Strict vigilance of trespassers to not
carry inflammable materials to trails

47
S.
No
Recommendations/Strat
egies
Action Points Time
Frame
Indicators Agencies Remarks
prevention and
suppression activities.
and meadows by deploying more
forest staff in forests
7. Institutions such as
Panchayat, JFM, VFDCs,
VFDSs should be made an
integral part of forest fire
management
Engage with communities
through:
Controlled, ecologically
compatible and early dry-
season burning protocols
to reduce risk of serious
fires
Delegating responsibility
to the community through
sufficient policy and
legislative safeguards
Technical support and
training to communities to
enable them in assuming a
central role in fire
management.
Identify the training needs of
communities for forest fire
management as well as “prescribed
burning” where early dry-season
burning is done with an aim to
reduce the risk of forest fires
S Trainings for forest
fire management
conducted
Increase in number
of local institutions
that adopt and
implement local risk
reduction strategies
Training conducted.
Budget allocation to
forest fire programs.
Regulation of
tourism activities.
Awareness programs
through audio and
visual mediums.
Awareness program
in schools.
HPFD
DoEST
SBB
According to MoEF&CC and the World Bank
(2018):
The most important cause of forest fire in
Himachal Pradesh is negligence in use of fire
around forests, and
The second most important cause is resource
collection from forests especially grazing
The most important challenge to forest fire
management has been identified to be Public
Management.
Distribute pamphlets as a part of
awareness campaign containing
information regarding Fire Alert
Messaging System (FAMS) by
FSI41, and contact details of
JFMs/VFDCs, Panchayats, Fire
control rooms, DFOs, ROs, etc.
41 http://fsi.nic.in/uploads/documents/technical-information-series-v2-22-4-19.pdf

48
S.
No
Recommendations/Strat
egies
Action Points Time
Frame
Indicators Agencies Remarks
1.4 Restoration Potential
8. Restoration Potential of
1.58 mha should be
achieved across
landscapes to ensure
improvement in tree cover
and carbon sequestration.
Achieving the Restoration
potential can provide
direct benefits to the
communities through food
security, strengthened
energy security,
biodiversity conservation,
and soil and moisture
conservation. Therefore, a
livelihood assessment is
necessary to identify such
value chains to support
livelihood.
Design and implement a restoration
program to regenerate degraded
land by prioritizing areas based
upon restoration potential.
M Proportion of land
that is restored over
total degraded land
Increase in area of
forest under tree
cover
Carbon Stock
sequestrated
MoEF&CC
NRSC
HPFD
DoEST
SBB
JFM
VFDCs
The Restoration opportunities atlas for India
has been launched by WRI. The Atlas can be
used to prioritize areas/landscapes in
Himachal Pradesh that have potential to be
restored. The Restoration Potential (RP) for
HP is 1.58 Mha and Carbon Sequestration
(CS) Potential is 53.42-63.57 MT (Chaturvedi
et al, 2018).
The Restoration Opportunities Assessment
Methodology (ROAM) has been developed
by WRI where a case study of Sidhi in MP
has been conducted. The highlights of the
study are as follows (Sungh et al, 2018):
1. Restoration can provide direct benefit of
3.75 million person-days of wage labour and
INR 710.76 million in wage income
2. 31,000 jobs for women, unemployed and
landless can be generated by value chain
development around six key tree species
3. 7 million tonnes of CO2eq can be
sequestered
Explore the suitability of ROAM
methodology developed by WRI to
conduct pilots for landscape
restoration including interventions
such as identification of degraded
landscapes, plantation of native
species, assisted natural
regeneration, mixed plantations,
agri-horti-forestry, trees on
boundaries as well as farmer
managed natural regeneration
Identify native tree species and
associated value chain of key tree
species for livelihood
diversification and income
generation of local communities
1.5 Preparation of PBRs
9. Preparation of PBRs
should be expedited as per
the mandate in
Biodiversity Act 2002,
along with building
capacity of BMCs
Facilitate preparation of PBRs in
time bound manner by setting up a
committee under HPSBB, and a
dedicated fund to expedite this
process.
S Increase in Number
of PBRs prepared
Formation of
Committee under
SBB to facilitate
preparation of PBRs
DoEST
SBB
NBA
BMCs
Conduct scientific surveys on a
continuous basis using latest tools

49
S.
No
Recommendations/Strat
egies
Action Points Time
Frame
Indicators Agencies Remarks
Supplement PBRs with
regular scientific surveys
to timely update key
threatened, critical,
endangered, vulnerable
and rare species
and technology to timely update
PBRs. This should appear as a
separate budget line item on SBB
budget.
PBRs utilized as key
document in
identifying targeted
species as well as
traditional
knowledge for ABS
contracts
ABS mechanism
starts to show results
in terms of number
of ABS contracts
signed and revenue
raised.
Commission a study for assessment
of the total potential of ABS in
Sikkim
Commission a study for assessment
of current use of natural resources
which is liable for ABS and the key
issues impacting ABS collection.
A continuous dialogue with
industrial users and traders on the
importance and need for ABS for
long term sustainability of resource
is important.
1.6 Wildlife crime
10. Strengthen the existing
mechanism to address
wildlife crime as outlined
below:
1. A comprehensive
database on wildlife crime
to prevent illegal hunting
and wildlife trade should
be prepared
Develop database on wildlife crime
in consultation with local
communities, local level institutions
such as Praja Mandal, Panchayat
Raj, VFDCs, VFDSs as well as
forest guards in the field, police and
various other line departments
S-M A state-level
database on
proportion of traded
wildlife that was
poached or illicitly
trafficked
Number of capacity
building and anti-
trafficking trainings
conducted
HPFD
Police
department
BMCs
TRAFFIC
WTI
WCCB
There are several routes for illegal wildlife
trade which are reported to be operating in
HP, the main exit points of which are:
Border areas of Leh-Ladakh, Chamba and
Pathankot as well as Tiuni-Vikasnagar in
Uttarakhand (Chauhan, 2019).
A trend analysis for Hamirpur district has
found that during 2001-13, 58 out of 123
leopards were found dead due to illegal
hunting (Kumar, Chandel, Kumar, &
Sankhyan, 2015)
Identify gaps in staff strength and
funding based on security audits
conducted by various agencies such
as WTI, TRAFFIC

50
S.
No
Recommendations/Strat
egies
Action Points Time
Frame
Indicators Agencies Remarks
2. Gap analysis in terms
of frontline staff to be
conducted
3. Training to build
capacity of government
staff is important
4. Local communities to
be an integral part of fight
against wildlife crime
5. Identification of trade
channels and coordination
in trans-border (national
and international) law to
prevent illegal trading in
skin and other body parts
of wild animals
Design training modules and
provide anti-trafficking training to
all the enforcement agencies
Number of
awareness
workshops
organized
Gap in number of
incidents and cases
reported is reduced
Number of incidents
show a decline
Local
Community
Groups
NGOs
A state-level database needs to be prepared
on:
Number of retaliatory killing
Cases of poaching for trade of animals’
derivatives
Illegal Trade channels
Organize awareness programs for
farmers, herders, communities in
uphill regions regarding the
vulnerability of species like
Panthera uncia (snow leopard) and
need for their conservation
Institutionalize community-based
surveillance and patrolling systems
especially in higher altitude
landscapes
Educate local communities
regarding the need of wildlife crime
prevention as well as ill-effects of
retaliatory killing of wild animals
using print media like posters, bill
boards, pamphlets.
1.7 Invasive alien species
11. Strengthen arrangements
to identify Invasive Alien
Species (IAS) and
develop measures to
eradicate them
Develop database via ecological
assessment of invasive species and
its impact on habitat in the state
M Database prepared
Mapping and
reporting of invasive
species is included
in PBRs
HPFD
SBB
BMCs
Local
Communities
Traditional knowledge can be very helpful in
developing effective measures to eradicate
invasive species: Lantana Camara (654 sq.
km), Ageratina adenophora (39 sq. km),
Ageratum conyzoides (36 sq. km), Melochia
corchorifolia (30 sq. km) and Dioscorea
deltoidea (29 sq. km) (FSI, 2019)
Document traditional knowledge
via scientific surveys in PBRs to
eradicate or put invasive species to
alternate use

51
S.
No
Recommendations/Strat
egies
Action Points Time
Frame
Indicators Agencies Remarks
Develop Restoration Plan for area
affected by invasive species. The
plan should include regeneration of
native species as well
PBRs are prepared
and used as a key
document in
identifying IAS
A list of targeted
species is finalized
Rural
Development
Department
Currently, management of invasive species is
being done under ‘Policy for removal of
Lantana Camara’. The scope of such policy
can be expanded by identifying and including
other invasive species Involve cottage industries and
incentivize them to utilize invasive
species. Some of the industrial uses
of invasive species found in HP are:
Use of Lantana Camara as
bioethanol fuel (Pasha et al,
2007)
Fresh roots of Ageratina
adenophora have
antibacterial qualities
(Dong et al, 2017)
Parts of Melochia
corchorifolia can be used as
fodder and also have
antioxidant and anti-
bacterial qualities
(Mamatha et al, 2018)
1.8 Biodiversity Heritage Sites (BHS)
12. Biodiversity Heritage
Sites (BHS) should be
identified in the state with
active involvement of
local institutions and
communities.
Identify and manage biodiversity
rich areas based upon species,
ecosystem services as well as
livelihood benefits to local
communities
Identification of BHS can also be
done as a part of eco-tourism
programme
M Delineation of
boundaries of BHS
being done
Monitoring of BHS
done regularly
HPFD
SBB
PRIs
Rural
Development
Department

52
S.
No
Recommendations/Strat
egies
Action Points Time
Frame
Indicators Agencies Remarks
Involve local communities as well
as local level institutions (such as
Panchayats, BMCs, VFDCs, JFMs)
in the process of identification and
management of BHS
Use GIS mapping to carefully
delineate the boundaries of such
sites
Conduct regular monitoring once
sites have been identified in light of
anthropogenic pressure
1.9 Database
13. Database on ENVIS HP
portal should be
strengthened to make it a
repository of credible data
and knowledge on
biodiversity
Integrate data collection,
collation and management
efforts to enable easy
access to data for policy
analysis & minimize
duplication of efforts.
Update existing database to include
endangered, extinct, rare,
threatened, vulnerable species along
with trend in species composition in
HP with the help of educational
institutions
S
Strength
ening of
ENVIS
should
be a
continuo
us
process
ENVIS HP Portal
comes up as a
comprehensive data
and knowledge base
ENVIS is made user
friendly and
interactive
Policy research is
produced using
ENVIS
Educational
institutions
registered and
utilized ENVIS
MoEF&CC
HPFD
DoEST
SBB
ENVIS
This will be helpful in identifying further data
needs and in keeping records of data usage
and thus tracking usefulness of the portal
Identify additional software and
staff needs to strengthen ENVIS HP
portal
Make arrangements with reputed
institutions, experts and agencies
that are working on biodiversity for
sharing of information on ENVIS
HP portal on a regular basis

53
S.
No
Recommendations/Strat
egies
Action Points Time
Frame
Indicators Agencies Remarks
1.10 In-situ Conservation
14. Comprehensive strategies
for threatened floral and
faunal species for in-situ
conservation are
important
Identify appropriate
conservation strategies
including mass
multiplication protocols in
their natural habitat
Prepare a plan for conservation of
threatened indigenous species
published by SBB.
S-M Species as well as
sites for in-situ
conservation
prioritised
Conservation
protocols developed
and standardised.
Number of
workshops
organized to spread
awareness regarding
indigenous species
Number of animal
genetic species
secured in medium
or long -term
conservation
facilities
HPFD
DoA
SBB
NBA
NBAGR
Some of the threatned species in HP are:
Fauna: Glyptothorax kashmirensis, Tor
putitora, Kashmir Gray Langur, Wagur, Snow
leopard, Asla, Asian small clawed otter, Tarai
grey langur, Neallogaster ornata, Gangetic
ailia, Siberian Ibex
Flora: Gentiana kurroo Royle, Nardostachys
jatamansi (D.Don) DC, Saussurea costus
(Falc.) Lipsch, Aconitum chasmanthum Stapf
ex Holmes, Lilium polyphyllum D.Don,
Carex kashmirensis, Vigna khandalensis,
Cajanus cajanifolius, Webb Fir, Jungli pyaz
Identify sites for restoration in light
of conservation of native species
and plan for long-term
environmental monitoring42
Consider incorporating traditional
knowledge in PBRs for crop
breeding, especially for the crops of
economic importance to help
farmers43
Organize workshops at village-level
with help of BMCs to spread
awareness regarding the importance
of indigenous species and need of
community-led conservation in the
high-altitude areas
42 https://nmhs.org.in/fellowship_04_2015_16.php 43 https://www.nap.edu/read/2116/chapter/7#119

54
S.
No
Recommendations/Strat
egies
Action Points Time
Frame
Indicators Agencies Remarks
1.11 Ex-situ conservation
15. Conserve genetic diversity
of threatened flora and
fauna in the state
Identify species for Ex-situ
conservation and provide
economic and technical
support for conservation
Develop database based upon
morphological studies for chemical
and molecular characterization of
species for ex-situ conservation as
well as standardize mass
multiplication, breeding protocol of
rare, threatened, vulnerable,
endemic and endangered species
S-M ENVIS HP database
strengthened and
updated for agro-
climate zone-wise
threatened
indigenous species
A priority list and
action plan is
prepared.
Necessary protocols
are developed, and
relevant agencies
identified.
Proportion of faunal
and floral species
classified as being at
risk, not at risk or at
unknown level of
risk of extinction
Number of animal
genetic species
secured in medium
or long -term
conservation
facilities
Number of species
cultivated through
tissue culture
HPFD
DoA
SBB
NBA
NBAGR
Down to Earth (1997) finds that for long term
preservation of endangered breeds, storage of
DNA and RNA is a must.
Scientific surveys can help in designing
suitable propagation plan
A fine example can be drawn from
development of Community Reserve in
Singchung Bugun Village, Arunachal Pradesh
to conserve Buguns (Akhtar M. 2018;
Dasgupta S., 2018). Here communities gave
up approximately 17 km of land to make
community reserve
Strengthen seed banks for seed
conservation as well as plant
breeding for further seed
development
Mass multiplication of threatened
species through conventional and
tissue culture techniques by
selecting highest quality parents for
breeding
Germplasm collection to be
strengthened to conserve animal
genetic resources.

55
S.
No
Recommendations/Strat
egies
Action Points Time
Frame
Indicators Agencies Remarks
1.12 Cultivation of MAPs
16. Create value chain
through partnership
between industry and
local communities for
commercially viable
species of (MAPs) which
are on the verge of
extinction due to
unscientific extraction
MAP species extracted in
huge quantities in HP are:
Aconitum heterophyllum,
Angelica glauca, Berberis
spp., Betula utilis,
Centella asiatica,
Ephedra gerardiiana,
Picrorhiza kurrooa,
Podophyllum hexandrum,
Selinum tenuifolium,
Valeriana spp.
A comprehensive focused program
should be introduced to provide
support for identified medicinal and
Aromatic plants.
From field level consultations the
following were identified:
Patish (Aconitum heterophyllum)
Wild Garlic (Allium ursinum)
Kuth (Saussurea lappa)
Kaala Jeera (Elwendia persica)
Kutki (Picrorhiza kurrooa)
Pushkarmool (Inula Recemosa)
M A focused program
introduced
A business model
for promotion of
MAPs implemented
HPFD
Rural
Development
Department
HPAB
HPSAMB
HPSMPB
57 species of MAPs are threatened in HP44.
Over-extraction of decoction of plants like
Crotolaria juncea (Pataku) and Eclipta alba
(Bringraj) by local communities to cure
diseases as well as for livestock has been
done by local communities (Parkash &
Aggarwal, 2010)
Study conducted in Kullu district reveals that
due to premature and frequent harvesting, the
size of roots of Jurinea macrocephala has
become smaller (Singh G. S., 2011)
The extraction of species like A.
heterophyllum, A. glauca, H. spicatum in HP
at the flowering stage or before ripening of
seeds has affected their high germination
potential which is a constraint in their
propagation (Butola and Badola 2008)
As a part of business model, start cultivation
on a smaller scale and then scale-up the
cultivation once farmers’ trust is established.
Funds can be procured from potential sources
like AYUSH Mission, National Medicinal
Plant Board for the same.
Assist entrepreneurship, business
models as well as R&D keeping in
view the market demand and adopt
an inclusive approach to make
scientific inputs available to local
communities for cultivation of
medicinal plant.
The model should include quality
specifications, bio-chemical
compositions suitable for crops and
a buy-back guarantee to farmers
44 https://hpforest.nic.in/files/ANNEXURE%20-%20I.pdf

56
S.
No
Recommendations/Strat
egies
Action Points Time
Frame
Indicators Agencies Remarks
Regulate enforcement of
biodiversity related community-
level rules (by-laws) such as
penalties imposed by Praja Mandals
for illegal extraction of MAPs.
Explore cultivation of carefully
selected species as a mixed, inter or
companion crop in agro and farm
forestry (Karki et al, 2003)
2. AGRICULTURE AND BIODIVERSITY
2.1 Organic Farming
1.
Scheme for branding,
labelling and marketing,
and value addition of
organic produce of local
varieties
Selling these local
varieties (mentioned in
remarks column) as
premium organic produce,
supported with marketing
can fetch a higher price
and ensure synergy
between
commercialization and
conservation
Introduce a comprehensive focused
program to provide support to
identified niche organic products
such as peas, kala jeera, wild garlic,
kuth, kutki45
S-M Trainings on organic
farming organized
A comprehensive
target-oriented
program is
introduced
Area under organic
shows an increase.
Labelling and
certification
DoA
DoEST
SBB
HIMCOSTE
Some of the traditional varieties of crop in HP
(HPSBB, 2018):
Amaranthus hypochondriacus L. (Amaranth),
Cajanus cajan (L.) Millsp. (Arhar daal),
Chenopodium album L (Chenopod), Cicer
arietinum L. (Chana), Echinochloa
frumentacea Link (Shownk), Eleusine
coracana Gaertn. (Koda), Fagopyrum
esculentum Moench. (Buckwheat), Glycine
max (L.) Merr. (Soybean)
To enhance organic agricultural production, it
is important to adopt and inclusive approach
where farmers are incentivized to shift
towards organic farming
The program should involve
branding, labelling, value added
products, marketing, pricing as well
as cold chains
Training to farmers regarding
suitable organic crop combination,
crop rotation, nutrient and residue
management protocol, crop-
livestock integration, post-harvest
management and storage practices
45 Consultative workshop organized by NIPFP on 25th September 2019 in Kilar, Pangi Valley, Himachal Pradesh

57
S.
No
Recommendations/Strat
egies
Action Points Time
Frame
Indicators Agencies Remarks
Strengthen the facility of
certification of organic produce
Explore potential of PGS
Certification of not for export
varieties. 46
2.2 Community Seed Banks
2. Improve seed viability
and storage technology to
conserve Plant Genetic
Resources for Food and
Agriculture (PGFRA)
through development of
Community Seed Banks
Collaborate with
organizations like
Navdanya which develop
seed banks in various
agro-climatic zones, &
provide training to
farmers.
Establish community seed banks to
make local variety of seeds
available to farmers. Monitor
quality seed production response to
threats posed to plant genetic
resources due to climate change
S-M Number of
community banks
established
Local seeds
classified as being at
risk, not at risk or at
unknown level of
risk of extinction
DoA
DoH
HPSBB
NBA
GBPIHED
Cultivation has been shifting away from
traditional crops which have tolerance to
moisture stress and are adapted to poor
fertile soils: Setaria italica (Koni),
Paspalum scrobiculatum (Kodo), Eleusine
coracana (Ragi), Panicum miliaceum
(cheena), pseudocereals like grain
amaranth, green chenopod and buckwheat
(TERI, 2015).
Agro-climatic zone-wise analysis shows
shifting of farmers preferences away from
traditional crops:
Lahaul- Bunium persicum bioss. (kala
zeera), Fagopyrum esculentum Moench.
(buckwheat), Amranthus candatus L.
(amaranth), Saussurea costus Falc. (Kuth)
and Crocus sativus L. (saffron)
Kullu- Plums, Apples, sarson oilseed
Kangra- Basmati rice and maize crops
Shimla- Cereals and pulses
The following steps should be
followed in setting up and
maintaining a community seed
bank:
Select villages and assess
the needs through FGDs
Identify the farmers and
plan seed production based
upon needs assessment
Provide training to build
capacity
Plan for renewal of
diversity with focus on
traditional and local
varieties
46 PGS Certification facilitates farmers to certify their organic produce, label and market their products domestically. It is a scheme under the Paramparagat Krishi Vikas Yojana (PKVY)

58
S.
No
Recommendations/Strat
egies
Action Points Time
Frame
Indicators Agencies Remarks
Monitor to ensure quality
seed production
Document the amount of
seed available for local use
and supply
(Rana et. al, 2013)
2.3 Fodder management
3. Fodder management
needs to be done to check
shortage of fodder,
especially in winters. The
following
recommendations are
outlined:
1. Revive degraded
pasture lands on regular
basis with native species
(native trees, grass,
legumes) used as fodder
2. Make Nomadic/ Semi-
Nomadic herders such as
Gaddis and other
communities an integral
part of VFDCs to address
the problem of grazing
conflicts
Prepare plans to grow species of
grass, fodder trees and legumes
which are high in protein & can be
planted in high altitude regions of
the state to feed livestock. Such
as47:
Poplar tree (Populus spp.)
Willow (Salix spp.)
Himalayan Birch (Betula utilis)
Sea-buckthorn (Hippophae)
Bichhu Booti (Urtica dioica)
S-M Degradation of
Grazing lands is
halted.
Fodder situation has
improved and
dependence on
forests for fodder is
reduced
Development of
fodder bank model
at suitable sites
established.
DoA
DoAH
Rural
Development
Department
CSKHPKV
IGFRI
PRI
Local
communities
Gupta et al (1998) estimated that in HP, there
was an overall deficit of 32% of fodder
requirement of which deficit was 13% in case
of grasses, 14% in cases of tree fodder and
55% in case of straw.
The grasslands in HP are poor in respect of
their productive potential and carrying
capacity; and there is also an imbalance in
human cattle population (1:1.25) indicating
heavy pressure on natural forest for fodder,
small pole, timber and fuel wood etc
(Khanna, 2019)
Dhyani, Maikhuri and Dhyani (2013) have
developed a Fodder Bank Model in Kedarnath
Wildlife Sanctuary, Uttarakhand. Fast
growing, nutritious and high biomass yielding
fodder species have been identified to include
in the model. Women have been actively
engaged in the model.
Awareness of farmers regarding
efficient use of fodder, for e.g.,
adding of urea and mineral
supplements to enrich crop residues
and dry fodder
Training of local communities in
scientific production &
management of fodder under Uttam
Chaara Utpadan Yojana for higher
productivity of livestock and less
pressure on forests
47 Consultative workshop organized by NIPFP on 25th September 2019 in Kilar, Pangi Valley, Himachal Pradesh

59
S.
No
Recommendations/Strat
egies
Action Points Time
Frame
Indicators Agencies Remarks
3. Training of
communities for fodder
management
Develop a Fodder Bank with
technical help from local
institutions to enhance quantity and
quality of fodder. This will help
local communities in terms of
increased milk output and less
pressure on grazing lands.
2.4 Irrigation
4. Need to revisit irrigation
planning in HP to balance
the need for small hydro
power projects with
traditional irrigation
systems and practices.
Due to small hydro power
projects, there has been
diversion of streams
which is resulting in
drying of traditional
irrigation system called
Kuhls.
The following strategies
may be considered.
1. Promotion of Rain
water harvesting
Promote Kuhls which is a
traditional irrigation practice in the
state48
S Traditional irrigation
systems supported
and revived
Increase in access to
solar pumping sets
DoA
DoH
DoEST
HPSBB
HPAU
ICAR
Rural
Development
Department
The study conducted by Immerzeel,
Stoorvogel, & Antle (2008) showcases the
concept of PES to
Incentivize farmers to save water in a small
catchment on the Tibetan plateau.
Revise small Hydro power policy to
consider the issue of divergence of
water from micro irrigation systems
such as Kuhls49
Explore PES as a mode of
compensation to incentivize
farmers to change irrigation
practices and yield substantial water
savings
Increase the number as well as
reach of solar pumping sets to
farmers under Saur Sinchayee
Yojana
48 https://www.indiawaterportal.org/articles/kuhl-kohli-and-lost-tradition 49 https://www.indiawaterportal.org/articles/kuhl-kohli-and-lost-tradition

60
S.
No
Recommendations/Strat
egies
Action Points Time
Frame
Indicators Agencies Remarks
2. Promotion of solar
energy and pumps
3. Promotion of traditional
irrigation systems such as
Kuhls
2.5 Agro-forestry
5. Rehabilitate degraded
land via agro-forestry
system in lines with
existing crop and
livestock needs.
Identify hotspots of
agroforestry in HP
Promote Silviculture
Incentivize farmers to grow local
varieties by demonstrating and
encouraging suitable farming
practices such as Silvipastoral
system done in Kandaghat block of
Solan District
S-M % of degraded area
rehabilitated through
agro-forestry
A Plan is prepared
on agro-forestry
(agro-climatic zone-
wise)
Number of plants
provided as planting
material to farmers
for agro-forestry
A nodal agency for
restoration is formed
DoA
DoH
HPFD
DoAH
SBB
Involving local communities in reviving
degraded forests via agro-forestry can give
them a sense of responsibility towards
restoration of degraded forests (Matsvange,
Sagonda and Kaundikiza 2016)
Based on four case studies Adhikari and
Taylor (2012) have outlined that communities
should be involved in adaption efforts which
are undertaken as a response towards climate
change.
Strengthen arrangements such as
set-up high-tech nurseries in higher
altitude regions as well as improved
varieties of planting materials to the
farmers for agro-forestry such as
tall plants through already existing
nurseries
Sloping Land Conversion Program
in China which provides subsidies
to farmers who convert degraded
and highly sloping cropland back
into forests can be explored for its
suitability in HP.
2.6 Bio-control agents
6. Strengthen State Bio control labs to
provide suitable bio-control agents
M DoA

61
S.
No
Recommendations/Strat
egies
Action Points Time
Frame
Indicators Agencies Remarks
Use of bio-control agents
should be promoted
This should be
accompanied with
enabling safe use of
pesticides on agricultural
land
especially for higher altitude
regions
Number of trainings
provided to farmers
for Pesticide
Application
Technology
DoH
There are currently 2 State Bio-control labs in
the state50:
Holta, Palanpur, Distt. Kangra
Distt. Mandi, H.P.
As per Himachal Pradesh Horticulture
Development Project, most of the facilities
have already been created in the laboratory to
provide bio-control agents. However, with the
addition of inputs, some more number of Bio-
agents, Bio-pesticides and Bio fertilizers
could be produced51
Provide on-farm training to farmers
in order to ensure adoption of
Pesticide Application Technology
for minimum residue and reduced
pesticide risk
2.7 Adaptation towards climate change
7. Identify relevant tools and
methods to assess the
impact on and
vulnerability of
biodiversity due to
climate change
Establish phenology monitoring
units in the state as a continuous
monitoring source of climate
change. This should be in a program
mode such that adequate monitoring
is undertaken
M-L A program for
adequate monitoring
of climate change
being implemented
No-Go Zones
identified
Integration of
Climate Change
adaptation measures
HPFD
DoEST
SBB
IUCN
BMC
HPKCCC
Phenology is an important indicator for
assessing climate change and should be made
part of further research in the state
Research published by IUCN has made
repeated calls for identifying “No-Go Zones”
in response to environmental threats Map fragile ecosystems and
demarcate them as “No-Go Zones”.
This needs to be accompanied with
identifying critical species which
are vulnerable to climate change for
information and awareness of
farmers, local communities,
50 http://ppqs.gov.in/divisions/integrated-pest-management/bio-control-labs 51 http://documents.worldbank.org/curated/en/215321468252650728/pdf/HPHDP-ESMP-draftfinal.pdf

62
S.
No
Recommendations/Strat
egies
Action Points Time
Frame
Indicators Agencies Remarks
ecotourism activities and other
development works
in existing policies
across relevant
sectors
Ensure availability of drought
resilient seeds, public health
measures for heat-waves, cold-
waves, vector-borne diseases,
disaster risk reduction, water
management as well as climate
smart agriculture
Sensitize communities
8. Strengthen measures to
promote cultivation of
local varieties as
livelihood adaptation
measure in the context of
Climate Change
This would require
improving seed viability,
storage technology,
strengthening of market
channels as well as
awareness raising among
communities
Demonstrate and encourage suitable
agro-forestry systems such as
Hortipastoral, Silvipastoral.
Such systems have been explored
by Kumar, et al. (2018) for
Kandaghat block of Solan District
S-M Community seed
banks established
Number of plant
genetic resources for
food and agriculture
secured in either
medium- or long-
term conservation
facilities
DoA
DoH
SBB
HPSAMB
HIMCOSTE
NBA
BMCs
The suitable crops suggested for Kandaghat
block of Solan district are (Kumar et al.,
2018):
Rabi crops- wheat, pea, mustard, barley and
cabbage, cauliflower
Kharif crops- maize, colocassia, beans,
capsicum, tomato, ginger and turmeric
Additionally, set-up high-tech
nurseries to produce improved
varieties of planting materials like
tall plants that can be grown on
farmlands

63
S.
No
Recommendations/Strat
egies
Action Points Time
Frame
Indicators Agencies Remarks
3. ANIMAL HUSBANDRY AND BIODIVERSITY
3.1 Promoting genetic diversity
1. Arrangements to conserve
and promote genetic
diversity of indigenous
animal species should be
strengthened
Propagation of indigenous breed of
cow by using sex-sorted semen
(SSS) as has been practiced in 10
states in India under Rashtriya
Gokul Mission (Katiyar, 2019)
M-L Bovine stations set-
up
Number of animal
genetic species
secured in medium
or long -term
conservation
facilities
DoAH
SBB
NBA
NBAGR
Sex-sorted semen (SSS) can help in
controlling birth of bulls, reduce stray cattle,
boost milk production, propagate indigenous
species (KAtiyar, 2019)
Sati and Singh (2010) and Koireng et al
(2018) observe that indigenous species of
livestock are more adaptable to the fragile hill
environments than the crossbreed one and
their potentials for economic enhancement of
the region have yet to be utilized.
Indigenous species are losing their economic
viability due to which communities do not
work towards preserving them. Local
communities need to be incentivized towards
preservation of such species.
Set-up more ‘bovine stations’ for
animal preservation through
germplasm collection where genetic
material is stored in the form of
semen, embroys as well as DNAs.
3.2 Stray cattle management
2. Design effective measures
for stray cattle
management. This would
require:
1. Strengthening
arrangements to
Strengthen ‘Gokul
Grams/Gosadans’ to increase the
capacity to accommodate stray
cattle52
M-L Gokul Grams
established
Registration of cattle
completed
DoAH
SBB
NBA
Currently, number of Gosadans and their
capacity to accommodate stray cattle falls
short due to increasing number of stray cattle
Make registration of animals
compulsory with the help of local
52 According to 19th Livestock Census 2012, there are 32160 stray cattle in Himachal Pradesh. Stray cattle Policy 2014 mentions that there are 75 Gosadans with a capacity to house only
7451 cattle.

64
S.
No
Recommendations/Strat
egies
Action Points Time
Frame
Indicators Agencies Remarks
accommodate stray cattle
(PTI, 2015; TNN, 2019)
2.Involving both local
level institutions as well
as local communities to
ensure effective stray
cattle management
3.Designing a mechanism
to identify and punish
defaulters who have
abandon their
unproductive cattle
level formal/informal institutions
such as Panchayat, Yuvak Mandal,
Mahila Mandal
A pilot for sex-
sorted semen
conducted
Gokul Grams have been established under
Rashtriya Gokul Mission in 13 States so far
Conduct pilot for sex-sorted semen
to ensure that female calves are
born using the technology. This will
increase productivity of cows,
profitability of farmers as well as
reduce the problem of stray cattle
(Katiyar, 2019)
Explore providing incentive to local
communities as a possible strategy
such as monthly remuneration to
adopt stray cattle (Sharma, 2019)
3.3 Diseases among livestock
3. Research on diseases
among livestock should
be strengthened
(Jitendran, KP, 2000;
Rana and Randhawa, n.d.)
Conduct studies to identify diseases,
causing agents as well as etiological
agents (Holden and Butler, 2018) of
diseases including the impact of
these diseases on bovines across all
the districts
S Studies on diseases
among livestock
conducted
PBRs being used as
key document in
recording traditional
knowledge
regarding ethno
veterinary practices
DoAH
DoEST
SBB
HPAB
GSB
SAWB
HPSVC
Katoch, et al. (2017) has evaluated the impact
of diseases among bovines along with the
disease-causing agents across 7 districts of
Himachal Pradesh. The existing preliminary
research on diseases among livestock in the
state require further follow up studies across
all the districts on:
Identification of etiological agents and their
origin
Impact evaluation of these diseases on animal
health and production
Document traditional knowledge in
PBRs related to ethno veterinary
plants to cure animal diseases
Similar documentation has been
done for ethno veterinary practices
in Jawalmukhi, as well as Hamirpur
district (Bhatti et al, 2017)

65
S.
No
Recommendations/Strat
egies
Action Points Time
Frame
Indicators Agencies Remarks
Appropriate management and veterinary
practices to reduce incidence of such diseases
3.4 Diseases among migratory livestock
4. Focus needs to be put on
diseases among migratory
livestock. This requires:
1. Identification of
diseases like FMD53,
chlamydial strains
(Bhardwaj, et al. 2017)
2. Creating awareness
among local communities
3.Appropriate
arrangements for
vaccination of migratory
livestock
Conduct regular serological surveys
to calculate rate of titer54 of disease
antibody in the herd
M Surveys conducted
Number of animal
genetic species
secured in medium
or long -term
conservation
facilities
Number of
workshops
organized for
nomadic herders
DoAH
DoEST
SBB
HPAB
SAWB
HPSVC
Pathogens to diseases need to be identified to
avoid widespread epidemics. An early
detection can be an effective controlling
strategy.
Diagnostic kits can be provided to herders to
facilitate rapid diagnostic tests (Ding, et al.
2013).
Make provisions for compulsory
vaccination of cattle before they are
taken for grazing uphill by
nomadic/semi-nomadic community
to avoid the spread of diseases like
Foot and Mouth Disease (FMD)55
53 https://www.rufford.org/files/14311-1%20Detailed%20Final%20Report.pdf 54 https://labtestsonline.org/glossary/titer 55 https://www.rufford.org/files/14311-1%20Detailed%20Final%20Report.pdf

66
S.
No
Recommendations/Strat
egies
Action Points Time
Frame
Indicators Agencies Remarks
Organize workshops for semi-
nomadic/nomadic communities to
make them aware regarding
preventive strategies such as timed
sequences of treatments for
livestock, evasive strategies such as
anthelmintic treatment56
3.5 Yak population
5. The issue of declining yak
population due to climate
change need to be curbed
by strengthening
arrangements for Yak
breeding (Sharma, 2018)57
Involve local communities
in high altitude in the
planning process to
increase yak population
Document and disseminate
indigenous knowledge of yak
rearers in the state
M PBRs to be used as a
document for
traditional
knowledge related to
yak rearing in high
altitude regions
Yak Breeding unit
established
DoAH
SBB
SAWB
HPKCCC
All India level documentation has been done
by National Research Centre on Yak for
Indian Yak rearers (Ramesha, et al. 2009)
There exists enormous knowledge among yak
rearers in uphill that can be tapped in PBRs
Himachal Prakriti, an NGO in Uttarakhand
maintains a breeding herd of Yaks in the
Ralam Valley and is currently exploring the
option of putting in place a system of freezing
yak semen for animal artificial insemination.
Scope of such initiatives can be explored for
Himachal Pradesh
Increase the number of Yak
breeding farms similar to the
breeding farm (with 51 yaks) in
Lari, Lahual and Spiti district
Facilitate artificial insemination
using yak semen in the remote
regions of the state to increase yak
population58
56 http://www.hpagrisnet.gov.in/Agrisnet/AnimalHusbandry/pdf%20files/DM.pdf 57 There has been a decline in yak population in Himachal Pradesh from 5690 (Census 1997) to 2921 (Census 2012) 58 http://www.himalprakriti.org/?q=content/yak-breeding

67
S.
No
Recommendations/Strat
egies
Action Points Time
Frame
Indicators Agencies Remarks
3.6 Fodder management
6. Provide training to
farmers and other local
communities for scientific
production and
management of fodder
Document methods to educate
farmers to enrich crop residues and
use it as fodder by adding urea,
mineral supplements, etc.
S A detailed training
manual for scientific
production of fodder
being prepared
Number of trainings
provided to farmers
for fodder
management
DoA
Rural
Development
Department
DoAH
SBB
Shortage of fodder is an issue particularly in
winter season where cattle holders have to
move uphill to graze their cattle or go the
forest area to collect fodder.
In such as case, process of improving crop
residues in terms of its nutritive value can be
explored
Demonstrate the process of
improving nutritive value as well as
taste of crop residues as feedstock
to farmers, such as a 21-day
treatment process organized by
ICRISAT in Karnataka (ICRISAT,
2018)
3.7 Grazing Policy
7. Grazing Policy needs to
be formulated and
implemented in the state
Formulate a grazing policy to
outline guidelines for management
and development of pasture lands
by:
Defining zones for grazing
in higher altitude regions of
the state
Identify and revive pasture
lands for natural prey base
(such as ibex, blue sheep)
of wild carnivores (such as
snow leopards, black bear)
Organizing workshops at
block level to make
nomadic herders like
Gaddis aware of the
M Grazing Policy
formulated
Zones for grazing
defined
Workshops for
nomadic herders
conducted
Suitable grass
species and fodder
trees planted
NBPGR
HPFD
DoA
DoAH
HPAU
Identification and plantation of species for
high altitude regions (that can be used to stall
feed livestock) can help in the following
ways:
Pasture lands can be revived to
maintain wild animal base in forests
Availability of fodder can help in
preventing herders to enter wild
animal habitat for grazing livestock
Some species have already been identified
by the State Government (DoA, n.d.):
Zone 1:
Siratro (Macroptilium atropurium)
Glycine (Neonotonia weightii)
Dolichos (Macrotyloma axillara)
Zone 2:

68
S.
No
Recommendations/Strat
egies
Action Points Time
Frame
Indicators Agencies Remarks
harmful impacts of
overgrazing
Put a cap on number of
livestock each herder takes
up hill while issuing
permits for grazing
Based upon routes taken by
nomadic herders uphill,
identify spots to establish
check points and provide
vaccination to migratory
livestock
Identify species of grass,
fodder trees and legumes
which are high in protein &
plant them across agro-
climatic zones of the State
to feed livestock59
Glycine (Neonotonia weightii)
Dolichos (Macrotyloma axillare)
White clover (Trifolium repense)
Red clover (Trifolium pratense)
Zone 3:
Red clover (Trifolium pratense)
White clover (Trifolium repens)
Zone 4:
Lucerne (Medicago sativa)
White clover (Trifolium repens)
Red clover (Trifolium pratense)
4. AQUATIC BIODIVERSITY
4.1 Wetlands
1. Strengthen existing
protocols to regulate
overgrazing and mass
tourism
Prepare wetland data-base
including:
Biological diversity (plant
and animal species and
population, genetic
M Database prepared
HPFD
DoEST
DoF
Wetland ecosystems and services have been
under constant threat mainly due to increasing
anthropogenic pressures: Overgrazing and
Mass tourism
59 Some of the species identified for high altitude during consultative workshop organized by NIPFP on 25th September, 2019, are Poplar tree (Populus spp.), Willow (Salix spp.), Himalayan
Birch (Betula utilis), Sea-buckthorn (Hippophae), Bichhu Booti (Urtica dioica).

69
S.
No
Recommendations/Strat
egies
Action Points Time
Frame
Indicators Agencies Remarks
diversity, microbial
diversity)
Socio-economic values and
potential (and real) threats
Studies on the status
of wetlands
conducted
Proportion of water
bodies with good
ambient water
quality
Change in the extent
of water-related
ecosystems over
time
HPSBB
HIMCOSTE
HPSWA
ZSI
GBPIHED
Chemical-intensive agricultural practices are
causing eutrophication of water bodies which
has negative impacts on wetland ecosystem
Identify wetlands facing
environmental degradation and
develop site-specific action plan for
restoration
Strengthen the focus on wetland in
agriculture sector’s environmental
commitments to develop
cooperation between agricultural
practices and environmental
protection (ICRISAT, 2018)
Promote eco-tourism over
Mass/expansionary model of
tourism, especially for wetlands
which are facing environmental
degradation
4.2 Revival of fish species
2. Rehabilitation of fish
species needs to be done
to revive the affected fish
spawning grounds due to
To improve the quality of cultivable
species and genetically improved
strains in the supply chain, establish
and strengthen fish brood bank,
especially for native species such as
mahseer (ICAR, 2018), 60,
M
Rehabilit
ation
Fish brood bank
established
DoF
DoEST
HIMCOSTE
Hydraulic flushing can be explored as a
possible solution to desilt the river bed
60 http://www.dcfr.res.in/user_upload/90_noticerecommendations.pdf

70
S.
No
Recommendations/Strat
egies
Action Points Time
Frame
Indicators Agencies Remarks
silting of riverbeds and
reservoirs (Sharma, 2013)
In light of increasing the population
of native fish species and
conserving their germplasm in HP,
take initiatives such as
‘rehabilitation programmes’ for
ranching fish seed of mahseer and
snow trout61
should
be an
ongoing
process
Rehabilitation
programs designed
and executed
Designation of fish
sanctuaries in rivers
Desilting of
riverbeds and
reservoirs done on
regular basis
HPSPCB Rehabilitation of fish species can be
developed by making fish eco-parks where
angling as a sport can be encouraged with
scientific catch and release method.
Designate deep pools in rivers as
fish sanctuaries in consultation with
Fisheries Department, Universities
and local communities (HP
Environmental Master Plan, 2013)
Explore methods such as manual
excavation and dredging of material
for hydraulic flushing62 to desilt the
riverbeds and reservoirs (Draft
Policy on Sediment Management,
2017)
4.3 Construction of dams
3. Adequate ‘water flow
release pattern’ from
dams to maintain natural
ecological functions of
wetland ecosystem should
be maintained
Conduct Environmental Flows
Assessment (E-Flows) to determine
River Health Regime, which
describes the temporal and spatial
variations in quantity and quality of
water required for freshwater and
estuarine systems to perform their
natural ecological functions
(Thakkar, 2015)
S E-Flows assessment
conducted
DoE
DoF
Water abstraction for power generation is one
of the biggest reasons to reduce appropriate
water flow which disrupts aquatic life.
Recommendations from report of three-
member committee on assessment of
environmental flows (E-flows) should be
61 One such programme has been done at Pancheshwar, Uttarakhand: https://www.dcfr.res.in/user_upload/67_noticePancheshwar_Angling_Event_2016.pdf 62 https://pdfs.semanticscholar.org/63ed/674b59e97b15bf4cc720fe44ca7c9396466b.pdf

71
S.
No
Recommendations/Strat
egies
Action Points Time
Frame
Indicators Agencies Remarks
Periodic check on hydropower
projects for an already existing
mandate of 15-20% lean season
water flow downstream
(Vijayakumar vs State of Himachal
Pradesh, 2019; Kennedy et al, 2016)
considered in improving the health of rivers
(Thakkar, 2015)
Make small adjustments in flow
regime in hydel projects during
hydro peaking to conserve shoreline
river bed habitat (Dandekar, 2012)
4.4 Fish movement
4. Mandate appropriate
channels to check
obstruction of fish
movement and facilitate
easy fish movement
through dams
(Theophilus, 2014)
Dams to provide fish ladders/ fish
pass for the movement of fishes
compulsorily (Sharma, 2013)
S Assessment of fish
dams for fish ladder
done
DoE
DoEST
DoF
HIMCOSTE
DoF
Fish population is affected due to obstruction
in its movement. Moreover, Hydro Power
Projects also impact breeding grounds for
fishes. There is no study to document project-
wise impact on fisheries in the state.
Every project should have a mandatory fish
pass/fish ladder. Such a requirement should
be made compulsory for all the projects to get
approved before their construction.
Timely removal of fallen rocks and
debris from fish pass channel in the
dams
Assessment of design of fish ladder
for both existing as well as
upcoming dams.
Physical and hydraulic
characteristics of different fish
ladders impact fish species
movement differently
4.5 Pollution
5. Urgent need for plan to
address CPCB identified 7
Conduct study to estimate the gap
between total sewage generation
and treatment capacity of STPs in
the state to plan effective sewage
M-L Installed sewage
treatment capacity
as a proportion of
DoE
DoI
Septic tanks that have been constructed
around water bodies result in seepage of
pollutants into these bodies. Analyzing
current and future scenarios for capacity of

72
S.
No
Recommendations/Strat
egies
Action Points Time
Frame
Indicators Agencies Remarks
polluted river stretches in
HP
management (IANS, 2014; CPCB,
2019; IANS, 2019 (ii))
sewage generated in
urban areas
Proportion of waste
treated
Percentage of
industries complying
with waste water
treatment as per
CPCB norms
HPSPCB
sewage treatment plants paves a way forward
to enhance the capacity of such plants
(Batliwala and Kania 2019).
CPCB (2018) report has identified 351
polluted stretches across 323 rivers in India
out of which 7 stretches in Himachal Pradesh
have been identified as “Critically Polluted”63
River Rejuvenation Committee should take
recommendations of such reports.
Identify locations to lay down
additional pipelines to treat
effluents before their disposal in
river (Action Plan for Baddi
Industrial Cluster, 2018)
Involve public in reporting
discharges by default industries
(CPCB, 2019)
5. MICROBIAL DIVERSITY
5.1 Microbial diversity database
1. Documentation of
microbial diversity (in
both aquatic and
terrestrial ecosystem)
across the state by
preparing web-based
curated microbial
diversity database should
be done (Dasgupta, 2014;
Bhalla, 2015)
Identify locations using geo-based
plotting (Bhattacharjee and Joshi,
2014) across a diverse range of
temperature, altitudinal and soil
gradients to collect soil samples and
characterize biochemical64,
morphological65 and molecular
properties (Dasgupta, 2014)
S-M
Strength
ening of
portal
should
be a
continuo
us
process
A comprehensive
microbial diversity
database prepared
An interactive web
portal designed
where online user
registration allows
access and use of
data with other
institutions
HPFD
DoEST
SBB
HIMCOSTE
ENVIS
BSI
ZSI
Currently, HP ENVIS portal does not provide
detailed data on microorganisms in the state
Making a portal will help keeping a track of
data usage and identifying data needs by
researchers. Such an ongoing process will
ensure timely updating of the portal
Create a web portal to provide
information, allow data download
as well as answers to frequently
asked queries by microbiologists
63 http://www.indiaenvironmentportal.org.in/files/file/Report%20on%20River%20Stretches%20For%20Restoration%20Of%20Water%20Quality.pdf 64 Properties such as utilization of nutrients and products of metabolism 65 Physical properties such as cell size, type, etc.

73
S.
No
Recommendations/Strat
egies
Action Points Time
Frame
Indicators Agencies Remarks
similar to North East India
Microbial Database (NEMiD)
(Dasgupta, 2014)
Documentation of traditional
knowledge in PBRs related to use of
microorganisms in fermented food,
beverages, dyes, Ayurvedic
medicines as well as in agricultural
fields66
5.2 Application of microbes in farming
2. Identify and strengthen
measures for utilization of
plant growth promoting
microbes (PGPM) which
can be used as a substitute
to agri-xenobiotics
(Juchau and Chen, 1998)
This will result in
reduction in use of
chemicals on farmlands as
well as utilization of
bioremediation, bio
control and bio fertilizer
properties of microbes in
agriculture
Conduct study to:
1. Identify response of soil
microbial community to
organic fertilizers to
explore the applications of
microbes in farming in the
state
2. Identify bio control agents
suitable for different agro-
climatic zones such as
pathogens to weed
3. Collect soil samples from
each agro-climatic zone
and test them to analyse
the impact of chemicals
used in agricultural lands
on microorganisms
M Studies to document
applications of
microbes in
agriculture
conducted
Percentage use of
nitrogen fertilizer
out of total N,P,K,
(Nitrogen,
Phosphorous,
Potassium)
Awareness
workshops
conducted
DoEST
DoAH
HPAU
IHBT
Kaushal, et al. 2011 have explored PGPM
that includes mycorrhizal fungi and several
genera of bacteria. Based upon the properties
of these microbial species, the following
applications have been suggested:
Use of PGPM to improve capsicum
productivity under mid-hill conditions in
North-Western Himalayan region
Enhancement of phosphorous and nitrogen
content of shoot and root
Treatment of tomato crop using bacteria B.
subtilis CKS1strain to increase root and shoot
length (Kaushal, et al. 2011)
Facilitate availability of
endosymbionts to farmers for
66 http://www.bdu.ac.in/schools/biotechnology-and-genetic-engineering/biotechnology/sekardb.htm

74
S.
No
Recommendations/Strat
egies
Action Points Time
Frame
Indicators Agencies Remarks
biological nitrogen fixation such as
Rhizobium (Sly, 2010)
The recommendations can be utilized to
explore the application of microbes in organic
farming in the state To spread awareness among farmers
for use of microbes on farmlands
instead of chemicals, conduct
awareness workshops based upon
recommendations of scientific
studies to explore the use of
microbes in improving agricultural
productivity
This can also be done by including
information on microbial diversity
and related threats in workshops
organized by HPSBB for local
communities67
5.3 Conservation of aquatic microbial diversity
3. Conservation measures
for aquatic biodiversity
should include microbes
by:
1. Incorporating micro
biodiversity in the impact
assessments of projects
2. Developing indicators
for microbial monitoring.
One such application has
Explore the application of
developing microbial indicators in
Environmental Impact Assessment
of developmental projects (such as
dam construction) should consider
impact on microorganisms as well
(NBAP, 2008)
S Studies conducted
for micro-
biodiversity
inclusive
environment impact
assessment
DoE
DOEST
Study done by Sims, et al. (2013) outlines the
following:
Assessment of wetland health conditions
should include microbial indicators
Effective restoration of wetlands can be done
in lines with bacterial diversity
Such recommendations can be referred to in
assessing environmental health of natural
resources
Strengthen Microbial Germplasm
Bank (MGB) in the state to expand
the scope of research to include
aquatic microbial diversity
67 http://www.hpbiodiversity.gov.in/Workshop_1.aspx

75
S.
No
Recommendations/Strat
egies
Action Points Time
Frame
Indicators Agencies Remarks
been explored in wetland
assessment
Provide adequate resources to research
institutes to hire experts and facilitate them
with equipment
The scope of research on microbial diversity
should be expanded to include issues related
to aquatic microbial diversity such as ‘impact
of quarrying river beds on
microorganisms’
5.4 Direct-fed microbes
4. Explore the application of
microbes (called Direct-
fed Microbes) to augment
indigenous cattle
performance
Expand the scope of research to
identify DFM to improve health and
productivity of livestock
Methodology of the above-
mentioned studies can be adopted to
facilitate the research
S Scientific studies
conducted
DoAH
HPSVC
DoEST
HPAU
I
HBT
A number of universities have Microbiology
Department. Experts in these departments can
be facilitated with appropriate funds to
conduct research & explore the application of
microbes in enhancing productivity of
indigenous cows in the state
6. TOURISM
6.1 Ecotourism
1. There is a need to shift
from an Expansionary
Model of Tourism/Mass
Tourism to Eco-tourism
Undertake capacity building
programme for local communities
for “high value-low impact” tourism
S-M Capacity building
program for local
communities
designed
TCAD
HPFD
PRI
Local
communities
Studies related to analyses of local residents’
perception can be conducted such that they
can be made an integral part of tourism
planning to promote community-based
tourism (Lee and Jan 2019) Promote community-based eco-
tourism where local communities
are involved such as impart training
for home stays in rural areas under
‘Home stay policy (2008)’

76
S.
No
Recommendations/Strat
egies
Action Points Time
Frame
Indicators Agencies Remarks
Encourage high-value tourists such
as international tourists
Establish convergence between
‘Ecotourism policy’ of Forest
Department and ‘Tourism policy’ of
Tourism Department
Seek Global Certification
from organisations such
as the Global Sustainable
Tourism Council
(GSTC). Being certified
means that the state
complies with the highest
social and environmental
standards on the market.
Certification will provide
credibility and enhance
regulated tourism
The GGD standard has more than
400 indicators that provide hotel
and tour operators a map that takes
executives and entrepreneurs on a
path to be more successful in their
business while being responsible
with employees and their families,
the community, the cultural heritage
and traditions including the
environment.
S-M Major tourist areas
certified
TCAD
HPFD
The GREAT Green Deal Sustainable
Certification Program (GGD) represents a
way of doing business while taking care of all
stakeholders involved in the tourism
operations
6.2 Carrying capacity
2. Conduct carrying
capacity studies to limit
the maximum number of
tourists at a time
Develop indicators to establish links
between use levels and impacts of
tourism on environment
S-M Carrying capacity
studies conducted
TCAD
HPFD
Lindberg, McCool, & Stankey (1997) outline
that focusing only on the number of tourists
can result in misguided simplicity. It has been
recommended that indicators selected for
conducting carrying capacity should stem out
of desired social, economic as well as
ecological conditions.
Establish rationing system for
tourists such as ‘first come, first
serve’ to limit the access to
ecologically fragile areas
Design programs to divert trekker
influx to less ecologically fragile
areas.

77
S.
No
Recommendations/Strat
egies
Action Points Time
Frame
Indicators Agencies Remarks
6.3 Payment for ecosystem services
3. Explore PES
model for tourism which
provides a fair and
equitable mechanism to
incentivize communities
for biodiversity
conservation
Identify opportunities for PES. An
“Opportunity assessment” should be
conducted to develop PES scheme
for tourism
M Opportunities
assessment for PES
conducted
TCAD
HPFD
SBB
Currently, the following fees is being charged
in HP:
Permit fee for cars entering
Rohtang Pass, Kullu
Green Fees in Manali
A best practice guide developed for PES
outlines that PES should be clearly informed
by opportunities assessment to identify the
beneficiaries as well as the funding streams
(Smith et.al, 2013)
In order to generate funds in Philippines’
National Park, for the continuous preservation
of reefs, the Management Board placed user
fees on recreational scuba divers. This user
fees constitutes a fund, used for maintenance
of the national park (Macandog, 2016)
The following are the indicative
ideas for the model:
Trekking trails with tourism
influx should have a permit
fee associated to the
entrance such as Triund
(Kangra), Kheerganga
(Kullu)
Permit fees should be
imposed for vehicles
entering valleys/pass such
as Sach Pass, Khajjiar
(Chamba)
6.4 Impact Assessment
4. There should be a study
for assessing the impacts
of specific tourism
activities like trekking,
off-road driving, camping
The impact of these
activities should be
studied on habitat
disturbances, solid waste
Conduct Environmental Impact
Assessment of tourism activities in
HP:
Trekking and camping
Adventure sports
Pilgrimage tourism
Off-road driving
S Impact assessment
for each tourist
activity in HP
conducted
TCAD
DoEST
HPFD
A case study has been done for Ladakh, using
GIS modelling. The study assesses the impact
of various tourism activities like trail-use,
trekking, off-road driving, and camping.
The stressor intensity, receptor vulnerability
and value have been assessed. This study is
suitable to support the drawing of tourism
plans and policies68
68 https://www.zobodat.at/pdf/IGF-Forschungsberichte_2_0062-0070.pdf

78
S.
No
Recommendations/Strat
egies
Action Points Time
Frame
Indicators Agencies Remarks
accumulation, water
pollution, air pollution
and soil health
7. ECONOMIC VALUATION AND NATURAL CAPITAL ACCOUNTING
7.1 Economic valuation of biodiversity
1. Assessment of
biodiversity to be
explored using economic
valuation methods
Need to focus on
economic valuation of
bio-resources for ABS
mechanism
Develop institutional mechanism to
facilitate ABS, incorporating the
real values of bio-resources and
ensure a stream of benefits to local
communities who are ‘providers’
(Nelliyat, n.d.)
M Studies on economic
valuation of bio-
resources
MoEF&CC
HPFD
HPSBB
DoA
DoH
DoEST
FSI
HP is rich in floral species with 3400 species
in 1038 genera.
Species of genera Asteraceae, Poaceae &
Fabaceae, Carex, Polygonum, Poa are
important bio-resources
A number of plant species are used as
traditional veterinary medicines in HP69:
Roost of Thalictrum foliolosum are
used to treat boils and Foot and
Mouth disease
Cell-sap of Pyrus pashia for
Conjunctivitis
Leaves of Leucas lanata are used to
cure Diarrhoea
HP is rich in MAPs which are extracted in
huge quantities: Aconitum heterophyllum,
Angelica glauca, Berberis spp., Betula utilis,
Centella asiatica, Ephedra gerardiiana,
Picrorhiza kurrooa, Podophyllum
hexandrum, Selinum tenuifolium, Valeriana
spp.
Support studies for measuring the
economic valuation of bio-resources
for appropriate benefit sharing,
using revealed preference
approaches:
Observed market value and
related goods approach
The productivity approach
Cost-based methods
69 http://www.hillagric.ac.in/edu/covas/vpharma/winter%20school/lectures/38%20Herbal%20bioresources%20of%20HP.pdf

79
S.
No
Recommendations/Strat
egies
Action Points Time
Frame
Indicators Agencies Remarks
Based upon marginal willingness to
pay by the pharmaceutical
companies, the net bio-prospecting
value/ha for Himachal Pradesh has
been estimated to be Rs. 31,758
(Gundimeda et. al, 2006)
The study to for economic valuation of forests
in HP has found that the maximum per
hectare value is generated by watershed
function followed by carbon sink,
biodiversity, ecotourism (all non-marketed
values) and recommends the following
(Verma, 2000):
The difference between estimated and
actual market value to be interpreted
to reflect true contribution of forests
To compensate forestry sector for
indirect benefits to other sectors
Utilize the valuation studies to claim
actual share in allocation of
developmental funds
Integrate recommendations of
studies conducting sector-wise
economic valuation of ecosystem
services into various
schemes/programmes
The study conducted for forest
sector in HP estimates ‘the total
value of goods/services in terms of
area under tree cover and scrub
forest’ to be Rs. 7.45 lakh/hectare
7.2 Natural Capital Accounting
2. Explore application of
Natural Capital
Accounting to all the
sectors in HP
Prioritize ecosystem services in
research conducted for valuation not
only on the basis of higher
economic benefits but also on the
basis of sensitivity to environmental
changes and their significance to
environmental thresholds
M Number and
coverage of
ecosystem services
in valuation studies
Reflection of
biodiversity and
ecosystem studies in
policy decisions,
planning and
reporting processes
MoEF&CC
HPFD
DoA
DoH
DoAH
DoEST
TCAD
SBB
FSI
Natural Capital Accounting has been explored
by IIT Bombay for Forest Sector in Himachal
Pradesh and recommends the following
(WAVES, 2015):
Feasibility and planning study should
be conducted for all the sectors
Population pressure and its impact on
environment to be included in the
policy planning
Modify training modules towards
ecosystem approach to build capacity
Training of institutions like
Panchayati Raj
Measure the value of depletion and
degradation of biodiversity and
examine ways to conserve forests
by linking with PES, REDD+, etc.

80
S.
No
Recommendations/Strat
egies
Action Points Time
Frame
Indicators Agencies Remarks
Conduct analysis for various sectors
8. EDUCATION, AWARENESS AND TRAINING
8.1 Environmental education
1. Mainstream
environmental studies in
education to increase
awareness about
biodiversity conservation
Revise curricula to incorporate
subject areas such as integrated
mitigation, adaptation, impact
reduction and early warning for
climate change
Ongoing Extent to which
environmental
education for
sustainable
development is
mainstreamed in
primary, secondary
as well as tertiary
curricula
Plantation drives
organized
CBSE
ICSE
HPBOSE
DoEE
HPFD
SBB
There has been considerable progress in terms
of trainings and workshops. Moving towards
more innovative methods of awareness using
electronic as well as print media can also be
considered.
Organize plantation drives to ensure
plantation of shrubs as well as trees
in accordance to different agro-
climatic zones
8.2 Awareness through communication media
2. Awareness regarding
biodiversity conservation
should be created through
appropriate
communication media
Promote communication media
such as short films and
documentaries, besides stories in
print media such as weekly columns
in local dailies. These can include
topics ranging from conservation
challenges, to HP’s vast ecological
wealth
S Short films prepared SBB

81
S.
No
Recommendations/Strat
egies
Action Points Time
Frame
Indicators Agencies Remarks
8.3 Community-based natural resource management
3. Community-based natural
resource management to
strengthen biodiversity
conservation
Regulate enforcement of
biodiversity related community-
level rules (by-laws) such as
penalties imposed by Praja Mandals
for illegal extraction of medicinal
and aromatic plants
Ongoing Community-level
rules (by-laws)
regulated
Number of trainings
organized for local-
level institutions
MoEF&CC
HPFD
SBB
DoTD
YSSD
Resurgence and strengthening of such local-
level institutions should be an ongoing
process across all the districts
Promote collaboration between
institutions such as self-governing
bodies like Praja Mandals,
Panchayat, VFDCs, VFDSs, JFM,
local administration, research
institutes as well as NGOs
Identify training needs that
strengthen the role of institutions
like Van Panchayats, Yuvak
Mandals, Mahila Mandals, Praja
Mandals
8.4 Development of portal
4. A portal for documenting
and sharing national and
international best
practices to relevant
functionaries and
stakeholders should be
developed
This may be included in the scope
of work of ENVIS, covering global
& national best practices, and
spreading awareness about HP’s
achievements and conservation
programmes.
S Portal being
developed
HPFD
DOEST
SBB
ENVIS

82
S.
No
Recommendations/Strat
egies
Action Points Time
Frame
Indicators Agencies Remarks
9. POLICIES, LAWS & INSTITUTIONS
9.1 Procurement of green products
1. Public procurement
practices should be
revisited for green
products
Develop sustainable public
procurement manuals for line
departments to encourage
procurement of green products
based upon life-cycle costing70
M Material footprint per
capita, or material
footprint per GSDP71,
72
Sustainable public
procurement policy
implemented
DoI
Procurement of green products includes:
electrical appliances, paper, daily
consumables, construction material, etc. can
help in promoting sustainability in both
consumption and production
9.2 Community participation
2. Adapting capacity73 of
local communities to
adverse impacts of
climate change should be
focused in policy making
Explore the suitability of
Adaptation Coalition Framework74
(ACF) to create community
institutions with the mandate of
increasing resilience to climate
change over the long-term
This can be done by facilitating
coalitions/alliances of local
communities and mobilising local
M Climate resilience
incorporated in
policy-making
Pilot ACF
conducted
DoEST
PRI
JFM
VFDCs
Local
Communities
ACF has been outlined in a study by World
Bank where suitability of this framework has
been assessed for Latin America (Ashwill,
Flora, & Flora, 2011).
The four basic steps of ACF includes
knowledge exchange, Training and
Information Gathering, Feedback and
Planning and Strengthening Coalitions.
70 Life-cycle cost refers to the total cost over the life of an asset and can include costs before, during and after the usage of an asset 71 The indicator developed with an aim to ensure resource efficiency in both consumption and production. This will include use of paper, plastic, water use, biomass use, fossil fuel
minerals, non-fossil fuel minerals and metals (industry, agriculture, residential, commercial, transport, municipal levels), use of local materials in construction 72 As per the report, “Going Green: Best Practices for Sustainable Procurement” published by OECD, the total volume of public procurement in India is estimated to constitute about 30%
of gross domestic product (GDP). Accessible at: oecd.org/governance/ethics/Going_Green_Best_Practices_for_Sustainable_Procurement.pdf 73 Adaptive capacity is the degree to which adjustments in practices, processes, or structures can moderate or offset the potential for damage or take advantage of opportunities created by
a given change in climate 74The Study by World Bank, “Building Community Resilience to Climate Change Testing the Adaptation Coalition Framework in Latin America” defines Adaptation Coalition Framework
as Derived from the Advocacy Coalition Framework, is a process through which local groups form coalitions or alliances with outside groups around climate change issues in order to
achieve common desired futures. Accessible at: http://siteresources.worldbank.org/EXTSOCIALDEVELOPMENT/Resources/244362-1232059926563/5747581-
1239131985528/Adaptation-Coalition-Framework-Latin-America_web.pdf

83
S.
No
Recommendations/Strat
egies
Action Points Time
Frame
Indicators Agencies Remarks
assets including human, social and
financial.
The feasibility of this framework has been
analysed and presented as case studies for
Argentina, Bolivia, Dominican Republic,
Paraguay as well as Peru
9.3 Investment in agricultural research
3. Increase investment in
agricultural research,
infrastructure and
technology development
as well as plant gene
banks
Develop Agriculture Orientation
Index75 to compare government
spending on agriculture vis-à-vis its
contribution to total economy
S
Should
be an
ongoing
exercise
The agriculture
orientation index for
government
expenditures
prepared
DoA
DoH
HPAU
ICAR
Such an analysis throws light on the extent to
which government expenditure is required for
agriculture with an aim to improve food
security, reduce inequalities, inclusive
growth76
9.4 Regional cooperation
4. Promote regional
cooperation between
Himalayan States by
strengthening existing
mechanisms and explore
possibility of new
agreements
Agreements should increase access
to science, technology and
innovation and enhance knowledge-
sharing on mutually agreed terms.
Exchang
e of
knowled
ge
should
be an
ongoing
process
Cooperation
agreements between
Himalayan States
signed
Himalayan
State Regional
Council
Himalayan State Regional Council has been
constituted on the basis of the
recommendation of Five thematic Working
Group Reports of NITI Aayog. This council
was constituted with an aim to promote
sustainable development in the Indian
Himalayan Region.
The work on Post 2020
framework is in progress
at the CBD. Once the new
framework and targets are
A plan along with a budget should
be made ready for necessary
revision in this SBSAP Report.
Planning
,
Manage
ment and
SBB
Subject
experts
75 The Agriculture Orientation Index (AOI) for Government Expenditures is defined as the Agriculture Share of Government Expenditures, divided by the Agriculture Share of GDP,
where Agriculture refers to the agriculture, forestry, fishing and hunting sector. The measure is a currency-free index, calculated as the ratio of these two shares. This indicator will measure
progress towards SDG Target 2.a. Accessible at: http://www.fao.org/sustainable-development-goals/indicators/2a1/en/ 76 http://www.fao.org/sustainable-development-goals/indicators/2a1/en/

84
S.
No
Recommendations/Strat
egies
Action Points Time
Frame
Indicators Agencies Remarks
developed and notified,
there will be a need to
align the SBSAP of
Sikkim with the new
biodiversity framework.
Coordina
tion
One District One Product
(ODOP) is an initiative
which is seen as a
transformational step
forward towards realizing
the true potential of a
district, fuel economic
growth and generate
employment and rural
entrepreneurship, taking
us to the goal of
AtmaNirbhar Bharat.
All twelve districts of HP have been
listed in the scheme. An inter-
ministerial group or an expert group
with representatives of the relevant
departments should be formed to
finalise the products under the
scheme.
Relevant
departments
SBB
Department of
Planning
ODOP initiative is operationally merged with
‘Districts as Export Hub’ initiative being
implemented by DGFT, Department of
Commerce, with Department for Promotion
of Industry and Internal Trade (DPIIT) as a
major stakeholder.
Seek support from the
National Biodiversity
Mission under their
programmes related to
building an inventory of
India’s Biodiversity,
mapping key ecosystem
services, developing
various conservation
actions while maximising
benefits to local people,
quantify the role of
India’s forests, and
components under
Planning in this direction would
include, among others,
identification of sites for the pilots,
and products to be promoted; and
strengthening of BMC both in terms
of capacity and finances.
The Mission will focus on 117 aspirational
districts in the country; and in HP, Chamba
has been identified as an aspirational district.
The Mission proposes a national effort that
aims to transform biodiversity science by
linking it to the peoples’ economic prosperity.
It further aims to help India realize the United
Nation’s Sustainable Development Goals by
using India’s rich biodiversity to create
solutions for challenges in agriculture, health,
and climate change.

85
S.
No
Recommendations/Strat
egies
Action Points Time
Frame
Indicators Agencies Remarks
Biodiversity and
Agriculture, and
Biodiversity and Health
Programmes.
As part of the preparatory phase, the
mission’s programs will be implemented in
two pilot districts - west Sikkim and Raichur
in Karnataka. The Panchayat-level
biodiversity management committees will
create a "people's biodiversity register",
which will document the flora, fauna and
traditional knowledge of people about them.
Before launching the full-fledged project,
pilot will be carried out in these two districts.
The objective of the pilot will be to test the
interest and involvement of local
communities. NBA will be the nodal agency
of the mission.
Source: Authors

86
Chapter 5: Biodiversity Expenditure Review
5.1 What is a Biodiversity Expenditure Review (BER)
Biodiversity Expenditure Review (BER) is a standard tool used to map the sources and amount
of funds flow towards biodiversity and ecosystem conservation and protection. It is a useful
instrument in assessing the alignment of an economy’s concerns and priorities in respect of
biodiversity loss with its expenditure on conservation of biodiversity77. In this report the
purpose of BER is to map and estimate the current expenditure on biodiversity through various
schemes and programmes of the central, state and district plans. The BER is in turn used to
estimate the additional funding required for implementing the proposed SBSAP in HP.
Biodiversity expenditure can be direct (restoration, tree planting and other conservation and
protection activities) or indirect (training awareness building of stakeholders, research,
measuring and mapping of biodiversity etc.). Similarly, expenditure on biodiversity can be to
achieve one or more goals of CBD or achieve one or more NBTs. Therefore, it is important to
have a framework (Table 5.1) for the analysis of BER results to examine which aspects of
biodiversity conservation have been addressed adequately and where gaps remain.
Table 5.1: Framework Used in Analysis of BER Strategic Goal
A
Strategic
Goal B
Strategic
Goal C
Strategic Goal D Strategic Goal
E
CBD
Strategic
Goal
Address
underlying
causes of
biodiversity
loss by
mainstreaming
biodiversity
across
Reduce
direct
pressures on
biodiversity
and promote
sustainable
use
Improve the
status of
biodiversity
by
safeguarding
ecosystems
species and
genetic
diversity
Enhance the benefits to
all from biodiversity
and ecosystem services
Enhance
implementation
through
participatory
Planning,
knowledge
management
and Capacity
building
NBTs NBTs (1,2,10) NBTs
(3,4,5, 6)
NBTs (6 & 7) NBTs (3,8, 9) NBTs (10,11,
12)
Aichi
Targets
1,2,3&4 5,6,7,8,9 &
10
11,12 & 13 14,15 & 16 17,18,19 & 20
BIOFIN
Taxonomy
Biodiversity
Mainstreaming
Sustainable
use of
Resources
except
Prevention
& Control of
invasive
species
(Aichi
Target 9 &
NBT4)
Protection
Strategies
include Aichi
Target 9 and
NBT 4
Restoration
strategies
ABS
(Aichi
Target 16
& NBT
9)
Implementation
Strategies
Impact on
Biodiversity
Indirect Indirect
In most
cases except
Direct Direct
In most
cases except
when it is a
Direct Indirect
Direct only
when
implemented by
77 In this report the term biodiversity conservation has been used as a generic term although in our analysis it
corresponds CBD definition in this context.

87
Strategic Goal
A
Strategic
Goal B
Strategic
Goal C
Strategic Goal D Strategic Goal
E
Aichi Target
9 & NBT4
very small
component
MOEF&CC;
There can be
some deviations Source: Authors’ Construct
5.2 Mapping Public Expenditure for Biodiversity in Himachal Pradesh
The BER in Himachal Pradesh considers only budgetary flows of funds during the period 2011-
12 to 2016-17 comprising:
i. Central government funds in the form of Centrally Sponsored Schemes (CSS),
Central Sector Schemes (CS), and Additional Central Assistance (ACA). Some of these
schemes could be fully funded by the Centre while others would require the state
government to contribute its share. For Himachal Pradesh, funds for all CSS are
contributed in the ratio 90:10, where the Centre contributes 90% of the share and the
state contributes 10% of the share.
ii. Consolidated fund of the State funding a number of state schemes.
iii. Union Finance Commission of India: The Thirteenth Finance Commission, (which
covered a period April 2010 to March 2015) provided a forest grant of Rs. 5000 crore
to the states based on the criteria of standing forest (stock) in each state.
iv. External Aid: During the study period the following key projects having components
and activities relevant for biodiversity have been identified.
a. World Bank Aided Mid Himalayan Watershed Development Project – The overall
objective of this component was to promote value addition in crop, livestock, and non-
timber forest produce in the project area. It also involves implementation of Bio-Carbon
Project focused on reforestation to protect watersheds, improve rural livelihoods, and
generate additional income through carbon credits. Implemented in 11 watershed
divisions falling in 10 districts, a total of 140 GPs was prioritized to sequester
greenhouse gas (GHG) emissions through reforestation, mitigate climate change risks,
generate additional income through carbon credits, and enable an environment for
additional employment opportunities.
b. Himachal Pradesh Forest Eco-System Climate Proofing Project – It aims at
minimizing and mitigating the negative impact of climate change, resulting in an
increase in biodiversity and sustained income in rural areas through sustainable
management of forest resources and making the forests resilient to climate change. The
project has been launched with German collaboration, with funding from KfW bank.
c. Himachal Pradesh Forests for Prosperity Project: The objective of the project is to
improve the governance, management, and community use of forests and pastures at
selected sites in HP, by strengthening the institutional capacity of the state,
strengthening value chain of select NTFPs and increasing the value of eco-tourism in
select areas. The project is being assisted by the World Bank, and is being implemented
by the Department of Forest, HP.

88
d. Himachal Pradesh Forest Ecosystems Management and Livelihoods Improvement
Project: The objective is to manage and enhance forest area ecosystems in the project
area by sustainable forest ecosystem management, biodiversity conservation,
livelihoods improvement support and strengthening institutional capacity, thereby
contributing to environmental conservation and sustainable socio-economic
development in the project area in the state of Himachal Pradesh. The project is being
implemented by HP Forest Department and JICA.
Using the Budget documents of Government of Himachal Pradesh and the specific guidelines
of schemes, which were obtained from various sources, we reviewed the entire list of schemes
and identified schemes which have activities/components directly or indirectly relevant for
biodiversity conservation. For each scheme, budget codes for the major head, sub-major head,
and minor head along with the scheme code have been recorded for easy tracking of the scheme
as well as sectoral and department-wise analysis of expenditure. For the identified schemes
data on actual expenditure was collated for further analysis.
5.3 Methodology for Determining Expenditure Attributable to Biodiversity
Conservation in Himachal Pradesh
Having collected the data pertaining to funds released for various biodiversity relevant
schemes, the next step is to determine the proportion of expenditure under each of the identified
scheme which would be attributed to biodiversity conservation. This involves the following
steps:
i. The relevance or significance of the identified schemes with respect to their impact on
biodiversity is not same; and may vary significantly. Some schemes may have a direct
bearing on biodiversity while others may indirectly influence it. Conceptualization on
schemes’ relevance (in terms of impact on biodiversity conservation) in this study is
guided by the Rio markers, OECD78 methodology and a study of BER conducted for
Maharashtra by the authors of this report79.
ii. We approach the biodiversity attribution issue by defining ‘tiers’ of relevance into
direct (where ‘primary’ purpose of the scheme/activity is biodiversity conservation) and
indirect (when conservation of biodiversity is not primary but a ‘significant’
objective)80. The tier ‘Indirect’ comprises activities that are relevant for biodiversity
but not as a primary purpose. A range of activities can be listed in this tier e.g.
promotion of organic farming, sustainable fisheries, data management, pollution
control, watershed management (Table 5.1). However, contribution of all these
activities to biodiversity is not the same. To reflect their varied levels of contribution
the ‘indirect’ tier has been classified into: indirect high; indirect medium; and indirect
low (see Table 5.2)
While expenditure on schemes/activities classified as ‘direct’ is conceptualized to be fully
attributed to biodiversity, a system for attribution (coefficients/ proportion of expenditure
attributable to biodiversity conservation) of expenditure of schemes/activities under the tier
‘indirect’ has been developed (Table 5.2).
78 https://www.oecd.org/dac/environment-
development/Revised%20climate%20marker%20handbook_FINAL.pdf 79 Pandey et al (2020); available at: https://www.nipfp.org.in/media/medialibrary/2020/07/WP_311_2020.pdf 80 This is consistent with the approach used in existing methodologies.

89
Table 5.2: Determining Attribution for Biodiversity Expenditures
Biodiversity
Relevance
Broad Thematic Areas Expenditure
Attributable to
Biodiversity
Conservation
Direct
(Range: 90 – 100%)
Where primary purpose of the scheme is
biodiversity conservation. Example: Wildlife
conservation, Afforestation and Regeneration of
forest, Research on ecology.
95 Percent
Indirect Very High
(Range: 75 – 90%)
Where conservation of biodiversity is a significant
objective. Ex. Promotion of organic farming,
Ecosystem restoration - River
conservation/rejuvenation, conservation of
wetlands (lakes, ponds, tanks, etc), preventing
pollution of water bodies by treating sewage, etc.
82.5 percent
Indirect High
(Range: 50 – 75%)
Where the emphasis is on strengthening the
grassroot level institutions (considering role of
Panchayats in BMCs, etc)
62.5 Percent
Indirect Medium
(Range 25-50%)
Where biodiversity is not the main but significant
biodiversity relevant outcomes are expected. Ex.
Sustainable Agriculture, Integrated Watershed
Development, Programs of animal husbandry,
fisheries and poultry which include promoting on-
farm diversity
37.5 percent
Indirect Low
(Range: 5 – 25%)
Example: River management including flood
management and erosion control, Developing water
resources information system
15 percent
Indirect Marginal
(Range: 0 – 5%)
Example: renewable energy, general awareness and
training, climate mitigation activities
2.5 percent
Major Scheme Where some components are highly related to
biodiversity, some are related as medium, some as
marginal, a weighted attribution coefficient is
calculated.
For example: In case of RKVY, about 11.5%
(10/87) of the permissible activities are in the
nature of IWSM, which come under indirect
medium (37.5%); about 5.7% (5/87) of activities
are organic farming related and fall under indirect
very high (82.5%); overall attribution = 0.375 ×
0.115 + 0.825 × 0.057 = 0.0901
Calculated for each
scheme
individually
Large Multi-purpose
Scheme
Example: MGNREGA, AMRUT Calculated for each
scheme
individually
Apart from classifying schemes into Direct and Indirect Biodiversity relevance, the identified
schemes are also classified into six CBD themes using the framework developed by us in Table
6.1. These six themes are: (i) Sectoral Mainstreaming, (ii) Natural Resource Uses, (iii)
Biodiversity Protection, (iv) Biodiversity Restoration, (v) Access and Benefit Sharing, and (vi)
Enhancing Implementation. This framework can be used to align thematic classification with

90
NBAP targets, Aichi targets and CBD goals for tracking which aspects are being adequately
provided for and where more focus may be required.
5.4. Analysis of Findings and Results
A snapshot of flow of scheme based central and state funds during 2011-12 to 2016-17 to
Himachal Pradesh is presented in Table 5.3. The number of biodiversity relevant schemes has
been increasing over the period of study, from 77 in 2011-12 to 189 in 2016-17. The share of
biodiversity attributable expenditure in the total expenditure of the state and GSDP compares
well with the number estimated through a similar exercise for the states of Sikkim and
Maharashtra. As noted earlier, significance of the biodiversity relevant schemes with respect
to their impact on biodiversity is not the same and varies significantly across schemes.
Applying the coefficients (Table 5.2), we have found that the total expenditure attributable to
biodiversity in Himachal Pradesh ranges from Rs. 159.33 crore to Rs. 457.35 crore.
Table 5.3: Biodiversity Related Expenditure in Himachal Pradesh (Summary)
2011-12 2012-13 2013-14 2014-15 2015-16 2016-17
No. of Biodiversity
Relevant Schemes
77 89 143 171 178 189
Biodiversity
Attributable
Expenditure (Rs.
Crores)
159.33 166.25 211.51 288.01 369.75 457.35
Attributable
Expenditure as % of
Total Expenditure of
the State
0.91 0.83 1.00 1.17 1.34 1.45
Biodiversity
Attributable
Expenditure as % of
GSDP of the State
0.22 0.20 0.22 0.28 0.32 0.37
Source: Authors’ calculation
Figure 5.1: Total Biodiversity Attributable Expenditure
Source: Authors’ Construct
0.00
50.00
100.00
150.00
200.00
250.00
300.00
350.00
400.00
450.00
500.00
2011-12 2012-13 2013-14 2014-15 2015-16 2016-17
Rs.
Cro
re

91
Figure 5.1 shows that the total expenditure attributable to biodiversity over the study period
has been increasing. (The red dotted line shows the increasing trend of the biodiversity related
expenditure.)
The schemes relevant to biodiversity have been classified according to the BIOFIN thematic
classification (see Table 5.4). The figures in brackets show the number of schemes for a
particular category in that year, and the figure outside the
brackets show the expenditure incurred within a particular
category in a given year. Most of the biodiversity relevant
schemes are for Natural Resource Use (ranging from 29 in
2011-12 to 82 in 2016-17) and Protection (ranging from 29 in
2011-12 to 66 in 2016-17). However, the schemes for
Protection have the highest expenditure attributable to
biodiversity over the years, ranging from Rs. 108.90 crore in
2011-12 to Rs. 143.69 crore in 2016-17. In later years, 2015-
16 and 2016-17, the expenditure of schemes under the category Natural Resource Use is
maximum (Rs. 157.52 crore and Rs. 157.09 crore respectively). Although the number of
schemes for Sectoral Mainstreaming is lower in the earlier years, it increases steadily after
2014. The expenditure in this category follows the same trend.
Table 5.4: Attributable Expenditure under CBD (BIOFIN) Classification (Rs. Crore)
Type of Expenditure
(BIOFIN Classification)
2011-12 2012-13 2013-14 2014-15 2015-16 2016-17
Enhancing
Implementation
14.40
(6)
15.69
(7)
19.81
(10)
19.22
(10)
29.61
(10)
28.23
(10)
Natural Resource Use 29.34
(29)
26.51
(33)
28.89
(64)
45.84
(77)
157.52
(81)
157.09
(82)
Protection 108.90
(29)
105.95
(35)
146.98
(52)
198.92
(57)
143.46
(56)
143.69
(66)
Restoration 5.05
(6)
15.22
(6)
13.22
(9)
15.60
(9)
18.97
(11)
23.67
(13)
Sectoral Mainstreaming 1.64
(7)
2.88
(8)
2.61
(8)
8.43
(18)
20.20
(20)
104.66
(17)
Total Biodiversity
Attributable Expenditure 159.33 166.25 211.51 288.01 369.75 457.35
Source: Authors’ Calculation. Note: Figures in brackes are number of schemes
Figure 5.2 shows the departments incurring significant expenditure in biodiversity. As
expected, the Department of Forest incurs the highest expenditure on biodiversity over the
study period (Rs. 97.38 crore in 2011-12 to Rs. 125.69 crore in 2016-17). The expenditure of
Department of Agriculture, Department of Horticulture and Department of Irrigation, water
supply and sanitation rise steadily over the years. The expenditure incurred by the Department
of Rural Management and Development (RMDD) has shown a sudden increase in the last tow
years of study. In 2011-12 the expenditure of the RMDD is Rs. 7.71 crore, while in 2016-17
the expenditure rises almost 11 times to Rs. 77.24 crore. The reason for this sudden jump is
because of sudden surge in the expenditure undertaken through MGNREGA in 2015-16 and
2016-17.
A study by the WRI in 2019 puts
forest and landscape restoration
potential in HP at 1.58 MHa.
However, the number of schemes
focusing on restoration and the
expenditure incurred within them is
low indicating a lower focus on
restoration.

92
Figure 5.2: Attributable Expenditure to Biodiversity by Key Departments
Source: Authors’ Construct
Table 5.5 shows the department wise expenditure classified as per the themes of BIOFIN.
Table 5.5: Department-wise Expenditure on Biodiversity (Rs. Crore) Departments 2011-12 2012-13 2013-14 2014-15 2015-16 2016-17
En
han
cin
g I
mp
lem
enta
tion
Agriculture 7.81 7.92 9.55 8.87 17.30 16.20
Forest and Wildlife 0.06 0.06 0.07 0.07 0.06 0.04
Horticulture 6.50 7.68 10.16 10.16 10.16 10.16
Police 0.00 0.00 0.00 0.00 0.00 0.32
Planning and Backward
Area Sub-Plan
0.03 0.03 0.03 0.03 0.04 0.04
Scheduled Castes Sub
Plan.
0.00 0.00 0.00 0.09 1.77 1.33
Tribal Development 0.00 0.00 0.00 0.00 0.28 0.13
Na
tura
l R
eso
urc
e U
se
Agriculture 0 0 0 5 8 8
Forest and Wildlife 0.56 0.82 1.13 1.50 1.88 1.75
Horticulture 3.63 4.02 3.55 19.30 21.46 27.66
Irrigation, Water Supply
and Sanitation
12.45 9.78 10.93 10.63 16.44 26.77
Miscellaneous General
Services
0.32 0.41 0.07 0.00 0.00 0.00
Planning and Backward
Area Sub-Plan
0.17 0.22 0.42 0.30 0.16 0.05
Rural Development 7.71 7.83 9.20 0.58 95.81 77.24
Scheduled Castes Sub Plan 4.04 2.80 3.08 7.50 12.21 12.73
Tribal Development 0.46 0.64 0.52 0.93 1.69 2.79
Pro
tect
ion
General Administration 0.00 0.00 0.00 0.00 0.00 0.00
Agriculture 5.17 5.48 5.71 5.72 5.53 12.75
Animal Husbandry, Dairy
Development and
Fisheries
0.00 0.00 0.00 7.21 0.00 1.58
0.00
20.00
40.00
60.00
80.00
100.00
120.00
140.00
160.00
2011-12 2012-13 2013-14 2014-15 2015-16 2016-17
Rs.
Cro
re
Agriculture Horticulture
Irrigation, Water Supply And Sanitation Forest And Wild Life
Rural Management and Development

93
Departments 2011-12 2012-13 2013-14 2014-15 2015-16 2016-17
Forest And Wild Life 96.38 92.01 130.40 127.37 120.46 110.63
Horticulture 6.04 6.86 9.67 8.81 8.28 7.44
Irrigation, Water Supply
and Sanitation
0.00 0.00 0.00 34.09 5.16 6.29
Planning and Backward
Area Sub-Plan
0.30 0.17 0.15 0.13 0.14 0.13
Scheduled Castes Sub
Plan.
0.00 0.00 0.00 13.65 3.17 3.24
Tribal Development 1.00 1.43 1.05 1.93 0.71 1.63
Res
tora
tio
n
Forest And Wild Life 0.38 9.19 7.29 9.99 12.67 13.27
Irrigation, Water Supply
and Sanitation
1.65 2.09 1.92 1.49 2.18 6.27
Planning and Backward
Area Sub-Plan
3.02 3.93 4.01 4.07 4.12 4.13
Tribal Development 0.00 0.00 0.00 0.00 0.00 0.00
Scheduled Castes Sub
Plan.
0.00 0.00 0.00 0.05 0.00 0.00
Sec
tora
l M
ain
stre
am
ing
Education 0.00 0.00 0.00 0.00 0.00 0.00
Health and Family Welfare 1.57 2.19 1.97 0.67 1.23 1.77
Animal Husbandry, Dairy
Development and
Fisheries
0.08 0.13 0.06 0.02 0.03 3.69
Urban Development,
Town and Country
Planning and Housing
0.00 0.00 0.00 0.00 12.60 82.19
Tribal Development 0.00 0.14 0.13 0.97 0.92 1.71
Scheduled Castes Sub
Plan.
0.00 0.42 0.46 6.77 5.42 15.30
Total 159.33 166.25 211.51 288.01 369.75 457.35
Source: Authors’ Calculation
5.5 BER for Landscapes under SECURE Project
The SECURE project is situated in two snow leopard landscapes of Himachal Pradesh –
Lahual-Pangi Landscape and Kinnaur Landscape. In what follows an attempt is made to
examine expenditure on biodiversity in detail in these landscapes.
The project landscapes are spread over the districts of Kinnaur, Lahaul-Spiti, and Chamba
(Pangi is a sub-district of Chamba). These areas are covered under the Scheduled Areas under
the Fifth Schedule of the Constitution as these areas fulfil the minimum criterion of 50 percent
of the ST population concentration in a community development block.81 These areas are vast
in size characterised by snow glaciers, high altitudes, highly rugged terrain, fast-flowing rivers,
81 Community development block is a rural area administratively earmarked for development. The area is
administered by the Block Development Officer, supported by several technical specialists and village level
workers.

94
and small and dispersed population and thus very high per unit cost of infrastructure
development.
5.5.1 Fund Flow Arrangements to the Landscapes
Before launching the Fifth Five Year Plan, the Planning Commission of India made a decision
of incorporating a Tribal Sub-plan in the Annual Plan of the state, so that the Government can
focus on the welfare of the tribal population.
Till 1995-96, State Planning Department used to allocate plan outlays to different sectoral
departments in consultation with Tribal Development Department. The departments concerned
then used to carve out outlays for Tribal Sub-plan as per their own discretion and priorities,
and to decide as to which of the schemes, programmes and development works are to be taken
up from the funds provided under Tribal Sub-Plan. There was, therefore, a feeling that the
Tribal Sub-Plan was merely agglomeration of the State Plan schemes taken-up in the Tribal
Area and emphasis given to mainly arithmetical figures rather than the scheme really benefiting
tribal families.
To address this short coming of the policy, the state government had decided to introduce
fundamental change in the process of formulation of Tribal Sub-Plan at the directions of
Ministry of Welfare, (now Tribal Affairs) Government of India since 1996-97. Under this new
system, the State Planning department shall communicate 9 percent ceiling of the total State
Plan outlays to the Tribal Development Department who in turn shall allocate the divisible
outlays to each of the Integrated Tribal Development Project (ITDP) viz. Kinnaur, Lahaul,
Spiti, Pangi and Bharmour. The indivisible outlays in the nature of grant-in-aid etc. shall be
conveyed to the Administrative departments. Each ITDP has its own needs and requirements
as such each ITDP shall be free to determine its own priorities and allocate funds only to those
schemes which are relevant to the area.
5.5.2 A snapshot of number of biodiversity relevant schemes implemented
The number of schemes implemented in Kinnaur, Lahaul-Spiti, and Pangi landscapes (Tables
5.6 and 5.7) ranged from (64 – 72) during 2014-15 to 2016-17. It would be seen from these
tables that in terms of number there is an upward trend which is encouraging.
Table 5.6: Number of Biodiversity Relevant Scheme by Type of Impact
Classification by Impact 2014-15 2015-16 2016-17
Direct 20 20 23
Indirect Very High 6 6 7
Indirect Medium 13 13 14
Indirect Low 13 13 15
Indirect Marginal 3 3 3
Large Multipurpose scheme 1 1 1
Major Scheme 8 9 9
Total 64 65 72
Source: Authors’ Calculation

95
Table 5.7: Number of Biodiversity Relevant Schemes (CBD Classification)
Type of Expenditure 2014-15 2015-16 2016-17
Enhancing Implementation 8 8 8
Natural Resource Use 25 26 29
Protection 18 18 22
Restoration 7 7 7
Sectoral Mainstreaming 6 6 6
Total 64 65 72
Source: Authors’ Calculation
Analysis of funds flow under these schemes shows a significant variation in terms of both the
amounts as well as type of expenditure across SECURE districts/sub-districts. Therefore, we
present the analysis and results separately for these areas.
A. PANGI (Sub-district of Chamba)
The biodiversity related expenditure shows a gradual increase during the period under study
(Table 5.8). The focus of these schemes is on promoting protection and sustainable use of
natural resources. However, it is encouraging to note that the restoration related activities and
those contributing to enhancing implementation of schemes and programs are showing an
upward trend (Figure 5.3).
Table 5.9 shows that maximum expenditure has been incurred in the schemes having direct and
indirect very high impact on biodiversity, which is encouraging.
Table 5.7: Biodiversity Attributable Expenditure
2014-15 2015-16 2016-17
Biodiversity Attributable Expenditure
(Rs. Crore) 2.46 2.38 3.25
Attributable Expenditure as % of Total
Biodiversity Attributable Expenditure of
State
0.85 0.64 0.71
Attributable Expenditure as % of Total
Expenditure of the State 0.010 0.009 0.010
Biodiversity Attributable Expenditure as %
of GSDP of the State 0.0024 0.0021 0.0026
Source: Authors’ Calculation
Table 5.8: Expenditure of Biodiversity Relevant Scheme by Type of Impact (Rs. Lakh)
Classification of Impact 2014-15 2015-16 2016-17
Direct 116.37 66.65 107.87
Indirect Very High 91.13 95.33 118.37
Indirect Medium 1.8 44.80 49.56

96
Indirect Low 17.15 21.41 28.16
Indirect Marginal
0.25 0.35 1.04
Large Multi-purpose Scheme
4.58 6.74 17.91
Major Scheme 15.10 2.88 2.40
Total
246.38 238.16 325.31
Source: Authors’ Calculation
Figure 5.3: Biodiversity Related Expenditure (CBD Classification)
Source: Authors’ construct
Table 5.9 presents department-wise expenditure on biodiversity conservation. As expected, the
Departments of Agriculture and Forest are key departments in terms of total expenditure on
biodiversity in Pangi. Department of Horticulture, irrigation and rural development show an
increasing trend in expenditure which is a good sign as these expenditures support livelihood
opportunities. Animal husbandry is pretty steady, while tourism, transport and Ayurveda are
non-existent which can potentially contribute to livelihood opportunities and reduce pressure
on forest resources and conflict with wild animals.
Table 5.9: Department-wise Biodiversity Attributable Expenditure (Rs. Lakh)
Departments 2014-15 2015-16 2016-17 Departments 2014-15 2015-16 2016-17
Agriculture 97.53 104.16 117.42 Irrigation 11.56 19.75 27.11
Animal
Husbandry 4.18 4.18 4.37 Renewable
Energy 0.26 0.35 1.04
Ayurveda 0 0.00 1.33 Rural
Development 15.29 7.46 20.99
0.00
20.00
40.00
60.00
80.00
100.00
120.00
140.00
160.00
180.00
2014-15 2015-16 2016-17
Rs.
La
kh
Enhancing Implementation Natural Resource Use Protection
Restoration Sectoral Mainstreaming

97
Fisheries 1.93 2.09 3.46 Tourism 0.00 0.00 0
Forest 109.73 59.76 99.02 Transport 0 0 0
Horticulture 5.72 40.29 50.56 Water &
Sewerage 0.01 0.01 0.01
Youth and
Sports 0.19 0.11 0
Source: Authors’ Calculation
B. LAHAUL
Biodiversity attributable expenditure in Lahaul shows gradual increase during 2014-15 to
2016-17 (Table 5.10). Sustainable use of natural resource is the top focus followed by activities
contributing to enhancing implementation of biodiversity conservation. As in the case of Pangi,
expenditure on restoration activities shows a positive trend which is a good sign (Figure 5.4).
Table 5.10: Biodiversity Attributable Expenditure in Lahaul
2014-15 2015-16 2016-17
Biodiversity Attributable Expenditure
(Rs. Crore) 2.47 2.44 3.06
Attributable Expenditure as % of Total
Biodiversity Attributable Expenditure of
State 1.33 1.23 1.40
Attributable Expenditure as % of Total
Expenditure of the State 0.010 0.009 0.010
Biodiversity Attributable Expenditure as
% of GSDP of the State 0.0024 0.0021 0.0024 Source: Author’s Calculation.

98
Figure 5.4: Biodiversity Related Expenditure (CBD Classification)
Source: Authors’ Construct
Table 5.11: Direct and Indirect Impact-wise Biodiversity Attributable Expenditure (Rs. Lakh)
Classification of Impact 2014-15 2015-16 2016-17
Direct 98.99 57.82 74.57
Indirect Very High 95.16 98.94 132.68
Indirect Medium 1.9 45.57 49.60
Indirect Low 35.14 23.00 25.51
Indirect Marginal 0.26 0.35 1.04
Large Multi-purpose Scheme 4.58 6.74 17.91
Major Scheme 11.59 12.14 4.97
Total 247.62 244.56 306.28 Source: Authors’ Calculations.
Table 5.12 shows the contribution of schemes of different departments of the District during
the period 2014-15 to 2016-17 on various activities which support biodiversity conservation.
As expected, the Departments of Agriculture and Forest are key departments in terms of total
expenditure on biodiversity. Department of Horticulture, and especially rural development
show a sharp increase in expenditure which is a good sign as these expenditures support
livelihood opportunities. As in Pangi, expenditure by the Animal husbandry is steady, while
tourism, transport and Ayurveda are non-existent which can potentially contribute to livelihood
opportunities and reduce pressure on forest resources and conflict with wild animals.
0.00
20.00
40.00
60.00
80.00
100.00
120.00
140.00
160.00
180.00
200.00
2014-15 2015-16 2016-17
Rs.
La
kh
Enhancing Implementation Natural Resource Use Protection
Restoration Sectoral Mainstreaming

99
Table 5.12: Department-wise Biodiversity Attributable Expenditure (Rs. Lakh)
Departments 2014-15 2015-16
2016-
17 Departments 2014-15 2015-16 2016-17
Agriculture 103.23 105.1 131.29 Irrigation 25.05 21.34 22.96
Animal
Husbandry 4.18 4.18 4.37
Renewable
Energy 0.26 0.35 1.04
Ayurveda 0 0.00 1.33
Rural
Development 9.73 13.85 20.99
Fisheries 5.55 4.42 3.63 Tourism 0.00 0.00 0
Forest 85.5 47.41 65.05 Transport 0 0 0
Horticulture 11.88 44.92 53.04
Water &
Sewerage 2.06 2.88 2.58
Youth and
Sports 0.19 0.11 0 Source: Authors’ Calculation
C. KINNAUR
The biodiversity related expenditure has increased gradually over the study period of 2014-15
to 2016-17 (Table 5.13). Sustainable use of natural resource is the top focus followed by
activities contributing to enhancing implementation of biodiversity conservation. However,
during 2016-17, there is a sudden increase in the expenditure incurred in the schemes related
to restoration. This is due to the expenditure incurred by the Transport department under the
head “Land Compensation including NPV” (Figure 5.5).
Table 5.13 Biodiversity Attributable Expenditure
2014-15 2015-16 2016-17
Biodiversity Attributable Expenditure
(Rs. Crore) 2.23 2.49 5.39
Attributable Expenditure as % of Total
Biodiversity Attributable Expenditure of
State
0.77 0.67 1.18
Attributable Expenditure as % of Total
Expenditure of the State 0.009 0.009 0.017
Biodiversity Attributable Expenditure as %
of GSDP of the State 0.0021 0.0022 0.0043
Source: Authors’ Calculation

100
Table 5.14 Expenditure of Biodiversity Relevant Scheme by Type of Impact (Rs. Lakh)
2014-15 2015-16 2016-17
Direct 74.26 56.97 287.11
Indirect Very High 98.99 99.91 143.39
Indirect Medium 2.976 46.44 51.79
Indirect Low 26.26 23.05 30.14
Indirect Marginal 0.32 0.41 1.04
Large Multi-purpose Scheme
4.58 6.74 17.91
Major Scheme 15.86 16.45 7.96
Total 223.25 249.96 539.32
Source: Authors’ Calculation
Figure 5.5: Biodiversity Related Expenditure (CBD Classification)
Source: Authors’ construct
Table 5.15 shows the contribution of schemes of different departments of the District during
the period 2014-15 to 2016-17 on various activities which support biodiversity conservation.
As expected, the Departments of Agriculture and Forest are key departments in terms of total
expenditure on biodiversity. Department of Horticulture show a sharp increase in expenditure
which is a good sign as these expenditures support livelihood opportunities. As in Pangi,
expenditure by the Animal husbandry is steady, while tourism and Ayurveda are non-existent
which can potentially contribute to livelihood opportunities and reduce pressure on forest
resources and conflict with wild animals. There is a sharp rise in the expenditure of transport
department, due to the expenditure incurred by the department under the head “Land
Compensation including NPV”.
0.00
50.00
100.00
150.00
200.00
250.00
2014-15 2015-16 2016-17
Rs.
La
kh
Enhancing Implementation Natural Resource Use Protection
Restoration Sectoral Mainstreaming

101
Table 5.15: Department-wise Biodiversity Attributable Expenditure (Rs. Lakh)
Departments 2014-15 2015-16 2016-17 Departments 2014-15 2015-16 2016-17
Agriculture 100.30 107.31 137.48 Irrigation 19.86 21.39 28.34
Animal
Husbandry
4.18 4.18 4.37 Renewable
Energy
0.26 0.35 1.04
Ayurveda 0 0.00 1.33 Rural
Development
14.2 17.55 20.99
Fisheries 2.39 2.45 2.40 Tourism 0.06 0.06 0
Forest 60.78 44.01 77.60 Transport 0 0 197.24
Horticulture 19.18 49.07 62.97 Water &
Sewerage
1.86 3.48 5.56
Youth and
Sports
0.19 0.11 0
Source: Computed by Authors
5.6 Projections
Using the principle of Least Square Methods which assumes a linear trend we project the
attributable expenditure for biodiversity in Himachal Pradesh. We have actual data on
expenditures for six years from 2011-12 to 2016-17. The projections or the forecast is made
for the next 4 years starting from 2017-18 till 2020-21 (Figure 5.6).
Figure 5.6: Projections of Biodiversity Attributable Expenditure
Source: Authors’ construct
0.00
100.00
200.00
300.00
400.00
500.00
600.00
700.00
800.00
Rs.
Cro
re
Series1 Series2

102
5.7 Conclusion
The number of biodiversity relevant schemes, whether CSS or State Scheme, have seen an
increase over the study period. Similarly, the expenditure incurred through these schemes has
shown and increasing trend an impressive growth over the years. Expenditure on different
aspects of biodiversity conservation in the state is expected to show variation across thematic
areas in different years. This will be guided by central and state priorities which, in turn, will
be guided by the local requirements and the need to meet the NBTs. We would like to mention
here that since the BER analysis is based on actual expenditure, and this data becomes available
with a lag of 2-3 years in different states; for HP 2016-17 is the latest year for which the data
was available.
An important point to note here is that although, expenditure on restoration is negligible from
the CSS, the state schemes have been increasingly focusing on restoration within the state
which is encouraging. The expenditure on restoration has increased from Rs. 5.05 crore in
2011-12 to Rs. 23.67 crore in 2016-17 (which is little under 5 times). There is an urgent need
to provide more funds for the purpose of restoration, given huge requirement for restoration in
the state. CAMPA can be tapped for this purpose.
In Lahaul, Pangi, and Kinnaur biodiversity related expenditure shows a gradual increase during
the period under study. While in Pangi the emphasis appears to be on promoting protection
and sustainable use of natural resources; in lahaul and Kinnaur sustainable use of natural
resources is the top focus followed by activities contributing to enhancing implementation of
biodiversity conservation.

103
Chapter 6: Mapping Revenue from Biodiversity in Himachal Pradesh
6.1 Objectives and Scope
It is important to capture revenue from biodiversity to understand and describe the fiscal value
that biodiversity and ecosystem services provide to the national and state governments.
However, mapping and analysis of full potential of revenue from biodiversity or even current
revenue from biodiversity is an under researched subject in the literature. There is an increasing
recognition that it is important to identify and map the revenue to the governments from
biodiversity for at least the following reasons:
i. Well-designed fiscal and other economic instruments are important instrument for
governments to shape relative prices of goods and services and address the problems
with property rights.
ii. An analysis of the type of instruments used to raise revenue can help assess the
appropriateness and under-utilized potential of some of these instruments in
conservation of biodiversity.
iii. Identifying and supporting revenue streams from biodiversity-positive actions that
could generate increased private sector investment
iv. Explore the feasibility of using these revenues for creating a fund dedicated to
biodiversity management and conservation.
In this chapter, we have mapped the revenue from biodiversity for Himachal Pradesh. This
involved the following steps:
i. Identify economic sectors within the state having positive and negative impacts on
biodiversity.
ii. Identify revenue generated from biodiversity within these sectors by referring to official
Acts, rules, notifications and reports.
6.2 Guidance from Literature
Table 6.1: Economic Instruments for Biodiversity Conservation and Addressing Specific
Externalities
Economic Instrument Description
Property Rights Established or strengthened to reinforce private incentives for
conservation, and to underpin other market-based conservation tools.
Market creation and
enhancement
Used to strengthen the role of the market in guiding the allocation and
use of resources, and providing economic incentives for conservation.
Includes establishment of:
Carbon sequestration offsets,
Tradable development rights,
Tradable quota systems,
Eco-labelling and environmental certification,
Bioprospecting
Charges for service
provided directly to
consumer
User fees
Collection of charges for solid waste pick-up
Tolls on public roads
Access fees (ex – for recreational access)

104
Economic Instrument Description
Fiscal Instruments Used to discourage unsustainable production and consumption
practices and raise public revenues. Examples:
Differential land use taxation
Deforestation taxes82
Tax exemptions or tax deductions
Removal or mitigation of perverse fiscal policies relevant to
biodiversity protection83
Liability Systems
Addressing risks of past
future activities
Required liability or environmental insurance
Performance bonds for proper site remediation/closure
Civil and criminal penalties for natural resource damages
Environmental Funds While not per se economic instruments, can be used to complement
such instruments by financing conservation activities.
Based on UNEP, 2004.
OECD dataset on environmental related tax revenues
Taxes related to environment84 are an important instrument for governments to shape relative
prices of environmental goods and services. In OECD data set85, sources and instruments of
revenue are identified by economic sectors.
Table 6.2: Sectoral Categorization of Environmentally related Tax Revenues in OECD Dataset
Sectors Revenue source/Instruments
Energy Energy products (Fossil Fuels, Electricity)
Transportation fuels (Petrol, Diesel)
All CO2 related taxes
Motor Vehicles and Transport86 One-off import or sales taxes on transport
equipment
Recurrent taxes on ownership
Registration or road use of motor vehicles
Other transport-related taxes.
Other environment related tax Environment related taxes not included elsewhere, e.g.
hunting and fishing taxes,
SOx and NOx emission taxes.
82 Apply a high(er) tax rate to certain logging activities thus providing a disincentive for activities that cause
deforestation. They usually are unit payments applied to each hectare or cubic metre of wood extracted. They can
be partially refunded if the logging enterprises engage in reforestation within a certain time period. 83 It involves the reform of a range of measures such as subsidies in the agricultural sector, the fisheries sector or
other natural resource sectors, and import taxes related to technology transfer relevant to biodiversity protection. 84 The characteristics of such taxes included in the database (e.g. revenue, tax base, tax rates, exemptions, etc.)
are used to construct the environmentally related tax revenue with a breakdown by environmental domain. 85The OECD maintains a database of Instruments used for environmental policy, originally developed in co-
operation with the European Environment Agency (EEA). The database contains detailed qualitative and
quantitative information on environmentally related taxes, fees and charges, tradable permits, deposit-refund
systems, environmentally motivated subsidies and voluntary approaches used for environmental policy.
www.oecd.org/env/policies/database. https://stats.oecd.org/Index.aspx?DataSetCode=env_envpolicy 86Excludes excise taxes on automotive fuels.

105
Sectors Revenue source/Instruments
Water and wastewater87 Taxes on:
Water extraction
Piped water
Discharge of wastewater
Other water-related taxes.
Mining and Quarrying Mining royalties
Excavation taxes (e.g. sand and gravel).
Waste Management Taxes on:
Final disposal of solid waste
On packaging (e.g. plastic bags), and
Other waste-related taxes (e.g. batteries,
tyres).
Ozone – depleting substances Taxes on specific substances, such as
Chlorofluorocarbons (CFCs)
Carbon tetrachloride,
Hydro chlorofluorocarbon (HCFCs)
Other Ozone-depleting substances. Source: Compiled by Authors
6.3 Framework and Methodology
Economic sectors and biodiversity are usually evaluated separately from each other, even
though they are linked in significant ways. This is because these links are often invisible.
However, some economic sectors rely, and impose several unquantified externalities88 on
biodiversity. Profitability in some sectors (tourism, forestry and wildlife, fisheries) directly
depend upon healthy ecosystems and biodiversity. Whereas, other sectors, like mining and
hydropower, have a direct impact on biodiversity through their process of production. Sources
of revenue in these sectors have been analysed and those related to biodiversity have been
identified89.
Table 6.3: Sectors Related to Biodiversity
Sector Relation to biodiversity
Tourism HP is increasingly becoming a prime attraction for nature-based
tourism. Therefore, maintaining a healthy eco-system and conserving
biodiversity is of importance to maintain viability of the tourism
ventures.
However, due to high influx of the tourism, there is a threat to the
fragile ecosystem of the State which leads to loss of biodiversity.
Forestry and Wildlife Forests of the state are haven of floral and faunal diversity of any area,
especially threatened and rare flora and fauna.
Fisheries This sector is dependent on diversity among fish species.
87Fees and charges related to water supply are not included. 88 An externality is said to arise when (i) the actions of one economic agent in society impose costs or benefits on
other agent(s) in society, and (ii) these costs or benefits are not fully compensated for and thus do not factor into
that agent’s decision-making. Without intervention in the free market to internalize externalities, positive
externality benefits are chronically under-supplied and negative externality costs are over-supplied 89 For mapping the revenue, the acts, rules, official notification and departmental reports were referred to.

106
Sector Relation to biodiversity
However, over-exploitation due to unchecked fishing activities may
lead to some of the fish species being threatened.
There are scientific evidences that, on the time scale of decades, over-
fishing can change genetic, species, and ecosystem diversity from levels
that have been achieved over millions of years through natural selection
(Boehlert 1996)
Mining Mining does not rely on biodiversity for inputs in the process of
production. But site preparation for mining operations is a destructive
process which changes abiotic and biotic conditions, sometimes causing
decline in rare and threatened species and ecosystems.
Hydropower Although hydropower does not depend on biodiversity for inputs in
process of production, setting up a hydropower plant leads to
submergence, deforestation, loss of flora/fauna, and soil erosion.
Local natural water sources get disturbed and often dry up as a result of
the tunnelling activity for hydro projects (Sharma and Rana 2014) Source: Compiled by Authors
6.4 Revenue Receipts: Sectoral Analysis
6.4.1 Tourism
It is one of the primary sources of revenue for the state. The state collects revenue from the
sector in form of the economic instruments shown in Table 6.4. Table 6.5 show the budgetary
receipts from the sector.
Table 6.4: Economic Instruments Levied in Tourism Sector related to Biodiversity
Environmental Fees
Composite Environmental Fees,
Manali
Green Fees, Shimla
Green Tax, Bir Billing
Entry Tax, Pong Lake
Congestion Charges, Gulaba Bridge
(Near Rohtang Pass
Registration Fees
Himachal Pradesh Tourism
Development and Registration of
Tourism Trade Rules, 2012
Permits
Rohtang Pass
Source: Compiled by Authors
Table 6.5: Revenue Earned from Tourism (Rs. Lakh)
Budget
Code
Budget Head 2011
Actual
2012
Actual
2013
Actual
2014
Actual
2015
Actual
2016
Actual
1452 Tourism 104.92 26.50 57.85 59.95 89.95 76.44
105 Rent and Catering
Receipts
11.27 6.24 19.34 3.53 4.79 3.14
01 Rent and Catering
Receipt
11.27 6.24 19.34 3.53 4.79 3.14

107
Budget
Code
Budget Head 2011
Actual
2012
Actual
2013
Actual
2014
Actual
2015
Actual
2016
Actual
800 Other Receipts 93.64 20.26 38.51 56.42 85.16 73.30
01 Registration of
Hotels, Travel, AG
and Guides
16.24 15.55 28.47 47.87 35.89 50.98
13 Recovery of over
payment
77.40 4.71 10.04 8.54 49.27 22.31
Source: State Budget, Various Years
6.4.2 Forests and Wildlife
The state keeps a check on human activities in the forest through a number of economic
instruments in form of royalty, import fees and entry fees. These economic instruments, in
addition to keeping a check on the human intervention within the forest ecosystem, also
generate revenues for the state. A part of this should be diverted towards conservation of that
biodiversity. Table 6.6 shows the economic instruments levied on the forest products in the
state.
Table 6.6: Economic Instruments Levied on Forest Produce
Economic Instrument Purpose Levied On
Royalty It is levied on use of a natural resource.
It is an important means of discovering
resource price.
Deodar Stumps: 20% of the Sale
realisation per quintal; revised every
three years.
Timber (Refer to Annexure – 4)
Transit Fees
Regulate the movement of forest
produce within the state, into the state
from outside and from the state to the
outside areas.
Keeps a check on illegal activities
Medicinal Plants and other minor
forest produce
Entry Fees It is levied to recover the cost of
providing recreational services.
National Parks
Wildlife Sanctuaries
Zoos
Other fees Fees collected for the purpose of issue of
certificates for purposes defined by the
forest department.
Keeps a track on the number of people
engaged in economic activities within
the forest area, checks over exploitation
and illegal activities.
All persons willing to transport forest
produce by land routes shall register
at the office of the Divisional Forest
Officer.
Registration of growers for
cultivation of medicinal plants90:
Net Present Value
and Charge for
Compensatory
Afforestation
Addressing loss of biodiversity and
ecosystem due to commercial or
developmental activities
On user agency meaning any person,
organisation or company or
department of the Central
Government or State Government
making a request for diversion or de-
notification of forest land for non-
forest purpose or using forest land for
non-forest purpose.
90 Notification No. FFE-B-A(3)-2/2013 dated 26-11-2013; Available at:
https://hpforest.nic.in/files/transit%20rules_1.pdf

108
Economic Instrument Purpose Levied On
Bioprospecting91 Sustainable use of genetic resources Medicinal and aromatic plants of the
state.
Fines and Penalties Induce behavioural change
Check activities harmful for
environment
On contravention of the provisions of
the rules and acts being implemented
in the state.
Note: For details on Transit fee, refer to annexure - 4
A. ABS as potential source of revenue from
biodiversity
Himachal Pradesh is very rich in bio-resources. There are
3400 species of plant diversity in the state. The bio-resources
of the state are also a source of revenue. 130 species of
medicinal plants are in heavy demand in the markets;
however, the economic potential of the plants is not realised
fully as major trade in medicinal plants goes unrecorded.
The implementation of Biological Diversity Act, 2002 and
increasing awareness of ABS has created opportunities for
local communities for ABS arrangements with bio-
prospecting industries and checking the illegal channels of
trade leading to unsustainable extraction of these bio-resources. The State Biodiversity Board
has approved the draft HP biodiversity rules in January 2020 and also reported that an amount
of Rs. 71,19,790 has been received in biodiversity fund from Dabur India Ltd.92
A study by Himachal Pradesh State Biodiversity Board “Tradable Bioresources in Himachal
Pradesh… Potential and Scope” has identified important bio-resources that have economic
potential (See Annexure 4). Some bio-resources of the state, that have high economic value
have reached a stage of being near critically endangered (atis, chirayata), endangered (somlata,
jatamanasi, kutki, talispatra), vulnerable (tejpatta, kalihari, taxus wallichiana), and near
threatened (Abies spectabilis) due to unregulated and unscientific harvesting. Focused on
sustainable utilisation of these resources, ABS assumes importance in regulating the use of
biodiversity.
It is reported that there are 706 industries/companies that are accessing the biological resources
from the State for commercial utilisation. With the recent notification of Biodiversity Rules,
revenue from ABS is expected to start yielding results.
Table 6.7: Revenue Earned from Forestry and Wildlife (Rs. In Crore)
Budget
Code
Budget Head 2011-12 2012-13 2013-14 2014-15 2015-16 2016-17
0406 Forestry and Wildlife 106.54 63.90 357.83 115.78 34.47 18.50
01 Forestry 106.52 63.89 357.82 115.73 34.42 18.37
101 Sale of Timber and
other Forest Produce
87.78 33.21 51.98 44.47 19.60 7.72
91 Systematic search for biochemical and genetic information in nature in order to develop commercially valuable
products for pharmaceutical, agricultural, cosmetic, and other application. 92 Proceedings of fourth meeting of HPSBB dated 23.01.2020, Available at:
http://hpbiodiversity.gov.in/Pdf/4th%20HP%20State%20Biodiversity%20Board%20Proceeding%20Final.pdf
Objectives of implementing ABS:
To stop Bio-piracy.
To protect biodiversity in general
in a holistic manner.
To regulate use of Biodiversity.
To ensure sustainable utilization
and equitable benefit sharing.
To provide legal recognition &
support to the Biodiversity and
associated traditional
knowledge.

109
Budget
Code
Budget Head 2011-12 2012-13 2013-14 2014-15 2015-16 2016-17
01 Timber and Other
Forest Produce
Removed from
Forests
0.22 0.37 0.10 0.14 0.08 0.06
02 Timber and Other
Forest Produce
Removed from Forests
by Consumers
31.67 12.64 45.38 32.64 7.00 3.98
03 Drift and Waif Wood 0.00 0.01 0.00 0.00 0.03 0.00
04 Other Forest Produce
Removed from Forests
by the Government
0.00 0.00 0.00 0.00 0.00 1.28
05 Sale of Timber and
other Forest Produce
Removed from FSC
55.65 19.69 5.93 10.73 11.66 1.80
06 Minor Forest Produce
including Medicinal
Plants
0.11 0.37 0.32 0.83 0.74 0.50
07 Receipt from Grazing
and Grass
0.13 0.13 0.25 0.13 0.09 0.10
102 Receipts from Social
and Farm Forestry
0.00 0.00 0.00 0.00 0.66 0.44
01 Receipt from
Registration Fees 0.00 0.00 0.00 0.00 0.66 0.44
02 Receipts from Forest
Societies 0.00 0.00 0.00 0.00 0.00 0.00
800 Other receipts 18.74 30.68 305.84 71.26 14.16 10.20
01 Receipt from Penalties
and Damage Bills
0.94 0.34 0.22 0.52 0.45 0.15
02 Receipt from Sale of
Trees To Right
Holders
0.02 0.11 0.20 1.15 1.63 0.97
03 Compensation under
Section 68 of IFA,
1927
1.99 3.75 2.97 3.63 3.06 1.95
04 Receipt from Rent of
Building
0.87 0.92 0.92 0.98 0.89 0.86
05 Receipt from
Registration Fees
0.19 0.22 0.31 0.37 0.00 0.00
06 Receipts from Forest
Societies
0.00 0.00 0.00 0.00 0.00 0.00
07 Receipt from Passing
of Timber
0.00 0.00 0.03 0.01 0.00 0.00

110
Budget
Code
Budget Head 2011-12 2012-13 2013-14 2014-15 2015-16 2016-17
08 Receipt from Sale of
Packing Cases
0.00 0.00 0.00 0.00 0.00 0.00
09 Receipt from Export
Permit Fees
0.93 1.50 1.35 1.39 1.15 1.22
10 Miscellaneous (Seized
Timber)
0.85 0.79 1.27 0.74 0.97 1.49
11 Guarantee Fee from
Forest Corporation
0.00 0.00 0.00 0.00 0.00 0.00
12 Receipt from Other
Departments to
Compensation
Forestry
8.19 0.86 0.59 59.68 5.16 1.05
13 Receipt from Forests
not Managed by
Government
0.01 0.06 0.02 0.01 0.02 0.00
15 Receipt from Sale of
Trees to Other
Deptt./Organisations
0.10 14.33 294.31 0.37 0.00 0.00
16 Receipt from Penalties
and Damage Bills etc
from HPFSC
0.13 0.14 0.12 0.07 0.21 0.19
17 Receipt from
Distribution of
Seedling
0.21 0.11 0.49 0.07 0.08 0.11
18 Other Miscellaneous
Receipt
4.30 7.56 3.03 2.27 0.53 2.21
02 Environmental
Forestry and Wildlife
0.02 0.01 0.02 0.05 0.05 0.13
800 Other Receipts 0.02 0.01 0.02 0.05 0.05 0.13
02 Entry Fee from
Zoos/Parks
0.02 0.01 0.02 0.05 0.05 0.13
Source: State Budget, Various Years.
6.4.3 Fisheries
Fisheries are an important sector of food production and providing nutritional security to the
food basket. Mapping revenues from this sector is tricky as the prime objective of the measures
undertaken for promotion of sustainable fishing is enhancing the income of fishermen. The
state earns revenue from this sector mainly in the form of fees, fines and sale of fish, fish seeds.

111
Table 6.8: Economic Instruments Related to Biodiversity levied in Fisheries Sector
License Fees Fines/Penalty Sale of Fish, Fish Seeds
Keep a check on the number of
people indulged in fishing
Induce behavioural change Recover the cost of production
This keeps a check on the
pressure put on the marine
resources of the state.
It keeps a check on activities
harmful to the marine
resources of the State.
Livelihood support to
fishermen
Following revenues (in Table 6.9) have been identified from the state budget which are relevant
for biodiversity conservation. The revenue collection in fisheries is showing a clear increasing
trend.
Table 6.9: Revenue Earned from Fisheries (Rs. In Thousands)
Actual
Budget
Code Budget Head 2011 2012 2013 2014 2015 2016
0405 Fisheries 13586 19400 25573 29704 39830 42728
102 Licence Fees, fines, etc. 1703 1942 2080 2041 29262 11620
01
Receipt from Licence Fees,
Fines etc. 0 1942 2080 0 29262 11266
103
Sale of Fish, Fish Seeds
etc. 11159 16620 19769 22305 9106 20389
01 Sale of Fish, Fish Seeds 731 517 1552 962 5782 14103
02 Royalty on Sale of Fish 10428 16103 18217 21343 3324 6285
800 Other receipts 0.04 0.04 0.34 0.50 0.06 0.95
01
Miscellaneous Receipts
from Fisheries 0.04 0.04 0.34 0.50 0.06 0.95 Source: State Budget, Various Years.
6.4.4 Mining
Mining industry in Himachal Pradesh has emerged as a major economic activity in the recent
years, and has been contributing significantly to the economy of the state. At the same time,
increasing mining operations have increased the threat to biodiversity in the state. According
to Sonter, Ali and Watson (2018), mining has direct and indirect impacts on biodiversity.
To counter such losses, in June 2015, the Mines and Minerals (Development and Regulation)
Act, 1957 was amended to introduce a new section, i.e., Section 9(B), which provides for the
establishment of District Mineral Foundation in any district affected by mining related
operations, the object of which shall be to work for the interest and benefit of people and areas
affected by mining.

112
Box 6.1: District Mineral Foundation
The District Mineral Foundation is funded by statutory contributions from holders of mining lease,
in the following manner:
For Major minerals (as prescribed by Central Government):
a) 10% of the royalty paid in terms of the Second Schedule to the MMDR Act, 1957 in respect
of the mining leases or, as the case may be, prospecting licence-cum-mining lease granted
on or after 12th January, 2015; and
b) 30% of the royalty paid in terms of the Second Schedule to the said Act in respect of mining
leases granted before 12th January 2015.
For Minor Minerals (as prescribed by the State Government):
a) Ordinary Soil/brick earth/Shale – Re. 1/-per tonne of the mineral dispatch
b) All other mineral material – Rs. 10/- per tonne of the Dispatch
The DMF will implement Pradhan Mantri Khanij Kshetra Kalyan Yojana (PMKKKY) for
implementation of development projects in the areas affected by mining. PMKKKY guidelines
prescribes that at least 60% of fund shall be utilised for high priority areas:
i. Drinking water supply
ii. Environment preservation and pollution control measures
iii. Health care
iv. Education
v. Welfare of women and children
vi. Welfare of aged and disabled people
vii. Skill development
viii. Sanitation
40% of funds shall be utilised for other priority areas:
i. Physical Infrastructure
ii. Irrigation
iii. Energy and Watershed Development
iv. Any other measure for enhancing environment quality in mining districts Source: Compiled by Authors
Out of the permissible works that can be undertaken using the funds of DMF, 3 are related to
biodiversity (Environment preservation, Sanitation, and Energy & Watershed Development).
Till November 2018, total collection under DMF in Himachal Pradesh amounted to Rs. 96.49
crore. Out of this, 89.33 percent of the collection comes from Major minerals (other than Coal
and Lignite) and the rest comes from minor minerals. The following table 6.10 shows the
details:
Table 6.10: Receipts of District Mineral Foundation
Head Amount (Rs. Crore)
Total amount collected in respect of major Minerals (Other
than Coal and Lignite) 86.19 (89.33%)
Total amount collected in respect of Minor Minerals 10.30 (10.67%)
Total amount collected in respect of coal and lignite 0
Total amount collected under DMF 96.49 (100%) Source: Compiled by Authors

113
Out of the total collection of Rs. 96.49 crore, no amount has been spent on any project in the
state.93 Apart from the receipts of DMF, other revenue earned from mining may be diverted
towards restoration and rehabilitation of biodiversity in mining affected areas. Table 6.11
shows the economic instruments by which revenue is raised in mining sector in Himachal
Pradesh.
Table 6.11: Economic Instruments related to Biodiversity in Mining Sector
Economic
Instruments Purpose
Royalty
The mining lease confers upon the lessee the right to extract minerals
from the land and to appropriate them for his own use or benefit. For
this, the lessee is required to pay a certain amount in respect of the
minerals extracted proportionate to the quantity so extracted. 94
Fees Charged for providing mining permit, mining lease.
Dead Rent
Charged to ensure a flow of income to the lessor in case the mine is not
being operated on and therefore, no royalty is being paid.
Surface Rent
In a mining lease, a lessee has to pay the lessor the rent for the area
leased. This rent is called Surface Rent
Penalty
On contravention of the provisions of the Himachal Pradesh Minor
Minerals (Concession) and Minerals (Prevention of Illegal Mining,
Transportation and Storage) Rules, 2015
District Mineral
Foundation
Established to counter adverse impacts of mining on environment and
livelihood of local people. Source: Compiled by Authors
Box 6.2: Surface Rent, Royalty and Dead Rent
In a mining lease, a lessee has to pay the lessor the rent for the area leased. This rent is called Surface
Rent.
Along with the right to use the property, the mining lease confers upon the lessee the right to extract
minerals from the land and to appropriate them for his own use or benefit. For this, the lessee is
required to pay a certain amount in respect of the minerals extracted proportionate to the quantity so
extracted. This payment is called Royalty.
It might happen that the mine does not yield enough return to the lessor in shape of royalty. In order
to ensure that the lessor gets a regular income, whether the mine is operated or not, a fixed amount
is to be paid to lessor by lessee. This is Dead Rent.
Source: 1986 AIR 1323, 1986 SCR (1) 479)95
Following revenues (in Table 6.12) have been identified from the state budget which are
relevant for biodiversity conservation. The revenue collection from rent and royalty is showing
a clear increasing trend.
93 Transform mining, released at National Workshop on DMF – PMKKKY, 2019 94 D.K. Trivedi and Sons and ors. Etc. ... vs State Of Gujarat and ors. etc. on 5 March, 1986. 95 D.K. Trivedi And Sons And Ors. Etc. ... vs State Of Gujarat And Ors. Etc. Etc on 5 March, 1986

114
Table 6.12: Revenues Earned from Mining
(Rs. In Crore)
Actual
Budget
Code
Budget Head 2011 2012 2013 2014 2015 2016
0853 Non-Ferrous Mining and
metallurgical industries
120.12 147.90 111.08 161.52 155.08 176.22
102 Mineral Concession Fee
Rent and Royalties
112.88 137.37 99.20 125.85 125.77 134.54
01 Receipts from Mineral
Concession, Fee
112.88 137.37 99.20 125.85 125.77 134.54
Source: State Budget, Various Years.
6.4.5 Hydropower
Although hydropower is clean energy, the construction of hydropower plants impact damages
livelihood and environment and biodiversity in different ways (Carew-Reid et al, 2010) is well
documented.
Figure 6.1: Impact of Hydropower Projects on Biodiversity
Source: Source: Compiled by Authors
However, the state has the potential to earn large revenues through hydropower projects. The
state levies a free power royalty on all the new hydro projects in the state, which means that
the power producer will provide the state royalty at the rate of 12 percent of net energy for the

115
entire agreement period.96 The state also charges royalty on water usage (HP Small Hydro
Power Policy, 2006).
Box 6.3: Local Area Development Fund Local Area Fund Development (LADF) has been set up as per provision 10.1 (h) of National Hydro
Power Policy 2008.
“An additional 1% free power from the project would be provided and earmarked for a Local Area
Development Fund, aimed at providing a regular stream of revenue for income generation and
welfare schemes, creation of additional infrastructure and common facilities, etc., on a sustained and
continued basis over the life of the project. It is recommended that the host state governments would
also provide a matching 1% from their share of 12% free power towards this corpus. This fund could
be operated by a standing committee headed by an officer of the State Government, not lower than a
district magistrate to be designated by the State Government, male and female representatives of the
Project Affected People and the project head nominated by the developer. This fund would be
available in the form of an annuity over the entire life of the project.
The objective of establishing the fund is to carry out local development activities so as to ensure
visible additional benefit to local communities in the project area.
The Fund would receive revenue from sale of 1% additional free power by the project developer and
matching share of the State Government from sale of 12% free power allocated by the projector
developer.
The funds of LADF would be kept in a joint account in any scheduled bank. The interest earned on
LADF will be a part of LADF Source: Draft Guidelines for Management of Local Area Development Fund.
The following table 6.13 shows the revenue earned from power sector is shown in the following
table.
Table 6.13: Revenue Earned from Power
(Rs. Crore)
Budget
Code
Budget Head 2011-12 2012-13 2013-14 2014-15 2015-16 2016-17
0801 Power 1145.70 637.15 696.29 1121.51 923.68 650.93
01 Hydel
Generation
1145.70 637.15 696.29 1121.51 923.68 650.93
800 Other receipts 1145.70 637.21 696.29 1121.51 925.58 650.93
01 Guarantee Fee
on Loans by
HPSEB
0 7.89 0 0 0 0.08
06 Free Power
Royalty from
HPSEB
47.64 34.79 25.00 112.24 333.42 0
10 Free Power
Royalty from
SJVN
101.74 170.04 121.58 437.53 242.50 179.95
Source: State Budget, Various Years
96 Notification No. MPP (F)-2/2005-X dated 15-05-2018; Available at:
http://hperc.org/File1/amendmentpolicy18.pdf

116
6.5 Way Forward
In this chapter, potential revenue sources
have been identified; which can be
divided into the following categories:
i. When revenue is generated from
sale, lease, access, use, etc. of
goods and services provided by
biodiversity.
ii. When income is generated from
implementing policies which
regulate economic activities (that
impact biodiversity) and
encourage sustainable practices
such as fee, fines, permits in case
of fisheries, tourism, etc.
iii. When a compensation amount,
impact fee etc. are levied on economic activities which cause significant adverse impact
on biodiversity sometimes leading to complete destruction and loss.
However, we find that the collection from these revenue items ranges from 0.27 percent of
GSDP to 0.77 percent of GSDP97, which is miniscule. To increase revenue from biodiversity,
following are some recommendations:
1. Effective Implementation of ABS: Corporations utilizing bio-resources of the state
should be persuaded to share the benefits accrued with the state. HP State Biodiversity
Board has released a report on tradable bio resources of the state. This report has
identified all the tradable resources of the state that have the potential for access and
benefit sharing, along with the industries which are using these bio-resources as raw
material. The resources identified in the report should be considered for development
of a robust ABS mechanism and the industries should be persuaded to pay for the
benefits they derive from state’s bio-resources. However, without the implementation
of strict rules, it would be difficult to bring all such stakeholders to the table of
discussion. Therefore, formulation of rules is of utmost importance.
2. Utilising District Mineral Foundation Fund: The collection of Rs. 96.49 crore in
DMF Fund has not ever been utilised. The state should start planning expenditure on
the priority areas from the fund to negate the negative impacts on the biodiversity
caused by mining activities. The state should also explore the possibility to transfer a
specific amount from DMF to the Environment Fund, which could be utilised for
conservation and restoration purposes.
3. CAMPA Fund is a promising source of revenue. There is a need to integrate
biodiversity in utilisation of CAMPA, especially for restoration and afforestation
activities. More focus should be on restoring the endangered and threatened species.
The state should explore the possibility of earmarking a specific amount for
conservation and restoration of biodiversity, which should be transferred to the
Environment Fund.
97 Authors’ calculation, data taken from state budget for various years
Revenue generated
from biodiversity
Sale, lease use ofgoods and servicesfrom biodiversity
Regulating charges(fees, fines) onactivities that mayharm environment
Compensationamount, impactfees on economicactivities thatcause significantimpact onbiodiversity
Figure 6.2: Categories of Revenue Generated from
Biodiversity

117
4. Environment Fund: The Environment Fund (See Annexure – 5), although already
established in 2008, has not been utilised till date. The amount in DMF and CAMPA
fund meant for biodiversity should be transferred to this fund. This amount should be
used for conservation of biodiversity and restoration of degraded area.
5. Increasing Involvement of Traditional Governance Systems: Traditional systems
like Praja, Mahila Mandal should be encouraged to take actions for conservation of
biodiversity like impose ban on environmentally harmful activities, implementing fees
and fines. This will induce behavioural changes along with raising revenue which can
be utilised for maintenance of biodiversity in their area.
6. The state already collects entry fees for ecologically fragile areas. The collection of
such fees from famous tourist spots is generous. A part of this fees should be earmarked
for maintenance of biodiversity in the area. To ensure that biodiversity is taken care of,
an ecological fund can be created at local level, where the earmarked amount for
biodiversity could be transferred.

118
Chapter 7: Financial Needs Assessment Based on Quantitative Targets
7.1 Financial Needs Assessment The State Biodiversity Strategy and Action Plan (SBSAP) is a strategic policy document
prepared with an aim to mainstream biodiversity through schemes and programmes of relevant
sectors. The implementation of SBSAP requires a comprehensive estimation of finance
resources. For this purpose, a financial needs assessment has been undertaken.
The methodology which has been adopted in this report for the purpose of assessment of
financial needs for implementing the SBSAP was developed as part of the BIOFIN initiative.
The comprehensive methodology is based on quantitative targets, developed with an aim to
implement the National Biodiversity Action Plan and achieve the 12 National Biodiversity
Targets.
With implications on country-level budgeting process and planning, finance for biodiversity
conservation is a complex policy matter in India. For undertaking the financial needs
assessment for implementation of SBSAP in Himachal Pradesh, quantitative targets have been
introduced in respect of specific action points. These quantitative targets have been derived
from the existing schemes, policies, programs and action plans, which have been prepared for
and are being implemented by different government departments of Himachal Pradesh. This is
because these policies, schemes, programs and action plans have been approved after much
deliberation at the highest levels in the government. Financial projections for the quantitative
targets were made by using government approved costs and cost norms.
The financial needs assessment has estimated the finances required to implement SBSAP, in
alignment with existing schemes and programmes and is outlined below. The action points
identified from the draft SBSAP of Himachal Pradesh form the basis of the assessment. These
action points spread across 8 thematic areas: Wild flora and fauna, Agriculture, Animal
husbandry, Aquatic biodiversity, Microbial biodiversity, Livelihood, Economic Valuation and
biodiversity, Education, Awareness and Training as well as Policies, Laws and Institutions

119
Table 7. 1: Financial Needs Assessment for Implementation of SBSAP
S.
No.
Action Points Targets Relevant Scheme Funding Gaps and Remarks
Wild flora and fauna
1 Training of JFMs, VFDCs, VFDSs, Yuvak
Mandals, Mahila Mandals etc. to create
opportunities for networking and awareness
raising for conservation of PAs
Target: 1567 JFMCs
364 VFDSs
154 VFDCs
Sanjhi Van Yojana (SVY)98
Training in Soil Conservation
Samudaik Van Samvardhan
Yojana (SVSY)
Funds approved. No Additional funds
needed.
2 Awareness campaigns for local communities
to educate them about the impacts of illicit
felling, unsustainable extraction of medicinal
plants, overgrazing, etc.
To be achieved with target for training
of JFMCs.
SVY
Vidyarthi Van Mittar Yojana
SVSY
Funds approved. No Additional funds
needed.
3. Sterilization of animals like Monkeys Annual target – 15,000 Monkey Sterilization Programme Annual cost = Rs. 1,35,00,000 (over 5
years)
4. Periodic cleaning of shrubs to provide free
movement of animals
Yearly target = 2500 ha each for very
dense and moderately dense forest.99
MGNREGA Total Annual cost VDF and MDF = Rs.
3.64 crore
5. Plant more fruiting trees in forests to avoid
raiding by animals in agricultural lands in
search of food
Target – 120000 hectares (HP Budget
speech, 2020-21)100
Raising nurseries for
departmental planting and public
CAPMA
NAP
Sanjhi Van Yojana
Funding has been approved, as
indicated in the budget speech.
6. Revive degraded pasturelands in uphill
Annual target = 5000 ha101,102 Development of Pastures and
Grazing
Annual cost to the State = Rs.
1.85crore103
7. Strengthen forest fire management in light of
increasing incidents of forest fires
600 more need to be deployed.
92 home guards in sensitive
division with equipment and good
Forest Fire Management Scheme
(State Scheme)
Total cost = Rs. 1.75 crore
98 One of the objectives of Sanjhi Van Yojana is to provide training to Training of forest staff, VFDS members and CBOs / NGOs for facilitating and strengthening community participation,
as outlined in HP Forest Manual, Volume I, Page no: 773: https://hpforest.nic.in/files/Forest%20Manual%20%20Volume%20I.pdf 99 HP State budget, 2020-21 has a target of clearing of lantana from 2,500 ha of land in 2020-21. This target has been taken as a proxy for clearing of shrubs. 100 https://ebudget.hp.nic.in/Aspx/Anonymous/pdf/FS_Eng_2020.pdf 101 HP state budget,2020-21 has set target of doing plantation in 5000 ha of land in 2020-21. This target has been taken as proxy for restoring pasturelands. 102 State aims to achieve the target of FTC by 2030 (State Budget Speech, 2020-21). This is the proxy duration for achieving the total target. 103 Since the data is not available for area of pastures available in tribal and non-tribal areas, we will consider the upper limit of the cost using norms of tribal areas.

120
S.
No.
Action Points Targets Relevant Scheme Funding Gaps and Remarks
vehicles to be deployed to bring
fires under control.104
8. Provision of cooking gas to reduce
dependency on biomass-based stoves often
used in open areas
Himachal Pradesh is the first state to
achieve 100% LPG Coverage under
the PM Ujjwala Yojana.105
Pradhan Mantri Ujjwala Yojana Target achieved.
No funding required.
9. Provide anti-trafficking training to all the
enforcement agencies
To be incorporated as a part of courses
offered at FTIs for training of all
forest staff106
State scheme on wildlife
preservation
Crime and Criminal Tracking
Network System
No additional funding required. To be
imparted as part of regular training.
10. Strengthen seed banks for seed conservation
as well as plant breeding for seed
development
One
(One gene bank is already being
established by GBPIHED, Mohal,
Kullu,)
Development and Strengthening
of Infrastructure Facilities for
Production and Distribution of
Quality Seeds (CSS Scheme)
No additional funding required.
11. Identify and plant native tree species to
restore degraded landscapes and curb the
issue of land desertification.
Annual target = 12000 ha. (Target for 2020-21 in state budget
=12000 ha
The State aims to achieve two-third FTC
by 2030 (State Budget Speech, 2020-21)
CAMPA
National Afforestation
Programme
Annual funds requirement = Rs. 15
crore
(This is the proxy for annual cost to be
borne for next 10 years, till 2030)
12. Develop Restoration Plan for area affected by
invasive species. The plan should include
regeneration of native species as well
Annual target = 2500 ha.107 CAMPA
National Afforestation
Programme
Samriti Van Yojana
Regeneration of forests
Improvement of tree cover
Sanjhi Van Yojana
Annual funds needed = Rs. 5.04 crore
(Annual cost to be borne till 2030,
similar to the target of FTC)
104 https://www.thestatesman.com/cities/shimla/govt-initiatives-curb-forest-fires-in-himachal-pradesh-1502771273.html 105 https://indianexpress.com/article/governance/himachal-pradesh-first-to-achieve-100-lpg-coverage-6283215/ 106 https://hpforest.nic.in/pages/display/NGY2NTRihnQ0ZjY1NA==-natural-resource-management-and-training-development-society 107 Target for 2020-21 is set at 2500 ha in HP state budget, 2020-21 which has been taken as proxy for yearly target.

121
S.
No.
Action Points Targets Relevant Scheme Funding Gaps and Remarks
13. Capacity building programme for local
communities to manage homestays and
restaurants
Target – 3544 people108 Loan assistance from Asian
Development Bank worth US $
95.16 million109
Cost = Rs. 10,63,200 for a training
session of 3 days
No additional funding required. Funds
will be sourced from the loan from
ADB.
Agriculture and Biodiversity
1. Increase the number as well as reach of solar
pumping sets to farmers under Saur
Sinchayee Yojana
17.50 lakh standalone solar powered
pumps to replace the diesel-powered
agricultural pumps by 2022.110
Saur Sinchayee Yojana
KUSUM Yojana111 (GoI)
No additional fund needed.
2. Training in scientific production &
management of fodder under Uttam Chaara
Utpadan Yojana for higher productivity of
livestock and less pressure on forests
Target = 25000 farmers
Uttam Chara Utpadan Yojana No additional funding needed the
provision is in the scheme.
3. Develop a Fodder Bank to enhance quantity
and quality of fodder.
Two fodder banks in an area of 6 ha
each112 proposed to be set in Lahaul-
Pangi landscape.
Rain fed Area Development
Programme
Sub mission on Fodder and Feed
Development under NLM
Total cost = Rs. 15 lakh
.
4. Set-up high-tech nurseries in higher altitude
regions
10 high tech nurseries are to be
set within the state.113
Establishment/Maintenance of
government orchards/nurseries
(Horticulture Department)
Total cost = Rs. 2 crore
No additional funding required.
Scheme has specific component for this
purpose.
108 In 2019-20, the Department of Tourism undertook training for Community Based Tourism in 6 districts: Chamba, Bilaspur, Kullu, Mandi, Solan and Shimla. The total number of
people trained is 3544. So, the next target is training people in other 6 districts. Target to match is 3544. 109 http://himachalservices.nic.in/economics/pdf/Economic_Survey_eng2019-20.pdf, page 116. 110 https://economictimes.indiatimes.com/small-biz/productline/power-generation/govts-special-scheme-for-farmers-for-the-installation-of-solar-pumps-and-grid-connected-solar-power-
plants/articleshow/69523504.cms?from=mdr 111 https://pib.gov.in/PressReleaseIframePage.aspx?PRID=1565274 112 The CFB in Maikhanda village in Uttarakhand was set up in community wasteland of 6 ha, an nursery was set up in small area of arable land; see page 21 in:
http://gbpihed.gov.in/PDF/Publication/25%20years%20research_final%20Report.pdf 113 http://www.hpagriculture.com/schemes.htm

122
S.
No.
Action Points Targets Relevant Scheme Funding Gaps and Remarks
5. Introduce a comprehensive focused program
to provide support for identified niche organic
products
Bring 20,000 ha into Natural
Farming System
Awareness campaigns for 1 lakh
farmers
Prakartik Kheti-Khushal Kisan
scheme
Funds have been approved by the state
budget. No additional funding required.
6. Train farmers for residue management to
improve soil health
Annual target: 50,.000 farmers
(In 2019-20, the State had trained 50,000
farmers for organic farming; this target
has been taken as a proxy for the annual
target)114
Soil Science and Chemistry (State
Scheme)
SHM under NMSA
National Project on Management
of Soil Health and Fertility
NMAET
Annual cost = Rs. 4.45 crore
7. Strengthen State Bio control labs to provide
suitable bio-control agents especially for
higher altitude regions
There are 2 biocontrol labs in the
State, one in Palampur and one in
Mandi115
Plant Protection
NMAET
Cost = Rs. 40 Lakh
No additional funds are needed.
8. Provide on-farm training to farmers in for
adoption of Pesticide Application Technology
for minimum residue and reduced pesticide
risk
There are 9.61 lakh farmers in the
State who need to be trained.
Annual target: 50,000 farmers116
NMAET Annual cost = Rs. 4.45 crore
9. Establish Community Seed Banks to make
local variety of seeds available to farmers.
One in each district Development and Strengthening
of Infrastructure Facilities for
Production and Distribution of
Quality Seeds (CSS Scheme)
Promotion & Strengthening of
agricultural machineries through
training, testing and
demonstration (100% CSS)
@highest cost norm the cost of seed
banks in the State = Rs. 6.82 crore
114 HP State Budget Speech, 2020-21 115 http://www.hpagriculture.com/schemes.htm 116 In 2019-20, the State had trained 50,000 farmers for organic farming; this target has been taken as a proxy for the yearly target

123
S.
No.
Action Points Targets Relevant Scheme Funding Gaps and Remarks
Animal Husbandry
1. Strengthen and extend veterinary services for
migratory livestock
Start Mobile Veterinary Sewa on pilot
basis
Fill up 120 posts of Gram Panchayat
Veterinary Assistants
Mobile Veterinary Sewa No additional funding required;
funding approved in the State budget.
2. Increase the number of Yak breeding farms
similar to the breeding farm (with 62 yaks) in
Lari, Lahaul and Spiti district
One farm Conservation of Threatened
Livestock Breed of Yak/Spiti Pony
Total cost = Rs. 50 lakh
3. Establish ‘Gokul Grams’ under Rashtriya
Gokul Mission
One gokul village in Una to be set
up.117
Rashtriya Gokul Mission Funds sanctioned under Rashtriya
Gokul Mission118
4. Explore providing incentive to local
communities as a possible strategy such as
monthly remuneration to adopt stray cattle
Annual target = 12,816 cattle Funds needed to be allotted by State.
No schemes supporting this initiative.
Annual cost = Rs. 13.84 crore
Aquatic Biodiversity
1. Establish and strengthen fish brood bank,
especially for native species such as mahseer
Establish 1 brood bank for Mahseer
and 1 for trout.
Rashtriya Krishi Vikas Yojana
(Animal Husbandry)
Total cost = Rs. 10 crore (Rs. 5 crore for
each brood bank)
3. Desilt the riverbeds and reservoirs 27 hydroelectric stations are there in
the state. Target for desilting: 27
hydro stations
No scheme. State government needs
to allot money.
Total cost = Rs. 5,35,21,074
4. Identify locations to lay down additional
pipelines to treat effluents before their
disposal in river
The Department of Irrigation and
Public Health has a target to lay the
pipeline for sewerage system of
Industrial Area Kala Amb and
Moginand
No scheme. Total cost = Rs. 30.40 crore
Project and cost have been approved.
No additional funding is required.
Microbial Diversity
117 https://pib.gov.in/PressReleasePage.aspx?PRID=1575277 118 https://pib.gov.in/PressReleasePage.aspx?PRID=1575277

124
S.
No.
Action Points Targets Relevant Scheme Funding Gaps and Remarks
1. Establish Microbial Germplasm Bank (MGB)
in the state.
One gene bank
No gene bank for microbial diversity
yet in the State.
National Mission on Himalayan
Studies
Total Cost = Rs. 69,61,760
Funds need to be allocated by the State.
2. Facilitate availability of endosymbionts to
farmers for biological nitrogen fixation such
as Rhizobium
Target: 9.55 lakh hectare.119
Integrated Nutrient Management
Scheme
@highest cost norm total cost for 9.55
lakh ha is Rs. 119.37 crore.
Education, Awareness and Training
1. Prepare short films and documentaries on
ecological wealth as well as the conservation
challenges of HP such as threats posed on
endangered species with their local names &
pictures in films for wider circulation
One documentary on the lines of the
documentary produced in Karnataka.
Yearly budget – Rs. 50 lakh
State needs to allocate funds for this
purpose.
2. Promote stories in print media, comic strips
that revolve around biodiversity and related
issues such as weekly columns in local
newspapers
Publicity in Print media – 75 numbers
Publicity in electronic media – 20
numbers
(This is the target set for spreading
awareness related to forest fire)
Total Cost = Rs. 20.51 lakh
State needs to allocate funds.
Total annual funding required Rs. 51.795 crore
Source: Computed by Authors
119 http://mospi.nic.in/sites/default/files/cocsso/2_HimachalPradesh.pdf

125
7.2 Mobilizing Conservation Finance
We suggest a combination of the following 4 different strategies for mobilisation of additional
funds.
7.2.1 Leverage existing sources like MNREGA, CAMPA, and Agriculture and
Horticulture Sector Schemes
There is a need to focus on mobilising resources through CAMPA, and other well-funded
Sectoral schemes such as the MGNREGA, Parampragat Krishi Vikas Yojana, Rashtriya Krishi
Vikas Yojana, National Agroforestry Program, KUSUM, and National Mission on Sustainable
Agriculture -- for implementation of relevant SBSAP action points covered under these
schemes and programs. This will require the relevant departments to pro-actively identify, plan,
and prioritise their activities accordingly so that the allocations made to their respective
departments are fully and efficiently utilised in a systematic manner. In other words, the
departments will need to augment their execution and thus absorption capacity. To facilitate
this process we recommend a formal institutional platform in the form of either an inter
departmental group or an inter-ministerial group where an annual action plan and/or multi-year
action plan for mainstreaming Action Points in SBSAP in programs of relevant departments.
Analysis in Chapter 5 clearly brings out that the key interventions required for conservation of
biodiversity such as: conservation of endangered species, afforestation, management of
protected areas, and conservation of ecosystems like wetlands, river rejuvenation; budgetary
finance is the primary sources of funding in India. The BER analysis shows that in HP,
biodiversity relevant expenditure has increased from Rs. 159.33 crore in 2011-12 to Rs. 457.35
crore in 2016-17 and is projected to increase to Rs. 741.87 crore in 2020-21. The detailed
analysis shows that while some aspects of conservation have received the required policy and
programmatic focus along with adequate funding, in some areas increase in both the policy
focus and funding is necessary. For instance, while a significant share (over 31-68%) of the
total biodiversity attributable expenditure is on ‘protection’ of biodiversity in the state;
expenditure on restoration has been low (3.16-5.17%) especially when compared with
restoration needs in the state. This calls for a greater policy focus and additional funding on
restoration. Similarly, additional funding will be required in other key areas such as
management of HWC, livelihood support, adequate compensation of farmers as an incentive
for wild biodiversity conservation, training and awareness etc.
7.2.2 Levy a Charge on Identified Sectors
Tourism department, and tourism activities by Forest department, and private sector tourism
activities benefit from the presence and enhancement of biodiversity. We propose that a
‘biodiversity cess’ at 10 percent on revenues from the tourism activities (irrespective of the
department involved) be charged and be transferred to the ‘Environment Fund’ of Himachal
Pradesh (Annexure 5).
Table 7.2: Economic Instruments Levied Across Economic Sectors in Himachal Pradesh
Sector Economic Instruments
Tourism Fees:
Environmental Fees (Green Fees (Shimla), Green
Tax (Bir Billing), Congestion Charges (Gulaba
Bridge))
Registration of Tourist Trade and Homestays

126
Sector Economic Instruments
Environmental Fees
Permits:
Rohtang Pass
Forestry and Wildlife Royalty
Transit Fees
Entry Fees
Fees collected for the purpose of issue of certificates
for purposes defined by the forest department.
CAMPA fund
Fines and Penalties Source: Compiled by Authors
Mining and Hydro power operations inflict negative stress on biodiversity. A number of
charges are levied on these two sectors which go the general budget or collected in a special
fund. For instance, in the case of Mining sector besides royalty and other levies, there is a
‘District Mineral Fund’. Similarly, from Hydro power sector besides the royalty and other
charges there is a ‘Local Area Development Fund’. We propose, that 50 percent of the annual
accruals in these funds be charged as ‘biodiversity cess’ and be transferred to the ‘Environment
Fund’ of Himachal Pradesh.
Table 7.3: Economic Sectors for Mainstreaming Biodiversity
Sector Economic Instruments
Mining Royalty
Permit Fees
Surface Rent
Dead Rent
Penalties
District Mineral Foundation
Hydropower Royalty
Sale of power
Local Area Development Fund Source: Compiled by Authors
7.2.3 Augment Environment Fund, Local Trust Fund through Rationalising user
charges, Environment Tax/Cess, CSR
PAs: The funding support to PAs is often limited with the exception of tiger reserves, leading
to a resource crunch in the other PAs (NBA, 2019). To finance the funding gap, the
Government of Himachal Pradesh needs to utilise the entry fees of PAs as has been done in
Sikkim. The Government of Sikkim has already developed a ‘Local Trust Fund’ for each PA
in the state which is serviced by the entry fee of PAs —70 percent of the proceeds go to EDCs
and 30 percent are retained by the Department of Forest and Environment for the management
of the PAs.

127
The Government of Himachal Pradesh should consider establishing a Local Trust Fund in
addition to revising and rationalizing the entry fee commensurate with the demand for the PA
and the pristine nature and services it offers. The state should also consider and levy a
conservation cess on tourism activities in 4-5 sq. km. area around PAs for augmenting the
receipts of Local Trust Fund.
CSR: The potential of CSR expenditure on biodiversity is estimated at Rs. 718.44 crore
(Pandey et al, 2020) for India. The same study shows that in India currently 2.64 percent of
total CSR is being spent on biodiversity. The reasons for low CSR investment towards
biodiversity are twofold—biodiversity is a complex multidisciplinary subject and that the
projects in this sector are of long gestation and often with intangible results and benefits. In
order to overcome this, at least partially, there is a need for SBB to develop a pipeline of
projects in priority areas of biodiversity in Himachal Pradesh. SBB should develop
collaboration with the India Business and Biodiversity Initiative (IBBI) for guidance and
technical help.
7.2.4 Focussed Efforts for Realising the full Potential of ABS
ABS is a highly underutilised tool in Himachal Pradesh. SBB should conduct a detailed study
on the potential of ABS in the state and the challenges in implementation of ABS. Also prepare
a detailed action plan on ABS with the help of policy and planning support from technical
agencies.
The ABS provisions of the Convention on Biological Diversity (CBD) are designed to ensure
that the physical access to genetic resources is facilitated and that the benefits obtained from
their use are shared equitably with the providers. In some cases, this also includes valuable
traditional knowledge associated with genetic resources that comes from indigenous and local
communities.
ABS is an important tool for raising conservation funds at the same time ensuring its equitable
distribution. It is based on the principle that the proceeds from commercialization of biological
resources should contribute to conservation of the resources that are monetized, and for
bridging the gap between users and providers/conservers of biological resources. Of all the
funds accrued by the NBA from ABS, five per cent is to be used by the NBA; of which 50
percent is to be passed on to the concerned SBB for administrative charges120. The remaining
ninety five percent of ABS amounts are to be disbursed to the concerned BMC(s) and/ or
benefit claimers121. If the benefit claimers are not identified, the funds accrued are to be used
to support conservation and sustainable use of biological resources and to promote livelihoods
of the local people from where the biological resources are accessed. Similarly, when the SBB
grants the approvals directly under the ABS Guidelines, it can retain 5 percent of ABS fees
towards administrative charges and the remaining 95 percent is to be passed on to the relevant
BMC or to the benefit claimers directly122.
7.2.5 Carbon Credits
Carbon credits create a market for reducing greenhouse emissions by giving a monetary value
to the cost of polluting the air. The mechanism of carbon credit trading was formalised in Kyoto
Protocol, which is an international agreement among more than 170 countries. Under the
120 Regulation 15 (1) (a) of the ABS Guidelines, 2014 121 Regulation 15 (1) (b) of the ABS Guidelines, 2014 122 Regulation 15 (1) Proviso of the ABS Guidelines, 2014

128
Protocol, all the developed countries are assigned a quota or cap for greenhouse gases known
as ‘Assigned amounts’. The countries that are not able to use up their quota are allowed to sell
it to the country who has outrun its quota of emissions, thus rewarding the country that has
reduced its emissions and thus, has unused quota left (UNFCCC, 2008). In India, there are
precedents where civic bodies or PSUs have generated revenue using carbon credits. The most
recent example is that of Indore Municipal Corporation, which has generated a revenue of Rs.
50 lakhs by trading 1.70 million tonne of CO2 under Verified Carbon Standard (VCS)
Programme of UNFCCC. The civic body had registered three of its projects – a 6oo tonnes-a-
day compost plant, a bio methanation plant of 35 35 Tons per Day (TPD) capacity and a 1.5
MW solar plant under the Verified Carbon Standard Programme. These projects reduced
carbon emissions by over 1.70 lakh tonnes (PTI, 2020). In past, Delhi Metro Rail Corporation
(DMRC) has benefitted from sale of carbon credits. In fact, Delhi Metro is the world’s first
railway network to earn carbon credits from UNFCCC. In 2011, the United Nations body
administering the clean development mechanism under the Kyoto Protocol had certified that
Delhi Metro has reduced emissions which earned DMRC carbon credits. The sale of these
carbon credits has fetched DMRC a revenue of Rs. 2.41 crore (PTI, 2011).
The Kyoto Protocol focuses on soil conservation by identifying the sequestration of carbon in
soil as a global environmental benefit that is eligible for payments under the carbon credit
mechanism (Dumanski, J., 2004). NITI Aayog, in its virtual high-level round-table on
‘Agroecology and Regenerative Agriculture’ stressed that India can have access to carbon
credits worth USD 50-60 billion if it propagates natural farming and agroecology.
Taking lessons from these experiences, HP can explore the option of registering its
environment friendly programmes and initiatives under VCS and generating revenue through
the carbon credits earned. Following are some recommended programs that can be considered:
Natural Faarming in Pangi
Restoration of degraded landscape
Initiative to address the issue of invasive species
Electric vehicles for public transport; like electric cars for taxis, or electric buses (as has been
already been done in the State).
7.3 Other Sources
7.3.1 Payment for Ecosystem Services (PES)
The basic idea behind PES is that those who provide ecosystem services – like any service –
should be paid for doing so. The ‘business-like’ conditional payment form is what differs PES
from traditional conservation mechanisms and therefore provides an opportunity to put a price
on previously un-priced ecosystem services (ES) like climate regulation, water quality
regulation and the provision of habitat for wildlife and, in doing so, brings them into the wider
economy. International donors, impact investment funds, private donors are potential funders
of PES programs.
In order to protect and manage natural resources in the state for sustained production of ES as
well as to generate additional economic incentives to the communities, Government of
Himachal Pradesh formed ‘Policy to institutionalize Payments for Ecosystem Services’ in
2013. The policy has outlined the following objectives:

129
To provide sustained flow of ES
To facilitate interface mechanism between ES generators and user
Incentivize ES generators for ecosystem conservation for incremental and continued
flows of ecosystem services
The ecosystem services which are eligible for payments under the policy includes: soil erosion
control, sediment load reduction, fire control, discharge in streams and springs especially
potable water, carbon sequestration, rehabilitation of weed infested areas, organic and
conservation agriculture, conservation horticulture, pollination and biodiversity conservation.
The following have been considered for identifying and quantifying ecosystem services:
temporal and spatial scales at which the ES are produced, an understanding of the impact of
land-cover and land-use patterns, soil conditions, hydrological cycles, etc., establish dynamic
baseline levels of the supply of the ES, determine practical incremental steps – both preventive
and restorative & assess gaps in current understanding and measurement.
The process to implement PES in the state includes not only identification of ES that needs to
be incentivized but also identification of stakeholders, strengthening the role of local level
community-institutions for mainstreaming eco-systems approach, as well as financial
arrangements. Appropriate economic instruments, such as environment cess, green tax,
voluntary payments, mitigation payments etc. will be explored for improving the financial basis
of PES and creating a larger financial pool, while also attempting to reduce transaction costs
and minimize overheads.
The policy also envisages regular monitoring of physical flow of ES as well as build capacity
of various institutions at all level. For successful implementation of the policy, the state needs
to resolve issues like absence of data and symmetric information and difficulty in monitoring
the effectiveness of PES schemes.
7.3.2 Fintech: These instruments have the potential to increase the breadth and depth of
conservation finance. Fintech reduce transaction cost and improve economic efficiency. The
use of technology reduces the cost of transaction, credit investigation, resources matching and
help overcome the scale issues. These work well at the retail level and bring overall efficiency.
There are several success stories available around these. SBB should explore this in addressing
man-animal conflicts.

130
References
Action Plan for Baddi Industrial Cluster, 2018; HP State Pollution Control Board.
ADB. (2010). Climate Change Adaptation in Himachal Pradesh: Sustainable Strategies for Water
Resources. Asian Development Bank. Available at:
https://www.adb.org/sites/default/files/publication/27999/cca-himachal-pradesh.pdf
Adger, W. N. (2000). Social and ecological resilience: are they related? Progress in Human Geography,
24(3), 347–364
Akhtar, M., (2018), “Community-led strategies offer hope for east Himalayan biodiversity”, Down To
Earth; Available at: https://www.downtoearth.org.in/news/wildlife-biodiversity/community-led-
strategies-offer-hope-for-east-himalayan-biodiversity-60834
ANI (2019), “Over 500 cases of forest fires in Himachal Pradesh”, Business Standard; Available at:
https://www.business-standard.com/article/news-ani/over-500-cases-of-forest-fires-in-himachal-
pradesh-119061101441_1.html
Ashwill, Maximillian, Cornelia Flora, and Jan Flora. 2011. Building Community Resilience to Climate
Change: Testing the Adaptation Coalition Framework in Latin America. Washington, DC: The World
Bank. http://siteresources.worldbank.org/EXTSOCIALDEVELOPMENT/Resources/244362-
1232059926563/5747581-1239131985528/Adaptation-Coalition-Framework-Latin-
America_web.pdf.
Ashwini. (2018), “Illegal Wildlife Trading” Tour my India. Available at:
https://www.tourmyindia.com/blog/illegal-wildlife-trading/
Basu, Saikat. 2018. “Poaching and Illegal Wildlife Trade and Trafficking causing havoc to wildlife.”
Accessed August, 18, 2019. http://sikkimexpress.com/NewsDetails?ContentID=9355
Batliwala, A., & Kania, R. (2019). Analyzing Capacity of Existing Sewage Treatment Plants, Surat
City. International Journal of Science and Research, 8(3), 525-528. doi:10.21275/ART2019599
Berkes, F., & Folke, C. (1994). Linking social and ecological systems for resilience and sustainability.
Workshop Property rights and the performance of natural Resource systems. Retrieved from
http://dlc.dlib.indiana.edu/dlc/bitstream/handle/10535/4352/Berkes-
linking_social_and_ecological_systems_for_resilience_and_sustainability.pdf?sequence=1
Bhatti, R. C., Nirmala, C., Kaur, A. D., Singh, S., Mor, P. K., Kaur, R., ... & Singh, A. N. (2017).
Harnessing of local plant species by indigenous people of Hamirpur district for ethno-veterinary
purposes. Annals of Plant Sciences, 6, 1898-1925
Bhattacharjee K, Joshi SR (2014) NEMiD: A Web-Based Curated Microbial Diversity Database with
Geo-Based Plotting. PLOS ONE 9(4): e94088. https://doi.org/10.1371/journal.pone.0094088
Bhalla, T C. Savitri, and Chauhan R (2015), “Microbial diversity of Indian Himalayan Region:
Himachal Pradesh”, ENVIS Newsletter on Himalayan Ecology, Vol. 12 (4), 2015; Available at:
http://gbpihedenvis.nic.in/ENVIS%20Newsletter/Newsletter_articles_12(4)/article_2.pdf
Bijoor, Ajay. “People, Livestock and Snow Leopards” NCF-India, 0AD, Available at: www.ncf-
india.org/high-altitudes/people-livestock-and-snow-leopards
Bisht, G. (2018). Punjab poachers now use poison not guns to kill leopards for hide”, Hindustan Times.
Available at: https://www.hindustantimes.com/punjab/poachers-now-use-poison-not-guns-to-kill-
leopards-for-hide/story-kXr7osOvyowam7MWwUx7rL.html
Bodh, A. (2016), “Death knell for HP sanjeevanis”, The Times of India; Available at:
https://timesofindia.indiatimes.com/city/shimla/Death-knell-for-HP-
sanjeevanis/articleshow/53791381.cms

131
Bodh, A. (2017), “With onset of winters, man-animal conflict starts in Himachal Pradesh”, The Times
of India, Available at: https://timesofindia.indiatimes.com/city/shimla/with-onset-of-winters-man-
animal-conflict-starts-in-himachal-pradesh/articleshow/61726150.cms
Butola, Jitendra S., and Hemant K. Badola. 2008. "Threatened Himalayan Medicinal plants and Their
Conservation in Himachal Pradesh." Journal of Tropical Medicinal Plants 9 (1): 125-142.
https://www.researchgate.net/publication/257985522_Himalayan_Threatened_Medicinal_plants_and_
Their_Conservation_in_Himachal_Pradesh.
Carew-Reid, J., Kempinski, J., & Clausen, A. (2010). Biodiversity and development of the hydropower
sector: lessons from the Vietnamese experience–volume I: review of the effects of hydropower
development on biodiversity in Vietnam. Hanoi: International Centre for Environmental Management
(ICEM).
Champion, H. G., & Seth, S. K. (1968). A revised survey of the forest types of India. Delhi: Manager
of Publications.
Chaturvedi, R., Duraisami, M., Jayahari, K. M., CB, K., Singh, R., Segarin, S., & Rajagopal, P. (2018).
Restoration opportunities atlas of India: State Reports. Washington, DC: World Resources Institute.
Retrieved November, 10, 2019.
Chauhan K (2019), “Come winter season and poiachers are on the prowl”, The Tribune; Available at:
https://www.tribuneindia.com/news/archive/himachaltribune/come-winter-season-poachers-are-on-
the-prowl-
712556#:~:text=Though%20hunting%20is%20banned%20in,to%20Churdhar%20in%20Chopal%20a
nd
Cohen, Jack D., and John E. Deeming. 1985. The National Fir Danger Rating System: basic equations.
California: Pacific Southwest Forest and Range Experiment Station.
https://www.fs.fed.us/psw/publications/documents/psw_gtr082/psw_gtr082.pdf
CPCB (2018), “River Stretches for Restoration of Water Quality”, Ministry of Environment, Forest and
Climate Change; Available at:
http://www.indiaenvironmentportal.org.in/files/file/Report%20on%20River%20Stretches%20For%20
Restoration%20Of%20Water%20Quality.pdf
CPCB (2019), “Indicative Guidelines for Restoration of Water Bodies”, Ministry of Environment,
Forest and Climate Change; Available at:
https://www.cpcb.nic.in/openpdffile.php?id=UmVwb3J0RmlsZXMvODkwXzE1NjAxNjU0NTFfbW
VkaWFwaG90bzE2MDQxLnBkZg==
CRGGS (2015). Climate Resilient Green Growth Strategies for Himachal Pradesh. Implemented by
The Energy and Resources Institute in collaboration with the Global Green Growth Institute and nodal
support from Department of Environment, Science & Technology, Government of Himachal Pradesh.
Das, P. K. (2012). Mass Tourism & Environ- Infrastructural Crises of Shimla City: A Case Study. 3(11).
Dasgupta S., (2014) “Documenting the microbial diversity of North East India” IndiaBiosciences;
Available at: https://indiabioscience.org/news/2014/documenting-the-microbial-diversity-of-north-
east-india
Dasgupta, S., (2018) “From a new bird to a community reserve, Arunachal’s Bagun Tribe sets
example”, The Wire; Availabile at: https://thewire.in/environment/arunachal-bagun-liocuchla-eaglenest-wildlife-sanctuary
Dandekar P. (2012), “Damaged rivers, collapsing fisheries: Impacts of dams in riverine fisheries in
India”, SANDRP.
Desertification and Land Degradation Atlas of India (2016). Accessible at:
https://www.sac.gov.in/SACSITE/Desertification_Atlas_2016_SAC_ISRO.pdf
Ding, Y.-Z., Chen, H.-T., Zhang, J., Zhou, J.-H., Ma, L.-N., Zhang, L., Liu, Y.-S. (2013). An overview
of control strategy and diagnostic technology for foot-and-mouth disease in China. Virology Journal
volume, 10(78).

132
DoA (n.d.), “Management and Improvement of Natural Grassland”; Available at:
http://hpagrisnet.gov.in/hpagris/Agriculture/Default.aspx?SiteID=2&PageID=359&Language=En
Dong, L. M., Zhang, M., Xu, Q. L., Zhang, Q., Luo, B., Luo, Q. W., & Tan, J. W. (2017). Two new
thymol derivatives from the roots of Ageratina adenophora. Molecules, 22(4), 592.
Down To Earth (1997), “Local Breeds First”; Available at: https://www.downtoearth.org.in/coverage/-
local-breeds-first-24433Draft Policy on Sediment Management, 2017, Ministry of Water Resources,
River Development and Ganga Rejuvenation, Government of India; Available at:
http://mowr.gov.in/sites/default/files/Draft_Policy_on_Sediment_Mgmt-June2017.pdf
Dumanski, J. (2004). Carbon Sequestration, Soil Conservation, and the Kyoto Protocol: Summary of
Implications. Climatic Change, 65(3), 255–261. doi:10.1023/b:clim.0000038210.66057.61
Economic Survey of Himachal Pradesh (2018-19), Economic and Statistics Department, Himachal
Pradesh. Retrieved from http://himachalservices.nic.in/economics/pdf/EconSurveyEng2018-19.pdf
Estrada, O. C. (2019). The Devastating Effects of Poaching. One Green Planet.
Fernandes, P. M., & Botelho, H. S. (2003). A review of prescribed burning effectiveness in fire hazard
reduction. International Journal of wildland fire, 12(2), 117-128.
FSI (2019), “India State of Forest Report”, Edition 16, Vol II, 2019
Goswami, S., (2018), “Himachal Pradesh forest fires: Dharamshala, Kasauli pine for respite”, Down to
Earth, Available at: https://www.downtoearth.org.in/news/natural-disasters/himachal-pradesh-forest-
fires-dhamarashala-kasauli-pine-for-respite-60665
Greentumble. (2017). Available at: https://greentumble.com/negative-effects-of-overgrazing-for-
native-species
Gundimeda, Haripriya, Sanjeev Sanya, Rajiv Sinha, and Pavan Sukhdev. 2006. The value of
biodiversity in India’s forests. New Delhi: TERI Press.
Gupta RK, Gupta T, Kaushal PS, and Pathania MS (1998), “A study on the status of fodder balance in
Himachal Pradesh”, Oecologia Montana 1998, 7, 39 - 42
Himachal Pradesh State of Environment Report (2009). Department of Environment, Science and
Technology. Government of Himachal Pradesh.
Himachal Pradesh Environment Master Plan (2013). Department of Environment, Science and
Technology. Government of Himachal Pradesh.
Himachal Pradesh Forests for Prosperity Project Environment Assessment and Management
Framework, 2018; Available at: https://hpforest.nic.in/files/20-11-
2018%20EMF%20HPFPP%20FINAL.PDF
Himachal Pradesh Forest Department (2014), “Rates of relief due to losses caused to human beings and
domestic livestock by the wild animals”, Notification, dated 4 March 2014; Available at:
https://hpforest.nic.in/files/Rates.pdf
Himachal Pradesh Home Stay Scheme, 2008; Available at: https://himachaltourism.gov.in/wp-
content/uploads/2018/06/Himachal-Pradesh-Home-Stay-Scheme-2008.pdf
HPSBB (2018), “Tradable Bioresources in Himachal Pradesh… Potential and Scope”, Government of
Himachal Pradesh; Available at:
http://www.hpbiodiversity.gov.in/Pdf/Tradable%20Bioresources%20of%20Himachal%20Pradesh.pdf
Himachal Pradesh State Strategy and Action Plan for Climate Change (2012). Department of
Environment, Science and Technology. Government of Himachal Pradesh.
Himachal Pradesh Tourism Policy, 2018; Available at: https://himachaltourism.gov.in/wp-
content/uploads/2019/09/Himachal-Pradesh-Tourism-Policy-2019.pdf
HIMCOSTE Status Report on Impact of Climate Change Assessment on Horticulture Sector in
District Kullu, Himachal Pradesh (2018); Available at:
http://www.hpccc.gov.in/documents/kulluhorticultre.pdf
https://himachaltourism.gov.in/wp-content/uploads/2018/06/Himachal-Pradesh-Home-Stay-Scheme-2008.pdf

133
Himachal Watcher (2019), “Farmers in Himachal Will Get 50% Subsidy on Barbed Wires, Channel
Link and 70% on Composite Fences under ‘Mukhya Mantri Khet Sanrakshan Yojana”, Himachal
Watcher, Available at: https://himachalwatcher.com/2019/09/05/farmers-in-himachal-will-get-50-
subsidy-on-barbed-wires-channel-link-and-70-on-composite-fences-under-mukhya-mantri-khet-
sanrakshan-yojana/
Holden, S. A., and S. T. Butler. 2018. "Review: Applications and benefits of sexed semen in dairyand
beef herds." Animal s97–s103. https://www.cambridge.org/core/services/aop-cambridge-
core/content/view/C094C511C7C6C859A540D9ADD699F66C/S1751731118000721a.pdf/review_ap
plications_and_benefits_of_sexed_semen_in_dairy_and_beef_herds.pdf
IANS (2014), “Toxic water is killing fish in Himachal Pradesh”, Firstpost; Available at:
https://www.firstpost.com/india/toxic-water-is-killing-fish-in-himachal-pradesh-1525473.html
IANS (2019) (i), “Dry Spell and High Temperature Triggers Forest Fires in Himachal,” News 18;
Available at: https://www.news18.com/news/india/dry-spell-and-high-temperature-triggers-forest-
fires-in-himachal-2168241.html
IANS (2019) (ii), “Due To High Pollution, Sirsa River Is Facing Ecological Disaster, says a Himachal
Pradesh-Based Green Group”, NDTV; Available at: https://swachhindia.ndtv.com/himachal-sirsa-
river-facing-ecological-disaster-green-group-29298/
ICAR (2018), “ICAR-DCFR, Bhimtal developed mahseer hatchery and brood bank at Mokokcheng,
Nagaland”; Available at: https://www.icar.org.in/content/icar-dcfr-bhimtal-developed-mahseer-
hatchery-and-brood-bank-mokokcheng-nagaland
ICRISAT (2018): Three weeks to mke tatier, healthier crop residues for animal feed; Available at:
https://www.icrisat.org/three-weeks-to-make-tastier-healthier-crop-residues-for-animal-feed/
IIED (2000), “Himachal Pradesh Forest Sector Review”, in collaboration with Himachal Pradesh Forest
Department; Available at: https://hpforest.nic.in/files/Forest-sector-review-2000.pdf
Jaswal, A., & Bhan, S. (2015). Seasonal and annual rainfall trends in Himachal Pradesh during 1951-
2005. MAUSAM, 66(2), 247-264
Jithendran, K. P. (2000). Helminth parasites-A constraint in animal health management in Himachal
Pradesh. ENIVS Bull. Himalayan Ecology & Development, 2(8).
Juchau, M. R., & Chen, H. (1998). Developmental enzymology: xenobiotic biotransformation.
In Handbook of developmental neurotoxicology (pp. 321-337). Academic Press.
Kanga, S., Kumar, S., & Singh, S. (2017). Climate induced variation in forest fire using Remote Sensing
and GIS in Bilaspur District of Himachal Pradesh. International Journal of Engineering And Computer
Science, 6(6), 21695-21702. doi:21695-21702
Karki, M., Tiwari, B., Badoni, A., & Bhattarai, N. (2003, February). Creating livelihoods enhancing
medicinal and aromatic plants-based biodiversity-rich production systems: preliminary lessons from
South Asia. In Oral paper presented at the 3rd world congress on medicinal and aromatic plants for
human welfare (WOCMAP III). Chiang Mai, Thailand (Vol. 10).
Katoch, S., Dohru, S., Sharma, M., Vashist, V., Chahota, R., Dhar, P., Verma, S. (2017). Seroprevalence
of viral and bacterial diseases among the bovines in Himachal Pradesh, India. Veterinary World, 10,
1421-1426
Kaushal, M., Kaushal, R., Thakur, B., & Spehia, R. (2011). Effect of plant growth-promoting
rhizobacteria at varying levels of N and P fertilizers on growth and yield of cauliflower in mid hills of
Himachal Pradesh. Journal of Farm Sciences, 1(1), 19-26. Retrieved from
https://www.researchgate.net/profile/Manoj_Kaushal/publication/277731943_Effect_of_plant_growth
-
promoting_rhizobacteria_at_varying_levels_of_N_and_P_fertilizers_on_growth_and_yield_of_caulif
lower_in_mid_hills_of_Himachal_Pradesh/links/564dd1ca08ae4988a7a4
Katiyar P. (2019), “India testing a new way to deal with stray catlle: Eliminate male bovine before
conception”, The Economic Times; Available at: https://economictimes.indiatimes.com/news/politics-

134
and-nation/india-testing-a-new-way-to-deal-with-stray-cattle-eliminate-male-bovine-before-
conception/articleshow/67918649.cms
Kenndey , Thodore A., Jeffrey D. Muehlbauer, Charles B. Yackulic, David A. Lytle, Scott W. Miller,
Kimberly L. Dibble, Eric W. Kortenhoeven, Anya A. Metacalfe, and Colden V. Baxter. 2016. "Flow
Management for Hydropower Extirpates Aquatic Insects, Undermining River Food Webs." BioScience
66 (7): 561-575.
Koireng R J., Anal PSR, Jana K., and Devi KHP, “Proespects of Sustainable Livestock Farming in NEH
Region of India”, International Journal of Current Microbiology and Applied Sciences, 2319 - 7706
Kumar, P., Chandel, S., Kumar, V., & Sankhyan, V. (2015). Leopard–Human Conflict Led Casualties
and Conservation Awareness Campaign in Shivalik Hills of Northern India. Biological Sciences, 87(3),
893-898. doi:10.1007/s40011-015-0653-3
Kumar, R., & Thakur, V. (2008). Effects of Forest Fire on Trees, Shrubs and Regeneration Behavior in
Chir Pine Forest in Northern Aspects Under Solan Forest Division, Himachal Pradesh. Indian Journal
of Forestry, 31(1), 19-27.
Lee, T. H., & Jan, F.-H. (2019). Can community-based tourism contribute to sustainable development?
Evidence from residents’ perceptions of the sustainability. Tourism Management, 70, 368–380.
doi:10.1016/j.tourman.2018.09.003
Lindberg, K., McCool, S., & Stankey, G. (1997). Rethinking carrying capacity. Annals of tourism
research, 24(2), 461-465.
Macandog, PBM (2016), “An overview of PES implementation in the Phillipines”, Economy and
Environment Program for Southeast Asia (EEPSEA)
Maikhuri, R. K., Nautiyal, M. C., & Khali, M. P. (1991). Lesser-known crops of food value in Garhwal
Himalaya and a strategy to conserve them. Plant Genetic Resources Newsletter, 86, 33-46.
Maikhuri, R. K., Rao, K. S., & Saxena, K. G. (1996). Traditional crop diversity for sustainable
development of Central Himalayan agroecosystems. The International Journal of Sustainable
Development & World Ecology, 3(3), 8-31
Mamatha, B. S., Palaksha, M. N., Gnanasekaran, D., Senthilkumar, G. P., & Tamizmani, T. (2018).
MELOCHIA CORCHORIFOLIA L: A REVIEW.
Mardaraj, P., & Sethy, J. (2015). Human-wildlife conflict: issues and managements. Biodiversity
Conservation Research, and Management, 158-173.
Mehra, B. S., and P. K. Mathur. 2001. "Livestock Grazing in the Great Himalayan National Park
Conservation Area --A Landscape Level Assessment." Himalaya 21 (2).
MoEF&CC, & the World Bank. (2018). Strenghtening forest fire management in India. The World
Bank. Retrieved from http://documents.worldbank.org/curated/en/333281529301442991/pdf/127284-
Forest-Fire-Prevention-Management-8Oct2018.pdf
Mohan, L (2018), “Illegal extraction threatens survival of kashmal herb”, The Tribune; Available at:
https://www.tribuneindia.com/news/archive/himachal/illegal-extraction-threatens-survival-of-
kashmal-herb-656857
Narayanan, Sumana. 2015. "Border conflict." https://www.downtoearth.org.in/news/border-conflict-
330.
National Biodiveristy Action Plan, 2008; Ministry of Environment, Forest and Climate Change,
Government of India
National Biodiversity Authority (NBA), 2019. Biodiversity Finance Plan (Working Document). GoI-
UNDP project on Biodiversity Finance Initiative (BIOFIN).
Nelliyat, Prakash. n.d. "‘Resource Rent’ from the ‘Access and Benefit Sharing’ Perspective." NBA.
http://nbaindia.org/unep-gef/pub1/Paper%201.pdf.
NWCG. 2002. Gaining an Understanding of the National Fire Danger Rating System. National
Wildfire Coordinating Group. https://www.nwcg.gov/sites/default/files/products/pms932.pdf

135
Pandey, P., Sharma, V., Singh, S. K., Goel, D., & Goyal, S. P. (2016). Curtailing Human-Leopard
Conflict Using Wildlife Forensics: A Case Study from Himachal Pradesh, India. Journal of Forensic
Research, 7(3). doi:10.4172/2157-7145.1000331
Pandey, Rita et al (2020), Biodiversity Finance: Identification and Analysis of Key Building Blocks of
a Biodiversity Finance Plan in India (https://www.nipfp.org.in/media/ medialibrary/2020/01/BIOFIN_II_REPORT.pdf), NIPFP study report 2020.
Pandey, Rita, Gupta, M., Sachdeva, P., Singh, A., & Sugand, S. (2020). Biodiversity Conservation in
India: Mapping Key Sources and Quantum of Funds (Working Paper No. 20/311), National Institute of
Public Finance and Policy, New Delhi, India.
Pandey, Rita, Priya, Malhotra (2021), A. Biodiversity Strategy and Action Plan & Finance Solutions
for Lahaul-Pangi and Kinnaur Landscapes in Himachal Pradesh. National Institute of Public Finance
and Policy, New Delhi, India.
Parkash, V., & Aggarwal, A. (2010). Traditional Uses of ethnomedicinal plants of lower foot-hills of
Himachal Pradesh-I. Indian Journal of Traditional Knowledge, 9(3), 519-521.
Parkash, O., & Sharma, R. (2008). Determining People's Participation in Forest Fire Control: A Study
of Himachal Pradesh. Indian Journal of Forestry, 31(1), 1-6.
Parikh, J., Sharma, A., Singh, C., Kaushik, A., & Dhingra, M. Socio Economic Vulnerability of
Himachal Pradesh to Climate Change; Available at:
https://irade.org/Socio%20Economic%20Vulnerability%20of%20Himachal%20Pradesh%20to%20Cli
mate%20Change_30.03.2015.pdf
Pasha, C., Nagavalli, M., & Venkateswar Rao, L. (2007). Lantana camara for fuel ethanol production
using thermotolerant yeast. Letters in applied microbiology, 44(6), 666-672.
Paul, A., Gajurel, P., & Das, A. (2015). Threats and conservation of Paris polyphylla an endangered,
highly exploited medicinal plant in the Indian Himalayan Region. Biodiversitas, 16(2), 295-302.
Pretty, Jules N., and Michael P. Pimbert. 2009. "Parks, People and Professionals: Putting 'Participation'
into portected-area management." In Social Change and Conservation, by Krishna B. Ghimire and
Michael P. Pimbert, 297-330. Earthscan.
PTI (2015), “Over 31,000 stray catlle in Himachal Pradesh: Govt”, Business Standard; Available at:
https://www.business-standard.com/article/pti-stories/over-31-000-stray-cattle-in-himachal-pradesh-
govt-115040701379_1.html
PTI (2020), “Indore civic body earns Rs. 50 lakh revenue from carbon credit”, The Times of India;
Available at: https://timesofindia.indiatimes.com/city/indore/indore-civic-body-earns-rs-50-lakh-
revenue-from-carbon-credit/articleshow/79219072.cms
PTI (2011), “Carbon credit sale fetches DMRC Rs. 2.41 crore”, The Hindu. Available at:
https://www.thehindubusinessline.com/economy/logistics/carbon-credit-sale-fetches-dmrc-rs-241-
cr/article20191002.ece
Puri, S. (2018). Now poaching activities kills man after taking lives of leopards and stray animals”, The
Times of India. Available at: https://timesofindia.indiatimes.com/city/shimla/now-poaching-activities-
kills-man-after-taking-lives-of-leopards-and-stray-animals/articleshow/63356299.cms
Raj, D. (2017). Environmental Threats of the Unrestrained Tourism and Ecotourism as a Tool against
Myopic Wilding of the Natural Resources: Case Study of Himachal Pradesh. Asian Journal of
Multidisciplinary Studies, 5(3), 129-135. Retrieved from https://core.ac.uk/reader/229681236
Ramesha, K. P., Manajit Bora, Kandeepan G., and P. Charkravarty. 2009. Indigenous traditional
knowledge of yak bearers. National Research Centre on Yak.
https://nrcy.icar.gov.in/pdf/Technical%20Buletin.pdf
Rana, I., & Randhawa, S. Animal Diseases influenced by Climate Variation in Himachal Pradesh.
Shimla: State Centre on Climate Change. Retrieved from
http://www.hpccc.gov.in/documents/Animal%20Diseases%20Influenced%20by%20Climatic%20Vari
ation%20in%20H.P.pdf

136
Rana, Ranbir Singh, R M Bhagat, Vaibhav Kalia, Harbans Lal, and Vijayshri Sen. 2013. "Indigenous
perceptions of climate change vis-a-vis mountain agricultural activities in Himachal Pradesh, India."
Indian Journal of Traditional Crops (Indian Journal of Traditional Knowledge) 12 (4): 596-604.
http://www.hpccc.gov.in/PDF/Agriculture/Indigeneous%20Perceptions%20of%20Climate%20Chang
e.pdf.
Rathore, L., Attri, S., & Jaswal, A. (2013). State Level Climate Change Trends in India. New Delhi:
India Meteorological Department, Earth System Science Organization, Ministry of Earth Sciences,
Government of India. Retrieved from
http://www.imd.gov.in/section/climate/StateLevelClimateChangeMonoFinal.pdf
Rattan T (2015), “Human-leopard conflict: big cats losing battle for survival”, Down to Earth; Available
at: https://www.downtoearth.org.in/blog/wildlife-biodiversity/human-leopard-conflict-big-cats-losing-
battle-for-survival-43734
Reddy, C. S., Saranya, K., Jha, C., Dadhwal, V., & Murthy, Y. K. (2017). Earth observation data for
habitat monitoring in protected areas of India. Remote Sensing Applications: Society and Environment,
8, 114–125.
Saberwal, Vasant K. 1996. "Pastoral Politics: Gaddi Grazing, Degradation, and Biodiversity
Conservationin Himachal Pradesh." Conservation Biology 10 (3): 741-749.
Sahoo, Santosh Kumar, and S.M. Mohnot. 2004. "A Survey of Crop Damage by Rhesus Monkeys and
Hanuman Langur in Himachal Pradesh, India." Tiger Paper 31 (4): 1-6.
Saraswat, R., Sinha, A., & Radhakrishna, S. (2015). A god becomes a pest? Human-rhesus macaque
interactions in Himachal Pradesh, northern India. Eur J Wildl Res, 61, 435–443. doi:10.1007/s10344-
015-0913-9
Satendra, & Kaushik, A. D. (2014). Forest Fire Disaster Management. National Institute of Disaster
Management. Avaiable at: https://nidm.gov.in/pdf/pubs/forest%20fire.pdf
Sati, V. P., & Singh, R. B. (2010). Prospects of sustainable livestock farming in the Uttarakhand
Himalaya, India. Journal of Livestock Science, 1, 9-16.
SDG India Index 2.0, NITI Aayog (2019-2020). Available at: https://niti.gov.in/sdg-india-index-
dashboard-2019-20
Sharma, Ashwani. 2016. "Man vs Monkey: How farmers are grappling with losses that have hit
Himachal’s economy." The Indian Express. https://indianexpress.com/article/india/india-news-
india/man-vs-monkey-how-farmers-are-grappling-with-losses-that-have-hit-himachals-economy/
Sharma A (2019), “Govt to pay you Rs 900 per month for adopting a stray cow in UP”, The Economic
Times; Available at: https://economictimes.indiatimes.com/news/politics-and-nation/govt-to-pay-you-
rs-900-per-month-for-adopting-a-stray-cow-in-up/articleshow/70563941.cms?from=mdr
Sharma DC., (2018), “Himalayan Yak facing threat of climate change”, The Hindu Business Line;
Available at: https://www.thehindubusinessline.com/news/science/himalayan-yak-facing-threat-of-
climate-change/article23503483.ece
Sharma V (2013), “Aquatic life in Himachal affected”, Business Standard; Available at:
https://www.business-standard.com/article/economy-policy/aquatic-life-in-himachal-affected-
108091101044_1.html
Shukla, A. (2017). Himachal Pradesh’s Model Of Tourism Is Not Sustainable. Retrieved from
https://hillpost.in/2017/08/himachal-mass-tourism-not-sustainable/109286/
Sims, A., Zhang, Y., Gajaraj, S., Brown, P., & Hu, Z. (2013). Toward the development of microbial
indicators for wetland assessment. Water Research, 47(5), Sims, A., Zhang, Y., Gajaraj, S., Brown, P.
B., & Hu, Z. (2013). Toward the development of microbial indicators for wetland assessment. Water
Research, 47(5), 1711–1725. doi:10.1016/j.watres.2013.01.023
Singh, D., Kaul, S., & Sivaramane, N. (2006). Migratory Sheep and Goat Production System: The
Mainstay of Tribal Hill Economy in Himachal Pradesh. Agricultural Economics Research Review, 19,
387-398.

137
Singh, G. S. (2011). Commercialization unsustainable to Himalayan environment. Ecological
Questions, 15, 71 – 75. doi:10.2478/v10090-011-00037-0
Singh R., Shelar K., Chaturvedi R., Duraisami M., and Gautam R. S., (2018) “Restoring Landscapes in
India for Climate and Communities: Key Findings from Madhya Pradesh’s Sidhi District”, World
Resorurce Institute of India
Sly, L. I. (2010). Biodiversity and the role of microbial resource centres (No. 656-2016-44603).
Smith, S., Rowcroft, P., Everard, M., Couldrick, L., Reed, M., Rogers, H., Quick, T., Eves, C. and
White, C. (2013). Payments for Ecosystem Services: A Best Practice Guide. Defra, London.
T E R I. 2015 Green Growth and Agriculture in Himachal Pradesh, New Delhi: The Energy and
Resources Institute. 28pp
Thakur, Tanveer. 2019. "Vegetable farmers struggle due to Himachal Pradesh government apathy."
Deccan Chronicle. https://www.deccanchronicle.com/nation/current-affairs/260119/vegetable-
farmers-struggle-due-to-himachal-pradesh-government-apathy.html
Thakkar, H (2015), “MoWR report on Assessment of E-flows is welcome, needs urgent
implementation”; SANDRP
Theophilus E (2014), “Larji Dam Fishladder: an unlovely trinket, a deceptive ornament”, SANDRP;
Available at: https://sandrp.in/2014/12/17/larji-dam-fishladder-an-unlovely-trinket-a-deceptive-
ornament/
TNN (2019), “2 % of livestock population in Himachal Pradesh is on roads”, The Times of India;
Availabale at: https://timesofindia.indiatimes.com/city/shimla/2-of-livestock-population-in-himachal-
pradesh-is-on-roads/articleshow/71108951.cms
UNEP (2004), “The Use of Economic Instruments in Environmental Policy: Opportunities and
Challenges”, United Nations Environment Program; Available at:
https://wedocs.unep.org/bitstream/handle/20.500.11822/8033/The%20Use%20of%20Economic%20In
struments.pdf?sequence=3&isAllowed=y
Vijaykumar vs State of Himachal Pradesh (2019), Original Application No. 425/2019 (India)
Vinayak, R. (2012). “Precious plants face extinction in Himachal Pradesh”, India Today. Available at:
https://www.indiatoday.in/magazine/environment/story/19920930-precious-plants-face-extinction-in-
himachal-pradesh-766917-2012-12-31
WAVES. 2015. Accounting for Forests in Himachal Pradesh: Feasibility and Planning Study.
Technical Report, WAVES
WRI (2018), “Restoration Opportunities Atlas: State Reports” Washington DC: World Resources
Institute; Available at:
http://wri-
sites.s3.amazonaws.com/ifmt/ROAManuals/Restoration%20Opportunities%20Atlas%20State%20Rep
orts_Highres.pdf
WWF (2020). Forest Practice Newsletter. “Fires, Forests and the Future: A crisis raging out of control?”
https://mailchi.mp/wwf/forest-practice-newsletter-september-2020?e=ab62939161

138
Annexure – 1 Table A1. 1: A Snapshot of Consultative Workshops and Meetings in HP
S.
No. Particulars Date Venue
Participation (Forest
Department)
Line Departments/Other
Organisations
1
Roundtable
meeting
14th
December,
2018
Vigyan
Bhawan,
Bemloe DFO (hqrs.)
HP State Biodiversity Board
Department of Animal
Husbandry, Department of
Agriculture, Department of
Horticulture, Himalayan Forest
Research Institute
2
Small group
meeting
14th
December,
2018
Himachal
Pradesh
Forest
Department,
Talland,
Shimla
PCCF (WL)
DFO (hqrs.)
UNDP representative
of PMU
3
Questionnaires
sent to line
departments
April-May
2019
Email, fax
and post mail
Secretary, Principal
Secretary Department of Horticulture,
Department of Agriculture,
Department of Forest,
Department of Health and Family
Welfare, Department of
Irrigation, Department of Rural
Development, Department of
Tribal Development, Department
of Urban Development,
Department of Tourism, HP State
Biodiversity Board, Department
of Animal Husbandry, Police,
Department of Education,
Directorate for empowerment of
SCs, OBCs, Minorities Affairs
and Specially Abled
4
Several follow
ups on
questionnaires
sent to line
departments
via email,
telephonic
conversations
May-July
2019
Telephone
and email
Secretary, Principal
Secretary
5
Second round
of follow up
on
questionnaires
August
2019
Telephone
and email
Secretary, Principal
Secretary
6 One-to-one and small group meetings and consultations
6.1 One- to One
consultations
and meetings
with
Department
Officials
16th May
2019
Himachal
Pradesh
Forest
Department,
Talland,
Shimla
APCCF-cum-CPD
Department of Forest,
Environment and Wildlife
Management
HP State
Biodiversity
Board,
Vigyan
Bhawan,
Bemloe
Group Meeting
Senior Scientific
Officer, State Project
Coordinator, Senior
Scientific Professional
HP SBB
Udyog
Bhawan, HP
Section Officer,
Additional Secretary
Department of Irrigation and
Public Health

139
S.
No. Particulars Date Venue
Participation (Forest
Department)
Line Departments/Other
Organisations
Udyog
Bhawan, HP
Principal Secretary Department of Agriculture
Udyog
Bhawan, HP
Principal Secretary,
Deputy Director
Department of Tribal
Development
Udyog
Bhawan, HP
Additional Chief
Secretary
Department of Rural
Management and Development
7 Consultation
workshop
25th
September
2019
Library
Conference
Hall, Kilar
53 Participants
RO Kilar, Forest
Guards
BMCs, Department of Animal
Husbandry, Tribes Advisory
Council, Representatives from
local bodies like Panchayat,
Mahila Mandal, Praja
8 One-to-one and small group meetings and consultations
8.1 One- to One
consultations
and meetings
with
Department
Officials
24th
September
Library Hall,
Pangi
Range officer, Pangi
8.2 One- to One
consultations
and meetings
with
Department
Officials
24th
September
Library Hall,
Pangi
BMC Chairperson,
Mindhal
8.3 One- to One
consultations
and meetings
with
Department
Officials
26th
September
Agriculture
Department,
Pangi
Agriculture
Development Officer,
Kilar
8.4 One- to One
consultations
and meetings
with
Department
Officials
26th
September
BDO Office,
Pangi
Block Development
Officer, Kilar
8.5 One- to One
consultations
and meetings
with
Department
Officials
26th
September
BDO Office,
Pangi
Panchayat Pradhan,
Pangi
8.6 One- to One
consultations
and meetings
with
26th
September
BDO Office,
Pangi
Panchayat Pradhan,
Karyas

140
S.
No. Particulars Date Venue
Participation (Forest
Department)
Line Departments/Other
Organisations
Department
Officials
8.7 One- to One
consultations
and meetings
with
Department
Officials
26th
September
Tehsildar
Office
Naib Tehsildar, Kilar
8.8 One- to One
consultations
and meetings
with
Department
Officials
26th
September
Pangi Panchayat Pradhan,
Lujh
8.9 One- to One
consultations
and meetings
with
Department
Officials
26th
September
Pangi Pradhan, Mahila
Mandal, Pangi
Table A1. 2: List of Participants in Consultative workshop in Kilar, Pangi
S.no. Name of the participant Organization/Departme
nt
Designation Contact Details
1. Suneel Kumar H.P. Forest Department Forest Guard 8988538838
2. Rajinder Kumar H.P. Forest Department Forest Guard 8988796515
3. Neeraj Kumar H.P. Forest Department Forest Guard 9418781088
4. Vimla Mahila Mandal Pradhan 9459516742
5. Suresh Kumar H.P. Forest Department Forest Guard 7649952602
6. Bhoopesh Thakur WII JRF 8219317989
7. Himanshu Burgali WII JRF 9627878981
8. Shiv Yadav WII JRF 8090939937
9. Amit Mehta UNDP UNV-L 9816620513
10. Tej Singh H.P. Forest Department Forest Guard 9418743379
11. Man Singh H.P. Forest Department Forest Guard 8988520089
12. Diwan Chand H.P. Forest Department Peon
13. Bimla Sharma Gram Panchayat Hudan Pradhan 9459233747
14. Sunita Sharma Gram PanchayatKilar Pradhan 9459934205
15. Sarita Sharma A.P. GDC Pangi 9459040105

141
S.no. Name of the participant Organization/Departme
nt
Designation Contact Details
16. Meghma Ghosh WII Junior Project
Biologist
7044910363
17. Bhawna Pandey WII Senior Project
Biologist
8979738898
18. Himanshu Bargali WII Junior Project
Biologist
9627878981
19. Manisha Mathela WII Junior Project
Biologist
8630660034
20. Manika Sharma WII Junior Project
Biologist
9455170070
21. Nidhi Singh WII Junior Project
Biologist
8004261042
22. Inder Prakash BMC Mindal Chairman 9418718325
23. Sonu Office of BDO Pangi LVDC
24. Hari Ram Sharma Agriculture Department Senior Officer 9459086940
25. Bhag Singh Gram Panchayat Sechu Up Pradhan 9418639609
26. Pan Devi Mahila Mandal Kilar Secretary
27. Sunam Devi Mahila Mandal Sach 9418239311
28. Sheela Mahila Mandal Kilar 8988325811
29. Raj Kumari Gram Panchayat Luj
30. M.K. Thaplial Forest Department Range Officer Kilar 9459856140
31. Turup Chand TAC 9418884383
32. Dr. Sanjeev Rana Animal Husbandry Dept. Senior Veterinary
Officer
33. Prem Singh Forest Department B.O.B 9418462491
34. Suji Ram Agriculture Department V.P.O Karyas 9459222724
35. Sony Kilar, Pangi Local 7292243229
36. Gian Chand Hudan Bhatori, Pangi Local
37. Sham Lal Office of BDO Kilar JE 9418960184
38. Hans Raj Gram Panchayat Luj Up Pradhan 9418593053
39. Meena Kumari Sach, Pangi Local 9418756604
40. Dhani Ram Kulal, Pangi Thekedar 9459823594
41. Tem Chand Gram Panchayat Farmer 9459986889
42. Shanta Kumar Sharma Gram Panchayat Up Pradhan 9418553545
43. Dev Raj Sharma Murch, Pangi Farmer 9459438618
44. Chatter Singh Mahaliyat, Pangi Farmer 9418550219
45. Hari Singh Jhalwas, Pangi Farmer 9459068429
46. Sanjay Pradhan WII 7895019702

142
S.no. Name of the participant Organization/Departme
nt
Designation Contact Details
47. Tej Singh Forest Department Forest Guard 9418743879
48. Man Singh Forest Department Forest Guard 8988520089
49. Abhishek Kumar UNDP Project Associate 9548562281
50. Dr. Amit Kumar WII Scientist 9012701262
51. Er. Arun Bhardwaj Himurja Project Officer 8988903603
52. Er. Yatin Sharma HPPWD Motor Vehicle
Inspector
53. Ram Karyuni, Pangi Local 9418255703

143
Annexure - 2 Table A2. 1: Threatened Medicinal and Aromatic plants in Himachal Pradesh123
S.No. Scientific Name
Medicinal Plants
1. Aconitum deinorrhizum Stapf
2. Aconitum heterophyllum
3. Aconitum laeve Royle
4. Aconitum violaceum Jacquem ex Stapf
5. Allium consanguineum Kunth
6. Angelica glauca Edgew.
7. Arnebia benthamii (Wall. Ex G.Don) I. M. Johnst
8. Arnebia euchroma (Royle)
9. Atropa acuminate Royale ex. Lindl.
10. Berberis aristata DC.
11. Betula utilis D.Don
12. Bunium persicum B. Fedtsch
13. Cinnamomum tamala (Buch.-Ham.) T. Nees & Nees
14. Colchicum luteum Baker
15. Dactylorhiza hatagirea D. Don
16. Desmodium gangeticum (L.) DC.
17. Didymocarpus pedicellata R.Br.
18. Dioscorea deltoidea Wall. ex Griseb.
19. Ephedra gerardiana Wall. ex Stapf
20. Fritillaria royalei Hook.
21. Gentiana kurroo Royale
22. Habenaria edgeworthii Hook. f. ec. Collett
123 https://hpforest.nic.in/files/ANNEXURE%20-%20I.pdf

144
S.No. Scientific Name
23. Habenaria intermedia D. Don
24. Hyoscyamus niger L.
25. Hypericum perforatum L.
26. Hyssopus officinalis L.
27. Juniperus communis L.
28. Jurinea dolomiaea Boiss
29. Lilium Polyphyllum D. Don
30. Litsea glutinosa (Lour.) C. B. Rob.
31. Malaxis muscifera (Lindl.) Kuntze
32. Malaxis acuminata D. Don
33. Nardostachys grandiflora DC
34. Onosma hispidum Wall. ex G. Don
35. Oroxylum indicum (L.) Kurz
36. Paeonia emodi Wall. ex Royle
37. Paris polyphylla Sm.
38. Picrorhiza kurroa Royle ex Benth.
39. Podophyllum hexandrum Royle
40. Polygonatum cirrhifolium (Wall.) Royle
41. Polygonatum multiflorum (L.) All
42. Polygonatum verticillatum (L.) All.
43. Rheum australe D. Don
44. Rheum moorcroftianum Royle
45. Rheum spiciforme Royle
46. Rheum webbianum Royle
47. Roscoea alpina Royle
48. Roscoea procera Wall.
49. Saussurea obvallata (DC.) Edgew.
50. Selinum connifolium
51. Selinum vaginatum (Edgew.) C. B. Clarke
52. Skimmia laureola (DC.) Siebold & Zucc. ex Walp

145
S.No. Scientific Name
53. Symplocos paniculata (Thunb.) Miq.
54. Swertia chirayita (Roxb, ex Fleming) Karsten
55. Taxus wallichiana Zucc.
56. Uraria picta (Jacquin) Desvaux ex DC.
57. Trillium govanianum Wall. Ex D. Don
Source: Himachal Pradesh Forest Department
Table A2. 2: Threatened Species of Animals Notified by the Himachal Pradesh State
Biodiversity Board124
S.
No.
Scientific Name Common Name Family
1. Aquila nipalensis Hodgson Steppe eagle Accipitridae
2. Canis lupus chanco Tibetan wolf Canidae
3. Capricornis thar hodgson Himalayan serow Bovidae
4. Catreus wallichii Hardwicke Chir pheasant Phasiandae
5. Gypaetus barbatus Linnaeus Bearded vulture Accipitridae
6. Gyps bengalensis Gmelin White rumped vulture Accipitridae
7. Gyps tenuirostris Gray Slender billed vulture Accipitridae
8. Hemitragus jemlahicus C.H. Smith Himalayan Tahr Bovidae
9. Moschus chrysogaster Hodgson Himalayan Musk deer Moschidae
10. Parnassius charltonius Gray Regal apollo Papilionidae
11. Parnassius imperator augustus Oberthur Snow Apollo/Imperial
apollo
Papilionidae
12. Polypedates maculatus Gray Himalayan tree frog/
Indian tree frog
Rhacophoridae
13. Pucrasia macrolopha Lesson Koklass pheasant Phasianidae
14. Sarcogyps calvus Scopoli Red headed vulture Accipitridae
124 http://www.hpbiodiversity.gov.in/BMC/Proceeding%20Threatened%20Animal.pdf

146
S.
No.
Scientific Name Common Name Family
15. Tragopan melanocephalus Gray Western
tragopan/Jujurana
Phasianidae
16. Uncia Schreber Snow leopard Felidae
Source: Himachal Pradesh State Biodiversity Board
Table A2. 3: Forest cover across districts of Himachal Pradesh
District Geographical
Area (GA)
2019 Assessment % of GA
Very
Dense
Forest
Mod.
Dense
Forest
Open
Forest
Total
Bilaspur 1,167 21.70 190.72 168.28 380.70 32.62
Chamba 6,522 767.89 1012.51 674.76 2455.16 37.64
Hamirpur 1,118 38.91 102.84 213.15 354.90 31.74
Kangra 5,739 298.76 1288.65 766.78 2354.19 41.02
Kinnaur 6,401 79.81 329.28 236.90 645.99 10.09
Kullu 5,503 586.08 879.25 510.96 1976.29 35.91
Lahaul &Spiti 13,841 15 30.87 114.48 160.35 1.16
Mandi 3,950 368.51 756.98 647.53 1773.02 44.89
Shimla 5,131 745.74 1090.30 583.37 2419.41 47.14
Sirmaur 2,825 130.22 689.96 570.69 1390.87 49.23
Solan 1,936 41.44 444.54 404.31 890.29 45.99
Una 1,540 18.65 310.03 303.67 632.35 41.06
Total 55,673 3112.71 7125.93 5194.88 15433.52 27.72
Source: State of Forest Report 2019, Forest Survey of India
Table A2. 4: Classification of forests in Himachal Pradesh
Forest Type Altitude and other Features Important Tree Species
Tropical Dry
Deciduous
Occupy the area having altitude
up to 1000 m above mean sea
level.
Rainfall varies from 75 to 125
cm/annum.
Shorea robusta, Acacia catechu, Anogeissus
latifolia, Boswellia serrata, Lanea
coromandelica, Aegle marmelos, Mallotus
philipinensis
Tropical Thorn Prosopis spicigera, Salvadora spp., Azadirachta
indica
Sub-tropical
Pine
Occupy area between altitudes
of 1000 m to 1800 m above sea
level.
Rainfall varies from 90 to 250
cm/annum.
Pinus roxburghii, Cedrus deodara, Pinus
wallichiana, Quercus incana, Lyonia ovalifolia,
Pyrus pashia, Cartaegus crenulata,
Rhododendron arboreum

147
Source: State of Environment Report 2009, Himachal Pradesh
Table A2. 5: Crop Diversity in Himachal Pradesh
Crop species English name Local name in H.P.
Allium cepa Onion Pyaz
Amaranthus hypocondriacus Amaranth Chaulai
A. caudatus Amaranth Chuwa/Marcha/ramdana
A.cruentus Amaranth Chaulai
Avena sativa Oat Jai
Brassica compestris Rape Toria
Brassica juncea Indian Mustard Sarson
Cajanus cajan Pigeon Pea Tur
Canabis sativa Hemp Bhang Beej
Chenopodium album Pig-weed, Goose foot Bethu, Bathu
Glycine max Soybean Bhatt
Colocasia asculenta Taro, Dasheen Pindalu, Kuchain, Kachalu
Echinochloa frumentasea Barnyard millet Jhangora
Elusine coracana Finger millet Koda
Fagopyrum esculentum Buck Wheat Oggal
Fagopyrum tataricum Buck wheat Phapher
Hibiscus cannabinus Kenaf, Jute Buili
Hordeum himalayens Nacked bariey O-wa-jau
Hordeum vulgare Barley Jau
Lens esculenta Lentil Masoor
Macrotyloma uniflorum Horsegram Gahat, Kultha
Oryza sativa Paddy Chawal, Dhan
Panicum millacuem Hog-millet Cheena/Bhangna
Penila frutescene Perilia Bhangjeera
Phaseolus vulgaris Kidney bean Rajmah
Sub-tropical
Dry Evergreen
Extend up to an altitude of 1000
m above mean sea level.
Rainfall varies from 50 to 100
cm/annum.
Olea cuspidate, Pinus roxburghii
Himalayan
Moist
Temperate
Between the altitude of 1500 to
3300 m.
Quercus incana, Cedrus deodara, Pinus
wallichiana, Pinus roxburghii, Rhododendron
arboretum, Lyonia ovalifolia, Litsia umbrosa,
Quercus dilatata, Q. semicarpifolia, Picea
smithiana, Abies pindrow
Sub-Alpine
and Alpine
Between the altitude of 2,900 m
and 3500 m.
Snowfall is a regular feature.
Abies spectabilis, Pinus wallichiana, Picea
smithiana, Rhododendron companulatum,
Taxus baccata

148
Crop species English name Local name in H.P.
Pisum sativum Pea Matar, Dal Matar
Sesamum indicum Sesame Til
Setaria italica Foxtail millet Kauni, Kangni
Solamum tuberosum Potato Aloo
Sorghum vulgare Pearl millet Junyail, Jawar
Triticum aestivum Wheat Gehun
Vigna aconitifolia Mat bean Bhringa, Moth
V. angularis Adjuki bean Rains, Riuns
Phaeseoius mungo Black gram Urad, Mah
P. radiata Green gram Mung
V. umbellata Rice bean Bhotia
Zea mays Maize Mungri, Makki, Kukdi
Zingiber officinate Ginger Adrak
Source: State of Environment Report, Himachal Pradesh, 2009
Table A2. 6: Crop Production of major food crops (2010-11 to 2018-19)
Item Unit 2010-11 2011-12 2012-13 2013-14 2014-15 2015-16
Food grains:
A. Cereals:
1. Wheat
2. Maize
3. Rice
4. Barley
5. Ragi
6. Small Millets
Total Cereals
’000
M.T
,,
,,
,,
,,
,,
,,
,,
614.89
670.90
128.92
32.17
2.11
3.28
1452.27
629.09
715.42
131.63
31.46
2.80
3.31
1513.71
671.94
657.16
125.28
34.83
2.50
3.55
1495.26
685.45
678.25
128.49
35.18
1.97
3.60
1525.94
648.29
735.96
127.38
36.70
1.91
3.39
1553.63
667.62
737.65
129.88
34.33
1.93
3.09
1574.50
B. Pulses:
1. Gram
2. Other Pulses
Total Pulses
,,
,,
,,
0.60
40.99
41.59
0.66
30.12
30.78
0.49
45.58
46.07
0.40
51.80
52.20
0.38
53.88
54.26
0.38
59.17
59.55
Total Food grains ,, 1493.86 1544.49 1541.33 1585.14 1607.89 1634.05
Potato ,, 205.97 152.98 182.87 205.28 181.38 183.25
Vegetables ,, 1268.90 1356.60 1398.05 1465.96 1576.45 1608.55
Ginger ,, 1.56 1.53 1.69 1.84 16.50 32.33
Contd….

149
Item Unit 2015-16 2016-17 2017-18
(3rd Estimate)*
2018-19
(Target)*
Food grains:
A. Cereals:
1. Wheat
2. Maize
3. Rice
4. Barley
5. Ragi
6. Small Millets
Total Cereals
’000
M.T
,,
,,
,,
,,
,,
,,
,,
667.62
737.65
129.88
34.33
1.93
3.09
1574.50
605.18
736.46
135.48
28.66
1.60
4.80
1512.18
670.00
644.44
117.80
36.00
1.48
3.70
1473.42
690.00
742.00
132.00
36.00
2.10
3.70
1605.80
B. Pulses:
1. Gram
2. Other Pulses
Total Pulses
,,
,,
,,
0.38
59.17
59.55
0.41
50.14
50.55
0.45
57.00
57.45
0.45
62.50
62.95
Total Food grains ,, 1634.05 1562.73 1530.87 1668.75
Potato ,, 183.25 195.84 198.66 195.00
Vegetables ,, 1608.55 1653.51 1691.56 1650.00
Ginger ,, 32.33 35.39 33.70 35.00
Source: Compiled by NIPFP
*3rd estimates for the year 2017-18 and targets for the year 2018-19 have been taken to prepare the
table from Economic Survey, Himachal Pradesh 2018-19.
Table A2. 7: Monsoon season rainfall (June-September, 2018)125:
District Actual
(mm)
Normal*
(mm)
Excess or Deficient**
Total (mm) %
Bilaspur 1211 877 334 38
Chamba 873 1406 534 (-) 38
Hamirpur 1388 1079 309 29
Kangra 2123 1582 541 34
Kinnaur 180 264 (-) 84 (-) 32
Kullu 776 520 256 49
Lahaul & Spiti 263 458 (-) 195 (-) 43
Mandi 1353 1093 20 24
Shimla 807 634 173 27
Sirmaur 1320 1325 (-) 5 0
Solan 1111 1000 111 11
Una 1375 863 512 59
Average 917 825 92 11
125 http://himachalservices.nic.in/economics/pdf/EconSurveyEng2018-19.pdf

150
Source: Economic Survey, Himachal Pradesh
*Normal = -19% to +19%, Excess = 20% and above, Deficiency = -20% to -59% and Scanty = -60% to -59%
Table A2. 8: Post Monsoon Seasons Rainfall Data (October-December, 2018)126
District Actual
(mm)
Normal
(mm)
Excess or Deficient
Total (mm) %
Bilaspur 40 70 (-) 30 (-) 43
Chamba 88 127 (-) 39 (-) 31
Hamirpur 34 86 (-) 52 (-) 61
Kangra 40 105 (-) 64 (-) 61
Kinnaur 49 102 (-) 53 (-) 52
Kullu 110 98 12 12
Lahaul & Spiti 61 144 (-) 82 (-)57
Mandi 50 81 (-) 30 (-) 38
Shimla 52 75 (-) 23 (-) 31
Sirmaur 35 87 (-) 52 (-) 60
Solan 48 89 (-) 41 (-)46
Una 19 72 (-) 52 (-) 73
Average 56 108 (-) 52 (-) 48
Source: Economic Survey, Himachal Pradesh
*Normal = -19% to +19%, Excess = 20% and above, Deficiency = -20% to -59% and Scanty = -60% to -59%
Table A2. 9: Consumption of fertilizers (in M.T.):
Year Kharif (N+P+K) Rabi (N+P+K) Total (N+P+K)
2010-11 19811 35322 55133
2011-12 21332 30151 51483
2012-13 19846 27818 47664
2013-14 20486 29673 50160
2014-15 19388 33667 53055
2015-16 23742 33838 57580
2016-17 22063 34428 53055
2017-18 21156 36404 57560
Source: Economic Survey, Himachal Pradesh (2018-19)
126 http://himachalservices.nic.in/economics/pdf/EconSurveyEng2018-19.pdf

151
Table A2. 10: Species of honey bees in Himachal Pradesh
Honeybee Species Remarks
Apis melifera (Italian honeybee): Sub-Temperate and Sub-tropical
zone; produces 3 times more honey than A.cerana,
foraging range is double than that of Naïve honeybee.
A.cerana indica (Indian honeybee); temperate zone; attacked by mites;
kept in wall (fixed type) hives or movable hallowed out
logs, wooden boxes, earthen pots, etc. Crude and
indigenous method of honey collection from these
traditional hives.
A.dorseta (Wild honeybee in HP); makes single combs; hiney
harvested fro wild hives by professional honey hunters.
A.florea -do-
Source: Himachal Pradesh State Biodiversity Strategy and Action Plan (2002)
Table A2. 11: District-Wise Livestock in Himachal Pradesh127
District Cattle Buffaloes Yak Mithun
Crossbred Indigenous Total
Bilaspur 26170 21722 47892 100586 0 0
Chamba 50746 262448 313194 32465 643 73
Hamirpur 23402 3856 27258 108083 311 38
Kangra 222247 136882 359129 149719 54 4
Kinnaur 11971 9586 21557 0 225 72
Kullu 95372 79339 174711 720 39 535
Lahaul &
Spiti
7969 5228 13197 3 1267 0
Mandi 223403 216364 439767 69320 236 137
Shimla 145223 131560 276783 9189 13 28
Sirmaur 66860 212265 279125 42907 7 9
Solan 71123 73927 145050 79937 63 10
Una 39442 12154 51596 123087 63 12
Total 983928 1165331 2149259 716016 2921 918
Contd…
District Sheep Goat Horse and
Ponies
Mule
Crossbred Indigenous Total
Bilaspur 1154 269 1423 59244 101 773
Chamba 13345 241584 254929 204511 1596 5418
127 http://hpagrisnet.gov.in/Agrisnet/AnimalHusbandry/pdf%20files/19th%20Livestock%20Census-2012.pdf

152
Hamirpur 4740 4235 8975 24722 207 834
Kangra 49817 34811 84628 202694 3781 4068
Kinnaur 32461 34146 66607 33229 582 620
Kullu 82498 41195 123693 68946 2143 855
Lahaul &
Spiti
19191 16823 36014 8196 1028 14
Mandi 36828 77125 113953 195465 2278 5114
Shimla 61425 40149 101574 103089 1959 2786
Sirmaur 3077 8236 11313 144722 862 1782
Solan 644 1057 1701 61104 277 982
Una 11 50 61 13569 267 69
Total 305191 499680 804871 1119491 15081 23315
Contd…
District Donkey Camel Pig Total
Crossbred Indigenous Total
Bilaspur 186 0 59 175 234 210439
Chamba 279 10 411 703 1114 814232
Hamirpur 245 0 170 58 228 170901
Kangra 390 16 205 432 637 805120
Kinnaur 2918 12 0 35 35 125857
Kullu 40 0 52 0 52 371734
Lahaul &
Spiti
1803 50 3 3 6 61578
Mandi 183 13 238 330 568 827034
Shimla 747 16 202 343 545 496729
Sirmaur 285 46 398 816 1214 482272
Solan 182 2 122 183 305 289613
Una 91 12 83 12 95 188922
Total 7349 177 1943 3090 5033 4844431
District Poultry
Backyard Hatcheries/Farm Total Poultry
Bilaspur 21143 74874 96017
Chamba 43576 3500 47076
Hamirpur 10492 32581 43073
Kangra 58419 307877 366296
Kinnaur 9149 241 9390
Kullu 13634 0 13634

153
Lahaul & Spiti 1854 172 2026
Mandi 36101 31254 67355
Shimla 27778 9000 36778
Sirmaur 10860 905567 101427
Solan 15451 232518 247969
Una 6041 67394 73435
Total 254498 849978 1104476
Source: Livestock Census (2012)
Table A2. 12: Government Poultry Farms/Extension Centres in Himachal Pradesh128
Name/Address of the Farm Year of
Opening of the
Farm
Area of the Farm Total Chick production
Poultry Farm, Jalgran, Distt. Una 1979 00-95-52
24 Kanal 12 Marla
Rearing centre only
Regional Poultry Farm, Kamlahi, Distt.
Shimla
1956 54.6 bighas Rearing centre only
Central Poultry Farm, (Hatchery)
Nahan, Distt. Sirmour
1960 36 bighas 2,24,316
Poultry Farm, Chauntra, Distt. Mandi 1965 18-00-13 Hectare Rearing centre only
Him Hatchery, Sundernagar, Distt.
Mandi
1958 2503 sq. mts. 2,37,196
Poultry Farm, Palampur, Distt. Kangra 1958 10 kanal 13 marla Rearing centre only
Poultry Extension Centre, Bhawarna,
Distt. Kangra
1966 17 kanal 11 marla Rearing centre only
Poultry Extension Centre, Reckong -
Peo, Distt. Kinnaur
1962 02-80-69 Hectare (out
of which 0-99-76
Hectare leased out to
K.V. School)
Rearing centre only
Poultry Extension Centre, Sarol, Distt.
Chamba
1958 2 acre Rearing centre only
Poultry Extension Centre, Solan, Distt.
Solan
1961 14.1 bighas Rearing centre only
Poultry Extension Centre, Paonta-
Sahib, Distt. Sirmour
1960 2.5 bighas Rearing centre only
Source: Department of Animal Husbandry
Table A2. 13: Mahseer Major River Stretch in Himachal Pradesh
Name of river Stretch Stream length in kms.
Beas Seri mulag-Confluence of Binwa to Beas 5
128 http://hpagrisnet.gov.in/hpagris/AnimalHusbandry/Default.aspx?SiteID=3&PageID=286

154
Beas Harsipattan-Confluence of Kunha tributary
of Beas
10
Beas Chambapattan 5
Beas Kuran 5
Beas Dehra Gopipur 10
Beas Baner 5
Giri Bata
Source: Department of Fisheries, Himachal Pradesh
Table A2. 14: Trout Major River Stretch in Himachal Pradesh
Name of river Stretch Stream length in kms.
Beas Katrain to Manali 18
Tirthan Largi to Nagni 20
Sainj Largi to Ropa 22
Lambadug Barot to Lohardi 6
Uhl Barot to Kothikhad 10
Ravi Holi to Main bridge 5s
Source: Department of Fisheries, Himachal Pradesh
Table A2. 15: Recreational Fisheries Zone for Trout Water129
Name of river Stretch Stream length in kms.
Beas Katrain to Manali 18
Tirthan Largi to Nagni 20
Sainj Largi to Ropa 22
Lambadug Barot to Lohardi 6
Uhl Barot to Kothikhad 10
Ravi Holi to Main bridge 5
Source: HPBSAP, 2002
Table A2. 16: Recreational Fisheries Zone for Mahseer water130
Name of river Stretch Stream length in kms.
Beas Seri mulag-Confluence of Binwa to Beas 5
Beas Harsipattan-Confluence of Kunha tributary
of Beas
10
Beas Chambapattan 5
Beas Kuran 5
Beas Dehra Gopipur 10
Beas Baner 5
Giri Bata
129 https://himachal.nic.in/index1.php?lang=1&dpt_id=4&level=1&lid=168&sublinkid=146 130 https://himachal.nic.in/index1.php?lang=1&dpt_id=4&level=1&lid=168&sublinkid=146

155
Source: HPBSAP, 2002

156
Sector Key Sectoral
Drivers/Threats
Policy Context Objectives Issues
addressed
Recommenda
tion in the
policy
NBTs
achieved
SDGs
achieved
Forest >Habitat
loss/degradation
>Forest Fire
>Illicit felling
>Animal-human
conflict
>Encroachment
>Unscientific
extraction of
medicinal plants
>Overgrazing
Forest Sector
Policy and
Strategy 2005
The policy has
been implemented
with an aim to
identify forest as a
“Sector” to
encompass it’s
environmental
and biophysical
components
>To conserve natural
resources through
watershed
management practices
>To provide
livelihood security to
forest dependent
communities
>To focus on
appropriate forest land
use in the state
>To review the policy
regularly with
changing
circumstances and
needs using best
scientific information
and management
practices
>Various
components of
forestry such as
classification of
forests, rights
and concessions
on forest
produce,
afforestation,
biodiversity
conservation,
forest-based
industries, eco-
tourism have
been focused in
the state level
policy
Target 1,
3, 5
Target
8.9, 12.2,
15.2,
15.3, 15.4
Annexure – 3
Table A3. 1: Sectoral Policy Analysis

157
Policy on
Development of
Eco-tourism in
H.P. 2005
State Government
attempts to put in
place adequate
safeguards and
systems for
preservation of
natural resources
with tourist influx
as well as bringing
tourists closer to
wilderness of the
State
>To make the state a
leading eco-tourism
destination
>To promote
community-based eco-
tourism (CBET)
>To effectively
regulate ecotourism
activities in forest area
>To generate resource
through Special
Purpose Vehicle via
assets made available
by Forest Department
>To promote the
concept of homestays
in rural areas
>To work in tandem
with Rural Tourism
Scheme of the
Department of
Tourism
Concentration of
tourism activities
to
major hill
stations like
Shimla, Manali,
Dharamshala and
Dalhousie
putting pressure
on fragile
ecosystem
Employment
opportunities to
local
communities
Awareness for
preserving
environment
>Carrying
capacity needs
to be kept in
mind while
allowing for
tourists
>Management
plans should
establish
standard for
development,
waste disposal,
treatment of
sewage and
optimum use
of fragile
ecosystem
>Environment
al concerns
should be a
part Tourism
Master Plans
>A part of
revenue
generated
should be
ploughed back
in restoring
environment
Target 2
Target
1.4, 8.9,
17.14

158
Himachal
Pradesh
Forestry Sector
Medicinal
Plants Policy
2006
The policy aims to
look into the
unregulated and
exploitative
nature of trade in
medicinal plants
which has caused
threat to a number
of plant species
and has resulted in
low remuneration
to the local people
despite the
immense potential
of this sector
>To develop a system
of pricing the wild
harvest reflecting both
the conservation costs
and community
benefit
>To put in place
institutional
mechanism for
development of herbal
sector in the state
>To build network
with other North-
Western Himalayan
states to push
community-oriented
trade
>To maximize yield of
medicinal plants
through sustainable
regeneration
Exploitation of
medicinal plants
for trade
>Recognition
of Medicinal
plant resources
as important
forest produce
>Enabling
institutional
mechanism
and legislation
to develop this
sector firmly
>Germplasm
of medicinal
plant diversity
needs to be
conserved in
its natural
habitat
Target 2,
4, 5,7,
Target
12.2,15.4,
15.8

159
Policy on
Payment for
Ecosystem
Services (PES)
in Himachal
Pradesh
Due to
anthropogenic
pressure, there has
been decline in the
ecosystem
services,
adversely
impacting lives of
local
communities.
Therefore,
incentive-based
mechanism needs
to be explored to
promote
sustainable
livelihood
>To provide sustained
flow of ecosystem
services
>To facilitate interface
mechanism between
ecosystem service
generators and user
>Incentivize ES
generators for
ecosystem
conservation for
incremental and
continued flows of
ecosystem services
Anthropogenic
pressure on
ecosystems
>Involving and
incentivizing
local
communities
to conserve
ecosystem
Target 8
Target
6.4, 8.9,
15.4,
15.6
Collection and
Removal of
Chil Pine
needles from
Forest land
The policy
focuses on
efficient
utilization of Chil
pine needles
which are highly
inflammable in
nature
>To encourage
stakeholders to work
for removal of Chil
Pine
needles from the
forest land in order to
reduce fire hazards
>To encourage
industries to use Chil
Pine needles as a fuel
Forest fire due to
acidic and
inflammable
nature of Pine
needles
>Local right
holders shall
be encouraged
for collection
of pine
needles for
bonafide use
>Industries
should be
encouraged to
use pine
needles as raw
material
Target
3,5,7
Target
2.5, 6.4,
13.1,
15.2,
15.4, 15.5

160
131 https://hillpost.in/2017/08/himachal-mass-tourism-not-sustainable/109286/
Policy for
managing
Lantana in
Himachal
Pradesh
To eradicate
Lantana camara
which is a pan-
tropical weed with
very high
management cost
>To encourage all
stakeholders to work
for Lantana
eradication
>To encourage
Lantana based
industry
Invasion of
unwanted
Lantana camara
weed
>Already
allocated
budget can be
utilized for
eradication of
lantana
>Incentive can
be provided to
private
industries by
Forest
Department as
per the
availability of
budget
Tourism >Expansionist
model of
tourism131
>Unplanned
expansion of
infrastructure
Himachal
Pradesh
Sustainable
Tourism
Development
policy 2013
The state has built
upon promoting
sustainable
tourism to ensure
green growth in
tourism sector
>To establish
Himachal Pradesh as a
leading global
sustainable tourism
destination
>To make sustainable
tourism as one of the
prime engines of
socioeconomic growth
in the state
>To achieve proposed
targets by 2029
Growth in
number of
tourists
Target 2,
3, 8
Target
1.4, 8.9,
9.1, 15.4,
15.9,
17.14

161
132 http://www.hpagriculture.com/Annual%20Action%20Plan%202018-2019.pdf
Agricultur
e
>Fragmentation
of agricultural
farmlands
>Diversion of
land for non-
agricultural use
>Increased use of
pesticides
>Inadequate
infrastructure132
Organic
Farming Policy
The policy aims
for low
consumption of
fertilizers and
facilitate adoption
of organic farming
by the farmers
with relative ease
in niche areas
>To recognize
relevance of organic
farming in overall
development
of agriculture in the
state
>To develop
favourable plans to
strengthen crop-
livestock linkages
of the farming sector
>To facilitate organic
fodder supply for
livestock, organic
grazing areas and
organic NTFPs
>To create investment
environment for
organic agro-business
High cost of
chemical
fertilizers and
pesticides
Decreased
productive
capacity of soil
due to chemicals
>Building
departmental
linkages via
appropriate
institutional
mechanism
>Agriculture
and allied
sectors policies
need to be
brought in line
with organic
vision
>Improvement
in scientific
manpower to
undertake
research in
organic
agriculture
>Development
of the state
level web
hosted data
base system
Target 5
Target
2.4, 8.4,
12.2,
Biodiversi
ty
>Fragmentation
of habitat due to
dam construction
>Invasive species
Biotechnology
Policy 2014
The policy aims to
convert Himachal
Pradesh into a
Himalayan Bio
business Hub via
application of
>To support R&D in
potential areas of
biotechnology
>To conserve and
commercially exploit
Conservation
and commercial
exploitation of
bio-resources
Target 5,7
Target
2.5, 12.2

162
>Illegal mining
>Poaching of wild
animals
>Quarrying of
river bed
biotechnology in
agriculture,
animal husbandry,
horticulture,
medicine,
environment,
biodiversity
conservation and
utilization and
bio-industrial
development
bio-resources of the
state
>To create awareness
about the investment
opportunities in
biotechnology
Development of
Biotechnology
infrastructure
Animal
Husbandr
y
>Shortage of
fodder
>Inadequacy of
Gosadans
>Low budgetary
provision
Breeding Policy
for cattle and
buffaloes 2016
The policy aims to
fill some gaps in
the existing cattle
breeding policy
which envisages
upgrading of local
hilly (Non-
descript) cows
with
Jersey bulls
>To provide flexibility
to farmers
in selecting the kind of
breed he/she wants to
rear
> To replace
propagation of poor
germplasm with high
yielding pure bred
animals
> To ensure breeding
soundness of all stud
bulls and fix the
minimum production
standards (Dam’s
yield) for breeding
bulls
>To make area
Milk production
potential of
exotic breeds
Disease
resistance
Choice of farmer
regarding the
breed he/she
wants to rear
Inclusion of
indigenous breed
in the policy
>Across
different agro-
climatic zones,
depending
upon whether a
farmer keeping
cattle is in an
inaccessible
area, is
connected by
road, wants to
keep a hilly
cattle or any
other breed,
she/he should
be allowed to
choose
whether to
keep local hilly
cattle or opt for
cross breeding
with either
Jersey, Red
Target 7 Target 2.5

163
specific
recommendations for
cattle and buffalo
breeding
Sindhi,
Sahiwal breeds
or Holstein
Friesian.
Policy to tackle
problem of
stray cattle
2014
The existing stray
cattle policy is
constrained by a
number of factors
making it difficult
to mitigate the
problem of stray
cattle which are
abandoned by
farmers once
cattle become
unproductive
> To address the
constraints relating to
the financing of
Gosadans
>To ensure
performance of Gram
Panchayats for the
same
>To reduce stray cattle
population
>To address factors
responsible for
unproductivity of
cross bred cattle
Identification
marks on the
cattle
Registration of
livestock by
owners with
Gram Panchayat
>Greater
resources need
to be mobilized
to run existing
Gosadans
>People/agenc
ies/industrial
houses etc.
should be
motivated to
contribute
towards stray
cattle
rehabilitation
Target 7 Target 2.5
Policy for
purchase of
veterinary
medicines 2017-
18
The policy has
been elucidated
due to absence of
any policy for
veterinary
medicines with
HP Wool
Federation as the
Nodal Agency
>To provide medicine
of specified quantity
and quality
>To procure
medicines on a
competitive basis at a
lowest
reasonable price
>To procure
Purchase of
medicines in
accordance with
the prevailing
disease pattern
Qualitative
animal health
care
Target 2,
7,
Target
2.5, 15.9

164
133 https://pdfs.semanticscholar.org/f545/35a3b85c7e91c9c2dda0e540d49a7b762f77.pdf 134https://www.researchgate.net/publication/295857661_EIA_of_Hydropower_Project_in_Himachal_Pradesh_An_Analysis 135 https://www.indiatoday.in/india/story/severe-water-crisis-grips-himachal-a-land-where-ravi-beas-chenab-originate-1245671-2018-05-30
medicines as per area-
based requirement
Energy
(Hydropo
wer)
>Deforestation for
hydropower
projects133
>Loss of
biodiversity due to
stream diversion
>Prevention of
upstream fish
movement
>Reduced river
flow and water
quality134
Hydro Power
Plant Policy
2006
The policy aims to
ensure reliable
and eco-friendly
power
development in
the state
>To address the
problem of ecological
imbalance and
environmental
degradation caused by
implementation of the
Projects
>To promote &
provide continued
support for
development of
renewable
energy sources like
SHPs, Solar, Biomass,
and Water Mills
Synergy between
departments by
making separate
Joint Inspection
Committee of all
departments
>Subsidies
provided by
different
Departments
should
gradually be
phased out
>Gadgets
using non-
conventional
energy sources
at affordable
prices (up to
50% of the
cost) should be
promoted by
State
Government
Target 2,
3, 8
Target
7.1, 7.2,
9.4, 12.2,
15.4,
15.9,
17.14
Water >Water crises135
>Exploitation of
groundwater
State Water
Policy 2014
The Policy aims to
ensure sustainable
utilization of
water by resolving
complex issues
related to
groundwater
>To protect water
sources of the state
>To map water
sources and bring them
Provision of safe
drinking water
Pipes supply for
irrigation
Target 2,
6,
Target
1.5, 2.4,
6.3, 6.4,
6.5, 6.6,
12.2,
13.1,
15.1,

165
136 https://www.indiawaterportal.org/articles/irrigation-systems-himachal-threatened-hydropower-projects
>Damage to
Kuhls136
extraction, water
distribution and its
usage as well as
water quality in
the State
in the category of
utilizable resources
>To engender
community
participation in water
conservation
>To promote water-
shed management
GIS mapping of
hand pumps to
curb
groundwater
exploitation
Revision of
water adalats to
resolve water
conflicts
Development of
water related
information
system
15.4,
17.14

166
Annexure - 4
The Forest department earns royalty on timber extracted from timber lots that have been
deemed as commercially unviable by the Himachal Pradesh State Forest Development
Corporation Ltd. The following table shows the rates of royalty charged:
Timber extracted by Government
Department
50% of the approved royalty on timber
Timber extracted to be utilised in Furniture
workshop of Forest Department and HPSFDC
Ltd.
25% of the approved royalty on timber
Source: Notification No. No. FFE-B-F(6)-1/2018, dated 27 July 2018, Forest Department, Government of
Himachal Pradesh137
Details of Transit Fees
Table A4. 1: Transit Fees in Himachal Pradesh
S.no. Botanical name Local Name Plant Part Permit/ Pass
Fee Rs/Qtl
1. Abies spectabilis/
A. pindrow
Talis Patra Needles/Leaves 125
2. Acacia catetchu Khair a. Heartlwood/chips
b. Khair billet 9With Bark)
c. Khair waste chips after
Katha extraction
d. Dry uprooted waste
lantana (not processed) in
Government and private land
a. 250
b. 175
c. 25
d.10
3. Aconitum
dienorrhizum
Mohra Tubers 7,500
4. Aconitum
heterophyllum
Atis/Patis/Karvi
Patis
Tubers 5,000
5. Aconitum
violaceum
Mitha Patis Tubers 1,000
6. Acorus calamus Bach/Bare/Ghor
Bach
Rhizomes
150
7. Adhatoda
zeylanica/ A.
vasica
Basuti/Bansa Leaves 125
8. Adiantum
lunulatum
Dungtuli/Hansraj Whole Plant 125
9. Aegle marmelos Bilgiri Fruits 500
137 http://rajpatrahimachal.nic.in/OPENFILE1.aspx?ID=%2094/GAZETTE/2018-
01/08/2018%20&etype=SPECIAL

167
S.no. Botanical name Local Name Plant Part Permit/ Pass
Fee Rs/Qtl
10. Aesculus indica Khanor Fruits/Seeds 150
11. Ainsliae aptera Sathjalori Roots 150
12. Ajuga beacteosa Neelkanthi Leaves 125
13. Alnus nitida Kosh Cones Dry Cones 150
14. Angelica glauca Chora Roots 150
15. Aretiim lappa Jangli Kuth Roots 125
16. Arnebia enchroma/
A. benthami
Ratanjot Roots 200
17. Artemisia
brevifolia
Seski Flowering shoots 125
18. Asparagus
adscendens
Shatavari/Sanspai Root tubers 200
19. Atropa acuminata Jharka Leaves 125
20. Berberis spp Kashmal/
Daruhaldi
Roots/Stems 200
21. Bergenia ciliata Pasahnbhed Roots 150
22. Betula utilis Bhoj Patra Bark
Dry Cone
500
200
23. Bunium persicum Kala Zira Fruits 2,000
24. Carum Carvi Shingu Zira Fruits 1,000
25. Cedrus deodara Deodar Rosette Dry Cone Part 150
26. Cinnamomum
tamala
Tejpatra Leaves 500
27. Colebrookia
oppositifolia
Bindi Phool Leaves/Roots 125
28. Coleus aromaticus Pathan Bail Leaves, Seeds 30
29. Curcuma
angustifolia
Ban Haldi Rhizomes 150
30. Dactylorhiza
hatageria
Salam Panja Root tubers 6,000
31. Dioscorea
deltoidea
Singli Mingli Roots 900
32. Emblica officinalis Amla Fruits 150
33. Ephedra gererdiana Somlata Twigs 200
34. Fritillaria roylei Ban Lehsun Bulb 10,000

168
S.no. Botanical name Local Name Plant Part Permit/ Pass
Fee Rs/Qtl
35. Geranium
nepalense
Raktjari Roots 125
36. Girardiana
diversifolia
Bicchu Buti Roots 150
37. Hedychium
acuminatum
Kapur Kachri Roots 100
38. Heracleum spp
candicans
Patrala Roots 100
39. Hyocymus niger Khurasani
Ajwain
Seeds/Leaves 150
40. Hypericum
patulum
Khaarera Whole plant 250
41. Hyssopus
officinalis
Juffa Flowering Twigs 500
42. Iris germanica Safed Bach Rhizomes 125
43. Juglans regia Akhrot Bark 1000
44. Juniperus
communis
Hauber Berries 250
45. Juniperus recurva Bether Patta Leaves 150
46. Jurinea
macrocephala
Dhoop Roots 500
47. Lichens Chalora/ Chharila
/jhula/ Mehndi/
Stone
Thallus 500
48. Mentha longifolia Jangli Pudina Leaves 125
49. Morchella
esculenta
Gucchi Fruiting Body 10,000
50. Mosses Green Moss Ghas Thallus 250
51. Murraya koenigii Mitthi Neem Leaves 150
52. Myrica esculenta Kaphal Bark 200
53. Nardostachys
grandiflora
Jatamanasi Roots 1000
54. Origanum vulgare Ban Tulasi Leaves 150
55. Oroxylum indicum Shyonak,
Tatpalanga
Bark, Pod 125
56. Paris polyphylla Dudhiya Bach/
Satva
Rhizomes 200
57. Picrorhiza kurrao Karoo/Kutki Rhizomes 1000
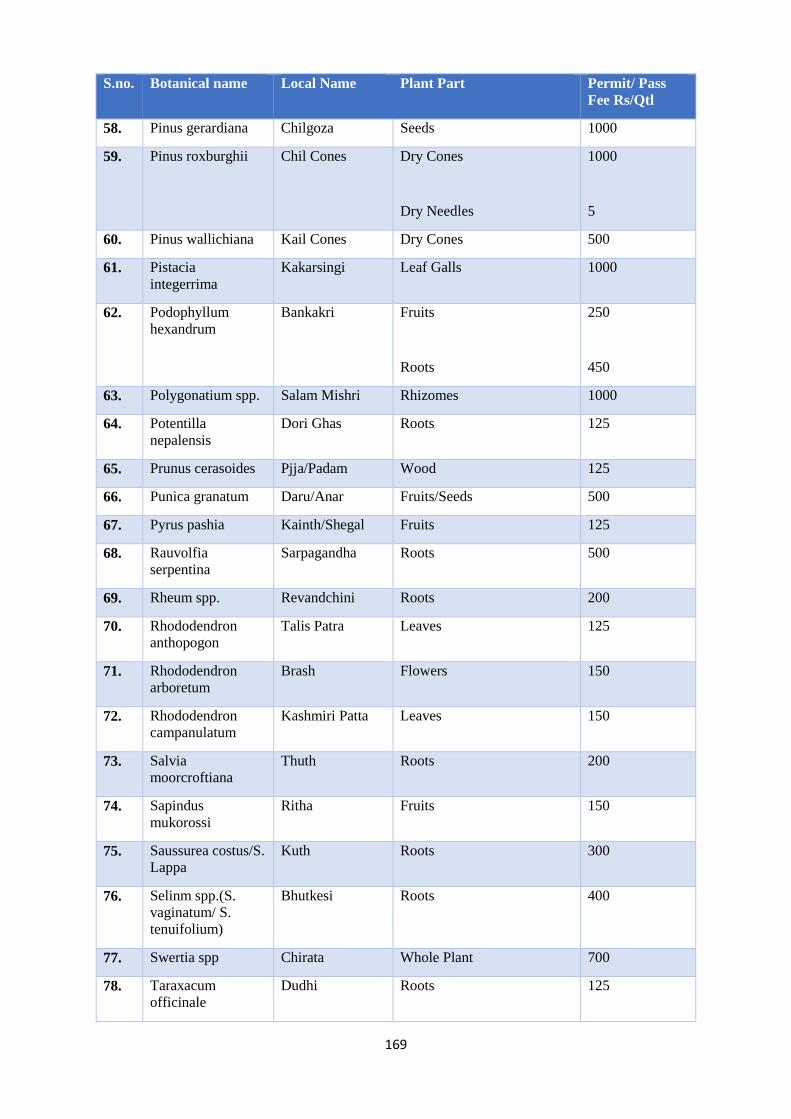
169
S.no. Botanical name Local Name Plant Part Permit/ Pass
Fee Rs/Qtl
58. Pinus gerardiana Chilgoza Seeds 1000
59. Pinus roxburghii Chil Cones Dry Cones
Dry Needles
1000
5
60. Pinus wallichiana Kail Cones Dry Cones 500
61. Pistacia
integerrima
Kakarsingi Leaf Galls 1000
62. Podophyllum
hexandrum
Bankakri Fruits
Roots
250
450
63. Polygonatium spp. Salam Mishri Rhizomes 1000
64. Potentilla
nepalensis
Dori Ghas Roots 125
65. Prunus cerasoides Pjja/Padam Wood 125
66. Punica granatum Daru/Anar Fruits/Seeds 500
67. Pyrus pashia Kainth/Shegal Fruits 125
68. Rauvolfia
serpentina
Sarpagandha Roots 500
69. Rheum spp. Revandchini Roots 200
70. Rhododendron
anthopogon
Talis Patra Leaves 125
71. Rhododendron
arboretum
Brash Flowers 150
72. Rhododendron
campanulatum
Kashmiri Patta Leaves 150
73. Salvia
moorcroftiana
Thuth Roots 200
74. Sapindus
mukorossi
Ritha Fruits 150
75. Saussurea costus/S.
Lappa
Kuth Roots 300
76. Selinm spp.(S.
vaginatum/ S.
tenuifolium)
Bhutkesi Roots 400
77. Swertia spp Chirata Whole Plant 700
78. Taraxacum
officinale
Dudhi Roots 125

170
S.no. Botanical name Local Name Plant Part Permit/ Pass
Fee Rs/Qtl
79. Taxus wallichiana Birmi/ Thuna/
Rakhal
Needles 600
80. Terminalia bellirica Bahera Fruits 300
81. Terminalia chebula Harar Fruits 500
82. Thalictrum
foliolosum
Mamiri Roots 350
83. Thymus serpyllum Banajwain Aerial Parts 125
84. Tinospora
cordifolia
Giloe Stems 125
85. Toona ciliata Bari Phool Dried fruits 125
86. Trillidium
govanianum
Nag Chhatri Roots/Rhizomes 8000
87. Valeriana spp. Mushakbala/
Tagar/ Nihanu
Roots/Rhizomes 600
88. Viola Spp. Banafsha Flowers/aerial 2250
89. Withania somnifera Ashvagandha Roots 200
90. Woodfordia
fruticosa
Dhatki/ Dhai Flowers 150
91. Zanthoxylum
armatum
Tirmir Fruits/Seeds 250
Source: Notification No. FFE-B-A(3)-2/2013 dated 09-12-2014138
Table A4. 2: Potential Bioresources of Himachal Pradesh
S.
No.
Name
(Scientific,
Common)
Estimated
Annual
Trade (MT)
Estimated
Market
Price
(Rs. per
Kg)
Geographical
Location
Traditional Uses Status
(CR,
EN,
VU,
NT)
1. Abies spectabilis
(D. Don) Spach
(Talispatra)
500 – 1000 30 – 50 At altitude of 2800
– 4000 m
NT
2. Acacia catechu
(L.F.) Willd.
(Katha)
200 – 500 10 – 15 Mandi, Hamirpur,
Una, Bilaspur,
Nalagarh, Solan
Used in bronchial
asthama, chest pain, sore
mouth, colic pain and
cancer
3. Aconitum
heterophyllum
Wall. ex Royle
(Atis)
200 – 500 2000 –
4000
Shimla, Kinnaur,
Lahaul - Spiti,
Chamba, kangra
and Kullu
Used stomach ache,
bilious complaints,
intermittent fevers,
diarrhoea, dysentery,
acute inflammatory
CR
138 https://hpforest.nic.in/files/Notification%20in%20english.pdf

171
S.
No.
Name
(Scientific,
Common)
Estimated
Annual
Trade (MT)
Estimated
Market
Price
(Rs. per
Kg)
Geographical
Location
Traditional Uses Status
(CR,
EN,
VU,
NT)
infections, antiperiodic,
aphrodisiac, and as bitter
tonic.139
4. Acorus calamus
L.
(Vach)
500 – 1000 30 – 35 Shimla, Kinnaur,
Kullu, Mandi,
Sirmour, Chamba
and Kangra
Root powder is used as
vermifuge. Used to treat
bronchitis and fever.
5. Adhatoda
zeylanica Medic.
(Adusa)
2000 – 5000 10 – 25 Leaf juice is used to treat
chronic bronchitis and
asthama. Flowers
improve circulation of
blood, and roots are
useful in bronchitis,
asthama, and sore eyes.
(Sutare and Kareppa
2009)
6. Aegle marmelos
(Bael)
2000 – 5000 10 – 25 Nalagarh, Una,
Kangra, Bilaspur,
Mandi, Kunihar,
Nahan, and Paonta
Sahik
Fruit of the plant is used
for cure against
dysentery, diarrhoea, and
to improve appetite and
digestion. The leaf of the
plant has antibiotic
properties.
7. Asparagus
racemosus Willd.
(Shatavari)
2000 – 5000 40 – 70 Solan, Mandi,
Kangra, Bilaspur,
Hamirpur, Chamba
and Una
Mostly used as veterinary
medicine. Useful in
dysentery, diarrhoea,
leprosy, and throat
infection
8. Bacopa monnieri
(L.) Pennell
(Brahmi)
2000 – 5000 30 – 35 At an altitude of
1341 m
Used to treat anxiety
neurosis, and mental
fatigue, epilepsy,
insomnia, asthma,
rheumatism. It is
effective against
bronchitis, arthritis,
backache, constipation,
hair loss, fever, digestive
problems.
9. Berberis aristata
DC.
(Daruhaldi)
500 – 1000 15 – 35 Shimla, Sirmour,
Kullu, Chamba,
Mandi, and
Kinnaur
Used to treat skin
ailments, eye infections,
jaundice, menorrhagia
and diarrhoea.
10. Bergenia ciliate
(How.) Stern.
(Pashanabheda)
200 – 500 15 – 20 Kinnaur, Shimla,
Kullu, Chamba,
Sirmour,Mandi and
Kangra
Root is used as
astringent, tonic, diuretic
useful in fever,
opthalmia, and boils.
139
http://www.bioinformaticssikkim.gov.in/pages/added/Medicinal/Aconitum%20heterophyllum%20Wall.%20ex.
%20Royle.htm

172
S.
No.
Name
(Scientific,
Common)
Estimated
Annual
Trade (MT)
Estimated
Market
Price
(Rs. per
Kg)
Geographical
Location
Traditional Uses Status
(CR,
EN,
VU,
NT)
Also useful in dissolving
kidney stones.
11. Bombax ceiba L.
(Mochrus)
100 – 200 50 – 60 Found in warmer
regions with an
elevation not
exceeding 1400 m.
Used to treat tooth aches,
and gum problems, fever,
mouth sores, rheumatism,
enlarged spleen, leg
pains, pneumonia,
leprosy, atropy, cholera,
neuralgia, and rinderpest
disease.
12. Butea
monosperma
(Lam.) Taub
(Tesu phool)
200 – 500 15 – 20 Solan, Bilaspur,
Hamirpur, Kangra,
Chamba, Mandi,
and Sirmour
Used to treat diarrhoea,
dysentery, ulcers, sore
throat, bladder
haemorrhage and pthisis.
13. Cassia fistula L.
(Amaltas)
200 – 500 30 – 40 Una, Hamirpur,
Bilaspur, Mandi,
Kangra, Chamba,
and Solan
Used to treat leprosy,
indigestion, heart
diseases, flatulence,
ringworm, gripping boils,
fever colic, and heart
diseases.
14. Cassia tora L.
(Chakoda beeja)
5000 –
10,000
5 – 10 Throughout HP up
to elevation of
1400 m
Leaves are applied on
cuts and wounds. It also
treats skin ailments,
tumours, leprosy,
psoriasis and ulcers.
15. Cedrus deodara
(Roxb.) loud.
(Devdar)
500 – 1000 25 – 35 Found in most part
of the state
between elevation
of 2200 – 2800 m.
Used to treat paralysis,
fever, heart palpitations,
flatulence, urinary
diseases, and pulmonary
problems.
16. Celastrus
paniculatus
Willd.
(Malkangani)
200 – 500 48 – 55 Found at an
altitude of 1800 m
Used to treat
tuberculosis, acidity,
intestinal worms, skin
diseases, ringworm, and
stomach ache
17. Centella asiatica
(L.) Urban
(Bhrami Booti)
500 – 1000 25 – 35 Throughout HP
below 1300 m
elevation
Used for treating leprosy,
epilepsy and loss of
memory.
18. Centratherum
Anthelminticum
(L.) O. Kuntze
(Kali Zeeri)
500 – 1000 70 – 75 Used to treat skin
diseases, itching and skin
irritation, roundworm,
tapeworm, thread
worm.140
19. Cinnamomum
tamala
500 – 1000 15 – 35 Solan, Shimla,
Mandi, Hamirpur,
Used to treat rheumatism,
colic and diarrhoea
VU
140 https://www.ayurtimes.com/kali-jeeri-kalijiri-centratherum-anthelminticum/

173
S.
No.
Name
(Scientific,
Common)
Estimated
Annual
Trade (MT)
Estimated
Market
Price
(Rs. per
Kg)
Geographical
Location
Traditional Uses Status
(CR,
EN,
VU,
NT)
(Tejpatta) Kangra and
Chamba
20. Emblica
officinalis Gaertn
(Amla)
16000 30 – 35 Nahan, Nalagarh,
Mandi, Solan,
Hamirpur and
Bilaspur
Enriched in Vitamin – C
and bears laxative,
diuretic and astringent
properties.
21. Ephedra
gerardiana Wll.
(Somlata)
200 – 500 25 – 35 Chamba, Kinnaur,
Lahaul-Spiti
Used to treat asthma, and
other respiratory
ailments, syphilis, and
rheumatism.
EN
22. Gloriosa superba
L.
(Kalihari)
100 – 200 600 – 750 Kangra and
Sirmour
Used to treat ulcers,
leprosy, inflammation,
piles, skin ailments and
intestinal worm disorders.
VU
23. Holorrhena
pubescens Wall.
ex. G. Don
(Kutja)
1000 – 2000 75 – 100 Nahan, Una,
Hamirpur, Kangra,
Bilaspur, Solan and
Mandi
Used to treat amoebic
dysentery, piles, anaemia,
asthma,
bronchopneumonia,
dropsy, influenza, tooth
ache, rheumatism,
vomiting and nausea.
24. Juniperus
communis L.
(Hauber)
500 – 1000 35 – 45 Kullu, Chamba,
Sirmaur, Kinnaur
and Shimla
Useful in asthma,
stomatitis, hemicranias,
chronic bronchitis,
diseases of liver and
spleen
25. Jurinea
macrocephala
(Dhoop)
1000 – 2000 75 – 100 Chamba, Kullu,
Kinnaur and
Shimla
Aromatic roots are used
as incense and are main
ingredient of Dhoop
industry. Root oil is
useful in treatment for
gout and rheumatism.
26. Litsea glutinosa
(Lour.) Robinson
(Maida Chhal)
100 – 200 20 – 35 Altitude of 500-
1900 m
Powdered form used to
treat bruises inflicted by
blows, skin diseases and
use as plastering material
over fractures or sprains
in humans and animals.
(Ramana and Raju 2017)
27. Nardostachys
grandiflora DC.
(Jatamanasi)
200 – 500 110 – 150 Alpine rocky
slopes, The Great
Himalayan
National Park
Used to treat epilepsy,
hysteria, leprosy,
respiratory disorders,
nervous excitement,
palpitation of heart and
flatulence.
EN
28. Onosma
hispidum Wall.
ex G. Don
(Ratanjot)
500 – 1000 50 – 60 At altitude of 4000
m
Root yields red colour
commercial dye, mainly
used for colouring
foodstuffs, wools, oils
and medicinal
preparations. Also, used

174
S.
No.
Name
(Scientific,
Common)
Estimated
Annual
Trade (MT)
Estimated
Market
Price
(Rs. per
Kg)
Geographical
Location
Traditional Uses Status
(CR,
EN,
VU,
NT)
in the treatment of
wounds, pain relief,
fevers, infectious
diseases, bites and stings.
Flowers are used as
stimulant and cardiac
tonic. Bruised roots of
ratanjot are applied
externally to cutaneous
eruptions.141
29. Oroxylum
indicum
(Tetu chhal)
1000 – 2000 20 – 30 Kullu, Kangra,
Una, Hamirpur,
Bilaspur, Chamba,
Solan, and Sirmaur
Useful for treating
dysentery and diarrhoea,
headaches, and ulcers
treatment.
30. Parmelia perlata
(Chadila)
1000 – 2000 80 – 90 Useful in bronchitis,
excessive salivation,
vomiting, toothache,
boils, inflammations.142
31. Picrorhiza kurrao
Royle ex. Benth
(Kutki)
200 – 500 220 – 230 Kinnaur, Chamba,
Kullu and Lahaul
Used to treat blood
pressure, cold, cough,
leprosy, jaundice and
asthma.
EN
32. Pistacia
integerrima
(Kakar singi)
150 – 200 90 – 110 Chamba, Kinnaur,
Kullu, Mandi,
Shimla, Solan,
Hamirpur, Una and
Sirmaur
Used to treat asthma,
phtisis and other
respiratory ailments.
33. Rheum austral D.
Don
(Revan Chini)
500 – 1000 25 – 30 Kangra, Chamba,
Kullu, Shimla,
Kinnaur, Lahaul
and Spiti
Used to clean teeth and
treat ulcers.
34. Rhododendron
anthopogon D.
Don
(Talispatra)
100 – 200 15 – 30 Shimla, Kullu and
Chamba
Leaves possess stimulant
properties. These are
aromatic and are
administered as an
errhine to produce
sneezing.
VU
35. Sapindus
mukorossi
(Reetha)
200 – 500 30 – 40 Chamba, Kangra,
Una, Hamirpur,
bilaspur, Solan,
Sirmaur, mandi
and Shimla
Used to treat epilepsy and
chlorosis. Leaves are
used as fodder.
36. Swertia chirayata
(Chirayata)
500 – 1000 200 – 225 Treats asthma, cold,
cough, ulcer, asthma,
inflammation, piles and
skin diseases
CR
141 https://www.motherherbs.com/onosma-hispidium.html 142 Kumar GP, Kumar VS, Kumar SA (2015), “Pharmacological and phytochemical aspects of Lichen Parmelia
Perlata: A review”, Int. J. Res. Ayurveda Pharm. Jan – Feb 2016; 7(Suppl 1): 102 – 107; Available at:
http://dx.doi.org/10.7897/2277-4343.07138

175
S.
No.
Name
(Scientific,
Common)
Estimated
Annual
Trade (MT)
Estimated
Market
Price
(Rs. per
Kg)
Geographical
Location
Traditional Uses Status
(CR,
EN,
VU,
NT)
37. Taxus
Wallichiana
Zucc.
(Talispatra)
100 – 200 75 – 90 At an altitude of
1800m to 3300 m
Used in treatment of
headaches, falling pulse
EN
38. Terminalia arjuna
(Arjun)
2000 – 5000 10 – 15 Nahan, Nauni and
Solan
Used in treatment of
blood dysentery, blood
pressure, bone fracture,
heart diseases and ear
aches.
39. Terminalia
bellirica
(Behra)
2000 – 5000 10 – 15 Shivalik zone of
HP
Used in treatment of
piles, spleen enlargement,
leprosy and headaches
40. Terminalia
chebula
(Harda)
5000 –
10,000
10 – 15 Sirmaur, Hamirpur,
Mandi, Bilaspur,
Kangra and Una
Used to treat asthma,
blood pressure, gum
ulcers, dysentery, and
piles
41. Tinospora
cordifolia
(Giloy)
2000 – 5000 10 – 15 It has medicinal
properties like anti-
diabetic, anti-periodic,
anti-spasmodic, anti-
inflammatory, anti-
arthritic, anti-oxidant,
anti-allergic, anti-stress,
anti-leprotic, anti-
malarial,
hepatoprotective,
immunomodulatory and
anti-neoplastic activities.
(Kumar et al 2015)
42. Valeriana
jatamansi
(Musakbala)
100 – 200 95 – 100 Kinnaur, Kullu,
Chamba, Mandi
and Shimla
Used for producing
perfumed powder and
also medicines for
hysteria and nervous
disorders.
VU
43. Viola pilosa bi.
(Banafsa)
200 – 500 300 – 350 Chamba, Kinnaur,
Kullu, Mandi,
Kangra, Bilaspur,
Shimla and Solan
Used to treat asthma,
bleeding piles, throat
cancer, fever, headache
and skin diseases
44. Withania
somnifera
(Ashwagndha)
2000 – 5000 60 – 70 Una, Hamirpur,
Kullu, Kangra,
Mandi, Bilaspur,
and Sirmaur
Used to treat cough,
dropsy, general
weakness, debility,
rheumatism and it is a
potent tonic for delaying
aging.
45. Woodfordia
fruticosa (L.)
Kurz
(Dhai phool)
2000 – 5000 10 – 15 Used for curing/ treating
various
ailments/disorders like
leprosy, toothache,
leucorrhea, fever,

176
S.
No.
Name
(Scientific,
Common)
Estimated
Annual
Trade (MT)
Estimated
Market
Price
(Rs. per
Kg)
Geographical
Location
Traditional Uses Status
(CR,
EN,
VU,
NT)
dysentery, bowel disease.
(Kumar et al 2016)

177
Annexure – 5
Himachal Pradesh Environment Fund
The Department of Environment, Science and Technology created The Himachal Pradesh
Environment Fund on 4th November 2008. For administering the fund, the Environment Fund
Administering Committee was also notified which was to administer the Fund.
The following amounts would be credited to the Fund:
i. Direct contribution, donations from individuals, industrialists, NGOs, industries
associations, hotel associations, Departments, Corporations, etc.
ii. Any other source of donation which the State Government may deem fit.
Out of the total collection from the Fund, computed at the end of the financial year:
% of Funds Permissible Works
50% of the
collected fund
Environmental protection, conservation, restoration and mitigation
works, including the efforts to reduce the carbon footprints
25% of the
collected fund
Development of the environmental infrastructure in the state
10% of the
collected fund
Environmental educational activities awareness programmes
10% of the
collected fund
Any environmental purposes at the discretion of Chairman of the
‘Environment Fund Administering Committee’
5% of the
collected funds
Keep as contingency for administering of the Fund including expenses
for maintenance of accounts, logistics, organizing of meetings, etc.
Expenditure from the Fund can only be incurred after approved by the Environment Fund
Administering Committee for the purposes defined in the table above, except for the 10% of
the total earmarked for expenditure at discretion of Chairman of the ‘Environment Fund
Administering Committee.