Bioactive Compounds Isolated from Marine Bacterium Vibrio ...

Mar. Drugs 2014, 12, 4045-4068; doi:10.3390/md12074045
marine drugs ISSN 1660-3397
www.mdpi.com/journal/marinedrugs
Article
Bioactive Cembrane Derivatives from the Indian Ocean Soft
Coral, Sinularia kavarattiensis
Katja-Emilia Lillsunde 1, Carmen Festa
2, Harshada Adel
3, Simona De Marino
2,
Valter Lombardi 4, Supriya Tilvi
3, Dorota A. Nawrot
1, Angela Zampella
2,
Lisette D’Souza 3, Maria Valeria D’Auria
2 and Päivi Tammela
1,*
1 Centre for Drug Research, Division of Pharmaceutical Biosciences, Faculty of Pharmacy,
P.O. Box 56, University of Helsinki, Helsinki FI-00014, Finland;
E-Mails: [email protected] (K.-E.L.); [email protected] (D.A.N.) 2 Department of Pharmacy, University of Naples Federico II (USNF), Naples I-80131, Italy;
E-Mails: [email protected] (C.F.); [email protected] (S.D.M.); [email protected] (A.Z.);
[email protected] (M.V.D.) 3 CSIR-National Institute of Oceanography, Dona Paula, Goa 403004, India;
E-Mails: [email protected] (H.A.); [email protected] (S.T.); [email protected] (L.D.) 4 EuroEspes Biotechnology, Department of Cellular Immunology, Bergondo 15165, A Coruña,
Spain; E-Mail: [email protected]
* Author to whom correspondence should be addressed; E-Mail: [email protected];
Tel.: +358-2941-59628; Fax: +358-2941-59138.
Received: 1 April 2014; in revised form: 5 June 2014 / Accepted: 17 June 2014 /
Published: 3 July 2014
Abstract: Marine organisms and their metabolites represent a unique source of potential
pharmaceutical substances. In this study, we examined marine-derived substances for their
bioactive properties in a cell-based Chikungunya virus (CHIKV) replicon model and for
in vitro anti-inflammatory activity. In the screening of a marine sample library, crude
extracts from the Indian soft coral, Sinularia kavarattiensis, showed promising activity
against the CHIKV replicon. Bioassay-guided chemical fractionation of S. kavarattiensis
resulted in the isolation of six known norcembranoids (1–6) and one new compound,
named kavaranolide (7). The structures were elucidated on the basis of NMR and MS
spectroscopic data. Compounds 1–3 and 5–7 were evaluated for their replicon-inhibiting
potential in the CHIKV model by using a luminescence-based detection technique and live
cell imaging. Compounds 1 and 2 showed moderate inhibition of the CHIKV replicon, but
imaging studies also revealed cytotoxic properties. Moreover, the effects of the isolated
OPEN ACCESS

Mar. Drugs 2014, 12 4046
compounds on primary microglial cells, an experimental model for neuroinflammation,
were evaluated. Compound 2 was shown to modulate the immune response in microglial
cells and to possess potential anti-inflammatory properties by dose-dependently reducing
the release of pro- and anti-inflammatory cytokines.
Keywords: Sinularia kavarattiensis; soft coral; norcembranoid; NMR spectroscopy;
Chikungunya; replicon cell line; live cell imaging; neuroinflammation
1. Introduction
Chikungunya virus (CHIKV) is an alphavirus transmitted by Aedes mosquitoes and the cause of
Chikungunya fever, a disease characterized by acute high fever, polyarthralgia, myalgia, nausea,
headache and skin symptoms [1–3]. In addition to acute phase symptoms, CHIKV infection is often
associated with chronic rheumatic manifestations that are relapsing and incapacitating [4,5]. The
rheumatic symptoms can persist from months to years after the initial virus infection.
A new lineage of CHIKV emerged in 2004 as a result of a single mutation in the viral genome,
which enabled the adaptation of the virus to the Aedes albopictus mosquito vector, a common vector of
arthropod-borne diseases [6,7]. This mutation permitted the massive spread of the virus to many
countries in the Indian Ocean region in the epidemics that escalated in 2005 [8]. As a consequence of
vector adaptation and the resulting Chikungunya epidemic, local transmission of the virus has lately
been reported not only in tropical, but also in temperate regions, such as Italy and south-eastern
France [9–11]. There are currently neither vaccines nor specific therapies against CHIKV, and hence,
infections can only be avoided by preventing exposure to mosquitoes in affected regions. The current
treatment is symptomatic and mainly includes analgesics, anti-inflammatory drugs and corticosteroids [3].
The CHIKV genome is a single-stranded positive-sense RNA, which encodes for structural and
non-structural proteins [12]. The genetic material is protected by a nucleocapsid, and the virion enters
its host cell via receptor-mediated endocytosis. The drug discovery approaches applied to the treatment
and prevention of CHIKV infection include entry inhibition, interference with viral protein translation,
protein replication inhibition and modulation of the host immune response [13]. The replicon cell line
used in our study expresses CHIKV non-structural proteins and can be used to identify potential
CHIKV replication inhibitors. The replicon cell line enables safe and efficient screening that can be
performed in a biosafety Level 2 laboratory. This is a great advantage compared to studies on
infectious CHIKV, which requires handling in biosafety Level 3 facilities.
In the course of the multinational collaborative project, MAREX, a library of extracts originating
from marine organisms collected from the Indian Ocean were studied for their potential antiviral
properties by using the CHIKV replicon model. The extract of the soft coral, Sinularia kavarattiensis,
displayed promising anti-CHIKV activity and was consequently selected for bioassay-guided fractionation.
The coral species of the genus, Sinularia, are widespread in coral reefs all over the world and have been
reported to contain a variety of compounds with novel chemical structures [14]: sesquiterpenes [15,16],
diterpenes [17], in particular cembranoids and norcembranoids, and polyhydroxylated steroids [18],
which possess unique structural diversity. These metabolites display potential bioactivities, such as

Mar. Drugs 2014, 12 4047
antimicrobial [14], anti-inflammatory [19–24], antiviral [25] and cytotoxic activity [26–28]. In the
present study, the enriched chloroform extract of S. kavarattiensis afforded four known 14-membered
macrocyclic norcembranoids, 1–4 (5-epi-sinuleptolide [29], sinuleptolide [30], scabrolide D [31,32]
and norcembranoid 4 [33]), all of which lack a C-18 carbon substituent in their structures; one known
germacrane-type sesquiterpenoid, 5 (ent-germacra-4(15),5E,10(14)-trien-1β-ol) [34], one known
C19-norcembranoid diterpene ineleganolide, 6 [35], and the novel norcembranoid, named kavaranolide 7
(Figure 1), possessing a tricyclic carbocycle with the trans-fused six and seven-membered rings.
Figure 1. Compounds (1–7) isolated from the soft coral S. kavarattiensis.
S. kavarattiensis was primarily chosen for bioactivity-guided purification based on promising
results against the CHIKV replicon. Corals of the genus, Sinularia, are, however, well-known sources
of anti-inflammatory agents [19–24]. The isolated compounds were therefore, in addition to
anti-CHIKV replicon activity, also studied for potential anti-inflammatory activity in primary
microglial cells that serve as a model for neuroinflammation. Microglial cells are the resident immune
cells of the central nervous system [36]. In the resting state, microglia are highly dynamic and control
the environment by rapidly extending and retracting motile processes. Microglia are closely associated
with astrocytes and neurons, particularly at the synapses, and many data indicate that neurotransmission
plays a role in regulating the morphology and the function of surveying or resting microglia. The
presence of reactive glia has been described in all neurodegenerative diseases, and microglial activation
may contribute to the neuropathology observed [37,38]. The inhibition of neuroinflammation has been
postulated as a putative target in the treatment of neurodegenerative diseases, and research has focused on
the study of the potential neuroprotective effects of anti-inflammatory compounds in experimental models
of neurodegeneration occurring in the presence of reactive glia.
The present paper describes bioassay-guided isolation, structure elucidation and antiviral and
anti-inflammatory activity studies of the compounds isolated from S. kavarattiensis.

Mar. Drugs 2014, 12 4048
2. Results and Discussion
2.1. Bioassay-Guided Fractionation of S. kavarattiensis Extract
In a CHIKV replicon screen of a large marine sample library, we identified potential anti-CHIKV
replication activity in the methanol and methanol-chloroform extracts from the marine soft coral,
S. kavarattiensis. In primary screening, the extracts showed a 71% (methanol extract) and 72%
(methanol-chloroform extract) decrease in the Rluc marker levels in the BHK-CHIKV-NCT (baby hamster
kidney [BHK] cells expressing a non-cytotoxic [NCT] Chikungunya virus [CHIKV] replicon) cell line
at a 100 μg/mL concentration. The crude extracts were tested for cytotoxic activity to rule out the
possibility of the reduction in marker levels due to toxicity towards the host cell line. The extracts
showed moderate cytotoxicity: the methanol extract caused 15% cytotoxicity, as measured by the
reduction in ATP levels, and the methanol-chloroform extract a 17% reduction. As a follow up, the
activity of the crude extracts was confirmed in dose-response assays. The extracts showed
dose-dependent inhibition of the CHIKV replicon in the cell model. These promising results led to the
selection of S. kavarattiensis for a bioactivity-guided purification study.
The crude methanol extract was fractionated according to the modified Kupchan partitioning
procedure [39], and the obtained enriched extracts were studied for replicon inhibition and cytotoxic
activity in the BHK-CHIKV-NCT cell line. At a 100 μg/mL concentration, the chloroform- and ethyl
acetate-enriched extracts proved to possess inhibitory activity against the CHIKV replicon, causing
a 47% and 65% decrease of the Rluc marker level, with a cytotoxic effect of 24% and 20%, respectively.
The chloroform-enriched extract (3.2 g) was further fractionated by silica gel MPLC using a solvent
gradient system from CH2Cl2 to MeOH followed by reverse phase HPLC to afford pure compounds.
2.2. Chemical Characterization
Kavaranolide 7 was isolated as a white amorphous solid, and its formula of C19H22O5, implying
nine degrees of unsaturation, was established by high-resolution ESIMS based on the pseudomolecular
ion [M − H]− at m/z 329.1381.
The 13
C NMR data confirmed the presence of 19 carbons (Table 1), including three ketone signals
at δC 195.7, 207.9 and 211.3, one acyl signal at δC 174.1, one trisubstituted double bond (δC 149.0, d and
139.5, s) and one disubstituted double bond (δC 147.2, s and 111.2, t). The carbonyl and olefinic carbons
account for six degrees of unsaturation; hence, the compound is tricyclic. Analysis of the 1H NMR
spectrum revealed an isopropenyl group (δH 1.63 (3H, s), 4.43, (1H, br s) and 4.75 (1H, br s)), a
deshielded olefin proton at δH 7.36 (1H, br d, J = 7.5 Hz) and a ketone methyl at δH 2.21 (3H, s).
Careful analysis of the COSY spectrum allowed us to build up a single spin system (Figure 2): H-5,
H-10 (by allylic coupling), H-11 (H2-7), H-12, H-13 (H-4), H2-14, H-1 (H2-16 and H3-17, by allylic
coupling), H2-2. Even if no scalar coupling was observed between H-4 and H-5, the linkage C-4/C-5,
as well as the location of two ketone functions at C-3 and C-6 were easily inferred from HMBC
correlations H-5/C-3, C-4, C-6, C-7 and H-4/C-3, C-5, C-6, C-13. The acetyl group was placed at C-9
on the basis of HMBC correlations H3-18/C-8, C-9, whereas the long-range correlation, H-12/C-19,
allowed the placing of the carboxy group at C-12. These data, together with additional HMBC correlations
(Table 1 and Figure 2) defined the planar structure of kavaranolide (7), as depicted in Figure 1.

Mar. Drugs 2014, 12 4049
Table 1. 1H and
13C NMR data (700 and 175 MHz, DMSO-d6) of kavaranolide (7).
δH a δC HMBC
1 2.62 m 39.9
2α 2.50 b 43.9 C1, C3, C15
2β 2.36 m C3, C14
3 - 207.9
4 3.12 d (12.6) 50.5 C3, C5, C6, C13
5 4.30 br s 43.3 C3, C4, C6, C7, C8, C9, C10, C13
6 - 211.3
7α 2.19 c 39.2 C6, C10, C11, C12
7β 2.24 m C6, C12
8 - 195.7
9 - 139.5
10 7.36 br d (7.5) 149.0 C5, C7, C8, C11
11 3.17 m 34.7
12 2.29 dd (5.2, 7.5) 48.8 C4, C10, C13, C19
13 1.84 m 36.1
14α 1.55 m 31.7
14β 2.44 m C13, C15
15 - 147.2
16 4.75 br s 111.2 C1, C15, C17
4.43 br s C1, C17
17 1.63 s 21.8 C1, C15, C16
18 2.21 s 24.8 C8, C9
19 - 174.1 a Coupling constants are in parentheses and given in hertz. 1H and 13C assignments were aided by COSY,
HSQC and HMBC experiments; b overlapped with the solvent signal; c overlapped with the other signal.
Figure 2. (a) COSY connectivities (bold bonds) and key HMBC (black arrows)
correlations; (b) key NOE (red dashed arrows) correlations for Compound 7.
The relative stereochemistry of Compound 7 was deduced from the analysis of the coupling
constants and some key dipolar coupling evidenced by the NOESY spectrum (Figure 2).
The NOE correlations between H-13/H2-16, H-11 and H-12 suggested that they are on the same
face of the rings. By analogy with ineleganolide [35], which co-occurs in the same specimen and for
which the relative configuration has been established by X-ray diffraction analysis, we assigned these
signals as α protons.

Mar. Drugs 2014, 12 4050
The six- and seven-membered rings are trans-fused on the basis of the large value of JH-4/H-13 (12.6 Hz);
therefore, H-4 has a β-orientation. When it comes to the H-5 configuration, no diagnostic dipolar
couplings were observed for this proton. The absence of scalar couplings between H-4 and H-5
indicated that they have a dihedral angle of ca. 90°. Force field calculations evidenced that the closure
of the bridged structure of kavaranolide and the geometric relationship between H-4 and H-5 were only
compatible with an α-orientation of the H-5 proton. Therefore, the stereostructure of kavaranolide (7)
was determined as depicted in Figure 1. The bridged 6,7,6-ring-fused framework of kavaranolide
closely resembles that of ineleganolide (6), also isolated from the extract of S. kavarattiensis in the
present study, and of horiolide (11), isolated from an Indian Ocean collection of Sinularia sp. [40].
The similar experimental scalar and dipolar coupling patterns observed for ineleganolide (6), horiolide (11)
and kavaranolide (7) gave further support to the structural assignment. Furthermore, the observed structural
and stereochemical homology between these derivatives suggested a common biosynthetic origin.
Scheme 1. A plausible biosynthetic route to kavaranolide (7).
In a recent report, Li et al. [41] proposed biosynthetic pathways that likely lead to polycyclic
skeletons of norcembranoids through transannular Michael reactions from norcembranoid macrocyclic
precursors. In particular, they speculated that the tricyclic ring system in ineleganolide (6) may
originate in vivo from 5-epi-sinuleptolide (1) by two successive Michael reactions, involving the
nucleophilic centers at C-4 and C-7 and the electrophilic centers at C-13 and C-11 in 1 [41]. The
proposed biosynthetic route to 6 from 1 was strongly supported by subsequent studies, which
demonstrated the in vitro conversion of 1 to 6, in strong base conditions [42]. Interestingly it turned out
that under different experimental conditions, the main product was the novel polycyclic derivative, 10
(Scheme 1). Its formation from ineleganolide (6) was proposed to take place by a reverse oxy-Michael
reaction and two successive aldol reactions. The key trione intermediate, 9, could undergo an aldol
reaction leading to the polycyclic derivative, 10, or a Michael reaction leading to horiolide (11). In this
context, kavaranolide (7) is likely to be derived in vivo from horiolide (11) by a reverse oxy-Michael
reaction (Scheme 1). It is also conceivable that kavaranolide (7) could be derived from trione, 9, by
opening of the 5-ring lactone followed by an intramolecular Michael reaction and then dehydration.
Mar. Drugs 2014, 12 4051
As neither intermediate 9 nor intermediate 10 have been reported as natural compounds, the isolation
of kavaranolide (7) gave further support to the proposed biosynthetic route.
2.3. Inhibition of CHIKV Replicon by Compounds Isolated from S. kavarattiensis
2.3.1. Primary Evaluation by Rluc Detection and ATP Quantitation
The replicon-inhibiting potential of Compounds 1–3 and 5–7 was primarily evaluated in the
BHK-CHIKV-NCT cell line by detection of Rluc marker levels as a measure of the inhibition of the
CHIKV replicon. Additionally, we evaluated the compounds for cytotoxic activity by ATP
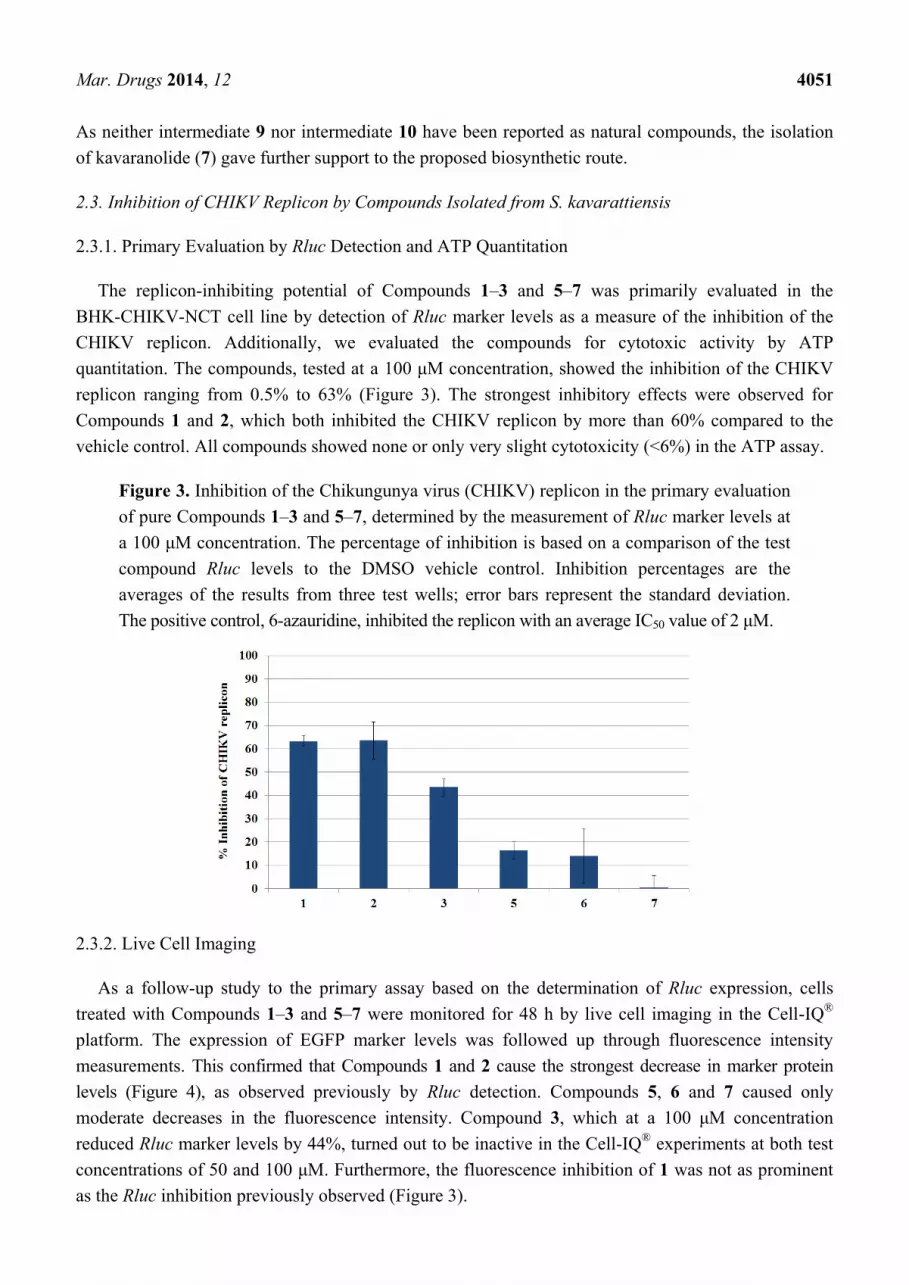
quantitation. The compounds, tested at a 100 μM concentration, showed the inhibition of the CHIKV
replicon ranging from 0.5% to 63% (Figure 3). The strongest inhibitory effects were observed for
Compounds 1 and 2, which both inhibited the CHIKV replicon by more than 60% compared to the
vehicle control. All compounds showed none or only very slight cytotoxicity (<6%) in the ATP assay.
Figure 3. Inhibition of the Chikungunya virus (CHIKV) replicon in the primary evaluation
of pure Compounds 1–3 and 5–7, determined by the measurement of Rluc marker levels at
a 100 μM concentration. The percentage of inhibition is based on a comparison of the test
compound Rluc levels to the DMSO vehicle control. Inhibition percentages are the
averages of the results from three test wells; error bars represent the standard deviation.
The positive control, 6-azauridine, inhibited the replicon with an average IC50 value of 2 μM.
2.3.2. Live Cell Imaging
As a follow-up study to the primary assay based on the determination of Rluc expression, cells
treated with Compounds 1–3 and 5–7 were monitored for 48 h by live cell imaging in the Cell-IQ®
platform. The expression of EGFP marker levels was followed up through fluorescence intensity
measurements. This confirmed that Compounds 1 and 2 cause the strongest decrease in marker protein
levels (Figure 4), as observed previously by Rluc detection. Compounds 5, 6 and 7 caused only
moderate decreases in the fluorescence intensity. Compound 3, which at a 100 μM concentration
reduced Rluc marker levels by 44%, turned out to be inactive in the Cell-IQ®
experiments at both test
concentrations of 50 and 100 μM. Furthermore, the fluorescence inhibition of 1 was not as prominent
as the Rluc inhibition previously observed (Figure 3).
Mar. Drugs 2014, 12 4052
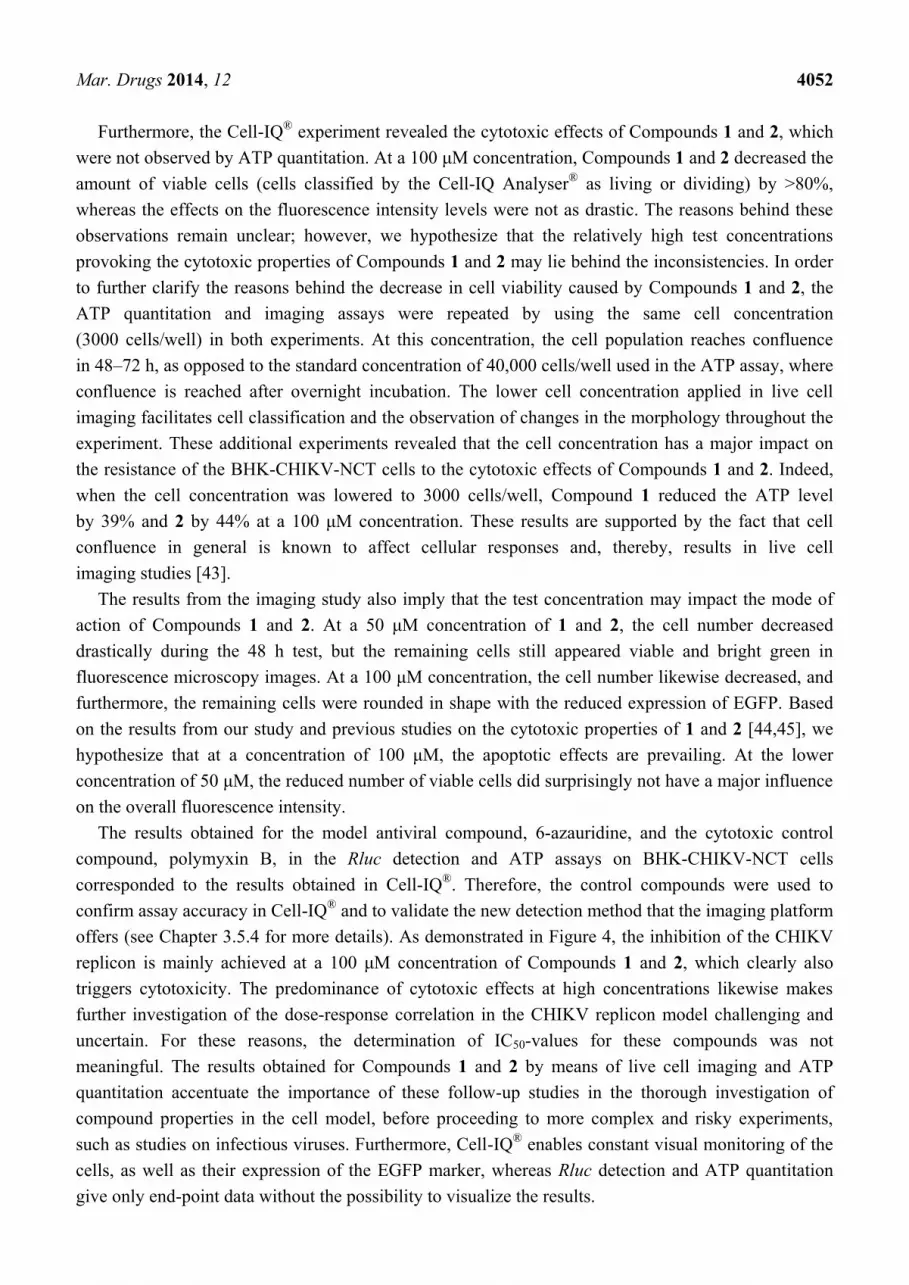
Furthermore, the Cell-IQ®
experiment revealed the cytotoxic effects of Compounds 1 and 2, which
were not observed by ATP quantitation. At a 100 μM concentration, Compounds 1 and 2 decreased the
amount of viable cells (cells classified by the Cell-IQ Analyser®
as living or dividing) by >80%,
whereas the effects on the fluorescence intensity levels were not as drastic. The reasons behind these
observations remain unclear; however, we hypothesize that the relatively high test concentrations
provoking the cytotoxic properties of Compounds 1 and 2 may lie behind the inconsistencies. In order
to further clarify the reasons behind the decrease in cell viability caused by Compounds 1 and 2, the
ATP quantitation and imaging assays were repeated by using the same cell concentration
(3000 cells/well) in both experiments. At this concentration, the cell population reaches confluence
in 48–72 h, as opposed to the standard concentration of 40,000 cells/well used in the ATP assay, where
confluence is reached after overnight incubation. The lower cell concentration applied in live cell
imaging facilitates cell classification and the observation of changes in the morphology throughout the
experiment. These additional experiments revealed that the cell concentration has a major impact on
the resistance of the BHK-CHIKV-NCT cells to the cytotoxic effects of Compounds 1 and 2. Indeed,
when the cell concentration was lowered to 3000 cells/well, Compound 1 reduced the ATP level
by 39% and 2 by 44% at a 100 μM concentration. These results are supported by the fact that cell
confluence in general is known to affect cellular responses and, thereby, results in live cell
imaging studies [43].
The results from the imaging study also imply that the test concentration may impact the mode of
action of Compounds 1 and 2. At a 50 μM concentration of 1 and 2, the cell number decreased
drastically during the 48 h test, but the remaining cells still appeared viable and bright green in
fluorescence microscopy images. At a 100 μM concentration, the cell number likewise decreased, and
furthermore, the remaining cells were rounded in shape with the reduced expression of EGFP. Based
on the results from our study and previous studies on the cytotoxic properties of 1 and 2 [44,45], we
hypothesize that at a concentration of 100 μM, the apoptotic effects are prevailing. At the lower
concentration of 50 μM, the reduced number of viable cells did surprisingly not have a major influence
on the overall fluorescence intensity.
The results obtained for the model antiviral compound, 6-azauridine, and the cytotoxic control
compound, polymyxin B, in the Rluc detection and ATP assays on BHK-CHIKV-NCT cells
corresponded to the results obtained in Cell-IQ®
. Therefore, the control compounds were used to
confirm assay accuracy in Cell-IQ®
and to validate the new detection method that the imaging platform
offers (see Chapter 3.5.4 for more details). As demonstrated in Figure 4, the inhibition of the CHIKV
replicon is mainly achieved at a 100 μM concentration of Compounds 1 and 2, which clearly also
triggers cytotoxicity. The predominance of cytotoxic effects at high concentrations likewise makes
further investigation of the dose-response correlation in the CHIKV replicon model challenging and
uncertain. For these reasons, the determination of IC50-values for these compounds was not
meaningful. The results obtained for Compounds 1 and 2 by means of live cell imaging and ATP
quantitation accentuate the importance of these follow-up studies in the thorough investigation of
compound properties in the cell model, before proceeding to more complex and risky experiments,
such as studies on infectious viruses. Furthermore, Cell-IQ®
enables constant visual monitoring of the
cells, as well as their expression of the EGFP marker, whereas Rluc detection and ATP quantitation
give only end-point data without the possibility to visualize the results.

Mar. Drugs 2014, 12 4053
Figure 4. The inhibition of the CHIKV replicon and the cytotoxicity of Compounds 1–3
and 5–7 measured by Cell-IQ®
live cell imaging in the BHK-CHIKV-NCT cell line at test
concentrations of 50 and 100 μM. Results are shown together with representative
photomicrographs captured after 48 h. The percentage of inhibition and cytotoxicity were
calculated by a comparison to the DMSO vehicle control. Values are the averages of two
independent assays with three replicates each; error bars represent the standard deviation.
Pictomicrographs of cells treated with control compounds (10 μM 6-azauridine and
0.5% DMSO) for 48 h are shown for comparison. More detailed information on the effects
of control compounds in the live cell imaging study can be found in Chapter 3.5.4.
We can summarize that imaging in Cell-IQ®
completes the information obtained by the primary
detection techniques. In the present study, the imaging studies guided us to a more thorough
investigation of the cytotoxic properties of the compounds obtained from S. kavarattiensis. As a
conclusion, a marked CHIKV replicon inhibitory potential was found for the crude extracts of
S. kavarattiensis, whereas Compounds 1 and 2 exhibited moderate inhibition of the CHIKV replicon
along with prevailing cytotoxic activity.
2.4. Anti-Inflammatory Activity of Isolated Compounds
The biological activity of isolated Compounds 1–4 and 6 was tested by using primary microglial
cell cultures. Microglial cells in untreated cell cultures usually appeared as ramified cells homogeneously
distributed in the cultures. These ramified microglial (RM) cells, resembling the ramified type of

Mar. Drugs 2014, 12 4054
microglia in vivo, displayed a pleomorphic cell body with a variable number of branching processes,
sometimes with a spiny-like appearance. The cells were usually found as isolated cells without forming
cell clusters. Apart from the RM, a number of amoeboid microglia (AM) was also distinguished. AM
were smaller than RM and displayed pseudopodia and/or filopodia instead of cell processes. The AM
cell density in non-treated cell cultures (NTCC) was about 85% lower than in lipopolysaccharide
(LPS)-treated cultures (TC). After treatment with three different concentrations (1.0 μg/mL; 2.5 μg/mL
and 5.0 μg/mL) of Compounds 1–4 and 6, significant RM and AM mean differences were observed in
cultures treated with 2.5 μg/mL (7.2 μM) and 5.0 μg/mL (14.4 μM) of 2 (Figure 5). The observed
results suggest that 2 was able to induce a shift from AM to RM shapes. Since AM cells are mainly
activated cells, we conclude that this compound shows the ability to modulate an immune response and
could interfere with the progression of chronic neurodegenerative diseases, although the underlying
mechanisms are still unclear.
Figure 5. The effects on primary microglial cells in LPS-treated cultures (TC), non-treated
cell cultures (NTCC) and after stimulation of LPS-treated cultures with different
concentrations (1 μg/mL, 2.5 μg/mL and 5 μg/mL) of Compounds 1–4 and 6. In the healthy
CNS, microglial cells have a highly ramified morphology with thin processes. Microglia,
in this surveillance state, have been defined as ramified microglia. In contrast, reactive
microglia (i.e., microglia that are no longer ramified microglia) can adopt different
morphologies, including a hypertrophic cell with enlarged processes or an amoeboid
macrophage-like morphology. Microglial cell density quantification (number of cells/field)
in the treated and untreated primary microglial cell cultures shows the ability of
Compound 2 at 2.5 μg/mL and 5.0 μg/mL to significantly reduce the number of activated
amoeboid cells (p < 0.05 with respect to the TC control) and increase the number of
ramified/resting cells (p < 0.05 with respect to the TC control).

Mar. Drugs 2014, 12 4055
Figure 5. Cont.
Microglia have the capacity to release a large number of substances that can be detrimental to the
surrounding neurons, including glutamate, ATP, reactive oxygen species and pro-inflammatory
cytokines. In glial cultures, different pro- and anti-inflammatory cytokines, as well as reactive oxygen
and nitrogen species, are produced in response to LPS treatment. These factors are involved in the
inflammatory response of reactive glial cells and the resolution of the inflammation. IL-10 is a
cytokine with main immunoregulatory and anti-inflammatory properties. Several studies have shown
the inhibitory effect of IL-10 treatment on the production of pro-inflammatory cytokines by reactive
glia in response to LPS [46,47]. In addition to the morphological changes, cytokine release in
supernatants was also quantified both in treated and control microglial cultures. The levels of
pro-inflammatory cytokines, such as IL-1β, IL-6, IL-8, IL-18 and TNF-α, were significantly (p < 0.05)
elevated (Table 2) in primary microglial cultures treated with LPS compared to controls. A significant
difference was observed in the levels of pro-inflammatory cytokines IL-1β, IL-6, IL-8, IL-18, TNF-α,
as well as in anti-inflammatory cytokines, such as IL-4 and IL-10, between Compound 2 at
concentrations of 2.5 μg/mL (7.2 μM) and 5.0 μg/mL (14.4 μM) and the controls (Table 2).

Mar. Drugs 2014, 12 4056
Table 2. Cytokine release (pg/mL) in the supernatants of primary microglial cells after
72 h of stimulation with different concentrations (C1: 1.0 μg/mL; C2: 2.5 μg/mL; and
C3: 5.0 μg/mL) of Compounds 1–4 and 6.
IL-1β IL-6 IL-8 IL-18 TNF-α IL-4 IL-10
LPS-treated (TC) (1 μg/mL) 1.05 ± 0.06 13.5 ± 1.2 257 ± 5.7 325 ± 8.4 34.5 ± 12.2 1.4 ± 2.4 1.6 ± 2.1
Non-treated (NTCC) (Medium) 0.05 ± 0.02 1.5 ± 0.8 7 ± 1.1 8 ± 1.3 5 ± 1.8 7.3 ± 0.05 8.1 ± 0.08
1(C1) 1.04 ± 0.08 14.2 ± 1.8 256 ± 12 319 ± 8.1 33.5 ± 11.2 1.9 ± 0.9 7.6 ± 1.6
1(C2) 1.09 ± 0.1 11.7 ± 1.2 239 ± 5 318 ± 7.5 31.2 ± 9.2 2.1 ± 0.8 8.2 ± 1.8
1(C3) 1.08 ± 0.05 13.5 ± 1.4 241 ± 7 315 ± 8.1 33.6 ± 11.1 1.9 ± 0.4 8.7 ± 2.1
2(C1) 1.08 ± 0.02 12.1 ± 0.9 249±13 326 ± 4.9 34.1 ± 9.1 2.1 ± 0.9 7.9 ± 3.4
2(C2) 0.07 ± 0.04 * 7.8 ± 1.4 * 123 ± 11 * 187 ± 14 * 12.3 ± 3.4 * 15.5 ± 2.3 * 17.4 ± 2.3 *
2(C3) 0.08 ± 0.06 * 8.5 ± 1.3 * 108 ± 9 * 155 ± 11 * 9.8 ± 3.3 * 18.4 ± 1.8 * 18.5 ± 1.9 *
3(C1) 1.1 ± 0.05 12.9 ± 1.1 247 ± 8 312 ± 8.2 33.6 ± 11.2 1.5 ± 0.9 7.5 ± 1.4
3(C2) 1.3 ± 0.06 11.5 ± 1.3 237 ± 4 321 ± 7.8 24.5 ± 6.9 1.6 ± 0.8 6.8 ± 1.5
3(C3) 1.2 ± 0.05 13.2 ± 1.2 244 ± 11 318 ± 7.6 35.4 ± 12.4 1.7 ± 0.5 6.9 ± 1.5
4(C1) 1.01 ± 0.04 12.1 ± 1.3 247 ± 8 312 ± 8.2 33.2 ± 2.8 2.2 ± 0.2 8.4 ± 2.6
4(C2) 1.02 ± 0.04 14.1 ± 1.1 247 ± 8 312 ± 8.2 29.8 ± 2.5 2.3 ± 0.5 7.9 ± 2.5
4(C3) 1.01 ± 0.02 12.1 ± 1.3 247 ± 8 312 ± 8.2 32.5 ± 3.7 1.8 ± 0.2 7.8 ± 3.2
6(C1) 1.07 ± 0.07 13.2 ± 0.2 247 ± 8 312 ± 8.2 31.2 ± 2.9 1.8 ± 0.6 8.5 ± 3.2
6(C2) 1.1 ± 0.05 12.1 ± 0.9 247 ± 8 312 ± 8.2 30.6 ± 2.6 1.9 ± 0.6 7.8 ± 2.2
6(C3) 1.09 ± 0.02 11.8 ± 1.2 247 ± 8 312 ± 8.2 32.3 ± 3.2 1.9 ± 0.9 7.5 ± 2.1
* p < 0.05.
Table 3. In vitro cytotoxic effects (IC50) on primary microglial cell cultures and the
inhibitory effect on LPS-induced pro-inflammatory cytokine release of Compounds 1–4
and 6. Each value represents the mean of triplicate determinations.
Sample Cytotoxicity IL-1β IL-6 IL-8 IL-18 TNF-α IL-4 IL-10
IC50 (μg/mL)
1 >100 >12.5 >12.5 >12.5 >12.5 >12.5 >12.5 >12.5
2 >100 0.5 2.2 2.3 2.9 1.7 0.5 0.5
3 >100 >12.5 >12.5 >12.5 >12.5 >12.5 >12.5 >12.5
4 >100 >12.5 >12.5 >12.5 >12.5 >12.5 >12.5 >12.5
6 >100 >12.5 >12.5 >12.5 >12.5 >12.5 >12.5 >12.5
Tamoxifen 3.60 ND ND ND ND ND ND ND
Prednisolone ND 12 13 15 16 10 20 15
ND: not determined.
Furthermore, the inhibition of cytokine release and the cytotoxicity towards primary microglial cell
cultures was measured at several compound concentrations to determine the IC50 values (Table 3).
Compounds 1–4 and 6 were tested for cytotoxicity at seven concentrations ranging from 1.56 to
100 μg/mL and for cytokine release at six concentrations ranging from 0.39 to 12.5 μg/mL. Tamoxifen
and prednisolone were used as positive controls in the MTT assay and in cytokine quantification,
respectively. Similarly to previous data presented in Table 2, Compound 2 showed effective and
dose-dependent inhibition of cytokine release. As demonstrated in Table 3, the IC50-values for the
inhibition of cytokine release for Compound 2 ranged from 0.5 μg/mL (1.4 μM) to 2.9 μg/mL

Mar. Drugs 2014, 12 4057
(8.3 μM); all of them being markedly lower than those of the positive control prednisolone. The
IC50-values for cytotoxic activity for each of the tested compounds, 1–4 and 6, turned out to be higher
than the maximal test concentration of 100 μg/mL, and the cytotoxicity was thus not influencing the
observed anti-inflammatory properties. In accordance with these results, we suggest that among new
anti-inflammatory agents, special attention should be paid to Compound 2.
2.5. Bioactivity Potential and Structure-Activity Relationships of Metabolites from S. kavarattiensis
The anti-inflammatory properties of metabolites from Sinularia species have previously been
reported in numerous studies [19–24]. Our results imply that Compound 2, in addition to anti-inflammatory
activity, also possesses promising immunomodulatory activity. Takaki and coworkers described
the anti-inflammatory effects of 2 by demonstrating the inhibition of LPS-induced TNF-α production
in murine macrophage-like cells [48]. Our results show that the anti-inflammatory activity of 2, except
for the inhibition of TNF-α release, also takes place through the inhibition of the release of cytokines
that belong to the interleukin family.
The CHIKV replicon-inhibiting potential of isolated Compounds 1–3 and 5–7 was not as striking as
the activity observed for the crude extracts and the enriched fractions of S. kavarattiensis. On the one
hand, the reason behind this observation may be the synergetic activity of the compounds in the
extracts and fractions, which leads to higher inhibition percentages than those exhibited by each
compound separately. On the other hand, the primary test concentration for the extracts and fractions
was as high as 100 μg/mL, whereas the test concentration of the pure compounds in the CHIKV
replicon model, 100 μM, equals a concentration of 35 μg/mL in the case of Compounds 1 and 2.
5-epi-Sinuleptolide 1 and sinuleptolide 2 share a common α-β-unsaturated-γ-butyrolactone moiety,
which is recognized to play a pivotal role in the interactions with unidentified molecular
targets [49,50]. The inactivity in both the CHIKV replicon model and the anti-inflammatory assays of
Compounds 3–7 that lack this functionality strongly suggests the involvement of an electrophilic
conjugated function in 1 and 2, which could act as a Michael acceptor toward reactive lysine or
cysteine residues in the biological targets. Compound 1 and 2 only differ from each other regarding the
configuration of one stereogenic center. The inactivity in the anti-inflammatory assays of Compound 1
is, however, not surprising. The covalent interaction with protein targets requires a correct positioning
through specific the non-covalent interactions of the active functional group within the active site of
the biological target.
The observed cytotoxicity against the BHK-CHIKV-NCT at high concentrations of Compounds 1
and 2 could be explained in terms of their potential Michael acceptor activity, which can lead to cell
damage and general toxicity [51]. The predominating cytotoxic properties at the effective concentrations
make further exploration of the antiviral potential of these compounds challenging. On the contrary,
Compound 2 inhibited the release of pro-inflammatory cytokines and displayed immunomodulatory
activity at concentrations that caused no cytotoxicity against the primary microglial cells used in our
study. Huang and coworkers [26] have described the cytotoxic properties of the acetate of 1
(5-epi-sinuleptolide acetate) at low concentrations against a panel of cancer cell lines, demonstrating
apoptosis induction and cell cycle arrest to lie behind the cytotoxic effects. Furthermore, Liang and
coworkers has demonstrated that 1 triggers cell cycle arrest and apoptosis in skin cancer cells at low

Mar. Drugs 2014, 12 4058
concentrations [44]. Liang et al. studied the cytotoxicity of both 1 and 2 and found that 1 causes more
prominent cytotoxic effects with lower IC50-values against the studied cancer cell lines. Our results
imply that at 50 μM concentration, 1 is slightly more cytotoxic to the BHK-CHIKV-NCT cells than 2;
however, at 100 μM, the differences in cytotoxicity are minor. The impact of cellular confluence is
nevertheless critical. Our results show that cell cultures that have reached confluence before the
treatment with compounds is started are more resistant to the cytotoxic effects.
3. Experimental Section
3.1. General Experimental Procedures
Specific rotations were measured on a PerkinElmer 243 B polarimeter. High-resolution ESI-MS
spectra were performed with a Micromass QTOF Micromass spectrometer. ESI-MS experiments were
performed on an Applied Biosystem API 2000 triple-quadrupole mass spectrometer. NMR spectra
were obtained on Varian Inova 700 MHz spectrometer (1H at 700 MHz,
13C at 175 MHz, respectively)
equipped with a Sun hardware, δ (ppm), J in Hz; and spectra referred to DMSO-d6 (δH 2.50, δC 39.5)
as the internal standard. Through-space 1H connectivities were evidenced using a ROESY experiment
with a mixing time of 200 and 300 ms. HPLC was performed using a Waters Model 510 pump
equipped with a Waters Rheodyne injector and a differential refractometer, model 401. Silica gel
(200–400 mesh) from Macherey-Nagel Company (Düren, Germany) was used for flash
chromatography. The purities of compounds were determined to be greater than 95% by HPLC.
3.2. Biological Material
Soft coral, Sinularia kavarattiensis Alderslade & Prita, was collected off the coast of
Rameshwaram, Tamil Nadu, India (Latitude: 916′60′′N Longitude: 7917′60′′E) in December 2010.
It was frozen at −20 °C and transferred to the Council of Scientific and Industrial Research-National
Institute of Oceanography (CSIR-NIO) Laboratory, Goa, India. The organism was identified by
Panachamoottil Abraham Thomas, Emeritus Scientist, Vizhingam Research Center, Central Marine
Fisheries Research Institute, Kerala, India. A voucher specimen (14S021) is deposited at the
CSIR-NIO. Four hundred grams of freeze-dried organism were extracted four times with 80%
methanol (500 mL) each time to obtain 23 g of the crude methanolic extract. The same sample was
then extracted three times with methanol:chloroform (1:1). The extracts were concentrated at 30 °C
using a Rotavapor and a vacuum pump.
3.3. Chemical Characterization
The crude methanolic extract (18.061 g) was subjected to a modified Kupchan’s partitioning
procedure [39], as follows. The methanol extract was dissolved in a mixture of MeOH/H2O containing
10% H2O and partitioned against n-hexane to give 2.9 g of the crude extract. The water content
(% v/v) of the MeOH extract was adjusted to 30% and partitioned against CHCl3 to give 3.2 g of the
crude extract. The aqueous phase was concentrated to remove MeOH and, then, subsequently extracted
with ethyl acetate (0.29 g) and with n-BuOH (1.6 g).
Mar. Drugs 2014, 12 4059
The CHCl3 extract (3.2 g) was fractionated by silica gel MPLC using a solvent gradient system
from CH2Cl2 to MeOH. The fraction eluted with CH2Cl2/MeOH 995:5 (138 mg) contained pure
ent-germacra-4(15),5E,10(14)-trien-1β-ol 5 (19 mg; 0.005% yield). The fraction eluted with
CH2Cl2/MeOH 99:1 (101 mg) was further purified by HPLC on a Nucleodur 100-5 C18 (5 μm;
4.6 mm i.d. × 250 mm) with 55% MeOH/H2O as the eluent (flow rate 1 mL/min) to give 1.3 mg of
kavaranolide 7 (tR = 8.5 min, 0.0003% yield), 3.9 mg of ineleganolide 6 (tR = 10 min; 0.001% yield),
2.4 mg of scabrolide D 3 (tR = 15.5 min; 0.0006% yield) and 1.0 mg of norcembranoid 4 (tR = 19.5 min;
0.0003% yield). The other fraction eluted with CH2Cl2/MeOH 99:1 (125 mg) was further purified by
HPLC on a Nucleodur 100-5 C18 (5 μm; 4.6 mm i.d. × 250 mm) with 40% MeOH/H2O as the eluent
(flow rate 1 mL/min) to give 13.0 mg of 5-epi-sinuleptolide 1 (tR = 20 min; 0.003% yield) and 8.0 mg
of sinuleptolide 2 (tR = 24 min; 0.002% yield). The reported percentage yields are referred to 400 g of
freeze-dried material.
3.4. Characteristic Data for Natural Compounds
NMR data for Compounds 1–6 as previously reported [29,30,32–35].
Kavaranolide 7: white amorphous solid; [α]D25
+14.5 (c 0.13, MeOH); 1H and
13C NMR
spectroscopic data in DMSO-d6 given in Table 1; ESIMS: m/z 329.1 [M − H]−. HRMS (ESI) m/z
329.1381 [M − H]− (calcd. for C19H21O5 m/z 329.1389).
3.5. Evaluation of Anti-CHIKV Replicon Properties
3.5.1. BHK-CHIKV-NCT Cell Culture
A stable BHK21 cell line (BHK-CHIKV-NCT), described by Pohjala and coworkers [52], was used
for studying potential anti-CHIKV activity. The cell line harbors the CHIKV replicon and
continuously expresses the selection marker puromycin acetyltransferase and two marker proteins
(enhanced green fluorescent protein (EGFP) and Renilla luciferase (Rluc)) for detecting the inhibition
of the viral replicon. The BHK-CHIKV-NCT cells were subcultured three times a week and
maintained at 37 °C, 5% CO2 and 95% humidity in Dulbecco’s Modified Eagle’s Medium with
high glucose and L-glutamine (Gibco®) supplemented with 7.5% fetal bovine serum (FBS), 2%
tryptose-broth phosphate, 1 mM sodium pyruvate, 100 IU/mL penicillin, 100 μg/mL streptomycin and
5 μg/mL puromycin.
3.5.2. CHIKV Replicon Assay, Rluc Detection
BHK-CHIKV-NCT cells were seeded onto opaque-white, clear-bottomed 96-well plates
(PerkinElmer Inc., Waltham, MA, USA) with a cell density of 40,000 cells/well. The cells were
exposed to test samples after 24 h of incubation at 37 °C. The sample stocks were diluted into assay
medium consisting of Dulbecco’s Modified Eagle’s Medium with high glucose and L-glutamine
(Gibco®
) supplemented with 5% fetal bovine serum (FBS), 1 mM sodium pyruvate, 100 IU/mL
penicillin and 100 μg/mL streptomycin. Puromycin was excluded from the assay medium to avoid
puromycin-induced toxicity. The exposure time to test samples was 48 h, after which the Rluc
expression was determined by using a Renilla luciferase assay kit (Promega, Madison, WI, USA),

Mar. Drugs 2014, 12 4060
according to the manufacturer’s instructions. The luminescence signal was recorded using a Varioskan
Flash plate reader (Thermo Fischer Scientific, Vantaa, Finland) with a measurement time of 1 s and
automatic dynamic range settings. The primary test concentration for crude extracts was 100 μg/mL
(n = 3). The percentage of inhibition of the viral replicon was calculated by comparing the sample
signal to the yielded maximum signal (DMSO vehicle in assay medium), and the activity threshold
was set at >50% inhibition of Rluc expression.
The screening assay was optimized for Rluc detection and validated by dose-response experiments
for the positive control, 6-azauridine. The dose-response curve for 6-azauridine determined by Rluc
detection showed sigmoidal, dose-dependent reduction in the marker level, with an IC50 value of 2 μM.
The 6-azauridine concentration used as a positive control on every assay plate was 10 μM, which
caused an average inhibition of 69%. The signal-to-background ratio (S/B) and signal-to-noise ratio
(S/N) were calculated for each plate as a measure of assay quality [53]. DMSO in assay medium
represented the maximum signal and wells with only medium and reagents the background.
3.5.3. Cytotoxicity Assay
The viability of BHK-CHIKV-NCT cells was determined after treatment with hit samples in order
to exclude possible false positives. The test conditions were identical to those described for the Rluc
assay. After 48 h of exposure to the samples, cell viability was determined by ATP quantitation using a
CellTiter GLO®
Luminescent Cell Viability Assay kit (Promega, Madison, WI, USA). Briefly, the
cells were equilibrated to room temperature and washed with 100 μL of phosphate buffered saline
solution, after which 50 μL of CellTiter GLO®
Reagent and 50 μL of assay medium were added. The
plate was subjected to shaking for 2 min to induce cell lysis, and after 10 min, the luminescence was
measured by using a Varioskan Flash plate reader.
Each sample was tested in triplicate, and the cytotoxic effect of test samples was determined as a
percentage by using the maximum signal (DMSO vehicle in the assay medium) as the reference and
cells with no reagent added as the background value. The cytotoxicity assay was validated by
dose-response experiments for the positive control, polymyxin B, which showed dose-dependent
cytotoxicity. The ED50 for the cytotoxic activity of polymyxin B was determined as 5900 IU/mL.
The polymyxin B concentration used in the experiments was 10,000 IU/mL and caused an average
toxicity of 93%.
3.5.4. CHIKV Replicon Assay, Live Cell Imaging
The effects of the control compounds and test samples on proliferation, morphology and expression
of EGFP in BHK-CHIKV-NCT cells was analyzed in a continuous cell culturing platform with
integrated optics (Cell-IQ®
Fluorescence, Chip-Man Technologies Ltd., Tampere, Finland). The
expression of EGFP is an equally valid marker as Rluc for the inhibition of the CHIKV replicon.
The test conditions were optimized by evaluating different imaging settings and cell densities.
The cells were seeded onto clear-bottomed black-framed 96-well plates (PerkinElmer Inc., Waltham,
MA, USA) with a density of 3000 cells/well and incubated for 24 h at 37 °C before starting the
treatment. The samples were diluted into assay medium, as for the Rluc and cytotoxicity assays. Each
sample was tested in triplicate. After starting the treatment, phase-contrast and fluorescent images were

Mar. Drugs 2014, 12 4061
taken with 30 min intervals for 48 h using a 10× objective. Before starting the imaging, a Cell-Secure
Lid (Chip-Man Technologies, Tampere, Finland) equipped with a gas input connector and a sterile
0.2-μm filter was sealed to the plate. The plate was incubated at 37 °C using the manufacturer’s default
CO2 flow setting (8 min flow, 20 min pause, 30 min initial flow). For the phase contrast images, the
z-stack was 17.60 μm and the exposure time 10 ms; for the fluorescent images, the default imaging
settings for green fluorescent protein with binning 2 × 2 and an exposure time of 200 ms were applied.
Protocols for analyzing the images captured in Cell-IQ®
were created according to the
manufacturer’s instructions using the Cell-IQ Analyser®
software (Chip-Man Technologies, Tampere,
Finland). Details on the creation of analysis protocols can be found in the Supplementary Information.
Figure 6. The effects of control compounds (DMSO vehicle, 6-azauridine, polymyxin B)
on BHK-CHIKV-NCT cells imaged with Cell-IQ®
and analyzed with Cell-IQ Analyser®
software: Fluorescence and cell count at 1 h, 24 h and 48 h and combined fluorescent and
phase contrast images for each time point. The number of viable cells is determined as the
sum of cells classified as living and dividing.
The experiments performed in Cell-IQ®
were validated through tests on the control compounds
used in the Rluc assay and the cytotoxicity assay: DMSO vehicle in the assay medium, 6-azauridine as
a model antiviral agent and polymyxin B as a model cytotoxic agent. BHK-CHIKV-NCT cells treated

Mar. Drugs 2014, 12 4062
with control compounds were imaged for 48 h, after which the created analysis protocols were applied.
The results of cell classification and fluorescence intensity analysis for BHK-CHIKV-NCT cells
treated with control compounds are shown for three time points in Figure 6. Positive control
6-azauridine decreases the fluorescence intensity of the cells, without affecting cell morphology,
whereas polymyxin B radically decreases both the number of viable cells and, as a consequence, the
fluorescence intensity.
Percentages of CHIKV replicon inhibition based on fluorescence detection and cytotoxicity based
on cell classification were calculated for each sample. To additionally increase the reliability, results
reported for test samples are averages from two independent assays with 3 replicate wells each.
3.6. Evaluation of Anti-Inflammatory Properties
3.6.1. Preparation of Microglial Primary Cell Cultures
Primary microglial cell cultures were prepared from brains of newborn Wistar rats [54]. Ethics
approval for the experiments was granted by the EBIOTEC Review Board (Valter Lombardi, Iván
Carrera and Lucía Fernández-Novoa; Project Identification Code: Sinularia Project October 2013;
approved 30 October 2013). The neocortex of one-day-old postnatal rats was aseptically dissected out,
and the meninges and blood vessels were carefully removed. Following cutting in a medium
containing 20% horse serum, the suspension was filtered through a 40-mm filter and transferred as a
single cell suspension to culture dishes, using 5.0 mL of medium per dish. The cultures were incubated at
37 °C in an atmosphere containing 5% CO2. The culture medium consisted of Minimum Essential Medium
Eagle, supplemented with L-glutamine, amino acids, vitamins, penicillin, gentamicin, sodium bicarbonate
and 20% heat-inactivated horse serum. The medium was changed twice a week. After 1 week, the
concentration of horse serum was reduced to 10%. After sixteen days in culture, cells were treated
with 1 μg/mL of lipopolysaccharide (LPS). After six hours, different concentrations (1.0 μg/mL, 2.5 μg/mL
and 5.0 μg/mL) of Compounds 1–4 and 6 were added to each well, and plates were incubated for 72 h
at 37 °C in an atmosphere containing 5% CO2. Positive controls were treated only with LPS, while
negative controls were treated with complete medium. After 72 h of incubation, cells were counted,
and 2.5 mL of the supernatants were collected from each well and frozen at −40 °C for cytokine analyses.
All experiments were carried out twice.
3.6.2. Cell Count
Statistical analysis was carried out from three randomly chosen untreated dishes and three randomly
chosen treated dishes. Microglial density values were obtained by counting 10 fields in the microglial
area for each cell culture using a 20× objective. The ANOVA test was performed at the 95%
significance level in order to contrast differences.
3.6.3. Determination of Cytokine Concentration
The supernatants obtained from cell cultures were analyzed for TNF-α, IL-1β, IL-4, IL-6, IL-8,
IL-10 and IL-18 using commercially available ELISA kits following the manufacturers’ instructions.
Mar. Drugs 2014, 12 4063
All samples were assayed in duplicate, and equivocal results were repeated. The cytokine
concentration was calculated from a standard curve of the corresponding recombinant cytokine.
3.6.4. Determination of IC50 Values by Quantitation of Cytokine Release and Colorimetric Methyl
Thiazol Tetrazolium (MTT) Cytotoxicity Assay
The cytotoxicity of the compounds was measured by the colorimetric methyl thiazol tetrazolium
(MTT) assay and scored as a percentage of the absorbance reduction of treated cultures versus
untreated control cultures. Primary microglial cell cultures were seeded into 96-well microplates at
104 cells per well and allowed to grow for 24 h. The initial concentration of Compounds 1–4 and 6 was
100 μg/mL in DMSO. The compounds were serially diluted in complete culture medium with two-fold
dilutions (100, 50, 25, 12.5, 6.25, 3.12 and 1.56 μg/mL for in vitro cytotoxicity; 12.5, 6.25, 3.12, 1.56,
0.78 and 0.39 μg/mL for cytokine release). Different concentrations of the compounds were added to
each well, and Tamoxifen was used as a positive control, with concentrations ranging from 50 to
1.56 μg/mL. Plates were incubated at 37 °C for 72 h under 5% CO2 atmosphere. Then, the 50 μL of
MTT-PBS solution in culture medium were added to each well. The plates were further incubated for
4 h under the same conditions. The medium was then removed and replaced with 200 μL of DMSO to
solubilize the MTT formazan product. The solutions were shaken for 20 min, and the absorbance was
measured at 570 nm. One hundred microliters of the supernatants collected after incubation were used for
cytokine quantification, as described in Section 3.6.3, and prednisolone was used as a positive control.
Each value represents the mean of triplicate determinations. The IC50 values were calculated from the
compound concentration-response curves.
3.6.5. Statistics
The results are expressed as the mean ± standard deviation. Paired and unpaired Student’s t-tests
were used to determine the significance of differences; a value of p < 0.05 was considered
statistically significant.
4. Conclusions
The investigation of bioactive natural products from an Indian soft coral, Sinularia kavarattiensis,
led to the isolation of a novel norcembranoid, named kavaranolide (7), along with six known
compounds (1–6). Despite its inactivity in the CHIKV replicon model, the isolation and
characterization of kavaranolide (7) adds value to the outcomes of this study. Imaging experiments on
the CHIKV replicon model with the isolated compounds indicated that both 1 and 2 show moderate
activity against the CHIKV replicon, but also remarkable cytotoxic properties. The effects of the
isolated compounds on primary microglial cells, on the contrary, clearly indicate that Compound 2 is
able to regulate the morphology and function of surveying/resting microglia and to decrease the
activation of microglia, which could contribute to the progression of chronic neurodegenerative
diseases. Since Compound 2 also shows potential anti-inflammatory properties based on the effect on
cytokine release, it is possible to hypothesize that it may have the capacity to reduce the release of a
large number of substances that can be detrimental to the surrounding neurons and finally contribute to
Mar. Drugs 2014, 12 4064
a CNS homeostasis. In recent years, several natural products isolated from herbal plants [55] were
proven to act as inhibitors of microglial neurotoxicity. This study represents the first report of a marine
natural product with modulatory activity on neuroinflammation.
Acknowledgments
The research leading to these results has received funding from the European Union Seventh
Framework Programme under grant agreement No. FP7-KBBE-2009-3-245137 (MAREX). We thank
Harri Jäälinoja (Light Microscopy Unit, University of Helsinki) for the excellent assistance in the
design and result analysis of the live-cell imaging studies.
Author Contributions
Katja-Emilia Lillsunde, Dorota A. Nawrot and Päivi Tammela designed and performed the CHIKV
replicon experiments and the live cell imaging studies and analyzed the results. Simona De Marino and
Carmen Festa achieved whole chemical experiments, including isolation, NMR analysis and structure
investigation. Angela Zampella and Maria Valeria D’Auria contributed to the organization and
discussion of isolation and structural characterization. Lisette D’Souza, Harshada Adel and Supriya
Tilvi contributed to the collection, taxonomic identification and preliminary extraction of the soft coral.
Valter Lombardi designed and performed the anti-inflammatory experiments and related result analysis.
Katja-Emilia Lillsunde, Carmen Festa, Simona De Marino, Valter Lombardi, Supriya Tilvi, Dorota A.
Nawrot, Angela Zampella, Lisette D’Souza, Maria Valeria D’Auria and Päivi Tammela contributed to
writing the paper.
Conflicts of Interest
The authors declare no conflict of interest.
References
1. Borgherini, G.; Poubeau, P.; Staikowsky, F.; Lory, M.; le Moullec, N.; Becquart, J.P.; Wengling, C.;
Michault, A.; Paganin, F. Outbreak of Chikungunya on Reunion island: Early clinical and
laboratory features in 157 adult patients. Clin. Infect. Dis. 2007, 44, 1401–1407.
2. Powers, A.M.; Logue, C.H. Changing patterns of chikungunya virus: Re-emergence of a zoonotic
arbovirus. J. Gen. Virol. 2007, 88, 2363–2377.
3. Simon, F.; Parola, P.; Grandadam, M.; Fourcade, S.; Oliver, M.; Brouqui, P.; Hance, P.; Kraemer, P.;
Mohamed, A.A.; de Lamballerie, X.; et al. Chikungunya Infection: An emerging rheumatism
among travelers returned from Indian Ocean islands. Medicine 2007, 86, 123–137.
4. Moro, M.L.; Grilli, E.; Corvetta, A.; Silvi, G.; Angelini, R.; Mascella, F.; Miserocchi, F.;
Sambo, P.; Finarelli, A.C.; Sambri, V.; et al. Long-term Chikungunya infection clinical
manifestations after an outbreak in Italy: A prognostic cohort study. J. Infect. 2012, 65, 165–172.
5. Pialoux, G.; Gaüzère, B.A.; Jauréguiberry, S.; Strobel, M. Chikungunya, an epidemic arbovirosis.
Lancet Infect. Dis. 2007, 7, 319–327.

Mar. Drugs 2014, 12 4065
6. Gratz, N.G. Critical review of the vector status of Aedes albopictus. Med. Vet. Entomol. 2004, 18,
215–227.
7. Tsetsarkin, K.A.; Chen, R.; Leal, G.; Forrester, N.; Higgs, S.; Huang, J.; Weaver, S.C.
Chikungunya virus emergence is constrained in Asia by lineage-specific adaptive landscapes.
Proc. Natl. Acad. Sci. USA 2011, 108, 7872–7877.
8. Schuffenecker, I.; Iteman, I.; Michault, A.; Murri, S.; Frangeul, L.; Vaney, M.; Lavenir, R.;
Pardigon, N.; Reynes, J.; Pettinelli, F.; et al. Genome microevolution of Chikungunya viruses
causing the Indian Ocean outbreak. PLoS Med. 2006, 3, 1058–1070.
9. Grandadam, M.; Caro, V.; Plumet, S.; Thiberge, J.; Souarès, Y.; Failloux, A.; Tolou, H.J.;
Budelot, M.; Cosserat, D.; Leparc-Goffart, I.; et al. Chikungunya virus, southeastern France.
Emerg. Infect. Dis. 2011, 17, 910–913.
10. Rezza, G.; Nicoletti, L.; Angelini, R.; Romi, R.; Finarelli, A.; Panning, M.; Cordioli, P.;
Fortuna, C.; Boros, S.; Magurano, F.; et al. Infection with Chikungunya virus in Italy: An
outbreak in a temperate region. Lancet 2007, 370, 1840–1846.
11. Vega-Rua, A.; Zouache, K.; Caro, V.; Diancourt, L.; Delaunay, P.; Grandadam, M.; Failloux, A.
High efficiency of temperate Aedes albopictus to transmit Chikungunya and Dengue viruses in the
southeast of France. PLoS One 2013, 8, doi:10.1371/journal.pone.0059716.
12. Strauss, J.H.; Strauss, E.G. The alphaviruses: Gene expression, replication, and evolution.
Microbiol. Rev. 1994, 58, 491–562.
13. Kaur, P.; Chu, J.J.H. Chikungunya virus: An update on antiviral development and challenges.
Drug Discov. Today 2013, 18, 969–983.
14. Lakshmi, V.; Kumar, R. Metabolites from Sinularia species. Nat. Prod. Res. 2009, 23, 801–850.
15. Chao, C.H.; Hsieh, C.H.; Chen, S.P.; Lu, C.K.; Dai, C.F.; Sheu, J.H. Sinularianins A and B,
novel Sesquiterpenoids from the Formosan soft coral Sinularia sp. Tetrahedron Lett. 2006, 47,
5889–5891.
16. Tseng, Y.J.; Shen, K.P.; Lin, H.L.; Huang, C.Y.; Dai, C.F.; Sheu, J.H. Lochmolins A–G, new
Sesquiterpenoids from the soft coral Sinularia lochmodes. Mar. Drugs 2012, 10, 1572–1581.
17. Kamel, H.N.; Slattery, M. Terpenoids of Sinularia: Chemistry and biomedical applications.
Pharm. Biol. 2005, 43, 253–269.
18. Sarma, N.S.; Krishna, M.S.; Pasha, S.G.; Rao, T.S.P.; Venkateswarlu, Y.; Parameswaran, P.S.
Marine metabolites: The sterols of soft coral. Chem. Rev. 2009, 109, 2803–2828.
19. Ahmed, A.F.; Tai, S.H.; Wen, Z.H.; Su, J.H.; Wu, Y.C.; Hu, W.P.; Sheu, J.H. A C-3 Methylated
isocembranoid and 10-oxocembranoids from a Formosan soft coral, Sinularia grandilobata.
J. Nat. Prod. 2008, 71, 946–951.
20. Cheng, S.Y.; Chuang, C.T.; Wen, Z.H.; Wang, S.K.; Chiou, S.F.; Hsu, C.H.; Dai, C.F.; Duh, C.Y.
Bioactive norditerpenoids from the soft coral Sinularia gyrosa. Bioorg. Med. Chem. 2010, 18,
3379–3386.
21. Hu, L.C.; Yen, W.H.; Su, J.H.; Chiang, M.Y.N.; Wen, Z.H.; Chen, W.F.; Lu, T.J.; Chang, Y.W.;
Chen, Y.H.; Wang, W.H.; et al. Cembrane derivatives from the soft corals, Sinularia gaweli and
Sinularia flexibilis. Mar. Drugs 2013, 11, 2154–2167.

Mar. Drugs 2014, 12 4066
22. Lu, Y.; Huang, C.Y.; Lin, Y.F.; Wen, Z.H.; Su, J.H.; Kuo, Y.H.; Chiang, M.Y.; Sheu, J.H.
Anti-inflammatory cembranoids from the soft corals Sinularia querciformis and Sinularia granosa.
J. Nat. Prod. 2008, 71, 1754–1759.
23. Lu, Y.; Su, J.H.; Huang, C.Y.; Liu, Y.C.; Kuo, Y.H.; Wen, Z.H.; Hsu, C.H.; Sheu, J.H. Cembranoids
from the soft corals Sinularia granosa and Sinularia querciformis. Chem. Pharm. Bull. 2010, 58,
464–466.
24. Wei, W.C.; Sung, P.J.; Duh, C.Y.; Chen, B.W.; Sheu, J.H.; Yang, N.S. Anti-inflammatory activities of
natural products isolated from soft corals of Taiwan between 2008 and 2012. Mar. Drugs 2013, 11,
4083–4126.
25. Cheng, S.; Chuang, C.; Wang, S.; Wen, Z.; Chiou, S.; Hsu, C.; Dai, C.; Duh, C. Antiviral and
anti-inflammatory diterpenoids from the soft coral Sinularia gyrosa. J. Nat. Prod. 2010, 73,
1184–1187.
26. Huang, K.J.; Chen, Y.C.; El-Shazly, M.; Du, Y.C.; Su, J.H.; Tsao, C.W.; Yen, W.H.;
Chang, W.B.; Su, Y.D.; Yeh, Y.T.; et al. 5-Episinuleptolide Acetate, a norcembranoidal diterpene
from the Formosan soft coral Sinularia sp. induces leukemia cell apoptosis through Hsp90
inhibition. Molecules 2013, 18, 2924–2933.
27. Li, G.; Zhang, Y.; Deng, Z.; van Ofwegen, L.; Proksch, P.; Lin, W. Cytotoxic cembranoid
diterpenes from a soft coral Sinularia gibberosa. J. Nat. Prod. 2005, 68, 649–652.
28. Neoh, C.A.; Wang, R.Y.L.; Din, Z.H.; Su, J.H.; Chen, Y.K.; Tsai, F.J.; Weng, S.H.; Wu, Y.J.
Induction of apoptosis by Sinulariolide from soft coral through mitochondrial-related and
p38MAPK pathways on human bladder carcinoma cells. Mar. Drugs 2012, 10, 2893–2911.
29. Bowden, B.F.; Coll, J.C.; Mitchell, S.J.; Mulder, J.; Stokie, G.J. Studies of Australian Soft Corals.
IX. A novel nor-diterpene from the soft coral Sinularia leptoclados. Aust. J. Chem. 1978, 31,
2049–2056.
30. Shoji, N.; Umeyama, A.; Arihara, S.A. Novel norditerpenoid from the Okinawan soft coral
Sinularia sp. J. Nat. Prod. 1993, 56, 1651–1653.
31. Saitman, A.; Rulliere, P.; Sullivan, S.D.E.; Theodorakis, E.A. Total synthesis of Norcembrenolide
B and Scabrolide D. Org. Lett. 2011, 13, 5854–5857.
32. Sheu, J.H.; Ahmed, A.F.; Shiue, R.T.; Dai, C.F.; Kuo, Y.H. Scabrolides A–D, four new
norditerpenoids isolated from the soft coral Sinularia scabra. J. Nat. Prod. 2002, 65, 1904–1908.
33. Sato, A.; Fenical, W.; Qi-tai, Z.; Clardy, J. Norcembrene diterpenoids from Pacific soft-corals of
the genus Sinularia (Alcyonacea; Octocorallia). Tetrahedron 1985, 41, 4303–4308.
34. Nagashima, F.; Toyota, M.; Asakawa, Y. Terpenoids from some Japanese liverworts.
Phytochemistry 1990, 29, 2169–2174.
35. Duh, C.Y.; Wang, S.K.; Chia, M.C.; Chiang, M.Y. A novel cytotoxic norditerpenoid from the
Formosan soft coral Sinularia inelegans. Tetrahedron Lett. 1999, 40, 6033–6035.
36. Ransohoff, R.M.; Perry, V.H. Microglial physiology: Unique stimuli, specialized responses.
Annu. Rev. Immunol. 2009, 27, 119–145.
37. Glass, C.K.; Saijo, K.; Winner, B.; Marchetto, M.C.; Gage, F.H. Mechanisms underlying
inflammation in neurodegeneration. Cell 2010, 140, 918–934.
38. Perry, V.H.; Nicoll, J.A.R.; Holmes, C. Microglia in neurodegenerative disease. Nat. Rev. Neurol.
2010, 6, 193–201.

Mar. Drugs 2014, 12 4067
39. Kubanek, J.; Jensen, P.R.; Keifer, P.A.; Sullards, M.C.; Collins, D.O.; Fenical, W. Seaweed
resistance to microbial attack: A targeted chemical defense against marine fungi. Proc. Natl.
Acad. Sci. USA 2003, 100, 6916–6921.
40. Radhika, P.; Subba Rao, P.V.; Anjaneyulu, V.; Asolkar, R.N.; Laatsch, H. Horiolide, a novel
norditerpenoid from Indian Ocean soft coral of the Genus Sinularia. J. Nat. Prod. 2002, 65,
737–739.
41. Li, Y.; Pattenden, G. Novel macrocyclic and polycyclic norcembranoid diterpenes from Sinularia.
species of soft coral: Structural relationships and biosynthetic speculations. Nat. Prod. Rep. 2011,
28, 429–440.
42. Li, Y.; Pattenden, G. Biomimetic syntheses of ineleganolide and sinulochmodin C from
5-episinuleptolide via sequences of transannular Michael reactions. Tetrahedron 2011, 67,
10045–10052
43. Parhamifar, L.; Wu, L.; Andersen, H.; Moghimi, S.M. Live-cell fluorescent microscopy platforms
for real-time monitoring of polyplex-cell interaction: Basic guidelines. Methods 2014, 68,
300–307.
44. Liang, C.H.; Wang, G.H.; Chou, T.H.; Wang, S.H.; Lin, R.J.; Chan, L.P.; So, E.C.; Sheu, J.H.
5-epi-Sinuleptolide induces cell cycle arrest and apoptosis through tumor necrosis
factor/mitochondria-mediated Caspase signaling pathway in human skin cancer cells. BBA Gen.
Subj. 2012, 1820, 1149–1157.
45. Yen, W.; Hu, L.; Su, J.; Lu, M.; Twan, W.; Yang, S.; Kuo, Y.; Weng, C.; Lee, C.; Kuo, Y.; et al.
Norcembranoidal diterpenes from a Formosan soft coral Sinularia sp. Molecules 2012, 17,
14058–14066.
46. Ledeboer, A.; Brevé, J.J.P.; Poole, S.; Tilders, F.J.H.; van Dam, A. Interleukin-10, interleukin-4,
and transforming growth factor-beta differentially regulate lipopolysaccharide-induced production
of pro-inflammatory cytokines and nitric oxide in co-cultures of rat astroglial and microglial cells.
Glia 2000, 30, 134–142.
47. Molina-Holgado, F.; Grencis, R.; Rothwell, N.J. Actions of exogenous and endogenous IL-10 on
glial responses to bacterial LPS/Cytokines. Glia 2001, 33, 97–106.
48. Takaki, H.; Koganemaru, R.; Iwakawa, Y.; Higuchi, R.; Miyamoto, T. Inhibitory effect
of norditerpenes on LPS-induced TNF-alpha; Production from the Okinawan soft coral,
Sinularia sp. Biol. Pharm. Bull. 2003, 26, 380–382.
49. Avonto, C.; Taglialatela-Scafati, O.; Pollastro, F.; Minassi, A.; di-Marzo, V.; de-Petrocellis, L.;
Appendino, G. An NMR spectroscopic method to identify and classify thiol-trapping agents:
Revival of Michael acceptors for drug discovery? Angew. Chem. Int. Ed. 2011, 50, 467–471.
50. Powers, J.C.; Asgian, J.L.; Ekici, O.D.; James, K.E. Irreversible inhibitors of Serine, Cysteine,
and Threonine proteases. Chem. Rev. 2002, 102, 4639–4750.
51. Amslinger, S. The tunable functionality of α,β-unsaturated carbonyl compounds enables their
differential application in biological systems. Chem. Med. Chem. 2010, 5, 351–356.
52. Pohjala, L.; Utt, A.; Varjak, M.; Lulla, A.; Merits, A.; Ahola, T.; Tammela, P. Inhibitors
of alphavirus entry and replication identified with a stable Chikungunya replicon cell line and
virus-based assays. PLoS One 2011, doi:10.1371/journal.pone.0028923.
Mar. Drugs 2014, 12 4068
53. Bollini, S.; Herbst, J.J.; Gaughan, G.T.; Verdoorn, T.A.; Ditta, J.; Dubowchik, G.M.; Vinitsky, A.
High-throughput fluorescence polarization method for identification of FKBP12 ligands.
J. Biomol. Screen. 2002, 7, 526–530.
54. Takata, K.; Kitamura, Y.; Tsuchiya, D.; Kawasaki, T.; Taniguchi, T.; Shimohama, S. High
mobility group Box Protein-1 inhibits microglial Aβ clearance and enhances Aβ neurotoxicity.
J. Neurosci. Res. 2004, 78, 880–891.
55. Choi, D.K.; Koppula, S.; Suk, K. Inhibitors of microglial neurotoxicity: Focus on natural
products. Molecules 2011, 16, 1021–1043.
© 2014 by the authors; licensee MDPI, Basel, Switzerland. This article is an open access article
distributed under the terms and conditions of the Creative Commons Attribution license
(http://creativecommons.org/licenses/by/3.0/).
Copyright © 2022 FDOKUMEN