Bio-economical and ethical impacts of alien finfish culture in European inland waters
30
Bio-economical and ethical impacts of alien finfish culture in European inland waters Giovanni M. Turchini Sena S. De Silva Received: 5 October 2006 / Accepted: 5 October 2007 / Published online: 27 October 2007 Ó Springer Science+Business Media B.V. 2007 Abstract Since 1989, and in comparison to the global trend, inland aquaculture production of European finfish has declined. To date, the yearly European freshwater aquaculture production is 371,727 tons, valued at over US$1 billion. Indigenous species accounted for less than one-third of the production, whereas alien species (a species that has been moved beyond its natural range of distribution) accounts for the remainder. However, in general, indigenous species command a higher market price. Currently, food quality and food safety are leading concerns of consumers, and European consumers are also becoming alert to environmentally detrimental practices. Therefore, to aim at economic sustainability, the sector needs to satisfy consumer expectations of environmentally friendly practices. It is believed that farming alien finfish species can threaten local biodiversity through escapes, and this represents a current environmental concern relative to aquaculture. In this context, an attempt is made in this paper to understand and quantify the impacts of alien finfish cultivation in European inland waters, and to suggest remedial measures. Keywords Alien species Á Biodiversity Á Ethical quality Á European aquaculture Á Organic aquaculture Á Sustainability Introduction In spite of a recent decrease in the rate of growth in aquaculture in most continents, it is still the fastest growing primary production sector in the world, having recorded an average annual growth rate of 11.1%, 8.8% and 6.3% per year over the 5 year-periods of 1990– 1994, 1995–1999 and 2000–2004, respectively (FAO 2006). Of all cultured aquatic G. M. Turchini (&) Á S. S. De Silva School of Life and Environmental Sciences, Deakin University, Warrnambool, VIC 3280, Australia e-mail: [email protected] S. S. De Silva Network of Aquaculture Centres in Asia-Pacific, PO Box 1040, Kasetsart Post Office, Bangkok 10903, Thailand 123 Aquacult Int (2008) 16:243–272 DOI 10.1007/s10499-007-9141-y
Transcript of Bio-economical and ethical impacts of alien finfish culture in European inland waters

Bio-economical and ethical impacts of alien finfishculture in European inland waters
Giovanni M. Turchini Æ Sena S. De Silva
Received: 5 October 2006 / Accepted: 5 October 2007 / Published online: 27 October 2007� Springer Science+Business Media B.V. 2007
Abstract Since 1989, and in comparison to the global trend, inland aquaculture
production of European finfish has declined. To date, the yearly European freshwater
aquaculture production is 371,727 tons, valued at over US$1 billion. Indigenous species
accounted for less than one-third of the production, whereas alien species (a species that has
been moved beyond its natural range of distribution) accounts for the remainder. However,
in general, indigenous species command a higher market price. Currently, food quality and
food safety are leading concerns of consumers, and European consumers are also becoming
alert to environmentally detrimental practices. Therefore, to aim at economic sustainability,
the sector needs to satisfy consumer expectations of environmentally friendly practices. It is
believed that farming alien finfish species can threaten local biodiversity through escapes,
and this represents a current environmental concern relative to aquaculture. In this context,
an attempt is made in this paper to understand and quantify the impacts of alien finfish
cultivation in European inland waters, and to suggest remedial measures.
Keywords Alien species � Biodiversity � Ethical quality � European aquaculture �Organic aquaculture � Sustainability
Introduction
In spite of a recent decrease in the rate of growth in aquaculture in most continents, it is
still the fastest growing primary production sector in the world, having recorded an average
annual growth rate of 11.1%, 8.8% and 6.3% per year over the 5 year-periods of 1990–
1994, 1995–1999 and 2000–2004, respectively (FAO 2006). Of all cultured aquatic
G. M. Turchini (&) � S. S. De SilvaSchool of Life and Environmental Sciences, Deakin University,Warrnambool, VIC 3280, Australiae-mail: [email protected]
S. S. De SilvaNetwork of Aquaculture Centres in Asia-Pacific, PO Box 1040,Kasetsart Post Office, Bangkok 10903, Thailand
123
Aquacult Int (2008) 16:243–272DOI 10.1007/s10499-007-9141-y

organisms, finfish accounts for 47.4% of a global production of 59.4 million tons, valued at
US$70.3 billion (FAO 2006).
The share of European finfish aquaculture in world aquaculture production has declined
from 11% in 1990 to 5.2% in 2004 as a result of greater expansion in other continents.
Nevertheless, in absolute terms European aquaculture is still growing and in 2004 it
reached a total production of 1,473,905 tons. This increase has been supported by the fast
growth of marine aquaculture, while on the other hand, inland finfish production in Europe
has declined. Since 1989, when the European inland finfish production (excluding the
Russian federation) recorded its highest production of 477,714 tons, valued at over
US$1.28 billion, a sharp reduction in production was recorded by 2004, when the levels
were 358,336 tons and US$1 billion, respectively (FAO 2006).
Thus, the potential growth for global aquaculture and European mariculture is prom-
ising, but the opposite holds for the European inland sector. In inland waters, competition
for freshwater resources will increase further, and the success of aquaculture will depend
largely on the sector’s ability to cope with new challenges through technology advance,
market development and active involvement in integrating a sustainable resource man-
agement (Varadi 2001).
In spite of the growth in global aquaculture, the sector has recently had to face heavy
criticism of the negative environmental influences resulting from some of its practices, in
particular its increasing dependence on wild fish for feed production (Naylor et al. 2000;
Tacon 2004), discharge of nutrients, chemicals, antibiotics and other therapeutants to the
environment (Black 2001; Pillay 2004), and influences on biodiversity (IUCN 2000;
Kapuscinski and Brister 2001; Nguyen and De Silva 2007). In general, alien species are
considered to pose a major threat to biodiversity in respect of all habitats (IUCN 2000), and
inland aquatic habitats can be considered even more susceptible to such threats
(Leppakoski et al. 2002). The increasing dependence of aquaculture on alien species
(De Silva et al. 2006; Nguyen and De Silva 2007) poses a major hazard to biodiversity and
hence its sustainability.
It is evident that the history of introduction of non-indigenous (alien) species into
European water dates back to pre-historic times (Leppakoski et al. 2002). The ancient
history of European inland aquaculture is directly linked to the introduction of common
carp (Cyprinus carpio L.) culture in monastic houses in the Middle Ages, and subsequently
of brown trout (Salmo trutta L.) in France in the fourteenth century (Pillay and Kutty
2005). Even now, European inland aquaculture is still dominated by common carp, which
have been spread from the original native countries into the entire continent, and by trout
culture. However, the leading trout species cultured at present is the rainbow trout
(Oncorhynchus mykiss W.), a species native to North America and introduced into Europe
in the nineteenth century to establish populations both for recreational angling and for
aquacultural purposes (Fausch et al. 2001).
European inland aquaculture is nowadays dominated by alien species (Anonymous
1995) and, in relation to its historical developments, it can be considered as an advanced
sub-model of global aquaculture sector. However, high production levels achieved at the
expense of social and environmental damage/perturbations are no longer acceptable to the
community or by the markets.
Food quality and food safety are leading concerns for the consumers (Johnsen 1991;
Moretti et al. 2003) and European consumers are also becoming concerned about and alert
to environmentally detrimental practices (Jaffry et al. 2004; Rohr et al. 2005; Vermeir and
Verbeke 2006), such as the impacts on biodiversity of alien species (Naylor et al. 2001).
The future success of the European inland aquaculture sector will, as for global
244 Aquacult Int (2008) 16:243–272
123

aquaculture, be increasingly market driven (Josupeit et al. 2001) and principally dependent
on its ability to conform to increasing consumer expectation for environmentally friendly
and sustainable culture practices (Pettinger et al. 2004; Focardi et al. 2005; Vermeir and
Verbeke 2006). Thus, in assessing the success of finfish cultivation, a more holistic
approach is needed, not only in respect of the bio-economical aspects but also of the ethical
aspects aimed at delivering a final product to meet consumer and public expectations and
aspirations. In this rather complex context, an attempt is made in this paper to understand
and quantify the impacts of alien finfish cultivation in European inland waters, and to
suggest remedial measures.
Database, classification and analysis
The present study has been based on the database of the FAO, Fishery Department, Fishery
Information, Data and Statistics Unit. FISHSTAT PLUS: Universal software for fishery
statistical time series, Version 2.3. Databases: Aquaculture production: quantities 1950–
2004; Aquaculture production: values 1984–2004 (FAO 2006). The values reported are
expressed in US$ as the nominal value, therefore not inflation adjusted. In the present
treatise, only finfish species cultured in freshwater have been included. A detailed list of
the selected countries is reported in the Appendix.
The natural distribution of the species in question was determined with reference to the
sites http://www.fishbase.org (Froese and Pauly 2006) and also checked against the Catalog
of Fishes of the California Academy of Sciences, commonly referred to as the Eschmeyer
Catalog, and the database of invasive species (http://www.issg.org/database/welcome/)
from the Invasive Species Specialist Group (ISSG) which is part of the Species Survival
Commission (SSC) of the World Conservation Union (IUCN).
The origin of the common carp is a widely debated issue. Its origin was considered by
Balon (1995) who concluded that the wild ancestor of the common carp originated in the
Black, Caspian and Aral Seas drainages and dispersed east into Siberia and China and west
as far as the Danube River.
For some species entries in the FAO databases, the full scientific names are not provided
and are reported as ‘‘nei’’ (not elsewhere identified). In such cases, entries were considered
indigenous if there was a reasonable probability that they were European native species
(i.e., freshwater breams nei, mullets nei, roachs nei, chubs nei). On the other hand, if the
named group can aggregate well known species which can be alien or indigenous (i.e.,
cyprinids nei, catfishes nei, chars nei, salmonids nei, sturgeons nei, trouts nei, whitefishes
nei) then these were considered as ‘‘not specified’’, treated separately and not included in
the indigenous/alien computations. The total values (quantity and value) reported for these
not specified species were relatively small and therefore only a slight underestimation of
alien species is expected.
The European inland freshwater finfish culture
European inland freshwater aquaculture is a diverse and complex industry, showing a great
diversity in terms of technologies, resources, size and intensity of operations. In addition to
geographical diversity, there are also significant socio-economic differences between the
western and eastern parts of Europe (Varadi 2001). Amongst the most common culture
systems employed in Europe there are extensive and semi-intensive common carp, other
Aquacult Int (2008) 16:243–272 245
123

cyprinids and catfish farming in ponds, land-based intensive flow-through farming systems
mainly of trout or other salmonids, and recirculating farming systems for eels or other high
valued species (Anonymous 1995).
The yearly European freshwater aquaculture production in the 5-year period from 2000
to 2004 was 371,727 tons, valued at over US$1 billion. Indigenous species accounted for
120,780 tons, alien species for 245,879 tons and ‘‘not specified’’ species for 5.698 tons
(Table 1).
Total value of cultured alien species was almost double that of indigenous species,
although the average value per unit (expressed as US$ kg–1) was higher for the latter. The
‘‘not specified’’ species recorded the highest value per unit which was mainly due to the
entry production of ‘‘Sturgeon nei’’ in different countries.
In the analysis of the origin of farmed species in Europe, it is important to underline that
the same species were considered either indigenous or alien in relation to the country of
production. For example, Atlantic salmon (Salmo salar) recorded in Greece was consid-
ered to be alien, while common carp was considered as indigenous to, for example,
Germany and other eastern European countries, but alien to France and other western
European countries.
Within the indigenous species farmed in Europe (Table 2), common carp accounted for
the highest production with more than 93,900 tons valued over US$225 million. The
second species in order of production was the European eel (Anguilla anguilla) with only
8,684 tons, followed by brown trout (Salmo trutta) with 2,489 tons. However, the unitary
value of brown trout and European eel compared to common carp were double and triple,
respectively. Other indigenous species farmed in Europe with an yearly production above
1,000 tons were two other cyprinids species: roach (Rutilus rutilus) and tench (Tincatinca).
The group of alien farmed fish in the inland European aquaculture was dominated by
rainbow trout (Oncorhynchus mykiss) which is the most cultured finfish in Europe,
accounting for a total production of more than 210,186 tons (Table 3). Nearly 1.5% of the
total European freshwater culture production in the last 5 years was reported for species
the origin of which it was impossible to ascertain. The two most important groups from a
production viewpoint were Cyprinids nei accounting for 2,834 tons and Sturgeons nei for
1,382 tons (Table 4).
Sturgeons nei showed the highest total value with more than US$9 million and a rel-
atively higher unitary value in term of US$ kg–1. This production ([1,100 tons) of highly
valued sturgeons nei occurred mainly in Italy. It is possible to speculate that the majority of
this production is the North American species Acipenser transmontanus and hybrids of
indigenous and alien species (Williot et al. 2001).
Table 1 The yearly European aquaculture production and value of freshwater finfish (average of 2000–2004), subdivided by species origin
Production (·1,000 tons) Value (millions US$) Value per unit (US$ kg–1)
Indigenous species 120.8 341.0 2.82
Alien species 245.6 640.6 2.61
Not specified 5.7 21.8 3.83
246 Aquacult Int (2008) 16:243–272
123

Overall status of alien species in European inland aquaculture
The European freshwater aquaculture production increased steadily from a little more than
32,000 tons/year in the early 1950s to more than 418,000 tons/year during the first 5 years
of the 1990s (Fig. 1). It is important to underline that, in the database used, a sharp increase
of production in 1988 has been recorded when former USSR countries were included. The
alien species accounted for less than 20% of the total production in the 1950s and their
contribution increased to more than 65% in recent years.
Table 2 The yearly European aquaculture production and value of indigenous freshwater finfish (averageof 2000–2004)
Common name Scientific name Production(tons)
Value(thousands US$)
Value per unit(US$ kg–1)
Common carpa Cyprinus carpio 93,900.8 225,485.6 2.40
Freshwater fishes neib Osteichthyes 9,172.0 18,979.5 2.07
European eel Anguilla anguilla 8,684.4 66,961.2 7.71
Brown trout Salmo trutta 2,489.6 11,434.0 4.59
Roach Rutilus rutilus 2,250.8 5,300.0 2.35
Tench Tinca tinca 1,395.2 3,579.6 2.57
Crucian carp Carassius carassius 988.6 2,566.1 2.60
Arctic char Salvelinus alpinus 404.2 2,084.8 5.16
Northern pike Esox lucius 373.8 1,358.8 3.64
Wels catfish Silurus glanis 283.4 1,137.1 4.01
Pike-percha Stizostedion lucioperca 184.2 534.5 2.90
Freshwater bream Abramis brama 148.6 278.1 1.87
Rudd Scardinius erythrophthalmus 123.0 264.8 2.15
Huchen Hucho hucho 90.2 202.9 2.25
European perch Perca fluviatilis 89.8 311.4 3.47
Flathead grey mullet Mugil cephalus 39.2 149.0 3.80
Bleak Alburnus alburnus 38.8 73.8 1.90
Roaches nei Rutilus spp. 32.8 26.2 0.80
Atlantic salmon Salmo salar 30.4 130.6 4.29
Mullets nei Mugilidae 15.2 45.2 2.97
Freshwater gobies nei Gobiidae 12.8 27.2 2.13
Whitefishes nei Coregonus spp 11.4 29.1 2.55
Danube sturgeon Acipenser gueldenstaedtii 8.6 34.0 3.95
Chubs nei Leuciscus spp. 3.4 13.6 4.00
Freshwater breams nei Abramis spp. 2.8 7.6 2.70
Grayling Thymallus thymallus 2.2 6.4 2.90
Peled Coregonus peled 1.6 5.0 3.11
Sturgeon Acipenser sturio 1.2 10.6 8.85
Sterlet sturgeon Acipenser ruthenus 0.6 2.9 4.80
Orfe Leuciscus idus 0.2 0.3 1.50
a Production in European countries where considered indigenousb nei: not elsewhere identified
Aquacult Int (2008) 16:243–272 247
123

Since the early 1990s, the European freshwater aquaculture production showed a
negative trend, in particular in respect of the value (Fig. 2), when it declined from more
than US$1,200 million/year in 1988 to US$1,000 million/year in 2004. Alien species
contributed approximately 65% to the total value of European freshwater aquaculture.
Table 3 The yearly European aquaculture production and value of alien freshwater finfish (average of2000–2004)
Common name Scientific name Production(tons)
Value(thousandsUS$)
Valueper unit(US$ kg–1)
Rainbow trout Oncorhynchus mykiss 210,186.8 572,781.0 2.73
Silver carp Hypophthalmichthys molitrix 13,862.2 25,400.3 1.83
Common carpa Cyprinus carpio 6,068.2 8,868.1 1.46
Bighead carp Hypophthalmichthys nobilis 5,508.8 10,612.4 1.93
North African catfish Clarias gariepinus 3,879.8 6,340.5 1.63
Goldfish Carassius auratus 1,998.2 3,031.7 1.52
Grass carp Ctenopharyngodon idellus 1,612.8 3,453.0 2.14
Brook trout Salvelinus fontinalis 727.8 3,042.9 4.18
Black bullhead Ameiurus melas 473.4 1,770.7 3.74
Wels catfish Silurus glanis 373 1,115.6 2.99
Tilapias neib Oreochromis spp. 264 1,059.9 4.01
Torpedo-shaped catfishes nei Clarias spp. 212 649.1 3.06
Siberian sturgeona Acipenser baerii 118.6 732.0 6.17
Pike-percha Stizostedion lucioperca 92 683.0 7.42
Striped bass, hybrid Morone chrysops · M. saxatilis 86.8 444.6 5.12
Nile tilapia Oreochromis niloticus 71 194.0 2.73
European whitefisha Coregonus lavaretus 65.2 258.5 3.96
Atlantic salmona Salmo salar 16.8 140.1 8.34
Largemouth black bass Micropterus salmoides 3.6 25.4 7.06
Buffalofishes nei Ictiobus spp. 0.4 1.0 2.50
a Production in European countries where considered alienb nei: not elsewhere identified
Table 4 The yearly European aquaculture production and value of not specified freshwater finfish groups(average of 2000–2004)
Common name Scientific name Production(tons)
Value(thousands US$)
Value per unit(US$ kg–1)
Cyprinids neia Cyprinidae 2,834.2 5,672.7 2.0
Sturgeons nei Acipenseridae 1,382.2 9,392.7 6.8
Trouts nei Salmo spp. 637.2 2,758.6 4.3
Chars nei Salvelinus spp. 470.4 2,175.5 4.6
Salmonoids nei Salmonoidei 372.6 1,830.7 4.9
Catfishes nei Ictalurus spp. 1.6 2.4 1.5
Freshwater siluroids nei Siluroidei 0.2 3.3 16.7
a nei: not elsewhere identified
248 Aquacult Int (2008) 16:243–272
123

Alien species percent contribution to total inland aquaculture value in Germany and
Central Europe (62.7 and 34.2%, respectively) was higher then the relative contribution to
production (55.7 and 24.1%, respectively) (Table 5). It is therefore evident that the culture
of alien species has a positive effect on the sector value in these areas. On the other hand,
in all other instances the opposite was evident, showing that the culture of indigenous
species has a positive impact on the value of aquaculture production.
0
50
100
150
200
250
300
350
400
450
50-54 55-59 60-64 65-69 70-74 75-79 80-84 85-89 90-94 95-99 00-040
10
20
30
40
50
60
70
80
Production
Alien %
Years
utler
oruE
epna
qacauu
)t 0001x( noitcudorp
% A
lien
Fig. 1 Mean yearly production of cultured freshwater finfish in European nations and the percentcontribution of alien production to total European freshwater finfish culture
Years
noitcudorp erutlucauqa naeporuE
)$SU snoilli
m( eulav
% A
lien
0
200
400
600
800
1000
1200
1400
1600
1800
2000
1988 1989 1990 1991 1992 1993 1994 1995 1996 1997 1998 1999 2000 2001 2002 2003 20040
10
20
30
40
50
60
70
80
90
100
Production Value
Alien% Value
Fig. 2 Mean yearly production value (millions US$) of cultured freshwater finfish in European nations andthe percent contribution of the alien production to total European freshwater finfish culture value (% alien)
Aquacult Int (2008) 16:243–272 249
123

Ta
ble
5T
he
yea
rly
aqu
acu
ltu
rep
rod
uct
ion
,v
alue
and
per
cen
tco
ntr
ibu
tio
no
fal
ien
spec
ies
inE
uro
pea
nn
atio
ns/
area
s
Gro
up
Co
un
trie
sP
rodu
ctio
n(t
on
s)V
alu
e(t
ho
usa
nd
sU
S$
)%
Ali
enp
rod
uct
ion
%A
lien
val
ue
Fra
nce
Fra
nce
53
,28
41
13
,53
98
8.3
81
.7
Ger
man
yG
erm
any
43
,03
31
44
,00
85
5.7
62
.7
Ital
yIt
aly
42
,20
81
21
,44
39
2.8
83
.1
Eas
tern
Euro
pe
Bel
arus,
Est
onia
,L
atvia
,L
ithuan
ia,
Mold
ova,
Ukra
ine
39,4
59
96,8
80
32.8
28.0
Cen
tral
Eu
rope
Au
stri
a,C
zech
Rep
ub
lic,
Hu
ng
ary,
Slo
vak
ia,
Sw
itze
rlan
d3
6,4
97
92
,99
02
4.1
34
.2
Po
lan
dP
ola
nd
34
,75
06
9,6
60
34
.83
3.8
Iber
ian
pen
insu
laS
pai
n,
Po
rtu
gal
34
,22
87
7,3
13
99
.19
7.5
Den
mar
kD
enm
ark
32
,75
31
08
,87
09
3.3
83
.7
Bal
kan
pen
insu
laA
lban
ia,
Bosn
iaan
dH
erze
govin
a,B
ulg
aria
,C
roat
ia,
Gre
ece,
Mac
edo
nia
,R
om
ania
,S
erb
iaan
dM
onte
neg
ro,
Slo
ven
ia3
0,2
96
70
,36
24
6.9
45
.6
No
rther
nE
uro
pe
Bel
giu
m,
Fin
land
,Ic
elan
d,
Net
her
lan
ds,
Sw
eden
14
,12
25
9,1
91
63
.43
8.7
Bri
tish
Isle
sIr
elan
d,
Un
ited
Kin
gd
om
13
,93
05
3,4
80
98
.09
6.4
Dat
are
pre
sen
tth
eav
erag
efo
r2
00
0–
20
04
.E
uro
pea
nco
un
trie
sh
ave
bee
nag
gre
gat
edac
cord
ing
toto
tal
pro
duct
ion
and
mai
ng
eog
rap
hic
alar
eas
250 Aquacult Int (2008) 16:243–272
123

Moreover, it is interesting to point out that the contribution of alien species to the total
inland finfish production is extremely high (\88%) in the western regions (France, Italy,
Iberian peninsula, Denmark, and the British Isles) independent of latitude, while on the
other hand, in the eastern region the percentage contribution of alien species is consistently
lower (\47%). In Germany and Northern Europe, which can be considered as the longi-
tudinal center of Europe, the contribution of alien species is 55–63%. This geographical
western to eastern trend can be clearly related to the different roles that rainbow trout and
cyprinids have in the relative markets. Generally, in the western regions the production is
dominated by the alien rainbow trout while native cyprinids are more important in the
eastern regions (Varadi 2001).
Alien species of intra-continental origin
In European inland aquaculture, there are a number of finfish species that have been
translocated within the continent across nations and watersheds. In year 2004, a total
production of 6,898 tons of farmed European finfish species were outside their natural
range of distribution, which is mainly ascribable to common carp (5,063 tons), while in its
natural range of distribution its production in 2004 was 94,282 tons. There is conflicting
evidence with regard to the ancestry of common carp, and in the present analysis the
suggestion of Balon (1995), who reported that common carp dispersed towards European
countries as far as the Danube River, was adopted. Accordingly, common carp is alien to
Belgium, France, Greece, Italy, Sweden, Switzerland and the United Kingdom. Another
species, the wels catfish (Silurus glanis) originally from Eastern Europe and Asia, has been
translocated within Europe and is currently farmed in Croatia and France.
The situation with the European whitefish (Coregonus lavaretus) is controversial,
especially in respect of its still debated taxonomic status, consequently making it com-
plicated to determine its native range of distribution. It is farmed on a small scale in the
Czech Republic and in Finland, where its native status has been questioned, and can be
considered to be alien (Welcomme 1988). Other intra-continent translocations of farmed
fish are pike-perch (Stizostedion lucioperca) farmed in Croatia, Denmark, France and
Slovenia, the Atlantic salmon (Salmo salar) in Greece, and the Siberian sturgeon
(Acipenser baerii) in France. The FAO database reports an increasing production of
sturgeon nei which is dealt with in detail by Williot et al. (2001).
Alien species of American origin
Alien rainbow trout (Oncorhynchus mykiss), originating from the Pacific coast of North
America, is the most cultured species in European freshwater . In the period 2000–2004,
the yearly average total production of rainbow trout in European inland waters was
210,187 tons, accounting for US$572.8 million (Fig. 3a, b). It is also cultured in brackish
and marine water and a sharp increase in production has been observed in Europe (Fig. 3c).
European trout production can be divided into two sub-sectors which differ not only in the
environment but also in the final product size: namely ‘portion-size’ and ‘large’ trout
exceeding 1 kg, produced in fresh water and in marine conditions, respectively (Varadi
et al. 2001). The unit value of trout cultured in fresh, brackish and marine waters was
US$2.73, US$3.15 and US$2.48, respectively.
Aquacult Int (2008) 16:243–272 251
123

A
B
0
5000
10000
15000
20000
25000
30000
35000
40000
45000
50000
rFa
cne latI
y
bIe
epnair
n nis
lu a
neDm
arkynamreG rB
i iths
isles
loPa
dn
laBk
lusninepna
a
roNth
ren
ruEo
ep
neCtra
ruEl
oep
etsaE
r
ruEn
oep
85-89
90-94
95-99
00-04fonoitcudorp
ylraeY
)t(reta
whserfnituort
wobniar
0.00
1.00
2.00
3.00
4.00
5.00
6.00
cnarF
eIta
yl
Iebri
naep
in nusla
Dmne
a kr
Germa
yn
Br
elsihsiti
sloPa
dn
Balk
nepna
isnula eporuEnrehtroN
eCtn ra
lruEo
ep
retsaE
nuEr
epo
85-89
90-94
95-99
00-04
tuortwobniar
foeulav
egarevA
gk$S
U (reta
whserfni
demarf
1-)
0
50000
100000
150000
200000
250000
Freshwater culture Mariculture Brackishwater culture
85-89
90-94
95-99
00-04
tuortwobniar
fonoitc udorp
ylr aeY
)t(stne
mnorivn etnereffidni
C
Fig. 3 Mean yearly production (a) and the average unit value (b) of rainbow trout cultured in freshwater inEurope. Mean yearly production of rainbow trout in different environments in Europe (c). Data representaverage of 5-year periods from 1985 to 2004
252 Aquacult Int (2008) 16:243–272
123

In Europe, inland trout production is typically carried out in intensive and environ-
ment-controlled systems, mostly flow-through raceways (Anonymous 1995). Trout
culture is likely to be constrained in the future by the rising price of water and by costs
associated with effluent treatment (Varadi 2001; Wedekind et al. 2001). Industry esti-
mates advocate that this sector’s expansion will be possible mainly in Spain or in some
eastern European countries, through increased capital investment and adoption of more
up-to-date technology. However, the potential growth of the trout culture sector will be
counterbalanced by a drastic decline in countries such as Denmark and Germany, where
environmental controls are becoming increasingly restrictive (Anonymous 1995; Varadi
2001; Wedekind et al. 2001), and the gradual decline in market price (Josupeit et al.
2001).
Other salmonids native to the Pacific coast of North America (Oncorhynchus spp.) are
also farmed in European waters, mainly in Spain and France. Recent increases in brook
trout (Salvelinus fontinalis) production has been reported from Belgium, Bosnia and
Herzegovina, Bulgaria, Czech Republic, Denmark, France, Romania, Slovakia, Slovenia
and the United Kingdom.
In European inland aquaculture, there are other American native finfish species sup-
porting a relatively good production (1,292 tons/year in the 5-year period 2000–2004). The
Italian production (1,118 tons in 2004) of the not specified sturgeons which is mainly
ascribable to the North American species Acipenser transmontanus (Williot et al. 2001)
could be added. Other Central or North American finfish species which are currently farmed
in European inland waters are the black bullhead (Ameiurus melas), the buffalofishes nei
(Ictiobus spp.), the channel catfish (Ictalurus punctatus), the largemouth black bass
(Micropterus salmoides) and the hybrid striped bass (Morone chrysops · M. saxatilis).
Alien species of Asian origin
Alien species of Asian origin form the second largest group of non indigenous fish farmed
in European waters accounting for more than 5% of the European freshwater production.
Five Asian cyprinid species are commonly farmed in central and eastern European
countries: the grass carp (Ctenopharyngodon idellus), the bighead carp (Hypophthal-michthys nobilis), the black carp (Mylopharyngodon piceus), the goldfish (Carassiusauratus) and the silver carp (Hypophthalmichthys molitrix).
Alien species of African origin
Until 1983, African finfish species were not farmed in Europe. In 1984, an initial pro-
duction of 20 tons of the North African catfish (Clarias gariepinus) was recorded in the
Netherlands. Thereafter, an increase in the production of African finfish was recorded at a
rate of more than 65% per year. Apart from the North African catfish, other African species
such as the Mozambique tilapia (Oreochromis mossambicus), the Nile tilapia (O. niloticus)
and other unspecified tilapias are now farmed in Belgium, Greece, Hungary, Italy,
Netherlands, Slovakia, Spain, Switzerland and the United Kingdom. In 2004, the total
production of African finfish in the European waters was 5,859 tons/year with a total value
of over US$8 million.
Aquacult Int (2008) 16:243–272 253
123

Country perspectives
In the previous sections, a synthesis of the role of indigenous versus alien species in
European aquaculture was attempted. It is also important to consider the extent to which
alien species are utilized in inland aquaculture of individual European nations, particularly
in view of the fact that decisions pertaining to agricultural–primary production sectors are
common to most nations of the European Union, and therefore may impact future
developments and trends of the sector. However, in the following section no attempt is
made to evaluate the farming systems per se.
France
France is the biggest European freshwater aquaculture producer accounting for more than
14.2% of that of Europe. The bulk of French production is represented by two alien
species, rainbow trout (41,346 tons/year) and common carp (5,042 tons/year) (Table 6).
The production of two alien species, wels catfish and Siberian sturgeon, have increased
sharply, probably backed by the high market value (US$3.13 kg–1 and US$6.17 kg–1,
respectively). The culture of alien species in France accounts for 88.3% of the national
production but only for 81.7% of the total value (Table 5). Three indigenous species are
farmed in French freshwaters: roach, brown trout and tench. While roach and tench pro-
duction fluctuates, brown trout production has recently increased steadily. The market
price of brown trout is considerably higher than its alien counterparts (US$4.49 kg–1 and
US$2.03 kg–1, respectively).
Germany
Germany is the second largest producer of farmed freshwater finfish in Europe amounting
to 43,033 tons/year or 11.5% of the European production (Table 5). As in France, German
production (Table 6) is dominated by rainbow trout (23,884 tons/year) followed by
common carp (12,928 tons/year). The main difference between the two countries is that
common carp is considered to be indigenous to Germany (Balon 1995). Therefore, alien
species culture accounts for little more than half of the entire German inland finfish
production, while in monetary terms it represents 62% of the value (Table 5).
German aquaculture, as well as the inland fishery, changed drastically after reunification
in 1990. The collapse of the infrastructure (i.e., large co-operative production and mar-
keting structure) in East Germany led to a dramatic decline in production from lake
fisheries and aquaculture (Wedekind et al. 2001).
The difficult situation which is facing the German inland aquaculture sector is exac-
erbated by different constraints. Carp farming is mainly limited by imposed production
limits and by the seasonal nature and unreliability of the market, while trout farming seems
to be mainly limited by pathological issues, lack of adequate technologies and investments,
and a number of obstacles derived from bureaucracy, which make fish production difficult
and increase costs (Wedekind et al. 2001). However, there is a growing interest in the
potential culture of two native salmonids, brown trout and arctic char, which are high
valued and can compensate for the encountered difficulties. In the last 5 years, European
eel and wels catfish production have also been recorded for this country (Table 6). In 2004,
254 Aquacult Int (2008) 16:243–272
123

Ta
ble
6T
he
yea
rly
aqu
acu
ltu
rep
rod
uct
ion
(to
ns)
and
val
ue
per
un
it(U
S$
kg
–1)
of
fres
hw
ater
fin
fish
inF
ran
ce,
Ger
man
y,
Iber
ian
pen
insu
laan
dIt
aly
Sp
ecie
sO
rig
in1
98
5–
19
89
19
90–
19
94
19
95–
19
99
20
00–
20
04
To
ns
US
$k
g–1
To
ns
US
$k
g–1
To
ns
US
$k
g–1
To
ns
US
$k
g–1
Fra
nce
Ro
ach
Ind
igen
ou
s1
,78
8.0
2.4
52
,500
.02
.52
2,6
40
.02
.53
2,2
38
.02
.35
Bro
wn
tro
ut
Ind
igen
ou
s6
20
.04
.53
1,2
20
.03
.12
1,6
59
.03
.51
1,6
81
.24
.49
Ten
chIn
dig
eno
us
78
8.0
2.9
94
8.0
2.5
09
72
.02
.56
1,0
70
.02
.32
Rai
nb
ow
tro
ut
Ali
en2
8,5
30
.03
.27
41
,10
0.0
2.8
24
6,4
20
.02
.83
41
,34
6.6
2.0
3
Co
mm
on
carp
Ali
en4
,09
5.0
1.8
44
,800
.03
.12
5,4
14
.02
.37
5,0
42
.01
.16
Wel
sca
tfish
Ali
en1
6.0
6.7
61
26
.07
.18
32
2.2
5.4
23
24
.83
.13
Sib
eria
nst
urg
eon
Ali
en8
.06
.68
66
.01
2.3
81
93
.81
1.2
41
18
.66
.17
To
tal
ind
igen
ou
s3
,19
6.0
2.9
93
,768
.02
.72
5,2
71
.02
.84
4,9
89
.23
.07
Tota
lal
ien
32,6
49.0
3.0
946,0
92.0
2.8
852,3
50.0
2.8
346,8
32.0
1.9
5
Ger
ma
ny
Co
mm
on
carp
Ind
igen
ou
s1
9,5
32
.42
.40
14
,58
9.0
2.4
51
1,8
40
.02
.26
1,2
92
7.6
3.1
3
Eu
ropea
nee
lIn
dig
eno
us
––
––
––
18
4.4
11
.57
Wel
sca
tfish
Ind
igen
ou
s–
––
––
–2
9.0
8.0
8
Rai
nb
ow
tro
ut
Ali
en1
9,4
44
.23
.11
24
,07
0.8
4.2
92
5,0
00
.02
.92
23
,88
4.2
3.7
6
To
tal
ind
igen
ou
s1
9,5
32
.42
.40
14
,58
9.0
2.4
51
1,8
40
.02
.26
13
,14
1.0
3.2
6
Tota
lal
ien
19,4
44.2
3.1
124,0
70.8
4.2
925,0
00.0
2.9
223,8
84.2
3.7
6
Iber
ian
pen
insu
la
Ten
chIn
dig
eno
us
36
2.6
2.5
03
89
.83
.63
17
3.4
5.6
88
1.8
5.6
9
Bro
wn
tro
ut
Ind
igen
ou
s–
–0
.25
.30
––
0.6
3.0
3
Rai
nb
ow
tro
ut
Ali
en1
8,1
71
.43
.15
20
,29
9.8
2.5
52
8,3
49
.02
.29
33
,89
2.2
2.2
2
Til
apia
sn
eiA
lien
––
––
––
34
.04
.00
To
tal
ind
igen
ou
s3
62
.62
.50
39
0.0
3.6
41
73
.45
.68
82
.45
.67
Tota
lal
ien
18,1
71.4
3.1
520,2
99.8
2.5
528,3
49.0
2.2
933,9
26.2
2.2
2
Aquacult Int (2008) 16:243–272 255
123

Ta
ble
6co
nti
nu
ed
Sp
ecie
sO
rig
in1
98
5–
19
89
19
90–
19
94
19
95–
19
99
20
00–
20
04
To
ns
US
$k
g–1
To
ns
US
$k
g–1
To
ns
US
$k
g–1
To
ns
US
$k
g–1
Ita
ly
Eu
ropea
nee
lIn
dig
eno
us
2,5
40
.08
.14
2,1
03
.09
.99
2,6
06
.09
.67
1,7
50
.47
.06
Ten
chD
ou
btf
ul
––
––
––
19
.62
.44
Rai
nb
ow
tro
ut
Ali
en2
8,0
00
.03
.42
40
,00
0.0
3.0
34
8,2
00
.02
.27
38
,09
9.4
2.5
7
Str
iped
bas
s,h
yb
rid
Ali
en–
––
––
–8
6.8
5.1
2
No
rth
Afr
ican
catfi
shA
lien
––
––
––
50
.62
.86
Co
mm
on
carp
Ali
en5
95
.02
.50
36
6.0
2.8
06
60
.03
.24
50
0.8
3.0
4
Bla
ckb
ull
hea
dA
lien
1,5
60
.02
.41
1,8
06
.44
.75
69
0.0
3.8
14
73
.43
.74
Til
apia
sn
eiA
lien
––
––
––
4.0
4.9
8
To
tal
ind
igen
ou
s2
,54
0.0
8.1
42
,103
.09
.99
2,6
06
.09
.67
1,7
70
.07
.01
Tota
lal
ien
30,1
55.0
3.3
542,1
72.4
3.1
049,5
50.0
2.3
039,2
15.0
2.5
9
Dat
are
pre
sen
tav
erag
eo
f5
-yea
rp
erio
ds
from
19
85
to2
00
4.
En
trie
sar
ere
stri
cted
toth
ose
wh
ich
reco
rded
ap
rod
uct
ion
in2
00
4an
dfo
rw
hic
hit
was
po
ssib
leto
det
erm
ine
the
ori
gin
256 Aquacult Int (2008) 16:243–272
123

a production of 37 tons of not specified sturgeons (at US$8.08 kg–1) has been recorded,
likely to be Siberian sturgeons and hybrids (Williot et al. 2001).
Italy
Italy is historically considered as one of the world leaders in rainbow trout production.
However, in recent years, a contraction of its production has been recorded, and in the
period from 2000 to 2004 the average yearly production was 38,099 tons (Table 6).
Simultaneously, a downward phase in the indigenous eel production has also been
recorded, probably because of the continuing increasing price of elvers. The black bull-
head, which is sometime erroneously considered as an indigenous Italian catfish
(considered naturalized in 1908: Froese and Pauly 2006), is a North American native
species. Its production is declining and attributed to the outbreak of a viral epizootic
disease termed ‘‘iridovirosis’’ in the early 1990s (Favero et al. 2001), which compromised
the Italian catfish farm industry. During the last 5 years, interesting new production has
been recorded: the tench (Tinca tinca) (which is usually considered to be an indigenous
species, but it seems that it has been introduced and naturalized during the 17th century:
Froese and Pauly 2006), and three alien species, the hybrid striped bass, the North African
catfish and tilapia. The not specified sturgeon production has increased to 1,100 tons/year
in 2004. As mentioned previously, the majority of this production is of alien species; in
particular the North American species and hybrids of indigenous and alien species (Williot
et al. 2001). The unitary value of sturgeons is the highest at US$7.89 kg–1, second only to
the value recorded for eels (US$11.28 kg–1).
Iberian peninsula
Rainbow trout dominates inland aquaculture of Spain and Portugal and represents almost
the entire production (Tables 5 and 6). A fluctuating production of the indigenous tench
and brown trout and a recent production of tilapia have been recorded in Spain. Here, an
increasing production (225 tons in 2004) of not specified sturgeons has also been reported.
The sturgeons farmed in the Iberian peninsula are likely to be the Siberian sturgeon and the
Adriatic sturgeon (Acipenser naccarii) (Williot et al. 2001), and the two species can be
considered as aliens to Iberian inland freshwaters.
Eel production in Portugal was a well established industry until 1994, where an inland
production of 976 tons in freshwater was recorded. In spite of its high market value, eel
production decreased dramatically due to the high price of wild juveniles and the inca-
pability of the local eel industry to cope with competing countries (Bernardino 2000). The
major inland production in Portugal is represented by rainbow trout, but as seen in many
other European countries the production is declining.
Denmark
In spite of the relatively small size of Denmark territory, it supports 8.7% of the total
European freshwater finfish production. The indigenous species farmed in the Danish
freshwater are the European eel (1,885 tons/year), brown trout (235 tons/year) and
Atlantic salmon (9.2 tons/year), while the farmed alien species are rainbow trout
Aquacult Int (2008) 16:243–272 257
123

(30,430 tons/year), brook trout (126 tons/year) and pike-perch (3.2 tons/year). Alien
species culture account for more than 93% of the entire national inland production and
83% in monetary terms (Table 5). The highest unitary value has been reported for the
indigenous European eel with more than US$8.84 kg–1, the lowest (US$2.97 kg–1) for
rainbow trout (Table 7).
British Isles
As in the majority of the western European countries, the freshwater production in the
British Isles is dominated by rainbow trout (Table 7). An oscillating but increasing pro-
duction of brown trout, with a high unitary value (US$6.57 kg–1), has been recorded.
Interestingly, in the last 5 years in the United Kingdom, novel productions of many
indigenous species have appeared, likely due to diversification activities of farmers
searching for alternative, better value species. On the other hand, in Ireland the only
species farmed is the rainbow trout.
Northern Europe
In the northern European countries (Belgium, Finland, Iceland, Netherlands and Sweden; there
is no entry for Norway, while Denmark has already been treated separately) freshwater
aquaculture is equally distributed between one native and two alien species. In the last 5 years,
rainbow trout accounted for 5,249 tons/year, European eel for 4,247 tons/year and the North
African catfish for 3,032 tons/year. Rainbow trout production is declining, while the pro-
duction of the European eel and the North African catfish are sharply increasing, reaching
more than 10-fold increments since the late 1980s to the beginning of the millennium. Sur-
prisingly, the two species receive a very different appreciation from the market: European eel
is valued at US$7.48 kg–1 while the North African catfish is only US$1.46 kg –1.
Central Europe
In central Europe, as defined in Table 5, 75.9% of the total inland finfish production is
supported by indigenous species. The bulk of the production is represented by common
carp (25,840 tons/year) followed by a small but steadily increasing production of another
native cyprinid (tench, 214 tons/year) and the wels catfish (180 tons/year). Within the
group of native cultured freshwater finfish, brown trout and arctic char command the
highest market prices of US$5.92 kg–1 and US$6.00 kg–1, respectively. As regards farmed
alien species, rainbow trout is the most dominant (4,202 tons/year) followed by silver carp,
bighead carp and grass carp. A recent increase in the production of other alien species, such
as the North African catfish, brook trout and Nile tilapia has been recorded (Table 8).
Balkan peninsula
The Balkan peninsula (Table 5) is a heterogeneous area including countries with consid-
erable geographical and geophysical differences and different river systems draining into
the Mediterranean and Black Seas.
258 Aquacult Int (2008) 16:243–272
123

Ta
ble
7T
he
yea
rly
aqu
acu
ltu
rep
rod
uct
ion
(to
ns)
and
val
ue
per
un
it(U
S$
kg
–1)
of
fres
hw
ater
fin
fish
inth
eB
riti
shIs
les,
Den
mar
kan
dN
ort
her
nE
uro
pe
Sp
ecie
sO
rig
in1
98
5–
19
89
19
90–
19
94
19
95–
19
99
20
00–
20
04
To
ns
US
$k
g–1
To
ns
US
$k
g–1
To
ns
US
$k
g–1
To
ns
US
$k
g–1
Bri
tish
Isle
s
Bro
wn
tro
ut
Ind
igen
ou
s1
53
.43
.79
28
8.6
9.3
61
46
.49
.42
24
8.0
6.5
7
Arc
tic
char
Ind
igen
ou
s–
––
–0
.64
4.2
4.0
0
Fre
shw
ater
bre
amIn
dig
eno
us
––
––
––
4.0
4.0
0
Ch
ub
sn
eiIn
dig
eno
us
––
––
––
3.4
4.0
0
Ten
chIn
dig
eno
us
––
––
––
3.0
4.0
0
Ro
ach
Ind
igen
ou
s–
––
––
–2
.24
.00
Cru
cian
carp
Ind
igen
ou
s–
––
––
–0
.64
.00
Ru
dd
Ind
igen
ou
s–
––
––
–0
.44
.00
Rai
nb
ow
tro
ut
Ali
en1
4,0
70
.23
.03
15
,33
8.4
3.5
51
7,2
04
.04
.18
13
,60
8.8
3.7
9
Co
mm
on
carp
Ali
en1
38
.02
.50
36
.24
.51
5.2
4.4
03
3.6
4.0
0
Bro
ok
tro
ut
Ali
en–
–1
.65
.51
2.2
5.8
00
.86
.00
To
tal
ind
igen
ou
s1
53
.43
.79
28
8.6
9.3
61
47
.09
.40
26
5.8
6.3
9
Tota
lal
ien
14,2
08.2
3.0
215,3
76.2
3.5
517,2
11.4
4.1
813,6
43.2
3.7
9
Den
ma
rk
Eu
ropea
nee
lIn
dig
eno
us
24
6.0
8.9
98
61
.29
.67
1,8
44
.89
.25
1,8
85
.88
.84
Bro
wn
tro
ut
Ind
igen
ou
s5
0.0
33
25
0.0
3.1
42
24
.03
.14
23
5.6
3.8
0
Atl
anti
csa
lmo
nIn
dig
eno
us
––
––
––
9.2
3.8
2
Rai
nb
ow
tro
ut
Ali
en2
2,7
23
.23
.27
34
,09
6.4
3.1
73
3,1
78
.63
.12
30
,42
9.8
2.9
7
Bro
ok
tro
ut
Ali
en–
––
––
–1
26
.04
.00
Pik
e-p
erch
Ali
en–
––
––
–3
.28
.51
To
tal
ind
igen
ou
s2
96
.07
.87
1,1
11
.28
.20
2,0
68
.88
.59
2,1
30
.68
.26
Tota
lal
ien
22,7
23.2
3.2
734,0
96.4
3.1
733,1
78.6
3.1
230,5
59.0
2.9
8
Aquacult Int (2008) 16:243–272 259
123

Ta
ble
7co
nti
nu
ed
Sp
ecie
sO
rig
in1
98
5–
19
89
19
90–
19
94
19
95–
19
99
20
00–
20
04
To
ns
US
$k
g–1
To
ns
US
$k
g–1
To
ns
US
$k
g–1
To
ns
US
$k
g–1
No
rthe
rnE
uro
pe
Eu
ropea
nee
lIn
dig
eno
us
28
4.2
7.0
41
,021
.09
.60
2,7
11
.08
.56
4,2
47
.27
.48
Arc
tic
char
Ind
igen
ou
s–
––
–2
09
.05
.33
35
5.0
5.3
2
Bro
wn
tro
ut
Ind
igen
ou
s3
.65
.08
3.4
7.1
21
9.0
3.0
01
4.4
3.9
2
Atl
anti
csa
lmo
nIn
dig
eno
us
––
––
––
0.8
4.5
0
Rai
nb
ow
tro
ut
Ali
en6
,38
6.8
4.3
57
,579
.84
.19
6,1
67
.23
.36
5,2
49
.43
.12
No
rth
Afr
ican
catfi
shA
lien
31
0.0
2.8
16
22
.02
.71
1,3
32
.02
.47
3,0
32
.41
.46
Co
mm
on
carp
Ali
en2
1.0
2.9
68
5.0
2.6
81
40
.02
.55
35
6.0
2.2
5
Til
apia
sn
eiA
lien
18
8.0
4.5
52
00
.04
.72
20
9.2
4.7
22
26
.04
.00
Nil
eti
lap
iaA
lien
––
––
––
60
.02
.50
Eu
ropea
nw
hit
efish
Ali
en1
.05
.96
––
6.6
3.2
73
1.0
5.3
6
To
tal
ind
igen
ou
s2
87
.87
.02
1,0
24
.49
.59
2,9
39
.08
.30
4,6
17
.47
.30
Tota
lal
ien
6,9
06.8
4.2
98,4
86.8
4.0
87,8
55.0
3.2
38,9
54.8
2.5
5
Dat
are
pre
sen
tav
erag
eo
f5
-yea
rp
erio
ds
from
19
85
to2
00
4.
En
trie
sar
ere
stri
cted
toth
ose
wh
ich
reco
rded
ap
rod
uct
ion
in2
00
4an
dfo
rw
hic
hit
was
po
ssib
leto
det
erm
ine
the
ori
gin
260 Aquacult Int (2008) 16:243–272
123

Ta
ble
8T
he
yea
rly
aqu
acu
ltu
rep
rod
uct
ion
(to
ns)
and
val
ue
per
un
it(U
S$
kg
–1)
of
fres
hw
ater
fin
fish
inC
entr
alE
uro
pe
Sp
ecie
sO
rig
in1
98
5–
19
89
19
90–
19
94
19
95–
19
99
20
00–
20
04
To
ns
US
$k
g–1
To
ns
US
$k
g–1
To
ns
US
$k
g–1
To
ns
US
$k
g–1
Co
mm
on
carp
Ind
igen
ou
s1
2,9
62
.61
.34
17
,89
0.0
2.0
42
3,7
49
.42
.50
25
,84
0.4
2.2
0
Ten
chIn
dig
eno
us
6.6
1.4
21
18
.02
.57
34
4.0
2.5
22
14
.22
.61
Wel
sca
tfish
Ind
igen
ou
s8
5.8
3.3
61
10
.84
.40
15
4.6
4.1
31
80
.43
.96
No
rther
np
ike
Ind
igen
ou
s–
–3
7.0
2.3
81
13
.62
.76
12
8.0
2.9
9
Pik
e-p
erch
Ind
igen
ou
s1
9.6
3.7
44
0.2
3.9
07
4.2
3.3
97
4.0
3.7
1
Bro
wn
tro
ut
Ind
igen
ou
s–
––
–5
5.6
3.9
75
9.6
5.9
2
Eu
ropea
nee
lIn
dig
eno
us
48
.86
.07
40
.87
.70
––
26
.23
.64
Eu
ropea
np
erch
Ind
igen
ou
s–
–5
.82
.60
19
.02
.63
20
.42
.64
Arc
tic
char
Ind
igen
ou
s–
––
–1
.24
.53
2.6
6.0
0
Hu
chen
Ind
igen
ou
s–
––
––
–0
.44
.85
Rai
nb
ow
tro
ut
Ali
en3
,67
6.4
4.1
03
,759
.65
.63
4,4
52
.85
.33
4,2
02
.25
.36
Sil
ver
carp
Ali
en3
,32
4.2
0.5
82
,345
.00
.64
1,5
59
.60
.97
1,6
26
.21
.12
Big
hea
dca
rpA
lien
2,1
26
.60
.57
63
4.6
1.3
06
30
.02
.09
94
9.6
2.2
9
Gra
ssca
rpA
lien
39
5.8
0.8
84
79
.61
.72
51
4.8
2.1
28
06
.42
.04
No
rth
Afr
ican
catfi
shA
lien
––
––
––
79
6.2
2.2
1
Bro
ok
tro
ut
Ali
en–
–7
.62
.60
19
5.8
3.2
93
11
.04
.71
Eu
ropea
nw
hit
efish
Ali
en–
–6
1.8
2.6
09
9.6
2.6
53
4.2
2.7
0
Go
ldfi
shA
lien
––
––
1.4
0.6
71
8.4
1.1
3
Nil
eti
lap
iaA
lien
––
––
––
11
.04
.00
To
tal
ind
igen
ou
s1
3,1
23
.41
.37
18
,24
2.6
2.0
72
4,5
11
.62
.52
26
,54
6.2
2.2
3
Tota
lal
ien
9,5
23.0
1.9
57,2
88.2
3.3
67,4
54.0
3.8
48,7
55.2
3.6
0
Dat
are
pre
sen
tav
erag
eo
f5
-yea
rp
erio
ds
from
19
85
to2
00
4.
En
trie
sar
ere
stri
cted
toth
ose
wh
ich
reco
rded
ap
rod
uct
ion
in2
00
4an
dfo
rw
hic
hit
was
po
ssib
leto
det
erm
ine
the
ori
gin
Aquacult Int (2008) 16:243–272 261
123

In some countries, such as Croatia and Greece, mariculture is the principal aquaculture
industry, while in other countries the bulk of the production is mainly ascribable to inland
farming. Within this diverse group, the dominant farmed freshwater finfish is indigenous
common carp (9,595 tons/year), but its production is declining (Table 9). The second
largest production is represented by alien rainbow trout (7,258 tons/year) which recorded a
2-fold increase in the last 5 years. Simultaneously, a reduction of brown trout has been
recorded even if, compared to rainbow trout, the unitary value is considerably higher.
The farming of the indigenous European eel and wels catfish are two fast growing
inland aquaculture industries in this region and similar positive trends are shown for alien
brook trout and pike-perch. Alien cyprinids, such as the silver carp, the bighead carp, the
grass carp and the goldfish are abundant, but their production is declining. An interesting
small production of Atlantic salmon is well established in Greece. In the last 5 years, in the
Balkan region, a small production of many indigenous species has also been recorded
(Table 9).
Poland and Eastern Europe
Polish production accounts for over 9.3% of the entire European inland aquaculture pro-
duction and is almost completely based on two species: indigenous common carp
(20,480 tons/year) and alien rainbow trout (11,899 tons/year) (Table 10).
Eastern Europe is the European region where alien species are less important and
account for only 32.8% of the total production (28% in monetary terms). Rainbow trout
production is limited, while a bigger role is taken by other alien finfish, mainly cyprinids
(Table 10). The bulk of the local production is represented by indigenous common carp
(25,172 tons/year), followed by another indigenous cyprinid, the crucian carp (975 tons/
year). There are other emerging farmed indigenous species such as freshwater bream,
northern pike, pike-perch, European perch, roach, European eel, rudd and tench.
Environmental impacts of cultured alien finfish farming in Europe
Problems associated with the practice of culturing non-native (alien) fish can be varying.
These can be categorized according to the time frame of impact, immediate or on long-
term or the typology of the effect, direct and indirect. Introduction of new species across
non-native geographical areas has been a common practice worldwide and primarily done
for aquaculture purposes (Welcomme 1988; De Silva et al. 2006). The diffusion of alien
finfish from farms into natural environments is mainly due to the unavoidable event of fish
escape (Pillay 2004). A representative example of such occurrence is the recorded well
established fisheries of rainbow trout in the Loch Fad (Scotland) dependent on the escaped
trout from local cage farms (Phillips et al. 1985).
Among the immediate impacts of fish translocations is the potential spread of new
pathogens. For example, the unintentional diffusion of the cestode Bothriocephalusacheilognathi has been ascribed to the introduction of grass carp from Asia to Europe
(Ivasik et al. 1969). The bacterial disease furunculosis (caused by Aeromonas salmonicida)
has been introduced probably from Denmark into United Kingdom waters with the
translocation of brown trout, and successively from the United Kongdom to Norway with
infected salmon smolts (Pillay 2004). An example of the introduction of a parasite asso-
ciated with finfish translocation is that of the nematodes parasite (Anguillicola) which is
262 Aquacult Int (2008) 16:243–272
123

Ta
ble
9T
he
yea
rly
aqu
acu
ltu
rep
rod
uct
ion
(to
ns)
and
val
ue
per
un
it(U
S$
kg
–1)
of
fres
hw
ater
fin
fish
inth
eB
alk
anp
enin
sula
Sp
ecie
sO
rig
in1
98
5–
19
89
19
90–
19
94
19
95–
19
99
20
00–
20
04
To
ns
US
$k
g–1
To
ns
US
$k
g–1
To
ns
US
$k
g–1
To
ns
US
$k
g–1
Co
mm
on
carp
Ind
igen
ou
s2
5,7
34
.82
.35
17
,30
8.0
2.5
51
2,1
61
.02
.40
9,5
95
.22
.29
Eu
ropea
nee
lIn
dig
eno
us
15
.68
.52
19
2.4
9.2
04
60
.68
.91
47
1.4
6.3
5
Bro
wn
tro
ut
Ind
igen
ou
s4
95
.23
.00
39
0.8
3.3
43
39
.04
.94
15
2.6
4.4
5
Wel
sca
tfish
Ind
igen
ou
s1
.82
.40
56
.01
.96
36
0.6
1.6
01
20
.22
.35
Fre
shw
ater
bre
amIn
dig
eno
us
10
6.2
2.5
07
2.0
2.5
71
30
.81
.47
68
.80
.89
No
rther
np
ike
Ind
igen
ou
s4
.82
.50
0.4
2.0
06
9.2
2.4
95
5.2
2.1
3
Fla
thea
dg
rey
mu
llet
Ind
igen
ou
s–
–9
.64
.93
42
.44
.24
38
.23
.82
Ro
ach
esn
eiIn
dig
eno
us
––
––
––
34
.20
.86
Eu
ropea
np
erch
Ind
igen
ou
s3
.22
.10
––
6.4
1.8
21
8.0
1.8
0
Cru
cian
carp
Ind
igen
ou
s–
––
––
–1
2.4
1.5
5
Dan
ub
est
urg
eon
Ind
igen
ou
s–
––
––
–8
.63
.95
Ten
chIn
dig
eno
us
––
––
––
2.0
1.5
0
Ble
akIn
dig
eno
us
––
––
––
0.8
1.5
0
Sta
rry
stu
rgeo
nIn
dig
eno
us
––
––
––
0.2
8.4
0
Rai
nb
ow
tro
ut
Ali
en3
,552
.23
.34
3,2
49
.23
.26
3,7
28
.43
.65
7,2
58
.42
.91
Sil
ver
carp
Ali
en1
0,7
94
.22
.48
8,7
13
.42
.56
5,1
84
.61
.82
3,0
13
.81
.82
Big
hea
dca
rpA
lien
5,9
29
.02
.50
4,7
20
.02
.58
1,6
60
.21
.92
1,7
29
.61
.05
Go
ldfi
shA
lien
9,9
43
.02
.50
3,2
00
.02
.59
2,2
60
.81
.97
1,5
14
.01
.22
Gra
ssca
rpA
lien
2,1
65
.42
.50
2,0
59
.62
.58
68
1.0
2.4
35
91
.02
.30
Bro
ok
tro
ut
Ali
en–
–3
.82
.92
10
.02
.88
16
2.8
3.2
2
Pik
e-p
erch
Ali
en5
.22
.50
9.4
2.0
01
1.6
2.0
54
3.6
2.2
0
Atl
anti
csa
lmo
nA
lien
6.6
12
.44
33
.89
.58
9.6
13
.19
16
.88
.34
Aquacult Int (2008) 16:243–272 263
123

Ta
ble
9co
nti
nu
ed
Sp
ecie
sO
rig
in1
98
5–
19
89
19
90–
19
94
19
95–
19
99
20
00–
20
04
To
ns
US
$k
g–1
To
ns
US
$k
g–1
To
ns
US
$k
g–1
To
ns
US
$k
g–1
To
tal
Iid
igen
ou
s2
6,3
61
.62
.38
18
,02
9.2
2.6
41
3,5
70
.02
.68
10
,57
7.8
2.4
9
Tota
lal
ien
32,3
95.6
2.5
921,9
89.2
2.6
913,5
46.2
2.4
14,3
30.0
2.2
6
Dat
are
pre
sen
tav
erag
eo
f5
-yea
rp
erio
ds
from
19
85
to2
00
4.
En
trie
sar
ere
stri
cted
toth
ose
wh
ich
reco
rded
ap
rod
uct
ion
in2
00
4an
dfo
rw
hic
hit
was
po
ssib
leto
det
erm
ine
the
ori
gin
264 Aquacult Int (2008) 16:243–272
123

Ta
ble
10
Th
ey
earl
yaq
uac
ult
ure
pro
duct
ion
(to
ns)
and
val
ue
per
un
it(U
S$
kg
–1)
of
fres
hw
ater
fin
fish
inea
ster
nE
uro
pe
and
Po
lan
d
Sp
ecie
sO
rig
in1
98
5–
19
89
19
90
–1
99
41
99
5–
199
92
00
0–
200
4
To
ns
US
$k
g–1
To
ns
US
$k
g–1
To
ns
US
$k
g–1
To
ns
US
$k
g–1
Ea
ster
nE
uro
pe
Co
mm
on
carp
Ind
igen
ou
s4
2,3
61
.42
.20
62
,03
6.6
2.4
02
5,2
69
.22
.68
25
,17
2.4
2.6
4
Cru
cian
carp
Ind
igen
ou
s–
–2
74
.82
.33
46
5.0
2.3
39
75
.62
.61
Fre
shw
ater
bre
amIn
dig
eno
us
––
7.0
2.5
44
6.8
2.6
07
5.2
2.6
6
No
rther
np
ike
Ind
igen
ou
s–
–5
30
.82
.58
1,0
07
.02
.52
59
.22
.48
Pik
e-p
erch
Ind
igen
ou
s–
–0
.42
.50
2.4
2.5
05
2.8
2.6
0
Eu
ropea
np
erch
Ind
igen
ou
s–
––
–0
.22
.00
17
.01
.98
Ro
ach
Ind
igen
ou
s–
––
––
–9
.22
.65
Eu
ropea
nee
lIn
dig
eno
us
––
––
––
5.4
5.9
0
Fre
shw
ater
bre
ams
nei
Ind
igen
ou
s–
––
–0
.22
.70
2.8
2.7
0
Ru
dd
Ind
igen
ou
s–
––
––
–2
.62
.70
Pel
edIn
dig
eno
us
16
.04
.04
2.0
4.5
0–
–1
.63
.11
Ten
chIn
dig
eno
us
––
––
––
1.2
2.0
2
Sil
ver
carp
Ali
en8
,781
.02
.08
10
,82
1.0
2.1
08
,10
5.2
2.0
79
,21
6.2
1.9
6
Big
hea
dca
rpA
lien
––
3,3
87
.22
.06
3,0
32
.82
.28
2,8
00
.02
.34
Go
ldfi
shA
lien
––
99
.82
.54
40
6.4
2.5
14
63
.02
.51
Rai
nb
ow
tro
ut
Ali
en2
44
.41
.80
41
5.4
2.3
41
93
.23
.03
27
6.4
3.2
5
Gra
ssca
rpA
lien
––
29
7.4
1.4
42
09
.61
.88
19
6.4
2.0
9
To
tal
ind
igen
ou
s4
2,3
77
.42
.26
,28
51
.62
.42
6,7
90
.82
.67
26
,37
5.0
2.6
4
To
alal
ien
9,0
25
.42
.08
15
,02
0.8
2.0
81
1,9
47
.22
.14
12
,95
2.0
2.0
9
Po
lan
d
Co
mm
on
carp
Ind
igen
ou
s1
9,4
04
.61
.91
21
,08
0.0
1.7
32
0,3
25
.82
.19
20
,48
0.0
1.9
6
Rai
nb
ow
tro
ut
Ali
en2
,427
.82
.69
4,1
31
.82
.34
7,6
76
.82
.28
11
,89
9.4
1.9
3
To
rped
o-s
hap
edca
tfish
nei
Ali
en–
––
––
–2
12
.03
.06
Aquacult Int (2008) 16:243–272 265
123
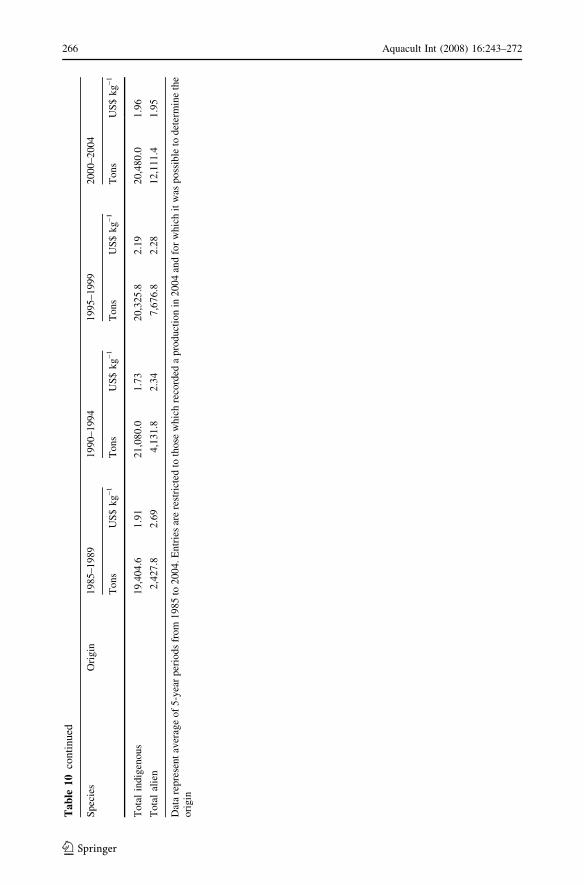
Ta
ble
10
con
tin
ued
Sp
ecie
sO
rig
in1
98
5–
19
89
19
90
–1
99
41
99
5–
199
92
00
0–
200
4
To
ns
US
$k
g–1
To
ns
US
$k
g–1
To
ns
US
$k
g–1
To
ns
US
$k
g–1
To
tal
ind
igen
ou
s1
9,4
04
.61
.91
21
,08
0.0
1.7
32
0,3
25
.82
.19
20
,48
0.0
1.9
6
Tota
lal
ien
2,4
27.8
2.6
94,1
31.8
2.3
47,6
76.8
2.2
812,1
11.4
1.9
5
Dat
are
pre
sen
tav
erag
eo
f5
-yea
rp
erio
ds
from
19
85
to2
00
4.
En
trie
sar
ere
stri
cted
toth
ose
wh
ich
reco
rded
ap
rod
uct
ion
in2
00
4an
dfo
rw
hic
hit
was
po
ssib
leto
det
erm
ine
the
ori
gin
266 Aquacult Int (2008) 16:243–272
123

endemic to Australian and Asian eels. The parasite is believed to have been introduced into
Europe together with imported oriental eels and has since spread rapidly through northern
Europe (Lehtonen 2002) and central Europe (Barus 1995). In addition to the direct
introduction of diseases, fish translocations can also have a catalytic effect as in the case of
viral hemorrhagic septicemia in brown trout in the British Isles after the introduction of the
North American rainbow trout, which were very susceptible to the disease (Mills 1982).
Besides disease-related problems, the introduction of alien species can impact the
indigenous flora and fauna directly through predation or competition and indirectly by
reducing the local biodiversity. The introduction of new diseases, increased pathogenicity
of local bacteria or virus strains, the competition for food, the habitat disruption, or direct
predation derived by introduction of alien fish, can obviously affect the local fauna, modify
the natural selection processes and reduce population size, or even be responsible for the
extinction of local population/species (Kapuscinski and Brister 2001; Pillay 2004; De Silva
et al. 2006; Nguyen and De Silva 2007). In a nutshell, the introduction of alien species can
dramatically affect biodiversity. The problem can be exacerbated by decreased population
size and the subsequent risk of inbreeding depression (Kapuscinski and Brister 2001).
Another direct assault on biodiversity can be borne out by the potential outbreeding
depression or even worse by hybridization and introgression (Kapuscinski and Brister
2001; Nguyen and De Silva 2007).
The impacts of aquaculture on biodiversity and particularly the utilization of alien
species for culture purposes are of current and increasing concern (Beardmore et al. 1997),
and the consequences of decreasing or changing biodiversity are well known to be
potentially devastating (Chapin et al. 2000). More than a decade ago, 134 non-native fish
species had already been reported to have been introduced into European freshwaters
(Holcik 1991), of which 76 were non-European. More than 50 finfish species were reported
to be successfully introduced to at least one European country (Lehtonen 2002). It has been
speculated that the presence of alien fish can be a reliable indicator of river health
(Kennard et al. 2005), and therefore the wellbeing of European inland waters can be
considered to be at high risk (Leppakoski et al. 2002).
Economic impacts of alien species
Variable results have been accomplished by species introductions, depending on the
species and geographic area. Only a few finfish species are generally recognized as ben-
eficial from a socio-economic viewpoint, usually by improving fishing or aquaculture
opportunities (Lehtonen 2002; De Silva et al. 2006). In natural waters, the introductions
have resulted in many cases in economically profitable fisheries, although most intro-
ductions have failed or led to unwanted consequences in the form of reduced or collapsed
native fish stocks (Lehtonen 2002).
It is evident, from the data discussed earlier, that European aquaculture has, in the past,
gained large benefits from the cultivation of rainbow trout, common carp and other Asian
carps. In the eastern European countries, inland aquaculture is historically dominated by
carp culture, while alien finfish cultivation (mainly rainbow trout) is responsible for a
limited (\50%) contribution. In western European countries, inland aquaculture is totally
dominated (*90%) by alien finfish (almost entirely rainbow trout). In both areas, either
carp or rainbow trout farming are today directly involved in the dramatic collapse of the
European inland aquaculture now showing the lowest market prices. On the other hand,
many European native species are in recent years supporting small but fast growing
Aquacult Int (2008) 16:243–272 267
123

industries. In particular, European eel, brown trout, arctic char, tench, wels catfish,
northern pike, European perch and native sturgeons seem to be able to gain market
recognition and a higher value. As such, these species represent an alternative to the
almost unprofitable rainbow trout and carp farming. At the same time, in recent years, in
the complex panorama of European inland aquaculture, the appearance of new exotic
species for culture purposes should be considered with concern. Wels catfish is increas-
ingly farmed outside its native range even if the market price is considerably lower
(US$2.99 kg–1) relative to that in the native countries (US$4.01 kg–1). Alien species from
Africa such as the North African catfish and tilapias are now increasingly farmed, com-
monly in indoor facilities, in different European countries. The utilization of alien
sturgeons from intra- and inter-continent origins is another worrying concern. An appro-
priate cost–benefit analysis from economic, social and environmental points of view should
be undertaken sooner rather than later.
Towards sustainable development of European inland aquaculture
The European Union strategies for sustainable development of the aquaculture industry
aspire at creating long-term economic viability and secure employment (Focardi et al.
2005). To achieve these goals, the assurance of product quality (Moretti et al. 2003; Valfre
et al. 2003; Myhr and Dalm 2005; Rohr et al. 2005), promotion of high animal health and
welfare standards (Huntingford et al. 2006) and ensuring an environmentally sound
industry (Jaffry et al. 2004; Pillay 2004) are essential.
In this complex and multifactorial context the role of alien finfish farming need to be
carefully considered. At present, it is almost impossible to predict how a non-indigenous
species will behave in a new environment. Therefore, treating all introduced species as
‘‘guilty until proven innocent’’ appears to be the only environmentally acceptable approach
(Leppakoski et al. 2002). The eradication of established alien finfish is a considerably
difficult exercise, possibly successful only in restricted areas (Britton and Brazier 2006),
and almost impossible, so far, in open waters (Leppakoski et al. 2002). Avoiding new
occurrences is today imperative for sustainable development of aquaculture (Black 2001).
Organic aquaculture
In recent years, growing interest has been given, particularly from European rainbow trout
farmers, to the development of certified organic aquaculture products mainly as a tool to
increase product value and therefore increase economic viability. However, it seems
essential to point out that the term ‘organic aquaculture’, or more generally ‘organic
agriculture’, refers to a process that uses methods respectful of the environment from the
production stages through handling and processing. Organic production is not merely
concerned with a product, but also with the whole production system and processes
(Scialabba and Hattam 2002). The quantities and diversity of certified organic aquaculture
produce remain small, partly due to the absence of universally accepted standards and
accreditation criteria for organic aquaculture (Scialabba and Hattam 2002). At the
European Community level, organic agriculture is regulated by Council Regulations (EEC)
No.2092/91 of 24 June 1991 and (EC) No.1804/1999 of 19 July 1999 which do not apply to
aquaculture. In fact, harmonization is not feasible until individual nations develop relevant
national legislation. Italy may become the leading country in Europe for the development
268 Aquacult Int (2008) 16:243–272
123

of organic aquaculture. Indeed, two draft laws, aiming to establish a national quality
trademark, a system of certification authorities and control regulations, are currently being
discussed in Parliament (D’Andrea 2006). The proposed regulations include only marine
species endemic to the Mediterranean Sea, while in freshwater aquaculture some alien
salmonids, catfishes and sturgeons are permitted. In Denmark in 2004, a new regulation on
organic aquaculture came into force for a voluntary ‘Organic’ label. Farmed fish for
organic labeling may be treated with antibiotics only once, and no genetically modified or
biologically treated fish are permitted on the farm. The ‘organic’ label can only be used for
European eel and fish from the family Salmonidae (salmon and trout, independent of their
origin) (Larsen 2006). In Germany, guidelines have been developed for eco-fish farming in
ponds by the Biokreis Association, and there are additional general guidelines for organic
farming that have to be observed. These guidelines address different issues and the only
mention of species is that they should be ‘‘preferably regional species’’ (Barg 2006). In the
draft of general principles concerning organic aquaculture production by IFOAM (Inter-
national Federation of Organic Agriculture Movements), a basic principle is that ‘‘when
introducing non-native species, special care must be taken to avoid permanent disruption to
natural ecosystems’’ (Scialabba and Hattam 2002).
In consideration of the aforementioned environmental impacts of alien finfish farming, a
fundamental criterion which needs to be considered as mandatory in developing ‘organic’
aquaculture is to restrict the eligibility to such qualifying attribution to indigenous species
only.
Ethical quality
During the last decade, many studies and surveys have highlighted the increasing concern
of most of the European actors involved in food production systems about health and safety
issues (Botonaki et al. 2006). Even though public interest in sustainability is increasing and
consumer attitudes are positive, behavioral patterns are not always consistent. The domi-
nant attribute to which consumers pay more attention in decision making seems to be the
price followed by others, such as the brand, convenience, packaging, ingredients, taste, and
at times the presence of credence attributes like sustainability (Vermeir and Verbeke
2006). However, it has also been reported that environmental, organic and ethical issues
are increasingly important factors influencing consumer food choices in different European
countries (Torjusen et al. 2001; Pettinger et al. 2004).
Concerns about utilization of alien finfish species can be compared to the globally
debated concerns about the utilization of genetically modified organisms (GMOs) in the
food industry. Some of the thoughts and considerations about ethical issues relative to
GMOs can be transferred to the context of alien finfish cultivation.
If one were to compare consumer health to the environmental status of an inland water
body, the unpredictable effects on human health of the introduction of new genetic material
from GMOs is comparable to the unpredictable effect on the environmental equilibrium of
the introduction of new genetic material from an alien species. Consequently, as the theory
of the ‘‘substantial equivalence’’ (chemically similarity to its natural counterpart) of a
genetically modified food is limited and misguided (Millstone et al. 1999) and an ‘‘ethical
equivalence’’ should be included (Pouteau 2000), similarly in the context of alien finfish
farming an ethical assurance needs to be developed. Continuing the parallel, we can
cogitate that a rainbow trout and a brown trout can be substantially considered equivalent
both from an eco-biological and a nutritional point of view. However, considering the
Aquacult Int (2008) 16:243–272 269
123

numerous environmental hazards of farming non-indigenous species (Kapuscinski and
Brister 2001; Pillay 2004; Kennard et al. 2005; Nguyen and De Silva 2007), in Europe
rainbow trout fails the test of ethical equivalence. On the other hand, in measuring the
‘‘ethical equivalence’’ the context is of a paramount importance (Pouteau 2002). As such,
while the utilization of alien species can be ethically acceptable in some developing
countries where there is an inadequate food production and there are no native species
available with favorable farming attributes (De Silva et al. 2006), it seems that in European
inland aquaculture the farming of alien fish is unjustifiable.
Conclusions
While in other regions of the world, mainly in developing countries, the benefits of alien
finfish farming can outweigh the potential negative environmental impacts of such prac-
tices, in the European context the situation is different. To aim at economic sustainability,
the sector needs to satisfy consumer expectations of environmentally friendly practices.
Moreover, the local finfish fauna is considerably rich in species with optimal cultural
potential and the market is already showing positive appraisal of such products. It is known
that the aquaculture sector is constantly and increasingly market driven and therefore it is
logical and advisable to farm native species. In the desirable evolution of food ethical
assurance, the origin of farmed species needs to be considered as a standard requirement.
Acknowledgement Giovanni M. Turchini’s contribution to this study was made whilst holding an APDDiscovery, Post Doctoral Fellowship from the Australian Research Council (ARC) for the projectDP0772271 and the latter support is gratefully acknowledged.
Appendix
The European countries selected in the present treatise were: Albania, Austria, Belgium,
Bulgaria, Channel Islands, Denmark, Faeroe Islands, Finland, France, Germany, Greece,
Hungary, Iceland, Ireland, Italy, Malta, Netherlands, Norway, Poland, Portugal, Romania,
Spain, Sweden, Switzerland, United Kingdom, Yugoslavia SFR (until 1991), Bosnia and
Herzegovina (from 1992), Croatia (from 1992), Macedonia (from 1992), Serbia and
Montenegro (from 1992), Slovenia (from 1992), Czechoslovakia (until 1992), Czech
Republic (from 1993), Slovakia (from 1993), Belarus (from 1988), Estonia (from 1988),
Latvia (from 1988), Lithuania (from 1988), Moldova (from 1988), Ukraine (from 1988).
The Russian Federation was excluded because of much overlap to the Asian continent,
and no entries were recorded for finfish culture in freshwater environments for the Channel
Islands, Faeroe Islands, Malta and Norway.
The selected European nations have been aggregated according to total production and
main geographical areas and therefore eleven major nation groups were considered divided
into the five individual largest European producers (Denmark, France, Germany, Italy and
Poland) and six main geographical areas: Balkan peninsula (Albania, Bosnia and
Herzegovina, Bulgaria, Croatia, Greece, Macedonia, Romania, Serbia and Montenegro,
Slovenia), British Isles (Ireland, United Kingdom), Central Europe (Austria, Czech
Republic, Hungary, Slovakia, Switzerland), Eastern Europe (Belarus, Estonia, Latvia,
Lithuania, Moldova, Ukraine), Iberian peninsula (Spain, Portugal) and Northern Europe
(Belgium, Finland, Iceland, Netherlands, Sweden).
270 Aquacult Int (2008) 16:243–272
123

References
Anonymous (1995) Aquaculture and the environment in the European Community. European Commission,Directorate-general for fisheries, Luxembourg
Balon EK (1995) Origin and domestication of the wild carp, Cyprinus carpio: from Roman gourmets to theswimming flowers. Aquaculture 129:3–48
Barg U (2006) National aquaculture legislation overview—Germany. In: National aquaculture legislationoverview fact sheets. FAO Inland Water Resources and Aquaculture Service (FIRI), Rome
Barus V (1995) First record of Anguillicola crassus (Nematoda) in the Morava River drainage basin.Helminthologia (Bratislava) 32:89
Beardmore JA Mair GC Lewis RI (1997) Biodiversity in aquatic systems in relation to aquaculture.Aquacult Res 28:829–839
Bernardino FNV (2000) Review of aquaculture development in Portugal. J Appl Ichthyol 16:196–199Black KD (2001) Sustainability of aquaculture. In: Black KD (ed) Environmental impacts of aquaculture.
Sheffield Academic Press, Sheffield, pp 199–212Botonaki A, Polymeros K, Tsakiridou E, Mattas K (2006) The role of food quality certification on
consumers’ food choices. Br Food J 108:77–90Britton JR, Brazier M (2006) Eradicating the invasive topmouth gudgeon, Pseudorasbora parva, from a
recreational fishery in northern England. Fish Manag Ecol 13:329–335Chapin FSI, Zavaleta ES, Eviner VT, Naylor RL, Vitousek PM, Reynolds HL, Hooper DU, Lavorel S, Sala
OE, Hobbie SE, Mack MC, Dıaz S (2000) Consequences of changing biodiversity. Nature 405:234–242D’Andrea A (2006) National aquaculture legislation overview—Italy. In: National aquaculture legislation
overview fact sheets. FAO Inland Water Resources and Aquaculture Service (FIRI), RomeDe Silva SS, Nguyen TTT, Abery NW, Amarasinghe US (2006) An evaluation of the role and impacts of
alien finfish in Asian inland aquaculture. Aquac Res 37:1–17FAO (2006) Food and Agriculture Organization of the United Nation, Fishery Department, Fishery Infor-
mation, Data and Statistics Unit. FISHSTAT Plus: Universal software for fishery statistical time series.Version 2.3 2000
Fausch KD, Taniguchi Y, Nakano S, Grossman GD, Townsende CR (2001) Flood disturbance regimesinfluence rainbow trout invasion success among five holarctic regions. Ecol Appl 11:1438–1455
Favero L, Bovo G, Borghesan F, Mutinelli F, Manfrin A, Selli L, Cappellozza E, Giacometti P, Ormelli S(2001) Iridovirosis in catfish (Ictalurus melas): aetiopathogenetic and anatomo-histopathologicalaspects. Boll Soc It Patol Ittica 13:39–48
Focardi S, Corsi I, Franchi E (2005) Safety issues and sustainability development of European aquaculture:new tools for environmentally sound aquaculture. Aquac Int 13:3–17
Froese R, Pauly D (2006) Fishbase, World Wide Web electronic publication. http://www.fishbase.org,version (07/2006)
Holcik J (1991) Fish introductions in Europe with particular reference to its central and eastern part. Can JFish Aquat Sci 48:13–23
Huntingford FA, Adams C, Braithwaite VA, Kadri S, Pottinger TG, Sandøe P, Turnbull JF (2006) Currentissues in fish welfare. J Fish Biol 68:332–372
IUCN (2000) Guidelines for the prevention of biodiversity loss caused by alien invasive species. InvasiveSpecies Specialist Group (ISSG), Species Survival Commission (SSC) of the World Conservation Union(IUCN). IUCN, Gland, Switzerland (also see http://www.issg.org/database/welcome/)
Ivasik VM, Kulakovskaya OP, Vorona NI (1969) Parasite exchange of herbivorous fish species and carps inponds of the western Ukraine. Hydrobiol J 5:68–71
Jaffry S, Pickering H, Ghulam Y, Whitmarsh D, Wattage P (2004) Consumer choices for quality andsustainability labelled seafood products in the UK. Food Policy 29:215–228
Johnsen PB (1991) Aquaculture product quality issues—Market position opportunities under mandatoryseafood inspection regulations. J Anim Sci 69:4209–4215
Josupeit H. Lem A, Lupin H (2001) Aquaculture products: quality, safety, marketing and trade. In:Subasinghe RP, Bueno P, Phillips MJ, Hough C, McGladdery SE, Artur JR (eds) Aquaculture in thethird millennium. Technical proceedings of the conference on aquaculture in the third millennium,Bangkok, Thailand, 20–25 February 2000. NACA, Bangkok and FAO, Rome, pp 249–257
Kapuscinski AR, Brister DJ (2001) Genetic impacts of aquaculture. In: Black KD (ed) Environmentalimpacts of aquaculture. Sheffield Academic Press, Sheffield, pp 128–153
Kennard MJ, Arthington AH, Pusey BJ, Harch BD (2005) Are alien fish a reliable indicator of river health?Freshw Biol 50:174–193
Larsen K (2006) National aquaculture sector overview—Denmark. In: National aquaculture sector overviewfact sheets. FAO Inland Water Resources and Aquaculture Service (FIRI), Rome
Aquacult Int (2008) 16:243–272 271
123

Lehtonen H (2002) Alien freshwater fishes of Europe. In: Leppakoski E, Gollasch S, Olenin S (eds) Invasiveaquatic species of Europe. Distribution, impacts and management. Kluwer, Dordrecht, pp 153–162
Leppakoski E, Gollasch S, Olenin S (2002) Alien species in European waters. In: Leppakoski E, Gollasch S,Olenin S (eds) Invasive aquatic species of Europe. Distribution, impacts and management. Kluwer,Dordrecht, pp 1–6
Mills S (1982) Britain’s native trout is floundering. New Sci 96:498–501Millstone E, Brunner E, Mayer S (1999) Beyond ‘substantial equivalence’. Nature 401:525–526Moretti VM, Turchini GM, Bellagamba F, Caprino F (2003) Traceability issues in fishery and aquaculture
products. Vet Res Commun 27:497–505Myhr AI, Dalm RA (2005) Introduction of genetic engineering in aquaculture: ecological and ethical
implications for science and governance. Aquaculture 250:542–554Naylor RL, Williams SL, Strong DR (2001) Aquaculture—a gateway for exotic species. Science 294:
1655–1656Naylor RL, Goldburg RJ, Primavera J, Kautsky N, Beveridge MCM, Clay J, Folkes C, Lubchence J,
Mooney H, Troell M (2000) Effects of aquaculture on world food supplies. Nature 405:1017–1024Nguyen TTT, De Silva SS (2007, in press) Freshwater finfish biodiversity and conservation: an Asian
perspective. Biod Cons, doi:10.1007/s10531-005-0312-8Pettinger C, Holdsworth M, Gerber M (2004) Psycho-social influences on food choice in Southern France
and Central England. Appetite 42:307–316Phillips MJ, Beveridge MCM, Ross LG (1985) The environmental impact of salmonid cage culture in inland
fisheries: present status and future trends. J Fish Biol 27:123–137Pillay TVR (2004) Aquaculture and the environment. Blackwell, OxfordPillay TVR, Kutty MN (2005) Aquaculture, principles and practices. Blackwell Publishing, OxfordPouteau S (2000) Beyond substantial equivalence: ethical equivalence. J Agric Environ Ethics 13:273–291Pouteau S (2002) The food debate: ethical versus substantial equivalence. J Agric Environ Ethics 15:
291–303Rohr A, Luddecke K, Drusch S, Muller MJ, Alvensleben RV (2005) Food quality and safety—consumer
perception and public health concern. Food Control 16:649–655Scialabba NEH, Hattam C (2002) Organic agriculture, environment and food security. FAO, Food and
Agriculture Organization of the United Nations, RomeTacon AGJ (2004) Use of fish meal and fish oil in aquaculture: a global perspective. Aquat Resour Cult Dev
1:3–14Torjusen H, Lieblein G, Wandel M, Francis CA (2001) Food system orientation and quality perception
among consumers and producers of organic food in Hedmark County, Norway. Food Qual Pref 12:207–216
Valfre F, Caprino F, Turchini GM (2003) The health benefit of seafood. Vet Res Commun 27:507–512Varadi L (2001) Review of trends in the development of European inland aquaculture linkages with
fisheries. Fish Manag Ecol 8:453–462Varadi L, Szucs I, Pekar F, Blokhin S, Csavas I (2001) Aquaculture Development Trends in Europe. In:
Subasinghe RP, Bueno P, Phillips MJ, Hough C, McGladdery SE, Artur JR (eds) Aquaculture in thethird millennium. Technical proceedings of the conference on aquaculture in the third millennium,Bangkok, Thailand, 20–25 February 2000. NACA, Bangkok and FAO, Rome, pp 397–416
Vermeir I, Verbeke W (2006) Sustainable food consumption: exploring the consumer ‘‘attitude—behavioralintention’’ gap. J Agric Environ Ethics 19:169–194
Wedekind H, Hilge V, Steffens W (2001) Present status, and social and economic significance of inlandfisheries in Germany. Fish Manag Ecol 8:405–414
Welcomme RL (1988) International introductions of inland aquatic species. FAO Fisheries TechnicalPaper 294
Williot P, Sabeau L, Gessner J, Arlati G, Bronzi P, Gulyas T, Berni P (2001) Sturgeon farming in WesternEurope: recent developments and perspectives. Aquat Living Resour 14:367–374
272 Aquacult Int (2008) 16:243–272
123