
A GUIDE TO THE DECISION SUPPORT SYSTEM FOR ENVIRONMENTAL ASSESSMENT OF MARINE FINFiSH AQUACULTURE
40
.- . - L.. I ' .' " =-- - -(* .,,-.z +?.W -. , 1,- - - - , A GUIDE TO THE DECISION SUPPORT SYSTEM FOR ENVIRONMENTAL ASSESSMENT ". OF MARINE FINFLSH AQUACULTURE L.L Doucette and B.T. Hargrave Marine Environmental Sciences Division Science Branch Bedford Institute of Oceanography P.O. Box 1006 Dartmouth, Nova Scotia B2Y 4A2 Canadian Technical Report of Fisheries and Aquatic Sciences No. 2426 ~etOceans Canada
-
Upload
independent -
Category
Documents
-
view
2 -
download
0
Transcript of A GUIDE TO THE DECISION SUPPORT SYSTEM FOR ENVIRONMENTAL ASSESSMENT OF MARINE FINFiSH AQUACULTURE

.- . - L . . I' .'
" =-- - - ( * . , , - . z +?.W -. , 1,- - - - ,
A GUIDE TO THE DECISION SUPPORT SYSTEM FOR ENVIRONMENTAL ASSESSMENT ".
OF MARINE FINFLSH AQUACULTURE
L.L Doucette and B.T. Hargrave
Marine Environmental Sciences Division Science Branch Bedford Institute of Oceanography P.O. Box 1006 Dartmouth, Nova Scotia B2Y 4A2
Canadian Technical Report of Fisheries and Aquatic Sciences No. 2426
~ e t O c e a n s Canada

Canadian Technical Report of Fisheries and Aquatic Sciences No. 2426
A Guide to the Decision Support System for Environmenhl Assessment of Marine Finfish Aquaculture
L.I. Doucette and B.T. Hargrave
Department of Fisheries and Oceans Mai-ine Environmental Sciences Division
Science Branch Bedford Institute of Oceanography
P.O. Box 1006 Dartmouth, Nova Scotia
B2Y 4A2

O Minister of Public Works and Government Sewices Canada 2002 Cat. No. Fs 97-612426E ISSN 0706-6457
Coi-sect citation for this publication:
Doucette, L.I. and Hargrave, B.T. 2002. A Guide to the Decision Support System for Environmental Assessment of Maiine Finfish Aquaculture. Can. Tech. Rep. Fish. Aquat. Sci. 2426: iv + 35 pp.

ABSTRACT
INTRODUCTION
ACCESSING THE SYSTEM
STRUCTURE OF THE MFADSS
iii
TABLE OF CONTENTS
SECTION 1 : GENERAL INFORMATION SECTION 11: ECOSYSTEM VARIABLES SECTION 111: SITE VARIABLES OVER-RIDING VARIABLES SCORING
Cumulative Ecosystem Index (El) Cumulative Site Index (SI) Matrix for Combined Ecosystem and Site Index Scores
A GUIDE FOR COMPLETING THE MFADSS
GENERAL INFORMATION ECOSYSTEM VARIABLES SITE VARLABLES
FREQUENTLY ASKED QUESTIONS
REFERENCES

ABSTRACT
Doucette, L.I. and B.T. Hargrave. 2002. A Guide to the Decision Support System for Environmental Assessment of Maiine Finfish Aquaculture. Can. Tech. Rep. Fish. Aquat. Sci. 2426: iv + 35 p.
The Maline Finfish Aquaculture Decision Support System (MFADSS) is designed to provide structured scientific advice to aid Habitat Managers in making decisions and to increase consistency in evaluating environmental data provided in maiine finfish lease applications. The MFADSS requires input of lease site infom-rnation and answers to two sets of questions to examine far field and site specific variables. Most of the required information is provided with a lease application. This guide explains how to compile the site and environmental data from a lease application and input the info~mation into the MFADS S .
Doucette, L.I. and B.T. Hargave. 2002. A Guide to the Decision Support System for Environmental Assessment of Maline Finfish Aquaculture. Rapp. tech. can. sci. halieut. aquat. 2426: iv + 35 p.
Le systeme de soutien decisionnel a I'aquaculture des poissons de mer (MFADSS) a pour but de donner des avis scientifiques structures aux gestionnaires de l'habitat pour les aider a prendre des decisions et pour assures une coherence dans l'e\laluation des donnees environnementales contenues dans les demandes de baux aquacoles. Le MFADSS necessite la saisie de renseignements sur le site consider6 et des reponses a deux series de questions pour pemiettre l'exameli des variables concernant le champ lointain et le site a proprenieilt parler. La plupart des renseignements demandes sont contenus dans la demande de bail. Le present guide explique comment reunir l'information sur le site et les donnees environnementales h pal-tir d'une demande de bail et conlrnent saisir ces renseignements dansle MFADSS.

INTRODUCTION
A decision support system (DSS) is a computer-based integrated approach for suppoi-ting management decisions. The DSS method has been widely used in diverse fields where a valiety of inforniation ~liust be evaluated in making decisions. The approach has recently been proposed as a method for applying the precautionary psincipal to fisheries management decisions (Halliday et al. 2001). A web-based environmental assessment tool for freshwater aquaculture in the Great Lakes Basin is now available online (Brister and Kapuscinski 2002). Previous applications range from using a DSS as a medical diagnostic tool, to models for socioecononiic development, environmental impact assessment and water resource ~nanagement (Hargrave 2002). A decision support system for marine finfish aquaculture intended to assist Department of Fisheries and Oceans (DFO) Habitat Managers in making siting decisions when evaluating finfish lease applications is described in Hargave (2002). It provides a stsuctured framework for providing scientific advice 011 aquaculture lease applications and, by applying a standard set of criteria, increases consistency in decision making. This report provides a more detailed description of how to input information into the Marine Finfish Aquaculture Decision Suppoi-t S ystern (MFADSS).
The MFADSS is based on a Traffic Light Method of scoring answers to questions that assess the state of environmental variables both near and distant from potential finfish aquaculture sites. It is intended to assist managers in compiling and assessing physical, chemical and biological infol-n~ation provided in site applications, allowing them to make informed, scientifically based decisions on environmental aspects of site assessments. It provides scientific input to siting decisions in a structured, uniform, and unbiased basis.
It must be emphasized that the MFADSS is intended to be used only as a screening tool. It provides a guide to assist in decision making rather than a system that provides a11 outcome that must be adhered to. Habitat Managers will still make the final decision on the acceptability or unacceptability of an individual application based on a broad range of criteria. However, the MFADSS serves to focus an assessor's attention on a set of potentially critical environmental variables that may be overlooked or not fully evaluated. Output from the system can be used as a warning of potential environmelltal problems and then managers can seek specific scientific recommendations on these issues. Managers are not obligated to use a decision rendered by the MFADSS. However, if an unacceptable rating is rendered for a site, and a decision is made to allow licensing to proceed, the decision would halie to be justified with respect to variables identified as resulting in negative scores.
ACCESSING THE SYSTEM
The MFADSS is a web-based application that is currently accessible only through the Fisheries and Oceans (DFO) Intranet. The system administrator (contact I~lformatics Division or the Marine Environmental Sciences Division at Bedford Institute of Oceanography) must assign a user name and password for access to the Oracle-based system. Detailed instructions ("Maline Finfish Aquaculture Decision Support Systein

User Guide") will be provided by the systenl administrator after a new user name and password are assigned.
It is recommended that all information required to enter data into the MFADSS be assembled before accessing the system through the DFO Intranet. When input is completed and information is saved, scores are calculated and the input data is compiled in a unique database record within the MFADSS. If an application is re-entered (for example to alter some of the input infornlation) an additional record is saved in the database. A database is thereby created for all users of the system. In its present configuration answersldata are required for all questions. If data are missing, the assessor must use their best judgement to substitute answers or estimated values based on knowledge of the lease area and other site applications. This would allow a temporary assessment of site suitability. A final assessment could only be con~pleted when missing infornlation is obtained. Changes that occur in variables as more recent information is provided by the proponent, such as mitigation measures that have been established or additional data for site variables (i.e. current speed, dissolved oxygen levels, Secchi depth, sediment geochemical variables, etc.), can be entered in the MFADSS as reassessments. Most importantly, if a site is monitored over time (for example in an environmental monitoling program) multiple entry of data for one site is possible for comparative purposes.
STRUCTURE OF THE MFADSS
The MFADSS consists of three sections (General Infonnation, Ecosystem and Site Variables):
SECTION I: GENERAL INFORMATION
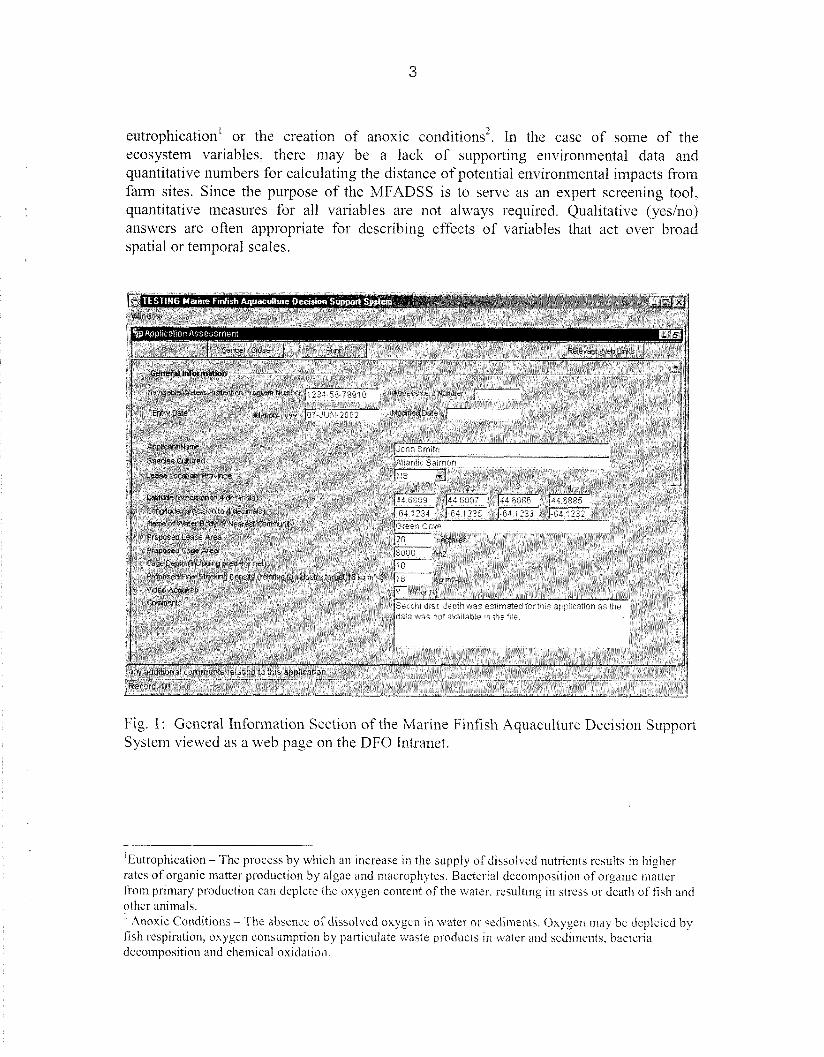
14 questions are used to record general lease site and species culture information (Fig. 1 ). A box for comments allows infonnation to be added which a11 assessor considers relevant to the assessment.
SECTION 11: ECOSYSTEM VARIABLES
This section consists of 10 questions used to determine the potential for impacts at the ecosystem (far field) level (Fig. 2). The questions are designed to examine the possible broad scale effects of fish farms and to indicate the potential for conflicts of ecosystem use where natural processes take precedence over potential interactions resulting from additional use. A net decision is created as a cumulative Ecosystern Index (El) score.
Cumulative environmental effects of finfish farms are difficult to quantify (Hargave 2002). Few simple, direct measures are available to measure broad scale effects such as
eutrophication' or the creation of anoxic conditions" In the case of some of the ecosystem variables, there may be a lack of supporting environmental data and quantitative numbers for calculating the distance of potential environmental impacts from farm sites. Since the purpose of the MFADSS is to serve as an expert screening tool, quantitative measures for all variables are not always required. Qualitative (yesino) answers are often appropriate for describing effects of variables that act over broad spatial or tei~iporal scales.
Fig. 1 : General Inforinatioli Section of the Marine Finfish Aquaculture Decision Support System viewed as a web page on the DFO Intranet.
1 Eutrophication - The procesi by wh~ch an Increase In the supply of dissolved nutr~ents results in h~gher rates of organlc matter productlon by algae and rndcrophytes Bacterial decon~poi~tion of organic matter fro111 prlnrary productlon can deplete the oxygen content of the water. rciult~ng In streqs or death of fish and other anlnials ' Anox~c Condtttorrs - The absence of dissolved oxygen In \s,ater or \edirnents Oxygen may be depleted by fish respiration. oxygen consumption by partrculate naite productc; In water and redlmenti. bacteria decompos~tion and cllernical oxidat~on

Fig. 2: Ecosystem Variables Section of the Marine Finfish Aquaculture Decision Support System as viewed on the DFO Intranet.
SECTION 111: SITE VARIABLES
This section consists of a set of 12 questions structured to obtain site-specific information and to consider near field effects (Fig. 3). The questions consider effects of physical. chemical and biological variables (as measures of water and sediment quality) at the proposed lease site, to be used in calculations to assess enviro~imel~tai risks. A lie1 decision is created as a cumulative Site Index (ST) score.
OVER-RIDING VARIABLES
In both the Ecosystem and Siting Sections there are two or three questions tliar have an over-riding (pre-ernptive) effect on the cumulative score for the respective index. Input that results in a C score for an over-riding question, produces a C score for that index and an unacceptable net decision.
SCORING
Answers to each of the 22 questions in the ecosyste~n and siting sectioiis produce positive to negative scores (A = +3, B+ = 11.5, B- = -1.5, C = -3). The arbitrary scale creates four

separate ranking scores from acceptable (A) to unacceptable (C) with two intermediate scores for conditional acceptance. The broader range (-1.5 to +1.5) for the two intermediate scoring categories reflect uncertainty associated with conditions that are not clearly desirable or undesirable. By assigning a broader range of scores to intermediate values, the MFADSS call be used as a coarse screening tool for evaluating site suitability. Small changes in scores do not radically change cumulative scores unless values are near specified thresholds. This sensitivity is most critical at the transition from B- to C scores. The cumulative indices EI and SI are calculated and assessed as A, B+, B-, or C.
Fig. 3: Siting variables section of the Marine Finfish Aquaculture Decision Support System as viewed on the DFO Intranet.
Cumalative fiicosystem index (Ei): This value is the sum of numeric scores for ecosystem variable questions. If C is assigned for one of the three pre-emptive questions. EI = C. The n~aximnm value for El is 30 and the mini~lluln is -25.5.
A = EI > 20 B-t- El from 10 to 19 B- = EI from 5 to 9 C = E I < 4

Cumulative Site Index (SI): This value is the sum of numeric scores for site variable questions. If scores are C for one of the two over-riding questions, SI = C. If neither of these scores is C , the maximum value for SI from the site variable questions is 30 and the minimum is -27.
A = SI > 20 B+ = SI from 5 to 19 B- = SI froln -10 to 1 4 e = SI < - l o
The net decision based on EI and SI indices provides an overall decision (A = acceptable, B+ and B- = provisioilal acceptance (caution required), C = unacceptable) (Fig. 3).
Matrix for Combined Ecosystem and Site Index Scores:
To maximize the information in the separate EI and SI indices, while at the same time providing a blended score as a guide for advice, the four colour scoring system is transfom~ed to a conventional three colour [green (G) , yellow (Y). red (R)] Traffic Light. This simplifies the decision matrix to give clear decision points for acceptable, conditional and unacceptable. The intermediate light green colour (Bi-) closest to green is scored as 50% green and 50% yellow, while the more conditional intermediate orange score (B-) closest to red is designated as 50% yellow and 50% red. The GYR colour combinations for cuiniilative EI and SI scores are placed in a decision matrix to represent all possible EI and SI score combinations from GG to RR (Fig. 4). A11 acceptable decision is indicated if the colour matrix consists of green > 50'36, while an unacceptable decision is indicated if red > 50%. Combined EI and SI scores containing B+ and B- indicate a provisional level of acceptance only if red = 25%. A decision of unacceptable is rendered if both yellow and red = 50% (EI = B- and SI = B-) since both indices show that caution is advised.
A GUIDE FOR COMPLETING THE MFADSS
GENERAL INFORMATION
1 ) Nuvigc~hle Wuters Protection Progrtrn? Nzrnzher
The NWPP number is used as a unique indentifying label for each application in the MFADSS and cannot be duplicated by two different users. Failure to enter a unique NWPP or other identification number could result in the loss of all data when an attempt is made to save the record. If a NWPP number for an application is not available or unknown, another suitable identifier (e.g. Habitat Management File number) could be used if it is confirmed that this nunlber has not been used previously. Previous use can be determined by viewing the applicatiosls already present in the database, which are listed in order by their NWPP or other assigned numbers.

Fig. 4: Matrix for Combined Ecosystenl and Site Index Scores.
The assessment number is the numeric counter for subsequent reassessments of the same application. Each time an application is reassessed the counter increases by one in the fonn of an extension to the identifier number. This occurs automatically and no data entry is required. Multiple reassessments for the same site are allowed and will be saved in the database.
3 ) Ei l t~y Date
The entry date for the application occurs automatically and user input is not required.
4) Modified Date
Entry date for a reassessment of the application. This is not required for a new application but it occurs automatically wlien an exisiting site is reassessed.
5 ) Applicant Ncrr.~e
The name of the person or company on the site applicatio~i.

6 ) Species Cu'ultzavetl
The species being cultured is recorded to allow species-specific calculatiolls (e.g. differences in growth efficiency between species) to be included for modeling purposes (e.g. oxygen consumption, waste production, or nutrient release).
7 ) Leuse Loccr tion: Province
A record of tlie geographic location of a lease site by province allows regional differences (e.g. physical characteristics such as Secchi disc visibility or local government regulations) to be incorporated. The location also serves to categorize sites by provilice for ease in searching files.
8) Lafifzldrs and Longitudes
Geo-referenced positions (as degree decimals) are required at either three or four corners of a potential lease area. If the specified lease site has only three sides, the fourtli set of co-ordinates can be left blank. If the lease area has more than four corners then only four co-ordinates should be entered that are most representative of the total area (Fig, 5) . The infornlation allows a new location to be compared to previously approved leases and to determine proximity to existing farm sites.
Fig. 5 : The co-ordinates for comers I . 2, 3 and 5 should be entered for a lease area of this shape.

The following examples describe the conversion of latitude and longitude to degree decimal format:
If the co-ordinates of a lease are given in degrees, minutes, seconds they can be converted to degee decimal as follows:
hW corner given as: 45"12'06.8" N; 66"34'08.2" W
* Divide seconds by 60: 06.8 sec160 = 0.1 133 * Add seconds to minutes = 12.1 133 minutes
Divide minutes by 60: 12.1 133 mid 60 = 0.2019 * Add minutes to degrees = 45.20 19 N
North and east are positive, south and west are negative
The co-ordinates for the NW corner in degrees decimals are 45.2019; - 66.5689.
If co-ordinates are given as minutes with decimals (Fig. 6) simply divide the minutes by 60 and add to the degrees.
Fig. 6: An example of lease co-ordinates given as degrees and nlinutes with decimals. The NW corner beconles 40.5668, - 62.0241 when converted to degree decimal.

9 ) ATanze of Water Bo& or Nearest Coi?zinurzity
The geographic or proper noun place name is used to identify the area where the lease is located. This is usually provided in the application. If it is not available, any appropriate place name for the geogsaphic location can be used.
10) Proposed Lease Arecr (hectares)
The lease area gives the spatial scale with which fanning operations will occur. This information is important for establishing navigable waters clearance distances. It may also be used for characterizing the region where site specific variables apply and for calculati~lg near field waste loading rates within the lease boundaly ( 1 hectare = lo4 m').
I 1) PI-opnsed cage Area (m')
The number of cages times their surface area allows the total area of sediment under net pens to be calculated assuming no lateral movement of the pens. This value is used to detenlline the area of sediment subject to direct deposition of waste feed and feces under pens. For polar circle net-pens with a radius 7- this is calculated as a circular area under a cage (A = x r'; Fig. 7).
Fig. 7. The area under one net pen is multiplied by the number of net pens to detei-mine the total area. For example, a 30 m diameter polar circle pen has an area of 707 m'. The 20 pens in this example have a total area of 20 x 707 = 14 140 m'.

12) Cage Deptlz (irzcludirzg predcltor net; 772)
The cage depth below the water is used to calculate the total volume of water in all pens and the depth between the lowest net and the bottom. The cage depth (D) can be multiplied by the cage area (A) to calculate cage volume. This value can be used to confirm or calculate the proposed stocking density based on proposed numbers of fish to be cultured (see General Information, Question 13 below and Fig. I ) . It is assumed that the total number of fish is equally divided among all cages, although in practice some cages are kept empty for transfer during ,orow-out. It is also assumed that fish utilize the total pen volume.
Cage depth is subtracted from total water column depth duiing a tidal cycle for MFADSS calculations. Depths < 5 m for > 50% of the time are considered to be insufficient to allow horizontal dispersion of particulate waste material. The measure of cage depth must include predator nets because these nets will also accumulate debris, macrofauna and 1nacroaIgae (Fig. 8). Accumulated debiis can potentiaIly reduce water flow, result in lower oxygen levels and greater deposition irnrnediately below the cages.
Fig. 8: The depth of the predator net is included in the deternlination of cage depth.
13) PI-oposed Final Stockir~p Density (1-elntive to indusny target of IS kg 772-')
The stocking density is the average biomass (wet weight) of fish in all pens on a lease site. This value is used to deteimine feeding rates (using assumed food conversion ratios) and the amount of dissolved and particulate waste potentially released at the site. This value is usually provided in a lease application or call be calculated (see General Illformation, Question 12 above).

14) Video Acquir-ed
Information (yeslno) regarding submission of a video is recorded in the MFADSS to confirm that a visual record of bottom conditions was obtained prior to occupation of a potential new lease site. This is often required by provincial licensing autho~ies as part of a new site application. It provides a visual record of sedimentary features at a site that can be used to confirm requested site specific information on bottom type (sediment grain size), organic matter content and other sediment geochemical variables discussed below.
Text for any additional comrnents relating to the application can be entered in the Corn~nents box. For example, since input into all fields in the MFADSS is required to complete the assessment, it may be necessary to use assumed or substituted values to provide answers to some of the questions. The Comrllents box can be used to indicate if assumed values were used due to missing data. Input into all fields in the MFADSS is required to complete the assessment (with the exception of the fourth pair of latitude/ longitude boxes).
ECOSYSTEM VARIABLES
I ) Have there been slzellfish closures irz the area? What is tlze clistarzce (knlj fronz tlze yr-oyosed lease site? No closures = 0
Shellfish closure areas indicate organic (sewage) enrichment. This may be in the immediate area of a proposed lease site or in an adjacent area within the same general region. A linear distance measure is used to indicate proximity. The Canadian Federal Department of the Environment maintains a website of areas of shellfisl~ closures: ~www.ns.ec.gc.ca~epb/sfish/maps/class/html~.
Scoring:
A = no closure(s) (0), or closure(s) > 10 km away B+ = closure(s) 5 to 10 km away B- = closure(s) 3 to 4.9 km away C = closure(s) < 3 km away
2) Are there arzy species Cfislz or irz\iertebrntes) Izarvested for food or mncro-ocrlgnl beds rvitlzirz 300 r?z ?
A new farm site could potentially diminish or prevent harvesting of a traditional fishery. Wild and colnmercial intertidal shellfish beds should be a minimum distance away from a finfish aquaculture site. In the cussent version of the MFADSS, 300 n~ was assumed to provide a lninin~um distance to avoid negative impacts of mateiial released from netpens. Productivity of macroalgal beds could be negatively impacted by increased water

turbidity and fine particle sedimentation associated with finfish farm operations (e.g. fish fecal matter release and net cleaning activities). Macroalgal beds also offer habitat for juvenile fish and represent an integsal part of the ecosystem that should be not be negatively affected.
Scoring:
N o = A Yes = B+
3 ) Is tlzere crfiiilzfisl? aqunculture lease site witlzirz 3 b2? (over-lidirzg variable)
The cumulative effect of fai-rns already approved in or adjacent to an inlet system within a threshold distance must be considered when making a decision to increase the number of licensed sites in a restricted area. In the present MFADSS a distance of 3 l<m between licensed sites is assumed to be required to minimize cunlulative impacts. The value could be higher or lower depending on hydrogaphic conditions. The designation of this variable as over-iiding indicates to the assessor that proximity of a new site to other existing licensed sites within the specified distance is a critical siting criterion.
Scoring:
Yes = C = over-riding variable :. EI = C and the site is Unacceptable N o = A
4 ) Is tlzere a Mari;irze Protected Area, Marine Pad-, or otlzer protected area withirz 5 k ~ ~ z ?
Siting close to a protected area should be avoided to ensure a sufficient buffer area for environmental protection. As with other variables a linear distance is used to determine if sufficient separation exists between the proposed licensed him site and a sensitive ~narine area designated for protection. A link to the DFO Oceans Progsam Activity website provides map-based infoi~nation on Maiine Protected Areas: < uruiw.dfo-rnpo.gc.ca/Ca~~Oceans/Index.htrn>.
Scoring:
Yes = B+ N o = A
5 ) Are tlzere any erzdc~i?geredfisl?, inanzrnal or bircl species at the site or rvitl~ir~ 5 lo11 .for wlziclz ~~zitigatior? carzrlot be applied? (over-riding variable)
Aquaculture sites should not be located within 5 km of habitat utilized by any protected or endangered species unless mitigation measures can be applied to reduce potential harmful effects. In some cases more than 5 krn may be required in order to ensure that large mammals are not affected. For example, acoustic deteirent devices are often used to protect cultured fish against predators. These devices can elnit noise that interfers with

predator behaviour over distances greater than 5 km. Use of alternative predator avoidance methods could be used to reduce potential harmful effects on an endangered species.
Endangered fish species are protected under legislation within the Department of Environment. A list of all endangered species is available froin The Conservation Data Centre and the Committee on the Status of Endangered Wildlife in Canada. A link to their website is provided in the MFADSS: <~vww.cosewic.gc.ca>.
Scoring:
Yes = C = over-riding variable :. EI = C and the site is Unacceptable N o = A
6 ) Is tlzere river disclznl-ge irzto tile inlet/bay systenz or otl?er- factors to create strcrtificatiorz at arz?~ time of the year?
Stratification is due to the presence of a less dense surface layer of water that reduces water column mixing. Stratification is caused by freshwater inflow into a coastal area or increased temperatures during summer that create a warm surface layer above the theixnocline (sharp temperature gradient) or halocline (sharp salinity gradient). Warrn water is less dense than cold water and freshwater is less dense than seawater. A gravitationally stable water column is described as being stratified. consistiilg of layers of water with increasing density over depth. A strongly stratified water coluinn is very stable with reduced mixing between deep and surface layers. This traps denser water below the surface layer where oxygen depletion and nutrient increases due to decompositioil and the remineralization of settled particulate organic matter may occur.
Scoring:
Yes = B- N o = A
7 ) Is there a sill at nrzy locatiorz ~.vitl?irz the inlet/ e~?zbnyr?zerzt systet?l?z?
A sill is a submerged elevation separating two basins (Fig. 9). As with temperature andlor salinity stratification, a sill can restrict the exchange of deep water and reduce mixing within the surface layer. Depositional basins (deep areas behind sills) are usually sites where settled particulate material is retained and accumulated in bottom deposits. Sediments accumulated in areas behind sills are usually fine-grained with a high proportion of silt and clay size particles.
Uneven bottom topography may have the same effect as a sill in that fine grain sediments may be deposited in depressions. This increases the possibility of anoxic conditions in water and sediments and of negative environmental impacts due to oxygen depletion.

Scoring:
Yes = B- N o = A
Fig. 9: A hydrographic chart of the k t a n g Inlet in SW New Brunswick. Depth contours show the presence of a sill that creates a depositional area in the inner bay. (Canadian Hydrographic Service Chart No. 4 124)
8) Is tlzei-e any irzdustiy (e. g. p ulp alzcl papel; logging, fislz pl-ocessirzg, i?zcri-inn) vvitlzirz 5 k17z of the site?
The presence of other industries with marine waste discharges already located within an inlet system could increase the cumulative effects on the ecosystem when aquaculture site development occurs.
Scoring:
Yes = B- N o = A
9) How ~zarzy people live tvitljiiz 1 LI?Z of tlze site?
General population size can be used to scale the potential iinpacts of human land use. Any population greater than 500 is scored C. This takes into account not only sewage

discharge but also other sources of urban discharges and run-off. Different methods of sewage treatment are not take11 into consideration. A town of more than 500 people will have some negative effect on water quality in a bay regardless of the means of sewage treatment.
Scoring:
A = population < 10 B+ = population LO to 49 B- = population 50 to 500 C = population > 500
10) Is there a critical fislz lzabitctt (e.g. syalvrziizg or ~zur-sely area, nzigr-ntioiz I-o-oute) at or vvitlzii? 1 A772 of tlze site? (o~jei--riiliizg ~jariable)
Spawning and nursery areas are considered to be essential for seprodrrction and to sustain local populations of juvenile and adult fish and invertebrates. In some areas new finfish aquaculture sites could have potential negative irnpacts on ciitical fish habitat due to increased water turbidity, sedimentation, release of chen~icals, or the use of acoustic deterrent devices. Use of acoustic deter-rent devices may cause avoidance of breeding areas by migrating species that lnove into a11 area for reproduction (e.g. wild Atlantic salmon migrating to home livers to spawn).
Examples of ci-itical spawning habitat:
A river where wild Atlantic s a l m o ~ ~ spawn (saln~on-bearlng stream). Aquaculture sites should be located at least 1 k n ~ from the mouth of such a river.
h b s t e r spawning h a b' rtat. * Herring spawning areas that are designated as vital, major or important by DFO and provinci a1 governments.
Scoring:
Yes = C = over-riding variable :. EI = C and the site is Unacceptable N o = A

SITE VARIABLES
1) Iftlze locat io~~ is vvitl?i~z a11 inlet or. Day, give the area (lzendlctrzd to lzendlalzd; low2).
This dimension provides an area enclosed within a defined shoreline perimeter for making calculations of tidal exchange volun~es and for determining loading rates of dissolved and particulate matter additions from waste discharges.
The exact surface area of the inlet or bay does not need to be calculated. Simple shapes may be used to estimate the surface area from headland to headland. The most appropriate shape should be drawn and surface area calculated based on the scale of the map.
A rectangle is used to calculate the area of Gabarus Bay (Fig. 10).
Scale 1 cn-~ = 0.63 km Rectangle = A = I x w A = 11.2 cm x 9.0 cm = 7.1 km x 5.7 km Calculated Asea = 40.5 km2: Actual Area (HW) = 42.6 km' (Gregory et al. 1993)
Note: This calculation was based on the ol-iginal map (Gregory et al. 1993). The map in the figure may not be to scale. Results may vary depending on how the rectangle is drawn. The calculation of the surface area of the bay serves only as an approximation.
Fig. 10: A rectangle was used to estimate the area of Gabasus Bay. Isregular lilies join headlands. The estimated area (40.5 km') is similar to the actual area (42.6 km') determined by Gregory et al. (1993).

Isosceles triangles are used to calculate the areas of Indian and Wine Harbours (Fig. 11).
Scale 1 cin = 0.57 knl Isosceles Triangle: A = ab/2 (a = base, b = height)
Indian Harbour: A = (5.9 cm x 10.4 cm )/ 2 = (3.4 km x 5.9 k1n)/2 Calculated Area = 10.0 km'; Actual Area ( H W ) = 1 1.3 l u n " ~ r e g o r ~ et al. 1993)
Wine Harbour: A = (4.0 crn x 6.0 cm )/ 2 = (2.3 krn x 3.4 krn)/2 Calculated Area = 3.9 km'; Actual Area (HW) = 4.1 km' (Gregory et al. 1993)
Note: These calculations were based on the original map (Gregory et al. 1993). The map in the figure may not be to scale.
Fig. 11: Isosceles triangles were used to estimate the area of Indian Harbour and Wine Harbour, Issegular lines join headlands for each harbour. The estimated areas are similar to actual areas determined by Gregory et al. (1993).
Scoring:
No score is directly applied to the estimate for headland to headland area.
2) LLW deptlz (Lower Low 'CVater; CHS C1zat-t Datum; 771)
Values for lower low water (LLW) depth can be obtained from published maximud minimum tide heights (Canadian Hydrogaphic Service) or directly from hydrographic charts. The mean depth of the proposed lease area should be used (Fig. 12). No score is applied to this value. The number entered for LLW is used with the values entered for Cage Depth and Tidal Amplitude to detelmine the minimum distance between the net and

the bottom at vaiious times over a tidal cycle (see Site Variables, Question 3 below and Fig. 3).
Scoring: No score is directly applied to LLW depth.
Fig. 12: If the mean LLW depth is not given in the lease application it can be determined from a hydrographic chart by calculating the mean of the depths within the proposed lease area. Mean LLW depth in this example is 2 1.7 m.
3) Ticlnl ar7zplitude (sprirzg tide deprlz variatiolz; in} (over-riding variable)
The tidal amplitude is used with the values entered for Cage Depth and LLW depth to determine the percentage of time that depth under net pens is < 5 m (Fig. 13). DFO Pacific Region requires at least 10 m of clearance between the net pens and the bottom. However, in other areas in Canada (i.e. the Maritimes) water depths are too shallow to pelnit this ideal water depth. The distance used in the present MFADSS is considered a minimum clearance to ensure that nets remain far enough above the bottom to reduce deposition of particulate waste directly under pens. The Canadian Tide tables can be accessed at <www.lau.chs-shc.dfo-inpo.gc.ca~marees/produits/accueil.htm~.
Scoring:
A =dep th<5 m f o r < 108of t ime B+ = depth < 5 m for 10 to 29.9% of time

B- = depth < 5 m for 30 to 50% of time C = depth < 5 m for > 50% of time = over-riding variable :. SI = C and the site is Unacceptable
Time (h)
Fig. 13: A sine curve is used to calculate variations in water depth (m) under a pen through a 24 hour tidal cycle.
4 ) Meal2 peak curr-elzt speed for current meter record dulzttioll ( c n ~ s-'J (over-riding val-iable)
This is the mean maximum current speed over several consecutive tidal cycles. A sine curve is used to descilbe changes in current velocity over time during a tidal cycle (Fig. 14). The percentage of time that the current speed is less than 2 cm s-' is calculated.
Current velocity may be reported in a site application in several ways. Typically it is presented as either a chart (Fig. 15) or in a table (Table 1). Cuirent speed recorded hourly over the recommended time period of at least 29 days could results in tables that are many pages in length. The mean peak cuirent speed should be taken from the maximum speed that is reported in the table over several tidal cycles.

-20.00 ' I
Time (h)
Fig. 14: A sine curve is used to calculate variations in current velocity (cm s-I) through a 24 hour tidal cycle.
Current Speed
Time (hours)
Fig. 15: Mean peak current speed call be deteimined when current speed is reported over time by choosing maxiinurn current speeds that are repeated several times. In this figure the duration of the cui-sent record is only 48 hours. This makes it difficult to detern~ine why there is a large peak in velocity between 6 and 9 hours. Is it due to tides or high winds? Is it a regular occurrence or an anomaly? The average peak current velocity of 5 cm s-' may be a low estimate. However without a longer current record we must estimated the current speed conservatively. A record length > 7 days is preferable.

Table 1: A 24-hour cuirent velocity record. The mean peak cuirent velocity would lie between the Maximum Speed ( 3 1 cm s-I) and the Mean Velocity (1 2.0 cm s-'). The length of the record is very short (1 day) and three peaks occur in the velocity record. From these three time periods a mean peak current speed of 22.7 cln f1 can be calculated. This is > 14.9 cm s-' and therefore a score of " A would be assigned. Note: The minirnuni reportecl current speed is 2 cm s-', however current meters are not accurate at velocities < 2 cm s-'. Therefore the rninirnum reported current velocity is likely not the nctnnl minimum current velocity
Time of Day Speed (cm s-') Direction (degrees)
1200 6 165 1330 3 140
Scoring:
Minimum Speed: 2.0 cm s-' hilaximum Speed: 31.0 cm i1 Mean Velocity: 12.0 cm s*' Mean Direction: 23 1 "
A = current velocity < 2 cm s' < 10% of the time; corresponding range = entered value > 14.9 cm s-'
B+ = current velocity < 2 cm s-' 10 to 19.9% of the time: coiresponding range = entered value 5.3 to 14.9 cm s-"
- 1 B- = cuirent velocity < 2 cm s 20 to 40% of the time; corresponding range = entered value 3.3 to 5.2 cm s-'
C = current velocity < 2 cm s-' > 40% of the time; cosresponding range = entered value < 3.3 cm s-'
X =I 22.7 cm S"

5) Per-cent satur-ntiorz of clissolved o.xygerz in sug%ce water irz late sur7znzer-/ early fall nzorztlzs (01- arzrzual r7zi1zinzunz)
Depth profiles for percent saturation of dissolved oxygen in the water column may be measured at va~ious locations (for example at each corner of a potential lease site) over a given depth profile (Table 2). If dissolved oxygen falls to < 6.4 mg I-' (approxilllately 78 5% saturation at typical late summer rnaximum temperatures in temperate east coast waters) fish such as Atlantic salrnon will be stressed (Davis 1975). Good husbandry requires reduced feeding levels at these times to account for lower rates of food intake associated with stress from oxygen limitation. Oxygen consuming processes such as microbial respiration of naturally occuvring organic matter also creates seasonal minima of dissolved oxygen in surface or deep water at some locations in both eastern and western coastal regions in Canada. If the proposed lease area is in such a region, additional oxygen depletion through direct consumption by fish and increased water co1un111 and sedinlent respiration could reduce oxygen to stressful levels. The minimum dissolved oxygen concentration is a critical variable not only for the cultured species but also the ecosystem as a whole.
If the oxygen levels are reported for a temporal peciod other than late surnmed early fall the data should be considered cautiously. Oxygen concentrations in late sumrnel-/ early fall will typically be lower than at other times of the year. Therefore, if data collected in December show low oxygen concentrations (i.e. 80 to 85%) they will be even lower (i.e. < 80%) and unacceptable during the wanner summer period.
Scoring:
6 ) Secclzi disc depth (m)
An extinction coefficient describes the exponential reduction in light with increasing depth due to selective absorption and scattering by water and dissolved and particulate matter in suspension. The extinction coefficient can be approximated from a Secchi disc reading: the depth at which a 30 cm dianleter white disc disappears from sight under calm conditions during the day. For any given coastal area it should be possible to find published data for cl~aracteristic values of Secchi disc depth if this was not requested or provided in the site application. This variable could also be assigned an expected range that could change seasonally for a specific region. A typical value for Secchi disc depth in clear coastal waters is > 9 m. Water with increasing turbidity due to suspended particulate matter (SPM) is undesirable for salmon aquaculture. High SPM levels indicate the potential for increased bacterial biomass and respiration in the water column. which may lead to increased rates of oxygen consumption.

Table 2: An example of a dissolved oxygen data table for water column measurements as reported in a finfish aquaculture lease application. An average value for percent saturation of dissolved oxygen car] be calculated as the mean of data over all depths.
Scoring:
7 ) Percerzt sedirnerzt dry weight as silt + clay
A simple classification of bottom sediment g a i n size may be reported as proportions of clay (< 2 pm), silt (2 to 50 pm) and sand (50 to 2000 pm). The proportions of sediment weight in various size categories can be used to infer cunent velocity near the seabed (Table 3). Areas of high cussent velocity will have geater resuspension, preventing accumulation of fine-grained mateiial (silt1 clay) and hence coarser (higher proportion of sand to clay/silt) p i n e d deposits.
Scoring:
A = < 5 % silt + clay B+ = 5 to 49.9 % silt + clay B- = 50 to 90% silt + clay C = > 90 70 silt + clay
8 ) Sedi~zerzt orgrrrtic nzntter corzteizt (5% rveigl7t loss on ignition)
Percent of sediment dry weight lost on ignition is a conveilient measure of total organic matter (OM). This value is inversely related to sediment grain size, although in certain coastal areas tel-sigenous inputs (e.g. wood fibre, coal fragments) may alter the expected inverse relationship. Fine-grained deposits have a higher surface area and contain more OM g-' than more coarse-gained sediments. Generally, unenliched (non-eutrophic) coastal sediment with varying proportio~ls of silt, clay and fine sand contains < 5% organic mattes (Fig. 16). Fine-gained sediments with high OIVI indicate depositional environments where resuspension is minimized and cussent speeds are low. A C score indicates high levels of OM beyond the range of values normally found in coastal sediments receiving organic matter from natural sources.
In some applications "Total Organic Carbon" is enoneously reposted when what was actually measured was "Organic Matter" (Table 4). Determination of organic carbotl is more costly than gravimetric determinations of organic matter since elemental analysis requires a dedicated analyzer. Organic Matter is measured by conlbustion of pre-weighed sediment in a muffle furnace at 550 "C for four hours to determine the percent weight loss. Measures of organic matter by combustion are much less expensive than elemental analysis. If methods used to measure organic matter (carbon) are not reported in an application, then it may be assumed that Organic Matter was measured rather than Total Organic Carbon.


/ * /
Letang / Farm Sites
e / ' ,, 0 /- /'
, - Bedford 0 0 * ,/d
Basin
0 5 10 15 20 25 30 35 40
PERCENT ORGANIC MATTER
Fig. 16: Percent organic matter in sediment is measured by cornbusting material in an ashing oven or muffle furnace at 550 "C. Sediment organic carbon is measured with an elemental analyzer. Percent organic matter refers to all organic material (lipids, carbohydrates and proteins) in the sediment and will generally be two to four times geater than the percentage of organic carbon.

f: g 0 - '3 a C" E . r, - V) a g$ 5 % a, f - cS
a 5 Y - Y z F c3 3 * * 0' "F, r, y Y * T z z C 0 Lg .-
S cj CS
E Y '- 0 8 - 2 z > Ti g g . as Y .- s a w " " .z g s 5
r, $ s
V) 2 S G E .- . 2 W L f
2 g z 9 a w . m L C a C" .- 0 > >E - $- ~2 a .g P c f 0.::
s u V)$
0 .- 20 g $2 w - a,U 0 Ij 0 .- 5 ' 2 2 - a z0 g 2 , .- 0 g- 8 Y 5 4 H e-3 g a 2=: e,
a 2 3 % a b - 0

Scoring:
9 ) Sedir~zerzt total sulf-icle ( p M )
All maline sediments contain both micro- and macro-organisms that require oxygen for survival. However, in some areas of high organic matter supply, rates of oxygen consumptioi~ may exceed rates of supply through diffusion and advective exchange with surface water. Oxygen is then depleted from sediment pore water below a specific depth determined by relative rates of supply and consumption. In certain cases, the sediment may be anoxic even at the sediment-water interface.
Aerobic and anaerobic organisms may live at the oxiclanoxic interface, but at deeper depths in sediments where complete anoxic co~iditions occur only anaerobic taxa are found. Bacteria such as sulfate reducers utilize SO4= as a hydrogen acceptor in anaerobic sediments and H2S (rotten egg smelling gas) is produced as an inorganic metabolic by- product. This diffuses upwards to form a substrate for chemosynthetic bacteiia at the anoxic/oxic interface. In anoxic pore water, H2S may be precipitated as FeS (black sediment) or dissociate into H+ + HS- (Fig 17). The rate of sulfate reduction and accun~ulation of reduced forms of S= are related to the rate of organic matter supply and sediment accumulation.
Free sulfide ions (S=) can be measured in freshly collected sediments using a silver/sulfide (AgIS) combination electrode. Total sulfide concentration (pM) in the surface layer (0 to 2 cm depth) are used in the MFADSS to quantify anoxic conditions (Table 5 ) (Wildish et al. 1999). A score of C indicates high S= levels beyond the range of values nonnally found in coastal sediments receiving organic matter from natural sources.
10) Sedirnerzt Elz (r-edox) yoterztinl (mV)
A platinum electrode is used to measure the Eh (redox) potential of marine sediments. When corrected to the nonnal hydrogen electrode (NHE), based on the reference electrode potential, EhNHE provides a measure of electron activity as the potential between the reference and Pt electrodes. In contrast, pH is a measure of proton (I-I+)

activity. EhNm potentials in marine sediments froni surface to subsurface depths usually vary between -300 and + 300 mV. Oxygenated surface layers should have positive (> 0 mV) potentials and as oxygen is depleted with sediment depth, or in surface layers under conditions of high organic matter input, EhNHE potentials decrease (< 0 rnV; Table 5). In anaerobic sediments where sulfate reduction occurs, EhNIE potentials decrease logarithmically as sulfide concentrations increase (Fig. 18). Changes in EhNHE potentials in combination with S= measurements can be used to determine the presence/absence of oxygen in the sediment (Wildish et al. 1999). A general relationship between Eh and pH has been used in a similar manner to classify benthic enrichment associated with finfish cage aquaculture in Norway (Anon. 2000).
Scoring:
Fig. 17: The chemical zonation of sediments is visible in colour variations depending on the presence of iron or manganese. Oxidized sediments appear light brown to yellow (surface), the oxic/anoxic interface appears grey, and anoxic (FeS) sediments are black. Oxygen (02) is replaced by hydrogen sulfide (H2S) gas with increasing depth and the redox potential (Eh) decreases with depth. This depth-related diagram of changes in geochemical variables with sediment depth (~iglit) is from Fenchel (1969).

Table 5: A table of geochesnical sedirilent ~neasureme~lts provides reclox potential a~icf sulfide cosicentration data. The mean of sulfide co~icentratio~l (pM) and redox potential (111V) are calc~ilatecl for all sanlples collected. If data is provided for Inore than one depth, use the ~neali of the sediment-water interface layer for an input value to the MFADSS.

10 100 1000 10000
TOTAL SULFIDES (uM)
Fig. 1 8: In anaerobic sediments where sulfate reduction occurs, EhNHE potentials decrease loga~ithmically with increasing total sulfide concentrations. Thus, high sulfide levels (2 1000 pM) are characteristic of hypoxic or anoxic sediments when Ehm potentials are < +I00 mV. In oxic sediments low sulfide coilcentrations (< 500 pM) should be associated with high EhNHE potentials (> + 100 mV). If this general relationship does not appear in the data, measurements reported for one of the variables may be suspect.
1 1 ) N~41nbel- o f sedi~ze~zt sanzylirzg locatiorzs in potential Zec~se area
This variable is related to the quality of sediment observations. For statistical comparisons and determination of vasiability in data collected in different areas at different times, a minimum number of obser-vations (n) is required. For example, if n < 3 for sulfide and Eh detesminations in sediments, only a mean and range of values can be reported. Since there is no measure of valiance, no statistical comparisons (spatial or temporal) are possible between the proposed farm and reference sites. It is recommended that a minimum of n = 5 sediment samples be collected at both a proposed lease site and a reference location (> 500 nl distant) to calculate mean and variance values. Additional sampling could be requested if the number of observations reported was small h e . n < 5).

12) Cui.re.ent 17zett.r- (deploymeizt) lengtl? (days)
Variability in current velocity obsenied at a site will be determined by the length of the period of observation. Shol-t periods of measurement (e.g. a few hours) will be affected by tidal conditions at the time of observations. An accurate description of major tidal variations requires a minimum 45 day record to observe both lunar and solar frequencies. Longer periods of observations also increase the likelihood for observations of variability due to episodic wind and climatic events. Since 29 day or longer cursent rneter records are required to differentiate spring and neap tidal variations, > 29 days is the minimum required to accurately determine the proportion of time currents < 2 ern s-' occur. A current rneter record of this length will help to resolve fluctuations that are caused by high winds and storm surges and to deteimine the proportion of time that the cul-sent is < 2 cm s-'. A longer record of current measurements could be requested if the duration for observations reported was too short (i.e. < 2 days).
Scoring:
A = > 29 days B+ = 7 to 28.99 days B- = 2 to 6.99 days C = < 2 days
FREQUENTLY ASKED QUESTIONS
1 ) IVhat values do you eizter iizto tlze MFADSS iftlze proposed lease site is located oiz n rock Dottol?~ arzd hence rzo geoclzcrnical r?zeaszcrernerzts are reported?
If the proposed aquaculture site is located on rock substrate then it is in a high energy, erosional area. The current velocity should be high and very little sediment would be deposited at the site. This can be verified by examination of a video if this has been obtained from the site. The assumed data for these variables should be reported in the Comments box under General Information. The location would be scored "A" for geochemical variables if the following assumed values were assigned:

Percent Sediment Dq7 Weight as Silt + Clay = < 5 70 Sediment Organic Matter Content = < 570 Sediment Total Sulfide = < 300 pM Sediment Eh Potential = > + 100 mV
2) I f sar7zyles are not collected fi-or71 orze or more poirzts at tlze lease site (i.e. due to the preserzre of a rock ledge) clo you estimate tlze geochenziccrl nzeasurenzerzts .for- tlzese poirzts as irz questiorz 1 (above)?
Whenever possible the n~ean value for input into the MFADSS should be determined from the data provided. If benthic geochemical data is available for at least three of the sampling points then the mean should be detennined using the infoinlation supplied. It is possible that even a high-energy area, such as a rock ledge, could accumulate organic matter if sufficient organic waste collects in the sediment at other points under the cages. In some cases, it may be necessary to request additional sampling.
3 ) How is vnrinbility Iznrzdled .for- input h t n ? For e~xanzyfc, tvlzcrt sho~rld be clone if geocl7enzicnl nzensurer~zerzts froin orze co lflrzer of tize pr-oposed lerrse site arc. tie7 y difSeiaerzt fi-onz tize otlzer sanzylirzg points (e.g. r-edo.~ yoterztials are rnzrch l o ~ ) e r arzd sulfide concerztratiorzs are lziglzer-) ?
Anolnalous data should not be ignored. If there are relatively few measurements and one value is very different from other measurements, the anomalous value should not be included in calculations of a mean. Low redox potentials and high sulfide concentrations are signs of the presence of increased organic matter in surface sediments. An effort should be made to determine the source of the organic matter. River outflow or the presence of an aquaculture site at that location in the past are two possible causes of increased organic matter. It may be necessary to adjust the location of the proposed lease site to avoid such areas. Variability in any measured \w-iable associated with site specific observations should be reported in the Conllnents box under site information. This variability is critical for a full evaluation of environmental conditions in all near field vai-iables and it must be considered in designing an environmental monitoring progsam for the site.

REFERENCES
Anon. 2000. Environmental rnonitoring of marine fish farms. English translation of Norwegian Standard NS 9410 (E). 22 pp. Available from Pronorm, e-mail: firmapost @prononn.no
Brister, D.J. and Kapuscinski, A.R. 2002. Environmental Assessment Tool for Aquaculture in the Great Lakes Basin Version 1.2. Great Lakes Fishery Commission Miscellaneous Report [online] URL http://www.glfc.org/pubs/pub/htm
Davis, D.D. 1975. Minimum dissolved oxygen requirements of aquatic life with emphasis on Canadian species: a review. J. Fish. Res. Board Can. 32: 2295-2332.
Fenchel, T. 1969. The ecology of masine microbenthos IV. Structure and function of the benthic ecosystem, its chemical and physical factors and the microfauna communities with special reference to the ciliated protozoa. Ophelia 6: 1 - 182.
Gregory, D., B. Petiie, F. Jordan, and P. Langille. 1993. Oceanographic, geographic, and hydrological parameters of Scotia-Fundy and Southern Gulf of St. Lawreilce inlets. Can. Tech. Rep. Hydro. Ocean Sci. No. 143: viii + 248 pp.
Halliday, R.G.. L.P. Fanning and R.K. Mohn. 2001. Use of the Traffic Light Method ill fishery management planning. Can. Sci. Adv. Res. Doc. 2001/0841 pp.
Hargrave, B.T. 2002. A traffic light decision system for marine finfish aquaculture siting. Ocean and Coastal Management 45: 215-235.
Wildish, D.J., H.M. Akagi, N. Hamilton, and B.T. Hargrave. 1999. A recommended method for monitoring sediments to detect organic enrichment from mariculture in the Bay of Fundy. Can. Tech. Rep. Fish. Aquat. Sci. 2286: iii + 3 1 pp.