photolysis of caged ATP (P3-1(2-nitrophenyl)ethyladenosine 5
Upload
independentCategory
view
7download
0
Binding Kinetics of Calbindin-D28k Determined by Flash Photolysis ofCaged Ca21
U. Valentin Nagerl,* David Novo,† Istvan Mody,† and Julio L. Vergara†
†Departments of Physiology and Neurology and *IDP Neuroscience, UCLA School of Medicine, Los Angeles, California 90095 USA
ABSTRACT We have used UV flash photolysis of DM-nitrophen in combination with model-based analysis of Oregon Green488 BAPTA-5N fluorescence transients to study the kinetics of Ca21 binding to calbindin-D28K. The experiments usedsaturated DM-nitrophen at a [Ca21] of 1.5 mM. Under these conditions, UV laser flashes produced rapid steplike increasesin [Ca21] in the absence of calbindin-D28K, and in its presence the decay of the flash-induced fluorescence was due solelyto the Ca21 buffering by the protein. We developed a novel method for kinetic parameter derivation and used the syntheticCa21 buffer EGTA to confirm its validity. We provide evidence that calbindin-D28K binds Ca21 in at least two distinct kineticpatterns, one arising from high-affinity sites that bind Ca21 with a kon comparable to that of EGTA (i.e., ;1 3 107 M21 s21)and another with lower affinity and an approximately eightfold faster kon. In view of the inability of conventional approachesto adequately resolve rapid Ca21 binding kinetics of Ca21 buffers, this method promises to be highly valuable for studyingthe Ca21 binding properties of other biologically important Ca21 binding proteins.
INTRODUCTION
Calcium signaling in excitable cells is characterized byrapid calcium concentration ([Ca21]) increases resultingfrom influx through specialized channels in the cell mem-brane or release from intracellular stores. The [Ca21] re-turns to its resting level via the action of extrusion pumps,Ca21 exchangers, Ca21 binding proteins (CBPs), and otherendogenous buffers. [Ca21] signals can propagate throughan entire cell as Ca21 waves (Davis, 1992) or can quicklyrise and fall in a spatially restricted manner (Neher, 1998b;DiGregorio et al., 1999) and are thought to be shaped byCBPs (Neher, 1998b; Stern, 1992). To understand the in-teractions between rapidly changing [Ca21] levels andCBPs, one must not only know the protein’s concentrationand equilibrium binding properties (Kd), but also the asso-ciation and dissociation rate constants (kon andkoff, respec-tively) of the Ca21 binding reaction.
Calbindin-D28K (CB28K) is a prominent member of theEF hand superfamily of CBPs, characterized by the EF handmotif, which permits the specific and reversible binding ofCa21 (Kawasaki et al., 1998). CB28k is found in specificcentral nervous system (CNS) neurons (Celio, 1990) such ascerebellar Purkinje cells and hippocampal granule cells,where it is thought to be present in high cytosolic concen-trations (up to hundreds of micromolar) (Fierro and Llano,1996; Baimbridge, 1992). Thus far CB28K has not beenfound to play a role in Ca21-dependent regulation of enzy-matic activity comparable to that of calmodulin (Kennedy,1989). However, in view of its ability to bind four Ca21 ionsper molecule (Veenstra et al., 1997) with physiologically
relevant affinity (Cheung et al., 1993; Gross et al., 1993), itis expected to play a major role as an intracellular Ca21
buffer. Indeed, data from CB28k knock-out mice experi-ments are consistent with such a role (Airaksinen et al.,1997; Klapstein et al., 1998; Pasti et al., 1999). Further-more, CB28k was shown to limit the Ca21-dependent inac-tivation of Ca21 currents in hippocampal granule cells(Nagerl et al., 2000), presumably by competing for Ca21
with the Ca21 sensor responsible for inactivation.Little is known about the Ca21 binding kinetics of CPBs,
including CB28K. This is mainly due to technical limitationsinvolved in measuring association rate constants of diffu-sion-limited reactions (Eigen, 1963). A commonly usedtechnique for these purposes is stopped flow, which haspreviously been used to investigate the Ca21 binding kinet-ics of CPBs other than CB28k, such as synaptotagmin (Daviset al., 1999), calmodulin (Bayley et al., 1984), and calbi-ndin-D9k (CB9K) (Martin et al., 1990). A major limitation ofthe stopped-flow method is its inherent dead time in therange between 1 and 2 ms (Czerlinski, 1966). To accuratelydetermine kinetic rate constants we must have informationon both the amplitude and shape of the Ca21 signals duringthe initial phases of the reaction, which can occur during thedead time of the technique. This limitation is especiallyevident when one measures Ca21 association rate constantsof polypeptides such as the C2A domain of synaptotagmin,where the entire reaction was completed within the deadtime of the instrument and only a lower estimate of thekon
could be determined (Davis et al., 1999).The temperature-jump method is another means for track-
ing fast kinetics, which has been used to characterize theCa21 binding reactions of chelators and dyes (Kao andTsien, 1988; Naraghi, 1997). Even though this techniquehas a dead time of only several microseconds, its usefulnessis limited by the fact that the kinetic rate constants areinferred from a temperature-jump-induced displacementfrom equilibrium for multiple Ca21-binding molecular spe-
Received for publication 14 July 2000 and in final form 31 August 2000.
Address reprint requests to Dr. Valentin Na¨gerl, Max-Planck Institute ofNeurobiology, Am Klopferspitz 18A, 82152 Martinsried, Germany, Tel:49-89-8578-3718, Fax: 49-89-8995-0037, E-mail: [email protected].
© 2000 by the Biophysical Society
0006-3495/00/12/3009/10 $2.00
3009Biophysical Journal Volume 79 December 2000 3009–3018
cies. The interpretation of the relaxation has only beenaccomplished assuming either simplifying conditions suchas small perturbations in the [Ca21] (Czerlinski, 1966) orthat the relaxation responses are a complicated sum ofexponentials (Naraghi, 1997). Neither assumption is neces-sarily valid under all experimental conditions that onewould wish to examine.
Here we report a novel technique to measure the Ca21
binding kinetics of CBPs, such as CB28K, that is based onflash photolysis of DM-nitrophen (DM-n), a caged Ca21
compound. The method was modified from that previouslyreported (Escobar et al., 1995, 1997), where it was used toinvestigate the kinetic properties of Ca21 indicator dyes.Several changes were made to accurately determine theCa21 binding properties of nonfluorescent Ca21 buffers: 1)The free [Ca21] was monitored using OGB-5N, a low-affinity Ca21 indicator with binding kinetics faster thanthose of any of the buffers studied. 2) A relatively highpreflash free [Ca21] was used to generate a steplike [Ca21]driving function, fast enough (,200ms rise time) to resolverapid Ca21 binding kinetics. 3) Mathematical model simu-lations, which incorporated the Ca21-binding reactions ofall of the species in the solution, were fitted to the experi-mental data to extract kinetic parameters. The dead timeassociated with this flash photolysis method is as low as 10ms (Escobar et al., 1997), thus allowing us to clearly resolvethe rising phase and amplitude of fast Ca21 signals afterlaser pulse delivery.
We first confirmed the validity of this technique by usingEGTA, a well-characterized Ca21 buffer (Naraghi, 1997;Smith et al., 1984; McGuigan et al., 1991; DiGregorio et al.,1998, 1999). We then used it to study Ca21 binding toCB28K. Our results show that CB28K possesses two kineti-cally distinct types of Ca21 binding sites.
The methodology described here should have broad ap-plicability for the study of the Ca21 binding properties of awide array of CBPs, which should be useful for understand-ing biological processes such as synaptic transmission(Adler et al., 1991; Atluri and Regehr, 1996; Chen andRegehr, 1999) and muscle excitation-contraction coupling(Vergara and Delay, 1985; Hollingworth et al., 1996), inwhich Ca21 buffering is thought to play a key role.
MATERIALS AND METHODS
Optical set-up
As described previously (Escobar et al., 1997), the experimental setupconsisted of a spot detection system and a fiber optic system to deliverflashes of UV light to sample droplets (flash solution) placed on anexperimental chamber situated in the field of view of an inverted fluores-cence microscope (model IM; Zeiss, Oberkochen, Germany). Epifluores-cence illumination was supplied by an argon laser (488 nm, model 95;Lexel, Freemont, CA) operated at power output levels between 45 and90 mW. The laser beam was spatially filtered with a Gaussian filter(15-mm-diameter pinhole) and then focused onto the epifluorescence illu-mination port of the microscope. A dichroic mirror, with a central wave-
length of 510 nm, and a 515-nm emission filter (Melles Griot, Carlsbad,CA) were used for proper wavelength selection. A 403 objective (MPlan40; Nikon, Tokyo, Japan) was used to form the image of the pinhole(illumination spot) and to collect the fluorescence. The effective illumina-tion spot measured 1.3mm in diameter.
UV flash delivery
Flashes of UV light (347 nm for 20 ns) were generated by a frequency-doubled ruby laser (Lumonics, Rugby, UK) and guided through a claddedfused-silica fiber optic (diameter 200mm). With a micropositioner, thefiber optic was centered relative to the illumination spot, its tip touching thecoverslip of the experimental chamber, and fully immersed in a 20-ml flashsolution droplet. The energy of each UV flash was measured with a peakdetection circuit located in the laser head, the output of which was acquiredsimultaneously with the fluorescence traces and calibrated with a digitalbolometer (model 36-5002T2; Scientech, Boulder, CO).
Fluorescence recording
OGB-5N (Molecular Probes, Eugene, OR) fluorescence was measuredwith an ultralow capacitance PIN photodiode (HR-005; United DetectorTechnologies, Culver City, CA), using the integrating headstage of apatch-clamp amplifier (Axopatch 200A; Axon Instruments, Foster City,CA) as a current-to-voltage converter. The analog signal was filtered withan 8-pole low-pass Bessel filter with a cut-off frequency set at 2 kHz anddigitized at 50 kHz (PCI-MIO-16XE-10; National Instruments, Austin,TX). Although the excitation spectrum of OGB-5N peaks at 494 nm, thehigh energy of the UV flash still induced a large and brief fluorescencetransient, which would have saturated the detection system. To avoid thisartifact, the integrating capacitor of the Axopatch headstage was short-circuited for 50 ms, encompassing the point of UV flash delivery, toprevent the amplifier from saturating and to allow faithful recording of therising phase of fluorescence transients immediately after flash delivery.Data acquisition and timing were controlled by custom-written software inG-language (LabVIEW; National Instruments). Flash generation, shuttercontrol, and capacitor blanking were timed with a Digitimer D4030 (Hert-fordshire, England).
All fluorescence traces were expressed as
DF
F5
F~t! 2 Frest
Frest(1)
where F(t) is the acquired fluorescence record andFrest is the restingfluorescence before flash delivery. The data were imported into Origin(Microcal, Northampton, MA) for exponential time constant fitting using anonlinear least-squares algorithm. Steady-stateDF/F values were con-verted into absolute [Ca21], using the following equilibrium formula(Vergara and DiFranco, 1992; Escobar et al., 1997):
@Ca21# 5 KdSF/Fmax 2 1/Fratio
1 2 F/FmaxD (2)
whereKd is the equilibrium dissociation constant of OGB-5N,Fmax is themaximum fluorescence,Fratio is the ratio of the maximum and minimumfluorescence, andF is the steady-state fluorescence.Fmaxwas measured byraising the [Ca21] in the flash solution to 5 mM.
Ca21 electrode measurements
The [Ca21] of all solutions was measured with custom-made Ca21 elec-trodes (Baudet et al., 1994). Glass pipettes (BF-160-80-10; Sutter Instru-ment, Novato, CA) were fire-polished, silenized, and filled by capillary
3010 Nagerl et al.
Biophysical Journal 79(6) 3009–3018

action with a Ca21-selective ionophore (Cocktail A; Fluka, Milwaukee,WI) mixed at equal volume with 1% polyvinylchloride PVC dissolved intetrahydrofuran (THF). A thin membrane was formed after evaporation ofthe THF, and the electrodes were stored at room temperature for at least 2days before use. NaCl-based pCa standard solutions (290 mOsm, Calbuf-2;WPI, New Haven, CT) were used for calibration. The pCa 6 standard wasused as the intrapipette reference solution. The voltage offsets were zeroedwhen the electrode was submerged in the pCa 6 solution. Electrodes wereused only if they exhibited linearity (.26.5 mV/decade) in the pCa rangefrom 3 to 7.4 and suffered less than 1 mV/h drift. The voltage offset in thepCa electrode reading due to the salt mismatch between the NaCl-basedCa21 calibration and the KCl-based flash solutions was measured as afunction of the [Ca21] and corrected. In the Scatchard EGTA experiments,NaCl was used in the buffer solution to avoid complications associatedwith variable offsets at low [Ca21].
Preparation of solutions
All flash solutions contained (in mM) 120 KCl, 40 HEPES, 5 DM-n, and0.1 OGB-5N. Osmolarity and pH were set at 280 mOsm and 7.3, respec-tively. They also included either variable concentrations (0, 0.25, 0.5, 1,and 2 mM) of EGTA (Sigma, St. Louis, MO) or 700mg of lyophilizedrecombinant CB28k (courtesy of Dr. K. G. Baimbridge, University ofBritish Columbia) per 200ml of solution (125mM). The [Ca21] of the flashsolutions was titrated to 1.5mM with CaCl2. A 20-ml droplet of flashsolution was placed on the coverslip, fully enclosing the tip of the fiberoptic. Because the fraction of the droplet volume exposed to the flash wassmall, we were able to acquire;10 flash-evoked transients from singledroplets without significant changes in the baseline conditions. All exper-iments were conducted at room temperature (20–22°C).
Scatchard analysis of Ca21 equilibriumbinding to EGTA
The effective equilibrium dissociation constant (Kd) of EGTA was mea-sured by titration, using the Ca21 electrode, and calculated from Scatchardplots according to procedures described elsewhere (Bers, 1982; DiPolo etal., 1983). The solution volume of 10 ml was mixed intermittently with amagnetic stir bar when CaCl2 from stock solutions (1 M, 100 mM, 25 mM,5 mM) was introduced via a calibrated pipette. For comparison, we alsocalculatedKd values for EGTA, using the MaxChelator simulation package(Bers et al., 1994).
Data analysis and kinetic parameter extraction
A general-purpose differential equation solver (Berkeley Madonna 8.0, UCBerkeley) was used for model fitting and parameter extraction, in which adownhill simplex optimization algorithm minimized the root-mean-square(RMS) value between model predictions and experimental data traces. Themodel simulated UV flash-inducedDF/F fluorescence transients in the pres-ence of a known concentration of a Ca21 buffer according to the schemeshown in Fig. 1. The dynamic redistribution of Ca21 among the threeCa21-binding species (DM-n, OGB-5N, and the Ca21 buffer under inves-tigation) was modeled after a rapid (t 5 20 ms) and drastic (.600,000-fold) increase in the dissociation rate constant of DM-n (Ellis-Davies andKaplan, 1994; Escobar et al., 1997) (see Appendix for details), whicheffectively liberated and acted as the source for Ca21. The kinetic andfluorescent properties of OGB-5N and DM-n used in the model were takenfrom the literature or were independently verified in our laboratory (seeAppendix for details). To match the signal conditioning of modeled datawith that of the experimental traces, the output of the model was digitallyfiltered. For computational efficiency we implemented a single time con-stant filter (t 5 80 ms) that approximated the analog Bessel filter. The
filtered model simulations were fitted to the normalized fluorescencetransients usinga (flash energy),kon, andKd as the only floating param-eters. Up to fiveDF/F traces obtained from the same droplet but at differentflash energies (i.e., [Ca21] step size) were fitted simultaneously by forcingthe values ofkon andKd to be identical (for any family of simulatedDF/Ftransients) and allowing only thea parameter to vary within.
RESULTS
Photolysis of DM-n generates steps in free [Ca21]
A previous paper has described in detail the dynamic prop-erties of Ca21 spikes induced by DM-n flash photolysis andtheir dependence on the experimental conditions, namelythe resting [Ca21] and the UV flash energy (Escobar et al.,1997). It was suggested that at relatively high preflash[Ca21], flash photolysis generates Ca21 steps because underthese conditions DM-n is saturated and any rebinding ofCa21 to free DM-n becomes negligible. Fig. 2 shows thatwhen the resting [Ca21] was titrated to 1.5mM, in theabsence of EGTA or CBPs, we were able to induce steplikechanges in [Ca21]. These were evidenced by rapid increasesin OGB-5N fluorescence (200ms, 10–90% rise time), the
FIGURE 1 Scheme of the model used to simulate the dynamic redistri-bution of Ca21 generated by flash photolysis of DM-n. CaDM, CaD, andCaB represent the concentration of Ca21 bound to DM-n, dye, or buffer,respectively. Ca21, D, and B are the free concentrations of Ca21, dye, andbuffer, respectively.a models the fraction of Ca21-bound DMn that isphotolyzed by the UV laser flash.
FIGURE 2 UV flash photolysis of DM-n produces steplike changes in[Ca21]. (A) OGB-5N fluorescence increases in response to UV laserflashes (delivered at thearrow) of six different energies. The measuredrelative energies (from bottom to top trace) were 1.00, 1.20, 1.44, and 1.57.The absolute [Ca21] plateau values (10 ms after flash delivery) werecalculated as described in Materials and Methods and are shown on theright-hand side of each trace. (B) As in A, but on an expanded time scale.
Ca21 Binding Kinetics of Calbindin-D28k 3011
Biophysical Journal 79(6) 3009–3018

amplitude of which depended on the flash energy (Fig. 2).The decay of these fluorescence signals was constrained towithin ,8% in 60 ms and;5% in 20 ms (Fig. 2A),demonstrating only a moderate [Ca21] decrease (either bydiffusion out of the detection volume or rebinding to resid-ual DM-n) on the time scale of Ca21 buffering we sought tostudy. Fig. 2B shows, on an expanded time scale, that flashartifacts do not compromise the onset of the fluorescencesignal.
Ca21 association with EGTA
To test the validity of using UV flash photolysis to accu-rately estimate the kinetic Ca21 binding properties of non-fluorescent Ca21 buffers, we chose to study the well-knownsynthetic Ca21 buffer EGTA, because it is available in highpurity (.97%) and it binds Ca21 with simple 1:1 stoichi-ometry (Bers et al., 1994). Moreover, the kinetic propertiesof this buffer have been studied (Smith et al., 1984; Naraghi,1997; DiGregorio and Vergara, 1997).
Scatchard analysis of EGTA equilibrium binding of Ca21
Because the affinity of EGTA for Ca21 is strongly influ-enced by parameters such as ionic strength and pH (Bers,1982; Bers et al., 1994), we determined its effective equi-librium dissociation constant (Kd) by Scatchard analysis ofour experimental solutions. Fig. 3A shows linear regres-sions of the titration data obtained with Ca21-sensitiveelectrodes. The filled symbols represent uncorrected data,yielding aKd of 72 6 4 nM (n 5 3) and a total [EGTA] of920mM. We chose to correct the data by assuming that thetotal [EGTA] in the solution was exactly 1 mM, whichimplied a total Ca21 contamination of 80mmol/liter. Theorder of magnitude of this contamination is consistent withthe specified maximum Ca21 levels inherent in the stockcompounds. The corrected values were replotted (open sym-bols in Fig. 3 A), and theKd obtained from the linear fit tothe corrected data was 686 3.5 nM (n 5 3). However,multiple linear regression analysis revealed that the twoKd
values were not statistically different (p . 0.2).
Single time constant fitting approach
Fig. 3 B shows the exponential decay of flash-inducedOGB-5N fluorescence transients in the presence of variableconcentrations of EGTA (0.25, 0.5, 1, and 2 mM). Theaddition of EGTA to the flash solution led to the appearanceof a decay phase in the transients, which became more rapidand pronounced as the concentration of EGTA was in-creased from 0 to 2 mM. Because the relaxation of thefluorescence transients could be well fitted by single expo-nentials (smooth linesin Fig. 3B), one might be tempted todirectly derive the kinetic rate constants from these time
constants. If the only Ca21 binding reaction occurring in thedroplet involved EGTA, it would obey the simple scheme
@Ca21# 1 @EGTA#9|=kon
koff
@CaEGTA# (3)
Under these circumstances, the [Ca21] response to a smallstep intotal [Ca21], relative to thetotal [EGTA], would bean initial jump followed by an exponential decay with thetime constant
t 5 ~kon 3 @EGTA# 1 koff!21 (4)
Nevertheless, this simple kinetic analysis is inappropriateunder our experimental conditions for the following rea-sons. First, the single-buffer assumption is invalid, because
FIGURE 3 (A) Scatchard plot to determine the effective Ca21 dissocia-tion constant (Kd) of EGTA. The ordinate represents the ratio of theconcentration of bound [Ca21] over free [Ca21], and the abscissa is thebound [Ca21] as calculated from Ca21 electrode data. The straight line isa linear least-squares (regression) fit to the data points. The open circlesshow the same data set corrected for 80mmole/liter Ca21 contamination,which was found to shift thex axis intercept of the regression line to 1 mM.(B) Dependence of the decay inDF/F transients on the [EGTA]. Thin linesrepresent fits to the data (fit function:A 3 exp(2t/t) 1 C, whereA isamplitude, C is steady-state offset, andt is a time constant) and aresuperimposed on the individual data traces (thick lines). The values of total[EGTA] and t are shown above each trace.
3012 Nagerl et al.
Biophysical Journal 79(6) 3009–3018
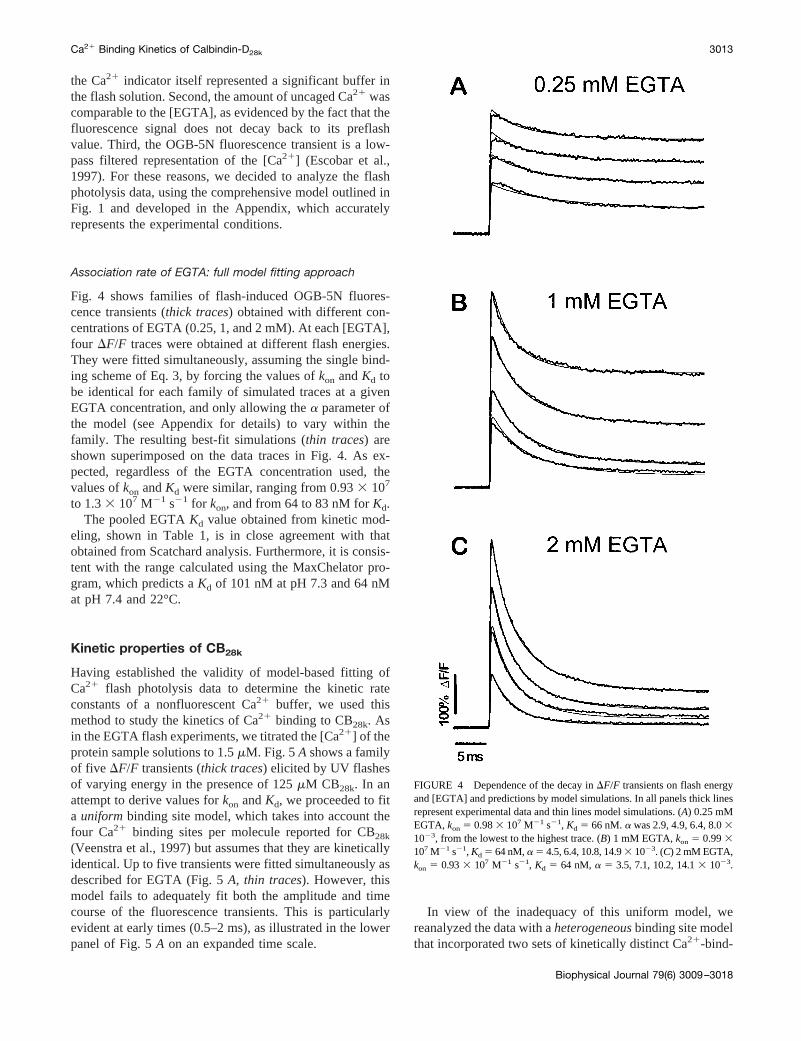
the Ca21 indicator itself represented a significant buffer inthe flash solution. Second, the amount of uncaged Ca21 wascomparable to the [EGTA], as evidenced by the fact that thefluorescence signal does not decay back to its preflashvalue. Third, the OGB-5N fluorescence transient is a low-pass filtered representation of the [Ca21] (Escobar et al.,1997). For these reasons, we decided to analyze the flashphotolysis data, using the comprehensive model outlined inFig. 1 and developed in the Appendix, which accuratelyrepresents the experimental conditions.
Association rate of EGTA: full model fitting approach
Fig. 4 shows families of flash-induced OGB-5N fluores-cence transients (thick traces) obtained with different con-centrations of EGTA (0.25, 1, and 2 mM). At each [EGTA],four DF/F traces were obtained at different flash energies.They were fitted simultaneously, assuming the single bind-ing scheme of Eq. 3, by forcing the values ofkon andKd tobe identical for each family of simulated traces at a givenEGTA concentration, and only allowing thea parameter ofthe model (see Appendix for details) to vary within thefamily. The resulting best-fit simulations (thin traces) areshown superimposed on the data traces in Fig. 4. As ex-pected, regardless of the EGTA concentration used, thevalues ofkon andKd were similar, ranging from 0.933 107
to 1.33 107 M21 s21 for kon, and from 64 to 83 nM forKd.The pooled EGTAKd value obtained from kinetic mod-
eling, shown in Table 1, is in close agreement with thatobtained from Scatchard analysis. Furthermore, it is consis-tent with the range calculated using the MaxChelator pro-gram, which predicts aKd of 101 nM at pH 7.3 and 64 nMat pH 7.4 and 22°C.
Kinetic properties of CB28k
Having established the validity of model-based fitting ofCa21 flash photolysis data to determine the kinetic rateconstants of a nonfluorescent Ca21 buffer, we used thismethod to study the kinetics of Ca21 binding to CB28k. Asin the EGTA flash experiments, we titrated the [Ca21] of theprotein sample solutions to 1.5mM. Fig. 5A shows a familyof five DF/F transients (thick traces) elicited by UV flashesof varying energy in the presence of 125mM CB28k. In anattempt to derive values forkon andKd, we proceeded to fita uniform binding site model, which takes into account thefour Ca21 binding sites per molecule reported for CB28k
(Veenstra et al., 1997) but assumes that they are kineticallyidentical. Up to five transients were fitted simultaneously asdescribed for EGTA (Fig. 5A, thin traces). However, thismodel fails to adequately fit both the amplitude and timecourse of the fluorescence transients. This is particularlyevident at early times (0.5–2 ms), as illustrated in the lowerpanel of Fig. 5A on an expanded time scale.
In view of the inadequacy of this uniform model, wereanalyzed the data with aheterogeneousbinding site modelthat incorporated two sets of kinetically distinct Ca21-bind-
FIGURE 4 Dependence of the decay inDF/F transients on flash energyand [EGTA] and predictions by model simulations. In all panels thick linesrepresent experimental data and thin lines model simulations. (A) 0.25 mMEGTA, kon 5 0.983 107 M21 s21, Kd 5 66 nM.a was 2.9, 4.9, 6.4, 8.031023, from the lowest to the highest trace. (B) 1 mM EGTA,kon 5 0.993107 M21 s21, Kd 5 64 nM,a 5 4.5, 6.4, 10.8, 14.93 1023. (C) 2 mM EGTA,kon 5 0.933 107 M21 s21, Kd 5 64 nM, a 5 3.5, 7.1, 10.2, 14.13 1023.
Ca21 Binding Kinetics of Calbindin-D28k 3013
Biophysical Journal 79(6) 3009–3018
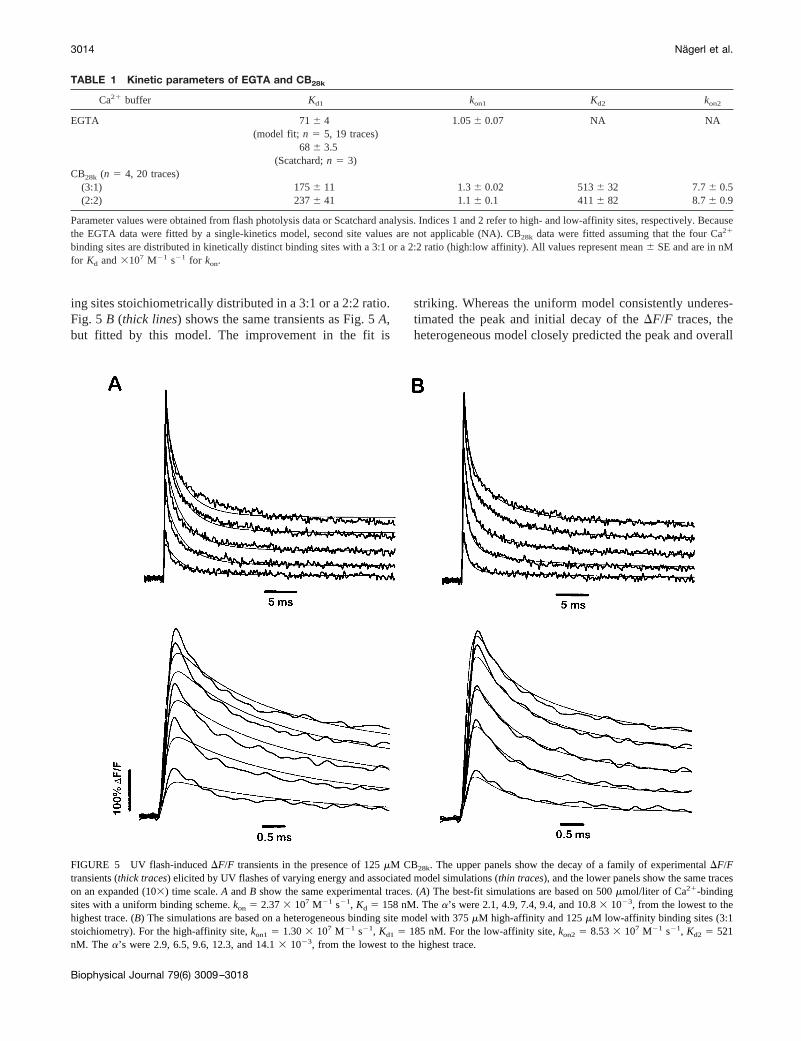
ing sites stoichiometrically distributed in a 3:1 or a 2:2 ratio.Fig. 5 B (thick lines) shows the same transients as Fig. 5A,but fitted by this model. The improvement in the fit is
striking. Whereas the uniform model consistently underes-timated the peak and initial decay of theDF/F traces, theheterogeneous model closely predicted the peak and overall
TABLE 1 Kinetic parameters of EGTA and CB28k
Ca21 buffer Kd1 kon1 Kd2 kon2
EGTA 716 4 1.056 0.07 NA NA(model fit; n 5 5, 19 traces)
686 3.5(Scatchard;n 5 3)
CB28k (n 5 4, 20 traces)(3:1) 1756 11 1.36 0.02 5136 32 7.76 0.5(2:2) 2376 41 1.16 0.1 4116 82 8.76 0.9
Parameter values were obtained from flash photolysis data or Scatchard analysis. Indices 1 and 2 refer to high- and low-affinity sites, respectively. Becausethe EGTA data were fitted by a single-kinetics model, second site values are not applicable (NA). CB28k data were fitted assuming that the four Ca21
binding sites are distributed in kinetically distinct binding sites with a 3:1 or a 2:2 ratio (high:low affinity). All values represent mean6 SE and are in nMfor Kd and3107 M21 s21 for kon.
FIGURE 5 UV flash-inducedDF/F transients in the presence of 125mM CB28k. The upper panels show the decay of a family of experimentalDF/Ftransients (thick traces) elicited by UV flashes of varying energy and associated model simulations (thin traces), and the lower panels show the same traceson an expanded (103) time scale.A andB show the same experimental traces. (A) The best-fit simulations are based on 500mmol/liter of Ca21-bindingsites with a uniform binding scheme.kon 5 2.373 107 M21 s21, Kd 5 158 nM. Thea’s were 2.1, 4.9, 7.4, 9.4, and 10.83 1023, from the lowest to thehighest trace. (B) The simulations are based on a heterogeneous binding site model with 375mM high-affinity and 125mM low-affinity binding sites (3:1stoichiometry). For the high-affinity site,kon1 5 1.303 107 M21 s21, Kd1 5 185 nM. For the low-affinity site,kon2 5 8.533 107 M21 s21, Kd2 5 521nM. The a’s were 2.9, 6.5, 9.6, 12.3, and 14.13 1023, from the lowest to the highest trace.
3014 Nagerl et al.
Biophysical Journal 79(6) 3009–3018
time course of the transients. This improvement is quanti-tatively reflected by a factor of 2 decrease in the RMS value.Moreover, we found that a stoichiometry of three high-affinity sites and one low-affinity site yielded a slightlybetter but not statistically significant (p . 0.2, paired Stu-dent’st-test) fit than the 2:2 stoichiometry (RMS5 0.3160.2 versus 0.376 0.6 (mean6 SE, respectively). Table 1lists the kon and Kd values of CB28k as derived from theheterogeneous binding site model for both stoichiometries.
DISCUSSION
We have used UV laser flash photolysis of DM-n in com-bination with model fitting to study the kinetic Ca21 bind-ing properties of human recombinant CB28k. Our resultsdemonstrate that CB28k binds Ca21 in at least two distinctkinetic patterns, one arising from high-affinity sites thatbind Ca21 with a kon comparable to that of EGTA (i.e.,;1 3 107 M21 s21) and another with lower affinity and anapproximately eightfold fasterkon.
UV flash photolysis provides a means for eliciting rapidand large [Ca21] changes and deriving Ca21 binding rateconstants of Ca21 buffers from nonlinear model analysis.The model explicitly included all Ca21 binding reactions;parameters other than the unknown Ca21 buffering rateconstants were either measured or set at published values.Furthermore, the analysis avoided linearizing assumptionsrequired for fitting analytical functions to the data (Neher,1998a). As a consequence, robust signals with excellentsignal-to-noise ratio generated in response to the large Ca21
driving functions could be used to analyze the kinetic reac-tions. The use of UV flashes of varying energy allowed usto generate a range ofDF/F transients and to fit the modelpredictions simultaneously. These constraints increaseour confidence in the uniqueness of the derived kineticparameters.
The brief dead time of the methodology makes it possibleto faithfully resolve the rising phase of the fluorescencetransient and thus obtain its amplitude directly rather thanby extrapolating to critical early time points. By titrating thepre-flash [Ca21] to 1.5 mM, .99.5% of the DM-n wasloaded with Ca21. Thus there is practically no rebinding ofCa21 to DM-n regardless of UV flash energy, and photol-ysis produced steplike increases in [Ca21] in the absence ofbuffers (Fig. 2). In the presence of synthetic buffers orCBPs, any fluorescence decay can be solely ascribed to theirCa21 binding properties (Figs. 3B, 4, and 5).
As a test for this approach to estimating kinetic parame-ters of Ca21 buffers, we determined theKd andkon of Ca21
binding to EGTA. The model-derivedKd (71 6 4 nM, n 55) was in close agreement with those calculated from Scat-chard analysis (686 3.5 nM, n 5 3, Fig. 3A) and by theMaxChelator software. At pH 7.3, ourkon value of 1.053107 M21 s21 matches that previously determined bystopped-flow analysis at the same pH (Smith et al., 1984),
which is approximately fivefold faster than at pH 7.0(Naraghi, 1997). Moreover, ourKd value of 71 nM isapproximately fivefold lower than those reported at pH 7(Harrison and Bers, 1987). Altogether, these results rein-force the notion that the higher affinity of EGTA at alowered protonation state is due primarily to an increase inkon, leaving koff unchanged (Hellam and Podolsky, 1969;Tsien, 1980; Smith et al., 1984; Harrison and Bers, 1987).
The EGTA experiments demonstrate that our flash pho-tolysis kinetic method is sufficiently sensitive to accuratelyresolve aKd of less than 100 nM, even though 95% ofEGTA is Ca21 bound when 1.5mM of [Ca21] is presentbefore flash delivery. Thus, we chose to determine theKd
values of CB28k from the analysis of flash photolysis tran-sients, rather than from Scatchard analysis, to avoid thelatter method’s intrinsic difficulties in resolvingKd valuesof Ca21-binding sites that differ by less than an order ofmagnitude. No less problematic was the limited availabilityof the protein, given the substantial quantities that would beconsumed by decalcification and titration of the proteinsample (Celio et al., 1996). We used a KCl-based buffersolution with pH and osmolarity values intended to mimicthe physiological intracellular conditions of mammalianCNS neurons. Given that Ca21 binding to a buffer is usuallyassociated with the release of protons (Tsien, 1980), the pHof the flash solutions was strongly buffered. For this studywe excluded any Mg21 from the solutions to avoid compli-cations caused by UV flash-induced release of Mg21 fromDM-n (Kaplan and Ellis-Davies, 1988; Ayer and Zucker,1999). It is known that the Ca21 binding properties ofcertain EF-hand CBPs are influenced by [Mg21] because ofbinding competition between Ca21 and Mg21 for so-calledmixed binding sites (Celio et al., 1996). Therefore, ourresults may provide upper limits for the apparentkon and theaffinity of CB28k for Ca21, because it is possible that theseparameters are lowered in the presence of physiological[Mg21].
Even though CB28k binds four Ca21 ions with domainsthat are characterized by stereotypical EF hand structuralmotifs (Celio et al., 1996), the ability of the heterogeneousbinding sites model to drastically improve on the uniformbinding sites model (Fig. 5 and Table 1) strongly argues forthe existence of at least two types of kinetically distinctCa21-binding sites on the protein, which is consistent withprevious observations (Gross et al., 1987, 1988, 1993). TheCB28k model analysis contrasts sharply with the EGTAfindings, which demonstrated that the experimental tran-sients could be fitted well by a single (i.e., uniform) bindingsite model. Indeed, incorporation of a second, different siteinto the model for EGTA did not improve the RMS value ofthe fit (RMS values 0.205 versus 0.197, respectively; datanot shown), whereas the need for adopting a heterogeneousmodel was evident. The correct stoichiometry of the twokinetically distinct Ca21-binding sites remains uncertain.The data could be fitted well, assuming a 2:2 or a 3:1
Ca21 Binding Kinetics of Calbindin-D28k 3015
Biophysical Journal 79(6) 3009–3018
stoichiometry for the high- and low-affinity sites, respec-tively. It is important to note that the use of conventionaltechniques, such as stopped flow, would have likely made itimpossible to resolve the rate constant associated with thefast Ca21 binding site, because the fast fluorescence decayoccurred within less than 2 ms (Fig. 5).
No attempt was made to characterize possible Ca21-dependent cooperative interactions between the bindingsites, which have been reported for CB9k (Linse and Chazin,1995). Future studies of mutant CB28k proteins with alteredEF hand motifs should allow us to examine the Ca21
binding properties of individual binding sites and clarifythese important subtleties. Also, a number of technicaladvances should be incorporated to probe more sophisti-cated Ca21 binding models. A faster equilibrating Ca21
indicator dye would improve the accuracy of the derivedkinetic parameters of the Ca21 buffer under study because itwould render the model analysis less sensitive to the preciserate constants of the dye. We believe that the recentlyintroduced Fluo-5N (Molecular Probes) is a good candidate.In addition, it is desirable for the uncaging compound tohave a reduced affinity for Mg21, which would make itpossible to study the Ca21 binding kinetics in the presenceof physiological [Mg21]. An elevated affinity for Ca21
would permit the generation of Ca21 steps at lower, morephysiological [Ca21]. This may also allow us to resolvehigher affinity sites in CBPs, such as the 1 nM one reportedby Gross et al. (1993), which remained undetectable by ourcurrent method. The novel caged Ca21 compound dimeth-oxynitrophenyl-EGTA-4 (DMNPE-4) was reported to havea very low affinity for Mg21, but unfortunately it has aneven lower affinity for Ca21 than does DM-n (DelPrincipeet al., 1999).
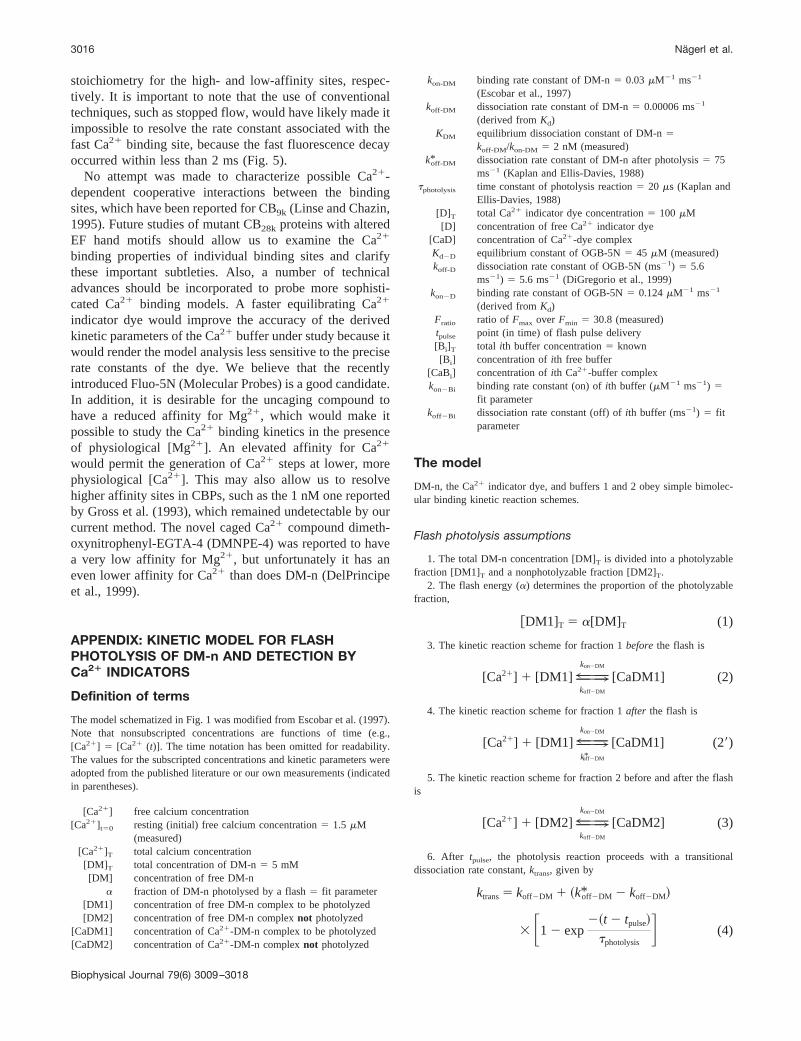
APPENDIX: KINETIC MODEL FOR FLASHPHOTOLYSIS OF DM-n AND DETECTION BYCa21 INDICATORS
Definition of terms
The model schematized in Fig. 1 was modified from Escobar et al. (1997).Note that nonsubscripted concentrations are functions of time (e.g.,[Ca21] 5 [Ca21 (t)]. The time notation has been omitted for readability.The values for the subscripted concentrations and kinetic parameters wereadopted from the published literature or our own measurements (indicatedin parentheses).
[Ca21] free calcium concentration[Ca21]t50 resting (initial) free calcium concentration5 1.5 mM
(measured)[Ca21]T total calcium concentration[DM] T total concentration of DM-n5 5 mM[DM] concentration of free DM-n
a fraction of DM-n photolysed by a flash5 fit parameter[DM1] concentration of free DM-n complex to be photolyzed[DM2] concentration of free DM-n complexnot photolyzed
[CaDM1] concentration of Ca21-DM-n complex to be photolyzed[CaDM2] concentration of Ca21-DM-n complexnot photolyzed
kon-DM binding rate constant of DM-n5 0.03 mM21 ms21
(Escobar et al., 1997)koff-DM dissociation rate constant of DM-n5 0.00006 ms21
(derived fromKd)KDM equilibrium dissociation constant of DM-n5
koff-DM/kon-DM 5 2 nM (measured)k*off-DM dissociation rate constant of DM-n after photolysis5 75
ms21 (Kaplan and Ellis-Davies, 1988)tphotolysis time constant of photolysis reaction5 20 ms (Kaplan and
Ellis-Davies, 1988)[D]T total Ca21 indicator dye concentration5 100 mM[D] concentration of free Ca21 indicator dye
[CaD] concentration of Ca21-dye complexKd2D equilibrium constant of OGB-5N5 45 mM (measured)koff-D dissociation rate constant of OGB-5N (ms21) 5 5.6
ms21) 5 5.6 ms21 (DiGregorio et al., 1999)kon2D binding rate constant of OGB-5N5 0.124mM21 ms21
(derived fromKd)Fratio ratio of Fmax over Fmin 5 30.8 (measured)tpulse point (in time) of flash pulse delivery[Bi]T total ith buffer concentration5 known[Bi] concentration ofith free buffer
[CaBi] concentration ofith Ca21-buffer complexkon2Bi binding rate constant (on) ofith buffer (mM21 ms21) 5
fit parameterkoff2Bi dissociation rate constant (off) ofith buffer (ms21) 5 fit
parameter
The model
DM-n, the Ca21 indicator dye, and buffers 1 and 2 obey simple bimolec-ular binding kinetic reaction schemes.
Flash photolysis assumptions
1. The total DM-n concentration [DM]T is divided into a photolyzablefraction [DM1]T and a nonphotolyzable fraction [DM2]T.
2. The flash energy (a) determines the proportion of the photolyzablefraction,
@DM1]T 5 a[DM] T (1)
3. The kinetic reaction scheme for fraction 1beforethe flash is
[Ca21] 1 [DM1] 9|=kon2DM
koff2DM
[CaDM1] (2)
4. The kinetic reaction scheme for fraction 1after the flash is
[Ca21] 1 [DM1] 9|=kon2DM
k*off2DM
[CaDM1] (29)
5. The kinetic reaction scheme for fraction 2 before and after the flashis
[Ca21] 1 [DM2] 9|=kon2DM
koff2DM
[CaDM2] (3)
6. After tpulse, the photolysis reaction proceeds with a transitionaldissociation rate constant,ktrans, given by
ktrans5 koff2DM 1 ~k*off2DM 2 koff2DM!
3 F1 2 exp2~t 2 tpulse!
tphotolysisG (4)
3016 Nagerl et al.
Biophysical Journal 79(6) 3009–3018
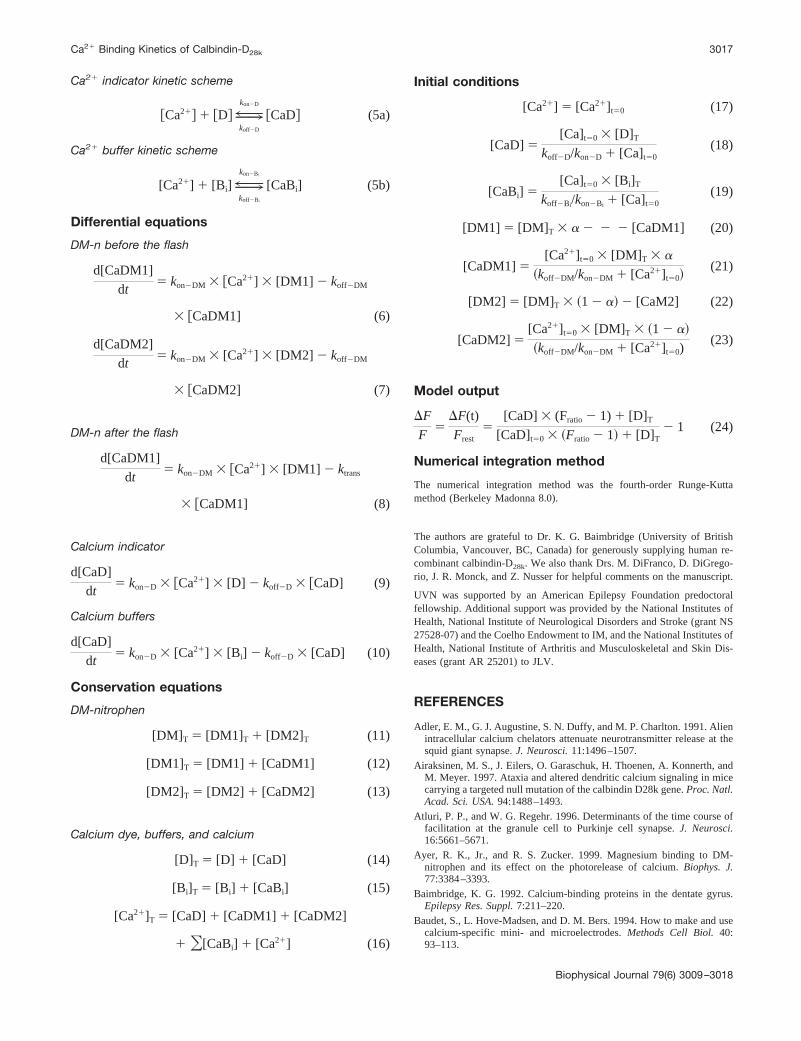
Ca21 indicator kinetic scheme
@Ca21# 1 @D#9|=kon2D
koff2D
@CaD# (5a)
Ca21 buffer kinetic scheme
[Ca21] 1 [Bi] 9|=kon2Bi
koff2Bi
[CaBi] (5b)
Differential equations
DM-n before the flash
d[CaDM1]
dt5 kon2DM 3 @Ca21] 3 [DM1] 2 koff2DM
3 @CaDM1] (6)
d[CaDM2]
dt5 kon2DM 3 [Ca21] 3 [DM2] 2 koff2DM
3 @CaDM2] (7)
DM-n after the flash
d[CaDM1]
dt5 kon2DM 3 @Ca21] 3 [DM1] 2 ktrans
3 @CaDM1] (8)
Calcium indicator
d[CaD]
dt5 kon2D 3 @Ca21] 3 [D] 2 koff2D 3 @CaD] (9)
Calcium buffers
d[CaD]
dt5 kon2D 3 [Ca21] 3 [Bi] 2 koff2D 3 [CaD] (10)
Conservation equations
DM-nitrophen
[DM] T 5 [DM1]T 1 [DM2]T (11)
[DM1]T 5 [DM1] 1 [CaDM1] (12)
[DM2]T 5 [DM2] 1 [CaDM2] (13)
Calcium dye, buffers, and calcium
[D]T 5 [D] 1 [CaD] (14)
[Bi]T 5 [Bi] 1 [CaBi] (15)
[Ca21]T 5 [CaD] 1 [CaDM1] 1 [CaDM2]
1 O[CaBi] 1 [Ca21] (16)
Initial conditions
[Ca21] 5 [Ca21]t50 (17)
[CaD] 5[Ca]t50 3 [D]T
koff2D/kon2D 1 [Ca]t50(18)
[CaBi] 5[Ca]t50 3 [Bi]T
koff2Bi/kon2Bi 1 [Ca]t50(19)
[DM1] 5 [DM] T 3 a 2 2 2 [CaDM1] (20)
[CaDM1] 5[Ca21]t50 3 [DM] T 3 a
~koff2DM/kon2DM 1 [Ca21]t50!(21)
[DM2] 5 [DM] T 3 ~1 2 a! 2 [CaM2] (22)
[CaDM2] 5[Ca21]t50 3 [DM] T 3 ~1 2 a!
~koff2DM/kon2DM 1 [Ca21]t50)(23)
Model output
DF
F5
DF(t)
Frest5
[CaD] 3 (Fratio 2 1) 1 [D]T
[CaD]t50 3 ~Fratio 2 1! 1 [D]T2 1 (24)
Numerical integration method
The numerical integration method was the fourth-order Runge-Kuttamethod (Berkeley Madonna 8.0).
The authors are grateful to Dr. K. G. Baimbridge (University of BritishColumbia, Vancouver, BC, Canada) for generously supplying human re-combinant calbindin-D28k. We also thank Drs. M. DiFranco, D. DiGrego-rio, J. R. Monck, and Z. Nusser for helpful comments on the manuscript.
UVN was supported by an American Epilepsy Foundation predoctoralfellowship. Additional support was provided by the National Institutes ofHealth, National Institute of Neurological Disorders and Stroke (grant NS27528-07) and the Coelho Endowment to IM, and the National Institutes ofHealth, National Institute of Arthritis and Musculoskeletal and Skin Dis-eases (grant AR 25201) to JLV.
REFERENCES
Adler, E. M., G. J. Augustine, S. N. Duffy, and M. P. Charlton. 1991. Alienintracellular calcium chelators attenuate neurotransmitter release at thesquid giant synapse.J. Neurosci.11:1496–1507.
Airaksinen, M. S., J. Eilers, O. Garaschuk, H. Thoenen, A. Konnerth, andM. Meyer. 1997. Ataxia and altered dendritic calcium signaling in micecarrying a targeted null mutation of the calbindin D28k gene.Proc. Natl.Acad. Sci. USA.94:1488–1493.
Atluri, P. P., and W. G. Regehr. 1996. Determinants of the time course offacilitation at the granule cell to Purkinje cell synapse.J. Neurosci.16:5661–5671.
Ayer, R. K., Jr., and R. S. Zucker. 1999. Magnesium binding to DM-nitrophen and its effect on the photorelease of calcium.Biophys. J.77:3384–3393.
Baimbridge, K. G. 1992. Calcium-binding proteins in the dentate gyrus.Epilepsy Res. Suppl.7:211–220.
Baudet, S., L. Hove-Madsen, and D. M. Bers. 1994. How to make and usecalcium-specific mini- and microelectrodes.Methods Cell Biol.40:93–113.
Ca21 Binding Kinetics of Calbindin-D28k 3017
Biophysical Journal 79(6) 3009–3018
Bayley, P., P. Ahlstrom, S. R. Martin, and S. Forsen. 1984. The kinetics ofcalcium binding to calmodulin: Quin 2 and ANS stopped-flow fluores-cence studies.Biochem. Biophys. Res. Commun.120:185–191.
Bers, D. M. 1982. A simple method for the accurate determination of free[Ca] in Ca-EGTA solutions.Am. J. Physiol.242:C404–C408.
Bers, D. M., C. W. Patton, and R. Nuccitelli. 1994. A practical guide to thepreparation of Ca21 buffers.Methods Cell Biol.40:3–29.
Celio, M. R. 1990. Calbindin D-28k and parvalbumin in the rat nervoussystem.Neuroscience.35:375–475.
Celio, M. R., T. L. Pauls, and B. Schwaller. 1996. Guidebook to theCalcium-Binding Proteins. Sambrook & Tooze Publications at OxfordUniversity Press, Oxford and New York.
Chen, C., and W. G. Regehr. 1999. Contributions of residual calcium tofast synaptic transmission.J. Neurosci.19:6257–6266.
Cheung, W. T., D. E. Richards, and J. H. Rogers. 1993. Calcium bindingby chick calretinin and rat calbindin D28k synthesised in bacteria.Eur.J. Biochem.215:401–410.
Czerlinski, G. H. 1966. Chemical Relaxation: An Introduction to Theoryand Application of Stepwise Perturbation. M. Dekker, New York.
Davis, A. F., J. Bai, D. Fasshauer, M. J. Wolowick, J. L. Lewis, and E. R.Chapman. 1999. Kinetics of synaptotagmin responses to Ca21 andassembly with the core SNARE complex onto membranesNeuron.24:363–376 (erratum 24:1049).
Davis, T. N. 1992. What’s new with calcium?Cell. 71:557–564.
DelPrincipe, F., M. Egger, G. C. Ellis-Davies, and E. Niggli. 1999. Two-photon and UV-laser flash photolysis of the Ca21 cage, dimethoxyni-trophenyl-EGTA-4.Cell Calcium.25:85–91.
DiGregorio, D. A., J. Marengo, A. Peskoff, and J. L. Vergara. 1998.Measurement of presynaptic calcium microdomains in a cultured neu-romuscular junction.In Meeting for the Society of Neuroscience.D-72.
DiGregorio, D. A., A. Peskoff, and J. L. Vergara. 1999. Measurement ofaction potential-induced presynaptic calcium domains at a culturedneuromuscular junction.J. Neurosci.19:7846–7859.
DiGregorio, D. A., and J. L. Vergara. 1997. Localized detection of actionpotential-induced presynaptic calcium transients at aXenopusneuro-muscular junction.J. Physiol. (Lond.).505:585–592.
DiPolo, R., H. Rojas, J. Vergara, R. Lopez, and C. Caputo. 1983. Mea-surements of intracellular ionized calcium in squid giant axons usingcalcium-selective electrodes.Biochim. Biophys. Acta.728:311–318.
Eigen, M. 1963. Fast elementary steps in chemical reaction mechanisms.Pure Appl. Chem.6:97–115.
Ellis-Davies, G. C., and J. H. Kaplan. 1994. Nitrophenyl-EGTA, a photo-labile chelator that selectively binds Ca21 with high affinity and releasesit rapidly upon photolysis.Proc. Natl. Acad. Sci. USA.91:187–191.
Escobar, A. L., F. Cifuentes, and J. L. Vergara. 1995. Detection ofCa(21)-transients elicited by flash photolysis of DM-nitrophen with afast calcium indicator.FEBS Lett.364:335–338.
Escobar, A. L., P. Velez, A. M. Kim, F. Cifuentes, M. Fill, and J. L.Vergara. 1997. Kinetic properties of DM-nitrophen and calciumindicators: rapid transient response to flash photolysis.Pflugers Arch.434:615–631.
Fierro, L., and I. Llano. 1996. High endogenous calcium buffering inPurkinje cells from rat cerebellar slices.J. Physiol. (Lond.).496:617–625.
Gross, M. D., M. Gosnell, A. Tsarbopoulos, and W. Hunziker. 1993. Afunctional and degenerate pair of EF hands contains the very highaffinity calcium-binding site of calbindin-D28K.J. Biol. Chem.268:20917–20922.
Gross, M. D., R. Kumar, and W. Hunziker. 1988. Expression inEsche-richia coli of full-length and mutant rat brain calbindin D28. Compari-son with the purified native protein.J. Biol. Chem.263:14426–14432.
Gross, M. D., G. L. Nelsestuen, and R. Kumar. 1987. Observations on thebinding of lanthanides and calcium to vitamin D-dependent chick intes-tinal calcium-binding protein. Implications regarding calcium-bindingprotein function.J. Biol. Chem.262:6539–6545.
Harrison, S. M., and D. M. Bers. 1987. The effect of temperature and ionicstrength on the apparent Ca affinity of EGTA and the analogous Cachelators BAPTA and dibromo-BAPTA.Biochim. Biophys. Acta.925:133–143.
Hellam, D. C., and R. J. Podolsky. 1969. Force measurements in skinnedmuscle fibres.J. Physiol. (Lond.).200:807–819.
Hollingworth, S., M. Zhao, and S. M. Baylor. 1996. The amplitude andtime course of the myoplasmic free [Ca21] transient in fast-twitch fibersof mouse muscle.J. Gen. Physiol.108:455–469.
Kao, J. P., and R. Y. Tsien. 1988. Ca21 binding kinetics of fura-2 and azo-1from temperature-jump relaxation measurements.Biophys. J. 53:635–639.
Kaplan, J. H., and G. C. Ellis-Davies. 1988. Photolabile chelators for therapid photorelease of divalent cations.Proc. Natl. Acad. Sci. USA.85:6571–6575.
Kawasaki, H., S. Nakayama, and R. H. Kretsinger. 1998. Classification andevolution of EF-hand proteins.Biometals.11:277–295.
Kennedy, M. B. 1989. Regulation of neuronal function by calcium.TrendsNeurosci.12:417–420.
Klapstein, G. J., S. Vietla, D. N. Lieberman, P. A. Gray, M. S. Airaksinen,H. Thoenen, M. Meyer, and I. Mody. 1998. Calbindin-D28k fails toprotect hippocampal neurons against ischemia in spite of its cytoplasmiccalcium buffering properties: evidence from calbindin-D28k knockoutmice.Neuroscience.85:361–373.
Linse, S., and W. J. Chazin. 1995. Quantitative measurements of thecooperativity in an EF-hand protein with sequential calcium binding.Protein Sci.4:1038–1044.
Martin, S. R., S. Linse, C. Johansson, P. M. Bayley, and S. Forsen. 1990.Protein surface charges and Ca21 binding to individual sites in calbindinD9k: stopped-flow studies.Biochemistry.29:4188–4193.
McGuigan, J. A., D. Luthi, and A. Buri. 1991. Calcium buffer solutions andhow to make them: a do it yourself guide.Can. J. Physiol. Pharmacol.69:1733–1749.
Nagerl, U. V., I. Mody, M. Jeub, A. A. Lie, C. E. Elger, and H. Beck. 2000.Surviving granule cells of the sclerotic human hippocampus have re-duced Ca(21) influx because of a loss of calbindin-D(28k) in temporallobe epilepsy.J. Neurosci.20:1831–1836.
Naraghi, M. 1997. T-jump study of calcium binding kinetics of calciumchelators.Cell Calcium.22:255–268.
Neher, E. 1998a. Usefulness and limitations of linear approximations to theunderstanding of Ca11 signals Cell Calcium. 24:345–357 (erratum25:275).
Neher, E. 1998b. Vesicle pools and Ca21 microdomains: new tools forunderstanding their roles in neurotransmitter release.Neuron. 20:389–399.
Pasti, L., G. Carmignoto, T. Pozzan, R. Battini, S. Ferrari, G. Lally, andP. C. Emson. 1999. Cellular calcium handling in brain slices fromcalbindin D28k-deficient mice.Neuroreport.10:2367–2372.
Smith, P. D., G. W. Liesegang, R. L. Berger, G. Czerlinski, and R. J.Podolsky. 1984. A stopped-flow investigation of calcium ion binding byethylene glycol bis(beta-aminoethyl ether)-N,N9-tetraacetic acid.Anal.Biochem.143:188–195.
Stern, M. D. 1992. Buffering of calcium in the vicinity of a channel pore.Cell Calcium.13:183–192.
Tsien, R. Y. 1980. New calcium indicators and buffers with high selectivityagainst magnesium and protons: design, synthesis, and properties ofprototype structures.Biochemistry.19:2396–2404.
Veenstra, T. D., K. L. Johnson, A. J. Tomlinson, S. Naylor, and R. Kumar.1997. Determination of calcium-binding sites in rat brain calbindinD28K by electrospray ionization mass spectrometry.Biochemistry.36:3535–3542.
Vergara, J., and M. Delay. 1985. The use of metallochromic Ca indicatorsin skeletal muscle.Cell Calcium.6:119–132.
Vergara, J., and M. DiFranco. 1992. Imaging of calcium transients duringexcitation-contraction coupling in skeletal muscle fibers.Adv. Exp. Med.Biol. 311:227–236.
3018 Nagerl et al.
Biophysical Journal 79(6) 3009–3018
Copyright © 2022 FDOKUMEN