
BIM and IT Based Analysis for Construction Project Manager - Clash Detection & 4D Modeling
41
48-764 BIM Final Report Group 1_ Structure Widjava, Aswin ( awidjava) Wu, Hau-Wen (hauwenw) Yu, Chiaowei (chiaowey) Song, Xiaoxi (xiaoxiso)
Transcript of BIM and IT Based Analysis for Construction Project Manager - Clash Detection & 4D Modeling
48-764 BIM Final Report
Group 1_ Structure
Widjava, Aswin ( awidjava)
Wu, Hau-Wen (hauwenw)
Yu, Chiaowei (chiaowey)
Song, Xiaoxi (xiaoxiso)

4D Modeling
4D Modeling video: https://www.youtube.com/watch?v=m_dK7deA5YM&feature=youtu.be
Explain your phasing plan showing how the work will be completed? Where the
work is going to start (e.g., north side, south side), and how it will proceed?
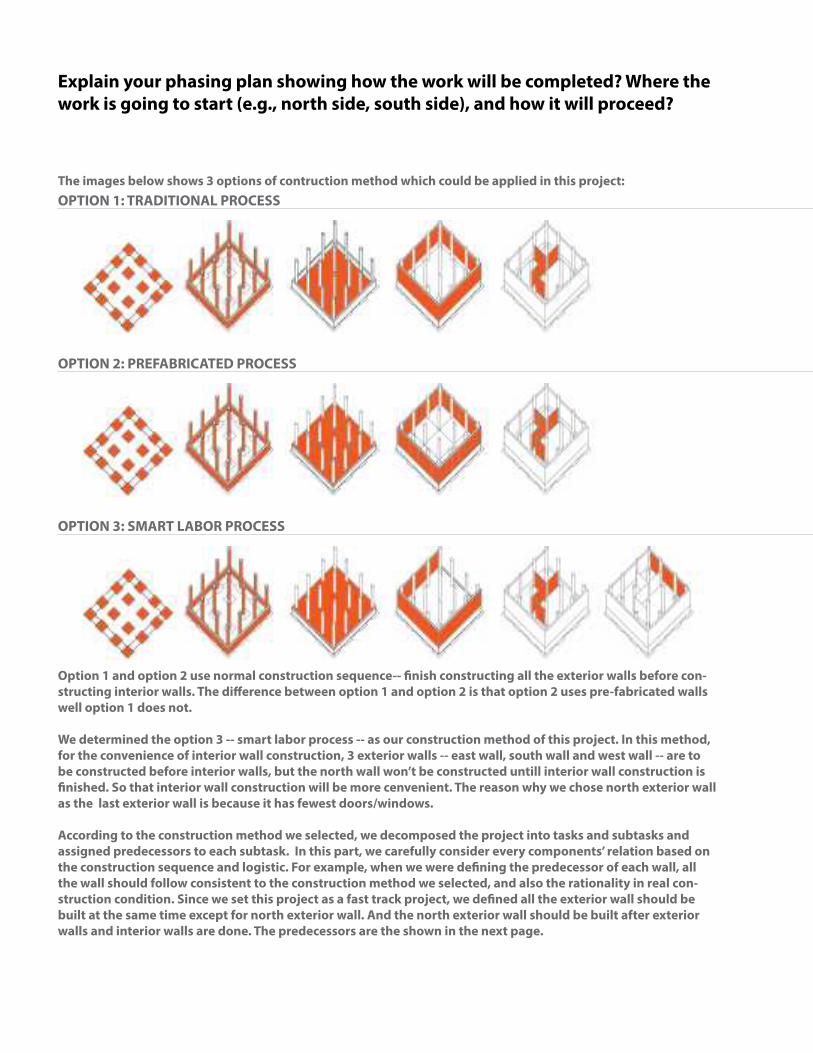
The images below shows 3 options of contruction method which could be applied in this project:
Option 1 and option 2 use normal construction sequence-- inish constructing all the exterior walls before con-
structing interior walls. The diference between option 1 and option 2 is that option 2 uses pre-fabricated walls
well option 1 does not.
We determined the option 3 -- smart labor process -- as our construction method of this project. In this method,
for the convenience of interior wall construction, 3 exterior walls -- east wall, south wall and west wall -- are to
be constructed before interior walls, but the north wall won’t be constructed untill interior wall construction is
inished. So that interior wall construction will be more cenvenient. The reason why we chose north exterior wall
as the last exterior wall is because it has fewest doors/windows.
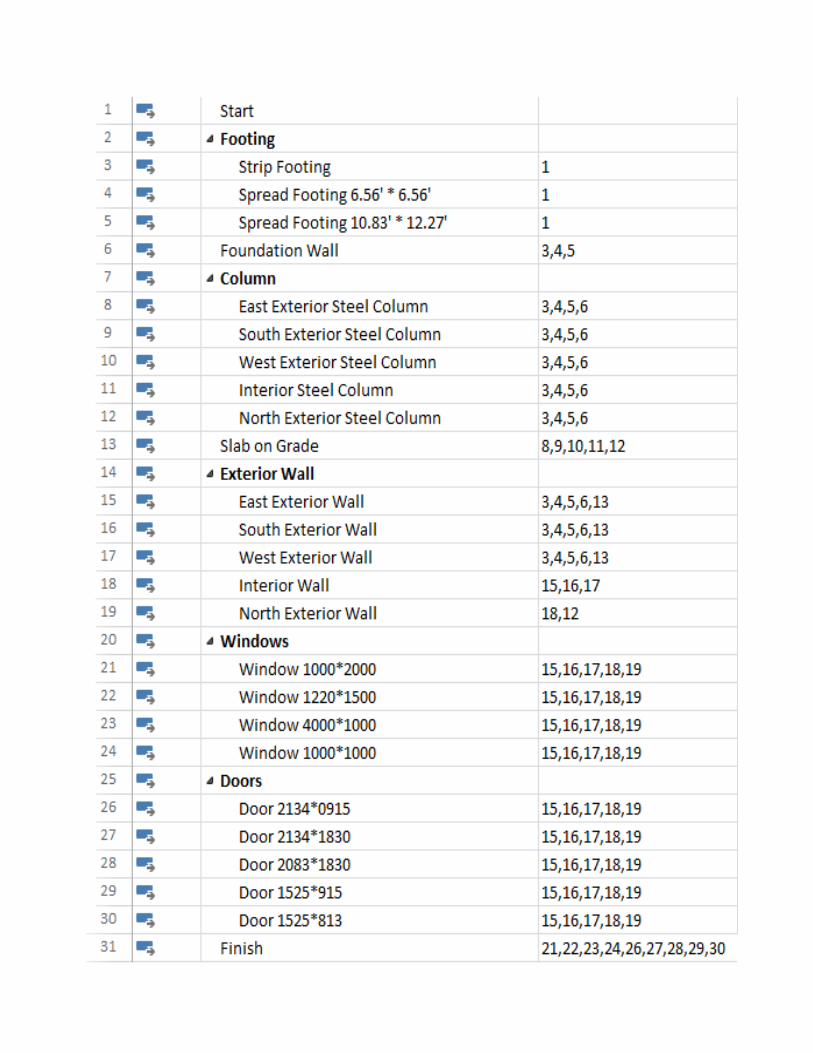
According to the construction method we selected, we decomposed the project into tasks and subtasks and
assigned predecessors to each subtask. In this part, we carefully consider every components’ relation based on
the construction sequence and logistic. For example, when we were deining the predecessor of each wall, all
the wall should follow consistent to the construction method we selected, and also the rationality in real con-
struction condition. Since we set this project as a fast track project, we deined all the exterior wall should be
built at the same time except for north exterior wall. And the north exterior wall should be built after exterior
walls and interior walls are done. The predecessors are the shown in the next page.
OPTION 1: TRADITIONAL PROCESS
OPTION 2: PREFABRICATED PROCESS
OPTION 3: SMART LABOR PROCESS

Next step is to deine how we decomposed each task, as we learn in former project, it is useful and fast to do Quan-
tity take-of in Vico Oice. However, the division of building components in Vico Oice’s automatic quantity take-of
model is not entirely consistent with the way we divided our tasks. So we used the paint mode to re-divide building
components in the 3D model to get a more accurate and useful quantity take-of.
Crew type and labor rate was found in RS Means. In order to achieve fast-track construction, we determined to use
larger labor amount than what’s given in RSMeans.
Task Name(description) Code/Line Number Crew Type Crew Amount Unit Quantity Unit Labor Hours Total Labor Hours Duration(hours)
Footing
Strip Footing C.I.P. concrete forms, footing, continuous wall 031113450500 C1 3 L.F 755.3 0.064 48.3392 16.11306667
Sread Footing 6.56’ * 6.56’ C.I.P. concrete forms, 8’ * 8’ Footing 031113456100 C1 3 Ea. 40 1.6 64 21.33333333
Spread Footing 10.83’ * 12.27 C.I.P. concrete forms, 12’ * 12’ Footing 031113456150 C1 3 Ea. 1 1.882 1.882 0.627333333
Steel Column
East Exterior Steel Column W 10 * 45 (W 250*67) 05223177000 E2 3 meter 26.28 0.175 4.599 1.533
South Exterior Steel Column W 10 * 45 (W 250*67) 05223177000 E3 3 meter 36.88 0.175 6.454 2.151333333
West Exterior Steel Column W 10 * 45 (W 250*67) 05223177000 E4 3 meter 21.06 0.175 3.6855 1.2285
North Exterior Steel Column W 10 * 45 (W 250*67) 05223177000 E5 3 meter 31.61 0.175 5.53175 1.843916667
Interior Steel Column W 10 * 45 (W 250*67) 05223177000 E6 3 meter 82.2 0.175 14.385 4.795
Wall
Foundation Wall Concrete Block, Foundation Wall, Normal Weight, 12” * 8” * 16” 042210260600 D9 3 S.F 1867.6 0.137 255.8612 85.28706667
Exterior Wall
East Exterior Wall Concrete Block, Exterior,Normal Weight, 12” * 8” * 16” 042210240300 D9 3 S.F 1493.6 0.192 286.7712 95.5904
South Exterior Wall Concrete Block, Exterior,Normal Weight, 12” * 8” * 16” 042210240300 D10 3 S.F 1994.9 0.192 383.0208 127.6736
West Exterior Wall Concrete Block, Exterior,Normal Weight, 12” * 8” * 16” 042210240300 D11 3 S.F 1505.1 0.192 288.9792 96.3264
North Exterior Wall Concrete Block, Exterior,Normal Weight, 12” * 8” * 16” 042210240300 D12 3 S.F 2299.6 0.192 441.5232 147.1744
Interior Wall Concrete Block, Partitions with non-reiforce(8”*16”*4”) 042210341100 D8 24 S.F. 24484.7 0.091 2228.1077 92.83782083
Windows
Window 1000*2000 Aluminum window,2’8”*6’8”, standard 085113203300 2 Sswk 3 Each. 1 2 2 0.666666667
Window 1220*1500 Aluminum window,3’4”*5’, standard 085113202700 2Sswk 3 Each. 21 1.778 37.338 12.446
Window 4000*1000 Aluminum Windows ,2.8’*13.6’ 085113203300 2Sswk 3 Each. 1 4 4 1.333333333
Window 1000*1000 Aluminum windows, 3’1”*3’2” 085113201000 2Sswk 3 Each. 2 1.6 3.2 1.066666667
Doors
Door 2134*915 Smooth wood doors(3’*7) 081416090108 2Carp 3 Each. 55 1 55 18.33333333
Door 2134*1830 Smooth wood doors(6’*7) 081416090112 2 Carp 3 Pr.(pair) 2 1.778 3.556 1.185333333
Door 2083*1830 Birch Face(2*3’*6.8) 081416090180 2 Carp 3 Each. 4 1.882 7.528 2.509333333
Door 1525*915 Birch Face(3’*6.8’) 081416090180 3 Carp 3 Each. 2 0.941 1.882 0.627333333
Door 1525*813 Standard hollow Metal Doors 081313130020 2 Carp 3 Each. 3 0.8 2.4 0.8
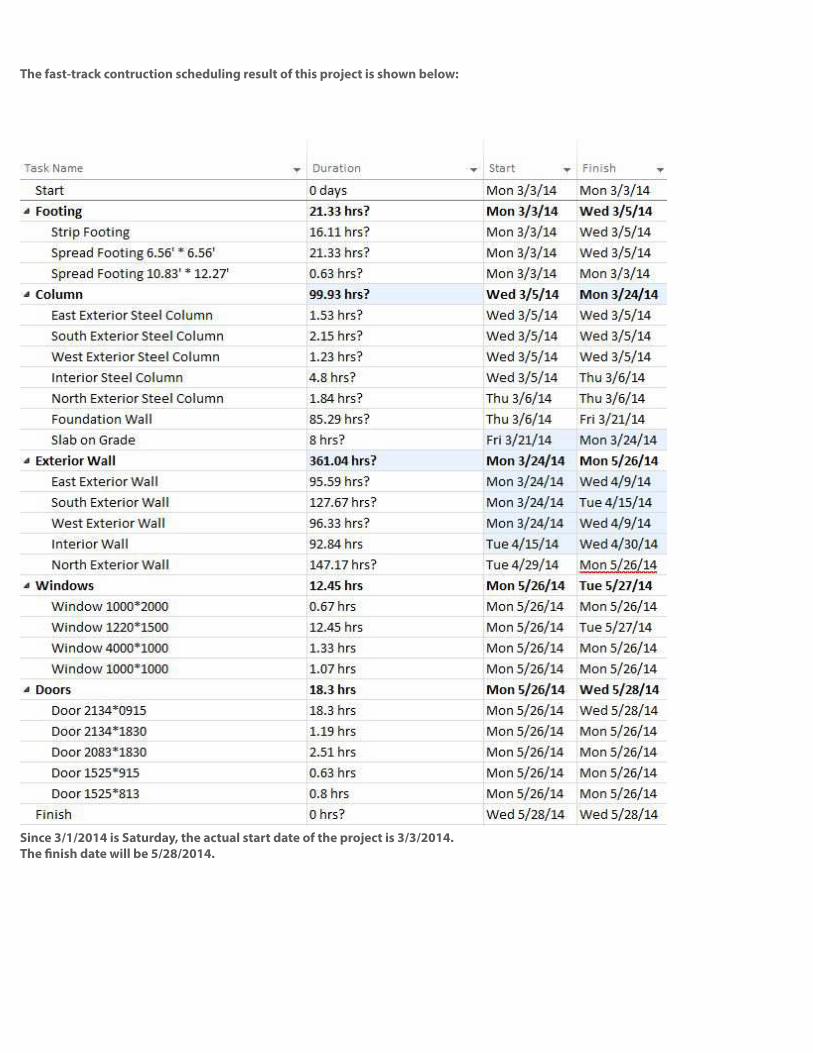
The fast-track contruction scheduling result of this project is shown below:
Since 3/1/2014 is Saturday, the actual start date of the project is 3/3/2014.
The inish date will be 5/28/2014.

The level of detail in our decomposed activities in our schedule depended on both RS Means’ standard and
construction sequence. For example, when we were deining footing components, we classiied footing as strip
footings and spread footings based on the construction sequence, therefore, we could break down spread foot-
ing into more speciic classiication based on RS Means’ standard: Spread Footing with dimension 6.56’*6.56’
and Spread Footing with dimension 10.83’*12.27’
Level of Detail of Steel Column:
Since the Steel Colum is the same type of steel, we classify steel column based of construction consequence.
Explain to what level of detail you decomposed activities in your schedule.
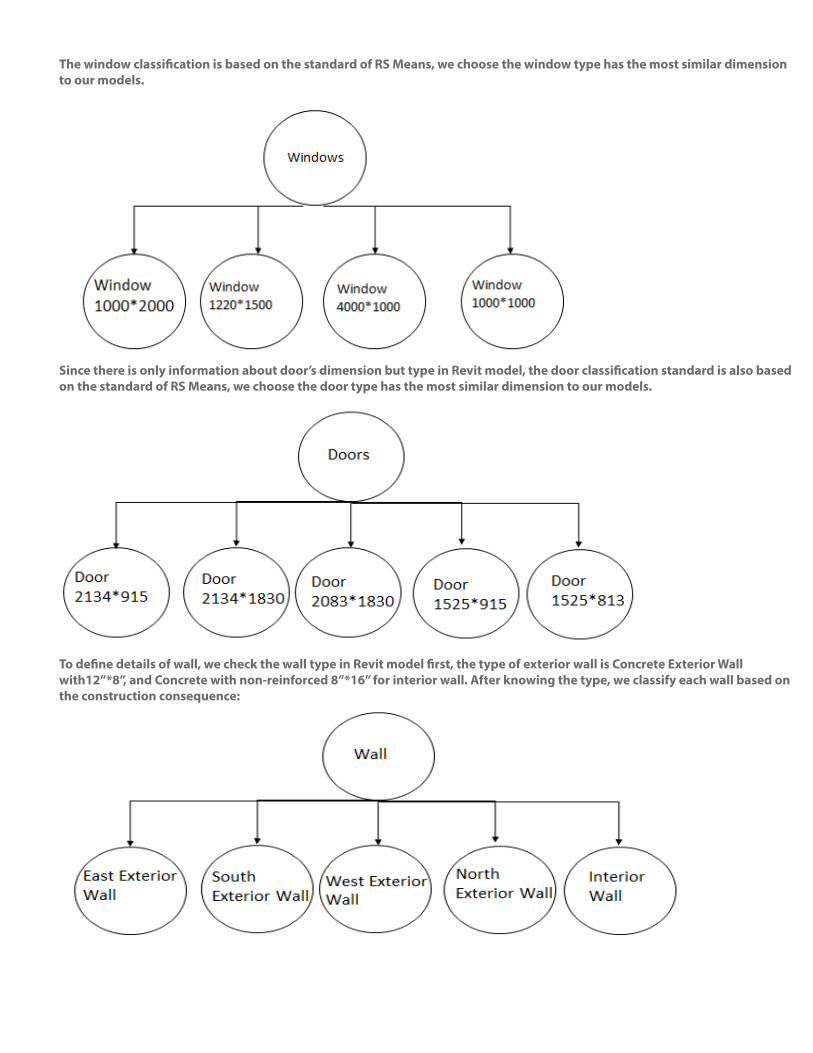
The window classiication is based on the standard of RS Means, we choose the window type has the most similar dimension
to our models.
Since there is only information about door’s dimension but type in Revit model, the door classiication standard is also based
on the standard of RS Means, we choose the door type has the most similar dimension to our models.
To deine details of wall, we check the wall type in Revit model irst, the type of exterior wall is Concrete Exterior Wall
with12”*8”, and Concrete with non-reinforced 8”*16” for interior wall. After knowing the type, we classify each wall based on
the construction consequence:

Project schedules and even designs get changed and updated frequently during con-
struction. Assuming that you might have a modiied schedule, discuss how easy it would
be to recreate the 4D model.
Project schedule changes and design changes require updates in the models, the more frequently the changes hap-
pen, the more workload are in demand, which has been a major problem in the industry. Making updates to 4D model
in Synchro has both convenience and impediments.
The features that make the 4D model updating easy include:
•Inthesituationthattheonlycertaintaskdurationschangeandthere’snonewtasksaddedtotheschedule,theupdate can easily be done by changing the values in Duration column of Gann chart and modify the camera and focus
time points in animation editor to update the animation. There’s no need to reimport the schedule or model. And
there’s no need to reassign building components in 3D model to tasks in schedule.
•Ifmorechangesaremadetoschedule,wecanalwaysimportthenew.xmlilecreatedinMSProjecteasily.•SchedulesmadeinMSProject(.xmlformat)caneasilybeimportedintoSynchro.There’snoneedtodomanualinfor-
mation transfer.
•ShedulechangescanalsobemadedirectlyinSynchro.SowedonotneedtogobacktoMSProjectwhenthereareonly minor changes in schedule.
The features that cause trouble to the 4D model updating work include:
•Whennewtasksareaddedtotheschedule,andwhenthedecompositionoftaskschanges,wehavetoreassignbuilding components s in 3D model to tasks. Since this assigning work cannot be done automatically done by Syn-
chro, manual assigning is needed, which takes a lot of time and efort.
•Theupdatingofanimationalsoneedtobedonemanually.Whentaskdurationchangesorwhentherearenewtasksadded to the schedule or when the decomposition of task changes, time and efort need to be spent on the modiica-
tion of the camera and focus time points in animation editor.
•Ascomparedtoschedulechanges,designchangesaremoretroublesome.Whendesignchangeshappen,new3Dmodels need to be created and imported into Synchro. In this situation, we have to repeat every step in the creating
the original 4D model, including assigning building components to tasks, editing animation, etc, and create a whole
new 4D model.
In summary, it is easy to update the 4D model when there’s no change in design and the changes in schedule are mi-
nor, it is not easy to update the 4D model when the changes in schedule are large or when there’s changes n design.
However, in real cases, schedule changes happen frequently and there are often new tasks added or old tasks de-
lected. What’s more, design changes happen. So even though there are both convenience and inconvenience in
updating the 4D model when schedule changes and design changes happen, the convenience still could not counter
balance the inconvenience.
The inconvenience mostly come from the need to do redundant works. Since there are already inconveniences in
creating a 4D model in Synchro even when creating an original model, as opposed to updating, the more redundancy
there are in the work, the more we are inluenced by the cost brought by the inconvenient features. Those inconve-
nient features will be illustrated in detail in the anwer to the following question.

Discuss the features that you liked and the things that can be improved in the 4D system
that you used. Create a wishlist containing 5-10 items that you would like to have in an
“ideal” 4D system.
According to our experience of the 4D system, the things that we like include:
•SchedulesmadeinMSProjectandsavedin.xmlformatcanbeeasilyimportedintoSynchrowithoutlosingimport-ant information.
•The3DmodelandtheGantchart,includingtaskinformation,canbeshownatthesametime,whichgivesusagoodunderstanding of the whole project and makes it easy to assign building components in 3D model to tasks.
•Wecanassignbuildingcomponentsin3Dmodeltotasks.Eventhoughthisrequiresmanualworkwhichtakestimeand efort, this feature is still favorable in a certain degree because it brings in lexibility. Since schedules of diferent
projects decompose tasks to diferent degrees of detail, for example, there are diferent types of doors in some build-
ings but only one type of doors in other buildings, it is makes the 4D model more accurate to assign building compo-
nents to tasks manually than automatically.
Things that can be improved in the 4D system include:
•Afterprojectscheduleismade,eachtaskhasalreadybeenassignedaduration,astarttime,andainishtime.How-
ever, when we create animation, the task duration, start time and inish time information cannot be automatically
detected and included in the animation. We still have to assign the view of certain construction phases to certain time
points manually, using focus time points function or other function in animation editor.
•Wehavetoassignbuildingcomponentsin3Dmodelstotasksmanually.Thisfeatureisalsolistedasathingthatwelike above. However, it is very time consuming to do this task manually and mistakes, omissions and repeating hap-
pens especially when the model is complicated. It’s better to have an automatic take-of and some manual modiica-
tion, as how the take-of model in Vico Oice works--- automatic quantity take of in which building components can
be reassigned to categories in the paint mode.
•EventhoughtheIFCmodelcontainssizeinformation,andcancontainmaterialandotherinformation,thoseinfor-
mation of the model cannot be seen in Synchro. However, thoso information are needed when we assign building
components to tasks. For example, when there’s construction of 6’ * 6’ doors and construction of 6’ * 8’ doors in sched-
ule, we need to assign the doors in the model accordingly.
Our wishlist for an ideal 4D system is as below:
•Animationcanbegeneratedautomaticallyaccordingtotaskinformationinthescheduling:duration,starttimeandinish time.
•Havethefunctionofautomaticquantitytake-of,asthetake-ofmodelinVicoOice.•Buildingcomponentscanbeautomaticallyassignedtotasksandemodiiedmanuallyafterit.•Sizeinformationofbuildingcomponentscanbechecked.Sothere’snoneedtoopenthemodelinRevittoobtainsuch information.
•__HaveRSMeanscontentincludedinthesoftware,eitherafunctionofindingcodeautomatically,orsimplyaplat-form for user to search code by themselves, as how they do on RS Means Online.

Discuss what some value propositions for creating a 4D model during construction are.
Similarly, discuss what some impediments are. What are some characteristics of a project
that would beneit the most from a 4D system?
ZAHA’S DILEMMA
A recent article on Zaha Hadid’s comment “Preventing migrant deaths at Qatar Stadium
site is not my duty as an architect” has sparked controversies all over the world. The article
seems to suggest that the Qatari government is the one held responsible for these deaths.
In response, the issue has not came up in any of other Zaha’s projects around the world, but
the question whether or not the architect has power or not seems otherwise.
The use of 4D modeling construction in relation to BIM has allowed a vast improvement
in construction safety. Each process and concstruction elements can be mapped onto a
time map, which allows construction to much safer. Since BIM is the epitome that “Building
equals to Data”, each component can also be mapped digitally precisely on a vector point.
With such technology, the era where workers have to be hoisted loosely on a rope or
pry themselves across trusses to screw a bolt are over. Using a 4D BIM process is almost
a foolproof method to prevent casualties and deaths. If everything can be mapped from
a vector point, then however complicated the building geometry is, each scafolding
and safety features of the construction phase can be mapped and included within the
construction cost.
Some artists would say that s/he would die for art, but the question is “do you have to?”. No.
Aside from increasing construction safety, 4D modelling beneits construction time,
construction eiciency, and interoperability between project members. Modiications
during construction can also be easily implemented due to the software’s eiciency. Since
4D model illustrates construction method digitally, it can be stored eiciently, and may
be used for litigations purposes proving the safety measures taken during construction
process. With that being said, a few impediments include...

Clash Detection
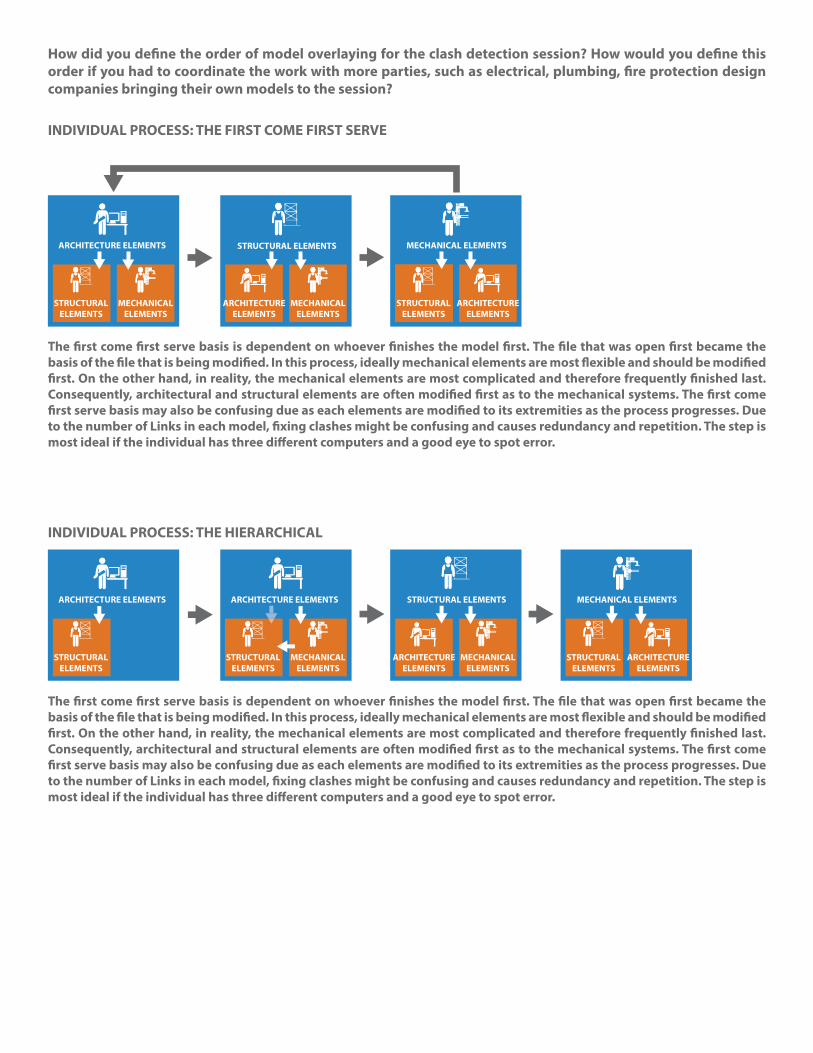
How did you deine the order of model overlaying for the clash detection session? How would you deine this
order if you had to coordinate the work with more parties, such as electrical, plumbing, ire protection design
companies bringing their own models to the session?
ARCHITECTURE ELEMENTS
STRUCTURAL
ELEMENTS
MECHANICAL
ELEMENTS
ARCHITECTURE
ELEMENTS
MECHANICAL
ELEMENTS
STRUCTURAL
ELEMENTS
ARCHITECTURE
ELEMENTS
STRUCTURAL ELEMENTS MECHANICAL ELEMENTS
ARCHITECTURE ELEMENTS
MECHANICAL
ELEMENTS
ARCHITECTURE ELEMENTS
STRUCTURAL
ELEMENTS
STRUCTURAL ELEMENTS
ARCHITECTURE
ELEMENTS
MECHANICAL
ELEMENTS
MECHANICAL ELEMENTS
STRUCTURAL
ELEMENTS
ARCHITECTURE
ELEMENTS
STRUCTURAL
ELEMENTS
INDIVIDUAL PROCESS: THE FIRST COME FIRST SERVE
INDIVIDUAL PROCESS: THE HIERARCHICAL
The irst come irst serve basis is dependent on whoever inishes the model irst. The ile that was open irst became the
basis of the ile that is being modiied. In this process, ideally mechanical elements are most lexible and should be modiied
irst. On the other hand, in reality, the mechanical elements are most complicated and therefore frequently inished last.
Consequently, architectural and structural elements are often modiied irst as to the mechanical systems. The irst come
irst serve basis may also be confusing due as each elements are modiied to its extremities as the process progresses. Due
to the number of Links in each model, ixing clashes might be confusing and causes redundancy and repetition. The step is
most ideal if the individual has three diferent computers and a good eye to spot error.

ARCHITECTURE ELEMENTS
STRUCTURAL
ELEMENTS
MECHANICAL
ELEMENTS
ARCHITECTURE
ELEMENTS
MECHANICAL
ELEMENTS
STRUCTURAL
ELEMENTS
ARCHITECTURE
ELEMENTS
STRUCTURAL ELEMENTS MECHANICAL ELEMENTS
ARCHITECTURE ELEMENTS
STRUCTURAL
ELEMENTS
ARCHITECTURE
ELEMENTS
STRUCTURAL ELEMENTSARCHITECTURE ELEMENTS
MECHANICAL
ELEMENTS
MECHANICAL
ELEMENTS
STRUCTURAL
ELEMENTS
STRUCTURAL ELEMENTS
MECHANICAL ELEMENTS
ARCHITECTURE
ELEMENTS
MECHANICAL ELEMENTS
TEAM PROCESS: THE EXTREME IDEAL
TEAM PROCESS: THE ONE-BY-ONE PLEASE
With each project team representing their own elements, the meeting can be kept at a more civilized manner rather than
sounding like a New York Stock Exchange. The civilized manner may also call for a slight bias and hierarchical viewpoint
from each individual representing each elements. Unlike the First Come First Serve Method, this method allows for diferent
individuals to be incharge of each element, hence increases the amount of dexterity and precision of each model. Each error
can be identiied easier. On the other hand, due to the simultaneous changes that can be potential made by each individual,
the model has to be saved frequently (another reason why Revit always autosave). Although such process may be faster for
experienced individuals, but maybe catastrophic otherwise.
The extreme ideal process may be the best process that can be implemented to determine clashes from each element group
with the following element. The process may even be categorized into smaller groups (e.g. in MEP elements, elements can
be subcategorized into electrical conduits, water pipes, heating, and cooling ducts), but it requires an extremely powerful
and large cloud storage that can be withstand the amount of data. In addition, each computer need to be equipped with
an extremely fast RAM memory to enable fast update and changes by each individual element. This is by far the most
eicient clash detection process but requires the most advanced equipment and organization between and across each
team individuals.
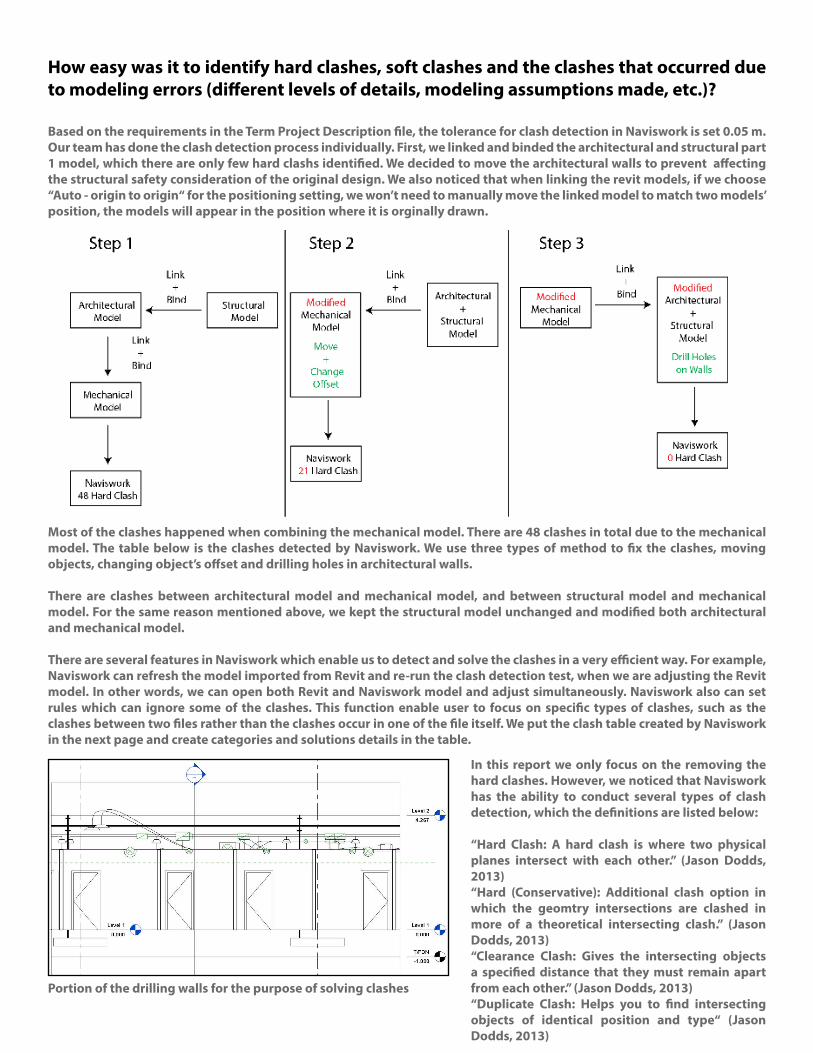
How easy was it to identify hard clashes, soft clashes and the clashes that occurred due
to modeling errors (diferent levels of details, modeling assumptions made, etc.)?
Based on the requirements in the Term Project Description ile, the tolerance for clash detection in Naviswork is set 0.05 m.
Our team has done the clash detection process individually. First, we linked and binded the architectural and structural part
1 model, which there are only few hard clashs identiied. We decided to move the architectural walls to prevent afecting
the structural safety consideration of the original design. We also noticed that when linking the revit models, if we choose
“Auto - origin to origin“ for the positioning setting, we won’t need to manually move the linked model to match two models’
position, the models will appear in the position where it is orginally drawn.
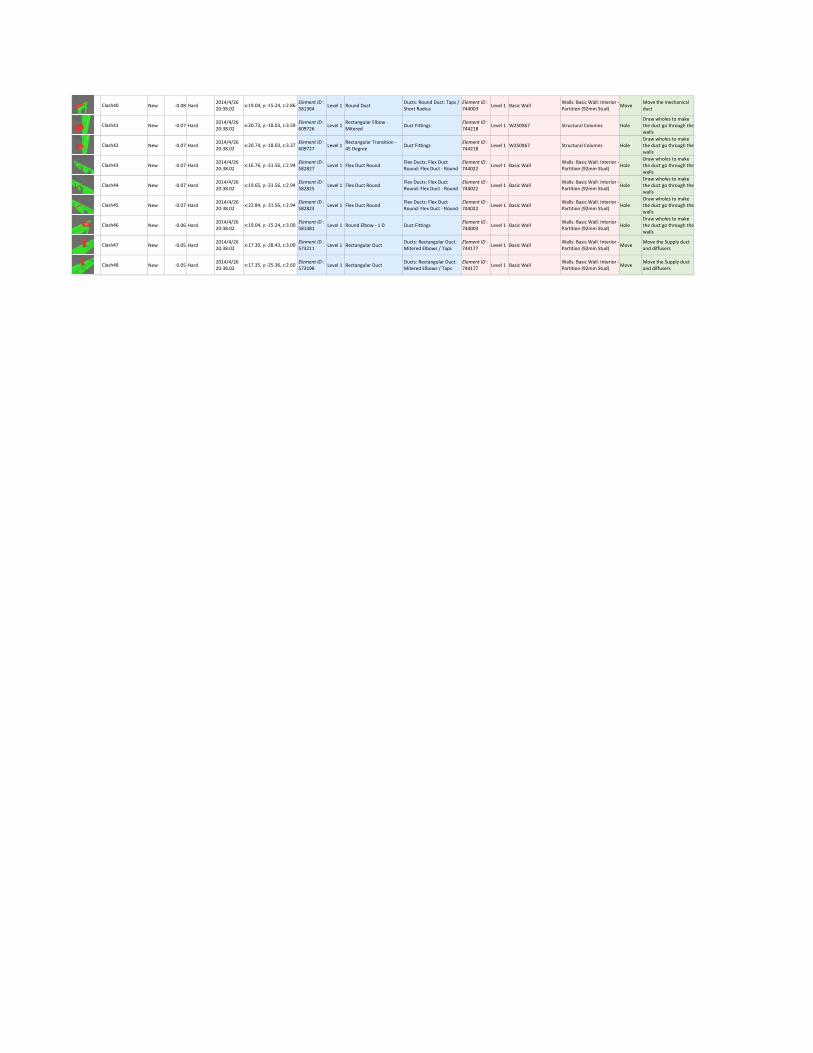
Most of the clashes happened when combining the mechanical model. There are 48 clashes in total due to the mechanical
model. The table below is the clashes detected by Naviswork. We use three types of method to ix the clashes, moving
objects, changing object’s ofset and drilling holes in architectural walls.
There are clashes between architectural model and mechanical model, and between structural model and mechanical
model. For the same reason mentioned above, we kept the structural model unchanged and modiied both architectural
and mechanical model.
There are several features in Naviswork which enable us to detect and solve the clashes in a very eicient way. For example,
Naviswork can refresh the model imported from Revit and re-run the clash detection test, when we are adjusting the Revit
model. In other words, we can open both Revit and Naviswork model and adjust simultaneously. Naviswork also can set
rules which can ignore some of the clashes. This function enable user to focus on speciic types of clashes, such as the
clashes between two iles rather than the clashes occur in one of the ile itself. We put the clash table created by Naviswork
in the next page and create categories and solutions details in the table.
In this report we only focus on the removing the
hard clashes. However, we noticed that Naviswork
has the ability to conduct several types of clash
detection, which the deinitions are listed below:
“Hard Clash: A hard clash is where two physical
planes intersect with each other.” (Jason Dodds,
2013)
“Hard (Conservative): Additional clash option in
which the geomtry intersections are clashed in
more of a theoretical intersecting clash.” (Jason
Dodds, 2013)
“Clearance Clash: Gives the intersecting objects
a speciied distance that they must remain apart
from each other.” (Jason Dodds, 2013)
“Duplicate Clash: Helps you to ind intersecting
objects of identical position and type“ (Jason
Dodds, 2013)
Portion of the drilling walls for the purpose of solving clashes

Tolerance Clashes New Active Reviewed Approved Resolved Type Status
0.05m 48 48 0 0 0 0 Hard OK
Status Distance Description Date Found Item ID Layer Item Name Item Type Item ID Layer Item Name Item Type Solution Solution Description
New ‐0.23 Hard2014/4/26 20:38.02
Element ID : 560444
Level 1600 x 600 Face 300 x 300 Connection
Air TerminalsElement ID : 743994
Level 1 Masonry ‐ Brick Solid MoveMove the Location of the air diffuser.
New ‐0.21 Hard2014/4/26 20:38.02
Element ID : 572142
Level 1 Rectangular DuctDucts: Rectangular Duct: Mitered Elbows / Taps
Element ID : 744264
Level 1 W460X60 Structural FramingReset Offset
Change the offset from 4.056 m to 3.4 m.
New ‐0.2 Hard2014/4/26 20:38.02
Element ID : 579484
Level 1 Round DuctDucts: Round Duct: Taps / Short Radius
Element ID : 744029
Level 1 Basic WallWalls: Basic Wall: Interior ‐Partition (92mm Stud) Hole
Draw wholes to make the duct go through the walls
New ‐0.2 Hard2014/4/26 20:38.02
Element ID : 559576
Level 1600 x 600 Face 300 x 300 Connection
Air TerminalsElement ID : 744177
Level 1 Basic WallWalls: Basic Wall: Interior ‐Partition (92mm Stud) Move
Move the Supply duct and diffusers
New ‐0.2 Hard2014/4/26 20:38.02
Element ID : 744177
Level 1 Basic WallWalls: Basic Wall: Interior ‐Partition (92mm Stud)
Element ID : 559588
Level 1600 x 600 Face 300 x 300 Connection Air Terminals Move
Move the Supply duct and diffusers
New ‐0.19 Hard2014/4/26 20:38.02
Element ID : 744018
Level 1 Basic WallWalls: Basic Wall: Interior ‐Partition (92mm Stud)
Element ID : 579484
Level 1 Round DuctDucts: Round Duct: Taps / Short Radius Hole
Draw wholes to make the duct go through the walls
New ‐0.18 Hard2014/4/26 20:38.02
Element ID : 579423
Level 1 400 mm Mechanical EquipmentElement ID : 744181
Level 1 Basic WallWalls: Basic Wall: Interior ‐Partition (92mm Stud) Hole
Draw wholes to make the duct go through the walls
New ‐0.17 Hard2014/4/26 20:38.02
Element ID : 580335
Level 1 Round DuctDucts: Round Duct: Taps / Short Radius
Element ID : 744022
Level 1 Basic WallWalls: Basic Wall: Interior ‐Partition (92mm Stud) Hole
Draw wholes to make the duct go through the walls
New ‐0.17 Hard2014/4/26 20:38.02
Element ID : 582883
Level 1 Round DuctDucts: Round Duct: Taps / Short Radius
Element ID : 744177
Level 1 Basic WallWalls: Basic Wall: Interior ‐Partition (92mm Stud) Hole
Draw wholes to make the duct go through the walls
New ‐0.17 Hard2014/4/26 20:38.02
Element ID : 580480
Level 1 Round DuctDucts: Round Duct: Taps / Short Radius
Element ID : 744026
Level 1 Basic WallWalls: Basic Wall: Interior ‐Partition (92mm Stud) Hole
Draw wholes to make the duct go through the walls
New ‐0.17 Hard2014/4/26 20:38.02
Element ID : 744010
Level 1 Basic WallWalls: Basic Wall: Interior ‐Partition (92mm Stud)
Element ID : 581377
Level 1 Round DuctDucts: Round Duct: Taps / Short Radius Hole
Draw wholes to make the duct go through the walls
New ‐0.16 Hard2014/4/26 20:38.02
Element ID : 744007
Level 1 Basic WallWalls: Basic Wall: Interior ‐Partition (92mm Stud)
Element ID : 579624
Level 1 Round DuctDucts: Round Duct: Taps / Short Radius Hole
Draw wholes to make the duct go through the walls
New ‐0.16 Hard2014/4/26 20:38.02
Element ID : 579236
Level 1 Round DuctDucts: Round Duct: Taps / Short Radius
Element ID : 743998
Level 1 Basic WallWalls: Basic Wall: Interior ‐Partition (92mm Stud) Hole
Draw wholes to make the duct go through the walls
New ‐0.16 Hard2014/4/26 20:38.02
Element ID : 744263
Level 1 W460X60 Structural FramingElement ID : 559587
Level 1600 x 600 Face 300 x 300 Connection Air Terminals Move
Move the Location of the air diffuser.
New ‐0.16 Hard2014/4/26 20:38.02
Element ID : 744263
Level 1 W460X60 Structural FramingElement ID : 573163
Level 1 Rectangular DuctDucts: Rectangular Duct: Mitered Elbows / Taps
Reset Offset
Change the offset from 4.056 m to 3.4 m
New ‐0.14 Hard2014/4/26 20:38.02
Element ID : 579877
Level 1 Round DuctDucts: Round Duct: Taps / Short Radius
Element ID : 744030
Level 1 Basic WallWalls: Basic Wall: Interior ‐Partition (92mm Stud) Hole
Draw wholes to make the duct go through the walls
New ‐0.14 Hard2014/4/26 20:38.02
Element ID : 743997
Level 1 Basic WallWalls: Basic Wall: Interior ‐Partition (92mm Stud)
Element ID : 579242
Level 1 Round DuctDucts: Round Duct: Taps / Short Radius Hole
Draw wholes to make the duct go through the walls
New ‐0.14 Hard2014/4/26 20:38.02
Element ID : 580817
Level 1 Round DuctDucts: Round Duct: Taps / Short Radius
Element ID : 744021
Level 1 Basic WallWalls: Basic Wall: Interior ‐Partition (92mm Stud) Hole
Draw wholes to make the duct go through the walls
New ‐0.13 Hard2014/4/26 20:38.02
Element ID : 579513
Level 1 Round DuctDucts: Round Duct: Taps / Short Radius
Element ID : 744177
Level 1 Basic WallWalls: Basic Wall: Interior ‐Partition (92mm Stud) Hole
Draw wholes to make the duct go through the walls
New ‐0.13 Hard2014/4/26 20:38.02
Element ID : 579531
Level 1 Round DuctDucts: Round Duct: Taps / Short Radius
Element ID : 744177
Level 1 Basic WallWalls: Basic Wall: Interior ‐Partition (92mm Stud) Hole
Draw wholes to make the duct go through the walls
New ‐0.12 Hard2014/4/26 20:38.02
Element ID : 560832
Level 1600 x 600 Face 300 x 300 Connection
Air TerminalsElement ID : 744204
Level 1 W250X67 Structural Columns MoveMove the Location of the air diffuser.
New ‐0.12 Hard2014/4/26 20:38.02
Element ID : 560664
Level 1600 x 600 Face 300 x 300 Connection
Air TerminalsElement ID : 744268
Level 1 W460X60 Structural Framing MoveMove the Location of the air diffuser.
New ‐0.12 Hard2014/4/26 20:38.02
Element ID : 573211
Level 1 Rectangular DuctDucts: Rectangular Duct: Mitered Elbows / Taps
Element ID : 744263
Level 1 W460X60 Structural FramingReset Offset
Change the offset from 4.056 m to 3.4 m
New ‐0.12 Hard2014/4/26 20:38.02
Element ID : 744178
Level 1 Basic WallWalls: Basic Wall: Interior ‐Partition (92mm Stud)
Element ID : 579081
Level 1 Round DuctDucts: Round Duct: Taps / Short Radius Hole
Draw wholes to make the duct go through the walls
New ‐0.12 Hard2014/4/26 20:38.02
Element ID : 558946
Level 1600 x 600 Face 300 x 300 Connection
Air TerminalsElement ID : 744218
Level 1 W250X67 Structural Columns MoveMove the Location of the air diffuser.
New ‐0.12 Hard2014/4/26 20:38.02
Element ID : 579816
Level 1Rectangular to Round Transition ‐ 45 Degree Duct Fittings
Element ID : 744268
Level 1 W460X60 Structural Framing MoveMove the Location of the air diffuser.
New ‐0.11 Hard2014/4/26 20:38.02
Element ID : 579818
Level 1Rectangular to Round Transition ‐ 45 Degree Duct Fittings
Element ID : 744263
Level 1 W460X60 Structural Framing MoveMove the Location of the air diffuser.
New ‐0.11 Hard2014/4/26 20:38.02
Element ID : 744263
Level 1 W460X60 Structural FramingElement ID : 572910
Level 1 Rectangular DuctDucts: Rectangular Duct: Mitered Elbows / Taps
Reset Offset
Change the offset from 4.056 m to 3.4 m
New ‐0.11 Hard2014/4/26 20:38.02
Element ID : 579808
Level 1Rectangular to Round Transition ‐ 45 Degree Duct Fittings
Element ID : 743994
Level 1 Plasterboard Solid MoveMove the Location of the air diffuser.
New ‐0.1 Hard2014/4/26 20:38.02
Element ID : 744181
Level 1 Basic WallWalls: Basic Wall: Interior ‐Partition (92mm Stud)
Element ID : 581364
Level 1 Round DuctDucts: Round Duct: Taps / Short Radius Move
Move the mechanical duct
New ‐0.09 Hard2014/4/26 20:38.02
Element ID : 579236
Level 1 Round DuctDucts: Round Duct: Taps / Short Radius
Element ID : 744000
Level 1 Basic WallWalls: Basic Wall: Interior ‐Partition (92mm Stud)
New ‐0.09 Hard2014/4/26 20:38.02
Element ID : 560832
Level 1600 x 600 Face 300 x 300 Connection
Air TerminalsElement ID : 744189
Level 1 Basic WallWalls: Basic Wall: Interior ‐Partition (92mm Stud) Move
Move the Location of the air diffuser.
New ‐0.09 Hard2014/4/26 20:38.02
Element ID : 573211
Level 1 Rectangular DuctDucts: Rectangular Duct: Mitered Elbows / Taps
Element ID : 579513
Level 1 Round DuctDucts: Round Duct: Taps / Short Radius Move
Move the Supply duct and diffusers
New ‐0.09 Hard2014/4/26 20:38.02
Element ID : 573198
Level 1 Rectangular DuctDucts: Rectangular Duct: Mitered Elbows / Taps
Element ID : 579531
Level 1 Round DuctDucts: Round Duct: Taps / Short Radius Move
Move the Supply duct and diffusers
New ‐0.09 Hard2014/4/26 20:38.02
Element ID : 560652
Level 1600 x 600 Face 300 x 300 Connection
Air TerminalsElement ID : 743994
Level 1 Plasterboard Solid MoveMove the Location of the air diffuser.
New ‐0.09 Hard2014/4/26 20:38.02
Element ID : 559575
Level 1600 x 600 Face 300 x 300 Connection
Air TerminalsElement ID : 744268
Level 1 W460X60 Structural Framing MoveMove the Location of the air diffuser.
New ‐0.08 Hard2014/4/26 20:38.02
Element ID : 579779
Level 1Rectangular to Round Transition ‐ 45 Degree Duct Fittings
Element ID : 744204
Level 1 W250X67 Structural Columns MoveMove the Location of the air diffuser.
New ‐0.08 Hard2014/4/26 20:38.02
Element ID : 579797
Level 1Rectangular to Round Transition ‐ 45 Degree Duct Fittings
Element ID : 743994
Level 1 Masonry ‐ Brick Solid MoveMove the Location of the air diffuser.
New ‐0.08 Hard2014/4/26 20:38.02
Element ID : 744001
Level 1 Basic WallWalls: Basic Wall: Interior ‐Partition (92mm Stud)
Element ID : 578941
Level 1 Rectangular DuctDucts: Rectangular Duct: Mitered Elbows / Taps
Reset Offset
Change the offset from 4.056 m to 3.4 m.
Clash38 x:‐0.50, y:‐19.60, z:3.50
Clash39 x:8.20, y:‐14.36, z:2.83
Clash36 x:12.18, y:‐25.64, z:3.83
Clash37 x:5.94, y:‐12.10, z:2.10
Clash34 x:17.30, y:‐25.51, z:2.87
Clash35 x:‐0.15, y:‐29.59, z:3.23
Clash32 x:6.09, y:‐12.25, z:2.00
Clash33 x:17.30, y:‐28.29, z:2.87
Clash30 x:18.88, y:‐16.00, z:2.90
Clash31 x:7.62, y:‐16.37, z:2.83
Clash28 x:18.54, y:‐28.18, z:4.07
Clash29 x:‐0.15, y:‐29.96, z:3.28
Clash26 x:12.18, y:‐25.40, z:3.97
Clash27 x:14.55, y:‐28.17, z:4.05
Clash24 x:8.20, y:‐18.80, z:2.88
Clash25 x:20.80, y:‐18.00, z:2.50
Clash22 x:12.18, y:‐25.09, z:3.88
Clash23 x:17.30, y:‐28.25, z:3.66
Clash20 x:17.35, y:‐25.50, z:2.87
Clash21 x:5.96, y:‐12.09, z:2.00
Clash18 x:23.23, y:‐29.91, z:2.87
Clash19 x:17.35, y:‐28.29, z:2.87
Clash16 x:20.87, y:‐26.32, z:2.79
Clash17 x:3.19, y:‐14.36, z:2.85
Clash14 x:14.43, y:‐28.18, z:3.87
Clash15 x:17.20, y:‐28.18, z:4.06
Clash12 x:14.05, y:‐16.54, z:2.79
Clash13 x:5.62, y:‐16.38, z:2.83
Clash10 x:24.26, y:‐31.85, z:2.79
Clash11 x:21.11, y:‐15.02, z:2.85
Clash8 x:14.47, y:‐31.68, z:2.79
Clash9 x:17.35, y:‐23.37, z:2.83
Clash6 x:18.02, y:‐19.52, z:2.80
Clash7 x:17.81, y:‐15.88, z:2.75
Clash4 x:17.35, y:‐25.67, z:2.59
Clash5 x:17.35, y:‐28.45, z:2.59
Clash2 x:20.80, y:‐31.19, z:3.92
Clash3 x:18.04, y:‐26.09, z:2.80
Item 1 Item 2 Solution
Clash Report
Image Clash Name Clash Point
Clash1 x:‐0.50, y:‐19.79, z:3.30
Test 1
New ‐0.08 Hard2014/4/26 20:38.02
Element ID : 581364
Level 1 Round DuctDucts: Round Duct: Taps / Short Radius
Element ID : 744003
Level 1 Basic WallWalls: Basic Wall: Interior ‐Partition (92mm Stud) Move
Move the mechanical duct
New ‐0.07 Hard2014/4/26 20:38.02
Element ID : 609726
Level 1Rectangular Elbow ‐ Mitered
Duct FittingsElement ID : 744218
Level 1 W250X67 Structural Columns Hole
Draw wholes to make the duct go through the walls
New ‐0.07 Hard2014/4/26 20:38.02
Element ID : 609727
Level 1Rectangular Transition ‐ 45 Degree Duct Fittings
Element ID : 744218
Level 1 W250X67 Structural Columns Hole
Draw wholes to make the duct go through the walls
New ‐0.07 Hard2014/4/26 20:38.02
Element ID : 582827
Level 1 Flex Duct RoundFlex Ducts: Flex Duct Round: Flex Duct ‐ Round
Element ID : 744022
Level 1 Basic WallWalls: Basic Wall: Interior ‐Partition (92mm Stud) Hole
Draw wholes to make the duct go through the walls
New ‐0.07 Hard2014/4/26 20:38.02
Element ID : 582825
Level 1 Flex Duct RoundFlex Ducts: Flex Duct Round: Flex Duct ‐ Round
Element ID : 744022
Level 1 Basic WallWalls: Basic Wall: Interior ‐Partition (92mm Stud) Hole
Draw wholes to make the duct go through the walls
New ‐0.07 Hard2014/4/26 20:38.02
Element ID : 582823
Level 1 Flex Duct RoundFlex Ducts: Flex Duct Round: Flex Duct ‐ Round
Element ID : 744022
Level 1 Basic WallWalls: Basic Wall: Interior ‐Partition (92mm Stud) Hole
Draw wholes to make the duct go through the walls
New ‐0.06 Hard2014/4/26 20:38.02
Element ID : 581381
Level 1 Round Elbow ‐ 1 D Duct FittingsElement ID : 744003
Level 1 Basic WallWalls: Basic Wall: Interior ‐Partition (92mm Stud) Hole
Draw wholes to make the duct go through the walls
New ‐0.05 Hard2014/4/26 20:38.02
Element ID : 573211
Level 1 Rectangular DuctDucts: Rectangular Duct: Mitered Elbows / Taps
Element ID : 744177
Level 1 Basic WallWalls: Basic Wall: Interior ‐Partition (92mm Stud) Move
Move the Supply duct and diffusers
New ‐0.05 Hard2014/4/26 20:38.02
Element ID : 573198
Level 1 Rectangular DuctDucts: Rectangular Duct: Mitered Elbows / Taps
Element ID : 744177
Level 1 Basic WallWalls: Basic Wall: Interior ‐Partition (92mm Stud) Move
Move the Supply duct and diffusers
Clash48 x:17.35, y:‐25.36, z:2.60
Clash46 x:19.04, y:‐15.24, z:3.00
Clash47 x:17.30, y:‐28.43, z:3.00
Clash44 x:19.65, y:‐31.56, z:2.94
Clash45 x:22.84, y:‐31.56, z:2.94
Clash42 x:20.74, y:‐18.03, z:3.37
Clash43 x:16.76, y:‐31.56, z:2.94
Clash40 x:19.04, y:‐15.24, z:2.86
Clash41 x:20.73, y:‐18.03, z:3.59
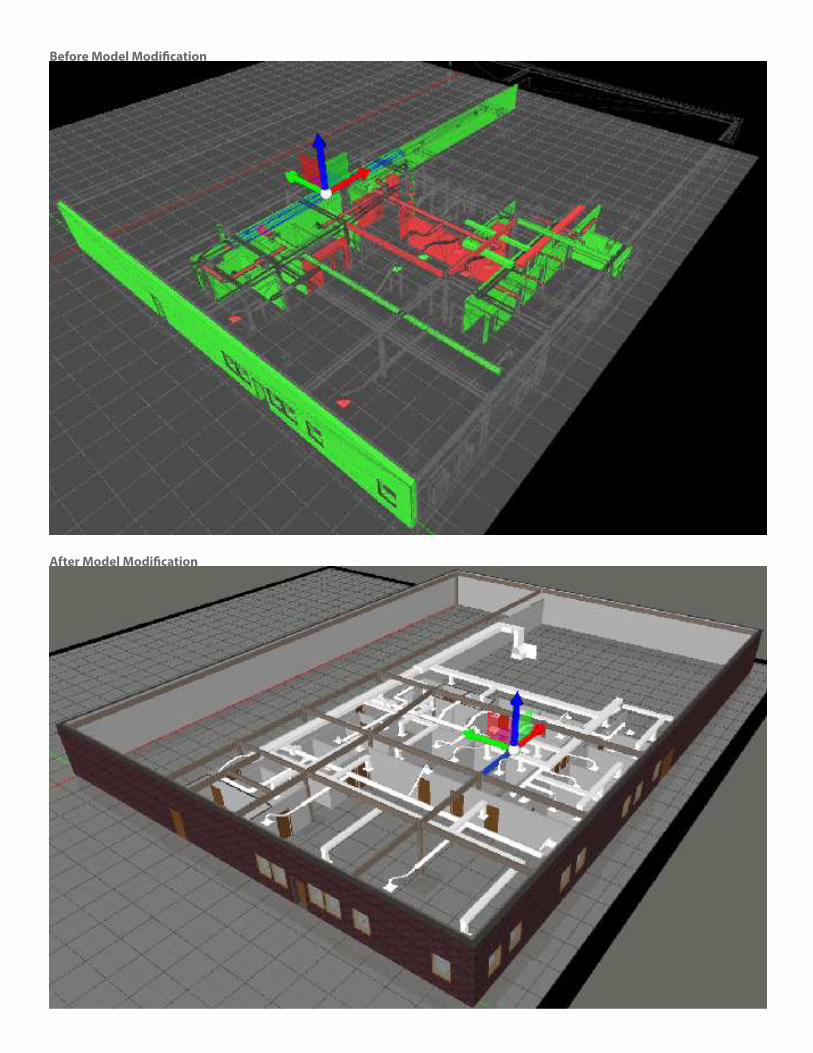
Before Model Modiication
After Model Modiication
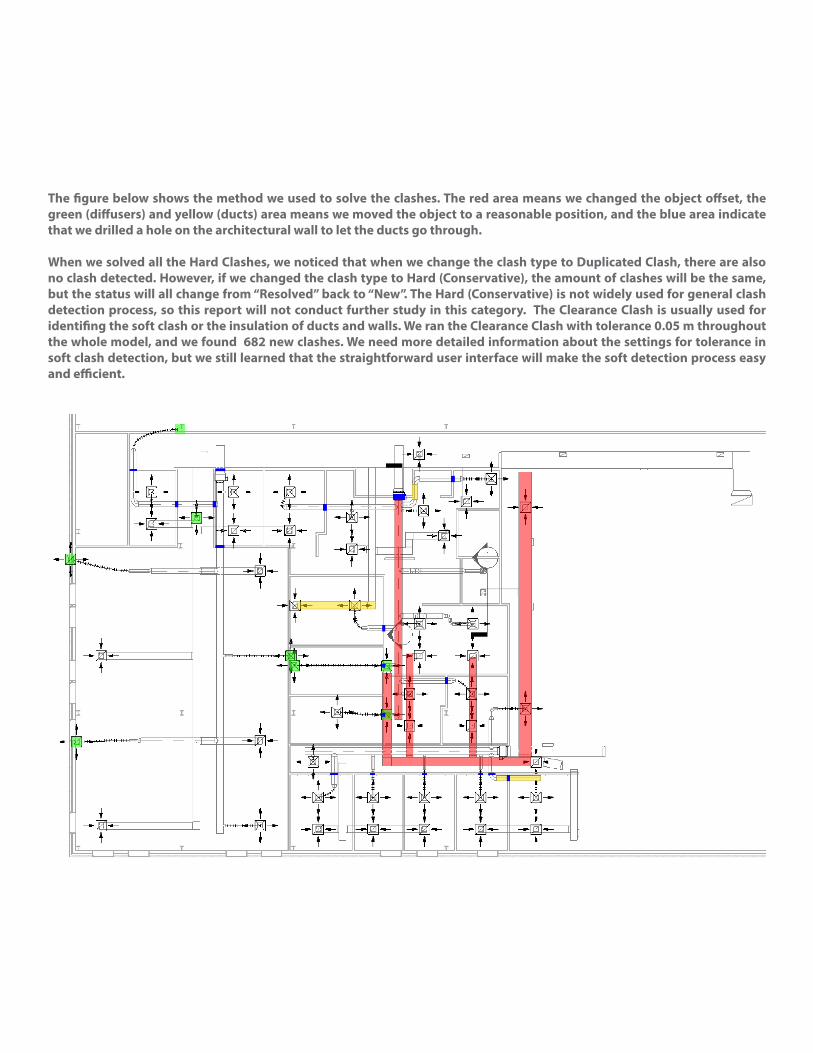
The igure below shows the method we used to solve the clashes. The red area means we changed the object ofset, the
green (difusers) and yellow (ducts) area means we moved the object to a reasonable position, and the blue area indicate
that we drilled a hole on the architectural wall to let the ducts go through.
When we solved all the Hard Clashes, we noticed that when we change the clash type to Duplicated Clash, there are also
no clash detected. However, if we changed the clash type to Hard (Conservative), the amount of clashes will be the same,
but the status will all change from “Resolved” back to “New”. The Hard (Conservative) is not widely used for general clash
detection process, so this report will not conduct further study in this category. The Clearance Clash is usually used for
identiing the soft clash or the insulation of ducts and walls. We ran the Clearance Clash with tolerance 0.05 m throughout
the whole model, and we found 682 new clashes. We need more detailed information about the settings for tolerance in
soft clash detection, but we still learned that the straightforward user interface will make the soft detection process easy
and eicient.
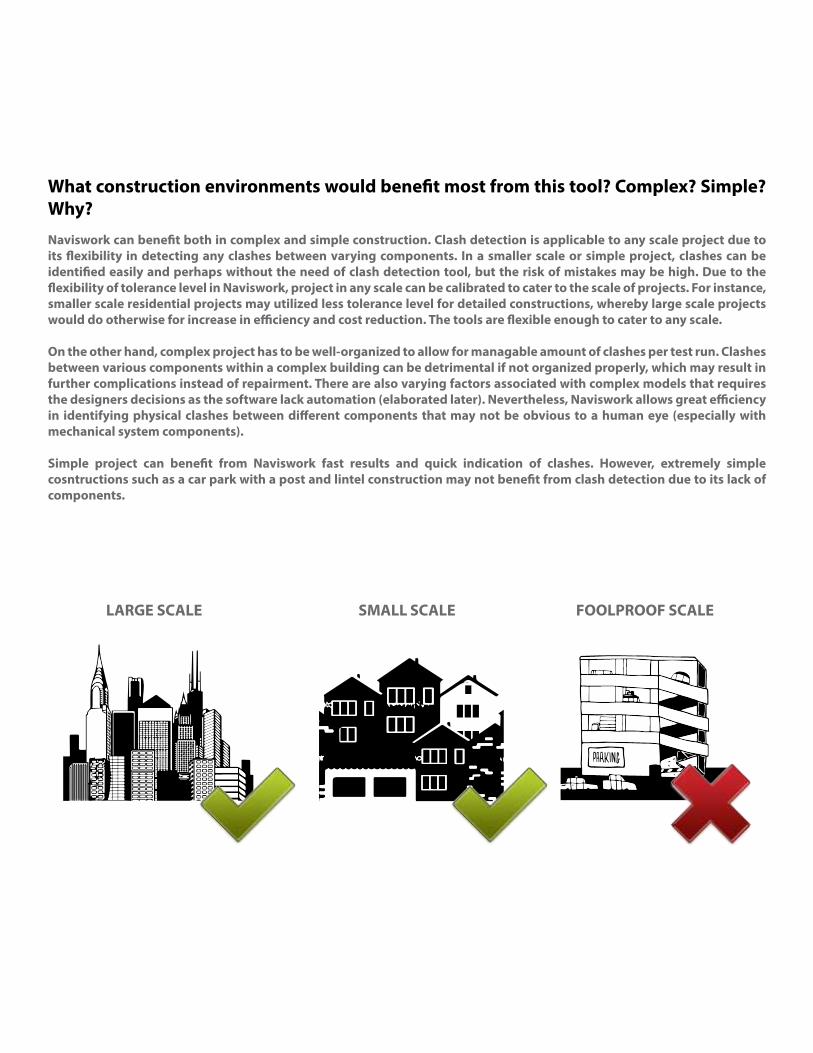
What construction environments would beneit most from this tool? Complex? Simple?
Why?
Naviswork can beneit both in complex and simple construction. Clash detection is applicable to any scale project due to
its lexibility in detecting any clashes between varying components. In a smaller scale or simple project, clashes can be
identiied easily and perhaps without the need of clash detection tool, but the risk of mistakes may be high. Due to the
lexibility of tolerance level in Naviswork, project in any scale can be calibrated to cater to the scale of projects. For instance,
smaller scale residential projects may utilized less tolerance level for detailed constructions, whereby large scale projects
would do otherwise for increase in eiciency and cost reduction. The tools are lexible enough to cater to any scale.
On the other hand, complex project has to be well-organized to allow for managable amount of clashes per test run. Clashes
between various components within a complex building can be detrimental if not organized properly, which may result in
further complications instead of repairment. There are also varying factors associated with complex models that requires
the designers decisions as the software lack automation (elaborated later). Nevertheless, Naviswork allows great eiciency
in identifying physical clashes between diferent components that may not be obvious to a human eye (especially with
mechanical system components).
Simple project can beneit from Naviswork fast results and quick indication of clashes. However, extremely simple
cosntructions such as a car park with a post and lintel construction may not beneit from clash detection due to its lack of
components.
LARGE SCALE SMALL SCALE FOOLPROOF SCALE
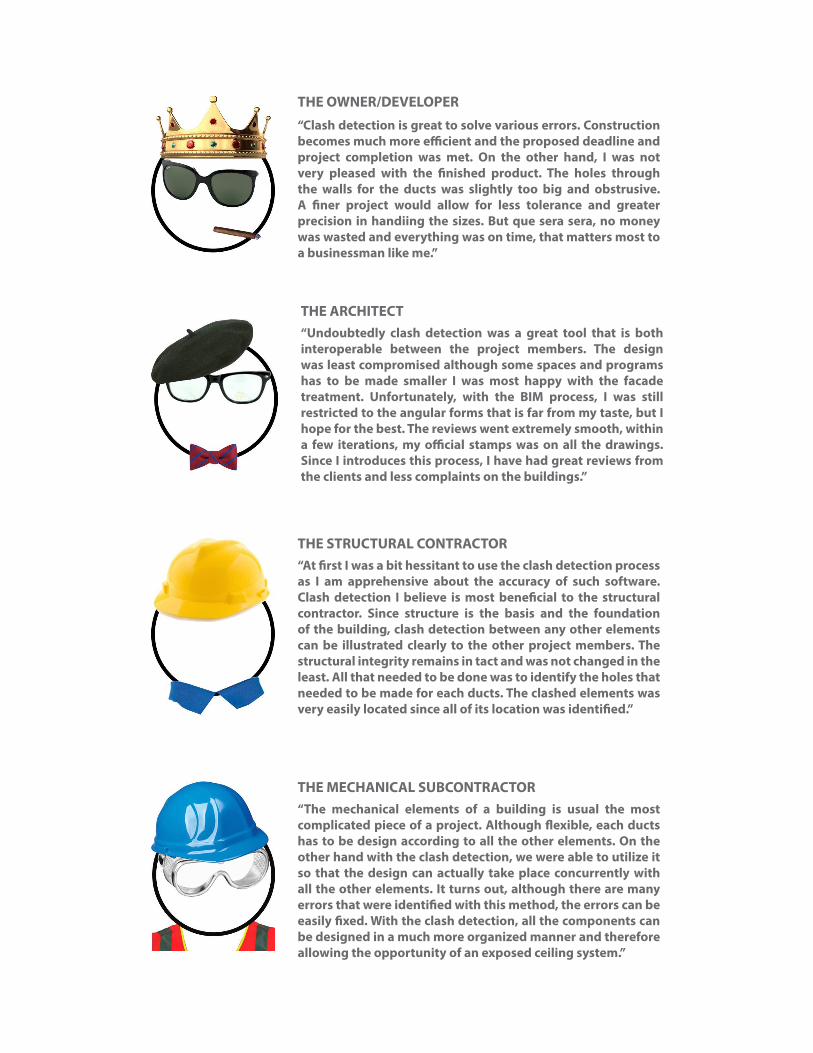
THE OWNER/DEVELOPER
THE ARCHITECT
THE STRUCTURAL CONTRACTOR
THE MECHANICAL SUBCONTRACTOR
“Clash detection is great to solve various errors. Construction
becomes much more eicient and the proposed deadline and
project completion was met. On the other hand, I was not
very pleased with the inished product. The holes through
the walls for the ducts was slightly too big and obstrusive.
A iner project would allow for less tolerance and greater
precision in handiing the sizes. But que sera sera, no money
was wasted and everything was on time, that matters most to
a businessman like me.”
“Undoubtedly clash detection was a great tool that is both
interoperable between the project members. The design
was least compromised although some spaces and programs
has to be made smaller I was most happy with the facade
treatment. Unfortunately, with the BIM process, I was still
restricted to the angular forms that is far from my taste, but I
hope for the best. The reviews went extremely smooth, within
a few iterations, my oicial stamps was on all the drawings.
Since I introduces this process, I have had great reviews from
the clients and less complaints on the buildings.”
“At irst I was a bit hessitant to use the clash detection process
as I am apprehensive about the accuracy of such software.
Clash detection I believe is most beneicial to the structural
contractor. Since structure is the basis and the foundation
of the building, clash detection between any other elements
can be illustrated clearly to the other project members. The
structural integrity remains in tact and was not changed in the
least. All that needed to be done was to identify the holes that
needed to be made for each ducts. The clashed elements was
very easily located since all of its location was identiied.”
“The mechanical elements of a building is usual the most
complicated piece of a project. Although lexible, each ducts
has to be design according to all the other elements. On the
other hand with the clash detection, we were able to utilize it
so that the design can actually take place concurrently with
all the other elements. It turns out, although there are many
errors that were identiied with this method, the errors can be
easily ixed. With the clash detection, all the components can
be designed in a much more organized manner and therefore
allowing the opportunity of an exposed ceiling system.”
The clashes can be selected by each components based on two diferent
iles (as long as the components allign with each other). Due to this
fact, each element can be assessed easily by the various components.
The clash detective selection tool allows better eiciency especially in
complex large-scale projects. Spaces within a building can be divided
into smaller categories and analyzed seperately, allowing a greater
depth of analysis and precision for each space and careful observation
between clashes.
SELECTION A - SELECTION B
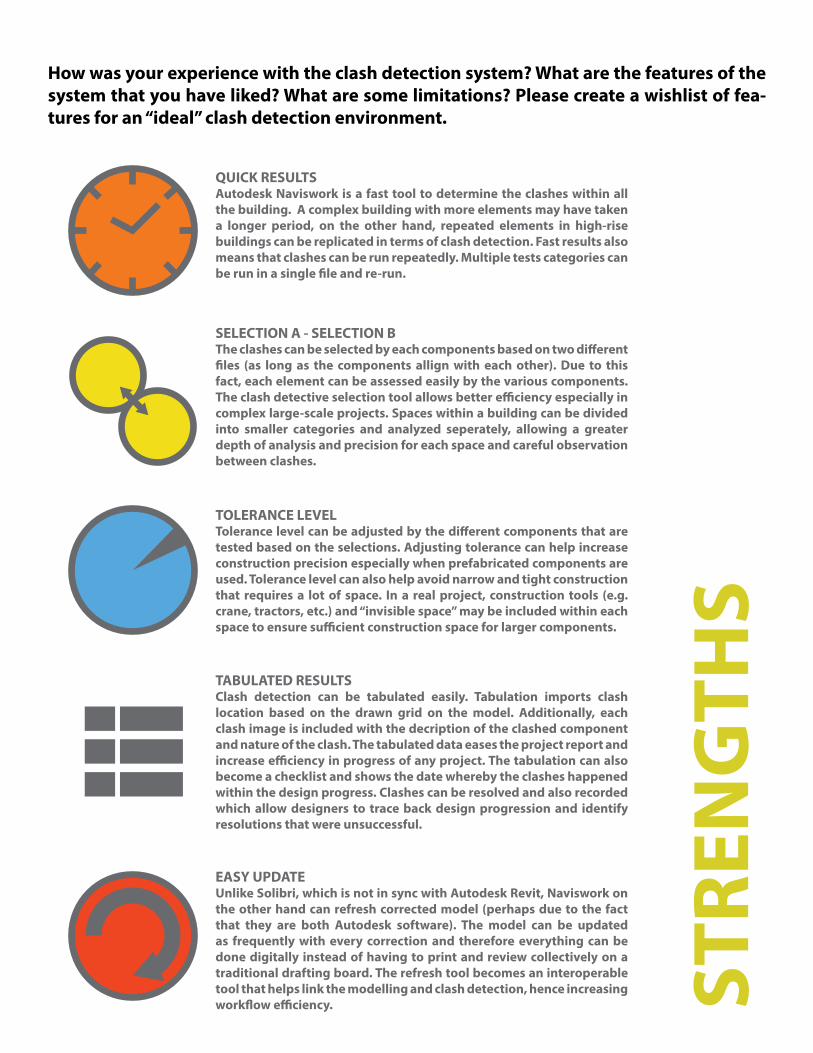
How was your experience with the clash detection system? What are the features of the
system that you have liked? What are some limitations? Please create a wishlist of fea-
tures for an “ideal” clash detection environment.
QUICK RESULTSAutodesk Naviswork is a fast tool to determine the clashes within all
the building. A complex building with more elements may have taken
a longer period, on the other hand, repeated elements in high-rise
buildings can be replicated in terms of clash detection. Fast results also
means that clashes can be run repeatedly. Multiple tests categories can
be run in a single ile and re-run.
Tolerance level can be adjusted by the diferent components that are
tested based on the selections. Adjusting tolerance can help increase
construction precision especially when prefabricated components are
used. Tolerance level can also help avoid narrow and tight construction
that requires a lot of space. In a real project, construction tools (e.g.
crane, tractors, etc.) and “invisible space” may be included within each
space to ensure suicient construction space for larger components.
Unlike Solibri, which is not in sync with Autodesk Revit, Naviswork on
the other hand can refresh corrected model (perhaps due to the fact
that they are both Autodesk software). The model can be updated
as frequently with every correction and therefore everything can be
done digitally instead of having to print and review collectively on a
traditional drafting board. The refresh tool becomes an interoperable
tool that helps link the modelling and clash detection, hence increasing
worklow eiciency.
Clash detection can be tabulated easily. Tabulation imports clash
location based on the drawn grid on the model. Additionally, each
clash image is included with the decription of the clashed component
and nature of the clash. The tabulated data eases the project report and
increase eiciency in progress of any project. The tabulation can also
become a checklist and shows the date whereby the clashes happened
within the design progress. Clashes can be resolved and also recorded
which allow designers to trace back design progression and identify
resolutions that were unsuccessful.
TOLERANCE LEVEL
TABULATED RESULTS
EASY UPDATE
ST
RE
NG
TH
S
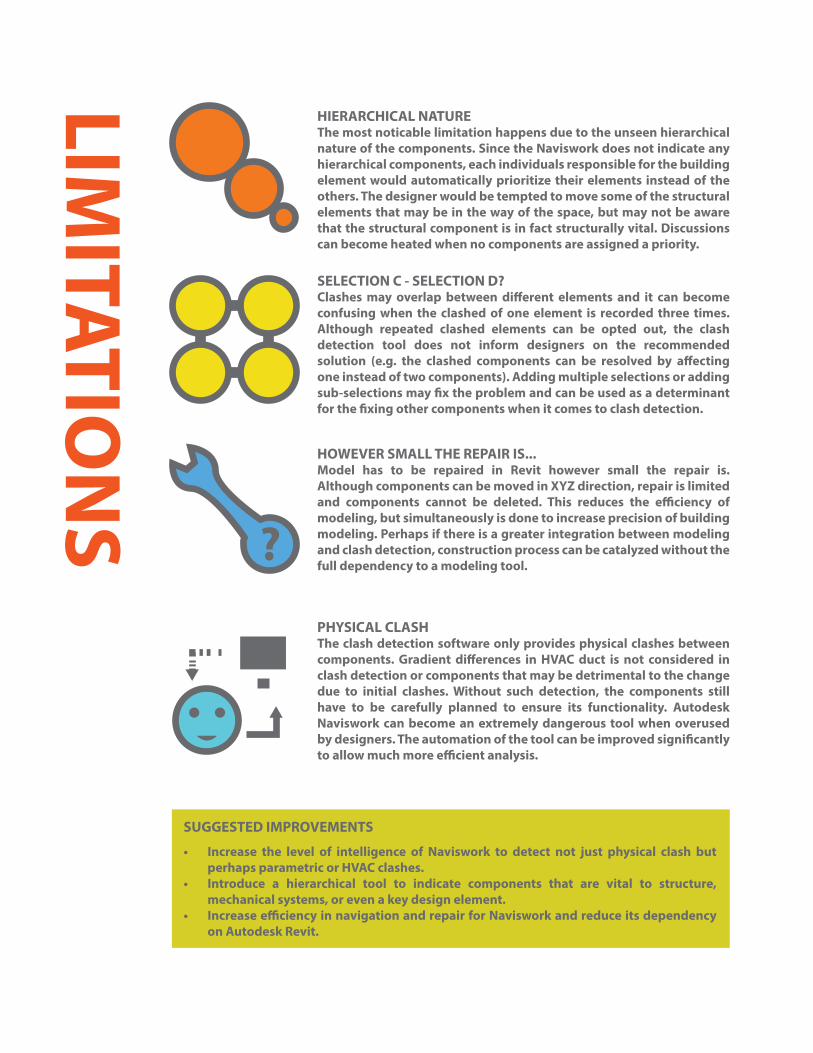
Clashes may overlap between diferent elements and it can become
confusing when the clashed of one element is recorded three times.
Although repeated clashed elements can be opted out, the clash
detection tool does not inform designers on the recommended
solution (e.g. the clashed components can be resolved by afecting
one instead of two components). Adding multiple selections or adding
sub-selections may ix the problem and can be used as a determinant
for the ixing other components when it comes to clash detection.
SELECTION C - SELECTION D?
HIERARCHICAL NATUREThe most noticable limitation happens due to the unseen hierarchical
nature of the components. Since the Naviswork does not indicate any
hierarchical components, each individuals responsible for the building
element would automatically prioritize their elements instead of the
others. The designer would be tempted to move some of the structural
elements that may be in the way of the space, but may not be aware
that the structural component is in fact structurally vital. Discussions
can become heated when no components are assigned a priority.
Model has to be repaired in Revit however small the repair is.
Although components can be moved in XYZ direction, repair is limited
and components cannot be deleted. This reduces the eiciency of
modeling, but simultaneously is done to increase precision of building
modeling. Perhaps if there is a greater integration between modeling
and clash detection, construction process can be catalyzed without the
full dependency to a modeling tool.
HOWEVER SMALL THE REPAIR IS...
The clash detection software only provides physical clashes between
components. Gradient diferences in HVAC duct is not considered in
clash detection or components that may be detrimental to the change
due to initial clashes. Without such detection, the components still
have to be carefully planned to ensure its functionality. Autodesk
Naviswork can become an extremely dangerous tool when overused
by designers. The automation of the tool can be improved signiicantly
to allow much more eicient analysis.
PHYSICAL CLASH
LIM
ITA
TIO
NS
?
SUGGESTED IMPROVEMENTS
• Increase the level of intelligence of Naviswork to detect not just physical clash but
perhaps parametric or HVAC clashes.
• Introduce a hierarchical tool to indicate components that are vital to structure,
mechanical systems, or even a key design element.
• Increase eiciency in navigation and repair for Naviswork and reduce its dependency
on Autodesk Revit.

Contempoporary Topic:BIM and Building Energy Modeling
INTRODUCTION: BIM in Architecture-Engineering-Construction Insustry
According to a report made by NIST (the National Institute of Standards and Technology), the lack of interoperability
and unsatisfying data management costs construction industry $15,800,000,000 annually, which is 3-4% of the cost
for the total industry. [13] BIM (Building Information Modeling) is regarded as the key to solve this problem. However,
currently, BIM has not been very prevailing in the Architecture-Engineering-Construction Industry.
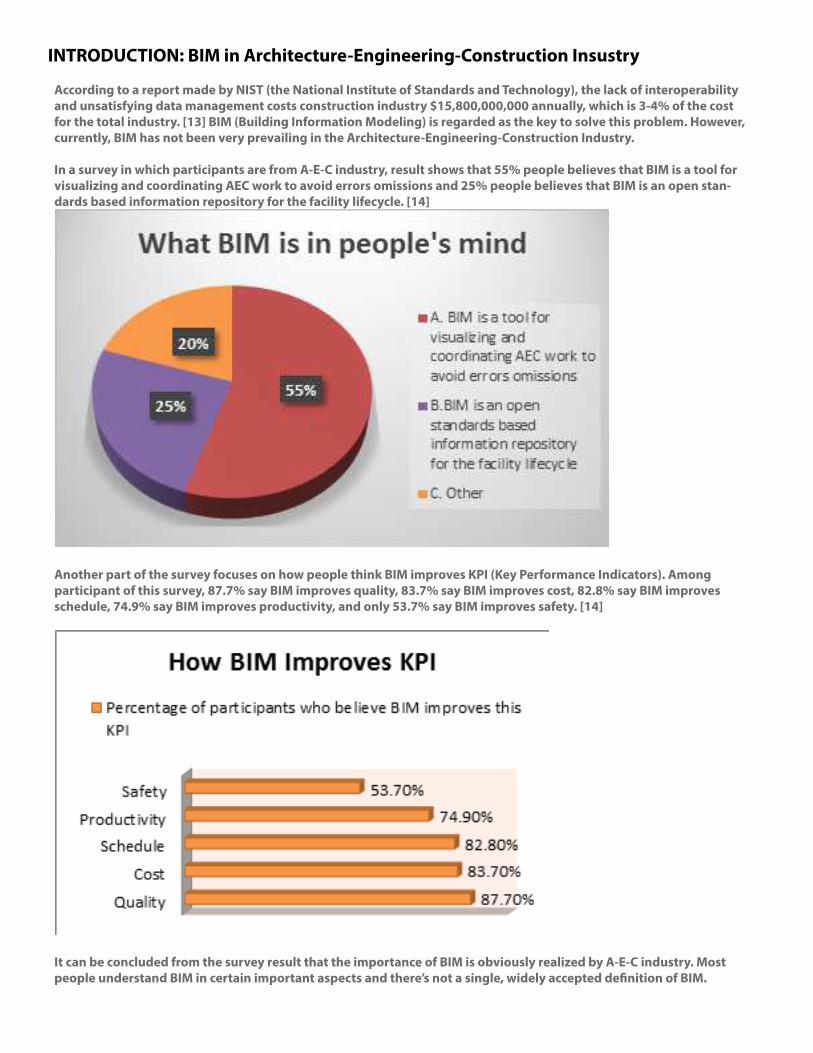
In a survey in which participants are from A-E-C industry, result shows that 55% people believes that BIM is a tool for
visualizing and coordinating AEC work to avoid errors omissions and 25% people believes that BIM is an open stan-
dards based information repository for the facility lifecycle. [14]
Another part of the survey focuses on how people think BIM improves KPI (Key Performance Indicators). Among
participant of this survey, 87.7% say BIM improves quality, 83.7% say BIM improves cost, 82.8% say BIM improves
schedule, 74.9% say BIM improves productivity, and only 53.7% say BIM improves safety. [14]
It can be concluded from the survey result that the importance of BIM is obviously realized by A-E-C industry. Most
people understand BIM in certain important aspects and there’s not a single, widely accepted deinition of BIM.
DEFINITION: BIM, BPM and BEMThere’s not a single, widely accepted deinition of Building Information Modeling (BIM). Various deinitions focuses on
diferent aspects of it: what kinds of information are stored, whom does it serve, when is it used, and what’s the func-
tion of it.
National Building Information Model Standard Project Committee: Building Information Modeling (BIM) is a digital
representation of physical and functional characteristics of a facility. A BIM is a shared knowledge resource for informa-
tion about a facility forming a reliable basis for decisions during its life-cycle; deined as existing from earliest concep-
tion to demolition.
ArchiCAD: A single repository including both graphical documents -drawings - and non-graphical documents -specii-
cation, schedules, and other data.
Bentley: A modeling of both graphical and non-graphical aspect of the entire building life cycle in a federated database
management system.
AutoDesk: A building design and documentation methodology characterized by the creation and use of coordinated,
internally consistent, computable information about a building project in design and construction. [22]
A common misunderstanding by some companies in A-E-C industry i that BIM refers to BIM softwares. In fact, BIM in
neither a collection of software nor a single step in construction management, but a process that goes through the
whole lifecycle of buildings.
Building Performance Modeling (BPM) analysis is the creation of a digital deinition, description, and simulation pro-
cess of a building behavior. In essence, it illustrates performance and operational components of a facility. [3] The two
terms, BPM and BEM, are often regarded as interchangeable. Building Energy Modeling (BEM) focuses on the simula-
tion of building energy. As a human body consists of circulatory system, the respiratory system, the nervous system,
etc, which correlate to each other and function together as a whole, a building consists of lighting system, HVAC sys-
tem, equipments, etc, which are like parts of a human body. [6] Building Energy Modeling is a way to put the systems of
the building together to foresee how the design will perform in energy aspect.
Important aspects of building energy modeling include air distribution, HVAC, lighting, daylighting performance, glaz-
ing and envelope. Building Energy Modeling inputs include location-- setpoint, orientation, etc; loads and occupan-
cy-- people, lighting, computer, occupancy hours, etc; construction information-- wall to window area, glazing, opaque
area, etc; mechanical system-- heating, cooling, dual duct variable air colume, water cooled chillers, heat recovery or
economizers, fan and pump inputs, and renewable energy, etc; domestic hot water-- storage size, etc; and speciality
equipment.
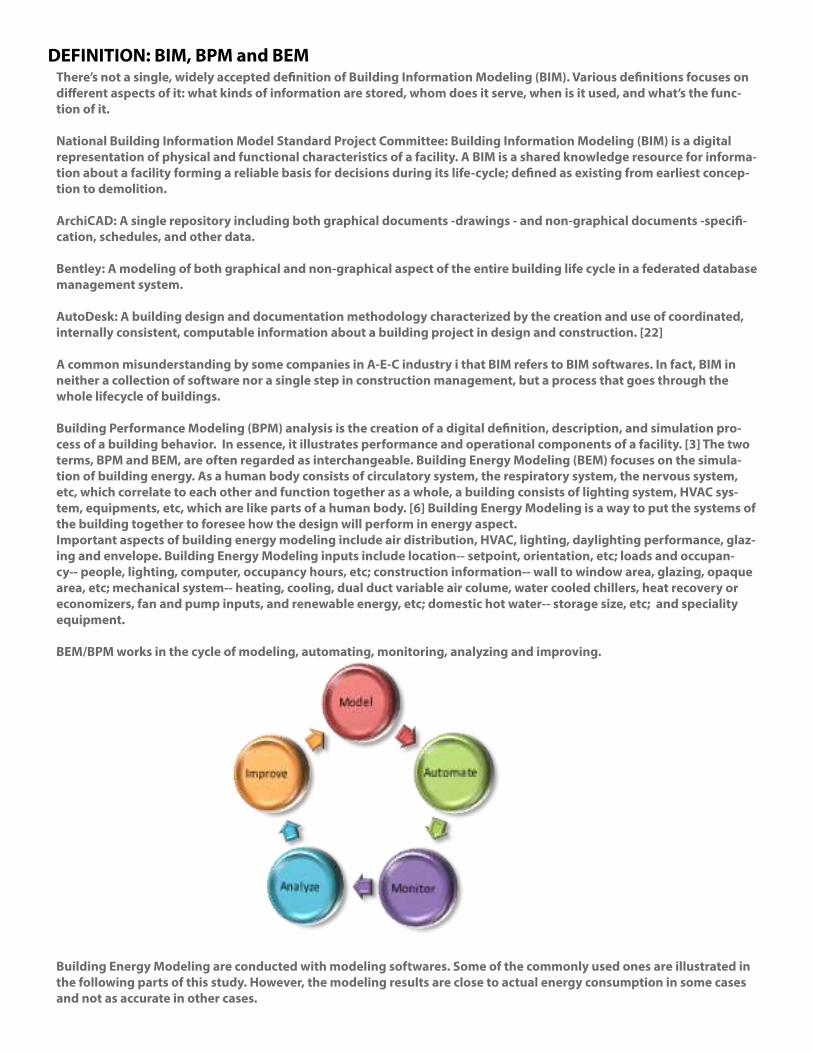
BEM/BPM works in the cycle of modeling, automating, monitoring, analyzing and improving.
Building Energy Modeling are conducted with modeling softwares. Some of the commonly used ones are illustrated in
the following parts of this study. However, the modeling results are close to actual energy consumption in some cases
and not as accurate in other cases.

Allows the user to “play”
with design ideas at
the conceptual stages,
providing essential analysis
feedback from even the
simplest sketch model.
ECOTECT progressively
guides the user as more
detailed design information
becomes available.
SOFTWARE DEVELOPMENT
Autodesk Ecotect
Autodesk Green Building Studio
eQUEST - DOE2
EnergyPlus
Integrated Environmental Solutions
BENEFITS RESULTS AND OUTPUTINPUT VARIABLES
- Enables hourly analyses
much earlier in the design
process
- Reduces design and
analysis costs
- Compression of early
design time, speeding
project time to completion
- Accelerates analysis for
LEED compliance
The unique strength of
eQUEST is that it is an
energy performance
design tool that
evaluates whole-building
performance throughout
the entire design process.
it supports detailed
analysis throughout the
construction documents,
Accurate, detailed
simulation capabilities
through complex modeling
capabilities. Input is geared
to the ‘object’ model way
of thinking. Successful
interfacing using IFC
standard architectural
model available for
obtaining geometry from
Comprehensive analysis
options ofered across a
wide range of metrics
Simulation results are
linked between modules
Unrivalled interoperability
with other CAD/BIM
platforms
Intuitive 3D CAD interface
allows validation of the
simplest sketch design to
highly complex 3D models.
Can also import 3DS and
DXF iles.
gbXML-enabled BIM
gbXML-enabled 3D-CAD
Inputs can be provided
at three levels: schematic
design wizard, design
development wizard, and
detailed (DOE-2) interface.
In the wizards, ALL inputs
have defaults (based on the
California Title 24 building
energy code).
EnergyPlus uses a simple
ASCII input ile.
Geometrical building data
may be imported from a
range of CAD/BIM systems
(e.g. Revit/SketchUp/
Trelligence/Vectorworks/
Graphisoft) or gbXML, IFC,
DXF iles.
Metailes, Bitmaps
animations, Tables of data
RADIANCE, POV Ray
VRML, AutoCAD DXF
EnergyPlus, AIOLOSHTB2,
CheNATH, ESP-r, ASCII Mod iles,
and XML.
- Estimated energy;
- Cost summary
- Renewable energy potential
- Weather data summary and
- User deined graphics
- gbXML ile for import to Trane
TRACE 700 or
- other gbXML-compliant tools
- VRML ile
- Graphical summary reports
- Single-run results summary
- Comparative results summary
- Parametric tabular reports
EnergyPlus has a number of
ASCII output iles - readily
adapted into spreadsheet form
for further analysis.
Tabular, graphical, video,
photorealistic images,
colour contoured 3D
geometric visualisation
of analysis results, fully
populated reportage to
match LEED / BREEAM /
daylighting / solar shading
all included within the
package.
SOFTWARE USER RECOMMENDATION
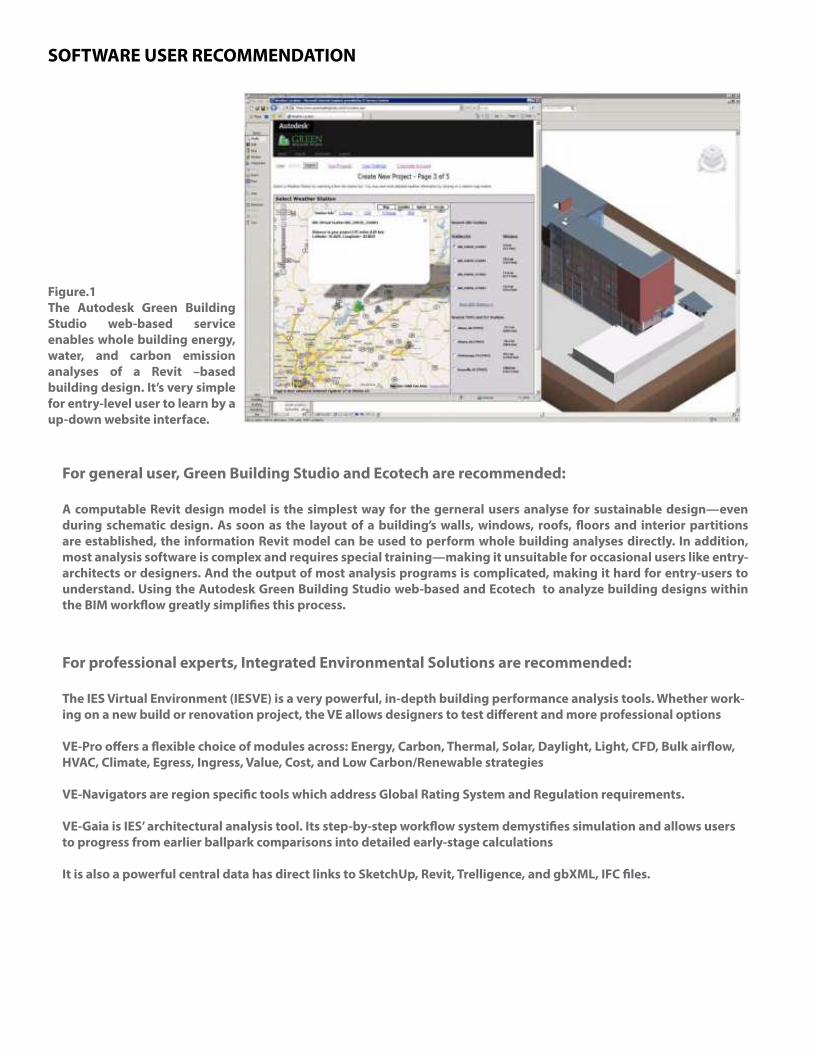
For general user, Green Building Studio and Ecotech are recommended:
A computable Revit design model is the simplest way for the gerneral users analyse for sustainable design—even
during schematic design. As soon as the layout of a building’s walls, windows, roofs, loors and interior partitions
are established, the information Revit model can be used to perform whole building analyses directly. In addition,
most analysis software is complex and requires special training—making it unsuitable for occasional users like entry-
architects or designers. And the output of most analysis programs is complicated, making it hard for entry-users to
understand. Using the Autodesk Green Building Studio web-based and Ecotech to analyze building designs within
the BIM worklow greatly simpliies this process.
Figure.1
The Autodesk Green Building
Studio web-based service
enables whole building energy,
water, and carbon emission
analyses of a Revit –based
building design. It’s very simple
for entry-level user to learn by a
up-down website interface.
For professional experts, Integrated Environmental Solutions are recommended:
The IES Virtual Environment (IESVE) is a very powerful, in-depth building performance analysis tools. Whether work-
ing on a new build or renovation project, the VE allows designers to test diferent and more professional options
VE-Pro ofers a lexible choice of modules across: Energy, Carbon, Thermal, Solar, Daylight, Light, CFD, Bulk airlow,
HVAC, Climate, Egress, Ingress, Value, Cost, and Low Carbon/Renewable strategies
VE-Navigators are region speciic tools which address Global Rating System and Regulation requirements.
VE-Gaia is IES’ architectural analysis tool. Its step-by-step worklow system demystiies simulation and allows users
to progress from earlier ballpark comparisons into detailed early-stage calculations
It is also a powerful central data has direct links to SketchUp, Revit, Trelligence, and gbXML, IFC iles.

PARTICIPANT ROLE PARTICIPANTS AFFILIATION
UTILIZING BEM IN CURRENT PROJECTSIn 2010, Shady Attia conducted two surveys focusing on the building performance modeling software. The participants
included AIA Committee on the Environment (COTE), USGBC, 2030 Challenge, 2007 Solar Decathlon entry teams, and also
schools and departments of architectural engineering, environmental design and architecture irm which received Top Ten
Green Architecture Awards from 2005 to 2008. The survey has a balanced amount of architects and engineers, the amount
is controled in order to compare the condition of adoption between architects and engineers industry. The survey also
asked about the participants’ ailiation. There are 15% of AIA certiied architects, 25% of ASHRAE certiied engineers, 36%
of LEED AP, and the “Other” includes construction management professionals and students.
The survey also asked about which kind of BPM tools and geometric modeling tools the participants used. The purpose of
the question is to identify how the building industry link the geometric models and the thermal models. The results are the
architects mostly used AutoCAD and Sketchup with Ecotect, and engineers tend to use Revit with EnergyPlus. The result
shows an obvious inconsistency of tool use between designers (architects) and engineers or consultants.
BPM TOOLS USED BY PARTICIPANTS
GEOMETRIC MODELING TOOLS
USED BY PARTICIPANTS
ARCHITECT
ENGINEER
ARCHITECT
ENGINEER

To analysis the diferent tools used in diferent phase of the projects, the survey designed a follow up questions for BPM
tools used. The results shows that ECOTECT, eQUEST and Energy 10 are more widely used in the early design phase (pre-
conceptual and schematic design), and DesignBuilder and EnergyPlus are mostly used in detailed design and design
optimization since they are able to conduct more detailed analysis.
Pre-
conceptual
Schematic
Design
Design
Development
Design
Optimization
HEED 38 7
Energy 10 56 6
GBS 34 18
Ecotect 86 107 13
eQUEST 56 110 67 9
DB 77 84 87
EP SU 4 23 27
EP 43 45
DOE-2 15 19
There are also questions about which features are the most important in the BPM tools, and the results shows a contradictory
priority for architects and engineers. For the architects, the ability to develop complex design strategies are the irst priority,
and the following abilities are renewable energy system simulation, and ability to evaluate emissions related to building
energy use. The engineers, on the other hand, concern most about the ability to support HVAC system, life-cycle analysis
and then the complex design strategies.
PRIORITY AND ABILITY OF BPM TOOLS
BPM TOOLS PRIORITY ARCHITECT
ENGINEER
The below chart is the actual abilities comparing the ten BPM tools. The abilities of software has matched the current
adopt condition of architects and engineers. For instance, the software that engineers widely used such as EnergyPlus and
DesignBuilder support HVAC system, and the architects’ favorite ECOTECT has the ability to analysis the emissions due to
energy use.
DB
DO
E-2
En
erg
y+
IES
VE
GB
S
En
erg
y 1
0
eQ
UE
ST
Ske
tch
up
EC
OT
EC
T
HE
ED
Complex Design Strategies X X X X
Renewable Energy System Simulation X X X X X
Evaluation of emissions evaluation X X X X X X
Support HVAC system evaluation X X X X X X X
Life-cycle analysis X X X X X X X X
Support various building types X X X X X X X X X X
Overall ability (%) 85% 85% 85% 83% 78% 63% 61% 35% 35% 33%
LIMITATIONS ON THE SOFTWARE
Although the development of BIM has improved signiicantly since its conception, there are still discussions of discrepancies
between predicted and actual data. The few major causes of discrepancies are due to the unpredictable variables, diferent
assumptions, and impending errors in multiple data inputs and sensitivity. Many diferent studies have been done to
determine the solutions to increase accuracy and predictability, such as using evidence-based assumptions and using ‘top-
down’ or ‘bottom-up’ approaches, therefore Increasing accuracy of BIM simulation has been know to reduce project cost
and time (Nassar 2010).
The three-way interactions between people, climate, and building dictates the energy needed in building. BIM tools lack
considerations in terms of occupant’s behavior. According to a presentation by Dr. Rajat Gupta of UNEP, certain variables
such as the it out, equipment added, and pattern of use by occupants are most unpredictable in BIM. Furthermore, building
quality and commissioning is also not taken into consideration of the energy performance analysis.
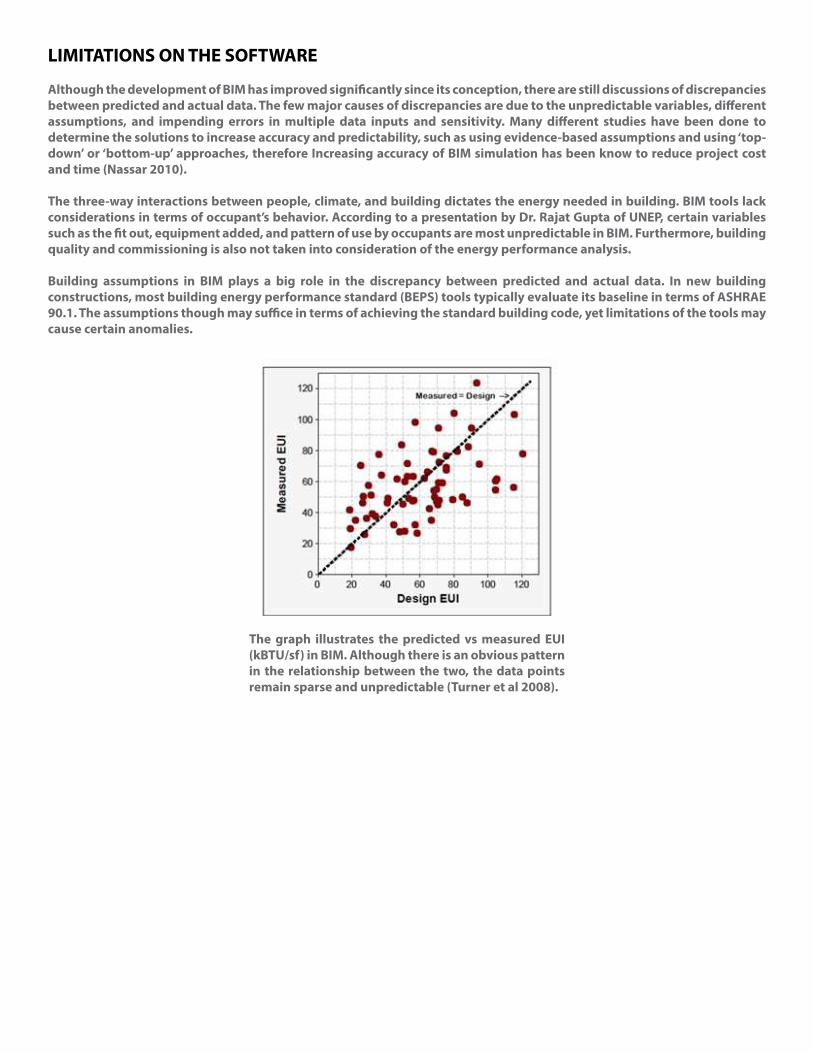
Building assumptions in BIM plays a big role in the discrepancy between predicted and actual data. In new building
constructions, most building energy performance standard (BEPS) tools typically evaluate its baseline in terms of ASHRAE
90.1. The assumptions though may suice in terms of achieving the standard building code, yet limitations of the tools may
cause certain anomalies.
The graph illustrates the predicted vs measured EUI
(kBTU/sf) in BIM. Although there is an obvious pattern
in the relationship between the two, the data points
remain sparse and unpredictable (Turner et al 2008).

BEM CASE STUDY: A Successful BEM Case—BEM of DPR Construction Inc. Head-
quarters Building [15]
The building energy modeling of DPR Construction Inc. headquarter building was conducted in 2 phases.
Not as common cases in which energy modeling only happen in design phase, DPR Construction Inc. headquarter
building have done energy modeling both in design phase and and in operation phase.
The phase 1 modeling, which happened in design phase, was conducted in order to help the building obtain LEED
certiication and comply with California’s Energy Eiciency Standard for Residential and Non-residential Buildings,
also known as Title 24. It happened in design phase, year 2002.[15]
Phase 1 modeling was made using a non-BIM software, EnergyPro, which was chosen because of its compliance with
Title 24.
EnergyPro, provides duplicates of the forms provided by the California Energy Commission. EnergyPro also in-
cludes external links to the Common Energy Standard (CES) ile technology to allow the user to plug in new energy
standards, such as Standard 90, as they become available. Using the Standards software, government agencies can
deliver fully functional CES iles that contain speciic implementations of energy standards for code compliance
purposes. [19]
Phase 1 modeling result shows that DPR Construction Inc. headquarter building improves energy performance by
20% as compared to California’s Energy Eiciency Standard for Residential and Non-residential Buildings , which
equals to $25,000 annual energy cost savings [15]
In order to satisfy the clients’ desire to know how LEED certiied building improves performance, phase 2 modeling
was conducted in year 2008, in the operating phase of the facility. To do this analysis, DPR Construction Inc. devel-
oped a building information model using software IES Virtual Environment. Input data include contextual data—
weather, location, time-period, ground relection rating, terrain type and wind exposure rating; HVAC data--- fuel
type, generator seasonal eiciency, heating delivery eiciency, cooling mechanism type, and auxiliary equipment
information; building envelope performance--- materiality and thermal properties; and space usage data--- number
of building occupants, lighting types, equipment types and occupancy schedules. Output data include annual cool-
ing load, annual heating load, CO2 emissions, natural gas usage and electricity usage. [15]
IES Virtual Environment (VE), which is mentiond in the Software Comparison and Conclusion part of this study,
allows various types of input iles including Revit, SketchUp, Trelligence, Vectorworks, Graphisoft, gbXML, IFC, DXF
iles. Input of data relating to materials, occupancy, internal gains, climate, weather iles, air movement and systems
is managed entirely through graphical interfaces and supported by extensive database. Uses can get a 3D meomet-
ric visualization output package. [20]
Phase 2 analysis shows that the facility energy usage is 27% percent less than Building Owners and Managers Asso-
ciation (BOMA), which equals to $2,800 annual energy savings, close to previous estimation of $25,000. [15]
This building energy modeling case is regarded as successful because of the accuracy of phase 1 prediction. A simu-
lation model is often considered accurate if it falls within a speciic error margin (e.g., 5%). [16]
Reasons for the success of the energy modeling in this case may include:
• Accurateinputmeasuredinformation• Comprehensiveandcompletedatainput• Exactpredictionofscheduling
BEM CASE STUDY: A Failed BEM Case— A Semi-Detached house
An energy modeling of a refurbished two-bedroom, 76.9 sqm, semi-detached dwelling in Oxford, England is consid-
ered a failed energy modeling case because of the extremely large diference between predicted energy consump-
tion and actual energy consumption.
The dwelling was built in nineteen century and refurbished in twentieth century, occupied by a couple. One occu-
pant stayed in the house most of the weekdays and weekends due to health reasons. The other occupant works part-
time during weekdays.
Pre-occupancy energy prediction in this case was conducted in compliance to SAP 2005. SAP (Standard Assessment
Procedure) is UK Government’s standard assessment procedure for energy rating of dwellings. The SAP rating/cal-
culation is based on the energy costs associated with space heating, water heating, ventilation and lighting, less
cost savings from energy generation technologies. It is adjusted for loor area so that it is essentially independent
of dwelling size for a given built form. [21] SAP software is used in SAP ratings/calculations. It is required that data
should be inputted in the form of worksheet into SAP software.
The SAP calculation is based on the energy balance taking into account a range of factors that contribute to energy
eiciency:
• Materialsusedforconstructionofthedwelling• Thermalinsulationofthebuildingfabric• Ventilationcharacteristicsofthedwellingandventilationequipment• Eiciencyandcontroloftheheatingsystem(s)• Solargainsthroughopeningsofthedwelling• Thefuelusedtoprovidespaceandwaterheating,ventilationandlighting• Renewableenergytechnologies
The SAP calculation is independent of factors related to the individual characteristics of the household
occupying the dwelling when the rating is calculated, for example:
• Householdsizeandcomposition;• Ownershipandeiciencyofparticulardomesticelectricalappliances;• Individualheatingpatternsandtemperatures.[22]
It is obvious that SAP energy calculation is diferent from the common energy modeling in US since the energy mod-
eling in US do consider factors that SAP calculation are independent of. And SAP in used especially on dwellings.
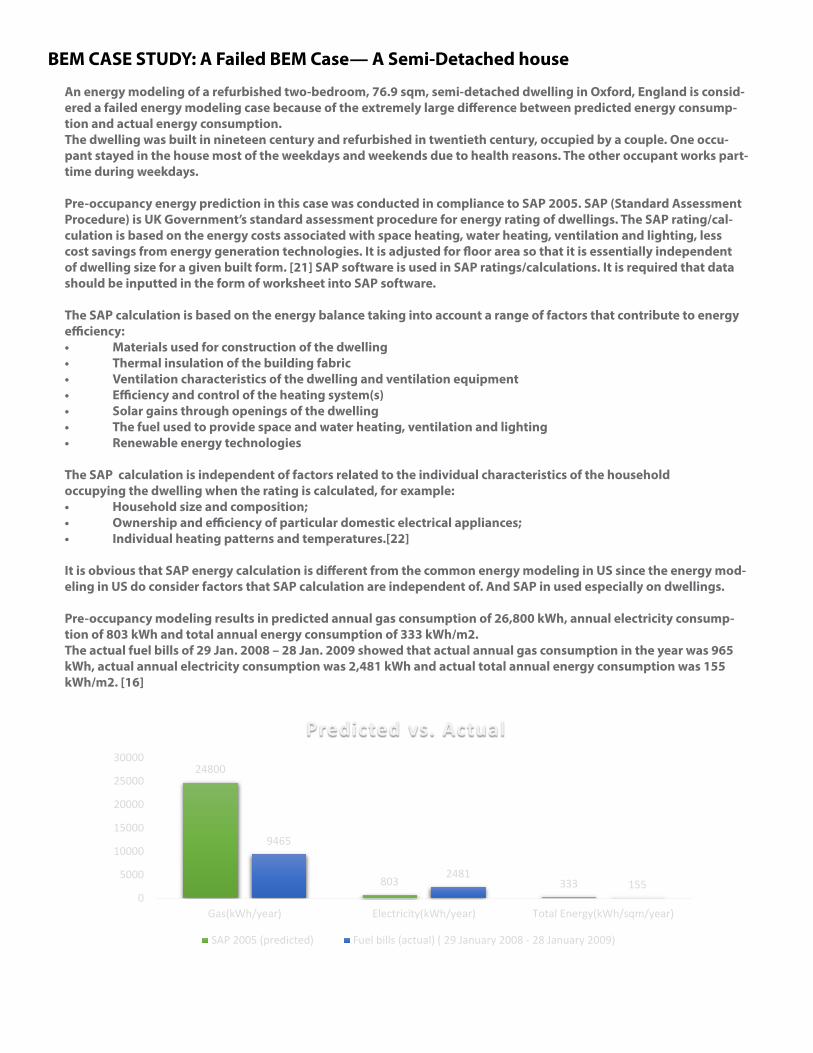
Pre-occupancy modeling results in predicted annual gas consumption of 26,800 kWh, annual electricity consump-
tion of 803 kWh and total annual energy consumption of 333 kWh/m2.
The actual fuel bills of 29 Jan. 2008 – 28 Jan. 2009 showed that actual annual gas consumption in the year was 965
kWh, actual annual electricity consumption was 2,481 kWh and actual total annual energy consumption was 155
kWh/m2. [16]
24800
803 333
9465
2481155
0
5000
10000
15000
20000
25000
30000
Gas(kWh/year) Electricity(kWh/year) Total Energy(kWh/sqm/year)
Predicted vs. Actual
SAP 2005 (predicted) Fuel bills (actual) ( 29 January 2008 - 28 January 2009)
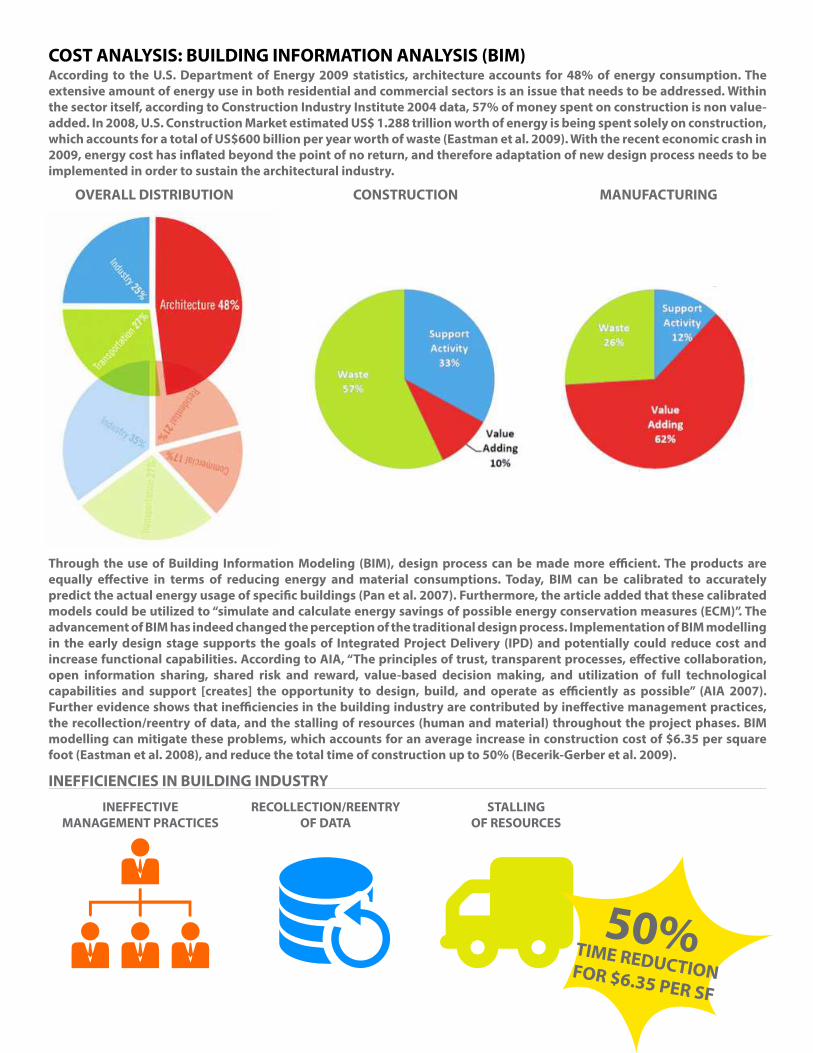
COST ANALYSIS: BUILDING INFORMATION ANALYSIS (BIM)According to the U.S. Department of Energy 2009 statistics, architecture accounts for 48% of energy consumption. The
extensive amount of energy use in both residential and commercial sectors is an issue that needs to be addressed. Within
the sector itself, according to Construction Industry Institute 2004 data, 57% of money spent on construction is non value-
added. In 2008, U.S. Construction Market estimated US$ 1.288 trillion worth of energy is being spent solely on construction,
which accounts for a total of US$600 billion per year worth of waste (Eastman et al. 2009). With the recent economic crash in
2009, energy cost has inlated beyond the point of no return, and therefore adaptation of new design process needs to be
implemented in order to sustain the architectural industry.
OVERALL DISTRIBUTION CONSTRUCTION MANUFACTURING
Through the use of Building Information Modeling (BIM), design process can be made more eicient. The products are
equally efective in terms of reducing energy and material consumptions. Today, BIM can be calibrated to accurately
predict the actual energy usage of speciic buildings (Pan et al. 2007). Furthermore, the article added that these calibrated
models could be utilized to “simulate and calculate energy savings of possible energy conservation measures (ECM)”. The
advancement of BIM has indeed changed the perception of the traditional design process. Implementation of BIM modelling
in the early design stage supports the goals of Integrated Project Delivery (IPD) and potentially could reduce cost and
increase functional capabilities. According to AIA, “The principles of trust, transparent processes, efective collaboration,
open information sharing, shared risk and reward, value-based decision making, and utilization of full technological
capabilities and support [creates] the opportunity to design, build, and operate as eiciently as possible” (AIA 2007).
Further evidence shows that ineiciencies in the building industry are contributed by inefective management practices,
the recollection/reentry of data, and the stalling of resources (human and material) throughout the project phases. BIM
modelling can mitigate these problems, which accounts for an average increase in construction cost of $6.35 per square
foot (Eastman et al. 2008), and reduce the total time of construction up to 50% (Becerik-Gerber et al. 2009).
INEFFECTIVE
MANAGEMENT PRACTICES
RECOLLECTION/REENTRY
OF DATA
STALLING
OF RESOURCES
INEFFICIENCIES IN BUILDING INDUSTRY
50% TIME REDUCTIONFOR $6.35 PER SF
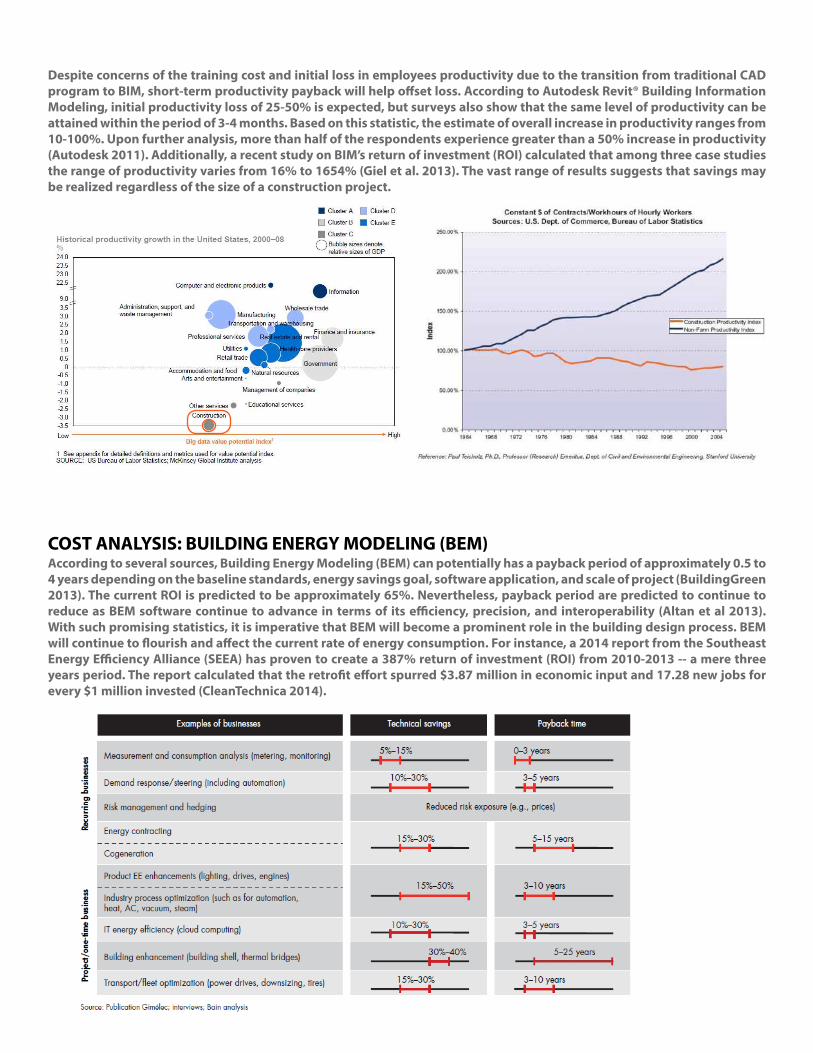
Despite concerns of the training cost and initial loss in employees productivity due to the transition from traditional CAD
program to BIM, short-term productivity payback will help ofset loss. According to Autodesk Revit® Building Information
Modeling, initial productivity loss of 25-50% is expected, but surveys also show that the same level of productivity can be
attained within the period of 3-4 months. Based on this statistic, the estimate of overall increase in productivity ranges from
10-100%. Upon further analysis, more than half of the respondents experience greater than a 50% increase in productivity
(Autodesk 2011). Additionally, a recent study on BIM’s return of investment (ROI) calculated that among three case studies
the range of productivity varies from 16% to 1654% (Giel et al. 2013). The vast range of results suggests that savings may
be realized regardless of the size of a construction project.
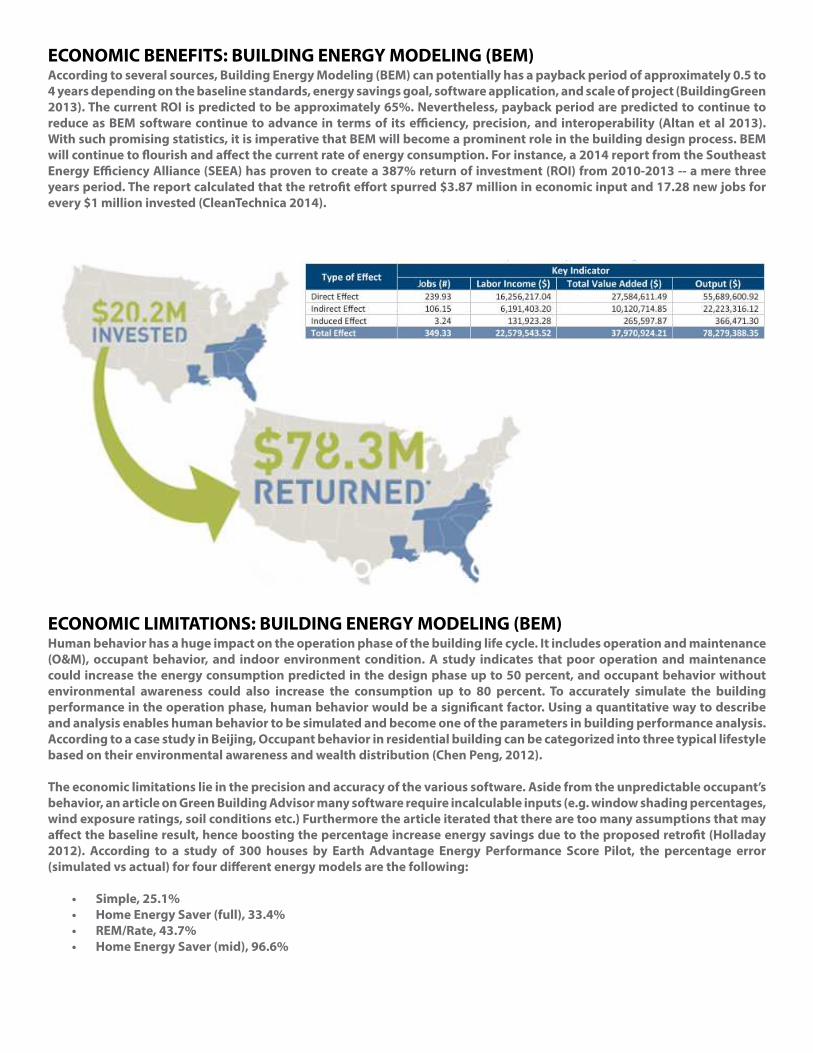
According to several sources, Building Energy Modeling (BEM) can potentially has a payback period of approximately 0.5 to
4 years depending on the baseline standards, energy savings goal, software application, and scale of project (BuildingGreen
2013). The current ROI is predicted to be approximately 65%. Nevertheless, payback period are predicted to continue to
reduce as BEM software continue to advance in terms of its eiciency, precision, and interoperability (Altan et al 2013).
With such promising statistics, it is imperative that BEM will become a prominent role in the building design process. BEM
will continue to lourish and afect the current rate of energy consumption. For instance, a 2014 report from the Southeast
Energy Eiciency Alliance (SEEA) has proven to create a 387% return of investment (ROI) from 2010-2013 -- a mere three
years period. The report calculated that the retroit efort spurred $3.87 million in economic input and 17.28 new jobs for
every $1 million invested (CleanTechnica 2014).
COST ANALYSIS: BUILDING ENERGY MODELING (BEM)
According to several sources, Building Energy Modeling (BEM) can potentially has a payback period of approximately 0.5 to
4 years depending on the baseline standards, energy savings goal, software application, and scale of project (BuildingGreen
2013). The current ROI is predicted to be approximately 65%. Nevertheless, payback period are predicted to continue to
reduce as BEM software continue to advance in terms of its eiciency, precision, and interoperability (Altan et al 2013).
With such promising statistics, it is imperative that BEM will become a prominent role in the building design process. BEM
will continue to lourish and afect the current rate of energy consumption. For instance, a 2014 report from the Southeast
Energy Eiciency Alliance (SEEA) has proven to create a 387% return of investment (ROI) from 2010-2013 -- a mere three
years period. The report calculated that the retroit efort spurred $3.87 million in economic input and 17.28 new jobs for
every $1 million invested (CleanTechnica 2014).
Human behavior has a huge impact on the operation phase of the building life cycle. It includes operation and maintenance
(O&M), occupant behavior, and indoor environment condition. A study indicates that poor operation and maintenance
could increase the energy consumption predicted in the design phase up to 50 percent, and occupant behavior without
environmental awareness could also increase the consumption up to 80 percent. To accurately simulate the building
performance in the operation phase, human behavior would be a signiicant factor. Using a quantitative way to describe
and analysis enables human behavior to be simulated and become one of the parameters in building performance analysis.
According to a case study in Beijing, Occupant behavior in residential building can be categorized into three typical lifestyle
based on their environmental awareness and wealth distribution (Chen Peng, 2012).
The economic limitations lie in the precision and accuracy of the various software. Aside from the unpredictable occupant’s
behavior, an article on Green Building Advisor many software require incalculable inputs (e.g. window shading percentages,
wind exposure ratings, soil conditions etc.) Furthermore the article iterated that there are too many assumptions that may
afect the baseline result, hence boosting the percentage increase energy savings due to the proposed retroit (Holladay
2012). According to a study of 300 houses by Earth Advantage Energy Performance Score Pilot, the percentage error
(simulated vs actual) for four diferent energy models are the following:
• Simple, 25.1%
• Home Energy Saver (full), 33.4%
• REM/Rate, 43.7%
• Home Energy Saver (mid), 96.6%
ECONOMIC BENEFITS: BUILDING ENERGY MODELING (BEM)
ECONOMIC LIMITATIONS: BUILDING ENERGY MODELING (BEM)
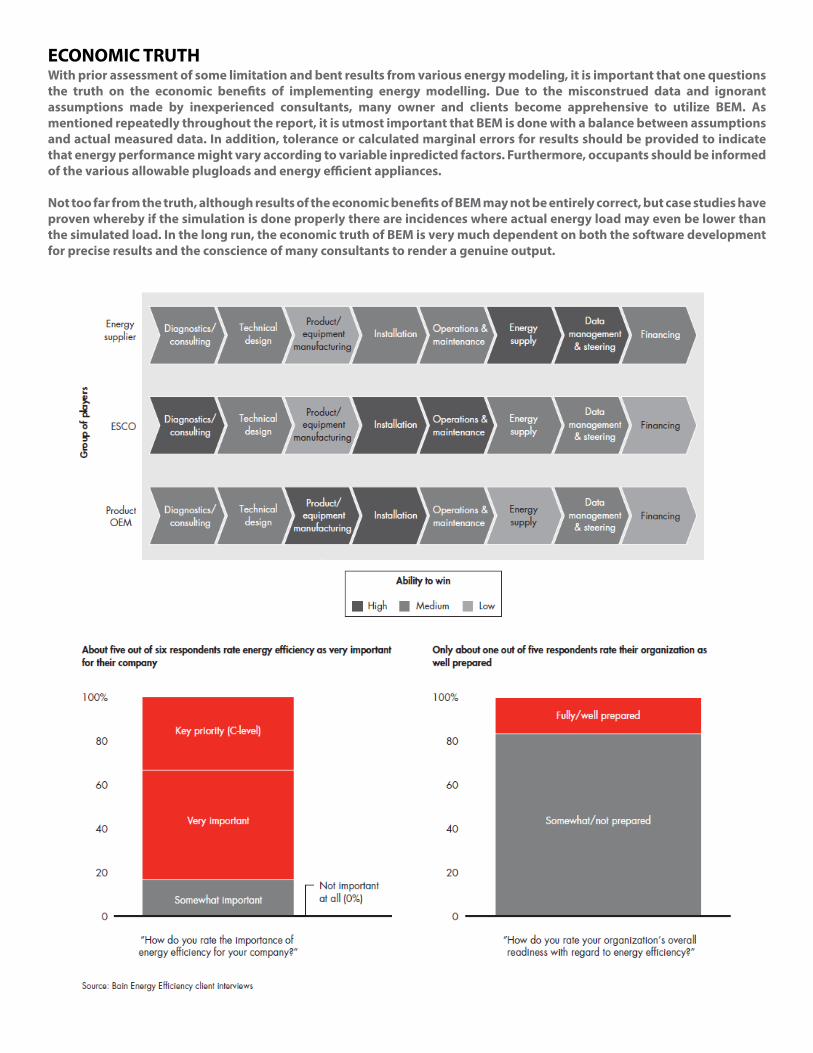
With prior assessment of some limitation and bent results from various energy modeling, it is important that one questions
the truth on the economic beneits of implementing energy modelling. Due to the misconstrued data and ignorant
assumptions made by inexperienced consultants, many owner and clients become apprehensive to utilize BEM. As
mentioned repeatedly throughout the report, it is utmost important that BEM is done with a balance between assumptions
and actual measured data. In addition, tolerance or calculated marginal errors for results should be provided to indicate
that energy performance might vary according to variable inpredicted factors. Furthermore, occupants should be informed
of the various allowable plugloads and energy eicient appliances.
Not too far from the truth, although results of the economic beneits of BEM may not be entirely correct, but case studies have
proven whereby if the simulation is done properly there are incidences where actual energy load may even be lower than
the simulated load. In the long run, the economic truth of BEM is very much dependent on both the software development
for precise results and the conscience of many consultants to render a genuine output.
ECONOMIC TRUTH

ADVANTAGESDISADVANTAGES
• Lack of interoperability between diferent
softwares, especially with DOE-2 engines,
such as missing feedback between modules.
Absence of common ile format.
• Older software does not have the capability
to adapt newer systems and adding more
functionality is cumbersome compared to
component-based engines.
• Engines need to be frequently updated to
adapt to the fast growing new technologies.
• Lack of user-friendly graphical inteface,
which result in the dependency of other
modeling software.
• Ideal HVAC components (simple and compact
deinition without detailed information
about components and topology).
• Various baselines on diferent standards
can be used to determine the diferences
between the desired building benchmark. As
a result, energy performance improvements
become unreliable.
• Incomplete qualities or disadvantages of
programs are sometimes hidden or diicult
to evaluate. There may be lack of resources
to navigate through the software.
• May be unapplicable to large scale studies,
such as region or market wide, due to over
generalization and conlicting manufacturers
and resources.
• Driven by various incentives, mandatory
code compliances instead of environmentally
conscious educational choice.
• Newer simulation engines has started to
introduce greater interoperable ile format,
such as the development of IFC.
• Faster running engines and computer help
render faster, while results can be tabulated
and represented clearly.
• Educational program starts to introduce
an interdisciplinary approach to better
understand diferent aspects of building
design. The knowledge overlap is crucial to
increase communication eiciency.
• Provide a benchmark to determine operation
and maintenance cost of building, hence
proitting client/owner in the long run.
• Development of software has increased
precision and accuracy of energy modeling
through various mandatory input.
• Increase in incentives for certain standard
compliancy or accreditation.
• Increase in availability of energy modeler,
professional auditor, and product
manufacturer, which allow for faster and
inexpensive retroit.
• Ensure occupant’s comfort and productivity.
• Greater environmental awareness.
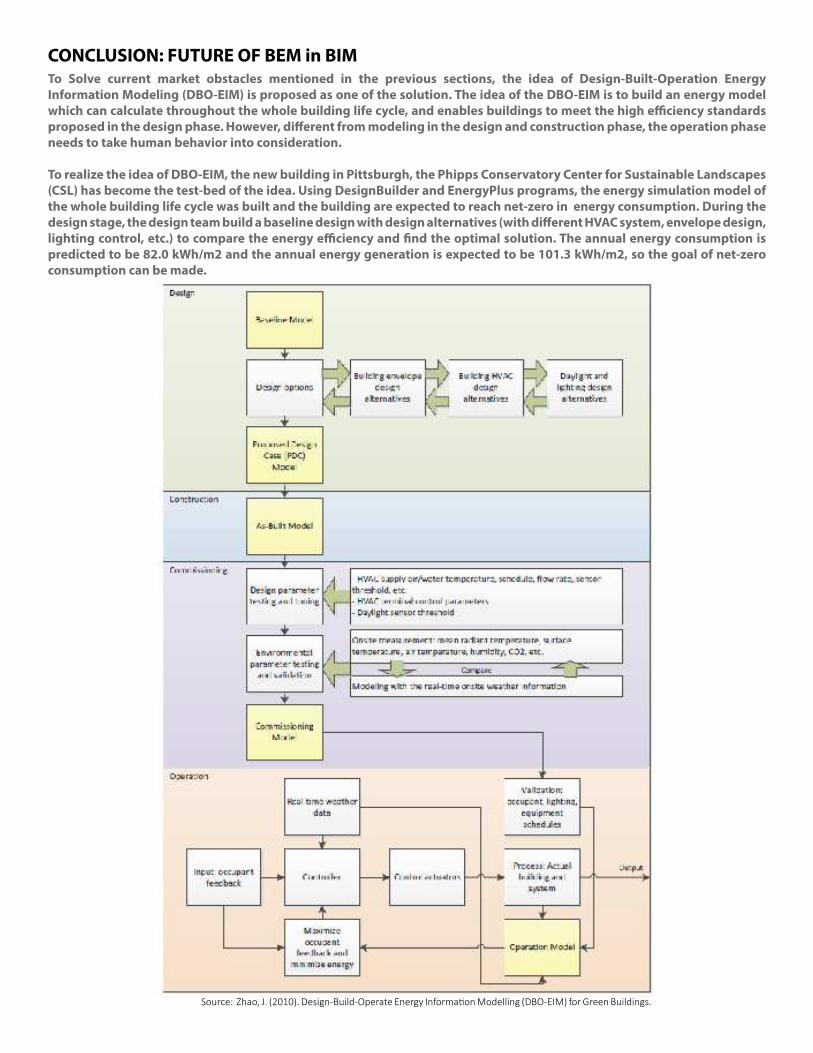
CONCLUSION: FUTURE OF BEM in BIMTo Solve current market obstacles mentioned in the previous sections, the idea of Design-Built-Operation Energy
Information Modeling (DBO-EIM) is proposed as one of the solution. The idea of the DBO-EIM is to build an energy model
which can calculate throughout the whole building life cycle, and enables buildings to meet the high eiciency standards
proposed in the design phase. However, diferent from modeling in the design and construction phase, the operation phase
needs to take human behavior into consideration.
To realize the idea of DBO-EIM, the new building in Pittsburgh, the Phipps Conservatory Center for Sustainable Landscapes
(CSL) has become the test-bed of the idea. Using DesignBuilder and EnergyPlus programs, the energy simulation model of
the whole building life cycle was built and the building are expected to reach net-zero in energy consumption. During the
design stage, the design team build a baseline design with design alternatives (with diferent HVAC system, envelope design,
lighting control, etc.) to compare the energy eiciency and ind the optimal solution. The annual energy consumption is
predicted to be 82.0 kWh/m2 and the annual energy generation is expected to be 101.3 kWh/m2, so the goal of net-zero
consumption can be made.
Source: Zhao, J. (2010). Design-Build-Operate Energy Informaion Modelling (DBO-EIM) for Green Buildings.

Five Selection Criteria (Major Challenges)
Shady Attia has identiied 5 major challenges for the BPM tools future development, by summarizing literature indings.
The 5 criteria are shown below:
1. Usability and Information Management (UIM) of the interface
“The usability and information management of the interface refers to the human-computer interaction” (Shady
Attia, 2010). The challenge means that both tool users and presenters expects the tools have more simpliied and
lexible control interface, and are able to generate a more straightforward results. This requires the software to
have better abilities to manage large information data and produce a concise graphs and results.
2. Integration of Intelligent design Knowledge-Base (IIKB)
The building performance simulation industry is still in the early stage of development. Hence, the BPM tools
should educate the users and designers in order to provide guidance and directions in the design process.
3. Accuracy and Ability to simulate Detailed and Complex building Components (AADCC)
This challenge is the most widely found in the literatures related to BPM tools. The challenge lies in not only have
the ability to simulate complex and detail building components but also achieve an accurate result of simulation.
4. Interoperability of Building Modeling
The development of Building Information Modeling (BIM) and the applications of the IFC format have enable the
potential of integration project delivery in the building industry. However, the challenge is that only in the detailed
design phase of BIM can the project team deliver the information for conducting energy simulation. On the other
hand, if the project team adopt BIM in the early design phase, the complexity of the procedure will limit the potential
design options. (Eisenberg, Done et al. 2002; Donn, Selkowitz et al. 2009)
5. Integration of tools in Building Design Process (IBDP)
The inal challenge lies in improving the way to utilize the BPM tools. The current BPM tools are contradicted to the
nature of the design process. (Morbitzer, Strachan et al. 2001; Yezioro 2008).
Source: Shady Aia (2010). Building Performance Simulaion Tools: Selecion Criteria and User Survey.

REFERENCES
1. Autodesk. Autodesk Building Information Modeling: Realizing the Beneits of BIM. 2011.
2. Autodesk. Revit Building Information Modeling: Transitioning to BIM. 2007.
3. Becerik-Gerber, B. and Rice, S. The Value of Building Information Modeling: Can We Measure the ROI of BIM?.
University of Southern California AECbytes Issue 47. August 2009.
4. Eastman, Charles M., et al. BIM Handbook : A Guide to Building Information Modeling for Owners, Managers,
Designers, Engineers, and Contractors. Hoboken, N.J.: Wiley, 2008.
5. Eastman, Charles M., et al. BIM Handbook : A Guide to Building Information Modeling for Owners, Managers,
Designers, Engineers, and Contractors. Hoboken, N.J.: Wiley, 2009.
6. Giel, B. and Issa, R. Return of Investment Analysis of Using Building Information Modeling in Construction. Journal
of Computing Civil Engineering Vol 27 Issue 5. September 2013.
7. Kendra Tupper, Ellen Franconi, Coreina Chan, Stephanie Hodgin, Aaron Buys and Merritt Jenkins. (2011). Building
Energy Modeling: Industry-Wide Issues And Potential Solutions. Hanover, NH.
8. Ibrahim, M. and Krawczyk, R. The Level of Knowledge of CAD Objects within the Building Information Model.
Proceedings of the 2003 Annual Conference of the Association for Computer Aided Design in Architecture. pg 173-
177. 2003.
9. The American Institute of Architects (AIA) and AIA California Council. Integrated Project Delivery: A Guide Version
1. 2007.
10. Shady Attia (2010). Building Performance Simulation Tools: Selection Criteria and User Survey. Architecture et
climat, Université catholique de Louvain, Louvain La Neuve, Belgium.
11. U.S. Department of Energy. Energy Data Book. 2008.
12. Zhao, J., Lam, K.P., Karaguzel, O.T., Ahmadi, S. (2012). Design-Build-Operate Energy Information Modelling
(DBO-EIM) for Green Buildings: Case Study of a Net Zero Energy Building. Proceedings of the 1st Asia conference of
International Building Performance Simulation Association (IBPSA). Shanghai, China.
13. Gallaher, M., O’Connor, A., Dettbarn, J., and Gilday, L. (2004). “Cost Analysis of Inadequate Interoperability in the
U.S. Capital Facilities Industry”
14. Patrick C. Suermann, Raja R.A. Issa. (2009). “Evaluating Industry Perceptions Of Building
15. Information Modeling (Bim) Impact On Construction”
16. Salman Azhar, Justin W. Brown, Anoop Sattineni. (2010).” A Case Study Of Building Performance Analyses Using
Building Information Modeling”
Maile. 2010. “Tobias A Method to Compare Measured and Simulated Data to Assess Building Energy Performance”
17. Gupta, R. and Chandiwala, S. (2010). “Understanding occupants: feedback techniques for large scale low-carbon
domestic refurbishments, Building Research & Information”
18. Kristopher Baker, Rob Bolin. Syska Hennessy Group. Energy Modeling Improves Building Performance
19. EnergySoft: http://www.energysoft.com/main/page_energypro_ep_information.html
20. U.S. Department of Energy Building Energy Software Tools Directory http://apps1.eere.energy.gov/buildings/
tools_directory/software.cfm/ID=615/pagename_submenu=hvac_systems/pagename_menu=materials_
components/pagename=subjects
21. The Government’s Standard Assessment Procedure for Energy Rating of Dwellings. 2005 edition. Revision 3.
22. Carnegie Mellon University, BIM cours lecture