BHUTAN JOURNAL of - Department of Livestock
159
Volume 4 Issue 1 March 2020 DOL Department of Livestock Ministry of Agriculture and Forests, Royal Government of Bhutan BHUTAN JOURNAL of
-
Upload
khangminh22 -
Category
Documents
-
view
0 -
download
0
Transcript of BHUTAN JOURNAL of - Department of Livestock

Volume 4 Issue 1 March 2020
DOL
Department of Livestock Ministry of Agriculture and Forests, Royal Government of Bhutan
BHUTAN JOURNAL of

International Standard Serial Number (ISSN) 2520-0194
Key title :Bhutan Journal of Animal Science Abbreviated key title :Bhutan J. Anim. Sci. Parallel Title :BJAS
Copyright © Department of Livestock, 2020
Ministry of Agriculture and Forests Royal Government of Bhutan
All rights reserved.
Publisher
Department of Livestock Ministry of Agriculture and Forests, Royal Government of Bhutan, Post Box 113, Postal Code 11001, Tashichhodzong, Thimphu, Bhutan
Journal Concept & Design Dr. Kesang Wangchuk
Front Cover page Dr. Kesang Wangchuk and Mr. Namgay Dorji
Back Cover Page Dr. Karma Wangdi
Printing company Tshangpa Printing Press, Kawajangsa, Thimphu, Bhutan
BJAS is registered permanently with the ISSN International Centre, 45
rue de Turbigo, 75003 Paris, FRANCE

About the Journal
The Bhutan Journal of Animal Science (BJAS), founded in 2017, is an open access
English-language journal on animal science. All papers are peer and double blind
reviewed. BJAS is supervised by the Department of Livestock, Ministry of
Agriculture and Forests, and financed by the Royal Government of Bhutan. BJAS is
published annually with original work that makes a significant contribution to
understanding and enhancing the animal production practices in smallholder systems
in the mountains. The original works encompass the social, cultural, economic, and
policy influences affecting the use and management of plant and animal resources.
BJAS publishes research, reviews, reports on all aspects of ruminants, piggery,
poultry, aquaculture, and apiculture. BJAS also accepts livestock associated research
reports on climate change, sustainable development, rural livelihood, socio-
economics, and policy. BJAS requires academic papers and research reports to
display universal, strategic and innovative characteristics in both theory and practice.
BJAS is a forum for sharing information between researchers, policy makers and
practitioners.
Articles in BJAS present the results of original research, contributions to theory or
new conclusions reached from the review of a topic. Their structure conforms to that
of standard scientific articles and writing style is made clear and concise. Results are
critically analyzed and objectively presented.
Major topics published are on animal production, breeding and genetics, animal
health, socio-economic and post-production.
Bibliographic Details
ISSN: 2520-0194; Frequency: Annual; Current Issue: Volume 4 (1)

BHUTAN JOURNAL OF ANIMAL SCIENCE (BJAS) Volume 4, Issue 1, 2020
Foreword
I am very pleased to present the 4th issue of Bhutan Journal of Animal Science (BJAS). As research findings has to be
communicated effectively to contribute to knowledge and development, the BJAS provides a unique platform for all
the researchers to share new knowledge and research technologies amongst relevant stakeholders to facilitate them in
making an informed decision, framing enabling policies and guidelines, and promoting relevant technologies. On this
note, I am equally excited that the journal is motivating and inculcating young researchers in the mountains to publish
and share their knowledge and key research recommendations thereby fulfilling the intended goal of the journal.
This issue of BJAS present 24 papers which radiates light on both historical and contemporary questions in various
livestock development areas such as animal production, breeding and genetics, and animal health. The papers in this
journal are presented in two categories as the full-length paper and short communication organized in a standard
format as presented in the earlier volumes called “IMRAD” referring to the main sections of the paper: Introduction,
Materials and Methods, Results and Discussion. Though, there are number of journals covering the aforementioned
areas yet, the BJAS is unique in itself which encourages young and novice authors to submit works addressing the
fundamental and scientific aspects together with practical issues.
I would like to congratulate Mr. Towchu Rabgay, the Chief of “RED” and Mr. Jigme Wangdi, the Editor-in-Chief of
BJAS and the team for their commitment and hard works in timely publishing this journal. My sincere gratitude goes
to the dynamic leadership and guidance of Hon'ble Minister Yeshey Penjor and Dasho Rinzin Dorji, Secretary,
Ministry of Agriculture and Forests.
Finally, I would like to thank all the authors, reviewers and readers for their supports.
Tashi Delek!
Dr. Tashi Samdup (PhD)
Chief Advisor

EDITORIAL BOARD
BHUTAN JOURNAL OF ANIMAL SCIENCE (BJAS) Volume 4, Issue 1, 2020
CHIEF ADVISOR DR. TASHI SAMDUP DEPARTMENT OF LIVESTOCK, MINISTRY OF AGRICULTURE AND FORESTS, THIMPHU, BHUTAN EMAIL: [email protected], PH: +975 17114221
CO-ADVISOR MR. TOWCHU RABGAY
DEPARTMENT OF LIVESTOCK, MINISTRY OF AGRICULTURE AND FORESTS, THIMPHU, BHUTAN EMAIL: [email protected], PH: +97517605539
EDITOR-IN-CHIEF MR. JIGME WANGDI
NATIONAL DAIRY RESEARH AND DEVELOPMENT CENTRE, DEPARTMENT OF LIVESTOCK, MINISTRY OF AGRICULTURE AND FORESTS, BHUTAN Email: [email protected], PH: +97577653485
ASSOCIATE EDITORS DR. RATNA B GURUNG NATIONAL CENTRE FOR ANIMAL HEALTH, SERBITHANG, THIMPHU DR. KUENGA NAMGAY DEPARTMENT OF LIVESTOCK, THIMPHU MR. JAMBAY GYELTSHEN NATIONAL RESEARCH & DEVELOPMENT CENTRE FOR ANIMAL NUTRITION, JAKAR DR. DHAN B RAI NATIONAL DAIRY RESEARCH AND DEVELOPMENT CENTRE, YUSIPANG, THIMPHU DR. NB TAMANG NATIONAL DAIRY RESEARCH AND DEVELOPMENT CENTRE, YUSIPANG, THIMPHU DR. KARMA WANGDI DEPARTMENT OF LIVESTOCK, THIMPHU DR. NARAPATI DAHAL DEPARTMENT OF LIVESTOCK, THIMPHU DR. VIJAY RAIKA NATIONAL HIGHLAND RESEARCH & DEVELOPMENT CENTRE, JAKAR DR. MP TIMSINA DEPARTMENT OF LIVESTOCK, THIMPHU DR. KARMA RINZIN DEPARTMENT OF LIVESTOCK, THIMPHU MR. TASHI DHENDUP DEPARTMENT OF LIVESTOCK, THIMPHU MR. SONAM NORBU REGIONAL PIG BREEDING CENTRE, YUSIPANG, THIMPHU MR. SINGYE TSHERING NATIONAL RESEARCH & DEVELOPMENT CENTRE FOR RIVERINE & LAKE FISHERIES, HAA
DR. SURYA B CHAMLING RAI NATIONAL POULTRY RESEARCH AND DEVELOPMNENT CENTRE, SARPANG
Editorial correspondence should be addressed to: The Editor-in-Chief, Bhutan Journal of Animal Science, Department of Livestock, Ministry of Agriculture and Forests, Thimphu, Bhutan.

Vol. 4 No. 1 March 2020
BHUTAN JOURNAL OF ANIMAL SCIENCE (BJAS)
A. Full Length paper
1. Effect of body condition, season of estrous induction and fixed time artificial insemination
on calving rate of local Thrabam cattle in Bhutan
NAR B TAMANG, DHAN B RAI AND ABI N KOIRALA
1-4
2. Y-chromosomal diversity on indigenous sheep (Ovis aries) breeds in Nepal: comparison with
domestic and wild sheep
NEENA AMATYA GORKHALI, LIN JIANG, SAROJ SAPKOTA, XIAO-HONG HE, QIAN-
JUN ZHAO, JIAN-LIN HAN AND YUE-HUI MA
5-12
3. Disentangling conflicts in pastoralism: genesis, arbitration and institutions
KUENGA NAMGAY 13-22
4. Dairy farming in Punakha: understanding constraints and opportunities
PEMA UGYEN 23-27
5. The demographic characteristics of dogs presented for the capture-neuter-vaccinate-release
(CNVR) program in Bhutan
KARMA RINZIN, IAN D ROBERTSON, HIRUKA MAHAT, KEYUR PATEL, SATISH
RAGHORTHE AND KINZANG DUKPA
28-37
6. Socio-economic importance of buffalo farming in Samtse district
TASHI DHENDUP 38-46
7. Staphanofilarial dermatitis (hump sore) treatment trial in Tashicholing, Samtse district
SANGAY RINCHEN, KARMA WANGDI, SONAM JAMTSHO, KARMA WANGCHUK,
KARMA TSHERING, BINDHU PARAJULI, YANGCHEN DEMA AND BASANT SHARMA
47-53
8. Milking management practices by small-scale dairy farmers of Trashiyangtse district in
Bhutan
TASHI DENDUP AND JIGDREL DORJI
54-59
9. A case study of pungdzong dairy farmers group: analysis of milk value chain
PEMA UGYEN AND RESIE OUDE LUTTIKHUIS 60-67
10. Evaluation of a capture-neuter-vaccinate-release (CNVR) program: intervention to control
the dog population and rabies in Bhutan
KARMA RINZIN, ID ROBERTSON, YESHEY TSHERING, N DAHAL AND RK PANDEY
68-75
11. Assess milk production of cattle breeds in different agro-ecological zones of western Bhutan
DEKI CHODEN, LOKEY THAPA AND NB TAMANG 76-82
12. Public perceptions towards macaque population along Thimphu-Phuentsholing highway:
imminent public health and conservation threats
KARMA WANGDI, SANGAY RINCHEN, SONAM JAMTSHO, KARMA WANGCHUK,
BINDHU PARAJULI AND BASANT SHARMA
83-89
13. Breed improvement, milk production and socio-economic benefit of contract heifer and bull
production program in west and west-central region of Bhutan
DHAN B RAI, NAR B TAMANG, LOKAY THAPA AND ABI N KOIRALA
90-97
14. Comparative performance of commercial broiler hybrids in sub-tropical zone of Bhutan
SURYA BC RAI, TASHI JAMTSHO AND KINLEY DEMA 98-102
15. Assessment of milk production and income from traditional and improved management
system of small dairy farmers in Bhutan
LOKEY THAPA, DEKI CHODEN AND NAR B TAMANG
103-109
16 Compositional analysis of market milk in Thimphu & Paro districts
PHUNTSHO T NORBU, KINLEY CHOKI AND SONAM YANGCHEN 110-113
17. Perception of Bhutanese farmers towards pig farming
GYEMBO TSHETEN, TENZIN PENJOR, PEMA SHERAB AND TASHI DORJI
114-118

18. Assessment of poultry farm bio-security measures in southern Bhutan
TASHI JAMTSHO, SB CHAMLING RAI, KINLEY DEMA AND CHENCHO TSHERING
119-123
B. Short Communication
19. Swine-fish integration: effect on culture performance of Ctenopharyngodon idella and
Cyprinus carpio
PEMA THINLEY, NAMGAY DORJI AND DRUKPOLA
124-127
20. A preliminary finding on the effectiveness of fishways at Kurichhu dam in Bhutan
CHANGLU, GOPAL PRASAD KHANAL, SANGAY NORBU AND SINGYE TSHERING 128-132
21. Exploring of alien fish species diversity in Amochhu of Bhutan
SANGAY NORBU, GOPAL PRASAD KHANAL, SINGYE TSHERING, PEMA TSHERING
AND CHANGLU
133-138
22. Comparison of growth performance of pig sucklers’ fed with creep feed and sow ration
TENZIN PENJOR, GYEMBO TSHETEN, PEMA SHERAB AND VIJAY RAIKA 139-142
23. Benefit-cost analysis of pullet rearing in Sarpang district
SURYA BC RAI, TASHI JAMTSHOAND KINLEY DEMA 143-146
24. Effect on milk production and compositions of jersey cross cows fed with dried lucerne chaff
as feed supplements in late autumn
WANGCHUK, JAMBAY GYELTSHEN, CHIMI RINZIN AND SONAM WANGCHUK
147-150

Bhutan Journal of Animal Science (BJAS) Volume 4, Issue 1, Page 1-4, 2020
1
Full length paper
EFFECT OF BODY CONDITION, SEASON OF ESTROUS INDUCTION AND FIXED TIME ARTIFICIAL
INSEMINATION ON CALVING RATE OF LOCAL THRABAM CATTLE IN BHUTAN
NAR B TAMANG*, DHAN B RAI AND ABI N KOIRALA
National Dairy Research and Development Centre, Department of Livestock, Yusipang
*Author for correspondence: [email protected]
Copyright © 2020 Nar B Tamang. The original work must be properly cited to permit
unrestricted use, distribution, and reproduction of this article in any medium.
ABSTRACT: Response and calving rates of local Thrabam heifers and cows artificially
inseminated in induced estrous (heat) was assessed. A total of 298 animals in three Agro-
Ecological Zones of Samtse (Tading) and Tsirang (Barsong & Sergethang) were
inseminated on induced estrous and followed up till animals calved. Results indicated that
calving rate was 12.08% when inseminated on induced estrous (n=36/298) as compared to
37.5% (n=6/16) when animals were inseminated in natural estrous. Further, Thrabam
cows/heifers with average Body Condition Score (BCS) of 2.8 (n=41) had significantly
higher response to hormonal treatment, conception and calving (p<0.000) than animals
with BCS less than 2.4 indicating good health/better plane of nutrition are prerequisite for
birth of more calves when inseminated on induced estrous. Besides, estrous induction/
estrous synchronization with hormonal treatment (TRIU-B) and insemination during
winter produced less calves (14.2% calving) than estrous induced and inseminated in
summer (31.5% calving) in same cattle type. This indicates that seasonal variation of
environmental condition alters conception/calving. Hence, Artificial Insemination of cattle
on induced estrous in Bhutanese environment will be more conducive in summer when
weather is favorable for adequate access to green forages by animals. Thrabam
synchronized and inseminated during same season had lower conception than exotic dairy
breeds (Jersey & Jersey cross). Study concludes that estrous induced in animals using
hormonal drugs does not necessarily result in conception even when animals are
inseminated by skilled Technicians. Hence, selection of dairy cattle with optimum body
condition score, cattle breed/type, choosing of right season of the year for inducing estrous
and insemination is necessary for better outcome of such interventions.
Keywords: Artificial insemination; calving rate; induced estrous; local Thrabam cattle.
1. INTRODUCTION
Bhutan has over 317,451 heads of cattle of which about
39% (119121 heads) is improved breed with Bos taurus
inheritance (DoL 2017) and rest are local breeds and
crosses. Local Thrabam cattle (Bos indicus) reared by
farmers has low productivity. It has lower reproductive
efficiency including longer age at puberty/first calving
and long inter-calving period (Tamang & Perkins 2014).
Breed improvement effort along with good management
is fundamental to improve production which can offer
significant promise in reducing poverty and malnutrition
in the world (Hemme & Otte 2010). Genetic up-gradation
through artificial insemination with quality frozen semen
can improve reproductive efficiency of this cattle type
therefore can improve productivity and make dairy
farming profitable. To address the issue of high
reproductive inefficiency of local cattle types, treatment
of infertile animals with hormonal preparation to
minimize reproductive waste is tried (Tshering 2018).
This is aimed at inducing estrous in non-cycling/ infertile
female to bring into production through timed artificial
insemination applying technologies successfully applied
in developed world. In Australia where animals are
healthy with good body condition, mass estrous
synchronization and fix time Artificial Insemination is
reported to improve reproductive performance; produce
good number of desired types progenies (Lamb et al.
2001). Although such effort optimized time and resources
use by shortening the calving interval and increasing the
uniformity of the calf crop in developed countries, it is
not known whether similar intervention in harsh

Bhutan Journal of Animal Science (BJAS), Volume 4, Issue 1, Page 11-14, 2020
Tamang et al. (2020) 2
Bhutanese farming environment, where most animals
underfed can bring about substantial benefits to farmers.
Hence, efficiency and effectiveness of estrous
synchronization/ estrous induction and artificial
insemination to bring more animals into production was
assessed with the following objectives: to determine the
response rate (start of cycling in anestrous cows),
conception rate/calving rates of Thrabam cows/heifer
inseminated during estrous induced through hormonal
treatment and understand various underlying factors
hindering effectiveness of the program.
2. MATERIALS AND METHODS
2.1 Selection of study site and data collection
Areas having adequate breedable local Thrabam cattle
were selected covering three Agro-Ecological Zones
(AEZs). The sites identified were: Tading geog (sub-
district) in Samtse and Barsong and Sergithang geogs in
Tsirang Dzongkhag (district) (Table 1).
2.2 Pre-selection of breedable females
Breedable females at the test sites were selected at Tading
geog of Samtse dzongkhag, Sergethang and Barsong
geogs of Tsirang dzongkhag of Bhutan from October to
December 2017 through consultative process with local
leader and extension agents.
2.3 Mating/insemination with four sire lines
Mating scheme was designed dividing breedable females
into four groups to receive almost equal doses of semen
of four Thai Holstein Friesian (THF) sire lines (poppular,
push, pound and puzzle) provided by Dairy Promotion
Organization, Thailand.
2.4 Body Condition Scoring
Body condition scoring to evaluate fatness or thinness
according to a five-point scale (PSU 2018) was applied.
A score of 1 was considered a very thin cow with poor
access to quality nutrition, while 5 denotes an excessively
fat cow with access of nutrition and 2.5 to 3 is considered
an average body condition.
2.5 Estrous induction and fixed time Artificial
Insemination (AI)
Estrous was induced in a total of 298 pre-selected local
Thrabam cows/heifers using intra-vaginal insert (TRIU-
B with 1380mg Progesterone) plus Gonadotropin
Releasing Hormone (GnRH)-0.0084 mg I/M. In total 153
inseminations done at Tading geog, Samtse, 74 at
Barsong geog and 71 at Sergithang geog, Tsirang from
December 2017 to January, 2018. Progesterone vaginal
implant was inserted on Day 0 (zero), and along with it
GnRH was administered. The insert was removed on Day
7 (seven) in all animals as per schedule. Animals were
inseminated 48-52 hours after removal of the inserts as
per standard practice/protocol.
2.6 Follow up and data recording
Follow-up was done after one year (November 2018 to
January 2019) and progenies born were ear tagged using
National Bovine Identification Number (NBIN), calves
body weight estimated and recorded in National Cattle
Information System (NCIS). The data available were
compared with similar intervention carried out in other
dzongkhags viz., Tsirang, Sarpang and Samdrup
Jongkhar.
2.7 Data analysis
Inferential data was analyzed using Minitab Version- 18
and descriptive data were analyzed using MS Excel. Field
observation was described.
3. RESULTS AND DISCUSSIONS
3.1 Response rate to hormonal treatment
Over 91% (n=270) of animal treated with vaginal
hormonal insert responded and manifested estrous signs
and remaining 9% (n=28) either did not respond or
vaginal inserts were prematurely removed accidentally.
3.2 Calving rate
Over 298 cows/heifers were inseminated both in natural
and induced estrous with almost equal doses of frozen
semen from four Thai Holstein Friesian sire lines. A total
of 42 progenies (19 male and 23 female) were born and
registered. The overall AI success rate accounted to
14.1% (Table 2).
Among the progenies born recorded above (Table
2), six calves were born from 16 inseminations in natural
estrous, which accounts to AI success rate of 37.5%, and
is equivalent to the national average of 37% (NDRDC
2017). However, it was only 12.08% in induced estrous
Table 1: Dzongkhag/geogs selected for study in different Agro-ecological Zones (AEZs)
Dzongkhag Geog Agro-Ecological
Zone
Altitude
(masl)
Temp 0C
(mean)
Rainfall
(mm)
Female population
(Thrabam)
Tsirang Barsong Dry Sub-tropical 1200-1800 17 850- 980 275
Tsirang Sergithang Humid Sub-tropical 600-1200 19.7 950-1200 265
Samtse Tading Wet Sub-Tropical 150-600 24 1500- 4000 1234

Bhutan Journal of Animal Science (BJAS), Volume 4, Issue 1, Page 11-14, 2020
Tamang et al. (2020) 3
(n=36/298) indicating that insemination in induced
estrous in Thrabam cattle may not be cost effective.
Among sire line used Pound has higher number of
progenies (Table 2), but Chi Square Test revealed no
significant association (p>0.05) between the four sire
lines used hinting that all sire lines tested is equally good.
Similar study on effectiveness of inducing estrous with
Prostaglandin (PGF2α) and insemination during natural
oestrus in Ethopia noted higher conception rate in natural
estrous (32.07%) as compared to synchronization result
of 26.88% (Tewodros et al. 2005). Besides, many other
authors have reported a decrease in pregnancy rates when
small follicles were induced to ovulate following fixed-
time AI in both heifers and cows (CIDR Protocol – Lamb
et al. 2001; CO-Synch protocol – Perry et al. 2001).
3.3 Body condition score and calving rate
Body Condition Score (BCS) is determined by nutrient
intake that influences health of the animals. It has direct
bearing on response rate to hormonal drugs and calving
rate. In a sampled population, animal with average BCS
of 2.8 (n=41) had significantly higher response to
hormonal treatment, conception and calving (p<0.000)
when inseminated during induced estrous. Animals with
BCS of below 2.4 (n=28) had poor response rate and even
if it responded, conception rate and calving remained
poor. This finding is supported by Mania et al. (2008)
who reported that Zebu cattle (Bos indicus) with BCS 2.5
to 3, exhibited medium follicles (p<0.001) than cows with
BCS 1 and 2 indicating that incidences of cycling and
pregnancy is positively correlated with BCS. Further,
research has shown an increase in pregnancy rates with a
flushing effect on cattle bred on increasing plane of
nutrition than cattle bred on a declining plane of nutrition
(Bethany 2013). These findings are further confirmed
through study on endocrine and ovarian changes in Bos
indicus heifers by Rhodes et al. (1996). Their study
reported that nutritionally induced anestrous through
reduced dietary intake of animals had significantly lower
mean concentrations of Luteinizing Hormone (LH) than
animals in ad-libitum dietary intake. Insufficient
circulating LH to stimulate maturation of the ovulatory
follicle and hindering release of ovum results in un-
ovulatory estrous.
3.4 Season of estrous induction and calving rate
Induction of estrous in animals with intra-vaginal implant
and artificial insemination done in late autumn and winter
had low conception rate (14.2%). However, animals
synchronized in late spring and summer of 2018 in similar
environment of Sarpang, Tsirang and Samdrup Jongkhar
resulted in 31.5% conception rate (n=19). Harsh weather
condition and scarcity of fodder during winter is likely to
affect health and reproduction of animals in Bhutan. This
finding is consistent with Gwazdauskas (1985) who
reported that seasonal variation of environment, nutrition,
and management alters estrous cycle and conception rates
are reduced under stress of heat and cold. Hence, if
synchronization and AI is timed in winter when fodder
shortage is acute and animals are struggling to adjust to
cold winter days, conception rate/calving rate is likely to
be low.
3.5 Breed type and calving/conception rate
In present study local Thrabam cattle synchronized and
inseminated had very low conception rate (14.1%) as
compared to 48% in Jersey cattle through similar
intervention at similar time (Rai et al. 2019). Studies have
also found that estrous induction and AI in cows with Bos
indicus influenced genetics is a challenge with low
conception rates (Hierset al. 2003) and is often
disappointing (Saldarriaga et al. 2005). This suggests that
cattle with Bos taurus gene could be targeted for estrous
synchronization and fixed time AI for better outcome of
such interventions. Nevertheless, though many animals
have not conceived, estrous induction/synchronization
with hormonal treatment is believed to have brought
many anestrous Bos indicus cattle to regular cycle
(Sanyasi pers. comm. 2018). Similarly, Sá Filhoa et al.
(2011) supplemented the view that exogenous estradiol
Table 2: Summary of AI done, progeny born and AI success rate
Location
Particulars THF Bulls used for AI and Progeny born recorded
Push
(C5008)
Puzzle
(C5009)
Pound(C4908) Poppular
(C4902) Total
Tading, Samtse AI 41 37 29 36 153
Progeny born 4 6 4 3 17
Barsong, Tsirang AI 20 19 23 12 74
Progeny born 3 1 8 2 14
Sergithang,
Tsirang
AI 16 19 16 20 71
Progeny born 2 3 3 3 11
Total AI 77 75 68 68 298
Total Progeny born 9 10 15 8 42
AI success rate by bull (%) 11.7 13.3 22.1 11.8 14.1

Bhutan Journal of Animal Science (BJAS), Volume 4, Issue 1, Page 11-14, 2020
Tamang et al. (2020) 4
use can display better ovarian responses in Bos indicus
cows.
4. CONCLUSION & RECOMMENDATIONS
An animal's nutritional status is usually assessed on
changes in its live weight and body condition. The animal
with body condition score above 2.5 in village herd has
higher response and calving rate. In contrary, animal with
body condition score below 2.4 either does not respond to
treatment or conception will be low. In order to make
judicious use of expensive hormone to treat infertility and
induce estrous, animal in poor health should be excluded
until plane of nutrition improves and animals regain their
body condition. Owing to low level of circulating
Luteinizing Hormone (required to induce ovulation),
estrous induced in weak/underfed animals using
hormonal drugs does not necessarily result in conception
even when animals are inseminated by skilled
Technician. Hence, selection of dairy farmers with
healthy cattle, breed types for estrous induction/estrous
synchronization is crucial for better success rate. Timing
of estrous induction and insemination during summer
when animals have access to better nutrition can result in
better conception rate/calving rate than in winter. Hence,
mass estrous induction in lean season especially during
winter (when fodder scarcity is obvious) needs to be
avoided. Conception rate of local cattle when inseminated
in induced estrous is highly discouraging but animals
inseminated in natural estrous conception rate is better
even during winter. Hence, it is recommended to
inseminate local Thrabam cattle preferably in natural
estrous.
ACKNOWLEDGEMENT
Authors gratefully acknowledge the support of Mr. RB
Chuwan, Mr. Sherman Tamang and Mr. Ugyen
Wangchuk, Livestock Extension staff of Barsong,
Sergethang and Tading respectively without whose help
the study would have been incomplete.
REFERENCES
Bethany J (2013). Plane of Nutrition can Significantly
Impact Pregnancy Rates in Heifers and Young Cows,
Panhandle Research & Extension Center, University
of Nebraska-Lincoln
DoL(2017). Annual Livestock Statistics, Department of
Livestock (DoL), Thimphu, Bhutan
Gwazdauskas FC (1985). Effects of Climate on
Reproduction in Cattle, Journal of Dairy Science,
68(6):1568–1578.
Hiers EA, Barthle CR, Dahms MkV, Portillo GE, Bridges
GA, Rae DO, Thatcher WW and Yelich JV (2003).
Synchronization of Bos indicus x Bos taurus cows for
timed artificial insemination using gonadotropin-
releasing hormone plus PGF2α in combination with
melengestrol acetate. Journal of Animal Science, 81:
830- 835.
Lamb CG, Stevenson JS, Kesler DJ, Garverick HA,
Brown DR and Salfen BE (2001). Inclusion of intra-
vaginal progesterone inserts plus GnRH and PG F2α
for ovulation control in postpartum suckled beef
cows. Journal of Animal Science, 79:2253-2259.
NDRDC (2017). Annual Centre Report, National Dairy
R&D Centre, Yusipang, Thimphu, Bhutan
Perry GA (2005). Comparison of the efficiency and
accuracy of three estrous detection methods to
indicate ovulation in beef cattle. South Dakota State
University Beef Report. p. 122-127.
PSU (2018). Body Condition Scoring, Pennsylvania
Extension: Pennsylvania State University, USA
Rai DB, Tamang NB and Koirala AN (2019).
Reproductive Efficiencies of Cows and Heifers
Artificially Inseminated with Sex-sorted and
Conventional semen in Bhutan. Bhutan Journal of
Animal Science, 3(1):37-41.
Rhodes FM, Entwistle KW and Kinder JE (1996).
Changes in Ovarian Function and Gonadotropin
Secretion Preceding the Onset of Nutritionally
Induced Anoestrus in Bos indicus Heifers. Biology of
Reproduction, 55(6):1437–1443.
Sa Filhoa M, Santosb J, Ferreiraa RJ, Salesa N and
Barusellia P (2011). Importance of estrus on
pregnancy per insemination in suckled Bos indicus
cows submitted to estradiol/progesterone-based timed
insemination protocols. Theriogenology, 76: 455–
463.
Saldarriaga J, Zuluaga F, Cartmill J, Cooper D and
Williams G (2005). Synchronization of ovulation for
timed AI (TAI) in Bos indicus-influenced cattle using
CIDR-based, GnRH-prostaglandin combinations,
Journal of Animal Science, 83(Suppl. 1).
Tamang NB and Perkins JM (2014). Effect of interspecies
crossing on cattle productivity in Bhutan. In Proc.
Asian-Australasian Animal Production Congress,
Yogakarta, Indonesia.
Tewodros A, Wondifraw M, Guadie M and Zewdu A
(2015). Study on the Conception Rate of Dairy Cows
Artificially Inseminated During Natural Estrous and
By Synchronization in Fogera Woreda, Ethiopia.
African Journal of Basic & Applied Sciences, 7 (5):
291-297.
Tshering L (2018). Estrous Synchronization and
Insemination (field report), NDRDC, Yusipang.
VA Muktar A and Sabo YG (2008). Effects of Body
Condition Score on Ovarian Activity of Bos
indicus (Zebu) Cows. Asian Journal of Scientific
Research, 1(4): 421-428.

Bhutan Journal of Animal Science (BJAS) Volume 4, Issue 1, Page 5-12, 2020
------------------------------------------------------------------------------------------------------------------------------------------
5
Full length paper
Y-CHROMOSOMAL DIVERSITY ON INDIGENOUS SHEEP (OVIS ARIES) BREEDS IN NEPAL:
COMPARISON WITH DOMESTIC AND WILD SHEEP
NEENA AMATYA GORKHALI1*, LIN JIANG2, SAROJ SAPKOTA1, XIAO-HONG HE2,
QIAN-JUN ZHAO2, JIAN-LIN HAN2,3 AND YUE-HUI MA2
1Animal Breeding Division, National Animal Science Research Institute, Nepal Agriculture
Research Council (NARC), Kathmandu, Nepal 2CAAS-ILRI Joint Laboratory on Livestock and Forage Genetic Resources, Institute of Animal
Science, Chinese Academy of Agricultural Sciences (CAAS), Beijing, China 3International Livestock Research Institute (ILRI), Nairobi, Kenya
*Author for correspondence: [email protected]
Copyright © 2020. Neena A Gorkhali. The original work must be properly cited to permit
unrestricted use, distribution, and reproduction of this article in any medium.
ABSTRACT: Studies are limited in the Asian region to separate out the male-specific contribution
specifically during breed development in domestic animals. The ancestral origin and genetic
diversity of the Nepalese sheep population was investigated in four Nepalese sheep breeds (n=50
rams) and 11 Argali (O. ammon byth) sampled in the northwestern China near Nepal using Y-
chromosome microsatellites and SNPs variation in SRY 5’ promoter gene. In the present study,
Nepalese sheep as well as Argali, wild species found in northwestern China, showed the paternal
monomorphism. Nepalese sheep shared the haplotype which most likely corresponds with defined
haplotype HY_6. This haplotype includes mouflons and high percentage of domestic sheep.
Nepalese sheep and speculated ancestor population, Argali population clustered separately revealed
that there is no introgression from any of the extant wild populations to today’s sheep population.
Paternal monomorphism in Nepalese male sheep might be due to an exaggerated reduction in male
effective population size; however, the reason for monomorphism in case of Argali is not clear. For
latter, further research with inclusion of more Y-chromosome markers are warranted for rigid
conclusion.
Keywords: Genetic diversity; Nepal; Ovis aries; Ovis ammon byth; Y-chromosome.
1. INTRODUCTION
The mammalian Y chromosome has two components, a
pseudo-autosomal region which frequently recombines
with the X chromosome and a male-specific region
(MSY). The human MSY makes up around 95% of the
chromosome and contains approximately 27 distinct
proteins or protein family related genes (Lahn and Page
1999; Jobling and Tyler-Smith 2003). The MSY is male
specific and constitutively haploid and constitutes a non-
recombinant block. One-half of this block consists of
tandemly repeated satellite data and the rest carries few
genes. Unlike other chromosomes, Y-chromosome
escapes meiotic recombination as in mitochondrial DNA
and therefore, passes intact from father to son from
generation to generation. The change occurs only by
mutations such as Single Nucleotide Polymorphisms
(SNPs), insertions and deletions (Indels) and/or structural
rearrangements with low mutation rates (Wallner et al.
2013). Using these binary polymorphisms with low
mutation rates, a unique phylogeny can easily be
constructed. Y chromosome, therefore, is an excellent
tool for investigating recent evolution from the male
perspective.
Genetic variation present at the male-specific region
of the Y-chromosome provides crucial complementary
information in understanding male-mediated events and
their impact during livestock domestication and recent
breed development (Groeneveld et al. 2010). Information
from the MSY is important specifically in domestic
animals where the contribution of a small number of
males involved in breed development. In addition,
examination of the Y-chromosome has the capacity to
reveal the identity of those wild ancestors, which were
domesticated to found the breeds of today. In cattle, for
instance, investigation of a Bos indicus-specific Y-
Bhutan Journal of Animal Science (BJAS), Volume 4, Issue 1, Page 5-12, 2020
Gorkhali et al. (2020) 6
chromosomal sequence provided a contrasting
evolutionary perspective to that reflected in the
mitochondrial (mt) genome (Bradley et al. 1994; Taele et
al. 1995; MacHugh et al. 1997; Hanotte et al. 2000;
Kikkawa et al. 2003). The powerful phylogeographical
information of Y-chromosome has a counterpart in
mitochondrial genome and their comparison has often
been particularly informative and provides almost
complete picture of the origin, domestication of species
and breed development (Ferencakovic et al. 2012).
Like in other livestock species (Ling et al. 2010;
Wallner et al. 2013), studies into the genetic diversity of
sheep are dominated by studies on autosomal and
mitochondrial sequence variation. Diversity of mtDNA
has been widely used to assess the origin, phylogeny and
population structure of sheep breeds all over the world
(Hiendleder et al. 1998a, 1998b, 2002; Meadows et al.
2005, 2007; Pedrosa et al. 2005, 2007; Pereira et al. 2006;
Tapio et al. 2006; Oner et al. 2013), specifically in China
(Guo et al. 2005; Luo et al. 2005; Chen et al. 2006; Wang
et al. 2007a, b; Sulaiman et al. 2011; Zhao et al. 2011) and
India (Pardeshi et al. 2007; Arora et al. 2013; Singh et al.
2013). Analyses of mtDNA have provided genetic
evidence for multiple domestication events and have
revealed the genetic structure of sheep population
worldwide but have failed to establish well-resolved
phylogenies between breeds (Meadows et al. 2005).
However, introgression is generally ruled out as the cause
of clearly differentiated maternal lineages in livestock,
since introgression via females seems quite improbable as
introgression of males are more common. The genetic
diversity study would be more inclusive if the male-
mediated markers are considered along with the maternal
lineage marker. Nevertheless, some recent investigations
have been focused on variation on male specific region of
Y-chromosomal in sheep (Ovis aries) (Meadows et al.
2004, 2006; Meadows and Kijas 2009; Zhang et al. 2011).
Assuming a 1:1 sex ratio, in the population as a
whole, the effective population size of the Y-chromosome
is expected to be one quarter of that of any autosome, one-
third of that of the X-chromosome and similar to that of
the effectively haploid mtDNA. Moreover, it does not
undergo recombination like other chromosomes. Taking
all these facts into account, the lower sequences diversity
is expected on the Y-chromosome than elsewhere in the
nuclear genome which is indeed observed in different
domestic species (horses: Lindgren et al. 2004; Ling et al.
2010; Wallner et al. 2013; cattle: Hellborg and Ellegren
2004) and sheep is not an exception (Meadow et al. 2004).
In sheep, mutation at Y-specific microsatellites
(SRYM18) and the oY1-oY9 SNP polymorphisms have
been observed while studying the domestication and
population structure of the domestic sheep (Meadows and
Kijas 2009; Zhang et al. 2011), from which, SRYM18 and
oY1 (AY604734.2: g.67 A>G) were found to be
informative for domestic sheep and mouflons and widely
used as a haplotype block in ovine wild as well as
domestic populations (Meadows and Kijas 2009).
Genotyping of haplotype block established 17 haplotypes
in domestic and wild sheep (Meadows and Kijas 2009).
Only eight of these haplotypes (HY-4 to HY-10 and HY-
12) were present in domestic sheep (Meadows and Kijas
2009). The predominant and widely distributed haplotype
HY-6, fixed in mouflons, is considered to be the “wild”
ancestral Y-chromosome haplotype (Meadows and Kijas
2009). Only four haplotypes (HY-5, HY-6, HY-7 and
HY-8) have been identified in European breeds.
Haplotype HY-7 was found only in Europe, whereas HY-
4 was reported as being characteristic of African and
Asian breeds. HY-5 most likely descended from HY-7
and, like HY-7, it has a European origin (Meadows and
Kijas 2009).
Nepal, lying between India and China, can be
broadly divided into three geographic regions, the
Himalayan, the lower mountain or hill and the terai
regions (Joshi and Khatiwada 1986). As most of area of
the country is covered with high hills and mountains
(about 90%), domestic sheep (Ovis aries) have become
indispensable part of the life of inhabitants in these
regions. As per the FAO, 2014, the total population of
sheep in the country numbers to around 809,536 sheep
which originated from four different indigenous breeds:
Bhyanglung in the alpine region, Baruwal in the high
hills, Kage in the mid hills and Lampuchhre in the low
lands. Despite of its importance, their genetic
characterization remains scant (Gorkhali et al. 2014).
Many wild sheep, which are still found in the globe,
could have contributed to the origin of the modern sheep
population. Similar as in mitochondrial DNA study result
(Heindleder et al. 1998), on the modern sheep, clustering
was observed only with the feral species - Ovis mouflon
while studying ancestral population in sheep (Meadows
and Kijas 2009). Other extant wild species of sheep
separate out from the domestic population. However,
different sub-species of Ovis ammon population and
Pseudois nayaur (blue sheep/Bharal) are found around
alpine region of Nepal (Namgail et al. 2004) and also in
the northwestern region of China (Zhang et al. 2011).
Nepalese ewes are speculated to be hybridized
(introgression) through the crossing with males of wild
species specifically Argali, Ovis ammon byth as these are
abundantly found in the periphery.
The current study aims to investigate the origin,
population relationship and genetic diversity of the
Nepalese sheep population using paternal genealogy. The
study also investigated the patrilineal genetic variations
of Nepalese sheep breeds and their phylogeographic
polymorphisms using Y-chromosome microsatellites and
SNPs variation in SRY 5’ promoter gene. Further, the
study explored for evidence of gene flow between
Nepalese sheep and their speculated paternal ancestors
(Argali (Ovis ammon byth)) population using the samples
from Argali found around Nepal and northeast China

Bhutan Journal of Animal Science (BJAS), Volume 4, Issue 1, Page 5-12, 2020
Gorkhali et al. (2020) 7
including GenBank sequences of the expanded set of
domestic and wild sheep.
2. MATERIALS AND METHODS
2.1 Samples, material analysed and DNA extraction
Blood samples were collected from well-defined four
distinct indigenous breeds of Nepal: Bhyanglung (NSBh,
n=10), Baruwal (NSBa, n=13), Kage (NSKa, n=12) and
Lampuchhre (NSBa, n=15) and skin samples from wild
sheep, Argali (Ovis ammon byth) (WSAr, n=11) from
northwestern China. Information on Y-chromosome
haplotypes obtained from Meadows et al 2006 and
Meadows and Kijas 2009. For comparative analysis of
our sequences with sheep found surrounding the country,
SRY region of Y-chromosome sequences of domestic and
wild sheep (Table 1) were included during the analyses.
Total genomic DNA was extracted from whole
blood using standard phenol/chloroform extraction
protocol followed by ethanol precipitation (Sambrook et
al. 2001).
2.2 Re-sequencing the SRY region
The polymerase chain reaction (PCR) and re-sequencing
of the same region of the SRY gene and microsatellite
SRYM18 locus were performed for Nepalese sheep
according to Meadows et al (2004, 2006). Genetic marker
AY604734.2: g67A>G (oY1) is a SNP located in the 5’-
promoter region of the ovine sex determining region Y
(SRY) gene (Meadows et al. 2004).
Primer pair SRY 5'-promoter (3F): 5' - TCA GTA
GCT TAG GTA CAT TCA - 3' and SRY 5'-promoter
(3R): 5' - GTG CTA CAT AAA TAT GAT CTG C - 3'
were amplified 611-bp fragment following the procedure
described by Meadows et al. (2004). PCR amplification
was carried out in 50 µl reaction mixtures. The PCR
thermocycling condition included an initial denaturing
step at 95oC for 5 min followed by 35 amplification cycles
(94oC for 50 s, 57oC for 60 s and 72oC for 60 s) and a final
extension at 72oC for 10 min. Amplified mtDNA control
region fragments were directly sequenced.
A set of primers SRYM18 F (5' - GGC ATC ACA
AAC AGG ATC AGC AAT - 3') and SRYM18 R (5' -
GTG ATG GCA GTT CTC ACA ATC TCC T - 3') were
used for PCR amplification of SRYM18 microsatellite
loci. PCR was performed using standard conditions
(Meadows et al. 2004). Amplified fragments (143-bp)
were cloned and sequenced.
2.3 Data analyses
The raw sequencing profiles of mtDNA control region
from each of the 50 Nepalese sheep and 11 Argali sheep
were manually edited using program Chromas version
2.23 (http://www.technelysium.com.au/chromas.html).
Cleaned sequences were aligned using the Cluster W
algorithm included in program MEGA version 4.0
(Tamura et al. 2007) to identify different haplotypes.
Table 1: SRY region of Y-chromosome sequences of domestic and wild sheep
Domestic and Wild species GenBank # Reference
Ovis aries AY604734 Meadows et al. 2004
Ammotragus lervia EU938019-21 Meadows and Kijas 2009
Ovis aries musimon EU938022-23 Meadows and Kijas 2009
Ovis ammon EU938024-27 Meadows and Kijas 2009
Ovis vignei EU938028-31 Meadows and Kijas 2009
Ovis canadensis EU938032-33 Meadows and Kijas 2009
Ovis dalli EU938034-37 Meadows and Kijas 2009
Ovis aries EU938038-45 Meadows and Kijas 2009
Ovis aries HQ840956 Zhang et al. 2012
Ovis dalli JN992679-81 Driscoll 2011
Ovis nivicola JN992682-83 Driscoll 2011
Ovis orientalis JN992684 Driscoll 2011
Ovis vignei JN992685-87 Driscoll 2011
Ovis dalli JN992688-89 Driscoll 2011
Ovis canadensis JN992690 Driscoll 2011
Ovis ammon JN992691-93 Driscoll 2011
Ovis ariesg JX484138-40 Niemi et al. 2013

Bhutan Journal of Animal Science (BJAS), Volume 4, Issue 1, Page 5-12, 2020
Gorkhali et al. (2020) 8
Haplotypes were constructed by combining sequence data
describing the repeat structure of SRYM18 with
genotypic data from oY1. Genotyping was then performed
and haplotypes assigned based on fragment length
(SRYM18) and SNP genotype (oY1). It should be noted
that the assignment of haplotypes, in the presence of
demonstrated microsatellite homoplasy, relied on
fragment length for the majority of individuals.
The relationship between haplotypes were
investigated by constructing median networks using
Table 2: Haplotypes generated through the combination of a compound microsatellite and five SNPs
Haplotype1 SRYM18 SRY SNPs Species
[TTTTG]m
Indel(G/-)
[TG]n Allele (bp)
oY1 88 nt oY5 157
nt oY6 393
nt oY7
397 nt oY8 399 nt
H1 4 – 14 145 A T A G T Ovis dalli
H2 4 – 13 143 A T A G T Ovis
dalli/Ovis canadensis
H3 4 – 11 139 A T A G T Ovis
dalli/Ovis canadensis
H4 3 G 16 145 A C G G A Ovis aries H5 3 G 16 145 G C G G A Ovis aries
H6 3 G 15 143 A C G G A
Ovis aries/ Ovis musimon/
Nepalese sheep (this
study) H7 3 G 15 143 G C G G A Ovis aries H8 3 G 14 141 A C G G A Ovis aries H9 3 G 9 131 A C G G A Ovis aries H10 NA NA NA 110 A C G G A Ovis aries
H11 NA NA NA 106 A T A G A Ammontragus
lervia H12 3 G 13 139 A C G G A Ovis aries H13 3 G 14 149 A C A T G Ovis vignei H14 3 G 17 147 A C A T G Ovis vignei H15 3 G 20 153 A C G G G Ovis ammon H16 3 G 17 147 A C G G G Ovis ammon H17 3 G 15 143 A C G G G Ovis ammon Source: (Meadows and Kijas 2009)

Bhutan Journal of Animal Science (BJAS), Volume 4, Issue 1, Page 5-12, 2020
Gorkhali et al. (2020) 9
Network version 4.1.1.2 (http://www.fluxus-
engineering.com)
The population pairwise differences (FST) values
were calculated using Arlequin version 3.5.1.2 software
(http://anthropologie.unige.ch/arlequin/). Pairwise FST
values were calculated with 10,000 bootstrap and values
were displayed as an unrooted cladogram drawn with
MEGA version 4.0.
3. RESULTS
3.1 Sequence architecture of microsatellite SRYM18
The microsatellite array found in sheep are to be a
compound, comprising a penta-nucleotide and a di-
nucleotide repeat separated by an indel ([TTTTG]mG/-
[TG]n) and are multi-allelic (Meadows et al. 2006).
Investigation after cloning and sequencing showed that
all Nepalese male sheep population are monomorphic
displaying the same length fragment of 143-bp with same
SRYM18 repeat motif (Table 2). They fall on the same
cluster group which corresponds with HY-6 (referred in
Meadows et al. 2006) which is the most abundantly found
Y-chromosome haplotype in the globe (Table 2). The
similar finding has been arisen from the analysis of Y-
haplotypes in phenotypically divergent dog breeds where
one common haplotype was distributed across groups
(Sundqvist et al. 2006). It is possible, however, that a
significant portion of animals that carry HY-6 are not
identical-by-descent due to homoplasy or the mutability
and recurrent mutation associated with microsatellite loci
(Heyer et al. 1997; de Knijff 2000). This haplotype
includes the feral species of mouflons: O. musimon, O.
orientalis and domestic sheep (Ovis aries); however
earlier studies revealed that at least two paternal lineages
present in the modern domestic sheep (Meadows et al.
2006).
3.2 Sequence variation of 5’ promoter region of Y
chromosome (Determination of the ancestral allele of
SNP oY1) in Nepalese domestic sheep
The second locus that we investigated was an A>G SNP
located upstream of SRY that has been previously
described (Meadows et al. 2004). All Nepalese sheep are
observed to be monomorphic with A-oY1 locus as well as
in other identified loci. When analyzed with other
sequences in the GenBank, Nepalese sheep shared the
same haplotype with Ovis musimon (Table 2, Figure 1)
which is most likely corresponds with very common in
domestic breeds of sheep from across Africa, Asia, the
Caribbean, Europe, the Middle East/ Central Asia and
Australia (Meadows et al. 2006). Furthermore, the result
is strengthened by the cladogram drawn by Fst value
calculated in order to determine the genetic distance
between different species of wild and domestic
populations (Figure 2).

Bhutan Journal of Animal Science (BJAS), Volume 4, Issue 1, Page 5-12, 2020
Gorkhali et al. (2020) 10
3.3 Sequence variation of 5’ promoter region of Y
chromosome in wild sheep, Argali
SRY 5’ promoter region of Y chromosome sequences
from individuals of Argali sheep population in the study
were consensus with the sequences that were published
earlier for O. ammon which were already proven unlikely
to be one of the ancestors (Meadows and Kijas 2009).
Nonetheless, Argali and Nepalese sheep have obvious
two different clusters. This result, therefore, further
revealed that the domestic sheep including Nepalese
sheep is less likely to be influenced by different species
Argali and furthermore, also strengthened the view that
domestic sheep are free from signatures of wild sheep
introgression. However, for concrete conclusion,
comprehensive investigations using the different Y-
chromosome markers are necessary with samples of
different sheep breeds in the world.
3.4 Median- Joining (MJ) Network analyses
Possible gene flow different wild and domestic
population using the sequences of 5’ promoter region of
Y-chromosome using MJ-network. Nepalese sheep
clearly clustered together (H-4 in Figure 2) with other
domestic sheep along with different species of mouflons
(O. musimon, O. orientalis). Argali sequences from the
northwestern China clustered with other Argali sequences
which were in a single mutation difference from the
cluster developed by Nepalese sheep sequences. In order
to rule out the possibility of Argali to be one of the
ancestors of the modern sheep, more comprehensive
sampling from the northwestern China is warranted.
4. DISCUSSIONS
Investigations into the origin of the modern sheep have to
date primarily utilized maternally inherited mitochondrial
sequence variation. Very few studies have been done to
separate out the male-specific contribution specifically
during breed development in domestic animals,
specifically in the Asian region.
In the present study, Nepalese sheep showed the
paternal monomorphism with no substitution in bases in
all four breeds, in contrast to the analyses of mtDNA of
Nepalese sheep breeds revealed four maternal
haplogroups and high haplotype diversity of maternal
lineages (Gorkhali et al. 2014). Low Y-chromosome
diversity was well-expected in domesticated animals
where, following domestication, a strictly controlled
breeding system has been imposed. This has resulted in
highly skewed male reproductive success where a small
number of males contribute a disproportionately large
amount to subsequent generations. Hellborg and Ellegren
(2004) compared sequence from 3.0 kb of the MSY
within 10 cattle from five taurine breeds and failed to
identify any segregating sites. Similarly, 14.3 kb of MSY
sequence was compared between 52 horses from 15
breeds and also failed to identify a SNP (Lindgren et al.
2004).
It is therefore reasonable to conclude that the
complete absence Y chromosomal nucleotide diversity
observed within Nepalese sheep can be primarily results
from an exaggerated reduction in male effective
population size. This result is consistent with earlier
researches which had also shown the low polymorphism
in Y-chromosome (Meadows et al. 2004) illustrating the
paternal homogeneity in most of the sheep populations
(Ferencakovic et al. 2012). The present study adds to the
emerging view that low nucleotide diversity on the Y
chromosome is a common feature of domestic species and
indeed is a feature of the sex-limited chromosome across
other species including birds (Montell et al. 2001) and
plants (Filatov et al. 2000).
This is also supported by the high nucleotide
diversity observed within chimpanzees (Stone et al.
2002). This promiscuous wild species has a contrasting
breeding structure to domestic animals where a much
higher proportion of males contribute to subsequent
generations (Yu et al. 2004). The result is chimpanzees
have an effective male population size four times higher
than humans (Stone et al. 2002). The fact that
chimpanzees also have approximately fourfold higher
nucleotide diversity compared with humans (The
International SNP Map Working Group, 2001) implicates
effective population size as a major determinant of
nucleotide diversity. This is, however, not the case in
Argali, wild sheep species abundantly found in
northwestern China, showed no base substitution in SRY
5’ promoter region in its population.
Argali sequences from the northwestern China
clustered with other argali sequences which were in a
single mutation difference from the cluster developed by
Nepalese sheep sequences. In order to rule out the
possibility of Argali to be one of the ancestors of the
modern sheep, more comprehensive sampling from the
northwestern China is warranted.
5. CONCLUSION
Absence of Y chromosomal nucleotide diversity observed
among Nepalese breeds and paternally monomorphic can
be due to low effective population size of breeding ram
which is a major determinant of nucleotide diversity.
However, in wild, the breeding is natural and there is
unlikely the human interference for male selection, but
still the Argali in northwestern China also showed
monomorphic sequences and were the same as in
recorded sequences. Nepalese domestic sheep follows the
most common haplotype developed by mouflons (Ovis
musimon and O. orientalis) and majority of the domestic
sheep. This study contributes at least some information on
the understanding of domestication and development of
global sheep populations.

Bhutan Journal of Animal Science (BJAS), Volume 4, Issue 1, Page 5-12, 2020
Gorkhali et al. (2020) 11
REFERENCES
Harrison PJ and Laatikainen LM and Tunbridge EM and
Eastwood S (2010). Human brain weight is correlated
with expression of the ‘housekeeping genes’ beta-2-
microglobulin (β2M) and TATA-binding protein (TBP).
Neuropathology and applied neurobiology. 36: 498-504.
10.1111/j.1365-2990.2010.01098. x.
Arora R, Yadav H and Mishra B (2013). Mitochondrial DNA
diversity in Indian sheep. Livestock Science. 153(1): 50-
55.
Bradley DG, MacHugh DE, Loftus RT, Sow RS, Hoste CH
and Cunningham EP (1994). Zebu-taurine variation in Y
chromosomal DNA: a sensitive assay for genetic
introgression in West African tryanotolerant cattle
populations. Animal Genetics 15: 7–12.
Chen SY, Duan ZY, Sha T, Xiangyu J, Wu SF and Zhang
YP (2006). Origin, genetic diversity, and population
structure of Chinese domestic sheep. Gene 376(2): 216-
223.
de Knijff P (2000) Messages through bottlenecks: on the
combined use of slow and fast evolving polymorphic
markers on the human Y chromosome. American Journal
of Human Genetics 67: 1055–61.
Driscoll C (2011). Population genetics of ovis and
phylogenetics of caprinae: A comparison of different
genetic markers for evaluation of diversity at multiple
taxonomic levels (unpublished, Thesis)
Ferencakovic M, Curik I, Pérez-Pardal L, Royo LJ, Cubric-
Curik V, Ferna´ndez I, A´ lvarez I, Kostelic A, Sprem N,
K. Krapinec K and Goyache F (2013). Mitochondrial
DNA and Y-chromosome diversity in East Adriatic
sheep. Animal Genetics 44: 184-192.
Filatov DA, Moneger F, Negrutiu I and Charlesworth D
(2000) Low variability in a Y-linked plant gene and its
implications for Y-chromosome evolution. Nature 404:
388–90.
Gorkhali NA, Han JL and Ma YH (2014). Mitochondrial
DNA variation in indigenous sheep (Ovis aries) breeds
of Nepal. Proceeding of the twenty sixth annual congress
of the Post Graduate Institute of Agriculture (PGIA) 26:
3 (Abstract)
Groeneveld LF, Lenstra JA, Eding H, Toro MA, Scherf B,
Pilling D, Negrini R, Finlay EK, Han JL, Groeneveld E
and Weigend S (2010). Genetic diversity in farm
animals–a review. Animal Genetics, 41(s1): 6-31.
Guo, J, Du LX, Ma YH, Guan WJ, Li HB, Zhao QJ, Li X
and Rao SQ (2005). A novel maternal lineage revealed
in sheep (Ovis aries). Animal Genetics 36(4): 331-336.
Hanotte O, Tawah CL, Bradley DG, Okomo M, Verjee Y,
Ochieng J and Rege JE (2000). Geographic distribution
and frequency of a taurine Bos taurus and an indicine Bos
indicus Y specific allele amongst sub-Saharan African
cattle breeds. Molecular Ecology 9: 387–96.
Hellborg L and Ellegren H (2004). Low levels of nucleotide
diversity in mammalian Y chromosomes. Molecular
Biology and Evolution 21: 158–63.
Heyer E, Puymirat J, Dieltjes P, Bakker E and de Knijff P
(1997). Estimating Y chromosome specific
microsatellite mutation frequencies using deep rooting
pedigrees. Human Molecular Genetics 6: 799–803.
Hiendleder S, Kaupe B, Wassmuth R and Janke A (2002).
Molecular analysis of wild and domestic sheep questions
current nomenclature and provides evidence for
domestication from two different subspecies. Proc. Biol.
Sci. 269(1494): 893-904.
Hiendleder S, Lewalski H, Wassmuth R and Janke A
(1998a). The complete mitochondrial DNA sequence of
the domestic sheep (Ovis aries) and comparison with the
other major ovine haplotype. J. Mol. Evol. 47(4): 441-
448.
Hiendleder S, Mainz K, Plante Y and Lewalski H (1998b).
Analysis of mitochondrial DNA indicates that domestic
sheep are derived from two different ancestral maternal
sources: no evidence for contributions from urial and
argali sheep. J. Hered. 89(2):113-120.
Food and Agriculture Organization of the United Nations
(2014). FAOSTAT statistical database. [Rome]: FAO.
Hurst LD and Ellegren H (1998). Sex biases in the mutation
rate. Trends in Genetics 14: 446–52.
Jobling MA and Tyler-Smith C (2003). The human Y-
chromosome: an evolutionary marker comes of age.
Nature Reviews Genetics 4(8): 598-612
Joshi RM and Khatiwada MK (1986). Agricultural handbook
Nepal, AGRI. Publication series, Kathmandu, Nepal.
Kikkawa Y, Takada T, Nomura K, Namikawa T, Yonekawa
H and Amano T (2003). Phylogenies using mtDNA and
SRY provide evidence for male-mediated introgression
in Asian domestic cattle. Animal Genetics 34: 96-101.
Lahn BT and Page DC (1999). Four evolutionary strata on
the human X chromosome. Science 286: 964–7.
Lindgren G, Backstrom N, Swinburne J, Hellborg L,
Einarsson A, Sandberg K, Cothran G, Vila C, Binns M
and Ellegren H (2004). Limited number of patrilines in
horse domestication. Nature Genetics 36: 335–6.
Ling YH, Ma YH, Guan WJ, Cheng YJ, Wang YP, Han JL,
Jin DP, Mang L and Mahmut H (2010). Identification of
Y-chromosome Genetic variations in Chinese
Indigenous Horse Breeds. Journal of Heredity
101(5):639-643.
Luo, YZ, Cheng SR, Lkhagva B, Badamdorji D, Hanotte O
and Han JL (2005). Origin and genetic diversity of
Mongolian and Chinese sheep using mitochondrial DNA
D-loop sequences. Acta Genetica Sinica, 32(12): 1256-
1265.
MacHugh DE, Shriver MD, Loftus RT, Cunningham P and
Bradley DG (1997). Microsatellite DNA variation and
the evolution, domestication and phylogeography of
taurine and zebu cattle (Bos taurus and Bos indicus).
Genetics 146: 1071– 86.
Meadows J, Hawken R and Kijas JW (2004) Nucleotide
diversity on the ovine Y chromosome. Animal Genetics,
35: 379-385.
Meadows J, Li K, Kantanen J, Tapio M, Sipos W, Pardeshi
V, Gupta V, Calvo J, Whan V and Norris B (2005).
Mitochondrial sequence reveals high levels of gene flow
between breeds of domestic sheep from Asia and Europe.
Journal of Heredity, 96(5): 494-501.

Bhutan Journal of Animal Science (BJAS), Volume 4, Issue 1, Page 5-12, 2020
Gorkhali et al. (2020) 12
Meadows J, Hanotte O, Drögemüller C, Calvo J, Godfrey R,
Coltman D, Maddox JF, Marzanov N and Kantanen J
(2006). Globally dispersed Y chromosomal haplotypes in
wild and domestic sheep. Animal Genetics 37: 444-453.
Meadows JR, Cemal I, Karaca O, Gootwine E and Kijas JW
(2007). Five ovine mitochondrial lineages identified
from sheep breeds of the near East. Genetics 175(3):
1371-1379.
Meadows J and Kijas JW (2009). Re-sequencing regions of
the ovine Y chromosome in domestic and wild sheep
reveals novel paternal haplotypes. Animal Genetics, 40:
119-123.
Montell H, Fridolfsson A-K and Ellegren H (2001).
Contrasting levels of nucleotide diversity on the avian Z
and W sex chromosomes. Molecular Biology and
Evolution 18: 2010-2016.
Namgail T, Fox JL and Bhatnagar YV (2004). Habitat
segregation between sympatric Tibetan argali Ovis
ammon hodgsoni and blue sheep Pseudois nayaur in the
Indian Trans-Himalaya. Journal of Zoology (London),
262: 57–63.
Oner Y, Calvo JH and Elmaci C (2013). Investigation of the
genetic diversity among native Turkish sheep breeds
using mtDNA polymorphisms. Tropical Animal Health
Production, 45(4): 947-951.
Pardeshi V, Kadoo N, Sainani M, Meadows J, Kijas J and
Gupta V (2007). Mitochondrial haplotypes reveal a
strong genetic structure for three Indian sheep breeds.
Animal Genetics, 38(5): 460-466.
Pedrosa S, Arranz J-J, Brito N, Molina A, San Primitivo F
and Bayón Y (2007). Mitochondrial diversity and the
origin of Iberian sheep. Genetic Selection Evolution.
39(1): 91-103.
Pedrosa S, Uzun M, Arranz J-J, Gutiérrez-Gil B, San
Primitivo F and Bayón Y (2005). Evidence of three
maternal lineages in near eastern sheep supporting
multiple domestication events. Proceedings of the Royal
Society B: Biological Sciences, 272(1577): 2211-2217.
Pereira F, Davis SJ, Pereira L, McEvoy B, Bradley DG and
Amorim A (2006). Genetic signatures of a
Mediterranean influence in Iberian Peninsula sheep
husbandry. Mol. Biol. Evol. 23(7):1420-1426.
Sambrook J, Fritsch EF and Maniatis T (2001). Molecular
Cloning: A Laboratory Manual, 3rd ed. Cold Spring
Harbor Laboratory Press, Cold Spring Harbor, New
York.
Singh S, Kumar Jr. S, Kolte AP and Kumar S (2013).
Extensive variation and sub-structuring in lineage A
mtDNA in Indian sheep: genetic evidence for
domestication of sheep in India. PLoS ONE 8(11),
e77858.
Stone AC, Griffiths RC, Zegura SL and Hammer MF (2002).
High levels of Y-chromosome nucleotide diversity in the
genus Pan. Proceedings of the National Academy of
Science of the United States of America 99:43–8.
Sulaiman Y, Wu C and Zhao C (2011). Phylogeny of 19
indigenous sheep populations in northwestern China
inferred from mitochondrial DNA control region. Asian
Journal of Animal and Veterinary Advances, 6(1): 71-
79.
Sundqvist AK, Bjornerfeldt S, Leonard JA, Hailer F,
Hedhammar A, Ellegren H and Vila C (2006). Unequal
contribution of sexes in the origin of dog breeds.
Genetics 172: 1121–8.
Tamura K, Peterson D, Peterson, N, Stecher G, Nei M and
Kumar S (2011). MEGA5: molecular evolutionary
genetics analysis using maximum likelihood,
evolutionary distance, and maximum parsimony
methods. Mol. Biol. Evol. 28(10): 2731-2739.
Tapio M, Marzanov N, Ozerov M, Ćinkulov M, Gonzarenko
G, Kiselyova T, Murawski M, Viinalass H and
Kantanen, J (2006). Sheep mitochondrial DNA variation
in European, Caucasian, and Central Asian areas. Mol.
Biol. Evol. 23(9): 1776-1783.
Teale AJ, Wambugu J, Gwakisa PS, Stranzinger G, Bradley
D and Kemp SJ (1995). A polymorphism in randomly
amplified DNA that differentiates the Y chromosomes of
Bos indicus and Bos taurus. Animal Genetics, 26:243–8.
The International SNP Map Working Group (2001). A map
of human genome sequence variation containing 1.42
million single nucleotide polymorphisms. Nature 409:
928–33.
Wallner B, Brem G, Muller M and Achmann R (2013). Fixed
nucleotide differences on the Y-chromosome indicate
clear divergence between Equus przewalskii and Equus
caballus. Animal Genetics, 34:453-456
Wang X, Chen H and Lei C (2007b). Genetic diversity and
phylogenetic analysis of the mtDNA D-loop region in
Tibetan sheep. Asian Australasian Journal of Animal
Sciences 2007, 20(3):313.
Wang X, Ma Y, Chen H and Guan W (2007a). Genetic and
phylogenetic studies of Chinese native sheep breeds
(Ovis aries) based on mtDNA D-loop sequences. Small
Ruminant Res. 72(2): 232-236.
Yu N, Jensen-Seaman MI, Chemnick L, Ryder O and Li WH
(2004). Nucleotide diversity in gorillas. Genetics, 166:
1375– 83.
Zhang G, Vahidi SMF, Ma YH and Han JL (2011). Limited
polymorphisms of two Y-chromosomal SNPs in Chinese
and Iranian sheep. Animal Genetics. 479-80.
Zhao Y, Zhao E, Zhang N and Duan C (2011). Mitochondrial
DNA diversity, origin, and phylogenic relationships of
three Chinese large-fat-tailed sheep breeds. Tropical
Animal Health Production. 43(7): 1405-1410.

Bhutan Journal of Animal Science (BJAS)
Volume 4, Issue 1, Page 13-22, 2020
13
Full length paper
DISENTANGLING CONFLICTS IN PASTORALISM: GENESIS, ARBITRATION AND INSTITUTIONS
KUENGA NAMGAY*
Department of Livestock, Ministry of Agriculture and Forests, Thimphu, Bhutan.
*Author for correspondence: [email protected]
Copyright © 2020. Kuenga Namgay. The original work must be properly cited to permit
unrestricted use, distribution, and reproduction of this article in any medium.
ABSTRACT: Increasing human population and reduced resource availability is expected to result
in conflicts owing to the vicious cycle of irrational resource use and management. Worldwide,
mobile herders are caught in conflicts brought about by changing policies, shifting user rights and
climate change. This study explored different types of conflicts mobile herders in Bhutan face,
existing arbitration forums and changes being experienced, against the backdrop of new land law
that sought to nationalize grazing areas. Research information was collected through qualitative in-
depth interview with 33 informants and seven focus group discussions with mobile herders,
residents downstream living adjacent to herders’ grazing areas and government agents. Results
revealed mobile herders face various types of conflicts but not necessarily lead to neo-Malthusian
and Hardinian situation. Old traditional institutional arrangements and formal government structures
are being rendered defunct by new legislations, causing confusion and varied interpretations. With
the new land law now under implementation and having nationalized all grazing areas, how these
conflicts transform and impact the mobile herders is yet to be seen. Much of the conflicts are brought
on to the mobile herders, owing to their way of life and new policies, and not of their making.
Consistent policy interpretation and sustained tenurial rights will reduce conflicts herders face. Prior
participatory consultation and information sharing with the constituents would enhance
understanding and ownership of such policy changes and reduce conflict.
Keywords: conflict, grazing, land legislation, land tenure, pastoralism, rangeland, rights.
1. INTRODUCTION
The increasing human population and shrinking resource
size and availability, lead to conflicts in accessing these
resources. As productive resources such as land and water
become scarcer, conflicts between mobile pastoralists and
sedentary farmers escalate (Dixon et al. 2001). The
growth in human population and equivalent reduction in
human-animal ratio amongst pastoral societies is most
apparent in Greater Horn of Africa than anywhere else
(Sandford 2006). Conflicts also result from land grabs,
either state sponsored or through corporate capture, with
vague tenure arrangements (Hall et al. 2011).
Reports on conflicts affecting mobile pastoralists
are largely on African pastoralists (Moritz 2006; Blench
2017) and Mongolian pastoralists (Boone et al. 2008;
Mearns 1993, 2004). The narratives often evoke neo-
Malthusian and neo-Hardinian models of population
growth and the vicious cycle of irrational and
unsustainable resource management (Milligan & Binns
2007). The discussions on these models dominate the
political and public policy making discourse in the
developing world.
It is important to note that crisis situations, conflicts,
and weakening of indigenous customary institutions are
not uniform. Spatial and temporal heterogeneity within
regions and states also needs to be considered (Milligan
& Binns 2007; Moritz et al. 2009).
In Bhutan, the environmental policies take pride in
following a middle path approach, balancing
conservation objectives with livelihood and wellbeing of
the people (RGoB 1998). However, with more than 51%
of land under some form of protection and changing
policies on resource access for extensive pastoral
practices, some conflicts are inevitable. Moreover,
conflicts with the residents living adjacent to herders’
grazing areas were reported in 2009 by some mobile
herders from Ura Village in Bumthang district. It was also
reported later in the Bhutanese mainstream media about
such conflicts from other districts, particularly after the
enactment of Land Act of Bhutan 2007.
1.1 Conflicts in pastoralism
Moritz (2006) in a review on conflicts notes, Africa has
transformed, ‘from an abundance to scarcity of land in

Bhutan Journal of Animal Science (BJAS), Volume 4, Issue 1, Page 13-22, 2020
Namgay (2020) 14
one century’. Over the years, increasing imbalances in
humans, livestock and the environment has resulted in
inequality and impoverishment of pastoralists (Sandford
2006). Consequently, pastoral conflicts in Africa take a
whole new level, often involving arms, on the grounds of
ethnicity, religion, and culture in addition to the normal
herder-farmer and herder-herder conflicts (Moritz 2006).
The rise in human population and trade, means more
demand for meat and milk, but with taking over of fertile
river bed areas by croppers and government’s policy of
adopting ranching system for these traditional nomadic
pastoralists means more conflict (Blench 2017).
Similarly, in Mongolia pastoral populations have
increased after the collectivised system ended in 1990.
Many former technical and urban cadres, rendered
redundant by the decollectivisation, took up pastoral
trade. High numbers of new entrants in pastoral systems
reduced overall grazing resource availability and caused
tension. In 1995, more than 40% of these Mongolian
pastoralists owned less than 50 head of livestock per
household (Boone, et al., 2008; Mearns, 1993, 2004).
However, Milligan and Binns (2007) contends contrary to
the dominant discourse on the herder-farmer conflicts,
symbiosis between them does exist in many places and
local resource management rules are being adhered to.
The authors further note myopic focus on natural resource
degradation and management, donor influence, lack of
reliable research and statistics constrained by funds, and
lack of space for pastoralists to articulate their needs,
impedes formulating evidence-based policies (Milligan &
Binns 2007).
Similarly, Moritz et al. (2009) have argued that
despite similar if not greater increases in human
population in West Africa than Greater Horn of Africa,
pastoralism is not necessarily in crisis. They have shown
how West African pastoralists have used different
strategies such as integration and intensification;
movement to the sub humid zone; and extensification to
cope with pressures on their pastoral systems.
In Bhutan, the national parks provide incentives
such as corrugated aluminum sheets, electric cookers and
a few exotic crossbred cattle to compensate for the
restrictions imposed on pastoralists’ access to forest
resources for roofing materials, firewood, and traditional
extensive system of grazing local cattle in forest
tsamdros. However, such incentives do not meet local
people’s needs, while restrictions on the locals’ access to
the natural resources are many and sanctions often
punitive (RGoB 1995). This creates resentment and risks
retaliatory actions, such as poisoning wild animals or
poaching which, again risks stricter penalties (RGoB
1999; Rinzin et al. 2009; Wang et al. 2006; Wangchuk
2004). Such policies and conflicts together have caused
loss or weakening of traditional resource management
institutions.
1.2 Pastoral conflict in Bhutan
The study reported here is an excerpt out of a broader PhD
project on transhumant agro-pastoralism in Bhutan. One
of the issues that prompted this study at the conceptual
stage and later emerged strongly during the in-depth
interviews in 2010 was, the conflict between the mobile
herders from northern Bhutan with the residents
downstream, living adjacent to winter tsamdros (grazing
areas). It appeared though some conflicts existed earlier,
however, the magnitude and frequency has increased with
the enactment of the new land law (Land Act of Bhutan
2007).
This paper, therefore, attempts to understand the
nature of conflicts, its causes and how such conflicts were
resolved in context of modernization and new legislations
replacing local traditional/indigenous institutions.
2. MATERIALS AND METHODS
The results reported here are based on the qualitative data
collected from six pastoralist villages in western region,
two pastoralist villages in central east, and 2 resident
villages in the south, Kungkha in Chhukha district in the
south and Brokser in Mongar district, in the east.
A qualitative in-depth interview with 33 informants
involving 24 herders, six government employees, and
three non-government informants, collected information
on different types of conflicts that existed between mobile
herders from northern Bhutan and residents living
downstream adjacent-to or along the migratory routes.
This was later probed further and triangulated with seven
focus groups discussion with mobile herders, downstream
residents and government agents.
In-depth interviews in 2010 in six villages, namely,
Papali, Bempu, Tshebji, and Damchena in the western
region, and Urchi and Doshi in the central east region in
Bhutan (Figure 1), confirmed the report of such conflicts
brought to Ministry of Agriculture and Forests’ notice in
2009 by herders in Ura, Bumthang. These villages were
selected as majority of people in these villages relied
heavily on their cattle raised through mobile herding.
This was followed up in 2011 with focus group
discussions with mobile pastoralists in Tshebji village in
west, Doshi and Urchi Village in central east, and
downstream villages of Brokser in east, and Kungkha in
west south. Another focus group discussion was held with
livestock development personnel in Lhuentse district, in
the east where Doshi herds migrate to (Figure 2).
Purposive sampling was done to select key
informants who had extensive knowledge on mobile
herding and issues surrounding it. A few informants,
initially selected based on their local knowledge, helped
to gather more informants through the snow-balling
technique (Noy 2008). The nine agency informants
possessed substantial knowledge on livestock
development and conservation policies in Bhutan.
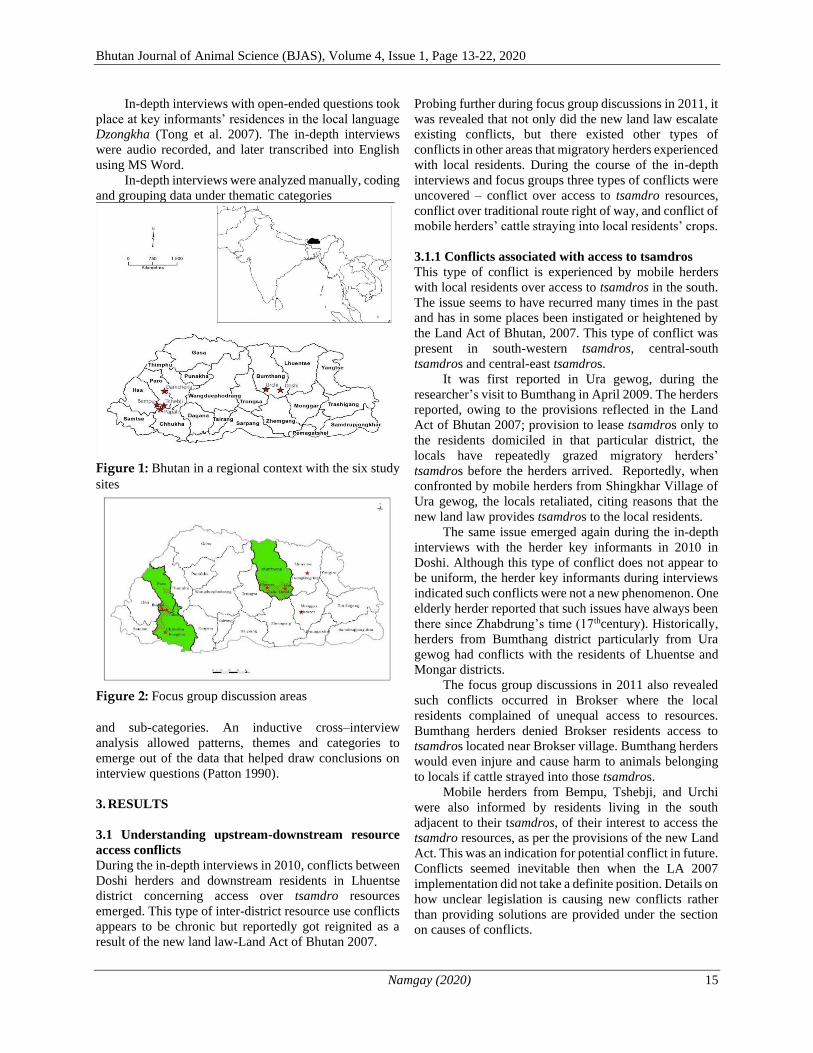
Bhutan Journal of Animal Science (BJAS), Volume 4, Issue 1, Page 13-22, 2020
Namgay (2020) 15
In-depth interviews with open-ended questions took
place at key informants’ residences in the local language
Dzongkha (Tong et al. 2007). The in-depth interviews
were audio recorded, and later transcribed into English
using MS Word.
In-depth interviews were analyzed manually, coding
and grouping data under thematic categories
Figure 1: Bhutan in a regional context with the six study
sites
Figure 2: Focus group discussion areas
and sub-categories. An inductive cross–interview
analysis allowed patterns, themes and categories to
emerge out of the data that helped draw conclusions on
interview questions (Patton 1990).
3. RESULTS
3.1 Understanding upstream-downstream resource
access conflicts
During the in-depth interviews in 2010, conflicts between
Doshi herders and downstream residents in Lhuentse
district concerning access over tsamdro resources
emerged. This type of inter-district resource use conflicts
appears to be chronic but reportedly got reignited as a
result of the new land law-Land Act of Bhutan 2007.
Probing further during focus group discussions in 2011, it
was revealed that not only did the new land law escalate
existing conflicts, but there existed other types of
conflicts in other areas that migratory herders experienced
with local residents. During the course of the in-depth
interviews and focus groups three types of conflicts were
uncovered – conflict over access to tsamdro resources,
conflict over traditional route right of way, and conflict of
mobile herders’ cattle straying into local residents’ crops.
3.1.1 Conflicts associated with access to tsamdros
This type of conflict is experienced by mobile herders
with local residents over access to tsamdros in the south.
The issue seems to have recurred many times in the past
and has in some places been instigated or heightened by
the Land Act of Bhutan, 2007. This type of conflict was
present in south-western tsamdros, central-south
tsamdros and central-east tsamdros.
It was first reported in Ura gewog, during the
researcher’s visit to Bumthang in April 2009. The herders
reported, owing to the provisions reflected in the Land
Act of Bhutan 2007; provision to lease tsamdros only to
the residents domiciled in that particular district, the
locals have repeatedly grazed migratory herders’
tsamdros before the herders arrived. Reportedly, when
confronted by mobile herders from Shingkhar Village of
Ura gewog, the locals retaliated, citing reasons that the
new land law provides tsamdros to the local residents.
The same issue emerged again during the in-depth
interviews with the herder key informants in 2010 in
Doshi. Although this type of conflict does not appear to
be uniform, the herder key informants during interviews
indicated such conflicts were not a new phenomenon. One
elderly herder reported that such issues have always been
there since Zhabdrung’s time (17thcentury). Historically,
herders from Bumthang district particularly from Ura
gewog had conflicts with the residents of Lhuentse and
Mongar districts.
The focus group discussions in 2011 also revealed
such conflicts occurred in Brokser where the local
residents complained of unequal access to resources.
Bumthang herders denied Brokser residents access to
tsamdros located near Brokser village. Bumthang herders
would even injure and cause harm to animals belonging
to locals if cattle strayed into those tsamdros.
Mobile herders from Bempu, Tshebji, and Urchi
were also informed by residents living in the south
adjacent to their tsamdros, of their interest to access the
tsamdro resources, as per the provisions of the new Land
Act. This was an indication for potential conflict in future.
Conflicts seemed inevitable then when the LA 2007
implementation did not take a definite position. Details on
how unclear legislation is causing new conflicts rather
than providing solutions are provided under the section
on causes of conflicts.

Bhutan Journal of Animal Science (BJAS), Volume 4, Issue 1, Page 13-22, 2020
Namgay (2020) 16
3.1.2 Conflicts over the traditional migration routes
The second type of conflict is the blocking of mobile
herders’ traditional routes used for migration, by local
residents, fencing it off and making paddocks for their
sedentarised herd. This type of conflict was mentioned
during focus group discussions in Doshi and during the
researcher’s visit to Sengoren-route, Mongar and
Lhuentse. While Doshi herders complained that Sengor
residents have fenced off their traditional routes of
migration, Sengor herders alleged Ura herders had
destroyed their fences and paddocks. Details on how such
episodes occurred are detailed in the succeeding sections.
3.1.3 Conflicts caused by migratory cattle straying
into local residents’ crops
The third type of conflict is caused by migratory cattle
straying into the local residents’ fields. The participants
from Tshebji reported their cattle straying into others’
crops. In cases where the conflict could not be resolved in
the villages, it was referred to Phuntsholing Drungkhag
(sub-district) court. One elderly herder from Tshebji,
however, asserts this type of conflict is a thing of the past
and do not occur now.
However, participants in Kungkha indicated that the
problem of Jabana and Geling herds straying into their
crops still exist. Cattle from these herds stray into their
maize fields, cardamom orchards, vegetable gardens and
destroyed other plants such as Napier, Ficus saplings, and
other planting materials including the ones supplied
through Sustainable Land Management Project (SLMP).
Participants in Kungkha also reported, some of the Jabana
herders started leaving behind the general herd (dry cows,
young stock and old animals) and took back only milking
cows and oxen (used for ploughing the fields) when they
migrate back to their villages in spring. Jababs seemingly
owing to shortage of family labour, are not in position to
manage larger herds. The local residents reported this is
becoming a real menace in summer as these stray cattle
damaged their crops.
3.2 Factors causing conflicts
Although the new land legislation is often criticized by
many mobile herders as the main contributor to inter-
district conflicts, either directly or implied, there are other
reasons that are important in understanding the conflicts.
These factors that contribute to the contentious resource
access issues are discussed in the following sections.
3.2.1 Development interventions by government
agencies that overlooked local institutions caused
inter-community conflict
There is evidence from Doshi and Sengor to suggest that
government agencies promoting intervention programs
such as subsidising improved pasture seeds, exotic
crossbred cattle, and supplying fencing materials to fence
and develop modern style paddocks, may have been
ignorant or have deliberately overlooked local
institutional arrangements. This had resulted in
unintended inter-community conflict amongst the Sengor
locals and Ura mobile herders.
The focus group participants in Doshi indicated how
one such intervention by a development agency supplying
barbed wire fencing materials to fence the paddocks,
blocked their traditional migratory route at Sengor.
During a focus group discussion, a male participant in his
thirties from Doshi said:
“… it appears very likely that we will again have some conflict soon. The Sengorpas have fenced with barbed
wire on our traditional migratory route and left only the highway. Sengor is traditionally our camping area. They
said the fence was supplied by the Park … for generations it has been our tradition to spend a night
there and it’s our traditional route. Nobody says anything …”
That has not only caused them inconvenience, but has
created dispute with Sengor herders with whom they have
traditionally had mutual respect based on their traditional
rights and customs.
3.2.2 Conflict arising from the location of Tsamdros
All the focus group discussions highlighted that the
conflicts arising due to migratory cattle straying into local
residents’ crops or locals grazing herders’ tsamdros is
inevitable and had much to do with the evolution of some
villages in the south. Dovan village in Sarpang district,
where Urchi herds migrate to, Dolepchen village in
Chhuka district, where Tshebji herds go, Kungkha village
in Chhukha, where some Jabana herds go, and Brokser
village in Mongar distrct, where some Bumthang herds
go, were all carved out of former tsamdros. These villages
were tsamdro of the migratory herds prior to settlement
of today’s residents. The residents cleared the forest and
started settling in those existing tsamdros to what locals
today call their village. Kungkha, Dolepchen, and Dovan
tsamdros were cleared and villages formed in later part of
the 1960s and early 1970s. The focus group participants
in Bempu and Kungkha indicated that until 1971 the
tsamdro right holders of the then tsamdros collected lease
fees from the new settlers. These settlers were mostly
ethnic Nepalese settling in those tsamdros and cultivating
maize. Participants in Kungkha revealed the following,
thus supporting the view of the herders from Bempu,
Tshebji and Urchi:
“The reason why such conflicts occur is because our village [Kungkha] was a tsamdro before our parents and grandparents started settling down. They leased part of these tsamdros … cleared and grew crops for
which they paid lease fees in kind called TanamPathi ...
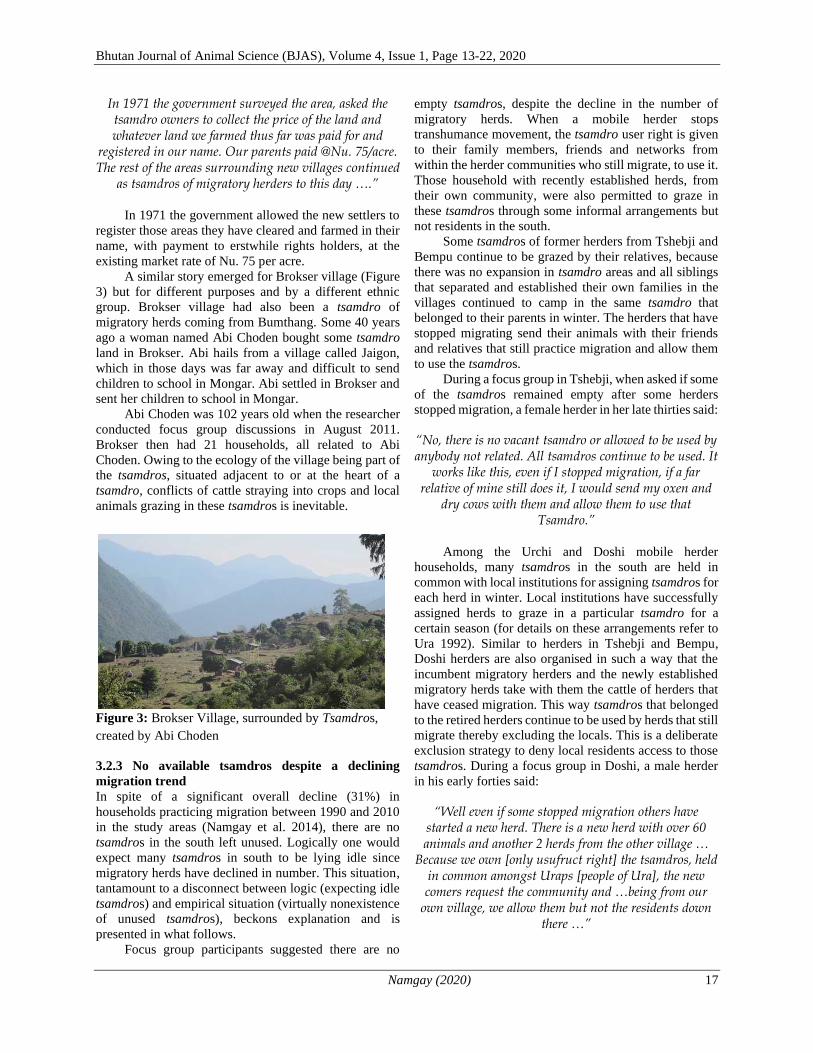
Bhutan Journal of Animal Science (BJAS), Volume 4, Issue 1, Page 13-22, 2020
Namgay (2020) 17
In 1971 the government surveyed the area, asked the tsamdro owners to collect the price of the land and whatever land we farmed thus far was paid for and
registered in our name. Our parents paid @Nu. 75/acre. The rest of the areas surrounding new villages continued
as tsamdros of migratory herders to this day ….”
In 1971 the government allowed the new settlers to
register those areas they have cleared and farmed in their
name, with payment to erstwhile rights holders, at the
existing market rate of Nu. 75 per acre.
A similar story emerged for Brokser village (Figure
3) but for different purposes and by a different ethnic
group. Brokser village had also been a tsamdro of
migratory herds coming from Bumthang. Some 40 years
ago a woman named Abi Choden bought some tsamdro
land in Brokser. Abi hails from a village called Jaigon,
which in those days was far away and difficult to send
children to school in Mongar. Abi settled in Brokser and
sent her children to school in Mongar.
Abi Choden was 102 years old when the researcher
conducted focus group discussions in August 2011.
Brokser then had 21 households, all related to Abi
Choden. Owing to the ecology of the village being part of
the tsamdros, situated adjacent to or at the heart of a
tsamdro, conflicts of cattle straying into crops and local
animals grazing in these tsamdros is inevitable.
3.2.3 No available tsamdros despite a declining
migration trend
In spite of a significant overall decline (31%) in
households practicing migration between 1990 and 2010
in the study areas (Namgay et al. 2014), there are no
tsamdros in the south left unused. Logically one would
expect many tsamdros in south to be lying idle since
migratory herds have declined in number. This situation,
tantamount to a disconnect between logic (expecting idle
tsamdros) and empirical situation (virtually nonexistence
of unused tsamdros), beckons explanation and is
presented in what follows.
Focus group participants suggested there are no
empty tsamdros, despite the decline in the number of
migratory herds. When a mobile herder stops
transhumance movement, the tsamdro user right is given
to their family members, friends and networks from
within the herder communities who still migrate, to use it.
Those household with recently established herds, from
their own community, were also permitted to graze in
these tsamdros through some informal arrangements but
not residents in the south.
Some tsamdros of former herders from Tshebji and
Bempu continue to be grazed by their relatives, because
there was no expansion in tsamdro areas and all siblings
that separated and established their own families in the
villages continued to camp in the same tsamdro that
belonged to their parents in winter. The herders that have
stopped migrating send their animals with their friends
and relatives that still practice migration and allow them
to use the tsamdros.
During a focus group in Tshebji, when asked if some
of the tsamdros remained empty after some herders
stopped migration, a female herder in her late thirties said:
“No, there is no vacant tsamdro or allowed to be used by anybody not related. All tsamdros continue to be used. It
works like this, even if I stopped migration, if a far relative of mine still does it, I would send my oxen and
dry cows with them and allow them to use that Tsamdro.”
Among the Urchi and Doshi mobile herder
households, many tsamdros in the south are held in
common with local institutions for assigning tsamdros for
each herd in winter. Local institutions have successfully
assigned herds to graze in a particular tsamdro for a
certain season (for details on these arrangements refer to
Ura 1992). Similar to herders in Tshebji and Bempu,
Doshi herders are also organised in such a way that the
incumbent migratory herders and the newly established
migratory herds take with them the cattle of herders that
have ceased migration. This way tsamdros that belonged
to the retired herders continue to be used by herds that still
migrate thereby excluding the locals. This is a deliberate
exclusion strategy to deny local residents access to those
tsamdros. During a focus group in Doshi, a male herder
in his early forties said:
“Well even if some stopped migration others have started a new herd. There is a new herd with over 60 animals and another 2 herds from the other village …
Because we own [only usufruct right] the tsamdros, held in common amongst Uraps [people of Ura], the new comers request the community and …being from our
own village, we allow them but not the residents down there …”
Figure 3: Brokser Village, surrounded by Tsamdros,
created by Abi Choden

Bhutan Journal of Animal Science (BJAS), Volume 4, Issue 1, Page 13-22, 2020
Namgay (2020) 18
Arrangements among herders are made to ensure the
continuity of tsamdros in the south and keep away the
locals. They use many justifications such as local
residents from warmer areas can grow different crops
continually throughout the year, as opposed to herders
being in high altitudes where choice of crops is limited
with short growing season. Some herders also tend to use
their usufructory rights almost as a private property rights
to keep away the locals and deny giving rights to locals to
graze in those tsamdros.
3.2.4 Contradictory claims of rights over tsamdro and
possible ignorance by development personnel of the
existence of such conflicts
The focus group discussions with development agency
personnel in Lhuentse and informal conversations with
some agency personnel in Mongar indicated a lack of
awareness of herder conflicts and disputes. One livestock
extension personnel in Lhuentse reported that a Lhuentse
herder claimed that Bumthaps and Lhuentse herders had
equal rights over the tsamdros. The tsamdros in Lhuentse
used to be grazed at the same time occupying different
sites. This claim, however, was dismissed by the Doshi
herders.
The development agency personnel in both Mongar
and Lhuentse districts similarly indicated being unaware
of the conflicts, saying it had not been brought to their
attention. While the herders reported the Ura-Kurtoe
conflict as chronic and had required central authority’s
intervention in the past, because local authorities were
ineffective, the agency personnel appeared ignorant of the
conflicts. These agency personnel are also unaware of the
issue of migratory herders from Ura confronting herders
in Sengor. When asked if the district livestock personnel
have come across such conflicts, one district livestock
personnel said: “No, so far we haven’t had any issues
brought here for settlement.”
3.2.5 Unclear legislation responsible for some conflicts
The focus groups discussions revealed that number of
inter-district disputes either on-going or newly
developing or escalating in seriousness have been the
result of uncertainty in the law and a lack of enforcement
by authorities.
The focus group participants in Doshi believed the
conflicts had escalated between the Ura herders and some
of the Lhuentse local residents. The participants are of the
view, although some occasional disputes existed in the
past, but it largely remained benign. Locals have always
respected the existing policies and judgements passed
down through generation of our monarchs, that has given
rights to Bumthaps to graze. With new land law giving
rights to locals in contrast to previous laws, the locals
have now become bolder and started grazing Urap’s
tsamdros. The Doshi participants highlighted, a recent
incident where altercations had occurred between an old
herder couple from Ura and a group of young locals from
Lhuentse, in a tsamdro, over grazing accessibility. This
dispute was said to have become serious and almost led
to physical assault. The focus group participants indicated
that the case has been referred to local authorities but the
locals do not heed the restrictions and continue to graze
their tsamdros:
“… It’s been 4 years [indicating effect of the Land Act 2007] they have been grazing our tsamdros in our
absence. Earlier by 5th month [June] it is Ridam[forest closure] and their animals cannot even step into our tsamdros. We have asked them repeatedly not to graze but they don’t listen …. They say they have heard over
radio that they can use it or some survey people told them …as per law they have the right ….”
In another instance Bempu, Tshebji and Urchi
participants mentioned that locals downstream have
indicated to them of interest to get access to those
tsamdros. A male herder in his fifties during a focus group
in Bempu said:
“It is only now that they informally indicate that there is a government order that people from different District are not allowed to graze in other districts. We tell them
that such orders have never been relayed to us but rather we were told by the newly elected government in 2008 that traditional system can continue as it used to be in
the past.”
In Urchi the focus group participants said the
tsamdros in their locality which had exclusive rights with
certain families have now become a common property as
a result of the new Land Law, and no one could now
exclude the other.
In the study areas and in eastern Bhutan as informed
by one agency key informant, new land legislation was
either not explained to the herders or grossly distorted in
interpretation by individuals, resulting in more confusion
and uneasiness among the mobile herders as well as local
residents.
The data indicated that while herders despite making
strong claims to tsamdros are also unsure what the final
decision will be regarding mobile herding and the locals
in Brokser are even more concerned. For example, focus
group participants in Brokser mentioned, the local
authorities told them the government was going to take
over even the smaller grazing areas they had access to and
they will have to pay an annual fee of Nu 1000 per acre if
they wished to lease it back.
When asked what they understood about the
provisions on accessing tsamdros in relation to the new
land law, a male resident in his for early fifties from
Brokser said:
Bhutan Journal of Animal Science (BJAS), Volume 4, Issue 1, Page 13-22, 2020
Namgay (2020) 19
“We are also … confused hearing issues like the government is going to close the tsamdros. We do not know what to do. But if such an opportunity is granted to us to utilise some of the tsamdros around our village, we of course have aspirations to rear more cattle … we
feel that an amount of Nu. 1000 per acre is very expensive for a simple farmer given the income from
animals is not substantial. I wish people here are given access to tsamdros around our village without having to
pay lease fees.”
However, the researcher crosschecked with the land
lease rules. The amount of Nu 1000 mentioned relates to
the lease of annual fee per acre for leasing government
reserved forest (GRF) land for commercial agriculture
and not for tsamdros. Even this amount has been reduced
to Nu 640. The lease fees for tsamdros is much lesser.
In all the study areas the provisions of the new land
law were not explained well to local people and in places
like Chumey gewog where some information was relayed,
it was with no clear mechanisms on how to lease tsamdros
and GRF land for pasture development and what the
process entailed.
When asked if the herders have heard about
possibilities of leasing GRF land for pasture
development, participants in Urchi said,
“… The Tshogpa told us about the possibility with government approval but nobody applied so far, we do
not know the procedures yet.”
A Tshogpa (village representative) during a focus
group in Brokser said the authorities told them that
Bumthang herders had the priority to tsamdros around
Brokser locality even if the government leased it back
after nationalisation:
“When we asked if we can get access to some of the
Bumthap tsamdros around our village, our local authorities told us that we can get only if those
Bumthaps [previous right holders] do not lease it back for themselves. In case they [Bumthaps] wish to lease it
back, they have stronger say over us.”
The information collected from mobile herder
communities and downstream locals demonstrates that
while the legislation has not been properly understood
both by local authorities and communities, little
information that was relayed by the authorities to
communities was incomplete with no understanding of
the mechanisms for leasing GRF land.
3.3 Strategies and institutional arrangements used to
avoid further conflicts
Tshebji herders in a focus group reported that because the
conflicts have been recurring in the past, some locals have
adapted and adjusted their cropping seasons to avoid
conflicts. While residents have started fencing the fields
paying special attention to critical entry points for the
animals, others have completely abandoned winter
cropping. The Tshebji focus group herder participants
said they also tie their animals and help the local erect
fences at critical entry points to their fields. A male
participant in his late fifties from Tshebji said:
“… they stopped certain crops and fenced others properly and we too take care of our animals strictly – we both have realised the inconveniences caused to us
both in the event of cattle destroying crops.”
The Kungkha residents hope to avoid conflicts in the
future through mutual respect and want the Jababs take
back all of their animals in summer and look after their
cattle well in winter. The focus group participants in
Kungkha said they needed to co-exist and respect each
other’s way of life. When asked how they think such
disputes with migratory herds coming from Jabana could
be resolved in future, a male resident in his forties
responded by saying:
“We don’t ask them to stop migrating or rearing cattle, it is their traditional practice and lifestyle and we need to co-exist. We just wish they do it as it used to be done
in the past and take back their cattle in summer and come only in winter and pay more attention to their
animals. As long as they take responsibility to take care of their animals, we should not have any problem.”
Although certain disputes continue as a result of
migratory animals straying into the crops of the local
residents, it appears the latter are tolerant as long as the
herders respect their local institutional arrangements to
compensate and take responsibility for after their animals.
3.3.1 Conflicts at local level are handled by local
institutions
It emerged from the focus group discussions that local
institutional arrangements existed either for allocating
resources within a village or for settling minor disputes
within the village. However, the jurisdiction and
effectiveness of such institutions appear to be limited to
their village and subject to parties’ agreement with the
decision passed by the local institution.
Focus group participants in Doshi, Kungkha, and
Tshebji indicated how and when such conflicts were
either settled within the gewog (local government for
group of villages) or brought to the court to settle their

Bhutan Journal of Animal Science (BJAS), Volume 4, Issue 1, Page 13-22, 2020
Namgay (2020) 20
case. Tshebji herders and Kungkha residents said that
some of the cases of mobile herders’ cattle straying into
local crop fields have been settled amicably within the
village through the Thoksup (village crop administrator).
Similarly, a local mechanism existed to allocate tsamdros
among herders in Ura to graze in their common pastures,
and a system amongst Tshebji herders to use tsamdros
together for joint right holding. However, Tshebji herders
indicated that sometimes when the parties do not agree
with the decision of local Thoksup then it has to be
referred to judicial court.
3.3.2 Conflicts at a larger scale require higher level
intervention
When confronted with disputes or conflicts involving
parties from different district jurisdictions or when parties
fail to respect the decision of the local institutions, these
cases need intervention either from district administration
office or district court.
Herders in Bempu, Doshi, Urchi and local residents
in Brokser indicated that conflicts over tsamdro resource
use in the past have sought district administration and
judicial court intervention, sometimes reaching the high
court in Thimphu. An elderly focus group participant in
Bempu said:
“When we put up the case in Drungkhag court [sub-district court] in Phuntsholing, they [Chimups]
argued that in the past they too have contributed butter and meat tax to the government. However, the court passed the verdict in our favour because we had the
registration in our names. Since then they never grazed and we did not have formal issues with them.”
Once the court or district administration intervenes,
the parties must respect the verdict and restrict resource
appropriation within the boundaries set by the verdict.
However, herders indicated that the Land Act of Bhutan
2007 has and is fueling more conflicts and causing social
disharmony among mobile herders and residents
downstream living adjacent to tsamdros.
For example, an elderly Doshi herder with a
substantial herd size, indicated an ongoing case with the
downstream residents over access to tsamdro, as being
exacerbated by the new land law. His tsamdro was
reportedly grazed by downstream residents for which he
had sought clarification from the district administration.
His application was reportedly forwarded to the Ministry
of Home & Cultural Affairs (MoHCA), following which
a ‘status quo’ has been issued by MoHCA as per the old
land law (Land Act of Bhutan 1979). The status quo
allows for herders to continue migrating and utilise the
tsamdros in the south in winter as they have done for
hundreds of years until further notice.
During the interview with the herder in Doshi in
2010 he explained that the encroachers did not stop even
after the status quo had been issued. One herder reported
his pasture was again being grazed and he is expecting
further conflicts next season:
“… the residents have grazed …. about half of our tsamdros … prior to our arrival and we had a conflict ...
they have grazed even this year… Now … they are saying, as per legislation Bumthaps are not supposed to migrate down and they can graze in those tsamdros.”
While these herders faced with increased conflicts
are relying on the status quo issued by the government as
a temporary measure, rest of the herders and downstream
residents appeared confused because of the uncertain
nature of the new land law.
DISCUSSION
The study revealed the dynamics of conflicts mobile
herders face at their winter grazing areas and along the
migratory routes. It showed the local institutional
arrangements existed to resolve the issues traditionally
though at times it warranted authorities’ interventions. It
indicated when the polices are clear with firm legislation,
it is easier for local authorities to resolve local conflicts
as there is a basis to relate their judgement. It is when new
legislation in contradiction with previous understanding
and in contrast to local traditional systems is formed, it
makes everyone confused. Moreover, when these policies
are not informed well to those who are potentially
affected, people are confused and make their own
interpretations to suit their desire. The authorities too, in
absence of clarity in the legislation, are confused. It also
showed, how when the government development workers
are ignorant of local traditional arrangements, their
development interventions instead of being beneficial
yield unintended negative effects.
The results also suggested conflicts are partly
because mobile herders deploy different strategies to
exclude the locals from accessing tsamdros. Herders do
that because with the uncertainty of implementation of the
new Land Law, there is hope, the law could be repealed
someday. Problems leading to conflicts are not always
self-evident. As much as it is material, it is also perception
based. Therefore, prior to suggesting policy solutions, it
is important to engage stakeholders to understand the
perception of each stakeholder on the same issue (Adams
et al. 2003). Genuine participatory process, conducted
exhaustively in a transparent manner, will enhance
understanding of main problems leading to these
conflicts.
Government policies and interventions that fail to
recognize traditional institutions that have successfully
managed common local resources sustainably, often

Bhutan Journal of Animal Science (BJAS), Volume 4, Issue 1, Page 13-22, 2020
Namgay (2020) 21
impose ban or restrict pastoral way of life. Such policies
also favor sedentary systems that is causing conflict with
pastoralists over resource (land, fodder, and water) and
passage access (Chakrabarti 2011; Greenough 2007).
Today, pastoralists are faced with conflicts either
directly with government policies or with farmers
because of the interventions promoted through these
policies (Chakrabarti 2011; Blench 2017). It is evident,
most of the conflicts the mobile herder face, whether it is
in Africa or Mongolia or Sikkim in India or Bhutan, they
have little contribution. It is often brought to them and
they end up at the receiving end. The grazing areas in
Africa are encroached by agriculturists and
conservationist with government policy supporting them
and yet herders are blamed (Blench 2017). Mobile herders
in Mongolia face competition from mining giants but
miners have state and donor support, while pastoralists
face degradation of environment and their livelihood
(Byambajav 2012; Upton 2012).
This supports similar findings by Chakrabarti
(2011) in the Sikkim State of India where government
policy aimed to completely halt mobile yak herding
system in contrast to their traditional way of governing
the commons. Policies restrict traditional way of life
before identifying and implementing interventions that
make a meaningful contribution to herders’ livelihood
(Chakrabarti 2011).
It is necessary to understand and respect local
institutional arrangements while implementing
development interventions lest some communities are
adversely affected in the name of development elsewhere.
When locals are consulted and facilitated well through
genuine participatory process, a workable solution is
possible. Additionally, a proper management plan, strong
community by-laws, an opportunity for learning
processes and strong involvement of local stakeholders
are found to be important components in managing such
conflicts (Wangchuk et al. 2006).
When there is lack of clarity of legislation or policy,
it ignites conflicts and defeats the intended purpose of the
very legislation, to bring peace and order in the society.
The old system of village representatives, now members
of parliament, going back to their constituencies and
explaining to subjects the new laws enacted and
resolutions of the parliamentary sessions is crucial
(Namgay et al. 2017). With the Land Act of Bhutan 2007
being implemented as it is, while writing this paper, it is
yet to be seen what implications it will result in livelihood
and wellbeing of the mobile herders. Nationalization of
tsamdros has now been completed. However, accessing
tsamdros on lease, as was foreseen in the new land law,
has not happened yet.
While previous rights have ceased with the new
legislation, herders are unsure of how the new leasing
scheme would play out. Meanwhile, some herders
continue to hang on to the previous rights while others are
too eager to make new claims. The result is more
conflicts, often getting violent and requiring police
intervention. On October 31, 2015 Kuensel, Bhutan’s
national print media reported police in Sakteng sub-
district in Trashigang district, investigating a case on
herder conflicts which involved physical feud and caused
injury (Tshering 2015).
4. CONCLUSION
Rising population and shrinking resource sizes does not
always result in neo-Malthusian situation and lead to
conflicts in pastoral societies. Adhering to age old,
sustained, local institutional arrangements and
participatory involvement of stakeholders, result in
amicable solutions. When these are ignored during
development process or creation of new legislation, it
creates confusion and brews conflict. It also indicates in
absence of clarity in rules, people would use all sorts of
tactics and intimidation to hang on to the resources while
others jump at the opportunity to counteract and grab it.
While exact impact on herders’ livelihood is yet to be
established, with the nationalization of tsamdro under
process, it will help to reinstate old system of MPs visiting
constituencies and briefing the subjects on new
legislations and resolutions. More importantly, it would
help if MPs consult their constituents and village elders
thoroughly prior to coming up with discussion on policies
or new laws in the parliament. As a good fence makes
good neighbors, it would be necessary to clearly
demarcate the pasture boundaries once leasing starts with
support for fencing materials. This will ensure sustainable
pasture management while maintaining harmony in the
pastoral society.
REFERENCES
Adams WM, Brockington D, Dyson J & Vira B (2003).
Managing tragedies: understanding conflict over
common pool resources. Science, 302(5652):1915-
1916.
Blench R (2017). Pastoral conflict and supplying Nigeria
with meat: how can the paradox be resolved? Field
investigations on pastoralist-farmers crises areas and
enhancement of MISEREOR’s partners interventions
in Nigeria, Phase 3, Project No. 131-004-1030 ZG,
131-010-1021 XG, 131-015-1030 ZG, 131-026-1019
ZG. EVALUATION N° 2166-Z1031-1158.
Boone RB, Burnsilver SB, Worden JS, Galvin KA &
Hobbs NT (2008). Large-Scale Movements of Large
Herbivores Livestock following changes in seasonal
forage supply. Resource Ecology, 187-206.
Byambajav D (2012). Mobilizing against dispossession:
Gold mining and a local resistance movement in
Mongolia. Journal of the Center for Northern
Humanities, 513-32.

Bhutan Journal of Animal Science (BJAS), Volume 4, Issue 1, Page 13-22, 2020
Namgay (2020) 22
Chakrabarti A (2011). Transhumance, livelihood and
sustainable development and conflict between formal
institution and communal governance: An evaluative
note on East Himalayan State of Sikkim, India. Paper
presented at the International Conference on Social
Science and Humanity, Singapore.
Dixon JA, Gibbon DP & Gulliver A (2001). Farming
systems and poverty: improving farmers' livelihoods
in a changing world. Rome & Washington D. C.: FAO
and World Bank.
Greenough KM (2007). Development agents and
nomadic agency: Four perspectives in the
development “Market”. NAPA Bulletin, 27(1):110-
128. doi: 10.1525/napa.2007.27.1.110
Hall D, Hirsch P & Li T (2011). Powers of exclusion: land
dilemmas in Southeast Asia. Singapore: NUS Press.
Mearns R (1993). Territoriality and land tenure among
Mongolian pastoralists: variation, continuity and
change. Nomadic Peoples, 33:(73-103).
Mearns R (2004). Decentralisation, rural livelihoods and
pasture-land management in post-socialist Mongolia.
European Journal of Development Research,
16(1):133-152. doi:
10.1080/09578810410001688770
Milligan S & Binns T (2007). Crisis in policy, policy in
crisis: understanding environmental discourse and
resource-use conflict in northern Nigeria. [Article].
Geographical Journal, 173(2):143-156. doi:
10.1111/j.1475-4959.2007.00231.x
Moritz M (2006). Changing contexts and dynamics of
herder-farmer conflicts across West Africa. Canadian
Journal of African Studies, 40(1):1-28.
Moritz M, Kyle BR, Nolan KC, Patrick S, Shaffer MF &
Thampy G (2009). Too Many People and Too Few
Livestock in West Africa? An Evaluation of
Sandford's Thesis. Journal of Development Studies,
45(7), 1113-1133. doi: 10.1080/00220380902811058
Namgay K, Millar J, Black R & Samdup T (2014).
Changes in Transhumant Agro-pastoralism in Bhutan:
A disappearing livelihood? Human Ecology. doi:
10.1007/s10745-014-9684-2
Namgay K, Millar J and Black R (2017). Dynamics of
grazing policy and its impact on migratory herders in
Bhutan. The Rangeland Journal. 39(1): 97 – 104.
Noy C (2008). Sampling Knowledge: The Hermeneutics
of Snowball Sampling in Qualitative Research.
International Journal of Social Research
Methodology, 11(4): 327-344. doi:
10.1080/13645570701401305
Patton MQ (1990). Qualitative evaluation and research
methods: Sage Publications, Inc.
RGoB (1995). The Forest and Nature Conservation Act
of Bhutan 1995. Thimphu: Ministry of Agriculture
and Forests, Royal Government of Bhutan.
RGoB (1998). The Middle Path: National Environment
Strategy for Bhutan. Thimphu: National Environment
Commission, Royal Government of Bhutan.
RGoB (1999). Bhutan 2020: A Vision for Peace,
Prosperity and Happiness. Bangkok: Keen
Publishing.
Rinzin C, Vermeulen WJV, Wassen MJ & Glasbergen P
(2009). Nature Conservation and Human Well-Being
in Bhutan: An Assessment of Local Community
Perceptions. The Journal of Environment &
Development, 18(2): 177-202. doi:
10.1177/1070496509334294
Sandford S (2006). Too many people, too few livestock:
the crisis affecting pastoralists in the Greater Horn of
Africa Future Agricultures Consortium debate.
Brighton: Institute of Development Studies,
University of Sussex.
Tong A, Sainsbury P & Craig J (2007). Consolidated
criteria for reporting qualitative research (COREQ): a
32-item checklist for interviews and focus groups.
International Journal for Quality in Health Care,
19(6):349-357. doi: 10.1093/intqhc/mzm042
Upton C (2012). Mining, resistance and pastoral
livelihoods in contemporary Mongolia. In: Change in
Democratic Mongolia. Pp. 221–248.
doi:https://doi.org/10.1163/9789004231474_012
Wangchuk K, Dorji K and Lhendup U (2006). Crushing
the bone: Minimizing grazing conflicts in community
Tsamdro. A case study from Dhur village, Choekhor
Gewog, Bumthang.
Wang SW, Lassoie JP & Curtis PD (2006). Farmer
attitudes towards conservation in Jigme Singye
Wangchuck National Park, Bhutan. Environmental
Conservation, 33(2), 148-156.
Wangchuk T (2004). Predator-prey dynamics: The role of
predators in the control of problem species. Journal of
Bhutan Studies, 10:68-89.
Wangdi T (2015, Oct 31). Police investigates tsamdro
dispute. Kuensel. Retreived from
http://www.kuenselonline.com/police-investigates-
tsamdro-dispute/

Bhutan Journal of Animal Science (BJAS)
Volume 4, Issue 1, Page 23-27, 2020
23
Full length paper
DAIRY FARMING IN PUNAKHA: UNDERSTANDING CONSTRAINTS AND OPPORTUNITIES
PEMA UGYEN
District Livestock Sector, Dzongkhag Administration, Punakha
*Author for correspondence: [email protected]
Copyright © 2020 Pema Ugyen. The original work must be properly cited to permit unrestricted
use, distribution, and reproduction of this article in any medium.
ABSTRACT: The study was undertaken to gain a deeper understanding of the constraints and
opportunities of dairy farming in Punakha District. The field survey was conducted using both
open and closed-ended structured questionnaire with dairy farmer groups in seven subdistricts
of Barp, Dzomi, Guma, Kabisa, Shelnga-Bjemi, Talog and Toedwang in Punakha district. A
total of 60 respondents; 30 existing milk suppliers of Pungdzong Dairy Farmer’s Groups and
30 non-milk suppliers, were drawn using a simple random sampling technique. The data were
analyzed using the Statistical Package for Social Sciences software version 20. The study found
that the daily mean milk production by each household was higher in DFGs which was found
to be 12.23 ± 7.89 litres in comparison to 8.75 ± 5.03 litres in Non-DFGs. The result showed the
majority (87%) of the respondents do not have improved pasture developed. Further, the area
of landholding under improved pastureland was only 0.44 ± 0.63 acres per household. Women
have a major contribution in all areas of dairy farming activities such as cattle herding, milking
and processing of milk into butter and cheese. It was found that 85% of the respondents were
ready to increase their milk production capacity despite of limited land holdings of 2-3 acres
per households being a limiting factor for dairy sector growth. To this, the land lease rules and
regulation formulated in 2018 allows the farmers to develop pasture in the state reserved forest
land under lease which provides opportunities for dairy commercialization. Further, the study
concluded that DFGs are ahead of Non-DGs in terms of milk production and dairy management
system, that provides avenue for linking smallholder dairy farmers to modern dairy value chains
which will be a special feature in encouraging Non-DFGs to form the groups for sustainable
milk production and marketing. Overall, there is good scope for the dairy value chain and
achieve milk self-sufficiency in the District.
Keywords: Dairy farming; dairy farmer groups; milk production.
1. INTRODUCTION
Dairy farming is a primary livelihood income for most
of the rural population in developing countries. In most
of the countries, milk produced by smallholder farmers
play an essential role in the dairy value chain, and milk
production contributes directly to household livelihood,
food security and nutrition (Chagunda 2016). The
global milk output was recorded at 811 million tons in
the year 2017, which is 1.4% higher than in 2016 (Food
and Agriculture Organisation [FAO] 2018).
Particularly in Asia, the milk output increased by 1.9%
with a significant contribution from India and China.
Dairying in Bhutan is a very important economic
activity to the farmers and a flourishing sector with
various resources and potentials. By volume, 21.88% of
liquid milk is consumed in the country out of 52,496
MT of milk produced in 2018 (Department of Livestock
[DoL] 2019). It has also reported that self-sufficiency
for fresh milk, butter and cheese combined is 88.80%
as of 2018 (DoL 2019). Dairy farming in Punakha
District is kept mainly for subsistence; however, the
trend is picking up towards commercialization. Out of
6,079 households in the district, 30.71% (n = 1867) of
the families owns dairy cattle (DoL 2018). The district
has 11,045 cattle heads with improved dairy cattle of
jersey and brown Swiss breeds accounting to about
30% of the total cattle population in the year 2017. The
DoL (2018) also indicated that close to 1251 MT of
milk is being produced in the district, achieving milk
self-sufficiency of about 62%. The rest 38% of the milk
shortfall is being imported from a dairy processing
company within the country as well as from India in the
form of fresh milk and tetra pack milk respectively. The
district has to put a further concerted effort to attain
self-sufficiency in the dairy sector by taking realistic
approaches. The district livestock sector during the 11th
FYP (2013-2018) had worked closely with relevant
stakeholders to enhance production, market access and
innovation in the dairy sector and is mandated to focus
on a similar approach of mainstreaming value chain in
12th FYP (2018-2023) as documented in 12th FYP of

Bhutan Journal of Animal Science (BJAS), Volume 4, Issue 1, Page 23-27, 2020
Ugyen (2020) 24
Livestock Department (DoL 2019). The demand for
fresh milk and dairy products in the market is
increasing with high marketing scope, mainly from
urban settlement and neighbouring district (Regional
Livestock Development Centre [RLDC] 2015). Going
by this trend, the need for milk is anticipated to increase
further in the future with a growing population and an
increase in purchasing power. In addition, with the
increasing awareness on the importance of dairy
products in healthy diets, the demand for milk and milk
products is expected to increase in the future.
Therefore, this study was undertaken to gain a
deeper understanding of the constraints and
opportunities of dairy farming in Punakha District.
2. MATERIAL AND METHODS
2.1 Study area
Punakha district is located in the west-central part of
Bhutan and stretches over an area of 1,109.81 square
kilometers with an altitude of 1200–5400 meter above
sea level (National Statistical Bureau [NSB] 2017). The
district is administratively divided into eleven
subdistricts, with a population of 29,391 people and
6,079 households (NSB 2018). The favourable climatic
conditions make this district most suitable for dairy
compared to other districts. The study was conducted in
seven subdistricts; four existing subdistricts (Dzomi,
Guma, Kabisa, Toedwang) currently supplying the milk
at Milk Processing Unit (MPU), Khuruthang and three
subdistricts (Barp, Shelnga-Bjemi, Talo) which are near
and having potentials to deliver milk to MPU.
2.2 Research methods and sample size
The data were collected through a survey using both
closed and open-ended structured questionnaire. A
sample of 30 respondents was drawn using simple
random sampling technique from 108 registered
Pungdzong dairy group members currently engaged in
milk supply and marketing chain from four subdistricts
of Dzomi, Guma, Kabisa and Toedwang. Similarly, a
total of 30 respondents out of 76 registered dairy
farmers from three subdistricts of Barp, Shelnga-Bjemi
and Talo. This technique had been proposed confirming
each member had an equal probability of being chosen
through random draws using random calculating
function Microsoft Excel 2016. The top 30 samples
drawn from the sampling frame were surveyed from
both groups in July 2019 using semi-structured
questionnaire.
2.3 Data Analysis
The data collected from the survey were computed
using MS Microsoft Office Professional Excel 2016,
and the coded data were analyzed using Statistical
Package for Social Sciences (SPSS) IBM statistics
version 20. Both descriptive (mean, proportion,
crosstab) and inferential (Chi-square) (χ2) statistics
were used to analyze the data. Simple bar graph, pie
charts and contingency tables were used where
appropriate to interpret and present the survey findings.
3. RESULT AND DISCUSSION
3.1 Socio-demographic information of the study
area
The socio-demographic information of the respondents
is presented in Table 1. From the total respondents
interviewed (n = 60), 16 were male and 44 female
respondents. The mean age of respondents in DFGs was
51.70 years and 53.53 years for non-DFGs indicating
the respondent selection was within the same age range.
Majority of the respondents were illiterate with
exceptionally some respondents having a primary and
secondary level of education. The household family
labour ranged between one to six members and farming
land between 0.25 acres to 6.30 acres.
Table 1: Socio-demographic information of the study area
Variable Groups Male Female Total No. of respondents
DFGs 6 24 30
Non-DFGs 10 20 30
Total 16 44 60 Level of education
Illiterate Primary Above secondary
Educational background
DFGs 23 7 0
Non-DFGs 21 6 3
Total 44 13 3
Mean Minimum Maximum
Age of respondents (Years)
DFGs 51.70 26 80 Non-DFGs 53.53 32 78
Household family labour (Nos.)
DFGs 2.97 1 6
Non-DFGs 2.37 1 5
Farmland (Acres) DFGs 2.02 0.25 5.00
Non-DFGs 2.64 0.50 6.30

Bhutan Journal of Animal Science (BJAS), Volume 4, Issue 1, Page 23-27, 2020
Ugyen (2020) 25
3.2 Cattle population and milk production The finding reveals that the non-DFGs had a
maximum number of cattle holding (8.53 ± 4.99) in
comparison to DFGs with 5.70 ± 3.14 number of
cattle (Table 2). However, DFGs had a maximum
number of improved cattle breeds of 4.80 ± 3.14
cattle when compared to non-DFGs of 4.40 ± 3.45
number of cattle. The finding also shows that the total
daily milk production per household was higher in
DFGs which was found to be 12.23 ± 7.89 litres in
comparison to 8.75 ± 5.09 litres in Non-DFGs.
Similarly, the mean daily milk production per cow
was higher in DFGs which was estimated at 6.25
litres when compared to 3.60 litres in Non-DFGs.
3.3 Cattle housing and management system
Cattle housing differed significantly within the study
areas (Table 3). The result showed majority (70%) of
respondents had permanent shed over the temporary
shed. A day-out & night-in cattle rearing system is
predominant (72%) over the stall-feeding system. The
study found the presence of more permanent dairy shed
when compared to temporary shed in the district. In
contrast, Tamang and Perkins (2005) had found that the
majority of households had temporary cattle housing
made of wooden poles and a bamboo mat or plastic
sheet for roofing. The finding is conclusive that the
increased support of livestock sector to dairy farmers
with shed construction materials and awareness on
good dairy husbandry could have probably attributed to
the increase in the number of permanent dairy shed in
the district. Provision of such supports in the initial
years may have motivated farmers for dairy farming
which is evident and promoting element for the
presence of more permanent dairy shed in the district.
3.4 Availability of fodder resources and source
The findings on the availability of feed and fodder
resources in the study area (Figure 1) revealed that the
majority (87%) of the respondents do not have
improved pasture developed. Further, the area of
Figure 1: Availability of fodder resources and their resources
Table 2: Cattle population and milk production in the study area
Variable Groups Mean SD Minimum Maximum
Local cattle holding (Nos.) DFGs 0.90 2.14 0 10
Non-DFGs 4.13 5.13 0 16
Improved cattle holding (Nos.) DFGs 4.80 2.34 1 11
Non-DFGs 4.40 3.45 0 16
Total cattle holding (Nos.) DFGs 5.70 3.14 1 16
Non-DFGs 8.53 4.99 3 19
Milking cows (Nos.) DFGs 2.07 0.83 1 4
Non-DFGs 2.43 1.46 1 6
Morning milk production per household
(Litres)
DFGs 7.53 4.87 3.50 22.00
Non-DFGs 5.23 3.40 0.50 15.00
Evening milk production per household
(Litres)
DFGs 4.70 3.08 0.00 12.00
Non-DFGs 3.51 2.14 0.00 8.00
Daily total milk production per household
(Litres)
DFGs 12.23 7.89 5.00 34.00
Non-DFGs 8.75 5.03 1.00 23.00
Table 3: Number of respondents with the different cattle housing and management system Variab
le Type DFGs Non-
DFGs Total
Cattle shed
Permanent shed
23 19 42 (70%)
Temporary shed
7 11 18 (30%)
Total 30 30 60 (100%) Management system
Stall feeding
9 8 17 (28%)
Day-out night-in
21 22 43 (72%)
Total 30 30 60 (100%)

Bhutan Journal of Animal Science (BJAS), Volume 4, Issue 1, Page 23-27, 2020
Ugyen (2020) 26
landholding under improved pastureland was only 0.44
± 0.63 acres per household.
To overcome this problem, farmers are dependent
on different sources of feed and fodder resources. By
proportion, the maximum feed resource comes from
winter oat cultivation and the minimum from enriched
fodder and others inclusive of vegetables, beverage
residues and tree fodder. Thus, the finding revealed
that dairy farmers were constrained with inadequate
feed and fodder resource due to limited landholding for
fodder development. This limitation is common with
most of the dairy farmers, though adequate fodder
resources are available to meet the nutrient requirement
of dairy cattle in the west-central region of Bhutan
(Bhujel et al. 2018).
However, this study found that the National Land
Commission of Bhutan had recently formulated the
land lease rules and regulation 2018 in order to
facilitate various socio-economic developmental
activities (National Land Commission Secretariat
[NLCS] 2018). With this policy change, dairy farmers
will have an opportunity to lease in the state reserved
forest land to develop Tsamdro (pasture) and enhance
feed and fodder development activities in the district.
The policy, financial and technical support is vital for
the progression of dairy activities. The overall national,
regional and district-level support for dairy
development program is strong. Dairy farmers are
guided by the strong policy as they play a vital role in
commercializing dairy production and fulfilling the
dairy commodity policy objectives (Sonam and
Martwanna 2011). The support for establishment and
conservation of fodder resources will lead to better
feed, higher productivity and reduction of feed costs for
the dairy farmers.
3.5 Household farm labour contribution
Respondents' views on farm labour contribution to
dairy farming activities shows that women have a major
contribution in all areas of dairy farming activities such
as cattle herding, cleaning of sheds, feeding, fodder
collection, milking and processing of milk into butter
and cheese (Figure 2). Among the 60 respondents, it
was reported that the work of cattle herding is mostly
done by women (50%). The dairy producers in this
study area rarely use their children and hired farm
labourer in dairy farming activities.
In this study, the contribution of children in dairy
farming is very less and contradicts to the findings of
Phangchung et al. (2002) who mentioned that children
also play a critical role in dairy farming especially for
cattle fodder collection, feeding and herding during off-
Figure 3: The proportion of respondents' plan towards
increasing milk
hour from the school. This could be attributed to an
increasing number of children being enrolled in schools
for education orthe children prefer staying away from
home in search of temporary jobs during off-hours and
they cannot make household labour contribution to
dairy farming. A similar conclusion was reached by
Tshering (2018) who reported that most youths stay
away from home seeking better opportunities in the
Figure 2: Farm labour contribution of family members

Bhutan Journal of Animal Science (BJAS), Volume 4, Issue 1, Page 23-27, 2020
Ugyen (2020) 27
urban areas and they cannot extend help to their parents
in dairy farming.
3.6 The readiness of dairy producers towards
increased milk production
The study looked into the readiness of dairy producers
in increasing their production capacity. It was found
that 85% of the respondents were ready to increase their
milk production capacity through one or more of the
dairy farming activities; sourcing of good quality dairy
cows, growth from within farm through breed
improvement program, production of more on-farm
animal feeds, purchase of commercial feeds,
dependency on extension advice(Figure 3). By
proportion, the maximum outcome of 31% will rely on
on-farm growth of high yielding dairy cattle and the
minimum (7%) through timely extension advice and
supports.
4. CONCLUSION
This study highlights the constraints and opportunities
of dairy farming in Punakha district. The milk
production performance in the district implies that milk
production per household is attributed to the difference
in the type of dairy cattle owned, feeding and
management system. The major share in the total cost
of milk production was of variable cost and is important
to recognise that the cost of milk production should be
taken into consideration as a benchmark upon which to
base their milk pricing decisions. Remarkably, DFGs
are ahead of Non-DFGs in terms of milk production and
overall dairy management system. This is one way of
linking smallholder dairy farmers to modern dairy
value chains and will be a special feature in
encouraging Non-DFGs to form the groups to increase
their milk production and supply. There is good scope
for dairy value chain and achieve milk self-sufficiency
in the District by taking advantage of revised land lease
rules and regulation formulated in 2018 as it allows to
develop pasture in the state reserved forest land under
lease against the limiting factor of limited land holding
of farmers for dairy commercialization.
ACKNOWLEDGEMENT
The author would like to sincerely thank District
Livestock Officer and Livestock Extension Officers of
Punakha District for their boundless support provided
during the research works. Appreciation to all the
respondents for their cooperation, support and
providing all the valuable information without any
hesitations during the field works.
REFERENCES
Bhujel AK, Namgyel U and Rai BD (2018). Dry matter
content of fodder resources utilised by dairy
farmers' groups in west-central Bhutan. Bhutan
Journal of Animal Science, 2(1):70-74.
Chagunda M (2016). Assessing and managing
intensification in smallholder dairy systems for food
and nutrition security in Sub-Saharan Africa.
Regional Environmental Change, 16(8): 2257-
2267.
DoL (2018). Livestock Statistics 2017, Department of
Livestock, Thimphu, Bhutan.
DoL (2019). 12th FYP Write-up, Department of
Livestock, Thimphu, Bhutan.
FAO (2018). Transforming food and agriculture to
achieve the SDGs. [Online] available at:
http://www.fao.org/3/I9900EN/i9900en.pdf
[Accessed 21 04 2019].
Kaur I, Singh VP, Kaur H and Singh P (2012). Cost of
Milk Production in Punjab: A Pre-requisite for
Pricing Policy. Indian Research Journal of
Extension Education, Vol. 1, pp. 313-321.
Kumawat R, Singh N and Meena CL (2014). Economic
analysis of cost and returns of milk production, the
extent of adoption of recommended management
practices on sample dairy farms in Bikaner district
of Rajasthan. Global Journal Inc. (USA), 14(5).
NLCS (2018). Land Lease Rules and Regulations 2018.
National Land Commission Secretariat, Thimphu,
Bhutan.
NSB (2017). Punakha Dzongkhag at a Glance, National
Statistics Bureau, Thimphu.
NSB (2018). World Statistics Day, National Statistics
Bureau, Thimphu.
Phangchung, Dorji P, Sonam T and Peldon K (2002).
Sustainable development of smallholder dairy
farming in Bhutan. In PM Tulachan, Mohamed A
Jabbar and M Saleem (Eds.), Smallholder dairy in
mixed farming systems of the HKH (pp. 19-34),
ICIMOD, Kathmandu, Nepal:.
Rai DB and Norbu PT ( 2011). Dairy Production,
quality control and marketing system in Bhutan. In:
SK Pal & MNA Siddiky (eds). Dairy production,
quality control and marketing system in SAARC
Countries. Dhaka: SAARC Agriculture Centre, pp.
25-52.
RLDC (2015). Regional Livestock Development
Centre, Ministry of Agriculture and Forests.
[Online] Available at:
http://www.moaf.gov.bt/freshmilkforpunakha/[Acc
essed 27 05 2019].
Sonam T and Martwanna N (2011). Smallholder dairy
farmers' group development in Bhutan:
strengthening rural communities through group
mobilization. Khon Kaen Agriculture Journal, Vol.
39: 413-428.
Tamang N and Perkins J (2005). Cattle management
systems in humid subtropical areas of western
Bhutan. Journal of Bhutan Studies, 5:105-118.
Tshering G (2018). Dairy farming enhances household
income in peri-urban and rural areas of Choekor in
Bumthang, Bhutan. Bhutan Journal of Animal
Science, 2(1):107-111.

Bhutan Journal of Animal Science (BJAS)
Volume 4, Issue 1, Page 28-37, 2020
28
Full length paper
THE DEMOGRAPHIC CHARACTERISTICS OF DOGS PRESENTED FOR THE CAPTURE-
NEUTER-VACCINATE-RELEASE (CNVR) PROGRAM IN BHUTAN
KARMA RINZIN1*, IAN D ROBERTSON2, HIRUKA MAHAT4, KEYUR PATEL3,
SATISH RAGHORTHE3 AND KINZANG DUKPA4
1Department of Livestock, Ministry of Agriculture and Forests, Thimphu, Bhutan 2College of Veterinary Medicine, School of Veterinary and Life Sciences, Murdoch
University, 90 South Street Murdoch, Perth, WA, Australia 6150 3Humane Society International, Ahmedabad, Gujarat, India
4National Centre for Animal Health, Department of Livestock, Serbithang, Thimphu, Bhutan
*Author for correspondence: [email protected]
Copyright © 2020 Karma Rinzin. The original work must be properly cited to permit
unrestricted use, distribution, and reproduction of this article in any medium.
ABSTRACT: A Capture Neuter Vaccinate Release (CNVR) programme was started in 2009
in Bhutan with the aim to control the dog population and the number of cases of rabies in humans
and other animals. As of 30 June 2013, a total of 48,051 dogs had been neutered and vaccinated
in Bhutan. A clear understanding of the dynamics of the owned and un-owned dog population
that were presented for the programme would enable better planning and targeting of resources
to maximise the benefits of this programme. The aims of this study were to: describe the
population demographics and health status of the dogs presented at the CNVR clinics. Analyses
were performed on data of 22,399 dogs processed at the CNVR clinic from 01 July 2011 to 30
June 2013, which had individual records of their owner, sex, age, neuter and pregnancy status,
and presence or absence of diseases such as transmissible venereal tumour (TVT), pyometra
and mange. More than half (53.3%; 95% CI 52.8 – 53.7) of the dogs presented to the CNVR
clinic were not owned (stray animals). The overall sex ratio in dogs was 1.2 males per female
(1.06:1 for the stray dogs and 1.4:1 for the owned dogs). The age distribution was highly
skewed towards the adult age groups in both the stray and owned dog populations.
Approximately one quarter of the dogs brought to the clinic had been previously neutered. A
higher proportion of owned dogs (32.7%) had previously been neutered than stray dogs (15.8%).
Approximately 5% of the dogs presented to the CNVR clinic had one or more health problems
(mange, TVT or pyometra). Stray dogs were at increased risk of acquiring a health problem
(OR = 2.75; 95% CI 2.40 - 3.16) and this highlighted the need for a sustainable programme to
look after both the health and welfare of the stray dog population. Of the 7,929 female dogs
that were neutered at the clinic, 6.5% were pregnant. The number of foetuses ranged from 1 to
11 with a mean count of 4.9 ±1.6 (n = 518). The mean foetal count was lower in juvenile bitches
(4.1 ±1.3) than in adult females (5.1 ±1.6). The mean foetal count in stray dogs (5.2 ±1.6) was
higher than in owned dogs (4.4 ±1.5). Pregnant bitches were seen thorough-out the year;
however more pregnancies were observed in September to December. To maximize the impact
of the programme, future CNVR programmes should target females (owned and stray) with
reinforcement of the programme at the time of the peak mating season.
Keywords: Bhutan; CNVR; demographic; dog population; free-roaming.
1. INTRODUCTION
In many developing countries, including Bhutan, there
are large numbers of free-roaming or stray dogs (Childs
et al. 1997; Kato et al. 2003; Kayali et al. 2003; Reece
and Chawla 2006; Totton et al. 2010c). Although
domestic dog plays an important role in human life, ,
they pose a significant public health threats through
dog bites and transmission of diverse range of zoonotic
diseases (Ashford et al. 1998; Robertson and Thompson
2002; Acha and Szyfres 2003c, a, b; Schlundt et al.
2004). It has been estimated that approximately 55,000
people die each year from rabies globally and infection
is mainly acquired from street dogs (WHO 1996, 2004).
In Bhutan from 1996 to 2009, a total of 814 cases of
rabies were reported in domestic livestock species, of
which cattle and dogs accounted for 55% and 39% of
the cases, respectively (Tenzin et al. 2011c). From 2006
to 2011, a total of 18 human deaths due to rabies (3 in

Bhutan Journal of Animal Science (BJAS), Volume 4, Issue 1, Page 28-37, 2020
Rinzin et al. (2020) 29
2006, 2 in 2007, 3 in 2008, 4 in 2009, 1 in 2010 and 5
in 2011) were reported in Bhutan (BHMIS 2012).
Although domestication of dogs was initiated
14,000 years ago they retain some of their wild
instincts, including behaviours that can lead to attacks
on humans. Dog bites in humans are a serious public
health problem and have been well documented
worldwide (Bernardo et al. 2002; Feldman et al. 2004;
Gilchrist et al. 2008; Brooks et al. 2010; Cornelissen
and Hopster 2010; Hossain et al. 2013). A survey of dog
bites conducted in three hospital catchment areas in
Bhutan reported an annual dog bite incidence of 869.8,
293.8 and 284.8 per 100,000 population in Gelephu,
Phuentsholing and Thimphu, respectively (Tenzin et al.
2011b). There has been considerable media coverage
concerning the stray dog population, the risk of dog
bites and the public nuisance caused by free-roaming
dogs in Bhutan (Gyelmo 2011). The free-roaming dogs
also pose a threat to endangered wildlife species
through the transmission of diseases or predation
(Butler et al. 2003; Manor and Saltz 2003; Cleaveland
et al. 2007). Despite Bhutan being a popular tourist
destination, the presence of large numbers of free-
roaming dogs and incessant barking at night can have
an adverse effect on tourism (TCB 2010a 2011). In
addition, free-roaming dogs cause other problems
including fouling public places with excreta, causing
road accidents and putting pressure on the road users
(Robinson 1974). In addition stray dogs in the
developing countries suffer from poor welfare
conditions such as skin diseases, starvation,
malnutrition, high mortality and injury from road
accidents and abuse by humans (Jackman and Rowan
2007). The Bhutan National News paper (Kuensel)
issue on the 11th September 2011 reported the treatment
at the National Animal Hospital, Chubachu, Thimphu
of 64 dogs that were injured as a result of motor vehicle
accidents between January and August 2011 (Pelden
2011). This is likely to be an underestimate of the real
number of cases as many dog injuries would go
unreported.
Several strategies were implemented in the past to
control the population of free-roaming dogs and their
associated problems (WHO 1987; WHO and WSPA
1990; ICAMC 2007; OIE 2010). These include
population control through culling of unwanted dogs
and reproductive control, habitat control and legislative
measures including responsible dog ownership
(registration of dogs, restriction on number of dogs that
can be owned, providing food and shelter to the dogs,
confining of the dogs). However population control
through culling has been opposed by members of the
public and has not been effective as dogs from adjacent
areas moved in and replaced the culled dogs and
population growth from the surviving dogs quickly
repopulate the area where culling has been
implemented (OIE 2010). It has been demonstrated that
the combination of animal birth control (ABC) and
vaccination programme was successful in reducing the
size of dog population and elimination of rabies
incidence and improving the welfare condition of stray
dogs in the campaign programme area in India (Reece
and Chawla 2006; Reece et al. 2008; Totton et al.
2010c; Totton et al. 2011a).
Since the 1970s Bhutan has attempted several
measures to control the free roaming dog population
(NCAH 2006; UNDP 2008; Wangmo 2010). As a part
of the national rabies control programme, mass culling
of dogs was undertaken in the 1970s and 1980s. This
was discontinued as it was not effective in controlling
the dog population or the number of rabies cases, as
well as being heavily criticized by the Bhutanese
community. Impounding of stray dogs was
implemented in 2008, but was also discontinued due to
its associated costs and on animal welfare ground. Ad
hoc vaccination and sterilization of both owned and
stray dogs were initiated in the 1990s, however this was
not successful in controlling rabies or the dog
population due to the low coverage (below 20%)
compared with the recommended target of 75% (WHO
2004).
To address the chronic dog population and rabies
problem in Bhutan, the Humane Society International
and the Royal Government of Bhutan jointly embarked
on the National Dog Population Management and
Rabies Control Project in 2009. Through this project
dogs are caught, neutered, vaccinated and released back
to their place of origin. As of 30 June 2013, a total of
48,051 dogs had been neutered and vaccinated. A
clearer understanding of the dynamics of the owned and
un-owned dog population that were processed at the
Capture Neuter Vaccinate Release (CNVR) clinics
would enable better planning and targeting of resources
to maximise the benefits of the ongoing CNVR
programme in Bhutan. The aims of this study was to
describe the population demographics and health status
of the dogs presented at the CNVR clinics from July
2011 to June 2013.
2. MATERIALS AND METHODS
2.1 National Dog Population Management and
Rabies Control Programme
The Department of Livestock of the Royal Government
of Bhutan and the Humane Society International (HSI),
USA initiated a pilot spay/neuter/vaccination program
or CNVR programme between February and June 2009
in Thimphu, the capital city of Bhutan. After the
success of this pilot project, the two entities signed a
memorandum of understanding in September 2009 and
formed a partnership to implement a long term project
titled the “National Dog Population Management and
Rabies Control Project” (NDPM & RCP) to undertake
a three to five year CNVR campaign.
The CNVR programme focused on sterilization
and vaccination of stray and owned dogs. All
procedures performed on dogs were approved by the
Murdoch University Animal Ethics Committee. All the
animal handling and surgical procedures were done by
veterinarians and para-veterinarians trained on the

Bhutan Journal of Animal Science (BJAS), Volume 4, Issue 1, Page 28-37, 2020
Rinzin et al. (2020) 30
standard HSI protocol for the CNVR programme.
Sexually intact dogs older than 4 months of age were
humanely captured by trained dog catchers using nets.
The owned dogs were either brought to the clinics by
their owners or collected from a designated place. The
dogs brought to the CNVR clinics were administered
xylazine (1mg/kg) and atropine sulphate (0.05 to
1mg/kg) as pre-anaesthetic medications and
anaesthetised using intramuscular ketamine at 15mg/kg
body weight. All dogs were given ivermectin (1% w/v)
injectable for parasite control. Benzathine penicillin
(11,000 to 22,000 IU/kg) and meloxicam (0.2 mg/kg)
were administered to prevent secondary bacterial
infection and to relieve pain, respectively. Male dogs
were castrated through a single prescrotal incision.
Bitches were sterilized by complete
ovariohysterectomy through a mid-ventral abdominal
incision. To identify the neutered dogs, they were ear
notched while anaesthetized using a cautery device.
After surgery the dogs were observed until they were
fully recovered from their anaesthesia and were then
either returned to their owners or to the place where
they had been captured.
A brief physical examination of the dogs was done
to assess their health condition as well as to check for
the presence of skin and other health problems. During
the surgery female dogs were examined for the
presence of pyometra and pregnancy.
2.2 CNVR data
As of June 2013 a total of 48,051 dogs and 2,636 cats
had been neutered and vaccinated in Bhutan (Figure 1).
Data were compiled separately for two different periods
i.e. from Feb 2009 to June 2011 (first phase) and July
2011 to June 2013 (second phase). There are no
electronic records of individual animals processed at
the CNVR clinic during the first phase. The data were
compiled and aggregated by district on a monthly basis.
During the first phase period 25,594 dogs were neutered
and vaccinated, of which 54.2% were strays.
From July 2011 onwards the CNVR team
recorded all cases in a database. The field data were
entered in an excel spreadsheet which were later
uploaded to the main database maintained at the
project’s headquarters. The short comings of the
previous recording system were addressed in this
second phase. Separate records for dogs and cats, as
well as records of animals that were only vaccinated or
those that were vaccinated and neutered were kept.
During this period a total of 22,399 dogs and 2,578 cats
were either neutered and vaccinated or vaccinated only.
2.3 Data Analysis
Analyses were performed on data of 22,399 dogs
processed at the CNVR clinic from 01 July 2011 to 30
June 2013, which had individual records of their owner,
sex, age, neuter and pregnancy status, and presence or
absence of diseases such as TVT, pyometra and mange.
Analyses were done using Microsoft Excel (Microsoft
Excel 2010, Redmond, USA) and Statistical software R
Figure 1: Number of dogs and cats nutered and vaccinated in two phase

Bhutan Journal of Animal Science (BJAS), Volume 4, Issue 1, Page 28-37, 2020
Rinzin et al. (2020) 31
(R Development Core Team 2013). Descriptive
statistics were performed and 95% CI for proportions
were calculated using the exact binomial method (Ross
2003). Chi-square tests were used to compare the
proportions of dogs presented between groups
categorised by gender, age, neuter status, owner status,
pregnancy status and presence or absence of disease
conditions. Reproductive parameters, including
proportion of pregnant females, foetal counts and
monthly pattern of pregnancy, were evaluated and
compared by age class and owner status. An
independent two sample student’s t-test was used to
compare the mean foetal counts of the pregnant bitches
between owned and stray dogs as well as adult and
juvenile bitches. The χ² Goodness-of-Fit test was used
to investigate the influence of season on the monthly
pattern of pregnancies. Risk factors associated with the
occurrence of various health problems such as mange,
transmissible venereal tumour (TVT) and pyometra
were assessed in different groups by odds ratios and
their 95% confidence intervals.
3. RESULTS
3.1 CNVR Programme in Bhutan
From February 2009 to June 2013 a total of 48,964 dogs
and 2,636 cats were presented to the CNVR Clinic
including 913 dogs that were brought from Indian
border towns. Of the total of 48,051 dogs neutered and
vaccinated in Bhutan, 22,443 were owned and 25,608
were stray. The details of the dogs presented to the
CNVR clinic are shown in Figure 1. The CNVR
programme was undertaken in all 20 districts of Bhutan
with the highest number of dogs neutered and
vaccinated in Thimphu followed by Samtse, Sarpang,
Paro, Chukha and Samdrup Jongkhar (Figure 2). The
lowest number of dogs (less than 1,000 dogs) were
vaccinated and neutered in Gasa, Lhuentse, Trongsa
and Haa.
3.2 Demographic characteristics of the dog
population.
The analysis reported in this paper was from a total
dataset of 22,399 dogs that were presented to the CNVR
clinic between July 2011 and June 2013, that had
individual data on their owner, sex, age, neuter and
pregnancy status, and presence or absence of disease
conditions. The demographic characteristics of the dogs
presented at the CNVR clinic during this two year
period are summarised in Table 1.
3.2.1 Sex ratios
Overall there were slightly more males (54.6%; 95% CI
53.9 - 55.2) than female dogs (46.1%; 95% CI 44.8 -
46.1) presented to the CNVR clinic (sex ratio of male:
female of 1.2:1 - Table 1). There was a similar
distribution of males (51.4%; 95% CI 50.5 - 52.3) and
females (48.6; 95% CI 47.7 - 49.5) with a sex ratio of
1.06:1 for the stray dogs. There was a greater proportion
of males (58.1%; 95% CI 57.1 to 59.0) compared with
females (41.9%; 95% CI 41.0 - 42.9) with a sex ratio of
1.4:1 for the owned dogs. Sex ratios of the stray dogs
were significantly different to that of the owned dogs
(χ² = 101.20, df = 1, p <0.001).
3.2.2 Age structure
The age distribution was highly skewed towards the
adult age groups (73.4%; 95% CI 72.8 - 74.0) followed
by juveniles (13.4%; 95% CI 13.0 - 13.7) and puppies
(13.1%; 95%CI 12.7 - 13.6). There was no significant
difference in the age distribution of owned and stray
dogs (χ² = 0.00, df = 1, p = 0.98).
Figure 2: A district map of Bhutan showing the total number of dogs vaccinated and neutered (shown as
proportional symbols) from February 2009 to June 2013 (n = 48051).

Bhutan Journal of Animal Science (BJAS), Volume 4, Issue 1, Page 28-37, 2020
Rinzin et al. (2020) 32
3.2.3 Neuter status
Approximately one quarter (23.8%; 95% CI 23.3 - 24.4)
of the dogs brought to the clinic had been neutered
previously. Not surprisingly a significantly higher
proportion of owned dogs (32.7%; 95% CI 31.8 - 33.6)
had previously been neutered than stray dogs (15.8%;
95% CI 15.1 - 16.4) (χ² = 886.38, df = 1, p <0.001).
3.2.4 Health condition
Most dogs presented to the CNVR clinics were
categorised as being in good health condition (84.9%;
95% CI 84.4 - 85.4). Significantly more un-owned dogs
(87.1%; 95% CI 86.5 - 87.7) were in good health
condition than owned dogs (82.5%; 95% CI 81.7 - 83.2)
(χ² = 136.06, df = 2, p <0.001).
3.2.5 Health problems
Of the dogs presented to the CNVR clinics, 4.8% (95%
CI 4.6 - 5.1) had one or more health problems (mange,
TVT or pyometra). Significantly more stray dogs
(6.9%; 95% CI 6.4 - 7.3) had a health problem than
owned dogs (2.6%; 95% CI 2.3% to 2.9%). The risk of
a stray dog having a health problem was 2.75 greater
than that of owned dogs (95% CI 2.40 - 3.16; χ² =
220.12, df = 1, p <0.001). The various risk factors
associated with occurrence of different health problems
are presented in Table 2. There was no difference in the
risk of mange in male and female dogs (OR = 1.02; 95%
CI 0.88 – 1.19), while male dogs were less likely to
have TVT (OR = 0.65; 95% CI 0.48 – 0.88). Intact
dogs were at increased risk of mange (OR = 4.02; 95%
CI 3.03 – 5.34) and TVT (OR = 4.19; 95% CI 2.33 –
7.54). Adult dogs were at increased risk of acquiring
pyometra (OR = 2.47; 95% CI 1.75 – 3.47) and TVT
(OR = 2.61; 95% CI 1.65 – 4.12), while they were less
likely to have mange (OR = 0.70; 95% CI 0.61 – 0.84)
than young dogs.
3.2.4 Reproductive parameters
Of the 7,929 females that were neutered at the clinic,
6.5% (95% CI 6.0% to 7.1%) were pregnant (Figure 3).
The pregnancy levels of owned (7.0%, 95% CI 6.1 to
8.0%) and stray dogs (6.2%, 95% CI 5.6% to 6.9%)
were similar (χ² = 1.80, df = 1, p =0.18). The foetal
count in pregnant bitches ranged from 1 to 11 with a
mean foetal count of 4.9 ±1.6 (n = 518). The mean
foetal count was significantly lower in juvenile bitches
(4.1 ±1.3, n = 90) than in adult females (5.1 ±1.6, n =
Table 1: Characteristics of dogs presented at the capture-neuter-vaccinate-release (CNVR) clinic from 01 July 2011 to 30 June 2013
Characteristics Total n (%) Stray n (%) Owned n (%) χ² P-Value
Sex
Male 12221 (54.6) 6033 (51.4) 6188 (58.1) 101.20 <0.001
Female 10175 (45.4) 5709 (48.6) 4466 (41.9)
Unknown 3 (0.01) 3 (0.03) 0 (0)
Age
Adult 16451 (73.4) 8627 (73.5) 7824 (73.4) 0.00 0.98
Juvenile 5948 (26.6) 1397 (26.5) 1607 (26.6)
Neuter status
Neutered 5336 (23.8) 1850 (15.7) 3486 (32.7) 886.38 <0.001
Intact 17063 (76.2) 9895 (84.3) 7168 (67.3)
Health condition
Poor 381 (1.7) 230 (2.0) 150 (1.4) 136.06 <0.001
Okay 3003 (13.4) 1285 (10.9) 1718 (16.1)
Good 19015 (84.9) 10229 (87.1) 8786 (82.5)
Presence of health problems
Yes 1085 (4.8) 807 (6.9) 278 (2.6) 220.12 <0.001
No 21314 (95.2) 10938 (93.1) 10376 (97.4)
Pregnancy status
Yes 518 (6.5) 304 (6.2) 214 (7.0) 1.80 0.18
No 7411 (93.5) 4569 (93.8) 2842 (93.0)
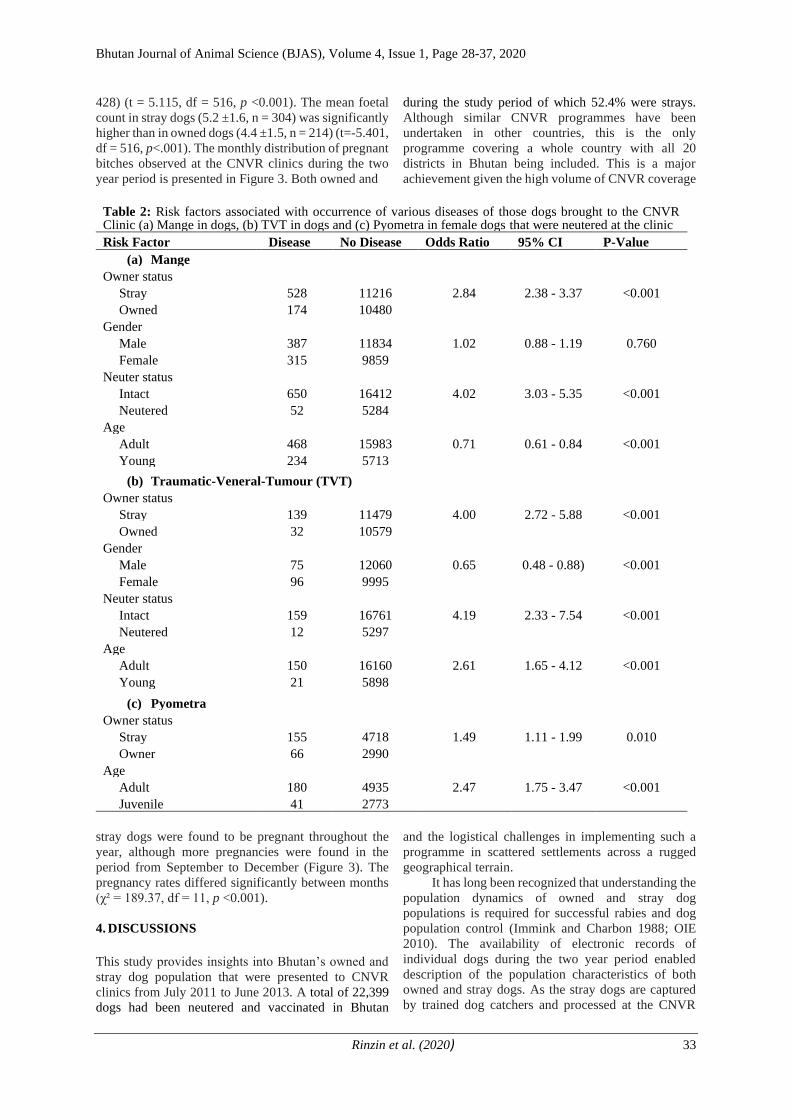
Bhutan Journal of Animal Science (BJAS), Volume 4, Issue 1, Page 28-37, 2020
Rinzin et al. (2020) 33
428) (t = 5.115, df = 516, p <0.001). The mean foetal
count in stray dogs (5.2 ±1.6, n = 304) was significantly
higher than in owned dogs (4.4 ±1.5, n = 214) (t=-5.401,
df = 516, p<.001). The monthly distribution of pregnant
bitches observed at the CNVR clinics during the two
year period is presented in Figure 3. Both owned and
stray dogs were found to be pregnant throughout the
year, although more pregnancies were found in the
period from September to December (Figure 3). The
pregnancy rates differed significantly between months
(χ² = 189.37, df = 11, p <0.001).
4. DISCUSSIONS
This study provides insights into Bhutan’s owned and
stray dog population that were presented to CNVR
clinics from July 2011 to June 2013. A total of 22,399
dogs had been neutered and vaccinated in Bhutan
during the study period of which 52.4% were strays.
Although similar CNVR programmes have been
undertaken in other countries, this is the only
programme covering a whole country with all 20
districts in Bhutan being included. This is a major
achievement given the high volume of CNVR coverage
and the logistical challenges in implementing such a
programme in scattered settlements across a rugged
geographical terrain.
It has long been recognized that understanding the
population dynamics of owned and stray dog
populations is required for successful rabies and dog
population control (Immink and Charbon 1988; OIE
2010). The availability of electronic records of
individual dogs during the two year period enabled
description of the population characteristics of both
owned and stray dogs. As the stray dogs are captured
by trained dog catchers and processed at the CNVR
Table 2: Risk factors associated with occurrence of various diseases of those dogs brought to the CNVR Clinic (a) Mange in dogs, (b) TVT in dogs and (c) Pyometra in female dogs that were neutered at the clinic
Risk Factor Disease No Disease Odds Ratio 95% CI P-Value
(a) Mange Owner status
Stray 528 11216 2.84 2.38 - 3.37 <0.001
Owned 174 10480 Gender
Male 387 11834 1.02 0.88 - 1.19 0.760
Female 315 9859 Neuter status
Intact 650 16412 4.02 3.03 - 5.35 <0.001
Neutered 52 5284 Age
Adult 468 15983 0.71 0.61 - 0.84 <0.001
Young 234 5713 (b) Traumatic-Veneral-Tumour (TVT)
Owner status Stray 139 11479 4.00 2.72 - 5.88 <0.001
Owned 32 10579 Gender
Male 75 12060 0.65 0.48 - 0.88) <0.001
Female 96 9995 Neuter status
Intact 159 16761 4.19 2.33 - 7.54 <0.001
Neutered 12 5297 Age
Adult 150 16160 2.61 1.65 - 4.12 <0.001
Young 21 5898 (c) Pyometra
Owner status Stray 155 4718 1.49 1.11 - 1.99 0.010
Owner 66 2990 Age
Adult 180 4935 2.47 1.75 - 3.47 <0.001
Juvenile 41 2773

Bhutan Journal of Animal Science (BJAS), Volume 4, Issue 1, Page 28-37, 2020
Rinzin et al. (2020) 34
clinic while owned dogs are presented on a voluntary
basis by their owners, there are potential sampling
biases and as such the demographic characteristics
reported in this study must be interpreted with caution.
Some studies in other developing countries have
reported the demographic characteristics of the owned
dog population (Brooks 1990; De Balogh et al. 1993;
Butler and Bingham 2000; Matter et al. 2000; Kitala et
al. 2001a; Kongkaew et al. 2004; Knobel et al. 2008;
Suzuki et al. 2008; Acosta-Jamett et al. 2010).
However, there are very limited studies that have
examined the demographical characteristics of stray or
un-owned dogs (Childs et al. 1997; Kato et al. 2003;
Reece and Chawla 2006; Reece et al. 2008; Totton et
al. 2010b; Totton et al. 2011b).
Even though the main focus of the HSI/ RGOB
CNVR programme was towards stray dogs, 47.6% of
the dogs presented were owned dogs. This high
percentage is likely due to effective dissemination of
information about the programme and involvement and
support provided by livestock officials in the districts
and sub-districts to the project team. Approximately
92.3% of the owned dog population (based on 2012
census) (22443 of 24320) had been neutered and
vaccinated from February 2009 until June 2013. This
high proportion may be due to underestimation of the
actual owned dog population from the census which is
focused on livestock and rural communities rather than
urban and pet animals. In order to come up with a
reliable estimate of the owned dog population, a
properly planned cross-sectional household survey in
both rural and urban areas should be undertaken (De
Balogh et al. 1993; Childs et al. 1997; Butler and
Bingham 2000; Kitala et al. 2001b; Kayali et al. 2003;
Flores-Ibarra and Estrella-Valenzuella 2004;
Horisberger et al. 2004; Gsell et al. 2012; Hossain et al.
2013). It is likely this would be cheaper, as well as more
accurate, than a census. Similarly population estimates
of free-roaming and stray dogs should be undertaken in
urban areas using wildlife techniques which are now
commonly applied for estimating populations of free-
roaming dogs (Caughley 1977; Bookhout 1994;
Sutherland 2006). These methods have been used in
several countries including Bangladesh, Bhutan, Cairo,
India, Nepal and Sri Lanka to enumerate free-roaming
dogs (WHO and WSPA 1990; WSPA 2009; Hiby et al.
2011).
In this study we found a similar distribution of
males and females (sex ratio of 1.05:1) for stray dogs,
although more males were owned than females (sex
ratio of 1.39:1). The preference for owning male dogs
is consistent with the findings of other studies and is
likely associated with avoiding the issues of oestrus in
female dogs or the likelihood of pregnancies (De
Balogh et al. 1993; Suzuki et al. 2008; Ratsitorahina et
al. 2009). The age distribution was more skewed
towards the adult age group for both owned and stray
dogs. There were fewer juveniles and puppies as a
reasonable proportion of the adult females had already
been neutered and the likely poor survival rates of the
Figure 3: Monthly pattern of female dogs neutered and proportion of pregnant bitches observed when spayed
during the CNVR programme in Bhutan from July 2012 to June 2013.

Bhutan Journal of Animal Science (BJAS), Volume 4, Issue 1, Page 28-37, 2020
Rinzin et al. (2020) 35
puppies. High mortality rates of puppies has been
reported in other studies undertaken in developing
countries (Brooks 1990; De Balogh et al. 1993; Butler
and Bingham 2000; Kitala et al. 2001b). Correct
records of the number of puppies born and those that
survived in both owned and stray dogs would be a
useful adjunct to better understand the dog population
dynamics.
In this study 15.8 and 32.7% of the stray and
owned dogs, respectively presented to the clinics were
already neutered. This demonstrates that some of the
dogs which had been neutered prior to the initiation of
the ongoing CNVR campaigns are still surviving. Ad
hoc neutering and vaccination campaigns have been
conducted in Bhutan since the early 1990s by the
Department of Livestock as part of an anti-rabies
campaign for both owned and stray dogs (NCAH 2006,
2007). As a result of these campaigns, in combination
with the removal of in-contact animals during rabies
outbreaks, outbreaks of rabies in animals are now
reported only from the Southern border districts
(Tenzin et al. 2010; Tenzin et al. 2011a; Tenzin et al.
2011c; Tenzin et al. 2011d). Recent outbreaks in the
interior part of the country have been associated with
the movement of domestic animals from the south
where rabies is still endemic (Tenzin et al. 2010; Tenzin
et al. 2011a; Tenzin et al. 2011c). The coverage of
previous campaigns has been below the WHO/WSPA
recommendations of 70%. These low coverages would
not be sufficient to significantly reduce the dog
population or to prevent an outbreak of rabies.
Most of the dogs observed at the CNVR clinics
were found to be in good health (84.9%), with very few
owned (1.4%) or stray (2.0%) dogs being in poor health
condition. This highlights that even stray dogs have
access to a reliable food source, most likely from the
predominantly Buddhist community. Approximately
5% of the dogs presented to the clinic had a
recognisable health problem. Not surprisingly a higher
proportion of stray dogs (6.9%) had health problems
than owned dogs (2.6%). Stray dogs were more likely
to have mange, TVT and pyometra. These differences
are likely to be associated with differences in
behavioural, hormonal and immunological factors
between the two populations (Reece and Chawla 2006;
Totton et al. 2011a; Yoak et al. 2014).
Approximately 6.5% of the female dogs that were
neutered at the clinic were found to be pregnant. The
pregnancy rates in the owned and stray dogs were not
significantly different which likely indicates that the
owned dogs were not continuously confined but had
access to males during oestrus. As expected lower
foetal counts were observed in younger dogs than in
adult females and similar findings have been reported
by others (Brooks 1990; Butler and Bingham 2000;
Kitala et al. 2001b). Stray dogs had a higher mean foetal
count than owned dogs. Pregnancies in both owned and
stray dogs were observed throughout the year, although
more pregnancies were reported in the months of
September to December (Figure 3). Higher pregnancies
have been observed in these months in similar studies
conducted in Jodhpur and Jaipur City in India (Reece et
al. 2008; Totton et al. 2010a; Hiby et al. 2011). To
maximize the impact of the programme, future CNVR
programmes should target females (owned and stray)
with reinforcement of the programme at the time of the
peak mating season (August to October).
In conclusion, this study provided insight on the
population demographics of the owned and stray dog
population presented to CNVR clinics in Bhutan. This
study will allow better planning and targeting of
resources to maximise the benefits of the ongoing
CNVR programme in Bhutan. As expected, stray dogs
are more prone to acquiring health problems and this
highlights the need for a sustainable programme to look
after both the health and welfare of the stray dog
population. The owned dog population are likely to be
the main source of stray dogs due to poor responsible
ownership (uncontrolled breeding and abandoning of
puppies). Therefore the CNVR programme should
focus on both owned and stray dogs by working closely
with the communities and the relevant stakeholders
through a one health approach in order to bring the free-
roaming dog population down to a manageable level. In
order to have a sustainable dog population control
programme, the CNVR programme should be
continued along with implementation of legislative
measures to ensure responsible dog ownership, better
habitat control through proper solid waste management
in the urban areas, as well as aggressive awareness
campaigns on the benefits of CNVR programme.
REFERENCES
Acha PN and Szyfres B (Eds.) (2003a). Zoonoses and
Communicable Diseases Common to Man and
Animals: Bacterioses and Mycoses. Pan American
Health Organisation Washington D.C.
Acha PN and Szyfres B (Eds.) (2003b). Zoonoses and
Communicable Diseases Common to Man and
Animals: Chlamydioses, Rickettsioses and Viroses.
Pan American Health Organisation Washington D.C.
Acha PN and Szyfres B (Eds.)(2003c). Zoonosis and
communicable diseases common to man and animals:
Parasitoses. Pan American Health Organization
Washington D.C.
Acosta-Jamett G, Cleaveland S, Cunningham AA and
Bronsvoort BM (2010). Demography of domestic dogs
in rural and urban areas of the Coquimbo region of
Chile and implications for disaese transmissions.
Preventive Veterinary Medicine 94: 272-281.
Ashford DA, David JR, Freire M, David R, Sherlock I,
Eulalio MC, Sampaio DP and Badaro R (1998).
Studies on control of visceral leishmaniasis: impact of
dog control on canine and human visceral
leishmaniasis in Jacobina, Bahia, Brazil. American
Journal of Tropical Medicine and Hygiene 59:53-57.
Bernardo LM, Gardner MJ, Rosenfield RL, Cohen B and
Pitetti R (2002). A comparison of dog bite injuries in
younger and older children treated in a pediatric

Bhutan Journal of Animal Science (BJAS), Volume 4, Issue 1, Page 28-37, 2020
Rinzin et al. (2020) 36
emergency department. Pediatr Emerg Care, 18:247-
249.
BHMIS (2012). Annual Health Bulletin 2013. Ministry of
Health, Royal Government of Bhutan, Thimphu.
Bookhout TA (Ed.)(1994). Research and Management
Techniques for Wildlife and Habitats. The Wildlife
Society, Bethesda, Maryland.
Brooks A, Moxon R and England GC (2010). Incidence
and impact of dog attacks on guide dogs in the UK.
Veterinary Record, 166:778-781.
Brooks R (1990). Survey of the dog population of
Zimbabwe and its level of rabies vaccination.
Veterinary Record, 127:592-596.
Butler J and Bingham J (2000). Demography and dog-
human relationships of dog population in Zimbabwean
communal lands. The Veterinary Record, 147:442-
446.
Butler J, du Toit J and Bingham J (2003). Free-ranging
domestic dogs (Canis familiaris) as predators and prey
in rural Zimbabwe; threats of competition and disease
to large wild carnivores. Biological Conservation,
115:369-378.
Caughley G (1977). Analysis of Vertebrate Populations.
John Wiley & Sons.
Childs J, Robinson L, Sadek R, Madden A and Miranda
M (1997). Density estimates of rural dog populations
and an assessment of marking methods during a rabies
vaccination campaign in the Philippines. Preventive
Veterinary Medicine, 33: 207-218.
Cleaveland S, Mlengeya T, Kaare M, Haydon D, Lembo
T, Laurenson MK and Packer C (2007). The
conservation relevance of epidemiological research
into carnivore viral diseases in the Serengeti.
Conservation Biology, 21:612-622.
Cornelissen JM and Hopster H (2010). Dog bites in The
Netherlands: a study of victims, injuries,
circumstances and aggressors to support evaluation of
breed specific legislation. Veterinary Journal,
186:292-298.
De Balogh KK, Wandeler AI and Meslin FX (1993). A
dog ecology study in an urban and a semi-rural area of
Zambia. Onderstepoort Journal of Veterinary
Research, 60, 437-443.
Feldman K, Trent R and Jay M (2004). Epidemiology of
Hospitalizations resulting from dog bites in California,
1991-1998. American Journal of Public Health
94:1940-1941.
Flores-Ibarra, M and Estrella-Valenzuella G (2004).
Canine ecology and socioeconomic factors associated
with dogs unvaccinated against rabies in a Mexican
city across the US-Mexico border Preventive
Veterinary Medicine 62, 79-87.
Gilchrist J, Sacks JJ, White D and Kresnow MJ (2008).
Dog bites: still a problem? Injury Prevention, 14:296-
301.
Gsell AS, Knobel DL, Kazwala RR, Vounatsou P and
Zinsstag J (2012). Domestic dog demographic
structure and dynamics relevant to rabies control
planning in urban areas in Africa: the case of Iringa,
Tanzania. Bmc Veterinary Research, 8:1-10.
Gyelmo D (2011). Dog bite numbers go through the roof
Kuensel. Kuensel Corporation Limited, Thimphu, 4.
Hiby LR, Reece JF, Wright R, Jaisinghan R, Wright R,
Singh B and Hiby EF (2011). A mark-resight survey
method to estimate the roaming dog population in
three cities in Rajasthan, India. BMC Veterinary
Research, 7/46.
Horisberger U, Stark KD, Rufenacht J, Pillonel C and
Steiger A (2004). [Demographic characteristics of dog
population in Switzerland]. Schweiz Arch Tierheilkd,
146:223-232.
Hossain M, Ahmed K, Marma ASP, Hossain S, Ali M.,
Shamsuzzaman AM and Nishizono A (2013). A
survey of the dog population in rural Bangladesh.
Preventive Veterinary Medicine, 111:134-138.
ICAMC (2007). Humane Dog Population Management
Guidance. International Companion Animal
Coalition.
Immink WF and Charbon GA (1988). Distinction between
alpha-adrenergic receptors in eight vascular areas of
the dog. Arch Int Pharmacodyn Ther 292:172-181.
Jackman J and Rowan A (2007). Free-Roaming Dogs in
Developing Countries: The Benefits of Capture,
Neuter, and Return Programs. The State of the
Animals IV. 55-78.
Kato M., Yamamoto H, Inukai Y and Kira S (2003).
Survey of the stray dog population and the health
education program on the prevention of dog bites and
dog-acquired infections: a comparative study in Nepal
and Okayama Prefecture, Japan. Acta Med Okayama,
57:261-266.
Kayali U, Mindekem R, Yémadji N, Vounatsou P,
Kaninga Y, Ndoutamia AG and Zinsstag J (2003).
Coverage of pilot parenteral vaccination campaign
against canine rabies in N’Djaména, Chad. Bulletin of
World Health Organization 81, 7.
Kitala P, McDermott J, Kyule M, Gathuma J, Perry B and
Wandeler A (2001a). Dog ecology and demography
information to support the planning of rabies control
in Machakos District, Kenya. Acta Tropica, 78:217-
230.
Kitala P, McDermott J, Kyule M, Gathuma J, Perry B and
Wandeler A (2001b). Dog ecology and demography
information to support the planning of rabies control
in Machakos District, Kenya. Acta Tropica, 78:217-
230.
Knobel DL, Laurenson MK, Kazwala RR, Boden LA and
Cleaveland S (2008). A cross-sectional study of factors
associated with dog ownership in Tanzania. BMC
Veterinary Research, 4(5).
Kongkaew W, Coleman P, Pfeiffer DU, Antarasena C and
Thiptara A (2004). Vaccination coverage and
epidemiological parameters of the owned-dog
population in Thungsong District, Thailand.
Preventive Veterinary Medicine, 65:105-115.
Manor R and Saltz D (2003). The impact of free-roaming
dogs on gazelle kid/ female ratio in a fragmented area.
Biological Conservation 119:231-236.
Matter HC, Wandeler AI, Neuenschwander BE,
Harischandra LP and Meslin FX (2000). Study of the
dog population and the rabies control activities in the
Mirigama area of Sri Lanka. Acta Trop 75: 95-108.
NCAH (2006). A policy and operational strategy:
Guidelines for prevention and control of rabies in
Bhutan and emergency preparedness plan, National
Bhutan Journal of Animal Science (BJAS), Volume 4, Issue 1, Page 28-37, 2020
Rinzin et al. (2020) 37
Centre for Animal Health, Department of Livestock,
Thimphu.
NCAH (2007). WHO Project on Rabies Prevention and
Control in Bhutan. National Centre for Animal Health,
Department of Livestock, Mnistry of Agriculture,
Royal Government of Bhutan, Thimphu.
OIE (2010). Terrestrial Animal Health Code In: OIE (Ed.),
Chapter 7.7 : Stray dog population control.
Pelden S (2011). Collateral damage of increased traffic.
Kuensel. Kuensel Corporation Limited Thimphu.
Ratsitorahina M, Rasambainarivo JH, Raharimanana, S,
Rakotonandrasana H, Andriamiarisoa MP,
Rakalomanana FA and Richard V (2009). Dog ecology
and demography in Antananarivo, 2007. BMC
Veterinary Research 5.
Reece JF and Chawla S (2006). Control of rabies in Jaipur,
India, by the sterilisation and vaccination of
neighbourhood dogs The Veterinary Record 159, 379-
383.
Reece JF, Chawla SK, Hiby EF and Hiby LR (2008).
Fecundity and Longevity of roaming dogs in Jaipur,
India. BMC Veterinary Research 4:6.
Robertson I and Thompson R (2002). Enteric parasitic
zoonoses of domesticated dogs and cats. Microbes and
Infection 4:867-873.
Robinson D (1974). Dog Nuisance vs Dog Control.
Journal of American Veterinary Medical Association
165.
Ross TD (2003). Accurate confidence intervals for
binomial proportion and Poisson rate estimation
Computers in Biology and Medicine 33, 509-531.
Schlundt J, Toyofuku H, Jansen J and Herbst SA (2004).
Emerging foodborne zoonoses. Rev. Sci. tech Off. int.
Epiz. 23:513-553.
Sutherland WJ (Ed.) (2006). Ecological Census
Techniques - A Handbook. Cambridge University
Press.
Suzuki K, Pereira JA, Frias LA, Lopez R, Mutinelli LE
and Pons ER (2008). Rabies-vaccination coverage and
profiles of the owned-dog population in Santa Cruz de
la Sierra, Bolivia. Zoonoses Public Health 55:177-183.
TCB (2010). Bhutan tourism monitor: Annual report 2009.
Tourism Council of Bhutan, Royal Government of
Bhutan, Thimphu.
TCB (2011). Bhutan tourism monitor: Annual report 2010.
Tourism Council of Bhutan, Royal Government of
Bhutan, Thimphu.
Tenzin, Dhand NK, Dorjee J and Ward MP (2011a). Re-
emergence of rabies in dogs and other domestic
animals in eastern Bhutan, 2005-2007. Epidemiology
and Infection 139:220-225.
Tenzin, Dhand NK, Gyeltshen T, Firestone S, Zangmo C,
Dema C, Gyeltshen R and Ward MP (2011b). Dog
bites in humans and estimating human rabies mortality
in rabies endemic areas of Bhutan. PLoS neglected
tropical diseases 5, e1391.
Tenzin, Dhand NK and Ward MP (2011c). Patterns of
Rabies Occurrence in Bhutan between 1996 and 2009.
Zoonoses and public health, 58:463-471.
Tenzin, Sharma B, Dhand NK, Timsina N and Ward MP
(2010). Reemergence of Rabies in Chhukha District,
Bhutan, 2008. Emerging Infectious Diseases, 16:1925-
1930.
Tenzin, Wacharapluesadee S, Denduangboripant J, Dhand
NK, Dorji R, Tshering D, Rinzin K, Raika V, Dahal N
and Ward MP (2011d). Rabies virus strains circulating
in Bhutan: implications for control. Epidemiology and
Infection, 139:1457-1462.
Totton SC, Wandeler AI, Gartley CJ, Kachhawaha S,
Suman M, Ribble CS, Rosatte RC and McEwen SA
(2010a). Assessing reproductive patterns and disorders
in free-ranging dogs in Jodhpur, India to optimize a
population control program. Theriogenology, 74:1115
- 1120.
Totton SC, Wandeler AI, Ribble CS, Rosatte RC and
McEwen SA (2011a). Stray dog population health in
Jodhpur, India in the wake of an animal birth control
(ABC) program. Prev Vet Med 98: 215-220.
Totton SC, Wandeler AI, Ribble CS, Rosatte RC and
McEwen SA (2011b). Stray dog population health in
Jodhpur, India in the wake of an animal birth control
(ABC) program. Preventive Veterinary Medicine,
98:215-220.
Totton SC, Wandeler AI, Zinsstag J, Bauch CT, Ribble,
CS, Rosatte RC and McEwen SA (2010b). Stray dog
population demographics in Jodhpur, India following
a population control/rabies vaccination program.
Preventive Veterinary Medicine, 97, 51-57.
UNDP (2008). Grappling with Stray Dog Problem in
Bhutan - Advice; Experiences. Thimphu, 15.
Wangmo S (2010). The Stray Dog Dillema of Bhutan.
New York.
WHO (1987). Guidelines for dog rabies control. World
Health Organization.
WHO (1996). Report on third international symposium of
rabies in Asia. World Health Organization,
WHO/EMC/ZOO/96.98.
WHO (2004). WHO Expert Consultation on Rabies World
Health Organization, Geneva.
WHO & WSPA (1990). Guidelines for dog population
management. In: Frucht, K., Drysdale, G., Remfry, J.
(Eds.) World Health Organization and World Society
for the Protection of Animals, WHO/ZOO/90.166.
WSPA (2009). Surveing roaming dog populations:
guidelines on methodology. WSPA, London.
Yoak AJ, Reece JF, Gehrt SD, Hamilton IM (2014).
Disease control through fertility control: Secondary
benefits of animal birth control in Indian street dogs.
Preventive Veterinary Medicine, 113:152-156.

Bhutan Journal of Animal Science (BJAS)
Volume 4, Issue 1, Page 38-46, 2020
38
Full length paper
SOCIO-ECONOMIC IMPORTANCE OF BUFFALO FARMING IN SAMTSE DISTRICT
TASHI DHENDUP*
Department of Livestock, Ministry of Agriculture and Forests, Bhutan
*Author for Correspondence: [email protected]
Copyright © 2020 Tashi Dhendup. The original work must be properly cited to permit
unrestricted use, distribution, and reproduction of this article in any medium.
ABSTRACT: The study was aimed to assess the socio-economic importance of buffalo
farming in Dorokha, Samtse, Lharini, Gumouney and Sipsoo gewogs under Samtse district.
A total of 34 households were purposively sampled and surveyed using semi-structured
questionnaire for the study. Data gathered were analyzed descriptively and multi regression
analysis was applied. The study found out that the socio-cultural and economic importance
of buffalo is declining in general, yet for those buffalo rearing households it still has some
importance during marriages as dowry, inheritance to children, gaining access to social and
financial services serving as surety or mortgage and serves as social status in the
community. Economic contributions from buffalo are similar to neighboring regions with
substantial contribution of 19.2% to the overall household income and 66.2% towards dairy
income. Among the household assets, household size and number of household members
with tertiary literacy level determines 25% of variance of buffalo herd size. Household size
significantly affected the buffalo herd size. Majority of farmers (94.1%) attribute decline
of buffalo population to fodder scarcity and non-availability of buffalo breeding bulls. With
the current level of policy and technical support from the government, buffalo farming is
doomed to decline further. Nonetheless, with appropriate and timely interventions
particularly subsidy on breeding inputs and pasture development policy could perhaps
revive and sustain the buffalo farming tradition.
Keywords: Buffalo farming; herd size; household income; socio-cultural importance;
subsidy.
1. INTRODUCTION
Agriculture farming in Bhutan is traditionally a
subsistence type based on integration of crop and
livestock. But livestock has more multi-functional roles
ranging from provision of food, manure, cloths and
draught power to provision of social security such as
insurance, mortgage and dowry. Cattle dominates
livestock species in Bhutan with over 90% of households
owning them (MoA 1999). However, the importance of
livestock varies depending on functionality, contribution
to household income and geographic locations. Buffalo
(Bubalus bubalis) is one of the versatile livestock species
fulfilling social, cultural and economic functions in
southern foothill districts in Bhutan Globally, buffalo
farming has significant contribution of milk and meat
product in south west and south-east Asia. Majority about
70 % of global buffalo population is concentrated in India
(98.5 million head), Pakistan (29.8 million head) and
Nepal (4.4 million head). Cruz (2010) reported an annual
increase in buffalo population by about 1.5 percent in the
aforementioned countries. Buffalo rearing dates back to
many years with population concentrated in warmer
regions of southern districts in Bhutan. Nonetheless,
unlike other buffalo rearing countries in the region the
buffalo population has declined sharply over the years
despite it possessing better productivity, reproductive
efficiency and higher economic return as compared to
local Siri cattle (Tamang et al. 2009). Nanda (2003) also
reported better performance of buffalo over the local
Indian cattle. However, the superior performance of
buffaloes couldn’t draw as much attention as cattle from
scientists, policy makers and other relevant stakeholders,
and to this the buffalo has remained as the “undervalued
asset” of the household in most of the livestock dominated
regions (FAO 2000). Similarly, despite buffalo farming
having significant contribution to the socio-economic
development of rural households had not received

Bhutan Journal of Animal Science (BJAS), Volume 4, Issue 1, Page 38-46, 2020
Dhendup et al. (2020) 39
adequate policy attentions in Bhutan. In addition,
research studies were neither undertaken nor planned to
document the socio-economic roles of buffalo farming to
the rural household livelihood in Bhutan. Thus, this study
was conducted to document the socio-economic
importance of buffalo farming to rural populace under
Samtse district.
2. MATERIALS AND METHODS
2.1 Site selection and characteristics
The study was conducted in five gewogs (sub-districts)
viz. Samtse, Sipsoo, Lharini, Dorokha and Gumouney of
Samtse district (Figure 1). Aforementioned sites were
selected due to highest numbers of buffalo rearing
farmers with buffalo population of 479 heads (DoL 2008)
in the country. In the district, buffalo farming spreads
from the lower plains to the hilly areas. Wetland
cultivation is an important activity with rice as the main
staple food, and the people also depend on maize, orange
and cardamom cultivation in the district.
The study area selected for the study lies
between 300 to 2100 meters above sea-level (masl) and
experiences mean annual rainfall of 1500-4000 mm, and
mean temperature ranges between 15 to 30 degree Celsius
(NSB 2010).
Figure 1: Study locations
2.2 Sampling and data collection method
Initially secondary data on buffalo population were
collected from the Livestock Statistics 2008 compiled
centrally by the Information and Management Section
(IMS), Department of Livestock (DoL). The data
gathered centrally was authenticated with records
maintained at the District Livestock Sector (DLS). The
DLS records 77 households rearing 356 numbers of
buffaloes in Samtse in 2008. However, on field
verification for the study recorded only 44 households
rearing about 181 heads of buffalo in five sub-districts
viz. Dorokha, Sipsoo, Lharini, Gumouney and Samtse.
From this total buffalo rearing households, 34 households
were purposively sampled for the study. The data on
economic variables, labor and inputs variables, household
assets and socio-cultural contribution were collected
using semi-structured questionnaires developed based on
the conceptual framework (Figure 2). In addition to the
field data specified in the socio-cultural conceptual
framework historical information on buffalo farming in
Bhutan and their future prospects was gathered using
focus group discussion.
The conceptual framework was adopted to assess
economic and socio-cultural contribution from buffalo
farming towards household income. Indicators relevant to
socio-cultural and economic are illustrated under
respective functions. Surety, which fulfills both socio-
cultural and economic functions, is shown as items with
dual functions.
Information gathered from the survey
questionnaires were validated with available secondary
information.
Figure 2: Framework of investigation of socio-cultural
and production functions of buffalo farming on household
income
2.3 Data Analysis
Data collected was analyzed using statistical software –
Statistical Package for the Social Sciences (SPSS version
16). Descriptive statistics and multiple regression were
applied for data analysis. Multiple regression was
modeled as:
µi =β0 +β1Si + β2ei +εij
Where µi = Buffalo herd size for household i (i=
1…, ni)
Si = household size in nos. for household i (i=
1…, ni)
ei = household members with tertiary education
level in nos. for household i (i= 1…, ni)
εij= random errors, assumed to be independent
and N (0, σ2)
β0 = constant
β1= pooled within group regression coefficient
of household size

Bhutan Journal of Animal Science (BJAS), Volume 4, Issue 1, Page 38-46, 2020
Dhendup et al. (2020) 40
β2= pooled within group regression coefficient
of nos. of household members with tertiary
education level.
3. RESULTS AND DISCUSSIONS
3.1 Socio-demographic profile of buffalo rearing
households
Table 1 shows socio-demographic information of the
respondents. Majority of respondents in the study were
male constituting 82.4% and remaining 17.6% were
female. The respondents involved in buffalo farming
consisted of five casts namely Chhetri (11.8%), Ghalley
(2.9%), Rai (20.6%), Sharma (32.4%) and Uraon (32.4%)
rearing buffalo.
Table 1: Social demography profile of the buffalo
rearing household
Parameters Percentage
Caste Chhetri 11.8
Ghalley 2.90
Rai 20.6
Sharma 32.4
Uraon 32.4
Gender Male 82.4
Female 17.6
3.2 Buffalo rearing system
Figure 3 illustrates the buffalo rearing system and their
interaction with different components. Inputs like feed
concentrate, roughage (straw) and molasses were
required for buffalo production. The input in the form of
household labor was required for buffalo rearing, but in
return buffalo also supplemented household labor
requirement.
Draft
Fodder
Labour
Milk
Butter
Cheese
Market
IncomePurchase inputs
Concentrate
Roughages
Milk
Cheese
Butter
Manure
Hides
Household
Land Buffalo
Forest
Forages
Leaf litter
Crops
manure
Figure 1: Buffalo rearing system framework
Major outputs from buffalo rearing were milk, butter,
cheese and draught power for ploughing land. Milk,
butter and cheese were either consumed at household
level or sold to the market to generate cash income. Forest
grazing and rice straws were the major roughage for
buffalo. Buffalo provided manure and draught power
which helps in crop production for sustenance of the
household system.
Due to less income generating options in the rural
areas, outputs especially butter and cheese constituted the
main income generating sources. Where there was labor
shortage, buffalo draught power also served as an
alternate and substituted the labor shortage issue through
hiring and bullock exchange system in the locality.
3.3 Buffalo husbandry practices
Majority of farmers do not provide shelter for buffaloes
with exception to calves. Calves are provided with shed
or kept close to homestead for about a year. Other
categories of buffaloes are tethered in the open field and
such practices is reported to saves household labor
through dung being directly deposited to agriculture field.
Buffaloes are let loose and taken for grazing in the
forest beside grazing freely in open field. Buffaloes were
also left to graze the of fodder or grasses along the
waysides. The buffalo in general were found to graze in
the open field freely for around 7-8 hours a day. Farmers
reported that buffaloes prefer to browse on their own than
feeding cut forages. The animals are tethered in the
evening, and fed rice straw which is the major roughage
source and looped green fodder. Rice bran and hulls were
also fed whenever available. Farmers reported that
commercial concentrate feed are fed to milking buffaloes
only.
Farmers in general believe that buffaloes are more
resistant to diseases as compared to cattle. Nonetheless,
worm infestation and tick infestation in buffalo are
reported as the most important problem encountered by
61.8% and 20.60% respondents, respectively. Farmers
reported that diseases such as Foot and Mouth Disease
(FMD), Black Quarter (BQ) and Hemorrhagic Septicemia
(HS) are the common concern in cattle farming but it is
not a threat to buffalo. The respondents reported that
wallowing (locally known as aal khel) at least once a day
for buffalo is necessary to cool their body temperature,
and having access to wallowing result into enhanced milk
production. Farmers in general preferred to rear one or
two cattle along with buffalo herd to improve market
access for buffalo products in particular to butter. The
farmers interviewed reported that the butter of buffalo
being whiter in color than the butter of cattle is not
preferred by the consumers readily.
3.4 Buffalo breed preference
Figure 4 shows the buffalo breed preference by the
farmers under Samtse district. Murrah buffalo locally
known as Gujarati is highly preferred due to high milk
producing capacity, followed by local breed. Dobla the
crossbreed between the local and Surti breed followed by
Kagay is the least preferred buffalo breed mainly due to
its’ low milk producing capacity and small body size. The

Bhutan Journal of Animal Science (BJAS), Volume 4, Issue 1, Page 38-46, 2020
Dhendup et al. (2020) 41
study found that 85.3 % respondents preferred Gujarati
followed by local (11.8%) and 2.9 % for the Dobla.
Figure 2: Buffalo type preferences by respondents
3.5 Sources of livelihood
The households surveyed in this study are mostly depend
on livestock rearing, crop cultivation and partly on
horticulture for their livelihood. The study recorded that
more 90 % of respondent are dependent of mixed crop-
livestock farming for their livelihood, and the rest are
dependent on business and off farm activities for
livelihood sustenance.
3.6 Socio-cultural beliefs and importance of buffalo
In contrast to cattle, people associate and perceive buffalo
as unholy. This is due to their association with water that
buffaloes need for wallowing “aal khel (wallowing or
puddling in marshes and ponds)” on daily basis in dirty
ponds and marshes. The belief that buffalo emerged from
ocean also culminate it as unholy animal. In addition,
buffalo by myth is considered as ghost or demons as such
milk and milk products of buffaloes were not used in the
religious offerings. In line, unlike cow dung which is
popularly used for plastering homes, buffalo dungs were
not used in plastering homes attributing to the above
myth. However, there is a logical reasoning for not using
buffalo dung for plastering of homes. The buffalo dung is
comparatively finer and smoother than cow dungs and
when plastered, it tends to peel off unlike the cow dung.
The exact date when buffalo rearing started under
Samtse district could not be traced. But most respondents
in this study claimed that the buffalo was reared since
their grand parents’ time. The study areas fall under
different topographical settings and buffalo rearing was
found to be accustomed in accordance to topography and
its importance. For instance, farmers in Dorokha gewog
reared buffalo only for milk and manure, and are never
used for draught purpose. Whereas, in the lower plain area
buffaloes are reared for milk, meat manure and draught
too.
Among Hindus, some castes eat buffalo meat as
such these groups prefer to rear buffalo than cattle. Even
if a buffalo dies accidentally or otherwise, there is a
saying that “Charo khuto moryo bune eek khuto uben
cha” which means that they will recover the cost of one
limb even if four limbs die. Therefore, at all times some
part of household income is assured from buffalo carcass.
The age-old tradition like bullock carts or ranga
gari (bullock carts drawn by buffalo bulls), marts and
melas, bull fights are lost due to socio-economic
development and better road connectivity. Today, most of
the cart wheels drawn by the buffaloes in the past can be
seen hanging on the walls. Currently, buffaloes are only
used for ploughing in the study area. Most respondents
(73.5%) reported that the buffalo has a socio-cultural
Figure 5: Percentage of households against respective social attributes
0
20
40
60
80
100
Kagay Dobla Gujarati Local
0 2.9
85.3
11.8Pe
rce
nt
pre
fere
nce
23.5
14.7
64.7
41
52
0 10 20 30 40 50 60 70
Dowry
Gift
Inheritance
mortgage
Status symbol
% Respondent
Soci
al A
ttri
bu
tes

Bhutan Journal of Animal Science (BJAS), Volume 4, Issue 1, Page 38-46, 2020
Dhendup et al. (2020) 42
significance, and it is changing or dying. Buffalo is
inherited to their siblings as reported by 64.7% of the
respondents in this study, and 23.5% of the respondents
reported buffalo as a medium of payment for dowry
during marriages (Figure 5).
While the tradition of doya (requesting for buffalo
from relatives and neighbors) are rare now, 14.7%
responded that they still gave buffalo as gifts to their
immediate friends and family. In most areas, having large
herd of buffalo is still considered as rich and affluent
individual in the community. The study observed that all
family members are engaged in buffalo farming but
differs in time of engagement. In average father was
found to be engaging more time about 8.6 hours a day
managing buffaloes. The other household members also
shared their time on buffalo farming (Table 2).
All respondents interview reported that buffalo do not
have any religious significance in contrary to the findings
of Tamang et al. (2009), who reported use of buffalo as
sacrificial animals. It was also observed that none of the
products from buffalo were used in the festivities and
religious offerings in the study areas.
Figure 6: Annual income (Nu) contribution from various
sources
3.7 Income from buffalo farming
Figure 6 and 7 represents different annual income sources
for the buffalo rearing households. Income from various
sources was assessed to determine proportion of income
contributed through buffalo rearing to the household
annual income. The study recorded the highest mean
annual income of Nu. 13529.41 from dairy farming,
followed by Orange and Arecanut farming of Nu. 5000
and 4852.94, respectively. The household also generate
additional cash income through engagement in off farm
activities and sale of vegetable and cardamom.
On further assessment of annual income generated
for the household from dairy farming, the study observed
that buffalo farming contributed to 66.2% of the total
annual income of the household. It was observed that
most respondents do not market fresh milk but they
processed into butter and cheese for home consumption
and excess produced are sold. The sale of butter and
cheese contributed to 55% and 23 % of the household
annual income, respectively. The remaining income of
about 22 % was contributed through hiring of draught
animals (Figure 6). The dung produced by buffaloes are
not monetized and not included in the income source for
this study as it is used to fertilize the agriculture field
directly.
Live buffalo serves as a living bank and it is highly
valued by the farmers. The use of live buffalo as a surety
4416.76
4852.94
5000
13529.41
1176.47
7941.18
0 5000 10000 15000
Ginger
Off farm
Arecanut
Dairy
Rice
Orange
Nu.
So
urc
e o
f in
com
e
Table 2: Daily engagement of household
members in buffalo farming
Family member Time allocation (hr)
Father 8.6
Mother 1.7
Children 1.4
Hired Labor 1.1
Figure 8: Respondents' opinion on the buffalo population
trend
55.3
23.0 21.7
Butter Cheese Draught hire
0
15
30
45
60
Income sources
% c
on
trib
uti
on
Figure 7: Income contribution (%) from buffalo milk
and milk products
94.1
5.90
0
20
40
60
80
100
Decreasing Same Increasing
Per
cent
Status of buffalo herd size at farm level

Bhutan Journal of Animal Science (BJAS), Volume 4, Issue 1, Page 38-46, 2020
Dhendup et al. (2020) 43
to acquire loans and lending was reported by 48.8% of the
respondents in this study. The mean value of female and
male buffalo reported during the study period was about
Nu. 17588.24 and Nu. 18661.76, respectively. However,
the value of buffalo was found to vary based on the
location and utility. For instance, the price range for
buffalo bulls was found higher in the lower plains as
compared to mid altitude region mainly due to utility
purpose of ploughing field in lower plains area. The study
recorded that the buffaloes are not used for draught power
in Dorokha gewog.
3.8 Influence of household assets on buffalo farming
Table 3 shows the household assets and distribution of
household members with different educational levels in
the study areas. The study recorded highest and lowest
mean household member size of 14 numbers and 5.8
numbers in Lharini gewog and Ghumouney gewog
respectively. Whereas, Dorokha and Samtse gewog
recorded the highest and lowest mean land holding size of
7.5 acres and 1.2 acres, respectively.
Linear regression on buffaloes (in LU) as
dependable variable was carried out to assess the
influence of household assets on buffalo herd size.
Among the assets assessed, household size significantly
(p<0.05) affected the buffalo herd size. For every unit
increase in household size, buffalo herd size increased by
0.24 LU. Similarly, the number of household members
with tertiary education level significantly (p<0.05)
affected the buffalo herd size. For every unit increase in
the number of household members with tertiary education
level, buffalo herd size increased by about 0.49 LU in the
study area. These household assets explained only 25% of
variation of buffalo herd size in the study area.
3.9 Perceptions on the future of buffalo farming
A decline in buffalo population both at household and
village level was reported. Of the total respondents in this
study, 94.1 % reported that the buffalo herd size had
decreased at the household level, and the remaining
reported that the herd size have not changed over the time
(Figure 8). The main reasons attributing to decline in
buffalo population as reported by the respondents are feed
and fodder shortage (85.3%), non-availability of breeding
bulls (70.6%) and sale of live buffalo (41.2%). A few
respondents about 5.9% reported low economic returns as
Table 3: Mean (± SD) household assets and distribution of household members by education levels in study area
Gewogs
HH Assets Dorokha Sipsoo Lharini Samtse Gumouney
N 12 11 4 2 5
Total HH Size 6.9 ± 3.9 9.1 ± 4.1 14 ± 4.3 6 ± 2.8 5.8 ± 0.8
Total Land Holding 7.5 ± 8.7 5.1 ± 5.1 5.3 ± 2.7 1.2 ± 1.0 5.7 ± 6.4
Total large ruminants 13.5 ± 12.7 9.5± 4.0 18 ± 4.5 8.5 ± 2.1 5 ± 1.5
Education level Primary 2.5 ± 1.9 1.2 ± 1.1 2.5 ± 2.5 0 ± 0 1.8 ± 0.8
Secondary 1.3 ± 1.6 0.8 ± 1.1 1.5 ± 1.0 1 ± 0 0 ± 0
Tertiary 0.5 ± 0.9 0.3 ± 0.9 1.5 ± 1.7 0.5 ± 0.7 0 ± 0
No Education 2.2 ± 2.5 6.1 ± 4.1 3.0 ± 0.8 4.5 ± 3.5 3.6 ± 1.5
0 10 20 30 40 50 60 70 80 90
Non-avail. B.bull
Slaughter
Live buff. Sale
F.& fodder shortage
Not profitable
Respondents (%)
Figure 9: Causes of buffalo population decline

Bhutan Journal of Animal Science (BJAS), Volume 4, Issue 1, Page 38-46, 2020
Dhendup et al. (2020) 44
one of the causes for decline in buffalo population (Figure
9). The other factors reported to have contributed in
decline of buffalo population in study areas are drying up
of wallowing ponds, labor shortage, schooling, rural-
urban drift, and shrinking of grazing areas. On the future
buffalo rearing prospects, 82.4% farmers responded that
they will continue rearing buffalo in the future, while
8.8% of the farmers said that they will stop rearing buffalo
in the future. 8.8% of the respondents said that they will
increase their present herd size and rear buffalo in future
(Figure 10).
There is a clear indication of the need for buffalo
breeding bull in the study areas. 44.1% of the respondents
were of the view that the supply buffalo breeding bulls by
government could help reviving and sustaining buffalo
rearing. While 35.3% suggested artificial insemination, if
introduced could boost up buffalo rearing. Another 11.8%
of the respondents felt that the government land lease and
other input subsidy could revive and sustain buffalo
rearing (Figure 11).
3.10 Socio-cultural and economic significance
In general, socio-cultural traditions that had relation to
buffalo is decreasing in the study areas. This is in contrast
to the strong prevalence of traditions such as dowry
during marriages and buffalo recreations like bull-cart
racing, bull racing, buffalo ploughing contest and bull
fights in Pakistan and India (Iqbal et al. 2009). The
decreasing roles of buffalo in socio-cultural and traditions
activities could be attributed to the availability of other
alternative gifts during marriages and other entertainment
alternatives in the study areas. The other reasons could be
lesser dominance of buffalo farming as compared to cattle
and weak policy and technical support rendered in
promotion and development of buffalo in the country.
The contribution from dairy accounts to about
66.2% of annual household income, and the study
recorded that buffalo farming alone contributed about
19.2% shares to the annual household income. The
findings on income contribution from buffalo farming in
study area was found similar to the observations of Nanda
and Nakao (2003), who reported contributing to about 10-
25% of household income from buffalo in the region.
Despite similarities of findings, income contribution
from buffalo in our context could possibly be over-
estimated due to respondents’ inability to exactly quantify
the milk and milk products of buffalo and other cattle
separately. Milk from buffalo and other cattle in first
place are not recorded and it is processed together.
Buffalo farming although may not be popular in the study
Table 4: Regression coefficient for selected variables buffalo (in LU) as dependent variable.
ls mean s.e1 regression s.e
Buffalo Herd Size (LU) 3.87 0.91
Household size (No) 0.24* 0.12
No. of HH members with tertiary education (No) R2 full model: 25%
0.49 0.50
1 standard error; * p<0.05
Figure 10: Perception on future of buffalo rearing
Figure 11: Respondents expectations from the
government
0
10
20
30
40
50
60
70
80
90
Continuerearing
Stop rearing Increaseherd
% R
esp
on
den
t
0 10 20 30 40 50
Supply breeding bulls
Supply replacementstocks
Introduce AI
Others..land lease, etc
Respondent (%)

Bhutan Journal of Animal Science (BJAS), Volume 4, Issue 1, Page 38-46, 2020
Dhendup et al. (2020) 45
areas, it however, has the potential given its sturdy
characteristics, strong resistance to diseases and cultural
acceptability of certain caste of people.
3.11 Influence of household assets on buffalo farming
Household assets possession significantly affected the
buffalo herd size (Table 4). When the household size is
bigger, it is more likely that there will be more labor
availability and the household could afford to rear more
buffaloes. Further, when there are more family members
in a household, they can afford to engage in other
activities as well. It is also likely that if the household size
is bigger, the opportunity to attend school and vocational
or agricultural trainings is more. This may affect in
decision making and favor buffalo rearing. This finding
confirms to the findings of Tamang et al. (2009), whereby
one of the causes of buffalo population decline in Bhutan
was attributed to labor shortage. Similar findings were
also reported (Nanda and Nakao 2003) and Cruz (2007).
3.12 Influence of household assets on future of buffalo
farming
Majority of the farmers (94.1%) are of the view that the
population of buffalo in the study area is decreasing. The
main reasons attributing to decline in buffalo farming are
feed and fodder shortage (85.3%) and non-availability of
breeding bulls (70.6%) (Figure 9), which is in line with
the findings of Tamang et al. (2003). Nanda and Nakao
(2003) reported rapid urbanizations resulting in shrinking
of grazing areas as one of the causes of buffalo population
decline in neighboring regions.
With the enactment of Land Act (2007), it could
further exacerbate feed and fodder shortage hence urgent
interventions in the form of government land lease for
pasture development and subsidy support for breeding
inputs is essential to revive and sustain buffalo farming
tradition. About 44.1% of the respondents had similarly
expressed the need of buffalo breeding bulls while 35.3%
expressed the need for AI services.
4 CONCLUSION AND RECOMMENDATIONS
Buffalo farming is a multi-functional enterprise. Buffalo
farming system is not bound simply to livestock farming
alone but has inter-linkages to crop farming and
surrounding natural resources. It has both economic and
socio-cultural importance. Socio-cultural importance,
although may be on a decline, it still has some importance
for: marriage serving dowry, family cohesion serving as
parental inheritance to children, building social status
serving as wealth, gaining access to social and financial
services serving as surety or mortgage.
Economic contributions from buffalo are similar to
neighboring buffalo rearing countries in the regions with
substantial contribution of about 19.2% to the overall
household income and 66.2% towards dairy income.
However, assessment could possibly be slightly
overestimated with the failure to distinctly identify
buffalo products from other cattle products.
Among the assets, household size and number of
household members with tertiary literacy level
determines 25% of variance of buffalo herd size.
Household size significantly affected the buffalo herd
size. Majority of farmers (94.1%) attributes decline of
buffalo population to fodder scarcity and non-availability
of buffalo breeding bulls.
With the current level of policy and interventions
from the government, the buffalo farming is doomed to
decline further. Nonetheless, with appropriate and timely
interventions particularly subsidy on breeding inputs and
pasture development policy could perhaps revive and
sustain the buffalo farming tradition.
A comparative assessment of contribution of buffalo
and cattle is recommended to understand the relative
socio-economic importance of cattle and buffalo.
REFERENCES
Arbenz M and Tshering G (2000). Local Bos Indicus and
Bos taurus cattle in Bhutan. Phenotypic and genotypic
characterisation of siri and other Bhutanese local
cattle and assessment of conservation strategy.
Bumthang: RNR-RC, Jakar, A Special Publication
No.4.
Chantalakhana C (2000). Buffalo breeding programme in
Thailand. AICAR Technical Series (p. 485). Italy:
ICAR, Villa del Ragno, Via Nomentana 134, 00162
Rome, Italy.
Chantalakhana C(2001). Urgent need in buffalo
development for food security and self-sufficiency.
Proceedings of National Workshop on Swamp
Buffalo, (pp. 1-10). Hanoi, Vietnam.
Chantalakhana C & Bunyavejchewin P (1995). Breeding
strategies for optimum utilization of available
resources in rural buffalo production system.
Proceeding of a Regional Symposium (pp. 155-174).
Peradeniya, Sri Lanka: Buffalo Research Programme,
Natural Resources, Energy and Science Authority of
Sri Lanka.
Cruz LC (2007). Trends in buffalo production in Asia.
Italian Journal of Animal Science, 9-24.
Cruz LC (2010). Recent Developments in the Buffalo
Industry in Asia. Proceedings 9th World Buffalo
Congress (p. 153). Buenos Aires, Argentina:
International Buffalo Federation.
Devendra C (1989). Forage supplements: : Nutritional
significance and utilization for draught, meat and milk
production in buffaloes. II World Buffalo Congress
(p. 37). New Delhi, India: International Development
Research Centre.
EL-Serafy AM (1989). Feeding riverine buffaloes for
milk/dual purpose production. Proceedings of the

Bhutan Journal of Animal Science (BJAS), Volume 4, Issue 1, Page 38-46, 2020
Dhendup et al. (2020) 46
FAO Expert Consultation (pp. 50-62). Bangkok,
Thailand: Food and Agriculture Organization, Rome.
FAO (Food and Agriculture Organization). (2000). Water
buffalo: an asset undervalued. FAO Regional Office
for Asia and Pacific, Thailand, 1-6.
FAOSTAT (2009). Agriculture Data. Food and
Agriculture Organization Statistics, Rome, Italy.
Iqbal A, Khan BB & Raiz M (2009). Water buffalo: Some
socio-economic and welfare aspects - a review.
Pakistan Journal of Zoology, 503 - 509.
MoA (1999). RNR Statistics. Thmphu: Ministry of
Agriculture.
MoA (2008). Livestock Statistics. Thimphu: Department
of Livestock, MoA.
Nanda AS & Nakao T (2003). Role of buffalo in the
socioeconomic development of rural Asia: Current
status and future prospectus. Animal Science Journal,
Japan, 443 - 455.
NSB (2010). Annual Dzongkhag Statistics. Thimphu:
National Statistics Bureau.
Perera B, Siriwardhene JD, Horadagoda N & Ibrahim M
(1995). Role of the buffalo in rural development.
Proceedings of a Regional Symposium (p. 155).
Colombo, Sri Lanka: NARESA.
Planning Commission (1986). 4th Five Year Plan.
Thimphu: Planning Commission.
Planning Commission (1991). 5th Five Year Plan.
Thimphu: Planning Commission.
Ranjhan SK (2007). Buffalo as a social animal for
humanity. Italian Journal of Animal Science, pp. 30-
38.
Tamang NB, Sherpa DL, Sharma BN, Tshering G,
Thinley G and Rai DB (2009). Buffalo farming in
Bhutan - vanishing before it's full potential is
explored. Journal of Renewable Natural Resources,
Bhutan, 86.

Bhutan Journal of Animal Science (BJAS)
Volume 4, Issue 1, Page 47-53, 2020
47
Full length paper
STAPHANOFILARIAL DERMATITIS (HUMPSORE) TREATMENT TRIAL IN TASHICHOLING,
SAMTSE DISTRICT
SANGAY RINCHEN*1, KARMA WANGDI2, SONAM JAMTSHO3, KARMA
WANGCHUK4, KARMA TSHERING4, BINDHU PARAJULI4, YANGCHEN DEMA4 AND
BASANT SHARMA4
1National Centre for Animal Health, Department of Livestock, Serbithang, Thimphu 2Animal Health Division, Department of Livestock, Thimphu 3Thromde Veterinary Hospital and Satellite laboratory, Department of Livestock, Chukha 4Regional Livestock Development Centre, Department of Livestock, Tsimasham, Chukha
*Author for correspondence: [email protected]
Copyright © 2020 Sangay Rinchen. The original work must be properly cited to permit
unrestricted use, distribution, and reproduction of this article in any medium.
ABSTRACT: Humpsore is a skin disease in cattle caused by a vector borne nematode belonging to
the genus, Staphanofilaria. To select a treatment option with the highest sore recovery rate, a
treatment trial was conducted in four villages under Tashicholing Drungkhag, Samtse involving 80
humpsore affected animals. These animals were randomly assigned to four groups namely: 1) group
1 (single ivermectin injection sub-cutaneously @ 1ml/50 kg body weight + topical application of
Zinc Oxide (ZnO) ointment daily); 2) group 2 (single levamisole HCl injection sub-cutaneously @
1ml/50 kg body weightt + topical application of Zinc Oxide (ZnO) ointment daily); 3) group 3
(Topical application of Zinc Oxide (ZnO) ointment daily); and group 4 (untreated control). ZnO
ointment was applied daily for the entire trial period. Ivermectin and Levamisole injection was given
on the second day of the trial. The sore size (in cm) was measured before application of any
treatment and thereafter on weekly interval. The change in mean sore size for each group was
computed using a one sample t-test while the comparison between group was made using one-way
ANOVA and pair-wise t-test. In total 24 deep lesion scrapings were collected from the animals that
were enrolled in the trial as well as from those which were not. Samples were processed using
conventional sedimentation method and the Baermann’ technique for recovery of the parasite. By
the end of the trial, complete healing of the lesion was observed in 14 (70%) animals under group
1, 12 (60%) under group 2 and 13 (62%) under group 3. Analysis showed that the reduction in the
mean sore size for all the group was statistically significant (p <0.0001) except for the control group
(p=0.06). There was no statistically significant difference in the mean sore size between the groups
before the start of the trial (p=0.24). By the third week, the difference in the mean sore size for all
the treatment groups, group 1 (p <0.0001), group 2 (p <0.001) and group three (p <0.0001) was
statistically significant difference from the control group. Microfilaria was isolated in 9 of the 24
samples with a microfilaria recovery rate of 37.5%. This study has further validated that ivermectin
injection @ 1 ml/50kg body weight with topical application of zinc oxide ointment for three weeks
has the highest efficacy against humpsore. It also proposes a speculation, for further validation, that
isolating active microfilaria is more likely in samples that are collected in the later part of the day.
Keywords: Bhutan; humpsore; microfilaria; parasitic dermatitis; Staphanofilaria assamensis.
1. INTRODUCTION
Staphanofilarial dermatitis, commonly called as
humpsore, is a vector borne skin disease caused by a
nematode parasite belonging to the genus
Stephanofilaria. The muscid flies are known to be the
common biological vector for the parasite (Saparov et al.
2014). Based on the species of parasite affecting their

Bhutan Journal of Animal Science (BJAS), Volume 4, Issue 1, Page 47-53, 2020
Rinchen et al. (2020) 48
host, the lesion can be found in different parts of the body.
For instance, S. assamensis is known to cause a condition
called humpsore as the lesions in animals are commonly
seen on and around the hump. While the S. stilisi usually
affects the ventral line of the host’s body. The lesions are
characterized by alopecia and ulcerative nodular
dermatitis in cattle. Humpsore is mostly prevalent in the
Indian sub-continent and south-east Asian countries (Rai
et al. 1994). The impact of this disease is numerous.
Besides compromising the animal welfare, economic
loses result from the lose of hide value, draught power,
decreased milk production, and decreased growth rate are
reported (Rai et al. 2010). In Bhutan, humpsore is highly
prevalent in the southern foothills of the country with hot
and humid weather conditions that favour biting fly
activities. In a study conducted at Sarpang Dzongkhag,
Dukpa et al. (2008) reported humpsore herd prevalence of
36.3%. Treating humpsore is difficult as it requires a
multifactorial approach targeted towards management of
the parasite, biological vector, and environment.
Approaches aligned towards any one of these has yielded
no success, and if at all, just for a transient period. As
early as 1948, researchers have conducted several
treatment trials using different parasiticides such as
acriflavine, anthiomalin, anthisan, antimony tartarate,
fenitrothin formula, florocid, formalin, levamisole,
methyridine, promintic, sodium arsenite, suramin, tartar
emetic, tetramisole, tobacco extract, vaseline, neem leave
extract and reported varying efficacy (Rai et al. 1994;
Dukpa et al. 2008; Al Masud et al. 2017; Johnson 1989;
Ibrahim et al. 2013; Singh et al. 2014). In a maiden study
conducted in Bhutan, Dukpa et al. (2008) reported that the
combination of ivermectin injection and zinc oxide
ointment showed the highest treatment efficacy rate of
85% followed by the group comprising of the
combination of levamisole and zinc oxide application
(80%), Salycilic acid and butox ointment (75%) and
Coumaphous ointment (70%). However, the trial
involved only 20 animals. There are no trials conducted
thus far in other humpsore endemic parts of the country.
Humpsore has remained a persistent problem in the
southern parts of the country inflicting heavy economic
loses to the marginal farmers and compromising animal
welfare. Therefore, this trial was conducted to identify
and document the most effective treatment option against
humpsore and their associated benefit in veterinary
medicine indenting and supply at the field level.
2. MATERIALS AND METHODS
2.1 Study area
Of the two southern districts, Chukha and Samtse, under
the western region of Bhutan, Samtse reports the highest
number of humpsore cases. Therefore, Samtse was
selected for the trial. Under Samtse dzongkhag, several
sub-districts report humpsore in cattle. However, based
on the convenience (logistic), Tashicholing was selected.
Humpsore affected cattle from four villages namely,
Dewachen, Peljorling A, Peljorling B and Norgangsa
under Tashicholing geogs were enrolled. Tashicholing is
a sub-tropical sub-district. The annual average maximum
temperature during 2017 was 29.1 degrees centigrade and
the annual average minimum temperature was 18.3
degrees centigrade. The annual total rainfall received was
5763.2 mm that year.
2.2 Study design
Before the start of the trial, two days meeting was
arranged with the dairy farmers who owned cattle that
were affected with humpsore from the selected study
areas. This meeting was organized to sensitize them about
the study and obtain their consent to participate, besides
educating them on the pathogenesis, treatment options
and prevention of humpsore in cattle. The meeting also
provided us an opportunity to learn about the
ethnoveterinary practices that are currently used to treat
humpsore.
After the meeting, with the help of the gewog livestock
extension agent, households in the villages mentioned
above were visited. Based on the convenience,
households nearby the livestock extension centre were
visited first and then the visit stretched out until the
required number of humpsore affected animals was met.
In this study, all the animals that had ulcerative nodular
lesion on their skin were considered humpsore positive.
As the team visited the humpsore affected cattle, best
effort was made to randomly assign animals to the
treatment groups designed for the study. In total 80
humpsore affected animals were enrolled for the trial, 20
each in the group 1 & 2 and 21 and 19 each in group three
and four respectively. And for identification, apart from
taking the photographs of each animal, the horns were
Figure 1: Painting the horn of the animals selected for the
trial: A) red colour horn corresponds to the treatment
group 1, B) Blue colour corresponds to the group 2, C)
Green colour corresponds to the group 3 and D) Brown
colour to untreated control

Bhutan Journal of Animal Science (BJAS), Volume 4, Issue 1, Page 47-53, 2020
Rinchen et al. (2020) 49
painted corresponding to the treatment that they would
receive. The animals that were assigned to group 1, 2 and
3 were painted red, blue, and green respectively while the
untreated controls were painted brown (Figure 1). For the
animals that were dehorned, their hooves were painted.
The paints although faded over the trial period, it was
clear enough to recognize till the end of the trial.
2.3 Data collection
A record of the animals such as age, gender, breed, weight
and the size, number and location of the sore was
collected during the inventory. Weight of the animals was
estimated using a body weight estimating tape. For the
purpose of this study, the longest open wound was
recorded as the sore size. The sore size was measured
using a plastic ruler and recorded in centimeters.
2.4 Treatment protocols
Three treatment options were designed for this study
(Figure 2). The first group received a single injection of
ivermectin sub-cutaneously @1ml/50kg body weight and
application of Zinc Oxide (ZnO) ointment daily while the
second received a single shot of levamisole hydrochloride
sub-cutaneously @7mg per kg body weight and
application of ZnO ointment once daily. The animals in
the third group was applied only ZnO ointment daily.
Depending on the size of the sore, around 15-30 gm of
ZnO was applied once daily (between 6 am to 9 am) on
the lesion for successive 21 days. The animals in group 4
(untreated control) was not provided any treatment.
A clear instruction was reiterated to the animal
owners in the control group to ensure that no treatment,
in any form, must be given to the animals until the
completion of the trial. Starting 9th day, cypermethrin
(5%) was sprayed around the wound to control fly activity
for group 1, 2 and 3.
The presentation of the ZnO used was 15% W/W in
white soft paraffin jelly. The ointment was prepared at the
Livestock Extension Center. A required amount of ZnO
powder was taken on an ointment slab and mixed.
Subsequently, a required amount of white soft paraffin
jelly was weighed. Then the ZnO powder and paraffin
jelly was uniformly mixed to form a homogenous
ointment. The preparation was stored in small containers
which were carried to the field next day for application.
2.5 Efficacy indicator
To assess the effect of treatment, the sore size was
measured at a weekly interval. As an attempt to control
measurement bias, the study recorded the cattle owners’
subjective assessment of treatment on four qualitative
scales-no improvement, mild improvement, drastic
improvement and complete healing- on the first and
second week after the start of the trial. In this study, the
reduction in the size of the sore was taken as an efficacy
indicator. In animals having more than one sore, the size
of the largest sore was recorded, and used for analysis.
2.6 Sample collection and isolation of microfilaria
Deep skin scraping samples were randomly collected
from 24 humpsore affected animals. Some of the animals
were those enrolled in the study while some were not.
After incubating the samples in normal saline for 2 hours,
the samples were centrifuged at 1000 revolutions per
minute (rpm) for 3 minutes. For isolation of adult parasite,
the tissue debris were separated by decantation and
presence of actively motile adults were examined as
described by Singh et al. (8). An aliquot of tissue debris,
after thorough mixing, were placed on a glass slide and
examined for the presence of microfilaria under
microscope (10 and 40X). The study also adopted
Baermann’s technique to overcome the limitation
Figure 2: Trail time line and different activities undertaken once the trial was initiated

Bhutan Journal of Animal Science (BJAS), Volume 4, Issue 1, Page 47-53, 2020
Rinchen et al. (2020) 50
(obscuring field) of observing tissue debris under the
microscope. Skin scrapping collected from 5-6 animals
were pooled in a muslin cloth which was then suspended
in an inverted funnel containing a distilled water. It was
ensured that the sample remained fully immersed in the
water. The sample was incubated for 24 hours. After
incubation, the filtrate was taken in a centrifuge pipette
and centrifuged at 1000 rpm for 3 minutes. Discarding the
supernatant, the sediment was observed for the presence
of microfilaria. Due to the lack of adequate facilities,
identification of isolated parasites was not carried out.
2.7 Data analysis
The sore size of each animal for three measurements were
managed in Microsoft excel 2013 (Microsoft excel 2013,
Redmond, USA). All the analyses were conducted in R
statistical software using inbuilt packages “dplyr”,
“descr” and “ggplot2”. For analysis, measurement of the
largest sore was used in those animals that had more than
one sore. Descriptive analysis was conducted to derive the
maximum, minimum and mean size of the sore for all the
treatment groups. To assess the effect of each treatment
on the reduction of the sore size, the mean sore size of
each treatment group before and weekly (first week,
second week and third week) after the start of the trial was
compared on weekly interval. The comparison of the
mean sore size of each treatment group before and after
the start of trial was made using a one sample t-test. The
comparison of the mean sore size between the treatment
groups before and after the start of the trial was conducted
using one-way analysis of variance (ANOVA) and
pairwise t-test. All the test with p-value of less than 0.05
was considered statistically significant.
3. RESULTS
In total, 80 humpsore affected cattle were included in the
trial of which 62 were female and 18 males. Forty-five
cattle were jersey cross while the rest were local cattle.
Except for four heifers, rest of the affected animals were
all adults. The youngest animal affected was the 11
months old heifer. The sore was observed mainly on the
hump region, neck, forehead, base of the ear, inner eye
canthus. Forty-four animals had humpsore lesion only on
the single location while the rest had on multiple
locations.
3.1 Mean sore size before treatment and at weekly
interval categorized by group
The mean sore size has decreased in all the treatment
groups including the control group. The details of the
decreasing sore size are provided in Table 1 and
graphically presented in figure 6. The overall mean sore
size before the treatment started was 7.8 cm (range=2-
17cm). One week after the start of treatment, the overall
mean sore size decreased to 5.5 cm (range=0-15cm) and
subsequently to 2.8 cm (0-9.5cm) and 1.8 cm (0-10cm)
second and third week respectively.
The paired t-test analysis showed that the reduction
in the mean sore size for all the treatment group before
the start of the trial and after completion of the trial was
statistically significant (p <0.0001) except for the control
group (p=0.06). Complete healing of the lesion was
observed in 14 (70%) animals under the group 1, 12
(60%) under group 2 and 13 (62%) under group 3.
Surprisingly, complete healing of humpsore lesion was
also observed in 2 (10%) animals under the control group.
There was no statistically significant difference in the
mean sore size between the groups before the start of the
Table 1: Details of the sore size at weekly interval for the different treatment groups
Treatment group Mean sore size (in cm)
Before trial First week Second week Third week
The overall 7.8 (2-17) 5.5 (0-15) 2.8 (0-9.5) 1.8 (0-10)
Group 1 9.9 (5-17) 6.6 (0-15) 2.5 (0-9.5) 0.67 (0-5)
Group 2 8.05 (3.5-15) 4.8 (0-15) 2.4 (0-9) 1.5 (0-10)
Group 3 7.7 (4-15) 6.0 (2-14) 2.2 (0-6) 1.1 (0-5.5)
Control 5.7 (2-15) 4.6 (2-14) 4.3 (0-9) 4.1 (0-10) The figures in the parenthesis represent the range of sore size
Figure 4: Image showing the humpsore before
and after treatment trial

Bhutan Journal of Animal Science (BJAS), Volume 4, Issue 1, Page 47-53, 2020
Rinchen et al. (2020) 51
trial (p=0.24). By the third week, the difference in the
mean sore size for all the treatment groups, group 1
(p<0.0001), group 2 (p <0.001) and group three (p
<0.0001) was statistically significant from the control
group. Whereas, there was no difference in the mean sore
size between the groups where treatment was given.
3.2 Subjective assessment
The farmers’ subjective assessment of the lesion healing
supported the assessment in this study. One week after the
trial, 16 farmers under group 1 reported drastic
improvement in the humpsore lesion while 4 reported
mild improvement. Similarly, for the group 2, 1 farmer
reported complete healing, while 16 reported drastic
improvement and 3 mild. For group three, 15 farmers
reported drastic improvement while 5 reported a mild
improvement and 1 reported no improvement in the
lesion.
Two weeks after the trial, for the group 1, 3 farmers
reported complete healing while the rest reported drastic
improvement (Figure 4). For the group two, 4 farmers
reported complete healing while the rest drastic
improvement. For group 3, 18 famers reported drastic
improvement, 2 reported mild improvement and one
reported no improvement in the lesion.
3.3 Recovery of parasite
This study could not isolate adult parasite in any of the
sample. However, microfilaria was isolated in 9 of the 24
samples with a microfilaria recovery rate of 37.5%
(Figure 5). The active microfilaria was mostly observed
in the samples that were collected in the evening and
examined later that day as opposed to the samples that
were collected in the morning and examined during the
mid-day. Interestingly, the study could have also isolated
microfilaria using Baermann’s technique. However, since
the samples were incubated for 24 hours, live microfilaria
could not be isolated using this technique. The
microfilaria thus isolated presented in an open circle or c-
shape form.
4. DISCUSSION
The trial compared three commonly used treatment
options for treating humpsore. All the three treatment
Figure 3: Microfilaria observed under oil immersion
isolated using Baermann's technique(A) and observed
under 40X using direct method (B)
Figure 4: Figures showing the variation in the sore size on a weekly interval for different treatment groups

Bhutan Journal of Animal Science (BJAS), Volume 4, Issue 1, Page 47-53, 2020
Rinchen et al. (2020) 52
options brought about drastic improvement in humpsore
lesion. Group 1 (Ivermectin and daily application of zinc
oxide ointment) had the highest cure rate (70%). This
finding agrees with the finding reported by Dukpa et al.
(2008) and Johnson (1989). Contrast to the finding
reported by Dukpa et al. (2008), group three had efficacy
rate of 62% followed by group two (60%). The finding
was also in contrast with the study conducted by Rai et al.
(1994) who reported that application of zinc oxide
ointment alone failed to cure a single case while
combination of levamisole HCl and topical zinc ointment
application cured all the animals. Taking into the account
of cattle owners’ assessment, the cure rate after second
week of the trial was higher in the group 2 than other
groups; however, it was observed that a common side
effect associated to levamisole HCl injection was
swelling at the injection site.
In this study, humpsore was largely restricted to
adult animals. This could be attributed to the differences
in the way adult and young cattle are managed. A
predisposing factor to humpsore development is a break
in epidermis (wound) where biological vectors can
deposit the microfilaria. Unlike the calves, which are
mostly tethered and managed in the cattle shed, adult
cattle are free grazed in the forest whereby the chances of
sustaining scratch wounds are higher.
Apart from the humpsore treatment services that the
farmers avail from the nearest livestock extension centre,
they reported resorting to ethnoveterinary practices such
as application of used engine oil, turmeric powder mixed
in mustard oil, application of soot, application of pork lard
and battery contents. The efficacy of these agents in
curing humpsore is still unknown. The study suspects that
the 10% cure rate in the untreated control group could
have resulted from farmers non-compliance to the
instructions of not using any medication in the control
animals till the end of the trial.
Except for topical application of Zinc Oxide alone,
which do not have anti-microfilarial property, two other
treatment groups were designed to kill microfilaria in the
lesion (ivermectin and levamisole HCl), prevent
biological vectors from further depositing microfilaria
(Zinc oxide ointment paste and cypermethrin spray
around the lesion), and expediting wound healing (Zinc
Oxide ointment). However, finding group 3 (Zinc Oxide
alone) having more cure rate than group 2 (levamisole
HCl and topical application of Zinc Oxide ointment) was
surprising.
No adult parasites could be isolated. This could be
because of the issues associated with sample collection.
Some of the earlier studies have reported not being able
to isolate adult parasites from the lesion (Dukpa et al.
2008) while those who could were mostly in a tissue
section (Saparov et al 2014; Md. Nazur Islam et al. 2018).
Thus, this finding points out to variation in the location
between adult parasites and microfilaria. In contrast,
microfilaria was recovered in 38% of the samples that
were collected. Our observation of detecting active
microfilaria in the samples collected at the later part of the
day and observed subsequently than in sample collected
during the earlier part of the day could be associated with
the biological rhythm of the microfilaria. Although the
number of samples collected and examined were limited,
it was speculated that the Staphanofilaria microfilaria
recovery would be enhanced in the samples collected in
the later part of the day and examined subsequently.
However, this claim requires further validation. One
problem associated with direct microscopic examination
of tissue sediment was the risk of missing dead
microfilaria. The tissue and hair particle made the
microscopic field crowded obscuring the observation
field, and thus decreasing the sensitivity of this method of
examination. The Baermann’s technique proved to be
very effective in isolating microfilaria in addition to the
advantage of having no crowded microscopic field as the
direct method. The Baermann’s technique was employed
for the first time in isolating Staphanofilaria microfilaria
through this study. While the study could only observe
dead microfilaria, it was assumed that the incubating time
can be calibrated (shortened) to isolate live microfilaria
using this technique.
While many cattle have been affected by
Staphanofilaria spp., it was surprising to see minimal
number of effective drugs, such as ivermectin and
levamisole, available in the livestock centres. For
instance, the total supply of ivermectin to Tashicholing
geog for the fiscal year 2018-2019 was about 10% of the
total ivermectin that would have been required. This
observation underlines the gaps in the current veterinary
drug indenting and supply mechanism. If the indenting of
veterinary medicine is done based on the need relating to
the types of cases common in the area followed by supply
of medicines as per the indent, the current problem of
drug shortages and the disparity in the indent and supply
of the drugs can be drastically alleviated.
This trial has some limitations. Firstly, as described
in the materials and methods section, due to the
withdrawal period for the ivermectin and levamisole HCl
in milk, it was ensured that milking animals were not
placed in group 1 and group 2 where ivermectin and
levamisole respectively, was used. This must have
resulted in the selection bias. Secondly, for the objective
assessment of the lesion recovery by the measuring the
sore size, the study could have blinded the assessment
using officials who were not involved in the trial.
However, due to the shortage in human resources, the
individuals involved in the trial were involved in
measuring the sore size. Furthermore, not the same person
measured the sore sizes. Differences in the measurement
resulting from different assessors must have resulted and
this was evident from some of the sore sizes observed in
this study. Due to the limited trial period and difficulty in

Bhutan Journal of Animal Science (BJAS), Volume 4, Issue 1, Page 47-53, 2020
Rinchen et al. (2020) 53
accurately assessing the humpsore based on isolation of
etiological agent, the study assumed all the animals
having sore on the skin as humpsore positive animals.
This assumption can be questioned as numerous other
agents can be attributed to skin lesion, particularly
dermatophytes which produces similar lesion in animals.
If conducted in future, it would bring improvement in
selection of case animals (based on isolation of etiological
agent), randomization and allocation to treatment groups,
blinding while assessing/measuring the sore size and use
proper methods to identify the isolated microfilaria.
5. CONCLUSION
This study has further validated that ivermectin injection
@ 1 ml/50kg body weight with topical application of
zincoxide ointment for three weeks has the highest
efficacy against humpsore. Furthermore, the use of
levamisole HCl in place of ivermectin had a comparable
efficacy. Although topical application of Zinc Oxide
alone showed a comparable efficacy in treating
humpsore, as ZnO doesn’t have anti-microfilarial
activity, adopting to this option as a choice of treatment
may be made with caution. The study also proposes a
speculation, for further validation, that isolating active
microfilaria is more likely in samples that are collected in
the later part of the day
ACKNOWLEDGEMENT
The team would like to thank Dasho Director General for
his continued guidance and directives. We would extend
our acknowledgement to the Dzongkhag Livestock
Sector, Samtse for facilitating this study and providing
support where required. Further, our heartfelt thanks also
go to the in-charge RNR-EC Tashicholing for his support
during the entire study period. We also would like to
thank our support staff during the field work. Finally, we
extend our special thanks to the cattle owners of
Tashicholing and those animals that were involved in the
trial. Mr. Yab Raj Ghalley and Ms. Januki Chettri for
their effort and tireless commitment in supporting the
team.
REFERENCES
Al Masud MA, Aziz FB, Labony SS, Hasan MM, Islam
R and Rashid MB (2017). Comparative efficacy of
tobacco leaves ointment and neem leaves extract
against stephanofilariasis in cattle. International
Journal of Natural and Social Sciences, 4(4):4.
Dukpa K, Thapa L, Tshering K, Tobgay T and Gabur C
(2008). Prevalence and treatment efficacy of
humpsore in cattle in Sarpang. Bhutan Journal of
RNR, 4(1):9.
Ibrahim MZU, Hashim MA, Hossain MA and I.I. A-S
(2013). Comparative efficacy between surgical
intervention, organophosphorus and ivermectin
against humpsore Stephanofilariasis) in cattle.
Journal of Advanced Biomedical & Pathobiology
Research., 3(3):10
Johnson SJ (1989). Studies on stephanofilariasis in
Queensland: James Cook University.
Md. Nazur Islam LAA, Mahfuza Akther, Arup Sen and
Rahul Das Talukdar Avi MSBJ (2018).
Dermatopathological study of stephanofilariasis
(hump sore) in cattle and its therapeutic approaches.
International Journal of Current Researches in Life
Sciences, 7(06):5.
Rai RB, Srivastava N, Jaisunder AK and Jeykumar S
(2010). Stephanofilariasis in bovines: Prevalence,
control and eradication in Andaman and Nicobar
Islands, India. Indian Journal of Animal Sciences
Rai RB, Ahlawat SPS, Singh S and Nagarajan V (1994).
Levamisole hydrochloride: An effective treatment
for stephano~ dermatitis (humpsore) in cattle.
Tropical Animal Health & Production.
Saparov KA, Akramova FD, Azimov DA and Golovanov
VI (2014). Study of Biology, Morphology and
Taxonomy of The Nematode Stephanofilaria
Assamensis (Filariina, Stephanofilariidae). Vestnik
Zoologii, 48(3):269-74. doi: 10.2478/vzoo-2014-
0030.
Singh KS, Mukhopadhayay SK, Majumdhar S, Laha R,
Niyogi D and Ganguly S (2014). Study on different
aspects of Staphanofilarial dermatitis infection in
cattle population of West Bengal. IIOAB, 5(1).

Bhutan Journal of Animal Science (BJAS)
Volume 4, Issue 1, Page 54-59, 2020
54
Full length paper
MILKING MANAGEMENT PRACTICES BY SMALL SCALE DAIRY FARMERS OF
TRASHIYANGTSE DISTRICT IN BHUTAN
TASHI DENDUP1 AND JIGDREL DORJI2*
1Department of Sustainable Development, College of Natural Resources, Royal University of
Bhutan, Lobesa, Punakha 2Department of Animal Science, College of Natural Resources, Royal University of Bhutan
* Author for correspondence: [email protected]
Copyright ©2020 Tashi Dendup. The original work must be properly cited to permit unrestricted
use, distribution, and reproduction of this article in any medium.
ABSTRACT: This study was conducted to draw baseline information on milking management
practices adopted by small-scale dairy farmers of Yangtse and Boomdeling gewogs under
Trashiyangtse dzongkhag, Bhutan. The study sites and respondents were selected using multi-stage
random sampling, whereas data were gathered using pre-tested structured questionnaires through
face-to-face interviews with dairy farmers and field observations in December 2019. The data
gathered from 131 dairy farmers were cleaned and analyzed using descriptive statistics. The results
show that person milking animals are mostly female and illiterate. Dairy farmers predominantly rear
jersey cross and native cattle. Most farmers manually milk using hands, milk letdown by allowing
calves to suck before milking, practice straining of milk, and breed cattle by bulls. However, the
majority of farmers use stripping or knuckling milking methods, follow irregular milking intervals,
milking in the byre, do not practice teat dip, do not test for mastitis, maintain wide calving intervals,
and keep drying periods longer than two months. The findings from the study show a lack of
scientific knowledge and skills in milking practices. Accordingly, this study recommends concern
stakeholders to educate dairy farmers of rural Bhutan on scientific milking management practices.
Keywords: Milk management; milking practices; small-scale dairy farmers; stripping.
1. INTRODUCTION
People engaged in self-employment, particularly those
working on their land, predominate Bhutan's economy
(National Statistics Bureau [NSB] 2019). For instance,
53.7% of overall employment and 74% of rural
employment is in the agriculture sector (NSB 2018a).
Livestock plays a vital role in the self-subsistence
integrated farming system of Bhutan to meet households'
nutrition, draft power, income, and manure. Among
others, cattle are widely reared animals in many parts of
Bhutan. According to the Department of Livestock
(2018), the cattle population in Bhutan as of 2018 was
317,451. Traditionally, dairying involved the rearing of
native cattle (e.g., Siri breed). Despite low productivity,
native cattle are resistant to diseases and easy to manage
compared to improve animals (Tamang et al. 2019).
However, with the commencement of dairy development
programs in the country in the 1960s, the Royal
Government of Bhutan has been investing in extension
services to increase animal production and improve
animal management. Extension services include breeding
programs (supply of breeding bulls and artificial
insemination), animal disease management, fodder
management, animal production, and product value
addition. Additionally, the government has been
supporting dairy farmers to buy high-yielding animals
and the construction of sheds on a cost-sharing basis
(Thapa et al. 2019).
Today, dairy farmers are gradually transforming
from self-subsistence to semi-commercial and
commercial farming by adopting improved cattle and
better management practices. According to NSB (2019),
the population of improved cattle increased from 99,544
in 2016 to 112,648 in 2018, whereas the population of
native cattle in Bhutan dropped to 185,953 in 2018 from
203,194 in 2016. It is essential to ensure clean dairy
products for self-consumption and customers during such
a transformation of dairying. However, Asian dairy
farmers are less aware of the economic aspect of
scientific milk production because they are smallholders,
illiterate, and follow traditional dairying (Aulukh and
Singh 2015). Similarly, there is a limited understanding
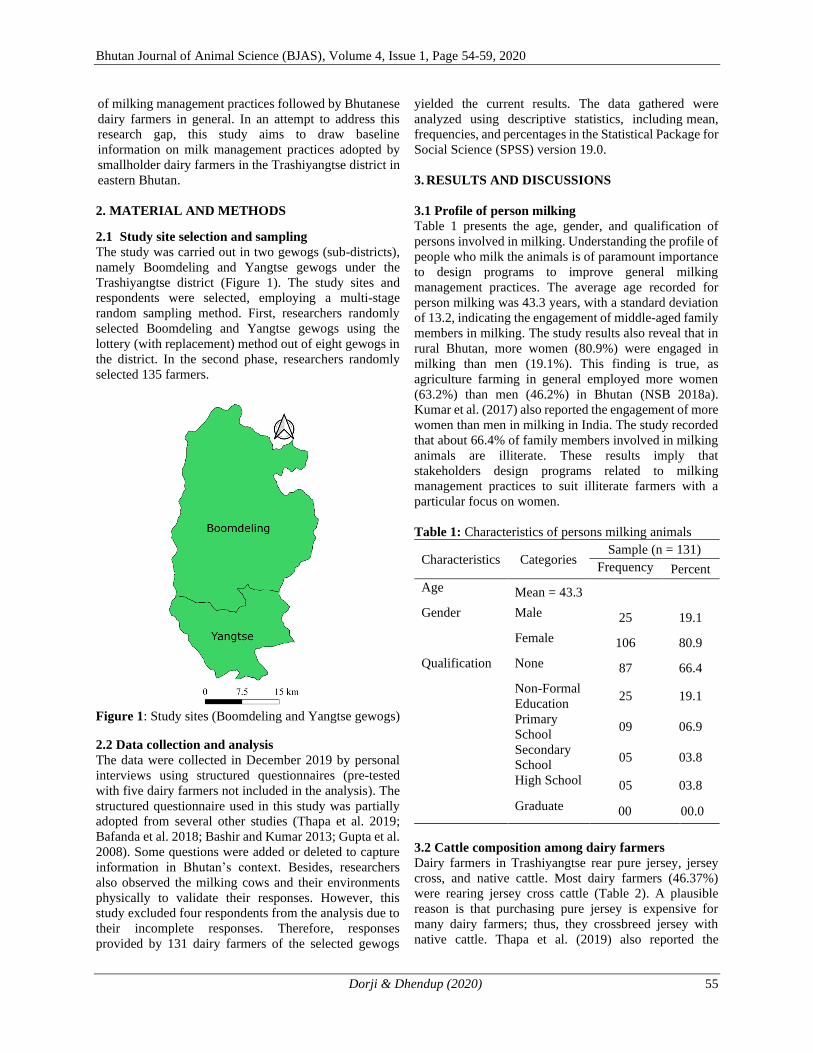
Bhutan Journal of Animal Science (BJAS), Volume 4, Issue 1, Page 54-59, 2020
Dorji & Dhendup (2020) 55
of milking management practices followed by Bhutanese
dairy farmers in general. In an attempt to address this
research gap, this study aims to draw baseline
information on milk management practices adopted by
smallholder dairy farmers in the Trashiyangtse district in
eastern Bhutan.
2. MATERIAL AND METHODS
2.1 Study site selection and sampling
The study was carried out in two gewogs (sub-districts),
namely Boomdeling and Yangtse gewogs under the
Trashiyangtse district (Figure 1). The study sites and
respondents were selected, employing a multi-stage
random sampling method. First, researchers randomly
selected Boomdeling and Yangtse gewogs using the
lottery (with replacement) method out of eight gewogs in
the district. In the second phase, researchers randomly
selected 135 farmers.
Figure 1: Study sites (Boomdeling and Yangtse gewogs)
2.2 Data collection and analysis
The data were collected in December 2019 by personal
interviews using structured questionnaires (pre-tested
with five dairy farmers not included in the analysis). The
structured questionnaire used in this study was partially
adopted from several other studies (Thapa et al. 2019;
Bafanda et al. 2018; Bashir and Kumar 2013; Gupta et al.
2008). Some questions were added or deleted to capture
information in Bhutan’s context. Besides, researchers
also observed the milking cows and their environments
physically to validate their responses. However, this
study excluded four respondents from the analysis due to
their incomplete responses. Therefore, responses
provided by 131 dairy farmers of the selected gewogs
yielded the current results. The data gathered were
analyzed using descriptive statistics, including mean,
frequencies, and percentages in the Statistical Package for
Social Science (SPSS) version 19.0.
3. RESULTS AND DISCUSSIONS
3.1 Profile of person milking
Table 1 presents the age, gender, and qualification of
persons involved in milking. Understanding the profile of
people who milk the animals is of paramount importance
to design programs to improve general milking
management practices. The average age recorded for
person milking was 43.3 years, with a standard deviation
of 13.2, indicating the engagement of middle-aged family
members in milking. The study results also reveal that in
rural Bhutan, more women (80.9%) were engaged in
milking than men (19.1%). This finding is true, as
agriculture farming in general employed more women
(63.2%) than men (46.2%) in Bhutan (NSB 2018a).
Kumar et al. (2017) also reported the engagement of more
women than men in milking in India. The study recorded
that about 66.4% of family members involved in milking
animals are illiterate. These results imply that
stakeholders design programs related to milking
management practices to suit illiterate farmers with a
particular focus on women.
Table 1: Characteristics of persons milking animals
Characteristics Categories Sample (n = 131)
Frequency Percent
Age Mean = 43.3
Gender Male 25 19.1
Female 106 80.9
Qualification None 87 66.4
Non-Formal
Education 25 19.1
Primary
School 09 06.9
Secondary
School 05 03.8
High School 05 03.8
Graduate 00 00.0
3.2 Cattle composition among dairy farmers
Dairy farmers in Trashiyangtse rear pure jersey, jersey
cross, and native cattle. Most dairy farmers (46.37%)
were rearing jersey cross cattle (Table 2). A plausible
reason is that purchasing pure jersey is expensive for
many dairy farmers; thus, they crossbreed jersey with
native cattle. Thapa et al. (2019) also reported the

Bhutan Journal of Animal Science (BJAS), Volume 4, Issue 1, Page 54-59, 2020
Dorji & Dhendup (2020) 56
crossbreeding of improved cattle with native cattle as a
common practice in Bhutan. The total number of native
cattle was also large at 42.15%. The prevalence of low-
yielding cattle, such as native and jersey cross, indicates
that dairying for many farmers is a small-scale venture
meant for self-consumption. Less quantity of milk due to
the fewer high-yielding cattle (Tamang et al. 2019) could
be a potential reason for not having a milk-processing unit
in these two gewogs in 2018 (NSB 2018b). However,
farmers also rear native bulls (8.55%) and jersey cross
bulls (6.67%) as draft animals because of their known
resistance against geo-climatic conditions of the region
(Tamang et al. 2019).
3.3 Milking management practices
Table 3 presents the milking management practices
adopted by smallholder dairy farmers. The study recorded
that all dairy farmers milk animals manually with their
hands. In agreement with this result, several published
papers in India have also reported that the majority of
dairy farmers practiced hand-milking (Bafanda et al.
2018; Kumar et al. 2017; Bashir and Kumar 2013).
In the study area, farmers practice small-scale
dairying with few numbers of milking cows; thus, they do
not require sophisticated machines for milking, unlike
commercial dairy farmers. More than half of the dairy
farmers (50.4%) used the stripping milking method,
followed by a few farmers (9.2%) practicing the
knuckling milking method. Several other studies
conducted in India have also reported that the majority of
smallholder dairy farmers practice either knuckling or
stripping milking methods (Kumar et al. 2017; Sabapara
et al. 2016; Sabapara et al. 2015; Kumar et al. 2014;
Rathore et al. 2010). Scientifically, these two methods are
unhealthy practices because they can injure teats and
cause mastitis (Bafanda et al. 2018). Thus, extension
officials should educate and encourage rural farmers to
use the full hand milking method like farmers of some
regions in India (Bashir and Kumar 2013; Kumar and
Mehla 2011). The results suggest that some dairy farmers
are less aware of proper milking methods even today. The
study recorded about 50% of dairy farmers milking cows
with wet hands, which upsets the health of udder
(Sabapara et al. 2016, 2015).
The study recorded 84.7% of the total respondents
adopting calf to suck teats before milking as the most
common practice to initiate milk letdown. Similar other
studies have also supported the practice of milk letdown
with the help of calves as a widespread practice (Thapa et
al. 2019; Bafanda et al. 2018; Kumar et al. 2017; Sabapara
et al. 2015; Gupta et al. 2008). However, when the calf is
dead, concentrate feeding is popular (54.2%), followed by
letting dams lick the hide of the dead calf (22.9%), and
the use of warm water (19.8%). The majority of farmers
in the Surat District of India also reported using
concentrate feeding during the death of the calf (Sabapara
et al. 2015). Only 3.1% of dairy farmers have access to
oxytocin, and the majority of respondents are neither
aware of its availability nor its uses.
It was observed that 91.6% of respondents milked
the animals once a day, which might be attributed to being
smallholders’ dairy farmers, rearing a few numbers of
native cattle or jersey, and also calves are released along
with dams for grazing during the daytime. This finding
disagrees with the results of studies from India (Kumar et
al. 2014; Bashir and Kumar 2013; Gupta et al. 2008), who
have reported milking the animals twice a day. The
remaining farmers (8.4%) who reared pure jersey and
adopted stall feeding reported milking their animals twice
a day. More than half of the dairy farmers (55.7%) had an
irregular milking interval showing the need to create
awareness on the merits of milking at regular intervals.
On average, dairy farmers took slightly over eight
minutes to complete milking a cow. Scientifically,
milking should complete within a short time, as the
oxytocin effect lasts only about five to seven minutes
(Bafanda et al. 2018). Thus, there is a need for concerned
stakeholders to educate dairy farmers on the benefits of
completing milking in the shortest time possible.
The majority of dairy farmers (80.2%) tethered
milking animals in the byre. A conceivable reason could
be that many cowsheds have concrete floorings and zinc
roofing, which is much cleaner than the traditional sheds.
However, dairy farmers should be encouraged to milk
outside the cowsheds (preferably dry and hygienic places)
to improve milk cleanliness. Similarly, dairy farmers in
India were also found milking animals in the byre (Kumar
et al. 2014; Bashir and Kumar 2013; Rathore et al. 2010;
Table 2: Average cattle composition of dairy farmers
Cattle Type Calf
Milch Dry Heifer Bull Total Male Female
Jersey 10 (1.17) 19 (2.22) 29 (3.40) 11 (1.29) 15 (1.76) 14 (1.64) 98 (11.48)
Jersey cross 37 (4.33) 70 (8.20) 93 (10.89) 66 (7.73) 73 (8.55) 57 (6.67) 396 (46.37)
Native 30 (3.51) 48 (5.62) 66 (7.73) 90 (10.54) 53 (6.21) 73 (8.55) 360 (42.15)
Total 77 (9.02) 137 (16.04) 188 (22.01) 167 (19.56) 141 (16.51) 144 (16.86) 854 (100)

Bhutan Journal of Animal Science (BJAS), Volume 4, Issue 1, Page 54-59, 2020
Dorji & Dhendup (2020) 57
Gupta et al. 2008). The majority of dairy farmers (95.4%)
in the study areas strain milk before milking using a clean
piece of cloth or a sieve. This result was encouraging in
contrast to the result reported by Bafanda et al. (2018),
where farmers in the Jammu district of India do not strain
milk.
Maintaining a healthy udder is necessary for milking
cows. Thus, dairy farmers should regularly practice teat
dip after milking and test for mastitis to reduce udder
infection. However, the result observed that the majority
of farmers (90.1%) did not practice teat dip or test for
mastitis (61.1%). Several studies in neighboring India
have also reported that dairy farmers do not practice teat
dips and do not test for mastitis (Bafanda et al. 2018;
Bakat et al. 2017; Sabapara et al. 2016; Sabapara et al.
2015; Bashir and Kumar 2013). These two results suggest
that dairy farmers in rural Bhutan are less aware of the
advantages of teat dipping and mastitis testing. As teat
dipping and testing for mastitis will improve udder health
by reducing infections in the long run, concerned
stakeholders should design training programs to enhance
farmers’ knowledge and skills to practice teat dip and test
mastitis.
It is essential for dairy farmers to dry-off milking
cows roughly two months before the beginning of the next
lactation (Bafanda et al. 2018; Sabapara et al. 2016).
However, the study recorded longer drying periods with
a mean of 4.47 months and a standard deviation of 3.48.
This finding disagrees with that of Sabapara et al. (2016),
who reported that farmers dry-off dairy animals for less
than two months. Plausible reasons reported are failure to
detect heat on time and failure to meet the nutritional
Table 2: Milking methods practiced by dairy farmers
Milk management practices Categories Sample (n=131)
Frequency Percent
Milking mode Hand milking 131 100.0 Machine milking 0 00.0
Hand milking style Full Hand 13 09.9 Knuckling 12 09.2 Stripping 106 80.9
Habit of milking Dry hand 66 50.4 Wet hand 65 49.6
Milk let down (calf alive) Sucking by calf 111 84.7
Concentrate feeding 9 6.9 Combination of above two 11 8.4
Milk let down (calf dead) Concentrate feeding 71 54.2 Use of oxytocin 4 3.1 Letting dam lick the hide of a dead calf 30 22.9 Use of warm water 26 19.8
Daily milking times Once 120 91.6 Twice 11 8.4
Milking interval Regular 58 44.3 Irregular 73 55.7
Milking completion time (minutes)
Mean = 8.30
Milking place Tethering in the byre 105 80.2 Outside of the byre 26 19.8
Straining of milk Yes 125 95.4 No 06 04.6
Teat dip practices Practice teat dip 13 9.9 Do not practice teat dip 118 90.1
Mastitis control Test for mastitis 51 38.9 Do not test for mastitis 80 61.1
Drying off cow Self-drying 107 81.7 Complete cessation of milking 19 14.5 Incomplete milking 04 03.1 Intermittent milking 01 00.8
Drying period (months) Mean = 4.47 Breeding method Natural insemination 119 90.8
Artificial insemination 12 9.2 Calving interval Mean = 1.44

Bhutan Journal of Animal Science (BJAS), Volume 4, Issue 1, Page 54-59, 2020
Dorji & Dhendup (2020) 58
requirements of cows. Farmers are not able to meet the
nutritional requirements of animals because commercial
concentrate feeds are expensive and not affordable by
many small dairy farmers owing to high transportation
costs. The Department of Livestock and relevant
authorities should explore alternative solutions to
increase access to commercial concentrate feeds at
reasonable prices.
Despite several techniques of drying milking cows,
self-drying and complete cessation of milking are widely
practiced by dairy farmers with 81.7% and 14.5%,
respectively. Kumar et al. (2017) and Kumar et al. (2014)
also reported cases where the majority of farmers
practiced self-drying. All farmers practice the drying of
cows. However, maintaining an extended drying period
and the practice of self-drying indicates that farmers are
not able to meet the nutritional requirements of cows.
Thus, stakeholders must create awareness of the
importance of feeding a nutritive diet, so that cows can
give milk for about ten months, followed by two months
of drying-off periods.
More than 90% of dairy farmers breed cattle by
breeding bulls supplied by the government or those
owned by private individuals in the community. A recent
study by Thapa et al. (2019) conveyed that members of
dairy farmer groups are more likely to adopt artificial
insemination (AI) compared to non-members. The
prevalence of exceptionally few such groups in the study
area could also be a reason for not opting AI. However,
improving access to resources of the AI could accelerate
its usage soon. In agreement with the current findings,
Rathore et al. (2010) and Gupta et al. (2008) also reported
that the majority of farmers were relying on natural
services for breeding their cattle. The average time taken
by a cow to give a calf is 1.44 years, with a standard
deviation of 0.67, possibly due to poor heat detection and
undernutrition.
4. CONCLUSION & RECOMMENDATIONS
The current study suggests that dairy farmers in rural
Bhutan still lack knowledge and skills in scientific
milking management practices. For instance, many
farmers use the stripping and knuckling style of hand
milking, which could cause teat and udder infection.
Additionally, farmers neither practice teat dipping nor test
for mastitis. Furthermore, results found unhealthy
practices, including milk at irregular intervals, milk in the
unhygienic byre, take more than 7 minutes to complete
milking, prolong calving interval, and maintain an
extended drying period (more than two months). Given
these findings, the Department of Livestock, along with
other stakeholders, needs to provide hands-on training
programs on good milking management practices to dairy
farmers in rural Bhutan. Training packages containing
demonstrations, field visits to integrated dairy farms, and
awareness sessions could provide adequate exposure to
good milking management practices. Since the majority
of people milking in remote areas are women and
illiterate, the training design and other interventions
should focus on this section.
ACKNOWLEDGEMENT
The authors would like to acknowledge extension
officials, dairy farmers, and enumerators lending help
during data collection in the field.
REFERENCES
Aulakh GS and Singh R (2015). Socio-economic
characteristics of farmers and status of buffalo health
care practices. The Indian Journal of Animal
Sciences, 85(12): 1396-1398.
Bafanda RA, Nanda R, Minhaj SU, Choudhary F and
Thapa L (2018). Analysis of milking management
practices followed by dairy farmers of RS Pura Block
in Jammu District. Advances in Research, 15(6): 1-7.
Bashir BP and Kumar VG (2013). Milking management
practices followed in selected areas of the Kottayam
District of Kerala State. Journal of Life Sciences, 5(1):
53-55.
Bhakat C, Chatterjee A, Mandal DK, Karunakaran M,
Mandal A, Garai S and Dutta TK (2017). Milking
management practices and IMI in Jersey crossbred
cows in changing scenario. Indian Journal of Animal
Sciences, 87(4): 95-100.
Department of Livestock (2018). Livestock Statistics
2018. Department of Livestock, Thimphu Bhutan.
Gupta DC, Suresh A and Mann JS (2008). Management
practices and productivity status of cattle and
buffaloes in Rajasthan. Indian Journal of Animal
Sciences, 78(7): 769-774.
Kumar M and Mehla RK (2011). Milking management
practices of buffaloes in the rural areas of Punjab.
Indian Journal of Animal Production and
Management, 27(1/2): 23-25.
Kumar S, Jain A and Gupta AK (2014). Studies on
breeding, health care and milking management
practices adopted by the dairy owners in Shahdol
district of MP, India. International Research Journal
of Biological Sciences, 3(10): 32-36.
Kumar S, Subash S and Jangir R (2017). Feeding and
milking management practices adopted by indigenous
cattle farmers in Thar Desert of Rajasthan. Journal of
Animal Health and Production, 5(1): 14-18.
NSB (2018a). Labour Force Survey Report, Bhutan.
Royal Government of Bhutan, Thimphu Bhutan.
NSB (2018b). Trashiyangtse Dzongkhag at a Glance,
2018. Royal Government of Bhutan, Thimphu
Bhutan.

Bhutan Journal of Animal Science (BJAS), Volume 4, Issue 1, Page 54-59, 2020
Dorji & Dhendup (2020) 59
NSB (2019). Statistical Yearbook of Bhutan 2019. Royal
Government of Bhutan, Thimphu Bhutan.
Rathore RS, Singh R, Kachwaha RN and Kumar R
(2010). Existing management practices followed by
the cattle keepers in Churu district of
Rajasthan. Indian Journal of Animal Sciences, 80(8):
798-805.
Sabapara GP, Desai PM and Kharadi VB (2016). Milking
management practices of dairy animals in tribal area
of South Gujarat, India. Livestock Research
International, 4(1): 55-58.
Sabapara GP, Fulsoundar AB and Kharadi VB (2015).
Milking and health care management practices
followed by dairy animal owners in rural areas of
Surat district. Scholars Journal of Agriculture and
Veterinary Sciences, 2(2A): 112-117.
Tamang NB, Rai DB, Dendup T, Koirala AN and
Tshering S (2019). Effect of parity on milk yield and
calving interval of thrabam cattle at Nucleus Herd,
Tashiyangphu, Bhutan. Bhutan Journal of Animal
Science. 3 (1): 22-26.
Thapa L, Choden D and Tamang NB (2019). Adoption of
improved dairy production practices by dairy and non-
dairy farmers’ groups. Bhutan Journal of Animal
Science, 3(1): 14-21.

Bhutan Journal of Animal Science (BJAS)
Volume 4, Issue 1, Page 60-67, 2020
60
Full length paper
A CASE STUDY OF PUNGDZONG DAIRY FARMER’S GROUP: ANALYSIS OF MILK VALUE CHAIN
PEMA UGYEN1* AND RESIE OUDE LUTTIKHUIS2
1District Livestock Sector, Dzongkhag Administration, Punakha, Bhutan 2Van Hall Larenstein University of Applied Sciences, The Netherlands
*Author for correspondence: [email protected]
Copyright © 2020 Pema Ugyen. The original work must be properly cited to permit unrestricted
use, distribution, and reproduction of this article in any medium.
ABSTRACT: This applied research is an attempt to analyse the effectiveness of milk marketing
and facilitate developing a sustainable milk value chain for dairy farmer’s groups in Punakha
district. Both quantitative and qualitative methods of survey, key informant interviews and focus
group discussion were used as research strategies to obtain relevant information. The survey was
conducted using both open and closed-ended structured questionnaire in seven subdistricts of
Barp, Dzomi, Guma, Kabisa, Shelnga-Bjemi, Talog and Toedwang. A total of 60 respondents; 30
existing milk suppliers and 30 non-milk suppliers were drawn using a simple random sampling
technique. One-to-one interviews were conducted following semi-structured questions with eight
key informants in the chain. One focus group interview was conducted with the existing dairy
farmer groups representatives to triangulate and discover in-depth information about the situation
of the milk value chain in the district. The survey data was analysed using the Statistical Package
for Social Sciences software version 20. A method of grounded theory design was used to analyse
the qualitative data of interviews and focus group discussion. Value chain mapping was employed
for assessing the operational situation of the current milk chain. The mean cost of milk production
was estimated at Nu.27.53 per litre and the maximum expenses were incurred in animal feeds
which were estimated to be 46.34% of the total cost of milk production. In this study, milk
producers had the highest share of added value and profit which were estimated at 45.45% and
44.85% respectively. Limited information and coordination amongst stakeholders have
contributed to slow progression in the formal milk market. The finding reveals that 90% of non-
dairy farmer groups respondents were interested in joining formal milk marketing. The average
morning milk available for supply from this group would be 4.41 ± 3.07 litres daily by each
household. The study also found that 50% of the respondents were interested in supplying evening
milk with an average of 4.43 ± 2.25 litres per day per household. Based on the result of this study,
it was concluded that there are possibilities of expanding the milk value chain in the district.
However, there is a need to enhance consistent milk supply through a quality-based milk payment
system, access to reasonable input supplies, and facilitate strong multi-stakeholder processes along
the milk value chain.
Keywords: Dairy farmer groups; milk; stakeholders; value chain.
1. INTRODUCTION
Dairying in Bhutan is a very important economic
activity to the farmers and a flourishing sector with
various resources and potentials. By volume, 21.88% of
liquid milk is consumed in the country out of 50,250.50
MT of milk produced in 2017 (Department of Livestock
[DoL] 2018). It has also reported that self-sufficiency for
fresh milk, butter and cheese combined is 88.80% as of
2017 (DoL 2019). The average per capita milk
consumption for Bhutan stands over 68 kg of milk per
year, while the average global milk consumption
according to Hemme and Otte (2010) was about 100 kg
of milk per year, indicating significant differences
between developed and underdeveloped countries.
The scenarios of a future dairy value chain in
developed countries are intended towards producing
differentiated raw milk with improved manufacturing
practices, reduced the production of individualistic dairy
products and shift towards environmentally sustainable
dairy farming with improved animal welfare (Demeter et
al. 2009). However, for developing countries, the

Bhutan Journal of Animal Science (BJAS), Volume 4, Issue 1, Page 60-67, 2020
Ugyen & Luttikhuis (2020) 61
scenarios of a dairy value chain are still in infant stages.
The study conducted by Muhamma et al. (2014) on dairy
supply chain management and critical investigations on
dairy informal channel partners in Pakistan revealed that
without formal dairy value chain, most of the milk
producers and consumers are facing economic, social
and health losses due to informal dairy supply chain
partners. The United Nations Development Programme
(2016) reported that the surplus milk and milk products
produced by the typical Bhutanese dairy farmers’ are
sold both through the informal and formal markets. The
author refers informal system for the sells of milk and
milk products to neighbours and in the local market,
while formal system refers to the collection of milk
through organised dairy farmers’ group initiative at the
milk processing unit.
The milk value chain in Punakha district has both
formal and non-formal milk marketing system. The
formal market is functioned mainly by organised Dairy
Farmer Groups (DFGs) and links the market in a
coordinated chain. The informal market is primarily
practised by individualist dairy farmers that are not
registered in a group. The district recognises collective
action thorough DFGs as a positive force for developing
the dairy sector and has formed 19 DFGs so far. In the
year 2017, five DFGs from four subdistricts of Dzomi,
Guma, Kabisa and Toedwang with a total of 99
members have started fresh milk supply and marketing
at Khuruthang town in Punakha district.
The main constraint of this milk value chain is
insufficient milk supply. As a result, the milk processor
is not able to use maximum plant capacity to collect,
process and sell milk and milk products for better
economic gains. Thus, this study will respond to the
need for a clear analysis of the milk value chain in the
district. The research will also enhance the decision-
making ability of the milk processor, other chain actors
and supporters to invest in expanding the milk value
chain.
2. MATERIALS AND METHODS
2.1 Study area
The study was conducted at seven subdistricts; four
existing subdistricts (Dzomi, Guma, Kabisa, Toedwang)
currently supplying the milk and three new subdistricts
(Barp, Shelnga-Bjemi, Talo) which are near and having
potentials to deliver milk in the milk processing unit
(Figure 1).
Figure 1: Study areas

Bhutan Journal of Animal Science (BJAS), Volume 4, Issue 1, Page 60-67, 2020
Ugyen & Luttikhuis (2020) 62
2.2 Research methods and sample size
2.2.1 Survey
A sample of 30 respondents was drawn using simple
random sampling technique from 108 registered
Pungdzong dairy group members currently engaged in
milk supply and marketing chain from four subdistricts
of Dzomi, Guma, Kabisa and Toedwang. Similarly, a
total of 30 respondents out of 76 non-dairy group
farmers from three subdistricts of Barp, Shelnga-Bjemi
and Talog. This technique had been proposed
confirming each member had an equal probability of
being chosen through random draws using random
calculating function Microsoft Excel 2016. The top 30
samples drawn from the sampling frame were surveyed
from both groups
2.2.2 Key Informant Interviews
One-to-one interviews were conducted following semi-
structured questions to gather as much information as
possible. The conduct of these interviews with key
informants assisted to collect a varied and wide range of
open-ended, both qualitative and quantitative data
required to identify possibilities towards increasing milk
supply. Purposive sampling technique was considered to
conduct key informant interviews with milk transporters,
processor and supporters in the chain as mentioned in
Table 1.
2.2.3 Focus group discussion
One group discussion (focus group) was initiated
between the representatives of existing DFG having
similar characteristics or experiences. It was aimed to
discover in-depth information about how groups think
about expanding the milk value chain in the district and
triangulate on varying information gathered during the
survey and key informant interviews. Thus, focus group
discussion was organised using checklist questions after
the completion of the survey and interviews and shared
results of the survey and key informant interviews for
further triangulation.
2.3 Data Analysis
2.3.1 Quantitative data
The data collected from the survey was computed using
MS Microsoft Office Professional Excel 2016, and the
coded data were analysed using Statistical Package for
Social Sciences (SPSS) IBM statistics version 20.
Both descriptive (mean, proportion, crosstab)
and inferential (Chi-square) statistics were used to
analyse the data. Simple bar graph, pie charts and
contingency tables were used where appropriate to
interpret and present the survey findings.
2.3.2 Qualitative data
A method of grounded theory design was used to
analyse the qualitative data of interviews and focus
group discussion following five logical steps of
organising data in fragments, determining the relevance,
open coding, axial coding and selective coding (Baarda
2014). The findings of grounded theory were organised
around the key dimensions identified in the conceptual
framework.
2.3.3 Other analytical tools
This study had used simple value chain mapping to chart
existing and future milk value chain in the district.
Through this chain mapping, clear segmentation of the
various actors, supporters and facilitators involved in the
chain were mapped.
3 RESULTS AND DISCUSSIONS
3.1 Analysis of existing milk value chain
The value chain in Punakha district has both formal and
non-formal milk marketing system (Figure 2). The
formal market is functioned mainly by organized DFGs
and links the market in a coordinated chain. The
informal market is primarily practiced by individualist
dairy farmers that are not registered in a group. The total
milk production in the district was 1261 MT in the year
2018 recording a growth every year (DoL 2019).
The statistics also indicated that 108 MT of milk
was sold as fresh milk through formal and informal milk
market. Similarly, the data maintained by District
Livestock Sector recorded a little over 86 MT of milk
collection by MPU in 2018 through the formal milk
market which is 79.63% of the total estimated fresh milk
marketed in the district.
Table 1: Overview of key informant interview
respondents
No/Code Function of
interviewee Current Address
KI1 Milk transporter Dzomi-Toedwang
area
KI2 Milk transporter Guma-Kabisa area
KI3 Processor MPU- Khuruthang
KI4 Livestock
Extension Officer Toedwang
KI5 Livestock
Extension Officer Kabisa
KI6 District Livestock
Officer Punakha
KI7 Head of Livestock
Regulatory Unit BAFRA, Punakha
KI8 Head of Feed &
Fodder Unit RLDC, Wangdue

Bhutan Journal of Animal Science (BJAS), Volume 4, Issue 1, Page 60-67, 2020
Ugyen & Luttikhuis (2020) 63
3.2 Cost of producing milk
The maximum milk production expenses as illustrated in
Figure 3 were incurred in animal feeds (46.34%) and
minimum (12.80%) for the cost of other expenses that
includes depreciation and maintenance of dairy sheds,
and interest of herd value. The COP was estimated at
Nu.27.53 per litre milk in the study area. The variable
costs shared most of the total production costs and are
like the findings of Kaur et al. (2012) and Kumawat et
al. (2014). It is quite complex to compare the milk COP
and economic performance of the milk value chain.
There is variation in calculating the COP of milk from
one producer area to the next and mainly depends on
costs and availability of resources to manage the dairy
farming.
3.3 Economic performance of the milk value chain
Figure 4 illustrates the distribution of profit and added
value share among the chain actors in the milk value Figure 3: Distribution of milk production costs
Figure 2: Current milk marketing system in Punakha district

Bhutan Journal of Animal Science (BJAS), Volume 4, Issue 1, Page 60-67, 2020
Ugyen & Luttikhuis (2020) 64
chain. This value chain is a typical chain in which the
milk producers lead the chain forward and the majority
(45.45%) of the added value of the chain is captured by
the milk producers. The result also shows that milk
producers receive the largest share (44.85%) of the
profit, while the milk transporters get the marginal profit
of only 1.83% of the total profit made in the chain.
Milk processor who has a constant risk of meeting
the consumer demands in terms of quality products
compounded by competition for the insubstantial market
from other districts for the same brand of dairy products
takes the second position in the profit share. It should
also be justified that milk processor has to bear fixed
costs (staff salaries, rental charge, interest, depreciation)
which constituted the maximum proportion of costs for
the milk processor. This contradicts the findings of Ishaq
Table 2: Stakeholders analysis for the milk value chain in Punakha district
Stakeholders Key Roles Supporting forces to expand the milk value chain
Hindering forces to expand the milk value chain
Dairy producers
Fresh milk production and delivery
Trained farmers on milk production and quality control. Strong Government support to DFGs
Limited landholding for feed and fodder development. Low yielding dairy cattle. Difficulty in land leasing.
Milk transporters
Milk collection and transportation
A reliable source of income
Insufficient milk collection particularly during winter Late delivery of milk at the collection point by dairy producers. Less profitable during winter because of high transportation costs and less milk collection. Difficulty in maintaining milk quality especially during the rainy season without the proper milk collection sheds.
Processor Milk bulking, processing, packaging and sales
Income and employment opportunities. Trade policy and regulation
Insufficient milk supply Inconsistent milk supply
District/Extension Officer (subdistrict)
Provide livestock extension, animal health services and capacity development
Clearly defined roles, functions and institutional setup (DoL, 2016) Aligned in 12th FYP documents at the district level.
Fewer linkages between the chain actors and supporters. Lack of technical expertise on the milk value chain and product diversification. Limited landholding for dairy farmers to facilitate improved fodder development.
RLDC Post-production and marketing activities
Clearly defined roles, functions and institutional setup (DoL, 2016). Aligned in 12th FYP documents at a regional level.
Limited approved budget to perform post-production activities in the region. Poor marketing system in place (congesting the already limited market place by competing on similar products between the DFGs in the region).
BAFRA
Quality control and food safety measures
Food rules and regulation of Bhutan 2017
Limited manpower to conduct the frequent regulatory check. Limited budget to conduct milk quality standards and educational program for the chain actors.
Figure 4: Distribution of profits and added value in
the formal milk marketing system
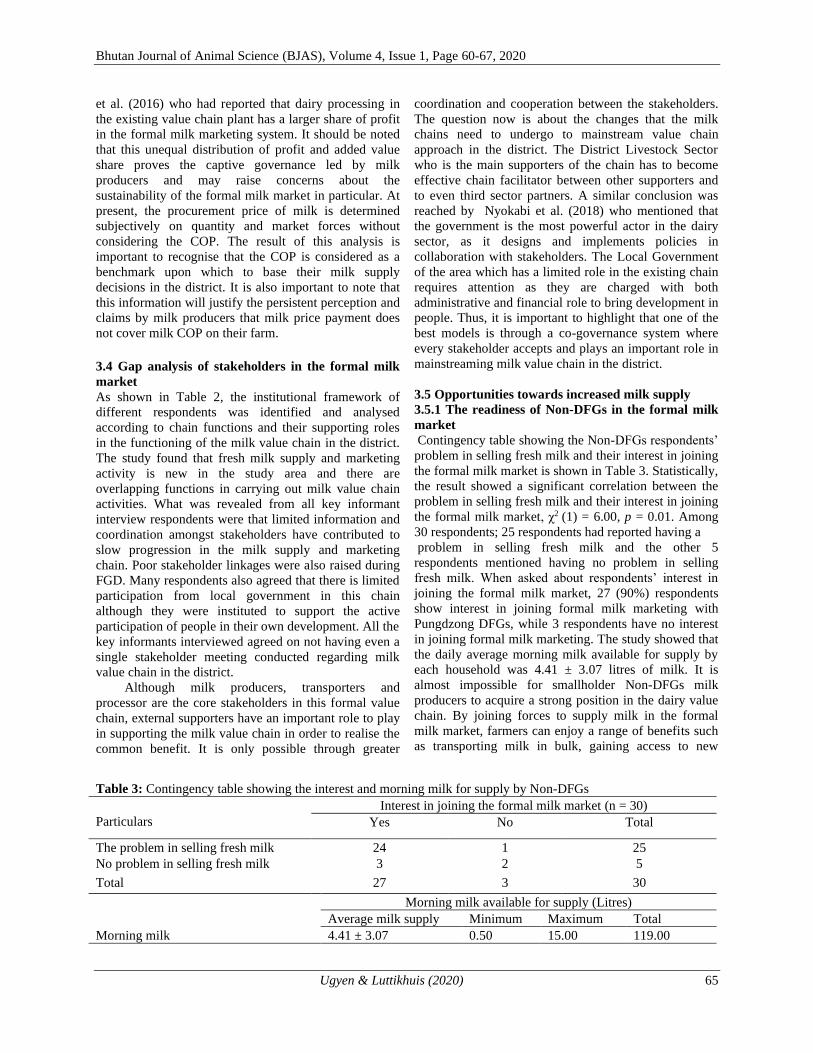
Bhutan Journal of Animal Science (BJAS), Volume 4, Issue 1, Page 60-67, 2020
Ugyen & Luttikhuis (2020) 65
et al. (2016) who had reported that dairy processing in
the existing value chain plant has a larger share of profit
in the formal milk marketing system. It should be noted
that this unequal distribution of profit and added value
share proves the captive governance led by milk
producers and may raise concerns about the
sustainability of the formal milk market in particular. At
present, the procurement price of milk is determined
subjectively on quantity and market forces without
considering the COP. The result of this analysis is
important to recognise that the COP is considered as a
benchmark upon which to base their milk supply
decisions in the district. It is also important to note that
this information will justify the persistent perception and
claims by milk producers that milk price payment does
not cover milk COP on their farm. 3.4 Gap analysis of stakeholders in the formal milk
market
As shown in Table 2, the institutional framework of
different respondents was identified and analysed
according to chain functions and their supporting roles
in the functioning of the milk value chain in the district.
The study found that fresh milk supply and marketing
activity is new in the study area and there are
overlapping functions in carrying out milk value chain
activities. What was revealed from all key informant
interview respondents were that limited information and
coordination amongst stakeholders have contributed to
slow progression in the milk supply and marketing
chain. Poor stakeholder linkages were also raised during
FGD. Many respondents also agreed that there is limited
participation from local government in this chain
although they were instituted to support the active
participation of people in their own development. All the
key informants interviewed agreed on not having even a
single stakeholder meeting conducted regarding milk
value chain in the district.
Although milk producers, transporters and
processor are the core stakeholders in this formal value
chain, external supporters have an important role to play
in supporting the milk value chain in order to realise the
common benefit. It is only possible through greater
coordination and cooperation between the stakeholders.
The question now is about the changes that the milk
chains need to undergo to mainstream value chain
approach in the district. The District Livestock Sector
who is the main supporters of the chain has to become
effective chain facilitator between other supporters and
to even third sector partners. A similar conclusion was
reached by Nyokabi et al. (2018) who mentioned that
the government is the most powerful actor in the dairy
sector, as it designs and implements policies in
collaboration with stakeholders. The Local Government
of the area which has a limited role in the existing chain
requires attention as they are charged with both
administrative and financial role to bring development in
people. Thus, it is important to highlight that one of the
best models is through a co-governance system where
every stakeholder accepts and plays an important role in
mainstreaming milk value chain in the district.
3.5 Opportunities towards increased milk supply
3.5.1 The readiness of Non-DFGs in the formal milk
market
Contingency table showing the Non-DFGs respondents’
problem in selling fresh milk and their interest in joining
the formal milk market is shown in Table 3. Statistically,
the result showed a significant correlation between the
problem in selling fresh milk and their interest in joining
the formal milk market, χ2 (1) = 6.00, p = 0.01. Among
30 respondents; 25 respondents had reported having a
problem in selling fresh milk and the other 5
respondents mentioned having no problem in selling
fresh milk. When asked about respondents’ interest in
joining the formal milk market, 27 (90%) respondents
show interest in joining formal milk marketing with
Pungdzong DFGs, while 3 respondents have no interest
in joining formal milk marketing. The study showed that
the daily average morning milk available for supply by
each household was 4.41 ± 3.07 litres of milk. It is
almost impossible for smallholder Non-DFGs milk
producers to acquire a strong position in the dairy value
chain. By joining forces to supply milk in the formal
milk market, farmers can enjoy a range of benefits such
as transporting milk in bulk, gaining access to new
Table 3: Contingency table showing the interest and morning milk for supply by Non-DFGs
Particulars
Interest in joining the formal milk market (n = 30)
Yes No Total
The problem in selling fresh milk 24 1 25
No problem in selling fresh milk 3 2 5
Total 27 3 30
Morning milk available for supply (Litres)
Average milk supply Minimum Maximum Total
Morning milk 4.41 ± 3.07 0.50 15.00 119.00
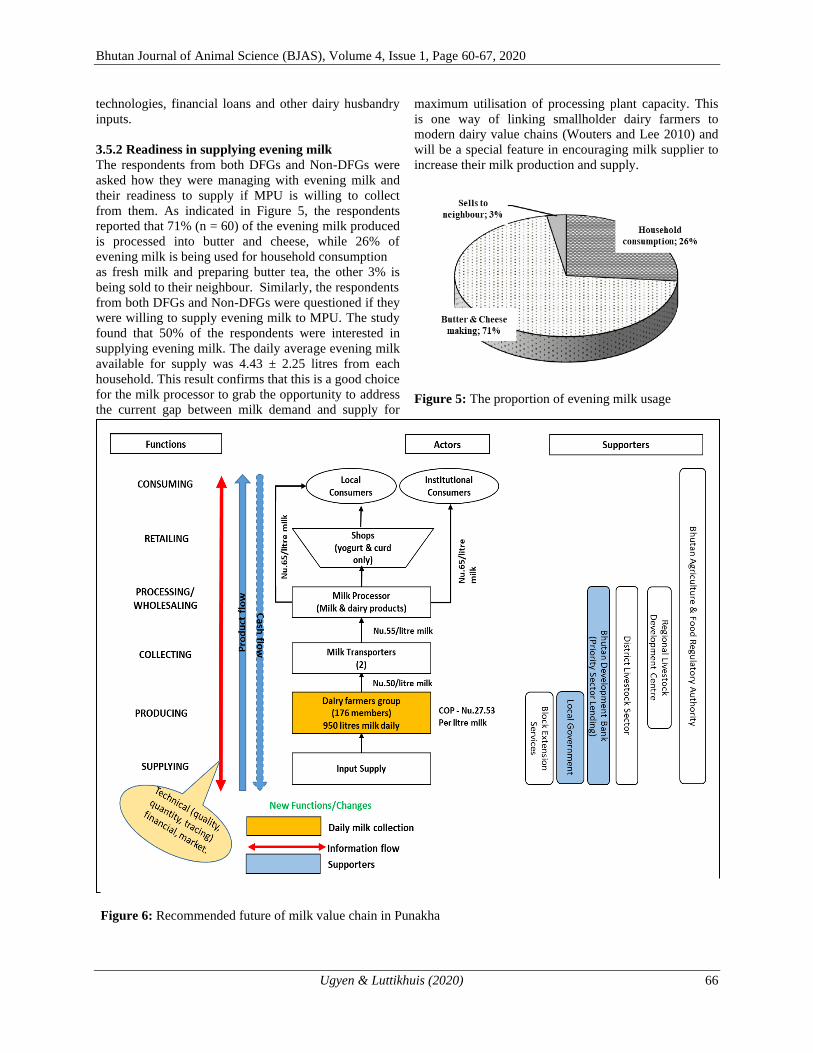
Bhutan Journal of Animal Science (BJAS), Volume 4, Issue 1, Page 60-67, 2020
Ugyen & Luttikhuis (2020) 66
technologies, financial loans and other dairy husbandry
inputs.
3.5.2 Readiness in supplying evening milk
The respondents from both DFGs and Non-DFGs were
asked how they were managing with evening milk and
their readiness to supply if MPU is willing to collect
from them. As indicated in Figure 5, the respondents
reported that 71% (n = 60) of the evening milk produced
is processed into butter and cheese, while 26% of
evening milk is being used for household consumption
as fresh milk and preparing butter tea, the other 3% is
being sold to their neighbour. Similarly, the respondents
from both DFGs and Non-DFGs were questioned if they
were willing to supply evening milk to MPU. The study
found that 50% of the respondents were interested in
supplying evening milk. The daily average evening milk
available for supply was 4.43 ± 2.25 litres from each
household. This result confirms that this is a good choice
for the milk processor to grab the opportunity to address
the current gap between milk demand and supply for
maximum utilisation of processing plant capacity. This
is one way of linking smallholder dairy farmers to
modern dairy value chains (Wouters and Lee 2010) and
will be a special feature in encouraging milk supplier to
increase their milk production and supply.
Figure 5: The proportion of evening milk usage
Figure 6: Recommended future of milk value chain in Punakha

Bhutan Journal of Animal Science (BJAS), Volume 4, Issue 1, Page 60-67, 2020
Ugyen & Luttikhuis (2020) 67
4. CONCLUSION & RECOMMENDATIONS
The formal milk value chain concept is new in the
district, only a few producers’ groups and its members
actively participate now. The major share in the total
cost of milk production was of variable cost and is
important to recognise that the cost of milk production
should be taken into consideration as a benchmark upon
which to base their milk supply decisions. Many milk
producers prefer formal milk marketing instead of the
informal distribution system due to irregular consumer
demands and not being able to sell surplus milk. There
are overlapping functions in mainstreaming milk value
chain approach. The most significant findings are on the
distribution of the added value and profit share, where
milk producer is leading the chain with a maximum
share of profit. This study concludes that there is scope
for expanding the milk value chain in the district by
implementing the following applied recommendations
presented in Figure 6. Since the milk supply and
marketing business is multi-faceted involving multi-
stakeholder in the value chain processes, stakeholders’
relationship matters in the smooth transition of the
business venture. The District Livestock Sector which is
the main supporter in the chain should take a lead role in
nurturing chain coordination and information flow on
quality milk production, supply, processing and
marketing. The DFGs should consider entering into an
agreement with Non-DFGs for increased milk collection
as the overall goal of organising formal milk market is to
link milk producers to the market and increase the
income of the actors involved in the milk value chain.
The DFGs should consider the possibilities of collecting
evening milk. This could be done by developing a
simplified milk collection system which is suitable for
all the parties involved in the chain. In the absence of
milk collection sheds, the quality of milk collected is
being compromised during unfavourable weather
conditions. Therefore, the milk processor should initiate
the construction of milk collection sheds in strategic
locations with the support of key partners. Public-Private
Partnership (PPP) model is suitable for this program by
involving Local Government and other relevant
stakeholders to ensure necessary investment and
effective resource management. The concept of the dairy
value chain is gaining popularity in Bhutan particularly
in the execution of the 12th FYP. It is imperative that the
capacity of the staff on value chain development is
provided for appropriate dissemination of planned
activities.
ACKNOWLEDGEMENT
The author would like to thank all the respondents of
field surveys, key informant interviews and focus group
discussion for providing all the valuable information
without any hesitations.
REFERENCES
Baarda B (2014). Guidelines on how to design, perform
and evaluate quantitative and qualitative research.
2nd ed. Groningen, The Netherlands: Noordhoff
Uitgevers.
Demeter RM, Meuwissen M, Lansink AO and Arendonk
J (2009). Scenarios for a future dairy chain in the
Netherlands. NJAS Wageningen Journal of Life
Sciences, 56(4):301-323.
Department of Livestock (2018). Livestock Statistics
2017, Department of Livestock, Thimphu.
Department of Livestock (2019). Livestock Statistics
2018, Thimphu: Department of Livestock.
Department of Livestock (2019). 12th FYP Write-up,
Department of Livestock, Thimphu, Bhutan:
Hemme T and Otte J (2010). Status and prospects for
smallholder milk production; A global perspective,
2010: Food and Agriculture Organisation.
Ishaq MN, Xia LC, Rasheed R and Nyuyen NB (2016).
Economic analysis of milk marketing channels in the
south region of Punjab, Pakistan; An empirical
estimation of marketing and profit efficiency.
Russian Journal of Agricultural and Socio-Economic
Sciences, 3(51):30-43.
Kaur I, Singh VP, Kaur H and Singh P (2012). Cost of
Milk Production in Punjab: A Pre-requisite for
Pricing Policy. Indian Research Journal of Extension
Education, vol.1:313-321.
Kumawat R, Singh N and Meena CL (2014). Economic
analysis of cost and returns of milk production, the
extent of adoption of recommended management
practices on sample dairy farms in Bikaner district of
Rajasthan. Global Journal Inc. (USA), 14(5).
Nyokabia S, Oostingb S, Bebec B, Pheland S, Bette B
Lindahlf J and Boer I (2018). The Kenyan sector:
stakeholder roles and relationships, and their impact
on milk quality. Chania, Greece, European IFSA
Symposium, pp. 1-12.
United Nation Development Program (2016). Value
Chain and Market Analysis of Renewable Natural
Resources Products Report, United Nation
Development Program, Thimphu, Bhutan.
Wouters B and Lee JVD (2010). Inclusion of small-scale
milk producers in modern dairy value chains, The
Netherlands: Wageningen UR.

Bhutan Journal of Animal Science (BJAS)
Volume 4, Issue 1, Page 68-75, 2020
68
Full length paper
EVALUATION OF A CAPTURE-NEUTER-VACCINATE-RELEASE (CNVR) PROGRAM:
INTERVENTION TO CONTROL THE DOG POPULATION AND RABIES IN BHUTAN
KARMA RINZIN*1 ID ROBERTSON2, YESHEY TSHERING 1, N DAHAL 1 and RK
PANDEY 2
1Department of Livestock, Ministry of Agriculture and Forests, P.O. Box 155, Thimphu, Bhutan *College of Veterinary Medicine, School of Veterinary and Life Sciences, Murdoch University,
90 South Street Murdoch, Perth, WA, Australia 6150
* Author for correspondence: [email protected]
Copyright © 2020 Karma Rinzin. The original work must be properly cited to permit
unrestricted use, distribution, and reproduction of this article in any medium.
ABSTRACT: Dog population survey was undertaken in the months of January and February
2012 in the main towns of six selected districts to monitor and evaluate the effectiveness and
progress of the CNVR programme in Bhutan. The field survey included counting male and
female dogs with and without ear notches, lactating females and puppies. The study also
assessed the body and skin condition of the neutered and un-neutered free-roaming dogs. The
population survey in the field indicated an overall CNVR coverage of 52% ranging from 32%
in Bumthang to 72% in Samdrup Jongkhar. Approximately 8% of the adult females were seen
lactating and 11% of the dogs were puppies in the survey areas. The body condition of neutered
dogs was found significantly better than entire dogs with 36% of un-notched dogs being
categorised as thin to very thin, compared with 26% of notched dogs. There was no significant
difference in the proportion of dogs with skin problems in the notched (19%) and un-notched
dogs (23%). Based on the findings of this study, it is recommended to carry out further rounds
of CNVR campaigns, and institute continuous follow-up programmes in all districts targeting
females, and extending the CNVR campaign to adjoining Indian towns to improve animal
welfare and to effectively control rabies. The indicator count should be repeated along the fixed
routes at least twice a year after the six weeks period of the peak whelping seasons i.e., July and
January to continuously monitor the CNVR programme.
Keywords: Animal welfare; capture-neuter-vaccinate-release; dogs; free-roaming; rabies.
1. INTRODUCTION
Dogs were the first species to be domesticated
sometimes 14000 to 15000 years ago (Clutton-Brock
1995; Savolainen 2007). Since then people have been
intimately involved in domesticating wild dogs for use
as pets and companions, for hunting, as guard dogs,
draught animals, or for commercial purposes
(Coppinger and Schneider 1995; Stafford 2006).
Currently, dogs are used for specialized works
including the detection of illegal goods, tracking
criminals, search and rescue work and in sporting
activities (Murray and Penridge 1992; Stafford 2006).
Dogs play an important role in society, enhancing the
psychological and physiological well-being of many
people (Blackshaw 1996; DiSalvo et al. 2005). Paul &
Serpell (1996) suggested association of keeping pets
with a higher level of self-esteem in children.
Although many dogs are confined and have
owners within communities, there are others that roam
freely in the neighborhood, which are designated as
free-roaming dogs. A free-roaming dog population can
rapidly increase in size due to a high reproductive
potential resulting in a hazard to animals, humans and
the environment. A diverse range of zoonotic
infections, including parasitic, bacterial, viral,
protozoal and fungal diseases, can be transmitted from
dogs to humans (Robertson and Thompson 2002;
Schlundt et al. 2004). The majority of cases of rabies in
humans are acquired from street dogs (Childs et al.
1997; Cleaveland et al. 2003; Hemachudha 2005;
Kayali et al. 2003; Kitala et al. 2001a; Matter et al.
2000b; Zinsstag et al. 2011) resulting in more than
55,000 deaths per year, mainly in Asia and Africa
(WHO 1987; 1988, 1996, 2004; WHO/WSPA 1990).
The impact of free-roaming dogs on the spread of rabies
and infectious diseases to wildlife is also of significant
concern (Butler et al. 2003; Cleaveland Sarah et al.
2007; Manor and Saltz 2003). In addition, free-roaming
dogs cause many other problems through dog bites, by
fouling public places with excreta, noise pollution,
causing road traffic accidents and putting pressure on
the road users (Feldman et al. 2004; Keuster et al. 2005;

Bhutan Journal of Animal Science (BJAS), Volume 4, Issue 1, Page 68-75, 2020
Rinzin et al. (2020) 69
Marsh et al. 2004; Overall and Love 2001; Robinson
1974 ; Tenzin et al. 2011c).
Rabies is endemic in the southern districts of
Bhutan sharing borders with India. Dogs are the main
reservoir of rabies and are responsible for spill-over
infection to other domestic species, especially cattle
(Rinzin et al. 2006; Tenzin et al. 2011a; Tenzin et al.
2011b; Tenzin et al. 2010). A survey conducted in three
hospital catchment areas reported an annual dog bite
incidence in humans of 869.8, 293.8 and 284.8 per
100,000 population in Gelephu, Phuentsholing and
Thimphu, respectively (Tenzin et al. 2011c). The
presence of large numbers of free-roaming dogs and the
associated barking at night also has an adverse effect on
tourism (TCB 2010 2011), which is an important
industry in Bhutan.
Several initiatives to control the free-roaming dog
population have been made by international
organizations (OIE, FAO, WHO), animal welfare
organizations (WSPA, HSI) and national authorities
(ICAMC 2007; OIE 2010; WHO/WSPA 1990). Mass
culling of dogs has historically been used in many
developing countries to control the dog population.
However, there is no direct evidence that removal of
dogs alone has a significant impact on the dog
population density or the spread of rabies (OIE 2010).
Animal birth control (ABC) through capture-neuter-
vaccinate-release (CNVR) programme is an alternative
means of population control pursued in many
developing countries, including Bhutan. The World
Health Organization (WHO) Expert Committee on
Rabies in 2004 recommended that at least 70%
vaccination coverage was required to break the rabies
cycle and at least 70% of dogs sterilized to maintain a
stable dog population (WHO 2004).
The coverage of past CNVR campaigns was
inadequate to break the rabies cycle and stabilize the
dog population (NCAH 2006) in Bhutan. Thus, the
Department of Livestock, Royal Government of Bhutan
(RGOB) in collaboration with the Humane Society
International (HSI), USA commenced a CNVR
programme from February 2009 in Bhutan. As of
January 2012, a total of 32,276 dogs was neutered,
vaccinated and released back to their place of origin in
18 of the 20 districts in Bhutan.
Following a CNVR programme a field survey
was recommended to assess its success (Childs et al.
1997; Hiby 2005; Hiby et al. 2011; Kayali et al. 2003;
Kitala et al. 2001a; Matter et al. 2000a; Reece and
Chawla 2006). Therefore, the study was undertaken to
monitor and evaluate the effectiveness and progress of
the ongoing RGOB-HSI project on dog population
management and rabies control.
2. MATERIALS AND METHODS
2.1 CNVR programme
The CNVR programme focused on sterilization and
vaccination of captured stray and owned dogs. Sexually
intact dogs older than 4 months of age were humanely
captured by trained dog catchers using nets. The owned
dogs were either brought to the clinics by their owners
or collected from a designated place. The dogs brought
to the CNVR clinics were administered xylazine
(1mg/kg) and atropine sulphate (0.05 to 1mg/kg) as pre-
anesthetic medications and anesthetized using
intramuscular ketamine at 15mg/kg body weight. All
dogs were given ivermectin (1% w/v) injectable for
parasite control. Benzathine penicillin (11000 to 22000
IU/kg) and meloxicam (0.2 mg/kg), were administered
to prevent secondary bacterial infection and to relieve
pain, respectively. Male dogs were castrated through a
single prescrotal incision, and female dogs were
sterilized by complete ovariohysterectomy through a
mid-ventral abdominal incision. The neutered dogs
were ear notched while anesthetized using a cautery
device for identification. After surgery the dogs were
observed in an enclosure and once fully recovered from
anesthesia were either returned to their owners or the
place where they were captured. All procedures
performed on the dogs were approved by the Murdoch
University Animal Ethics Committee. All the animal
handling and surgical procedures were performed by
Veterinarians and Para-veterinarians trained on the
standard HSI protocol for the CNVR programme.
2.2 Population surveys
A survey to monitor and evaluate the CNVR
programme was undertaken in January and February
2012 in the main towns of six districts (Bumthang,
Samtse, Samdrup Jongkha (SJ), Tashigang, Thimphu
and Tsirang). These districts were distributed in
different agro-ecological zones representing the
different regions of Bhutan. Before the surveys were
conducted the enumerators were trained on dog
population counting techniques and scoring of body
and skin conditions. The process included counting
male and female dogs with and without ear notches,
lactating females and puppies. A similar count was
undertaken in the border Indian towns within a 3 km
radius of SJ town, as CNVR had also been performed
in these places.
The health condition of both neutered and entire
dogs was scored in Thimphu through visual assessment
on a scale of 1 to 5 (1 = very thin, 2 = thin, 3 = ideal, 4
= stout and 5 = overweight). The skin condition (mange
score) was assessed for each dog using a four point
scale (0 = normal, 1 = mild, 2 = moderate, 3 = severe).
Dogs were assessed in the street without physical
contact to maximize the examiners safety and to
minimize stress to the dogs.
2.3 Statistical analysis
Descriptive analyses of the proportion of neutered and
vaccinated dogs, lactating female among adult female
dogs and puppies were undertaken and expressed as a
percentage with 95% confidence intervals for each
district town. The Chi-square test of independence was
used to compare the difference in proportions of
neutered dogs (notched dogs) between gender and

Bhutan Journal of Animal Science (BJAS), Volume 4, Issue 1, Page 68-75, 2020
Rinzin et al. (2020) 70
districts. The proportion of puppies of all dogs sighted
and lactating females of adult females were also
compared using chi-square tests. To determine if there
was an association between the CNVR programme and
various health indices, the proportion of dogs in the
different assessment groups were also compared using
chi-square tests. A Pearson’s product-moment
correlation coefficient was computed to assess the
relationship between the proportion of dogs covered
under CNVR and the proportion of lactating bitches and
puppies. Statistical significance was assessed at the 5%
level. All analyses were carried out using the statistical
software package PASW Statistics v18 (SPSS Inc.,
Chicago, IL, USA).
3. RESULTS
3.1 CNVR programme
A total of 32,276 dogs, of which 15,217 (47.2; 95% CI
46.60, 47.69%) were females had been processed
through the CNVR programme by January 2012. More
than half (52.4%; 95% CI 51.89, 52.98) of the dogs
presented to the CNVR clinic were ownerless. The
team came across 526 (1.6%) cases of transmissible
venereal tumour (TVT), 1,112 (7.3%) cases of
pyometra and 1,607 (5.0%) cases of mange during the
CNVR programme. A total of 1,263 bitches (8.1%;
95% CI 7.65, 8.51%) brought to the CNVR clinic were
pregnant.
3.2 Population surveys
A total of 2,886 dogs (2,581 adults and 305 puppies)
were sighted during the survey period in the main towns
of six districts. All dogs found in public places were
classified as free-roaming dogs. For this study adult
dogs were classified as those older than approximately
four months which were eligible for sterilization. Of the
2,581 adults the neuter status of 70 dogs was not known
and 71 dogs had been sterilized in previous anti-rabies
campaigns but had not been ear notched. Consequently,
the final analyses were undertaken on 2,440 adult dogs.
Just over half (52%; 95% CI 50.3, 54.2%) of the adult
dogs sighted had been processed through the CNVR
program. Of these 56.1% were males and 43.9%
females. There were no significant differences in the
sterilization and vaccination coverage between male
(53%) and female dogs (52%) (χ² = 1.486, df = 1; p =
0.22).
The proportions of the CNVR coverage in the
different districts are presented in Table 1. The
coverage was lowest in Bumthang (44/137, 32%) and
highest in SJ (182/252, 72%). Overall, the coverage was
significantly different between the districts (χ² = 70.45,
df = 5; p <0.001). There was no significant difference
in the coverage in SJ town (107/139, 77%) compared
with the adjacent border town in India (49/65, 75%) (χ²
= 0.06, df = 1; p = 0.803).
In Table 2 data on sightings of lactating females
and puppies are presented. A total of 91 (8.3%)
lactating females and 305 (11.1%) puppies were
counted in the visited areas. The proportion of lactating
females of all adult female dogs was significantly
different between districts (χ² = 11.95, df = 5; p = 0.035)
with the highest percentage in Bumthang (9/54, 16.7%)
followed by Samtse (12/91, 13.2%) and Tsirang
(10/108, 9.3%). Similarly, the proportion of puppies
was significantly different between districts (χ² = 38.73,
df = 5; p <0.001) with the highest proportion in Tsirang
(38/187, 20.3%) followed by Samtse (43/234, 18.4) and
Bumthang (23/160, 14.4%). There was a negative
correlation between the proportion of dogs covered
under CNVR and the proportion of lactating bitches (r
= -0.739, n = 6, p = 0.093) and puppies (r = -0.606, n =
6; p = 0.202).
In total 1,835 adult dogs (857 notched and 978 un-
notched) from Thimphu were assessed for body and
skin condition. Approximately two-thirds (61%; 95%
CI 59.2 - 63.6) of the dogs had a body condition score
of 3 which is considered an ideal body condition, 32%
(95% CI 29.6 to 39.9) were thin to very thin (2 to 1) and
only 7% (95% CI 5.8 to 8.1) were categorized as stout
to overweight (4 to 5). Only 21% (95% CI 19.3 to 23.0)
of the sighted dogs had skin problems (skin condition
score 1 to 3).
The proportion of dogs in the five body condition
scores for notched and un-notched dogs in Thimphu
was assessed. Neutered dogs were found to be in
significantly better body condition than entire dogs (χ²
= 27.39, df = 4, p <0.001) with 36% of un-notched dogs
being categorised as thin to very thin compared with
26% of notched dogs. There was no significant
difference in the proportion of dogs with skin problems
in the notched (19%) and un-notched dogs (23%) (χ² =
6.63, df = 3, p = 0.085).
4. DISCUSSION
The counting of dogs with and without ear notches,
lactating bitches and puppies in the selected towns of
six districts was useful for determining the progress of
the CNVR programme in Bhutan. The CNVR coverage
varied from 32% in Bumthang to 73% in SJ (Table 1).
This finding is consistent with studies conducted in
other countries where the coverage differed widely
between locations (Hiby et al. 2011; Kayali et al. 2003;
Kitala et al. 2001a; Matter HC et al. 2000a). The
coverage in the districts was highly dependent on when
the CNVR was carried out, the number of CNVR
programmes conducted in that particular area and the
number of days spent in the area. Bumthang district had
the lowest coverage as the first round of CNVR was
completed in January 2010 and there had been no
subsequent follow-up campaigns. In contrast, SJ had
the highest coverage as the second round of CNVR
program was already completed. The coverage in five
out of six districts surveyed were lower than the
WHO/WSPA recommended minimum vaccination and
sterilization coverage of 70% to eliminate rabies in
dogs and to stabilize the dog population, respectively

Bhutan Journal of Animal Science (BJAS), Volume 4, Issue 1, Page 68-75, 2020
Rinzin et al. (2020) 71
(Cleaveland et al. 2003; Coleman and Dye 1996; WHO
1987, 2004; WHO/WSPA 1990).
A large reduction in the street dog population was
reported in two Indian cities following the
implementation of Animal Birth Control (ABC)
programme. Reece and Chawla (2006) reported a 28%
reduction in the street dog population in Jaipur city
following the ABC programme implemented between
1994 to 2002, as well as reduction of human rabies
cases to zero in the campaign area when compared with
a non-campaign area. Similarly a reduction in the street
dog population in three of the five areas surveyed was
reported in Jodhpur following the implementation of
ABC program between 2005 to 2007 (Totton et al.
2010). There may not be a sudden reduction of the street
dog population seen after implementation of a CNVR
programme in Bhutan owing to the longer lifespan of
dogs in Bhutan. Moreover, the CNVR programme in
Jaipur and Jodhpur were concentrated in one city over
a long period of time unlike the Bhutan programme
where the CNVR team was required to move from
district to district. Therefore, the CNVR programme
should be carried out in all districts until the population
stabilization threshold is achieved.
With the existing composition of the CNVR team
only three districts can be covered simultaneously at a
Table 1: Percentage of free-roaming dogs neutered and vaccinated in selected districts with 95% confidence intervals.
District Notched
dogs Un-notched
dogs CNVR Coverage
(95% CI) Remarks
Bumthang 44 93 32.12 (24.9 - 40.3) First round in October 2009 to Jan 2010
Samtse 100 91 52.36 (45.3 - 59.3) First round in Feb to May 2011.
Samdrup Jongkhar 182 70 72.22 (66.4 - 77.4) Second round completed in January 2012
Tashigang 55 38 59.14 (49.0 - 68.6) First round in May to Aug 2011
Thimphu 825 793 50.99 (48.6 - 53.4) Second round completed in November 2011
Tsirang 64 85 42.95 (35.3 - 51.0) First round ongoing Total 1270 1170 52.05 (50.1 - 54.0)
CNVR programme in SJ town and adjoining Indian border towns within 3 km of the international border
Bhutan side 107 32 77.0 (69.3 - 83.2) Second round completed in January 2012
Indian side 49 16 75.4 (63.7 - 84.2) Second round completed in January 2012
Table 2: Number and percentage of lactating bitches and puppies counted in the main towns of the six selected
districts.
District
Total
dogs
Matured
Female
No. of
Puppies
No. of
Lactating Puppies (%) Lactating (%) Bumthang 160 45 23 9 14.4 20.0 Tashigang 100 43 7 2 7.0 4.7 Tsirang 187 98 38 10 20.3 10.2 Samtse 234 79 43 12 18.4 15.2 SJ 274 101 22 7 8.0 6.9 Thimphu 1790 704 172 51 9.6 7.2 Overall 2745 1070 305 91 11.1 8.5
CNVR progamme along Indo-Bhutan border (SJ, Bhutan and Daranga, Assam, India)
Bhutan (SJ Town
to Char kilo) 135 4 11 150 3.0 7.3
India (from
Bhutan gate to
Mela Bazaar) 65 1 6 72 1.5 8.3

Bhutan Journal of Animal Science (BJAS), Volume 4, Issue 1, Page 68-75, 2020
Rinzin et al. (2020) 72
given time. In order to have sustainable dog population
control it is recommended to build a technical and
staffing capacity in every district to carry out ABC
programmes regularly, in addition to the existing
CNVR team. Since rabies is endemic only in a few
districts, annual dog rabies vaccination should be
carried out in these high-risk areas, in addition to the
ongoing CNVR programme.
In the current survey a higher number of male than
female free-roaming dogs was found in all study areas.
Similarly higher proportions of males have been
observed in studies conducted in other developing
countries (Acosta-Jamett et al. 2010; Brooks 1990;
Butler and Bingham 2000; Kitala et al. 2001b). The
CNVR coverage in male dogs was slightly higher than
female dogs, although ideally a higher proportion of
females should be neutered to have a greater impact on
the dog population. The ABC programme for the street
dog population in Jaipur in India covered only female
dogs to maximize the impact of that programme (Reece
and Chawla 2006; Reece et al. 2008).
In this study it was assumed that there was an
equal probability of detecting a notched and un-notched
dog during the field survey. However, dogs not caught
by the CNVR team are likely to be more sensitive and
the probability of missing those dogs by the
enumerators during the field surveys was high, leading
to overestimation of the number of dogs neutered in the
CNVR programme.
Approximately 75% of observed dogs on the
Indian side had been neutered and vaccinated (Table 1).
The programme had been successful due to the active
involvement of members of the Bhutan Indian
Friendship Association (BIFA) and local leaders on
both sides of the border (Dechen, K – Personal
Communication).
It is recommended that CNVR be extended to
other border towns of India in consultation with the
local Indian authorities. This effort will create a buffer
zone and significantly contribute towards the control of
rabies in humans and other animals in both India and
Bhutan. The number of lactating females and puppies
seen following the CNVR programme was a good
indicator of the success of the programme.
Similarly, it is anticipated that a successful
campaign will result in a change in the age structure of
the population with a greater proportion of adult dogs
in areas where a CNVR programme had been
conducted compared to those where the programme had
not been implemented. The proportion of lactating
females and puppies seen during the survey depended
on when the first round of CNVR had been carried out,
whether the team visited the area for the second time
and the stage of the first and the second round of CNVR
programme (Table 2). Bumthang had the highest
proportion of lactating bitches as the last CNVR
programme had been carried out from October 2009 to
January 2010. The proportion of puppies was highest in
Tsirang due to the fact that the first round of the CNVR
was ongoing during the survey period. A similar study
conducted by Totton et al. (2010) in the Indian city of
Jodhpur reported a higher proportion of adults in the
population (80 to 96%) when compared with sub-adults
(0-18%) and puppies (0-4%). Although there was a
negative correlation between the proportion of dogs
covered under CNVR and the proportion of lactating
females and puppies, the correlation was not
significant. This indicates that the current CNVR
coverage is not sufficient to stabilize the free-roaming
dog population and more dogs, especially females,
should be neutered and vaccinated.
Most of the free-roaming dogs in Bhutan were
found to be in good health condition as they are fed by
members of the local Buddhist communities. The health
condition of the neutered dogs was observed generally
better than that of entire dogs. A similar finding was
reported in a study conducted in Rajasthan in India
(Totton et al. 2011; Yoak et al. 2014). This is due to a
number of behavioral and health benefits arising from
the neutering of dogs (Reichler 2009). The repeated
pregnancies in female dogs can physically stress the
animals while the absence of pregnancy can improve
the health of dogs (Jackman and Rowan 2007). There is
a reduced risk of acquiring cancer or other diseases of
the reproductive organs, including TVT and pyometra,
after sterilization (Jackman and Rowan 2007, Michell
1998). Neutering has been identified as an important
risk factor for obesity in dogs due to increased food
consumption, decreased metabolic rate and reduced
physical activity (German 2005; Robertson 2003).
However, in this study only few obese dogs (1%) were
sighted. This could be due to the type of diet that free-
roaming dogs can access and their continuous physical
activity searching for food when compared to owned
and confined dogs or dogs in other nations.
Approximately 20% of the dogs had skin
problems with 17% having mild, 2% moderate and 1%
severe problems. There was no significant difference in
the skin condition scores between neutered and entire
dogs. Although neutered dogs would be expected to
have fewer skin problems as they were treated with
ivermectin in this study, the time of examination after
the single treatment was more than 3 months when the
antiparasitic effect of ivermectin would have gone or
been reduced (Campbell and Benz 1984, Scheidt et al.
1984). In contrast others have found a higher
prevalence of skin problems in sterilized dogs. This was
believed to be due to infections acquired during the
CNVR programmes and transfer of ticks to dogs
awaiting surgery (Totton et al. 2011; Yoak et al. 2014).
These contrasting findings may also be due to the
influence of external factors such as climate, breed, and
type of food available. It is likely that in the current
study the prevalence of skin problems was
underestimated as it is difficult to assess animals from
a distance, in contrast to caught or anesthetized dogs.
Through the ongoing CNVR programme 32,276
dogs were neutered and vaccinated, representing 65%
of the 2005 dog population (DOL 2006). In contrast,
based on more recent population surveys in six districts,
Bhutan Journal of Animal Science (BJAS), Volume 4, Issue 1, Page 68-75, 2020
Rinzin et al. (2020) 73
the coverage is estimated at 52%. The calculation of
coverage (neutered and vaccinated) based on the earlier
record may be an overestimate due to under estimation
of the population as the 2005 census did not include
stray dogs. It is important to estimate the population of
both owned and un-owned dogs using suitable
scientific methods. Cross-sectional household surveys
have been performed to estimate the owned dog
population (Butler and Bingham 2000; De Balogh et al.
1993; Kitala et al. 2001b; Matter et al. 2000a) while for
free-roaming dog populations, capture-mark-recapture
surveys have been used (Childs et al. 1998; De Balogh
et al. 1993; Hiby et al. 2011). In order to plan long term
dog population control, it is important to confirm the
proportion of owned dogs that are free-roaming.
Enumeration of dogs should be undertaken before the
start of any CNVR programme, and during and after its
implementation to allow effective planning of the
programme and monitoring of its success. In order to
continuously monitor and evaluate the success of the
CNVR programme, indicator counts should be
undertaken by selecting one or two routes across the
cities. Repeated indicator counts should be conducted
along the fixed routes at least twice a year
approximately six weeks after the peak whelping
season i.e. July and January in Bhutan.
5. CONCLUSION
The high tolerance of the Bhutanese society to free-
roaming dogs may lead to the dog population becoming
unmanageable, resulting in a threat to the welfare of
dogs and public health if appropriate interventions are
not taken. The CNVR programme undertaken by the
Royal Government of Bhutan and Humane Society
International provides a solution to address the
increasing dog population problem. This study
highlighted the status of the CNVR programme in
Bhutan, as well as various benefits to the welfare of the
dogs and the control of rabies. Dogs that were neutered
and vaccinated were found to be in better body
condition compared with un-neutered and un-
vaccinated dogs. The proportion of the lactating
females and puppies sighted were higher in those places
where the CNVR programme was carried out less
frequently. The overall CNVR coverage of 52% is
much lower than the WHO Expert Committee
recommended 70% vaccination and sterilization
coverage to break the rabies cycle and to maintain a
stable dog population. This indicates that there should
be continuous follow-up CNVR programmes in all
districts by specifically targeting females. The CNVR
programme should be continued and combined with
education on responsible dog ownership and habit
control (food, water and shelter) through a one health
approach. At the same time routine monitoring work
should be repeated at six monthly intervals to evaluate
the dog population control programme, as well as its
benefit to the welfare of the dogs.
ACKNOWLEDGEMENT
The authors would like to thank Department of
Livestock, Royal Government of Bhutan and Humane
Society International for supporting this research. We
would also like to thank the concerned officials from
NCAH, Dzongkhag Livestock Office and National Dog
Population Management and Rabies Control Project
team in Bhutan for their support during the field
surveys. We wish to thank Australian Postgraduate
Endeavour Award Team for funding the principal
author’s scholarship to undertake PhD programme at
Murdoch University.
REFERENCES
Acosta-Jamett G, Cleaveland S, Cunningham AA and
Bronsvoort BM (2010). Demography of domestic
dogs in rural and urban areas of the Coquimbo
region of Chile and implications for disaese
transmissions. Preventive Veterinary Medicine 94:
272-281.
Brooks R (1990) Survey of the dog population of
Zimbabwe and its level of rabies vaccination.
Veterinary Record, 127: 592-596.
Butler J and Bingham J (2000). Demography and dog-
human relationships of dog population in
Zimbabwean communal lands. The Veterinary
Record 147: 442-446.
Butler J, du Toit J and Bingham J (2003) Free-ranging
domestic dogs (Canis familiaris) as predators and
prey in rural Zimbabwe; threats of competition and
disease to large wild carnivores. Biological
Conservation 115: 369-378.
Campbell WC and Benz GW (1984). Iveermectin - A
review of efficacy and safety. Journal of Veterinary
Pharmacology and Therapeutics 7: 1-16.
Childs JE, Robinson LE, Sadek R, Madden A, Miranda
ME and Miranda NL (1998). Density estimates of
rural dog populations and an assessment of marking
methods during a rabies vaccination campaign in
the Philippines. Preventive Veterinary Medicine,
33: 207-218.
Cleaveland S, Kaare M, Tiringa P, Mlengeya T and
Barrat J (2003). A dog rabies vaccination campaign
in rural Africa: impact on the incidence of dog
rabies and human dog-bite injuries. Vaccine, 21: 1965-
1973.
Cleaveland S, Mlengeya T, Kaare M, Haydon D,
Lembo T, Laurenson MK and Packer C (2007). The
conservation relevance of epidemiological research
into carnivore viral diseases in the Serengeti.
Conservation Biology 21: 612-622.
Clutton-Brock J (1995). Origins of the dog:
domestication and early history Cambridge
University Press.
Coleman PG and Dye C (1996). Immunization coverage
required to prevent outbreaks of dog rabies. Vaccine
14: 185-186.

Bhutan Journal of Animal Science (BJAS), Volume 4, Issue 1, Page 68-75, 2020
Rinzin et al. (2020) 74
Coppinger R and Schneider R (1995). Evolution of
working dogs: Cambridge University Press.
De Balogh KK, Wandeler AI and Meslin FX (1993). A
dog ecology study in an urban and a semi-rural area
of Zambia. Onderstepoort. Journal of Veterinary
Research, 60: 437-443.
DoL (2005). Livestock Statistics. Department of
Livestock, Thimphu, Bhutan
Feldman K, Trent R and Jay M (2004). Epidemiology
of Hospitalizations resulting from dog bites in
California, 1991-1998. American Journal of Public
Health 94: 1940-1941.
German AJ (2005). The Growing Problem of Obesity in
Dogs and Cats Pages 1940 - 1946 in Finley DA,
Kallfeltz FA, Morris JG, Rogers QR, eds. The
WALTHAM International Nutritional Sciences
Symposium: Innovations in Companion Animal
Nutrition. Washington DC.
Hemachudha T (2005). Rabies and dog population
control in Thailand: success or failure? J Med Assoc
Thai 88: 120-123.
Hiby LR (2005). Final Report. Estimating the number
of stray dogs in greater Cairo – final report to the
World Society for the Protection of Animals
(WSPA). . Cairo: World Society for Protection of
Animals (WSPA). Report no.
Hiby LR, Reece JF, Wright R, Jaisinghan R, Wright R,
Singh B and Hiby EF (2011). A mark-resight survey
method to estimate the roaming dog population in
three cities in Rajasthan, India. BMC Veterinary
Research 7/46.
International Companion Animal Management
Coalition (2007). Humane Dog Population
Management Guidance. International Companion
Animal Coalition. Report no.
Jackman J and Rowan A (2007). Free-Roaming Dogs in
Developing Countries: The Benefits of Capture,
Neuter, and Return Programs. Pages 55-78. The
State of the Animals IV.
Kayali U, Mindekem R, Yémadji N, Vounatsou P,
Kaninga Y, Ndoutamia AG and Zinsstag J (2003).
Coverage of pilot parenteral vaccination campaign
against canine rabies in N’Djaména, Chad. Bulletin
of World Health Organization 81: 7.
Keuster T, Lamoureux J and Kahn A (2005).
Epidemiology of dog bites: A Belgian experience of
canine behaviour and public health concerns The
Veterinary Journal
Kitala P, McDermott J, Kyule M, Gathuma J, Perry B
and Wandeler A (2001). Dog ecology and
demography information to support the planning of
rabies control in Machakos District, Kenya. Acta
Tropica, 78: 217-230.
Manor R and Saltz D (2003). The impact of free-
roaming dogs on gazelle kid/ female ratio in a
fragmented area. Biological Conservation, 119:
231-236.
Marsh L, Langley J and Gauld R (2004). Dog bite
injuries. New Zealand Medical Journal, 117: 1-6.
Matter H, Wandeler A, Neuenschwander B,
Harischandra L and Meslin F (2000). Study opf the
dog population and the rabies control activities in
the Mirigama arae of Sri Lanka. Acta Tropica 75:
95-108.
Michell A (1998). Neutering and longevity in dogs.
Veterinary Record, 142: 288.
Murray R and Penridge H (1992). Dogs in the urban
environment - A Handbook of Municipal
Management Chiron Media Mackay.
National Centre for Animal Health (2006). A policy and
operational strategy: Guidelines for prevention and
control of rabies in Bhutan and emergency
preparedness plan. Thimphu: National Centre for
Animal Health, Department of Livestock.
Office Internation des Epizooties (2010). Terrestrial
Animal Health Code in OIE, ed. Chapter 7.7 : Stray
dog population control.
Overall K and Love M (2001). Dog bites to humans -
demography, epidemiology, injury, and risk.
Journal of American Veterinary Medical
Association, 218: 1923-1934.
Reece J and Chawla S (2006). Control of rabies in
Jaipur, India, by the sterilisation and vaccination of
neighbourhood dogs The Veterinary Record, 159:
379-383.
Reece JF, Chawla SK, Hiby EF and Hiby LR (2008).
Fecundity and Longevity of roaming dogs in Jaipur,
India. BMC Veterinary Research, 4:6.
Reichler IM (2009). Gonadectomy in Cats and Dogs: A
Review of Risks and Benefits. Reprod Dom Animal
44: 29-35.
Rinzin K, Tenzin T, JTebje-Kelly JBU, Tshering P and
Stevenson MA (2006). Descriptive spatial and
temporal epidemiology of rabies in Bhutan 11th
International Symposium on Veterinary
Epidemiology and Economics (ISVEE) conference.
Cairns, Queensland, Australia
Robertson I and Thompson R (2002). Enteric parasitic
zoonoses of domesticated dogs and cats. Microbes
and Infection, 4: 867-873.
Robertson ID (2003). The association of exercise, diet
and other factors with owner-perceived obesity in
privately owned dogs from metropolitan Perth, WA
Preventive Veterinary Medicine, 58: 75-83.
Robinson D (1974). Dog Nuisance vs Dog Control.
Journal of American Veterinary Medical
Association, 165.
Savolainen P (2007) Domestication of dogs in Jensen
P, ed. The Behaviour Biology of Dogs Cromwell
Press.
Scheidt VJ, Medleau L, Seward RL and Schwartzman
RM (1984). An evaluation of ivermectin in the
treatment of sarcoptic mange in dogs. American
Journal of Veterinary Research 45: 1201-1202.
Schlundt J, Toyofuku H, Jansen J and Herbst SA
(2004). Emerging foodborne zoonoses. Rev. Sci.
tech Off. int. Epiz. 23: 513-553.
Stafford K (2006). The Domestication, Behaviour and
Use of Dogs Dordrecht: Springer.
Bhutan Journal of Animal Science (BJAS), Volume 4, Issue 1, Page 68-75, 2020
Rinzin et al. (2020) 75
Tourism Council of Bhutan (2010). Bhutan tourism
monitor: Annual report 2009. Thimphu: Tourism
Council of Bhutan, Royal Government of Bhutan.
Tourism Council of Bhutan (2011). Bhutan tourism
monitor: Annual report 2010. Thimphu: Tourism
Council of Bhutan, Royal Government of Bhutan.
Tenzin, Dhand NK, Ward MP (2011a). Patterns of
Rabies Occurrence in Bhutan between 1996 and
2009. Zoonoses and public health, 58: 463-471.
Tenzin, Dhand NK, Dorjee J, Ward MP 2011b Re-
emergence of rabies in dogs and other domestic
animals in eastern Bhutan, 2005-2007.
Epidemiology and Infection 139: 220-225.
Tenzin, Sharma B, Dhand NK, Timsina N and Ward
MP (2010) Reemergence of Rabies in Chhukha
District, Bhutan, 2008. Emerging Infectious
Diseases, 16: 1925-1930.
Tenzin, Dhand NK, Gyeltshen T, Firestone S, Zangmo
C, Dema C, Gyeltshen R and Ward MP (2011c) Dog
bites in humans and estimating human rabies
mortality in rabies endemic areas of Bhutan. PLoS
neglected tropical diseases, 5: e1391.
Totton SC, Wandeler AI, Ribble CS, Rosatte RC and
McEwen SA (2011). Stray dog population health in
Jodhpur, India in the wake of an animal birth control
(ABC) program. Preventive Veterinary Medicine,
98: 215-220.
Totton SC, Wandeler AI, Zinsstag J, Bauch CT, Ribble
CS, Rosatte RC and McEwen SA (2010). Stray dog
population demographics in Jodhpur, India
following a population control/rabies vaccination
program. Preventive Veterinary Medicine, 97: 51-
57.
World Health Organization (1987) Guidelines for dog
rabies control: World Health Organization.
World Health Organization (1988). Report of WHO
consultation on dog ecology studies related to rabies
control: WHO/Rab.Res/88.25.
World Health Organization (1996). Report on third
international symposium of rabies in Asia. World
Health Organization. Report no.
World Health Organization (2004). WHO Expert
Consultation on Rabies Geneva: World Health
Organization. Report no.
World Health Organization and World Society for
Protection of Animals (1990). Guidelines for dog
population management Geneva, Switzerland:
World Health Organization and World Society for
Protection of Animals Report no.
Yoak AJ, Reece JF, Gehrt SD and Hamilton IM (2014)
Disease control through fertility control: Secondary
benefits of animal birth control in Indian street dogs.
Preventive Veterinary Medicine, 113: 152-156.
Zinsstag J, Durr S, Penny MA, Mindekem R, Roth F,
Menendez Gonzalez S, Naissengar S and
Hattendorf J (2011). Transmission dynamics and
cost-effectiveness of rabies control in dogs and
humans in an African city. Medecine tropicale :
revue du Corps de sante colonial 71: 596-604.

Bhutan Journal of Animal Science (BJAS)
Volume 4, Issue 1, Page 76-82, 2020
76
Full length paper
ASSESS MILK PRODUCTION OF CATTLE BREEDS IN DIFFERENT AGRO-ECOLOGICAL ZONES
OF WESTERN BHUTAN
DEKI CHODEN*, LOKEY THAPA AND NB TAMANG
National Dairy Research and Development Centre, Department of Livestock, Ministry of
Agriculture and Forests
*Author of correspondence: [email protected]
Copyright © 2020 Deki Choden. The original work must be properly cited to permit unrestricted
use, distribution, and reproduction of this article in any medium.
ABSTRACT: The study was conducted in seven functional Dairy Farmers Groups (DFGs) of
Thimphu and Chukha Dzongkhags from June 2017 to May 2018, to assess milk production level of
dairy cattle breeds with varying exotic inheritance level, lactation no, age and herd type in three
Agro-Ecological Zones (AEZ) of western Bhutan. The study also compared milk yield in different
seasons and AM-PM milking. Prevalent dairy cattle breeds in the study area were Jersey Cross (JX),
pure Holstein Friesian (HF) and HF cross. The overall mean daily milk yield (DMY) was 7.72 ±3.75
litres and days in milk (DIM) was 266.51±81.03 days. Mean DMY recorded in Cool temperate, Warm
temperate and Dry sub-tropical AEZs were 5.63±2.14, 6.30±1.94 and 9.07±4.28 litres respectively.
Mean DMY of HF pure, HF cross and JX cows were 12.41±3.7, 10.74±5.79 and 6.92±3.07 litres
respectively. Cows of exotic inheritance level of 50-75% produced higher mean DMY of 8.44±3.89
l/day than exotic inheritance level of above 75% (7.58±3.66 l/day) and below 50% (5.57±2.2 l/day).
Similarly among different herd size, mean DMY of medium herd size (6-10 cows) was highest
(11.81±4.79 l/day) as compared to very small (1-2), small (3-5),and large (>10 milking dairy cows)
herd sizes which yielded 6.58±2.94, 6.96±2.98, and 10.2±2.47 l/day, respectively. The aspects that
determined productivity were breed, exotic inheritance level and herd type which showed significant
differences (p<0.05) in DMY. The DMY increased from 1st (6.57±3.67) to 2nd (8.68±3.38) and highest
was observed in 3rd lactation (8.77±4.67). Thus, the findings suggest that cows above 11 years of
age, are not advisable to retain in farmers’ field because of its decreasing productivity with age.
Significant difference in milk yield between AM (4.74±2.19) and PM (3.16±1.59) milking was observed.
However, no significant difference was observed in DMY across seasons although yield in winter (7.42±4.16)
and autumn (7.60 ±3.93) were lower than summer (8.07 ±4.51) and spring (7.86±4.49) seasons. As the
study found higher productivity of cows in the lower altitudes, it can be deduced that dairy farming is more
suitable in such warmer areas. Nonetheless, further studies are needed to establish whether altitude or other
management practices affect milk production.
Keywords: Agro-ecological zones; cattle breeds; milk production.
1. INTRODUCTION
In Bhutan, cattle form an important element of farming
system, mainly reared for milk, manure and draught
power. So, it is inevitable to know about milk production
aspects because major chunk of farmers' income come
from milk, data from milk recording forms the basis to
control herd management and genetic improvement of
cows (Siddiky 2017). Cunha et al. (2010) reported that in
some countries, the established dairy farms use various
Lactation Curve Models designed by Brody et al. (1923);
Brody et al. (1924);Wood (1967); Cobby & LeDu (1978);
Wilmink (1987); Rook et al. (1993); Dijkstra et al. (1997)
and Pollott (2000) for estimating milk production.
Lactation curve models are useful in genetic breeding
programs, herd nutritional management, decision taking
on the culling of cows and milk production simulation
systems.
However, in Bhutanese context, data on livestock
population, milk production and its allied products are
obtained during livestock census conducted annually
through enumeration of households by the Extension staff
of the respective geog. These data sets are compiled,
validated and published annually by Department of
Livestock (DoL), Ministry of Agriculture and Forests.
According to livestock statistics 2017 there are 303,250

Bhutan Journal of Animal Science (BJAS), Volume 4, Issue 1, Page 76-82, 2020
Choden et al. (2020) 77
heads of cattle out of which 88,257 are in milk including
10,521 milking yaks and 3,386 milking Zom and
produced 50250.504 MT of milk in the country. In order
to bring improvement in the livestock statistics, in 2014 a
pilot survey on estimation of milk production was first
implemented by DoL in Haa Dzongkhag followed by
another survey in Samdrup Jongkhar Dzongkhag in 2016
with more precise operational and technical details. Both
the surveys were in support towards “Implementation of
Food and Agriculture Organization (FAO) Global
Strategy for Improving Agricultural and Rural Statistics”
funded by FAO. The survey although had reference
period of one year for reporting milk production livestock
census is conducted only once a year so the respondents
may not be able to recall the past production level which
may lead to under or over reporting of data. Moreover,
time series data of livestock census show variations in
livestock number as well as production in a number of
Gewogs. This may be due to missing data sets or other
factors like season, management practices, type of animal
etc. Therefore, this study attempts to find out milk
production trends in dairy cattle of different breeds, exotic
inheritance level and parity and compare milk yield of
different season and AM/PM milking in three agro-
ecological zones of Western Bhutan.
2. MATERIALS AND METHODS
2.1 Location of the study
This study was carried out in Chukha and Thimphu
Dzongkhas representing three Agro-Ecological Zones
(AEZs); Cool temperate (2600-3600), Warm temperate
(1800-2600) and Dry sub-tropical (1200-1800) masl
(adapted from MoAF 9th FYP and BAP III).
2.2 Data collection method
Seven functional Dairy Farmers Groups (DFGs) of these
two Dzongkhags falling under 3 AEZs having dairy cattle
either milking or cows in advanced pregnancy stages
were purposively sampled and 50% of members were
randomly drawn from the list provided by the respective
livestock sector offices. Data were collected by recording
Daily Milk Yield (DMY) of dairy cows by the farmer of
the sampled households across all four seasons covering
a period of one year from June 2017 to May 2018.
Animals were categorized into three groups depending
upon exotic inheritance level (> 75%), (50-75%) and
(<50%) through phenotypic characteristics and owner’s
information. Herd size was clustered into four groups
namely very small (1-2), small (3-5), medium (6-10) and
large (>10) milking dairy cows according to
characteristics of dairy production system practiced in the
country. Seasons were Spring (March, April, May);
Summer (June, July, August); Autumn (September,
October, November) and Winter (December, January,
February).
2.3 Milk recording
For monthly milk recording, Owner-Sampler (O-S)
testing method used for Dairy Herd Improvement (DHI)
testing program adopted by United States Dairy
Association (USDA) was applied. Sampled households
were provided with a booklet to record the DMY of each
cow for both morning (AM) and evening PM) milking by
the owner. This booklet captured information such as
animal breed, exotic inheritance level, age, lactation
no/stage, parity and herd type. AM and PM milk yield
were recorded individually and the total daily yield was
obtained by summing up the two partial milk yields.
DMY was obtained by dividing the total daily yield by
total days-in-milk (DIM). Recordings through the study
period were validated by visiting herd/ household at
monthly interval. Records of those animals either died or
sold during the study period were discarded. Absence of
evening milking and milk production during dry days as
well as when animals were sick were coded as missing
data. After cleaning the data, out of 405 heads listed,
records of 372 animals belonging to 162 members were
considered for the study.
2.4 Data analysis
Statistical Package for Social Science- version 20 was
used to analyze both quantitative and qualitative data.
Mean, standard deviation and percentage were used to
describe the quantitative variables while qualitative data
were presented by ANOVA and paired sample T test.
Excel was used producing graph. Field observations and
impressions were described.
Table 1: Mean (±SD) milk yields and days in milk in different agro-ecological zones
Variables Cool temperate Warm temperate Dry Sub-Tropical Overall
No of DFG 2 2 3 7
No of members 22 69 71 162
No of cows(N) 53 115 204 372
Total milk yield (l) 1366.23 ± 820.76 1704.33 ± 735.69 2515.45 ± 115.75 2100.96 ± 1315.76*
AM milk yield (l) 929.39 ± 534.47 984.17 ± 409.63 1547.61 ± 877.47 1285.35 ± 772.61*
PM milk yield (l) 492.61 ± 328.00 720.15 ± 339.24 982.27 ± 652.69 835.83 ± 562.78*
Days in milk 236.19 ± 91.55 267.70 ± 80.42 273.71 ± 77.00 266.51 ± 81.03*
* The mean difference is significant at the .05 level

Bhutan Journal of Animal Science (BJAS), Volume 4, Issue 1, Page 76-82, 2020
Choden et al. (2020) 78
3. RESULTS AND DISCUSSIONS
3.1 Milk Production Profile
Overall mean days in milk (DIM) for dairy cattle in the
study area was 266.51±81.03 days. With the lactation
length, total milk from 372 milking cows belonging to
162 farmers under three AEZ zones recorded daily (both
morning and evening) showed an overall mean milk yield
of 2100.96 ±1315.76 litres (AEZs), 1285.35±772.61
(AM) and 835.83±562.78 litres PM) (Table 1). This
finding is far above the South Asian average of 627.86
litres during 2011 (Siddiky 2017) indicating cows in
Bhutan are better producers than in other south Asian
countries.
3.2 Mean DMY in different agro-ecological zones
The overall average DMY in the study area was 7.72
(±3.75), ranging from 2.29 to 23.01 litres/day. Mean
DMY in dry sub-tropical zone (9.07±4.28) was
significantly higher than cool temperate zone (5.63±2.14)
and warm temperate zones (6.30±1.94) whereas DMY
between warm temperate and cool temperate zones were
not significantly different (Table 2). This could be
attributed to different environment conditions and
adoption of different management practices, particularly
the feeding and management practices (i.e. stall-feeding
verses open grazing) as reported by Rahman & Aleman
(2008). In this study, for instance, cows in dry sub-
tropical zones are completely stall-fed and presence of
Pasakha Brewery Industry within vicinity of the farms is
a boon to the farmers because industrial brewery by-
products (wet distiller grain) are available at a very cheap
price and is easily accessible to feed the milking cows.
Besides, broad leafed fodder trees are also found
bountifully in the farms of sampled farmers of this zone.
Moreover, cattle concentrate is also manufactured nearby
incurring less transportation cost, enables farmers to
provide as per requirement. In contrast, majority of the
farmers in cool and warm temperate zones practice
mostly semi or complete open grazing native pastures in
forest. Native pastures are often low in nutritive value
(Siddiky 2017). Although concentrate is fed to milking
animals but affordability vis-a-vis feeding of required
quantity by all sampled farmers of this zone is a question.
Another reason for difference in DMY in different AEZ
may be attributed to herd composition of different dairy
breeds because Holstein Friesian (HF) breed, which is
comparatively high yielder than Jersey (Rahman &
Aleman, 2008), was not found in Cool temperate zone
except few heads in Warm temperate zone as seen in Dry
sub-tropical zone during the study period. The overall
average DMY in the study was consistent with yields of
7.15 l/day among Indian exotic/crossbred cows (DoAH
2016).
3.3 Mean DMY of different dairy cattle breeds
Prevalent dairy cattle breeds in the study area were Jersey
and HF considered as exotic breeds. Jersey Cross (JX)
was found across all the AEZ while HF and its crosses
were found only in Dry sub-tropical zone. There were
significant differences in DMY among the breeds
(p<0.05). HF pure cows produced significantly higher
daily yield (12.41±3.7) than JX (6.92±3.07). However, no
significant difference in DMY was observed within HF
pure and its crosses (10.74±5.79) cows (Table 2).
Wangdi et al. (2014) accredited difference in DMY
to genetic potential of the different dairy cattle breeds in
producing milk beside management and environmental
factors (Wanjala & Njehia, 2014). Jersey is a temperate
breed; nonetheless, DMY of JX crossed with Bos indicus
gene increases with decrease in altitude, indicating JX can
perform better in warmer climate. This could be attributed
Table 2: Mean DMY by breed, exotic inheritance level and herd type in different AEZ
Variables/
Cool
temperate Warm temperate
Dry
sub-tropical Overall
p
value
Categories Mean SD Mean SD Mean SD N Mean SD AEZs 5.63 2.14 6.30 1.94 9.07 4.28 372 7.72 3.75 .000
Jersey Cross 5.63 2.14 6.30 1.95 7.87 3.72 315 6.92 3.07 .000
HF pure 0.00 0.00 6.91 0.00 12.53 3.64 48 12.41 3.70
HF cross 0.00 0.00 0.00 0.00 10.74 5.79 9 10.74 5.79
>75% 6.77 2.41 8.12 0.00 8.28 4.65 22 7.58 3.66 .000
50-75% 5.70 2.20 6.51 1.86 9.58 4.18 264 8.44 3.89
<50% 4.97 1.73 5.94 2.03 5.32 2.86 86 5.57 2.21
Very small 5.83 2.35 0.00 0.00 0.00 0.00 175 6.58 2.94 .000
Small herd 5.26 1.85 6.08 1.89 7.50 3.94 116 6.96 2.86
Medium herd 6.67 2.54 7.02 1.96 7.89 3.27 55 11.81 4.79
Large herd 0.00 0.00 0.00 0.00 12.19 4.12 26 10.20 2.47
The mean difference is significant at the 0.05 level

Bhutan Journal of Animal Science (BJAS), Volume 4, Issue 1, Page 76-82, 2020
Choden et al. (2020) 79
to feeding and management practices adopted by farmers.
In cool temperate zone farmers were found to be relying
on less nutritive forages via forest grazing. Thus, under-
feeding in temperate zones might have not allowed cows
to express its full genetic potential in producing milk.
DMY of JX in this study is almost double of 3.57 ±0.04
litres that was reported in the country by Wangdi et al.
(2014) and at par with Jerseys under sub-temperate
conditions of Himachal Pradesh in India and tropical
Kenya for yields of 6.06 and 6.47 litres per day
respectively (Dinesh et al. 2014; Wanjala & Njehia 2014).
HF was ranked as highest milk yielder in India (Landes et
al. 2017).
3.4 Mean DMY of different exotic inheritance level
Majority of animals (70.9%) were in 50 – 75% exotic
inheritance level. Six and 23.3percent were above 75%
and below 50% exotic inheritance level respectively.
Result showed that across AEZs there was significant
differences in DMY among different exotic inheritance
level (p<0.05). Cows with exotic inheritance level of 50-
75% yielded significantly higher mean milk yield
(8.44±3.89) l/day than cows of other two categories,
above 75% (7.58±3.66) l/day or below 50%
(5.57±2.21)l/day (Table 2). This is indicative that most
suitable exotic inheritance level at the village level for
optimum production is between 50-75%. Higher yields
from cows of this group may be attributed to its
adaptability to local environment and ease in management
of animals. The result is in agreement with the earlier
findings of Choden and Tamang (2018) who reported that
exotic inheritance level of 50-75% was the most preferred
exotic inheritance slab by the farmers owing to ease in
management. However, exotic inheritance of 50% was
found to be ideal for both production and reproduction in
India (Landes et al. 2017).
3.5 Mean DMY of different herd size
Majority of farms (47%) were very small and were found
only in cool temperate zone while small (14.8%) and
medium (31.2%) farms were found across all zones of the
study area. Large size herds (7%) were found in sub-
tropical zone only. There were significant differences in
DMY across herd sizes at p<0.05. Medium herd size
(11.81±4.79) yielded highest milk yield followed by large
(10.2±2.47), small (6.96±2.98) and very small
(6.58±2.94) was lowest (Table 2). The result indicates
that medium herd size is better off in milk production than
other herd sizes. It also suggested that too big or too small
herd size is either difficult to manage or not cost-effective
owing to shortage of labor, feed and fodder resources
constraint and inadequate technical knowhow on dairy
husbandry aspects. Aujla & Hussain (2015) also
supplemented the view that feeding and labor cost are
most important variable cost in milk production, hence
any variation will impact productivity of the individual
animal. Thus, labor saving devices for the larger herds
such as milking machine and knowing economic
efficiency for smallholders may increase productivity of
the animals. However, in India herd size ranges from 1-6
cows with DMY of 7.02 litres from crossbred cows
during 2012-13 (Rajeshwaran 2016).
3.6 Mean DMY of different lactations
The study found that mean DMY increased from 1st
lactation (6.57±3.67) to 2nd (8.68±3.38) and recorded
peak in 3rd lactation (8.77±4.67). The production then
declined with increase in number of lactations (Figure 1).
Figure 1: Mean DMY in different lactations
There is slight deviation from earlier findings of Tamang
et al (2018), where milk production is reported to increase
till the fourth lactation in Government farm in Bhutan. In
current study the yield could not reach the maximum
point as expected, mainly because of improper
management of animals. Under-feeding of cows with
high genetic merit is reported to be one of the biggest
nutritionally induced problems being faced by many
smallholder farmers, as improvement in feeding systems
resulted in harnessing maximum productivity from cows
of high genetic potential (Siddiky 2017). Estimation of
total lactation yield of different exotic inheritance level
and breed indicated that lactation yield was highest for
exotic inheritance level of 50-75 % (2574 litres).
Similarly, lactation yield of HF Pure was highest with
3307 litres followed by HF cross 2862 litres and Jersey
cross 1844 litres. Corrected lactation yield (305 days)
however was higher than lactation yield with 3785 litres,
3275 and 2110 for pure HF, HF cross and Jersey cross
respectively (Table 3).
Table 3: Lactation yield and corrected lactation yield of different breed and exotic inheritance level Breed and exotic inheritance level
Lactation yield(litres)
Corrected 305 days lactation yield (litres)
HF pure HF cross Jersey cross >75%
3307 2862 1844 2020
3785 3275 2110 2312
50-75% 2249 2574 <50% 1484 1698 Lactation yield was calculated based on mean DMY and DIM 266.5days
0.00
1.00
2.00
3.00
4.00
5.00
6.00
7.00
8.00
9.00
10.00
1 2 3 4 5 6 7 8 9M
ean
DM
Y (
l)
Lactations

Bhutan Journal of Animal Science (BJAS), Volume 4, Issue 1, Page 76-82, 2020
Choden et al. (2020) 80
3.7 Mean DMY of different age
This study found that milk yield increases as the cows
matures till eight years old with little exception at seven
years that corresponds to 3rd lactation with average age at
first calving of 3 years and inter-calving period of 14
months. Thereafter, production capacity gradually
declines (Figure 2). The result suggests that cows above
11 years of age corresponding to 6th lactation are not
advisable to retain in farmers’ field because production is
too low that it may not cover its cost of production.
Likewise, Fernando et al. (2016) claimed that when cows
become older the structure of udder change due to
deposition of fat resulting in reduced milk yield.
Figure 2: Mean DMY of cows at different age
3.8 Mean DMY in different season
Although milk yield in summer and spring was higher
than other seasons, seasonal variation in daily milk yield
was not significantly different (Table 4). This is in
divergent with the findings of other researchers who had
observed influence of season on milk production (Dorji &
Tamang 2016). This may be due to management aspects
especially housing and interaction between animal and its
surrounding environment. It was observed animals were
housed in thick walled shed in colder areas while in
warmer areas sheds just have roof to protect from rain and
heat allowing enough airflow. Bhutan is a temperate
country so animals do not suffer from heat induced stress
in summer. Similarly, cattle have mechanism making
thermal balance of body even in unfavorable cold
conditions and are adapted to conditions of low air
temperature than higher (Cerny et al. 2016). Accordingly,
animals may be adapted to cooler environment of the
country. This proves true as Singh et al. (2015) reported
milk production performance of dairy cattle under same
management conditions were markedly affected by
seasonal variation in sub-tropical country like India. Milk
yield was lowest in rainy season though green fodder was
abundant but of lower nutritive value due to high moisture
content but feed intake reduced as a result of high relative
humidity and air temperature.
Table 4: DMY in different season
Season N Mean SD SE p value Summer 334 8.07 4.51 0.25 0.231
Autumn 345 7.60 3.93 0.21
Winter 302 7.42 4.16 0.24
Spring 258 7.86 4.49 0.28
3.9 Mean DMY of AM and PM milking
A paired-samples t-test showed significant difference in
actual milk yield obtained during AM and PM milking
(Table 5). On an average, DMY in AM milking
(4.74±2.19) was 33.34% higher than PM milking
(3.16±1.59). The milk yield was reported to vary
considerably between the AM and PM milking because
there is usually a much shorter interval between the AM
and PM milking than between the PM and AM milking
and cows tend to produce more milk during AM than PM
milking (Cziszter et al. 2013). Factors influencing these
yields differ for different circumstances (Ouweltjesn
1998). In the present context this could be attributed to
management factors. It is because in some study area once
the AM milking is finished dams are either tied or let
loose nearby homestead while calves are retained in the
shed. Many other times due to absence or negligence of
owner, calf suckles accidentally, leaving no or less milk
for PM milking. Another reason could be due to common
practice of gradual drying off method, by reducing
milking of teats towards end of lactation or not milking
some cows in the evening. Finding of DIM for AM
(266.51±81.03) was significantly higher than PM
(254.08±85.24), which supports the view.
Table 4: Mean AM / PM milking and days in milk Variables N Mean SD Sig. (2-tailed) AM-DMY 372 4.74 2.19 .000 PM-DMY 362 3.16 1.59
AM- DIM 372 266.51 81.03 .000
PM-DIM 362 254.08 85.24
4. CONCLUSION & RECOMMENDATIONS
With thorough assessment of milk production in different
AEZs, the study concluded that overall average daily yield of
exotic cross cows is 7.72 litres. Cows tend to perform
comparatively better in dry sub-tropical zone both in terms of
milk yield as well as days in milk indicating lower/warmer
altitude is better for dairy farming. Nonetheless, further studies
are needed to establish whether altitude or other management
practices affect the milk production. Pure HF cows produced
significantly higher milk yield than that of JX. Jersey
breed though a temperate breed, its crosses (JX) with Bos
indicus (local cattle) with increased adaptability to
environment, are found to perform well even in warmer
0.00
1.00
2.00
3.00
4.00
5.00
6.00
7.00
8.00
9.00
10.00
2 3 4 5 6 7 8 9 10 11 12 14
Mean
DM
Y (
l)
Age (years)

Bhutan Journal of Animal Science (BJAS), Volume 4, Issue 1, Page 76-82, 2020
Choden et al. (2020) 81
climate at lower altitude. Cows with exotic inheritance
level of 50-75% yielded highest average quantity of milk
suggesting the range of exotic inheritance most suitable
for optimum production at farmers’ field. All AEZs were
dominated by small and medium sized farm (3-10 cows)
which has better milk production than other farm sizes,
suggesting it as optimum herd size for Bhutanese farmers.
Milk yield increases as cows matures till eight years old
corresponding to 3rd lactation and thereafter production
capacity gradually declines, and it is not economical to
rear cows beyond 11 years of age corresponding to 6th
lactation. Milk yield in the evening is much lower than in
the morning owing to shorter interval between the AM
and PM milking. Optimizing milking frequency/ timing
of milking may improve milk production. The assessment
of probable factors that affect milk production provided
baseline information on productivity of dairy cattle which
can form important scientific basis for planning of dairy sector
development in Bhutan.
ACKNOWLEDGEMENT
The authors would like to sincerely thank Dzongkhag
Livestock Officers and Livestock Extension Agents of
Chukha and Thimphu Dzongkhags and management
committee members of the sampled DFGs for their
unfailing logistic and other supports during the entire
field study. We are extremely grateful to the owners of
sampled animals for taking pain in measuring and
recording milk yield on daily basis without which the
study would not have been materialized. Our heartfelt
gratitude goes to our colleague Mr. Yuvraj Giri for being
active member in the team during the field work. Finally,
this study would not have been materialized without the
financial support, guidance and other logistic supports
from Program Director, NDRDC, Yusipang.
REFERENCES
Aujla KM and Hussain A (2015). Economis of Milk
Production of Major Dairy Buffalo Breeds by Agro-
Ecological Zones in Pakistan. Pakistan Journal of
Agriculture, Vol. 28(2).
Bhutan Weather. (n.d.). Retrieved April 7, 2017, from
http://www.bhutan-weather.com/seasons
Cerny T, Vecera M, Falta D and Chladek G (2016). The
Effect of the Season on the Behaviour and Milk yield
of the Czech Fleckvich Cows. Acta Universitatis
Agriculturae et Silviculturae Mendelianae Brunensis ,
64(4):1125-1130.
Cunha DD, Pereira JS, Silva FF, Campos OF and
Martuscello JA (2010). Selection of models of
lactation curves to use in milk production simulation
systems. Revista Brasileira de Zootecnia .
Cziszter LT, Neamt RI, Ilie DE, Gavojdian D, Acatincai
S, Silvia E (2013 ). Estimating the Lactation Curve on
a.m./p.m. Milkings in Dairy Cows. Animal Science
and Biotechnologies, (2) 46.
Department of Animal Husbandry, Dairying and
Fisheries, India. (2016, October 3). Government of
India. A Digital India Initiative.
community.data.gov.in:https://community.data.gov.i
n/ Retrieved Novemner 20, 2018, from
Dinesh K, Thakur YP, Katoch S and Sankhyan V (2014).
Lifetime Milk Production Efficiency of Jersey Cows
under Sub-temperate Conditions. Indian Journal of
Animal Science , 48 (3): 286-289.
DoL (2014). Pilot Livestock Survey on Estimation of
Milk Production in Haa (An implementation of FAO
Global Strategy for Improving Agricultural and Rural
Statistics). Thimphu: Department of Livestock,
Ministry of Agriculture and Forests.
Dorji N and Tamang NB (2016). Sample Survey on
Estimation of Milk Production in Samdrup Jongkhar
Dzongkhag (An implementation of FAO Global
Strategy for Improving Agricultural and Rural
Statistics). Thimphu: Department of Livestock,
Ministry of Agriculture and Forests.
Dorji N, Thinley J, Wangdi K, Cheda, Rizal K and
Tshering, K (2016). Herd Management practices
related to the Five Freedoms on Cattle Farming
System of some villages of Bhutan. Bhutan Journal of
Natural Resources and Development, 21-32.
Fernando P, Sinniah J and Thatchaneshkanth S (2016).
Productive and Reproductive Performance of jersey
Cattle in the Hills Country of Sri Lanka. Global
Veterinaria, 17 (4):392-400.
Joshi R, KlaffenbÖck M and Zhitia E (2015). Comparison
of dairy cattle production systems in Austria.
Nepalese Journal of Animal Sciences .
Landes M, Cessna J, Kuberka L and Jones K (2017).
Indian Dairy Sector: Structure, Performance and
Prospects. A Report from the Economic Research
Service; Outlook, United State Department of
Agriculture .
DoL (2017). Livestock Statistics. Thimphu: Department
of Livestock, Ministry of Agriculture & Forests.
Ouweltjes W (1998). The relationship between milk yield
and milking interval in dairy cows. Livestock
Production Science, 56:193-201. 10.1016/S0301-
6226(98):00154-7.
Rahman I and Aleman TA (2008). Productive and
Reproductive Performance of Holstein-Friesian under
Tropical Condition with Special Reference to Sudan:
A Review. Agri.Rev.' 29(1): 68-73.
Rajeshwaran S (2016). Milk production in India rises by
a historic 6.25% in 2014-15: A boon or a bane?
https://www.researchgate.net/publications. Retrieved
November 16, 2018:
Siddiky M (2017). Dairying in South Asian Region:
Opportunities, Challenges and Wayforward. SARRC
Journal of Agriculture, 15 (1):173-187.

Bhutan Journal of Animal Science (BJAS), Volume 4, Issue 1, Page 76-82, 2020
Choden et al. (2020) 82
Singh V, Dubey M and Chaubey AK (2015). Seasonal
Influence on Milk Production Performance in
Different Breeds of Dairy Cows. Environment &
Ecology, (33): 371-374.
Tamang NB and Dorji N (2016). Sample Survey on
Estimation of Milk Production in Samdrup Jongkhar
Dzongkhag (An implementation of FAO Global
Strategy for Improving Agricultural and Rural
Statistics). Department of Livestock, Ministry of
Agriculture & Forests, Thimphu.
Tamang NB, Rai DB, Koirala AN, Dhendup and Dorji S
(2018). Effect of Parity on Milk Yield and Calving
Interval of local Thrabam Cattle Managed at the
Nucleus Herd, Tahiyangphu, Bhutan. Bhutan Journal
of Animal Science (in presss) .
Wangdi J, Dema T, Karma, Mindu and Bhujel P (2014).
The compositional quality of cows milk in Bhutan.
Biological Sciences and Pharmaceutical Research ,
Vol.2(7):062-068.
Wanjala SP and Njehia KB (2014). Herd Characteristics
on Smallholder Dairy Farms in Western Kenya.
Journal of Animal Sciences Advances, 4(8): 996-1003
.

Bhutan Journal of Animal Science (BJAS)
Volume 4, Issue 1, Page 83-89, 2020
83
Full length paper
PUBLIC PERCEPTIONS TOWARDS MACAQUE POPULATION ALONG THIMPHU-
PHUENTSHOLING HIGHWAY: IMMINENT PUBLIC HEALTH AND CONSERVATION THREATS
KARMA WANGDI1, SANGAY RINCHEN*2, SONAM JAMTSHO3, KARMA
WANGCHUK4, BINDHU PARAJULI4 AND BASANT SHARMA4
1Animal Health Division, Department of Livestock, Thimphu 2National Centre for Animal Health, Department of Livestock, Serbithang, Thimphu 3Thromde Veterinary Hospital and Satellite laboratory, Department of Livestock, Phuentsholing,
Chukha 4Regional Livestock Development Centre, Department of Livestock, Tsimasham, Chukha
*Author for correspondence: [email protected]
Copyright © 2020 Karma Wangdi. The original work must be properly cited to permit
unrestricted use, distribution, and reproduction of this article in any medium.
ABSTRACT: Currently, there are seven species of primate recorded in Bhutan. Two species of
primates namely the Assamese macaque (Macaca assamensis) and the Hanuman langur
(Semnopithecus entellus) are commonly sighted in the western region of the country. There are
reports of increasing macaque population along the Thimphu-Phuentsholing highway, with few
stray reports on interaction between humans and monkeys. Given the similarity in genetical,
physiological and behavioural characteristics, interactions between monkeys and humans can
facilitate cross-transmission of pathogens. Pathogen swapping can not only threaten the public
health but also pose a potential conservation threat. This study was conducted as an approach to
understand the perception of the people on the macaque population along the highway, geo-locate
the areas where macaques are commonly sighted, and review the zoonotic pathogens that can be
cross transmitted between humans and macaques. The study interviewed 129 participants along the
highway using a questionnaire to understand their perception. For reviewing the zoonotic diseases,
literatures were collated from google scholar using search terms “macaque” and “zoonosis”. More
resources were acquired by checking the references of literature obtained from the google scholar
search. Majority of the participants had high tolerance towards macaque in their community. Of the
participants who have seen monkey in their locality (n=71), 17 (14%) could recall seeing some form
of interactions (people killing monkeys, monkeys biting people) between humans and monkeys
while 45 (36%) of them have seen interaction between dogs and monkeys. Hundred and fourteen
participants reported that the monkey population is increasing along the highway and 99 (89%) of
the participants thought it was due to people feeding food. The study recorded 19 geo-coordinates
along the Thimphu-Phuentsholing highway where the macaques were commonly sighted. The
literatures review recorded 14 viral diseases, 8 bacterial diseases, 11 parasitic diseases and a fungal
disease that are of concern when considering the human macaque interaction. This study provides a
preliminary evidence of the people’s perception towards monkey population along the Thimphu-
Phuentsholing highway and their level of knowledge about the zoonosis associated with macaques.
This study also provides geo-location of the common areas where the macaques are commonly
sighted which can be useful in displaying public notices for garnering compliances. Furthermore,
this study provides an overview of the common zoonoses that are of concern when considering the
human macaque interaction.
Keywords: Human-wildlife-interaction; Macaca assamensis; monkeys; zoonoses.
1. INTRODUCTION
Interaction between human and macaques occur for
various reasons. While they play a significant socio-
cultural and religious role in certain parts of the world
such as India and Nepal (Jones-Engel et al. 2006;
Pragatheesh 2011), they are often sought as a source of
food and their meat for medicinal values in other parts of

Bhutan Journal of Animal Science (BJAS), Volume 4, Issue 1, Page 83-89, 2020
Rinchen et al. (2020) 84
the world (Walker 2010; Muehlenbein 2017).
Furthermore, interactions occur when they are kept as
companion animal and displayed for tourist attraction
(Muehlenbein 2017). Such interactions can facilitate
cross-transmission of diseases between human and
primate population posing public health and conservation
threats. Furthermore, uncontrolled monkey population
can be a reason for serious social nuisance as reported
from India and south east Asia (Kreston 2014; Tapper
2014). A total of 1415 species of infectious agents in 472
genera have been reported to cause disease in humans. Of
these 868 (61%) from 313 genera are known to be
zoonotic. A total of 175 species of infectious agents from
96 genera are associated with emerging disease (Taylor et
al. 2001).
Most of the microbes that have evolved to infect
humans have its origin from the animal species
(Cleaveland et al. 2001). Several factors can be attributed
to the infectious agents’ ability to cross species barrier
which include those related to the host, the infectious
agents and the environment. Owing to the similarity
between humans and non-human primates in terms of
genetic, physiological and behavioural characteristics, the
non-human primates are considered high-risk sources of
infectious agents with the capacity to infect humans.
Recent incidences of epidemics in humans because of on-
human primate origin infections are Ebola and zika virus.
With around 60% of the country under forest
coverage, Bhutan is considered as one of the bio-diversity
hotspots in the world. There are seven recorded primate
species in Bhutan namely, the slow loris (Nycticebus
bengalensis), Assamese macaque (Macaca assamensis),
Rhesus macaque (Macaca mulatta), Hanuman langur
(Semnopithecus entellus), golden langur (Trachypithecus
geei), and capped langur (Trachypithecus pileatus)
(Choudhury 2008). In the western parts of the country the
Assamese macaque and the Hanuman langur are
commonly sighted. While there have been home range
studies carried out for the Assamese macaque in the
western region, no studies have been conducted to detect
any infectious agents of zoonotic concern.
Furthermore, despite the informal reports of
growing macaque population along the western highway,
no studies have been conducted to understand people’s
perception toward macaque along the highway and their
knowledge about diseases that can be cross transmitted
between humans and the macaques.
Therefore, the objectives of this study are to and to
1) understand public perception on the monkey
population between Thimphu and Phuentsholing national
highway 2) geo-locate places where monkeys are sighted
along the highway and 3) review some of the important
zoonotic diseases that are cross-transmitted between
humans and macaques.
2. MATERIALS AND METHODS
2.1 Study area
Western region has five client Dzongkhags under its
technical jurisdiction namely, Thimphu, Paro, Haa,
Chukha, Samtse. Both the capital city of Bhutan,
Thimphu and the major commercial hub, Phuentsholing
under Chukha Dzongkhag lies under the Western region.
These places are connected by a national highway.
Assamese macaques are present along this highway.
Therefore, people residing along this highway was
included for the interview.
2.2 Survey questionnaire
A questionnaire comprising four different sections
was prepared and used for data collection. Section one
comprised questions regarding the participants’
information while the section two comprised questions
relating to interactions between humans and macaques.
Section three comprised questions related to participants
knowledge about disease transmission between macaques
and humans and the fourth section comprised question
relating to the participants perception and practices. Both
open ended and close ended questions were used in the
questionnaire.
Four livestock personnel working in Regional
Livestock Development Centre (RLDC), Tsimasham
were recruited and trained as enumerators. The
questionnaire was pretested during mock interviews and
modified accordingly to improve clarity. The
questionnaire was enumerated during the month of March
2019 by visiting only the accessible household along the
highway. One of the adult members in households who
were 18 years and above were included for the interview.
Prior to start of the interviews, the objectives of the study
were explained to the participant and subsequently an oral
consent was sought.
2.3 Review of zoonosis
The zoonotic diseases that are transmissible between non-
human primates, especially between macaques and the
humans were reviewed and information relevant to this
study were referred.
2.4 Statistical analysis
The researchers drove thrice along the Thimphu -
Phuentsholing highway to map geo-coordinates of
locations where monkeys were spotted. During each visit,
the coordinates where the monkeys were spotted were
recorded using google maps app in Samsung s-6 cellular
phone.
The coordinates were then managed in the MS Excel
worksheet (Microsoft excel 2013, Redmond, USA) and
projected on the western region shapefile and a map was
generated using Quantum GIS software (QGIS

Bhutan Journal of Animal Science (BJAS), Volume 4, Issue 1, Page 83-89, 2020
Rinchen et al. (2020) 85
Development Team 2017) (Figure 2). The Thimphu-
Phuentsholing stretch is around 151 kms.
The data gathered during the survey were
descriptively analysed.
3. RESULTS
3.1 Socio-demographic characteristics
In total, 129 participants were interviewed in the study
area. One-hundred and three (80%) were females and 26
(20%) were males. The mean age of the participants was
38 years. Ninety-three (74%) were engaged in some form
of business, 31 (24%) farmers, 1 govt employee and 1
student. Seventy-one (55%) of them had not attained any
formal education. 96 (74%) of the participants owned
animals of which 42 owned pet and rest livestock for
production purpose.
3.2 Interactions with macaques and knowledge about
disease transmission
In total 125 (97%) participants have seen monkeys near
their residence. Majority of the participants, 71 (57%)
have seen monkey in their locality since more than 10
years and the rest for 10 years (Figure 1). Of these, 17
(14%) could recall some form of interactions (people
killing monkeys, monkeys biting people) between
humans and monkeys while 45 (36%) of them have seen
interaction between dogs and monkeys. Fifty (42%)
participants reported that humans can contract diseases
from monkeys while 51(40%) were not sure if humans
could contract disease. Twenty participants reported that
humans cannot contract disease from the monkeys.
Figure 2: Number of years people have been seeing
macaques in their locality
3.3 Participants’ practices and perception
In total, 29 participants reported that they had a very high
level of tolerance towards monkeys’ presence in their
locality while 86 said they had a high level of tolerance.
Only 14 of them reported to have low tolerance on seeing
monkeys in their locality. Of the total participants, only
16 of them reported feeding monkeys while 93 (72%)
participants reported seeing people feeding monkeys
along highway. The participants reported that 91 (98%)
of the people who they saw feeding monkey were
Bhutanese travellers while one was tourist and the other
one roadside vegetable vendor. Hundred and fourteen
participants reported that the monkey population is
increasing along the highway while 8 of them said that
there is no increase in the population. Five of the
participants were not sure about the population status of
the monkey. Of the two reasons that were provided to be
chosen as the most relevant reason for the increasing
monkey population, 99 (89%) chose “people feeding”
while 4 chose “deforestation”. Rest of the participants
were not sure of a reason for the growing monkey
population. Of the 127 participants (2 missing), 120
participants felt that the growing monkey population
along the highway was a problem while 7 reported it was
not. Most of the participants think that the community
Figure 1: Map of Chukha showing the
Phuentsholing-Thimphu highway (grey coloured),
households surveyed along the highway (blue dots),
and locations of monkey sighting (red dots)

Bhutan Journal of Animal Science (BJAS), Volume 4, Issue 1, Page 83-89, 2020
Rinchen et al. (2020) 86
should come forward and take responsibilities in
controlling the growing monkey population while almost
equally, participants think it is the government’s
responsibility.
3.4 Geo-coordinates of the areas where monkeys were
sighted, and interview conducted
Monkeys were sighted at 20 locations along the Thimphu-
Phuentsholing highway (Figure 1). Between Chukha and
Thimphu stretch, monkeys were sighted only in one
location before reaching to Chuzom (confluence);
whereas, the sighting increased between the Chukha and
Phuentsholing stretch. The sightings located were the
aggregate of the three times travel along this highway.
Monkeys were not sighted in all locations during a single
travel. The study also observed people feeding monkeys,
roadkill of an adult macaque, and free-roaming dogs
feeding on monkey carcass along the highway.
3.5 Review of important zoonosis associated with
macaques
A total of 20 papers were reviewed in addition to
collecting information from four other webpages
regarding the zoonoses of non-human primates. It is
critical to understand that not only can the non-human
primates be the source of diseases to humans, equally
humans can transmit diseases that non-human primates
are susceptible and can pose potential conservation
threats (zooanthroponosis). There are currently about 376
species of non-human primates (OIE terrestrial Animal
Health Code 2018). While there are so many diseases that
can be cross transmitted between non-human primates
and humans, the study listed diseases that are relevant to
the macaques. Table 2 presents some of the important
viral pathogens that can be transmitted from macaques to
the humans such as rabies, herpes simiae, simian virus 40,
simian type D retrovirus, Simian T-cell lymphotropic
virus type 1 (STLV-1), Simian hemorrhagic fever, Rota
virus, Monkey pox virus, Hepatitis A, and Measles
(Emerging Infectious Diseases 1998; Engel et al. 2002;
Huff and Barry 2003; Switzer et al. 2004; Jones-Engel et
al. 2005; Conly and Johnston 2008; Brinton et al. 2015;
OIE terrestrial Manual 2018). While some of the
significant bacterial pathogens reported (Table 1) are
Campylobacter jejuni, Salmonella sp., Shigella sp.,
Leptospira interrogans, Streptococcus pnuemoniae,
Mycobacterium tuberculosis and Haemophilus influenzae
(Nath et al. 2012; OIE terrestrial Manual 2018). In
addition, there are also some ecto and endo parasites such
as Anaplasma phagocytophilum, Plasmodium sp.,
Entamoeba sp., Giardia sp., Chilomastix sp., Ascaris sp.,
Strongyloides sp., Ancylostoma sp., Trichuris sp.,
Oesophagostomus sp., Enterobius sp., and Hymenolepis
sp., that can be transmitted between macaques and
humans (Nakayima et al. 2014; Faust and Dobson 2015;
Li et al. 2015; Maharajan 2015; Begum et al. 2018; Dixit
et al. 2018).
4. DISCUSSION
The study was conducted to assess the public perception
towards macaque population and review some of the
Table 1: Some of the important bacterial diseases that can be transmitted to human / swapped between humans and macaques Pathogen Transmission mode Remarks
Campylobacter jejuni Contaminated food and water Salmonella sp. Contaminated food and water
Shigella sp. Contaminated food and water Leptospira interrogans Skin abrasion and visible mucous membranes Streptococcus pnuemoniae Aerosolized droplets, close contact Mycobacterium tuberculosis Aerosolized droplets Haemophilus influenzae Aerosolized droplets Plasmodium sp. Mosquito bites (Maharajan
2015) Entamoeba sp. Contaminated food and water Giardia sp. Contaminated food and water Chilomastix sp. Ingestion of cysts in contaminated water, food, or by the
fecal-oral route
Ascaris sp. Ingestion of eggs in contaminated water, food, or by the fecal-oral route
Strongyloides sp. larvae enter the body through exposed skin, such as bare feet Ancylostoma sp. larvae enter the body through exposed skin, such as bare feet Trichuris sp. Ingestion of eggs in contaminated water, food, or by the fecal-
oral route
Oesophagostomus sp. Ingesting infective larva Enterobius sp. Faeco-oral route Hymenolepis sp. Ingestion of eggs in contaminated water, food, or by the fecal-
oral route
Trichophyton Direct and indirect contact (fomites)

Bhutan Journal of Animal Science (BJAS), Volume 4, Issue 1, Page 83-89, 2020
Rinchen et al. (2020) 87
potential public health consequences that would result
from the increasing interactions between macaques and
human. Several informal reports of people feeding
macaques, macaque attacks and increasing population
along Thimphu-Phuentsholing highway have been made
on the social media such as Facebook. While there are no
past records to compare and assess the absolute growth in
monkey population, majority of the participants reported
that macaque population along the highway is increasing.
Supporting to the common observation during the one-
month study period, participants reported people feeding
the monkeys as one of the common reasons for the
population growth. This may not be an absolute increase
in the macaque population per se but an increase in the
population that have now started residing by the highway
due to easy access to food. Assamese macaques are
omnivorous, and plants form the major part of their diet
(Zhou et al. 2011; Norbu et al. 2016; Koirala et al. 2017).
However, humans feeding monkeys can alter the feeding
behaviour and activity budget of the macaques (Koirala et
al. 2017)). As they don’t have to move around in search
for food, they spend more time along the highways which
in turn provides opportunity for close interactions with
humans. This could be the reason why they are frequently
spotted along the highway compared to the past when
vehicle plying along highway was relatively less and so
was the number of humans providing food to the
monkeys.
Participants reported observing some form of
interactions between humans and macaques and
macaques and dogs. However, it was observed that most
of the participants didn’t know that humans can contract
diseases from macaques. Close interactions between
humans and macaques can facilitate exchange of a wide
range of pathogens and have detrimental consequences on
the health of both species (Koirala et al. 2017).
Furthermore, interactions between macaques and dogs
can lead to spread of rabies, which is a commonly
reported notifiable zoonotic disease in dogs, in the
macaque population. Although macaques are not a known
reservoir for rabies and cannot transmit rabies to other
species, their social behaviour of grooming and
dominance demonstration through fights can facilitate
rabies transmission within the macaque population posing
a potential conservation threat.
Participants report of a high tolerance towards
monkey and observing Bhutanese travellers as the most
common food provider for the macaques can be attributed
Table 2: Important virus (diseases) that can be transmitted to human / swapped between humans and macaques
Pathogen Transmission mode Remarks
Rabies Bite, scratches
Herpesvirus simiae Bites and scratches (Huff and Barry 2003) Simian virus 40 Contact with urine and body fluids (Jones-
Engel et al. 2006) Associated with cancer formation
Simian type D retrovirus Through direct contact between infected and susceptible animals, or indirectly through contact with contaminated instruments or equipment (e.g. tattoo needles, transfer boxes, dental instruments, or gavage tubes)
Virus is shed in saliva hence mutual grooming or aggressive interactions involving biting and scratching
Simian T-cell lymphotropic virus type 1 (STLV-1)
bites, scratches and mucosal splashes (Conly and Johnston 2008)
Simian Foamy Virus (SFV)
bites, scratches and mucosal splashes (Conly and Johnston 2008)
Rhesus Cytomegalovirus Growth of RhCMV in human cells has been demonstrated in vitro however no human infection with RhCMV has been reported (OIE terrestrial Manual 2019).
Simian hemorrhagic fever Bites, direct and indirect contacts
KFD virus Ticks
Rota virus Fecal-oral route
Monkey pox virus Contact with the virus from an animal, human, or materials contaminated with the virus
Hepatitis A fecal-oral route or consumption of contaminated food or water
Measles Aerosolized droplets

Bhutan Journal of Animal Science (BJAS), Volume 4, Issue 1, Page 83-89, 2020
Rinchen et al. (2020) 88
to mythological association of monkey to the Buddhist
and Hindu religion. Majority of the Bhutanese population
are Buddhist followed by Hindu. Therefore, this finding
underscores the need for awareness education among the
travellers (Bhutanese and tourist) regarding the potential
consequences to the health of humans and macaques that
would result from feeding the macaques. Awareness
education should also be designed to the public transport
drivers as they are the ones who ply most along the
highway.
Most of the participants reporting that the
communities should be taking lead in applying mitigation
measures to control the growing monkey population
along the highway indicates the willingness to share
responsibilities with the relevant government agencies
and take ownership. Therefore, initiatives should be
undertaken to engage communities and give ownerships
to the communities to apply measures that can discourage
anthropological activities leading to growing macaque
population along the highways. Implementing strict
measures will require commitment and support from
different sectors such as the National Environment
Commission, local community, Department of Forest and
Park Services, Department of Livestock, and municipal
corporations.
The study recorded the coordinates of the areas
where the monkeys were spotted along the highway.
However, monkeys are not spotted in all the locations
recorded during the visit. This could be because the
monkeys must be staying in different areas along the
stretch depending on the time of the day and food
availability. (Norbu et al. 2016) reported rather a large
home range group of the macaques that were tagged with
radio-collars. The coordinates recorded during the study
would however be of great value to display notices and
share information for the travellers to comply with,
especially requesting them not to feed macaques and
other wildlife.
Convenience sampling was administered for
interviewing people along the highway. As the
participants of this study doesn’t represent the whole
population along the highway, caution needs to be placed
in generalizing the findings of the study. Due to
inaccessibility to published articles, we could only review
papers that were accessible. Furthermore, the search
method the study adopted was not robust and must have
missed articles that were accessible. In this process, the
study might have also missed out important diseases that
are of relevance in the pretext of macaque and human
interaction. Although the study presents a list of zoonotic
pathogens that can be swapped between humans and
Macaques (Table 2); currently, there is no data on the
pathogens that macaques harbour along the highway. To
ensure targeted awareness, intervention and contingency
plans are developed, it is essential to know the prevalence
of zoonotic pathogens in the macaque population. Such
researches can be clubbed with studies that are being
conducted by Department of Forests and Park Services
(DoFPS) to understand the home range, feeding
behaviours, morphological and genetic characteristics of
the Assamese macaque (Norbu et al. 2016).
5. CONCLUSION
This study shows that there is interaction between the
human population and the macaques along the Thimphu-
Phuentsholing highway. Furthermore, from the interview,
it has been determined that people think there is increase
in the population of macaques along the highway. The
increasing presence of macaques can be associated with
the human behaviours and thus there is need to design
strategies to control growing macaque population along
the highways targeting the change in current practices of
travellers. Implementing effective measures to reduce the
presence of macaques along the highway has the benefit
of enhancing conservation of the macaque population as
well as averting risk that can result from cross
transmission of pathogens between humans and
macaques.
REFERENCES
Begum A, Mukutmoni M and Tabasshum T (2018).
"Occurrence of gastrointestinal Helminths in captive
rhesus macaques (Macaca mulatta)." Bangladesh
Journal of Zoology, 46(2): 231-237.
Brinton MA, Di H and Vatter HA (2015). "Simian
hemorrhagic fever virus: Recent advances." Virus
Research, 202: 112-119.
Choudhury A (2008). "Primates of Bhutan and
Observations of Hybrid Langurs." Primate
Conservation, 23(1): 65-73.
Cleaveland S, Laurenson MK and Taylor LH (2001).
"Disease of humans and their domestic mammals:
pathogen characteristics, host range and the risk of re-
emergence." Philos Trans R Soc Lond B Biol Sci.
Conly JM and Johnston BL(2008). "The infectious
diseases consequences of monkey business." Can J
Infect Dis Med Microbiol, 19(1).
Dixit J, Zachariah A, KSP, Chandramohan B,
Shanmuganatham V and Karanth KP (2018).
"Reinvestigating the status of malaria parasite
(Plasmodium sp.) in Indian non-human primates."
PLoS Negl Trop Dis, 12(12): e0006801.
Emerging Infectious Diseases (1998). "B-virus from Pet
Macaque Monkeys: An Emerging Threat in the
United States?" Emerging Infectious Disease Journal,
4(1).
Engel GA, Jones-Engel LS, Michael A, Suaryana KG,
Putra A, Fuentes A and Henkel R (2002). "Human
Exposure to Herpesvirus B–Seropositive Macaques,

Bhutan Journal of Animal Science (BJAS), Volume 4, Issue 1, Page 83-89, 2020
Rinchen et al. (2020) 89
Bali, Indonesia " Emerging Infectious Disease
Journal, 8(8): 7.
Faust C and Dobson AP (2015). "Primate malarias:
Diversity, distribution and insights for zoonotic
Plasmodium." One Health, 1: 66-75.
Huff JL and Barry PA (2003). "B-Virus (Cercopithecine
herpesvirus 1) Infection in Humans and Macaques
Potential for Zoonotic Disease." Emerging Infectious
Diseases Journal, 9(2).
Jones-Engel L, Engel GA, Heidrich J, Chalise M, Poudel
N, Viscidi R, Barry PA, Allan JS, Grant R and Kyes
R (2006). "Temple Monkeys and Health Implications
of Commensalism, Kathmandu, Nepal " Emerging
Infectious Disease Journal, 12(6): 7.
Jones-Engel L, Engel GA, Schillaci MA, Rompis A, Putra
A, Suaryana KGF, Agustin B Beer, Hicks S, White R,
Wilson B and Allan JS (2005). "Primate-to-Human
Retroviral Transmission in Asia." Emerging
Infectious Disease Journal, 11(7): 8.
Koirala S, Chalise MK, Katuwal HB, Gaire R, Pandey B
and Ogawa H (2017). "Diet and Activity of Macaca
assamensis in Wild and Semi-Provisioned Groups in
Shivapuri Nagarjun National Park, Nepal." Folia
Primatol (Basel), 88(2): 57-74.
Kreston R (2014). Hanuman’s Bite: Temple Monkeys &
Pathogen Swapping.
Li M, Zhao B, Li B, Wang Q, Niu L, Deng J, Gu X, Peng
X, Wang T and Yang G (2015). "Prevalence of
gastrointestinal parasites in captive non-human
primates of twenty-four zoological gardens in China."
J Med Primatol, 44(3): 168-173.
Maharajan M (2015). "Endo-parasites of Primates and
their Zoonotic Importance." National Zoonoses and
Food Hygiene Research, 21(2): 4.
Muehlenbein MP (2017). "Primates on display: Potential
disease consequences beyond bushmeat." Am J Phys
Anthropol, 162 Suppl 63: 32-43.
Nakayima J, Hayashida K, Nakao R, Ishii A, Ogawa H,
Ichiro N, Moonga L, Hang’ombe BM, Mweene AS,
Thomas Y, Orba Y, Sawa H and Sugimoto C (2014).
"Detection and characterization of zoonotic pathogens
of free-ranging non-human primates from Zambia."
Parasites & Vectors, 7(1): 7.
Nath BG, Rahman T and Chakraborty A (2012).
"Tuberculosis in non-human primates of Assam use
of PrimaTB STAT-PAK Assay for detection of
tuberculosis." Journal of Threatened Taxa, 4(4): 4.
Norbu T, Wangda P, Dorji T, Chhetri PB, Rabgay K,
Dorji R, Hamada Y, Kawamoto Y, Oi T and Chijiwa
A (2016). Ecology, Morphology and Genetic study of
Macaque.
OIE terrestrial Animal Health Code (2018). "Zoonoses
Transmissible From non-human primates."
Retrieved 10/6/2019, 2019, from
www.oie.int/index.php?id=169&L=0&htmfile=chapi
tre_zoonoses_non_human_primate.htm.
OIE terrestrial Manual (2018). "Zoonoses Transmissible
From non-human primates ", 2019, from
http://www.oie.int/fileadmin/Home/eng/Health_stan
dards/tahm/3.09.11_NONHUMAN_PRIMATES.pdf
.
Pragatheesh A (2011). "Effect of human feeding on the
road mortality of Rhesus Macaques on National
Highway - 7 routed along Pench Tiger Reserve,
Madhya Pradesh, India." Journal of Threatened Taxa,
3(4): 7.
QGIS Development Team. (2017). "QGIS Geographic
Information System Open Source Geospatial
Foundation Project." Retrieved 28/7/2018, 2017,
from http://qgis.osgeo.org.
Switzer WM, Bhullar V, Shanmugam V, M.-e. Cong,
Parekh B, Lerche NW, Yee JL, Ely JJ, Boneva R,
Chapman LE, Folks TM and Heneine W (2004).
"Frequent Simian Foamy Virus Infection in Persons
Occupationally Exposed to Nonhuman Primates."
Journal of Virology, 78(6): 2780.
Tapper J (2014). Delhi’s 30,000 unruly monkeys steal
stuff, terrorize people and even kill. GlobalPost.
Taylor LH, Latham SM and Woolhouse ME (2001).
"Risk factors for human disease emergence." Philos
Trans R Soc Lond B Biol Sci, 356(1411): 983-989.
Walker M (2010). Folk medicine poses global threat to
primate species. BBC. UK.
Zhou Q, Wei H, Huang Z and Huang C (2011). "Diet of
the Assamese macaque Macaca assamensis in lime-
stone habitats of Nonggang, China." Current Zoology,
57(1): 8.

Bhutan Journal of Animal Science (BJAS)
Volume 4, Issue 1, Page 90-97, 2020
90
Full Length paper
BREED IMPROVEMENT, MILK PRODUCTION AND SOCIO-ECONOMIC BENEFIT OF CONTRACT
HEIFER AND BULL PRODUCTION PROGRAM IN WEST AND WEST-CENTRAL REGION OF
BHUTAN
DHAN B RAI*, NAR B TAMANG, LOKAY THAPA AND ABI N KOIRALA
National Dairy Research and Development Centre, Department of Livestock, Ministry of
Agriculture and Forests, Yusipang
*Author for correspondence: [email protected]
Copyright © 2020 DHAN B RAI. The original work must be properly cited to permit unrestricted
use, distribution, and reproduction of this article in any medium.
ABSTRACT: The study assessed breed improvement of cattle, milk production and socio-
economic benefit of Contract Heifer and Bull Production Program (CHBPP) in west and west-
central region of Bhutan. The data were gathered using semi-structure survey questionnaire in May
and June 2019. A total of 471 households were visited and interviewed. Jersey cross (JX) population
and animals registered under CHBPP increased by two and three folds, respectively. The study
found that with the initiation of CHBPP (2007-2012) the Artificial Insemination (AI) services
through adoption of progeny tested semen had contributed significantly in breed improvement
(p=0.000) of the herd. Most animals in the CHBPP herds are farm born (96%) indicating adequate
replacement heifers for the herd. With breed improvement over the period the average daily milk
production had increased significantly (p=000) from 5.9±2.3 l (inception) to 7.8±3.0 l in 2019. The
productivity of JX cows of blood level 50%, 62.5%, 75%, 87.5% and 93.75% was 5.8±1.7, 6.5±2.2,
8.4±2.3, 10.7±3.2 and 13.5±4.0 l/day respectively, differing significantly (p=0.000) in every blood
level. Gross income generation by the CHBPP members through sale of milk in 2019 was four times
higher than at inception. Besides, the members sold excess animals to generate added income. Thus,
dairy farming with improved breed holds promise for the future as it was major source of income
for 72% of farmers interviewed. Additionally, initiation of CHBPP triggered formation of dairy
groups/cooperatives in the country, promoting a harmonious society and social cohesiveness. The
government livestock staffs though provided adequate AI services, follow up on progeny recording
remained inadequate at the moment. Further difficulty in disposal of bull calves born in the herds,
irregular AI services/repeat breeding of cows remain a challenge in dairy sector development. Some
critical area of interventions is timely supply of vital AI inputs adopting wider use of sex sorted
semen, intensify and incentivize Community AI Technicians, upgrade skills of existing AI
Technicians, and ensure effective recording system and reproductive waste management services.
Keywords: Breed improvement; contract production; jersey; productivity; socio-economic benefit.
1. INTRODUCTION
Artificial Insemination (AI) and supply of breeding bulls
are the main cattle breeding services provided in Bhutan.
AI is provided in accessible areas, whereas breeding bulls
are supplied to inaccessible areas. The average AI
coverage recorded was 17% in 11th five-year plan
(NDRDC 2018) and as result the annual breeding bulls
demand, particularly for Jersey exceeded far more than
the production capacity of the government nucleus farms.
To complement the government nucleus farms in
production and supply of breeding bulls the Contract
Heifer and Bull Production Program (CHBPP) was
initiated as multiplier herds for Jersey. However, the areas
selected to implement the CHBPP have to be accessible
to AI facility, minimum of 10 members interested on it
and each member should have at least one breedable
Jersey cow/heifer with minimum 50% Jersey inheritance.
The farmers meeting said criteria become member
upon signing a contract agreement with the Government
for compliance on Do's and Don'ts of the Program. The
registered farmers are provided with progeny tested
imported frozen semen for faster genetic progress and
productivity enhancement in their herd. As of 2019, there
are 55 CHBPPs established across the country covering
20 Dzongkhags (districts) (NDRDC 2018). Arrangement

Bhutan Journal of Animal Science (BJAS), Volume 4, Issue 1, Page 90-97, 2020
Rai et al. (2020) 91
is made to procure breeding bulls from CHBPP by
National Jersey Breeding Centre (NJBC), Samtse, for
further distribution to Dzongkhags while members
themselves sell excess heifers to other farmers. CHBPP
program has been initiated for little over a decade, but no
comprehensive assessment was made so far. Hence,
performance of CHBPP in West and West-central region
was assessed with the objectives to ascertain breed
improvement progress and milk production by blood
level, socio-economic benefit to the CHBPP members
and their compliance to CHBPP norms, services provided
by the govt. and hindrances if any in pursuit to find a way
forward to improve dairy breeding program.
2. MATERIALS AND METHODS
2.1 Data Collection
The data were collected from 471 registered CHBPP
members (H/h) selected randomly from west and west-
central regions using semi-structured survey
questionnaire. The questionnaire was designed to capture
relevant information on CHBPP management, milk
production, socio- economic benefits being part of the
program, and challenges faced in the implementation of
the program. Survey was conducted in three Dzongkhags;
Chukha, Samtse and Paro with seven CHBPPs and in
Western region and four Dzongkhags; Punakha,
Wangdue, Dagana and Tsirang, with eight CHBPPs in
West-central region (Table 1) from May to June 2019.
The quantitative data on breed improvement was
collected from herd book and milk production from
individual bovine register maintained for animals by the
rmers. A total of 1793 milk records of 718 milking cows
were compiled. The milking cows were segregated into
two groups based on exotic inheritance of 50-75% jersey
as baseline (available at the inception of CHBPP) and
>87.5% as progress in breed improvement in 2019 (Table
2). Data pertaining to annual breeding bull procurement
and supply from CHBPP were collected from NJBC,
Samtse.
2.2Data analysis
The data were analyzed using student t-test, Chi-square
test and ANOVA in Statistical Package for Social Science
(SPSS) version 23. Field observations and impressions
were described.
3. RESULTS AND DISCUSSION
3.1 Households and animals at inception and review
The increase in Jersey cattle population and CHBPP
members at review in 2019 was significant (p=0.000)
than at inception year. The increase was three folds for
members, particularly in west central (Table 1) and two
folds for animals. The higher increase in membership
could be attributed to advantages of joining the program
such as imported progeny-tested semen, ear-tagging of
animals which fetched higher price and better health care
services members can receive, whereas only two folds
increase in no. of animals could be attributed to limited
land holdings of the farmers. The comparison of no. of
animals between the two regions both at inception and
review revealed significantly higher no. in west than in
west-central region (Table 3). According to FAO (2018),
the benefits farmers can derive through ownership of
improved dairy cattle is positive indication of pathways
to poverty reduction.
Table 1: CHBPP areas, households and survey coverage
Region Dzongkhag CHBPP Inception year H/h at inception Existing H/h Coverage (H/h)
(nos) (nos) (Nos) (%)
West
Chukha Darla 2012 99 150 45 30
Sampleling 2011 25 74 29 39
Samtse Ugyentse 2007 26 55 29 53
Yoseltse 2007 20 68 42 62
Paro Shari 2011 45 105 36 34
Wangchang 2011 40 86 34 40
Shaba 2011 13 40 20 50
Sub-total
268 578 235 41
West-
central
Punakha Guma 2012 30 82 30 37
Wangdue Tshogom 2010 25 60 26 43
Dagana Goshi 2011 20 50 28 56
Tsendagang 2011 25 64 39 61
Tashiding 2011 17 42 18 43
Tsirang Kikhorthang 2008 16 89 42 47
Rangthaling 2010 25 75 24 32
Gosarling 2008 16 89 29 33
Sub-total
174 551 236 43
Total 15/32 442 1129 471 42

Bhutan Journal of Animal Science (BJAS), Volume 4, Issue 1, Page 90-97, 2020
Rai et al. (2020) 92
3.2 Contribution to breed improvement
Assessment of breed improvement program by way of
breeding bull procurement/supply (from CHBPP vis-a-vis
NJBC, Samtse) for 10 years revealed that the CHBPP
supplemented 69.8% breeding bull demand, which was a
noteworthy in term of contribution it made for
propagation of Jersey germ-plasm to wider beneficiaries.
Similarly, the increase in population of Jersey cattle
(>87.5% blood level) is significantly higher at the time of
review compared to inception (p=0.000), indicating
substantial contribution of the CHBPP in breed
improvement program in the targeted herds. The analysis
of progress in breed improvement by blood level revealed
that animals in both categories were significantly higher
in West than in West central region, which indicates that
western region is ahead in dairy breed improvement front
(Table 4)
3 Production of replacement heifers from own herd to
curtail import
The study revealed that 95.2% (n=471) of the CHBPP
members interviewed did not import animals in their herd
in the past for a decade because members could produce
replacement stock from their own herd. According to
Pennsylvania State Extension (2011), replacement
heifers are the source of new genetics for the herd and
are a long-term investment. Thus, production of
sufficient heifers in the own herd is an approach to
sustainable breed improvement program whereby
Table 2: CHBPP cattle population and milking cows by exotic blood level in surveyed areas
Region Dzongkhag CHBPP Cattle registered with CHBPP during the inception period
Cattle registered with CHBPP in 2019
No. of milking cows owned by the respondents
50 - 75% >87.5% 50 - 75% >87.5% 50 - 75% >87.5%
West Chukha Drala 83 0 140 42 65 8
Sampheling 87 0 97 68 42 31
Samtse Ugyentse 48 0 91 46 38 5
Yoseltse 80 0 172 74 72 7
Paro Dopshari 100 0 113 33 51 8
Wangchang 71 1 83 20 43 6
Shaba, Paro 45 0 64 10 30 4
Sub-total 514 1 760 293 341 69
West-central
Punakha Guma 73 0 82 12 33 7
Wangdue Tshogom 52 0 77 18 30 2
Dagana Gozhi 47 0 63 20 31 5
Tsendagang 52 0 80 8 44 2
Tashiding 25 0 31 17 16 3
Tsirang Kilkhorthang 77 0 138 31 56 8
Rangthangling 36 0 65 13 23 5
Gosarling 43 0 69 41 27 16
Sub-total 405 0 605 159 260 67
Total 919 1 1365 452 601 117
Table 3: Animals in the CHBPP at inception and
review (2019)
Region
HH Animals
at
inception
Animals at
review (2019)
West 235 2.187 4.481
West-
central
236 1.716 3.237
p value 0.001 0.000
Table 4: CHBPP members and animals by blood level in two regions
Parameters Blood level West (n=235) West-central (n=236) P value
Animals selected
initially
Mean Std. dev. Mean Std. dev.
50-75% 2.187 1.8648 1.716 1.0478 0.001
87.5% and above 000 000 000 000
Animals at review
(2019)
50-75% 3.234 2.2285 2.564 1..7577 0.000
87.5% and above 1.247 2.0669 0.674 0.9405 0.000

Bhutan Journal of Animal Science (BJAS), Volume 4, Issue 1, Page 90-97, 2020
Rai et al. (2020) 93
members need not import animals in future to avoid
implications such as poor adaptability of imported
animals, high mortality and incursion of exotic diseases.
3.4 Productivity by blood level and lactation number
The assessment of productivity of CHBPP cows revealed
steady increase in average daily milk yield in every blood
level with increasing exotic inheritance (Table 5).
The overall mean daily milk yield at the time of
review was 7.8+3.04 l, which is a significant increase
(p<0.000) from the inception of the program (5.9+2.31 l),
indicating considerable improvement in breed and
productivity. The current finding is almost at par with the
findings of Periyasamy et al. (2019) who reported average
yield of 8.06 l/day for crossbred Jersey cattle maintained
at Veterinary College and Research Institute, Orathanadu,
Tamil Nadu, India. Similarly, analysis of daily milk yield by lactation
number reveled that production increased steadily from 6.8+2.72 l in 1st lactation to 9.1+3.2 l in 3rd lactation and then production declined thereafter (Table 5). This finding is coherent with the findings of Tamang et al. (2019) for Karan Fries breed but deviates for Jersey pure
breed where peak production was observed in 4th lactation.
However, the analysis of difference in daily milk
yield by blood level revealed significant difference
(p<0.000) in every blood level (Table 6). Similarly,
varying degree of differences in production were
observed between lactation numbers (Table 7).
Milking cows were mostly reared until 4th lactations, and
members cull off as productivity declines after 5th
lactation. Farmer’s improved awareness on maintaining
productive herds, disposing off less productive animals
by 6th lactation is eminent. 3.5 Income generated by CHBPP members
In the study area 920 animals were registered to CHBPP
(at the inception) and total estimated milk production was
about 6,348 l/day earning a gross income of Nu.222,180
daily (@ Nu.35/l).
Over the years, animal registered increased to 1817
heads with increase in no. of animals with exotic
inheritance level as well as productivity. Estimated milk
production during the time of review (2019) was 22,167
Table 5: Milking cows and daily milk yield (l) of CHBPP animals by blood level and lactation number in 2019
Lactation number (n)
Blood level Avg.
50% (550) 62.5% (271) 75% (689) 87.5% (223) >93.75% (59)
L-I (653) 4.9±1.33 (191) 5.5±1.76 (92) 7.1±1.73 (259) 9.4±2.99 (82) 12.5±3.42 (29) 6.8±2.72
L-II (452) 6.0±1.46 (136) 6.7±2.11 (65) 8.9±2.19 (181) 11.4±3.19 (52) 14.7±4.12 (18) 8.24±3.1
L-III (306) 6.6±1.58 (97) 7.9±2.25 (47) 10.1±2.3(119) 12.5±2.81 (36) 15.8±4.84 (7) 9.1±3.2
L-IV (186) 6.5±1.68 (63) 7.7±2.34 (34) 9.5±2.05 (64) 11.9±3.01 (22) 14.0±4.58 (3) 8.5±2.9
L-V (91) 6.0±1.41 (27) 7.1±2.13 (15) 9.0±1.76 (33) 11.0±2.53 (15) 12.0±0 (1) 8.2±2.6
L-VI (50) 5.9±1.67 (15) 5.8±1.29 (7) 8.3±1.94 (19) 10±2.43(9) - 7.6±2.4
L-VII (21) 5.4±1.01 (7) 4.7±0.87 (4) 7.4±1.20 (6) 8.5±3.0(4) - 6.4±2.1
L-VIII (17) 5.4±0.89 (5) 4.5±1.50 (3) 6.3±1.21 (6) 8.3±2.89 (3) - 6.1±1.9
L-IX (9) 4.9±1.36(6) 5.0±1.41 (2) 6.0±0 (1) 5.1±12
L-X (7) 4.7±0.58 (3) 4.5±2.12 (2) 4.0±0 (1) - 7.0±0 (1) 4.9±1.3
Avg. (l/day) 5.8±1.69 6.5±2.23 8.4±2.32 10.7±3.18 13.5±4.01 7.8±3.04
Table 6: Mean difference of daily milk yield (l/day) by blood level
Blood level Milk Yield 50% 62.5% 75% 87.5% 93.75%
50% Mean difference -0.784* -2.683* -4.990* -7.790*
p value 0.000 0.000 0.000 0.000
62.5% Mean difference 0.784* -1.899* -4.206* -7.005*
p value 0.000 0.000 0.000 0.000
75% Mean difference 2.683* 1.899* -2.307* -5.107*
p value 0.000 0.000 0.000 0.000
87.5% Mean difference 4.990* 4.206* 2.307* -2.799*
p value 0.000 0.000 0.000 0.000
93.75% Mean difference 7.790* 7.005* 5.107* 2.799*
p value 0.000 0.000 0.000 0.000
*The mean difference is significant at the 0.05 level
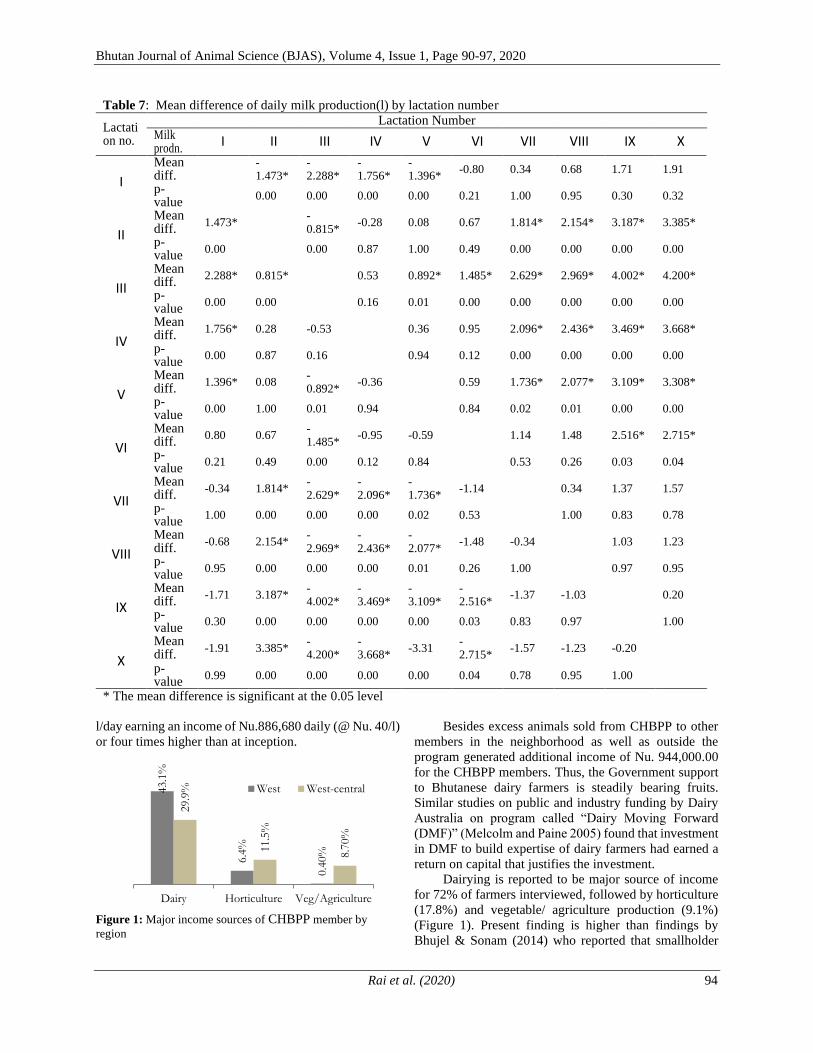
Bhutan Journal of Animal Science (BJAS), Volume 4, Issue 1, Page 90-97, 2020
Rai et al. (2020) 94
l/day earning an income of Nu.886,680 daily (@ Nu. 40/l)
or four times higher than at inception.
Besides excess animals sold from CHBPP to other
members in the neighborhood as well as outside the
program generated additional income of Nu. 944,000.00
for the CHBPP members. Thus, the Government support
to Bhutanese dairy farmers is steadily bearing fruits.
Similar studies on public and industry funding by Dairy
Australia on program called “Dairy Moving Forward
(DMF)” (Melcolm and Paine 2005) found that investment
in DMF to build expertise of dairy farmers had earned a
return on capital that justifies the investment.
Dairying is reported to be major source of income
for 72% of farmers interviewed, followed by horticulture
(17.8%) and vegetable/ agriculture production (9.1%)
(Figure 1). Present finding is higher than findings by
Bhujel & Sonam (2014) who reported that smallholder
Table 7: Mean difference of daily milk production(l) by lactation number
Lactation no.
Lactation Number Milk prodn.
I II III IV V VI VII VIII IX X
I
Mean diff.
-1.473*
-2.288*
-1.756*
-1.396*
-0.80 0.34 0.68 1.71 1.91
p-value
0.00 0.00 0.00 0.00 0.21 1.00 0.95 0.30 0.32
II
Mean diff.
1.473* -0.815*
-0.28 0.08 0.67 1.814* 2.154* 3.187* 3.385*
p-value
0.00 0.00 0.87 1.00 0.49 0.00 0.00 0.00 0.00
III
Mean diff.
2.288* 0.815* 0.53 0.892* 1.485* 2.629* 2.969* 4.002* 4.200*
p-value
0.00 0.00 0.16 0.01 0.00 0.00 0.00 0.00 0.00
IV
Mean diff.
1.756* 0.28 -0.53 0.36 0.95 2.096* 2.436* 3.469* 3.668*
p-value
0.00 0.87 0.16 0.94 0.12 0.00 0.00 0.00 0.00
V
Mean diff.
1.396* 0.08 -0.892*
-0.36 0.59 1.736* 2.077* 3.109* 3.308*
p-value
0.00 1.00 0.01 0.94 0.84 0.02 0.01 0.00 0.00
VI
Mean diff.
0.80 0.67 -1.485*
-0.95 -0.59 1.14 1.48 2.516* 2.715*
p-value
0.21 0.49 0.00 0.12 0.84 0.53 0.26 0.03 0.04
VII
Mean diff.
-0.34 1.814* -2.629*
-2.096*
-1.736*
-1.14 0.34 1.37 1.57
p-value
1.00 0.00 0.00 0.00 0.02 0.53 1.00 0.83 0.78
VIII
Mean diff.
-0.68 2.154* -2.969*
-2.436*
-2.077*
-1.48 -0.34 1.03 1.23
p-value
0.95 0.00 0.00 0.00 0.01 0.26 1.00 0.97 0.95
IX
Mean diff.
-1.71 3.187* -4.002*
-3.469*
-3.109*
-2.516*
-1.37 -1.03 0.20
p-value
0.30 0.00 0.00 0.00 0.00 0.03 0.83 0.97 1.00
X
Mean diff.
-1.91 3.385* -4.200*
-3.668*
-3.31 -2.715*
-1.57 -1.23 -0.20
p-value
0.99 0.00 0.00 0.00 0.00 0.04 0.78 0.95 1.00
* The mean difference is significant at the 0.05 level
43.1%
6.4%
0.40%
29.9%
11.5%
8.70%
Dairy Horticulture Veg/Agriculture
West West-central
Figure 1: Major income sources of CHBPP member by
region

Bhutan Journal of Animal Science (BJAS), Volume 4, Issue 1, Page 90-97, 2020
Rai et al. (2020) 95
dairy farming in three agro-ecological zone of Bhutan
contributes to 18% of the household annual income (of
which 14% is through milk and dairy product sales, and
4% from live animal sales). Wide difference could be
because present study purposively focused on CHBPP
members with good sample size whereas later studies had
only 90 random samples which could have affected the
results. Similarly, in Nepal dairy contributes 52% and
45% of total household income for small and medium
livestock-holders and in India, milk constitutes the major
share (67%) and is the single largest commodity
contributing from agriculture (Payal et al. 2018). Dairy
farming therefore contributes to large share of household
income in other countries too.
3.6 Economic benefits
Income generated from improved dairy farming/milk
production enabled farmers to repair house or built new
houses, meet expenditure of school going children, buy
daily household needs including purchase of food items
and household appliances. Thus, CHBPP has provided
multiple benefits to improve their living. Studies
elsewhere also provide strong evidence that dairy has the
power to provide individuals, families, and communities
basic necessities of life: food, water, shelter and clothing
and accessible pathway to come out of poverty (FAO
2018). While other authors suggest that milk production
and expenditure is better measure of household welfare
than income (Chuveret 2011).
3.7 Socio-economic benefit derived from CHBPP
With the initiation of CHBPP there had been social
benefits too. Every location where CHBPP was initiated
triggered formation of dairy groups/cooperatives
whereby farmers solve the challenges they encounter on
the farm collectively, working in group for a common
cause. This enhanced social cohesiveness for a
harmonious society. Besides, on-farm employment
generation through dairy farming for livelihoods and
income are other benefits. U.S. African Development
Foundation [USADF] (2018) supported the view that
dairy cooperatives increase food security, nutrition and
incomes of farming families and empowers women in
particular to be bread winners for their families.
Figure 2: CHBPP members' compliance to norms and services
13
3
4
42
15
6
23
14
3
36
13
9
17 2339
13
22
0
10
8 16
4 22
6
46 8
0
15
4
38
050
100150200250
AI
Bu
ll
Bo
th (
AI
+ b
ull
)
Yes No
Yes No
Per
man
ent
Sem
i-p
erm
anen
t
Tem
pora
ry
Breeding of animals Maintain monthly
milk records
Feeding of
commercial
concentrate
Housing of animals
Fully Partially
42%
44%
49%
48%
28%
31% 37%
36% 50%
50%
8%
6%
1% 2%
22
%
19
%
13
%
14
%
0%
0%
0%
10%
20%
30%
40%
50%
60%
Wes
t
Wes
t-ce
ntr
al
Wes
t
Wes
t-ce
ntr
al
Wes
t
Wes
t-ce
ntr
al
Wes
t
Wes
t-ce
ntr
al
Wes
t
Wes
t-ce
ntr
al
Awareness on CHBPP
provided
Breeding records
updated after AI
Progeny born ear
tagged
IBR issued for tagged
animals
Health care services
provided
Yes
No
Figure 3: Services provided as per CHBPP contract agreement

Bhutan Journal of Animal Science (BJAS), Volume 4, Issue 1, Page 90-97, 2020
Rai et al. (2020) 96
3.8 Compliance to CHBPP norms and Services
delivery and Hindrances
3.8.1 Compliance of CHBPP members to the contract
agreement
The CHBPP members as expected to comply with
contract agreement: to avail AI services at all times
avoiding use of breeding bull, maintain monthly milk
records and ensure proper feeding and management of
animals registered. Chi Square (χ2) test revealed
significant compliance (p=0.000) for all activities, except
for feeding concentrate (Figure 2) which could be because
feeding commercial concentrate was not affordable or
commercial feeds supplier may be absent in some of the
study areas.
3.8.2 Services provided to CHBPP members
When the services provided were compared between the
region, Chi-Square (χ2) test confirmed no significant
association (p>0.05), hinting that the services provided
were uniform in both the regions (Figure 3).
The services provision from Government to
members as per CHBPP contract agreement included
keeping proper records after AI, ear-tagging of progeny
born, issuance of Individual Bovine Register (IBR) for
tagged animals and health care facilities.
3.8.3 Hindrance to CHBPP implementation
Study found that 73.3% farmers expressed no hindrances
while 26.7% expressed some hindrances existed while
implementing the program.
Difficulty in disposal of bull born from the CHBPP
is reported to be a major constraint though irregular AI
services, repeat breeding AI and infertility cases were also
reported. The problem of bull disposal could be attributed
to saturation of bull demand or no demand for bulls of
lower blood level < 75% Jersey. Irregular AI services are
attributed to shortage of AI technician with current
staffing policy of one extension staff per gewog, and
requiring to deliver multiple animal extension services.
4. CONCLUSION
The CHBPP since its inception has gained momentum as
more farmers have joined the program with added number
of quality animals in their herd. Thus, the program met
the intended purpose to facilitate and create awareness
among farmers on uptake of AI technology through use
of progeny tested semen. CHBPP with the capacity to
meet about 70% of bull requirement in the country
annually has immensely contributed to breed
improvement program nation-wide and is supplementing
Jersey bull demand of NJBC. There had been significant
increase in Jersey cattle population above F3 generation
(>87.5% Jersey blood) during study/assessment period in
2019 especially in western region, confirming that breed
improvement milestones have been met through this
intervention. This can provide platform for identification
of high yielding cows nearing pure-line blood level as
“Bull Dam” for selection of young bulls intended for
frozen semen production in the near future.
Genetic progress made in CHBPP herd has
invariably improved productivity of the dairy herds.
Dairy thus has emerged as the primary source of income
to 72% of CHBPP members in the study area. Members
generated household income through sale of milk, milk
products and excess animals and helped to be
economically better off for a decent living.
Disposal of bull progeny born is one of the major
hindrances. Thus, wider use of sex-sorted semen having
assurance of about 90% female calf birth is recommended
in CHBPPs. Issue pertaining to irregular AI services and
repeat breeding can be overcome through training and
deployment of Community based AI Technicians and
regular refresher courses to field AI Technicians. Besides,
provision of adequate input generation and transportation
facilities including effective reproductive waste
management services can strengthen breed intensification
and overall dairy production initiatives.
ACKNOWLEDGEMENT
The authors highly acknowledge the support and
cooperation of the Farm Manager, NJBC Samtse, DLOs,
field staffs and CHBPP farmers of the study area in field
data collection without which this review would have
been impossible.
REFERENCES
Asaminew T and Seifu E (2009). Smallholder dairy
system and emergency of dairy cooperatives in
BahirdarZuria and Mecha Woredas, northern,
Ethiopia. World J. Dairy and Food Sci. 4: 185-192.
Bhujel A and Sonam T (2014). Smallholder Dairy
Farming as a Source of Livelihood: A Case Study
from Three Agro-Ecological Zones of Bhutan,
Bhutan Journal of Natural Resources
&Development, 1(1): 11-17.
Chuvert J (2011). Dairy farmers reap the benefits of
working together in a co-operative society, Package
94: Participatory Radio Campaigns and agricultural
co-operatives, Africa
FAO (2008). Asia Smallholder Dairy Development
Strategy and Outline Investment Plan. Common
Fund for Commodities Animal Production & Health
Commission for Asia and the Pacific, Bangkok
FAO (2018). Dairy Development’s Impact on Poverty
Reduction. Food and Agriculture Organization of
the United Nations, the Global Dairy Platform and
IFCN Dairy Research Network, Chicago

Bhutan Journal of Animal Science (BJAS), Volume 4, Issue 1, Page 90-97, 2020
Rai et al. (2020) 97
Malcolm B and Paine M (2005). Dairy Moving
Forward. Charles Sturt University and University of
Melbourne. Australia
NDRDC (2018). Annual Centre Report. National Dairy
Research and Development Centre (NDRDC),
Yusipang, Thimphu
Payal J, Hemkant C and Ashulata N (2018).
Contribution of dairy farming in employment and
household nutrition in India.International Journal of
Avian and Wild life Biology, 3(1):78-79.
Periyasamy VK, Arunasalam S, Paramasivan S,
Masilamani R and Richard C (2019). Production
and Reproduction Performances of Crossbred
Jersey Cows. Veterinary Research International,
7(2): 56-59.
PSE (2011). Replacement Heifers Selection, Penn
State Extension, The Pennsylvania State
University, USA.
Singh M and Maharajan KL (2005). Dairy production
and its implication in household income in the Tarai
Region of Nepal: A case study of Chitwan district,
Nepal. CNAS Journal, 32 (2): 213-231
Tamang NB, Rai DB, Dhendup T, Koirala AN,
Tshering L, Wangchuk P and Timsina, MP (2019).
Karan Fries vs. Jersey Cattle in Southern Foothills
of Bhutan. Bhutan Journal of Animal Science, 3 (1):
27-32.
USADF (2017). Three reasons why dairy farming is
empowering, U.S. African Development
Foundation (USADF) Africa.

Bhutan Journal of Animal Science (BJAS)
Volume 4, Issue 1, Page 98-102, 2020
98
Full length paper
COMPARATIVE PERFORMANCE OF COMMERCIAL BROILER HYBRIDS IN SUB-TROPICAL
ZONE OF BHUTAN
SURYA B CHAMLING RAI*, TASHI JAMTSHO AND KINLEY DEMA
National Poultry Research and Development Centre, Department of Livestock, Ministry of
Agriculture and Forests, Sarpang, Bhutan
*Author for correspondence: [email protected]
Copyright © 2020 Surya B Chamling Rai. The original work must be properly cited to permit
unrestricted use, distribution, and reproduction of this article in any medium.
ABSTRACT: The study was conducted to evaluate the growth rate and feed conversion ratio
of two commercial broiler hybrids namely Vencobb 400Y and Ross 308. A total of 330 unsexed
day-old chicks comprising of 165 numbers each of Vencobb 400Y and Ross 308 were used for
the study. Each experimental group was randomly allocated with 55 numbers of birds with three
replicates and were reared in an open sided poultry shed. The performance data were collected
for 42 days and, analyzed using sample independent t-test. There was significant difference
(p=0.00) between two broiler hybrids in terms of final body weight. Initial body weight of Ross
308 was found higher than the Vencobb 400Y hybrid. However, at the end trial (42 days), the
final live body weight of Vencobb 400Y was observed higher than Ross 308. The final live
body weights recorded for Ross 308 and Vencobb 400Y were 2280.24 ± 37.75 gm and 2636.20
± 31.13 gm respectively. The final FCR of 2.02 for Ross 308 and 1.78 for Vencobb 400Y were
recorded. There was no significant difference (p=0.06) between the two broiler hybrids for feed
conversion ratio and mortality. In overall, the performance of these two commercial broiler
hybrids was found comparable in sub-tropical zone during spring.
Keywords: Broiler hybrids; body weight; day old chick; feed conversion ratio.
1. INTRODUCTION
Broiler production is one of the ways to supply quality
animal protein at relatively low cost (Vasanth et al.
2015). Broiler chicken is the cheapest and safest animal
protein that can rapidly and efficiently fulfill the protein
shortage (Rahman 2014). The commercial broiler
hybrid is one of the fastest growing birds. Thus, with a
short production cycle, the economic returns are quick.
Investment in broiler farming has been found most
profitable on large farms, followed by medium and
small farms (Balamurugan & Manoharan 2014). The
modern intensive poultry production system produces
marketable size birds at six weeks of age (Shankar et al.
2017). The poultry industry worldwide, is rapidly
shaping-up into an attractive enterprise in response to
increasing demand for animal protein (Hossain et al.
2011).
Poultry industry plays a vital role in supplying
premium quality meat. Protein deficiency has been the
major contributory factor in malnutrition
(Rokonuzzaman et al. 2015). In many parts of the
world, the poultry sector is expected to grow with
increasing demand for protein as a result of rising
incomes, urbanization and population growth (Mottet et
al. 2017). In 2017, Brazil produced 13,250 million tons
of chicken followed by the European Union and China
with 11,700 and 11,600 million tons of chicken
respectively (United States Department of Agriculture
[USDA] 2017). In the same year, Brazil exported 4000
million tons of chicken while Japan imported 995
million tons followed by Saudi Arabia and Mexico with
780 and 750 million tons respectively. Among South
East Asia countries, poultry is the largest livestock
sector in Malaysia, Thailand and Indonesia (Iowa
Economic Development Authority [IEDA] 2017).
According to Hashim (2015), Malaysian poultry meat
production increased from 1.30 million MT in 2010 to
1.5 million MT in 2013, with a growth rate of 12.5%
per annum. According to Chatterjee & Rajkumar
(2015), India and China are the largest and second
largest poultry meat producers in Asia. India produced
about 3.8 million tons of poultry meat from 3000
million broilers per annum contributing Rs.70,000
crores to\the national GDP (Chatterjee & Rajkumar
2015). In Bangladesh, poultry meat alone contributes
37 % of the total meat production. Throughout the
world, poultry meat has become a mass consumer
product, in every region with different developments
and, in diverse forms (Magdelaine et al. 2008). On an
average in 2014, the world consumed poultry meat at
the rate of 13.2 kg/capita/year. The highest poultry
meat consumption was recorded in the US with 44.1
kg/capita/year, followed by Saudi Arabia and Malaysia

Bhutan Journal of Animal Science (BJAS), Volume 4, Issue 1, Page 98-102, 2020
Rai et al. (2020) 99
with 43.6 and 40.6 kg/capita/year respectively
(OECD/FAO 2015). According to Dawa (2014), about
21.6% of the Bhutanese consume chicken.
Prior to the earliest livestock regulations, the per
capita poultry meat consumption for Bhutan was
recorded at only 0.2 kg (Tobias & Morrison 2009).
There has been a remarkable increase in poultry
production in the country with a production figure of
1349 MT in 2017 (Bhutan RNR Statistics 2017).
Chicken import too has proportionately increased with
an import figure of 1583.97 MT (Bhutan RNR Statistics
2017). Thus, the per capita consumption of poultry
meat has increased to3.99 kgs in 2017.
Given the current chicken import trend, it will
continue to increase in coming years. Thus, Bhutan has
great potential to expand commercial broiler production
to substitute import. In-country produce ensures better
quality assurance.
Broiler farming is undertaken by both the small
scale and large-scale commercial entrepreneurs under
different farming conditions. In Bhutan, two
commercial broiler hybrids (Ross 308 and Vencobb
400Y) are reared. However, no comparative studies had
been undertaken so far to find the breed/s that is more
suitable to Bhutanese context and seasons.
The parent breeder of Ross 308 is imported from
India by the National Poultry Research and
Development Centre (NPRDC), Sarpang. The
commercial broiler Day-Old Chicks (DoC) of Vencobb
400Y is imported by private entrepreneurs. Therefore,
this research was designed to compare the production
performance of two renowned broiler commercial
hybrids. Such assessment of the fast-growing broiler
hybrids will help increase in-country chicken
production, thereby reducing the import.
2. MATERIALS AND METHODS
2.1 Experimental site
The experiment was conducted in the premises of
NPRDC (26° 52' 35" N 90° 15' 2" E, 346 meters above
sea level), Sarpang Dzongkhag (District) between 28th
February 2018 to 11th April 2018.
The experiment site has warm sub-tropical
characterized by hot summer and moderately cool
winter. The average temperature is 22°C and the
average annual rainfall ranges from 1200 mm to 2500
mm (Dzongkhag 2018).
2.2 Experimental design and birds
A total of 330 unsexed chicks comprising of 165 chicks
each of Ross 308 and Vencobb 400Y were used in this
study. The Ross 308 DoCs were hatched at NPRDC,
whereas Vencobb 400Y DoCs were imported from M/S
Eastern Hatcheries Pvt. Ltd., West Bengal, India. These
two broiler hybrids were considered as treatment birds.
55 DoCs of each hybrid were in each treatment group.
There were three replicates of each treatment group.
2.3 Management of experimental birds
All chicks were reared up to six weeks of age in an
open-sided house under deep litter system. The chicks
in all replicates were provided uniform stocking
density, feed, and water. They were reared under
identical standard management conditions throughout
the experimental period. Brooding preparation was
made prior to the arrival of chicks. Chicks were
provided uniform lighting facilities of 15-watt compact
florescent light (CFL) bulbs. For the first three days, 24
hours of lighting was provided followed by 23 hours of
lighting until chicks attained one week. Fresh, clean and
sun-dried sawdust was used as bedding materials.
Liquid petroleum gas and electric brooders were used
for brooding. Chicks were vaccinated as per the
standard vaccination schedule as in Table 1.
2.4 Feeding regime
At day zero, chicks were fed ad libitum. From day 1 to
23, birds were provided chick starter in accordance with
standard management guidelines of Ross 308 and
Vencobb 400Y (Aviagen 2009 & Cobb 2013). On the
24th day, broiler starter (crumble) and broiler finisher
(mash) were mixed and fed at 70:30 ratio. On day 25,
birds were provided starter and finisher at 50 % each.
On the 26th day, birds were fed starter and finisher at
30 % and 70 % respectively. From 27th day, the birds
were provided broiler finisher till 42 days of age.
2.5 Data collection
The data was collected for 42 days of rearing from 28th
February to 11th May, 2018. The body weights were
measured (Phoenix, with 0.001g precision) at weekly
intervals and mortality recorded on a daily basis. FCR,
mortality and Average Daily Gain (ADG) were
determined on a weekly basis by using the following
formulae:
ADG = Final weight−Initial weight (g)
Age of Birds (days)
FCR =Total feed Intake (g)
final weight gain (g)
Mortality =No.of dead birds
No.of initial birds x 100
Table 1: Vaccination schedule adopted
Age Vaccine Route
0 day Marek disease Sub-Coetaneous Muscular
3rd Day Infectious Bursal Disease Intra ocular
7th Day Newcastle Disease(B1) Intra ocular
14th Day Infectious Bursal Disease Intraocular
28th Day Infectious Bursal Disease Intraocular

Bhutan Journal of Animal Science (BJAS), Volume 4, Issue 1, Page 98-102, 2020
Rai et al. (2020) 100
2.6 Data Analysis
The data were entered in Microsoft Excel 2010. The
normality of data was tested with the Shapiro Wilk test
and homogeneity of variance by Levene’s test. The
growth performance and FCR of two commercial
hybrid broilers were tested with sample independent t-
test. The two broiler breeds were the independent
variables while FCR and body weight were the
dependent variables. Differences in dependent
variables were considered significant when p values
were less than 0.05. The statistical software Statistical
Package for Social Science (SPSS) version 23 was used
to analyze the data (IBM n.d.).
3. RESULTS AND DISCUSSIONS
3.1 Body weight
The initial body weights of Ross 308 and Vencobb
400Y were 47.20 ± 0.42 g and 43±0.35 gm respectively.
Though the initial body weight of Ross 308 was
comparatively higher than Vencobb 400Y, the final
average live body weight of later was higher under the
same environmental and management conditions. The
final average live body weights were recorded at
2280.24 ± 37.75 gm and 2636.20 ± 31.13 gm for Ross
308 and Vencobb 400Y respectively (Figure 1). A
highly significant difference (p = 0.001) was observed
between two commercial broiler hybrids’ body weight
at 42 days of age. At the end of the experiment,
Vencobb 400y broilers attained higher average live
weight than Ross 308 birds by 15.61%. The results of
this study are supported by Hristakieva et al. (2014)
where a significant difference was observed between
two hybrids. Similarly, Torshizi, (2006) in their study
revealed numerically higher body weight of Vencobb
compared to Ross. Another study by Pascalau et al.
(2017) observed slightly superior final body weight for
Vencobb 500 hybrid by 3.42% compared to Ross 308
0
500
1000
1500
2000
2500
3000
3500
1 2 3 4 5 6
Bo
dy w
eight
(g)
Age (week)
Ross 308
Cobb 400y
Figure 1: Average live body weight of two commercial broiler hybrids
0
10
20
30
40
50
60
70
80
90
100
1 2 3 4 5 6
Aver
age
Dai
ly G
ain (
g)
Age (Weeks)
Ross 308
Cobb 400y
Figure 2: Average daily weight gain of two commercial broiler hybrids

Bhutan Journal of Animal Science (BJAS), Volume 4, Issue 1, Page 98-102, 2020
Rai et al. (2020) 101
hybrid. On contrary, Hascik et al. (2010) showed high
numerical average body weight for Ross 308 compared
to Vencobb at slaughtering age of 35 days. However,
no significant difference was observed. Ciurescu &
Grosu (2011) demonstrated a slightly lower final body
weight for Vencobb 500 broilers than Ross 308, but
difference was not significant (p > 0.05). Amao et al.
(2015) found the final body weight of 1423g in eight
weeks for Vencobb hybrid which is much lower than
the current study findings. The relatively higher initial
body weight for Ross chicks may be attributed to the
fact that they are hatched on station while the Vencobb
400Y DoCs were imported from India because of which
chicks are expected to undergo transit weight loss. The
differences in the performances of broiler hybrids may
be affected by various factors like breeding,
management, nutrition, disease control, weather
conditions and so on.
3.2 Average Daily Gain
At the first week, an average daily weight gain for Ross
308 was 10.35 ± 0.08 g and 12.39 ± 0.21 g for Vencobb
400Y (Figure 2). There was a significant difference (p
> 0.05) between two broiler hybrids’ ADG except on
week three and five. The result is supported by
Namakparvar et al. (2014) where a significant
difference was observed in body weight gain among
three hybrids of Ross 308, Vencobb 500 and Arian.
They observed Vencobb hybrid had the highest daily
weight gain compared to Ross 308 and Arian. In the
current study, an average daily weight gain of 53.15 ±
2.88 g and 60.07 ± 3.19 g was observed for Ross 308
and Vencobb 400Y, respectively for 42 days. A study
by Amao et al. (2015) revealed 66 g daily weight gain
in Vencobb hybrid which was slightly greater than the
current result. This result contradicts the study by
Ciurescu & Grosu (2011) where Ross 308 had higher
average daily weight gain of 58.05 g as compared to
56.55 g for Vencobb 500. Namakparvar et al. (2014)
observed average daily weight gain of 46.1 ± 0.6 g for
Ross 308 and 50.7 ± 1 g for Vencobb 500 which are
lower than the current study results. Pascalau et al.
(2017) observed a slightly higher average daily weight
gain in Vencobb 500 (53.69g) as compared to Ross 308
at 51.83g.
3.3 Feed Conversion Ratio
The final FCR of 2.02 and 1.78 was observed for Ross
308 and Vencobb 400Y, respectively (Figure 3). There
was no significant difference in FCR between Ross 308
and Vencobb 400y (p ˃0.05). This result is supported
by Ciurescu & Grosu, (2011) who observed no
significant difference among three broiler hybrids of
Ross 308, Vencobb 500 and Arbor Acres. The FCR of
Vencobb 400Y chicken is slightly better than Ross 308.
In contrast, Pascalau et al. (2017) demonstrated a
slightly better FCR value of 1.88 for Ross 308. A study
by Iqbal (2012) revealed FCR of 2.17 for Ross 308 in
seven weeks of age in Pakistan. In the present study,
Ross 308 chicken exhibited slightly higher FCR value
compared to Vencobb 400Y. This indicates that
Vencobb 400Y performed better than Ross 308 during
the experiment. In contrast, Hascik et al. (2010)
revealed 1.644 as FCR value of Ross 308 which is
slightly lower than 1.7 of Vencobb 500 at the age of 35
days. Pathak et al. (2016) recorded FCR value of 1.85
in Vencobb 400Y which is slightly higher than 1.78 for
Vencobb 400Y in this study. This difference could be
attributed to the independent variables, breed and
season.
3.4 Mortality
Statistically, the result demonstrated no significant
difference (p > 0.05) between two broiler hybrids in
terms of mortality. At the end of the experiment, 7.87
% and 6.06 % of mortality were recorded for Ross 308
and Vencobb 400Y respectively. Similar result was
obtained by Rokonuzzaman et. al (2015) where no
significant difference was observed between three
improved breeds of Vencobb-500, Hubbard Classic,
and Arbor Acres.
0
0.5
1
1.5
2
2.5
1 2 3 4 5 6
FC
R
Age (weeks)
Ross 308
Cobb 400y
Figure 2: Comparison of FCR between two commercial broiler hybrids
Bhutan Journal of Animal Science (BJAS), Volume 4, Issue 1, Page 98-102, 2020
Rai et al. (2020) 102
4. CONCLUSION
The performance of Vencobb 400Y and Ross 308
broiler hybrids were found comparable in the sub-
tropical zone during spring. There was no significance
difference in FCR, the main criterion for evaluation of
performance and profitability. But, the contribution of
season to this result need to be further authenticated.
The trial needs to be conducted for repeatability in other
agro-ecological zones. In addition, faster growing
Vencobb 400Y has its own share of animal welfare
issues. Thus, choice of hybrid must be made with care
and further scientific evidences.
REFERENCES
Amao SR, Ojedapo L & Oso OE (2015). Evaluation of two
commercial broiler strains differing in efficiency of
feed utilization. Journal of New Sciences, 14(1):432–
437. https://doi.org/10.3382/ps.0661101
Aviagen (2009). Ross Broiler Management Manual.
Balamurugan V & Manoharan M (2014). Cost and benefit
of investment in integrated broiler farming -A case
Study, 2(4):114–123.
Chatterjee RN & Rajkumar U (2015). An overview of
poultry production in India. Indian Journal of Animal
Health., 54(2):89–108.
Ciurescu G & Grosu H (2011). Efficiency of feed
utilization by different hybrids of broiler chicks, 36–
43. Retrieved from National Research- Development
Institute for Animal Biology and Nutrition (IBNA)-
Calea Bucuresti nr.1, 077015 Baloteti, Ilfov, Romania
Cobb (2013). COBB Broiler Management Guide
Introduction.
Dawa (2014). A demand analysis of meat in bhutanese
households.
Hascik P, Kacaniova M, Mihok M, Pochop J and
Benczova E (2010). Performance of various broiler
chicken hybrids fed with commercially produced feed
mixtures. International Journal of Poultry Science,
9(11):1076–1082.
https://doi.org/10.3923/ijps.2010.1076.1 082
Hashim FAH (2015). Strategies to strengthen livestock
industry in Malaysia. Malaysian Agricultural Research
and Development Institute (MARDI), 1–6.
Hossain MA, Suvo KB & Islam MM (2011). Fast-
Growing Broiler Strains Raised Under Farming
Condition in Bangladesh. International Journal of
Agricultural Research Innovation & Technology,
1((1&2)):37–43.
Hristakieva P, Mincheva N, Oblakova M, Lalev M &
Ivanova I (2014). Effect of Genotype on Production
Traits in Broiler Chickens. Slovak Journal of Animal
Science, 47(1):19– 24.
IBM (n.d.). IBM SPSS Statistics 23 Brief Guide.
Iowa Economic Development Authority (2017). Poultry
Sector in South East Asia. Poultry Sector in South East
Asia. Orissa International Pte. Ltd.
Iqbal J, Mian AA, Ahmad T, Hassan S & Khan HS (2012).
Comparative Performance of Different Economic
Traits of Four Imported Broiler Strains Under Local.
Pakistan Journal of Agricultural Research, 25(1).
Magdelaine P, Spiess MP & Valceschini E (2008). Poultry
meat consumption trends in Europe. World’s Poultry
Science Journal, 64(1):53–63.
https://doi.org/10.1017/S0043933907001 717
Mottet A de, Haan C, Falcucci A, Tempio G, Opio C &
Gerber P (2017). Livestock: On our plates or eating at
our table? A new analysis of the feed/food debate.
Global Food Security, 14(August): 1–8.
https://doi.org/10.1016/j.gfs.2017.01.001
Namakparvar R, Shariatmadari F, & Hossieni SH (2014).
Strain and sex effects on ascites development in
commercial broiler chickens. Iranian Journal of
Veterinary Research, Shiraz University, 15(2): 116–
121.
Pascalau S, Cadar M, Raducu C & Marchis Z (2017).
Evaluation of productive performances in Ross 308
and Cobb 500 hybrids, 9(1): 22–27
Pathak R, Ali N, Kumar S & Chauhan, HS (2016).
Evaluation of Growth Performance of Broiler (Cobb-
400) Under Different Evaluation of Growth
Performance of Broiler (Cobb- 400) Under Different
Composition of Diets. An International Quarterly
Journal of Life Science, (November 2015), 0–4.
Perter Hascik, Miroslava Kacaniova, Michal Mihok,
Jaroslav Pochop, EB (2010). Performance of Various
Broilr Chicken Hybrids Fed wwith Commercially
Produced Feed Mistures. Slovakia.
Rahman MS (2014). Morphological analysis of breast and
thigh muscles in different postnatal ages of broiler
chicken and its carcass characteristics. Bangladesh
Journal of Vet. Med, 12 (2):115–120.
Rokonuzzaman MD, Jahan Sarwan Syed, Ali SHawkat
MD, Islam Akhtarul ISM D (2015). Growth
performance of three broiler strains in winter seasons
in Bangladesh. International Journal of Agricultural
Policy and Research, 3(July):308–313.
Shankar PA, Premavalli K, Omprakash AV, Kirubakaran
JJ & Hudson GH (2017). Effect of Dietary Yeast
Supplementation on Broiler Performance.
International Journal of Advanced Biological
Research, 7(2), 222–228.
Tobias BM & Morrison JG (2009). “Animal Rights in
Bhutan”.
Torshizi K (2006). Comparison of growth performance of
six commercial broiler hybrids in Iran, 7(2), 38–44.
United States Department of Agriculture (USDA) (2017).
Livestock and Poultry: World Markets and Trade. In
United States Department of Agriculture. Foreign
Agricultural Service (p. 27). Retrieved from
https://apps.fas.usda.gov/psdonline/circul
ars/livestock_poultry.pdf
Vasanth S, Dipu MT, Mercy AD & Shyama (2015).
Studies on Production Performance in Broiler Chicken
Supplementing Copper and Flavomycin in Feed, 3(3):
269–272.

Bhutan Journal of Animal Science (BJAS)
Volume 4, Issue 1, Page 103-109, 2020
103
Full length paper
ASSESSMENT OF MILK PRODUCTION AND INCOME FROM TRADITIONAL AND IMPROVED
MANAGEMENT SYSTEM OF SMALL DAIRY FARMERS IN BHUTAN
LOKEY THAPA*, DEKI CHODEN AND NAR B TAMANG
National Dairy Research and Development Centre, Department of Livestock, Ministry of
Agriculture and Forests, Yusipang
*Author for correspondence: [email protected]
Copyright © 2020 Lokey Thapa. The original work must be properly cited to permit unrestricted
use, distribution, and reproduction of this article in any medium.
ABSTRACT: The study was conducted to compare and assess the productivity of dairy cattle
and corresponding household income from traditional and improved dairy management system.
The study area falling under four regions were randomly selected by selecting one Dzongkhag
from each region. The study also documented major challenges encountered in enhancing
productivity of dairy animals. The average daily milk yield and monthly household income for
traditional and improved management system under small holder dairy farming were 1.63 l and
7.37 land Nu. 4,167.50/month and Nu. 19,586/month respectively. The average daily milk yield
and corresponding household income adopting improve management system was significantly
higher (p<0.001) than traditional system. The study also found that about 75 percent of the
respondents adopting improved dairy management system meet their household expenses from
income generated from dairy farming whereas only 35 percent of the respondents practicing
traditional management system meet their household expenses through the sale of milk and milk
products. The major challenges encountered in small holder system were lack of technology
adoption such as AI services for breeding and fodder conservation, and marketing support. The
study concluded that the dairy farming has contributed immensely in improving livelihoods of
rural farming communities. Further, the improved dairy farming has enabled the farmers to earn
income by four times higher than traditional dairy farming. Therefore, any form of support
provided to the farmers in modernizing dairy farming and adopting better technologies will have
positive impact on livelihoods of the farmers.
Keywords: Dairy farming; household income; improved farming; small holder; traditional
farming.
1. INTRODUCTION
Bhutan is an agrarian country with more than 60
percent of the population depending on subsistence
agriculture and livestock farming for their livelihood
(Wangmo and Dorji 2017). Small holder dairy farming
is widely practiced by Bhutanese farmers and is mainly
reared for milk and milk products, draught power and
manure. Sale of milk products is increasingly a main
source of income to farming community.
About 48 percent of the household in the country
rear 3,04,178 heads of cattle out of which 65.4% are
local cattle and remaining 34.6% are exotic cross
breeds (Livestock statictics 2017). Crossbreeding of
local cattle with exotic dairy breeds started from 1985.
Improved crossbred cows are stall-fed for increased
milk production (Samdup et al. 2010). Milk production
varies with the breed type, age, stage of lactation,
nutritional status, pregnancy and water availability.
High milk yield is the most important for higher
economic returns. However, without proper nutrition
and management, milk production of the dairy animals
cannot be improved. Studies have proven that stall-fed
cattle showed a significantly higher milk yield and
better reproductive performance than the free range
animals (Sultana et al. 2001). The regular earnings from
the sale of milk and milk products have favorable
effects on the cash flow to rural households and
improve their livelihoods.
Despite potential contribution of dairy farming
towards improved household livelihoods, farmers are
yet to realize benefit of optimizing production. Majority
of farmers failed to understand the connection between
improved management practices and income.
Therefore, the practice of feeding and management on
milk production and income was carried out to assess
productivity and household income from traditional and
improved dairy management systems as well as identify
major challenges under traditional and improved
management systems.
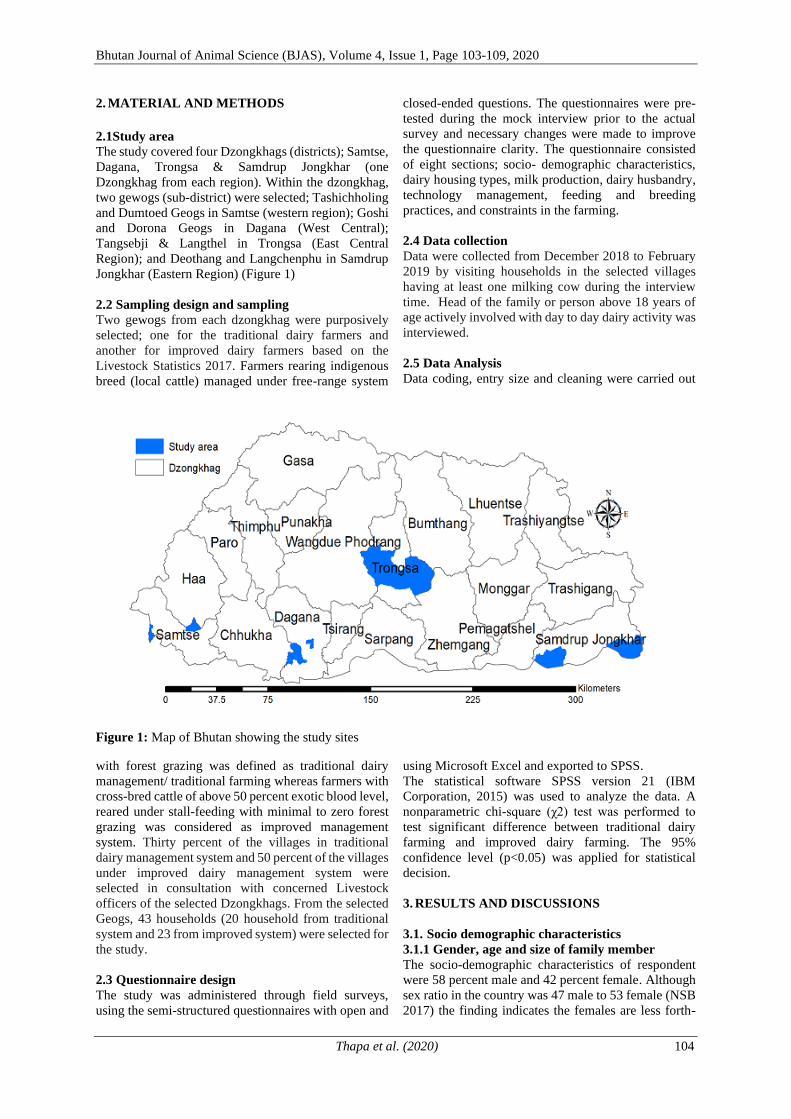
Bhutan Journal of Animal Science (BJAS), Volume 4, Issue 1, Page 103-109, 2020
Thapa et al. (2020) 104
2. MATERIAL AND METHODS
2.1Study area
The study covered four Dzongkhags (districts); Samtse,
Dagana, Trongsa & Samdrup Jongkhar (one
Dzongkhag from each region). Within the dzongkhag,
two gewogs (sub-district) were selected; Tashichholing
and Dumtoed Geogs in Samtse (western region); Goshi
and Dorona Geogs in Dagana (West Central);
Tangsebji & Langthel in Trongsa (East Central
Region); and Deothang and Langchenphu in Samdrup
Jongkhar (Eastern Region) (Figure 1)
2.2 Sampling design and sampling
Two gewogs from each dzongkhag were purposively
selected; one for the traditional dairy farmers and
another for improved dairy farmers based on the
Livestock Statistics 2017. Farmers rearing indigenous
breed (local cattle) managed under free-range system
with forest grazing was defined as traditional dairy
management/ traditional farming whereas farmers with
cross-bred cattle of above 50 percent exotic blood level,
reared under stall-feeding with minimal to zero forest
grazing was considered as improved management
system. Thirty percent of the villages in traditional
dairy management system and 50 percent of the villages
under improved dairy management system were
selected in consultation with concerned Livestock
officers of the selected Dzongkhags. From the selected
Geogs, 43 households (20 household from traditional
system and 23 from improved system) were selected for
the study.
2.3 Questionnaire design
The study was administered through field surveys,
using the semi-structured questionnaires with open and
closed-ended questions. The questionnaires were pre-
tested during the mock interview prior to the actual
survey and necessary changes were made to improve
the questionnaire clarity. The questionnaire consisted
of eight sections; socio- demographic characteristics,
dairy housing types, milk production, dairy husbandry,
technology management, feeding and breeding
practices, and constraints in the farming.
2.4 Data collection
Data were collected from December 2018 to February
2019 by visiting households in the selected villages
having at least one milking cow during the interview
time. Head of the family or person above 18 years of
age actively involved with day to day dairy activity was
interviewed.
2.5 Data Analysis
Data coding, entry size and cleaning were carried out
using Microsoft Excel and exported to SPSS.
The statistical software SPSS version 21 (IBM
Corporation, 2015) was used to analyze the data. A
nonparametric chi-square (χ2) test was performed to
test significant difference between traditional dairy
farming and improved dairy farming. The 95%
confidence level (p<0.05) was applied for statistical
decision.
3. RESULTS AND DISCUSSIONS
3.1. Socio demographic characteristics
3.1.1 Gender, age and size of family member
The socio-demographic characteristics of respondent
were 58 percent male and 42 percent female. Although
sex ratio in the country was 47 male to 53 female (NSB
2017) the finding indicates the females are less forth-
Figure 1: Map of Bhutan showing the study sites

Bhutan Journal of Animal Science (BJAS), Volume 4, Issue 1, Page 103-109, 2020
Thapa et al. (2020) 105
coming in dairy activities. Fifty four percent of the
respondents were in the middle age group (36 to 56
years), 27 percent old age above 56 years and 19
percent were young age group below 35 years,
indicating that not many youths are taking up dairy
farming activity. Almost 70 percent of the households
in the study area has less than 6 members in the family
living in village. This could be because of more
educated people are moving in the urban town and
some serving in government offices elsewhere.
However, in socio-demographic characteristics
significant difference (p<0.05) was observed only in
education level; Secondary and higher secondary and
above and land holdings that propelled farmers in
traditional and improved farming system (Table 1).
3.1.2 Literacy
Majority (71.5%) of respondents in this study were
illiterate though the literacy rate is 71 percent literacy
rate (PHCB, 2018). Majority of dairy farmers in rural
areas who practice traditional dairy farming are mostly
illiterate and not aware of improved dairy farming. The
findings from the study revealed that more educated
respondents in the study area are taking up the
improved dairy farming and earn better income (Table
2).
3.2 Average land holdings & Pasture development
The overall average land holding in the study area was
3.69 acres with 3.3 acres for households in traditional
management system and 4.03 acres in improved
management system. The average household
landholding in study area was higher than the national
average land holdings of 2.16 (PHCB 2018). Study also
found that 93 percent of households with improved
management system and 73.6 percent of household
with traditional management system have improved
pasture land with average of 0.62 acres.
Table 1: Socio demographic characteristics for traditional and improved dairy farming
Variables Categories Traditional farming
(n=80)
Improved
farming(n=92) Total p value
Gender Male 45 (56) 55 (60) 100 (58)
0.64 Female 35 (44) 37 (40) 72 (42)
Age 18 - 35 years 16 (20) 17 (18) 33 (19)
0.96 35 - 55 years 42 (53) 50 (54) 92 (54)
Above 56 years 22 (27) 25 (27) 47 (27)
Education No Education 62 (77) 61 (66) 123 (71.5)
Primary 15 (19) 15 (17) 30 (17.4)
0.043 Secondary 2 (2.5) 12 (13) 14 (8.1)
Higher Secondary
above 1 (1.3) 4 (4) 5 (2.9)
Total land 0 - 2 acres 26 (32.5) 35 (38) 61 (35.5)
0.03 2.1- 5 acres 49 (61.3) 41 (44.6) 90 (52.3)
Above 5 acres 5 (6.3) 16 (17.4) 21 (12.2)
Pasture Land Improved pasture (Yes) 59 (73.6) 84 (93) 143 (83) 0
Improved pasture (No) 21 (26.3) 6 (6.5) 27 (16)
Herd Size Till 4 animals 17 (21) 18 (20) 35 (20) 0.85
Above 4 animals 63 (79) 74 (80.4) 137 (80)
Family
member Less than 6 44 (55) 74 (80) 118 (69)
0
6 and above 6 36 (45) 18 (20) 54 (31) Note: The figure in the bracket represent percentage, Chi Square p value test, Family members (mean = 5.86) categorized less than 6
and 6 and above. Livestock herd size (mean 5.16) categorized less than 6 and above 6
Table 2: Milk production and income under traditional and improved management system Parameters Improved cattle Local Cattle p-value
Average milk yield (litres/day) 7.00 ± 3.60 1.63 ± 0.69 0.00 ✓ Trongsa 7.37 ± 3.22 1.33 ± 0.68 0.01
✓ Samtse 5.46 ± 2.60 1.49 ± 0.87 0.01
✓ SamdrupJongkhar 7.06 ± 3.18 1.62 ± 0.32 0.01
✓ Dagana 8.10 ± 4.74 2.07 ± 0.59 0.01
Average milking animal (no) 2.03 ±1.043 1.79 ±0.931 NS
Lactation length (months) 9.92 ± 2.50 9.34 ± 3.34 NS
Monthly Income (Nu) 19,586.96 ±10457.30 4,167.50 ±2248.87 0.00 Milk production reduction in summer and winter (%) 27.29 ± 6.60 24.50 ± 4.47 NS Note: The figure in the bracket represent percentage, Chi Square p value test

Bhutan Journal of Animal Science (BJAS), Volume 4, Issue 1, Page 103-109, 2020
Thapa et al. (2020) 106
The average improved pasture with traditional
management system and improved management system
was 0.23 acre and 0.95 acres respectively. Owing to
small land holdings, only small portion of the
agriculture land is devoted for pasture development and
rest are used for agriculture purpose. The finding is
consistent with Maleko et al. (2018), who reported that
farmers devote about 87 percent of the land to grow
crops and only small portion is reserved for pasture
development.
3.3 Herd Size
Average milking animals reared by traditional farmers
was 1.79 heads and improved farmers was 2.03 heads.
Majority (80%) of the respondents kept more than four
animals and rest had a herd size of less than 4 animals
(Table 1). There was no difference between traditional
dairy farmers and improved dairy farmers on herd size.
3.4 Milk production, household income and
contribution
3.4.1 Milk production
Recall and milk record data were used to record daily
milk yield of dairy cattle managed under traditional and
improved management systems. Average daily milk
yield was 1.6 litres and 7.0 litres for the traditional and
improved management systems respectively. The
average daily milk yield under improve management
system was found significantly higher (p<0.001) than
those reared under traditional management system,
which could be due to low genetic potential of local
breed, poor feeding and husbandry practices, compared
to higher exotic blood level cows under improved
management system with better feeding and
management. The result is consistent with Samdup et
al. (2010) who reported milk yield of 2.4 - 4.6 times
higher for crossbred/ improved cattle than in local
cattle.
Milk production in winter was reduced by more
than 27 percent in improved management compared to
about 25 percent in traditional management. The
reduction in milk production in winter was attributed
mainly to fodder shortage and was substantiated by the
findings of Wangchuk et al. (2019) that fodder shortage
as an impediments to increasing milk production.
The average monthly household income of dairy
cattle reared under traditional and improved
management systems were Nu. 4,167.50 (range
Nu.1000 – 12000) and Nu 19,586.96 (range Nu. 4500 –
45000) respectively. The average household income
was highly significant (p<0.001) to improved
management system for higher milk yield owing to
feeding of concentrate feeds, more improved pasture
and engagement of more educated people in it
compared to traditional management system (Table 2).
Hence, if the traditional farmers take up improved dairy
management system, the average income is likely to
multiply by more than four times.
3.4.2 Contribution from dairy farming to household
income
The study found that about 75 percent of the
respondents adopting improved dairy cattle
management system meet their household expenses
from sale of milk and milk products whereas only 35
percent of the respondent under traditional management
system meet their expenses through sale of milk and
milk products, and rest from sale of cash crops and
other activities (Figure 2).
Figure 2: Source of income by traditional and
improved dairy farming
Findings from this study suggest that irrespective of
management types, dairy has contributed immensely
(above 95 %) in meeting the household expenditure,
Schooling of their children and grandchildren, buying
feed and household food items thereby improving
livelihoods of farming community (Table 3).
3.4.2 Milk marketing
Milk marketing due to lack of adequate infrastructure
and road connectivity among rural farmers was a major
problem. About 75 percent of respondents of the
traditional and 64 percent of respondent of the
improved dairy farmer respondent process daily
0
10
20
30
40
50
60
70
80
90
Dairy
farming
Cardamom Betel nut Crop and
vegetable
Others
Inco
me
sou
rce
(%)
Improved farmingTraditional farming
Table 3: Contribution of household income from traditional and improved farming
Variables Categories Traditional farming
(n=80) Improved farming
(n=92) Total
Household expenses Yes 80 (100) 92 (100) 172 (100)
No 0 0 0 Schooling Yes 77 (96) 91 (98.9) 168 (98)
No 1 (1.3) 1 (1.1) 2 (1.2) Feed purchase Yes 2(2.2) 91 (99) 93 (54)
No 72 (90) 1 (1.1) 73 (42.4) The figure in the bracket represents percentage, Chi Square p value test

Bhutan Journal of Animal Science (BJAS), Volume 4, Issue 1, Page 103-109, 2020
Thapa et al. (2020) 107
produced milk into butter and cheese. However, it is
reported to be labour intensive and time
consuming. Therefore, the need to adopt improved
technology for product processing is warranted to ease
the problem.
3.5 Dairy management system
Housing is important to ensure proper and easy
management of dairy cows. The study recorded about
85 percent of farmers rearing improved cattle
constructed permanent dairy shed, followed by 13
percent and 2 percent with semi-permanent/temporary
sheds respectively (Figure 3).
On the contrary, only 29 percent of traditional
dairy farmers had permanent shed followed by 11
percent and 60 percent in semi-permanent and
temporary shed respectively. The type of dairy shed and
shed floor significantly affect the milk production in
traditional and improved dairy farming (p<0.001). The
result shows that the current types of sheds are
influenced by the availability of financial resources. In
many places cattle were kept in confined area and floor
was made from mud without drainage system to protect
from cold. Most of the traditional system do not have
dairy sheds as their animals are migrated to their
orchards for manuring purpose and also in search of
green grass in different seasons. Clean milking practice
such as washing of hands, udder and milking utensil
before milking were practiced by both traditional and
improved dairy farming equally.
3.6 Feeding management
3.6.1 Traditional management system
Adequate/ balanced feeding is considered as one of the
important components for optimum production.
Finding from the study indicates that 100 percent of the
traditional management system feed crop residue as
primary feed to their milking animals which ranged
from 2 to 25 kg per day (Table 4).
The finding from the present study indicated that
about 30 percent of the traditional dairy farmers feed 5
– 10 kg of paddy straw as an alternative feeding during
winter owing to non-availability of green fodders.
However, no concentrate feeds were given under
traditional management system due to non-availability
of feed agent and high feed price in the area (Table 5).
More than 97 percent of the traditional management
system tethered their dairy cows in their private land or
near the forest which is the main source of fodder.
3.6.2 Improved management system
Finding from the study indicates that 100 percent of the
improved management system feed crop residue as one
the major feed component to their milking animals and
were given in the range of 5 to 30 kg daily (Table 4).
Crop residue ingredients include paddy straw,
leftover vegetables, sorghum, pumpkin, banana stem,
mustard cake etc. Beside this, fodder grasses were also
fed to the dairy animals in the range of 5 – 20 kg. More
than 95 percent of the improved management system
feed commercial feeds to their milking cows during
morning and evening before milking and were given in
the range of 2 to 3 kg (Table 4 & 5). The findings from
the present study indicated that about 69.5 percent of
the improved dairy farmers fed paddy straw as an
alternative feed during winter owing to non-availability
of green fodders.
Figure 3: Dairy Sheds in traditional and improved
dairy farmers
Table 5: Different feeding and fodder availability in traditional & improved dairy farming
Variables Categories Traditional dairy farming Improved dairy farming Total
(n=80) (n=92) p value
Feeding Concentrates to the
milking cows
Yes 4 (4.7) 82 (95.3) 86 (50) 0.00
No 76 (88.4) 10 (11.6) 86 (50)
Tether milking cow in field
for grazing
Yes 78 (97.5) 41 (44.6) 119 (69.2) 0.00
No 2 (2.5) 51 (55.4) 53 (30.8)
Feed crop residue Yes 80 (100) 92 (100) 172 (100))
NS No 0 0 0
Feed paddy straw Yes 24 (30) 63 (68.5) 87 (50.6)
0.00 No 56 (70) 29 (31.5) 85 (49.4)
Have feed agent to buy Yes 0 82 (89) 82 (48)
0.00 No 80 (100) 10 (11) 90 (52)
The figure in the bracket represent percentage. Chi Square p value test
Table 4: Feeds and feeding trend
Cattle type
Improved(N=9) Local(N=80) Crop residue (kg) 5-30 2-25 Concentrate (kg) 2-3 0 Fodder (kg) 5-18 5 - 10 Water (l) 20–30 15–20
60
11
29
85
0
10
20
30
40
50
60
70
80
90
Temporary Shed Semi permanent
Shed
Permanent shed
Nu
mb
er o
f re
spon
den
t (%
) Traditional dairy farming
Improved dairy farming

Bhutan Journal of Animal Science (BJAS), Volume 4, Issue 1, Page 103-109, 2020
Thapa et al. (2020) 108
These crop residues and fodder fed to milking
cows have low level of nutrients and can meet only 35
to 45 percent of the feed demand of the ruminant
(Maleko et al. 2018). Crop residue have low palatability
and digestibility due to high fibre contents which is less
than 18 percent. Thus, treatment with urea molasses of
high fibre crops was recommended for better
performance and more milk production. Efforts to
reduce the problem of dry season over fodder shortage
by hay making technologies were introduced. However,
the technology did not pick up in the farmer’s field
although it was effective and successful elsewhere.
Low adoption of this technology could be due to limited
practice of fodder conservation, low level of awareness/
extension support, and labour and land shortages as the
similar situation was reported by Maleko et al. (2018).
Findings from the study area revealed that concentrate
feeding among improved management system was 2 to
3 kg and no concentrate was fed in traditional
management system.
3.7 Water
The result from the study revealed that farmers
provided 15 to 20 litters of water/day to local cattle
compared to 20 to 30 litters of water per day to
improved cattle (Table 4). The finding is in consistent
to the findings of Smith et al. (2017) which provided
20 to 40 litters of water daily to crossbred milking
cows. However, water consumption is found to be
proportionate to milk production and different
seasons of the year.
3.8 Breeding
About 70 percent of the traditional dairy farmer
respondents use local breeding bull to breed their
cows compared to one percent by the improved dairy
farmer respondents (Figure 4).
Similarly, 23.8 percent of the farmers in traditional
system use community Jersey bull to breed their cattle
compared to 33.7 percent of the farmers in improved
system, indicating that the farmers in improved system
have preference for sires with higher exotic blood level
than those in traditional system. There was significant
difference in milk production (p<0.001) resulting from
different breeding types; artificial insemination (AI)
and different breed of breeding bulls. None of the
traditional dairy farmer used AI to breed their dairy
cows compared to 56.5 percent of the farmers in
improved farming. Ninety nine percent of the
traditional farmers did not avail AI services due to lack
of facility compared to 98 percent of improved dairy
farmers who availed AI facility as available in the
Geog. More awareness on benefit of AI over natural
service and AI facilities need to be provided with
adequate logistic support in villages to encourage breed
improvement for higher milk production and income.
Figure 5: Challenges faced by farmers in traditional & improved management system
Figure 4: Different types of breeding practiced by
traditional and improved dairy farming
0 20 40 60 80 100
Yes
No
Yes
No
Yes
No
Yes
No
Can
yo
u s
ale
fres
h m
ilk
Rep
eat
case
No i
rrig
atio
n
to p
astu
re
du
rin
g
win
ter
Hig
h f
eed
pri
ce
Improved Farming Traditional Farming
0
10
20
30
40
50
60
Local
breeding
bull
Community
Jersey bull
Government
jersey bull
Government
AI
Res
po
nd
ent
(No
.)
Traditional dairy farming
Improved dairy farming
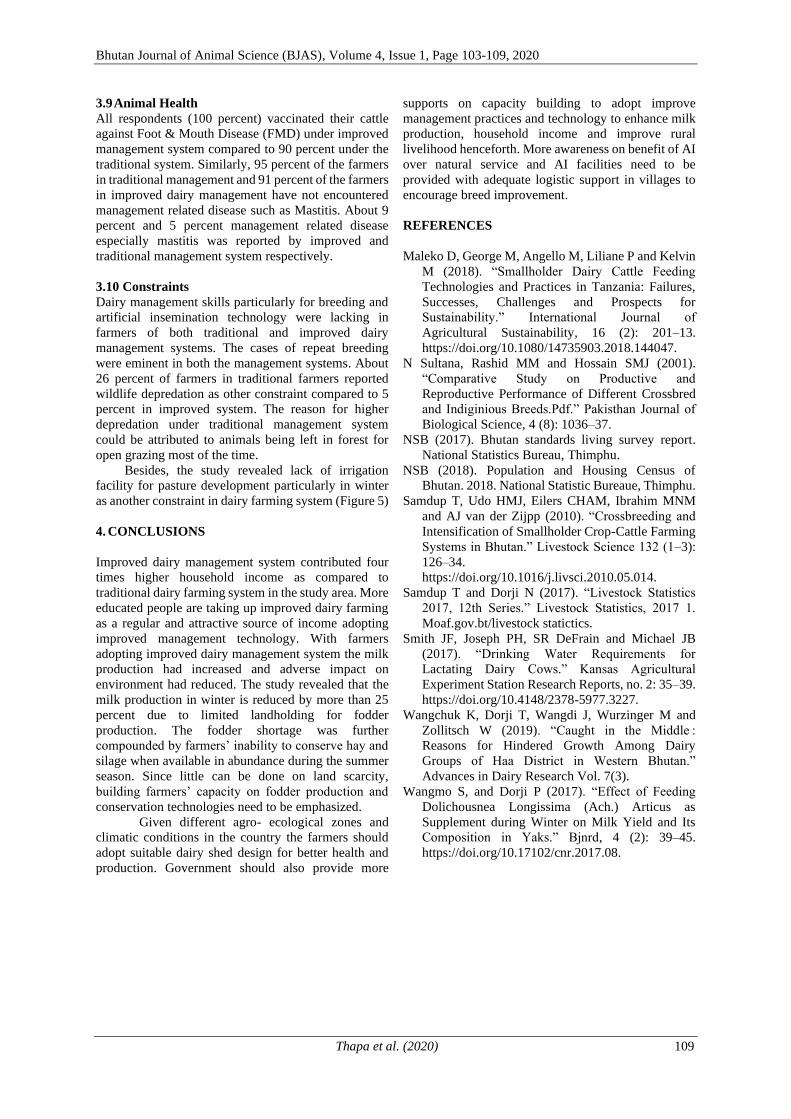
Bhutan Journal of Animal Science (BJAS), Volume 4, Issue 1, Page 103-109, 2020
Thapa et al. (2020) 109
3.9 Animal Health
All respondents (100 percent) vaccinated their cattle
against Foot & Mouth Disease (FMD) under improved
management system compared to 90 percent under the
traditional system. Similarly, 95 percent of the farmers
in traditional management and 91 percent of the farmers
in improved dairy management have not encountered
management related disease such as Mastitis. About 9
percent and 5 percent management related disease
especially mastitis was reported by improved and
traditional management system respectively.
3.10 Constraints
Dairy management skills particularly for breeding and
artificial insemination technology were lacking in
farmers of both traditional and improved dairy
management systems. The cases of repeat breeding
were eminent in both the management systems. About
26 percent of farmers in traditional farmers reported
wildlife depredation as other constraint compared to 5
percent in improved system. The reason for higher
depredation under traditional management system
could be attributed to animals being left in forest for
open grazing most of the time.
Besides, the study revealed lack of irrigation
facility for pasture development particularly in winter
as another constraint in dairy farming system (Figure 5)
4. CONCLUSIONS
Improved dairy management system contributed four
times higher household income as compared to
traditional dairy farming system in the study area. More
educated people are taking up improved dairy farming
as a regular and attractive source of income adopting
improved management technology. With farmers
adopting improved dairy management system the milk
production had increased and adverse impact on
environment had reduced. The study revealed that the
milk production in winter is reduced by more than 25
percent due to limited landholding for fodder
production. The fodder shortage was further
compounded by farmers’ inability to conserve hay and
silage when available in abundance during the summer
season. Since little can be done on land scarcity,
building farmers’ capacity on fodder production and
conservation technologies need to be emphasized.
Given different agro- ecological zones and
climatic conditions in the country the farmers should
adopt suitable dairy shed design for better health and
production. Government should also provide more
supports on capacity building to adopt improve
management practices and technology to enhance milk
production, household income and improve rural
livelihood henceforth. More awareness on benefit of AI
over natural service and AI facilities need to be
provided with adequate logistic support in villages to
encourage breed improvement.
REFERENCES
Maleko D, George M, Angello M, Liliane P and Kelvin
M (2018). “Smallholder Dairy Cattle Feeding
Technologies and Practices in Tanzania: Failures,
Successes, Challenges and Prospects for
Sustainability.” International Journal of
Agricultural Sustainability, 16 (2): 201–13.
https://doi.org/10.1080/14735903.2018.144047.
N Sultana, Rashid MM and Hossain SMJ (2001).
“Comparative Study on Productive and
Reproductive Performance of Different Crossbred
and Indiginious Breeds.Pdf.” Pakisthan Journal of
Biological Science, 4 (8): 1036–37.
NSB (2017). Bhutan standards living survey report.
National Statistics Bureau, Thimphu.
NSB (2018). Population and Housing Census of
Bhutan. 2018. National Statistic Bureaue, Thimphu.
Samdup T, Udo HMJ, Eilers CHAM, Ibrahim MNM
and AJ van der Zijpp (2010). “Crossbreeding and
Intensification of Smallholder Crop-Cattle Farming
Systems in Bhutan.” Livestock Science 132 (1–3):
126–34.
https://doi.org/10.1016/j.livsci.2010.05.014.
Samdup T and Dorji N (2017). “Livestock Statistics
2017, 12th Series.” Livestock Statistics, 2017 1.
Moaf.gov.bt/livestock statictics.
Smith JF, Joseph PH, SR DeFrain and Michael JB
(2017). “Drinking Water Requirements for
Lactating Dairy Cows.” Kansas Agricultural
Experiment Station Research Reports, no. 2: 35–39.
https://doi.org/10.4148/2378-5977.3227.
Wangchuk K, Dorji T, Wangdi J, Wurzinger M and
Zollitsch W (2019). “Caught in the Middle :
Reasons for Hindered Growth Among Dairy
Groups of Haa District in Western Bhutan.” Advances in Dairy Research Vol. 7(3).
Wangmo S, and Dorji P (2017). “Effect of Feeding
Dolichousnea Longissima (Ach.) Articus as
Supplement during Winter on Milk Yield and Its
Composition in Yaks.” Bjnrd, 4 (2): 39–45.
https://doi.org/10.17102/cnr.2017.08.

Bhutan Journal of Animal Science (BJAS)
Volume 4, Issue 1, Page 110-113, 2020
110
Full length paper
COMPOSITIONAL ANALYSIS OF MARKET MILK IN THIMPHU & PARO DISTRICTS
PHUNTSHO T NORBU1*, KINLEY CHOKI1 AND SONAM YANGCHEN2
1National Dairy Research and Development Centre, Department of Livestock, Yusipang 2Department of Livestock, MoAF, Thimphu
*Author for correspondence: [email protected]
Copyright © 2020 Phuntsho T Norbu. The original work must be properly cited to permit
unrestricted use, distribution, and reproduction of this article in any medium.
ABSTRACT: Milk available in the market is not subject to systematic regulations or monitoring
for control of quality. The compositional quality of milk is not maintained due to lack of regulations
leading to adulteration of milk and supply of poor-quality milk to consumers. The study on
compositional quality of milk available in the market of Thimphu and Paro revealed deviation and
variation in all milk components from expected constituents as well as consistent adulteration with
water. Milk available in the market of Thimphu and Paro is found to be of poor quality with unfair
trade practices and deception of consumers through sale of inferior quality milk. Besides, the study
also found that the Lactoscan MCCW has a higher precision than Portable milk analyzer for
detecting added water in milk as adulterant. The Centre will continue to undertake studies on milk
composition throughout the country and will also undertake to identify the source of adulteration
(producers – middlemen – retail outlets) for corrective action to be taken for improving the quality
of milk and formulation of standards for milk.
Keywords: Adulteration; equipment specificity; milk composition; raw milk.
1. INTRODUCTION
Milk is defined as the secretion from the lacteal glands of
one or more cows and serves as a source of essential
nutrients. The composition of milk varies according to
species, breed, age, diet etc. Normal cow milk is generally
composed of fat within the 3 – 6% variation, protein
content of about 3.5%, lactose of 4.8% and
minerals/salts/vitamins in the range of 0.7 – 0.8% (Fox
2011). These components are known as the solids
component and comprises of about 13.4% of the milk
content with the remaining 86.6% being the water content
of milk on average.
Additionally, normal milk has a titratable acidity of 0.14
- 0.16%, pH of 6.5 – 6.7, specific gravity of 1.030 - 1.035,
and freezing point of -0.512 to -0.550 ºC (McCarthy
2002). The depression of freezing point is used as the
basis for the detection of milk adulterated with water
(Henno et al. 2008). Wangdi et al (2014) in his study
recorded an overall mean composition of milk in the
country as being constituted of 4.99% fat, 3.25% protein,
5.48% lactose and 0.67% salts. The study also recorded
the density of milk as 1.028 kg/liter and a freezing point
of -0.571ºC. Similarly, the milk composition obtained
from the farm of National Dairy Research and
Development Centre (NDRDC), Yusipang was 4.7% fat,
3.4% protein, 4.6% lactose, 0.7% salts and a freezing
point of -0.550.
Dairy farmers groups of Thimphu, Paro and Haa
market their milk and milk products in their respective
areas as well as in Thimphu that has a higher buying
potential for dairy products. Most of the milk and milk
products from Paro and Haa are also available in Thimphu
through the various dairy outlets set up in the capital city.
All of the milk available is raw milk directly sourced from
the dairy farmers groups and sold unprocessed in plastic
bottles. The price for 1 liter milk is sold at the market rate
of Nu. 60 – 65 per liter in the outlets. The outlets procure
the milk from the dairy groups in bulk and packaging is
done at the respective outlets in either new or re-used
mineral water bottles. Some outlets sell the milk directly
from the bulk containers in containers bought by the
customers. A common feature in the supply of milk from
the dairy groups is the use of middlemen for
transportation and sale of milk from the point of
production to the marketing outlets.
As there is no systematic regulation or monitoring
mechanism in place for the sale of raw liquid milk, the
compositional quality of milk is not maintained for the
consumers with variations in compositional quality and
adulteration with water being common practice. The use
of water as an adulterant to increase the volume of milk
Bhutan Journal of Animal Science (BJAS), Volume 4, Issue 1, Page 110-113, 2020
Norbu et al. (2020) 111
sold can pose a risk to human health through the use of
contaminated and unclean water leading to the rapid
deterioration of milk quality as well as the reduction of
milk solids (Handford et al. 2016).
No study to determine the compositional quality of
raw milk available in the market has been carried out and
this study aims to address the lack of information and
quantitative data. Through this study, initial information
on the compositional quality of milk will be made
available for future reference and corrective measures to
be implemented in case of adulteration.
2. MATERIALS AND METHODS
The study is carried out to investigate the compositional
quality of raw milk and incidences of water adulteration
in milk available through the various milk sales outlets in
Thimphu and Paro town areas. About 20 random samples
each were collected from four different milk outlets (T1,
T2, T3 and T4) in Thimphu and two different outlets (P1
and P2) in Paro for compositional analysis. Physical
examination of all samples was made for appearance,
odor, color and packaging material used. Compositional
analysis of the samples was carried out using ultrasonic
milk analyzer, Lactoscan MCCW, Milktronics Ltd.
(Bulgaria) and the portable milk analyzer Master Eco
used in various Milk Collection Centers and Milk
Processing Units. All samples were measured in triplicate
for fat, protein, lactose, salts, density, SNF and added
water. The milk composition obtained from the farm of
the NDRDC, Yusipang was used as reference for
analysis.
3. RESULTS AND DISCUSSIONS
3.1 Physical appearance
Majority of the samples had acceptable appearance, odor
and color. All samples from one outlet in Paro had the
distinctive odor of areca nut and an odor of unknown
origin in one instance. The origin of the areca nut odor
was from the storage of bottled milk in the same
refrigerator as the areca nut and also due to simultaneous
handling of the products. One sample from the same
outlet was also found to be tainted due to improper
washing of the reused bottle as it was reported in the study
of Shaikh et al. (2013).
All the samples procured were packaged in plastic
mineral water containers. The packaging material used in
four of the six outlets were predominantly recycled
mineral water bottles with one outlet also using plastic
fruit juice bottles. Two outlets in Thimphu claimed to be
using fresh new bottles for packaging the milk.
Samples from outlets in Thimphu analyzed with the
Lactoscan MCCW showed fat content ranging from 3.17
– 4.89%, protein ranging from 1.99 – 2.72%, lactose 2.99
– 4.00% and SNF content of 5.44 – 7.51% (Figure 1).
On average all samples were adulterated with water
ranging from 10.09 – 35.52% added water (Figure 1).
Figure 1: Composition of milk for Thimphu outlets
analyzed using Lactoscan MCCW
The freezing point of the samples was detected in
the range of -0.335ºC to -0.468ºC.
The same samples were also analyzed using the
portable Master Eco available in most MCCs and MPUs.
Figure 2: Milk composition for Thimphu outlets
analyzed using portable milk analyzer Master Eco
Results obtained from the samples showed fat range from
3.03 – 4.60%, protein 2.26 – 3.10%, lactose 3.06 – 4.10%
and SNF 6.15 – 8.56%. Samples were also found to be
adulterated with water ranging from 2.80 – 26.79% added
water and freezing point range of -0.350ºC to -0.488ºC
(Figure 2).
Similarly, samples from outlets in Paro analyzed
with the Lactoscan MCCW showed a fat content in the
range of 3.61 – 4.06%, protein content of 2.69 – 2.83%,
lactose 4.04 – 4.25% and SNF content of 7.35 – 7.72%
(Figure 3).
-
5
10
15
20
25
30
35
40
T1 T2 T3 T4
%
Fat
Protein
Added Water
-
5
10
15
20
25
30
T1 T2 T3 T4
%
FatProteinAdded Water

Bhutan Journal of Animal Science (BJAS), Volume 4, Issue 1, Page 110-113, 2020
Norbu et al. (2020) 112
Adulteration with water was found to range between
5.42 – 10.90% added water with freezing point range of -
0.464ºC to -0.491ºC (Figure 3).
The samples were also analyzed using the portable
Master Eco with results of fat content ranging from 3.42
– 3.81%, protein content 3.15 – 3.31, lactose from 4.23 –
4.42 and SNF content of 8.35 – 8.82% (Figure 4).
The samples analyzed with the portable milk
analyzer detected adulteration with water at a range of
only 0.13 – 0.29% added water while the freezing point
was found to be in the range of -0.495ºC to -0.523ºC.
3.2 Milk fat content
Milk analyzed using the Lactoscan MCCW produced fat
content of milk in Thimphu in the range of 3.17 – 4.89%
and 3.61 – 4.06% in Paro. Analysis with the Portable Milk
Analyzer produced a range of 3.03 – 4.60% fat for
Thimphu market milk. However, some samples produced
milk fat measurement below the 3% level which is
considerably lower than the reference milk fat content of
4.7%. It is expected that as majority of cows present in
the Thimphu and Paro region constitutes a mixture of
Jersey Cross and local cattle, both of which are known to
produce high fat milk, the fat content should have been
higher than the average of 3.72%. It is possible that either
the producers or retail outlets are practicing skimming of
milk for the sale of cream or manufacture of butter in
addition to adulteration with water.
3.3 Protein content of milk
The protein content analyzed using the Lactoscan MCCW
for Thimphu and Paro was found in the range of 1.99 –
2.72% and 2.69 – 2.83% respectively. Analysis with the
portable milk analyzer produced results in the range of
2.26 – 3.10% for Thimphu and 3.15 – 3.31% for Paro.
Overall, majority of the samples analyzed had low protein
content in comparison to the reference value of 3.4%
which could be attributed to the adulteration of milk with
water. The significance of feed intake also needs to be
taken into consideration for the low overall protein
content of milk.
3.4 Lactose content of milk
The lactose content was analyzed in the range of 2.99 –
4.00% for Thimphu market milk and 4.04 – 4.25% for
Paro market milk with the Lactoscan MCCW. The
portable milk analyzer produced results in the range of
3.06 – 4.10% in Thimphu milk and 4.23 – 4.42% in Paro
milk. The lactose content is generally considered to be the
least variable milk component but variation in lactose
content is evident in samples analyzed and is also lower
than the reference value of 4.6%. This variation could be
attributed to the adulteration of milk with water.
3.5 Freezing Point of milk
The freezing point of the samples was also analyzed with
the two machines with large variations found through the
analysis. Market milk in Thimphu was found to have
freezing point in the range of -0.335 to -0.468ºC while
Paro market milk had -0.464 to -0.491ºC using the
Lactoscan MCCW. Analysis with the portable milk
analyzer produced a freezing point of -0.350 to -0.488ºC
for Thimphu and -0.495 to -0.523ºC for Paro. Paro milk
had a freezing point closer to the freezing point of the
reference value but variation in freezing point exists in
milk samples from both districts. The depression of
freezing point is used as a measure of adulteration of milk
with water (Henno et al. 2008), and with the variation that
exists in the samples, adulteration with water is a common
occurrence in market milk available in Thimphu and Paro.
3.6 Added Water in milk
The Lactoscan MCCW and the portable milk analyzer
also measures the amount of water added as an adulterant
-
2
4
6
8
10
12
P1 P2
%
Added Water Fat Protein
-
1
2
3
4
5
P1 P2
%
Added Water Fat Protein
Figure 3: Composition of milk for Paro outlets
analyzed using Lactoscan MCCW
Figure 4: Milk composition for Paro outlets analyzed
using portable milk analyzer Master Eco

Bhutan Journal of Animal Science (BJAS), Volume 4, Issue 1, Page 110-113, 2020
Norbu et al. (2020) 113
in milk. The Lactoscan MCCW showed an added water
range of 10.09 – 35.52% water addition in Thimphu
market milk and 5.42 – 10.09% added water for Paro
market milk. The portable milk analyzer showed a lower
added water content in milk with a range of 2.80 – 26.79%
added water for Thimphu market milk and 0.13 – 0.29%
added water for Paro market milk.
3.7 Lactoscan MCCW and Portable Milk Analyzer
An ANOVA analysis was made between the equipment
with findings revealing significant difference for
measured parameters of lactose, protein, freezing point,
density, and added water. No significant difference was
observed for the measurement of fat content. Further
investigation into the discrepancy on the amount of added
water between the equipment was carried out with the
results indicating that the portable milk analyzer does not
detect added water up to 10%. The Lactoscan MCCW has
a higher precision for detecting added water but the
equipment is more expensive to procure and is suitable
for laboratory purposes and not for field use.
4. CONCLUSIONS
Milk available in the markets of Thimphu and Paro was
found to show variation in all milk components and also
found to be consistently adulterated with water. This
adulteration with water is the primary cause in the
variations of milk components from the normal expected
milk composition leading to inferior quality milk.
Adulteration with water further reduces the nutritional
value of milk in addition to introducing microbes through
use of poor-quality water as an adulterant. Unfair trade
practices and deception of consumer through the sale of
adulterated milk at high prices is also an area of major
concern as consumers should receive good quality milk.
Further study is required to identify whether the source of
adulteration arises from the producers, the middlemen or
the retail outlets so that corrective action can be taken and
the market quality of milk improved. Additionally, the
use of recycled mineral water containers and in particular
fruit juice containers or other bottles needs to be
discouraged as these are also potential sources of
contamination.
ACKNOWLEDGMENT
The authors would like to acknowledge the contributions
of Dr. NB Tamang, Specialist Head of the National Dairy
Research and Development Centre and Mr. Jigme
Wangdi, Specialist, Department of Livestock for their
contributions in the development of this paper.
REFERENCES
Barham GS, Khaskheli M, Soomro AH and Nizamani ZA
(2015). Surveillance of milk adulteration and its
impact on physical characteristic of milk. Advances in
Biochemistry and Biotechnology, Vol. 1(1)
Brindha P, Chitra P, Janarthanan R and Murali A (2017).
A study on detection of adulteration in milk samples
from different regions of Thuraiyur district in Tamil
Nadu, India. International Journal of Current
Microbiology and Applied Sciences, 6(12): 3303 –
3310.
Chappalwar AM, Devangare AA, Kodamlwar NK and
Sahu RK (2014). Detection of extraneous water
adulteration and physicochemical quality of market
milk collected from different areas of Parbhani.
Research Journal of Animal Husbandry and Dairy
Sciences, Vol. 5(2):109 – 112.
Faraz A, Lateef M, Mustafa MI, Akhtar M, Yaqoob M
and Rehman S (2013). Detection of adulteration,
chemical composition and hygienic status of milk
supplied to various canteens of educational institutes
and public places in Faisalabad. The Journal of
Animal and Plant Sciences, Pakistan, 23(1
Suppl.):119 – 124.
Fox PF (2011). Bovine Milk, Encyclopedia of Dairy
Sciences, Vol. 3:478 – 483
Handford CE, Campbell K and Elliott C (2016). Impacts
of Milk Fraud on Food Safety and Nutrition with
Special Emphasis on Developing Countries,
Comprehensive Reviews in Food Science and Food
Safety, Vol. 15.
Henno M, Ots M, Joudu, I, Kaart T and Kart O (2008).
Factors affecting the freezing point stability of milk
from individual cows. International Dairy Journal,
18:210 – 215.
McCarthy OJ (2002). Physical and Physico-Chemical
Properties of Milk, Encyclopedia of Dairy Sciences,
Vol. 3: 467 - 477
Shaikh N, Soomro AH, Sheikh SA and Khaskheli M
(2013). Extent of water adulteration and its influence
on physical characteristics of market milk. Pakistan
Journal of Nutrition, 12(2): 178 – 181.
Swathi JK and Kauser N (2015). A study on adulteration
of milk and milk products from local vendors.
International Journal of Biomedical and Advance
Research, 6(09): 678 – 681.
Wangdi J, Zangmo T, Karma, Mindu and Bhujel P
(2014). Compositional quality of cow’s milk and its
seasonal variation in Bhutan. Issues in Biological
Sciences and Pharmaceutical Research, Vol. 2(7): 062
– 068.

Bhutan Journal of Animal Science (BJAS)
Volume 4, Issue 1, Page 114-118, 2020
114
Full length paper
PERCEPTION OF BHUTANESE FARMER TOWARDS PIG FARMING IN BHUTAN
GYEMBO TSHETEN1*, TENZIN PENJOR1, PEMA SHERAB1 AND TASHI
DORJI2
1National Piggery Research and Development Centre, Department of Livestock, Ministry
of Agriculture & Forests, Gelephu, Bhutan 2International Centre for Integrated Mountain Development, Katmandu, Nepal
*Author for correspondence: [email protected]
Copyright © 2020 Gyembo Tsheten. The original work must be properly cited to permit
unrestricted use, distribution, and reproduction of this article in any medium.
ABSTRACT: The study was conducted to understand attitude and perceptions of pig
rearing farmers towards the future of piggery development. Data were collected from 420
respondents through face-to-face interview using semi-structured questionnaire between
October 2018 and April 2019. The data were analyzed using descriptive statistics. Majority
of pig farmers were found to practice backyard pig production, and most of them are either
illiterate (51%) or with non-formal education (32%). Pigs are reared mainly for income
generation and household consumption. The study recoded only 6.2% of the respondents
against 93.8% involved in breeding and fattening of pig, respectively. Majority of the
respondents reported that the pig farming is profitable, and prefers to rear exotic pig breeds
due to faster growth rate. Despite many challenges such as religious disapproval,
inadequate and high commercial feeds costs and labour shortage hindering pig
development in the country, more than 73% of the respondents reported to continue pig
farming as a source of livelihood. Nonetheless, if appropriate policy interventions are not
made, the pig farming is likely to decline and local pigs might extinct over the period.
Keywords: Attitudes; farmers’ perceptions; pig farming; subsidy; sustainable.
1. INTRODUCTION
Livestock production is operated either on small or large
scale (Walugembe et al. 2014) that alleviate poverty
(FAO 2014) through improving access to food
particularly as a source of protein (FAO 2012), fibre,
income, employment, draught power and fertilizers
(Chauhan et al. 2016; Upton 2004). Pigs compete for food
with people, but they utilize household wastes and
agricultural by-products (Obayelu et al. 2017) and
provide food to humans. Thus, pig production plays a
vital role beyond pork production and income generation
(Ogunniyi and Omoteso 2011). In Bhutan, the piggery
sector development started since inception of the first
five-year plan in 1960s, yet the growth remained slow
despite enabling government policy interventions with
introduction of exotic pig breeds. The indigenous pig
population has declined at alarming rate with decrease in
local pig rearing household from 36.1% (PHCB 2005) to
3.2% (PHCB 2017) over the past decades. The overall pig
population has declined at the rate of 2.5% annually over
the last decade (DoL 2007-2017). This decrease in pig
population was attributed to increasing religious
disapprovals (Nidup et al. 2011). The pig population
recorded was 18815 head, with annual domestic pork
production of about 1000 metric tons (MT) (DoL 2017)
in 2017. This has resulted to huge import of pork at 2127
MT equivalent to Nu. 283 million in term of value (MoAF
2015).
Today, the number of pig rearing households are
declining, while on the other hand the demand for pork
have had increased due to increase in income, growing
population and urbanization in the country. Thus, it was
felt necessary to investigate and understand the
perceptions of current pig farmers towards piggery
development so that the government could make
informed policy decisions.
2. METHODS AND MATERIALS
2.1. Study area
The study was conducted in fourteen dzongkhags
(districts) covering 46 gewogs (sub-districts) which are

Bhutan Journal of Animal Science (BJAS), Volume 4, Issue 1, Page 114-118, 2020
Tsheten et al. (2020) 115
purposively selected based on existing pig farming
households recorded in 2018.
2.2 Sample size and respondents
The sample size was calculated using Yamane’s formula,
with 95% confidence level and ±5% precision level as per
the equation 1 below:
Equation 1: 𝑛 =𝑁
1+𝑁 (𝑒2)
Wherein, n stands for sample size, N is equal to
population size and e is equal to level of precision
In total 420 pig rearing households were identified from
different pig rearing Dzongkhags in consultation with
respective livestock officials working in the dzongkhag
and gewog livestock Sector.
2.3 Pig farm classifications
The pig farming in this study was classified according to
farm size and type as backyard (5 fattening pigs),
breeding farm (female breeding pigs irrespective of size)
and fattening farm (> 5 fattening pigs) to comprehend the
type of pig production.
2.4 Data collection
The data was gathered from October 2018 to April 2019
through face-to-face interview of 420 respondents in total
using semi-structured questionnaire. The questionnaire
consisted of three parts: i) respondent details, ii) socio-
economic background and iii) other information related
to pig farming to generate information pertaining to pig
farmers’ attitude and perception towards piggery farming
and development.
2.5 Data Analysis
The survey data were compiled in Microsoft Excel sheet
with coding of questions and responses. The data were
descriptively analysed using SPSS version 23.0. Cross
tabulation was carried out to determine farm type and
educational level of the participating respondents.
3. RESULTS AND DISCUSSION
3.1 Characteristics of respondents
The gender ratio of the participating respondents was
almost equal with 52% male and 48% female. Similarly,
about 50% of the respondents were head of households
and the remaining 50% were other household members.
The average household member size recorded was five,
and more that 50 % of the respondent had family
members size more than five in this study. The study
recorded five ethnic groups – sharchop (27.86), lhotsham
(52.38%), Ngalop (9.76%), Khengpa (9.52%) and doyap
(.48%) from various religious background such as
Buddhism (73.81%), Hindu (16.91%) and others (9.29%)
were found rearing pigs.
The age, education level and farming experiences
are the internal factor which can affect pig farming effort
(Suratiyah 2006 cited in Katagame et al. 2017). The age
of majority of the respondents (94%) were between 17-64
years and 6% were 65 years and above. In accordance
with PHCB (2017), population between 15-64 years of
age are considered to be of productive age while
population ages of 65 years and above fall under elderly
age group. In this study, about 52% of the respondents
were between 17-45 years of age, and more than 79%
within this age range were involved in pig farming
indicating younger generation preference in pig farming.
This is in contrast to Brooks et al. (2013) findings, where
they reported younger generation would rather migrate to
urban areas in search of salaried jobs not showing interest
in farming. The study recorded that people interested to
rear pigs are mostly from low income earning group such
as people working as national work force (NWF),
caretakers for landlords, security guards and cooks in
schools/institutions and projects. Interestingly this group
of people are actually deprived of subsidy and normal
inputs supply supports provided by government.
The policy support on providing subsidy package to
these low earning section, mass awareness & motivation
through establishment of model farm in their vicinity,
sensitizing local leaders & community on import
substitution & food security and leasing out government
land to educated youths for pig farming would help boost
domestic pork production. The pig farming in general are
dominated by back yard faming; yet there are few farmers
taking up commercial pig farming in the southern belts of
the country. The study recorded 51% and 32% of the
small pig farmers are illiterate and had either primary or
non-formal education, respectively. The average
experiences of respondent in pig farming was six years,
with about 50 % having involved in pig farming for more
than six years.
2.2. Pig farm type
The pig farming was mainly oriented towards the pork
production with only 6.2% of the farms operating
exclusively for breeding and production of piglets. The
study found that about 72.9% of respondents are involved
in backyard pig farming for fattening. Others 13.8 % and
13.3 % of respondents were found rearing pigs either for
breeding or both breeding and fattening. The study
recorded that only about 14% of the fattening farm rears
more than five pigs, while the remaining fattening farm
rears less than pig pigs for household consumption and to
meet various household expenses. The farm rearing 1- 5
pigs is considered back yard in Bhutanese context. The
study recorded most back yard farm maintaining two pigs
in average. This might be because of involvement of
eople with low-income in pig farming and also small

Bhutan Journal of Animal Science (BJAS), Volume 4, Issue 1, Page 114-118, 2020
Tsheten et al. (2020) 116
farms involve minimum amount of inputs, and needed
little time and investment (Muys and Westenbrink 2004).
It was reported that to develop small and traditional farms
into large scale farms would require diligence and special
guidance either from livestock extension officer or
relevant agencies (Katagame et al. 2017). However, small
holdings of few pigs with low inputs and poor bio-
security translates into low output and productivity
(Beltran-Alcrudo et al. 2018). It is reported that the
backyard farms may not necessarily contribute to national
pork self-sufficiency but may help to increase rural
livelihood and availability of local protein (Oosting et al.
2014). Small holder farming systems improve livelihood
and food security for the poorest people (Dixon et al.
2001; Kumaresan et al. 2009). The policy intervention to
these group of pig farmers with supports on subsidy
package, government land lease, promoting youth
engagement through employment schemes, ensuring
access to low interest rate loan and facilitating marketing
chains and outlets would help commercialization of pig
farming in the country.
2.3. Preference for pig breeds
Figure 1 presents the respondents’ preference for pig
breeds between local and improved. The study recorded
that 76% of the respondents preferred to rear exotic pig
breeds, while 16.4% of the respondent preferred to rear
local pig breeds given various reasons. Similarly, Tenzin
et al. (2018) in their recent study reported that 77% of the
pig farmers rear exotic pig breeds in Bhutan.
The major reasons reported for the preference of exotic
breeds were faster growth rate, higher income and non-
availability of local piglets.
With improved management, exotic pigs are
marketed as early as six months of age (Mutua et al.
2010). FAO (2011a) reported preference for exotic pig
breeds are due to higher carcass output and shorter
fattening duration. Similar to the findings in this study
Ayizanga et al. (2018) reported that the farmers will resort
to rearing other pig breeds if preferred breeds are not
available. However, the exotic pig breeds are resource
demanding and difficult to rear. Thus, remaining
respondent preferred to rear local pig breeds owing to
limited resources and better adaptability of local pigs to
varying rearing systems and high demand for local meat.
Although the local pigs are comparatively inferior to
exotic pigs in terms of performance (Ayizanga et al.
2018), it is well adapted to low input and harsh production
systems (Livingston and Fowler 1984). Nonetheless, the
population of local pigs is declining at alarming rate, and
not much has been done beside conservation efforts to
protect our local genetic resources. There are few farmers
groups undertaking local pig (Sapha) farming in eastern
region supported by National Biodiversity Centre to
promote conservation and sustainable utilization.
2.4 Reasons for rearing pigs
Pigs as reported by the respondents are reared mainly for
income generation and household consumption. The
other reasons for pig rearing as reported are to meet
expenses for school going children and ritual purpose,
loan repayment, conservation, easy market and source of
income to invest on other businesses. Majority (87.1%)
indicated that the pig farming is a profitable business and
could generate reasonable income for their family. They
mentioned pigs to provide faster return with low
investment particularly under back yard conditions. Pigs
are fed with household leftovers and agricultural crop by-
products which cannot be consumed by the household
members. In olden days, pigs were found to play an
important role even in ritual offerings to local deities
across many parts of Bhutan (Nidup et al. 2011).
However, this practice seemed to have declined as only
1% (n=3) of respondents from across the study area kept
pigs for ritual purpose.
4.5. Perception on future of pig farming in Bhutan
The study recorded little less than 30% of the respondents
perceived that the pig farming is profitable while 1.7%
indicated that the pig farming is not profitable. Likewise,
5.7% and 2.4% stated that the pig farming is sinful and
difficult to manage, respectively. Other remaining
respondents have mixed perceptions about the pig
farming such as profitable but difficult to manage (2.9%),
profitable but sinful (13.1%), profitable but difficult to
manage and sinful as well (37.4%).
The study recorded that 73.6 % of respondent will
continue with pig farming as a source of livelihood, while
the remaining 26.4% reported to discontinue pig farming.
The reasons to discontinue pig farming were religious
disapproval, inadequate and high cost of commercial feed
and lack of labour, inadequate land, not interested
anymore and availability of alternative farming options
among others. Few respondents indicated that they would
discontinue pig farming once their bank loans are
liquidated and school going children completes their
education.
0
50
100
150
200
250
300
350
Exotic pigs Local pigs Both localand exotic
Don’t Know
Res
po
nd
ent
(No
)
Figure 1: Preference for pig breeds

Bhutan Journal of Animal Science (BJAS), Volume 4, Issue 1, Page 114-118, 2020
Tsheten et al. (2020) 117
4.5.1 Problems and risks of pig farming in Bhutan
Majority (72.4%) of respondent reported that they faced
problem and encounter risks in pig farming. One of the
main problems was religious disapproval that if not
adhered might result to communal criticism and
ultimately outcast from the community. Other problems
reported, inadequate and non-availability of commercial
feeds at affordable price, and labour shortage. In addition,
no availability of piglets from government farms on time
and supply of low-quality piglets from private firms were
raised impacting pig farming.
4.5.2 Priority support for piggery development
Majority (74.1%) of the farmers reported that the subsidy
support provided by the government should continue. In
addition, the farmers expect to include subsidy support on
commercial feed at least for one production cycle or
government should control price of commercial feed,
piglet buyback subsidy to encourage private breeders, fast
track government land leasing processes, and access to
low rate interest loan. One farmer even suggested
government to support on production of cost-effective
feed through feed formulation using local feed resources.
5. CONCLUSIONS
Pig is reared by different ethnic groups in southern
Bhutan despite religious disapproval. Religious
sentiments, inadequate feed and labour shortage were
perceived as the key drivers for unsuccessful pig farming
in the country. Despite various challenges faced in
piggery development, many farmers interviewed were
interested to continue piggery farming as a source of
livelihood. The government policy interventions should
focus on providing additional subsidy supports on feed,
piglet buyback, transportation and creating access to low
interest rate loans to encourage farmers continue and
sustain pig farming in Bhutan. Other supports the
government could provide to develop pig sector are
educational and capacity development programs focusing
on local feed formulation, health, clean pig production
and market assurance.
ACKNOWLEDGEMENT
The authors are thankful to all the pig farmers accepting
to participate in the study and provide information. We
would also like to thank the Dzongkhag Livestock
Officers and Geog Livestock Officers of the study areas
for providing necessary logistic supports. The authors
remain thankful to Dr. Kesang Wangchuk (PhD),
Principal Research Officer, Department Livestock and
Dr. Vijay Raika (PhD), Programme Director, National
Highland Research and Development Centre, Bumthang
for providing necessary technical guidance in particular
to reviewing the questionnaire and data analysis.
REFERENCES
Ayizanga R, Kayang B, Adomako K and Larbi A (2018).
Rural pig production systems and breeding
preferences of pig farmers in northern Ghana.
Ghanaian Journal of Animal Science, 9 (1).
Brooks K, Zorya S, Gautam A and Goyal A (2013).
Agriculture as a sector of opportunity for young
people in Africa. The World Bank Policy Research
Working Paper 6473, viewed 04 September 2014,
from http://www.ypard.net/sites/ypard.net/files/Agri
culture%20opportunity%20youth%20africa.pdf
Chauhan A, Patel BHM, Rajveer M, Sushil Kumar,
Shukla S & Subodh Kumar (2016). Pig production
system as a source of livelihood in Indian scenario
(an overview). International Journal of Science,
5(4):2089-2096.
Dixon J, Gulliver A, Gibbon D and Hall M (2001).
Farming systems and poverty: Improving farmers’
livelihoods in a changing world. Rome: FAO,
Washington, DC: World Bank.
DoL (2007-2017). Livestock statistics 2007-2017.
Department of Livestock, Ministry of Agriculture &
Forests. Thimphu.
DoL (2017). Livestock statistic 2017. Department of
Livestock, Ministry of Agriculture & Forests.
Thimphu.
FAO (2011a). Molecular genetic characterization of
animal genetic resources. Health guidelines. No. 9.
Rome: Food and Agriculture Organization.
FAO (2012). Livestock sector development for poverty
reduction: An Economic and Policy Perspective –
Livestock’s many virtues, by J. Otte, A. Costales, J.
Dijkman, U. Pica-Ciamarra, T. Robinson, V. Ahuja,
C. Ly and D. Roland-Holst. Rome.
FAO (2014). Impact of mastitis in small scale dairy
production systems. FAO Animal Production and
Health Working Paper. Food and Agriculture
Organization of United Nations. Rome
Katagame A, Fanani Z and Nugroho BA (2017). Income
Contribution of Pig Livestock toward Poverty
Reduction and Factors Influencing Pig Farming in
Mimika Papua. IOSR Journal of Agriculture and
Veterinary Science, 10 (1): 11-15.DOI:
10.9790/2380-1001011115
Kumaresan A, Bujarbaruah KM, Pathak KA, Das A and
Bardoloi RK (2009). Integrated resource-driven pig
production systems in a mountainous area of
Northeast India: production practices and pig
performance. Tropical Animal Health Production,
41: 1187. https://doi.org/10.1007/s11250-008-9299-
y
Livingston RM and Fowler VR (1984). Pig feeding, the
future; Back to nature? (Span 93) :108 – 110.

Bhutan Journal of Animal Science (BJAS), Volume 4, Issue 1, Page 114-118, 2020
Tsheten et al. (2020) 118
MoAF (2015). Bhutan RNR Statistics 2015. RNR
Statistical Coordination Section Policy and Planning
Division, July 2015
Mutua F, Arimi S, Ogara W, Dewey C and Schelling E
(2010). Farmer Perceptions on Indigenous Pig
Farming in Kakamega District, Western Kenya.
Nordic Journal of African Studies 19(1): 43–57.
Muys, D & Westenbrink, G (2004). Keeping pigs in the
Tropics. 4th edn. Agromisa Foundation,
Wageningen.
http://www.journeytoforever.org/farm_library/AD1.
pdf. Accessed July 7, 2017.
Nidup K, Tshering D, Wangdi S, Gyeltshen C, Phuntsho
T & Moran C (2011). Farming and Biodiversity of
pigs in Bhutan. Animal Genetics Resources, 48: 47-
61.
Obayelo AE, Ogunmola OO & Sowande OK (2017).
Economic Analysis and the Determinants of Pig
Production in Ogun State, Nigeria. 2: 61–70. DOI:
10.1515/ats‑2017‑0007/
Ogunniyi LT and Omoteso OA (2011). Economic
analysis of swine production in Nigeria: A case study
of Ibadan zone of Oyo State. Journal of Human
Ecology, 35(2): 137 – 142.
Oosting S, Udo HMJ and Viets TC (2014). Development
of livestock production in the tropics: Farm and
farmers' perspectives. International Journal of
Animal Bioscience, 8:1-11.
10.1017/S1751731114000548.
PHCB (2017). Population and Housing Census of Bhutan
2017. National Statistics Bureau of Bhutan, Royal
Government of Bhutan, Bhutan.
Quac NK, Phung TV and Husssain GJ (1996). Study on
the physiological characteristics and reproduction of
crossbred-sows F1 (Yorkshire x Mong Cai).
Agricultural Tropical University, 29: 59 – 64.
Swanepoel F, Strabel A & Moyo S (2010). The role of
livestock in developing communities: enhancing
multi-functionality. Wageningen University, The
Netherlands: The Technical Centre for Agricultural
& Rural Cooperative.
Tenzin P, Tsheten G, Sherab P and Timsina MP (2018).
Exotic pigs receive different fattening periods from
Bhutanese farmers. Bhutan Journal of Animal
Science, 2 (1):31-36.
Upton M (2004). The role of livestock in economic
development and poverty reduction. Pro-poor
Livestock Policy Initiatives. Rome: FAO.
Walugembe M, Nadiope G, Stock JD, Stalder KJ, Pezo D
and Rothschild MF (2014). Prediction of live body
weight using various body measurements in
Ugandan village pigs. Department of Animal
Science, Iowa State University, Ames, USA.

Bhutan Journal of Animal Science (BJAS)
Volume 4, Issue 1, Page 119-123, 2020
119
Full length paper
ASSESSMENT OF POULTRY FARM BIO-SECURITY MEASURES IN SOUTHERN BHUTAN
TASHI JAMTSHO*1, SB CHAMLING RAI1, KINLEY DEMA1 AND CHENCHO
TSHERING2
1National Poultry Research and Development Centre, Department of Livestock, Sarpang,
Bhutan. 2Regional Poultry Breeding Centre, Department of Livestock, Khangkhu, Paro, Bhutan
*Author for correspondence: [email protected]
Copyright © 2020 Tashi Jamtsho. The original work must be properly cited to permit
unrestricted use, distribution, and reproduction of this article in any medium.
ABSTRACT: The farm biosecurity measures adopted by poultry rearing farmers in five
southern districts of Bhutan was assessed. The data were gathered from 96 respondents
purposively selected, through face-to-face interview using semi-structured questionnaire.
The data gathered were descriptively analyzed and association amongst variables were
measured using Chi-square and Pearson’s correlation. The study recorded majority (74 %)
of the poultry sheds being constructed within 50 meters distance from the residential area,
and 66.8 % of respondents did not have any biosecurity fencing. The study recorded use of
foot dip at the entrance of the poultry shed as the main biosecurity measures, and about
90% of the respondents interviewed did not maintained visitors record. There was no
significant association between the education level and biosecurity measures being adopted
(p = 0.98). However, a significant difference was observed on the use of personal protective
equipment (p < .05) among the five districts. The study concludes that the majority of the
respondents are not aware on the importance of poultry farm biosecurity measures. The
study recommends creating adequate awareness on the importance of maintaining farm
biosecurity measures to minimize diseases outbreak and enhance production.
Keywords: Biosecurity; disinfectants; education level; personal protective equipment.
1. INTRODUCTION
Infectious agent significantly reduces the productivity,
profitability and financial viability of the farm in long
term. Therefore, farm biosecurity measures are
implemented.to reduces the risk of introducing and
transmitting disease agents (Mahmoud et al. 2014) or
organisms into a flock or herd (Dorea et al. 2010). Bio-
security encompasses a range of measures when properly
implemented serves to protect the health of poultry from
diseases, pests and pathogens. Noremark et al. (2014)
reported a role in spreading both endemic and exotic
diseases through indirect contacts from visitors.
Biosecurity is achieved by maintaining minimum entry of
pathogenic organisms such as bacteria, viruses and
rodents in the farms (Wijesinghe et al. 2017).
Implementation of biosecurity measures will not only
significantly reduce the introduction of diseases but will
enhance the financial strength (Dorea et al. 2010) and
increase competitive edge of the farms. Today about 1078
households’ rear improve poultry ranging between 200 to
10,000 bird in Bhutan, and had achieved 100 % egg self-
sufficiency since 2012, with no import of eggs. The
poultry population recorded in Bhutan was 1.067 million
numbers, with native poultry accounting to about 11.83
% (RNR Statistics 2017). Majority of the country’s
poultry population (68.67 %) and the larger poultry
farmers are concentrated in five southern dzongkhags
(districts). Many farmers had venture into commercial
poultry farming since 2010 after the ban imposed on
import of eggs after the outbreak of Highly Pathogenic
Avian Influenza. The growth of commercial poultry
sector was much faster than other livestock commodities;
and in parallel if adequate bio-security measure are not
put in place the risk of disease incursion and outbreaks are
expected to increase by manifolds. Such disaster if
occurred might impact the growth of poultry sector in the
country. Thus, to reduce and prevent the risks of
introducing poultry diseases and outbreaks necessitate
having good biosecurity. Currently there is no empirical
information on adoption of biosecurity measures by the
poultry farmers and different farm sizes in Bhutan.

Bhutan Journal of Animal Science (BJAS), Volume 4, Issue 1, Page 119-123, 2020
Jamtsho et al. (2020) 120
Therefore, this study was planned to assess the existing
biosecurity measures adopted by farmers and different
sizes of poultry farm in five southern districts of Bhutan.
2 MATERIALS AND METHODS
2.1 Study sites and respondents
The study sites Gelephu, Dekiling, Samtenling and
Sompangkha gewogs (sub-districts) under Sarpang
dzongkhag (district); Goserling, Tsholingkhar,
Kilkhorthang and Dunglagang gewogs under Tsirang
dzongkhag; Tashiding and Dagapela under Dagana;
Phuentsholing and Samphelling gewog under Chukha
dzongkhag and Norbugang and Samtse gewogs under
Samtse dzongkhag were purposively selected based on
existence of high number of poultry rearing farmers and
farms. Further, amongst the existing poultry farms, a total
of 96 households rearing more than 200 poultry birds
were again purposively selected for the study. The
climatic condition of study sites ranges from warm sub-
tropical to warm temperate.
2.2 Data collection and analysis
The data were collected from identified poultry rearing
farmers through face to face interview using a semi-
structured questionnaire from November to December
2018. The data gathered were descriptively analyzed and
association amongst variables were measured using Chi-
square and Pearson’s correlation in Statistical Package for
the Social Sciences (SPSS) Version 23 (IBM n.d.).
3. RESULTS AND DISCUSSIONS
3.1 Profile of respondents
The study recorded 65.6 % male and 34.4 % female
respondents. Majority of respondents were literate against
28.1 % illiterate respondent recorded. It was observed that
about 71.9 % of the respondents had education level
higher than primary education or had attended non-formal
education (NFE). The respondents with primary and
secondary level qualification comprises of 35.4% and
24%, respectively.
3.2 Poultry farming and farm type
Figure 1 presents different poultry farm types owned by
the respondents in this study. The study recorded 71.9 %
and 18.8 % of the respondents involved in commercial
layer and broiler farming for egg and chicken production,
respectively. About 9.4 % of the respondents were found
rearing both layer and broiler. Similarly, Maduka et al.
(2016) reported more layer farms than broiler in their
study.
There was no significant association between the
education level of respondents and farm type (p = 0.79)
owned in this study.
Farm with flock size of 500-1000 birds (39.6 %)
were the most common enterprise, followed by 1001-
5000 (32.3 %), less than 499 (19.8 %) and 5001-10,000
(8.3 %) birds. This finding indicates that majority of the
respondents are into either semi-commercial or
commercials poultry farming. In the Bhutanese context,
poultry farm with birds between 500-1000 numbers and
above 1001 birds are considered a semi-commercial and
commercial farm, respectively. All respondents in this
study had an open-sided house of deep litter system. The
Day-Old-Chicks (DoCs) demand for the layer farms were
met from the government farms. Whereas, the majority of
broiler DoCs were supplied to interested farmers by
private entrepreneur through import from neighbouring
states of India. The government farm also produces and
supply small numbers of broiler DoCs.
Figure 1: Poultry farm types owned by farmers
The study recorded that about 74% of respondents have
constructed poultry sheds within 50 m distance from the
residential areas. Whereas, about 12.5 % and 7.3 % of
respondents have constructed poultry sheds beyond 100
m and between 51- 60 m, respectively. Alabi et al. (2014)
and Martindah et al. (2014) also found that majority of the
poultry sheds in Nigeria and Indonesia are constructed
within 100m owing to ease of the management.
The biosecurity guidelines requires the commercial
poultry farms to be constructed away from the residential
areas and public roads to avoid direct contact for
biosecurity reasons in Bhutan (BAFRA 2015); however,
the actual distance requirement is not specified. With
most farms constructed within proximity to residential
areas in the study sites, there’s a very high possibility of
disease occurrence and transmission during outbreaks.
Biosecurity fencing, as a physical barrier, plays a
crucial role in preventing entry of unwanted visitors and
spreading of pests and diseases. However, the study
0
10
20
30
40
50
60
70
80
Layer Broiler Layer and Broiler
No
. o
f F
arm
s

Bhutan Journal of Animal Science (BJAS), Volume 4, Issue 1, Page 119-123, 2020
Jamtsho et al. (2020) 121
recorded only 31.2 % of the farms with established
biosecurity fencing (Table 1).
Most poultry farms in Sarpang district had the bio-
security fencing and it could be mainly because of
respondents having adequate experiences and knowledge
on poultry farming.
3.3 Disinfectant programs and downtime period
The study revealed that the majority 87(90.6 %) of the
poultry farms had foot dip at the entrance of the shed
against 9.4 % respondents without foot dip facility. The
majority of the respondents used lime (CaCO3) as a main
disinfectant in the sheds while potassium permanganate
and Kohrsolin-Th (Glutaraldehyde) are also used at the
entrance of the sheds. In contrast, Negro-calduch et al.
(2012) revealed that phenol-based products were mostly
used as a disinfectant, followed by lime.
Also, 65 % of the respondents did not use hand
sprayer for disinfection at the farm. A similar result was
also observed by Tenzin et al. (2017) where the majority
of the respondents did not use hand sprayer rather they
use soap and water.
The current study did not find any significant
association between education level and disinfectant
program (p = 0.98). It was revealed that 77 (80 %) of the
respondents use disinfectants in the farm. Whereas, in
Libya only 20 % of the farms use disinfectant at the entry
with likely increase risk of poultry farm exposure to the
pathogen (Kammon et al. 2017).
In the study areas, all respondents reported having
kept the downtime of different durations (Table 2). It was
recorded that 57.3 % (55) of the respondents had kept the
downtime of more than one month, followed by 17.7%
downtime of 21-30 days, 13.5% for 10-15 days, 7.3% for
less than 10 days and 4.2% for 16-20 days. Mohammed
et al. (2016) observed that rest period between production
cycles was found to be kept at 4-7 days. In normal
circumstances, a minimum downtime duration of two
weeks is recommended (Hy-line International 2018).
Table 2: Duration of downtime by respondents
Duration downtime Number of Respondent
Percent of respondent
Less than 10 days 7 7.3 10-15 days 13 13.5 16-20 days 4 4.2 21-30 days 17 17.7 More than 30 days 55 57.3
Total 96 100
3.4 Cleaning of sheds and equipment;
In the study areas, it was revealed that 74 (77.1 %) of the
respondents cleaned the poultry sheds once in a cycle,
followed by two and four times with 9 (9.4 %) each.
Tenzin et al. (2017) reported that the cleaning of poultry
shed was done daily, weekly and monthly basis. The
cleaning and disinfection are key components of routine
farm biosecurity and decontamination that is expected to
kill all pathogenic organisms that are present in the farm.
The study recorded that about 64 respondents clean
the water drinkers on daily basis. Whereas, about 17 and
11 respondents claim to clean the water drinkers on a
weekly and monthly basis, respectively. The study also
recorded 49 (51 %) of the respondents cleaning the
poultry feeders every month, while 25 (26%) and 22
(22.9%) of the respondents have reported cleaning the
feeders on daily and weekly basis, respectively (Figure 2).
Negro-calduch et al. (2012) in their findings also revealed
that cleanliness of water drinkers and other equipment
was poorly managed in Egyptian farms.
Figure 2: Percent respondent cleaning of drinkers and
feeders
3.5 Feed and Feeding
The study observed that all respondents used commercial
poultry feed from different feed company such as Karma
feed, MAHA, Samrat feed and BMG. The study found
that about 80.2 % (77) of the respondents purchased the
0
10
20
30
40
50
60
70
80
Daily Weekly Monthly
No
. o
f R
esp
ond
ent
Cleaning of poultry equipment
Feeder Drinker
Table 1: Adoption of bio-security fencing at Farms
Dzongkhag Bio-security fencing
(No.)
Total
Yes No
Tsirang 2 20 22
Dagana 0 6 6
Sarpang 23 33 56
Chukha 3 2 5
Samtse 2 5 7
Total 30 66 96

Bhutan Journal of Animal Science (BJAS), Volume 4, Issue 1, Page 119-123, 2020
Jamtsho et al. (2020) 122
feed on weekly basis as to avoid feed contamination or
spoilage. It was also recorded that about 10.4 % of the
respondent purchased feed on monthly basis and feeds are
stored in a separate feed store by about 80.2 % of the
respondents in the study areas.
3.6 Workers hygiene and visitor records
The study revealed that about 47.9 % (46) of the farms
provide clothing for the workers, and the remaining farms
did not provide working dresses. It was also observed that
the workers in 33.3 % (32) of the farms studied use
footwears, while remaining 64.6 % (62) farms did not use
footwears while working in the farms. Wearing different
clothes and footwear while working in the farm will
reduce the spread of pests and diseases. The significant
difference on the use of Personal Protective Equipment
(PPE) amongst the farms in five districts was observed (p
<0.05), which contradicts the finding of Dorea et al.
(2010). About 96 % of the respondents revealed that in a
day, about 1-3 workers are allowed to enter the farms.
About 75 % of the respondents in this study reported that
the farm attendants visit first from young to old flock
while 25 % visited from old to the young flock (Table 3).
The study found that 92.7 % of the respondents did
not maintain visitor records at the farm. It was recorded
that only seven respondents six from Sarpang and one
from Samtse districts had maintained visitor records. This
indicates that poultry farmers are unaware of the
importance of keeping the visitor logbook. If such records
are maintained would help poultry farmers to conduct a
risk assessment during disease outbreak in the farm. It
also indicates that the visitors are allowed to visit the farm
without any restrictions unlike implementation of entry
restriction to poultry farms. Whereas, Kammon et al.
(2017) reported 81 % of the farms in Libya region have
entry restriction records to poultry farms. Scott et al.
(2018) in their study reported that visitor recording books
are used by the majority of the poultry farms in Australia.
Table 3: Sequence of visiting flock
Dzongkhag Visiting of flock Total
Young first Old first
Tsirang 15 7 22
Dagana 5 1 6
Sarpang 43 13 56
Chukha 4 1 5
Samtse 5 2 7
Total 72 24 96
3.7 Brooding and isolation pen facilities
Figure 3 presents the brooding and isolation of pen
facilities. Brooding of chicks is important to provide extra
care after hatching. The study recorded that 51(53 %) of
the respondent did not have separate brooding pen in the
farm, while about 63.5% (61) of the respondent had
maintained an isolation pen to keep sick birds. The sick
birds are separated and kept in the same shed after
partitioning in farms without isolation pen. Furthermore,
the study revealed that 82.3% (79) of respondents had
different sheds for the different age group of birds, and
the remaining respondent stock the birds of different age
groups in the same shed.
Figure 3: No. of respondents with isolation pen
4. CONCLUSION
Majority of the poultry farmers are more concerned on
production aspect and have neglected the minimum
biosecurity requirements which plays a vital role in
overall farm performance. The possibility of diseases
occurrence and transmission during outbreaks within and
amongst the poultry farm is very high. Further, the poultry
farmers do not have adequate knowledge on biosecurity
measures, flock health management and personal
hygiene. It is imperative that awareness and education
programs on need for an effective farm bio-security
measures are imparted amongst poultry farmers in the
country to reduce pests incursion, diseases outbreak and
transmissions.
ACKNOWLEDGEMENT
Authors would like to thank the Director General,
Department of Livestock for fund supports and Dr.
Kesang Wangchuk, Principal Research Officer for
continuous advice and collaboration. We would also like
to thank all the staffs of NPRDC, Sarpang for their
assistance in data collection.
REFERENCES
Alabi RA, Aghimien CI, Osasogie DI & Erie OG (2014).
Environmental Effects of Poultry Production In Edo
State, Nigeria Environmental Effects of Poultry
Production In Edo State, Nigeria, (August).
https://doi.org/10.9734/AJEA/2014/11958
0
5
10
15
20
25
30
35
40
45
50
Tsirang Dagana Sarpang Chukha Samtse
No
. o
f R
esp
ond
ents
Dzongkhag
Yes No

Bhutan Journal of Animal Science (BJAS), Volume 4, Issue 1, Page 119-123, 2020
Jamtsho et al. (2020) 123
Bhutan Agriculture and Food Regulatory Authority.
(2015). In-Country Livetsock Biosecurity (No.
Version 1). Thimphu.
Dorea FC, Berghaus R, Hofacre C & Cole DJ (2010).
Survey of Biosecurity Protocols and Practices
Adopted by Growers on Commercial Poultry Farms
in Georgia, U.S.A. Avian Diseases, 54(3):1007–1015.
https://doi.org/10.1637/9233-011210-Reg.1
Hy-line International (2018). Management Guide for
Hyline Commercial Layers. Hy-Line International.
Retrieved from www.hyline.com
IBM. (n.d.). IBM SPSS Statistics 23 Brief Guide.
Kammon A, Mulatti P, Lorenzetto M, Ferre N, Sharif M
& Eldaghayes I (2017). Biosecurity and geospatial
analysis of mycoplasma infections in poultry farms at
Al-Jabal Al-Gharbi region of Libya, 7:81–85.
Maduka CV, Igbokwe IO & Atsanda NN (2016).
Appraisal of Chicken Production with Associated
Biosecurity Practices in Commercial Poultry Farms
Located in Jos, Nigeria, 2016.
Mahmoud MA, Atif EA & Hayfa MI (2014). Evaluation
of biosecurity measures on broiler farms in
Khartoum, Sudan. Journal of Veterinary Medicine
and Animal Health, 6(5):138–144.
https://doi.org/10.5897/JVMAH2014.0276
Martindah E, Ilham N & Basuno E (2014). Biosecurity
Level of Poultry Production Cluster ( PPC ) in West
Java, Indonesia. International Journal of Poultry
Science, 13(30):408–415.
Mohammed AN, El H & Helal S (2016). Current situation
assessment of biosecurity measures of some poultry
sectors and hatcheries in Egypt, 23(2):143–154.
Negro-calduch E, Elfadaly S, Tibbo M, Ankers P &
Bailey E (2012). Assessment of biosecurity practices
of small-scale broiler producers in central
Assessment of biosecurity practices of small-scale
broiler producers in central Egypt. Preventive
Veterinary Medicine, 110(2):253–262.
https://doi.org/10.1016/j.prevetmed.2012.11.014
Nöremark M & Sternberg-Lewerin S (2014). On-farm
biosecurity as perceived by professionals visiting
Swedish farms. Acta Veterinaria Scandinavica, 56,
28. https://doi.org/10.1186/1751-0147-56-28
RNR Statistics (2017). Livestock statistics. Ministry of
Agriculture and Forests, 1(1):1–23.
Scott AB, Sinh M, Groves P, Hernandez-jover M, Barnes
B, Glass K and Toribio J (2018). Biosecurity practices
on Australian commercial layer and meat chicken
farms : Performance and perceptions of farmers, 1–
17.
Tenzin T, Wandi C & Rai PB (2017). Biosecurity survey
in relation to the risk of HPAI outbreaks in backyard
poultry holdings in Thimphu city area , Bhutan, 1–9.
https://doi.org/10.1186/s12917-017-1033-4
Wijesinghe WJB, Silva PGJC De & Gunaratne SP (2017).
Evaluation of Biosecurity Status in Commercial
Broiler Farms in Sri Lanka, 7(4):114–119

Bhutan Journal of Animal Science (BJAS)
Volume 4, Issue 1, Page 124-127, 2020
124
Short Communication
SWINE-FISH INTEGRATION: EFFECT ON CULTURE PERFORMANCE OF
CTENOPHARYNGODON IDELLA AND CYPRINUS CARPIO
PEMA THINLEY*, NAMGAY DORJI AND DRUKPOLA
National Research & Development Centre for Aquaculture, Department of Livestock,
Gelephu, Bhutan.
*Author for correspondence: [email protected]
Copyright © 2020 Pema Thinley. The original work must be properly cited to permit
unrestricted use, distribution and reproduction of this article in any medium.
ABSTRACT: The study compared the growth performance of Ctenopharyngodon Idella and
Cyprinus carpio cultured under conventional management and integration of fish swine farming
intended to optimize the biomass production from unit land in subtropical agro-ecosystem. The
carp culture was integrated with swine production, where swine excreta was drained directly to
the pond. The fishes in both treatments were fed thrice a day with locally formulated feed as a
supplement at the rate of 2% wet body weight of fish fingerlings during the study period. The
growth performance of carp fish in T1 (111.80 ± 10.07 g) was higher than T2 of 74.48 ± 6.29
g, and found significantly different (p < 0.05). In addition, this study although not significantly
different the survival rate was found comparatively higher in fish swine integrated pond. The
total fish production recorded was 3155.79 and 2076.42 kg/ha in fish swine integration system
and conventional management, respectively. This study concludes that swine fish integration is
feasible in subtropical area and there are possibilities to enhanced unit fish production.
Keywords: Ctenopharyngodon idella; Cyprinus carpio; culture performance; swine-fish
integration.
1. INTRODUCTION
An integration of agriculture and aquaculture are
mostly practiced at subsistence level in African
countries such as Nigeria, Benin, Madagascar, Zambia,
Cameroon and Malawi (Gabriel et al. 2007). In Asia,
integrated agriculture and aquaculture dates back to
more than 1500 years in India (Coche 1967) and more
than 2400 years in China (Willman et al. 1998). While
a wide range of integrated agriculture and aquaculture
systems are practiced in Bangladesh, Indonesia,
Malaysia, Thailand and Vietnam integrated fish
farming with duck, chickens and swine is adopted in
India and China (Majhi 2016). The author reported that
such practices will minimize waste from various
subsystems on the farm to increase yields with low
inputs. Similarly, Zira et al. (2015) reported that wastes
or by-products from swine farming are used as inputs
in aquaculture to improve the productivity at lower cost.
Integrated livestock fish systems were reported to have
practiced since the Ming dynasty (14-17th century) to
alleviate the pressure of high population densities and
limited resources in China (Mani 2015). Henriksson et
al. (2015) claims extension of integration practices in
China as a result of their contribution to world’s total
aquaculture production of more than 60%. Fish farming
is a lucrative business for the farmers in southern
Bhutan. There are more than 500 fish farmers in
Bhutan, and many of them practices fish farming along
with other livestock such as pig, poultry and duck.
Integration of fish farming with other livestock is
practiced in some areas of Bhutan but it is not very
popular at the moment, which might be due to lack of
knowledge on the technology. Thus, this on-farm
experiment was carried out to assess effect of swine fish
farming integration to culture performance of Cyprinus
carpio (CC) and Ctenopharyngodon idella (CI).
2. METHODS AND MATERIALS
2.1 Study Site
The on-farm experiment of integrated swine fish culture
was conducted at NR&DCA, Gelephu located at
26°51.790’ N and 090°31.961’ E at an elevation of 252
masl. The area falls under sub-tropical climatic
condition ranging from warm and dry winter, wet and
hot summer with mean rainfall ranging between 1500-
to 500 mm per annum. The temperature ranges from 16-
30° C.
The experiment was conducted for a duration of
nine months starting from 30th September 2018 to 30th
June 2019.

Bhutan Journal of Animal Science (BJAS), Volume 4, Issue 1, Page 124-127, 2020
Thinley et al. (2020) 125
2.2 Fish species selection and stocking of
Two fish species namely Cyprinus carpio and
Ctenopharyngodon idella were selected for the
experiment based on the preference of fish farmers
attributed to fast growth rate and high FCR. In total,
2160 numbers of fishes were stocked in two ponds of
270 m2 in area each. The first pond integrated with
swine is allotted as treatment 1 (T1) and second pond
was allotted as treatment 2 (T2). Both ponds were
stocked with 50% Cyprinus carpio and 50 %
Ctenopharyngodon idella @ 4 fishes/m2 area. During
initially stocking, the mean weight recorded was 6.81 g
and 3.86 g for Cyprinus carpio and Ctenopharyngodon
Idella, respectively.
2.5 Fish feeding
Research ponds were fed with crude feed formulated
from rice bran (RB) and mustard oil cake (MoC) in 2:3
ratios (Thinley et al. 2018). Feeding rate of 3% body
weight per day was adopted for this research (Jenaet al.
2001). The total biomass increment of the research
ponds was estimated every bi-monthly based on
sampling data (Thinley et al. 2018). Fishes during the
experiment were fed thrice a day i.e once in morning at
8 AM, once in afternoon at 12:00 PM and then once in
evening at 4 PM.
2.6 Swine feeding
During the experiment, the pigs were fed adequately
with crude feed twice a day i.e. once in morning at 8.00
am and once in evening at 4.00 pm) following the
recommeded feeding rate for swine (FAO 2009) during
entire research period.
2.3 Data collection and analysis
Data for culture performance of Cyprinus carpio and
Ctenopharyngodon Idella was recorded bi-monthly
through random sampling. Forty numbers of each fish
species were sampled every fortnightly and their body
weight and body length were measured using digital
weighing balance and length measuring board,
respectively. The sampling process accounted animal
welfare through application of standard operating
procedure (SOP) of NR&DCA to record culture
performance fortnightly. Mortality of fishes was also
recorded during the research period to derive survival
inferences.
The performance data collected for the study were
administered independent t-test using SPSS version
23.0 and other culture performance parameters such as
mean gain in length and weight, Specific Growth Rate
(SGR (% per day)), survival rate (%), feed conversion
ratio (FCR) and production were calculated using
following formulae:
Equation 1: Mean gain in length (cm)
= Mean final length (cm) – Mean initial
length (cm)
Equation 2: Mean gain in weight (g)
= Mean final weight (g) – Mean initial
weight (g)
Equation 3: Specific growth rate (SGR) (% per day)
= ((logW2 –logW1)/ T)) X 100
Where, W2 = mean final weight (g), W1 =
mean initial weight (g), T is culture period
(days)
Equation 4: Survival rate (%)
= (No. of fishes harvested/ No. of fishes
stocked) x 100
Equation 5: Feed Conversion Ratio (FCR)
= ((Total feed consumed (Kg)/ Total weight
gained (Kg)) X 100
Equation 6: Production (kg/ha/9 months)
= No. of fish harvested X average weight at
harvest (Kg)
Figure 1: ADG of C. carpio and C. idella across
different treatments
3.RESULTS AND DISCUSSION
3.1 Mean body weight and length of fish
The final body length and weight of the experiment fish
species are illustrated in Figure 2 and 3. The mean final
body weight recorded for Cyprinus carpio and
Ctenopharyngodon idella cultured under fish swine
farming integration was 93.85 ± 6.24 g and 129.75 ±
18.85 g respectively. Whereas, the mean final body
length recorded was 18.55 ± 0.48 cm and 20.46 ± 0.78
cm for Cyprinus carpio and Ctenopharyngodon idella,
respectively, under similar condition. The mean final
body weight recorded was 79.01 ± 4.50 g and 69.95 ±
11.79 g for Cyprinus carpio and Ctenopharyngodon
idella cultured without integration. Under same

Bhutan Journal of Animal Science (BJAS), Volume 4, Issue 1, Page 124-127, 2020
Thinley et al. (2020) 126
treatment, the mean final length recorded was 17.12 ±
0.49 cm and 15.84 ± 0.83 cm for Cyprinus carpio and
Ctenopharyngodon idella which was not statistically
significant (p>0.05). Similar range of growth
performance of Cyprinus carpio and
Ctenopharyngodon idella was recorded in mid-altitude
area of Punakha district in Bhutan (Thinley 2018).
However, this result contradicts with the findings of
Molnar et al. (2010) who reported relatively higher
mean growth indices which could have resulted due to
incorporation of fodder additives.
A significant difference (p<.05) was observed in
the overall mean final body weight of fish in T1 and T2.
The overall mean of final body weight recorded was
111.80 ± 10.07 g with length reaching about 19.51 ±
0.47 cm); whereas, in T2 the overall mean of final body
weight of fish observed was 74.48 ± 6.29 g with length
reaching about 16.48 ± 0.48 cm (Figure 1). T-test
results depicted higher growth rate in integrated pond
which is an indicative of positive effect of integration
having improved natural productivity sustaining pond
ecosystem.
3.2 Specific growth rate
The percent SGR recorded for Cyprinus carpio was
0.42 and 0.39 in T1 and in T2, respectively. Whereas, the
percent SGR recorded for Ctenopharyngodon idella
was 0.57 and 0.47 in T1 and T2, respectively.
Therefore, it is clear that fishes cultured with swine
integration exhibits high SGR (% per day) than culture
without integration. The reason for high SGR in T1 than
T2 could be due to optimum natural productivity from
day to day organic manure contributed directly from sty
into T1 fish pond.
3.3 Feed Conversion Ratio (FCR)
Concurrent with growth performance, feed conversion
ratio of locally formulated feed was evaluated after
nineth month of culture period for Cyprinus carpio and
Ctenopharyngodon idella. The highest FCR of 9.79 and
5.68 was recorded for Cyprinus carpio and
Ctenopharyngodon idella in ninth and eighth month of
culture period, respectively.
The FCR value provides basic understanding on
the overall efficiency of locally formulated feed and its
interaction effect under integrated swine fish farming.
Thus, the growth rate and FCR of two species in this
study clearly indicates poor efficacy of locally
formulated feed which contradicts the FCR value of
1.59 reported for local feed in Pakistan (Soom et al
2009).
3.4 Survival rate (%)
The overall survival rate recorded during the entire
culture period was 74.07% and 69.26% for T1 and T2
respectively (Table 4). This finding clearly revealed
that fishes cultured with swine recorded higher survival
rate which could be attributed to favorable natural
productivity supplements derived from exogenous
feeding.
Molnar et al. (2010) reported a high survival rates
during their experiment on influence of fodder additives
on the growth indices and survival rate of Cyprinus
carpio and Ctenopharyngodon idella.
3.5 Fish production
At the end of empirical investigation of swine fish
integration farming, net production from T1 and T2 were
85.21 kg and 56.06 kg respectively. The fish production
per unit area recorded was 0.32 and 0.21 kg, with total
production estimation of approximately 3155.79 and
2076.42 kg/ha from T1 and T2, respectively. This
finding indicates that fish farmers can derive
substantially more fish products when integrated with
swine that manures fish pond for natural productivity
on daily basis.
Figure 2: Final body length of two fish species
Figure 3: Final mean body weight of fish species

Bhutan Journal of Animal Science (BJAS), Volume 4, Issue 1, Page 124-127, 2020
Thinley et al. (2020) 127
4. CONCLUSION
The production efficiency of cultured C. carpio and C.
idella was found better in swine fish integration system
as compared to conventional fish farming. Thus, it
concludes that swine-fish integration can be promoted
for higher fish production and maximization of
resources use in the subtropical region of Bhutan.
ACKNOWLEDGEMENTS
The authors greatly acknowledge the support and
coordination of NR&DCA management and farm
attendants especially Mrs. Nidup Zangmo and Mrs.
Sangay Choden for their valuable contribution towards
fish feeding.
REFERENCES
Abid M and Ahmed M (2009). Efficacy of Feeding
Frequency on Growth and Survival of Labeo rohita
(Hamilton, 1822): Fingerlings under Intensive
Rearing. The Journal of Animal & Plant Sciences.
111-113.
Biswas A (2015). Fish Duck Integrated Farming.
Kolkata, India: Central Institude of Fisheries
Education.
Bora J and Das AK (2013). Costs and Returns of
Integrated Fish Farming in Jorh at District of
Assam. Agriculture Science Disgest , 289-293.
Chandan D, Gulab SY, Lopamudra S, and Mrinmoy D
(2013). Integrated Fish Farming for Sustainable
Livelihood of Farmers of Tripura. Indian Farming.
18-21.
Coche A (1967). Fish culture in rice field: A world-
wide synthesis hydrobiologia.
Daba T, Alemayew A and Megerssa E (2017). Potential
of Integrated Fish-Poultry-Vegetable Farming
System in Mitigating Nutritional Insecurity at Small
Scale Farmer's Level in East Wollega, Oromia,
Ethiopia. International Journal of Fisheries and
Aquatic Studies. , 377-382.
Delmendo M (1983). Integrated Farming Sustems in
Asia and the Pacific. In: FAO Report fo the Expert
Consultation on the Development of Integrated and
Mixed Farming Systems and Water Conservancies
in Rainfed Areas. . Bangkok: Thailand: Food and
Agriculture Organization (FAO).
DoL (2017). Livestock Statistics. Department of
Livestock, Thimphu:.
Dzongkhag Administration (n.d). Royal Government of
Bhutan. Retrieved September 27, 2018, from
www.sarpang.gov.bt.
FAO (2009). Farmer's Hand Book on Pig Production
(For the Small Holeders at Village Level). Italy:
Food and Agriculture Organization.
Gabriel U, Akinrotimi O, Bekibele D, Anyanwu P and
Onunkwo D (2007). Economical Benefit and
Ecological Efficiency of Integrated Fish Farming in
Nigeria. Academic journals , 302-308.
Henriksson P, Metian M, Leadbitter D and Troell M
(2015). Global food supply: China's aquaculture
and the world's wild fisheries. pp. 1-38.
Jena J, Ayyappan S, Aravindakshan P and Muduli H
(2001). Comparative Evaluation of Growth,
Survival and Production of Carp Species at
Different Stocking Densities under Polyculture.
Indian Journal of Fishery. 17-25.
Khalid UB, Shahbaz P, Haq SU and Javeed S (2017).
Economic Analysis of Intergrated Farming Systems
on Farm Income: A Case Study of Shiwa District,
Punjab, Pakistan. Research and Analysis Journal.
1434-1444.
Majhi A (2016). Integrated Duck cum Fish Farming and
its Economic Efficiency: A Study in Purulia
District, West Bengal. International Journal of
Science and Research , 1390-1395.
Mani S (2015). A Review on Integrated Farming
Systems. A Journal of International Academic
Research for multidisciplinary, 319-328.
Molnar F, Sara A, and Ani AR. (2010). The Influence
of Some Fodder Additives on the Growth Indices
and Survival Rate of Common Carp (Cyprinus
carpio L.) and Grass Carp (Ctenopharyngodon
idella L.) Juveniles. Animal Science and
Biotechnologies, 43(1). 84-87.
Nidup K, Moran C and Dochen T. (2011). Farming and
Biodiversity of Pigs in Bhutan. All Genetics
Resources, 47-61.
Ogello E, Mlingi F, Nyonje B, Charo-Karisa H, and
Munguti J. (2013). Can Integrated Livestock-Fish
Culture be a Solution to East Africa's Food
Insecurity? A Review. African Journal of Food,
Agriculture, Nutrition and Development.
Rahman S and Monir M. (2013). Effect of stocking
density on survival, growth and production of Thai
Anabas Testudineus fingerlings under nursery pond
management in Northern regions of Bangladesh.
Journal of Experimental Biology and Agricultural
Sciences, 465-472.
Soom U, Salim M, Shahzadi T, and Barlas A. (2009).
Growth performance and feed conversion ratio
(FCR) in hybrid fish (Catla catla X Labeo rohita)
fed on wheat bran, rice broken and blood meal.
Pakistan Veterinary Journal.
Thinley P. (2018). Policy Framing for Control of
Transboundary Aquatic Animal Diseases. Dhaka-
Bangladesh: SAARC Agriculture Centre (SAC).
Thinley P, Drukpola, and Dorji N. (2018). Effect of
Stocking Density on Performance of Cultivable
Carps in Southern Bhutan. Bhutan Journal of
Animal Science (BJAS), 25-30.
Willman R, Halwatt M and Barg U. (1998). Integrating
fisheries and agriculture to enhance fish production
and food security. FAO Aquaculture Newsletter.
Zira J, Ja' afaru A, Badejo B, Ghumdia A, and Ali M.
(2015). Integrated Fish Farming and Poverty
Alleviation/Hunger Eradication in Nigeria. Journal
of Agriculture and Veterinary Science (IOSR-
JAVS), 15-20

Bhutan Journal of Animal Science (BJAS)
Volume 4, Issue 1, Page 128-132, 2020
128
Short Communication
A PRELIMINARY FINDING ON THE EFFECTIVENESS OF FISHWAYS AT KURICHHU DAM IN
BHUTAN
CHANGLU*, GOPAL PRASAD KHANAL, SANGAY NORBU AND SINGYE TSHERING
National Research and Development Centre for Riverine and Lake Fisheries, Department of
Livestock, Ministry of Agriculture and Forests, Haa, Bhutan.
*Author for correspondence: [email protected]
Copy right ©2020 Changlu. The original work must be properly cited to permit unrestricted use,
distribution, and reproduction of this article in any medium.
ABSTRACT: Fishways are constructed at Kurichhu and Dagachhu hydropower projects to mitigate
the impact of hydropower projects on migratory fishes. But none of the agencies has made attempts
to evaluate the efficiency of the existing fishways until today. Thus, the study was undertaken to
collect preliminary data on fish species diversity and size span that ascends through fishway of
Kurichhu dam. Fish species composition and diversity varied among the sampling period. The
preliminary findings recorded nine fish species within the vicinity of the project area, of which eight
fish species irrespective of their sizes were found utilizing the fishway facility.
Keywords: Fishway; size span; species diversity.
1.INTRODUCTION
Bhutan is endowed with rich perennial water resources
with estimated hydropower generation potential of
30,000 megawatts (MW) reported the technical feasibility
of generating about 23,503 MW of hydropower from 72
projects (NORAD 2017). At present, only 1606 MW has
been harnessed from six Hydropower Plants (HPP’s)
(NSB 2016). Besides, four Hydroelectricity projects
namely Punatshangchhu Hydro Power Authority-I & II,
Tangsibji Hydro Energy Limited and Mangdechhu Hydro
Power Authority are currently under various stages of
construction that is capable of producing 3058 MW in
total.
The construction of the hydropower plant is
expected to disturb the fish diversity and aquatic
ecosystem for which the World Bank (2016) had
recommended to evaluate the impacts of hydropower
development on aquatic ecosystems before
implementation. A lack of comprehensive baseline data
on fish species diversity makes difficult to assess the
impacts of aquatic fragmentation in Bhutan. The World
Bank (2017) had reviewed and identified 123 fish species
of which 111 are indigenous and 12 exotics. The latest
review indicated presence of 130 fish species in water
bodies of Bhutan (Thoni & Gurung 2018; NBC 2019).
The Water Regulation of Bhutan (2014) identified and
recommended measures to mitigate impacts on aquatic
biodiversity by establishing minimum environmental
flows (e-flows) for hydroelectric projects as per
Environment Impact Assessment (EIA). The other
recommendations are to construct fishways to facilitate
upstream movements of fishes or to compensate through
investment on on-site hatchery facilities to produce and
release native fish fingerlings.
Currently, fishways intended to mitigate the impact
on migratory fishes are only available on the Kurichhu
and Dagachhu HPPs. While those structures are in place
the effectiveness was not evaluated at this juncture and
the effectiveness of fishway at Kurichhu HPP was
questioned (Virdi & Theophilus 2014). Thus, this study
was planned to generate preliminary empirical
information on the effectiveness of fishway at Kurichhu
HPP dam.
2.MATERIALS AND METHODS
2.1 Study area
The study was conducted within the vicinity of Kurichhu
Hydroelectric Project (KHEP). The data on fish species
diversity were gathered from Morichhu, an upstream
tributary flowing along Lingmethang that joins the right
bank of Kurichhu, approximately six kilometers (km)

Bhutan Journal of Animal Science (BJAS), Volume 4, Issue 1, Page 128-132, 2020
Changlu et al. (2020) 129
above the dam; and from Yunari stream the downstream
tributaries that join the right bank of Kurichhu,
approximately 0.300 km below the dam; and the Yongri,
a small stream that joins the left bank of Kurichhu,
approximately 0.800 km below the dam as presented in
Figure 1.
Figure 1: Study area along the Kurichhu HEP in Mongar
2.2 Kurichhu fishway structure
The 55 m high concrete gravity dam of Kurichhu HEP
with 250 m in width and is provided with fishway at the
right bank of Kurichhu. It is a pool and weir type, with
submerged orifice and centrally located notch. The
fishway entrance is located at 492 masl. Two entrances
were provided for different water levels in the reservoir.
The upper exit is located at 529 masl and the lower exit at
524 masl. This gives the fishway height of 32 and 37 m,
depending upon the level of water in the reservoir. The
water discharged was approximately 1.05-1.27 cumecs at
the time of sampling.
The detail information is presented in Figure 2 and
Table 1.
Figure 2. Diagrammatic representation of fishway and
sampling sites (4-10).

Bhutan Journal of Animal Science (BJAS), Volume 4, Issue 1, Page 128-132, 2020
Changlu et al. (2020) 130
2.3 Data collection methods
The data on fish species diversity were gathered three
times viz., from 25th - 29th June 2018, 20th - 22nd
November 2018 and 30th May- 3rd June 2019. Whereas,
data on fish attempting to ascend fishway was collected
twice in June 2018 and between May and June 2019. Fish
with good swimming ability and those with adhesive
organs were recorded from fishway.
2.4 Fish sampling
Fish samples were collected randomly from the main
Kurichhu river and tributaries using electrofisher (Model:
ELT62-2D; Grassl, Germany; DC 3KV) during June
2018 and November 2018. Whereas, in May 2019 the
fish samples were collected using locally improvised
electrofisher. The gates of fishway were gradually closed
to reduce the velocity of the water. Then, the fishes were
captured using dip nets from various elevations of the
fishway.
2.5 Velocity of water
The velocity of water flowing through the fishway was
measured at the middle of the fishway pool using
flowmeter (Model: FP111; Global Water Instruments,
USA). In addition, the depth of water along the fishway
was measured.
2.5 Basic water quality
The basic water quality parameters such as pH,
temperature and dissolved oxygen were determined from
Morichhu, Fishway, Yunari and Yongri. The pH and
temperature were determined using multiparameter kit
(MODEL: 98194; Hanna Instruments, Romania), and
dissolved oxygen (DO) was recorded using DO meter
(Model: SLD 150; Extech, Taiwan).
2.6 Data analysis
2.6.1 Morphometric measurement
The morphometric measurement was recorded,
particularly total length, standard length and the body
depth of fishes for this study. This is mainly for the
selection of a type of tags to be employed for the final
evaluation. Data collected on morphometric
measurement and fish species diversity were analyzed in
Microsoft Excel 2010.
3. RESULTS
3.1 Fish species diversity
The study recorded nine fish species viz., Neolissochilus
hexagonolepis, Schizothorax richardsonii, Schizothorax
progastus, Garra gotyla, Garrra lissorhynchus,
Psilorhynchus homaloptera, Pseudecheneis sulcata,
Glyptothorax sp., and Parachiloglanis hodgarti in total
from upstream and downstream of Kurichhu dam site.
Amongst the tributaries, Morichhu exhibited the highest
diversity with eight fish species followed by Yunari and
Yongri with six and four species, respectively.
3.2 Fish species and size attempting to ascend fishway
The sampling was done twice in various elevation of the
fishway when it was operational. The overall study
recorded eight fish species attempting to ascend the
fishway. During first sampling in June 2018, a total of six
species were observed along various elevations of the
fishway as presented in Table 1. However, during the
second sampling period carried out between May-June
2019,additional two species namely Parachiloglanis
hodgarti and Psilorhynchus homaloptera were recorded
(Table 1).
Table 1: Fish Species attempting to ascend fishway
Fish species June 2018
May-Jun 2019
Neolissochilus hexagonolepis * *
Schizothorax richardsonii * *
Schizothorax progastus * *
Garra gotyla * *
Pseudochenesis sulcata * *
Glyptothorax sp. * *
Psilorhynchus homaloptera - *
Parachiloglanis hodgarti - *
In order to have comprehensive information on sizes of
fish ascending the fishway, total length and body depth
was measured. This is carried out mainly to select suitable
tag and tagging method to evaluate the effectiveness of
fishway during the final course. The study recorded size
Table 1. Fishway design at Kurichhu dam
Particulars Remarks Type Pool-and-weir (Pool
Pass with Submerged Orifice)
Height of fishway (upper exit) 37 m
Height of fishway (lower exit) 32 m
No. of Pools 103
Dimension of Pool (L x B x H) 3 m x 1.5 m x 2 m
Dimension of Baffle (L x H) 1.5 m x 1.5 m
Dimension of Submerged Orifice (L x H)
0.45 m x 0.70 m
Dimension of Central Notch (L x H)
0.45 m x 0.30 m
Discharge 1.05-1.27 cumecs

Bhutan Journal of Animal Science (BJAS), Volume 4, Issue 1, Page 128-132, 2020
Changlu et al. (2020) 131
span of 186 fishes in June 2018 and 102 fishes in May and
June 2019. The record showed variation in the size of
species in different sampling time.
3.2.1 Average body depth of fish
Table 2 presents the mean body depth of fish captured
from fishway during the study. The highest mean body
depth of fish recorded was 69.56 ± 5.07 mm for
Neolissochilus hexagonolepis, and lowest of 6.4 ± 0.60
mm was recorded for Psilorhynchus homaloptera.
3.2.2 Average length of fish
Table 3 shows the mean body length of fish ascending
fishway measured twice during study period. The longest
mean length of 323.82 ± 22.82 mm and shortest of 82.00
±1.97 mm was recorded for Neolissochilus hexagonolepis
and Psilorhynchus homaloptera, respectively.
3.3 Composition of fish utilizing fishway
The total composition of fishes from fishway was
determined during two period’s viz., June 2018 and
May/June 2019). The composition of fish species
recorded in different sampling periods differed. The study
recorded highest composition was Schizothorax
richardsonii (46.43%) in June 2018; whereas, in
May/June 2019, the highest composition was Garra
gotyla (30.39 %). The least composition was recorded for
Neolissochilus hexagonolepis (4.76%) in June 2018 and
0.98% each for Parachiloglanis hodgarti and
Pseudochenesis sulcata in 2019 as presented in Table 4.
3.3 Water discharge and flow in fishway
The water discharge in fishway was approximately 1.27
cumecs during June 2018 and 1.05 cumecs in May 2019.
The average velocity of water in fishway was 0.62 m/s in
May and 0.70 m/s in June 2018 and. The average water
depth of fishway was 1.11 m in May and 1.21 m in June
2018.
3.5 Basic water quality
The basic water quality parameter from four selected sites
at various elevation on fishway and three sites from
different tributaries was recorded. The pH values
recorded in this study fall within the reported satisfactory
range of 6-9 by Central Pollution Control Board (CPCB),
India. The pH values between 6.5 to 8.5 are known to
supports healthy, diverse and productive fish and
macroinvertebrates communities (NAS 1972). The pH
and dissolved oxygen values of all sampling locations are
Table 2: Average body depth of fish ascending fishway
Fish species June 2018 May/June
2019
Neolissochilus hexagonolepis
75.00 ± 13.36
68.83 ± 5.27
Schizothorax richardsonii
37.89 ± 2.63 54.17 ± 7.00
Schizothorax progastus
27.42 ± .29 40
Garra gotyla 16.00 ± 2.13 16.13 ± 1.15
Pseudecheneis sulcata
13.87 ± 1.02 20
Glyptothorax sp. 9.20 ± 1.66 11.76 ± 1.10
Psilorhynchus homaloptera
0 6.4 ± 0.60
Parachiloglanis hodgarti
0 20
Table 3: Average body length of fish ascending fishway Fish species June 2018 May/June 2019 Neolissochilus hexagonolepis 355.00 ± 93.32 319.67 ± 23.38
Schizothorax richardsonii
214.08 ± 10.94 276.50 ± 35.40
Schizothorax progastus
150.43 ± 5.04 190
Garra gotyla 120.00 ± 4.30 122.26 ± 4.11 Pseudecheneis sulcata
112.57 ± 5.03 130
Glyptothorax sp. 102.00 ± 12.81 110.05 ± 7.53
Psilorhynchus homaloptera
0 82.00 ± 1.97
Parachiloglanis hodgarti 0 100
Table 4: Composition of fish species for different
sampling
Fish species June 2018 May/Ju
ne 2019
Neolissochilus hexagonolepis 4.76% 29.41%
Schizothorax richardsonii 46.43% 11.76%
Schizothorax progastus 8.33% 0.98%
Garra gotyla 7.14% 30.39%
Pseudocheneis sulcata 27.38% 0.98%
Glyptothorax sp. 5.95% 20.59%
Psilorhynchus homaloptera 0 4.90%
Parachiloglanis hodgarti 0 0.98%
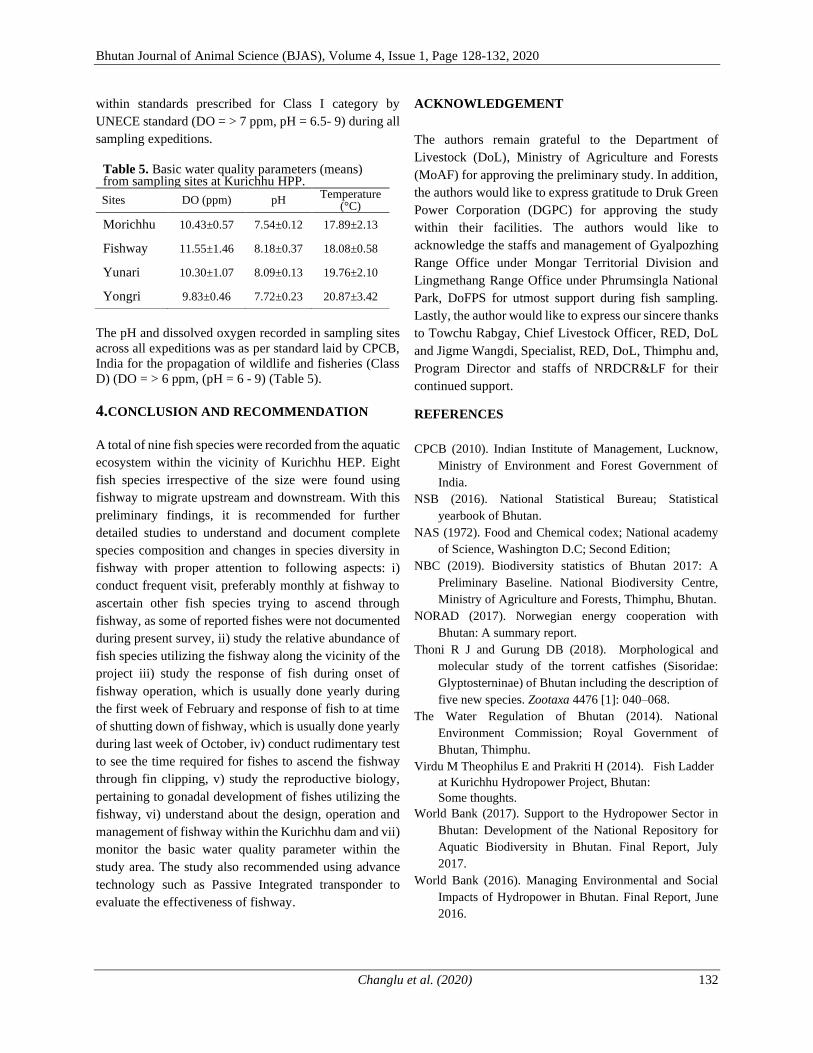
Bhutan Journal of Animal Science (BJAS), Volume 4, Issue 1, Page 128-132, 2020
Changlu et al. (2020) 132
within standards prescribed for Class I category by
UNECE standard (DO = > 7 ppm, pH = 6.5- 9) during all
sampling expeditions.
The pH and dissolved oxygen recorded in sampling sites
across all expeditions was as per standard laid by CPCB,
India for the propagation of wildlife and fisheries (Class
D) (DO = > 6 ppm, (pH = 6 - 9) (Table 5).
4.CONCLUSION AND RECOMMENDATION
A total of nine fish species were recorded from the aquatic
ecosystem within the vicinity of Kurichhu HEP. Eight
fish species irrespective of the size were found using
fishway to migrate upstream and downstream. With this
preliminary findings, it is recommended for further
detailed studies to understand and document complete
species composition and changes in species diversity in
fishway with proper attention to following aspects: i)
conduct frequent visit, preferably monthly at fishway to
ascertain other fish species trying to ascend through
fishway, as some of reported fishes were not documented
during present survey, ii) study the relative abundance of
fish species utilizing the fishway along the vicinity of the
project iii) study the response of fish during onset of
fishway operation, which is usually done yearly during
the first week of February and response of fish to at time
of shutting down of fishway, which is usually done yearly
during last week of October, iv) conduct rudimentary test
to see the time required for fishes to ascend the fishway
through fin clipping, v) study the reproductive biology,
pertaining to gonadal development of fishes utilizing the
fishway, vi) understand about the design, operation and
management of fishway within the Kurichhu dam and vii)
monitor the basic water quality parameter within the
study area. The study also recommended using advance
technology such as Passive Integrated transponder to
evaluate the effectiveness of fishway.
ACKNOWLEDGEMENT
The authors remain grateful to the Department of
Livestock (DoL), Ministry of Agriculture and Forests
(MoAF) for approving the preliminary study. In addition,
the authors would like to express gratitude to Druk Green
Power Corporation (DGPC) for approving the study
within their facilities. The authors would like to
acknowledge the staffs and management of Gyalpozhing
Range Office under Mongar Territorial Division and
Lingmethang Range Office under Phrumsingla National
Park, DoFPS for utmost support during fish sampling.
Lastly, the author would like to express our sincere thanks
to Towchu Rabgay, Chief Livestock Officer, RED, DoL
and Jigme Wangdi, Specialist, RED, DoL, Thimphu and,
Program Director and staffs of NRDCR&LF for their
continued support.
REFERENCES
CPCB (2010). Indian Institute of Management, Lucknow,
Ministry of Environment and Forest Government of
India.
NSB (2016). National Statistical Bureau; Statistical
yearbook of Bhutan.
NAS (1972). Food and Chemical codex; National academy
of Science, Washington D.C; Second Edition;
NBC (2019). Biodiversity statistics of Bhutan 2017: A
Preliminary Baseline. National Biodiversity Centre,
Ministry of Agriculture and Forests, Thimphu, Bhutan.
NORAD (2017). Norwegian energy cooperation with
Bhutan: A summary report.
Thoni R J and Gurung DB (2018). Morphological and
molecular study of the torrent catfishes (Sisoridae:
Glyptosterninae) of Bhutan including the description of
five new species. Zootaxa 4476 [1]: 040–068.
The Water Regulation of Bhutan (2014). National
Environment Commission; Royal Government of
Bhutan, Thimphu.
Virdu M Theophilus E and Prakriti H (2014). Fish Ladder
at Kurichhu Hydropower Project, Bhutan:
Some thoughts.
World Bank (2017). Support to the Hydropower Sector in
Bhutan: Development of the National Repository for
Aquatic Biodiversity in Bhutan. Final Report, July
2017.
World Bank (2016). Managing Environmental and Social
Impacts of Hydropower in Bhutan. Final Report, June
2016.
Table 5. Basic water quality parameters (means) from sampling sites at Kurichhu HPP.
Sites DO (ppm) pH Temperature
(°C)
Morichhu 10.43±0.57 7.54±0.12 17.89±2.13
Fishway 11.55±1.46 8.18±0.37 18.08±0.58
Yunari 10.30±1.07 8.09±0.13 19.76±2.10
Yongri 9.83±0.46 7.72±0.23 20.87±3.42

Bhutan Journal of Animal Science (BJAS)
Volume 4, Issue 1, Page 133-138, 2020
133
Short Communication
EXPLORING OF ALIEN FISH SPECIES DIVERSITY IN AMOCHHU OF BHUTAN
SANGAY NORBU*, GOPAL PRASAD KHANAL, SINGYE TSHERING, PEMA
TSHERING AND CHANGLU
National Research and Development Centre for Riverine and Lake Fisheries, Department of
Livestock, Ministry of Agriculture and Forests, Haa, Bhutan.
*Author for correspondence: [email protected]
Copyright © 2020 Sangay Norbu. The original work must be properly cited to permit unrestricted
use, distribution, and reproduction of this article in any medium.
ABSTRACT: A number of alien fish species are introduced into aquatic ecosystem undermining
their adverse impacts to the natural ecosystem, despites having a good ichthyofauna diversity
inclusive of some endemic fish species in Bhutan. The survey was undertaken to explore and
document alien fish species diversity in Amochhu and Haachhu due to high vulnerability from
anthropogenic influences. A total of 13 sites -11 sites at Amochhu and one site each from adjoining
fish hatcheries at National Research and Development Center for Riverine and Lake Fisheries, Haa
and National Research and Development Center for Aquaculture, Gelephu were selected for the
survey. The present survey recorded 37 fish species inclusive of five alien fish species namely
Cyprinus carpio, Cyprinus carpio, Ompok pabda, Clarias gariepinus and Salmo trutta. The
presence of Cyprinus carpio, Clarias gariepinus and Salmo trutta was confirmed in wild habitat;
whereas, Oreochromis mossambicus was observed established under confinement. The current
survey found out that the Salmo trutta had established a self-sustaining population, and Ompok
pabda was recorded for the first time in Amochhu. However, this survey could not ascertain the
pathway of introduction of those alien fish species. There is a need for the government to intervene
and put in proper policy measures to control introduction of both alien and cultured fish species in
waterbodies of Bhutan; and in parallel, it is felt important to educate general public on the
consequences of introducing alien fish species into the waterbodies.
Keywords: Alien fish species; invasive species; Cyprinus carpio; Clarias gariepinus;
Oreochromis mossambicus; Salmo trutta; tsethar.
1.INTRODUCTION
Alien fishes are introduced intentionally either for the
enhancement of food fish production for species
diversification, sport or recreational fishing and
ornamental purpose. Introduction and/or spread of
invasive alien species (IAS) threaten biological diversity
(CBD 2002) by establishing natural or semi-natural
ecosystems or habitat, as an agent of change (ICUN 2000),
through increasing biological invasions worldwide (Juette
et al. 2014). Biological invasion is a process whereby a
species is transported and introduced (intentionally or
accidentally) beyond its native range, spreads and
establishes self-sustaining populations into new habitats
(Juette et al. 2014).
Introduction of alien fish dates back to 1930’s in
Bhutan. Brown trout (Salmo trutta) was introduced for the
first time in 1930 for sport fishing (Rajbanshi and Csavas
1982) through release in rivers, streams and lakes of
Bhutan (Dubey 1978; Petrs 1999). Currently, brown trout
are found in many lakes, rivers and their tributaries such
as Wangchhu (Haachhu, Parochhu and Thimchhu),
Punatshangchhu (Mochhu and Phochhu), Manas
(Mangdechhu, Chamkharchhu and Nikachhu) (Dubey
1978; Petrs 1999; Gurung 2013; Gurung & Thoni 2015
and NRDCRLF 2017) of Bhutan. In addition, the
government had introduced seven warm-water and one
cold-water aquaculture fish species in 1980’s (Péteri
1987) and 2007 respectively, to enhance fish production.
Besides, unauthorized introduction of highly invasive
African sharp tooth catfish (Clarias gariepinus) to

Bhutan Journal of Animal Science (BJAS), Volume 4, Issue 1, Page 133-138, 2020
Norbu et al. (2020) 134
Bhutanese water system in the form of Tsethar or life
release (mercy release) are reported (Gurung 2013;
Gurung et al. 2013). Such introduction of new fish species
and their establishment with self-sustaining population in
their introduced habitat (Kolar & Lodge 2001) is
considered as an important phase of invasion process
(Weyl et al. 2016). Cucherousset & Olen (2011)
summarized and reported ecological impact of invasive
alien freshwater fish according to five levels of biological
organization into genetic, individual, population,
community and ecosystem. Currently, empirical
information on alien fish diversity in Bhutan river systems
is lacking nor attempts are made to survey and document
till date. Therefore, this survey attempts to assess and
document alien fish species diversity along with their
introduction pathways in Amochhu.
2.MATERIALS AND METHODS
2.1 Survey areas
Amochhu (chhu is local name for river), Aiechhu and
Haachhu were sampled to access the presence of alien fish
species diversity in wild habitat. Amochhu and Omchhu
at Phuntsholing and the headwater of Amochhu at
Sombaykha Dungkhag, Haa is the core survey area.
Further, Aiechhu (Maokhola) at Gelephu and Haachhu, at
Haa was considered to access the escapement of feral
population of aquaculture species in wild habitat as
presented in Figure 1.
Figure 1: Survey areas and sampling sites
2.2 Sites selection
A total of 13 sites - 11 sites are at Amochhu and one site
each adjoining to fish hatcheries of National Research and
Development Centre for Riverine and Lake Fisheries
(NRDCRLF), Haa and National Research and
Development Centre for Aquaculture (NRDCA), Gelephu
were identified.
2.3 Fish sampling
Fish sampling was conducted twice using handheld
electrofisher. Initial sampling was conducted in from 25th
September to 2nd October 2018 representing offset of
monsoon season. The second fish sampling was
conducted from 24th March to 4th April 2019 representing
pre-monsoon season. Each sampling site was
approximately 200 meters in length and uniform sampling
effort of 30 minutes was considered. The samples of
exotic fishes were collected and the live fish photographs
were also taken at field level to record pictorial form of
qualitative data (shape, colours, spots, patterns and other
visible characters), as formalin decolorizes the fish.
2.4 Morphometric measurement
The total length (TL) of the captured alien fishes were
measured on-sites using wooden board scale. The shape
and size of the fish was analyzed in the laboratory at
NRDCRLF using digital venire caliper.
2.5 Fish preservation
The fish samples collected from the field were preserved
in 10 % formalin (Jayaram 1981), with head facing
downward in the container to prevent damage to caudal
fin (Mandal & Jha 2013). The samples containers were
labelled properly against the datasheet of the sampling
sites before transportation to fish laboratory at the
NRDCRLF, Haa.
2.5 Fish identification
The fish species samples were identified at the laboratory
with references to taxonomic characters of the fishes
(Vishwanath et al. 2007; Talwar & Jhingran 1991;
NRDCRLF 2017). The valid taxa names were followed
from the Fish base. The ecological status on invasiveness
fish species identified was reported in accordance to
Global Invasive Species Database (GISD). The specimens
collected after identification were then preserved in 70 %
ethanol for future studies and references.
3.RESULTS AND DISCUSSIONS
3.1 Species diversity
Table 1 shows fish species diversity recorded from
Amochhu at Phuntsholing and Sombaykha, Haa. The
survey recorded 37 fish species inclusive of five alien fish
species belonging to six orders, 14 families and 30 genera
in Amochhu
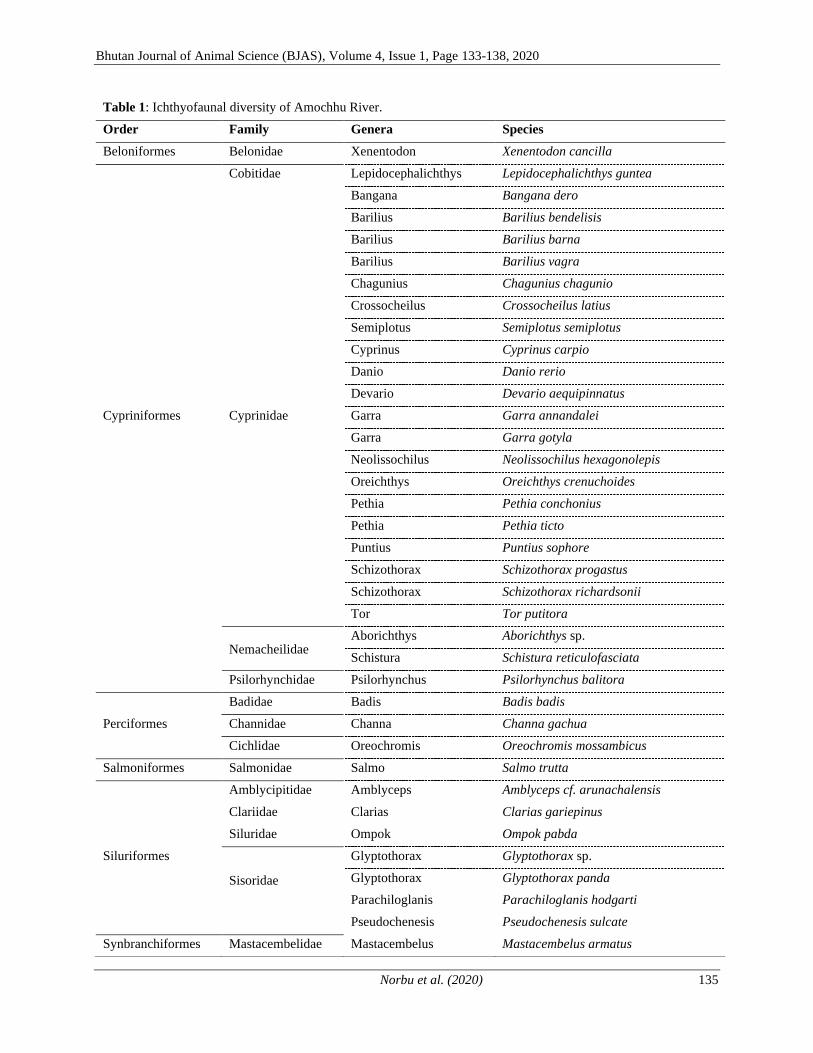
Bhutan Journal of Animal Science (BJAS), Volume 4, Issue 1, Page 133-138, 2020
Norbu et al. (2020) 135
Table 1: Ichthyofaunal diversity of Amochhu River.
Order Family Genera Species
Beloniformes Belonidae Xenentodon Xenentodon cancilla
Cobitidae Lepidocephalichthys Lepidocephalichthys guntea
Bangana Bangana dero
Barilius Barilius bendelisis
Barilius Barilius barna
Barilius Barilius vagra
Chagunius Chagunius chagunio
Crossocheilus Crossocheilus latius
Semiplotus Semiplotus semiplotus
Cyprinus Cyprinus carpio
Danio Danio rerio
Devario Devario aequipinnatus
Cypriniformes Cyprinidae Garra Garra annandalei
Garra Garra gotyla
Neolissochilus Neolissochilus hexagonolepis
Oreichthys Oreichthys crenuchoides
Pethia Pethia conchonius
Pethia Pethia ticto
Puntius Puntius sophore
Schizothorax Schizothorax progastus
Schizothorax Schizothorax richardsonii
Tor Tor putitora
Nemacheilidae Aborichthys Aborichthys sp.
Schistura Schistura reticulofasciata
Psilorhynchidae Psilorhynchus Psilorhynchus balitora
Badidae Badis Badis badis
Perciformes Channidae Channa Channa gachua
Cichlidae Oreochromis Oreochromis mossambicus
Salmoniformes Salmonidae Salmo Salmo trutta
Amblycipitidae Amblyceps Amblyceps cf. arunachalensis
Clariidae Clarias Clarias gariepinus
Siluridae Ompok Ompok pabda
Siluriformes
Sisoridae
Glyptothorax Glyptothorax sp.
Glyptothorax Glyptothorax panda
Parachiloglanis Parachiloglanis hodgarti
Pseudochenesis Pseudochenesis sulcate
Synbranchiformes Mastacembelidae Mastacembelus Mastacembelus armatus

Bhutan Journal of Animal Science (BJAS), Volume 4, Issue 1, Page 133-138, 2020
Norbu et al. (2020) 136
3.2 Alien fish species and mechanism of invasion
The survey with reference to Global Invasive Species
Database (GISD) recorded five alien fish species (Figure
1) namely Clarias gariepinus, Cyprinus carpio,
Oreochromis mossambicus, Ompok pabda and Salmo
trutta in Amochhu (Torsa). The Clarias gariepinus and
Cyprinus carpio was presumed to be introduced in the
country through Tsethar (life saving) and Salmo trutta
was introduced in 1930s as sport fishing. The
Oreochromis mossambicus was found only in Crocodile
farm, used for feeding Crocodile, while Clarias
gariepinus was captured from main Amochhu and small
pools formed by the stream flowing from the right side of
Omchhu located along the workshop area in Phuntsholing.
The survey also confirmed presence of Ompok pabda
in Amochhu, and it was found sharing habitat with Clarias
gariepinus along the pools. The introduction of Clarias
gariepinus in Amochhu was also presumed to be through
Tsethar as likelihood was reported very high (Gurung
2013). The presence of Cyprinus carpio in Amochhu was
also established but did not record any feral population of
aquaculture species in the sampling sites adjoining fish
hatcheries. Nonetheless, the introduction mode of
Cyprinus carpio in Amochhu remains uncertain as
aquaculture activity was absent within the vicinity of
sampling area. Although, brown trout was recorded in
abundance in Haachhu, their pathway of introduction
could not be established.
Clarias gariepinus
Cyprinus carpio
Ompok pabda
Oreochromis mossambicus
Salmo trutta
Figure 1: Alien fish species recorded in Amochhu river
3.3 Alien fish species size (Length) and maturity
Morphometric measurement was recorded for the
captured alien fish species. The mean total length recorded
was 144.43 mm, 145 mm, 207.86±61.27 mm and
153.65±7.69 mm for Cyprinus carpio (n=1), Ompok
pabda (n=1), Clarias gariepinus (n=3) and Salmo trutta
(n=23), respectively.
According to Fish Base, the length at first maturity
for Cyprinus carpio ranges between 250 - 360 mm, 340
mm for Clarias gariepinus and 100 - 600 mm for Salmo
trutta. The length recorded by NRDCRLF for Cyprinus
carpio (n=1) from Omchhu was 174 mm in 2014. The
Salmo trutta captured in this survey was observed to be of
biologically breed-able size; whereas the Clarias
gariepinus and Cyprinus carpio have crossed half the
length at first maturity. Therefore, if additional
populations of same length-class are present these fish
species are expected to attain maturity soon and develop
self-sustaining population within Amochhu system. It was
reported that the Cyprinus carpio had successfully

Bhutan Journal of Animal Science (BJAS), Volume 4, Issue 1, Page 133-138, 2020
Norbu et al. (2020) 137
spawned, established and constitute highest among fish
catch from Ganga River (Singh et al. 2010). The Clarias
gariepinus was reported to have established itself in Brazil
and South America (Weyl et al. 2016) and India among
others (Singh et al. 2010).
4. CONCLUSION
The current survey recorded 37 fish species inclusive of
five invasive alien species in Amochhu. Ompok pabda
was recorded for the very first time in Amochhu. The
Clarias gariepinus and Cyprinus carpio are adapted and
established within the Amochhu in Bhutan. Amochhu has
high ichthyofaunal diversity and at the same time it is
highly vulnerable to human influences. Currently,
tshethar or live release of fish into river ecosystem
remains a challenge with inevitable adverse consequences
on indigenous fish faunal diversity. Thus, it is imperative
to have proper policy strategies on introduction of exotic
and cultured fish species into the waterbodies of Bhutan.
In line, the government should also prioritize and
intervene on the conservation and development of local
fish species. It is also imperative to advocate and educate
general public on the consequences of unintentional and
intentional introduction of alien fish species into
waterbodies of Bhutan.
ACKNOWLEDGMENTS
The authors would like to immensely thank the
Department of Livestock (DoL), for valuable advice,
guidance and direction. The authors would like thanks the
officials of Gedu Territorial Division and Jigme Khesar
Strict Nature Reserve, particularly those based at
Phuntsholing and Sombaykha in providing necessary field
support. The authors would like to thanks Mr. Jigme
Wangdi, Specialist, DoL and Dr. Kesang Wangchuk,
Biodiversity specialist, International Center for Integrated
Mountain Development, Kathmandu, Nepal for their
continued support and advice. Finally, authors would like
to express sincere appreciation to the Program Director
and staffs of NRDCRLF for their continued support
during the entire survey period.
REFERENCES
Allen WL, Street SE & Capellini I (2017). Fast life history
traits promote invasion success in amphibians and
reptiles, Ecology Letters, 20: 222–230.
CBD (2002). Decision VI/23: Alien species that threaten
ecosystems, habitats and species. Document
UNEP/CBD/COP/6/23. Convention on Biological
Diversity Secretariat, Montreal, Canada.
Charles H and Dukes J (2007). Impacts of invasive species
on ecosystem services. In W. Nentwig, ed. Biological
Invasions. Berlin: Springer-Verlag. 217-237.
Cucherousset J and Olden JD (2011). Ecological impacts
of non-native freshwater fishes. Fisheries, 36 (5): 215-
230.
Devin S and Beisel JN (2006). Biological and ecological
characteristics of invasive species: a gammarid survey.
Biological Invasions, 9 (1): 13 pp.
Dubey GP (1978). Survey of the waters of Bhutan
physiography and fishery potential. Document
Repository. FAO, Rome.
Gurung DB (2013). Introduction of African catfish,
Clarias gariepinus in Bhutan. In the newsletter of the
IUCN-SSC/WI freshwater fish specialist group -
South Asia & the Freshwater Fish Conservation
Network of South Asia, 1, 26.
Gurung DB, Dorji S, Tshering U and Wangyal JT (2013).
An annotated checklist of fishes from Bhutan. Journal
of Threatened Taxa, 5 (14):4880–4886.
Gurung DB and Thoni RJ (2015). Fishes of Bhutan: A
preliminary checklist. Kuensel Publishing Thimphu,
Bhutan, 87 pp.
ICUN (2000). IUCN guidelines for the prevention of
biodiversity loss caused by alien invasive species.
ICUN, Gland, Switzerland.
Jayaram KC (1981). The Freshwater Fishes of India. Hand
Book, Zoological Survey of India, Calcutta
Juette T, Cucherousset J and Cote J (2014). Animal
personality and the ecological impacts of freshwater
non-native species. Current Zoology, 60 (3):417–427.
Kolar CS and Lodge DM (2001). Progress in invasion
biology: predicting invaders. Trends in Ecology &
Evolution, 16 (4):199-204.
Kumar J and Pandey AK (2013). Present status of
ichthyofaunal diversity and impact of exotics in Uttar
Pradesh. Journal of Experimental Zoology, 16 (2):
429-434.
Liu C, Comte L and Olden JD (2017). Heads you win, tails
you lose: life-history traits predict invasion and
extension risk of the world’s freshwater fishes.
Aquatic Conserve: Marine and Freshwater
Ecosystems, 27 :773-779.
Macdonald J and Tonkin Z (2008). A review of the impact
of eastern gambusia on native fishes of the Murray-

Bhutan Journal of Animal Science (BJAS), Volume 4, Issue 1, Page 133-138, 2020
Norbu et al. (2020) 138
Darling Basin. Arthur Rylah Institute for
Environmental Research, Department of
Sustainability and Environment, Heidelberg, Victoria.
42 pp.
Marchetti MP, Moyle PB and Levine R (2004). Invasive
species profiling? Exploring the characteristics of non-
native fishes across invasion stages in California.
Freshwater Biology, 49: 646–661.
Moyle PB (1986). Biological invasions of fresh water:
Empirical rules and assembly theory
NRDCRLF (2017). Field Guide to Fishes of Western
Bhutan. National Research Centre for Riverine and
Lake Fisheries, Department of Livestock, Ministry of
Agriculture and Forests, 191 pp.
Péteri A (1987). Bhutan development of Fish Seed
Production Centre, Gelephu. Document Repository.
FAO, Rome.
Petr T (1999). Coldwater Fish and Fisheries in Bhutan.
FAO Fisheries Technical Papers Document
Repository. FAO, Rome.
Pimentel D, Zuniga R and Morrison D (2005). Update on
the environmental and economic costs associated with
alien-invasive species in the United States. Ecological
Economics, Elsevier, 52 (3):273-288.
Rahim KAA, Esa Y and Arshad A (2013). The influence
of alien fish species on native fish community
structure in Malaysian waters. Kuroshio Science, 7
(1):81-93.
Rajbanshi KG and Csavas I (1982). Bhutan aquaculture
development in Bhutan (5 April to 29 May 1981).
Document Repository. FAO, Rome.
Sakai AK, Allendorf FW, Holt JS, Lodge DM, Molofsky
J, With KA, Baughman S, Cabin RJ, Cohen JE,
Ellstrand NC, McCauley DE, O’Neil P, Parker IM,
Thompson JM and Weller SG (2001). The population
biology of invasive species. Annual Review of
Ecology. System, 32:305–332.
Singh AK, Pathak AK and Lakra WS (2010). Invasion of
an exotic fish-common carp, Cyprinus Carpio L.
(Actinopterygii: Cypriniformes: Cyprinidae) in the
Ganga river, India and its impacts. Acta Ichthyologica
et Piscatoria, 40(1):11–19.
Talwar PK and Jhingran AG (1991) Inland fishes of India
and Adjacent Countries, Vol. I & II. Oxford & IBH
Publishing Coperation Private Limited, New Delhi,
Bombay, Calcutta.
Vishwanath W, Lakra WS and Sarkar UK (2007). Fishes
of North East India. National Bureau of Fish Genetic
Resources Lucknow.
William JD and Meffe GK (1998). Non-indigenous
species. In: Status and trends of the Nation’s biological
resources, United States, Vol. 1:117-129.

Bhutan Journal of Animal Science (BJAS)
Volume 4, Issue 1, Page 139-142, 2020
139
Short Communication
COMPARISON OF GROWTH PERFORMANCE OF PIG SUCKLERS’ FED WITH CREEP
FEED AND SOW RATION
TENZIN PENJOR1*, GYEMBO TSHETEN1, PEMA SHERAB1 AND VIJAY
RAIKA MONGAR2
1National Piggery Research and Development Centre, Department of Livestock, MoAF,
Gelephu, Sarpang, Bhutan 2National Highland Research & Development Centre, Jakar, Bumthang, Bhutan
*Author for correspondences: [email protected]
Copyright © 2020 Tenzin Penjor. The original work must be properly cited to permit
unrestricted use, distribution, and reproduction of this article in any medium.
ABSTRACT: The study was conducted to compare the overall growth performance of pig
sucklers fed with creep feed against current practices adopted in two government pig
breeding farms. A total of 100 sucklers each selected for the study were allotted to two
treatments viz., creep feeding (T1) and non-creep feeding (T2) through lucky draw. Same
number of sucklers from three pig breeds namely Duroc, Large Black and Saddle Back
were used in the experiment. The birth weights of pig sucklers’ were recorded on zero day
(at birth), on start of feeding creep feed (5th day), and thereafter weighed every three days
until weaning period. Post weaning body weight were measured and compared. The feeds
fed in both treatments were mixed with effective micro-organism (EM) solution for better
digestion. The animals were fed ad libitum. All data gathered were analyzed using t-test.
The study revealed that there was no significant difference (p=0.83) in mean body weight
at weaning between the two treatments. The mean body weight recorded was 10.48 and
10.56 kg for creep feeding and non-creep feeding respectively. The experiment revealed
that creep feeding of sucklers does not have any effect on the growth performance, and it
simply adds on to cost of production. Thus, the study concludes that creep feeding of
sucklers is not necessary and may discontinue in future.
Keywords: Average daily gain; creep feed; lactating sow; pre-weaning; post-weaning;
sucklers.
1 INTRODUCTION
Piggery sector has grown since 11 five-year plan (FYP)
triggered by the government subsidy package supports
in the country. Since then, the piggery enterprises both
for breeding and fattening have emerged, and in
subsequent piglet demand had increased by manifolds.
The government breeding farms bred and supply piglets
to interested farmers at subsidized rate much below cost
of production. Sucklers are fed creep feed from fifth day
after birth to weaning age of 35-42 days as it helps
stimulate piglets’ post- weaning feed consumption
(Cabrera et al. 2013). The two government pig breeding
farms at Gelephu and Lingmethang had spent Nu. 0.584
million on creep feed in 2018. FINNOR- Asia, Thailand
recommended to feed sucklers with sow ration instead
of creep while in lactation stage to reduce cost of
production. It is also timely for the management to look
for a possible cost cutting measures in pig breeding
farms without any compromises on overall growth
performance of piglets. Moreover, the effects of feeding
creep feed on the performance of piglets are not assessed
in the country as of date. Therefore, this study was
carried out to compare the performance of sucklers’
growth with and without feeding creep feed until
weaning age.
2. MATERIALS AND METHODS
2.1 Study area and duration
The on-farm feeding trial was conducted in two
government pig farms at the National Piggery Research

Bhutan Journal of Animal Science (BJAS), Volume 4, Issue 1, Page 139-142, 2020
Penjor et al. (2020) 140
and Development Centre, Gelephu and Regional Pig and
Poultry Breeding Centre (RPPBC), Lingmethang during
summer months from August-October.
2.2 Study design
A total of 100 sucklers each were selected, ear-notched
and allotted through lucky draw to two treatments –
creep feeding (T1) and non-creep feeding (T2). Sucklers
from lactating sows (Duroc, Large Black and Saddle
Back) between second to sixth parity were used for the
study. Animals in both treatments are fed ad libitum
twice a day. Similar environment condition particularly
the temperature and humidity were maintained during
the study period.
2.3 Feeding Management
The sucklers in T1 were fed creep feed and in T2 the
sucklers were fed sow ration as per the existing
conventional practices of the farm. Feeds are mixed with
effective micro-organism (EM) solution prior to feeding
to improve digestion.
The creep feed fed to sucklers in T1 contained 20%
crude protein (CP), 0.96% Lysine, 0.56% Methionine,
0.18% Tryptophan, 0.80% Ca, 0.60% available P, 3500
kcal/kg DE; while the sow ration fed to sucklers in T2
contained 14% CP, 0.58% Lysine, 0.36 % Methionine,
0.13% Tryptophan, 0.75% Ca, 0.50% available P and
3300 DE kcal/kg. The sucklers were fed twice a day,
morning and evening starting from 5th day after birth
until weaning (42 days).
After weaning the piglets were fed with starter feed
as a normal feeding regime of the farm until termination
of the trial until 16th measurement at 60 days.
2.4 Data collection
The body weight of sucklers were measured at 0 day (at
birth), 5th day on start of feeding sucklers, and thereafter
body weight was recorded every three days until
weaning (42 days), and continued for 5 more
measurements after weaning. The final body weight was
measured at the 60th day using digital weighing balance
(CAMRY- Model: EL10/EL11).
Mortality and morbidity of the study animals were
also recorded and analysed. The average weight gain of
animals was derived using formula; (Final live weight –
Initial live weight)/duration of experiment.
2.5. Data Analysis
Microsoft Excel was used for data compilation and
cleaning. T-Test was administered for data analysis
using SPSS version 23.
3. RESULT AND DISCUSSIONS
3.1 Initial and final body weight
There was not much difference in initial weights of
animals used in this research. Similarly, the body weight
of sucklers measured at the start of trial (5th day), and
overall weight gain measured at the end of the research
period (16th measurements) for both treatments did not
show any significant difference (Table1). This is in line
with findings of Sulabo, (2009), who confirmed feeding
of creep feed did not affect pre-weaning gains and
weaning weights of pigs. However, in contrast Lee &
Kim (2018) reported that feeding creep feed improves
the growth performance of piglets.
Table1: Body weights at different stages and its
performance
Body weight
measurement (Kg)
Treatment
Creep Non-creep
feeding
N 100 100
Zero Day 1.69+0.35 1.63+0.32
5th Day 2.48+0.56 2.46+0.47
60th Day 10.48+2.29 10.56+2.75
3.2 Weight gain trend until weaning
The trend showed that there was significant difference in
weight gain until weaning (35 - 42 days old). There was
no significant difference in sucklers performance and
post weaning weight gain fed with creep feed (9.24 kg)
and non-creep (9.15kg) (Figure 1). Bruininx (2004)
reported that the consumption of creep feed while
suckling stimulates feed intake and growth after
weaning, and in line Heo et al. (2018) reported that
highly digestible creep feed improved pre-weaning
performance and feeding grain-based creep feed will
improve post-weaning performance in pigs.
Figure 1: Weight gain trend until weaning
0
1
2
3
4
5
6
7
8
9
10
Birth
weight
Onset of
trial
At transfer At weaning
Weig
ht (K
g)
Body weight gain
Creep Non-creep

Bhutan Journal of Animal Science (BJAS), Volume 4, Issue 1, Page 139-142, 2020
Penjor et al. (2020) 141
3.3 Post weaning weight gain and overall
performance
There was no significant difference (p=0.83) in post-
weaning weight gain of animals fed with two different
feeds in this study. The post weaning weight gain for
animals fed with creep and non-creep feeds were 10.48
± 2.29 and 10.56 ± 2.75 (kg) respectively (Figure 2). On
the contrary, it was reported greater post-weaning feed
intake and daily gains for pigs fed with creep feeding as
compared to non-fed animals (Sulabo 2009). In addition,
the same author reported that low feed intake during
lactation negatively affect sow and litter performance.
Few mortality cases were observed for both treatments
prior to weaning with incidences of diarrhoea and health
issues. Similarly, Saikia et al. (2018) reported that the
overall incidences of diarrhoea from birth to 10th week
of age were not significant among the different weaning
groups fed with pre-starter, starter and grower feeds.
Figure 2: Post- weaning performance of animals fed
with different feeds
4. CONCLUSION
There was no difference in the body weight gain and
overall performance of the pigs fed with creep feed and
sow ration. The study concludes that unless highly
digestible and economical creep feed is made available
withdrawing of creep feeding to sucklers will have no
adverse effect on sucklers overall performance and post
weaning body weight under subtropical condition.
ACKNOWLEDGEMENT
The authors immensely acknowledge the logistics
support of management and all technical staff of
NPiRDC, Gelephu and RPPBC, Lingmethang, in
particular, Mr. Rinzin Wangchuk (LPS), RPPBC,
Lingmethang who played vital role in data collection
during the study. We thank Dr. Kesang Wangchuk,
Principle Research Officer, Research and Extension
Division, Department of Livestock for his technical
assistance in designing the experiment and tireless
guidance throughout the study period. At the same time,
the Research Unit is grateful to NRDCAN, Bumthang
for rendering technical and laboratory services on
animal feed nutrient analysis. We are indeed grateful to
Mr. Pema Thinley, Livestock Production Officer,
National Centre for Aquaculture, Gelephu for providing
assistance in data analysis.
REFERENCES
Bruininx EA, Binnendijk GP, van der Peet - Schwering
CM, Schrama JW, den Hartog LA and Everts, H
(2002). Effect of creep feed consumption on
individual feed intake characterisitics and
performance of group- housed weanling pigs. Journal
of Animal Science, 80: 1413 - 1418.
Bruininx EA, Schellingerhout AB, Binnendijk G P, van
der Peet- Schwering CM, Schrama JW and den Hartog
LA (2004). Individually assessed creep food
consumption by suckled piglets: influence on post-
weaning food intake characteristics and indicators of
gut structure and hind-gut fermentation. British
Soceity of Animal Science, 1357 - 7298.
CP Njoku OO (2015). Growth Performance, Carcass
Yield and Organ Weight of Growing Pigs and Fed
Different Levels of Feed. Slovak J. Animal Science,
48.
Cabrera RA, Usry JL, Arrellano C, Nogueira ET,
Kutschenko M and Moeser AJ (2013). Effects of
creep feeding and supplemental glutamine or
glutamine plus glutamate (Aminogut) on pre-and
post-weaning growth performance and intestinal
health of piglets. Journal of Animal Science and
Biotechnology, 4:29.
Coetzee F(2016). The importance of Creep Feeding.
PORCUS.
Eung Gi Kwon BK(2009). Effects of Fattening Period on
Growth Performance, Carcass Characteristics and
Lipogenic Gene Expression in Hanwoo Steers. Asian
-Australian. Journal of Animal Science, 232-952.
Isabelle Correge GP (2015). Positive impact of piglet
PCV2 vaccination on fattening pig performance in a
sub-clinically infected farm. 7th European
Symposium of Porcine Health Management. France:
ifip.
Kanora A (2009). Efffect on Productivity of Treating
Fattening Pigs Every 5 Weeks with Flubendazole in
Feed. Vlaams Diergeneeskundig Tridschrift, 78.
Malgorzata Kasprowicz Potocka AF (2011). Effect of
Protein Level in Diets of Grower- Finisher Pigs on
Growth Performance, Nitrogen Excretion and Carcass
Value. Polish Journal of Natural Sciences, 293- 301.
10.48
10.56
10.2
10.3
10.4
10.5
10.6
10.7
10.8
10.9
11
Creep Non-creep
Weig
ht
(Kg
)
Treatment

Bhutan Journal of Animal Science (BJAS), Volume 4, Issue 1, Page 139-142, 2020
Penjor et al. (2020) 142
Popescu A (2012). Research Concerning the Economic
Efficiency in Pig Fattening in Farms of Various Sizes.
Animal Science and Biotechnologies, 45(2).
Potter AO (1930, November). Fattening Pigs for Market.
Agricultural Experiment Station Bulletin, p. 269.
R Stupka MS (2004). The impact of sex on the economics
of pig fattening. Czech University of Agriculture,
Prague, Czech Republic .
SB S, MW V, IH K, OS K & JM V (2005). Effects of
feeding antibiotic - free creep feed supplimented with
oligofructose, probiotics or synbiotics to suckling
piglets increase the pre-weaning weight gain and
composition of intestinal microbiota. US: US
National Library of Medicine: National Institute of
Health.
Stender DR (2012). Swine Feed Efficiency: Influence of
Market Weight. Iowa: Iowa State University.
Sulabo RC (2009). Influence of creep feeding on
individual consumption characteristics and growth
performance of neonatal and weanling pigs.
Manhattan, Kansas: Kansas State University.
Sulabo RC, Jacela JY, Tokach MD, Dritz SS, Goodband
RD and DeRouchey JM (2014). Effects of lactation
feed intake and creep feeding on sow and piglet
performance. Journal of Animal Science , 3145- 3153.
Viscente Rodrigues Estevez MS (2011). Average daily
weight gain of Iberian fattening pigs when grazing
natural resources. Livestock Science, 292- 295.
YS Kim SM (2004). Increasing the Pig Market Weight:
World Trends, Expected Consequences and Practical
Considerations. Jinju, Korea: Regional Animal
Industry Research Centre, Jinju National University.
Lee S & Kim IH (2018). Creep feeding improves growth
performance of suckling piglets. Brazilian Journal of
Animal Science, 1- 6.
Heo PS, Kim DH, Jang JC, Hong JS & Kim YY (2018).
Effects of different creep feed types on pre-weaning
and post-weaning performance and gut development.
Asian Australas Journal of Animal Science, 1956-
1962.

Bhutan Journal of Animal Science (BJAS)
Volume 4, Issue 1, Page 143-146, 2020
143
Short Communication
BENEFIT-COST ANALYSIS OF PULLET REARING IN SARPANG DISTRICT
SURYA B CHAMLING RAI*, TASHI JAMTSHO AND KINLEY DEMA
National Poultry Research and Development Centre, Department of Livestock, Ministry
of Agriculture and Forests, Sarpang, Bhutan.
*Author for correspondence: [email protected]
Copyright © 2020 Surya B Chamling Rai. The original work must be properly cited to
permit unrestricted use, distribution, and reproduction of this article in any medium
ABSTRACT: The study was designed to assess the benefit-cost analysis of pullet rearing
in Sarpang district. A total of 2000 numbers of commercial Hy-line Brown Day-Old Chicks
were placed at the stocking density of 10 birds/m2 in a private pullet rearing farm. The
chicks were reared in a semi-permanent shed in accordance with the entrepreneur’s normal
management practices. A total depreciated fixed cost, variable cost and total revenue were
calculated to compute the unit cost of pullet production at 56 days age. The study revealed
that 88 % of the total cost of production was incurred on variable cost and 12 % for fixed
cost. Amongst the variable cost, the highest expenditure was recorded on feed cost and
least on utilities. For the total fixed cost, large share of investment of 50.23 % was incurred
on poultry shed construction, and the least of 1% on chick drinker. The average unit cost
of producing eight weeks old pullet was computed at Nu. 131. Rearing 2000 DoCs earns a
net profit of Nu. 89,451 at the existing farm gate price of Nu.175. The profitability would
further increase with increase in production cycles from four to five per annum. This study
indicates that pullet rearing is a profitable venture and need to be encouraged in other
regions of the country
Keywords; Benefit cost; cost of production; day old chicks; profitable; pullet.
1. INTRODUCTION
Livestock sector plays an important role in improving
livelihood of the people worldwide. Among many other
livestock sub-sectors, poultry production has seen a
drastic change in the last 35 years. Windhorst (2014)
reported that the poultry meat and egg has been increasing
faster than beef and pork since 1975 to 2005. The rapid
changes seen in poultry sector are essentially due to
introduction of modern intensive production methods,
genetic improvements, improved preventive disease
control and biosecurity measures, increasing income and
human population and, urbanization (Narrod et al. 2006).
According to Irfana et al. (2015) the poultry sector
generates income and provides employment opportunity
for 1.5 million population in Pakistan.
In Asia, poultry industry has become one of the most
successful businesses and plays a vital role in generating
and supplementing the family income especially for those
with small land holdings. Globally, India is ranked third
after China and USA with egg production of 53.3 billion
and ranked 5th after USA, China, Brazil and Mexico in
chicken production (Hellin et al. 2015). In Bhutan, 60 %
of the population are dependent on livestock farming, and
livestock sector contributes 3.5 % to the country’s Gross
domestic product (GDP) (National Statistic Bureau
[NSB] 2013). Poultry farming is an important farming
opportunity for income generation and employment for
many Bhutanese producers and entrepreneurs, (Gyeltshen
et al. 2012).
Currently, Bhutan has three nucleus farms, viz.,
National Poultry Research and Development Centre
(NPRDC) in Sarpang, and two regional farms located in
Paro and Mongar. From these three farms, commercial
layer Day-Old Chicks (DoCs) are produced and
distributed to all districts for egg production. NPRDC is
the only agency that produces and distributes the broiler
DoCs. Off late, few poultry entrepreneurs have shown
interest in pullet rearing pullet rather than keeping layers,
for distribution to poultry farmers of higher altitudes.
Layer farmers claim that higher cost of pullets had
contributed to increased cost of production of table eggs.
This is yet to be substantiated. Currently, there are very
few farmers who are into pullets farming creating a

Bhutan Journal of Animal Science (BJAS), Volume 4, Issue 1, Page 143-146, 2020
Rai et al. (2020) 144
favorable condition of imperfectly competitive market.
Thus, the pullet farmers are seen as profit makers. The
study on cost benefit analysis of pullet and unit cost of
production had never been conducted in the country and
published. Therefore, the study was mainly aimed to
compute the unit cost of production and cost benefit
analysis of pullet at eight weeks of age.
2. MATERIALS AND METHODS
2.1 Study Area
The study was conducted at K.K. Pullet Farm located at
26°52'39"N, 90°16'12"E, 344 meters above the sea level
under Sompangkha geog, Sarpang from September 19th to
14th November, 2018.
The study area has warm sub-tropical climate,
characterized by hot and humid summer and moderately
cool and dry winter. The average annual temperature is
22°C and average annual rainfall ranges from 1200-2500
mm.
2.2 Experimental design
A total of 2000 numbers of commercial Hy-line Brown
DoCs were purchased from NPRDC, Sarpang and
stocked at K.K. Pullet Farm. The DoCs were reared at the
stocking density of 10 birds/m2 in a single shed. The birds
were reared up to eight weeks of age.
Standard management practices with regard to
brooding, lighting, feed and water provision and, bedding
requirement were followed. Also, the standard
recommended vaccination regime for poultry in Bhutan
was performed.
2.3 Data Collection and analysis
The data were collected for 56 days from 19th September
to 14th November, 2018. The body weights were
measured weekly and mortality recorded on a daily basis.
The actual data on fixed and variable costs were recorded
to assess unit cost of pullet production. The revenue
generated from the sale of birds and manure were also
recorded.
The data collected were entered, cleaned and coded using
Microsoft-Excel spreadsheet 2010 version. Simple
descriptive statistics (means and percentages) were used
to draw the inferences of the study.
The depreciation costs were calculated based on the
number of batches reared in a year. Simple total cost and
revenue generated were calculated to determine the
profit/loss statement of the pullet farms. The following
formulae were used to determine the relationships.
TC = TVC + TFC
NFI = TR – TC,
Where TC is the total cost, TVC is the total variable cost,
TFC is the total fixed cost, NFI is the net farm income
and, TR is the total revenue.
3. RESULTS AND DISCUSSIONS
3.1 Fixed Cost
Fixed cost is the cost that remains constant regardless of
changes in the level of activity. The current study
included fixed cost depreciation on poultry shed,
equipment and appreciation on land lease. The
depreciation of shed was computed at the useful life of ten
years by number of batches reared in a year. The land on
lease was calculated for five years by number of batches
reared in a year. However, for the poultry equipment (e.g.,
drinkers, feeder) it was totally depreciated within a year
by number of batches to be reared in a year.
The study revealed that the total of Nu. 28,865 was
incurred as overall fixed cost for 56 days (Table 1) which
constituted 12 % of the total cost of production. This
finding was in line with study by Abdurofi et al. (2017)
and Olorunwa (2018) where they observed comparatively
low investment on fixed cost. Similar result was also
revealed by Maikasuwa (2014) in economic analysis of
small-layer production in Nigeria with birds ranging from
one to 500 numbers for a typical enterprise.
The highest total fixed cost was attributed to poultry
shed construction (50.23%), followed by purchase of
tarpaulin and medium feeders with 12 % and 11.78 %,
respectively. The least fixed cost was computed for chick
drinker which accounted to only 1% of the total fixed
Table 1: Depreciated fixed cost per batch of four cycles per annum
Particular Qty (No.) Unit cost (Nu.) Amount (Nu.) Per batch (Nu.) Percent
Land on lease 1 7500 7500 375 1.3 Cost of shed construction 1 580000 580000 14500 50.23 Brooder ring 2 1200 2400 600 2.08 Electric-brooder 2 4500 9000 2250 7.79 Chick Feeder 20 124 2480 620 2.15 Medium feeder 40 340 13600 3400 11.78 Chick drinker 20 59 1180 295 1.02 Drinker 40 200 8000 2000 6.93 Tarpaulin 3 4700 14100 3525 12.21 Beak Trimmer 1 5200 5200 1300 4.5
Total
28,865 100

Bhutan Journal of Animal Science (BJAS), Volume 4, Issue 1, Page 143-146, 2020
Rai et al. (2020) 145
cost. The similar results of 55% fixed cost fixed on shed
construction and 1% on equipment were (Regional
Livestock Development Centre [RLDC] 2019).
3.2 Variable Cost
The variable cost changes with the change in activities.
The variable cost includes the cost of DoC, feed, labour,
bedding materials, consumables (vaccines and medicines)
and utility charges such as electricity. The total variable
cost of Nu. 214,684 was computed for 2000 number of
chicks in a rearing period of 56 days with a 95% livability
(Table 2).
Table 2:Total variable cost (Nu)
Particular Amount (Nu.) %
Transportation of feed 8000 3.7
Vitamins and minerals 5000 2.3
Saw dust 4000 1.9
Electricity 600 0.3
DoC 60000 27.9
Labour 32000 14.9
Feed 105084 48.9
Total 214,684 100
The result from the total variable cost showed that the
highest proportion of production cost was attributed to
commercial feed at 48.9 % followed by cost on DoC at
27.9 % and labour at 14.9 %. The least production cost
was incurred in electricity bill and bedding materials
which came to 0.3 % and 1.9 %, respectively. This result
was supported by Demircan et al. (2010) where feed cost
was ranked first among the cost items in the study.
Result by Abdurofi et al. (2017) found that feed cost
alone accounts for 70 % which is comparatively higher
than current study. In contrasts, Islam et al. (2016)
revealed feed cost of 13.58% from the total production
cost. The huge variation in feed cost may be attributed to
the economy of scale and production systems. For
instance, the 13.58% cost, as above, was estimated in
rural tribal community with 10 numbers of birds. In
poultry production, it is universally accepted that feed
represents the major cost, constituting up to 50% of the
total cost. The cost of DoC accounted to 27.9 % which is
higher than the results by Olorunwa (2018) in the broiler
production. The payment for labor accounted 14.9 % in
the current study which is comparable to the results
obtained by Olorunwa (2018).
3.3 Total Cost
Total cost is the sum of total fixed cost and variable cost.
During the study, a total cost of Nu. 243,549 was
computed for rearing pullet till 56 days old. Of the total
cost was incurred, variable cost and total fixed cost were
88% and 12 % respectively.
3.4 Cost of Production of Pullet
The Cost of Production (CoP) is the essential expenditure
to get the factors of production of land, labor, capital and
management needed to produce a particular commodity
(Guthrie & Wallace, 1969). The unit CoP of pullet was
calculated by using the following formula;
𝑈𝑛𝑖𝑡 𝐶𝑜𝑠𝑡 𝑜𝑓 𝑃𝑟𝑜𝑑𝑢𝑐𝑡𝑖𝑜𝑛 =𝑇𝑜𝑡𝑎𝑙 𝐶𝑜𝑠𝑡
𝑇𝑜𝑡𝑎𝑙 𝑛𝑢𝑚𝑏𝑒𝑟𝑠 𝑜𝑓 𝐵𝑖𝑟𝑑
The study revealed that the unit cost of production of
pullet stood at Nu.131. This means that Nu. 131 was
incurred to produce one pullet of 56 days of age (Table
3). The study revealed that the rearing of pullet is a
profitable venture at the existing farm gate price of Nu.
175 per pullet. The finding of the study was computed
based on four batches of pullet production per annum
only. However, in ideal circumstance, five batches per
annum can be reared in the same facility keeping the
recommended downtime period of two weeks (Hy-line
International 2018).
Table 3: Unit cost of pullet production (Nu)
Description Amount (Nu.)
Total Fixed Cost 28865
Total Variable Cost 219684
Total Cost 248549
Total Bird 1900
Cost of Production 131
Table 4: Estimated Net Profit (Nu) generated from rearing pullets
Description Quantity Existing Rate (Nu.) Amount (Nu.) %
Sale of pullet (No) 1900 170 323,000 97
Sale of manure (bag) 200 50 10,000 3
Total Revenue
333,000
Total cost
243,549
Net Profit (TR-TC)
89,451 100

Bhutan Journal of Animal Science (BJAS), Volume 4, Issue 1, Page 143-146, 2020
Rai et al. (2020) 146
3.5 Total Revenue
Total revenue of Nu. 333,000 was generated from the sale
of pullets and manure (Table 4). The maximum revenue
(97 %) was generated from the sale of pullets and only
3% was accounted from the sale of manure. The net profit
of Nu. 89,451 was generated after deducting the total cost.
3.6 Profitability of Pullet rearing
Farm budgeting tool (manually developed in MS excel
sheet, version 2010) was used to determine the
profitability of pullet rearing. The findings showed that
the total variable cost constituted the highest proportion
(88 %) of the total cost of production. The findings of this
study are in line with the results of Maikasuwa (2014),
where they observed that total variable cost constituted
94.46 % of the total cost. In broiler production, Olorunwa
(2018) observed 81.85% of the average total cost of
production was on the variable inputs where feed
constituted highest amongst the variable cost.
Nonetheless, the study results indicated that pullet
farming is economically viable in the study area.
4. CONCLUSION
On the basis of the present findings, pullet rearing is a
profitable venture due to short rearing cycle. The result
can be partially attributed to nearness of the pullet rearing
farm to the DoCs producing farm and feed mills where-
by the transportation cost is greatly reduced. Timely
supply of DoCs and strict disease and pests control
measures in place also would have a bearing on net
profitability. However, this finding may not apply to
pullet production in areas where feed transportation cost
is high, colder climatic condition and regions far from
DoC supply centre.
REFERENCES
Abdurofi I, Ismail MM, Kamal HAW and Gabdo BH
(2017). Economic analysis of broiler production in
Peninsular Malaysia. International Food Research
Journal, 24(April), 761–766.
NSB (2013). Statistical Yearbook of Bhutan. National
Staistics Bureaue, Thimphu
Demircan V, Yilmaz H, Dernek Z, Ba T, Gül M and
Koknaroglu H (2010). Economic analysis of different
laying hen farm capacities in Turkey, (1375): 489–
497.
Hellin J, Krishna VV, Erenstein O and Boeber C (2015).
India’s Poultry Revolution : Implications for its
Sustenance and the Global Poultry Trade, 18: 151–
164.
Hy-line International ((2018)). Management Guide for
Hy-line Commercial Layers. Hy-Line International.
Retrieved from www.hyline.com when date of
retrival/access
Irfana M, Memon N, Noonari S and Pathan M (2015).
Economic Analysis of Poultry Egg Production in
Quetta District, 14:5–13.
Islam R, Nath P, Bharali A and Borah R (2016). Analysis
of benefit-cost ( B : C ) ratio of Vanaraja and Local
chicken of Assam under backyard system of rearing.
Analysis of benefit-cost ( B : C ) ratio of Vanaraja and
Local chicken of Assam under backyard system of
rearing.
John A. Guthrie, Robert F. Wallace.1969. Economics
4th edition (.1st edition 1965), Homewood, Ill. : R. D.
Irwin, 1969.
Maikasuwa MA (2014). Economics of Small-Scale Layer
Production in Three Selected Local Government
Areas ( LGAs ) of Sokoto State , Nigeria. International
Journal of Agriculture Innovations and Research,
3(1): 229–234.
Narrod C, Tiongco M and Costales A (2006). Global
poultry sector trends and external drivers of structural
change, pp. 1–28.
Olorunwa OJ (2018). Economic Analysis of Broiler
Production in Lagos State Poultry Estate , Nigeria.
Journal of Investment and Management, 7(1):35–44.
https://doi.org/10.11648/j.jim.20180701.15
RLDC (2019). Annual progress report 2018 – 2019.
Regional Livestock Development Centre, Kanglung.
Windhorst H (2014). Changes in poultry production and
trade, https://doi.org/10.1017/ S0043933906001140
Bhutan Journal of Animal Science (BJAS)
Volume 4, Issue 1, Page 147-150, 2020
147
Short Communication
EFFECT ON MILK PRODUCTION AND COMPOSITIONS OF JERSEY CROSS COWS FED WITH
DRIED LUCERNE CHAFF AS FEED SUPPLEMENTS IN LATE AUTUMN
WANGCHUK*, JAMBAY GYELTSHEN, CHIMI RINZIN AND SONAM WANGCHUK
National Research & Development Center for Animal Nutrition, Department of Livestock,
Bumthang
*Author of correspondence: [email protected]
Copyright © 2020 Wangchuk. The original work must be properly cited to permit unrestricted use,
distribution, and reproduction of this article in any medium.
ABSTRACT: The study evaluated the effects of feeding dried Lucerne chaff as feed supplement
on milk production and composition in Jersey cross cows grazing temperate pasture. The feeding
experiment was conducted in late autumn in the month of October 2019 at the Brown Swiss Farm,
Bumthang. Ten lactating Jersey cross cows weighing 329.80 ± 45.06 kg live body weight were
divided into two groups of five each based on milk yield and stage of lactation as control and
experimental group. The animals in control group were allowed to graze in open pasture for seven
hours daily and were supplemented with cattle concentrate @ 1.5 kg per day. The cows in the
experimental group were fed with dried Lucerne chaff @ 30 % (2.32 ± 0.34 kg) of the total DM
requirement in addition to normal feeding regime as control group. The daily milk yield was
recorded for ten days after two weeks of feed adaption period. Milk samples were collected from all
experiment animals and analyzed weekly for the major nutrient composition. The daily milk yield
from the experimental group was observed significantly (p ˂ 0.05) higher than the control group.
There was no significance (p ˃ 0.05) difference in milk composition between the two groups. The
findings from current study reveal that the dried Lucerne chaff can be used as a legume-based protein
source for feeding dairy cows during fodder deficit period.
Keywords: Dried lucerne chaff; dairy; milk; crude protein; total mixed ration.
1. INTRODUCTION
Livestock production is an important farming activity of
rural populace which contributes for an economic
development, rural livelihoods and poverty alleviation
(Hossain et al. 2017). In Bhutan, livestock farming is the
important component of Bhutanese farming system and
plays an important role in improving the livelihood of
rural farmers (Wangdi, 2006). The government has been
prioritizing dairy sector to enhance milk production
through policy interventions such as timely supply of
inputs, efficient services delivery, and providing
subsidies and market facilities. Dairy farming is gaining
momentum amongst rural population in Bhutan. As a
result, improved cattle population are increasing, and
milk production had increased too. But, the genetic
potential of these improved cattle breeds are not fully
explored mainly due to poor feedings. One of the
important strategies to achieve this is to improve the
quality of feed, especially under farmers’ management
condition. In any commercial livestock farming, feeding
is the main driving force for successful livestock venture
and most expensive item of production cost (Makkar
2016). Devendra and Leng (2011) have mentioned that
the locally available feed resources act as the backbone
for improving productivity of animals in developing
countries. To maximize profitability from the dairy
farming, one need to ensure that the dairy cows receive
required quantity of essential nutrients in a cost-effective
way, preferably from locally available feed resources. In
any country, pasture based feeding system is the best and

Bhutan Journal of Animal Science (BJAS), Volume 4, Issue 1, Page 147-150, 2020
Wangchuk et al. (2020) 148
cheapest for sustainable dairy farming. Although the use
of pasture is a profitable low cost feeding system, there
are some nutrient limitations to milk production.
Therefore, supplements must be considered to correct for
nutritional imbalances and deficiencies in pasture. In
Bhutan, milk production under smallholder farming
systems is season sensitive. Fluctuations of feeds in both
quantity and quality is a major driver. Milk production
decline in dry season due to forage scarcity is a common
phenomenon. One of the options for improving feeding
strategy is to use legume based roughage such as dried
Lucerne chaff prepared from green fodder Lucerne
(Medicago sativa) to supplement grazing animal or feed
during the scarcity of green fodder. The quality of forages
fed, has a great impact on the performance of the cow.
Alfalfa (Lucerne) is considered a high-quality pasture due
to its lower fiber content and a higher protein content (Lin
et al. 2019). Lucerne is the most widely cultivated legume
in the world (FAO 2013) and may be grazed, preserved as
hay or ensiled. The crude protein content of the Lucerne
ranges from 15-20 % on dry matter basis, NDF from 26-
39 % and ADF ranges from 20-25% of the dry matter
(Gyeltshen et al. 2017). Therefore, to come up with
suitable feeding strategy in temperate region, present
study investigated the effect of feeding dried Lucerne
chaff as supplement on milk production and composition
of Jersey cross cows in late autumn.
2. MATERIALS AND METHODS
2.1 Experiment site
The feeding experiment was performed for 25 days (from
1st to 25th October 2019) at Brown Swiss farm in
Choekhor Geog under Bumthang Dzongkhag. The farm
is located at an altitude of 2700 masl with geographical
location between 27.54° North latitude and 90.75° East
longitude. The experimental site experiences a cool
temperate climate characterized by cool and humid
summer and cold dry winter. The average annual
temperature and rainfall reported was 22°C and was 63.82
mm respectively (NCHM 2018).
2.2 Animal selection and management
A total of 10 lactating Jersey cross cows weighing 329.80
± 45.06 kg live body weight of same age and lactation
stage were selected for the study. Prior to the feeding trial,
the selected animals were observed for physical health
status and were dewormed with Rafoxanide +Levamisole
@ 7.5 mg per kg live body weight.
2.3 Experiment design
The 10 jersey cross cows were blocked into two groups
with five cows of similar milk yield and lactation stage in
each group accordingly. Then each group was randomly
assigned one of the two dietary treatments: i)
Supplementation of Lucerne chaff ii) Normal feeding
regime without supplementation of Lucerne chaff.
2.4 Preparation of dried Lucerne chaff
The green Lucerne fodder was harvested at early
flowering stage and chopped into required size by chaff
cutter. The chopped fresh Lucerne fodder was sun dried
for one week inside Plastic green house at NRDCAN to
prepare dried Lucerne chaff.
2.5 Experimental feeding and diet composition
The treatments were divided into two equal parts and
were fed twice a day along with the basal diet. The
inclusion level of dried Lucerne chaff in experiment diet
per day was 2.32 ± 0.34 (SD) kg (30 % of the total dry
matter requirement of the cows). The experimental cows
were allowed to graze in the pasture field along with the
herd during the day and water was supplied throughout
the day. The basal diet consisted of forage intake from
seven hour of grazing in temperate farm pasture and cattle
concentrate were fed as supplement as shown in Table 1.
Table 1: Diet composition (%) of experimental ration
Parameter Experimental Control
Dried Lucerne chaff (%) 30
Cattle concentrate (%) 18:20 18.20
Grazing pasture in hour
a day
7 7
2.6 Laboratory analysis
Composite sample of dried Lucerne chaff weighing 250
gm was collected from dried lot. The laboratory analysis
for dry matter and nutrient content was done at the
Animal Nutrition Laboratory, Bumthang. The proximate
analysis was performed to determine crude protein, crude
fat and crude fiber content. The nutrient composition of
dried Lucerne chaff was shown in Table 2.
Table 2: Nutrient composition of dried lucerne chaff
Forage sample
Percentage (%)
DM Ash Crude
fat
Crude
protein
Dried Lucerne
chaff
89 13.02 1.00 14.98

Bhutan Journal of Animal Science (BJAS), Volume 4, Issue 1, Page 147-150, 2020
Wangchuk et al. (2020) 149
2.7 Milk production and recording
The experimental animals were milked twice a day; once
in the morning and in the evening and the milk yield was
recorded during each milking. The animals were milked
by bucket milking machine and the milk yield was
recorded in kilograms using weighing balance.
2.8 Milk sample collection and analysis
Milk samples were collected in the last day of every week.
The milk samples were tested in automatic milk analyzer
for determination of milk fat, milk protein, lactose and
SNF.
2.9 Statistical analysis
The data on milk production and composition recorded
during the experimental period was analyzed using
Microsoft excel and IBM SPSS version 23. The dataset
was checked for outliers, followed by Shapiro Wilk’s and
Levene’s tests for normality of data and homogeneity of
variance, respectively. The data was analyzed for
descriptive statistics such as mean and standard deviation.
Two sample independent t test was performed to find the
significance effect of treatments on milk yield and
composition in lactating cows.
3 RESULT AND DISCUSSIONS
3.1 Milk production and composition
Table 3 presents the milk production and composition of
control and experiment group.
In present study, the daily average milk production of
cows in the experimental diet group was found
significantly (p˂0.05) higher than the control group. This
finding is in line with the result of Wang et al. (2014) who
reported increased milk production when supplemented
with alfalfa hay forage. The increased milk yield for
experimental diet group may be attributed to increased
dry matter intake from additional feeding of Lucerne
chaff in addition to normal feeding regime of the farm.
Increasing energy intake can improve milk yield and
supply more energy and nutrients for milk synthesis (Wei
et al. 2019). The pasture intake from autumn grazing in
temperate pasture appears to be not sufficient to sustain
milk production with limited concentrate feeding.
According to Reynolds et al. (2011), a higher milk yield
in alfalfa hay diet resulted in the highest feed efficiency
and digestibility represents an important indicator for
improving the efficiency of energy utilization in dairy
cows. The ingredients and composition of diets fed to
dairy cows also affect nutrient digestibility and milk
production performance (Weiss et al. 2009). Concentrate
inclusion level were similar between the two diets and
therefore, the differences were attributed to the increase
DMI from additional legume forage source. But there
was no significant (p˃0.05) effect observed on milk
composition such as milk fat, SNF, milk density, lactose
and salt content between experimental and control group.
Similar finding was reported by Kahyani et al. (2013) and
Zyl et al. (2014) when feeding cows with various chopped
lengths and different quality of alfalfa hay. A decreased
ruminal pH due to low dietary fibre content can decrease
the ratio of acetate to propionate, which in turn could
cause a reduction in the milk fat content (Mertens 1997).
Grant et al. (1990) also reported that a reduction in hay
particle size resulted in a decreased milk fat content, and
eventually a reduction in 4% fat corrected milk (FCM)
production. However, additional feeding from legume
forage source in this experiment did not alter any of the
parameters of milk quality. This indicates the minimal
changes in the ratio of acetate to propionate despite
supplementary feeding of legume forage in this
experiment.
4 CONCLUSION
The current study concluded that the supplementation of
legume based roughage such as dried Lucerne chaff to
late autumn grazing dairy cows in temperate pasture can
increase the milk production. It is also convinced that the
dairy cows in Bhutan are not receiving adequate protein
and thus not being able to produce as per their genetic
potential. Based on the present finding, it is recommended
that dried Lucerne chaff can be fed as legume based
protein source for dairy cows during fodder deficit period
to enhance milk production in temperate region. It can
Table 3: Milk production and composition in
lactating Jersey cross cows (Means ± SD)
Parameters Control Experiment Sig.
level
Milk yield
(kg/day)
4.33 ± 0.52 5.61 ± 0.24 *
Milk fat (%) 5.96 ± 1.12 5.94 ± 1.62 ns
Solid not fat
(%)
8.54 ± 0.49 8.66 ± 0.46 ns
Lactose (%) 4.68 ± 0.28 4.74 ± 0.24 ns
Salt content
(%)
0.64 ± 0.05 0.66 ± 0.05 ns
Milk density 27.37 ± 1.45 27.88 ± 2.07 ns
*p ≤ 0.05; ns: nonsignificant

Bhutan Journal of Animal Science (BJAS), Volume 4, Issue 1, Page 147-150, 2020
Wangchuk et al. (2020) 150
also complement protein source without negative effect
on milk production and economic return. However,
additional research is needed to recommend optimum
level of Lucerne supplementation to increase cow’s
productivity given its genetic composition.
ACKNOWLEDGEMENT
The authors would like to thank Mr. Dorji Samdrup (Sr.
LPS) and the staff of Brown Swiss Farm for their kind
assistance. The authors are also thankful to Dr. Kezang
Wangchuk (PRO), RED, DoL for his kind technical
assistance. The kind support of Mrs. Ganga Maya Rizal
(CFFO), Animal Nutrition Division DoL, Mr. Towchu
Rabgay (CLPO), RED, DoL and the staff of NRDCAN
Bumthang are highly acknowledged.
REFERENCE
Devendra C and Leng RA (2011). Feed resources for
animals in Asia: issues, strategies for use,
intensification and integration for increased
productivity. Asian-Australian Journal of Animal
Science, 24(3): 303–321.
FAO (2013). Production crops. FAOSTAT-Food and
Agriculture Organization of the United Nations.
Grant RJ, Colenbrander VF and Mertens DR (1990). Milk
fat depression in dairy cows: role of particle size of
alfalfa hay. Journal of Dairy Science, 73: 1823-1833.
Gyeltshen J, Wangda P and Wangchuk K (2017).
Handbook for Feed and Fodder Development Worker
in Bhutan, 3rd ed. National Research and
Development Center for Animal Nutrition, Jakar,
Bhutan.
Hossain SA, Sherasia PL, Phondba BT, Pathan FK and
Garg MR (2017). Effect of feeding green fodder based
diet in lactating buffaloes: Milk production,
economics and methane emission. Indian Journal of
Dairy Science, 70(6):767-773.
Kahyyani A, Ghorbani GR, Khorvash M, Nasrollahi SM
and Beauchemin KA (2013). Effect of alfalfa particle
size in high concentrate diets supplemented with
unsaturated fat: Chewing behavior, total tract
digestibility and milk production of dairy cows.
Journal of dairy science, 96:7110-7119.
Lin X, Hu Z, Li N, Hou Q, Wang Y, Peng J, Jiang Y and
Wang Z (2019). Power on rumen digestion,
metabolism and production performance in lactating
dairy cows. Advances in Bioscience and
biotechnology, 10: 197- 217.
Makkar HPS (2016). Animal nutrition in a 360-degree
view and a framework for future R&D work: towards
sustainable livestock production. Anim Prod Sci.
56(10): 1561–1568.
Mertens DR (1997). Creating a system for meeting the
fiber requirements of dairy cows. Journal of Dairy
Science, 80:1463-1481.
NCHM (2018). Climate Data Book of Bhutan. Royal
Government of Bhutan, Thimphu.
Reynolds CK, Crompton LA and Mills JAN (2011).
Improving the efficiency of energy utilization in
cattle. Anim. Prod. Sci. 51:6–12.
Wang B, Mao SY, Yang HJ, Wu YM, Wang JK, Li SL,
Shen ZM and Liu JX (2014). Effects of alfalfa and
cereal straw as a forage source on nutrient digestibility
and lactation performance in lactating dairy cows.
Journal of Dairy Science, 97:7706 – 7715.
Wangdi K (2006). Country Pasture/Forage Resources
Profile. FAO.
Weiss WP, St-Pierre NR, and Willett LB (2009). Varying
type of forage, concentration of metabolizable protein
and source of carbohydrate affects nutrient
digestibility and production by dairy cows. Journal of
Dairy Science, 92:5595–5606.
Wei ZH, Liang SL, Wang DM, Lui HY, Wanapat M and
Lui JX (2019). Lactation performance and rumen
fermentation in dairy cows fed a diet with alfalfa hay
replaced by corn stover and supplemented with
molasses. Asian- Australian Journal of Animal
Science, 32 (8): 1122-1127.
Zyl MV, Meeske R, Scholtz GD and Einkarmerer OB
(2014). The effect of Lucerne (Medicago sativa) hay
quality on milk production and composition of jersey
cows. South African Journal of Animal Science,
44(5): 25-30.

Schematic diagram of flow cytometry method for sex
sorting
HOW MUCH DO YOU KNOW ABOUT SEXED SEMEN TECHNOLOGY?
What is sexed semen?
Semen having X or Y bearing sperm to produce progenies of a desired sex either female or male (with about 80-90% accuracy).
Sex sorting technology was developed by the USDA (United States Department of Agriculture) researchers in Livermore,
California, and Beltsville, Maryland. The technology was patented as “Beltsville Sperm sexing technology”. The
commercialization of sexed semen started in United States in 2001 with a license granted to Sexing Technologies (ST), Texas.
Presently, sexed semen is commercially available only for Holstein Friesian and Jersey breeds of cattle.
How Sexed Semen is produced?
Sperm are sorted by identifying differences between the X- and Y- bearing sperm. The X-chromosome (female) contains about
3.8% more DNA than the Y-chromosome (male) in cattle. This difference in DNA content is used to sort the X- from the Y-
bearing sperm. Among several methods for semen sexing, flow cytometry-based sorting has emerged as most efficient. The
technology is refined through the decades and finally sex sorting is possible at the purity of more than 90%. The technique is
well standardized, patented and commercialized in USA, Europe and other countries.
Is it safe?
Yes, it is safe to use sexed semen for artificial
insemination. But sperm concentration in sexed
semen per dose is less and also the conception rate is
10 to 15 % less as compared to conventional semen.
What are the advantages of using sexed semen?
• Produce mostly female calves; increase heifers’
production for replacement within herd, and
increase opportunity to sell surplus heifers to
other farmers/farms
• Speed up genetic improvement
Technological limitations of using sexed semen
• High cost of sex sorting machine
• Waste of approximately 50% of sperm, hence
low sorting efficiency and speed
• Require highly skilled person to operate sex
sorting machines
• Damage to the sperm due to shear force,
electrostatic charge, could reduce freezing
potential of the sorted sperm
Implementation limitations using sexed semen
• High cost of the product which include the
cost of the intellectual property right
• The lower conception rate of sexed semen, critical considering
low AI coverage and conception rate in field
• Sperm concentration of sexed semen ranges between 2 million/dose whereas it is 20 million/dose in conventional semen.
• Managing sex semen with lower sperm concentration will be a challenge if AI Technician donor follow prescribed SoP.
Where can we buy and what is the price?
Sexed semen is commercially available mainly from Sexing Technology, USA. But there are other breeding companies in USA,
Canada and Europe producing sexed semen commercially using license from Sexing Technology, USA. NDRDC, DoL
Yusipang procures sex semen from abroad from recognized company such as World Wide Sires, USA, Cogent Genetics, UK,
Viking Genetics, Denmark. Average price of sex semen is USD 18 to 23 per dose which is higher than imported
normal/conventional semen.
Is sexed semen used only for heifer?
Sexed semen is recommended to be used only in heifers (especially virgin heifers) due to high fertility rate. However, it can also
be used in cows up to third lactation with excellent reproduction record.
Contributed by: National Dairy Research and Development Centre (NDRDC), Yusipang, Thimphu

AFRICAN SWINE FEVER (ASF)
ASF is a highly contagious disease of domestic and wild pigs and one
of the notifiable diseases. There is no vaccine and no treatment for
ASF. The disease does not affect human, but it causes high pig
mortality and severe economic loss. The virus is stubborn and
remains infectious in the environment and in contaminated pig
products for several days.
Key Biosecurity Principles to Protect your farms!
A. SEGREGATION: Establish physical barriers to limit the disease spread by human,
animals or feed and equipment’s to your farm.
i. Restrict entry of animal and unauthorized people into the farm
ii. Strictly monitor staff and visitor movements on the farm
iii. Implement quarantine measures when introducing new stock into the farm
B. CLEANING & DISINFECTION: Materials (e.g. vehicles, equipment) entering or
leaving a farm must be thoroughly cleaned and disinfected to inactivate pathogens present
on materials
i. Wash hands with soap and water prior to and after visiting a pig farm
ii. Wear dedicated farm cloths and boots while working in the farm
iii. Clean and disinfect vehicles, foot wears and farm equipment regularly
iv. Clean and disinfect animal shed regularly
C. PREVENTION MEASURES: Adequate measures should be undertaken to prevent
incursion of infection in the farm and timely reporting of suspected cases to enhance rapid
detection and containment.
i. Report any suspected case of ASF (dead or alive) to the nearest Livestock Office or
BAFRA.
ii. Prevent direct or indirect contact with neighbor’s pig & wild pig.
iii. Do not feed untreated swills containing meat products to your pigs.
Contributed by: Dr. Karma Wangdi
Senior Veterinary Officer
Animal Health Division, DoL