BEYOND THE MEAN BIAS: THE EFFECT OF WARNING AGAINST FAKING ON BIODATA ITEM VARIANCES
18
PERSONNEL PSYCHOLOGY 1993.66 BEYOND THE MEAN BIAS: THE EFFECT OF WARNING AGAINST FAKING ON BIODATA ITEM VARIANCES AVRAHAM N. KLUGER Department of Industrial Relations and Human Resources Institute of Management and Labor Relations Rutgers University ADRIENNE COLELLA Department of Management, School of Business Rutgers University We studied the effects of faking biodata test items by randomly warn- ing 214 of 429 applicants for a nurse’s assistant position against fak- ing. While the warning mitigated the propensity to fake, the specific warning effects depended on item transparency. For transparent items, warning reduced the extremeness of item means and increased item variances. For nontransparent items, warning did not have an effect on item means and reduced item variances. These faking effects were best predicted when transparency was operationalized in terms of item- specificjob desirability in addition to the item-general social desirabil- ity. We also demonstrated a psychometric principle: The effect of warning on means at the item level is preserved in scales constructed from those items, but the effect on variances at the item level is masked at the scale level. These results raise new questions regarding the atten- uating effects of faking on validity, and regarding the benefit of warning applicants against faking. There are several advantages for using biodata tests in personnel se- lection: high validities (Hunter & Hunter, 1984; Reilly & Chao, 1982; Reilly & Warech, 1990; Schmitt, Gooding, Noe, & Kirsch, 1984), small or no adverse impact (Reilly & Chao, 1982; Reilly & Warech, 1990), and possibly positive attitudes of job applicants toward such tests (Huger & Rothstein, in press). However, one potential disadvantage of biodata tests is susceptibility to faking, which raises three questions: (a) Does faking occur in operational settings? (for a review see Huger, Reilly, & The authors wish to thank Philip Bobko, Angel0 DeNisi, Mark Huselid, Dick Reilly, and three anonymous reviewers for valuable comments on an earlier draft of this paper. Portions of this paper were presented at the Annual Conference of the Society for Industrial and Organization Psychology in San Francisco (May, 1993). The preparation of this manuscript was partially supported by a 1992-93 grant from the Research Council of Rutgers University awarded to the first author. Correspondence concerning this article should be addressed to Avraham N. Kluger, Department of Industrial Relations and Human Resources, Institute of Management and Labor Relations, Livingston Campus, Rutgers University, New Brunswick, New Jersey 08903-5062 (e-mail address: [email protected]). COPYRIGHT @ 1993 PERSONNEL PSYCHOLOGY, INC. 763
Transcript of BEYOND THE MEAN BIAS: THE EFFECT OF WARNING AGAINST FAKING ON BIODATA ITEM VARIANCES
PERSONNEL PSYCHOLOGY 1993.66
BEYOND THE MEAN BIAS: THE EFFECT OF WARNING AGAINST FAKING ON BIODATA ITEM VARIANCES
AVRAHAM N. KLUGER Department of Industrial Relations and Human Resources
Institute of Management and Labor Relations Rutgers University
ADRIENNE COLELLA Department of Management, School of Business
Rutgers University
We studied the effects of faking biodata test items by randomly warn- ing 214 of 429 applicants for a nurse’s assistant position against fak- ing. While the warning mitigated the propensity to fake, the specific warning effects depended on item transparency. For transparent items, warning reduced the extremeness of item means and increased item variances. For nontransparent items, warning did not have an effect on item means and reduced item variances. These faking effects were best predicted when transparency was operationalized in terms of item- specific job desirability in addition to the item-general social desirabil- ity. We also demonstrated a psychometric principle: The effect of warning on means at the item level is preserved in scales constructed from those items, but the effect on variances at the item level is masked at the scale level. These results raise new questions regarding the atten- uating effects of faking on validity, and regarding the benefit of warning applicants against faking.
There are several advantages for using biodata tests in personnel se- lection: high validities (Hunter & Hunter, 1984; Reilly & Chao, 1982; Reilly & Warech, 1990; Schmitt, Gooding, Noe, & Kirsch, 1984), small or no adverse impact (Reilly & Chao, 1982; Reilly & Warech, 1990), and possibly positive attitudes of job applicants toward such tests (Huger & Rothstein, in press). However, one potential disadvantage of biodata tests is susceptibility to faking, which raises three questions: (a) Does faking occur in operational settings? (for a review see Huger, Reilly, &
The authors wish to thank Philip Bobko, Angel0 DeNisi, Mark Huselid, Dick Reilly, and three anonymous reviewers for valuable comments on an earlier draft of this paper.
Portions of this paper were presented at the Annual Conference of the Society for Industrial and Organization Psychology in San Francisco (May, 1993). The preparation of this manuscript was partially supported by a 1992-93 grant from the Research Council of Rutgers University awarded to the first author.
Correspondence concerning this article should be addressed to Avraham N. Kluger, Department of Industrial Relations and Human Resources, Institute of Management and Labor Relations, Livingston Campus, Rutgers University, New Brunswick, New Jersey 08903-5062 (e-mail address: [email protected]).
COPYRIGHT @ 1993 PERSONNEL PSYCHOLOGY, INC.
763
764 PERSONNEL PSYCHOLOGY
Russell, 1991); (b) If faking occurs, can it be mitigated? (for a review see Mael, 1991); and (c) To what extent does faking attenuate validity? (for a review see Hough, Eaton, Dunnette, Kamp, & McCloy, 1990). In the present paper we demonstrate that a warning against faking a biodata test affects job applicant responses, suggesting both that faking occurs in an operational setting and that it can be mitigated. Furthermore, we in- vestigated the effects of a warning against faking at the item level, raising new questions regarding the attenuating effect of faking on validity.
Although some researchers have found little evidence of faking in biodata tests (Becker & Colquitt, 1992; Cascio, 1975; Keating, Patterson, & Stone, 1950; Mosel & Cozan, 1952), others have reported substantial evidence of faking (Goldstein, 1971; Hogan & Stokes, 1989; Weiss & Dawis, 1960; for an extended review see Lautenschlager, in press). At least part of this apparent inconsistency can be explained by the key- ing method used (Kluger et al., 1991) and the type of items employed (Becker & Colquitt, 1992; Mael, 1991; Shaffer, Sanders, & Owens, 1986). Faking is more likely to be detected in scales validated with tra- ditional keying methods (item-criterion correlations) than in scales vali- dated with nonlinear keying methods, such as option keying (contrasting group method in which the validity of each item’s alternatives are eval- uated separately; England, 1961). In addition, faking is less likely to happen in objective items than in subjective items (Shaffer et al., 1986) or, more specifically, in items that are (a) historical, (b) discrete, (c) ex- ternal, and (d) not apparently job relevant (Becker & Colquitt, 1992).
Thus, it may appear that biodata tests should employ only (a) non- linear keying procedures (Kluger et al., 1991) and (b) nonfakable items (i.e., objective, verifiable, or subtle items; Becker & Colquitt, 1992; Shaf- fer et al., 1986). Yet, either approach may lower validities and, con- sequently, may be counterproductive. First, linear keying procedures may explain criterion variance above and beyond nonlinear keying pro- cedures and vice versa (Kluger et al., 1991). Second, fakable (obvious) items may have higher validities than nonfakable (subtle) items (Hogan & Stokes, 1989; for a review see Hough et al., 1990). For example, Hough et al. (1990) inferred that “subtle items.. . are often less valid than obvious items and may reduce scale validity” (p. 582). Moreover, the social desirability rating of items, one index of fakability, was found to positively correlate with item validity (Hogan & Stokes, 1989; Trent, 1987). As one reviewer suggested, items that are easy to fake have high validities not because they are fakable, but because of an unfortunate by-product of measuring the most obvious valid behaviors. Parentheti- cally, even researchers who believe that nonfakable items are superior to fakable items (e.g., Mael, 1991) concede that nonfakable items may suffer from a variety of practical shortcomings (e.g., legal defensibility).
IUUGER A N D COLLELA 765
Thus, because of both empirical benefits and practical considerations, avoiding fakable items and scoring techniques which are susceptible to the effects of faking may be unwarranted.
The superior validity of fakable items does not mean that faking be- havior enhances validity. On the contrary, while the social desirability of an item seems to be correlated with the item’s validity (e.g., Hough et al., 1990), the social desirability trait of the respondent may attenuate the validity of the instrument (e.g., Hough et al., 1990, Tmble 7). These results suggest that the inclusion of fakable items in a scale enhances validity, while actual faking behavior attenuates validity. Therefore, re- taining valid, but fakable, items and mitigating the propensity to fake may further increase validity.
Faking can be mitigated by warning subjects that their answers may be verified (for a review see Lautenschlager, in press). When items are subjective, and verification therefore is impossible, faking can be mitigated by a warning that a lie scale is embedded in the questionnaire (Schrader & Osburn, 1977), or by a warning that faking can reduce one’s score due to a special scoring key (option keying). The latter type of warning is fair because option-keyed scores seem resistant to inflation due to faking (Kluger et al., 1991), so that, on the average, half the fakers are expected to receive a lower score than they would have had received had they answered honestly. Such a warning was used in the present investigation.
Past research regarding faking of subjective items and the effective- ness of warning interventions is subject to external and/or internal va- lidity threats. This research has typically been conducted in laboratory settings (e.g., Kluger et al., 1991), in nonoperational settings such as concurrent-validity samples (Hough et al., 1990), or with nonequivalent group comparisons of an operational setting to a nonoperational setting (e.g., Becker & Colquitt, 1992; Hough et al., 1990). External validity is threatened by the possibility that applicants fake their responses in the laboratory, or when specially instructed to do so, while they do not fake in actual practice (Becker & Colquitt, 1992), and thus, the d,egree of ac- tual faking may be overestimated. Internal validity is threatened by the possibility that applicant responses appear similar to (supposedly hon- est) incumbent responses not because of lack of faking, but because of the validity of the selection test (i.e., incumbents have high scores on the selection test because they are truly better than applicants, while appli- cants have high scores because they are faking; Hough et al., 1990). This internal validity threat may suggest that actual faking is underestimated. Therefore, our first objective was to provide empirical evidence for the existence of faking biodata tests in practice, in a manner that will mini- mize threats to external and internal validity.
766 PERSONNEL PSYCHOLOGY
Given the little research in operational settings, it is not surpris- ing that even less evidence exists regarding the effectiveness of warning against faking under actual test conditions (Lautenschlager, in press). In fact, Mael (1991) concluded, “Whether the warning would also be effec- tive with a large operational sample remains to be determined by addi- tional research” (p. 778). Although Mael referred specifically to warn- ings regarding verification of the items, to the best of our knowledge, the situation is the same regarding other types of warnings (e.g., a lie scale is embedded). Therefore, our second objective was to experimentally determine in an operational setting (a) whether warning subjects not to fake will affect their responses, and (b) if the responses are affected, how are they affected. In this study we randomly warned half of actual job ap- plicants that faking can reduce their score. We assume that the warned group gave us (more) honest answers, and that if we detect differences between the unwarned group and the warned group, we can attribute the differences to faking which occurred in the unwarned group.
Applicants may distort their responses in at least four ways: (a) They may intentionally present themselves as possessing more (or less) of the qualities deemed desirable in general (i.e., social desirability bias; Ed- wards, 1990); (b) they may intentionally present themselves as possessing more (or less) of the qualities deemed desirable for the specific job for which they apply (i,e., job desirability bias); (c) they may use knowledge of the empirical keys (i.e., outright fraud); and (d) they may distort their responses unconsciously (Paulhus, 1984). The latter two ways of faking are unlikely to be influenced by a warning and therefore, are beyond the scope of the present investigation. Thus, this study compared the roles of social desirability and job desirability in distorting the response to bio- data tests.
Social Desirability (SO) Versus Job Desirability (JD)
Most research on intentional faking has focused on SD. Yet, although applicants may respond in a socially desirable way, we hypothesize that they will tailor their answer to the specific job for which they are apply ing. In fact, while evidence for the existence of job specific bias in labora- tory settings is mixed (Kluger et al., 1991), it is likely that in operational settings a concern for JD of the response will override the concern for SD. Applicants attempting to enhance their chance of being hired, may present themselves as possessing qualities they perceive to be important for the particular job. These qualities may not necessarily be socially de- sirable, and they may even be socially undesirable. The following exam- ple uses an item with a 5-point Likert scale, often used in biodata tests: The SD of the item “I can handle seeing someone suffer” is ambiguous
KLUGER AND COLLELA 767
(where 1 = “never” and 5 = “often” or “always”). Yet, for applicants for a nurse’s assistant job it seems that answering 5 would be most appro- priate for the job. Accordingly, we hypothesized that any biases found in biodata items due to faking will be better predicted by the item’s JD than by the item’s SD.
The Effect of Faking on the Item Means and kriances
Fakers will most likely endorse extreme alternatives which are most job desirable, when the JD direction of the items are transparent (ob- vious). The increased frequency of endorsing extreme alternatives on transparent items will cause the item means of unwarned applicants to be more extreme than the item means of warned (presumably more honest) applicants. This prediction is consistent with the findings that fakers are more likely to answer with extreme alternatives (e.g., 1 or 5 on a 5-point Likert-type item) than honest respondents (Kluger et al., 1991). More importantly, this increased frequency of endorsing extreme alternatives will also reduce the variance of transparent items because the responses of fakers will converge on the same extreme alternatives.
On the other hand, for nontransparent items, the “best” response will not be clear. Applicants who fake and are faced with a non- transparent item have three logical choices. First, fakers may still try to guess the “best” alternative, so that some will use 1 and some will use 5. Second, they may chose the “safe” middle ground (Le., respond with 3). Third, they may give up faking and respond honestly. What- ever strategy fakers use, it is unlikely to have a systematic effect on item means. However, each of these strategies would have a different effect on item variances. If fakers endorse extreme alternatives for nontrans- parent items, faking will increase item variances because some will answer 1 and some will answer 5. If fakers converge on the middle ground, fak- ing will reduce variance. Finally, if fakers give up faking nontransparent items, there would be no systematic effect on variance for such items.
We hypothesize that fakers will largely use the first strategy (i.e., fak- ers faced with nontransparent items would search for linear “solutions” to their predicament) rather than use nonlinear responses (e.g., 3). Judg- ment literature suggests that people are pretty good at discovering lin- ear relationships between one cue (item) and a criterion, but have great difficulty in discovering nonlinear relationships (e.g., Hammond & Sum- mers, 1972), and in discarding a linear hypothesis in favor of a nonlinear one (Brehmer, 1980). Thus, for items for which the JD is not trans- parent, fakers will still attempt to discover the “best” extreme alterna- tive. Therefore, item variance for nontransparent items should be larger
768 PERSONNEL PSYCHOLOGY
among unwarned applicants than among warned applicants. Some ap- plicants may use the other two strategies which may attenuate the effects on variance we hypothesized. However, if the majority of fakers use the first strategy for the majority of the nontransparent items, then our pre- diction should hold. In sum, we hypothesized that for transparent items, a warning against faking will decrease the extremeness of item means and increase item variances, but that for nontransparent items, a warn- ing against faking will have no effect on item means and will decrease item variances.
The Relationship Between Item JD Transparency and Item Means
Items for which JD is transparent are likely to have extreme honest means. This should happen because of self-selection of applicants out of the general population. For example, applicants for the job of a nurse’s assistant are likely to respond with 1, rather than with any other option, to the item “I become sick when I see vomit,” where 1 = “never” and 5 = “always.” Note that a response of 1 may be the honest response of peo- ple who applied for the job of a nursing assistant. Similarly, applicants for a body guard job may answer with 5 to the item “I push people who are in my way.” Of course, not all items which are transparent in regard to JD will have extreme means, but most of these items will. Conversely, items for which the JD is not clear are much more likely to have honest means around the midpoint of the item (e.g., 3 on a 5-point Likert scale). This relationship between item JD transparency and means entails a re- lationship between item JD and item variance. The more transparent the item is, the more extreme its honest mean, and therefore, itsvariance will be smaller due to ceiling or floor effects. In contrast, nontransparent items are likely to have large variance. These effects will be greater for those who are faking (i.e., a prediction simply derived from our hypoth- esis regarding the effect of faking on item variances). This issue has an implication for the effect of faking on biodata scales.
The Effect of Faking on the Biodata Scale Means and Variances
So far we made predictions regarding the effects of faking at the item level. Valid biodata items are typically summed with a unit-weight in order to create a biodata scale. The mean of such a scale is identical to the grand mean of the means of all the items composing it. Therefore, the average effect of faking at the item level will be identical to the effects of faking at the scale level.
However, a scale variance is not a simple average of the variances of the items composing it. In fact, the “variance of a sum of variables
KLUGER AND COLLELA 769
equals the sum of the variances of the variable plus twice the sum of all possible covariances among the variables” (Nunnally, 1978, p. 153; sicale = C s:~,,, + 2 C COQ where i # j ) . Since most scales will be composed of items with different item variances, the items that have larger variances and larger (nonnegative) covariances are likely to make a larger contribution to the scale variance. In our case, the items that have larger variances are also likely to be the least transparent items. Theoretically, when all covariances are equal, the variance of the non- transparent items will dominate the variance of the scale. The variance of nontransparent items is predicted to increase due to faking. There- fore, when all covariances are equal, the effect of faking on the least transparent items will dominate the variance of biodata scales. However, unless the effect of faking on covariances is known, which requires an a priori knowledge of the exact composition of items in regard to trans- parency and intercorrelations, an exact prediction of the effect of faking on biodata scale variances is impossible. However, the point is that the effects of faking obtained for item variances may not necessarily carry over to the variance of biodata scales composed of these items.
The Present Study
The present investigation is based on an experiment with a warning manipulation and a control group. In addition, each item was rated to determine its transparency in regard to both its SD and JD. Accordingly, our operational hypotheses are that:
Hypothesis 1: A warning against faking will decrease the extremeness of transparent item means, but will not affect the means of nontransparent items.
Hypothesis 2: A warning against faking will increase the variance of trans- parent items, but decrease the variance of nontransparent items.
Hypothesis 3: JD will predict the effects of a warning against faking (above) better than SD.
Hypothesis 4: Judges’ ratings of transparency will be highly correlated with actual item means, even among honest (warned) applicants.
In addition, we sought to demonstrate a psychometric phenomenon: The average effect of warning against faking on item variances will be masked when items are aggregated into a scale.
770 PERSONNEL PSYCHOLOGY
Method
Subjects
The subjects were 429 job applicants for nurse’s assistant (NA) po- sitions in a geriatric nursing home. The median age of the applicants was 29 years. Eighty-five percent of the applicants were female, 46% African-Americans, and 42% white.
Test Development
The test was developed to predict turnover and performance of NAs through interviews with 25 incumbents and their supervisors. A set of 191 items was written to reflect behaviors, attitudes, and experiences that the interviewees believed to be crucial for either surviving in the job or for good performance. Items were reviewed for redundancy and read- ability both by the researchers and by the administration of the nursing home. This review produced a final set of 167 items. The test was com- puterized, and all items were presented with a 5-point Likert scale.
Procedure
Applicants were first interviewed by the personnel director and then escorted to a work station with a personal computer. The computer wel- comed the applicants to the nursing home, assured them that no expe- rience with computers was necessary, and guided them through a short practice of using the computer keys. Applicants were then informed that they would be presented with “questions about you and your experiences which may be used to determine your fit to the job.” Actually, the test was not used to determine fit to the job because it is still in the validation stage. Applicants were randomly selected by the computer to receive a warning regarding faking. Half of the applicants received a warning just before reading the instructions regarding the biodata questionnaire. The warning screen read: “IMPORTANT NOTICE !!! The question- naire that you are going to answer calls for your honest responses. If you give dishonest responses you will NOT increase your chances of getting a job. In fact, we use a special scoring system such that dishonest re- sponses may reduce your total score. Therefore, please give your honest answers to the questions below.” The control group took the test in the same manner as the experimental group, but was not shown the warning screen.
IUUGER AND COLLELA 771
Measures
SD ratings. Six Ph.D. students in the social sciences and 6 job appli- cants (who were exempted from the test) served as independent judges. Judges may easily rate the SD direction of an item, but they may not agree on the exact alternative on a Likert-type scale (Kluger et al., 1991). Accordingly, the judges were asked to rate each biodata item by indicat- ing the direction of the most socially desirable response to that items by using the extreme alternatives (1 or 5). We stressed to the job applicant judges that we were interested in the response that will be given by a can- didate “who is not very concerned with getting a job, but very concerned with being perceived as a good person.” If judges could not decide which extreme was socially desirable, they were asked to indicate that the most desirable alternative is moderate or that they could not rate the item. This was done because, as one reviewer suggested, judges may avoid ex- treme ratings either because they believe that the most socially desirable response is a moderate one, or because they cannot figure out which ex- treme is most desirable. Reliability for these judgments was estimated with Kappa (Siegel, & Castellan, 1988) for agreement of 6 judges in clas- sifying 167 items into four categories. Kappa was .53 for the 6 students and .44 for the 6 applicants.
Each judge rated, on average, only 2 items out of 167 with an indica- tion that SD cannot be determined, and no item was rated as “cannot be determined” by more than 3 out of the 12 judges; these judgments were treated as missing values. Items judged to have a moderate SD were given a value of 3. Thus, we constructed a continuous SD scale which provided greater statistical power. The ratings for each group of judges were than averaged for each item, yielding two SD ratings: student rat- ings (SSD) and applicant ratings (ASD).
JD ratings. The judges were asked to rate the items by indicating the direction of the most job desirable response to each item with the same format they used to rate SD. Specifically, they were asked to rate the items in a manner that would maximize the chances of an applicant getting an NA job in a geriatric nursing home. Each judge rated both SD and JD for all items. Order of judgment (SD or JD first) was randomized within each group of judges (students and applicants). Kappa was .65 for the 6 students and .42 for the 6 applicants. Again, each judge rated, on average, only 5 items with an indication that JD cannot be determined, and no item was rated as “cannot be determined” by more than 3 (out of 12) judges. Therefore, SJD and AJD scales were constructed in the same fashion as the SSD and ASD scales. The relatively low, but significant (p < .OOl) Kappas for both SD and JD ratings reflect the inability of the judges to agree on the ratings of items for which the rating was not 1 or
772 PERSONNEL PSYCHOLOGY
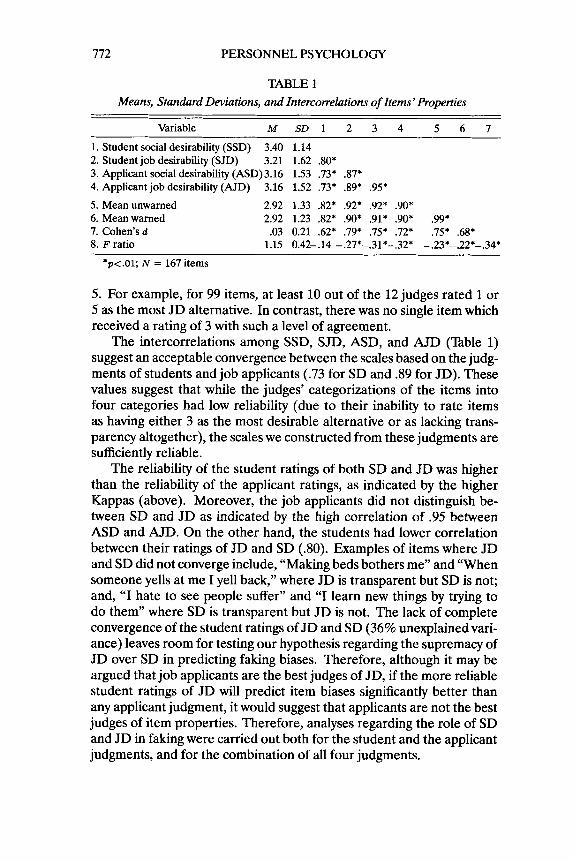
TABLE 1 Means, Standard Deviations, and Intercorrelations of Items’ Properties
Variable M S D 1 2 3 4 5 6 7
1. Student social desirability (SSD) 3.40 1.14 2. Student job desirability (SJD) 3.21 1.62 .80* 3. Applicant social desirability (ASD)3.16 1.53 .73* .87* 4. Applicant job desirability (AJD) 3.16 1.52 .73* .89* .95*
5. Mean unwamed 2.92 1.33 .82* .92* .92* .90* 6. Mean warned 2.92 1.23 .82* .90* .91* .90* .99* 7. Cohen’s d -.03 0.21 .62* .79* .75* .72* .75* .68* 8. F ratio 1.15 0.42-.14 -.27*-.31*-.32* -.23*-.22*-.34*
*p<.O1; N = 167 items
5. For example, for 99 items, at least 10 out of the 12 judges rated 1 or 5 as the most JD alternative. In contrast, there was no single item which received a rating of 3 with such a level of agreement.
The intercorrelations among SSD, SJD, ASD, and AJD (Table 1) suggest an acceptable convergence between the scales based on the judg- ments of students and job applicants (.73 for SD and .89 for JD). These values suggest that while the judges’ categorizations of the items into four categories had low reliability (due to their inability to rate items as having either 3 as the most desirable alternative or as lacking trans- parency altogether), the scales we constructed from these judgments are sufficiently reliable.
The reliability of the student ratings of both SD and JD was higher than the reliability of the applicant ratings, as indicated by the higher Kappas (above). Moreover, the job applicants did not distinguish be- tween SD and JD as indicated by the high correlation of .95 between ASD and AJD. On the other hand, the students had lower correlation between their ratings of JD and SD (30). Examples of items where JD and SD did not converge include, “Making beds bothers me” and “When someone yells at me I yell back,’’ where JD is transparent but SD is not; and, “I hate to see people suffer” and “I learn new things by trying to do them” where SD is transparent but JD is not. The lack of complete convergence of the student ratings of JD and SD (36% unexplained vari- ance) leaves room for testing our hypothesis regarding the supremacy of JD over SD in predicting faking biases. Therefore, although it may be argued that job applicants are the best judges of JD, if the more reliable student ratings of JD will predict item biases significantly better than any applicant judgment, it would suggest that applicants are not the best judges of item properties. Therefore, analyses regarding the role of SD and JD in faking were carried out both for the student and the applicant judgments, and for the combination of all four judgments.
KLUGER AND COLLELA 773
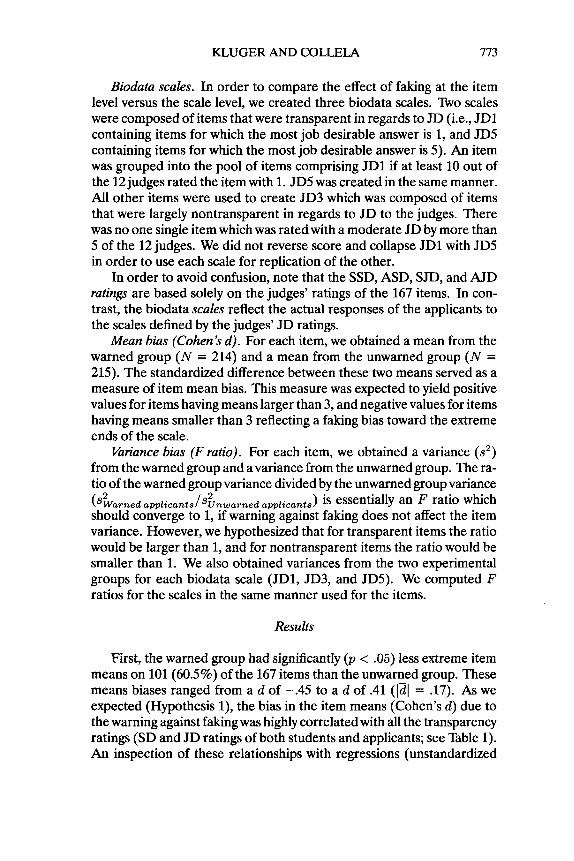
Biodata scales. In order to compare the effect of faking at the item level versus the scale level, we created three biodata scales. nkro scales were composed of items that were transparent in regards to JD (i.e., JD1 containing items for which the most job desirable answer is 1, and JD5 containing items for which the most job desirable answer is 5). An item was grouped into the pool of items comprising JD1 if at least 10 out of the 12 judges rated the item with 1. JD5 was created in the same manner. All other items were used to create JD3 which was composed of items that were largely nontransparent in regards to JD to the judges. There was no one single item which was rated with a moderate JD by more than 5 of the 12 judges. We did not reverse score and collapse JD1 with JD5 in order to use each scale for replication of the other.
In order to avoid confusion, note that the SSD, ASD, SJD, and AJD ratings are based solely on the judges’ ratings of the 167 items. In con- trast, the biodata scales reflect the actual responses of the applicants to the scales defined by the judges’ JD ratings.
Mean bias (Cohen 5. d). For each item, we obtained a mean from the warned group (N = 214) and a mean from the unwarned group (N = 215). The standardized difference between these two means served as a measure of item mean bias. This measure was expected to yield positive values for items having means larger than 3, and negative values for items having means smaller than 3 reflecting a faking bias toward the extreme ends of the scale.
Eriance bias (F ratio). For each item, we obtained a variance (s2) from the warned group and a variance from the unwarned group. The ra- tio of the warned group variance divided by the unwarned group variance
should converge to 1, if warning against faking does not affect the item variance. However, we hypothesized that for transparent items the ratio would be larger than 1, and for nontransparent items the ratio would be smaller than 1. We also obtained variances from the two experimental groups for each biodata scale (JD1, JD3, and JD5). We computed F ratios for the scales in the same manner used for the items.
(sLa,,,d applicantslS2unwarned applicants) is essentially an F ratio which
Results
First, the warned group had significantly 0, < .05) less extreme item means on 101 (60.5%) of the 167 items than the unwarned group. These means biases ranged from a d of -.45 to a d of .41 (Id1 = .17). As we expected (Hypothesis l), the bias in the item means (Cohen’s d) due to the warning against faking was highly correlated with all the transparency ratings (SD and JD ratings of both students and applicants; see Table 1). An inspection of these relationships with regressions (unstandardized
774 PERSONNEL PSYCHOLOGY
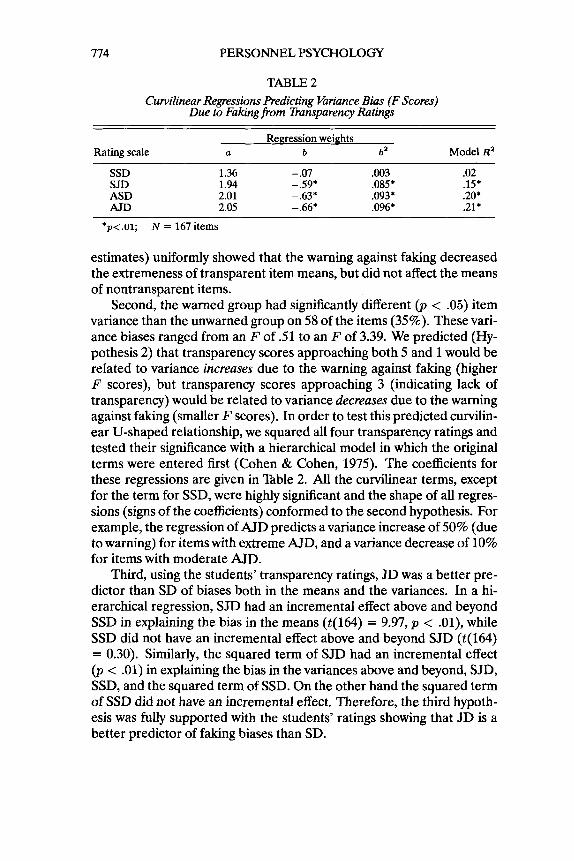
TABLE 2 Curvilinear Regressions Predicting Variance Bias (F Scores)
Due to Faking from Transparency Ratings
Regression weights Rating scale a b ba Model Ra
SSD 1.36 - .07 .003 .02 SJD 1.94 - .59* .085* .15* ASD 2.01 -.63* .093* .20* AJD 2.05 -.66* .096* .21*
*p<.01; N = 167 items
estimates) uniformly showed that the warning against faking decreased the extremeness of transparent item means, but did not affect the means of nontransparent items.
Second, the warned group had significantly different (p < .05) item variance than the unwarned group on 58 of the items (35%). These vari- ance biases ranged from an F of .51 to an F of 3.39. We predicted (Hy- pothesis 2) that transparency scores approaching both 5 and 1 would be related to variance increases due to the warning against faking (higher F scores), but transparency scores approaching 3 (indicating lack of transparency) would be related to variance decreases due to the warning against faking (smaller F scores). In order to test this predicted curvilin- ear U-shaped relationship, we squared all four transparency ratings and tested their significance with a hierarchical model in which the original terms were entered first (Cohen & Cohen, 1975). The coefficients for these regressions are given in Table 2. All the curvilinear terms, except for the term for SSD, were highly significant and the shape of all regres- sions (signs of the coefficients) conformed to the second hypothesis. For example, the regression of AJD predicts a variance increase of 50% (due to warning) for items with extreme AJD, and a variance decrease of 10% for items with moderate AJD.
Third, using the students’ transparency ratings, JD was a better pre- dictor than SD of biases both in the means and the variances. In a hi- erarchical regression, SJD had an incremental effect above and beyond SSD in explaining the bias in the means (t(164) = 9.97, p < .Ol), while SSD did not have an incremental effect above and beyond SJD (t(164) = 0.30). Similarly, the squared term of SJD had an incremental effect (p < .01) in explaining the bias in the variances above and beyond, SJD, SSD, and the squared term of SSD. On the other hand the squared term of SSD did not have an incremental effect. Therefore, the third hypoth- esis was fully supported with the students’ ratings showing that JD is a better predictor of faking biases than SD.
KLUGER AND COLLELA 775
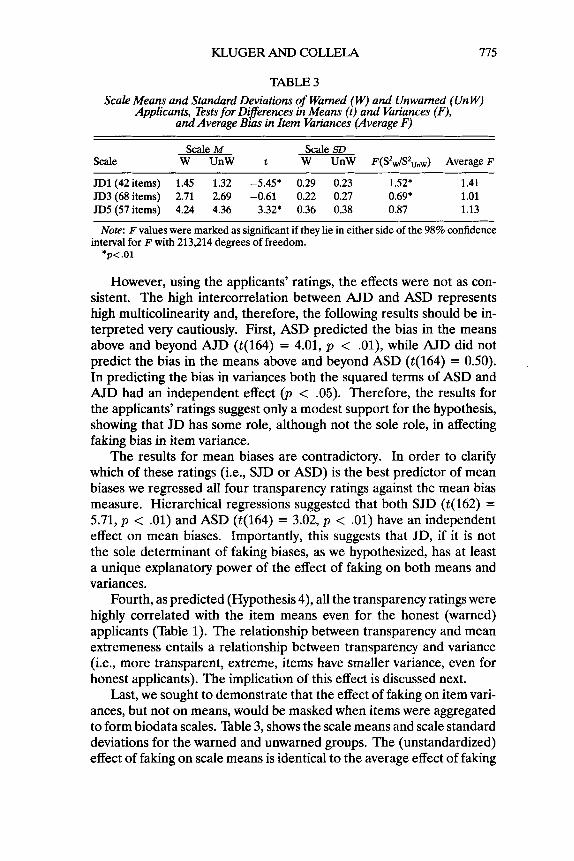
TABLE 3 Scale Means and Standard Deviations of Waned (W) and Unwamed (UnW)
Applicants, Tests for Diflerences in Means (t) and Variances (F), and Average Bias in Item Variances (Average F)
~ ~~~~~~~~ ~
Scale M Scale SD Scale W UnW t W UnW F(SZW/S2,,,) Average F
JD1 (42items) 1.45 1.32 -5.45* 0.29 0.23 1.52* 1.41
JD5 (57 items) 4.24 4.36 3.32* 0.36 0.38 0.87 1.13
interval for F with 213,214 degrees of freedom.
JD3 (68 items) 2.71 2.69 -0.61 0.22 0.27 0.69* 1.01
Note: F values were marked as significant if they lie in either side of the 98% confidence
*p<.01
However, using the applicants’ ratings, the effects were not as con- sistent. The high intercorrelation between AJD and ASD represents high multicolinearity and, therefore, the following results should be in- terpreted very cautiously. First, ASD predicted the bias in the means above and beyond AJD (t(164) = 4.01, p < .Ol ) , while AJD did not predict the bias in the means above and beyond ASD (t(164) = 0.50). In predicting the bias in variances both the squared terms of ASD and AJD had an independent effect (p < .05). Therefore, the results for the applicants’ ratings suggest only a modest support for the hypothesis, showing that JD has some role, although not the sole role, in affecting faking bias in item variance.
The results for mean biases are contradictory. In order to clarify which of these ratings (i.e., SJD or ASD) is the best predictor of mean biases we regressed all four transparency ratings against the mean bias measure. Hierarchical regressions suggested that both SJD (t( 162) = 5.71, p < . O l ) and ASD (t(164) = 3.02, p < .01) have an independent effect on mean biases. Importantly, this suggests that JD, if it is not the sole determinant of faking biases, as we hypothesized, has at least a unique explanatory power of the effect of faking on both means and variances.
Fourth, as predicted (Hypothesis 4), all the transparency ratings were highly correlated with the item means even for the honest (warned) applicants (Table 1). The relationship between transparency and mean extremeness entails a relationship between transparency and variance (i.e., more transparent, extreme, items have smaller variance, even for honest applicants). The implication of this effect is discussed next.
Last, we sought to demonstrate that the effect of faking on item vari- ances, but not on means, would be masked when items were aggregated to form biodata scales. Table 3, shows the scale means and scale standard deviations for the warned and unwarned groups. The (unstandardized) effect of faking on scale means is identical to the average effect of faking
776 PERSONNEL PSYCHOLOGY
on item means, out of mathematical necessity. Therefore, it is not sur- prising that the conclusions from the t tests for scale mean differences are identical to those we obtained at the item level (i.e., for scales composed of transparent items, JD1 and JD5, faking increased the extremeness of the scale mean, but for a scale composed of nontransparent items, JD3, faking did not have an effect on the scale mean).
The effect of faking on scale variances (s2) yielded significant F ra- tios for JD1 and JD3 (in order to test JD3 with a traditional F,,, test, the inverse of .69 can be tested, and it would lead to an identical con- clusion). The effect of faking on scale variances preserved the reZutive effects (ie., the nontransparent biodata scale, JD3, showed the least vari- ance increase due to the warning against faking). However, the effects on the scales variances (column before last) were different from the av- erage effect on the item variances (last column). For JD3, the difference between these estimates can be attributed to the presence of the most transparent items in the scale. These items which are shown to have a variance enhancement due to faking, dominate the variance of the un- warned group and as result influence the F ratio. For the transparent scales, the aggregation both increased the relative variance of the warned group (the larger F for JD1) and decreased it (JD5), suggesting that the specific combination of item covariances reversed the effect of the least transparent items of the JD1 scale.
Discussion
The results of this study demonstrate that faking biodata items occurs in operational settings, and that a warning against faking can mitigate faking behavior. Specifically, for scales composed of mostly transparent items in regard to JD, warning reduces the extremeness of the responses by at least one third of a standard deviation (Table 3). The accuracy in which transparency ratings obtained from only a few judges predicted the actual item means obtained from hundreds of (even warned) ap- plicants. indicates how easy it is to fake responses to biodata items. In contrast to previous biodata studies of faking and warning, these results were obtained in a true field experiment and, therefore, are not sub- ject to as many internal or external threats to validity. Moreover, the results largely supported our hypotheses and showed that (a) faking af- fects both item means and item variances, but that the specific effects are determined by item transparency, and (b) JD is a unique predictor, if not always the best predictor, of faking biases.
Four characteristics of the present study should be noted in general- izing its results. First, the estimates of the effects of faking were obtained
KLUGER A N D COLLELA 777
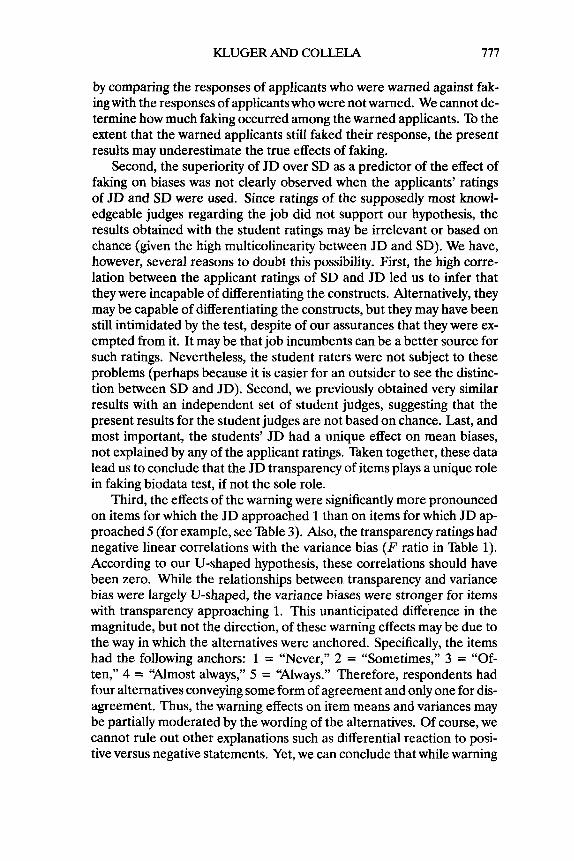
by comparing the responses of applicants who were warned against fak- ing with the responses of applicants who were not warned. We cannot de- termine how much faking occurred among the warned applicants. To the extent that the warned applicants still faked their response, the present results may underestimate the true effects of faking.
Second, the superiority of JD over SD as a predictor of the effect of faking on biases was not clearly observed when the applicants’ ratings of JD and SD were used. Since ratings of the supposedly most knowl- edgeable judges regarding the job did not support our hypothesis, the results obtained with the student ratings may be irrelevant or based on chance (given the high multicolinearity between JD and SD). We have, however, several reasons to doubt this possibility. First, the high corre- lation between the applicant ratings of SD and JD led us to infer that they were incapable of differentiating the constructs. Alternatively, they may be capable of differentiating the constructs, but they may have been still intimidated by the test, despite of our assurances that they were ex- empted from it. It may be that job incumbents can be a better source for such ratings. Nevertheless, the student raters were not subject to these problems (perhaps because it is easier for an outsider to see the distinc- tion between SD and JD). Second, we previously obtained very similar results with an independent set of student judges, suggesting that the present results for the student judges are not based on chance. Last, and most important, the students’ JD had a unique effect on mean biases, not explained by any of the applicant ratings. l lken together, these data lead us to conclude that the JD transparency of items plays a unique role in faking biodata test, if not the sole role.
Third, the effects of the warning were significantly more pronounced on items for which the JD approached 1 than on items for which JD ap- proached 5 (for example, see n b l e 3). Also, the transparency ratings had negative linear correlations with the variance bias (F ratio in Table 1). According to our U-shaped hypothesis, these correlations should have been zero. While the relationships between transparency and variance bias were largely U-shaped, the variance biases were stronger for items with transparency approaching 1. This unanticipated difference in the magnitude, but not the direction, of these warning effects may be due to the way in which the alternatives were anchored. Specifically, the items had the following anchors: 1 = “Never,” 2 = “Sometimes,” 3 = “Of- ten,” 4 = “Almost always,” 5 = “Always.” Therefore, respondents had four alternatives conveying some form of agreement and only one for dis- agreement. Thus, the warning effects on item means and variances may be partially moderated by the wording of the alternatives. Of course, we cannot rule out other explanations such as differential reaction to posi- tive versus negative statements. Yet, we can conclude that while warning
778 PERSONNEL PSYCHOLOGY
effects are found on both ends of the scale, attention should be given to the anchoring of the item as one possible moderator of faking effects on item properties.
Fourth, our definitions of nontransparency is based on the judges’ lack of agreement regarding transparency, and not on positive agree- ment regarding nontransparency. In fact, our judges did not find a sin- gle item that they agreed to be either nontransparent or having a mod- erate alternative as the most desirable one. While this may reflect poor item sampling on our behalf, we believe that the judges’ behavior is just another evidence for the schema which an applicant attempting faking invokes: Assume that there is one best extreme alternative (linear hy- pothesis), guess it, and bias the answer toward it.
One important limitation of our study is that we do not have validity data. Nevertheless, our results have implications for future validity stud- ies. Specifically, past research of the effects of faking on validity yielded, unexpectedly, only weak attenuating effects in organizational research (Ganster, Hennessey, & Luthans, 1983), and specifically in selection re- search (Hough et al., 1990). Our results suggest at least three testable explanations for these findings. First, past studies employed SD as a measure of faking. The superiority of JD over SD in predicting the bias both in the means and variances of biodata items suggests that past stud- ies may have somewhat underestimated the attenuating effects of faking because they measured only a correlate of the motivation to fake.
Second, our warning against faking increased the variances of trans- parent items and decreased the variance of nontransparent items. These findings are consistent with a report (Stokes, Hogan, & Snel, 1993) that incumbents had significantly different variances than applicants on most test items, and that these differences reflect both increases and decreases in item variances. While severe reduction in item variance is likely to reduce item validity (Nunnally, 1978), item variance does not have to reflect item validity. Yet, the effects of faking (or warning against it) on item variances beg the question of whether these effects will also be found on item validities. If the effects of faking on validity interact with item type such that faking both increases and decreases validity, then the effect of faking on biodata scales will mask these effects, consistent with the typical weak attenuating effect of faking on validity.
Third, past studies estimated the effects of faking on validity on tests validated without a warning against faking. In contrast, we used items that are still in the validation process. Many of our items had low vari- ance among the warned applicants, and even lower variance among the unwarned applicants. Therefore, it is possible that one effect of faking on validity is to reduce item variances to such a degree that items are rendered useless. Such items, naturally, will not be considered in studies of faking that use items validated under “normal” conditions.
KLUGER AND COLLELA 779
Our results suggest three directions for future research. First, faking should be measured with an index that captures the specific motivations the respondents have to fake, and not merely SD. Second, the moderat- ing effect of faking on test-criterion validities should be investigated at the item level (cf. Lautenschlager, in press). Last, considerations of the consequences of faking for validity should be expanded to include the ef- fect of faking on item survival. The latter point indirectly suggests that, under faking conditions, the relationship between item transparency and item validity is curvilinear because transparent items tend to be valid (Hough et al., 1990), but that extremely transparent items lack sufficient variance. All of these questions are testable and should be addressed in future research.
The possibility that the validity of nontransparent items is enhanced by faking suggests that warning applicants against faking (Hough et al., 1990; Kluger et al., 1991) is unwarranted until empirical evidence is obtained (Mael, 1991). Indeed, one unpublished study (Guilford & Lacey, 1947) found that a strong warning to avoid falsification of factual items did not affect validity. Alternatively, until the effect of warning on validity is understood, it seems advisable to use in decision settings the same warning condition (yes/no) employed in the validation stage.
In summary, we have demonstrated that (a) faking of biodata tests does occur in an operational setting as evidenced by the effectiveness of the warning against faking, (b) the specific effect of faking on biodata test items depends on the item transparency in regard to JD, and (c) depend- ing on item transparency, the effect of faking may or may not be detected in item means and item variances. Our findings raise the possibility that the weak attenuating effect of faking on scale-criterion validities reflects both increases and decreases in item-criterion validities. Therefore, fu- ture research of the effects of faking should be conducted at the item level, and consider item transparency with respect to JD.
REFERENCES
Becker TE, Colquitt AL. (1992). Potential versus actual faking of biodata form: An anal- ysis along several dimensions of item type. PERSONNEL PSYCHOLOGY, 6,389406.
Brehmer B. (1980). In one word Not from experience. Acta Psychologica, 45,233-241. Cascio WE (1975). Accuracy of verifiable biographical information blank responses. Jour-
Cohen J, Cohen P. (1975). Applied multiple regressionlcorrelation analysh for the behavioral
Edwards AL. (1990). Construct validity and social desirability. Arnericun Psychologist, 45,
England GW. (1961). Development and use of weighted application blanks. Dubuque, I A
Ganster DC, Hennessey HW, Luthans F. (1983). Social desirability response effects: Three
Goldstein IL. (1971). The application blank: How honest are the responses? Journal of
nal ofApplied Psychology, 60,576-580.
sciences. Hillsdale, NJ: Erlbaum.
287-289.
W. C. Brown.
alternative models. Academy of Management Journal, 26,321-331.
Applied Psychology, 55,491492.
780 PERSONNEL PSYCHOLOGY
Guilford JP, Lacey JI. (1947). Biographical data. In Printed classification tests (Report No. 5). Army Air Forces Aviation Psychology Research Reports. Reported in Lautenschlager GJ. (in press). Accuracy and faking of background data. In Stokes GS, Mumford MD, Owens WA. (Eds.). The biodata handbook Theory, research and applications. Palo Alto, C A Consulting Psychologists Press.
Hammond KR, Summers DA. (1972). Cognitive control. Psychological Review, 79,5847. Hogan JB, Stokes GS. (1989, April). The influence of socially desirable responding on
biographical data of applicant versus incumbent samples: Implications for predictive and concurrent research designs. Paper presented at the Annual Conference of the Society for Industrial and Organizational Psychology, Boston, MA.
Hough LM, Eaton NK, Dunnette MD, Kamp JD, McCloy RA. (1990). Criterion-related validities of personality constructs and the effects of response distortion on those validities. Journal ofApplied Psychology, 75,581-595.
Hunter JE, Hunter RE (1984). Validity and utility of alternative predictors of job perfor- mance. Psychological Bulletin, 96,72-98.
Keating HG, Patterson DG, Stone CH. (1950). Validity of work histories obtained by interview. Journal ofApplied Psychology, 34,l-5.
Huger AN, Reilly RR, Russell C. (1991). Faking biodata tests: Are option-keyed instru- ments more resistant?, Journal ofApplied Psychology, 76,889-896.
Huger AN, Rothstein H. (in press). The influence of selection test type on applicant reactions to employment testing. Journal of Business and Psychology.
Lautenschlager GJ. (in press). Accuracy and faking of background data. In Stokes GS, Mumford MD, Owens WA. (Eds.). The biodata handbook Theov, research and applications. Palo Alto, C A Consulting Psychologists Press.
Mae1 FA. (1991). A conceptual rationale for the domain and attributes of biodata items. PERSONNEL PSYCHOLOGY, 44,763-792.
Mosel JL, Cozan LW. (1952). The accuracy of application blank work histories. Journal of Applied Psychology, 36,365-369.
Nunnally JC. (1978). Psychometic Beery (2nd Ed.). New York McGraw-Hill. Paulhus DL. (1984). Wo-component models of socially desirable responding. Journal of
Personality and Social Psychology, 46,598-609. Reilly RR, Chao GT. (1982). Validity and fairness of some alternative employee selection
procedures. PERSONNEL PSYCHOLOGY, 35,143. Reilly RR, Warech MW. (1990). The validity and fairness of alternatives to cognitive tests.
Commission on Testing and Public Policy, Berkeley, CA. Schmitt N, Gooding RZ, Noe RA, Kirsch M. (1984). Meta-analysis of validity studies
published between 1964 and 1982 and the investigation of study characteristics. PERSONNEL PSYCHOLOGY, 37,407-422.
Schrader AD, Osburn HG. (1977). Biodata faking: Effects of induced subtlety and position specificity. PERSONNEL PSYCHOLOGY, 30,395404.
Shaffer GS, Saunders V, Owens WA. (1986). Additional evidence for the accuracy of biographical data: Long-term retest and observer rating. PERSONNEL PSYCHOLOGY,
Siege1 S, Castellan NJ Jr. (1988). Nonparametic statistics for the behavioral sciences. New York McGraw-Hill.
Stokes GS, Hogan JB, Snel AS. (1993). Comparability of incumbent and applicant samples for the empirical development of biodata keys. Manuscript submitted for publication.
Bent T (1987, August). Armed forces adaptability screening: Theproblem of item response distortion. Paper presented at the Annual Convention of the American Psycholog- ical Association, New York.
Weiss DJ, Dawis RV. (1960). An objective validation of factual interview data. Journal of
39,791-809.
Applied Psychology, 44,381-385.