between consumer motivations & engagement with brands in ...
89
EXPLORING THE RELATION BETWEEN CONSUMER MOTIVATIONS & ENGAGEMENT WITH BRANDS IN FACEBOOK SOFIA COUTINHO REBELO BRANCO LOPES DISSERTATION WRITTEN UNDER THE SUPERVISION OF PROFESSOR CAROLINA AFONSO DISSERTATION SUBMITTED IN PARTIAL FULFILMENT OF REQUIREMENTS FOR THE INTERNATIONAL MSC IN BUSINESS ADMINISTRATION, AT THE UNIVERSIDADE CATÓLICA PORTUGUESA, SEPTEMBER 2016.
-
Upload
khangminh22 -
Category
Documents
-
view
2 -
download
0
Transcript of between consumer motivations & engagement with brands in ...

EXPLORING THE RELATION
BETWEEN CONSUMER
MOTIVATIONS & ENGAGEMENT
WITH BRANDS IN FACEBOOK
SOFIA COUTINHO REBELO BRANCO LOPES
DISSERTATION WRITTEN UNDER THE SUPERVISION OF PROFESSOR
CAROLINA AFONSO
DISSERTATION SUBMITTED IN PARTIAL FULFILMENT OF REQUIREMENTS FOR
THE INTERNATIONAL MSC IN BUSINESS ADMINISTRATION, AT THE
UNIVERSIDADE CATÓLICA PORTUGUESA, SEPTEMBER 2016.

ABSTRACT
Dissertation Title: Exploring the relation between Consumer Motivations &
Engagement with brands in Facebook
Author: Sofia Coutinho Rebelo Branco Lopes
This thesis aims to explore the digital consumer behavior and proposes a conceptual
framework that allows to comprehend the consumer’s Motivations and Engagement types
to interact with brands in Facebook. Specifically, the research goal is to explore the
relationship between the two and point out which Motivations better explain Engagement.
Lastly, the analysis consists of segmenting Facebook users based on their Motivations
and exploring their Engagement levels.
The present research addresses the Portuguese Facebook users’ behavior based on
Motivational and Engagement variables. Those were chosen with the intention of
recognizing their importance in this context and exploring the connection between both.
Scales from previous literatures were adapted and used to explore the Motivations,
Enginkaya and Yilmaz (2014), and the Engagement, Malciute (2012).
A quantitative and exploratory study was conducted and an online questionnaire was
applied to a convenience sample of 350 Facebook users. Results indicated that the main
Motivations to interact with brands in Facebook are Opportunity Seeking, Conversation
and Entertainment. Moreover, the main Consumer Engagement dimension is Emotional.
Further, there is a significant relation between Motivations and Engagement, and the
Motivations that better help to predict Engagement are Brand Affiliation, Entertainment
and Investigation. Moreover, three segments of Facebook users were identified and the
main one presents the highest Engagement levels.
The framework might serve as a tool for managers to better understand Facebook users’
behaviors regarding brands, thus enabling them to improve the allocation of digital
resources, especially regarding Facebook and their marketing strategies with a suitable
segmentation approach.

RESUMO
Título da Dissertação: A explorar a relação entre as Motivações dos consumidores & o
seu “Engagement” com as marcas através do “Facebook”
Autora: Sofia Coutinho Rebelo Branco Lopes
Esta tese tem como objetivo explorar o comportamento do consumidor digital e propõe
um quadro conceptual que visa facilitar a compreensão das Motivações que levam o
consumidor a interagir com as marcas no “Facebook” e o seu “Engagement”. A intenção
fulcral desta pesquisa é investigar a relação entre Motivações e “Engagement” e realçar
as Motivações que melhor explicam o “Engagement”. O propósito final é segmentar os
usuários de “Facebook” consoante as suas Motivações e explorar o seu nível de
“Engagement”.
A presente pesquisa relativa aos usuários do “Facebook” portugueses tem como base
variáveis de Motivação e “Engagement”, sendo que as mesmas foram retiradas e
adaptadas do estudo de Enginkaya e Yilmaz (2014) e do de Malciute (2012),
respetivamente. Estas variáveis foram selecionadas com a finalidade de verificar a sua
importância neste contexto e explorar a relação entre ambas.
Um estudo quantitativo e exploratório foi elaborado. Foi aplicado um questionário
“online” a uma amostra de 350 usuários de “Facebook”. Os resultados indicam que as
principais Motivações são: Procura de Oportunidades, Conversacional e Entretenimento.
Relativamente ao “Engagement” a dimensão com maior relevância é a Emocional. Os
resultados comprovam a relação entre Motivações e “Engagement” e destacam a Filiação
às Marcas, o Entretenimento e a Investigação como sendo as Motivações, que melhor
explicam o “Engagement”.
O quadro conceptual poderá assim servir como ferramenta para que as marcas
compreendam o comportamento do consumidor “facebookiano”, tornando mais
eficientes a alocação de recursos “online” e estratégias de marketing com uma boa
abordagem de segmentação.

Acknowledgements
I would first like to thank my thesis advisor Professor Carolina Afonso for the great
support and availability provided during these months. She consistently allowed this to
be my own work, but at the same time she played a crucial role of steering me always in
the right direction.
I must express my gratitude to all of my teachers of this institution, Universidade Católica
de Lisboa and also of Escola Alemã de Lisboa. In particular I would like to thank
Professor Kiril Lakishyk, Professor Fernando Branco, Professor Rui Carvalho and
Professor Rui Albuquerque for making me understand how much I like management,
particularly marketing, and for sharing their wise knowledge with me.
Besides them, I would like to show my gratitude to my seminar colleagues for the
cooperative work and the help provided whenever some major doubts occurred.
My sincere thanks go to my role models – my parents, who had to deal with my times of
despair and grumpiness of some of these days. Also, to my sisters, Sara and Inês, who
even though living abroad, felt like they were writing the thesis themselves as they heard
so much about it. I thank my grandma for the constant worry about my well-being and
her concern regarding my work overload. Finally I thank all of my friends for the support
and encouragement during all of my years of studying, especially Joana Almeida Sande.
This accomplishment would never be possible without them. Thank you!
“The good life is one inspired by love and guided by knowledge.”
Bertrand Russel

Table of Contents
Chapter 1. Introduction ................................................................................................. 1
1.1 Background ............................................................................................................. 1
1.2 Problem Statement .................................................................................................. 2
1.3 Aim ......................................................................................................................... 3
1.4 Scope ....................................................................................................................... 4
1.5 Academic and Managerial Relevance ..................................................................... 4
1.5.1 Academic Relevance ........................................................................................ 4
1.5.2 Managerial Relevance ...................................................................................... 5
1.6 Dissertation Outline ................................................................................................ 6
Chapter 2. Literature Review and Conceptual Framework....................................... 8
2.1 Web 2.0 and the Emergence of Social Media ......................................................... 8
2.1.1 Definition of Web 2.0....................................................................................... 8
2.1.2 From Web 1.0 to Web 2.0 ................................................................................ 8
2.1.3 Definition and Types of Social Media .......................................................... 10
2.1.4 Web 2.0 and SM in the Business Context ...................................................... 10
2.1.5 Challenges ...................................................................................................... 11
2.2 Brands’ Presence in Facebook .............................................................................. 12
2.2.1 Facebook History and its Unique Features .................................................... 12
2.2.2 Facebook in a Business Context and Top Brands .......................................... 13
2.2.3 Benefits of Using Facebook ........................................................................... 14
2.3 Consumer Motivations to interact with a brand in SM ......................................... 15
2.3.1 Definition of Motivations ............................................................................... 15
2.3.2 Brand Affiliation ............................................................................................ 15
2.3.3 Opportunity Seeking ...................................................................................... 16
2.3.4 Conversation................................................................................................... 17
2.3.5 Entertainment ................................................................................................. 17
2.3.6 Investigation ................................................................................................... 18
2.3.7 Market Segmentation of SM users ................................................................. 19
2.4 Consumer Engagement ......................................................................................... 19
2.4.1 Definition of Consumer Engagement ............................................................. 19
2.4.2 Behavioral Dimension .................................................................................... 20
2.4.3 Emotional Dimension ..................................................................................... 21

2.4.4 Cognitive Dimension...................................................................................... 22
2.5 Conclusions and Conceptual Framework ............................................................. 22
Chapter 3. Methodology .............................................................................................. 24
3.1 Research Approach ............................................................................................... 24
3.2 Research Instruments ............................................................................................ 24
3.2.1 Population and Sample ................................................................................... 24
3.2.2 The Questionnaire .......................................................................................... 25
3.2.3 The Measures ................................................................................................. 25
Chapter 4. Results Analysis ......................................................................................... 27
4.1 Preliminary Analysis ............................................................................................. 27
4.1.1 Data Collection and Analysis ......................................................................... 27
4.1.2 Sample Characterization ................................................................................ 27
4.1.3 Data Screening Univariate Outliers – Multivariate Outliers .......................... 29
4.1.4 Data Reliability .............................................................................................. 30
4.1.5 Principal Component Analysis ....................................................................... 31
4.1.6 Measurement Model ....................................................................................... 32
4.1.7 Correlation Analysis ....................................................................................... 33
4.2 In Depth-Analysis ................................................................................................. 33
4.2.1 The main Motivations and Consumer Engagement ....................................... 33
4.2.2 The Power of Motivations as a Predictor of Engagement .............................. 34
4.2.3 The Importance of Segmentation based on Motivations ................................ 36
4.2.3.1 Cluster 1: The Facebook Addicts ............................................................ 39
4.2.3.2 Cluster 2: The Young Promotion Diggers ............................................... 39
4.3.2.3 Cluster 3: The Passive Seniors ................................................................ 40
Chapter 5. Main Conclusions ...................................................................................... 41
5.1 Conclusions and Limitations ................................................................................ 41
5.1.1 Academic Contributions ............................................................................. 41
5.1.2 Managerial Contributions ........................................................................... 42
5.2 Limitations and Future Research .......................................................................... 44

List of Figures
Figure 1. Worldwide Social Network Ad Revenue Share by Company ........................ 14
Figure 2. Conceptual Framework. .................................................................................. 23
Figure 3. Gender Distribution ......................................................................................... 27
Figure 4. Age Distribution .............................................................................................. 28
Figure 5. Monthly Net Income Distribution ................................................................... 28
Figure 6. Cluster Size ..................................................................................................... 37
List of Tables
Table 1. Characteristics of Web 1.0 and Web 2.0 .......................................................... 9
Table 2. Reliability Test – Motivations .......................................................................... 30
Table 3. Reliability Test – Consumer Engagement ........................................................ 30
Table 4. Reliability Test – Consumer Engagement ........................................................ 32
Table 5. Descriptive Statistics – Motivations ................................................................. 33
Table 6. Descriptive Statistics - Consumer Engagement ............................................... 34
Table 7. Linear Regression ............................................................................................. 35
Table 8. Multiple Linear Regression .............................................................................. 35
Table 9. The Three Clusters’ Identities .......................................................................... 38

Sofia Branco Lopes
EXPLORING THE RELATION BETWEEN CONSUMER MOTIVATIONS & ENGAGEMENT WTH BRANDS IN FACEBOOK
1
Chapter 1. Introduction
1.1 Background
While in the past consumers presented a clear and simple process of purchasing products
and services, nowadays this journey is complex and the online experience is considered
a key step in the process. Especially the emergence of social media has revolutionized the
way consumers interact with brands (Tsai & Men, 2013; Muntinga, Moorman, & Smit,
2011).
The “Digital in 2016” report states that the annual increase from 2015 to 2016 of active
social users is substantial and amounts to 10% worldwide, such that in 2016 the number
of active social media users corresponds to 2,3 billion (Kemp, 2016). This reality also
applies to the Portuguese market, given that in the year of 2016, 54% of the population
are active social media users (Kemp, 2016). Due to this significant number of users, more
and more brands are joining the social networking platforms, with the intention of
acquiring followers (Robinson, 2014).
Facebook is considered by companies as the most attractive social media to be used for
marketing purposes and in particular for B2C businesses (Cvijikj & Michahelles, 2014).
Since Facebook has the highest number of active users among all platforms, which
correspond to 1,59 billion globally (Kemp, 2016), this platform gained enormous
popularity and interest. Particularly, in the Portuguese market almost half of the
companies communicate through social networks with consumers, suppliers and business
partners (Lusa, 2016). Among all popular social networks, Facebook also stands out for
the Portuguese individuals as it has 4,211 million users, while others like YouTube,
Instagram and Twitter only have 1,849-, 1,300- and 1,062 million, respectively (Marktest,
2015).
Using Facebook in a business context covers two perspectives, the one of the company
and the one of its users. Both parties have to have an interest on being present and
participating actively in Facebook brand pages (Davis, Piven, & Breazeale, 2014; Jahn &
Kunz, 2012).

Sofia Branco Lopes
EXPLORING THE RELATION BETWEEN CONSUMER MOTIVATIONS & ENGAGEMENT WTH BRANDS IN FACEBOOK
2
The motives of brands to establish an online presence are evident. Facebook gives brands
the possibility of raising brand awareness, generating leads, increasing local sales, driving
online sales and promoting their app through their platform (Facebook Business, 2016).
Contrarily to the acknowledged incentives of brands to be online, the motives of users to
interact with brands through Facebook still need to be better understood (Davis et al.,
2014). While some authors refer to Motivations such as social interaction, Entertainment,
convenience, information and professional advancement (Kim, Sohn, & Choi, 2011),
others enumerate functional, Emotional, self-oriented, social and relational reasons
(Davis et al., 2014). Lastly the participation of users in those Facebook brand pages and
their Engagement with the page is essential for creating strong, loyal followers, who
ultimately become ambassadors of the brand (Bond, Ferraro, Luxton, & Sands, 2010).
1.2 Problem Statement
The reality of our world today is that consumers are online (Schivinski & Dabrowski,
2016) and expect brands to be as well (Parsons, 2011). Therefore brands should make an
effort to be present in social platforms in the most effective way.
Most of the times the inefficiency of the brands social media presence is observable and
therefore it is important to study how companies can overcome this weakness. Clarke
(2012) mentions successful companies that fail miserably in their Facebook presence, for
instance Tesla Motors, Netflix and Goldmansachs are examples of those. These
companies failed for diverse reasons. While Tesla failed for not sharing online its unique
feature, which is its backstory, for Netflix the problem was that the company did not reply
to the consumer’s negative comments and those accumulated quickly, finally for
Goldmansachs the failure cause was merely an issue of online inactivity.
Studying the Motivations that lead consumers to interact with brands in Facebook is the
first step to understand the consumers’ minds and their behaviors and is therefore a very
important issue for companies (Chen, Papazafeiropoulou, Chen, Duan, & Liu, 2014). This
clarification is advantageous as it helps brands to develop successful marketing
campaigns (Underwood, 2016) and communication strategies.

Sofia Branco Lopes
EXPLORING THE RELATION BETWEEN CONSUMER MOTIVATIONS & ENGAGEMENT WTH BRANDS IN FACEBOOK
3
Next, the main Engagement dimension is explored, since it contributes to the core
relationship management of brands (Hollebeek, 2011; Verhoef, Reinartz, & Krafft, 2010)
After both constructs are studied, and as Engagement leads to commitment (Alves da
Silva, 2015; Cheung, Lee, & Jin, 2011) and loyalty (Alves da Silva, 2015; Bowden, 2009)
of consumers, analyzing if there is a causality effect with Motivations is key. With this
result brands perceive better the importance of Motivations and they can work upon it,
allocating more efficiently resources to their page. Finally finding out which Motivations
better explain Consumer Engagement, serves as a selection instrument for the
identification of the most relevant Motivations. For that reason brands should pay
attention to the Motivations that better succeed in explaining consumer behavior and
invest primarily in those. The possibility of segmenting the users dependent on their
Motivations facilitates the resource allocation of brands to their target audience. Besides,
exploring the level of Engagement of each segment leads to a better comprehension of
their loyalty behavior towards the brands.
The research problem of the present thesis is to explore the main Motivations of
consumers to interact with brands in Facebook and the main Consumer Engagement type.
Then the study focuses on exploring whether a causality exists between Motivations and
Consumer Engagement, and if it does, the objective is then to discover which Motivations
better explain Engagement. Finally, the idea is to investigate if there are different
segments according to the different Motivations and if so, the level of Engagement of
each segment is explored.
1.3 Aim
The generic aim of this dissertation is to understand to what extent consumer Motivations
to interact with brands through Facebook are related with Consumer Engagement with
brands. In order to address this aim, four distinct research questions are put forward,
namely:
RQ1. What are the main Motivations for consumers to interact with brands through
Facebook?

Sofia Branco Lopes
EXPLORING THE RELATION BETWEEN CONSUMER MOTIVATIONS & ENGAGEMENT WTH BRANDS IN FACEBOOK
4
RQ2: From a consumer’s perspective, which is the stronger Engagement type
- Behavioral, Emotional or Cognitive- in Facebook?
RQ3. A) Does Motivations influence Consumer Engagement with brands in Facebook?
B) If yes, which are the Motivations that better explain consumers’ Engagement
with brands in Facebook?
RQ4. A) Are there different segments of consumers in terms of Motivations to interact
with brands in Facebook?
B) If yes, what is the Engagement level of each segment?
1.4 Scope
This dissertation objective is to explore Motivational and Engagement aspects of
consumer interaction with brands through a specific social media platform, namely
Facebook. Moreover, the study is based only on the behavior of Portuguese Facebook
users. Thereafter, a quantitative and exploratory study was held with primary data
collected through an online, self-administered questionnaire from 17/October 2016 until
11/November 2016.
1.5 Academic and Managerial Relevance
1.5.1 Academic Relevance
The way people use social media is changing (Underwood, 2016) and the importance it
has acquired in the business context is increasing, since social media has the unique
feature of providing one-to-one conversations at scale (Kemp, 2016). Due to this rapid
change, limited academic research has been carried out to comprehend how to enhance
consumers’ brand experiences through social media (Chen et al., 2014).
Several studies have considered the Motivation factors of consumers to interact with a
brand through social networking sites (Enginkaya & Yilmaz, 2014; Davis et al., 2014;
Kim, Kim, & Nam, 2010; Spiliotopoulos & Oakley, 2013). However none of them studied

Sofia Branco Lopes
EXPLORING THE RELATION BETWEEN CONSUMER MOTIVATIONS & ENGAGEMENT WTH BRANDS IN FACEBOOK
5
it applied to the Portuguese market nor the particular Facebook platform. Besides, there
is much literature on C2C Motivations to interact with brands through social media
networks and still a lack regarding B2C (Weman, 2011; Arnone, Colot, Croquet, Geerts,
& Pozniak, 2010).
Consumer Engagement in the marketing literature is still considered as a new topic
(Jayasingh & Venkatesh, 2015) and a promising emerging concept (Pham & Avnet, 2009;
Avnet & Higgins, 2006; Schau, Muñiz Jr, & Arnould, 2009). The study of the relation
between Motivations and Consumer Engagement is similarly lacking in the academic
literature, even though many authors are aware of the importance of addressing
consumers’ Motivations and interests in order to obtain Consumer Engagement (Tsai &
Men, 2013). Kim, Kim and Wachter (2013) research on this causality exclusively
regarding mobile users, which is limited in terms of scope. Likewise references about the
study regarding the Motivations that better explain consumers’ Engagement are still very
few in the literature. Only Chen (2015) has researched about which Motivations are the
strongest predictors of frequency of social media usage. Nevertheless, this study is limited
to the women bloggers and one specific item of the Consumer Engagement, which is
frequency of social media use. It is missing a richer study of all the drivers of Consumer
Engagement; more items of Motivational factors and a broader spectrum, which is not
focused on a specific industry. Regarding segmentation based on Motivations there is a
lot of literature for the travel industry (Park & Yoon, 2009; Loker-Murphy, 1997; Cha,
McCleary, & Uysal, 1995), however the same does not apply to the digital consumer
Motivations studies (Rohm & Swaminathan, 2004).
This research makes a relevant contribution to the current literature by exploring
Motivations and Consumer Engagement in-depth as well as those concepts’ relation.
1.5.2 Managerial Relevance
This research on the digital consumer behavior covers very relevant issues that are critical
for businesses success, specifically their long-run marketing success (Hutter, Hautz,
Dennhardt, & Füller, 2013). With the increasing number of consumers in social media, it
is still doubtful if companies can effectively tap into this market (Parsons, 2013).

Sofia Branco Lopes
EXPLORING THE RELATION BETWEEN CONSUMER MOTIVATIONS & ENGAGEMENT WTH BRANDS IN FACEBOOK
6
Firstly, studying Motivations, which means understanding how and why people use social
helps marketers create campaigns that resonate with their target audience generating
better results for their clients (Underwood, 2016). As such, brands could adapt the content
in Facebook to their consumers’ preferences, either focusing on giving information,
creating a sense of belonging, promoting offers, promoting socialization among
consumers or even creating viral marketing campaigns and online buzzes. According to
the Social Media Examiner (2015) the marketers themselves are not confident about their
online efforts, as only 45% believe in the success of their work.
Then studying which are the strongest Consumer Engagement dimensions is crucial in
order to acquire insights that help develop social media strategies and achieve the desired
outcomes (Kabadayi & Price, 2014).
After having these two constructs analyzed, it is central to study the Engagement
association to the Motivational factors, since consumers nowadays are bombarded with
information making it imperative for marketers to hold on to consumers’ attention and
keep them engaged (Vohra & Bhardwaj, 2016). Additionally, developing Engagement
strategies increases activities of fans and promotes sustainable brand loyalty (Luarn, Lin,
& Chiu, 2015). For managers knowing about Consumer Engagement levels is not enough
to develop an action plan, since the origins are missing. Highlighting specific Motivations
that better explain Consumer Engagement, gives managers the opportunity of enhancing
their online marketing presence. Again, the objective of managers is to promote
Engagement expecting to acquire consumers’ devotion to the brands (Luarn et al., 2015).
Finally, segmenting the market serves as a basis for understanding and targeting different
groups of consumers and effectively tailor the brands’ social content and activities to
reach those (Rohm & Swaminathan, 2004). So, knowing the Engagement level of each
segment helps identifying the segments that are more and least involved with the brands.
In essence this boils down to the limited understanding of marketers on how social media
can be used most effectively (Nelson-Field Riebe, & Sharp, 2012; Nelson-Field & Klose,
2010) and this study serves as a tool to overcome these managerial difficulties.
1.6 Dissertation Outline
This first chapter presents a brief introduction to the thesis’ subject. The purpose is to
provide an overview of the background scenario, an explanation of the problem and

Sofia Branco Lopes
EXPLORING THE RELATION BETWEEN CONSUMER MOTIVATIONS & ENGAGEMENT WTH BRANDS IN FACEBOOK
7
present its academic and managerial relevance. Chapter 2 presents the results of a review
of extant literature on digital consumer behavior, specifically the use of Facebook as a
business tool, the consumers’ Motivations, the Consumer Engagement and segmentation
issues. Based on this, research questions about the Motivations, the Consumer
Engagement, its relationship and segmentation are formulated for further statistical
testing. The revision of those main concepts serves as a basis for the development of a
Conceptual Framework. Chapter 3 describes the employed methodology used to analyze
the proposed research questions, as both primary and secondary data were collected and
statistically studied. Next, the fourth chapter clarifies the results of this dissertation’s
analysis. In the first place, a preliminary analysis is undertaken in order to check the data
reliability and suitability. After that, the in-depth analysis is carried out. Finally, the last
chapter provides the main conclusions of the thesis and it describes the limitations and
further research that could be conducted in the present context.
Sofia Branco Lopes
EXPLORING THE RELATION BETWEEN CONSUMER MOTIVATIONS & ENGAGEMENT WTH BRANDS IN FACEBOOK
8
Chapter 2. Literature Review and Conceptual Framework
2.1 Web 2.0 and the Emergence of Social Media
2.1.1 Definition of Web 2.0
Web 2.0 was created and defined by O’Reilly in 2004. This second generation of web
enables its users to communicate, connect, share and most importantly create content
online (Baur, 2016). Due to these features, the web was denominated by Vickery and
Wunsch-Vincent (2007) as the “participative web”.
Costa (2014) mentions the concept of user-generated content as being an attribute of Web
2.0. Yoo and Gretzel (2016) differentiate between user-to-user interactions and user-to-
content interactions, for instance ranking the content and posting comments are examples
of user-to-user whereas creating content in a form of text, images, audio or video is part
of user-to-content communications.
Mata and Quesada (2014) consider that Web 2.0 may be regarded as a great social
experiment on a global scale that was made for people and by people (Lai & Turban,
2008; Gillmor, 2006). The global scale mentioned above is confirmed when looking at
the number of internet users throughout the world, 3,419 billion, almost half of the
population worldwide (Kemp, 2016).
In the Portuguese market, more specifically, 92% of individuals under 25 go online
everyday whereas 80% of individuals with an age between 25 and 34 claim to go online
on a daily basis (Google, 2015). Hence these statistics are a proof of the volume of Web
2.0 usage and its relevance.
2.1.2 From Web 1.0 to Web 2.0
The core difference between Web 1.0 to Web 2.0 is that the second-generation websites
allow its users to do more than just retrieving information as it was the case of Web 1.0
(Hollensen & Raman, 2014). To put it differently, Web 1.0 is referred to as the “Web-as-
information source” and Web 2.0 is called the “Web-as-participation-platform” (Gerlitz
& Helmond, 2013; Song, 2010).

Sofia Branco Lopes
EXPLORING THE RELATION BETWEEN CONSUMER MOTIVATIONS & ENGAGEMENT WTH BRANDS IN FACEBOOK
9
The fundamental concept of Web 2.0 is that online users add value by creating contents
using tools such as blogs, wikis and social networks (Yoo & Gretzel, 2016; Chaffey, Ellis-
Chadwick, Mayer, & Johnston, 2009, Parise & Guinan, 2008, O’Reilley, 2005).
As shown in Table 1, Web 2.0 facilitates networking effects among its users whereas Web
1.0 software is seen as merely a product, which offers its users the possibility of visiting
portals that fulfill their information demand.
Table 1. Characteristics of Web 1.0 and Web 2.0 (Mata & Quesada, 2014, based on
O’Reilly, 2007; Lai & Turban, 2008)
FEATURE WEB 1.0 WEB 2.0
METAPHOR FOR THE INTERNET INFORMATION SUPERHIGHWAY PLATFORM FOR INTERACTION
METAPHOR FOR THE WWW
WEB OF INFORMATION RESOURCES
STORED ON A GLOBAL NETWORK
OF SERVERS WHERE WHAT MATTERS
IS RETRIEVAL AND DISPLAY
HUMAN WEB WHERE WHAT
MATTERS IS HUMAN CONTACTS
AND RELATIONS BETWEEN
INDIVIDUALS
MAJOR SITES INFORMATION PORTALS ONLINE SOCIAL NETWORKS
TOOLS
ORIENTED TO DISPLAY AND
RETRIEVE INFORMATION STORED
ON THE INTERNET
DESIGNED TO ENABLE
COLLABORATION AND CONTENT
CREATION ON THE INTERNET
STRATEGY PURSUED EFFICIENCY EFFECTIVENESS
ECONOMIES SOUGHT ECONOMIES OF SCALE NETWORK EFFECTS
SOFTWARE USED SOFTWARE AS A PRODUCT SOFTWARE AS A SERVICE
COMPUTING MODEL CLIENT-SERVER CLOUD COMPUTING
COMMUNICATION RANGE WIDE AND LOCAL AREA NETWORKS MOBILE COMMUNICATION ALSO
CONSIDERED
ISSUES TECHNOLOGICAL SOCIAL
Another web that arouse was Web 3.0, which is recognized as the semantic web (Reis,
2016; Morris, 2011; Hendler, 2009). This third version of web has the particularity of
using metadata, therefore Giustini (2007) believes that this version will transform the web
into a giant database. Hence, Web 3.0 consists on having data as well as documents on
the web so that machines are able to process, transform, assemble, and act on the data in
useful means (Morris, 2011).

Sofia Branco Lopes
EXPLORING THE RELATION BETWEEN CONSUMER MOTIVATIONS & ENGAGEMENT WTH BRANDS IN FACEBOOK
10
2.1.3 Definition and Types of Social Media
Web 2.0 was the platform that enabled the appearance and evolution of social media
(Costa, 2014). According to Hollensen and Raman (2014) the transformation of Web 1.0
to 2.0 relies on switching from a broadcast media monologues, one-to-many, into social
media dialogues, many-to-many.
Any type of website which enables users to share their opinions, contents, interactions,
community building and views can be classified as a social media (Kaur, 2016).
Kaplan and Haenlein (2010) enumerate a number of social networks, namely Delicious,
Digg, Facebook, Flickr, LinkedIn, My Space, Reddit, Second Life, Stumble Upon,
Twitter, Wikis and YouTube (as cited in Montalvo, 2016). In this list social media
platforms as Instagram and Snapchat are missing, which are according to Scheltgen
(2016) the advertisement platforms of the year of 2016.
From a users’ perspective, Xiang and Gretzel (2009) point out the range of opportunities
given to them when visiting social media platforms, such as “posting”, “tagging”,
“digging” and “blogging” (as cited in Yoo and Gretzel, 2016).
The growth of social media and its popularity among consumers is notorious. The world
is witnessing an immense evolution, since already 2,307 billion individuals are active
social media users (Kemp, 2016). In particular in Portugal the consumption of social
media has triplicated in the last seven years (Lusa, 2016). In Portugal, the Facebook
platform has the biggest media users’ market penetration with 93,6%, followed by
YouTube (41,4%), Google+ (40,2%), LinkedIn (37,3%), Instagram (28,9%) and Twitter
(23,6%) (Marktest, 2016).
2.1.4 Web 2.0 and SM in the Business Context
In a business context, firms have realized the significance of Web 2.0 and social media,
since it offers in the first place potential for interacting with consumers and also enables
companies to promote their products and services (Yan Xin, Ramayah, Soto-Acosta,
Popa, & Ai Ping, 2014; Molina-Castillo, Lopez-Nicolas, & Soto-Acosta, 2012). Smith,
Fischer and Yongjian (2012) highlight the increased visibility a brand acquires when it is
present in social networking sites, such as Facebook, YouTube and Twitter (as cited in
Schivinski & Dabrowski, 2016). The emergence of social media is affecting the

Sofia Branco Lopes
EXPLORING THE RELATION BETWEEN CONSUMER MOTIVATIONS & ENGAGEMENT WTH BRANDS IN FACEBOOK
11
companies’ marketing strategies (Erragcha & Romdhane, 2014), since a well-designed
social media marketing strategy will consequently result in: a better understanding of
consumers’ behaviors and preferences; making customers share the brand’s
communication as word-of-mouth among their network; connecting to consumer for
improvement and R&D procedures; increasing brand Engagement and brand message
awareness; and driving traffic to corporate websites (Google, 2015; Smith & Zook, 2011;
Tuten, 2008).
Schivinski and Dabrowski (2016) give examples of companies, such as Starbucks, Coca-
Cola and Guinness, which are highly attuned to consumers’ preferences and tastes, so as
to it is not a coincidence that social media was rapidly integrated into their marketing
strategy. In Portugal the Facebook pages with the largest audiences are Continente, MEO
and NOS with 1882-, 1407-, 1295 million fans, respectively (Social Bakers, 2016).
However, these rankings suffer variances as for instance in October 2016 the top brands
on Facebook were Vodafone PT, McDonalds and Samsung (Social Bakers, 2016).
Parson (2013) argues that it makes no sense nowadays to discuss themes as advertising
and marketing without considering the use of social media. To demonstrate the
dimensions of social media interactions, Bennet (2012) states that every 60 seconds
consumers share more than 600,000 pieces of content, upload 48h of video, create text
greater than 100,000 messages, and create over 25,000 posts with in social media (as cited
in Daugherty and Hoffman, 2014). When considering the Portuguese market, not only did
brands accounted for 30 million interactions in social media throughout the year of 2015
(Markstrat, 2015), but also in the following year 62% of the population claimed to follow
brands in social networks (Markstrat, 2016).
2.1.5 Challenges
Even though the use of Web 2.0 and social media has the purpose of managing to interact
better with its consumers, thus resulting in gaining higher levels of customer satisfaction,
customer loyalty, and customer lifetime value (Baur, 2016); some challenges will appear.
Companies are confronted with new methods of intelligence marketing (Erragcha &
Romdhane, 2014; Viot & Bressolles, 2012), as customers are changing where and how
they spend their time (Parsons, 2013) online.

Sofia Branco Lopes
EXPLORING THE RELATION BETWEEN CONSUMER MOTIVATIONS & ENGAGEMENT WTH BRANDS IN FACEBOOK
12
According to Nair (2011) it is not sufficient for companies to establish online presence,
they must discover how to attract and interact with visitors.
Also Kaur (2016) emphasizes that social media requires time commitment along with
technological expertise, thus companies must be aware that the implementation of an
online strategy costs internal resources.
Another challenge brands face is the increased difficulty to reach fans, since there is high
competition in news feed story given that users are bombarded with an average of 1500
possible stories (Success Stories about Facebook Advertising, 2016). To overcome this
obstacle, brands have to stand out in some way, for instance by paying for online ads.
Furthermore, another key success factor is to achieve consistency among traditional
integrated marketing communication tools and social networking (Hollensen & Raman,
2014). This alignment of online and offline communication is essential as it secures a
clear understanding of the brand image and message.
2.2 Brands’ Presence in Facebook
2.2.1 Facebook History and its Unique Features
Facebook is a social-networking website (Thusoo, 2010) which was founded on the 4th of
February 2004 by Mark Zuckerberg with the aim of providing people power to share and
make the world open and connected (Facebook, 2016).
According to Kaur (2016) Facebook is the most popular social network of the current
days. As a matter of fact, Kemp (2016) states that presently Facebook has 1,59 billion
users worldwide, hence no other social media platform has the ability of boasting the
speed user uptake as Facebook does (Nelson-Field et al., 2012). Also Popp, Wilson,
Horbel and Woratschek (2015) consider Facebook as the most prominent and relevant
example of a social network.
In Portugal, Facebook appears to be an important and well-established social media
platform. The success of Facebook is visible due to its number of users, namely 94% of
the social media users have an account in Facebook (Markstrat, 2016). A study conducted

Sofia Branco Lopes
EXPLORING THE RELATION BETWEEN CONSUMER MOTIVATIONS & ENGAGEMENT WTH BRANDS IN FACEBOOK
13
in October 2016 by Social Bakers proves that 88% of the users interact with brands by
reacting in the form of likes, 9% share their content and 4% comment of their posts (Social
Bakers, 2016). Additionally, this study presents the top 5 industries in Facebook for the
Portuguese audience for the largest 200 pages, namely firstly the retail industry which
accounts 12,496 million likes, followed by the FMCG food, the fashion, the e-commerce
and at lastly the services industries.
2.2.2 Facebook in a Business Context and Top Brands
Facebook is a platform which if used correctly can generate and add value to companies
(Figure 1). Facebook has changed the way companies interact with their network as it
offers several options to contact and communicate with consumers (Jahn & Kunz, 2012).
For the purpose of helping brands in their marketing efforts, Facebook provides guidance
on how to raise brand awareness, generate leads, increase online sales, drive online sales
and promote corporate apps (Facebook – About | Facebook, 2016).
Companies consider Facebook the most attractive social media platform for marketing,
especially for B2C businesses as it offers five distinct options: Facebook Ads; Facebook
Brand Pages; Social Plugins; Facebook Applications; and Sponsored Stories (Cvijikj &
Michahelles, 2014). All of these can be measured using the free tool Facebook provides:
Facebook Analytics. According to Chen (2015) when the goal is creating Consumer
Engagement, marketers and public relations practitioners choose Facebook to reach their
consumers.
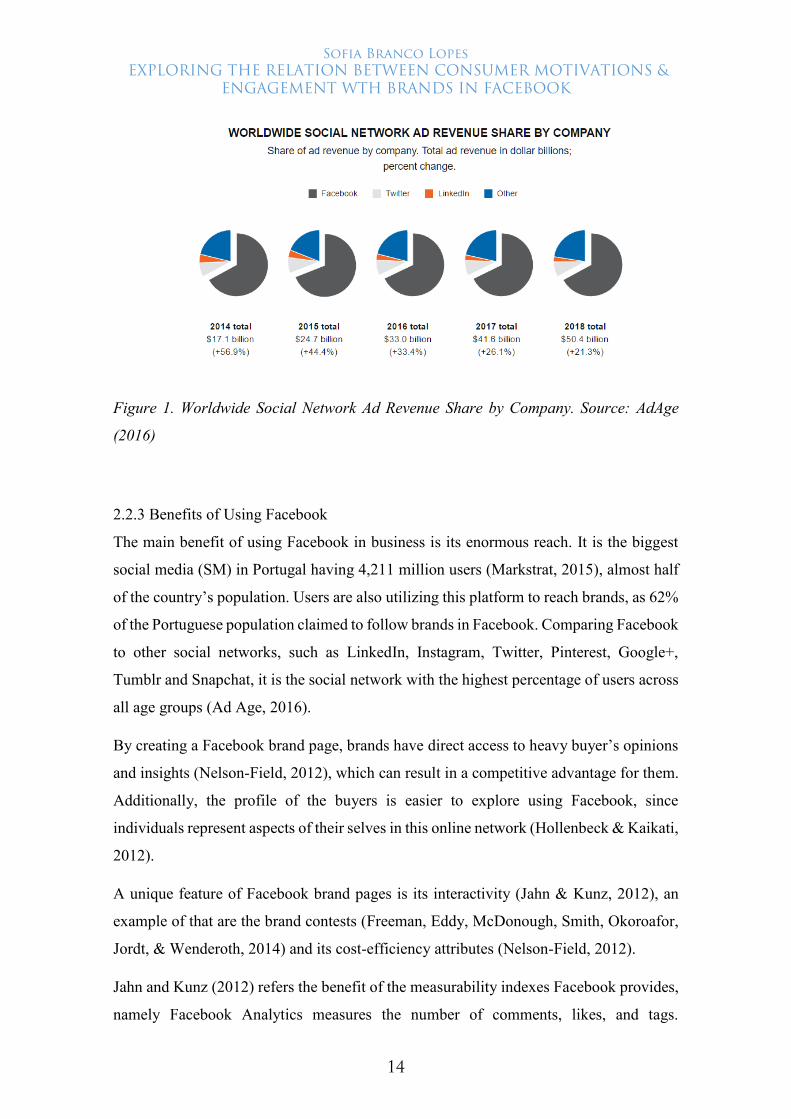
Indeed, Facebook is a useful instrument for brands, since the worldwide social network
ad revenue 2014-2018 comes predominantly from Facebook. As presented in Figure 1,
the revenue derived from Facebook accounts 67% in each of the presented years.
Sofia Branco Lopes
EXPLORING THE RELATION BETWEEN CONSUMER MOTIVATIONS & ENGAGEMENT WTH BRANDS IN FACEBOOK
14
Figure 1. Worldwide Social Network Ad Revenue Share by Company. Source: AdAge
(2016)
2.2.3 Benefits of Using Facebook
The main benefit of using Facebook in business is its enormous reach. It is the biggest
social media (SM) in Portugal having 4,211 million users (Markstrat, 2015), almost half
of the country’s population. Users are also utilizing this platform to reach brands, as 62%
of the Portuguese population claimed to follow brands in Facebook. Comparing Facebook
to other social networks, such as LinkedIn, Instagram, Twitter, Pinterest, Google+,
Tumblr and Snapchat, it is the social network with the highest percentage of users across
all age groups (Ad Age, 2016).
By creating a Facebook brand page, brands have direct access to heavy buyer’s opinions
and insights (Nelson-Field, 2012), which can result in a competitive advantage for them.
Additionally, the profile of the buyers is easier to explore using Facebook, since
individuals represent aspects of their selves in this online network (Hollenbeck & Kaikati,
2012).
A unique feature of Facebook brand pages is its interactivity (Jahn & Kunz, 2012), an
example of that are the brand contests (Freeman, Eddy, McDonough, Smith, Okoroafor,
Jordt, & Wenderoth, 2014) and its cost-efficiency attributes (Nelson-Field, 2012).
Jahn and Kunz (2012) refers the benefit of the measurability indexes Facebook provides,
namely Facebook Analytics measures the number of comments, likes, and tags.

Sofia Branco Lopes
EXPLORING THE RELATION BETWEEN CONSUMER MOTIVATIONS & ENGAGEMENT WTH BRANDS IN FACEBOOK
15
Furthermore, in terms of segmenting the brands’ market, Facebook facilitates this process
as it provides tools to do so effectively.
2.3 Consumer Motivations to interact with a brand in SM
2.3.1 Definition of Motivations
In a general manner, to be motivated means to be moved to do something (Ryan & Deci,
2000). Several authors address the topic of consumer Motivations as they study which are
the Motivations users have to interact with companies through Facebook.
Some authors argue that Motivations differ among self- and social-related stimuli
(Sukoco & Wu, 2010), while others refer to two different types of Motivations; intrinsic
and extrinsic (Shin, 2009). A more complex approach of the types of existing Motivations
is supported by Joinson (2008) as he refers seven different sorts: social connection, shared
identities, photographs, content, social Investigation, social network surfing and status
updating.
Conversely Alves da Silva (2015) refers to the Motivations as a sequential process. He
describes that in the first instance users experience Motivations of Entertainment,
followed by functional Motivations, Motivations about the brand and finally social
Motivations.
To conclude another study conducted by Enginkaya and Yilmaz (2014) revealed another
five distinct Motivation factors, which are “Brand Affiliation”, “Investigation”,
“Opportunity Seeking”, “Conversation”, and “Entertainment”.
2.3.2 Brand Affiliation
Brand Affiliation is a Motivation that describes the congruity with the user’s lifestyle,
possession desires, preference inclination, and intention to promote the brand (Enginkaya
& Yilmaz, 2014). To put it in another way, this connection refers to the extent of overlap
between the brand and the self of its users (Escalas, 2004; Escalas & Bettman, 2003).

Sofia Branco Lopes
EXPLORING THE RELATION BETWEEN CONSUMER MOTIVATIONS & ENGAGEMENT WTH BRANDS IN FACEBOOK
16
Notably Brand Affiliation is contingent upon the quality of consumers’ past experience
with the brand (Escalas & Bettman, 2003; Fournier, 1998). For that reason Brand
Affiliation, might suffer some variances over time depending on the lived experiences.
According to Ferraro, Kirmani and Matherly (2013) individuals with high Brand
Affiliation will maintain their favorable view of the brand, even if brands behave in a
negative manner and vice versa. Therefore the set of brands associations will result in an
important component of brand equity (Escalas & Bettman, 2003).
Several authors describe Brand Affiliation as a process of matching or pairing, where
consumers often select products and brands that are consistent with their self-images
(Kemp, Childers, & Williams, 2012; Hankinson, 2004; Dolich, 1969). For this reason,
when users categorize brands as part of themselves, they develop a sense of oneness with
the brand, therefore establishing Cognitive links that connect the brand with the self (Park,
MacInnis, Priester, Eisingerich, & Iacobucci, 2010).
In essence Brand Affiliation can be measured for instance by analyzing the level of
perceived congruency among users’ lifestyle and the brand (Enginkaya & Yilmaz, 2014).
2.3.3 Opportunity Seeking
Opportunity Seeking is related to the economic benefits consumers can extract by
following a brand in Facebook (Enginkaya & Yilmaz, 2014).
It is common to mention sales, discounts and special offers as frequent reasons for users
to follow a brand in social media platforms (Beukeboom, Kerkhof, & Vries, 2015). This
theory has been tested by Campos (2015) in his research and he confirms that the
inclusion of a discount price or discount percentage on Facebook post images contributes
to an increase in social reach. Also Luarn et al. (2015) believe that remuneration posts
can increase Consumer Engagement.
Seeking for opportunities can be a starting point for consumers to start following brands.
According to Kang, Ryu, Yang, Ko, Cho, Kang, and Cheon (2015) online users tend to
initiate a new relationship with a business when sales promotions are available on their
Facebook brand pages.
To sum up Opportunity Seeking motives are based on incentives users have to pursue
promotions, discounts and new offerings of specific brands via Facebook.
Sofia Branco Lopes
EXPLORING THE RELATION BETWEEN CONSUMER MOTIVATIONS & ENGAGEMENT WTH BRANDS IN FACEBOOK
17
2.3.4 Conversation
Conversation as a Motivational component symbolizes consumers’ need to communicate
with the brands and other consumers (Enginkaya & Yilmaz, 2014).
In addition, also Kim et al. (2010) consider that the need for integration and social
interaction stimulates people to join social networking sites. Conversation gives
consumers the perception that social media is giving them a chance to be heard and
provides at the same time a feeling of being part of something tangible (Davis et al.,
2014). This feeling of belongingness and consideration is valued by consumers,
henceforth social connectedness is accounted for a motive to join Facebook pages of
brands (Logan, 2014; Bonds-Raacke & Raacke, 2010).
Consumers desire connectedness and social interaction (Bond et al., 2010), consequently
if brands provide the conditions for collective social interactions consumers will sense
that their experience with the brands is more valuable (Davis et al., 2014). Besides social
network platforms allow brands to receive feedback and suggestions from consumers
more easily, so that brands respond instantaneously to their consumers providing a better
service (Coelho, Nobre, & Becker, 2014).
In brief Conversation motivations can be measured by understanding how much
consumers value the simplicity and free access Facebook provides to its consumers
(Enginkaya & Yilmaz, 2014).
2.3.5 Entertainment
For Enginkaya and Yilmaz (2014) Entertainment reflects consumers’ affection with the
corporate pages and / or brand related contents boosted by feelings of amusement and
fun. Consumers visit corporate Facebook pages with the intention of finding enjoyable
activities, thus Entertainment, relaxation and passing time are some motives for visiting
those sites (Ruehl & Ingenhoff, 2016). Entertainment activities may include watching
posts, such as videos, anecdotes teasers, slogans or wordplays (Luarn et al., 2015; Cvijikj
& Michahelles, 2013).
Several authors go even further as they consider Entertainment as the most crucial factor
affecting consumer behavior (Luarn et al., 2015; Lin & Lu, 2011; Sledgianowski &

Sofia Branco Lopes
EXPLORING THE RELATION BETWEEN CONSUMER MOTIVATIONS & ENGAGEMENT WTH BRANDS IN FACEBOOK
18
Kulviwat, 2009). Logan (2014) points out two specific social networking sites, which
satisfy consumers need for Entertainment, namely Facebook and Twitter. Not only
brands, but also the own Facebook platform is concerned about giving its users a sense
of Entertainment and fun. In the year of 2016, Facebook launched the possibility of
reacting to posts in form of emojis besides having just the Like button (Denison, 2016).
Videos are one of the main Entertainment activities brands share with its followers. Some
industry experts talk about the video era and state that by 2020 80% of the internet traffic
will be video based (Heine, 2016). In the same way Johnson (2016) states that social
videos will make up 50% of publisher's revenue.
Overall, Entertainment serves as Motivation of following brands in Facebook if for
example users are pursuing influential and creative content online (Enginkaya & Yilmaz,
2014).
2.3.6 Investigation
Investigation is related to the consumers’ quest of reliable information about the brands
and its products or services (Enginkaya & Yilmaz, 2014).
Ruehl and Ingenhoff (2016) describe how the exchange of information among users of
the corporate social network is a major incentive to be present in those networking sites.
Kang et al. (2015) agree that the participation with brands in Facebook happens due to
their purpose of information seeking. Ruehl and Igenhoff (2016) believe that consumers
use those networking sites to seek for unique information that is not available anywhere
else. Besides Logan (2014) sees the desire for information seeking as a tool for customers
to reduce risk when making purchasing decisions. Informative content of posts updates
users about alternatives, so that they end up making better choices (Luarn et al., 2015;
Muntiga et al., 2011).
According to Logan (2014) and Langstedt (2013) there are two types of information
seeking individuals, namely the ones who are passive and just gather information and the
active ones who take a participative role.
Even the Facebook platform is aware of the importance of general informational content
for its users, that’s why in August of 2016, Facebook implemented a new “ranking signal”
that can forecast the type of stories each user find most informative so that it is selected
and appears on their news feed (Shah, 2016).
Sofia Branco Lopes
EXPLORING THE RELATION BETWEEN CONSUMER MOTIVATIONS & ENGAGEMENT WTH BRANDS IN FACEBOOK
19
In a word, information seeking Motivations occur when users acknowledge the reliability
of information in Facebook brand pages (Enginkaya & Yilmaz, 2014).
2.3.7 Market Segmentation of SM users
Segmentation and targeting are commonly identified as the platform for strategic
marketing that benefits sellers as well as consumers (Klein, 2016). Basic forms of market
segmentation, such as distinction between women and men and between buyers vs. non-
buyers, exist ever since the concept of trade appeared. Nowadays the segmentation
approach has evolved and refinements have been made in order to adjust to the increasing
complexity of the marketplace (Plummer, 1974). The advent of “big data” and rise of
digital and social media have changed the segmentation traditional approaches (Baker &
Saren, 2016). Understanding online target segments will facilitate analysis of consumer
Engagement to form insights on a broad spectrum of business activities, for instance
product development, brand and marketing strategy, sales-lead generation, and customer
service and support (Chiu, Lin, & Silverman, 2012). Besides, creating different strategies
for the various groups will result in not only consumer Engagement, but also brand
awareness (Fan & Gordon, 2014). Social media users are a specific kind of audience for
brands. All Facebook users will not use the site in the same way, as they are motivated
by different purposes and understanding the different types of Facebook users is the first
step to communicate with them effectively and offer suitable features (Azar, Machado,
Vacas-de-Carvalho, & Mendes, 2016). Additionally, segmenting has become a valuable
instrument in planning appropriate marketing strategies (Bieger & Laesser, 2002) as it
can concentrate brands’ limited resources (Lee, Lee, & Wicks, 2004) and tailor their
offering to the various customer types (Rohm & Swaminathan, 2004).
2.4 Consumer Engagement
2.4.1 Definition of Consumer Engagement
Malciute (2012) describes the concept of customer brand Engagement on online social
media platforms as interactive customer experiences with the brand, which comprise
expressions of Behavioral, Emotional and Cognitive commitment.

Sofia Branco Lopes
EXPLORING THE RELATION BETWEEN CONSUMER MOTIVATIONS & ENGAGEMENT WTH BRANDS IN FACEBOOK
20
In another perspective, O’Brien (2010) describes Engagement as the quality degree of
consumer experience with the brands and measures it by the level of focused attention,
the perceived usability, the aesthetics, the durability, the novelty and the involvement felt
by its consumers.
The level of Engagement of consumers is influenced by the content brands share with
their followers (Luarn et al., 2015). Choosing the right content is therefore essential, as
Engagement is the first step in building a relationship between the brand and its
consumers. Another advantage of this new online Engagement type is the possibility
brands have to extract insights from not only existing but also potential customers
(Kabadayi & Price, 2014).
Online Engagement has the particularity of provoking the denominated megaphone
effect, which is the high velocity and reach online communication acquires though
consumer comments, shares, likes and page mentions (Campos, 2015).
Specifically, the social platform of Facebook may potentially influence Engagement,
which can be observed through the number of interactions; likes, comments or shares,
number of brand fans (Jayasingh & Venkatesh, 2015). In addition to those tools,
Facebook motivates brands to succeed in engaging its customers, since it awards the most
engaging Pages of the month by distributing the “Blue Ribbon Award” (Ostrow, 2009).
Besides, Facebook continues to have the most engaged users when compared to other
social media platforms, being that 70% of its users log on daily, including 43% who do
so several times a day (Pew Research Center, 2015).
2.4.2 Behavioral Dimension
The Behavioral perspective of Consumer Engagement is considered the most common
construct (Feitosa, Lourenço, Botelho, & Saraiva, 2013; Brodie et al., 2011). Vivek,
Beatty and Morgan (2012) describe the Behavioral context as the actions of consumers.
Thus, Hollebeek et al. (2014) use the term “activation” as a Behavioral dimension as it
defines the level of energy, effort and time spent on a brand in a particular consumer-
brand interaction. For Wirtz, den Ambtman, Bloemer, Horváth, Ramaseshan, van de
Klundert and Kandampully (2013) Consumer Engagement is the Behavioral expression
toward a brand or a firm, which goes beyond the act of purchase.
Sofia Branco Lopes
EXPLORING THE RELATION BETWEEN CONSUMER MOTIVATIONS & ENGAGEMENT WTH BRANDS IN FACEBOOK
21
The Behavioral sphere can be measured through the time users spend on the page of the
brand and the regency of those online visits (Mollen & Wilson, 2010). Van Doorn,
Lemon, Mittal, Nass, Pick, Pirner, and Verhoef (2010) go into more detail as they describe
measures of behavior, for instance word-of-mouth recommendations, helping other
customers, blogging, and writing reviews. In short, higher participation is considered a
Behavioral consequence (Brodie, Hollebeek, Juric, & Ilic, 2011).
The concept of brand loyalty is also mentioned when considering consumer behavior.
According to Vivek et al. (2012) brand loyalty is the biased Behavioral response
expressed over a period of time. Certainly when consumers sense satisfaction from past
interactions with brands, they will develop a positive behavior (Wirtz et al., 2013).
The behavior of consumer is subject to change over time, thus presenting high
vulnerability. According to Hollebeek et al. (2014) the reason for the switching behavior
pattern of consumers is the today’s highly competitive environment.
To sum up the Behavioral sphere of Consumer Engagement can be measured through the
frequency of Facebook brand page visits or interactions in a Facebook brand page
(Malciute, 2012).
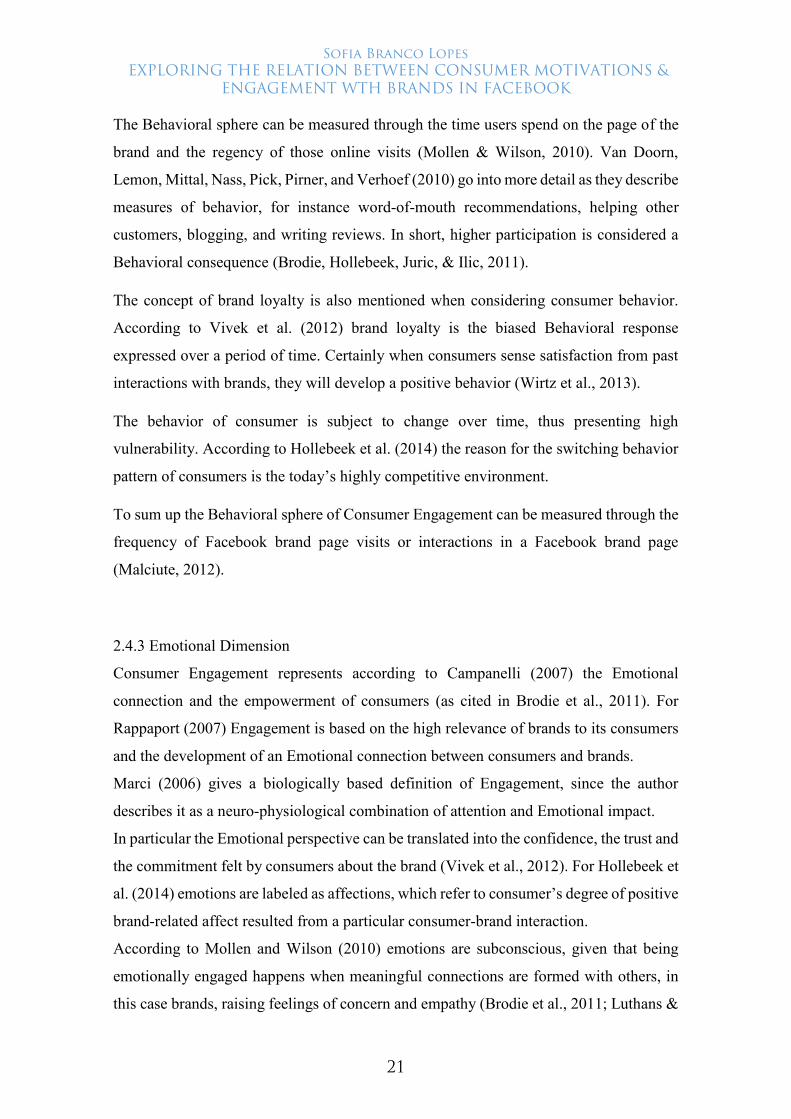
2.4.3 Emotional Dimension
Consumer Engagement represents according to Campanelli (2007) the Emotional
connection and the empowerment of consumers (as cited in Brodie et al., 2011). For
Rappaport (2007) Engagement is based on the high relevance of brands to its consumers
and the development of an Emotional connection between consumers and brands.
Marci (2006) gives a biologically based definition of Engagement, since the author
describes it as a neuro-physiological combination of attention and Emotional impact.
In particular the Emotional perspective can be translated into the confidence, the trust and
the commitment felt by consumers about the brand (Vivek et al., 2012). For Hollebeek et
al. (2014) emotions are labeled as affections, which refer to consumer’s degree of positive
brand-related affect resulted from a particular consumer-brand interaction.
According to Mollen and Wilson (2010) emotions are subconscious, given that being
emotionally engaged happens when meaningful connections are formed with others, in
this case brands, raising feelings of concern and empathy (Brodie et al., 2011; Luthans &

Sofia Branco Lopes
EXPLORING THE RELATION BETWEEN CONSUMER MOTIVATIONS & ENGAGEMENT WTH BRANDS IN FACEBOOK
22
Peterson, 2002). Contrarily Hollebeek et al. (2014) explain that brand experiences are not
related to an Emotional relationship concept.
On the whole the Emotional dimension of Consumer Engagement can be verified by the
level of enthusiasm, excitement, significance, interest or inspiration users have about the
Facebook fan page of a brand (Malciute, 2012).
2.4.4 Cognitive Dimension
While some authors define Consumer Engagement as a multidimensional concept which
embodies Cognitive, Emotional and Behavioral activities (Hollebeek et al., 2014), others
restrict the concept to an activity that involves mainly Cognitive processes, such as
problem-solving, reasoning, decision-making and evaluation (Mollen & Wilson, 2010;
Kearsley & Schneiderman, 1998). Then again some authors do not agree with this
approach and consider that Engagement requires more than just the exercise of cognition;
it requires satisficing of experimental- and instrumental value (Mollen & Wilson, 2010).
In many literature works the notion of cognition and connection are related. Brodie et al.
(2011) link the Cognitive and Emotional dimensions to the term connection. It is
important to emphasize the main difference among Emotional dimensions, as they are
considered subconscious decisions (Mollen & Wilson, 2010), and the Cognitive
dimensions, which expresses conscious decisions (Kim et al., 2013).
Cognitive elements are subjective to its users, as they incorporate the experiences and the
feelings of customers towards the brands (Vivek et al., 2012). According to Kim et al.
(2013) Cognitive behavior is connected to consumer’s perception about the brand and
usually it includes utilitarian motives.
The degree of cognition that relies in Consumer Engagement can be explored by asking
some attitudinal patterns, for instance if the sense of time is lost when users are browsing
on the Facebook brand page (Malciute, 2012).
2.5 Conclusions and Conceptual Framework
The focus of the study is to explore the relation between consumer Motivations and
Engagement with brands of Facebook users. The Motivations are assessed and based on

Sofia Branco Lopes
EXPLORING THE RELATION BETWEEN CONSUMER MOTIVATIONS & ENGAGEMENT WTH BRANDS IN FACEBOOK
23
Enginkaya and Yilmaz’s (2014) study, which identifies five distinct items: “Brand
Affiliation”, “Investigation”, “Opportunity Seeking”, “Conversation”, and
“Entertainment”. For the Consumer Engagement factors the study of Malciute (2012)
serves as a basis, which includes three dimensions: “Behavioral”, “Emotional”, and
“Cognitive”.
Firstly, the aim is to explore which Motivations are the most significant and from a
consumer’s perspective which are the key Consumer Engagement dimensions. Secondly,
the five Motivation factors are explored, in order to check if they are related to the
Consumer Engagement and which ones better explain the Engagement. Lastly, the
objective is to segment the market according to the consumers’ Motivations and discover
which segments are more engaged with brands.
Figure 2 schematizes the conceptual framework developed.
Figure 2. Conceptual Framework.
Source: Own Source.

Sofia Branco Lopes
EXPLORING THE RELATION BETWEEN CONSUMER MOTIVATIONS & ENGAGEMENT WTH BRANDS IN FACEBOOK
24
Chapter 3. Methodology
3.1 Research Approach
According to Saunders, Thornhill and Prandelli (2009) there are three types of research
approaches, namely the exploratory, the descriptive and the explanatory research.
Exploratory research is used to comprehend a problem, which has not yet been studied
in-depth. For this approach the researchers describe the new problem statement by
collecting primary data, frequently through qualitative research, such as interviews and
focus groups (Saunders et. al, 2009). The second approach, the descriptive research, has
the objective of providing a meticulous point of view of an issue or theory that has been
analyzed already in the past. In contrast to the first approach, the descriptive research is
supported on secondary data collected through quantitative research. Finally, the
explanatory method’s goal is to establish a causality between variables, in other words it
tests the causal relationships underlying a problem. This approach is used when
theoretical insights exist, so that hypotheses are formulated and tested. Generally all the
process is completed through qualitative research and primary data collection.
In this dissertation, an exploratory and descriptive research approach was undertaken, by
analyzing the main Motivations and Consumer Engagement dimensions of the studied
sample. The present study is quantitative.
3.2 Research Instruments
3.2.1 Population and Sample
The statistical population defined by Malhotra (2006) is the collection of elements or
objects that possess the information desired by the researcher and that will be of use for
his conclusions. The population is defined by four dimensions, to be exact it is described
by its elements, sampling units, extent and time. The statistical sample is the portion or
parcel selected according to the population (Marconi & Lakatos, 2011).
Sofia Branco Lopes
EXPLORING THE RELATION BETWEEN CONSUMER MOTIVATIONS & ENGAGEMENT WTH BRANDS IN FACEBOOK
25
For this dissertation, the population is composed by Portuguese individuals, aged up 18
years old, that have an account on Facebook. According to the Marktest studies (2016)
94% of the Portuguese social media active individuals have a Facebook account,
corresponding to circa 4,211 million individuals. The present study uses a non-
probabilistic convenience sample.
3.2.2 The Questionnaire
This research used a structured and self-administered questionnaire (Appendix 1), which
considered the information needs and the data collection method chosen, namely an
online questionnaire.
Efforts were made to guarantee that the questions were as comprehensible and uniform
as possible, in order to prevent that different meanings could create some confusions
among respondents, resulting in incorrect answers. This objective was achieved based on
Malhotra’s (1999) and DeVellis’ (1991) recommendations.
Nonetheless, an attempt was made to certify that wordings of the attributes were clear,
objective and not too extensive, following some author’s recommendations (Malhotra,
1999).
It should be taken into account that the final part of the questionnaire consisted of socio-
demographic characterization data.
Finally the questionnaire was subjected to a pre-test before the launch. This pre-test was
answered by 37 individuals and the main findings were that the measurement model had
good internal consistency and proved to be adequate for the study.
3.2.3 The Measures
The measures were adapted from previous studies. The Motivation scale was measured
by fifteen items adapted from Enginkaya and Yilmaz (2014). The Consumer Engagement
scale was measured by twenty-one items adapted from Malciute (2012).
In this questionnaire, 7-point Likert Scale was used, with the intention of classifying
respondents’ positions on each one of the questions.

Sofia Branco Lopes
EXPLORING THE RELATION BETWEEN CONSUMER MOTIVATIONS & ENGAGEMENT WTH BRANDS IN FACEBOOK
26
According to Malhotra (2006) this scale is widely used and requires respondents to
indicate a degree of agreement and disagreement with each of a series of statements. Most
of the items were measured on a 7-point Likert scale, where 1 represents “strongly
disagree” and 7 represents “strongly agree”. The remaining items requires the respondents
to indicate the frequency of some actions. For that the items were measured also on a 7-
point scale, where 1 represents “Never” and 7 represents “All the Time”.
The English questionnaire was translated into Portuguese (Appendix 2). With the purpose
of ensuring that the questionnaire captured the same meanings across languages,
considerable effort was undertaken to ensure conceptual comparability.
The professional questionnaire service, Qualtrics (www.qualtrics.com), was used to
create an online survey and to ensure data protection.

Sofia Branco Lopes
EXPLORING THE RELATION BETWEEN CONSUMER MOTIVATIONS & ENGAGEMENT WTH BRANDS IN FACEBOOK
27
Chapter 4. Results Analysis
4.1 Preliminary Analysis
4.1.1 Data Collection and Analysis
The questionnaire was considered by 478 individuals, by which 122 started to fill the
survey and did not entirely complete it. From the 356 respondents that completed the
survey, 6 are not Facebook users, therefore the total sample comprised 350 participants.
The sample collection took place from 17th of October 2016 until the 11th of November
2016 and its distribution was made via social media, mainly Facebook as it was suited for
its users, LinkedIn and via e-mail.
The analysis of the data collected was carried out with the program SPSS – Statistical
Package for Social Sciences 24.0.
4.1.2 Sample Characterization
The final sample of the questionnaire consisted of marginally more female, 62%, than
male participants, 38% (Figure 3).
With regard to the sample age distribution there was a clear majority of young adults
between the ages of 18 and 25, 64%; following the next generation of individuals between
Male38%
Female62%
Gender Distribution
Male Female
Figure 3. Gender Distribution. Source: Own source.

Sofia Branco Lopes
EXPLORING THE RELATION BETWEEN CONSUMER MOTIVATIONS & ENGAGEMENT WTH BRANDS IN FACEBOOK
28
26 and 30 years old, 15%; 11% were adults from 31 to 45 years old and 9% were aged
between 46 and 60 years. Representing only 1% of the sample were elderly with more
than 60 years (Figure 4).
As far as the monthly income of the respondents is concerned, the most common net
income value was equivalent to 0 – 500 Euros, 42,3% of the sample. Next 87 individuals
claimed to have a net income that corresponds to a value between 1,001 – 2,500 Euros
and 75 stated that they receive less, namely from 501 to 1,000 Euros. Very few
respondents had monthly net incomes between 2,501 and 3,500 Euros and more than
3,500 Euros, namely just 6,3% and 5,1%, respectively (Figure 5).
Figure 5. Monthly Net Income Distribution. Source: Own source.
148: 42,3%
75; 21,4%
87; 24,9%
22; 6,3%
18; 5,1%
Monthly Net Income Distribution
> 3500 € 2501 - 3500 € 1001 - 2500 € 501 - 1000 € 0-500 €
225; 64%
54; 15%37; 11% 32; 9%
2; 1%
Age Distribution
18 - 25 26 - 30 31 - 45 46 - 60 > 60
Figure 4. Age Distribution. Source: Own Source.
Sofia Branco Lopes
EXPLORING THE RELATION BETWEEN CONSUMER MOTIVATIONS & ENGAGEMENT WTH BRANDS IN FACEBOOK
29
4.1.3 Data Screening Univariate Outliers – Multivariate Outliers
With the aim of improving the quality of the data, the first step before proceeding to the
analysis is to undertake a data cleaning process. This process involves an outlier analysis
in univariate and multivariate terms.
This first analysis of the univariate outliers enables to identify cases of extreme values,
in other words it recognizes values that are not common among the sample for the 36
items of the dataset.
In order to verify the presence of outliers in the single variables, all scores of each item
were converted into standardized Z-scores. For a level of significance of 5%, Z-scores
larger and smaller than 3,29 are considered outliers. With this in mind, the dataset
presented seven univariate outliers of three different variables, as observable in Appendix
3.
The second outlier analysis is the multivariate, which enables the identification of
respondents with uncommon combination of values in two or more variables.
This test involved the calculation of Mahalanobis D² for each respondent using the Linear
Regression for the eight different variables and saving the Mahalanobis values. Then a
Chi-square distribution was created and the results show that no p-value was below 0,001
confirming the non-existence of multivariate outliers.
The outcome of this analysis confirms the existence of only univariate outliers in the
dataset, however they were not eliminated from the sample. The decision to keep the
outliers in the sample was due to the fact that the literature is still controversial regarding
this subject.

Sofia Branco Lopes
EXPLORING THE RELATION BETWEEN CONSUMER MOTIVATIONS & ENGAGEMENT WTH BRANDS IN FACEBOOK
30
4.1.4 Data Reliability
Cronbach’s alpha for both scales was assessed, as presented in Table 2 and Table 3.
Table 2. Reliability Test – Motivations
SCALE INITIAL
NUMBER OF
ITEMS CRONBACH’S Aᵃ
CRONBACH’S Aᵇ
IF ITEM DELETED ITEM
DELETED
FINAL
NUMBER OF
ITEMS BRAND
AFFILIATION 4 0,853 --- --- 4
OPPORTUNITY
SEEKING 3 0,827 --- --- 3
CONVERSATION 3 0,811 --- --- 3
ENTERTAINMENT 3 0,729 --- --- 3
INVESTIGATION 2 0,843 --- --- 2
ᵃ: Cronbach’s alpha for the total measure
ᵇ: Cronbach’s alpha after excluding items
Source: Own source.
Table 2 demonstrates that all Motivation items have satisfactory levels of internal
consistency, since all alpha values are greater than 0,70. According to DeVellis (1991)
alphas that are below 0,6 are unacceptable, alphas between 0,65 and 0,7 are minimally
accepted, alphas between 0,7 and 0,8 are considered to be good and alphas from 0,8 until
0,9 are very good, therefore all of the presented alphas are good and most of them even
very good. Given that the alphas are so strong, no items should be deleted from each of
the five variables.
Table 3. Reliability Test – Consumer Engagement
SCALE INITIAL
NUMBER OF
ITEMS CRONBACH’S Aᵃ
CRONBACH’S Aᵇ
IF ITEM DELETED ITEM
DELETED
FINAL
NUMBER OF
ITEMS BEHAVIORAL 9 0, 907 --- --- 9
EMOTIONAL 6 0, 924 --- --- 6
COGNITIVE 6 0, 942 --- --- 6
ᵃ: Cronbach’s alpha for the total measure
ᵇ: Cronbach’s alpha after excluding items
Source: Own source.
Likewise, Table 3 presents very strong levels of internal consistency in all of the three
items. All alpha values are greater than 0,9, very good according to DeVellis (1991).

Sofia Branco Lopes
EXPLORING THE RELATION BETWEEN CONSUMER MOTIVATIONS & ENGAGEMENT WTH BRANDS IN FACEBOOK
31
4.1.5 Principal Component Analysis
Since one of the main goals of the study is to discover if a causality among the two
constructs exists, a Principal Component Analysis (PCA) is performed as a first step. This
analysis is used to assess the dimensionality of the constructs and to verify if all factors
are aggregated around the component they are supposed to measure.
Comrey and Lee (1992) define the efficiency of samples according to their sample size,
so that they advocated the idea that a sample of less than 100 respondents is poor, a sample
of 200 respondents is fair, a sample of 500 is considered by them as a very good sample
and indeed one of 1000 respondents is excellent. Since this research is based on a dataset
of 350 respondents it is between a fair and very good sample consideration and therefore
it is adequate to perform a factor analysis like this.
PCA was run with Varimax rotation. The factor analysis was subject to a fixed number
of factors, 8, which represent the total number of items present in both constructs. The
results demonstrate that with this 8 Factor Analysis 74,917% of the variance is explained.
Almost all the items belonging to each variable were allocated to one factor, except for 6
items.
Within the two different variables, Behavioral and Emotional, six items were not
aggregated around the factor they were supposed to: EM6, BE1, BE2, BE3, BE8, and
BE9. These items were then removed.
The Kaiser-Meyer-Olkin Measure of Sampling Adequacy (KMO) varies between 0 and
1. In this case the KMO value is high as it corresponds to 0,953, this means that the
correlations are compact consequently the factor analysis will yield reliable factors.
Kaiser (1974) considers KMO’s in the 0,90s range as marvelous values.
The Barlett’s Test of Sphericity value is supposed to reach a significance level that
supports the factorability of the correlation matrix obtained from the items. This test
revealed a significance value of p<0,001, which proves that the factorability of the
correlation matrix is appropriate. The approximated Chi-square value is of 10252,043.
All of these results are presented in Appendix 4.

Sofia Branco Lopes
EXPLORING THE RELATION BETWEEN CONSUMER MOTIVATIONS & ENGAGEMENT WTH BRANDS IN FACEBOOK
32
4.1.6 Measurement Model
Due to the elimination of the six items that were present in the Behavioral and Emotional
Scale, a new analysis regarding these scales’ reliability was performed and presented in
Table 4.
Table 4. Reliability Test – Consumer Engagement
SCALE INITIAL
NUMBER OF
ITEMS
CRONBACH’S
Aᵃ
CRONBACH’S
Aᵇ IF ITEM
DELETED ITEM DELETED
FINAL
NUMBER OF
ITEMS BEHAVIORAL 4 0,859 --- --- 4
EMOTIONAL 5 0,919 --- --- 5
ᵃ: Cronbach’s alpha for the total measure
ᵇ: Cronbach’s alpha after excluding items
Source: Own source.
Identically to the previous results, the levels of internal consistency are very good based
on the DeVellis (1991) references and for that reason none of the items are worth
removing.
A PCA was drawn with the new items selection, excluding the items that were identified
in the previous analysis. In this case, the factor analysis, which passed through the same
procedure, namely using a Varimax rotation and setting 8 fixed number of items, showed
satisfactory results. All the various items belonging to each variable were allocated to
distinct factors, this time with no exceptions. The results prove that with this 8 Factor
Analysis 77,053% of the variance is explained.
Moreover, the KMO is high as it corresponds to 0,943. For Hutcheson and Sofroniou
(1999) values between 0,5 and 0,7 are normal, values between 0,7 and 0,8 are good,
values between 0,8 and 0,9 are great and values above 0,9 superb. In that line of thought
the presented KMO value is superb.
The Barlett’s Test of Sphericity value is proven to be significant (p<0,001) confirming
the suitability of the factorability of the correlation matrix obtained from the items. For
the approximated Chi-square value the result is of 7879,664. The results of this test are
revealed in Appendix 5.

Sofia Branco Lopes
EXPLORING THE RELATION BETWEEN CONSUMER MOTIVATIONS & ENGAGEMENT WTH BRANDS IN FACEBOOK
33
4.1.7 Correlation Analysis
A Pearson Correlation Analysis was assessed for all variables. This analysis had the
purpose of testing the strength and significance of the correlations between the eight
variables. Results show that all the correlations are positive and significant at the level of
0,01 and most of them are strong with values above 0,45 as presented in Appendix 6.
4.2 In Depth-Analysis
4.2.1 The main Motivations and Consumer Engagement
RQ1. What are the main Motivations for consumers to interact with brands through
Facebook?
New variables based on the dimensions mentioned in the Literature Review, were created,
namely Brand Affiliation, Opportunity Seeking, Conversation, Entertainment and
Investigation (as it can be observed in Appendix 7).
Table 5. Descriptive Statistics – Motivations
N MINIMUM MAXIMUM MEAN STD.
DEVIATION BRAND
AFFILIATION 350 1,00 7,00 4,2057 1,36269
OPPORTUNITY
SEEKING 350 1,00 7,00 4,8000 1,14250
CONVERSATION 350 1,00 7,00 4,6810 1,18442
ENTERTAINMENT 350 1,00 7,00 4,4648 1,10014
INVESTIGATION 350 1,00 7,00 4,3743 1,13421
VALID N ( LISTWISE)
350
Source: Own source.
The main Motivations to interact with brands through Facebook are Opportunity Seeking
(�̅� = 4,8), Conversation (�̅� = 4,7) and Entertainment (�̅� = 4,5).

Sofia Branco Lopes
EXPLORING THE RELATION BETWEEN CONSUMER MOTIVATIONS & ENGAGEMENT WTH BRANDS IN FACEBOOK
34
RQ2: From a consumer’s perspective, which is the stronger Engagement type
- Behavioral, Emotional or Cognitive- in Facebook?
New variables based on the dimensions mentioned in the Literature Review, were created,
namely Behavioral, Emotional and Cognitive (as it can be observed in Appendix 8).
Table 6. Descriptive Statistics - Consumer Engagement
N MINIMUM MAXIMUM MEAN STD.
DEVIATION BEHAVIORAL 350 1,00 7,00 2,1893 1,06541
EMOTIONAL 350 1,00 7,00 3,2520 1,45414
COGNITIVE 350 1,00 7,00 2,7171 1,43649
VALID N ( LISTWISE)
350
Source: Own source.
From a consumer’s perspective, the Emotional (�̅� = 3,3) dimension is the strongest
Engagement type.
4.2.2 The Power of Motivations as a Predictor of Engagement
RQ3. A) Does Motivations influence Consumer Engagement with brands in Facebook?
B) If yes, which are the Motivations that better explain consumers’ Engagement
with brands in Facebook?
New variables based on the dimensions mentioned in the Literature Review, were created,
namely Motivations and Consumer Engagement (as it can be observed in Appendix 9).

Sofia Branco Lopes
EXPLORING THE RELATION BETWEEN CONSUMER MOTIVATIONS & ENGAGEMENT WTH BRANDS IN FACEBOOK
35
Table 7. Linear Regression
DEPENDENT VARIABLE: CONSUMER ENGAGEMENT
Independent Variable
Standardized Betas
T Sig.
(CONSTANT) - -5,134 0,000
MOTIVATIONS 0,685 17,538 0,000
ADJUSTED R² 0,468 (D-W= 1,879)
F (1, 348) 307,565 (P=0,000)
p<0,05; D-W=Durbin-Watson test
Source: Own source.
In order to analyze whether Motivations influence the Consumer Engagement a Linear
Regression (Table 7) was performed. The results of this test demonstrate that this
causality is verified and significant, due to its F value, F(1,348)=307,565; p=0,000. The
model presents an adjusted R² of 0,468, pointing out that 46,8% of the variable variation
is explained by this model. The Motivations have a beta of 0,685 and a p-value of 0,000,
which proves again its significance and that the influence on Consumer Engagement is
positive. Hence, the third research question, which suggested the effect of Motivations in
Consumer Engagement is confirmed.
Table 8. Multiple Linear Regression
DEPENDENT VARIABLE: CONSUMER ENGAGEMENT
INDEPENDENT
VARIABLE STANDARDIZED
BETAS T SIG. VIF.
(CONSTANT) - -3,861 0,000 -
BRAND
AFFILIATION 0, 398 7,654 0,000 1,838
OPPORTUNITY
SEEKING 0, 079 1,517 0,130 1,827
CONVERSATION 0, 082 1,671 0,096 1,618
ENTERTAINMENT 0, 152 2,936 0,004 1,821
INVESTIGATION 0, 161 3,154 0,002 1,768
ADJUSTED R² 0,486 (D-W= 1,917)
F (5, 344) 67,098 (P=0,000)
p<0,05; D-W=Durbin-Watson test; VIF= Variance inflation factor (Multicollinearity
measure; VIF<5,000)
Source: Own source.
A deeper analysis of this causality consists on exploring which Motivations better explain
Consumer Engagement. For this purpose a Linear Multiple Regression (Table 8) was

Sofia Branco Lopes
EXPLORING THE RELATION BETWEEN CONSUMER MOTIVATIONS & ENGAGEMENT WTH BRANDS IN FACEBOOK
36
undertaken. In like manner, the adjusted R² is high and represents 48,6%, which is the
percentage of the variable variance that is explained by the model. In addition to that the
test is significant as it has a p-value of 0,000, F(5, 344)=67,098.
Regarding the Motivation dimensions, two of them are not significant for a confidence
level of 5%. These dimensions are Opportunity Seeking and Conversation, since its p-
values are of 0,130 and 0,096, respectively. The remaining three are significant. In
particular Brand Affiliation is the most significant with a standardized beta of 0,398.
Following this Motivation is Investigation (ß= 0,161) and Entertainment (ß= 0,152).
Since all betas present values above 0, the influence of each Motivation factor towards
Consumer Engagement is positive. Overall the answer to the research question is that
Brand Affiliation, followed by Investigation and Entertainment are the Motivations that
better explain Engagement. In fact the remaining Motivations do not significantly explain
Consumer Engagement.
4.2.3 The Importance of Segmentation based on Motivations
RQ4. A) Are there different segments of consumers in terms of Motivations to interact
with brands in Facebook?
B) If yes, what is the Engagement level of each segment?
Following the remark by Dibb, Stern and Wensley (2002) and Kotler (1997) marketing
segmentation is one of the fundamental principles of marketing, since consumers cannot
be considered as homogeneous group. The Two-Step cluster analysis is suitable for large
samples (Okazaki, 2006), for that reason this was the method chosen to segment the
market based on the Motivational factors of consumers. Schwarz criterion identifies three
distinct clusters as the optimum solution for this procedure. The importance of each
predictor was observed and results demonstrate that Brand Affiliation is the most
important predictor of this segmentation process, since it has the maximum value of 1,00.
Following this variable is Investigation with an importance of 0,67; Opportunity Seeking
(0,66), Entertainment (0,63) and Conversation (0,60). The silhouette measure of cohesion
and separation is a measure of the clustering solution’s overall goodness-of-fit. In this
case the value accounts 0,4. This measure is essentially based on the average distances
between the objects and can vary between 0 and 1. Specifically, a silhouette measure of

Sofia Branco Lopes
EXPLORING THE RELATION BETWEEN CONSUMER MOTIVATIONS & ENGAGEMENT WTH BRANDS IN FACEBOOK
37
less than 0,20 indicates a poor solution quality, a measure between 0,20 and 0,50 a fair
solution, whereas values of more than 0,50 indicate a good solution (Appendix 10).
From a total of 350, more than a half was assigned to the second cluster, namely 190
(54,3%) individuals. The remaining were distributed to the third cluster, 102 (29,1%) and
58 (16,6%) to the first cluster (Appendix 11). This segmentation process is the answer to
the fifth research question, which aspires to explore the segments according to the
Motivations of using Facebook as a platform to interact with brands (Figure 6).
Figure 6. Cluster Size
Source: Own source.
Table 9 presents the main characteristics of each segment, namely the Motivations and
Consumer Engagement relevance, the demographic traits and even certain behavioral
patterns insights. Regarding the significance of our segmentation-based variables, all of
the five Motivations are significant among clusters (Appendix 12). Likewise the
Consumer Engagement dimensions are significantly different among clusters (p-value
(Behavioral)= 0,000; p-value (Emotional)= 0,000; p-value (Cognitive)= 0,000),
(Appendix 13). It is important to emphasize that the demographic characteristics such as
gender and monthly income have proven not to be significant among clusters (p-value
(gender)= 0,126; p-value (income)= 0,803) and only the age was considered significant
(p-value= 0,001), (Appendix 14). Besides, even though the behavioral traits are not based
on previous statistical tested scales, those have proven to be significantly different
Cluster 117%
Cluster 254%
Cluster 329%
CLUSTER SIZE

Sofia Branco Lopes
EXPLORING THE RELATION BETWEEN CONSUMER MOTIVATIONS & ENGAGEMENT WTH BRANDS IN FACEBOOK
38
regarding frequency of Facebook, Instagram, LinkedIn and Pinterest usage (Recoded
variables, Appendix 15), the hours spent on social media, the amount of brands liked in
Facebook and the likes made to brands of the Fashion sector (Recoded Variables,
Appendix 16). The only variables that are not significantly different among clusters are
the likes to brands within the Technology, Design and Tourism industries (Appendix 17).
Table 9. The Three Clusters’ Identities
THE FACEBOOK ADDICTS THE YOUNG PROMOTION
DIGGERS THE PASSIVE SENIORS
1. Conversation 2. Opportunity Seeking 3. Investigation
1. Opportunity Seeking 2. Conversation 3. Brand Affiliation
1. Conversation 2. Opportunity Seeking 3. Entertainment
1. Emotional 2. Cognitive 3. Behavioral
1. Emotional 2. Cognitive 3. Behavioral
1. Emotional 2. Behavioral 3. Cognitive
40% Male 60% Female
Age 18 – 45 (100%)
Majority income (47%): 0 – 500€
33% Male 67% Female
Age 18 – 30 (84%)
51% income: 501 – 3500€
45% Male 55% Female
Age 31 – 60 (35%)
85% income: 0 – 2500€
83 % Are Heavy Facebook Users
17% more than 3 hours / day on Facebook
64 % liked more than 15 brands
Brands Liked: Technology , Fashion
68 % Are Heavy Facebook users, 55% Are Heavy Instagram users
31% Between 1 and 2 hours / day on Facebook
38 % Liked more than 15 brands
Brands Liked: Fashion, Tourism
48 % Are Heavy Facebook users, 36% Are Light Instagram users
Minority (7%) More than 3 Hours on Facebook a day
75 % Liked between 1 and 5 brands
Brands Liked: Fashion, Tourism
Source: Own Source.
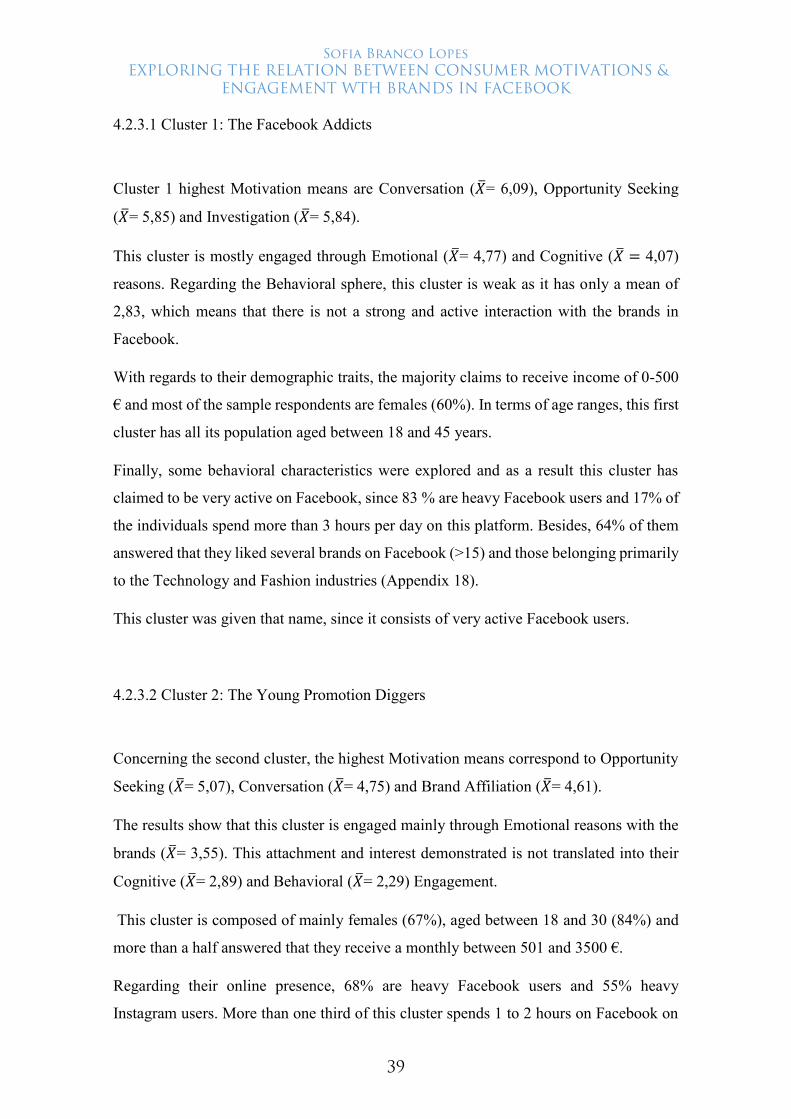
Sofia Branco Lopes
EXPLORING THE RELATION BETWEEN CONSUMER MOTIVATIONS & ENGAGEMENT WTH BRANDS IN FACEBOOK
39
4.2.3.1 Cluster 1: The Facebook Addicts
Cluster 1 highest Motivation means are Conversation (�̅�= 6,09), Opportunity Seeking
(�̅�= 5,85) and Investigation (�̅�= 5,84).
This cluster is mostly engaged through Emotional (�̅�= 4,77) and Cognitive (�̅� = 4,07)
reasons. Regarding the Behavioral sphere, this cluster is weak as it has only a mean of
2,83, which means that there is not a strong and active interaction with the brands in
Facebook.
With regards to their demographic traits, the majority claims to receive income of 0-500
€ and most of the sample respondents are females (60%). In terms of age ranges, this first
cluster has all its population aged between 18 and 45 years.
Finally, some behavioral characteristics were explored and as a result this cluster has
claimed to be very active on Facebook, since 83 % are heavy Facebook users and 17% of
the individuals spend more than 3 hours per day on this platform. Besides, 64% of them
answered that they liked several brands on Facebook (>15) and those belonging primarily
to the Technology and Fashion industries (Appendix 18).
This cluster was given that name, since it consists of very active Facebook users.
4.2.3.2 Cluster 2: The Young Promotion Diggers
Concerning the second cluster, the highest Motivation means correspond to Opportunity
Seeking (�̅�= 5,07), Conversation (�̅�= 4,75) and Brand Affiliation (�̅�= 4,61).
The results show that this cluster is engaged mainly through Emotional reasons with the
brands (�̅�= 3,55). This attachment and interest demonstrated is not translated into their
Cognitive (�̅�= 2,89) and Behavioral (�̅�= 2,29) Engagement.
This cluster is composed of mainly females (67%), aged between 18 and 30 (84%) and
more than a half answered that they receive a monthly between 501 and 3500 €.
Regarding their online presence, 68% are heavy Facebook users and 55% heavy
Instagram users. More than one third of this cluster spends 1 to 2 hours on Facebook on

Sofia Branco Lopes
EXPLORING THE RELATION BETWEEN CONSUMER MOTIVATIONS & ENGAGEMENT WTH BRANDS IN FACEBOOK
40
a daily basis and liked more than 15 brands. Those liked brands are related mainly to the
Fashion and Tourism industries (Appendix 19).
The name given to this second cluster is justified by the young age of the individuals and
their Motivation to use Facebook brand pages as a platform that offers economic benefits.
4.3.2.3 Cluster 3: The Passive Seniors
The third cluster’s highest Motivation means are found in Conversation (�̅�= 3,76),
Opportunity Seeking (�̅�= 3,71) and Entertainment (�̅�= 3,57).
This third cluster represented the lowest levels of Consumer Engagement. Just as the other
segments, this cluster had the highest mean on the Emotional dimension (�̅�= 1,83),
followed by the Behavioral (�̅�= 1,63) and the Cognitive (�̅�= 1,62) measures.
The third cluster is composed of 45% males and 55% females. In terms of ages, this
cluster is the most diverse one. Among the three clusters it has the lowest percentage of
individuals aged between 18 and 25 (54%) and the highest amount of individuals aged
between 31 and 60 (35%). The majority (85%) of the persons of this cluster said that their
monthly income varies between 0 and 2500 €.
Lastly, this group consists mainly of medium Facebook users, 51%. Meaning that they
are not very active online, since the majority (36%) claimed to spend only 0 to 30 min a
day on Facebook and only 7% spend more than 3 hours a day. In addition to that, most
answered (75%) that they liked only 1 to 5 brands and those belong primarily to the
Fashion or Tourism businesses (Appendix 20).
Cluster three was named “The Passive Seniors”, since this segment does not spend much
time online and their age range proportion is mostly composed by elderly individuals.

Sofia Branco Lopes
EXPLORING THE RELATION BETWEEN CONSUMER MOTIVATIONS & ENGAGEMENT WTH BRANDS IN FACEBOOK
41
Chapter 5. Main Conclusions
5.1 Conclusions and Limitations
5.1.1 Academic Contributions
Exploring the main Motivations and Consumer Engagement dimensions that boost
consumers to interact with brands online, more specifically through Facebook, is crucial
to understand their behavior and preferences. Even though there are already several
studies regarding Consumers’ Motivations for participating online with brands by posting
reviews (Heinonen, 2011; Henning-Thurau, 2004; Moldovan and Serban, 2006), very few
studies investigate the antecedents of social media adoption (Gangadharbatla, 2008) and
their Motivations to do so. In addition to that it is known that the academic research is
more concerned with the content posted online, rather than with the web user itself
(Joines, Scherer, & Scheufele, 2003). Regarding Consumer Engagement, the Marketing
Science Institute’s (MSI, 2010) emphasized the need for further research addressing the
Consumer Engagement concept. According to Nelson-Field and Taylor (2012) the new
marketing catchphrase is “Engage or die”, hence it is significant to explore the
Engagement levels of consumers. The first conclusion that derives from this study is
related to these issues as it recognized Opportunity Seeking, Conversational and
Entertainment as the main Motivations and Emotional as the key Engagement dimension.
Besides that, very few literature has centered its attention to the relation between
Motivations and Consumer Engagement. According to some authors (Vivek et al., 2012;
Holbrook, 2006; Sheth, Newman, & Gross, 1991) consumer’s Motivations toward
Engagement is contingent on the value they expect to receive from the experience with
the brand. While these authors recognize this link between Consumer Engagement and
Motivations, some others suggest that involvement and Motivations are conceptually
distinct (Lawler & Hall, 1970). This study has revealed that, indeed, this causality was
verified and proven to be positive, meaning that higher levels of Motivations result in
higher levels of Engagement. In addition to that it explored which Motivations better
explain Engagement and the findings showed that Brand Affiliation and Investigation are
the ones.

Sofia Branco Lopes
EXPLORING THE RELATION BETWEEN CONSUMER MOTIVATIONS & ENGAGEMENT WTH BRANDS IN FACEBOOK
42
In terms of segmentation approaches, there are a number of perspectives for which
consumers can be segmented (Jayawardhena, Souchon, Farrell, & Glanville, 2007;
Reynolds & Beatty, 1999), however the existent literature regarding segmentation is
mainly focused on demographic approaches, rather than behavioral patterns or consumer
Motivations (Bieger & Laesser, 2002). Even though demographic information is useful,
that alone provides little diagnosis about web users (Bhatnagar & Ghose, 2004). This
study illustrates the segments based on their Motivations and complementarily it analyzes
the level of Engagement of each segment, their demographic traits and behavioral
patterns, so that the analysis gives a new perspective to the current literature.
5.1.2 Managerial Contributions
The study contributes for the understanding of consumers’ main Motivations and
Engagement dimension to interact with brands through Facebook. Thus, knowing what
motivates people is important in order to develop new communication strategies (Baek,
Holton, Harp, & Yaschur, 2011) that satisfy the audience. Additionally, Dunne, Lawlor,
and Rowley (2010) point out the relevance of studying Motivations in the context of
social media, since it is becoming a valuable marketing communications channel for
brands. In terms of Consumer Engagement, there is a strong connection between
Engagement and organizational performance outcomes, including sales increase, cost
reductions, brand referrals, consumer contribution to collaborative product development
and co-creative experiences resulting in superior profitability (Hollebeek et al., 2014;
Sawhney, Verona, & Prandelli, 2005; Nambisan & Baron 2007; Prahalad 2004; Bijmolt,
Leeflang, Block, Eisenbeiss, Hardie, Lemmens, & Saffert, 2010). Under those
circumstances, it is considered a managerial competitive advantage to know the main
Consumer Engagement dimensions. Moreover, Engagement serves as a way to create
deeper and more lasting customer brand relationships (Kumar, Novak, & Tomkins, 2010).
Findings about the relation between Motivations and Consumer Engagement contributes
to a better understanding of both constructs and would help advertisers address
consumers’ needs and interests capitalizing on the interactive, communicative and
collaborative characteristics (Tsai & Men, 2013) of Facebook, thus generating higher
levels of Engagement. By knowing that Brand Affiliation and Investigation are the
Motivations that better explain Engagement, brands should make sure that these

Sofia Branco Lopes
EXPLORING THE RELATION BETWEEN CONSUMER MOTIVATIONS & ENGAGEMENT WTH BRANDS IN FACEBOOK
43
Motivations are fulfilled and perceived by the consumers. For Brand Affiliation,
marketers could try to provide consumers good experiences with the brand or give them
particular importance. Regarding Investigation, marketers could focus on transmitting
through Facebook reliable information, unique insights and updated comments and news.
By segmenting Facebook users, it became clear how to attract each segment and their
level of Engagement at the present time. In addition to that, establishing links between
the four evaluated dimensions; Motivations, Consumer Engagement, demographics and
behavioral patterns; and taking into account the clusters’ sizes, serves as a very complete
marketing tool. According to Bieger and Laesser (2002) the segmentation of consumers
based on Motivations is a valuable instrument to plan appropriate marketing strategies.
The assumption underlying market segmentation is that consumers vary widely in terms
of needs, preferences and their perceptions to marketing offerings, thus a good
segmentation will result in consumer satisfaction and marketing efficiency (Arens &
Schaefer, 2008).Still with regard to segmentation, the Facebook platform is a very
suitable tool for this purpose as it allows brands to target based on locations, age, gender,
languages, demographics, interests and/or behaviors and connections towards the brands
pages, apps or events (Facebook business, 2016). In this study, three Facebook users’
segments were identified. The first segment is very attractive as it has the highest levels
of Engagement in each dimension. Through the segmentation it became evident that in
order to retain these type of individuals, brands could make it easier for them to make
suggestions or recommendations online as they have proven to be motivated by it. For
the second cluster, which is also very attractive due to its size, 54% of the sample,
marketers could use the Facebook platform to deliver reliable information. Finally, the
third cluster has still to be pushed to use Facebook as a daily platform and more regularly,
therefore in order to attract this senior crowd marketers could enable Entertainment
content such as videos in their Facebook brand pages.
Lastly, as an illustration of the complete study a conceptual framework was drawn, which
based on these findings has proven to be viable and can therefore serve as a valuable tool
for brands that strive to better understand both constructs with regard to their Facebook
followers.

Sofia Branco Lopes
EXPLORING THE RELATION BETWEEN CONSUMER MOTIVATIONS & ENGAGEMENT WTH BRANDS IN FACEBOOK
44
5.2 Limitations and Future Research
The major limitation of this study is that the sample used cannot be considered
representative of the population, since it is a convenience sample (Malhotra, 2006).
Another key point is that the study could enrich in terms of its viability with a qualitative
component, in other words the results could have been more complete if for instance a
focus group discussion would have been undertaken. An opportunity for future research
could be to adapt this study to other trendy social media platforms, such as Instagram or
LinkedIn. Besides that, it would be interesting to conduct this research to other countries
that differ in terms of the Hofstede dimensions, since this study is related to behavioral
factors and therefore the outputs may vary.
Despite the limitations and suggestions made for further research, this study was useful
as it contributed to develop a suitable and effective conceptual framework of digital
consumers, linking both constructs: Motivations and Consumer Engagement. Besides, it
serves to comprehend the behavioral patterns across segments, consequently allowing
marketers to create more efficient marketing strategies.

References
AdAge. (2016). Ad Age Social Media Facts 2016. Retrieved from:
http://adage.com/article/news/social-media-poster/305631/
Alves da Silva, J. (2015). Facebook: A Relação entre a Marca, os Fãs e o Engagement.
Lisbon School of Economics & Management.
Arens, W. F., & Schaefer, D. H. (2008). Essentials of contemporary advertising.
Recording for Blind & Dyslexic.
Arnone, L., Colot, O., Croquet, M., Geerts, A., & Pozniak, L. (2010). Company managed
virtual communities in global brand strategy. Global Journal of Business Research, 4(2),
97-102.
Avnet, T., & Higgins, E. T. (2006). How regulatory fit affects value in consumer choices
and opinions. Journal of Marketing Research, 43(1), 1-10.
Azar, S. L., Machado, J. C., Vacas-de-Carvalho, L., & Mendes, A. (2016). Motivations
to interact with brands on Facebook–Towards a typology of consumer–brand interactions.
Journal of Brand Management, 23(2), 153-178.
Baek, K., Holton, A., Harp, D., & Yaschur, C. (2011). The links that bind: Uncovering
novel motivations for linking on Facebook. Computers in Human Behavior, 27(6), 2243-
2248.
Baker, M. J., & Saren, M. (Eds.). (2016). Marketing theory: a student text. Sage.
Baur, D. K. A. W. (2016). New ways to leverage Web 2.0: Social media content for
market intelligence and customer interaction. ESCP Europe Wirtschaftshochschule
Berlin.
Bennett, S. (2012). Twitter, Facebook, Google, YouTube– What Happens on the Internet
Every60Seconds?. Retrieved from: http://www.mediabistro-.com/alltwitter/data-
neversleeps_b24551
Beukeboom, C. J., Kerkhof, P., & de Vries, M. (2015). Does a Virtual Like Cause Actual
Liking? How Following a Brand's Facebook Updates Enhances Brand Evaluations and
Purchase Intention. Journal of Interactive Marketing, 32, 26-36.
Bhatnagar, A., & Ghose, S. (2004). Segmenting consumers based on the benefits and
risks of Internet shopping. Journal of Business Research, 57(12), 1352-1360.
Bieger, T., & Laesser, C. (2002). Market segmentation by motivation: The case of
Switzerland. Journal of Travel research, 41(1), 68-76.

Bijmolt, T. H., Leeflang, P. S., Block, F., Eisenbeiss, M., Hardie, B. G., Lemmens, A., &
Saffert, P. (2010). Analytics for customer engagement. Journal of Service Research,
13(3), 341-356.
Bond, C., Ferraro, C., Luxton, S., & Sands, S. (2010, November). Social media
advertising: An investigation of consumer perceptions, attitudes, and preferences for
engagement. In ANZMAC Annual Conference 2010 (Dave Fortin and Lucie K Ozanne 29
November 2010 to 1 December 2010) (pp. 1-7). Department of Management University
of Canterbury.
Bonds-Raacke, J., &Raacke, J. (2010). Myspace and Facebook: Identifying dimensions
of uses and gratifications for friend networking sites. Individual Differences Research,
8(1), 27-33.
Bowden, J. L. H. (2009). The process of customer engagement: A conceptual framework.
Journal of Marketing Theory and Practice, 17(1), 63-74. Brisbane; 2006.. 4–6 December.
Brodie, R. J., Hollebeek, L. D., Juric, B., & Ilic, A. (2011). Customer engagement:
conceptual domain, fundamental propositions, and implications for research. Journal of
Service Research, 1094670511411703.
Campanelli, M. (2007). Engagement is the next phase in marketing communications:
Experian summit. Retrieved May, 10, 2012.
Campos, F. (2015). The Impact of User-Generated Content on Facebook Advertising
Performance. CATÓLICA LISBON School of Business & Economics.
Cha, S., McCleary, K. W., & Uysal, M. (1995). Travel motivations of Japanese overseas
travelers: A factor-cluster segmentation approach. Journal of travel research, 34(1), 33-
39.
Chaffey, D., Ellis-Chadwick, F., Mayer, R., & Johnston, K. (2009). Internet marketing:
strategy, implementation and practice. Pearson Education.
Chen, G. M. (2015). Why do women bloggers use social media? Recreation and
information motivations outweigh engagement motivations. new media & society, 17(1),
24-40.
Chen, H., Papazafeiropoulou, A., Chen, T. K., Duan, Y., & Liu, H. W. (2014). Exploring
the commercial value of social networks: Enhancing consumers’ brand experience
through Facebook pages. Journal of Enterprise Information Management, 27(5), 576-
598.

Cheung, C., Lee, M., & Jin, X. (2011). Customer engagement in an online social platform:
A conceptual model and scale development.
Chiu, C., Lin, D., & Silverman, A. (2012). China’s social-media boom. McKinsey and
Company.
Clarke, D. (2012, February 1). 3 brands that failed on Facebook. iMedia. Retrieved from
http://www.imediaconnection.com/articles/ported-articles/red-dot-articles/2012/feb/3-
brands-that-failed-on-facebook/
Coelho, J., Nobre, H., & Becker, K. (2014). The impact of Facebook presence on brand
image. International Journal of Technology Marketing 6, 9(3), 320-332.
Comrey, A. L., & Lee, H. B. (2013). A first course in factor analysis. Psychology Press.
Costa, C.F.L. (2014). Determinantes do Envolvimento do Consumidor com as marcas de
luxo online: o caso do Facebook. FEP Economia e Gestão.
Cvijikj, I. P., & Michahelles, F. (2013). Online engagement factors on Facebook brand
pages. Social Network Analysis and Mining, 3(4), 843-861.
Daugherty, T., & Hoffman, E. (2014). eWOM and the importance of capturing consumer
attention within social media. Journal of Marketing Communications, 20(1-2), 82-102.
Davis, R., Piven, I., & Breazeale, M. (2014). Conceptualizing the brand in social media
community: The five sources model. Journal of retailing and consumer services, 21(4),
468-481.
Denison, C. (2016). Love it! Facebook launches reaction emojis globally. Digital Trends.
Retrieved from: http://www.digitaltrends.com/dt-daily/facebook-launches-reaction-
emojis-globally-and-macs-get-siri/
DeVellis, R. F. (1991). Scale development: Theory and applications. Newbury Park, CA:
Sage.
Dibb, S., Stern, P., & Wensley, R. (2002). Marketing knowledge and the value of
segmentation. Marketing Intelligence & Planning, 20(2), 113-119.
Dolich, I. J. (1969). Congruence relationships between self images and product brands.
Journal of Marketing Research, 80-84.
Dunne, Á., Lawlor, M. A., & Rowley, J. (2010). Young people's use of online social
networking sites-a uses and gratifications perspective. Journal of Research in Interactive
Marketing, 4(1), 46-58.

Edson Escalas, J. (2004). Narrative processing: Building consumer connections to brands.
Escalas, Jennifer Edson (2004)," Narrative Processing: Building Consumer Connections
to Brands," Journal of Consumer Psychology, 14(1), 168-179.
Edson Escalas, J., & Bettman, J. R. (2003). You are what they eat: The influence of
reference groups on consumers' connections to brands. Journal of consumer psychology,
13(3), 339-348.
Enginkaya, E., & Yılmaz, H. (2014). What drives consumers to interact with brands
through social media? A motivation scale development study. Procedia-Social and
Behavioral Sciences, 148, 219-226.
Erragcha, N., & Romdhane, R. (2014). New faces of marketing in the era of the web:
from marketing 1.0 to marketing 3.0. Journal of Research in Marketing, 2 (2), 137-142.
Erragcha, N., & Romdhane, R. (2014). Social networks as marketing tools. Journal of
Internet Banking and Commerce, 19(1), 1.
Escalas, J. E., & Bettman, J. R. (2003). 13 Using narratives to discern self-identity related
consumer goals and motivations. The why of consumption: Contemporary perspectives
on consumer motives, goals, and desires, 1, 237.
Facebook - About | Facebook. (2016). Retrieved from:
https://www.facebook.com/pg/facebook/about/
Facebook Business. (2016). Retrieved from: https://www.facebook.com/business/
Fan, W., & Gordon, M. D. (2014). The power of social media analytics. Communications
of the ACM, 57(6), 74-81.
Feitosa, W. R., Lourenço, C. E., Botelho, D., & Saraiva, F. (2013, June). Virtual Brand
Communities and Engagement Creation– a Qualitative Approach. In 10 CONTECSI.
Ferguson, S. (2016). 5 Examples of Brands that Have Truly Mastered Social Media.
Social Media Today. Retrieved from: http://www.socialmediatoday.com/marketing/5-
examples-brands-have-truly-mastered-social-media
Ferraro, R., Kirmani, A., & Matherly, T. (2013). Look at me! Look at me! Conspicuous
brand usage, self-brand connection, and dilution. Journal of Marketing Research, 50(4),
477-488.
Foster, M. K., Francescucci, A., & West, B. C. (2010). Why users participate in online
social networks. International Journal of e-Business Management, 4(1), 3.
Fournier, S. (1998). Consumers and their brands: Developing relationship theory in
consumer research. Journal of consumer research, 24(4), 343-373.
Freeman, S., Eddy, S. L., McDonough, M., Smith, M. K., Okoroafor, N., Jordt, H., &
Wenderoth, M. P. (2014). Active learning increases student performance in science,
engineering, and mathematics. Proceedings of the National Academy of Sciences,
111(23), 8410-8415.
Gangadharbatla, H. (2008). Facebook me: Collective self-esteem, need to belong, and
internet self-efficacy as predictors of the iGeneration’s attitudes toward social networking
sites. Journal of interactive advertising, 8(2), 5-15.
Gerlitz, C., & Helmond, A. (2013). The like economy: Social buttons and the data-
intensive web. New Media & Society, 1461444812472322.
Gillmor D (2006) We the media: grassroots journalism by the people, for the people. O’
Reilly Media, Sebastopol.
Giustini, D. (2007). Web 3.0 and medicine. BMJ, 335(7633), 1273-1274.
Google. (2015). Country Report – Portugal. Retrieved from:
https://drive.google.com/drive/folders/0B1ASrW73JhWhaW9fWTNPZEUwcm8
Hankinson, G. (2004). The brand images of tourism destinations: a study of the saliency
of organic images. Journal of Product & Brand Management, 13(1), 6-14.
Heine, C. (2016). 7 Digital Marketing Stats That Grabbed Our Attention This Week.
AdWeek. Retrieved from: http://www.adweek.com/news/technology/7-digital-
marketing-stats-grabbed-our-attention-week-172825
Heinonen, K. (2011). Consumer activity in social media: Managerial approaches to
consumers' social media behavior. Journal of Consumer Behaviour, 10(6), 356-364.
Hendler, J. (2009). Web 3.0 Emerging. Computer, 42(1), 111-113.
Henning-Thurau, T. (2004). Motive des Lesens von Kundenartikulationen im Internet:
Theoretische und empirische Analyse. In Konsumentenverhalten im Internet (pp. 171-
193). Gabler Verlag.
Holbrook, M. B. (2006). Consumption experience, customer value, and subjective
personal introspection: An illustrative photographic essay. Journal of Business Research,
59(6), 714-725.
Hollebeek, L. D., Glynn, M. S., & Brodie, R. J. (2014). Consumer brand engagement in
social media: Conceptualization, scale development and validation. Journal of interactive
marketing, 28(2), 149-165.
Hollenbeck, C. R., & Kaikati, A. M. (2012). Consumers' use of brands to reflect their
actual and ideal selves on Facebook. International Journal of Research in Marketing,
29(4), 395-405.
Hollensen, S., & Raman, A. (2014). Social Media Marketing. Marketing Canada-Journal
of the Canadian Institute of Marketing.
Hutcheson, G. D., & Sofroniou, N. (1999). The multivariate social scientist: Introductory
statistics using generalized linear models. Sage.
Hutter, K., Hautz, J., Dennhardt, S., & Füller, J. (2013). The impact of user interactions
in social media on brand awareness and purchase intention: the case of MINI on
Facebook. Journal of Product & Brand Management, 22(5/6), 342-351.
Jahn, B., & Kunz, W. (2012). Online brand fandom on social networking sites: the impact
of fan page usage and engagement on customer relationships. In Marketing Theory and
Applications Proceedings of 2012 AMA Winter Educators’ Conference (pp. 188-189).
Jayasingh, S., & Venkatesh, R. (2015). Customer Engagement Factors in Facebook Brand
Pages. Asian Social Science, 11(26), 19.
Jayawardhena, C., Souchon, A. L., Farrell, A. M., & Glanville, K. (2007). Outcomes of
service encounter quality in a business-to-business context. Industrial Marketing
Management, 36(5), 575-588.
Johnson, L. (2016). How Tasty's Addictive Cooking Videos Helped BuzzFeed Build a
Food Empire. AdWeek. Retrieved from: http://www.adweek.com/news/technology/how-
tasty-mastered-social-publishing-part-buzzfeed-s-plan-make-50-revenue-video-174325
Joines, J. L., Scherer, C. W., & Scheufele, D. A. (2003). Exploring motivations for
consumer Web use and their implications for e-commerce. Journal of consumer
marketing, 20(2), 90-108.
Joinson, A. N. (2008, April). Looking at, looking up or keeping up with people?: motives
and use of facebook. In Proceedings of the SIGCHI conference on Human Factors in
Computing Systems (pp. 1027-1036). ACM.
Kabadayi, S., & Price, K. (2014). Consumer–brand engagement on Facebook: liking and
commenting behaviors. Journal of Research in Interactive Marketing, 8(3), 203-223.
Kaiser, H. F. (1974). An index of factorial simplicity. Psychometrika, 39(1), 31-36.
Kang, S. G., Ryu, B. J., Yang, K. S., Ko, Y. H., Cho, S., Kang, S. H., & Cheon, J. (2015).
An effective repetitive training schedule to achieve skill proficiency using a novel robotic
virtual reality simulator. Journal of surgical education, 72(3), 369-376.

Kaplan, A. M., & Haenlein, M. (2010). Users of the world, unite! The challenges and
opportunities of Social Media. Business horizons, 53(1), 59-68.
Kaur, G. (2016). Social Media Marketing. Asian Journal of Multidisciplinary Studies,
4(7).
Kearsley, G., & Shneiderman, B. (1998). Engagement Theory: A Framework for
Technology-Based Teaching and Learning. Educational technology, 38(5), 20-23.
Kemp, E., Childers, C. Y., & Williams, K. H. (2012). Place branding: creating self-brand
connections and brand advocacy. Journal of Product & Brand Management, 21(7), 508-
515.
Kemp, S. (2016). 10 Social Trends you need to know. WeAreSocial. Retrieved from:
http://wearesocial.com/uk/thought-leadership/10-social-trends-you-need-to-know
Kemp, S. (2016). 2016 Digital Yearbook. WeAreSocial. Retrieved from:
pt.slideshare.net/wearesocialsg/2016-digital-yearbook
Kim, J. H., Kim, M. S., & Nam, Y. (2010). An analysis of self-construals, motivations,
Facebook use, and user satisfaction. Intl. Journal of Human–Computer Interaction,
26(11-12), 1077-1099.
Kim, Y. H., Kim, D. J., & Wachter, K. (2013). A study of mobile user engagement
(MoEN): Engagement motivations, perceived value, satisfaction, and continued
engagement intention. Decision Support Systems, 56, 361-370.
Kim, Y., Sohn, D., & Choi, S. M. (2011). Cultural difference in motivations for using
social network sites: A comparative study of American and Korean college students.
Computers in Human Behavior, 27(1), 365-372.
Klein, T. A. (2016). Exploring the ethical and societal implications of market
segmentation and targeting: Macromarketing and distributive justice perspectives. Social
Business, 6(2), 109-124.
Kotler, P. (1997). Marketing management: Analysis, planning, implementation and
control. Englewood Clliffs.
Kumar, R., Novak, J., & Tomkins, A. (2010). Structure and evolution of online social
networks. In Link mining: models, algorithms, and applications (pp. 337-357). Springer
New York.
Lai, L. S., & Turban, E. (2008). Groups formation and operations in the Web 2.0
environment and social networks. Group Decision and negotiation, 17(5), 387-402.
Langstedt, Eric (2013), “An Examination of the Role of the Communicator on
Gratifications Attained on Social Network Sites,” Journal of Social Media in Society, 2
(1), 126–44.
Lawler, E. E., & Hall, D. T. (1970). Relationship of job characteristics to job involvement,
satisfaction, and intrinsic motivation. Journal of Applied psychology, 54(4), 305.
Lee, C. K., Lee, Y. K., & Wicks, B. E. (2004). Segmentation of festival motivation by
nationality and satisfaction. Tourism management, 25(1), 61-70.
Lin, K. Y., & Lu, H. P. (2011). Why people use social networking sites: An empirical
study integrating network externalities and motivation theory. Computers in Human
Behavior, 27(3), 1152-1161.
Logan, K. (2014). Why isn't everyone doing it? A comparison of antecedents to following
brands on Twitter and Facebook. Journal of Interactive Advertising, 14(2), 60-72.
Loker-Murphy, L. (1997). Backpackers in Australia: A motivation-based segmentation
study. Journal of Travel & Tourism Marketing, 5(4), 23-45.
Luarn, P., Lin, Y. F., & Chiu, Y. P. (2015). Influence of Facebook brand-page posts on
online engagement. Online Information Review, 39(4), 505-519.
Lusa. (2016, November 21). Quase metade das empresas portuguesas comunicam através
das redes sociais. Notícias ao Minuto. Retrieved from
https://www.noticiasaominuto.com/economia/691542/quase-metade-das-empresas-
portuguesas-comunicam-atraves-das-redes-sociais
Luthans, F., & Peterson, S. J. (2002). Employee engagement and manager self-efficacy.
Journal of management development, 21(5), 376-387.
Malciute, J. (2012). Customer Brand Engagement on Online Social Media Platforms.
Unpublished master thesis.
Malhotra, N. K. (1999). Marketing research: An applied orientation..Upper Saddle River:
Prentice-Hall.
Malhotra, N.K. (2006). Pesquisa de Marketing: Uma Orientação. Bookman Companhia
Ed, 2006, 8536306505, 9788536306506.
Marci, C. D. (2006). A biologically based measure of emotional engagement: Context
matters. Journal of Advertising Research, 46(4), 381-387.
Marconi, M. D. A., & Lakatos, E. M. (2011). Técnicas de pesquisa: planejamento e
execução de pesquisas, amostragens e técnicas de pesquisa, elaboração, análise e
interpretação de dados. Atlas.
Marktest. (2015). As marcas nos social media. Retrieved from:
http://www.marktest.com/wap/a/grp/p~95.aspx
Marktest. (2016). Os portugueses e as redes sociais. Retrieved from:
http://www.marktest.com/wap/a/grp/p~96.aspx
Mata, F. J., & Quesada, A. (2014). Web 2.0, social networks and e-commerce as
marketing tools. Journal of theoretical and applied electronic commerce research, 9(1),
56-69.
Moldovan, G. S., & Serban, G. (2006, March). Aspect mining using a vector-space model
based clustering approach. In Proceedings of Linking Aspect Technology and Evolution
(LATE) Workshop (pp. 36-40).
Molina-Castillo, F.-J., Lopez-Nicolas, C., & Soto-Acosta, P. (2012). Interaction effects
of media and message on perceived complexity, risk and trust of innovative products.
European Management Journal, 30(6), 30–54.
Mollen, A., & Wilson, H. (2010). Engagement, telepresence and interactivity in online
consumer experience: Reconciling scholastic and managerial perspectives. Journal of
business research, 63(9), 919-925.
Montalvo, R. E. (2011). Social media management. International Journal of Management
& Information Systems (IJMIS), 15(3), 91-96.
Morris, R. D. (2011). Web 3.0: Implications for online learning. TechTrends, 55(1), 42-
46.
MSI (2010), 2010-2012 Research Priorities. Boston, MA: Marketing Science Institute.
Muntinga, D. G., Moorman, M., & Smit, E. G. (2011). Introducing COBRAs: Exploring
motivations for brand-related social media use. International Journal of Advertising,
30(1), 13-46.
Nair, M. (2011). Understanding and measuring the value of social media. The Journal of
Corporate Accounting & Finance, 22(3), 45-51.
Nambisan, S., & Baron, R. A. (2007). Interactions in virtual customer environments:
Implications for product support and customer relationship management. Journal of
interactive marketing, 21(2), 42-62.
Nelson-Field, K. (2010). The social media leap: Integrating social media into marketing
strategy (Doctoral dissertation, ESOMAR).
Nelson-Field, K., & Taylor, J. (2012). Facebook fans: A fan for life? (Doctoral
dissertation, Warc).

Nelson-Field, K., Riebe, E., & Sharp, B. (2012). What's not to “Like?”. Journal of
Advertising Research, 52(2), 262-269.
O’Brien, H. L. (2010). The influence of hedonic and utilitarian motivations on user
engagement: The case of online shopping experiences. Interacting with Computers,
22(5), 344-352.
O’Reilly, T. (2005). What is Web 2.0. Design Patterns and Business Models for the Next
Generation of Software. Retrieved from: http://oreilly.com/web2/archive/what-is-web-
20.html
Okazaki, S. (2006). What do we know about mobile Internet adopters? A cluster analysis.
Information & Management, 43(2), 127-141.
Ostrow, A. (2009). Facebook Gives Props to Top Brand Marketers. Mashable. Retrieved
from: http://mashable.com/2009/06/11/facebook-brand-marketers-2/#.OJK_iAaqkqC
Parise, S., & Guinan, P. J. (2008, January). Marketing using web 2.0. In Hawaii
International Conference on System Sciences, Proceedings of the 41st Annual (pp. 281-
281). IEEE.
Park, D. B., & Yoon, Y. S. (2009). Segmentation by motivation in rural tourism: A
Korean case study. Tourism management, 30(1), 99-108.
Parsons, A. (2013). Using social media to reach consumers: A content analysis of official
Facebook pages. Academy of Marketing Studies Journal, 17(2), 27.
Parsons, A. L. (2011, July). Social media from a corporate perspective: A content analysis
of official Facebook pages. In Allied Academies International Conference. Academy of
Marketing Studies. Proceedings (Vol. 16, No. 2, p. 11). Jordan Whitney Enterprises, Inc.
Pew Research Center. (2015). HubSpot. Retrieved from:
https://www.hubspot.com/marketing-statistics
Pham, M. T., & Avnet, T. (2009). Rethinking regulatory engagement theory. Journal of
Consumer Psychology, 19(2), 115-123.
Plummer, J. T. (1974). The concept and application of life style segmentation. the Journal
of Marketing, 33-37.
Popp, B., Wilson, B., Horbel, C., & Woratschek, H. (2015). Relationship building through
Facebook brand pages: the multifaceted roles of identification, satisfaction, and perceived
relationship investment. Journal of Strategic Marketing, 1-17.
Prahalad, C. K. (2004). The cocreation of value. Journal of Marketing, 68(1), 23.

Rappaport, S. D. (2007). Lessons from online practice: new advertising models. Journal
of Advertising Research, 47(2), 135-141.
Reis, R. L. D. P. (2016). O jornalismo em Portugal e os desafios da Web 3.0 (Doctoral
dissertation).
Robinson, J. (2014). Measuring Facebook Engagement. News on, 10.
Rohm, A. J., & Swaminathan, V. (2004). A typology of online shoppers based on
shopping motivations. Journal of business research, 57(7), 748-757.
Ruehl, C. H., & Ingenhoff, D. (2016, January). Community Management on Social
Networking Sites: Why and How Stakeholders Use Corporate Facebook Pages. In 2016
49th Hawaii International Conference on System Sciences (HICSS) (pp. 2216-2226).
IEEE.
Ryan, R. M., & Deci, E. L. (2000). Self-determination theory and the facilitation of
intrinsic motivation, social development, and well-being. American psychologist, 55(1),
68.
Saunders, M.N.K., Thornhill, A., & Lewis, P., 2009. Research Methods for Business
Students (5th Edition) 5th Edition.
Sawhney, M., Verona, G., & Prandelli, E. (2005). Collaborating to create: The Internet
as a platform for customer engagement in product innovation. Journal of interactive
marketing, 19(4), 4-17.
Schau, H. J., Muñiz Jr, A. M., & Arnould, E. J. (2009). How brand community practices
create value. Journal of marketing, 73(5), 30-51.
Scheltgen, J. (2016). The top 20 social media trends in 2016. Retrieved from:
https://bitly.com/blog/the-top-20-social-media-trends-in-2016-according/
Schivinski, B., & Dabrowski, D. (2016). The effect of social media communication on
consumer perceptions of brands. Journal of Marketing Communications, 22(2), 189-214.
Shah, S. (2016). Facebook lets small businesses go global with international ad-targeting
tools. Digital Trends. Retrieved from: http://www.digitaltrends.com/social-
media/facebook-global-ad-targeting/
Shah, S. (2016). Facebook tinkers with its News Feed to show you more ‘informative
stories’. Digital Trends. Retrieved from: http://www.digitaltrends.com/social-
media/facebook-news-feed-informative-stories/
Sheth, J. N., Newman, B. I., & Gross, B. L. (1991). Why we buy what we buy: A theory
of consumption values. Journal of business research, 22(2), 159-170.

Shin, D. H. (2009). The evaluation of user experience of the virtual world in relation to
extrinsic and intrinsic motivation. International Journal of Human-Computer Interaction,
25(6), 530-553.
Sledgianowski, D., & Kulviwat, S. (2009). Using social network sites: The effects of
playfulness, critical mass and trust in a hedonic context. Journal of Computer Information
Systems, 49(4), 74-83.
Smith, A.N., E. Fischer, and C. Yongjian. 2012. How Does Brand-Related User-
Generated Content Differ Across YouTube, Facebook, and Twitter? Journal of
Interactive Marketing 26, no. 2 (May): 102–113.
Smith, P. R., & Zook, Z. (2011). Marketing communications: integrating offline and
online with social media. Kogan Page Ltd..
Social Bakers. (2016). Facebook stats – Brands in Portugal. Retrieved from
https://www.socialbakers.com/statistics/facebook/pages/total/portugal/brands/
Social Bakers. (2016, October). Social Marketing Report. Retrieved from:
https://www.socialbakers.com/resources/reports/portugal/2016/october/
Social Media Examiner. (2015). Social Media Statistics. HubSpot. Retrieved from:
https://www.hubspot.com/marketing-statistics
Song, F. W. (2010). Theorizing web 2.0: A cultural perspective. Information,
Communication & Society, 13(2), 249-275.
Spiliotopoulos, T., & Oakley, I. (2013, April). Understanding motivations for Facebook
use: Usage metrics, network structure, and privacy. In Proceedings of the SIGCHI
Conference on Human Factors in Computing Systems (pp. 3287-3296). ACM.
Success Stories about Facebook Advertising. (2016). Retrieved from:
https://www.facebook.com/business/success
Sukoco, B. M., & Wu, W. Y. (2010). The personal and social motivation of customers'
participation in brand community. African Journal of Business Management, 4(5), 614.
Thusoo, A., Shao, Z., Anthony, S., Borthakur, D., Jain, N., Sen Sarma, J., ... & Liu, H.
(2010, June). Data warehousing and analytics infrastructure at facebook. In Proceedings
of the 2010 ACM SIGMOD International Conference on Management of data (pp. 1013-
1020). ACM.
Tsai, W. H. S., & Men, L. R. (2013). Motivations and antecedents of consumer
engagement with brand pages on social networking sites. Journal of Interactive
Advertising, 13(2), 76-87.

Tuten, T. L. (2008). Advertising 2.0: Social Media Marketing in a Web 2.0 World: Social
Media Marketing in a Web 2.0 World. ABC-CLIO.
Underwood, L. (2016). How motivations to use social media have evolved. WeAreSocial.
Retrieved from: http://wearesocial.com/uk/blog/2016/05/how-motivations-to-use-social-
media-have-evolved
Van Doorn, J., Lemon, K. N., Mittal, V., Nass, S., Pick, D., Pirner, P., & Verhoef, P. C.
(2010). Customer engagement behavior: Theoretical foundations and research directions.
Journal of Service Research, 13(3), 253-266.
Verhoef, P. C., Reinartz, W. J., & Krafft, M. (2010). Customer engagement as a new
perspective in customer management. Journal of Service Research, 13(3), 247-252.
Vickery, G., & Wunsch-Vincent, S. (2007). Participative web and user-created content:
Web 2.0 wikis and social networking. Organization for Economic Cooperation and
Development (OECD).
Viot, C., & Bressolles, G. (2012). Les Agents Virtuels Intelligents Quels atouts pour la
relation client?. Décisions marketing, (65), 45.
Vivek, S. D., Beatty, S. E., & Morgan, R. M. (2012). Customer engagement: Exploring
customer relationships beyond purchase. Journal of Marketing Theory and Practice,
20(2), 122-146.
Vohra, A., & Bhardwaj, N. (2016). A Conceptual Presentation of Customer Engagement
in the Context of Social Media-An Emerging Market Perspective. International Journal
in Management & Social Sciences, Forthcoming.
Weman, E. (2011). Consumer motivations to join a brand community on Facebook
(Master’s thesis). Retrieved from:
https://helda.helsinki.fi/bitstream/handle/10227/798/weman.pdf
Whan Park, C., MacInnis, D. J., Priester, J., Eisingerich, A. B., & Iacobucci, D. (2010).
Brand attachment and brand attitude strength: Conceptual and empirical differentiation
of two critical brand equity drivers. Journal of marketing, 74(6), 1-17.
Wirtz, J., den Ambtman, A., Bloemer, J., Horváth, C., Ramaseshan, B., van de Klundert,
J., ... & Kandampully, J. (2013). Managing brands and customer engagement in online
brand communities. Journal of Service Management, 24(3), 223-244.
Xiang, Z. and Gretzel, U. (2009). Role of social media in online travel information search,
Tourism Management. 31(2), 179-188

Yan Xin, J., Ramayah, T., Soto-Acosta, P., Popa, S., & Ai Ping, T. (2014). Analyzing the
Use of Web 2.0 for Brand Awareness and Competitive Advantage: An Empirical Study
in the Malaysian Hospitability Industry. Information Systems Management, 31(2), 96-
103.
Yoo, K. H., & Gretzel, U. (2016). Use and Creation of Social Media by. Social media in
travel, tourism and hospitality: Theory, practice and cases, 189.

Appendices
Appendix 1. Questionnaire
Tese_DigitalConsumerBehaviour Caro participante, Muito obrigada por dispensar o seu tempo para responder a estas questões. Este questionário é realizado no âmbito da tese para conclusão do mestrado Internacional em Gestão na Universidade Católica Portuguesa, tendo como objetivo estudar o comportamento do consumidor digital no mercado português. O questionário não demorará mais do que 10 minutos. Importa salientar que não existem respostas certas ou erradas, apenas a sua colaboração é fundamental para o estudo. Agradeço desde já o seu tão importante contributo para o meu trabalho final e declaro que toda a informação prestada será confidencial. Q1 Indique com que frequência utiliza cada uma das seguintes redes sociais, numa escala entre 1 (Nunca) e 7 (Sempre que possível)?
Nunca
(1)
Quase nunca
(2)
Raramente (3)
Às vezes
(4)
Frequentemente (5)
Quase sempre
(6)
Sempre (7)
Facebook (2)
O O O O O O O
Foursquare (3)
O O O O O O O
Google+ (4) O O O O O O O Instagram (5)
O O O O O O O
LinkedIn (6) O O O O O O O Pinterest (7)
O O O O O O O
Twitter (8) O O O O O O O Yelp (9) O O O O O O O
Other (10) O O O O O O O
Q2 Por favor indique o seu nível de concordância com as seguintes frases relativas à sua atividade no Facebook, numa escala entre 1 (Discordo totalmente) e 7 (Concordo totalmente).
Discordo
totalmente (1)
Discordo
muito (2)
Discordo (3)
Não conco
rdo nem
discordo (4)
Concordo (5)
Concordo
muito (6)
Concordo
totalmente (7)
Sigo normalmente marcas no Facebook que são congruentes com o meu estilo de vida. (1)
O O O O O O O
No Facebook sigo algumas marcas cujos produtos/ serviços gostaria de comprar
O O O O O O O
no futuro, embora não tenha possibilidade de

pagar neste momento. (2) Sigo marcas no Facebook cujos produtos/ serviços consumo e/ou compro com frequência. (3)
O O O O O O O
Julgo que o meu envolvimento com marcas no Facebook devido à minha satisfação / insatisfação influencia os meus amigos na minha rede social. (4)
O O O O O O O
Promoções e campanhas de descontos oferecidos no Facebook por marcas geram benefícios financeiros para os consumidores. (5)
O O O O O O O
Ao seguir as páginas de Facebook de marcas, posso-me informar em relação a descontos e promoções sem ter que visitar as lojas e/ou armazéns. (6)
O O O O O O O
Seguir marcas no Facebook ajuda-me a obter informação relativa a novas ofertas. (7)
O O O O O O O
Q3 Por favor indique o seu nível de concordância com as seguintes frases relativas à sua atividade no Facebook, numa escala entre 1 (Discordo totalmente) e 7 (Concordo totalmente).
Discordo
totalmente (1)
Discordo
muito (2)
Discordo (3)
Não conco
rdo nem
discordo (4)
Concordo (5)
Concordo
muito (6)
Concordo
totalmente (7)
Para mim, o Facebook é uma ferramenta muito conveniente para que os consumidores transmitam as suas reclamações e sugestões para com as marcas. (1)
O O O O O O O
Julgo ser possível comunicar instantaneamente com marcas no Facebook sem que haja limitações de tempo e espaço. (2)
O O O O O O O
Entrar em contacto com empresas
O O O O O O O

através do Facebook é fácil, porque é simples e gratuito. (3) Gosto dos conteúdos influentes e criativos no Facebook que são gerados por marcas. (4)
O O O O O O O
Jogos e/ ou vídeos criados por marcas, proporcionam-me a oportunidade de ter momentos de diversão no Facebook. (5)
O O O O O O O
Acho que conteúdo de entretenimento providenciado por marcas no Facebook influencia positivamente as atitudes do consumidor e a imagem da empresa. (6)
O O O O O O O
Acredito que o conteúdo informativo relacionado com os produtos que pode ser obtido no Facebook é relativamente confiável. (7)
O O O O O O O
O Facebook fornece recurso a informação confiável ao possibilitar uma integração transparente entre marcas e consumidores. (8)
O O O O O O O
Q4 Por favor indique com que frequência interage com as marcas no Facebook nas seguintes circunstâncias, numa escala entre 1 (Nunca) e 7 (Sempre).
Nunca
(1)
Quase nunca
(2)
Raramente (3)
Às vezes
(4)
Frequentemen
te (5)
Quase sempre
(6)
Sempre (7)
Com que frequência visita a página de Facebook de marcas? (1)
O O O O O O O
Com que frequência repara nas publicações feitas por marcas no seu feed de notícias no Facebook? (2)
O O O O O O O
Com que frequência lê as publicações de marcas no Facebook? (3)
O O O O O O O

Com que frequência coloca um “like” nas publicações de marcas no Facebook? (4)
O O O O O O O
Com que frequência comenta as publicações de marcas no Facebook? (5)
O O O O O O O
Com que frequência partilha as publicações de marcas no Facebook com os seus amigos? (6)
O O O O O O O
Com que frequência faz publicações na página de Facebook de marcas? (7)
O O O O O O O
Q5 Por favor indique o seu nível de concordância com as seguintes frases, numa escala entre 1 (Discordo totalmente) e 7 (Concordo totalmente).
Discordo
totalmente (1)
Discordo
muito (2)
Discordo (3)
Não conco
rdo nem
discordo (4)
Concordo (5)
Concordo
muito (6)
Concordo
totalmente (7)
Continuo a navegar na página de Facebook de marcas durante longos períodos. (1)
O O O O O O O
Dedico muita energia à página de Facebook de marcas. (2)
O O O O O O O
Estou entusiasmado/a com a página de Facebook de marcas. (3)
O O O O O O O
A página de Facebook de marcas inspira-me. (4)
O O O O O O O
Considero as páginas de Facebook de marcas cheias de significado e propósito. (5)
O O O O O O O
Fico entusiasmado/a quando navego e interajo com as páginas de Facebook de marcas. (6)
O O O O O O O
Estou interessado/a nas páginas de Facebook de marcas. (7)
O O O O O O O
Orgulho-me de ser fã de marcas no Facebook. (8)
O O O O O O O
O tempo voa quando estou a navegar nas páginas de Facebook de marcas. (9)
O O O O O O O

Navegar nas páginas de Facebook de marcas é tão absorvente que me esqueço de tudo o resto. (10)
O O O O O O O
Estou realmente distraído quando navego na página de Facebook de marcas. (11)
O O O O O O O
Estou imerso na navegação e interação com marcas no Facebook. (12)
O O O O O O O
A minha mente está focada quando estou a navegar nas páginas de Facebook de marcas. (13)
O O O O O O O
Dou muita atenção às páginas de Facebook de marcas. (14)
O O O O O O O
Q6 QUANTAS HORAS POR DIA, EM MÉDIA, PASSA NO FACEBOOK? 0 - 0.5 H (1) 0.5 - 1 H (2) 1 - 2 H (3) 2 - 3 H (4) > 3 H (5) Q7 QUANTAS MARCAS GOSTOU (COLOCOU "LIKE") NO FACEBOOK? 1 - 5 (2) 5 - 15 (3) > 15 (4) Q8 COLOQUE POR ORDEM AS INDÚSTRIAS DAS MARCAS QUE MAIS GOSTOU (COLOCOU "LIKE") NO
FACEBOOK. ______ ALIMENTAÇÃO/ RESTAURAÇÃO (1) ______ AUTOMÓVEL (2) ______ DECORAÇÃO DE INTERIORES (3) ______ ENTRETENIMENTO (4) ______ VESTUÁRIO (5) ______ TECNOLOGIA (6) ______ TURISMO (7) ______ OUTRA (8) PARA FINALIZAR GOSTARIA DE SABER UM POUCO SOBRE SI... Q9 INDIQUE QUAL O SEU GÉNERO: MASCULINO (1) FEMININO (2)

Q10 INDIQUE QUAL A SUA IDADE: 18 - 25 (1) 26 - 30 (2) 31 - 45 (3) 46 - 60 (4) > 60 (5)
Q11 INDIQUE O SEU NÍVEL DE RENDIMENTO LÍQUIDO MENSAL: 0-500 € (1) 501 - 1000 € (2) 1001 - 2500 € (3) 2501 - 3500 € (4) > 3500 € (5) INDIQUE O SEU E-MAIL E HABILITE A RECEBER 25 EUROS DE CHEQUE FNAC!! A SUA RESPOSTA FOI REGISTADA. MUITO OBRIGADA PELA SUA PARTICIPAÇÃO! SOFIA
Appendix 2. Questionnaire Translation
MOTIVATION’S SCALE (ENGINKAYA & YILMAZ, 2014)
ITEMS
VARIABLE ORIGINAL TRANSLATION AND ADAPTATION
BRAND AFFILIATION
I GENERALLY FOLLOW THE BRANDS ON SOCIAL
MEDIA (SM) WHICH ARE CONGRUENT WITH
MY LIFE STYLE.
SIGO NORMALMENTE MARCAS NO FACEBOOK
QUE SÃO CONGRUENTES COM O MEU ESTILO
DE VIDA.
ON SM, I FOLLOW SOME BRANDS THAT I
FANCY TO BUY IN FUTURE, ALTHOUGH I CAN
NOT AFFORD BUYING RIGHT NOW.
NO FACEBOOK SIGO ALGUMAS MARCAS CUJOS
PRODUTOS/ SERVIÇOS GOSTARIA DE COMPRAR
NO FUTURO, EMBORA NÃO TENHA
POSSIBILIDADE DE PAGAR NESTE MOMENTO.
I FOLLOW THE BRANDS ON SM WHICH I
CONSUME AND/OR PURCHASE OFTEN.
SIGO MARCAS NO FACEBOOK CUJOS
PRODUTOS/ SERVIÇOS CONSUMO E/OU
COMPRO COM FREQUÊNCIA.
I THINK THAT MY INVOLVEMENT WITH A
BRAND ON SM DUE TO MY SATISFACTION /
DISSATISFACTION INFLUENCES MY FRIENDS IN
MY SOCIAL NETWORK.
JULGO QUE O MEU ENVOLVIMENTO COM
MARCAS NO FACEBOOK DEVIDO À MINHA
SATISFAÇÃO / INSATISFAÇÃO INFLUENCIA OS
MEUS AMIGOS NA MINHA REDE SOCIAL.
OPPORTUNITY SEEKING
PROMOTIONS AND DISCOUNT CAMPAIGNS
OFFERED ON SM BY THE BRANDS GENERATE
FINANCIAL BENEFITS FOR THE CUSTOMERS.
PROMOÇÕES E CAMPANHAS DE DESCONTOS
OFERECIDOS NO FACEBOOK POR MARCAS
GERAM BENEFÍCIOS FINANCEIROS PARA OS
CONSUMIDORES.
BY FOLLOWING THE SM PAGES OF BRANDS, I
CAN BE INFORMED OF THE DISCOUNTS AND
AO SEGUIR AS PÁGINAS DE FACEBOOK DE
MARCAS, POSSO-ME INFORMAR EM RELAÇÃO A

PROMOTIONS WITHOUT VISITING ANY STORES
AND/OR SHOPS.
DESCONTOS E PROMOÇÕES SEM TER QUE
VISITAR AS LOJAS E/OU ARMAZÉNS.
FOLLOWING BRANDS ON SM HELPS ME TO GET
INFORMATION ABOUT NEW OFFERINGS.
SEGUIR MARCAS NO FACEBOOK AJUDA-ME A
OBTER INFORMAÇÃO RELATIVA A NOVAS
OFERTAS.
CONVERSATION
TO ME, SOCIAL MEDIA (SM) IS A VERY
CONVENIENT TOOL FOR THE CUSTOMERS TO
TRANSMIT THEIR COMPLAINTS AND
SUGGESTIONS TO THE BRANDS
PARA MIM, O FACEBOOK É UMA FERRAMENTA
MUITO CONVENIENTE PARA QUE OS
CONSUMIDORES TRANSMITAM AS SUAS
RECLAMAÇÕES E SUGESTÕES PARA COM AS
MARCAS.
I THINK IT IS POSSIBLE TO COMMUNICATE
INSTANTLY WITH BRANDS ON SM WITHOUT
ANY TIME AND SPACE BOUNDARIES.
JULGO SER POSSÍVEL COMUNICAR
INSTANTANEAMENTE COM MARCAS NO
FACEBOOK SEM QUE HAJA LIMITAÇÕES DE
TEMPO E ESPAÇO.
GETTING INTO CONTACT WITH COMPANIES IS
EASY THROUGH SM BECAUSE IT'S SIMPLE AND
FREE.
ENTRAR EM CONTACTO COM EMPRESAS
ATRAVÉS DO FACEBOOK É FÁCIL, PORQUE É
SIMPLES E GRATUITO.
ENTERTAINMENT
I LIKE THE INFLUENTIAL AND CREATIVE
CONTENTS ON SM WHICH WERE GENERATED
BY THE BRANDS.
GOSTO DOS CONTEÚDOS INFLUENTES E
CRIATIVOS NO FACEBOOK QUE SÃO GERADOS
POR MARCAS.
GAMES AND / OR VIDEOS CREATED BY BRANDS,
PROVIDES OPPORTUNITY FOR ME TO HAVE FUN
TIME OVER SM. GAMES AND / OR VIDEOS
CREATED BY BRANDS, PROVIDES OPPORTUNITY
FOR ME TO HAVE FUN TIME OVER SM.
JOGOS E/ OU VÍDEOS CRIADOS POR MARCAS,
PROPORCIONAM-ME A OPORTUNIDADE DE TER
MOMENTOS DE DIVERSÃO NO FACEBOOK.
I THINK THE ENTERTAINING CONTENT
PROVIDED BY A BRAND ON SM POSITIVELY
INFLUENCES THE CUSTOMER ATTITUDES AND
COMPANY'S IMAGE.
ACHO QUE CONTEÚDO DE ENTRETENIMENTO
PROVIDENCIADO POR MARCAS NO FACEBOOK
INFLUENCIA POSITIVAMENTE AS ATITUDES DO
CONSUMIDOR E A IMAGEM DA EMPRESA.
INVESTIGATION
I BELIEVE THAT THE PRODUCT RELATED
INFORMATION WHICH CAN BE GATHERED
FROM SM IS RELATIVELY RELIABLE.
ACREDITO QUE O CONTEÚDO INFORMATIVO
RELACIONADO COM OS PRODUTOS QUE PODE
SER OBTIDO NO FACEBOOK É RELATIVAMENTE
CONFIÁVEL.
SM PROVIDES A RELIABLE INFORMATION
RESOURCE BY ENABLING A TRANSPARENT
INTEGRATION BETWEEN BRANDS AND
CONSUMERS.
O FACEBOOK FORNECE RECURSO A
INFORMAÇÃO CONFIÁVEL AO POSSIBILITAR
UMA INTEGRAÇÃO TRANSPARENTE ENTRE
MARCAS E CONSUMIDORES.
Codification: 1 –“Strongly Disagree” 2 – “Disagree” 3 – “Somewhat Disagree” 4 – “Neither
agree nor disagree” 5 – “Somewhat Agree” 6 – “Agree” 7 – “Strongly Agree”

CONSUMER ENGAGEMENT SCALE (MALCIUTE, 2012)
ITEMS
VARIABLE ORIGINAL TRANSLATION AND ADAPTATION
BEHAVIORAL
How often do you visit the
Facebook fan page of brand X?
Com que frequência visita a página
de Facebook de marcas?
How often do you notice the posts
by brand X in your news feed?
Com que frequência repara nas
publicações feitas por marcas no seu
feed de notícias no Facebook?
How often do you read posts by
brand X?
Com que frequência lê as
publicações de marcas no Facebook?
How often do you “like” posts by
brand X?
Com que frequência coloca um “like”
nas publicações de marcas no
Facebook?
How often do you comment on
posts by brand X?
Com que frequência comenta as
publicações de marcas no Facebook?
How often do you share posts by
brand x with your friends?
Com que frequência partilha as
publicações de marcas no Facebook
com os seus amigos?
How often do you post on the
Facebook fan page of brand X
yourself?
Com que frequência faz publicações
na página de Facebook de marcas?
I CONTINUE BROWSING ON THE FACEBOOK
FAN PAGE OF BRAND X FOR LONG PERIODS AT
A TIME.
CONTINUO A NAVEGAR NA PÁGINA DE
FACEBOOK DE MARCAS DURANTE LONGOS
PERÍODOS.
I DEVOTE A LOT OF ENERGY TO THE FACEBOOK
FAN PAGE OF BRAND X?
DEDICO MUITA ENERGIA À PÁGINA DE
FACEBOOK DE MARCAS.
EMOTIONAL
I AM ENTHUSIASTIC ABOUT THE FACEBOOK
FAN PAGE OF BRAND X.
ESTOU ENTUSIASMADO/A COM A PÁGINA DE
FACEBOOK DE MARCAS.
THE FACEBOOK FAN PAGE OF BRAND X
INSPIRES ME.
A PÁGINA DE FACEBOOK DE MARCAS INSPIRA-
ME.
I FIND THE FACEBOOK FAN PAGE OF BRAND X
FULL OF MEANING AND PURPOSE.
CONSIDERO AS PÁGINAS DE FACEBOOK DE
MARCAS CHEIAS DE SIGNIFICADO E
PROPÓSITO.
I AM EXCITED WHEN BROWSING ON AND
INTERACTING WITH THE FACEBOOK BRAND
PAGE OF BRAND X.
FICO ENTUSIASMADO/A QUANDO NAVEGO E
INTERAJO COM AS PÁGINAS DE FACEBOOK DE
MARCAS.
I AM INTERESTED IN THE FACEBOOK FAN PAGE
OF BRAND X.
ESTOU INTERESSADO/A NAS PÁGINAS DE
FACEBOOK DE MARCAS.
I AM PROUD OF BEING A FAN OF BRAND X. ORGULHO-ME DE SER FÃ DE MARCAS NO
FACEBOOK.
COGNITIVE
TIME FLIES WHEN I AM BROWSING ON THE
FACEBOOK PAGE OF BRAND X.
O TEMPO VOA QUANDO ESTOU A NAVEGAR
NAS PÁGINAS DE FACEBOOK DE MARCAS.
BROWSING ON THE FACEBOOK BRAND PAGE
OF BRAND X IS SO ABSORBING THAT I FORGET
ABOUT EVERYTHING ELSE.
NAVEGAR NAS PÁGINAS DE FACEBOOK DE
MARCAS É TÃO ABSORVENTE QUE ME ESQUEÇO
DE TUDO O RESTO.

I AM RARELY DISTRACTED WHEN BROWSING
ON THE FACEBOOK PAGE OF BRAND X.
ESTOU REALMENTE DISTRAÍDO QUANDO
NAVEGO NA PÁGINA DE FACEBOOK DE
MARCAS.
I am immersed in browsing and
interacting with the Facebook
brand of brand X.
Estou imerso na navegação e
interação com marcas no Facebook.
My mind is focused when browsing
on the Facebook page of brand X.
A minha mente está focada quando
estou a navegar nas páginas de
Facebook de marcas.
I pay a lot of attention to the
Facebook page of brand X.
Dou muita atenção às páginas de
Facebook de marcas.
Codification: 1 – “Strongly Disagree” 2 – “Disagree” 3 – “Somewhat Disagree” 4 – “Neither
agree nor disagree” 5 – “Somewhat Agree” 6 – “Agree” 7 – “Strongly Agree”
Codification (Frequency): 1 – “Never” 2 – “Almost Never” 3 – “Rarely” 4 – “Sometimes” 5 –
“Often” 6 – “Almost All the Time” 7 – “All the time”
Appendix 3. Univariate Outliers
ITEMS ITEMS NAME NUMBER OF UNIVARIATE OUTLIERS
FREQUENCY OF COMMENTS ON BRANDS’
POSTS BE5 3
FREQUENCY OF SHARED BRANDS’ POSTS BE6 1
FREQUENCY OF POSTS ON BRANDS’
FACEBOOK FAN PAGE BE7 3
Appendix 4. Principal Component Analysis
KMO AND BARTLETT’S TEST
KAISER-MEYER-OLKIN MEASURE OF SAMPLING ADEQUACY. 0,953
BARTLETT’S TEST OF SPHERICITY
APPROX. CHI-SQUARE 10252,043
DF 630
SIG. 0,000
TOTAL VARIANCE EXPLAINED
INITIAL EIGENVALUES EXTRACTION SUMS OF SQUARED
LOADINGS
ROTATION SUMS OF SQUARED
LOADINGS
COMPONENT TOTAL %OF
VARIANCE
CUMULATI
VE % TOTAL
%OF
VARIANCE
CUMULATI
VE % TOTAL
%OF
VARIANCE
CUMULATI
VE %
1 16,494 45,816 45,816 16,494 45,816 45,816 6,195 17,207 17,207
2 2,863 7,952 53,767 2,863 7,952 53,767 4,355 12,098 29,305
3 1,894 5,260 59,028 1,894 5,260 59,028 4,284 11,901 41,206
4 1,689 4,693 63,721 1,689 4,693 63,721 3,234 8,983 50,189
5 1,207 3,353 67,074 1,207 3,353 67,074 2,768 7,690 57,879
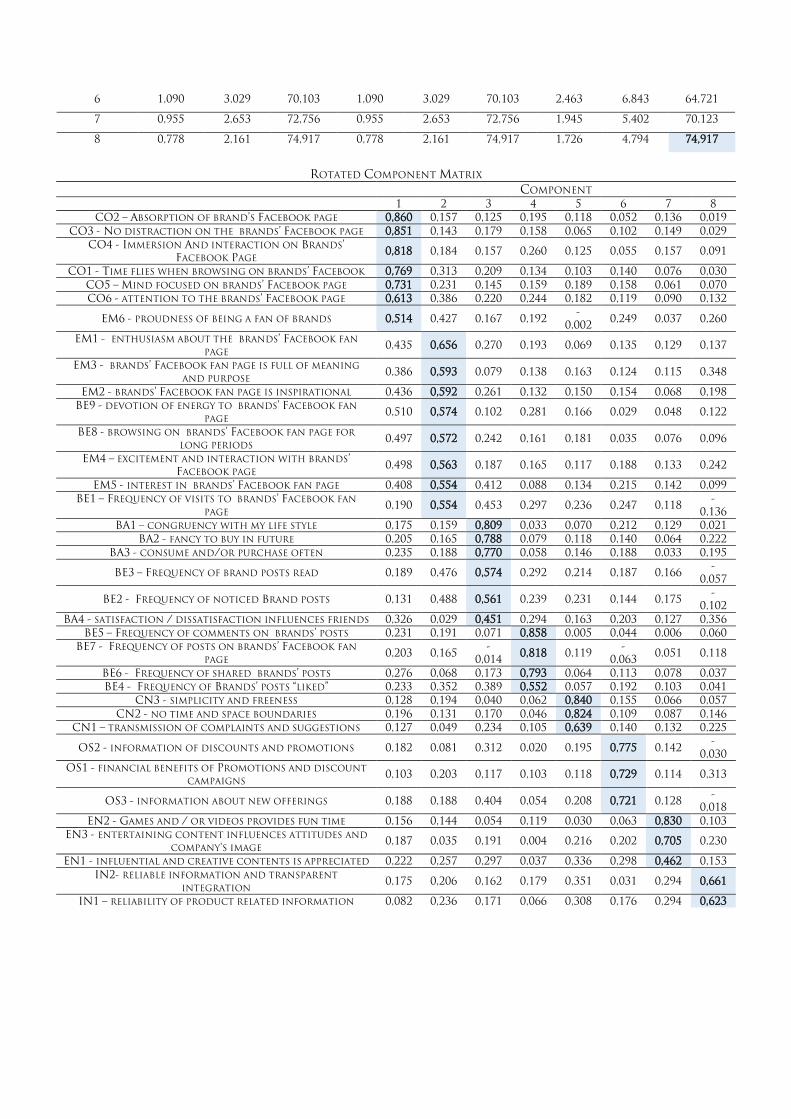
6 1,090 3,029 70,103 1,090 3,029 70,103 2,463 6,843 64,721
7 0,955 2,653 72,756 0,955 2,653 72,756 1,945 5,402 70,123
8 0,778 2,161 74,917 0,778 2,161 74,917 1,726 4,794 74,917
ROTATED COMPONENT MATRIX
COMPONENT 1 2 3 4 5 6 7 8
CO2 – ABSORPTION OF BRAND’S FACEBOOK PAGE 0,860 0,157 0,125 0,195 0,118 0,052 0,136 0,019 CO3 - NO DISTRACTION ON THE BRANDS’ FACEBOOK PAGE 0,851 0,143 0,179 0,158 0,065 0,102 0,149 0,029
CO4 - IMMERSION AND INTERACTION ON BRANDS’ FACEBOOK PAGE
0,818 0,184 0,157 0,260 0,125 0,055 0,157 0,091
CO1 - TIME FLIES WHEN BROWSING ON BRANDS’ FACEBOOK 0,769 0,313 0,209 0,134 0,103 0,140 0,076 0,030 CO5 – MIND FOCUSED ON BRANDS’ FACEBOOK PAGE 0,731 0,231 0,145 0,159 0,189 0,158 0,061 0,070 CO6 - ATTENTION TO THE BRANDS’ FACEBOOK PAGE 0,613 0,386 0,220 0,244 0,182 0,119 0,090 0,132
EM6 - PROUDNESS OF BEING A FAN OF BRANDS 0,514 0,427 0,167 0,192 -
0,002 0,249 0,037 0,260
EM1 - ENTHUSIASM ABOUT THE BRANDS’ FACEBOOK FAN
PAGE 0,435 0,656 0,270 0,193 0,069 0,135 0,129 0,137
EM3 - BRANDS’ FACEBOOK FAN PAGE IS FULL OF MEANING
AND PURPOSE 0,386 0,593 0,079 0,138 0,163 0,124 0,115 0,348
EM2 - BRANDS’ FACEBOOK FAN PAGE IS INSPIRATIONAL 0,436 0,592 0,261 0,132 0,150 0,154 0,068 0,198
BE9 - DEVOTION OF ENERGY TO BRANDS’ FACEBOOK FAN
PAGE 0,510 0,574 0,102 0,281 0,166 0,029 0,048 0,122
BE8 - BROWSING ON BRANDS’ FACEBOOK FAN PAGE FOR
LONG PERIODS 0,497 0,572 0,242 0,161 0,181 0,035 0,076 0,096
EM4 – EXCITEMENT AND INTERACTION WITH BRANDS’ FACEBOOK PAGE
0,498 0,563 0,187 0,165 0,117 0,188 0,133 0,242
EM5 - INTEREST IN BRANDS’ FACEBOOK FAN PAGE 0,408 0,554 0,412 0,088 0,134 0,215 0,142 0,099
BE1 – FREQUENCY OF VISITS TO BRANDS’ FACEBOOK FAN
PAGE 0,190 0,554 0,453 0,297 0,236 0,247 0,118
-0,136
BA1 – CONGRUENCY WITH MY LIFE STYLE 0,175 0,159 0,809 0,033 0,070 0,212 0,129 0,021
BA2 - FANCY TO BUY IN FUTURE 0,205 0,165 0,788 0,079 0,118 0,140 0,064 0,222
BA3 - CONSUME AND/OR PURCHASE OFTEN 0,235 0,188 0,770 0,058 0,146 0,188 0,033 0,195
BE3 – FREQUENCY OF BRAND POSTS READ 0,189 0,476 0,574 0,292 0,214 0,187 0,166 -
0,057
BE2 - FREQUENCY OF NOTICED BRAND POSTS 0,131 0,488 0,561 0,239 0,231 0,144 0,175 -
0,102
BA4 - SATISFACTION / DISSATISFACTION INFLUENCES FRIENDS 0,326 0,029 0,451 0,294 0,163 0,203 0,127 0,356
BE5 – FREQUENCY OF COMMENTS ON BRANDS’ POSTS 0,231 0,191 0,071 0,858 0,005 0,044 0,006 0,060
BE7 - FREQUENCY OF POSTS ON BRANDS’ FACEBOOK FAN
PAGE 0,203 0,165
-0,014
0,818 0,119 -
0,063 0,051 0,118
BE6 - FREQUENCY OF SHARED BRANDS’ POSTS 0,276 0,068 0,173 0,793 0,064 0,113 0,078 0,037
BE4 - FREQUENCY OF BRANDS’ POSTS “LIKED” 0,233 0,352 0,389 0,552 0,057 0,192 0,103 0,041
CN3 - SIMPLICITY AND FREENESS 0,128 0,194 0,040 0,062 0,840 0,155 0,066 0,057
CN2 - NO TIME AND SPACE BOUNDARIES 0,196 0,131 0,170 0,046 0,824 0,109 0,087 0,146
CN1 – TRANSMISSION OF COMPLAINTS AND SUGGESTIONS 0,127 0,049 0,234 0,105 0,639 0,140 0,132 0,225
OS2 - INFORMATION OF DISCOUNTS AND PROMOTIONS 0,182 0,081 0,312 0,020 0,195 0,775 0,142 -
0,030
OS1 - FINANCIAL BENEFITS OF PROMOTIONS AND DISCOUNT
CAMPAIGNS 0,103 0,203 0,117 0,103 0,118 0,729 0,114 0,313
OS3 - INFORMATION ABOUT NEW OFFERINGS 0,188 0,188 0,404 0,054 0,208 0,721 0,128 -
0,018
EN2 - GAMES AND / OR VIDEOS PROVIDES FUN TIME 0,156 0,144 0,054 0,119 0,030 0,063 0,830 0,103
EN3 - ENTERTAINING CONTENT INFLUENCES ATTITUDES AND
COMPANY'S IMAGE 0,187 0,035 0,191 0,004 0,216 0,202 0,705 0,230
EN1 - INFLUENTIAL AND CREATIVE CONTENTS IS APPRECIATED 0,222 0,257 0,297 0,037 0,336 0,298 0,462 0,153
IN2- RELIABLE INFORMATION AND TRANSPARENT
INTEGRATION 0,175 0,206 0,162 0,179 0,351 0,031 0,294 0,661
IN1 – RELIABILITY OF PRODUCT RELATED INFORMATION 0,082 0,236 0,171 0,066 0,308 0,176 0,294 0,623

Appendix 5. Principal Component Analysis
KMO AND BARTLETT’S TEST
KAISER-MEYER-OLKIN MEASURE OF SAMPLING ADEQUACY. 0,943
BARTLETT’S TEST OF SPHERICITY
APPROX. CHI-SQUARE 7879,664
DF 435
SIG. 0,000
TOTAL VARIANCE EXPLAINED
INITIAL EIGENVALUES EXTRACTION SUMS OF SQUARED
LOADINGS
ROTATION SUMS OF SQUARED
LOADINGS
COMPONENT TOTAL %OF
VARIANCE
CUMULATIVE
% TOTAL
%OF
VARIANCE
CUMULATIVE
% TOTAL
%OF
VARIANCE
CUMULATIVE
%
1 13,236 44,121 44,121 13,236 44,121 44,121 4,985 16,618 16,618
2 2,703 9,010 53,131 2,703 9,010 53,131 3,289 10,963 27,580
3 1,736 5,786 58,917 1,736 5,786 58,917 3,270 10,900 38,480
4 1,594 5,314 64,230 1,594 5,314 64,230 3,062 10,207 48,687
5 1,153 3,842 68,072 1,153 3,842 68,072 2,566 8,555 57,242
6 1,020 3,400 71,473 1,020 3,400 71,473 2,411 8,038 65,279
7 0,922 3,072 74,544 0,922 3,072 74,544 1,775 5,916 71,195
8 0,752 2,508 77,053 0,752 2,508 77,053 1,757 5,857 77,053
ROTATED COMPONENT MATRIX
COMPONENT
1 2 3 4 5 6 7 8 CO2 – ABSORPTION OF BRAND’S FACEBOOK PAGE 0,874 0,142 0,116 0,202 0,100 0,070 0,115 0,088
CO3 - NO DISTRACTION ON THE BRANDS’ FACEBOOK
PAGE 0,848 0,177 0,167 0,170 0,062 0,113 0,142 0,048
CO4 - IMMERSION AND INTERACTION ON BRANDS’ FACEBOOK PAGE
0,814 0,224 0,137 0,269 0,118 0,064 0,148 0,111
CO1 - TIME FLIES WHEN BROWSING ON BRANDS’ FACEBOOK
0,767 0,312 0,204 0,156 0,096 0,158 0,045 0,073
CO5 – MIND FOCUSED ON BRANDS’ FACEBOOK PAGE 0,731 0,285 0,117 0,166 0,180 0,156 0,042 0,095 CO6 - ATTENTION TO THE BRANDS’ FACEBOOK PAGE 0,587 0,436 0,207 0,265 0,190 0,117 0,086 0,113
EM3 - BRANDS’ FACEBOOK FAN PAGE IS FULL OF
MEANING AND PURPOSE 0,307 0,704 0,090 0,177 0,209 0,087 0,157 0,196
EM2 - BRANDS’ FACEBOOK FAN PAGE IS INSPIRATIONAL 0,363 0,701 0,263 0,171 0,193 0,135 0,090 0,072
EM4 – EXCITEMENT AND INTERACTION WITH BRANDS’ FACEBOOK PAGE
0,441 0,655 0,191 0,200 0,142 0,173 0,136 0,159
EM1 - ENTHUSIASM ABOUT THE BRANDS’ FACEBOOK
FAN PAGE 0,411 0,632 0,276 0,228 0,064 0,164 0,103 0,145
EM5 - INTEREST IN BRANDS’ FACEBOOK FAN PAGE 0,386 0,591 0,394 0,117 0,142 0,229 0,103 0,103
BA1 – CONGRUENCY WITH MY LIFE STYLE 0,155 0,165 0,816 0,062 0,086 0,241 0,122 0,005
BA2 - FANCY TO BUY IN FUTURE 0,164 0,204 0,807 0,115 0,140 0,155 0,083 0,145
BA3 - CONSUME AND/OR PURCHASE OFTEN 0,221 0,188 0,778 0,087 0,156 0,203 0,030 0,175
BA4 - SATISFACTION / DISSATISFACTION INFLUENCES
FRIENDS. 0,250 0,158 0,446 0,316 0,234 0,162 0,262 0,117
BE5 – FREQUENCY OF COMMENTS ON BRANDS’ POSTS 0,212 0,170 0,062 0,871 0,012 0,047 0,012 0,045
BE7 - FREQUENCY OF POSTS ON BRANDS’ FACEBOOK
FAN PAGE 0,192 0,125
-0,014
0,826 0,114 -
0,060 0,046 0,134
BE6 - FREQUENCY OF SHARED BRANDS’ POSTS 0,262 0,064 0,151 0,801 0,072 0,122 0,078 0,032
BE4 - FREQUENCY OF BRANDS’ POSTS “LIKED” 0,210 0,371 0,358 0,574 0,074 0,209 0,086 0,024
CN3 - SIMPLICITY AND FREENESS 0,122 0,176 0,026 0,067 0,826 0,181 0,016 0,136
CN2 - NO TIME AND SPACE BOUNDARIES 0,194 0,124 0,155 0,051 0,817 0,125 0,064 0,197
CN1 – TRANSMISSION OF COMPLAINTS AND
SUGGESTIONS 0,082 0,096 0,234 0,114 0,697 0,108 0,221 0,097

OS2 - INFORMATION OF DISCOUNTS AND PROMOTIONS 0,182 0,055 0,299 0,030 0,178 0,806 0,108 0,025
OS3 - INFORMATION ABOUT NEW OFFERINGS 0,189 0,168 0,380 0,065 0,204 0,743 0,103 0,022
OS1 - FINANCIAL BENEFITS OF PROMOTIONS AND
DISCOUNT CAMPAIGNS 0,088 0,231 0,085 0,111 0,116 0,718 0,136 0,268
EN2 - GAMES AND / OR VIDEOS PROVIDES FUN TIME 0,130 0,165 0,050 0,121 0,057 0,074 0,856 0,081
EN3 - ENTERTAINING CONTENT INFLUENCES ATTITUDES
AND COMPANY'S IMAGE 0,178 0,058 0,195
-0,002
0,208 0,210 0,685 0,279
EN1 - INFLUENTIAL AND CREATIVE CONTENTS IS
APPRECIATED 0,201 0,314 0,283 0,047 0,326 0,320 0,395 0,211
IN1 – RELIABILITY OF PRODUCT RELATED INFORMATION 0,126 0,177 0,158 0,067 0,215 0,214 0,170 0,816
IN2- RELIABLE INFORMATION AND TRANSPARENT
INTEGRATION 0,189 0,195 0,155 0,186 0,289 0,054 0,217 0,766
Appendix 6. Pearson Correlation
SCALE PEARSON CORRELATION
BRAND AFFILIATION, OPPORTUNITY SEEKING 0,615
BRAND AFFILIATION, CONVERSATION 0,463
BRAND AFFILIATION, ENTERTAINMENT 0,513
BRAND AFFILIATION, INVESTIGATION 0,462
BRAND AFFILIATION, BEHAVIORAL 0,458
BRAND AFFILIATION, EMOTIONAL 0,649
BRAND AFFILIATION, COGNITIVE 0,544
OPPORTUNITY SEEKING, CONVERSATION 0,465
OPPORTUNITY SEEKING, ENTERTAINMENT 0,517
OPPORTUNITY SEEKING, INVESTIGATION 0,435
OPPORTUNITY SEEKING, BEHAVIORAL 0,328
OPPORTUNITY SEEKING, EMOTIONAL 0,540
OPPORTUNITY SEEKING, COGNITIVE 0,445
CONVERSATION, ENTERTAINMENT 0,482
CONVERSATION, INVESTIGATION 0,538
CONVERSATION, BEHAVIORAL 0,299
CONVERSATION, EMOTIONAL 0,480
CONVERSATION, COGNITIVE 0,411
ENTERTAINMENT, INVESTIGATION 0,577
ENTERTAINMENT, BEHAVIORAL 0,334
ENTERTAINMENT, EMOTIONAL 0,553
ENTERTAINMENT, COGNITIVE 0,473
INVESTIGATION, BEHAVIORAL 0,356
INVESTIGATION, EMOTIONAL 0,532
INVESTIGATION, COGNITIVE 0,434
BEHAVIORAL, EMOTIONAL 0,571
BEHAVIORAL, COGNITIVE 0,574
EMOTIONAL, COGNITIVE 0,779

Appendix 7. Motivation Dimensions – Descriptives & Reliability
BRAND AFFILIATION ITEM MEAN STD. DEVIATION CRONBACH’S Α MEAN BA1 4,68 1,568
0,863 4,2057 BA2 4,25 1,634 BA3 4,35 1,698 BA4 3,54 1,569
OPPORTUNITY SEEKING ITEM MEAN STD. DEVIATION CRONBACH’S Α MEAN OS1 4,32 1,411
0,827 4,8000 OS2 5,05 1,289 OS3 5,03 1,271
CONVERSATION ITEM MEAN STD. DEVIATION CRONBACH’S Α MEAN CN1 4,68 1,413
0,811 4,6810 CN2 4,59 1,402 CN3 4,77 1,354
ENTERTAINMENT ITEM MEAN STD. DEVIATION CRONBACH’S Α MEAN EN1 4,67 1,282
0,729 4,4648 EN2 3,99 1,567 EN3 4,73 1,224
INVESTIGATION ITEM MEAN STD. DEVIATION CRONBACH’S Α MEAN IN1 4,42 1,217
0,843 4,3743 IN2 4,33 1,222
Appendix 8. Consumer Engagement Dimensions – Descriptives & Reliability
BEHAVIORAL
ITEM MEAN STD. DEVIATION CRONBACH’S Α MEAN
BE4 3,10 1,483
0,859 2,1893 BE5 1,82 1,163
BE6 2,18 1,297
BE7 1,66 1,106
EMOTIONAL
ITEM MEAN STD. DEVIATION CRONBACH’S Α MEAN
EM1 3,04 1,671
0,919 3,2520
EM2 3,23 1,681
EM3 3,15 1,573
EM4 3,08 1,667
EM5 3,75 1,770
COGNITIVE
ITEM MEAN STD. DEVIATION CRONBACH’S Α MEAN
CO1 3,07 1,781
0,942 2,7171
CO2 2,48 1,611
CO3 2,65 1,616
CO4 2,56 1,566
CO5 2,81 1,596
CO6 2,873 1,601

Appendix 9. Motivation Dimension and Consumer Engagement Dimension– Descriptives and
Reliability
MOTIVATIONS
ITEM MEAN STD. DEVIATION CRONBACH’S Α MEAN
BRAND
AFFILIATION 4,2057 1,36269
0,835 4,505
OPPORTUNITY
SEEKING 4,8000 1,14250
CONVERSATION 4,6810 1,18442
ENTERTAINMENT 4,4648 1,10014
INVESTIGATION 4,3743 1,13421
CONSUMER ENGAGEMENT
ITEM MEAN STD. DEVIATION CRONBACH’S Α MEAN
BEHAVIORAL 2,1893 1,06541
0,841 2,719 EMOTIONAL 3,2520 1,45414
COGNITIVE 2,7171 1,43649
Appendix 10. Quality of the Cluster Analysis & Importance of Predictors
ALGORITHM TWO STEP
INPUTS 5
CLUSTERS 3
OOR
FAIR GOOD

Appendix 11. Two Step Cluster, Cluster Distribution
CLUSTER DISTRIBUTION
CLUSTER N % OF COMBINED % OF TOTAL
1 58 16,6% 16,6%
2 190 54,3% 54,3%
3 102 29,1% 29,1%
TOTAL 350 100% 100%
SIZE OF SMALLEST CLUSTER 58 (16, 6%)
SIZE OF LARGEST CLUSTER 190 (54, 3%)
RATIO OF SIZES: LARGEST CLUSTER TO SMALLEST
CLUSTER 3,28
1
0,67
0,66
0,63
0,6
IMPORTANCE OF THE PREDICTORS
Conversation Entertainment Opportunity Seeking
Investigation Brand Affiliation

Appendix 12. One Way ANOVA – Clusters & Motivations
Sum of
Squares DF MEAN SQUARE F SIG.
BRAND
AFFILIATION
BETWEEN
GROUPS 378,912 2 189,456 244,254 0,000
WHITHIN
GROUPS 269,151 347 0,776
TOTAL 648,064 349
OPPORTUNITY
SEEKING
BETWEEN
GROUPS 199,630 2 99,815 135,335 0,000
WHITHIN
GROUPS 255,926 347 0,738
TOTAL 455,556 349
CONVERSATION
BETWEEN
GROUPS 201,571 2 100,786 121,422 0,000
WHITHIN
GROUPS 288,024 347 0,830
TOTAL 489,595 349
ENTERTAINMENT
BETWEEN
GROUPS 180,573 2 90,286 129,553 0,000
WHITHIN
GROUPS 241,826 347 0,697
TOTAL 422,399 349
INVESTIGATION
BETWEEN
GROUPS 200,246 2 100,123 139,685 0,000
WHITHIN
GROUPS 248,722 347 0,717
TOTAL 448,969 349
Appendix 13. One Way ANOVA – Clusters & Consumer Engagement
Sum of
Squares DF MEAN SQUARE F SIG.
BEHAVIORAL
BETWEEN
GROUPS 57,928 2 28,964 29,716 0,000
WHITHIN
GROUPS 338,219 347 0,975
TOTAL 396,147 349
EMOTIONAL BETWEEN
GROUPS 356,176 2 178,088 161,857 0,000

WHITHIN
GROUPS 381,797 347 1,100
TOTAL 737,974 349
COGNITIVE
BETWEEN
GROUPS 234,833 2 117,416 83,950 0,000
WHITHIN
GROUPS 485,331 347 1,399
TOTAL 720,164 349
Appendix 14. Cross Tabulation – Clusters & Demographics
PEARSON CHI-SQUARE CLUSTERS & GENDER CLUSTERS & AGE CLUSTERS & MONTHLY
NET INCOME
VALUE 4,140 33,320 4,569
DF 2 12 8
ASYMP. SIG. (2-SIDED) 0,126 0,001 0,803
Appendix 15. SM User Profile, Recoded Variables
Type Of SM User Q2 Frequency of Social Media Usage, Scale: Never (1) - All the Time (7)?
HEAVY Almost all the time (6); All the Time (7)
MEDIUM Often (5); Sometimes (4); Rarely (3)
LIGHT ALMOST NEVER (2); NEVER (1)
Appendix 16. Industries Preference on Facebook, Recoded Variables
Level of Preference of Brands
of Industry X measured by
likes
Order of the Brand’s Industries with the majority of
Facebook Likes, Scale: Most Likes (1) – Least Likes (7)
HIGH 1, 2
MEDIUM 3, 4, 5
LOW 6, 7

Appendix 17. Cross Tabulation – Clusters & Behavioral Patterns
CLUSTERS & SOCIAL MEDIA USAGE
PEARSON CHI-
SQUARE FACEBOOK INSTAGRAM LINKEDIN PINTEREST
VALUE 23,530 19,015 25,069 11,368
DF 4 4 4 4
ASYMP. SIG. (2-
SIDED) 0,000 0,001 0,000 0,023
CLUSTERS & FREQUENCY & NUMBER OF LIKED BRANDS
PEARSON CHI-SQUARE CLUSTERS & TIME SPENT ON SOCIAL MEDIA CLUSTERS & PREFERRED INDUSTRIES
VALUE 27,528 99,557
DF 8 4
ASYMP. SIG. (2-SIDED) 0,001 0,000
CLUSTERS & INDUSTRIES OF THE BRANDS OF INTEREST
PEARSON CHI-SQUARE TECHNOLOGY DESIGN TOURISM FASHION
VALUE 1,241 2,895 3,883 26,180
DF 4 4 4 4
ASYMP. SIG. (2-SIDED) 0,871 0,575 0,422 0,000
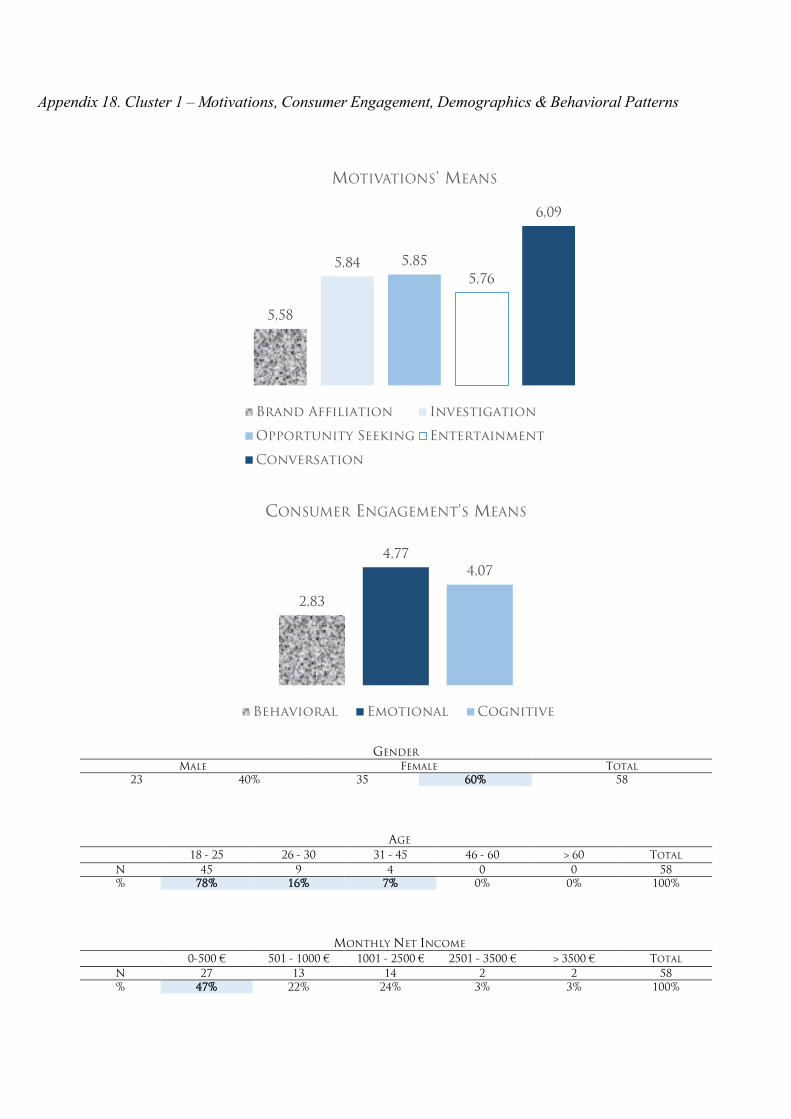
Appendix 18. Cluster 1 – Motivations, Consumer Engagement, Demographics & Behavioral Patterns
GENDER MALE FEMALE TOTAL
23 40% 35 60% 58
AGE
18 - 25 26 - 30 31 - 45 46 - 60 > 60 TOTAL N 45 9 4 0 0 58 % 78% 16% 7% 0% 0% 100%
MONTHLY NET INCOME
0-500 € 501 - 1000 € 1001 - 2500 € 2501 - 3500 € > 3500 € TOTAL N 27 13 14 2 2 58 % 47% 22% 24% 3% 3% 100%
5,58
5,84 5,85
5,76
6,09
MOTIVATIONS' MEANS
Brand Affiliation Investigation
Opportunity Seeking Entertainment
Conversation
2,83
4,77
4,07
CONSUMER ENGAGEMENT'S MEANS
Behavioral Emotional Cognitive

TYPES OF SOCIAL MEDIA USERS
SOCIAL MEDIA
PLATFORM LIGHT MEDIUM HEAVY
FACEBOOK N 0 10 48
% 0% 17% 83%
INSTAGRAM N 10 13 36
% 17% 22% 61%
LINKEDIN N 9 32 17
% 16% 55% 29%
PINTEREST N 36 17 6
% 62% 29% 10%
HOURS SPENT ON FACEBOOK
0 – 0,5 H 0,5 – 1 H 1 – 2 H 2 – 3 H >3 H TOTAL
N 6 12 20 10 10 58
% 10% 21% 34% 17% 17% 100%
NUMBER OF BRANDS LIKED ON FACEBOOK
1 – 5 5 – 15 >15 TOTAL
N 4 17 37 58
% 7% 29% 64% 100%
LEVEL OF PREFERENCE ACROSS INDUSTRIES
INDUSTRY LOW MEDIUM HIGH
TECHNOLOGY N 18 26 14
% 31% 45% 24%
DESIGN
N 35 14 9
% 60% 24% 16%
TOURISM N 9 40 9
% 16% 69% 16%
FASHION N 29 50 23
% 28% 49% 23%

Appendix 19. Cluster 2 – Motivations, Consumer Engagement, Demographics & Behavioral Patterns
GENDER MALE FEMALE TOTAL
63 33% 127 67% 190
AGE
18 - 25 26 - 30 31 - 45 46 - 60 > 60 TOTAL N 125 35 15 14 1 190 % 66% 18% 8% 7% 1% 100%
MONTHLY NET INCOME
0-500 € 501 - 1000 € 1001 - 2500 € 2501 - 3500 € > 3500 € TOTAL N 84 38 48 11 9 190 % 44% 20% 25% 6% 5% 100%
4,61
4,39
5,07
4,55
4,75
MOTIVATIONS' MEANS
Brand Affiliation Investigation
Opportunity Seeking Entertainment
Conversation
2,29
3,55
2,89
CONSUMER ENGAGEMENT'S MEANS
Behavioral Emotional Cognitive

TYPES OF SOCIAL MEDIA USERS
SOCIAL MEDIA
PLATFORM LIGHT MEDIUM HEAVY
FACEBOOK N 4 57 129
% 2% 30% 68%
INSTAGRAM N 35 51 104
% 18% 27% 55%
LINKEDIN N 65 93 32
% 34% 49% 17%
PINTEREST N 122 56 12
% 64% 29% 6%
HOURS SPENT ON FACEBOOK
0 – 0,5 H 0,5 – 1 H 1 – 2 H 2 – 3 H >3 H TOTAL
N 32 60 59 24 15 190
% 17% 32% 31% 13% 8% 100%
NUMBER OF BRANDS LIKED ON FACEBOOK
1 – 5 5 – 15 >15 TOTAL
N 49 68 73 190
% 26% 36% 38% 100%
LEVEL OF PREFERENCE ACROSS INDUSTRIES
INDUSTRY LOW MEDIUM HIGH
TECHNOLOGY N 55 95 40
% 29% 50% 21%
DESIGN
N 106 66 18
% 56% 35% 9%
TOURISM N 42 105 43
% 22% 55% 23%
FASHION N 26 65 99
% 14% 34% 52%
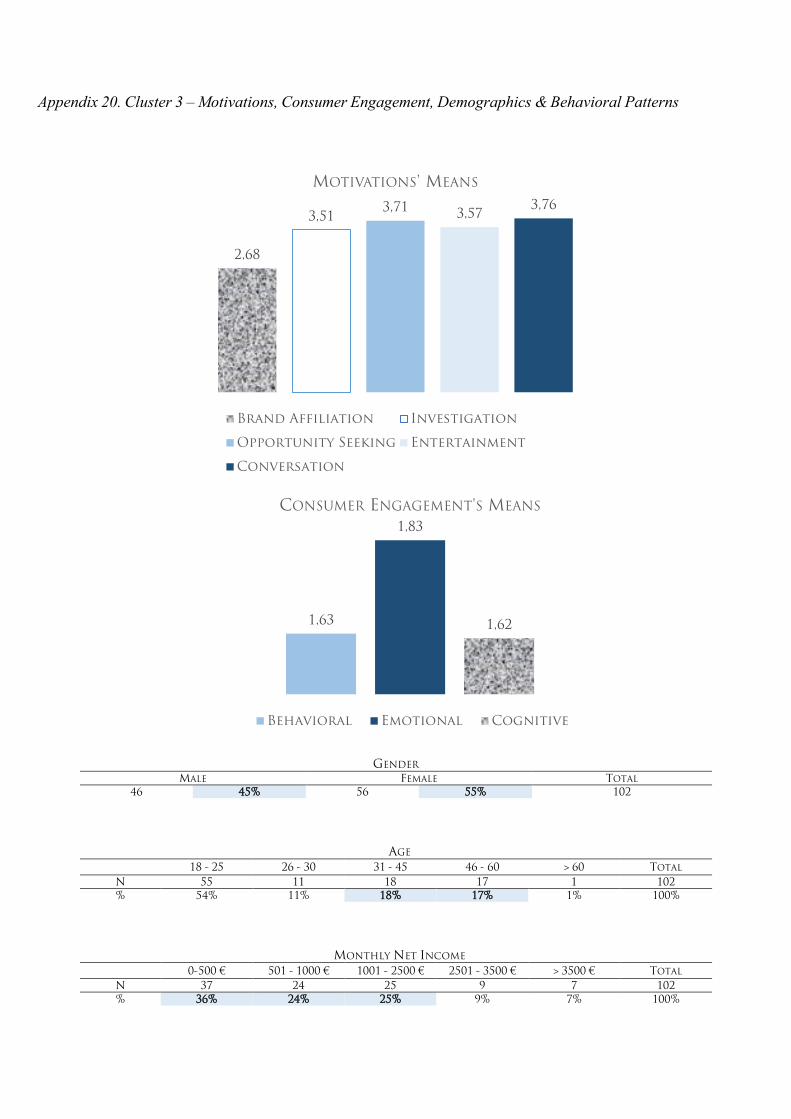
Appendix 20. Cluster 3 – Motivations, Consumer Engagement, Demographics & Behavioral Patterns
GENDER MALE FEMALE TOTAL
46 45% 56 55% 102
AGE
18 - 25 26 - 30 31 - 45 46 - 60 > 60 TOTAL N 55 11 18 17 1 102 % 54% 11% 18% 17% 1% 100%
MONTHLY NET INCOME
0-500 € 501 - 1000 € 1001 - 2500 € 2501 - 3500 € > 3500 € TOTAL N 37 24 25 9 7 102 % 36% 24% 25% 9% 7% 100%
2,68
3,513,71 3,57
3,76
MOTIVATIONS' MEANS
Brand Affiliation Investigation
Opportunity Seeking Entertainment
Conversation
1,63
1,83
1,62
CONSUMER ENGAGEMENT'S MEANS
Behavioral Emotional Cognitive
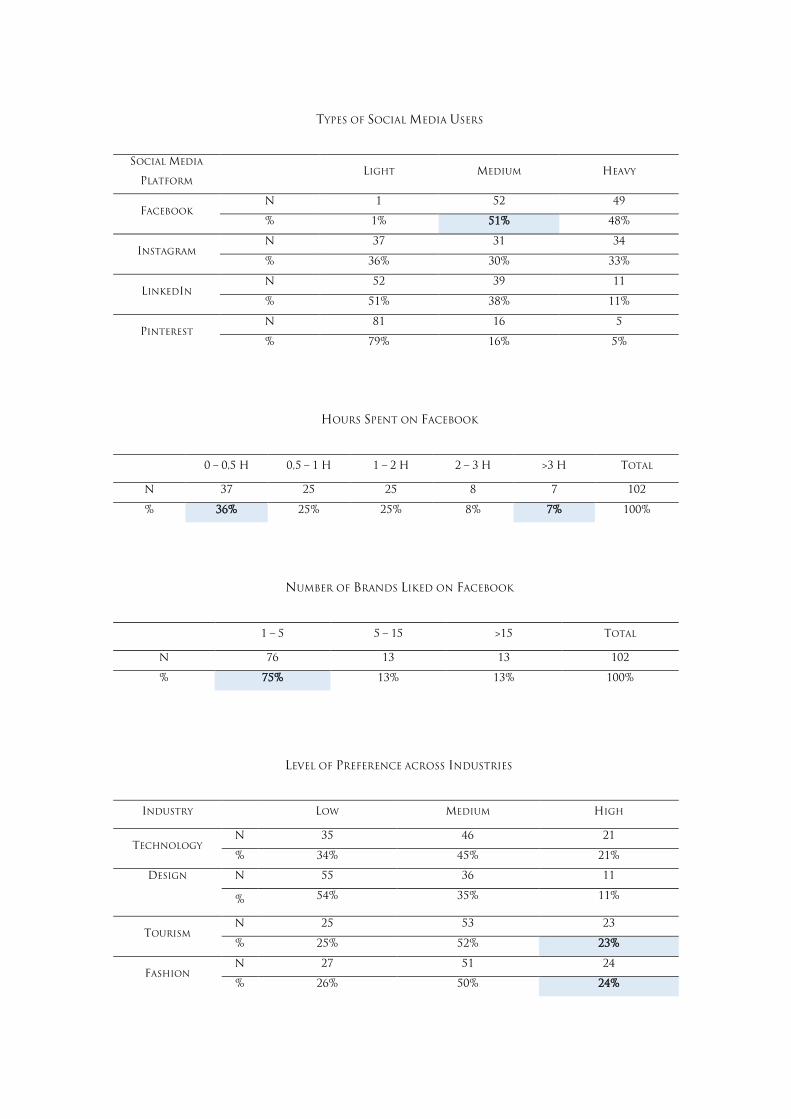
TYPES OF SOCIAL MEDIA USERS
SOCIAL MEDIA
PLATFORM LIGHT MEDIUM HEAVY
FACEBOOK N 1 52 49
% 1% 51% 48%
INSTAGRAM N 37 31 34
% 36% 30% 33%
LINKEDIN N 52 39 11
% 51% 38% 11%
PINTEREST N 81 16 5
% 79% 16% 5%
HOURS SPENT ON FACEBOOK
0 – 0,5 H 0,5 – 1 H 1 – 2 H 2 – 3 H >3 H TOTAL
N 37 25 25 8 7 102
% 36% 25% 25% 8% 7% 100%
NUMBER OF BRANDS LIKED ON FACEBOOK
1 – 5 5 – 15 >15 TOTAL
N 76 13 13 102
% 75% 13% 13% 100%
LEVEL OF PREFERENCE ACROSS INDUSTRIES
INDUSTRY LOW MEDIUM HIGH
TECHNOLOGY N 35 46 21
% 34% 45% 21%
DESIGN
N 55 36 11
% 54% 35% 11%
TOURISM N 25 53 23
% 25% 52% 23%
FASHION N 27 51 24
% 26% 50% 24%