Best practice guidelines for surveys and monitoring of great ape populations
36
Best Practice Guidelines for Surveys and Monitoring of Great Ape Populations Occasional Paper of the IUCN Species Survival Commission No. 36 H. Kühl, F. Maisels, M. Ancrenaz & E.A. Williamson Series Editor: E.A. Williamson
Transcript of Best practice guidelines for surveys and monitoring of great ape populations

Best Practice Guidelines for Surveys and Monitoring of Great Ape Populations
Occasional Paper of the IUCN Species Survival Commission No. 36
H. Kühl, F. Maisels, M. Ancrenaz & E.A. Williamson
Series Editor: E.A. Williamson

The International Union for Conservation of Nature (IUCN)Founded in 1948, IUCN brings together States, government agencies and a diverse range of non-governmental organizations in a unique
world partnership: over 1,000 members in all, spread across some 140 countries. As a Union, IUCN seeks to influence, encourage and assist societies throughout the world to conserve the integrity and diversity of nature and to ensure that any use of natural resources is equitable and ecologically sustainable. IUCN builds on the strengths of its members, networks and partners to enhance their capacity and to support global alliances to safeguard natural resources at local, regional and global levels.
IUCN Species Survival Commission The Species Survival Commission (SSC) is the largest of IUCN’s six volunteer commissions with a global membership of 8,000 experts.
SSC advises IUCN and its members on the wide range of technical and scientific aspects of species conservation and is dedicated to securing a future for biodiversity. SSC has significant input into the international agreements dealing with biodiversity conservation. Web: www.iucn.org/themes/ssc
IUCN Species Programme The IUCN Species Programme supports the activities of the IUCN Species Survival Commission and individual Specialist Groups, as well
as implementing global species conservation initiatives. It is an integral part of the IUCN Secretariat and is managed from IUCN’s international headquarters in Gland, Switzerland. The Species Programme includes a number of technical units covering Wildlife Trade, the Red List, Freshwater Biodiversity Assessments (all located in Cambridge, UK), and the Global Biodiversity Assessment Initiative (located in Washington DC, USA).
IUCN SSC Primate Specialist GroupThe Primate Specialist Group (PSG) is concerned with the conservation of more than 630 species and subspecies of prosimians,
monkeys, and apes. Its particular tasks include carrying out conservation status assessments, the compilation of action plans, making recommendations on taxonomic issues, and publishing information on primates to inform IUCN policy as a whole. The PSG facilitates the exchange of critical information among primatologists and the professional conservation community. The PSG Chairman is Russell A. Mittermeier, the Deputy Chair is Anthony B. Rylands, and the Coordinator for the Section on Great Apes is Liz Williamson. Web: www.primate-sg.org/

Best Practice Guidelines for Surveys and Monitoring of Great Ape Populations
H. Kühl, F. Maisels, M. Ancrenaz & E.A. Williamson
Series Editor: E.A. Williamson
Occasional Paper of the IUCN Species Survival Commission No. 36

The designation of geographical entities in this book, and the presentation of the material, do not imply the expression of any opinion whatsoever on the part of IUCN or other participating organizations concerning the legal status of any country, territory, or area, or of its authorities, or concerning the delimitation of its frontiers or boundaries. The views expressed in this publication do not necessarily reflect those of IUCN or other participating organizations.
Published by: IUCN, Gland, Switzerland in collaboration with the Center for Applied Biodiversity Science at Conservation International
Copyright: © 2008 International Union for Conservation of Nature and Natural Resources
Reproduction of this publication for educational or other non-commercial uses is authorized without prior written permission from the copyright holder(s) provided the source is fully acknowledged.
Reproduction of this publication for resale or other commercial purposes is prohibited without prior written permission of the copyright holder(s).
Citation: H. Kühl, F. Maisels, M. Ancrenaz and E.A. Williamson (2008). Best Practice Guidelines for Surveys and Monitoring of Great Ape Populations. Gland, Switzerland: IUCN SSC Primate Specialist Group (PSG). 32 pp.
ISBN: 978-2-8317-1062-4
Cover photo: © Crickette Sanz
Layout by: Center for Applied Biodiversity Science at Conservation International
Available from: [e-mail] [email protected]; [web] http://www.primate-sg.org/

iii
Table of Contents
Executive Summary .......................................................................................................... 1
Section 1. Introduction .................................................................................................... 21.1. Overview ............................................................................................................................2
1.2. Scope of these guidelines ..................................................................................................3
1.3. Defining terms and differentiating surveys from monitoring ..............................................4
1.4. Sampling objectives and design ........................................................................................5
1.5. Quantifying ape abundance ..............................................................................................6
Section 2. Review of Great Ape Survey Methods .............................................................. 72.1. Introduction ........................................................................................................................7
2.2. Distance sampling methods ..............................................................................................8
2.3. Distance-related methods — strip transects and plots ....................................................11
2.4. Index sampling .................................................................................................................11
2.5. Direct vs. indirect surveys ................................................................................................12
2.6. Occupancy method ..........................................................................................................17
2.7. Full or complete counts....................................................................................................17
2.8. Mark-recapture surveys ...................................................................................................19
2.9. Home range estimator......................................................................................................21
2.10. Interview techniques ........................................................................................................21
2.11. Suitability of different methods ........................................................................................22
Decision Tree: Surveys and Monitoring — what to do when .................................................. 22
Acknowledgements ........................................................................................................ 23
Bibliography .................................................................................................................. 23Literature cited ..........................................................................................................................23
Additional useful literature .......................................................................................................26
Annex I: Contacts and Resources for Further Information and Funding ........................... 28
Annex II: Online Sources of GIS Data .............................................................................. 28


1
Executive Summary
The combination of threats currently facing the remaining great apes requires immediate conser-
vation action at all scales — from site-level initiatives, through national and regional strategies, to
international conventions and action plans. Baseline density estimates and subsequent monitor-
ing of ape populations are essential for assessing the impacts of particular threats and measuring
whether conservation programmes are succeeding.
This document outlines current approaches to great ape surveys and monitoring for field biol-
ogists, protected area managers, government wildlife departments and the conservation com-
munity at large. Detailed, additional information on survey design, field methods, analytical
approaches, and practical considerations such as logistics, finance, and standardised reporting,
form Sections 3 to 8, which are available online and can be downloaded at http://apes.eva.mpg.
de/guidelines.html. These guidelines are mostly web-based to allow continuous revision and to
supply updates as field methods and statistical packages improve with time. It should be kept
in mind that there is no “best” survey method that suits all purposes, and is efficient, precise,
reliable, simple and cheap at the same time. An effort has been made not simply to repeat texts
that already exist in the literature, but to provide real and practical guidance that may not exist
elsewhere. Some key texts by other authors, such as Blake (2005) and White and Edwards (2000),
can be found at http://apes.eva.mpg.de/documentation.html. A bibliography and resource lists
that provide contacts for further information and funding (Annex I) and for obtaining GIS data
(Annex II) conclude this document.
The conservation of wild great apes requires a detailed understanding of their population size,
spatial distribution and demographic trends. Survey and monitoring programmes are designed
to provide exactly this kind of information. Ideally, survey and monitoring data permit evaluation
of the sources and impacts of threats, such as hunting, habitat degradation and fragmentation,
disease and natural catastrophes. They should enable identification of areas of high conservation
value and evaluation of the effectiveness of protection and management strategies. However, in
reality the conservation status of most wild ape populations is still poorly known. Great apes occur
at low densities throughout their range, and often in remote places with difficult access. When
these factors are combined with their cryptic nature, the implementation of efficient survey and
monitoring programmes is notoriously difficult. As a result, action plans issued for both African
and Asian great apes over the past few years have emphasized the need to properly document
the conservation status of wild populations (e.g., Kormos and Boesch 2003; Singleton et al. 2004;
Tutin et al. 2005). Examining the distribution and intensity of threats, and current great ape distribu-
tions helps in the identification of the best sites for new protected areas, and provides empirical
data to evaluate existing management strategies in protected and non-protected areas harbouring
great ape populations. Finally, these data are essential for IUCN Red List of Threatened Species™
assessments, which should be based on actual population size and status.
Surveying most great ape
populations requires long walks
in remote forests. Here a team
is looking for orangutan nests
during a combination of recce
walks and line transects in the
forests of Sabah, Malaysian
Borneo.
Photo: © M. Ancrenaz

2
Section 1. Introduction
1.1. Overview
From the beginning, biologists studying great apes have been producing maps of their geographic
distributions. Population size estimates followed, which ranged from “best guesses” based on
interviews with local hunters or foresters at remote sites, through sample-based methods aimed at
estimating a mean density across a large area, to fairly accurate head counts which assumed that
most of the apes in an area of interest were known individually. Monitoring of great apes has most
often consisted of long-term studies of focal groups, such as the chimpanzees of Gombe (Pusey
et al. 2007) and Mahale (Nishida et al. 2003), and the mountain gorillas of Karisoke (Robbins et al.
2001). However, it is neither feasible nor cost effective to habituate and monitor multiple groups of
each great ape taxon over a large landscape.
As habitat loss and fragmentation of humid forests became more widespread in the 1980s, and
as it became known that hunting and illegal killing were taking direct and heavy tolls on great
apes throughout their range, concerned scientists began to consider whether it was possible to
estimate the size of entire populations of a given species and monitor changes in their distribu-
tion and abundance (Ghiglieri 1984; Tutin and Fernandez 1984). A major indirect threat to great
apes is conventional industrial logging, which alters their habitat and most importantly creates a
network of roads through the forests, allowing hunters and agriculturalists easy access to previ-
ously remote territory (thus facilitating both hunting and further habitat loss). Civil unrest pushes
displaced people into remote, uninhabited forests where they disturb and may hunt larger species
such as apes (e.g., Hart and Mwinyihali 2001; Kalpers 2001). Civil unrest also results in the prolif-
eration of automatic weapons. This in turn leads to increased hunting of wildlife, and a breakdown
of law and order where wildlife protection laws are often the first to be ignored.
A network of protected areas now exists across the forested humid tropics, where, in theory at
least, apes are protected from hunting by law and the forests themselves are protected from
logging or other human modifications. This combination of protecting the apes themselves and
protecting large areas of good quality habitat should, in theory, have protected viable ape popula-
tions in perpetuity. However, it has recently become clear that infectious diseases and emergent
pathogens also pose significant risks to the world’s great apes (Leendertz et al. 2006; Köndgen
et al. 2008). In large parts of western equatorial Africa, gorilla and chimpanzee populations have
been greatly reduced by Ebola haemorrhagic fever, which causes rapid and dramatic declines in
A field technician in Gabon
measures the perpendicular
distance from a dungpile to a
transect line.
Photo © F. Maisels

3
as little as a year (Bermejo et al. 2006). It is believed that this devastating disease has halved ape
populations in the region within the last 20 years (Walsh et al. 2003, 2007). It has been estimated
that, even if hunting and habitat loss could be halted today, it will take more than a century for ape
populations in the areas so far affected by Ebola to fully recover.
Survey and monitoring efforts must not only take into account the behaviour of great apes and
the variables known to be associated with favourable habitat, but also collect information on all
major threats that jeopardize their long-term survival. Specifically, information on human signs and
covariates of disturbance should be recorded during surveys. Information on the location of roads
and railway lines, navigable rivers, human settlements and newly developed agricultural schemes
should also be recorded as these variables affect great ape distribution and density.
Great apes build nests that consist of vegetative structures that can remain visible for weeks or
months. Sample-based methods generally involve indirect counts of nests rather than direct counts
of the apes themselves. Much effort has therefore gone into estimating the size of ape populations
by counting their nests which (i) are much more numerous than their makers (ii) do not run away
and (iii) are more visible. Nests accumulate over many months in any given area. Counting nest
density thus allows us to estimate population density, assuming a standing crop of nests which
decay at a given rate at a given site at a given season. Therefore, they are less sensitive than direct
observations to short-term fluctuations in local density (due to seasonality). Repeated nest counts
have been used to monitor the Virunga mountain gorillas since 1959. Some studies have concen-
trated on small populations based in and around existing protected areas, some on nationwide
surveys, and still others have compared different survey and mapping methods to determine which
was the most accurate, precise, or appropriate for different situations.
To date, most surveys have been carried out using nest counts for a specific site-based pur-
pose. Many have been part of a research project, or a protected area monitoring programme.
Many large areas have been surveyed only once, or not at all, due to lack of human and financial
resources. Even where surveys have been undertaken recently, the results may not be precise
enough to enable detection of change, whether positive or negative (Plumptre 2000). Another
major problem is the conversion of nest counts into great ape population estimates. A constant
fixed relationship between nest density and ape density does not exist. The rate of nest decay
varies greatly between sites and seasons, so ideally surveys should incorporate a locally-derived
and seasonally-appropriate estimate of nest decay rate. The data required to estimate nest decay
can take more than a year to collect prior to the actual survey. This is rarely feasible when a series
of sites across a nation or region is to be surveyed within a limited time (and budget). In addition,
the sheer cost of covering large areas of wilderness on foot remains an obstacle to improving the
precision and accuracy of survey and monitoring data.
Rarely have great ape survey and monitoring data for an entire country or species been centralised
and examined for rate of decline or for changes in past and current geographic distribution. Most
raw data and reports are scattered in desk drawers and filing cabinets or on hard drives or ageing
discs. The recently established web-based Ape Populations, Environments and Surveys “A.P.E.S.”
database (http://apes.eva.mpg.de) aims to centralise all great ape survey data, past and present.
Analysis of these data will allow changes in great ape distribution and numbers to be tracked by
and for the global conservation community. Government agencies in the great ape range states
and international conservation agencies such as IUCN will be able to make informed decisions
based on these data, which will provide a more comprehensive picture of great apes at the species
and population level, not just the site-based information which exists today. All holders of relevant
data are encouraged to contact A.P.E.S. (email [email protected]).
1.2. Scope of these guidelines
Most great apes live in dense tropical forest with poor visibility. Only in a very few cases can we
count apes by direct observation. In the vast majority of cases we must rely on indirect signs or evi-
dence, namely nests or dung. The tricky part is to translate the frequency with which these objects
occur in the habitat into some measure of ape abundance. A variety of survey methods have been
developed, and an overview is given in the next section, Section 2.

4
Survey results cannot be extrapolated from one region to another
because ape density has been shown to vary dramatically even
over small spatial scales. The relationship between the number
of nests counted at one location and the number of apes pro-
ducing them might be very different at another location due to
variation in conversion factors (nest production, nest decay) or to
differences in habitat between sites. Therefore, we must choose
an appropriate survey design, one which will allow us to obtain a
representative sample from the area of interest. Section 3 (online)
discusses Survey Design and gives examples.
Ideally there should be adequate time and financial resources to
conduct a well-designed survey of the area of interest. However,
the unfortunate reality is that most projects have limited budgets
and technical expertise. Section 4 (online) discusses Finance
and Administration of Survey and Monitoring Projects.
The “garbage in, garbage out” data syndrome holds true for ape
surveys. If the quality of data collected is poor, or the sampling
design is not representative of the area of interest, we will have problems analysing and interpret-
ing the data. Sampling procedure should follow a strict sampling design and field protocol to
ensure consistent data collection of the best possible quality. More details can be found online in
Section 5 (Field Issues: Logistics and Data Collection Protocols) and Section 6 (Training).
Data Analysis is a fundamental part of every survey and monitoring project (Section 7 online).
A variety of analytical procedures and software tools have been developed. It is worthwhile con-
sulting a professional statistician who is experienced in wildlife surveys and monitoring, when
preparing a survey.
Surveys are often conducted for a specific project, which ends with a final report or publication.
Others are conducted as part of a protected area monitoring programme. These data are valuable
and are needed to analyse population trends. The archiving of data is therefore an important issue,
and is discussed in Section 8 (Standardised Reporting, online).
1.3. Defining terms and differentiating surveys from monitoring
Great ape populations show high variability in space and time in their behavioural and movement
patterns. They may respond to seasonal changes in resource abundance or dispersion with dif-
ferent grouping patterns, differences in home-range use, habitat switching, and/or changes in
activity patterns (Wich et al. 2004). They leave signs, such as nests, dung, or feeding remains,
which decompose at different rates throughout the year generally related to rainfall and intensity
of insect activity, especially for dung (Ancrenaz et al. 2004 a). Great apes behave more elusively at
certain times than at others, and adapt their behaviour to persistent threats, such as hunting. Over
a longer time-scale, density (number of individuals per unit area) might change as a result of natural
or human induced factors. As a result, estimating ape abundance is a complex task.
Surveys: Establishing baseline abundance estimates
Surveys provide baseline information on species distribution and population size. Surveys assess a
situation at a particular moment, whereas monitoring programmes are generally designed to detect
progress towards a target situation. Sometimes, due to financial, logistical, or time constraints, ape
surveys can only deliver abundance indices such as nest-group encounter rate, instead of total
population size estimates. Different types of survey approaches exist and are appropriate to differ-
ent situations (see Section 1.4).
Practical and budgetary constraints necessitate a compromise between ideal and achievable
survey objectives. In an ideal world we would have accurate and precise density estimates for all
ape populations, as this would allow for fully informed management and conservation decisions
(status of a particular population, or value of a given area for protection of a sub-population).
However, constraints may oblige the survey or monitoring programme to estimate only relative
abundance indices (see below). In many cases, and especially outside protected areas, similar
Young chimpanzee, Pan troglodytes verus.Photo: © K. Hockings

5
constraints may mean that after a survey is conducted, there is no follow-up. Relative abundance
provides useful information on spatial distribution and population size (Greenwood 1996), and it
can form the baseline for a future monitoring programme. However, baselines of absolute abun-
dance (when possible) are more informative. Surveys are also important when designing protected
area networks, determining reserve boundaries or limits of corridors linking isolated populations,
and when deciding where to invest time and effort in protection or research activities.
Monitoring: Detecting population change
Monitoring refers to the regular, periodic surveying of a population through space and time.
Monitoring programmes can be implemented simply to detect temporal changes in population
size. Ideally a population, distribution, or density target is predefined, so that progress towards this
target can be measured, and management actions can be taken to address identified problems.
Interventions may be short-term to address immediate threats associated with population decline
(e.g., antipoaching patrols), or longer-term remedial strategies based on analysis of longitudinal
trends in both population status and threats. The latter can be based on a more sophisticated
understanding of factors affecting ape population density, and can most usefully inform conserva-
tion management strategies.
Population monitoring contributes to our understanding of the impact of threats, such as hunting,
disease outbreaks, the effects of logging and habitat degradation and/or fragmentation, or the
impacts of tourism activities, and can deliver basic information about the apes’ ecology and their
responses to specific disturbance factors. Given the slow reproductive capacity of great apes,
monitoring programmes should repeat surveys every one to five years. However, there is no gen-
eral rule for survey frequency. It depends on the species surveyed, the situation of a particular
population and threat intensity. Shorter intervals between repeat surveys are better, as they will
provide information for a time series analysis, but costs and staff considerations usually prevent
this. The variance around the estimate in each survey should be small enough that significant
trends over time are detected.
Ideally large mammal and human-impact monitoring programmes should include regularly con-
ducted surveys. The design and timing of such a programme should allow easy and rapid detection
of change. This will inform management about the spatial distribution and abundance of the spe-
cies of interest, and variation in these parameters over time and space — both seasonally and on
a longer-term basis. Importantly, such a programme would contribute information on the sources,
distribution, and intensity of threats (although this will usually be complemented by law-enforce-
ment monitoring specifically designed to gather data on threats). Biological and law-enforcement
monitoring data can then be used to guide conservation actions (adaptive management), and to
evaluate the success or failure of management strategies. In this document we provide information
to aid managers in selecting cost-effective methods that address these key issues.
1.4. Sampling objectives and design
Different objectives require different sampling approaches, and no sampling regime is suitable to
address all questions about the status of a population (more details in Section 2). It is absolutely
vital to choose the most appropriate sampling design and statistical procedures to be used for
data processing and analysis before embarking on either a survey or a monitoring programme.
It is equally important to become trained in the field methods that are going to be used. A pilot
study should be conducted, which not only contributes towards staff training, but also provides
data on variance in encounter rates (number of objects encountered per unit of sample, such as
nest groups per kilometre walked). A combination of the encounter rate itself and of its variation
will determine total sampling effort (number of sampling units to be visited and/or total number of
objects to be counted). If the objectives and design have not been correctly defined, the results will
be at best inconclusive, and at worst inaccurate and misleading. The first step of every survey or
monitoring project should be to carefully identify the goals of the study, the sampling design, and
the analysis protocol before embarking on field activities.
We can distinguish three broad categories of information that can be collected by means of a
sample survey or census; these are outlined below in order of increasing complexity.

6
Distribution is usually the easiest and cheapest information to obtain
Objective: To map the occurrence, range, and distribution of a given species.
These surveys range from the collection of basic presence/absence data, to some measure of
relative density per unit area. They are also used to collect geographically specific information
on sources of threat and on habitat preferences of the species of interest. Distributional surveys
include recce (Walsh and White 1999) and occupancy methods (MacKenzie and Royle 2005). Under
certain circumstances occupancy methods can also be used to estimate abundance (e.g. Royle
and Nichols 2003).
Pros: Simple to conduct, do not require highly trained staff, or a high level of expertise for data
analysis. Cheaper and faster to conduct than density estimates. These types of survey can con-
tribute to the identification of key habitats or sites for the conservation of a single species, a guild
of species, or an important habitat type within which the species is known to occur (McGraw 1998;
van Krunkelsven et al. 2000).
Cons: Some methods are sensitive to interobserver differences, and variation in habitat or season-
specific species detectability, and do not provide absolute population estimates.
Abundance estimates through sample surveys
Objective: To obtain an estimate of total population size for a certain area.
Abundance estimates are obtained by sampling a subset of the population of interest. The current
standard method for estimating ape abundance is nest counts using line transect distance sam-
pling. The size of the entire population in the predefined area is then estimated by extrapolating
from the sample. A major assumption is that the sample is representative of the whole area, includ-
ing threats, topography, vegetation and altitude.
Pros: Provides more information about ape population status, when conducted properly, than
simple presence/absence.
Cons: More cost and labour intensive than simple presence/absence. Requires higher-level train-
ing in data collection and analysis.
Total count of a population (census)
Objective: To record all individuals present at a given time at a given location.
Pros: Highly informative, and very accurate if assumption is not violated that all individuals present
are counted once, and no individual is double counted.
Cons: Rarely feasible with great apes, and precision cannot be calculated, since this method is
based on the assumption that all individuals are counted. If animals are missed or double counted
this is impossible to ascertain.
Any of these survey methods can be used for trend estimation or to define management response
by providing information about changes in population status and patterns of human impact,
although to a different level of accuracy. The monitoring of population trends does not necessarily
require an estimate of population size or density. Indices of ape abundance, such as the encounter
rate of ape nests per kilometre walked, or the density of ape nests without converting to individual
apes, can be used if certain requirements are met. However, great care must be taken as detection
probability and sign decay may vary with season and/or rainfall.
1.5. Quantifying ape abundance
The types of information and variables to be recorded in the field obviously depend on the goals of
the survey. Methods need to be standardised before fieldwork begins so as to ensure the collection
of good quality data. Effort should be made to standardise data with other sites/projects/surveys
to allow comparability. Although other sections of this manual will detail these different variables,
here is a brief overview. Parameters to be measured during ape surveys can be divided into four
categories: great ape signs, human signs, habitat descriptors and climate factors.

7
Great apes and their signs
Indicators of the presence and abundance of great apes include direct observations, nests, dung,
feeding remains, tools, footprints, vocalisations, carcasses, and verbal information provided by
local people. These variables may be collected with a variety of different methods, depending on
the objectives of a survey. Details are provided in the following sections. Keep in mind that conclu-
sive proof of the absence of a species in a given area will require prolonged study and/or repeated
investigation (Ross and Neeve 2003). Instead, occupancy modelling provides probabilities of ape
occurrence, even for sites at which no ape sign is detected (MacKenzie and Royle 2005).
Human signs
The type, distribution, and intensity of human activities affecting great apes and their habitats need
to be quantified in order to assess their impact on great ape population size and spatial distribu-
tion, and on the probability of being able to effectively manage areas for improved survival of these
species.
Vegetation type and geographic features
Vegetation type is an important factor determining the distribution and abundance of food and
shelter. In addition, predator abundance and distribution (including humans as predators) is partly
determined by vegetation. Topography and the presence of natural barriers are also key factors.
Vegetation can be described both qualitatively and quantitatively. A qualitative assessment uses
descriptions of the major features encountered in the field, for example, a Raphia swamp, or a
terra firma mixed forest. Quantitative descriptions use numerical values to document each feature
(e.g., a 20% slope), or the percent botanical composition of different habitat types. The selection
of variables to be recorded during fieldwork will be determined by the survey objectives, avail-
able timeframe, the skills of fieldworkers, and the size and current knowledge of the area to be
investigated.
Climatic factors
Additional information sometimes needed to interpret population distribution and change includes
temperature, humidity, and rainfall. Their effects are probably greatest where they determine what
the vegetation types are and how productive they are, and therefore how many apes the habitat
can support. They will almost certainly have some bearing on disease occurrence and prevalence,
and on human activities in the habitat. Climatic variables also affect rates of decomposition of
nests, dung, and other sign.
Land use classification
The administrative status of the sites in which each ape sign is found (whether or not it is a pro-
tected area, mining or logging concession, etc) should be recorded, as more than 80% of ape
habitat lies outside protected areas.
Section 2. Review of Great Ape Survey Methods
2.1. Introduction
This section gives an overview of the variety of methods used to survey and monitor great ape
populations. The most commonly used methods are monitoring of focal groups and conducting
nest counts on transects. We also cover less frequently used approaches such as total counts and
recently developed techniques such as helicopter surveys. The section closes with a summary on
potential future developments such as genetic or camera capture-mark-recapture surveys that
have been successfully applied to other large mammals. An extensive literature exists for most
survey methods, and the reader is encouraged to obtain more details about the respective meth-
ods from the bibliography at the end of this document.

8
Table 1. List of survey methods
Method Objective Pros/Cons Section
Distance sampling Presence/AbsenceDistributionDensity and abundance
Well developed, robust, currently the standard ape survey method 2.2
Distance related methods Presence/AbsenceDistributionAbundance
Easily applicable, prone to bias, if not carefully done 2.3
Index methods Presence/AbsenceDistributionAbundance index
Easily applicable, prone to bias, if not carefully done 2.4
Occupancy methods Presence/AbsenceDistributionAbundance
Not yet applied for ape surveys 2.6
Full counts DistributionAbundance
Only rarely feasible, critical assumptions are easily violated 2.7
Capture-recapture surveys Abundance Ape ranging behaviour makes further development necessary 2.8
Genetic surveys (Minimum)AbundancePopulation structure
Theoretically highly accurate, methods for apes still in development, require high level of expertise
2.8
Camera trapping Presence/AbsenceDistributionAbundancePopulation structure
Great potential, methods still in development 2.8
Home range estimator Abundance Only rarely used, method needs further development 2.9
Interview techniques Presence/Absence Provide rapidly information on ape occurrence over large areaOften inaccurate
2.10
Survey objectives need to be clearly defined. For example, do we want to know the spatial distribu-
tion of apes at a given site, or do we want to know the number of individuals in a given population?
Are we most interested in the temporal trends of a population and their causes, or do we need to
know the causal factors of population density gradients? Not every survey method can address
these questions simultaneously. Depending on the objective of the survey, different approaches
are required (Table 1) and decisions need to be taken on the design and the data to be collected
(Box 1).
2.2. Distance sampling methods
Currently the most widely used approach is distance sampling, which has been described exten-
sively (Buckland et al. 1993, 2001, 2004). Distance sampling can be based either on the detection
of animals themselves or on their signs (also called cues) such as nests and dung on predefined
transects.
Observers applying distance sampling techniques follow either
a series of line transects or cover a series of point transects. In
either case, information (perpendicular distance, radial sighting
distance and angle, or simply radial distance for point transects)
is collected to allow calculation of the shortest distance from
the line or point to detected objects of interest (individual ani-
mals, animal groups, nests, etc.). With the exception of objects
on the transect line or at the centre point, it is not assumed
that all objects are detected. This is especially useful in forest
habitats with limited visibility, where the probability of detect-
ing an object decreases rapidly with increasing distance from
the observer. Distance sampling uses statistical tools to esti-
mate the drop-off in detection probability with increasing dis-
tance from the observer and to ultimately infer the true object
abundance (Whitesides et al. 1988; Buckland et al. 1993, 2001,
2004). Probability of detection is modelled as a function of the
observed distances and then combined with encounter rate
Box 1. The decisions required in preparation for great ape surveys
Based on the objective of the survey, decisions need to
be made about:
1) Objects to be recorded: Nests, Dung,
Feeding Signs, Footprints, Individuals, DNA,
Vocalisations
2) Survey approach: e.g. Transect survey, Recce
survey, Plot survey, Full count, Aerial survey,
Capture-Mark-Recapture Survey.
3) Auxiliary variables: e.g. Nest decay rate,
Deposition/Construction rate, Group size.

9
Box 2. Critical assumptions underlying distance sampling theory
1) Line or point transects are located randomly with
respect to the distribution of the animals or objects of
interest.
2) All animals or objects directly above or on the line or
point must be detected.
3) Distance to animals detected is recorded at their initial
location, before they move towards or away from the
observer.
4) Sightings are independent events.
5) Distances and/or angles are measured accurately and
precisely.
(and estimated group size, if groups are the unit of observation) to calculate the density and abun-
dance of objects of interest in the study area. As long as a random sample is obtained by means of
a well-designed survey, and the number of objects and the distance from each object at its initial
location to a point or to a line is recorded accurately, reliable density estimates for the objects can
be obtained — even if an unknown number located away from the observer go undetected. This is
a crucial aspect of distance sampling theory.
Major assumptions of distance sampling
The major assumptions of this method (Buckland et al. 2001)
are outlined in Box 2. Surveys must be designed and conducted
by people who are competent in distance methodology (see
Section 3 Survey Design, online). Poorly designed surveys with
improperly measured distances will result in inaccurate density
estimates. Lines or points need to be placed randomly or sys-
tematically with a random start point. Establishing transects
along existing roads or trails used by humans will not achieve
good density estimates, because human presence is very likely
to alter the ape abundance. Laying transects along unused
roads or trails means that the habitat is not sampled in a repre-
sentative manner: roads and trails are often either on ridges or
along waterways, thus over or under-sampling some habitats.
Roads are also normally flanked by a corridor of secondary light-
loving vegetation, a relatively rare habitat in the forest matrix as
a whole, and one preferred by some apes (e.g. gorillas).
Violation of the assumption that all objects located above and
on the transect line are detected will create a major bias. Some
objects (especially nests) can go undetected even if they are directly above the observer; this leads
to underestimates of the true density (see van Schaik et al. 2005). Aside from detecting all objects
of interest directly on/above the line or point, the distance measurement must be obtained with
accuracy before there is any movement in reaction to the observer. If sightings are not independ-
ent events this does not bias the density estimate, but it does have implications for the estimate
of variance. Hence for animals or objects that occur in groups (apes or nest sites), the group is
the preferred unit of observation and the distance to the centre of the group is the information
required.
Assuming that these basic assumptions are met in the design and execution of field surveys, the
software package DISTANCE (Thomas et al. 2006), which is free to download, is normally used
to design surveys and to analyse survey data (to fit a detection function, and estimate density
and sampling variance). See Section 7 Data Analysis (online) for more detail, and to obtain the
software and other information go to: http://www.ruwpa.st-and.ac.uk/distance/.
Other factors to consider with distance sampling
Observer effectiveness: Several studies have shown that experience influences object detec-
tion (e.g., nest detection: van Schaik et al. 2005). Surveyors’ skills depend on several factors:
a) Individual ability to detect objects: individual differences in vision, hearing, height and dedica-
tion will affect the number of nests detected during surveys. However, because distance sampling
models the probability of detecting the objects of interest, keeping the same individual observers
or observers of the same skill level throughout one sampling cycle will eliminate this first problem;
b) Fatigue: it is important to keep survey sessions short. If surveyors feel tired, they will detect fewer
objects and thereby introduce additional variability into the detection process; c) Concentration:
if too many types of objects have to be recorded (e.g., multi-species survey), it is highly likely that
detection probability and data quality (the accuracy of the distance measurements, for example)
will be affected — in short, do not try to look for too many things at once. Normally one person
should look up for tree nests and another observer should look down for ground nests (when appli-
cable) and for ancillary data such as dung, footprints, or signs of human activities.

10
Environment: Environmental variables and seasonality are likely to determine the number of
objects detected by affecting encounter rates, the detection process, or even group sizes: such
environmental factors include weather (wind, rain, available light, angle of the sun), forest structure
and composition, forest height, and so on (Bibby and Buckland
1987). Physical features of the survey area also affect observ-
ers’ abilities to detect individuals, nests and other signs: harsh
conditions (steep areas, marshes, rivers, thick vegetation),
for instance, hamper efficient detection or change encounter
rates. However as long as these factors are recorded for each
object detected, they can be included in analyses as covari-
ates. Similarly, recording variables that are likely to influence
encounter rates (e.g., noting when habitat type changes) allows
for post-stratification by these variables during analysis.
Adequate sample size: A minimum of 60– 80 observations is
required to fulfil the basic requirements of distance sampling.
However, considerably larger samples are required to generate
reliable estimates of other values critical to estimating densities
and population sizes (see online Section 3 Survey Design and
Section 7 Data Analysis). In areas with low densities of objects
(nest groups, individuals) these minimum numbers of observa-
tions can be difficult to reach unless substantial effort is allo-
cated to the surveys. Because nest groups are often clumped
within suitable habitat, it is important to determine a transect
length that will be long enough to minimise the probability that
there are zero nests on any given transect. Examination of exist-
ing data from the area or data from a pilot study can inform this
important decision.
Distance sampling on line transects
The line-transect is a plotless method in which the observ-
ers walk along straight lines of known length, which are either
placed randomly or systematically across the survey area (see
Box 3). The area sampled along a line transect is the hypotheti-
cal area in which all sign or animals are assumed to have been
detected. This area is equal to 2 Lμ, where L is the total length
of the transect and μ is the width of the strip within which the
number of objects missed is equal to the number seen beyond
this distance). μ is known as the effective strip width and is
determined using Distance software.
To estimate μ, perpendicular distances from target objects
detected on a transect line must be recorded accurately.
Sometimes, to ensure that the assumptions underlying dis-
tance sampling are met, the sighting/radial distance and angle
(which can be used to calculate perpendicular distance) are
recorded instead; this mostly applies to observations of live ani-
mals. Methods using sighting distances also require a sighting
angle to calculate perpendicular distance and hence to estimate
density (reviewed in Hayes and Buckland 1983). It is generally
recognised that this sighting distance and angle method is sta-
tistically invalid compared to the perpendicular distance method
(e.g., Plumptre and Cox 2006).
Perpendicular distances can be measured (or estimated) directly
(ungrouped data) or placed in proper distance categories
(grouped data). The latter should be considered as an option
d2
d3d4 d5
d6d7 d8
d9
d1
Box 3. Line transect sampling
A single transect line is shown. Circles represent target objects
distributed in the area around the transect. The perpendicular
distance of the nine objects actually detected is denoted as
d1, d2…d8 (see Buckland et al. 2001).
Box 4. Aerial orangutan nest survey in Sabah, northeast Borneo
Surveys in Sabah were carried out with a small Bell 206 Jet Ranger aircraft at a constant speed and height (70 km/h and 60–80 m above canopy). A systematic stratified sampling method using equidistant parallel line transects was designed, the location of the first line being randomly selected (see Ancrenaz et al. 2005 for detailed methodology).
Nest detectability from a helicopter or fixed-wing aircraft depends heavily on forest canopy structure and observer ability. Ideally, specific models for deriving nest densities from aerial indices should be designed for different habi-tat types and for different levels of observer skill. Before such models are designed, ground-truthing must be con-ducted in different habitat types in order to validate a baseline model and to determine habitat-specific correc-tion factors when necessary. Video cameras mounted on each side of the aircraft can record all sightings and the recording can be carefully analysed after the flight.
It is not possible to record nest distance from aerial transect lines, and thus it is impossible to derive oran-gutan nest density estimates directly from these flights. Instead encounter rates are obtained. Aerial surveys are conducted in conjunction with a pre-calibrating stage based on nest surveys on the ground to obtain more tra-ditional orangutan nest density estimates. A robust sta-tistical model can then be developed, correlating aerial indices with orangutan nest densities. This model was applied to all forests in the State of Sabah for which only aerial data were available. In future it may be possible to group nest sightings into distance intervals either side of the aircraft, thus facilitating estimation of the probability of detection.

11
only when it is impossible to obtain exact distances because grouping data severely restricts the
options for analysis. Having collected exact distance data, one might still choose to group these
data to deal with distance measurement problems; therefore exact distance data offer more flex-
ibility at the analysis stage.
Aerial strip and line transect surveys
In Sabah (North-East Borneo), aerial line transect surveys have been employed to survey orangu-
tan nests throughout the state (Ancrenaz et al. 2005). Aerial surveys significantly increase the area
sampled per unit time. They also provide a means of surveying remote areas that are not readily
accessible from the ground, and can be conducted in much shorter time and require lower human
investment than typical ground surveys (Caughley 1974; Ancrenaz et al. 2004b). The utility of aerial
surveys depends on the proportion of target objects that observers can accurately detect from the
air; if substantially less than 100% of target objects are detectable from the air, then methods are
needed to correct observed values (see Box 4).
Aerial nest surveys will likely be of little use in Africa, because African great apes nest lower in the
canopy or even on the forest floor and nests are hidden by the canopy. It may also be impossible
to distinguish between gorilla and chimpanzee nests from the air in areas where the two species
are sympatric. However, aerial surveys could prove useful to determine population distribution and
relative abundance in open landscapes, such as savanna mosaics in West Africa.
Distance sampling on point transects
Point transects (or Point Counts) can be thought of as line transects of zero length. A series of
points is investigated and the radial distance between detected
objects and the centre point are measured (see Box 5). In prac-
tice, a series of points is located along a straight line. In point
transects, only the area at the centre point can have a detec-
tion probability of one. The area searched on point transects is
A = π r2, where r is the estimated effective radius.
2.3. Distance-related methods — strip transects and plots
Strip transects give a total count within a given rectangle (or
quadrat) of known length and width, thus area. No distances
are measured during strip transect sampling; but this method
requires that all objects in the strip are detected. With great
apes, this assumption is likely to be violated, especially in
forest, because the observer only walks down the middle and
may miss objects at the edges of the strip, leading to an under-
estimate of true density (e.g., Vincent et al. 1996). Therefore, a
modified approach has been used to survey orangutan nests in
a Bornean swamp forest: Circular or box-plots of a fixed size
were randomly located on a map and delineated in the forest.
Their boundaries were clearly marked, and plots searched thor-
oughly to count all objects within these plots. This approach pre-
supposes a finite population sampling theory (Cochran 1977),
where the exact size of a survey area is known in advance and
where all objects in the sampling area are detected. Plot counts
produced a significantly higher nest density estimate than
line transects, and came close to the estimated true density
obtained via other approaches (van Schaik et al. 2005).
2.4. Index sampling
Index sampling provides encounter rates, which are assumed to be proportional to actual densi-
ties. These are often easier to obtain than density estimates. However, such indices may reflect
variance in factors other than density. They may also reflect differences in detection probability
between observers and between vegetation types, or variation in production rates, decay rates,
r5r1
r4
r2
r6
r10
r7
r8
r9r3
Box 5. Point transect sampling
The radial distances of the 10 objects detected are denoted
as r 1, r 2…r10 (see Buckland et al., 2001). The circle represents
the maximum distance from the centre at which objects are
detected.

12
and clumping of nests or dung. Possible sources of variation
should be carefully considered when using indices, and controls
should be established to interpret and minimise such variation,
such as plotting cumulative number of observations per unit
distance and sampling until the plotted curve levels out.
Reconnaissance walks. The basic principle of reconnaissance
or “recce” walks is to walk in a predetermined direction taking
the path of least resistance through the survey area (Walsh and
White 1999). “Guided” recce walks should deviate no more than
40° from a predetermined direction; they are considered more
informative than “travel” recce walks, which can deviate by any
degree. Data collection is the same as on line transects (number
of objects, distance along the line, associated ancillary data),
except that perpendicular distances are not recorded and the
width of the strip sampled is fixed (usually 1 m either side of
the observer) to minimise variation in visibility between habitat
types. Recce walks are often used in survey pilot studies; they
are valuable in allowing surveyors to become acquainted with a
study area (vegetation, topography) and to familiarise themselves with detection of different signs.
Recce walks are also used to collect data on the spatial distribution of a species. Even though
these indices can be useful to some extent, it should be kept in mind that recces do not provide
an unbiased sample of the area, and variation in recce encounter rates is very likely to result from
a variety of sources and not just variation in density. Biomonitoring protocols often combine line
transects with recces (Box 6).
2.5. Direct vs. indirect surveys
Direct Surveys. These are counts of individual animals or groups of animals, and are possible if
animals are easily detectable and move slowly with respect to the observer. This is unfortunately
not usually the case with great apes, which tend to be shy and elusive. For known communities of
great apes, direct monitoring is more likely to be possible and it can provide evidence of fluctua-
tions in ape population size (Boesch and Boesch-Achermann 2002; Bermejo et al. 2006; Pusey
et al. 2007). Most line transect surveys of African great apes count groups rather than individuals.
This is required to meet the criterion of independent observations, which is more likely to hold true
for groups than for individuals. However, it is also important to count all individuals encountered in
groups, and to factor the mean and standard deviation of group size into estimates of density and
population size.
Indirect surveys. Because direct surveys of great apes are rarely feasible, the majority of sur-
veys are conducted using indirect traces of ape presence. Signs (or cues) of ape presence are
counted, not individual apes or groups. The easiest to see and the most numerous are ape nests.
Other signs, such as dung, can also be counted, but this proves almost impossible for the strictly
arboreal orangutans. Indirect surveys aiming to provide density estimates of apes must be based
on known rates of production of the target objects and of their decay, and the proportion of the
population that actually leaves the ‘detectable’ signs, so that ape density can be calculated from
the density of indirect signs. Results obtained by indirect surveys should be validated against esti-
mates of true density, whenever possible.
While the goal of surveys is to detect true temporal or spatial variation in ape population size, indi-
rect surveys may yield different density estimates for a number of reasons that are unrelated to real
variation in ape abundance. Some sources of sampling error, such as differences in methods, vari-
ation in skill among survey teams, and differential detectability of nests in different forest types can
be readily addressed through training, analytical tools, and use of standard protocols. However,
other sources of error are more difficult to control. The largest source of error when calculating
ape density estimates from nest survey data is the estimate of nest duration. Nest duration (i.e.,
the mean time for which an ape nest remains visible) varies substantially both within and between
areas for a wide range of factors, including rainfall, altitude, soil pH, nest height and exposure, and
nest tree species (van Schaik et al. 1995; Singleton 2000; Buij et al. 2003; Ancrenaz et al. 2004 a,b;
Box 6. Recces combined with line transects
A section of a survey design is shown. The transects
(short solid lines) are connected by guided recces (dashed
lines). Perpendicular distance is measured only along the
line transects.

13
Johnson et al. 2005; Marshall et al. 2006, 2007; Mathewson
et al. 2008). Density estimates may also be influenced by the
choice of observation unit (individual nests vs. nest groups).
Morgan et al. (2006) found that density estimates based on nest
groups produced estimates 15-20% higher than those derived
from individual nests. However, too few studies are available to
explain the causes of this difference. Survey teams and manag-
ers must be aware of both the magnitude and direction of the
effects of different types of sampling error on population density
estimates. Only after careful consideration of sources of sam-
pling error is it possible to assess whether different density esti-
mates reflect true differences between survey sites or periods.
Nest counts
Weaned individuals of all great ape species build nests in which
they sleep at night or sometimes rest during the day. Nests
can remain visible in the forest for several weeks or months
after construction and use. Therefore they are encountered
at much higher rates than the apes themselves, resulting in a
large number of data points during surveys and a correspond-
ingly better precision of resulting estimates, assuming that the
variables used to calculate density (i.e., production rate, decay
rate) are also estimated with reasonable precision. Furthermore,
nests are immobile, which makes the determination of perpen-
dicular distances and group size much easier compared to
detections of the apes themselves. It is important to distinguish
inter-specific differences between nest characteristics in areas
where two great ape species are sympatric (Tutin et al. 1995).
Sanz et al. (2007) have shown that with the collection of a few
additional nest characteristics, nests of chimpanzees and gorillas can be reliably distinguished.
Special attention also needs to be made not to confuse ape nests with those built by other species.
In Asia, giant squirrels, sun bears or some bird species (adjutant storks, raptors) make nests that
novice observers can mistake for orangutan nests. This calls for careful training of observers.
Two types of nest counts are used, standing crop nest counts (e.g., Tutin and Fernandez 1984; Morgan
et al. 2006) and marked nest counts (Plumptre and Reynolds 1994, 1996; Hashimoto 1995; Furuichi
et al. 2001). For the standing crop method, all nests encountered are recorded. For the marked-nest
count, only nests that have been built recently (i.e., those built since the initial or previous survey) are
recorded during repeated passages. Both methods require auxiliary variables or conversion factors to
convert nest counts to ape abundance. The standing crop method requires a nest construction rate
and a nest decay rate; the marked nest method needs only the former (see Box 7). This difference
leads to pros and cons for both methods in terms of survey efficiency and precision (see below).
Determining auxiliary variables to use as conversion factors
Quantifying auxiliary variables is not a simple task, since there is no static relationship between
ape nest density and ape density. Nest decay rate and nest construction rate show high spatio-
temporal variability (e.g., Walsh and White 2005). Therefore, ape surveys that rely on rates taken
from the literature (see Table 2), instead of site- and temporally-specific rates, are likely to produce
large biases (e.g., Mathewson et al. 2008). For example, Sumatran orangutans regularly make day
nests at midday, but most Bornean orangutans do not (Ancrenaz et al. 2004 a).
Marked nest counts
Marked nest counts do not require nest decay rates (Plumptre and Reynolds 1994, 1996; Hashimoto
1995; Plumptre and Cox 2006). During a marked nest count survey, transects are walked repeat-
edly and only nests constructed between two transect visits are counted. Since the time elapsed
between transect visits is known precisely, nest density can be translated into ape density without
Box 7. Converting nest counts into ape density
Standing crop nest count
all_nestsˆˆˆ
ˆ=Apes
DDp× r × t
where nestsallD _ˆ is the estimated nest density of all
nests, p the estimated proportion of nest builders, r the
estimated rate of nest production per day per individual,
and t the estimated mean life span of a nest, in days.
Marked nest count
recent_nests
ˆˆˆ
ˆ=Apes
DDp×c × r × d
ˆ _nestsrecentD is the estimated density of only recently
built nests, c the proportion of nests remaining until the
next census in fresh or recent age classes, and d is the
inter-visit interval, in days, between first/previous and
revisit for the marked nest count method.

14
needing to estimate nest decay rate, as long as the interval is sufficiently short to assume that
no nests have disappeared (completely decomposed) during the interval. However, recently built
nests will be encountered at a very low rate unless ape density in the area is high. Therefore much
more effort has to be invested to yield a nest encounter rate and a precision comparable to stand-
ing crop nest counts.
The premise of the marked nest method is that all existing nests along transects will be marked
and subsequent surveys will be repeated at short enough intervals so as to record all nests con-
structed since the last passage. A two-week interval has been used to survey chimpanzee nests
in East Africa (e.g., Furuichi et al. 2001), although intervals of up to six weeks are used to survey
orangutan nests in Sabah, Borneo. It is important that ape nests are not being created and dis-
appearing between two successive passages, which would result in an underestimation of ape
density. This could be of particular concern for gorilla nests, which show variable decay rates
depending on nest type and construction (Tutin and Fernandez 1984). Intervals between passages
should be shorter to take account of the short decay rates of some types of gorilla nest. We should
also mention that repeated surveys can be time and labour intensive, particularly in remote areas
where logistical support is limited.
Nest decay rates
Nest decay rate varies with great ape species, nesting tree species, forest type, and abiotic param-
eters such as rainfall, altitude, temperature, soil type and pH (van Schaik et al. 1995; Buij et al.
2003; Ancrenaz et al. 2004 a; Walsh and White 2005; Marshall et al. 2006; Mathewson et al. 2008).
Because of the large variations associated with these parameters, any attempt to extrapolate
decay rates from published studies to any other survey is liable to produce serious errors in density
estimation. Such generalisations have been the cause of inaccuracies in some density estimates
(Ancrenaz et al. 2005).
Nest decay rate needs to be estimated such that it reflects the temporal and site-specific decay
rate of nests encountered at or close to the time of a survey. Environmental conditions before a
survey are not necessarily the same as those afterwards or at any other time. Nest decay rates
determined independently of a survey are very likely to be unrepresentative of the survey itself. The
most reliable estimates for nest decay rate are obtained by direct monitoring of the survival of a
sufficient number of nests (Buij et al. 2003; Ancrenaz et al. 2004 a) through multiple visits before a
survey, although admittedly this can take several years to complete.
Table 2. Spatial variability in nest decay rates. The large differences clearly demonstrate the need for site- and survey-specific decay rate
estimates
SpeciesEstimated decay
time [days]Location Source
Bonobo 7699
Southwest Salonga, DRCLomako, DRC
Mohneke & Fruth 2008van Krunkelsven 2001
Chimpanzee 7390
106111114221
Taï, Côte d’IvoireGoualougo, CongoLopé, GabonKibale, UgandaBelinga, GabonFouta Djallon, Guinea
Marchesi et al. 1995Morgan et al. 2007Hall et al. 1998Ghiglieri 1979Tutin & Fernandez 1984Ham 1998
Gorilla 547890
170
Belinga, GabonLopé, GabonGoualougo, CongoNgotto, CAR
Tutin & Fernandez 1984Tutin et al. 1995Morgan et al. 2007Brugière & Sakom 2001
Orangutan 81145202217228250
258 / 399319602
Ketambe, IndonesiaDanau Sentarum, W. Kalimantan, Indonesia Kinabatangan, Malaysia Central Kalimantanswamp forest Suaq Balimbing, Indonesia Ketambe, Indonesia Gunung Palung, W. Kalimantan, Indonesia hill forest Suaq Balimbing, Indonesia Lesan, E Kalimantan, Indonesia
Rijksen 1978Russon et al. 2001Ancrenaz et al. 2004 aMorrogh-Bernard et al. 2003Singleton 2000Buij et al. 2003Johnson et al. 2005Singleton 2000Mathewson et al. 2008

15
The definition of when a nest is considered to have decayed is a problematic issue, for which no
satisfactory solution has been found up to now. Usually nests are categorized into four or five age
classes (fresh, recent, old, rotting). However, this classification is subject to interobserver differ-
ences, and prone to bias estimates of nest decay time. A more objective measurement of nest
decay state is needed.
Retrospective decay rate estimate using two visits
An approach previously suggested is to estimate decay rate retrospectively based on only two
visits per nest site (Laing et al. 2003). The idea behind this approach is that environmental con-
ditions before the survey determine the decay rate and thus the standing stock of nests at the
time of surveys. This method requires that freshly constructed nest sites are located in a spatially
representative manner across the survey area. The search for these freshly constructed nest sites
should be repeated during at least six regularly spaced missions in the time leading up to the
survey. The first of these missions should be scheduled such that most of the nests detected have
decayed by the start of a survey. At the beginning of a survey, the number of decayed/surviving
nests (using objective criteria) at a site is then determined, from which decay rate can be estimated
using logistic regression. In addition, this approach allows the inclusion of covariate information
such as habitat type, rainfall or tree species.
Since no survey is instantaneous, ideally this approach is repeated for each subregion of the
survey area. This is labour intensive and requires a lot of travel effort, but in return this approach
will deliver reliable site and temporally-specific nest decay rate estimates.
Markov chain methodology
Due to the substantial time investment required to monitor the decay of a sufficiently large sample
of nests to provide accurate estimates of nest duration, a number of studies have used Markov
chain analysis to estimate nest duration (van Schaik et al. 1995; Russon et al. 2001; Buij et al. 2003;
Morrogh-Bernard et al. 2003; Johnson et al. 2005; Mathewson et al. 2008). This technique uses
matrix mathematics to estimate nest duration based on transition rates between predefined “decay
states” (e.g., a freshly made nest; a nest with some dead leaves). One benefit of this technique is that
it permits use of “censored” observations (e.g., nests that were not found soon after construction
or that did not disappear within the study period), thus increasing sample sizes for analysis. Markov
chain analyses allow the process of nest decay to be modelled and provide an estimate of t from
as few as two nest surveys (van Schaik et al. 1995). When they have been calibrated against actual
decay rates, Markov chain analyses tend to overestimate nest duration (van Schaik et al. 1995; Buij
et al. 2003; Johnson et al. 2005) because longer-lasting nests are more likely to be recorded. A cor-
rection factor is usually applied to provide a more accurate estimate of nest duration. This correc-
tion factor is calculated by comparing observed nest duration with results obtained from a Markov
analysis. Like nest duration estimates themselves, correction factors tend to be site-specific.
Predicting nest decay
It has also been suggested that nest decay rate can be to predicted from environmental covariates,
such as temperature, rainfall, altitude, or pH (van Schaik et al. 1995; Buij et al. 2003; Walsh and
White 2005). However, the extent to which these environmental factors reliably correlate with nest
duration is unknown. In some cases, relationships established at one site have failed to accurately
predict nest decay at other sites. For example, while pH might correlate with nest decay rate in dry-
land forests in Sumatra (Buij et al. 2003), it has proved unreliable at two sites in Borneo (Johnson
et al. 2005; Marshall et al. 2006).
Nest construction rates
A second variable required for both nest count approaches is nest construction rate. This is the
number of nests built on average by an individual per 24 hr period. Nest construction rates cannot
be determined during a survey. Rates are usually derived from observations of habituated apes resi-
dent in the survey area or in similar habitat, which is why only a very few nest production rate esti-
mates are available. Bradley et al. (2008) have shown that gorillas may build more than one nest in
a single night; at other times sleeping on bare ground. Such habits are likely to vary both seasonally

16
and spatially, and will influence the standing stock of nests. Therefore, if nest construction rates
have been taken from published studies, density estimates should be interpreted with care, as this
(usually unknown) rate influences the standing stock of nests and thus the estimate considerably.
Nest construction rates are needed to accurately convert nest density into individual density, and it
should be kept in mind that nest construction rates may show spatiotemporal variation (Table 4).
Re-use of nest and other issues
Great apes occasionally re-use nests (e.g., chimpanzees: Plumptre and Reynolds 1996; gorillas:
Iwata and Ando 2007; orangutans: Ancrenaz et al. 2004 a). Direct monitoring of a sufficient number
of nests will theoretically take into account the fact that some nests are used twice (since a few
nests in the samples can be expected to be re-used). This behaviour must also be taken into
account when estimating daily production rates.
In some highly disturbed areas of East Kalimantan rates of up to 10% nest re-use have been found
in areas where few nest-site choices were available. This suggests that nest re-use is not uniform
across habitats, but a function of nest-site availability. Applying nest decay estimates from areas
where nests are heavily re-used to areas where they are rarely re-used, or vice versa, could seri-
ously bias results.
The issue of duration of visibility should also be noted. It is one thing to monitor nests over several
months, or years, checking each month whether or not they are still visible. But, determining decay
rates in this way is liable to overestimate decay rate, since many nests in the latter stages of decay
may not be readily detected or identifiable as a nest during a one-off survey. This leads to potential
overestimates of decay rates, unless there was a way to reliably cease monitoring a nest and class
it as “gone”, at the exact same stage of decay that it would be at if it was no longer detected during
a survey (van Schaik and Azwar 1991).
Proportion of nest-builders
By translating nest density into ape density, we miss infants who sleep with their mothers and are
not yet constructing their own nests. In theory, if the proportion of nest builders in a population
is known from habituated apes (see Table 5), this could be factored into a population estimate.
However, the proportion of nest-builders is not a fixed constant, since the age structure of ape
Table 5. Proportion of nest-builders (proportion of individuals who construct nests)
Species Proportion of nest-builders Location Source
Bonobo 0.7–0.81 Lomako, DRC Fruth 1995
Chimpanzee 0.83 Budongo, Kalinzu, Bwindi and Kibale, Uganda
Plumptre & Cox 2006
Gorilla 0.76–0.77 Bwindi, Uganda and Virunga Volcanoes McNeilage et al. 2006; Gray et al. in review
Orangutan 0.85–0.90 Borneo, Sumatra McKinnon 1972; Payne 1988; van Schaik et al. 2005; Ancrenaz et al. 2004 a; Johnson 2005
1 Value approximated in Eyengo community excluding infants
Table 4. Nest construction rates (nests per weaned individual per 24 h)
Species Nest construction rate Location Source
Bonobo 1.37 Lomako, DRC Mohneke & Fruth 2008
Chimpanzee 1.09 Budongo, Uganda Plumptre & Reynolds 1997
1.09 Goualougo, Congo Morgan et al. 2007
Gorilla 1.0 Goualougo, Congo Morgan et al. 2007
Orangutan 1.0 Kinabatangan, Sabah, Malaysia Ancrenaz et al. 2004 a
1.2 Gunung Palung, Malaysia Johnson et al. 2005
1.7 Ketambe, Indonesia van Schaik et al. 1995
1.9 Suaq Balimbing, Indonesia Singleton 2000

17
populations varies through time and space. Therefore, estimates
of proportions of nest-builders derived from habituated apes can
be considered only as an approximation.
Dung counts
Dung survey methods are widely used for many species, but are
of limited use with great apes, since ape dung encounter rates
are very low. One exception is the western lowland gorilla, for
which dung counts may have some potential, as a recent study
at Bai Hokou has recorded gorilla dung encounter rates com-
parable to those of nests (Todd et al. 2008). Dung counts can be conducted in the same manner
as transect nest counts (methods above) (Plumptre 2000). In addition, the rapid decay of gorilla
dung has the advantage that decay rates can be determined continuously during surveys, which
eliminates the problem we face with nests. However, gorilla dung decay rates show enormous
spatio-temporal variation (Kühl et al. 2007). Therefore, decay rates should never be extrapolated
from one survey site to another.
Methods of estimating dung decay rates during surveys have been published (Plumptre and Harris
1995; Laing et al. 2003; Kühl et al. 2007); see also nest decay rates above. One issue of dung
counts that needs to be factored into surveys is that piles of dung rather than single defeca-
tion events are counted. Therefore, dung pile production rate rather than dung defecation rate is
needed to translate dung density into ape density. Estimates from Bai Hokou (Todd et al. 2008) are
given in Table 6.
Gorilla dung counts have not yet been widely used. However, this approach may be useful in areas
where nest counts are problematic because chimpanzees and gorillas are sympatric.
2.6. Occupancy method
Objects to be sampled: All signs of great ape presence (nests, dung, feeding signs, etc.)
Sampling approach: Plots, point transects
Auxiliary variables: None needed
Occupancy surveys are used for many species, but have not yet been widely used for apes.
Occupancy methods (e.g., MacKenzie and Royle 2005; Pellet and Schmidt 2005; Buij et al. 2007)
use the fraction of sampling units, such as point transects, in which a species is present to make
inferences about a species occurrence, range, distribution, and habitat selection. Their application
is relatively easy and efficient. Occupancy methods use one or, more often, repeat visits to sample
locations and evaluate whether a particular species is present. For apes, nests, dung, feeding signs
and so on are indicators of presence. Several approaches have been developed to reduce “false
negatives” (wrongly recorded absence) due to imperfect detection (e.g., MacKenzie and Royle
2005). If certain assumptions are met, occupancy methods can also be used to estimate abun-
dance (e.g., Royle and Nichols 2003). As with all surveys, the study must be carefully designed.
2.7. Full or complete counts
Objects to be sampled: Individuals, dung (DNA)
Sampling approach: Tracking, direct observation
Auxiliary variables: None needed
A full count or census presupposes that all objects present in a given area at the time of survey are
detected and counted. Absolute population sizes are obtained. Complete counts are feasible only
in relatively small areas, such as the 400 km2 Virunga Volcanoes range and Bwindi Impenetrable
National Park (Harcourt and Fossey 1981; Aveling and Harcourt 1984; McNeilage et al. 2001, 2006;
see Box 8). The following methods have been used to obtain full counts.
Sweep survey
In a sweep survey, a line of observers moves in the same direction to record all objects of interest
during their progression. They are separated from each other by a short distance to minimise the
probability that objects remain undetected. This methodology can also be used to count nests in
Table 6. Western lowland gorilla dung defecation/dung pile
production rates
Measurement Age-class Estimate (range)
Dung piles/day SilverbackSubadult
5.03 (3.99–10.64)5.57 (2.08–12.03)
Defecation events/day SilverbackSubadult
4.30 (1.82–8.71)4.36 (2.46–9.26)
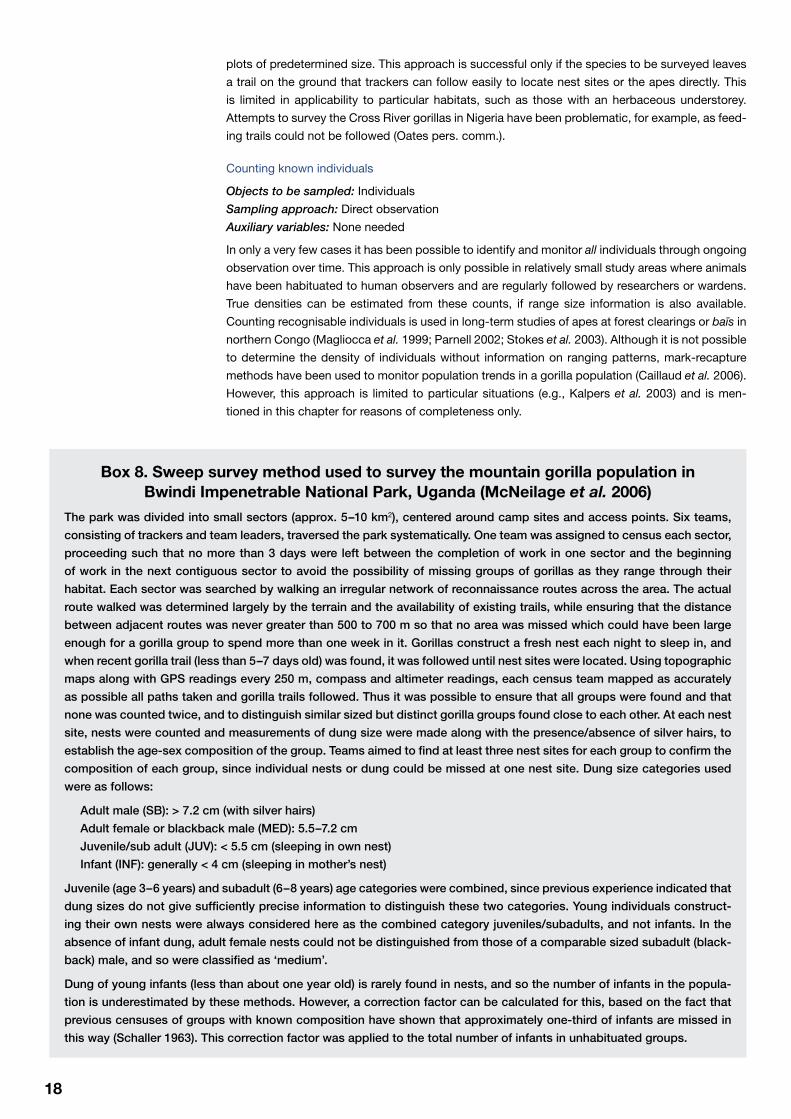
18
plots of predetermined size. This approach is successful only if the species to be surveyed leaves
a trail on the ground that trackers can follow easily to locate nest sites or the apes directly. This
is limited in applicability to particular habitats, such as those with an herbaceous understorey.
Attempts to survey the Cross River gorillas in Nigeria have been problematic, for example, as feed-
ing trails could not be followed (Oates pers. comm.).
Counting known individuals
Objects to be sampled: Individuals
Sampling approach: Direct observation
Auxiliary variables: None needed
In only a very few cases it has been possible to identify and monitor all individuals through ongoing
observation over time. This approach is only possible in relatively small study areas where animals
have been habituated to human observers and are regularly followed by researchers or wardens.
True densities can be estimated from these counts, if range size information is also available.
Counting recognisable individuals is used in long-term studies of apes at forest clearings or baïs in
northern Congo (Magliocca et al. 1999; Parnell 2002; Stokes et al. 2003). Although it is not possible
to determine the density of individuals without information on ranging patterns, mark-recapture
methods have been used to monitor population trends in a gorilla population (Caillaud et al. 2006).
However, this approach is limited to particular situations (e.g., Kalpers et al. 2003) and is men-
tioned in this chapter for reasons of completeness only.
Box 8. Sweep survey method used to survey the mountain gorilla population in Bwindi Impenetrable National Park, Uganda (McNeilage et al. 2006)
The park was divided into small sectors (approx. 5–10 km2), centered around camp sites and access points. Six teams,
consisting of trackers and team leaders, traversed the park systematically. One team was assigned to census each sector,
proceeding such that no more than 3 days were left between the completion of work in one sector and the beginning
of work in the next contiguous sector to avoid the possibility of missing groups of gorillas as they range through their
habitat. Each sector was searched by walking an irregular network of reconnaissance routes across the area. The actual
route walked was determined largely by the terrain and the availability of existing trails, while ensuring that the distance
between adjacent routes was never greater than 500 to 700 m so that no area was missed which could have been large
enough for a gorilla group to spend more than one week in it. Gorillas construct a fresh nest each night to sleep in, and
when recent gorilla trail (less than 5–7 days old) was found, it was followed until nest sites were located. Using topographic
maps along with GPS readings every 250 m, compass and altimeter readings, each census team mapped as accurately
as possible all paths taken and gorilla trails followed. Thus it was possible to ensure that all groups were found and that
none was counted twice, and to distinguish similar sized but distinct gorilla groups found close to each other. At each nest
site, nests were counted and measurements of dung size were made along with the presence/absence of silver hairs, to
establish the age-sex composition of the group. Teams aimed to find at least three nest sites for each group to confirm the
composition of each group, since individual nests or dung could be missed at one nest site. Dung size categories used
were as follows:
Adult male (SB): > 7.2 cm (with silver hairs)
Adult female or blackback male (MED): 5.5–7.2 cm
Juvenile/sub adult (JUV): < 5.5 cm (sleeping in own nest)
Infant (INF): generally < 4 cm (sleeping in mother’s nest)
Juvenile (age 3–6 years) and subadult (6–8 years) age categories were combined, since previous experience indicated that
dung sizes do not give sufficiently precise information to distinguish these two categories. Young individuals construct-
ing their own nests were always considered here as the combined category juveniles/subadults, and not infants. In the
absence of infant dung, adult female nests could not be distinguished from those of a comparable sized subadult (black-
back) male, and so were classified as ‘medium’.
Dung of young infants (less than about one year old) is rarely found in nests, and so the number of infants in the popula-
tion is underestimated by these methods. However, a correction factor can be calculated for this, based on the fact that
previous censuses of groups with known composition have shown that approximately one-third of infants are missed in
this way (Schaller 1963). This correction factor was applied to the total number of infants in unhabituated groups.

19
2.8. Mark-recapture surveys
Objects to be sampled: Individuals, DNA
Sampling approach: Direct observation
Auxiliary variables: None needed
The principal idea behind capture-recapture studies is that the proportion of individuals identified
(“captured”) in a population during a first “trapping round” should equal the proportion of re-identified
(“recaptured”) individuals in a second “trapping round” some time later (see Box 9).
Capture-recapture methods can be used without physically capturing the animals (trapping of
great apes is neither practical nor ethical) if the individuals can be systematically detected and
identified. This can be done at a distance using individual physi-
cal traits, or using genetic profiles as determined from matter
deposited in the environment, such as shed hairs and faeces.
A wide range of methods exists. For reviews of techniques,
assumptions and calculations, see Nichols and Conroy (1996),
Borchers et al. (2002), or Ross and Reeves (2003). A number of
free software packages are also available for data processing
(see Southwood and Henderson 2000, and see below).
Capture-recapture methods require that markers are not lost
during the study and are always correctly recognised. Recent
methods have been developed to deal with violation of this
assumption, and were developed in part to address problems
of DNA capture-recapture (see Lukacs and Burnham 2005 a).
Basic analyses assume that all animals have an equal prob-
ability of capture, but analysis techniques also exist that allow
capture probability to vary for individual animals or subsets of
the population (heterogeneity), through time or capture history
(behaviour). The duration of sampling should be short enough
to assume a closed population if mark-recapture techniques
are to be used to estimate abundance, not just to estimate
survival, mortality or other population parameters. Genetic and
camera-trap capture-recapture studies have been used for a variety of forest-dwelling species
(e.g., Karanth and Nichols 1998; Mowat and Strobeck 2000; Henschel and Ray 2003; Goswami
et al. 2007). These methods could potentially be applied to great apes. However, individuals do not
mix randomly within a population, but occupy home ranges. Consequently there would be a large
capture heterogeneity between individuals. Although, non-standard capture-recapture models
have been developed for similar situations, currently there is no standardized method applicable
to great apes.
Genetic minimum counts and capture-recapture
Objects to be sampled: Dung (DNA)
Sampling approach: e.g., Tracking
Auxiliary variables: None needed
In recent years, non-invasive genetic sampling has been increasingly used for capture-recapture
studies and applied to a variety of species (see review in Lukacs and Burnham 2005 b). First of all,
a minimum number of apes in a given area can be determined simply by counting the number of
“fingerprinted” individuals identified by their DNA. Secondly, estimating abundance using DNA-
based capture-recapture methods is likely to be most useful for relatively small populations (up to
a few thousand individuals), which is the case for most great ape populations. The principle is the
same as for individuals recognised by physiognomic characteristics: the DNA of each individual is
unique and can be “fingerprinted” from dung or hair. As with other approaches, sampling design
is important, and will be dependent on biology of the species, size of the area, timeframe, and the
financial and human resources available.
Box 9. The principle of capture-mark-recapture
There must be at least two rounds of trapping in a given
population. During the first round, a total of n1 different
individuals are “caught” and identified. In the second
round, we catch a set of n2 individuals from which m2
individuals are individuals captured already in the first
round. In this case, we can expect that the ratio of ani-
mals caught during the second round (m2) to the total
number of animals captured on the second round n2
equals the ratio of the number of animals available for
capture (or number caught during the first round) to the
total population:
^m2
N total=n1 * n2

20
In general, signs of animals are searched for, and non-invasive samples collected. For great apes,
faecal samples tend to be the most reliable source of DNA. Samples of approximately 5 g should
be as fresh as possible (e.g., from fresh or very recent night nests) and stored appropriately to
prevent degradation of genetic material in a tube containing ~30 ml ethanol. The day after col-
lection the faecal bolus should be transferred into fresh silica tubes for further drying (Nsubuga
et al. 2004). Samples are then typed for highly variable genetic markers to discriminate individuals.
Most current studies rely on microsatellite loci, since these are short and therefore amplifiable from
non-invasive samples, easy to type by performing length discrimination, and highly variable (see
Di Fiore 2003 for discussion of different genetic markers). Most studies report the number of unique
“genetic fingerprints” (the composite genotype of the specific alleles at the different microsatel-
lite loci) as the minimum number of individuals in an area (e.g., Bergl and Vigilant 2007). However,
genetic fingerprinting can also be used to “mark” individuals for capture-recapture analysis.
A major issue with DNA-based capture-recapture is the possibility of genotypic errors. Therefore,
studies should follow the stringent protocols developed for low quality and quantity samples
(Taberlet and Luikart 1999; Taberlet et al. 1999; Mills et al. 2000; Morin et al. 2001; Waits 2004).
Ideally an assessment prior to the actual study should determine enough variable microsatellite
loci to establish a high probability of identity discrimination (Waits and Paetkau 2005). Recently,
a Bayesian method of population size estimation was applied to non-invasive capture-recapture
data, and showed that genotyping errors did not substantially bias population size estimates and
furthermore allowed for multiple sampling sessions, which had previously been a limitation of tradi-
tional capture-recapture methods (Petit and Valiere 2006). In addition, closed population capture-
recapture models have been developed to account for genotyping errors (Lukacs 2005; Lukacs
and Burnham 2005 a, 2005 b). Other models have been developed to estimate survival, emigration
rates, fecundity and population growth in open populations (Nichols 1992), and a variety of soft-
ware packages exist for capture-recapture analysis:
Mark http://www.phidot.org/software/mark
M-Surge http://www.cefe.cnrs.fr/BIOM/en/softwares.htm
Popan http://www.cs.umanitoba.ca/~popan/
Online forum for analysis of data from marked individuals www.phidot.org/forum.
As with all other survey methods, we strongly recommend consulting a professional statistician
who is familiar with these methods, to both design a DNA-based capture-recapture survey, and to
process the data collected.
Camera trapping
Objects to be sampled: Individuals
Sampling approach: Random or systematic placement of cameras
Auxiliary variables: None needed
Camera trapping has become an increasingly popular tool by which wildlife managers assess spe-
cies’ presence in a given area, monitor population trends, and identify individuals. In theory, if all
individuals caught on camera are positively identified then capture-recapture analytical tools can
be used to estimate population size (Karanth and Nichols 1998).
Capture history can be synthesized in a binary matrix that is fed in turn into standard capture-
recapture software to produce a population estimate (see Sanderson and Trolle 2005). However, as
mentioned under 2.8, the non-random distribution within ape populations violates a basic assump-
tion of standard capture-mark-recapture models. Further method development is needed before
this could be applied to apes.
Camera trapping may also be difficult to apply because apes use three-dimensional habitats (oran-
gutans are the least terrestrial of all). That said, gorillas and chimpanzees have been identified in
the Ndoki forests via camera traps by people familiar with individual study animals (Sanz et al.
2004; Breuer pers. comm.). Although abundance estimates have not yet been calculated from
those data, accumulation curves and comparisons with data on habituated groups indicate that all
apes in a region could be effectively recorded with these devices (Morgan and Sanz pers. comm.).

21
This approach also has potential for ape surveys, however, further evaluation and development are
needed before this method can be applied routinely.
2.9. Home range estimator
Objects to be sampled: Individuals, signs
Sampling approach: e.g., Tracking
Auxiliary variables: None needed
Home range size can be used to estimate the number of ape communities resident in a certain
area. When combined with the average number of individuals in a community, and knowledge of
the extent of home range overlap, this measure can be used to estimate population size over large
areas.
The first use of home range size to estimate ape population size dates back several decades (e.g.,
Reynolds and Reynolds 1965). Bermejo et al. (2006) used ranging data from several adjacent gorilla
groups in the Republic of the Congo; first to estimate home range size and overlap, and second to
estimate gorilla density. The principal idea behind this approach is to track the positions of individ-
uals belonging to the same group over time. This may be done through direct observation or signs,
such as nests or camera images. A broad variety of statistical and non-statistical approaches exist
to then derive home range size estimates from these location data (e.g., minimum convex polygon,
kernel density estimation). When properly applied, this approach should provide a reliable estimate
of ape density, which can be used to confirm estimates derived from other approaches or to cali-
brate other methods. However, this method could prove difficult to implement for apes with highly
overlapping ranges (Singleton 2000).
Home range size and overlap can differ enormously over different spatial scales. In orangutans, it
also differs between sexes and probably with age. That means that home range size and number
of community members have to be estimated in a representative manner for a specific survey area
(Singleton 2000). Extrapolation of home range size will likely yield biased results. Although this
method may have potential for assessing ape population status, it needs further development,
before it can be used routinely.
2.10. Interview techniques
Objects to be sampled: Verbal information
Sampling approach: Questionnaire
Auxiliary variables: None needed
Interviews with hunters, local villagers, and/or officials from in-country governmental organizations
are useful for obtaining information on the perceived presence of apes over large areas, and can be
accomplished relatively rapidly and economically (Sugiyama and Soumah 1988; Hoppe-Dominik
1991).
However, information gathered in interviews is often inaccurate, as it tends to be out-dated and
interviewee reliability is notoriously difficult to assess. Nevertheless, treated with caution, inter-
views can be a useful preliminary step to conducting a field survey, or to obtaining information to
supplement field surveys.
There are two main types of interviews: (i) mailed-in questionnaires or (ii) face-to-face interviews.
In the former case, a questionnaire is prepared in advance and is sent to targeted people work-
ing in the selected area. The latter involves conducting interviews at either randomly or system-
atically selected sites. Interviews should be structured or semi-structured. Both interview types
cover specific questions or topics, but with the possibility of open discussion in semi-structured
interviews (Bernard 2002). To prepare for face-to-face interviews, it is helpful to learn the local
names of each primate species thought to occur in the area, to have photographs or drawings of
specimens and, if possible, recordings of their vocalisations. To confirm the presence of a spe-
cies, there should be concordance between the name, identification of species in the pictures, and
description of its behaviour, given by the interviewee without any leading questions asked by the
interviewer. Interviews are generally more reliable when confirming absence, as opposed to pres-
ence. Presence reports should always be verified first hand.

22
2. Is the rough encounter rate of nest groups or other signs that will be used to estimate density already known?
3. Decide on the target coefficient of variation you require for a survey. If a survey or series of surveys is to be used for monitoring purposes, then a power analysis should be conducted to estimate the probability of being able to detect a trend given the potential variability in the data and the given monitoring design (same can be said for methods based on mark-recapture, etc.). Using the encounter rate derived from a pilot study, calculate how many kilo-metres of transect you would need to estimate density of nest groups. (Use the formula found in Chapter 7, section 7.2.2.1. of Buckland et al. (2001). Is the number of kilometres feasible given the time and resources available?
1. Are all animals in the population known individually and can they be found within a few weeks and/or are they are relatively few in number, make night nests, and found within a small area?
If yes, Carry out full count of known individuals, or use sweep sample to cover the whole of the area of interest.
4. You cannot calculate density without enormous cost. Therefore you cannot estimate num-bers of animals using transect methods. Would you be able to use genetic methods?
5. Are there sufficient resources to cover the whole area using recce walks?
No
No
No
No
No If no, go to 2.
Conduct a pilot study consisting of a few transects throughout the area of interest in order to obtain a rough idea of encounter rate (this should only take a couple of weeks). Then go to 3.
If no, go to 4.
If no, consider index methods (go to 5).
If no, consider interview-only surveys.
If yes, design a transect-based survey using a combination of the DISTANCE programme and either ArcView or ArcGIS. Implement it using trained field teams; use the results to estimate the ape population in the area surveyed.
If yes, and if you have access to trained staff and a partner laboratory to process samples, con-sider designing a survey using genetic markers and implement it. (NB: Pilot study is advised — this may or may not be more costly than transect methods).
If yes, create a recce sampling design using a combination of ArcView or ArcGIS and the DISTANCE programme and implement it using trained teams in the field. Results will provide a distribution map and relative abundance over the area.
Yes
(See also Section 3.2 “Methods: what to do and what order to do it in” in Hedges, S. and D. Lawson. 2006. Dung survey standards for the MIKE programme. CITES MIKE Programme, Nairobi, Kenya http://www.cites.org/eng/prog/MIKE/index.shtml)
2.11. Suitability of different methods
As pointed out earlier, there is no “best” great ape survey technique. Here we present a decision tree that can be used to determine which method to use in different circumstances.
Decision Tree: Surveys and Monitoring — what to do when
I. First let us assume you need to know how many animals are present in the population.
Yes
Yes
Yes
Yes
II. You cannot estimate how many animals are present in the population and/or you do not need to know at this point. However you can calculate area of occupancy (distribution maps) and relative abundance.

23
Acknowledgements
We are very grateful to the following reviewers who generously lent their time and expertise to improving this document: Richard
Bergl, Aditya Gangadharan, Kath Jeffery, Andrew Marshall, David Morgan, James D. Nichols, John F. Oates, Andrew Plumptre, Anne
Russon, Crickette Sanz, Ian Singleton, Emma Stokes, Samantha Strindberg and Caroline Tutin. Special thanks for specific input on
genetic analyses go to Mimi Arandjelovic, Richard Bergl, Katja Guschanski, Kath Jeffery and Dieter Lucas, and to Barbara Fruth for
input on nests.
Thanks are also extended to Kim Meek for graphic design, to Anthony Rylands for editorial guidance, and to Kim Hockings and
Crickette Sanz for the use of their photographs. Christophe Boesch and the Max Planck Institute for Evolutionary Anthropology,
Conservation International, Hutan, the Margot Marsh Biodiversity Foundation, and the Wildlife Conservation Society supported
the writing and development of these guidelines. Publication was kindly sponsored by a grant from the Arcus Foundation.
Bibliography
Literature cited
Ancrenaz, M., Calaque, R. and Lackman-Ancrenaz, I. 2004a. Orang-utan (Pongo pygmaeus) nesting behaviour in disturbed forest (Sabah, Malaysia): implications for nest census. International Journal of Primatology 25:983–1000.
Ancrenaz, M., Gimenez, O., Goossens, B., Sawang, A. and Lackman-Ancrenaz, I. 2004b. Determination of ape distribution and population size with ground and aerial surveys: a case study with orang-utans in lower Kinabatangan, Sabah, Malaysia. Animal Conservation 7:375–385.
Ancrenaz, M., Gimenez, O., Ambu, L., Ancrenaz, K., Andau, P., Goossens, B., Payne, J., Tuuga, A. and Lackman-Ancrenaz, I. 2005. Aerial surveys give new estimates for orang-utans in Sabah, Malaysia. Plos Biology 3:30–37.
Aveling, C. and Harcourt, A.H. 1984. A census of the Virunga gorillas. Oryx 18:8–13. Bergl, R.A. and Vigilant, L. 2007. Genetic analysis reveals population structure and recent migration within the highly fragmented range of the Cross
River gorilla (Gorilla gorilla diehli). Molecular Ecology 16:501–516.Bermejo, M., Rodríguez-Teijeiro, J.D., Illera, G., Barroso, A., Vilà, C. and Walsh, P.D. 2006. Ebola outbreak killed 5000 gorillas. Science
314(5805):1564.Bernard, H.R. 2002. Research Methods in Anthropology: Qualitative and Quantitative Methods. Third Edition. Altimara Press, Walnut Creek, USA.Bibby, C.J. and Buckland, S.T. 1987. Bias of bird census results due to detectability varying with habitat. Journal of Applied Ecology 22:619–633.Blake, S. 2005. Long-Term System for Monitoring the Illegal Killing of Elephants (MIKE): Central African Forests-Final Report of Population Surveys
(2003-2004). Wildlife Conservation Society, New York. Boesch, C. and Boesch-Achermann, H. 2000. The Chimpanzees of the Taï Forest: Behavioral Ecology and Evolution. Oxford University Press, New York. Borchers, D.L., Buckland, S.T. and Zucchini, W. 2002. Estimating Animal Abundance: Closed Populations. Springer-Verlag, London.Bradley, B.J., Doran-Sheehy, D.M. and Vigilant, L. 2008. Genetic identification of elusive animals: re-evaluating tracking and nesting data for wild
western gorillas. Journal of Zoology 275:333-340.Brugière, D . and Sakom, D. 2001. Population density and nesting, behaviour of lowland gorillas (Gorilla gorilla gorilla) in the Ngotto forest, Central
African Republic. Journal of Zoology 255:251–259.Buckland, S.T., Anderson, D.R., Burnham, K.P. and Laake, J.L. 1993. Distance Sampling: Estimating Abundance of Biological Populations. Chapman
and Hall, London. Free download http://www.ruwpa.st-and.ac.uk/distance.book/Buckland, S.T., Anderson, D.R., Burnham, K.P., Laake, J.L., Borchers, D.L. and Thomas, L. 2001. Introduction to Distance Sampling. Oxford University
Press, Oxford.Buckland, S.T., Anderson, D.R., Burnham, K.P., Laake, J.L., Borchers, D.L. and Thomas, L. 2004. Advanced Distance Sampling: Estimating Abundance
of Biological Populations. Chapman and Hall, London.Buij, R., Singleton, I., Krakauer, E. and van Schaik, C.P. 2003. Rapid assessment of orangutan density. Biological Conservation 114:103–113.Buij, R., McShea, W.J., Campbell, P., Lee, M.E., Dallmeier, F., Guimondoud, S., Mackaga, L., Guisseougou, N., Mboumba, S., Hines, J., Nichols, J.D.
and Alonso, A. 2007. Patch-occupancy models indicate human activity as major determinant of forest elephant Loxodonta cyclotis seasonal distribution in an industrial corridor in Gabon. Biological Conservation 35:189–201.
Caillaud, D., Levréro, F., Cristescu, R., Gatti, S., Dewas, M., Douadi, M., Gautier-Hion, A., Raymond, M. and Ménard, N. 2006. Gorilla susceptibility to Ebola virus: the cost of sociality. Current Biology 16: 489–491.
Caughley, G. 1974. Bias in aerial survey. Journal of Wildlife Management 38:921–933.Cochran, W.G. 1977. Sampling Techniques. John Wiley and Sons, New York.Di Fiore, A. 2003. Molecular genetic approaches to the study of primate behavior, social organization, and reproduction. American Journal of Physical
Anthropology 122:62–99.Fruth, B. 1995. Nests and nest groups in wild bonobos: Ecological and Behavioural correlates. Ph.D. thesis, Ludwig-Maximilian University, Munich.Furuichi, T., Hashimoto, C. and Tashiro, Y. 2001. Extended application of a marked-nest census method to examine seasonal changes in habitat use
by chimpanzees. International Journal of Primatology 22:913–928.Ghiglieri, M.P. 1979. The socio-ecology of chimpanzees in Kibale Forest, Uganda. Ph.D. thesis, University of California, Davis.Ghiglieri, M.P. 1984. The Chimpanzee of Kibale Forest. Columbia University Press, New York.Goswami, V.R., Madhusudan, M.D. and Karanth, K.U. 2007. Application of photographic capture-recapture modelling to estimate demographic
parameters for male Asian elephants. Animal Conservation 10:391–99.Gray, M., McNeilage, A., Fawcett, K. Robbins, M.M., Ssebide, B., Mbula, D. and Uwingeli, P. in review. Censusing the mountain gorillas in the Virunga
Volcanoes: Complete sweep method vs. monitoring. African Journal of Ecology.

24
Greenwood, J.J.D. 1996. Basic techniques. In: W.J. Sutherland (ed.), Ecological Census Techniques: A Handbook. pp.11–110. Cambridge University Press, Cambridge, UK.
Hall, J.S., White, L.J.T., Inogwabini, B.-I., Omari, I., Simons-Morland, H., Williamson, E.A., Saltonstall, K., Walsh, P., Sikubwabo, C., Bonny, D., Prince Kiswele, K., Vedder, A. and Freeman, K. 1998. Survey of Grauer’s gorillas (Gorilla gorilla graueri) and eastern chimpanzees (Pan troglodytes sch-weinfurthii) in the Kahuzi-Biega National Park lowland sector and adjacent forest in eastern Democratic Republic of Congo. International Journal of Primatology 19:207–235.
Ham, R. 1998. Nationwide Chimpanzee Census and Large Mammal Survey in the Republic of Guinea. Unpublished report to the European Union, Conakry, Guinea.
Harcourt, A.H. and Fossey, D. 1981. The Virunga gorillas: decline of an island population. African Journal of Ecology 19:83–97.Hart, T. and Mwinyihali, R. 2001. Armed Conflict and Biodiversity in Sub-Saharan Africa: The Case of the Democratic Republic of Congo. Biodiversity
Support Program, Washington, DC.Hashimoto, C. 1995. Population census of the chimpanzees in the Kalinzu Forest, Uganda: comparison between methods with nest counts. Primates
36:477–488.Hayes, R.J. and Buckland, S.T. 1983. Radial distance models for the line-transect methods. Biometrics 39:29–42.Hedges, S. and D. Lawson. 2006. Dung survey standards for the MIKE programme. CITES MIKE Programme, Nairobi, Kenya. Website: www.cites.
org/eng/prog/MIKE/index.shtmlHenschel, P. and Ray, J.C. 2003. Leopards in African Rainforests: Survey and Monitoring Techniques. Wildlife Conservation Society, New York.
Website: www.savingwildplaces.com/swp-globalcarnivore (English and French pdfs).Hoppe-Dominik, B. 1991. Distribution and status of chimpanzees (Pan troglodytes verus) on the Ivory Coast. Primate Report 31:45–75.Iwata, Y. and Ando, C. 2007. Bed and bed-site reuse by western lowland gorillas (Gorilla g. gorilla) in Moukalaba-Doudou National Park, Gabon.
Primates 48:77–80. Johnson, A.E., Knott, C.D., Pamungkas, B., Pasaribu, M. and Marshall, A.J. 2005. A survey of the orangutan (Pongo pygmaeus wurmbii) population
in and around Gunung Palung National Park, West Kalimantan, Indonesia, based on nest counts. Biological Conservation 121:495–507.Kalpers, J. 2001. Volcanoes Under Siege: Impact of a Decade of Armed Conflict in the Virungas. Biodiversity Support Program, Washington, DC.Kalpers, J., Williamson, E.A., Robbins, M.M., McNeilage, A., Nzamurambaho, A., Lola, N. and Mugiri, G. 2003. Gorillas in the crossfire: assessment
of population dynamics of the Virunga mountain gorillas over the past three decades. Oryx 37:326–337.Karanth, K.U. and Nichols, J.D. 1998. Estimation of tiger densities in India using photographic captures and recaptures. Ecology 79:2852–2862.Köndgen, S., Kühl, H., N’Goran, P.K., Walsh, P.D., Schenk, S., Ernst, N., Biek, R., Formenty, P., Maetz-Rensing, K., Schweiger, B., Junglen, S.,
Ellerbrok, H., Nitsche, A., Briese, T., Lipkin, W.I. Pauli, G., Boesch, C. and Leendertz, F.H. 2008. Pandemic human viruses cause decline of endan-gered great apes. Current Biology 18:260–264.
Kormos, R. and Boesch, C. 2003. Regional Action Plan for the Conservation of Chimpanzees in West Africa. Conservation International, Washington, DC.
Kühl, H.S, Todd, A., Boesch, C. and Walsh, P.D. 2007. Manipulating dung decay time for efficient large-mammal density estimation: gorillas and dung height. Ecological Applications 17:2403–2414.
Laing, S.E., Buckland, S.T., Burn, R.W., Lambie, D. and Amphlett, A. 2003. Dung and nest survey: estimating decay rates. Journal of Applied Ecology 40:1102–1111.
Leendertz, F.H., Pauli, G., Maetz-Rensing, K., Boardman, W., Nunn, C., Ellerbrok, H., Jensen, S.A., Junglen, S. and Boesch, C. 2006. Pathogens as drivers of population declines: the importance of systematic monitoring in great apes and other threatened mammals. Biological Conservation 131:325–337.
Lukacs, P.M. 2005. Statistical aspects of using genetic markers for individual identification in capture-recapture studies. Ph.D. thesis, Colorado University, USA.
Lukacs, P.M. and Burnham, K.P. 2005a. Estimating population size from DNA-based closed capture–recapture data incorporating genotyping error. Journal of Wildlife Management 69:396–403.
Lukacs, P.M. and Burnham, K.P. 2005b. Review of capture–recapture methods applicable to noninvasive genetic sampling. Molecular Ecology 14:3909–3919.
MacKenzie, D.I. and Royle, J.A. 2005. Designing occupancy studies: general advice and allocating survey effort. Journal of Applied Ecology 42:1105–1114.
MacKinnon, J. 1974. The behaviour and ecology of wild orang-utans (Pongo pygmaeus). Animal Behaviour 22:3–74.Magliocca, F., Querouil, S. and Gautier Hion, A. 1999. Population structure and group composition of western lowland gorillas in north-western
Republic of Congo. American Journal of Primatology 48:1–14.Marchesi, P., Marchesi, N., Fruth, B. and Boesch, C. 1995. Census and distribution of chimpanzees in Cote d’Ivoire. Primates 36:591–607.Marshall, A.J., Nardiyono, L., Engstrom, M., Pamungkas, B. and Palapa, J. 2006. The blowgun is mightier than the chainsaw in determining popula-
tion density of Bornean orang-utans in the forests of East Kalimantan. Biological Conservation 129:566–578. Marshall, A.J., Salas, L.A., Stephens, S., Nardiyono, L., Engstrom, M., Meijaard, E. and Stanley, S.A. 2007. Use of limestone karst forests by Bornean
orang-utans in the Sangkuliran Peninsula, East Kalimantan, Indonesia. American Journal of Primatology 69:1–8.Mathewson, P.D., Spehar, S.N., Meijaard, E., Nardiyono, Purnomo, Sasmirul, A., Sudiyanto, Oman, Sulhnudin, Jasary, Jumali, and Marshall, A.J. 2008.
Evaluating orangutan census techniques using nest decay rates: implications for population estimates. Ecological Applications 18:208–221.McGraw, W.S. 1998. Three monkeys nearing extinction in the forest reserves of eastern Côte d’Ivoire. Oryx 32:233–236.McNeilage, A., Plumptre, A.J., Brock-Doyle, A. and Vedder, A. 2001. Bwindi Impenetrable National Park, Uganda: gorilla census 1997. Oryx
35:39–47. McNeilage, A., Robbins, M.M., Gray, M., Olupot, W., Babaasa, D., Bitariho, R., Kasangaki, A., Rainer, A., Asuma, S., Mugiri, G. and Baker, J. 2006.
Census of the mountain gorilla Gorilla beringei beringei population in Bwindi Impenetrable National Park, Uganda. Oryx 40:419–427.Mills, L.S., Citta, J.J., Lair, K.P., Schwartz, M.K. and Talmon, D.A. 2000. Estimating animal abundance using noninvasive DNA sampling: promise and
pitfalls. Ecological Applications 10:238–294.Mohneke, M. and Fruth, B. 2008. Bonobo (Pan paniscus) density estimation in the SW-Salonga National Park, Democratic Republic of Congo:
Common methodology revisited. In: T. Furuichi and J. Thompson (eds.), The Bonobos. Behavior, Ecology, and Conservation, pp.151–166. Springer, New York.
Morgan, D., Sanz, S., Onononga, J.R. and Strindberg, S. 2006. Ape abundance and habitat use in the Goualougo Triangle, Republic of Congo. International Journal of Primatology 27:147–179.

25
Morin, P.A., Chambers, K.E., Boesch, C. and Vigilant L. 2001. Quantitative polymerase chain reaction analysis of DNA from noninvasive samples for accurate microsatellite genotyping of wild chimpanzees (Pan troglodytes verus). Molecular Ecology 10:1835–1844.
Morrogh-Bernard, H., Husson, S., Page, S.E. and Rieley, J.O. 2003. Population status of the Bornean orang-utan (Pongo pygmaeus) in the Sebangau peatswamp forest, Central Kalimantan, Indonesia. Biological Conservation 110:141–152.
Mowat, G. and C. Strobeck. 2000. Estimating population size of grizzly bears using hair capture, DNA profiling and mark-recapture analysis. Journal of Wildlife Management 64:183–193.
Nichols, J.D. 1992. Capture-recapture models. Bioscience 42:94–102.Nichols, J.D. and Conroy, M.J. 1996. Techniques for estimating abundance and species diversity. In: D.E. Wilson, F.R. Cole, J.D. Nichols, R. Rudran
and M.S. Foster (eds.), Measuring and Monitoring Biological Diversity: Standard Methods for Mammals, pp.177–234. Smithsonian Institution Press, Washington, DC.
Nishida, T., Corp, N., Hamai, M., Hasegawa, T., Hiraiwa-Hasegawa, M., Hosaka, K., Hunt, K.D., Itoh, N., Kawanaka, K., Matsumoto-Oda, A., Mitani, J.C., Nakamura, M., Norikoshi, K., Sakamaki, T., Turner, L., Uehara, S. and Zamma, K. 2003. Demography, female life history, and reproductive profiles among the chimpanzees of Mahale. American Journal of Primatology 59:99–121.
Nsubuga, A.M., Robbins, M.M., Roeder, A.D., Morin, P.A., Boesch, C. and Vigilant, L. 2004. Factors affecting the amount of genomic DNA extracted from ape faeces and the identification of an improved sample storage method. Molecular Ecology 13:2089–2094.
Parnell, R.J. 2002. Group size and structure in Western Lowland Gorillas (Gorilla gorilla gorilla) at Mbeli Bai, Republic of Congo. American Journal of Primatology 56:193–206.
Payne, J. 1988. Orang-utan conservation in Sabah. WWF-Malaysia International, Report 3759, Kuala Lumpur, Malaysia.Pellet, J. and Schmidt, B.R. 2005. Monitoring distributions using call surveys: estimating site occupancy, detection probabilities and inferring absence.
Biological Conservation 123:27–35.Petit, E. and Valiere, N. 2006. Estimating population size with noninvasive capture-mark-recapture data. Conservation Biology 20:1062–1073.Plumptre, A.J. 2000. Monitoring mammal populations with line transect techniques in African forests. Journal of Applied Ecology 37:356–368.Plumptre, A.J. and Cox, D. 2006. Counting primates for conservation: primate surveys in Uganda. Primates 47:65–73.Plumptre, A.J. and Harris, S. 1995. Estimating the biomass of large mammalian herbivores in a tropical montane forest: a method of faecal counting
that avoids assuming a ‘steady state’ assumption. Journal of Applied Ecology 32:111–120.Plumptre, A.J. and Reynolds, V. 1994. The impact of selective logging on the primate populations in the Budongo Forest Reserve, Uganda. Journal
of Applied Ecology 31:631–641. Plumptre, A.J. and Reynolds, V. 1996. Censusing chimpanzees in the Budongo Forest, Uganda. International Journal of Primatology 17:85–99.Plumptre, A.J. and Reynolds, V. 1997. Nesting behaviour of chimpanzees: implications for censuses. International Journal of Primatology
18:475–485.Pusey, A.E., Pintea, L., Wilson, M.L., Kamenya, S. and Goodall, J. 2007. The contribution of long-term research at Gombe National Park to chimpan-
zee conservation. Conservation Biology 21:623–634.Reynolds, V. and Reynolds, F. 1965. Chimpanzees of the Budongo Forest. In: I. DeVore (ed.), Primate Behavior. Field Studies of Monkeys and Apes,
pp.368–424. Holt, Rinehart and Winston, New York. Rijksen, H.D. 1978. A Field Study on Sumatran Orang Utans (Pongo pygmaeus abelii Lesson 1827): Ecology, Behaviour and Conservation. H. Veenman
and Zonen B.V., Wageningen, The Netherlands.Robbins, M.M., Sicotte, P. and Stewart, K.J. (eds.). 2001. Mountain Gorillas: Three Decades of Research at Karisoke. Cambridge University Press,
Cambridge, UK.Ross, C. and Reeve, N. 2003. Survey and census methods: population distribution and density. In: J.M. Setchell and D.J. Curtis (eds.), Field and
Laboratory Methods in Primatology, pp.90–109. Cambridge University Press, Cambridge, UK.Royle, J.A. and Nichols, J.D. 2003. Estimating abundance from repeated presence absence data or point counts. Ecology 84:777–790.Russon, A.E., Erman, A. and Dennis, R. 2001. The population and distribution of orang-utans (Pongo pygmaeus pygmaeus) in and around the Danau
Sentarum Wildlife Reserve, West Kalimantan, Indonesia. Biological Conservation 97:21–28.Sanderson, J.G. and Trolle, M. 2005. Monitoring elusive mammals. American Scientist 701:148–155.Sanz, C., Morgan, D. and Gulick, S. 2004. New insights into chimpanzees, tools, and termites from the Congo basin. American Naturalist
164:567–581.Sanz, C., Morgan, D., Strindberg, S. and Onononga, J.R. 2007. Distinguishing between the nests of sympatric chimpanzees and gorillas. Journal of
Applied Ecology 44:263–272.Singleton, I. 2000. Ranging behaviour and seasonal movements of Sumatran orang-utans (Pongo pygmaeus abelii) in swamp forests. Ph.D. thesis,
University of Kent at Canterbury, UK.Singleton, I., Wich, S., Husson, S., Stephens, S., Utami-Atmoko, S.S., Leighton, M., Rossen, N., Traylor-Holzer, K., Lacy, R. and Byers, O. 2004.
Orangutan Population and Habitat Viability Assessment: Final Report. IUCN/SSC Conservation Breeding Specialist Group, Apple Valley, MN.Southwood, T.R.E. and Henderson, P.A. 2000. Ecological Methods, 3rd edition. Blackwell Sciences, Oxford.Stokes, E.J., Parnell, R.J. and C. Olejniczak. 2003. Female dispersal and reproductive success in wild western lowland gorillas (Gorilla gorilla gorilla).
Behavioural Ecology and Sociobiology 54:329–339.Sugiyama, Y. and Soumah, A.G. 1988. Preliminary survey of the distribution and population of chimpanzees in the Republic of Guinea. Primates
29:569–574. Taberlet, P. and Luikart, G. 1999. Non-invasive genetic sampling and individual identification. Biological Journal of the Linnean Society 68:41–55.Taberlet, P., Waits, L.P. and Luikart, G. 1999. Noninvasive genetic sampling: look before you leap. Trends in Ecology and Evolution 14:323–327.Thomas, L., Laake, J.L., Strindberg, S., Marques, F.F.C., Buckland, S.T., Borchers, D.L., Anderson, D.R., Burnham, K.P., Hedley, S.L., Pollard, J.H.,
Bishop, J.R.B., and Marques, T.A. 2006. Distance 5.0. Release 2. Research Unit for Wildlife Population Assessment, University of St. Andrews, U.K. Website: www.ruwpa.st-and.ac.uk/distance/
Todd, A.F., Kühl, H.S, Cipolletta, C. and Walsh, P.D. 2008. Using dung to estimate gorilla density: Modeling dung production rate. International Journal of Primatology 29:549–563.
Tutin, C.E.G. and Fernandez, M. 1984. Nationwide census of gorilla (Gorilla g. gorilla) and chimpanzee (Pan t. troglodytes) populations in Gabon. American Journal of Primatology 6:313–336.
Tutin, C.E.G., Parnell, R.J., White, L.J.T. and Fernandez, M. 1995. Nest building by lowland gorillas in the Lopé Reserve, Gabon: environmental influ-ences and implications for censusing. International Journal of Primatology 16:53–76.

26
Tutin, C., Stokes, E., Boesch, C., Morgan, D., Sanz, C., Reed, T., Blom, A., Walsh, P., Blake, S. and Kormos, R. 2005. Regional Action Plan for the Conservation of Chimpanzees and Gorillas in Western Equatorial Africa. Conservation International, Washington DC, USA.
van Krunkelsven, E. 2001. Density estimation of bonobos (Pan paniscus) in Salonga National Park, Congo. Biological Conservation 99:387–391.van Krunkelsven, E., Bila-Isia, I. and Draulans, D. 2000. A survey of bonobos and other large mammals in the Salonga National Park, Democratic
Republic of Congo. Oryx 34:180–187.van Schaik, C.P. and Azwar. 1991. Orang-utan densities in different forest types in the Gunung Leuser National Park (Sumatra), as determined by nest
counts. Unpublished report to PHPA, LIPI and L.S.B. Leakey Foundation, Durham, NC.van Schaik, C.P., Priatna, A. and Priatna, D. 1995. Population estimates and habitat preferences of orang-utans (Pongo pygmaeus) based on line
transects of nests. In: R.D. Nadler, B.F.M. Galdikas, L.K. Sheeran and N. Rosen, (eds.), The Neglected Ape, pp.129–147. Plenum Press, New York.
van Schaik, C.P., Wich, S., Utami, S. and Odom, K. 2005. A simple alternative to line transects of nests for estimating orangutan densities. Primates 46:249–254.
Vincent, J.-P., Hewison, A.J.M, Angibault, J.-M. and Cargnelutti, B. 1996. Testing density estimators on a fallow deer population of known size. Journal of Wildlife Management 60:18–28.
Waits, L.P. 2004. Using noninvasive genetic sampling to detect and estimate abundance of rare wildlife species. In: W.L. Thomson (ed.), Sampling rare or elusive species: concepts, designs and techniques for estimating population parameters, pp.211–228. Island Press, Washington, DC.
Waits, L.P. and Paetkau, D. 2005. Noninvasive genetic sampling tools for wildlife biologists: A review of applications and recommendations for accu-rate data collection. Journal of Wildlife Management 69:1419–1433.
Walsh, P.D. and White, L.J.T. 1999. What will it take to monitor forest elephant populations? Conservation Biology 13:1194–1202.Walsh, P.D. and White, L.J.T. 2005. Evaluating the steady state assumption: simulations of gorilla nest decay. Ecological Applications
15:1342–1350.Walsh, P.D., Abernethy, K.A., Bermejo, M., Beyersk, R., De Wachter, P., Akou, M.E., Huijbregts, B., Mambounga, D.I., Toham, A.K., Kilbourn, A.M.,
Lahm, S.A., Latour, S., Maisels, S.F., Mbina, C., Mihindou, Y., Obiang, S.N., Effa, E.N. and Starkey, M. 2003. Catastrophic ape decline in western equatorial Africa. Nature 422:611–614.
White, L.J.T. and Edwards, A. (eds.) 2000. Conservation Research in the African Rain Forests: A Technical Handbook. Wildlife Conservation Society, New York.
Whitesides, G.H., Oates, J.F., Green, S. and Kluberdanz, R.P. 1988. Estimating primate densities from transects in a West African rainforest: a com-parison of techniques. Journal of Animal Ecology 57:345–367.
Wich, S.A., Buij, R. and van Schaik, C.P. 2004. Determinants of orang-utan density in the dryland forests of the Leuser ecosystem. Primates 45:177–182.
Additional useful literature
1. Surveys and Censuses: Overview and General InformationBrockelman, W.Y. and Ali, R. 1987. Methods of surveying and sampling forest primate populations. In: C.W. Marsh and R.A. Mittermeier (eds.),
Primate Conservation in the Tropical Rain Forest, pp.23–62. Alan R. Liss, New York, USA. Ganzhorn, J.U. 2003. Habitat description and phenology. In: J.M. Setchell and D.J. Curtis (eds.), Field and Laboratory Methods in Primatology,
pp. 40–56. Cambridge University Press, Cambridge, UK.Gruber, B., Reineking, B., Calabrese, J.M., Kranz, A., Poledníková, K., Poledník, L., Klenke, R., Valentin, A. and Henle, K. 2008. A new method for
estimating visitation rates of cryptic animals via repeated surveys of indirect signs. Journal of Applied Ecology 45:728–735.MacKenzie, D.I., Nichols, J.D., Royle, J.A., Pollock, K.H., Bailey, L.L. and Hines, J.E. 2005. Occupancy Estimation and Modeling: Inferring Patterns
and Dynamics of Species Occurrence. Elsevier, San Diego.Skorupa, J.P. 1987. Do line-transect surveys systematically underestimate primate densities in logged forests? American Journal of Primatology
13:1–9.Sutherland, W.J. 2000. Monitoring. In: W.J. Sutherland (ed.), The Conservation Handbook: Research, Management and Policy, pp.36–64. Blackwell
Science, Oxford.Sutherland, W.J. 1996. The twenty commonest censusing sins. In: W.J. Sutherland (ed.), Ecological Census Techniques. A Handbook, pp.317–318.
Cambridge University Press, Cambridge, UK.Williams, B.K., Nichols, J.D. and Conroy, M.J. 2002. Analysis and Management of Animal Populations. Academic Press, San Diego.
2. Distance Sampling and Statistical AnalysesBarnes, R.F.W. 2002. The problem of precision and trend detection posed by small elephant populations in West Africa. African Journal of Ecology
40:179–185.Barnes, R., Beardsley, K., Michelmore, F., Barnes, K.L., Alers, M.P.T. and Blom, A. 1997. Estimating forest elephant numbers with dung counts and a
geographic information system. Journal of Wildlife Management 61:1384–1393.Burnham, K.P. and Anderson. D.R. 2002. Model Selection and Multimodel Interference: A Practical Information-Theoretic Approach, 2nd edition.
Springer-Verlag, New York.Chen, S.C. 2000. Animal abundance estimation in independent observer line transect surveys. Environmental and Ecological Statistics 7:285–299.Crain, B.R. 1998. Some comments on line transect grouped data analysis. Ecological Modelling 109:243–249.Hedley, S. and Buckland, S.T. 2004. Spatial Models for Line Transect Sampling. Journal of Agricultural, Biological and Environmental Statistics
9:181–199.MacKenzie, D.I., Nichols, J.D., Lachman, G.B., Droege, S., Royle, J.A. and Langtimm, C.A. 2002. Estimating site occupancy when detection prob-
abilities are less than one. Ecology 83:2248–2255.Marques, T. 2004. Predicting and correcting bias caused by measurement error in line transect sampling using multiplicative error models. Biometrics
60:757–763.Marshall, A.R., Lovett, J.C. and White, P.C.L. 2008. Selection of line-transect methods for estimating the density of group-living animals: Lessons
from the primates. American Journal of Primatology 70:452–462.Otis, D.L., Burnham, K.P., White, G.C. and Anderson, D.R. 1978. Statistical inference from capture data on closed animal populations. Wildlife
Monographs 62:1–135.

27
Strayer, D. 1999. Statistical power of presence-absence data to detect population declines. Conservation Biology 13:1034–1038.Strindberg, S. and Buckland, S.T. 2004. Zigzag survey designs in line transect sampling. Journal of Agricultural, Biological and Environmental Statistics
9:443–461.Vaughan, I.P. and Ormerod, S.J. 2005. The continuing challenges of testing species distribution models. Journal of Applied Ecology 42:720–730.Walsh, P.D., White, L.J.T., Mbina, C., Idiata, D., Mihindou, Y., Maisels, F. and Thibault, M. 2001. Estimates of forest elephant abundance: projecting
the relationship between precision and effort. Journal of Applied Ecology 38:217–228.
3. Measurable Variables used in Great Ape Surveys Baldwin, P.J., Sabater Pi, J., McGrew, W.C. and Tutin, C.E.G. 1981. Comparisons of nests made by different populations of chimpanzees (Pan trog-
lodytes). Primates 22:474–486.Brownlow, A.R., Plumptre, A.J., Reynolds, V. and Ward, R. 2001. Sources of variation in the nesting behavior of chimpanzees (Pan troglodytes sch-
weinfurthii) in the Budongo Forest, Uganda. American Journal of Primatology 55:49–55.Fruth, B. and Hohmann, G. 1993. Ecological and behavioral aspects of nest building in wild bonobos (Pan paniscus). Ethology 94:113–126.Johns, A.D. 1985. Differential detectability of primates between primary and selectively logged habitats and implications for population surveys.
American Journal of Primatology 8:31–36.Sugardjito, J. 1983. Selecting nest-sites of Sumatran orang-utans, Pongo pygmaeus abelii, in the Gunung Leuser National Park, Indonesia. Primates
24:467–474.Yamagiwa, J. 2001. Factors influencing the formation of ground nests by eastern lowland gorillas in Kahuzi-Biega National Park: some evolutionary
implications of nesting behaviour. Journal of Human Evolution 40:99–109.
4. African Ape SurveysDevos, C., Walsh, P.D., Arnhem, E. and Huynen, M.C. 2008. Monitoring population decline: can transect surveys detect the impact of the Ebola virus
on apes? Oryx 42:367–374. Devos, C., Sanz, C., Morgan, D., Onononga, J.R., Laporte, N. and Huynen, M.C. 2008. Comparing ape densities and habitats in Northern Congo:
surveys of sympatric gorillas and chimpanzees in the Odzala and Ndoki regions. American Journal of Primatology 70:439–451.Gonzalez-Kirchner, J.P. 1997. Census of western lowland gorilla population in Rio Muni region, Equatorial Guinea. Folia Zoologica 46:15–22.Grossmann, F., Hart, J.A., Vosper, A. and Ilambu, O. 2008. Range occupation and population estimates of bonobos in the Salonga National Park:
application to large-scale surveys of bonobos in the Democratic Republic of Congo. In: T. Furuichi and J. Thompson (eds.), The Bonobos. Behavior, Ecology, and Conservation, pp.189–216. Springer, New York.
Thomas, S.C. 1991. Population densities and patterns of habitat use among anthropoid primates of the Ituri forest, Zaire. Biotropica 23:68–83.Williamson, E.A. and Usongo, L. 1996. Survey of gorillas Gorilla gorilla and chimpanzees Pan troglodytes in the Réserve de Faune du Dja, Cameroun.
African Primates 2:67–72.Yamagiwa, J., Mwanza, N., Spangenberg, A., Maruhashi, T., Yumoto, T., Fischer, A. and Steinhauer-Burkart, B. 1993. A census of the eastern lowland
gorillas Gorilla gorilla graueri in Kahuzi-Biega National Park with reference to mountain gorillas G.g.beringei in the Virunga region, Zaire. Biological Conservation 64:83–89.
5. Orangutan SurveysAncrenaz, M. 2006. Consultancy on survey design and data analysis at Betung Kerihun National Park, Indonesia. WWF– Germany. http://www.wwf.
or.id/admin/file-upload/files/FCT1165193058.pdfBlouch, R.A. 1997. Distribution and abundance of orang-utans (Pongo pygmaeus) and other primates in the Lanjak Entimau Wildlife Sanctuary,
Sarawak, Malaysia. Tropical Biodiversity 4:259–274. Felton, A.M., Engstrom, L.M., Felton, A. and Knott, C.D. 2003. Orangutan population density, forest structure and fruit availability in hand-logged and
unlogged peat swamp forests in West Kalimantan, Indonesia. Biological Conservation 114:91–101. Knop, E., Ward, P.I. and Wich, S.A. 2004. A comparison of orang-utan density in a logged and unlogged forest on Sumatra. Biological Conservation
120:183–188.
6. Aerial SurveysAlpizar-Jara, R. and Pollock, K.H. 1996. A combination line transect and capture-recapture sampling model for multiple observers in aerial surveys.
Environmental and Ecological Statistics 3:311–327.Ottichilo, W.K. and Khaemba, W.M. 2001. Validation of observer and aircraft calibration for aerial surveys of animals. African Journal of Ecology 39:45–50.Quang, P.X. and Becker, E.F. 1997. Combining line transect and double count sampling techniques for aerial surveys. Journal of Agriculture Biological
and Environmental Statistics 2:1–14.Whitehouse, A.M., Hall-Martin, A.J. and. Knight, M.H. 2001. A comparison of methods used to count the elephant population of the Addo Elephant
National Park, South Africa. African Journal of Ecology 39:140–145.
7. Genetics, Capture-RecaptureBergl, R.A. 2006. Conservation Biology of the Cross River Gorilla (Gorilla gorilla diehli). Ph.D. thesis, City University of New York, New York.Guschanski, K., Vigilant, L., McNeilage, A., Gray, M., Kagoda, E. and Robbins, M.M. In review. Counting elusive animals: comparison of a field and
genetic census of the entire population of mountain gorillas of Bwindi Impenetrable National Park, Uganda.Huggins, R.M. 1989. On the statistical analysis of capture experiments. Biometrika 76:133–140.Kohn, M.H., York, E.C., Kamradt, D.A., Haught, D., Sauvajot, R.M. and Wayne, R.K. 1999. Estimating population size by genotyping faeces. Proc.
Roy. Soc. Lond. B 266:657–663.Lukacs, P.M., Eggert, L.S. and Burnham, K.P. 2008. Estimating population size from multiple detections with non-invasive genetic data. Wildlife
Biology in Practice 3:83–92.Miller, C.R., Joyce, P. and Waits, L.P. 2005. A new method for estimating the size of small populations from genetic mark-recapture data. Molecular
Ecology 14:1991–2005.Pledger, S. 2000. Unified maximum likelihood estimates for closed capture-recapture models using mixtures. Biometrics 56:434–442.Trolle, M., Noss, A.J., Cordeiro, J.L.P. and Oliviera, L.F.B. 2008. Brazilian tapir density in the Pantanal: A comparison of systematic camera-trapping
and line-transect surveys. Biotropica 40:211–217.White, G.C., Anderson, D.R., Burnham, K.P. and Otis, D.L. 1982. Capture-recapture and removal methods for sampling closed populations. Los
Alamos National Laboratory, Los Alamos.

28
Annex I Contacts and Resources for Further Information and Funding
Ape Populations, Environments and Surveys (A.P.E.S.) Databasehttp://apes.eva.mpg.de/
Email: [email protected]
DISTANCEhttp://www.ruwpa.st-and.ac.uk/distance/
USFWS Great Apes Programhttp://www.fws.gov/international/rfps/gahow.htm
Biodiversity Conservation and Habitat and Ecosystem Protection Donor Newslettershttp://www.bothends.org/service/stand4.html
Conservation Information Service (CIS)CIS links persons developing and managing conservation-
related projects with donors who share their goals.
http://www.primate.wisc.edu/pin/cis/
FAO Collaborative Partnership on ForestsForest Funding News
http://www.fao.org/forestry/site/33747/en/
Society for Conservation BiologyListing of granting Institutions and contact information for sup-
port of research and other conservation activities in Africa.
http://www.conbio.org/sections/Africa/africafunding.cfm
Tropical Biology Association Funding Databasewww.tropical-biology.org/alumni/database/main.php
Annex II Online Sources of GIS Data
Raster dataUSGS Geographic Data Download/Earth Resources Observation and Science (EROS)
http://edc.usgs.gov/
Topographic data 1km
Digital Elevation Model (DEM) — National Geophysical Data
Center (NGDC)
http://www.ngdc.noaa.gov/mgg/topo/globe.html
Topographic data 90m
SRTM Data — The CGIAR Consortium for Spatial Information
(CGIAR-CSI)
http://srtm.csi.cgiar.org/SELECTION/inputCoord.asp
Vector dataWorld Base Map — ESRI
http://arcdata.esri.com/data_downloader/DataDownloader?part=10200 (vector)
The GIS Data Depot (requires Login)
http://data.geocomm.com/catalog/
Collection of GIS dataUniversity of California, Berkeley
http://biogeo.berkeley.edu/bgm/gdata.php
The CIESIN World Data Center for Human Interactions in the Environment
http://sedac.ciesin.columbia.edu/wdc/index.jsp
Africover — Food and Agriculture Organisation of the United
Nations (requires Login)
http://www.africover.org/system/africover_data.php
Carpe Data Explorer — Central African Regional Program for the Enviroment
http://maps.geog.umd.edu/metadataexplorer/explorer.jsp
Global Land Cover Facility — University of Maryland
http://glcf.umiacs.umd.edu/index.shtml
Maps (not georeferenced)Perry-Castañeda Library Map Collection
http://www.lib.utexas.edu/maps/

Occasional Papers of the IUCN Species Survival Commission1. Species Conservation Priorities in the Tropical Forests of Southeast Asia. Edited by R.A. Mittermeier and W.R. Konstant, 1985, 58pp.* 2. Priorités en matière de conservation des espèces à Madagascar. Edited by R.A. Mittermeier, L.H. Rakotovao, V. Randrianasolo, E.J.
Sterling and D. Devitre, 1987, 167pp.*3. Biology and Conservation of River Dolphins. Edited by W.F. Perrin, R.K. Brownell, Zhou Kaiya and Liu Jiankang, 1989, 173pp.*4. Rodents. A World Survey of Species of Conservation Concern. Edited by W.Z. Lidicker, Jr., 1989, 60pp.5. The Conservation Biology of Tortoises. Edited by I.R. Swingland and M.W. Klemens, 1989, 202pp. *6. Biodiversity in Sub-Saharan Africa and its Islands: Conservation, Management, and Sustainable Use. Compiled by S.N. Stuart and
R.J. Adams, with a contribution from M.D. Jenkins, 1991, 242pp.7. Polar Bears: Proceedings of the Tenth Working Meeting of the IUCN/SSC Polar Bear Specialist Group, 1991, 107pp.8. Conservation Biology of Lycaenidae (Butterflies). Edited by T.R. New, 1993, 173pp.*9. The Conservation Biology of Molluscs: Proceedings of a Symposium held at the 9th International Malacological Congress, Edinburgh,
Scotland, 1986. Edited by A. Kay. Including a Status Report on Molluscan Diversity, by A. Kay, 1995, 81pp.10. Polar Bears: Proceedings of the Eleventh Working Meeting of the IUCN/SSC Polar Bear Specialist Group, January 25 – 28 1993,
Copenhagen, Denmark. Compiled by Ø. Wiig, E.W. Born and G.W. Garner, 1995, 192pp.11. African Elephant Database 1995. M.Y. Said, R.N. Chunge, G.C. Craig, C.R. Thouless, R.F.W. Barnes and H.T. Dublin, 1995, 225pp.12. Assessing the Sustainability of Uses of Wild Species: Case Studies and Initial Assessment Procedure. Edited by R. and C. Prescott-
Allen, 1996, 135pp.13. Tecnicas para el Manejo del Guanaco [Techniques for the Management of the Guanaco]. Edited by S. Puig, South American Camelid
Specialist Group, 1995, 231pp.14. Tourist Hunting in Tanzania. Edited by N. Leader-Williams, J.A. Kayera and G.L. Overton, 1996, 138pp.15. Community-based Conservation in Tanzania. Edited by N. Leader-Williams, J.A. Kayera and G.L. Overton, 1996, 226pp.16. The Live Bird Trade in Tanzania. Edited by N. Leader-Williams and R.K. Tibanyenda, 1996, 129pp.17. Sturgeon Stocks and Caviar Trade Workshop: Proceedings of a Workshop, 9 – 10 October 1995 Bonn, Germany. Federal Ministry for
the Environment, Nature Conservation and Nuclear Safety and the Federal Agency for Nature Conservation. Edited by V.J. Birstein, A. Bauer and A. Kaiser-Pohlmann, 1997, 88pp.
18. Manejo y Uso Sustentable de Pecaries en la Amazonia Peruana. R. Bodmer, R. Aquino, P. Puertas, C. Reyes, T. Fang and N. Gottdenker, 1997, 102pp.
19. Proceedings of the Twelfth Working Meeting of the IUCN/SSC Polar Bear Specialist Group, 3 – 7 February 1997, Oslo, Norway. Compiled by A.E. Derocher, G.W. Garner, N.J. Lunn and Ø. Wiig, 1998, 159pp.
20. Sharks and their Relatives – Ecology and Conservation. Compiled by M. Camhi, S. Fowler, J. Musick, A. Bräutigam and S. Fordham, 1998, 39pp. (Also in French)
21. African Antelope Database 1998. Compiled by R. East and the IUCN/SSC Antelope Specialist Group, 1999, 434pp.22. African Elephant Database 1998. R.F.W. Barnes, G.C. Craig, H.T. Dublin, G. Overton, W. Simons and C.R. Thouless, 1999, 249pp.23. Biology and Conservation of Freshwater Cetaceans in Asia. Edited by R.R. Reeves, B.D. Smith and T. Kasuya, 2000, 152pp.24. Links between Biodiversity Conservation, Livelihoods and Food Security: The Sustainable Use of Wild Species for Meat. Edited by
S.A. Mainka and M. Trivedi, 2002, 137pp. (Also in French)25. Elasmobranch Biodiversity, Conservation and Management. Proceedings of the International Seminar and Workshop, Sabah, Malaysia,
July 1997. Edited by S.L. Fowler, T.M. Reed and F.A. Dipper, 2002, 258pp.26. Polar Bears: Proceedings of the Thirteenth Working Meeting of the IUCN/SSC Polar Bear Specialist Group, 23 – 28 June 2001, Nuuk,
Greenland. Compiled by N.J. Lunn, S. Schliebe and E.W. Born, 2002, 153pp.27. Guidance for CITES Scientific Authorities: Checklist to Assist in Making Non-detriment Findings for Appendix II Exports. Compiled by
A.R. Rosser and M.J. Haywood, 2002, 146pp.28. Turning the Tide: The Eradication of Invasive Species. Proceedings of the International Conference on Eradication of Island Invasives.
Edited by C.R. Veitch and M.N. Clout, 2002, 414pp.29. African Elephant Status Report 2002: An Update from the African Elephant Database. J.J. Blanc, C.R. Thouless, J.A. Hart, H.T. Dublin,
I. Douglas-Hamilton, C.G. Craig and R.F.W. Barnes, 2003, 302pp.30. Conservation and Development Interventions at the Wildlife/Livestock Interface: Implications for Wildlife, Livestock and Human Health.
Compiled by S.A. Osofsky and S. Cleaveland, W.B. Karesh, M.D. Kock, P.J. Nyhus, L. Starr and A. Yang, 2005, 220pp.31. The Status and Distribution of Freshwater Biodiversity in Eastern Africa. Compiled by W. Darwall, K. Smith, T. Lower and J.-C. Vié, 2005, 36pp.32. Polar Bears: Proceedings of the 14th Working Meeting of the IUCN/SSC Polar Bear Specialist Group, 20–24 June 2005, Seattle,
Washington, USA. Compiled by J. Aars, N.J. Lunn and A.E. Derocher, 2006, 189pp.33. African Elephant Status Report 2007: An Update from the African Elephant Database. Compiled by J.J. Blanc, R.F.W. Barnes,
C.G. Craig, H.T. Dublin, C.R. Thouless, I. Douglas-Hamilton and J.A. Hart, 2007, 275pp.34. Best Practice Guidelines for Reducing the Impact of Commercial Logging on Great Apes in Western Equatorial Africa. D. Morgan and
C. Sanz, 2007, 32pp. (Also in French)35. Best Practice Guidelines for the Re-introduction of Great Apes. B. Beck K. Walkup, M. Rodrigues, S. Unwin, D. Travis, and T. Stoinski,
2007, 48pp. (Also in French at http://www.primate-sg.org/BP.reintro.htm)
Many of these publications are available online at: www.iucn.org/themes/ssc/publications/thematic_pubs.htm
*(Out of print)

Rue Mauverney 281196 GlandSwitzerland
Tel +41 22 999 0000Fax +41 22 999 0002
www.iucn.org
World Headquarters