Benefits for agriculture and the environment from urban waste
10
This article appeared in a journal published by Elsevier. The attached copy is furnished to the author for internal non-commercial research and education use, including for instruction at the authors institution and sharing with colleagues. Other uses, including reproduction and distribution, or selling or licensing copies, or posting to personal, institutional or third party websites are prohibited. In most cases authors are permitted to post their version of the article (e.g. in Word or Tex form) to their personal website or institutional repository. Authors requiring further information regarding Elsevier’s archiving and manuscript policies are encouraged to visit: http://www.elsevier.com/authorsrights
Transcript of Benefits for agriculture and the environment from urban waste
This article appeared in a journal published by Elsevier. The attachedcopy is furnished to the author for internal non-commercial researchand education use, including for instruction at the authors institution
and sharing with colleagues.
Other uses, including reproduction and distribution, or selling orlicensing copies, or posting to personal, institutional or third party
websites are prohibited.
In most cases authors are permitted to post their version of thearticle (e.g. in Word or Tex form) to their personal website orinstitutional repository. Authors requiring further information
regarding Elsevier’s archiving and manuscript policies areencouraged to visit:
http://www.elsevier.com/authorsrights
Author's personal copy
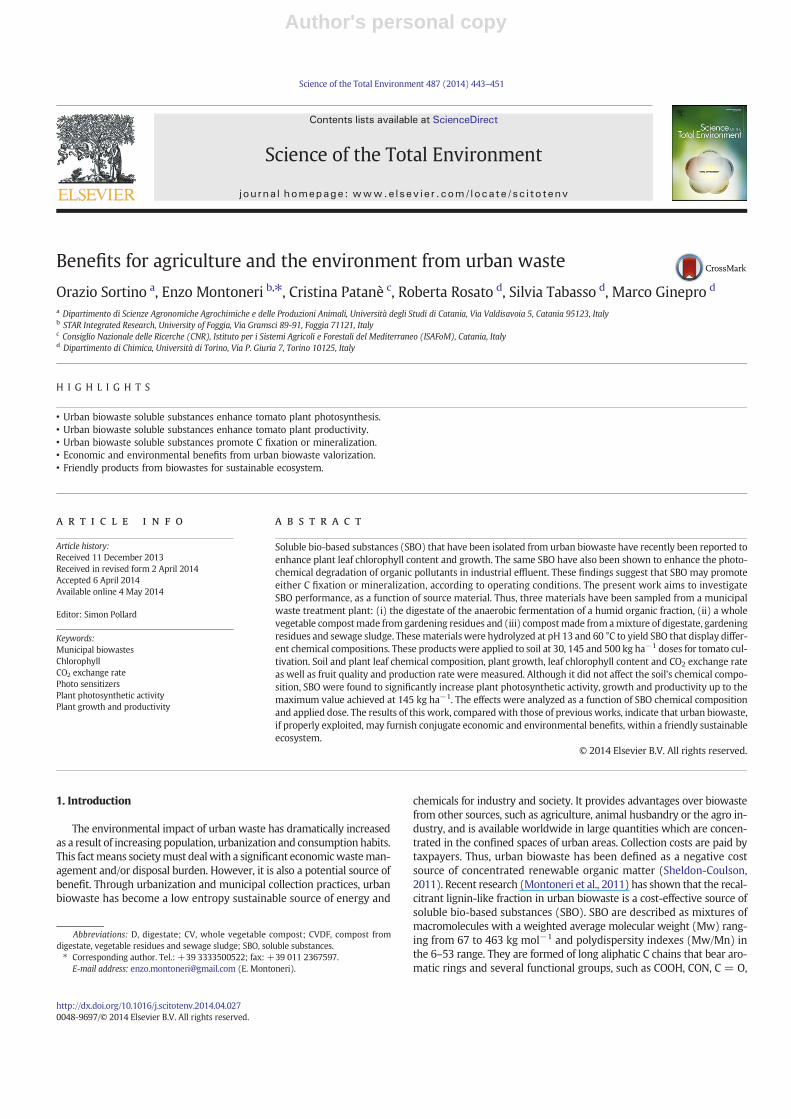
Benefits for agriculture and the environment from urban waste
Orazio Sortino a, Enzo Montoneri b,⁎, Cristina Patanè c, Roberta Rosato d, Silvia Tabasso d, Marco Ginepro d
a Dipartimento di Scienze Agronomiche Agrochimiche e delle Produzioni Animali, Università degli Studi di Catania, Via Valdisavoia 5, Catania 95123, Italyb STAR Integrated Research, University of Foggia, Via Gramsci 89-91, Foggia 71121, Italyc Consiglio Nazionale delle Ricerche (CNR), Istituto per i Sistemi Agricoli e Forestali del Mediterraneo (ISAFoM), Catania, Italyd Dipartimento di Chimica, Università di Torino, Via P. Giuria 7, Torino 10125, Italy
H I G H L I G H T S
• Urban biowaste soluble substances enhance tomato plant photosynthesis.• Urban biowaste soluble substances enhance tomato plant productivity.• Urban biowaste soluble substances promote C fixation or mineralization.• Economic and environmental benefits from urban biowaste valorization.• Friendly products from biowastes for sustainable ecosystem.
a b s t r a c ta r t i c l e i n f o
Article history:Received 11 December 2013Received in revised form 2 April 2014Accepted 6 April 2014Available online 4 May 2014
Editor: Simon Pollard
Keywords:Municipal biowastesChlorophyllCO2 exchange ratePhoto sensitizersPlant photosynthetic activityPlant growth and productivity
Soluble bio-based substances (SBO) that have been isolated from urban biowaste have recently been reported toenhance plant leaf chlorophyll content and growth. The same SBO have also been shown to enhance the photo-chemical degradation of organic pollutants in industrial effluent. These findings suggest that SBO may promoteeither C fixation or mineralization, according to operating conditions. The present work aims to investigateSBO performance, as a function of source material. Thus, three materials have been sampled from a municipalwaste treatment plant: (i) the digestate of the anaerobic fermentation of a humid organic fraction, (ii) a wholevegetable compostmade from gardening residues and (iii) compostmade fromamixture of digestate, gardeningresidues and sewage sludge. Thesematerials were hydrolyzed at pH 13 and 60 °C to yield SBO that display differ-ent chemical compositions. These products were applied to soil at 30, 145 and 500 kg ha−1 doses for tomato cul-tivation. Soil and plant leaf chemical composition, plant growth, leaf chlorophyll content and CO2 exchange rateas well as fruit quality and production rate were measured. Although it did not affect the soil's chemical compo-sition, SBO were found to significantly increase plant photosynthetic activity, growth and productivity up to themaximum value achieved at 145 kg ha−1. The effects were analyzed as a function of SBO chemical compositionand applied dose. The results of this work, comparedwith those of previous works, indicate that urban biowaste,if properly exploited, may furnish conjugate economic and environmental benefits, within a friendly sustainableecosystem.
© 2014 Elsevier B.V. All rights reserved.
1. Introduction
The environmental impact of urban waste has dramatically increasedas a result of increasing population, urbanization and consumption habits.This factmeans societymust dealwith a significant economicwasteman-agement and/or disposal burden. However, it is also a potential source ofbenefit. Through urbanization and municipal collection practices, urbanbiowaste has become a low entropy sustainable source of energy and
chemicals for industry and society. It provides advantages over biowastefrom other sources, such as agriculture, animal husbandry or the agro in-dustry, and is available worldwide in large quantities which are concen-trated in the confined spaces of urban areas. Collection costs are paid bytaxpayers. Thus, urban biowaste has been defined as a negative costsource of concentrated renewable organic matter (Sheldon-Coulson,2011). Recent research (Montoneri et al., 2011) has shown that the recal-citrant lignin-like fraction in urban biowaste is a cost-effective source ofsoluble bio-based substances (SBO). SBO are described as mixtures ofmacromolecules with a weighted average molecular weight (Mw) rang-ing from 67 to 463 kg mol−1 and polydispersity indexes (Mw/Mn) inthe 6–53 range. They are formed of long aliphatic C chains that bear aro-matic rings and several functional groups, such as COOH, CON, C = O,
Science of the Total Environment 487 (2014) 443–451
Abbreviations: D, digestate; CV, whole vegetable compost; CVDF, compost fromdigestate, vegetable residues and sewage sludge; SBO, soluble substances.⁎ Corresponding author. Tel.: +39 3333500522; fax: +39 011 2367597.
E-mail address: [email protected] (E. Montoneri).
http://dx.doi.org/10.1016/j.scitotenv.2014.04.0270048-9697/© 2014 Elsevier B.V. All rights reserved.
Contents lists available at ScienceDirect
Science of the Total Environment
j ourna l homepage: www.e lsev ie r .com/ locate /sc i totenv
Author's personal copy
PhOH, O-alkyl, OAr, OCO, OMe and NRR′, where R and R′ are alkyl and/oraryl substituents. These organic moieties are probably the memory ofthe main constituents of the sourcing bio-organic waste which are notcompletely mineralized during aging under aerobic fermentation condi-tions. The SBO bear chemical similarities with the natural organic matter(NOM) present in soil and water. For these reasons, no adverse environ-mental impact is expected from SBO.
A number of properties and uses have been proven for SBO that havebeen isolated from different urban bio-waste sources. These substancesalso behave like anionic surfactants because of the presence of lipophil-ic, aliphatic and aromaticmoieties and of hydrophilic functional groups.They have accordingly been shown to be effective (Montoneri et al.,2011) as detergents, auxiliaries for textile dyeing, emulsifiers, floccu-lants and dispersants, binding agents for ceramic manufacture, tem-plates for the fabrication of nanostructured materials for chemical andbiochemical catalysis aswell as being active agents for cleaning pollutedsoil via surfactant assisted washing. More recent studies point to a pos-sible role for these substances in the ecosystem C cycle.
Studies on the in vitro fermentation of animal feed (Montoneri et al.,2013) and in vivo animal weaning (Dinuccio et al., 2013) have shownthat SBO are capable of decreasing the mineralization of organic N dur-ing anaerobic digestion,when added to the cecal content of pig or rabbitfeed, and therefore of reducing emissions of ammonia and greenhousegases from animal husbandry.
Several organic molecules, typically found in the effluents of manychemical industrial processes, have been shown to degrade rapidlywith relevant organic C mineralization, when exposed in solution tosolar light in the presence of SBO (Bianco Prevot et al., 2010, 2012;Avetta et al., 2013). Gomis et al. (2013) have reported that these effectsderive from the capacity of SBO to interact with the target organic pol-lutant and form a photoactive complex, or perhaps from the presenceof functional groups with strong metal chelating power.
Concurrentwith the above findings is a separate studywhich has re-ported that SBO, isolated from a composted mix of food and vegetableresidues and applied to soil as organic fertilizer for tomato cultivationin greenhouses, enhance leaf chlorophyll content and plant growth(Sortino et al., 2012). The idea that SBO could also promote photosyn-thesis was rather intriguing.
In the present work, three different SBO, hereinafter referred to bythe acronyms D, CV and CVDF, were isolated from the three majorproducts of a municipal waste treatment plant located in North Italy:D is sourced from the digestate obtained from the anaerobic digestionof the organic humid fraction, CV is from the compost obtained fromhome gardening and public park trimmings and CVDF is from acompostedmix of gardening and park trimmings, digestate and sewagesludge. The SBO were applied to soil for the cultivation of tomato atthree different doses. Plant leaf CO2 exchange rate and chlorophyll con-tent, growth and fruit productivity were monitored. The objectives ofthe experimental work were (i) to find direct evidence of the effectSBO have on plant photosynthetic activity and biomass production,(ii) to study these effects as a function of dose and (iii) to assesswhetherthe effects are general for SBO obtained from themajor product of urbanwaste treatment plants and/or how they are related to SBO chemicalcomposition.
2. Materials and methods
2.1. Materials
SBO sourcing materials were obtained from the Acea PineroleseIndustriale plant located in Pinerolo (TO), Italy. The plant carried outthe anaerobic and aerobic digestion of urban biowaste. Anaerobic diges-tion was carried out for 15 days with the organic humid fraction ofurban waste from a separate source collection. This process yieldedbiogas and a solid digestate containing residual organic matter thatwas not converted into biogas. Aerobic digestion was performed on
two different wastes; home gardening and park trimming residueswere composted for 180 days to yield whole vegetable compost, andsecondly a mix of digestate, home gardening and park trimming resi-dues as well as sewage sludge, at a 3.5/5.5/1 respective weight ratio,which was composted for 110 days. Each of the three plant products(i.e., the digestate and the two composts) was separately further hydro-lyzedwith KOH alkalinewater at pH 13 and 60 °C to obtain the SBO. Thehydrolyzate was run through an ultra filtration polysulphone mem-brane with 5 kDa cutoff. The membrane retentate was dried at 60 °Cto yield the final SBO product as black solid in a 15–20% yield, relativeto the starting material. Further experimental details for all processesand product analytical characterization have been reported by Sortinoet al. (2012). The tomato (Lycopersicon esculentum Mill.) seeds wereproduced in Kenya and were supplied by Syngenta Seeds (SyngentaSeeds s.p.a., Milano, Italy). Nursery plants for transplanting in the culti-vation soil were grown from these seeds.
2.2. Set up of cultivation trials
Tomato cultivation trials were carried out on the same farm as in thepreviously reported tomato study (Sortino et al., 2012). Farm soil wasclassified as loamy-sandy based on its texture: sand 79.9 ± 2.5, finesand 5.3 ± 0.7, silt 10.6 ± 1.8, clay 4.2 ± 0.4% w/w. The experimentwas set up as a completely randomized design with 3 replications in agreenhouse constructed from0.15mmthick polyethylene film support-ed by cement and wood. Greenhouse soil was divided into 30 parcels,each containing 10 m2 soil surface. Three control parcels had no addedSBO. The other 27 parcels were divided into three groups of nine parcelseach: one groupwas treated with D, one groupwith CVDF and the thirdgroup with CV. Each group of nine parcels was treated with three dosesof SBO in triplicates: i.e., three plots with 30 kg ha−1, three plots with145 kg ha−1 and three plots with a 500 kg ha−1 dose. The solid SBOwere incorporated into the soil on November 21, 2011. Two days later,10 cm long nursery test plants, eachwith 6 true leaves, were transplantedin all parcels to yield three sets of double rows per parcel, with a distanceof 120 cm between sets, 80 cm between rows in each set and 30 cmbetween plants in each row. Plant density was 3.3 plants m−2. Aftertransplanting, the soil was covered with white polyethylene filmequipped for sub-surface drip irrigation. All other cultivation detailswere the same for all parcels and carried out according to the proto-col adopted by the hosting farm in its normal cultivation practice(Sortino et al., 2012). Thus, all plots of soil in the greenhouse hadthe following base mineral fertilization (Dorais, 2007; ChapagainandWiesman, 2004): P2O5 60 kg ha−1 supplied asmineral ammoniumphosphate and K2O 100 kg ha−1 supplied as potassium sulfate. This wasfollowed by the addition of the SBO, and then by nursery plant trans-plantation. The experimental planwas carried out over about 7 monthsfrom transplanting to harvesting (April to June 2012). Over this time,soil irrigation was performed using the drip irrigation system (Ho,1984) to supplement natural soil water andmineral depletion and fulfilplant needs over the plant growth and production cycles. To this end,the above phosphate and sulfate products were used in conjunctionwith a mineral nitrogen fertilizer containing 32.4% total N as nitrate,ammonia and urea in 1:1:2.5 weight ratio, respectively. The frequencyof irrigation depended on weather conditions and was the same for allsoil plots. Irrigation was performed approximately every 10–15 daysand covered the whole harvest production cycle in order to providedifferent N/K ratios according to plants' growth/production stage:i.e., 1:3 N/K from transplanting to flowering; N to encourage plantflowering; 1:2 N/K at beginning of fruit-setting of the fourth cluster;1:1 N/K after the start of fruit ripening to promote leaf development.Throughout the entire harvest cycle, the total amount of supplied nu-trientswas at about 800N kgha−1 and 1000K kgha−1. The plantswerepruned in March in order to stop vegetative growth and enhance fruitproduction. Thus, monitoring of the plant biometric data ended on thesame date. The soil, plants, leaves and fruit were analyzed at time
444 O. Sortino et al. / Science of the Total Environment 487 (2014) 443–451
Author's personal copy
intervals for chemical and physical features. Results are reported onlyfor surveys performed at dates where significant differences werefound over the previous survey.
2.3. Soil, plant and harvest analyses and measurements
Throughout the growing season, from April to late June, four plantsfrom the central rows of each plot were selected for plant height anddiameter measurements, of leaf chlorophyll content and gas exchangerate and of fruit productivity and quality. Ripe fruit (approximately2 kg per plot) was sampled for laboratory analyses (AOAC, 1990). Tenpieces of fruit from the 2 kg sample were washed with running waterto remove dirt and dried thoroughly with absorbent paper, beforefurther analyses. The chlorophyll content of thefifth plant leafwasmea-sured at three moments during the growing season (January 13, March16 and May 9) by means of a portable SPAD-502 Minolta chlorophyllmeter. At the same dates, leaf CO2 gas exchange was measured at mid-day, using a portable infra-red gas analyzer LICOR LI-6200 (LICOR Inc.,Lincoln, Nebraska, USA) with a 250 cm2 leaf chamber. On June 10, oneadditional measurement of leaf chlorophyll content was performed tofurther monitor plant photosynthetic activity. Based on the good corre-lation obtained between leaf chlorophyll content and CO2 exchange ratefrom the three previous measurements (see Section 3), the June 10SPAD data alonewere assumed as reliable indicators of the plant photo-synthetic activity at that date without the need for further CO2 ex-change rate measurements. All other analytical details relating to soilphysical-chemical features, to soil and leaf mineral element contentand to fruit total soluble solids, pH, titratable acidity, electrical conduc-tivity and firmness were as previously reported (Sortino et al., 2012).
2.4. Statistical treatment of data
Data were statistically analyzed by a one-way analysis of variance(ANOVA) using COSTAT version 6.003 (CoHort Software). Differencesbetween mean values were evaluated for significance using theStudent–Newman–Keuls (SNK) test, according to Snedecor and Cochran(1989). A one-way ANOVA was adopted for statistical analysis since theexperiment included a single control group for all treatments. Moreover,the effects of the rate of compost do not appear to be univocal and themain effects (product and dose) are unclear.
3. Results
3.1. Chemical nature of SBO
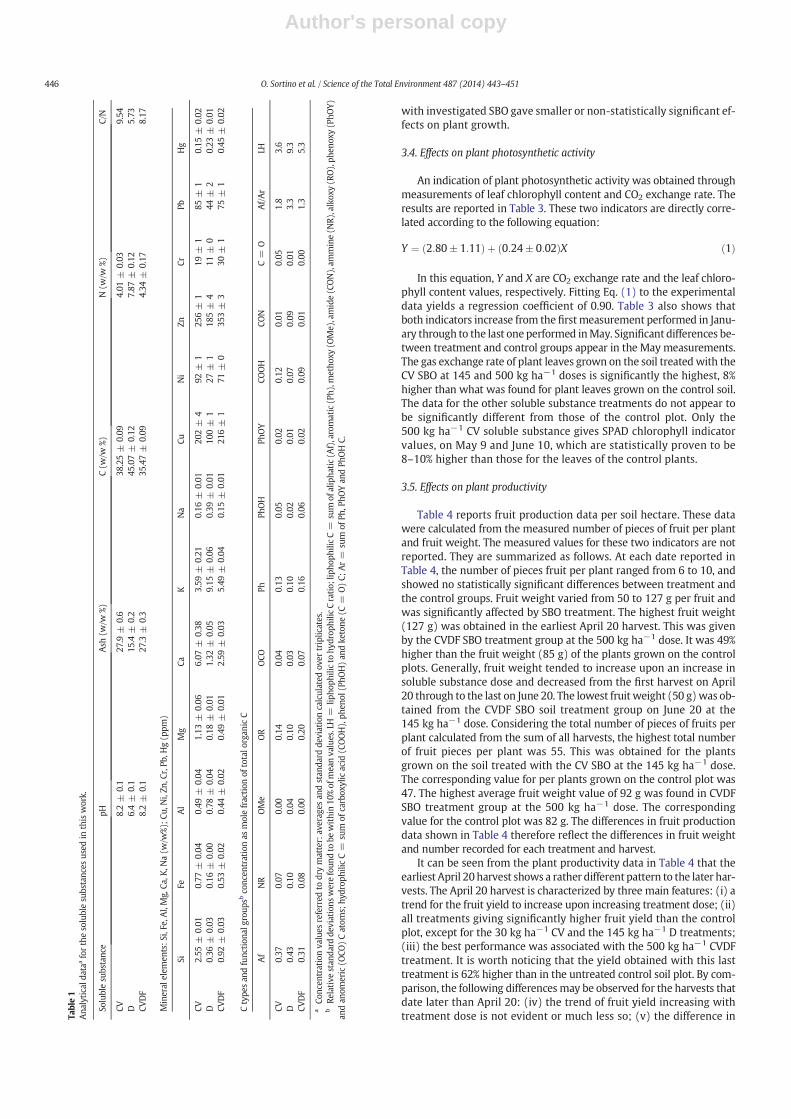
The SBO, derived from the digestate and composts supplied by theAcea Pinerolese municipal waste treatment plant, were obtained viathe alkaline hydrolysis of the sourcing materials, followed by thefiltration of the hydrolysate through a 5 kDa cut-off polysulphonemem-brane and the drying of the retentate (see Section 2.1). Thus, they arehydrolysates with molecular weight of over 5000 D. They containwater soluble polymeric molecules which, according to a previouswork (Montoneri et al., 2011), may range up to several hundred kgmole−1. Their chemical nature is identified by the concentrations of Ctypes and functional groups, as reported in Table 1. The data showthat due to their differing origin, the SBO displayed different C typeand functional group distributions. These are listed as aliphatic (Af), ar-omatic (Ph), methoxy (OMe), amide (CON), ammine (NR), alkoxy (RO),phenoxy (PhOY), anomeric (OCO), carboxylic acid (COOH), phenol(PhOH) and ketone (C = O) C atoms. Ranking these substances by thevalues of each of these C atoms is rather difficult. An easier and moremeaningful way of doing this uses the following two parameters: oneis the LH parameter which is given by the ratio of the sum of thelipophilic Af, Ph, OMe, CON, NR, RO, PhOY and anomeric C atoms tothe sum of the hydrophilic COOH, PhOH and C=O C atoms. By this def-inition, LH is an index of the degree of SBO lipophilicity. The other
parameter is given by the Af/Ar C ratio, where Ar is given by the sumof Ph, PhOY and PhOH C atoms. By this definition, Af/Ar indicates thetype of lipophilicity. Thus, based on Table 1 data, it may be observedthat the SBO obtained from the digestate (D) and from the whole vege-table compost (CV) exhibit the largest differences. The former has thelowest values for C/N elemental ratio and ash COOH acid group content,while exhibiting the highest LH and Af/Ar values. This indicates D SBOasthemost lipophilic, aliphatic and least acidic product and it also displaysthe highest content of organic N. At the other extreme of the empiricalchemical scale, CV SBO have the highest C/N ratio, the highest contentof COOH acid groups and the lowest LH values. Thus, these appear tobe the most hydrophilic acid substances and are characterized by thelowest content of organic N. The SBO listed in Table 1 also have differentmineral compositions. The D SBO have the lowest content ofmineral el-ements, particularly Si, Ca, Mg, Fe and heavy elements, while exhibitingthe highest content of K andNa. The CVSBO are distinguished for havingthe highest content of Ca, Mg, Fe and Si.
3.2. Effects on soil and plant leaves
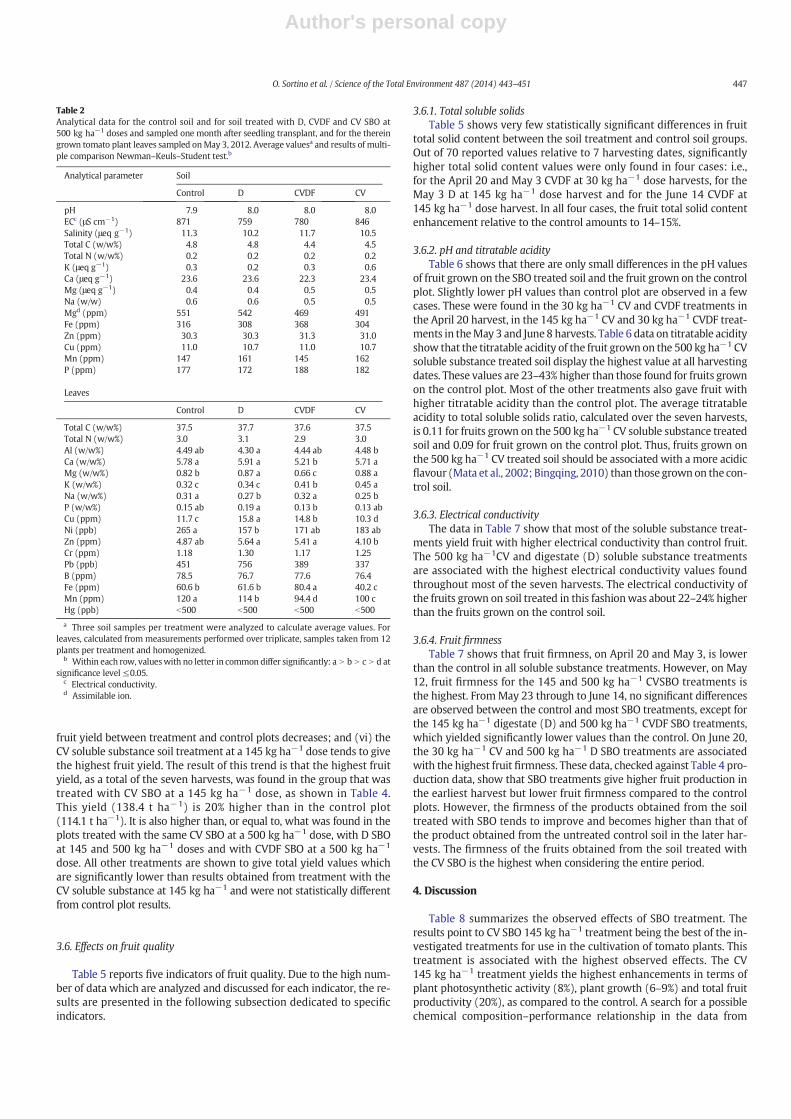
Soil was analyzed for electrical conductivity, salinity, pH, total organ-ic C and N and for the content of several mineral elements. The analyseswere performed on untreated soil and on the SBO treated soil at the ap-plied doses of 30, 145 and 500 kg ha−1. No significant SBO treatment ef-fects were evident, from the chemical nature or the dose of the solublesubstance. Typical analytical data are reported in Table 2 for the controluntreated soil and for the soil treatedwith the highest 500 kg ha−1 doseof each of the three applied SBO.
Leaves were analyzed for C, N, P and several other mineral elements.The importance of these parameters and their relationships in soil andleaves are reported in more details in the specialized literature (Dorais,2007; Pagliarulo, 2000). Generally however, the chemical analysis ofleaves is an indicator of plant nutritional status and soil analyses areintended to provide guidance on the ability of soil to supply plants withthe elements that are essential during the growing season. As for soil,the leaf analyses were performed for plants grown in the untreated soiland on the soil treated with the SBO at the applied doses of 30, 145 and500 kg ha−1. No significant or important differences from soil treatmentwere evident. Table 2 reports analytical data for the leaves of plantsgrown in the control soil and in the soil treated with the SBO at thehighest applied dose. It can be observed that no significant differencesin C, N, Cr, Pb and B leaf concentration are evident. Some statisticallysignificant differences in the concentration values of the other elementscan be picked out in the leaf chemical composition of the plants grownon the treated soil. The leaves of the plants grown on the soil treatedwith theD SBO seem to have the highest content of Cu andMg. The leavesof the plants grown on the soil treated with the CVDF SBO have thehighest content of Fe, and the leaves of the plants grown on the soil treat-ed with the CV soluble substance have the highest content of Mg and K.Differences in the concentration of the main plant nutrients, N, P, K, Caand Mg, due to the soil treatments, are not significant or were containedwithin 30% of the maximum found value.
3.3. Effects on plant growth
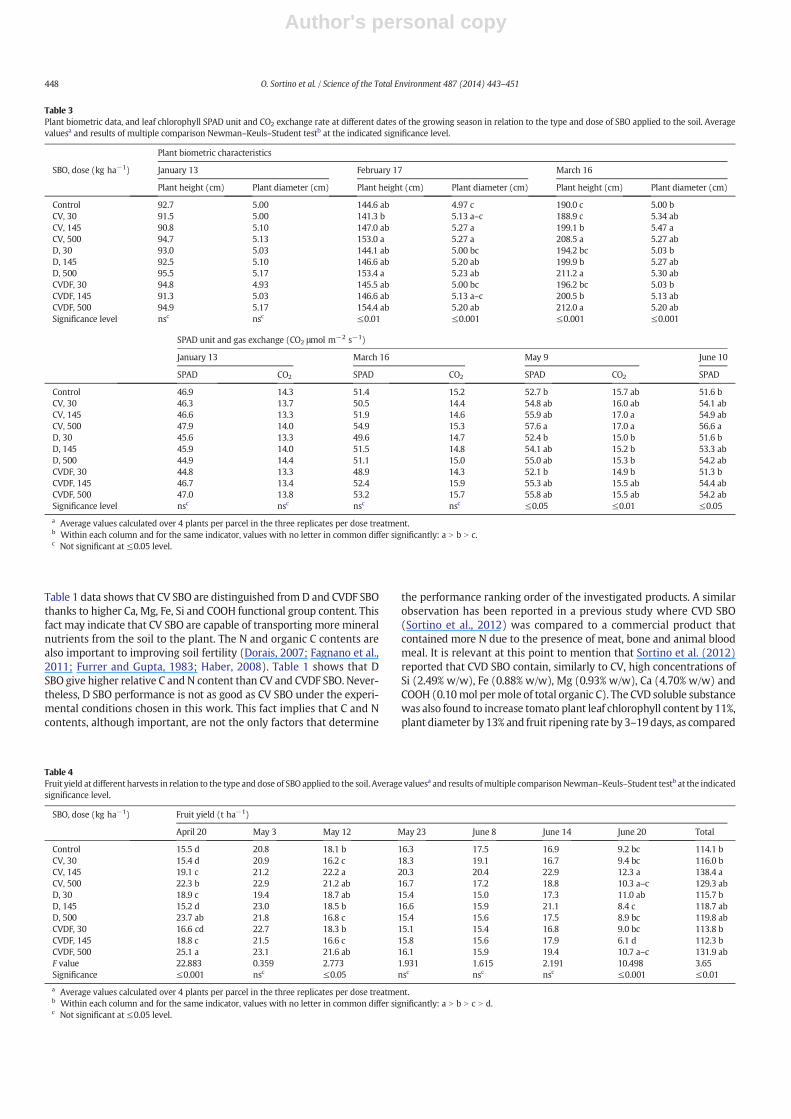
Table 3 shows that, on January 16, no statistically significant differ-ences in plant growth that may be caused by the SBO treatment are ev-ident. Effects become evident at later dates. Compared to the control,the highest increase in plant growth is exhibited by the CV SBO treat-ments at 145 and 500 kg ha−1 doses, but not at the lowest 30 kg ha−1
dose. Treatment with CV SBO at 145 and 500 kg ha−1 doses caused a6% plant diameter increase on February 17 and a 4.8–9.7% plantheight increase on March 16. At the same date of March 16, onlythe CV 145 kg ha−1 treatment is shown to have caused a statisticallysignificant plant diameter increase, of 9.4%. The other treatments
445O. Sortino et al. / Science of the Total Environment 487 (2014) 443–451
Author's personal copy
with investigated SBO gave smaller or non-statistically significant ef-fects on plant growth.
3.4. Effects on plant photosynthetic activity
An indication of plant photosynthetic activity was obtained throughmeasurements of leaf chlorophyll content and CO2 exchange rate. Theresults are reported in Table 3. These two indicators are directly corre-lated according to the following equation:
Y ¼ 2:80� 1:11ð Þ þ 0:24� 0:02ð ÞX ð1Þ
In this equation, Y and X are CO2 exchange rate and the leaf chloro-phyll content values, respectively. Fitting Eq. (1) to the experimentaldata yields a regression coefficient of 0.90. Table 3 also shows thatboth indicators increase from the firstmeasurement performed in Janu-ary through to the last one performed inMay. Significant differences be-tween treatment and control groups appear in the May measurements.The gas exchange rate of plant leaves grown on the soil treated with theCV SBO at 145 and 500 kg ha−1 doses is significantly the highest, 8%higher than what was found for plant leaves grown on the control soil.The data for the other soluble substance treatments do not appear tobe significantly different from those of the control plot. Only the500 kg ha−1 CV soluble substance gives SPAD chlorophyll indicatorvalues, on May 9 and June 10, which are statistically proven to be8–10% higher than those for the leaves of the control plants.
3.5. Effects on plant productivity
Table 4 reports fruit production data per soil hectare. These datawere calculated from the measured number of pieces of fruit per plantand fruit weight. The measured values for these two indicators are notreported. They are summarized as follows. At each date reported inTable 4, the number of pieces fruit per plant ranged from 6 to 10, andshowed no statistically significant differences between treatment andthe control groups. Fruit weight varied from 50 to 127 g per fruit andwas significantly affected by SBO treatment. The highest fruit weight(127 g) was obtained in the earliest April 20 harvest. This was givenby the CVDF SBO treatment group at the 500 kg ha−1 dose. It was 49%higher than the fruit weight (85 g) of the plants grown on the controlplots. Generally, fruit weight tended to increase upon an increase insoluble substance dose and decreased from the first harvest on April20 through to the last on June 20. The lowest fruit weight (50 g)was ob-tained from the CVDF SBO soil treatment group on June 20 at the145 kg ha−1 dose. Considering the total number of pieces of fruits perplant calculated from the sum of all harvests, the highest total numberof fruit pieces per plant was 55. This was obtained for the plantsgrown on the soil treated with the CV SBO at the 145 kg ha−1 dose.The corresponding value for per plants grown on the control plot was47. The highest average fruit weight value of 92 g was found in CVDFSBO treatment group at the 500 kg ha−1 dose. The correspondingvalue for the control plot was 82 g. The differences in fruit productiondata shown in Table 4 therefore reflect the differences in fruit weightand number recorded for each treatment and harvest.
It can be seen from the plant productivity data in Table 4 that theearliest April 20harvest shows a rather different pattern to the later har-vests. The April 20 harvest is characterized by three main features: (i) atrend for the fruit yield to increase upon increasing treatment dose; (ii)all treatments giving significantly higher fruit yield than the controlplot, except for the 30 kg ha−1 CV and the 145 kg ha−1 D treatments;(iii) the best performance was associated with the 500 kg ha−1 CVDFtreatment. It is worth noticing that the yield obtained with this lasttreatment is 62% higher than in the untreated control soil plot. By com-parison, the following differences may be observed for the harvests thatdate later than April 20: (iv) the trend of fruit yield increasing withtreatment dose is not evident or much less so; (v) the difference inTa
ble1
Ana
lyticald
ataa
forthesolublesubstanc
esus
edin
thiswork.
Solublesu
bstanc
epH
Ash
(w/w
%)C(w
/w%)
N(w
/w%)
C/N
CV8.2±
0.1
27.9
±0.6
38.25±
0.09
4.01
±0.03
9.54
D6.4±
0.1
15.4
±0.2
45.07±
0.12
7.87
±0.12
5.73
CVDF
8.2±
0.1
27.3
±0.3
35.47±
0.09
4.34
±0.17
8.17
Mineral
elem
ents:S
i,Fe,A
l,Mg,
Ca,K
,Na(w
/w%)
;Cu,
Ni,Zn
,Cr,Pb
,Hg(p
pm)
SiFe
Al
Mg
CaK
Na
CuNi
ZnCr
PbHg
CV2.55
±0.01
0.77
±0.04
0.49
±0.04
1.13
±0.06
6.07
±0.38
3.59
±0.21
0.16
±0.01
202±
492
±1
256±
119
±1
85±
10.15
±0.02
D0.36
±0.03
0.16
±0.00
0.78
±0.04
0.18
±0.01
1.32
±0.05
9.15
±0.06
0.39
±0.01
100±
127
±1
185±
411
±0
44±
20.23
±0.01
CVDF
0.92
±0.03
0.53
±0.02
0.44
±0.02
0.49
±0.01
2.59
±0.03
5.49
±0.04
0.15
±0.01
216±
171
±0
353±
330
±1
75±
10.45
±0.02
Ctype
san
dfunc
tion
algrou
psbco
ncen
trationas
molefraction
oftotalo
rgan
icC
Af
NR
OMe
OR
OCO
PhPh
OH
PhOY
COOH
CON
C=
OAf/Ar
LH
CV0.37
0.07
0.00
0.14
0.04
0.13
0.05
0.02
0.12
0.01
0.05
1.8
3.6
D0.43
0.10
0.04
0.10
0.03
0.10
0.02
0.01
0.07
0.09
0.01
3.3
9.3
CVDF
0.31
0.08
0.00
0.20
0.07
0.16
0.06
0.02
0.09
0.01
0.00
1.3
5.3
aCo
ncen
trationva
lues
referred
todrymatter:av
erag
esan
dstan
dard
deviationcalculated
over
triplic
ates.
bRe
lative
stan
dard
deviations
werefoun
dto
bewithin10
%of
meanva
lues.LH
=lip
hoph
ilicto
hydrop
hilic
Cratio;
lipho
philicC=
sum
ofalipha
tic(A
f),aromatic(Ph)
,metho
xy(O
Me),amide(C
ON),am
mine(N
R),alkox
y(R
O),ph
enox
y(PhO
Y)an
dan
omeric
(OCO
)Catom
s;hy
drop
hilic
C=
sum
ofcarbox
ylic
acid
(COOH),ph
enol
(PhO
H)an
dke
tone
(C=
O)C;
Ar=
sum
ofPh
,PhO
Yan
dPh
OHC.
446 O. Sortino et al. / Science of the Total Environment 487 (2014) 443–451
Author's personal copy
fruit yield between treatment and control plots decreases; and (vi) theCV soluble substance soil treatment at a 145 kg ha−1 dose tends to givethe highest fruit yield. The result of this trend is that the highest fruityield, as a total of the seven harvests, was found in the group that wastreated with CV SBO at a 145 kg ha−1 dose, as shown in Table 4.This yield (138.4 t ha−1) is 20% higher than in the control plot(114.1 t ha−1). It is also higher than, or equal to, what was found in theplots treated with the same CV SBO at a 500 kg ha−1 dose, with D SBOat 145 and 500 kg ha−1 doses and with CVDF SBO at a 500 kg ha−1
dose. All other treatments are shown to give total yield values whichare significantly lower than results obtained from treatment with theCV soluble substance at 145 kg ha−1 and were not statistically differentfrom control plot results.
3.6. Effects on fruit quality
Table 5 reports five indicators of fruit quality. Due to the high num-ber of data which are analyzed and discussed for each indicator, the re-sults are presented in the following subsection dedicated to specificindicators.
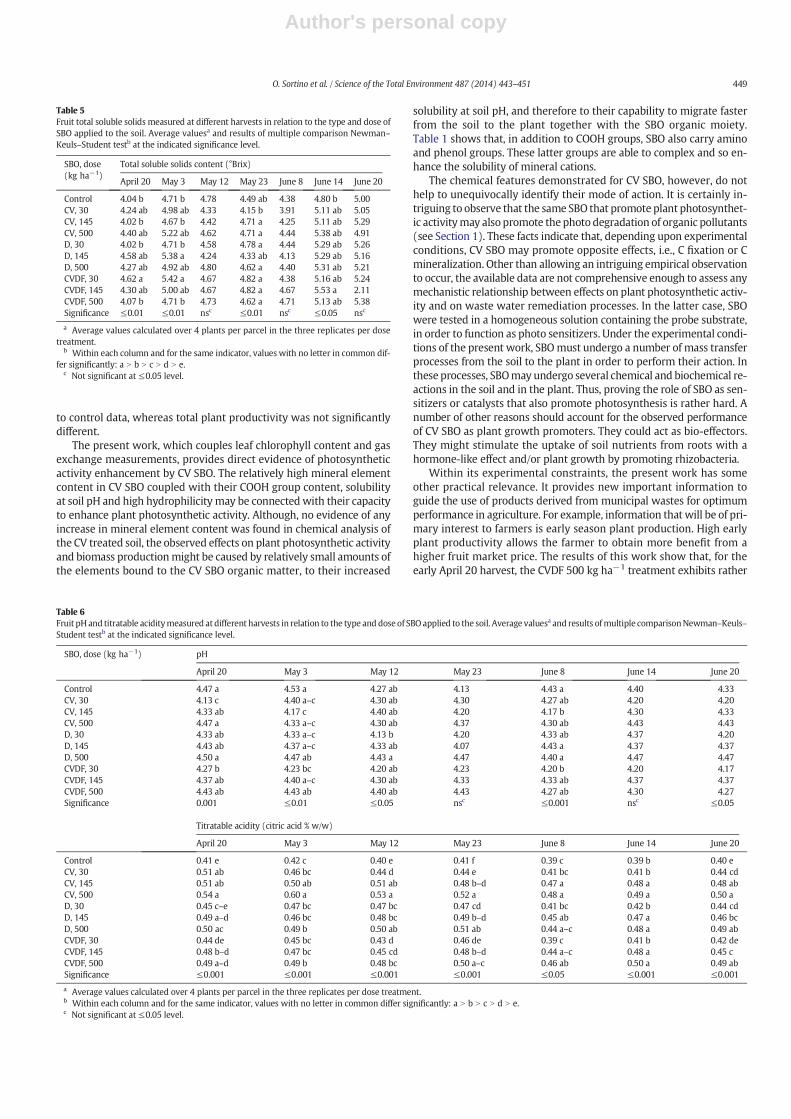
3.6.1. Total soluble solidsTable 5 shows very few statistically significant differences in fruit
total solid content between the soil treatment and control soil groups.Out of 70 reported values relative to 7 harvesting dates, significantlyhigher total solid content values were only found in four cases: i.e.,for the April 20 and May 3 CVDF at 30 kg ha−1 dose harvests, for theMay 3 D at 145 kg ha−1 dose harvest and for the June 14 CVDF at145 kg ha−1 dose harvest. In all four cases, the fruit total solid contentenhancement relative to the control amounts to 14–15%.
3.6.2. pH and titratable acidityTable 6 shows that there are only small differences in the pH values
of fruit grown on the SBO treated soil and the fruit grown on the controlplot. Slightly lower pH values than control plot are observed in a fewcases. These were found in the 30 kg ha−1 CV and CVDF treatments inthe April 20 harvest, in the 145 kg ha−1 CV and 30 kg ha−1 CVDF treat-ments in theMay 3 and June 8 harvests. Table 6 data on titratable acidityshow that the titratable acidity of the fruit grown on the 500 kg ha−1 CVsoluble substance treated soil display the highest value at all harvestingdates. These values are 23–43% higher than those found for fruits grownon the control plot. Most of the other treatments also gave fruit withhigher titratable acidity than the control plot. The average titratableacidity to total soluble solids ratio, calculated over the seven harvests,is 0.11 for fruits grown on the 500 kg ha−1 CV soluble substance treatedsoil and 0.09 for fruit grown on the control plot. Thus, fruits grown onthe 500 kg ha−1 CV treated soil should be associated with a more acidicflavour (Mata et al., 2002; Bingqing, 2010) than those grownon the con-trol soil.
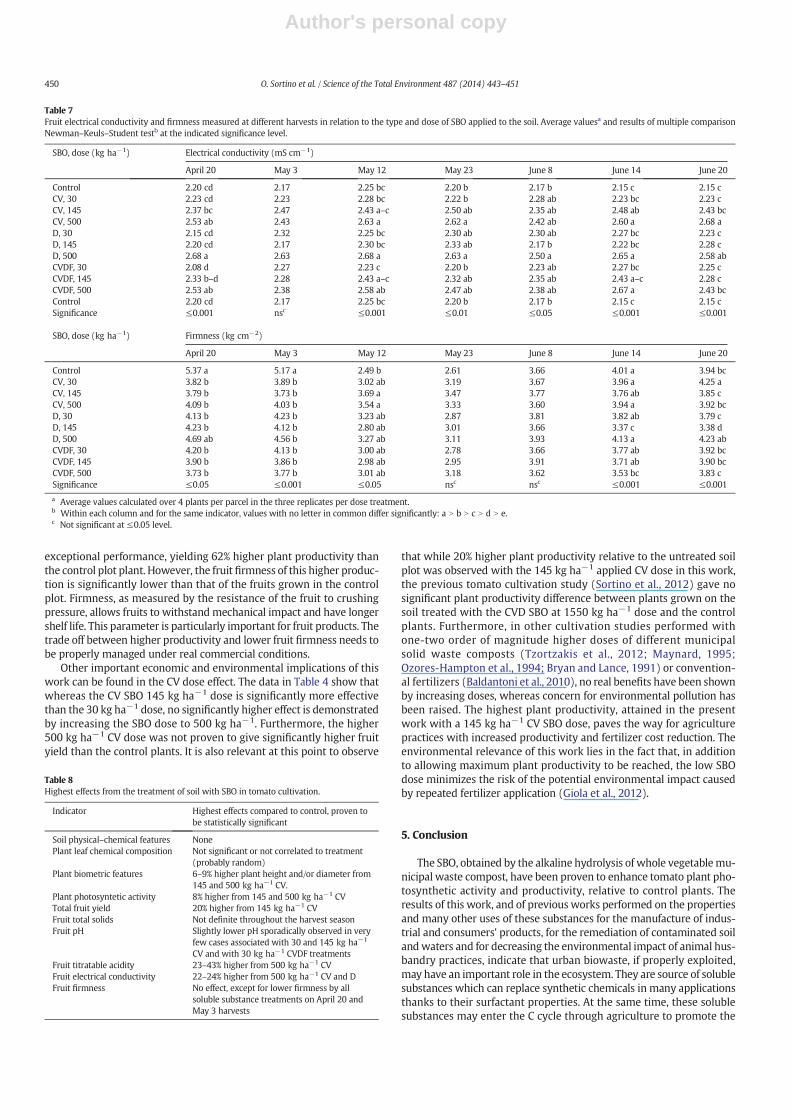
3.6.3. Electrical conductivityThe data in Table 7 show that most of the soluble substance treat-
ments yield fruit with higher electrical conductivity than control fruit.The 500 kg ha−1CV and digestate (D) soluble substance treatmentsare associated with the highest electrical conductivity values foundthroughout most of the seven harvests. The electrical conductivity ofthe fruits grown on soil treated in this fashionwas about 22–24% higherthan the fruits grown on the control soil.
3.6.4. Fruit firmnessTable 7 shows that fruit firmness, on April 20 and May 3, is lower
than the control in all soluble substance treatments. However, on May12, fruit firmness for the 145 and 500 kg ha−1 CVSBO treatments isthe highest. FromMay 23 through to June 14, no significant differencesare observed between the control and most SBO treatments, except forthe 145 kg ha−1 digestate (D) and 500 kg ha−1 CVDF SBO treatments,which yielded significantly lower values than the control. On June 20,the 30 kg ha−1 CV and 500 kg ha−1 D SBO treatments are associatedwith the highest fruit firmness. These data, checked against Table 4 pro-duction data, show that SBO treatments give higher fruit production inthe earliest harvest but lower fruit firmness compared to the controlplots. However, the firmness of the products obtained from the soiltreated with SBO tends to improve and becomes higher than that ofthe product obtained from the untreated control soil in the later har-vests. The firmness of the fruits obtained from the soil treated withthe CV SBO is the highest when considering the entire period.
4. Discussion
Table 8 summarizes the observed effects of SBO treatment. Theresults point to CV SBO 145 kg ha−1 treatment being the best of the in-vestigated treatments for use in the cultivation of tomato plants. Thistreatment is associated with the highest observed effects. The CV145 kg ha−1 treatment yields the highest enhancements in terms ofplant photosynthetic activity (8%), plant growth (6–9%) and total fruitproductivity (20%), as compared to the control. A search for a possiblechemical composition–performance relationship in the data from
Table 2Analytical data for the control soil and for soil treated with D, CVDF and CV SBO at500 kg ha−1 doses and sampled one month after seedling transplant, and for the thereingrown tomato plant leaves sampled onMay 3, 2012. Average valuesa and results of multi-ple comparison Newman–Keuls–Student test.b
Analytical parameter Soil
Control D CVDF CV
pH 7.9 8.0 8.0 8.0ECc (μS cm−1) 871 759 780 846Salinity (μeq g−1) 11.3 10.2 11.7 10.5Total C (w/w%) 4.8 4.8 4.4 4.5Total N (w/w%) 0.2 0.2 0.2 0.2K (μeq g−1) 0.3 0.2 0.3 0.6Ca (μeq g−1) 23.6 23.6 22.3 23.4Mg (μeq g−1) 0.4 0.4 0.5 0.5Na (w/w) 0.6 0.6 0.5 0.5Mgd (ppm) 551 542 469 491Fe (ppm) 316 308 368 304Zn (ppm) 30.3 30.3 31.3 31.0Cu (ppm) 11.0 10.7 11.0 10.7Mn (ppm) 147 161 145 162P (ppm) 177 172 188 182
Leaves
Control D CVDF CV
Total C (w/w%) 37.5 37.7 37.6 37.5Total N (w/w%) 3.0 3.1 2.9 3.0Al (w/w%) 4.49 ab 4.30 a 4.44 ab 4.48 bCa (w/w%) 5.78 a 5.91 a 5.21 b 5.71 aMg (w/w%) 0.82 b 0.87 a 0.66 c 0.88 aK (w/w%) 0.32 c 0.34 c 0.41 b 0.45 aNa (w/w%) 0.31 a 0.27 b 0.32 a 0.25 bP (w/w%) 0.15 ab 0.19 a 0.13 b 0.13 abCu (ppm) 11.7 c 15.8 a 14.8 b 10.3 dNi (ppb) 265 a 157 b 171 ab 183 abZn (ppm) 4.87 ab 5.64 a 5.41 a 4.10 bCr (ppm) 1.18 1.30 1.17 1.25Pb (ppb) 451 756 389 337B (ppm) 78.5 76.7 77.6 76.4Fe (ppm) 60.6 b 61.6 b 80.4 a 40.2 cMn (ppm) 120 a 114 b 94.4 d 100 cHg (ppb) b500 b500 b500 b500
a Three soil samples per treatment were analyzed to calculate average values. Forleaves, calculated from measurements performed over triplicate, samples taken from 12plants per treatment and homogenized.
b Within each row, valueswith no letter in common differ significantly: a N b N c N d atsignificance level ≤0.05.
c Electrical conductivity.d Assimilable ion.
447O. Sortino et al. / Science of the Total Environment 487 (2014) 443–451
Author's personal copy
Table 1 data shows that CV SBO are distinguished from D and CVDF SBOthanks to higher Ca, Mg, Fe, Si and COOH functional group content. Thisfact may indicate that CV SBO are capable of transporting more mineralnutrients from the soil to the plant. The N and organic C contents arealso important to improving soil fertility (Dorais, 2007; Fagnano et al.,2011; Furrer and Gupta, 1983; Haber, 2008). Table 1 shows that DSBO give higher relative C and N content than CV and CVDF SBO. Never-theless, D SBO performance is not as good as CV SBO under the experi-mental conditions chosen in this work. This fact implies that C and Ncontents, although important, are not the only factors that determine
the performance ranking order of the investigated products. A similarobservation has been reported in a previous study where CVD SBO(Sortino et al., 2012) was compared to a commercial product thatcontained more N due to the presence of meat, bone and animal bloodmeal. It is relevant at this point to mention that Sortino et al. (2012)reported that CVD SBO contain, similarly to CV, high concentrations ofSi (2.49% w/w), Fe (0.88% w/w), Mg (0.93% w/w), Ca (4.70% w/w) andCOOH (0.10mol permole of total organic C). The CVD soluble substancewas also found to increase tomato plant leaf chlorophyll content by 11%,plant diameter by 13% and fruit ripening rate by 3–19days, as compared
Table 3Plant biometric data, and leaf chlorophyll SPAD unit and CO2 exchange rate at different dates of the growing season in relation to the type and dose of SBO applied to the soil. Averagevaluesa and results of multiple comparison Newman–Keuls–Student testb at the indicated significance level.
Plant biometric characteristics
SBO, dose (kg ha−1) January 13 February 17 March 16
Plant height (cm) Plant diameter (cm) Plant height (cm) Plant diameter (cm) Plant height (cm) Plant diameter (cm)
Control 92.7 5.00 144.6 ab 4.97 c 190.0 c 5.00 bCV, 30 91.5 5.00 141.3 b 5.13 a–c 188.9 c 5.34 abCV, 145 90.8 5.10 147.0 ab 5.27 a 199.1 b 5.47 aCV, 500 94.7 5.13 153.0 a 5.27 a 208.5 a 5.27 abD, 30 93.0 5.03 144.1 ab 5.00 bc 194.2 bc 5.03 bD, 145 92.5 5.10 146.6 ab 5.20 ab 199.9 b 5.27 abD, 500 95.5 5.17 153.4 a 5.23 ab 211.2 a 5.30 abCVDF, 30 94.8 4.93 145.5 ab 5.00 bc 196.2 bc 5.03 bCVDF, 145 91.3 5.03 146.6 ab 5.13 a–c 200.5 b 5.13 abCVDF, 500 94.9 5.17 154.4 ab 5.20 ab 212.0 a 5.20 abSignificance level nsc nsc ≤0.01 ≤0.001 ≤0.001 ≤0.001
SPAD unit and gas exchange (CO2 μmol m−2 s−1)
January 13 March 16 May 9 June 10
SPAD CO2 SPAD CO2 SPAD CO2 SPAD
Control 46.9 14.3 51.4 15.2 52.7 b 15.7 ab 51.6 bCV, 30 46.3 13.7 50.5 14.4 54.8 ab 16.0 ab 54.1 abCV, 145 46.6 13.3 51.9 14.6 55.9 ab 17.0 a 54.9 abCV, 500 47.9 14.0 54.9 15.3 57.6 a 17.0 a 56.6 aD, 30 45.6 13.3 49.6 14.7 52.4 b 15.0 b 51.6 bD, 145 45.9 14.0 51.5 14.8 54.1 ab 15.2 b 53.3 abD, 500 44.9 14.4 51.1 15.0 55.0 ab 15.3 b 54.2 abCVDF, 30 44.8 13.3 48.9 14.3 52.1 b 14.9 b 51.3 bCVDF, 145 46.7 13.4 52.4 15.9 55.3 ab 15.5 ab 54.4 abCVDF, 500 47.0 13.8 53.2 15.7 55.8 ab 15.5 ab 54.2 abSignificance level nsc nsc nsc nsc ≤0.05 ≤0.01 ≤0.05
a Average values calculated over 4 plants per parcel in the three replicates per dose treatment.b Within each column and for the same indicator, values with no letter in common differ significantly: a N b N c.c Not significant at ≤0.05 level.
Table 4Fruit yield at different harvests in relation to the type and dose of SBO applied to the soil. Average valuesa and results ofmultiple comparisonNewman–Keuls–Student testb at the indicatedsignificance level.
SBO, dose (kg ha−1) Fruit yield (t ha−1)
April 20 May 3 May 12 May 23 June 8 June 14 June 20 Total
Control 15.5 d 20.8 18.1 b 16.3 17.5 16.9 9.2 bc 114.1 bCV, 30 15.4 d 20.9 16.2 c 18.3 19.1 16.7 9.4 bc 116.0 bCV, 145 19.1 c 21.2 22.2 a 20.3 20.4 22.9 12.3 a 138.4 aCV, 500 22.3 b 22.9 21.2 ab 16.7 17.2 18.8 10.3 a–c 129.3 abD, 30 18.9 c 19.4 18.7 ab 15.4 15.0 17.3 11.0 ab 115.7 bD, 145 15.2 d 23.0 18.5 b 16.6 15.9 21.1 8.4 c 118.7 abD, 500 23.7 ab 21.8 16.8 c 15.4 15.6 17.5 8.9 bc 119.8 abCVDF, 30 16.6 cd 22.7 18.3 b 15.1 15.4 16.8 9.0 bc 113.8 bCVDF, 145 18.8 c 21.5 16.6 c 15.8 15.6 17.9 6.1 d 112.3 bCVDF, 500 25.1 a 23.1 21.6 ab 16.1 15.9 19.4 10.7 a–c 131.9 abF value 22.883 0.359 2.773 1.931 1.615 2.191 10.498 3.65Significance ≤0.001 nsc ≤0.05 nsc nsc nsc ≤0.001 ≤0.01
a Average values calculated over 4 plants per parcel in the three replicates per dose treatment.b Within each column and for the same indicator, values with no letter in common differ significantly: a N b N c N d.c Not significant at ≤0.05 level.
448 O. Sortino et al. / Science of the Total Environment 487 (2014) 443–451
Author's personal copy
to control data, whereas total plant productivity was not significantlydifferent.
The present work, which couples leaf chlorophyll content and gasexchange measurements, provides direct evidence of photosyntheticactivity enhancement by CV SBO. The relatively high mineral elementcontent in CV SBO coupled with their COOH group content, solubilityat soil pH and high hydrophilicity may be connected with their capacityto enhance plant photosynthetic activity. Although, no evidence of anyincrease in mineral element content was found in chemical analysis ofthe CV treated soil, the observed effects on plant photosynthetic activityand biomass productionmight be caused by relatively small amounts ofthe elements bound to the CV SBO organic matter, to their increased
solubility at soil pH, and therefore to their capability to migrate fasterfrom the soil to the plant together with the SBO organic moiety.Table 1 shows that, in addition to COOH groups, SBO also carry aminoand phenol groups. These latter groups are able to complex and so en-hance the solubility of mineral cations.
The chemical features demonstrated for CV SBO, however, do nothelp to unequivocally identify their mode of action. It is certainly in-triguing to observe that the same SBO that promote plant photosynthet-ic activitymay also promote the photo degradation of organic pollutants(see Section 1). These facts indicate that, depending upon experimentalconditions, CV SBO may promote opposite effects, i.e., C fixation or Cmineralization. Other than allowing an intriguing empirical observationto occur, the available data are not comprehensive enough to assess anymechanistic relationship between effects on plant photosynthetic activ-ity and on waste water remediation processes. In the latter case, SBOwere tested in a homogeneous solution containing the probe substrate,in order to function as photo sensitizers. Under the experimental condi-tions of the present work, SBOmust undergo a number of mass transferprocesses from the soil to the plant in order to perform their action. Inthese processes, SBOmay undergo several chemical and biochemical re-actions in the soil and in the plant. Thus, proving the role of SBO as sen-sitizers or catalysts that also promote photosynthesis is rather hard. Anumber of other reasons should account for the observed performanceof CV SBO as plant growth promoters. They could act as bio-effectors.They might stimulate the uptake of soil nutrients from roots with ahormone-like effect and/or plant growth by promoting rhizobacteria.
Within its experimental constraints, the present work has someother practical relevance. It provides new important information toguide the use of products derived from municipal wastes for optimumperformance in agriculture. For example, information that will be of pri-mary interest to farmers is early season plant production. High earlyplant productivity allows the farmer to obtain more benefit from ahigher fruit market price. The results of this work show that, for theearly April 20 harvest, the CVDF 500 kg ha−1 treatment exhibits rather
Table 5Fruit total soluble solids measured at different harvests in relation to the type and dose ofSBO applied to the soil. Average valuesa and results of multiple comparison Newman–Keuls–Student testb at the indicated significance level.
SBO, dose(kg ha−1)
Total soluble solids content (°Brix)
April 20 May 3 May 12 May 23 June 8 June 14 June 20
Control 4.04 b 4.71 b 4.78 4.49 ab 4.38 4.80 b 5.00CV, 30 4.24 ab 4.98 ab 4.33 4.15 b 3.91 5.11 ab 5.05CV, 145 4.02 b 4.67 b 4.42 4.71 a 4.25 5.11 ab 5.29CV, 500 4.40 ab 5.22 ab 4.62 4.71 a 4.44 5.38 ab 4.91D, 30 4.02 b 4.71 b 4.58 4.78 a 4.44 5.29 ab 5.26D, 145 4.58 ab 5.38 a 4.24 4.33 ab 4.13 5.29 ab 5.16D, 500 4.27 ab 4.92 ab 4.80 4.62 a 4.40 5.31 ab 5.21CVDF, 30 4.62 a 5.42 a 4.67 4.82 a 4.38 5.16 ab 5.24CVDF, 145 4.30 ab 5.00 ab 4.67 4.82 a 4.67 5.53 a 2.11CVDF, 500 4.07 b 4.71 b 4.73 4.62 a 4.71 5.13 ab 5.38Significance ≤0.01 ≤0.01 nsc ≤0.01 nsc ≤0.05 nsc
a Average values calculated over 4 plants per parcel in the three replicates per dosetreatment.
b Within each column and for the same indicator, values with no letter in common dif-fer significantly: a N b N c N d N e.
c Not significant at ≤0.05 level.
Table 6Fruit pH and titratable aciditymeasured at different harvests in relation to the type and dose of SBO applied to the soil. Average valuesa and results ofmultiple comparisonNewman–Keuls–Student testb at the indicated significance level.
SBO, dose (kg ha−1) pH
April 20 May 3 May 12 May 23 June 8 June 14 June 20
Control 4.47 a 4.53 a 4.27 ab 4.13 4.43 a 4.40 4.33CV, 30 4.13 c 4.40 a–c 4.30 ab 4.30 4.27 ab 4.20 4.20CV, 145 4.33 ab 4.17 c 4.40 ab 4.20 4.17 b 4.30 4.33CV, 500 4.47 a 4.33 a–c 4.30 ab 4.37 4.30 ab 4.43 4.43D, 30 4.33 ab 4.33 a–c 4.13 b 4.20 4.33 ab 4.37 4.20D, 145 4.43 ab 4.37 a–c 4.33 ab 4.07 4.43 a 4.37 4.37D, 500 4.50 a 4.47 ab 4.43 a 4.47 4.40 a 4.47 4.47CVDF, 30 4.27 b 4.23 bc 4.20 ab 4.23 4.20 b 4.20 4.17CVDF, 145 4.37 ab 4.40 a–c 4.30 ab 4.33 4.33 ab 4.37 4.37CVDF, 500 4.43 ab 4.43 ab 4.40 ab 4.43 4.27 ab 4.30 4.27Significance 0.001 ≤0.01 ≤0.05 nsc ≤0.001 nsc ≤0.05
Titratable acidity (citric acid % w/w)
April 20 May 3 May 12 May 23 June 8 June 14 June 20
Control 0.41 e 0.42 c 0.40 e 0.41 f 0.39 c 0.39 b 0.40 eCV, 30 0.51 ab 0.46 bc 0.44 d 0.44 e 0.41 bc 0.41 b 0.44 cdCV, 145 0.51 ab 0.50 ab 0.51 ab 0.48 b–d 0.47 a 0.48 a 0.48 abCV, 500 0.54 a 0.60 a 0.53 a 0.52 a 0.48 a 0.49 a 0.50 aD, 30 0.45 c–e 0.47 bc 0.47 bc 0.47 cd 0.41 bc 0.42 b 0.44 cdD, 145 0.49 a–d 0.46 bc 0.48 bc 0.49 b–d 0.45 ab 0.47 a 0.46 bcD, 500 0.50 ac 0.49 b 0.50 ab 0.51 ab 0.44 a–c 0.48 a 0.49 abCVDF, 30 0.44 de 0.45 bc 0.43 d 0.46 de 0.39 c 0.41 b 0.42 deCVDF, 145 0.48 b–d 0.47 bc 0.45 cd 0.48 b–d 0.44 a–c 0.48 a 0.45 cCVDF, 500 0.49 a–d 0.49 b 0.48 bc 0.50 a–c 0.46 ab 0.50 a 0.49 abSignificance ≤0.001 ≤0.001 ≤0.001 ≤0.001 ≤0.05 ≤0.001 ≤0.001
a Average values calculated over 4 plants per parcel in the three replicates per dose treatment.b Within each column and for the same indicator, values with no letter in common differ significantly: a N b N c N d N e.c Not significant at ≤0.05 level.
449O. Sortino et al. / Science of the Total Environment 487 (2014) 443–451
Author's personal copy
exceptional performance, yielding 62% higher plant productivity thanthe control plot plant. However, the fruit firmness of this higher produc-tion is significantly lower than that of the fruits grown in the controlplot. Firmness, as measured by the resistance of the fruit to crushingpressure, allows fruits to withstandmechanical impact and have longershelf life. This parameter is particularly important for fruit products. Thetrade off between higher productivity and lower fruit firmness needs tobe properly managed under real commercial conditions.
Other important economic and environmental implications of thiswork can be found in the CV dose effect. The data in Table 4 show thatwhereas the CV SBO 145 kg ha−1 dose is significantly more effectivethan the 30 kg ha−1 dose, no significantly higher effect is demonstratedby increasing the SBO dose to 500 kg ha−1. Furthermore, the higher500 kg ha−1 CV dose was not proven to give significantly higher fruityield than the control plants. It is also relevant at this point to observe
that while 20% higher plant productivity relative to the untreated soilplot was observed with the 145 kg ha−1 applied CV dose in this work,the previous tomato cultivation study (Sortino et al., 2012) gave nosignificant plant productivity difference between plants grown on thesoil treated with the CVD SBO at 1550 kg ha−1 dose and the controlplants. Furthermore, in other cultivation studies performed withone-two order of magnitude higher doses of different municipalsolid waste composts (Tzortzakis et al., 2012; Maynard, 1995;Ozores-Hampton et al., 1994; Bryan and Lance, 1991) or convention-al fertilizers (Baldantoni et al., 2010), no real benefits have been shownby increasing doses, whereas concern for environmental pollution hasbeen raised. The highest plant productivity, attained in the presentwork with a 145 kg ha−1 CV SBO dose, paves the way for agriculturepractices with increased productivity and fertilizer cost reduction. Theenvironmental relevance of this work lies in the fact that, in additionto allowing maximum plant productivity to be reached, the low SBOdose minimizes the risk of the potential environmental impact causedby repeated fertilizer application (Giola et al., 2012).
5. Conclusion
The SBO, obtained by the alkaline hydrolysis of whole vegetablemu-nicipal waste compost, have been proven to enhance tomato plant pho-tosynthetic activity and productivity, relative to control plants. Theresults of this work, and of previous works performed on the propertiesand many other uses of these substances for the manufacture of indus-trial and consumers' products, for the remediation of contaminated soilandwaters and for decreasing the environmental impact of animal hus-bandry practices, indicate that urban biowaste, if properly exploited,may have an important role in the ecosystem. They are source of solublesubstances which can replace synthetic chemicals in many applicationsthanks to their surfactant properties. At the same time, these solublesubstances may enter the C cycle through agriculture to promote the
Table 8Highest effects from the treatment of soil with SBO in tomato cultivation.
Indicator Highest effects compared to control, proven tobe statistically significant
Soil physical–chemical features NonePlant leaf chemical composition Not significant or not correlated to treatment
(probably random)Plant biometric features 6–9% higher plant height and/or diameter from
145 and 500 kg ha−1 CV.Plant photosyntetic activity 8% higher from 145 and 500 kg ha−1 CVTotal fruit yield 20% higher from 145 kg ha−1 CVFruit total solids Not definite throughout the harvest seasonFruit pH Slightly lower pH sporadically observed in very
few cases associated with 30 and 145 kg ha−1
CV and with 30 kg ha−1 CVDF treatmentsFruit titratable acidity 23–43% higher from 500 kg ha−1 CVFruit electrical conductivity 22–24% higher from 500 kg ha−1 CV and DFruit firmness No effect, except for lower firmness by all
soluble substance treatments on April 20 andMay 3 harvests
Table 7Fruit electrical conductivity and firmness measured at different harvests in relation to the type and dose of SBO applied to the soil. Average valuesa and results of multiple comparisonNewman–Keuls–Student testb at the indicated significance level.
SBO, dose (kg ha−1) Electrical conductivity (mS cm−1)
April 20 May 3 May 12 May 23 June 8 June 14 June 20
Control 2.20 cd 2.17 2.25 bc 2.20 b 2.17 b 2.15 c 2.15 cCV, 30 2.23 cd 2.23 2.28 bc 2.22 b 2.28 ab 2.23 bc 2.23 cCV, 145 2.37 bc 2.47 2.43 a–c 2.50 ab 2.35 ab 2.48 ab 2.43 bcCV, 500 2.53 ab 2.43 2.63 a 2.62 a 2.42 ab 2.60 a 2.68 aD, 30 2.15 cd 2.32 2.25 bc 2.30 ab 2.30 ab 2.27 bc 2.23 cD, 145 2.20 cd 2.17 2.30 bc 2.33 ab 2.17 b 2.22 bc 2.28 cD, 500 2.68 a 2.63 2.68 a 2.63 a 2.50 a 2.65 a 2.58 abCVDF, 30 2.08 d 2.27 2.23 c 2.20 b 2.23 ab 2.27 bc 2.25 cCVDF, 145 2.33 b–d 2.28 2.43 a–c 2.32 ab 2.35 ab 2.43 a–c 2.28 cCVDF, 500 2.53 ab 2.38 2.58 ab 2.47 ab 2.38 ab 2.67 a 2.43 bcControl 2.20 cd 2.17 2.25 bc 2.20 b 2.17 b 2.15 c 2.15 cSignificance ≤0.001 nsc ≤0.001 ≤0.01 ≤0.05 ≤0.001 ≤0.001
SBO, dose (kg ha−1) Firmness (kg cm−2)
April 20 May 3 May 12 May 23 June 8 June 14 June 20
Control 5.37 a 5.17 a 2.49 b 2.61 3.66 4.01 a 3.94 bcCV, 30 3.82 b 3.89 b 3.02 ab 3.19 3.67 3.96 a 4.25 aCV, 145 3.79 b 3.73 b 3.69 a 3.47 3.77 3.76 ab 3.85 cCV, 500 4.09 b 4.03 b 3.54 a 3.33 3.60 3.94 a 3.92 bcD, 30 4.13 b 4.23 b 3.23 ab 2.87 3.81 3.82 ab 3.79 cD, 145 4.23 b 4.12 b 2.80 ab 3.01 3.66 3.37 c 3.38 dD, 500 4.69 ab 4.56 b 3.27 ab 3.11 3.93 4.13 a 4.23 abCVDF, 30 4.20 b 4.13 b 3.00 ab 2.78 3.66 3.77 ab 3.92 bcCVDF, 145 3.90 b 3.86 b 2.98 ab 2.95 3.91 3.71 ab 3.90 bcCVDF, 500 3.73 b 3.77 b 3.01 ab 3.18 3.62 3.53 bc 3.83 cSignificance ≤0.05 ≤0.001 ≤0.05 nsc nsc ≤0.001 ≤0.001
a Average values calculated over 4 plants per parcel in the three replicates per dose treatment.b Within each column and for the same indicator, values with no letter in common differ significantly: a N b N c N d N e.c Not significant at ≤0.05 level.
450 O. Sortino et al. / Science of the Total Environment 487 (2014) 443–451
Author's personal copy
production of biomass for human consumption, which will in turn gen-erate other renewable organic C waste.
With specific focus on agriculture, this work points to relevanteconomic and environmental benefits that may derive from the use ofSBO. It also highlights the significant differences in chemical composi-tion and performance found in SBO isolated from different materialswhich are either pre-treated by anaerobic or aerobic fermentation.Potential users should be aware of such differences. The results of thiswork certainly offer worthwhile scope for further trials which wouldtest SBO, isolated from other biowaste sources and/or in differentexperimental conditions, in order to understand the reasons for theirperformance and exploit their full potential. The development of aself-sustainable ecosystem based on cycling renewable organic C be-tween wastes and added value products appears to be a feasible futuregoal.
Acknowledgements
Thisworkwas carried out partly with funds from theMinistero dellePolitiche Agricole as part of the Agrienergia project. The authorsare grateful to the following private and/or public Italian institutions:(i) the Piombo farm, run by Giovanni Gambuzza, for making the green-house installation, located along the sea shore in Punta Secca in theprovince of Ragusa, available; (ii) Acea Pinerolese Spa in Pinerolo (TO)for supplying the SBO sourcing biomaterials from its urban waste man-agement plant; and (iii) Studio Chiono edAssociati in Rivarolo Canavese(TO) for making pilot equipment and services for SBO productionavailable.
References
AOAC. Official Methods of Analysis. 15th ed. Washington, DC, USA: Association of OfficialAnalytical Chemists; 1990.
Avetta P, Bella F, Bianco Prevot A, Laurenti E, Montoneri E, Arques A, et al. Waste cleaningwaste: photodegradation of monochlorophenols in the presence of waste derivedphotosensitizer. ACS Sustainable Chemistry & Engineering, 1; 2013. p. 1545–50.
Baldantoni D, Leone A, Lovieno P, Morra L, Zaccardelli M, Alfani A. Total and available soiltrace element concentrations in twoMediterranean agricultural systems treatedwithmunicipal waste compost or conventional mineral fertilizers. Chemosphere 2010;80:1006–13.
Bianco Prevot A, Fabbri D, Pramauro E, Baiocchi C, Medana C, Montoneri E, et al. Sensitiz-ing effect of bio-based chemicals from urban wastes on the photodegradation of azo-dyes. J Photochem Photobiol A Chem 2010;209:224–31.
Bianco Prevot A, Avetta P, Fabbri D, Boffa V,Montoneri E. Bio-organics isolated from urbanbio-refuse for the remediation of industrial effluents containing azo dyes. Desalina-tion and Water Treatment, 39; 2012. p. 308–15.
Bingqing Y. Tomato taste. Droevendaalsesteeg 1, Wageningen: Horticultural SupplyChains (HPC) Group; 2010 [Wageningenhttp://www.google.it/url?sa=t&source=web&cd=1&sqi=2&ved=0CBsQFjAA&url=http%3A%2F%2Fedepot.wur.nl%2F155199&ei=IBlZTsX5MIvc4QSuqoCtBQ&usg=AFQjCNEl3HpCFgtlL4hzoZkFEOGCNo-fUQ (accessed October 1, 2013)].
Bryan HH, Lance CJ. Compost trials on vegetable and tropical harvests. ByoCycle 1991;27:36–7.
Chapagain BP, Wiesman Z. Effect of Nutri-Vant-PeaK foliar spray on plant development,yield, and fruit quality in greenhouse tomatoes. Sci Hortic 2004;102:177–88.
Dinuccio E, Biagini D, Rosato R, Balsari P, Lazzaroni C,Montoneri E. Use of acid soluble bio-organic substances extract as rabbits feed additive to reduce manure gases emissionduring storage. Adv Anim Biosci 2013;4(Special Issue 2):515.
Dorais M. Organic production of vegetables: state of the art and challenges. Can J Plant Sci2007;87:1055–66.
Fagnano M, Adamo P, Zampella MV, Fiorentino N. Environmental and agronomic impactof fertilization with composted organic fraction from municipal solid waste. AgrEcosyst Environ 2011;141:100–7.
Furrer OJ, Gupta SK. Effects of agricultural use of municipal composts. Plant Foods HumNutr 1983;33:251–9.
Giola P, Basso B, Pruneddua G, Giunta F, Jones JW. Impact of manure and slurry applica-tions on soil nitrate in amaize–triticale rotation: field study and long term simulationanalysis. Eur J Agron 2012;38:43–53.
Gomis J, Vercher RF, Amat AM, Mártire DO, González MC, Bianco Prevot A, et al. Ap-plication of soluble bio-organic substances (SBO) as photocatalysts for wastewa-ter treatment: sensitizing effect and photo-Fenton-like process. Catal Today2013;209:176–80.
Haber N. Sustainable compost application in agriculture. ECN INFO PAPER 02:1-36.European Compost Network ECN e.V. LTZ. Germany: Center for Agricultural Technol-ogy Augustenberg Karlsruhe; 2008.
Ho LC. Partitioning of assimilates in fruiting tomato plants. Plant Growth Regul 1984;2:277–85.
Mata MCS, Hurtado MC, Ripollés SR, Galiana-Balaguer L, Isasa MET, Vinals FN. Breedingfor flavour of fresh market tomato: sources for increasing acid content. Acta PhysiolPlant 2002;22:250–3.
Maynard AA. Increasing tomato yields with MSW compost. BioCycle 1995;46:104–6.Montoneri E, Mainero D, Boffa V, Perrone DG, Montoneri C. Biochemenergy: a project to
turn a urban wastes treatment plant into biorefinery for the production of energy,chemicals and consumer's products with friendly environmental impact. Int J GlobalEnviron Issues 2011;11:170–96.
Montoneri C, Montoneri E, Tomasso L, Piva A. Compost derived substances decrease feedprotein N mineralization in swine cecal fermentation. J Agric Sci 2013;13:31–44.
Ozores-Hampton M, Schaffer B, Bryan HH, Hanlon EA. Nutrient concentrations, growth,and yield of tomato and squash in municipal solid-waste-amended soil. Hortscience1994;29:785–8.
Pagliarulo C. Growing Hydroponic Tomatoes. College of Agriculture, University of Arizona;2000 [http://ag.arizona.edu/hydroponictomatoes/nutritio.htm].
Sheldon-Coulson GA. Production of levulinic acid in urban borefineries. Massachusetts In-stitute of Technology; 2011 [Available fromMassachusetts Institute of Technology Li-braries Archives].
Snedecor G, Cochran WG. Statistical Methods. 8th ed. Iowa State University Press; 1989.Sortino O, Dipasquale M, Montoneri E, Tomasso L, Perrone DG, Vindrola D, et al. Refuse
derived soluble bio-organics enhancing tomato plant growth and productivity.Waste Manag 2012;32:1788–97.
Tzortzakis N, Gouma S, Dagianta E, Saridakis C, Papamichalaki M, Goumas D, et al. Use offertigation and municipal solid waste compost for greenhouse pepper cultivation. SciWorld J 2012. http://dx.doi.org/10.1100/2012/973193. [Article ID 973193].
451O. Sortino et al. / Science of the Total Environment 487 (2014) 443–451