Benefication Studies RPT Shakespeare TWP - Geology Ontario
422
itL MAR 2 2 2007 GEOSCIENCE ASSESSMENT OFFICE 3449 4 Proposed Grinding System FOR THE SHAKESPEARE DEPOSIT BASED ON SMALL-SCALE DATA prepared for URSA MAJOR MINERALS INCORPORATED Project 10044-139 - Report 1 December 21, 2005 NOTE: This report refers to the samples as received. The practice of this Company in issuing reports of this nature is to require the recipient not to publish the report or any part thereof without the written consent of SGS Lakefield Research Limited. SGS Lakefield Research Limited P.O. Box 4300, 185 Concession Street, Lakefield, Ontario, Canada KOL 2H0 Tel: (705) 652-2000 Fax: (705) 652-6365 www.sgslakefield.comwww.ca.sgs.com Member of the SGS Group (SGS SA)
-
Upload
khangminh22 -
Category
Documents
-
view
0 -
download
0
Transcript of Benefication Studies RPT Shakespeare TWP - Geology Ontario

itL
MAR 2 2 2007
GEOSCIENCE ASSESSMENT OFFICE
3449 4 Proposed Grinding System
FOR THE SHAKESPEARE DEPOSIT BASED ON SMALL-SCALE DATA
prepared for
URSA MAJOR MINERALS INCORPORATED Project 10044-139 - Report 1
December 21, 2005
NOTE: This report refers to the samples as received.
The practice of this Company in issuing reports of this nature is to require the recipient not to publish the report or any part thereof without the written consent of SGS Lakefield Research Limited.
SGS Lakefield Research Limited P.O. Box 4300, 185 Concession Street, Lakefield, Ontario, Canada KOL 2H0 Tel: (705) 652-2000 Fax: (705) 652-6365 www.sgslakefield.comwww.ca.sgs.com
Member of the SGS Group (SGS SA)

430000E 1116248 1116249 11,6351'111.
1116Z'5èriil62S7 inigse^ 1116361 !
435000E
5135000N
5130000N
UTM Zone 17 6000m grid
6136000N
430000E
CL7883 5130000N "i
440000E
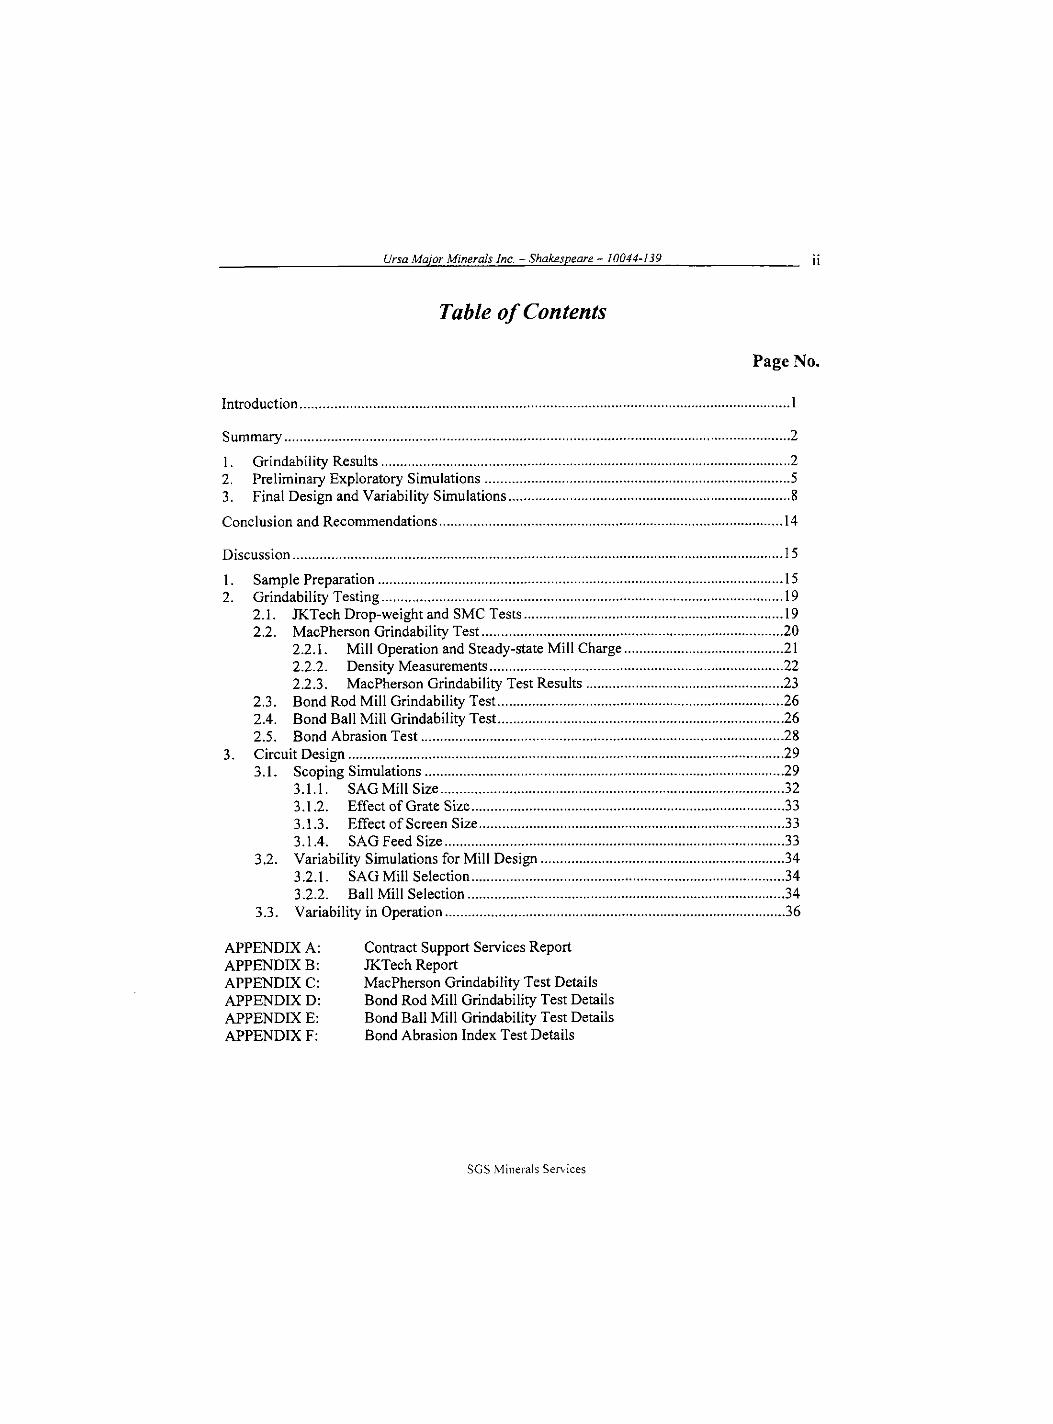
Ursa Major Minerals Inc. - Shakespeare - 10044-139 iii
Table of Contents
Page No.
Introduction 1
Summary 2
1. Grindability Results 2 2. Preliminary Exploratory Simulations 5 3. Final Design and Variability Simulations 8
Conclusion and Recommendations 14
Discussion 15
1. Sample Preparation 15 2. Grindability Testing 19
2.1. JKTech Drop-weight and SMC Tests 19 2.2. MacPherson Grindability Test 20
2.2.1. Mill Operation and Steady-state Mill Charge 21 2.2.2. Density Measurements 22 2.2.3. MacPherson Grindability Test Results 23
2.3. Bond Rod Mill Grindability Test 26 2.4. Bond Ball Mill Grindability Test 26 2.5. Bond Abrasion Test 28
3. Circuit Design 29 3.1. Scoping Simulations 29
3.1.1. SAG Mill Size 32 3.1.2. Effect of Grate Size 33 3.1.3. Effect of Screen Size 33 3.1.4. SAG Feed Size 33
3.2. Variability Simulations for Mill Design 34 3.2.1. SAG Mill Selection 34 3.2.2. Ball Mill Selection 34
3.3. Variability in Operation 36
APPENDIX A APPENDIX B APPENDIX C APPENDIX D APPENDIX E APPENDIX F
Contract Support Services Report JKTech Report MacPherson Grindability Test Details Bond Rod Mill Grindability Test Details Bond Ball Mill Grindability Test Details Bond Abrasion Index Test Details
SGS Minerals Sei-\'ices

Ursa Major Minerals Inc. - Shakespeare - 10044-139 iii
List of Tables Page No.
Table 1 : Grindability Test Summary 3 Table 2: Summary of Variability Simulations at Fixed Throughput and Grind 9 Table 3: Grinding Mill Design Summary 10 Table 4: Summary of Variability Simulations under Normal Operation 12 Table 5: Shake SAG-1 Composite 15 Table 6: List of Shakespeare Variability Metallurgical Lump Ore (SVMLO) 17 Table 7: List of Shakespeare Variability Metallurgical Drill Core (SVMDC) 18 Table 8: JKTech Drop-weight Tests Results 20 Table 9: Density Measurement 22 Table 10: MacPherson Grindability Test Summary 23 Table I I : Bond Rod Mill Work Index Test Summary 26 Table 12: Bond Ball Mill Work Index Test Summary 27 Table 13: Bond Abrasion Test Summary 28 Table 14: SAG Mill Simulation Summary 31 Table 15: Ball Mill Simulation Summary 32 Table 16: Variability Simulation Summary at Fixed Design Criteria - SAG Mill 35 Table 17: Variability Simulation Summary at Fixed Design Criteria - BM 36 Table 18: Variability Simulation Summary at Fixed BM Power - SAG Mill 37 Table 19: Variability Simulation Summary at Fixed BM Power - BM 38
SGS Minerals Sei-\'ices

Ursa Major Minerals Inc. - Shakespeare - 10044-139 iii
List of Figures Page No.
Figure 1: 'A x b' Cumulative Frequency Curve 4 Figure 2: BWI Cumulative Frequency Curve 4 Figure 3: Steady-state Mill Charge (Fraction -1" to +¥4") 5 Figure 4: SABC Flowsheet 6 Figure 5: Gross Power Requirement at 4.5 kt/d 7 Figure 6: Gross Power Requirement at 5 kt/d 7 Figure 7: Cumulative Distribution of Power at 4500 t/d and 80 p,m Pgo 10 Figure 8: Cumulative Frequency of Throughput and Grind under Normal Operation 11 Figure 9: Composite Sample Preparation Flowsheet 16 Figure 10: Variability Samples Preparation Flowsheet 16 Figure 11 : MacPherson Mill Throughput and Specific Energy Input 21 Figure 12: Mill Feed and Charge PSA's 22 Figure 13: MacPherson Autogenous Grindability Test Database 24 Figure 14: MacPherson Mill Throughput Database 24 Figure 15: MacPherson Mill Specific Energy Input Database 25 Figure 16: MacPherson Mill Product Database 25 Figure 17: Bond Rod Mill Grindability Test Database 26 Figure 18: Bond Ball Mill Grindability Test Database 27 Figure 19: Bond Abrasion Test Database 28 Figure 20: SAG Feed Particle Size Distributions 30
SGS Minerals Sei-\'ices

Ursa Major Minerals Inc. - Shakespeare - 10044-139 iii
Introduction
Mr. Richard Gowans of Micon International Limited (Micon), on behalf of Ursa Major Minerals
Incorporated, requested that SGS Minerals Services perform a grindability study on samples
from the Shakespeare deposit in Ontario,, Canada. One composite, representing the deposit, was
submitted to the full suite of grindability testing recommended for autogenous grinding circuit
design. The variability within the deposit was measured through SMC and Bond ball mill
grindability tests.
The data generated was used to design a grinding system, capable of milling 4500 t/d, based on
the criteria provided by Messieurs Gowans and Ian Ward of Micon. This report presents the
results of this study, which was performed in conjunction with Lakefield's metallurgical project
10616-003.
SGS Minerals Services
François-Olivier Verret, Project Metallurgist
André McKen, Group Leader - Comminution
Investigation by: François-Olivier Verret and André McKen Report Preparation by: François-Olivier Verret, André McKen and Su McKenzie
SGS Minerals Sei-\'ices

Ursa Major Minerals Inc. - Shakespeare - 10044-139 iii
Summary
One composite, identified as Shake SAG-1, and representing tiie Shakespeare mineral deposit
was prepared for the program and was submitted to a series of grindability tests, listed below:
> JKTech Drop-weight Test
> SAG Mill Comminution (SMC) Test
> MacPherson Grindability Test
> Bond Rod Mill Grindability Test
> Bond Ball Mill Grindability Test
In addition, nineteen variability samples were prepared and submitted for SMC and Bond ball
mill grindability tests. Two Bond abrasion index tests were also performed on composites
prepared from these samples. The results are summarised in Table 1 and discussed in Section 2.
The test details are appended.
1. Grindability Results
The Shakespeare composite was very hard with respect to the drop-weight test impact
(A X b = 22; percentile 97'*') and abrasion (ta = 0.23; percentile 92"' ) parameters. As a result, it
achieved a low throughput rate in the continuous MacPherson 18" mill (6.7 kg/h; percentile 81^')
and a substantial build-up of coarse pebbles could be observed in the steady-state mill charge, as
depicted in Figure 3. The ore was much softer at a finer size, as indicated by its Bond ball mill
work index of 13.8 kWh/t, which is medium-soft. As a result, the MacPherson mill product Pgo
was very fine, i.e. within the finest in our database, resulting in a relatively low correlated work
index of 15.0 kWh/t. Only 2% of the material in our database produced a finer grind.
The size-by-size hardness gradient, as measured in the drop-weight test, demonstrated that the
Shakespeare ore will remain very competent at a coarser size. Figure 6 in the Contract Support
Services' report (Appendix A), depicts a gradient of 4% at 0.25 kWh/t, which is lower than
typical. Typically, friable ores depict a high gradient (up to -40%) because the frequency of
cracks increases at a coarser size, while the gradient for very competent ores leans towards zero.
SGS Minerals Sei-\'ices

Ursa Major Minerals Inc. - Shakespeare - 10044-139 iii
Table 1: Grindability Test Summary
Sample Name Lithology Ore Density DWT Parameters MacPherson Test Work Indices (kWh/t) AI
(g/cm') A b A x b t . D W I (kg/h) (kWh/t) AWI R W I BWI (g) Shake S AG-1' SS 3.05 100 0.22 22.0 0.23 12.4* 6.7 12.4 15.0 16.3 13.8 -
Shake SAG-1 SS 3.02 100 0.23 23.0 - 11.7 - - - - - -
SVMLO-1 SS 3.10 84.3 0.34 28.7 - 9.5 - - - 17.2 14.5 -
SVMLO-2 SS 3.06 81.8 0.34 27.8 - 9.9 - - - 18.7 15.8 SVMLO-3 SS 3.01 60.6 0.42 25.5 - 10.5 - - - 15.7 13.3 SVMLO-4 SS 2.97 70.9 0.37 26.2 - 10.2 - - - 14.6 12.3 SVMLO-5 SS 3.00 80.8 0.28 22.6 - 11.7 - - - 17.6 14.9 SVMLO-6 SS 3.22 72.9 0.47 34.3 - 8.5 - - - 17.1 14.4 SVMLO-7 SS 3.00 50.9 0.60 30.5 - 8.8 - - - 16.4 13.8 SVMLO-8 SS 3.00 74.9 0.33 24.7 - 10.8 - - - 16.7 14.1 SVMDC-1 DissemS 3.01 66.5 0.37 24.6 - 11.0 - - - 17.1 14.5 SVMDC-2 Dissemi 2.99 66.6 0.37 24.6 - 10.8 - - - 15.5 13.1 SVMDC-3 Blebby 3.04 59.8 0.40 23.9 - 11.5 - - - 15.5 13.0 SVMDC-4 Dissemi 3.03 52.4 0.52 27.2 - 9.9 - - - 14.8 12.5 SVMDC-5 Blebby 3.02 74.7 0.32 23.9 - 11.2 - - - 15.1 12.7 SVMDC-6 Dissemi 3.03 76.1 0.28 21.3 - 12.9 - - - 15.4 13.0 SVMDC-7 Blebby 2.97 63.2 0.41 25.9 - 10.1 - - - 14.1 11.9 SVMDC-8 Dissemi 3.04 100 0.21 21.0 - 13.1 - - - 16.5 13.9 SVMDC-9 Blebby 3.03 82.4 0.28 23.1 - 11.8 - - - 14.5 12.2 SVMDC-10 Dissem2 3.00 100 0.20 20.0 - 13.6 - - - 15.9 13.4 SVMDC-11 DissemS 2.85 100 0.21 21.0 - 12.2 - - - 15.4 13.0
Disseminated^ 3 .02* 73.8* 0 .35* 23 .5* - 11.7* - - - - 13.1 * 0.217
Blebbv' 3 .02* 70.0* 0.35 * 24 .2* - 11.2* - - - - 12.5* 0.145 Average 3.02 77.1 0.34 24.9 0.23 11.1 6.7 12.4 15.0 16.0 13.5 S.D. 0.07 16.0 0.11 3.5 - 1.4 - - - - 1.0 Rel. S.D. 2.2 20.7 31.1 14.0 - 12.4 - - - - 7.4 Min 2.85 50.9 0.20 20.0 - 8.5 - - - - 11.9 lOrd Percentile 2.97 59.8 0.21 21.0 - 9.5 - - - - 12.3 25rd Percentile 3.00 66.5 0.28 22.6 - 10.1 - - - - 12.9 Median 3.02 74.9 0.34 24.6 - 11.0 - - - - 13.3 75th Percentile 3.04 84.3 0.40 26.2 - 11.8 - - - - 14.2 90th Percentile 3.06 100 0.47 28.7 - 12.9 - - - - 14.6 Max 3.22 100 0.60 34.3 - 13.6 - - - - 15.8 ' Drop-weight test results ' Composite from SVMDC-2, 4,6 and 8 ' Composite from SVMDC-3, 5, 7 and 9 • Calculated RWI in italics were estimatedfrom the ratio RWl/BWl measured on the composite Lithology Reference SS = Surface Sample Blebby = exhibit predominantly the blebby styles of po and cpy mineralization Dissemi = exhibit predominantly the disseminated style of po and cpy mineralization DissemS = represent the typical disseminated style of po and cpy mineralization in the Dissem2 = exhibit pred. the disseminated styles of po and cpy with only the occasional DissemS = exhibit pred. the diss, styles of po and cpy, the minor localized occurrences
upper part of the Shalcespeare project scattered blebs of po and cpy mineralization, of the blebby styles of po and cpy mineral.
The variability within the ore, as measured through the SMC (A x b) and Bond ball mill
grindability tests (BWI), was relatively small, with relative standard deviations of 14% and 7%,
respectively. The cumulative frequency distributions of the drop-weight index 'A x b' and ball
SGS Minerals Sei-\'ices

Ursa Major Minerals Inc. - Shakespeare - 10044-139 iii
mill work index for the Shakespeare samples are compared to our database, in Figure 1 and
Figure 2.
s u 3 S" u 4> >
' 1 ! U
0 25 50 75 100 125
A x b
150 175 200 225 250
Figure 1: ' A x b ' Cumulative Frequency Curve
w g 3
I
0 2 4 6 8 10 12 14 16 18 20 22 24 26 28 30
BWI (kWh/t)
Figure 2: BWI Cumulative Frequency Curve
SGS Minerals Sei-\'ices

Ursa Major Minerals Inc. - Shakespeare - 10044-139 iii
The 'A X b' distribution is quite narrow and lies on the very harder end of the overall database
distribution. The BWI's are also narrowly distributed around a median value of 13.3 kWh/t,
which is slightly softer than the overall median of 14.8 kWh/t.
Figure 3: Steady-state Mill Charge (Fraction -1" to +3/4")
2. Preliminary Exploratory Simulations
Based on the grindability results, an SABC circuit was selected. The simplified flowsheet is
presented in Figure 4. Pebble extraction and pebble crushing will be mandatory for such a
competent ore.
The circuit was initially designed to process 4500 to 5000 t/d (10% safety factor) at a final grind
of 80 microns. The base case design was performed for a feed Fgo of 150 mm, and with a
classification screen of Vi \ but additional simulations were performed with finer classifications
(1/4" and 6 mesh). A 26' x 9' EGL (Effective Grinding Length) SAG, operating with a 10-12%
ball charge, would be adequate for this circuit, but the overall power requirement would be fairly
high, in the range 20.9 to 23.6 kWh/t. (12.6 to 13.7 kWh/t for the SAG mill, which is very high.)
SGS Minerals Sei-\'ices

Ursa Major Minerals Inc. - Shakespeare - 10044-139 iii
It is often preferable to maximise the work performed in the crushers for such a competent ore,
as they are much more efficient at crushing hard rocks. Therefore, a second series of simulations
was performed with a feed size of 110 mm, which would require a more aggressive preparation
(blasting and crushing). The results were marginally better, with the overall power consumption
decreasing to 20.3-23.0 kWh/t. The SAG power requirement was still high, at 12.1 to
13.0 kWh/t.
Figure 4: SABC Flowsheet
A pre-crushed feed, with an Fgo of 60 mm, was also simulated in order to further increase the
contribution of the crushers to the comminution of the coarse/competent rocks. This made a
significant improvement in performance and the SAG mill ball charge decreased to 4-5%,
meaning it would have extra capacity, so the simulations were repeated with a smaller 24' x 7'
EGL SAG mill. With this mill, the SAG power requirement decreased to 7.6 to 8.1 kWh/t (at 8-
9% ball charge), with an overall requirement of 16.6 to 19.5 kWh/t. The details of the
simulations are discussed in Section 3.
SGS Minerals Sei-\'ices

Ursa Major Minerals Inc. - Shakespeare - 10044-139 iii
6 8 10
Screen Size (mm)
12
— - SAG, F80 ^ = 150
- -o- -BM, F80 = 150
-O ' aH F80 = = 150
— - SAG, F80 = = 110
- - BM, F80 = 110
-O 'aH F80 = = 110
— - SAG, F80 = = 60
- .c. -BM,F80 = 60 1
-O'all, F80 = = 60 Î
14
F i g u r e 5: G r o s s P o w e r R e q u i r e m e n t a t 4 .5 k t /d
25
20
1 u
S" Pi t I PM o h o
.«rr. 10 » » « •
5
6 8 10
Screen Size (mm)
12
— - SAG,F80= 150
; - -o- - BM, F80 = 150
O'all, F80= 150
— - SAG, F80= 110
i - -o- - BM, F80= 110
— O ' a l l , F80= 110
: —»- - SAG, F80 = 60
: - -a- . BM, F80 = 60
— ^ 0 ' a ] ] , F 8 0 = 60
14
F i g u r e 6 : G r o s s P o w e r R e q u i r e m e n t a t 5 k t /d
SGS Minerals Sei-\'ices

Ursa Major Minerals Inc. - Shakespeare - 10044-139 iii
The effect of the various parameters on the circuit power requirements are compared in Figure 5
and Figure 6. The graphs clearly show the positive effect of both feed size and classification size
on the circuit performance. The finer feed will decrease the SAG power requirement, while the
finer classification will mainly affect the ball mill power requirement. In both cases, the overall
power would decrease accordingly.
3. Final Design and Variability Simulations
The results of the preliminary simulations were reviewed by Micon's personnel, who provided
the following instructions/guidelines for the final design.
1. It was decided that the pre-crush option would be rejected
2. A fine screen could be tolerated
3. The 10% safety factor was to be removed from the design, due to limitation in site power availability
4. The SAG mill should be designed to operate at ~15% ball charge maximum for the hardest ores
Based on this, the simulations were repeated at 4500 t/d and a final grind of 80 microns. This
was done for the composite sample and all the variability samples. The mill size was revisited
based on the higher SAG ball charge and the exclusion of the safety factor. The revised SAG
mill is a 24' X 9 EGL. The results are summarised in Table 2 and the details are presented in
Table 16 and Table 17 of the Discussion, in Section 3.2. The frequency distributions of power
for the SAG, ball mill and overall circuit are presented in Figure 7, based on a fixed throughput
rate (4500 t/d) and grind (80 microns). The average and median power requirement for the ball
mill is about 1900 kW, which was used for the final design which is presented in Table 3. The
SAG mill is a 24' x 9' EGL, with internal dimensions 7.11 x 2.74 m. The mill shell was
designed to operate up to 15% ball charge. A 3400 HP motor is recommended. The ball mill is
a 15' X 22' with internal dimension 4.42 x 6.55 m. The ball mill was designed based on a 35%
ball charge but the 3000 HP motor will have sufficient capacity to increase this to 40%, if the
mill geometry permits. The final design should be confirmed with the supplier.
SGS Minerals Sei-\'ices

Ursa Major Minerals Inc. - Shakespeare - 10044-139
Table 2: Summary of Variability Simulations at Fixed Throughput and Grind Simulations Feed SAG Mill Circuit Ball Mill Circuit Overall
JKFile „ ^ Nam.
Ore S.G.
(e/cm') JK Drop-
weight
Small-Scale Work Inilices
(kWh/t)
Feed Rate at
Utilisation
Ball Charge
Mill Speed
Class. Slots Size
Recycle T|o Gross Power Requirement
Gross Power Requirement P »
Total Gross Power
Gross Power Re, .
File Feed A l b la RWI BWI trti t/d % Vol •/« of mm t/h % (Un kW kWh/t kW kWh/t )im kW kWh/t kWh/t 31 SIM-31 SAG-1 3.05 22.0 0.23 16.3 13.8 204 4500 73 36 974 2447 12.0 1948 9.6 80 4395 21.6 19.0 32 SIM-32 33 SIM-33 34 SIM-34 35 SIM-35 36 SIM-36 37 SIM-37 38 SIM-38 39 SIM-39
SVMLO-1 SVMLO-2 SVMLO-3 SVMLO-4 SVMLO-5 SVMLO-6 SVMLO-7 SVMLO-8
3.10 3.06 3.01 2.97 3.00 3.22 3.00 3.00
28.7 0.29 27.8 0.28 25.5 0,25 26.2 0 .26 22.6 0.23 34.3 0.34 30.5 0.31 24.7 0.25
17.2 18.7 15,7 146 17.6 17.1 16.4 16.7
14.5 15.8 13.3 12.3 14.9 14.4 13.8 14.1
204 204 204 204 204 204 204 204
4500 4500 4500 4500 4500 4500 4500 4500
10 10 12 11
14 9 10 12
68 69 71 70 73 63 67 71
33 34 35 34 36 31 33 35
708 740 926 849 977 605 801 893
2198 2231 2320 2267 2412 2156 2167 2324
10.8 10,9 11,4 1 1 . 1
11.8 1 0 , 6
10 ,6
11,4
1921 2130 1922 1735 2138 1849 1936 2005
9,4 10,5 9.4 8.5 10.5 9,1 9 5 9.8
4119 4361 4242 4002 4550 4005 4103 4329
20.2
21.4 20.8 19.6 22.3 19.7 20.1 2 1 . 2
17.8 18.8 18.3 17,3 19.6 17.3 17.7 18.7
40 41 42 43 44 45 46 47 48 49 50
SIM-40 SIM-41 SIM-42 SIM-43 SIM^4 SIM-45 SIM^6 SIM-47 SIM-48 SIM-49 SIM-50
SVMDC-1 SVMDC-2 SVMDC-3 SVMDC-4 SVMDC-5 SVMDC-6 SVMDC-7 SVMDC-8 SVMDC-9 SVMDC-10 SVMDC-11
3.01 2.99 3.04 3.03 3.02 3.03 2.97 3.04 3.03 3.00 2.85
24.6 0.25 24.6 0.25 23.9 0.24 27.2 0.27 23.9 0.24 21.3 0.21 25.9 0.26 2 1 , 0 0 , 2 1
23,1 0.23 20.0 0.20
21.0 0.21
17.1 15,5 15.5 14.8 15.1 15.4 14.1 16.5 14,5 15.9 15,4
14.5 13.1 13.0 12.5 12.7 13.0 11.9 13 9 12.2 13.4 13.0
204 204 204 204 204 199 204 198 204 188 195
4500 4500 4500 4500 4500 4394 4500 4372 4500 4151 4306
12 12 13 11 13 15 12
15 13 15 15
72 72 73 70 72 72 70 71 73 68 68
35 35 36 34 35 36 34 36 36 36 35
923 921 980 879 934 1070 888 1038 961 1035 1017
2326 2322 2364 2243 2359 2511 2279 2513 2405 2506 2479
11.4 11.4 11.6 11.0 11.6 1 2 , 6
11.2 12 7 11,8
13,3 12,7
2078 1881 1916 1783 1829 1885 1700 1953 1755 1776 1786
10.2 9.2 9 4 8.7 9.0 9.5 8.3 9.9 8.6 9.4 9 2
4404 4203 4280 4026 4188 4396 3979 4466 4160 4282 4265
21.6 20.6
21 0 19.8 20.5 2 2 , 1
19 5 22.6 20,4 2 2 , 8
21.9
19.0 18.1 18.5 17.4 1 8 . 1
19.4 17.2 19.8 17.9 20.0 19.2
AveraRe 3.02 24.9 0.25 16.0 13,5 202 4461 70 35 906 2341 11,6 4238 21,0 18.4 Minimum 10th Percentile 25th Percentile Median 75th Percentile 90th Percentile Maximum
2.85 2.97 3.00 3.02 3.04 3.06 3.22
34.3 0.34 28.8 0.29 26.5 0.26 24.6 0,25 22.5 0.23 21.0 0.21 20,0 0.20
14.1 14.6 15,3 15,8 16.8
17.2 18.7
11.9 12.3 12.9 13.3 14.2 14.6 15.8
188 198 204 204 204 204 204
4151 4365 4500 4500 4500 4500 4500
9 10 11
12 14 15 15
63 68 69 71 72 73 73
31 33 34 35 36 36 36
605 737 872 925 978 1035 1070
2156 2195 2261 2325 2421 2507 2513
106 1 0 , 8
11 , 1
11.4 11.9 12.7 13.3
1700 1753 1785 1900 1949 2084 2138
8.3 86 9,0 9.4 9.6 10.2 10,5
3979 4005 4115 4254 4370 4411 4550
19.5 19.6 20,2 20,9 21.7 22.3 22.8
17.2 17.3 17.7 18.4 19,1 19,6 20.0
SG.S Minevals Services

Ursa Major Minerals Inc. - Shakespeare - 10044-139 iii
1500 2000 2500 3000 3500 4000 4500 5000
Gross Power Requirement (kW)
Figure 7: Cumulative Distribution of Power at 4500 t/d and 80 |a,m Pgo
Table 3: Grinding Mill Design Summary
Mill Dimensions SAG Mill Bail Mill Number in Parallel 1 1 Nominal Dimension 24 'x 10' 15 ' x 2 2 ' Inside Liner Dimension (metre) 7.11 x2 .74 4.42 x6.55 Mill Speed (RPM) % of Critical Speed (%) Cone Angle (degree)
12.0 77 15
14.8 75 0
Grinding Steel Diameter Recommended (inch) 5 2 Design Ball Charge (%Vol.) Maximum Ball Charge (%)
9-13 15
35 40
Motor Design Power (kW) 2390 1900 Installed Power (kW) 2511 2238 Installed Power (HP) 3400 3000
Classification
Type 1/4" Vibrating
Screen Hydrocyclones
SGS Minerals Sei-\'ices

Ursa Major Minerals Inc. - Shakespeare - 10044-139 iii
The previous simulations were performed at a fixed throughput rate and grind in order to
generate the range of power requirement for the mill selection. In reality, SAG mill performance
will vary with ore hardness, and, unless variable frequency drives are installed on both mills, the
throughput to the plant will naturally swing on a daily basis, resulting in associated variations in
final grind. The last series of simulations projects the variation in throughput and grind for the
Shakespeare ore. The circuit was simulated with an average operating ball charge of 13% and a
target speed of 77% critical to the SAG. For each sample, the throughput was allowed to vary
with ore hardness and the final grind was established. An arbitrary coarser limit of 87 microns
was selected, at which point the circuit was considered ball mill-limited and the throughput rate
was restrained. For the very hard samples, the mill speed was allowed to increase to 78%. This
capability would require a variable speed motor. The simulations are discussed in Section 3.3 of
the Discussion, and a summary is presented in Table 4. The cumulative frequency distributions
of throughput and grind are depicted in Figure 8.
60
Final Grind at 1900 kW of Bail Mill Power (Microns) 65 70 75 80 85 90
4000 4250 4500 4750 5000 5250
Throughput Rate at 92% Utilisation (t/d)
5500
Figure 8: Cumulative Frequency of Throughput and Grind under Normal Operation
SGS Minerals Sei-\'ices

Ursa Major Minerals Inc. - Shakespeare - 10044-139 12
Table 4: Summary of Variability Simulations under Normal Operation Simulations Feed SAG Mill Circuit Ball Mill Circuit Overall
JKFile „ _ N . m .
Ore S.G.
(g/cn.')
JK Drop-weight
Stnall-Scale Work Indices
(kWh/1)
Feed Rate at 92%
Utilisation
Ball Charge
Mill Speed
Oass. Slots Size
Recycle T „ Gross Power Requirement
Gross Power Requirement
Total Gross Power
Gross Power Req.
Wio
File Feed A l b ta RWI BWI t/h t/d % Vol % o f mm l/h v . (tm kW kWh/t kW kWh/t Hm kW kWh/t kWh/t 51 SIM-51 SAG-1 3.05 22.0 0.23 16.3 13.8 200 4416 13 77 63 73 37 947 2404 12.0 1900 9.5 80 4304 21.5 18.9 52 SIM-52 SVMLO-1 3.10 28.7 0.29 17.2 14.5 204 4504 13 73 6,3 62 30 712 2265 11.1 1900 9.3 81 4165 20.4 18.1 53 SIM-53 SVMLO-2 3 06 27.8 0.28 18.7 15.8 198 4372 13 73 6.3 61 31 719 2258 11.4 1900 9.6 87 4158 21.0 19.3 54 SIM-54 SVMLO-3 3,01 25.5 0.25 15.7 13.3 204 4504 13 76 6.3 69 34 928 2345 11.5 1900 9.3 81 4245 20.8 18.4 55 SIM-55 SVMLO-4 2.97 26.2 026 14.6 12.3 218 4813 13 76 6.3 73 33 919 2350 10.8 1900 8.7 80 4250 19.5 17,1 56 SIM-56 SVMLO-5 3.00 22.6 0.23 17.6 14.9 197 4350 13 77 6.3 70 36 934 2370 12.0 1900 9.6 87 4270 21.7 19.9 57 SIM-57 SVMLO-6 3.22 34.3 0.34 17.1 14.4 208 4593 13 71 6 3 58 28 638 2206 10.6 1900 9.1 80 4106 19.7 17.4 58 SIM-58 SVMLO-7 3.00 30.5 0.31 16.4 13.8 204 4504 13 72 6.3 60 29 802 2218 10.9 1900 9 3 82 4118 20.2 18 0 59 SIM-59 SVMLO-8 3.00 24.7 0.25 16.7 14.1 204 4504 13 76 6.3 69 34 895 2346 11.5 1900 9 3 85 4246 20.8 18.9 60 SIM-60 SVMDC-1 3.01 24.6 0.25 17.1 14.5 201 4438 13 76 6 3 68 34 911 2341 11.6 1900 9.5 87 4241 21.1 19.4 61 SIM-61 SVMDC-2 299 24.6 0.25 15.5 13 1 214 4725 13 77 6 3 74 35 974 2378 111 1900 8.9 85 4278 20.0 18 1 62 SIM-62 SVMDC-3 3.04 23.9 0.24 15.5 13.0 208 4593 13 77 6.3 74 36 1002 2389 11.5 1900 9.1 83 4289 20.6 18.5 63 SIM-63 SVMDC-4 3.03 27.2 0.27 14.8 12.5 215 4747 13 75 6 3 70 33 927 2321 10.8 1900 8.8 80 4221 19.6 17.3 64 SIM-64 SVMDC-5 3.02 23.9 0.24 15.1 12.7 208 4593 13 77 6.3 72 35 957 2384 11.5 1900 9 1 79 4284 20.6 18.0 65 SIM-65 SVMDC-6 3.03 21.3 0.21 15.4 13.0 194 4284 13 78 6 3 74 38 1028 2421 12.5 1900 9.8 75 4321 22.3 18.9 66 SIM-66 SVMDC-7 2.97 25.9 0.26 14.1 11.9 224 4946 13 77 6.3 76 34 983 2374 10.6 1900 8.5 80 4274 19.1 168 67 SIM-67 SVMDC-8 3.04 21.0 0.21 16.5 13.9 193 4261 13 78 6.3 73 38 994 2423 12.6 1900 9.8 79 4323 22.4 19.6 68 SIM-68 SVMDC-9 3.03 23.1 0.23 14.5 12.2 202 4460 13 77 6.3 72 36 946 2387 11.8 1900 9.4 71 4287 21.2 17.5 69 SIM-69 SVMDC-10 3.00 20.0 0.20 15.9 13.4 185 4085 13 78 6.3 71 38 998 2414 13.0 1900 10.3 71 4314 23.3 19.3 70 SIM-70 SVMDC-U 2.85 21.0 0.21 15.4 13.0 191 4217 13 78 6.3 70 37 976 2383 12.5 1900 9 9 71 4283 22.4 18.5 Average 3.02 24.9 0.25 16.0 13.5 204 4495 . 76 . 69 34 910 2349 11.6 - 9.4 80 4249 20.9 18.4 Minimum 2.85 34.3 0.34 14.1 11.9 185 4085 71 - 58 28 638 2206 10.6 8.5 71 4106 19.1 168 10th Percentile 2.97 28 8 0.29 14.6 12.3 193 4257 - 73 - 61 30 718 2254 10.8 8.8 71 4154 19.6 17.2 25th Percentile 3.00 26.5 0.26 15.3 12.9 198 4366 - 76 69 33 907 2336 11.0 9.1 79 4236 20.1 17.9 Median 3.02 24.6 0.25 15.8 13.3 204 4504 - 77 - 71 34 940 2372 11.5 - 9.3 80 4272 20.8 18.4 75th Percentile 3.04 22.5 0.23 16 8 14.2 208 4593 77 - 73 36 978 2388 12.0 - 9.6 84 4288 21.6 190 90th Percentile 3.06 21.0 0.21 17.2 14,6 215 4754 - 78 - 74 38 998 2415 12.5 - 9.9 87 4315 22.4 19.4 Maximum 3.22 20.0 0.20 18.7 15.8 224 4946 - 78 - 76 38 1028 2423 13.0 - 10.3 87 4323 23.3 19.9
SGS Minerals Services

Ursa Major Minerals Inc. - Shakespeare - 10044-139 iii
These conditions would allow producing 4500 t/d at 80 microns, on average. The throughput
would swing between 4100 and 4950 t/d, producing final grinds in the range 71 to 87 microns.
The circuit would be SAG mill limited -20% of the time, and ball mill limited -15% of the time
(based on the 87 microns upper limit). The rest of time, this circuit should be well-balanced.
SGS Minerals Sei-\'ices

Ursa Major Minerals Inc. - Shakespeare - 10044-139 iii
Conclusion and Recommendations
The Shakespeare ore is extremely competent and will be SAG mill unfriendly. The A x b values
performed on twenty samples were all very low, most of them falling within the 10% hardest
material in the JKTech database. The ore was medium in terms of ball mill grindability. As a
result, the ore achieved a low throughput rate in the continuous MacPherson autogenous mill,
and produced a very fine grind. A coarse build-up of pebbles was observed in the mill charge.
Such a hard ore will require extra crusher power to handle the competent rocks, in the form of
pre-crushing and/or pebble crushing. A fine classification is also recommended to maintain a
proper level of fines in the autogenous mill, and take advantage of its ability to deliver a fine
product. An SABC configuration with a 1/4" classification was selected. The screen deck
should be designed to handle a finer separation and a recycle up to 50%.
Because of the limited power available at the site, we recommend that pre-crushing be re-
evaluated as it would likely result in significant reduction in overall power requirement. A
combination of coarse feed and high ball charge may be very inefficient on such a competent
ore. The costs of pre-crushing should be compared against the associated power savings.
We also recommend that a high-pressure grinding roll approach be considered, as this would
require significantly less energy per ton. The energy savings can be evaluated at small-scale,
which would require about one drum of sample for a series of tests, at various pressure and
moisture contents.
Based on the extreme competency of the ore, as measured by the drop-weight test (percentile
it would be desirable and prudent to proceed with a proper pilot plant confirmation, unless
a large safety factor is applied to the proposed design.
SGS Minerals Sei-\'ices

Ursa Major Minerals Inc. - Shakespeare - 10044-139 iii
Discussion
The grindability study was performed on one composite sample, identified as Shalce SAG-1, and
nineteen variability samples divided into two groups (SVMLO and SVMDC).
1. Sample Preparation
The Shalce SAG-1 sample was received on August 24, 2005 in a shipment of twenty bags, and
given our receipt number LR2502116. Table 5 lists an inventory of the samples, which were
prepared as shown in Figure 9. Forty-three bags of samples were received for the variability
program on August 26, 2005 and given our receipt number LR2502160. A description of the
variability samples is listed in Table 6 and Table 7 and Figure 7 presents the sample preparation
flowsheet.
Table 5: Shake SAG-1 Composite
Sample Bags Location Weight
Marked Collection Site (kg) Ic SVMLO-1 20 Ic SVMLO-1 20 Ic SVMLO-1 22 Ic SVMLO-1 19 2c SVMLO-2 22 2c SVMLO-2 22 2c SVMLO-2 19 2c SVMLO-2 16 3c SVMLO-3 18 3c SVMLO-3 22 3c SVMLO-3 21 3c SVMLO-3 23 4c SVMLO-4 20 4c SVMLO-4 22 4c SVMLO-4 17 4c SVMLO-4 17 5c SVMLO-5 19 5c SVMLO-5 20 5c SVMLO-5 17 5c SVMLO-5 13
20 Bags 389
SGS Minerals Sei-\'ices

Ursa Major Minerals Inc. - Shakespeare - 10044-139 iii
Store as SMC
_R£ieçt_
Shake SAG-1 (389 kg)
Store remainder
Screen at
-22 +19 mm
20 kg
SMC
• Stage-crush to
to 2-1/2"
cone ana quarter
245 kg
Stage-crush to
1 lO
- 1/4"
1 r
Stage-crush to to
1/2"
Stage-crush to to
6-mesh
75 kg
200 kg
IS kg
10kg
DWT
18 " Mill
RWI @ 14 mesh
BWI @ 150 mesh
Figure 9: Composite Sample Preparation Flowsheet
19 variability samples (40 to 60 kg)
Store as remainder Unused - 1 1/4"
2kg charges for Ai
Stage-crush to to
1 - 1/4"
»-one ana viuarier
10 kg
Stage-crush to to
6-mesh
BWI ISO mesh
20 kg Screen at
-22 +19 mm SMC
Store as SMC Reject
Figure 10: Variability Samples Preparation Flowsheet
SGS Minerals Sei-\'ices

Ursa Major Minerals Inc. - Shakespeare - 10044-139 iii
Table 6: List of Shakespeare Variability Metallurgical Lump Ore (SVMLO)
Sample Drill Hole From To Identification Number M's / UTM's N M's /UTM's E Weight (kg)
SVMLO-1 Surface Sample -6" Lump Ore
5133221 0435888 50
SVMLO-2 Surface Sample -6" Lump Ore
5133275 0435882 50
SVMLO-3 Surface Sample -6" Lump Ore
5133282 0435976 50
SVMLO-4 Surface Sample 6" Lump Ore
5133326 0436041 50
SVMLO-5 Surface Sample -6" Lump Ore
5133428 0436241 50
•SVMLO-6 Surface Sample -6" Lump Ore
5233221 0435888 50
•SVMLO-7 Surface Sample -6" Lump Ore
5133377 0436109 50
•SVMLO-8 Surface Sample -6" Lump Ore
5133600 0436538 50
Total: 400 * Supplementary Shakespeare surface -6" lump ore sample to be collected for variability
testing work only.
SGS Minerals Sei-\'ices

Ursa Major Minerals Inc. - Shakespeare - 10044-139 iii
Table 7: List of Shakespeare Variability Metallurgical Drill Core (SVMDC)
Sample Drill Hole From To Interval Weight based on Identification Number M's / UTM's N M's / UTM's E Distance 1.2 kg's per Linear
Meter of Drill Core SVMDC-1 U-03-66 1.18 11.04 9.86 49
9.86 49 SVMDC-2 U-03-66 11.04 20.9 9.86 49
9.86 49 SVMDC-3 U-03-69 33.8 68 34.2 41
U-03-70 4.75 11.17 6.42 8 U-03-71 25.7 34.7 9 11
49.62 60 SVMDC-4 U-03-69 68 102.2 34.2 41
U-03-70 11.17 17.6 6.43 8 U-03-71 34.7 43.7 9 11
49.63 60 SVMDC-5 U-03-74 90.5 103.65 13.15 16
U-03-75 89.4 117.5 28.1 34 U-03-76 180.2 185.35 5.15 6
46.4 56 SVMDC-6 U-03-74 103.65 116.8 13.15 16
U-03-75 117.5 145.6 28.1 34 U-03-76 185.35 190.5 5.15 6
46.4 56 SVMDC-7 U-03-82 90 127.1 37.1 45
U-03-79 62.2 68.55 6.35 8 43.45 52
SVMDC-8 U-03-82 127.1 164.2 37.1 45 U-03-79 68.55 74.9 6.35 8
43.45 52 SVMDC-9 U-03-83 49.5 90.3 40.8 49
40.8 49 ••SVMDC-10 U-03-36 76.46 78.46 2 2
U-03-36 81.3 82.3 1 1 U-03-36 85.25 88.25 3 4 U-03-36 89.25 92.25 3 4 U-03-36 93.25 97.25 4 5 U-03-40 49.69 77.55 27.86 33
40.86 49 ••SVMDC-11 U-03-29 137.94 145.58 7.64 9
U-03-33 226.25 242.3 16.05 19 U-03-52 207 221 14 17
37.69 45 Total: 418.02 577
** Supplementary Shakespeare Project diamond drill core samples collected for variability testing work only.
SGS Minerals Sei-\'ices

Ursa Major Minerals Inc. - Shakespeare - 10044-139 iii
2. Grindability Testing
The grindability testing was performed on one composite and nineteen variability samples
selected within the deposit. The composite was submitted to the full suite of grindability tests,
including the JKTech drop-weight test, the SAG mill comminution (SMC) test, the MacPherson
grindability test, as well as the Bond ball mill and rod mill grindability tests. Variability within
the ore was tested through the SMC and Bond ball mill grindability tests. Two Bond abrasion
tests were also performed on composites made from the variability samples and representing the
Blebby and Disseminated styles of pyrrhotite and chalcopyrite mineralization.
2.1. JKTech Drop-weight and SMC Tests
A JKTech drop-weight test was performed on the Shake SAG-1 composite sample. The results
were interpreted by Contract Support Services (CSS), the North American agent for JKTech.
The drop-weight test procedure and details are presented in the CSS report (Appendix A).
The SAG Mill Comminution (SMC) test is an abbreviated version of the standard JKTech drop-
weigh, performed on small rocks in a single size fraction (19-22 mm), and was performed on the
nineteen variability samples. The SMC test must be calibrated against the standard JKTech
drop-weight test in order to take into consideration the natural gradient of hardness by size,
which widely varies from one ore to another. The SMC test procedure, calibration and details
are discussed in the JKTech report in Appendix B. The results of the SMC tests were calibrated
against the drop-weight test results obtained on Composite Shake SAG-1
The results from both tests are summarised in Table 8. In general, the Shakespeare samples were
very hard with respect to resistance to impact breakage (A x b). In terms of abrasion resistance
(which is only measured through the drop-weight test) the composite sample Shake SAG-1 fell
in the very hard range.
Figure 6 in the CSS report presents the effect of energy input and particle size on the 'tio'. Tio
represents 'breakage' as the percent of the fragments that passes I/IO'^ of the original rock size
after impact. A greater tio represents a lower resistance to impact breakage, thus a softer ore.
Typical ores show a gradient of tio increasing with coarser size, which can be explained by a
SGS Minerals Sei-\'ices

Ursa Major Minerals Inc. - Shakespeare - 10044-139 iii
greater frequency of 'cracks' as the rock size increases. The Shakespeare ore showed little
gradient by size, indicating that this ore maintained a high competency at a coarse size. The
competency of the ore, at a coarse size, is not measured with the SMC test, which is why the test
must be calibrated.
Table 8: JKTech Drop-weight Tests Results
Sample Name Lithology A b A X b Percentile of t. Percentile of Drop-weight Ore Density
Hardness Hardness Index Cg/cm') Shake SAG-1 100.0 0.22 22.0 97 0.23 92 - 3.05 Shake SAG-1 SS 100.0 0.23 23.0 97 - 11.7 3.02 SVMLO-1 ss 84.3 0.34 28.7 90 - 9.5 3.10 SVMLO-2 SS 81.8 0.34 27.8 91 - 9.9 3.06 SVMLO-3 ss 60.6 0.42 25.5 95 - 10.5 3.01 SVMLO-4 ss 70.9 0.37 26.2 93 - 10.2 2.97 SVMLO-5 ss 80.8 0.28 22.6 97 - 11.7 3.00 SVMLO-6 ss 72.9 0.47 34.3 78 - 85 3.22 SVMLO-7 ss 50.9 0.60 30.5 87 - 8.8 3.00 SVMLO-8 ss 74.9 0.33 24.7 95 - 10.8 3.00 SVMDC-1 DissemS 66.5 0.37 24.6 95 11.0 3.01 SVMDC-2 Dissemi 66.6 0.37 24.6 95 - 10.8 2.99 SVMDC-3 Blebby 59.8 0.40 23.9 96 - 11.5 3.04 SVMDC-4 Dissemi 52.4 0.52 27.2 92 - 9.9 3.03 SVMDC-5 Blebby 74.7 0.32 23.9 96 - 11.2 3.02 SVMDC-6 Dissemi 76.1 0.28 21.3 98 - 12.9 3.03 SVMDC-7 Blebby 63.2 0.41 25.9 94 - 10.1 2.97 SVMDC-8 Dissemi 100.0 0.21 21.0 98 - 13.1 3.04 SVMDC-9 Blebby 82.4 0.28 23.1 97 - 11.8 3.03 SVMDC-IO Dissem2 100.0 0.20 20.0 98 - 13.6 3.00 SVMDC-II DissemS 100.0 0.21 21.0 98 _ 12.2 2.85 SMC Tests in italics
2.2. MacPherson Grindability Test
The Macpherson autogenous grindability test is a continuous test performed in an 18" semi-
autogenous mill, operated with an 8% steel charge. The mill charge level is maintained at about
25% volume by means of a sound-controlled system. The test is operated continuously as a
small pilot plant for a minimum of six hours and until steady-state is achieved. Then, the circuit
is sampled for one hour, in which the flow rates are measured, and all streams are sampled and
submitted to a particle size analysis (PSA). At test completion, the steady-state mill charge is
SGS Minerals Sei-\'ices

Ursa Major Minerals Inc. - Shakespeare - 10044-139 iii
dumped and submitted to PSA and specific gravity (S.G.) determinations in order to assess any
coarse size build-up or a mineral concentration in the charge. Photos of the sized fractions are
taken for reference. The test results are summarised in Table 10, and the details are appended
(Appendix C), along with a description of the test procedure, methodology and pictures of the
mill feed and steady-state charge. The test results are discussed in the following sub-sections.
2.2.1. Mill Operation and Steady-state Mill Charge
Variations in MacPherson mill throughput and specific energy input over time are presented in
Figure 11. The throughput rate remained low for the entire test duration, and displayed a slight
decrease over time, which was caused by a build-up of coarse pebble, as depicted in Figure 12
which compares the MacPherson mill feed and charge PSA's. Photos of the mill charge as
presented in Figure 3 and in Appendix C confirmed the presence of hard rounded pebbles in the
coarser size fractions.
• Throughput Rate — ^ Specific Energy Input
25
20
ec 15
« tc 10 "O 10
u 5
0 r
2 3 4 5
Time Duration (h)
25
20 o.
15
w ^ lOu ^
5
0
u E '3 s.
Figure 11: MacPherson Mill Throughput and Specific Energy Input
SGS Minerals Sei-\'ices

Ursa Major Minerals Inc. - Shakespeare - 10044-139 iii
•o
<u
40
35
30
25
20 15
10
5
0
PP Feed pp Charge
Size (microns)
Figure 12: Mill Feed and Charge PSA's
2.2.2. Density Measurements
Various density determinations were performed on the composite feed and on the MacPherson
steady-state mill charge, as follows. The results are presented in Table 9.
1. The feed density on the minus 1/4" was determined by gas pycnometer.
2. A gas pycnometer determination was also performed on a minus 1/4" sample of the mill charge.
3. A water displacement technique was used to measure the individual density of 18 coarse rocks from the mill charge, in the range 1/2" to 1-1/4".
4. The drop-weight densities were also measured by water displacement.
Table 9: Density Measurement
Sample Composite Shake SAG-1
Specific Gravity
Mill Charge+1" Mill Charge +3/4" Mill Charge +1/2" Mill Charge -1/4" ^ Feed +1" (DWT) Feed -1/4" *
3.01 3.01 2.94 3.07 3.05 3.15
* Gas Pycnometer in g/cm
SGS Minerals Sei-\'ices

Ursa Major Minerals Inc. - Shakespeare - 10044-139 23
There was a slight decrease in density between the mill feed and charge, which may be the result
of lighter minerals building up in the autogenous mill. There also seemed to be a slight increase
in the density of the minus 1/4" fraction, indicating a potential concentration of heavy minerals
in the fines or a reduction in rock porosity. In both cases the variation was small.
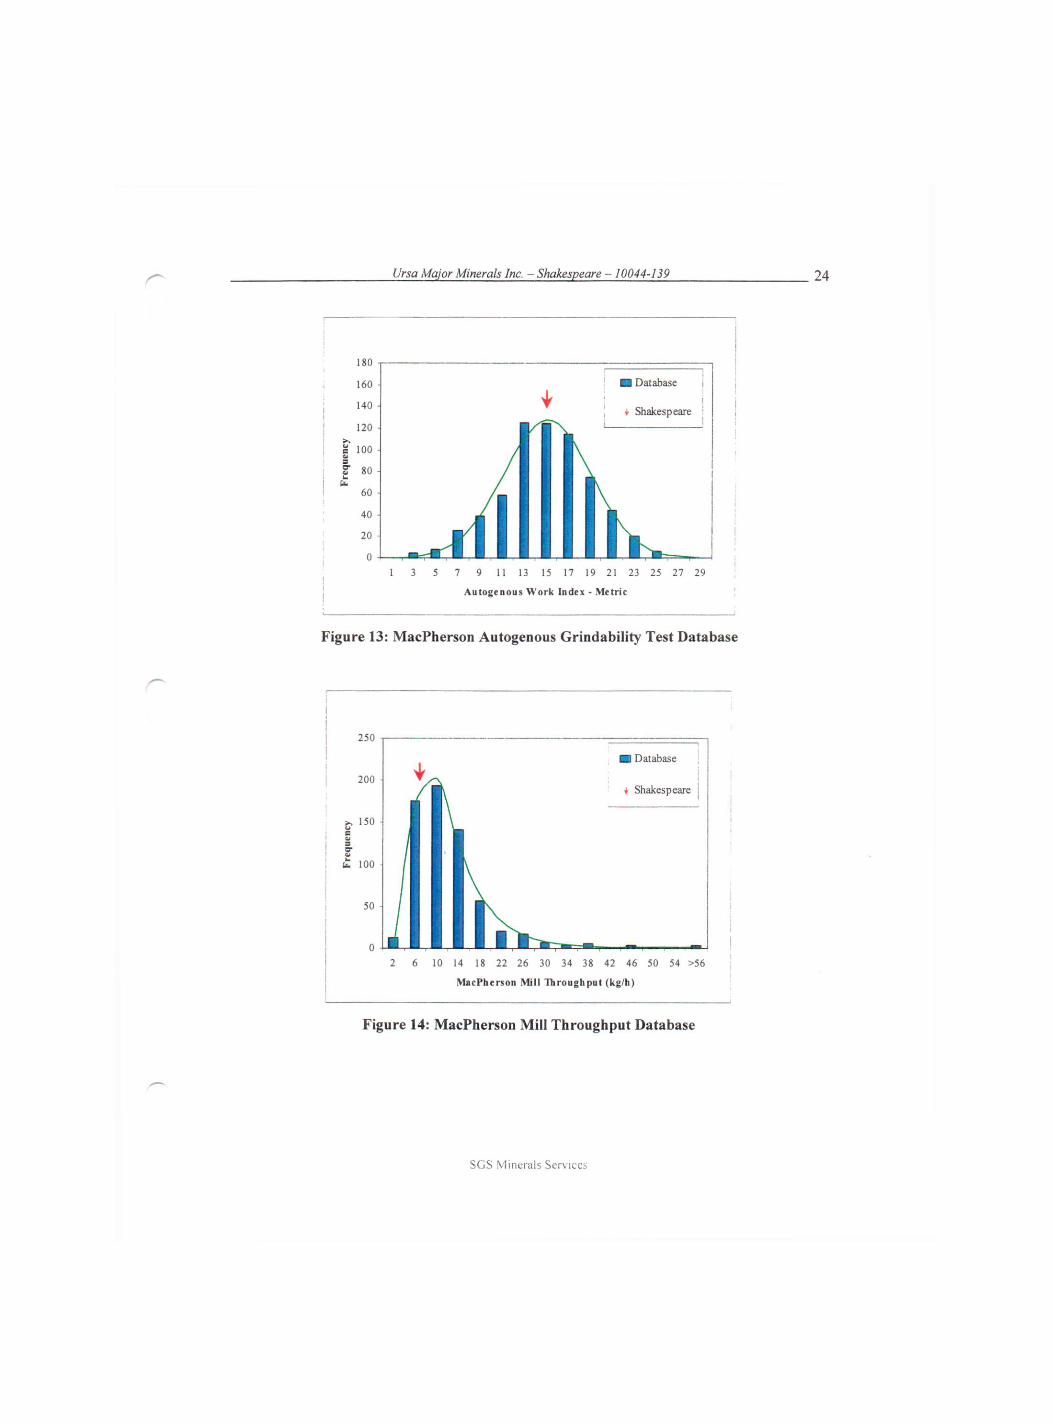
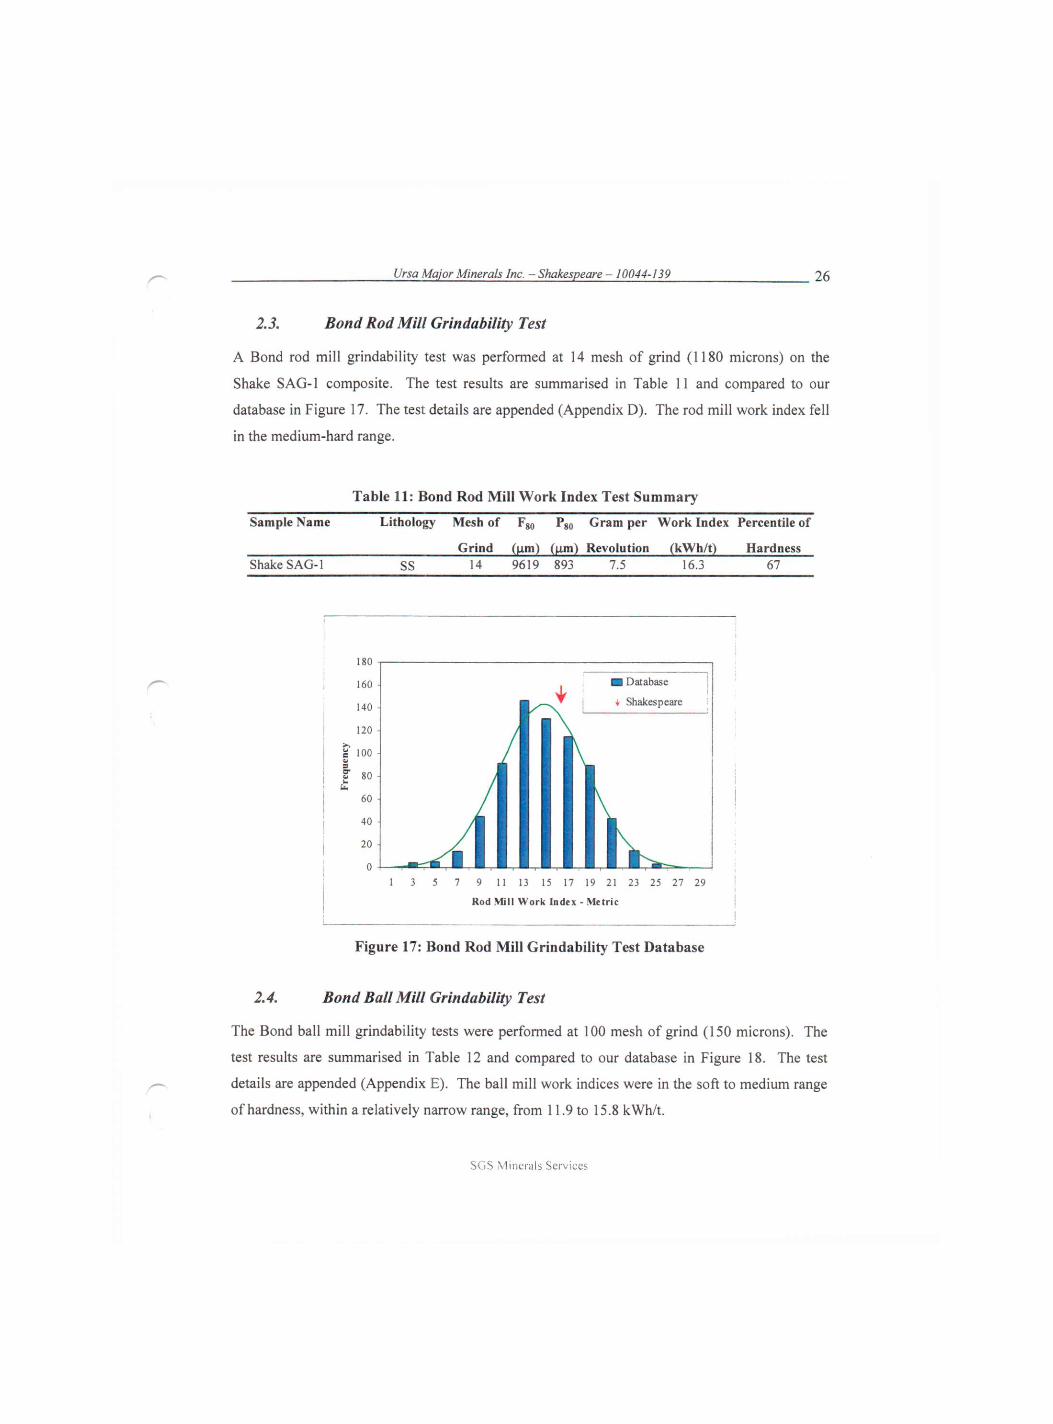
2.2.3. MacPherson Grindability Test Results
The MacPherson test results are summarised in Table 10. The MacPherson mill throughput rate
(hardness percentile 81^') and specific energy input (hardness percentile 80"') indicate a hard ore,
which is consistent with the drop-weight test results, but the test produced a very fine grind,
resulting in a relatively low correlated work index, in the medium range (percentile 51"). In fact,
only 2% of the ores tested in our database produced a finer grind. The MacPherson mill Pgo is
ore-dependent, and is indicative of the actual Pgo that can be obtained in industrial-scale mills,
although this is also clearly affected by the classification system. With a MacPherson mill
product Pgo of 174, the Shakespeare ore should produce a fine grind in a semi-autogenous milling
environment.
Table 10: MacPherson Grindability Test Summary
Sample Name Feed Percentile Fgo Pso Gross Work Correlated Percentile Gross Specific of Index Work Index of Energy Input
(kg/h) Hardness (um) (Hm) (kWh/t) (kWh/t) Hardness (kWh/t) Shake SAG-1 6.7 81 22225 174 18.0 15.0 51 12.4
The autogenous work index, MacPherson mill throughput, product size obtained, and specific
energy consumption are compared to our database in Figure 13 to Figure 16.
S(jS Xiiiicrals ^erv
Ursa Major Minerals Inc. - Shakespeare - 10044-139 iii
3 5 7 9 11 13 15 17 19 21 23 25 27 29
A u t o g e n o u s Work Index - Metric
Figure 13: MacPherson Autogenous Grindability Test Database
250
• Database
+ Shakespeare
2 6 10 14 18 22 26 30 34 38 42 46 50 54 >56
MacPherson Mill Throughput (kg/h)
Figure 14: MacPherson Mill Throughput Database
SGS Minerals Sei-\'ices

Ursa Major Minerals Inc. - Shakespeare - 10044-139 iii
m Database
i Shakespeare
3 5 7 9 11 13 15 17 19 21 23 25 27 >28
MacPherson Mill Speci f ic Energy Input (kWh/t )
Figure 15: MacPherson Mill Specific Energy Input Database
50 100 150 200 250 300 350 400 450 500 550 600 650 700 750
MacPherson Mill Product K,,
Figure 16: MacPherson Mill Product Database
SGS Minerals Sei-\'ices
Ursa Major Minerals Inc. - Shakespeare - 10044-139 iii
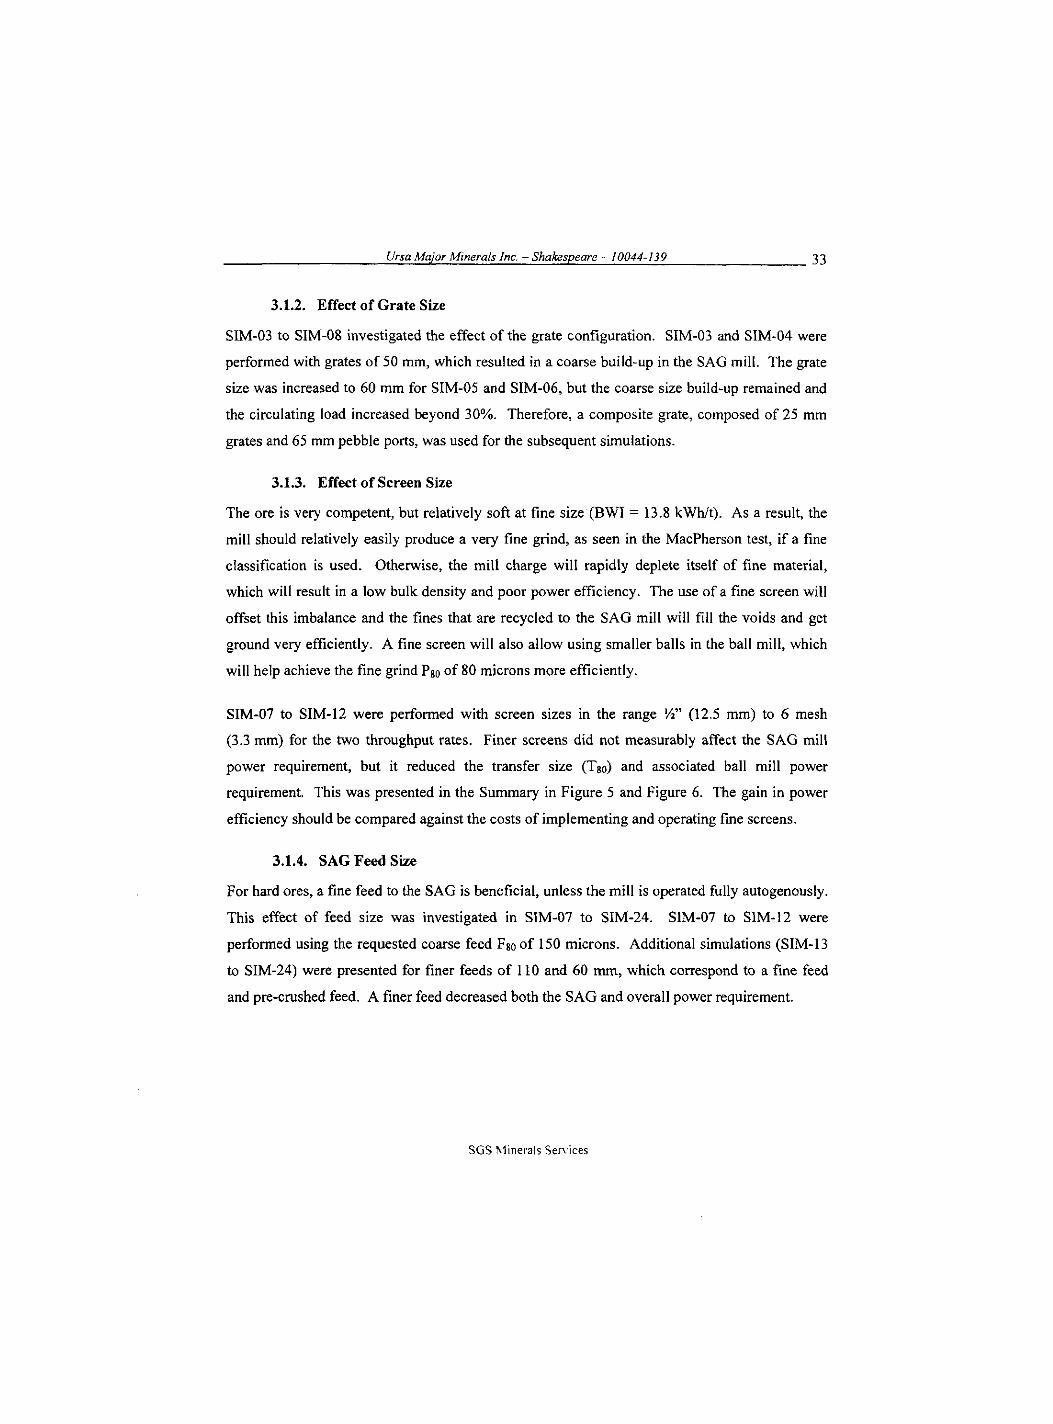
2.3. Bond Rod Mill Grindability Test
A Bond rod mill grindability test was performed at 14 mesh of grind (1180 microns) on the
Shake SAG-1 composite. The test results are summarised in Table 11 and compared to our
database in Figure 17. The test details are appended (Appendix D). The rod mill work index fell
in the medium-hard range.
Table 11: Bond Rod Mill Work Index Test Summary
Sample Name Lithoiogy Mesh of Fso Pgo Gram per Work Index Percentile of
Grind (nm) (nm) Revolution (kWh/t) Hardness Shake SAG-1 SS 14 9619 893 7.5 16.3 67
• Database
+ Shakespeare
9 11 13 15 17 19 21 23 25 27 29
Rod Mill Work Index - Metric
Figure 17: Bond Rod Mill Grindability Test Database
2.4. Bond Ball Mill Grindability Test
The Bond ball mill grindability tests were performed at 100 mesh of grind (150 microns). The
test results are summarised in Table 12 and compared to our database in Figure 18. The test
details are appended (Appendix E). The ball mill work indices were in the soft to medium range
of hardness, within a relatively narrow range, from 11.9 to 15.8 kWh/t.
SGS Minerals Sei-\'ices

Ursa Major Minerals Inc. - Shakespeare - 10044-139 iii
Table 12: B o n d Bal l Mil l W o r k Index Test S u m m a r y
Sample Name Lithology Mesh of ^80 Pso Gram per Work Index Percentile of
Grind (l^m) (wm) Revolution (kWh/t) Hardness Shake SAG-1 SS 150 1904 83.7 1.52 13.8 43 SVMLO-1 ss 150 2012 86.0 1.44 14.5 50 SVMLO-2 SS 150 2020 88.3 1.33 15.8 64 SVMLO-3 ss 150 2121 82.3 1.55 13.3 38 SVMLO-4 ss 150 2101 82.0 1.69 12.3 29 SVMLO-5 ss 150 2128 83.4 1.36 14.9 54 SVMLO-6 ss 150 1985 83.9 1.43 14.4 50 SVMLO-7 ss 150 2074 87.1 1.54 13.8 43 SVMLO-8 ss 150 2119 83.0 1.44 14.1 47 SVMDC-1 DissemS 150 2116 82.8 1.40 14.5 50 SVMDC-2 Dissemi 150 2093 78.0 1.51 13.1 36 SVMDC-3 Blebby 150 2059 81.1 1.57 13.0 36 SVMDC-4 Dissemi 150 2092 78.7 1.62 12.5 30 SVMDC-5 Blebby 150 2104 81.2 1.61 12.7 33 SVMDC-6 Dissemi 150 2062 83.9 1.61 13.0 36 SVMDC-7 Blebby 150 2113 79.8 1.72 11.9 25 SVMDC-8 Dissemi 150 2103 84.0 1.48 13.9 44 SVMDC-9 Blebby 150 2084 81.8 1.70 12.2 28 SVMDC-10 Dissem2 150 2091 82.8 1.54 13.4 39 SVMDC-11 DissemS 150 2085 81.0 1.58 13.0 35
1 3 5 7 9 11 13 15 17 19 21 23 25 27 >28
Bond Ball Mill Work Index - Metric
Figure 18: B o n d Ball Mill Grindabil i ty Test Database
SGS Minerals Sei-\'ices

Ursa Major Minerals Inc. - Shakespeare - 10044-139 iii
2.5. Bond Abrasion Test
Two composites, representing the Blebby and Disseminated mineralizations, were submitted to a
Bond abrasion test. The Disseminated composite was made from the SVMDC-2, 4, 6 and 8
samples, while the Blebby composite was prepared from the SVMDC-3, 5, 7 and 9 samples. The
test details are appended (Appendix F), the results are summarised in Table 13. Comparison to
our database is depicted in Figure 19. The two composites were in the mildly abrasive range.
Table 13: Bond Abrasion Test Summary
Sample Name Abrasion Percentile of
Index (g) Abrasivity Disseminated 0.217 35
Blebby 0.145 24
• Database
+ Shakespeare
o o o o
Abrasion Index
Figure 19: Bond Abrasion Test Database
SGS Minerals Sei-\'ices

Ursa Major Minerals Inc. - Shakespeare - 10044-139 iii
3. Circuit Design
The circuit design was performed using the results of grindability tests along with the JKSimMet
software and the third theory of coniminution. The work was performed in three steps:
1- The first set of scoping simulations was performed on the Shake SAG-1 composite, to evaluate the effect of the design parameters, such as the grate size, screen size and feed size distribution, on the SAG and ball mill performance. The results were discussed with the client and a circuit was selected.
2- The final design was established based on the variability samples.
3- The variability samples were simulated, based on a given set of operating conditions for the selected design, in order to evaluate the potential variability in throughout and grind for the selected circuit.
3.1. Scoping Sim ulatiom
The initial design criteria are presented below.
Design Criteria: Expected
Daily Tonnage: 4500 t/d Utilisation Rate: 92% Throughput Rate: 204 t/h Fgo : 150 mm. Pgo : 80 microns
The client also requested that the mill be designed to handle a 10% safety factor, i.e. 5000 t/d, or
226 t/h. A "Coarse" feed size distribution with an Fgo of 150 mm was proposed by the client,
which is not unrealistic for such a hard ore. A "Fine" feed with a Fgo of 110 mm and a "Pre-
crushed" feed (Fgo of 60 mm) were also simulated to evaluate the effect of feed size. The three
feed PSA's that were used for the simulations are presented in Figure 20. It was agreed that a
pebble crusher was mandatory for such a competent ore.
SGS Minerals Sei-\'ices

Ursa Major Minerals Inc. - Shakespeare - 10044-139 iii
10 100 1000 10000
Size (Microns)
100000 1000000
Figure 20: SAG Feed Particle Size Distributions
The simulations were performed for daily throughput rates of 4500 t/d and 5000 t/d at a final
grind of 80 microns. All the simulations were performed with a SAG mill charge level of 25%,
which is the average in the JKSimMet model database, and is considered optimal for throughput.
The base case simulations were performed with a 1/2" screen and a targeted maximum of 25-
30% recycle rate. Additional simulations were performed with finer screens (1/4" and 6 mesh),
in which case the recycle rate was allowed to increase up to 50%. The SAG mill speed was set
to 77% of the critical speed. The pebble crusher was simulated with a Pgo of -13 mm. The
power requirement to the ball mill circuit was calculated using the Bond work index and the third
theory of comminution, after correction for the fines in the SAG product with the phantom
cyclone technique.
The results of the simulations are presented in Table 14 and Table 15.
SGS Minerals Sei-\'ices

Ursa Major Minerals Inc. - Shakespeare - 10044-139 31
Table 14: SAG Mill Simulation Summary SAG Mill Circuit
JKFile Name
Ore Type
Ore S.C.
(g /c" ' )
SAG Size {Norn dia I EGL)
Feed Rate at 92%
Utilisation Feed Size Pebble
Cruah. Bail Size
Bail Charge %Sol. Mill
Speed Grate Size
Pebble Port Size
Qass. Slots Size
Recycle Mill Charge T »
Gross Power Requirement
FUe Feed t/h t/d -12 mm F „ (Y/N) mm •/• Vol •/. •/. of mm mm mm t/h % "/. Vol Hm kW HP kWh/t 1 SIM-01 SAG-1 3.05 27' X 9' 226 5000 11.6 150 Y 125 11 65 77 50 - 12.7 64 28 25 1145 3080 4129 13,6 2 SIM-02 SAG-1 3.05 27' X 9' 204 4500 11,6 150 Y 125 9 65 77 50 12.7 59 29 25 980 2960 3968 14,5 3 SIM-03 SAG-1 3.05 26' X 9' 226 5000 11.6 150 Y 125 12 65 77 50 - 12.7 63 28 25 1291 2910 3901 12.9 4 SlM-04 SAG-1 3.05 26' X 9' 204 4500 11.6 150 Y 125 11 65 77 50 12.7 58 28 25 1124 2785 3733 13.7 5 SIM-05 SAO-1 3.05 26' X 9' 226 5000 116 150 Y 125 11 65 77 60 - 12.7 77 34 25 1328 2847 3816 12.6 6 SIM-06 SAG-1 3.05 26'X 9' 204 4500 11.6 150 Y 125 10 65 77 60 - 12.7 71 35 25 1154 2731 3661 13.4 7 SIM-07 SAG-1 3.05 26' X 9' 226 5000 11.6 150 Y 125 11 65 77 25 65 12.7 59 26 25 1562 2855 3827 12,6 8 SIM-08 SAG-1 3.05 26' X 9' 204 4500 11.6 150 Y 125 10 65 77 25 65 12.7 54 26 25 1376 2739 3672 13,4 9 SIM-09 SAG-1 3.05 26'X 9' 226 5000 11.6 150 Y 125 12 65 77 25 65 6,3 84 37 25 840 2863 3838 12,6 10 SIM-10 SAG-! 3.05 26'X 9' 204 4500 11.6 150 Y 125 10 65 77 25 65 6.3 76 37 25 735 2746 3681 13,5 11 SIM-11 SAG-1 3.05 26'X 9' 226 5000 11,6 150 Y 125 12 65 77 25 65 3,3 103 45 25 566 2871 3849 12.7 12 SIM-12 SAG-1 3.05 26' X 9' 204 4500 11.6 150 Y 125 10 65 77 25 65 3,3 92 45 25 505 2746 3681 13.5 13 SIM-13 SAG-1 3.05 26' X 9' 226 5000 28,3 110 Y 125 10 65 77 25 65 12.7 64 28 25 1609 2739 3672 12.1 14 SIM-14 SAG-1 3.05 26' X 9' 204 4500 28,3 110 Y 125 9 65 77 25 65 12.7 59 29 25 1448 2638 3536 12.9 15 SIM-15 SAG-1 3.05 26' X 9' 226 5000 28,3 110 Y 125 10 65 77 25 65 6.3 90 40 25 835 2746 3681 12.1 16 SIM-16 SAG-1 3.05 26' X 9' 204 4500 28,3 110 Y 125 9 65 77 25 65 6.3 82 40 25 740 2646 3547 13.0 17 SIM-17 SAG-1 3.05 26' X 9' 226 5000 28 3 110 Y 125 10 65 77 25 65 3.3 109 48 25 555 2754 3692 12.2 18 SIM-18 SAG-1 3.05 26'X 9' 204 4500 28 3 110 Y 125 9 65 77 25 65 3.3 98 48 25 504 2646 3547 13.0 19 SIM-19 SAG-1 3.05 26'X 9' 226 5000 37.6 60 Y 125 5 65 77 25 65 12.7 83 37 25 1937 2343 3141 10.3 20 SIM-20 SAG-1 3.05 26'X 9' 204 4500 37.6 60 Y 125 4 65 77 25 65 12.7 77 38 25 1858 2281 3058 11.2 21 SIM-21 SAG-1 3.05 26' X 9' 226 5000 37.6 60 Y 125 5 65 77 25 65 6.3 116 51 25 861 2343 3141 10.3 22 SIM-22 SAG-1 3.05 26'X 9' 204 4500 37,6 60 Y 125 4 65 77 25 65 6.3 107 53 25 808 2281 3058 11.2 23 SIM-23 SAG-1 3.05 26'X 9' 226 5000 37,6 60 Y 125 5 65 77 25 65 3.3 137 60 25 549 2343 3141 10.3 24 SIM-24 SAG-1 3.05 26'X 9' 204 4500 37,6 60 Y 125 4 65 77 25 65 3.3 125 61 25 518 2281 3058 11.2 25 SIM-25 SAG-1 3.05 24' X 7' 226 5000 37,6 60 Y 125 9 65 77 25 65 12.7 78 34 25 2673 1727 2315 7.6 26 SIM-26 SAG-1 3.05 24'X 7' 204 4500 37,6 60 Y 125 8 65 77 25 65 12.7 74 36 25 2567 1653 2216 8.1 27 SIM-27 SAG-1 3.05 24' X 7' 226 5000 37,6 60 Y 125 9 65 77 25 65 6.3 115 51 25 1299 1732 2322 7.6 28 SIM-28 SAG-1 3.05 24'X 7' 204 4500 37.6 60 Y 125 8 65 77 25 65 6.3 107 53 25 1213 1658 2223 8.1 29 SIM-23 SAG-1 3.05 24' X 7' 226 5000 37.6 60 Y 125 9 65 77 25 65 3.3 142 63 25 803 1737 2328 7.7 30 SIM-30 SAG-1 3.05 24' X 7' 204 4500 37.6 60 Y 125 8 65 77 25 65 3.3 131 64 25 748 1658 2223 8.1
S G S Minerals Services

Ursa Major Minerals Inc. - Shakespeare - 10044-139 iii
Table 15: Ball Mill Simulation Summary Ball Mill Circuit Overall
File Ore Type F.0 Feed Rate at
92% Utilisation
Gross Power Requirement
Circ. Load
Ball Size P80
Small-Scale Work Indices
(kWh/t)
Total Gross Power
Gross Power Req.
Wio
Hm t/h t/d kW HP kWh/t % inch ^m RWI BWI kW kWh/t kWh/t 1 SIM-01 SAG-1 1145 226 5000 2201 2950 9.7 250 2 80 16.3 13,8 5281 23.3 20.5 2 SIM-02 SAG-1 980 204 4500 1935 2594 9.5 250 2 80 16.3 13,8 4895 24.0 21.1 3 SIM-03 SAG-1 1291 226 5000 2247 3011 9.9 250 2 80 16.3 13,8 5157 22.8 20.0 4 SIM-04 SAG-1 1124 204 4500 1978 2652 9.7 250 2 80 16.3 13.8 4763 23.4 20.5 5 SIM-05 SAG-1 1328 226 5000 2254 3021 10.0 250 2 80 16,3 13,8 5101 22.5 19.8 6 SIM-06 SAG-1 1154 204 4500 1984 2659 9.7 250 2 80 16.3 13,8 4715 23.1 20.3 7 SIM-07 SAG-1 1562 226 5000 2339 3136 10.3 250 2 80 16.3 13,8 5194 22.9 20.2 8 SlM-08 SAG-\ 1376 204 4500 2066 2770 10.1 250 2 80 16.3 13,8 4805 23.6 20.7 9 SIM-09 SAG-1 840 226 5000 2069 2774 9.1 250 2 80 16.3 13,8 4932 21.8 19.1 10 SIM-10 SAG-1 735 204 4500 1805 2420 8.9 250 2 80 16.3 13,8 4551 22,3 19,6 11 SIM-11 SAG-1 566 226 5000 1862 2497 8.2 250 1.5 80 16,3 13,8 4733 20,9 18,4 12 SIM-12 SAG-1 505 204 4500 1617 2168 7.9 250 1.5 80 16.3 13.8 4363 21,4 18,8 13 SIM-13 SAG-1 1609 226 5000 2341 3138 10.3 250 2 80 16,3 13.8 5080 22,4 19,8 14 SIM-14 SAG-1 1448 204 4500 2080 2788 10.2 250 2 80 16,3 13.8 4718 23,1 20,4 15 SIM-15 SAG-1 835 226 5000 2074 2780 9.2 250 2 80 16,3 13.8 4820 21.3 18,8 16 SIM-16 SAG-1 740 204 4500 1816 2434 8.9 250 2 80 16.3 13.8 4462 21.9 19,3 17 SIM-17 SAG-1 555 226 5000 1856 2488 8.2 250 1.5 80 16.3 13.8 4610 20.4 18,0 18 SIM-18 SAG-1 504 204 4500 1612 2161 7.9 250 1.5 80 16.3 13.8 4258 20.9 18,4 19 SIM-19 SAG-1 1937 226 5000 2378 3188 10.5 250 2 80 16.3 13.8 4721 20.8 18,6 20 SIM-20 SAG-1 1858 204 4500 2128 2852 10.4 250 2 80 16.3 13.8 4409 21.6 19,3 21 SIM-21 SAG-1 861 226 5000 2039 2733 9.0 250 2 80 16.3 13.8 4382 19.4 17,2 22 SIM-22 SAG-1 808 204 4500 1803 2417 8.8 250 2 80 16,3 13,8 4084 20.0 17,9 23 SIM-23 SAG-1 549 226 5000 1811 2427 8.0 250 1.5 80 16,3 13,8 4154 18.3 16,3 24 SIM-24 SAG-1 518 204 4500 1594 2137 7.8 250 1.5 80 16,3 13,8 3875 19.0 16,9 25 SIM-25 SAG-1 2673 226 5000 2604 3490 11.5 250 2 80 16,3 13.8 4331 19.1 17,0 26 SIM-26 SAG-1 2567 204 4500 2317 3105 11.4 250 2 80 16,3 13.8 3970 19.5 17,4 27 SIM-27 SAG-1 1299 226 5000 2256 3025 10.0 250 2 80 16,3 13.8 3988 17.6 15,7 28 SIM-28 SAG-1 1213 204 4500 1988 2664 9.8 250 2 80 16,3 13.8 3646 17.9 15,9 29 SIM-23 SAG-1 803 226 5000 2040 2734 9.0 250 1.5 80 16,3 13.8 3777 16.7 14,9 30 SIM-30 SAG-1 748 204 4500 1796 2408 8.8 250 1.5 80 16,3 13.8 3454 16.9 15,1
3.1.1. SAG Mill Size
SIM-01 to SIM-04 investigated two SAG mill sizes for Shake SAG-1 composite, based on a 10-
12% ball charge. Two sizes were tested, i.e. 27' x 9' and 26' x 9' (Nominal Diameter x EGL).
The 26' mill was selected based on power efficiency and lower capital costs, but both mills
would be adequate. The selected SAG mill was a 26' x 9' EGL with internal dimensions of 8.05
x 2.74 m and 15 degree cone angles. The mill was designed to operate in the range of 10-12 %,
but a 4200 HP motor should be installed to allow an increase in the ball charge up to 15%. This
mill would be adequate for both the Coarse and Fine feed, but the pre-crush option, a 24' x 7'
SAG mill with a 2800 HP motor was selected (SIM-25 to SIM-30).
SGS Minerals Sei-\'ices
Ursa Major Minerals Inc. - Shakespeare - 10044-139 iii
3.1.2. Effect of Grate Size
SIM-03 to SIM-08 investigated the effect of the grate configuration. SIM-03 and SIM-04 were
performed with grates of 50 mm, which resulted in a coarse build-up in the SAG mill. The grate
size was increased to 60 mm for SIM-05 and SIM-06, but the coarse size build-up remained and
the circulating load increased beyond 30%. Therefore, a composite grate, composed of 25 mm
grates and 65 mm pebble ports, was used for the subsequent simulations.
3.1.3. Effect of Screen Size
The ore is very competent, but relatively soft at fine size (BWI = 13.8 kWh/t). As a result, the
mill should relatively easily produce a very fine grind, as seen in the MacPherson test, if a fine
classification is used. Otherwise, the mill charge will rapidly deplete itself of fine material,
which will result in a low bulk density and poor power efficiency. The use of a fine screen will
offset this imbalance and the fines that are recycled to the SAG mill will fill the voids and get
ground very efficiently. A fine screen will also allow using smaller balls in the ball mill, which
will help achieve the fine grind Pso of 80 microns more efficiently.
SIM-07 to SIM-12 were performed with screen sizes in the range '/z" (12.5 mm) to 6 mesh
(3.3 mm) for the two throughput rates. Finer screens did not measurably affect the SAG mill
power requirement, but it reduced the transfer size (Tgo) and associated ball mill power
requirement. This was presented in the Summary in Figure 5 and Figure 6. The gain in power
efficiency should be compared against the costs of implementing and operating fine screens.
3.1.4. SAG Feed Size
For hard ores, a fine feed to the SAG is beneficial, unless the mill is operated fully autogenously.
This effect of feed size was investigated in SIM-07 to SIM-24. SIM-07 to SIM-12 were
performed using the requested coarse feed Fgo of 150 microns. Additional simulations (SIM-13
to SIM-24) were presented for finer feeds of 110 and 60 mm, which correspond to a fine feed
and pre-crushed feed. A finer feed decreased both the SAG and overall power requirement.
SGS Minerals Sei-\'ices

Ursa Major Minerals Inc. - Shakespeare - 10044-139 iii
3.2. Variability Simulations for Mill Design
The site has limited power available, so only the 4500 t/d scenario was considered, i.e. the 10%
safety factor was excluded from the design. The pre-crushing option was also rejected. The
SAG mill dimensions were re-evaluated to minimise the power draw. The client requested that
the SAG mill be designed based on a 15% ball charge for the hardest ores. The circuit design
was based on a classification based on the coarse feed Fgo of 150 microns.
3.2.1. SAG Mill Selection
Under these new assumptions, the proposed SAG mill is a 24' x 9' EGL with internal
dimensions of 7.11 x 2.74 m, based on 15 degree cone angles. The mill would operate in the
range of 9-15 %, requiring 2900 to 3400 HP. A 3500 HP should be installed to cover the range
of power. SIM-31 to SIM-50 were all performed at the design throughput rate of 204 t/d and a
final grind Pgo of 80 |xm. The required ball charge was determined up to 15%. The results are
presented in Table 16 and Table 17.
3.2.2. Ball Mill Selection
The ball mill power requirement was determined for each variability sample. Figure 7 presents
the cumulative frequency of power requirements for both the SAG mill and ball mill, based on a
fixed throughout rate of 4500 t/d. The red lines correspond to the median gross power
requirements, which are 2325 kW for the SAG mill and 1900 kW for the ball mill. The averages
were 2341 kW for the SAG mill and 1896 kW for the ball mill, respectively. Based on this, a
power of 1900 kW was selected for the ball mill.
SGS Minerals Sei-\'ices

Ursa Major Minerals Inc. - Shakespeare - 10044-139
Table 16: Variability Simulation Summary at Fixed Design Criteria - SAG Mill SAG MUI Circuit
JKFUe Name Ore Type
Ore S.G.
(e/cm') JK Drop-
weight
SAG Siie (Nom dia x
EGL)
Feed Rale at 9 1 %
Utilisation Feed Sac Pebble
Crush. Ball Ball Size Charge
MUI Speed
Class. Slots Size
Recycle Mill Charge
Gross Power Requirement
File Feed A l b ta t/h t/d -12 mm F „ (Y/N) mm •/. Vol % •/. of mm t/h V. y. Vol )lin kW HP kWh/t 31 SIM-31 SAG-1 3 OS 22,00 0,23 24' X 9' 204 4500 11,6 150 Y 125 14 65 77 6,3 73 36 25 974 2447 3280 12.0 32 SIM-32 SVMLO-1 3,10 28,66 0,29 24'X 9' 204 4500 11,6 150 Y 125 10 65 77 6,3 68 33 25 708 2198 2946 10,8 33 SrM-33 SVMLO-2 3,06 27,81 0,28 24' X 9' 204 4500 11,6 150 Y 125 10 65 77 6,3 69 34 25 740 2231 2991 10,9 34 SIM-34 SVMLO-3 3,01 2S,45 025 24' X 9' 204 4500 11,6 150 Y 125 12 65 77 6,3 71 35 25 926 2320 3110 11,4 35 SIM-35 SVMLO-4 2,97 26.23 0,26 24' X 9' 204 4500 116 150 Y 125 11 65 77 6,3 70 34 25 849 2267 3039 11,1 36 SIM-36 SVMLO-5 3,00 22.62 0.23 24' X 9' 204 4500 11,6 150 Y 125 14 65 77 6,3 73 36 25 977 2412 3233 11,8 37 SIM-37 SVMLO-6 3.12 34,16 0.34 24' X 9' 204 4S00 11,6 150 Y 125 9 65 77 6,3 63 31 25 605 2156 2890 10,6 38 SIM-38 SVMLO-7 3,00 30,54 0,31 24'X 9' 204 4500 11,6 150 Y 125 10 65 77 6,3 67 33 25 801 2167 2905 10,6 39 SIM-39 SVMLO-8 3.00 24,72 0,25 24'X 9' 204 4500 11,6 150 Y 125 12 65 77 6,3 71 35 25 893 2324 3115 11,4 40 SIM-40 SVMDC-I 3,01 24.61 0,25 24' X 9' 204 4500 11,6 150 Y 125 12 65 77 6,3 72 35 25 923 2326 3118 11,4 41 SlM-41 SVMDC-2 299 24,64 0,25 24' X 9' 204 4500 11,6 150 Y 125 12 65 77 6,3 72 35 25 921 2322 3113 11,4 42 SIM-42 SVMDC-3 3,04 23.92 0,24 24' X 9' 204 4500 11,6 150 Y 125 13 65 77 6,3 73 36 25 980 2364 3169 11.6 43 SIM-43 SVMDC^ 3,03 27.25 0,27 24' X 9' 204 4500 11,6 150 Y 125 11 65 77 6,3 70 34 25 879 2243 3007 11,0 44 SIM-44 SVMDC-5 3,02 23.90 0,24 24' X 9' 204 4500 11,6 150 Y 125 13 65 77 6,3 72 35 25 934 2359 3162 11,6 45 SIM-45 SVMDC-6 3,03 21,31 0,21 24'X 9' 199 4394 11,6 150 Y 125 15 65 77 6,3 72 36 25 1070 2511 3366 12,6 46 SIM-« SVMDC-7 2,97 25,91 0,26 24' X 9' 204 4500 11,6 ISO Y 125 12 65 77 6,3 70 34 25 888 2279 3055 11,2 47 SIM-47 SVMDC-8 3,04 21,00 0,21 24' X 9' 198 4372 11,6 150 Y 125 15 65 77 6,3 71 36 25 1038 2513 3369 12,7 48 SIM-48 SVMDC-9 3,03 23,07 0,23 24'X 9' 204 4500 11.6 150 Y 125 13 65 77 6,3 73 36 25 961 2405 3224 11,8 49 SIM^9 SVMDC-10 3 00 20,00 0,20 24' X 9' 188 4151 116 150 Y 125 15 65 77 6,3 68 36 25 1035 2506 3359 13,3 SO SIM-50 SVMDC-11 2.85 21,00 0,21 24' X 9' 195 4306 11.6 ISO Y 125 15 65 77 6,3 68 35 25 1017 2479 3323 12,7
SGS Minerals Services

Ursa Major Minerals Inc. - Shakespeare - 10044-139 iii
Table 17: Variability Simulation Summary at Fixed Design Criteria - BM Ball Mill Circuit Overall
File Ore Type F,„ Feed Rate
at 92% Utilisation
Gross Power Requirement
Circ. Load
Ball Size Pbo
Small-Scale Work Indices
(kWh/t)
Total Gross Power
Gross Power Req.
Wio
fim t/h t/d kW H P kWh/t % inch )im RWI BWI kW kWh/t kWh/t
31 SIM-31 SAG-1 974 204 4500 1948 2611 9.6 250 2 80 16.3 13.8 4395 21.6 19.0 32 SIM-32 SVMLO-1 708 204 4500 1921 2575 9.4 250 2 80 17.2 14.5 4119 20.2 17.8 33 SIM-33 SVMLO-2 740 204 4500 2130 2855 10.5 250 2 80 18.7 15.8 4361 21.4 18.8 34 SlM-34 SVMLO-3 926 204 4500 1922 2576 9.4 250 2 80 15.7 13.3 4242 20.8 18.3 35 SlM-35 SVMLO-4 849 204 4500 1735 2326 8.5 250 2 80 14.6 12.3 4002 19.6 17.3 36 SIM-36 SVMLO-5 977 204 4500 2138 2866 10.5 250 2 80 17.6 14.9 4550 22.3 19.6 37 SIM-37 SVMLO-6 605 204 4500 1849 2478 9.1 250 2 80 17.1 14.4 4005 19.7 17.3 38 SlM-38 SVMLO-7 801 204 4500 1936 2595 9.5 250 2 80 16.4 13.8 4103 20.1 17.7 39 SIM-39 SVMLO-8 893 204 4500 2005 2688 9,8 250 2 80 16.7 14.1 4329 21.2 18.7 40 SIM-40 SVMDC-1 923 204 4500 2078 2786 10.2 250 2 80 17.1 14.5 4404 21.6 19.0 41 SIM-41 SVMDC-2 921 204 4500 1881 2522 9.2 250 2 80 15.5 13.1 4203 20.6 18.1 42 SIM-42 SVMDC-3 980 204 4500 1916 2568 9.4 250 2 80 15.5 13.0 4280 21.0 18.5 43 SIM-43 SVMDC-4 879 204 4500 1783 2390 8.7 250 2 80 14.8 12.5 4026 19.8 17.4 44 SIM-44 SVMDC-5 934 204 4500 1829 2452 9.0 250 2 80 15.1 12.7 4188 20.5 18.1 45 SIM-45 SVMDC-6 1070 199 4394 1885 2527 9.5 250 2 80 15.4 13.0 4396 22 .1 19.4 46 SIM-46 SVMDC-7 888 204 4500 1700 2278 8.3 250 2 80 14.1 11.9 3979 19.5 17.2 47 SIM-47 SVMDC-8 1038 198 4372 1953 2618 9.9 250 2 80 16.5 13.9 4466 22.6 19.8 48 SIM-4g SVMDC-9 961 204 4500 1755 2353 8.6 250 2 80 14.5 12.2 4160 20.4 17.9 49 SIM-49 SVMDC-10 1035 188 4151 1776 2380 9.4 250 2 80 15.9 13.4 4282 22.8 20.0 50 SIM-50 S V M D C - n 1017 195 4306 1786 2395 9.2 250 2 80 15.4 13.0 4265 21.9 19.2
3.3. Variability in Operation
In reality, the grinding circuit throughput and final grind will vary on a daily basis with ore
hardness. The variation can be handled with variable speed mills, which is common for
autogenous mill. The final series of simulations were performed to outline the range of
throughput and grind that may be observed in the plant. The SAG mill was simulated with an
operating ball charge of 13%. An operating power of 1900 kW was selected for the ball mill
based on the median from Figure 7. The SAG mill throughput rate was allowed to vary with ore
hardness up to a final grind of 87 microns, at which point, the circuit was considered ball mill-
limited, and the feed rate was restrained. The ability to control this in the plant would preferably
require a variable speed drive of the SAG mill. Table 18 and Table 19 summarise the results of
the simulations.
SGS Minerals Sei-\'ices

Ursa Major Minerals Inc. -Shakespeare - 10044-139 37
Table 18: Variability Simulation Summary at Fixed BM Power - SAG Mill SAG Mill Circuit
JKFUe Name Ore Type
Ore S.G.
(£/cm')
JK Drop-weight
SAG Size (Nom dia x
EGL)
Feed Rate at 92%
Utilisation Feed Size Pebble
Crujh. Bail Size
Bail Charge •/.Sol. Mill
Speed
Qais. Slots Size
Recycle Mill Charge T „ Gross Power
Requirement
FUe Feed A l b ta t/h t/d -12 mm F,. (Y/N) mm •/, Vol % o f mm t/h % •/. Vol )lm kW HP kWh/t 51 SIM-51 SAG-1 3.05 22.00 0.23 24' X 9' 200 4416 11.6 150 Y 125 13 65 77 63 73 37 25 947 2404 3223 120 52 SIM-52 SVMLO-1 3.10 28.66 0.29 24'X 9' 204 4504 11.6 150 Y 125 13 65 73 6.3 62 30 25 712 2265 3036 11.1 53 SIM-53 SVMLO-2 3.06 27.81 0.28 24' X 9' 198 4372 11.6 150 Y 125 13 65 73 63 61 31 25 719 2258 3027 11.4 54 SIM-54 SVMLO-3 3.01 25.45 0.25 24' X 9' 204 4504 116 ISO Y 125 13 65 76 6.3 69 34 25 928 2345 3143 11.5 55 SIM-55 SVMLO-4 2.97 26.23 0.26 24' X 9' 218 4813 11.6 150 Y 125 13 65 76 6.3 73 33 25 919 2350 3150 10.8 56 SIM-56 SVMLO-5 3.00 22.62 0.23 24' X 9' 197 4350 11.6 150 Y 125 13 65 77 6.3 70 36 25 934 2370 3177 12.0 57 SIM-57 SVMLO-6 3.22 34.26 0.34 24' X 9' 208 4593 11.6 150 Y 125 13 65 71 6.3 58 28 25 638 2206 2957 106 58 SIM-58 SVMLO-7 3.00 3054 0.31 24' X 9' 204 4504 11.6 150 Y 125 13 65 72 6.3 60 29 25 802 2218 2973 10.9 59 SIM-59 SVMLO-8 3.00 24.72 0.25 24' X 9' 204 4504 116 150 Y 125 13 65 76 6.3 69 34 25 895 2346 3145 11.5 60 SIM-60 SVMDC-1 3.01 24.61 0.25 24' X 9' 201 4438 11.6 150 Y 125 13 65 76 6.3 68 34 25 911 2341 3138 11.6 61 SIM-61 SVMDC-2 2.99 24.64 0.25 24'X 9' 214 4725 11.6 150 Y 125 13 65 77 6.3 74 35 25 974 2378 3188 11.1 62 SIM-62 SVMDC-3 3.04 23.92 0.24 24' X 9' 208 4593 11.6 150 Y 125 13 65 77 63 74 36 25 1002 2389 3202 11.5 63 SIM-63 SVMDC-4 3.03 27.25 0.27 24' X 9' 215 4747 11.6 150 Y 125 13 65 75 6.3 70 33 25 927 2321 3U1 10.8 64 SIM-64 SVMDC-5 3.02 23.90 0.24 24' X 9' 208 4593 11.6 150 Y 125 13 65 77 63 72 35 25 957 2384 3196 115 65 SIM-65 SVMDC-6 3.03 21 31 0.21 24'X 9' 194 4284 116 150 Y 125 13 65 78 63 74 38 25 1028 2421 3245 12.5 66 SIM-66 SVMDC-7 2.97 25.91 0.26 24'x9' 224 4946 11.6 150 Y 125 13 65 77 6.3 76 34 25 983 2374 3182 10.6 67 SIM-67 SVMDC-8 3.04 21.00 0.21 24' X 9' 193 4261 11.6 150 Y 125 13 65 78 6.3 73 38 25 994 2423 3248 126 68 SIM-68 SVMDC-9 3.03 23.07 0.23 24'x9' 202 4460 11.6 150 Y 125 13 65 77 6.3 72 36 25 946 2387 3200 11.8 69 SIM-69 SVMDC-10 3.00 20.00 0.20 24'X 9- 185 4085 116 150 Y 125 13 65 78 6.3 71 38 25 998 2414 3236 13.0 70 SIM-70 SVMDC-11 2.85 21 00 0.21 24' X 9' 191 4217 11.6 150 Y 125 13 65 78 6.3 70 37 25 976 2383 3194 125
SGS Minerals Servie

Ursa Major Minerals Inc. - Shakespeare - 10044-139 iii
Table 19: Variability Simulation Summary at Fixed BM Power - BM Ball Mill Circuit Overall
File Ore Type F,„ Feed Rate
at 92% Utilisation
Gross Power Requirement
Circ. Load
Ball Size P80
Small-Scale Work Indices
(kWh/t)
Total Gross Power
Gross Power Req.
Wio
(im t/h t/d kW HP kWh/t % inch |im RWI BWI kW kWh/t kWh/t 51 SIM-51 SAG-1 947 200 4416 1900 2547 9.5 250 2 80 16.3 13.8 4304 21.5 18.9 52 SIM-52 SVMLO-1 712 204 4504 1900 2547 9.3 250 2 81 17.2 14.5 4165 20.4 18.1 53 SIM-53 SVMLO-2 719 198 4372 1900 2547 9,6 250 2 87 18.7 15.8 4158 21.0 19.3 54 SIM-54 SVMLO-3 928 204 4504 1900 2547 9.3 250 2 81 15.7 13.3 4245 20.8 18.4 55 SIM-55 SVMLO-4 919 218 4813 1900 2547 8.7 250 2 80 14.6 12.3 4250 19.5 17.1 56 SIM-56 SVMLO-5 934 197 4350 1900 2547 9.6 250 2 87 17.6 14.9 4270 21.7 19.9 57 SIM-57 SVMLO-6 638 208 4593 1900 2547 9.1 250 2 80 17.1 14.4 4106 19,7 17.4 58 SIM-58 SVMLO-7 802 204 4504 1900 2547 9.3 250 2 82 16.4 13.8 4118 20.2 18.0 59 SIM-59 SVMLO-8 895 204 4504 1900 2547 9.3 250 2 85 16.7 14.1 4246 20.8 18.9 60 SIM-60 SVMDC-1 911 201 4438 1900 2547 9.5 250 2 87 17.1 14.5 4241 21.1 19.4 61 SIM-61 SVMDC-2 974 214 4725 1900 2547 8.9 250 2 85 15.5 13.1 4278 20.0 18.1 62 SIM-62 SVMDC-3 1002 208 4593 1900 2547 9.1 250 2 83 15.5 13,0 4289 20.6 18.5 63 SIM-63 SVMDC-4 927 215 4747 1900 2547 8.8 250 2 80 14.8 12.5 4221 19,6 17.3 64 SIM-64 SVMDC-5 957 208 4593 1900 2547 9.1 250 2 79 15.1 12.7 4284 20.6 18,0 65 SIM-65 SVMDC-6 1028 194 4284 1900 2547 9.8 250 2 75 15.4 13.0 4321 22,3 18.9 66 SIM-66 SVMDC-7 983 224 4946 1900 2547 8.5 250 2 80 14.1 11,9 4274 19.1 16.8 67 SIM-67 SVMDC-8 994 193 4261 1900 2547 9.8 250 2 79 16.5 13,9 4323 22.4 19.6 68 SIM-68 SVMDC-9 946 202 4460 1900 2547 9.4 250 2 71 14.5 12.2 4287 21.2 17.5 69 SIM-69 SVMDC-10 998 185 4085 1900 2547 10.3 250 2 71 15.9 13.4 4314 23.3 19.3 70 SIM-70 SVMDC-11 976 191 4217 1900 2547 9.9 250 2 71 15.4 13.0 4283 22.4 18.5
SGS Minerals Sei-\'ices

Ursa Major Minerals Inc. - Shakespeare - 10044-139 iii
APPENDIXA:
Contract Support Services Report
SGS Minerals Sei-\'ices

DROP WEIGHT TEST REPORT on
SAG-1 Sample from
Shakespeare
A. R. MacPherson Consultants Ltd. I SGS Lakefield Research Ltd.
Lakefield, Ontario, Canada
SGS Lakefield Research Job No. 10044-139 - September 2005

Contract Support Services, Inc.
DROP WEIGHT TEST REPORT on
SAG-1 Sample from
Shakespeare
SGS Lakefield Research Job No. 10044-139 - September 2005
Submitted to
A. R. MACPHERSON CONSULTANTS I SGS LAKEFIELD RESEARCH LTD. LAKEFIELD, ONTARIO, CANADA

Drop Weight Test Report on SAG-1 Sample Shakespeare
TABLE OF CONTENTS Page No
1 INTRODUCTION 1 2 DROP WEIGHT TEST PROCEDURE 1
2.1 Impact Breakage Testing 1 2.2 Abrasion Breakage Testing 3
3 USING STANDARD DROP WEIGHT TEST RESULTS IN JKSimMet 3 3.1 SAG/autogenous Mill Model 3 3.1.1 High Energy or Impact Breakage 3 3.1.2 Low Energy or Abrasion Breakage 3 3.1.3 Combined Breakage 4 3.2 Crusher Model 4 3.3 Limitations 4
4 RESULTS 5 4.1 SAG/autogenous Mill Model Parameters 5 4.2 Crusher Model Parameters 6
5 COMMENTS ON STANDARD DROP WEIGHT TEST RESULTS 6 5.1 Resistance to impact breakage 6 5.2 Resistance to abrasion breakage 7 5.3 Effect of Particle Size on Resistance to Impact 9
6 ORE DENSITY MEASUREMENT 10 6.1 Results 10 6.2 Comments on Ore Density 10
7 REFERENCES 11
TABLE OF FIGURES Figure 1 - The JK Drop Weight Tester 1 Figure 2 - Tio/Ecs Relationship for Shakespeare SAG-i Sample 5 Figure 3 - Frequency Distribution of A*b in the JKTech Database 8 Figure 4 - Frequency Distribution of tio@1kWh/t in the JKTech Database 8 Figure 5 - Frequency Distribution of ta in the JKTech Database 8 Figure 6 - Variation of Impact Resistance with Particle Size - Shakespeare SAG-i
Sample 9 Figure 7 - Histogram of Relative Density Meas. - 30 Particles - Shakespeare
SAG-1 Sample 10
TABLE OF TABLES Table 1 - SAG/autogenous mill parameters for Shakespeare SAG-i Sample 5 Table 2 - Crusher Model Parameters for Shakespeare SAG-i Sample 6 Table 3 - Parameter Interactions for Shakespeare SAG-i Sample 7 Table 4 - Relative Density Measurements for 30 Particles - Shakespeare SAG-i
Sample 11
SGS Lakefield Research Job No. 10044-139 47

Drop Weight Test Report on SAG-1 Sample Shakespeare
1 INTRODUCTION Drop weight test data for a sample from Shakespeare, designated as "SAG-1 Sample" was received from Lakefleld Research In September, 2005 by CSS for analysis. The analysis was completed In mid-September, 2005.
The JKTech drop weight test provides ore specific parameters for use in the JKSImMet Mineral Processing Simulator software. In JKSImMet, these parameters are combined with equipment details and operating conditions to analyse and/or predict SAG/autogenous mill performance. The same test procedure also provides ore type characterisation for the JKSImMet crusher model. These ore specific parameters have been calculated from the test results and are supplied to Lakefleld Research and their clients In this report as part of the standard procedure.
2 DROP WEIGHT TEST PROCEDURE This section provides a brief description of the drop weight test procedure.
To characterise ore breakage at different energy levels, the JKTech method uses two complimentary techniques:
1. To characterise breakage at moderate to high energy levels (ie. impact breakage), a drop weight device Is used.
2. To characterise breakage at low energy Inputs (ie. the abrasion component of breakage), a tumbling test is used.
2.1 Impact Breakage Testing The JK drop weight device comprises a steel drop-weight which is raised by a winch to a known height. A pneumatic switch releases the drop weight which falls under gravity and impacts the rock particle which is placed on a steel anvil. The device is
enclosed in perspex and incorporates a variety of features to ensure operator safety. By varying the height from which the drop weight is released and the mass of the drop weight, a very wide range of energy inputs can be generated. A schematic drawing of the device is given in Figure 1.
Drop weight
Guide Rod
Perspex enclosure
Winch
Anvil
Concrete platfoim
After release, the drop weight descends under the Influence of gravity and impacts the target particle.
Figure 1 - The JK Drop Weight Tester
SGS Lakefield Research Job No. 10044-139 1

Drop Weight Test Report on SAG-1 Sample Shakespeare
The particle is broi<en and the drop-weight is brought to rest at a distance above the anvil approximately equal to the largest product particle. The difference in distance between the initial starting point and the final resting place of the drop-weight is used to calculate the energy that is expended in breaking the particle. Thus
E i = M g ( h - X M ) ( 1 )
where:
E| = energy used for breakage M = drop-weight mass g = gravitational constant h = initial height of the drop-weight above the anvil Xm = final height of the drop-weight above the anvil.
Providing the drop-weight does not rebound after impact, the application of equation (1) is valid. Where rebound occurs an additional term is required to account for the energy re-transmitted to the drop-weight. Rebound has been seen to occur only at elevated input energies. This energy will be assessed during the test work program. It is likely, however, that its magnitude will be relatively small and can be ignored with only a minimal loss in accuracy.
The assumption is made that all the energy provided is utilised in the breakage of the particle. Thus
Ecs = Eis = Ej / m
where:
E|s = specific input energy Eos = specific comminution energy m = mean particle mass
To test an ore type, the original 100 kg sample is sized into selected fourth-root-of-two size fractions. Ten (10) to thirty (30) particles are required in each size fraction for each energy level, depending on particle mass. Typically fifteen (15) size/energy combinations are selected. The input energy levels for a particular test are designed to suit ore hardness but a standard set of energies are used whenever possible.
The breakage products of all particles for each size/energy combination are collected and sized. The size distribution produced is normalised with respect to original particle size. For a wide range of energy inputs, particle sizes and ore types, the relative size distributions remain similar in shape and can be described by a single point on the distribution. The JKTech convention is to use the percentage passing one-tenth of the original particle size. This is referred to as the "tio".
In the manner described above, a set of tio and Ecs values are produced for the 15 energy/size combinations of the standard JKTech drop test.
SGS Lakefield Research Job No. 10044-139 49
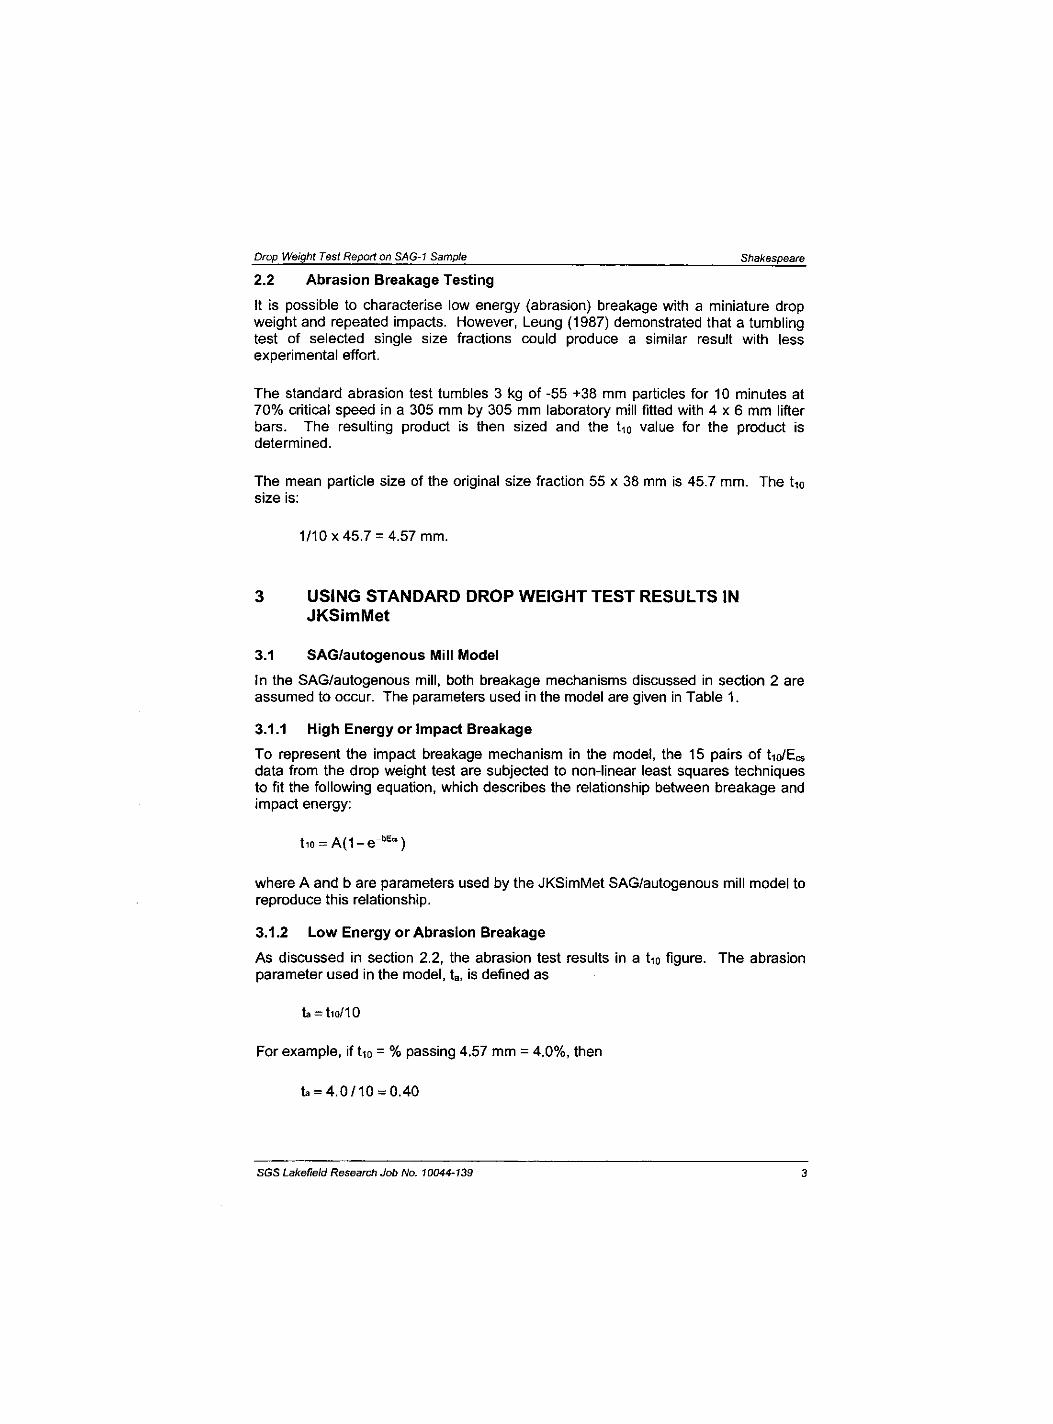
Drop Weight Test Report on SAG-1 Sample Shakespeare
2.2 Abrasion Breakage Testing It is possible to characterise low energy (abrasion) breakage witfi a miniature drop weight and repeated impacts. However, Leung (1987) demonstrated that a tumbling test of selected single size fractions could produce a similar result with less experimental effort.
The standard abrasion test tumbles 3 kg of -55 +38 mm particles for 10 minutes at 70% critical speed in a 305 mm by 305 mm laboratory mill fitted with 4 x 6 mm lifter bars. The resulting product is then sized and the tio value for the product is determined.
The mean particle size of the original size fraction 55 x 38 mm is 45.7 mm. The tio size is:
1/10x45.7 = 4.57 mm.
3 USING STANDARD DROP WEIGHT TEST RESULTS IN JKSimMet
3.1 SAG/autogenous Mill Model In the SAG/autogenous mill, both breakage mechanisms discussed in section 2 are assumed to occur. The parameters used in the model are given in Table 1.
3.1.1 High Energy or impact Breakage To represent the impact breakage mechanism in the model, the 15 pairs of tio/Ecs data from the drop weight test are subjected to non-linear least squares techniques to fit the following equation, which describes the relationship between breakage and impact energy:
where A and b are parameters used by the JKSimMet SAG/autogenous mill model to reproduce this relationship.
3.1.2 Low Energy or Abrasion Breakage
As discussed in section 2.2, the abrasion test results in a tio figure. The abrasion parameter used in the model, ta, is defined as
ta-tlo/10
For example, if tio = % passing 4.57 mm = 4.0%, then
ta = 4.0/10 = 0.40
SGS Lakefield Research Job No. 10044-139 50

Drop Weight Test Report on SAG-1 Sample Shakespeare
3.1.3 Combined Breakage These two sets of parameters representing the two breakage modes are used in combination by the model to generate an ore specific appearance function. The scaling factor of 10 is applied in the calculation of ta so that the relative proportions of high and low energy breakage represented in the combined appearance function are correct.
The assumption is made that all brittle rock types break with the same general pattern and that general pattern is built into the model. This assumption does not mean that the amount of energy required to achieve a particular tio is the same for all brittle rocks. It simply means that if a single particle is broken to a particular tio value, then the complete size distribution of the broken fragments is known.
This assumption is not perfect but is quite adequate for the purposes of the SAG/autogenous model.
To use the results of testing, the ore type parameters A and b (from drop weight testing) and ta (from abrasion testing), are input in the SAG/autogenous mill model available in JKSimMet, together with machine dependent parameters of mill size, grate size, ball load, etc. The simulation predicts product size and mill load using appropriate breakage rates. The simulator can then also be used to predict mill performance with variations in screen and classifier configurations or even with recycle crushing.
Details of the SAG/autogenous mill model are given in Leung (1987) and Leung, Morrison, and Whiten (1987). The calculations on which the power prediction for SAG/autogenous mills is based are described in Morrell (1996).
3.2 Crusher Model For the crusher model, only the high energy or impact breakage test results are used. These are presented in a somewhat different manner from the SAG/autogenous mill model.
The assumption that all brittle rocks break with the same breakage pattern is not made and the pattern for the ore under test is used. The crusher model uses the parameters given in Table 2. The appearance function defines the shape of the breakage distribution curve at various degrees of "broken-ness", as defined by tio. The specific comminution energy table defines the amount of energy required to achieve varying levels of "broken-ness". The form of the specific comminution energy table reflects the fact that the energy required to achieve a certain degree of breakage is sometimes found to be dependent on the initial particle size.
Details of the crusher model including power prediction are described in Andersen and Napier-Munn (1988).
3.3 Limitations Experience to date demonstrates that the drop weight test is appropriate for brittle ores over a wide range of hardness. However, it is not useful for ores which undergo plastic deformation rather than brittle fracture, such as those of high clay content.
SGS Lakefield Research Job No. 10044-139 4

Drop Weight Test Report on SAG-1 Sample Shakespeare
The testing procedure is limited by the maximum particle size tested. If the ore is fractured or weaker at larger particle sizes, then JKSimMet simulations will be conservative.
For autogenous mills it is essential to have competent material in the range 150 mm to 100 mm in the feed to form the media. If autogenous milling is seriously contemplated, testing of media competency at larger particle sizes should be conducted. This can be achieved by drop weight testing, media competency testing or full pilot plant testing.
4 RESULTS
4.1 SAG/autogenous Mill Model Parameters Table 1 shows the SAG/autogenous mill model parameters the Shakespeare SAG-1 Sample. The tio/Ecs relationship for the sample is given in Figure 2.
Table 1 - SAG/autogenous mill parameters for Shakespeare SAG-1 Sample
Ore Source A b ta
Shakespeare SAG-1 100 0.22 0.23
1.5 2 2.5
Ecs (kWh/t)
Figure 2 - Tio/Ecs Relationship for Shakespeare SAG-1 Sample
SGS Lakefield Research Job No. 10044-139 52

Drop Weight Test Report on SAG-1 Sample Shakespeare
4.2 Crusher Model Parameters
Table 2 shows the crusher model parameters for the Shakespeare SAG-1 Sample
Table 2 - Crusher Model Parameters for Shakespeare SAG-1 Sample
Size Relative to Initial Size
t75 t2
tlO cumulative percent passing
10.0 3.2 3.9 5.6 21.6 52.4 20.0 6.3 7.8 11.3 43.7 85.8 30.0 9.7 11.9 17.2 63.9 100.0
Specific Comminution Energy:
tio
Initial Particle Size, mm
tio
14.53 20.63 28.89 41.08 57.78 tio Ecs, kWh/t 10 0.56 0.48 0.44 0.42 0.42" 20 1.19 1.02 0.93 0.88 0.88" 30 1.90 1.63 1.49 1.41 1.41"
** The Ecs values for 57.78 mm particles at t10 = 10, 20 and 30 are doubtful. Values from the next finest particle size have been substituted.
5 COMMENTS ON STANDARD DROP WEIGHT TEST RESULTS
5.1 Resistance to impact breakage One of the problems with the functional form used to represent the tio v Ecs relationship is that the parameters A and b are not independent and thus can not be used directly for comparisons between ore types. Two alternative parameters give a better comparison. These are the product A*b and the tio achieved by the application of 1.0 kWh/t of Specific Comminution Energy ( E c s ) . In each case, the smaller the number the greater the resistance to impact breakage. These values are given for the Shakespeare SAG-1 Sample in Table 3, which also includes values from the JKTech database of ores tested. The values for the Shakespeare SAG-1 Sample put that material in the very hard range of resistance to impact breakage. Only 2.8 % of the 1568 ore types in the JKTech data base have lower A*b values, while only 4.7% have lower values of tio@1kWh/t. The frequency distribution of the parameters A*b and tio@1kWh/t from the JKTech database of ores tested are given in Figure 3 and Figure 4 respectively.
SGS Lakefield Research Job No. 10044-139 53

Drop Weight Test Report on SAG-1 Sample Shakespeare
5.2 Resistance to abrasion breakage Resistance to abrasion is indicated by the ta parameter. As with parameter A*b, a smaller value of ta indicates more resistance, this time to abrasion breakage. With a ta of 0.23, the Shakespeare SAG-1 Sample falls into the very hard abrasion range compared with the other ore types in Table 3. Only 8.1 % of the 1688 ore types in the JKTech database have lower ta values. The frequency distribution of the ta parameter from the JKTech database of ores tested is given in Figure 5.
Table 3 - Parameter Interactions for Shakespeare SAG-1 Sample
Ore Type A * b tio @ Ecs = 1 kWh/t ta Value Rank % Value Rank % Value Rank %
Data Base Min (hardest) 13.2 1 0 7.9 1 0 0.05 1 0
Data Base Median 48.3 784 50 32.4 784 50 0.46 847 50
Data Base Mean 68.1 1108 71 34.8 900 57 0.65 1191 71
Data Base Max (softest) 809.6 1568 100 93.6 1568 100 5.78 1688 100 Shakespear
eBulk 2 2 . 0 4 4 2 . 8 1 9 . 7 7 3 4 . 7 0 . 2 3 1 3 7 8 . 1
SGS Lakefield Research Job No. 10044-139 54

Drop Weight Test Report on SAG-1 Sample Shakespeare
A X b - JKTech Database to August 2004
WW:.
Axb
Figure 3 - Frequency Distribution of A*b in the JKTech Database
t10 @ 1 kWh/t - JKTech Database to August 2004
t 1 0 @ 1 kWh/t
Figure 4 - Frequency Distribution of tio@1kWh/t in the JKTech Database
ta Values - JKTech Database to August 2004
Figure 5 - Frequency Distribution of ta in the JKTech Database
SGS Lakefield Research Job No. 10044-139 55

Drop Weight Test Report on SAG-1 Sample Shakespeare
5.3 Effect of Particle Size on Resistance to impact Variation of impact resistance with particle size is important in botli crusher power draw and SAG/autogenous mill media competency considerations. Some ores exhibit significant decrease in impact resistance with increasing particle size and others show no variation with size. The opposite trend of Increasing impact resistance with increasing particle size Is extremely rare.
The data In Table 2 Indicate that for particles up to 63 mm, some variation of impact resistance with particle size occurs.
The data presented In Figure 6 are the tio values for up to 3 different particle sizes for the Shakespeare SAG-1 Sample, all broken with the very similar specific comminution energies (0.25 kWh/t, 1.0 kWh/t and 2.5 kWh/t). These data follow the frequently observed trend of decreasing slope with decreasing energy (Ecs values). However, it Is both the slope and the absolute values of the low energy tio values that are of interest for SAG/autogenous milling as these data give an Indication of the ability of media particles to survive. If the trend of the tio values with increasing particle size is significantly upwards, it can be infen-ed by extrapolation that particles In the 100 - 200 mm size range (normal media size) will not be strong enough to survive. The same argument applies if the absolute values of tio at low energy are sufficiently high.
Shake SAG-1
s ?
100
90
80
70
60
50
40
30
20
10
0
• 0.25 • 1.0 A 2.5
y = 0.0397X + 3.3068
10 15 20 25 30 35 40
Particle Size (mm) 45 50 55 60
Figure 6 - Variation of Impact Resistance with Particle Size - Shakespeare SAG-1 Sample
SGS Lakefield Research Job No. 10044-139 56

Drop Weight Test Report on SAG-1 Sample Shakespeare
ORE DENSITY MEASUREMENT
6.1 Results
As part of the standard JKTech ore property assessment procedures, the relative density of 30 randomly selected particles in the size range 31.5 mm to 26.5 mm is determined by weighing each particle in water and in air. The results are given in Table 4 and shown graphically in Figure 7.
It should be noted that this method does not account for internal porosity in the particles tested. More accurate determination is available using a Helium Pycnometer.
6.2 Comments on Ore Density At the coarse particle size tested, It is normal to find a range of relative densities as the mineralogy of the particles varies. However, of great concern in SAG/autogenous milling is the possibility of a component in the ore which is both high density and resistant to breakage. Such material will concentrate in the load in a SAG/autogenous mill and result in higher than expected power draw.
The Shakespeare SAG-1 Sample data shows very little evidence of bimodality in the relative density distribution, that is, evidence of a dense component which could concentrate in the mill load and cause power problems. There is a very slight possibility of bimodal peaks at 2.7 and 3.7 SG, but these are very small and most of the data is tightly grouped around the mean of 3.05.
Shake SAG-1
(A O U t ra
0 .
2 0
18
1 6
14
12H
10
8H
6
4H
2
0 in c4 V
c v i r g n n n n m ^ ' ^ ^ ' ^ ^ i r i i r i v v v v v v v v v v v v v v
Relative Density (top of Range)
Figure 7 - Histogram of the Relative Density Measurements for 30 Particles Shakespeare SAG-1 Sample
SGS Lakefield Research Job No. 10044-139 10

Drop Weight Test Report on SAG-1 Sample Shakespeare
Table 4 - Relative Density l\/leasurements for 30 Particles - Shakespeare SAG-1 Sample
3.03 2.98 2.99 3.23 3.02 3.01 2.58 3.05 3.55 3.13 3.18 3.03 3.07 3.13 2.55 3.17 3.01 3.06 3.04 3.02 2.93 3.06 3.02 3.03 2.99 3.22 3.07 3.03 3.16 3.24
Mean 3.05 Standard Deviation 0.18 Maximum 3.55 Minimum 2.55
7 REFERENCES Andersen, J. and Napier-Munn, T.J., 1988. "Power Prediction for Cone Crushers",
Third Mill Operators' Conference, Aus.l.M.M (Cobar, NSW), May 1988, pp 103 -106.
Leung, K. 1987. "An Energy-Based Ore Specific Model for Autogenous and Semi-Autogenous Grinding Mills." Ph.D. Thesis. University of Queensland (unpublished).
Leung, K., Morrison, R.D. and Whiten, W.J., 1987. "An Energy Based Ore Specific Model for Autogenous and Semi-autogenous Grinding", Copper 87, Vina del Mar, Vol. 2, pp 71 - 86.
Morrell, S. 1996. "Power Draw of Wet Tumbling Mills and Its Relationship to Charge Dynamics - Parts I and II." Transaction Inst. Min. Metall. (Sect C: Mineral Process Extr. Metall.), 105, 1996, pp C43-C62.
SGS Lakefield Research Job No. 10044-139 11

Ursa Major Minerals Inc. - Shakespeare - 10044-139 iii
APPENDIX B:
JKTech Report
S G S Minerals Sei-\'ices

m JKMRC ^ ^ Technology Transfer
SMC TEST REPORT
on
Twenty Samples from the
Shakespeare Property
Tested at
SGS Lakefield Research Limited, Ontario, Canada
for
Ursa Major Minerals inc
JKTech Job No. 05007 - September 2005

JKMRC jfliiliiJ Technology Transfer
JKTech Pty Ltd
SMC TEST REPORT on
Twenty Samples from the
Shakespeare Property
JKTech Job No. 05007 - September 2005
Submitted to
Ursa Major Minerals Inc
Tested at SGS Lakefield Research Limited, Ontario, Canada

SMC Test Report on Twenty Samples from the Shakespeare Property Ursa Major Minerals Inc
TABLE OF CONTENTS
Page No
1 INTRODUCTION 1
2 THE SMC TEST 2
2.1 Introduction 2
2.2 Description of the SMC Procedure 2
2.2.1 General 2
2.2.2 Outline of the Procedure 2
2.3 Drop-Weight Index Results 3
3 DISCLAIMER 8
APPENDICES
Page No
APPENDIX A BACKGROUND TO THE SMC TEST 10
TABLE OF FIGURES
Page No
Figure 1 - Orientations of Pieces for Breakage 3
Figure 2 - Distribution of DWi Values in the SMC Test Database 5
Figure 3 - Frequency Distribution of A*b in the JKTech Database 7
Figure 4 - Frequency Distribution of t10@1kWh/t in the JKTech Database 7
TABLE OF TABLES
Page No
Table 1 - SMC Test Results 4
Table 2 - Derived Values for A*b and tlO at 1 kWh/t 6
JKTech Job No. 05007 2
SMC Test Report on Twenty Samples from the Shakespeare Property Ursa Major Minerals Inc
1 INTRODUCTION
SMC test data for twenty samples from the Shakespeare Property were received from SGS Lakefield Research Limited on October 4, 2005, by JKTech for data analysis. The samples were identified as the Shake SAG-1 sample, the SVMDC Series (11 samples) and the SVMLO Series (8 samples). The test results were forwarded to SMC Testing Pty Ltd for analysis. Analysis and reporting were completed on October 19, 2005.
JKTech Job No. 05007 10

SMC Test Report on Twenty Samples from the Shakespeare Property Ursa Major Minerals Inc
2 THE SMC TEST
2 . 1 INTRODUCTION
The standard JKTech drop-weight test provides ore specific parameters for use in the JKSimMet Mineral Processing Simulator software. In JKSimMet, these parameters are combined with equipment details and operating conditions to analyse and/or predict SAG/autogenous mil! performance. The same test procedure also provides ore type characterisation for the JKSimMet crusher model.
The SMC (SAG Mill Comminution) test was developed by Steve Morrell of SMC Testing Pty Ltd (SMCT) to provide a cost effective means of obtaining these parameters from drill core or in situations where limited quantities of material are available. The ore specific parameters have been calculated from the test results and are supplied to Ursa Major Minerals Inc in this report as part of the standard procedure.
2 . 2 DESCRIPTION OF THE S M C PROCEDURE
2.2.1 General
The SMC test is a precision test, which uses particles that are either cut from drill core using a diamond saw to achieve close size replication or else selected from crushed material so that particle mass variation is controlled within a prescribed range. The particles are then broken at a number of prescribed impact energies. The high degree of control imposed on both the size of particles and the energies used to break them, means that the test is largely free of the repeatability problems that plague tumbling mill rock characterisation tests. Such tests usually suffer from variations in feed size (which is not closely controlled) and energy input, often assumed to be constant when in reality it can be highly variable (Levin, 1989).
2.2.2 Outline of the Procedure
The test normally uses cut pieces of quartered (slivered) drill core. Whole core or half core can be used, but when received in this form it needs to be first quartered as a preliminary step in the procedure. Once quartered, any broken or tapered ends of the quartered lengths are cut, to square them off. Before the lengths of quartered core are cut to produce the pieces for the drop-weight testing, each one is weighed in air and then in water, to obtain a density measurement and a measure of its mass per unit length.
The test calls for a prescribed target volume for the core pieces, chosen so that their volume is equivalent to the mean volume of particles in one of the standard drop-weight test size fractions. The size fraction targeted depends on the original core diameter and the choice is made so as to ensure that pieces of the correct volume have "chunky" rather than "slabby" proportions.
Having measured the density of the core, the target volume can be translated into a target mass and with the average mass per unit length value also known, an average cutting interval can be determined for the core.
JKTech Job No. 05007 10

SMC Test Report on Twenty Samples from the Shakespeare Property Ursa Major Minerals Inc
Sufficient pieces of the quartered core are cut to generate 100 particles. These are divided into five groups of 20. Each group is then broken in the drop-weight tester at a different specific energy level. Within each group the three possible orientations of the particles are equally represented (as far as possible, given that there are 20 particles). The orientations prescribed for testing are shown in Figure 1.
Figure 1 - Orientations of Pieces for Breakage
The rest height of the drop-head (gap) is recorded for each particle. After breaking all 20 particles in a group, the broken product is sieved at a sieve size that is one tenth of the original particle size. Thus the percent passing mass gives a direct reading of the t10 value at that energy level.
If only bulk sample is available or if the core is too friable for cutting, then the particle selection method is used. In this case, particles are selected so that their individual masses lie within ±30% of the target mass and the mean mass for each set of 20 lies within ±10% of the target mass. This method is also normally used for cores with diameters exceeding 70 mm, where the particle masses are too large to achieve the highest prescribed energy level.
2.3 DROP-WEIGHT INDEX RESULTS
The results of the SMC tests on the twenty samples from the Shakespeare Property are given in Table 1. This table includes the average rock density and the drop-weight index that is the direct result of the test procedure. It also includes the derived estimates of parameters A and b.
In the case of the twenty samples from the Shakespeare Property, the A and b estimates are based on the results of full drop-weight testing on similar ore (Shake SAG-1). The full drop-weight test results were used to calibrate the DWi versus A and b correlations.
JKTech Job No. 05007 10

SMC Test Report on Twenty Samples from the Shakespeare Property Ursa Major Minerals Inc
Table 1 - SMC Test Results
SG SlUC SIViC Test
Sample Designation SG Test Derived Vaiues
Dwi A b
Shake SAG-1 3.02 11.7 100.0 0.23 SVMDC-1 3.01 11.0 66.5 0.37 SVMDC-2 2.99 10.8 66.6 0.37 SVMDC-3 3.04 11.5 59.8 0.40 SVMDC-4 3.03 9.9 52.4 0.52 SVMDC-5 3.02 11.2 74.7 0.32 SVMDC-6 3.03 12.9 76.1 0.28 SVMDC-7 2.97 10.1 63.2 0.41 SVMDC-8 3.04 13.1 100.0 0.21 SVMDC-9 3.03 11.8 82.4 0.28
SVMDC-10 3.00 13.6 100.0 0.20 SVIWDC-11 2.85 12.2 100.0 0.21 SVMLO-1 3.10 9.5 84.3 0.34 SVMLO-2 3.06 9.9 81.8 0.34 SVMLO-3 3.01 10.5 60.6 0.42 SVMLO-4 2.97 10.2 70.9 0.37 SViWLO-5 3.00 11.7 80.8 0.28 SVMLO-6 3.22 8.5 72.9 0.47 SVMLO-7 3.00 8.8 50.9 0.60 SVMLO-8 3.00 10.8 74.9 0.33
For the entire population of roci< samples so far tested, the majority of DWi values lie in the range 2 to 12, soft ores being at the low end of the scale and hard ores at the high end. The DWi results for the twenty samples from the Shakespeare Property ranged from 8.5 to 13.6 giving an average of 11.0. This places them at the very hard end of the DWi range. A histogram of DWi values from the SMCT database is shown in Figure 2 for comparison.
JKTech Job No. 05007 10

SMC Test Report on Twenty Samples from the Shakespeare Property Ursa Major Minerals Inc
Figure 2 - Distribution of DWi Values in the SMC Test Database
The value of A*b, which is also a measure of resistance to impact breakage, is calculated and presented in Table 2 along with indicators of how each A*b value compares with the accumulated values in the JKTech database (from full drop-weight testing). These indicators are the Category (eg "soft" etc), the Rank (how many out of 1568 recordings in database are harder) and the % of database values that are harder. Note that in contrast to the DWi, a high value of A*b means that an ore is soft whilst a low value means that it is hard.
JKTech Job No. 05007 10

SMC Test Report on Twenty Samples from the Shakespeare Property Ursa Major Minerals Inc
Table 2 - Derived Values for A*b and t10 at 1 kWh/t
Sample Designation A*b t io @ 1 kWh/t
Sample Designation
Value Category Rank % Value Category Rank %
Shake SAG-1 23.0 very hard 53 3.4% 20.5 very hard 108 6.9% SVMDC-1 24.6 very hard 72 4.6% 20.6 very hard 108 6.9% SVMDC-2 24.7 very hard 73 4.7% 20.6 very hard 109 7.0% SVMDC-3 23.9 very hard 64 4.1% 19.7 very hard 84 5.4% SVMDC-4 27.3 very hard 126 8.0% 21.3 very hard 135 8.6% SVMDC-5 23.9 very hard 64 4.1% 20.4 very hard 105 6.7% SVMDC-6 21.3 very hard 34 2.2% 18.6 very hard 59 3.8% SVMDC-7 25.9 very hard 96 6.1% 21.2 very hard 134 8.5% SVMDC-8 21.0 very hard 32 2.0% 18.9 very hard 71 4.5% SVMDC-9 23.1 very hard 54 3.4% 20.1 very hard 94 6.0% SVMDC-10 20.0 very hard 26 1.7% 18.1 very hard 50 3.2% SVMDC-11 21.0 very hard 32 2.0% 18.9 very hard 71 4.5% SVMLO-1 28.7 hard 164 10.5% 24.3 hard 276 17.6% S V M L a 2 27.8 very hard 136 8.7% 23.6 hard 239 15.2% SVMLO-3 25.4 very hard 87 5.5% 20.8 very hard 115 7.3% SVMLO-4 26.2 very hard 104 6.6% 21.9 very hard 153 9.8% SVMLO-5 22.6 very hard 50 3.2% 19.7 very hard 85 5.4% SVMLO-6 34.2 hard 353 22.5% 27.3 hard 458 29.2% SVMLO-7 30.6 hard 211 13.5% 23.0 hard 208 13.3% SVMLO-8 24.7 very hard 74 4.7% 21.1 very hard 129 8.2%
The calculated value of tio at an Ecs of 1 kWh/t is also shown in Table 2. This is again accompanied by Category, Rank and the % of values in the database that are harder, so each can be seen against the yard-stick of all other samples in the JKTech database.
The derived A*b values range from 20.0 to 34.2 giving an average of 25.0, while the tio at 1 kWh/t values ranged from 18.1 to 27.3 giving an average of 21.0.
In Figure 3 and Figure 4 below, histogram style frequency distributions for the A*b values and for the tio at 1 kWh/t values in the JKTech database are shown respectively.
JKTech Job No. 05007 10

SMC Test Report on Twenty Samples from the Shakespeare Property Ursa Major Minerals Inc
A X b - JKTech Database to August 2004
200 T — - -
> o c 0) 3 o-0>
CM C\J Axb
Figure 3 - Frequency Distribution of A*b in the JKTech Database
t10 @ 1 kWh/t - JKTech Database to August 2004
^ 100 c 0) u-9>
t10@1 kWh/t
Figure 4 - Frequency Distribution of t10@1kWh/t in the JKTech Database
JKTech Job No. 05007 10

SMC Test Report on Twenty Samples from the Shakespeare Property Ursa Major Minerals Inc
3 DISCLAIMER
All JKTech Pty Ltd reports are subject to a standard disclaimer as follows:
1. JKTech Pty Ltd and University staff operating with JKTech Pty Ltd make reasonable efforts to ensure an accurate understanding of client requirements. The information in this report is based on that understanding and JKTech Pty Ltd strives to be accurate in its advice.
2. While reasonable care has been taken in the preparation of this report/proposal, this report/proposal and all information, assumptions, and recommendations herein are published, given, made, or expressed without any responsibility whatsoever on the part of JKTech Pty Ltd, whether arising by way of negligence, breach of contract, breach of statutory duty or otherwise.
3. No warranty or representation of accuracy or reliability in respect of the report/proposal is given by JKTech Pty Ltd or its directors, employees, servants, agents, consultants, successors in title and assigns.
4. If liability is not, by law, capable of exclusion, then JKTech Pty Ltd accepts liability to the minimum level set by that law.
5. This disclaimer shall apply to liability to any person whatsoever, irrespective of how such liability arises, whether by use of this report/proposal by that person or you or any other person or otherwise.
6. JKTech Pty Ltd is not responsible in any way whatsoever for the error neglect or default of others upon whom it has placed reliance in the preparation of this report/proposal.
7. You shall indemnify JKTech Pty Ltd and its directors, employees, servants, agents, consultants, successors in title and assigns against any claim made against any or all of them by third parties arising out of the disclosure of the report/proposal, whether directly or indirectly, to a third party.
JKTech Job No. 05007 10

SMC Test Report on Twenty Samples from the Shakespeare Property Ursa Major Minerals Inc
APPENDICES
JKTech Job No. 05007 10
SMC Test Report on Twenty Samples from the Shakespeare Property Ursa Major Minerals Inc
APPENDIX A BACKGROUND TO THE SMC TEST
A 1 H o w THE S M C TEST RESULTS ARE USED
The SMC test generates a relationship between specific input energy (l<Wh/t) and the percent of broken product passing a specified sieve size. The results are used to determine the drop-weight index (DWi), which is a measure of the strength of the rock when broken under impact conditions. The DWi is directly related to the JK rock breakage parameters A and b and hence can be used to estimate the values of these parameters.
Provision of a relatively low cost method of estimating the A and b parameters opens the possibility of incorporating these data into mine and mill planning operations. However a number of full drop-weight tests is still recommended for any particular orebody, to ensure that an accurate correlation between the DWi and the A and b parameters is available. The number of full drop-weight tests required for a given orebody will depend on its variablity and should at least cover the major recognised ore types.
The A and b parameters are used in AG/SAG mill models, such as those in JKSimMet, for predicting how the rock will break inside the mill. From this description the models can predict what the throughput, power draw and product size distribution will be (Napier-Munn et al (1996)). Modelling also enables a detailed flowsheet to be built up of the comminution circuit response to changes in ore type. It also allows optimisation strategies to be developed to overcome any deleterious changes in circuit performance predicted from differences in ore type when such changes are indicated by the SMC test. These strategies can include both changes to how mills are operated (eg ball load, speed etc) and changes to feed size distribution through modification of blasting practices and primary crusher operation (mine-to-mill).
The mine to mill models require information on rock mass competence such as provided by the point load index. The DWi is correlated with the point load index and hence can also be used in blast fragmentation modelling where direct measurements of point load index are not available.
The DWi is related to the resistance of a rock to breakage under impact. SMCT has developed a series of equations that relate the DWi to the specific energy (kWh/t) requirements of complete AG and SAG mill circuits. These equations take into consideration factors such as ball charge, feed size, aspect ratio, whether the mill is operated with or without a pebble crusher and whether it is closed with a fine classifier such as a cyclone. The ability of these equations to predict AG/SAG mill circuit specific energy is illustrated in App. Fig. 1. The data shown cover 19 different operations and include Cu, Au, Ni and Pb/Zn ores.
JKTech Job No. 05007 10

SMC Test Report on Twenty Samples from the Shakespeare Property Ursa Major Minerals Inc
16
14
12
1 10
•a V 8 S
8
8 6
A
2
0 r i I —
6 8 10 Pred cted kWWt
O wihom pebbe crusher » wth pebble caishe'
App. Fig. 1 - Mill Power Prediction Based on DWi
It should be noted that the parameter ta, which is the parameter representing the low energy abrasion component of breakage, is not yielded by the SMC test. This parameter is derived from a tumbling test that is carried out as part of the full drop-weight test. The fact that it is also required as an input to the JKSimMet SAG/AG models provides a further reason for ensuring that some full drop-weight tests are also performed to represent at least the main rock types of an orebody.
A 2 IMPACT COMMINUTION THEORY
When a rock fragment is broken, the degree of breakage can be characterised by the "tlO" parameter. The t10 value is the percentage of the original rock mass that passes a screen aperture one tenth of the original rock fragment size. This parameter allows the degree of breakage to be compared across different starting sizes.
The specific comminution energy (Ecs) has the units kWh/t and is the energy applied during impact breakage. As the impact energy is varied, so does the tlO value vary in response. Higher impact energies produce higher values of tlO, which of course means products with finer size distributions.
The equation describing the relationship between the t10 and Ecs is given below.
tlO = A ( 1 - e -b .Ecs )
As can be seen from this equation, there are two rock breakage parameters A and b that relate the t10 (size distribution index) to the applied specific energy (Ecs). These parameters are ore specific and are normally determined from a full drop-weight test.
A typical plot of t10 vs Ecs from a drop-weight test is shown in App. Fig. 2. The relationship is characterised by the two-parameter equation above, where t10 is the dependent variable.
JKTech Job No. 05007 10

SMC Test Report on Twenty Samples from the Shakespeare Property Ursa Major Minerals Inc
60
50 •
40 •
? 30
20
10 -I
0 0 0.5 1 1.5 2
fccs (kWM)
2.5
• 57.8mm «41.1mm A28.9mm X20.6mm • 14.5mm
App. Fig. 2 - Typical t10 v Ecs Plot
The t10 can be thought of as a "fineness index" with larger values of t10 indicating a finer product size distribution. The value of parameter A is the limiting value of t10. This limit indicates that at higher energies, little additional size reduction occurs as the Ecs is increased beyond a certain value. A*b is the slope of the curve at 'zero' input energy and is generally regarded as an indication of the strength of the rock, lower values indicating a higher strength.
The A and b parameters can also be used with equation 1 to generate a table of Ecs values, given a range of t lO values. Such a table is used in crusher modelling to predict the power requirement of the crusher given a feed and a product size specification.
The DWi can be used to estimate the JK rock breakage parameters A and b by utilizing the fact that there is usually a pronounced (and ore specific) trend to decreasing rock strength with increasing particle size. This trend is illustrated in App. Fig. 3, which shows a plot of A*b versus particle size for three different rock types.
JKTech Job No. 05007 10

SMC Test Report on Twenty Samples from the Shakespeare Property Ursa Major Minerals Inc
120
100
80
ê 60
40
20
0
10 20 30 40
size (mm)
50 60 70
-oretypel - ^ o r e t y p e 2 —*-oretype3 -mean » ore type 6 - oretype? o ore type 8
oretype 4 * oretype 5 j
App. Fig. 3 - Size Dependence of A*b for a Range of Ore Types
In the case of a conventional drop-weight test these values are effectively averaged and a mean value of A and b is reported. The SMC test uses a single size and makes use of relationships such as that shown in App. Fig. 3 to predict the A and b of the particle size that has the same value as the mean for a full drop-weight test.
An example of this is illustrated in App. Fig. 4 where the observed values of the product A*b are plotted against those predicted using the DWi. Each of the data points in App. Fig. 4 is a result from a different ore type within an orebody.
Observea A'b
App. Fig. 4 - Predicted v Observed A*b
JKTech Job No. 05007 10

Ursa Major Minerals Inc. - Shakespeare - 10044-139
APPENDIX C:
MacPherson Grindability Tests Details
SGS Minerals Services

MacPherson Autogenous Grindability Tests
Description of the Aerofall Test Mill The Aerofall test mill, as shown in the attached figure, consists of an 18 inch diameter mill as a crushing and grinding unit, a draft fan to supply the airflow required to remove the ground material from the mill, and a collection system to recover the ground material from the airstream.
The Aerofall mill consists of a cylindrical steel shell 18 inch in diameter by 10 1/2 inch long and is fitted with axially-mounted hollow steel trunnions on ball bearings in the bearing housings. The mill ends are lined with deflector-shaped steel liners, while 18 impact bars, or rails, line the breast. The mill is driven at 52 rpm or 83% of critical speed by a 1/2 HP motor.
Six peripheral discharge ports for discharge of a coarse product, if desired, are cut into the mill shell and are located on the discharge side below the deflector liners.
The draft fan is a Sheldon's 1203-B "PH" blower fitted with a variable-speed drive and gives a range of airflow capacities up to 180 cu ft/min.
The collection equipment located between the mill and the draft fan are:
1. An 8 inch diameter Model V2 Vertical Classifier used as a coarse primary collector. The collected product is discharged continuously through a discharge trap sealed by a rubber flap.
2. A 9 inch diameter 6B cyclone used as a fine-product collector and fitted with a double-flap discharge trap for the continuous discharge of the collected product.
3. A CD-I Pangbom dust collector used for collecting fine dust and fitted with a manually-operated valve for the intermittent discharge of the collected product.
The mill is fed fi-om a feed hopper by a 4 inch wide by 10 inch long Syntron feeder actuated automatically by a Milltronics Limited feed rate control system. This control continuously regulates the feed rate by maintaining a preset sound level with a microphone located below the mill shell and therefore controls mill load level.
Net mill power is calculated according to the relationship established by prony brake tests:
Net Watts = 0.682 (3.2 - 3 x Lf) (Lf) (D) where D = density of the total mill load, Ib/cu ft and Lf = fi^ctional filling of the mill
In practice, the mill is operated under a given set of conditions for a period of time sufficient to establish balanced mill conditions. The feed rate is controlled automatically, and output and product distributions are established by weighing the collected products at regular timed intervals. Samples are taken normally over a one- or two-hour period and at regular timed intervals.

M A C P H E R S O N TESTING 18" MILL TEST CIRCUIT
Feed
Storage Bin
Vertical Cyclone Classifier
a
Vibrat ing Screen (14 Mesh)
Screen Undersize
Cyclone Underf low
Product
Draf t Fan
Baghouse ^^ ® Filter
->c
- a
Filter Product
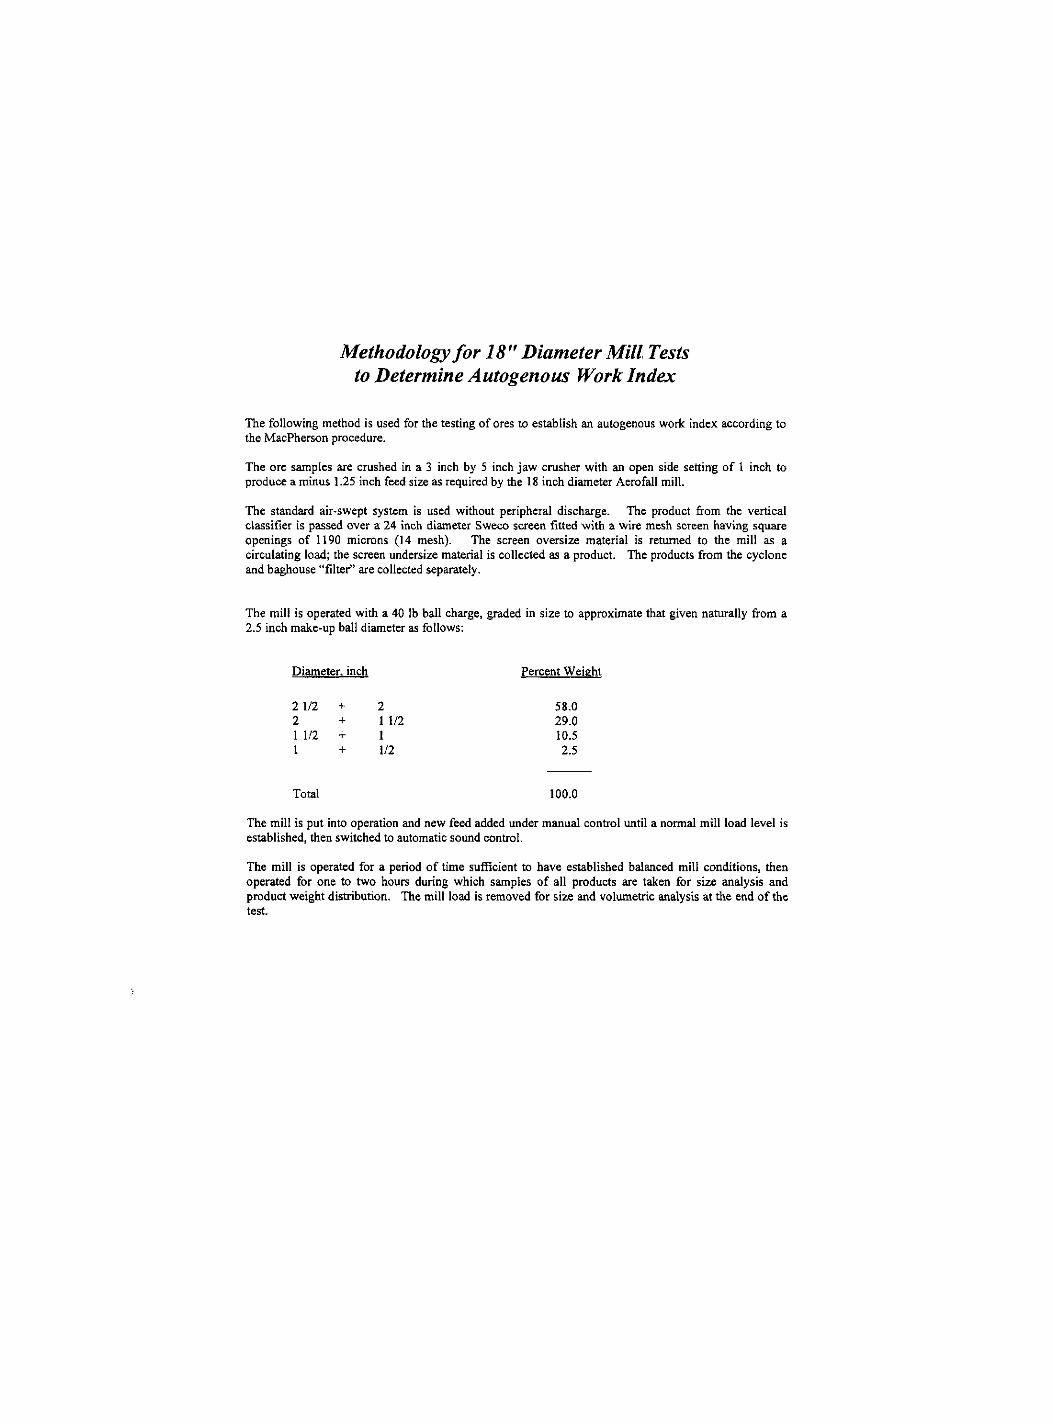
Methodology for 18" Diameter Mill Tests to Determine Autogenous Work Index
The following method is used for the testing of ores to establish an autogenous work index according to the MacPherson procedure.
The ore samples are crushed in a 3 inch by 5 inch jaw crusher with an open side setting of 1 inch to produce a minus 1.25 inch feed size as required by the 18 inch diameter Aerofall mill.
The standard air-swept system is used without peripheral discharge. The product from the vertical classifier is passed over a 24 inch diameter Sweco screen fitted with a wire mesh screen having square openings of 1190 microns (14 mesh). The screen oversize material is returned to the mill as a circulating load; the screen undersize material is collected as a product. The products from the cyclone and baghouse "filter" are collected separately.
The mill is operated with a 40 lb ball charge, graded in size to approximate that given naturally from a 2.5 inch make-up ball diameter as follows:
Diameter, inch Percent Weight
2 1/2 + 2 58.0 2 + 1 1/2 29.0 1 1/2 + 1 10.5 1 + 1/2 2.5
Total 100.0
The mill is put into operation and new feed added under manual control until a normal mill load level is established, then switched to automatic sound control.
The mill is operated for a period of time sufficient to have established balanced mill conditions, then operated for one to two hours during which samples of all products are taken for size analysis and product weight distribution. The mill load is removed for size and volumetric analysis at the end of the test.

Appendix C Standard MacPherson Grindability Test
Date: Project No:
Test No:
Aug-05 10044-139
Shake SAG-1
Purpose: To determine the autogenous work index for the sample provided in accordance with the procedure described as the MacPherson system.
Procedure: Standard MacPherson test methodology. The sample was stage crushed to 100 % minus 1.25 inch.
Sample: Client Identified: Ursa Major Minerals Inc. Sample Number: 1
Results: Mill Products at Steady State
Mill Product Minus 14 Mesh Undersize Cyclone Underflow Baghouse (Filter) Feed (computed)
Weight % 7.7
88.0 4.3
100.0
Plus 14 Mesh Oversize mill recirculating load
0.9
Power Calculations and Summary Data
Mill Charge Data Ore Charge (Bulk Density)
J c ^ cm 16.6 9162.7
cc 1.81
Total Charge (Bulk Density) cm
34.7 12370
Specific Gravity, Feed" Specific Gravity, Charge* ** by pycnometei
JA cc 2.81
Test Results
3.15 g/cc 3.07 g/cc
AW,, Gross • AWb Gross •
Mill Output, Gross Mill Output, Net Mill Power Draw Power Consumed, Gross Power Consumed, Net Plus 14 Mesh in Feed ^80 Pso
6.71 kg/h 6.03 kg/h
83.31 W 12.42 kWh/mt 13.84 kWh/mt 89.76 %
22,225 microns 174 microns
AW^(kWh/st) = Power Consumed (kWh/st)
10 10
16.3 kWh/st 18.0 kWh/mt
C-1

Appendix C Standard MacPherson Grindability Test
Date: Project No:
Test No:
Aug-05 10044-139
Shake SAG-1
Particle Size Distribution Summary
Screen Size (Retained) Individual Product Weight Distribution, % Total Mill Product, %
Tyler Mill Mill Screen Products Cyclone Bag House Direct Cumulative Mesh Microns Feed Charge +14 M - 1 4 M Underflow (Filter) Weight % Passing
1-1/4 in 31,500 0.0 0.0 1 25,000 12.7 6.3
3/4 19,000 13.3 26.9 1/2 12,700 12.0 18.3
3/8 9,525 12.7 8.0 1/4 6,350 12.7 10.4
4 mesh 4,750 8.8 5.8 30.4 6 3,350 7.0 6.1 11.4 8 2,350 4.6 4.5 11.5
10 1,700 3.2 3.1 15.7 14 1,180 2.7 2.7 25.4 0.0 0.0 0.0 0.0 100.0 20 850 1.9 1.8 4.7 3.0 0.0 0.0 0.2 99.8 28 600 1.7 1.7 0.2 5.5 0.0 0.0 0.4 99.4 35 425 1.1 1.5 0.0 14.5 0.1 0.0 1.2 98.1 48 300 1.0 1.2 0.2 37.3 1.8 0.5 4.4 93.7 65 212 0.9 0.8 0.0 25.1 7.3 1.1 8.4 85.3
100 150 0.7 0.5 0.0 10.0 10.0 2.6 9.6 75.6 150 106 0.5 0.3 0.0 3.4 11.2 4.3 10.3 65.3 200 75 0.6 0.2 0.0 0.7 13.0 3.9 11.6 53.7 270 53 0.5 0.0 0.0 0.1 10.0 3.6 8.9 44.7 400 38 0.5 0.0 0.0 0.0 9.4 2.6 8.4 36.4
-400 -38 0.9 0.1 0.5 0.4 37.3 81.5 36.4 0.0 Totals: 100.0 100.0 100.0 100.0 100.0 100.0 100.0
C-2

Appendix C Standard MacPherson Grindability Test
Date: Project No:
Test No:
Aug-05 10044-139
Shake SAG-1
Mill Feed Particle Size Analysis
Screen Size Mill Feed Total (Retained) Mill Feed, + 1/4 in Mill Feed, - 1/4 in
Tyler Direct Cximulative Wt. % Mesh Microns kg Wt. % g Wt. % Wt. % Passing Retained
1-1/4 in 31,500 0.0 0.0 0.0 100.0 0.0 1 25,000 24.1 12.7 12.7 87.3 12.7
3/4 19,000 25.3 13.3 13.3 74.0 26.0 1/2 12,700 22.8 12.0 12.0 62.0 38.0
3/8 9,525 24.1 12.7 12.7 49.3 50.7 1/4 6,350 24.1 12.7 12.7 36.6 63.4
-1/4 -6,350 69.5 36.6 Totals: 190.0 100.0
4 mesh 4,750 258.0 24.0 8.8 27.8 72.2 6 3,350 205.9 19.2 7.0 20.8 79.2 8 2,350 135.2 12.6 4.6 16.2 83.8
10 1,700 95.0 8.8 3.2 13.0 87.0 14 1,180 80.1 7.5 2.7 10.2 89.8 20 850 55.0 5.1 1.9 8.4 91.6 28 600 49.1 4.6 1.7 6.7 93.3 35 425 31.9 3.0 1.1 5.6 94.4 48 300 28.4 2.6 1.0 4.7 95.3 65 212 25.5 2.4 0.9 3.8 96.2
100 150 20.6 1.9 0.7 3.1 96.9 150 106 15.6 1.5 0.5 2.6 97.4 200 75 18.8 1.7 0.6 1.9 98.1 270 53 16.1 1.5 0.5 1.4 98.6 400 38 13.8 1.3 0.5 0.9 99.1
-400 -38 26.3 2.4 0.9 0.0 100.0 Totals: 1,075.2 100.0 100.0
C-3

Appendix C Standard MacPherson Grindability Test
Date: Project No:
Test No:
Aug-05 10044-139
Shake SAG-1
Mill Charge Particle Size Analysis
Screen Size (Retained) Mill Charge, + 1/4 in Mill Charge, - 1 / 4 in
Mill Charge Total
Tyler Mesh Microns kg Wt. % g Wt. %
Direct Wt. %
Cumulative Wt. % Passing Retained
1-1/4 in 31,500 0.0 0.0 0.0 100.0 0.0 1 25,000 1.0 6.3 6.3 93.7 6.3
3/4 19,000 4.5 26.9 26.9 66.8 33.2 1/2 12,700 3.0 18.3 18.3 48.6 51.4 3/8 9,525 1.3 8.0 8.0 40.6 59.4 1/4 6,350 1.7 10.4 10.4 30.1 69.9
-1/4 -6,350 5.0 30.1 Totals: 16.6 100.0
4 mesh 4,750 257.4 19.3 5.8 24.3 75.7 6 3,350 267.8 20.1 6.1 18.3 81.7 8 2,350 200.6 15.0 4.5 13.7 86.3 10 1,700 136.1 10.2 3.1 10.7 89.3 14 1,180 119.6 9.0 2.7 7.9 92.1 20 850 77.8 5.8 1.8 6.2 93.8 28 600 75.1 5.6 1.7 4.5 95.5 35 425 64.2 4.8 1.5 3.0 97.0 48 300 54.2 4.1 1.2 1.8 98.2 65 212 34.5 2.6 0.8 1.0 99.0 100 150 20.5 1.5 0.5 0.6 99.4 150 106 12.5 0.9 0.3 0.3 99.7 200 75 6.7 0.5 0.2 0.1 99.9 270 53 2.1 0.2 0.0 0.1 99.9 400 38 1.1 0.1 0.0 0.1 99.9 -400 -38 2.9 0.2 0.1 0.0 100.0
Totals: 1,333.1 100.0 100.0
C-4

Appendix C Standard MacPherson Grindability Test
Date: Project No:
Test No:
Aug-05 10044-139
Shake SAG-1
Mill Product Data
Screen Size Screen Oversize Screen Undersize Cyclone Underflow Bag House (Filter) Microns g Wt. % g Wt. % g Wt. % g Wt. % 4,750 18.2 30.4 0.0 0.0 0.0 0.0 0.0 0.0 3,350 6.8 11.4 0.0 0.0 0.0 0.0 0.0 0.0 2,350 6.9 11.5 0.0 0.0 0.0 0.0 0.0 0.0 1,700 9.4 15.7 0.0 0.0 0.0 0.0 0.0 0.0 1,180 15.2 25.4 0.0 0.0 0.0 0.0 0.0 0.0
850 2.8 4.7 7.8 3.0 0.0 0.0 0.0 0.0 600 0.1 0.2 14.2 5.5 0.0 0.0 0.0 0.0 425 0.0 0.0 37.7 14.5 0.2 0.1 0.0 0.0 300 0.1 0.2 96.8 37.3 2.7 1.8 0.7 0.5 212 0.0 0.0 65.3 25.1 11.2 7.3 1.5 1.1 150 0.0 0.0 26.0 10.0 15.2 10.0 3.7 2.6 106 0.0 0.0 8.9 3.4 17.1 11.2 6.0 4.3 75 0.0 0.0 1.8 0.7 19.8 13.0 5.4 3.9 53 0.0 0.0 0.2 0.1 15.2 10.0 5.0 3.6 38 0.0 0.0 0.0 0.0 14.3 9.4 3.6 2.6
-38 0.3 0.5 1.1 0.4 56.9 37.3 114.2 81.5 Totals: 59.8 100.0 259.8 100.0 152.6 100.0 140.1 100.0
C-5

Appendix C Standard MacPherson Grindability Test
Date: Project No:
Test No:
Aug-05 10044-139
Shake SAG-1
Cumulative % Passing -vs- Particle Size
100
90
80
70
60 00 £ CO p.,
f 50 ea
S 3 u
40
30
20
10
0
- A - M i l l Feed
- ^ M i l l Charge
Mill Product
10 100 1,000 10,000
Particle Size (microns)
100,000
C-6

Appendix C Standard MacPherson Grindability Test
Date: Project No:
Test No:
Aug-05 10044-139
Shake SAG-1
Purpose: To determine the specific gravity by water displacement for the pebbles in the 18 inch SAG Mill charge.
Results: Plus 1 inch Number Weight Volume Specific Gravity g ml g/cc
1 33.7 10.8 3.12 2 26.7 8.9 3.00 3 48.5 16.4 2.96 4 40.7 13.6 2.99 5 36.0 12.0 3.00 6 39.0 12.9 3.02
Average 3.01 Plus 3/4 inch Number Weight Volimie Specific Gravity
g ml g/cc 1 24.9 8.5 2.93 2 28.7 9.5 3.02 3 28.8 9.3 3.10 4 21.8 7.4 2.95 5 21.7 7.0 3.10 6 30.5 10.3 2.96
Average 3.01 Plus 1/2 inch Number Weight Volume Specific Gravity
g ml g/cc 1 10.2 3.4 3.00 2 8.1 2.9 2.79 3 12.0 4.1 2.93 4 15.6 5.4 2.89 5 11.8 3.9 3.03 6 11.8 3.9 3.03
Average 2.94 Total Overall Average 3.00
C-7

Pictures of MacPherson Mill Charge (+1", +3/4", +3/8", +1/2", +1/4"), and Mill Feed of the Shake SAG-1 sample.

Ursa Major Minerals Inc. - Shakespeare - 10044-139
APPENDIXD:
Bond Rod Mill Grindability Test Details
SGS Minerals Services

SGS LAKEFIELD RESEARCH
Standard Bond Rod Mill Grindability Test
Project No.:
Sample.:
Purpose:
Procedure:
10044-139 Product: Minus 1/2 inch
Shake SAG-1
Date: Sept. 6, 2005
To determine the rod mill grindability of the sample m terms of a Bond work index number
The equipment and procedure duplicate the Bond method for determining rod mill work indices
Test Conditions: Mesh of grind: 14 mesh Test feed weight (1250 mL); 2178 grams Weight % of the undersize material in the rod mill feed 13.2 % Weight of undersize product for 100% circulating load 1089 grams
Results: Average for Last Three Stages = 7.54g. 99% Circulation load
CALCULATION OF A BOND WORK INDEX
R W I = 62
PI = 100% passing size of the product Grp = Grams per revolution P80 = 80% passing size of product F80 = 80% passing size of the feed
1180 microns 7.54 grams 893 microns
9619 microns
RWI= 14.8 kWh/ton (imperial)
RWI= 163 kWh/ton (metric)
Shake s AG-1 Results updated 09/28/2005
SGS Lakefield Research Limited CONFIDEI^TIAL Page 1 of 3

indability Test Data Project No.: 10044-139 Test No.: Shake S AG-1
Undersize U'Size Undersize Product Stage New In To Be In Per Mill No. Revs Feed Feed Ground Product Total Rev
(grams) (grams) (grams) (grams) (grams) (grams) 1 50 2,178 289 800 525 236 4.73 2 180 525 70 1,019 1,188 1,118 6.21 3 150 1,188 157 932 1,248 1,091 7.27 4 127 1,248 165 924 1,100 935 7.36 5 128 1,100 146 943 1,098 952 7.44 6 127 1,098 145 944 1113 968 7.62 7 124 1,113 147 942 1047 900 7.25 8 131 1,047 139 950 1128 989 7.55 9 124 1,128 149 940 1091 942 7.59 10 124 1,091 145 944 1070 925 7.46
Average for Last Three Stages = 1096g. 7.54g.
FeedKSO Size Weight % Retained % Passing
Mesh Hm grams Individual Cumulative Cumulative
1/2 12,700 0.0 0.0 0.0 100.0 7/16 11,200 124.3 10.0 10.0 90.0 3/8 9,500 133.1 10.7 20.8 79.2 3 6,700 366.3 29.6 50.3 49.7 4 4,750 180.7 14.6 64.9 35.1 6 3,350 103.5 8.4 73.2 26.8 8 2,360 70.2 5.7 78.9 21.1 10 1,700 50.4 4.1 83.0 17.0 14 1,180 46.8 3.8 86.8 13.2 20 850 26.9 2.2 88.9 11.1 28 600 24.9 2.0 90.9 9.1
Pan -600 112.4 9.1 100.0 0.0 Total - 1239.5 100.0 - -
K80 9,619
iK80 Size Weight % Retained % Passing
Mesh Hm grams Individual Ciunulative Cumulative
18 1,000 42.5 13.3 13.3 86.7 20 850 30.6 9.5 22.8 77.2 28 600 52.7 16.4 39.3 60.7 35 425 37.7 11.8 51.0 49.0 48 300 27.8 8.7 59.7 40.3 65 212 20.4 6.4 66.1 33.9 100 150 15.6 4.9 70.9 29.1 Pan -150 93.2 29.1 100.0 0.0
Total - 320.5 100.0 - -
K80 893
Shake SAG-1 Results updated 09/28/2005
SGS Lakefield Research Limited CONFIDENTIAL Page 2 of 3

Project No.: 10044-139 Test No.: Shake S AG-1
100
90
80
70
S 60 « eu
« 50
I 40 O
30
20
10
100
Particle Size Distribution
Jr T
/ i
i
I
-•-Feed Product
1,000 10,000 S c r e e n S i z e ( m i c r o m e t e r s )
100,000
Shake s AG-1 Results updated 09/23/2005
SGS Lakefield Research Limited CONFIDENTIAL Page 3 of 3

Ursa Major Minerals Inc. - Shakespeare - 10044-139
APPENDIXE:
Bond Ball Mill Grindability Test Details
SGS Minerals Services

SGS LAKEFIELD RESEARCH
Standard Bond Ball Mill Grindability Test
Project No.: 10044-139 Product: Minus 6 Mesh Date: Sept. 08, 2005
Sample.: Shake SAG-1
Purpose: To determine the ball mill grindability of the sample in terms of a Bond work index number
Procedure: The equipment and procedure duplicate the Bond method for determining ball mill work indices
Test Conditions: Mesh of grind: 150 mesh Test feed weight (700 mL) 1349 grams Equivalent to : 1927 kg/m' at Minus 6 mesh Weight % of the undersize material in the ball mill feed 13.5 % Weight of undersize product for 250% circulating load 385 grams
Results: Average for Last Three Stages = 1.52g. 249% Circulation load
CALCULATION OF A BOND WORK DsIDEX
BW[ = 44.5
P f ^ x X {10 10 1
PI = 100% passing size of the product 106 microns Grp - Grams per revolution 1.52 grams P80 = 80% passing size of product 84 microns F80 = 80% passing size of the feed 1904 microns
BWI = 12.5 (imperial)
BWI = 13.8 (metric)

indability Test Data Project No.: 10044-139 Test No.: Shake SAG-1
Undersize U'Size Undersize Product Stage New In To Be In Per Mill
No. Revs Feed Feed Ground Product Total Rev (grams) (grams) (grams) (grams) (grams) (grams)
1 150 1,349 182 204 421 239 1.60 2 206 421 57 329 350 293 1.42 3 238 350 47 338 394 347 1.46 4 228 394 53 332 399 346 1.52 5 219 399 54 332 381 327 1.49 6 224 381 51 334 388 337 1.50 7 222 388 52 333 391 339 1.53 8 215 391 53 333 380 327 1.52
Average for Last Three Stages = 386g. 1.52g.
Feed K80 Size Weight % Retained % Passing
Mesh um grams Individual Cumulative Cumulative
6 3,360 0.0 0.0 0.0 100.0 7 2,800 12.3 1.6 1.6 98.4 8 2,360 51.7 6.6 8.2 91.8 10 1,700 132.6 16.9 25.1 74.9 14 1,180 143.2 18.3 43.3 56.7 20 850 94.6 12.1 55.4 44.6 28 600 73.2 9.3 64.7 35.3 35 425 51.7 6.6 71.3 28.7 48 300 37.9 4.8 76.1 23.9 65 212 30.9 3.9 80.1 19.9 100 150 25.8 3.3 83.3 16.7 150 106 25.0 3.2 86.5 13.5 Pan -106 105.7 13.5 100.0 0.0
Total - 784.6 100.0 - -
K80 1,904
Product K80 Size Weight % Retained % Passing
Mesh |im grams Individual Cumulative Cumulative
65 212 0.0 0.0 0.0 lOO.O 100 150 0.0 0.0 0.0 100.0 150 106 0.0 0.0 0.0 100.0 170 90 21.6 15.8 15.8 84.2 200 75 13.3 9.8 25.6 74.4 270 53 24.2 17.7 43.3 56.7 400 38 - 17.6 12.9 56.2 43.8 Pan -38 59.7 43.8 100.0 0.0
Total - 136.4 100.0 - -
K80 84

Project No.: 10044-139 Test No.: Shake SAG-1
100
90
80
70
60
50
40
30
20
10
0
10
Particle Size Distribution
/
I
Hi-Feed -•-Product
100 1,000
Screen Size (micrometers)
10,000

SGS LAKEFIELD RESEARCH
Standard Bond Ball Mill Griodabiiity Test
Project No.: 10044-139 Product: Minus 6 Mesh Date: Sep. 8, 2005
Sample.: SVMLO-1
Purpose: To determine the ball mill grindability of the sample in terms of a Bond work index number.
Procedure: The equipment and procedure duplicate the Bond method for determining ball mill work indices
Test Conditions: Mesh of grind: 150 mesh Test feed weight (700 mL): 1377 grams Equivalent to : 1967 kg/m^ at Minus 6 mesh Weight % of the undersize material in the ball mill feed 10.0 % Weight of undersize product for 250% circulating load 393 grams
Results: Avers^e for Last Three Stages = 1.44g.
CALCULATION OF A BOND WORK INDEX
249% Circulation load
PI = 100% passing size of the product Grp = Grams per revolution P80 = 80% passing size of product F80 = 80% passing size of the feed
106 microns 1.44 grams
86 microns 2012 microns
BWI =
BWI =
13.2 (imperial)
14.5 (metric)

indability Test Data Project No.: 10044-139 Test No.: SVMLO-1
Undersize LTSize Undersize Product Stage New In To Be In Per Mill No. Revs Feed Feed Ground Product Total Rev
(grams) (grams) (grams) (grams) (grams) (grams) 1 150 1,377 137 256 371 234 1.56 2 200 371 37 356 299 262 1.31 3 270 299 30 364 384 354 1.31 4 271 384 38 355 403 365 1.35 5 262 403 40 353 403 363 1.38 6 255 403 40 353 410 370 1.45 7 239 410 41 353 390 349 1.46 8 243 390 39 355 384 345 1.42
Average for Last Three Stages = 395g. 1.44g.
Feed K80 Size Weight % Retained % Passing
Mesh lun grams Individual Cumulative Cumulative
6 3,360 0.0 0.0 0.0 100.0 7 2,800 20.0 2.5 2.5 97.5 8 2,360 63.7 8.1 10.6 89.4 10 1,700 139.5 17.6 28.2 71.8 14 1,180 141.8 17.9 46.2 53.8 20 850 92.3 11.7 57.8 42.2 28 600 73.5 9.3 67.1 32.9 35 425 53.9 6.8 73.9 26.1 48 300 40.2 5.1 79.0 21.0 65 212 32.9 4.2 83.2 16.8 100 150 26.9 3.4 86.6 13.4 150 106 27.3 3.5 90.0 10.0 Pan -106 78.8 10.0 100.0 0.0
Total - 790.8 100.0 - -
K80 2,012
Product K80 Size Weight % Retained % Passing
Mesh ^m grams Individual Cumulative Cumulative
65 212 0.0 0.0 0.0 100.0 100 150 0.0 0.0 0.0 100.0 150 106 0.0 0.0 0.0 100.0 170 90 24.3 17.1 17.1 82.9 200 75 15.5 10.9 27.9 72.1 270 53 25.7 18.0 46.0 54.0 400 38 18.0 12.6 58.6 41.4 Pan -38 58.9 41.4 100.0 0.0
Total - 142.4 100.0 - -
K80 86

Project No.: 10044-139 Test No.: Shake SAG-1
Particle Size Distribution
100
90
80
70
a '55 tn « 60 O. i -41 50 .i 50
"a E 40 Ô
30
20
10
0
10
1
• I»
-Feed -Product
100 1,000
Screen Size (micrometers)
10,000

SGS LAKEFIELD RESEARCH
Standard Bond Ball Mill Grindability Test
Project No.: 10044-139 Product: Minus 6 Mesh Date: Sept. 9 2005
Sample.: SVMLO-2
Purpose: To determine the ball mill grindability of the sample in terms of a Bond work index number
Procedure: The equipment and procedure duplicate the Bond method for determining ball mill work indices
Test Conditions: Mesh of grind: 150 mesh Test feed weight (700 mL): 1314 grams Equivalent to : 1877 kg/m' at Minus 6 mesh Weight % of the undersize material in the ball mill feed 10.1 % Weight of undersize product for 250% circulating load 375 grams
Results: Average for Last Three Stages = 1.33g. 247% Circulation load
CALCULATION OF A BOND WORK INDEX
PI = 100% passing size of the product Grp = Grams per revolution P80 = 80% passing size of product FSO = 80% passing size of the feed
106 microns 1.33 grams
88 microns 2020 microns
BWI =
BWI =
143 (imperial)
15.8 (metric)

indability Test Data Project No.: 10044-139 Test No.: SVMLO-2
Undersize U'Size Undersize Product Stage New In To Be In Per Mill
No. Revs Feed Feed Ground Product Total Rev (grams) (grams) (grams) (grams) (grams) (grams)
1 150 1,314 133 243 321 188 1.26 2 273 321 32 343 354 322 1.18 3 288 354 36 340 387 351 1.22 4 276 387 39 336 392 353 1.28 5 263 392 40 336 380 340 1.29 6 260 380 38 337 382 344 1.32 7 255 382 39 337 379 340 1.34 8 253 379 38 337 374 336 1.33
Average for Last Three Stages = 378g. 1.33g.
Feed K80 Size Weight % Retained % Passing
Mesh ym grams Individual Cumulative Cumulative
6 3,360 0.0 0.0 0.0 100.0 7 2,800 20.5 2.5 2.5 97.5 8 2,360 63.7 7.9 10.4 89.6 10 1,700 147.6 18.2 28.6 71.4 14 1,180 144.1 17.8 46.5 53.5 20 850 93.0 11.5 58.0 42.0 28 600 73.3 9.1 67.0 33.0 35 425 53.7 6.6 73.6 26.4 48 300 40.2 5.0 78.6 21.4 65 212 33.9 4.2 82.8 17.2 100 150 27.9 3.4 86.3 13.7 150 106 29.6 3.7 89.9 10.1 Pan -106 81.6 10.1 100.0 0.0
Total - 809.1 100.0 - -
K80 2,020
Product K80 Size Weight % Retained % Passing
Mesh (im grams Individual Cumulative Cumulative
65 212 0.0 0.0 0.0 100.0 100 150 0.0 0.0 0.0 100.0 150 106 0.0 0.0 0.0 100.0 170 90 33.7 19.2 19.2 80.8 200 75 16.5 9.4 28.6 71.4 270 53 30.0 17.1 45.6 54.4 400 38 21.3 12.1 57.7 42.3 Pan -38 74.3 42.3 100.0 0.0
Total - 175.8 100.0 - -
K80 88

Project No.: 10044-139 Test No.: Shake SAG-1
100
90
80
70
60
50
40
30
20
10
0
10
Particle Size Distribution
r • w— / »
/ /
/ / / i /
i / r
} /
/ } 1 - • - F e e d
— P r o d u c t
1
100 1,000 Screen Size (micrometers)
10,000

SGS LAKEFIELD RESEARCH
Standard Bond Ball Mill Grindability Test
Project No.: 10044-139 Product: Minus 6 Mesh Date: Sept. 12 2005
Sample.: SVMLO-3
Purpose: To determine the ball mill grindability of the sample in terms of a Bond work index number.
Procedure: The equipment and procedure duplicate the Bond method for determining ball mill work indices
Test Conditions: Mesh of grind: 150 mesh Test feed weight (700 mL): 1229 grams Equivalent to : 1756 kg/m' at Minus 6 mesh Weight % of the undersize material in the ball mill feed 10.4 % Weight of undersize product for 250% circulating load 351 grams
Results: Average for Last Three Stages = 1.55g. 252% Circulation load
CALCULATION OF A BOND WORK INDEX
PI = ' 100% passing size of the product 106 microns Grp = Grams per revolution 1.55 grams P80 = 80% passing size of product 82 microns F80 = 80% passing size of the feed 2121 microns
BWI = 12.0 (imperial)
BWI = 13 J (metric)

indability Test Data Project No.: 10044-139 Test No.: SVMLO-3
Undersize U'Size Undersize Product Stage New In To Be In Per Mill
No. Revs Feed Feed Ground Product Total Rev (grams) (grams) (grams) (grams) (grams) (grams)
I 150 1,229 128 223 374 246 1.64 2 190 374 39 312 324 285 1.50 3 212 324 34 317 347 313 1.48 4 213 347 36 315 371 335 1.57 5 199 371 39 312 345 306 1.54 6 205 345 36 315 357 321 1.57 7 200 357 37 314 344 307 1.53
Average for Last Three Stages = 349g. 1.55g.
FeedKSO Size Weight % Retained % Passing
Mesh lim grams Individual Cumulative Cumulative
6 3,360 0.0 0.0 0.0 100.0 7 2,800 19.9 2.6 2.6 97.4 8 2,360 71.2 9.2 11.8 88.2 10 1,700 161.1 20.8 32.6 67.4 14 1,180 142.9 18.5 51.1 48.9 20 850 83.1 10.7 61.8 38.2 28 600 63.2 8.2 70.0 30.0 35 425 44.3 5.7 75.7 24.3 48 300 32.2 4.2 79.9 20.1 65 212 26.9 3.5 83.4 16.6 100 150 22.3 2.9 86.2 13.8 150 106 25.9 3.3 89.6 10.4 Pan -106 80.6 10.4 100.0 0.0
Total - 773.6 100.0 - -
K80 2,121
Product K80 Size Weight % Retained % Passing
Mesh Hm grams Individual Cumulative Cumulative
65 212 0.0 0.0 0.0 100.0 100 150 0.0 0.0 0.0 100.0 150 106 0.0 0.0 0.0 100.0 170 90 23.1 15.5 15.5 84.5 200 75 13.0 8.7 24.2 75.8 270 53 24.4 16.4 40.6 59.4 400 38 19.0 12.8 53.4 46.6 Pan -38 69.4 46.6 100.0 0.0
Total - 148.9 100.0 - -
K80 82

Project No.: 10044-139 Test No.: Shake SAG-1
Particle Size Distribution
E Ô
100
90
80
70
60
50
40
30
20
10
10
/
• I»
-Feed
-Product
100 1,000
Screen Size (micrometers)
10,000
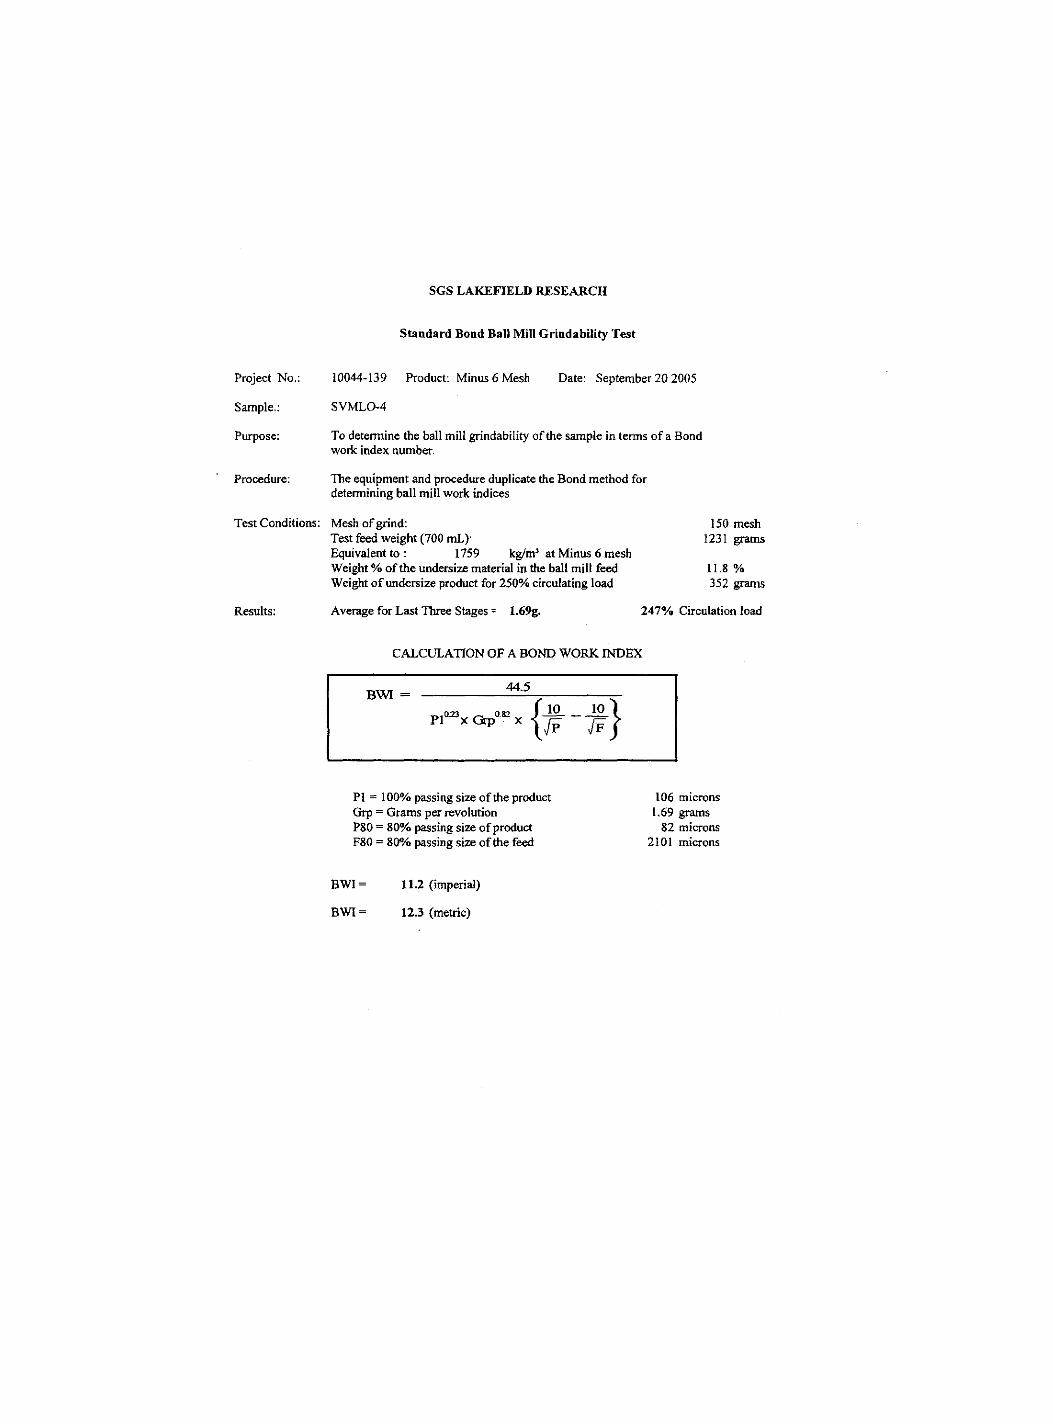
SGS LAKEFIELD RESEARCH
Standard Boad Ball Mill Grindability Test
Project No.: 10044-139 Product: Minus 6 Mesh Date: September 20 2005
Sample.: SVMLO-4
Purpose: To determine the ball mill grindability of the sample in terms of a Bond work index number.
Procedure: The equipment and procedure duplicate the Bond method for determining ball mill work indices
Test Conditions: Mesh of grind: 150 mesh Test feed weight (700 mL): 1231 grams Equivalent to : 1759 kg/m^ at Minus 6 mesh Weight % of the undersize material in the ball mill feed 11.8 % Weight of undersize product for 250% circulating load 352 grams
Results: Average for Last Three Stages = 1.69g. 247% Circulation load
CALCULATION OF A BOND WORK INDEX
PI = 100% passing size of the product 106 microns Grp = Grams per revolution 1.69 grams P80 = 80% passing size of product 82 microns F80 = 80% passing size of the feed 2101 microns
BWI = 11.2 (imperial)
BWI = 12.3 (metric)

indability Test Data Project No.: 10044-139 Test No.: SVMLO-4
Undersize U-Size Undersize Product Stage New In To Be In Per Mill No. Revs Feed Feed Ground Product Total Rev
(grams) (grams) (grams) (grams) (grams) (grams) 1 150 1,231 145 207 380 235 1.57 2 196 380 45 307 349 304 1.55 3 200 349 41 311 351 310 1.55 4 200 351 41 310 350 309 1.54 5 201 350 41 310 372 331 1.65 6 187 372 44 308 354 310 1.66 7 187 354 42 310 361 319 1.71 8 181 361 43 309 349 306 1.69
Average for Last Three Stages = 355g. 1.69g.
Feed K80 Size Weight % Retained % Passing
Mesh iim grams Individual Cumulative Cumulative
6 3,360 0.0 0.0 0.0 100.0 7 2,800 23.9 2.9 2.9 97.1 8 2,360 74.1 8.9 11.8 88.2 10 1,700 162.5 19.6 31.4 68.6 14 1,180 151.3 18.2 49.6 50.4 20 850 88.4 10.7 60.3 39.7 28 600 67.6 8.1 68.4 31.6 35 425 48.1 5.8 74.2 25.8 48 300 35.3 4.3 78.5 21.5 65 212 29.1 3.5 82.0 18.0 100 150 24.6 3.0 85.0 15.0 150 106 26.9 3.2 88.2 11.8 Pan -106 97.8 11.8 100.0 0.0
Total - 829.6 100.0 - -
K80 2,101
Product K80 Size Weight % Retained % Passing
Mesh ^m grams Individual Cumulative Cumulative
65 212 0.0 0.0 0.0 100.0 100 150 0.0 0.0 0.0 100.0 150 106 0.0 0.0 0.0 100.0 170 90 22.7 14.8 14.8 85.2 200 75 14.2 9.3 24.1 75.9 270 53 27.3 17.8 42.0 58.0 400 38 18.9 12.4 54.3 45.7 Pan -38 69.9 45.7 100.0 0.0
Total - 153.0 100.0 - -
K80 82

Project No.: 10044-139 Test No.: Shake SAG-1
100
90
80
70 m a I 60 s? ¥ 50
i 40 o
30
20
10
0
10
Particle Size Distribution
w— / / J
j 1 / f /
4 1 T
/ } ( - • - F e e d
- • — Product
J r '
100 1,000
Screen Size (micrometers)
10,000

SGS LAKEFIELD RESEARCH
Standard Bond Ball Mill Grindabiiity Test
Project No.: 10044-139 Product: Minus 6 Mesh Date: Sept 21 2005
Sample.: SVMLO-5
Purpose: To determine the ball mill grindabiiity of the sample in terms of a Bond work index number.
Procedure: The equipment and procedure duplicate the Bond method for determining ball mill work indices
Test Conditions: Mesh of grind: 150 mesh Test feed weight (700 mL); 1313 grams Equivalent to : 1876 kg/m' at Minus 6 mesh Weight % of the undersize material in the ball mill feed 10.8 % Weight of undersize product for 250% circulating load 375 grams
Results: Average for Last Three Stages = 251% Circulation load
CALCULATION OF A BOND WORK INDEX
PI = 100% passing size of the product Grp = Grams per revolution P80 = 80% passing size of product F80 = 80% passing size of the feed
106 microns 1.36 grams
83 microns 2128 microns
BWI =
BWI =
13.5 (imperial)
14.9 (metric)

indability Test Data Project No.: 10044-139 Test No.: SVMLO-5
Undersize U'Size Undersize Product Stage New In To Be In Per Mill
No. Revs Feed Feed Ground Product Total Rev (grams) (grams) (grams) (grams) (grams) (grams)
1 150 1,313 141 234 346 205 1.36 2 248 346 37 338 326 289 1.16 3 292 326 35 340 410 375 1.28 4 258 410 44 331 399 355 1.38 5 242 399 43 332 369 326 1.35 6 249 369 40 335 380 340 1.37 7 245 380 41 334 374 333 1.36
Average for Last Three Stages = 374g. 1.36g.
Feed K80 Size Weight % Retained % Passing
Mesh lun grams Individual Cumulative Cumulative
6 3,360 0.0 0.0 0.0 100.0 7 2,800 22.9 2.9 2.9 97.1 8 2,360 74.6 9.3 12.2 87.8 10 1,700 164.1 20.5 32.7 67.3 14 1,180 145.5 18.2 50.9 49.1 20 850 86.4 10.8 61.7 38.3 28 600 66.6 8.3 70.1 29.9 35 425 47.3 5.9 76.0 24.0 48 300 34.0 4.3 80.2 19.8 65 212 27.1 3.4 83.6 16.4 100 150 22.0 2.8 86.4 13.6 150 106 23.0 2.9 89.2 10.8 Pan -106 86.0 10.8 100.0 0.0
Total - 799.5 100.0 - -
K80 2,128
Product K80 Size Wei^t % Retained % Passing
Mesh fim grams Individual Cumulative Cumulative
65 212 0.0 0.0 0.0 100.0 100 150 0.0 0.0 0.0 100.0 150 106 0.0 0.0 0.0 100.0 170 90 21.0 15.9 15.9 84.1 200 75 12.1 9.2 25.1 74.9 270 53 22.9 17.4 42.5 57.5 400 38 17.0 12.9 55.3 44.7 Pan -38 58.9 44.7 100.0 0.0
Total - 131.9 100.0 - -
K80 83

Project No.: 10044-139 Test No.: Shake SAG-1
Particle Size Distribution
100
90
80
70 e I 60 a. S? j; 50 tc 9B B 40 3 o
30
20
10
0 10
• f
Y -Feed
-Product
100 1,000
Screen Size (micrometers)
10,000

SGS LAKEFIELD RESEARCH
Standard Bond Ball Mill Grindability Test
Project No.: 10044-139 Product: Minus 6 Mesh Date: Sept 20 2005
Sample.: SVMLO-6
Purpose: To determine the ball mill grindability of the sample in terms of a Bond work index number
Procedure: The equipment and procedure duplicate the Bond method for determining ball mill work indices
Test Conditions: Mesh of grind: 150 mesh Test feed weight (700 mL): 1371 grams Equivalent to : 1959 kg/m' at Minus 6 mesh Weight % of the undersize material in the ball mill feed 10.2 % Weight of undersize product for 250% circulating load 392 grams
Results: Average for Last Three Stages = 1.43g. 249% Circulation load
CALCULATION OF A BOND WORK INDEX
Pl = 100% passing size of the product 106 microns Grp = Grams per revolution 1.43 grams P80 = 80% passing size of product 84 microns F80 = 80% passing size of the feed 1985 microns
BWI = 13.1 (imperial)
BWI = 14.4 (metric)

indability Test Data Project No.: 10044-139 Test No.: SVMLO-6
Undersize U'Size Undersize Produci Stage New In To Be In Per Mill No. Revs Feed Feed Ground Product Total Rev
(grams) (grams) (grams) (grams) (grams) (grams) 1 150 1,371 140 251 362 222 1.48 2 240 362 37 355 375 338 1.41 3 251 375 38 353 391 353 1.40 4 250 391 40 352 396 356 1.42 5 247 396 41 351 398 357 1.45 6 243 398 41 351 385 344 1.42 7 249 385 39 352 394 355 1.42
Average for Last Three Stages = 392g. 1.43 g.
Feed K80 Size Weight % Retained % Passing
Mesh tim grams Individual Cumulative Cumulative
6 3,360 0.0 0.0 0.0 100.0 7 2,800 18.6 2.4 2.4 97.6 8 2,360 57.8 7.4 9.8 90.2 10 1,700 137.2 17.6 27.4 72.6 14 1,180 138.0 17.7 45.0 55.0 20 850 87.6 11.2 56.3 43.8 28 600 71.9 9.2 65.5 34.5 35 425 54.5 7.0 72.4 27.6 48 300 41.4 5.3 77.7 22.3 65 212 34.8 4.5 • 82.2 17.8 100 150 29.0 3.7 85.9 14.1 150 106 30.0 3.8 89.8 10.2 Pan -106 80.0 10.2 100.0 0.0
Total - 780.8 100.0 - -
K80 1,985
Product K80 Size Weight % Retained % Passing
Mesh Hm grams Individual Cumulative Cumulative
65 212 0.0 0.0 0.0 100.0 100 150 0.0 0.0 0.0 100.0 150 106 0.0 0.0 0.0 100.0 170 90 24.8 15.6 15.6 84.4 200 75 16.8 10.6 26.2 73.8 270 53 28.5 18.0 44.2 55.8 400 38 20.6 13.0 57.2 42.8 Pan -38 68.0 42.8 100.0 0.0
Total - 158.7 100.0 - -
K80 84

Project No.: 10044-139 Test No.: Shake SAG-1
100
90
80
70 M e M <« 60
^ 50 .t 50
"2 E 40 5
30
20
10
0
10
Particle Size Distribution
i / -Feed
-Product
100 1,000
Screen Size (micrometers)
10,000

SGS LAKEFIELD RESEARCH
Project No.:
Sample.:
Purpose:
Procedure:
10044-139
SVMLO-7
Standard Bond Ball Mill Grindability Test
Product: Minus 6 Mesh Date: Sept 23 2005
To determine the ball mill grindability of the sample in terms of a Bond work index number.
The equipment and procedure duplicate the Bond method for determining ball mill work indices
Test Conditions: Mesh of grind: 150 mesh Test feed weight (700 mL): 1246 grams Equivalent to : 1780 kg/m' at Minus 6 mesh Weight % of the undersize material in the ball mill feed 10.3 % Weight of undersize product for 250% circulating load 356 grams
Results: Average for Last Three Stages = 1.54g. 250% Circulation load
CALCULATION OF A BOND WORK INDEX
PI = 100% passing size of the product 106 microns Grp = Grams per revolution 1.54 grams P80 = 80% passing size of product 87 microns F80 = 80% passing size of the feed 2074 microns
BWI = 12.6 (imperial)
BWI = 13.8 (metric)

indability Test Data Project No.: 10044-139 Test No.: SVMLO-7
Undersize U-Size Undersize Product Stage New In To Be In Per Mill No. Revs Feed Feed Ground Product Total Rev
(grams) (grams) (grams) (grams) (grams) (grams) 1 150 1,246 128 228 363 235 1.57 2 204 363 37 319 306 269 1.32 3 246 306 31 325 382 351 1.42 4 222 382 39 317 368 329 1.48 5 215 368 38 318 354 316 1.47 6 217 354 36 320 368 332 1.53 7 208 368 38 318 356 318 1.53 8 209 356 37 319 362 325 1.56 9 205 362 37 319 351 314 1.53
Average for Last Three Stages = 356g. 1.54g.
Feed K80 Size Weight % Retained % Passing
Mesh urn grams Individual Cumulative Cumulative
6 3,360 0.0 0.0 0.0 100.0 7 2,800 17.4 2.1 2.1 97.9 8 2,360 69.2 8.4 10.5 89.5 10 1,700 169.3 20.6 31.1 68.9 14 1,180 155.2 18.8 49.9 50.1 20 850 92.5 11.2 61.1 38.9 28 600 72.2 8.8 69.9 30.1 35 425 51.4 6.2 76.2 23.8 48 300 36.4 4.4 80.6 19.4 65 212 28.8 3.5 84.1 15.9 100 150 22.8 2.8 86.8 13.2 150 106 23.7 2.9 89.7 10.3 Pan -106 84.7 10.3 100.0 0.0
Total - 823.6 100.0 - -
K80 2,074
Product K80 Size Weight % Retained % Passing
Mesh Hm grams Individual Cumulative Cumulative
65 212 0.0 0.0 0.0 100.0 100 150 0.0 0.0 0.0 100.0 150 106 0.0 0.0 0.0 100.0 170 90 27.3 18.0 18.0 82.0 200 75 17.3 11.4 29.4 70.6 270 53 31.9 21.0 50.5 49.5 400 38 25.7 17.0 67.4 32.6 Pan -38 49.4 32.6 100.0 0.0
Total - 151.6 100.0 - -
K80 87

Project No.: 10044-139 Test No.: Shake SAG-1
100
90
80
70
60
50
40
30
20
10
0
10
Particle Size Distribution
/
i
À -Feed
-Product
100 1,000
Screen Size (micrometers)
10,000

SGS LAKEFIELD RESEARCH
Standard Bond Ball Mill Grindability Test
Project No.: 10044-139 Product: Minus 6 Mesh Date: Sept 23 05
Sample.: SVMLO-8
Purpose: To determine the ball mill grindability of the sample in terms of a Bond work index number
Procedure: The equipment and procedure duplicate the Bond method for determining ball mill work indices
Test Conditions: Mesh of grind: 150 mesh Test feed weight (700 mL): 1252 grams Equivalent to : 1789 kg/m^ at Minus 6 mesh Weight % of the undersize material in the ball mill feed 9.8 % Weight of undersize product for 250% circulating load 358 grams
Results: Average for Last Three Stages = 1.44g. 246% Circulation load
CALCULATION OF A BOND WORK INDEX
BWI = 44.5
P f ^ x G r p ' ' ^ X I 10 10 }
PI = 100% passing size of the product Grp = Grams per revolution P80 = 80% passing size of product F80 = 80% passing size of the feed
106 microns 1.44 grams
83 microns 2119 microns
BWI =
BWI =
12.8 (imperial)
14.1 (metric)

indability Test Data Project No.: 10044-139 Test No.: SVMLO-8
Undersize U'Size Undersize Product Stage New In To Be In Per Mill No. Revs Feed Feed Ground Product Total Rev
(grams) (grams) (grams) (grams) (grams) (grams) 1 150 1,252 123 235 347 224 1.49 2 217 347 34 324 313 279 1.29 3 254 313 31 327 367 336 1.32 4 243 367 36 322 371 335 1.38 5 233 371 37 321 359 322 1.38 6 233 359 35 322 369 334 1.43 7 224 369 36 321 361 325 1.45 8 222 361 36 322 356 320 1.44
Average for Last Three Stages = 362g. 1.44g.
Feed K80 Size Weight % Retained % Passing
Mesh iim grams Individual Cumulative Cumulative
6 3,360 0.0 0.0 0.0 100.0 7 2,800 21.7 2.6 2.6 97.4 8 2,360 76.3 9.1 11.7 88.3 10 1,700 174.3 20.9 32.6 67.4 14 1,180 155.3 18.6 51.2 48.8 20 850 91.9 11.0 62.3 37.7 28 600 71.9 8.6 70.9 29.1 35 425 50.1 6.0 76.9 23.1 48 300 36.0 4.3 81.2 18.8 65 212 28.4 3.4 84.6 15.4 100 150 22.5 2.7 87.3 12.7 150 106 23.9 2.9 90.2 9.8 Pan -106 82.1 9.8 100.0 0.0
Total - 834.4 100.0 - -
K80 2,119
Product K80 Size Weight % Retained % Passing
Mesh grams Individual Cumulative Cumulative
65 212 0.0 0.0 0.0 100.0 100 150 0.0 0.0 0.0 100.0 150 106 0.0 0.0 0.0 100.0 170 90 24.0 16.0 16.0 84.0 200 75 13.0 8.7 24.6 75.4 270 53 20.5 13.6 38.3 61.7 400 38 16.1 10.7 49.0 51.0 Pan -38 76.6 51.0 100.0 0.0
Total - 150.2 100.0 - -
K80 83

Project No.: 10044-139 Test No.: Shake SAG-1
100
90
80
70
S 60 ùm ^ i- 50
1 40 U
30
20
10
0 10
Particle Size Distribution
/
-Feed
-Product
100 1,000
Screen Size (micrometers)
10.000

SGS LAKEFIELD RESEARCH
Standard Boad Bail Mill Grindability Test
Project No.: 10044-139 Product: Minus 6 Mesh Date: Sept 20 2005
Sample.: SVMDC-1
Purpose: To determine the ball mill grindability of the sample in terms of a Bond work index number.
Procedure: The equipment and procedure duplicate the Bond method for determining ball mill work indices
Test Conditions: Mesh of grind; 150 mesh Test feed weight (700 mL): 1272 grams Equivalent to : 1817 kg/m' at Minus 6 mesh Weight % of the undersize material in the ball mill feed 10.5 % Weight of undersize product for 250% circulating load 363 grams
Results: Average for Last Three Stages = 1.40g. 249% Circulation load
CALCULATION OF A BOND WORK INDEX
Pl = • 100% passing size of the product 106 microns Grp = Grams per revolution 1.40 grams P80 = 80% passing size of product 83 microns F80 = 80% passing size of the feed 2116 microns
BWI = 13.1 (imperial)
BWI = 14.5 (metric)

indability Test Data Project No.: 10044-139 Test No.: SVMDC-1
Undersize U'Size Undersize Product Stage New In To Be In Per Mill
No. Revs Feed Feed Ground Product Total Rev (grams) (grams) (grams) (grams) (grams) (grams)
1 150 1,272 134 230 328 194 1.30 2 254 328 34 329 367 333 1.31 3 248 367 39 325 365 326 1.32 4 247 365 38 325 375 337 1.36 5 238 375 39 324 374 335 1.41 6 231 374 39 324 366 327 1.41 7 230 366 38 325 354 316 1.37
Average for Last Three Stages = 365g. 1.40g.
Feed K80 Size
Mesh I Weight % Retained % Passing grams Individual Cumulative Cumulative
6 3,360 0.0 0.0 0.0 lOO.O 7 2,800 16.8 2.2 2.2 97.8 8 2,360 71.3 9.2 11.4 88.6 10 1,700 164.0 21.2 32.6 67.4 14 1,180 141.8 18.3 51.0 49.0 20 850 84.0 10.9 61.8 38.2 28 600 66.0 8.5 70.4 29.6 35 425 46.1 6.0 76.3 23.7 48 300 33.5 4.3 80.7 19.3 65 212 26.7 3.5 84.1 15.9 100 150 20.7 2.7 86.8 13.2 150 106 20.7 2.7 89.5 10.5 Pan -106 81.2 10.5 100.0 0.0
Total - 772.8 100.0 - -
K80 2,116
Product K80 Size Weight % Retained % Passing
Mesh ^m grams Individual Cumulative Cumulative
65 212 0.0 0.0 0.0 100.0 100 150 0.0 0.0 0.0 100.0 150 106 0.0 0.0 0.0 100.0 170 90 24.4 16.2 16.2 83.8 200 75 11.7 7.8 24.0 76.0 270 53 22.1 14.7 38.7 61.3 400 38 16.4 10.9 49.6 50.4 Pan -38 75.8 50.4 100.0 0.0
Total - 150.4 100.0 - -
K80 83

Project No.: 10044-139 Test No.: Shake SAG-1
Particle Size Distribution
100
90
80
70 «
S 60 Î? « 50 ce i 40 s U
30
20
10
0 10
/
-Feed
-Product
100 1,000 Screen Size (micrometers)
10,000

SGS LAKEFIELD RESEARCH
Standard Bond Ball Mill Grindability Test
Project No.: 10044-139 Product: Minus 6 Mesh Date: Sept 19 2005
Sample.: SVMDC-2
Purpose: To determine the ball mill grindability of the sample in terms of a Bond work index number.
Procedure: The equipment and procedure duplicate the Bond method for determining ball mill work indices
Test Conditions: Mesh of grind: 150 mesh Test feed weight (700 mL): 1315 grams Equivalent to : 1879 kg/m' at Minus 6 mesh Weight % of the undersize material in the ball mill feed 10.6 % Weight of undersize product for 250% circulating load 376 grams
Results: Average for Last Three Stages = l.Slg. 242% Circulation load
CALCULATION OF A BOND WORK INDEX
BWI = 44.5
„,0 23 ^ 082 f JO- _ 10 \ PI x G r p y ^ l
PI = 100% passing size of the product 106 microns Grp = Grams per revolution 1.51 grams P80 = 80% passing size of product 78 microns F80 = 80% passing size of the feed 2093 microns
BWI =
BWI =
11.9 (imperial)
13.1 (metric)

indability Test Data Project No.: 10044-139 Test No.: SVMDC-2
Undersize U'Size Undersize Produci Stage New In To Be In Per Mill No. Revs Feed Feed Ground Product Total Rev
(grams) (grams) (grams) (grams) (grams) (grams) 1 150 1,315 139 237 363 224 1.49 2 226 363 38 337 324 286 1.26 3 270 324 34 341 397 363 1.34 4 248 397 42 334 389 347 1.40 5 239 389 41 335 399 358 1.50 6 223 399 42 334 382 340 1.52 7 220 382 40 335 372 332 1.51
Average for Last Three Stages = 384g. 1.5Ig.
Feed K80 Size Weight % Retained % Passing
Mesh imi grams Individual Cumulative Cumulative
6 3,360 0.0 0.0 0.0 100.0 7 2,800 18.9 2.4 2.4 97.6 8 2,360 71.9 9.0 11.3 88.7 10 1,700 162.2 20.2 31.5 68.5 14 1,180 146.0 18.2 49.7 50.3 20 850 89.0 11.1 60.8 39.2 28 600 69.2 8.6 69.4 30.6 35 425 48.9 6.1 75.5 24.5 48 300 35.5 4.4 80.0 20.0 65 212 28.4 3.5 83.5 16.5 100 150 23.0 2.9 86.4 13.6 150 106 24.7 3.1 89.4 10.6 Pan -106 84.8 10.6 100.0 0.0
Total - 802.4 100.0 - -
K80 2,093
Product K80 Size Weight % Retained % Passing
Mesh ^m grams Individual Cumulative Cumulative
65 212 0.0 0.0 0.0 100.0 100 150 0.0 0.0 0.0 100.0 150 106 0.0 0.0 0.0 100.0 170 90 14.1 12.6 12.6 87.4 200 75 9.8 8.8 21.3 78.7 270 53 17.9 16.0 37.3 62.7 400 38 12.8 11.4 48.8 51.3 Pan -38 57.4 51.3 100.0 0.0
Total - 112.0 100.0 - -
K80 78

Project No.: 10044-139 Test No.: Shake SAG-1
Particle Size Distribution
100
90
80
70
60
50
40
30
20
10
0 10
7
r
- F e e d
- P r o d u c t
100 1,000 Screeo Size (mic rometers )
10,000

SGS LAKEFIELD RESEARCH
Standard Bond Ball Mill Grindability Test
Project No.: 10044-139 Product: Minus 6 Mesh Date: September 19 2005
Sample.: SVMDC-3
Purpose: To determine the ball mill grindability of the sample in terms of a Bond work index number.
Procedure: The equipment and procedure duplicate the Bond method for determining ball mill work indices
Test Conditions: Mesh of grind: 150 mesh Test feed weight (700 mL): 1239 grams Equivalent to : 1770 kg/m' at Minus 6 mesh Weight % of the undersize material in the ball mill feed 11.8 % Weight of undersize product for 250% circulating load 354 grams
Results: Average for Last Three Stages = 1.57g. 249% Circulation load
CALCULATION OF A BOND WORK INDEX
PI = = 100% passing size of the product 106 microns Grp = Grams per revolution 1.57 grams P80 = 80% passing size of product 81 microns F80 = 80% passing size of the feed 2059 microns
BWI = 11.8 (imperial)
BWI = 13.0 (metric)
indability Test Data Project No.: 10044-139 Test No.: SVMDC-3
Undersize U'Size Undersize Product Stage New In To Be In Per Mill
No. Revs Feed Feed Ground Product Total Rev (grams) (grams) (grams) (grams) (grams) (grams)
1 150 1,239 146 208 368 222 1.48 2 210 368 43 311 345 302 1.44 3 218 345 41 313 353 312 1.43 4 218 353 42 312 374 332 1.53 5 203 374 44 310 359 315 1.55 6 201 359 42 312 356 314 1.56 7 200 356 42 312 357 315 1.58 8 198 357 42 312 352 310 1.57
Average for Last Three Stages = 355g. 1.51%.
Feed K80 Size Weight % Retained % Passing
Mesh urn grams Individual Cumulative Cumulative
6 3,360 0.2 0.0 0.0 100.0 7 2,800 16.1 2.0 2.1 97.9 8 2,360 64.8 8.2 10.3 89.7 10 1,700 158.3 20.1 30.4 69.6 14 1,180 143.7 18.2 48.6 51.4 20 850 87.4 11.1 59.7 40.3 28 600 67.3 8.5 68.2 31.8 35 425 47.1 6.0 74.2 25.8 48 300 34.2 4.3 78.5 21.5 65 212 28.0 3.6 82.1 17.9 100 150 23.1 2.9 85.0 15.0 150 106 25.3 3.2 88.2 11.8 Pan -106 92.7 11.8 100.0 0.0
Total - 788.2 100.0 - -
K80 2,059
Product K80 Size Weight % Retained % Passing
Mesh ^m grams Individual Cumulative Cumulative
65 212 0.0 0.0 0.0 100.0 100 150 0.0 0.0 0.0 100.0 150 106 0.0 0.0 0.0 100.0 170 90 22.2 14.7 14.7 85.3 200 75 13.5 8.9 23.6 76.4 270 53 24.6 16.2 39.8 60.2 400 38 19.2 12.7 52.5 47.5 Pan -38 72.0 47.5 100.0 0.0
Total - 151.5 100.0 - -
K80 81

Project No.: 10044-139 Test No.: Shake SAG-3
100
90
80
70 M e
1 60 a.
« > 50
« "S e 40 3
<J
30
20
10
0
10
Particle Size Distribution
i /
C
-Feed
-Product
100 1,000 Screcn Size (micrometers)
10,000

SGS LAKEFIELD RESEARCH
Standard Bond Ball Mill Griodability Test
Project No.: 10044-139 Product: Minus 6 Mesh Date: Sept 24 2005
Sample.: SVMDC-4
Purpose: To determine the ball mill grindability of the sample in terms of a Bond work index number
Procedure: The equipment and procedure duplicate the Bond method for determining ball mill work indices
Test Conditions : Mesh of grind: 150 mesh Test feed weight (700 mL): 1309 grams Equivalent to : 1870 kg/m' at Minus 6 mesh Weight % of the undersize material in the ball mill feed 11.9 % Weight of undersize product for 250% circulating load 374 grams
Results: Average for Last Three Stages = 1.62g. 241% Circulation load
CALCULATION OF A BOND WORK INDEX
BWI = 44.5
Pl = 100% passing size of the product 106 microns Grp = Grams per revolution 1.62 grams P80 = 80% passing size of product 79 microns F80 = 80% passing size of the feed 2092 microns
BWI = l U (imperial)
BWI = 12.5 (metric)

Grindability Test Data Project No.: 10044-139 Test No.: SVMDC-4
Undersize U'Size Undersize Produci Stage New In To Be In Per Mill No. Revs Feed Feed Ground Product Total Rev
(grams) (grams) (grams) (grams) (grams) (grams) 1 150 1309 155 2Î9 393 238 i l l 2 207 393 47 327 370 323 1 56 3 211 370 44 330 367 323 1.53 4 216 367 44 330 366 322 1.49 5 221 366 43 331 396 353 1.60 6 205 396 47 327 381 334 1.63 7 202 381 45 329 374 329 1.63
Average for Last Three Stages = 384g. 1.62g.
Feed K80 Size Weight % Retained % Passing
Mesh lun grams Individual Cumulative Cumulative
6 3,360 0.0 0.0 0.0 100.0 7 2,800 16.0 2.0 2.0 98.0 8 2,360 69.8 8.7 10.7 89.3 10 1,700 167.7 21.0 31.7 68.3 14 1,180 146.2 18.3 50.0 50.0 20 850 86.1 10.8 60.7 39.3 28 600 66.4 8.3 69.0 31.0 35 425 46.4 5.8 74.8 25.2 48 300 33.7 4.2 79.0 21.0 65 212 27.2 3.4 82.4 17.6 100 150 22.1 2.8 85.2 14.8 150 106 23.4 2.9 88.1 11.9 Pan -106 95.0 11.9 100.0 0.0
Total - 800.0 100.0 - -
K80 2,092
Product K80 Size Weight % Retained % Passing
Mesh ^m grams Individual Cumulative Cumulative
65 212 0.0 0.0 0.0 100.0 100 150 0.0 0.0 0.0 100.0 150 106 0.0 0.0 0.0 100.0 170 90 24.4 13.0 13.0 87.0 200 75 17.0 9.1 22.1 77.9 270 53 30.6 16.3 38.4 61.6 400 38 23.5 12.5 50.9 49.1 Pan -38 92.2 49.1 100.0 0.0
Total - 187.7 100.0 - -
K80 79

Project No.: 10044-139 Test No.: Shake SAG-4
Particle Size Distribution
100
90
SO
70
60
50
40
30
20
10
0
10
/
• I»
m
- • - F e e d -•—Product
100 1,000
Screen Size (micrometers)
10,000

SGS LAKEFIELD RESEARCH
Standard Bond Ball Mill Grindability Test
Project No.: 10044-139 Product: Minus 6 Mesh Date: Sept 21 2005
Sample.: SVMDC-5
Purpose: To determine the ball mill grindability of the sample in terms of a Bond work index number.
Procedure; The equipment and procedure duplicate the Bond method for determining ball mill work indices
Test Conditions: Mesh of grind: 150 mesh Test feed weight (700 mL): 1267 grams Equivalent to : 1810 kg/m' at Minus 6 mesh Weight % of the undersize material in the ball mill feed 11.8 % Weight of undersize product for 250% circulating load 362 grams
Results: Average for Last Three Stages = 1.61g. 252% Circulation load
CALCULATION OF A BOND WORK INDEX
BW[ == 44.5
P I ^ ^ x G r p ^ ^ x I 10.
- t }
PI = 100% passing size of the product 106 microns Grp = Grams per revolution 1.61 grams P80 = 80% passing size of product 81 microns F80 = 80% passing size of the feed 2104 microns
BWI =
BWI =
11.6 (imperial)
12.7 (metric)

indability Test Data Project No.: 10044-139 Test No.: SVMDC-5
Undersize LTSize Undersize Product Stage New In To Be In Per Mill
No. Revs Feed Feed Ground Product Total Rev (grams) (grams) (grams) (grams) (grams) (grams)
1 150 1,267 149 213 415 266 1.77 2 177 415 49 313 413 364 2.06 3 152 413 49 313 294 245 1.61 4 203 294 35 327 372 337 1.66 5 191 372 44 318 349 305 1.60 6 201 349 41 321 366 325 1.62 7 199 366 43 319 364 321 1.61
Average for Last Three Stages = 360g. 1.61 g.
FeedKSO Size Weight % Retained % Passing
Mesh um grams Individual Cumulative Cumulative
6 3,360 0.0 0.0 0.0 100.0 7 2,800 22.1 2.7 2.7 97.3 8 2,360 73.7 9.1 11.9 88.1
10 1,700 159.3 19.7 31.6 68.4 14 1,180 144.4 17.9 49.4 50.6 20 850 86.9 10.8 60.2 39.8 28 600 66.8 8.3 68.5 31.5 35 425 47.9 5.9 74.4 25.6 48 300 34.9 4.3 78.7 21.3 65 212 28.6 3.5 82.3 17.7 100 150 23.4 2.9 85.1 14.9 150 106 25.0 3.1 88.2 11.8 Pan -106 95.0 11.8 100.0 0.0
Total - 808.0 100.0 - -
KSO 2,104
Product K80 Size Weight % Retained % Passing
Mesh fim grams Individual Cumulative Cumulative
65 212 0.0 0.0 0.0 100.0 100 150 0.0 0.0 0.0 100.0 150 106 0.0 0.0 0.0 100.0 170 90 21.9 14.6 14.6 85.4 200 75 13.9 9.2 23.8 76.2 270 53 23.6 15.7 39.5 60.5 400 38 18.5 12.3 51.8 48.2 Pan -38 72.6 48.2 100.0 0.0
Total - 150.5 100.0 - -
K80 81

Project No.: 10044-139 Test No.: Shake SAG-5
100
90
80
70
60
50
40
30
20
10
0 10
Particle Size Distribution
/
n
-Feed
-Product
100 1,000
Screea Size (micrometers)
10,000

SGS LAKEFIELD RESEARCH
Standard Bond Ball Mill Grindability Test
Project No.: 10044-139 Product: Minus 6 Mesh Date: Sept 22 05
Sample.: SVMDC-6
Purpose: To determine the ball mill grindability of the sample in terms of a Bond work index number.
Procedure: The equipment and procedure duplicate the Bond method for determining ball mill work indices
Test Conditions: Mesh of grind: 150 mesh Test feed weight (700 mL); 1293 grams Equivalent to : 1847 kg/m' at Minus 6 mesh Weight % of the undersize material in the ball mill feed 11.7 % Weight of undersize product for 250% circulating load 369 grams
Results: Average for Last Three Stages = 1.61g. 253% Circulation load
CALCULATION OF A BOND WORK INDEX
BWI = 44.5
^ , 0 2 3 ^ 0 8 2 / J 0 _ _ _ 1 0 \ PI x G r p / F ;
PI = 100% passing size of the product 106 microns Grp = Grams per revolution 1.61 grams P80 = 80% passing size of product 84 microns F80 = 80®/o passing size of the feed 2062 microns
BWI = 11.8 (imperial)
BWI = 13.0 (metric)

indability Test Data Project No.: 10044-139 Test No.: SVMDC-6
Undersize LTSize Undersize Product Stage New In To Be In Per Mill No. Revs Feed Feed Ground Product Total Rev
(grams) (grams) (grams) (grams) (grams) (grams) 1 150 1,293 152 218 393 241 1.61 2 201 393 46 323 340 294 1.46 3 225 340 40 330 367 327 1.45 4 224 367 43 326 385 342 1.53 5 212 385 45 324 374 329 1.55 6 210 374 44 326 369 325 1.55 7 211 369 43 326 382 339 1.61 8 202 382 45 325 383 338 1.67 9 194 383 45 325 357 312 1.61 10 204 357 42 328 369 327 1.60 11 203 369 43 326 373 330 1.62
Average for Last Three Stages = 366g. 1 -6Ig.
Feed K80 Size Weight % Retained % Passing
Mesh lun grams Individual Cumulative Cumulative
6 3,360 0.0 0.0 0.0 100.0 7 2,800 17.0 2.1 2.1 97.9 8 2,360 68.3 8.3 10.3 89.7 10 1,700 167.0 20.2 30.6 69.4 14 1,180 149.5 18.1 48.7 51.3 20 850 92.2 11.2 59.8 40.2 28 600 71.2 8.6 68.5 31.5 35 425 49.4 6.0 74.4 25.6 48 300 35.6 4.3 78.7 21.3 65 212 28.8 3.5 82.2 17.8 100 150 23.7 2.9 85.1 14.9 150 106 26.2 3.2 88.3 11.7 Pan -106 96.8 11.7 100.0 0.0
Total - 825.7 100.0 - -
K80 2,062
Product K80 Size Weight % Retained % Passing
Mesh nm grams Individual Cumulative Cumulative
65 212 0.0 0.0 0.0 100.0 100 150 0.0 0.0 0.0 100.0 150 106 0.0 0.0 0.0 100.0 170 90 24.5 16.1 16.1 83.9 200 75 14.5 9.6 25.7 74.3 270 53 24.4 16.1 41.8 58.2 400 38 18.8 12.4 54.2 45.8 Pan -38 69.6 45.8 100.0 0.0
Total - 151.8 100.0 - -
K80 84

Project No.: 10044-139 Test No.: Shake SAG-6
100
90
80
70
60
50
40
30
20
10
0 10
Particle Size Distribution
L i
-Feed
- •—Produc t
100 1,000
Screen Size (micrometers)
10,000

SGS LAKEFIELD RESEAJRCH
Standard Bond Ball Mill Grindability Test
Project No.: 10044-139 Product: Minus 6 Mesh Date: Sept. 13 2005
Sample.: SVMDC-7
Purpose: To determine the ball mill grindability of the sample in terms of a Bond work index number
Procedure: The equipment and procedure duplicate the Bond method for determining ball mill work indices
Test Conditions: Mesh of grind: 150 mesh Test feed weight (700 mL): 1343 grams Equivalent to : 1919 kg/m' at Minus 6 mesh Weight % of the undersize material in the ball mill feed 10.5 % Weight of undersize product for 250% circulating load 384 grams
Results: Average for Last Three Stages = 1.72g. 244% Circulation load
CALCULATION OF A BOND WORK INDEX
PI = 100% passing size of the product 106 microns Grp = Grams per revolution 1.72 grams P80 = 80% passing size of product 80 microns F80 = 80% passing size of the feed 2113 microns
BWI = 10.8 (imperial)
BW1 = 11.9 (metric)

Grindability Test Data Project No.: 10044-139 TestNo.: SVMDC-7
Stage Undersize U'Size Undersize Product
Stage New In To Be In Per Mill No. Revs Feed Feed Ground Product Total Rev
(grams) (grams) (grams) (grams) (grams) (grams) 1 150 1,343 141 243 430 289 1.93 2 176 430 45 339 348 303 1.72 3 202 348 37 347 373 336 1.67 4 207 373 39 345 381 342 1.65 5 208 381 40 344 398 358 1.72 6 204 398 42 342 398 356 1.75 7 196 398 42 342 374 332 1.69
Average for Last Three Stages = 390g. i .72g.
Feed K80 Size Weight % Retained % Passing
Mesh mn grams Individual Cumulative Cumulative
6 3,360 0.0 0.0 0.0 100.0 7 2,800 21.8 2.6 2.6 97.4 8 2,360 78.3 9.2 11.7 88.3 10 1,700 174.3 20.4 32.1 67.9 14 1,180 150.9 17.7 49.8 50.2 20 850 92.3 10.8 60.6 39.4 28 600 71.0 8.3 69.0 31.0 35 425 50.3 5.9 74.9 25.1 48 300 36.3 4.3 79.1 20.9 65 212 30.4 3.6 82.7 17.3 100 150 25.2 3.0 85.6 14.4 150 106 33.0 3.9 89.5 10.5 Pan -106 89.7 10.5 100.0 0.0
Total - 853.5 100.0 - -
K80 2,113
Product K80
Mesh Size Weight % Retained % Passing
Mesh ^m grams Individual Cumulative Cumulative
65 212 0.0 0.0 0.0 100.0 100 150 0.0 0.0 0.0 100.0 150 106 0.0 0.0 0.0 100.0 170 90 22.6 13.8 13.8 86.2 200 75 14.7 9.0 22.8 77.2 270 53 27.4 16.7 39.5 60.5 400 38 22.3 13.6 53.2 46.8 Pan -38 76.6 46.8 100.0 0.0
Total - 163.6 100.0 - -
K80 80

Project No.: 10044-139 Test No.: Shake SAG-7
100
90
80
70
60
50
40
30
20
10
0
10
Particle Size Distribution
T ' * — / »
/ *
/ J\ 1 /
/ / 4 r /
i( - • - F e e d
—•—Product 1
- • - F e e d
—•—Product 1
100 1,000
Screen Size (micrometers)
10,000

SGS LAKEFIELD RESEARCH
Standard Bond Ball Mill Grindability Test
Project No.: 10044-139 Product: Minus 6 Mesh Date: Sept. 13 2005
Sample.: SVMDC-8
Purpose: To determine the ball mill grindability of the sample in terms of a Bond work index number
Procedure: The equipment and procedure duplicate the Bond method for determining ball mill work indices
Test Conditions: Mesh of grind: 150 mesh Test feed weight (700 mL): 1298 grams Equivalent to : 1854 kg/m' at Minus 6 mesh Weight % of the undersize material in the ball mill feed 10.2 % Weight of undersize product for 250% circulating load 371 grams
Results: Average for Last Three Stages = 1.48g. 250% Circulation load
CALCULATION OF A BOND WORK INDEX
PI = 100% passing size of the product 106 microns Grp = Grams per revolution 1.48 grams P80 = 80% passing size of product 84 microns F80 = 80% passing size of the feed 2103 microns
BWI =
BWI =
12.6 (imperial)
13.9 (metric)

indability Test Data Project No.: 10044-139 Test No.: SVMDC-8
Undersize U'Size Undersize Produci Stage New In To Be In Per Mill No. Revs Feed Feed Ground Product Total Rev
(grams) (grams) (grams) (grams) (grams) (grams) 1 150 1,298 132 238 363 231 1.54 2 200 363 37 334 319 282 1.41 3 240 319 33 338 372 339 1.41 4 235 372 38 333 383 345 1.47 5 226 383 39 332 372 333 1.47 6 226 372 38 333 375 337 1.49 7 223 375 38 333 367 329 1.47
Average for Last Three Stages = 37Ig. 1.48g.
Feed K80 Size Weight % Retained % Passing
Mesh jxin grflnis Individu&l Oumulâtivc Cumulative
6 3,360 0.0 0.0 0.0 100.0 7 2,800 21.6 2.7 2.7 97.3 8 2,360 69.8 8.8 11.5 88.5 10 1,700 161.7 20.4 31.9 68.1 14 1,180 141.8 17.9 49.7 50.3 20 850 87.1 11.0 60.7 39.3 28 600 66.6 8.4 69.1 30.9 35 425 46.5 5.9 74.9 25.1 48 300 34.1 4.3 79.2 20.8 65 212 28.5 3.6 82.8 17.2 100 150 23.7 3.0 85.8 14.2 150 106 31.6 4.0 89.8 10.2 Pan -106 81.0 10.2 100.0 0.0
Total - 794.0 100.0 - -
K80 2,103
Product K80 Size Weight % Retained % Passing
Mesh (im grams Individual Cumulative Cumulative
65 212 0.0 0.0 0.0 100.0 100 150 0.0 0.0 0.0 100.0 150 106 0.0 0.0 0.0 100.0 170 90 21.3 16.3 16.3 83.7 200 75 12.3 9.4 25.7 74.3 270 53 23.1 17.6 43.3 56.7 400 38 17.1 13.1 56.4 43.6 Pan -38 57.1 43.6 100.0 0.0
Total - 130.9 100.0 - -
K80 84

Project No.: 10044-139 Test No.: Shake SAG-8
« S M a.
100
90
80
70
60
50
40
30
20
10
0 10
Particle Size Distribution
w—
1 m
t i
/ /
j f /
4 / r
/ - • - F e e d
—•—Product
{
/ - • - F e e d
—•—Product
{
/
100 1,000
Screen Size (micrometers)
10,000

SGS LAKEFIELD RESEARCH
Standard Bond Ball Mill Grindability Test
Project No.: 10044-139 Product: Minus 6 Mesh Date: September 15 2005
Sample.: SVMDC-9
Purpose: To determine the ball mill grindability of the sample in terms of a Bond work index number
Procedure: The equipment and procedure duplicate the Bond method for determining ball mill work indices
Test Conditions: Mesh of grind: 150 mesh Test feed weight (700 mL) 1281 grams Equivalent to : 1830 kg/m' at Minus 6 mesh Weight % of the undersize material in the ball mill feed 11.2 % Weight of undersize product for 250% circulating load 366 grams
Results: Average for Last Three Stages = 1.70g. 251% Circulation load
CALCULATION OF A BOND WORK INDEX
PI = 100% passing size of the product 106 microns Grp = Grams per revolution 1.70 grams P80 = 80% passing size of product 82 microns F80 = 80% passing size of the feed 2084 microns
BWI =
BWI =
11.1 (imperial)
12.2 (metric)

indability Test Data Project No.: 10044-139 Test No.: SVMDC-9
Undersize U'Size Undersize Produci Stage New In To Be In Per Mill
No. Revs Feed Feed Ground Product Total Rev (grams) (grams) (grams) (grams) (grams) (grams)
1 150 1,281 143 223 391 248 1.65 2 190 391 44 322 354 310 1.63 3 200 354 39 327 358 319 1.59 4 205 358 40 326 383 343 1.67 5 193 383 43 323 379 336 1.74 6 186 379 42 324 366 324 1.74 7 187 366 41 325 360 319 1.71 8 191 360 40 326 363 323 1.69 9 193 363 40 326 372 332 1.72
Average for Last Three Stages = 365g. 1.70g.
FeedKSO Size Weight % Retained % Passing
Mesh jyn grams Individual Cumulative Cumulative
6 3,360 0.0 0.0 0.0 100.0 7 2,800 16.8 2.0 2.0 98.0 8 2,360 74.4 8.7 10.7 89.3 10 1,700 176.3 20.7 31.3 68.7 14 1,180 155.4 18.2 49.6 50.4 20 850 93.0 10.9 60.5 39.5 28 600 71.0 8.3 68.8 31.2 35 425 49.4 5.8 74.6 25.4 48 300 36.2 4.2 78.8 21.2 65 212 29.8 3.5 82.3 17.7 100 150 24.9 2.9 85.2 14.8 150 106 31.0 3.6 88.8 11.2 Pan -106 95.2 11.2 100.0 0.0
Total - 853.4 100.0 - -
K80 2,084
Product K80 Size Weight % Retained % Passing
Mesh Hm grams Individual Cumulative Cumulative
65 212 0.0 0.0 0.0 100.0 100 150 0.0 0.0 0.0 100.0 150 106 0.0 0.0 0.0 100.0 170 90 17.3 15.0 15.0 85.0 200 75 10.6 9.2 24.2 75.8 270 53 19.2 16.6 40.8 59.2 400 38 15.6 13.5 54.3 45.7 Pan -38 52.7 45.7 100.0 0.0
Total - 115.4 100.0 - -
K80 82

Project No.: 10044-139 Test No.: Shake SAG-9
100
90
80
70 BI '5 «0 « 60
V > 50 •a ee
E 40
Ô
30
20
10
0
10
Particle Size Distribution
I m
t / J
Y
/ / / /
< r /
1 < - • - F e e d /
— P r o d u c t
, 1
100 1,000
Screen Size (micrometers)
10,000

SGS LAKEFIELD RESEARCH
Standard Bond Ball Mill Grindability Test
Project No.: 10044-139 Product: Minus 6 Mesh Date: Sept. 13 2005
Sample.: SVMDC-10
Purpose: To determine the ball mill grindability of the sample in terms of a Bond work index number.
Procedure: The equipment and procedure duplicate the Bond method for determining ball mill work indices
Test Conditions: Mesh of grind: 150 mesh Test feed weight (700 mL): 1200 grams Equivalent to : 1714 kg/m^ at Minus 6 mesh Weight % of the undersize material in the ball mill feed 12.1 % Weight of undersize product for 250% circulating load 343 grams
Results: Average for Last Three Stages = 1.54g. 245% Circulation load
CALCULATION OF A BOND WORK INDEX
PI = 100% passing size of the product Grp = Grams per revolution P80 = 80% passing size of product F80 = 80% passing size of the feed
106 microns 1.54 grams
83 microns 2091 microns
BWI =
BWI =
12.1 (imperial)
13.4 (metric)
indability Test Data Project No.: 10044-139 Test No.: SVMDC-10
Undersize LTSize Undersize Product Stage New In To Be In Per Mill No. Revs Feed Feed Ground Product Total Rev
(grams) (grams) (grams) (grams) (grams) (grams) 1 150 1,200 145 198 351 206 1.37 2 219 351 42 300 332 290 1.32 3 229 332 40 303 360 320 1.40 4 214 360 44 299 364 320 1.50 5 200 364 44 299 354 310 1.55 6 194 354 43 300 336 293 1.51 7 200 336 41 302 352 311 1.56
Average for Last Three Stages = 347g. 1.54g.
Feed K80 Size Weight % Retained % Passing
Mesh lun ffl-ams Individual Cumulative Cumulative
6 3,360 0.0 0.0 0.0 100.0 7 2,800 18.6 2.2 2.2 97.8 8 2,360 75.0 8.9 11.1 88.9 10 1,700 171.3 20.3 31.4 68.6 14 1,180 154.9 18.4 49.8 50.2 20 850 91.7 10.9 60.7 39.3 28 600 69.8 8.3 69.0 31.0 35 425 49.5 5.9 74.8 25.2 48 300 35.9 4.3 79.1 20.9 65 212 29.3 3.5 82.6 17.4 100 150 24.3 2.9 85.5 14.5 150 106 20.5 2.4 87.9 12.1 Pan -106 102.0 12.1 100.0 0.0
Total - 842.8 100.0 - -
K80 2,091
Product K80 Size Weight % Retained % Passing
Mesh ^m grams Individual Cumulative Cumulative
65 212 0.0 0.0 0.0 100.0 100 150 0.0 0.0 0.0 100.0 150 106 0.0 0.0 0.0 100.0 170 90 20.3 15.7 15.7 84.3 200 75 11.3 8.8 24.5 75.5 270 53 21.1 16.4 40.9 59.1 400 38 15.9 12.3 53.2 46.8 Pan -38 60.3 46.8 100.0 0.0
Total - 128.9 100.0 - -
K80 83

Project No.: 10044-139 Test No.: Shake SAG-10
« S «C
c .
j ; « 3
E s U
100
90
80
70
60
50
40
30
20
10
0 10
Particle Size Distribution
w / 1 / i J
y
/
/ f /
4 f
1 { - • - F e e d
— • — P r o d u c t
1
100 1,000
Screen Size (micrometers)
10,000

SGS LAKEFIELD RESEARCH
Standard Bond Ball Mill Grindability Test
Project No.: 10044-139 Product: Minus 6 Mesh Date: Septl3 2005
Sample.: SVMDC-11
Purpose: To determine the ball mill grindability of the sample in terms of a Bond work index number
Procedure: The equipment and procedure duplicate the Bond method for determining ball mill work indices
Test Conditions: Mesh of grind: 150 mesh Test feed weight (700 mL): 1178 grams Equivalent to : 1683 kg/m' at Minus 6 mesh Weight % of the undersize material in the ball mill feed 12.1 % Weight of undersize product for 250% circulating load 337 grams
Results: Average for Last Three Stages = 1.58g. 246% Circulation load
CALCULATION OF A BOND WORK INDEX
PI = 100% passing size oftiie product Grp = Grams per revolution P80 = 80% passing size of product F80 = 80% passing size of the feed
106 microns 1.58 grams
81 microns 2085 microns
BWI =
BWI =
11.8 (imperial)
13.0 (metric)
indability Test Data Project No.: 10044-139 Test No.: SVMDC-11
Undersize U'Size Undersize Product Stage New In To Be In Per Mill
No. Revs Feed Feed Ground Product Total Rev (grams) (grams) (grams) (grams) (grams) (grams)
I 150 1,178 143 194 371 228 1.52 2 192 371 45 292 317 272 1.42 3 210 317 38 298 343 305 1.45 4 203 343 42 295 350 308 1.52 5 194 350 42 294 337 295 1.52 6 195 337 41 296 353 312 1.60 7 184 353 43 294 330 287 1.56 8 190 330 40 297 337 297 1.56
Average for Last Three Stages = 340g. 1.58g.
Feed K80 Size Weight % Retained % Passing
Mesh iim grams Individual Cumulative Cumulative
6 3,360 0.0 0.0 0.0 100.0 7 2,800 19.8 2.5 2.5 97.5 8 2,360 69.5 8.7 11.2 88.8 10 1,700 159.0 20.0 31.2 68.8 14 1,180 144.9 18.2 49.4 50.6 20 850 88.3 11.1 60.5 39.5 28 600 67.4 8.5 68.9 31.1 35 425 47.3 5.9 74.9 25.1 48 300 34.2 4.3 79.2 20.8 65 212 27.9 3.5 82.7 17.3 100 150 22.7 2.9 85.5 14.5 150 106 18.9 2.4 87.9 12.1 Pan -106 96.5 12.1 100.0 0.0
Total - 796.4 100.0 - -
K80 2,085
Product K80 Size Weight % Retained % Passing
Mesh Hm grams Individual Cumulative Cumulative
65 212 0.0 0.0 0.0 100.0 100 150 0.0 0.0 0.0 100.0 150 106 0.0 0.0 0.0 100.0 170 90 20.7 14.2 14.2 85.8 200 75 13.8 9.5 23.7 76.3 270 53 25.4 17.5 41.2 58.8 400 38 20.0 13.8 55.0 45.0 Pan -38 65.5 45.0 100.0 0.0
Total - 145.4 100.0 - -
K80 81

Project No.: 10044-139 Test No.: Shake SAG-11
100
90
80
70
60
50
40
30
20
10
0 10
Particle Size Distribution
; r - — / / i
J -. i
J / /
/ / • 4
f
/
A < - « - F e e d /
—•—Product
1
100 1,000
Screen Size (micrometers)
10,000

Ursa Major Minerals Inc. - Shakespeare - 10044-139
APPENDIX F
Bond Abrasion Test Details
SGS Minerals Semces

SGS LAKEFIELD RESEARCH
STANDARD BOND ABRASION TEST
Project No.: 10044-139 Test : Abrasion
Sample: Disseminated Comp
September 21 2005
Purpose: To determine the Abrasion Index of the sample
Procedure: The equipment and procedure duplicate the Bond method for determining an abrasion index.
Feed: 1600 grams minus 3/4 inch plus 1/2 inch fraction
Results: Original paddle weight, gram Final paddle weight, grams:
Abrasion Index, Ai:
94.3716 94.1546
0.2170
Predicted Wear Rates:
Wet rod mill, rods: Wet rod mill, liners:
Wet ball mill, balls: (1) Wet ball mill, liners: (1)
Dry ball mill, balls: (2) Diy ball mill, liners: (2)
Crusher, liners: (3)
Roll crusher, shells:
0.35*(Ai-0.020)^0.20 O.O35*(Ai-0.OI5)'H).30
0.35*(Ai-0.015r0.33 0.026*(Ai-0.015)^.30
0.05*(Ai)'K).5 0.005*(Ai)'^0.5
(Ai+0.22)/ll
(Ai/10)'X).67
Ib/kwh 0.25
0.022
0.21 0.016
0.040
0.077
kg/kwh 0.11
0.010
0.094 0.0073
0.023 0.011 0.0023 0.0011
0.018
0.035
(1) overflow and grate discharge types (2) grate discharge type (3) gyratory, jaw, cone

STANDARD BOND ABRASION TEST
Final Product Test : Abrasion Sample: Disseminated Comp
Microns Mesh Weight Grams
% Weight Microns Mesh Weight Grams Ind. Cum. Passing
13,330 1/2 in 417.3 48.6 48.6 51.4 9,423 3/8 in 171.1 19.9 68.5 31.5 6,680 3 34.2 4.0 72.5 27.5 4,699 4 18.3 2.1 74.6 25.4 3,327 6 7.1 0.8 75.5 24.5 2,362 8 3.7 0.4 75.9 24.1 1,651 10 2.6 0.3 76.2 23.8 1,168 14 2.7 0.3 76.5 23.5 833 20 3.4 0.4 76.9 23.1 589 28 7.6 0.9 77.8 22.2 417 35 11.1 1.3 79.1 20.9 295 48 17.2 2.0 81.1 18.9 208 65 16.5 1.9 83.0 17.0 147 100 16.0 1.9 84.9 15.1
-147 -100 129.8 15.1 100.0 -
Total 858.5 100.0 - -
bo 'S5
pL,
<D >
1 1
U
Cumulative Percent Passing vs. Particle Size
100 90 80 70 60 50 40 30 20 10
10
t 100 1,000 10,000
Screen Size (micrometers)
100,000

LAKEFIELD RESEARCH
STANDARD BOND ABRASION TEST
Project No.: 10044-139
Sample: Blebby Comp
Test : Abrasion September 21 2005
Purpose: To determine the Abrasion Index of the sample
Procedure: The equipment and procedure duplicate the Bond method for determining an abrasion index.
Feed: 1600 grams minus 3/4 inch plus 1/2 inch fi-action
Results: Original paddle weight, gram Final paddle weight, grams:
Abrasion Index, Ai:
93.9563 93.8115
0.1448
Predicted Wear Rates:
Wet rod mill, rods: Wet rod mill, liners:
0.35*(Ai-0.020)^.20 0.035*(Ai-0.015)'^.30
Ib/kwh 0.23
0.019
ke/kwh 0.10
0.009
Wet ball mill, balls: (1) Wet ball mill, liners: (1)
0.3 5 *(Ai-0.015)^^0.33 0.026*(Ai-0.015)'H).30
0.18 0.014
0.081 0.0064
Diy ball mill, balls: (2) Diy ball mill, liners: (2)
0.05*(Air0.5 0.005*(Ai)'X).5
0.019 0.0019
0.009 0.0009
Crusher, liners: (3) (Ai+0.22)/ll 0.033 0.015
Roll crusher, shells: (Ai/lOrO.67 0.059 0.027
(1) overflow and grate discharge types (2) grate discharge type (3) gyratory, jaw, cone

STANDARD BOND ABRASION TEST
Final Product Test : Abrasion Sample: Blebby Comp
Microns Mesh Weight Grams
% Weight Microns Mesh Weight Grams Ind. Cum. Passing
13,330 1/2 in 200.8 28.9 28.9 71.1 9,423 3/8 in 207.7 29.9 58.8 41.2 6,680 3 37.6 5.4 64.3 35.7 4,699 4 7.3 1.1 65.3 34.7 3,327 6 7.4 1.1 66.4 33.6 2,362 8 5.8 0.8 67.2 32.8 1,651 10 3.2 0.5 67.7 32.3 1,168 14 3.5 0.5 68.2 31.8 833 20 4.1 0.6 68.8 31.2 589 28 8.0 1.2 69.9 30.1 417 35 11.4 1.6 71.6 28.4 295 48 17.1 2.5 74.0 26.0 208 65 16.3 2.3 76.4 23.6 147 100 15.6 2.2 78.6 21.4
-147 -100 148.4 21.4 100.0 -
Total 694.2 100.0 - -
bO •S
0 - . «
>
3 E 3 u
Cumulative Percent Passing vs. Particle Size
100 90 80
70 60 50 40 30 20 1 0 ^
10 100 1,000 10,000
Screen Size (micrometers)
100,000

An Update on
METALLURGICAL VARIABILITY TESTING OF THE SHAKESPEARE ORES
prepared for
URSA MAJOR LIMITED Project 10616-003 - Report 2
February 3, 2006
NOTE: This report refers to the samples as received.
The practice of this Company in issuing reports of this nature is to require the recipient not to publish the report or any part thereof without the written consent of SGS Lakefield Research Limited.
SGS Lakefield Research Limited P.O. Box 4300, 185 Concession Street, Lal<efield, Ontario, Canada KOL 2H0 Tel: (705) 652-2000 Fax; (705) 652-6365 www.sgslakefield.comwww.ca.sgs.com
Member of the SGS Group (SGS SA)

Ursa Major Limited - Shakespeare -10616-003 159
TABLE OF CONTENTS
Executive Summary 3
Introduction 5
Testworlc Summary 6
1. Samples and Sample Preparation 6 1.1 Samples and Sample Preparation
1.2 Head Analyses 6
2. Variability Flotation Testing: Procedure 8
3. Variability Flotation Testing: Results 10
4. QEMSCAN™ Variability Mineralogy Studies 14 4.1 Regression Analysis 14
5. Conclusions and Recommendations 18
Conclusions and Recommendations
Appendix 1 - Flotation Test Sheets Appendix 2 - QEMSCAN™ Data Sheets
SGS Minerals Services

Ursa Major Limited - Shakespeare -10616-003 160
Executive Summary
As part of a feasibility study conducted on the Shakespeare property near Sudbury, Ontario, Ursa
Major Minerals contracted SGS to conduct metallurgical testing designed to create feasibility-
level metallurgical information on the property. This is the second of two reports prepared
describing this work.
Two types of samples were provided. The first, lump ore samples, taken from the surface, were
oxidized and, in reality, probably represent only a small tonnage, so the flotation data on these
has been largely discounted. The second samples were drill core, and were both fresh and more
representative of the deposit as a whole, to have comprised the bulk of the applicable data.
Mineralogy has been used, where possible, to infer likely metallurgical performance of the lump
ore, as fresh material.
The flotation results from this variability study (Table 1) support the pre-feasibility metallurgical
projections, based on the testwork in the master composite. The greatest variation of
performance is in the Pd recoveries, while Cu and Ni recoveries are quite consistent. There is no
correlation between head grade and flotation recovery, for any of the principal metals of value in
the ore.
Table 1. Summarized Variability Flotation Metallurgy
head grades batch cleaner recoveries (to 15% Cu+Ni conc) Pt,g/t Pd,g/t Cu,% Ni, % Pt,% Pd,% Cu,% Ni,%
DC2 0.46 0.57 0.51 0.45 54.4 29.0 91.6 70.3 DCl 0.51 0.60 0.60 0.51 74.7 32.7 88.5 71.7 DC3 0.38 0.48 0.52 0.44 69.9 32.9 91.3 68.4 DC4 0.43 0.51 0.47 0.43 62.2 30.5 90.5 69.6 DC5 0.42 0.47 0.50 0.43 76.6 43.1 94.3 76.4 DC6 0.32 0.41 0.41 0.34 68.1 37.3 93.0 76.1 DC7 0.49 0.62 0.49 0.48 70.8 30.0 94.0 72.2 DC8 0.38 0.52 0.55 0.43 69.9 43.9 94.7 78.1 DC9 0.43 0.52 0.44 0.40 74.8 51.2 94.9 78.5 DCIO 0.45 0.57 0.56 0.47 64.4 40.4 90.4 74.0 DCll 0.28 0.30 0.32 0.28 64.4 41.6 94.1 66.0 Average 0.41 0.51 0.49 0.42 68.2 37.5 92.5 72.9 Std Dev 0.07 0.09 0.08 0.06 6.5 7.1 2.1 4.1
SGS Minerals Services

Ursa Major Limited - Shakespeare -10616-003 161
Mineralogical drivers dictating Cu and Ni metallurgy include:
• The abundance of chlorite/feldspar mineralization (gabbro ore types?) - inverse strong correlation with Ni recovery.
• Mean pentlandite grain size - direct weak correlation with Ni recovery.
• Mean chalcopyrite grain size - direct weak correlation with Cu recovery.
Data indicate that the surface samples contain relatively fine-grained pentlandite, which is a
likely contributing cause of the poor metallurgy.
SGS Minerals Services

Ursa Major Limited - Shakespeare -10616-003 162
Variability testing on a composite of ore from tlie Shakespeare deposit was conducted at the SGS
Lakefield site in October and November, 2005. The work consisted of 38 batch cleaner flotation
tests, at the 2-kg scale. This work was supported by mineralogical studies conducted, using
QEMSCAN™.
The testing was conducted by Dan Lang, under the guidance of Chris Martin, the project
manager. The results were reported both through emails and the occasional presentation to
Richard Gowans, who acted as the owner's representative during the program.
Chris Martin, M.Eng Group Leader, Mineral Technologies
C.A. Fleming, Ph. D., Executive Vice President & Manager - Metallurgical Operations
Report preparation by: S. McKenzie
SGS Minerals Services

Ursa Major Limited - Shakespeare - 10616-003 163
Testwork Summary
1. Samples Received and Sample Preparation
1.1 Samples and Sample Preparation
Eight lump ore samples (LO 1-8) and 11 drill core samples (DC 1-11) were received at the SGS
Lakefield site. The lump ore samples were obtained from oxidized, surface material, while the
drill core samples were a better representation of the composite as a whole, and consisted of
fresh material.
1.2 Head Analyses The head assays are shown in Figures 1 and 2.
• % Cu • %Ni
Figure 1. Base Metal Head Assays (% Cu and Ni) of the Variability Composites
S G S Millet a is Services

Ursa Major Limited - Shakespeare - 10616-003 164
pi»»
. • •
S S 6 S w M 5 s 1 M5 W) > tfl CO
0.35
0.3
0.25
0.2
0.15
0.1
0.05
0
Aug/1
Pdg/t
ô Ô ô ô 5 Ô Ô
« CO > » c n « c o « c o c o > c o ( / î w o ï
C o 5 c O ( O C O C O < f l « c O { 5 c O CO CO CO CO CO
Figure 2. PGE and Au Assays of the Variability Composites
Assay reconciliation between assayed head grades, and calculated head grades, for each of the
principal metals are shown in Figure 3. This not only provides a quality control measurement,
the accuracy of assaying in the program, but also some insight into the likely presence of nugget
mineralization (especially for the PGE). Reproducibility of the Cu and Ni head assays is
generally excellent, indicating the data set is free from any systemic problems in assaying, or any
drift in assay accuracy for the program. The average assayed head and calculated head assay
differs by about 1% for each of the base metals. Reproducibility for the PGE is not as good, with
significant sample-to-sample variation for platinum (indicating the likelihood of some coarser Pt
mineralization) and a negative mean call factor for Pt of 13% and Pd of 7%.
^GS' Mineralï , Service!-

Ursa Major Limited - Shakespeare - 10616-003 165
^ 8 S 0.80
0.70
0.60
0.50
0.40
0.30
0.20
Pd. qA I
A
0.80
0.70
0.60
0.50
0.40
0.30
0.20
0.80
0.70
0.60
0.50
0.40
0.30
0.20
0.80
0.70
0.60
0.50
0.40
0.30
0.20
/ V A / ^ w Y
0.80
0.70
0.60
0.50
0.40
0.30
0.20
1 y \ / \ ^ —«—calculated headi •
0.80
0.70
0.60
0.50
0.40
0.30
0.20 calculated hesdl assayed head
0.10
0.00 i o S S 5 8 § § 8 g S ? ? o 8 8 3 8 8 S 8 g S § O 1-
8 8
Figure 3. Assay Reconciliation, Variability Samples
These data point to the potential presence of variability in observed metallurgical performance
with respect to Pt and Pd, which could be ascribed to random sampling error and possible
systemic deviations in assaying. The reader should be cautioned against over-interpretation of
these data. The Cu and Ni assayed and reconstituted data are, however, consistent, and no such
caution is required here.
2. Variability Flotation Testing: Procedure
Minor variations of the flowsheet described in Figure 4 were used for variability cleaner flotation
testing. In many cases, a pyrrhotite scavenger was also floated for environmental reasons.
However, this part of the procedure has no bearing on the overall grade/recovery relationship of
the valuables, so for the sake of simplicity it has been excluded from the flowsheet, as described
at this point.
v i i i u - i i i l s . S t r - v i c e ^

Ursa Major Limited - Shakespeare - 10616-003 166
Primary grind: K80 = 80 microns
Rougher flotation: 16 minutes SIPX 20 g/t. DTP 15 g/t, MIBC 25 g/t all stage added
Feed
SlPX2.5g/t.
P'cleaner: DTP 2.5 g/t, 3mins
Lime 200 g/t
Lime 20 g/t
SIPX 2.5 g/t DTP 2.5 g/t Lime: 50 g/t
SIPX 1 g/t MIBC: 2.5 g/t
SIPX I g/t CMC 10 g/t
MIBC: 25 g/t Lime: 10 g/t
SIPX 1 g/t CMC 10 g/t
MIBC 2.5 g/t Lime: lOg/t
Final tails
cleaner scav: 2.5 mins
cleaner 3.5 mins
3'''' cleaner 2 mins
cleaner 2 mins
Final concentrate
Figure 4. Metallurgical Procedure Used for Variability Testing
The flowsheet is based on that used in the locked cycle testing, reported in Progress Report 1,
describing the flowsheet development part of the program. While a consistent grind time was
used throughout the program, in reality, some variation in product size resulted. This is indicated
(in terms of scavenger tails size distributions) in Table 2. The average scavenger tails size
distribution (Kgo) was 85 microns, equivalent to a primary grind size (Kgo) of roughly 81
microns.
SCiS M i i i e t H l s S e r v i c es

Ursa Major Limited - Shakespeare - 10616-003 JQ
Table 2. Scavenger Tails Kgo
Sample kSO, microns Sample k80, microns D C l l 78 DCl 81 DCIO 82 L08 88 DC9 73 L 0 7 88 DCS 84 L06 93 DC7 70 L05 96 DC6 84 L04 94 DC5 75 L03 86 DC4 73 L02 102 DC3 79 LOI 97 DC2 88 Average 85 std dev 6
3. Variability Flotation Testing: Results
Results, pertaining to copper flotation, from the variability tests are described in Figure 5 (where
copper recovery is plotted against a combined copper/nickel concentrate grade), and detailed in
the Appendix A. Copper metallurgy exhibited minor variability, even with the oxidized lump ore
samples. Only one sample performed poorly, SVML08. In the figure, the drill core data are
described in blue, while the lump ore data are described in orange. Batch flotation data (from
Progress Report 1) on the Master Composite is shown in Figure 4 as black squares.
Copper cleaner performance deteriorated somewhat in the final cleaner stages, however, this is
likely the result of a slightly less-than-optimal reagent dosage for these samples (all these tests
were essentially "one-offs" with no opportunity afforded to the technologist to optimize the
flowsheet. Such variability is minor enough that, with the cleaner middlings circulation, and on-
stream analysis and routine flotation plant operation, it would be addressed as a matter of routine
in the plant.

Ursa Major Limited - Shakespeare - 10616-003 11
35 •
30
U 25
§ 20 a •8 c
B 8
15
10
. A S V M L O l 1 0 S V M L 0 2 ! O S V M L 0 3 J K S V M L 0 4
X
o
O i • S V M L 0 5 ' X S V M L 0 6 ' X S V M L 0 7
* S V M L 0 8 • S V M D C l • S V M D C 2 • SVMDC3
J • S V M D C 4 1 SaSVMDC5
» S V M D C 6 • S V M D C 7
^ • S V M D C 8 1 " S V M D C Q i • SVMDCIO
• S V M D C l 1 - • Compos i t e
• 4 • S V M D C l • S V M D C 2 • SVMDC3
J • S V M D C 4 1 SaSVMDC5
» S V M D C 6 • S V M D C 7
^ • S V M D C 8 1 " S V M D C Q i • SVMDCIO
• S V M D C l 1 - • Compos i t e
• S V M D C l • S V M D C 2 • SVMDC3
J • S V M D C 4 1 SaSVMDC5
» S V M D C 6 • S V M D C 7
^ • S V M D C 8 1 " S V M D C Q i • SVMDCIO
• S V M D C l 1 - • Compos i t e
^Ik 1 A H
• S V M D C l • S V M D C 2 • SVMDC3
J • S V M D C 4 1 SaSVMDC5
» S V M D C 6 • S V M D C 7
^ • S V M D C 8 1 " S V M D C Q i • SVMDCIO
• S V M D C l 1 - • Compos i t e • ^ ^ :
50 60 70 80
Cu recovery, %
90 100
Figure 5. Variability in Batch Test Cu/Ni Combined Grade vs. Cu Recovery
Nickel flotation results are shown in Figure 6. Nickel flotation of the drill core variability
samples reflects the batch data on the master composite quite closely. Again, recovery drops off
somewhat at the higher levels of cleaning, this would in reality be addressed both by tighter
control in the plant and the circulating loads in the 2"'' and 1®' cleaners.
35 y -
30
I ^ M
§ 20
5 15
10
£3 • • î i -
• . i f a » ^
o f
i S V M L O l 0 S V M L 0 2 G S V M L 0 3 « S V M L 0 4 • S V M L 0 5 X S V M L 0 6 * S V M L 0 7 » S V M L 0 8 • S V M D C l • S V M D C 2 • S V M D C 3 • S V M D C 4 S3SVMDC5 1 S V M D C 6 • S V M D C 7 • S V M D C 8 • S V M D C 9 • SVMDCIO • S V M D C l 1 • Compos i t e
t l
50 60 70 80
Ni recovery, %
90 100
Figure 6. Variability in Batch Test Cu/Ni Combined Grade vs. Ni Recovery
SV j .S M i n e r a l s S e r v i e s

Ursa Major Limited - Shakespeare - 10616-003 12
The lump ore nickel flotation performance is poor. SGS understands that the lump ore material
was highly oxidized surface material and presumably represents only a very minor proportion of
the total deposit. However, it clearly does not float well. Ursa Major should be cautioned against
blending it with fresh ore.
The variability in platinum flotation response is shown in Figure 7. Once again, platinum
metallurgy for the variability drill core samples is quite consistent with the data from the master
composite. Unlike copper and nickel metallurgy, which can in part be influenced by optimization
of the flotation process, platinum metallurgy is usually driven by mineralogy, specifically the
proportion of platinum that is either present in suitably-liberated, floatable-sized grains of the
PGM or as solid-solution Pt in the floatable sulphide minerals (the latter is unlikely to be
significant in this case). Therefore, these results are a reflection of the Pt-bearing PGM grain size
distribution. Except for DC 10, "fresh" ore samples all responded reasonably well in terms of
platinum metallurgy.
35
30
1 25
20 3
U
3 15
10
X X • • > •
V
I A SVMLOl Io SVML02 O SVML03
_i « SVML04 I •SVML05 X SVML06
^ K SVML07 J » SVML08 IBSVMDCl I • SVMDC2 I BSYMDCS
• SVMDC4 H £aSVMDC5 ! * SVMDC6
• SVMDC7 • SVMDC8
SVMDC9 SVMDCIO SVMDCll Composite
A • • •
20 30 40 50 60 70
Pt recovery, %
80 90 100
Figure 7. Variability in Batch Test Cu/Ni Combined Grade vs. Pt Recovery
S( iS MiiU'ials Sfcrvice>

Ursa Major Limited - Shakespeare - 10616-003 13
The variability in Pd flotation response is shown in Figure 8. Palladium flotation recoveries were
similar to, if not slightly, lower than the composite. Again, the difference would not be
considered significant.
35 T -
30
SS 25
1 20 3
(J
I 15
10 u
O o •
-iF. S X
• » • • X
A • •
H f s a '
ASVMLOI O SVML02 OSVML03 « SVML04 • SVML05
, X SVML06 I X SVML07
«•SVML08 • SVMDCl • SVMDC2 • SVMDC3 • SVMDC4 E3SVMDC5 ASVMDC6 •SVMDC7 • SVMDC8 • SVMDC9 • SVMDCIO • SVMDCll • Composite
20 40 60
Pd recovery, %
80 100
Figure 8. Variability in Batch Test Cu/Ni Combined Grade vs. Pd Recovery
The data have been examined to establish the presence of any head grade vs. recovery
relationships, based on the test data on the drill core samples. Assuming a target grade of 15%
combined copper and nickel (not all the composites were floated to a combined concentrate
grade of 18% Cu+Ni), the results are shown in Figure 9. There is no strong correlation between
head grade and recovery, for any of the principal metals, so recovery can be expected to be
largely unaffected by head grade, based on the samples tested in this program. There is a slight,
somewhat unusual, negative correlation between Cu head grade and recovery, which is unusual
for such ores.
S(.;S Mintiai . ' ; .^tîrs iceï

Ursa Major Limited - Shakespeare - 10616-003 14
100
90
80
70
^ 60
50 u >
^ 40
30
20
10
A Û
— f ^ a . fa* ^ ^ H — I » " :
• •
• •
1 • • . _ •
• — 1 •
• • _ M • — 1
i
• Pt, %
• Pd, %
A Cu, %
Q Ni, %
Linear (Cu, %)
Linear (Ni, %)
Linear (Pt, %)
Linear (Pd, %)
0.30 0.35 0.40 0.45 0.50 0.55
Head grade (%, g't)
0.60 0.65
Figure 9. Head Grade vs. Flotation Recovery to a 15% Combined Cu+Ni Concentrate Grade
Batch recoveries averaged 3-10% lower for these tests, compared to the locked cycle test
recoveries for the same concentrate grade, described in the first progress report. This is to be
expected owing to the lack of any supplemental recovery achieved by re-processing the
middlings streams, as is conducted in locked cycle testing. Assuming a commonly used rule of
thumb, that 50% of the recycled metal finally reports to the final concentrate in locked cycle
testing, points, for example, to a mean projected Ni recovery of 78% to a concentrate assaying
15% combined Cu and Ni, roughly 1-2% below that actually projected.
4. QEMSCAN™ Variability Mineralogy Studies
4.1 Regression Analysis
A regression analysis has been conducted between mineralogical and metallurgical data, to
identify mineralogical triggers to metallurgical performance. Specifically, links between
mineralogy and copper recovery, nickel recovery and grindability were investigated. The results.
nG.S Vlnjci'a..-, Sft•^

Ursa Major Limited - Shakespeare - 10616-003 15
in terms of R^ regression fits, are shown in Figure 10. Owing to the likely detrimental effect of
oxidation on the lump ore samples, these data were excluded from the regression exercise.
Mincralogical Factors vs Nickel Recovery Mincralogical Factors vs Copper Recover>'
1.0
0 . 8
0.6
0.4
0.2
0.0
-0.2
-0.4
-0 .6
- 0 8
-1.0
1
r - |
• - - i 1 n 1
.K 1 £ i f T t H - h
r - - i i t
Mineral Grain Siz: vs Gnndabilit>'
1 4 X 4 I T T l
1
0.8
0.6
0.4
02
0
-0.2
-0.4
-0 .6
- 0 . 8
-1
1
0.8
0.6
0.4
0.2
0
-0.2
•0.4
-0.6
-0.8
- 1
§ -Ê ^
Mineral Abimdance vs Grindability
F P = I
' » 1 - U » 4 1
- . I V 1 a Ï Ji
1 1 1 ! F I L L ' ! ' ÏI 1
1
Figure 10: Regressions Coefficients Describing Mineralogical Factors Affecting Cu Recovery, Ni Recovery and Grindability.
A positive R^ indicates a direct correlation, a negative R^ indicates an inverse correlation.
Typically, a regression coefficient greater than 0.3 (or less than -0.3) indicates a weak link
between the mineralogical parameter and flotation performance, and 0.6 (or less than -0.6)
indicates the factor is a significant contributor to the metallurgical performance parameter.
In this case:
• Pentlandite grain size has a weak direct correlation with nickel recovery.
• The combined abundance of chlorite and feldspar has a significant negative correlation with nickel recovery. This is hard to explain from flotation principals and may indicate that chlorite/feldspar-rich (possibly gabbro) ores contain a fraction of hard-to-float (perhaps micro-sized) pentlandite, or more than normal Ni dispersed in the silicate matrix.
• Copper recovery is weakly correlated with chalcopyrite grain size.
SCtS .Mnifrals .Sen. ice?.

Ursa Major Limited - Shakespeare - 10616-003 16
There is a weak negative correlation with pyrrhotite abundance, and very weak correlations with chalcopyrite and pentlandite abundance - perhaps pointing to collector starvation in the flowsheet for the higher-grade samples.
There is a weak negative correlation between chlorite abundance and grindability.
The bulk modal mineralogical composition of the 19 samples is shown in Table 3 and Figure 11 :
• Chlorite and feldspar contents are quite consistent throughout the dataset, with only three samples (including two lump ore samples) that contain less of these minerals. These three samples, as fresh ore, may exhibit somewhat better than average Ni recovery (two are oxidized lump ore samples).
• The consistent chlorite contents, and the lack of other mineralogical drivers affecting grindability, point to a reasonably consistent grindability throughout the deposit, as was observed from most of the test Kgo's through the program (Table 2).
• Pyrrhotite abundance is higher in SVML06, pointing to possible poor copper recoveries, however, this was not observed in the test program.
The grain size data are shown in Figure 12.
• Chalcopyrite is more finely disseminated in the lump ore (near-surface) samples, pointing to a possibility of slightly lower recoveries early in the life of the project. Samples SVML04-8 would be expected to responded relatively poorly, as they generally did. However, the sample SVML08, which performed particularly poorly in the flotation program, does not appear to have any specific mineralogical problems and was probably just excessively weathered.
• Some of the SVMDC samples (1, 2 and 4) also contained finely disseminated chalcopyrite, and indeed performed quite poorly in the lab.
• Pentlandite in the lump ore samples is also relatively finely disseminated, and would be expected to respond worse than most drill core samples to flotation. This supports the actual test data, and points to the near-surface material, as fresh material, probably performing a little worse than the material occurring deeper in the deposit. It is likely that oxidation has adversely affected Ni recoveries in these tests, however, mineralogy should not be discounted as a factor.

Ursa Major Limited - Shakespeare - 10616-003 17
Table 3. Bulk Modal Mineralogical Composition of Shakespeare Samples
CM in CN •7 f S» o> o
d -1 2 2 2 2 2 2 2 8 H H i 1
m (0 1 i 1 1 1 i i i
S s;
S S; 1 I S
s; m Pentlandite 0.7 0.8 0.6 0.8 0.8 1.3 1.1 0.7 1.0 1.2 0.8 1.4 0.9 1.3 0.8 1.0 0.9 0.3 Ni-Arsenides DL DL DL DL DL DL DL DL DL DL DL DL DL DL DL DL DL DL Cobaltite DL DL DL DL DL DL DL DL DL DL DL DL DL DL DL DL DL DL Pyrrhotite 14.9 7.4 3.0 4.4 3.6 27.1 3.7 3.7 3.9 4.0 4.2 6.6 4.5 10.2 2.8 2.7 4.0 1.8 Cu-Sulphides 1.2 2.0 1.1 1.4 1.2 1.5 1.9 0.8 1.3 1.4 1.3 2.7 1.2 2.0 1.6 1.1 1.2 0.7 Other sulphides/PGM DL DL DL DL DL DL DL DL DL DL DL DL DL DL DL DL DL DL Fe/Ti/Cr-Oxides 1.9 1.3 1.0 1.0 0.9 2.2 1.2 1.2 0.8 0.8 1.0 1.3 0,9 1.2 1.0 1.2 0.9 0.9 Amphibole 31.3 35.2 36.9 31.0 30.7 21.1 35.5 32.1 32.1 30.5 28.6 55.8 26.9 42.5 32.2 26.6 32.0 21.4 Chlorite 6.5 12.1 21.6 19.2 18.2 8.2 41.7 22.0 21.8 20.5 21.0 25.2 22.4 13.3 15.3 21.8 23.2 22.0 Biotite/Phlog. 6.5 2.9 2.7 3.4 1.1 6.6 4.8 1.9 0.4 0.6 3.6 7.0 3.9 5.2 3.1 1.6 4.0 6.3 Micas 2.8 3.7 3.6 6.7 3.2 2.7 3.8 1.3 1.5 2.1 2.9 2.0 2.2 0.7 2.3 2.5 3.1 2.0 Epidote 3.4 4.7 8.1 9.0 12.1 3.8 18.8 9.2 9.9 9.9 6.1 9.0 8.4 11.8 12.1 9.4 5.2 10.7 Feldspar 14.1 21.2 9.5 14.4 17.9 10.7 28.4 16.0 18.0 19.0 16.8 14.7 13.8 5.6 16.4 19.3 12.7 17,7 Quartz 16.1 8.3 11.1 8.2 9.6 14.1 25.8 10.0 8.6 9.1 12.8 12.7 13.9 5.1 11.4 11.5 12.1 15.1 Accessories 0.7 0.3 0.9 0.6 0.8 0.5 2.8 1.1 0.5 0.8 0.8 1.8 1.0 1.0 1.0 1.4 0.8 1.1
60% •
• Chlontc
• Feldspar
• Epidotc
• Micas
• Biotite/Phiog.
• Quartz
• Amphibole
• F e m C r - a d d e s
Bother sulphides/PGM
• Cu-Sulphides
• Pyrrhotitc
• Cobaltite
• Ni-Areerades
• Pentlandite
Figure 11. Variability in Bulk Modal Mineralogy of the Variability Samples (DL: below the detection limit for any form of reliable abundance information)
S i ; S M i i u ' i a t s i'-ci ^i^•e^.

Ursa Major Limited - Shakespeare - 10616-003 18
70
60
I 50
1 30
20
10
0
p. . . :
•A
• .m.
• • « ..A-.. ..A-. •"A-,
A..
k -....... • • • . ''•M/ j
. ài' 'V
m é
m • • . . ••
o o T ^ Ô cj 2 =
Pcntlandite
Cobaltite
•A Pyrrhotitt
• •• Cu-Sulphides
C/3 sample
Figure 12. Mean Grain Size of principal Sulphide Minerals
5. Conclusions and Recommendations
Both sample condition and mineralogy have been driving the metallurgy observed in these tests.
These tests have shown:
Relatively consistent Cu, Ni and Pd recovery irrespective of head grade and sample location, however, both the mineralogy and metallurgy indicate Cu and Ni recoveries may be somewhat poorer when treating the near-surface materials.
Some variability in Pt recovery, however, this may be a reflection of the challenges in reconciling head grades.
Oxidized material will yield poorer Ni recoveries, and slightly poorer Cu, Pt and Pd recoveries.
Grindability is quite consistent and there are no strong links between ore mineralogy and grindability.
S G S \ l i n e r ; ( i s S e r v i c j ' j
Ursa Major Limited - Shakespeare -10616-003 19
Appendix 1 Flotation Test Sheets
SGS Minerals Services

Tes t No.: V ] P ro j ec t No.: 10616-003 Opera to r : DL Date: 28-Sep-05
Purpose: To use the Locked cycle test conditions of test F40 on the Variability sample SVMLO-1. Produce a Pyrhotite reduced tailing for Environmental testwork. Produce a Pyrhotite r ich for Environmental testwork, comprised of the Scavenger concentrate combined with the 1 st Cleaner Scavenger Tailing.
Procedure: Flotation was conducted as described below. A l l products were submitted for Pt, Pd, Cu, Ni, and S analyses.
Feed: 2 x 2 kg of minus 10 mesh SVMLO-1
Gr ind : 30 minutes / 2 kg @ 65% solids in laboratory ball mil l {BM-2). Rghr Tail Keo = 97 (im
Stage Ca(OH)j SIPX Reagents adde
3477 ;d, grams per t
CMC onne
CUSO4 H2S04 MIBC Tir
Grind tie, mini Cond.
utes Froth pH
Grind 200 30 9,2
Rougher 1 250 10 10 1 2 9.5 Ro concentrate I kept separate to go direct to 1st cleaner feed NO REGRIND
Rougher 2 7.5 2.5 ! 2 Rougher 3 5 2.5 2,5 1 4 Rougher 4 7.5 5 1 4 Rougher 5 2.5 2.5 DF250 5 1 4 8.0 Sacvenger 15 100 250 2,5 1-H 2 7,0
15 5 5 1 2 7.1 15 5 2.5 50 5 1 3 7.2
Final pH 7 J Regrind feed is the Rougher Concentrate 2-5
Reo-ind P.M. I 75 | 2.5 50 8 1st Cleaner feed is the regroimd product phis the Rougher Concentrate 1
1st Cleaner 1 4 9.6 1st Cleaner Scav 2,5 2.5 0 2.5 1 2 9.5
2nd Cleaner 0 0 2.5 1 3 9,7 3rd Cleaner 1 10 2.5 1 3 9.7 4th Cleaner 10 1 1 2 9.7
Total 525 71.0 30.0 22.5 200.0 250.0 46.0
Stage Roughers Cleaners Flotation Cell 10 L D-2 2 L D - 1 Speed: rpm 1400 1500
Some Sec Cu in Ro 1 and 2 Sec Cu and galena in 4th CI Tails
Meta l lu rg ica l Ba lance
Product Weight Assays,%,g/t % Distr ibution
R 1 % Pt Pd Cu Ni S Pt Pd Cu Ni S 4th Cleaner Cone 92.6 1 2.32 8.22 3,36 17.0 6.56 33.4 58.6 27.4 88.6 33.7 15.8 4th Cleaner Tail 110.3 2.76 0.57 0.91 0.7 3.11 32.7 4.8 8.8 4.2 19.0 18.4 3rd Cleaner Tai l 32.6 0.82 0.49 1.06 0.42' 1.52 25.7 1,2 3.0 0,8 2.8 4.3 2nd CleanrTail 65.8 1.65 0.78 0,74 0.17 1.14 20 4,0 4.3 0,6 4.2 6.7 1st CInr Scav Cone 107.9 2,70 1.34 0.52 0.13 1.45 33 11.1 4.9 0,8 8.7 18.2 High Sulph Tail 390.8 1 9,77 0.51 0.35 0,054 0.64 17.2 15.3 12.0 1.2 13.9 34.3 Scavenger Tail ing 3200.01 80.00 0.02 1 0.14 0.021 0,10 0.14 4.9 39.4 3.8 17.8 2.3
Head (calc.) 4000.0j 100.0 0.32 0.28 0,44 0.45 4.90 100.0 100.0 100,0 100.0 100.0 (direct) 0.55 ! 0.30 0,44 0.43
Combined Products 4thCleaner Cone 3rdCleaner Cone 2nd Cleaner Cone 1st Cleaner Cone Jst CI Conc+ CI Sc Cone iRo -t- Scav Cone
2.32 8.22 3.36 17.0 6.56 33.4 58.6 27.4 8,6 33.7 5.07 5.89 7.53
I 10.23 I 20.00
4.06 3.57 2.96 2.53 1.54
2.03 1.89 1.64 L35 0.86
8.1
7.1 5.6 4.1 2.1
4.68 33.0 63.4 36.2 92.8 52.8 15.8 34.2
4.25 3.57
32.0 29.4
64.7 68.6
39.3 43.6
93.6 94.2
55.5 59.7
38.5 45.2
3.01 1.85
30.3 23.9
79.7 95.1
48.5 60.6
95.0 96,2
68.4 82.2
63.4 97.7

Tes t No.: V2 P r o j e c t No. : 10616-003 O p e r a t o r : DL Date : 28 -Sep-05
Purpose:
P r o c e d u r e :
Feed :
G r i n d :
C o n d i t i o n s :
To use the Locked cycle test condi t ions o f test F40 on the Variabi l i ty sample S V M L O - 1 . Produce a S t a n d a r d tai l ing for Envi ronmenta l testwork.
Flotation was conducted as described below. A l l products were submitted for Pt, Pd, Cu, Ni , and S analyses.
2 X 2 kg o f minus 10 mesh SVMLO-1
30 minutes / 2 kg @ 65% solids in laboratory ball mi l l (BM-2). Rghr Tai l K,o ~ 97 ( im
Stage Ca(0H)2 SIPX Reagents adde
3477 ;d, grams per t(
C M C 5nne
CuSO, H2S04 M I B C Tin
Grind ne, mini Cond.
lites Froth PH
Grind 200 30 9.2
Rougher 1 250 10 10 1 2 9.5 Ro concentrate 1 kept separate to go direct to Jst cleaner feed NO REGRIND
Rougher 2 7.5 2.5 1 2 Rougher 3 5 2.5 2.5 1 4 Rougher 4 7.5 5 1 4 Rougher 5 2.5 2.5 5 1 4 8.0
Total 450 22.5 15.0 0.0 0.0 0.0 25.0
Stage Roughers
Flotation Cel l l O L D - 2
Speed: rpm 1400
M e t a l l u r g i c a l B a l a n c e
P r o d u c t W e i g h t Assays,®/», g/t % D i s t r i b u t i o n
P ! % P t P d i t C u Ni S Pt P d Cu Ni S Ro Cone 1 U 7 . 0 2.93 3.59 2.25 11.7 4.37 18.8 27.6 22.2 73.2 28.1 10.6 Ro Cone 2-5 475.0 11.88 1.96 0.87 0.8 1.61 22 61.2 34,8 20.1 42.0 50.3 Rougher Tai l ing 3408.0 85.20 0.05 0.15 0.037 0.16 2.38 11.2 43.0 6.7 29.9 39.1
Head (calc.) 4000.0 100.0 0.38 0.30 0.47 0.46 5.19 100.0 100.0 100.0 100.0 100.0 (direct) 0.55 0.30 0.44 0.43 1 1
C o m b i n e d P r o d u c t s |Ro Cone US 14.80 2.28 1.14 . 2.9 2.16 21.4 l.g 57.0 93.3 70.1 60.9

Sample: Ro Tail
SGS Lakefield Research Limited Size Distribution Analysis
Project No. 10616-003
Test No,: V2
Size Weight % Retained % Passing Mesh M m grams Individual Cumulative Cumulative
65 212 0.7 1.0 1.0 99.0 100 150 3.1 4.3 5.2 94.8 150 106 7.4 10.2 15.5 84.5 200 75 10.3 14.2 29.7 70.3 270 53 11.9 16.4 46.1 53.9 400 38 8.6 11.9 58.0 42.0 Pan -38 30.4 42.0 100.0 0.0
Total - 72.4 100.0 - -
K80 96
0 1 Ç
U)
2
I i s 3
E O
1 0 0
90 80 70 60 50 40 30 20 10
0 10
Particle Size Distribution
• !
1 mT' 1 1 1 1
y 1 i M 1
• !
• 1 1 1 1 ) 1
K80 = 96 urn '— ! ! 1 ^ 1
1 1 i ^ 1 i
100 Screen Size (micrometers)
1,000

Test No.: V2 Project No.: 10616-003 Operator: DL Date: 28-Sep-05
Purpose:
Procedure:
Feed:
Grind:
Conditions:
To use the Locked cycle test conditions of test F40 on the Variability sample SVMLO-2. Produce a Standard tailing for Environmental testwork.
2 X 2 kg o f minus 10 mesh S V M L O - 2
30 minutes / 2 kg @ 65% solids in laboratory bal l m i l l (BM-2 ) . R g h r T a i l K g g - 102 urn
Stage Ca(OH)2 SIPX Reagents adde
3477 ;d, grams per tc
C M C mne
CUSO4 H2S04 M I B C T i r
Gr ind ne, mini
Cond. jtes
Froth p H
Gr ind 200 30 9.2
Rougher 1 50 10 10 1 2 9.5
Ro concentrate 1 kepi separate to go direct to 1st cleaner feed NO REGRIND Rougher 2 l.S 2.5 1 2
Rougher 3 5 2.5 2.5 1 4
Rougher 4 7.5 5 \ 4
Rougher 5 2.5 2.5 5 1 4 8.0
Total 250 22.5 15.0 0.0 0.0 0.0 25.0
Stage Roughers
Flotat ion Ce l l 10 L D - 2
Speed: rpm 1400
Metallurgical Balance
Product Weight Assays, g A % Distribution g % Pt Pd Cu Ni S Pt Pd Cu Ni S
Ro Cone 1 147.2 3.68 5.17 3.96 16.8 6.35 24.3 33.8 21.5 89.5 40.7 28.0
Ro Cone 2-5 291.4 7.29 4.25 3.27 0.47 3.48 19.2 55.1 35.1 5.0 44.2 43.8
Rougher Ta i l ing 3561.4 89.04 0.07 0.33 0.043 0.10 1.01 11.1 43.4 5.5 15.1 28.2
Head (calc.) 4000.0 100.0 0.56 0.68 0.69 0.57 3.19 100.0 100,0 100.0 100.0 100.0
(direct) 0.64 0.67 0.65 0.52
Combined Products |Ro Cone 1-5 10.97 4.56 3.50 . 6.0 4.44 20.9 88.9 56.6 94.5 84.9 71.8

SGS Lakefield Research Limited Size Distribution Analysis
Project No. 10616-003
Sample: Ro Tail Test No.: V3
Size Weight % Retained % Passing Mesh |jm grams Individual Cumulative Cumulative
65 212 1.2 0.9 0.9 99.1 100 150 6.2 4.6 5.5 94.5 150 106 13.5 10.1 15.6 84.4 200 75 21.1 15.7 31.3 68.7 270 53 19.1 14.3 45.6 54.4 400 38 16.6 12.4 58.0 42.0 Pan -38 56.3 42.0 100.0 0.0
Total - 134.0 100.0 - -
K80 97
0 5 . Ç ' t n <n 05
CL
0) >
TO
E 3 o
100 90 80 70 60 50 40 30 20 10 0
1 0
Particle Size Distribution
1 0 0
Screen Size (micrometers)
1 — r
1
u / 1
i 1
u 1
y •
1 1
1 ! t i i 1 i i
1
1 1 i
K80 = 97 Mm ! i I i
: i 1 1
1 i
K80 = 97 Mm i 1 !
1
i : i i M i i : i 1 i l l ! i M
1,000

Test No.: V4 Project No.: 10616-003 Opera tor : DL Date: 29-Sep-05
Purpose: To use the Locked cycle test conditions of test F40 on the Variability sample SVMLO-2. Produce a Pyrhotite reduced tailing for Environmental testwork. Produce a Pyrhotite rich for Environmental testwork, comprised of the Scavenger concentrate combined with the 1st Cleaner Scavenger Tailing.
Procedure: Flotation was conducted as described below. Ai l products were submitted for Pt, Pd, Cu, Ni, and S analyses.
Feed: 2 x 2 kg of minus 10 mesh SV!vIL0-2
Gr ind: 30 minutes / 2 kg @ 65% solids in laboratory ball mill (BM-2). Rghr Tail Kgo - 102 jim
Stage Ca(0H)2 SIPX Reagents add(
3477 sd, grams per toi
CMC line
CUSO4 H2S04 MIBC Tin
Grind ne, mini Cond.
iites Froth pH
Grind 200 30 8.7
Rougher 1 50 10 10 1 2 9.5 Ro concentrate 1 kept separate to go direct to 1st cleaner feed NO REGRIND
Rougher 2 7.5 2.5 1 2 Rougher 3 5 2.5 1 4 Rougher 4 7.5 5 1 4 Rougher 5 2.5 2.5 DF250 5 1 4 8.0 Sacvenger 15 1.25 100 200 2.5 1+1 2 7.0
15 5 1.25 5 1 2 7.1 15 5 1.25 50 5 1 3 12
C M C Final pH 7.5 Regrind feed is the Rougher Concentrate 2-5
Regrind P.M. 1 75 | 2.5 50 8 8.9 1st Cleaner feed is the reground product plus the Rou iher Concentrate 1
1st Cleaner 1 4 9.6 1st Cleaner Scav 2.5 0 0 0 1 1 9.5
2nd Cleaner 0 0 0 1 3 9.7 3rd Cleaner 1 10 2.5 1 2 9.7 4th Cleaner 5 1 1 1.5 9.1
Total 325 71.0 27.5 200.0 200.0 41.0
Stage Roughers Cleaners Flotation Cell 10 L D-2 2L D-1 Speed: rpm 1400 1500
Metallurgical Balance
Product Weight Assays, g A % Distribution
R % Pt Pd Cu N l S Pt Pd Cu Nl S 4th Cleaner Cone 108.2 2.71 11.00 3.60 20.0 7.93 30.7 57.9 15.8 88.0 43.7 30.4 4th Cleaner Tail 34.8 0.87 3.59 4.05 1.8 8.94 29.0 6.1 5.7 2.6 15.8 9.2 3rd Cleaner Tail 86.9 i I 2.17 1.86 3.63 0.75 3.67 29.3 7.9 12.8 2.6 16.2 23.3 2nd Cleanr Tail 48.6 1.22 1.20 2.59 0.39 2.00 21.0 2.8 5.1 0.8 4.9 9.3 IstClnrScavConc 19.6 0.49 1.23 1.86 0.22 1.33 25.9 1.2 1.5 0.2 1.3 4.6 High Sulph Tail 202.3 5.06 0.90 1.11 0,160 0.52 10.2 8.9 9.1 1.3 5.4 18.9 Scavenger Tailing 3499.6 87.49 0.09 0.35 0.032 0.071 0.13 15.3 49.8 4.6 12.6 4.2
Head (calc.) 4000.0 100.0 0.51 0.61 0.62 0.49 2.73 100.0 100.0 100.0 100.0 100.0 (direct) 0.64 0.67 0.65 0.52
Combined Products 4thCleanerConc 2.71 11.00 3.60 20.0 7.93 30.7 57.9 15.8 88.0 43.7 30.4 3rdCleaner Cone 3.58 9.20 3.71 15.6 8.18 30.3 64.0 21.6 90.5 59.5 39.6 2nd Cleaner Cone 5.75 6.42 3.68 10.0 6.47 29.9 71.8 34.4 93.2 75.7 63.0 1st Cleaner Cone 6.96 5.51 3.49 8.30 5.69 28.4 74.7 39.5 94.0 80.7 72.3 1st CI Conc+ CI Sc Cone i 7.45 5.23 3.38 7.77 5.41 28.2 75.8 41.0 94.1 82.0 76.9 Ro + Scav Cone i 12.51 3.48 2.46 4.69 3.43 20.9 84.7 50.2 95.4 87.4 95.8

SGS Lakefield Research Limited Size Distribution Analysis
Project No. 10616-003
Sample: Scav Tail Test No.: V4
Size Weight % Re Bined % Passing Mesh |jm grams Individual Cumulative Cumulative
65 212 1.2 1.5 1.5 98.5 100 150 4.5 5.6 7.1 92.9 150 106 8.8 11.0 18.1 81.9 200 75 12.8 16.0 34.1 65.9 270 53 11.1 13.9 48.0 52.0 400 38 9.5 11.9 59.9 40.1 Pan -38 32.1 40.1 100.0 0.0
Total - 80.0 100.0 - -
K80 102
c n c
'm tn TO
Q .
0)
ra
E o
1 0 0
90 80 70 60 50 40 30 20 10 0
10
Particle Size Distribution
1 i
1 ! ! i i ! j !
— r -i L ; 1 i : I
i j /
T 1 1
! : ! • i 1 1 1 1
1 j 1 1 i i
1 i j \ \ i i
• 1 j ' 1 ! i
•1 1 i !
i i 1 1 : i
. . 1 . 1 1 (
1 K « U = 1 0 2 M m j •• i
i ! i M I i : i ! 1 1 i ! i i
-I—1 - L j
1 0 0
Screen Size (micrometers)
1,000

Test No.: V2 Project No.: 10616-003 Operator: DL Date: 28-Sep-05
Purpose:
Procedure:
Feed:
Grind:
Conditions:
To use the Locked cycle test conditions of test F40 on the Variability sample SVMLO-3. Produce a Standard tailing for Environmental testwork.
Flotation was conducted as described below. All products were submitted for Pt, Pd, Cu, Ni, and S analyses.
2 X 2 kg of minus 10 mesh SVMLO-3
30 minutes / 2 kg @ 65% solids in laboratory ball mill (BM-2). Rghr Tail Kj, ~ 86 nm
Stage Ca(OH)j SIPX Reagents addec
3477 1, grams per
CMC tonne
CuSO, H2S04 MIBC Tir
Grind ne, min Cond.
utes Froth pH
Grind 250 30 8.4
Rougher 1 100 10 10 1 2 9.5 Ro concentrate 1 kept separate to go direct to ht cleaner feed NO REGRIND
Rougher 2 7.5 2.5 1 2 8.9 Rougher 3 5 2.5 2.5 1 4 Rougher 4 7.5 5 1 4 8.6 Rougher 5 2.5 2.5 5 1 4 8.0
Total 350 22.5 15.0 0.0 0.0 0.0 25.0
Stage Roughers Flotation Cell lOLD-2 Speed: rpm 1400
Metallurgical Balance
Product Weight Assays, { !/t % Distribution g % Pt Pd Cu Ni S Pt Pd Cu Ni S
Ro Cone 1 106.4 2.66 4.25 2.96 9.6 4.66 16.9 37.5 20.3 79.6 38.7 26.9 Ro Cone 2-5 309.6 7.74 1.62 1.68 0.58 1.44 11.6 41.6 33.5 14.0 34.8 53.8 Rougher Tailing 3584.0 89.60 0.07 0.20 0.023 0.10 0.36 20.8 46.2 6.4 26.6 19.3
Head (calc.) 4000.0 100.0 0.30 0.39 0.32 0.32 1.67 f ^ f f 100.0 100.0 100.0 100.0 (direct) 0.34 0.33 0.34 0.34
Combined Products iRoConc 1-5 10.40 2.29 2.01 2.9 2.26 13.0 79.2 53.8 93.6 73.4 80.7 1

Sample: Ro Tail
SGS Lakefield Research Limited Size Distribution Analysis
Project No. 10616-003
Test No.: V5
Size Weight % Retained % Passing Mesh I j m grams individual Cumulative Cumulative
65 212 0.4 0.3 0.3 99.7 100 150 2.8 2.3 2.7 97.3 150 106 8.9 7.4 10.1 89.9 200 75 15.4 12.8 22.9 77.1 270 53 20.1 16.8 39.7 60.3 400 38 15.8 13.2 52.8 47.2 Pan -38 56.6 47.2 100.0 0.0
Total - 120.0 100.0 - -
K80 82
O ) Ç 'm (/) TO
O .
(U >
TO 3
E o
1 0 0
90 80 70 60 50 40 30 20 10 0
10
Particle Size Distribution
1 0 0
Screen Size (micrometers)
i y
/ 1 1 i
i /
i i 1 i 1
; ^ i ' • i / T I i i ; 1 ' • i ! i 1 L J ! 1
1 1 1 i i i j i 1 i ; j i
K80 = ! !
i i !
i K80 = 82 (jm
i i ! i i i i i 1 1 1 1 1
1,000

Tes t No.: V186 Pro jec t No.: 10616-003 Opera to r : DL Date: 29-Sep-05
Purpose: To use the Locked cycle test conditions of test F40 on the Variability sample SVMLO-3. Produce a Pyrhotite reduced tailing for Environmental testwork. Produce a Pyrhotite r ich for Environmental testwork, comprised of the Scavenger concentrate combined with the 1st Cleaner Scavenger Tailing.
Procedure: Flotation was conducted as described below. A l l products were submitted for Ft, Pd, Cu, Ni , and S analyses.
Feed: 2 x 2 kg o f minus 10 mesh SVMLO-Î
Gr ind : 30 minutes / 2 kg @ 65% solids in laboratory ball mi l l (BM-2). Rghr Tail K,,, - 86 (im
Stage Ca(OH)j SIPX Reagents add(
3477 ;d, grams per tc
CMC inne
CUSO4 H2S04 M I B C Tir
Grind ne, mini Cond.
utes Froth pH
Grind 200 30 8.2
Rougher 1 150 10 10 1 2 9.5 Ro concentrate I kept separate to go direct to 1st cleaner feed NO REGRIND
Rougher 2 7.5 2.5 1 2 Rougher 3 5 2.5 2.5 1 4 Rougher 4 7.5 5 1 4 Rougher 5 2.5 2.5 DF250 5 1 4 8.3 Sacvenger 15 1.25 100 150 2.5 1+1 2 7.0
15 5 1.25 5 1 2 7.1 15 5 1.25 50 5 1 3 7.2
Final pH 7.5 Regrind feed is the Rougher Concentrate 2-5
Reerind P.M. 1 75 | 2.5 50 8 9.4 J St Cleaner feed is the reground product plus the Rougher Concentrate I
1st Cleaner 1 4 9.6 1st Cleaner Scav 1 2.5 0 2.5 1 2 8.8
2nd Cleaner 0 0 2.5 1 3 9.7 3rd Cleaner 1 10 2.5 I 3 9.7 4th Cleaner 10 1
46.0 1 2 9.7
Total 425 69.5 30.0 23.8 200.0 150.0 1
46.0
Stage Roughers Cleaners Flotation Cell 10 L D-2 2L D-1 Speed: rpm 1400 1500
Fine Pn in 2nd CI Tail
Meta l lu rg ica l Balance
P r o d u c t Weight Assays, g/t % Distr ibution
S 1 % Pt 1 Pd C u i Ni S Pt P d Cu Ni S 4th Cleaner Cone 65.5 j 1.64 9.17 3.12 17.4 8.55 31.4 52.1 15.1 92.7 45.9 33.1 4th Cleaner Tail 9.8 1 0.25 4.06 5.41 1.4- 9.37 28.1 3.5 3.9 1.1 7.5 4.4 3rd Cleaner Tail 18.6 0.47 1.79 5.02 0.67 2.61 16.7 2.9 6.9 1.0 4.0 5.0 2nd Cleanr Tail 41.6 1.04 1.32 2.51 0.21 1.36 11.5 4.8 7.7 0.7 4.6 7.7 1st CInr Scav Cone 27.0 0.68 1.96 2.45 0.29 2.19 20.5 4.6 4.9 0.6 4.8 8.9 High Sulph Tail 239.5 5.99 0.95 0.92 0.049 0.61 9.6 19.7 16.3 1.0 12.0 36.8 Scavenger Tailing 3598.0 89.95 0.04 0.17 0.010 0.072 0.07 12.5 45.2 2.9 21.2 4.1
Head (calc.) 4000.0 100.0 0.29 0.34 0.31 0.31 1.55 100.0 100.0 100.0 100.0 100.0 (direct) 0.34 0.34 0.34 0.33
C o m b i n e d Produc ts 4thCleanerConc 1.64 9.17 3.12 17.4 8.55 31.4 52.1 15.1 92.7 45.9 33.1 3rdCleaner Cone 1.88 8.50 3.42 15.3 8.66 31.0 55.5 19.0 93.8 53.4 37.5 2nd Cleaner Cone 2.35 7.17 3.74 12.4 7.46 28.1 58.4 25.9 94.8 57.4 42.5 1st Cleaner Cone 3.39 5,38 3.36 8.7 5.59 23.0 63.2 33.6 95.5 62.0 50.2 1st CI Conc+ CI Sc Cone 4.06 4.81 3.21 7.3 5.02 22.6 67.8 38.5 96.1 66.8 59.1 Ro + Scav Cone 10.05 2.51 1.84 3.0 2.39 14.8 87.5 54.8 97.1 78.8 95.9

SGS Lakefield Research Limited Size Distribution Analysis
Project No. 10616-003'
Sample: Scav Tail Test No.: V6
Size Weight % Retained % Passing Mesh I j m grams Individual Cumulative Cumulative
65 212 0.3 0.4 0.4 99.6 100 150 2.3 2.9 3.3 96.7 150 106 6.8 8.6 11.9 88.1 200 75 10.2 12.9 24.7 75.3 270 53 12.2 15.4 40.2 59.8 400 38 9.5 12.0 52.1 47.9 Pan -38 37.9 47.9 100.0 0.0
Total - 79.2 100.0 - -
K80 86
0 3 C (0 (n CO
CL
0)
J S 3
E o
1 0 0
90 80 70 60 50 40 30 20 10 0
10
Particle Size Distribution
1 0 0
Screen Size (micrometers)
1 i 1
^— — 1 : 1 1
i . • 1 i 1 1
1 1 I i i
; 1 1 ! • i
y i 1 • ' p 1 1 ! i
/ I i i
1 1 1 i
i 1
^ i i ! ; ; p 1
1
M i l i i 1 t 1 i i 1 I
! 1 > !
1 ! 1 1 i \
1 i i ; i
} 1
1 1
J — r ... —
! 1 '
K8Q = 861 Î i 1
' ' ! 1 : .. i
1 '
K8Q = 861 J i i { 1 1
Î • ; i i 1 ! i i
! i ; i ! i ! i I l 1 1 ! 1 1 1 1 i i
1,000

Test No..- Vg Project No.: 10616-003 Operator: DL Date: 07-5ct-05
Purpose:
Procedure:
Feed:
Grind:
Conditions:
To use the Locked cycle test conditions of test F40 on the Variability sample SVMLO-4. Produce a Pyrhotite reduced tailing for Environmental testwork. Produce a Pyrhotite rich for Environmental testwork, comprised of the Scavenger concentrate combined with the 1 st Cleaner Scavenger Tailing.
Flotation was conducted as described below. All products were submitted for Pt, Pd, Cu, Ni, and S analyses.
2 X 2 kg of minus 10 mesh SVMLO-4
30 minutes / 2 kg @ 65% solids in laboratory ball mill (BM-2). Rghr Tail Kgo -94 nm
Stage Ca(OH): SIPX Reagents added
3477 1, grams per t
CMC onne
CUSO4 H2S04 MIBC Tin
Grind ne, mini Cond.
iites Froth PH
Grind 200 30 8.7
Rougher 1 200 10 10 1 2 9.5 Ro concentrate 1 kept separate to go direct to 1st cleaner feed NO REGRIND
Rougher 2 7.5 2.5 1 2 9.0 Rougher 3 5 2.5 2.5 1 4 Rougher 4 7.5 5 1 4 Rougher 5 2.5 2.5 DF2S0 5 1 4 8.0 Sacvenger 15 1.25 100 125 2.5 1-t-l 2 7.0
15 5 1.25 5 1 2 7.1 15 5 1.25 50 5 1 3 7.2
CMC FinalpH 7.5 Regrind feed is the Rougher Concentrate 2-5
Reerind P.M. 1 75 | 2.5 50 8 8.9 1st Cleaner feed is the reground product plus the Roui jAer Concentrate 1
1st Cleaner 4 9.6 1st Cleaner Scav 0 2.5 0 2.5 1 2 8.6
2nd Cleaner 1 0 2.5 1 3 9.7 3rd Cleaner 1 5 2.5 1 3 9.7 4th Cleaner 5 1 1 2 9.7
Total 475 69.5 30.0 200.0 125.0 46.0
Stage Roughers Cleaners Flotation Cell lOLD-2 2L D - 1
Speed: rpm 1400 ilSOO
Light grey froth, weak Cu floatation in Ro 1 Coarse Chalco, and fine Pn in Ro 2 Maybe loo much lime m the Ro feed
Metallurgical Balance
Product Weight Assays, g /t % Distribution R % Pt Pd Cu Ni S Pt Pd Cu Ni S
4th Cleaner Cone 55.4 1.39 8.13 3.27 24.0 5.38 32.1 30.0 9.9 89.2 27.6 26.6 4th Cleaner Tail 15.0 0.38 2.29 6.23 3.0 6.18 16.5 2.3 5.1 3.1 8.6 3.7 3rd Cleaner Tail 18.8 0.47 1.98 5.07 1.01 2.60 8.8 2.5 5.2 1.3 4.5 2.5 2nd Cleanr Tail 46.5 1.16 2.11 2.43 0.15- 1.07 5.53 6.5 6.2 0.5 4.6 3.8 1st Clnr Scav Cone 19.3 0.48 3.67 3.31 0.32 4.00 13.9 4.7 3.5 0.4 7.1 4.0 High Sulph Tail 249.1 6.23 2.97 1.13 0.075 1.10 14.5 49.2 15.3 1.3 25.3 54.0 Scavenger Tailing 3595.9 89.90 0.02 0.28 0.018 0.07 0.10 4.8 54.9 4.3 22.3 5.4
Head (calc.) 4000.0 100.0 0.38 0.46 0.37 0.27 1.67 ijjjll 100.0 100.0 100.0 100.0 (direct) 0.51 0.49 0.40 0.30
Combined Products 4thCIeanerConc 1.39 8.13 3.27 24.0 5.38 32.1 30.0 9.9 89.2 27.6 26.6 3rdCleaiierConc 1.76 6.89 3.90 19.5 5.55 28.8 32.3 15.0 92.2 36.1 30.3 2nd Cleaner Cone 2.23 5.85 4.15 15.6 4.93 24.6 34.7 20.2 93.5 40.6 32.8 1st Cleaner Cone 3.39 4.57 3.56 10.3 3.61 18.0 41.3 26.3 94.0 45.2 36.6 1st CI Conc+ CI Sc Cone 3.88 4.46 3.53 9.1 3.66 17.5 46.0 29.8 94.4 52.4 40.6 Rd + Scav Cone 10.10 3.54 2.05 3.5 2.08 15.7 95.2 45.1 95.7 77.7 94.6

SGS Lakefield Research Limited Size Distribution Analysis
Project No. 10616-003
Sample: Scav Tail Test No.: V7
Size Weight % Retained % Passing Mesli |jm grams Individual Cumulative Cumulative
48 300 0.2 0.2 0.2 99.8 65 212 1.1 1.2 1.5 98.5 100 150 3.8 4.3 5.7 94.3 150 106 8.3 9.4 15.1 84.9 200 75 11.7 13.2 28.3 71.7 270 53 13.6 15.3 43.6 56.4 400 38 10.3 11.6 55.2 44.8 Pan -38 39.7 44.8 100.0 0.0
Total - 88.7 100.0 - -
K80 94
ai Ç
'<n tn ro
Q .
<u
ro
E O
1 0 0
90 80 70 60 50 40 30 20 10 0
10
Particle Size Distribution
1 0 0
Screen Size (micrometers)
1 1
! B 1 1 1 1
i 1 1
1
j • yi 1 j 1
! 1 ! 1 1 1
i \ i 1 ! : i 1 1 < i • . 1 •
• r i i • ; i • j
1 1 : i i i i !
i 1 1 ; 1 ; 1 i ; ' 1
i 1 K 8 Q = 9 4 | j m 1 1 1 < ! 1 1 i i
i -i 1 i i i
1,000

Test No..- Vg Project No.: 10616-003 Operator: DL Date: 07-0ct-05
Purpose:
Procedure:
Feed:
Grind:
Conditions:
To use the Locked cycle test conditions of test F40 on the Variability sample SVMLO-5 Produce a Pyrliotite reduced tailing for Environmental testwork. Produce a Pyrliotite rich for Environmental testwork, comprised of the Scavenger concentrate combined with the 1st Cleaner Scavenger Tailing.
Flotation was conducted as described below. All products were submitted for Pt, Pd, Cu, Ni, and S analyses.
2 X 2 kg of minus 10 mesh SVMLO-5
30 minutes / 2 kg @ 65% solids in laboratory ball mill (BM-2). Rghr Tail Kjo ~ 96 nm
Stage Ca(0H)2 SIPX ^.eagents addec
3477 I, grams per i
CMC tonne
CUSO4 H2S04 MIBC Tin
Grind ne, mini Cond.
ites Froth pH
Grind 250 30 8.8
Rougher 1 150 10 10 1 2 9.5 Ro concentrate I kept separate to go direct to 1st cleaner feed NO REGRIND
Rougher 2 7.S 2.5 1 2 Rougher 3 5 2.5 2.5 1 4 Rougher 4 7.5 5 1 4 Rougher 5 2.5 2.5 DF250 5 1 4 8.0 Sacvenger 15 1.25 100 250 2.5 1+1 2 7.0
15 5 1.25 5 1 2 7.1 15 5 1.25 5 1 3 7.2
CMC Final pH 7.5 Regrind feed is the Rougher Concentrate 2-5
ReErind P.M. 1 75 | 2.5 50 8 8.7 1st Cleaner feed is the reground product plus the Rougher Concentrate I
1st Cleaner 1 4 9.6 1st Cleaner Scav 0 2.5 0 2.5 1 2 8.5
2nd Cleaner 0 0 1.25 1 3 9.7 3rd Cleaner 1 10 2.5 1 3 9.7 4th Cleaner
475 5 1 1 2 9.7
Total 475 68.5 30.0 18.8 150.0 250.0 44.8 1 2 9.7
Stage Roughers Cleaners Flotation Cell lOLD-2 2L D-1 Speed: rpm 1400 1500
Metallurgical Balance
Product Weight Assays, JX % Distribution g % Pt Pd Cu Ni S Pt Pd Cu Ni S
4th Cleaner Cone 112.8 2.82 6.27 3.07 13.3 8.56 30.4 50.4 20.3 86.7 61.4 38.7 4th Cleaner Tail 41.8 1.05 2.33 3.44 1.1 3.67 29.4 6.9 8.4 2.7 9.8 13.9 3rd Cleaner Tail 47.9 1.20 0.95 2.49 0.51 1.74 28.7 3.2 7.0 1.4 5.3 15.5 2nd CleanrTail 35.4 0.89 0.82 1.85 0.39 1.40 19.4 2.1 3.8 0.8 3.2 7.7 IstClnr Scav Cone 31.2 0.78 0.57 1.04 0.25 1.14 27.6 1.3 1.9 0.5 2.3 9.7 High Sulph Tail 242.5 6.06 0.36 0.66 0.100 0.27 3.7 6.2 9.4 1.4 4.2 10.2 Scavenger Tailing 3488.4 87.21 0.12 0.24
j 0.032 0.06 0.11 29.8 49. i 6.5 14.0 4.3
Head (calc.) 4000.0 1 100.0 0.35 0.43 0.43 0.39 2.22 100.0 100.0 100.0 100.0 (direct) 0.45 0.53 0.45 0.40 1
Combined Products 4thCleanerConc 2.82 6.27 3.07 13.3 8.56 30.4 50.4 20.3 86.7 61.4 38.7 3rdCleaner Cone 3.87 5.20 3.17 10.0 7.24 30.1 57.4 28.8 89.5 71.2 52.5 2nd Cleaner Cone 5.06 4.20 3.01 7.8 5.94 29.8 60.6 35.7 90.9 76.4 68.0 1st Cleaner Cone 5.95 3.70 2.84 6.7 5.26 28.2 62.7 39.6 91.7 79.6 75.8 1st CI Conc-^ CI Sc Cone 6.73 3.33 2.63 5.9 4.78 28.2 63.9 41.5 92.1 81.9 85.5 Ro + Scav Cone 12.79 1.92 1.70 3.2 2.64 16.6 70.2 50.9 93.5 86.0 95.7

Sample: Scav Tail
SGS Lakefield Research Limited Size Distribution Analysis
Project No. 10616-003
Test No.: V8
Size Weight % Retained % Passing Mesh |jm grams Individual Cumulative Cumulative
48 300 0.2 0.2 0.2 99.8 65 212 1.4 1.2 1.3 98.7 100 150 5.9 4.8 6.2 93.8 150 106 12.0 9.9 16.0 84.0 200 75 15.2 12.5 28.5 71.5 270 53 17.4 14.3 42.8 57.2 400 38 13.7 11.3 54.1 45.9 Pan -38 55.9 45.9 100.0 0.0
Total - 121.7 100.0 - -
K80 96
O) g OT m (D
Q .
0) >
E o
1 0 0
90 80 70 60 50 40 30 20 10 0
10
Particle Size Distribution
1 0 0
Screen Size (micrometers)
!
1 i 1 a - H * 7 t 1 Î
1 i 1 i i
1 i i
i I j ! i ; 1
1 1 1
i , 1 ! i 1 :
1 ! • !
j I !
i i i
j
1 ! 1 I
j K s o = 9 6 M m
i 1 i i ! !
1,000

Test No..- Vg Project No.: 10616-003 Operator: DL Date: 0 7 - 0 7 c t - 0 5
Purpose:
Procedure:
Feed:
Grind:
Conditions:
To use the Locked cycle test conditions of test F40 on the Variability sample SVMLO-6 Produce a Pyrliotite reduced tailing for Environmental testwork. Produce a Pyrhotite rich for Environmental testwork, comprised of the Scavenger concentrate combined with the 1st Cleaner Scavenger Tailing.
Flotation was conducted as described below. All products were submitted for Ft, Pd, Cu, Ni, and S analyses.
2 X 2 kg of minus 10 mesh SVMLO-6
30 minutes / 2 kg @ 65% solids in laboratory ball mill (BM-2). Rghr Tail IQo ~ 93 (im
Stage Ca(OH)2 SIPX Reagents add
3477 «1, grams per ti
CMC onne
CUSO4 H2S04 MIBC Tin
Grind ne, min Cond.
utes Froth pH
Grind 250 30
Rougher 1 150 15 10 1 2 8.8 Ro concentrate 1 kept separate to go direct to 1st cleaner feed NO REGRIND
Rougher 2 50 7.5 5 1 2 8.5 Rougher 3 5 2.5 5 1 4 Rougher 4 7.5 5 1 4 Rougher 5 2.5 2.5 DF2S0 5 1 4 8.0 Sacvenger 15 1.25 100 250 2.5 1+1 2 7.0
15 5 1.25 5 1 2 7.1 15 5 1.25 5 1 3 7.2
Final pH 7.5 Regrind feed is the Rougher Concentrate 2-5
RegrindP.M. I 125 | 2.5 50 8 1st Cleaner feed is the reground product plus the Rougher Concentrate 1
1st Cleaner I 2.5 1 4 9.6 1st Cleaner Scav 2.5 2.5 0 0 I I 9.5
2nd Cleaner 0 0 0 1 3 9.6 3rd Cleaner 1 5 0 1 3 9.6 4th Cleaner 5 1 1 2 9.7
Total 575 72.0 37.5 13.8 150.0 250.0 43.5 1
Stage Roughers Cleaners Flotation Cell lOLD-2 2L D-1 Speed: rpm 1400 1500
Metallurgical Balance
Product Weight Assays, s / t % Distribution g % Pt Pd Cu Ni S Pt Pd Cu Ni S
4th Cleaner Cone 142.5 3.56 2.31 2.49 17.2 4.88 33.8 25.5 36.2 89.6 30.0 16.0 4th Cleaner Tail 36.1 0.90 0.31 0.95 1.6 3.22 31.2 0.9 3.5 2.1 5.0 3.7 3rd Cleaner Tail 15.2 0.38 0.49 1.27 1.5(5 2.27 21.0 0.6 2.0 0.9 1.5 1.1 2nd Cleanr Tail 134.3 3.36 0.75 0.62 0.52 2.26 26 7.8 8.5 2.6 13.1 11.6 1st Clnr Scav Cone 101.7 2.54 1.40 0.31 0.14 2.69 35.4 11.0 3.2 0.5 11.8 11.9 High Sulph Tail 617.6 15.44 0.94 0.31 0.066 1.12 26.5 45.0 19.5 1.5 29.8 54.2 Scavenger Tailing 2952.6 73.82 0.04 0,09 0.027 0.07 0.16 9.2 27.1 2.9 8.9 1.6
Head (calc.) 4000.0 100.0 0.32 0.25 0.68 0.58 7.55 100.0 100.0 100.0 100.0 100.0 (direct) 0.23 0.26 0.74 0.67
Combined Products 4thCleaner Cone 3.56 2.31 2.49 17.2 4.88 33.8 25.5 36.2 89.6 30.0 16.0 3rdCleaner Cone 4.47 1.91 2.18 14.0 4.54 33.3 26.4 39.7 91.7 35.0 19.7 2nd Cleaner Cone 4.85 1.79 2.11 13.1 4.37 32.3 27.0 41.7 92.5 36.4 20.7 1st Cleaner Cone 8.20 1.37 1.50 7.9 3.50 29.7 34.8 50.2 95.1 49.5 32.3 1st CI Conc+ CI ScConc 10.75 1.37 1.22 6.1 3.31 31.1 45.8 53.4 95.6 61.3 44.2 Ro + Scav Cone 26.19 1.12 0.68 2.5 2.02 28.4 90.8 72.9 97.1 91.1 98.4

Sample: Scav Tail
SGS Lakefield Research Limited Size Distribution Analysis
Project No. 10616-003
Test No.: V9
Size Weight % Retained % Passing Mesh |jm grams Individual Cumulative Cumulative
48 300 0.1 0.1 0.1 99.9 65 212 0.8 1.0 1.1 98.9 100 150 3.5 4.4 5.6 94.4 150 106 6.6 8.4 14.0 86.0 200 75 12.2 15.5 29.4 70.6 270 53 11.5 14.6 44.0 56.0 400 38 9.7 12.3 56.3 43.7 Pan -38 34.4 43.7 100.0 0.0
Total - 78.8 100.0 - -
K80 93
0 3 c «
TO Û .
(U >
E o
1 0 0
90 80 70 60 50 40 30 20 10 0
10
Particle Size Distribution
100
Screen Size (micrometers)
! ! m—1 1—
1 1 / 1 1 i If / 1 i i 1
i • r i ! ; i ' i i
! i ! j i 1 i 1 ! 1 1 • 1 1 i ! K80 = 93 \im
1 1 j : j j i < —:
i i K80 = 93 \im 1 1 :
i ' 1 1 1 1 i i 1 1
! j i i .
1,000

Test No..- Vg Project No.: 10616-003 Operator: DL Date: 07-5ct-05
Purpose: To use the Locked cycle test conditions of test F40 on the Variability sample SVMLO-7 Produce a Pyrhotite reduced tailing for Environmental testwork. Produce a Pyrhotite rich for Environmental testwork, comprised of the Scavenger concentrate combined with the 1st Cleaner Scavenger Tailing.
Procedure: Flotation was conducted as described below. All products were submitted for Pt, Pd, Cu, Ni, and S analyses.
Feed: 2 x 2 kg of minus 10 mesh SVMLO-7
Grind: 30 minutes / 2 kg @ 65% solids in laboratory ball mill (BM-2). Rghr Tail Kk, ~ jim
Conditions:
Stage Ca(0H)3 SIPX Reagents adde
3477 d, grams per to
CMC nne
CuSO. H2S04 MIBC Tin
Grind lie, mini Cond.
Jtes Froth pH
Grind 250 30 8.2
Rougher 1 150 10 10 1 2 9.5 Ro concentrate 1 kepi separate to go direct to 1st cleaner feed NO REGRIND
Rougher 2 7.5 2.5 1 2 8.8 Rougher 3 5 2.5 2.5 1 4 Rougher 4 7.5 5 1 4 Rougher 5 2.5 2.5 DF2S0 5 1 4 8.0 Sacvenger 15 1.25 100 250 2.5 1+1 2
15 5 1.25 5 1 2 15 5 1.25 5 I 3
FinalpH 7.7 Regrind feed is the Rougher Concentrate 2-5
RegrindP.M. 1 75 | 2.5 50 8 8.8 1st Cleaner feed is the reground product plus the Jîow çfter Concentrate 1
1st Cleaner 25 1 4 9.6 1st Cleaner Scav 0 2.5 0 2,5 1 2 8.8
2nd Cleaner 1 0 2.5 1 3 9.7 StdQeaner 10 1 5 2.5 1 3 9.7 4th Cleaner 5 I 1 2 9.7
Toul 510 69.5 30.0 13.8 150.0 250.0 46.0
Stage Roughers Ist,2ndCIcaiien 3rd,'lthCleaner5 Flotation Cell 10 L D-2 2L D-1 lLD-1 Speed: rpm 1400 1500 1200
Ro 1 Weak Ro2 lots of coarse Chalco, which should be in Ro 1 pH too high in Rol Coarse Pn losses in the 4Ih CI Tail
Metallurgical Balance
Product Weight Assays, g/t % Distribution ^ < % Pt Pd Au Cu NI Co S Pt Pd Au Cu N1 Co S
4th Cleaner Cone 73.3 1.83 7.78 2.64 1.52 12.8 7.48 0.48 34.9 59.6 21.4 19.0 92.1 48.9 39.5 36.8 4tli Cleaner Tail 31.6 0.79 1.66 1.78 1.00 0.6 5.57 0.33 34.9 5.5 6.2 5.4 1.9 15.7 11.7 15.9 3rd Cleaner Tail 8.9 0.22 1.52 2.65 1.61 0.37 2.17 0.1 26.0 1.4 2.6 2.4 0.3 1.7 1.1 3.3 2nd Cleanr Tail 23.0 0.58 1.27 1.70 l.OI 0.20 1.42 0.1 14 3.1 4.3 4.0 0.5 2.9 2.1 4.6 IstCInrScav Cone 30.1 0.75 1.17 0.93 0.60 ,0.13 1.45 0.1 23.4 3.7 3.1 3.1 0.4 3.9 2.7 10.1 High SulphTail 229.8 5.75 0.80 0.42 0.27 0.056 0.43 O.Ol 7.4 19.2 10.7 10.6 1.3 8.8 2.6 24.5 Scavenger Tailing 3603.3 90.08 0.02 0.13 0.09 0.010 0.056 0.01 0.09 7,5 51.7 55,4 3.5 18.0 40.4 4.7
Head (calc.) 4000.0 100.0 0.24 0.23 0.15 0.25 0.28 0.02 1.74 100.0 100.0 100.0 100.0 100.0 lOO.O 100.0 (direct) 0.19 0.25 0.14 0.25 0.29
Combined Products 4thCleancr Cone 1.83 7.78 2.64 1.52 12.8 7.48 0,5 34.9 59.6 21.4 19.0 92.1 48.9 39.5 36.8 3rdCleaner Cone 2.62 5.94 2.38 1.36 9.1 6.90 0,4 34.9 65.1 27,6 24.4 94.0 64.6 51.2 52.7 2nd Cleaner Cone 2.85 5.59 2.40 1.38 8.4 6.53 0.4 34.2 66.5 30.2 26.9 94.4 66.4 52.2 56.0 1st Cleaner Cone 3.42 4.86 2.28 1.32 7.1 5.67 0.4 30.8 69.6 34.5 30.9 94.8 69.3 54.3 60.7 1st CI Conc+ CI Sc Cone 4.17 4.20 2.04 1.19 5.8 4.91 0.3 29.5 73.2 37.6 34.0 95.2 73.2 57.0 70.8 Ro + Scav Cone 9.92 2.23 1.10 0.66 2.5 2.32 0.1 16.7 92.5 48.3 44.6 96.5 82.0 59.6 95.3

Sample: Scav Tail
SGS Lakefield Research Limited Size Distribution Analysis
Project No. 10616-003
Test No.: VI0
Size Weight % Retained % Passing Mesh M m grams Individual Cumulative Cumulative
65 212 0.6 0.5 0.5 99.5 100 150 3.6 3.0 3.5 96.5 150 106 10.8 8.9 12.4 87.6 200 75 16.2 13.4 25.8 74.2 270 53 17.4 14.4 40.2 59.8 400 38 14.2 11.7 51.9 48.1 Pan -38 58.1 48.1 100.0 0.0
Total - 120.9 100.0 - -
K80 88
O )
'u) TO
Q .
a: TO 3 E 3 o
90 80 70 60 50 40 30 20 10 0
10
Particle Size Distribution
1 0 0
Screen Size (micrometers)
! i i 1 1 1 ! 1 ^ ^ — ; j j j
1 1 i 1 J
i i 1 J / T 1 ! 1
i ' I 1 ! 1 I
1 ! i !
i
J / ' m •
! !
1 1
i • t
! 1 1 i
1 K B U = » 8 | j m 1
! i 1 ! 1 1 i i i ! i
1,000

Test No..- Vg Project No.: 10616-003 Operator: DL Date: 0 7 - 2 0 c t - 0 5
Purpose: To use the Locked cycle test conditions of test F40 on the Variability sample SVMLO-8 Produce a Pyrhotite reduced tailing for Environmental testwork. Produce a Pyrhotite rich for Environmental testwork, comprised of the Scavenger concentrate combined with the 1st Cleaner Scavenger Tailing.
Procedure: Flotation was conducted as described below. Al l products were submitted for Pt, Pd, Cu, Ni, and S analyses.
Feed: 2 x 2 kg of minus 10 mesh SVMLO-8
Grind: 30 minutes / 2 kg @ 65% solids in laboratory ball mill (BM-2). Rghr Tail Kjo ~ 88 (im
Stage Ca(OH)j SIPX Reagents added
3477 I, grams per t
CMC onne
CUSO4 H2S04 MIBC Tir
Grind ne, mini Cond.
ates Froth pH
Grind 250 30 8.0
Rougher I 50 10 10 1 2 8.0 Ro concentrate I kept separate to go direct to 1st cleaner feed NO REGRIND
Rougher 2 7.5 2.5 I 2 7.8 Rougher 3 5 2.5 2.5 1 4 7.7 Rougher 4 7.5 5 I 4 Rougher 5 2.5 2.5 DHSO 5 1 4 7.6 Sacvenger 15 1.25 100 250 2.5 H I 2 L 6.5
15 5 1.25 5 1 2 15 5 1.25 5 1 3
Final pH 7.3 Regrind feed is the Rougher Concentrate 2-5
RezrindP.M. 1 75 I 2.5 50 8 1st Cleaner feed is the reground product plus the Rou rher Concentrate I
1st Cleaner 25 1 4 9.3 1st Cleaner Scav 2.5 2.5 0 0 I 2 8.6
2nd Cleaner 0 0 2.5 I 3 9.7 3rd Cleaner 10 2 10 1.25 1 3 9.7 4th Qeaner 1 5 1 1 2 9.7
Total 410 73.0 30.0 18.8 150.0 250.0 42.3 1
Stage Roughers lst,2ndClcaiien 3rd,4thClcaiKrs Flotation Cell 10 L D-2 2L D-1 I L D - I Speed: rpm 1400 1500 1200
Metallurgical Balance
Product Weight Assays, g/t % Distribution g % Pt Pd Cu NI S Pt Pd Cu NI S
4th Cleaner Cone 109.9 2.75 8.09 3.10 12.4 7.23 33.7 59.3 19.2 76.3 47.4 40.7 4th Cleaner Tail 45.7 1.14 1.00 1.81 2.0 i i 4.01 34 3.1 4.7 5.0 10.9 17.1 3rd Cleaner Tail 26.8 0.67 1.48 3.65 1.70 2.78 28.9 2.6 5.5 2.5 4.4 8.5 2nd Cleanr Tail 46.3 1.16 1.14 2.63 1.48 2.25 16.6 3.5 6.9 3.8 6.2 8.4 1st Clnr Scav Cone 17.0 0.43 1.14 2.10 0.97 2.13 27.9 1.3 2.0 0.9 2.2 5.2 High Sulph Tail 334.3 8J6 0.43 0.82 0.170 0.42 2.8 9.6 15.5 3.2 8.4 10.3 Scavenger Tailing 3420.0 85.50 0.09 0.24 0.043 0.10 0.26 20.5 46.3 8.2 20.4 9.8
Hcad(calc.) 4000.0 100.0 0.37 0.44 0.45 0.42 2.28 100.0 100.0 100.0 100.0 (direct) 0.36 0.45 0.40 0.42
Combined Products 4thaeanerConc 2.75 8.09 3.10 12.4 7.23 33.7 59.3 19.2 76.3 47.4 40.7 3rdCleanerConc 3.89 6,01 2.72 9.33 6.28 33.8 62.4 23.9 81.3 58.4 57.8 2nd Cleaner Cone 4.56 5.34 2.86 8.21 5.77 33.1 65.0 29,4 83.8 62.8 66.3 1 st Cleaner Cone 5.72 4.49 2.81 6.85 5.06 29.7 68.6 36.3 87.7 69.0 74.7 lstClConc•^Cl ScConc 6.14 4.26 2.76 6.44 4.85 29.6 69.9 38.3 88.6 71.2 79.9 Ro -1- Scav Cone 14.50 2.05 1.64 2.8 2.30 14.2 79.5 53.7 91,8 79.6 90.2

Sample: Scav Tail
SGS Lakefield Research Limited Size Distribution Analysis
Project No. 10616-003
Test No.; V11
Size Weight % Re ;ained % Passing Mesh |jm grams Individual Cumulative Cumulative
65 212 0.8 0.8 0.8 99.2 100 150 3.7 3.7 4.5 95.5 150 106 8.4 8.4 13.0 87.0 200 75 12.4 12.4 25.4 74.6 270 53 14.4 14.5 39.9 60.1 400 38 11.3 11.3 51.2 48.8 Pan -38 48.6 48.8 100.0 0.0
T o t a l - 9 9 . 6 100.0 - -
K 8 0 8 8
cn c "to «3 ro a.
0) >
TO E 3 o
100 90 80 70 60 50 40 30 20 10 0
10
Particle Size Distribution
1 0 0
Screen Size (micrometers)
1
m -i
i ! 1 1
1 i 1
j 1 1 i
i ! 1 ! i 1 1 i 1 1 1
1 ! !
K 8 0 = 8 8 | i m j i M ! : j'
' i ! ; 1 i ! i
1
! !
K 8 0 = 8 8 | i m
! : i 1 i 1 i .1 i ' • ' !
1,000

Test No.; V12 Project No.; 10616-003 Operator: DL Date; 20-0ct-05
Purpose: To use the Locked cycle test conditions of test F40 on the Variability sample SVMDC-2 Produce a Pyrhotite reduced tailing for Environmental testwork. Produce a Pyrhotite rich for Environmental testwork, comprised of the Scavenger concentrate combined with the 1st Cleaner Scavenger Tailing.
Procedure: Flotation was conducted as described below. Al l products were submitted for Pt, Pd, Cu, Ni, and S analyses.
Feed: 2 x 2 kg of minus 10 mesh SVMDC-2
Grind: 30 minutes / 2 kg @ 65% solids in laboratory ball mill (BM-2). Rghr Tail Kgc - 88 fim
Stage Ca(OH), SIPX Reagents addi
3477 sd, grams per toi
CMC ine
CUSO4 H2S04 MIBC Tir
Grind ne, mini
Cond. ates
Froth pH
Grind 250 30 9.1
Rougher 1 0 10 10 1 2 9.1 Ro concentrate I kept separate to go direct to 1st cleaner feed NO RECRIND
Rougher 2 7.5 2.5 1 2 8.8 Rougher 3 5 2.5 2.5 1 4 Rougher 4 7.5 5 1 4 8.4 Rougher 5 2.5 2.5 DF250 5 1 4 7.3 Sacvenger 15 1.25 100 250 2.5 1+1 2 7.1
15 5 1.25 5 1 2 15 5 1.25 5 1 3
Final pH 7.5 Regrind feed is the Rougher Concentrate 2-5
RegrindP.M. 1 75 | 2.5 50 8 1st Cleaner feed is the reground product plus the Rou) ?her Concentrate I
1st Cleaner 25 1.25 1 4 9.3
1st Cleaner Scav 2.5 2.5 0 0 1 2 8.5 2nd Cleaner 0 0 2.5 1 3 9.7 3rd aeaner 10 2 10 1.25 1 3 9.7 4th Cleaner
360 1
74.3 5 1 1 2 9.7
Total 360 1
74.3 30.0 18.8 150.0 250.0 42.3
Stage Roughers l5t.2ndC1eaners 3rd,4thCleana5 Flotation Cell lOLD-2 2LD-1 l L D - 1 Speed: rpm 1400 1500 1200
Metallurgical Balance
Product Weight Assays, / t °/e Distribution
E % Pt Pd Cu N1 S Pt Pd Cu N1 S 4th Cleaner Cone 99.8 2.50 6.04 2.15 17.7 6.64 32.4 32.7 9.3 87.2 36.4 33.6 4th Cleaner Tail 19.4 0.49 6.04 5.24 2.0 12.5 26 6.4 4.4 1.9 13.3 5.2 3ni Cleaner Tail 30.5 0.76 4.30 5.03 1.03 6.35 18.5 7.1 6.7 1.6 10.7 5.9 2nd Cleanr Tail 33.8 0.85 1.98 3.48 0.37 2.54 12.4 3.6 5.1 0.6 4.7 4.4 1st Cinr Scav Cone 44.2 1.11 3.09 2.95 0.31 3.45 22.8 7.4 5.7 0.7 8.4 10.5 High Sulph Tail 362.5 9.06 1.23 1.26 0.096 0.64 9.3 24.2 19.9 1.7 12.8 35.1 Scavenger Tailing 3409.8 85.24 0.10 0.33 0.038 0.07 0.15 18.5 48.9 6.4 13.7 5.3
Head (calc.) 4000.0 100.0 0.46 0.57 0.51 0.45 2.40 100.0 100.0 100.0 100.0 100.0 (direct) 0.48 0.57 0.48 0.45
Combined Products 4thCleaner Cone 2.50 6.04 2.15 17.7 6.64 32.4 32.7 9.3 87.2 36.4 33.6 3rdCleaner Cone 2.98 6.04 2.65 15.1 7.59 31.4 39.1 13.8 89.0 49.8 38.9 2nd Cleaner Cone 3.74 5.69 3.14 12.3 7.34 28.7 46.2 20.4 90.6 60.4 44.7 1st Cleaner Cone 4.S9 5.00 3.20 lO.l 6.46 25.7 49.9 25.5 91.2 65.2 49.1 1st CI Conc+ CI Sc Cone 5.69 4.63 3.15 8.2 5.87 25.2 57J 31.2 91.9 73.5 59.6 Ro + Scav Cone 14.76 2.54 1.99 3.2 2.66 15.4 81.5 51.1 93.6 86.3 94.7

SGS Lakefield Research Limited Size Distribution Analysis
Project No. i 10616-003
Sample: Scav Tail Test No.; V12
Size Weight % Re ained % Passing Mesh Ijm grams Individual Cumulative Cumulative
65 212 0.6 0.6 0.6 99.4 100 150 3.7 3.7 4.4 95.6 150 106 8.6 8.7 13.1 86.9 200 75 12.6 12.8 25.8 74.2 270 53 14.0 14.2 40.0 60.0 400 38 12.2 12.4 52.4 47.6 Pan -38 47.0 47.6 100.0 0.0
Total - 98.7 100.0 -
K80 88
O ) Ç
"ot w CD a.
<u
TO E
O
1 0 0
90 80 70 60 50 40 30 20 10 0
10
Particle Size Distribution
! 1
1 i i
1 1 i !
; ! 1 i 1 !
! 1 i ' 1 1
!
1 ! ! 1
1 1 1 i
1
i
i 1
! i • i
!
i ! i j
1 i
1 [
K80 = i ! i K80 = Mm
1 j i J ^ 1 i
100
Screen Size (micrometers)
1,000
Tes t No..- Vg Pro jec t No.: 10616-003 Opera to r : DL Date: 07-5ct-05
Purpose:
Procedure:
Feed:
Gr ind :
Conditions:
To use the Locked cycle test conditions of test F40 on the Variability sample SVMDC-1 Produce a Pyrhotite reduced tailing for Environmental testwork. Produce a Pyrhotite rich for Environmental testwork, comprised of the Scavenger concentrate combined with the 1st Cleaner Scavenger Tailing.
Flotation was conducted as described below. A l l products were submitted for Pt, Pd, Cu, Ni, and S analyses.
2 X 2 kg o f minus 10 mesh SVMDC-1
30 minutes / 2 kg @ 65% solids in laboratory ball mi l l (BM-2). Rghr Tail Kjo ~ 81 (im
Stage Ca(OH)j SIPX Reagents add
3477 ed, grams per tor
CMC me
CUSO4 H2S04 MIBC Tin
Grind ne, mini Cond.
ites Froth pH
Grind 250 30 «.1
Rougher 1 0 10 10 1 2 7.9 Ro concentrate I kept separate to go direct to 1st cleaner feed NO REGRIND
Rougher 2 7.5 2.5 1 2 7.8 Rougher 3 5 2.5 5 1 4 Rougher 4 7.5 5 1 4 7.8 Rougher 5 2.5 2.5 DF250 5 1 4 7.3 Sacvenger 15 1.25 100 250 2.5 1+1 2 7.3
15 5 1.25 5 1 3 15 5 1.25 5 1 4
Final pH 7.3 Regrind feed is the Rougher Concentrate 2-5
Regrind P.M. I 75 | 2.5 50 8 8.1 1st Cleaner feed is the reground product plus the Rou îAer Concentrate 1
1st Cleaner 50 1.25 1 4 9.3
1st Cleaner Scav 2.5 2.5 0 0 1 1 8.7 2nd Cleaner 0 0 2.5 1 3 9.7 3rd Cleaner 10 2 10 1.25 1 3 9.7 4th Cleaner i 5 1 1 2 9.7
Total 385 74.3 30.0 18.8 150.0 250.0 44.8
Stage Roughers ist.2ndCleaiien 3rd,4thaMnCTS Flotation Cell 10 L D-2 2 L D - 1 l L D - 1 Speed: tpm 1400 1500 1200
Metal lurg ica l Balance
Product Weight Assays, g / t % Distr ibution
S % Pt 1 Pd Cu Ni S Pt Pd Cu N i S 4th Cleaner Cone 173.5 4.34 8.34 ! 3.56 11.6 7.04 35 70.7 25.5 84.0 60.3 55.8 4th Cleaner Tai l 74.3 1.86 1.23 2.61 1.6 3.46 32.2 4.5 8.0 5.0 12.7 22.0 3rd Cleaner Tai l 29.0 0.73 1.14 2.65 0.9^ 2.01 21.7 1.6 3.2 1.2 2.9 5.8 2nd Cleanr Tail 46.5 1.16 0.93 2.35 0.65 0.97 5.98 2.1 4.5 1.3 2.2 2.6 1st Clnr Scav Cone 27.5 0.69 1.20 2.36 0.65 1.20 15.3 1.6 2.7 0.7 1.6 3.9 High Sulph Tail 322.3 8.06 0.41 0.80 0.140 0.32 1.7 6.5 10.7 1.9 5.1 5.0 Scavenger Tail ing 3326.9 83.17 0.08 0.33
i 0.042
1 0.092 0.16 13.0 45.4 5.8 15.1 4.9
Head(calc.) 4000.0 100.0 0.51 0.60 0.60 0.51 2.72 lOO.O 100.0 100.0 100.0 100.0 (direct) 0.58 0.67 0.55 0.50 l .
Combined Products 4thCleaner Cone 4.34 8.34 3.56 11.6 7.04 35.0 70.7 25.5 84.0 60.3 55.8 3rdCleaner Cone 6.20 6.21 3.28 8.6 5.97 34,2 75.2 33.6 89.1 73.0 77.9 2nd Cleaner Cone 6.92 5.68 3.21 7.8 5.55 32.9 76.8 36.7 90.3 75.9 83.6 1st Cleaner Cone 8.08 4.99 3.09 6.8 4.89 29.0 78.9 41.3 91.5 78.2 86.2 1st C I ConcH- CI Sc Cone 8.77 4.70 3.03 6.3 4.60 27.9 80.5 43.9 92.3 79.8 90.1 Ro + Scav Cone 16.83 2.64 1.96 3.4 2.55 15.4 87.0 54.6 94.2 84.9 95.1

Sample: Scav Tail
SGS Lakefield Research Limited Size Distribution Analysis
Project No. 10616-003
Test No.: VI3
Size Weight % Retained % Passing IVIesh |jm grams Individual Cumulative Cumulative
65 212 0.4 0.4 0.4 99.6 100 150 2.5 2.8 3.3 96.7 150 106 6.8 7.6 10.9 89.1 200 75 10.5 11.8 22.6 77.4 270 53 12.2 13.7 36.3 63.7 400 38 10.7 12.0 48.3 51.7 Pan -38 46.1 51.7 100.0 0.0
Total - 89.2 100.0 - -
K80 81
0 1 c
' o t m TO
CL
Q) >
ro E 3
O
1 0 0
90 80 70 60 50 40 30 20 10 0
10
Particle Size Distribution
1 0 0
Screen Size (micrometers)
1 ^ ^ r r 1
1 X 1 i-* 1
i wf 1 i • j i ! 1
_____ i 1
1 i ! i 1 ; K80 = 81 Mm
1 ; ! i i 1
1 ; K80 = 81 Mm 1 1 1
i i 1 i i
! ! M ! i 1 !
1,000

Test No..- Vg Project No.: 10616-003 Operator: DL Date: 0 7 - 0 8 c t - 0 5
Purpose:
Procedure:
Feed:
Grind:
To use the Locked cycle test conditions of test F40 on the Variability sample SVMDC-3 Produce a Pyrhotite reduced tailing for Environmental testwork. Produce a Pyrhotite rich for Environmental teshvoik, comprised of the Scavenger concentrate combined with the 1st Cleaner Scavenger Tailing.
FloUtion was conducted as described below. Al l products were submitted for Pt, Pd, Cu, Ni, and S analyses.
2 X 2 kg of minus 10 mesh SVMDC-3
30 minutes / 2 kg @ 65% solids in laboratory ball mill (BM-2). Rghr Tail Kgo ~ 79 gm
Stage Ca(OH), SIPX Reagents adds
3477 id, grams per ton
CMC ne
CuSO. H2S04 MIBC Tir
Grind ne, mini
Cond. jtes
Froth pH
Grind 250 30 9.1
Rougher 1 0 10 10 1 2 9.1 Ro concentrate 1 kept separate to go direct to 1st cleaner feed NO REGRIND
Rougher 2 7.5 2.5 1 2 Rouglier 3 5 2.5 5 1 4 Rougher 4 7.5 5 1 4 8.8 Rougher 5 2.5 2.5 DF250 5 1 4 Sacvenger 15 1.25 100 250 2.5 1+1 2 7.2
15 5 1.25 5 1 3 15 5 1.25 5 1 4 15 5 1.25 5 1 2
Final pH 7.6 Regrind feed is the Rougher Concentrate 2-5
ReerindP.M. 1 75 | 2.5 50 8 1st Cleaner feed is the reground product plus the Rougher Concentrate 1
1st Cleaner 50 1.25 1 4 9.4 1.25 1 1
1st Cleaner Scav 2.5 2.5 0 0 1 1 8.7 2nd Cleaner 1 0 2.5 1 3 9.7 3rd Cleaner 10 2 10 1.25 I 3 9.7
Total 385 90.5 35.0 15.0 150.0 250.0 48.8
Stage Roughers Ist^ndCleanos 3rd,4thaeaiiCTS
Flotation Cell 10 L D-2 2LD-1 l LD-1 Speed: rpra 1400 1500 1200
Metallurgical Balance
Product Weight Assays, ] A % Distribution K % Pt Pd Cu N1 S Pt Pd Cu Ni S
3rd Cleaner Cone 164.1 4.10 6.05 2.96 11.4 6.42 31.0 64.9 25.5 89.8 60.5 51.5 3rd Cleaner Tail 29.8 0.75 2.03 3.74 0.8 3.22 23.2 4.0 5.9 1.2 5.5 7.0 2nd Cleanr Tail 72.5 1.81 1.12 1.93 0.45 . 2.67 16.3 5.3 7.4 1.6 11.1 12.0 1st Clnr Scav Cone 52.0 1.30 0.78 0.90 0.18 1.25 23.8 2.6 2.5 0.4 3.7 12.5 High Sulph Tail 347.5 8.69 0.64 0.82 0.12 0.37 3.6 14.5 15.0 2.0 7.4 12.7 Scavenger Tailing 3334.1 83.35 0.04 0.25 0.031 0.06 0.13 8.7 43.8 5.0 11.7 4.4
Head (calc.) 4000.0 100.0 0.38 0.48 0.52 0.44 2.47 100.0 100.0 100.0 100.0 100.0 (direct) 0.57 0.51 0.49 0.42
Combined Products 3rdCleanerConc 4.10 6.05 2.96 11.4 2nd Cleaner Cone 4.85 5.43 3.08 9.8 1st Cleaner Cone 6.66 4.26 2.77 7.2 1st CI Conc+ CI Sc Cone 7.96 3.69 2.46 6.1 Ro + Scav Cone 1 16.65 2.10 1.61 3.0
6.42 5.93 _ 5.04 4.42 2.31"
31.0 29.8
64.9 68.8
25.5 31.4
89.8 91.0
60.5 66.1
51.5 58.5
26.1 25.7
74.1 76.8
38.7 41.2
92.6 93.0
14.2 91.3 56.2 95.0
77.2 80.9 88.3
70.4 83.0 95.6

Sample: Scav Tail
SGS Minerals Services Size Distribution Analysis
Test No.: V14
Project No. 10616-003
S ze Weight % Retained % Passing Mesh pm grams individual Cumulative Cumulative
65 212 0.2 0.3 0.3 99.7 100 150 1.3 1.7 2.0 98.0 150 106 5.4 7.2 9.2 90.8 200 75 9.3 12.4 21.5 78.5 270 53 11.0 14.6 36.2 63.8 400 38 10.2 13.6 49.7 50.3 Pan -38 37.8 50.3 100.0 0.0
Total - 75.2 100.0 - -
K80 79
100 90 80 70 60
o 50 • I 40
c n c "55 w (0
DL
JO
E O
30 20 10 0
10
Particle Size Distribution
1 0 0
Screen Size (micrometers)
1 i 1 •
j i - ! ! ! 1 1 I •1
: ! 1 ! r
) i » / 1 1 i
1
: 1 K80 =
i • i K80 = 79 Jim
i i i i 1 1
1,000

Test No..- Vg Project No.: 10616-003 Operator: DL Date: 0 7 - 0 8 c t - 0 5
Purpose:
Procedure:
Feed:
Grind:
Conditions:
To use the Lockcd cycle test conditions of test F40 on the Variability sample SVMDC-4 Produce a Pyrhotite reduced tailing for Environmental testwork. Produce a Pyrhotite rich for Environmental testwork, comprised of the Scavenger concentrate combined with the 1st Cleaner Scavenger Tailing.
Flotation was conducted as described below. All products were submitted for Pt, Pd, Cu, Ni, and S analyses.
2 X 2 kg of minus 10 mesh SVMDC-4
30 minutes / 2 kg @ 65% solids in laboratory ball mill {BM-2). Rghr Tail Kjo - 73 pra
Stage Ca(OHh SIPX Reagents add
3477 ed, grams per ton
CMC me
CuSO, H2S04 MIBC Tir
Grind ne, mini Cond.
utes Froth pH
Grind 250 30 9.3
Rougher 1 0 10 10 1 2 9.2 Ro concentrate I kept separate to go direct to 1st cleaner feed NO REGRIND
Rougher 2 7.5 2.5 1 2 9.1 Rougher 3 5 2.5 5 1 4 Rougher 4 7.5 5 1 4 Rougher 5 2.5 2.5 DF250 5 1 4 Sacvenger 15 1.25 100 250 2.5 I + l 2 7.5
15 5 1.25 5 1 3 15 5 1.25 5 1 4
Final pH 7.8 Regrind feed is the Rougher Concentrate 2-5
Rewind P.M. | 75 | 2.5 50 8 1st Cleaner feed is the reground product plus the Rougher Concentrate I
1st Cleaner 50 1.25 1 4 9.3
1st Cleaner Scav 2.5 2,5 0 0 1 1 8.7 2nd Cleaner 0 0 2.5 1 3 9.7 3rd Cleaner 10 2 10 1,25 1 3 9,7 4th Cleaner 1 5 1 1 2 9.7
Total 385 74.3 30.0 18.8 150.0 250.0 44.8
Suge Roughers lst,2ndacanm 3rd.4[hCIeanei3 Flotation Cell 10 L D-2 2L D-1 l L D - 1 Speed: tpm 1400 1500 1200
Metallurgical Balance
Product Weight Assays, g/t % Distribution 1
g % Pt Pd Cu Ni S Pt Pd Cu N1 S 3rd Cleaner Cone I88.I 4.70 5.59 3.20 9.0 6.34 30.0 61.5 29.6 90.3 68.8 57.3 3rd Cleaner Tail 36.8 0.92 1.61 2.79 0.6 2.09 18.2 3.5 5.0 1.1 4.4 6.8 2nd Cleanr Tail 53.7 1.34 1.14 1.53 0.18' 0.75 6.91 3.6 4.0 0.5 2.3 3.8 1st Clnr Scav Cone 38.8 0.97 1.58 1.99 0.39 1.61 32.8 3.6 3.8 0.8 3.6 12.9 High Sulph Tail 282.4 7.06 0.84 1.02 0.10 0.45 5.00 13.9 14.1 1.5 7.3 14.3 Sca%'enger Tailing 3400 85.01 0.07 0.26 0.032 0.069 0.14 13.9 43.4 5.8 13.5 4.8
Head (calc.) 4000.0 100.0 0.43 0.51 0.47 0.43 2.46 100.0 100.0 100.0 100.0 100.0 (direct) 0.42 0.51 0.44 0.44
Combined Products 3rdCleaner Cone 4.70 5.59 3.20 9.0 6.34 30.0 61.5 29.6 90.3 68.8 57.3 2nd Cleaner Cone 5.62 4.94 3.13 7.7 5.64 28.1 65.0 34.6 91.4 73.2 64.1 1st Cleaner Cone 6.97 4.21 2.82 6.2 4.70 24.0 68.6 38.6 91.9 75.5 67.9 1st CI Conc+Cl Sc Cone 7.94 3.89 2.72 5.5 4.32 25.1 72.2 42.4 92.7 79.1 80.8 Ro + Scav Cone 1 14.99 2.45 1.92 3.0 2.50 15.6 86.1 56.6 94.2 86.5 95.2

SGS Minerals Services Size Distribution Analysis
Project No. 10616-003
Sample: Scav Tail Test No.: VI5
Size Weight % Retained % Passing Mesh tjm grams Individual Cumulative Cumulative
65 212 0.3 0.3 0.3 99.7 100 150 1.9 2.2 2.5 97.5 150 106 4.7 5.4 7.9 92.1 200 75 9.4 10.8 18.7 81,3 270 53 13.9 15.9 34.6 65.4 400 38 11.6 13.3 47.9 52.1 Pan -38 45.4 52.1 100.0 0.0
Total - 87.2 100.0 - -
K80 73
CD C '55 vt ro
Q .
(U
E o
100 90 80 70 60 50 40 30 20 10 0
10
Particle Size Distribution
100
Screen Size (micrometers)
m j
1 <
A i i
• 1 1 i
j i ; i
1 ^ 1
1 j
j 1 1 i i '' i i i • 1 1
1 j 1 K 8 0 = 7 3 Jim ! ! ! •
1 1 1 ! i i ; , • - 1
-4 i i i M ! M
1,000

Test No..- Vg P r o j e c t No.: 10616-003 Opera to r : DL Date: 0 7 - 0 8 c t - 0 5
Purpose:
Procedure:
Feed:
Gr ind :
Condit ions:
To use the Locked cycle test conditions of test F40 on the Variability sample SVMDC-5 Produce a Pyrhot i te reduced tailing for Environmental testwork. Produce a Pyrhoti te r ich for Environmental testwork, comprised of the Scavenger concentrate combined with the 1st Cleaner Scavenger Tailing.
Flotation was conducted as described below. A l l products were submitted for Pt, Pd, Cu, Ni, and S analyses.
2 X 2 kg of minus 10 mesh SVMDC-5
30 minutes / 2 kg @ 65% solids in laboratory ball mi l l (BM-2). Rghr Tail K, , - 75 jim
Stage Ca(0H)2 SIPX Reagents add
3477 led, grams per to
CMC nne
CUSO4 H2S04 MIBC Tir
Grind ne, min Cond.
utes Froth pH
Grind 250 30 9.3
Rougher 1 0 10 10 1 2 9.2 Ro concentrate I kept separate to go direct to ht cleaner feed NO REGRJND
Rougher 2 7.5 2.5 1 2 Rougher 3 5 2.5 5 1 4 Rougher 4 7.5 5 1 4 Rougher 5 2.5 2.5 DF250 5 1 4 8.1 Sacvenger 15 1.25 100 250 2.5 1+1 2 7.6
15 5 1.25 5 1 3 15 5 1.25 5 1 4
Final pH 7.6 Regrind feed is the Rougher Concentrate 2-5
Regrind P.M. I 75 | 2.5 50 8 J St Cleaner feed is the reground product plus the Rougher Concentrate I
1st Cleaner 50 1.25 1 4 9.4
1st Cleaner Scav 2.5 2.5 0 1.25 1 1 8.9 2nd Cleaner 0 0 2.5 1 3 9.7 3rd Cleaner 10 3 10 1.25 1 3 9.7
Total 385 74.3 30.0 13.8 150.0 250.0 45.0
Stage Roughers 1st- 3rdClMnen Flotation Cell 10 L D-2 2L D-1 Speed: rpm 1400 1500
Meta l lurg ica l Balance
Product Weight Assays, •A % Distr ibution % Pt Pd Cu Ni S Pt Pd Cu NI S
3rd Cleaner Cone 131.8 3.30 8.63 4.38 14.1 7.69 29.9 68.3 30.8 92.4 58.4 36.0 3rd Cleaner Tai l 77.8 1.95 1.70 2.83 0.46 3.90 26.7 7.9 11.7 1.8 17.5 19.0 2nd Cleanr Tail 69.8 1.75 0.86 1.50 0.16 1.30 15.3 3.6 5.6 0.6 5.2 9.7 1st Clnr Scav Cone 48.8 1.22 0.93 1.20 0.15 1.19 27.4 2.7 3.1 0.4 3.3 12.2 High Sulph Tail 302.5 7.56 0.51 0.68 0.100 0.32 7.4 9.3 11.0 1.5 5.6 20.4 Scavenger Tail ing 3369.3 84.23 0.04 0.21 0.020 0.051 0.09 8.1 37.8 3.4 9.9 2.8
Head (calc.) 4000.0 100.0 0.42 0.47 0.50 0.43 2.74 100.0 100.0 100.0 lOO.O 100.0 (direct) 0.44 0.52 0.49 0.46
Combined Products 3rdCleaner Cone 3.30 8.63 4.38 14.1 7.69 29.9 68.3 30.8 92.4 58.4 36.0 2nd Cleaner Cone 5.24 6.06 3.80 9.0 6.28 28.7 76.3 42.6 94.2 75.9 54.9 1st Cleaner Cone 6.99 4.76 3.23 6.8 5.04 25.4 79.9 48.1 94.8 81.2 64.6 1st CI Conc+ CI Sc Cone 8.21 4.19 2.93 5.8 4.47 25.7 82.6 51.3 95.1 84.5 76.8 Ro + Scav Cone 15.77 2.42 1.85 3.1 2.48 16.9 91.9 62.2 96.6 90.1 97.2

Sample: Scav Tail
SGS Minerals Services Size Distribution Analysis
Test No.:
Project No. 10616-003
VI6
Size Weight % Retained % Passing IVIesh ym grams Individual Cumulative Cumulative
65 212 0.2 0.2 0.2 99.8 100 150 1.5 1.5 1.7 98.3 150 106 6.3 6.4 8.1 91.9 200 75 11.6 11.7 19.8 80.2 270 53 14.6 14.8 34.6 65.4 400 38 13.8 14.0 48.6 51.4 Pan -38 50.8 51.4 100.0 0.0
Total - 98.8 100.0 m -
K80 75
0 5 c 'to m (0
CL
<u
S E
O
100 90 80 4 70 -t 60 ^
40 30 f 2 0 -r 10 0
10
Particle Size Distribution
100
Screen Size (micrometers)
i m 1
1 1 !
; • 1
; i J K !
; t y ; • / «
i i 1
i
j
i 1
1 K B O = 7 5 p m
j ! 1 ! 1 1
1,000

Tes t No..- Vg Projec t No.: 10616-003 O p e r a t o r : DL Date: 0 7 - 0 9 c t - 0 5
P u r p o s e :
P r o c e d u r e :
Feed:
G r i n d :
Cond i t ions :
To use the Locked cycle test conditions of test F40 on the Variability sample SVMDC-6 Produce a Pyrhot i te reduced tailing for Environmental testwork. Produce a Pyrhot i te r ich for Environmental testwork, comprised of the Scavenger concentrate combined with the 1st Cleaner Scavenger Tailing.
Flotation was conducted as described below. Al l products were submitted for Pt, Pd, Cu, Ni, and S analyses.
2 X 2 kg of minus 10 mesh SVMDC-6
30 minutes / 2 kg @ 65% solids in laboratory ball mi l l (BM-2). Rghr Tail Kjo ~ 84 nm
Stage Ca(OH)2 SIPX Reagents add
3477 ed, grams per tc
CMC )nne
CUSO4 H2S04 MIBC Tir
Grind ne, min Cond.
utes Froth pH
Grind 250 30 9.4
Rougher 1 0 10 10 1 2 9.3 Ro concentrate 1 kept separate to go direct to ht cleaner feed NO REGRJND
Rougher 2 7.5 2.5 1 2 Rougher 3 5 2.5 5 1 4 Rougher 4 7.5 5 1 4 Rougher 5 2.5 2.5 DF2S0 5 1 4 8.8 Scavenger 15 1.25 2.5 1-H 2 7.9
15 5 1.25 100 250 5 1 3 8.1 15 5 1.25 5 1 4
Fiiialf JH 8.1 Regrind feed is the Rougher Concentrate 2-5
ReerindP.M. I 75 | 2.5 50 8 Isc Cleaner feed is the regromdproduct plus the Rougher Concentrate I
1st Cleaner 12.5 1.25 1 4 9.5
1st Cleaner Scav 2.5 2.5 0 0 1 1 8.7 2nd Cleaner 1.25 0 2.5 1 3 9.7 3rd Cleaner 10 2 10 1.25 1 3 9.7
Total 348 74.5 30.0 13.8 150.0 250.0 43.8
Stage Roughers la-3niCleantrs Flotation Cell 10 L D-2 2L D-1 Speed: rpm 1400 1500
Meta l lu rg i ca l Ba lance
P r o d u c t Weigh t Assays, % Distr ibution
P % Pt Pd 1 Cu Ni S P t P d Cu Ni S 3rd Cleaner Cone 150.5 3.76 5.62 3.75 ! : 9.98 6.69 28.6 66.1 34.1 92.4 73.5 54.7 3rd Cleaner Tai l 36.6 0.92 1.18 2.44 0.41 1.71 24.5 3.4 5.4 0.9 4.6 11.4 2nd Cleanr Tail 68.1 1.70 0.80 1.49 0.26 0.95 16.9 4.3 6.1 1.1 4.7 14.6 1st Clnr Scav Cone 16.8 0.42 1.20 1.81 0.32 0.92 18.4 1.6 1.8 0.3 1.1 3.9 High Sulph Tail 174.5 4.36 0.79 0.91 0.098 0.33 5.5 10.8 9.6 1.1 4.2 12.3 Scavenger Tail ing 3553.5 88.84 0.05 0.20 0.019 0.046 0.07 13.9 42.9 4.2 11.9 3.2
Head (calc.) 4000.0 100.0 0.32 0.41 0.41 0.34 1.97 100.0 100.0 lOO.O 100.0 100.0 (direct) 0.42 0.65 0.40 0.35
C o m b i n e d Produc t s 3rdCleaner Cone 3.76 5.62 3.75 10.0 6.69 28.6 66.1 34.1 92.4 73.5 54.7 2nd Cleaner Cone 4.68 4.75 3.49 8.1 5.72 27.8 69.5 39.5 93.4 78.0 66.0 1st Cleaner Cone 6.38 3.70 2.96 6.0 4.44 24.9 73.8 45.6 94.5 82.7 80.7 I s t C l C o n c + C l Sc Cone I 6.80 3.54 2.89 5.7 4.23 24.5 75.3 47.5 94.8 83.9 84.6 Ro -1- Scav Cone 1 11.16 2.47 2.12 3.5 2.70 17.1 86.1 57.1 95.8 88.1 96.8

Sample: Scav Tail
SGS Minerals Services Size Distribution Analysis
Test No.: V17
Project No. 10616-003
Size Weight % Retained % Passing Mesh |jm grams Individual Cumulative Cumulative
48 300 0.3 0.3 0.3 99.7 65 212 0.4 0.4 0.8 99.2 100 150 2.3 2.5 3.3 96.7 150 106 7.3 8.0 11.3 88.7 200 75 11.3 12.4 23.7 76.3 270 53 14.6 16.0 39.6 60.4 400 38 10.0 11.0 50.6 49.4 Pan -38 45.1 49.4 100.0 0.0
Total - 91.3 100.0 - -
K80 84
1 0 0
90 80 70 60
^ 50 ••I 40
O) g
"to ro
D .
3 E 3
o
30 ^ 20 t 10 f
0 4-10
Particle Size Distribution
K80 = 84 pm
1 0 0
Screen Size (micrometers)
j
— 1 1
!
1
! i
W > !
; 1
1 ; ; 1 1
1
1 1
- M 1
! 1
r A
1
1 r 1 1 ^ — 1 — ^ ! i : ! i i 1 i 1 I
1 ^ " T l
i
. 1
!
— • r
1
i :
i i
1,000

Test No..- Vg Project No.: 10616-003 O p e r a t o r : DL Date: 0 7 - 0 9 c t - 0 5
Purpose:
Procedure:
Feed:
Gr ind :
Condit ions:
To use the Locked cycle test conditions of test F40 on the Variability sample SVMDC-7 Produce a Pyrhoti te reduced tailing for Environmental testworlc. Produce a Pyrhoti te rich for Environmental testwork, comprised of the Scavenger concentrate combined with the 1st Cleaner Scavenger Tailing.
Flotation was conducted as described beloW; A l l products were submitted for Pt, Pd, Cu, Ni, and S analyses.
2 X 2 kg of minus 10 mesh SVMDC-7
30 minutes / 2 kg @ 65% solids in laboratory ball mil! (BM-2). Rghr Tail Kjo - 70 nm
Stage Ca(0H)3 SIPX Reagents add<
3477 ed, grams per to;
CMC nne
CuSO, H2S04 MIBC Tin
Grind le, mini Cond.
utes Froth pH
Grind 250 30 9.3
Rougher 1 0 10 10 1 2 9.3 Ro concentrate 1 kept separate to go direct to 1st cleaner feed NO REGRIND
Rougher 2 7.5 2.5 1 2 Rougher 3 5 2.5 5 1 4 Rougher 4 7.5 5 1 4 Rougher 5 2.5 2.5 DF2S0 5 1 4 Scavenger 15 1.25 100 250 2.5 1+1 2 7.6
15 5 1.25 5 1 3 15 5 1.25 5 1 4
Final pH 7.7 Regrindfeed is the Rougher Concentrate 2-5
Reerind P.M. 1 75 | 2.5 50 i 1st Cleaner feed is the reground product plus the Rougher Concentrate I
1st Cleaner 50 1.25 1 4 9.4
1st Cleaner Scav 2.5 2.5 0 0 1 2 8.9 2nd Cleaner 0 0 1.25 1 3 9.5 3rd Cleaner 10 2 10 2.5 1 3 9.6
Total 385 73.3 30.0 13.8 150.0 250.0 43.8
Stage Rougher^ l$t-3rdCleaners Flotation Cell l O L D - 2 2L D-1 Speed: rpm 1400 1500
Metal lurgical Balance
P roduc t Weight Assays, { /« % Distribution
% % Pt Pd Cn NI S Pt Pd Cu Ni S 3rd Cleaner Cone 157.7 3.94 8.34 3.56 11.6 7.33 30.6 66.8 22.6 92.7 60.8 38.9 3rd Cleaner Tail 114.3 2.86 1.14 2.65 0.37 3.12 27.8 6.6 12.2 2.1 18.8 25.6 2nd Cleanr Tail 58.5 1.46 0.93 2.35 0.25 1.28 11.4 2.8 5.5 0.7 3.9 5.4 1st Clnr Scav Cone 48.0 1.20 1.20 2.36 0.17 0.82 22.7 2.9 4.6 0.4 2.1 8.8 High SulphTail 366.6 9.16 0.41 0.80 0.063 0.24 5.4 7.6 11.8 1.2 4.6 16.1 Scavenger Tailing 3254.9 81.37 0.08 0.33 0.017 0.057 0.20 13.2 43.3 2.8 9.8 5.2
Head (calc.) 4000.0 100.0 0.49 0.62 0.49 0.48 3.10 100.0 100.0 100.0 100.0 100.0 (direct) 0.51 0.51 0.49 0.46
Combined Products 3rdCleaner Cone 3.94 8.34 3.56 11.6 7.33 30.6 66.8 22.6 92.7 60.8 38.9 2nd Cleaner Cone 6.80 5.31 3.18 6.9 5.56 29.4 73.4 34.8 94.9 79.6 64.5 1st Cleaner Cone 8.26 4.54 3.03 5.7 4.80 26.2 76.2 40.4 95.6 83.5 69.9 l s tC lConc+ CI Sc Cone 9.46 4.11 2.95 5.0 4.30 25.8 79.1 44.9 96.0 85.6 78.7 Ro + Scav Cone 18.63 2.29 1.89 2.6 2.30 15.8 86.8 56.7 97.2 90.2 94.8

Sample: Scav Tail
SGS Minerals Services Size Distribution Analysis
Test No.: V18
Project No. 10616-003
Size Weigtit % Retained % Passing Mesh fjm grams Individual Cumulative Cumulative
48 300 0.0 0.0 0.0 100.0 65 212 0.1 0.1 0.1 99.9 100 150 1.0 1.3 1.4 98.6 150 106 3.3 4.3 5.7 94.3 200 75 8.1 10.6 16.3 83.7 270 53 12.0 15.7 32.0 68.0 400 38 11.2 14.6 46.6 53.4 Pan -38 40.9 53.4 100.0 0.0
Total - 76.6 100.0 - -
K80 70
100 T-
O ) c
' (/J O) 03
Q.
(U >
3 E 3 o
80 70 ^
50 40 30 20 10 0
10
Particle Size Distribution
100
Screen Size (micrometers)
; i i 1 ! ! ! - ; M : ' . 1 1 i i i
1 i 1
i ; ' ! 1 ; i 1 ! ! : i i !
A y 1 i i ! i l l i 1
/ • i i :
1 1 Î • y i
1 i i 1 !
1 1 J i
1 1 ! , ! !
K8U = 7 0 p m
1 1 i ] 1
1,000

Test No..- Vg Project No.: 10616-003 Operator: DL Date: 07-5ct-05
Purpose:
Procedure:
Feed:
Grind:
Conditions:
To use the Locked cycle test conditions of lest F40 on the Variability sample SVMDC-8 Produce a Pyrhotite reduced tailing for Environmental testwork. Produce a Pyrhotite rich for Environmental testwork, comprised of the Scavenger concentrate combined with the 1st Cleaner Scavenger Tailing.
Flotation was conducted as described below. All products were submitted for Pt, Pd, Cu, Ni, and S analyses.
2 X 2 kg of minus 10 mesh SNTvlDC-S
30 minutes / 2 kg @ 65% solids in laboratory ball mill (BM-2). Rghr Tail K,o - 84 pm
Stage Ca(OH): SIPX Reagents add
3477 ed, grams per tor
CMC me
CuSO, H2S04 MIBC Tir
Grind ne, mini Cond.
utes Froth PH
Grind 250 30 9.3
Rougher 1 0 10 10 1 2 9.3 Ro concentrate 1 kept separate lo %o direct to 1st cleaner feed NO REGRIND
Rougher 2 7.5 2.5 1 2 Rougher 3 5 2.5 5 1 4 Router 4 7.5 5 1 4 Rougher 5 2.5 2.5 DF2S0 5 I 4 Scavenger 15 1.25 100 250 2.5 1+1 2 7,6
15 5 1.25 5 1 3 15 5 1.25 S 1 4
FinalpH 7.7 Regrind feed is the Rougher Concentrate 2-5
RegrindP.M. 1 75 | 2.5 50 8 1st Cleaner feed is the reground product plus the Rout f/ier Concentrate 1
1st Cleaner 50 1.25 1 4 9.4
1st Cleaner Scav 2.5 2.5 0 0 1 1 8.8 2nd Cleaner 0 0 1.25 1 3 9.5 3rd Qeaner 10 2 10 2.5 1 3 9.6
Total 385 73.3 30.0 13.8 150.0 250.0 43.8
Stage Roughers 1st-3rdClnmeis 1 Flotation Cell 10 L D-2 2L D-1 Speed: rpm 1400 1500
Metallurgical Balance
Product Weight Assays, g A % Distribution % Pt Pd Cu Nl S Pt Pd Cu Nl S
3rd Cleaner Cone 156.8 3.92 6.13 4.59 13.1 7.45 30.0 63.5 34,5 93.2 67.2 46.9 3rd Cleaner Tail 31.8 0.80 1.40 2,94 0.52 3.07 25.7 2.9 4.5 0.8 5.6 8.1 2nd Cleanr Tail 33.9 0.85 1.25 2.56 0.37- 2.25 18.1 2.8 4.2 0.6 4,4 6.1 1st Clnr Scav Cone 35.8 0.90 1.27 1,79 0,32 2.02 28.7 3.0 3.1 0.5 4,2 10.2 High Sulph Tail 278.4 6.96 0.76 0,91 0.130 0.49 8.82 14.0 12.2 1.6 7,9 24.5 Scavenger Tailing 3463,3 86.58 0.06 0,25
j 0.021 0.054 0.12 13.7 41.6 3.3 10.8 4.1
Head (calc.) 4000.0 100.0 0.38 i 0.52 0,55 0.43 2.51 100.0 100.0 100.0 100.0 100,0 (direct) 1 0.46 ! 0.56 0,52 0.41
Combined Products 3rdCleaner Cone 3,92 6.13 4.59 13.1 7.45 30.0 63.5 34.5 93.2 67.2 46.9 2nd Cleaner Cone 4,72 5.33 4.31 11.0 6.71 29.3 66.5 39.0 94.0 72.8 55.0 1st Cleaner Cone 5,56 4.71 4.04 9.4 6,03 27.6 69.3 43.2 94.5 77.2 61.1 1st CI Conc-t- CI So Cone 6,46 4.23 3.73 8.1 5.48 27.7 72.3 46.3 95,1 81.4 71.4 Ro+Scav Cone 13.42 2.43 2.27 4.0 2.89 17.9 86,3 58.4 96,7 89.2 95.9

Sample: Scav Tail
SGS Minerals Services Size Distribution Analysis
Test No.: V19
Project No. 10616-003
Size Weight % Retained % Passing Mesh |jm grams individual Cumulative Cumulative
48 300 0.0 0.0 0.0 100.0 65 212 0.3 0.4 0.4 99.6 100 150 1.7 2.4 2.8 97,2 150 106 5.9 8.2 10.9 89.1 200 75 9.6 13.3 24.2 75.8 270 53 10.7 14.8 39.1 60.9 400 38 9.2 12.7 51.8 48.2 Pan -38 34.8 48.2 100.0 0.0
Total - 72.2 100.0 - -
K80 84
O) c
U) CO
Q-
0) >
ro E o
1 0 0
90 80 70 60 50 40 30 20 10 0
10
Particle Size Distribution
100
Screen Size (micrometers)
i i ; 1
! 1 1 ! i f"
1 ! ! ! •
! !
/ 1
! 1
i I • 1
i
i ^ i ^ ! i 'i 1 : i
1 j
i i l ! i Î Î i
K80 = 84 |jm 1
!
• • ; ! i . i i ; i
Î Î i
K80 = 84 |jm 1
} 1
^ i I i 1
i M i !
1,000

Test No..- Vg Project No.: 10616-003 Operator: DL Date: 07-5ct-05
Purpose: To use the Locked cycle test conditions of test F40 on the Variability sample SVMDC-9 Produce a Pyrhotite reduced tailing for Environmental testwork. Produce a Pyrhotite rich for Environmental testwork, comprised of the Scavenger concentrate combined with the 1st Cleaner Scavenger Tailing.
Procedure: Flotation was conducted as described below. All products were submitted for Pt, Pd, Cu, Ni, and S analyses.
Feed: 2 x 2 kg of minus 10 mesh SVMDC-9
Grind: 30 minutes / 2 kg @ 65% solids in laboratory ball mill (BM-2). Rghr Tail Kg,, ~ 73 Mm
Stage Ca(OH), SIPX Reagents add<
3477 :d, grams per toi
CMC nne
CUSO4 H2S04 MIBC Tir
Grind ne, mini Cond.
iites Froth pH
Grind 250 30 9.3
Rougher 1 0 10 10 1 2 9.3 Ro concentrate I kept separate to go direct to Ist cleaner feed NO REGRIND
Rougher 2 7.5 2.5 1 2 Rougher 3 5 2.5 5 1 4 Rougher 4 7.5 5 I 4 Rougher 5 2.5 2.5 DF250 5 I 4 8.9 Scavenger 15 1.25 100 250 2.5 1+1 2 7.9
15 5 1.25 5 1 3 15 5 1.25 5 1 4
Final pH 7.9 Regrind feed is the Rougher Concentrate 2-5
ResiindP-M. 1 75 | 2.5 50 g /st Cleaner feed is the reground product plus the Rou) j/ier Concentrate 1
1st Cleaner 50 1.25 1 4 9.4
IstaeanerScav 2.5 2.5 0 0 1 1 8.9 2nd Cleaner 0 0 1.25 1 3 9.5 3rd Cleaner 10 2 10 2.5 1 3 9.6
Total 385 73.3 30.0 13.8 150.0 250.0 43.8
Stage Roughers 1st-JrdCleancn Flotation Cell 10 L D-2 2LD- t Speed: rpm 1400 1500
MeUllurgical Balance
Product Weight Assays, g/t % Distribution
E % Pt ! I'd Cu Ni ! s Pt Pd Cu Ni S 3rd Cleaner Cone 139.5 3.49 8.59 6.56 11.9 8.04 30.9 70.0 44.4 93.6 69.5 51.6 3td Cleaner Tail 36.0 0.90 1.30 2.26 0.40 2.57 28.5 2.7 3.9 0.8 5.7 12.3 2nd Cleanr Tail 36.9 0.92 1.58 2.60 0.35 2.37 13.2 3.4 4.7 0.7 5.4 5.8 IstClnrScavConc 31.1 0.78 1.22 1.65 0.21 1.45 25.7 2.2 2.5 0.4 2.8 9.6 High Sulph Tail 273.8 6.84 0.59 0.68 0.075 0.29 5.1 9.4 9.0 1.2 4.9 16.6 Scavenger Tailing 3482.7 87.07 0.06 0.21 0.017 0.054 0.10 12.2 35.5 3.3 11.7 4.2
Head(calc.) 4000.0 100.0 0.43 0.52 0.44 0.40 2.09 100.0 100.0 100.0 100.0 100.0 (direct) 0.46 0.52 0.41 0.40 !
Combined Products 3rdCleanerConc 3.49 8.59 6.56 11.9 8.04 30.9 70.0 44.4 93.6 69.5 51.6 2nd Cleaner Cone 4.39 7.09 5.68 9.5 6.92 30.4 72.7 48.3 94.4 75.2 63.8 1st Cleaner Cone 5.31 6.14 5.14 7.9 6.13 27.4 76.1 53.0 95.1 80.6 69.7 1st CI Conc+ CI Sc Cone 1 6.09 5.51 4.70 7.0 5.53 27.2 78.4 55.5 95.5 83.4 79.2 Ro -t- Scav Cone ! 12.93 2.91 2.57 3.3 2.76 15.5 87.8 64.5 96.7 88.3 95.8

Sample: Scav Tail
SGS Minerals Services Size Distribution Analysis
Test No.: V20
Project No. 10616-003
Size Weight % Retained % Passing Mesh I J m grams Individual Cumulative Cumulative
48 300 0.0 0.0 0.0 100.0 65 212 0.4 0.5 0.5 99.5 100 150 1.3 1.5 1.9 98.1 150 106 5.0 5.7 7.6 92.4 200 75 9.8 11.1 18.7 81.3 270 53 14.9 16.9 35.6 64.4 400 38 11.5 13.1 48.7 51.3 Pan -38 45.2 51.3 100.0 0.0
Total - 88.1 100.0 - -
K80 73
O) Ç 'in (0 CO
QL
<u
ro
E ZI
O
100 90 80 70 60 50 40 30 20 10 0
10
Particle Size Distribution
100
Screen Size (micrometers)
i 1
• 1 r
> ! ! j
1 j
I j !
1 ! • !
i i i 1
1 1
i
1 i
K U U = ( j m
- 1 1 i i
1,000

Test No..- Vg Project No.: 10616-003 Operator : DL Date: 0 7 - 1 4 c t - 0 5
Purpose:
Procedure:
Feed:
Grind:
Conditions:
To use the Locked cycle test conditions of test F40 on the Variability sample SVMDC-10 Produce a Pyrhotite reduced tailing for Environmental testwork. Produce a Pyrhotite rich for Environmental testwork, comprised of the Scavenger concentrate combined with the 1 st Cleaner Scavenger Tailing.
Flotation was conducted as described below. Al l products were submitted for Pt, Pd, Cu, Ni, and S analyses.
2 X 2 kg of minus 10 mesh SVMDC-10
30 minutes / 2 kg @ 65% solids in laboratory ball mill (BM-2). Rghr Tail Kgo ~ 82 Mm
Stage Ca(OH)j SIPX Reagents add
3477 ed, grams per tor
CMC me
CUSO4 H2S04 MIBC Tir
Grind ne, mini Cond.
jtes Froth pH
Grind 250 30 9.5
Rougher 1 0 10 10 1 2 9.5 Ro concentrate 1 kept separate to go direct to 1st cleaner feed NO REGRIND
Rougher 2 7.5 2.5 I 2 9.2 Rougher 3 5 2.5 5 I 4 Rougher 4 7.5 5 1 4 7.8 Rougher 5 2.5 2.5 DF2S0 5 1 4 7.8 Sacvenger 15 1.25 2.5 1+1 2
15 5 1.25 5 1 3 15 5 1.25 100 100 5 1 4 7.6
Final pH 7.6 Regrindfeed is the Rougher Concentrate 2-5
RfigrindP.M. 1 75 | 2.5 50 8 1st Cleaner feed is the reground product plus the Rouf 'her Concentrate 1
1st Cleaner 50 1.25 1 4 9.3
1st Cleaner Scav 2.5 2.5 0 0 1 2 8.5 2nd Cleaner 0 0 2.5 1 3 9.7 3rd Cleaner 10 2 10 1.25 Î 3 9.7
Total 385 73.3 30.0 13.8 150.0 100.0 43.8
Stage Roughers 1st-JrdCliMiiCTs Flotation Cell lOLD-2 2LD- I Speed: ipm 1400 1500
Metallurgical Balance
Product Weight Assays, g/t % Distribution E % Pt Pd Cu Ni S Pt Pd Cu Ni S
3rd Cleaner Cone 161.7 4.04 6.77 4.67 12.4 7.61 31.6 60.3 33.1 88.8 65.0 49.6 3rd Cleaner Tail 46.6 1.17 1.25 2.44 0.58 3.03 25.6 3.2 5.0 1.2 7.5 11.6 2nd Qeanr Tail 38.3 0.96 1.24 2.21 0.36 1.54 11.8 2.6 3.7 0.6 3.1 4.4 1st Clnr Scav Cone 34.3 0.86 1.49 1.56 0.27 1.44 22.4 2.8 2 J 0.4 2.6 7.5 High Sulph Tail 327.8 8.19 0.79 0.88 0.100 0.41 6.3 14.3 12.7 1.5 7.1 20.1 Scavenger Tailing 3391.3 84.78 0.09 0.29 0.050 0.082 0.21 16.8 43.2 7.5 14.7 6.9
Head (calc.) 4000.0 100.0 0.45 0.57 0.56 0.47 2.58 100.0 100.0 100.0 100.0 100.0 (direct) 0.46 0.60 0.53 0.48
Combined Products 3rdCleanerConc 4.04 6.77 4.67 12.4 7.61 31.6 60.3 33.1 88.8 65.0 49.6 2nd Cleaner Cone 5.21 5.54 4.17 9.8 6.59 30.3 63.5 38.1 90.0 72.5 61.1 1st Cleaner Cone 6.17 4.87 3.87 8.3 5.80 27.4 66.1 41.8 90.6 75.6 65.5 1st CI Conc+ CI Sc Cone ! 7.02 4.46 3.58 7.3 5.27 26.8 68.9 44.2 91.0 78.2 73.0 Ro -1- Scav Cone i 15.22 2.48 2.13 3.4 2.65 15.8 83.2 56.8 92.5 85.3 93.1

Sample: Scav Tail
SGS Minerals Services Size Distribution Analysis
Test No.: V21
Project No. 10616-003
Size Weiglit % Retained % Passing Mesh pm grams Individual Cumulative Cumulative
48 300 0.0 0.0 0.0 100.0 65 212 0.3 0.3 0.3 99.7 100 150 2.0 2.1 2.4 97.6 150 106 7.7 8.1 10.6 89.4 200 75 11.9 12,6 23.1 76.9 270 53 13.9 14.7 37.8 62.2 400 38 12.2 12.9 50.7 49.3 Pan -38 46.7 49.3 100.0 0.0
Total - 94.7 100.0 - -
K80 82
D ) Ç '<n V) CO
Û .
<D >
ro E
O
100 90 80 70 60 50 40 30 20 10 0
10
Particle Size Distribution
1 0 0
Screen Size (micrometers)
; i j 1 1 1 -jM 1 ' 1 f
i 1 y M i
i i ! 1
w 1
: 1 i i / i 1
i
! 1 i i i ! 1 1
i ! ^ " 1 ; 1 1 ; 1
1
' ; ' i • M i : M l ' • 1
! i
. I I I ! i { i 1 i 1 !
82 (jm 1
i 1 ;
i i 1 i i | 1 j K80 = 1 !
82 (jm i !
i ! ^ ! i ' 1 1 ^ ! : i 1 ! ! : i !
1,000

Test No..- Vg Projec t No.: 10616-003 Opera tor : DL Date: 0 7 - 1 4 c t - 0 5
Purpose:
Procedure;
Feed:
Grind:
Conditions:
To use the Locked cycle test conditions of test F40 on the Variability sample SVMDC-11 Produce a Pyrhotite reduced tailing for Environmental testwork. Produce a Pyrliotite r ich for Environmental testwork, comprised of tlie Scavenger concentrate combined with the 1st Cleaner Scavenger Tailing.
Flotation was conducted as described below. A l l products were submitted for Pt, Pd, Cu, Ni, and S analyses.
2 X 2 kg of minus 10 mesh S VMDC-11
30 minutes / 2 kg @ 65% solids in laboratory ball mil l (BM-2). Rghr Tail Kgo ~ 78 nm
Stage Ca(OH)j SIPX Reagents add
3477 ed, grams per to
CMC nne
CUSO4 H2S04 MIBC Tir
Grind ne, mini Cond.
jtes Froth pH
Grind 250 30 9.5
Rougher 1 0 10 10 I 2 9.5 Ro concentrate I kept separate to go direct to ht cleaner feed NO REGRIND
Rougher 2 7.5 2.5 1 2 Rougher 3 5 2.5 5 1 4 Rougher 4 7.5 5 I 4 Rougher 5 2.5 2.5 DF250 5 1 4
Sacvenger 15 1.25 2.5 1+1 2 15 5 1.25 5 1 3 15 5 1.25 100 100 5 1 4
Final pH 7.6 Regrind feed is the Rougher Concentrate 2-5
Rearind P.M. t 75 | 2.5 50 8 J St Cleaner feed is the reground product plus the Rougher Concentrate 1
1st Cleaner 25 1.25 2.5 1 4 9.4
1 st Cleaner Scav 2.5 2.5 0 0 1 2 8.8 2nd Cleaner 40 1.25 0 2.5 1 3 9.7 3rd Cleaner 10 2 10 5 I 3 9.7
Total 400 74.5 30.0 13.8 150.0 100.0 50.0
Stage Roughers 1st-3rdCleaners Flotation Cell l O L D - 2 2L D-1 Speed: rpm 1400 1500
Metal lurgical Balance
Product Weight Assays, j v . I Distribution
g % Pt Pd i Cu Ni S Pt Pd Cu Ni S 3rd Cleaner Cone 91.2 2.28 7.54 4.80 13.1- 7.17 27 60.4 36.2 93.2 58.9 40.8 3rd Cleaner Tail 30.7 0.77 1.16 1.72 0.31 2.04 24.4 3.1 4.4 0.7 5.6 12.4 2nd Cleanr Tail 44.4 l . I l 1.08 1.49 0.20 1.75 12.2 5.5 0.7 7.0 9.0 1st Clnr Scav Cone 26.5 0.66 0.95 0.81 0.13 0.96 19.1 2.2 1.8 0.3 2.3 8.4 High Sulph Tail 262.2 6.56 0.63 0.52 0.058 0.28 5.71 14.5 11.3 1.2 6.6 24.8 Scavenger Tailing 3545.0 88.62 0.05 0.14 0.014 0.061 0.08 15.6 41.0 3.9 19.5 4.7
Head (calc.) 4000.0 100.0 0.28 0.30 0.32 0.28 1.51 100.0 100.0 100.0 100.0 100.0 (direct) 0.53 0.32 0.33 0.25
Combined Products 3rdCleaner Cone 2.28 7.54 4.80 13.1 7.17 27.0 60.4 36.2 93.2 58.9 40.8 2nd Cleaner Cone 3.05 5.93 4.02 9.9 5.88 26.3 63.5 40.5 94.0 64.6 53.2 1st Cleaner Cone 4.16 4.64 3.35 7.3 4.78 22.6 67.7 46.0 94.7 71.6 62.1 1st CI Conc+CI Sc Cone ! 4.82 4.13 3.00 6.3 4.25 22.1 69.9 47.8 94.9 73.9 70.5 Ro + Scav Cone i 11.38 2.11 1.57 2.7 1.96 12.7 84.4 59.0 96.1 80.5 95.3
Sample: Scav Tail
SGS Minerals Services Size Distribution Analysis
Test No.: V22
Project No. 10616-003
Size Weight % Retained % Passing Mesh jjm grams Individual Cumulative Cumulative
48 300 0.0 0.0 0.0 100.0 65 212 0.2 0.2 0.2 99.8 100 150 1.3 1.4 1.7 98.3 150 106 6.5 7.2 8.9 91.1 200 75 11.0 12.2 21.1 78.9 270 53 13.6 15.1 36.2 63.8 400 38 12.1 13.4 49.7 50.3 Pan -38 45.3 50.3 100.0 0.0
Total - 90.0 100.0 - -
K80 78
1 0 0
90 80 70 60
Î 50 i 40
OJ g 'co V) CD
Û .
TO Zi E Z3
O
30 20 10 0
10
Particle Size Distribution
100
Screen Size (micrometers)
i F • 1 i- i 1
1 -n i
r ! i 1 i
1 / 1 ' ; i : : i i i : j ! ' i :
m» ! 1 1
1 ! i ; : 1
•1 1 1
1 1 i
I i 1 !
! i i i i 1 1 i
' 1 ; 1 i i
MJO = 7 8 p m !
! i !
i i
1,000

Test No..- Vg Project No.: 10616-003 Operator: DL Date: 0 7 - 1 6 c t - 0 5
Purpose: To use the Locked cycle test conditions o f test F40 on the Variability sample SVMDC-5. Produce a Standard tail ing for Environmental testwork.
Procedure:
Feed:
Gr ind :
Condit ions:
Flotation was conducted as described below. A l l products were submitted for Pt, Pd, Cu, Ni, and S analyses.
2 X 2 kg o f minus 10 mesh SVMDC-5
30 minutes / 2 kg @ 65% solids in laboratory ball mi l l (BM-2). Rghr Tail Kjo ~ 75 urn
Stage Ca(OH), SIPX Reagents add(
3477 :d, grams per to
CMC inne
CUSO4 H2SG4 MIBC Tin
Grind [le, min Cond.
utes Froth PH
Grind 250 30 9.3
Rougher 1 0 10 10 1 2 9.2 Ro concentrate J kept separate to go direct to 1st cleaner feed NO REGRIND
Rougher 2 7.5 2.5 1 2 Rougher 3 5 2.5 5 I 4 Rougher 4 7.5 5 1 4 Rougher 5 2.5 2.5 5 1 4 8.1
Total 250 22.5 15.0 0.0 0.0 0.0 27.5
Stage Roughers Flotation Cell l O L D - 2 Speed: rpm 1400
Meta l lu rg ica l Balance
Product Weight Assays, £ 'A % Distr ibut ion
g % Pt ! Pd Cu N i S Pt Pd Cu Nl S Ro Cone 1 144.7 3.62 3.23 2.62 12.3 3.86 18.5 29.4 20.1 90.4 32.0 24.8 Ro Cone 2-5 411.8 10.30 2.05 1.82 0.30 2.30 14.9 53.2 39.7 6.3 54.3 56.8 Scavenger Tai l ing 3443.5 86.09 0.08 0.22 0.019 0.069 0.58 17.4 40.2 3.3 13.6 18.5
Head (calc.) 4000.0 100.0 0.40 0.47 0.49 0.44 2.70 100.0 100.0 100.0 100.0 100.0 (direct) 0.44 0.52 0.49 0.46
Combiaed Products Ro Cone 1 3.62 3,23 2.62 12.3 3.86 18.5 29.4 20.1 90.4 32.0 24.8 RoConc 1-5 i 13.91 2.36 2.03 3.4 2.71 15.8 82.6 59.8 96.7 86.4 81.5

Test No.: V24 Project No.: 10616-003 Operator: DL Date: 16-Nov-05
Purpose: To use the Locked cycle test conditions of test F40 on the Variability sample SVMDC-10. Produce a Standard tailing for Environmental testwork.
Procedure:
Feed:
Grind:
Conditions:
Flotation was conducted as described below. A l l products were submitted forPt, Pd, Cu, N i , and S analyses.
2 X 2 kg o f minus 10 mesh SVMDC-10.
30 minutes / 2 kg @ 65% solids in laboratory ball mi l l (BM-2). Rghr Tai l Kjo ~ 82 nm
Stage Ca(OH), SIPX Reagents add
3477 ed, grams per to
CMC nne
CuSO< H 2 S 0 ^ M I B C Tin
Grind ne, mini
Cond. 11 tes
Froth pH
Grind 250 30 9.3
Rougher 1 0 10 10 1 2 9.2 Ro concentrate / kept separate to go direct to 1st cleaner feed NO REGRIND
Rougher 2 7.5 2.5 1 2 Rougher 3 5 2.5 5 1 4 Rougher 4 7.5 5 1 4 Rougher 5 2.5 2.5 5 1 4 8.1
Total 250 22.5 15.0 0.0 0.0 0.0 27.5
Stage Roughers
Flotation Cel l 10 L D-2 Speed: rpm 1400
Metallurgical Balance
Product Weight Assays, g/t % Distribution g % Pt i Pd Cu Ni S Pt Pd Cu NI S
Ro Cone 1 164.3 4.11 1.44 j 2.38 11.6 2.79 16.8 12.2 17.2 88.6 24.6 26.6 Ro Cone 2-5 369.0 9.23 3.59 2.29 0.41 1 2.96 14.1 68.2 37.1 7.0 58.5 50.1 Scavenger Tai l ing 3466.7, 86.67 0.11
1 0.30 0.027 0.091 0.70 19.6 45.7 4.4 16.9 23.4
Head (calc.) 4000.0 100.0 0.49 0.57 0.54 0.47 2.60 100.0 100.0 100.0 100.0 100.0 (direct) 0.44 0.52 0.49 0.46
Combined Products Ro Cone 1 4.11 1.44 2.38 11.6 2.79 16.8 12.2 17.2 88.6 24.6 26.6 RoConc 1-5 1 13.33 2.93 2.32 3.9 2.91 14.9 S0.4 54.3 95.6 83.1 76.6

Test No.: V25 Project No.; 10616-003 Operator: DL Date: 22-Nov-05
Purpose: To repeat test VI but reduce the pH and modify the conditions slightly to improve on the Ni recovery.
Procedure:
Feed:
Grind:
Conditions:
Flotation was conducted as described below. All products were submitted for Pt, Pd, Cu, Ni, and S analyses.
2 kg of minus 10 mesh SVMLO-1
30 minutes / 2 kg @ 65% solids in laboratory ball mill (BM-2). Rghr Tail Kgo = 97 jim
Stage Ca(OH)2 SIPX Reagents addei
3477 d, grams per to
CMC mne
CuSO^ H2S04 MIBC Tir
Grind ne, mini Cond.
utes Froth pH
Grind 250 30 8.2
Rougher I 10 10 1 2 8.2 Ro concentrate 1 kept separate to go direct to 1st cleaner feed NO REGRIND
Rougher 2 7.5 2.5 1 2 7.5 Rougher 3 5 2.5 2.5 1 4 Rougher 4 7.5 5 1 4 Rougher 5 2.5 2.5 5 1 4
Final pH 7.3 Regrind feed is the Rougher Concentrate 2-5
Regrind P.M. I 75 | 2.5 50 8 1st Cleaner feed is the reground product plus the Rou gher Concentrate 1
1st Cleaner 1 3 7.9 1st Cleaner Scav 2.5 2.5 0 2.5 1 1 7.7
2nd Cleaner 2 0 2.5 1 3 8.7 3rd Cleaner 1 5 2.5 1 2.5 8.8
Total 325 28.0 20.0 5.0 50.0 0.0 32.5
Stage Roughers Cleaners Flotation Cell 10 L D-2 2L D-1 Speed: rpm 1400 1500
Metallurgical Balance
Product Weight Assays,%, g/t % Distribution
g % Pt Pd Cu Ni S Pt Pd Cu Ni S 3rd Cleaner Cone 150.6 7.63 n/a n/a 5.1 3.46 n/a n/a n/a 87.2 62.9 n/a 3rd Cleaner Tail 16.0 0.81 n/a n/a 1.29 1.58 n/a n/a n/a 2.3 3.1 n/a 2nd Cleanr Tail 23.0 1.17 n/a n/a 0.48 0.91 n/a n/a n/a 1.2 2.5 n/a 1st Clnr Scav Cone 50.7 2.57 n/a n/a 0.30 1.21 n/a n/a n/a 1.7 7.4 n/a 1st CI Scav Tail 174.6 8.85 n/a n/a 0.210 0.52 n/a n/a n/a 4.1 11.0 n/a Scavenger Tailing 1558.0 78.97 n/a n/a 0.019 0.07 n/a n/a n/a 3.3 13.2 n/a
Head (calc.) 1972.9 lOO.O n/a n/a 0.45 0.42 n/a n/a n/a 100.0 100.0 n/a (direct) 1 0.55 0.30 0.44 0.43
Combined Products 3rdCleaner Cone 7.63 n/a n/a 5.1 3.46 n/a n/a n/a 87.2 62.9 n/a 2nd Cleaner Cone 8.44 n/a n/a 4.8 3.28 n/a n/a n/a 89.6 65.9 n/a 1st Cleaner Cone 9.61 n/a n/a 4.2 2.99 n/a n/a n/a 90.8 68.5 n/a 1st CI Conc+ CI Sc Cone 12.18 n/a n/a 3.4 2.62 n/a n/a n/a 92.5 75.9 n/a Ro Cone 21.03 n/a n/a 2.1 1.73 n/a n/a n/a 96.7 86.8 n/a

Test No.: V26 Project No.: 10616-003 Operator . DL Date: 22-N0V-O5
Purpose; To repeat test V9 but reduce the pH and modify the conditions slightly to improve on the Ni recovery.
Procedure:
Feed:
Grind:
Conditions:
Flotation was conducted as described below. All products were submitted for Pt, Pd, Cu, Ni, and S analyses.
2 kg of minus 10 mesh SVMLO-4
30 minutes / 2 kg @ 65% solids in laboratory ball mill (BM-2). Rghi- Tail Kjo = 94 nm
Stage Ca(0H)2 S IPX Reagents add
3477 :d, grams per I
CMC ;onne
CuSO, H2S04 MIBC Tir
Grind ne, min Cond.
utes Froth pH
Grind 250 30 7.5
Rougher 1 5 10 10 1 2 7.5 Ro concentrate 1 kept separate to go direct to 1st cleaner feed NO REG BIND
Rougher 2 7.5 2.5 1 2 7.4 Rougher 3 5 2.5 5 1 4 Rougher 4 7.5 2.5 5 1 4 Rougher 5 5 5 5 1 4 Rougher 6 10
Final pH 7.4 Regrindfeed is the Rougher Concentrate 2-5
Reerind P.M. I 50 ( 5 50 8 1st Cleaner feed is the reground product plus the Rougher Concentrate 1
1st Cleaner 2.5 1 4 7.8 1st Cleaner Scav 2.5 2.5 0 2.5 1 1.5 7.7
2nd Cleaner 2.5 0 5 1 3 8.7 3rd Cleaner 2.5 5 2.5 1 2.5 8.8
Total 300 47.5 27.5 5.0 50.0 0.0 40.0
Stage Roughers Cleaners Flotation Cell lOLD-2 2L D-1 Speed; tpm 1400 1500
Lots of slow floating middlings at end of rougher Ni veiy sluggish in the cleaners
Metallurgical Balance
Product Weight Assays,%,g/t % Distribution S % Pt i Pd 1 Cu 1 Ni 1 S Pt 1 Pd 1 Cu 1 Ni 1 S
3rd Cleaner Cone 89.2 4.49 n/a n/a 7.9 4.39 n/a n/a n/a 90.8 66.2 n/a 3rd Cleaner Tail 13.1 0.66 n/a n/a 1.08 1.34 n/a n/a n/a 1.8 3.0 n/a 2nd Cleanr Tail 22.7 1.14 n/a n/a 0.44 0.68 n/a n/a n/a 1.3 2.6 n/a 1st Cliir Scav Cone 19.0 0.96 n/a n/a 0.38 0.87 n/a n/a n/a 0.9 2.8 n/a 1st CI Scav Tail 138.2 6.95 n/a n/a 0.076 0.20 n/a n/a n/a 1.4 4.7 n/a Scavenger Tailing 1705.0 85.80 n/a n/a 0.017 0.07 n/a n/a n/a 3.7 20.8 n/a
Head (calc.) 1987.2 100.0 n/a n/a 0.39 0.30 n/a n/a n/a 100.0 100.0 n/a (direct) 0.51 0.49 0.40 0.30
Combined Products 3rdCleaner Cone 4.49 n/a n/a 7.9 4.39 n/a n/a n/a 90.8 66.2 n/a 2nd Cleaner Cone 5.15 n/a n/a 7.0 4.00 n/a n/a n/a 92.7 69.2 n/a 1st Cleaner Cone 6.29 n/a n/a 5.8 3.40 n/a n/a n/a 94.0 71.8 n/a 1st CI Cone+ CI Sc Cone 7.25 n/a n/a 5.1 3.06 n/a n/a n/a 94.9 74.6 n/a Ro Cone 14.20 n/a n/a 2.6 1.66 n/a n/a n/a 96.3 79.2 n/a

Test No.: V27 Project No.: 10616-003 Operator. DL Date: 22-N0V-O5
Purpose: To repeat test V9 but reduce the pH and modify the conditions slightly to improve on the Ni recovery.
Procedure:
Feed:
Grind:
Flotation was conducted as described below. Al! products were submitted for Pt, Pd, Cu, Ni, and S analyses.
2 kg of minus 10 mesh SVMLO-6
30 minutes / 2 kg @ 65% solids in laboratory ball mill (BM-2). Rghr Tail Kgo = 93 nm
Stage Ca(0H)2 SIPX Reagents add(
3477 ;d, grams per t
CMC onne
CUSO4 H2S04 MIBC Tir
Grind ne, min Cond.
utes Froth pH
Grind 250 30 7.3
Rougher 1 5 15 10 1 2 7.3 Ro concentrate I kepi separate to go direct to Jst cleaner feed NO REGRIHD
Rougher 2 7.5 5 1 2 7.3 Rougher 3 5 2.5 5 1 4 Rougher 4 7.5 0 DF250 5 1 4 Rougher 5 5 5 2.5 5 1 4
Final pH 7.3 Regrindfeed is the Rougher Concentrate 2-5
RegrindP.M. I 75 | 5 50 8 Jst Cleaner feed is the reground product plus the Rougher Concentrate I
1st Cleaner X 5 2.5 2.5 1 4 8.0 1st Cleaner Scav 2.5 2.5 0 2.5 1 1.5
2nd Cleaner X 0 10 5 1 3 8.2 3rd Cleaner X 1.25 5 2.5 1 2.5 8.5
Total 325 38.8 32.5 17.5 50.0 0.0 42.5
Stage Roughers Cleaners Flotation Cell lOLD-2 2LD-1 Speed: rpm 1400 1500
Ro 5 - Lots of silicates with fine sulfide inclusions
Metallurgical Balance
Product Weight Assays,%,g/t % Distribution 6 % Pt 1 Pd 1 Cu 1 NI 1 S Pt 1 Pd 1 Cu 1 Ni i S
3rd Cleaner Cone 247.6 12.43 n/a n/a 5.08 2.93 n/a n/a n/a 89.9 61.1 n/a 3rd Cleaner Tail 33.0 1.66 n/a n/a 0.93 1.80 n/a n/a n/a 2.2 5.0 n/a 2nd Cleaiff Tail 20.5 1.03 n/a n/a 0.72 1.11 n/a n/a n/a l . l 1.9 n/a 1 St Chir Scav Cone 128.3 6.44 n/a n/a 0.28 1.35 n/a n/a n/a 2.6 14.6 n/a 1st CI Scav Tail 135.3 6.79 n/a n/a 0.180 0.55 n/a n/a n/a 1.7 6.3 n/a Scavenger Tailing 1428.0 71.66 n/a n/a 0.025 0.09 n/a n/a n/a 2.6 11.1 n/a
Head (calc.) 1992.7 100.0 n/a n/a 0.70 0.60 n/a n/a n/a 100.0 100.0 n/a (direct) 0.23 0.26 0.74 0.67
Combined Products 3rdCleaner Cone 12.43 n/a n/a 5.1 2.93 n/a n/a n/a 89.9 61.1 n/a 2nd Cleaner Cone 14.08 n/a n/a 4.6 2.80 n/a n/a n/a 92.1 66.1 n/a 1st Cleaner Cone 15.11 n/a n/a 4.3 2.68 n/a n/a n/a 93.1 68.1 n/a 1st CI Conc+ CI Se Cone 21.55 n/a n/a 3.1 2.28 n/a n/a n/a 95.7 82.7 n/a Ro Cone 28.34 n/a n/a 2.4 1.87 n/a n/a n/a 97.4 88.9 n/a

Test No.: V28 Project No.: 10616-003 Opera to r . DL Date: 22-N0V-O5
Purpose: To repeat test V9 but reduce the pH and modify the conditions slightly to improve on the Ni recovery.
Procedure: Flotation was conducted as described below. All products were submitted for Pt, Pd, Cu, Ni, and S analyses.
Feed: 2 kg of minus 10 mesh SVMLO-7
Grind: 30 minutes / 2 kg @ 65% solids in laboratory ball mill (BM-2). Rghr Tail Kgo = 88 im
Stage Ca(OH)2 SIPX Reagents add<
3477 'A, grams per t
CMC onne
CUSO4 H2S04 MIBC Tin
Grind ne, min Cond.
utes Froth pH
Grind 250 30 8.1
Rougher 1 5 15 10 1 2 8.0 Ro concentrate 1 kept separate to go direct to 1st cleaner feed NO REGRIND
Rougher 2 7.5 5 1 2 7.9 Rougher 3 5 2,5 5 1 4 7.8 Rougher 4 7.5 0 DF250 5 1 4 Rougher 5 5 5 2.5 5 1 4
1 Final pH 7.8 Regrind feed is the Rougher Concentrate 2-5
Reerind P.M. i 25 | 2.5 50 8 1st Cleaner feed is the reground product plus the Rougher Concentrate 1
1st Cleaner X 2.5 2.5 2.5 1 4 7.8 1st Cleaner Scav 2.5 2.5 0 2.5 i 1.5
2nd Cleaner X 1.25 10 5 1 3 7.8 3rd Cleaner X 1.25 5 2.5 1 2.5 8.4
Total lis 37.5 30.0 17.5 50.0 0.0 42.5
Stage Roughers Cleaners Flotation Cell lOLD-2 2L D-1 Speed: rpm 1400 1500
Ro 5 - Lots of silicates with fine sulfide inclusions
Metallurgical Balance
Product Weight Assays,%,g/t % Distribution
S % Pt 1 Pd Cu Ni S Pt i Pd Cu Ni S 3rd Cleaner Cone 48.0 2.42 n/a n/a 8.42 6.32 n/a n/a n/a 80.8 55.2 n/a 3rd Cleaner Tail 16.5 0.83 n/a n/a 1.70 2.40 n/a n/a n/a 5.6 7.2 n/a 2nd Cleanr Tail 28.0 1.41 n/a n/a 0.59 1.03 n/a n/a n/a 3.3 5.2 n/a 1st Clnr Scav Cone 16.0 0.81 n/a n/a 0.57 1.14 n/a n/a n/a 1.8 3.3 n/a 1st CI Scav Tail 113.8 5.74 n/a n/a O.IIO 0.26 n/a n/a n/a 2.5 5.4 n/a Scavenger Tailing 1759.0 88.78 n/a n/a 0.017 0.07 n/a n/a n/a 6.0 23.7 n/a
Head (calc.) 19S1.3 100.0 n/a n/a 0.25 0.28 n/a n/a n/a 100.0 100.0 n/a (direct) i 0.25 0.29 i
Combined Products 3rdCleaner Cone 2.42 n/a n/a 8.4 6.32 n/a n/a n/a 80.8 55.2 n/a 2nd Cleaner Cone 3.26 n/a n/a 6.7 5.32 n/a n/a n/a 86.4 62.4 n/a 1st Cleaner Cone 4.67 n/a n/a 4.9 4.02 n/a n/a n/a 89.7 67.6 n/a 1st CI Cone+ CI Sc Cone 5.48 n/a n/a 4.2 3.59 n/a n/a n/a 91.5 70.9 n/a Ro Cone 11.22 n/a n/a 2.1 1.89 n/a n/a n/a 94.0 76.3 n/a

Test No.: V29 Project No.: 10616-003 Opera tor . DL Date: 22-N0V-O5
Purpose: To repeat test V9 but reduce the pH and modify the conditions slightly to improve on the Ni recovery.
Procedure:
Feed:
Grind:
Conditions:
Flotation was conducted as described below. All products were submitted for Pt, Pd, Cu, Ni, and S analyses.
2 kg of minus 10 mesh SVMLO-8
30 minutes / 2 kg @ 65% solids in laboratory ball mill (BM-2). Rghr Tail ICjo = 88 ^m
Stage Ca(OH)2 SIPX Reagents addf
3477 ;d, grams per t
CMC onne
CuSO^ H2S04 MIBC Tic
Grind ne, min Cond.
utes Froth pH
Grind 250 30 8.1
Rougher 1 5 10 10 1 2 8.0 Ro concentrate I kept separate to go direct to 1st cleaner feed NO REG RIND
Rougher 2 7.5 5 1 2 7.8 Rougher 3 5 2.5 5 1 4 7.7 Rougher 4 7.5 0 DF250 5 1 4 Rougher 5 5 5 2.5 5 1 4
Final pH 7.7 Regrind feed is the Rougher Concentrate 2-5
RegrindP.M. | 50 | 2.5 50 8 1st Cleaner feed is the reground product plus the Rougher Concentrate I
1st Cleaner A 2.5 2.5 2.5 1 4 8.3 1st Cleaner Scav 2.5 2.5 0 2.5 1 1.5
2nd Cleaner X 1.25 .0 2.5 1 3 8.5 3rd Cleaner X 1.25 5 2.5 1 2.5 9.0
Total 300 37.5 25.0 7.5 50.0 0.0 40.0
Stage Roughers Cleaners Flotation Cell lOLD-2 2L D-1 Speed; ipm 1400 1500
worst sample for fine inclusions of Sulphide in silicates left in the Rougher tails
Metallurgical Balance
Product Weight Assays,%, g/t % Distribution g % Pt i Pd 1 Cu 1 Ni 1 S Pt 1 Pd 1 Cu I Nl i S
3rd Cleaner Cone 72.9 3.67 n/a n/a 9.9 6.73 n/a n/a n/a 83.6 59.2 n/a 3rd Cleaner Tail 31.6 1 1.59 n/a n/a 1.26 2.06 n/a n/a n/a 4.6 7.8 n/a 2nd Cleanr Tail 32.2 1.62 n/a n/a 0.53 0.92 n/a n/a n/a 2.0 3.6 n/a 1st Clnr Scav Cone 27.4 1.38 n/a n/a 0.66 0.98 n/a n/a n/a 2.1 3.2 n/a 1st CI Scav Tail 128.2 6.45 n/a n/a 0.120 0.24 n/a n/a n/a 1.8 3.7 n/a Scavenger Tailing 1694.0 85.28 n/a n/a 0.030 0.11 n/a n/a n/a 5.9 22.5 n/a
Head (calc.) 1986.3 100.0 n/a n/a 0.43 0.42 n/a n/a n/a 100.0 100.0 n/a (direct) 0.44 0.42
Combined Products 3rdCleaner Cone 3.67 n/a n/a 9.9 6.73 n/a n/a n/a 83.6 59.2 n/a 2nd Cleaner Cone 5.26 n/a n/a 7.3 5.32 n/a n/a n/a 88.3 67.0 n/a 1st Cleaner Cone 6.88 n/a n/a 5.7 4.28 n/a n/a n/a 90.2 70.6 n/a 1st CI Conc+ CI So Cone 8.26 n/a n/a 4.9 3.73 n/a n/a n/a 92.3 73.8 n/a Ro Cone 14.72 n/a n/a 2.8 2.20 n/a n/a n/a 94.1 77.5 n/a

Test No..- Vg Project No.: 10616-003 Operator: DL Date: 0 7 - 2 3 c t - 0 5
Purpose:
Procedure:
Feed:
Grind:
Conditions:
To prepare approximately I kg of clcaner concentrate for Settling aud filtration tcstwork.
Flotation was conducted as described below. All products were submitted for Pt, Pd, Cu, Ni, and S analyses.
2 X 10 kg of minus 10 mesh SVMDC-Coraposite ore
42 minutes / 10 kg @ 65% solids in the i 0 kg laboratory ball mi l l . Rglir Tail Kj„ - 82 )im Grav Tail Kj,, - nm
Suge Ca(OH), SIPX Reagents adde<
3477 i, grams per ton
CMC ne
CuSO, H2S04 MIBC Tir
Grind ne, mini Cond.
ates Frolb pH
Grind 250 30 9.4
Rougber1 0 10 10 1 2 9.4 Ro concentrate 1 kepi separate lo go direct to 1st cleaner feed NO REGRIND
Rougher 2 7.5 2.5 1 2 9.2 Rougher 3 5 2.5 5 1 4 Rougher 4 7.5 5 1 4 7.8 Rougher S 2.5 2.5 5 1 4 7.8
The Ro Tails were densifled and placed in ihe Agilttir cell and the Scavenger was conducted as outlined Sacvengcr 10 5 5 1 3 7.6
20 2.5 2.5 1 10 10 2.5 50 100 2.5 1 5 7.4
FmalpH 7.4 Scav Cone Recrind R.M. 25
The Scav Cone was reground and placed in an agitated vessel where the Magnetics were removed by a magnet. the non magnetics were ireates on the Mozley mineral separator where 7 concentrates were remaverd and submitted for assay
Regrind feed is ihe Rougher Concentrate 2-5 Renind R.M. 1 50 | 2.5 50 15 9.8
1st Cleaner feed is the reground product plus the Rougher Concentrate 1 IstQeaner 50 1.25 1 " 7 9.7-9.1
1st Cleaner Scav 2.5 2.5 0 0 1 3 8.9 2nd Cleaner X 0 0 2.5 1 5 9.3
X 0.5 1 2
Total 350 66.3 30.0 0.0 100.0 100.0 40.0
Sta(te Roughcrs Scavenger lstand2adO Flotation Cell Agitair Agitair 4LD-1 Speed: tpm 1900 1900 1800
Metallursical Balance
Product Wei{ ;bt Assa. YS,g/t % Distribution
E % Pt Pd Au Cu Ni Fe Pt Pd Au ! ! Cu Ni Fe 2nd Cleaner Cone 1095.9 5.48 5.60 3.55 1.45 7.5 6.12 32.3 70.9 37.6 27.5 91.9 73.4 14.6 2nd Cleaur Tail 339.3 1.70 0.46 1.39 0.73 0.19 0.76 22.5 1.8 4.6 4.3 0.7 2.8 3.1 1st Chir Scav Cone 212.0 1.06 0.52 1.56 0.87 0 20 1.12 31.7 1.3 3.2 3.2 0.5 2.6 2.8 1st Clnr Scav Tail 589.0 2.95 0.15 0.72 0.41- 0.11 11.0 1.0 4.1 4.2 0.7 2.6 2.7 Grav Cone 1 1.2 0.01 76.00 9.67 50.10 3.22 3.18 38.9 1.1 0.1 1.0 0.0 0.0 0.0 Grav Cone 2 3.7 0.02 1.62 0.84 0.71 0.18 0.78 24.6 0.1 0.0 0.0 0.0 0.0 0.0 Grav Tail 606.0 3,03 1.20 1.18 1.13 0.14 0.34 12.4 8.4 6.9 11.9 0.9 2.3 3.1 L.I Mags 260.5 1.30 0.61 i 0.40 0.24 0.100 0.97 46.4 1.8 1.0 1.1 0.3 2.8 5.0 Scavenger Tailing 16892.4 84.46 0.07 1 0.26 0.16 0.026 0.073 9.85 13.7 42.5 46.8 4.9 13.5 68.7
Hea<i(calc.) 20000.0 100.0 0.433 0.517 0.289 0.45 0.46 12.1 100.0 100.0 100.0 100.0 100.0 100.0 (direct) 0.46 0.60 0.26 0.53 0.48
, ' i estimated - no assay available Combined Products 2ndCleanerConc 5.48 5.60 3.55 1.45 7.5 6.12 32.3 70.9 37.6 27.5 91.9 73.4 14.6 1st Cleaner Cone 7.18 4.38 3.04 1.28 5.8 4.85 30.0 72.7 42.2 31.8 92.6 76,2 17.8 1st a Conc+ CI Sc Cone 8.24 3.89 2.85 1.23 5.1 4.37 30.2 74.0 45.4 35.0 93.1 78.8 20,5 Rougher Cone 11.18 2.90 2.29 1.01 3.8 3.33 25.1 75.0 49.5 39.2 93.8 81,4 23,2 Rougher Cone + Grav Cone 1+2 11.21 2.94 2.29 1.04 3.8 3.32 25.2 76.1 49.6 40.3 93.9 81,5 23.3 Scav Cone 4.36 1.13 0.96 0.93 0.1 0.53 22.7 11.4 8.1 14.0 1.3 5.1 8.1 Ro + Scav Cone 15.54 2.41 1.91 0.99 2.7 2.54 24.4 86.3 57.5 53.2 95.1 86.5 31.3

Ursa Major Limited - Shakespeare - 10616-003 2 0
Appendix 2 QEMScan Data Sheets
SC^S M i n e r a i s S e r v i c e s

Sample Name SVMLO-1 SVMLO-2 SVMLO-3 SVMLO-4 Weight split 71,00 29.00 58.20 41,80 47.00 53.00 43.20 56.80
Fraction Name sinks floats sinks floats sinks floats sinks floats Fraction ID 1 2 1 2 1 2 1 2 Min Size (Microns) 20.00 38.00 38.00 20,00 38.00 20.00 38.00 20.00 Max Size (Microns) 38.00 53.00 53.00 38.00 53,00 38.00 53.00 38.00 Mass Size Distribution (%) 71.00 29.00 58.20 41.80 47.00 53.00 43.20 56.80 Volume Size Distribution (%) 100.00 100.00 100.00 100.00 100.00 100.00 100.00 100.00 Particle Size 65.31 106.16 108.96 181.72 71.81 88.14 121.23 44.40 Total Mass 71.00 29.00 58.20 41.80 47.00 53.00 43.20 56.80 Total Volume 100.00 100.00 100.00 100.00 100.00 100.00 100.00 100.00 S (QEMSCAN) 10.93 0.24 7.97 0.36 4.30 0.38 6.61 0.68 S (Chemical) 7.70 0.35 4.16 0.38 3.42 0.31 3.63 0.39 Co (QEMSCAN) 0.03 0.00 0.04 0.00 0.04 0.00 0.04 0.01 Ni (QEMSCAN) 0.59 0.06 0.75 0.03 0.61 0.11 0.78 0.17 Ni (Chemical) 0.58 0.09 0.79 0,12 0.52 0.14 0.54 0.12 Cu (QEMSCAN) 0.58 0.06 1.14 0.24 0.78 009 0.96 0.21 Cu (Chemical) 0.60 0.09 0.99 0.17 0.61 0.08 0.79 0.12
Sample Name SVMLO-1 SVMLO-2 SVMLO-3 SVMLO-4 Fraction Name sinks floats sinks floats sinks floats sinks floats Mineral Mass(%) Pendandite 1.13 0.13 1.73 0.04 1.49 0.18 1.90 0.40 Mineral Mass(%)
Ni-Arsenides 0.00 0,00 0.01 0.00 0.00 0.00 O.OO O.OO Cobaltite 0.01 0.00 0.00 0.00 0.01 0.00 0.00 0.00 Pyrrhotite 25.12 0.30 15.76 0.24 7.55 0.55 12.17 0.70 Cu-Sulphides 1.69 0.18 3.28 0.69 2.25 0.27 2.77 0.62 O t o sulphides/PGM 0.06 0.00 0.02 0.00 0.04 0.04 0.01 0.00 Fe/Ti/Cr-Oxides 2.93 0.41 1.92 0.87 1.58 0.92 2.25 0.56 Amphibole 35.10 5.29 47.11 6.87 42.13 23.57 43.99 14.14 Chlorite 5.88 3.93 5J5 15.58 14.72 22.04 7J1 22.77 Biotite/Phlog. 5.74 1.79 3.01 0.91 2.11 1.92 3.10 2.07 Micas 1.75 2.22 085 4.63 0.85 4.24 1.69 7.31 Epidote 2.60 3.31 4.29 3.77 11.70 4.04 11.42 5.90 Feldspar 5.84 42.47 5.05 55.46 6.40 19.32 9.00 27.94 Quartz 11.37 39.77 11.21 10.84 7.63 22.72 3.58 17.13 Accessories 0.76 0.18 0.49 0.09 1.54 0.20 0.81 0.45
100.00 100.00 100.00 100.00 100.00 100.00 100.00 100.00
Sample Name SVMLO-1 SVMLO-2 SVMLO-3 SVMLO-4 Fraction Name sinks floats sinks floats sinks floats sinks floats Mineral Volume(%) Fentlandite 0.91 0.13 1.34 0.04 1.11 0.14 . 1,44 0.33 Mineral Volume(%)
Ni-Anenides 0.00 0.00 ao i 0.00 0.00 0.00 0.00 0.00 Cobaltite 0.01 0.00 0.00 0.00 0.00 0.00 0,00 0.00 Pyntotite 20.80 0.31 12.62 0.23 5.82 0.46 9,35 0.58 Cu-Sulphides 1.57 0.21 2.95 0.73 1.95 0.25 2.43 0.59 Other sulphides/PGM 0.04 0.00 0.02 0.00 0.03 0.02 0.01 0.00 Fe/Ti/Cr-Oxides 2.50 0.48 1.64 0.93 1.25 0.84 1.77 0.49 Amphibole 40.91 7.66 53.89 9.21 46.71 28.17 49.23 17.09 Chlorite 6.88 5.74 5.95 20.76 16.23 26.30 8.19 27.55 Biotite/Phlog. 7.88 3.05 4.00 1.42 2.69 2.65 4.00 2.89 Micas 2.39 3.78 1.13 7.20 1,09 5.84 2.18 10.18 Epidote 2.89 4.58 4.61 4.77 12,12 4.53 11.97 6.68 Feldspar 4.23 38.26 3.54 45.74 4.33 14.11 6.15 20.63 Quartz 8.18 35.56 7.80 8.87 5,11 16.47 2.43 12.55 Accessories 0.82 0.24 0.49 0.10 1,57 0.22 0.85 0.44
Combined Minerai Name SVMLO-1 SVMLO-2 SVMLO-3 SVMLO-4 Content Pentlandite 0.68 0.80 0.60 0.81
Ni-Arsenides 0.00 0.00 0.00 0.00 Cobaltite 0.00 0.00 0.00 0.00 Pynhotite 14.86 7.44 2.98 4.37 Cu-Sulphides 1.18 2.02 1.05 1.38 Other sulphides/PGM 0.03 0.01 0.02 0,00 Fe/Ti/Cr-Oxides 1.91 1.34 1.03 1,04 Amphibole 3126 35.22 36.88 30.97 Chlorite 6.55 12.14 21.56 19,19 Biotite/Phlog. 6.48 2.92 2.67 3,37 Micas 2.7$ 3.67 3.60 6,72 Epidote 3.38 4.68 8.09 8,96 Feldspar 14.10 21.18 9.51 14,38 Quartz 16.12 8.25 11.13 8.18 Accessories 0.65 0.33 0.85 0.61

Sample Name SVMLO-1 SVMLO-2 SVMLO-3 SVMLO-4
Frsction Name sinks floats sinks floats sinks floats sinks floats Pentlandite 0.23 73% 0.27 87% 0.20 96% 0.28 93% Pyirhotite 0.09 28% 0.04 14% 0.02 8% 0.03 9% Silicates (estimated) 0.00 -1% 0.00 -2% -0.01 -4% -0.01 -2%
\irain Size Pentlandite 16.01 21.32 44.45 11.61 25.24 15.29 22.18 14.50 \ irain Size Ni-Arsenides 0.00 7.48 48.61 0.00 0.00 0.00 0.00 0.00 CobaWte 7.48 5.30 5.61 0.00 4.36 0.00 3.74 5.23 Pyrrhotite 15.67 53.46 60.13 8.22 43.02 16.56 41.08 10.84 Cu-Sulphides 18.70 44.04 74.02 20.26 73.16 17.83 34.56 16.92 Other sulphides/PGM 11.22 18.37 36.46 3.74 16.39 6.91 11.22 10.28 Fe/Ti/Cr-Oxides 5.35 12.05 9.53 5.35 12.00 6.02 18.67 7.32 Amphibole 27.79 44.96 69.27 17.03 55.32 33.76 54.67 18.54 Chlorite 18.43 15.37 23.50 46.11 32.57 33.78 18.71 28.36 Biotite/Phlog. 18.16 27.03 20.86 12.98 19.82 13.05 18.60 10.20 Micas 5.86 5.20 5.57 6.44 8.49 13.65 7.48 15.72 Epidote 6.23 12.06 23.50 7.59 28.10 8.50 20.28 7.24 Feldspar 31.44 14.25 13.31 31.37 10.72 20.04 10.05 17.36 Quartz 82.11 29.91 26.79 25.98 26.82 37.67 15.17 35.59 Accessories 18.48 20.40 14.78 5.44 29.54 11.22 20.65 14,74
Combioed Mineral Name SVMLO-1 SVMLO-2 SVMLO-3 SVMLO-4 Combioed Mineral Pendatulite 16.3 43.9 24.1 20.5 Ni-Arsenides 0.0 48.6 Cobaltite 7.4 5.6 4.4 5.0 Pyrrhotite 15.9 59.6 41.0 39.0 Cu-Sulphides 19.8 67.0 66.6 30.6 Other sulphides/PGM 11.4 35.6 11.4 10.8 Fe/Ti/Cr-Oxides 5.7 8.5 9.6 15.9 Amphibole 28.8 64.3 47.0 43.9 Chlorite 17.8 38.9 33.3 26.5 Biotile/Phlog. 19.2 19.5 16.4 14.7 Micas 5.6 6.3 12.9 14.5 Epidote 8.2 17.3 22.6 15.0 Feldspar 18.6 29.3 17.9 15.9 Quartz 51.4 26.5 35.2 32.8 Accessories 18.7 13.7 27.3 18.2

Sample Name SVMLO-S SVMLO-6 SVMLO-7 SVMLO-8 Sample Weight split 53.80 46.20 69.80 30.20 30.40 69.60 34.10 65.90
Fraction Name sinks floats sinks floats sinks floats sinks floats Fraction ID 1 2 1 2 1 2 1 2 Min Size (Microns) 38.00 20.00 38.00 20.00 38.00 20.00 38.00 20.00 Max Size (Microns) 53.00 38.00 53.00 38.00 53.00 38.00 53.00 38.00 Mass Size Distribution (%) 53.80 46.20 69.80 30.20 30.40 69.60 34.10 65.90 Volume Size Distribution (%) 100.00 100.00 100.00 100.00 100.00 100.00 100.00 100.00 Particle Size 92.76 55.33 57.17 76.12 75.50 53.28 82.46 46.89 Total Mass 53.80 46.20 69.80 30.20 30.40 139.20 34.10 65.90 Total Volume 100.00 100.00 100.00 100.00 100.00 200.00 100.00 100.00 S (QEMSCAN) 4.56 0.35 18.72 0.83 6.07 2.06 6.23 0.47 S (Chemical) 3.72 0.43 11.32 0.56 5.23 0.39 5.57 0.53 Co (QEMSCAN) 0.04 0.00 0.04 0.01 0.03 0.03 0.05 0.01 Ni (QEMSCAN) 0.65 0.09 0.95 0.22 0.65 0.48 0.83 0.14 Ni (Chemical) 0.65 0.13 0.88 0.16 0.61 0.15 0.85 0.18 Cu (QEMSCAN) 0.71 0.14 0.64 0.27 0.69 0.69 0.71 0.11 Cu (Chemical) 0.74 0.13 0.87 0.14 0.72 0.09 0.95 0.16
Sample Fraction
Name SVMLO-5 SVMLO-6 SVMLO-7 SVMLO-8 Sample Fraction Name sinks floats sinks floats sinks floats sinks floats
Mineral Mass(%) Pentlandite 1.64 0.17 1.93 0.60 1.52 1.21 1.86 0.29 Mineral Mass(%) Ni-Arsenides 0.00 0.00 0.00 0.00 0.02 0.00 0.16 0.00 Cobaltite 0.00 0.00 0.02 0.00 0.00 0.00 0.01 0.00 Pyirhotite 8.18 0.32 44.00 0.79 11.98 1.35 12.25 0.63 Cu-Sulphides 2.04 0.41 1.86 0.79 1.99 2.00 2.04 0.33 Other sulphides/PGM 0.00 0.00 0.08 0.00 0.02 0.00 0.04 0.01 Fe/Ti/Cr-Oxides 1.63 0,48 2.67 1.34 2.21 1.01 3.14 0.50 Amphibole 37.28 13.03 20.18 9.11 31.31 28.36 44,63 18.30 Chlorite 10.71 19.89 5.08 9.42 7.97 44.75 7.71 23.77 Biotite/Phlog. 0.53 0.99 4.84 3.50 2.06 3.98 1,13 1.52 Micas 1.35 3.26 1.74 2.06 0.75 3.54 0,62 1.05 Epidote 15.33 5.89 2.67 4.07 20.41 14.93 9.87 7.45 Feldspar 12.57 36.42 5.93 29.82 12.23 48.71 9.54 27.70 (Juartz 7.60 18.79 8.58 37.94 5.90 46.73 5.25 1781 Accessories 1.11 0.34 0.42 0.54 1.64 3.43 1.76 0.62
100.00 100.00 100.00 100.00 100.00 200.00 100.00 100.00
Sample Fraction
Name SVMLO-S SVMLO-6 SVMLO-7 SVMLO-8 Sample Fraction Name sinks floats sinks floats sinks floats sinks floats
' !neralVolume(%) Pentlandite 1.27 0.15 1.64 0.56 1.19 1.02 1.44 0.24 ' !neralVolume(%) Nî-Aisenides 0.00 0.00 0.00 0.00 0.01 0.00 0.07 0.00 Cobaltite 0.00 0.00 0.01 0.00 0,00 0.00 0.00 0.00 Pyrrhotite 6.52 0.29 38.53 0.76 9.54 1.15 9.70 0,53 Cu-Sulphides 1.83 0.41 1.82 0.85 1.79 1.96 1.82 0.32 Other sulphides/PGM 0.00 0.00 0.06 0.00 0.02 0.00 0.03 0,01 FeTTi/Cr-Oxides 1.33 0.46 2.53 1.34 1.83 0.93 2.50 0.45 Amphibole 42.76 16.69 24.90 12.31 36.09 35.31 50.82 22.47 Chlorite 12.15 25.21 6.28 12.77 9.21 55.87 8.70 28.94 Biotite/Phlog. 0.71 1.46 7.02 5.56 2.74 5.73 1.49 2.16 Micas 1.78 4.81 2.51 3.27 1.00 5.07 0.82 1.49 Epidote 16.46 7.07 3.13 5.25 22.05 17.42 10.53 8.59 Feldspar 8.80 28.49 4.55 25.05 8.61 37.05 6.63 20,81 Quartz 5.28 14.59 6.53 31.63 4.12 35.28 3.62 13,28 Accessories 1.10 0.38 0.49 0.64 1.79 3.21 1.83 0,70

Combined Mineral Content
Name SVMLO-S SVMLO-6 SVMLO-7 SVMLO-8 Pentlandite 0.76 1.32 1.07 0.65 Ni-Aiscnides 0.00 0.00 0.00 0.03 Cobaltite 0.00 0.01 0.00 0.00 Pyrrhotite 3.64 27.12 3.70 3.66 Cu-Sulphides 1.18 1.53 1.91 0.83
Other sulphides/PGM 0.00 0.04 0.01 0.02 Fe/Ti/Cr-Oxides 0.92 2.17 1.20 1.15 Amphibole 30.72 21.10 35.54 32.14 Chlorite 18.18 8.24 41.69 22.04 Biotite/Phlog. 1.05 6.58 4.82 1.93 Micas 3.18 2.74 3.84 1.26 Epidote 12.12 3.77 18.83 9.25 Feldspar 17.90 10.74 28.41 15.98 Quartz 9.58 14.11 25.81 9.99 Accessories 0.77 0.53 2.78 1.09
Sample Name SVMLO-S SVMLO-fi SVMLO-7 SVMLO-8
Fraction Name sinks floats sinks floats sinks floats sinks floats Fraction Pentlandite 0.26 95% 0.45 74% 0.36 96% 0.22 95% Pyrrhotite 0.02 8% 0.16 27% 0.02 6% 0.02 9% Silicates (estimated) -0.01 -3% 0.00 0% -0.01 -1% -0.01 -4%
Grain Size Pentlandite 32.16 11.19 23.81 18.77 25.02 15.67 16.65 10.75 Grain Size Ni-Arsenides 5.61 3.74 7.48 0.00 36.15 0.00 22.88 11.22 Cobaltite 3.74 3.74 4.67 4.49 3.74 0.00 3.74 0.00 Pyrrhotite 47.08 13.15 43.48 14.12 35.21 11.46 39.92 15.60 Cu-Sulphides 34.52 16.50 38.46 23.12 61.85 19.83 42.23 13.17 Other sulphides/PGM 3.74 7.48 18.95 22.44 16.20 3.74 12.76 6.23 FeTTi/Cr-Oxides 12.32 5.59 8.42 9.95 13.58 6.48 20.84 6.38 Amphibole 47.63 25.49 37.85 25.52 51.18 25.48 58.67 22.76 Chlorite 33.90 34.67 14.32 22.52 22.38 30.23 27.73 30.52 Biotite/Phlog. 8.74 10.40 27.08 19.71 19.54 14.82 13.19 12.32 Micas 6.17 9.35 5.31 5.65 5.94 7.13 5.22 5.19 Epidote 22.34 8.47 14.18 7.86 31.50 10.13 20.68 7.12 Feldspar 11.47 22.84 19.55 26.00 13.84 20.41 15.12 17.88 Quartz 24.34 39^1 36.15 66.53 26.83 44.61 24.21 36.84 Accessories 23.15 14.70 18.13 23.69 40.91 15.94 28.06 19.82
Combined mineral Name SVMLO-5 SVMLO-6 SVMLO-7 SVMLO-8 Pentlandite 30.4 23.2 19.0 15.3 Ni-Arsenides 5.3 7.5 36.1 22.7 Cobaltite 3.7 4.7 3.7 3.7 Pyrrhotite 46.0 43.3 30.4 37.7 Cu-Sulphides 31.9 36.1 32.5 35.3 Other sulphides/PGM 6.2 19.0 14.7 10.3 Fe/Ti/Cr-Oxides n . o 8.7 9.9 17.4 Amphibole 42.5 35.8 33.8 42.8 Chlorite 34.4 18.0 29.7 30.1 Biotite/Phlog. 9.8 25.3 15.7 12.6 Micas 8.3 5.4 7.0 5.2 Epidote 18.9 11.7 18.1 12.6 Feldspar 19.6 24.0 19.8 17.5 Quartz 34.4 56.1 43.7 35.2
21.4 20.1 20.3 24.7

Sample Name SVMDC-1 S V M D C - 2 SVMDC-3 Sample Weight split 44.10 55.90 48.30 51.70 42.40 57.60
Fract ion Name sinks floats sinks floats sinks floats ID 1 2 1 2 I 2 M i n Size (Microns) 38.00 20.00 38.00 20.00 38.00 20.00 Max Size (Microns) 53.00 38.00 53.00 38.00 53.00 38.00 Mass Size Distribution (%) 44.10 55.90 48.30 51.70 42.40 57.60 Volume Size Distribution (%) 100.00 100.00 100.00 100.00 100.00 100.00 Particle Size 62.34 33.44 59.84 43.45 93.03 62.23 Total Mass 44.10 55.90 48.30 51.70 42.40 57.60 Total Volume 100.00 100.00 100.00 100.00 100.00 100.00 S (QEMSCAN) 5.81 0.76 5.83 0.60 6.68 0.41 S (Chemical) 5.29 0.71 4.62 0.54 5.65 0.53 Co (QEMSCAN) 0.06 0.01 0.06 0.01 0.06 0.01 N i (QEMSCAN) 1.02 0.19 0.98 0.18 1.06 0.10 N i (Chemical) 0.85 0.22 0.80 0.16 0.80 0.14 Cu (QEMSCAN) 0.75 0.29 0.90 0.20 0.94 0.14 Cu (Chemical) 1.05 0.23 0.82 0.20 0.97 0.17
Sample Name SVMDC-1 S V M D C - 2 SVMDC-3 Fract ioa Name sinks floats sinks floats sinks floats M ine ra l Mass(%) Pentlandite 2.29 0.47 2.56 0.44 2.18 0.21
Ni-Arsenides 0.27 0.00 0.00 0.00 0.42 0.00 Cobaltite 0.02 0.00 0.00 0.00 0.03 0.00 Pyrrhotite 10.40 0.71 9.91 0.56 12.22 0.46 Cu-Sulphidcs 2.18 0.85 2.59 0.58 2.71 0.42 Other sulphides/PGM 0.01 0.01 0.02 0.00 0.02 0.01 FesTi/Cr-Oxides 1.56 0.49 1.55 0.48 2.26 0.36 Amphibole 43.91 14,30 40.89 11.92 44.71 9.87 Chlorite 9.75 24.08 10.68 22.16 10.04 21.80 Biotite/Phlog. 0.18 0.36 0.40 0.48 3.67 1.88 Micas 0.51 1.54 0.55 2.28 0.59 3,03 Epidote 12.01 6.42 11.62 6.21 7,30 4.09 Feldspar 9.73 34.90 10.40 38.31 6.61 32.91 Quartz 6.42 15.58 7.90 16.05 5,73 24.76 Accessories 0.76 0.27 0.93 0.52 1.51 0.22
100.00 100.00 100.00 100.00 100.00 100.00
aple Name SVMDC-1 S V M D C - 2 SVMDC-3 ^ ract ion Name sinks floats sinks floats sinks floats M ine ra l Volume(%) Pentlandite 1.76 0.40 1.98 0.38 1.65 0.18
Ni-Arsenides 0.13 0.00 0.00 0.00 0.19 0.00 Cobaltite 0.01 0,00 0.00 0.00 0.02 0.00 PyiAot i te 8.12 0.61 7.79 0.49 9.43 0.40 Cu-Sulphides 1.94 0.84 2.33 0.58 2.38 0.42 Other sulphides/PGM 0.01 0.01 0.02 0.00 0.02 0.00 Fe/Ti/Cr-Oxides 1.28 0,46 1.26 0.46 1.78 0.35 Amphibole 50.01 18.01 46.92 15.26 50.11 12.71 Chlorite 11.06 30,28 12.19 28.31 11.29 28.22 Biotite/Phlog. 0.24 0.53 0.53 0.71 4.75 2.80 Micas 0.67 2.24 0.73 3.36 0.76 4.49 Epidote 12.81 7.58 12.47 7.45 7.66 4.94 Feldspar 6.76 26.85 7.27 29.95 4.52 25.89 Quartz 4.43 11.90 5.48 12.45 3.90 19.33 Accessories 0.77 0.30 1.02 0.60 1.53 0.26

Combined Minera i Name S V M D C - I SVMDC-2 SVMDC-3 Content Pentlandite 1.00 1.15 0.80
Ni-Aiseaides 0.06 0.00 0.08 Cobaltite 0,01 0.00 0.01 Pyrrhotite 3.92 4.02 4.23 Cu-Sulphides 1.33 1.42 1.25 Other sulphides/PGM 0.01 0.01 0.01 Fe/Ti/Cr-Oxides 0.82 0.85 0.96 Amphibole 32.12 30.55 28.57 Chlorite 21.80 20.52 21.04 Biotite/Phlog. 0.40 0.63 3.63 Micas 1.55 2.09 2.91 Epidote 9.88 9.87 6.09 Feldspar 17.99 19.00 16.83 Quartz 8.60 9.09 12.79 Accessories 0.51 0.81 0.80
Sample Name SVMDC-1 SVMDC-2 SVMDC-3 Fract ion Name sinks floats sinks floats sinks floats
Pentlandite 0.34 70% 0.39 74% 0.27 70% Pynhotite 0.08 16% 0.08 15% 0.08 22% Silicates (estimated) 0.07 13% 0.06 11% 0.03
Gra in Size Pentlandite 21.05 11.65 40.86 13.17 38.75 1 8 . ^ Ni-Arsenides 38.50 3.74 0.00 0.00 31.13 3.74 Cobaltite 4.39 3.74 4.99 3.74 4.81 3.74 Pyrrhotite 33.69 10.18 39.09 10.00 51.35 15.31 Cu-Sulphides 35.24 13.82 38.26 14.94 57.10 18.09 Other sulphides/PGM 3.74 10.54 10.80 6.23 14.96 7.48 Fe/Ti/Cr-Oxides 12.51 6.68 12.85 6.50 22.43 6.58 Amphibole 51.51 17.70 48.81 19.13 68.29 23.53 Chlorite 22.91 25.22 25.66 30.44 27.72 37.62 Biotite/Phlog. 8.36 8.74 10.11 8.98 23.26 14.15 Micas 5.28 7.35 5.48 9.28 6.69 11.61 Epidote 24.54 7.55 24.57 8.03 23.69 6.74 Feldspar 14.38 22.81 15.05 27.13 14.99 27.83 Quartz 21.61 33.56 25.20 36.18 27.37 57.93 Accessories 18.01 12.18 22.63 16.42 35.14 18.87
nbined Minera l Name SVMDC-1 SVMDC-2 SVMDC-3 Pentlandite 19.1 36.6 36.4 Ni-Aisenides 38.3 30.9 Cobaltite 4.3 4.7 4.8 Pyrrhotite 31.8 37.4 49.6 Cu-Sulphides 28.1 33.8 50.4 Other sulphides/PGM 8.0 9.9 13.0 Fe/Ti/Cr-Oxides 10.9 11.3 19.6 Amphibole 41.6 41.7 58.0 Chlorite 24.7 29.0 35.1 Biotite/Phlog. 8.6 9.5 19.5 Micas 6.9 8.6 11.0 Epidote 17.7 18.5 16.4 Feldspar 21.3 24.7 26.2 Quartz 30.6 32.7 53.5 Accessories 16.2 20.3 32.5
Sample Name SVMDC-4 SVMDC-S SVMDC-6 S\'MDC-7 Sample Weight split 40.10 59.90 33.90 66.10 60.20 39.80 55.80 44.20
Fraction Name sinks floats sinks floats sinks floats sinks floats Fraction ID 1 2 1 2 1 2 1 2 Min Size (Microns) 38.00 20.00 38.00 20.00 38.00 20.00 38.00 20.00 Max Size (Microns) 53.00 38.00 53.00 38.00 53.00 38.00 53.00 38.00 Mass Size Distribution (%) 40.10 59.90 33.90 66.10 60.20 39.80 44.20 55.80 Volume Size Distribution (%) 100.00 100.00 100.00 100.00 100.00 100.00 100.00 100.00 Particle Size 46.38 48.65 89.85 50.21 73.44 99.01 58.47 56.98 Total Mass 80.20 59.90 33.90 66.10 60.20 39.80 44.20 55.80 Total Volume 200.00 100.00 100.00 100.00 100.00 100.00 100.00 100.00 S (QEMSCAN) 12.46 0.50 7.76 0.70 3.05 8.77 0.44 0.31 S (Chemical) 5.29 0.55 7.24 0.51 3.31 0.35 6.57 0.57 Co (QEMSCAN) 0.10 0.01 0.07 0.01 0.02 0.06 0.01 0.00 Ni (QEMSCAN) 1.64 0.16 1.05 0.17 0.40 0.94 0.12 0.09 Ni (Chemical) 0.89 0.17 0.96 0.16 0.54 0.09 0.56 0.40 Cu (QEMSCAN) 1.18 0.19 1.04 0.16 1.00 0.46 0.15 0.08 Cu (Chemical) 0.48 0.18 0.93 0.19 0.14 0.61 0.87 0.21
Sample Fraction
Name SVMDC-4 SVMDC-5 SVMDC-6 SVMDC-7 Sample Fraction Name sinks floats sinks floats sinks floats sinks floats
Mineral Mas$(%) Pentlandite 2.01 0.35 2.59 0.39 2.17 0.87 0.25 0.20 Mineral Mas$(%) Ni-Arsenides 0.00 0.00 0.03 0.00 0.09 0.03 0.00 0.00 Cobaltite 0.01 0.00 0.00 0.00 0.00 0.00 O.OO 0.00 Pyrrhotite 10.60 0.39 14.70 0.95 17.65 5.76 0.46 0.39 Cu-Sulphides 3.40 0.54 2.99 0.48 2,89 1.33 0.44 0.22 Other sulphides/PGM 0.03 0.04 0.02 0.00 0.01 0.00 0.00 0.01 FeA"i/Cr-Oxides 1.66 0.59 2.28 0.46 1,51 1.61 0.37 0.47 Ançhibole 50.56 15.14 40.96 13.50 38,06 36.94 10.27 6.69 Chlorite 7.83 24.67 6.12 24.18 8.96 16.05 24.15 13.13 Biotitfi/Phlog. 4.54 2.80 3.53 2.49 4.38 3.36 2.44 1.73 Micas 0.55 1.66 0.67 2.03 0.51 0.67 1.46 1.93 Epidote 7,12 4.45 11.27 5.58 10.07 12.67 4.08 3.76 Feldspar 4.88 26.74 7.06 24.27 7.81 8.42 31.20 31.67 Quartz 5.21 22.01 6.26 25.10 5.02 11.17 24.52 37.98 Accessories 1.60 0.62 1.51 0.58 0.86 1.11 0.36 1.83
100.00 100.00 100.00 100.00 100.00 100.00 100.00 100.00
Sample Fraction
Name SVMDC-4 SVMDC-5 SVMDC-6 SVMDC-7 Sample Fraction Name sinks floats sinks floats sinks floats sinks floats Mineral Volume(%) Pentlandite 2.99 0.30 1.99 0.33 1.67 0.66 0.21 0.19 Mineral Volume(%)
Ni-Arsenides 0.00 0.00 0.02 0.00 0.04 0.01 0.00 0.00 Cobaltite 0.01 0.00 0.00 0.00 0.00 0.00 0.00 0.00 Pyrrhotite 15.95 0.33 11.62 0.82 13.95 4.50 0.41 0.37 Cu-Sulphides 5.86 0.52 2.66 0.46 2.58 1.17 0.44 0.24 Other sulphides/PGM 0.03 0.03 0.01 0.00 0.01 0.00 0.00 0.01 Fe/ti/Cr-Oxides 2.53 0.53 1.81 0.42 1.20 1.29 0.36 0.49 Amphibole 111.10 18.75 46.54 16.75 43.32 41.34 13.13 9.16 Chlorite 17.19 30.50 7.01 30.27 10.25 17.88 31.10 17.97 Biotite/Thlog. 11.53 4.01 4.64 3.57 5.76 4.36 3.60 2.74 Micas 1.40 2.36 0.88 2.90 0.67 0.86 2.15 3.05 Epidote 14.65 5.17 12.01 6.49 10.73 13.33 4.88 4.83 Feldspar 6.54 20.22 4.90 18.40 5.42 5.78 24.33 26.54 Quartz 6.93 16.51 4.32 18.89 3.46 7.61 18.98 31.59 Accessories 3.29 0.76 1.58 0.70 0.94 1.20 0.41 2.83

Combined Mineral Name SVMDC-4 SVMDC-S SVMDC-6 SVMDC-7 Content Pentlandite 1.38 0.89 1.27 0-20 Content
Ni-Arscnidcs 0.00 0.01 0.03 0.00 Cobaltite 0.00 0.00 0.00 0.00 Pyirhotitc 6.60 4.48 10.19 0.39 Cu-Sulpbides 2.66 !.21 2.02 0.35 Other sulphidcs/PGM 0.03 0.01 0.01 0.00 Fe/Ti/Cr-Oxides 1.33 0.89 1.24 0.42 Amphibole 55.79 26.85 42.53 11.37 Chlorite 25.16 22.39 13.29 25.30 Biotite/Phlog. 7.02 3.93 5.20 3.22 Micas 1.98 2.21 0.75 2.55 Epidote 8.97 8.36 11.77 4.85 Feldspar 14.74 13.82 5.56 25.31 Quartz 12.67 13.95 5.11 24.56 Accessoiies 1.77 1.00 1.04 1.48
Sample Name SVMDC-4 SVMDC-5 SVMDC-< SVMDC-7 Fraction Name sinks floats sinks floats sinks floats sinks floats Fraction
Pentlandite 0.47 69% 0.30 70% 0.43 61% 0.07 6% Pyrrhotite 0.13 19% 0.09 21% 0.20 29% 0.01 1% Silicates {estimated) 0.08 J2% 0.04 9% 0.07 10% 0.98 9_3%
Grain Siie Pentlandite 16.11 13.25 46.54 11.90 28.15 40.62 9.88 Grain Siie Ni-Arsenides 0.00 18.70 20.10 6.23 28.98 27.42 5.61 0.00 Cobaltite 4.53 7.48 4.67 O.OO 0.00 3.74 0.00 0.00 Pyrrhotite 31.13 9.94 52.17 17.98 40.63 59.38 11.07 12.44 Cu-Sulphides 39.09 17.60 66.90 16.79 46.10 63.10 15.62 14.82 Other sulphides/PGM 13.12 29.91 7.28 3.74 5.23 9.72 3.74 6.41 Fe/Ti/Cr-Oxides 14.91 7.02 19.26 5.95 11.06 17.94 5.57 5.47 Amphibole 42.58 23.11 65.66 23.34 50.29 68.79 23.78 17.34 Chlorite 19.71 32.23 20.64 31.94 32.78 25.26 34.33 26.25 Biotite/Phlog. 20.07 13.90 23.21 13.75 19.16 2151 13.96 14.57 Micas 5.34 7.21 6.47 8.55 5.63 5.99 7.06 7.85 Epidote 24.04 6.57 28.93 7.80 27.77 28.68 8.24 8.54 Feldspar 11.58 21.91 12.57 19.42 12.31 15.17 30.59 30.00 Quartz 20.18 42.55 27.97 47.40 27.05 29.46 54.43 65.52 Accessories 29.57 24.70 34.24 20.09 22.95 34.15 13.91 36.47
Combined Mineral Name SVMDC-4 SVMDC-5 SVMDC-6 SVMDC-7 Pentlandite 23.9 38.6 30.8 9.7 Ni-Aisenides 18.7 17.5 28.7 5.6 Cobaltite 5.2 4.7 0.0 Pynhotite 30.0 48.3 44.0 11.6 Cu-Sulphides 35.0 55.0 50.1 15.4 Other sulphides/PGM 24.5 6.8 6.1 5.5 FoTi/Cr-Oxides 12.2 15.5 13.9 5.5 Amphibole 36.6 49.1 57.5 21.6 Chlorite 30.0 30.6 28.7 31.9 Biotite/Phlog. 17.1 17.7 20.3 14.2 Micas 6.9 8.2 5.8 7.5 Epidote 15.6 18.6 28.2 8.4 Feldspar 20.8 18.5 13.5 30.3 QuaiU 39.5 45.2 28.5 60.5 Accessoiies 27.8 28.2 28.1 32.0

Sample Name SVMDC-8 SVMDC-9 SVMDC-IO SVMDC-11 Sample Weight split 55.30 44.70 48.40 51.60 36.00 64.00 38.30 61.70
FracdOD Name sinks floats sinks floats sinks floats sinks floats FracdOD ID 1 2 1 2 1 2 1 2 Min Size (Microns) 38.00 20.00 38.00 20.00 38.00 20.00 38.00 20.00 Max Sise (Microns) 53.00 38.00 53.00 38.00 53.00 38.00 53.00 38.00 Mass Size Distribution (%) 55.30 44.70 48.40 51.60 36.00 64.00 38.30 61.70 Volume Size Distribution (%) 100.00 lOO.OO 100.00 100.00 100.00 100.00 100.00 100.00 Particle Size 92.23 90.18 66.87 61.83 87.45 54.88 81.92 60.10 Total Mass 55.30 44.70 48.40 51.60 36.00 64.00 38.30 61.70 Total Volume 100.00 100.00 100.00 100.00 100.00 100.00 100.00 100.00 S (QEMSCAN) 3.98 0.40 4.27 0.31 7.29 0.48 3.21 0.18 S (Chemical) 4.34 0.51 4.05 0.37 6.05 0.58 3.58 0.26 Co (QEMSCAN) 0.04 0.01 0.06 0.01 0.07 0.01 0.02 0.00 Ni (QEMSCAN) 0.65 0.12 0.97 0.10 1.14 0.12 0.42 0.07 Ni (Chemical) 0.74 0.13 0.39 0.12 1,06 0.17 0.54 0.10 Cu (QEMSCAN) 0.96 0.18 0.77 0.10 1.04 0.16 0.65 0.05 Cu (Chemical) 0.80 0.20 0.69 0.13 1.05 0.24 0.61 0.14
Sample Fraction
Name SVMDC-8 S\TVIDC-9 SVMDC-IO SVMDC-n Sample Fraction N a m e sinks floats sinks floats sinks floats sinks floats
Mineral Mass(%) Pentlandite 1.54 0.29 1.15 0.24 2.68 0.23 0.95 0.13 Mineral Mass(%) Ni-Arsenides 0.06 0.00 0.05 0.00 0.17 O.OO 0.00 0.00 Cobaltite 0.01 0.00 0.00 0.00 0.01 0.00 0.00 O.OO Pyrrhotite 6.23 0.26 6.72 0.28 13.17 0.58 5.58 0.18 Cu-Sulphides 2.78 0.53 2.22 0.29 3.01 0.45 1.88 0.15 Other sulphides/PGM 0.00 0.01 0.00 0.01 0.03 0.01 0.00 0.01 Fe/Ti/Cr-Oxides 1.81 0.55 2.49 0.43 2.27 0.49 2.14 0.37 Amphibole 40.98 11.40 38.93 7.95 50.47 14.86 35.33 7.90 Chlorite 8.15 17.74 14.13 20.46 4.47 27.48 8.23 23.27 Biotite/Phlog. 2.52 1.89 1.46 0.87 3.62 2.52 6.91 3.17 Micas 0.65 2.69 0.80 2.55 0.46 3.23 0.72 I.8I Epidote 15.56 5.45 11.28 5.66 7.00 3.44 18.23 4.61 Feldspar 10.52 35.04 9.67 38.98 5.31 23.88 12.73 29.66 Quartz 8.43 23.27 8.18 21.49 6.22 22 J1 5.81 28.13 Accessories 0.75 0.89 1.58 0.79 1.11 0.53 1.49 0.60
100.00 100.00 98.68 100.00 100.00 100.00 lOO.OO 100.00
Sample Fraction
Name SVMDC-8 SVMDC-9 SVMDC-IO SVMDC-II Sample Fraction Name sinks floats sinks floats sinks floats sinks floats Mineral VolumeC/.) Pentlandite 1.18 0.25 1.89 0.21 2.04 0.19 0.72 0.12 Mineral VolumeC/.)
Ni-Arsenides 0.03 0.00 0.03 0.00 0.08 0.00 0.00 0.00 Cobaltite 0.00 0.00 0.00 0.00 0.01 0.00 0.00 0.00 Pyirhotite 4.90 0.24 5.30 0.26 10.19 0.48 4.32 0.16 Cu-Sulphides 2.47 0.Î3 1.97 0.29 2.65 0.43 1.64 0.15 Oûier sulphides/PGM 0.00 0.01 0.00 0.01 0.02 0.01 0.00 0.01 Fe/Ti/Cr-Oxides 1.44 0.55 1.96 0.42 1.77 0.44 1.65 0.35 Amphibole 46.28 14.73 44.00 10J7 56.62 18.10 39.45 10.18 Chlorite 9.14 22.89 15.98 27.18 5.02 33.43 9.22 29.99 Biotite/Phlog. 3.30 2.83 1.90 1.32 4.68 3.55 8.91 4.71 Micas 0.85 4.02 1.04 3.83 0.59 4.53 0.92 2.68 Epidote 16.52 6.63 11.95 6.92 7.35 3.92 19.04 5.56 Feldspar 7.28 27.77 6.69 31.10 3.63 17.76 8.67 23.33 Quartz 5.79 18.30 5.61 17.01 4.23 16.46 3.93 21.96 Accessories 0.81 1.24 1.68 1.08 1.12 0.70 1.53 0.80

Combined Mineral Name S\TVIDC-8 SVMDC-9 SVMDC-IO SVMDC-n
Content Pentlandite 0.77 1.02 0,86 0,35 Content Ni-Arscnides 0.02 0,01 0,03 0,00 Cobaltitc 0.00 0,00 0,00 0,00 Pyrrhotite 2.81 2,70 3.98 1,76 Cu-Sulphides l.SO 1.11 1.23 0.72 Other sulphides/PGM 0.00 0.00 0.01 0.01 Fcrri/Cr-Oxides 1.04 1,17 0,92 0.85 Amphibole 32.18 26,65 31,97 21.39 Chlorite 15.29 21,76 23,21 22.04 Biotitc/Phlog. 3.09 1,60 3,96 6.32 Micas 2.27 2.48 3,11 2.01 Epidote 12.10 9,36 5,16 10.72 Feldspar 16.44 19.28 12,67 17,71 Quartz 11.38 11.49 12,06 15,05 Accessories 1.00 1,37 0.85 1,08
Sample Name SVMDC-8 SVMDC-9 SVMDC-10 SVMDC-i l Fraction Name sinks floats sinks floats sinks floats sinks floats Fraction
Pentlandite 0.26 72% 0.35 76% 0.29 71% 0,12 63% Pyrrhotite 0.06 16% 0,05 12% 0,08 19% 0,04 19% Silicates (estimated) 0.05 12% 0,06 12% 0,04 10% 0,03 18%
Grain Size Pentlandite 54.15 15.64 45.70 14,17 39.21 9.09 35,44 13.40 Grain Size Ni-Arsenides 19.44 0.00 19,94 5,61 17.11 3.74 0,00 000 Cobaltite 4.27 0,00 3.74 0,00 3.74 3.74 0,00 0.00 Pyrrhotite 42.05 9.94 42.55 12,21 44,42 11.99 38,28 10.50 Cu-Sulphides 65.34 16,56 54.79 17,24 53,76 16.13 57.90 13.17 Other sulphides/PGM 9.97 26.17 3,74 15.89 27,11 6.80 5,61 9.72 Fen"i/Cr-Oxides 14.97 6.13 23,37 6.52 20.27 6.24 23,98 6.26 Amphibole 62.84 24,23 55,75 21.90 71,88 25,66 59,29 23.46 Chlorite 31.12 40.91 32,45 38.80 17,97 38,11 21.42 36.82 Biotite/Phlog. 20.76 14,15 15,38 11.40 22.93 13,61 25.31 15.31 Micas 5.67 7,77 7,32 11,27 5,69 12.29 6.18 8.31 Epidote 32.49 9.26 22,59 7,00 28.65 6.45 31,16 8,43 Feldspar 14.87 26.13 12,91 27,55 15,03 22.81 14.47 27 65 Quartz 28.24 54.57 27,07 49,40 24.40 43.81 25,84 56,96 Accessories 25.00 44.31 27,88 35,47 23.38 27,12 31.82 29.39
Combined Mineral Name SVMDC-8 SVMDC-9 SVMDC-10 SVMDC-I l Combined Mineral Pentlandite 49.1 40,1 35,2 31.4 Ni-Arsenides 19.4 18.9 17.0 Cobaltite 4.3 3.7 3.7 Pyrrhotite 41.0 41.2 42.1 36,9 Cu-Sulphides 58.9 50.2 45.9 52,7 Other sulphides/PGM 21.1 13.4 21.1 9.0 Fe/Ti/Cr-Gxides 13.2 20.7 16.4 20.1 Amphibole 55,8 49.7 56.0 49,8 Chlorite 37.4 36.3 36.4 34.1 Biotite/Phlog. 18.3 13.8 17,8 21.1 Micas 7.3 10.4 11,8 7,9 Epidote 27.4 17.2 18.3 24,6 Feldspar 23.1 24,8 21.9 24,9 Quartz 46.4 43.5 4 i a 53,4 Accessories 34.4 30.5 25.1 30,9
An Update on
METALLURGICAL FLOWSHEET DEVELOPMENT FOR THE SHAKESPEARE ORES
prepared for
URSA MAJOR LIMITED Project 10616-003 - Report 1
February 3, 2006
NOTE: This report refers to the samples as received.
The practice of this Company in issuing reports of this nature is to require the recipient not to publish the report or any part thereof without the written consent of SGS Lakefield Research Limited.
SGS Lakefield Research Limited P.O. Box 4300,185 Concession Street, Lal<efield, Ontario, Canada K0L2H0 Tel; (705) 652-2000 Fax: (705) 652-6365 www.sgslakefield.comwww.ca.sgs.com
Member of the SGS Group (SGS SA)

Feasibility Study Testwork - Shakespeare - 10616-003
TABLE OF CONTENTS
Executive Summary 4
Introduction 6
Testwork Summary 7 1. Samples Received and Sample Preparation 7
1.1 Samples and Sample Preparation 7 1.2 Data Quality Control 7
2. Flotation Testing; Rougher Flotation 9
3. Rougher Flotation Data and Implications to Nickel Mineralogy 17
4. Flotation of a Sulphide Concentrate from the Tailings Streams 18
5. Cleaner Flotation Testing 18
6. Flotation Confirmation Testing: Locked Cycle Testing 25
7. Treatment of Sulphide Concentrate by Magnetic Separation and Gravity Concentration
for Further PGM Recovery 27
8. Concentrate Characterisation 28
9. Solid-Liquid Separation 29
Conclusions and Recommendations 30
Appendix 1 - Rapid Mineral Scans Appendix 2 - Flotation Test Sheets
S G S Se rv ices

Feasibility Study Testwork-Shakespeare - 10616-003
LIST OF TABLES Table 1 : Head Assays 7 Table 2: Calculated Head Assays from the Flotation Tests 8 Table 3 : Rougher Flotation Test Conditions 10 Table 4: Comparative Study of Economic Value of Different Grinds 16 Table 5: Flowsheets and Conditions used in Cleaner Testwork 20 Table 6: Results from Locked Cycle Testing of Final Shakespeare Flowsheet 26 Table 7: Concentrate Characterisation 28
LIST OF FIGURES
Figure 1 : Reconstituted Head Assays 9 Figure 2: Metal Recovery vs Mass Pull, Effect of Grind pH 12 Figure 3 : Effect of Sulphite Species, pH and Pre-aeration on Rougher Flotation 13 Figure 4: Effect of Collector Dose on Rougher Flotation Performance 14 Figure 5 : Effect of Grind on Rougher Flotation Performance 15 Figure 6: Nickel/Pyrrhotite Selectivity 18 Figure 7: Mineralogy of the First and Second Rougher Concentrates 19 Figure 8: Cleaner Flotation Grade vs Recovery: A Comparison of Circuit 22 Figure 9 : Effect of Cleaner pH 23 Figure 10: Effect of Regrinding 24 Figure 11 : Flowsheet for Locked Cycle Testing 25 Figure 12: Flotation Grade vs Recovery, Locked Cycle Testing 26 Figure 13: Nickel Grades in Products from the Locked Cycle Tests 27 Figure 14: Settling Test Data on Shakespeare Concentrates 29
S G S fvîintTiils Se rv i ce s

Feasibility Study Testwork - Shakespeare - 10616-003
Executive Summary
This report describes the findings from a metallurgical study of ores from the Shakespeare
project, near Sudbury, Ontario. The study involved roughly 43 batch and 4 locked cycle flotation
tests, on a single composite of Shakespeare material. The tests were structured to arrive at a
flowsheet sufficiently well defined for feasibility level design purposes.
Based on the tests run on the sample as received, an optimal flowsheet has been established as is
shown below. The flowsheet incorporates primary grinding to a product size (kgo) of
approximately 70 microns, and rougher flotation using a conventional reagent scheme of lime,
MIBC frother and xanthate/dithiphosphate collectors. The single cleaner circuit incorporates a
light regrind and four stages of cleaning, using the same reagents, plus CMC. The flowsheet is
straightforward and conventional. While the flowsheet was developed on a single sample, it's
applicability to a variety of samples from the deposit has been tests, the results being reported in
a separate document.
The circuit is capable of yielding a wide variety of concentrate grades, and performance follows
the traditional trade-off between grade and recovery. Recoveries from locked cycle tests, to a
combined Cu&Ni concentrate grade of 18% were in the order of 96% for copper, 76% for nickel,
75% for platinum, 42% for palladium and 38% for gold. The final concentrate was tested for
deleterious minor elements, and we believe (subject to confirmation by smelters and consultants
in this field) contain no impurities likely to attract significant smelter penalties.
A small-tonnage sulphide-rich concentrate can be floated from the tails, so allowing for the
creation of essentially sulphide-free tailings. The treatment of this concentrate may offer a
possible future upside in recovery; however this was not extensively tested in the current study.
SGS Services
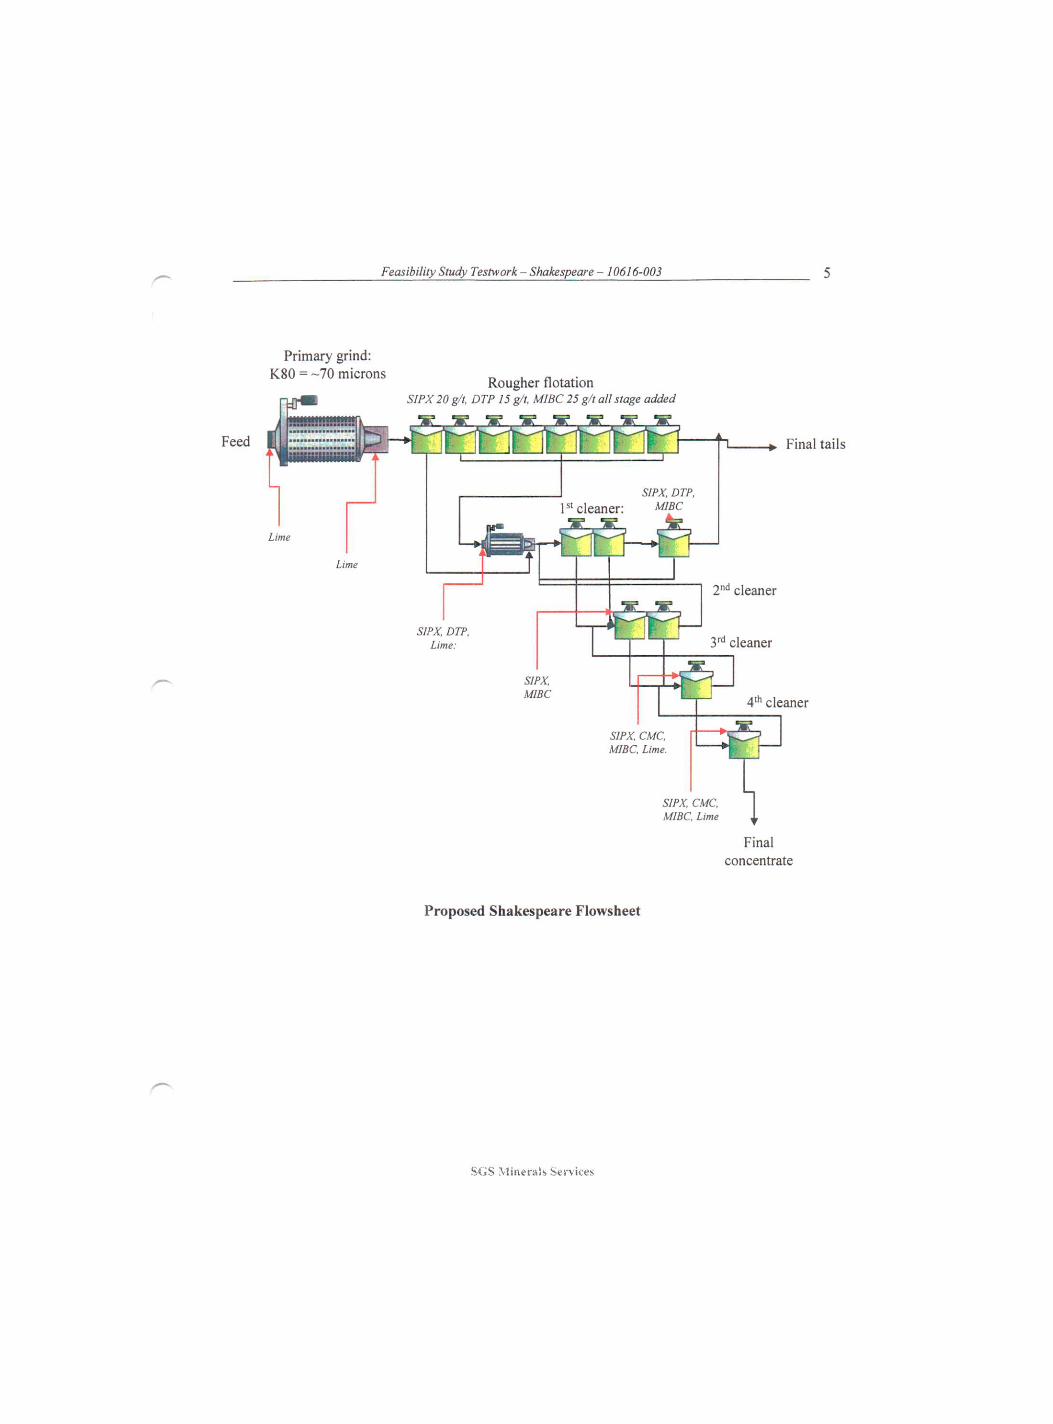
Feasibility Study Testwork - Shakespeare - 10616-003
Primary grind: K80 = - 7 0 microns
Feed
Lime
Rougher flotation SIPX20 g/t, DTP 15 g/t. MIBC 25 g/t all stage added
B B B B È B B B SIPX, DTP,
P« c l e a n e r : mibc W . W
SIPX. DTP. Lime:
Final tails
SIPX. MIBC
2"'' cleaner
cleaner
SIPX. CMC. MIBC. Lime.
cleaner
SIPX, CMC, MIBC, Lime
Final concentrate
Proposed Shakespeare Flowsheet
SGS .Viinerals Services

Feasibility Study Testwork - Shakespeare - 10616-003
Introduction
Flowsheet development testing on a composite of ore from the Shakespeare deposit was
conducted at the SGS Lakefield site between May and November 2005. The work consisted of
43 batch rougher and cleaner flotation tests and 4 locked cycle tests, mostly at the 2-kg scale.
However a small number of tests were conducted on 10-kg batches of ore. This work was
supported by mineralogical studies conducted using Rapid Mineral Scan and QEMSCAN™
techniques.
Most of the testing was conducted by Dan Lang, under the guidance of Chris Martin (project
manager). The results were reported both through emails and the occasional presentation to
Richard Gowans, Micon International Limited, who acted as the client representative during the
programme.
CM Chris Martin, M. Eng Group Leader, Mineral Technologies
Chris Fleming, PhD Executive VP, Metallurgical Operations
Report preparation by: S. McKenzie
SGS .Viinerals Services

Feasibility Study Testwork - Shakespeare - 10616-003
Testwork Summary
1. Samples Received and Sample Preparation
1.1 Samples and Sample Preparation
The samples received are listed in the appendix.
1.2 Data Quality Control
Triplicate head assays of the principal metals are shown in Table 1, together with a broad scan of
other constituents in the ore.
Table 1. Head Assays
Replicate Cu% Ni% S % Fe% Co% Ptg/t Pdg/t Aug/t Shakespeare 1 0.43 0.39 2.44 12.1 0.03 0.35 0.42 0.21 Shakespeare 2 0.39 0.34 2.36 12.0 <0.02 0.33 0.40 0.22 Shakespeare 3 0.43 0.38 2.54 11.3 0.03 0.35 0.41 0.21 AVERAGE 0.42 0.37 2.45 11.8 0.03 0.34 0.41 0.21
40-eleinent analysis:
Si02 % AI2O3 % Fe203 % MgO % CaO % Na20 % KaO % Ti02 % P2O5 % MnO % 49.4 13.3 17.5 7.14 6.89 1.69 0.77 0.73 0.07 0.17
CriOs % V2O5 % LOI % Agg/t Alg/t Asg/t Bag/t Beg/t Big/t Cag/t 0.04 0.05 2.82 < 3 66000 130 170 <0.3 < 2 0 43000
Cdg/t Crg/t Kg/t Lig/t Mgg/t Mng/t Mog/t Nag/t Nig/t Pg/t < 4 170 7800 < 8 42000 1100 < 8 12000 3500 240
Pbg/t Sbg/t Seg/t Sng/t Srg/t Tig/t Tlg/t Vg/t Yg/t Zng/t <25 < 10 < 3 0 < 2 0 130 3700 < 3 0 220 11 100
The replicate calculated head assays from the 43 flowsheet development tests are shown in Table
2 and Figure 1. Inspection of these data reveals if and how the assay precision may have varied
during the programme. Note the higher standard deviation for the PGE, a reflection of the low
grade in the ore, and an indication that cause/effect relationships in flotation of Pt, Pd and,
especially. Au may in some cases be masked by this assay variation.
S G S .Viinerals Services

Feasibility Study Testwork-Shakespeare - 10616-003
Table 2. Calculated Head Assays from the Flotation Tests
Pt Pd 1 A u C u N i S Flotation Test Pt, p/t P d , g / t i A u , g/t C u , % Ni, % s , %
1 0.31 0.37 0.24 0.39 0.36 2,38 2 0.41 0.40 0.24 0.38 0,36 2,46 3 0.35 0.41 0.24 0.39 0.36 2.36 4 0.36 0.41 0.25 0.40 0.36 2.38 5 0.35 0.41 0.25 0.41 0.37 2.39 6 0.37 0.41 0.23 0.41 0.37 2.35 7 0.35 0.42 0.43 0.40 0.38 2.50 8 0.38 0.40 0.26 0.41 0.37 2.46 9 0.37 0.40 0.24 0.43 0.38 2,52 10 0.31 0.37 0.24 0.39 0.36 2,38 11 0.37 0.46 0.27 0.43 0.36 2,57 12 0.35 0.48 0.26 0.43 0.37 2,81 13 0.35 0.41 0.39 0.36 2.54 14 0.36 0.42 0.40 0.36 2.51 15 0.38 0.41 0.37 0.35 2.42 16 0.34 0.41 0.39 0.35 2.41 17 0.35 0.40 0.41 0.36 2.50 18 0.33 0.40 0.38 0.34 2.42 19 0.34 0.51 0.39 0.35 2,04 20 0.35 0.39 0,40 0.35 2,54 21 0.38 0.40 0.40 0.37 2,75 22 0.32 0.38 0.41 0.34 2.56 23 0.36 0.39 0.39 0.35 2.58 24 0.34 0.36 0.43 0.36 2.58 25 0.37 0.39 0.39 0.37 2.68 26 0.36 0.39 0.42 0.38 2,46 27 0.38 0.40 0.40 0,37 2,33 28 0.30 0.44 0.41 0,37 2,36 29 0.36 0.42 0.39 0,35 2,45 30 0.31 0.41 0.41 0,37 2,56 31 0.41 0.37 2,34 32 0.32 0.37 0.38 0.38 2,79 33 0.38 0.40 0.39 0.36 2,42 34 0.31 0.37 0.39 0.36 2.51 35 0.34 0.42 0.45 0,40 2.44 36 0.36 0.39 0.40 0.36 2,40 37 0.37 0.42 0.41 0.37 2,52 38 0.30 0.38 0.22 0.39 0.36 2,21 39 0.32 0.40 0.39 0.36 2,55 40 0.31 0.38 0.22 0.39 0.36 2.37 41 0.30 0.33 0.19 0.39 0.36 2.31 42 0.32 0.35 0.23 0,40 0.36 2.35 43 0.34 0.40 0.25 0.38 0.36 2.36
Average 0.35 0.40 0.25 0.40 0.36 2.46 St. Deviation 0.03 0.03 0.05 0.02 0.01 0.14
Rel St. Deviation 8% 8% 20% 4% 3% 6%
(Where blank the assay was not conducted)
St îS Minerals S e n ices

Feasibility Study Testwork - Shakespeare - 10616-003
Test number
Figure 1. Reconstituted Head Assays
2. Flotation Testing: Rougher Flotation
The conditions used during rougher flotation are summarized in Table 3 and detailed in the
Appendix.
In this section, the entire test dataset is used to explore the effect of principal chemical conditions
on flotation performance. The results are detailed in the appendix; however they are described in
mass pull vs recovery form in this report. Flotation mass pull (key to defining the size of the
concentrate regrind and cleaner flotation circuits) and recovery are the key parameters in
assessing rougher flotation performance.
SGS .Viinerals Services

Feasibility Study Testwork - Shakespeare - 10616-003 10
Table 3. Rougher Flotation Test Conditions
Grind Depressants Collectors/frothers
Test Grind time Sodium Sodium Soda Rougher number minutes Grind pH lime sulphite bisulphite ash Aeration pH SIPX 3477 MIBC Scavenging
1 30 9.4 200 9.3 15 8 20 2 30 9.5 400 9,3 15 8 20 3 30 10.3 500 9.9 15 10 20 4 30 9.5 500 30 9.3 15 8 20 5 30 8.7 0 200 8.5 15 8 20 6 30 8.9 0 100 8.7 15 8 20 7 30 9.5 500 50 15 8 20 8 30 9.5 500 100 30 9.3 15 8 20 9 30 9.5 500 150 30 9.3 15 8 20 10 30 9.4 200 9.3 15 8 20 11 15 10.7 500 10.2 15 10 20 12 22 10.5 500 9.9 15 10 20 13 45 10.4 600 9.8 15 10 20 14 30 10.3 500 9,9 19 8 20 15 30 10.3 500 9.9 15 8 20 16 30 10.3 500 9.9 15 8 22.5 17 30 10.3 500 9.9 15 g 22.5 18 30 10.3 500 9.9 15 8 22.5 19 30 10.3 500 9.9 15 g 22.5 20 30 10.3 500 9.9 15 8 22.5 21 30 10.3 500 9.9 15 8 22.5 22 30 10.3 500 9.9 15 8 22.5 23 30 10.1 500 9.9 10 5 17.5 Abbreviated rougher 24 30 10.2 500 9.9 10 5 17.5 Abbreviated rougher 25 30 9.3 330 9.5 22.5 10 25 26 30 9.3 220 9.3 25 15 27.5 Includes Po scavenger 27 30 10.3 500 9.9 15 8 22.5 28 30 10.3 500 10,1 15 8 22.5 29 30 10.3 500 9.9 15 8 22.5 30 30 9.2 220 9.3 30 15 25 31 30 9.3 200 9.5 22.5 25 17.5 32 30 9.3 330 9,5 17.5 7.5 25 33 30 9.3 330 9.5 22.5 7.5 25 34 30 8.9 0 8.8 17.5 7.5 25 35 30 10 550 10 22.5 7.5 25 36 30 9.3 220 9.2 22.5 15 25 37 30 9.4 220 9.2 22.5 15 25 39 30 9.4 220 9.2 22.5 15 25 41 22 9,4 220 9.2 22.5 15 25
The rougher flotation results from some 31 applicable tests are summarized in Figure 2. These
figures show the effect of pH, where the higher pH (>10) tests are shown in black, the mid-pH
tests shown in red (9.3-9.6) and the lower pH tests in orange (<9). The test conditions are
described in Table 3. Inspection reveals that parameters independent from pH vary from test to
test; accordingly there is inherent scatter in the two datasets. However, broad trends are evident:
• Under optimal conditions, the recovery of floatable copper is complete once 6% of the mass is floated, 97% of the copper being floatable.
S G S rviinc-riiis StTNiccs

Feasibility Study Testwork- Shakespeare - 10616-003 H
• The recovery of floatable nickel, however, is only complete once about 10% of the weight is floated (effectively all the pyrrhotite).
• This relationship between Ni recovery and mass pull is more extensively probed later in this report as it provides excellent insight into the deportment of Ni in the ore.
• Platinum and palladium both float somewhat unselectively, indicating a likely greater association with non-sulphide gangue minerals and presence of very few liberated PGM. Roughly 85% of the Pt and 60% of the Pd are floatable to the rougher concentrate, at a mass pull of 10%.
The data trend was in favor of a mid-lower pH for rougher flotation, especially for Ni. The other
datasets are less clear, but, in general, they too favor mid or lower pH levels.
Using only the data from rougher flotation tests (Figure 3) conducted at a pH less than 10,
showed the following effects:
• The darker blue points denote tests using sulphite species alone at a lower pH, while,
• the paler blue points denote tests using sulphite depressants at a higher pH, in one case with pre-aeration, and
• The single test denoted in black used pre-aeration without sulphite dosage, at pH 9.5.
The use of sulphite depressants, coupled with higher doses of lime maintaining a pH of -9.5,
leads to very poor PGM flotation, and somewhat poor Ni flotation.
The use of sulphites, at the lower pH, yielded much better PGM flotation selectivity, but at
poorer final recoveries than in those tests not using sulphite species. Copper flotation was poor in
this case. Overall, the dosage of sulphite species, as tested in this programme, offered no
significant benefits.
A single test using preaeration yielded good copper and nickel flotation, but somewhat poorer
PGM flotation.
S ( i S ÀHneritis Se rv i ce s
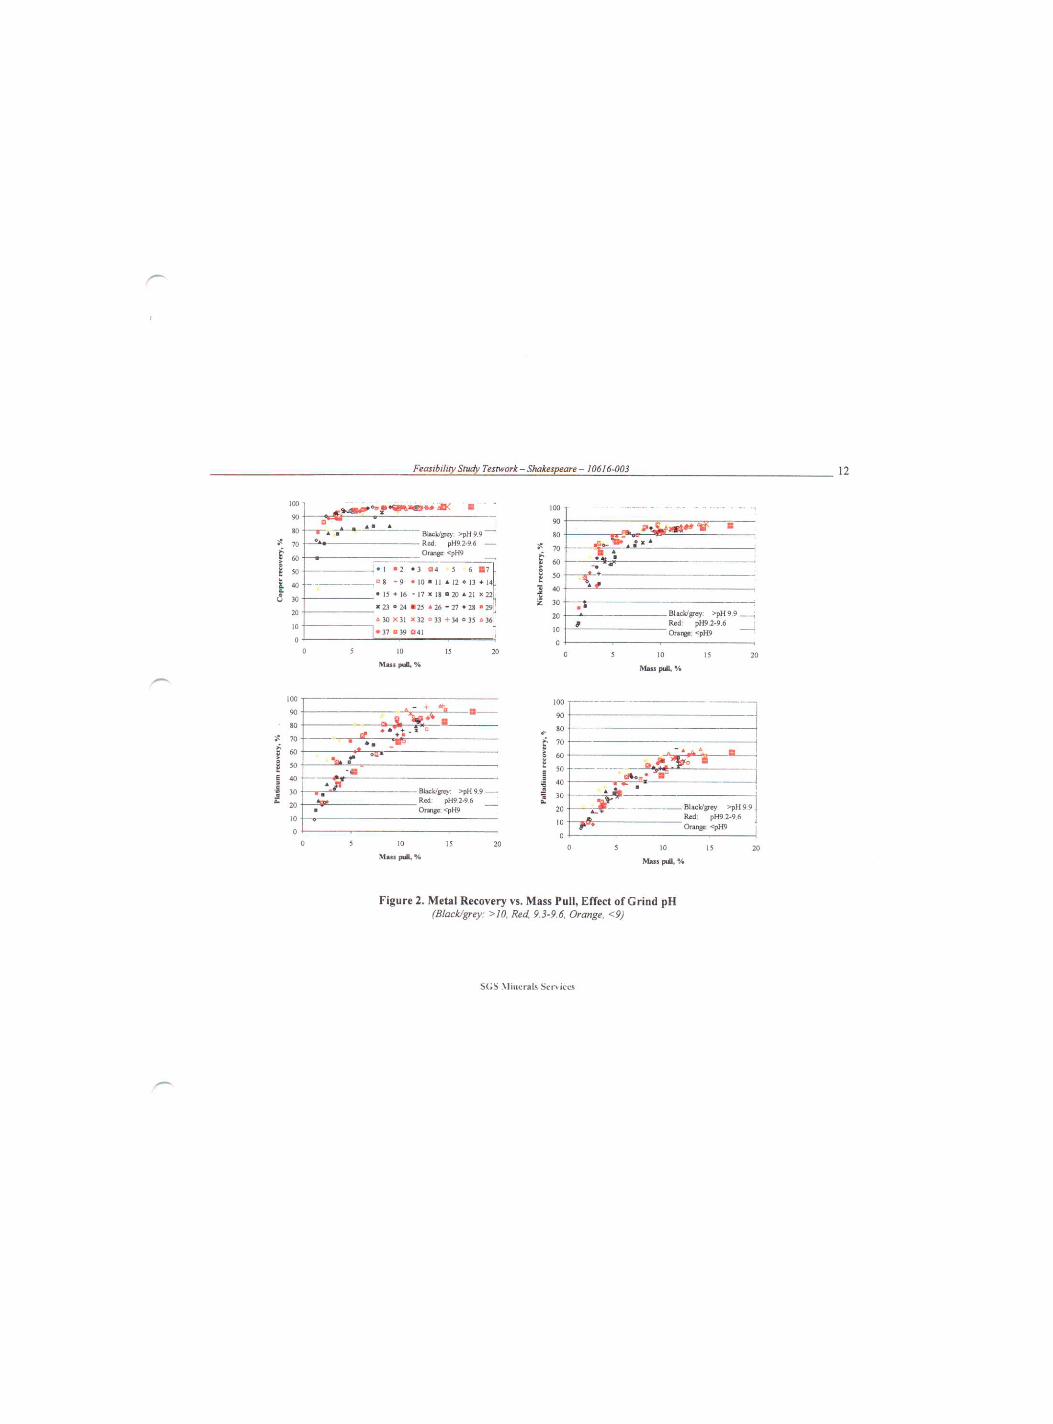
Feasibility Study Testwork - Shakespeare - 10616-003 12
100
90
70
f 60
i 50
" BLick/gre>'; >pH 9.9 - Rsd; pH9.2-9.6
Orange: <pH9
• 1 « 2 « 3 3 4 5 6 B 7
0 8 - 9 • 10 " II i 12 • 13 + 14
• 15 • 16 - 17 « 18 o 20 4 21 X 22
» 23 « 2 4 « 2 5 4 26 - 27 « 2 8 " 2 9
1 30 X31 >:32 •> 33 + 34 o 35 4 36
• 37 0 39 0 41
10 15
Mass pull, %
100
90
80
70 f
1 60
£ 50
1 40
iz 30
20
10
0
_ Black/grey: > p H 9 . 9 ; Red: pH9.2-9.6
" Orange: <pH9
10 15
Mass pull, %
20
100 90
i ! 70 -
A - - «b _ 100
90
£ o"- 80
f 70
«Û» 1
60
1 50
RlarWm^v >nH 0 9 . K 40
• •
'V Red: pH92-9.6 = R ft.
30
• Orange: <pH9 20 O 10
0 5 10 15 20
Mass puH, %
0
Black/grey: >pH 9.9 Red: pH9.2-9.6 Orange: <pH9
5 10 15 20
Mass pull, %
Figure 2. Metal Recovery vs. Mass Pull, Effect of Grind pH (Black/grey: >10, Red, 9.3-9.6, Orange, <9)
S(;S -Minerals Sen iocs

Feasibility Study Testwork - Shakespeare - 10616-003 13
100 •
90
80
70
r 60 •
i 50 •
t a. 40 a. Ô 30
20 •
10 •
0 -
(
100
90
80
70 i
60
50 E s 40 « £ 30
• " • 1 " 2 ^ 4 «5 1
a 6 " 7 A8 09 J
• 10 +25 « 26 • 27 j
28 - 30 «31 • 3 2 .
33 X 34 * 35 ° 36 _
X 37 «39 -41 J
• 1 " 2 ^ 4 «5 1
a 6 " 7 A8 09 J
• 10 +25 « 26 • 27 j
28 - 30 «31 • 3 2 .
33 X 34 * 35 ° 36 _
X 37 «39 -41 J
• 1 " 2 ^ 4 «5 1
a 6 " 7 A8 09 J
• 10 +25 « 26 • 27 j
28 - 30 «31 • 3 2 .
33 X 34 * 35 ° 36 _
X 37 «39 -41 J
• 1 " 2 ^ 4 «5 1
a 6 " 7 A8 09 J
• 10 +25 « 26 • 27 j
28 - 30 «31 • 3 2 .
33 X 34 * 35 ° 36 _
X 37 «39 -41 J
•
• 1 " 2 ^ 4 «5 1
a 6 " 7 A8 09 J
• 10 +25 « 26 • 27 j
28 - 30 «31 • 3 2 .
33 X 34 * 35 ° 36 _
X 37 «39 -41 J
• 1 " 2 ^ 4 «5 1
a 6 " 7 A8 09 J
• 10 +25 « 26 • 27 j
28 - 30 «31 • 3 2 .
33 X 34 * 35 ° 36 _
X 37 «39 -41 J
. _ Blue: wi th sulphite ( s ize rep Red: no sulphite
irpcpntc Hncagft)
10
Mass pull, %
„ nx' i _ Ï Ï
» ô T r
JS
Blue: with sulphite (size represents dosage) Red: no sulphite
10
Mass pull, %
20
20
100
90
80
70
60
50
40
30
20
10
0
Blue: with sulphite (size represents dosage) " Red: no sulphite
10
Mass pull, % 100
90
80
70
> 60
i 50 E
40 «
£ 30
20
10
0
•
X f
10
Mass pull, %
20
_ Blue: with sulphite (size represents dosage) _ Red: no sulphite
20
Figure 3. Effect of Sulphite Species, pH and Pre-aeration on Rougher Flotation Dark blue: Bisulphite, pH <9. Light blue: pH 9. 5, sulphite (tests 7, 8, 9 including pre-aeration). Black: Pre-aeration only
SGS Minerals Sen ices

Feasibility Study Testwork - Shakespeare - 10616-003 14
100 90
y 80 70
> 60 1 50
a. 40 & e 30 U 30
20 10 0
- Black: 22 g/t SIPX " -Red: 15g/tSIPX -
«1 " 2 «25 i 26 •28 i 30 X 31 X32 033 + 3 4 ' 4 36 «37 039 341
10
Mass puU, %
20
100
90 80 70 60 50 40 30 20
10 0
TjSC
- Bbck: 22 eJx SIPX -. Red; 15 g/t SIPX
5 10 15
Mass pull, %
20
100 90
is 80 70 V
> 0 60 Ë 50 E s 40 « 30 s 20
10 0
Black: 22 g/t SIPX " Red: 15 g/t SIPX
5 10 15
Mass pull, %
20
100 90
0-- 80 t 70 1 60
E 50 40 30
I 20 10 0
- Black: 22 g't SIPX ' -Red: 15 g/t SIPX
5 10 15
Mass pull, %
20
Figure 4. Effect of Collector Dose on Rougher Flotation Performance
SC;!> Minerals Services

Feasibility Study Testwork - Shakespeare - 10616-003 15
100
90
80
i 70
60
50
1 40
30
20
10
0
Blue: 59 microns Black/grey: 70 microns — Red. 104 microns Orange: 157 microns
-11 - ^ 1 2 15 + 16 20 A 21 2 4 - 2 7
10 Mass puU, %
- 1 3 17 22 28
100 90
s; 80
i 70 g 60 £ 50 s
40
= 30 20 10 0
10
Mass pull, %
20
Figure 5. Effect of Grind on Rougher Flotation Performance
SGS Miiitrals Sen iccs

Feasibility Study Testwork - Shakespeare - 10616-003 16
Table 4. Comparative Economic Study of Economic Value of Different Grinds
head assay: %,
g/t
assumed metal value:
% recovery to rougher conc
grind size, k80 S/lb, oz 59 70 104 157
Cu 0.42 1 98 97 83 83 Ni 0.37 5 81 78 73 72 Pt 0.34 800 75 75 81 75 Pd 0.41 250 50 50 52 40
recoverable metal approx recoverable
k80 value (excluding grinding value net of k80 smelter & costs, ball milling refining costs) @7.5c/kWh costs
59 $ 50.26 $ 1.51 $ 48.74 70 $ 48.94 $ 1.37 $ 47.58
104 $ 46.21 S 1.08 $ 45.13 157 $ 44.88 $ 0.83 $ 44.05
The test data included in Figure 4, therefore, represent only the tests employing best
conditions so far.
• pH 9.5 • No pre-aeration • No sulphite, or bi-sulphite depressants dosages
Xanthate (and dithiophosphate) dosage was varied during these tests. As a broad rule,
xanthate and dithiophosphate collectors are used together in Cu/Ni/PGM flotation as they
are believed to be most suitable for the recovery the base metals and the precious metals
respectively. In these tests, the two levels of collector doses were selected, based on past
experience on Shakespeare ores. The higher dose, in each case yielded the higher mass
pull and most consistent recoveries, and had little detrimental effect on flotation
selectivity.
Accordingly, they were incorporated as the preferred dosage level for the Shakespeare
flowsheet. The data shown in Figure 5, describe the effect of grind on flotation
performance. They indicate that, while the data are not necessarily consistent from metal
to metal, in general, recoveries rise with finer grind. Conducting a rudimentary economic
comparison applying rougher recoveries at a 10% mass pull indicates that the recoverable
metal values per tonne of ore appear to trend upwards with each finer grind (Table 4)'.
However, the risk of slimed nickel losses in a production plant rises markedly for grinds
finer than a k80 of 70 microns. Consequently, we suggest 70 microns is adopted as a
reasonable trade-off between apparent economic optimum and scale-up risk.
'This analysis uses generic metal prices and grinding costs, and should not be constmed as a substitute for the more precise data created for the feasibility study. The data are comparative in nature and are included merely to approximate the economic effect of grind size

Feasibility Study Testwork - Shakespeare - 10616-003 17
In many areas, further work could be done to improve this flowsheet; however it is
beyond the scope of the present work to fme-tune the flowsheet, beyond optimizing those
conditions that may substantially affect capital and operating costs.
3. Rougher Flotation Data and Implications to Nickel Mineralogy
Plotting nickel versus pyrrhotite recovery for a series of rougher flotation tests (Figure 6),
reveals some useful information on the deportment of Ni in the ore. There are three
features to the relationship:
1. Selective nickel recovery, with very little associated flotation of pyrrhotite, to a nickel recovery of -72%. This is indicative of, essentially, the flotation of discrete pentlandite, largely liberated from pyrrhotite. This indicates that approximately 72% of the nickel may be present as floatable pentlandite, liberated from pyrrhotite.
2. Pyrrhotite is then floated, its recovery closely linked to further nickel recovery. This linear relationship strongly points to the presence of a constant grade of Ni associated with the pyrrhotite. This is consistent with the previous and current mineralogical studies of the ore, which show the presence of flame pentlandite in pyrrhotite, as well a low concentration of Ni in solid solution in pyrrhotite. Roughly 20% of the nickel is intimately associated in this form with pyrrhotite, at a total mean grade of 1.6% Ni. Of this twenty percent; 13% is present as solid solution Ni in pyrrhotite (calculated by applying the "as-probed" concentration of Ni (1.07%) to the 4.3% pyrrhotite in the sample, and dividing by the total nickel assay); and 7% (the remainder) is present as flame lamellae pentlandite in pyrrhotite.
3. The remaining 8% is unrecoverable through sulphide flotation- i.e., it is present as fine inclusions of pentlandite, or as solid-solution Ni, in gangue.
This defines clear limits to the physical separability of Ni from pyrrhotite and non-
sulphide gangue - essentially the mineralogical limits of Ni flotation.
S G S : \ ' i i nen5 is S e r v î t e s

Feasibility Study Testwork - Shakespeare - 10616-003 18
Po recovery, % 70
• pre-F20
F26
F25
40 50 60
Nickel recovery, %
Figure 6. Nickel/Pyrrhotite Selectivity
4. Flotation of a Sulphide Concentrate from the Tailings Streams
Scavenger stages were added in two tests (F26 and F31), the objective being to float the
remaining sulphides from the tailings streams. The results are detailed in the Appendix.
No final flowsheet was developed, however the use of copper sulphate (100 g/t) as an
activator and SIPX as a collector, and a short 2-minute float in the laboratory, was
sufficient to increase sulphur recovery to the rougher concentrate to over 98%.
Combining this material with the cleaner tails will produce a low tonnage sulphur-rich
product for storage in a modest-sized lined impoundment, while leaving the majority of
the tailings virtually sulphur-free. This material contained roughly 50% of the lost PGE,
and may be a worthy target for some further metallurgical testing.
5. Cleaner Flotation Testing
Rapid mineral scans were conducted on the first and second rougher concentrate streams
to provide a qualitative evaluation of their sulphide mineralogy. Selected results are
SGS Minerals Services

Feasibility Study Testwork - Shakespeare - 10616-003 19
summarized below, the detailed reports are shown in the Appendix. The first rougher
concentrate is rich in liberated chalcopyrite and pentlandite. The second rougher
concentrate is rich in pyrrhotite, with minor pentlandite, at least half of which is locked,
mainly to pyrrhotite.
First rougher
Second rougher
• Chalcopyrite (Cp) i • Pentlandite (Pn) • Pyrrhotite (Po)
0% 20% 40% 60% 80% 100%
Abundance (% total sulphides)
1st Rougher - Cp
1st Rougher - Pn
2nd Rougher - Cp
2nd Rougher - Pn
• liberated • attached • locked
0% 20% 40% 60% 80%
Cumulative percent
100%
Figure 7. Mineralogy of the First and Second Rougher Concentrates
These studies point to substantially different occurrences of pentlandite in the
concentrates, implying the need for different cleaning philosophies, with a focus on
upgrading without regrinding for the first rougher concentrate, and regrinding followed
by cleaning for the second rougher concentrate.
The described approach to cleaner flotation optimization, set out in the next few pages, is
similar to that on rougher flotation optimization, whereby candidate conditions are
chosen through a process of elimination until the optimized flowsheet is created. In this
case, performance is not driven solely by recovery and mass pull (as are the key drivers
in rougher flotation), rather concentrate grade and recovery. The conditions used in the
batch cleaner tests are summarized below, and detailed in the Appendix.
SGS Minerals Services

FeasibilitySiu^^I^^ 20
Table 5. Flowsheets and Conditions used in Cleaner Testwork
S<.S ^ v i n e r a i s S e r v i c e s

Feasibility Study Testwork - Shakespeare - 10616-003 21
Two commonly used flowsheet philosophies were tested; the dual cleaner circuit favored
at such circuits as Strathcona and Voisey's Bay, and the single cleaner circuits favored at
Raglan and certain PGM operations. The results are illustrated in Figure 8.
Assuming the optimum concentrate grade lies between 15-20% copper and nickel
(combined), the performance of the respective circuits is best judged in this region of the
grade/recovery datasets. Although the bi-modal nickel distribution in the ore may indicate
the dual cleaner circuit may be more appropriate, in reality the results tend to show
otherwise. The difference is particularly clear in the case of the PGE, where the single
cleaner circuit yielded batch recoveries 20% and 10% higher for Pt and Pd respectively at
any given concentrate Cu&Ni grade. This is primarily because of difficulties in
satisfactorily upgrading the pyrrhotite-rich secondary rougher concentrate. Consequently,
a single cleaner circuit was adopted.
The effect of lime addition (as measured by pH level) is shown in Figure 9. A small
amount of lime is needed during regrinding and cleaning to ensure target concentrate
grades are achieved at acceptable base metal recoveries. Note how selectivity for several
metals falls short of optimum in many of the tests not using lime (pH <9). Only a small
dosage of lime is needed, no more than 20-70 g/t (Table 2).
Any benefit from regrinding appears to be minor, and contingent on careful optimization
of the grind size (Figure 10). Certainly any regrinding requirements will be minor,
probably no more than 5 kWh/tonne of rougher concentrate. For the sake of this study,
inclusion of a light regrind is recommended (and has been included in the locked cycle
flowsheet); however this part of the circuit should in the future be more carefully
assessed through locked cycle testing, perhaps during the basic engineering phase of the
project.
S l i S Mhu>rs' i i» S e r v i c e s

Feasibility Study Testwork - Shakespeare - }0616-003 22
• D <5 +
! • e , K A
o 'r^t :
O 14 " 1 5 » 16 » 17 » 18 + 2 0
• *2\ 0 2 2 « 2 3 0 2 4 i 25 * 26
; 0 27 a 28 » 29 o 30 A 31 » 32
; 0 33 A 34 X 3 5 X 36 0 3 9 + 4 1
• O 14 " 1 5 » 16 » 17 » 18 + 2 0
• *2\ 0 2 2 « 2 3 0 2 4 i 25 * 26
; 0 27 a 28 » 29 o 30 A 31 » 32
; 0 33 A 34 X 3 5 X 36 0 3 9 + 4 1
O 14 " 1 5 » 16 » 17 » 18 + 2 0
• *2\ 0 2 2 « 2 3 0 2 4 i 25 * 26
; 0 27 a 28 » 29 o 30 A 31 » 32
; 0 33 A 34 X 3 5 X 36 0 3 9 + 4 1
85 90
Cu recovery, */•
Red: dual cleaner circuits Black: single cleaner drcui t
A .
40 60
Ni r e c o v e r y , %
35
30
S! 25 4
R ^ : dual cleaner circuits Blade, single cleaner circuii
*< e
o* - V i l i l -
40 60
Pt recovery, %
35
30
25
1 20 u i « 15 3
0 10
5
0
30 40
Pd recovery, %
Figure 8. Cleaner Flotation Grade vs Recovery: A Comparison of Circuit Types (red: dual cleaners, black: single cleaner)
SGS Minerals Sen ices

Feasibility Study Testwork - Shakespeare - 10616-003 23
35
30
5Î 25
^ 20
" 10
5
0
80
35
30
5=: 25 c ^ 20 oi Z 15 «a s O 10
5
0
85 90
Cu recovery, %
95
+ V A
A 4 * A
20 40 60
Pt recovery, %
80
• 24 A 25
- H « 2 9 1 • 30
- J A 3 1 j « 3 2
- J D 33 ' A 34
X 3 5 X 3 6 0 3 9
• 24 A 25
- H « 2 9 1 • 30
- J A 3 1 j « 3 2
- J D 33 ' A 34
X 3 5 X 3 6 0 3 9
• • ° • • - ° « F A
• 24 A 25
- H « 2 9 1 • 30
- J A 3 1 j « 3 2
- J D 33 ' A 34
X 3 5 X 3 6 0 3 9
!
• 24 A 25
- H « 2 9 1 • 30
- J A 3 1 j « 3 2
- J D 33 ' A 34
X 3 5 X 3 6 0 3 9
• 24 A 25
- H « 2 9 1 • 30
- J A 3 1 j « 3 2
- J D 33 ' A 34
X 3 5 X 3 6 0 3 9 ^
100
35
30
25
4 £ 20 w
1 " <3 10
5
0
35
30
25
1 20 OX) iz 15 •a 9 10
5
0
100
20 40 60 Ni recovery, %
80 100
^
20 40
Pd recovery, %
60 80
Figure 9. Effect of Cleaner pH (Black: pH 9.5-10), Blue: pH <9.0)
SGS Minerals Ser\ ices

Feasibility Study Testwork - Shakespeare - 10616-003 24
25 jÇ ^ 20 •a Î
M 15
% 10
#
, «25 0 26
"" «32 «33
- A34 «35
J X 36 o 39
' E4I
m M , «25 0 26
"" «32 «33
- A34 «35
J X 36 o 39
' E4I
, «25 0 26
"" «32 «33
- A34 «35
J X 36 o 39
' E4I
, «25 0 26
"" «32 «33
- A34 «35
J X 36 o 39
' E4I
30
25
c 20 1 U 15
% 10 U 5
0 90
Cu recovery, % 40 60
Ni recovery, %
30
25 j ! u 20
1 10 u
5
0 20 40 60
Pt recovery, V»
80
30
25
4 20 m ou 15 Z «8 3 10 U
5
0 100 20 40 60
Pd recovery, % 80
Figure 10. Effect of Regrinding (green: no regrinding)
SGS Minerals Sen ices

Feasibility Study Testwork - Shakespeare - 10616-003 25
6. Flotation Confirmation Testing: Locked Cycle Testing
The flowsheet selected for locked cycle testing is shown in Figure 11, and is based on the batch
tests F36and F41:
Primary grind: K80 = 70 microns
Rougher flotation: 16 minutes SIPX 20 g/t, DTP 15 g/t, MIBC 25 g/t all stage added
Feed
Lime 200 g I
SIPX2.3g-l. DTP 2.5 g'I. Lime: SO g/t
SIPX I g I MIBC: 2.5 g/t.
SIPX 1 g/t. CMC 10 g'l
MIBC: 2.5 g/t Lime: 10 g/t,
SlPXlgt, CMC 10 g/t
MIBC 2.5 g't Lime: lOg/t
Final tails
P ' cleaner scav: 2.5 mins
2"'' cleaner 3.5 mins
3'''' cleaner 2 mins
4"" cleaner 2 mins
Final concentrate
Figure 11. Flowsheet for Locked Cycle Testing (F38; Flowsheets for F40, F43, F47 were identical except for slight reagent dosage differences)
The results from the four tests are summarized in Table 6, depicted in terms of concentrate grade
vs recovery in Figure 12 and detailed in the Appendix.
SGS Minerals Services

Feasibility Study Testwork - Shakespeare - 10616-003 26
Table 6: Results from Locked Cycle Testing of Final Shakespeare Flowsheet F38:
Produc t W e i g h t Assays, , % , g/ t % D is t r i bu t i on
g 1 % Pt 1 1 Pd 1 A u 1 1 Cu 1 N i 1 S Pt 1 Pd 1 A u 1 C u 1 N i 1 S 4th CI Concentrate 341 5.8 4.42 3.45 1.81 6.51 5.10 27.80 85.7 52.3 46.9 96.3 82.1 72.7 1st Cleaner Tail 422 7.1 0.31 0.50 0.29 0.04 0.23 4.39 7.5 9.4 9.3 0.8 4.5 14.2 Rougher Tail 5137 87.1 0.02 0.17 O.Il 0.01 0.06 0.33 6.7 38.4 43.8 2.9 13.3 13.1 Combined Final Tail 5559 94.2 0.05 0.19 0.13 0.02 0.07 0.64 14.3 47.7 53.1 3.7 17.9 27.3
100.0 0.30 0.38 0.22 0.39 0.36 2.21 100.0 100.0 100.0 100.0 100.0 100.0 | [Head 5900
F40:
Produc t W e i g h t Assays, % , g/t % D is t r i bu t i on
1 % Pt 1 Pd 1 A u 1 1 Cu 1 N i 1 S Pt Pd 1 A u 1 C u 1 N i 1 S 4th CI Concentrate 211 3.6 6.05 4,07 2.35 10.08 7.22 25.65 76.8 45.2 39.9 96.1 77.4 46.9 1st Cleaner Tail 423 7.2 0.39 0.53 0.28 0.04 0.30 8.22 98 11.8 9.4 0.8 6.5 30.1 Rougher Tail 5223 89.2 0.04 0.16 0.12 0.01 0.06 0.51 13.3 43.0 50.7 3.1 16.1 23.0 Combined Final Tail 5646 96.4 0.07 0.18 0.13 0.02 0.08 1.09 23.2 54.8 60.1 3.9 22.6 53.1
[Head
F43:
5857 100.0 0.28 0.32 0.21 0.38 0.34 1.97 100.0 100.0 100.0 100.0 100.0 100.0 |
Product W e i g h t Assays, % , g/t % D is t r i bu t i on
g 1 % Pt 1 Pd 1 A u 1 Cu 1 N i 1 S Pt 1 Pd 1 A u 1 C u 1 N i 1 S 4th CI Concentrate 140 2.4 6.88 3.20 2.32 15.21 8.24 27.17 58.6 22.0 22.4 95.3 67.2 29.3 1st Cleaner Tail 526 8.9 0.96 1 18 0.50 0.06 0.47 12.37 30.9 30.4 18.1 1.5 14.4 50.2 Rougher Tail 5246 88.7 0.03 0.18 0,16 0.01 0.06 0.51 10.5 47.6 59.5 3.2 18.3 20.5 Combined Final Tail 5772 97.6 0.12 0.27 0.20 0.02 0.10 1.59 41.4 78.0 77.6 4.7 32.8 70.7
5912 100.0 0.28 0.34 0.25 0.38 0.29 2.19 100.0 100.0 100.0 100.0 100.0 loo.ol I Head
F47:
Produc t W e i g h t Assays, % , g/t % D is t r i bu t i on
g % Pt Pd A u C u N i S Pt Pd A u Cu N i S 4th CI Concentrate 198.7 3.4 7.10 4.11 2.08 11.67 7.59 29.4 71.1 37.6 35.3 95.5 74.5 46.6 1st Cleaner Tail 640.0 11.1 0.50 0.70 0.34 0.05 0.34 7.96 16.2 20.6 18,8 1.4 10.8 40.7 Rougher Tail 4928.4 85.5 0.05 0.18 0.11 0.02 0.06 0.32 12.7 41.8 45,9 3.1 14.7 12.7 Combined Final Tail 5568.4 96.6 0.10 0.24 0.14 0.02 0.09 1.20 28.9 62.4 64.7 4.5 25.5 53.4
Head 5767.1 100.0 0.34 0.38 0.20 0.42 0.35 2.17 100.0 100.0 100.0 100.0 100.0 100.0
100.0 -
90.0 -
80.0 -
5? 70.0 -
t 60.0 -> e 50.0 -
40.0 -• s E 30.0 -
20.0 -
10.0 -
0.0 -10.0 12.0 14.0 16.0 18.0 20.0 22.0
C u & N i c o m b i n e d g r a d e , %
24.0 26.0
Figure 12. Flotation Grade vs Recovery, Locked Cycle Testing
SGS Minerals Services

Feasibility Study Testwork - Shakespeare - 10616-003 27
A concentrate grade of 18% combined copper and nickel, coincides with recoveries of 96% (Cu),
76% (Ni), 75% (Pt), 42% (Pd) and 38% (Au). The author should caution, however, that the tests
revealed potential stability problems when pushing for high grade concentrates (>20% combined
Cu & Ni), indicating that there may be a limit to how far the flowsheet can be pushed to make
concentrate grade. The product nickel assays are shown, by way of example, in Figure 13. In test
F43, the nickel assay of the cleaner tails has risen to near the concentrate assay, and the stage
recovery is less than 50%. As pentlandite can be expected to oxidize with extended residence
time in the cleaner circuit, this may be problematic.
• LCT F38 • LCT F40 • LCT F47 • LCT F43
2nd IstClnr IstClnr Rougher Cleaner ScavConc ScavTail Tail
Tall
Product
Figure 13. Nickel Grades in Products from the Locked Cycle Tests
Stability problems were a feature of the six-cycle tests F40 and F43; however the flowsheet
stabilized well during the 8-cycle test F47.
7. Treatment of Sulphide Concentrate by Magnetic Separation and Gravity Concentration for Further PGM Recovery
A sulphide concentrate was floated from a bulk flotation test (#V30), containing 10% of the Pt,
7% of the Pd and 12% of the Au. This concentrate assayed about 3 g/t PGE & Au (3E). This was
subjected to further treatment by fine grinding and subsequent low-intensity magnetic separation,
yielding a magnetic discard product assaying 1.25 g/t PGE & Au (3E). Gravity concentration of
the non-magnetics yielded a very small, high grade gravity product assaying 136 g/t PGE and Au
(3E) and containing 1% of the Pt and Au, and 0.1% of the Pd. While, as a stand-alone process,
SGS Minerals Services

Feasibility Study Testwork - Shakespeare - 10616-003 28
this probably offers little benefit, the poor gravity recovery may be a reflection of poor gravity
concentration efficiencies on the finely ground material. Selective PGE flotation from the
pyrrhotite may be more effective and may offer upside to the overall metallurgy, however this
was not tested.
8. Concentrate Characterisation
A full element scan of the concentrate is shown below; representing a concentrate that would
assay about 18% combined copper and nickel. This material would likely be acceptable to the
Sudbury-based nickel smelters, and would attract credits for the Pt, Pd, Au and Co, and would be
unlikely to attract any penalties.
Table 7. Concentrate Characterisation
Solution XRF ICP-MS Cu % 10.9 Fe % 29.1 Ni % 7.4 Pb % 0.01 Mo g/t 138.3 Zn g/t 331.3 As % 0.1 Sb % 0.003 U % <•002
Fire Assay Pt g/t 6.7 Pd g/t 3.7 Au _E/t 1.7
ICP ? g/t <200 Bi g/t <200 Cd g/t <20 Co % 0.41 A1 g/t 10389 Ca g/t 7993 Cr g/t 152.2 Mg g/t 4138 Mn g/t 126.0 Si g/t 37.6 Ti g/t 552 V g/t 71.3
Na g/t 2207 K g/t 1079
Cold Vapour AA
I H g g^t
Ga g/t A.l Ge g/t 2.5 In g/t 0.8 Te g/t 82.1 Tl g/t 19.4
Carbon/Sulphur C(t) % 0.3
S % 25.3
Powder XRF CI g/t 50.4 F % <.005
0.6
S<jS Serviifes

Feasibility Study Testwork - Shakespeare - 10616-003 29
9. Solid-Liquid Separation
Settling tests were conducted on concentrate from bulk cleaner flotation test V30. A nominal 1
g/t dosage of Mag 351 flocculant was used in each of two tests. These yielded a rise rate of 474
and 480 m3/m2/day in the two tests. Final underflow densities were 64% and 61% solids
respectively.
-LR-10616-003 Test: SI • Ultimate Density • IniL Seta Rate • init. Settl. Rate @ 50% of total level drop
•LR-10616-003 Test: S2 - Ultimate Density • Init. Settl Rate
- - Init .Sen) Rate g) 50% of loial level rirnn
r i i r : ^ r i - i : 2000
ISOO
1600
1400
£1200
I I 800
600
400
200
0
r t r i r i z i r . r p p T T r f p r z
! = J =
î ; î
10 20
Initial Settling Rûtc Target
30 40
itnc (min)
50 60
Figure 14. Settling Test Data on Shakespeare Concentrates
S G S M i n t r i i î s Se rv i ce s

Feasibility Study Testwork - Shakespeare - 10616-003 30
Conclusions and Recommendations
This programme of testing has arrived at a relatively straightforward and low-cost flotation
flowsheet, and has demonstrated, to reasonable confidence; the potential to make concentrates
assaying 18% combined copper and nickel, at recoveries of 96% and 76% respectively. Platinum
(75%), palladium (42%) and gold (38%) are all recovered to the final concentrate.
The flowsheet is conventional, and uses only well-proven techniques in flotation, with lime as
the pH modifier and conventional reagents as frother, collectors and depressants. No reagents
likely to cause any significant environmental, or health and safety issues would be employed.
Concentrate regrinding has been employed, although the data supporting this are not fully
convincing. The regrind installation will likely be cheap, however, and the use of regrinding as a
pre-conditioning step, if not a device enhancing liberation, may ultimately be useful when the
plant is operational. However, if the feasibility study indicates the project is sensitive to capital,
the need for this regrind mill could be reviewed.
The concentrate should be attractive to smelters, containing deleterious elements at levels below
what should attract penalties from the Sudbury-based smelters.
It is possible that upside in overall metal recoveries may exist through regrinding and careful
treatment of the sulphide concentrate. This may warrant further testing in due course.
S G S M i n e r a l s Se rv i ces

Feasibility Study Testwork - Shakespeare - 10616-003 31
Appendix 1 Rapid Mineral Scans
SGS Minerals Services

RAPID MINERAL SCAN DATA REPORT
Sample: Primary Ro Cone Date; June 16 2005 Mineralogist: AC Size Range: 80% passing 45 microns
Project number: 10616-003 Client: Ursa Major Property: Shakespeare LIMS: Ml 5019-Jun05
Pétrographie and XRD examination:
Chalcopyrita (Cp)
Pentlandito {Pn)
Pyrrtiotite (Po)
Molybdenite
Sphaleiite (Sp)
Arsenopyrite (Asp)
Magnetite
Non-opaqiies
mn ini H] n ' race Minor Moderate Major
(<1%) (1-5%) (5-20%) (>20%)
Chalcopyrite (Cp)
Pentlandite (Pn)
Pyrrtiotite (Po)
Molybdenite
Sphalerite (Sp)
Arsenopyrite (Asp)
Magnetite
Non-opaques
Mid g r a i n s i z e <10
microns 20 -40
microns microns 10-20 4 0 - 8 0
mic rons >80
microns
Chalcopyrite (Cp)
PenOandite (Pn)
Pyrrtiotite (Po)
Molybdenite
Sphalente (Sp)
Arsenopyrite (Asp)
Magnetite
Non-opaques
Mineral Association
<10% liberated
• • • c c • • • • • ec f t f tc • • c e o
10-50% >50% liberated liberated
Chalcopyrite (Cp) Pentlandite (Pn) Pyrrhotite (Po) Molybdenite Sphalerite (Sp) Arsenopyrite (Asp) Magnetite Non-opaques
Cp>Pn>Po Pn>Po Po>Sp Liberated Cp>Po>Sp Liberated
75 microns 15 microns
Photomicrographs of the polished section showing general appearance of sulfide phases under reflected light at 100X and 500X respectively. Plate 1 showing liberated grains of pentlandite (solid red arrow), chalcopyrite (white
Notes: an-ow); and composite gram of sphalerite (blue arrow) with chalcopyrite. Plate 2 showing locked flame-like pentlandite (indicated by solid red an-ow) within pyrrhotite (broken white arrow) and liberated grains of pentlandite (indicated broken red arrow), chalcopyrite (solid white amjw) and molybdenite (broken blue arrow).
SGS LBl(al>eld Researcii Mineral Tachnologws
Paget

SGS RAPID MINERAL SCAN
DATA REPORT Sample: Primary Ro Cone Date: June 16 2005 Mineralogist: AC Size Range: 80% passing 45 microns
Project number: 10616-003 Client: Ursa Major Property: Shakespeare LIMS: Ml 5019-Jun05
Pointcounting of principal minerals: Manual
Chalcopyrite. 328, 53%
Data labels denote:
2. no of obsen/alions 3. abundance -t'/-10%
Mineral Abundance
Mineral Abundance Chalcopyrite 53% Pentlandite 41% Pyrrhotite 6%
Total 100%
Liberation
liberated • attached
locked
Mineral No of
analyses liberated attached locked Chalcopyrite 328 85% 7% 8% Pentlandite 253 79% 9% 12% Pyrrhotite 39 64% 15% 21%
Total 620
0% 10% 20% 30% 40% 50% 60% 70% 80% 90% 100%
Liberation
Disclaimer:
The reader should be aware that this semi-qualitative study is designed to provide merely a broad picture of the mineralogy of the studied sample. Any numerical approximations should be treated as approximations only. Like any such study, its accuracy is subject to the representativity of the sample selected, and limited by the particle statistics inherent in such a study.
Aparup Chattopadhyay Mineralogy
Joe Zhou Project manager
Helen Dry Report Prep Specialist
SGS Lakalield Research Utneral Tecbndogies
Paae2

RAPID MINERAL S C A N DATA REPORT
Sample: Primary Ro Cone Project number: 10616-003
Date: June 16 2005 Client: Ursa Major
Mineralogist: AC Property: Shakespeare
Size Range: 80% passing 45 microns LIMS: Ml 5019-Jun05
Summary of Qualitative X-ray Diffraction Results:
Crystalline Mineral Assemblage (relative proportions based on peak height) Sample Major Moderate Minor Trace
Primary Ro Cone chalcopyrite amphibole, pentlandite
chlorite, pyrrhotite, pyrite, sphalerite, plagioclase-feldspar,
quartz, mica
•molybdenite.
•Tentative identification due to low concentrations, diffraction line overlap or poor crystallinity
Scan Conditions: Co radiation, graphite monochromator, 40 kV, 30 mA, Step: 0.02 o, Step time:1s Interpretations: JCPDS / ICDD powder diffraction files. Siemens Search / Match software. Detection Limit: 0.5-2%. Strongly dependent on crystallinity.
Interpretations do not reflect the presence of non-crystalline / amorphous compounds. Mineral proportions are based on relative peak heights and may be strongly influenced by crystallinity, structural group or preferred orientations. Interpretations and relative proportions should be accompanied by supporting pétrographie and geochemical data (WRA, ICP-OES).
Mineral Composition
Amphibole
Chalcopyrite Chlorite Magnetite Mica Molybdenite Pentlandite Plagioclase-Feldspar Pyrite Pyrrhotite Quartz Sphalerite
(Ca,Na)2(Mg,Fe)6(Si,AI)8022(0H)2
CuFeS2
(Fe,(Mg,Wln)5,AI)(Si3AI)O,0(OH)s
Fe304
K(Mg,Fe)Al2Si3AIOio(OH)2
M0S2
(Fe,Ni)9S8
(IMaSi,CaAI)AISi208 FeSs
f^Sd-xjS
8102
ZnS
Note:
N/A
Huyun Zhou, Ph.D. Mineralogy XRD Technologist
Joe Zhou, M.Sc. Senior Mineralogist
SGS Lakefield Research Mineral Technologies
Page 3

SGS Primary Ro Cone
100
^ I i f i t t - M < ; f 4 » i i i I fY 'Yi r i - .T i -^T • ..j-if - ^ - « i l ^ r .-fr ^ I . I T ' ' ' f t l ' '
2-The t a - S c a l e
ESPr imarv Ro C o n e - File: j un5019-4 . r aw - Type: 2Th /Th locked - Start: 6 , 0 0 0 0 3 7 - 0 4 7 1 (•) - Cnalcopyrito - C u F e S 2 0 8 5 - 2 1 5 8 (C) - M a a n e s i o h o r n b l e n a e - Ca2(Ma.F0)4AI(S i7AI )022(0H,F)2 B 7 9 - 1 2 7 0 (C) - CllnocWore - (Mg2 .96Fe1 .55Fe .136AI1 .275) (S i2 .622AI1 .3760 I S 7 9 - 1 9 1 0 (C) - Quar tz - S i 0 2 ® 8 6 - 2 4 6 8 (C) - Pent landi te - f rom Frood mine, Sudbury . Ontar io - Fe4 .40Ni4. S o 2 - 1 2 4 1 (D) - Pyrrholite - F e S
2 4 - 0 5 1 3 (D) - Molybdenite 2H1 - MoS2
X 0 7 - 0 0 3 2 (D) - Muscovi te 2M1, syn - KAI2SI3AIO10{OH)2 0 8 4 - 0 9 8 2 (C) - Albite low - Na(AISI308) E o s - o s e e (l) - spha le r i t e , syn - Z n S
71 -0053 (C) - Pyrite - F e S 2
SGS Lakefield Research Mineral Technologies
Page 4

SGS RAPID MINERAL SCAN DATA REPORT
Sample: Seœndary Ro Cone Date; June 16 2005 Mineralogist; AC Size Range; 80% passing 45 microns
Project number; 10616-003 Client; Ursa Major Property; Shakespeare LIMS; MI5019-Jun05
Pétrographie and XRD examination:
Pyrrhotite (Po)
Pentlandite (Pent)
Chalcopyrite (Cp)
Pyrite (Py)
Arsenopyrite
Sptialerite (Sp)
Motybdenite
Magnetite (Mt)
Non-opaques
Moderate (5-20%)
Major (>20%)
Pyrrllotite (Po)
Pentlandite (Pent)
Chalcopyrite (Cp)
Pyrite (Py)
Arsenopyrite
Sphaierite (Sp)
Molybdenite
Magnetite (Mt)
Non-opaques
Mid grain size <10 microns
10-20 nnicrïsns
20 -40 rnicrons
• 4 0 - 8 0
microns >80
microns
Association Pyrrtiotite (Po)
1 1 , Pyrrhotite (Po) Pentlandite (Pent)
j Chalcopyrite (Cp) [ Pyrite (Py)
Po>Pent>Cp Po>Pent>Cp Po>Pent>Cp Liberated
Pentlandite (Pent) 1 1
, Pyrrhotite (Po) Pentlandite (Pent)
j Chalcopyrite (Cp) [ Pyrite (Py)
Po>Pent>Cp Po>Pent>Cp Po>Pent>Cp Liberated Chalcopyfite (Cp)
, Pyrrhotite (Po) Pentlandite (Pent)
j Chalcopyrite (Cp) [ Pyrite (Py)
Po>Pent>Cp Po>Pent>Cp Po>Pent>Cp Liberated
Pyrite (Py) 1 t 1
Arsenopyrite Sphalerite (Sp)
! Molybdenite
Liberated Po>Sp>Mt Liberated
Arsenopyrite 1 f 1
Arsenopyrite Sphalerite (Sp)
! Molybdenite
Liberated Po>Sp>Mt Liberated
Sphalerite (Sp) 1 1 j I Magnetite (Mt) Molybdenite ; ; ;
INUI i - u p c t i ^ u c a
Magnetite (Mt) 1 I Non-opaques 1 1
< 1 0 % l iberated
• • • e e • • • • •
10-50% > 5 0 % l iberated l ibera ted
20 microns 60 microns
Photomicrographs of the polished section showing general appearance of sulfide phases under reflected light at 500X and 100X respectively. Plate 1 showing locked flame-like pentlandite (broken red arrow) within pyrrhotite (solid red arrow) and liberated grain of pyrrhotite (white an-ow). Plate 2 showing locked grain of pentlandite (broken red arrow) with pyrrhotite (solid red arrow) and locked grain of chalcopyrite (white arrow) within non-opaque.
Notes:
SGS Laltafield Research Mineral Technologies
Page 1

SGS Sample: Secondary Ro Cone Date: June 16 2005 Mineralogist: AC Size Range: 80% passing 45 microns
RAPID MINERAL SCAN DATA REPORT
Project number: 10616-003 Client: Ursa Major Property: Shakespeare LIMS: MI5019-Jun05
Pointcounting of principal minerals: Manual
Pyrrhotite, 482.
Data labels denote: 1. mineral 2. no of observations 3. abundance * M 0 %
Mineral Abundance
Mineral Abundance Pyrrhotite 84%
Pentlandite 11% Chalcopyrite 5%
Total 100%
Liberation
• liberated • attaclied • looked
Mineral No of
analyses liberated attached locked Pyntiotite 482 77% 10% 13%
Pentlandite 63 49% 24% 27% Chalcopyrite 26 31% 23% 46%
Total 571
10» 20» 3 0 * 4 0 * 50% 6 0 * 7 0 * 80 * 9 0 * 100*
Liberation
Disclaimer
The reader should be aware that this semi-qualitative study is designed to provide merely a broad picture of the mineralogy of the studied sample. Any numerical approximations should be treated as approximations only. Like any such study, its accuracy is subject to the representatlvity of the sample selected, and limited by the particle statistics Inherent in such a study.
Aparup Chattopadhyay Mineralogy
Joe Zhou Project manager
Helen Dry Report Prep Specialist
SGS Lal<«field Research Minerai Technologies
Page 2

RAPID MINERAL S C A N
Sample:
Date:
Mineralogist:
Size Range:
Secondary Ro Cone
June 162005
AC
80% passing 45 microns
DATA REPORT Project number:
Client:
Property:
LIMS:
10616-003
Ursa Major
Shakespeare
MI5019-Jun05
Summary of Qualitative X-ray Diffraction Results:
Crystalline Mineral Assemblage (relative proportions based on peak height) Sample Major Moderate Minor Trace
Secondary Ro Cone amphibole quartz, chlorite, pyrrhotite
mica, magnetite, plagioclase-feldspar
pyrite,sphalerite,
'chalcopyrite, •pentlandite
•Tentative identification due to low concentrations, diffraction line overlap or poor crystallinity
Instrument: Siemens D5000 diffractometer
Scan Conditions: Co radiation, graphite monochromator, 40 kV, 30 mA, Step: 0.02 o, Step time:1s Interpretations: JCPDS / ICDD powder diffraction files. Siemens Search / Match software. Detection Limit: 0.5-2%. Strongly dependent on crystallinity.
Interpretations do not reflect the presence of non-crystalline / amorphous compounds. Mineral proportions are based on relative peak heights and may be strongly influenced by crystallinity, structural group or preferred orientations. Interpretations and relative proportions should be accompanied by supporting pétrographie and geochemical data (WRA, ICP-OES).
Mineral Composition
Amphibole (Ca,Na)2(Mg,Fe)5(Si,AI)8022(0H)2
Chalcopyrite CuFeSz Chlorite (Fe,(Mg,Mn)5.Al)(Si3AI)O,0(OH)8 Magnetite FesOi Mica K(Mg,Fe)Al2Si3AIO,o(OH)2 Molybdenite M0S2 Pentlandite (Fe,Ni)9S8 Plagioclase-Feldspar (NaSi,CaAI)AISi208 Pyrite FeS2 Pyrrhotite Fe,i.„S
Quartz SiOz Sphalerite ZnS
Note:
N/A
Huyun Zhou, Ph.D. Mineralogy XRD Technologist
Joe Zhou, M.Sc. Senior Mineralogist
SGS Lakefield Research Mineral Technologies
Page 3

SGS Secondary Ro Cone
•J 100
L
2 - T h a t a - S c a l e ^ S e c o n d a r y R o C o n e - Fjie: j u n 5 0 1 9 - 7 . r a w - T y p e : 2T h /Th locked - Start; 6 . 1 0 7 ® 2 5 - 0 2 8 8 (D) - cna l copyr i t e - C u F e S 2 0 8 5 - 2 1 5 8 <C) - M a g n e s i o h o m b l e n d e - Ca2<Ma.Fe)4AI(S i7AI)022(OH,F)2 E i 2 - 0 2 4 3 (D) - Clinochlore - Mg-Fo-Fe-Al-Si -O-OH 0 7 9 - 1 9 1 0 (C) - Quar tz - S i 0 2 H 8 6 - 2 4 6 8 (C) - Pen t l and i t e - f rom Frood mine , S u d b u r y , Ontar io - Fe4 .40Ni4 .57 © 0 2 - 1 2 4 1 (D) - Pyrrtiotite - F e S l l ] 7 4 - 0 3 4 5 ( 0 ) - Muscovi te - KAI2(Si3AI)010(OH)2
l i i l84-0982 (C) - Albite iow - Na(AISi308) ^ 0 5 - 0 5 6 6 (I) - Spha le r i t e , syn - Z n S
7 1 - 0 0 5 3 ( C ) - P y r i t e - F e S 2 0 8 0 - 0 3 8 9 (C) - Magne t i t e - F e . 9 9 F e 1 . 9 7 C r . 0 3 N i . 0 1 0 4
SGS Lakefield Research Mineral Technologies
Page 4

SGS
Sample: F10-feed Date: June 2 2005 Mineralogist: AC Size Range: 80% passing 75 microns
RAPID MINERAL SCAN DATA REPORT
Project number: 10616-003 Client: Ursa Major Property: Shal^espeare LIMS: Ml 5003-Jun05
Pétrographie and XRD examination:
Arsenopynte
Pyrite
Chalcopynte
Pyrrhotite
Penllandite
Silicate
Cartxinate
Magnetite
Hematite
<10% liberated
• • • o c
10-50% litierated
Mineral Association Arsenopyrite liberated Pyrite Po>NOG Chalcopynte NOG>Po>Cp Pyrrhotite NOG>Sp>Cp Pentlandite Po>NOG>Sp.Cp Silicate Cartxsnate Magnetite Pn>Ht>Po Hematite Mt
>50% i iber^ted
Notes:
150 microns 150 microns
Photomicrographs of the polished section showing general appearance of sulfide phases under reflected light at 50X Plate 1 showing elongated in-egular and large liljerated grains of pyn-hotite (red arrow) and chalcopyrite (blue arrow) Plate 2 showing irregular grains of pentlandite (white arrow) and pyntiotite (red arrow)
SGS Laltafisid Research Mineral Tectinologies
Page 1

SGS RAPID MINERAL SCAN
DATA REPORT Sample: FlO-feed Date: June 2 2005 Mineralogist: AC Size Range: 80% passing 75 microns
Project numtier: 10616-003 Client: Ursa Major Property: Shakespeare LIMS: Ml 5003-Jun05
Pointcounting of principal minerals: Manual
A/senopyrite, , 0%
Pyrite. 29. 6%
Mineral Abundance
Data labels denote: 1. mineral
Mineral Abundance Arsenopyrite 0%
Pyrite 6% Chalcopyrite 12%
Pyrrhotite 80% Pentlandite 3%
Total 100%
Liberation
Pyrite
I Chalcopyrite
Pyrrhotite
liberated • attached • locked
Mineral No of
analyses liberated attached locked Arsenopyrite 0 100% 0% 0%
Pyrite 29 79% 8% 13% Chalcopyrite 64 74% 10% 16%
Pyn-hotite 419 82% 7% 11% Pentlandite 15 67% 14% 18%
Total 527
40% 60%
Litjeration
Disclaimer:
The reader should be aware that this semi-qualitative study is designed to provide merely a broad picture of the mineralogy of the studied sample. Any numerical approximations should be treated as approximations only. Like any such study, its accuracy is subject to the representativity of the sample selected, and limited by the particle statistics inherent in such a study.
Aparup Chattopadhyay Mineralogy
Joe Zhou Project manager
Helen Dry Report Prep Specialist
SGS Lakefiald Research MineraJ Technologies
Page 2

FIO Feed
I c •3
- f - - »
fcSlFile: j u n 5 0 0 3 - 1 . r a w 0 7 9 - 1 9 1 0 (C) - Q u a r t z - S i 0 2
! c ! " Cl ino^^hT' " ^ r M f ° .97)<A,Si3)O10<OH)2
0 7 6 - 0 9 4 8 (C) - Anor th i t e - C a ( A I 2 S i 2 0 8 )
IHJ02-0014 (D) - Mont rnomion i t e (Clay) - N a M 9 A I S i 0 2 ( 0 H ) H 2 0
2 - T h e t a - S c a l e
[ 3 8 6 - 2 3 3 4 (C) - C a l c i t e - C a ( C 0 3 ) 0 2 - 0 7 9 8 (D) - R h o d o c h r o s i t e - M n C 0 3
" - <Na2 .Ca ,K2)AI2S110024 7 H 2 0 08-0099 (D) - M a n g a n i t e - M n - 3 0 ( 0 H )
H J 2 5 - 0 4 1 0 (D) - Py r rho l i t e S C - ( F e ) l - x S
SGS Lakefield Research Mineral Technologies
Page 4

Feasibility Study Testwork - Shakespeare - 10616-003 281
Appendix 2 Flotation Test Sheets
SGS Minerals Services

Test No.: F1 Project No.: 10616-001 Operator: D.L. Date: 02-May-05
•rpose:
Procedure:
Feed:
Grind:
Conditions:
The first in a series of 6 tests to examine the rougher flotation kinetics of Shakespeare sample.
Flotation was conducted as described below. All products were submitted for Pt, Pd, Au, Cu, Ni,, and S analyses. The rougher tailing was also submitted for size analysis.
2 kg of minus 10 mesh Shakesperare.
30 minutes / 2 kg @ 65% solids in laboratory ball mill (BM-3). Rghr Tail Kgo = 78 (im.
Stage f
Ca(OH)2 leagents added
SIPX I, grams per torn
3477 le
M m e Grind Time, minu
Cond. tes
Froth PH
Grind 200 30
Rougher 1 5 0 7.5 1 1 9.4 Rougher 2 2.5 0 5 1 1 Rougher 3 • 2.5 2.5 2.5 1 3 9.4 Rougher 4 2.5 2.5 2.5 1 5 Rougher 5 2.5 2.5 2.5 1 5 9.2
Total 200 15 8 20
Stage Roughers Flotation Cell lOOOg-DI Speed: rpm 1800
tallurgical Balance
Product Weight S ^ % Pt Pd
Assa Au
lys, g/t Cu i Ni 1 S Pt
% Distribution Pd i Au ! Cu • Ni : s
Rougher Cone 1 50.0 2.52 2.72 i 1.16 1.19 13.8 ! ' 7.44 1 27.2 22.0 ! [ 7.9 : 12.3 ! 88.3 ! 51.7 • 28.7 Rougher Cone 2 18.5 0.93 6,43 1 3.96 2.49 1.80 7.03 ; 21.1 19.2 ! 10.0 ; 9.5 4.3 ' 18.1 : 8.2 Rougher Cone 3 38.0 1.91 3.03 ' 2.87 2.25 0.52 1.63 22.0 18.6 14.9 1 17.7 2.5 8.6 1 17.7 Rougher Cone 4 55.7 2.80 1.77 1 i 1.66 0.78 0.21 ! ! 0.67 18.1 15.9 12.7 9.0 1.5 5.2 ' 21.3 Rougher Cone 5 29.0 i 1.46 1.48 1 1.3 0.56 0.12 0.53 14.6 6.9 5.2 1 1 3.4 0.4 1 2.1 8.9 Rougher Tailing 1796.0 j 90.38 0.06 i 0.2 0.13 0.013 0.057 0.40 17.4 49.2 48.2 3.0 ' 14.2 15.2
Head (calc.) 1987.2 100.0 0.31 0.37 0.24 0.39 0.36 2.38 1
100.0 1
100.0 100.0 100.0 100.0 100.0 (direct) 1 1 0.43 0.37 2.41
Combined Products Rougher Cone -• 1 min. i 2.52 2.7 1.16 1.19 ! 13.8 7.4 27.2 22.0 7.9 12.3 88.3 51.7 ! 28.7 Rougher Cone -• 2 min. i 3.45 3.72 1.92 1.54. 10.56 7.33 25.6 41.2 18.0 21.8 92.5 69.8 ! 37.0 Rougher Cone • • 5 min. ! 5.36 3.48 2.26 1.79 6.98 5.30 24.3 59.8 32.9 39.5 95.1 ! 78.4 i 54.6 Rougher Cone -• 10 rain. j 8.16 2.89 2.05 1.45 4.65 3.71 22.2 75.7 45.6 48.4 96.6 83.6 1 75.9 Rougher Cone -• 15 min. ; 9.62 2.68 1.94 1.31 3.97 3.23 21.0 82.6 i 50.8 51.8 97.0 85.8 • 84.8
Observations Ro 1 Cone: Ro 2 Cone. Ro3: Ro5:
Clean Chalco floating,with some fine pyrhotite - duller colour, less lustre, still some chalco.
Lots of Pyrhotite, some silicates with Cu inclusions - some sulphides floating. Froth is very bare.
Shkespcare F1-F6 Fl updated 02/03/2006
SGS Ukefield Research Umlted CONFIDENTIAL Page I of I

SGS Lakefield Research Limited Size Distribution Analysis
Project No. 10616-003
Sample: Ro Tail Test No.: F1
Size Weight % Retained % Passing Mesh |jm grams Individual Cumulative Cumulative
65 212 0.5 0.3 0.3 99.7 100 150 3.6 2.3 2.6 97.4 150 106 9.4 5.9 8.5 91.5 200 75 20.4 12.8 21.3 78.7 270 53 24.8 15.6 37.0 63.0 400 38 20.7 13.0 50.0 50.0 Pan -38 79.4 50.0 100.0 0.0
Total - 158.8 100.0 - -
K80 78
Particle Size Distribution
D) C
"cn <n TO
CL
I ra E 13 o
ICQ 90 80 70 60 50 40 30 20 10
0 10 100
Screen Size (micrometers)
i 1 1 ! i l l ! ^ 1 i 1 ! i 1 i
i i 1 1 J r
1 ! ! : 1 M ! 1 , i i i 1 i
; 1 ' : i ' i ! ; i ! ; i 1 i : i •
H ! i 1
! • ! • ' I !
1 ; i : ; ; j ' M ; 1 : ' Î i ' • ! i I
K80 = 78 Mm ' ; ' !
i i M
! i I K80 = 78 Mm
: i [ i M i : 1 ! ! i i : M
1,000

Test No.: F2 Project No.: 10616-001 Operator: D.L. Date: 02-May-05
Purpose: The second in a series of 6 tests to examine the rougher flotation kinetics of Shakespeare sample.
Procedure: Flotation was conducted as described beiow. Al l products were submitted for Pt, Pd, Au, Cu, N i , , and S analyses.
Feed:
Grind:
2 kg of minus 10 mesh Shakesperare.
30 minutes / 2 kg @ 65% solids in laboratoiy ball mil l (BM-3). Rghr Tail Keo = VSgm.
Stage F
Na2C03 leagents added
SIPX ,, grams per tonr
3477 le
MIBC Grind Time, minu
Cond. tes
Froth pH
Grind 400 30
Rougher ! 5 7.5 1 1 9.5 Rougher 2 2.5 5 1 1 Rougher 3 2.5 2.5 2.5 1 3 9.3 Rougher 4 2.5 2.5 2.5 1 5 Rougher 5 2.5 2.5 2.5 1 5 9.3
Total 400 15 8 20
Stage Roughers Flotation Cell lOOOg-Dl Speed: rpm 1800
Metallurgical Balance
Product Weight Assays, g/t % Distribution
8 % Pt Pd Au Cu Ni S Pt Pd ; Au Cu Ni ^ S Rougher Cone 1 28.0 1.41 8.35 2.46 1.58 20.8 : 6.5 28.1 28.4 8.6 : 9.3 i 78.3 25.5 16.1 Rougher Cone 2 34.2 • 1.73 6.27 4.01 1.97 ; 2.86 i 9.60 i 21.7 26.1 i 17.2 14.1 13.1 ! 46.1 15.2 Rougher Cone 3 35.0 : 1.77 3.15 2.89 1.34 ; : 0.57 ; 1.55 ! 19.4 13.4 i 12.7 9.8 • 2.7 ' 7.6 : 13.9 Rougher Cone 4 30.4 ; 1.53 1.53 • 1.73 1 0.75 ! 0.26 ; 0.69 19.6 5.7 ! 6.6 4.8 : 1.1 ! 2.9 : 12.2 Rougher Cone 5 40.0 i 2.02 1.35 1.44 ; 0.57 0.17 i 0.6 ; 20.1 6.6 7.2 j 4.8 1 0.9 i 3.4 i 16.5 Rougher Tailing 1814.0i 91.54 0.09 ^ 0.21 • 0.15 1 0.016 j 0.057 1 0.70 19.9 47.7 57.1 1 1 3.9 i 14.5 i 1
j 26.0
Head (calc.) 1981.6: 100.0 0.41 , 0.40 ^ 0.24 ' 0.38 ' 0.36 2.46 100.0 ' loo.o; loo.oi 100.0 100.0 100.0 (direct) 0.43 ; 0.37 2.41 1 1
Combined Products Rougher Cone - 1 min. 1.41 8.4 2.46 1 1.58 20.8 ! 6.5 i 28.1 28.4 ! 8.6 9.3 78.3 25.5 16.1 Rougher Cone - 2 min. 3.14 7.21 ^ 3.31 ' 1.79 10.94 i 8.20 i 24.6 54.5 : 25.8 23.4 91.4 71.6 31.3 Rougher Cone - 5 min. 4.91 5.75 ^ 3.16 • 1.63 7.20 : 5.81 ; 22.7 67.9 38.5 33.3 94.1 79.2 45.3 Rougher Cone -10 min. 6.44 4.74 : 2.82 i 1.42 5.55 i 4.59 1 22.0 73.6 45.1 38.1 95.2 82.1 57.5 Rougher Cone -15 min. • 8.46 3.93 ! ! 2.49 i 1.22 : 4.27 ! 3.64 1 21.5 80.1 : 52.3 42.9 ! 96.1 85.5 74.0
Observations Ro 1 Cone: Ro 2 Cone. Ro3: RoS:
Clean Chalco floating,with some fine pyrhotite, stiffer froth than F1 - duller colour, less lustre, still some chalco.
Lots of Pyrhotite, some silicates with Cu inclusions - some sulphides floating. Froth is very bare.
Overall similar to F1 except poorer froth texture than FI

Test No.: F3 Project No.: 10616-001 Operator: D.L. Date: 02-May-0S
Purpose: The third in a series of 6 tests to examine the rougher flotation kinetics of Shakespeare sample.
Procedure: Flotation was conducted as described below. A l l products were submitted for Ft, Pd, Au, Cu, N i , , and S analyses.
Feed:
Grind:
2 kg of minus 10 mesh Shakesperare.
30 minutes / 2 kg @ 65% solids in laboratory ball mil l (BM-3). Rghr Tail K,» = -78 urn.
Stage P
Ca(0H)2 !.eagents added
SIPX , grams per tonr
3477 le
MIBC Grind Time, minu
Cond. tes
Froth pH
Grind 500 30
Rougher 1 5 7.5 1 1 10.3 Rougher 2 2.5 2.5 5 1 2 Rougher 3 2.5 2.5 2.5 1 3 10.0 Rougher 4 2,5 2.5 2.5 1 5 Rougher 5 2.5 2.5 2.5 1 5 9.7
Total 500 15 10 20
Stage Roughers Flotation Cell lOOOg-Dl Speed: rpm 1800
Metal lurgical Balance
Product Weight Assays, g/t % Distribution
g % Pt ^ Pd • Au : Cu ' Ni ' S. Pt Pd Au Cu Ni : S Rougher Cone 1 40.5 2.03 3.37 2.24 1.56 : 16.7 5.34 : 24.2 19,8 11,2 13.1 , 86.1 30.1 . 20.8 Rougher Cone 2 25.0 1.25 5.45 3.2 . 1.66 : 1.95 ! 9.35 16.2 19.8 9,9 8.6 j 6.2 32.6 8,6 Rougher Cone 3 32.6 ; . 1.64 3.27 3.36 ' 1.78 0.70 3.13 ! 14.3 15.5 . 13,5 ' 12.1 ' 2.9 i 14.2 • 9.9 Rougher Cone 4 34.6 ' 1.74 2.2 • 2.08 1.12 0.22 i 0.85 ' 15.8 11.0 8,9 ' 8.0 : 1.0 4,1 . 11.6 Rougher Cone 5 45.6 2.29 1.54 1.26 ; 0.57 i 0.11 0.6 18.9 10.2 7.1 : 5.4 ! 0.6 : 3,8 : 18.3 Rougher Tailing 1815.01 91.06 0.09 1 0.22 i 0.14 ;
1 0.014 i 0.06 1 1 0.80 23.7 49.4 i 52.8 ^ 3.2 i 15,2 j 30.8
Head (cale.) 1993.3: 100.0 0.35 1 0.41 i t
0.24 1 0.39 1 0.36 2.36 100,0 100.01 100.0 i 100.01 100,0 i 100,0 (direct) i 0.43 ^ 0.37 ; 2,41
j
Combined Products Rougher Cone - 1 min. 2.03 3.4 1 2.24 ' 1.56 1 16.7 ! 5.3 1 24,2 19.8 ; 11.2 13.1 86.1 1 30.1 i 20,8 Rougher Cone - 2 min. 3.29 4.16 • 2.61 ^ 1.60 ; 11.07 6.87 21,1 39.6 1 21.1 21.7 92.3 1 62.7 i 29,4 Rougher Cone-5 min. 4.92 3.87 j 2.86 1.66 1 7.62 j 5.63 18,9 55.1 1 34.6 33.8 95.2 i 76,9 1 39,3 Rougher Cone - 10 min. 6.66 3.43 i 2.65 j 1.52 1 5.69 j 4.38 18,1 66,1 43.5 1 41.8 96.1 : 81,0 : 50,9 Rougher Cone - 15 min. 8.94 2.95 ! 2.30 : 1.28 ! 4.27 ; 3.41 ; 18,3 76,3 50.6 ! 47.2 96.8 i 84,8 1 69,2
Observations Ro 1 Cone: Ro 2 Cone. Ro3 : R o 5 ;
Cleaner Chalco floating than in F l , Very nice froth texture - duller colour, less lustre, still some chalco.
Lots o f Pyrhotite, some silicates with Cu inclusions - some sulphides floating. Froth is very bare.

Test No.: F4 Projec t No.: 10616-001 Operator : D.L. Date: 02-May-05
Purpose: The fourth in a series of 286 tests to examine the rougher flotation kinetics of Shakespeaie sample.
Procedure: Flotation was conducted as described below. Alt products were submitted for Pt, Pd, Au, Cu, N i , , and S analyses.
Feed:
Grind:
2 kg of minus 10 mesh Shakesperare.
30 minutes / 2 kg @ 65% solids in laboratory ball mil l (BM-3).
asin F1 , but add 30 minutes aeration
Rghr Tail Kjo = -78 (im.
Stage F
Ca(0H)2 leagents added
SIPX , grams per tonr
3477 te
MIBC Grind Time, minu
Cond. tes
Froth pH
Grind 500 30 9.5 Aeration 30 9.3-8.7
Rougher 1 5 7.5 1 1 9.3 Roufîher 2 2.5 5 1 1 Rougher 3 2.5 2.5 2.5 1 3 9.3 Rougher 4 2.5 2.5 2.5 1 5 Rougher 5 2.5 2.5 2.5 1 5 9.3
Total 500 15 8 20
Stage Roughers Flotation Cell lOOOg-Dl Speed: rpm 1800
Metallurgical Balance
Produc t Weight Assays, g/t •/. Distr ibution
R ' i % f t : Pd i Au , ; Cu Ni ; 1 S Pt ; Pd ! Au Cu i Ni S Rougher Cone 1 39.5 i 1.98 3.87 1 2.04 ! 1.34 : 17.1 1 8.72 I 27.2 21.5 1 9.8 i 10.8 i j 85.8 ! I 48.0 22.7 Rougher Cone 2 29.1 1.46 7.52 4.33 ^ 2.17 1 1.83 ! 6.25 j 21.1 30.7 15.3 i 12.9 ! 6.8 : 25.4 13.0 Rougher Cone 3 52.5 2.64 2.71 2.94 1.37 ! 0-42 , 1.15 1 22.0 20.0 18.7 : 14.7 1 2.8 i 8.4 24.4 Rougher Cone 4 43.0 ; 2.16 1.44 ; 1.69 0.8 : : 0.21 j 1 0.64 i 1 18.1 8.7 8.8 i 7.0 i 1 1.1 : 3.8 j 16.4 Rougher Cone 5 27.1 ; ; 1.36 1.03 1.18 0.55 ; 0.16 i 1 0.47 1 14.6 3.9 3.9 ; 3.0 : 0.6 1.8 8.4 Rougher Tailing 1801.0 90.40 0.06 0.2 0.14 i 0.013 I 0.05 0.40 15.2 43.6 51.5 3.0 12.6 15.2
Head (calc.) 1992.2 100.0 0.36 i 0.41 0.25 0.40 0.36 2.38 100.0 100.0: 100.0 100.0 i 100.0 100.0 (direct)
1 1 0.43 ! 0.37 2.41 1 i
Combined Products Rougher Cone - 1 min. i 1.98 Rougher Cone - 2 min. 3.44 Rougher Cone - 5 min. 6.08 Rougher Cone -10 min. j 8.24 Rougher Cone -15 min. i 9 )
3.9 i 2.04 1 1.34 : 17.1 j 8.7 5.42 1 3.01 1.69 1 10.62 : 7.67 4.24 1 2.98 1.55 i 6.20 ; 4.84 3.51 i 2.64 1 1.36 i 4.63 3.74 3.16 i 2.44 ! 1.24 ! 4.00 3.28
1 27.2 i 24.6
23.5 22.1 21.0
21.5 i 9.8 i 10.8 ! 85.8 : 48.0 ; 22.7 52.2 i 25.0 i 23.7 1 92.5 : 73.4 : 35.6 72.2 i 43.7 ; 38.4 95.3 81.8 | 60.0 80.9 1 52.5 ; 45.4 j 96.5 85.7 i 76.4 84.8 ' 56.4 1 48.5 i 97.0 87.4 i 84.8
Observat ions Ro 1 Cone: Ro 2 Cone. Ro3 : Ro5 :
Clean Chalco froth Duller froth color than Ro 1 Lots of Pyrhotite, some silicates with Cu inclusions - some sulphides floating. Froth is very bare.

Test No.: F5 Project No.: 10616-001 Operator : D.L. Date: 02-May-05
Purpose: The fifth in a series of 6 tests to examine the rougher flotation kinetics of Shakespeare sample.
Procedure: Flotation was conducted as described below. A l l products were submitted for Pt, Pd, Au, Cu, N i , , and S analyses.
Feed:
Grind :
2 kg of minus 10 mesh Shakesperare.
30 minutes / 2 kg @ 65% solids in laboratory ball mil l (BM-3). RghrTailK,o= -78nm.
Stage F
Na2S205 Leagents added
SIPX , grams per tonr
3477 le
MIBC Grind Time, minu
Cond. tes
Froth pH
Grind 200 30 8.7
Rougher 1 5 0 7.5 1 1 8.7 Rougher 2 2.5 0 5 1 1 Rougher 3 2.5 2.5 2.5 1 3 «.5 Rougher 4 2.5 2.5 2.5 1 5 8.3 Rougher 5 2.5 2.5 2.5 1 5 8.3
Total 200 15 8 20
Stage Roughers Flotation Cell lOOOg-Dl Speed: rpm 1800
Metallurgical Balance
Product Weight Assays, g/t % Distribution g ' % Pt ! Pd ! 1 Au , Cu i Ni S. Pt i Pd 1 Au i Cu : N i i S
Rougher Cone 1 29.4 i 1.48 13.4 : 1 5.89 ! 2.49 ! 10.2 ; 11.6 23.8 56.6 1 21.0 14.6 36.7 ; 46.9 14.7 Rougher Cone 2 33.5 j 1.69 2.73 i 3.09 ! ' 1.54 ' 9.51 4.90 23.4 13.1 • 12.6 10.3 39.0 1 22.6 16.5 Rougher Cone 3 43.3 1 2.18 1.65 ; 2.47 Î i 1.31 i 0.48 0.72 20.4 10.3 i 13.0 11.3 2.5 i 4.3 : 18.6 Rougher Cone 4 56.7 i 2.85 0.87 i 1.31 ' 0.66 ( 1.98 1.3 21.2 7.1 1 9.0 7.5 13.7 i 10.1 : 25.3 Rougher Cone 5 30.7 1.54 0.58 0.83 i 1 0.44 . 0,25 0.53 17.7 2.6 1 3.1 2.7 0.9 i 2.2 1 11.4 Rougher Tailing 1794.0 90.26 0.04 0.19 1 0.15 0.032 0.056 0.36 10.3 i 41.4 53.7 7.0 1 13.8 13.6
Head (calc.) 1987.6! 100.0 0.35 0.41 0.25 0.41 0.37 2.39 1
100.0 100.0 100.0 lOO.Oj lOO.oj 100.0 (direct) i 0.43 0.37 i 2.41 i , i 1
Combined Products Rougher Cone - 1 min. 1.48 13.4 5.89 2.49 10.2 11.6 23.8 56.6 21.0 1 14.6 1 36.7 ! 46.9 ! 14.7 Rougher Cone - 2 min. 3.16 7.72 4.40 1.98 9.83 8.03 23.6 69.8 33.6 24.9 75.7 69.5 31.2 Rougher Cone - 5 min. 5.34 5.24 3.61 1.71 6.02 5.05 22.3 80.0 46.5 36.2 78.3 73.8 49.7 Rougher Cone - 10 min. 8.20 3.72 2.81 1.34 4.61 3.75 21.9 87.1 55.6 43.7 92.0 83.9 i • 75.0 Rougher Cone - 15 min. i 9.74 3.22 i 2.50 1.20 3.92 3.24 21.2 89.7 58.6 46.3 93.0 1 86.2 1 86.4
Observations Ro 1 Cone: Ro 2 Cone. Ro3: Ro5:
Weak No Cu color Stronger in ro 2 Cu seems to be dragging on to 3 and 4 rougher lots of pyrhotite, weak froth

Test No.: F4 Project No.: 10616-001 Opera to r : D.L. Date: 02-May-05
Purpose: The fourth in a series of 288 tests to examine the rougher flotation kinetics of Shakespeaie sample.
Procedure: Flotation was conducted as described below. All products were submitted for Ft, Pd, Au, Cu, Ni,, and S analyses.
Feed:
Gr ind :
2 kg of minus 10 mesh Shakesperare.
30 minutes / 2 kg @ 65% solids in laboratory ball mill (BM-3). Rghr Tail K,o = ~78nm.
Stage F
Na2S205 (.eagents added
SIPX grams per tonr
3477 le
MIBC Grind Time, minu
Cond. tes
Froth pH
Grind 100 30 8.9
Rougher 1 5 7.5 1 1 8.9 Rougher 2 2.5 5 1 1 Rougher 3 2.5 2.5 2.5 ! 3 8.7 Rougher 4 2.5 2.5 2.5 1 5 8.5 Rougher 5 2.5 2.5 2.5 1 5 8.5
Total 100 15 8 20
Stage Rou.ehers Floution Cell lOOOg-DI Speed; rpm 1800
Metallurgical Balance
Produc t Weight Assays, g/t % Distribution S • % Pt i Pd ' Au i Cu i Ni : S Pt Pd i Au 1 Cu ^ Ni ! s
Rougher Cone 1 50.0 ; 2.51 7.68 i 3.61 • 1.98 i 13.1 : 9.23 : 25.4 52.8 22.1 i 1 21.4 1 79.3 i 63.1 1 27.1 Rougher Cone 2 25.5 : 1.28 4.25 : 4.32 1.95 2.70 : 3.01 i i 18.4 14.9 13.5 [ 10.7 ^ 8.3 i 10.5 10.0 Rougher Cone 3 46.1 ; 2.31 1.86 : 2.39 1 1.13 0.67 0.94 i 16.9 11.8 13.5 11.3 i 3.7 5.9 16.6 Rougher Cone 4 38.3 1.92 1.19 ; 1.37 0.67 i 0.33 0.63 17.3 6.3 6.4 5.5 ! 1.5 3.3 14.1 Rougher Cone 5 51.0 1 2.56 0.63 0.81 0.44 0.17 0.51 16.2 4.4 5.1 4.9 i 1.0 3.6 17.6 Rougher Tailing 1781.01 89.41 0.04 S ; 0.18 0.12
i 0.028 i 1 0.056 0.38 9.8 39.3 46.2 ! 6.0 13.6 14.4
Head (calc.) 1991.9; 100.0 0.37 1 0.41 0.23 0.41 0.37 2.35 100.0 100.0 100.01 100.0 100.0 100.0 (direct) ! i 0.43 I 0.37 ! 2.41 ! ! :
Combined Products Rougher Cone -• 1 min. ; 2.51 7.7 3.61 ; 1.98 1 13.1 i 9.2 ! 25,4 52.8 ! 22.1 21.4 i 79.3 1 63.1 1 27.1 Rougher Cone -• 2 min. ! 3.79 6.52 : 3.85 i 1.97 j 9.59 ! 7.13 • 23.0 67.7 i 35.7 i 32.1 ; 87.6 i 73.6 37.1 Rougher Cone • • 5 min. ; 6.10 4.75 ^ 3.30 i 1.65 i 6,21 4.78 1 20,7 79.5 ! 49.2 ^ 43.4 i 91.4 79.5 53.8 Rougher Cone • • 10 min. ; 8.03 3.90 j 2.83 j 1.42! 4.80 3.79 1 19,9 85.8 i 55.6 49.0 1 92,9 82.8 67.9 Rougher Cone -• 15 min. ; 10.59 3.11 ! 2.35 ; 1.18 i 3.68 i ! 3.00 i 19.0 90.2 i 60.7 53,8 1 94.0 86.4 85.6
Observat ions Ro 1 Cone: Ro 2 Cone. Ro3: Ro5:
Cleaner Cu froth than in F5
Cu locked in silicates floating late in ro 4 and 5

Test No.: F4 Project No.: 10616-001 Operator: D.L. Date: 02-May-05
Purpose: The fourth in a series of 6 tests to examine the rougher flotation kinetics of Shakespeaie sample.
Procedure: Flotation was conducted as described below. A l l products were submitted for Ft, Pd, Au, Cu, N i , , and S analyses.
Peed: 2 kg of minus 10 mesh Shakesperare.
Gr ind: 30 minutes / 2 kg @ 65% solids in laboratory ball mill (BM-3).
asin F1 , but add 30 minutes aeration
Rghr Tail Kjo = nm.
Stage F
Ca(OH)2 Leagents added
SIPX , grams per tonr
3477 le
M[BC Grind Time, minu
Cond. tes
Froth pH
Grind 500 30 9.5 Aeration 30 9.3-8.7
Rougher 1 5 7.5 1 1 9.3 Rougher 2 2.5 5 1 1 Rougher 3 2.5 2.5 2.5 1 3 9,3 Rougher 4 2.5 2.5 2.5 1 5 Rougher 5 2.5 2.5 2.5 ! 5 9.3
Total 500 15 8 20
Stage Roughers Flotation Cell lOOOg-Dl Speed; rpni 1800
Metallurgical Balance
Product Weight Assays, g/t % Distribution S % Pt , Pd i Au Cu NI ! S Pt ; Pd 1 Au Cu ; Ni : S
Rougher Cone 1 62- 3.11 2.59 1 2.14 ^ 1.39 11.3 7.17 23.2 23.3 : 17.4 : 19.2 89.4 : 60.4 , 30.3 Rougher Cone 2 32.1 1.61 3.07 • 2.51 1.56 : 1.21 2.96 19.8 14.3 . 10.5 11.2 5.0 ; 12.9 13.4 Rougher Cone 3 54.8' 2.75 2.4 • 1.89 : 1.04 0.22 0.89 17.3 19.1 i 13.6 ^ 12.7 1.5 . 6.6 i 20.0 Rougher Cone 4 64.7 3.25 1.78 1.34 0.49 0.068 0.45 11.2 16.7 • 11.3 i 7.1 0.6 : 4.0 : 15.3 Rougher Cone 5 60.4 3.03 1.04 : 0.85 0.3 0.031 0.29 7.11 9.1 , 6.7 i 4.0 0.2 j 2.4 . 9.1 Rougher Tailing 1717! 86.24 0.07 ; 0.18 0.12 1 0.015 0.059 0.33 17.4 i 40.5 ; 45.9 3.3 ! 13.8 : 11.9
Head(calc.) 1991.0i 100.0 0.35 0.38 ; 0.23 ^ 0.39 0.37 2.38 100.01 100.0 100.0 100.01 100.0 100.0 (direct) 0.43 i 0.37 2.41 j 1
Combined Products Rougher Cone - 1 min. i 3.11 2.6 2.14 1 1.39 i 11.3 i 7.2 i 23.2 23.3 17.4 19.2 89.4 60.4 30.3 Rougher Cone - 2 min. • 4.73 2.75 2.27 1.45 1 7.86 j 5.73 ! 22.0 37.6 27.9 30.3 94.4 73.3 43.7 Rougher Cone - 5 min. ; 7.48 2.62 2.13 1.30 1 5.05 ! 3.95 ! 20.3 56.7 41.5 43.0 95.9 79.9 63.7 Rougher Cone -10 min. ; 10.73 2.37 1.89 1 1.05 : 3.54 ; 2.89 1 17.5 73.4 : 52.8 50.1 96.5 83.9 79.0 Rougher Cone -15 min. : 13.76 2.08 1 1.66 j 0.89 1 2.77 i 2.32 ! 15.2 82.6 i 59.5 1 54.1 96.7 86.2 88.1
Observa t ions Ro 1 Cone: Ro 2 Cone. Ro3 : Ro5:
Clean Chaico froth Duller froth color than Ro 1 Lots of Pyrhotite, some silicates with Cu inclusions - some sulphides floating. Froth is very bare.

Test No.: F8 Project No.; 10616-001 Operator: P.M. Date: 18-May-05
Purpose: The second in a series of 3 tests to investigate Po rejection in rougher flotation of Shakespeare sample.
Procedure: Flotation was conducted as described below. All products were submitted for Pt, Pd, Au, Cu, Ni,, and S analyses.
Feed: 2 kg of minus 10 mesh Shakesperare.
Grind: 30 minutes / 2 kg @ 65% solids in laboratory ball mill (BM-3).
asin F1 .but add 30 minutes aeration
RghrTailK,„ = -78 ^m.
Stage Ca(0H)2 Reagent!
NajSO, Î added, grams p
SIPX er tonne
3477 MIBC Grind Time, minui
Cond. tes
Froth PH
Grind 500 30 9.5 Aeration 30 9.3-8.7
Rougher 1 5 7.5 1 J 9.3 Po Rejection 50 1 Rougher 2 2.5 5 1 1 Rougher 3 2.5 2.5 2.5 1 3 9J Rougher 4 2.5 2.5 2.5 1 5 Rougher 5 2.5 2.5 2.5 1 5 9.3
Total 500 !5 8 20
Stage Roughers Flotation Cell lOOOg-DI Speed: rpm 1800
Metallurgical Balance
Product Weight Assays, g/t % Distribution
S ' % Pt ; Pd Au : Cu i Ni • S Pt Pd ' Au • Cu Ni • S Rougher Cone 1 7I.5i; 3.61 3.4 2.56 6.27 : 10 7.03 23 35.4 i ; 22.2 52.4 , 89.2 ! ! 66.6 i 33.2 Rougher Cone 2 33.11 1.67 1.99 ! 2.30 ; 2.07 1.22 1.87 12.8 9.6 9.2 ! 8.0 i 5.0 ' ' 8.2 8.6 Rougher Cone 3 88.2 j 4.45 1.74 ! 1.28 i 0.94 i 0.19 0.55 13 22.4 1 13.7 1 9.7 , 2.1 1 6.4 , 23.1 Rougher Cone 4 93 4.70 1.13 ! 0.99 0.43 ! 0.062 0.31 8.43 15.4 11.1 ! 4.7 1 0.7 ! 1 3.8 i 15.8 Rougher Cone 5 57.6 2.91 0.90 : 0.88 0.34 ; 0.042 0.25 6.92 7.6 6.1 i 2-3 i 0.3 1.9 ^ 8.0 Rougher Tailing 1637 82.66 0.04 0.19 0.12 0.013 0.06
1 0.34 9.6 1 37.7 23.0 ! 2.7
i 13.0 ! 11.2
1
Head (calc.) 1980.4 100.0 0.35 0.42 0.43 0.40 0.38 2.50 100.01 100.0 j 100.0 100.0 100.0 100.0 (direct) 1 ! 0.43 0.37 ! 2.41 ! i i
Combined Products Rougher Cone -• 1 min. 1 3.61 3.4 2.56 j 6.27 10.0 ! 7.0 23.0 35.4 1 22.2 52.4 i 89.2 66.6 33.2 Rougher Cone • • 2 min. ; 5.28 2.95 2.48 1 i 4.94 7.22 5.40 19.8 45.1 31.4 60.4 94.2 74.8 41.7 Rougher Cone -. 5 min. 1 9.74 2.39 1.93 i 3.11 4.00 3.18 16.7 67.5 45.1 70.1 96.3 81.3 64.9 Rougher Cone - 10 min. 1 14.43 1.98 1.62 1 2.24 , 2.72 2.25 14.0 82.9 56.2 74.8 97.0 85.1 • 80.7 Rougher Cone -• 15 min. ! 17.34 1.80 1.50 ! 1.92 2.27 1.91 12.8 90.4 62.3 77.0 97.3 87.0 ! 88.8
Obser\'atians Ro 1 Cone: Ro 2 Cone. Ro3; Ro5:

Test No.: F8 Project No.; 10616-001 Opera to r : P.M. Date: 18-May-05
Purpose: The second in a series of 3 tests to investigate Po rejection in rougher flotation of Shakespeare sample.
Procetlure: Flotation was conducted as described below. A l l products were submitted for Pt, Pd, Au, Cu, N i , , and S analyses.
feed: 2 kg of minus 10 mesh Shakesperare.
Grind: 30 minutes / 2 kg @ 65% solids in laboratory ball mil l (BM-3).
asin F1 , but add 30 minutes aeration
Rghr Tail K j , = -78 jim.
Stage Ca(0H)2 Reagent:
Na,SO, s added, grams :
SIPX ser tonne
3477 MIBC Grind Time, minu
Cond. tes
Froth PH
Grind 500 30 9.5 Aeration 30 9.3-8.7
Rougher 1 5 7.5 1 1 9.3 Po Rejection 100 1
Rougher 2 2.5 5 1 1 Rougher 3 2.5 2.5 2.5 1 3 9.3 Rougher 4 2.5 2.5 2.5 1 5 Rougher 5 2.5 2.5 2.5 1 5 9.3
Total 500 15 8 20
Stage Roughers Flotation Cell lOOOg-Dl Speed: rpm 1800
Metallurgical Balance
Product Weight Assays, g/t % Distribution g : % Pt : Pd Au i Cu NI ; s Pt Pd : Au Cu ; N i i Î s
Rougher Cone 1 70.0 ! 3.53 3.8 i 2.33 1.99 : 10.4 ; 7.04 22.8 35.6 20.5 ; 26.6 89.2 i 66.3 I 32.6 Rougher Cone 2 31.4 i 1.58 2.10 1 2.56 i 1.66 i 1.27 : 2.12 12.6 8.8 10.1 i lO.O 4.9 ! 9.0 i 8.1 Rougher Cone 3 48.2 i 2.43 2.08 i 1 1.69 1 1 1.04 0.29 1 0.64 11.2 13.4 10.3 : : 9.6 i 1.7 ! 4.1 1 ! 11.0 Rougher Cone 4 56.0 i 2.82 1.30 0.90 0.46 0.12 ; 0.41 11.5 9.7 6.3 1 1 4.9 j 0.8 1 3.1 13.2 Rougher Cone 5 45.8 ; 2.31 1.51 1.19 0.30 ; O - O ' ' j ! 0.39 12.5 9.2 6.9 2.6 ! 0.2 • 2.4 11.7 Rougher Tailing 1734.0] 87.34 0.10 0.21 0.14 0.015 0.065 0.66 23.2 45.9 46.3 15.2 23.4
Head (calc.) 1985.4 100.0 0.38 ; ; 0.40 0.26 0.41 1 0.00 0.00 100.0 100.0 100.0 1
100.0 ! 100.0 100.0 (direct)
! i 0.43 ; , 0.37 2.41
Combined Products Rougher Cone • • 1 min. : 3.53 3.8 2.33 1.99 { 1 10.4 7.0 22.8 35.6 20.5 26.6 i 89.2 66.3 32.6 Rougher Cone • - 2 min. ' 5.11 3.28 2.40 1.89 7.57 5.52 19.6 44.5 30.7 36.5 i 94.1 75.2 40.7 Rougher Cone • . 5 min. : 7.54 2.89 2.17 1.61 5.23 3.95 16.9 57.9 40.9 46.1 j 95.8 79.4 51.7 Rougher Cone • 10 min. i 10.36 2.46 1.83 1.30 3.84 2.98 15.4 67.6 47.3 ! i 96,6 82.4 64.9 Rougher Cone • 15 min. 1 12.66 2.29 i 1.71 1.12- 3.14 1 2.51 14.9 76.8 54.1 ! 53.7 96.8 84.8 76.6
Observations Ro 1 Cone: Ro 2 Cone. Ro3: Ro5:

Test No.: F9 Project No.: 10616-001 Opera tor : P.M. Date: i8-May-05
Purpose: The third in a series of 3 tests to investigate Po rejection in rougher flotation of Shakespeare sample.
Procedure: Flotation was conducted as described below. Al l products were submitted for Pt, Pd, Au, Cu, N i , , and S analyses.
Feed:
Grind:
2 kg of minus 10 mesh Shakesperare.
30 minutes / 2 kg @ 65% solids in laboratory ball mil l (BM-3).
asin Fi , but add 30 minutes aeration
Rghr Tail Kjo = -78 pm.
Stage Ca(0H)2 Reagent:
Na,SO, s added, grams [
SIPX 3er tonne
3477 MIBC Grind Time, minu
Cond. tes
Froth pH
Grind 500 30 9.5 Aeration 30 9.3-8.7
Rougher 1 5 7.5 1 1 9.3 Po Rejection 150 1 Rougher 2 2.5 5 1 1 Rougher 3 2.5 2.5 2.5 1 3 9.3 Rougher 4 2.5 2.5 2.5 1 5 Rougher 5 2.5 2.5 2.5 1 5 9.3
Total 500 15 g 20
Stage Roughers Flotation Cell lOOOg-Dl Speed: rpm 1800
Metallurgical Balance
Product Weight Assays, g/t % Distribution S % Pt : Pd Au Cu Ni ; S Pt Pd : Au Cu Ni ! S
Rougher Cone 1 57.4 2.88 4.0 i 2.26 , 1.69 13.3 • 7.57 1 25.3 30.9 16.5 ! 20.1 88.2 56.7 28.9 Rougher Cone 2 28.3 ' 1.42 2.36 2.81 : • 1.58 1.63 ; 4.07 1 ! 13.6 9.1 10.! J ! 9-3 5.3 15.0 7.7 Rougher Cone 3 35.0 1 1.76 1.85 2.58 ; 1.46 0.49 j 1.36 1 13.1 8.8 11.5 10.6 2.0 6.2 9.1 Rougher Cone 4 31.0 ! 1.55 1.77 : 1.28 , 0.72 0.14 0.6 13.7 7.4 5.0 4.6 0.5 2.4 1 8.5 Rougher Cone 5 29.3 ; 1.47 1.74 i 1.10 0.44 0.06 0.5 ; 14.9 6.9 ! 4.1 2.7 0.2 1,9 8.7 Rougher Tailing 1813.0.90.92 0.15 i 0.23 0.14 0.018 0.075 1.03 36.9 1 52.9 52.7 3.8 17.7 37.2
Head (calc.) I994.oi 100.0 0.37 i 0.40 0.24 0.43 0.38 2.52 100.0 i 100.0 100.0 100.0 100.0 100.0 (direct) 0.43 0.37 2.41 1 i i
Combined Products Rougher Cone • . 1 min. : 2.88 4.0 1 2.26 i 1.69 13.3 1 7.6 ! 25.3 30.9 16.5 20.1 88.2 j 56.7 28.9 Rougher Cone • • 2 min. i 4.30 3.43 1 2.44 i 1.65 9.45 6.41 1 21.4 39.9 26.5 29.4 93.6 1 71.7 36.6 Rougher Cone • . 5 min. i 6.05 2.97 i 2.48 1 1.60 i 6.85 i 1 4.95 19.0 48.7 38.0 40.0 95.5 i 77.9 i 45.7 Rougher Cone • • 10 min. : 7.61 2.73 i 2.24 i 1.42 ! 5.48 4.06 17.9 56.2 43.0 44.6 i 96.0 I 80.3 54.1 Rougher Cone • • 15 min. ! 9.08 2.57 ! 2.05 : 1.26.1 4.60 3.48 17.4 63.1 47.1 47.3 I 96.2 1 82.3 62.8
Observations Ro 1 Cone: Ro 2 Cone. Ro3: RoS:

Test No.: FIO Project No.: 10616-001 Operator: D.L. Date: 02-May-05
Purpose: To generate sample for mineralogigal studies.
Procedure: Flotation was conducted as described below. Al l products were submitted for Pt, Pd, Au, Cu, N i , , and S analyses. The rougher tailing was also submitted for size analysis.
Feed: 2 kg of minus 10 mesh Shakesperare.
Grind: 30 minutes / 2 kg @ 65% solids in laboratory ball mill (BM-3). Rghr Tail K,o = -78 nm.
Stage B
Ca(0H)2 Leagents added
SIPX grams per tonn
3477 e
MIBC Grind Time, minul
Cond. tes
Froth pH
Grind 200 30
Rougher 1 5 7.5 1 1 9.4 Rougher 2 2.5 5 I 1 Rougher 3 * 2.5 2.5 2.5 1 3 9.4 Rougher 4 2.5 2.5 2.5 1 5 Rougher 5 2.5 2.5 2.5 1 5 9.2
Total 200 15 g 20
Stage Roughers Flotation Cell lOOOg-Dl Speed: rpm 1800
Metallurgical Balance
Product Weight Assays, g/t % Distribution
g : % Pt ! Pd i Au i Cu Ni ^ S Pt Pd Au Cu Ni 1 S Rougher Cone 1 50.0 ; 2.52 2.72 ^ 1.16 1.19 13.8 7.44 . 27.2 22.0 ' 7.9 12.3 88.3 51.7 28.7 Rougher Cone 2 IS.5 ; 0.93 6.43 3.96 2.49 1.80 7.03 21.1 19.2 : 10.0 : 9.5 4.3 18.1 8.2 Rougher Cone 3 38.0 1.91 3.03 i 2.87 2.25 0.52 1.63 22.0 18.6 i i 14.9 i 17.7 2.5 8.6 1 : 17.7 Rougher Cone 4 55.7 2.80 1.77 • 1.66 0.78 0.21 i 0,67 : 18.1 15.9 ! 12.7 1.5 5.2 ; 21.3 Rougher Cone 5 29.0 1 1.46 1.48 i 1.3 0.56 0.12 j 0.53 ! 14.6 6.9 ; j 5.2 1 3.4 0.4 2.1 8.9 Rougher Tailing 1796.0) 90.38 0.06 i 0.2 0.13 0.013 ! 0.057 ! 0.40
i 1 17.4 49.2 { 48.2 3.0 14.2 15.2
Head (calc.) 1987.2 j 100.0 0.31 i 0.37 i 0.24 0.39 j 0.36 2.38 100.0 100.0 i 100.0 100.0 100.0 j 100.0 (direct) i j
0.43 • 0.37 2.41 i ! 1
Combined Products Rougher Cone • 1 min. j 2.52 2.7 1.16 j 1.19 13.8 1 7.4 27.2 22.0 ; ' 7.9 12.3 i [ 88.3 51.7 28.7 Rougher Cone • . 2 min. ' 3.45 3.72 1.92 j 1.54 10.56 1 7.33 25.6 41.2 i i 18.0 21.8 ! 92.5 69.8 37.0 Rougher Cone -• 5 min. • 5.36 3.48 : 2.26 1.79 j i 6.98 ! I 5.30 24.3 59.8 : 32.9 39.5 ; : 95.1 78.4 ! 54.6 Rougher Cone • . 10 min. j 8.16 2.89 i 2.05 1.45 ! 4.65 3.71 22.2 75.7 45.6 48.4 96.6 83.6 75.9 Rougher Cone • . 15 min. ! 9.62 2.68 i 1.94 1.31, i 1 3.97 i 3.23 21.0 82.6 50.8 51.8 97.0 85.8 84.8
Obser%-ations Ro 1 Cone: Ro 2 Cone. Ro3: Ro5:
Clean Chalco floating,with some fine pyrhotite - duller colour, less lustre, still some chalco. Lots of Pyrhotite, some silicates with Cu inclusions - some sulphides floating. Froth is very bare.

Test No.: F14 Project No.: 10616-001 Operator: D.L. Date: 02-JU11-05
Purpose: To evaluate the cfTectof primary grind fineuess on die rougher flotation kinetics of Shakespeare sample.
Procedure: Flotation was conducted as described below. All products were submitted for Pt, Pd, Au, Cu, Ni, , aud S analyses.
Peed: 2 kg of minus 10 mesh Shakesperare.
Grind: 15 minutes / 2 kg @ 65% solids in laboratory ball mill (BM-3).
F3 conditions with 15 niin Grind
RglirTailK„,= I57(im.
Stajie Roughers Flotation Cell lOOOg-Dl Speed: rpm ISOO
Stage f
Ca(0H)2 Uagents added.
SIPX , grams per tonne
3477 MIBC Grind Time, miuui
Cond. tes
Froth pH
Grind 500 15
Rougher 1 5 7.5 1 1 10.7 Rougher 2 2.5 2.5 5 1 2 Rougher 3 2.5 2.5 2.5 1 3 10.6 Rougher 4 2.5 2.5 2.5 1 5 Rougher 5 2.5 2.5 2.5 1 5 9.8
Toul 500 15 10 20
MeUllurgical Balance
Product Weight Assays, g/t % Distribution g ^ Pt i Pd • Au Cu i Ni • S Pt 1 Pd i Au Cti • Ni • S
Rougher Cone 1 27.4 • 1.38 4.19 1 2.23 i 4.6 i 18.4 • 3.79 1 24.9 15.6 6.6 i 23.2 i 64.3 : 14.4 ! 13.4 Rougher Cone 2 14.4 i 0.72 5.9 i 3.46 1 2.17 • 6.47 : , 6.22 i 16.6 11.5 5.4 ' 5.8 11.9 12.4 ; 4.7 Rougher Cone 3 28.6 i 1.44 3.4 i 3.06 1 1.64 i 2.03 i 4.15 1 10.9 13.2 9.5 ; 8.6 ; 7.4 16.5 6.1 Rougher Cone 4 33.8 • 1.70 3.34 ; 2.31 1.11 1 0.90 ! 4.2 1 13.9 15.3 8.4 1 ! 3.9 : 19.7 1 9.2 Rouglier Cone 5 40.4 ; 2.03 1.69 I 1.44 1 0.6 • 0.43 1.55 : 15.3 9.3 6.3 4.5 • 2.2 ; 8.7 • 12.1 Rougher Tailing 1846.8192.74 0.14 ; 0.32 ^ 0.15 ; 0.044 0.11 , 1.51 35.1 63.8 51.0 ; 10.4 ; 28.2 . 54.6
Head (calc.) 1991.4i 100.0 0.37 0.46 0.27 • 0.39 0.36 ! 2.57 100.0 I 100.0 100.0 100.0 i 100.0 • 100.0 (direct) 0.43 ; 0.37 : 2.41 1 :
Combined Products Rougher Cone - 1 min. 1.38 4.2 ; 2.23 1 4.60 ; 18.4 i 3.3 24.9 15.6 i 6.6 23.2 1 64.3 : 14.4 13.4 Rougher Cone - 2 rain. ; 2.10 4.78 2.65 3.76 i 14.29 4.63 ! 22.0 27.1 12.0 29.0 • 76.1 i 26.9 18.0 Rougher Cone - 5 min. i 3.54 4.22 2.82 ! 2.90 : 9.31 4.43 i I 17.5 40.3 : 21.4 37.6 i S3.5 1 43.4 24.1 Rougher Cone - 10 min. 5.23 3.93 2.65 1 2-32 1 6.58 4.36 ! 16.3 55.6 1 29.9 44.5 1 87.4 j 63.1 ' 33.3 Rougher Cone - 15 min. 7.26 3.31 I 2.31 ! 1.84 1 4.86 ! 3.57 i 16.1 64.9 i 36.2 49.0 ! 89.6 1 71.8 . 45.4
Observations Ro 1 CoBc: Ro 2 Cone. Ro3: Ro5;
Cleaner Chalco floating than in Fi , Very nice froth texmre too many Cu and Pn middlings Lots of Pyrhotite, some silicates witli Cu inclusions Middling floatation till the end

SGS Lakefield Research Limited Size Distribution Analysis
Project No. 10616-003
Sample: Ro Tail Test No,: F11
Size Weight % Retained % Passing Mesh pm grams individual Cumulative Cumulative
48 300 4.5 3.1 3.1 96.9 65 212 11.4 8.0 11.1 88.9 100 150 14.5 10.1 21.3 78.7 150 106 18.6 13.0 34.3 65.7 200 75 15.1 10.6 44.9 55.1 270 53 15.8 11.1 55.9 44.1 400 38 12.2 8.5 64.5 35.5 Pan -38 50.8 35.5 100.0 0.0
Total - 142.9 100.0 . - -
K80 157
03 Ç tfl V) ro CL
a> >
TO E D
O
100 90 80 70 60 50 40 30 20 10 0
10
Particle Size Distribution
1 1 ' i i 1 i ! 1 : ' i ; , : ' • ; 1 i 1 ; M ! i i 1 i : • ; i : ; 1 : i M M M 1 1 ' M : i ; ^
1 • • 1 : •
! . : : I J - T M i " ' •
; h i ; i
! : i ! i i 1 ; 1 1 K80 = 157 |im .
^ 1 ^ i M ! i h ! ! 1 i i ' M '
1 0 0
Screen Size (micrometers)
1,000

Test No.: F12 Project No.: 10616-001 Opera tor : D.L. Date: Ol-Jun-05
Purpose: To evaluate the effectof primary grind fineness on the rougher flotation kinetics of Shakespeare sample.
Procedure: Flotation was conducted as described below. Al l products were submitted for Pt, Pd, Au, Cu, N i , , and S analyses.
Feed:
Gr ind:
2 kg of minus 10 mesh Shakesperare.
22 minutes / 2 kg @ 65% solids in laboratory ball mil l (BM-3).
F3 conditions with 22 min Grind
RghrTai lK,o= 104nm.
Stage P
Ca(0H)2 [.eagents added
SIPX ^ grams per tonr
3477 le
MIBC Grind Time, minu
Cond. tes
Froth PH
Grind 500 22
Rougher 1 5 7.5 1 1 10.5 Rougher 2 2.5 2.5 5 I 2 Rougher 3 2.5 2.5 2.5 1 3 10.2 Rougher 4 2.5 2.5 2.5 1 5 Rougher 5 2.5 2.5 2.5 1 5 9.6
Total 500 15 10 20
Stage Roughers Flotation Cell lOOOg-Dl Speed: rpm 1800
Metallurgical Balance
Product Weight Assays, g/t % Distribution g : % PI Pd j Au i Cu ; Ni 1 S Pt : Pd ! Au : Cu 1 Ni : S
Rougher Cone 1 32.2 ; 1.63 4,9 2,37 I 3.05 • 18.8 ! 4.7 i 26.7 22.9 1 8.0 1 19.5 i 80.1 ! 20.8 i 15.5 Rougher Cone 2 17.0 ; 0.86 5.08 3.63 ; 1.84 . 3.33 i 9.40 1 18 12.5 i 6.5 ; 6.2 i 7.5 1 ' 21.9 j 5.5 Rougher Cone 3 28.0 : 1.42 4.05 3.48 i 1.81 0.99 5.17 i 13.6 16.5 ! 10.2 10.1 i 3.7 : 19,9 • 6.9 Rougher Cone 4 52.4 • 2.66 1.93 1.89 1 0.92 ; 0.24 1.25 i 13.8 14.7 : 10.4 9.6 i 1.7 , 9,0 : 13.0 Rougher Cone 5 46.1 , 2.34 1.49 ; 1.37 0.51 ; 0.11 1 0.61 ; 17.2 10.0 6,6 4.7 ; 0.7 i 3.9 ^ 14.3 Rougher Tailing 1797.21 91.09 0.09 0.31 . 0.14 i 0.027 • 0.1 i 1.38 23.5 ! 58.4 150-0 : 6.4 24.6 i 44.7
Head (calc.) 1972.9i 100.0 0.35 0.48 . 0.26 Î 0.38 i 10.37 : 2.81 100.0 100.0 100.0 100.0 100.01 100.0 (direct) 1 0.43 ; ! 0.37 1 2.4J 1
1 1
Combiaed Products Rougher Cone - 1 min. j 1.63 4.9 1 2.37 1 3.05 18.8 4.7 26.7 22.9 8.0 19.5 ! 80.1 20.8 ! 15.5 Rougher Cone - 2 min. ! 2.49 4.96 i 2.81 ! 2.63 13.45 6.32 23.7 35.4 14.5 25.7 87.6 42.7 21.0 Rougher Cone - 5 min. 3.91 4.63 1 3.05 i 2.33 8.93 5.91 20.0 51.9 24.7 35.8 91.2 62.5 27.9 Rougher Cone - 10 min. 6.57 3.54 i 2-58 ! 1.76 5.42 4,02 17.5 66.6 35.0 45.4 92.9 71.5 40.9 RougherConc- I5min. 8.91 3.00 ! 2.26 ! 1.43 4.03 3.13 17.4 76.5 41,6 50.0 93.6 75.4 55.3
Observa t ions Ro 1 Cone: Ro 2 Cone. Ro3: Ro5 :
Cleaner Chalco floating, Very nice froth texture too many Cu and Pn middlings Lots of Pyrhotite, some silicates with Cu inclusions Middling floatation t i l l the end

SGS Lakefield Research Limited Size Distribution Analysis
Project No. 10616-003
Sample: Ro Tail Test No.: F12
Size Welgiit % Retained % Passing IVIesh |jm grams individual Cumulative Cumulative
48 300 0.6 0.4 0.4 99.6 65 212 3.5 2.2 2.6 97.4 100 150 8.6 5.4 7.9 92.1 150 106 18.4 11.4 19.4 80.6 200 75 21.7 13.5 32.9 67.1 270 53 22.6 14.1 46.9 53.1 400 38 17.3 10.8 57.7 42.3 Pan -38 68.0 42.3 100.0 0.0
Total - 160.7 100.0 - -
K80 104
CD Ç W U) ca a.
03 >
m 3 E O
1 0 0
90 80 70 60 50 40 30 20 10 0
10
Particle Size Distribution
100
Screen Size (micrometers)
; ' ; ! i i i M ! ' i t ! i 1 • M ^ i 1 1 j !
' ! 1 1 1 il i 1 i 1 i 1 i ; ! j
i ' ' i i y M
' 1 ! i : i ' • :
1 1 ! i
i 1 L ! i i 1 1
1 ^ 1 1 1
' ! i • 1 :
! ! ; M ; M 1 ; ' . M
• !
i i . 1 ! • 1 i : ' !
K « U = 1 0 4 | j m
• i . ; • M i i : { ! ; ; : , !
1,000

Test No.: F13 Project No.: 10616-001 Operator: D.L. Date: Ol-Jun-05
Purpose: To evaluate the effectof primary grind fineness on the rougher flotation kinetics of Shakespeare sample.
Procedure: Flotation was conducted as described below. A l l products were submitted for Pt, Pd, Au, Cu, N i , , and S analyses.
Feed:
Gr ind:
2 kg of minus 10 mesh Shakesperare.
45 minutes / 2 kg @ 65% solids in laboratory ball mi l l (BM-3).
F3 conditions with 45 min Grind
RghrTailK8o= 59nm.
Stage F
Ca(0H)2 Reagents added
SIPX , grams per tonr
3477 le
MIBC Grind Time, minu
Cond. tes
Froth pH
Grind 600 45
Rougher 1 5 7.5 1 1 10.4 Rougher 2 2.5 2.5 5 1 2 Rougher 3 2.5 2.5 2.5 1 3 10.0 Rougher 4 2.5 2.5 2.5 1 5 Rougher 5 2.5 2.5 2.5 1 5 9.7
Total 600 15 10 20
Stage Roughers Flotation Cell lOOOg-Dl Speed: rpm 1800
Metal lurgical Balance
Product Weight Assays, g/t % Distr ibut ion
2 % Pt i Pd i C " M • S Pt i Pd 1 Cu i Ni S Rougher Cone 1 24.8 ! 1.24 2.49 1 1.67 i 22.7 . 3.68 : 27.6 8.8 1 5.1 i 72.7 : 12.7 13.5 Rougher Cone 2 20.2 ! 1.01 4.44 i 2.75 1 6-65 i 11.50 ; 20.7 12.8 . 6.9 ; 17.4 i 32.3 8.3 Rougher Cone 3 35.0 1 1.75 3.63 3.71 ; 1.10 ! 5.53 j 11.6 18.1 : 16.0 1 5.0 • 26.9 8.0 Rougher Cone 4 62.1 3.11 2.03 2.01 ; 0.22 : 0.84 ' 9.21 17.9 i 15.4 ; 1.8 i 7.3 I 11.3 Rougher Cone 5 43.7 2.19 1.85 0.97 : 0.11 • 0.52 : 17.3 11.5 i 5.2 • 0.6 i 3.2 1 14.9 Rougher Tailing 1812.4, 90.70 0.12 i 0.23 ; 0.011:
1 0.07 ; 1.23 30.9 1 51.4 !
t 2.6 1 17.6 44.0
Head (calc.) 1998.21 100,0 0.35 0.41 1 0.39 : 0.36 i 2.54 100.0 100.0 j 100.01 100.0 100.0 (direct) j 0.43 ; 0.37 i 2.41 i i 1 1
Combined Products Rougher Cone - 1 min. 1.24 2.5 1 1.67 ' 22.7 ! 3.7 27.6 8.8 5.1 72.7 i 12.7 ; 13.5 Rougher Cone - 2 min. ; 2.25 3.37 ! 2.15 1 15.501 7.19 24.5 21.5 12.0 90.1 ! 45.0 ; 21.8 Rougher Cone - 5 min. 4.00 3.48 • 2.84 ! 9.20 6.46 18.9 39.6 Î 28.0 95.0 i 71.9 29.8 Rougher Cone - 10 min. ^ 7.11 2.85 1 2.47 ! 5.27 ^ 4.01 ' 14.6 57.6 I 43.4 96.8 . 79.2 41.1 Rougher Cone - 15 min. ; 9.30 2.61 : 2.12 ! 4.06 1 3.19 1 15.3 69.1 48.6 i 97.4 i 82.4 i 56.0
Observations Ro I Cone: Ro 2 Cone. Ro3 : R o 5 :
Excellent Chaico floating , Very nice froth texture Starts too get slimy Clean Grey metallic froth, some silicates with Cu inclusions Slimy, slow to mineralize

Sample: Ro Tail
SGS Lakefield Research Limited Size Distribution Analysis
Project No. 10616-003
Test No.: F13
Size Weight % Retained % Passing Mesh pm grams Individual Cumulative Cumulative
65 212 0.0 0.0 0.0 100.0 100 150 0.3 0.2 0.2 99.8 150 106 3.3 2.2 2.4 97.6 200 75 10.0 6.8 9.3 90.7 270 53 22.3 15.2 24.4 75.6 400 38 21.3 14.5 38.9 61.1 Pan -38 89.8 61.1 100.0 0.0
Total - 147.0 100.0 - -
K80 59
O) g m (f l 00 Q.
0) >
ro E
O
100 90 80 70 60 50 40 30 20 10 0
10
Particle Size Distribution
1 ^ ^ : — : ; ^ j j t • ^ i — —
' : \ \ ] - 1 • • : - '
i : , :
; 1 • ; ^ : . • ^ : • , - • , • ! ; i • Î ; : '
i : : • > i
' 1 • ^ ' i K B O = s a | i m ; :
! ; 1 • i ' ! i ; i
• t 1 i ! : ; . 1 : • 1 ' ;
100
Screen Size (micrometers)
1,000

Test No.: F14 Project No.: 10616-001 Operator: D.L. Date: 02-JU11-05
Purpose: A preliminary test to examine tbe split circuit floaution metliod of treating the shakespeare sample.
Procedure: Flotation was conducted as described below. All products were submitted for Pt, Pd, Au, Cu, Ni, , and S analyses.
Feed:
Grind:
2 kg of minus 10 mesli Sliakesperare.
30 minutes / 2 kg @ 65% solids in laboratory ball mill (BM-3). RghrTailK,o = -78 urn.
Stasje Lime leagents added
SIPX . grams per tonn
3477 e
MIBC Grind Time, minu
Cond. tes
Frotli PH
Grind 500 30
Rouffher 1 5 7.5 1 1 10.3 Rouglier 2 2.5 5 1 1
Renrind PM 50 5 S.9 Ro CInr 1 * 1.25 2.5 1 2 10.0 RoCln r2 * 2.5 1 2 10.2
Scaven)!er 1 2.5 2.5 2.5 1 3 Scaveneer 2 2.5 2.5 2.5 1 5 Scavenger 3 2.5 2.5 2.5 1 5
Scav Cone Repind PM 150 2.5 10 10.2 ScavCl 1 1 4 Scav CI 2 * 1 3 10.2 ScavCI 3 • 1 2 10.3
Total 700 19 3 25
Suge Roughers Ro Chirl&2 ScavChlr 1-3 Rougher! Flotation Cell 4L IL IL lOOOg-Dl Speed: rpm 1800 1200 1200 1800
Metallurgical Balance
Product Weight Assays, j / t •/. Distribution
8 : % Pt ! Pd i Cu ' Ni S Pt Pd 1 Cu Ni i S 1 Rouglier G 2 Couc 23.9 I 1.20 2.03 1.76 1 27.9 j 3.36 30.6 6.7 5.0 ; 83.0 11.3 i 14.6 2 Rougher CI 2 Tail 9.5 ; 0.48 4.55 3.57 3.82 10.30 16.5 5.9 4.1 i 4.5 13.7 ; 3.1 3 Rougher CI 1 Tail 36.0 1.80 4.31 j 2.1 0.89 i 5.17 10.7 21.4 9.1 4.0 26.1 7.7 4 Scav a 3 Cone 7.8 0.39 5.77 i 10.6 3.32 10 19.2 6.2 9.9 3.2 10.9 3.0 5 Scav a 3 Tail 7.4 0.37 4.28 4.63 0.45 4.01 14.4 4.4 4.1 0.4 4.2 2.1 6 Scav a 2 Tail 16.2 0.81 2.45 2.65 0.21 1.75 12.2 5.5 5.2 i 1 0.4 4.0 4.0 7 Scav CI 1 Tail 91.7 4.60 1.8 1.17 0.07 ! 0.85 12.7 22.7 12.9 0.8 10.9 23.3 8 Rougher Tailing 1802.8 90.35 0.11 0.23 0.016 0.075 1.17 27.3 49.8 3.6 19.0 4 2 J
Head(calc.) 1995.3 100.0 0.36 0.42 0.40 0.36 2.51 100.0 100.0 100.0 100.0 1 100.0 (direct)
! 0.43 0.37 2.41
Combined Products 1 Rougher Q 2 Cone ! 1.20 2.0 1.76 27.9 3.4 30.6 6.7 5.0 83.0 11.3 14.6
1-2 Rougher CI 1 Cone i 1.67 2.75 2.27 21.05 5.33 26.6 12.6 9.1 87.6 25.0 17.8 1-3 Rougher Cone 3.48 3.56 2.18 10.59 5.25 18.3 34.0 18.2 91.5 51.1 25.5 4 Scav CI 3 Cone 0.39 5.77 10.60 3.32 10.00 192 6.2 9.9 3.2 10.9 3.0
4-5 Scav a 2 Cone ! 0.76 5.04 7.69 1.92 7.08 16.9 10.6 14.0 3.6 I5.I 5.1 4-6 Scav a I Cone 1.57 3.71 5.09 1.04 4.33 14.5 16.0 19.2 4.1 19.1 9.1 4-7 Scav Cone 6.17 2.29 2.17 0.32 1.74 13.1 38.7 32.1 4.9 30.0 32.4 1+4 Ro + Scav CI Cone 1.59 2.95 3.94 21.85 4.99 27.8 12.9 15.0 86.3 22.2 17.6
1-7 Ro + Scav Cone 9.65 2.74 2.18 4.02 3.00 15.0 72.7 50.2 96.4 81.0 57.8
Observations Ro 1 Cone: Ro 2 Cone. Ro3: Ro5:
Cleaner Cu froth tliau in F5
Cu locked in silicates floating late in ro 4 and S

Test No.: FIS Project No.: 10616-001 Operator: D.L. Date: 02-JU11-05
Purpose: To repeat test F14 but use CMC in the cleaners
Procedure: Flotation was conducted as described below. All products were submitted for Pt, Pd, Au, Cu, Ni,, and S analyses.
Feed:
Grind:
2 kg of minus 10 mesh Shakesperare.
30 minutes / 2 kg @ 65% solids in laboratory ball mill (BM-3). Rghr Tail K,o = -78 (im.
Stage Lime Reagent:
SIPX s added, grams p
3477 ler tonne
MIBC CMC Grind Time, minu
Cond. tes
Froth PH
Grind 500 30
Rougher 1 5 7.5 1 1 10.3 Rougher 2 2.5 5 1 I
Regrind PM 50 5 8.9 R o C b i r l * 1.25 2.5 10 1 2 10.0 R o a n r 2 « 2.5 5 1 2 10.2
Scavaiger 1 2.5 2.5 2.5 1 3 Scaveufter 2 2.5 2.5 2.5 1 5 Scavenser 3 2.5 2.5 2.5 1 5
Scav Cone Rearind PM 150 2.5 10 10.2 S c a v C l l 1.25 10 1 3 Scav CI 2 * 5 1 2 10.2
Total 700 20 S 25
Staiie RoufEfaers Ro Chirl&2 Scav Clnr 1-3 Roujtbers Floution Cell 4L IL IL lOOOg-Dl Speed: rpra ISOO 1200 1200 1800
Metallargical Balance
Product Weight Assays, g/t */• Distribution g ; % Pt Pd Cu ; Ni S Pt 1 Pd 1 Co Ni ! i S
1 Rougher CI 2 Cone 19.1 ; 0.96 1.23 1.26 32.1 1.17 33.6 3.1 3.0 1 82.7 3.2 13.3 2 Rougher CI 2 Tail 9.0 ; 0.45 5.99 4.58 4.16 12.70 19.2 7.0 5.1 5.0 16.3 3.6 3 Rougher CI 1 Tail 37.0 1.86 4.46 2.67 0.92 6.87 12.2 21.6 12.1 4.6 36.2 9.4 4 Scav a 2 Cone 6.0 0.30 6.56 5.2 2.9S 7.91 16.9 5.1 3.8 2.4 6.8 2.1 5 Scav CI 2 Tail 17.9 0.90 3.46 3.42 0.28 2.77 12.1 8.1 7.5 0.7 7.1 i 4.5 6 Scav CI 1 Tail 111.9 1 i 5.62 1.69 1.31 0.08 0.83 14.1 24.7 18.0 1.2 13.2 32.7 7 Rougher Tailing 1790.2' 1 89.91 0.13 0.23 0.014 1 0.068 1 0.93 30.4 50.5 3.4 17.3 34.5
Head(calc.) 1991.1 ! 100.0 0.38 0.41 1 0 J 7 i 0.35 2.42 100.0 100.0 loo.oj 100.0 1 100.0 (direct^ i 0.43 ; 0.37 ! 2.41 1 1
1 1
Combined Products 1 Rougher CI 2 Cone : 0.96 ; 1.2 1.26 ! 32.1 : 1.2 ! 33.6 3.1 ! 3.0 ; 82.7 3.2 13.3
1-2 RouglierCl 1 Cone i 1.41 j 2.75 2.32 23.15 ! 4.86 1 29.0 10.1 8.0 1 87.7 19.5 16.9 1-3 Rougher Cone • 3.27 3.72 2.52 10.52 i 6.00 i 19.4 31.7 20.1 ! 92.3 55.6 26.2 4 Scav CI 2 Cone ! 0.30 6.56 5.20 2.98 7.91 16.9 5.11 3.8 2.4 6.8 2.1
4+5 Scav a 1 Cone : 1.20 4.24 3.87 0.96 4.06 13.3 13.2 11.3 3.1 13.8 6.6 4-6 Scav Cone ! 6.82 ! 2.14 1.76 0.23 1.40 14.0 37.9 29.3 4.3 27.0 39.3 l-i-4 Ro Scav CI Cone i 1.26 2.50 2.20 25.14 2.78 29.6 8.2 6.8 85.1 9.9 15.4 1-6 Ro + Scav Cone i 10.09 2.65 2.01 3.57 2.89 15.7 ! 69.6 49.5 96.6 82.7 65.5
Obser\ 'ations

Test No.: F18 Project No.: 10616-001 Operator: D.L. Date: 07-JIU1-05
Purpose: A preliminary test to e*anime the split circuit floaution method of treating the shakespeare sample.
Procedure: Flotation was conducted as described below. All products were submitted for Ft, Pd, Au, Cu, Ni,, and S analyses.
Feed;
Grind:
2 kg of miuus 10 mesh Shakcsperare.
30 minutes / 2 kg @ 65% solids in laboratory ball mill (BM-3). RghrTailK,„ = - 7 8 n m .
SU(ïe Lime Reage
SIPX Its added, grams |
3477 3cr tomie
MIBC CMC Grind Time, minui
Cond. tes
Frodi pH
Grind 500 30
Pri Rouriier 1 5 7.5 1 1 10.3 Pri Rouuher 2 2.5 7.5 1 J 1.5 ^ Reiîriud PM 100 5 9.5
Prim Cu Chir 1 * 1.25 2.5 10 1 2 10.0 PriCu Clnr2 * 2.5 5 1 2 10.2
Pr iNiChir 2.5 2.5 1 2 9.5 2.5 1.25 1 1
Secondary Rougher 1 2.5 2.5 2.5 1 3 Secondary Roufçher 2 2.5 2.5 2.5 1 5 Secondary Rougher 3 2.5 2.5 2.5 1 5
Sec Coac Reiîriud PM 150 2.5 JO SecCu/Ni IstClnr I 2 9.9
2.5 2.5 I 2 Sec Cu/Ni 2nd Chir m 2.5 5 1 2 10.3 SecCu/Ni3rdClur 2.5 5 1 2 10.2
Total ISO 21 15 36 25
S a e e Roughers Ro Clnrl&2 ScavChir 1-3 Roughers Flotation Cell t L IL IL lOOOg-Dl Speed; tpm 1800 1200 1200 1800
Melallureical Balance
Product Weight Assays, g/t % Distributi ion e • % Pt Pd ! Cu ; Ni ; s Pt ; Pd i Cu Ni S
1 Pri Cu 2nd CI Cone 22.6 ; 1.13 1.75 ; 1.64 28.4 ! 1.93 1 31.2 5.9 i 4.5 ! 83.2 6.2 i 14.7 2 Pr Ni CI Cone 17.0 , 0.85 4.39 ; 3.97 1 4.06 j 14.40 1 20.7 11.1 ! 8.2 ; 8.9 1 34.7 j
3 Pri Ni a Tail 44.9 i 2.25 3.51 2.61 i 0.34 1 3.29 ! 9.0 23.5 ; 14.3 2.0 : 21.0 1 8.4 4 Sec Cu/Ni CI Coac 7.2 0.36 4.92 ; i 3.86 1.67 ! 6.98 j 21.7 5.3 i 3.4 i 1.6 • '•1 ; ! 3.3 5 Sec Cu/Ni 3rd CI Tail 9.3 0.47 3.38 3.04 0.20 ^ 2.55 ! 17.8 4.7 1 3.4 : 0.2 ; 3.4 1 6 Sec Cu/Ni 2nd CI Tail 27.5 1.38 1.99 ; 1.9 0.10 1.16 • 16.1 8.1 1 6.4 ! 0.4 4.5 1 9.2 7 S e c C u m i l s t O T a i l 74.4 : 3.73 1.58 ; 1.07 0.00 1 0.55 i 11.6 17.5 9.7 0.0 5.8 18.0 8 Rouglier Tailing 1789.7! 89.82 0.09 0.23 0.016 ! 0.068 0.96 24.0 ; SO. I 3.7 17.3 i 35.7
Head(calc.) 1
1992.6 i 100.0 0.34 0.41 •0.39 i 0.35 1 2.41 l o o . o ; 100.0 100.0 i 100.0 i 1 100.0
(direct) 1 0.43 1 0.37 i 2.41 1 i
Combined Products 1 Pri Cu 2nd CI Cone 1.13 1.8 ! 1.64 28.4 : 1.9 • 31.2 5.9 4.5 83.2 6.2 14.7
2-3 Pri Ni Feed 3.11 3.75 j 2.98 1.36 ' 6.34 ! 12.2 34.6 22.5 10.9 55.7 15.7 1-3 Pri Rougher Cone 4.24 3.22 i 2.62 8.59 1 5.16 i 17.3 40.4 27.0 94.1 61.9 30.4 4 Sec Cu/Ni 3rd a Cone 0.36 4.92 1 3.86 1.67 i 6.98 1 5.3 3.4 1.6 7.1 3.3
4-5 Sec Cu/Ni 2nd CI Cone 0.83 4.05 1 3.40 0.84 '; 4.48 i 19.5 9.9 6.8 1.8 10.5 6.7 4-6 Sec Cu/Ni 1st CI Couc ' 2.21 2,76 i 2.46 0.38 i 2.41 17.4 18.1 13.2 2.2 15.0 15.9 4-7 Sec Rougher Cone 5.94 2.02 i 1.59 0.14 1.24 13.7 35.6 22.9 2.2 20.8 33.9
1-7 Ro + Scav Couc 10.18 2.52 1 2.02 1 3.66 1 2.87 1 15.2 76.0 49.9 96.3 82.7 64.3
Observations

Test No.; F17 Project No.: 10616-001 Operator : D.L. Date: 07-Jun-05
Purpose:
Procedure:
To adopt a Primary and secondat>' Cu/Ni circuit flowsheet «Hthout regrinding the primary Cu/Ni rougher concentrate.
Flotation was conducted as described below. All products were submitted for Pt, Pd, Au, Cu, Ni , , and S analyses.
Feed:
Grind:
Conditions:
2 kg of minus 10 mesh Shakcsperare.
30 minutes / 2 kg @ 65% solids in laboratory ball mill (BM-3).
F3 conditions with split circuit cleaning
R g h r T a i l K j o - -78nm.
Stage Lime Reagent:
SIPX s added, grams p
3477 er tonne
MIBC CMC Grind Time, minut
Cond. es
Froth PH
Grind 500 30
Pri Rougher 1 5 7.5 1 1 10.2 Pri Rougher 2 2.5 7.5 1 1.5
Prim Cu/Ni C l n r l » 2.5 5 1 2 10.3 PriCufMi Clnr2 • 2.5 5 1 1.5 10.3
Secondary Rougher I 2.5 2.5 2.5 1 3 Secondary Rougher 2 2.5 2.5 2.5 1 5 Secondary Rougher 3 2.5 2.5 2.5 1 5
Sec Cone Repind PM 150 5 5 10 Sec Cu/Ni IstClnr 2.5 2.5 5 1 3 9.9
1.25 2.5 1 2 Sec Cu/Ni 2nd Clnr » 2.5 5 1 2 10.2 Sec Cu/Ni 3rd Clnr 4k 2.5 5 1 2 • 10,2
Total 650 21 18 35 25
Stage Roughers RoClnr l&2 ScavCInr 1-3 Roughers Flotation Cell 4L IL IL lOOOg-Dl Speed: rpm 1800 1200 1200 1800
Metallurgical Balance
Product Weight Assays, g/t % Distribution
fi ! % Pt 1 Pd ! Cu Ni ! S Pt j 1 Pd i Cu Ni : S Pri Cu/Ni 2nd CI Cone 32.4 : 1.63 7.19 ! 2.07 1 22.4 1 6.47 i 27.8 33.5 ! ! 8.5 ; 88.8 28.8 j i 18.1
PrCurt^i 2nd CI Tail 19.6 i 0.98 3.1 3.59 ; 1.16 ! 10.60 ! 14.5 8.7 8.9 2.8 28.6 ; 5.7 Pr Cu/Ni 1st CI Tail 38.3 ! 1.92 0.58 2 1 0.23 i 1.15 1 6.8 3.2 9.7 1.1 6.1 1
Sec Cu/Ni CI Cone 7.1 1 0.36 5.69 4.44 2.14 ! 5.89 18.8 5.8 4.0 1.9 5.8 1 2.7 Sec Cu/Ni 3rd CI Tail 9.3 ! 0.47 3.33 3.41 0.23 1 2.28 16,9 4.5 4.0 0,3 2.9 ! 3.2 Sec Cu/Ni 2nd CI Tail 27.8 1 1.40 1.88 2.11 0.17 1 1.19 15.5 7.5 7.4 0,6 4.6 : 8.7 Sec Cu/Ni 1st CI Tail 83.4 • 4.19 0,93 0.81 0.05 i 0.52 12.9 11.2 8.5 0.5 6.0 i 21.6 Rougher Tailing 1773.6! ] 89.06 0.1 0.22 0.019 i 0.071 0.98 25,5 49,2 4.1 17.3 I 34.9
1
Head(calc.) 1991.5! 100.0 i
0.35 0.40 0.41 1 0.36 2,50 100.0 100.0 100.0 t 100.0 ' 100.0 (direct) 0.43 1 0.37 2.41 i
Combined Products 1 Pri Cu/Ni 2nd CI Cone i 1.63 7.2 ! 2.07 22.4 6.5 27,8 i i 33.5 8.5 88.8 28.8 i 18.1
1-2 Pri Cu/Ni 1st CI Cone ! 2.61 5.6 i 2.64 14.4 8.0 22.8 42.3 17.3 91.6 57.4 23.8 1-3 Pri Rougher Cone , 4,53 3.5 2.37 8.4 5.1 j 16.0 45.5 27.0 92.7 63.5 29,0 4 Sec Cu/Ni 3rd CI Cone i 0,36 5.69 4.44 2,14 5.89 18.8 5.8 4.0 1.9 5.8 2.7
4-5 Sec Cu/Ni 2nd CI Cone •• 0,82 4.35 3.86 1.06 ; 3.84 • 17.7 10.3 8,0 2.1 8.7 5.8 4-6 Sec Cu/Ni 1st CI Cone 1 2,22 2.80 2.76 i 0.50 i 2.17 i ! 16.3 17.8 15,4 2.7 13.2 14.5 4-7 Sec Rougher Cone ; 6,41 1.58 j 1.48 1 0,20 ! 1.09 ! ! 14,1 29.0 23.9 3.2 19.2 36.1
1-7 Ro + Scav Cone ! 10,94 2.37 1 1 1.85 1 3,60 ! 2,76 • 14.9 74.5 50.8 95.9 82.7 65.1
Observations

Test No.: F18 Project No.: 10616-001 Operator: D.L. Date: 07-JIU1-05
Purpose; To adopt a Primary and secondary Cu/Ni circuit flowsheet witlvout regrinding tlie primary Cu/Ni rougher coiiceiitrate.
Procedure: Flotation was conducted as described below. Ail products were submitted for Pt, Pd, Au, Cu, Ni , , and S analyses.
Feed:
Gr ind:
2 kg of minus ID mesh Sliikesperare.
30 minutes / 2 kg @ 6S% solids in laboratory ball mill (BM-3). Rglir Tail Kjo = -78 |im.
Stage Lime Reagent:
SIPX Î added, grams p
3477 er tonne
MIBC CMC Grind Time, minut
Coud. es
Fro til pH
Grind 500 30
Pri Rougher 1 5 7.5 1 1 10.2 Pri Rougher 2 2.5 7.5 1 1.5
Pri Ro Cone Reg P.M. 100 5 5 Prim Cu/Ni Clnr 1 * 2.5 10 1 3 10.3 Pri Cu/Ni Clnr 2 * 2.5 5 1 2.5 10.3
Secondais Rougher 1 2.5 2.5 2.5 1 3 Secondary Rougher 2 2.5 2.5 2.5 1 5 Secondary Rougher 3 2.5 2.5 2.5 1 5
Sec Cone Regrind PM 150 2.5 10 Sec Cu/Ni 1st Clnr 2.5 2.5 5 I 3 9.9
2.5 2.5 2.5 I 2 Sec Cu/Ni 2iid Clnr « 2.5 5 1 2 10.2 Sec Cu/Ni 3rd Clnr * 2.5 5 I 2 10.2
Total 750 20 18 33 30
Stage Roughers Ro O m l S a S c a v a n r l - 3 i Flotation Cell 4L IL IL Speed: tpm 1800 1200 1200
Metallurgical Balance
Product Weight Assays, j / t % Distribution % Pt ; Pd Cu 1 NI S Pt Pd i Cu i 1 Ni S
Pri Cu/Ni 2nd CI Cone 31.2 ] 1 1.57 2.S5 j 2.37 21.9 1 3.62 28.2 13.4 9.2 1 90.0 i 1 16.5 18.3 Pr Ca 'Ni2ndClTai l 16.4 ; 0.82 3.19 2.71 0.58 i 6.82 ; 11.2 7.9 5.5 : 1.3 1 16.4 i i 3-8 Pr Cu/Ni 1st a Tail 34.5 i I 1.73 3.35 1 2 J 8 0.50 5.3 i ! I M 17.5 10.2 2.3 i I 2 6 . 7 : 7.9 Sec Cu/Ni a Cone 4.4 0.22 6,43 4.57 3,25 6.68 16.4 4.3 2.5 1.9 1 4.3 I 1.5 Sec Cu/Ni 3rd CI Tail 12.2 0.61 3,82 3.39 0.37 3.69 12.4 7.0 5.2 0.6 j i 1 3.1 Sec Cu/Ni 2ud CI Tail 22.6 1.14 1.9 2.1 0.14 1.12 10.1 6.5 5.9 0.4 3.7 ! 4.7 SecCurt>li 1st CI Tail 108.8 5.47 1.18 0.96 0.04 0.54 11.8 19.4 13.0 0.5 8.6 26.6 Rougher Tailing 1760.4 88.44 0.09 0.22 1 0.013 0.067 0.93 24.0 48.3 3.0 17.2 34.0
Head(calc.) 1990.5 100.0 0.33 1
0.40 i
0.38 1 0.34 2.42 lOO.O 100.0 i
100.0 100.0 ^ 100,0 (direct) 0.43 i 0.37 2.41
Combined Products 1 Pri Cu/Ni 2nd a Cone : 1.57 2.9 2.37 21.9 3.6 i i 28.2 13.4 9.2 ! 90.0 : 16.5 18.3
1-2 Pri Cu/Ni 1st CI Cone i 2.39 3.0 2.49 14.6 4.7 22.3 21.4 14.8 91.3 32.9 22.1 1-3 Pri Rougher Cone 4.12 3.1 2.44 8.6 5.0 17.6 38.8 25.0 93.5 59.6 30.0 4 Sec Cu/Ni 3rd CI Cone ! 0.22 6.43 4.57 3.25 6.68 16.4 4.3 2.5 1.9 4.3 1.5
4-5 Sec Cu/Ni 2nd CI Cone ! 0.83 4.51 3.70 1.13 4.48 13.5 11.3 7.7 2.5 10.9 4.6 4-6 Sec Cu/Ni IstClConc i 1.97 3.01 2.78 0.56 2.54 11.5 17.8 13.6 2.9 14.6 9.4 4-7 Sec Rougher Cone j 1.66 1.44 0.18 1.07 11.7 37.2 26.6 3.4 23.2 36.0
1-7 Ro + Scav Cone 1 11.56 2.19 1.80 3.20 2.46 13.8 76.0 51.7 97.0 32,8 66.0
Observations

Test No.: F14 Project No.: 10616-001 Operator: D.L. Date: 02-JU11-05
Purpose: To conduct a large scale test to produce a suitable amount of tailings sample for environmental testn'ork.
Procedure; Flotation was conducted as described below. All products were submitted for Pt, Pd, Au, Cu, Ni , , and S analyses.
Feed:
Grind:
2 X 10 k£ of minus 10 mesb Sbakcspeisrc.
42 minutes /10 kg @ 65% solids in the 10 kg laboratory ball mill. Rghr Tail K.^ " 72 Mm.
Stage Lime Reagents SIPX
added, grams pei 3477
r tonne MIBC CMC Grind
Time, minui Cond.
!es Froth pH
Grind 500 42
Pri Rouslier 1 5 7.5 I 2 10.2 Pri Rougher 2 2.5 7.5 1 3 Regrind RAl 100 2
Prim Cu Clnr 1 2.5 2.5 10 I 4 10.3 9.7
Secoodarv Rougher 1 2.5 2.5 2.5 I 4 Secoadarv Rougher 2 2.5 2.5 2.5 1 5 Secondary Rougher 3 2.5 2.5 2.5 1 5
Sec Cone Regrind RM 80 2.5 4 SecCu/Ni 1st Clnr 1 5 10.2
3 2.5 1 3 9.7 Total 680 23 10 25 10
Stage iRoughers Prim CI Sec CI Flotation Cell lOkgAgitair 4LD-1 lOL D-2 Speed: ipm 1800 1800 1500
Metallurgical Balance
Product Weight Assam's, g/t V, DUtribution g 1 " / . Pt Pd Cu Ni S Ft 1 Cu Ni 1 S
I Pri Cu 1st CI Cone 533.6 : 2.67 6.21 4.18 : ; 13.8 8.58 25.1 30.4 22.0 93.2 65.0 i : 32.9 2 Sec Cu.'Ni CI Cone 525.8 ! 2.63 4.01 • 4.23 ! 0.55 2.70 22.5 19.3 ! 21.9 3.7 20.2 i 29.0 3 Combined Tailing 18940.6 94.70 0.29 0.30 0.013 0.055 0.82 50.3 56.1 3.1 14.8 38.1
Head (ale.) 20000.0 100.0 0.55 0.51 0.39 0.35 2.04 100.0 j 100.0 100.0 100.0 lOO.O (direct) i 0.43 1 0.37 2.41 !
Combined Products 1 Pri Cu 1st CI Cone | 2 .67 6.2 ! 4.18 1 13.8 8.6 25.1 30.4 22.0 93.2 65.0 32.9
1-2 Pri Rougher Cone i ! 5.30 5.12 ! 4.20 ! 7.22 5.66 23.8 49.7 43.9 96.9 85.2 61.9
Observations

SGS Lakefield Research Limited Size Distribution Analysis
Project No. 10616-003
Sample: Ro Tail Test No.: F19
Size Weight % Retained % Passing Mesh |jm grams Individual Cumulative Cumulative
48 300 0.0 0.0 0.0 100.0 65 212 0.2 0.3 0.3 99.7 100 150 1.0 1.3 1.6 98.4 150 106 5.1 6.8 8.4 91.6 200 75 7.1 9.5 17.9 82.1 270 53 11.5 15.3 33.2 66.8 400 38 9.0 12.0 45.2 54.8 Pan -38 41.1 54.8 100.0 0.0
Total - 75.0 100.0 - -
K80 72
05 c
CO (0
Q.
0) >
m
£ n
O
1 0 0
90 80 70 60 50 40 30 20 10
0
10
Particle Size Distribution
: i ! : ! T i J I L i : ;
i i ! i 1 ; : p r ^ : ; : ! ! i i
i i , ; y • ' i i i i :
:
• ^ i T : M i •
: ; 1 .
' : . • ! t ;
; • ^ ' i j K 8 U = / z i j m ;
1 1 • - 1 i M i : : M
1 0 0
Screen Size (micrometers)
1,000

Test No.: F14 Project No.: 10616-001 Operator: D.L. Date: 02-JU11-05
Purpose:
Procedure:
To repeat test F16 but use SIPX in place of 3477 in the Ni Cleaner. Lower the pH in the Ni Cleaners and increase the collector to improve Ni recovery.
Flotation was conducted as described below. All products were submitted for Ft, Pd, Au, Ou, Ni , , and S analyses.
Feed:
Grind:
Conditions:
2 leg of minus 10 mesh Shakespeare.
30 minutes / 2 kg @ 65% solids in laboratory ball mill (BM-3).
Ni Cl Feed is Pri Cleaner Tails 1+2
RghrTai lK8„--78 (im.
Stage Lime F
SIPX •eagents added,
3477 p-ams per ton™
MIBC e
CMC H2S04 Grind Time, minu
Cond. tes
Froth pH
Grind 500 30
Pri Rougher 1 5 0 7.5 0 0 1 1 10.3 Pri Rougher 2 2.5 0 7.5 0 0 1 1.5 Regrind PM 100 0 0 5 10.2
Prim Cu Clnr 1 * 1.25 0 2.5 10 0 1 2 10.0 Pri Cu a n r 2 » 2.5 5 0 1 2 10.2
M Cl Feed is the combined 1st and 2nd CI Tails 0 0 Pri Ni Clnr 2.5 2.5 0 60 1 2 7.8
1.25 2.5 0 20 1 2 8.0 1.25 2.5 1 1 8.0
Secondary Rougher 1 2.5 2.5 2.5 0 0 1 3 Secondary Rougher 2 2.5 2.5 2.5 0 0 1 5 Secondary Rougher 3 2.5 2.5 2.5 0 0 1 5 Secondary Rougher 4 5 2.5 40 1 2
Perform Umaenetic Sep'n on the Sec Ro conc no. 4
Sec Conc Regrind PM 50 2.5 10 Sec Cu/Ni 1st Clnr 5 5 * 1 2 9.5
5 2.5 1 2 8.0 Sec Cu/Ni 2nd Clnr « 5 5 I 2 8.7 Sec Cui'Ni 3rd Clnr 2.5 5 1 2 8.3
Total 650 39 10 5 0 - 25 120
Stage Roughers Ro Clnrl&2 Scav Clnr 1-3 Roughers Flotation Cell 4L IL IL lOOOg-Dl Speed: ipm 1800 1200 1200 1800
Metallurgical Balance
Product Weight Assays, g/t % Distribution e % Ft Pd Cu 1 Ni ! S Pt ! Pd 1 Cu i Ni 1 S
Pri Cu 2nd CI Conc 25.8 1.30 2.31 • 1.78 26.6 1 3.72 ; 31.5 8.6 j 5.9 1 86.2 1 13.6 1 16.1 Pr Ni Cl Conc 24.8 1.25 5.93 : 4.71 ! 1.91 i 11.10 19.7 21.3 ; 15.1 5.9 i 39.1 1 9.7 Pri Ni Cl Tail 44.6 2.24 3.40 i 1.78 ' 0.31 1 2.77 8.1 22.0 10.3 1.7 i 17.5 i 7.1 Sec Cu/Ni CI Conc 13.0 0.65 6.80 ; 5.82 , 1.10 1 2.76 27.6 12.8 9.8 1.8 5.1 i 7.1 Sec Cu/Ni 3rd CI Tail 11.3 0.57 2.47 1 2.68 ! ! 0.25 i 1.13 20.4 4.0 3.9 0.4 1.8 ' 4.6 Sec Cu/Ni 2nd CI Tail 30.2 1.52 1.24 ! 1.41 i O'.ll i 0.79 i 19.3 5.4 : 5.5 ! 0.4 3.4 II.5 SecCuiHi 1st CI Tail 81.7 4.11 0.80 ; 0.7 i 0.03 0.35 10.6 9.5 7.4 0.3 4.1 17.1 Sec Ro Conc 4 Mags 19.0 0.95 0.23 i 0.2 1 : 0.03 0.75 35.8 0.6 0.5 O.I 2.0 13.4 Sec Ro Conc 4 Non Mags 9.2 0.46 0.43 i 1.01 1 0.12 i 0.26 6.14 0.6 1.2 0.1 0.3 1.1 Rougher Tailing 1730.1 86.95 0.06 1 0.18 0.014 0.053 0.36 15.1 40J 3.0 13.0 j 12.3
Head (calc.) 1989.7j 100.0 0.35 0.39 ! 0.40 0.35 ! 2.54 100.0 100.0 100.0 100.0 j 100.0 (direct) 0.36 1 0.40 ! 0.43 0.37 1 2.41 !
Combined Products Pri Cu 2nd CI Conc i 1.30 2.3 ! 1.78 26.6 3.7 31.5 8.6 5.9 86.2 13.6 16.1 Pri N i Feed ! 3.49 4.30 ! 2.83 0.88 S.75 12.2 43.3 25.4 7.7 56.6 16.8 Pri Rougher Conc ; 4.78 3.76 2.54 7.85 5.20 17.5 52.0 31.3 93.8 70.3 32.9 Comb CI Conc i 3.20 4.64 3.75 11.76 6.40 26.1 42.79 30.87 93.9 57.8 32.8 Sec Cu/Ni 3rd CI Conc 1 0.65 6.80 5.82 1.10 2.76 27.6 12.8 9.8 1.8 5.1 7.1 Sec Cu/Ni 2nd CI Conc 1 1.22 4.79 4.36 0.70 2.00 24.3 16.9 13.7 2.2 6.9 11.6 Sec Cu/Ni 1st CI Conc 1 2.74 2.82 2.73 0.38 1.33 21.5 22.3 19.2 2.6 10.3 23.2 Sec Rougher Conc 1-3 j 6.85 1.61 1.51 0.17 0.74 15.0 31.8 26.6 2.9 14.4 40.3 Sec Rougher Conc 1-4 ! 8.26 1.36 1.27 0.14 0.70 16.5 32.4 27.1 3.0 16.4 53.7 Ro + Scav Conc i 11.63 2.50 1.94 3.33 ! 2.58 16.0 83.7 58.0 96.8 84.6 73.1
Shkcjpeare F20-3tl F20 UpdaM 02^3/2006
SGS Uk«li*ld R c s w r c h Limitad CONFIDENTIAL 1 of I

Test No.: F21 Project No.: 10616-00! Operator; DX. Date: 21-JUI1-05
Purpose: To perform a 1st Cleaner Kinetics test using standard conditions without regrinding
Procedure: Flotation was conducted as described below. All products were submitted for Ft, Pd, An, Cu, Ni , , and S analyses.
Feed:
Grind;
2 kg of minus 10 mesh Shakesperare.
30 minutes / 2 kg @ 65% solids in laboratory ball mill (BM-3). Rglir Tail Kg,, = -78 )jm.
Stage Lime SIPX leagents added,
3477 jams per toitm
MIBC CMC H2S04 Grind Time, minu'
Cond. tes
Frotli PH
Grind 500 30
Pri RnuRlier 1 5 0 7.5 0 0 1 1.5 10.3 Pri Rougher 2 2.5 0 7.5 0 0 1 1.5
Prim Cu Clnr 1 * 1.5 0 0 10 0 1 2 9.4 Prim Cu Chir 1 * 1.5 0 2.5 0 0 1 2 Prim Cu Clnr 1 * 1.5 0 2.5 0 0 1 2 8.6
Secondary Rougher 1 2.5 2.5 2.5 0 0 1 3 10.0 Secondary Rougher 2 2.5 2.5 2.5 0 0 1 5 Secondary Rougher 3 2.5 2.5 2.5 0 0 I 5 9.0
SecCu/Ni 1st Clnr 2.5 1 2 S.O SecCu.'Ni I s t O n r 2.5 2.5 25 1 2 8.1 SecCn/Ni I s t Q n r 2.5 2.5 1 2 8.1
Total 500 27 S 33 10 25
1 1+2 1-3 1-4 5
5+6 5-7 S - 8
1-S
Suae Roughers Ro a n r l & 2 Scav Clur 1-3 Rouuhers Flotation Cell 4L IL IL lOOOg-Dl Speed: rpm 1800 1200 1200 1800
Metallurgical Balance
Product Weight Assays, j / t % Distribution 8 1 % Pt 1 Pd Cu Ni S Pt Pd 1 Cu ! Ni i S
Pri 1st CI Cone A 52.5 1 i 2.64 5.82 3.09 13.9 8.37 25.2 40.6 20.4 91.5 59.7 1 24.2 Pri 1st CI Cone B 10.7 0.54 1.77 4.93 0.96 3.93 12.2 2.5 6.6 1.3 5.7 1 2.4 Pri 1st CI Cone C 8.1 0.41 0.64 2.31 0.26 0.87 8.7 0.7 2.3 0.3 1.0 1 1.3 Pri 1st a Tail 29.3 1.47 0.33 0.48 0.033 0.22 4.37 1.3 1.8 1 0.1 0.9 : 2.3 Sec 1st a Cone A 41.8 2.10 5.22 3.15 0.27 2.03 21.4 29.0 16.5 ! 1.4 i [ 11.5 16.4 Sec 1st CI Cone B 17.1 0.86 0.95 1.61 0.19 0.74 21.8 2.2 3.5 0.4 1 1.7 6.8 Sec 1st CI Cone C II . I 0.56 0.56 1.16 0.16 0.58 17.5 0.8 1.6 0.2 0.9 3.6 Sec 1st CI Tail 59.5 2.99 0.24 0.42 0.02 0.23 i 5.78 1.9 3.1 1 0.1 1.9 6.3 Sec Rougher Tailijig 1759.0 88.43 0.09 0.2 0.021 0.07 1.14 21.0 i 44.2 i
1 4.6 16.7 36.7
Head(calc.) 1989.1 j 100.0 0.38 0.40 0.40 0.37 2.75 100.0 1 100.0 100.0 100.0 1 100.0 (direct) 1 0.36 0.40 0.43 0.37 2.41 ! i
Combined Products Pri 1st CI Cone A 1 1 2.64 5.8 1 3.09 ! 13.9 ' 8.4 1 25.2 40.6 20.4 91.5 59.7 24.2 Pri 1st CI Cone A+B 1 3.18 5.1 3.40 11.7 ! 7.6 1 23.0 43.1 27.0 92.8 65.4 26.6 Pri 1st CI Cone A-C 3.58 4.6 3.28 10.4 ! 6.9 21.4 43.8 29.3 93.1 66.4 27.9 Pri Rougher Cone 5.06 3.4 2.46 7.4 ! 4.9 16.4 45.1 31.1 93.2 67.3 30.2
Sec 1st CI Cone A 2.10 5.22 3.15 0.27 ! 2.03 21.4 29.0 16.5 1.4 11.5 16.4 Sec 1st a Cone A+B 2.96 3.98 2.70 0.25 1.66 21.5 31.2 20.0 1.8 13.3 23.2 Sec 1st CI Cone A-C 3.52 3.44 2.46 0.23 1.48 20.9 32.0 21.6 2.0 14.1 26.8 Sec Rougher Cone 6.51 1.97 1.52 0.14 0.91 13.9 33.9 24.7 2.2 16.0 33.1 Pri + Sec Ro Cone 11.57 2.58 1.93 3.31 2.66 15.0 79.0 55.8 95.4 83.3 63.3
Observations

TtstNo.: F22 Project No.: 10616-003 Operator: DX. Date: 21-;un-05
Purpose: To repeat test F21 but regrind the Primary and secondary concentrates.
Procedure: Flotation was conducted as described below. All products were submitted for Pt, Pd, Au, Cu, Ni, , and S analyses.
Feed:
Grind:
2 kg of minus 10 mesh Sliakespcrare.
30 minutes / 2 kg @ 65% solids in laboratory ball mill (BM-3). Rghr Tail 1C,„ = 82nm.
Stajçe Lime SIPX leagents added,
3477 ^ m s per toon<
MIBC e
CMC H2S04 Grind Time, minu;
Cond. tes
Froth pH
Grind 500 30
Pr i R o u E l i e r 1 5 0 7.5 0 0 1 1.5 10.3 Pri Roui^hcr 2 2.5 0 7.5 0 0 1 1.5 Regrind PM 100 0 0 5 9.5
Prim Cu Clnr 1 * 1.5 0 2.5 10 0 1 2 8.6 Prim Cu Clnr 1 • l.S 0 2.5 0 0 1 2 Prim Cu Clur I • 1.5 0 5 0 0 1 2
Secondary Rougher 1 2.5 2.5 2.5 0 0 1 3 Secondary Rougiier2 2.5 2.5 2.5 0 0 1 5 Secondary Rougher 3 2.5 2,5 2.5 0 0 1 5 Sec Cone Reerind PM 50 2.5 40 10
SecCu/Ni 1st Clnr 2.5 1 2 8.0 SecCu/Ni 1st Clnr 2.5 2.5 1 2 8.0 See Cu/Ni 1st Ch>r 2.5 1 2 8.0
Total 650 30 8 35 10 40
Staee Roughers Ro Clnrl&2 Scav Clnr 1-3 Roughers Flotation Cell 4L IL IL lOOOg-Dl Speed: rpm 1800 1200 1200 1800
Metallurgical Balance
Product Weight Assays, g/t % DistribuUon
K • % Pt 1 Fd Cu 1 Ni S Pt i Pd ' ! Cu Ni s Pri 1st CI Cone A 41.8 i 2.12 3.06 2,76 17.5 5.81 25.4 20.5 15.6 1 91.2 36.0 21,1 Pri 1st CI Cone B 15.0 1 0,76 4.11 3.41 1.25 6.71 i i 14 9.9 6.9 2.3 14.9 4,2 Pri 1st a Cone C 13.5 0,69 2.72 1,99 0.27 2.55 8.2 5.9 i 3,6 0.5 ! 5.1 2.2 Pti 1st CI Tail 30.9 1.57 1.54 0.67 0.06 0.83 5,36 7.6 2.8 0.2 3.8 3.3 Sec 1st a Cone A 25.7 : '-31 4.86 4,53 0.60 3.74 23 20.1 15.7 i i 1,9 14.2 : 11.7 Sec 1st CI Cone fi 13.3 i 0.93 1.85 1,89 0.16 1.35 20.4 5.4 t .7 i i 0.4 3.7 : 7.4 Sec 1st CI Cone C 16.5 1 0.84 1.36 1,19 0.10 0,83 18.6 3.6 2.7 0.2 2.0 6.1 Sec 1st CI Tail 78.2 i 3.97 0,6 0.34 0,03 0.27 7.01 7.5 3.6 0.2 3.1 i 10.9 Sec Rougher Tailing 1727.7 87.81 0.07 0.19 0.014 0.067 0.97 19.4 44.4 3,0 17.1 33.2
He»d(calc.) 1967,6 100.0 0,32 0.38 0.41 0.34 2.56 lOO.O 100.0 100,0 100.0 100.0 (direct) 0.36 0.40 0.43 0.37 2.41 i
Combined Products 1 Pri 1st Cl Cone A | 2,12 3.1 2.76 17,5 5.8 25.4 20.5 15.6 91.2 36.0 21.1
1-I-2 Pri I s t a C o n c A + B | 2.89 3.3 2,93 13.2 6.0 22.4 30.4 22.5 93.6 50.9 25.2 1-3 Pri I s t a C o n c A - C 3.57 3.2 2.75 10.7 5.4 19.7 36_3 26.1 94.0 56.0 27.4 1-4 Pri Rougher Cone 5.14 2.7 2.12 7.5 4,0 15.3 44.0 28.9 94.2 59.8 30.7 5 Sec 1st Cl Cone A 1.31 4.86 4.53 0.60 3.74 23.0 20.1 15.7 1.9 14.2 11.7
5-^6 Sec Is tClConc A+B 2.24 3.61 3.43 0.42 2.75 21.9 25.5 20.4 2.3 17.9 19.1 5 -7 Sec 1st a Coac A-C 3.07 2.99 2.82 0.33 2.22 21.0 29.1 23.1 2,5 19,9 25,2 5-S Sec Rougher Cone 7.05 1,64 1.42 0.16 1.12 13.1 36.6 26.7 2.7 23.1 36.1
1-8 Pri + Sec Ro Conc , 12.19 2,09 1,71 3.24 2.33 14.0 80.6 55.6 97.0 82.9 66.8
Observations

Test No.: F14 Project No.: 10616-001 Operator: D.L. Date: 02-JU11-05
Purpose:
Procedure:
To conduct a test to produce a combined Cu/Ni Cleaner concentrate,using F21 conditions.
Flotation was conducted as described below. All products were submitted for Pt, Pd, Au, Cu, Ni, , and S analyses.
Feed:
Grind:
2 kg of minus 10 mesh Shakesperare.
30 minutes / 2 kg @ 6S% solids in laboratory ball mill (BM-3). Rghr Tail Km -78 \un.
Stage Lime SIPX .eagents added,
3477 Xams per tonn<
MIBC CMC H2S04 Grind Time, minui
Cond. :es
Froth pH
Grind 500 30
Pri Roujîher 1 5 0 7.5 0 0 1 1.5 10.1 Pri Rousber 2 2.5 0 7.5 0 0 1 1.5 Pri RouEher 3 2.5 S 2.5 0 0 1 3 9.9
Pri Cu/Ni 1st cleaner 0 5 40 75 1 4 8.0 Conduct Mae Separarion on the 1st Cleaner tails
Pri Cu'Ni 2nd cleaner 0 5 20 0 1 3 7.5
Pri Cu/Ni 3rd cleaner 0 S 20 0 1 3 7.8
Pri Cu/Ni 4di cleaner 0 5 20 0 1 2 7.5 Combine 2nd to 4th CI Tails for regrinding as leed for the Sec Cu/Ni hi Cleaner Feed
Sec Cu/Ni Reg PM. 4
Sec Cu/Ni 1st Cleaner 5 * 1 4 7.5
Sec Cu/Ni 2nd Cleaner 10 1 2 7.6
Total 500 IS 5 38 110 75 1
Stage Rou^hers R o a n r l & 2 Scav Clnr 1-3 Roughers Flotation Cell 4L IL IL lOOOg-Dl Speed: rpm 1800 1200 1200 1800
Metallurgical Balance
Product Weight Assays, g/t V. Distribution S % Pt Pd ^ Cu 1 Ni ' S Pt Pd Cu ; Ni S
Pri Cu/Ni 4th CI Cone 36.5 1.84 7.57 2.01 19.0 ; 8.02 29.1 38.8 9.6 91.7 ! Î 43.1 20.7 Sec Cu/Ni CI Cone 9.1 0.46 5.93 i ! 6.37 2.06 12.20 23.1 7.6 7.6 2.5 16.4 4.1 S e c Q i / N i 2 n d a T a i l 7.1 0.36 J.27 3.78 0.42 5.09 14.1 3.3 3.5 0.4 5 J i O Sec Cu/Ni 1st CI Tail 13.4 i 0.67 2.35 2.53 0.200 3.06 9.63 4.4 4.4 0.4 6.0 2.5 Cu/Ni 1st CI Tail Mags 11.9 1 0.60 0.19 0.4 j 0.05 0.97 31 0.3 0.6 0.1 1.7 7.2 Sec Cu/Ni a Tail Non Mags 82.6 ' 4.16 0.39 1 I 1.35 0.12 0.34 1.45 4.5 14.6 1.3 4.1 2.3 Cu/Ni Rougher Tail 1826.8 ; 91.92 0.16 1 0.25 0.015 0.087
1 1.72 41.1 59.7 : 3.6
1 23.4 61.2
Head (cak.) 1987.4! 100.0 0.36 1 i ! 0.39 i 03S ! 0.34 2.58 100.0 100.0 100.0 100.0 100.0
(direct) 0.36 ! 0.40 1 0.43 i 0.37 ! 2.41
Combined Products I Pri Cu'Ni 4th CI Cone ! 1.84 7.6 ; 2.01 1 19.0 I 8.0 29.1 38.8 9.6 91.7 43.1 20.7
1+2 Pri + Sec 2nd Cu/Ni CI Cone ' 2.30 7.2 j 2.88 15.6 ; 8.9 27.9 46.4 17.2 94.2 59.5 24.8 1-3 Pri + Sec 1st Cu/Ni CI Cone : 2.65 6.7 ; 3.00 13.6 • 8.3 26.0 49.7 20.7 94.6 64.8 26.8 I - t Pri CI Cone + Sec Cu/Ni Feed ' 3.33 5.8 1 2.91 10.9 j 7.3 22.7 54.1 25.1 95.0 70.8 29.3 5 Pri Cu/Ni Ist CI Tail Mags • 0.60 0.19 i 0.40 0.05 i 0.97 1 31.0 0.3 0.6 0.1 1.7 7.2
5+6 Pri Cu/Ni 1st CI Tail • 4.75 0.36 i 1.23 0.11 0.42 4.8 15.2 1.4 5.8 9.5 1-6 Pri + Sec Ro Cone ! 8.08 2.61 1 1.92 4.53 3.24 1 12.4 58.9 4 0 J 96.4 76.6 38.8
Observations

Test No.: F18 Project No.: 10616-001 Operator: D.L. Date: 07-JIU1-05
Purpose:
Procedure:
To repeat conditions similar to F23 but use Metso in place of CMC and omit the mag separation.
Flotation was conducted as described below. All products were submitted for Ft, Pd, Au, Cu, Ni , , and S analyses.
Feed:
Grind:
2 kg of minus 10 mesh Shakesperare.
30 minutes / 2 kg @ 65% solids in laboratory ball mill (BM-3). RghrTailK,o= 82(im. 1st CI Tail K^ = 25 nm.
Staite Lime SIPX Uagents added,
3477 jrams per tonn
MIBC e
Metso H2S04 Grind Time, minu
Cond tes
Froth PH
Grind 500 30
Pri Rougher 1 5 0 7.5 0 0 1 1.5 10.2 Pri RouKher 2 2.5 0 7.5 0 0 1 1.5 Pri Rougher 3 2.5 5 2.5 0 0 1 3 9.9
PriCu/Ni 1st cleaner 0 5 100 70 1 4 8.0
Pri Cu/Ni 2nd cleaner 0 5 50 50 1 3 7.8
Pri Cu/Ni 3td cleaner 0 5 50 50 1 3 7.5
Combine 2nd to 4th CI Tails for reminding as feed for the Sec Cu/Ni 1st Cleaner Feed S«c CurtJi Re^ PM. 100 4
Sec Cu/Ni 1st Oeaner 10 50 1 3 7.5 2.5 7.5 1 2
Sec Cu/Ni 2nd Cleaner 25 1 2 7.5
Total 500 13 13 43 325 220
Stage Roughers Ro Clnrl&2 Scav Clnrl-3 Roughers Flotation Cell 4L IL IL 10002-D 1 Speed: ipm 1800 1200 1200 1800
Metallurgical Balance
Product Weight Assays, g/t % Distribution e i % Pt Pd 1 Cu . ; Ni S Pt Pd I i Cu Ni S
Pri Cu/Ni 4th CI Cone 22.8 ; 1.14 6.57 1.53 i 29.2 i 2.04 32.2 22.3 Î 4.9 : 79.8 6.4 14.3 Sec Cu/Ni CI Cone 25.0 : 1.25 5.59 3.63 i 3.30 ! 1 14.80 24.0 20.8 1 12.7 9.9 51.0 11.7 Sec Cu/Ni 2nd CI Tail 4.6 i 0.23 4.25 4 1 0.42 5.13 11.9 2.9 2.6 0.2 3.3 1.1 Sec Cu/Ni 1st CI Tail 20.6 j 1.03 2.67 2.25 1 0.220 2.99 7.39 8.2 5.5 0.5 8.5 3.0 Curt^i 1st CI Tail 74.6 ' 3.74 0.42 ! 1.35 1 0.18 0.53 5.99 4.7 14.1 1.6 5.4 8.7 Cu/Ni Rougher Tail 1846.8; 92.60 0.15 0.23 1 0.036 0.10 1.71 41.2 59.3 8.0 25.4 61.4
Head (calc.) i
1994.41 100.0 0.34 0.36 0.42 0.36 2.58 100.0 100.0 100.0 100.0 100.0 (direct)
i 0.36 0.40 1 0,43 : 0.37 2.41
Combined Products Pri Cu/Ni 4th CI Cone 1 1.14 6.6 1 1-53 ! 29.2 1 2.0 i 32.2 22.3 4.9 79.8 6.4 14.3 Pri + Sec 2nd Cu/Ni CI Cone ^ 2.40 6.1 ; 2.63 1 15.7 8.7 ^ 27.9 43.1 17.6 89.7 57.4 25.9 Pri + Sec 1st Cu/Ni CI Cone ! 2.63 5.9 ! 2.75 14.3 8.4 26.5 46.0 20.1 89.9 60.6 27.0 Pri CI Cone + Sec Cu/Ni Feed : 3.66 5.0 ! 2.61 10.3 6.9 21.1 54.1 26.6 90.4 69.1 29.9 Pri Cu/Ni 1st CI Tail , 3.74 0.42 ; 1.35 0.18 0.53 I 6.0 4.7 14.1 1.6 5.4 8.7 Pri + Sec Ro Cone ; 7.40 2.68 1 1.97 5.20 3.67 i 13.5 58.8 40.7 92.0 74.6 38.6
Observations

Test No.: F14 Project No.: 10616-001 Operator: D.L. Date: 02-JU11-05
Purpose: To repeat the conditions of test F15 from project 10616-001. conduct 5 staged roughers , collect total rougher concentrate , and clean it 3 times
Procedure:
Feed:
Grind:
Conditions:
Flotation was conducted as described below. All products were submitted for Ft, Pd, Au, Cu, Ni, Fe and S analyses.
2 kg of minus 10 mesh Shakespeare.
30 minutes / 2 kg @ 65% solids in laboratory ball mill (BM-3). Rghr Tail Kgo ~ 82 nm
Stage Ca(0H)2 Reagents ad<
S IPX led, grams per i
3477 tonne
CMC MIBC Tir
Grind ne, min Cond.
utes Froth pH
Grind 200 30 9.3
Rougher 1 20 7.5 2.5 10 1 1 9.5 Rougher 2 5 2.5 1 2 9.5 Rougher 3 30 5 2.5 2.5 1 4 9.6 Rougher 4 40 2.5 5 1 4 9.5 Rougher 5 40 2.5 2.5 5 1 4 9.5 Cleaner 1 20 1 3 9.6
Cleaner 1 Scav 2.5 0 2.5 1 2
Cleaner 2 10 1 2,5 1 3.5 9.5 Cleaner 3 10 1 0 5 1 2 9.6 Cleaner 4 10 1 20 5 1 2 9.7
40.0 Total 380 25.5 10.0 20.0 40.0
Stage Roughers Qeaners Flotation Cell lOOOg-Dl 250g-Dl Speed: rpm 1800 1200
Metailurgica] Balance
Product Weight Assays, g/t % Distribution g I % Pt i Pd Cu i Ni S Pt Pd ! Cu i Ni 1 s
4th Qeaner Cone 59.2 ; 2.97 8.10 j 3.66 12.5 ! 8.64 29.7 65.6 ^ 28.0 i 94.2 I 69.9 ; 32.9 4th Cleaner Tail 24.0 i 1.20 2.47 3.54 0.22 i 1.61 • 19.6 8.1 11.0 i 0.7 • 5.3 ; i 8.8 3rd Cleaner tail 20.5 j 1.03 0.68 1.97 0.25 i 0.90 1 19.7 1.9 i 5.2 0.7 i 2.5 i 7.6 2nd Cleaner Tail 33.8 ! 1.69 0.57 ; 1.54' 0.15 0.61 ! 13.6 2.6 I 6.7 0.6 i i 2.8 Ï i 8.6 1st Q n r Scav Cone 16.9 i 0.85 0.39 : : 1.06 0.17 0.57 17.6 0.9 : 2.3 0.4 i ! 1-3 i 5.6 I s tC ln r Scav Tail 42.5 i ! 2.13 0.20 1 0.47 0.039 ! i 0.20 1 4.39 1.2 ' 2.6 0.2 ! 1.2 ^ ' 3.5 Rougher Tailing 1797.3 90.13 0.08 0.19 0.014; 0.07 i 0.98 19.7 44.2 : 3.2 i i 33.0 1
Head (calc.) 1994.2 1 100.0 0.37 1 0.39 j 0.39 0.37 ! 2.68 100.0 100.0 100.0 100.0 100.0 (direct) 0.36 1 0.40 I 0.43 ! 0.37 j 2.37
Combined Products 4th Cleaner Cone 2.97 8.10 3.66 12.5 8.64 29.7 65.6 28.0 94.2 69.9 32.9 3rd Cleaner Cone 4.17 6.48 3.63 9.0 6.61 j 1 26.8 73.7 39.0 94.9 75.2 41.8 2nd Qeaner Cone 5.20 5.33 3.30 7.24 5.48 25.4 75.6 44.2 95.6 77.7 49.3 1st Cleaner Cone 6.89 4.16 2.87 5.49 4.29 22.5 78.3 50.9 96.2 80.6 57.9 1st Q n r + 1st Clnr Sc Cone 7.74 3.75 2.67 4.91 3.88 22.0 79.2 53.3 96.6 81.9 63.5 Rougher Cone. 9.87 2.98 2.19 3.86 3.08 18.2 80.3 55.8 96.8 83.0 67.0

Test No.; F27 Project No.: 10616-001 Opera tor : D.L. Date: 3 l-Jul-05
Purpose:
Procedure:
Feed:
Grind:
Conditions:
To repeat the conditions of test F17 from project 10616-001. is kept separate, and rougher conc 2-6 are combined for regrinding in the laboratory pebble mill as shown below. The reground product and the rougher 1 concentrate were combined for cleaning.
Flotation was conducted as described below. All products were submitted for Ft, Pd, Au, Cu, Ni, Fe and S analyses.
2 kg of minus 10 mesh U3 Met 2.
30 minutes / 2 kg @ 65% solids in laboratory ball mill (BM-2). Rghr Tail Kgo ~ 82 urn (as F2).
Stage Ca(OH)2 Reag
SIPX ents added, gra
3477 ms per tonne
CMC CUSO4 MIBC Tir
Grind ne, min
Cond. utes
Froth PH
Grind 200 30 9.3
Rougher I 20 10 10 I I 9.5 Rougher 2 7.5 2.5 1 2 Rougher 3 5 2.5 2.5 1 4 Rougher 4 7.5 5 I 4 Rougher 5 2.5 2.5 5 1 4 Rougher 6 2.5 100 2.5 1 1 9.0
Regrind P.M. 10 4 Cleaner 1 1 3 9.6
Cleaner 1 Scav 2.5 10 2.5 1 2
Cleaner 2 1 2.5 1 3.5 Cleaner 3 10 1 10 1 2 9.5
Total Total 240 27.0 17.5 20.0 100.0 32.5
Stage Roughers Cleaners Flotation Cell lOOOg-Dl 250g-Dl Speed: tpm 1800 1200
Metallurgical Balance
Product Weight Assays, j l/t % Distribution g % Pt Pd Cu Ni S Pt Pd Cu Ni S
3rd Cleaner Cone 72.7 3.64 7.13 4.14 10.8 7.68 26.7 72.5 38.8 93.8 74.3 39.5 3rd Cleaner Tail 17.9 0.90 1.39 3.77 0.48 1.55 17.8 3.5 8.7 1.0 3.7 6.5 2nd Clnr Scav Tail 11.0 0.55 0.71 2.04 0.20 0.78 9.55 1.1 2.9 0.3 1.1 2.1 1st Qiu- Scav Conc 26.0 1.30 0.86 1.33 .0.22 0.82 23.1 3.1 4.5 0.7 2.8 12.2 1st Cbir Scav Tail 114.7 5.74 0.32 0.61 0.082 0.31 8.68 5.1 9.0 1.1 4.7 20.3 Rougher Tailing 1754.7 87.87 0.06 0.16 0.015 0.06 0.54 14.7 36.2 3.1 13.3 19.3
Head (calc.) 1997.0 100.0 0.36 0.39 0.42 0.38 2.46 100.0 100.0 100.0 1 1 100.0 100.0
(direct) 0.36 0.40 0.43 0.37 2.37 i
Combined Products 3rd Cleaner Conc 3.64 7.13 4.14 10.8 7.68 26.7 72.5 1 38.8 93.8 74.3 39.5 2nd Cleaner Conc 4.54 6.00 4.07 8.8 6.47 24.9 75.9 47.5 94.8 78.0 46.0 1st Cleaner Conc 5.09 5.42 3.85 7.83 5.85 23.3 77.0 50.4 95.1 79.1 48.2 1 St Clnr + I St Clnr Sc Conc 6.39 4.49 3.33 6.28 4.83 23.2 80.2 54.8 95.7 82.0 60.4 Rougher Conc. 12.13 2.52 2.04 3.3S 2.69 16.3 85.3 63.8 96.9 86.7 80.7

Test No.; F27 Project No.: 10616-001 Operator: D.L. Date: 1 l-Jul-05
Purpose:
Procedure:
To repeat test F20 but lower the pH in the Primary and Secondary cleaners.
Flotation was conducted as described below. All products were submitted for Pt, Pd, Au, Cu. Ni,, and S analyses.
Feed:
Grind:
Conditions:
2 kg of minus 10 mesh Shakesperare.
30 minutes / 2 kg @ 65% solids in laboratory ball mill (BM-3). Rghr Tail K,o - 82 (im.
Sage Lime SIPX Reagents added.
3477 ^ams per tonn
MIBC e
CMC H2S04 Grind Time, minu
Cond. tes
Froth pH
Grind 500 30
Pri Rounher 1 5 0 7.5 0 0 1 1.5 10.3 Pri Rougher 2 2.5 2.5 7.5 0 0 I 1.5 ReErindPM 2.5 5 0 0 5
Prim Cu/Ni 1st elm 0 2.5 10 25 I 3 8.0
PriCu/Ni IstClnrScav 5 10 1 3 8.0
Secondary Rougher 1 2.5 2.5 2.5 0 0 1 3 Secondary Roufîher 2 2.5 2.5 2.5 0 0 1 5 Secondary Rougher 3 2.5 2.5 2.5 0 0 1 S
Remind Feed U Sec Ro Cone 1-3 + Pri Cu/Ni I si CI scav Tail Sec Cone Regrind PM 5 5 5
Sec Cu/Ni 1st Cbir 5 50 1 3 7.8 2.5 1 !
Sec Cu'Ni 2nd Clnr 5 10 10 1 3 7.6 Sec Cu/Ni 3rd Clnr 2.5 5 10 1 2 7.5
Conduct LMS Mag separation on l/ie Sec Cu/Ni 1 500
rd CI Cone using a hand.magnet 28 1 20 1 50 25 Total
l/ie Sec Cu/Ni 1 500
rd CI Cone using a hand.magnet 28 1 20 1 50 25 95
Stage Roughers Prictor 1 Sec Clnr 1 Sec Clnr 2-3 Flotalioo Cell 4L 2L 2L IL Speed: rpm 1800 1500 1500 1200
Metallurgical Balance
Product Weight Assays, g/t y . Distribution e % Pt Pd Cu Ni S Pt Pd Cu 1 N1 S
I Pri Cu/Ni 1st CI Cone 38.2 1.92 4.45 3.19 IS.4 7.72 28.2 22.7 15.2 89.4 40.5 23.2 2 Pr Cu/Ni 1st CI Scav Cone 16.4 0.82 4.00 4.57 0.77 7.15 13.2 8.7 9.3 1.6 16.1 4.7 3 Sec Cu/Ni 3rd CI Cone Non Mags 19.0 0.96 14.00 9.8B 1.98 4.5 15.8 35.5 23.4 i 4.8 11.7 6.5 4 Sec Cu/Ni 3rd CI Cone Mags 9.0 0.45 2.21 1.19 0.26 1.76 35.6 2.7 1.3 0.3 2.2 6.9 5 Sec Cu/Ni 3rd a Tail 16,5 0.83 2.18 1.79 0.14 1.35 18.6 4.8 3.7 0.3 3.1 6.6 6 Sec Cu/Ni Ind CI Tail 28.9 1.45 1.53 i 1.19 0.09 0.89 11.7 5.9 4.3 0.3 3.5 7.3 7 Sec Cu/Ni 1 s t CI Tail 98.4 4.95 0.97 0.63 0.05 0.53 5.18 12.7 7.7 0.6 7.2 11.0 8 Rougher Tailing 1762.0 88.61 0.03 0.16 0.012
1 0.065
1 0.89 7.0 35.1 2.7 15.7 33.8
Head (calc.) 1988.4 j 100.0 0.38 0.40 0.40 0.37 2.33 100.0 1 100.0 100.0 100.0 100.0 (direct) 1 0.36 0.40 0.43 0.37 2.41
Combined Products 1 Pri Cu/Ni 1st CI Cone 1.92 4.5 3.19 18.4 7.7 28.2 22.7 15.2 89.4 40.5 23.2
1+2 Pri Cu/Ni 1st CI Cone + CI Sc Cone 2.75 4.3 3.60 13.1 7.5 23.7 31.4 24.5 91.0 56.6 27.9 1-3 Comb CI Cone w/o Mags ; 3.70 6.82 5.22 10.23 6.76 21.7 66.88 47.88 9S.8 68.3 34.4 1-4 Comb CI CoDC i 4.15 6.31 4.78 9.15 6.22 23.2 69.53 49.22 96.1 70.5 41.3 3 Sec Cu/Ni 3rd CI Cone Non Mags ! 0.96 14.00 9.88 1.98 4.50 15.8 35.5 23.4 4.8 11.7 6.5 4 Sec CuWi 3rd CI Cone i 1.41 10.21 7.09 1.43 3.62 22.2 38.1 24.7 5.1 13.9 13.4
4-5 Sec Cu/Ni 2nd CI Cone i 2.24 7.23 5.12 0.95 2.78 20.8 42.9 28.4 5.4 17.0 20.0 4-6 SecCumi 1st CI Cone ! 3.69 4.99 3.57 0.61 2.03 17.2 48.8 32.7 5.7 20.5 27.3 4-7 Sec Rougher Cone 1-3 i 8.64 2.69 1.89 0.29 1.17 10.3 61.5 40,4 6.3 27.7 38.3 1-7 Pri + Sec Ro Cone 1 11,39 3.08 2.30 3.38 2.71 13.6 93.0 64,9 97.3 84.3 66.2
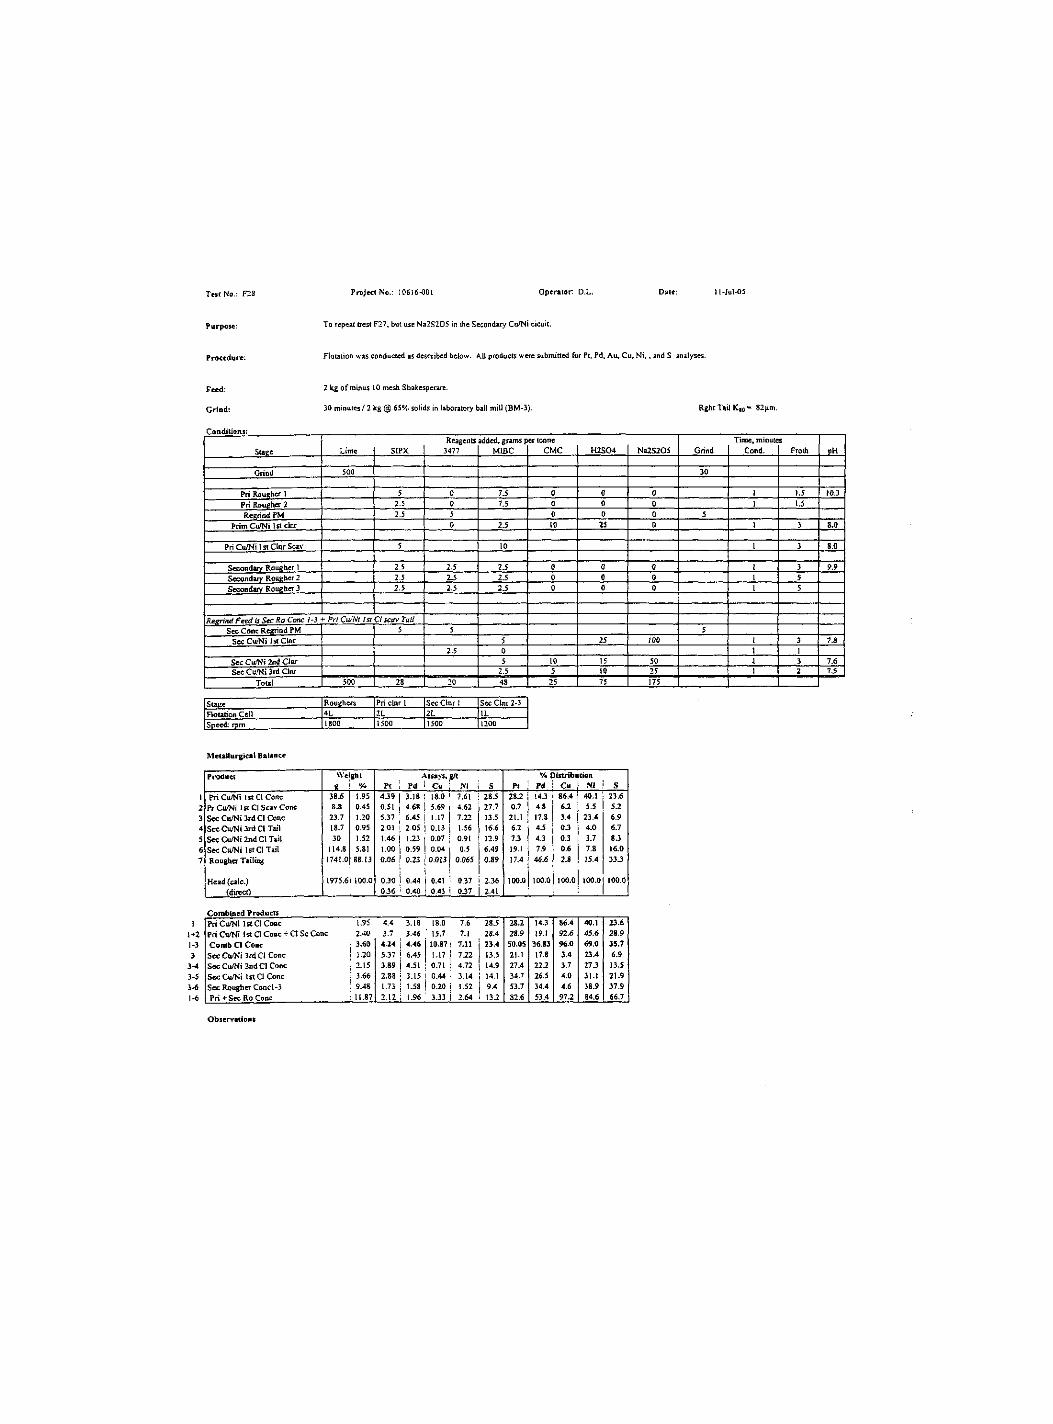
Test No.: F28
Purpose:
Procedure:
ProjeccNo.: 10616-001 Operator D.L. Dale:
To repeal trest F27, but use Na2S205 in the Secondary Cu/Ni cicuit.
Flotation was conducted as described below. All products were submitted for Pt, Pd, Au, Cu, Ni,, and S analyses.
ll-Jul-05
Keed:
Grind:
2 kg of minus 10 mesh Shakcspei^.
30 minutes / 2 kg @ 65% solids in laboratory ball mill (BM-3). Rghr Tail K,o - 82nm.
Staee Lime S IPX Reagents
3477 addetl, grams p
MIBC er tonne
CMC H2S04 Na2S205 Grind Time, minute
Cond. :s
Froth pH
Grind 500 30
Pri Roueher 1 5 0 7.5 0 0 0 1 1.5 10.3 Pri Roueher 2 2.5 0 7.5 0 0 0 1 1.5 Reerind FM 2.5 5 0 0 0 5
PrimCu.'Ni Istclnr 0 2.5 10 25 0 1 3 8.0
PriCufl>!ilstClnr Scav 5 10 1 3 8.0
Secondary Rougher 1 2.5 2.5 2.5 0 0 0 1 3 9.f Secondarv Rougher 2 2.5 2.5 2.5 0 0 0 1 5 Secondaryr Rougher 3 2.5 2.5 2.5 0 0 0 1 5
Remind Feed Is Sec Ro Cone 1-3 + Pri CwNi In CI scav Tail Sec Cone Resrind PM 5 5 5
Sec Cu/Ni IstClnr 5 25 100 1 3 7.8 2.5 0 1 1
Sec Cu/Ni 2nd Clnr 5 10 15 50 i 3 7.6 Sec CuiNi 3rd Clnr 2.5 5 10 25 1 2 7.5
Total 500 28 20 48 25 75 175
Stace Rouithers Pri clnr 1 Sec Clnr 1 Sec Clnr 2-3 Floution Cell 4L 2L 2L IL Speed: rpm 1800 1500 1500 1200
Metallurgical Balance
Product Weight Assays, g/t % Distribution 1! % Pt , : Pd ! Cu • NI i S ft ; ; Pd 1 Cu NI S
1 Pri Cu/Ni 1st CI Cone 38.6 1.95 4 J 9 3.18 I 18.0 1 7,61 ! 28.5 28,2 i 14J : 86.4 40,1 23,6 2 PrCll^^li 1st 01 Scav Cone 8.8 0.45 0.51 4.68 5.69 4.62 27.7 0.7 4.8 6a 5.5 5.2 3 Sec Cu/Ni 3rd CI Cone 23.7 1.20 5.37 6.45 1.17 7.22 13.5 21.1 17.8 3.4 23.4 6.9 4 Sec Cu/Ni 3rd CI Tail 18.7 0.95 2.01 2.05 i 0.13 1.56 16.6 6.2 4.5 0 3 4,0 6.7 5 Sec Cu/Ni 2nd CI Tail 30 1.52 1.46 1.23 1 0.07 ; 0.91 12.9 7J 4.3 OJ 3.7 8.3 6 Sec Cu/Ni 1st CI Tail 114.8 5.81 1.00 0.59 ! 0.04 0.5 6.49 19.1 7.9 0.6 7.8 16.0 7 Rougher Tailing 1741.0 8B.I3 0.06 0.23
i 0.013 0.065 0.89 17.4 46.6 2.8 J 5.4 33J
Head(calc.) 1975.6 100.0 0.30 0.44 0.41 i 0.37 i 2.36 100.0 100.0 100,0 100.0 100.0 (dirwtl
! 0.36 i 0.40 0.43 i 0.37 1 2.41
Combined Products 1 Pri Cu/Ni 1st CI Cone 1.95 4.4 3.18 18.0 7.6 28.5 2t2 14.3 86.4 40.1 23.6
1+2 Pri Cu/Ni 1st Q Cone + CI Sc Cone 2.40 3.7 3.46 ' 15.7 7.1 28.4 28.9 19.1 92.6 45.6 28.9 1-3 Comb CI Cone 1 3.60 4.24 1 4.46 10.871 7.11 23.4 50.05 36.83 96.0 69.0 35,7 3 Sec Cu/Ni 3rd CI Cone ! 1.20 5.37 6.45 1.17 7J2 13.5 21.1 17.8 3.4 23.4 6.9
3-4 Sec Cu/Ni 2nd CI Cone i - 1 5 3.89 4.51 0.71 4.72 14.9 27.4 22.2 3.7 27J 13.5 3-5 Sec Cu/Ni 1st CI Cone ; 3.66 2.88 3.15 0.44 ^ 3.14 14.1 34.7 26.5 4.0 31.1 21.9 3-6 Sec Rougher Cone 1-3 ! 9.48 1.73 i 1.58 0.20 ! 1.52 9.4 53.7 34.4 4.6 38.9 37.9 1-6 Pri + Sec Ro Cone ; 11.87 2.12 1 1.96 3.33 i 2.64 i 13J S2.6 53.4 97,2 84.6 66.7
Observations

Test No.: F29 ProjeccNo.: 10616-001 Operator D.L. Dale: ll-Jul-05
Purpose: To repeat ten F28 but use Na2S03 in place of Na2S205 in the Secondary cleaners
Flotation was conducted as described below. All products were submitted for Pt, Pd, Au, Cu. Ni, , and S analyses.
Feed:
Grind:
2 kg of minus 10 mesh Shakesperare.
30 minutes / 2 kg @ 65% solids in laboratory ball mill (BM-3). Rghr Tail K „ = 82 ^m
Staf^e Lime SIPX Reagents
3477 added, grants per
MIBC tonne
CMC H2S04 Na2S03 Grind Time, minute
Cond, s
Froth PH
Grind 500 30
Pri Rougher 1 5 0 10 0 0 0 1 1,5 10.3 Pri Roueher 2 2.5 0 7,5 0 0 0 1 1.5 Reprind PM 2.5 5 0 0 0 5
Prim Cu/Ni 1st cinr 0 2.5 10 50 0 1 3 8.0
Pri C u ^ i IstClnrScav 5 10 1 3 8.0
Secondary RouRher 1 2 5 2.5 2.5 0 0 0 1 3 Secondary Rougher 2 2.5 2,5 2.5 0 0 0 1 5 Secondary Roufiher 3 2.5 2.5 2.5 0 0 0 1 5
Rrmnd FceJ is Sec Ro Cone IS + Pri Cu/Ni 1st CI scav Tail Sec Cone Regrind PM 5 5 5
Sec Cu/Ni IstClnr 5 25 100 1 3 7,8 2.5 0 1 1
Sec Cu/Ni 2nd Clnr 5 10 15 50 1 3 7,6 Sec CuWi 3rd Clnr 2.5 5 10 25 1 2 7.5
Total 500 28 20 50 25 100 175
Stage Roughers Pri clnr 1 Sec Clnr 1 Sec Clnr 2-3 Flotation Cell 4L 2L 2L IL Speed: tpm 1800 1500 1500 1200
Metallurgical Balance
Product Weighi Assays, t/t Vi Distribution S % Pt •• Pd Cu Ni S Pt Pd Ctl Ni s
Pri Cu/Ni 1st CI Cone 42 2.11 4.33 ! 3.34 ; : 16.8 6.98 1 26.3 25.3 16.8 1 9 1 J 42.0 ! 22.6 Pr Cu/Ni 1st CI Scav Cone 6.6 0,33 5.05 ! 6.66 1,07 7.01 12.8 4.6 5.2 Î 0.9 6.6 ! 1.7 Sec Cu/Ni 3rd CI Cone 20,7 1,04 5.51 5.34 1,22 5.84 25.2 15.9 13.2 i 1 3,3 17,3 ! 10.7 Sec Cufl^i 3rd CI Tail 13 0,65 2,45 2.35 0.17 1.7 11.2 4,4 3.6 0.3 3.2 ; 3.0 Sec Cu/Ni 2nd CI Tail 19,4 0.97 1.62 1,21 0 12 : 0.92 7.94 4.4 2.8 0.3 2.6 ! 3.2 Sec Cu/Ni 1st CI Tail 103 5.17 1.26 0,75 0.039 0.62 : 7.62 18.1 9.2 0,5 : 9.1 1 16.1 Rougher Tailing 178S.0 89.73 0.11 0.23 0.014 0.075 i 1,17 27,4 49.1 3 2 i 19,2 ; 42.8
Head (calc) 1992.7 100.0 0.36 0.42 0.39 , 0,35 i 2,45 100,0 100.0 !####! 100,0 1 100.0 (direct) 0.36 0.40 1 0.43 i 0.37 2.41 !
Combined Products 1 Pri Cu/Ni 1st CI Cone 2,11 4.3 3.34 16.8 7.0 26,3 25,3 16.8 91.5 42.0 22.6
\*2 Pri Cu/Ni 1st a + CI Scav Cone 2,44 4,4 3.79 14.7 7.0 24.5 29.9 22.0 92.4 48.6 24.3 1-3 Comb CI Cone ; 3.48 4.75 1 4.2S 10.65 6.64 1 24.7 4S.79 35.2 95.6 65.9 35.0 3 Sec Cu/Ni 3rd a Cone ; 1,04 5.51 i 5.34 • 1.22 5,84 ! 25.2 15.9 13.2 3.3 17.3 10.7
3-4 Sec Cu/Ni 2nd O Cone 1 1.69 4.33 4.19 0.81 4,24 ! 19.8 20.3 16.9 3,6 20.5 13.7 3-5 Sec Cu/Ni 1st a Cone 1 2.66 3.34 3.10 0.56 3.03 15,5 24.7 19.7 3.9 23.0 16.8 3-6 Sec Rougher Cone 1-3 7.83 1.97 1.55 1 0.22 1.44 10,3 42.7 28.9 4.4 32.2 32.9 1-6 Pri + Sec Ro Cone i 10.27 2.55 , 2.08 ! 3,65 ! 2.76 13.7 72.6 50.9 96,8 80.8 57,2
Observations

Test No.: F30LCT Project No.; 10616-003 Operator: DL Date: 05-Aug-05
Purpose: To produce a Rougher Tail for environmental testwork that would not be acid generating. To observe the behaviour of the cleaning ciurcuit at probable cleaner densities.
Procedure: Flotation was conducted as described below. All products were submitted for Pt, Pd, Au, Cu, Ni, Fe and S analyses.
Feed: 2 X ID kg of minus 10 mesh Shakespeare composite sample.
Grind: 42 minutes/10 kg @ 65% solids in laboratory 10 kg ball mill. RghrTail!C,o 72nm(asF19).
Stage CaCOH), SIPX leagents added
3477 grams per torn
CMC le
CUSO4 H2S04 MIBC Tir
Grind ne, mini Cond.
ites Froth pH
Grind 200 30 9.2
Rougher 1 20 10 10 1 2 9.3 Rn concentrate I kept separate to go direct to 1st cleaner feed NO REGRIND
Rougher 2 7.5 2.5 1 3 Rougher 3 7.5 2.5 2.5 1 5 Rougher 4 7.5 5 1 5 Rougher 5 7.5 2.5 5 1 3 Sacvenger 15 100 2.5 1+1 2 8.1
10 5 100 5 1 2 7.7 10 5 100 5 1 3 7.5 10 5 50 50 5 i+r 2 7.5
Rewind feed is the Rougher Concentrate 2-5 ReerindP.M. 1 1 2.5 50 6
1st Cleaner feed is the reground product plus the Rougher Concentrate 1 1st Cleaner 1 8 8.1
1st Cleaner Scav ! 2.5 10 2.5 1 4 1st Cleaner Scav 2 10 1.25 1 3
2nd Cleaner 2.5 10 1 5 8.3 3rd Cleaner 10 1 I 4 8.2 4th Cleaner 5 1 3 8.0
Total 220 87.5 35.0 35.0 200.0 250.0 47.3
Stage Roughers 1st Cleaner 2nd-4lh Geaner FloUtion Cell Agitair lOLD-2 4LD-1 Speed: ipm 1500 1800
Metallurgical Balance
Product Weig ht Assays, g/t % Distribution e Pt ! Pd Cu i Ni ! S Pt Pd Cu 1 Ni S
4th Cleaner Cone 458.2 2.29 9.57 3.82 15.3 7,55 ! 34.9 69.6 21,1 85,7 46,5 1 31,2 4 4 Cleaner Tail 208.7 1,04 1.78 2.44 0,8 4,22 33.2 5.9 6,1 2,1 11,8 < 13.5 3nl Cleaner Tail 289.1 1,45 1.18 2.70 0,82 j 1 3.56 28.0 5,4 9,4 2,9 13,8 1 15.8 2nd CleanrTail 321.6 1.61 0.77 1 2.53 0,49 1 : 1.33 16.4 3,9 9.8 1,9 5,7 , 10.3 1st Clnr Scav Cone 1 160.2 0.80 1.20 i 3.34 0,77 1,32 18,1 3,1 6.5 1.5 2.8 ! 5.7 1st Clnr Scav Cone 2 63.0 0.32 1.27 3.62 0.74 1,33 9,32 1,3 ; 2.8 0.6 1.1 ! 1.1 1st Clnr Scav Tail 605.0 3.03 0.26 0.79 0,13 0,38 1,62 2,5 i 5.8 1.0 3.1 j 1.9 Scavenger Cone 691.0 3.46 0,26 0.38 0,085 0,30 12,0 2,9 3.2 0.7 2,8 1 16.2 Scavenger Tailing 17203.2 86.02 0,02 1 0.17 0,017 0,05 1 0,13 5,5 35,3 3.6 12,3
1 4.4
1
Head (calc.) 20000,0 100.0 0.31 0.41 0,41 0,37 2,56 100,0 100,0 100.0 i
100,0 ! 1
100.0 (direct) 0.36 ! ! 0.40 0,43 0,37 2,37
Combined Products 4thCIeaner Cone 2.29 9.57 3,82 15.3 7,55 34,9 69,6 21,1 85,7 46,5 31.2 3rd Cleaner Cone 3.33 7,13 3,39 10.8 6,51 34,4 75,5 27.3 87,8 58,3 44.7 2nd Cleaner Cone 4.78 5,33 3,18 7.8 5,62 32.4 80.9 36,7 90,7 72,2 60.5 1st Cleaner Cone 6.39 4,18 3,02 5.9 4,54 28.4 84.9 46,5 92,7 77,9 70.8 1st CI Conc+ CI Sc Cone 1 7,19 3,85 3,05 5.4 4,18 27.3 87,9 53,0 94,2 80,7 76,4 1st a Conc+ CI Sc Cone 1 &2 7.50 3,74 3.08 5.2 4,06 26,5 89,2 55,7 94,7 81,9 77,6 Rougher Cone 10.53 2.74 2.42 3.7 3,00 19.4 91,7 61,5 95,7 85,0 79,5 Ro + Scav Cone 13.98 2.13 1.92 2.8 2.33 17.5 94,5 64,7 96,4 87,7 95,6

Test No.: F31LCT Project No.; 10616-003 Operator: DL Date: 05-Aug-05
Purpose:
Procedure:
Feed:
Grind:
Conditions:
To repeat the conditions of test F26, but reduce the cleaning pH and increase the CMC slightly. Ro Cone 1 is kept separate, and rougher conc 2-6 are combined for regrinding in the laboratory pebble mill as shown below
The reground product and the rougher 1 concentrate were combined for cleaning.
Flotation was conducted as described below. All products were submitted for Pt, Pd, Au, Cu, Ni, Fe and S analyses.
2 kg of minus 10 mesh Shakespeare.
30 minutes / 2 kg @ 65% solids in laboratory ball mill (BM-2). Rghr Tail Kjo ~ 82 ^m (as F2).
Stage Ca(0H)2 Reag
S IPX ents added, gra:
3477 ms per tonne
CMC CuSO, MIBC Tir
Grind ne, mini Cond.
utes Froth pH
Grind 200 20 30 9.3
Rougher 1 10 1 2 9.5 Rougher 2 7.5 2.5 1 2 Rougher 3 15 5 5 1 g Rougher 4 5 5 100 10 1+1 5 8.4
H2S04 Scavenger 15 5 1 2 7.2
Regrind P.M. 5 4 8.5 Cleaner 1 1 3
Cleaner 1 Scav 5 2.5 10 2.5 1 2 8.2
Cleaner 2 1 15 * 2.5 1 3.5 7.5 Cleaner 3 1 15 « 1 2 7.0
Total 200 49.5 37.5 40.0 100.0 37.5
Stage Roughers Cleaners Flotation Cell lOOOg-Dl 250g-Dl Speed: rpm 1800 1200
Metallurgical Balance
Product Weight Assays, g/t % Distribution
fi i % Pt Pd i Cu i i Ni S Pt ! Pd Cu Ni S 3rd Cleaner Conc 92.0 i 4.61 5.50 3.82 1 8.27 5.95 29.0 72.9 42.4 93.6 74.2 57.3 3rd Cleaner Tail 28.4 i 1.42 1.24 2.50 0.43 1.48 18.0 5.1 8.6 1.5 5.7 11.0 2nd Clnr Scav Tail 25.1 ^ 1.26 0.75 1.58 0.28 0.90 11.8 2.7 4.8 0.9 3.1 6.4 1st Clnr Scav Conc 36.4 1 1.82 0.45 0.75 0.12 0.48 12.9 2.4 3.3 0.5 2.4 10.1 1st Clnr Scav Tail 113.6 ' 5.69 0.23 0.40 0.044 0.15 1.76 3.8 5.5 0.6 2.3 4.3 Scav Conc 42.7 2.14 0.20 0.31 0.049 0.28 10.5 1.2 1.6 0.3 1.6 9.6 Scavenger Tailing 1656.6 83.05 0.05 0.17 0.013 1 0.05 0.04 11.9 33.9 2.6 10.8 1.4
Head (calc.) 1994.8 100.0 0.35 0.42 0.41 0.37 2.34 100.0 100.0 100.0 100.0 100.0 (direct) 0.36 0.40 0.43 0.37 2.37
Combined Products 3rd Cleaner Conc 4.61 5.50 3.82 8.3 5.95 29.0 72.9 42.4 93.6 74.2 57.3 2nd Cleaner Conc 6.04 4.50 3.51 6.4 4.90 26.4 78.0 50.9 95.1 79.9 68.2 1st Cleaner Conc 7.29 3.85 3.18 5.36 4.21 23.9 80.7 55.7 95.9 82.9 74.6 1st Clnr + 1st Clnr Sc Conc 9.12 3.17 2.69 4.31 3.46 21.7 83.1 59.0 96.5 85.3 84.7 Rougher Conc. 14.81 2.04 1.81 2.67 2.19 14.0 86.8 64.5 97.1 87.6 89.0

Test No.: F32 Project No.: 10616-003 Opera tor : DL Date: 26-Jul-05
Purpose: To repeat the conditions of test F25, but conduct magnetic separation on the 4th cleaner concentrate.
Procedure:
Feed:
Grind:
Conditions:
Flotation was conducted as described below. All products were submitted for Pt, Pd, Au, Cu, Ni, Fe and S analyses.
2 kg of minus 10 mesh Shakespeare.
30 minutes / 2 kg @ 65% solids in laboratory ball mill (BM-3). Rghr Tail Kgo ~ 82 nm
Stage Ca(OH)2 Reagi
SIPX =nts added, grai
3477 ms per tonne
CMC CUSO4 MIBC Tir
Grind ne, min Cond.
utes Froth pH
Grind 200 30 9.3
Rougher 1 20 7.5 2.5 10 1 1 9.5 Rougher 2 5 2.5 1 2 9.5 Rougher 3 30 5 2.5 2.5 1 4 9.6 Rougher 4 40 2.5 5 1 4 9.5 Rougher 5 40 2.5 2.5 5 1 4 9.5 Cleaner 1 20 1 3 9.6
Cleaner 1 Scav 2.5 0 2.5 1 2
Cleaner 2 10 1 2.5 1 3.5 9.5 Cleaner 3 10 1 0 5 1 3 9.5 Cleaner 4 10 1 15 5 I 2.5 9.5
Total 380 25.5 10.0 15.0 0.0 40.0
Stage Roughers Cleaners Flotation Cell tOOOg-Dl 250g-Dl Speed: rpm 1800 1200
Metallurgical Balance
Product Weight Assays, g/t % Distribution
® i % Pt Pd Cu Ni ! S Pt Pd Cu Ni S 4th 01 Cone Non Mag 25.5 ! 1.28 16.00 7.70 12.4 8.35 25.5 64.2 27.8 73.6 39.6 13.1 4th Cleaner Cone Mag 58.0 i 2.91 1.63 0.83 1.14 2.51 35.9 14.9 6.8 15.4 27.1 42.0 4th Cleaner Tail 18.4 i 0.92 1.07 2.82 0.40 1.33 19.9 3.1 7.4 1.7 4.6 3rd Cleaner tail 7,9 1 0.40 0.80 2.65 0.33 0.81 12.8 1.0 3.0 0.6 1.2 2.0 2nd Cleaner Tail 20.6 : 1.03 0.51 1.53 0.19 0.55 9.44 1.7 4.5 0.9 2.1 3.9 1st Clnr Scav Cone 30.9 i 1.55 0.50 ! 0.94 0.22 0.66 20.6 2.4 4.1 1.6 3.8 12.8 1st Clnr Scav Tail 57.9 I 2.90 0.17 1 0.44, 0.058 1 0.17 3.22 1.5 3.6 0.8 1.8 3.8 Rougher Tailing 1774.6 89.01 0.04 i 0 .17 ' 0.013 0.06 0.42 11.2 42.8 5.4 19.8 15.0
Head (calc.) 1993.8 100.0 0.32 1 0.35 0.22 0.27 2.49 100.0 100.0 100.0 100.0 100.0 (direct) 0.36 j 0.40 0.43 0.37 2.37
Combined Products 4th Cleaner Cone Non Mag 1.28 16.00 7.70 12.4 8.35 25.5 64.2 27.8 73.6 39.6 13.1 4th Cleaner Cone 4.19 6.02 2.93 4.6 4.29 32.7 79.1 34.7 89.0 66.7 55.1 3rd Cleaner Cone 5.11 5.12 2.91 3.8 3.76 30.4 82.2 42.0 90.7 71.3 62.4 2nd Cleaner Cone 5.51 4.81 2.89 3.57 3.55 29.1 83.2 45.0 91.4 72.5 64.5 1st Cleaner Cone 6.54 4.13 2.68 3.04 3.07 26.0 84.8 49.5 92.3 74.6 68.4 1st Clnr + 1st Clnr Sc Cone 8.09 3.44 2.34 2.50 2.61 25.0 87.3 53.6 93.8 78.4 81.2 Rougher Cone. 10.99 2.57 1.84 1.85 1.96 19.2 88.8 57.2 94.6 80.2 85.0

Test No.: F33 Project No.: 10616-003 Opera tor : DL Date: 26-Jul-05
Purpose: To repeat the conditions of test F32, but regrind the rougher concentrate before cleaning.
Procedure:
Feed:
Grind:
Conditions:
Flotation was conducted as described below. All products were submitted for Pt, Pd, Au, Cu, Ni, Fe and S analyses.
2 kg of minus 10 mesh Shakespeare.
30 minutes / 2 kg @ 65% solids in laboratory ball mill (BM-3). Rghr Tail K50 ~ 82 jim
Stage Ca(OH)j Reag
S IPX ents added, gra
3477 ms per tonne
CMC CUSO4 MIBC Tir
Grind ne, min Cond.
utes Froth pH
Grind 200 30 9.3
Rougher 1 20 7,5 2.5 10 1 1 9.5 Rougher 2 5 2.5 1 2 9,5 Rougher 3 30 5 2.5 2.5 1 4 9,6 Rougher 4 40 2.5 5 1 4 9,5 Rougher 5 40 2.5 2.5 5 1 4 9.5
Regrind R.M. 100 5 5 4
Cleaner 1 20 2.5 1 3 9.6 Cleaner 1 Scav 5 2.5 0 2.5 1 2
Cleaner 2 10 5 2.5 1 3.5 •9.5 Cleaner 3 10 2.5 0 5 1 3 9.5 Cleaner 4 10 1 15 5 1 2.5 9.5
Total 480 41.0 15.0 15.0 0.0 42.5
Stage Roughers Cleaners Flotation Cell lOOOg-Dl 250g-Dl Speed: rpm 1800 1200
Metallurgical Balance
Product Weight Assays, g/t % Distribution B • % Pt i Pd Cu j Ni i S Pt 1 Pd 1 Cu Ni S
4th CI Cone Non Mag 47.3 : 2.37 7.95 ! 5.10 15,4 9,39 28.7 49.5 i 30.4 i 92.8 61.8 28.2 4th Cleaner Cone Mag 6.0 : 0.30 1.30 i 1.08 1,6 2.98 34,2 1.0 0.8 1.2 2.5 4.3 4th Cleaner Tail 5 . 1 0.26 2.84 4.49 0.35 2,54 20,1 1.9 2.9 0.2 1.8 2.1 3rd Cleaner tail 9 . 3 0.47 1,89 3.04 0.21 1.72 16.9 2.3 3.6 0.2 2.2 3.3 2nd Cleaner Tail 15.9 : 0.80 1,53 1.70 0.15 1.00 ; ; 1 2 . 2 3.2 3.4 0.3 2.2 4.0 1st Clnr Scav Cone 29.8 ; 1.49 2,48 2.28 0,26 1.62 1 19.2 9.7 8.6 1.0 6.7 11.9 1st Clnr Scav Tail I1I.3 5.58 1,25 0,56 0,047 i 0.36 5.9 18.3 ! 7 . 9 0.7 5.5 13.6 Rougher Tailing 1769.3 88,73 0,06 0.19
! 0.016
1 0.07 0.89 14.0 I 42.4
1 3.6 17.2 32.7
Head (calc.) 1994.0 !
i 100.0 0,38 j 0.40 j 0,39 0.36 2.42 100.0 ; 1 0 0 . 0 100.0 100.0 100.0 (direct) 0.36 ! 0.40 1 0,43 0.37 2.37 1
Combined Products 4th Cleaner Cone Non Mag 1 2.37 7.95 5.10 15.4 i 9.39 ! 28.7 49.5 j 30,4 92.8 61.8 28.2 4th Cleaner Cone j 2.67 7.20 4.65 13.8 1 8.67 29.3 50.5 31.3 94.0 64.3 32.4 3rd Cleaner Cone i 2.93 6.82 4.63 12.7 i 8,13 28.5 52.5 34.2 94.2 66.1 34.5 2nd Cleaner Cone i 3.40 6.14 4.41 I 1 10.95 7.25 26.9 54.8 37.7 94.4 68.3 i 37.8 1st Cleaner Cone 1 4.19 5.27 3.90 8.90 6.06 1 24.1 58.0 41.1 94.7 70.5 1 41.8 1st Clnr + 1st Clnr Sc Cone 5.69 4.53 3.47 j 6.63 4.90 1 22.8 67.7 49.7 95.7 77.3 j 53.7 Rougher Cone. 1 11.27 2.91 2.03 ! 3 . 3 7 1 2.65 ! 14.4 86.0 57.6 ! 96.4 82.8 i 67.3

Test No.: F34 Project No.: 10616-003 O p e r a t o r : DL Date: 26-Jul-05
Purpose: To repeat the conditions of test F32, but otnit Lime in the roughers, modify the pH slightly up in the cleaners
Procedure:
Feed:
Grind:
Conditions:
Flotation was conducted as described below. All products were submitted for Pt, Pd, Au, Cu, Ni, Fe and S analyses.
2 kg of minus 10 mesh Shakespeare.
30 minutes / 2 kg @ 65% solids in laboratory' ball mill (BM-3). Rghr Tail tCgQ -- 82 urn
Stage Ca(0H)2 Reag
S IPX ents added, gra
3477 ims per tonne
CMC CUSO4 MIBC Tit
Grind ne, min
Cond. utes
Froth pH
Grind 30
Rougher 1 7.5 2.5 10 1 1 8.9 Rougher 2 5 2.5 1 2 Rougher 3 5 2.5 2.5 1 4 Rougher 4 2.5 5 1 4 Rougher 5 2.5 2.5 5 1 4 8.6 Cleaner 1 50 1 3 9.3
Cleaner 1 Scav 2.5 0 2.5 1 2
Cleaner 2 10 1 8 2.5 1 3.5 9.3 Cleaner 3 10 I 5 5 1 3 • 9.3 Cleaner 4 10 1 0 5 1 2.5 9.3
Total 80 25-5 10.0 13.0 0.0 40.0
Stage Roughers Cleaners Flotation Cell lOOOg-DI 250g-Dl Speed: rpm 1800 1200
Metallurgical Balance
Product Weight Assays, g/t % Distribution g 1 % Pt i Pd Cu 1 Ni i S Pt 1 Pd Cu L Ni ' s
4th CI Cone 78.9 1 3.98 6.39 3.36 9.0 i 6.68 28.9 82.4 j I 36.0 92.8 73.5 i 45.7 4th Cleaner Tail 17.7 ! 0.89 0.80 2.01 0.3 0.98 22.5 2.3 4.8 0.7 2.4 i 8.0 3rd Qeaner Tail 22.2 j 1.12 0.56 1.73 0.26 0.73 13.7 2.0 5.2 0.8 2.3 6.1 2nd Cleaner tail 37.3 1 1.88 0.39 1.04 0.19 ; 0.50 12.3 2.4 5.3 0.9 2.6 9.2 1st Clnr Scav Cone 29.3 i 1.48 0.49 0.99 0.23 1 0.57 1 13.8 2.3 3.9 0.9 2.3 1 8.1 1st Clnr Scav Tail 64.5 ; 3.25 0.20 0.49 0.08 1 0.20 ! 3.15 2.1 4.3 0.6 i 1.8 i 4 . 1 Scav Cone 32.6 1 1.64 0.17 0.21' 0.048 1 0.40 i 18.3 0.9 1.2 1 0.2 1 1.8 12.0 Rougher Tailing 1701.0i 85,76 0.02 0.17 0.014 ! 0.06
1 0.20 5.6 39.3
i j 13.3 6.8
Head (calc.) I983.5I 100.0 0.31 0.37 j 0.39 1 ; 0.36 2.51 100.0 100.0 100.0 100.0 100.0
(direct) 1 0.36 0.40 1 0.43 ! 0.37 ! 2.37 1
Combined Products 4th Cleaner Cone ! 3.98 6.39 1 3.36 j 9.0 1 6.68 1 28.9 82.4 i 36.0 1 92.8 73.5 i 45.7 3rd Cleaner Cone ; 4.87 5.37 j 3.11 I i 7.4 : 5.64 j 27.7 84.7 i 40.8 j 93.5 75.9 i 53.7 2nd Cleaner Cone ' 5.99 4.47 2.85 6.1 i 4.72 i 25.1 86.7 46.0 ! 94.3 78.2 ; 59.8 1st Cleaner Cone 1 7.87 3.49 2.42 4.67 i 3.71 1 22.0 89.1 51.3 ' 95.2 80.8 i 69.0 1st Clnr+ 1st Clnr Sc Cone j 9.35 3.02 2.19 3.97 ; 3.21 j 20.7 91.4 1 55.2 1 96.1 i 83.1 i 77.1 Rougher Cone 1 12.60 2.29 1.75 2.96 ! 2.44 : 16.2 93.5 59.5 i 96.7 84.9 i 81.2 Ro + Scav Cone. i 14.24 2.05 1.58 2.63 : 2.20 ! 16.4 94.4 60.7 i 96.9 i 86.7 93.2

Test No.: F35 Project No.: 10616-003 O p e r a t o r : DL Date: 2 6 - J u l - 0 5
Purpose: To repeat the conditions of test F25 but use pH 10.0 in the toughers and cleaners and examine the eftect on Ni and PGM grade and recovery.
Procedure:
Feed:
Grind:
Conditions:
Flotation was conducted as described below. All products were submitted for Pt, Pd, Au, Cu, Ni, Fe and S analyses.
2 kg of minus 10 mesh Shakespeare.
30 minutes / 2 kg @ 65% solids in laboratory ball mill (BM-3). Rghr Tail Kgo - 82 ^m
Stage Ca(OH)j Reagi
SIPX ents added, gra
3477 ms per tonne
CMC CuSO^ MIBC Tir
Grind ne, min
Cond. utes
Froth pH
Grind 400 30 10.0
Rougher 1 7.5 2.5 10 1 1 10.0 Rougher 2 5 2.5 1 2 10.0 Rougher 3 40 5 2.5 2.5 1 4 10.0 Rougher 4 50 2.5 5 1 4 10.0 Rougher 5 60 2.5 2.5 5 1 4 9.8 Cleaner 1 20 1 3 9.8
Cleaner 1 Scav 2.5 0 1 2
Cleaner 2 10 1 1 3.5 10.0 Cleaner 3 10 1 0 2.5 1 2 • 10.0 Cleaner 4 10 1 20 5 I 2 9.8
Total 600 25.5 10.0 20.0 0.0 32.5
Stage Roughers Cleaners Flotation Cell lOOOg-Dl 250g-Dl Speed: rpm 1800 1200
Metallurgical Balance
Product Weight Assays, { % Distribution g % Pt i Pd Cu ! Ni S Pt ! Pd Cu i Ni s
4th Cleaner Cone 74.1 3.72 6.31 ! 3.20 11.3 1 7.92 27.1 68.6 1 28.5 94.0 73.7 41.2 4th Cleaner Tail 26.8 1.34 1.47 I 2.82 0.47 1 1.40 i 19.3 5.8 9.1 1.4 4.7 10.6 3rd Cleaner tail 22.6 1.13 0.72 : 1.97 0.24 1 0.90 1 12.4 2.4 5.3 0.6 2.6 5.8 2nd Cleaner Tail 30.7 1.54 0.41 1.18 0.12 1 0.37 5.87 1.8 4.4 0.4 1.4 1 3.7 1st ClnrScav Cone 27.3 1.37 0.44 1.00 0.150! 0.50 10.8 1.8 1 3.3 0.5 1.7 ! 6.1 1st Clnr Scav Tail 53.3 2.67 0.20 i 0.47 i&m, 0.17 2.16 1.6 j 3.0 I 0.3 1 1.1 2.4 Rougher Tailing 1759.0 88.22 0.07 ! 0.22 0.014 0.067 0.84 18.1 1 46.5 2.8 I 14.8 30.3
Head (calc.) 1993.8 100.0 0.34 0.42 0.45 0.40 2.44 100.0 100.0 100.0 i 1 100.0 100.0
(direct^ 0.36 ! 0.40 0.43 1 0.37 2.37 1 i i ' r estimated, insufficient sample
Combined Products 4th Cleaner Cone 3.72 6.31 ! 3.20 11.3 7.92 27.1 68.6 28.5 94.0 73.7 I 41.2 3rd Cleaner Cone 5.06 5.02 3.10 8,4 6.19 25.0 74.4 37.5 95.5 78.4 ! 51.8 2nd Cleaner Cone 6.19 4.24 2.89 6.93 5.22 22.7 76.8 42.9 96.1 80.9 57.6 1st Cleaner Cone 7.73 3.47 2.55 5.57 4.25 19.4 78.6 47.2 96.5 82.4 61.3 1st Clnr + 1st Clnr Sc Cone 9.10 3.02 2.32 4.76 3.69 18.1 80.4 50.5 96.9 84.1 67.3 Rougher Cone. 11.78 2.38 1.90 3.69 2.89 14.5 81.9 53.5 97.2 85.2 69.7

Test No.: F36 Project No.: 10616-003 Opera tor : DL Date: 26-Jul-05
Purpose:
Procedure:
Feed:
Grind:
Cooditions:
To repeat the conditions of test F26, but collect the 1st Rougher concentrate for 2 minutes and forward it to the 1st cleaner Collect the remaining concentrates for regrinding, combine the reground product with the 1st rougher concentrate for cleaning as outlined below.
Flotation was conducted as described below. All products were submitted for Pt, Pd, Au, Cu, Ni, Fe and S analyses.
2 kg of minus 10 mesh Shakespeare.
30 minutes / 2 kg @ 65% solids in laboratory ball mill (BM-2), Rghr Tail Kgo ~ 82 nm (as F2).
Stage Ca(0H)2 Reag
SIPX ents added, gra
3477 ms per tonne
CMC CUSO4 MIBC Tir
Grind ne, min
Cond. utes
Froth PH
Grind 200 30 9.3
Rougher 1 20 10 10 1 2 9.5 Rougher 2 7.5 2.5 1 2 9.4 Rougher 3 5 2.5 2.5 1 4 9.2 Rougher 4 7.5 5 1 4 9.1 Rougher 5 2.5 2.5 5 1 4 9.0 Rougher 6 2.5 100 2.5 1 1 8.7
Ro 1 conc is kept as is and combined unth the reground Ro conc 2-6 for 1st cleaner feed Regrind P.M. 50 4
Cleaner 1 2.5 1 3 9.6 Cleaner 1 Scav 2.5 10 2.5 1 2
Cleaner 2 1 2.5 1 3.5 Cleaner 3 10 1 10 2.5 1 2 9.5 Cleaner 4 10 1 10 2.5 1 2 9.5
Total 290 28.0 17.5 30.0 100.0 40.0
Stage Roughers Cleaners Flotation Cell lOOOg-Dl 250g-Dl Speed: rpm 1800 1200
Metallurgical Balance
Product Weight Assays, •Jt % Distribution g i % Pt Î Pd Cu Ni S Pt Pd Cu NI S
4th Qeaner Conc 71.0 ! 3.57 7.29 3.85 10.3 7.12 30.1 72.0 35.0 92.7 70.3 44.8 4th Cleaner Tail 14.8 0.74 1.26 2.74 0.44 1.49 21.7 2.6 5.2 0.8 3.1 6.7 3rd Cleaner tail 26.5 1.33 0.91 2.26 0.36 1.31 16.3 3.4 7.7 1.2 4.8 9.1 2nd Cleaner Tail 28.5 : : 1.43 0.49 1.08 0.12 0.45 6.11 1.9 3.9 0.4 1.8 3.7 1 St Clnr Scav Conc 46.0 i 2.31 0,78 1.07 0.120 0.63 17 5.0 6.3 0.7 4.0 16.4 1st Clnr Scav Tail 74.0 i 3.72 0.30 j 0.45 wA 0.18 2.42 3.1 4.3 0.5 1.9 3.8 Rougher Tailing 1729.01 86.89
i 0.05 0.17 0.017 0.059 0.43 12.0 37.6 3.7 14.2 15.6
Head (calc.) 1989.8 100.0 0.36 1 0.39 0.40 0.36 2.40 lOO.O 100.0 100.0 100.0 100.0 (direct) ! 0.36 1 0.40 0.43 0.37 2.37
Combined Products estimated, insufficient sample
4th Cleaner Conc 3.57 7.29 3.85 10.3 7.12 30.1 72.0 35.0 92.7 70.3 44.8 3rd Cleaner Conc 4.31 6.25 3.66 8.6 6.15 28.7 74.6 40.2 93.5 73.3 51.5 2nd Cleaner Conc 5.64 4.99 3.33 6.65 5.01 25.7 78.0 47.9 94.7 78.2 60.6 1st Cleaner Conc 7.08 4.08 2.87 5.33 4.08 21.8 79.9 51.8 95.1 79.9 64.3 1st Clnr + 1st Clnr Sc Conc 9.39 3.27 2.43 4.05 3.23 20.6 84.9 58.1 95.8 84.0 80.7 Rougher Conc. ! 13.11 2.42 1.87 2.91 2.37 15.4 88.0 62.4 96.3 85.8 84.4
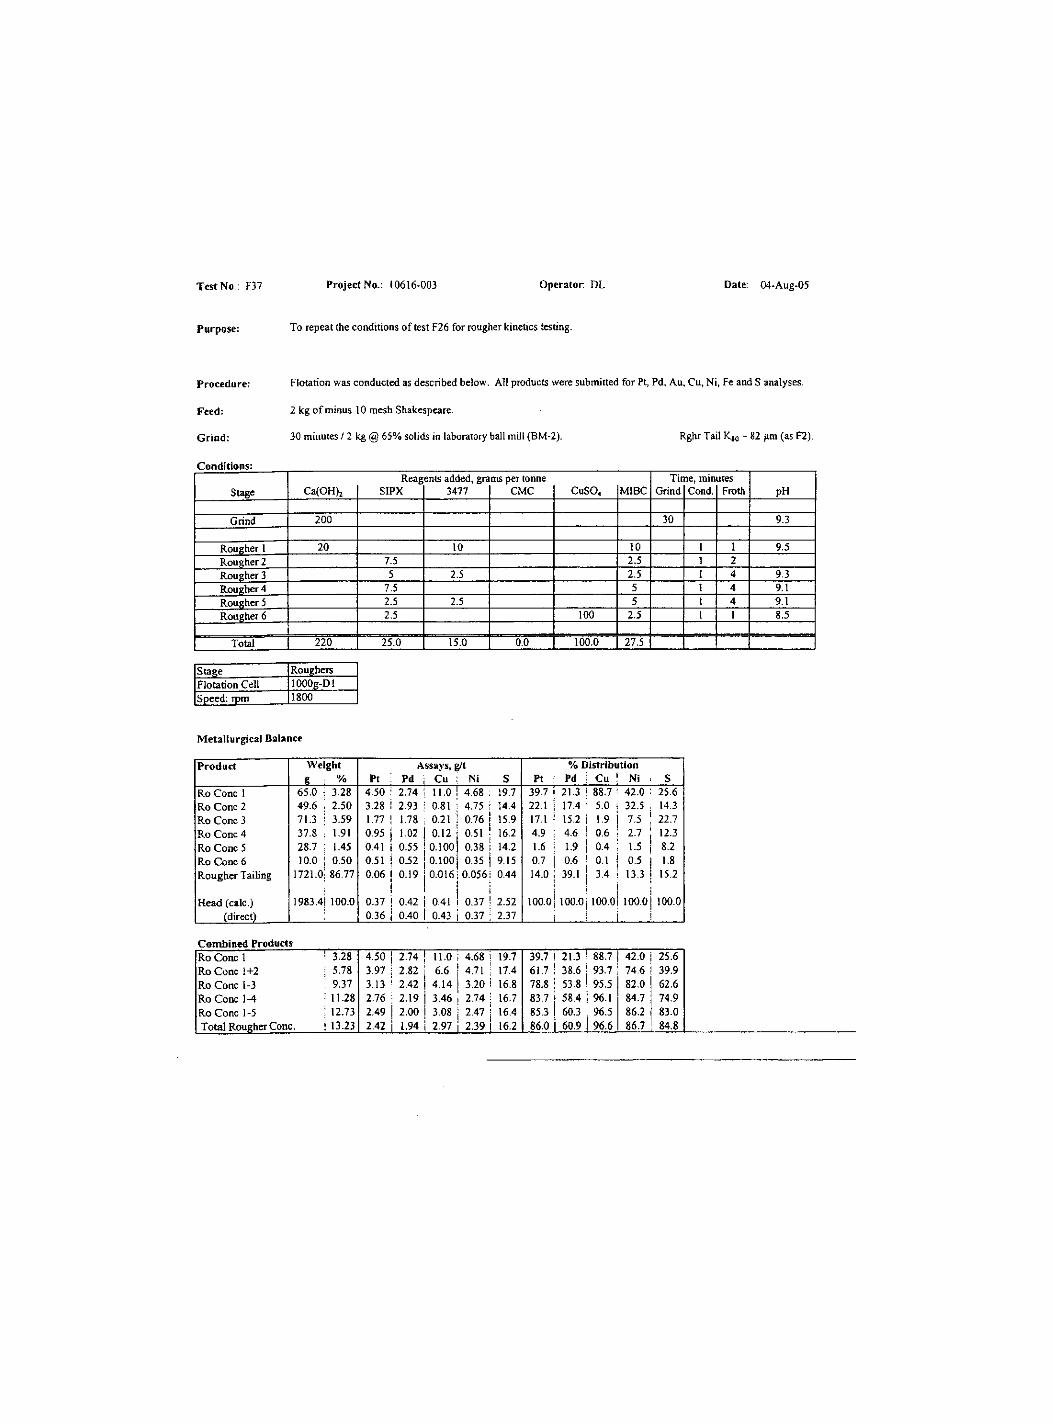
Tes t No.: F37 Pro jec t No.: 10616-003 O p e r a t o r : DL Date: 2 6 - J u l - 0 5
Purpose: To repeat the conditions of test F26 for rougher kinetics testing.
Procedure:
Feed:
Grind:
Conditions:
Flotation was conducted as described below. All products were submitted for Pt, Pd, Au, Cu, Ni, Fe and S analyses.
2 kg of minus 10 mesh Shakespeare.
30 minutes / 2 kg @ 65% solids in laboratory' ball mill (BM-2). Rghr Tail Kjo - 82 nm (as F2).
Stage Ca(0H)2 Reag
SIPX ents added, gra
3477 ms per tonne
CMC CuSO, MIBC Tir
Grind ne, mini
Cond. utes
Froth pH
Grind 200 30 9.3
Rougher 1 20 10 10 1 1 9.5 Rougher 2 7.5 2.5 1 2 Rougher 3 5 2.5 2.5 I 4 9.3 Rougher 4 7.5 5 1 4 9.1 Rougher 5 2.5 2.5 5 1 4 9.1 Rougher 6 2.5 100 2.5 1 1 8.5
Total 220 25.0 15.0 0.0 100.0 27.5
Stage Roughers Flotation Cell lOOOg-Dl Speed: rpm 1800
Metallurgical Balance
Product Weight Assays, g/t % Distribution
g : % Pt Pd j Cu : Ni S Pt : Pd ; Cu ' Ni : S Ro Cone 1 65.0 i 3.28 4.50 2.74 i 1 11.0 1 4.68 : 19.7 39.7 1 21.3 i 88.7 • 42.0 : 25.6 Ro Cone 2 49.6 , 2.50 3.28 2.93 i ! 0.81 i 4.75 i 14.4 22.1 i 17.4 5.0 i 32.5 , 14.3 Ro Cone 3 71.3 3.59 1.77 1.78 0.21 0.76 15.9 17.1 i 15.2 i 1.9 7.5 ! 22.7 Ro Cone 4 37.8 ; 1.91 0.95 1.02 0.12 0.51 16.2 4.9 ; 4.6 ! 0.6 2.7 12.3 Ro Cone 5 28.7 ; 1.45 0.41 0.55 0.100 0.38 1 14.2 1.6 1.9 1 0.4 1.5 8.2 Ro Cone 6 10.0 1 1 0.50 0.51 0.52 0.100 0.35 9.15 0.7 0.6 ! 0.1 0.5 1.8 Rougher Taihng 1721.0 86.77 0.06 0.19 0.016 0.056! 0.44 14.0 39.1 1 3.4 I 13.3 15.2
Head (calc.) 1983.4 100.0 0.37 0.42 0.41 0.37 ! ! 2.52 100.0 100.0 100.0 loo.oi 100.0 (direct) 0.36 0.40 0.43 1 0.37 ; 2.37 i .... i
Combined Products Ro Cone 1 ! 3.28 4.50 2.74 ! 11.0 4.68 ! 19.7 39.7 I 21.3 1 88.7 42.0 j 25.6 Ro Cone 1+2 i 5.78 3.97 2.82 6.6 4.71 ; 17.4 61.7 ! 38.6 93.7 74.6 39.9 Ro Cone 1-3 : 9.37 3.13 i 2.42 4.14 3.20 i 16.8 78.8 i 53.8 95.5 82.0 62.6 R o C o n e 1-4 ' 11.28 2.76 : i 2.19 3.46 ! 2.74 ; 16.7 83.7 58.4 96.1 84.7 74.9 Ro Cone 1-5 : 12.73 2.49 2.00 3.08 2.47 i 16.4 85.3 60.3 96.5 86.2 83.0 Total Rougher Cone. Î 13.23 2.42 i 1.94 2.97 i 2.39 16.2 86.0 1 60.9 96.6 86.7 84.8

Test No.: F39 Project No.: 10616-003 Operator: DL Date: 26 - Ju l -05
Purpose:
Procedure:
Feed:
Grind:
Conditions:
To repeat the conditions of test F36, but omit the regrind.
Flotation was conducted as described below. All products were submitted for Pt, Pd, Au, Cu, Ni, Fe and S analyses.
2 kg of minus 10 mesh Shakespeare.
30 minutes / 2 kg @ 65% solids in laboratory ball mill (BM-2). Rghr Tail Kjo ~ 82 fim (as F2).
Stage Ca(OH)j Reag
SIPX ents added, grar
3477 ns per tonne
CMC CuSO^ MIBC Tin
Grind ne, mini Cond.
ates Froth PH
Grind 200 30 9.3
Rougher 1 20 10 10 1 2 9.5 Rougher 2 7.5 2.5 1 2 9.4 Rougher 3 5 2.5 2.5 1 4 9.2 Rougher 4 7.5 5 1 4 9.1 Rougher 5 2.5 2.5 5 1 4 9.0 Rougher 6 2.5 100 2.5 1 1 8.7
Cleaner 1 2.5 1 3 9.6 Cleaner 1 Scav 2.5 10 2.5 1 2
Cleaner 2 1 2.5 1 3.5 Cleaner 3 10 1 10 2.5 1 2 9.5 Cleaner 4 10 1 10 2.5 1 2 9.5
Total 240 28.0 17.5 30.0 100.0 40.0
Stage Roughers Cleaners Flotation Cell lOOOg-Dl 250g-Dl Speed: rpm 1800 1200
Metallurgical Balance
Product Weight Assays, g/t % Distribution
8 i % Pt i Pd Cu Ni ! S Pt Pd Cu Ni ! S 4th Cleaner Cone 122.9 6.18 4.36 i 2.82 5.94 4.58 i 26.2 84.4 43.1 94.4 78.3 63.4 4th Cleaner Tail 30.9 1.55 0.48 j 1.41 0.23 0.70 ; 16.0 2.3 5.4 0.9 3.0 9.7 3Td Cleaner tail 31.4 1.58 0.40 i 1.15 0.18 0.49 1 8.35 2.0 4.5 0.7 2.1 5.2 2nd Cleaner Tail 42.1 i 2.12 0.20 j 0.56 0.07 0.23 2.81 1.3 2.9 0.4 1.3 2.3 1st Clnr Scav Cone 21.6 1.09 0.32 1 0.70 0.110 0.31 7.09 1.1 1.9 0.3 0.9 3.0 1st Clnr Scav Tail 39.5 1.99 0.13 i ! 0.41 0.047 i 0.14 2.14 0.8 2.0 0.2 0.8 1.7 Rougher Tailing 1701.5 . 85.51
1
0.03 0.19 i
0.014 1 0.057 0.44 8.0 40.2 3.1 13.5 14.7
Head (calc.) 1989.9i 100.0 0.32 j
1 ! 0.40 0.39 0.36 2.55 100.0 100.0 i 100.0 100.0 100.0
(direct) 0.36 i i 0.40 0.43 1 0.37 2.37
Combined Products 4th Cleaner Cone i 6.18 4.36 1 2.82 ! 5.9 4.58 26.2 84.4 j 43.1 : 94.4 i 78.3 ! 63.4 3rd Cleaner Cone ; 7.73 3.58 j 2.54 i 4.8 3.80 24.2 86.8 48.5 95.3 ; 81.3 i 73.1 2nd Cleaner Cone 9.31 3.04 i 2.30 4.01 3.24 21.5 88.7 53.0 96.0 j 83.5 Î 78.3 1st Cleaner Cone 11.42 2.51 1 1.98 3.28 2.68 18.0 90.1 55.9 96.4 i 84.8 80.6 1st Clnr + 1st Clnr Sc Cone 12.51 2.32 i 1.87 i 1 3.01 I 2.48 17.1 91.1 57.8 96.7 ! 85.7 ! 1 83.6 Rougher Cone. ! 14.49 2.02 Î 1.67 ! 2.60 1 2.16 15.0 ! 92.0 59.8 96.9 1 86.5 j 85.3

Test No.: F41 Project No.: 10616-003 O p e r a t o r : DL Date: 26-Jul-05
Purpose: To repeat the conditions of test F36, but target a primary grind of 110 microns.
Procedure:
Feed:
Grind:
Conditions:
Flotation was conducted as described below. All products were submitted for Ft, Pd, Au, Cu, Ni, Fe and S analyses.
2 kg of minus 10 mesh Shakespeare.
20 minutes / 2 kg @ 65% solids in laboratory ball mill (BM-2). Rghr Tail Kjo - 114 nm
Stage Ca(OH)2 Reag
SIPX ents added, gra
3477 ms per tonne
CMC CuSO, MIBC Tir
Grind ne, min Cond.
utes Froth pH
Grind 200 20 9.3
Rougher 1 20 10 10 1 2 9.5 Rougher 2 7.5 2,5 1 2 9.4 Rougher 3 5 2.5 2.5 1 4 9.2 Rougher 4 7.5 5 1 4 9.1 Rougher 5 2.5 2.5 5 1 4 g.S
Ro 1 conc is kept as is and combined with the reground Ro conc 2-6 for 1st cleaner feed Rcgrind P.M. 50 2.5 4
Cleaner 1 2.5 1 3 9.7 Cleaner 1 Scav 2.5 0 2.5 1 2
Cleaner 2 1 2.5 1 3.5 Cleaner 3 10 1 10 2.5 1 2 9.5 Qeaner 4 10 1 10 2.5 1 2 9.5
Total 290 25.5 20.0 20.0 0.0 37.5
Stage Roughers Cleaners Flotation Cell lOOOg-Dl 250g-Dl Speed: rpm 1800 1200
Metallurgical Balance
Product Weight Assays, g/t % Distribution
g % Pt Î Pd Au i Cu Ni 1 S Pt Pd Au Cu j i Ni S 4th Cleaner Conc 59.0 2.98 6.45 1 2,92 1.27 : ' 11.9 8.15 27.7 64.9 26.5 19.7 92.2 67,1 35.9 4th Cleaner Tail 12.7 0.64 0.92 ! 1 1,93 1.07 i 0.48 2.11 1 20.2 2.0 3.8 3.6 0.8 3,7 5.6 3rd Cleaner tail 22.0 1.11 0.86 2.03 1.12 i i 0.34 1,24 j i 15.8 3.2 6.9 6.5 1.0 3-8 7.6 2nd Cleaner Tail 58.0 2.93 0,68 0.94 0.49 1 0.12 0.63 1 14,5 6.7 8.4 7.5 0,9 5.1 18.4 1st Clnr Scav Conc 15.2 0.77 0.98 1.06 0.54 ! 0,140 0,83 20.5 2.5 2.5 2.2 0.3 1.8 6.8 1st Clnr Scav Tail 69.6 3.52 0.48 0,62 0.30 0.055 0,28 6.77 5.7 6.6 5.5 0.5 2.7 10.3 Rougher Tailing 1741.0 88.04 0.05 0.17 0.12 0.019 0,065 0.40 14.9 45.4 55.0 4.3 15.8 15.3
Head (calc.) 1977.5 1 100.0 0.30 0.33 0.19 0.39 ! 0,36 2.31 100.0 100.0 100.0 100.0 1 100.0 100.0 (direct) i 0,36 i 0.40 0.24 0.43 1 0,37 i 2.37 1 1
Combined Products 4th Cleaner Conc 2.98 6.45 2.92 1,27 11,9 8.15 1 27.7 64.9 26.5 19,7 92.2 67,1 35,9 3rd Cleaner Conc 3.63 5.47 2.74 1.23 9.9 7.08 26.4 66.9 30.2 23,3 93.0 70.8 41,5 2nd Cleaner Conc 4.74 4.39 2.58 1.21 7.64 5.71 23.9 70.2 37.1 29,8 94.0 74.6 49,1 1st Cleaner Conc 7.67 2.97 1.95 0.93 4.76 3.77 20.3 76,9 45.4 37,3 94.9 79.7 67,6 1st Clnr+ 1st ClnrSc Conc 8.44 2.79 1.87 0.90 4.34 3.50 20.3 79,4 47,9 39,5 95.2 81.5 74,4 Rougher Conc. 11.96 2.11 1.50 0.72 3.08 2.55 16.3 85,1 54.6 45.0 95,7 84.2 84.7 1

Sample: Ro Tail
SGS Lakefield Research Limited Size Distribution Analysis
Project No. 10616-003
Test No.: F41
S ze Weight % Retained % Passing Mesh jjm grams Individual Cumulative Cumulative
48 300 0.4 0.3 0.3 99.7 65 212 3.2 2.6 2.9 97.1 100 150 8.1 6.6 9.5 90.5 150 106 15.9 12.9 22.4 77.6 200 75 15.8 12.8 35.2 64.8 270 53 16.4 13.3 48.5 51.5 400 38 12.5 10.1 58.7 41.3 Pan -38 50.9 41.3 100.0 0.0
Total - 123.2 100.0 - -
K80 114
a> Ç ' o t «5 TO CL
0} >
E 3 o
ICQ 90 80 70 60 50 40 30 20 10 0
10
Particle Size Distribution
100
Screen Size (micrometers)
: 1 : 1 1 ! !
1 m— i 1 1 ! 1 i ! i 1 / i i i i
! j ! 1 ; ! ! ! • • i
; 1 1 i 1 X i -1 ! : i
! i i : I !
' ! ^ 1 i i ' t : ' ! 1 i i 1 1 ; i 1 ' i i 1
1 I K B U = 1 1 4 J j m ; i 1 1 : 1 • 1 1 !
1 1 ! i ' i 1 1 i |
1,000

Test No.: F328 Project No.: 10616-003 Operator : DL Date: 26-Jul-05
Purpose: To repeat the conditions of test F41, but target a primary grind of 160 microns.
Procedure:
Feed:
Gr ind:
Conditions:
Flotation was conducted as described below. All products were submitted for Pt, Pd, Au, Cu, Ni, Fe and S analyses.
2 kg of minus 10 mesh Shakespeare.
14 minutes / 2 kg @ 65% solids in laboratory ball mill (BM-2). Rghr Tail Kjo - 196 (im
Stage Ca(OH)2 Reagi
SIPX ents added, gra
3477 ms per tonne
CMC CUSO4 MIBC Tir
Grind ne, min\
Cond. jtes
Froth pH
Grind 200 14 9.3
Rougher 1 20 10 10 I 2 9.5 Rougher 2 7.5 2.5 1 2 9.4 Rougher 3 5 2.5 2.5 1 4 9.2 Rougher 4 7.5 5 1 4 9.1 Rougher 5 2.5 2.5 5 1 4 8.8
Ro 1 conc is kept as is and combined with the reground Ro conc 2-6 for 1st cleaner feed Regrind P.M. 50 2.5 4
Cleaner 1 2.5 1 3 9.7 Cleaner 1 Scav 2.5 2.5 1 2
Cleaner 2 1 1 3.5 Cleaner 3 10 1 10 1 2 9.5 Cleaner 4 10 I 10 2.5 1 2 9.5
Total 290 25.5 20.0 20.0 32.5
Stage Roughers Cleaners Flotation Cell lOOOg-Dl 250g-Dl Speed: rpm 1800 1200
Metallurgical Balance
Product Weight Assays, £ Vo Distribution g • % Pt I Pd 1 Au Cu NI i Fc i S Pt Pd Cu NI S
4th Cleaner Conc 55.1 j 2.78 6.41 ; 2.86 ; 12,0 8.02 i 2S.9 50.3 19.6 87.8 61.9 34.2 4th Cleaner Tail 19.0 ; 0.96 1.54 j 2.15 j 0.39 1.88 j 25.5 4.2 5,1 1.0 5.0 10.4 3rd Cleaner tail 24.3 1 1.23 0.90 1.89 1 0.32 1.22 17.9 3.1 5.7 1.0 4.1 9.3 2nd Cleaner Tail 24.5 i 1.24 0.59 1.31 i 0.18 0.50 { i : : 4.87 2.1 4.0 0 .6 1.7 2.6 1st CInr Scav Conc 33.7 i 1.70 1.07 1.55 0.2801 0.82 ! j 1 13.7 5.1 6.5 1.3 3,9 9.9 IstClnrScavTail 70.6 1 3.57 0.52 ! ; 0.76 i
1 i ' , 0.073 0.21 ; 2.8 5.2 6.7 0.7 2.1 4.2
Rougher Tailing 1752.3: 88.52 0.12 0.24 i 0.033 0.087 1
0.78 30.0 52.4 7.7 21.3 29.3
Head (calc.) 1979.5! 100.0 0.35 ! 0.41 0.00 0.38 0.36 0.0 2.35 100.0 100.0 100.0 100.0 100,0 (direct) 1 0.36 ! ! 0.40 ! 0.24 j i 0.43 1 0.37 i 2.41 2.37 i
Combined Products 4th Cleaner Conc 2.78 0.00 0.00 0.0 6.41 2.9 0,0 50.3 19,6 87.8 61.9 34,2 3rd Cleaner Conc 3.74 0.00 0.00 0.0 5.16 2.7 0,0 54.5 24.7 88,8 66,9 44.6 2nd Cleaner Conc 4.97 0.00 0.00 0.00 4,11 2,5 0,0 57.6 30.4 89,8 71.0 53.9 1st Cleaner Conc 6.21 0.00 0.00 0.00 3,41 2,2 0,0 59.7 34,4 90,4 72.7 56.5 l s tClnr+ 1st Clnr Sc Conc 7.91 0.00 0.00 0.00 2.90 2,1 0,0 64,8 40,9 91,6 76.6 66.4 Rougher Conc, 11.48 0,00 0.00 0.00 2.16 1,7 0.0 70.0 47,6 92,3 78,7 70.7

SGS Lakefield Research Limited Size Distribution Analysis
Project No. 10616-3
Sample: RO TAIL Test No.: F44
Size Weight % Retained % Passing Mesh pm grams Individual Cumulative Cumulative
48 300 10.0 5.7 5.7 94.3 65 212 18.8 10.8 16.5 83.5 100 150 24.8 14.2 30.7 69.3 150 106 22.8 13.0 43.7 56.3 200 75 19.4 11.1 54.8 45.2 270 53 15.0 8.6 63.4 36.6 400 38 13.7 7.8 71.2 28.8 Pan -38 50.3 28.8 100.0 0.0
Total - 174.8 100.0 - -
K80 196
05 Ç •<0 <0 (0 Q.
<u >
ro 3 £ o
100 90 80 70 60 50 40 30 20 10 0
10
Particle Size Distribution
I i i I !
: : ! 1 ; 1 ; M
: i ; • ^ ; : i M : , • • 1 ' ' 1 1
1 ; i - J - r - ! 1 ^ ; ! : M i i ! - !
; , 1 • • 1 ; . ; " : 1 ! ! 1 ;
: , - I ' • . : '
^ MJU = lyti |jm ; ; • i : , ; : ; h i
100
Screen Size (micrometers)
1,000

Test No.: F45 Project No.: 10616-003 Operator: DL Date: 26-Jul-05
Purpose: To repeat the conditions of test F44, but target a primary grind of 120 microns.
Procedure:
Feed:
Grind:
ConditiODS:
Flotation was conducted as described below. All products were submitted for Ft, Pd, Au, Cu, Ni, Fe and S analyses.
2 kg of minus 10 mesh Shakespeare.
20 minutes / 2 kg @ 65% solids in laboratory ball mill (BM-2). Rghr Tail K-jo ~ 133nm
Stage Ca(0H)2 Reagi
SIPX ents added, grai
3477 ms per tonne
CMC CuSO, MIBC Tin
Grind ne, mini Cond.
utes Froth pH
Grind 200 20 9.3
Rougher 1 20 10 10 1 2 9.5 Rougher 2 7.5 2.5 1 2 9.4 Rougher 3 5 2.5 2.5 1 4 9.2 Rougher 4 7.5 5 1 4 9.1 Rougher 5 2.5 2.5 5 1 4 8.8
Ro I conc is kept as is and combined with the reground Ro conc 2-6 for 1st cleaner feed Regrind P.M. 75 2.5 4
Cleaner 1 1 3 9.7 Cleaner 1 Scav 2.5 2.5 1 2
Cleaner 2 1 1 3.5 Cleaner 3 10 1 10 1 2 9.5 Cleaner 4 10 1 10 2.5 1 2 9.5
Total 315 25.5 20.0 20.0 30.0
Stage Roughers Cleaners Flotation Cell lOOOg-Dl 250g-Dl Speed: rpm 1800 1200
Metallurgical Balance
Product Weight Assays, g / t % Distribution
i % Pt ! Pd Au Cu NI Fe i ! S Pt Pd Cu Ni i S 4th Cleaner Conc 57.9 2.93 6.88 3.00 12.0 7.82 28.8 55.1 21.7 91.3 62.6 34,1 4th Cleaner Tail 17.0 0.86 1.70 2.18 0.30 1.60 22.3 4.0 4.6 0.7 3.8 7.7 3rd Cleaner tail 32.2 i 1.63 1.04 1.84 0.28 1.10 18.6 4.6 7.4 1.2 4,9 12.2 2nd Cleaner Tail 28.7 1.45 0.73 1.10 0.09 0.44 6.87 2.9 3.9 0.4 1.7 4.0 1st Clnr Scav Conc 43.3 2.19 1.27 1.51 0.180 0.91 16.2 7.6 8.2 1.0 5.5 14.3 IstClnr Scav Tail 73.8 3.74 0.66 0.73 0.050 0.24 4.52 6.7 6.7 0.5 2.4 6.8 Rougher Tailing 1723.0 87.20
1 0.08 0.22 0.022 0.080 0.59 19.1 47.4 5.0 19,1 20.8
Head (calc.) 1
1975.91 100.0 0.37 0.40 0.00 0.39 0.37 0.0 2.48 100.0 100.0 100.0 100.0 100.0 (direct)
1 0.36 0.40 , i 02A 0.43 0.37 1 2.41 ! 2.37
Combined Products 4th Cleaner Conc 2.93 0.00 0.00 0.0 0.00 0.0 55.1 21.7 91.3 62.6 34,1 3rd Cleaner Conc 3.79 0.00 0.00 0.0 0.00 0.0 59.1 26.3 92.0 66.4 41.8 2nd Cleaner Conc 5.42 0.00 0.00 0.00 0.00 0.0 63.7 33.8 93.2 71.3 54.1 1st Cleaner Conc 6.87 0.00 0.00 0.00 0.00 0.0 66.6 37.7 93.5 73.0 58.1 1st Clnr + 1st Clnr Sc Conc 9,06 0.00 0.00 0.00 0.00 0.0 74.2 45.9 94.5 78,5 72.4 Rougher Conc. 12.80 0.00 0.00 0.00 0.00 0.0 80.9 52.6 95.0 80.9 79.2

SGS Lakefield Research Limited Size Distribution Analysis
Project No. 10616-3
Sample: RO TAIL Test No.: F45
Size Weight % Retained % Passing Mesh im grams Individual Cumulative Cumulative
48 300 1.6 1.0 1.0 99.0 65 212 7.3 4.6 5.6 94.4 100 150 15.3 9.6 15.2 84.8 150 106 21.0 13.2 28.3 71.7 200 75 19.8 12.4 40.7 59.3 270 53 20.9 13.1 53.8 46.2 400 38 16.4 10.3 64.1 35.9 Pan -38 57.3 35.9 100.0 0.0
Total - 159.6 100.0 - -
K80 133
05 Ç
'<0 CO 03 CL
<U > TO =1 £ 3 o
100 90 80 70 60 50 40 30 20 10 0
10
Particle Size Distribution
: i i i i i i ' i : ' i l !
! ; i i ! i • 1 1 ; : i 1
i i i ! • ^ 1 ' • i ^ i _ _ i ! i
1 :
! 1 ; i ; i M M ;
J _ 1 i _ ! 1 : 1 i i 1 ; ' M !
i 1 - r M i i 1 ' i ! M i M i i i i i M j ; i • ^ ^ i - ! i
1 ' i l 1 :
' 1 K80 = 133 Mm 1 ; i ;
1 • 1 ! i 1 • i ! i
1 i i i i 1 1 i i M ; 1 M
100
Screen Size (micrometers)
1,000

Test No.: F46 Project No.: 10616-003 Opera to r : DL Date: 26-Jul-05
Purpose: To repeat the conditions of test F44, but target a primary grind of 50 microns.
Procedure:
Feed:
Grind:
Conditions:
Flotation was conducted as described below. All products were submitted for Ft, Pd, Au, Cu, Ni, Fe and S analyses.
2 kg of minus 10 mesh Shakespeare.
48 minutes / 2 kg @ 65% solids in laboratory' ball mill (BM-2). Rghr Tail Kjo ~ 61 (ira
Stage Ca(0H)2 Reag
SIPX ents added, gra
3477 ms per tonne
CMC CUSO4 MIBC Tir
Grind ne, min
Cond. utes
Froth PH
Grind 200 48 9.3
Rougher 1 20 10 10 I 2 9.5 Rougher 2 7.5 2.5 1 2 9.4 Rougher 3 5 2.5 2.5 \ 4 9.2 Rougher 4 7.5 5 1 4 9.1 Rougher 5 2.5 2.5 5 1 4 8.8
Ro I conc is kept as is and combined with the reground Ro conc 2-6 for 1st cleaner feed Regrind P.M. 75 2.5 4
Cleaner 1 1 3 9.7 Cleaner 1 Scav 2.5 0 2.5 1 2
Cleaner 2 1 1 3.5 Cleaner 3 10 1 10 1 2 9.5 Cleaner 4 10 1 10 2.5 1 2 9.5
Total 315 25.5 20.0 20.0 0.0 30.0
Stage Roughers Cleaners Flotation Cell lOOOg-Dl 250g-Dl Speed: rpm 1800 1200
Metallurgical Balance
Product Weight Assays, { î/t % Distribution ' % Pt Pd 1 Au Cu NI i Fe 1 S Pt j Pd i Cu 1 NI 1 S
4th Cleaner Conc 45.3 ; 2.30 7.28 3.15 15.4 8.74 i [ 29.7 46.2 18.1 93.2 57.2 28.9 4th Cleaner Tail 15.7 0.80 2.61 4.02 i 0.51 3.36 1 : 16.4 5.7 8.0 1.1 7.6 5.5 3rd Cleaner tail 26.5 1.34 1.30 2.78 0.23 1.22 i 1 11.9 4.8 9.3 0.8 4.7 6.8 2nd Cleaner Tail 37.4 ! 1.90 0.69 1.17 ! 0.08 0.40 j , 6.4 3.6 5.5 0.4 2.2 5.1 1st CInr Scav Conc 64.7 1 3.28 1.13 1.23 0.130 0.77 i 12.7 10.2 10.1 1.1 7.2 17.6 1st CInr Scav Tail 136.7 i 6.93 0.69 0.66 i 0.031 0.23 5.2 13.2 11.4 0.6 4.5 15.2 Rougher Tailing 1646.21 83.46 0.07 0.18 1 0.013 0.070 0.59 16.1 37.5 2.9 16.6 20.8
Head (calc.) 1972.5 i 100.0 0.36 0.40 0.38 0.35 i 2.36 100.0 100.0 100.0 100.0 100.0 (direct) i 0.36 0.40 1 0.24 0.43 0.37 î 2.41 2.37
Combined Products 4th Cleaner Conc 2.30 0.00 ! 0.00 1 1 0.0 0.00 0.0 46.2 18.1 93.2 57.2 28.9 3rd Cleaner Conc | 3.09 0.00 0.00 0.0 0.00 0.0 52.0 26.1 94.3 64.8 34.4 2nd Cleaner Conc 4.44 0.00 0.00 0.00 0.00 0.0 56.8 35.4 95.1 69.5 41.2 1st Cleaner Conc 6.33 0.00 0.00 0.00 0.00 0.0 60.4 40.9 95.5 71.6 46.3 1 St CInr + 1 st CInr Sc Conc 9.61 0.00 0.00 0.00 0.00 0.0 70.6 51.0 96.6 78.8 63.9 Rougher Conc. 16.54 0.00 0.00 0.00 0.00 0.0 83.9 62.5 97.1 83.4 79.2

SGS Lakefield Research Limited Size Distribution Analysis
Project No. 10616-3
Sample: RO TAIL Test No.: F46
Size Weight % Retained % Passing Mesh Ijm grams Individual Cumulative Cumulative
65 212 0.0 0.0 0.0 100.0 100 150 0.5 0.3 0.3 99.7 150 106 4.8 2.5 2.8 97.2 200 75 14.0 7.4 10.2 89.8 270 53 29.7 15.7 25.9 74.1 400 38 30.8 16.3 42.1 57.9 Pan -38 109.7 57.9 100.0 0.0
Total - 189.5 100.0 - -
K80 61
O) Ç
(0 OT ro
CL
0} ro E 3 o
100 90 80 70 60 50 40 30 20 10
10
Particle Size Distribution
! ' 1 • ! : Li--!" ! : • 1 i -t ' • ' i 1 ' • i • ; 1 j • 1 ' : • Î • 1 i : • i
i : ; V ! " ' ' '
i i, ! ; i : i i i ^ ; • ; ! I • • ! 1 ' :
M ! i : : M : :l i i 1 ! 1 i ^ ; i IM
< 1 1 ^ ; ' ^ • ^ ' , ! !
! . ] K80 = 61 Jim ! t . ' i 1 • i ^ i ; ' i i i i ' ! M 1 i
100
Screen Size (micrometers)
1,000

Test No.: F30LCT Project No.; 10616-003 Operator: DL Date: 05-Aug-05
Purpose: To prepare approximately 1 kg of cleaner concentrate for Settliug and filtration testwork.
Procedure: Flotation was conducted as described below. All products were submitted for Pt, Pd, Cu, Ni, and S analyses.
Feed: 2 x 10 kg of minus 10 mesh SVMDC-Composite ore
Grind: 42 minutes / 10 kg @ 65% solids in tlie 10 kg laboratory ball mil!. Rghr Tail K,,, ~ 82 (im Grav Tail Kgo - pm
Stage Ca(OH)j SIPX Reagents addet
3477 1, grams per ton
CMC ne
CuSO, H2S04 MIBC Tir
Grind ne, mini Cond.
utes Froth pH
Grind 250 30 9.4
Roucber1 0 10 10 2 9.4 Ro concentrale 1 kepi separate to go direa lo 1st cleaner feed NO REGRIND
Rougher 2 7.5 2.5 1 2 9.2 Rougher 3 5 2.5 5 1 4 RouEher 4 7.5 5 I 4 7.8 Rougher 5 2.5 2.5 5 1 4 7.8
The Ra Tails were densified and placed in the Agitair cell and the Scavenger mis conducted as outlined Sacvenger 10 5 5 1 3 7.6
20 2.5 2.5 1 10 10 2.5 50 100 2.5 1 5 7.4
FUtalpH 7.4 Scav Cone Regriod R.M. 25
The Scav Cone was reground and placed in an agitated vessel where the Magnetics were removed by a magnet, the nan magnetics were treates on the Mozley mineral separator where 2 concentrates were removerd and submitted far assay
Regrind feed is the Rougher Concentrate 2-5 RenindR-M. 1 50 I 2.5 50 15 9.8
1st Cleaner feed is the reground product plus the Rougher Concentrate 1 1st Cleaner 50 1.25 1 • 7 9.7-9.1
Is taeaaerScav 2.5 2.5 0 0 1 3 3.9 2nd Cleaner X 0 0 2.5 1 5 9.3
X 0.5 1 2
Total 350 66.8 30.0 0.0 100.0 100.0 40.0
Stage Roughers Scavenger lsland2mia Flotation Cell Agitair Agitair 4LD-1 Speed: rpra 1900 1900 1800
Metallurgical Balance
Product Weight Assays, g/t % Distribution Î 1 % Pt i Pd An ! Cu i 1 Ni Fe Pt ! Pd 1 Au Cu Ni Fe
2nd Qeaner Cone 1095.9 Î 5.48 5.60 3.55 1.45 7.5 6.12 32.3 70.9 37.6 27.5 91.9 73.4 14.6 2nd Oeanr Tail 339.3 1.70 0.46 1.39 0.73 0.19 0.76 i 22.5 1.8 4.6 4.3 0.7 2.8 3.1 1 S t Clnr Scav Cone 212.0 1.06 0.52 1.56 0.87 i P H 1.12 31.7 1.3 3.2 3.2 0.5 2.6 2.8 1 s t Clnr Scav Tail 589.0 2.95 0.15 0.72 0.41 o.ii M Q 11.0 1.0 4.1 4.2 0.7 2.6 2.7 Grav Cone 1 1.2 0.01 76.00 9.67 50.10 3.22 3.18 38.9 1.1 0.1 1.0 0.0 0.0 0.0 Grav Cone 2 3.7 0.02 1.62 0.84 1 0.71 0.18 0.78 24.6 0.1 0.0 0.0 0.0 0.0 0.0 Grav Tail 606.0 3.03 1.20 1.18 : 1.13 0.14 1 0.34 12.4 8.4 6.9 11.9 0.9 2.3 3.1 L.I Mags 260.5 1 1.30 0.61 i 0.40 j 0.24 0.100 0.97 i 46.4 1.8 1.0 I.I 0.3 2.8 5.0 Scavenger Tailing 16892.4 1 84.46 0.07 0.26 1 0.16
1 0.026 0.073 1 9.85 13.7 42.5 46.8 4.9 13.5 68.7
Head (cale.) 20000.0 I 100.0 0.433 0.517 0.289 0.45 1 0.4fi 12.1 100.0 100.0 100.0 100.0 100.0 ; 100.0 (direct) i 0.46 0.60 0.26 0.53 1 0.48
estimated - no assay available Combined Products 2ndCleaner Cone 5.48 5.60 3.55 1.45 7.5 6.12 32.3 70.9 37.6 27.3 91.9 73.4 14.6 1st Cleaner Cone 7.18 4.38 3.04 1.28 5.8 4.85 30.0 72.7 42.2 31.8 92.6 76.2 17.8 1st CI Cone-f CI Se Cone 1 8.24 3.89 2.85 1.23 5.1 4.37 30.2 74.0 45.4 35.0 93.1 78.8 20.5 Rougher Cone i 11.18 2.90 2.29 1.01 3.8 3.33 25.1 75.0 49.5 39.2 93.8 81.4 23.2 Rougher Cone Grav Cone 1+2 ! 11.21 2.94 2.29 1.04 3.8 3.32 25.2 76.1 49.6 40.3 93.9 81.5 23.3 Scav Cone i 4.36 1.13 0.96 0.93 0.1 0.53 22.7 11.4 8.1 14.0 1.3 5.1 8.1 Ro -t- Scav Cone i 15.54 2.41 1.91 0.99 2.7 2.54 24.4 86.3 57.5 53.2 95.1 86.5 31.3

Test No.: F38LCT Project No.; 10616-003 Operator: DL Date: 05-Aug-05
Purpose: To conduct a locked cycle test according to lest F36 conditions.
Procedure:
Feed:
Grind:
Flotation was conducted as described below. All products were submitted for Pt, Pd, Au. Cu, Ni, Fe and S analyses.
6 X 2 kg of minus 10 mesh Shakespeare.
30 minutes / 2 kg @ 65% solids in laboratory ball mill (BM-3). RghrTail Kgo--82 Mm
Stage Ca(OH); Rea
SIPX igents added, grams pei
3477 r tonne
CMC CUSO4 MIBC Grind Til
Cond. me, minut
Froth cs
pH
Grind 200 30 9.3
Rougher 1 20 10 10 1 2 9.5 Rougher 2 7.5 2.5 1 2 9.4 Rougher 3 5 2.5 2.5 1 4 9.2 Rougher 4 7.5 5 1 4 9.1 Rougher 5 2.5 2.5 5 1 4 9.0
Ro 1 conc is keol as is and combined with the reground Ro conc 2-6 for Isl cleaner feed Regrind P.M. 50 2.5 2.5 4
Cleaner 1 1 3 9.5 Cleaner I Scav 2.5 2.5 0 2.5 1 2.5
Cleaner 2 1 2.5 1 3.5 Cleaner 3 10 1 10 2.5 1 2 9.5 Cleaner 4 10 1 10 2.5 1 2 9.5
Total 290 30.5 20.0 20.0 0.0 35.0
Stage Roughers 1st Cleaner 2nd-4lhCleaner Flotation Cell 4L -Denver D1 2L -Denver Dl IL-Denver Dl Speed: rpm 1800 1500 1200
Metallurgical Projecflon (D-F)
Product Weight Assays, %, g/t v . Distribution K % Pt Pd Au Cu Ni S Pt Pd An Cu Ni S
4th CI ConcentiBte 340.9 5.8 4.42 3.45 1.81 6.51 5.10 27.8 gS.7 S2.3 46.9 96.3 82.1 72.7 1st Cleaner Tail 421.6 7.1 0.31 0.50 0.29 0.04 0.23 4.39 7.5 9.4 9.3 0.8 4.5 14.2 Rougher Tail 5137.0 87.1 0.023 0.17 0.11 0.01 0.06 0.33 6.7 38.4 43.8 2.9 13.3 13.1
Combined Final Tail 5558.6 94.2 0.045 0.19 0.13 0.02 0.07 0.64 14.3 47.7 53.1 3.7 17.9 27.3
Head 5899.5 100.0 0.30 0.38 0.22 0.39 0.36 2.21 100.0 100.0 100.0 100.0 100.0 100.0

Meullurgical Balance
Product Weight Assavs, %, g/t % Distribution R % Pt Pd Au Cu Ni S Pt Pd Au Cu Ni S
1 4th CI Cone A 50.4 0.42 8.7 3.74 1.77 14.10 8,65 28.3 11,9 4.1 3.4 15,1 10.1 5.0 2 4th CI Cone B 81.0 0.68 6.9 4.42 2.39 9.31 6,86 28.0 15.1 7.8 7.3 16.1 12.8 8.0 3 4th CI Cone C 92.7 0.78 3.7 2.5 1.16 8.32 6,46 27.8 9.4 5.1 4.1 16.4 13.8 9.1 4 4th CI Cone D 110.2 0.92 4.6 3.55 1.76 6.98 5,27 27.8 13.8 8.6 7.3 16.4 13.4 10.8 S 4th CI Cone E 112.4 0.94 4.6 3.71 1.88 6.81 5,35 27.7 14.2 9.1 8.0 16.3 13.9 11.0 6 4th a Cone F 118.3 0.99 4.2 3.22 1.85 6.01 4,88 28.8 13.5 8.3 8.3 15.1 13,3 12.0 7 4th CI Tail F 73.2 0.61 0.8 1.840 1.12 0.21 1,09 22.1 1,6 3.0 3.1 0.3 1.8 5,7 8 3rd Cl Tail F 76.5 0.64 0.75 1.810 0,92 0.17 0,87 18.3 3.0 2.7 0.3 1.5 4,9 9 2nd Cl Tail F 55.6 0.47 0.54 1.090 0.63 0,13 0.60 13.2 1.3 1.3 0.2 0.8 2.6
10 IstClnrScav Cone F 55.7 0.47 0.62 1.100 0.63 0,15 0.77 22.5 1.3 1.3 0.2 1.0 4,4 U 1st Clnr Scav Tail A 87.2 0.73 0.47 0.57 0.31 0.042 0.28 6.9 1,1 l.l 1.0 0.1 0.6 2,1 12 1st Clnr Scav Tail B 127.0 1.06 0.39 0.49 0.28 0.036 0.26 7.1 1.3 1.4 1.3 0.1 0.8 3,2 13 1 St Clnr Scav Tail C 113.2 0.95 0.35 0.57 0.33 0,053 0,25 6.2 1.1 1.4 1.4 0.1 0.7 2.5 14 Ist Clnr Scav Tail D 146.0 1.22 0.36 0.53 0.30 0.046 0.22 4.5 1.4 1.7 1.7 0.1 0.7 2.3 IS 1st Clnr Scav Tail E 131.6 1.10 0.28 0.45 0,27 0.040 0,21 3.6 1,3 1.3 0.1 0.6 1.7 16 1st Clnr Scav Tail F 144.0 1.21 0.31 0.53 0.31 0.047 0.26 5.1 1.2 1,7 1.7 0.1 0.9 2.6 17 Rougher Tail A 1759.0 14.74 0.03 0.180 0.12 0.013 0.058 0.39 1.4 6.9 8.0 0.5 2.4 2.4 IS Rougher TaiJ B 1735.0 14.54 0.06 0.180 0.12 0.013 0.057 0.26 2.8 6.8 7.8 0.5 2.3 1.6 19 Rougher Tail C 1727.0 14.47 0.05 0.180 0,11 0.013 0.055 0.28 2.4 6.8 7.2 0.5 2.2 1.7 20 Rougher Tail D 1708.0 14.31 0.02 0.170 0.11 0.012 0.054 0.27 64 7.1 0.4 2.1 1.6 21 Rougher Tail E 1715.0 14.37 0.03 0.170 0.(2 0,013 0.057 0.37 1.4 6.4 7.8 0.5 2.3 2.2 22 Rougher Tail F 1714.0 14.36 0.02 0.170 0.11 0,014 0.056 0.37 6.4 7.1 0.5 2.2 2.2
Head (cale) 11933.0 100.0 0.31 0.38 0.22 0.39 0.36 2.37 lOO.O lOO.O lOO.O lOO.O 100,0 100.0 Head (Direct) 0.36 0.40 0.24 0.43 0,37 2.37 CombiDcd Products 4th CI Cone A-F 4.73 5.1 3.5 1.8 7.93 5.93 28,1 78.0 43.1 38.2 95,5 77.2 56.1 Cleaner Tails 2.19 0.70 1.51 0.85 0.17 0.85 19,18 5.0 8.7 8.4 0.9 5.1 17.7 1st CI Tails A-F 6.3 0.35 0.52 0.30 0.04 0,24 5,44 7.2 8.5 8.4 0.7 4.2 14.4 CuRoTaU A-F 86.8 0,04 0.18 0,12 0.01 0.06 0.32 9.9 39.7 44,9 2.9 13.4 11.8
StabiUt)-Check StabiUt)-Check Cvcle Wt% Pt Pd Au Cu Ni S
0 0 0 0 0 G A 95.4 86.8 72.9 74,0 94.2 77.8 57.6 B 97.7 115.8 96.3 98.9 99.9 95.1 76.7 C 97.2 77.1 79.8 75.8 102,2 99.9 79,8 D 98.8 96.9 99.8 96.3 101,8 97.5 88,7 E 98.5 99.7 100.9 102.4 101,4 100.5 89.6 F 99.4 93.9 98.4 102.3 94,8 98.3 101,4
ave d-f 98.9 96.8 99.7 100.3 99,3 98.8 93.2
I
Circuit Stability
s
\ • -/A-
k - . ; • ••L- / .
ifcw
> t a i l A
œ a
i sS
3 4 Cycle

TtstNo : F40LCT Project No.: 10616-003 Operator: DL
Purpose; To repeat test F3SLCT but reduce the collector to the cleaners.and increase tile pH in the cleaners in an attempt to improve the concentrate grade.
Dale: II-AUE-05
Procedure:
Feed:
Grind:
Conditions:
Flotation was conducted as described below. All products were submitted for Pt, Pd, Au, Cu, NI, Fe and S analyses.
6 X 2 kg of minus 10 mesh Shakespeare.
30 minutes / 2 kg @ 65% solids in laboratory ball mill (BM-3). Rghr Tail K,o ~ 82 (un
Stage Ca(OH), Real
SIPX ents added, giams p<
3477 !r tonne
CMC CuSO, MIBC Grind Ti
Cond. me, minut
FrotI) es
pH
Grind 200 30 9.3
RoUKher1 20 10 10 1 2 9.5 Rougher 2 7.5 2,5 1 2 9.4 Rougher 3 5 2.5 2.5 1 4 9.2 Rougher 4 7.5 5 1 4 9.1 Rougher 5 2.5 2.5 5 1 4 9.0
Ro 1 conc is kept as is and combined with the reground Ro conc 2-6 for 1st cleaner feed Regtind P.M. 75 0 2.5 4
Cleaner 1 1 3 9.6 Cleaner 1 Scav 2.5 2.5 0 1 2
Cleaner 2 0 2.5 1 3 9.7 Cleaner 3 10 0 10 2.5 1 2 9.7 Cleaner 4 10 0 10 2.5 I 2 9.8
Total 315 25.0 20.0 20.0 0.0 32.5
Stage Roughers 1 St Cleaner 2nd - 4th Cleaner Flotation Cell 4L-Denver D1 2 L-Denver D1 IL-Denver Dl Speed: rpm 1800 1500 1200
Metallurgical Projection (D-F)
Product Weight Assays, •/., g/t */. Distribution « V. Pt Pd Au Cu Ni S Pt Pd An Cu Ni S
4tli CI Concentrate 211.0 3.6 6.05 4.07 2.35 10.08 7.22 25.7 76.8 45.2 39.» 96.1 77.4 46.9 1st Cleaner Tail 422.6 7.2 0.39 0.53 0.28 0.04 0.30 8.22 9.8 11.8 9.4 0.8 6.5 30.1 Rougher Tail 5223.0 89.2 0.042 0.16 0.12 0.01 0.06 0.51 13.3 43.0 50.7 3.1 16.1 23.0
Combined Final Tail 5645.6 96.4 0.068 0.18 0.13 0.02 0.08 1.09 23.2 54.8 60.1 3.9 22.6 53.1
Head 5856.6 100.0 0.28 0.32 0.21 0.38 0.34 1.97 100,0 100.0 100.0 100.0 100.0 100.0
Cycle D legrind bumped up to 5 minutes in the pebble mill, more material Cycle E and F omitted tlie SIPX to the regrind Cycle E and F omitted the MIBC to the 3rd and 4th cleaners

Metallurgical Balance
Product Weight Assays, %, g/t % Distribution 8 % Ft Pd Au Cu Ni S Pt Pd Au Cu Ni S
1 4ÛI CI Cone A 47,1 0.39 6.3 2.32 1.04 16.70 9.23 29,7 8.7 2.7 1.7 17.0 10.1 5.0
2 4tli CI Cone B 67.4 0.56 4.0 2.34 2,10 10.50 8.10 26,7 8,1 3.8 4.9 15.3 12.7 6.4 3 4th CI Cone C 77.6 0.65 5.2 3.46 2.28 9.61 7.16 27,8 12,0 6.5 6.2 16.1 12.9 7.6 4 4th CI Cone D 72.0 0.60 6.6 4.37 2.04 10.40 7.31 27.0 14,0 7.6 5.1 16.1 12.2 6.9 S 4th CI Cone E 69.7 0.58 6.1 4,16 2.99 9.89 7.21 26.0 12,6 7.0 7.3 14.9 II.6 6.4 6 4th CI Coac F 69.3 0.58 5.8 3.93 2.18 10.60 7.61 25.6 12.0 6.6 5.3 15.8 12.2 6.3 7 4th Cl Tail F 55.5 0.46 2.0 3,440 1.66 0.26 1.97 19.5 3.3 4.6 3.2 0.3 2,5 3.8 8 3rd Cl Tail F 105.1 0.88 1,05 2,010 1 0.13 0.90 18 3.3 5.1 3.7 0.3 2.2 6.7 9 2nd Cl Tail F 68.8 0.57 0,78 1.570 0.83 0.12 0.72 16.5 1.6 2,6 2.0 0.2 1.1 4.0
10 1st Clnr Scav Cone F 68.9 0.58 0,77 1.120 0.59 0.18 0.83 20.7 1.6 1.9 1.4 0.3 1.3 5,0 11 UtClnrScavTail A 107.1 0.89 0,43 0.62 0.34 0.064 0.30 6.9 1.4 1.6 1.3 0.1 2.6 12 1st Clnr Scav Tail B 148.0 1.24 0.39 0.67 0.37 0.059 0.37 8.2 1.7 2.4 1.9 0.2 1.3 4.3 13 1st Clnr Scav Tail C 130.4 1.09 0.37 0.52 0.31 0,045 0.29 6.3 1.4 1.6 1,4 0.1 2.9 14 1st Chir Scav Tail D 132.2 1.10 0.35 0.53 0.29 0,045 0.31 7.9 1.4 1.7 1.3 0.1 3.7 15 1st Clnr Scav Tail E 138.4 1.16 0.4 0.52 0.28 0,037 0.31 8.8 1.6 1.7 1.4 0,1 1.0 4.3 16 Is tCtarScavTai lF 152.0 1.27 0.43 0.57 0,28 0.042 0.31 8.6 1.9 2.1 1.5 0,1 1.1 4.6 17 Rougher Tail A 1761.0 14.71 0.05 0.160 0.25 0,013 0.064 0.54 2.6 6.8 15.3 0.5 3.4 IS Rougher TailB 1734.0 14.49 0.05 0.160 0.11 0.013 0.064 0.6 2.6 6.7 6.6 0.5 3.7 19 Rougher TailC 1740.0 14.54 0.03 0.150 0.10 0.013 0.062 0.46 1.5 6.3 6.1 0.5 2.5 2.8 20 Rougher TailD 1745.0 14.58 0.05 0.160 0.11 0.013 0.062 0.45 2.6 6.8 6.7 0.5 2.5 2.8 21 Rougher Tail E 1739.0 14.53 0,04 0.160 0.16 0.013 0.061 0.52 2,1 6.8 9.7 0.5 2.5 3.2 22 Rougher Tail F 1739.0 14.53 0.04 0.160 0.10 0.014 0.063 0.59 2.1 6.8 6.1 0.5 2.5 3.6
Head fcalc) 11967.5 100.0 0.28 0.34 0.24 0.39 0.36 2.36 iOO.O 100.0 100.0 100.0 100.0 100.0 Head (Direct) 0.36 0.40 0.24 0.43 0.37 2.37 Combined Products 4th CI Cone A-F 3.37 5.6 3.5 2.2 10.95 7.67 27.0 67.4 34.3 30.5 95.1 71.7 38.5 CleanerTails 2.49 1.10 1.97 0.99 0.16 1.04 18.56 9.7 14.3 10.3 1.1 7.2 19.6 1st CI Tails A-F 6.8 0.39 0.57 0,31 0.05 0.32 7.83 9.4 11.2 8.8 0.8 5.9 22.4 CuRo Tail A-F 87,4 0.04 0.16 0,14 0.01 0.06 0.53 13.4 40.2 50.5 3.0 15.2 19.5
SubUit>' Check SubUit>' Check Cycle Wt% Ft Pd Au Cu Ni S
0 0 0 0 0 0 A 96.0 76.3 66.7 109,9 105.6 80.6 65.7 B 97.7 74,0 779 80.9 95.6 99.0 86.0 C 97.7 89,8 87.0 81,8 100.2 97.5 80,3 D 97.7 107.7 96.7 78.9 100,6 93.9 80.0 E 97.6 98.0 93.3 109.9 92,8 90.6 83.4 F 98.3 95.7 92.9 76.9 99.0 95.1 87.1
ave d-f 97.9 100.5 94.3 88.5 97.4 93.2 83.5
Circuit Stability

SGS Lakefield Research Limited Size Distribution Analysis
Project No. i 10616-003
Sample: Ro Tail Test No.: F42
Size Weight % Re ained % Passing Mesh jjm grams Individual Cumulative Cumulative
65 212 0.0 0.0 0.0 100.0 100 150 0.1 0.1 0.1 99.9 150 106 1.9 1.7 1.8 98.2 200 75 6.8 6.3 8.1 91.9 270 53 15.6 14.3 22.4 77.6 400 38 16.3 15.0 37.4 62.6 Pan -38 68.1 62.6 100.0 0.0
Total • 108.8 100.0 - -
K80 56
cn Ç
' c o OT ro
a.
dj >
3 £
O
1 0 0
90 80 70 60 50 40 30 20 10 0
10
Particle Size Distribution
I 1 I 1 i r ! : M i : ;
1 i i ! y T l ; 1 ; i 1 i : 1 i ! i j i y • • ' 1 : i • :
, . , , _ . . J
• K 1 . , ! • 1 i 1 i 1 ! !
I ' M ! ; ! : ' i 1 - i
1 1 ! I 1 M ! i l ! i l i j - 1 N i i M h i ! i i M M ;
! 1 • ; n ! ! : i ^ M i i : i ; 1
• \
j ! ' 1 ! ' ; 1 ; : ; ;
; ! ; i : î ; K 8 0 = 5 6 M m : j ! i i : ' i
: • i M - i : i ! 1 : ! ! : ; i : i • M M
1 0 0
Screen Size (micrometers)
1,000

Test No.: F14 Project No.: 10616-001 Operator: D.L. Date: 02-JU11-05
Purpose: To repeat lest F40LCT but reduce Ihe collector to the cicaners.aiid increase Ihe pH lo 10.0 in Ihe cleaners ill an allempt to improve the concentrate grade.
Procedure: Flotation was conducted as described below. All products were submitted for Pt, Pd, Au, Cu, Ni, Fe and S analyses.
Feed: 6X2kgofminuslOmesh Shakespeare.
Grind: 30 minutes / 2 kg @ 65% solids in laboratory ball mill (BM-3). Rghr Tail K^ ~ 82 Mm
Conditions: 2nd CI tail, I st CI Scav Cone, and Ro Cone 2-5 are the Regrind feed
Stage Ca(OH), Reagents addetJ SIPX
1, grams per tonne 3477 CMC MIBC
T Grind
ime, mitiul Cond.
les Froth
Grind 200 30
Rougher 1 20 10 10 1 2 Rougher 2 7.5 2.5 1 2 Rougher 3 5 2.5 2.5 1 4 Rougher 4 7.5 5 1 4 Rougher 5 2.5 2.5 5 1 4
Ro I concis kepi as is and combined with the regromd Ro conc 2-6 for Isl clamer feal Regriiid P.M. 150 0 2.5 4
Cleaner 1 1 2.5 Cleaner 1 Scav 2.5 2.5 0 1 2
Cleaner 2 0 2.5 1 2.5 Cleaner 3 10 0 10 2.5 1 2 Cleaner 4 10 0 10 2.5 1 1.5
Total 390 25.0 20.0 20.0 32.5
Stage Rougliers 1 St Cleaner 2nd • 4th Cleaner Flotation Cell 4L -Denver Dl 2L-Denver Dl IL-Denver Dl Speed; ipm 1800 1500 1200
Metallurgical Projection (D-F)
Product Weight Assays, %, g/t % Distribution K % Pt Pd Au Cu Ni S Pt Pd Au Cu Ni S
4th CI Concentrate 139.9 2.4 6.88 3.20 2.32 15,21 8,24 27.2 S8.6 21.0 22.4 95.3 67.2 29.3 1st Cleaner Tail 525,8 8,9 0,96 1,18 0.50 0,06 0,47- 12.37 30.9 30.4 18.1 i.5 14,4 50.2 Rougher Tail 5246,0 88,7 0.033 0,18 0,16 0,01 0,06 0.51 10,5 47,6 59,5 3.2 18.3 20.5
Combined Final Tail 5771.8 97.6 0.118 0,27 0,20 0,02 0,10 1.59 41,4 78,0 77,6 4,7 32,8 70.7
Head 5911.7 100.0 0.28 0.34 0,25 0,38 0,29 2.19 100,0 100.0 100.0 100,0 100,0 100.0 seems to be building up in tlie Cleaner Tails streams
Cycle D regrind bumped up to 5 minutes in the pebble mill, more material Cycle D, E and F omitted the SIPX to the regriud

Metallurgical Balance
Product Weight Assays, %, g/t % Distribution
R % Pt Pd Au Cu NI S Pt Pd Au Cu Ni S 1 4th a Cone A 3S.6 0.30 10.7 2.6 1.51 19.50 8.23 29.5 9.4 1.9 1.8 15,1 3.7 2 4th CI Cone B 41.0 0.34 8.9 3.14 1.53 17.50 8.98 29.4 9.0 2.7 2.1 15,6 4.3 3 4th CI Cone C 51.0 0.43 7.5 3.28 1.91 14.40 10.40 28.5 9.5 3,5 3.3 15.9 12.4 5.1 4 4th CI Cone D 46.8 0.39 6.9 3.29 2.03 15.60 8.57 27.9 7.9 3.2 3.2 15.8 9.4 4.6 5 4th CI Cone E 46.0 0.38 7.1 3.12 2.91 15.60 7.87 273 8.1 3.0 4.5 15.6 4.4 6 4th CI Cone F 47.1 0.39 6.9 3.29 2.13 15.00 8,56 27.3 8.1 3.2 3.4 15.3 4.6 7 4th Cl Tail F 52.1 0.44 3.9 5.870 2.91 0.90 7.95 19.0 5.1 6.3 5.1 1.0 3.5 8 3rd CI Tail F 98.0 0.82 3.60 3.970 1.68 0.28 3.16 18.9 8.7 8.0 5.6 0.6 7.2 6.6 9 2nd Cl Tail F 80.5 0.67 1.95 3.240 1.50 0.20 1.33 16.6 3.9 5.4 4.1 0.3 2.5 4.7
10 IstClnrScavCone F S3.0 0.44 i.75 2.340 1.14 0.18 1.23 19.6 2.3 2.6 2.0 0.2 1.5 3.7 11 IstClnrSeavTail A 117.0 0.98 0.67 0.91 0.46 0.075 0.43 10.4 1.9 2.2 1.8 0.2 1.2 4.3 12 Ut Clnr Scav Tail B 134.3 1.12 0.51 0.71 0.37 0.057 0 J 6 8J 1.7 2.0 1.7 0.2 1.1 4.0 13 I s tClurSeavTaaC 163.8 1.37 0.54 0.94 0.49 0.076 0.38 10.3 3.2 2.7 0.3 1.5 6.0 14 1st Clnr Scav Tail D 184.5 1.54 0.85 1.12 0.54 0.071 0.48 13.2 3.9 4.3 3.4 0 3 2.1 8.6 15 1st Clnr Scav Tail E 167.7 1.40 1.06 1.26 0.50 0.063 0.50 12.3 4.4 4.4 2.8 0.2 2.0 7.3 16 IstCUirSeavTaUF 173.6 1.45 1.03 1.2 0.48 0.055 0.45 12.0 4.4 4.3 2.8 OJ 1.8 7.4 17 Rougher Tail A 1753.0 14.65 0.05 0.180 0.15 0.014 0.057 O J l 2.2 6.5 8.9 0.5 2.3 1.9 18 Rougher Tail B 1748.0 14.61 0.04 0.180 0.09 0.014 0.058 0.55 1,7 6.5 5 3 0.5 2.4 3.4 19 Rougher Tail C 1729.0 14.45 0.03 0.190 0.10 0.013 0.057 0.38 1,3 6.8 5.8 0.5 2.3 2.3 20 Rougher TailD 1752.0 14.64 0.03 0.180 0.09 0.014 0.058 0.43 1.3 6.5 5.3 0.5 2.4 2.7 21 Rougher TaiiE 1757.0 14.68 0.02 0.180 0.31 0.014 0.063 0.59 . 0.9 6.5 18.4 0.5 2.6 3.7 22 Rougher Tail F 1737.0 14.51 0.05 0.200 O.IO O.OU 0.061 0.52 2.1 7.2 5.9 0.3 2.5 32
Head (calc) 11968.0 lOO.O 0.34 0.40 0.25 038 0.36 2.36 100.0 100.0 100.0 100.0 100.0 100.0 Head (Direct) 0.36 0.40 0.24 0.43 0.37 2_37 Combined Products 4th CI Cone A-F 2.24 7.9 3.1 2.0 16.08 8.81 28.2 52,0 17.4 18.3 93.3 55.0 26.7 Cleaner Tails 2.37 2.85 3.81 1.75 035 3.16 18.40 20.0 22.3 16.8 2.2 20.9 18.5 IstClTaUs A-F 7.9 0.80 1.04 0.48 0.07 0.44 11.29 18.5 20.3 15.2 1.3 9.6 37.6 Cu Ro Tail A-F 87.5 0.04 0.18 0.14 0.01 0.06 0.46 9.5 40.0 49,6 3.1 14.4 17.2
Stability Check Stability Check Cycle WtV. Pt Pd .A.U Cu Ni S
0 0 0 0 D 0 A 95.5 81.2 63.8 75.1 94.7 62.1 59.7 B 96.4 74.7 66.8 54.7 97.6 72.5 70.2 C 97.4 77.7 80.5 71.1 100.2 96.8 80.7 D 99.4 78.6 83.8 71.4 100.0 82.8 95.5 E 98.8 80.3 83.2 154.5 98.0 78.0 92.5 F 98.1 87.8 88,1 72.4 96.4 82.3 90.7
aved-f 98.8 82.2 85.0 99.5 98.1 81.0 92.9
Circuit Stability

Test No.: F14 Project No.: 10616-001 Operator: D.L. Date: 0 2 - J U 1 1 - 0 5
Purpose: To repeat test F^SLCT but extend tlie cycle test to 8 cycles. Increase the Collector to the 4lh stage of the roughers slightly,reduce the pH to the cleaners, and niainuin a small addition of collector to tlie cleaners in an attempt to increase the nickel recovery.
Procedure:
Feed:
Grind:
Conditions:
Flotation was conducted as described below. All products were submitted for Pi, Pd, Au, Cu, Ni, Fe and S analyses.
8 X 2 kg of minus ID mesh Shakespeare.
30 minutes / 2 kg @ 65% solids in laboratoiy ball mill (BM-2).
2nd CI tail,] St CI Scav Cone, and Ro Cone 2-5 are the Regrind feed
Rghr Tail K , „ - 8 2 |im
Stage Ca(OH), Reagents addet SIPX
1, grams per tonne 3477 CMC MIBC
T Grind
mie, minul Cond.
;es Froth pH
Grind 200 30 9.3
Rougher 1 20 10 10 1 2 9.5 Rougher 2 7.5 2.5 1 2 9.4 Rougher 3 5 2.5 2.5 1 4 9.2 Rougher 4 7.5 2.5 5 1 4 9.1 Rougher 5 2.5 2.5 5 1 4 9.0
Ro 1 conc is kept as is and combined with the reground Ro cone 2-6 for 1st cicnncr feed Regrind P.M. 75 0 2.5 5
Cleaner I 2.5 2.5 1 3.5 9.5 Cleaner 1 Scav 2.5 2.5 0 1 2
Cleaner 2 1 1 2.5 9.5 Cleaner 3 10 1 10 2.5 1 2 9.5 Cleaner 4 10 0.5 5 1.25 1 1.5 9.6
Tola) 315 30.0 22.5 15.0 31.3
Stage Roughers 1 St Cleaner 2nd - 4th Cleaner Flotation Cell 4L -Denver D1 2L -Denver D1 IL-Denver D1 Speed: rpm 1800 1500 1200
MeUllurgical Projection (F-H)
Product Weight Assays, / . , g/l % Distribution « % Pt Pd Au Cu Ni S Pt Pd Au Cu Ni S
4th CI Concentrate 198.7 3.4 7.10 4.11 2.08 11.67 7.59 29.4 71.1 37.6 3S.3 95.5 74.5 46.6 1st Cleaner Tail 640.0 11.1 0.50 0.70 0.34 0.05 0.34 7.96 16.2 20.6 18.8 1.4 10.8 40.7 Rougher Tail 4928.4 85.5 0.05 0.18 0.11 0.02 0.06 0.32 12.7 41.8 45.9 3.1 14.7 12.7
Combined Final Tail 3568.4 96.6 0.10 0.24 0.14 0.02 0.09 1.20 28.9 62.4 64.7 4.5 25.5 53.4
Head 5767.1 100.0 0.34 0.38 0.20 0.42 0.35 2.17 100.0 100.0 100.0 100.0 100.0 100.0

Metallurgical Balance
Product Weieht Assavs, */«, g/t %Di! tribution E % Pt Pd Au Cu Ni S Pt Pd Au Cu Ni S
1 4th CI Cone A 47.9 0.30 7.8 3.3 1,41 14.60 8.13 29.5 6.7 2.5 2,0 10,9 6.6 3.7 2 4th CI Cone B 52.0 0.33 7.9 3.73 1,92 14.70 7.98 29.4 7.4 3,1 3,0 11,9 7.1 4.0 3 4lh c: cane C 76.7 0.49 6.4 3.84 2.05 10.10 7.96 28.2 4,7 4,7 12,1 10.4 5.6 4 4th CI Cone D 58.3 0.37 7.0 4.3 2.16 12.80 7.60 28.3 7.4 3,7 11,7 7.6 4.3 5 4th CI Cone E 78.6 0.50 6.3 4.1 2.05 9,83 7.86 28,4 5,1 4,8 12.1 10.5 5.8 6 4th CI Cone F 68.0 0.43 7.0 3.84 2.00 10,90 6.91 28,7 4,2 4,0 11.6 5.1 7 4th a Cone G 65.7 0.42 6.8 4.14 2.08 11,90 8.09 28,3 4,3 4,1 12,2 4.8 8 4th CI Cone H 65.0 0.41 7.1 4.1 2.03 11,50 7.32 29.3 4,3 3,9 11,7 8.1 5.0 9 4th 01 Tail H 85.8 0.55 2.4 3.420 1.70 0,57 3.86 25,0 3.6 4,7 4,3 0,8 5.6 5.6
10 3rd CI Tail H 105.7 0.67 1.26 2.470 1.32 0,19 1.32 21.3 2.4 4,2 4,2 0,3 2.4 5.9 11 2nd CI Tail H 94.8 0.60 0.81 1.650 0.93 0,12 0.87 20.5 1.4 2,5 2.6 0,2 1.4 5.1 12 1st Clnr Scav Cone H 68.8 0.44 0.80 1.370 0.78 0,12 1,00 22.9 1.0 1,5 1.6 0,1 1.2 4.1 13 IstClnrScavTailA 121.1 0.77 0.66 0.75 0.39 0,055 0.32 7.8 1.4 1,4 1.4 0,1 0.7 2.5 14 1 St Clnr Scav Tail B 196.0 1.25 0.6 0.68 0.33 0,047 0.33 8.2 2.1 2,1 1.9 0,1 1.1 4.2 15 1st Clnr Scav Tail C 177.0 1.13 0.57 0.71 0.35 0,052 0.30 7.2 2,0 (.8 0,1 3.3 16 1st Clnr Scav Tail D 199.0 1.27 0.54 0.71 0.35 0,061 0.36 8,6 2,3 2.1 0.2 1,2 4.4 17 1st Clnr Scav Tail E 178.1 I.I3 0.53 0.64 0.31 0.047 0.30 6.2 1.7 1,8 1.6 0.1 18 1st Clnr Scav Tail F 202.2 1.29 0.55 0.68 0.33 0.046 0.36 8.6 2.2 2.0 O.I 1,2 4.5 19 ls( Clnr Scav Tail G 220.7 1.40 0.48 0.67 0.34 0.052 0.33 7.9 1.9 2.4 2,2 0,2 1,2 20 1st Onr Scav Tail H 217.1 1.38 0.45 0.7 0.34 0.060 0.32 6.9 1.8 2,4 2.2 0.2 1,2 3.9 21 Rougher Tail A 1710.8 10,88 0.05 0.180 0.10 0.016 0.057 0.17 1.5 4,9 5.1 0.4 1.7 22 Rougher Tail B 1694.0 10.77 0.05 0.170 0.10 0.014 0.061 0.37 1.5 5,0 0.4 1.6 23 Rougher TailC 1688.7 10.74 0.06 0,190 O.ll 0.016 0.059 0.27 1.8 5,1 5,5 0.4 1.7 1.2 24 Rougher Tail D 1654.4 10.52 0.06 0.190 0.11 0.016 0.063 0.46 1.8 5.4 0.4 2.0 25 Rougher TailE 1673.6 10.64 0.05 0,170 0.10 0.014 0.059 0.31 1.5 4,5 5,0 0.4 1.7 1.3 26 Rougher Tail F 1670.9 10.62 0.06 0,180 0.10 0.015 0.059 0.37 1.8 5.0 0.4 1.7 1.6 27 Rougher Tail G 1636.7 10.41 0.04 0,180 0.11 0.015 0.059 0.31 1.2 4.7 5.4 0.4- 1.6 1.3 28 Rougher TaUH 1620.8 10.30 0.05 0.180 0.11 0.015 0,059 0.27 1.5 4.7 53 0.4 1.6 1.1
HeadCcalc) 15728.4 100.0 0.35 0.40 0.21 0,41 0.37 2.45 100.0 100.0 100.0 100.0 100.0 100.0 Head (Direct) 0.36 0.40 0.24 0,43 0,37 2J7 Combined Products 4th CI Cone A-F 3.26 6.9 3.9 2.0 11,77 7.72 28.7 64.2 32.2 30.3 94,2 67.4 38.2 Cleaner Tails 2.26 1.31 2.27 1.20 0.25 1.75 22.29 8.4 12.8 12.7 1,4 10,6 20.6 1st CI Tails A-F 9.6 0.54 0.69 0,34 0,05 0.33 7.70 14.7 16.6 15,3 1.2 8,5 30.3 Cu Ro Tail A-F 84.9 0.05 0.18 0.10 0,02 0.06 0.32 12.7 38.3 41.7 3.2 13,5 11.0
Stabilité' Check Cycle Wl% Pt Pd Au Cu NI S
0 0 0 0 0 D 0 A 95.6 77.5 71.1 68.1 91,7 71.7 55.1 1 B 98.8 88.7 78.5 79.5 99,7 79.5 78.2 2 C 98.8 99.9 94.6 96.4 101.4 104.1 81.1 3 D 97.2 89.0 90.1 89.9 98.1 84.4 85.7 4 E 98.2 96.9 92.0 91.4 100.6 105.0 80.2 5 F 98.7 99.0 89.2 88.1 97.0 87.5 89.5 6 G 97.8 89.! 91.2 93.3 102.3 95.6 85.6 7 H 96.8 92.fi 90.6 91.5 98.1 87.4 80.0 g
ave d-f 98.0 95.0 90,4 89.8 98.6 92.3 85.1
im.o
«0.0
Circuit Stability
- O u I-Ni
•PI --«-Pd

Data Input
SETTLING TEST ÎŒPORT DATA INPUT SHEET
Project: Sample :
^ Test: Dam
- ' Op«ator: I ' ' ^ "
" ^ Flocculailt I; , Flocoulant2:
^ , V
Ç o n ç ç n ^ t i o n :
ini^iîtftpâtp "Volûme:
Shakespeare V30 Cl Cone
Project N u m b e n | LR-106I6-0Ô3]
SI > 1
Nov 25 2005 D L
Mag 351 . p ^ Modif ier: ' Lime | | None Concentration: 5.0 WtW
Floe 1 Floe 2 Weight Added: 2.00000 g 1.00
' . .J^! 9.5 (measured) 5.0 niL * ï-i» * . f ^ ,
J >M*- r
2 0 3 0 mil ilniU^ Pulp Height 1 406 .4 1 I W 2404 .0 S
Settling V e k e l ^ î z e : 0 . 0 0 5 0 ma/m .
r s t s ; ™ ^
Dry~SoI Weight-,1523 miya
503.0
' X'tf. » ' Feod'ASolids based on pulp density fulp Density;^. 1184 g/)L''
'2092' %SQ1 ""M
T t a n e i v l h ^ l it f inal readme:
.'Jg^'OE^etvgtioas,
wm, i i l
• i t
a J :
^ ^ ' ^ - , Sett Î V ' - ^ ' . l ing T e s t - M e a s û r e m e n t s ' >
. - ... ... m i • M u d Line
m L Time ' {"Mud^Une -Min 1 '"-/'biL
T i m e ^ JMud Line ' 'mL
0 i 2030 20 480 0.17 1860 27 465 I
A 0.5 1600 44 450
/ s 0.75 1460
: 1
1 1300 j
r-' 1.5 1060 } 2 940
4 780
• -4.5 720
^ TH 5 700
1 • ••
7 625 1
• ••
10 570 1 • ••
15 1 520
Clear supernatant at 5 minutes
1 Î
1 i
«ïî-
i ® WB
- t
• ' ' s i - - '
tr'

Data Input
F D e n s i t y - 1 . F D e n s i t y - ? : F D e n s i t y - 3 .
6 0 . 0
Selected Underflow Densities
74 6 =%Sol at Compression Point
: : • ^ ^ = Ultimate %5ol
M a a s u r e m e n t s f o r Capac i ty C a l c u l a t i o n s
6 5 . 0 7 0 . 0
Wl% Wl% Wt.%
m VDlurnc "(mL) •«43 399».'
C/F Solids Conuatr.
(wr/Cu-M.) 108 126 146
Intersect with Tangeol
(Min)
-
31 is -
M a n u a l M e a s u r e m e n t s
H.
E
1 1ÎN,
1 ^ S
t ^ \ Compression Poiru
III
0 T, A 60 ^ 2 0 180
Time, minutes
initial <;ettl ing-Rate
Inteisect with X-Axis @ H,:]
Intersect wqthY-Axis'
Fnrm^niroenlïMiits feftinl Not'aparil delii., ^ , ^ , - -: T H I C K E N E R U N I T A R E A f l A L C n P L A T r O N
Rise Rate : . . ' ' " â û i S S e t t l i n g R ^ t c r . 480.4 .7 m3/naday , , ^ * % " ^
^ S a f e t y f e c t o n flûne- ' - T ^ t ' ' " R i s e K a t e : 4 8 0 . 4 7 ni3An2day " « . 1 9 . USGa4/f t2 , ' ' ^
w i i l i l ®
R e f e d a n d J P i s c h a r e e d ^ a t a : ,
F e e d P e r c e n t S à l i a s : I 2 0 - 9 |wt « FdDens i^ s^-~
Prqj<;ct: j S h i k e s p e a r e v , ^
"Pînàl % è o l i d s - '' - 6 1 ,Q " * w t « -
F l o o î U à n t S i N o n e - ^ T C ^ ^ I " ^ i
p » »
Page 2

Lakefield Research Limited SETTLING TEST REPORT
Project: Sample ;
Test: Date:
Operator:
Shakespeare V30 CI Cone
Project Number: LR-10616-003
SI Nov 25 2005
DL
Flocculant 1 Mag 351 pH Modifier: None Flocculant 2: None Concentration; 5.0 Wt%
Floe 1 Floe 2 Weight Added: 2.00000 S
Concentration: 1.00 g/L pH: 9.5 (measured)
Volume Added: 5.0 mL
Initial Pulp Volume: 2030 mL Initial Pulp Height: 406.4 mm.
Initial Net Pulp Weight- 2404.0 S Dry Solids Weight: 503.0 g Meas. Dry Sol. Weight; 503.0 g
Settling Vessel Size; 0.0050 m3/m 1523 mL/ft
Dry Solids S.G.: 3.90 g/cm'
Liquid S.G.: 1.00 g/cm' Feed % Solids based on pulp density Temperature: Ambient Degrees C Pulp Density: 1184 g/L
20.92 %Sol
Settling Test - Measurements Time Mud Line Time Mud Line Time 1 Mud Line Min mL Min mL Min mL
0 2030 20 480 0.17 1860 27 465 0.5 1600 44 450 :
0.75 1460 1 1300
1.5 1060 1 2 940 :
4 780 :
4.5 720 5 700 7 625 :
10 570 : J : :
15 520 I :
Supernatant after 1 hour: Supernatant at final reading:
Observations:
02/03/2006 Lakefield Research Limited S-1

Lakefield Research Limited SETTLING TEST REPORT
Project : Shakespeare Project Number : LR-10616-003
Test: SI Sample : V30 CI Cone
Date : Nov 25 2005
Settling Plot - Laboratory Test 2000
E
3 •o
Mag 351
Dosage
(g/MT)
9.9
Dry Solids S.G.
Liquid S.G.
Temperature
pH
3.90
1.00
g/cm'
g/cm^
Ambient "C
9.5
16 1
Time (min)
Rise Rate : Initial Settling Rate
Safety factor Rise Rate
Feed and Discharge Data : Feed Percent Solids:
Fd Density;
THICKENER UNIT AREA CALCULATION
m^/m^.day 480.47 none
4 8 0 . 4 7 m'/m^.day
20.9 1 1 8 4
Wt. %
g/L
Thickener Underflow Unit Area
8 .19 U S G P M / f l '
Final % Solids : 61.0 wt.%
Thickener Hydraulic Unit Area
Underflow Entersect
(Talmage and Fitch) (Overflow Capacity)
Underflow with tangent (No Safety Factor) (No Safety Factor) % Sol (Wt) Density (g/L) (min) (ra'/MTPD) (fr/STPD) (m^/MTPD) (fi'/STPD)
6 0 . 0 1806 2.2 0 . 0 1 5 0.15 0 . 0 0 6 0.06 6 5 . 0 1935 3.1 0 . 0 2 2 0.2 J 0 . 0 0 7 0.07 7 0 . 0 2086 3.9 0 . 0 2 7 0.26 0 . 0 0 7 0.07
- « N d t e i T b e t h i c k e n e r i i m t , a f e a 'ca)( ' u l a t i o n s c o n t a i n i 10 s à f e t y - f â ç f i ^ r i .
All boxed data are operator input
n2m/2no6 Lakefield Research Limited S-I

Project; Sample ;
Test: Date:
Operator:
Shakespeare V30 CI Cone
SI Nov 25 2005
DL
Project Number: ^-10616-003"
Estimated Intercept (Black/Solid Line): 2.4 min.
The program estimates two initial settling rate lines. The black/solid line is based on the first data points. The red/dashed line draws a line between the starting point of the test and a point on the settling curve at 50% of the total interface drop. Visually select the best representation. If neither is acceptable, you can change the black/solid line by entering an intercept point in the yellow box. Variations in axis scaling will change the determination of the compression point. In order to standardise the scaling, modify the scale of the X-axis until the initial settling rate line intercepts the X-axis at the arrow. When this is done, print the SHEET, not the chart only.
02/03/2006 Lakefield Research Limited S-1
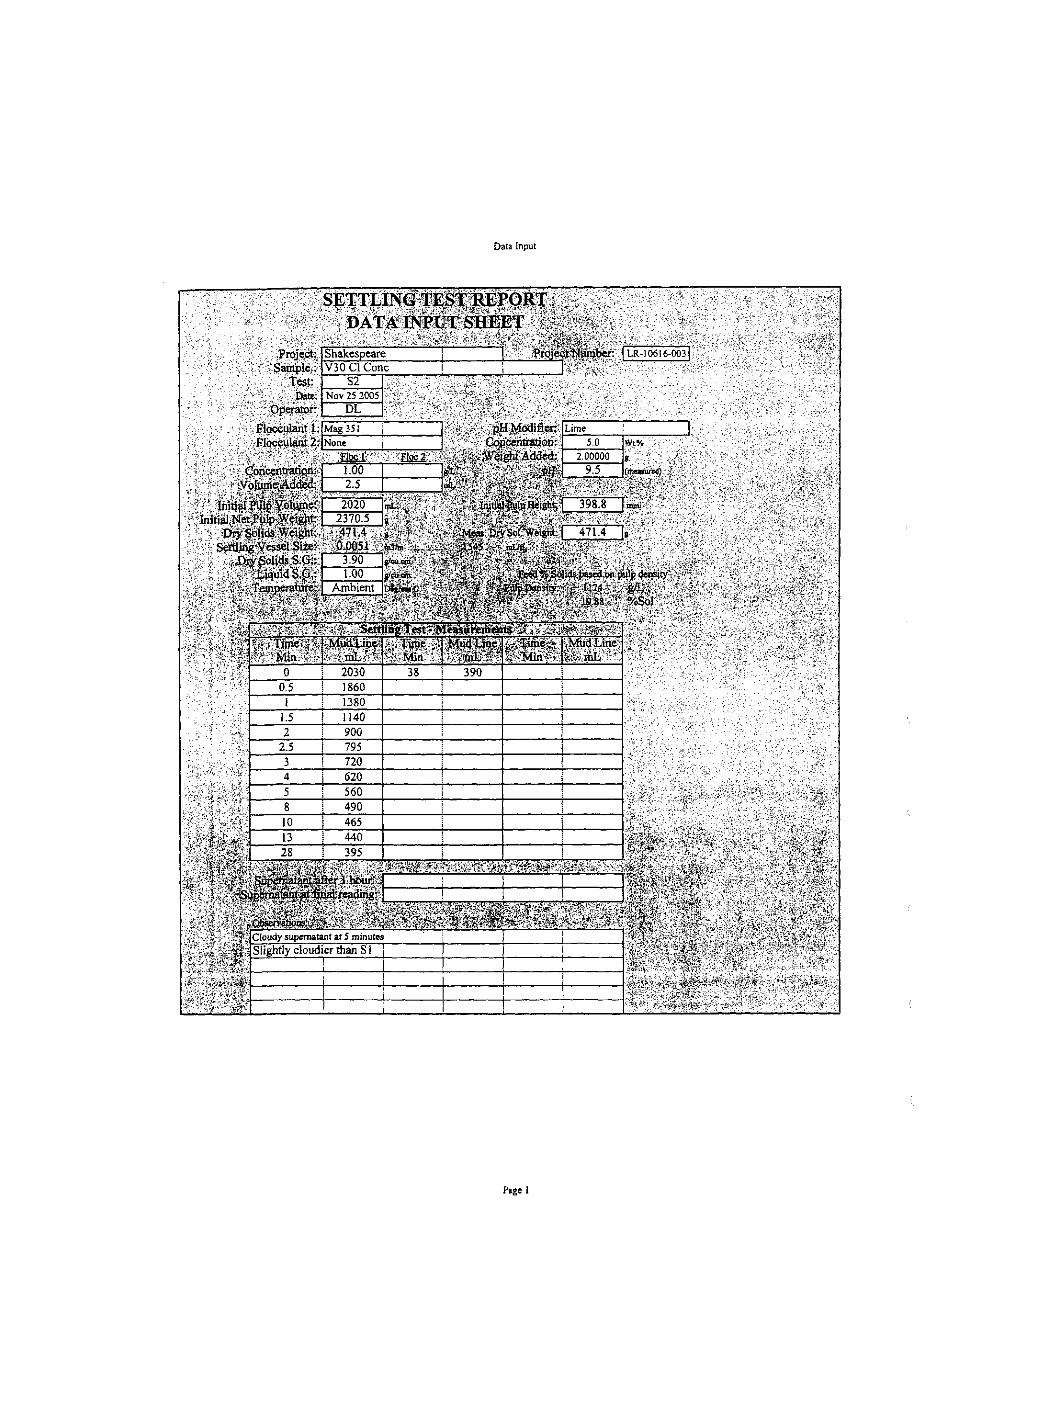
Data Input
Project: Shakespeare Sample-: V3Q CI Cone
Test: S2 Date Nov 25 2005
• Operator: Flocajlant l . |Mag35i PIacculant2:
, C'oncentr^oii:-• -^VoluineAdded:
• Initial fiflpYolHine: Initial I^et>ulp,l?fe1^t:
SETTLING TESl[;|UEPQRT: , , DATA BWUT SHEET ;
=Pro|èctilnmber: | LR-i 0616-003]
- , "
: None Bas!
pH^rfodifier; Copcentraiion:
' Added; . M
V • "'VJ ^ ' l i p , 'Mia
Mud Line IT Mud Line fiw ibL
> ^ 0 2030 38 390 i 0.5 I860 i 1380 j
1.5 1140 i 2 900 i
2.5 i 795 3 720 :
:
4 620 i
4. t 5 560 1 8 490 ! 10 465 ;
13 440 28 1 395 I 4 5 ^^ 4
fter 1 hftur -«if > W 3;ai.feading'
' ' " i f
r?'
Cloudy supernatant at 5 minutes Slightly cloudier than SI
1
• . « /I
Page I

Data Input
Selected Underflow Densities
TDensity-l: 'F Density-2: F Density-3:
60.0 65.0 70.0
Wtt4 wt'/. wt%
72 5 - % S o l at Compression Point
63 7 = Ultimate %Sol
M e a s u r e m e n t s for Capac i ty Calculat ions
U/F U/FSoUds Intersect
Volume Concentr. Willi Tingent
CmL) (Nff/Cu-M.) (Min)
435 1 , 108 2« -
374 7 126. 3 5
Î229 146 42
M a n u a l M e a s u r e m e n t s
CompreM»on Point
Tanipil
tnitial Settling Rate ' Intersect wthX-Axis
Intersectwith Y-Axisu V Tangent at
Tajvgent intersect with V Axis XtAxis intersects Y^ tids sl:
ingent intersect with X-Axis @ Hï: • _ Mudline
at Comp sion^^^
1.20
2,000
620.0 0.0
8.8
Min, TO mL (H.) Point mL CH,) mL (HO Min., ITJ)
nriline at Compression Point , JK' > sion Pomr I 300 0 |niL ' C^.
TTNTT AREA C:A.^ 'UIATION- ^ •
Rise Rate : Initial Settling Rate: 473.82 m3/m2day
Safety factor; none Rise Rate: ' 473.82 ra3/m2day
F e e d and D i scha rge Data : Fee4 Perœnt Solids: | 19.9 |wt v. . ;
Fd Density 1174 grt-
tioject: Shakespeare Sample; V30ClCoj3c
SETTLING TEST REPORT
l ln ib^Pcr t^ t lp l ids 19 9' wt^i.
tf v'- 'Tempe iâ^ : . ' Ambient Dtg^Q , . ^ • HoecuUtl : Mag351 , . ^ ^ '
Ftpccui#2: Nope . . ' ^ t|.00. pHModifier: LimeA ' ' .Dosage. ^
M M i l â t t o e : 390 ' ' ; ' ' J Y ^ ^ -^ Final Përceiit&lids; 63 7 wt% ^ ^ ^ i ^ . f .
Page 2

Lakefield Research Limited SETTLING TEST REPORT
Project: Sample :
Test: Date:
Operator:
Shakespeare V30 CI Cone
Project Number:
S2 Nov 25 2005
DL
LR-10616-003
Flocculant I: Mag 351 pH Modifier: None Flocculant 2: None Concentration; 5 .0 Wt.%
Flocl Floe 2 Weight Added: 2 . 0 0 0 0 0 g
Concentration: 1.00 g/L pH: 9.5 (measured)
Volume Added: 2.5 mL
Initial Pulp Volume: 2020 mL Initial Pulp Height: 398.8 mm.
Initial Net Pulp Weight: 2370.5 g Dry Solids Weight: 471.4 g Meas. Dry Sol. Weight: 471.4 g
Settling Vessel Size: 0.0051 m3/m 1545 mL/ft
Diy Solids S.G.: 3.90 g/cm'
Liquid S.G.: 1.00 g/cm' Feed % Sohds based on pulp density Temperature: Ambient Degrees C Pulp Density: 1 1 7 4 g/L
19 .88 %Sol
Settling Test - Measurements Time j Mud Line Min mL
Time Min
Mud Line mL
Time Min
Mud Line mL
0 i 2030 38 390 0.5 ! 1860 1 1380 !
1.5 i 1140 2 j 900
2.5 i 795 3 1 720 4 620 5 1 560 8 490 Î 10 465 13 440 28 395
Supernatant after I hour: Supernatant at final reading:
Observations: Cloudy supernatant at 5 minutes Slightly cloudier than SI
02/03/2006 Lakefield Research Limited S-2
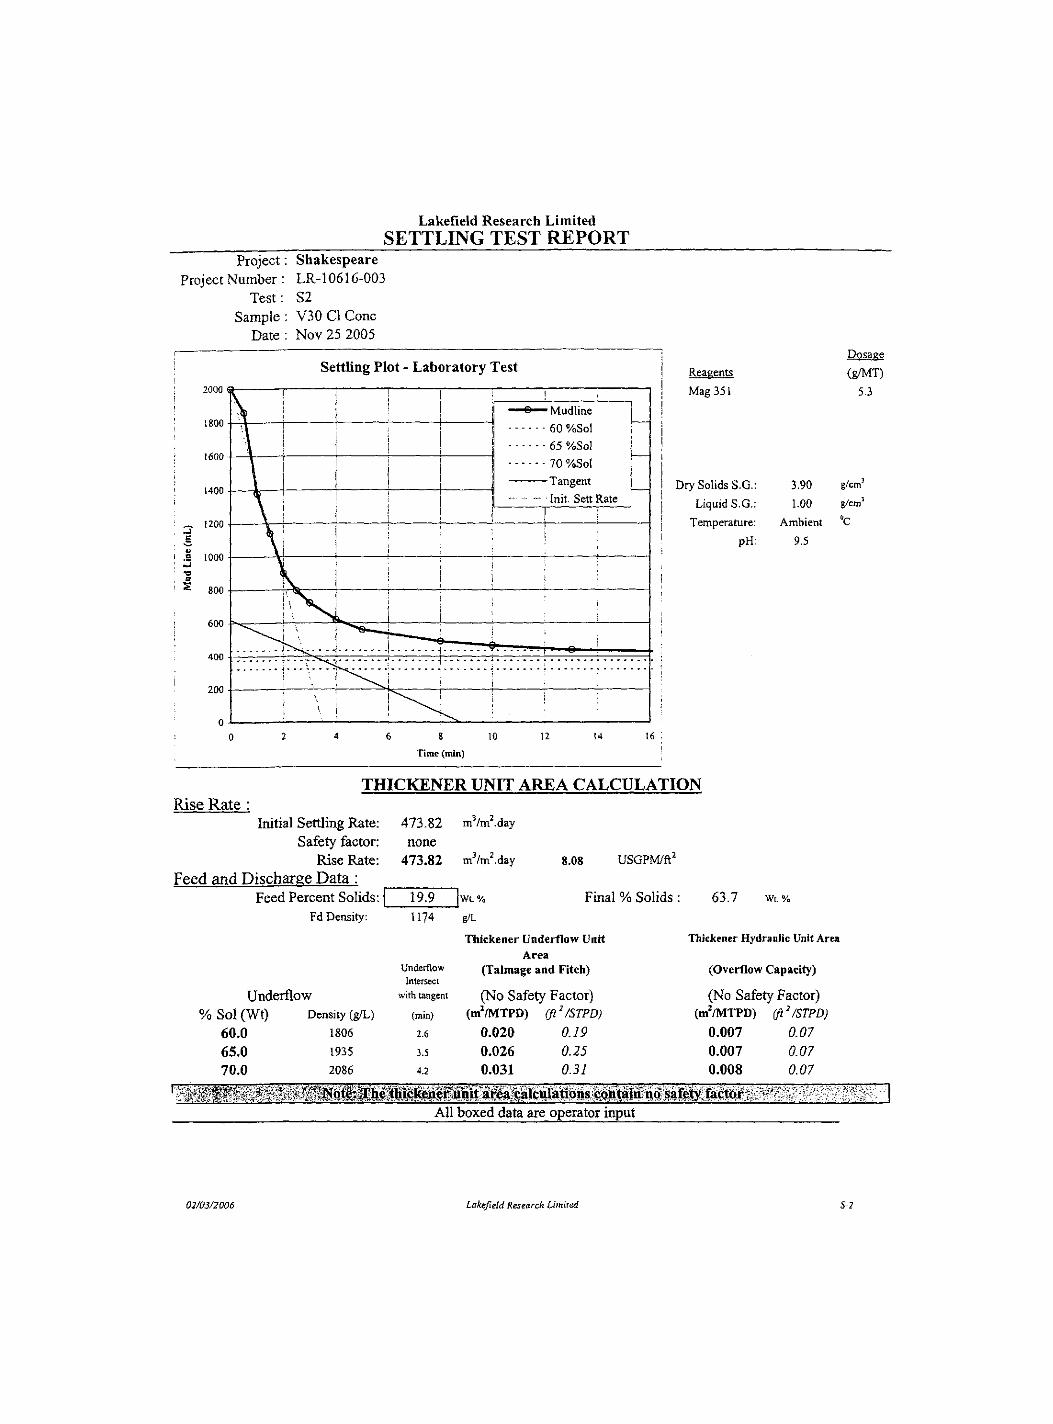
Lakefield Research Limited SETTLING TEST REPORT
Project : Shakespeare Project Number : LR-10616-003
Test: S2 Sample; V30 CI Cone
Date : Nov 25 2005
Settling Plot - Laboratory Test Reagents
Mag 351
Dosage
(g/MT)
5.3
j Dry Solids S.G.
Liquid S.G.
Temperature
pH
3.90
1.00
Ambient
9,5
g/cm'
g/cm'
Time (min)
THICKENER UNIT AREA CALCULATION Rise Rate
Initial Settling Rate Safety factor
Rise Rate
473.82 none
473.82
m^/m^.day
m^/m^.day 8.08 USGPM/ft '
Feed and Discharee Data : Feed Percent Solids: 19.9 Wt. % Final % Solids : 63.7 W t . %
Fd Density: 1174 g/L
Thickener Underflow Unit Thickener Hydraulic Unit Area Area
Underflow Intersect
(Taimage and Fitch) (Overflow Capacity)
Underflow with tangent (No Safety Factor) (No Safety Factor) % S o l ( W t ) Density (g/L) (min) (m^/MTPD) (ft^/STPD) (m^/MTPD) (fi^/STPD)
60,0 1806 1.6 0.020 0.19 0.007 0.07 65.0 1935 3.5 0.026 0.25 0.007 0.07 7 0 . 0 2086 4.2 0.031 0.31 0.008 0.07
' ' y ' é ' ^ ï ' + ' iNotêî îThë t^ ickenermi t îîrea calculations contain no safety factor - ' All boxed data are operator input
02/03/2006 Lakefield Research Limited S-2

Project; Sample ;
Test: Date:
Operator:
Shakespeare V30 CI Cone
S2 Nov 25 2005
DL
Project Number: ^ - [06 I6 -00 r
SETTLING CURVE - For Compression Point Determination
"Initial Settling Rate" Intercept Override Value: Estimated Intercept (Black/Solid Line): 3.5
nun min.
The prograrn estimates two initial settling rate lines. TTie black/solid line is based on the first data points. The red/dashed line draws a line between the starting point of the test and a point on the settling curve at 50% of the total interface drop. Visually select the best representation. If neither is acceptable, you can change the black/solid line by entering an intercept point in the yellow box. Variations in axis scaling will change the determination of the compression point. In order to standardise the scaling, modify the scale of the X-axis until the initial settling rate line intercepts the X-axis at the arrow. When this is done, print the SHEET, Dot the chart only.
02/03/2006 Lakefield Research Limited S-2

URSA MAJOR MINERALS INCORPORATED
SUPPORTING DOCUMENTATION

436,000
m 436,«)0
I 438,800
8 <N S -
HIGURE LOCATION • m / m o o nayo"^ » - 'OUNLOPTWP'
S36047
BALDWtN n
S36043
JL LEGEND
Ursa Major Claim
• SVMLO Surface Sample
' Section Une
Drill Holes
m SVMDC Sample Collar
Other Drill Collar
^ ^ SVMDC Sample
\ DH Trace-SVMDC Sample
Surface Trace
S35592
Note: SVMDG = Shakespeare Variability Metallurgical Drill Core SVMLO = Shakespeare Variability Metallurgical Lump Ore
S35595
U-03-66 • QSVMLO-S
U-03 -36 <
(A03-71 U-03^
SVMLO-2
SVMLO-1 O SVMLO-6
^ SVMLO-3
U-03-70 U-i >3-40
•
SVMLO-4
SVMLO-7
S35594
S36046 - U - 0 ^
U-03-52
S36045
U'03-76 U-03-82
\ SVMLO-8 > 0 3 - 7 4 ^ - 0 3 - 7 5 '
S35602
U-03-83
S35604
S35601
MN
w-S35603
1 Declination as of January 7, 2005: 9* J8 W
O'O' annual change 0 SO fOO
URSA MAJOR MINERALS INC. SHAKESPEARE DEPOSIT AREA
SiMkespaan TWp.. Sudbury Hlnlna DMslon
METALLURGICAL VARIABILITY SAMPLING
Drawn By: PDB NTS 41M
March «, 1007
436,000 436,400 «ëîsôô Projection UTMZone 17, NADB3

S "
/RIGlliRE LOCATION il ^ y Mv.-
v M • > • •o 'li-W V.F
L i THIS MAP r ..^ ig^
•T.. ' ^
LEGEND
I I Ursa Major Claim
• SVMLO Surface Sampte
Drill Holes
® SI/MDC Samp/e Coiiar
Other Drili Collar
SVMDC Sample
\ DH Trace - SVMDC Sample
Surface Trace
Note: SVMDG = Shal<espeare Varialiility Metallurgical Driil Core SVMLO = Sliai<espeare VrniabiHty Metailuiyicai Lump Ore
-.a Ale
IffOO 43»^
b, hU.l'i
U-03-76 U-03-82
\ SVMLO-8
U-03-83
U-03-68(D BSVMLO-S
SVMLO-7
SVMLO-4
s-
U-03-69 SVMLO-2
SVMLO-1 SVMLO-6
• SVMLO-3 U-03-70
'3-40
w-i'iôu'i;.
Daclinslwn as ot January 7. 2005 9-3BW (rO'annual change
SO MO
i3i>fi0.1
URSA MAJOR MINERALS INC. SHAKESPEARE DEPOSIT AREA
METALLURGICAL VARIABILITY SAMPLING
Drawn By: PDB
436^00 Projection UTM Zone f 7, NAD63

o o-
'O
CLAilV! ^ 3 £ Ô 0 2
50 fOO
metres
URSA MAJOR MINERALS INC. SHAKESPEARE DEPOSIT AREA
Shakespeare Twp., Sudbury Mining Division
METALLURGICAL VARIABILITY SAMPLING
CROSS SECTION 1+OOE LOOKING GRID WEST (237°)
-100 Drawn By: PDB March IS, 2007


- 1 0 0 100

-100 — I —
G 100 o o H Tf S (147°) N (327°)
o o ^ CO
o o-CM
o o •
50 100
metres
o - o
o - o
CO
o - o
CM
O l - o
URSA MAJOR MINERALS INC. SHAKESPEARE DEPOSIT AREA
Shakespeare Twp., Sudbury Mining Division
METALLURGICAL VARIABILITY SAMPLING
CROSS SECTION 6+OOW LOOKING GRID WEST (237°)
-100 Drawn By: PDB March IS, 2007

-100 100

o CM
o - o
URSA MAJOR MINERALS INC. SHAKESPEARE DEPOSIT AREA
Shakespeare Twp., Sudbury Mining Division
METALLURGICAL VARIABILITY SAMPLING
CROSS SECTION 13+OOE LOOKING GRID WEST (237°)
-100 Drawn By: PDB March IS, 2007

-100 100

-100 L _
o o H •<r S (147*')
o < = > H CO
o o-CM
100
N (327°)
o o-
50 100
metres o -
URSA MAJOR MINERALS INC. SHAKESPEARE DEPOSIT AREA
Shakespeare Twp., Sudbury Mining Division
o h o
o h o C O
o r o CM
o - o
METALLURGICAL VARIABILITY SAMPLING
CROSS SECTION 15+OOE LOOKING GRID WEST (237°)
-100 Drawn By: PDB March IS, 2007

-100 100 - J —
o o H S (147°) N (327°)
o o-CO
o-CM
SVMDC-4 SVMDC-3
U SVMDC-4
• J. ! r , 1 a -
s.
50 100
metres
o ho
o o CO
o o CVJ
o - o
URSA MAJOR MINERALS INC. SHAKESPEARE DEPOSIT AREA
Shakespeare Twp., Sudbury Mining [^vision
METALLURGICAL VARIABILITY SAMPLING
CROSS SECTION 16+OOW LOOKING GRID WEST (237°)
-100 Drawn By: PDB March IS, 2007

50
metres
100
URSA MAJOR MINERALS INC. SHAKESPEARE DEPOSIT AREA
Shakespeare Twp., Sudbury Mining Division
METALLURGICAL VARIABILITY SAMPLING
CROSS SECTION 17+OOE LOOKING GRID WEST (237")
-100 Drawn By: PDB March IS, 2007

-100 I
100
o o ^ •«r S (147'') N (327'')
o o-CO
o o • CM
o o •
Cw --r-A
50 100
metres
o h o Tf
o •o «
o •o CM
o - o
URSA MAJOR MINERALS INC. SHAKESPEARE DEPOSIT AREA
Shakespeare Twp., Sudbury Mining Division
METALLURGICAL VARIABILITY SAMPLING
CROSS SECTION 17+OOW LOOKING GRID WEST (237")
-100 Drawn By: PDB March IS, 2007

Date: Tuesday August 30'^, 2005
To: Richard Sutcliffe and J.P Chauvin
From: Harold Tracaneili
Re: Phase iV of the Shal espeare Project Metallurgical Variability and Composite Lump Ore Surface Sampling Program Report
Good Afternoon Richard and J.P.
Below please find a report describing the details for the 8, 50 kilogram -6" lump ore variability sample materials collected and the 389 kilogram Shake SAG-1 composite sample collected, as part of the Shakespeare Project Phase IV Metallurgical sampling - lump ore surface sampling program.
Introduction:
Midday, Wednesday August 03" ., 2005, it was expressed that "we are ready to the next phase of feasibility study metallurgical test work", and various instructions to that effect were provided.
The requested collection of the -6" sized fraction lump ore sample materials for Variability testing identified as SVMLO-1 to SVMLO-5 began on August 10* ., 2005 through to August 12*'., 2005. Sampling work continued on August 15 2005 and was completed on August 16"*., 2005. In the case of the samples SVMLO-1 to SVMLO-5, it was determined that 50 kilogram samples of the -6" fraction should be collected from each of the surface sites where in eariy April of 2005, 5, 20 kilogram lump ore samples of the -6" fraction were collected and then sent of to SGS Lakefield for Hardness testing studies.
As part of the collection process to generate samples SVMLO-1 to SVMLO-5, it was also decided that each of these samples sites, an additional 50 kilograms of the -6" size fraction lump ore materials was to be collected. These additional materials collected from the 5 sites were collected, with instructions having been provided to SGS Lakefield to combine these additional materials to form a composite sample to be subject to SAG Mill testing wori<. This composite sample has been identified as Shake SAG-1.
At each of the SVMLO-1 to SVMLO-5, sample sites, a portable air operated jack hammer, assorted pry bars and sledge hammers were utilized to free up and dislodge from the surface the assorted mineralized materials. These materials were then broken into smaller pieces to the -6" size fraction, were cleaned of as much of the aisty surface weathering - rind as possible, in an attempt to produce a lump of ore material that might resemble pit run ores after having been passed through a crusher. In order to determine the appropriate sample weights, a 20 liter plastic pail was used, in which approximately 20 kilograms of sample materials were loaded. The measure of materials were weighed with a 22 kilogram fish scale, and then a visible line on the inside of the pail was made so as to act a as a guide to be used for determining the approximate sample weights. As part of the efforts of the sample collection wori< earned out at each of the sites, to ensure that a sufficient weight of sample materials would be taken from the site, 6 pails of materials were collected. Although under ideal conditions and with the use of a more sophisticated measuring device, a measure of 5 pails of materials would have likely been sufficient.
On August 18* ., 2005, the plan and specific locations of 3 additional supplementary Shakespeare lump ore Variability testing samples identified as SVMLO-6 to SVMLO-8 were finalized.
On Monday August 22""., 2005 and Tuesday August 23"*., 2005, the field work efforts directed towards the collection of the three supplementary, -6" surface lump ore variability samples

SVMLO-6, SVMLO-07 and SVMLO-8, was carried out, and as such the materials were prepared and bagged in preparation for shipping to the SGS Lakefield laboratory in Lakefield, Ontario.
In terms of the variability sampling efforts, for this Shakespeare Phase IV metallurgical sampling program, a total of 8, 50 kilograms of the materials were collected, weighed out and inserted into 2 doubled up rice bags containing a total weight of materials approximately 25 kilograms each. For the Variability samples a total of 16 rice bags were collected for samples SVMLO-I to SVMLO-8, for a total weight of approximately 400 kilograms +/-.
The Shakespeare Project SAG Mill composite sample Shake SAG -1, which was collected in conjunction with samples SVMLO-1 to SVMLO-5, was collected into 20, doubled up rice bags, containing a total weight of 389 kilograms.
None of the sample materials collected as part of the supplementary sampling for SVMLO-6, SVMLO-7 and SVMLO-8 were to be incorporated into the Shake SAG -1 composite sample.
The collection of the 8 surface samples, 7 of which were collected from the Shakespeare West mineral deposit area, while 1 of the samples was collected from the Shakespeare East mineral deposit area, is considered to have went very well. Although there were a number of sample locations where some site preparations where required, and in places a fair bit of wori< was required to make up some of these samples. Overall, even with the sometimes challenging efforts, it has been possible to collect what is believed to be a series of high quality samples.
Various background information has been presented below which may be potentially use full in terms of the assessment of the various physical and chemical characteristics, relative to the geographic and lithological locations of the various materials collected off of the surface of tl e mineral deposit areas.

Shakespeare West Mineral Deposit Area - July of 2005
Facing grid west over the partially logged - cleared off Shakespeare West mineral deposit area near LO+00.

Shakespeare West Mineral Deposit Area - July of 2005
Facing grid east toward the eastern extent of ttie Shal<espeare West mineral deposit near the L10+00 W area.
Shakespeare Surface Lump Ore Sample Locations:
FjOr this Shakespeare Project Phase IV Metallurgical Program a total of 8, -6° surface lump or samples were collected,
SVMLO-1 to SVMLO-7, were collected off of the surface of the Shakespeare West mineral deposit.
SVMLO-8 was collected off of the surface near the western end of the Shakespeare East mineral deposit area.

The lump ore surface sample locations are shown on a Lidar image - figure below.
Shakespeare Project Area Lidar Image
436,000 436,500 436,500
t^i^sél^Iitjor Minerals Incorporated , espeare Project Phase r\' Metallurgical Sampling- Jj
I/August 2005
'arlabilitA- Sample Locations over Lidar Image^^^
A scanned and prepared 1:500 scale Lidar image depicting the locations of the 8 variability testing -6" lump ore sample materials.
Surfece Sampling Methods, Practices and Procedures:
Each of the 8 surface samples collected SVMLO-1 through to SVMLO-8, including the Shal<e SAG -1, were collected using an assortment of hand tools which included, 2, 4, 6 and 10 pound sledge hammers, various lengths of pry bars, and shovels. For the samples SVMLC)-2 to SVMLO-5, a portable gasoline powered, 85 cfm air compressor, powering a hand held jack hammer was used to help dear out any loose, badly weathered surface materials prior to sampling. The air jack hammer was also found to be very use full for helping to dislodge - free up some of the fresher materials which would then be required to be broken up into smaller scaled pieces using the various weights of sledge hammers.

Preparing the Site for Sampling
Preparing the site at the sample location of SVMLO-3 on the Shakespeare West mineral deposit prior to sampling work taking place. The air operated jack hammer was used to remove any loose and or badly weathered materials. Such materials would sometime 6e required to be moved to expose fresher materials that would be suitable for sampling. Brett Tracanelli (R) and Brandon Gervais (L), discussing ways in which these nxks might be broken apart.
At each of the sites, once the suitable and acceptable materials were identified to be sampled, the various sized fragments which may have measured from approximately 30 em's to over 1 meter across were carefully examined to try to determine where it would have been possible to most efficiently break the fragment - chunk into more manageable sizes. On the sample site, one person was usually assigned the task of breaking the larger scaled fragments into smaller, more manageable bits. At this primary breaking stage, it was possible to further examine the materials and determine their suitability and to be given consideration of further processing. Any materials which showed signs of significant surface weathering deterioration, structural deformation, or was of such a small size fraction, would be rejected and put to the side of the working area.
Following the primary breaking, these still sometimes largish scaled pieces would go on to l)e broken further with sledge hammers into smaller bits - lumps of sorts measuring from approximately -4° to - 6° size fractions. At times during the secondary breakage process, it was sometimes necessary to further reject some of the materials which showed significant rusty surface weathering - rind. At this stage it was some times necessary to further assess these materials and to detennine if it would be still possible, if required, to remove any further rusty weathering - rind in the final stages of the material preparation efforts. If at that time it was detennined that there would be too much weathering - rind, or other imperfections to be removed in the final preparation stages, such materials would also be rejected and set aside.

Examining the Materials to be Sampled
Large fragments 0.30 to some times >1.0 meter that were pried off of the outcrop were carefully examined to detennine whether the materials would be suitable for sampling, and further breakage efforts. This work was carried out on the site of SVMLO-3, on the Shakespeare West mineral deposit.
All materials which made it past the primary and secondary sledge hammer breaking process, would then be passed along to two fellows using 2 pound crack hammers at which time all reasonable attempts were made to break off - hue as much as possible any surface rind materials. If during this process, it was determined it was not possible to remove a sufficient quantity of the weathering rind, then these materials would also be rejected and set aside. The final finished - 6° product were piled to one side of the finishing work area in lieu of being weighed and then placed into the appropriately numbered rice bags. As a result of the various hammering efforts, the edges of many lump materials ended up becoming some what rounded and abraded. Such efforts may mimic the abrasions that these materials might be subject to as a result of the handling - moving about of the ore materials, loading into tmcks and so on.

Hand Hewing Surface Lump Ore Materials
Matt Gagnon at the site ofSVMLO-2,on the Shakespeare West mineral deposit, hewing with a 2 pound crack hammer the freshly broken lump or sample materials. Once the sample materials have tyeen cleaned of as much of the rusty weathering - rind as possible, then these materials are set aside to be later weighed and bagged.
Once a sufficient quantity on lump ore materials were collected, then the materials were loaded into the 20 liter pail, weighed and in the case of the SVMLO samples, two rice bags each containing approximately 25 kilograms each were required to make up each of these samples. For those materials involved for the collection of the Shake SAG - 1 composite sample, rice t)ags were filled with approximately 20 kilograms of materials. Each of the composite sample bags was mari<ed alpha numerically such as 1c, referring to the materials being derived from the site of SVMLO-1. As part of the efforts of the sample collection work canried out at each of the sites, to ensure that a sufficient weight of sample materials would be taken from the site, 6 pails of materials were collected, although under ideal conditions, and with the use of a more sophisticated measuring device, a measure of 5 pails of materials would have likely been sufficient. In these cases it would be best to have more materials, than not enough materials.
The author of this report was present on site to ensure and exercise care and control over the collection of all of the surface samples, to ensure that all of the appropriate data was collected -recorded and reported accordingly, and to ensure that the samples were being handled in such a fashion so as not to jeopardize to quality of the samples and to maintain the appropriate chain of custody.
All of the sample materials collected at the sites, were placed into appropriately numbered rice bags, then the open ends of the bags were secured - closed with cable ties. The bagged samples were then transported by ATV over to the URSA Major Minerals Incorporated., core shack facility. All of the sample materials were marshaled into the core shack, where the
samples were double bagged and tagged, then kept in the locked building until they were readied for shipment across to the Agnew Lake Lodge, where the samples were immediately loaded onto a pick up truck and transported the Manitoulin Transport Depot facility in Lively, Ontario.
Background Information:
The following information has been provided as a source of background data that may at some point be potentially use full in tenris of the assessment of the various physical and chemical characteristics, relative to the geographic and lithological locations of the materials collected off of the surface and so in the Shakespeare West mineral deposit area. The following infomiation may be found to be valuable in terms of the assessment of the results of the variability sampling.
On April 01®*., 2005, a report was prepared detailing the wori< involving the collection of 5, 20 kg samples that had been identified from 5 sites across the Shakespeare West mineral deposit area. These samples were then sent off to SGS Lakefield Research for "Hardness Testing" studies. At that time the 5 areas selected for sampling were chosen for being representative of both the blebby and disseminated styles of sulphide mineralization, hosted within the various lithogical rocks of the Shakespeare mineral deposit area. Representative grab samples were also collected at the same time, and analyzed for Au., R., Pd., Ni., Cu., Co., and Ag. The results of these assay efforts have been provided bellow, being an excerpt from the April 25* ., 2005 report describing the results of the assay sample efforts.
The information presented below is the compilation of the various assay data from the representative sample materials that were collected during the "Hardness Testing" sample collection efforts. It is interesting to note that the blebby materials sampled 98825-A to 98825 -E, exhibits some of typical variations in Ni., and Cu., grades commonly associated with the variability of the concentrations of po and cpy, which can be typically seen in the B1 / B2, blebby and interconnected zone in the Shakespeare quartz gabbro (4c) rocks. It is also quite interesting to note that a couple of the samples retumed copper values of 1.26 and 2.45%, which could be some of the highest copper grades so far reported from the property. No other assays retumed nickel values greater than 0.62%.
The metal values for sample 28826 -A, are quite interesting, at 0.55% Ni., and 0.67% Cu. These materials which were sampled represent a very consistently po and cpy mineralized massive, medium grained, equigranuiar melagabbro (4b), which typical develops in the lower portions of the Shakespeare suite, mineralized melagabbro sequence. These elevated Ni., and Cu., values may be consistent with a pattern that may have been recognized -developed, particularly in the eastern, deeper Shakespeare East drill hole intersections, where, there appears to be some sort of an increase in the metal concentrations towards the lower portions of the mineral deposit.
Samples 98827-A and 98829-A, appear to exhibit nickel values which are at or slightly below the average resource grade, while the copper values are higher than the average grade of the resource.
For sample 98828-A, the nickel values are significantly reduced, while the copper values reported are just slightly lower than the average grade for the resource. It should be noted that sample 28828-A, was purposely collected from an exposed part of the Shakespeare West mineral deposit, where the mineralized host rocks have been noticeably, and locally strongly deformed and altered. During the collection of the sample materials, a dark grey to blue - sooty looking mineral associated with limonite weathering and is though to be possibly chalcocite, and in this particular sample may be contributing to the elevated copper values relative to the reduced nickel values as a result of some local secondary enrichment. It is also interesting to note that back in 2000, while wori<ing with Geoff Shore, in around line 10+00W +/-, I found some native copper, associated with some of the thinly oxidizing mineralized rocks.

Samples Materials Collected:
The following is a detailed account and background data involving the various Hardness Testing Samples collected in April of 2005, the information of which has been presented in conjunction with the Phase IV, -6" lump ore variability testing samples.
In eariy April of 2005, a report was prepared describing the various efforts, locations and types of materials and the like which were collected from the Shakespeare West mineral deposit area, to be subject to the Hardness Testing sampling work at SGS Lakefield. Much of the information from that particular report has been incorporated into this report, owing that 5 out of the 8 samples were collected from the same locations, and as such the information presented in April 2005 would remain relevant at this time. Where required some additional information has been added.
For the Phase IV Metallurgical surface lump ore portion of the sampling program the various samples have been highlighted and underlined in red. The former, April of 2005 Hardness Testing sample numbers are black and have been bolded.
98825 Phase IV Metallurgical Lump Ore Sample Number: SVMLO-1
SAG Mill Composite Sample Shake SAG-1 / Bags 1c
Blebby po and cpy in (4c) - 81 / B2.
Representative lump sample materials were collected off of the many large sized chunks of scattered to interconnected blebs of po and cpy within Shakespeare quartz gabbro (4c), that were piled up on the east side of the newly excavated L19+00W trench.
Nad 83 UTM Coordinates: 0435888E / 5133221N
Sample Ident Au R Pd Ni Cu Co Ag Scheme Code FAI30P FAI30P FAI30P ICAY50 ICAY50 ICAY50 AAS12E Analysis Unit ppb ppb ppb % % % g/mt Detection Limit 1 10 1 0.01 0.01 0.01 0.3 98825A 149 295 231 0.33 0.17 0.04 <0.3 98825B 337 323 472 0.38 0.24 0.03 0.5 98825C 120 150 191 0.19 0.13 0.02 <0.3 98825D 232 255 436 0.47 2.45 0.04 7.3 98825E 109 251 311 0.62 1.26 0.06 3.9 DUP-98825A 137 376 245 0.33 0.17 0.04 <0.3
Brief description of the above samples collected.
98825-A 98825-B
98825-C
98825-D
98825-E
25 to 30% of cm scaled blebs of fine grained po rimmed by fine grained cpy 20 to 30% of cm scaled blebs of fine grained po rimmed by fine grained cpy and cut by cpy bearing fracture filling veins Visibly less well mineralized, with locally 0.5 cm scaled blebs of po and cpy, which include these rocks being cut by cpy and po bearing quartz-cartsonate fracture filling veins Selective high grade materials with abundant, well developed interconnected po and cpy mineralization Selective high grade materials with abundant, well developed interconnected po and cpy mineralization (The SVMLO-6 materials collected are believed to be very
10

similar in nature to those materials of sample 98825-E which were previously assayed during the Hardness Testing sampling program)
In the case of SVMLO-1 a representative sample of the -6" blebby ore materials were collected. While the sample was being collected care was taken so as not to high grade some of the very richest looking sulphide materials. While collecting these samples it was important to try to visualize - recollect what the blebby ore grade materials would look like from the various Shakespeare diamond drill holes.
It was relatively easy to produce lumps of ore materials in the -4" to -6" range, while attempting to eliminate any surface weather - rind materials. In some instances, some of the sulphide bearing quartz gabbro materials were found to be somewrtiat fragile, often breaking Into smaller scale bits without allot of hammering. In some instances where the quartz gabbro materials contained scattered blebs, it would not be uncommon for the materials to break apart as thin, slivers measuring the size of the palm of the hand, but only being an inch thick +/-.
For those materials collected for the sample that contained appreciable amounts of blebby sulphides, often being interconnected, these materials were often found to be quite friable, and would not take to allot of hammering before beginning to become rounded like.
98826 Phase IV Metallurgical Lump Ore Sample Number: SVMLO-2
SAG Mill Composite Sample Shake SAG-1 / Bags 2c
Disseminated po and cpy in (4b) - D1.
Representative lump sample materials were collected from the massive, equigranular like Shakespeare melagabbro (4b) with the characteristic well developed disseminated ( D1), po and cpy mineralization. The sample materials were collected off of a large sized slab of the mineralized melagabbro, which with a pry bar, we were able to loosen from the outcrop, at which time we then proceeded to break up the rocks and prepare the sample.
The sample is located at 7 meters grid west and 2 meters grid south of the Base Line station 15+OOW. The sample location is about 10 meters off the end, grid south +/- of the original Falconbridge discovery trench.
Nad 83 UTM: Coordinates: 0435882E / 5133275N
Sample Ident Au R Pd Ni Cu Co Ag Scheme Code FAI30P FAI30P FAI30P ICAY50 ICAY50 ICAY50 AAS12E Analysis Unit ppb ppb ppb % % % g/mt Detection Limit 1 10 1 0.01 0.01 0.01 0.3 98826A 284 420 569 0.55 0.67 0.03 3.3
In the case of the collection of sample SVMLO-2, the materials that were sampled were found to be very solid, and sometimes required allot of force to break with even the larger sledge hammers. Once the materials were broken it was not too difficult to fashion lumps in the order of
11

-4" to -6" range. Many of the lumps were fist size and looked more or less blocky like, while it was less common to produce thin knife like shards of the materials being sampled.
The surface weathering rind on these materials was found to be relatively thin ranging from less than 1mm to maybe 2 mm+/-. The removal of the rind materials was at time a little difficult. Materials which were found to exhibit too much rind that could not be removed were rejected, and not included with any of the sample materials.
98827 Phase IV Metallurgical Lump Ore Sample Number; SVMLO-3
SAG Mill Composite Sample Shake SAG-1 / Bags 3c
Disseminated and Blebby po and cpy in (4f) - D1 / D1S / 81.
Representative lump sample materials were collected from the massive to faintly altered and possibly mildly defonned Shakespeare rock fragment bearing melagabbro (4f), with the characteristic small scaled blebs and finer grained disseminations of po and cpy, which is typically developed in the transitional areas between the blebby and disseminated styles of sulphide mineralization, {D1 / D1S / 81).
The sample materials were collected from some chunks that we were able to dislodge with a pry bar from the outcropping, which we were able to break up in order to prepare the sample. This particular sample was collected very near the south end of the Falconbridge Shakespeare discovery trench.
The sample more specifically is located 12 meters at 337 degrees Az., from sample 98826, located north of the base line.
Nad 83 UTM Coordinates: 0435976E / 5133282N
Sample Ident Au Pt Pd Ni Cu Co Ag Scheme Code FAI30P FAI30P FAI30P ICAY50 ICAY50 ICAY50 AAS12E Analysis Unit ppb ppb ppb % % % g/mt Detection Limit 1 10 1 0.01 0.01 0.01 0.3 98827A 160 277 338 0.35 0.41 0.02 1.9
In the case of sample SVMLO-3, allot of surface preparation work was required prior to the sample being collected due to the effects of the deeper surface weathering in the vicinity of some of the stnjctural deformation known to be associated with the rocks that were to be sampled.
Once it was possible to free up some fresher looking blocks - chunks of materials, it was then possible to begin to break up and generate good lump ore materials. In many places it was still necessary to contend with weathering rind in the order of 1mm to say 5mm +/-, which in places was not too difficult to remove using the 2 pound crack hammers. Due to the somewhat altered looking nature of the lithology, the characteristic blebby and disseminated sulphide materials, these rocks were found to be relatively softer to break that in other sample areas. For these rocks it was possible to produce fist sized lumps to more shard like slabs.
Some local, micro thin, 1 mm to 2mm occurrences of dendritic form native copper were noted on some of the fracture surfaces of the materials that were samples, which may attest to some local supergene enrichment of the thinly weathered surface materials.
12

98828 Phase IV Metallurgical Lump Ore Sample Number: SVMLO-4
SAG Mill Composite Sample Shake SAG-1 / Bags 4c
Disseminated and Blebby po and cpy in (4f) - D1 / D1S / 81
Representative lump sample materials were collected from visibly, and in places strongly, altered and deformed Shakespeare rock fragment bearing melagabbro (4f). In places the rocks are quite visibly altered and also exhibit characteristic plainer to a highly deformation fabric that is often found in certain parts of the Shakespeare West mineral deposit area. Often open fractures or defonnation fabric exhibits locally abundant limonite weathering. In a few places it is also possible to see some sooty chalcocite developed. As has been descrit)ed in the previous sample 89927, both blebby and disseminated po and cpy sulphide mineralization have developed within theserocks(D1 /D1S/B1).
The sample material was derived from chunks which were pried directly off of the outcropping.
The sample is located 18.8 meters at 012 degrees Az., from BL 0+00 / L13+00W, and is grid north of the base line.
Nad 83 UTM Coordinates: 0436041E / 5133326N
Sample Ident Au R Pd Ni Cu Co Ag Scheme Code FAI30P FAI30P FAI30P ICAY50 ICAY50 ICAY50 AAS12E Analysis Unit ppb ppb ppb % % % g/mt Detection Limit 1 10 1 0.01 0.01 0.01 0.3 98828A 294 348 462 0.16 0.38 0.01 2.1
In the case sample SVMLO-4, these materials were very to those materials collected for sample SVMLO-3. At the SVMLO-4 sample collection area, there was also a fair bit of work required to prepare the site prior to sampling to begin. The sample raw sample materials for SVMLO-4 appeared to be more blocky like than, those for the SVMLO-3 sample area, and as such required less final preparation efforts to produce the specified lump ore sample. In places these rocks were found to be a little more difficult to break than the sample SVMLO-3 materials.
At this particular location, the sample materials contained the characteristic disseminated and blebby styles of po and cpy mineralization, but in a few instances some sooty pyrhhotite, sooty looking chalcocite, and possibly some fresher looking bomite were noticed within both areas of relatively ft-esh looking rock, as well near visible fractures. No occurrences of native copper were noted within these particular materials.
98829 Phase IV Metallurgical Lump Ore Sample Number: SVMLO-5
SAG Mill Composite Sample Shake SAG-1 / Bags 5c
Disseminated po and cpy in (4f / 4b) - D1
Representative lump sample materials were collected from a massive to slightly visibly altered Shakespeare melagabbro which is often characteristic in the areas where the melagabbro litholgy begins to change from the Shakespeare rock fragment melagabbro (4f) to the massive, equigranular melagabbro (4b). The rocks contain disseminations of po and cpy , but no blebs were noted.
13

The sample material was collected a relatively short distance grid south east of the L6+00W prospective bulk sample area. Large chucks - slabs of the mineralized rocks that were clearly dislodged from the outcrop were broken up and prepared for the sample.
The sample is located 7.0 meters at 176 degrees Az., from the BL 0+00 / 5+OOW station. The sample is grid south of the base line.
Nad 83 UTM Coordinates: 0436241E / 5133428N
Sample Ident Au Pt Pd Ni Cu Co Ag Scheme Code FAI30P FAI30P FAI30P ICAY50 ICAY50 ICAY50 AAS12E Analysis Unit ppb ppb ppb % % % g/mt Detection Limit 1 10 1 0.01 0.01 0.01 0.3 98829A 208 376 447 0.37 0.43 0.02 2.2
In the case of sample SVMLO-5, without allot of prior site preparation, and with some care it was possible to produce the specified lump ore sample. In this particular sample area, the rocks were found to be quite blocky, forming some fairly large joint blocks, that in places could be well broken to produce the lump sample materials. For these materials, it was found that at times, that a well hit piece of the rock might shatter into many smaller fragments, or slab off in a concoidai fashion, with a similar effect and sound made when bighting into a hard apple. The surface weathering rind on these rocks was found to be relatively thin, in the order of 1 to 2 mm+/-. Care was required during the hewing off of the rind materials, at times fist size lumps would be accidentally reduced to noticeably smaller fragments when trying to remove the rind materials even with the smaller 2 pound crack hammers. During the sample preparation wori<, often small scaled, knife sharp - arrow head / hatchet like shards were produced. VWth some difficulty, due to the apparent fragile nature of the materials, it was still possible to produce the bulk lump materials in the -4" to -6" size range. Overall these materials seemed to be the most fragile of all the lump ore materials sampled collected in this program.
Once the lump ore sample collection work was completed for samples SVMLO-1 to SVMLO-5, it was decided that 3 additional supplementary samples were to be collected. For these samples, 50 kilograms of the -6" lump ore materials were to be collected for the Shakespeare variability metallurgical testing work only, and that none of these materials would be incorporated into the Shake SAG-1 composite sample. A brief description as to the location and the -6° lump ore sample materials collected is presented below:
Supplementary Sampling, Phase IV Metallurgical Lump Ore Sample Number: SVMLO-6
The sample SVMLO-6 materials were collected from the blebby po - cpy bearing Shakespeare quartz gabbro rubble pile materials adjacent to the LI 9+OOW trench area, where sample SVMLO-1 had been collected.
This SVMLO-6 is located at the Nad 83 UTM coordinate of 0435888E and 5133221N Shakespeare West mineral deposit area
These materials were collected and represents a selective high grade of the well developed, interconnected - net textured blebs of po and cpy mineralization. With some study of the various blocks of the materials that had been previously piled on the site, it was possible, without too much difficulty to, produce a high graded lump ore sample. While preparing the sample materials it was noticed that these materials were found to be a bit more fragile than the blebby materials collected for sample SVMLO-1.
14

Supplementary Sampling, Phase IV Metallurgical Lump Ore Sample Number: SVMLO-?
The SVMLO-7 sample materials were collected from what is believed to be a potentially very old Falconbridge Limited shallow blasted surface pit - trench, about 20 meters north of the base line, near L10+00W, over the Shakespeare West mineral deposit area.
This SVMLO-7 sample is located at the Nad 83 UTN coordinate of 0436109E and 5133377N Shakespeare West mineral deposit area
The materials collected for this sample were derived from what appears to have been once massive Shakespeare quartz gabbro, with scattered blebs of po and cpy. These rocks have been subject to apparently intense looking structural defonnation, trending at 248 degrees Az., with steep dipping, >80 degrees NW, more or less parallel bands of strongly - well developed shear looking fabric. In places these rocks look quite schistose and look to be strongly and possibly deeply weathered. In several places relatively fresh looking "remnants" of the po and cpy bearing Shakespeare quartz gabbro materials could be seen. It is thought that these relatively undefomned and sulphide bearing rocks were what might have been initially targeted by the fomier trenching efforts, and as such it sample SVMLO-7 was collected from these same materials. For the most part these materials would be regarded as relatively low grade.
At times due to the structurally deformed nature of the some of these rocks, allot of the materials that were being considered for further breaking had to be rejected. With care in the selection of these primary materials from this site, it was still possible to collect a -4" to -6" lump ore sample.
Supplementary Sampling, Phase IV Metallurgical Lump Ore Sample Number: SVMLO-8
The SVMLO-8 sample materials were collected from the well developed occurrence of sulphide bearing riieomorphic breccia near the grid west end of the "Big H Trench", near the western part of the Shakespeare East mineral deposit area.
The SVMLO-8 sample is located at the Nad 83 UTM coordinate of 0436538E and 5133600N Shakespeare East mineral deposit area.
The -4" to -6" lump ore sample materials were derived from the rheomorphic breccia, which at this particular location contained both fine grained po and cpy mineralization in the breccia matrix, and breccia fragments of Shakespeare suite rocks that also contained the characteristic po and cpy mineralization.
Before the sampling work was begun, the site was carefully examined, so as it would be possible to collect the lump ore sample that contained both the sulphide bearing matrix materials as well as the potentially ore bearing breccia fragments. A fair bit of work was required to collect this sample in terms of both primary breaking and removal of the thin rind surfaces. Once sufficient, fresh looking materials were dislodged from the site, then it was possible to produce the variably sized lumps for the sample. In many instances due to the somewhat variable and contrasting nature between the breccia matrix and the breccia fragments, unusual looking, sometimes hackly looking lumps were produced.
15

Sampling of the Rheomorphic Breccia Materials
Douglas Macmillan (L) and Brett Tracanelli (R), breaking out some sample materials at the SVMLO-8 rheomorphic breccia sample site near the grid west end of the "Big H Trench ", near the west end of the Shakespeare East mineral deposit area. Note that some of these sample materials were collectedfrom an area offormer 2003 trench channel samples.
16

Lump Ore Materials from the Rheomorphic Breccia
A typical slightly smaller than fist sized hackly lump ore materials from the Rheomorphic breccia SVMLO-8 sample site.
17

Part of the Rheomorphic Breccia Sampling Crew
Douglas Macmillan (L), Brett Tracanelli (C), and Matt Gagnon (R)., preparing to collect a surface sample off of the rheomorphic breccia site, at the grid west end of the "Big H Trench", near the west end of the Shakespeare East mineral deposit area.
Conclusions
In early August of 2005, Ursa Major Minerals Incorporated embarked on the Shakespeare Project Phase IV of the Metallurgical sampling program which included, and as descrit)ed in the above report the successful collection of 8, 50 kilogram -6" sized fraction lump or variability testing samples (SVMLO-1 to SVMLO-8), and 1, 389 kilogram composite sample (Shake SAG -1). Not included in this Phase IV of the Shakespeare Project Metallurgical Variability and Composite Lump Ore Surface Sampling Program Report was the collection 11, Shakespeare Project diamond drill core samples identified as (SVMDC-1 to SVMDC-11).
Prior to the collection of the lump ore variability testing samples, careful consideration was given to selecting those areas though to be highly representative, and where it was also believed good quality sample materials could be obtained. It was determined that it would be appropriate to collect such samples from the same sample sites that were chosen for the Hardness Testing samples, collected back in eariy April of 2005. Initially 5, 50 kilogram -6° surface lump ore variability samples SVMLO-1 to SVMLO-5 and 1, 250 kilogram SAG Mill, Shakes SAG-1 composite sample were collected. Shortly after the completion of this work, 3, 50 kilogram, supplementary -6° lump ore variability samples SVMLO-6 to SVMLO-8 were collected
Each of the eight lump ore samples, nominally weighing 50 kilograms each, consist of many fragments which measure from approximately 2 inches to approximately 6 inches +/-. These samples were collected from 7 surface sites from the Shakespeare West
18

(SVMLO-1 to SVMLO-7), and 1 surface site from the Shakespeare East (SVMLO-8), mineral deposit areas. To the best of our abilities, the various practices and procedures that were employed during the collection of the samples resulted in the production of 8 lump ore samples and one lump ore composite sample to the prescribed specifications, In which we believe we were able to mimic size fractions that might be produced as a result of the crushing - reduction efforts of pit run muck. The author of this report was present during the collection of each of the surface samples to ensure that samples were being collected from the appropriate locations, that the appropriate practices and procedures were being followed, woricing towards maintaining a high standard of sample qualify control.
At this time all of the variability sample materials, which would include both the -6" lump ore, and sawn Shakespeare diamond drill core materials, including the Shake SAG-1 lump ore composite sample have been sent off to and have been received at the SGS - Lakefteld laboratory facilities in Lakefield, Ontario.
Acknowledgements of sample shipment receipt has been sent from the SGS Lakefield lab contact Hans Rabbe.
While on site preparing the various sample materials, all reasonable attempts were made to try to remove all or at least part of the rusty surface weathering - rind on the fragments that were being made up. In attempting to remove the rusty rind materials, some of the fragments will have been slightly to moderately dulled, with abraded edges, which at the sample scale may possibly mimic the wear and tear on crushed materials while the materials may be being handled, placed stock piles, dumped and passed through ore bins and feeders and the like, loaded onto trucks etc.
Recommendations
In mid August of 2005, we embarked on the Shakespeare Project Phase IV of the Metallurgical sampling program which included the collection of 8 surfaced lump ore samples, 1 composite sample as well as 11 diamond drill core samples for various metallurgical testing.
If there were ever the need to acquire additional surface sample materials of a similar nature as that which has been collected, then 1 would recommend returning to these same sites, where additional materials could be collected if required.
If there are any questions or comments with respect to the above report, please be sure to contact me.
Harold Tracanelli,GETN;P.Geo. URSA Major Minerals Incorporated.
Tuesday August 30* ., 2005
19

Date: Thursday August IS* ., 2005
To: Richard Siitcliffe
From: Harold Tracanelli
Re: Digital Photographic Views of a Couple of the Shakespeare Phase IV Metallurgical Supplementary Surface Sampling Sites.
Good Evening Richard
Yesterday afternoon I had an opportunity, while on my return from the Shakespeare Project weather station, to examine a couple of the sites and was able to photograph 2 of the 3 site where we will collect the supplementary lump ore samples for variability testing and so on.
1. Rheomorphic Breccia Sample Site:
Photo I
This would be the location of site 3., as identified in the August 18f''., 2005 E-mail describing the supplementary sampling plan.
This is a view of the rheomorphic breccia site, facing grid west along strike, near

the grid west edge of the Big H Trench, above the Water Falls Showing, on the Shakespeare East mineral deposit. There is an abundance of materials at this Particular location - occurrence to ensure that a high quality sample would taken.
2. Old Falconbridge Trench 9+50W / 0+65N
Photo 2
This would be the location of site 2.,as identified in the August 18'^., 2005 E-mail describing the supplementary sampling plan.
View facing grid west on the Shakespeare West mineral deposit, at the site of an old Falconbridge trench -pit like excavation located at approximately 9+50W/ 0+65N. This trench measures in the order of3m'sx5m'sx approximately 1 meter deep +/-, and is relatively small compared to the large scaled "original Falconbridge discovery trench ", located approximately 450feet along strike further to the west. Much of the blasted materials were piled on the north side of the excavation, being the right side of the photo. A series of channel samples cut by Ursa - Mike Perkins are located approximately 2 to 3 meters directly behind Brett Tracanelli standing in the photo.

3. Old Falconbridge Trench 9+50W / 0+65N
Photo 3
This would be the location of site 2.,as identified in the August ISf'., 2005 E-mail describing the supplementary sampling plan.
A view of the Shakespeare West mineral deposit - old Falconbridge trench facing more or less grid east, with Brett Tracanelli standing on top of some of the piled up blasted ore zone materials adjacent to the trench excavation.
Harold Tracanelli
Thursday August IS'^./, 2005
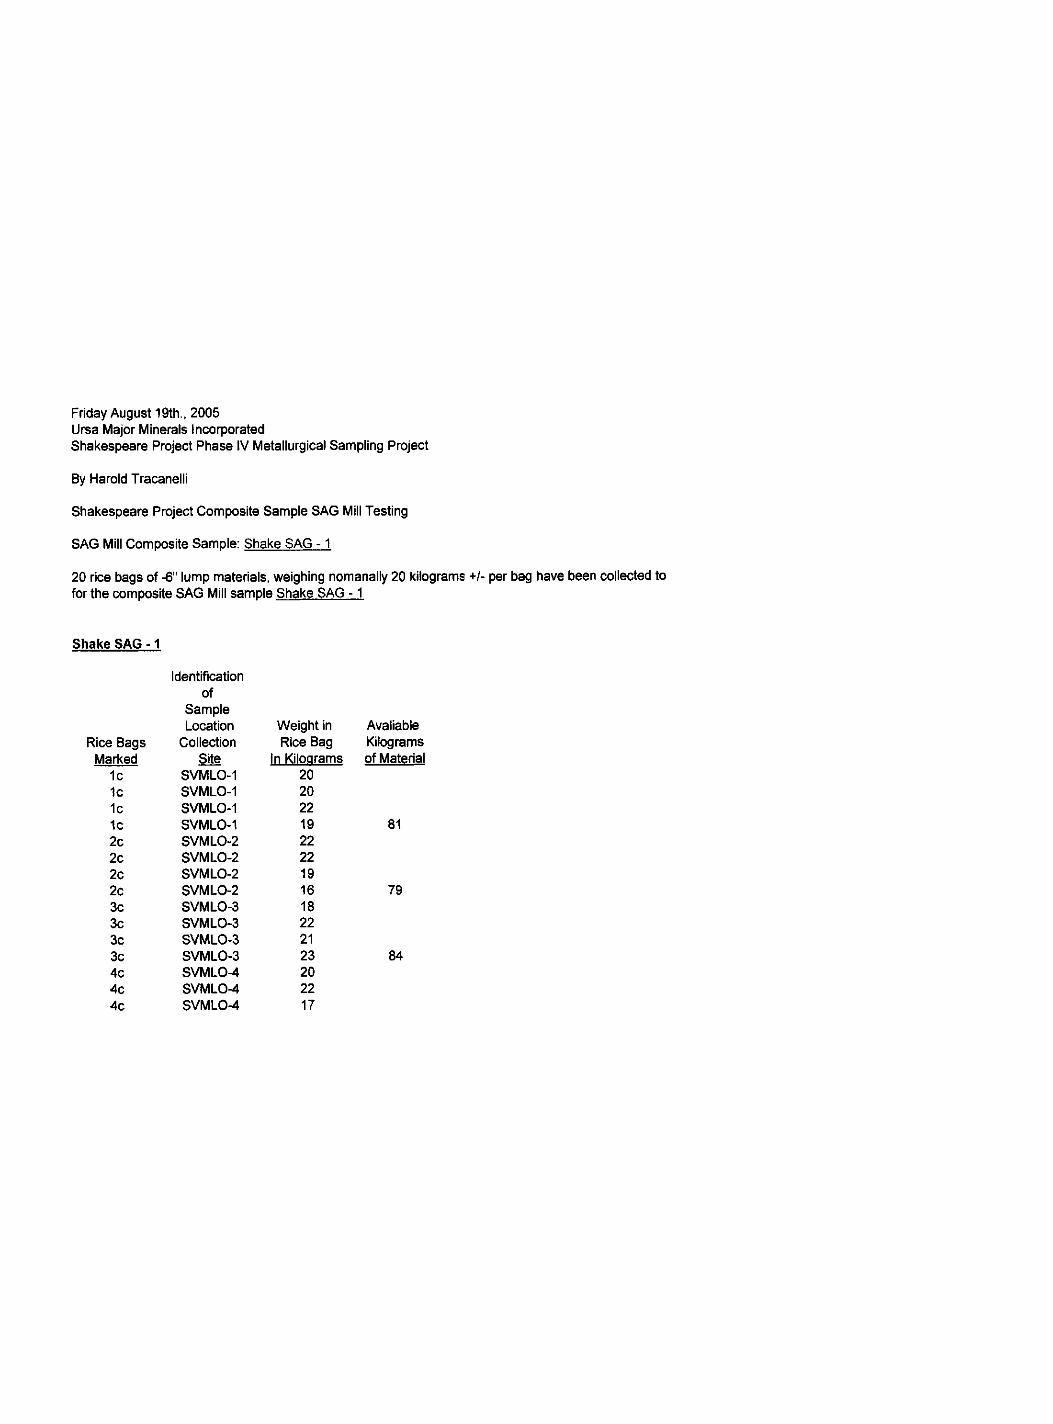
Friday August 19th., 2005 Ursa Major Minerals Incorporated
Shakespeare Project Phase IV Metallurgical Sampling Project
By Harold Tracanelli
Shakespeare Project Composite Sample SAG Mill Testing
SAG Mill Composite Sample: Shake SAG - 1 20 rice bags of -6" lump materials, weighing nomanally 20 kilograms +/- per bag have been collected to for the composite SAG Mill sample Shake SAG -1
Shake SAG - 1
Identification of
Sample Location Weight in Available
Rice Bags Collection Rice Bag Kilograms Marked Site In Kiloarams of Material
1c SVMLO-1 20 1c SVMLO-1 20 1c SVMLO-1 22 1c SVMLO-1 19 81 2c SVMLO-2 22 2c SVMLO-2 22 2c SVMLO-2 19 2c SVMLO-2 16 79 3c SVMLO-3 18 3c SVMLO-3 22 3c SVMLO-3 21 3c SVMLO-3 23 84 4c SVMLO-4 20 4c SVMLO-4 22 4c SVMLO-4 17

4c SVMLO-4 17 76 5c SVMLO-5 19 5c SVMLO-5 20 5c SVMLO-5 17 5ç SVMLO-5 13 69
20 Bags 389 389
The above -6" lump ore sample materials identified above are to be combines into one composite sample: Shake SAG -1

Ursa Major Minerals Incorporated Thursday August 18th., 2005
By Harold Tracanelli
Shakesoeare Project Phase IV Me talluralcal Studv SUDDIC imentarv DIa Tiond Drill C lore Samoli na Plan
For Samples SVMDC-10 and SVMDC-11
Summarv of Diar nond Drill Core Materials t 0 be Samo
DDH., U-03-36 Shakesoeare Project Ph« se IV Meta luralcal Stu dv SVMDC-10 Part 1 Thursday August 18th. ,2005
Sample Ident From: To: Distance: Au Pt Pd Ni Cu Co Scheme Code Sulphide FA30P FA30P FA30P ICAY50 ICAY50 ICAY50 Analysis Unit Code ppb ppb ppb % % % Detection Limit 1 10 1 0.01 0.01 0.01 59557 76.46 77.46 1 D1 210 433 496 0.4 0.45 0.03 59558 77.46 78.46 1 D1 177 477 428 0.42 0.48 0.03 59562 81.3 82.3 1 D1 189 361 434 0.33 0.42 0.02 59567 85.25 86.25 1 D1 288 558 646 0.55 0.58 0.03 59568 86.25 87.25 1 D1 270 502 590 0.49 0.58 0.03 59569 87.25 88.25 1 D1 182 338 414 0.36 0.45 0.03 59571 89.25 90.25 1 D1 252 559 577 0.49 0.56 0.03 59572 90.25 91.25 1 D1 333 544 566 0.49 0.54 0.03 59573 91.25 92.25 1 D1 253 389 410 0.36 0.44 0.02 59575 93.25 94.25 1 D1 236 324 415 0.41 0.45 0.03 59576 94.25 95.25 1 D1 320 579 549 0.44 0.53 0.03 59577 95.25 96.25 1 D1 341 522 574 0.48 0.59 0.03 59578 96.25 97.25 1 D1 251 405 446 0.38 0.48 0.02
WAG Check Feet Feet Interval Meters Meters Interval WAG WAG WAG WAG WAG WAG From: To: in Feet: From: To: in Meters Au. PT. Pd. Ni. Cu. Co.

3302.00 5991.00 6545.00 5.60 6.55 0.36 42.64 42.64 0 13 13 254 460.8462 503.4615 0.430769 0.503846
0.37 0.41 0.027692
Original Interval of 21.2 m's as per Ursa Press Release 0.430769 0.503846
0.37 0.41
DDH., U-03-40 Shakesoeare Project Phase IV Meta luraical Stii dv SVMDC-10 Part 2 Thursday August 18th., 2005
Sample Ident From: To: Distance: Au Pt Pd Ni Cu Co Scheme Code Sulphide FA30P FA30P FA30P ICAY50 ICAY50 ICAY50 Analysis Unit Code ppb ppb ppb % % % Detection Limit 1 10 1 0.01 0.01 0.01
59773 49.69 50.49 0.8 D1 265 582 587 0.65 0.46 0.02 59774 50.49 51.29 0.8 D1 /D1RB 278 577 599 0.64 0.5 0.03 59775 51.29 52.1 0.81 D1 /D1RB 291 568 641 0.66 0.57 0.03 59776 52.1 53.06 0.96 D1RB 236 481 554 0.54 0.47 0.03 59777 53.06 54.03 0.97 D1RB 253 525 611 0.59 0.48 0.03 59778 54.03 55 0.97 D1RB 224 523 559 0.59 0.44 0.04 59779 55 55.98 0.98 D1 / DIS 270 509 606 0.74 0.54 0.03 59780 55.98 56.97 0.99 D1 /D1RB 264 615 632 0.64 0.55 0.03 59781 56.97 57.96 0.99 D1 /D1RB 236 530 564 0.62 0.48 0.03 59782 57.96 58.95 0.99 D1 / DIS 255 529 600 0.71 0.52 0.03 59783 58.95 59.93 0.98 D1 275 529 628 0.65 0.53 0.03 59784 59.93 60.92 0.99 D1 / DIS 276 672 654 0.58 0.53 0.03 59785 60.92 61.91 0.99 D1 265 538 603 0.66 0.54 0.03 59787 61.91 62.89 0.98 D1 266 610 618 0.6 0.52 0.03 59788 62.89 63.87 0.98 D1 / DIS 253 648 604 0.58 0.49 0.03 59789 63.87 64.86 0.99 D1 / DIS 254 559 615 0.49 0.55 0.03 59790 64.86 65.85 0.99 D1 / DIS 114 233 268 0.47 0.49 0.03 59791 65.85 66.84 0.99 D1 232 434 534 0.49 0.46 0.03 59792 66.84 67.84 1 D1 270 526 621 0.57 0.51 0.03 59793 67.84 68.81 0.97 D2 / D2S 263 689 603 0.58 0.47 0.03 59794 68.81 69.78 0.97 D2 / D2S / B 275 508 621 0.66 0.54 0.03 59795 69.78 70.75 0.97 D2 / D2S / B 252 560 586 0.58 0.5 0.03 59796 70.75 71.73 0.98 D2 178 366 399 0.45 0.34 0.02 59797 71.73 72.7 0.97 D2/B1 132 262 296 0.3 0.24 0.02 59798 72.7 73.67 0.97 D2 / D2S 245 471 540 0.68 0.46 0.03 59799 73.67 74.64 0.97 D2 / D2S 288 588 647 0.64 0.54 0.03

59800 74.64 75.61 0.97 D2 / D2S 307 605 690 0.56 0.54 0.03 69401 75.61 76.58 0.97 D2 / D2S / B 353 717 799 0.72 0.64 0.04 69402 76.58 77.55 0.97 D2 / D2S / B 303 710 666 0.71 0.59 0.04
WAG Check Feet Feet Interval Meters Meters Interval WAG WAG WAG WAG WAG WAG From: To: in Feet: From: To: in Meters Au. PT. Pd. Ni. Cu. Co.
7069.02 15025.96 16263.51 16.64 13.92 0.84 162.9832 254.364 91.3808 49.69 77.55 27.86 253.73 539.3381 583.7584 0.597272 0.499641
0.60 0.50 0.030151
Ursa Press Release 0.597272 0.499641
0.60 0.50
DDH., U-03-29 Shakesoeare Project Phase IV Meta luraical Stii dvSVMDC-11 Parti Thursday August 18th., 2005
Sample Ident From: To: Distance: Au Pt Pd Ni Cu Co Scheme Code Sulphide FA30P FA30P FA30P ICAY50 ICAY50 ICAY50 Analysis Unit Code ppb ppb ppb % % % Detection Limit 1 10 1 0.01 0.01 0.01
682804 137.94 138.83 0.89 D2/B1S 188 331 394 0.29 0.28 0.02 682805 138.83 139.28 0.45 D2/B1S 274 448 576 0.47 0.46 0.03 682806 139.28 139.95 0.67 D2/B1S 120 190 259 0.31 0.21 0.01 682807 139.95 140.62 0.67 D2/B1S 199 382 426 0.43 0.34 0.02 682808 140.62 141.56 0.94 D2/B1S 279 411 513 0.42 0.44 0.03 682809 141.56 142.27 0.71 D2/B1S 72 198 149 0.15 0.15 0.01 682810 142.27 142.98 0.71 D2/B1S 106 169 213 0.24 0.16 0.01 682811 142.98 143.7 0.72 D2/B1S 151 181 270 0.24 0.21 0.02 682812 143.7 144.64 0.94 D1 /B1 121 213 240 0.22 0.19 0.01 682813 144.64 145.58 0.94 D1 /B1 134 355 243 0.26 0.2 0.01
WAG Check Feet Feet Interval Meters Meters Interval WAG WAG WAG WAG WAG WAG From: To: in Feet: From: To: in Meters Au. PT. Pd. Ni. Cu. Co.
1241.41 2190.58 2456.47 2.26 1.98 0.13 452.4432 477.5024 25.0592 137.94 145.58 7.64 162.4882 286.7251 321.5275 0.295812 0.2S9162 0.017016

Ursa Press Release 0.30 0.26
DDH., U-03-33 Case 2. Sha kesoeare Proiecl Phase IV /letalluraica Studv SVMDC-11 Part 2 Thursday August 18th., 2005
Sample Ident From: To: Distance: Au Pt Pd Ni Cu Co Scheme Code Sulphide FA30P FA30P FA30P ICAY50 ICAY50 ICAY50 Analysis Unit Code ppb ppb ppb % % % Detection Limit 1 10 1 0.01 0.01 0.01 57573 226.25 226.5 0.25 D1S 21 0.05 46 0.06 0.22 0.009 57574 226.5 227.5 1 D1 22 69 46 0.06 0.06 0.009 57575 227.5 228.5 1 D1 27 28 54 0.06 0.07 0.009 57576 228.5 229.5 1 D1 61 94 114 0.15 0.14 0.01
57573 226.25 226.5 0.25 D1S 21 0.05 46 0.06 0.22 0.009 57574 226.5 227.5 1 D1 22 69 46 0.06 0.06 0.009 57575 227.5 228.5 1 D1 27 28 54 0.06 0.07 0.009 57576 228.5 229.5 1 D1 61 94 114 0.15 0.14 0.01
57573 226.25 226.5 0.25 D1S 21 0.05 46 0.06 0.22 0.009 57574 226.5 227.5 1 D1 22 69 46 0.06 0.06 0.009 57575 227.5 228.5 1 D1 27 28 54 0.06 0.07 0.009 57576 228.5 229.5 1 D1 61 94 114 0.15 0.14 0.01
57573 226.25 226.5 0.25 D1S 21 0.05 46 0.06 0.22 0.009 57574 226.5 227.5 1 D1 22 69 46 0.06 0.06 0.009 57575 227.5 228.5 1 D1 27 28 54 0.06 0.07 0.009 57576 228.5 229.5 1 D1 61 94 114 0.15 0.14 0.01 57577 229.5 230.5 1 D1 116 238 208 0.27 0.24 0.02 57578 230.5 231.5 1 D1 135 186 247 0.29 0.27 0.02 57579 231.5 232.5 1 D1 259 448 479 0.45 0.51 0.03 57581 232.5 233.5 1 D1 194 263 324 0.29 0.35 0.02 57582 233.5 234.5 1 D1 99 212 203 0.22 0.22 0.02 57583 234.5 235 0.5 D1 72 84 154 0.15 0.2 0.01 57584 235 236 1 D1 158 406 358 0.36 0.43 0.02 57585 236 236.8 0.8 D1 203 402 444 0.28 0.34 0.02 57586 236.8 237.1 0.3 DIS 144 308 325 0.32 0.23 0.02 57587 237.1 237.6 0.5 D1 173 249 369 0.33 0.31 0.02 57588 237.6 238.6 1 D1 276 475 539 0.49 0.55 0.03 57589 238.6 239.6 1 D1 155 302 351 0.43 0.44 0.03 57590 239.6 240.6 1 D1 209 321 457 0.41 0.48 0.03 57591 240.6 241.3 0.7 D1 191 230 399 0.37 0.5 0.02 57592 241.3 241.8 0.5 D1/D1S 183 329 438 0.36 0.4 0.02 57593 241.8 242.3 0.5 D1 91 148 203 0.16 0.18 0.01
WAG Check Feet Feet Interval Meters Meters Interval WAG WAG WAG WAG WAG WAG From: To: in Feet: From: To: in Meters Au. PT. Pd. Ni. Cu. Co.
2368.55 4211.01 4928.00 4.78 5.31 0.33 742.1 794.744 52.644 226.25 242.3 16.05 147.5732 262.3682 307.0405 0.297819 0.330841
0.30 0.33 0.020561
Rounding 0.297819 0.330841
0.30 0.33

1 Interval Expanded fronn that of the Ursa Press Re ease
DDH., U-03-52 Shakesoeare Project Phase IV Meta luraical Sti dv SVMDC-11 Part 3 Thursday August 18th., 2005
Sample Ident From: To: Distance: Au Pt Pd Ni Cu Co Scheme Code Sulphide FA30P FA30P FA30P ICAY50 ICAY50 ICAY50 Analysis Unit Code ppb ppb ppb % % % Detection Limit 1 10 1 0.01 0.01 0.01
3198 207 208 1 B1 /B1S/D 337 439 549 0.42 0.63 0.03 3199 208 209 1 B t / D I 225 220 319 0.32 0.36 0.02 3200 209 210 1 D1 /B1 143 225 260 0.23 0.27 0.02 3201 210 211 1 D1 /B1 154 248 317 0.27 0.35 0.02 3203 211 212 1 D1 /B1 101 219 221 0.19 0.2 0.01 3204 212 213 1 D1 /B1 92 181 182 0.17 0.2 0.01 3205 213 214 1 D1 /B1 107 199 214 0.16 0.18 0.01 3206 214 215 1 D1 /B1 158 284 315 0.27 0.3 0.02 3207 215 216 1 D1 206 346 412 0.38 0.44 0.02 3208 216 217 1 D1 /D1S/B 252 329 372 0.28 0.32 0.02 3209 217 218 1 D1 358 414 491 0.4 0.48 0.02 3210 218 219 1 D1 220 369 378 0.32 0.38 0.02 3211 219 220 1 D1 327 374 377 0.4 0.41 0.02 3212 220 221 1 D1 547 373 445 0.37 0.37 0.02
WAG Check Feet Feet Interval Meters Meters Interval WAG WAG WAG WAG WAG WAG From: To: in Feet: From: To: in Meters Au. PT. Pd. Ni. Cu. Co.
3227.00 4220.00 4852.00 4.18 4.89 0.26 678.96 724.88 45.92 207 221 14 230.500 301.4286 346.5714 0.298571 0.349286
0.30 0.35 0.018571
Ursa Press Release 0.298571 0.349286
0.30 0.35
Drill Core Samples to Collect as of August 18th., 2005 Checked or

Supplementary Weight Recalculated Rounded Sample Diamond Meters Meters Interval In WAG oft he Metals WAG oft he Metals Number Drill Hole From: To: in Meters Kilograms NL Cu. NT Cu.
Shakespeare Hiaf- Grade SVMDC-10 U-03-36 0 13 13 15.60 0.430 0.503 0.43 0.50 Parti SVMDC-10 U-03-40 49.69 77.55 27.86 33.43 0.597 0.499 0.60 0.50 Part 2
49.03 Shakespeare Low Grade
SVMDC-11 U-03-29 137.94 145.58 7.64 9.17 0.295 0.258 0.30 0.26 Parti SVMDC-11 U-03-33 226.25 242.3 16.05 19.26 0.298 0.330 0.30 0.33 Part 2 SVMDC-11 U-03-52 207 221 14 16.80 0.298 0.349 030 0.35 Part 3
45.23

4c SVMLO-4 22 4c SVMLO-4 17 4c SVMLO-4 17 76 5c SVMLO-5 19 5c SVMLO-5 20 5c SVMLO-5 17 Ss SVMLO-5 l â gs
20 Bags 389 389
The above -6" lum 3 ore sample materials identified above are to be combines into one composite sample: Slial<e SAG -1
re Mineral Deoosit Varlabllitv - Metalluraical Testina
Weight of Sample Materials
Drill Hole Based on Weight of Weight of Weight of Number Location 1.2 l<g's per Core Lump Ore Lump Ore
Sample Sample Mat'ls From To Interval Linear Meter Materials Samples in Sample In Identification Derived From M"8 / UTM'S N M's/UTM'sE Distance of Drill Core In Pounds Kiloarams Pounds
SVMLO-1 Surface Sample 5133221 0435888 50 110.2 -6" Lump Ore
SVMLO-2 Surface Sample 5133275 0435882 50 110.2 -6" Lump Ore
SVMLO-3 Surface Sample 5133282 0435976 50 110.2 -6" Lump Ore
SVMLO-4 Surface Sample 5133326 0436041 50 110.2 6" Lump Ore
SVMLO-5 Surface Sample 5133428 0436241 50 110.2 -6" Lump Ore
•SVMLO-6 Surface Sample 5233221 0435888 50 110.2 -6" Lump Ore
•SVMLO-7 Surface Sample 5133377 0436109 50 110.2 -6" Lump Ore
•SVMLO-8 Surface Sample 5133600 0436538 50 110.2 -6" Lump Ore
Total: 400.00 881.60

. 1 SVMDC-1 U-03-66 1.18 11.04 9.86 49.3 108.66
Total: 1 9.86 49.3 108.66 49.30 108.66 SVMDC-2 U-03-66 11.04 20.9 QM 108.66
Total: 9.86 49.3 108.66 49.30 108.66 SVMDC-3 U-03-69 33.8 68 34.2 41.04 90.45
U-03-70 4.75 11.17 6.42 7.70 16.98 U-03-71 25.7 34.7 â m 23.80
Total: 1 49.62 59.544 131.23 59.54 131.23 SVMDC-4 U-03-69 68 102,2 34.2 41.04 90.45
U-03-70 11.17 17.6 6.43 7.72 17.01 U-03-71 34.7 43.7 â 10.8 23.80
Total: 49.63 59.556 131.26 59.55 131.2 SVMDC-5 U-03-74 90.5 103.65 13.15 15.78 34.78
U-03-75 89.4 117.5 28.1 33.72 74.32 U-03-76 180.2 185.35 5.15 Ç.19 13.62
Total: 1 46.4 55.68 122.72 55.68 122.72 SVMDC-6 U-03-74 103.65 116,8 13.15 15.78 34.78
U-03-75 117.5 145.6 28.1 33.72 74.32 U-03-76 185.35 190.5 5J5 6.18 13.62
Total: i 46.4 55.68 122.72 55.68 122.72 SVMDC-7 U-03-82 90 127.1 37.1 44.52 98.12
U-03-79 62.2 68.55 6.35 7.62 16.79 Total: i 1 43.45 52.14 114.92 52.14 114.92
SVMDC-8 U-03-82 127.1 164.2 37.1 44.52 98.12 U-03-79 68.55 74.9 QM 7.62 16,79
Total: 1 43.45 52.14 114.92 52.14 114.92 SVMDC-9 U-03-83 49.5 90.3 40.8 48.96 107.91
Total: 40.8 48.96 107.91 48.96 107.91 •*SVMDC-10 U-03-36 76.46 78.46 2 2.4 5.29
U-03-36 81.3 82.3 1 1.2 2.64 U-03-36 85.25 88.25 3 3.6 7.93 U-03-36 89.25 92.25 3 3.6 7.93 U-03-36 93.25 97.25 4 4.8 10.58 U-03-40 49.69 77.55 27.86 33.432 73.68
1 40.86 49.032 108.07 40.032 108.07 SVMDC-11 U-03-29 137.94 145.58 7.64 9.168 20.21
U-03-33 226.25 242.3 16.05 19.26 42.45 U-03-52 207 221 14 16.8 37.03

37.69 45.228 | 99.68 45.228 9 & M Total Weight of 1/4 Core Sample in Kilograms / Lbs. = 567.55 1270.72
Total Weight of Lump Ore Samples in kilograms / lbs. = 400.00 881.60 Total Weight of the SAG Mill -6" lump ore composite sample = 388.00 857.36
Total Weight in Kilograms / Lbs., of sample materials that were Collected = 1356.55 3009.67
Checked or Supplementary Weight Recalculated Rounded
Sample Diamond Meters Meters Interval In WAG of the Metals WAG of the Metals Number Drill Hole From: To: in Meters Kilograms NL CIL NL CIL
Shakesoeare HIah Grade: SVMDC-10 U-03-36 0 13 13 15.60 0.430 0.503 0.43 0.50 SVMDC-10 U-03-40 49.69 77.55 27.86 33.43 0.597 0.499 0.60 0.50
49.03 Shakesoeare Low Grade:
SVMDC-11 U-03-29 137.94 145.56 7.64 9.17 0.295 0.258 0,30 0.26 SVMDC-11 U-03-33 226.25 242.3 16.05 19.26 0.298 0.330 0.30 0.33 SVMDC-11 U-03-52 207 221 14 16.80 0.298 0.349 0.30 0.35
45.23
Color Coded EXD anatlons - Notes:
* Supplementary Shakespeare surface -6" lump ore sample to be collected for variability testing work only. i
* * Supplementary Shakespeare Project diamond drill core samples collected for variability testing work only. 1
These materials represent the typical disseminated style of po and cpy mineralization in the upper part of the Shakespeare Project HQ bulk sample hole U-03-66. These materials have likely been subject to the effects of surface weather. The depth extent of such surface weathering is not fully known at this time.
These materials represent the typical disseminated style of po and cpy mineralization in the upper part of the Shakespeare Project HQ bulk sample hole U-03-66. These materials have likely been subject to the effects of surface weather. The depth extent of such surface weathering is not fully known at this time.
These materials represent the typical disseminated style of po and cpy mineralization in the upper part of the Shakespeare Project HQ bulk sample hole U-03-66. These materials have likely been subject to the effects of surface weather. The depth extent of such surface weathering is not fully known at this time.
1 i 1 1 ! These drill core sample materials exhibit predominantly the blebby styles of po and cpy mineralization.
1 These drill core sample materials exhibit predominantly the disseminated style of po and cpy mineralization.
! 1
These drill core samples exhibit predominantly the disseminated styles of po and cpy with only the occasional scattered blebs of po and cpy mineralization. These drill core samples exhibit predominantly the disseminated styles of po and cpy with only the occasional scattered blebs of po and cpy mineralization.
1 These drill core materials exhibit predominantly the disseminated styles of po and cpy, the minor localized occurrences of the blebbv MES of DO and AW mineralization. These drill core materials exhibit predominantly the disseminated styles of po and cpy, the minor localized occurrences of the blebbv MES of DO and AW mineralization.

SVMLO-1 Shakespeare Variability Metallurgical Lump Ore -1 SVMDC-1 Shakespeare Variability Metallurgical Drill Core-1

URSA MINERALS MINERALS INCORPORATED Friday March 15, 2007 Compiled by Carol Dillabough
MANHOURS OF WORK FOR PHASE IV METALLURGICAL SURFACE SAMPLING PROGRAM for August 2005
Apr 05/05 $782.50 Apr 06/05 $782.50 Aug 10/05 $1,197.00 Aug 11/05 $1,159.50 Aug 12/05 $1,002.50 Aug 15/05 $973.50 Aug 16/05 $1,159.00 Aug 18/05 $1,113.50 Aug 22/05 $1,113.50 Aug 23/05 $1,113.50 Aug 24/05 $400.00 Aug 25/05 $400.00 Aug 26/05 $400.00 Aug 29/05 $400.00 Aug 30/05 $400.00 Aug 31/05 $475.00 Total $12,872.00
Harold Tracanelli $2,400.00 Bill Dillabough $2,000.00 Matt Gagnon $840.00 Brandon Gervais $371.00 Tim Heam $1,568.00 JayMorrell $1,163.00 Doug MacMillan $3,650.00 Brett Tracanelli $880.00 Total $12,872.00

Ursa Major Minerals Inc. - Shakespeare -10044-139 17
Table 6: List of Shakespeare Variability Metallurgical Lump Ore (SVMLO)
Sample Drill Hole From To Identificatioii Number M's/UTM'sN M's/UTM'sE Weight (kg)
SVMLO-1 Sur&ce Sample -6" Lump Ore
5133221 0435888 50
SVMLO-2 Surface Sample -6" Lump Ore
5133275 0435882 50
SVMLO-3 Sur&ce Sample -6" Lump Ore
5133282 0435976 50
SVMLO-4 Surface Sample 6" Lump Ore
5133326 0436041 50
SVMLO-5 Surface Sample -6" Lump Ore
5133428 0436241 50
•SVMLO-6 Surfece Sample -6" Lump Ore
5233221 0435888 50
•SVMLO-7 Surface Sample -6" Lump Ore
5133377 0436109 50
•SVMLO-8 Surface Sample -6" Lump Ore
5133600 0436538 50
Total: 400 * Supplementary Shakespeare surface -6" lump ore sample to be collected for variability
testing work cmly.
SvMtO)
H^u-lU)^^' c U>HP orji
SGS Minerals Services

Ursa Major Minerals Inc. - Shakespeare -10044-139 17
Table 7: List of Shakespeare Variability Metallurgical DriU Core (SVMDC)
Sample DrniHole From To Interval Weight based on Identification Number M's/UTM'sN M-s/UTM'sE Distance 1.2 kg's per Linear
Meter of Drill Core SVMDC-1 U-03-66 1.18 11.04 9.86 49
9.86 49 SVMDC-2 U-03-66 11.04 20.9 9.86 49
9.86 49 SVMDC-3 U-03-69 33.8 68 34.2 41
U-03-70 4.75 11.17 6.42 8 U-03-71 25.7 34.7 9 11
49.62 60 SVMDC-4 U-03-69 68 102.2 34.2 41
U-03-70 11.17 17.6 6.43 8 U-03-71 34.7 43.7 9 11
49.63 60 SVMDC-5 U-03-74 90.5 103.65 13.15 16
U-03-75 89.4 117.5 28.1 34 U-03-76 180.2 185.35 5.15 6
46.4 56 SVMDC-6 U-03-74 103.65 116.8 13.15 16
U-03-75 117-5 145.6 28.1 34 U-03-76 185-35 190.5 5.15 6
46.4 56 SVMDC-7 U-03-82 90 127-1 37.1 45
U-03-79 62.2 68.55 6.35 8 43.45 52
SVMDC-8 U-03-82 127.1 164.2 37.1 45 U-03-79 68.55 74.9 635 8
43.45 52 SVMDC-9 U-03-83 49.5 90.3 40.8 49
40.8 49 **SVMDC-10 U-03-36 76.46 78.46 2 2
U-03-36 81.3 82.3 1 1 U-03-36 85J25 88.25 3 4 U-03-36 89.25 92.25 3 4 U-03-36 93.25 97-25 4 5 U-03-40 49.69 77-55 27-86 33
40.86 49 »*SVMDC-11 U-03-29 137.94 145.58 7.64 9
U-03-33 226.25 242.3 16.05 19 U-03-52 207 221 14 17
31.69 45 Total: 418.02 577
Supplementary Shakespeare Project diamond drill core samples collected for variability testing work only.
SGS Minerals Services

Ursa Major Minerals Inc. - Shakespeare -10044-139 17
greater frequency of 'cracks' as the rock size increases. The Shakespeare ore showed little
gradient by size, indicating that this ore maintained a high competency at a coarse size. The
competency of the ore, at a coarse size, is not measured with the SMC test, which is why the test
must be calibrated.
Table 8: JKTech Drop-weight Tests Results Sample Name Lidiology A b A x b Perçentile of ^ PercentQe of Drop-weight Ore Density
Hardness Hardness Index (g/cm') Shake SAG-1 100.0 0.22 22.0 97 0.23 92 - 3.05 Shake SAG-l SS 100,0 0.23 23.0 97 - 11.7 3.02 SVMLO-1 SS 84.3 0.34 28.7 90 - 9.5 3.10 SVMLO-2 SS 81.8 0.34 27.8 91 - 9.9 3.06 SVMLO-3 SS 60.6 0.42 25.5 95 - 10.5 3.01 SVMLO-4 SS 70.9 0.37 26.2 93 - 10.2 2.97
£ rMLO-5 SS 80.8 0.28 22.6 97 - 11.7 3.00 Si MLO-6 SS 72.9 0.47 34.3 78 - 8.5 3.22 SVMLO-7 SS 50.9 0.60 30.5 87 - 8.8 3.00 SVMLO-8 SS 74.9 0.33 24.7 95 - 10.8 3.00 SVMDC-1 DissemS 66.5 0.37 24.6 95 - 11.0 3.01 SVMDC-2 Dissemi 66.6 0.37 24.6 95 - 10.8 2.99 SVMDC'3 Blebby 59.8 0.40 23.9 96 - 11.5 3.04 SVMDC-4 Dissemi 52.4 0.52 27.2 92 - 9.9 3.03 SVMDC-5 Blebby 74.7 0.32 23.9 96 - 11.2 3.02 SVMDC-6 Dissemi 761 0.28 21.3 98 - 12.9 3.03 SVMDC-7 Blebby 63.2 0.41 25.9 94 _ 10.1 2.97 SVMDC-8 Dissemi 100.0 0.21 21.0 98 _ 13.1 3.04 SVMDC-9 Blebby 82.4 0.28 23.1 97 _ 11.8 3.03 SVMDC-10 Dissemi 100.0 0.20 20.0 98 _ 13.6 3.00 SVMDC-11 DissemS 100.0 0.21 21.0 98 - 12.2 2.85 SMC Tests in italics
2.2. MacPherson GrindabiUty Test
The Macpherson autogenous grindability test is a continuous test performed in an 18" semi-
autogenous mill, operated with an 8% steel charge. The mill charge level is maintained at about
25% volume by means of a sound-controlled system. The test is opaated continuously as a
small pilot plant for a minimum of six hours and until steady-state is achieved. Then, the circuit
is sampled for one hour, in which the flow rates are measured, and all streams are sampled and
submitted to a particle size analysis (PSA). At test completion, the steady-state mill charge is
SGS Minerals Services

Ursa Major MineraU Inc. - Shakespeare -10044-139 12
Table 4: Summary of Variability Simulations under Normal Operation Siaaiatia» Feed SAGMUCiraut BattMiBCirarit O n n l l
JKFae „ ^ „ OreTjrpe Ore S.G. JKDrop-
weifkt
S B A - S C ^ WoffclMlices
Feed Kate at 92K BaO
Ckaise tm d a n .
Slab Seqnie T . Grass 1 Power Grass Power Pm
Talal Gross
Gross PVWCT Wio
name («'<-')
JKDrop-weifkt (kWk/l) DiakatiM
BaO Ckaise Apeed Size Pmrer Req.
File Feed A x b ta RWI BWI t/k tu K Val %ar a w tm % M" kW kWk/l kW kWkA kW kWk/t kWhrt
SI SIM-SI SAO-1 3.05 22.0 0.23 163 13.8 200 4416 13 77 6.3 73 37 947 2404 l i O 1900 9 3 so 4304 2 1 3 18.9 52 SIM-52 SVMLO-1 3.10 28.7 0.29 17.2 143 204 4S04 13 73 6 3 62 30 712 2265 111 1900 9 3 81 4165 20.4 18.1 S3 SIM-S3 SVMU>-2 3.06 27.8 0.28 18.7 15.8 198 4372 13 73 6 3 61 31 719 2258 11.4 1900 9.6 87 4158 21.0 19.3 54 SIM-54 SVMLO-3 3.01 25.5 0.25 15.7 133 204 4504 13 76 6.3 69 34 928 7Î45 11.5 1900 9J 81 4245 20.8 18.4 55 SIM-S$ SVMLCM Z9T 26.2 0.26 14.6 123 218 4813 13 76 6.3 73 33 919 2350 10.8 1900 17 80 4250 193 I7.I 56 SIM-56 SVMLO-S 3.00 22.6 0J3 17.6 14.9 197 4350 13 77 63 70 36 934 2370 IZO 1900 9.6 87 4270 21.7 19.9 57 SIM-57 SVMLO-6 3 2 2 34.3 0 3 4 17.1 14.4 208 4593 13 71 6.3 58 28 638 2206 10.6 1900 9.1 80 4106 19.7 17.4 58 SIM-5» SVMIJO-7 3.00 30.5 031 16.4 13.8 204 4504 13 72 6 3 60 29 802 2218 I0J9 1900 9 3 82 4118 20.2 18.0 59 SIM-S9 SVMLO-8 3JD0 24.7 0L2S 16.7 14.1 204 4504 13 76 6 3 69 34 895 2346 I I J 1900 9 3 SS 4246 20.8 18.9 60 SIM-«0 SVMDC-1 3.01 24.6 0.25 17.1 14.5 201 4438 13 76 6 3 68 34 911 2341 11.6 1900 9 3 87 4241 2I.I 19.4 61 SIM-61 SVMDC-2 Z99 24.6 0.25 15.5 13.1 214 4725 13 77 6.3 74 35 974 2378 11.1 1900 8.9 85 4278 ».o 18.1 62 SIM-62 SVMDC-3 3.04 23.9 0.24 153 13.0 208 4593 13 77 6 3 74 36 1002 2 8 9 l U 1900 9.1 83 4289 20.6 18.5 63 SIM-63 SVMDC-t 3.03 27J 0.27 14.8 12J 215 4747 13 75 6 3 70 33 927 2321 10.8 1900 8.8 80 4221 19.6 173 64 SIM-64 SVMDC-5 3.02 23.9 Ol24 15.1 12.7 208 4593 13 77 6 3 72 35 957 2384 113 1900 9.1 79 4284 20.6 18.0 «S SIM-6S SVMDC-6 3.03 21.3 0.21 15.4 13.0 194 4284 13 78 6 3 74 38 1028 2421 123 1900 9.8 75 4321 223 18.9 66 S n ^ SVMDC-7 zsrr 25.9 0.26 14.1 11.9 224 4946 13 77 6 3 76 34 983 2374 i a 6 1900 8 3 80 «174 19.1 16.8 67 SIM-67 SVMDC-8 3.04 21.0 0.21 16J 13.9 193 4261 13 78 6 3 73 38 994 2423 1Z6 1900 9.8 79 4323 22.4 19.6 68 SIM-<8 SVMDC-9 3.03 23.1 0.23 14.5 12.2 202 4460 13 77 6 3 72 36 946 2387 11.8 1900 9.4 71 4287 21.2 17.5 69 SIM-69 SVMDC-IO 3.00 20.0 0.20 15.9 13.4 185 4085 13 78 63 71 38 998 2414 13.0 1900 103 71 4314 233 193 70 SIM-70 SVMDC-Il 2.85 21.0 0.21 15.4 13.0 191 4217 13 78 6 3 70 Î7 976 2383 125 1900 9S 71 4283 22.4 183 Averafte 3.02 24.9 0.25 16 0 133 204 4495 - 76 . 69 34 910 2349 11.6 - 9.4 80 4249 209 18.4 Minimum 2.8S 34.3 034 14.1 11.9 185 4085 - 71 - 58 28 638 2206 10.6 - 8 3 71 4106 19.1 16.8 lOtk Percentile 2.97 28.8 0.29 14.6 123 193 4257 - 73 - 61 30 718 2254 10.8 - 8.8 71 4154 19.6 17.2 25thPetcentile 3.00 26.5 0.26 153 12,9 198 4366 - 76 - 69 33 907 2336 11.0 - 9.1 79 4236 20.1 17.9 Mediu 3.02 24.6 0.25 15.8 133 204 4504 - 77 - 71 34 940 2372 113 - 9 3 80 4272 20.8 18.4 7Sth?eTcentile 3.04 22.5 0.23 16.8 14.2 208 4593 - 77 - 73 36 978 2388 12.0 _ 9.6 84 4288 21.6 19.0 90th Percentile 3.06 21.0 0.21 17.2 14.6 215 4754 - 78 - 74 38 998 2415 12.5 - 9.9 87 4315 22.4 19.4 Mndmum 3.22 20.0 0.20 18.7 15.8 224 4946 - 78 - 76 38 1028 2423 13.0 - 103 87 4323 233 19.9
SVM L o Çkzkr^ a-t.^ V t Ci-h. 1ti^U/lor^f c.-^
SOS Minerals Services

111, REPRINTED INVOICE Invi sa NumiMr
Daio Fas»
:20000D8 : 17-MAY-C6
Pwject Project Msnagsr DascripUon
URSA MAJOR MINERALS INCORPORATED 8 KING STREET EAST SUITE 1300 TORONTO ON M5C 1B5 Cansfia
Richard Sutciiffe
(•mR-iOB'ie-oas MARTIN, CHRiSTOPh£R
CuslMnAi* Numbar Currvncy PayrtMinl T*rm
Î7Z370 OAD Naî Due in 30 Day?
Hw Amovtu Tax code Amount Prsjjavmont t>epe$)t
esT
HfltAmowrt CAD Sumcfïa* CAD
Total Amount CAD
S2,W0.CD 3,886.00
56,496.00
Cswact Nam»: Dirvotllns: S-msS:
MRT! i, CHRISTOPHER (7CS) $52-2000
Ptsase jse liirs rels-an^ wilT your jjaymart 2000008 ir-MAY-0527237C
SGS Sç 'iôfte I 3ÛS i.akaflôid Rô»fl?eh LHh l PO Boa 4300 ia5 CoriDCsapn Rd KQl XèPùld, Onîalû Canada
' SOS tax ® 8»21 eaSaftT MwruHar of SOS Creup trMTI m «CM MM H «M Cf«tfjpnil» 1E1P h M d M f e ^ itfodriflwcwBgry.'jtif v »c«aeitftttevfgpyt >yeyt«« oTt»iio<w>{*n»9>srémot«ctw«wwrf » tMterwrcf»».0{pQra9»ttiia»fe«p8l9yc«»« »f «r»wnr»«

REPRINTED INVOICE Pag«
20001 Of. 07-JUL-05 1 / 1
URSA MAJOR MINERAIS I N C O R P O R A T E D 5 K)NG ST5ÎEÊT EAST SUITE 1300 TOROi^O ON V15C IBS Canada
Customer Number Cvrnnny PaymwrtTsrm
î723-f CAD N»! in 30 Days
Richard Sutclifre
Prçfect ProJ»et Manager
CAIR-1031IÎ-003 MASTIV. C-HISTCfHER
Ovscriptlan Ndt Anwiiint Tsi* Cod» Amount
Sample pr»pafS!tt«i per cos*. «stbR»*» 2,142.14 SrintUMiiiy t«stlng l^ci Mfii tnd«x î(».oa 983.08 (Srlr/Jablilty tsstfng Bail Will Worii Index (S @ 1003) 6,001} 09 Qrt!i!i*&illtV tMtlns Abrar.!o;t bidM 7Sd.B0 302.59 Fleîation tost» ( l î ® ttlO.Oa) «4.43009 15,440.10
Ra-jghsr iests r M 3 Fbvtatlon tests (2®15e«) Î.136.0C 3.Î55,S2
Cleaner lasts F14-1S Mlnsi-ilagy U53.00 i . î s r . s ï
RaoM minofgl scan Grind CalitK-atlcn test; (2 @ ISO) 300.0« 3î,t.08 Projétt f râ twgswrt 4,014,90 4,295.94
At 15% of lesWofK «0S!5
GST 2.Î94.80
««AîTmuf* C!»P Sum of Tax CAD
32,782.30 2,Î946B
Total Amount CAD 35,077.70
Contact Namç: Direct Itns; E-ffiafl:
MARTIN, CHi?IS rCPHER (735)352-2000 ChHsHterthgsgs.co-n
=iMse us» (his rarertnSB with vouf ûà¥rî>e-i! 2C00108 07-JU!..03 2-'23ro
I " ' / - ' o u i ' I
SGS £erv>a'5 | SCS United PÛB w^atÛ 1A6CorceBior PoiKCL ';jrt»flo canaaa 705»8$2-200Q 705-832.6365
S S 5 T w I D 89S2 • 8 3 5 2 J n vttfnbftr SOS firojo W. «criv» WM-èJ i'n çR I^jt (Hi cvtKsfltM src tM«td tvitKi ttt 9rt«« Z^rn t^r* of CfMcv ^ H' tt er n v ^ at x as aftVA'M affsea upc. Ary p*pic rv

' n . r t i p : REPRINTED INVOICE Inv»l6» NumbS!-OfW Page
; 2Û0025S : 26.AUG-05 ; 1 / 1
URSA MAJOR MINERALS iNCORPOSATEO 8 KING STREET EAST SUITE 1300 TORONTO ON M5C 1BS Canada
Custamnr Number Cursney Paym»Rt Titrm
i7237g ca: Net Du» in 3C Cgys
Richirc! Sutcliffe
I»rej8« Prajaes M«niiH«r
CALa-i051&-003 MARTIN, CHRSrOPhCR
SHAKESPEARE fRE-FEASIBPJTY STUDY 0«ï»crîï>tlcn Amount Tax Coite Amount Cfeartwr Fiotiiticn testx. tlmHsd aasaya (23 @ iSSSM)
F1fl. P17, PIB, F20, f»21, «2, î=25, «4, FJg, F2S, F2?, r28, F29 F30, F32, F33. FM. F33. FSS ?37. FM. F41. F-t2
Looltad fsyefs tssts (3 @ Si «7} F33.1=40
MInsrglooy eupport ;2@ 12501 S X rspiS îPineral sssns (ooSeai Tinaratogy S XRD) anaiysis PGM enalysis of conoBntratsa f /g S40P0 sa) snd
Bulk f!»-va11on isats <Z ® fflOe.SO) F19, i a-i
Pwi««l msBagtment Ciargecf ai 15?» of <6sl costs - 25% ppojiosal rcljdsf repcm-ic at ICSi
»),064,00
is,JS4.eo
2,505.08
i9,COô.CO
5,ï1i.00
1l,S5B.tl>
11,067.38
2,ST5.W
20,s30.e0
I1,l30.4e
SST NstAmcunrt CAD SuimsfTs* CAD
Total Anwunt C A d "
«4.7S6.50 S,933.BS
90,700.16
Contact Nsme; Dir et lind: E-ma».-
MART N CH=?iSTa=HSR (75S)6S2-20CO Chris.P/tsringsus.con
Please UW tliis r fersnoe wWi V5ur isaytns-il iC0025S î6-A'J<S-05 272370
ses M-mrfs SSIVISM s;s Lws^ RMencn LiîtiIlBd PO Bon -«CC t»6 Oweassior Sd KOi. LskeSeld Cfraile Cerflce TOf-tK-JOM 7M-SS2-€3€5 ."SGS Ta» IC êSSÎi S352CT t,<«m5Bt rf SOS i3ID«J
« mfw* ** ocefiMf art s) Fwana end astffîotw îmwJ fcftlwr » sw .-sîs Cw w-* Mar. Air«i<d (Kfif tmmu uKo r«rfB « nw w a: wp: f w n www» «ff u r. -i Ii-fW {t tm fibnv ttf fl M ws ll «te-* tf piav», Iw CTtwff

.1
REPRINTED INVOICE Page
2000374 13-OCT.05
URSA MAJOR mine?:als INCORPORATED 3 KING STREET EAST SUITE 1300 TORONTO ON M5C1B6 Canada
Customer Numbsr C«?T«ncjf Payment Ten»
272-370 CAO Nat Dus ir, 30 Oaya
( reject Project Martagsr
Riof.ard Sulcisffe
CAi.R-1KM-i.13S VERRST. FRANCOÎS-OL s'lER
SHAKESPEARE SRINDASiLirr TESnVORK - LAKEFIgLO PROJECT 10316-003 Daacriptlon Not Amc-siftt Cods Amourx MaePiiofwn TssOng (fncluefM 1 6VVI 1 RVW) JKTeeh D>'6i>-vi'«igh( TbsI
Bond BàU Mill TMt (19^1000) Bpnd Abrasion Tsst
SMCTssi (20@1S00>
9,500.90 7.g00.00
19,000.03 1,390.04
30,090.00
10.1S5.00 S,34S.OO
20.330,00 1.«i>5.«S
»,108.00
«ST
Ust Amount CAO Sum of Tsx CAO
Total Amount c a d "
4,748.00
sr.Rooos 4.746.00
72,546.00
vonUst Dlr»et ifn»; Erfnaii'
ViRRfeT, FRANCOtS-OLIVIER V05-6S?.2000
Ptmse .>09 II-!» refe-ene» w.ît your psyment 2008374 13-CCT-Oâ 272370
SGS Minerais Sa^ - I» ! SGS L#:ciîie« P»MaKh UnUtea PO Ssx «CO iss Concession Rt) OL 2H0 laxsitaM, Cnta.1o Canads
SaSTfficiD 89S218»»5T MunoB' rf SGS Group
Al crïa Vï «CM O'ti «i nrc^ ftu^ KutlRs: to Ih» â'Z.A Qfenml OaMcwi

REPRINTED INVOICE invoice Nufnbar Osw Psge
•• 200Q85S : 29-OEC-05
I '
URSA MAJOR MINERALS iNCORPORATcD 8 KING STREET EAST SUITS 1300 TORONTO ON M5C IBS Canada
CiwtomAr Niimbcir Cursney Pnymsnt T«nn
272370 CAC Nsf Qua it) 3t Dsys
Richard Sulcllffe Prujoci Project Managftr
OALR-10044-139 VERRE". FRAiMCOIS-GL!VI=R
SHAKËSPÊARE GSiNDABlLITY THSTWORK • KEFIELD PROJECT 106-6<03 Oeao-iptlon Kot Amount Ta* Ccoo Amount
Dasisn (JKSImlttet Simulations} 7.300X0 3025.00
G3T &2S.C0
NeiAirount CAD r,5004P SumofTax GAD S2S.C0
ToîaJ Amount CAD 8,025 .00
Ccn»et Name: DIraci lliie:
VESR2Î, FRANCOIS-OLIVIER 7C'3-€52-200a
Plsass tnis re'srenso with your aaymtnt 2000653 29-DgC-f5S ÎT2370
•ynrhr
ses M'nsrate S«iv<o« ! S3S uSlwIeH Rosoort i t.irr.ito« PO gw 4300 -«S Ceiwiwsien « KM. uic«(l»W, Ontarto Csnace i •'0S -20fl0r06.e52-«l365 • S5STa<!0 39S21 ?J52S!T VMmsar SCS «louo
CttAHm «« tWMtf MUM » 3t» SOS 94rr«l ur rf a M-nwriM wiMMd Klrtfti W. .camj Ofl ;>m«rA H ««rMM-jcn A îMiVn 4«11 ti TA A ito I" eiBMi alt'»MWi y the nwiw II wasn* y W egnfrccrx! Sto

Mar IG 07 P l : 3 0 p P a t r i c i a M i n i n g r ^ U r s a M a j o r 4 1 6 8 6 4 0 6 2 0 p . 1 0
SGS Invo ice # : 916.14;.
D a t e : 04/23/2906
G.S.T. # : 8S;921 6352Rr lag-tSOO, 185 Concession Street, Lake!iel<l, Ontario, Canada, KOL 2H0
Tolophoo»; (703i-652-200rt (705). S2-8133 URSA MA.IOR MINERALS S KITv.'G STREET t A S T s u n ' t ^ f i j o u TORONTO, ON MSC IB5 Allr: RICMARD SLiTCl.lFFH
... ^
O u r P r o j e c t # : i06lW>ù3 Contact ; Sample Storage Supet vjsor
Piojec: Manager : « "i fis
A/R Code : » ' ' ^
Shakespeare deposh: CiiNi PUM feasibility study notation, grinding, miuCTii'ogy
S a m p l e S t o r a g e C h a r g e s
Invo ice P e r i o d F r o m : 12/31/2006
Q u a n t i t y Conta iner Type
X BOXTREbZfcR =
27 X BOX/INSIDE =
1 X DRU.M/FREEZER =
Total $ 5400.00
2700.00
750.00
G.S.T. a 7%
$
S850.00 619.50
9469,50
pkii.'.i' |ia> b5 ini uifi- • Ti'i'dn Net 3U liiiyj. 2% st-rvitc (.•Imiuc pi'r Dinnh on uvtrduf arfuui in.

Ursa Major Minerals Incorporated
Tuesday March 20th., 2007
Ursa Major Minerals Incorporated Shakspeare Project - Geotechnical Study Assessment Work Re porting Accounting.
Compiled By: Harold J. Tracanelli.Getn.P.Geo.
Key Elements of Work Work Food
Invoice Project Work Related Associated Related Related and Related Date Number Number Perform^ Costs Work Costs TransDortation Costs Lodaina Costs
April 7 2005 194563 051193003 Pit Slope Design 3819.89 Expenses 10.33 April 7 2005 194563 051193003 Waste Dump Design 2975.33
May 9 2005 194620 051193003 Pit Slope Design 10968.62 Secretarial 90.00 Auto 40.70 !
June 10 2005 194702 051193003 Pit Slope Design 4212.08 Secretarial 30.00 June 10 2005 194702 051193003 Core Logging / Sampling 490.00 June 10 2005 194702 051193003 Waste Dump Design 1615.00
i July 06 2005 194779 051193003 Core Logging / Sampling 31038.69 Auto 290.40 Expenses 1264.40 July 06 2005 194779 051193003 Waste Dump Design 1405.00 July 06 2005 194779 051193003 Packer Testing 8870.00 Drafting 637.50
i Sept 14 2005 194890 051193003 Pit Slope Design 16513.24 Secretarial 240.00 Sept 14 2005 194890 051193003 Core Logging / Sampling 18625.74 Plotting 66.00 Auto 24.20 Expenses 633.28
Drafting 375.00 Courirer 23.7
Sept 14 2005 194890 051193003 Waste Dump Design 5539.80 Sept 14 2005 194890 051193003 Packer Testing 4510.02
1 Dec 06 2005 195124 051193003 Pit Slope Design 15517.66 Report Prep 30.00
Secretarial 630.00 Map Supplies 28.51
Dec 06 2005 195124 051193003 Core Logging / Sampling 4707.95 Dec 06 2005 195124 051193003 Packer Testing 1321.56 0.00 0.00 0.00

Total = 132130.58 2150.71 355.3 1908.01
Summarv
Key Elements of
Work Rounded Performed Out Fiaures
Pit Slope Design 51031.49 51031.00 Waste Dump Design 11535.13 11535.00
Core Logging / Sampling 54862.38 54862.00 Pacl er Testing 14701.58 14702.00
Associated Work
Secretarial, Drafting, Report Preparation 2150.71 2151.00
TransDortation Auto 355.3 355.00
Food and
Lodqinq Agnew Lake Lodge 1908.01 1908.00
Total = 136544.60 136544.00
Assessment Work Disti bution % Area
Function Amount Minina Claim Involved Pit Slope - Waste Dump 63666.16
Shakspeare East and 12733.23 S-35595 0.20 West Pit Areas 9549.92 S-35594 0.15

Diamond Drill Hole
S-35595" 12733.23
^-35594 9549.92
S-35592
S-35595 12559.39
6366.62
S-35601 S-35601
S-35595 4945^45
Related Studies Core Logging / Sampling
Packer T ^ t i n ^ ^ U-03-42
U-03-70' U-03-71 U-03-73 U-03-76 U-03-77 U-03-78 U-03-79 U-03-80 U-03-80
9 Diamond Drill Holes
Total =
S-35595 "6653.18
6366.62 25466.4^6 6366.62 3183.31
63666.16
Amount
72878.44
12559.39 4945.45 6653.18 7889.54 11127.27 6779^9 '8036.36
S-35592 S-356Ô2 S-35601 S-36946 6 claims
Mining Claim
S-35595 S-35595 S-35595 S-35595 S-35602 S-35602
8963.63 4146.97 1777.27
72878.44
136544.60
S-35595 7889:54
S-35602 S-35602 S-35601 S-35602 3 Claims
Total Dist
0.10 0.40 0.10 0.05 1.00
% Area Involved
0.1723 0.0679 0.0913 Ô.1083 0.1527 0.0930 0.1103 0.1230 0.0569 0.0244 1.0000
bution
Totals 4478Ô.'79
9549.92
6366.62
Length of Drill Hole In Meters
243.80 96.00 129.15 153.15 216.00 131.60 156.00 174.00 80.50 MM 1414,70
Rounded Out Figures
44781.00
9550.00
6367.00

6366.62 4146.97 1 10513.59 10514.00 • /
S-35602 S-35602 S-35602 i S-356b"2 S-35602 8-35602 25466.46 11127.27 6779.39 8036.36 8963.63 1777.27 62150.38 62150.00 V /
S-36946 3183.31 1 3183.31 3183.00
136544.60 136545.00 \ 1

this infbtmation is used to maintain a public record. TTiis mfoonatioo w® be abo ttsed to « w w tse aKessraHSÉ twi* ame asme&esx mr r e » .. holder Questions about this collection should be directed to the Senior Manager, »«ning L»KJS Section, Mfesstiy of lto«WW î>E» ATW»WT a -à mms
Floor, 933 Ramsey Lake Road, Sudbury, Ontario, P3E 6B5. Telephone 1-888-415-9845.
Instaictions: - For work performed on Crown Lands before recording a claim, use fonn Assessment Work Perfcxmed B^djb Recording Claim(s)
- Please type or print in ink. - Submit to Geoscience Assessment Office, 933 Ramsey Lake Road,
Sudbury Ontario P3E 6B5. Telephone 1-888-415-9845.
Note All correspondence will be sent to the address on record in the Provincial Recording Office, as required urxter t w Mining Act, subsections 19(6) and (8).
1. Submitter I am an authorized agent or • the recorded hoWer {if a company, enter name of person sttonitei^ Name (last) (first) Client number (optiooaft
Address - Unit number. Street number, Street name
City, Town or Village /r^ , . (^ /JvJA p iAj fr -
Provence or State (CJ^TïiG^D
PuMOam
Telephone numt>er Fax number (70S) i 5 t l
E-mail address optional) / ' ^ i <|
2. Provide • where there is a surface rights holder, before starting ground exploration work for tiie first time on a
must provide notice to the surfôce rights holder(s) as required by the Mining Act and provide proof of ^ Ministry
your technical report and maps in paper or on a compact disc a cunrent legible map showing how the contiguous mining lands are linked for assigning work
• proof of beneficial interest (if assigning amongst different recorded holders)
p w mme
3. Work Performed - This includes the date you traveled to the fiekl or mobilized equipment to the date the iediiicat report was completed.
rom: DDIMWYYTY To: DD/MMATYY 2 6 A p ^ i L i c O L
Regulations: Calculate the time-adjusted credit column, in the tables below, as follows: 1. Work filed within 2 years of performance is claimed at 100%. (Enter 100% of actual costs in both of the iast 2 dAyni^ïl 2. Work filed after 2 years and up to 5 years after performance is credited at 50%. (Enter 100% of actuai costs in the last
column and 50% in the last column.) 3. Work older than 5 years is not eligible for credit 3(A) Dates and Costs of Work Performed From date DD/MMATYY
To date DD/MMATYY
Work Type UnHofWork (example: hours/day, metres of drilling, km of grid lines)
Cost per Unit of Work
Actual Cost
fSeeaolBBlaMia
11 f ià^ '1005 2Ô h e i ^ B ' ^ M G V t  -
l ^ e h M ^Tub i ^S /QQOCÏH ^ H /
"n* ——
PS/^ f t 0 .6 â1 kià ù s l i r ^ A lAa^ i f i f i i . L ^ l/SirWœ (olife CI ICA] . n. 3(B) Associate id Costs '
date ^IWYYYY
To date DD/MM/YYYY
Associated Costs (example: supplies, mobilization, demobilization)
Actual Costs ($)
( S e S î S l l

Total of Time Adjusted Credit Columns (3A through 3D)= Total Value of Assessment Work
4. Type of Work Performed - please check off the type of survey performed (optional) Work Type Survey Type Work Type Survey Type
Airborne geophysical
• AEM • AMAG • AVLF • other airborne
geophysical
y
Geophysical • EM • GRAV • IP • MAG • VLF • other geophysical
Assays g ^ y Broneficiation Q ^ o c h e m i c a l
Physical • manual work • re-cutting daim lines • mechanical work • trenching • overburden stripping O ^ e r physkal
Drilling • diamond drilling Prospecting • Prospecting • drill core submission to Rehabilitation • Rehabilitatron
1 MNOM • overburden drilling • boring other than core
Other-Please print examples: microscopic studies, bulk sampling, downhole geophysics
Line cutting • line cutting
Other-Please print examples: microscopic studies, bulk sampling, downhole geophysics
Geochemical Q^eochemical Geological • geological
5. Commodities Explored for please list (optional)
Ù K . , C o , à u .
6. Work Performed, Assigned, Banked 6(A) If you performed work on mining lands other than a staked mining claim, fill in the table below. Lease or Patented
Lease # or Parcel # a r G # o r L O #
GAO-Approved Identifier (office use only)
Hectares Amount of Work Performed on this Land ($)
Amount of Credits Assigned to Mining Glaim(s) ($)
Bank (Amount of credits to be assigned at a future date)
S - 3 5 0 ^ 4 s - z s
l y 2 2 6 S ' Z5ioOt ié
i b l O t . O Ô O ' ' " ' \o-l, o S o
Column Totals for 6(A) 635 •
L Jchedule attached (if you have more entries attach a schedule)
1
Column Total for 6(B) 0 Column Totals of 6(A) + 6(8)
Note: Work performed on mining claims = credits applied + credits banked
• Schedule attached (if you have more entries attach a schedule)
7. Some of the credits claimed in this Assessment Work form may be reduced. Please indicate below how you want your credits reduced if they are not approved. Check in the boxes below. If you have not indicated how your remaining credits are to be allocated, credits will be reduced from the Banl( flret, followed by option number 2 if necessary.
Credits are to be cutback:
• 1. Credits are to be cut back from the Bank first, followed by option 2 or 3 or 4 as indicated; or
• 2. Credits are to be cut back starfing with the claims listed last, working backwards; or
• 3. Credits are to be cut back equally over all claims listed in this Assessment Work form; or
• 4. Credits are to be cut back as shown below:
ist the claim numbers in the order you want the credits to be cut back (setting your priority list).
Priority Claim Number
1.
2.
3.
4.
5.
• Schedule attached (if you have more entries attach a schedule)
Priority Claim Number
6.
7.
8.
9.
10.
8. Certification lorized Agent
^ ^ • "r?a.Cci n e i i I (^e-Ui. p . h e r e b y certify on M â U M that I have personal (Signature) /nna/ iMM/wv^ / (DD/MMM/YYYY)
knowledge of the facts set forth in this Assessment Woric form having caused the work to be perfomied or witnessed the same during or after its completion and, to the best of my knowledge, the annexed report is true.
"Mining Lands Website: http://www.mndm.gov,on.ca/mndm/mines/lands/default_e.asp"

Ursa Major Minerals Incorporated Friday March 16th, 2007 Wednesday March 21st.,. 2007
Shakespeare Project Phase IV Metallurgical Variablltly Sampling Program By: SGS Lakefield Research Limited, for : Ursa Major Minerals Incorporated
May 2005 to December 21st., 2005
Compiled By; Harold Tracanelli.Getn. P.Geo
Technical stu dies oncollec ted samole mal erials obtain »d from the following min no claims:
Diamond Drill Hole or Number of Value of Total
Surface Mining Claim Portions of Work Identified Value Rounded Site Sample Sample Sample Associated Work Work Value of
Sample Materials Materials Materials Percentage with the Carried Out Carried Out Work on Identification Obtained Obtained Collected Distribution Claim on Claim on Claim Claim
SVMLO-1 SVMLO-1 S-35595 1 2.703 7852.31 S-35595 94227.67 94228.00 SVMLO-2 SVMLO-2 S-35595 1 2.703 7852.31 SVMLO-3 SVMLO-3 S-35594 1 2.703 7852.31 S-35594 78523.06 78523.00 SVMLO-4 SVMLO-4 S-35594 1 2.703 7852.31 Î SVMLO-5 SVMLO-5 S-35594 1 2.703 7852.31 SVMLO-6 SVMLO-6 S-35595 1 2.703 7852.31 SVMLO-7 SVMLO-7 S-35594 1 2.703 7852.31 " " " 1 1 SVMLO-8 SVMLO-8 S-35602 1 2.703 7852.31 S-35602 102079.98 102080.00
i
SVMDC-1 U-03-66 S-35594 1 2.703 7852.31 SVMDC-2 U-03-66 S-35594 1 2.703 7852.31 SVMDC-3 U-03-69 S-35595 1 2.703 7852.31
U-03-70 S-35595 1 2.703 7852.31 U-03-71 S-35595 1 2.703 7852.31
SVMDC-4 U-03-69 S-35595 1 2.703 7852.31 U-03-70 S-35595 1 2.703 7852.31 U-03-71 S-35595 1 2.703 7852.31

SVMDC-5 U-03-74 S-35602 1 2.703 7852.31 U-03-75 S-35602 1 2.703 7852.31 U-03-76 S-35602 1 2.703 7852.31
SVMDC-6 U-03-74 S-35602 1 2.703 7852.31 U-03-75 S-35602 1 2.703 7852.31 U-03-76 S-35602 1 2.703 7852.31
SVMDC-7 U-03-82 S-35602 1 2.703 7852.31 U-03-79 S-35602 1 2.703 7852.31
SVMDC-8 U-03-82 S-35602 1 2.703 7852.31 U-03-79 S-35602 1 2.703 7852.31
SVMDC-9 U-03-83 S-35602 1 2.703 7852.31 SVMDC-10 U-03-36 S-35594 1 2.703 7852.31
U-03-40 S-35595 1 2,703 7852.31 SVMDC-11 U-03-29 S-35602 1 2.703 7852.31
U-03-33 S-35601 1 2.703 7852.31 S-35601 15701.61 15702.00 U-03-52 S-35601 1 2.703 7852.31
Shake SAG-1 SVMLO-1 S-35595 1 2.703 7852.31 SVMLO-2 S-35595 1 2.703 7852.31 SVMLO-3 S-35594 1 2.703 7852.31 SVMLO-4 S-35594 1 2.703 7852.31
a SVMLO-5 S-35594 1 2.703 7852.31 0.00 0.00 0.00 20 Samples 37 100.00 290535.32 4 Claims 290532.32 290533.00
Lakefield CALR Invoice Project Project Invoice Invoice
Dgie Number Number Amount 17-May-05 10616-003 200008 56496.00 7-JUI-05 10616-003 2000108 36077.70
26-Aug-05 10616-003 2000258 90700.16 13-0ct-05 10616-003 2000374 72546.00 29-Dec-05 10616-003 2000853 8025.00 28-Apr-06 10616-003 91634 9469.5

Urs^anpower and Project Technical Support (Sample collection and associated functions)
Harold Tracanelli Bill Dillabough Matt Gagnon
Brandon Gervais Tim Hearn
Jason Morrel Douglas MacMillan
Brett Tracanelli
Manpower Accomodations Manpower Transportation Meals and Related Costs Field Related Supplies
Use of Ursa ATVs Use of Ursa Boats and Motors
2400.00 2000.00 840:00 ^
J 371.00 1 5 ^ 0 0 ^ 1163.00 3650^0 880.00
9 6 ^ " '75.00 '
400.00 290503.36