Benchmarking with TPC-H on Off-the-Shelf Hardware: An Experiments Report
13
Benchmarking with TPC-H on Off-the-Shelf Hardware An Experiments Report Anna Thanopoulou 1 , Paulo Carreira 1,2 , Helena Galhardas 1,2 1 Department of Computer Science and Engineering, Technical University of Lisbon, Lisbon, Portugal 2 INESC-ID, Lisbon, Portugal [email protected], [email protected], [email protected] Keywords: Database Benchmarking, Database Performance Tuning, Decision Support Abstract: Most medium-sized enterprises run their databases on inexpensive off-the-shelf hardware; still, answers to quite complex queries, like ad-hoc Decision Support System (DSS) ones, are required within a reasonable time window. Therefore, it becomes increasingly important that the chosen database system and its tuning be optimal for the specific database size and design. Such optimization could occur in-house, based on tests with academic database benchmarks adapted to the small-scale, easy-to-use requirements of a medium-sized enterprise. This paper focuses on industry standard TPC-H database benchmark that aims at measuring the performance of ad-hoc DSS queries. Since the only available TPC-H results feature large databases and run on high-end hardware, we attempt to assess whether the standard test is meaningfully downscalable and can be performed on off-the-shelf hardware, common in medium-sized enterprises. We present in detail the bench- mark and the steps that a non-expert must take to run a benchmark test following the TPC-H specifications. In addition, we report our own benchmark tests, comparing an open-source and a commercial database server running on off-the-shelf inexpensive hardware under a number of equivalent configurations, varying parame- ters that affect the performance of DSS queries. 1 INTRODUCTION In order to keep track of their activity, enterprises need well-structured databases, where to record de- tails about people (e.g., suppliers, clients, employees), items (e.g., raw materials, plants and equipment, in- ventory) and transactions (e.g., supplies or equipment purchases, products sales, expenses). In smaller en- terprises, the database is hosted on inexpensive, off- the-shelf hardware and software administered using basic rules-of-thumb. In the day-to-day operations of this enterprise, two types of queries are executed: the Online Transaction Processing (OLTP) and the Decision Support (DSS) ones. The former are basic information-retrieval and -renewal functions, such as looking up the address of a client or registering a new transaction. The latter are aimed at assisting management decisions regard- ing the company based on performance indicators and statistics retrieved from historical data. DSS queries tend to be far more complex, deal with a larger vol- ume of data and thus take much longer to return re- sults than OLTP ones. In addition, DSS queries can be further categorized into reporting and ad-hoc queries. Reporting DSS queries are routinely executed every now and then. For example, at the end of each month, management asks for the account with the higher per- formance in terms of sales volume. Conversely, ad- hoc DSS queries are executed on the spot when ex- ecutives need a specific answer. For example, man- agement may be considering applying some price dis- crimination technique according to customer order size. In order to verify the profitability of such action, they need to retrieve the distribution of customers by the size of orders they have made. As one would expect, from a database adminis- tration point of view, the most challenging queries are the ad-hoc DSS ones. Not only are they highly complex, but they are also introduced in a sponta- neous fashion, therefore not permitting the database designer to plan accordingly and optimize perfor- mance. Hence, it is very important to take all mea- sures at our disposal to facilitate the execution of these queries, since they may end up running for hours or even days, and may impair the execution of the usual OLTP queries. The time needed to execute ad-hoc DSS queries is above all related to the database design and size. Fur-
-
Upload
independent -
Category
Documents
-
view
1 -
download
0
Transcript of Benchmarking with TPC-H on Off-the-Shelf Hardware: An Experiments Report

Benchmarking with TPC-H on Off-the-Shelf HardwareAn Experiments Report
Anna Thanopoulou1, Paulo Carreira1,2, Helena Galhardas1,2
1Department of Computer Science and Engineering, Technical University of Lisbon, Lisbon, Portugal2INESC-ID, Lisbon, Portugal
[email protected], [email protected], [email protected]
Keywords: Database Benchmarking, Database Performance Tuning, Decision Support
Abstract: Most medium-sized enterprises run their databases on inexpensive off-the-shelf hardware; still, answers toquite complex queries, like ad-hoc Decision Support System (DSS) ones, are required within a reasonabletime window. Therefore, it becomes increasingly important that the chosen database system and its tuningbe optimal for the specific database size and design. Such optimization could occur in-house, based on testswith academic database benchmarks adapted to the small-scale, easy-to-use requirements of a medium-sizedenterprise. This paper focuses on industry standard TPC-H database benchmark that aims at measuring theperformance of ad-hoc DSS queries. Since the only available TPC-H results feature large databases and run onhigh-end hardware, we attempt to assess whether the standard test is meaningfully downscalable and can beperformed on off-the-shelf hardware, common in medium-sized enterprises. We present in detail the bench-mark and the steps that a non-expert must take to run a benchmark test following the TPC-H specifications.In addition, we report our own benchmark tests, comparing an open-source and a commercial database serverrunning on off-the-shelf inexpensive hardware under a number of equivalent configurations, varying parame-ters that affect the performance of DSS queries.
1 INTRODUCTION
In order to keep track of their activity, enterprisesneed well-structured databases, where to record de-tails about people (e.g., suppliers, clients, employees),items (e.g., raw materials, plants and equipment, in-ventory) and transactions (e.g., supplies or equipmentpurchases, products sales, expenses). In smaller en-terprises, the database is hosted on inexpensive, off-the-shelf hardware and software administered usingbasic rules-of-thumb.
In the day-to-day operations of this enterprise, twotypes of queries are executed: the Online TransactionProcessing (OLTP) and the Decision Support (DSS)ones. The former are basic information-retrieval and-renewal functions, such as looking up the address ofa client or registering a new transaction. The latterare aimed at assisting management decisions regard-ing the company based on performance indicators andstatistics retrieved from historical data. DSS queriestend to be far more complex, deal with a larger vol-ume of data and thus take much longer to return re-sults than OLTP ones. In addition, DSS queries can befurther categorized into reporting and ad-hoc queries.
Reporting DSS queries are routinely executed everynow and then. For example, at the end of each month,management asks for the account with the higher per-formance in terms of sales volume. Conversely, ad-hoc DSS queries are executed on the spot when ex-ecutives need a specific answer. For example, man-agement may be considering applying some price dis-crimination technique according to customer ordersize. In order to verify the profitability of such action,they need to retrieve the distribution of customers bythe size of orders they have made.
As one would expect, from a database adminis-tration point of view, the most challenging queriesare the ad-hoc DSS ones. Not only are they highlycomplex, but they are also introduced in a sponta-neous fashion, therefore not permitting the databasedesigner to plan accordingly and optimize perfor-mance. Hence, it is very important to take all mea-sures at our disposal to facilitate the execution of thesequeries, since they may end up running for hours oreven days, and may impair the execution of the usualOLTP queries.
The time needed to execute ad-hoc DSS queries isabove all related to the database design and size. Fur-

thermore, for a given database, time depends on thechoice of DBMS and its tuning. Given the wide offerof database systems nowadays as well as great com-plexity, it is crucial yet not trivial for the enterprise todetermine the best choice for its needs, both in termsof price and in terms of performance. The obvious an-swer is that one should choose the system achievingthe required performance level at the minimum cost.Therefore, it would be helpful to realize a quantitativecomparison of database systems performance undervarious comparable configurations, possibly using abenchmark. A benchmark is a standardized test thataims at comparing the performance of different sys-tems under the same conditions, presenting results aswork executed per time or money unit.
The Transaction Processing Performance Coun-cil (TPC) benchmark TPC-H constitutes an attemptto model a business database along with realistic ad-hoc DSS questions. It has been extensively used bydatabase software and hardware vendors to demon-strate the performance of their solutions, as well asby researchers looking to validate their approaches.However, TPC-H official results refer to very largedatabases running on high-end hardware that are dif-ficult to compare to the reality of a small enterprise.Moreover, it is not clear from the text of the standardhow to run the tests and whether a simple procedureto run them exists enabling small enterprises (i) to an-alyze different off-the-shelf DBMS and their configu-rations and (ii) to evaluate different tuning options.
This paper will examine whether TPC-H can beused as a tool by small enterprises to facilitate theirdatabase administration decisions, and it will com-pare the performance of a commercial and an open-source database system under different tuning settingswhen tested at this scale. Specifically, our contri-butions include: (i) a detailed description of all thesteps necessary to execute the TPC-H test on off-the-shelf hardware aimed at the non-expert; (ii) a com-parison of the performance of a commercial and anopen-source database system executing a small-scaleTPC-H test under various comparable configurationson off-the-shelf hardware; (iii) insights into the tun-ing parameters that influence DSS performance at thisscale; and (iv) an evaluation of the usefulness of theTPC-H test at lower scales.
Our text is organized as follows. In Section 2, wepresent some related work on the subject of optimiz-ing DSS queries. Sections 3 and 4 offer a presentationof the main features of the TPC-H schema and work-load, as well as the research methodology used dur-ing our TPC-H tests. Section 5 presents the results ofour full TPC-H test results for various tunings of SQLServer 2008 and MySQL 5.1. Finally, in Section 6 we
present our conclusions and outlook for future work.
2 RELATED WORK
The TPC-H databases and workload have been usedextensively in research as a means of validating thesuperiority, in terms of performance of a breath oftechniques related to multiple aspects of data storage,retrieval and processing. (Harizopoulos et al., 2005;Somogyi et al., 2009; Guehis et al., 2009; Kitsure-gawa et al., 2008; Lim et al., 2009). In addition, thebenchmark has been analyzed (Seng, ), synthesized(?) and reduced to a handful representative queries(Vandierendonck and Trancoso, 2006). There evenhave been attempts to propose alternative benchmarks(O’Neil et al., 2009; Darmont et al., ; Siqueira et al.,2010), mainly aiming at proposing a star schema thatfavors data warehousing; an issue soon to be resolvedby benchmark TPC-DS (Poess et al., 2002).
Understanding TPC-H requires significant techni-cal expertise and, to the best of our knowledge, nocomprehensive account of the deployment of the stan-dard exists in literature. Apart from generic guide-lines for benchmark execution (Oracle, 2006; Scalzo,2007), no step-by-step guide has been created for thenon-expert. Commercial solutions such as Bench-mark Factory (Software, 2008) that are capable ofrunning TPC-H validate the need for in-house deploy-ment of this standart.
Besides deployment of the benchmark, anotherconsideration is selecting a minimal set of meaningfultuning parameters to be varied in basic, low-scale ex-periments to determine a somewhat optimal tuning forDSS workloads. Indeed, there has been considerableamount of research on the topic of profiling automat-ically characterising a database workload as OLTP orDSS (Elnaffar, 2002; Elnaffar et al., 2002; Elnaffaret al., ). Determining the nature of each workload willassist the development of self-tuning database sys-tems (Chaudhuri and Narasayya, 2007; Wiese et al.,2008), as each workload type requires a different ap-proach to database system tuning. Some databasevendors and hardware manufacturers provide recom-mendations for tuning according to the workload type(IBM, 2004; Green, 2002; Paulsell, 1999; Packer andPress, 2001). In the case of TPC-H DSS queries, diskI/O has been isolated as the limiting factor for perfor-mance (DeSota, 2001; Kandaswamy and Knighten,2000). We based our recommendations for main tun-ing parameters to be varied in low-scale experimentswith TPC-H on this conclusion.

3 AN OVERVIEW OF TPC-H
The IT department of a small enterprise can benefitfrom deploying a benchmark in-house in a number ofways. For example, to choose which database man-agement system to use, given a set of hardware. Inthis case, the TPC-H test could be run on trial versionsof various database systems against their machine anddecide which one works best for them. There arenumerous advantages of using TPC-H instead of theactual business database for this purpose. First, theTPC-H workload has been thoroughly prepared to in-clude a number of representative examples of ad-hocDSS queries with various levels of complexity. Itwould require a lot of technical expertise and timeto “re-invent the wheel” within the company’s IT de-partment. Second, TPC-H allows the user to run ex-periments against small, medium, large or very largedatabases; hence, one does not necessarily need to runa test so long as it would have been against the actualdatabase to arrive to meaningful conclusions. Third,using the company database in various systems to ex-amine performance would involve re-writing code ina number of variations depending to each system’sstandard; TPC-H, conversely, allows the user to gen-erate the test code for different systems in a straight-forward way.
Other possible uses of TPC-H within the medium-sized company environment include choosing thehardware given the choice of a database system,deciding whether it is worthwhile in terms ofprice/performance to migrate to the new version of adatabase system, and locating whether a performanceproblem is due to system or database tuning.
3.1 The TPC-H Database Schema
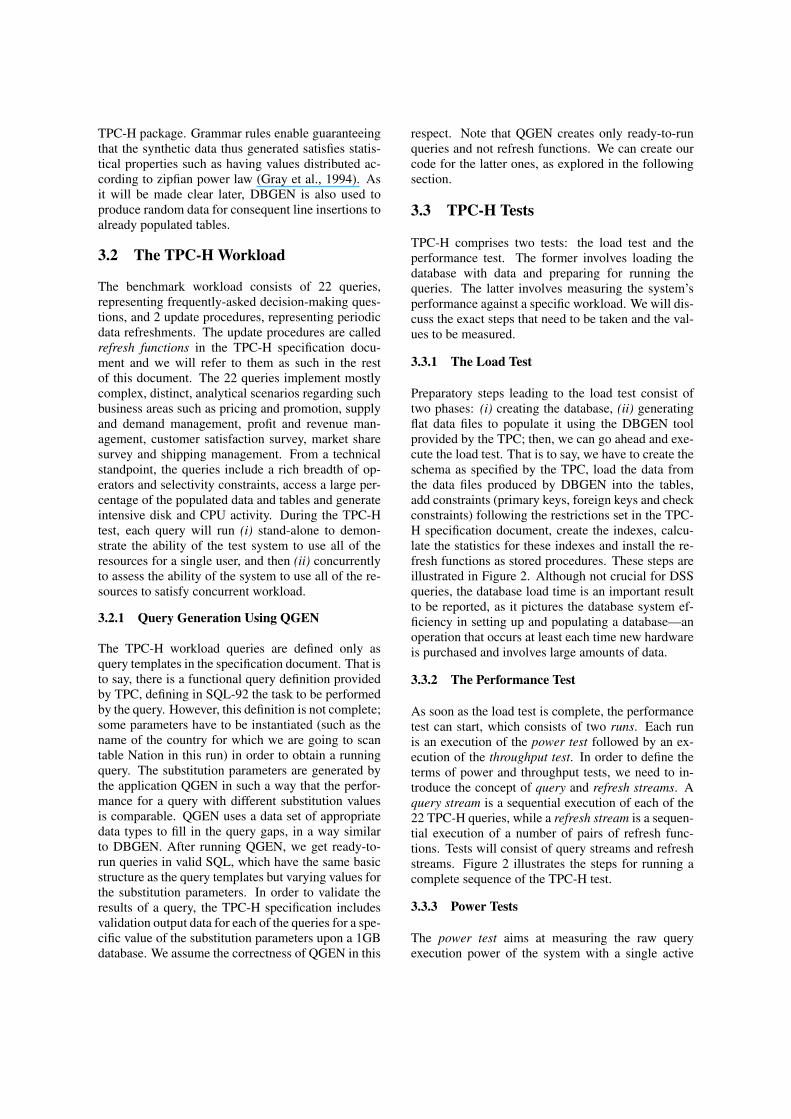
The goal of the TPC-H benchmark is to portray the ac-tivity of a product supplying enterprise. Although theTPC-H standard only provides the relational schema,we present the corresponding E-R diagram in Fig-ure 1, for clarity. The benchmark models any indus-try that manages, sells or distributes products world-wide, such as car rental, food distribution, parts orsuppliers. The entity Part stands for an individualpiece of product and the entity Supplier stands for aperson or company that supplies the product for ourcorporation. The Order entity represents a single or-der, which has been placed by a customer representedby the Customer entity. Each order is constituted oflines of items represented by the Lineitem entity andare provided from a specific supplier’s collection ofparts. Finally, since both suppliers and customers arepeople, they are citizens of a particular Nation that
Figure 1: Simplified ER diagram of the TPC-H databasemodel. Entity attributes are not displayed on the diagram.
belongs to a particular Region.This E-R diagram is converted into a relational
schema comprised by eight base tables, as specifiedby TPC. Tables have different sizes that, except fornation and region, change proportionally to a constantknown as scale factor (SF), as seen in Table 1. Theavailable scale factors are: 1, 10, 30, 100, 300, 1000,3000, 10000, 30000 and 100000. The scale factor de-termines the size of the database in GB. For instance,choosing the scale factor to be equal to 1 means therewill be generated 1GB of data in total, and so on.
Table 1: Number of rows per table in the TPC-H databaserelative to the scale factor. The two largest tables areLineitem and Orders and hold about 83% of the total data.
Table Name Number of RowsRegion 5Nation 25
Supplier 10,000×SFCustomer 150,000×SF
Part 200,000×SFPart Supp 300,000×SF
Orders 1,500,000×SFLineitem 6,000,000×SF
3.1.1 Data Generation Using DBGEN
DBGEN is a data generator provided in the TPC-H package to fill the database tables with differentamounts of synthetic data. The generation of syn-thetic data follows different rules according to thetype of column. DBGEN uses grammar rules for eachtype of column to generate large amounts of syntheticdata from a bank of base data elements within the
TPC-H package. Grammar rules enable guaranteeingthat the synthetic data thus generated satisfies statis-tical properties such as having values distributed ac-cording to zipfian power law (Gray et al., 1994). Asit will be made clear later, DBGEN is also used toproduce random data for consequent line insertions toalready populated tables.
3.2 The TPC-H Workload
The benchmark workload consists of 22 queries,representing frequently-asked decision-making ques-tions, and 2 update procedures, representing periodicdata refreshments. The update procedures are calledrefresh functions in the TPC-H specification docu-ment and we will refer to them as such in the restof this document. The 22 queries implement mostlycomplex, distinct, analytical scenarios regarding suchbusiness areas such as pricing and promotion, supplyand demand management, profit and revenue man-agement, customer satisfaction survey, market sharesurvey and shipping management. From a technicalstandpoint, the queries include a rich breadth of op-erators and selectivity constraints, access a large per-centage of the populated data and tables and generateintensive disk and CPU activity. During the TPC-Htest, each query will run (i) stand-alone to demon-strate the ability of the test system to use all of theresources for a single user, and then (ii) concurrentlyto assess the ability of the system to use all of the re-sources to satisfy concurrent workload.
3.2.1 Query Generation Using QGEN
The TPC-H workload queries are defined only asquery templates in the specification document. That isto say, there is a functional query definition providedby TPC, defining in SQL-92 the task to be performedby the query. However, this definition is not complete;some parameters have to be instantiated (such as thename of the country for which we are going to scantable Nation in this run) in order to obtain a runningquery. The substitution parameters are generated bythe application QGEN in such a way that the perfor-mance for a query with different substitution valuesis comparable. QGEN uses a data set of appropriatedata types to fill in the query gaps, in a way similarto DBGEN. After running QGEN, we get ready-to-run queries in valid SQL, which have the same basicstructure as the query templates but varying values forthe substitution parameters. In order to validate theresults of a query, the TPC-H specification includesvalidation output data for each of the queries for a spe-cific value of the substitution parameters upon a 1GBdatabase. We assume the correctness of QGEN in this
respect. Note that QGEN creates only ready-to-runqueries and not refresh functions. We can create ourcode for the latter ones, as explored in the followingsection.
3.3 TPC-H Tests
TPC-H comprises two tests: the load test and theperformance test. The former involves loading thedatabase with data and preparing for running thequeries. The latter involves measuring the system’sperformance against a specific workload. We will dis-cuss the exact steps that need to be taken and the val-ues to be measured.
3.3.1 The Load Test
Preparatory steps leading to the load test consist oftwo phases: (i) creating the database, (ii) generatingflat data files to populate it using the DBGEN toolprovided by the TPC; then, we can go ahead and exe-cute the load test. That is to say, we have to create theschema as specified by the TPC, load the data fromthe data files produced by DBGEN into the tables,add constraints (primary keys, foreign keys and checkconstraints) following the restrictions set in the TPC-H specification document, create the indexes, calcu-late the statistics for these indexes and install the re-fresh functions as stored procedures. These steps areillustrated in Figure 2. Although not crucial for DSSqueries, the database load time is an important resultto be reported, as it pictures the database system ef-ficiency in setting up and populating a database—anoperation that occurs at least each time new hardwareis purchased and involves large amounts of data.
3.3.2 The Performance Test
As soon as the load test is complete, the performancetest can start, which consists of two runs. Each runis an execution of the power test followed by an ex-ecution of the throughput test. In order to define theterms of power and throughput tests, we need to in-troduce the concept of query and refresh streams. Aquery stream is a sequential execution of each of the22 TPC-H queries, while a refresh stream is a sequen-tial execution of a number of pairs of refresh func-tions. Tests will consist of query streams and refreshstreams. Figure 2 illustrates the steps for running acomplete sequence of the TPC-H test.
3.3.3 Power Tests
The power test aims at measuring the raw queryexecution power of the system with a single active

Figure 2: Complete process for running the TPC-H tests. From left to right, first we present the off-the-clock preparatory stepsrequired to set up the test system including writing the required code, then we show the sequence in which each stream mustrun during the load, power and throughput tests. Note that the performance test is made up by the power and the throughputtest, and it needs to be executed twice.
stream, that is to say how fast can the system com-pute the answer to single queries. This is achieved byrunning a single query stream, that is to say by se-quentially running each one of the 22 queries. Thepower test also includes running a refresh stream ses-sion comprising a single pair of refresh functions.
In particular, there are three sequential steps nec-essary to implement the power test: (i) execution ofthe refresh function 1, (ii) execution of the querystream and (iii) execution of the refresh function 2.The query stream executed during the power test iscalled query stream 00. Correspondigly, the executedrefresh stream is called refresh stream 00. The TPCspecifies the exact execution sequence for the queriesin the query stream 00, so that results do not vary ac-cording to the content of the cache memory based onpreviously-run queries.
3.3.4 Throughput Tests
The purpose of the throughput test is to measure theability of the system to process the most queries in theleast amount of time, possibly taking advantage of I/Oand CPU parallelism. In other words, this test is usedto demonstrate the performance of the system againsta multi-user workload. For that reason, the through-put test includes at least two query stream sessions.Each stream executes queries serially but the streamsthemselves are executed in parallel.
The minimum number of query streams, referredto as S and specified by the TPC, increases with theincrease of the scale factor, as shown in Table 2. What
Table 2: The different scale factors (SF) along with thecorresponding number of query streams (S) used in thethroughput tests.
Scale Factor (SF) Number of Query Streams (S)1 2
10 330 4100 5300 6
1000 73000 810000 930000 10
100000 11
is more, the throughput test must be executed in par-allel with a single refresh stream comprising S refreshfunction pairs. Each query stream and refresh func-tion pair in the throughput test has an ordering num-ber represented as s and ranging from 01 to S.
Like in the power test, the execution sequence forthe queries in a query stream is pre-defined by TPCand determined by by each query’s ordering numbers. The purpose of this is to ensure that the differentquery streams running in parallel will not be execut-ing the same query at the same time.
3.4 Performance Metrics
While running the power and the performance tests,the scripts will report the time for each one of thesteps. Specifically, in the end we get three types oftiming measurements regarding: the database loadtime as discussed in Section 3.3, the measurement in-

terval and the timing intervals. The measurement in-terval represented as Ts is the total time needed to ex-ecute the throughput test. The timing interval repre-sented as QI(i,s) is the execution time for the queryQi within the query stream s, where i is the orderingnumber of the query ranging from 1 to 22 and s is 0 forthe power test and the ordering number of the querystream for the throughput test. The timing intervalrepresented as RI( j,s) is the execution time for therefresh function RFj within a refresh stream s, wherej is the ordering number of the refresh function rang-ing from 1 to 2 and s is 0 for the power test and theposition of the pair of refresh functions in the streamfor the throughput test. All the timing results must bemeasured in seconds, as specified by the TPC.
Timing measurement results must then be com-bined to produce global, comparable metrics. In or-der to avoid confusion, TPC-H uses only one primaryperformance metric indexed by the database size: thecomposite query-per-hour performance metric repre-sented as QphH@Size, where Size represents the sizeof data in the test database as implied by the scale fac-tor. For instance, we can have the metric QphH@1GBfor comparing systems using 1GB databases. Thismetric weighs evenly the contribution of the singleuser power metric and the multi-user throughput met-ric. We are now going to present in detail each one ofthem.
3.4.1 The Processing Power Metric
For a given database size, the processing power met-ric represented as Power@Size is computed using thereciprocal of the geometric mean of the executiontimes for each one of the queries and the refresh func-tions obtained during the power test, represented asQI(i,0) and RI( j,0) respectively. Please recall thatquery and refresh streams in the power test have asordering number s that is equal to 0.
The geometric mean indicates the central ten-dency of a set of numbers that are to be multipliedtogether to produce an outcome. Unlike arithmeticmean, instead of adding the set of numbers and thendividing the sum by the count of elements n, the num-bers are multiplied and then the nth root of the result-ing product is taken. For instance, the geometric meanof three numbers 1, 1/2, 1/4 is the cube root of theirproduct (1/8), which is 1/2; that is 3
√1× 12× 1/4 = 1/2.
The intuition behind the geometric mean is perhapsbest understood in terms of geometry. The geometricmean of two numbers, a and b, is the length of oneside of a square whose area is equal to the area of arectangle with sides of lengths a and b. Similarly, thegeometric mean of three numbers, a, b, and c, is thelength of one side of a cube whose volume is the same
as that of a cuboid with sides whose lengths are equalto the three given numbers.
Query execution times of TPC-H are by designsubstantially different from one another, i.e. signif-icantly too long or too short. This fact would in-fluence the arithmetic mean, therefore the geomet-ric mean is preferable as it is more robust. To illus-trate the concept, consider a set of three queries withelapsed times of 10, 12 and 500 seconds. The arith-metic mean would be 174 seconds while the geomet-ric one is 39.15 seconds. The processing power metricis defined as:
Power@Size=3600
24√
∏22i=1 QI(i,0)×∏
2j=1 RI( j,0)
×SF
The denominator computes the geometric mean of thetiming intervals for the 22 queries and the 2 refreshfunctions, in a total of 24 factors. It represents theaggregated effort in seconds to process a request, thatbeing a query or a refresh function. The numerator3600 is the number of seconds in an hour. There-fore, the fraction expresses the number of queries ex-ecuted per hour. This number is then multiplied bythe scale factor SF implied by the database size togive us Power@Size, where size is the GB implied bythe scale factor. The units of the Power@Size metricare queries-per-hour × SF. Finally, since the TPC-Hmetrics reported for a given system must represent aconservative evaluation of the system’s level of per-formance, the reported processing power metric mustbe for the run with the lower composite query-per-hour metric.
3.4.2 The Throughput Power Metric
The throughput power metric represented asT hroughput@Size is computed as the ratio betweenthe total number of queries (executed within all thequery streams of the throughput test) and the lengthof the total time required to run the throughput testfor s streams, Ts. In simpler words, this metric tellsus how many queries were executed in the elapsedtime. Let s be the number of streams correspondingto the scale factor SF . The throughput power metricis defined as:
T hroughput@Size =S×22
Ts×3600×SF
The numerator S×22 is the total number of executedqueries within all streams (S streams with 22 querieseach) and the denominator Ts is the total time for thethroughput test in seconds. Therefore, the fractionrepresents the number of queries executed per second.Multiplied by 3600 seconds, it gives the number of

queries executed per hour. This result is then multi-plied by the scale factor yielding Throughput@Size,where size is the GB implied by the scale factor. Theunits are queries-per-hour × SF. As in the case ofPower@Size, the reported processing power metricmust be for the run with the lower composite query-per-hour metric.
3.4.3 The Composite Query-Per-HourPerformance Metric
The composite query-per-hour performance metriccombines the values of the corresponding metricsPower@Size and Throughput@Size into a singlemetric. This metric is obtained from the geometricmean of the previous two metrics. The metric cap-tures the overall performance level of the system, bothfor single-user mode and multi-user mode. The com-posite query-per-hour metric is defined as:
QphH@Size =√
Power@Size×T hroughput@Size
3.4.4 The Price/Performance Metric
This last metric allows test implementers to makethe final price/performance comparison between sys-tems (especially in our case enabling to compare com-mercial and open-source solutions) and decide whichsystem gives the highest performance for money.The price/performance metric represented as Price−per − QphH@Size is the ratio of the total systemprice divided by the composite query-per-hour per-formance metric. This price/performance metric isdefined as:
Price-per-QphH@Size =$
QphH@Size
Where the symbol $ stands for the total system pricein the reported currency. The units are the usual cur-rency units.
4 EXPERIMENTS
The goal of our experiments is to showcase a set ofuseful TPC-H tests that any small entreprise couldperform in order to choose the database system andtuning configurations that offer optimal ad-hoc DSSperformance in their system. In addition, we run thesetests ourselves on off-the-shelf hardware, aiming toprovide some take-away rules-of-thumb for choosingbetween a commercial and an open-source databasesystem and optimizing the configurations for DSSqueries. These rules can be used by any entrepriseof this scale that will not run its own tests.
In the next sections, first we are going to exam-ine which are the parameters that affect DSS perfor-mance as identified in literature, then we will explainthe tests design and the rationale behind it, and finallywe will present the tests results and discuss them.
4.1 Parameters Affecting thePerformance of DSS Queries
We are interested in the characteristics of ad-hoc DSSworkloads and the tuning parameters that affect them,for a given database size. DSS queries most of thetimes are special requests for managerial use, suchas calculating the top salesperson last month or whatproducts had the largest gains in sales last quarter.They tend to be highly complex and include a smallnumber of large queries that involve large data scans,sorts and joins. On the other hand, they include veryfew, if any, updates.
Since DSS queries deal with large amounts of datawithin scans, sorts and joins, the size of the bufferpool and the sort buffer play an important role. Fol-lowing the same logic, the fill factor and the page sizecan also contribute to having more data in the datacache and should, therefore, influence performance.Another option that would prove beneficial for largescans of data is intra-partition parallelism.
Morevoer, since there are very few updates, wecan save some memory that would be allocated tothe log buffer and schedule less frequent checkpoints.Finally, because DSS queries usually include only asmall number of queries, we can reduce the number ofactive database agents as well as turn off intra-queryparallelism. For the same reason, locking manage-ment and deadlock detection do not need to be verystrict.
Modern database management systems havemany configuration options that affect they perfor-mance (Shasha and Bonnet, 2002), however, in ourexperiments we will be intereted in the main parame-ters: buffer pool size, sort buffer size, fill factor, pagesize and intra-partition parallelism.
4.2 Implementation Decisions
The TPC-H specification document provides the basicrules that need to be applied in order to run a legiti-mate test with comparable results. However, it doesallow some level of freedom in some aspects of theimplementation. Below, we discuss the implementa-tion decisions we made for our tests.

4.2.1 Refresh Functions
The refresh functions are not strictly defined by TPC,as their role is simply to ensure that the system un-der test is still able to execute basic updates in paral-lel with DSS query execution. As a consequence, wehave some freedom in implementing them, followingthe basic pseudo-code provided. We chose to imple-ment them as stored procedures.
4.2.2 Indexing
As explained before, the TPC-H benchmark (as op-posed to TPC-R) involves an ad-hoc workload; it isaimed at unpredictable query needs. The rationaleis: if you don’t know what the query is going to be,you can’t build a summary table or an index for it.TPC-H, therefore, allows indexes to be defined onlyfor primary keys, foreign keys or columns of the datedatatype. Specifically, TPC allows the definition ofthe primary and foreign keys of all tables, as wellas a number of specified constraint checks. In addi-tion, the standard allows single- or multiple-columnindexes, provided that they reference the same table.
4.2.3 Partitioning
TPC-H also allows horizontal partitioning as long asthe partitioning key is a primary or a foreign key or adatatype column. Partitioning used to split up largetables like Lineitem into multiple units enabling toparallelize I/O on aggregate (group by) queries. Un-fortunately, our I/O setup does not feature multiplephysical units.
4.2.4 Hardware
Our goal was to run the experiments on inexpensiveoff-the-shelf hardware, in order to simulate the mostcommon conditions in smaller enterprises. We usedan AMD Athlon processor with 1GB of RAM and aSATA 80 GB hard disk.
4.2.5 Scale Factor
Once again, in the interest of simulating the environ-ment of a smaller enterprise, we chose the lowest pos-sible scale factor yielding a 1 GB database. We be-lieve that it is interesting to provide some results witha lower scale factor, as the only available ones to dateare the official TPC-H results starting at 100 GB.
4.3 Parameters Varied in theExperiments
Our ambition was to test the two systems (SQL Serverand MySQL) while varying the parameters previ-ously identified as related to the performance of DSSqueries. The first limitation was that we were runningthe tests on a single-core machine, in an attempt tostay true to our premise of using realistic off-the-shelfhardware; therefore, we could not evaluate the effectof intra-partition parallelism.
Furthermore, not all of the parameters can be setby the user in each of the database systems at hand.In SQL Server, it is not possible to set the size of thebuffer pool or the sort buffer; only the total size ofmemory that the system can use can be set, by deter-mining its minimum and maximum values. MySQL,on the other hand, allows to set up a specific size forthe buffer pool and the sort buffer. Also, while SQLServer operates with a fixed page size of 8 KB, inMySQL the user can set the page size to 8, 16, 32 or64 KB. Finally, in SQL Server it is possible to specifythe fill factor for each page, while MySQL managesthe free space automatically, with tables populated insequential order having a fill factor of 15/16. Table 3display a summary with the names and values rangeof these parameters in MySQL 5.1 (SQL Server pa-rameter list left out due to lack of space).
Table 3: Major tuning parameters affecting DSS query per-formance in MySQL 5.1.
MySQL 5.1
Min Max Default ParameterName
BufferPoolSize
1 MB 4 GB 8 MB innodb bufferpool size
SortBufferSize
32 KB 4 GB 2 MB sort buffer size
FillFactor n/a n/a (1/2 to)
15/16 n/a
PageSize 8 KB 64
KB 16 KB univ page size
In light of these inconsistencies, we decided to runtwo general types of tests: the memory size test andthe number of rows per page test. The tests are sum-marized in Table 4.
In the memory size test, we will be varying thetotal memory size in the two systems between 16MBand 1024MB; for MySQL, we will allocate each time34 of the memory to the buffer pool and 1
4 to the sortbuffer, as recommended by MySQL distributors (Ora-cle, 2005). Meanwhile, we will keep the fill factor andpage size constant and approximately fair between the

Table 4: Parameters varied in the experiments for testing theinfluence of memory size and number of rows per page.
SQL Server MySQL
Mem SizeTest
Total Memory 16-1024 MB16-1024 MB(Buffer:sort 3:1)
Fill Factor 90% 15/16 (default)Page Size 8 KB (default) 8 KB
Rows perPage Test
Total Memory 128 MB128 MB(Buffer:sort 3:1)
Fill Factor 40-100% 15/16 (default)Page Size 8 KB (default) 8-64 KB
two systems. For SQL Server, the page size is 8K bydefault and we will set the fill factor at 90%, whichis almost equal to the MySQL default. Similarly, forMySQL, the page size is set at 8K and the fill factoris the default 15/16 (≈ 93%).
In the number of rows per page test, we will bevarying the fill factor in the case of SQL Server andthe page size in the case of MySQL. Note that theresulting range of number of rows per page is differ-ent for the two database systems, but that serves ex-actly the purpose of verifying whether allowing theuser to specify much larger page sizes gives MySQLan advantage. Meanwhile, the total memory is set ata medium value of 128MB; here too, the allocation ofmemory in MySQL is 3:1.
In the next sections, we are going to present theresults of running the full TPC-H test in each ofthe two systems, under the configurations presentedin Table 4. The tests were executed multiple timesand the time recorded is the average of the slowestruns. The scale factor we used was 1, yielding a 1GBdatabase. Apart from performance in minutes, we willalso show the values of the TPC-H metrics for eachtest. For these calculations, we considered the hard-ware cost to be approximately 500$ and the softwarecost the current price of 898$ for SQL Server 2008and 0$ for MySQL 5.1.
4.4 Full TPC-H Tests in SQL Server
For the memory size test, we run seven tests varyingthe total server memory from 16 to 1024 MB, whilekeeping the fill factor at 90%. For the number of rowsper page test, we run five tests varying the fill fac-tor from 40 to 100 %, while keeping the total servermemory at 128 MB. In both cases, the page size wasthe default 8 KB.
4.4.1 Varying the Memory Size
In the first tests with SQL Server , we keep the fill fac-tor at 90%, which is a realistic value for DSS work-loads with few updates, while varying the total server
Table 6: TPC-H full test results for increasing fill factor inMS SQL Server 2008. Results for 90% fill factor ommitedto due to space constraints without any significant loss indetail.
MS SQL Server 2008 - Number of Rows per Page Test
total memory 128 MB 128 MB 128 MB 128 MBfill factor 40% 60% 80% 100%page size 8 KB 8 KB 8 KB 8 KBload test 27min 22min 20min 19minperf. test 2h2min 1h9min 1h3min 59min
Power@1GB 24.86qph 117.41qph 119.42qph 120.01qphThrp.@1GB 48.13qph 54.64qph 66.83qph 69.89qphQphH@1GB 34.59qph 80.10qph 89.34qph 91.58qphPPQphH@1GB 40.42$ 17.45$ 15.65$ 15.23$
memory size. Both min server memory and maxserver memory parameters were set to the same value,to achieve a fixed memory size. As we change thevalue from 16 to 768 MB, the performance improvessignificantly. The system ends up reaching its full po-tential around 512 MB; moving to 768 MB does notmake much difference; it looks like 512 MB of mem-ory are just enough to allow the server to keep all use-ful pages in cache. Finally, when we run the test with1024 MB of server memory, the performance sufferedseverely compared to the previous value of 768 MB.In this case the server tries to allocate all physicalmemory in the system. Part of the buffer cache willbe on virtual memory causing pages to be swaped inand out incurring in further I/O operations. As a fi-nal note, in terms of the TPC-H price/performancemetric, we can claim that increasing the memory sizefrom 64MB to 768MB is equivalent to a 40.39% costreduction. This is a cost reduction of 0.06% for everyadditional MB of memory, not taking into account thetest outliers observed with memory size of 16 or 1024MB. Table 5 holds the results for the memory size testin SQL Server.
4.4.2 Varying the Number of Rows per Page
Subsequently, we attempted varying the value of thefill factor parameter. At first we attempted varyingthe parameter from 40% up to 100%, while keep-ing the total server memory at 768 MB. The resultswere identical and seemed to indicate that the fill fac-tor does not influence the performance. This wascounter-intuitive, since the fill factor definitely plays arole in the total amount of data that can be held in thebuffer pool: the buffer pool can only hold a specificnumber of data pages and each one of these pages car-ries as much data as the fill factor dictates. Therefore,we decided to run the tests again with the total servermemory set at 128 MB. Indeed, this time varying thefill factor did have a major impact on performance.The explanation for this is that a high memory size

Table 5: TPC-H full test results for increasing memory size in MS SQL Server 2008.
MS SQL Server 2008 - Memory Size Test
total server memory 16 MB 64 MB 128 MB 256 MB 512 MB 768 MB 1024 MBfill factor 90% 90% 90% 90% 90% 90% 90%page size 8 KB 8 KB 8 KB 8 KB 8 KB 8 KB 8 KBload test 46min 20min 19min 17min 16min 16min 36minperf. test 4h54min 1h13min 1h 52min 41min 40min 1h9min
Power@1GB 30.76qph 115.75qph 119.60qph 138.44qph 162.35qph 164.38qph 117.34qphThroughput@1GB 11.90qph 53.30qph 68.04qph 75.60qph 105.32qph 105.67qph 63.08qph
QphH@1GB 19.13qph 78.55qph 90.20qph 102.30qph 130.76qph 131.80qph 86.03qphPrice-per-QphH@1GB 73.08$ 17.80$ 15.49$ 13.67$ 10.69$ 10.61$ 16.25$
allowed the server to keep all necessary pages in thebuffer pool, even if a low fill factor meant more pagesand more I/Os the first time they are fetched. How-ever, a low memory size means that a limited numberof pages can be kept in the cache and is then sub-stituted by other pages, therefore the amount of datain each page is significant as it represents the totalamount of data kept in the cache and can lead to fewerI/Os for page substitutions.
One more reason why the fill factor significantlyinfluences performance is the fact that DSS queriestend to contain large table scans with high selectivity.That means that they tend to access the disk sequen-tially instead of randomly and, in most of the cases,fetching a data page to disk means taking advantageof a large portion of its data. Therefore, a higher fillfactor ensures less I/Os. Moreover, a higher fill factorcan cause slower inserts and updates; however, DSSworkloads have very few updates and we are runningthe tests on a single-core machine, therefore these fac-tors do not cause performance overhead.
In terms of the TPC-H price/performance metric,increasing the fill factor from 60% to 100% is equiv-alent to a 12.72% cost reduction. This is a cost reduc-tion of 0.32% for every additional 1% of fill factor,not taking into account the test outlier of fill factor40%. Table 6 holds the results for the number of rowsper page test in SQL Server.
4.5 Full TPC-H Tests in MySQL
For the memory size test, we run seven tests varyingthe total server memory from 16 to 1024 MB, whilekeeping the page size at 8 KB. For the number of rowsper page test, we run four tests varying the page sizefrom 8 to 64 KB, while keeping the total server mem-ory at 128 MB. In both cases, the fill factor was thedefault 15⁄16.
4.5.1 Varying the Memory Size
As with SQL Server, we observe that more spacefor caching data pages translates to performance im-
Table 8: TPC-H full test results for increasing page size inMySQL 5.1.
MySQL 5.1 - Number of Rows per Page Test
buf pool size 96 MB 96 MB 96 MB 96 MBsort buf size 32 MB 32 MB 32 MB 32 MB
fill factor 15/16 15/16 15/16 15/16page size 8 KB 16 KB 32 KB 64 KBload test 20min 18min 17min 17minperf. test 1h13min 59min 52min 50min
Power@1GB 114.67qph 122.58qph 141.73qph 144.88qphThrp.@1GB 55.59qph 69.66qph 79.57qph 82.58qphQphH@1GB 79.84qph 92.41qph 106.20qph 109.38qphPPQphH@1GB 6.26$ 5.41$ 4.71$ 4.57$
provements. Once again, the performance improvessignificantly when incrementing lower cache size andthe effect becomes less visible as the size increases.Again, when the cache size reaches the availablephysical system memory, the performance suffers.
Like in SQL Server, tuning more appropriatelyleads to impressive reductions on the cost: 27.88%price/performance metric difference between the testwith 64MB of total memory and that with 768MB.This is a cost reduction of 0.04% for every additionalMB of memory, not taking into account the test out-liers observed with memory size of 16 or 1024 MB.Table 7 holds the results for the memory size test inMySQL.
4.5.2 Varying the Number of Rows per Page
One could argue that a higher page size would notgreatly influence performance, as in the best case sce-nario it means the same amount of data in the bufferpool only differently organized and in the worst casescenario it means more irrelevant data were fetchedalong with relevant ones. However, DSS queries tendto access data sequentially with large table scans;thus, it is highly likely that each page fetched con-tains many relevant rows. This means that a higherpage size could lead to less I/Os during a scan. Whatis more, data pages include a page information pream-ble that occupies valuable space. Therefore, the lesspages we divide the buffer pool size into, the less

Table 7: TPC-H full test results for increasing memory size in MySQL 5.1.
MySQL 5.1 - Memory Size Test
buffer pool size 12 MB 48 MB 96 MB 192 MB 384 MB 576 MB 768 MBsort buffer size 4 MB 16 MB 32 MB 64 MB 128 MB 192 MB 256 MB
fill factor 15/16 15/16 15/16 15/16 15/16 15/16 15/16page size 8 KB 8 KB 8 KB 8 KB 8 KB 8 KB 8 KBload test 48min 23min 20min 16min 16min 14min 57min
performance test 5h32min 1h28min 1h13min 1h2min 56min 54min 1h44minPower@1GB 30.25qph 111.52qph 114.67qph 118.93qph 136.52qph 139.68qph 103.68qph
Throughput@1GB 10.02qph 51.39qph 55.59qph 67.76qph 78.73qph 79.08qph 48.12qphQphH@1GB 17.41qph 75.70qph 79.84qph 89.77qph 103.67qph 105.10qph 70.63qph
Price-per-QphH@1GB 28.72$ 6.60$ 6.26$ 5.57$ 4.82$ 4.76$ 7.80$
space goes wasted in non-data preambles. Finally, de-pending on the record size, it is possible that a largerpage size ensures that more data is stored per page:for instance, supposing fill factor 100%, if the recordsize is 4,5 KB, we can fit only one record in a 8 KBpage but three records in a 16 KB page. This last rea-son could explain the big performance difference weobserved between the test with page size 8 KB andthe one with 16 KB. Continuing to increase the pagesize, we found further improvement in the total runtime; however, less and less impressive. In terms ofthe TPC-H price/performance metric, increasing thepage size from 8 to 64 KB is equivalent to a 27.00%cost reduction. This is a cost reduction of 0.48% forevery additional KB of page size. Table 8 holds the re-sults for the number of rows per page test in MySQL.
4.6 Discussion
Examining the first tests in the results tables, we cansee that, for the same page size, approximately thesame total memory size, and a fill factor of 90%and automatically controlled respectively, the perfor-mance of MySQL is slightly worse, altough of thesame magnitude. This could mean that the automatichandling of the fill factor in MySQL cannot competewith the user-defined high fill factor in SQL Server, orthat there are some more tuning parameters (besidesthe major ones which we strived to set fairly) thatcause performance deterioration when left in their de-fault values. Most likely, however, this performancedifference indicates the superiority of SQL Server’squery optimizer when dealing with highly complexDSS queries, which can also be seen on Figure 4. Thisconclusion is strengthened by the observation that forour setup both systems seem to reach their full po-tential after 512 MB of total memory as their perfor-mance stops depending on the amount of data in thebuffer pool and becomes stable, and at that point SQLServer is ahead.
For the same total memory size, increasing thepage size is more effective for DSS queries than in-
creasing the fill factor. This makes total sense be-cause, as we discussed, since we have full scans, rel-evant data tend to be next to each other; therefore,the more data per page the better the performance. Ahigh fill factor in SQL Server can only achieve fulluse of the 8 KB data page, while a 32 or 64 KB pagein MySQL will store a lot more data regardless thefill factor automatically assigned by the system. Thusthe performance difference. As users, we can con-clude that having control over the page size is a bettertool for DSS queries performance enhancement thancontrol over the fill factor. Hence, here the MySQLapproach is superior. However, increasing the mem-ory size has an influence that exceeds both those ofincreasing the page size or the fill factor.
One final conclusion that can be drawn by theseresults is that, even though the TPC-H tests run fasterin SQL Server, the price/performance metric favorsMySQL by far (see Figures 3b and 4a). The addi-tional 898$1 required to purchase an SQL Server 2008license do not seem to be worthy for such low-scaledatabase needs in terms of performance difference.Therefore, there is a trade-off between high perfor-mance with SQL Server and cheaper implementationwith MySQL. Since the performance difference is notthat huge, it makes sense that MySQL is chosen bysmall businesses. However, in a setting of a large cor-poration where multuple DSS queries are run concur-rently, this performance difference will presumablyjustify the added price of the commercial SQL Serverlicense.
5 CONCLUSIONS AND FUTUREWORK
After examining the TPC-H benchmark in detail andhaving ran the tests, we can conclude that the testcan be downscaled. Even when using a low scalefactor as we did in order to run the tests on cheap
1circa 2010.

0"
50"
100"
150"
200"
250"
300"
350"
0" 200" 400" 600" 800" 1000" 1200"
Execu&on)Time)(minutes))
Total)Server)Memory)(MB))
SQL"Server"
Log."(SQL"Server)"
0.00##
10.00##
20.00##
30.00##
40.00##
50.00##
60.00##
70.00##
80.00##
16# 64# 128# 256# 512# 768# 1024#
Price&per&QphH@1GB/($)/
Total/Memory/Size/(MB)/
SQL#Server#
MySQL#
Figure 3: Impact of increasing the memory size parameter. Evolution of total execution on the left (a) and the evolution ofthe price/performance metric on the right (b) . The left graphic also displays the corresponding log fitting curve.
0"
50"
100"
150"
200"
250"
300"
350"
400"
(200" 0" 200" 400" 600" 800" 1000" 1200" 1400"
Execu&on)&me)(minutes))
Total)Server)Memory)(MB))
SQL"Server"
MySQL"
0"
10"
20"
30"
40"
50"
60"
70"
80"
0" 10" 20" 30" 40" 50" 60" 70"
Execu&on)&me))(minutes))
Page)Size)(KB))
MySQL"
Figure 4: Relative influence of different parameters on execution time and cost. Influence of memory size on the left (a) andinfluence of page size for MySQL only on the right (b). Larger bubles represent greater cost.
off-the-shelf hardware (thus yielding results that can-not be directly compared to the official TPC results)we could still observe differences between differentsystems and configurations. However our intuition isthat the set-up time and complexity for the databaseschema, workload and tests make the benchmark anunlikely choice for a medium-sized enterprise with-out a team of experts that can produce the requiredcode.
Running TPC-H gave us the motivation to lookdeeper into the factors that influence the performanceof DSS queries. We experimented with SQL Server2008 and MySQL 5.1 while varying such tuning op-tions and parameters, arriving to some interestingconclusions. From Sections 4.4 and 4.5 we concludethat the most influential tuning option is undoubtelythe memory size, namely the buffer pool and the sortbuffer sizes, which results in great improvement inthe price/performance metric. We observed clearlythat other parameters such as the page size and thefill factor can also play an important role in the per-formance of DSS queries and hence influence theprice/performance metric.
Since the two systems do not have identical con-figuration options, it is difficult to ascertain whetherwe tuned them fairly. Nevertheless, for similar con-figurations, MySQL is consistently slower than SQLServer (see Figure 3b and 4a). Since tuning is most
probably not responsible for this difference, we at-tribute it to different query optimizer philosophies. Inany case, MySQL might take a little longer to executethe TPC-H tests, yet it has a higher price/performanceratio thanks to being a freeware. In other words, if youare not going for optimal performance, it is certainlya viable and cheap alternative.
In the future, it would certainly be interesting torun the TPC-H test with a higher scale factor. Suchresults could be directly compared to the official onesand we could establish whether it is possible to recre-ate such performances using cheap off-the-shelf hard-ware. In addition, with a larger database we wouldbe able to observe finer differences between differentconfigurations and reach more conclusions.
Moreover, earlier we mentioned that DSS queriesare influenced by concurrency options, such as intra-partition parallelism. Running the tests on a multi-core machine would permit us to explore the perfor-mance differences caused by this option. There couldalso arise a trade-off between increasing the fill fac-tor or the page size in order to keep more data intothe cache, and keeping them low so that fewer data isunavailable when a page is locked.
Finally, having explored the process in detail, weare interested in developing our own plug-and-play kitof source code for running the TPC-H benchmark onany off-the-shelf hardware.

REFERENCES
Chaudhuri, S. and Narasayya, V. (2007). Self-tuningdatabase systems: a decade of progress. In VLDB’07,33rd Int’l Conference on Very Large Databases.VLDB Endowment Press.
Darmont, J., Bentayeb, F., and Boussaid, O. The design ofdweb. Int’l Journal of Business Intelligence and DataMining.
DeSota, D. (2001). Characterization of i/o for tpc-c andtpc-h workloads. In CAECW’01, 4th Workshop onComputer Architecture Evaluation using CommercialWorkloads. IBM Press.
Elnaffar, S. (2002). A methodology for auto-recognizingdbms workloads. In CASCON’02, 2002 Conferenceof the Centre for Advanced Studies on CollaborativeResearch. IBM Press.
Elnaffar, S., Martin, P., and Horman, R. (2002). Automat-ically classifying database workloads. In CIKM’02,11th Int’l Conference on Information and KnowledgeManagement. ACM Press.
Elnaffar, S., Martin, P., Schiefer, B., and Lightstone, S. Isit dss or oltp: automatically identifying dbms work-loads. Intelligent Information Systems.
Gray, J., Sundaresan, P., Englert, S., Baclawski, K., andWeinberger, P. (1994). Quickly generating billion-record synthetic databases. In SIGMOD’94, 1994ACM SIGMOD Int’l conference on Management ofData. ACM Press.
Green, C.-D. (2002). Oracle9i Database Performance Tun-ing Guide and Reference. Oracle, a96533-02 edition.
Guehis, S., Goasdoue-Thion, V., and Rigaux, P. (2009).Speeding-up data-driven applications with programsummaries. In IDEAS’09, 2009 Int’l Database En-gineering and Applications Symposium. ACM Press.
Harizopoulos, S., Shkapenyuk, V., and Ailamaki, A. (2005).Qpipe: a simultaneously pipelined relational queryengine. In SIGMOD’05, 2005 ACM SIGMOD Int’lConference on Management of Data. ACM Press.
IBM (2004). DB2 Universal Database V7 AdministrationGuide: Performance. IBM, sc09-4821 edition.
Kandaswamy, M. and Knighten, R. (2000). I/o phase char-acterization of tpc-h query operations. In IPDS’00, 4thInt’l Computer Performance and Dependability Sym-posium. IEEE Computer Society Press.
Kitsuregawa, M., Goda, K., and Hoshino, T. (2008). Stor-age fusion. In ICUIMC’08, 2nd Int’l Conference onUbiquitous Information Management and Communi-cation. ACM Press.
Lim, K., Chang, J., Mudge, T., Ranganathan, P., Reinhardt,S., and Wenisch, T. (2009). Disaggregated mem-ory for expansion and sharing in blade servers. InISCA’09, 36th Annual Int’l Symposium on ComputerArchitecture. ACM Press.
O’Neil, P., O’Neil, E., and Chen, X. (2009). The starschema benchmark (ssb). [Online; accessed Feb2012].
Oracle (2005). MySQL Reference Manual. Oracle, 28992edition.
Oracle (2006). Conducting a data warehouse benchmark.[White paper; accessed Feb 2012].
Packer, A. and Press, S. M. (2001). Configuring and Tun-ing Databases on the Solaris Platform. Prentice HallPTR, Upper Saddle River, 1st edition.
Paulsell, K. (1999). Sybase Adaptive Server Enterprise Per-formance and Tuning Guide. Sybase Inc., 32614-01-1200-02 edition.
Poess, M., Smith, B., Kollar, L., and Larson, P. (2002). Tpc-ds, taking decision support benchmarking to the nextlevel. In SIGMOD’02, 2002 ACM SIGMOD Int’l Con-ference on Management of Data. ACM Press.
Scalzo, B. (2007). Top 10 Benchmarking Misconceptions.Quest Software, 121007 edition.
Seng, J.-L. A study on industry and synthetic standardbenchmarks in relational and object databases. Indus-trial Management and Data Systems.
Shasha, D. and Bonnet, P. (2002). Database Tuning: Prin-ciples, Experiments, and Troubleshooting Techniques.Morgan Kaufmann Publishers Inc., San Francisco, 1stedition.
Siqueira, T. L., Ciferri, R., Times, V., and Ciferri, C. D. A.(2010). Benchmarking spatial data warehouses. InDAWAK10, 12th Iint’l Conference on Data Warehous-ing and Knowledge Discovery. Springer-Verlag Press.
Software, Q. (2008). Benchmark Factory for Databases.Quest Software, 090908 edition.
Somogyi, S., Wenisch, T., Ailamaki, A., and Falsa, B.(2009). Spatio-temporal memory streaming. InISCA’09, 36th Annual Int’l Symposium on ComputerArchitecture. ACM Press.
Vandierendonck, H. and Trancoso, P. (2006). Buildingand validating a reduced tpc-h benchmark. In MAS-COTS’06, 14th IEEE International Symposium onModeling, Analysis, and Simulation. IEEE ComputerSociety Press.
Wiese, D., Rabinovitch, G., Reichert, M., and Arenswald,S. (2008). Autonomic tuning expert: a framework forbest-practice oriented autonomic database tuning. InCASCON’08, 2008 Conference of the Center for Ad-vanced Studies on Collaborative Research: Meetingof Minds. ACM Press.