Behavioural adaptations to zonal maintenance of five species of tenebrionids living along a...
15
A. Aloia Æ I. Colombini Æ M. Fallaci Æ L. Chelazzi Behavioural adaptations to zonal maintenance of five species of tenebrionids living along a Tyrrhenian sandy shore Received: 16 October 1997 / Accepted: 23 November 1998 Abstract The spatial distribution of the following five nocturnal tenebrionid species was studied along a beach dune system: Phaleria provincialis Fauvel, Phaleria bimaculata Linnaeus, Halammobia pellucida Herbst, Xanthomus pallidus Curtis and Xanthomus pel- lucidus Mulsant. An integrated system of traps was used to sample the beetles during their active and resting phases. Environmental parameters were recorded locally during the experiments. Preference experiments were performed under controlled laboratory conditions. The aim of the study was to understand the environmental constraints influencing the species’ spatial distribution and the mechanisms involved in zonal maintenance. The results indicate that beetles exploit chemical and physi- cal gradients of the beach dune system; and the mech- anisms used for zonal recovery and/or maintenance are based on behavioural responses to visual and environ- mental stimuli. Controlled laboratory experiments showed that sand salinity was a limiting factor for all five species. For the two Phaleria species, which had a relatively seaward distribution, sand moistures were also important. In contrast, for the two Xanthomus species, which were distributed more landwards, grain size was a regulating factor. In the present study gradients in beetle responses to dierent environmental factors were ob- served. Introduction It has been recently demonstrated that sandy shore arthropods exhibit zonal partitioning of the beach en- vironment. Generally this occurs in fasciae parallel to the shoreline, but zonation can vary both in space and in time according to climatic conditions on a seasonal, daily and tidal basis (Chelazzi et al. 1983; Scapini et al. 1992; Colombini et al. 1994, 1996; Fallaci et al. 1996). Variations in zonation of arthropod species may be re- lated to sudden environmental changes (sea storms) and/ or to the physiological state of the invertebrate (e.g. sex, age, phase of the life cycle; Colombini and Chelazzi 1996; Fallaci et al. 1996). On the other hand, sandy shores are characterised by physical, chemical and veg- etation gradients perpendicular to the shoreline (Brown and McLachlan 1990; Hesp 1991; McLachlan 1991) that impose specific adaptations on the fauna. In particular, in some populations of the isopod Tylos europaeus Arcangeli, 1938, of the tenebrionid Phaleria cadaverina (Fabricius, 1773) and of the earwig Labidura riparia (Pallas, 1773), it has been shown that zonation patterns diered during the resting and active phases according to certain environmental factors (Colombini et al. 1996; Fallaci et al. 1996). Scapini et al. (1997) studied the in- fluence of the environmental parameters involved in the zonal recovery of spontaneously active sandhoppers (Talitrus saltator). During a study on darkling beetles conducted at Burano, a locality along the Tyrrhenian coast (Italy), it was found that the five most abundant tenebrionid species occupied specific zones in the beach dune system (Colombini et al. 1994). Of these, two belonged to the Phaleria genus, two to the Xanthomus genus and one to the Halammobia genus. All species were close taxo- nomically, had nocturnal habits and exhibited similar feeding behaviour, i.e. were mainly detritivorous. Fur- thermore, it was observed that species succession was quite regular from the sea towards the extralittoral and was maintained more or less constant over time even if distribution patterns could vary with seasonal changes. To understand the environmental constraints on each species and the mechanisms with which they maintain their distribution an in-depth study was carried out. In the field, the zonation of each species was registered both Marine Biology (1999) 133: 473–487 Ó Springer-Verlag 1999 Communicated by R. Cattaneo-Vietti, Genova A. Aloia Æ I. Colombini Æ M. Fallaci Æ L. Chelazzi (&) Centro di Studio per la Faunistica ed Ecologia Tropicali del C.N.R., Via Romana 17, I-50125 Florence, Italy
Transcript of Behavioural adaptations to zonal maintenance of five species of tenebrionids living along a...
A. Aloia á I. Colombini á M. Fallaci á L. Chelazzi
Behavioural adaptations to zonal maintenance of ®ve speciesof tenebrionids living along a Tyrrhenian sandy shore
Received: 16 October 1997 /Accepted: 23 November 1998
Abstract The spatial distribution of the following ®venocturnal tenebrionid species was studied along a beachdune system: Phaleria provincialis Fauvel,Phaleria bimaculata Linnaeus, Halammobia pellucidaHerbst, Xanthomus pallidus Curtis and Xanthomus pel-lucidus Mulsant. An integrated system of traps was usedto sample the beetles during their active and restingphases. Environmental parameters were recorded locallyduring the experiments. Preference experiments wereperformed under controlled laboratory conditions. Theaim of the study was to understand the environmentalconstraints in¯uencing the species' spatial distributionand the mechanisms involved in zonal maintenance. Theresults indicate that beetles exploit chemical and physi-cal gradients of the beach dune system; and the mech-anisms used for zonal recovery and/or maintenance arebased on behavioural responses to visual and environ-mental stimuli. Controlled laboratory experimentsshowed that sand salinity was a limiting factor for all®ve species. For the two Phaleria species, which had arelatively seaward distribution, sand moistures were alsoimportant. In contrast, for the two Xanthomus species,which were distributed more landwards, grain size was aregulating factor. In the present study gradients in beetleresponses to di�erent environmental factors were ob-served.
Introduction
It has been recently demonstrated that sandy shorearthropods exhibit zonal partitioning of the beach en-vironment. Generally this occurs in fasciae parallel to
the shoreline, but zonation can vary both in space and intime according to climatic conditions on a seasonal,daily and tidal basis (Chelazzi et al. 1983; Scapini et al.1992; Colombini et al. 1994, 1996; Fallaci et al. 1996).Variations in zonation of arthropod species may be re-lated to sudden environmental changes (sea storms) and/or to the physiological state of the invertebrate (e.g. sex,age, phase of the life cycle; Colombini and Chelazzi1996; Fallaci et al. 1996). On the other hand, sandyshores are characterised by physical, chemical and veg-etation gradients perpendicular to the shoreline (Brownand McLachlan 1990; Hesp 1991; McLachlan 1991) thatimpose speci®c adaptations on the fauna. In particular,in some populations of the isopod Tylos europaeusArcangeli, 1938, of the tenebrionid Phaleria cadaverina(Fabricius, 1773) and of the earwig Labidura riparia(Pallas, 1773), it has been shown that zonation patternsdi�ered during the resting and active phases accordingto certain environmental factors (Colombini et al. 1996;Fallaci et al. 1996). Scapini et al. (1997) studied the in-¯uence of the environmental parameters involved in thezonal recovery of spontaneously active sandhoppers(Talitrus saltator).
During a study on darkling beetles conducted atBurano, a locality along the Tyrrhenian coast (Italy), itwas found that the ®ve most abundant tenebrionidspecies occupied speci®c zones in the beach dune system(Colombini et al. 1994). Of these, two belonged to thePhaleria genus, two to the Xanthomus genus and one tothe Halammobia genus. All species were close taxo-nomically, had nocturnal habits and exhibited similarfeeding behaviour, i.e. were mainly detritivorous. Fur-thermore, it was observed that species succession wasquite regular from the sea towards the extralittoral andwas maintained more or less constant over time even ifdistribution patterns could vary with seasonal changes.To understand the environmental constraints on eachspecies and the mechanisms with which they maintaintheir distribution an in-depth study was carried out. Inthe ®eld, the zonation of each species was registered both
Marine Biology (1999) 133: 473±487 Ó Springer-Verlag 1999
Communicated by R. Cattaneo-Vietti, Genova
A. Aloia á I. Colombini á M. Fallaci á L. Chelazzi (&)Centro di Studio per la Faunisticaed Ecologia Tropicali del C.N.R., Via Romana 17,I-50125 Florence, Italy
during its active and resting phase. For the Phaleriaspecies the vertical distribution was analysed in semi-natural conditions during its burrowing phase. Eachhorizontal and vertical zonation pattern was then cor-related with the environmental parameters registeredlocally during the experiments. Each parameter wasindividually tested through preference experiments con-ducted under controlled laboratory conditions, in orderto better understand the intra- and interspeci®c variationof the response.
Materials and methods
Study area
Between the sea and the Burano Lagoon (Capalbio, GR, Italy,42°23¢30¢¢N; 11°22¢30¢¢E) lies a sand bar where two dunes coveredby vegetation (Pedrotti et al. 1975) can be clearly distinguished.From the sea to the summit of the ®rst dune two transects wereinvestigated, each approximately 100 m long. Each transect couldbe subdivided into three di�erent zones according to the mor-phology, exposure and vegetation cover (Fig. 1). The eulittoralzone includes the part of the beach which is devoid of vegetation,where wrack mounds are deposited by the sea. The mean breadthof this zone is ca. 35 m but like its pro®le this can vary dependingon the force of wave action, sea currents and wind. The supralit-toral zone extends about 20 m along the transect and forms theforedune with pioneer plants. The extralittoral zone was investi-gated only to the summit of the ®rst dune which was covered by aMediterranean maquis.
Species examined
Five nocturnal tenebrionid species were chosen for this study.Phaleria provincialis Fauvel, 1901 and Phaleria bimaculataLinnaeus, 1777 are typically spring/summer species, whereasXanthomus pallidus Curtis, 1830 and Xanthomus pellucidusMulsant, 1856 are mainly autumn/winter species. In contrast,Halammobia pellucida Herbst, 1799 is present at Burano through-out the entire year (Colombini et al. 1994; Fallaci et al. 1994).
Field experiments
Sampling from March 1991 to January 1992 was carried out on abimonthly basis. Two sampling methods were employed: pitfalltraps were used for beetles wandering over the ground, whilstburrowed specimens were collected with sieving techniques duringtheir resting phase.
The pitfall traps consisted of a single row of plastic cups(diam � 9.5 cm) buried to ground level and separated from eachother by a 5 m long strip of ®bre glass, 10 cm in height. The zerotrap was set at the base of the dune, and the other traps werenumbered seaward ()) and landward (+) from this reference point.The number of seaward traps varied depending on the force of thewave action and the seasonal di�erences in sea level. The collectingstations were always set in the same place along the transect duringthe 6-month observation period and each was deployed for 48consecutive hours. Traps were checked hourly at night and every2 h during the day; at these times all beetles were collected.
A second transect consisted of sieving stations spaced 5 m fromeach other. Each station consisted of a 1 m2 patch of sand whichwas gathered to a depth of 10 cm. Plants were sampled, andarthropods were collected by sifting the sand through a 1 mm meshsieve. For this second transect as well the number of seaward sta-tions varied. Sand samples to 10 cm of depth were taken for lab-oratory analysis. With standard techniques (Bremner 1965), thesubstrate moisture, salinity (conductivity of the sand solution) and
grain size were analysed for each station. Particle size analysis waselaborated according to Folk and Ward (1957). Furthermore sandtemperatures at the surface and at 20 cm in depth were registeredwhile collecting the beetles with the pitfall traps.
Experiments in seminatural conditions
During 19±20 March and 12±13 June 1996 two series of experi-ments were conducted at Burano to analyse the vertical distributionof the two Phaleria species during their resting phase. Two rows ofcores were placed in the sand in an area where the species normallyoccurs, at a distance of 5 and of 15 m from the shoreline. The coresof PVC, 16 cm in diameter and 35 cm in height, were pushed to adepth of 30 cm. Each row was composed of three groups of fourcores. At sunset of the day previous to the experiments, 30 beetleswere introduced into each core. Daily replicates were performed byplacing the same species in two cores of each group. The followingday the experiment was repeated, but without daily replicates. Eachgroup in the two rows was sampled at a speci®c time of day: sun-rise, midday and sunset. The sand in each core was analysed every5 cm (in depth) by mechanical aspiration and then sieved sepa-rately to collect the beetles. For each 5-cm strata, penetrability andtemperatures were recorded. Penetrability was measured with a rod(39 cm long, 0.8 cm in diameter and 52 g) released in a cylinder(1.5 cm in diameter) at 1 m of height. Furthermore, for each group,another core (3 cm in diameter and 35 cm in height) was pushedinto the ground to obtain sand samples for moisture analysis ofeach level.
Laboratory experiments
Temperature preference experiments were carried out in a straight,transparent Plexiglas arena (40 ´ 4 cm and 5 cm in height), with analuminium ¯oor; the arena was subdivided into ten connectedcompartments and closed o� by a transparent lid (Chelazzi andColombini 1990). For the autumn/winter species the gradientranged from 5 to 35 °C and from 10 to 40 °C for the spring/sum-mer species. Air humidity was 100% throughout the experiments.Tenebrionids were tested during daytime with arti®cial illumina-tion, and were individually introduced at the centre of the arena.The position of the beetles and the temperatures of the di�erentcompartments were recorded after 1 h. Mean temperatures of thecompartments chosen by the individuals were calculated togetherwith 95% con®dence limits.
Substrate moisture, salinity and grain size preferences weretested at night at a room temperature of 20 °C in circular arenasdivided into two compartments (20 cm in diameter, 5 cm in heightand ®lled with 3 cm of sand). For the moisture experiments eachbeetle could choose alternatively between dry and moist sands (0,2.5, 5, 10 and 20% of water added to the total weight of sand). Forthe salinity experiments the sand was previously washed with tapwater, oven dried at 105 °C and again moistened to 2% with asolution of demineralized water containing 0, 0.5, 1, 2.5, 5 and 10%of NaCl. For grain size experiments the sand of Burano was pre-viously sieved through meshes of di�erent sizes and moistened to2%. The most abundant portions were 180, 250, 355, 500 and710 lm. Controls were performed only with the 355 lm portionbecause it was the intermediate and dominant grain size. The po-sition of the individuals in the choice-chamber was registered thefollowing morning.
To test if the beetles could use other cues, such as landscapeand/or other silhouettes (beach debris, tufts of vegetation), tochoose their preferred beach zone, an experiment on their scoto-tactical abilities was performed. An arena with 72 perimetricalpitfall traps (Scapini and Pardi 1979) surrounded by and coveredwith a white Plexiglas cylindrical screen and lid was used. All in-dividuals were tested on dry substrate. Twelve neon tubes whichformed a regular hexagon around the arena (Ugolini et al. 1986)di�used light homogeneously. Silhouettes were made from a rect-angular piece of black cardboard (10 cm in height) that took up 45°
474
of the horizon subtending an angle of 25° from the centre of thearena. Alternatively the silhouette was placed to the north and tothe south. Experiments were conducted at 09:00, 12:00 and 15:00hrs in a dark room at a temperature of 20 °C. The results wereanalysed separately and then cumulated.
Statistical analysis
For ®eld experiments with pitfall traps and sieves only data withn ³ 16 (16 was the maximum number of pitfall traps in the transect)
and n ³ 8 were considered, respectively. Total mean monthlyzonations, the mean level of the vertical distribution of the beetlesand the preferred mean temperatures were calculated through one-sample analysis method with con®dence limits of 95%.
Multiple regression analysis (Bliss 1970; Zar 1984), through thebackward elimination method, was employed to correlate the dailydistribution of the beetles during both their active and restingphases with the di�erent environmental parameters. For thisanalysis the statistical package Statgraphics Version 4.0 (STSCInc.) was used. This same method was employed to correlate thevertical distribution of the Phaleria species with the related envi-ronmental parameters. Chi-square tests were used to verify if thechoices in the preference experiments were statistically signi®cant.Circular statistics analysis (Batschelet 1981) was used to evaluate ifbeetle responses to black silhouettes were signi®cant. The Rayleigh-test was employed to check whether the population was signi®-
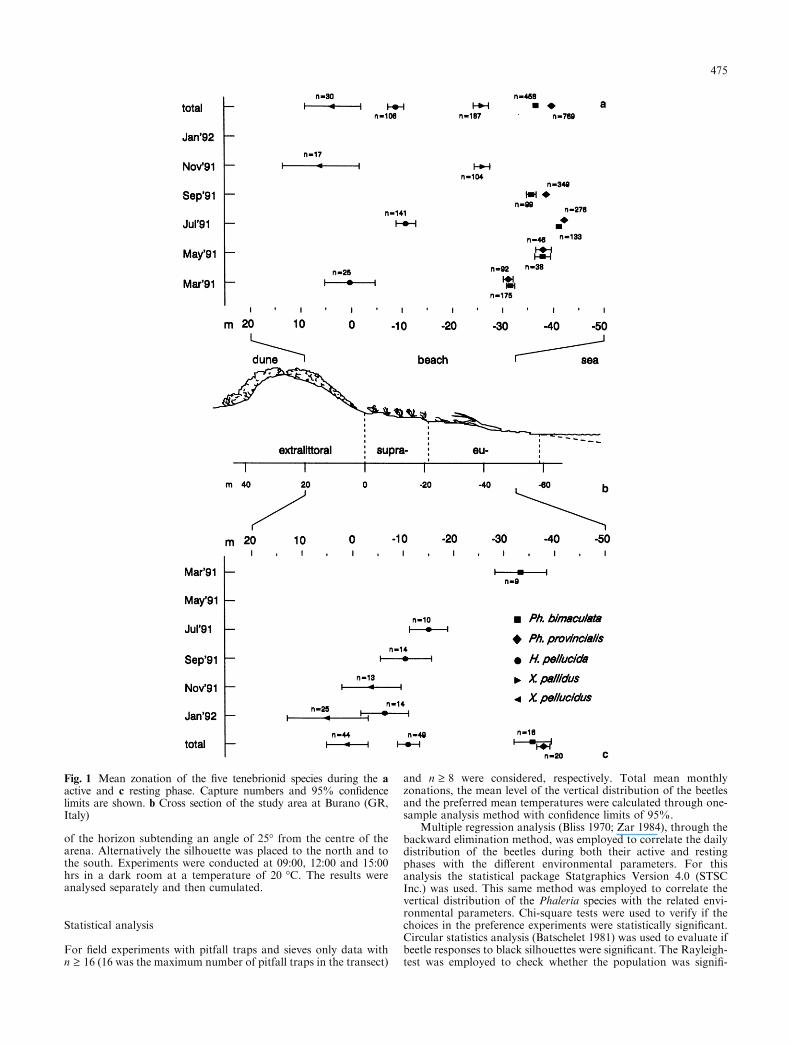
Fig. 1 Mean zonation of the ®ve tenebrionid species during the aactive and c resting phase. Capture numbers and 95% con®dencelimits are shown. b Cross section of the study area at Burano (GR,Italy)
475

cantly concentrated, and the V-test was applied to determine if thepopulation was signi®cantly concentrated around the silhouette'scentre (expected direction � 0°). When two equal and oppositesets of points were obtained in the distribution, bimodality wasconsidered. By doubling of angles (Batschelet 1981) the bimodaldistribution was transformed into a unimodal distribution, and thesecond trigonometric moment was calculated.
To test whether the concentration parameter (mean vectorlength, r) of two species di�ered from each other, a parametric testfor the concentration parameter was used (Batschelet 1981). When�r > 0:70 Watson and Williams' (1956) formula was used and valuesof the F-distribution were obtained. When 0:45 � �r � 0:70, Mar-dia's (1972) modi®cation was applied and Z-values of a normaldistribution were found.
In all tests probability levels were considered signi®cant whenp < 0.05.
Results
Field experiments
During nocturnal activity (Fig. 1a) the ®ve tenebrionidspecies presented statistically distinct total mean zona-tions. The two Phaleria species were closer to the seathan the other three species; Halammobia pellucida hadan intermediate zonation between the two Xanthomusspecies. During the resting phase (Fig. 1c) the totalzonation of the di�erent species followed more or lessthe same distribution pattern except for X. pallidus. Nosigni®cant di�erences were found between the zonationof the two Phaleria species when burrowed, howeverPh. provincialis was more seawards during its activityperiod than during its resting phase. When monthlymean zonations are considered, nocturnal activity of Ph.bimaculata and Ph. provincialis showed signi®cant sea-ward movements followed by landward movements asthe season changed. H. pellucida also advanced towardsthe sea by about 10 m in July. For the latter species asigni®cant di�erence in the zonation of burrowed beetleswas found between July 1991 and January 1992. ForX. pellucidus there did not seem to be di�erences in themean zonation between the active and resting phase nor,in the latter phase, between November 1991 and January1992.
In all months sand surface temperatures (Fig. 2a)were signi®cantly higher than sand temperatures belowthe surface in all three zones, except for September andNovember. Only in the supralittoral were below-surfacetemperatures higher than those on the surface for themonth of November. Maximum mean surface and be-low-surface temperatures were obtained in July(30.45 °C in the extralittoral) and in September(28.41 °C in the supralittoral), respectively. In Januaryminimum mean surface and below-surface temperatureswere recorded in the supralittoral (9.47 °C and 7.76 °C,respectively). No di�erences in sand moisture (Fig. 2b)were found between zones when comparisons were madewithin months even though higher mean values werefound in the eulittoral. July registered the lowest valuesof moisture. Mean values of sand salinity were againhigher in the eulittoral, but not signi®cantly di�erent
from the other zones due to great variability in the data.However, in July and September, there was a tendencyof higher mean values of salinity which appeared relatedto the more stable climatic conditions. As for the grainsize parameters, no di�erences were obtained within orbetween months in any of the three zones (Fig. 2c, d).
When the di�erent environmental parameters werecorrelated with the beetles' spatial distribution duringtheir active phase (Table 1), the two Phaleria speciesshowed similar trends. Distributions were never signi®-cantly correlated with sand surface temperatures norwith sand moistures in the di�erent months, except forthe correlation of the latter parameter with the annualdistribution of Ph. provincialis. Positive correlations withthe salinity of the sand were found in all months exceptfor July, when no signi®cant correlations were obtained.Spatial distribution of the two Phaleria species wascorrelated with grain size parameters in most months;mean grain size (Mz) showed negative correlations ex-cept for May and for the annual distribution, whenpositive and nonsigni®cant correlations occurred, re-spectively. Coe�cients of determination (R2) were above50% in all cases apart from July for Ph. bimaculata andfor the total annual distribution of both species. As forHalammobia pellucida negative correlations were ob-tained with sand surface temperature, sand moisture(except for July), salinity and mean grain size. The twospecies of the Xanthomus genus showed similar correla-tions with the di�erent parameters but the coe�cients ofdetermination were quite low. Note that no signi®cantcorrelations were found with sand salinity or mean grainsize.
When multiple regression analysis was applied to thespatial distribution of the burrowed individuals duringtheir resting phase, di�erent results were obtained(Table 2). For Phaleria bimaculata a su�cient numberof individuals was registered only in March, and signi-®cant correlations with sand moisture and with two ofthe four grain size parameters were found. For Ha-lammobia pellucida grain size parameters (excluding Mz)gave signi®cant correlations in September and January,but coe�cients of determination were less than 50%. Ofthe two Xanthomus species only X. pellucidus providedsu�cient data to be analysed; in January stronger cor-relations were obtained with the environmental param-eters and the coe�cient of determination was almostdouble that of November. Generally the annual spatialdistributions showed very low coe�cients of determi-nation.
Experiments in seminatural conditions
Di�erent results were obtained according to the monthsanalysed (Fig. 3). In March all individuals of bothPhaleria species were found in the upper 5 cm of sand atall hours of the day. In June there was greater variabilityin the depth of burrowing. In all cases, except forPh. provincialis at sunrise, the individuals were less
476

buried in the cores closer to the sea than in those 15 mfrom it. In the latter cores the tenebrionids burrowedsigni®cantly more deeply at midday and sunset com-pared to their position at sunrise. However no signi®cantdi�erences occurred between midday and sunset. At 5 m
during sunrise and at 15 m during midday Ph. provin-cialis was found deeper than Ph. bimaculata. For thelatter species maximum depths were reached at sunset inboth types of cores. In contrast, for Ph. provincialis,maximum depths were reached at midday and at sunsetin the cores at 15 and 5 m, respectively.
When di�erent environmental parameters (seeTable 3) were correlated, through multiple regressionanalysis, with the vertical distributions of the two Pha-leria species, in March the results were exactly the samebecause no di�erences were found in the vertical distri-
Fig. 2 Mean monthly values registered in the three zones of the beachdune system: a surface and below-surface sand temperatures (data aremissing for May), b sand moistures and salinities, c mean grain size(Mz) and inclusive graphic standard deviation (rI) and d inclusivegraphic skewness (SkI) and graphic kurtosis (KG). Con®dence limits(95%) are shown
477
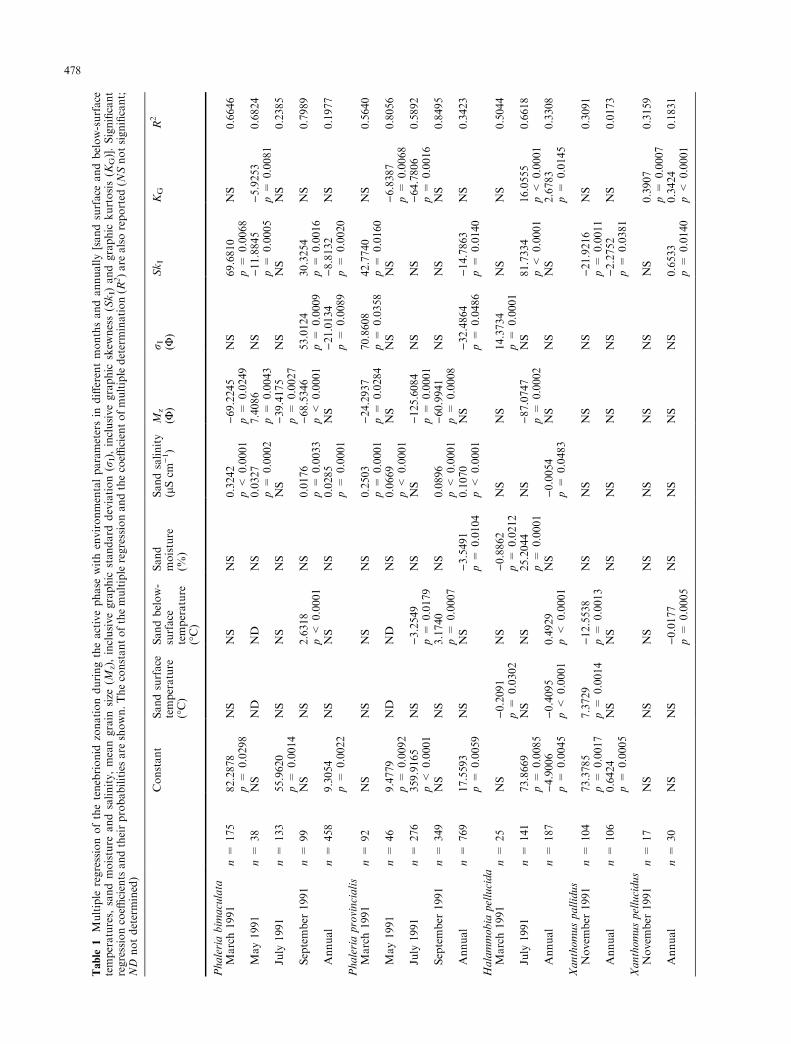
Table
1Multiple
regressionofthetenebrionid
zonationduringtheactivephase
withenvironmentalparametersin
di�erentmonthsandannually[sandsurface
andbelow-surface
temperatures,
sandmoisture
andsalinity,meangrain
size
(Mz),inclusivegraphic
standard
deviation(r
I),inclusivegraphic
skew
ness(SkI)
andgraphic
kurtosis(K
G)].Signi®cant
regressioncoe�
cientsandtheirprobabilitiesare
shown.Theconstantofthemultipleregressionandthecoe�
cientofmultipledetermination(R
2)are
alsoreported
(NSnotsigni®cant;
ND
notdetermined)
Constant
Sandsurface
temperature
(°C)
Sandbelow-
surface
temperature
(°C)
Sand
moisture
(%)
Sandsalinity
(lScm
)1)
Mz
(F)
r I (F)
SkI
KG
R2
Phaleriabim
aculata
March1991
n=
175
82.2878
p=
0.0298
NS
NS
NS
0.3242
p<
0.0001
)69.2245
p=
0.0249
NS
69.6810
p=
0.0068
NS
0.6646
May1991
n=
38
NS
ND
ND
NS
0.0327
p=
0.0002
7.4086
p=
0.0043
NS
)11.8845
p=
0.0005
)5.9253
p=
0.0081
0.6824
July
1991
n=
133
55.9620
p=
0.0014
NS
NS
NS
NS
)39.4175
p=
0.0027
NS
NS
NS
0.2385
September
1991
n=
99
NS
NS
2.6318
p<
0.0001
NS
0.0176
p=
0.0033
)68.5346
p<
0.0001
53.0124
p=
0.0009
30.3254
p=
0.0016
NS
0.7989
Annual
n=
458
9.3054
p=
0.0022
NS
NS
NS
0.0285
p=
0.0001
NS
)21.0134
p=
0.0089
)8.8132
p=
0.0020
NS
0.1977
Phaleriaprovincialis
March1991
n=
92
NS
NS
NS
NS
0.2503
p=
0.0001
)24.2937
p=
0.0284
70.8608
p=
0.0358
42.7740
p=
0.0160
NS
0.5640
May1991
n=
46
9.4779
p=
0.0092
ND
ND
NS
0.0669
p<
0.0001
NS
NS
NS
)6.8387
p=
0.0068
0.8056
July
1991
n=
276
359.9165
p<
0.0001
NS
)3.2549
p=
0.0179
NS
NS
)125.6084
p=
0.0001
NS
NS
)64.7806
p=
0.0016
0.5892
September
1991
n=
349
NS
NS
3.1740
p=
0.0007
NS
0.0896
p<
0.0001
)60.9941
p=
0.0008
NS
NS
NS
0.8495
Annual
n=
769
17.5593
p=
0.0059
NS
NS
)3.5491
p=
0.0104
0.1070
p<
0.0001
NS
)32.4864
p=
0.0486
)14.7863
p=
0.0140
NS
0.3423
Halammobia
pellucida
March1991
n=
25
NS
)0.2091
p=
0.0302
NS
)0.8862
p=
0.0212
NS
NS
14.3734
p=
0.0001
NS
NS
0.5044
July
1991
n=
141
73.8669
p=
0.0085
NS
NS
25.2044
p=
0.0001
NS
)87.0747
p=
0.0002
NS
81.7334
p<
0.0001
16.0555
p<
0.0001
0.6618
Annual
n=
187
)4.9006
p=
0.0045
)0.4095
p<
0.0001
0.4929
p<
0.0001
NS
)0.0054
p=
0.0483
NS
NS
NS
2.6783
p=
0.0145
0.3308
Xanthomuspallidus
Novem
ber
1991
n=
104
73.3785
p=
0.0017
7.3729
p=
0.0014
)12.5538
p=
0.0013
NS
NS
NS
NS
)21.9216
p=
0.0011
NS
0.3091
Annual
n=
106
0.6424
p=
0.0005
NS
NS
NS
NS
NS
NS
)2.2752
p=
0.0381
NS
0.0173
Xanthomuspellucidus
Novem
ber
1991
n=
17
NS
NS
NS
NS
NS
NS
NS
NS
0.3907
p=
0.0007
0.3159
Annual
n=
30
NS
NS
)0.0177
p=
0.0005
NS
NS
NS
NS
0.6533
p=
0.0140
0.3424
p<
0.0001
0.1831
478

Table2
Multipleregressionoftenebrionid
meanzonationduringtherestingphase
withenvironmentalparametersin
thedi�erentmonthsandannually.Forfurther
explanationssee
Table
1legend
Constant
Sandsurface
temperature
(°C)
Sandbelow-
surface
temperature
(°C)
Sand
moisture
(%)
Sandsalinity
(lScm
)1)
Mz
(F)
r I (F)
SkI
KG
R2
Phaleriabim
aculata
March1991
n=
9NS
NS
NS
2.5027
p=
0.0184
NS
)3.4729
p=
0.0340
NS
8.3690
p=
0.0221
NS
0.3605
Annual
n=
16
NS
NS
NS
0.1371
p=
0.0116
NS
NS
NS
NS
NS
0.0652
Phaleriaprovincialis
Annual
n=
20
NS
NS
NS
NS
0.0042
p=
0.0002
NS
NS
NS
NS
0.1361
Halammobia
pellucida
July
1991
n=
10
NS
NS
NS
NS
NS
NS
NS
NS
NS
0.0
September
1991
n=
14
NS
NS
NS
NS
NS
NS
)16.6250
p=
0.0106
5.1020
p=
0.0366
4.8407
p=
0.0058
0.4944
January
1992
n=
14
NS
NS
NS
NS
NS
NS
NS
NS
0.6072
p=
0.0371
0.2586
Annual
n=
49
NS
NS
NS
NS
NS
NS
)3.8374
p=
0.0372
1.5314
p=
0.0283
1.2923
p=
0.0065
0.2253
Xanthomuspellucidus
Novem
ber
1991
n=
13
NS
NS
2.9399
p=
0.0104
NS
)0.2012
p=
0.0104
)16.7896
p=
0.0171
NS
NS
)11.3830
p=
0.0229
0.3755
January
1992
n=
25
NS
)9.1510
p=
0.0200
NS
7.8415
p=
0.0019
)0.3107
p=
0.0010
64.6998
p=
0.0066
)42.2382
p=
0.0196
)59.8252
p=
0.0036
NS
0.6680
Annual
n=
44
1.7395
p=
0.0006
NS
)0.0632
p=
0.0096
NS
NS
NS
NS
NS
NS
0.0721
479

bution of the two species (Table 4). In the landwardcores (15 m from sea) correlations were found with sandtemperature, whereas this did not occur in the corescloser to the sea. In both rows of cores sand moisturesand penetrability had respectively negative and positive(except sunrise 15 m) correlations with the tenebrionid'svertical distribution. Correlations with depth were al-ways positive. In March coe�cients of determinationwere above 80%.
In June (Table 4) for Phaleria bimaculata, both at 15and at 5 m, correlations with sand temperature werenever signi®cant. Instead positive correlations werefound at 5 m with sand penetrability, but the constantwas not signi®cant. At 15 m the opposite occurred (sandpenetrability was not signi®cant but the constant was).Vertical distributions were correlated negatively withsand moistures at midday and sunset and positively withdepth at sunrise. Slightly di�erent results were obtainedwhen correlations were made with the vertical distribu-tion of Ph. provincialis. Sand temperatures presentedpositive correlations in two cases, and the constant wasnever signi®cant at 15 m. Taking the totals of bothmonths and both species into account correlations withthe environmental parameters gave similar results. In themonth of June coe�cients of determination were alwaysover 50%.
Laboratory experiments
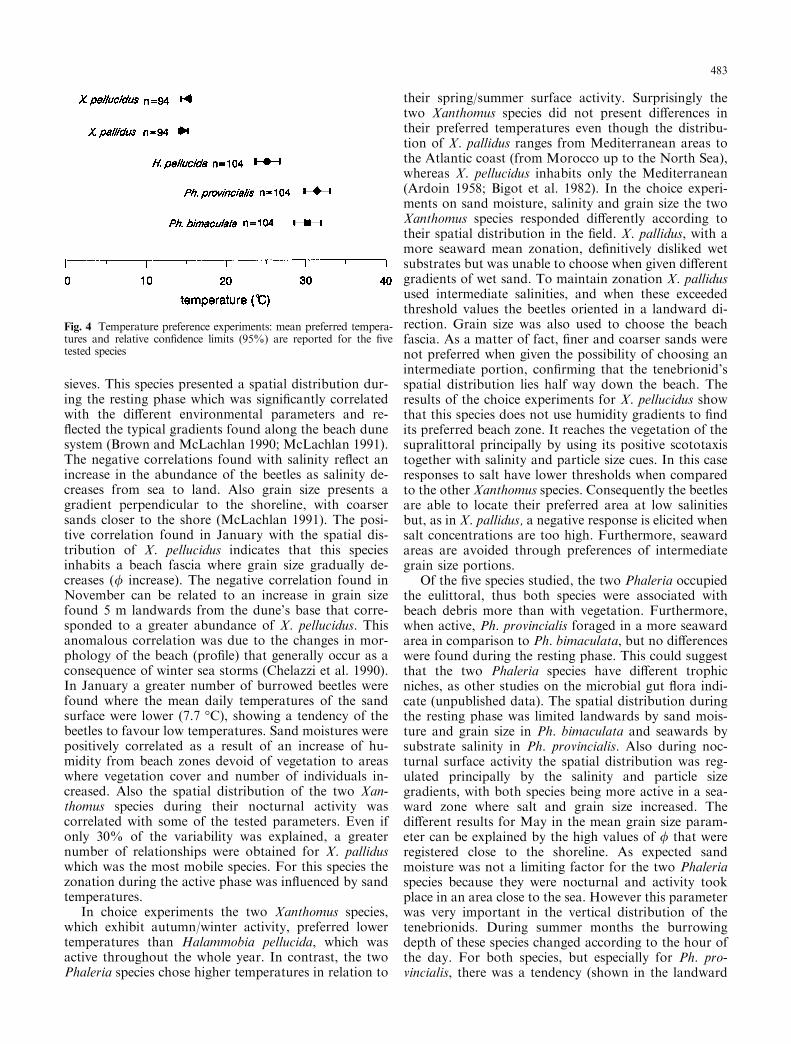
Controlled laboratory experiments (Fig. 4) showed thatthe two Phaleria species preferred mean temperaturesnot statistically di�erent from one another (Ph. pro-vincialis 31.32 °C � 1.63 °C; Ph. bimaculata30.19 °C � 1.64 °C). The same occurred for the twoXanthomus species (X. pellucidus 14.20 °C � 0.58 °C;X. pallidus 14.49 °C � 0.62 °C). Halammobia pellucida
chose an intermediate mean temperature of25.08 °C � 1.55 °C that was statistically di�erent fromthose of the above species.
Choice experiments on substrate moisture (Fig. 5a)showed that Halammobia pellucida and Xanthomus pel-lucidus never presented signi®cant preferences for a spe-ci®c sand humidity. The twoPhaleria species, on the otherhand, preferred dry (0%) over extremely wet sand (20%and 10%). Moreover Ph. bimaculata chose 0% against5% and 2.5% against 20%. X. pallidus always preferred0% over all the other wet sands, whereas in all the othercombinations no signi®cant results were obtained.
In the preference experiment for sand salinity(Fig. 5b) Phaleria bimaculata responded positively tolower percents of salt (0.5%) in contrast to Ph. pro-vincialis which did not start to react until 2.5%. In the®rst and second species no signi®cant results werefound respectively for 1% against 0% or 5% against0%. As for Halammobia pellucida choices were madeonly in two experiments and these were towards a non-salty substrate (0%), even though in one case theprobability level was not very high (p < 0.05). The twospecies of the Xanthomus genus showed preferences forall salty substrates except the combination against10%. X. pellucidus was the more sensitive of the twospecies to salinity, responding already at 1% salt.
The two Phaleria species together with Halammobiapellucida did not show preferences in grain size experi-ments (Fig. 5c). By contrast Xanthomus pallidus chosethe grain size most prevalent at Burano (355 lm) in allthe combinations where this was present, except in theexperiment against 500 lm when no choices were made.X. pellucidus seemed to have similar preferences but inthis case when cross tests were performed no signi®cantresults were obtained.
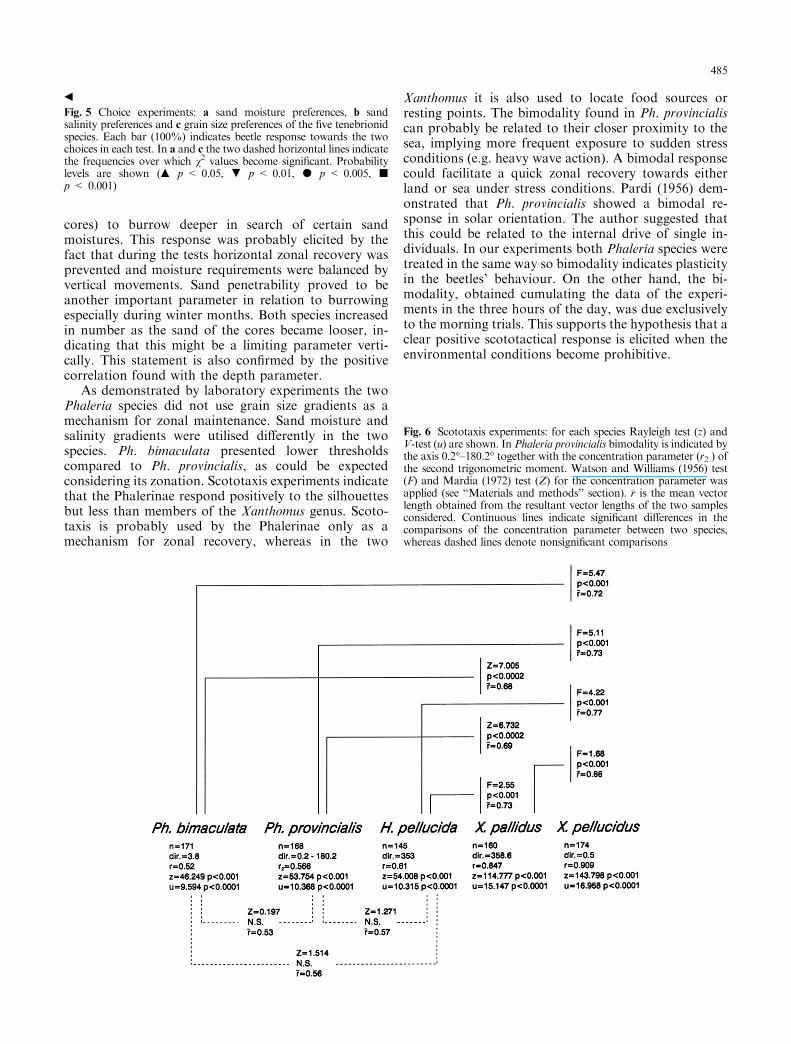
Each tested species displayed scototactical abilitiesin the orientation experiments (Fig. 6). In all distribu-tions individuals were signi®cantly concentrated andoriented towards the silhouette (see Rayleigh andV-test). Vector lengths were extremely long in Xantho-mus pellucidus and X. pallidus (r � 0.909 andr � 0.847, respectively), and in Phaleria provincialis asigni®cant bimodal distribution was obtained. In thelatter species if experiments for each of the three hoursof the day are considered separately a bimodal re-sponse was obtained only at 9:00 hrs, whereas at 12:00and at 15:00 hrs the beetles were positively orientedtowards the black cardboard. The concentrationparameters (r) di�ered signi®cantly in all cases whencomparisons were made between species, except whenPh. provincialis was compared to Ph. bimaculata and toHalammobia pellucida and when the latter two specieswere compared with each other.
Discussion
The two Xanthomus species present a zonation that re-¯ects their trophic and physiological needs. Of these two
Fig. 3 Experiments in seminatural conditions: mean depth ofburrowed individuals in three di�erent periods of the day. Openand closed symbols refer to the cores at 15 and 5 m from the sea,respectively. Each symbol represents the mean burrowing depth of 90tested individuals. Con®dence limits (95%) are indicated
480
species, X. pellucidus was more dispersed and landward.It was generally found associated with vegetation coversuch as Ammophila arenaria (L.), Otanthus maritimus(L.) and Echinophora spinosa (L.) but also with morelandward species like Medicago maritima (L.). X. pal-lidus presented a more concentrated zonation on theeulittoral and was frequently found burrowed in thesand under beach debris. Rarely it was associated withpioneer plants such as Otanthus maritimus and Cakilemaritima Scop. The comparison of the results obtainedfrom the pitfall traps with those from the sieves clearlyindicate that X. pallidus wanders on the sand surface insearch of detritus more than X. pellucidus (see capturenumbers). In fact movements of the latter species are
generally vertical, from the base of the plants wherediurnal hours are spent, to their top where feeding onseeds occurs. On the French Atlantic coast Caussanel(1965, 1970) reported that X. pallidus moves back andforth from the beach to the dune where plant debris arepresent. Furthermore, if compared to the Phalerinaespecies, the two Xanthomus species are adapted toclimbing more than to digging, as shown by their legmorphology (Ponel 1983). The reasons why X. palliduswas never collected in the sieves may be due to a sam-pling bias; for this species it would have been more ap-propriate to collect samples with a closer spacing. Incontrast X. pellucidus, which more frequently burrows insand associated with plant cover, was captured in the
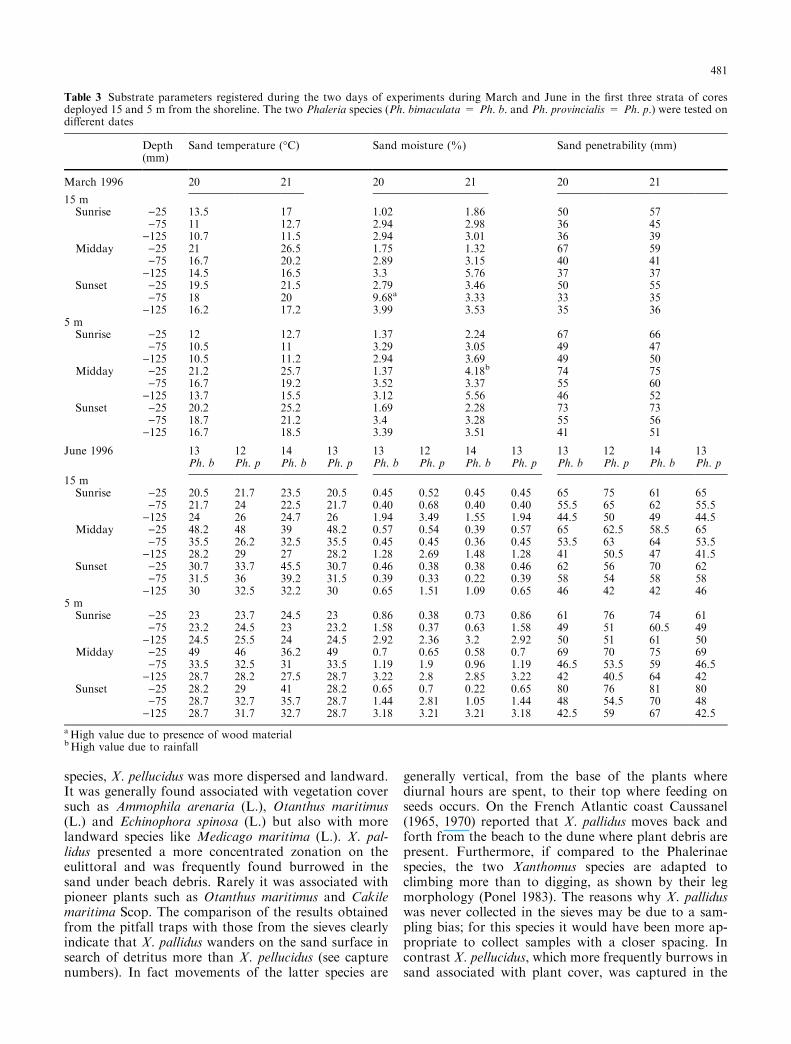
Table 3 Substrate parameters registered during the two days of experiments during March and June in the ®rst three strata of coresdeployed 15 and 5 m from the shoreline. The two Phaleria species (Ph. bimaculata = Ph. b. and Ph. provincialis = Ph. p.) were tested ondi�erent dates
Depth(mm)
Sand temperature (°C) Sand moisture (%) Sand penetrability (mm)
March 1996 20 21 20 21 20 21
15 mSunrise )25 13.5 17 1.02 1.86 50 57
)75 11 12.7 2.94 2.98 36 45)125 10.7 11.5 2.94 3.01 36 39
Midday )25 21 26.5 1.75 1.32 67 59)75 16.7 20.2 2.89 3.15 40 41
)125 14.5 16.5 3.3 5.76 37 37Sunset )25 19.5 21.5 2.79 3.46 50 55
)75 18 20 9.68a 3.33 33 35)125 16.2 17.2 3.99 3.53 35 36
5 mSunrise )25 12 12.7 1.37 2.24 67 66
)75 10.5 11 3.29 3.05 49 47)125 10.5 11.2 2.94 3.69 49 50
Midday )25 21.2 25.7 1.37 4.18b 74 75)75 16.7 19.2 3.52 3.37 55 60
)125 13.7 15.5 3.12 5.56 46 52Sunset )25 20.2 25.2 1.69 2.28 73 73
)75 18.7 21.2 3.4 3.28 55 56)125 16.7 18.5 3.39 3.51 41 51
June 1996 13 12 14 13 13 12 14 13 13 12 14 13Ph. b Ph. p Ph. b Ph. p Ph. b Ph. p Ph. b Ph. p Ph. b Ph. p Ph. b Ph. p
15 mSunrise )25 20.5 21.7 23.5 20.5 0.45 0.52 0.45 0.45 65 75 61 65
)75 21.7 24 22.5 21.7 0.40 0.68 0.40 0.40 55.5 65 62 55.5)125 24 26 24.7 26 1.94 3.49 1.55 1.94 44.5 50 49 44.5
Midday )25 48.2 48 39 48.2 0.57 0.54 0.39 0.57 65 62.5 58.5 65)75 35.5 26.2 32.5 35.5 0.45 0.45 0.36 0.45 53.5 63 64 53.5
)125 28.2 29 27 28.2 1.28 2.69 1.48 1.28 41 50.5 47 41.5Sunset )25 30.7 33.7 45.5 30.7 0.46 0.38 0.38 0.46 62 56 70 62
)75 31.5 36 39.2 31.5 0.39 0.33 0.22 0.39 58 54 58 58)125 30 32.5 32.2 30 0.65 1.51 1.09 0.65 46 42 42 46
5 mSunrise )25 23 23.7 24.5 23 0.86 0.38 0.73 0.86 61 76 74 61
)75 23.2 24.5 23 23.2 1.58 0.37 0.63 1.58 49 51 60.5 49)125 24.5 25.5 24 24.5 2.92 2.36 3.2 2.92 50 51 61 50
Midday )25 49 46 36.2 49 0.7 0.65 0.58 0.7 69 70 75 69)75 33.5 32.5 31 33.5 1.19 1.9 0.96 1.19 46.5 53.5 59 46.5
)125 28.7 28.2 27.5 28.7 3.22 2.8 2.85 3.22 42 40.5 64 42Sunset )25 28.2 29 41 28.2 0.65 0.7 0.22 0.65 80 76 81 80
)75 28.7 32.7 35.7 28.7 1.44 2.81 1.05 1.44 48 54.5 70 48)125 28.7 31.7 32.7 28.7 3.18 3.21 3.21 3.18 42.5 59 67 42.5
aHigh value due to presence of wood materialbHigh value due to rainfall
481

Table 4 Multiple regression of the number of individuals burrowed at 15 and 5 m from the shoreline with environmental parameters. Forfurther explanations see Table 1 legend
Constant Sandtemperature(°C)
Sandmoisture(%)
Sandpenetrability(mm)
Depth(mm)
R2
March 1996Phaleria bimaculata n = 540Phaleria provincialis n = 540
15 mSunrise n = 90 13.7653
p = 0.04514.5774p = 0.0086
)13.9578p = 0.0013
)0.6258p = 0.0432
NS 0.9986
Midday n = 90 )44.8099p = 0.0027
NS NS 1.1703p = 0.0011
NS 0.9325
Sunset n = 90 NS )2.0237p = 0.0068
NS 1.4209p = 0.0013
0.1290p = 0.0042
0.9937
Total n = 270 NS NS NS 0.5667p < 0.0001
0.1954p < 0.0001
0.8953
5 mSunrise n = 90 )81.2539
p = 0.0001NS NS 1.6692
p = 0.0001NS 0.9846
Midday n = 90 )62.7079p = 0.0149
NS NS 1.2051p = 0.0085
NS 0.8170
Sunset n = 90 67.8568p = 0.0012
NS )19.7801p = 0.0019
NS NS 0.9121
Total n = 270 )59.6780p < 0.0001
NS NS 1.2071p < 0.0001
NS 0.8104
Overall total n = 540 NS NS NS 0.4740p < 0.0001
0.1899p < 0.0001
0.8459
June 1996Phaleria bimaculata n = 540
15 mSunrise n = 90 28.6703
p = 0.0002NS 8.6619
p = 0.0186NS 0.3521
p = 0.00120.9804
Midday n = 90 20.7715p < 0.0001
NS )14.9291p = 0.0002
NS NS 0.9704
Sunset n = 90 21.1976p = 0.0041
NS )21.8450p = 0.0217
NS NS 0.7117
Total n = 270 21.5486p < 0.0001
NS NS NS 0.1591p = 0.0001
0.6058
5 mSunrise n = 90 NS NS NS 0.4636
p = 0.00580.2349p = 0.0177
0.5829
Midday n = 90 NS NS NS 0.3934p = 0.0031
0.1818p = 0.0142
0.8934
Sunset n = 90 NS NS )4.9020p = 0.0492
0.2734p = 0.0067
NS 0.8442
Total n = 270 NS NS 8.4474p = 0.0500
0.3990p = 0.0500
0.3804p = 0.0500
0.9157
Overall total n = 540 NS NS NS 0.3412p < 0.0001
0.1382p < 0.0001
0.8316
June 1996Phaleria provincialis n = 540
15 mSunrise n = 90 NS NS 10.8022
p = 0.01830.3970p = 0.0005
0.3006p = 0.0031
0.9825
Midday n = 90 NS 0.3098p = 0.0360
)44.3929p = 0.0091
NS )0.4301p = 0.0107
0.9215
Sunset n = 90 NS NS NS 0.1839p = 0.0195
NS 0.6967
Total n = 270 NS NS )8.0193p = 0.0328
0.2733p = 0.0001
NS 0.6428
5 mSunrise n = 90 NS 1.1901
p = 0.0011NS NS 0.2441
p = 0.00340.9388
Midday n = 90 NS NS 13.0077p = 0.0138
0.4591p = 0.0005
0.5063p = 0.0036
0.9833
Sunset n = 90 24.8541p = 0.0023
NS NS NS 0.1925p = 0.0102
0.7999
Total n = 270 29.6586p < 0.0001
NS 6.9858p = 0.0164
NS 0.4119p < 0.0001
0.8413
Overall total n = 540 NS NS NS 0.3043p < 0.0001
)0.1037p = 0.0002
0.6974
482
sieves. This species presented a spatial distribution dur-ing the resting phase which was signi®cantly correlatedwith the di�erent environmental parameters and re-¯ected the typical gradients found along the beach dunesystem (Brown and McLachlan 1990; McLachlan 1991).The negative correlations found with salinity re¯ect anincrease in the abundance of the beetles as salinity de-creases from sea to land. Also grain size presents agradient perpendicular to the shoreline, with coarsersands closer to the shore (McLachlan 1991). The posi-tive correlation found in January with the spatial dis-tribution of X. pellucidus indicates that this speciesinhabits a beach fascia where grain size gradually de-creases (/ increase). The negative correlation found inNovember can be related to an increase in grain sizefound 5 m landwards from the dune's base that corre-sponded to a greater abundance of X. pellucidus. Thisanomalous correlation was due to the changes in mor-phology of the beach (pro®le) that generally occur as aconsequence of winter sea storms (Chelazzi et al. 1990).In January a greater number of burrowed beetles werefound where the mean daily temperatures of the sandsurface were lower (7.7 °C), showing a tendency of thebeetles to favour low temperatures. Sand moistures werepositively correlated as a result of an increase of hu-midity from beach zones devoid of vegetation to areaswhere vegetation cover and number of individuals in-creased. Also the spatial distribution of the two Xan-thomus species during their nocturnal activity wascorrelated with some of the tested parameters. Even ifonly 30% of the variability was explained, a greaternumber of relationships were obtained for X. palliduswhich was the most mobile species. For this species thezonation during the active phase was in¯uenced by sandtemperatures.
In choice experiments the two Xanthomus species,which exhibit autumn/winter activity, preferred lowertemperatures than Halammobia pellucida, which wasactive throughout the whole year. In contrast, the twoPhaleria species chose higher temperatures in relation to
their spring/summer surface activity. Surprisingly thetwo Xanthomus species did not present di�erences intheir preferred temperatures even though the distribu-tion of X. pallidus ranges from Mediterranean areas tothe Atlantic coast (from Morocco up to the North Sea),whereas X. pellucidus inhabits only the Mediterranean(Ardoin 1958; Bigot et al. 1982). In the choice experi-ments on sand moisture, salinity and grain size the twoXanthomus species responded di�erently according totheir spatial distribution in the ®eld. X. pallidus, with amore seaward mean zonation, de®nitively disliked wetsubstrates but was unable to choose when given di�erentgradients of wet sand. To maintain zonation X. pallidusused intermediate salinities, and when these exceededthreshold values the beetles oriented in a landward di-rection. Grain size was also used to choose the beachfascia. As a matter of fact, ®ner and coarser sands werenot preferred when given the possibility of choosing anintermediate portion, con®rming that the tenebrionid'sspatial distribution lies half way down the beach. Theresults of the choice experiments for X. pellucidus showthat this species does not use humidity gradients to ®ndits preferred beach zone. It reaches the vegetation of thesupralittoral principally by using its positive scototaxistogether with salinity and particle size cues. In this caseresponses to salt have lower thresholds when comparedto the other Xanthomus species. Consequently the beetlesare able to locate their preferred area at low salinitiesbut, as in X. pallidus, a negative response is elicited whensalt concentrations are too high. Furthermore, seawardareas are avoided through preferences of intermediategrain size portions.
Of the ®ve species studied, the two Phaleria occupiedthe eulittoral, thus both species were associated withbeach debris more than with vegetation. Furthermore,when active, Ph. provincialis foraged in a more seawardarea in comparison to Ph. bimaculata, but no di�erenceswere found during the resting phase. This could suggestthat the two Phaleria species have di�erent trophicniches, as other studies on the microbial gut ¯ora indi-cate (unpublished data). The spatial distribution duringthe resting phase was limited landwards by sand mois-ture and grain size in Ph. bimaculata and seawards bysubstrate salinity in Ph. provincialis. Also during noc-turnal surface activity the spatial distribution was reg-ulated principally by the salinity and particle sizegradients, with both species being more active in a sea-ward zone where salt and grain size increased. Thedi�erent results for May in the mean grain size param-eter can be explained by the high values of / that wereregistered close to the shoreline. As expected sandmoisture was not a limiting factor for the two Phaleriaspecies because they were nocturnal and activity tookplace in an area close to the sea. However this parameterwas very important in the vertical distribution of thetenebrionids. During summer months the burrowingdepth of these species changed according to the hour ofthe day. For both species, but especially for Ph. pro-vincialis, there was a tendency (shown in the landward
Fig. 4 Temperature preference experiments: mean preferred tempera-tures and relative con®dence limits (95%) are reported for the ®vetested species
483

484
cores) to burrow deeper in search of certain sandmoistures. This response was probably elicited by thefact that during the tests horizontal zonal recovery wasprevented and moisture requirements were balanced byvertical movements. Sand penetrability proved to beanother important parameter in relation to burrowingespecially during winter months. Both species increasedin number as the sand of the cores became looser, in-dicating that this might be a limiting parameter verti-cally. This statement is also con®rmed by the positivecorrelation found with the depth parameter.
As demonstrated by laboratory experiments the twoPhaleria species did not use grain size gradients as amechanism for zonal maintenance. Sand moisture andsalinity gradients were utilised di�erently in the twospecies. Ph. bimaculata presented lower thresholdscompared to Ph. provincialis, as could be expectedconsidering its zonation. Scototaxis experiments indicatethat the Phalerinae respond positively to the silhouettesbut less than members of the Xanthomus genus. Scoto-taxis is probably used by the Phalerinae only as amechanism for zonal recovery, whereas in the two
Xanthomus it is also used to locate food sources orresting points. The bimodality found in Ph. provincialiscan probably be related to their closer proximity to thesea, implying more frequent exposure to sudden stressconditions (e.g. heavy wave action). A bimodal responsecould facilitate a quick zonal recovery towards eitherland or sea under stress conditions. Pardi (1956) dem-onstrated that Ph. provincialis showed a bimodal re-sponse in solar orientation. The author suggested thatthis could be related to the internal drive of single in-dividuals. In our experiments both Phaleria species weretreated in the same way so bimodality indicates plasticityin the beetles' behaviour. On the other hand, the bi-modality, obtained cumulating the data of the experi-ments in the three hours of the day, was due exclusivelyto the morning trials. This supports the hypothesis that aclear positive scototactical response is elicited when theenvironmental conditions become prohibitive.
Fig. 5 Choice experiments: a sand moisture preferences, b sandsalinity preferences and c grain size preferences of the ®ve tenebrionidspecies. Each bar (100%) indicates beetle response towards the twochoices in each test. In a and c the two dashed horizontal lines indicatethe frequencies over which v2 values become signi®cant. Probabilitylevels are shown (m p < 0.05, . p < 0.01, d p < 0.005, jp < 0.001)
b
Fig. 6 Scototaxis experiments: for each species Rayleigh test (z) andV-test (u) are shown. In Phaleria provincialis bimodality is indicated bythe axis 0.2°±180.2° together with the concentration parameter (r2 ) ofthe second trigonometric moment. Watson and Williams (1956) test(F) and Mardia (1972) test (Z) for the concentration parameter wasapplied (see ``Materials and methods'' section). �r is the mean vectorlength obtained from the resultant vector lengths of the two samplesconsidered. Continuous lines indicate signi®cant di�erences in thecomparisons of the concentration parameter between two species,whereas dashed lines denote nonsigni®cant comparisons
485

As previously reported (Binaghi 1964; Tongiorgi1969; Fallaci et al. 1994) Halammobia pellucida inhabitsthe supralittoral. Both during the active and restingphase this species was associated with pioneer plants. Infact when resting many individuals were principallyfound burrowed at the base of Echinophora spinosa (L.),Stachys recta (L.), Crucianella maritima (L.), and thisbehaviour was independent of the main tested parame-ters. The latter parameters instead in¯uenced the beetles'spatial distribution during the active phase according tothe season (see multiple regression results). For examplein March individuals were more active where sandmoistures were lower (landwards) whereas in July theopposite occurred. Signi®cant correlations with thisparameter were obtained only with H. pellucida and notwith the other tenebrionids studied. This might be re-lated to the di�erent feeding strategies of the ®ve species.The two detritivorous Phaleria species foraged near thesea, and their distribution was limited by salinity andgrain size gradients. The two Xanthomus species foragedon plants; their zonation was independent of substratecharacteristics but dependent on scototactical abilities.H. pellucida showed an intermediate behaviour as itforaged on detritus in the upper beach zone where sandmoisture was a limiting factor. In choice experimentsH. pellucida again showed an intermediate behaviourbetween the other two genera. Nonsigni®cant responseswere found with grain size, like in the two Phaleriaspecies, and with sand moisture, like in X. pellucidus. Onthe one hand, this re¯ects the phylogenetic vicinity ofH. pellucida to the genus Phaleria because they belong tothe same subfamily. On the other hand, H. pellucidapresents similar ecological features with X. pellucidusand is distributed in a fascia of the supralittoral betweenthe two Xanthomus species. This means that in thisspecies zonal maintenance and/or recovery is principallybased on the beetles' scototactical abilities and on theircapacity to discriminate substrate salinities.
Both ®eld and laboratory studies demonstrated thein¯uence of environmental constraints on the spatialdistribution of the ®ve closely related tenebrionid spe-cies. Food competition between species is avoidedthanks to di�erent temporal (life cycles) and spatialstrategies (Colombini et al. 1994). Chemical and physicalgradients, along the sea±land axis, together with insta-bility, are the main characteristics of beach dune envi-ronments (Brown and McLachlan 1990; McLachlan1991). The ®ve species studied exploit these gradients soas to subdivide their space, and to this aim they haveevolved particular behavioural strategies that permitchanges in their spatial distribution on a seasonal anddaily basis without leaving their preferred zone. Apartfrom an orientation capacity through astronomical cues(Pardi 1956), the mechanisms used to maintain the beachzones are based on behavioural responses to visual andenvironmental stimuli. This work points out the exis-tence of gradients in the beetles' responses that can varyqualitatively as well as in intensity in a spatially re-stricted area such as the beach of Burano. These re-
sponses take into account both the occupied beach fasciaand the phylogenetic relationship between species.
Acknowledgements We thank the World Wildlife Fund of Italyfor having given us the opportunity to work in the oasis of Bu-rano.
References
Ardoin P (1958) Contribution aÁ l'e tude des Helopinae de France.Annls Soc ent Fr 127: 9±49
Batschelet E (1981) Circular statistics in biology. Academic Press,London
Bigot L, Picard J, Roman ML (1982) Contribution aÁ l'e tude despeuplements des inverte bre s des milieux extreà mes. 1) La plage etles dunes vives de l'Espiguette (Grau-du-Roi, Gard). EcologiaMediterr 8: 3±29
Binaghi G (1964) Saggio sulla distribuzione della coleotterofaunasabulicola in un tratto di spiaggia laziale (Fregene ± Roma).Annali Mus civ Stor nat Giacomo Doria 74: 213±222
Bliss CI (1970) Statistics in biology. Vol. II. McGraw-Hill, NewYork
Bremner JM (1965) Methods of soil analysis. Vol. 2. Am Soc Agr,Madison, Wisconsin
Brown AC, McLachlan A (1990) Ecology of sandy shores. Elsevier,Amsterdam
Caussanel C (1965) Recherches pre liminaires sur le peuplement deCole opteÁ res d'une plage sableuse atlantique. Annls Soc ent Fr(NS) 1: 197±248
Caussanel C (1970) Contribution aÁ l'e tude du peuplement d'uneplage et d'une dune landaise. Vie Milieu 21: 59±104
Chelazzi G, Chelazzi L, Focardi S (1983) Dynamic zonation ofstaphylinoid beetles (Coleoptera: Staphylinoidea) on a sandybeach in East Africa. In: McLachlan A, Erasmus T (eds) Sandybeaches as ecosystems. W. Junk Publishers, The Hague, pp405±412
Chelazzi L, Colombini I (1990) Uso di ambienti a clima controllatoper lo studio dell'eco-etologia di artropodi terrestri. In: Tiano P(ed) Camere climatiche od ambientali nella ricerca applicata.Toscana Nuova, Firenze, pp 71±77
Chelazzi L, Colombini I, Bertin G, Cianfanelli A, Fallaci M,Lucarelli E, Mascagni A (1990) Gli artropodi del tombolo an-tistante la Laguna di Burano (GR): ambiente, microclima eprimi dati sul popolamento animale. Redia 73: 307±345
Colombini I, Aloia A, Chelazzi L, Fallaci M (1996) Spatial andtemporal strategies in the surface activity of some sandy beacharthropods living along the French Atlantic coast. Mar Biol127: 247±257
Colombini I, Chelazzi L (1996) Environmental factors in¯uencingthe surface activity of Eurynebria complanata (Linnaeus, 1767)(Coleoptera, Carabidae). Revta chil Hist nat 69: 511±537
Colombini I, Chelazzi L, Fallaci M, Palesse L (1994) Zonation andsurface activity of some tenebrionid beetles living on a Medi-terranean sandy beach. J arid Envirs 28: 215±230
Fallaci M, Colombini I, Chelazzi L (1994) An analysis of the Co-leoptera living along a Tyrrhenian beach-dune system: popu-lation dynamics, zonation and ecological indices. Vie Milieu 44:243±256
Fallaci M, Colombini I, Taiti S, Chelazzi L (1996) Environmentalfactors in¯uencing the surface activity and zonation of Tyloseuropaeus (Crustacea: Oniscidea) on a Tyrrhenian sandy beach.Mar Biol 125: 751±763
Folk RL, Ward WC (1957) Brazos river bar: a studi in the signif-icance of grain size parameters. J sedim Petrol 27: 3±26
Hesp PA (1991) Ecological processes and plant adaptations oncoastal dunes. J arid Envirs 21: 165±191
Mardia KV (1972) Statistics of directional data. Academic Press,London
McLachlan A (1991) Ecology of coastal dune fauna. J arid Envirs21: 229±243
486
Pardi L (1956) Orientamento solare in un Tenebrionidae alo®loPhaleria provincialis Fauv. (Coleopt.). Boll Ist Mus Zool UnivTorino 5: 5±43
Pedrotti F, Orsomando E, Cortini Pedrotti C (1975) Carta dellavegetazione del Lago di Burano e della duna di Capalbio (GR),1:5000. CNR, Florence
Ponel P (1983) Contribution aÁ la connaissance de la communauteÂdes Arthropodes psammophiles de l'isthme de Giens. Travscient Parc natn Port-Cros 9: 149±182
Scapini F, Audoglio M, Chelazzi L, Colombini I, Fallaci M (1997)Astronomical, landscape and climatic factors in¯uencing orient-ed movements of Talitrus saltator in nature. Mar Biol 128: 63±72
Scapini F, Chelazzi L, Colombini I, Fallaci M (1992) Surface ac-tivity, zonation and migration of Talitrus saltator (Montagu,1808) on a Mediterranean beach. Mar Biol 112: 573±581
Scapini F, Pardi L (1979) Nuovi dati sulla tendenza direzionaleinnata nell'orientamento solare degli an®podi litorali. Atti Ac-cad naz Lincei Rc (Ser VIII) 66: 592±597
Tongiorgi P (1969) Ricerche ecologiche sugli artropodi di unaspiaggia sabbiosa del litorale tirrenico. III ± Migrazioni e ritmodi attivitaÁ locomotoria nell'Isopode Tylos latreilli (Aud. & Sav.)e nei Tenebrionidi Phaleria provincialis Fauv. e Halammobiapellucida Herbst. Redia 51:1±19
Ugolini A, Scapini F, Pardi L (1986) Interaction between solarorientation and landscape in Talitrus saltator (Montagu)(Crustacea, Amphipoda). Mar Biol 90: 449±460
Watson GS, Williams EJ (1956) On the construction of signi®cancetests on the circle and the sphere. Biometrika 43: 344±352
Zar JH (1984) Biostatistical analysis, 2nd edn. Prentice-Hall, NewJersey
487