Behavioral, neurochemical and pharmaco-EEG profiles of the psychedelic drug...
65
Behavioral, Neurochemical and Pharmaco-EEG Profiles of the Psychedelic Drug 4-bromo-2,5- dimethoxyphenethylamine (2C-B) in Rats Journal: Psychopharmacology Manuscript ID: Draft Manuscript Type: original investigation Date Submitted by the Author: n/a Complete List of Authors: Páleníček, Tomáš; Prague Psychiatric Center , Laboratory of Biochemistry and Brain Patophysiology Fujáková, Michaela; Prague Psychiatric Center, Brunovský, Martin; Prague Psychiatric Center, Horáček, Jiří; Prague Psychiatric Center, Gorman, Ingmar; Prague Psychiatric Center, Balíková, Marie; 1st Faculty of Medicine, Charles University in Prague, Institute of Forensic Medicine and Toxicology Rambousek, Lukáš; Institute of Chemical Technology, Syslová, Kamila; Institute of Chemical Technology, Kačer, Petr; Institute of Chemical Technology, Zach, Petr; 3rd Faculty of Medicine, Charles University in Prague, Bubeníková-Valešová, Věra; Prague Psychiatric Center, Tylš, Filip; Prague Psychiatric Center, Kubešová, Anna; Prague Psychiatric Center, Puskarčíková, Jana; Prague Psychiatric Center, Höschl, Cyril; Prague Psychiatric Center, Keywords: 4-BROMO-2,5-DIMETHOXYPHENETHYLAMINE (2C-B), AMPHETAMINE, SEROTONIN, DOPAMINE, NUCLEUS ACCUMBENS, BEHAVIOR, MICRODIALYSIS, EEG POWER SPECTRA, EEG COHERENCE, RAT Note: The following files were submitted by the author for peer review, but cannot be converted to PDF. You must view these files (e.g. movies) online. Tab 2 - amph_ASR.xls Psychopharmacology
Transcript of Behavioral, neurochemical and pharmaco-EEG profiles of the psychedelic drug...

Behavioral, Neurochemical and Pharmaco-EEG Profiles of
the Psychedelic Drug 4-bromo-2,5-dimethoxyphenethylamine (2C-B) in Rats
Journal: Psychopharmacology
Manuscript ID: Draft
Manuscript Type: original investigation
Date Submitted by the Author: n/a
Complete List of Authors: Páleníček, Tomáš; Prague Psychiatric Center , Laboratory of Biochemistry and Brain Patophysiology Fujáková, Michaela; Prague Psychiatric Center, Brunovský, Martin; Prague Psychiatric Center, Horáček, Jiří; Prague Psychiatric Center, Gorman, Ingmar; Prague Psychiatric Center, Balíková, Marie; 1st Faculty of Medicine, Charles University in Prague, Institute of Forensic Medicine and Toxicology Rambousek, Lukáš; Institute of Chemical Technology, Syslová, Kamila; Institute of Chemical Technology, Kačer, Petr; Institute of Chemical Technology, Zach, Petr; 3rd Faculty of Medicine, Charles University in Prague, Bubeníková-Valešová, Věra; Prague Psychiatric Center, Tylš, Filip; Prague Psychiatric Center, Kubešová, Anna; Prague Psychiatric Center, Puskarčíková, Jana; Prague Psychiatric Center, Höschl, Cyril; Prague Psychiatric Center,
Keywords: 4-BROMO-2,5-DIMETHOXYPHENETHYLAMINE (2C-B), AMPHETAMINE, SEROTONIN, DOPAMINE, NUCLEUS ACCUMBENS, BEHAVIOR, MICRODIALYSIS, EEG POWER SPECTRA, EEG COHERENCE, RAT
Note: The following files were submitted by the author for peer review, but cannot be converted to PDF. You must view these files (e.g. movies) online.
Tab 2 - amph_ASR.xls
Psychopharmacology
Referee 1
Dear reviewer we have revised the manuscript and tried to make it more concise according to
your comments and recommendations as well as of those from other reviewers. Responses to
your suggestions are included below. All the changes are also highlighted in the manuscript in
green.
* Please consider to explicitly indicate in the first section of
the introduction why amphetamine was used as comparative drug: e.g.
"Amphetamine as a comparative drug was also used in our experiments to differentiate
empathogenic/entactogenic from stimulating or hallucinogenic activities." This may help the
reader to better understand the experimental hypotheses later in the manuscript
Amphetamine as a structurally related stimulant was also used in our experiments. It
served as a comparative drug to differentiate empathogenic/entactogenic and/or
hallucinogenic effects (activation of serotonin system) from any possible stimulant-like
activity (dopaminergic activation).
* The idea of separately analyzing NAc shell from core is elegant
in theory, however, the reported experiment ends up -due to a number of different experimental
reasons- with only n=4 and n=5 for respective NAc part. The applied ANOVA seems not
warranted for such small n-values and the authors should consider to either use alternative
statistical tests
(non-parametric?) or else to pool all NAc data to achieve an n=9 powered study. It is
appreciated that the latter would unfortunately impact on the interesting discussion on separate
NAc areas, however, the inadequate statistical powering for an ANOVA does presently not allow
any valid conclusions. So either way reanalysis and consequent changes in the manuscript seems
imperative.
Due to an insufficient number of animals for each part of NAc for the performing two-
way analysis and due to the comparable effects in each of them, the microdialysis data
were pooled and analyzed together. Analysis of levels of dopamine and its metabolites in
microdialysates was then performed with Friedman’s repeated measures ANOVA for
ranks with a subsequent Wilcoxon matched pairs test as the post hoc tests with the time of
sample collection as a repeated measure variable. The analysis was performed using the
Statistica v. 9.0 program; differences between groups with p<0.05 and lower were
considered significant.
Based on this we have modified the section in the results:
3.3. Levels of dopamine and its metabolites in microdialysates (Fig. 4A-D)
Friedman’s RM ANOVAs on ranks showed the significant effect of 2C-B treatment for
dopamine and all metabolites (χ2 = 99.3 (dopamine), 108.8 (DOPAC), 65.5 (HVA), 113.6
(3-MT), df = 14, p<0.001 for all monoamines).
2C-B 25 mg/kg significantly increased dopamine levels in both compartments of NAc (up
to 4.5 × more than the baseline, p<0.05-0.001). The increase in dopamine dialysate levels
persisted 120 min after drug administration. A similar pattern of changes was observed for
Page 1 of 66 Psychopharmacology
123456789101112131415161718192021222324252627282930313233343536373839404142434445464748495051525354555657585960
its metabolites HVA (up to 6 × more than the baseline, p<0.05-0.001) and 3-MT (up to 7
× more than the baseline, p<0.05-0.001). On the contrary, DOPAC decreased to 38% (in
the Core) and 25% (in the Shell) of the baseline levels.
However we still believe that we can present the data in graphs separately for each
compartment. And allow us to stress the role of these compartments in the introduction.
* On page 7 it reads: "all testing was performed during the light
phase of the cycle from 8 am to 2 pm" , while on page 13 it is stated that "all EEG recordings
were performed between 9 am and 2 pm". This causes some confusion: does the first statement
refer to behavioural testing only, while all EEG studies only started 1 hr later? What about
microdialysis experiments? Please rephrase in an unambiguous way.
Thank you for this comment. There was a mistake in defining the time in the EEG
experiments. All experiments were performed between 8 am and 2 pm. Therefore we have
omitted the sentence in the EEG section and slightly modified the sentence on page 7:
All testing (behavior, microdialysis and EEG recordings) was performed during the light
phase of the cycle from 8 am to 2 pm.
* On p11 it is indicated that: "....with a flow rate of 2 ml/min."
and "... vials containing 15 ml of 0.1 M HCl to ...". Please double check as it is most likely that
these volumes should be in microliters rather than milliliters !
Yes, you are right, thank you. We are sorry for this oversight. We have corrected it and
replaced ml with µl.
* Typo on p11: 'Breifly' should read 'Briefly"
We have corrected this.
* Please clearly indicate for each figure (i.e. 1 to 7) in legend
and/or title exactly what is indicated in the graph (e.g. Mean plus/minus SEM; )
Thank you for this comment. We have added this to all figures where appropriate.
Page 2 of 66Psychopharmacology
123456789101112131415161718192021222324252627282930313233343536373839404142434445464748495051525354555657585960
1
Behavioral, Neurochemical and Pharmaco-EEG Profiles of the Psychedelic Drug 4-
bromo-2,5-dimethoxyphenethylamine (2C-B) in Rats
Tomáš Páleníček1, Michaela Fujáková1,5, Martin Brunovský1, Jiří Horáček1, Ingmar Gorman1,
Marie Balíková2, Lukáš Rambousek3,4, Kamila Syslová3, Petr Kačer3, Petr Zach5, Věra
Bubeníková-Valešová1, Filip Tylš1,5, Anna Kubešová1,5, Jana Puskarčíková1,5, Cyril Höschl1
1 Prague Psychiatric Center, Ústavní 91, 181 03 Prague 8 –Bohnice, Czech Republic
2 Institute of Forensic Medicine and Toxicology, 1st Faculty of Medicine, Charles University
in Prague, Ke Karlovu 2, 121 08 Prague 2, Czech Republic
3 Institute of Chemical Technology, Technická 5, 160 00 Prague 6, Czech Republic
4 Institute of Physiology, Academy of Sciences of the Czech Republic, Vídeňská 1083, 140 00
Prague 4, Czech Republic
5 3rd Faculty of Medicine, Charles University in Prague, Ruská 87, 100 00 Prague 10, Czech
Republic
Corresponding Author:
Tomáš Páleníček, MD, PhD
Prague Psychiatric Centre
Ústavní 91
181 03 Prague 8 – Bohnice
Tel: + 420266003173
Fax: + 420266003160
Email: [email protected]
Page 3 of 66 Psychopharmacology
123456789101112131415161718192021222324252627282930313233343536373839404142434445464748495051525354555657585960
2
ABSTRACT
Rationale and objectives: Behavioral, neurochemical and pharmaco-EEG profiles of a new
synthetic drug 4-bromo-2,5-dimethoxyphenethylamine (2C-B) in rats were examined.
Materials and methods: Locomotor effects, prepulse inhibition (PPI) of acoustic startle
reaction (ASR), dopamine and its metabolite levels in nucleus accumbens (NAc), EEG power
spectra and coherence in freely moving rats were analyzed. Amphetamine was used as a
reference compound.
Results: 2C-B had a biphasic effect on locomotion with initial inhibitory followed by
excitatory effect; amphetamine induced only hyperlocomotion. Both drugs induced deficits in
the PPI; however they had opposite effects on ASR. 2C-B increased dopamine but decreased
3,4-dihydroxyphenylacetic acid (DOPAC) in the NAc. Low doses of 2C-B induced a decrease
in EEG power spectra and coherence. On the contrary, high dose of 2C-B 50 mg/kg had a
temporally biphasic effect with an initial decrease followed by an increase in EEG power;
decrease as well as increase in EEG coherence was observed. Amphetamine mainly induced
an increase in EEG power and coherence in theta and alpha bands. Increases in the theta and
alpha power and coherence in 2C-B and amphetamine were temporally linked to an increase
in locomotor activity and DA levels in NAc.
Conclusions: 2C-B is a centrally active compound similar to other hallucinogens, entactogens
and stimulants. Increased dopamine and decreased DOPAC in the NAc may reflect its
psychotomimetic and addictive potential and monoaminoxidase inhibition. Alterations in
brain functional connectivity reflected the behavioral and neurochemical changes produced by
the drug; a correlation between EEG changes and locomotor behavior was observed.
Page 4 of 66Psychopharmacology
123456789101112131415161718192021222324252627282930313233343536373839404142434445464748495051525354555657585960
3
Key Words: 4-bromo-2,5-dimethoxyphenethylamine (2C-B), amphetamine, serotonin,
dopamine, nucleus accumbens, behavior, microdialysis, EEG power spectra, EEG coherence,
rats
Page 5 of 66 Psychopharmacology
123456789101112131415161718192021222324252627282930313233343536373839404142434445464748495051525354555657585960
4
1. INTRODUCTION
There are many new synthetic psychoactive phenylethylamines, tryptamines,
piperazines and cathinones that have spread across the illicit market around the world over the
last two decades e.g. (Bossong et al. 2005; de Boer D et al. 2001; de Boer et al. 1999;
EMCDDA 2004; Smolinske et al. 2005; Sumnall and Wooding 2009; Thorlacius et al. 2008).
One of those, 4-bromo-2,5-dimethoxyphenethylamine (2C-B, desmethyl-DOB or Nexus), is a
phenylethylamine derivative with psychedelic / entactogenic* effects in humans (Shulgin and
Shulgin 1991; Shulgin and Carter 1975) and is representative for a group of so called “2Cs”
(e.g. 4-iodo-2,5-dimethoxyphenethylamine (2C-I), 2,5-dimethoxy-4-ethylphenethylamine
(2C-E), 2,5-dimethoxy-4-propylphenethylamine (2C-P) etc.). The drug is abused under
similar conditions as the recreational drug ecstasy (3,4-methylenedioxymethamphetamine,
MDMA) (Caudevilla-Galligo et al. 2012; Cole et al. 2002; de Boer and Bosman 2004;
EMCDDA 2004; Huang and Bai 2011). Recreational doses in humans vary in the range of 4-
30 mg indicating its higher potency compared to MDMA. In spite of its popularity among
recreational drug users, there is a substantial lack of evidence about its behavioral effects and
mechanisms of action in scientific literature. Except the 35-year old study in humans done by
Shulgin and Carter [1975], there is only one behavioral study performed on chickens to date
(Bronson et al. 1995). Despite its reported MDMA-like effects, there are no reports on its
activity on monoamine neurotransmission, and the only existing binding studies suggest 2C-B
acts as a partial agonist on serotonin 5-HT2A/C and 5-HT1A/B receptors, thus showing a
pharmacological profile similar to psychedelics (Acuna-Castillo et al. 2002; Glennon et al.
1988; Lobos et al. 1992; Moya et al. 2007). Compared to its phenylisopropylamine
hallucinogenic analog 4-bromo-2,5-dimethoxyamphetamine (DOB) it has a lower potency in
stimulating 5-HT2A receptors and is comparable in stimulating 5-HT2C receptors (Moya et
al. 2007). With respect to the above mentioned facts the intention of our work was to globally
Page 6 of 66Psychopharmacology
123456789101112131415161718192021222324252627282930313233343536373839404142434445464748495051525354555657585960
5
characterize 2C-B’s effects in rats. We concentrated on different modalities: behavior,
dopamine neurotransmission and quantitative EEG. Amphetamine as a structurally related
stimulant was also used in our experiments. It served as a comparative drug to differentiate
empathogenic/entactogenic and/or hallucinogenic effects (activation of serotonin system)
from any possible stimulant-like activity (dopaminergic activation).
In the behavioral part of our study we focused on locomotor activity and sensorimotor
gating. Both of these behavioral measures are typically affected by psychedelics as well as
entactogens (Bubenikova et al. 2005; Krebs-Thomson et al. 1998; Palenicek et al. 2007;
Palenicek et al. 2008; Palenicek et al. 2010) and enable to evaluate central stimulation and/or
depression, habituation to a novel environment or exploratory behavior (Lát 1973; Wishaw et
al. 1999) and the ability of an individual to appropriately filter and react to the inputs from the
environment (Koch 1999; Swerdlow et al. 2001). Since dopamine is a key neurotransmitter
involved in stimulatory effects of drugs, in the regulation of sensorimotor gating and is related
to addictive potential of drugs (Geyer et al. 2001; Lingford-Hughes and Nutt 2003; Roberts
and Koob 1997) we subsequently performed microdialysis experiments in the nucleus
accumbens (NAc). NAc is divided into two neurochemicaly and neuroanatomicaly distinct
compartments, the medioventral part, the NAc “shell” (related to limbic amygdala and plays a
role in emotional and motivational functions and in the addiction) and the laterodorsal part,
the NAc “core” (part of the striatopallidal complex and is involved in somatomotor functions,
e.g. locomotor activity, sensorimotor processing) (Deutch and Cameron 1992; Fiserova et al.
1999; Pontieri et al. 1995), therefore we have measured levels of DA and its metabolites in
both compartments. 2C-B’s reported mixed entactogenic / psychedelic properties lead us to a
thesis that it would induce comparable changes to psychedelics and / or entactogens such as
MDMA in all of these parameters.
Page 7 of 66 Psychopharmacology
123456789101112131415161718192021222324252627282930313233343536373839404142434445464748495051525354555657585960
6
The second objective of our work was to evaluate the effects of 2C-B on quantitative
EEG (QEEG). Quantitative EEG analysis (EEG power spectral analysis, EEG coherence etc.)
brings a new fundamental approach to describing the effects of psychoactive substances since
they reflect functional connectivity of the brain (Shaw et al. 1978; Thatcher et al. 1986). To be
able to analyze these parameters we used an innovative technique of EEG recording from 12
active cortical electrodes simultaneously in rats. In comparison to most frequently used
recordings from one or two electrodes our technique is more translational to human recording
conditions which provides important added value of these experiments. Another clear benefit
is in the possibility to correlate behavioral effects of the drug with characteristic patterns in
the EEG.
* The term "entactogen" has been suggested as a name for drugs such as MDMA that do not have pure
hallucinogenic or stimulant properties. It has a psychotherapeutic connotation of producing a touching within
(Nichols 1986).
Page 8 of 66Psychopharmacology
123456789101112131415161718192021222324252627282930313233343536373839404142434445464748495051525354555657585960
7
2. MATERIALS AND METHODS
2.1. Study design
With respect to previous findings with other psychedelic drugs having a biphasic
behavioral action e.g. (Adams and Geyer 1982; Geyer et al. 1979; Palenicek et al. 2008) as
well as the pharmacokinetics of the 2C-B (Rohanova et al. 2008) we monitored behavioral
parameters and EEG changes in two distinct temporal paradigms – during the onset of its
action and during the period of the highest expected brain concentrations (maximal brain
levels of 2C-B after subcutaneous (s.c.) administration are reached within 1-2 h (Rohanova et
al. 2008); described below in more detail in section 2.3). Additional behavioral and EEG
experiments were also performed in animals treated with the comparative stimulant
amphetamine. The doses of drugs that were used in the EEG and microdialysis experiments
were selected according to their behavioral activity in the open field and in the PPI ASR test.
2.2. Animals
All experiments were carried out on adult male Wistar rats (SPF animals; Hannover breed
Konárovice, Czech Republic) weighing 200–250 g. Animals were housed in pairs in a 12 h
light/dark regime (6 am lights on, 6 pm lights of) with temperatures ranging from 22 to 24°C
and were provided with free access to a standard diet and water. The rats were given an
acclimatization period of 7-10 days prior to the start of each experiment. During this period
the animals were weighed twice and handled four times. In the behavioral experiments, 9 – 11
animals were used in each experimental/treatment group; in the microdialysis study 7 animals
per each compartment of NAc and in the EEG experiments 12 animals per group were
introduced in the surgery. Each subject was tested only once. All testing (behavior,
microdialysis and EEG recordings) was performed during the light phase of the cycle from 8
Page 9 of 66 Psychopharmacology
123456789101112131415161718192021222324252627282930313233343536373839404142434445464748495051525354555657585960
8
am to 2 pm. All experiments respected the Guidelines of the European Union (86/609/EU)
and followed the instructions of the National Committee for the Care and Use of Laboratory
Animals.
2.3. Drugs and chemicals
4-bromo-2,5-dimethoxyphenethylamine hydrochloride (2C-B.HCl, purity +98%, hereinafter
referred to as 2C-B, synthesized at the Pharmaceutic faculty of Hradec Králové, Charles
University, Czech Republic) was dissolved in a physiological saline. The drug or a vehicle
was administered subcutaneously (s.c.) in a volume of 2 ml/kg. For the behavioral
experiments, 4 doses of 2C-B were used: 2.5, 10, 25 and 50 mg/kg; for the EEG recordings
only intermediate and high doses, 10 mg/kg and 50 mg/kg, were used, while microdialysis
was performed with 2C-B 25 mg/kg. All behavioral testing was evaluated in two separate
temporal constellations with the beginning of testing at a) 15 and b) 60 minutes after 2C-B
administration. For each of these temporal constellations a new group of animals for each
dose was used. Comparable design was used also for EEG analyses. d-Amphetamine sulfate
(1 and 4 mg/kg s.c.Sigma Aldrich) dissolved in saline was used as a comparative drug. In the
behavioral experiments the drug was administered 15 min before the start of each testing. In
the EEG experiments only the higher dose of 4 mg/kg was used.
2.4. Behavioral experiments
2.4.1. Open field (Ethovision)
Locomotor activity (trajectory length) and its spatial characteristic (thigmotaxis and time
spent in the center of the arena) in a novel environment were registered and analyzed by an
automatic video tracking system for recording behavioral activities (EthoVision Color Pro
v. 3.1.1, Noldus, Netherlands). A square black plastic box arena (68 x 68 x 30 cm) was
Page 10 of 66Psychopharmacology
123456789101112131415161718192021222324252627282930313233343536373839404142434445464748495051525354555657585960

9
situated in a sound-proof and evenly-lit room. Eight of the treatment groups were placed into
the center of the arena 15 min after the drug administration (2C-B 2.5, 10, 25, 50 mg/kg,
amphetamine 1 and 4 mg/kg and corresponding vehicle groups). For the remaining groups of
animals the testing started 60 min after the drug administration (2C-B 2.5, 10, 25, 50 mg/kg
and corresponding vehicle group). The locomotor activity was registered for 30 min after drug
administration. The EthoVision program was also used to calculate locomotor activity in 5
min time intervals. To evaluate the spatial characteristics of the movement in the open field,
the arena was virtually divided by the EthoVision program into 5 x 5 identical square zones
with 16 being located on the periphery and 9 centrally. Initially the total number of
appearances of the animal in each zone (frequency; f) was calculated by the program. The
thigmotaxis ( i ) was calculated as i = fperipheral zones / fall zones. Thus, the thigmotaxis is a relative
number which varies from 0 to 1 and indicates the probability of appearance in any of the
peripheral zones within the arena. As a complementary measure, time spent in the centre of
the arena (Tcenter) was analyzed, equaling the summation of time spent in the 9 central zones
(Σt1-9) (Palenicek et al. 2005). These measures may reflect alterations in exploratory behavior,
be associated with anxiety and in some cases can also describe the stereotyped behavior (Lát
1973; Palenicek et al. 2005; Palenicek et al. 2007; Palenicek et al. 2008; Palenicek et al. 2010;
Wishaw et al. 1999)
2.4.2. Sensorimotor gating
Sensorimotor gating was measured in a test of prepulse inhibition (PPI) of acoustic startle
reaction (ASR). All of the rats were habituated to the testing apparatus in a short session (a 5
min acclimatization period plus five single pulses 2 days before the experiment). On the day
of the measurements the same administration scheme was used as for the locomotor
experiments. Rats were administered with 2C-B 2.5, 10, 25 and 50 mg/kg or saline (15 or 60
Page 11 of 66 Psychopharmacology
123456789101112131415161718192021222324252627282930313233343536373839404142434445464748495051525354555657585960
10
min before placement into the testing chamber) or amphetamine 1 and 4 mg/kg or saline (15
min before placement into the testing chamber). All testing was performed in two calibrated
startle chambers (SR-LAB, San Diego Instruments, California, USA) which consist of a
sound-proof, evenly-lit enclosure with a Plexiglas stabilimeter with an 8.7 cm inner diameter
and a piezoelectric accelerometer. A high frequency loudspeaker mounted 24 cm above the
Plexiglas cylinder inside the chamber produced both a background noise of 62 dB and all the
acoustic stimuli. The experimental design was adopted from previous studies (Bubenikova et
al. 2005; Palenicek et al. 2008; Palenicek et al. 2010). After the acclimatization period (5 min)
the test began with the first session consisting of four initial startle stimuli (120 dB). It was
followed by the second session which consisted of four different trial types presented in a
pseudo-random order: (1) single pulse: 120 dB broadband burst, 20 ms duration; (2) prepulse-
pulse: prepulse 13 dB above the background noise, 20 ms duration, presented 100 ms before
the onset of the 120 dB pulse alone; (3) prepulse alone: 13 dB above the background noise, 20
ms duration; (4) no stimulus. Five presentations of each trial type were given with a floating
interstimulus interval of about 30 s. The PPI was expressed as a percentage of PPI [100 –
(mean response for the prepulse–pulse trials / startle response for the single pulse trials) ×
100]. The four single pulse trials at the beginning of the first session were not included in the
calculation of the PPI values. Animals with an average startle value lower than 10
manufacturer’s arbitrary units were excluded from the calculation of the PPI and were marked
as non-responders. The number of animals excluded from the analysis did not significantly
differ among all treatment groups; a maximum of 2 animals in one treatment group (in most
of the groups none or one animal) were excluded. The final number of animals used in the
analysis after non-responders exclusion remained between 9 and 11 per group as stated above.
2.5. Microdialysis
Page 12 of 66Psychopharmacology
123456789101112131415161718192021222324252627282930313233343536373839404142434445464748495051525354555657585960
11
2.5.1. Surgery and dialysis
Fourteen Male rats (280-330g) were anaesthetized with a halothane anesthesia (Narcotan)
before surgery. Each rat was placed in a stereotaxic apparatus (Stoelting Co., Illinois, USA)
and a guide cannula (MAB 4.15.IC; Agn Tho’s AB, Sweden) was implanted through a burr
hole 2 mm above the NAc Core (A +1,2 mm, L +/-2.0 mm, V –6.0 mm from bregma) and
NAc Shell (A +2.0 mm, L +/-1.2 mm, V –6.2 mm from bregma) (Paxinos and Watson 2003).
After surgery, the rats were placed separately in their cages and left seven days for recovery
prior to the collection of dialysates. Dialysis probes (MAB 4.15.2.Cu; AgnTho’s AB,
Sweden; cuprophane 2 mm membrane; cut-off 6 kD) were placed into the NAc under a light
halothane anesthesia. The probes were connected to a syringe pump (Univentor 864,
AgnTho’s AB) and perfused with artificial cerebro-spinal fluid with a flow rate of 2 µl/min.
After a 60 min wash-out period, the dialysates were collected at 20 min intervals in plastic
vials containing 15 µl of 0.1 M HCl to reduce decomposition of the analytes. Initially, 3
samples of dialysates were collected to establish baseline levels of dopamine and its
metabolites. Subsequently, 2C-B 25 mg/kg s.c. was administered and collection of samples
continued until 12 samples were gathered. Therefore, collection of microdialysates lasted for
5 hours in total. The placement of microdialysis probes was verified using Nissl staining.
After the microdialysis study, the rats were sacrificed by an overdose in halothane anesthesia
and the brains were removed and stored in 10% formaline. Determination of exact probe
implantation in the brains was verified by examination of brain slices (coronal frozen sections
of the brain at 40 µm intervals) under a Zeiss AxioVision Imaginer Z1. The appropriate
placement of the probe was estimated in comparison to the corresponding slices obtained by
the atlas (Paxinos and Watson 2003). After the verification, a total of 4 rats were used for the
determination of dopamine and its metabolites in the NAc Core and 5 in the NAc Shell. The
Page 13 of 66 Psychopharmacology
123456789101112131415161718192021222324252627282930313233343536373839404142434445464748495051525354555657585960
12
rest had to be excluded due to inappropriate position of the probe or due to unsuccessful
perfusion.
2.5.2. Determination of dopamine and its metabolites by liquid chromatography mass
spectroscopy (LC–MS)
Dopamine and its first phase metabolites homovanillic acid, 3-methoxytyramine and 3,4-
dihydroxyphenylacetic acid (HVA, 3-MT and DOPAC) were measured in microdialysis
samples from nucleus accumbens by LC-MS analysis, described in detail elsewhere (Syslova
et al. 2011). Briefly, a Varian ProStar high pressure liquid chromatography (HPLC) system
was used, consisting of a dual pump ProStar 210, a degasser, and a Varian 410 autosampler
(Varian, USA) equipped with a Gemini C18 5 µm 110Å 150 mm x 2 mm (Phenomenex,
USA). The mobile phase (solvent A: aqueous solution of acetic acid (pH 2); solvent B:
methanol) was used for a gradient elution at a flow rate of 150µl/min. The HPLC elution
program was as follows: 5% B (3 min) → 30% B (linear increase in 2min) → 30% B (10
min)→5% B (linear decrease in 1min)→5% B (4min). The column temperature was
maintained at 25 ◦C. The injection volume was 5 µl.
The HPLC system was directly coupled to a Varian 1200L triple quadrupole mass
spectrometer (Varian, USA) equipped with an electrospray ion source. The scan monitoring
reactions (precursor ion→fragment ion) used for the analyses and their collision induced
dissociated (CID) energy were as follows: m/z 137→m/z 120 (CID =−17.5 eV) for DA; m/z
141→m/z 123 (CID =−17.5 eV) for DA-d4; m/z 181→m/z 122 (CID = 17.0 eV) for HVA;
m/z 168→m/z 151 (CID =−11.5 eV) for 3-MT and m/z 167→m/z 122 (CID = 8.5 eV) for
DOPAC. Data were acquired and evaluated using ProStar version 6.91 (Varian, USA).
Page 14 of 66Psychopharmacology
123456789101112131415161718192021222324252627282930313233343536373839404142434445464748495051525354555657585960
13
2.6. EEG experiments
2.6.1. Stereotactic surgery
The rats were stereotactically implanted with 14 silver electrodes under halothane anesthesia
7 days before EEG recording. Twelve active electrodes were implanted on the surface of the
cortex in homologous areas of the frontal, parietal and temporal regions of the right and left
hemispheres. Stereotactic coordinates from bregma (Paxinos and Watson 2003) were: A +5
mm and L +/-2 mm for the frontal association cortex (electrodes F3/F4), A +2.2 mm and L +/-
3.2 mm for the primary motor cortex (electrodes C3/C4), A -3.8 mm and L +/-2.5 mm
(electrodes P3/P4) and A -4.5 mm and L +/-4.5 mm (electrodes P5/P6) for the medial and
lateral parietal association cortex, A -3.6 mm and L +/-7.2 mm for the temporal association
cortex (electrodes T3/T4) and A -8.3 mm and L +/-5.8 mm for the secondary auditory cortex
(electrodes T5/T6). The reference electrode was implanted above the olfactory bulb and the
ground electrode subcutaneously in the occipital region. All electrodes were fixed to the skull
with Dentalon dental cement. After the operation, the animals were individually placed in
plastic cages, where they remained until the EEG recording. The day before EEG recording, a
connector was mounted to the electrodes under short-term total halothane anesthesia and
again fixed with dental cement.
2.6.2. EEG recordings
Approximately fifteen minutes before administration of the compound, the animals were
deprived of food and water and connected to the EEG system in their home cages. A 10-min
recording session was obtained immediately before treatment to serve as a baseline condition.
Subsequently, 2C-B 10 or 50 mg/kg, amphetamine 4 mg/kg or saline were administered
subcutaneously and registration continued for another 65 min in the case of 2C-B and vehicle
treatments (total length of record: 75 min) and for 35 min in the case of amphetamine (total
Page 15 of 66 Psychopharmacology
123456789101112131415161718192021222324252627282930313233343536373839404142434445464748495051525354555657585960
14
length of record: 45 min). The rats were able to move freely in the cage during all EEG
recording while being connected with a cable to a data acquisition system. Raw EEG signals
were recorded using the BrainScope (Unimedis, Prague) data acquisition system with an
EADS-221 amplifier having a frequency band of 0.15–70 Hz. The system acquired the data
with a 16 bit depth, 7.63 nV/bit resolution (i.e. ~130 bit/µV) and a dynamic range of ± 500
µV. The data was recorded using a sampling rate of 250 Hz. EEG data were stored on a PC
hard disk for offline processing and analysis. Each rat was recorded only once with the
specific treatment. Animals were handled for a few seconds by an observer when a suspicion
of sleep was present (i.e. animals did not move and tended to close their eyes).
Concomitantly, a mark in the EEG trace was placed to label this epoch, which was then
excluded from the analysis. However, this happened only in the vehicle treated animals.
2.6.3. EEG signal processing
From the 12 operated animals, 10 animals for 2C-B 10 mg/kg and 9 animals for 50 mg/kg, 10
animals for amphetamine 4 mg/kg and 9 saline animals were included for signal analysis, the
others were excluded because of technical difficulties during recording and/or insufficient
data quality. The EEG data was bandpass filtered with a linear FIR (Finite Impulse Response)
filter with 111 coefficients in the range of 0.5-45 Hz. For a detailed description of FIR filters
see (Principe and Smith 1986). For each EEG recording session the following EEG segments
(10 min in duration) were edited for further processing: the first EEG segment was selected
from the baseline EEG record (0-10 min for all groups), the second set of data was taken
between 15-25 min (for vehicle and 2C-B treatments) and 10-20 min (for amphetamine
treatment), the third was taken between 25-35 min (for vehicle and amphetamine treatments)
and the last was taken 55-65 min (for vehicle and 2C-B treatments) after the administration of
the substance. Each 10-min EEG segment was subjected to editing procedures using
Page 16 of 66Psychopharmacology
123456789101112131415161718192021222324252627282930313233343536373839404142434445464748495051525354555657585960

15
Neuroguide software (Neuroguide© NG-2.4.6, Applied Neuroscience Inc., St. Petersburg,
FL) in which a one- to two-second template of “clean”, artifact-free EEG was selected. This
template was then used to compute matching amplitudes of EEG using flexible criteria of
equal amplitudes to amplitudes that are ≤1.25 times larger. The decision as to which clean
EEG sample multiplier is used was determined by the length of the sample 50 seconds as a
minimum, visual inspection of the digital EEG and when split-half reliability and test re-test
reliability measurements were ≥0.95. Split-half reliability is the ratio of variance between the
odd and even seconds of the time series of selected digital EEG while test re-test reliability is
the ratio of variance between the first half vs. the second half of the selected EEG segments
(variance = sum of the square of the deviation of each time point from the mean of the time
points). Test re-test reliability >0.90 is commonly accepted in scientific literature. For a
detailed description of editing procedures see Thatcher et al. [1987, 2003]. After multiple
visual inspections and selection of clean EEG samples, the edited samples varied in length
from 52 to 140 sec (mean 69.57 sec; s.d. 17.81 sec) for the 2C-B group, from 53 to 142 sec
(mean 75.6 sec; s.d. 22.77 sec) for the amphetamine group and from 53 to 119 sec (mean
71.92 sec; s.d. 16.2 sec) for the vehicle group. There was no significant difference across
groups in the length of edited data (One Way RM ANOVA for each treatment group;
F(2,16)=2.56, p=0.11 for 2C-B 10 mg/kg, F(2,14)= 1.66, p=0.23 for 2C-B 50 mg/kg, F(2,18)=0.94,
p=0.41 for amphetamine 4 mg/kg and F(4,36)=2.497, p=0.06 for vehicle).
The spectral content of the EEG was quantified by Fast-Fourier Transform (FFT)
analysis. The EEG was automatically downsampled by Neuroguide software to 128 Hz, and
spectra between 0.5 and 40 Hz were calculated at a 0.5-Hz resolution for each 2-s epoch. The
auto-spectra of individual electrodes and cross-spectra of selected electrode pairs were
obtained for the following frequency bands: delta (1 – 4 Hz), theta (4 - 7 Hz), alpha (8 – 12
Hz), beta (12 – 25 Hz), high beta (25 – 30 Hz) and gamma (30 – 40 Hz).
Page 17 of 66 Psychopharmacology
123456789101112131415161718192021222324252627282930313233343536373839404142434445464748495051525354555657585960
16
EEG coherence is defined as the cross-power spectrum per explicit frequency of two
electrode positions recorded simultaneously at different sites. This method enables us to
evaluate a resemblance of EEG activity between two cortical regions interpreted as an
indication of their functional interaction and/or connectivity. EEG coherence was derived
from auto-spectral and cross-spectral values for 30 intra-hemispheric electrode pairs (F3-C3,
F3-P3, F3-P5, F3-T3, F3-T5, C3-P3, C3-P5, C3-T3, C3-T5, P3-P5, P3-T3, P3-T5, P5-T3, P5-
T5, T3-T5 on the left hemisphere and analogically on the right) and 6 inter-hemisperic
electrode pairs (between electrodes F3-F4, C3-C4, P3-P4, P5-P6, T3-T4, T5-T6).
2.7. Statistical analysis
2.7.1. Behavioral and microdialysis experiments
Statistical analysis of total locomotion and PPI ASR was conducted by two-way analysis of
variance (ANOVA) with 2C-B treatment and time after administration as factors. In the case
of locomotion in 5 min intervals, a two-way repeated measures analysis of variance (RM
ANOVA) with treatment as the between-subjects factor and time interval as a repeated
measures factor were performed (for 15 and 60 min after administration separately). One-way
ANOVA was used for analysis of amphetamine induced behavioral changes. All analyses
were followed by Newman-Keuls post hoc tests and were performed using the program
SigmaStat v. 3.0; the differences between groups with p<0.05 and lower were considered
significant.
Due to an insufficient number of animals for each part of NAc for the performing two-way
analysis and due to the comparable effects in each of them, the microdialysis data were
pooled and analyzed together. Analysis of levels of dopamine and its metabolites in
microdialysates was then performed with Friedman’s repeated measures ANOVA for ranks
Page 18 of 66Psychopharmacology
123456789101112131415161718192021222324252627282930313233343536373839404142434445464748495051525354555657585960
17
with a subsequent Wilcoxon matched pairs test as the post hoc tests with the time of sample
collection as a repeated measure variable. The analysis was performed using the Statistica v.
9.0 program; differences between groups with p<0.05 and lower were considered significant.
2.7.2. EEG experiments
EEG data were analyzed by Neuroguide software v. 2.4.6. (© 2002 - 2008 Applied
Neuroscience, Inc.). In all EEG experiments each animal served as a self control (baseline
data (first 10 min before administration) were compared to data 10-20, 15-25, 25-35 or 55-65
min after administration). The power spectral analysis for each spectral band was calculated
using a one-way RM ANOVA with post hoc Newman-Keuls test. The mean power was
calculated from individual values of single electrodes from each animal exported from the
Neuroguide software and further statistical analysis was done by Sigmastat v. 3.0. EEG
coherence statistical analysis was done by Neuroguide software (Neurostat module) using a
paired T-test. Neuroguide calculated the coherence analysis for 65 pairs of electrodes (we are
presenting data only for all intrahemispheric and homologous interhemispheric pairs). The
difference between groups with p<0.05 was considered significant. Subsequently Familywise
Error (FWE) with Bonferroni correction was used to correct for multiple (65) comparisons in
leading to a level of significance p<0.015. Corrected results are displayed in the
corresponding figures.
Page 19 of 66 Psychopharmacology
123456789101112131415161718192021222324252627282930313233343536373839404142434445464748495051525354555657585960
18
3. RESULTS
3.1. Behavioral experiments - effects of 2C-B
3.1.1. Locomotion (Fig. 1A and 2)
Two-way ANOVA was conducted on total locomotion and revealed that there was a
significant interaction between the factor treatment × time after administration (F(4,89)=8.15,
p<0.001). Time after administration (F(1,89)=20.24, p<0.001) had a significant effect but
treatment (F(4,89)=0.23, p=0.92) on the other hand did not. Post hoc analysis showed that when
the drug was administered 15 min before testing, 2C-B 25 mg/kg decreased total locomotion
(p<0.05) and there was also a trend for 2C-B 50 mg/kg (p=0.06) while other doses did not
differ significantly from the vehicle group. On the contrary, administration of the drug 60 min
before testing induced an increase in locomotion after 2C-B 25 mg/kg (p<0.01), other doses
did not differ from the corresponding vehicle. Comparison between the two designs revealed
significantly longer trajectory of animals after 2C-B 10, 25 and 50 mg/kg at 60 minutes after
drug administration than at 15 min (p<0.05 - p<0.001). (Fig. 1A)
Detailed analysis of 5 minute intervals in animals administered 15 min before the
experiment (two-way RM ANOVA) showed significant interaction of the factors treatment ×
time interval (F(20,225)=14.13, p<0.001) along with significant treatment effect (F(4,225)=4.26,
p<0.01) and time interval effect (F(5,225)=30.32, p<0.001). Post hoc tests for time effects
showed that in vehicle and 2C-B 2.5 mg/kg treated animals the locomotion was shorter in all
subsequent intervals compared to the first interval (0-5 min) (p<0.001 for all intervals) and
similarly in the second interval (5-10 min) (p<0.01 - p<0.001). In vehicle treated animals the
same was observed for the third interval (10-15 min) compared to the fourth (20-25 min) and
fifth (25-30 min) interval (p<0.01). For all other doses of 2C-B (10, 25 and 50 mg/kg)
locomotion was almost constant in all time intervals showing no significant differences
between intervals. Post hoc tests for treatment effects showed that during the first two
Page 20 of 66Psychopharmacology
123456789101112131415161718192021222324252627282930313233343536373839404142434445464748495051525354555657585960
19
intervals 2C-B 10, 25 and 50 mg/kg significantly shortened trajectory compared to the vehicle
group (p<0.01 - p<0.001). (Fig. 2A)
In groups treated 60 min before the measurement two-way RM ANOVA again
revealed interaction of the factors treatment × time interval (F(20,220)=3.54, p<0.001) and
significant effects of treatment (F(4,220)=4.14, p<0.01) and time interval (F(5,220)=103.07,
p<0.001). Subsequent post hoc tests for time effects revealed that the locomotor effects in the
vehicle and 2C-B 2.5 mg/kg treated animals where comparable to the previous ones. In both
groups, locomotion continuously decreased during the second and third interval (p<0.05 -
p<0.001 for interval comparisons). On the contrary to administration 15 min prior to testing,
all other doses of 2C-B showed a similar, though less pronounced, decrease in locomotion
during the testing period as controls or 2C-B 2.5 mg/kg (p<0.05 - p<0.001 when compared to
the first two intervals). Post hoc tests for treatment effects showed that from the third interval
(10-15 min) until the end of measurement animals treated with 2C-B 10, 25 and 50 mg/kg had
longer total locomotion compared to the vehicle group while during the first two intervals the
locomotion was not significantly affected. (Fig. 2B)
3.1.2. Thigmotaxis (i) and time spent in the centre of the arena (Tcentre)
Two-way ANOVA of thigmotaxis revealed no significant effects of treatment (F(4,89)=0.99,
p=0.42), time (F(1,89)=2.27, p=0.14) or interaction (F(4,89)=1.42, p=0.23). However, two-way
ANOVA for time spent in the centre showed an interaction between factors treatment × time
after administration (F(4,89)=3.36, p<0.05) and an effect of treatment (F(4,89)=3.88, p<0.01) but
not of time (F(1,89)=2.17, p=0.14). Post hoc tests revealed that 2C-B 50 mg/kg administered 15
min before testing increased time spent in the centre of the arena (68.8 sec in vehicle versus
282.4 sec in 2C-B 50mg/kg, p<0.001). This was also apparent when compared to the same
treatment administered 60 min before testing (77.82 sec versus 282.4 sec, p<0.001). No
Page 21 of 66 Psychopharmacology
123456789101112131415161718192021222324252627282930313233343536373839404142434445464748495051525354555657585960
20
change was observed when comparing the effects of 2C-B administered 60 min before testing
versus the vehicle.
3.1.3. Acoustic startle reaction (ASR) and prepulse inhibition (PPI) of acoustic startle
reaction (Table 1 and Fig. 1B)
Two-way ANOVA of ASR revealed significant effect of treatment (F(4,90)=6.22,
p<0.001) and of time after administration (F(1,90)=11.14, p<0.001) but no interaction of factors
(F(1,90)=0.77, p=0.55). Post hoc tests showed that 2C-B administration significantly decreased
ASR of animals tested 15 minutes as well as 60 minutes after drug administration (p<0.05 -
p<0.01 except 2C-B 50 mg/kg tested 60 min after administration). The effect was more
pronounced at 15 min. (Table 1)
Two-way ANOVA for the effect on PPI showed a significant effect of treatment
(F(4,90)=7.86, p<0.001), but none for time after administration (F(1,90)=0.027, p=0.87) or
interaction (F(4,90)=0.87, p=0.48). Post hoc analysis revealed that in animals administered 15
min prior to testing 2C-B 10, 25 and 50 mg/kg significantly differed from the vehicle (p<0.05
- p<0.001). In animals treated 60 min prior to testing 2C-B 2.5, 10 and 50 mg/kg differed
significantly from the vehicle (p<0.05 - p<0.01), while in 2C-B 25 mg/kg we observed only a
trend to disrupt PPI (p=0.06). (Fig. 1B)
3.2. Behavioral experiments - effects of amphetamine
3.2.1. Locomotion (Fig. 3A)
One-way ANOVA analysis of amphetamine locomotor effects showed significant treatment
effects (F(2,28)=8.72, p<0.001). Both doses of amphetamine (1 and 4 mg/kg) significantly
increased locomotion when compared to the control group (p<0.01 - p<0.001) as was shown
by post hoc tests. (Fig. 3A)
Page 22 of 66Psychopharmacology
123456789101112131415161718192021222324252627282930313233343536373839404142434445464748495051525354555657585960
21
3.2.2. Acoustic startle reaction (ASR) and prepulse inhibition (PPI) of acoustic startle
reaction (Table 2 and Fig. 3B)
One-way ANOVA reveled that amphetamine significantly increased ASR (F(2,27)=4.75,
p<0.05) with only amphetamine 4mg/kg being significant (p<0.05). (Table 2). The PPI was
also attenuated by amphetamine (F(2,27)=3.94, p<0.05). Again only amphetamine 4 mg/kg
disrupted PPI (p<0.05). (Fig. 3B)
3.3. Levels of dopamine and its metabolites in microdialysates (Fig. 4A-D)
Friedman’s RM ANOVAs on ranks showed the significant effect of 2C-B treatment for
dopamine and all metabolites (χ2 = 99.3 (dopamine), 108.8 (DOPAC), 65.5 (HVA), 113.6 (3-
MT), df = 14, p<0.001 for all monoamines).
2C-B 25 mg/kg significantly increased dopamine levels in both compartments of NAc
(up to 4.5 × more than the baseline, p<0.05-0.001). The increase in dopamine dialysate levels
persisted 120 min after drug administration. A similar pattern of changes was observed for its
metabolites HVA (up to 6 × more than the baseline, p<0.05-0.001) and 3-MT (up to 7 × more
than the baseline, p<0.05-0.001). On the contrary, DOPAC decreased to 38% (in the Core)
and 25% (in the Shell) of the baseline levels.
3.4. EEG experiments – effect on EEG absolute power spectra
3.4.1. Effect of 2C-B on absolute EEG power spectra (Fig. 5A-B)
One-way RM ANOVAs revealed that 2C-B 10 mg/kg had a significant effect on the mean
power in beta (F(2,16)=4.96, p<0.05), high beta (F(2,16)=9.63, p<0.01) and gamma (F(2,16)=16.81,
p<0.001) bands. Post hoc tests showed that 2C-B 10 mg/kg significantly decreased the mean
power down to 88%, 77% and 74% of the baseline within the beta, high beta, and gamma
Page 23 of 66 Psychopharmacology
123456789101112131415161718192021222324252627282930313233343536373839404142434445464748495051525354555657585960
22
bands, respectively (p<0.05 - p<0.001). The effect was present during the initial phase of the
drug’s action (15-25 min after administration) as well as during the later stage (55-65 min
after administration). The decrease was present above almost all electrodes on both
hemispheres. There was also a slight insignificant increase of the power within the delta band
at 55-65 min. (Fig. 5A)
In 2C-B 50 mg/kg treated animals, one-way RM ANOVAs showed an effect of
treatment in the theta (F(2,14)=4.44, p<0.05), beta (F(2,14)=6.24, p<0.05), high beta (F(2,14)=6.74,
p<0.01) and gamma (F(2,14)=4.97, p<0.05) bands. Post hoc tests revealed that it significantly
decreased the mean power during the initial phase of the drug’s action (15-25 min after
administration) down to 76.3% of the baseline within the beta, high beta, and gamma bands
(p<0.05 - p<0.01 for each). During the later stage (55-65 min after administration) there was
only a significant decrease in the high beta band (p<0.05); though present, the decrease in
beta and gamma bands was insignificant. On the other hand, there was a significant increase
of the power within the theta band (135 % of the baseline, p<0.05) and an insignificant
increase in the delta band (125% of the baseline). The decrease and/or increase were present
almost above all electrodes in both hemispheres. (Fig. 5B)
3.4.2. Effect of amphetamine on absolute EEG power spectra (Fig. 6A)
One-way RM ANOVAs in amphetamine 4 mg/kg treated animals revealed a treatment effect
in the theta (F(2,18)=6.66, p<0.01), alpha (F(2,18)=4.58, p<0.05) and beta bands (F(2,18)=4.03,
p<0.05). Post hoc tests showed that amphetamine 4 mg/kg during the onset of its action (10-
20 min after administration) significantly increased the mean absolute power in the theta
(143.5% of the baseline, p<0.01) and alpha (163.7% of the baseline, p<0.05) bands. The
increase persisted at 25-35 min after administration (132.8% of baseline (p<0.05) for theta
and 172.5% of baseline (p<0.05) for alpha); however a significant decrease in the mean
Page 24 of 66Psychopharmacology
123456789101112131415161718192021222324252627282930313233343536373839404142434445464748495051525354555657585960
23
absolute power in the beta band (86.8% of the baseline, p<0.05) was also present. The power
increases were most obvious above the parietal electrodes on both hemispheres, while the
decreases in beta were recorded above the frontal and parietal electrodes. (Fig. 6A)
3.4.3. Effect of vehicle on absolute EEG power spectra (Fig. 6B)
One-way RM ANOVAs showed an effect in vehicle treated animals in the high beta
(F(3,27)=5.07, p<0.01) and gamma (F(3,27)=4.57, p=0.01) bands. Post hoc tests showed that
administration of the vehicle did not induce any changes in mean absolute power during the
15-25 min and 25-35 min intervals. However, during the 55-65 min interval a decrease in the
mean absolute power in the high beta (86.5% of the baseline, p<0.01) and gamma (82.9% of
the baseline, p<0.01) bands was observed. More specifically, the decrease in the beta band
was present only above the frontal and parietal electrodes; on the contrary the decrease in the
gamma band was observed above all electrodes. (Fig. 6B)
3.5. EEG experiments – effect on EEG coherence
3.5.1. The effect of 2C-B treatments on EEG coherence (Fig. 7A-B, Fig. 8A-B)
2C-B 10 mg/kg induced an overall decrease in the coherence in all frequency bands. During
the onset of the drug’s action (15 - 25 min after administration), the most prominent constant
decreases were observed in inter-hemispheric temporal coherence, intra-hemispheric parieto-
temporal and fronto-temporal coherence. In the beta, high beta and gamma bands, a decrease
in inter- and intra-hemispheric coherence between the frontal electrodes was also present (Fig.
7A). Later at 55-65 min after drug administration, the decrease in coherence had a similar
trend. In addition to the decrease in inter-hemispheric temporal coherence, a decrease in
parietal inter-hemispheric coherence was also observed, and intra-hemispheric parieto-
temporal and fronto-temporal coherence also decreased (Fig 7B).
Page 25 of 66 Psychopharmacology
123456789101112131415161718192021222324252627282930313233343536373839404142434445464748495051525354555657585960
24
2C-B 50 mg/kg induced a decrease as well as an increase in coherence between the
electrodes. During the onset of the drug’s action (15-25 min after administration) there was a
constant decrease of frontal, temporal and parietal inter-hemispheric coherence in the delta,
theta, alpha and beta bands. Changes were most robust in the beta band. In the higher
frequency bands, starting from beta, an increase in intra-hemispheric fronto-temporal and
fronto-parietal coherence was dominant (Fig. 8A). At 55-65 min after drug administration,
changes were of a similar trend. The decrease in temporal inter-hemispheric coherence
persisted; however there were fewer changes in the beta band. The increase of fronto-parietal
intra-hemispheric coherence was less pronounced than at 15-25 min and also shifted to the
lower part of the spectrum (theta and alpha). Most prominent changes were observed in the
theta, alpha, high beta and gamma bands. (Fig. 8B)
3.5.2. The effect of amphetamine 4mg/kg treatment on EEG coherence (Fig. 9A-B)
The main effect of amphetamine 4 mg/kg at 10-20 min after administration was a global
increase in coherence in theta and alpha bands. Some other increases were also present in the
beta, high beta and gamma bands. On the contrary, only minor decreases were observed in the
delta and even less in the beta and gamma bands (Fig. 9A). At 25-35 min after administration
the direction of changes was similar in the delta, theta, alpha and gamma bands; however in
the beta and high beta bands there was a greater decrease in coherence. (Fig. 9B).
3.5.3. The effect of vehicle treatment on EEG coherence (Fig. 10A-C)
Animals treated with the vehicle showed only minor changes in EEG coherence during 15-25
min and 25-35 min after administration of the vehicle. These changes were mainly increases
in fronto-temporal intra-hemispheric coherence in the delta and theta bands. A decrease in
coherence in the high beta and gamma bands especially at 25-35 min after administration was
Page 26 of 66Psychopharmacology
123456789101112131415161718192021222324252627282930313233343536373839404142434445464748495051525354555657585960
25
also observed (10A-B). However, during the last interval analyzed (55-65 min) there was only
an increase in inter-hemispheric temporal coherence in the delta band and on the contrary
there was a significant decrease in coherence mainly in the alpha, beta and high beta bands.
There were mainly fronto-temporal and fronto-parietal intra-hemispehric and frontal, parietal
and temporal inter-hemispheric decreases in coherence within these bands. Some minor
decreases with a similar trend were also observed in the theta and gamma bands (Fig. 10C).
Page 27 of 66 Psychopharmacology
123456789101112131415161718192021222324252627282930313233343536373839404142434445464748495051525354555657585960
26
4. DISCUSSION
2C-B affected most of the behavioral parameters and EEG measures analyzed and induced an
increase in the dopamine levels in the nucleus accumbens (NAc). The compound had a
biphasic effect on locomotion (decrease followed by an increase) and it disrupted
sensorimotor gating. In EEG experiments dose and time related biphasic effects were also
observed. The comparative active drug, amphetamine, also affected behavioral patterns and
EEG. It induced hyperlocomotion, deficits in sensorimotor gating and increases in EEG
power spectra and coherence.
4.1. Behavioral findings
2C-B yielded an initial decrease in locomotion during the onset of effects which changed to
an increase at 60 min after administration. The hyperlocomotion, most pronounced after 2C-B
25 mg/kg, temporally correlated with its potency to release dopamine and to its expected
maximal brain concentrations (Rohanova et al. 2008). A diminution of habituation after
higher doses of the drug was clearly visible in the detailed locomotor curve. This is very
similar to what we have previously found with mescaline (Palenicek et al. 2008) to which the
parent compound is closely related. The hypolocomotor and temporal and dose dependent
biphasic effects (with hypolocomotion followed by hyperlocomotion) are also characteristic
for many other psychedelics e.g. (Adams and Geyer 1982; Geyer et al. 1979; Krebs-Thomson
et al. 1998; Krebs-Thomson and Geyer 1996; Palenicek et al. 2006; Palenicek et al. 2010;
Sykes 1986) but not for entactogen MDMA or amphetamine, which have an inverted U shape
dose response curve (Hegadoren et al. 1995; Palenicek et al. 2005; Palenicek et al. 2007;
Spanos and Yamamoto 1989). The less pronounced increase in locomotion induced by 2C-B
50 mg/kg with increased time spent in the centre of the arena can be attributed to an
occurrence of stereotyped behavior which is a behavioral pattern characteristic for
Page 28 of 66Psychopharmacology
123456789101112131415161718192021222324252627282930313233343536373839404142434445464748495051525354555657585960

27
psychedelics, entactogens as well as stimulants e.g. (Gentry et al. 2004; Gold et al. 1989;
Palenicek et al. 2011a; Paulus and Geyer 1992). Increased time in the centre can also reflect
either the inhibitory locomotor action of 2C-B or decreased anxiety of animals (Bourin et al.
2007; Palenicek et al. 2008; Sykes 1986).
The disruption of PPI reflects alterations in informational processing (Swerdlow et al.
2000). Hallucinogenic, entactogenic and stimulant drugs which induce an inadequate sensory
filtering by manipulations with serotonin and dopamine systems typically induce such a
deficit (Brunell and Spear 2006; Bubenikova et al. 2005; Geyer 1998; Palenicek et al. 2008;
Palenicek et al. 2010; Swerdlow et al. 2003). Therefore, it is not surprising that PPI was
significantly disrupted in our experiments. Nevertheless, mainly during the onset of its action,
the 2C-B-induced PPI changes were also accompanied by decreased startle response per se.
Other psychedelics, MDMA or amphetamine show inconsistent effects on ASR e.g. (Brunell
and Spear 2006; Bubenikova et al. 2005; Davis 1987; Davis and Walters 1977; Palenicek et
al. 2008; Palenicek et al. 2010; Swerdlow et al. 2003; Varty et al. 2001) making comparisons
difficult. It can reflect decreased anxiety of animals (Bourin et al. 2007) which is in line with
the observation of increased time in the centre in the open field test. Another support for this
hypothesis is given by our recent results where 2C-B, similar to MDMA, decreased anxiety in
a test of ultrasonic vocalization (Kubesova et al. 2011) and that its amphetamine congener 4-
iodo-2,5-dimethoxyiodoamphetamine (DOI) showed anxiolytic properties in various tests for
anxiety (Masse et al. 2007b; Masse et al. 2007a). Since 2C-B in humans is reported to induce
euphoria, a mechanism called pleasure attenuation of ASR (Koch 1999; Koch and Schnitzler
1997) as well as altered motor coordination or ataxia may also theoretically contribute partly
to this (Swerdlow et al. 2000; Wecker and Ison 1986). However, a major effect of the latter
mentioned can be excluded since 2C-B decreased startle also at 60 min after administration
where the drug had minimal or slight hyperlocomotor effects.
Page 29 of 66 Psychopharmacology
123456789101112131415161718192021222324252627282930313233343536373839404142434445464748495051525354555657585960
28
It is of note that attenuated startle reaction can also interfere with the PPI itself. The
main confounding factor would be “floor effects” of the drug (Swerdlow et al. 2000),
representing the failure of decreasing startle which is of very low magnitude. Yet according to
the average baseline startle amplitude on “no-stimulus” which was below 5 manufacturer’s
arbitrary unites (data not shown) this can be excluded since even ASR was decreased
(between 35 – 72 manufacturer’s arbitrary unites) it could still be sufficiently inhibited by
prepulse. Moreover, the number of animals did not differ between 2C-B treated animals and
controls (on average less than 20%, which is typical in rats). Finally, the measurement at 60
min after administration yielded smaller changes in the ASR while the deficits in the PPI
persisted.
4.2. Microdialysis experiments
2C-B 25 mg/kg increased the release of dopamine (DA) in both main compartments of NAc
indicating it is involved in the observed locomotor changes, sensorimotor gating deficits as
well as in its psychotomimetic and addictive potential. Since there was a drop in DOPAC
levels, it clearly shows that the drug has inhibitory effects on monoamine oxidase (MAO). On
the contrary, 3-MT was increased indicating that catechol-O-methyl transferase (COMT)
remained unaffected. However, it is not clear how the final product HVA, which was
increased, was produced. 3-MT can be converted to HVA; however again MAO is necessary
(Youdim and Riederer 2004). There are two main forms of MAO, MAO A and B, which have
different roles in different parts of the brain in the deactivation of dopamine (Jahng et al.
1997). Probably the different local involvement of these two forms of MAO in DA
metabolism and the selective effects of 2C-B on only one type of MAO can underlie these
changes (Kalgutkar et al. 2001). Further experiments will be needed to explain this
discrepancy. The increase in DA can also be related to the effects on the dopamine
Page 30 of 66Psychopharmacology
123456789101112131415161718192021222324252627282930313233343536373839404142434445464748495051525354555657585960
29
transporter, which is also possible due to the structural similarity of the drug with dopamine
releasing agents such as amphetamine. Again, further experiments will be needed.
4.3 EEG findings
We did not observe any specific changes in the EEG in controls during the first 30 min after
the vehicle administration. However, 1 h after the administration of the vehicle a decrease in
the power in the high beta and gamma bands, an increase in delta power and a decrease in
coherence in the alpha – high beta bands were observed. We suggest the sleep-wake cycle
could contribute to these changes since comparable observations in rats and mice were
described during the slow wave sleep stages (Maloney et al. 1997; Vyazovskiy et al. 2004).
On the contrary to amphetamine or 2C-B treated animals, control animals had to be handled
during these later phases of recording to prevent sleep. The second variable which might
contribute to the observed effects is a fact that control animals in our experiments were
exposed to a mild sleep deprivation by handling. This could also result in (artificial) spectral
and coherence changes (Everson et al. 1989a; Everson et al. 1989b; Rechtschaffen et al.
1999).
2C-B decreased EEG power in higher frequency bands except 2C-B 50 mg/kg
treatment 1 h after administration which induced an increase of theta power. Similar power
increase within theta and alpha bands was induced by amphetamine. This theta / alpha peak
most likely reflects the locomotor activity of animals as was already shown for amphetamine
(Young 1988) and congruently might reflect increased wakefulness (Ambrosini et al. 1994). It
is also supported by our more recent findings (behavioral activity, moving, eating, grooming
etc. was associated with clear 7-8 Hz peak (Palenicek et al. 2011c; Palenicek et al. 2011d))
and is also congruent with others (Maloney et al. 1997; Vyazovskiy et al. 2006; Vyazovskiy et
al. 2007). Since at of the same time there was a peak in the DA release in the NAc we suggest
Page 31 of 66 Psychopharmacology
123456789101112131415161718192021222324252627282930313233343536373839404142434445464748495051525354555657585960
30
it is an underlying neurobiological substrate of these changes. Some similarities can also be
found in other studies with phenylalkylamine psychedelics and LSD in rats where an increase
in the frontal alpha1 (7 - 9.5 Hz) EEG power was described (Dimpfel et al. 1988; Dimpfel et
al. 1989). Interestingly, the increase was not present during the onset of action of these drugs
but at later stages where other authors have described an increase in behavioral activities
induced by these compounds (Geyer et al. 1979; Marona-Lewicka et al. 2005). MDMA used
in the above mentioned study (Dimpfel et al. 1989) also induced an increase in the alpha at
2.4 mg/kg (this dose produces hyperlocomotion (Palenicek et al. 2005)) but not with lower
doses, again indicating a resemblance of these effects. On the contrary to the theta / alpha
peak, the observed general power decrease after 2C-B was also observed with other
psychedelics (LSD, mescaline, psilocin and DOB) in our recent experiments (Fujakova et al.
2011; Tyls et al. 2011) and power decreases in all other frequency bands were also seen in the
mentioned studies with psychedelics as well as entactogens N-methyl-1-(1,3-benzodioxol-5-
yl)-2-butanamine (MBDB) and MDMA (Dimpfel et al. 1988; Dimpfel et al. 1989). Since the
behavioral activity of animals was inhibited along with the EEG power decreases, these
findings might reflect common serotonergic mechanisms with psychedelic drugs, e.g.
stimulation of 5-HT2A/C receptors.
2C-B also induced several changes in brain functional connectivity and again as with
behavioral experiments these were dose and time specific. The main observation was a
consistent disconnection with 2C-B 10 mg/kg contrary to 2C-B 50 mg/kg where an increase
in connectivity in higher parts of the spectrum was observed.
It is difficult to compare our results to other authors since there is a substantial lack of
such experiments throughout the literature. In our previous study we have found an overall
increase in coherence after ketamine administration which was present along with increased
locomotor activity (Palenicek et al. 2011b). Congruently, an increase in coherence associated
Page 32 of 66Psychopharmacology
123456789101112131415161718192021222324252627282930313233343536373839404142434445464748495051525354555657585960
31
with behavioral activity was observed in our recent studies (Palenicek et al. 2011c; Palenicek
et al. 2011d) and by Maloney et al. [1997]. Therefore the increase of coherence in 2C-B 50
mg/kg and also in amphetamine treated animals might again reflect their hyperlocomotor
effects and might be related to dopamine increase in NAc. On the contrary the decreases of
coherence that were present mainly with the 2C-B 10 mg/kg are in line with our recent
findings in other serotonergic hallucinogens (psilocin, mescaline, DOB and LSD) (Fujakova
et al. 2011; Tyls et al. 2011).
According to Lisman and Buzsaki 2008, synchronous gamma and theta oscillations are
related to cognitive functions and processing of spatial representations. Thus, the disturbances
of these oscillations observed in our spectral and coherence analysis might reflect the
disturbed informational processing including the appropriate acquisition and processing of
spatial representations. We might then associate it to the observed behavioral changes (altered
locomotion, stereotypy or disrupted PPI) and hypothesize it reflects the psychedelic potential
of 2C-B.
4.4. Underlying neurobiological substrates
Underlying neurochemical substrates, which contribute to the observed behavioral changes,
most likely involve stimulation of serotonergic as well as dopaminergic systems. The most
probable explanation of time and dose dependent biphasic effects is related to
pharmacodynamics. We propose that while dopamine increases 1 h after the administration of
2C-B, the initial effects of the drug are more related to its direct action at serotonin receptors
(Moya et al. 2007), while in later stages especially for high doses of the drug, dopamine plays
an important role. A support for this statement is found in studies with LSD, where the initial
effects of the drug correspond to its agonist effects on serotonin 5-HT2A/C receptors, while
latter effects can be attributed to its affinity at dopaminergic receptors (Marona-Lewicka et al.
Page 33 of 66 Psychopharmacology
123456789101112131415161718192021222324252627282930313233343536373839404142434445464748495051525354555657585960
32
2005; Marona-Lewicka and Nichols 2007). The other possible explanation is that a
sequestration of the parent drug into various compartments (2C-B has been shown to
accumulate in the lungs) with subsequent continuous release may lead to gradual penetration
to the brain (Rohanova et al. 2008)) and thus might be relevant for delaying some behavioral
effects of the drug. A similar pattern of accumulation in the lungs has been reported for its
amphetamine analog DOB (Berankova et al. 2007) and another congener para-
methoxymethamphetamine (PMMA) (Palenicek et al. 2011a; Rohanova and Balikova 2009).
Finally, the drug can be metabolized to an active metabolite which might have a different
pharmacological action as has been described e.g. for MDMA (metabolized to MDA) (Segura
et al. 2001) or PMMA (metabolized to PMA) (Rohanova and Balikova 2009). However to-
date no metabolite of 2C-B has been investigated as being possibly active (Carmo et al. 2004;
Carmo et al. 2005; Kanamori et al. 2005; Rohanova et al. 2008).
The NAc increase in DA levels can be definitely positively linked to the
hyperlocomotor effects of the drug and it can also contribute to the disruption of sensorimotor
gating (NAc core) (Geyer et al. 2001). Furthermore, it can contribute to the theoretical
addictive potential of this substance (Lingford-Hughes and Nutt 2003; Roberts and Koob
1997) and to its potential to induce psychotic symptoms (NAc shell) (Breier et al. 1998;
Vollenweider et al. 1999).
4.5. Conclusion
2C-B is a potent centrally active compound which induces behavioral, neurochemical
and electrophysiological changes comparable to other psychedelics as well as to entactogens
and stimulants. The drug has time and dose dependent biphasic effects of action which are
presumably linked to time differences in the involvement of serotonin and dopamine systems.
The effects of 2C-B on DA levels and turnover in the NAc suggest it presumably inhibits
Page 34 of 66Psychopharmacology
123456789101112131415161718192021222324252627282930313233343536373839404142434445464748495051525354555657585960

33
MAO and may be related to its addictive and psychotomimetic potential. The EEG findings
showed robust effects on functional connectivity in the brain which might correlate to altered
sensorimotor processing and its psychedelic potential. A temporal correlation of 2C-B’s
effects on locomotion and correlation between EEG changes and locomotor behavior are
emerging.
Page 35 of 66 Psychopharmacology
123456789101112131415161718192021222324252627282930313233343536373839404142434445464748495051525354555657585960
34
ACKNOWLEDGEMENTS
This study was supported by the grants IGA MHCR NS 10374, NS 10375, NT 13897,
MEYSCR 1M0517, MHCR MZ0PCP2005, MICR VG20122015075 and VG20122015080.
We thank Craig Hampson BSc (Hons) for his helpful comments and language correction.
Page 36 of 66Psychopharmacology
123456789101112131415161718192021222324252627282930313233343536373839404142434445464748495051525354555657585960
35
References
Acuna-Castillo C, Villalobos C, Moya PR, Saez P, Cassels BK, Huidobro-Toro JP (2002) Differences in potency and efficacy of a series of phenylisopropylamine/phenylethylamine pairs at 5-HT(2A) and 5-HT(2C) receptors. Br.J.Pharmacol. 136: 510-519
Adams LM, Geyer MA (1982) LSD-induced alterations of locomotor patterns and exploration in rats. Psychopharmacology (Berl) 77: 179-185
Ambrosini MV, Gambelunghe C, Mariucci G, Bruschelli G, Adami M, Giuditta A (1994) Sleep-wake variables and EEG power spectra in Mongolian gerbils and Wistar rats. Physiol Behav 56: 963-968
Berankova K, Szkutova M, Balikova M (2007) Distribution profile of 2,5-dimethoxy-4-bromoamphetamine (DOB) in rats after oral and subcutaneous doses. Forensic Sci Int 170: 94-99
Bossong MG, Van Dijk JP, Niesink RJ (2005) Methylone and mCPP, two new drugs of abuse? Addict.Biol. 10: 321-323
Bourin M, Petit-Demouliere B, Dhonnchadha BN, Hascoet M (2007) Animal models of anxiety in mice. Fundam.Clin.Pharmacol 21: 567-574
Breier A, Adler CM, Weisenfeld N, Su TP, Elman I, Picken L, Malhotra AK, Pickar D (1998) Effects of NMDA antagonism on striatal dopamine release in healthy subjects: application of a novel PET approach. Synapse 29: 142-147
Bronson ME, Jiang W, DeRuiter J, Clark CR (1995) A behavioral comparison of Nexus, cathinone, BDB, and MDA. Pharmacol.Biochem.Behav. 51: 473-475
Brunell SC, Spear LP (2006) Effects of acute ethanol or amphetamine administration on the acoustic startle response and prepulse inhibition in adolescent and adult rats. Psychopharmacology 186: 579-586
Bubenikova V, Votava M, Horacek J, Palenicek T (2005) Relation of sex and estrous phase to deficits in prepulse inhibition of the startle response induced by ecstasy (MDMA). Behav.Pharmacol. 16: 127-130
Carmo H, de BD, Remiao F, Carvalho F, dos Reys LA, de Lourdes BM (2004) Metabolism of the designer drug 4-bromo-2,5-dimethoxyphenethylamine (2C-B) in mice, after acute administration. J.Chromatogr.B Analyt.Technol.Biomed.Life Sci. 811: 143-152
Carmo H, Hengstler JG, de BD, Ringel M, Remiao F, Carvalho F, Fernandes E, dos Reys LA, Oesch F, de Lourdes BM (2005) Metabolic pathways of 4-bromo-2,5-dimethoxyphenethylamine (2C-B): analysis of phase I metabolism with hepatocytes of six species including human. Toxicology 206: 75-89
Caudevilla-Galligo F, Riba J, Ventura M, Gonzalez D, Farre M, Barbanoj MJ, Bouso JC (2012) 4-Bromo-2,5-dimethoxyphenethylamine (2C-B): presence in the recreational drug market in Spain, pattern of use and subjective effects. J.Psychopharmacol.
Page 37 of 66 Psychopharmacology
123456789101112131415161718192021222324252627282930313233343536373839404142434445464748495051525354555657585960
36
Cole MD, Lea C, Oxley N (2002) 4-Bromo-2,5-dimethoxyphenethylamine (2C-B): a review of the public domain literature. Sci.Justice. 42: 223-224
Davis M (1987) Mescaline: excitatory effects on acoustic startle are blocked by serotonin2 antagonists. Psychopharmacology (Berl) 93: 286-291
Davis M, Walters JK (1977) Psilocybin: biphasic dose-response effects on the acoustic startle reflex in the rat. Pharmacol.Biochem.Behav. 6: 427-431
de Boer D, Bosman IJ, Hidvegi E, Manzoni C, Benko AA, dos Reys LJ, Maes RA (2001) Piperazine-like compounds: a new group of designer drugs-of-abuse on the European market. Forensic Sci.Int. 121: 47-56
de Boer D, Bosman I (2004) A new trend in drugs-of-abuse; the 2C-series of phenethylamine designer drugs. Pharm.World Sci. 26: 110-113
de Boer D, Gijzels MJ, Bosman IJ, Maes RA (1999) More data about the new psychoactive drug 2C-B. J.Anal.Toxicol. 23: 227-228
Deutch AY, Cameron DS (1992) Pharmacological characterization of dopamine systems in the nucleus accumbens core and shell. Neuroscience 46: 49-56
Dimpfel W, Spuler M, Borbe HO (1988) Monitoring of the effects of antidepressant drugs in the freely moving rat by radioelectroencephalography (tele-stereo-EEG). Neuropsychobiology 19: 116-120
Dimpfel W, Spuler M, Nichols DE (1989) Hallucinogenic and stimulatory amphetamine derivatives: fingerprinting DOM, DOI, DOB, MDMA, and MBDB by spectral analysis of brain field potentials in the freely moving rat (Tele-Stereo-EEG). Psychopharmacology (Berl) 98: 297-303
EMCDDA (2004) Report on the risk assessment of 2C-I, 2C-T-2 and 2C-T-7 in the framework of the joint action on new synthetic drugs. European monitoring Centre for Drugs and Drug Addiction (EMCDDA),
Everson CA, Bergmann BM, Rechtschaffen A (1989a) Sleep deprivation in the rat: III. Total sleep deprivation. Sleep 12: 13-21
Everson CA, Gilliland MA, Kushida CA, Pilcher JJ, Fang VS, Refetoff S, Bergmann BM, Rechtschaffen A (1989b) Sleep deprivation in the rat: IX. Recovery. Sleep 12: 60-67
Fiserova M, Consolo S, Krsiak M (1999) Chronic morphine induces long-lasting changes in acetylcholine release in rat nucleus accumbens core and shell: an in vivo microdialysis study. Psychopharmacology (Berl) 142: 85-94
Fujakova, M, Palenicek, T, Tyls, F, Kubesova, A, Brunovsky, M, Krajca, V, and Horacek, J (2011) The effect of phenylethylamine hallucinogens on quantitative electronecephalography and behavior in rats. Behav Pharmacol 22: e38
Gentry WB, Ghafoor AU, Wessinger WD, Laurenzana EM, Hendrickson HP, Owens SM (2004) (+)-Methamphetamine-induced spontaneous behavior in rats depends on route of (+)METH administration. Pharmacol Biochem.Behav 79: 751-760
Page 38 of 66Psychopharmacology
123456789101112131415161718192021222324252627282930313233343536373839404142434445464748495051525354555657585960
37
Geyer MA (1998) Behavioral studies of hallucinogenic drugs in animals: implications for schizophrenia research. Pharmacopsychiatry 31 Suppl 2: 73-79
Geyer MA, Krebs-Thomson K, Braff DL, Swerdlow NR (2001) Pharmacological studies of prepulse inhibition models of sensorimotor gating deficits in schizophrenia: a decade in review. Psychopharmacology (Berl) 156: 117-154
Geyer MA, Light RK, Rose GJ, Petersen LR, Horwitt DD, Adams LM, Hawkins RL (1979) A characteristic effect of hallucinogens on investigatory responding in rats. Psychopharmacology (Berl) 65: 35-40
Glennon RA, Titeler M, Lyon RA (1988) A preliminary investigation of the psychoactive agent 4-bromo-2,5-dimethoxyphenethylamine: a potential drug of abuse. Pharmacol.Biochem.Behav. 30: 597-601
Gold LH, Geyer MA, Koob GF (1989) Neurochemical mechanisms involved in behavioral effects of amphetamines and related designer drugs. NIDA Res.Monogr 94: 101-126
Hegadoren KM, Martin-Iverson MT, Baker GB (1995) Comparative behavioural and neurochemical studies with a psychomotor stimulant, an hallucinogen and 3,4-methylenedioxy analogues of amphetamine. Psychopharmacology (Berl) 118: 295-304
Huang HH, Bai YM (2011) Persistent psychosis after ingestion of a single tablet of '2C-B'. Prog Neuropsychopharmacol Biol Psychiatry 35: 293-294
Jahng JW, Houpt TA, Wessel TC, Chen K, Shih JC, Joh TH (1997) Localization of monoamine oxidase A and B mRNA in the rat brain by in situ hybridization. Synapse 25: 30-36
Kalgutkar AS, Dalvie DK, Castagnoli N, Jr., Taylor TJ (2001) Interactions of nitrogen-containing xenobiotics with monoamine oxidase (MAO) isozymes A and B: SAR studies on MAO substrates and inhibitors. Chem.Res.Toxicol. 14: 1139-1162
Kanamori T, Tsujikawa K, Ohmae Y, Iwata YT, Inoue H, Kishi T, Nakahama T, Inouye Y (2005) A study of the metabolism of methamphetamine and 4-bromo-2,5-dimethoxyphenethylamine (2C-B) in isolated rat hepatocytes. Forensic Sci.Int. 148: 131-137
Koch M (1999) The neurobiology of startle. Prog.Neurobiol. 59: 107-128
Koch M, Schnitzler HU (1997) The acoustic startle response in rats--circuits mediating evocation, inhibition and potentiation. Behav Brain Res. 89: 35-49
Krebs-Thomson K, Geyer MA (1996) The role of 5-HT(1A) receptors in the locomotor-suppressant effects of LSD: WAY-100635 studies of 8-OH-DPAT, DOI and LSD in rats. Behav.Pharmacol. 7: 551-559
Krebs-Thomson K, Paulus MP, Geyer MA (1998) Effects of hallucinogens on locomotor and investigatory activity and patterns: influence of 5-HT2A and 5-HT2C receptors. Neuropsychopharmacology 18: 339-351
Page 39 of 66 Psychopharmacology
123456789101112131415161718192021222324252627282930313233343536373839404142434445464748495051525354555657585960
38
Kubesova A, Palenicek T, Votava M, Fujakova M, Tyls F, Sustkova M, Krsiak M (2011) The influence of 5-HT 1A/2A antagonists on changes in ultrasonic vocalization in rats induced by administration of MDMA and 2C-B. Behav Pharmacol 22: e71
Lát J (1973) The analysis of habituation. Acta Neurobiol.Exp.(Wars.) 33: 771-789
Lingford-Hughes A, Nutt D (2003) Neurobiology of addiction and implications for treatment. Br.J.Psychiatry 182: 97-100
Lisman J, Buzsaki G (2008) A neural coding scheme formed by the combined function of gamma and theta oscillations. Schizophr.Bull. 34: 974-980
Lobos M, Borges Y, Gonzalez E, Cassels BK (1992) The action of the psychoactive drug 2C-B on isolated rat thoracic aorta. Gen.Pharmacol. 23: 1139-1142
Maloney KJ, Cape EG, Gotman J, Jones BE (1997) High-frequency gamma electroencephalogram activity in association with sleep-wake states and spontaneous behaviors in the rat. Neuroscience 76: 541-555
Marona-Lewicka D, Nichols DE (2007) Further evidence that the delayed temporal dopaminergic effects of LSD are mediated by a mechanism different than the first temporal phase of action. Pharmacol Biochem.Behav 87: 453-461
Marona-Lewicka D, Thisted RA, Nichols DE (2005) Distinct temporal phases in the behavioral pharmacology of LSD: dopamine D2 receptor-mediated effects in the rat and implications for psychosis. Psychopharmacology (Berl) 180: 427-435
Masse F, Hascoet M, Bourin M (2007a) Effect of GABAergic ligands on the anxiolytic-like activity of DOI (a 5-HT(2A/2C) agonist) in the four-plate test in mice. Eur Neuropsychopharmacol 17: 483-491
Masse F, Nic Dhonnchadha BA, Hascoet M, Bourin M (2007b) Anxiolytic-like effect of 5-HT(2) ligands and benzodiazepines co-administration: comparison of two animal models of anxiety (the four-plate test and the elevated plus maze). Behav Brain Res. 177: 214-226
Moya PR, Berg KA, Gutierrez-Hernandez MA, Saez-Briones P, Reyes-Parada M, Cassels BK, Clarke WP (2007) Functional selectivity of hallucinogenic phenethylamine and phenylisopropylamine derivatives at human 5-hydroxytryptamine (5-HT)2A and 5-HT2C receptors. J.Pharmacol Exp.Ther. 321: 1054-1061
Nichols DE (1986) Differences between the mechanism of action of MDMA, MBDB, and the classic hallucinogens. Identification of a new therapeutic class: entactogens. J.Psychoactive Drugs 18: 305-313
Palenicek T, Bubenikova V, Votava M, Horacek J (2006) Účinky selektivního antagonisty serotoninového 5-HT2C receptoru SB242084 na lokomoci potkana v animálních modelech psychóz (The effects of selective antagonist of serotonin 5-HT2C receptor SB242084 on rat`s locomotion in animal models of psychosis). Adiktologie 10: 16-19
Palenicek T, Balikova M, Bubenikova-Valesova V, Horacek J (2008) Mescaline effects on rat behavior and its time profile in serum and brain tissue after a single subcutaneous dose. Psychopharmacology (Berl) 196: 51-62
Page 40 of 66Psychopharmacology
123456789101112131415161718192021222324252627282930313233343536373839404142434445464748495051525354555657585960
39
Palenicek T, Balikova M, Rohanova M, Novak T, Horacek J, Fujakova M, Hoschl C (2011a) Behavioral, hyperthermic and pharmacokinetic profile of para-methoxymethamphetamine (PMMA) in rats. Pharmacol Biochem.Behav 98: 130-139
Palenicek T, Fujakova M, Brunovsky M, Balikova M, Horacek J, Gorman I, Tyls F, Tislerova B, Sos P, Bubenikova-Valesova V, Hoschl C, Krajca V (2011b) Electroencephalographic spectral and coherence analysis of ketamine in rats: correlation with behavioral effects and pharmacokinetics. Neuropsychobiology 63: 202-218
Palenicek, T, Fujakova, M, Tyls, F, Brunovsky, M, Kubesova, A, Horacek, J, and Krajca, V (2011c) Quantitative EEG in animal models of psychosis: the impact of behaviour. Eur Neuropsychopharmacol 21: S317
Palenicek, T, Fujakova, M, Tyls, F, Kubesova, A, Brunovsky, M, Horacek, J, and Krajca, V (2011d) The impact of behavior on cortical EEG in rats. Neuroimaging through the lifespan: Brain development and brain diseases from adolescence to senescence - joint meeting of ISNIP/lSBET/ECNS September 7 - 10.2011, University of Heidelberg, Germany, Abstrakt Book: 106
Palenicek T, Hlinak Z, Bubenikova-Valesova V, Novak T, Horacek J (2010) Sex differences in the effects of N,N-diethyllysergamide (LSD) on behavioural activity and prepulse inhibition. Prog Neuropsychopharmacol Biol Psychiatry 34: 588-596
Palenicek T, Hlinak Z, Bubenikova-Valesova V, Votava M, Horacek J (2007) An analysis of spontaneous behavior following acute MDMA treatment in male and female rats. Neuro Endocrinol Lett 28: 781-788
Palenicek T, Votava M, Bubenikova V, Horacek J (2005) Increased sensitivity to the acute effects of MDMA ("ecstasy") in female rats. Physiol Behav. 86: 546-553
Paulus MP, Geyer MA (1992) The effects of MDMA and other methylenedioxy-substituted phenylalkylamines on the structure of rat locomotor activity. Neuropsychopharmacology 7: 15-31
Paxinos G, Watson C (2003) The Rat Brain in Stereotaxic Coordinates, 4th edn. Elsevier, Academic Press, New York
Pontieri FE, Tanda G, Di CG (1995) Intravenous cocaine, morphine, and amphetamine preferentially increase extracellular dopamine in the "shell" as compared with the "core" of the rat nucleus accumbens. Proc.Natl.Acad.Sci.U.S.A 92: 12304-12308
Principe JC, Smith JR (1986) Design and implementation of linear phase FIR filters for biological signal processing. IEEE Trans.Biomed.Eng 33: 550-559
Rechtschaffen A, Bergmann BM, Gilliland MA, Bauer K (1999) Effects of method, duration, and sleep stage on rebounds from sleep deprivation in the rat. Sleep 22: 11-31
Roberts AJ, Koob GF (1997) The neurobiology of addiction: an overview. Alcohol Health Res.World 21: 101-106
Page 41 of 66 Psychopharmacology
123456789101112131415161718192021222324252627282930313233343536373839404142434445464748495051525354555657585960
40
Rohanova M, Balikova M (2009) Studies on distribution of para-methoxymethamphetamine (PMMA) designer drug in rats using gas chromatography-mass spectrometry. Leg.Med.(Tokyo) 11 Suppl 1: S429-S430
Rohanova M, Palenicek T, Balikova M (2008) Disposition of 4-bromo-2,5-dimethoxyphenethylamine (2C-B) and its metabolite 4-bromo-2-hydroxy-5-methoxyphenethylamine in rats after subcutaneous administration. Toxicol.Lett. 178: 29-36
Segura M, Ortuno J, Farre M, McLure JA, Pujadas M, Pizarro N, Llebaria A, Joglar J, Roset PN, Segura J, de la TR (2001) 3,4-Dihydroxymethamphetamine (HHMA). A major in vivo 3,4-methylenedioxymethamphetamine (MDMA) metabolite in humans. Chem.Res.Toxicol. 14: 1203-1208
Shaw JC, O´Connor KP, Ongley OC (1978) EEG coherence as a measure of cerebral functional organization. In: Brazier MB, Petche H (eds) Architectonics of the Cerebral Cortex. Raven Press, New York, pp 245-256
Shulgin A, Shulgin A (1991) PIHKAL : A Chemical Love Story. Transform Press, Berkley, CA
Shulgin AT, Carter MF (1975) Centrally active phenethylamines. Psychopharmacol.Commun. 1: 93-98
Smolinske SC, Rastogi R, Schenkel S (2005) Foxy methoxy: a new drug of abuse. J.Med.Toxicol. 1: 22-25
Spanos LJ, Yamamoto BK (1989) Acute and subchronic effects of methylenedioxymethamphetamine [(+/-)MDMA] on locomotion and serotonin syndrome behavior in the rat. Pharmacol Biochem.Behav 32: 835-840
Sumnall, H and Wooding, O (2009) Mephedrone - an update on current knowledge. Centre for Public Health, Liverpool John Moores University,
Swerdlow NR, Braff DL, Geyer MA (2000) Animal models of deficient sensorimotor gating: what we know, what we think we know, and what we hope to know soon. Behav Pharmacol 11: 185-204
Swerdlow NR, Geyer MA, Braff DL (2001) Neural circuit regulation of prepulse inhibition of startle in the rat: current knowledge and future challenges. Psychopharmacology (Berl) 156: 194-215
Swerdlow NR, Stephany N, Wasserman LC, Talledo J, Shoemaker J, Auerbach PP (2003) Amphetamine effects on prepulse inhibition across-species: replication and parametric extension. Neuropsychopharmacology 28: 640-650
Sykes EA (1986) Mescaline-induced motor impairment in rats, assessed by two different methods. Life Sci. 39: 1051-1058
Thatcher RW, Biver CJ, North DM (2003) Quantitative EEG and the Frye and Daubert standards of admissibility. Clin.Electroencephalogr. 34: 39-53
Page 42 of 66Psychopharmacology
123456789101112131415161718192021222324252627282930313233343536373839404142434445464748495051525354555657585960

41
Thatcher RW, Krause PJ, Hrybyk M (1986) Cortico-cortical associations and EEG coherence: a two-compartmental model. Electroencephalogr.Clin.Neurophysiol. 64: 123-143
Thatcher RW, Walker RA, Giudice S (1987) Human cerebral hemispheres develop at different rates and ages. Science 236: 1110-1113
Thorlacius K, Borna C, Personne M (2008) [Bromo-dragon fly--life-threatening drug. Can cause tissue necrosis as demonstrated by the first described case]. Lakartidningen 105: 1199-1200
Tyls, F, Palenicek, T, Fujakova, M, Kubesova, A, Brunovsky, M, Krajca, V, and Horacek, J (2011) The effect of tryptamine hallucinogens on quantitative EEG and behavior in rats. Behav Pharmacol 22: e39
Varty GB, Walters N, Cohen-Williams M, Carey GJ (2001) Comparison of apomorphine, amphetamine and dizocilpine disruptions of prepulse inhibition in inbred and outbred mice strains. Eur J Pharmacol 424: 27-36
Vollenweider FX, Vontobel P, Hell D, Leenders KL (1999) 5-HT modulation of dopamine release in basal ganglia in psilocybin-induced psychosis in man--a PET study with [11C]raclopride. Neuropsychopharmacology 20: 424-433
Vyazovskiy V, Achermann P, Borbely AA, Tobler I (2004) Interhemispheric coherence of the sleep electroencephalogram in mice with congenital callosal dysgenesis. Neuroscience 124: 481-488
Vyazovskiy VV, Ruijgrok G, Deboer T, Tobler I (2006) Running wheel accessibility affects the regional electroencephalogram during sleep in mice. Cereb.Cortex 16: 328-336
Vyazovskiy VV, Tobler I, Winsky-Sommerer R (2007) Alteration of behavior in mice by muscimol is associated with regional electroencephalogram synchronization. Neuroscience 147: 833-841
Wecker JR, Ison JR (1986) Effects of Motor-Activity on the Elicitation and Modification of the Startle Reflex in Rats. Animal Learning & Behavior 14: 287-292
Wishaw IQ, Haun F, Kolb B (1999) Analysis of behavior in laboratory rodents. In: Windhorst U, Johansson H (eds) Modern techniques in neuroscience. Springer-Verlag, Berlin, Germany, pp 1243-1275
Youdim MB, Riederer PF (2004) A review of the mechanisms and role of monoamine oxidase inhibitors in Parkinson's disease. Neurology 63: S32-S35
Young GA (1988) Relationship between amphetamine-induced effects on EEG power spectra and motor activity in rats. Pharmacol Biochem.Behav 30: 489-492
Page 43 of 66 Psychopharmacology
123456789101112131415161718192021222324252627282930313233343536373839404142434445464748495051525354555657585960
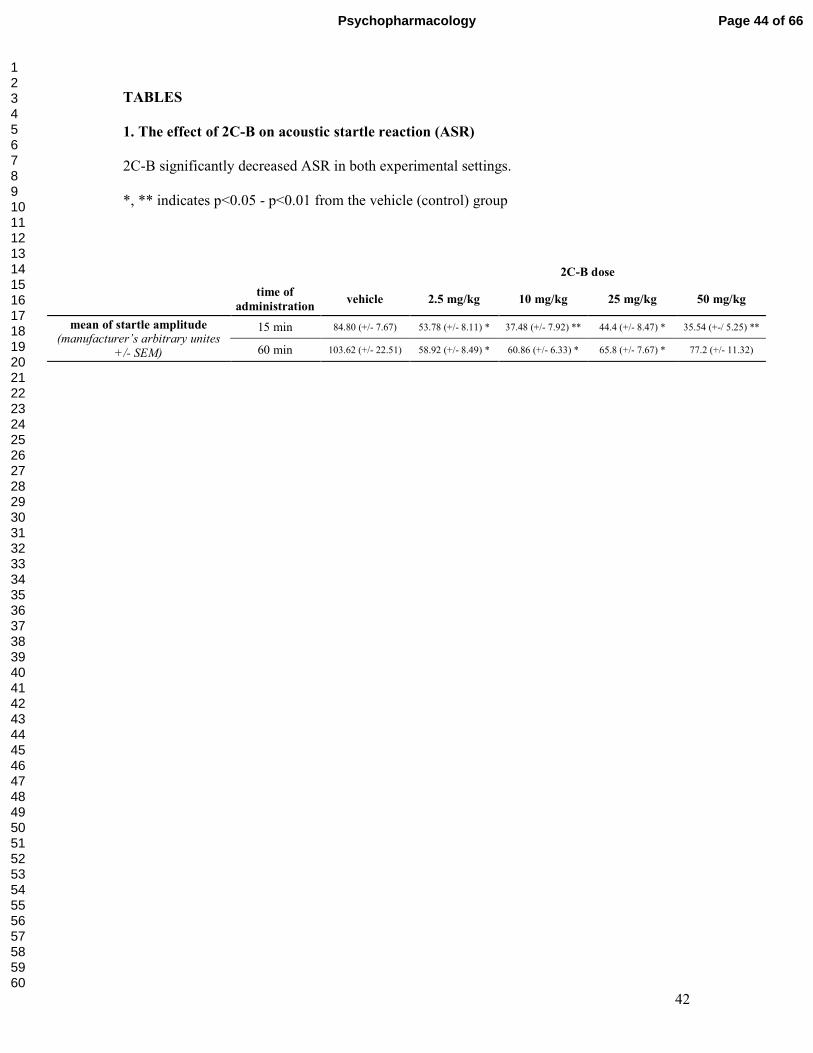
42
TABLES
1. The effect of 2C-B on acoustic startle reaction (ASR)
2C-B significantly decreased ASR in both experimental settings.
*, ** indicates p<0.05 - p<0.01 from the vehicle (control) group
2C-B dose
time of
administration vehicle 2.5 mg/kg 10 mg/kg 25 mg/kg 50 mg/kg
mean of startle amplitude
(manufacturer’s arbitrary unites +/- SEM)
15 min 84.80 (+/- 7.67) 53.78 (+/- 8.11) * 37.48 (+/- 7.92) ** 44.4 (+/- 8.47) * 35.54 (+-/ 5.25) **
60 min 103.62 (+/- 22.51) 58.92 (+/- 8.49) * 60.86 (+/- 6.33) * 65.8 (+/- 7.67) * 77.2 (+/- 11.32)
Page 44 of 66Psychopharmacology
123456789101112131415161718192021222324252627282930313233343536373839404142434445464748495051525354555657585960
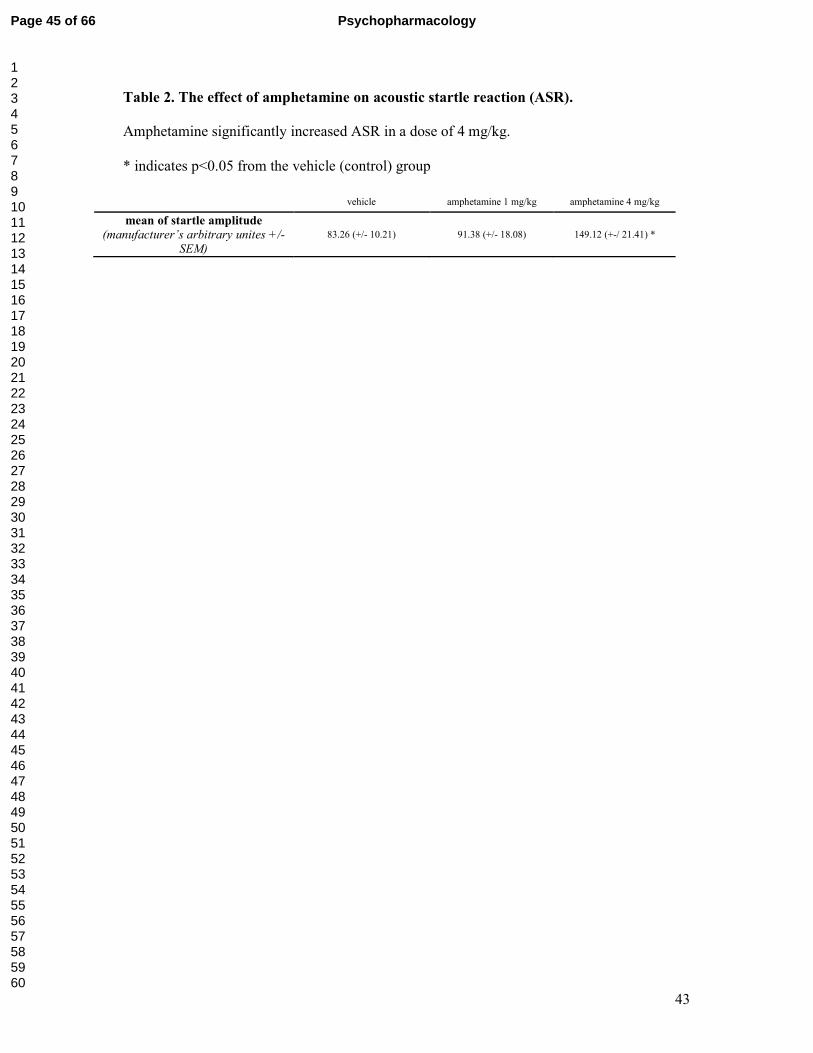
43
Table 2. The effect of amphetamine on acoustic startle reaction (ASR).
Amphetamine significantly increased ASR in a dose of 4 mg/kg.
* indicates p<0.05 from the vehicle (control) group
vehicle amphetamine 1 mg/kg amphetamine 4 mg/kg
mean of startle amplitude
(manufacturer’s arbitrary unites +/- SEM)
83.26 (+/- 10.21) 91.38 (+/- 18.08) 149.12 (+-/ 21.41) *
Page 45 of 66 Psychopharmacology
123456789101112131415161718192021222324252627282930313233343536373839404142434445464748495051525354555657585960
44
TITLES AND LEGENDS TO FIGURES
Figure 1. Effect of 2C-B on total locomotion (A) and on prepulse inhibition (PPI) of
acoustic startle reaction (ASR) (B)
(A) Total distance travelled was significantly decreased by 2C-B treatment when administered
15 min before the start of measurement, on the contrary an increase in locomotion was
observed when the drug was administered 60 min before measurement. Further, there was a
significant difference between 2C-B 25 and 50 mg/kg between the two timings. (B) Prepulse
inhibition was disrupted by 2C-B treatment in both timings. This effect was more obvious
when 2C-B was administered 15 min before the start of measurement. All data are presented
as mean +/- SEM.
*, **, *** indicates p<0.05, p<0.01 and p<0.001 from the respective vehicle (control) group
#, ### indicates p<0.05 and p<0.001 between the two timings
Page 46 of 66Psychopharmacology
123456789101112131415161718192021222324252627282930313233343536373839404142434445464748495051525354555657585960
45
Fig. 2. The effect of 2C-B on locomotion in 5-min intervals.
(A) Administration of 2C-B 15 min before the start of the measurement - 2C-B 10, 25 and 50
mg/kg induced hypolocomotion during the first two intervals. (B) Administration of 2C-B 60
min before the start of the measurement - 2C-B 10, 25 and 50 mg/kg induced
hyperlocomotion during the second part of the measurement. All data are presented as mean
+/- SEM.
*, **, *** indicates p<0.05, p<0.01 and p<0.001 from the vehicle (control) group for 2C-B 10
mg/kg
+, ++, +++ indicates p<0.05, p<0.01 and p<0.001 from the vehicle (control) group for 2C-B
25 mg/kg
#, ##, ### indicates p<0.05, p<0.01 and p<0.001 from the vehicle (control) group for 2C-B 50
mg/kg
Page 47 of 66 Psychopharmacology
123456789101112131415161718192021222324252627282930313233343536373839404142434445464748495051525354555657585960
46
Fig. 3. The effect of amphetamine on total locomotion and on prepulse inhibition (PPI)
of acoustic startle reaction (ASR)
(A) Amphetamine significantly increased locomotion in both doses. (B) PPI was significantly
disrupted by amphetamine 4 mg/kg. All data are presented as mean +/- SEM.
*, *** indicates p<0.05 and p<0.001 from the vehicle (control) group
Page 48 of 66Psychopharmacology
123456789101112131415161718192021222324252627282930313233343536373839404142434445464748495051525354555657585960
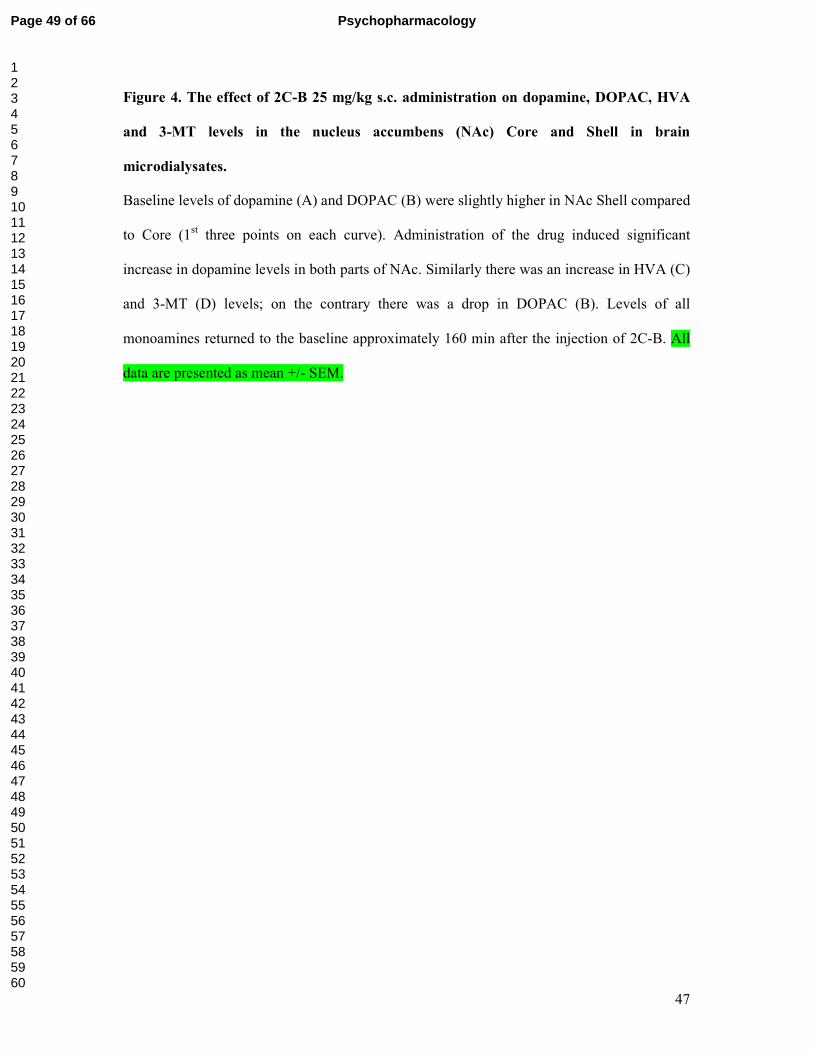
47
Figure 4. The effect of 2C-B 25 mg/kg s.c. administration on dopamine, DOPAC, HVA
and 3-MT levels in the nucleus accumbens (NAc) Core and Shell in brain
microdialysates.
Baseline levels of dopamine (A) and DOPAC (B) were slightly higher in NAc Shell compared
to Core (1st three points on each curve). Administration of the drug induced significant
increase in dopamine levels in both parts of NAc. Similarly there was an increase in HVA (C)
and 3-MT (D) levels; on the contrary there was a drop in DOPAC (B). Levels of all
monoamines returned to the baseline approximately 160 min after the injection of 2C-B. All
data are presented as mean +/- SEM.
Page 49 of 66 Psychopharmacology
123456789101112131415161718192021222324252627282930313233343536373839404142434445464748495051525354555657585960
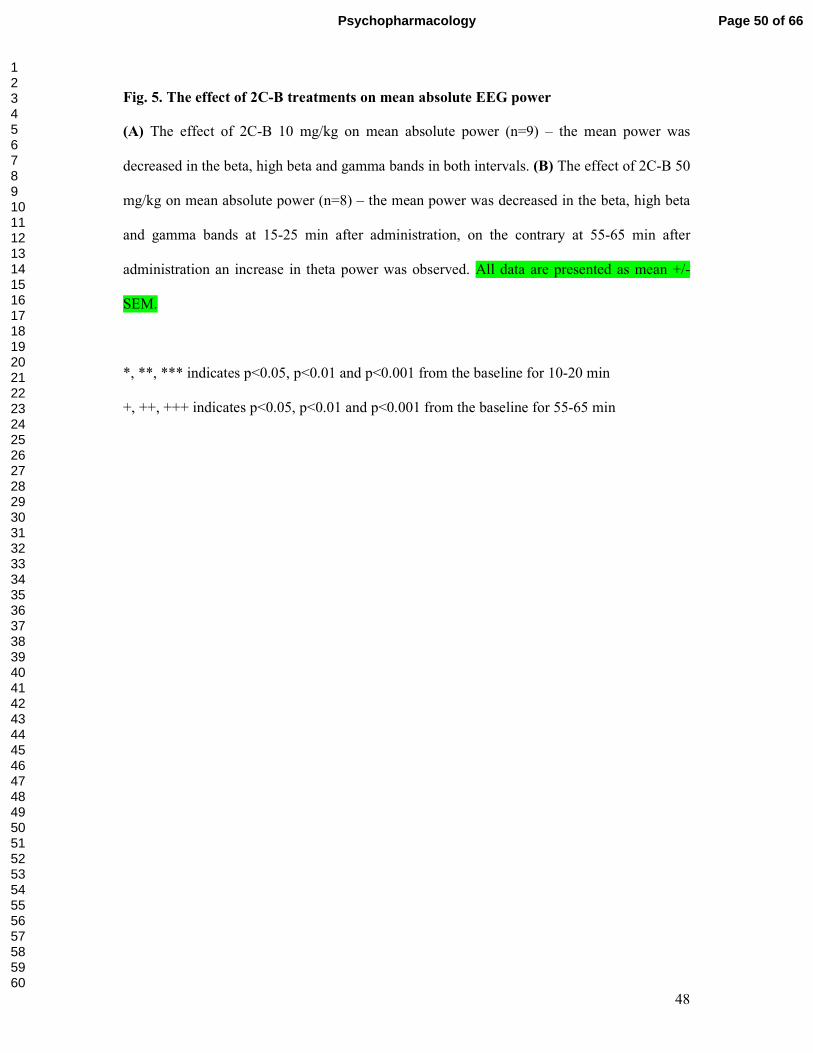
48
Fig. 5. The effect of 2C-B treatments on mean absolute EEG power
(A) The effect of 2C-B 10 mg/kg on mean absolute power (n=9) – the mean power was
decreased in the beta, high beta and gamma bands in both intervals. (B) The effect of 2C-B 50
mg/kg on mean absolute power (n=8) – the mean power was decreased in the beta, high beta
and gamma bands at 15-25 min after administration, on the contrary at 55-65 min after
administration an increase in theta power was observed. All data are presented as mean +/-
SEM.
*, **, *** indicates p<0.05, p<0.01 and p<0.001 from the baseline for 10-20 min
+, ++, +++ indicates p<0.05, p<0.01 and p<0.001 from the baseline for 55-65 min
Page 50 of 66Psychopharmacology
123456789101112131415161718192021222324252627282930313233343536373839404142434445464748495051525354555657585960

49
Fig. 6. The effect of amphetamine and vehicle treatments on the mean absolute EEG
power
(A) The effect of amphetamine 4 mg/kg on mean absolute power (n=10) – the mean power
was increased in theta and alpha bands in both timings; however during 25-30 min after
amphetamine administration a slight decrease in beta power was also observed. All data are
presented as mean +/- SEM.
*, ** indicates p<0.05 and p<0.01 from the baseline for 10-20 min
+, indicates p<0.05 from the baseline for 25-35 min
(B) The effect of the vehicle on mean absolute power (n=9) – mean power was not altered at
15-25 min and 25-35 min; however a significant decrease in power was observed in high beta
and gamma bands at 55-65 min after administration.
++ indicates p<0.01 from the baseline for 55-65 min
Page 51 of 66 Psychopharmacology
123456789101112131415161718192021222324252627282930313233343536373839404142434445464748495051525354555657585960
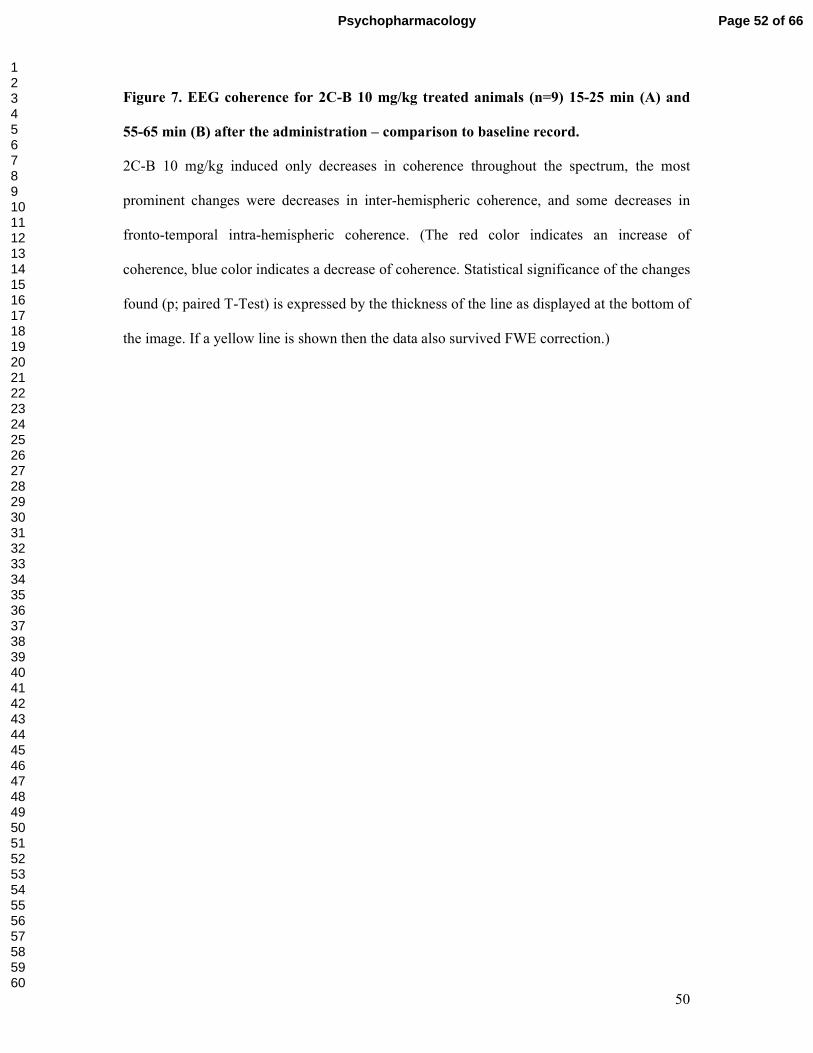
50
Figure 7. EEG coherence for 2C-B 10 mg/kg treated animals (n=9) 15-25 min (A) and
55-65 min (B) after the administration – comparison to baseline record.
2C-B 10 mg/kg induced only decreases in coherence throughout the spectrum, the most
prominent changes were decreases in inter-hemispheric coherence, and some decreases in
fronto-temporal intra-hemispheric coherence. (The red color indicates an increase of
coherence, blue color indicates a decrease of coherence. Statistical significance of the changes
found (p; paired T-Test) is expressed by the thickness of the line as displayed at the bottom of
the image. If a yellow line is shown then the data also survived FWE correction.)
Page 52 of 66Psychopharmacology
123456789101112131415161718192021222324252627282930313233343536373839404142434445464748495051525354555657585960
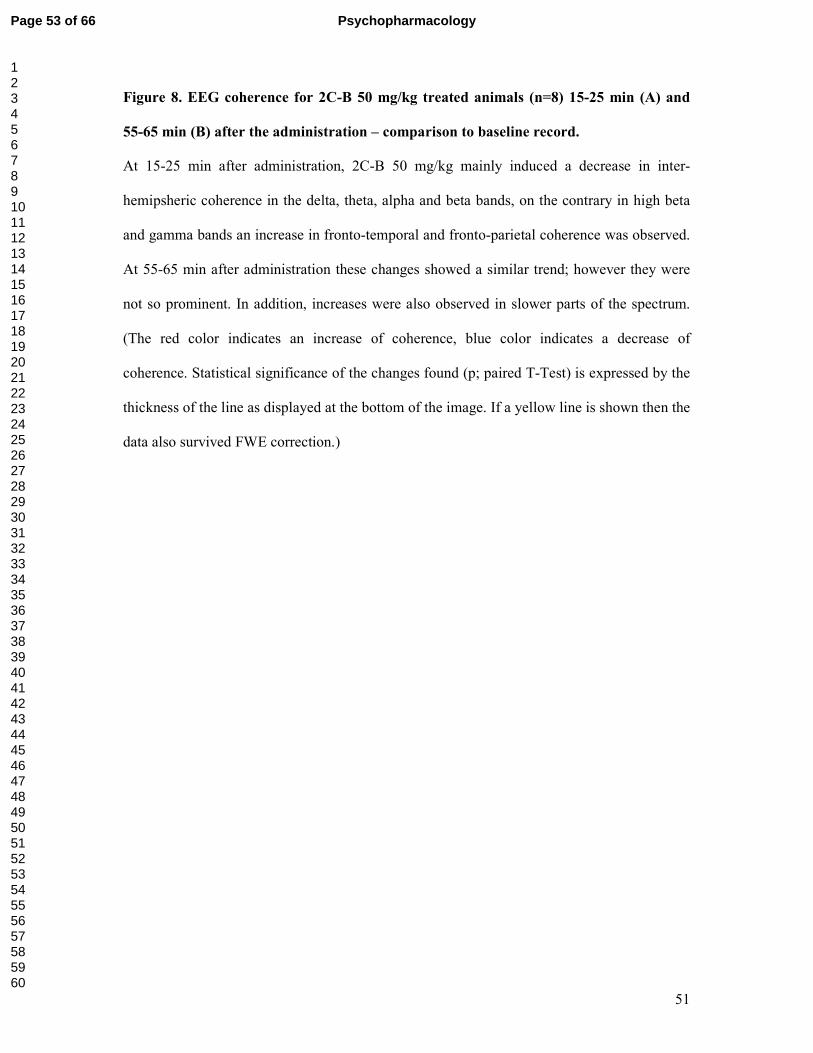
51
Figure 8. EEG coherence for 2C-B 50 mg/kg treated animals (n=8) 15-25 min (A) and
55-65 min (B) after the administration – comparison to baseline record.
At 15-25 min after administration, 2C-B 50 mg/kg mainly induced a decrease in inter-
hemipsheric coherence in the delta, theta, alpha and beta bands, on the contrary in high beta
and gamma bands an increase in fronto-temporal and fronto-parietal coherence was observed.
At 55-65 min after administration these changes showed a similar trend; however they were
not so prominent. In addition, increases were also observed in slower parts of the spectrum.
(The red color indicates an increase of coherence, blue color indicates a decrease of
coherence. Statistical significance of the changes found (p; paired T-Test) is expressed by the
thickness of the line as displayed at the bottom of the image. If a yellow line is shown then the
data also survived FWE correction.)
Page 53 of 66 Psychopharmacology
123456789101112131415161718192021222324252627282930313233343536373839404142434445464748495051525354555657585960
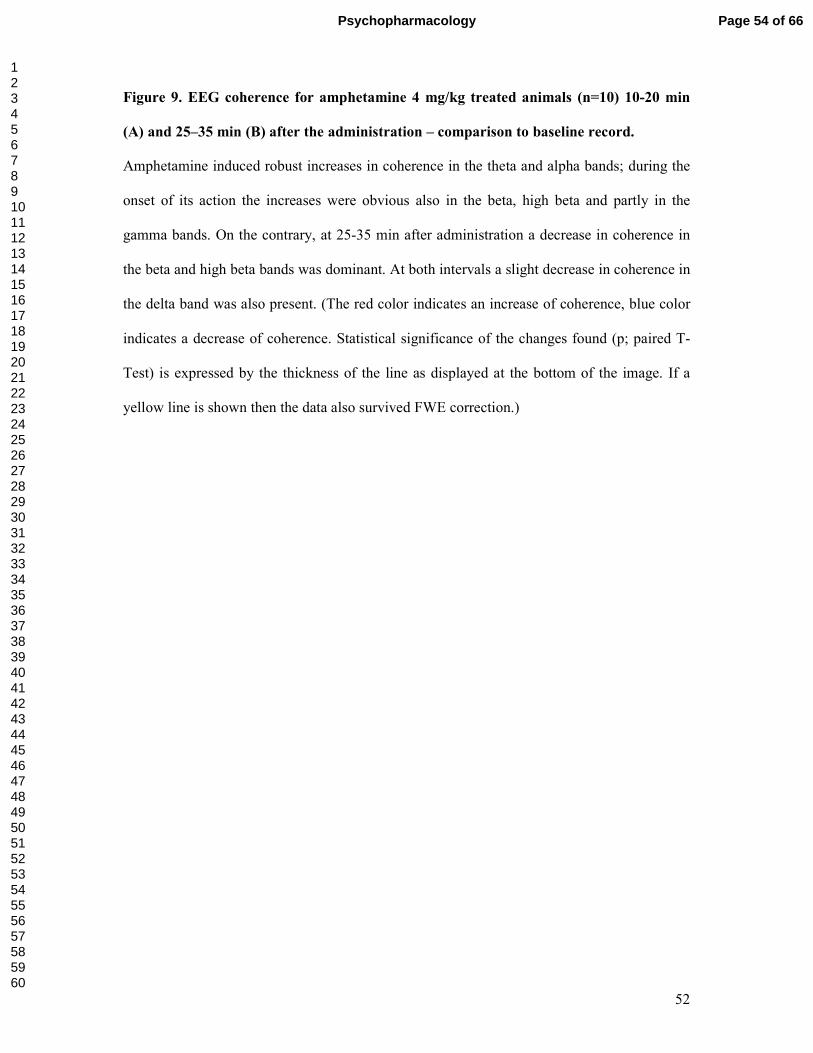
52
Figure 9. EEG coherence for amphetamine 4 mg/kg treated animals (n=10) 10-20 min
(A) and 25–35 min (B) after the administration – comparison to baseline record.
Amphetamine induced robust increases in coherence in the theta and alpha bands; during the
onset of its action the increases were obvious also in the beta, high beta and partly in the
gamma bands. On the contrary, at 25-35 min after administration a decrease in coherence in
the beta and high beta bands was dominant. At both intervals a slight decrease in coherence in
the delta band was also present. (The red color indicates an increase of coherence, blue color
indicates a decrease of coherence. Statistical significance of the changes found (p; paired T-
Test) is expressed by the thickness of the line as displayed at the bottom of the image. If a
yellow line is shown then the data also survived FWE correction.)
Page 54 of 66Psychopharmacology
123456789101112131415161718192021222324252627282930313233343536373839404142434445464748495051525354555657585960
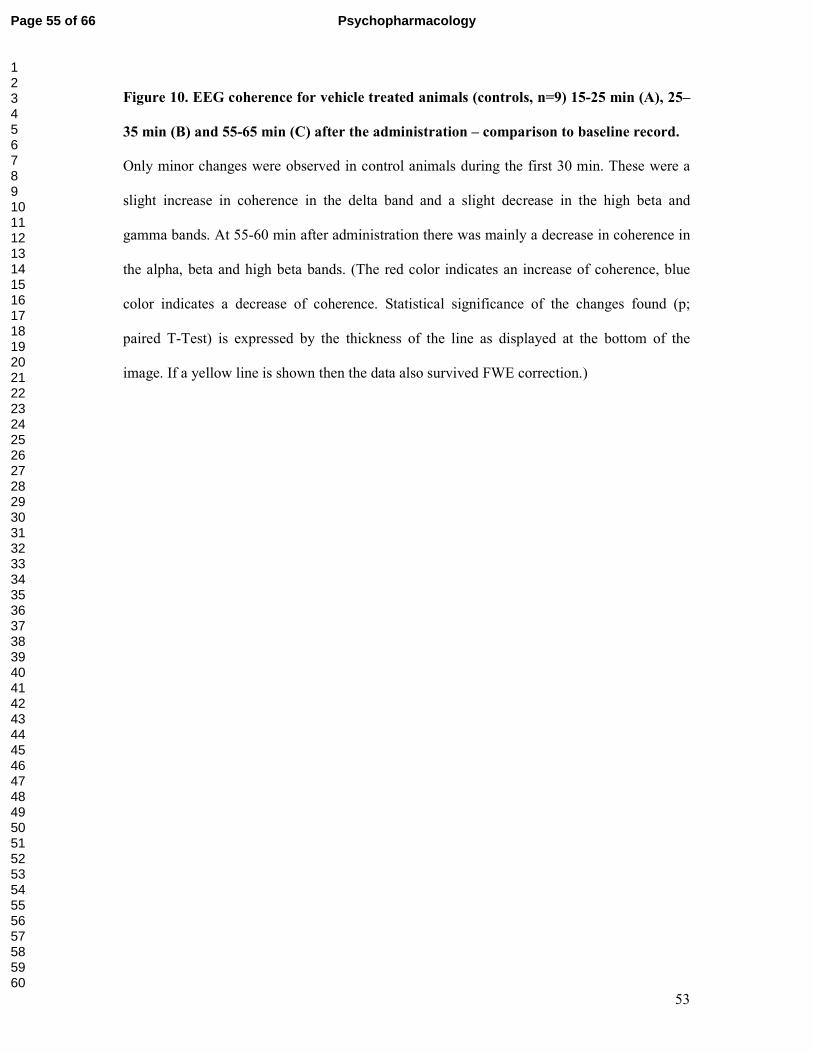
53
Figure 10. EEG coherence for vehicle treated animals (controls, n=9) 15-25 min (A), 25–
35 min (B) and 55-65 min (C) after the administration – comparison to baseline record.
Only minor changes were observed in control animals during the first 30 min. These were a
slight increase in coherence in the delta band and a slight decrease in the high beta and
gamma bands. At 55-60 min after administration there was mainly a decrease in coherence in
the alpha, beta and high beta bands. (The red color indicates an increase of coherence, blue
color indicates a decrease of coherence. Statistical significance of the changes found (p;
paired T-Test) is expressed by the thickness of the line as displayed at the bottom of the
image. If a yellow line is shown then the data also survived FWE correction.)
Page 55 of 66 Psychopharmacology
123456789101112131415161718192021222324252627282930313233343536373839404142434445464748495051525354555657585960
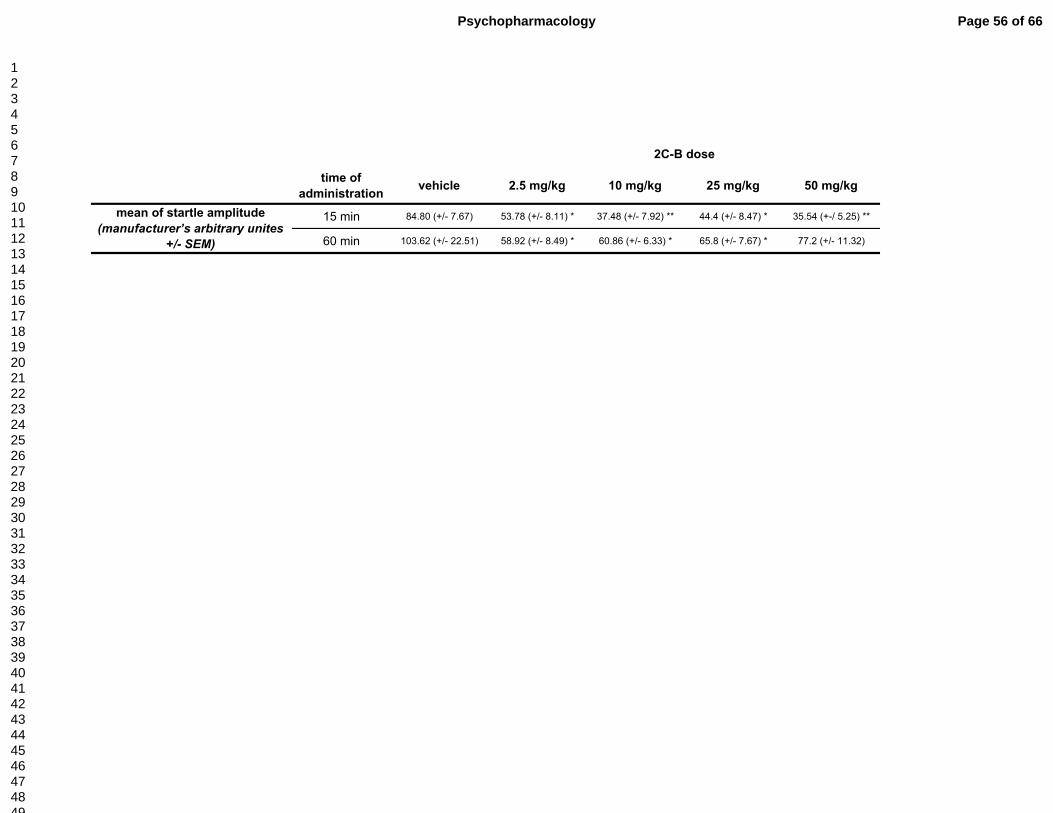
time of
administrationvehicle 2.5 mg/kg 10 mg/kg 25 mg/kg 50 mg/kg
15 min 84.80 (+/- 7.67) 53.78 (+/- 8.11) * 37.48 (+/- 7.92) ** 44.4 (+/- 8.47) * 35.54 (+-/ 5.25) **
60 min 103.62 (+/- 22.51) 58.92 (+/- 8.49) * 60.86 (+/- 6.33) * 65.8 (+/- 7.67) * 77.2 (+/- 11.32)
mean of startle amplitude
(manufacturer’s arbitrary unites
+/- SEM)
2C-B dose
Page 56 of 66Psychopharmacology
123456789101112131415161718192021222324252627282930313233343536373839404142434445464748495051525354555657585960
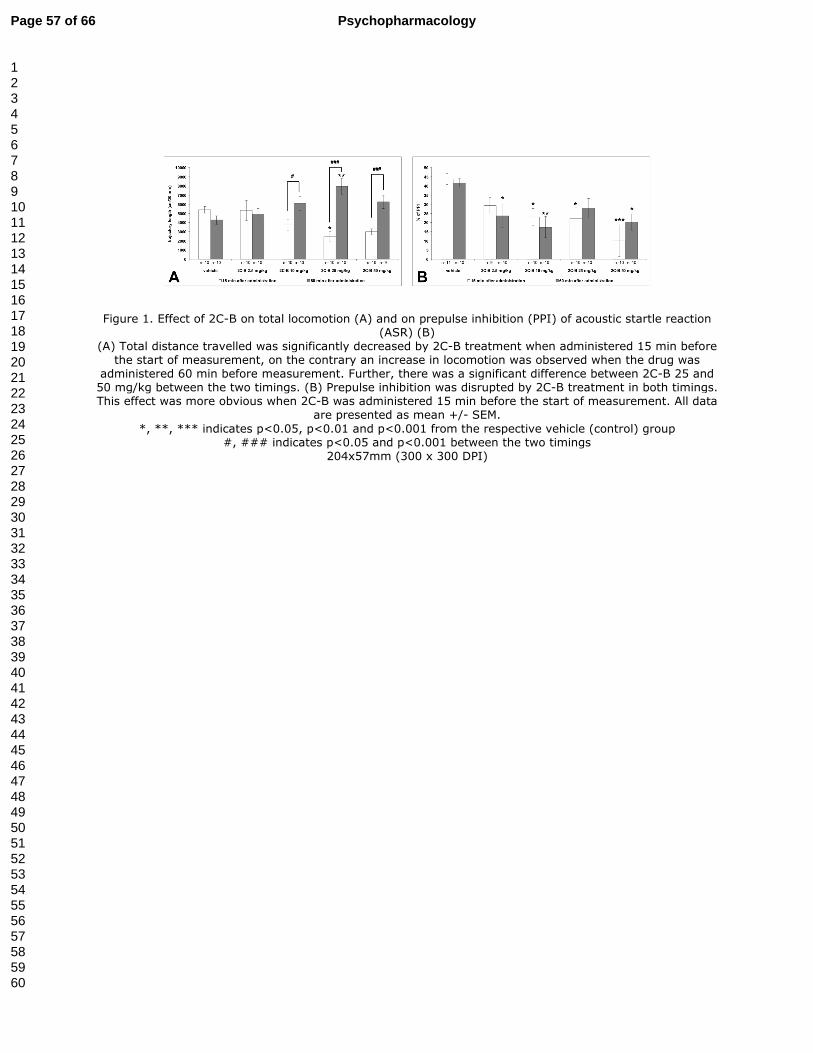
Figure 1. Effect of 2C-B on total locomotion (A) and on prepulse inhibition (PPI) of acoustic startle reaction (ASR) (B)
(A) Total distance travelled was significantly decreased by 2C-B treatment when administered 15 min before the start of measurement, on the contrary an increase in locomotion was observed when the drug was
administered 60 min before measurement. Further, there was a significant difference between 2C-B 25 and 50 mg/kg between the two timings. (B) Prepulse inhibition was disrupted by 2C-B treatment in both timings. This effect was more obvious when 2C-B was administered 15 min before the start of measurement. All data
are presented as mean +/- SEM.
*, **, *** indicates p<0.05, p<0.01 and p<0.001 from the respective vehicle (control) group #, ### indicates p<0.05 and p<0.001 between the two timings
204x57mm (300 x 300 DPI)
Page 57 of 66 Psychopharmacology
123456789101112131415161718192021222324252627282930313233343536373839404142434445464748495051525354555657585960
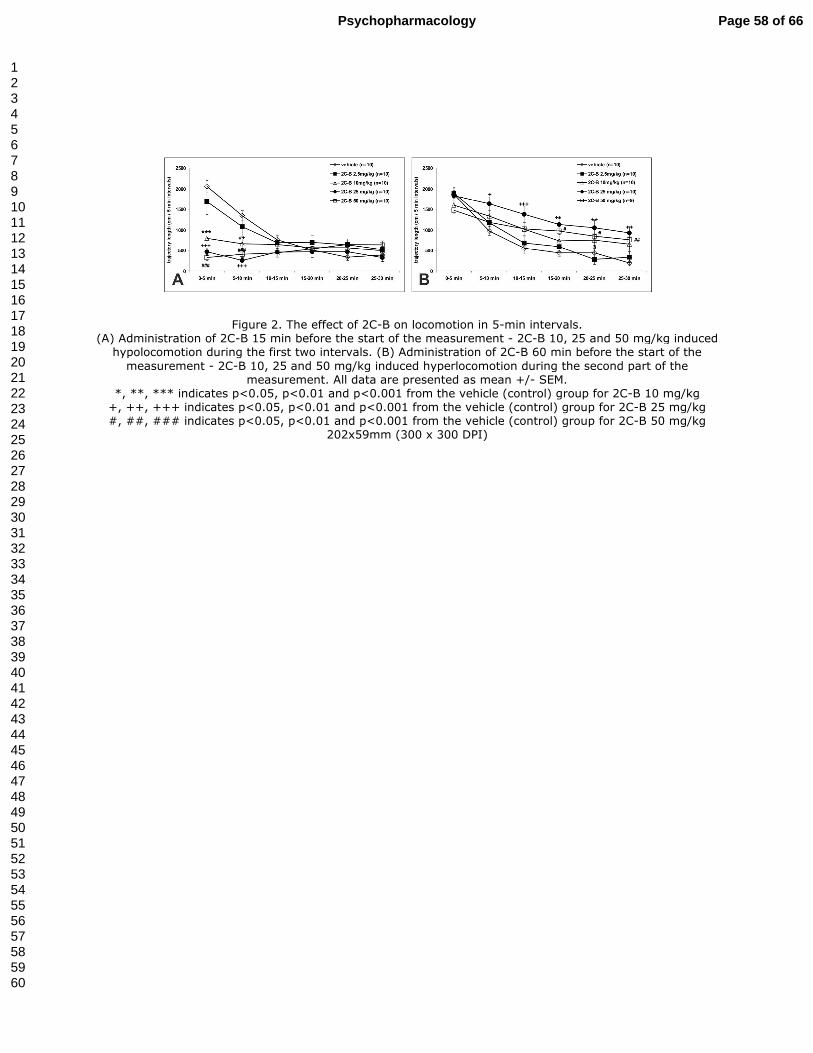
Figure 2. The effect of 2C-B on locomotion in 5-min intervals. (A) Administration of 2C-B 15 min before the start of the measurement - 2C-B 10, 25 and 50 mg/kg induced
hypolocomotion during the first two intervals. (B) Administration of 2C-B 60 min before the start of the
measurement - 2C-B 10, 25 and 50 mg/kg induced hyperlocomotion during the second part of the measurement. All data are presented as mean +/- SEM.
*, **, *** indicates p<0.05, p<0.01 and p<0.001 from the vehicle (control) group for 2C-B 10 mg/kg +, ++, +++ indicates p<0.05, p<0.01 and p<0.001 from the vehicle (control) group for 2C-B 25 mg/kg #, ##, ### indicates p<0.05, p<0.01 and p<0.001 from the vehicle (control) group for 2C-B 50 mg/kg
202x59mm (300 x 300 DPI)
Page 58 of 66Psychopharmacology
123456789101112131415161718192021222324252627282930313233343536373839404142434445464748495051525354555657585960
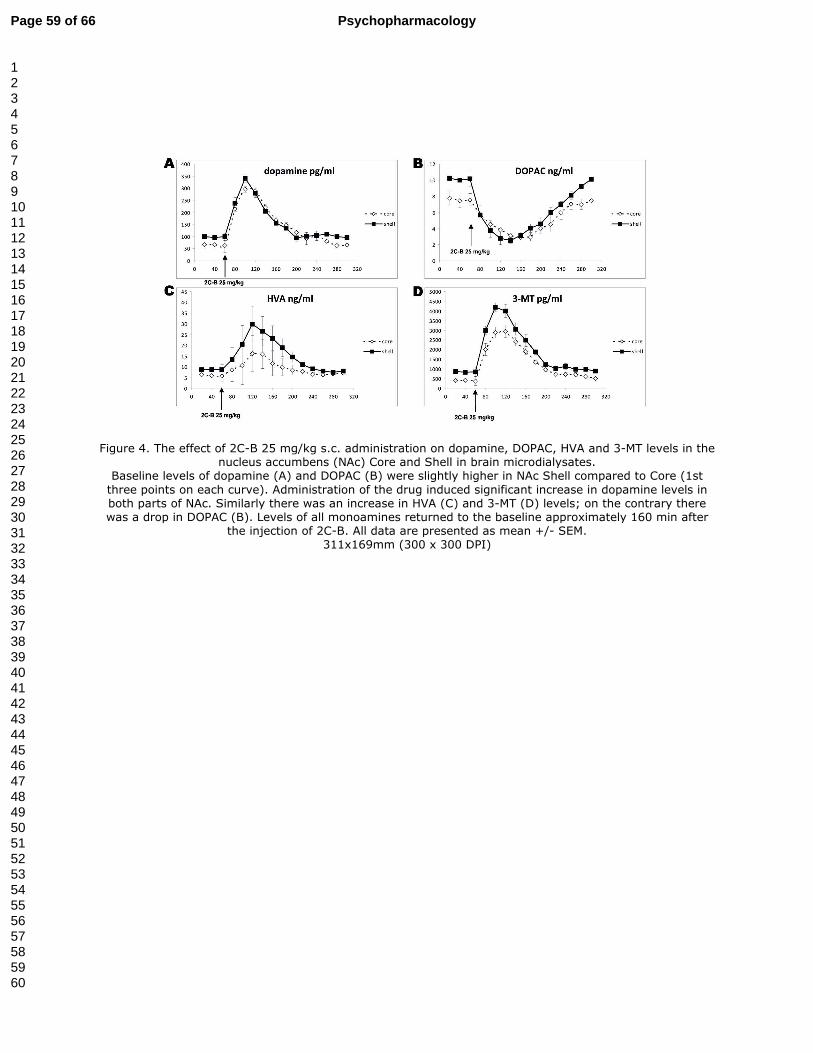
Figure 4. The effect of 2C-B 25 mg/kg s.c. administration on dopamine, DOPAC, HVA and 3-MT levels in the nucleus accumbens (NAc) Core and Shell in brain microdialysates.
Baseline levels of dopamine (A) and DOPAC (B) were slightly higher in NAc Shell compared to Core (1st
three points on each curve). Administration of the drug induced significant increase in dopamine levels in both parts of NAc. Similarly there was an increase in HVA (C) and 3-MT (D) levels; on the contrary there was a drop in DOPAC (B). Levels of all monoamines returned to the baseline approximately 160 min after
the injection of 2C-B. All data are presented as mean +/- SEM. 311x169mm (300 x 300 DPI)
Page 59 of 66 Psychopharmacology
123456789101112131415161718192021222324252627282930313233343536373839404142434445464748495051525354555657585960
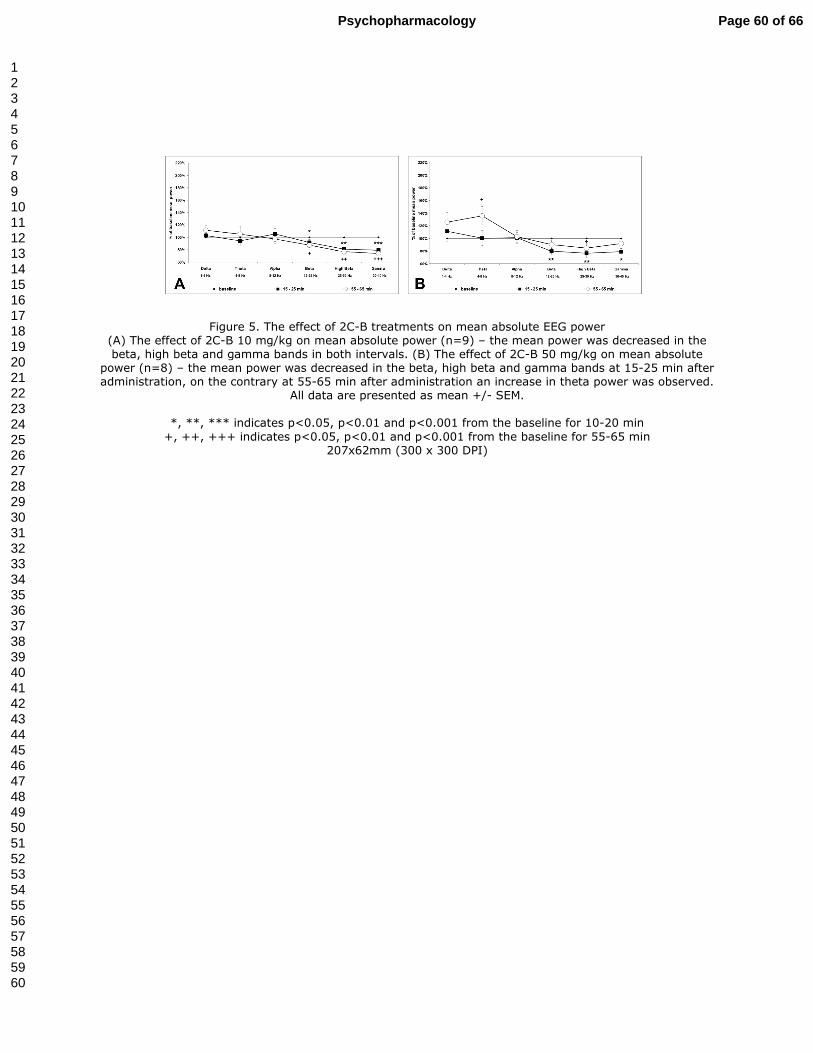
Figure 5. The effect of 2C-B treatments on mean absolute EEG power (A) The effect of 2C-B 10 mg/kg on mean absolute power (n=9) – the mean power was decreased in the beta, high beta and gamma bands in both intervals. (B) The effect of 2C-B 50 mg/kg on mean absolute
power (n=8) – the mean power was decreased in the beta, high beta and gamma bands at 15-25 min after administration, on the contrary at 55-65 min after administration an increase in theta power was observed.
All data are presented as mean +/- SEM.
*, **, *** indicates p<0.05, p<0.01 and p<0.001 from the baseline for 10-20 min
+, ++, +++ indicates p<0.05, p<0.01 and p<0.001 from the baseline for 55-65 min 207x62mm (300 x 300 DPI)
Page 60 of 66Psychopharmacology
123456789101112131415161718192021222324252627282930313233343536373839404142434445464748495051525354555657585960
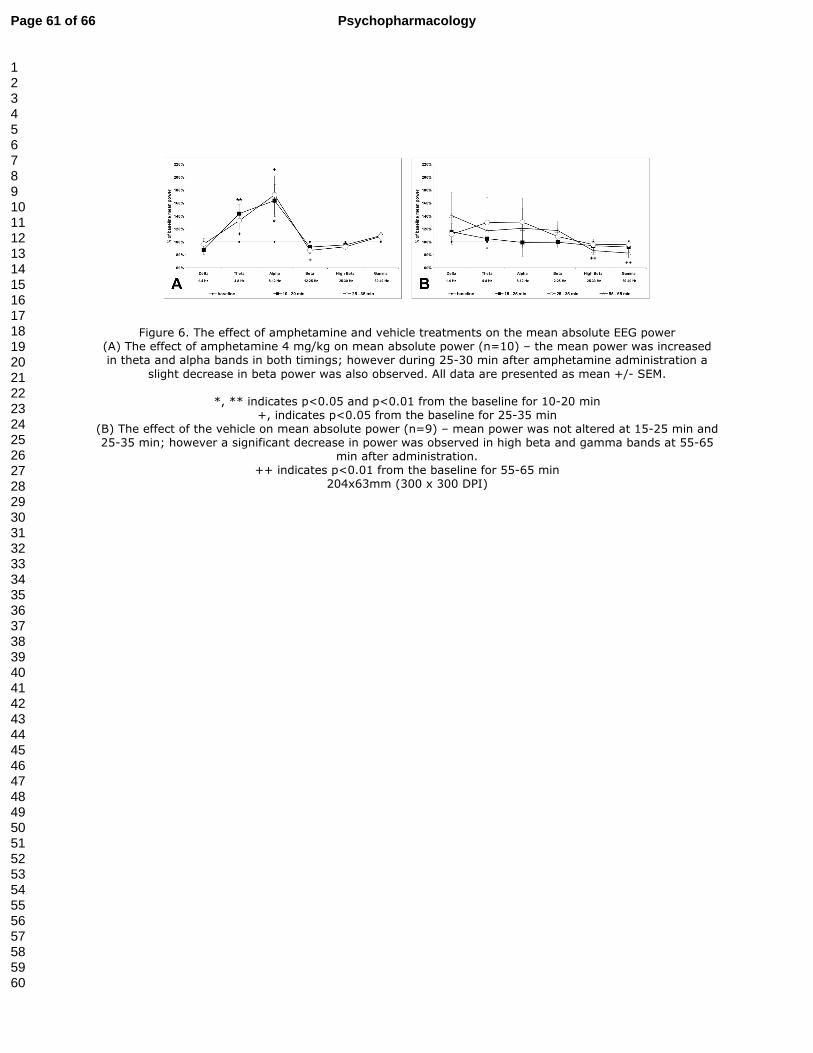
Figure 6. The effect of amphetamine and vehicle treatments on the mean absolute EEG power (A) The effect of amphetamine 4 mg/kg on mean absolute power (n=10) – the mean power was increased in theta and alpha bands in both timings; however during 25-30 min after amphetamine administration a
slight decrease in beta power was also observed. All data are presented as mean +/- SEM.
*, ** indicates p<0.05 and p<0.01 from the baseline for 10-20 min +, indicates p<0.05 from the baseline for 25-35 min
(B) The effect of the vehicle on mean absolute power (n=9) – mean power was not altered at 15-25 min and 25-35 min; however a significant decrease in power was observed in high beta and gamma bands at 55-65
min after administration. ++ indicates p<0.01 from the baseline for 55-65 min
204x63mm (300 x 300 DPI)
Page 61 of 66 Psychopharmacology
123456789101112131415161718192021222324252627282930313233343536373839404142434445464748495051525354555657585960
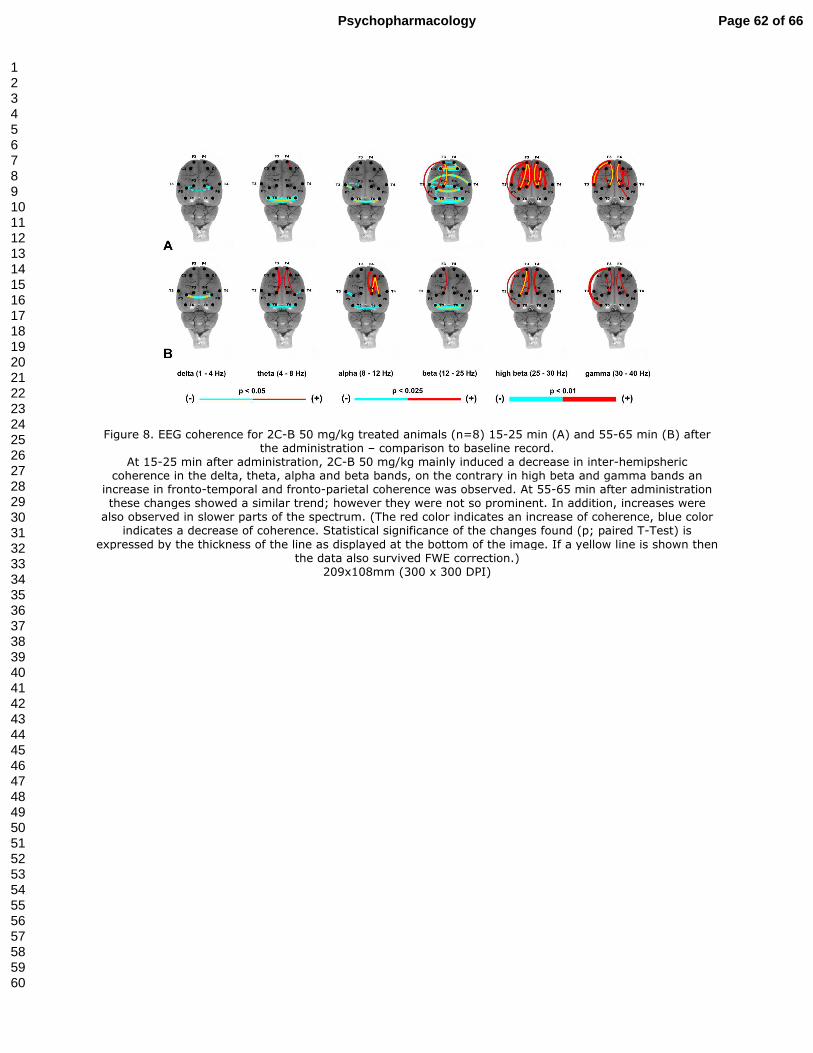
Figure 8. EEG coherence for 2C-B 50 mg/kg treated animals (n=8) 15-25 min (A) and 55-65 min (B) after the administration – comparison to baseline record.
At 15-25 min after administration, 2C-B 50 mg/kg mainly induced a decrease in inter-hemipsheric coherence in the delta, theta, alpha and beta bands, on the contrary in high beta and gamma bands an
increase in fronto-temporal and fronto-parietal coherence was observed. At 55-65 min after administration these changes showed a similar trend; however they were not so prominent. In addition, increases were also observed in slower parts of the spectrum. (The red color indicates an increase of coherence, blue color
indicates a decrease of coherence. Statistical significance of the changes found (p; paired T-Test) is
expressed by the thickness of the line as displayed at the bottom of the image. If a yellow line is shown then the data also survived FWE correction.)
209x108mm (300 x 300 DPI)
Page 62 of 66Psychopharmacology
123456789101112131415161718192021222324252627282930313233343536373839404142434445464748495051525354555657585960
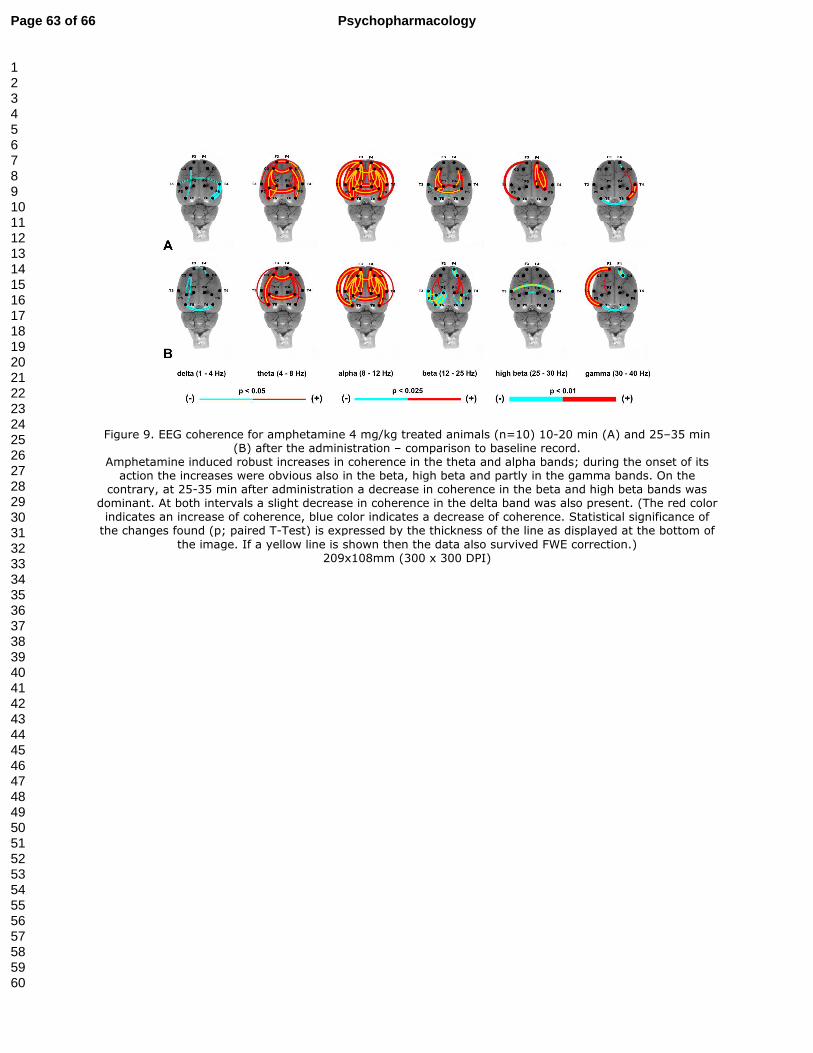
Figure 9. EEG coherence for amphetamine 4 mg/kg treated animals (n=10) 10-20 min (A) and 25–35 min (B) after the administration – comparison to baseline record.
Amphetamine induced robust increases in coherence in the theta and alpha bands; during the onset of its action the increases were obvious also in the beta, high beta and partly in the gamma bands. On the
contrary, at 25-35 min after administration a decrease in coherence in the beta and high beta bands was dominant. At both intervals a slight decrease in coherence in the delta band was also present. (The red color indicates an increase of coherence, blue color indicates a decrease of coherence. Statistical significance of
the changes found (p; paired T-Test) is expressed by the thickness of the line as displayed at the bottom of
the image. If a yellow line is shown then the data also survived FWE correction.) 209x108mm (300 x 300 DPI)
Page 63 of 66 Psychopharmacology
123456789101112131415161718192021222324252627282930313233343536373839404142434445464748495051525354555657585960
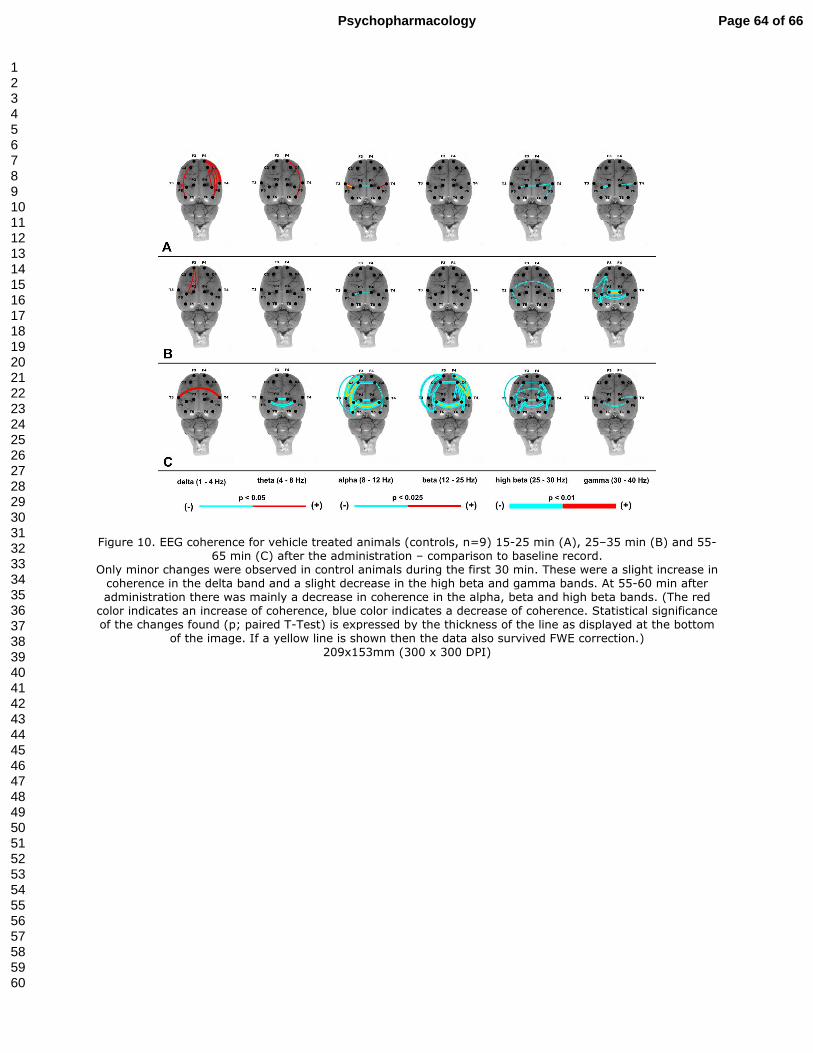
Figure 10. EEG coherence for vehicle treated animals (controls, n=9) 15-25 min (A), 25–35 min (B) and 55-65 min (C) after the administration – comparison to baseline record.
Only minor changes were observed in control animals during the first 30 min. These were a slight increase in coherence in the delta band and a slight decrease in the high beta and gamma bands. At 55-60 min after administration there was mainly a decrease in coherence in the alpha, beta and high beta bands. (The red
color indicates an increase of coherence, blue color indicates a decrease of coherence. Statistical significance of the changes found (p; paired T-Test) is expressed by the thickness of the line as displayed at the bottom
of the image. If a yellow line is shown then the data also survived FWE correction.)
209x153mm (300 x 300 DPI)
Page 64 of 66Psychopharmacology
123456789101112131415161718192021222324252627282930313233343536373839404142434445464748495051525354555657585960


![Tris(4-bromo-1 H-pyrazol-1-yl)borato derivatives of first-row transition and group 12 and 14 metals. X-ray crystal structure of [HB(4-Brpz) 3] 2 Cd. 113Cd solution NMR study of bis[poly(pyrazolyl)borato]cadmium](https://static.fdokumen.com/doc/165x107/631ca5f3a1cc32504f0c95bd/tris4-bromo-1-h-pyrazol-1-ylborato-derivatives-of-first-row-transition-and-group.jpg)


![Tris(4-bromo-1H-pyrazol-1-yl)borato derivatives of first-row transition and group 12 and 14 metals. X-ray crystal structure of [HB(4-Brpz)3]2 Cd. 113Cd solution NMR study of bis[poly(pyrazolyl)borato]cadmium](https://static.fdokumen.com/doc/165x107/6333ae5f7a687b71aa085361/tris4-bromo-1h-pyrazol-1-ylborato-derivatives-of-first-row-transition-and-group.jpg)