Beam-to-Column Shear Connections with Slotted Holes - ERA
211
Structural Engineering Report No. 260 University of Alberta Department of Civil & Environmental Engineering Beam-to-Column Shear Connections with Slotted Holes by Jack C.Y. Man January, 2006 Gilbert Y. Grondin and Robert G. Driver
-
Upload
khangminh22 -
Category
Documents
-
view
0 -
download
0
Transcript of Beam-to-Column Shear Connections with Slotted Holes - ERA

Structural Engineering Report No. 260
University of AlbertaDepartment of Civil &Environmental Engineering
Beam-to-Column Shear Connections
with Slotted Holes
by
Jack C.Y. Man
January, 2006
Gilbert Y. Grondin
and
Robert G. Driver

Beam-to-Column Shear Connections with Slotted Holes
by
Jack C.Y. Man
Gilbert Y. Grondin
and
Robert G. Driver
Structural Engineering Report 260
Department of Civil & Environmental Engineering University of Alberta Edmonton, Alberta
February, 2006

ii
ABSTRACT
Slotted holes in web framing angles of beam to column connections provide
greater fabrication tolerance and can facilitate both fabrication and erection of steel
structures. The current North American steel design standards require plate washers to
completely cover the slots in connections with long slotted holes in the outer plies of the
joint. Although plate washers are required in connections that require pretensioned bolts,
their need in bearing-type connections is questionable.
Tests on beam-to-column shear connections with slotted holes were conducted to
investigate the influence of a wide range of parameters on their strength and behaviour.
The angle leg connected to the supporting column was also investigated.
The test program indicated that plate washers are required with long slotted holes
to develop the expected shear capacity. The North American standards were not able to
predict the capacity of web framing angles failing in the leg connected to the column and
failing within the edge distance. New prediction models are proposed for these failure
modes.

iii
ACKNOWLEDGEMENTS
The authors would like to thank the Steel Structures Education Foundation
(SSEF) and the Natural Sciences and Engineering Research Council (NSERC) for the
financial support for this research project. Also, Waiward Steel Fabricators Ltd of
Edmonton, Alberta, has generously donated all the test specimens for this project.
Finally, thanks are extended to Mr. Paul Zubik from Waiward Steel Fabricators for his
encouragement to pursue this project.
The experimental work described in this report was conducted in the I.F.
Morrison Laboratory of the University of Alberta.

iv
TABLE OF CONTENTS
1 Introduction................................................................................................................. 1
1.1 Statement of Problem.......................................................................................... 1
1.2 Objectives and Scope.......................................................................................... 2
1.3 Organization of Thesis........................................................................................ 3
2 Literature Review........................................................................................................ 4
2.1 Introduction......................................................................................................... 4
2.2 Experimental and theoretical studies on slotted hole, single plate shear, single
angle and double angle connections ................................................................... 4
2.2.1 Double Angle Connections ......................................................................... 5
2.2.2 Single Angle and Single Plate Shear Connection ....................................... 7
2.2.3 Connections with Slotted Holes.................................................................. 9
2.2.3.1 Lap Joints with Slotted Holes ................................................................... 9
2.2.3.2 Single and Double Angle Connections with Slotted Holes .................... 10
2.2.3.3 Single Plate Shear Connections with Slotted Holes ............................... 11
2.3 Summary and Conclusion ................................................................................. 11
3 Experimental Program .............................................................................................. 12
3.1 Introduction....................................................................................................... 12
3.2 Test Specimens Designation ............................................................................. 12
3.3 Full-scale Test Setup......................................................................................... 13
3.4 Instrumentation ................................................................................................. 14
3.5 Specimen Installation........................................................................................ 15
3.6 Test Procedure .................................................................................................. 16
3.7 Ancillary Tests .................................................................................................. 16
3.7.1 Beam ......................................................................................................... 17
3.7.2 Angle......................................................................................................... 18
4 Test Results............................................................................................................... 41
4.1 Description of Failure Modes ........................................................................... 41
4.2 Material Properties............................................................................................ 44

v
4.2.1 Beam Material Properties ......................................................................... 44
4.2.2 Angle Material Properties ......................................................................... 44
4.3 Effect of Test Parameters on Connection Capacity and Behaviour.................. 45
4.3.1 Comparison with Tests from Franchuk et al. (2002)................................ 46
4.3.1.1 Effect of Plate Washer .......................................................................... 47
4.3.2 Comparison of Tests in Current Experimental Program........................... 47
4.3.2.1 Effect of Plate Washer .......................................................................... 47
4.3.2.2 Effect of Loaded End Distance ............................................................. 49
4.3.2.3 Effect of Slot Length............................................................................. 49
4.3.2.4 Effect of Bolt Pretension....................................................................... 50
4.3.2.5 Effect of Torsion Bracing ..................................................................... 51
4.3.2.6 Effect of Bolt Pitch ............................................................................... 51
4.3.2.7 Effect of Flange Cope ........................................................................... 53
4.3.2.8 Effect of Beam End Rotation................................................................ 54
4.3.2.9 Effect of Web Thickness....................................................................... 55
4.3.2.10 Effect of Bolt Diameter..................................................................... 55
4.3.3 Discussion of Specimens that Failed in the Leg Connected
to the Column............................................................................................ 56
4.3.3.1 Effect of Angle Thickness .................................................................... 57
4.3.3.2 Effect of Top End Distance................................................................... 57
4.3.3.3 Effect of Edge Distance ........................................................................ 57
4.3.3.4 Effect of Number of Bolts Connecting the Angle to the Column......... 58
4.3.3.5 Effect of Number of Web Framing Angles........................................... 58
4.4 Conclusions....................................................................................................... 58
5 Prediction of Test Results ......................................................................................... 89
5.1 Prediction Models ............................................................................................. 89
5.1.1 Angle End Tearing Failure........................................................................ 89
5.1.1.1 Proposed Prediction Method for Angle End Tearing Failure ............... 93
5.1.2 Beam Web Edge Distance Tearing ........................................................... 95
5.1.2.1 Failure Mechanism................................................................................ 95
5.1.3 Tension and Shear Block Failure of Beam Web....................................... 96

vi
5.1.3.1 Prediction Models ................................................................................. 96
5.1.4 Failure of Angle Leg Connected to the Column....................................... 97
5.1.4.1 Description of Failure Mode................................................................. 97
5.1.4.2 Current Design Practice ........................................................................ 98
5.1.4.3 Proposed Modified Instantaneous Centre of Rotation Method............. 98
5.1.4.4 Calculation of Limiting Bolt Force for the ICR Method .................... 101
5.1.4.4.1 CSA–S16–01 Tension and Shear Block Model................ 101
5.1.4.4.2 Modified Franchuk et al. (2002) Model ........................... 102
5.2 Comparison of Test Results with Various Prediction Models........................ 102
5.2.1 Angle End Tearing Failure...................................................................... 103
5.2.2 Beam Web Edge Distance Tearing ......................................................... 105
5.2.3 Tension and Shear Block Failure of Beam Web..................................... 105
5.2.4 Failure of Angle Leg Connected to the Column..................................... 106
5.3 Summary of All Prediction Models ................................................................ 107
6 Summary and Conclusions ..................................................................................... 125
6.1 Summary ......................................................................................................... 125
6.2 Conclusions..................................................................................................... 126
6.3 Recommendations for Design Engineers........................................................ 129
6.4 Recommendations for Future Research .......................................................... 131
References ................................................................................................................. 133
Appendix A – Photos of Failed Specimens ................................................................... 135
Appendix B – Load vs. Deformation and Twist vs. Deformation Response of Test
Specimens ............................................................................................... 156

vii
LIST OF TABLES
Table 3-1 As-built Connection Dimensions ..................................................................... 19
Table 3-2 Test Matrix Used to Investigate Angle Leg Connected to Beam..................... 21
Table 3-3 Test Matrix Used to Investigate the Angle Leg Connected to the Column...... 22
Table 4-1 Summary of Test Results.................................................................................. 62
Table 4-2 Material Properties ........................................................................................... 63
Table 4-3 As-built Dimensions of Tests IV and V from Franchuk et al. (2002).............. 66
Table 4-4 Material Properties of Angle from Franchuk et al. (2002)............................... 66
Table 4-5 Summary of Franchuk et al. (2002) Tests Results IV and V ........................... 66
Table 4-6 Summary of Test Parameters-Current Test Program ....................................... 67
Table 4-7 Summary of Test Parameters for Specimens that Failed at the Angle Leg
Connected to the Column.......................................................................................... 68
Table 5-1 Data for Instantaneous Center of Rotation Calculation.................................. 110
Table 5-2 Location of Instantaneous Center of Rotation and Ratio of Vertical Load to
Bolt Force................................................................................................................ 111
Table 5-3 Predicted Capacities of Specimens with Failure of Angle Leg Connected to the
Column.................................................................................................................... 112
Table 5-4 Predicted Capacities of Test Specimens with Rupture of Angle Net Shear Area
and Angle End Tearing Failure............................................................................... 113
Table 5-5 Predicted Capacities of Test Specimens with Beam Web Tension and Shear
Block and Beam Web Edge Distance Tearing........................................................ 114
Table 5-6 Predicted Capacities of Test Specimens Failed in the Angle Leg Connected to
the Supporting Column........................................................................................... 115
Table 5-7 Summary of Predicted Capacities by Various Design Models ...................... 116

viii
LIST OF FIGURES
Figure 3-1 Test Specimens Dimensions ........................................................................... 23
Figure 3-2 Nominal Angle Dimensions............................................................................ 24
Figure 3-3 Nominal Dimensions of Beam Connections ................................................... 26
Figure 3-4 Elevation View of Test Setup ......................................................................... 28
Figure 3-5 Overall Test Setup........................................................................................... 29
Figure 3-6 Reaction Actuator with Load Cell and Knife Edge ........................................ 30
Figure 3-7 Section of Test Setup at Load Point (refer to Figure 3-4)............................... 31
Figure 3-8 Loading Frame near the Connection ............................................................... 32
Figure 3-9 Lateral Bracing Near Connection.................................................................... 33
Figure 3-10 Section of Test Setup at Reaction Frame (refer to Figure 3-4) ..................... 34
Figure 3-11 Lateral Bracing at Load Point ....................................................................... 35
Figure 3-12 Lateral Bracing at Reaction Frame ............................................................... 36
Figure 3-13 Lateral Bracing at Reaction Frame ............................................................... 37
Figure 3-14 Instrumentation ............................................................................................. 38
Figure 3-15 Details of Instrumentation at Connection ..................................................... 38
Figure 3-16 Typical Tension Coupon Dimensions........................................................... 39
Figure 3-17 Typical Coupon Locations on Beam Web Material Sample......................... 39
Figure 3-18 Location of Coupons on Angle Sections....................................................... 40
Figure 4-1 Angle End Tearing Failure.............................................................................. 69
Figure 4-2 Angle End Tearing Failure (followed by rupture of shear area)..................... 69
Figure 4-3 Beam Web Edge Distance Tearing Failure..................................................... 70
Figure 4-4 Tension and Shear Block Failure of Coped Beam Web ................................. 70
Figure 4-5 Failure of Angle Leg Connected to the Column (End
Distance Tearing).......................................................................... 71
Figure 4-6 Failure of Angle Leg Connected to the Column (Top Corner Tearing) ......... 71
Figure 4-7 Failed of Angle Leg Connected to the Column (Top End
Distance Tearing).......................................................................... 72
Figure 4-8 Failure by Web Crippling................................................................................ 72
Figure 4-9 Typical Tension Stress vs. Strain Response.................................................... 73

ix
Figure 4-10 Connection Reaction vs. Bottom Flange Displacement –
Effect of Plate Washer .................................................................. 75
Figure 4-11 Connection Reaction vs. Bottom Flange Displacement –
Effect of Plate Washer .................................................................. 75
Figure 4-12 Connection Reaction vs. Bottom Flange Displacement –
Effect of Plate Washer .................................................................. 76
Figure 4-13 Connection Reaction vs. Bottom Flange Displacement –
Effect of Plate Washer .................................................................. 76
Figure 4-14 Connection Reaction vs. Bottom Flange Displacement –
Effect of Bottom End Distance ..................................................... 77
Figure 4-15 Connection Reaction vs. Bottom Flange Displacement –
Effect of Slot Length..................................................................... 77
Figure 4-16 Connection Reaction vs. Bottom Flange Displacement –
Effect of Bolt Pretension............................................................... 78
Figure 4-17 Connection Reaction vs. Bottom Flange Displacement –
Effect of Bolt Pretension............................................................... 78
Figure 4-18 Connection Reaction vs. Bottom Flange Displacement –
Effect of Torsion Bracing ............................................................. 79
Figure 4-19 Connection Reaction vs. Bottom Flange Displacement –
Effect of Bolt Pitch ....................................................................... 79
Figure 4-20 Connection Reaction vs. Bottom Flange Displacement –
Effect of Bolt Pitch ....................................................................... 80
Figure 4-21 Connection Reaction vs. Bottom Flange Displacement –
Effect of Bolt Pitch ....................................................................... 80
Figure 4-22 Connection Reaction vs. Bottom Flange Displacement –
Effect of Bolt Pitch ....................................................................... 81
Figure 4-23 Connection Reaction vs. Bottom Flange Displacement –
Effect of Flange Cope ................................................................... 81
Figure 4-24 Connection Reaction vs. Bottom Flange Displacement – Effect of Flange
Cope ............................................................................... 82

x
Figure 4-25 Connection Reaction vs. Bottom Flange Displacement –
Effect of Flange Cope ................................................................... 82
Figure 4-26 Connection Reaction vs. Bottom Flange Displacement –
Effect of Flange Cope ................................................................... 83
Figure 4-27 Connection Reaction vs. Bottom Flange Displacement –
Effect of End Rotation .................................................................. 83
Figure 4-28 Connection Reaction vs. Bottom Flange Displacement –
Effect of End Rotation .................................................................. 84
Figure 4-29 Connection Reaction vs. Bottom Flange Displacement –
Effect of Web Thickness............................................................... 84
Figure 4-30 Connection Reaction vs. Bottom Flange Displacement –
Effect of Web Thickness............................................................... 85
Figure 4-31 Connection Reaction vs. Bottom Flange Displacement –
Effect of Bolt Diameter................................................................. 85
Figure 4-32 Connection Reaction vs. Bottom Flange Displacement –
Effect of Bolt Diameter................................................................. 86
Figure 4-33 Effect of Angle Thickness on Capacity of Connection................................. 86
Figure 4-34 Effect of Top End Distance on Capacity of Connection............................... 87
Figure 4-35 Effect of Edge Distance on Capacity of Connection .................................... 87
Figure 4-36 Effect of Number of Bolts on Capacity of Connections ............................... 88
Figure 4-37 Effect of Number of Angles on Capacity of Connections ............................ 88
Figure 5-1 Collapse Load Capacity of End Distance in a Slotted Hole Connection ...... 119
Figure 5-2 Typical Eccentrically Loaded Single Angle Shear Connection.................... 120
Figure 5-3 Direction of Bolt Force ................................................................................. 121
Figure 5-4 Observed Failure Paths and Predicted Failure Models (cont’d) ................... 122
Figure 5-5 Comparison of Proposed Prediction Models for Specimens
Failed at the Leg Connected to the column .................................124
xi
LIST OF SYMBOLS
Agv = Gross shear area (mm2)
Ant = Net tensile area (mm2)
Anv = Net shear area (mm2)
Bu = Bearing capacity of a bolt in a connection (N)
d = Bolt diameter (mm), or
Dc = Cope depth on coped beam (mm)
dh = Bolt hole diameter of angle leg (mm)
Dh = Bolt hole diameter on beam web (mm)
dslot = Diameter of the slot (mm)
eg = Edge distance of angle leg (mm)
Eg = Edge distance of beam web (mm)
es = End distance of angle leg (mm)
Es = End distance on beam end, from centre of bolt hole to the outside face of
flange, or to the coped end (mm)
Fy = Material yield strength (MPa)
Fu = Material ultimate strength (MPa)
L = Horizontal distance from the vertical load to the centre of top bolt hole
(mm)
Lc = Cope length on coped beam (mm)
lc = Clear distance in the direction of applied force (mm)
le = End distance in the direction of applied force, from centre of bolt hole to
the end of material (mm)
lslot = Slot length (mm)
Mp = Plastic moment at the plastic hinge (N.mm)
θ = Vertical angle of top bolt force R1
p = Vertical spacing between bolt holes or slotted holes of angle leg (mm)
P = Predicted connection capacity using modified ICR method (N)
Pc = Collapse load of end distance at the end of angle (N)
Pr = Tension and shear block capacity (N)

xii
R = Force in the bolts connecting the angle to the column (N)
r = Distance from the Instantaneous Centre of Rotation to each bolt (mm)
ro = Horizontal distance from the Instantaneous Centre of Rotation to the top
bolt (mm)
Rt = Tension stress correction factor
Rv = Shear stress correction factor
S = Vertical spacing between bolt holes on beam web (mm)
Sr = Shear contribution of the inclined tension and shear block failure capacity
(N)
t = Thickness of connected material (mm)
Tr = Tension contribution of the inclined tension and shear block failure
capacity (N)
Vu = Nominal connection shear capacity (N)
w = Beam web thickness (mm)
με/min = Mircostrain per minute or 10-6mm/mm/min
σb = Applied bearing stress of bolt acting on the bolt hole by the fastener (MPa)

1
1 Introduction
1.1 Statement of Problem
Single or double angle bolted connections are often used in beam-to-column
connections as simple framing connections. When these connections have to
accommodate large rotations or when beams have to be erected at a slope, slotted holes,
either in the beam web or in the framing angles, are an economical means of achieving
the larger required tolerances (Shneur, 2003). Since the first application of high-strength
bolts in 1947, bolt holes 1/16 in. or 2 mm larger than the nominal bolt diameter have been
used for assembly (Kulak et al., 1987). Slotted holes are bolt holes with 2 mm clearance
in the transverse axis and oversized in the longitudinal axis. The slot length depends on
the amount of adjustment required during construction or to accommodate beam end
rotation. In this respect, slots are classified as either short slots or long slots. Short slots
have a length up to about 1.4 times the bolt diameter whereas long slots have slot lengths
up to 2.5 times the bolt diameter.
The current North American steel design standards require that for connections
with long slotted holes in the outer plies of the joint, a plate washer (or a continuous bar
8 mm or greater in thickness with standard holes) must be installed that completely
covers the slots. However, high strength bolts in connections with short slotted holes
require only the use of conventional hardened washers. Because of the significant amount
of material loss around a bolt in a long slotted hole, proper bolt preload is not achievable
unless plate washers are used. However, their need in bearing-type connections, where
bolt pretension is not required, has not been well demonstrated. It is believed that pull-out
of the bolt head or nut through the slot could occur in a connection without plate washers
when the holes deform sufficiently. However, no testing has shown that pull-out of the
bolts does, in fact, occur in these connections.
Extensive research has been conducted on single or double angle connections.
However, the majority of this past research emphasized the moment vs. rotation
behaviour and the rotational restraint provided by the connections, rather than the shear
capacity of the connections. Consequently the connections were not loaded to their

2
ultimate load carrying capacity. Moreover, the number of parameters investigated was
very limited. Therefore, a research program is initiated to acquire a better understanding
of bolted single and double angle connections with slotted holes with the slots in the
outer plies.
1.2 Objectives and Scope
The main objective of this research program was to investigate the strength and
behaviour of slotted-hole connections and the influence of various parameters on the
connection capacity. The research program consisted of a series of tests on full-scale
connections and assessment of predicted capacities using the current North American
steel design standards. Recommendations for improvement of the current prediction
models will be made when required.
The experimental program consisted of 40 tests. The parameters investigated
include: angle loaded end distance, plate washers, slot length, bolt pretension, torsion
brace, bolt pitch, flange cope, beam end rotation, web thickness and bolt diameter. In
addition, the effect of parameters related to failure in the leg connected to the supporting
column was also investigated. These parameters include: top end distance, top edge
distance, angle thickness and number of bolts on the angle leg connected to the
supporting column. The effect of the above parameters is assessed from a comparison of
the capacity and the load vs. deformation response of the test specimens.
In order to assess the adequacy and level of conservatism offered by the current
North American steel design standards on connections with slotted holes, the capacity of
all the specimens based on the relevant design equations is compared with the test results.
All the possible failure modes and the corresponding capacities are investigated.
Additionally, new prediction models for single angle shear connections with slotted holes
and eccentrically loaded single angle connections are proposed. These new predictions
models are also compared with the test results.

3
1.3 Organization of the Report
This report is divided into six chapters. A review of the relevant literature on the
strength and behaviour of shear connections and slotted hole connections is presented in
Chapter 2. A description of a test program on full-scale test connections is presented in
Chapter 3. The results of the test program are presented in Chapter 4 and in Appendices
A and B. Chapter 5 present an assessment of the current Canadian and American steel
design standards through a comparison of the design equations with the observed test
results. The same chapter presents proposed models for the prediction of failure modes
observed in the tests but poorly predicted by the current design equations. A summary,
conclusions and recommendations for future work are presented in Chapter 6.

4
2 Literature Review
2.1 Introduction
Angle connections are a common type of simple framing connection. Slotted
holes are often used in the angles, primarily to accommodate construction tolerances in
the field, but they also permit erection of beams on a slope while keeping the holes in the
beam perpendicular to the axis of the beam. The current North American steel design
standards require that plate washers be used for connections with long slotted holes, i.e.,
those having slot lengths from about 1.4 to 2.5 times the bolt diameter. Plate washers are
not required, however, in connections with short slotted holes, i.e., those with slot lengths
up to about 1.4 times the bolt diameter. In the case of bearing-type connections, plate
washers are required for long slots because it is feared that bolts might pull-out in a
connection without plate washers. However, until recently no testing has been completed
to show that pull-out of the bolt does in fact occur in these connections. In order to
investigate the behaviour of slotted hole connections without plate washers, five pilot
tests on single angle connections with slotted holes and without plate washers were
conducted by Franchuk et al. (2002). Slot lengths varying from 1.65 to 2.4 times the bolt
diameter were investigated. Other parameters included in the tests were bolt diameter,
location of the bolt within the slot, and number and spacing of the bolts in the connection.
Although very limited research on slotted hole connections without plate washers
has been conducted, extensive research has been conducted on single angle, single shear
plate, and double angle connections over the past few decades. A review of the research
conducted on single angle, single plate, and double angle connections is presented. A
review of tests conducted on slotted hole connections is presented as well.
2.2 Experimental and theoretical studies on slotted hole, single plate shear, single angle and double angle connections
Steel angles are often used as connecting elements to transfer shear between the
beams and columns in steel structures. Beam-to-column shear connections can use either
one or two angles and can either be bolted or welded. Single angle and double angle

5
connections are often designed as flexible connections as they are assumed in design to
act as pin connections that possess no rotational restraint. Over the past few decades,
extensive research has been conducted on single and double angle beam-to-column
connections. However, most of the research has focused on the moment vs. rotation
behaviour and the rotational restraint developed in these connections, rather than the
shear capacity. This section summarizes on single and double angle shear connections
and connections with shear plates. Both connections with circular holes and slotted holes
are reviewed.
2.2.1 Double Angle Connections
Rathbun (1936) was one of the first researchers who conducted tests on
beam-to-column steel connections. The main objectives of his research were to
investigate the rotational restraint on various types of riveted beam-to-column
connections, and to apply the test results on the existing analysis methods, including
slope deflection and moment distribution. He obtained 18 moment vs. rotation curves
from 18 test specimens. Seven of these tests were conducted on double angle riveted
connections. Elastic properties for each type of connection with different geometry were
derived from the experimental moment vs. rotation curves. The elastic and rotational
properties of the test connections were incorporated into analysis methods.
Munse et al. (1961) conducted four tests on both riveted and bolted
beam-to-column connections. The work focused on the moment vs. rotation
characteristics, moment resisting capacity, position of center rotation, slip and shear
deformation of connections, and deformation of fasteners. The angles from three of the
specimens were connected to the supporting column flange with ASTM A325 bolts and
to the beam web by rivets of ASTM A141 materials. The angles of the remaining
specimen were connected to the beam and column flanges with rivets. It was observed
that failure of double angle web connections was mainly due to flexure of the angles
rather than failure of bolts or rivets. The tests showed that the behaviour of double angle
web connections was independent of the moment-to-shear ratio. Moreover, it was found
that standard or flexible connections, which are assumed to behave as hinged
connections, provide some rotational restraint.

6
In order to verify the significant increase in allowable bolt bearing stress in CSA
standard S16.1–74 and in the Specification for Structural Joints Using ASTM A325 or
A490 Bolts (RCRBSJ, 1976), Birkemoe and Gilmor (1978) conducted two tests on
double angle shear connections: one test on a coped beam and one test on an uncoped
beam. The test specimens consisted of a W410x67 beam and L102x89x9.5 angles. The
beams were made of G40.21 300W steel. Two failure modes were observed: bearing
failure and edge distance rupture was observed in the uncoped beam and tension and
shear block failure was observed in the coped beam. These tests revealed that tension and
shear block failure, which involves a combination of tension fracture and shear failure,
could be more critical than bolt bearing failure in coped beams. The capacity of the coped
beam was reduced by 24% compared to its full-flange counterpart. A strength prediction
model was proposed that combined the tensile resistance along the net tension area at the
bottom bolt hole and the shear resistance of the web along the net shear area. The
proposed model showed reasonable agreement with the test results.
Yura et al. (1982) completed nine tests on beam web shear connections. The
objective of the test program was to verify the provisions of the 1978 AISC Specification
for edge distance, end distance and bearing stresses on bolted beam web connections. In
this series of tests, the connections were subjected to shear only. The test program was
conducted on W460x89 beams of grade ASTM A36 steel. Coped and uncoped beams,
single and double line of bolts, and circular and slotted holes (the slots were located in
the beam web) were incorporated in the test matrix. Number of bolts, bolt pitch, end and
edge distance were investigated. The specimens were fabricated with three or five ASTM
A325 3/4 in. bolts. They found that an increase in end distance from 25 mm to 50 mm
resulted in an increase in capacity of 16%. Connections with two lines of holes had less
strength that expected.
Ricles and Yura (1983) extended the work of Yura et al. (1982) by completing
eight additional tests on double angle connections. The additional test specimens were
two-line connections and all specimens, except for one, were fabricated with a coped
beam. The same size and grade of steel beams as used by Yura et al. (1982) were used for
the additional tests, except that four specimens were from a different heat of steel.
Although an increase in beam web edge distance from 25 mm to 50 mm resulted in an

7
increase in capacity of 18%, a similar increase in end distance resulted in an increase in
capacity of only 9%.
2.2.2 Single Angle and Single Plate Shear Connection
Lipson (1968) presented the results of an early study on single angle and single
plate framing connections. He investigated three types of connections: single angle bolted
to both the beam web and the supporting member, single vertical plate welded to the
supporting member and bolted to the beam, and single angle welded to the supporting
member and bolted to the beam. All bolts were ASTM A325 3/4 in. diameter bolts and all
welds were made using E60 and E70 SMAW electrodes. The parameters investigated
were: number of bolts, angle thickness, gauge distance, angle leg size and loading
condition. The connections were tested under combinations of vertical shear and moment.
The author’s interest was on the behaviour of connections under working loads,
maximum rotation capacity, and a consistent factor of safety and to determine whether
the connections can be treated as flexible connections. His work demonstrated the
feasibility of the three types of connections.
Lipson (1977) later examined the behaviour of welded and bolted single angle
connections. Five series of tests, consisting of 43 tests in total, were conducted. The
angles were bolted to the beam with 2 to 12 bolts and welded to the column. All the
connections were loaded and rotated to 0.024 rad to simulate actual service conditions, in
which the beam ends rotate under the action of the applied loads. The test specimens
were subjected to monotonic loading up to 2.5 times the working load of the bolts
permitted by the AISC and CSA steel design standards in 1969 for designing steel
structures. The moment vs. rotation characteristics were obtained for each test. The
results showed that the factors of safety for the bolts and welds were greater than 2.5 and
the rotation of 0.024 rad could be achieved in all connection sizes. For the connections
under cyclic load, the hysteretic loop were stable for at least three cycles at 2.5 times the
allowable working load permitted by AISC and CSA steel design standards in 1969.
Richard et al. (1980) investigated the moment vs. rotation characteristics of single
plate shear connections. The research program consisted of 126 single bolt, single shear

8
load vs. deformation tests with different bolt diameter, plate thickness, end distance and
steel grade. A finite element analysis, which used the results of single bolt shear tests,
was conducted and used to develop theoretical moment vs. rotation curves for single plate
shear connections. The finite element analysis was validated from results of five full-
scale tests on single plate shear connections. Although the finite element analysis results
showed good agreement with the test results, the connections were not loaded to their
maximum capacity and consequently, the ultimate limit state was not identified. A design
procedure was proposed to account for the moment resistance of single plate shear
connections.
Hormby et al. (1984) later extended the work by Richard et al. (1980) to include
connections with slotted holes on shear tab connections. Of eight tests conducted on shear
tab connections, six were on test specimens with slotted holes. The primary objective of
the test program was to investigate the effect of slotted holes and off-axis bolt groups
(centre of gravity of bolt groups does not coincide with the central axis of the beam) on
the beam eccentricity, defined as the distance from the location of zero moment along the
beam to the connection. The beam was loaded at midspan and beam eccentricity was
measured using strain gauges mounted on the beam flanges at different loading stages.
Tests conducted on connections with circular holes and slotted holes with pretensioned
bolts showed similar behaviour. It should be noted, however, that the tests were
conducted at load levels that did not cause slip in the bolted joints.
Astaneh et al. (1989) reported the results of five tests on shear tab connections
conducted to full capacity of the connection. All the test specimens were prepared with
circular holes and the connections were loaded in shear and controlled rotation. All the
connections failed by rupture of bolts in shear.
Three cyclic tests on single plate shear connections were conducted by Crocker
and Chambers (2004). The tests were conducted to determine the maximum deformation
demand on bolts in single plate shear connections under cyclic rotation. The test
specimens, which consisted of a single plate shear connection at the end of a 4 m long
cantilever beam, were subjected to bending moment and minimal shear. Connections
with three, four and six bolts were tested. The maximum imposed rotation on the

9
connection was 0.06 rad. Of the three tests, only the six-bolt connection failed by bolt
rupture. The connections with three and four bolts did not fail after reaching the specified
connection rotation. The authors suggested using a value of 8.6 mm as the limiting value
of deformation for ASTM A325 bolts in single plate shear connections.
2.2.3 Connections with Slotted Holes
2.2.3.1 Lap Joints with Slotted Holes
Allan and Fisher (1968) conducted 21 tests on standard, oversized and slotted hole
double lap joints. The test program was designed to investigate the effect of oversized
and slotted holes on the slip resistance and ultimate strength of bolted joints. The
specimens were made of four plies of 1 in. steel plates of grade ASTM A36 steel,
connected by two lines of 1 in. ASTM A325 bolts with a pitch of 133 mm (5 ¼ in.). Slot
lengths equal to 2.5 times the bolt diameter were used that were either oriented parallel or
transverse to the applied load. The plates with slotted holes were placed in the two inner
plies, covered with the outer plates. The bolts were installed using the turn-of-nut
method. All of the test joints were tested in tension. Of 21 specimens, 15 were designed
as slip-critical joints, including the joints with slots parallel to the applied load. The slip
behaviour of the test specimens was observed and the tests were stopped when the joints
went into bearing. The remaining six specimens were designed to carry load in bearing
and were tested to their ultimate capacity. Bolt pretension was measured in six specimens
and the pretension was monitored over time. Oversized or slotted holes did not affect the
pretension over time following installation. All test specimens with slotted holes placed
perpendicular to the line of action of the load did not show a reduction in tensile strength
of the plate or the shear strength of the bolts.
Wald et al. (2002) reported the results of 73 tests on double lap joints to determine
the bearing resistance, stiffness and ductility of cover plates with transverse slotted holes
of different lengths: standard size holes (bolt diameter+2 mm), short slots
(diameter+6 mm), long slots (up to 2.5 times the bolt diameter), and extra long slots (up
to 3.5 times the bolt diameter). Based on the observed test results the researchers
proposed a strength reduction factor β for slotted holes. Different reduction factors were

10
recommended for different slot lengths: 0.9 for short slotted holes, 0.7 for long slots, and
0.6 for extra long slots. This reduction factor was obtained as the ratio of the measured
capacity for the slotted hole joint to the capacity of the joint with circular holes.
2.2.3.2 Single and Double Angle Connections with Slotted Holes
As mentioned previously, Yura et al. (1982) conducted eight tests on double angle
connections, including three connections with slotted holes in the beam web. The authors
found that the slotted hole connections showed about 20% less capacity compared to
connections with standard circular holes.
Bergson and Galambos (1998) conducted an experimental investigation of the
strength and behaviour of single angle bolted shear connections with short slots. Six full-
scale connections were tested and the observed failure mode consisted of overall
connection twisting, which was influenced by the bracing condition, tension and shear
block failure in the beam web, and fracture of the angle. The limit states checked for
strength prediction consisted of bolt failure, bearing failure of the supported beam web,
yielding of the angle, fracture of the angle and formation of a plastic hinge in the beam.
The capacities computed from these limit states were compared to the ultimate capacity
of the test specimens. It was noted that all of the test connections reached a higher
capacity than expected based on the calculations. In addition, they were not able to
predict the failure mode accurately. All the test specimens were expected to fail in
bearing of the web when none of them did. The effect of slotted holes on single angle
connections could not be clearly identified. Both the failure mode and the test capacity
could not be predicted accurately using the current design specifications.
As described previously, Franchuk et al. (2002) conducted five tests on single
angle beam-to-column connections with slotted holes in the angles. Three-bolt and four-
bolt slotted hole connections were tested without plate washers on the outer plies. The
four-bolt connections failed by shear rupture of the net area in the leg of the angle
connected to the beam, while the three-bolt connections failed by tearing of bottom end
distance of angle and top edge distance of beam web, followed by severe tilting of the
middle bolt. Tilting of the middle bolt was not expected. Bolt pull-out was not observed
in any of the tests.

11
2.2.3.3 Single Plate Shear Connections with Slotted Holes
Hormby et al. (1984) also investigated the effect of slotted holes on the moment
resistance of single plate shear connections. For the case where the bolts were
pretensioned, the moment resistance of the connections with slotted holes was the same
as the resistance of joints with circular holes.
2.3 Summary and Conclusions
A review of the literature has shown that the research on single and double angle
connections mainly focused on the moment vs. rotation behaviour of connections. Many
test programs did not investigate the behaviour up to the ultimate capacity of the joint. No
research programs reported in the literature on single and double angle connections
provide comprehensive tests to assess the behaviour of joints with slotted holes in the
outer plies. CSA–S16–01 and AISC 2005 require that long slots be covered with plate
washers that cover the slots entirely. Although only few tests on connections with slotted
hole connections without plate washers have been conducted, there is no evidence that
the bolts might have the tendency to pull-out of the joint. However, the number of tests
on this type of joint is insufficient to draw definite conclusions. Moreover, the effect of
plate washers on the behaviour of the connections with long slots in the outer plies is not
well identified. More research is therefore required to study the strength and behaviour of
connections with slotted hole in the outer plies.

12
3 Experimental Program
3.1 Introduction
A review of the literature has indicated that test data on slotted hole shear
connections are scarce and the behaviour of such connections is not well understood.
Therefore, the main objectives of this research program are to investigate the strength and
behaviour of slotted hole shear connections, to increase the pool of available
experimental data, and to assess the ability of current prediction models to predict the
failure mode and strength of these connections. A description of the test program, the
test-setup, instrumentation, specimen installation, testing procedure and ancillary tests is
presented in the following.
3.2 Test Specimens Designation
The specimens used in this test program consisted of 3.6 m long wide flange
beams with connections fabricated at both ends. Single and double angle shear
connections were investigated. The test specimens were designated by an alphanumeric
identifier. The first two characters consist of either 1L or 2L to indicate whether the
connection is a single angle or a double angle connection. This is followed by a number
that designates the test number within each of the two groups of tests. The letter ‘a’
following the specimen designation indicates the single angle specimen had pretensioned
bolts connecting the angle to the column. The double angle specimens with letter ‘a’ after
the designations consisted of angle section L152x102x9.5 with the larger size leg
connected to the supporting column, while the remaining double angle specimens
consisted of angle section L102x102x9.5. The capital ‘E’ in the designation of test
specimen 1L2aE indicates that the test specimen was fabricated with a larger end distance
of 47 mm at the bottom end of the angle compared to the other test specimens, which
were fabricated with the minimum end distance. Three additional tests were carried out to
investigate the effect of end distance and edge distance on the capacity of the angle leg
connected to the column. These test specimens were identified as 1L12, 1L13 and 1L14.

13
The as-built dimensions of all the connections are presented in Table 3-1.
Variables specified in this table are defined in Figure 3-1. The nominal dimensions for all
connections are illustrated in Figures 3-2 and 3-3 and ‘w’, listed in column (24) of
Table 3-1, is the beam web thickness. All bolt holes in the beam web were drilled to a
diameter 2 mm (1/16 in.) larger than the bolt diameter. The long slots on the angle were
sub-punched and reamed to the desired dimension. The short slots and circular holes on
the angles were punched to the required diameter. The test matrix summarizing the
parameters investigated in this test program is shown in Table 3-2. The test matrix for
specimens 1L12, 1L13 and 1L14, used to investigate the angle leg connected to the
column is shown in Table 3-3.
3.3 Full-scale Test Setup
A test apparatus similar to the one used in an earlier test program (Franchuk et al.,
2002) was used to test full-scale shear connections under controlled end rotation. A
diagram of the test setup is illustrated in Figure 3-4, and a photograph of the overall test
setup is shown in Figure 3-5. The setup was designed to test a beam-to-column
connection under shear, with controlled rotation. The beam was connected to a reaction
column with either a single or double angle shear connection. Each angle was bolted to
the reaction column with two 1 in. ASTM A325 bolts, in either a snug-tight or
pretensioned condition. The single angle specimens identified with the letter ‘a’ in their
designation were installed with pretensioned bolts to the column. The other single angle
connections were installed with bolts to the column in a snug-tight condition. The
purpose of pretensioning the bolts on the column side in some single angle specimens
was to reduce the twist of the connection about the axis of the beam in the connections.
All the double angle connections were installed with bolts connecting to the reaction
column in a snug-tight condition. The beam was connected to the angle with three ASTM
A325 bolts.
For the tests with an imposed beam end rotation as a variable, the rotation was
controlled by adjusting the support hydraulic actuator at the end opposite to the test
connection. A knife-edge was placed between the beam and the hydraulic actuator to
simulate a simple support and a load cell was used to measure the reaction force.

14
Figure 3-6 shows a photograph of the support at the beam end opposite to the test
connection.
A vertical load was applied to the beam at approximately 400 mm from the
connection with a 890 kN hydraulic actuator. A spherical bearing assembly was used to
allow rotation in the plane of the beam web and allow free rotation about the axis of the
beam. A roller bearing was also used to prevent unwanted displacement restraint along
the axis of the beam. A diagram showing the section of test frame at the load point is
illustrated in Figure 3-7. A photograph illustrating the various elements of the loading
frame is shown in Figure 3-8.
Lateral supports were provided at two locations along the beam length. The load
point was laterally braced near the top flange with two pairs of rollers mounted on the
reaction frame columns and sliding on two pairs of HSS 51x25x3.2 clamped to the beam
near the load point, as shown in Figure 3-9. This simulates a beam element in a floor
system where the top flange is often laterally braced by the floor slab. At the reaction end
(end opposite to the test connection) of the beam, the top flange and bottom flanges were
supported by rollers riding on adjacent support columns as illustrated in Figure 3-10. A
rubber mallet was used to tap on the lateral supports to release any friction forces
developed between the test specimen and the lateral supports during the tests.
Photographs of the lateral bracing system at the loading frame and the reaction frame are
shown in Figures 3-11 and 3-12, respectively. In order to prevent web buckling at the
load point, bearing stiffeners, consisting of a pair of HSS 76x51x4.8 clamped to the web
of the beam as shown in Figure 3-11. A close-up of the bracing system and roller
assembly at the reaction frame is depicted in Figure 3-13.
3.4 Instrumentation
Vertical and lateral displacements, end rotation, applied load and reaction force
were measured electronically during the test. Figure 3-14 presents a summary of the
instrumentation used in the tests. Cable transducers were used to measure the vertical
displacement at the bottom flange under the load point and to measure the vertical
displacement at the reaction actuator. The vertical displacements of the beam at the load

15
point were also measured at regular load intervals using a dial gauge to check the
measurements obtained using electronic transducers. A 890 kN load cell was used to
measure the force applied with the load actuator. A second load cell was placed on top of
the reaction actuator to measure directly one of the two reaction forces. The connection
reaction force was obtained by subtracting the measured end reaction from the applied
load. Friction at the lateral supports was assumed negligible. At the connection, vertical
and lateral displacements of the angle and the beam were measured. The vertical
displacement of the angle was measured using two LVDTs installed just above and below
the connection (deflections 5Δ and 6Δ in Figure 3-15). Two cable transducers ( 7Δ and
8Δ in Figure 3-15) were used to measure the top and bottom flange vertical displacement
of the beam. To assess the angle of twist of the angle and the beam, the lateral
displacements of the angle and the beam were measured independently using four
LVDTs ( 1Δ , 2Δ , 3Δ and 4Δ in Figure 3-15). The angle of twist of the connection was
computed from the difference between the top and bottom lateral displacements and the
distance between the measurement points. A rotation transducer was also installed near
the connection on the beam web to provide an additional measurement of the beam end
rotation.
The measured displacements were recorded at regular intervals during the test
using an electronic data acquisition system.
3.5 Specimen Installation
The beam was first positioned on the knife-edge and load cell assembly at the end
of the beam opposite to the test connection. The beam was centered on the load cell to
ensure accurate measurement of the reaction load.
Test angles were loosely attached to the column using two ASTM A325 1 in. high
strength bolts in each angle. For the thin single angle specimens fabricated with
L102x102x6.4 (1LA, 1LB, 1LAa and 1LBa), an additional half-inch thick doubler plate
was placed on the angle leg connected to the column to minimize the shear angle
distortion during loading.

16
The position of the beam along its axis was adjusted so that the holes of the beam
were centered with the slots in the shear angle. The bolts in the angle to the beam joint
were installed and tightened to a snug-tight or pretensioned condition, depending on the
required test condition. In the case of single angle connections, the bolts in the connection
were installed with the head on the angle side and the nut on the beam side, with a single
standard hardened washer placed between the beam and the nut. All the plate washers
used in the current test program were 9.5 mm thick, which satisfies the requirement of
8 mm minimum thickness for plate washers in CAN/CSA–S16–01 and AISC 2005. A
spherical bearing and roller assembly was then placed on the beam under the load
actuator. The beam was then braced laterally close to the load point with two
HSS 51x25x3.2 clamped on either side of the beam and rollers installed on the reaction
frame column as depicted in Figure 3-11. The roller and HSS assembly provided lateral
restraint to the top flange without restraining the vertical displacement of the beam.
3.6 Test Procedure
Prior to each test, the surface of the test specimens was whitewashed in the
connection area in order to visually detect the onset of yielding. The test connections
were loaded quasi-statically under stroke control. Static load readings were recorded at
every 100 kN in the ascending part of the loading curve and at approximately every 3 mm
displacement of the connection in the remaining part of the loading curve. For the test
conducted under large end rotation, a rotation of °5.3 , measured using the rotation
transducer, was imposed at the connection end of the test specimen by adjusting the end
reaction actuator. The beam end rotation angle was maintained at °5.3 during the tests by
regularly adjusting the end support reaction actuator.
3.7 Ancillary Tests
In order to obtain the material properties of the beams and angles in the
connection, tension coupon tests were conducted on both the beam web and angle
sections. The coupons were fabricated in accordance to ASTM A370 (ASTM, 1997).
Sheet-type coupons were cut from both angle and beam sections. Typical coupon
dimensions are shown in Figure 3-16. The cross-sectional dimensions of each coupon

17
were measured at various locations along the final gauge length. The average area, which
was taken as the representative coupon cross-sectional area, was computed from the
measured dimensions. The strain was recorded using a 50 mm gauge length
extensometer. A pair of strain gauges was mounted on one coupon from each group of
thickness to verify the extensometer readings.
The stress was computed from the recorded machine load and the as-measured
initial cross-sectional area. During each coupon test, two values of static yield stresses
were obtained along the yield plateau. The testing machine was stopped for about five
minutes along the yield plateau and the load was recorded after each pause. The mean
static yield was taken as the average of the two values recorded along the yield plateau.
The upper yield strength was taken as the highest point on the stress versus strain curve,
just before the yield plateau. The lower yield strength was taken as the lowest point on
the stress vs. strain curve within the yield plateau. In contrast to the static yield strength,
the lower yield is obtained under dynamic loading condition. Static stress values were
also obtained at ultimate. The rupture stress and rupture strain were obtained from the
stress versus strain curve at the time of fracture. The strain-hardening strain was taken as
the strain where the stress started to increase after the yield plateau. Strain at ultimate
stress was obtained where the maximum load was reached. After each tension coupon
test, the two fractured ends of the coupon were fitted together and the gauge length was
measured. The reduced of area at the fractured location was also measured to obtain the
true stress at rupture. The reduction area was computed from the as-measured original
area and the reduced area. The strain rates used in the elastic, yield plateau and strain-
hardening ranges were approximately 1500με/min , 8000με/min and 60000με/min ,
respectively.
3.7.1 Beam
Three sheet-type coupons were obtained from each web plates from the midspan
after the experimental program. The coupons were oriented perpendicular to the axis of
the beam so that the material properties in the direction of loading at the end connection
could be assessed. Coupon tests were conducted on eight of the beam sections that failed
at the web. The typical location of coupons on the beam web material sample is shown in

18
Figure 3-17. The plate material sample shown in the figure was cut at the midspan of the
beam to assure that no yielding has taken place. The specified grade of steel for the
beams was CAN/CSA–G40.21 350W (CSA, 1998).
3.7.2 Angle
Additional lengths of angle of each size were ordered from the same heat as the
ones used for the test specimens. Three sheet-type coupons were fabricated and tested
from each piece of angle. The orientation of the coupon is the same as the direction of
loading. The coupons were oriented along the length of the angle as shown in
Figure 3-18. The grade of all the angle sections was CAN/CSA–G40.21 300W
(CSA, 1998).

Tab
le 3
-1 A
s-bu
ilt C
onne
ctio
n D
imen
sion
s
Ang
le (r
efer
to F
igur
es 3
-1a
and
3-1b
) B
eam
(ref
er to
Fig
ures
3-1
c an
d 3-
1d)
Test
Sp
ecim
en
e s1
p 1
p 2
e s2
e g
d slo
tl sl
ot
t e s
3 p 3
e s
4 e g
1 e g
2 d h
1 d h
2 E s
S 1
S 2
E g
D
hD
c L c
w
(1
) (2
) (3
) (4
) (5
) (6
) (7
) (8
) (9
) (1
0)(1
1)
(12)
(13)
(14)
(15)
(1
6)(1
7)(1
8)(1
9)
(20)
(21)
(22)
(23)
(24)
1LA
24
.1
102.
0 10
2.1
25.7
24
.520
.631
.26.
5950
.115
2.0
51.9
36.4
36.3
26.8
26
.926
.110
1.3
101.
625
.420
.734
.975
.57.
321L
B
31.0
10
2.2
102.
0 32
.4
33.5
27.7
40.4
6.55
58.0
151.
958
.036
.736
.626
.8
26.8
32.1
100.
810
0.9
30.8
26.5
36.1
81.7
6.91
1LA
a 26
.2
102.
0 10
2.0
24.7
23
.820
.731
.76.
4252
.115
2.5
50.8
35.9
36.2
27.0
27
.324
.810
1.4
101.
125
.020
.435
.974
.06.
921L
Ba
33.5
10
2.4
101.
6 31
.6
33.9
28.9
45.0
6.39
58.9
152.
358
.336
.436
.427
.2
27.2
32.4
101.
110
1.6
32.0
26.9
36.1
81.9
6.92
1L1
32.0
75
.7
76.2
32
.5
30.2
25.6
55.0
9.88
31.8
151.
732
.937
.136
.926
.6
26.8
58.4
76.0
75.8
30
.423
.8__
__
7.
211L
2 31
.4
101.
4 10
2.2
33.2
28
.824
.355
.19.
6357
.515
2.4
59.7
36.4
36.7
27.1
27
.262
.699
.910
2.4
29.1
23.7
__
__
6.98
1L3
32.0
10
1.6
102.
0 32
.9
30.1
24.7
55.0
9.83
58.1
152.
059
.437
.537
.126
.8
26.9
65.8
100.
610
1.7
28.6
23.5
__
__
8.98
1L4
31.0
10
1.5
101.
8 34
.2
29.4
25.1
54.8
9.66
57.5
152.
359
.636
.636
.927
.0
26.9
61.1
101.
910
1.3
29.0
23.7
__
__
7.05
1L5
30.8
10
1.5
101.
8 34
.4
29.6
25.5
54.8
9.59
57.3
152.
760
.036
.336
.527
.1
27.4
62.0
102.
410
1.9
29.7
23.9
__
__
7.02
1L6
30.9
10
1.8
101.
7 34
.6
29.7
25.7
54.8
9.69
56.6
151.
959
.836
.536
.226
.7
26.7
61.9
100.
910
2.1
30.6
24.1
__
__
7.08
1L7
32.0
76
.7
77.1
32
.3
30.4
25.7
55.0
9.94
32.8
151.
832
.236
.336
.526
.8
26.7
57.5
76.3
77.0
29
.323
.8__
__
7.
091L
8 31
.8
75.0
76
.2
32.8
30
.425
.955
.09.
9031
.815
1.9
33.2
37.0
36.8
27.0
27
.129
.775
.675
.4
30.3
24.1
35.9
78.9
6.91
1L9
31.4
10
2.1
102.
0 33
.5
30.3
23.7
28.3
9.63
57.5
151.
859
.236
.036
.126
.7
26.8
61.7
101.
610
1.4
29.5
23.9
__
__
7.06
1L10
31
.7
76.2
77
.1
34.5
29
.824
.628
.69.
5932
.915
2.2
32.8
36.5
36.5
26.7
26
.860
.274
.874
.7
30.0
23.5
__
__
7.26
1L1a
46
.1
75.9
76
.2
33.4
32
.525
.953
.89.
4146
.715
2.9
33.6
86.4
86.4
27.5
27
.675
.475
.975
.6
29.6
23.5
__
__
6.92
1L2a
46
.1
101.
6 10
1.4
34.0
27
.524
.955
.19.
4672
.715
2.2
59.3
86.0
86.2
27.1
27
.275
.710
0.9
101.
329
.523
.6__
__
7.
211L
2aE
48.6
10
2.3
102.
0 46
.3
33.5
25.2
53.6
9.51
74.4
152.
173
.386
.286
.127
.3
27.2
75.1
101.
910
2.0
29.6
23.6
__
__
7.32
1L3a
46
.2
102.
1 10
2.1
33.9
28
.324
.953
.99.
4472
.715
2.4
59.6
85.9
86.1
27.2
27
.243
.910
1.9
101.
830
.523
.936
.283
.09.
781L
4a
45.9
10
2.0
102.
0 33
.7
27.8
25.5
54.6
9.39
72.9
152.
759
.886
.386
.327
.5
27.6
76.3
101.
010
0.9
30.2
23.6
__
__
7.22
1L5a
46
.2
101.
6 10
2.3
33.9
27
.424
.855
.39.
4972
.815
2.2
59.4
86.0
86.1
27.1
27
.245
.810
1.9
102.
130
.024
.128
.082
.27.
251L
6a
46.5
10
1.7
101.
7 34
.3
27.8
25.0
55.0
9.51
72.9
152.
859
.786
.086
.427
.4
27.7
46.2
101.
910
1.5
29.4
23.9
29.3
82.5
7.22
1L7a
44
.9
75.4
76
.0
33.4
32
.425
.553
.39.
3745
.015
2.7
33.5
85.9
86.1
27.4
27
.675
.275
.475
.2
29.4
23.5
__
__
6.98
1L8a
46
.2
76.5
75
.8
33.6
32
.726
.053
.19.
4546
.915
2.4
33.3
86.1
86.4
27.4
27
.745
.075
.176
.0
29.9
23.5
36.7
79.4
6.89
1L9a
48
.0
101.
9 10
2.0
31.5
29
.923
.829
.29.
4974
.415
2.3
57.7
86.2
86.1
27.2
27
.376
.510
1.6
101.
030
.823
.7__
__
7.
311L
10a
46.6
76
.0
76.1
33
.5
31.6
23.8
28.5
9.53
32.0
153.
033
.279
.579
.727
.3
27.5
76.1
75.5
75.2
30
.923
.6__
__
6.
921L
11a
45.9
75
.5
75.8
35
.6
32.5
26.3
53.3
9.44
46.9
152.
435
.086
.386
.327
.4
27.6
75.8
75.7
75.4
30
.423
.7__
__
6.
99 N
ote:
All
dim
ensi
ons a
re in
mill
imet
res.
19

Tab
le 3
-1 A
s-bu
ilt C
onne
ctio
n D
imen
sion
s (co
nt’d
)
Ang
le (r
efer
to F
igur
es 3
-1a
and
3-1b
) B
eam
(ref
er to
Fig
ures
3-1
c an
d 3-
1d)
Test
Sp
ecim
en
e s1
p 1
p 2
e s2
e g
d slo
tl sl
ott
e s3
p 3
e s4
e g1
e g2
d h1
d h2
E s
S 1
S 2
E g
Dh
Dc
L c
w
(1)
(2)
(3)
(4)
(5)
(6)
(7)
(8)
(9)
(10)
(1
1)
(12)
(1
3)(1
4)
(15)
(16)
(17)
(18)
(1
9)
(20)
(21)
(22)
(23)
(24)
1L12
51
.8
75.7
75
.7
52.6
31
.723
.7—
9.
4832
.215
2.6
73.0
33
.733
.6
27.2
27.4
75.7
75.5
75
.330
.223
.6—
—
6.
931L
13
52.4
76
.1
76.0
52
.8
31.9
23.7
—
9.49
31.9
152.
4 73
.0
50.2
50.0
27
.027
.175
.676
.0
75.7
29.7
23.6
—
—
6.85
1L14
52
.2
75.8
76
.1
52.4
32
.723
.7—
9.
4632
.176
.2/7
6.51
73.3
33
.033
.0
27.3
27.3
75.5
75.3
75
.430
.623
.5—
—
6.
932L
1 31
.9
75.9
75
.7
33.2
29
.424
.455
.39.
7232
.215
1.9
33.2
36
.936
.8
27.0
27.0
57.4
75.8
74
.729
.723
.8—
—
7.
04
32.4
76
.3
76.0
32
.2
29.4
24.7
55.8
9.87
32.4
152.
3 32
.2
36.5
36.4
26
.826
.7—
—
—
—
—
—
—
—
2L
2 31
.9
101.
6 10
2.1
33.1
30
.125
.355
.19.
8357
.515
2.1
58.7
37
.137
.3
26.9
27.0
62.0
100.
910
1.1
29.8
23.7
—
—
7.10
31
.8
101.
8 10
2.1
32.6
29
.825
.355
.09.
7759
.015
1.9
58.6
36
.937
.0
26.9
27.0
—
—
—
—
—
—
—
—
2L3
30.5
10
2.5
101.
5 33
.8
29.3
25.2
55.6
9.70
57.5
152.
0 59
.2
35.9
35.9
26
.927
.165
.710
1.6
101.
230
.423
.6—
—
9.
29
31.6
10
2.2
101.
7 33
.6
30.0
25.2
55.3
9.71
58.3
152.
0 59
.5
36.8
37.0
26
.927
.0—
—
—
—
—
—
—
—
2L
4 31
.6
101.
6 10
1.7
33.3
29
.725
.255
.19.
8257
.615
2.0
59.0
37
.236
.8
27.1
27.1
62.0
102.
010
1.8
29.7
24.3
—
—
7.03
31
.7
101.
9 10
2.0
32.6
29
.525
.255
.19.
7157
.715
1.7
58.5
37
.036
.9
27.1
27.0
—
—
—
—
—
—
—
—
2L5
32.7
10
1.9
102.
1 31
.9
29.6
25.3
55.1
9.86
58.7
152.
1 57
.8
36.7
36.7
26
.926
.962
.410
0.4
101.
430
.624
.1—
—
7.
01
30.5
10
2.5
101.
5 33
.8
29.3
25.2
55.6
9.70
57.5
152.
0 59
.2
35.9
35.9
26
.927
.1—
—
—
—
—
—
—
—
2L
6 32
.0
75.5
75
.6
33.2
29
.625
.155
.99.
7725
.814
6.1
32.8
31
.536
.6
26.3
26.5
61.0
76.0
75
.530
.323
.6—
—
6.
98
31.8
75
.3
76.5
33
.5
29.7
24.8
55.4
9.80
31.9
151.
9 33
.3
36.8
36.9
26
.626
.8—
—
—
—
—
—
—
—
2L
7 32
.4
76.6
75
.9
31.7
30
.225
.855
.09.
7932
.215
1.6
32.4
36
.936
.9
26.9
27.1
28.6
74.8
74
.429
.424
.035
.975
.76.
87
31.9
75
.5
75.9
32
.3
29.8
24.3
54.9
9.75
32.1
151.
9 33
.0
37.0
36.6
26
.926
.9—
—
—
—
—
—
—
—
2L
1a
33.6
76
.1
75.9
31
.6
28.2
25.5
54.3
9.44
33.3
152.
7 32
.0
80.1
79.5
27
.727
.460
.776
.2
75.7
30.5
23.5
—
—
6.87
31
.3
76.1
75
.9
33.3
28
.125
.054
.69.
4132
.015
3.0
33.2
79
.579
.7
27.3
27.5
—
—
—
—
—
—
—
—
2L5a
33
.5
102.
2 10
2.2
31.3
28
.225
.754
.19.
3959
.715
2.6
57.8
79
.979
.8
27.6
27.3
60.6
101.
510
1.5
30.4
23.6
—
—
6.93
31
.6
101.
6 10
2.5
33.4
27
.824
.454
.29.
4457
.915
2.5
59.4
79
.679
.7
27.3
27.5
—
—
—
—
—
—
—
—
2L6a
33
.6
76.1
76
.5
31.0
28
.925
.954
.39.
4833
.415
2.8
31.6
79
.879
.7
27.5
27.4
60.6
75.8
75
.930
.023
.6—
—
6.
92
31.5
75
.8
76.1
32
.8
28.6
25.7
54.2
9.45
32.2
152.
6 33
.0
79.6
79.9
27
.427
.6—
—
—
—
—
—
—
—
2L
8a
31.5
10
2.2
102.
0 33
.7
28.4
25.9
53.8
9.38
57.9
152.
7 59
.5
79.3
79.8
27
.427
.529
.810
1.8
101.
930
.223
.730
.578
.16.
93
33.8
10
1.3
102.
0 31
.2
28.2
25.3
54.2
9.35
59.5
152.
7 57
.9
79.6
79.7
27
.327
.5—
—
—
—
—
—
—
—
1 S
peci
men
1L1
4 is
fabr
icat
ed w
ith 3
bol
t hol
es a
t the
ang
le le
g co
nnec
ted
to th
e co
lum
n. T
he n
umbe
rs sh
own
are
the
spac
ing
betw
een
the
thre
e bo
lt ho
les.
N
ote:
All
dim
ensi
ons a
re in
mill
imet
res.
20

21
Table 3-2 Test Matrix Used to Investigate Angle Leg Connected to Beam
Test Specimen
No. of Angles
Slot Length1
Plate Washer
Beam Web
Pre-tension
Bolt Pitch2
Torsion Brace
Beam Rotation3
Flange Cope Angle Beam
(1) (2) (3) (4) (5) (6) (7) (8) (9) (10) (11) (12) 1LA 4 1L Long 6 Yes Thin No Large No No Yes A5 B5 1LB 5 1L Long 6 Yes Thin No Large No No Yes A6 B6
1LAa 4 1L Long 6 Yes Thin No Large No No Yes A5 B5 1LBa 5 1L Long 6 Yes Thin No Large No No Yes A6 B6
1L1 1L Long No Thin No Std. No No No A1 B1 1L2 1L Long No Thin No Large No No No A2 B2 1L3 1L Long No Thick No Large No No No A2 B3 1L4 1L Long Yes Thin No Large No No No A2 B2 1L5 1L Long Yes Thin Yes Large No No No A2 B2 1L6 1L Long No Thin No Large Yes No No A2 B2 1L7 1L Long No Thin No Std. No Yes No A1 B1 1L8 1L Long No Thin No Std. No No Yes A1 B4 1L9 1L Short No Thin No Large No No No A3 B2
1L10 1L Short No Thin No Std. No Yes No A4 B1 1L1a 1L Long No Thin No Std. No No No C1 D1 1L2a 1L Long No Thin No Large No No No C2 D2
1L2aE 7 1L Long No Thin No Large No No No C7 D2 1L3a 1L Long No Thick No Large No No Yes C2 D3 1L4a 1L Long Yes Thin No Large No No No C2 D2 1L5a 1L Long Yes Thin Yes Large No No Yes C2 D2a 1L6a 1L Long No Thin No Large No No Yes C2 D2a 1L7a 1L Long No Thin No Std. No Yes No C1 D1 1L8a 1L Long No Thin No Std. No No Yes C1 D4 1L9a 1L Short No Thin No Large No No No C3 D2
1L10a 1L Short No Thin No Std. No Yes No C4 D1 1L11a 1L Long No Thin No Std. Yes No No C1 D1 2L1 2L Long No Thin No Std. No No No A1 B1 2L2 2L Long No Thin No Large No No No A2 B2 2L3 2L Long No Thick No Large No No No A2 B3 2L4 2L Long Yes Thin No Large No No No A2 B2 2L5 2L Long Yes Thin Yes Large No No No A2 B2 2L6 2L Long No Thin No Std. No Yes No A1 B1 2L7 2L Long No Thin No Std. No No Yes A1 B4 2L1a 2L Long No Thin No Std. No No No C1d B1 2L5a 2L Long Yes Thin Yes Large No No No C2d B2 2L6a 2L Long No Thin No Std. No Yes No C1d B1 2L8a 2L Long No Thin No Large No No Yes C2d D2da
All bolts are 22.2 mm (7/8 in.) diameter unless noted otherwise. All plate washers are 9.5 mm thick. Notes: 1: Long slot length = 55 mm, short slot length = 28 mm
2: Large bolt pitch = 102 mm, standard pitch = 76 mm 3: Beam end rotation = 3.5° for specimens with imposed rotation 4: Bolt diameter = 19.1 mm 5: Bolt diameter = 25.4 mm 6: Slot length = 1.65 times bolt diameter 7: With bottom end distance of 47 mm

22
Table 3-3 Test Matrix Used to Investigate the Angle Leg Connected to the Column
Nominal Distances Top End Edge Test
Specimen es3 eg1 Angle Beam Number of bolts
connected to column (mm) (mm)
(1) (2) (3) (4) (5) (6) 1L12 32 32 C8 D1 2 1L13 32 50 C9 D1 2 1L14 32 32 C10 D1 3

23
a) Typical Outstanding Leg of Angle b) Typical Leg of Angle Connected to the Column
c) Typical Beam with Full Flange d) Typical Beam with Coped Flange
Figure 3-1 Test Specimens Dimensions

24
a) A1 Test 1L1, 1L7, 1L8,
2L1, 2L6, 2L7
b) A2 Test 1L2, 1L3, 1L4, 1L5, 1L6,
2L2, 2L3, 2L4, 2L5
c) A3 Test 1L9
d) A4
Test 1L10 e) A5
Test 1LA, 1LAa f) A6
Test 1LB, 1LBa
Notes: A1 to A4 are fabricated from L102x102x9.5
A5 and A6 are fabricated from L102x102x6.4
C1d and C2d are fabricated from L152x102x9.5
g) C1d Test 2L1a, 2L6a
h) C2d Test 2L5a, 2L8a
Figure 3-2 Nominal Angle Dimensions
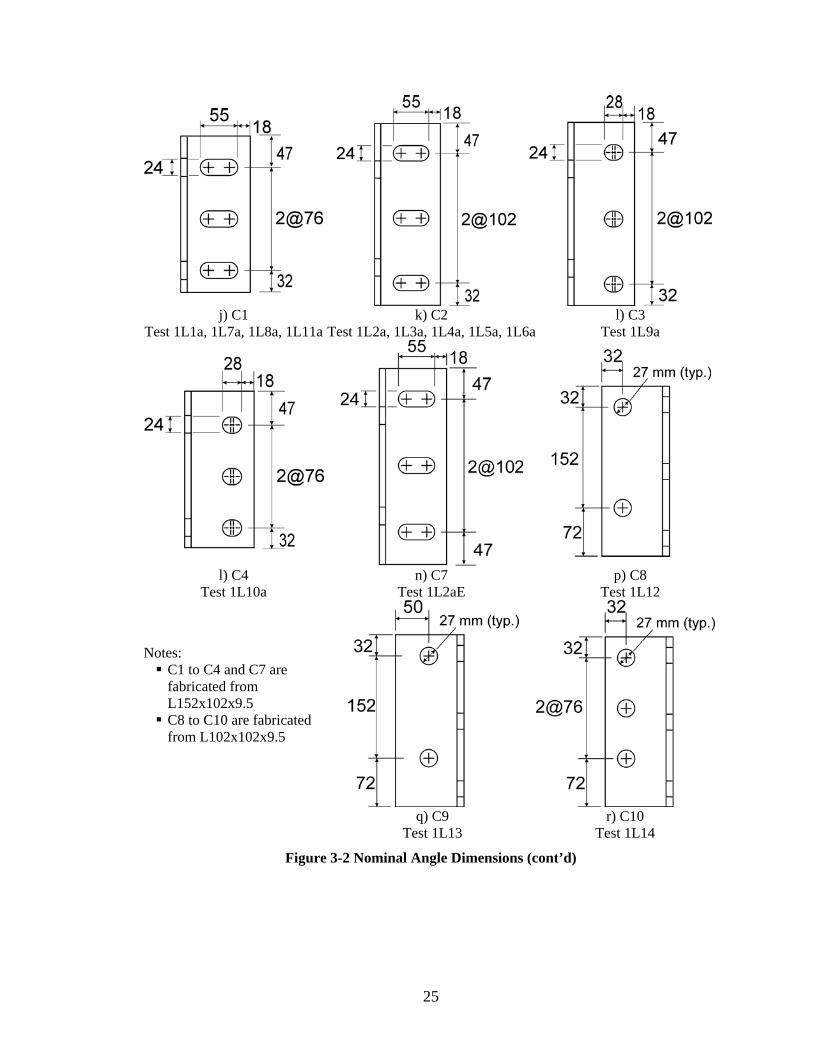
25
j) C1 Test 1L1a, 1L7a, 1L8a, 1L11a
k) C2 Test 1L2a, 1L3a, 1L4a, 1L5a, 1L6a
l) C3 Test 1L9a
l) C4 Test 1L10a
n) C7 Test 1L2aE
p) C8 Test 1L12
Notes: C1 to C4 and C7 are fabricated from L152x102x9.5
C8 to C10 are fabricated from L102x102x9.5
q) C9
Test 1L13 r) C10
Test 1L14
Figure 3-2 Nominal Angle Dimensions (cont’d)

26
a) B1 Test 1L1, 1L7, 1L10, 2L1, 2L6,
2L7, 2L1a, 2L6a
b) B2 Test 1L2, 1L4, 1L5, 1L6, 1L9,
2L2, 2L4, 2L5, 2L5a
c) B3 Test 1L3, 2L3
d) B4 Test 1L8, 2L7
e) B5 Test 1LA, 1LAa
f) B6 Test 1LB, 1LBa
Notes: All dimensions are in millimetres
All hole diameters are 24 mm unless noted otherwise
Figure 3-3 Nominal Dimensions of Beam Connections

27
g) D1 Test 1L1a, 1L7a, 1L10a, 1L11a
1L12, 1L13, 1L14
h) D2 Test 1L2a, 1L4a, 1L9a, 1L2aE
j) D3 Test 1L3a
k) D4 Test 1L8a
l) D2a Test 1L5a, 1L6a
m)D2da Test 2L8a
Notes: All dimensions are in millimetres
All hole diameters are 24mm unless noted otherwise All beams are W410x46 except B3 and D3
B3 is a W410x74 D3 is a W410x100
Figure 3-3 Nominal Dimensions of Beam Connections (cont’d)

28
Figure 3-4 Elevation View of Test Setup

29
Figure 3-5 Overall Test Setup
Loading actuator
Test beam
Lateral brace

30
Figure 3-6 Reaction Actuator with Load Cell and Knife Edge
Knife edge
890kN load cell
890kN reaction actuator
Cable transducer for support displacement monitoring.

31
Figure 3-7 Section of Test Setup at Load Point (refer to Figure 3-4)

32
Figure 3-8 Loading Frame near the Connection
Roller assembly
Spherical bearing
Lateral bracing
890 kN load actuator
890 kN load cell

33
Figure 3-9 Lateral Bracing Near Test Connection
Test connection
HSS51x25x3.2
Roller
Rotation transducer

34
Figure 3-10 Section of Test Setup at Reaction Frame (refer to Figure 3-4)

35
Figure 3-11 Lateral Bracing at Load Point
Spherical Bearing
HSS51x25x3.2
Roller assembly
Bearing Stiffener
Lateral bracing

36
Figure 3-12 Lateral Bracing at Reaction Frame

37
Figure 3-13 Lateral Bracing at Reaction Frame

38
Figure 3-14 Instrumentation
1Δ , 2Δ : Measurement of lateral displacement of angle
3Δ , 4Δ : Measurement of lateral displacement of beam
5Δ : Measurement of displacement of angle at the top
6Δ : Measurement of displacement of angle at the bottom
7Δ : Measurement of displacement of top flange of the beam
8Δ : Measurement of displacement of bottom flange of the beam
Section C-C in Figure 3-14
Figure 3-15 Details of Instrumentation at Connection

39
Figure 3-16 Typical Tension Coupon Dimensions
Figure 3-17 Typical Coupon Locations on Beam Web Material Sample

40
a) Location of Coupons
on Angle L152x102x9.5
b) Location of Coupons
on Angle L102x102x9.5
c) Location of Coupons
on Angle L102x102x6.4
Figure 3-18 Location of Coupons on Angle Sections
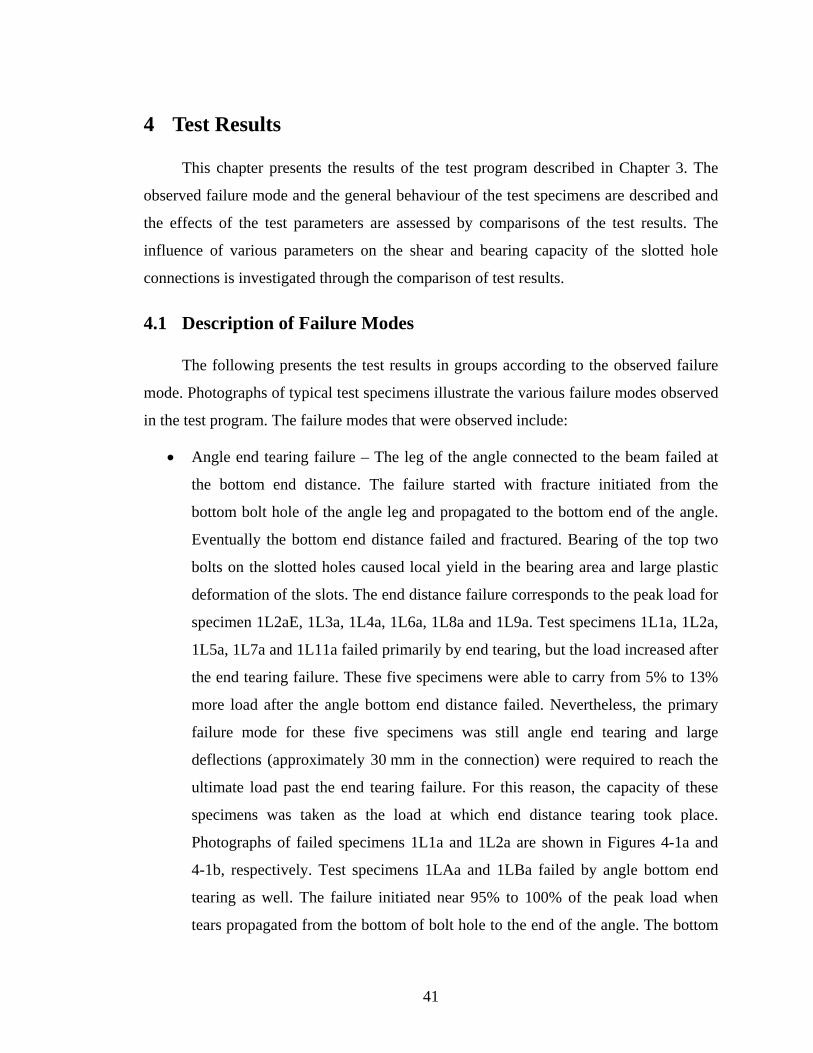
41
4 Test Results
This chapter presents the results of the test program described in Chapter 3. The
observed failure mode and the general behaviour of the test specimens are described and
the effects of the test parameters are assessed by comparisons of the test results. The
influence of various parameters on the shear and bearing capacity of the slotted hole
connections is investigated through the comparison of test results.
4.1 Description of Failure Modes
The following presents the test results in groups according to the observed failure
mode. Photographs of typical test specimens illustrate the various failure modes observed
in the test program. The failure modes that were observed include:
• Angle end tearing failure – The leg of the angle connected to the beam failed at
the bottom end distance. The failure started with fracture initiated from the
bottom bolt hole of the angle leg and propagated to the bottom end of the angle.
Eventually the bottom end distance failed and fractured. Bearing of the top two
bolts on the slotted holes caused local yield in the bearing area and large plastic
deformation of the slots. The end distance failure corresponds to the peak load for
specimen 1L2aE, 1L3a, 1L4a, 1L6a, 1L8a and 1L9a. Test specimens 1L1a, 1L2a,
1L5a, 1L7a and 1L11a failed primarily by end tearing, but the load increased after
the end tearing failure. These five specimens were able to carry from 5% to 13%
more load after the angle bottom end distance failed. Nevertheless, the primary
failure mode for these five specimens was still angle end tearing and large
deflections (approximately 30 mm in the connection) were required to reach the
ultimate load past the end tearing failure. For this reason, the capacity of these
specimens was taken as the load at which end distance tearing took place.
Photographs of failed specimens 1L1a and 1L2a are shown in Figures 4-1a and
4-1b, respectively. Test specimens 1LAa and 1LBa failed by angle bottom end
tearing as well. The failure initiated near 95% to 100% of the peak load when
tears propagated from the bottom of bolt hole to the end of the angle. The bottom

42
end fractured completely eventually. Unlike the other specimens with end tearing
failure, the angle failed by shear fracture after the angle bottom end failed. The
shear failure path intersects the slotted holes closer to the supporting column, as
shown in Figures 4-2a and 4-2b, respectively.
• Beam web edge distance tearing failure – Test specimens 2L1a, 2L2, 2L3, 2L4,
2L5a and 2L6a failed in the beam web by tearing of the edge distance at peak
load. This failure mode has similarities to the tension and shear block failure
mode described below. However, the top flange was not coped and a tension and
shear block failure could not take place. Large deformation of the top flange was
observed. Photos of failed specimens 2L1a and 2L2 are shown in Figures 4-3a
and 4-3b, respectively.
• Beam web tension and shear block failure – Two of the double angle specimens,
namely, 2L7 and 2L8a, failed by beam web tension and shear block tearing. This
failure mode initiates by a tension rupture of the edge distance, followed by shear
rupture. As illustrated in the photos of failed specimens 2L7 and 2L8a in Figures
4-4a and 4-4b, respectively, shear rupture does not take place at the same time as
the tension rupture.
• Failure of angle leg connected to the column – Failure of the angle leg connected
to the column characterized the failure mode for the test specimens with standard
bolt pitch (76 mm), namely, specimens 1L1, 1L7, 1L10 and 1L10a. In this failure
mode, the top end distance of the angle leg connected to the column fractured at
the peak load. Photographs of failed specimens 1L1 and 1L7 are shown in Figures
4-5a and 4-5b, respectively. Two double angle specimens, namely, 2L1 and 2L6,
also experienced this type of failure mode. The top (loaded) end distance of one
of the angle leg connected to the column severed just before the load peaked. For
the test specimens with a large pitch (102 mm) (specimens 1LB, 1L2, 1L3, 1L4,
1L5, 1L6 and 1L9), the top corner of angle fractured as the load reached its peak
value. Photographs of the failed angle from specimens 1LB and 1L2 are shown in
Figures 4-6a and 4-6b, respectively. Test specimen 1LA experienced a large twist
(approximately °4 ) before the test was terminated. An examination of the tested

43
specimen showed that a tear had formed around the top bolt hole, indicating that it
was close to failing at the angle leg connected to the column. Test specimens
1L12, 1L13 and 1L14 were designed to investigate this failure mode further.
These three specimens were fabricated with either minimum end or edge distance
at the top bolt hole of the angle leg connected to the column. Moreover, it is
suspected that the use of minimum top end and top edge distance at the angle leg
connected to the column would result in a capacity similar to that of specimens
1L1 to 1L10. The capacity of these specimens ranged from 288 kN to 430 kN. To
ensure failure in the angle leg connected to the column, standard holes were used
in the angle leg connected to the beam, and uncoped beams were used. As a
result, the predicted shear and bearing capacity of the connection on the beam side
was ensured to exceed the capacity of the angle leg connected to the column
(maximum capacity observed previously = 430 kN). The angle leg connected to
the column for these three specimens failed as expected, as shown in Figure 4-7.
• Web crippling under the load point – Test specimen 2L5 failed by web crippling
under the load point, which is believed to have resulted from improper installation
of the bearing stiffeners. The beam web buckled under the load point and,
unfortunately, the ultimate load of the connection could not be reached. This
failure mode is shown in Figure 4-8.
A summary of the test results is presented in Table 4-1, where the peak load is
shown in column (2). The numbers presented in brackets for specimens 1L1a, 1L2a,
1L5a, 1L7a and 1L11a are the load when the angle failed by angle end tearing. The angle
rotation about the beam axis and the angle of twist of the beam at the peak load are
presented in columns (3) and (4), respectively. The vertical displacement at the bottom of
the connection measured at the peak load is presented in column (5). Finally, column (6)
tabulates the observed failure mode. Photographs of each specimen, showing the failed
element of the connection, are presented in Appendix A. Load vs. deformation response
and the twist of connection vs. deformation response of all the specimens are presented in
Appendix B.

44
4.2 Material Properties Tension coupon tests were conducted to determine the material properties of the
angles and beam material used to fabricate the test specimens. Sheet-type coupons were
fabricated and tested according to ASTM standard A370 (ASTM, 1997). The properties
recorded from the tension coupon tests are the elastic modulus, the upper yield and lower
yield strength when visible, the static yield strength and static ultimate strength, the stress
at rupture, the strain at onset of strain hardening, the strain at the ultimate stress, the
strain at rupture, and the reduction in area. A summary of material properties is presented
in Table 4-2.
4.2.1 Beam Material Properties A total of 24 coupons fabricated from the beam web were tested. The tension
coupons were obtained from the web in order to obtain material properties more relevant
to the failure modes observed during the test program, namely, failure in the beam web
for some of the test specimens. The mechanical properties for all the beams met the
requirements of CAN/CSA–G40.21–98 350W steel (CSA, 1998)1. The 1998 edition of
G40.21 Structural Quality Steel (CSA, 1998) was the latest edition when the
experimental work was conducted. As shown in Table 4-2, the beams were from four
heats of steel, and the static yield strength and ultimate strength show slight variation
among them. The variation of static yield and static ultimate strength are accounted for in
the comparison of test results. Figure 4-9a shows a typical stress vs. strain response for a
tension coupon obtained from one of the beams.
4.2.2 Angle Material Properties
A total of 17 coupons were tested from the angle sections. A summary of measured
material properties is presented in Table 4-2. All the angle sections meet the mechanical
properties requirements of CAN/CSA–G40.21–98 300W steel (CSA, 1998). Except for
coupons identified as V and Z, all the coupons were obtained from a virgin section of 1 Note that CAN/CSA–G40.21–98 requires the tension coupons to be sampled from the flanges when the flange width of the W shape is greater than 150 mm. The same strength requirements are used in this project even if the coupons were obtained from the web.

45
angle. Specimens identified as V and Z, however, were obtained from test specimens
after testing. Therefore, it is possible that the measured yield strength is higher than
normal due to the strain-hardening effect. All the tension coupons from the V series
showed no yield plateau and yield strength, obtained by the 0.2% offset method,
significantly higher than the yield strength obtained from virgin material. Although the
static yield and static ultimate strengths are slightly lower than 300 MPa and 450 MPa,
the dynamic yield and ultimate strength for coupons X are higher than the prescribed
minimum of 300 MPa and 450 MPa, respectively, which is considered to be satisfactory.
A typical stress vs. strain response for coupons V and Y series are shown in Figures 4-9b
and 4-9c, respectively. Coupon V was obtained from the tested angles, whereas coupon Y
was obtained from virgin untested angles. As shown in Figure 4-9b, the yield plateau
cannot be identified on the stress vs. strain curve for the tested coupon V, whereas it can
be identified on the stress vs. strain curve of coupon Y as shown in Figure 4-9c.
4.3 Effect of Test Parameters on Connection Capacity and Behaviour
An analysis of the test results is presented in this section. The test program was
designed to investigate the effect of the following parameters: web angle bottom end
distance, plate washer, slot length, bolt pretension, torsion brace, bolt pitch, flange cope,
beam end rotation, web thickness and bolt diameter.
The test results for specimens that failed in the beam-to-angle connection are
discussed first. The parameters are discussed in their order of importance, starting with
the parameter that had the most significant effect on the connection strength and
behaviour. The load vs. deformation response, the observed behaviour, the failure mode
and the capacity of the test specimens are used as a basis of comparison. The measured
angle of twist is also used as a basis for comparison in all the single angle test specimens.
It should be noted that the load vs. deformation responses are not normalized in the
comparisons. However, if the material properties varied greatly between the two
specimens being compared, their material strengths are accounted for in the comparison.
For the case where the test specimens showed some increase in load carrying
capacity after the angle end tearing, the end tearing load is taken as the capacity of the

46
test specimen since large deformation (approximately 35 mm measured at the bottom
flange) were required for these specimens to reach the higher capacity.
The results of tests on specimens that failed in the angle leg connected to the
column are discussed second. The effects of the following parameters are investigated:
angle thickness, top edge distance, top end distance, number of bolts and number of
angles. The failure mode and capacity of these specimens are used a basis of comparison.
4.3.1 Comparison with Tests from Franchuk et al. (2002)
Two single angle test specimens from Franchuk et al. (2002), namely, tests IV and
V, and two from the current test program, namely, 1LAa and 1LBa, can be compared
directly. All four specimens were fabricated with L102x102x6.4 angle sections and
W410x46 coped wide flange beam sections. The as-built dimensions and material
properties of the test specimens from Franchuk et al. are shown in Table 4-3 and
Table 4-4, respectively. A summary of the test results for these two tests is presented in
Table 4-5.
All four test specimens were fabricated with a nominal bolt pitch of 102 mm, slot
lengths of 1.65 times the bolt diameter and coped beam. Specimens IV and 1LAa used
3/4 in. A325 bolts whereas specimens V and 1LBa used 1 in. A325 bolts. All bolts were
in the snug tight condition. Specimens IV and V were tested without plate washers
whereas specimens 1LAa and 1LBa were tested with a 9.5 mm plate washer. The yield
and ultimate strengths for the angle material used in specimens IV and V are 358 MPa
and 492 MPa, respectively, compared to 320 MPa and 470 MPa, respectively, for
specimens 1LAa and 1LBa, respectively.
Test specimens IV and V are reported to have failed by loaded end distance tearing,
followed by tilting of the middle bolt in a three bolt connection. Tearing of the bottom
end distance of the angle and top edge of the beam web at the connection occurred at
approximately 95% to 100% of the ultimate capacity, leaving only the middle bolt to
carry the load. The middle bolt titled about the axis of the beam in the direction of
eccentricity. The test-to-predicted ratio for test specimens IV and V were only 0.69 and
0.76, respectively. A detailed description of the test results can be found in Franchuk et

47
al. (2002). Test specimens 1LAa and 1LBa of the current test program were prepared
with the same dimensions as specimen IV and V, except that plate washers were used to
cover the slots. Specimens 1LAa and 1LBa, failed by angle bottom end tearing near the
peak load, followed by the fracture of shear area.
4.3.1.1 Effect of Plate Washer
As shown in Figure 4-10 and Figure 4-11, the test specimens with plate washer,
1LAa and 1LBa, had capacities of 24% and 27% higher than their counterparts without
plate washer, IV and V. The increase in capacity was likely due to the change in failure
mode from end tearing followed by tilting of the middle bolt to shear fracture of the
angle. It is suspected that test specimens IV and V were not capable of developing the
full net shear capacity of the angle because of the bolt tilting problem. The test specimens
had reached 95% to 100% of the test capacity when the bottom end distance of the angle
and the top edge distance of the beam web fractured. Although the material strength in
specimens IV and V was slightly higher than in specimens 1LAa and 1LBa, the strength
of the connection was significantly lower. It is believed that the plate washer prevented
the bolt tilting phenomenon in thin single angle connections, allowing the full shear
capacity to develop. The effect of the plate washer is further investigated with thicker
angles in the next section. It should be noted that the shear angles used for specimens IV,
V, 1LAa and 1LBa were thinner than the minimum recommended angle thickness from
the AISC Manual of Steel Construction (AISC, 1999). However, the Canadian design
practice (CISC, 2004) does not limit the thickness of web framing angles.
4.3.2 Comparison of Tests in Current Experimental Program
4.3.2.1 Effect of Plate Washer
In this comparison, four test specimens are included: two single angle specimens,
namely 1L2a and 1L4a, and two double angle specimens, 2L2 and 2L4. All angles have a
nominal thickness of 9.5 mm, compared to 6.4 mm used for the comparison presented in
section 4.3.1.1.

48
Figure 4-12 shows that test specimen 1L2a (without plate washer) had a 19%
lower peak load than specimen 1L4a (with plate washer). If we take the angle end tearing
as the failure load, as explained above, the reduction of capacity then becomes 29%. The
angle of twist of the beam and of the shear angle were very close throughout the test for
the specimen with plate washer (1L4a). Figure B-42 and Table 4-1 show a difference of
0.8° of the twist between the beam and the angle at the peak load. On the other hand for
the specimen without plate washer (1L2a), the angle of twist of the beam was
approximately °2 larger than the angle of twist of the shear angle at ultimate, as shown in
Figure B-36 and Table 4-1. The larger angle of twist observed in the beam than in the
angle for the test specimen 1L2a is possibly a result of a slight pullout of the top bolt
through the slot, although the bolt did not completely pull out of the hole during the test.
It is believed that the slight pullout and the separation between the beam and the angle
did not contribute to the loss of capacity observed in the test specimens without a plate
washer. The bolts were not pulled out enough to lose bearing. Inspection of failed
specimens after the test showed that yielding occurred around the bottom bolt hole in the
plate washer. It seems that one of the roles of the plate washer in the test specimens was
to redistribute the load between the bolts after the angle end tearing.
Test specimens 2L2 (without plate washer) and 2L4 (with plate washer) are
compared to assess the effect of plate washer on double angle connections. In both cases,
the specimens failed by edge distance rupture of the beam web. From Figure 4-13, it is
seen that specimen 2L4 had a 14% higher capacity than that of 2L2. An examination of
the failed specimens indicated that the angles underwent very little deformation when
plate washers are used, whereas the shear angle in 2L2 failed by angle end tearing after
reaching the ultimate capacity. It is suspected that the higher capacity of the specimen
with the plate washers, 2L4, is possibly due to the increased rigidity of the angles,
indicated by the observations of the failed specimens, and the friction developed between
the faying surfaces of the connection.
The plate washers have been found to improve the connection strength,
significantly. Calculations presented in Chapter 5 indicate that two specimens without
plate washer, namely, 1L2a and 2L2, have test-to-predicted ratios of 0.68 and 0.69,

49
respectively, as predicted by CSA–S16–01, whereas the specimens with plate washer,
1L4a and 2L4, have test-to-predicted ratios of 0.97 and 0.80, respectively.
4.3.2.2 Effect of Loaded End Distance
Test specimen 1L2aE was fabricated with a larger bottom end distance (47 mm)
than test specimen 1L2a (32 mm, which is the minimum for 7/8 in. diameter bolts). The
as-built end distance of 1L2aE was 36% larger than that of 1L2a. The difference in
geometry between the two specimens resulted in an increase in as-built gross shear area
of 6.2% and net shear area of 7.8% on the angle leg connected to the beam. The primary
failure mode for both specimens was angle end tearing. As shown in Figure 4-14, test
specimen 1L2a was able to carry more load after end tearing of the angle (from 321 kN to
364 kN). The peak load was reached when the edge distance of the web ruptured at a
measured connection displacement of about 32 mm. Test specimen 1L2aE, which had a
larger end distance than 1L2a, showed a load carrying capacity 53% larger than specimen
1L2a, fabricated with minimum end distance. A comparison of peak loads shows an
increase of capacity of 35% as the as-built end distance is increased by 36%.
4.3.2.3 Effect of Slot Length
The effect of slot length can be assessed by comparing test specimens 1L2a (long
slot) and 1L9a (short slot). Both test specimens were tested without a plate washer.
Figure 4-15 shows that the test specimens had the same initial stiffness. However, the test
specimen with short slots reached a capacity 25% higher than the connection with long
slots. The load at angle end tearing of the short slot specimen was 41% larger than the
load at end tearing of the specimen with long slots. Specimen 1L2a was able to carry
more load after the angle failed whereas the capacity of 1L9a dropped from 454 kN to
about 400 kN after angle end tearing.
The separation between the angle and beam web at the connection was larger for
the specimen with long slots (1L2a), as shown in Figures B-36 and B-52. The larger
separation between the beam and angle of specimen 1L2a was likely due to the large
deformation of slots in the load direction and greater flexibility of the material between
the slots, thus allowing the bolt head to pull through the slot partially. Nevertheless, the

50
partial pull-out of the bolt head occurred at a large deflection (about 30 mm). It is
therefore concluded that slot length does have a significant effect on capacity.
4.3.2.4 Effect of Bolt Pretension
The effect of bolt pretension can be assessed from a comparison of test 1L6a
(snug tight bolts) with test 1L5a (pretensioned bolts with a plate washer). In both tests,
the angle failed by end tearing, followed by beam web edge distance rupture. Figure 4-16
shows that specimen 1L5a had 24% higher ultimate capacity and 18% higher angle
failure capacity than specimen 1L6a. The general behaviour of the two specimens was
similar, but the specimen with pretensioned bolts had a slightly higher stiffness and load
carrying capacity. The increase in stiffness and capacity was likely due to friction
developed between the faying surfaces at the connection.
The effect of bolt pretension on double angle connections with slotted holes can
be assessed by comparing specimen 2L4 to 2L5a. Both specimens had plate washers on
the outer plies of the connection to cover the slotted holes. Test specimen 2L5a was
installed with pretensioned bolts connecting the angle to the beam, whereas specimen
2L4 had only snug-tight bolts. Both test specimens showed a similar beam web failure
mode, that is, the beam edge distance next to the bottom bolt ruptured at a load close to
the peak load. Figure 4-17 shows that specimen 2L5a had a capacity 13% higher than that
of 2L4. It is also noted that the test specimen with snug tight bolts had stiffness 50%
lower than that of the specimen with pretensioned bolts. Both the increase in capacity and
initial stiffness displayed by the specimen with pretensioned bolts are likely due to the
friction contribution. Since there was no visible sign of bolt deformation after the test, it
is suspected that the bolts maintained most of their pretension during the tests. The
beneficial effect of bolt pretension is not expected to be applicable when the connection
fails at a load capacity close to the shear capacity of the bolts since the plastic shear
deformations observed in bolts under this condition have the effect of releasing the
pretension force.

51
4.3.2.5 Effect of Torsion Bracing
The effect of torsion bracing can be assessed by comparing specimen 1L1a (top
flange braced only) to 1L11a (torsionally braced). Both exhibited similar behaviour and
end tearing of the angle, which was the primary failure mode for both specimens.
Although the difference in end tearing capacity between the two specimens was only 5%,
the two specimens showed different behaviour after the angle end tearing failure. As
shown in Figure 4-18, for specimen 1L11a bolt bearing failure was observed around the
top two bolts followed by tearing of the beam web edge distance at the middle bolt hole
at peak load. On the other hand, the capacity of specimen 1L1a was limited by twisting of
the beam, which caused the top bolt head to pull partially through the slot. The test was
stopped when the angle of twist of the beam became large (approximately °8 ) (See
Figure B-34). The ultimate capacity for the torsionally braced specimen (1L11a) was
12% higher than the capacity of specimen 1L1a. Moreover, due to the torsional bracing,
the beam angle of twist in specimen 1L11a was smaller than 1o at the peak load, as shown
Figure B-56. It is believed that a torsion brace affects the ultimate connection capacity
and behaviour of single angle connection at large deflections (about 25 mm), although its
benefit on the angle end tearing capacity is small.
4.3.2.6 Effect of Bolt Pitch
Four tests are used to assess the effect of bolt pitch in single angle connections,
namely, 1L1a, 1L2a, 1L6a and 1L8a. Two of them (1L1a and 1L8a) were fabricated with
a 76 mm bolt pitch and the other two (1L2a and 1L6a) were fabricated with a 102 mm
bolt pitch. Figure 4-19 shows a comparison of load versus deformation response of test
specimens 1L1a and 1L2a. Both test specimens failed by angle end tearing, followed by
beam web edge distance tearing for specimen 1L2a, and a combination of beam twisting
and top bolt pullout for specimen 1L1a. From Figure B-34 and B-36, the separation
between the angle and the beam at the connection was about °3 for specimen 1L1a and
°2 for specimen 1L2a at peak load. The peak capacity of the specimen with a larger bolt
pitch (1L2a) was 11% larger than that observed for a smaller pitch (1L1a), which is likely
due to different behaviour and failure modes observed after the angle failed by end

52
tearing. The difference in angle end tearing capacity was only 3% despite a 23% larger
gross area and a 32% larger net shear area in the angle leg connected to the beam web.
Test specimens 1L8a and 1L6a had identical configurations to 1L1a and 1L2a,
respectively, except that the beams were coped. Both specimens failed by angle end
tearing initially, which also corresponds to the peak load for both specimens. Following
the angle end tearing failure, the net shear area between the middle and bottom slotted
hole fractured at a displacement of about 35 mm for test specimen 1L8a. Tearing of the
web edge distance next to the middle bolt was observed in specimen 1L6a at a deflection
of about 35 mm. As shown in Figure 4-20, the peak capacity of specimen 1L6a (large
pitch) was only 8% higher than that of test specimen 1L8a, despite the increase of 32% of
the net area and 23% of the gross area in specimen 1L6a.
The effect of bolt pitch on double angle connections can be assessed by
comparing four tests: 2L1a, 2L2, 2L7 and 2L8a. Two of them (2L1a and 2L7) used a
nominal bolt pitch of 76 mm and the other two (2L2 and 2L8a) used a large pitch
(102 mm). Figure 4-21 shows the load vs. deformation curves for 2L1a and 2L2. Both
test specimens failed at the beam web. The difference in their ultimate capacity is about
1% and they demonstrated similar initial stiffness and ductility. The tensile strength of
the beam material in specimen 2L1a was 4% higher than that used in specimen 2L2, as
shown by the coupon test results. It is believed that the small difference in ultimate
strength of the beam web does not affect the comparison significantly. However, the
location of the edge distance rupture was different for the two specimens. Although both
specimens failed by tearing of the beam web edge distance, specimen 2L1a failed at the
bottom bolt hole, whereas specimen 2L2 failed at the middle bolt hole.
Figure 4-22 shows the load vs. deformation response of specimens 2L7 and 2L8a.
Both test specimens were identical to 2L1a and 2L2, except that the top flange of the
beam was coped. Both specimens failed by beam web tension and shear block failure.
Test specimen 2L8a showed an increase in capacity of 20% over 2L7, which is consistent
with an increase in net shear area resulting from the larger bolt pitch. However,
inspection of the failed specimens showed a slight difference in the block shear failure
mode. Specimen 2L7 had tension failure at the edge distance next to the bottom bolt, and

53
a shear fracture along the vertical shear area above the bottom bolt. For the specimen
with larger bolt pitch (2L8a), tension rupture was observed at the edge distance next to
middle bolt, and shear fracture was observed along the vertical shear area above the
middle bolt. Only some hole deformation was observed at the bottom bolt. Angle end
tearing was observed at peak load on both angles for specimen 2L8a as well.
4.3.2.7 Effect of Flange Cope
The same four single angle connections used in the bolt pitch investigation (1L1a,
1L2a, 1L6a and 1L8a) were also used to assess the effect of flange cope. Figure 4-23
shows a comparison of the load vs. deformation responses for test specimens 1L1a and
1L8a. A comparison of specimen 1L1a (uncoped) with 1L8a (coped) indicates a
difference of peak capacity of 8%. Although both specimens failed by angle end tearing
at approximately the same load (312 kN versus 306 kN), specimen 1L1a showed an
increase of capacity of 5% before failure by excessive beam twisting and partial pullout
of head of top bolt. Specimen 1L8a failed by angle end tearing followed by fracture of
the net shear area between the bottom and middle slotted hole. The two connections
showed similar stiffness and behaviour up to the point where the angle failed. Similar
observations can be made about specimens 1L2a (uncoped flange) and 1L6a (coped
flange). The peak capacity of specimen 1L2a was 10% higher than that of specimen
1L6a, as shown in Figure 4-24. The load at which angle end tearing took place only
differed by 3% between the two test specimens. Since failure took place in the angles
rather than in the beam web, no significant difference was observed between the coped
and uncoped specimens.
To assess the effect of flange cope on double angle connections, the same four
specimens (2L1a, 2L2, 2L7 and 2L8a) used in the bolt pitch comparison are used. The
load vs. deformation curves for this comparison are shown in Figures 4-25 and 4-26. Test
specimens 2L1a and 2L7 were fabricated with standard pitch (76 mm). Test specimen
2L7, with the coped flange, showed a 27% lower capacity than test specimen 2L1a.
Specimen 2L7 failed by tension and shear block failure of the beam web, whereas 2L1a
failed by edge distance rupture of the beam web, followed by bolt bearing and elongation
of bolt holes. The failure mode is similar to a tension and shear block failure, but the

54
difference in capacity is possibly attributed to the contribution from the top flange. The
top flange provided additional strength in terms of bearing resistance to the connection.
This change in failure mode is consistent with the observation by Birkemoe and
Gilmor (1978). Although both specimens showed beam web edge distance rupture at an
early stage, the residual strength of specimen 2L7 was contributed by the vertical shear
area of the beam web at the connection. The contribution to the strength of specimen
2L1a came from the vertical shear area as well as from the top flange, which resulted in
an increase in capacity.
A similar comparison can be made between test specimens 2L2 and 2L8a. The
coped specimen 2L8 showed a 14% lower capacity than its uncoped counterpart 2L2.
Although both specimens had beam web edge distance rupture initially, the decrease in
capacity of coped specimens was consistent with the change in failure mode from beam
web bearing to tension and shear block failure. It is believed that the presence of top
flange contributed to the increase in capacities of double angle specimens.
4.3.2.8 Effect of Beam End Rotation
The effect of beam end rotation on single angle connections can be assessed by
comparing test specimens 1L1a (measured rotation of 0.41− ° at peak load) to 1L7a
(measured rotation of 3.5° at peak load). Positive beam end rotation indicates rotation
created by lowering the reaction actuator at the end of member opposite to the
connection. Both test specimens failed by angle end tearing with a small increase in load
carrying capacity before the end of testing due to excessive twist. Figure 4-27 shows that
both test specimens displayed a similar load vs. deformation response. Table 4-1
indicates that the peak load for specimen 1L1a was 5% larger than the peak load for
specimen 1L7a. The angle end tearing load was 8% larger than for specimen 1L7a.
A comparison of test specimen 2L1a (measured rotation of 0.25− ° at peak load)
with 2L6a (measured rotation of 3.5° at peak load) shows less than 3% difference in
capacity. The load response is shown in Figure 4-28. The initial stiffness and behaviour
were nearly identical up to the peak load. Both test specimens failed by tearing of the
beam web edge distance. The beam web edge distance of test specimen 2L6a ruptured at

55
the middle bolt hole, combined with bottom end tearing of both angles near the ultimate
load. On the other hand, the beam web edge distance of specimen 2L1a ruptured at the
bottom bolt hole. Despite the difference of web edge distance rupture location, the failure
modes are similar. It is therefore concluded that beam end rotation has little effect on the
connection capacity. This observation is consistent with earlier observations by
Franchuk et al. (2002).
4.3.2.9 Effect of Web Thickness
The effect of beam web thickness can be assessed by comparing specimen 1L6a
(nominal web thickness of 7.0 mm) to 1L3a (nominal web thickness of 10.0 mm). In both
cases, the specimens reached their peak capacity when the angle failed by end tearing.
Figure 4-29 shows that the connection capacity of specimen 1L3a (nominal web
thickness of 10.0 mm) is only 4% larger than that of 1L6a (nominal web thickness of
7.0 mm). As expected, web thickness has negligible effect on angle failure capacity.
The effect of web thickness on double angle connections is assessed by
comparing specimens 2L2 (nominal web thickness of 7.0 mm) and 2L3 (nominal web
thickness of 9.7 mm). Both specimens used double angles with large bolt pitch and long
slots. The load vs. deformation response for both specimens is shown in Figure 4-30. Test
specimen 2L3 shows a 19% higher capacity than specimen 2L2, which can be attributed
partly to the difference of 31% in actual web thickness. However, the ultimate strength of
the web material of specimen 2L3 is 6% greater than that of specimen 2L2. From the
difference in material properties and web thickness, the difference in capacity between
specimens 2L2 and 2L3 should have been greater than observed. Angle end tearing has
been observed in both test specimens near the peak load. The angles were of the same
nominal thickness and from the same heat of steel. Therefore, it is suspected that the
angle end tearing partly contributed to the failure as well.
4.3.2.10 Effect of Bolt Diameter
The effect of bolt diameter can be assessed by comparing test specimen IV with V
from Franchuk et al. (2002), and test specimen 1LAa with 1LBa from the current test
program. Figure 4-31 shows the comparison of test specimen IV with V, which had

56
19.1 mm and 25.4 mm bolts, respectively. Test specimen V showed a capacity 12%
greater than that of test specimen IV, despite of a 2.5% larger as-built net area of
specimen IV. It is believed that the increase in capacity is likely due to the increase in
minimum end distance from 25 mm to 32 mm to accommodate the change in bolt
diameter. As mentioned previously, test specimens IV and V failed by the rupture of
angle bottom end distance rupture and beam web top edge distance, followed by tilting of
the middle bolt. The increase in net or gross shear area did not contribute significantly to
the increase in capacity.
Similar conclusions can be drawn from a comparison of test specimens 1LAa and
1LBa. In both cases, the connections failed by angle bottom end tearing near the peak
load. The angle used in test specimen 1LAa has a 4.7% larger as-built net shear area than
1LBa. However, specimen 1LBa showed a capacity 14% larger than that of 1LAa, as
shown in Figure 4-32. The increase in capacity is likely due to the increase in end
distance of 1LBa (32 mm) over 1LAa (25 mm). It was observed that the failure initiated
by tearing of bottom end distance, and both connections reached about 95% of the peak
load when the end distance failed. Rupture of the remaining shear area followed, and the
load decreased significantly afterward. The angles from both tests were from the same
heat of steel, thus the variations in material properties were negligible.
4.3.3 Discussion of Specimens that Failed in the Leg Connected to the Column All of the tests in the current test program were designed so that failure would
take place on the beam side. However, several specimens showed an unexpected failure
of the angle leg connected to the column, giving the opportunity to study an additional
failure mode. The specimens that failed with this type of failure mode include 1LA, 1LB,
1L1 to 1L10, 1L10a, 2L1 and 2L6. In addition, three tests, namely 1L12, 1L13 and 1L14,
were designed specifically to investigate this failure mode. The parameters investigated
were top end distance (es3), top edge distance (eg1), thickness of angle (t), number of bolts
and number of angles (single or double). These parameters were found to have an effect
on the capacity of connections with this type of failure mode. A summary of the test
parameters is shown in Table 4-7. As shown in the table, the test specimens 1LB, 1L1 to

57
1L10, 2L1 and 2L6 are divided into four groups. The nominal dimensions of specimens
within each group were identical. For comparison, the connection capacity of each group
is taken as the average of the capacities of the specimens within the group.
4.3.3.1 Effect of Angle Thickness
The test specimens from group 1 and the test specimens from group 3 are
compared to assess the effect of angle thickness. For all the test specimens in this group,
the nominal dimensions of the angle leg connected to the column are the same. The top
end distance, es3, is 58 mm and the edge distance, eg1, is 37 mm. Specimen 1LB was
fabricated with a 6.4 mm thick L102x102x6.4 angle, whereas the specimens from group 3
were fabricated with L102x102x9.5 angles. The test results presented in Figure 4-33
indicate that an increase of angle thickness of 48% (from 6.4 mm to 9.5 mm) results in an
increase in capacity of 30%. It should be noted that the yield and ultimate strengths of the
angles used in group 1 were 45% and 12% higher, respectively, than the ones used for the
test specimens of group 3, accounting for part of the difference.
4.3.3.2 Effect of Top End Distance
In order to assess the effect of top end distance, es3, test specimens from group 2
are compared to specimens from group 3. The top end distance of specimens from group
2 was 32 mm, whereas the one from group 3 was 58 mm, while the edge distance, eg1, for
both groups was 37 mm. As shown in Figure 4-34, an increase of top end distance of
81%, or by 26 mm, results in an increase of average capacity by 29%. Angles used in
both groups of tests were from the same heat of steel, thus the variation in material
properties was negligible.
4.3.3.3 Effect of Edge Distance
Specimens 1L12 and 1L13 are compared to assess the effect of edge distance, eg1,
on the capacity of the connection. The baseline test in this comparison is specimen 1L12,
which was fabricated with the minimum edge distance of 32 mm as required by CSA–
S16–01 (CSA, 2001). Specimen 1L13 was fabricated with an edge distance of 50 mm.
Both specimens had a top end distance, es3, of 32 mm. As shown in Figure 4-35, an

58
increase of edge distance of 56%, or 18 mm, resulted in an increase in capacity of 24%.
Again, the angle sections used in both specimens came from same heat of steel.
4.3.3.4 Effect of Number of Bolts Connecting the Angle to the Column
The effect of number of bolts on the connection capacity of a single angle
connection that failed in the angle leg connected to the column can be assessed by
comparing specimen 1L12 with 1L14. The angle in specimen 1L12 was connected to the
column with two ASTM A325 1 in. diameter bolts, whereas the one in specimen 1L14
was connected to the column using three ASTM A325 1 in. diameter bolts. Figure 4-36
shows that an increase of 2 bolts to 3 bolts results in a 21% increase in capacity.
4.3.3.5 Effect of Number of Web Framing Angles
The effect of number of angles (either single or double angles) on connection
capacity can be assessed by comparing the specimens from group 2 with the specimens
from group 4. Specimens from group 2 were single angle connections whereas specimens
from group 4 were double angle connections. The nominal dimensions of angle leg
connected to the column are identical for both groups. The failure path crossed the top
end of the angles in both groups. However, only one of the two angles failed in the
double angle for specimens in group 4. It is likely due to slight initial imperfection in
fabrication of the angles so that one of the top end distances of the angle is shorter than
the other. Figure 4-37 shows that the double angle specimens (group 4) had a 34% higher
capacity than the ones with single angle (group 2).
4.4 Conclusions
The effect of a wide range of parameters on the strength and behaviour of
connections with slotted holes was investigated. The main findings from an examination
of test results (40 tests from this test program and two from an earlier test program) are:
• Plate washers are beneficial for thin (nominal thickness = 6.4 mm) single angle
connections. They increased the capacity as well as the stability of the connection
(change in failure mode from tearing of loaded end distance followed by

59
bolt-tilting to shear failure of angle). The observed increase in capacity was from
24% to 27% for the specimens with plate washers as compared to equivalent
specimens without. Thicker single web framing angle (nominal thickness =
9.5 mm) specimens fabricated with a plate washer showed a 41% greater capacity
than the specimens without a plate washer. Double angle specimens with plate
washers (2L4) showed a 14% higher capacity than the specimen without plate
washers (2L2). The test-to-predicted ratio of 2L4 is 0.8, compared to 0.69 of test
specimen 2L2. The predicted capacities of both specimens are calculated based on
web bearing failure. However, it is suspected that the beam web edge distance
failed and the web bearing strength was not fully developed. As a result, the test
capacities of both specimens did not reach the expected capacities. The double
angle specimen with plate washers (2L4) has a higher capacity than the one
without plate washers (2L2), possibly due to the increased rigidity of the angle, as
well as the friction developed between the faying surfaces at the connection.
• The increase in capacity for single angle web framing connections with a plate
washer was possibly due to the difference in the load transfer mechanism at the
angle end. For the single angle specimen with a plate washer (1L4a), part of the
load was shared by the plate washer during the angle end tearing, allowing for a
better transfer of load from the end bolt to the other two bolts. This is indicated by
the observed yielding of the plate washer around the bottom bolt hole. Double
angle connections also showed an increase in capacity compared to the specimens
without plate washers. The possible cause of the increase in this case is the
friction contribution between the faying surfaces and increased rigidity of the
angles due to the installation of plate washers on the outer plies. Although the
bolts are in the snug-tight conditions, some friction might be developed between
the faying surfaces at the connection.
• The loaded end distance had a significant effect on the capacity of single web
framing angle connections that failed by angle end tearing. An increase in actual
bottom end distance of 36% was found to lead to an increase in connection
capacity of as much as 53%. As shown in Chapter 5, the test-to-predicted values

60
using CSA–S16–01 Clause 13.11(a) (tension and shear block failure) for a
specimen with a 47 mm nominal bottom end distance (1L2aE) is 0.98, compared
to 0.68 for a specimen with 32 mm nominal bottom end distance (1L2a). The
failure mode of these two connections combines tearing of the bottom end
distance and bearing failure at the bolts on the top two slotted holes. For specimen
1L2a, it is suspected that the bottom end distance failed before the rest of the
connection could mobilize its full bearing strength. Therefore, this specimen has a
significantly lower test-to-predicted ratio compared to the specimen with a larger
loaded end distance. It was also observed that the loaded end distance of
connections with long slots did not fail by shear and end splitting, but rather by a
combination of bending and bearing failure, as shown in Figures 4-2a and 4-2b.
The 2005 AISC specification has provisions for an exterior bolt failing by end
spitting, but the equation was based on the shear rupture of the net shear area in
front of the bolt hole. In order to address this issue, new prediction models are
developed in Chapter 5 to predict the capacity of slotted hole connections with
angle end tearing failure.
• Single angles with short slots showed a 41% higher angle failure capacity than
connections with long slots that failed by angle end tearing.
• Connections with pretensioned bolts showed a higher capacity (18% higher angle
end tearing capacity in single angle connections and 13% in double angle
connections) and initial stiffness (about 50%) than connections with snug tight
bolts.
• Connections with a larger bolt pitch did not show any significant increase (from
3% to 8%) in capacity, except for double angle specimens that failed by tension
and shear block. The single angle connections with different bolt pitch failed by
angle end tearing. Therefore, the increase in bolt pitch had little effect on the
capacity.
• Torsionally braced beams showed much less twisting ( 7° less) in the connection
and a higher capacity at large deflection (approximately 25 mm). However, the
angle failure capacity was only increased by 5%.

61
• For specimens that failed in the angle leg connected to the column, it was found
that increasing the thickness of angles, the loaded end distance, the edge distance
and the number of bolts all lead to an increase in capacity. Double angle
specimens with this type of failure mode also showed a higher capacity (34%)
than its single angle counterpart.

62
Table 4-1 Summary of Test Results
Test specimen
Peak test capacity
Rotation of angle at peak load1, 2
Beam end twist at
peak load2
Displacement of bottom of connection at
peak load Failure Mode (kN) (degrees) (degrees) (mm)
(1) (2) (3) (4) (5) (6) 1LA 280 3.52 3.58 19.5 Excessive twist of connection 1LB 288 2.31 2.42 29.6 Angle leg connected to the column failed
1LAa 299 1.64 1.71 28.3 Angle end tearing 1LBa 342 1.43 1.53 26.1 Angle end tearing 1L1 306 0.79 1.35 24.7 Angle leg connected to the column failed 1L2 346 4.67 5.23 24.7 Angle leg connected to the column failed 1L3 430 2.73 2.69 30.0 Angle leg connected to the column failed 1L4 378 4.41 4.49 23.4 Angle leg connected to the column failed 1L5 362 4.24 4.09 16.5 Angle leg connected to the column failed 1L6 368 0.75 1.63 31.1 Angle leg connected to the column failed 1L7 276 0.82 1.49 21.6 Angle leg connected to the column failed 1L8 290 0.31 0.28 21.0 Angle leg connected to the column failed 1L9 360 3.79 3.82 19.6 Angle leg connected to the column failed
1L10 291 0.84 0.72 17.7 Angle leg connected to the column failed 1L1a 329 (312) 3 2.94 7.60 41.8 (21.2) 3 Angle end tearing 1L2a 364 (321) 3 3.15 5.20 31.5 (16.2) 3 Angle end tearing
1L2aE 490 4.38 4.85 39.9 Angle end tearing 1L3a 345 1.03 1.40 14.4 Angle end tearing 1L4a 452 4.12 4.89 41.7 Angle end tearing 1L5a 412 (391) 3 1.57 1.98 31.3 (17.1) 3 Angle end tearing 1L6a 331 0.67 0.98 14.7 Angle end tearing 1L7a 312 (288) 3 1.84 5.60 31.0 (13.1) 3 Angle end tearing 1L8a 306 0.56 1.37 18.3 Angle end tearing 1L9a 454 3.50 3.85 29.3 Angle end tearing
1L10a 376 -0.07 2.30 30.5 Angle leg connected to the column failed 1L11a 367 (327) 3 -1.16 0.68 34.1 (20.3) 3 Angle end tearing 1L12 299 1.86 1.79 10.9 Angle leg connected to the column failed 1L13 372 1.97 1.62 14.6 Angle leg connected to the column failed 1L14 362 3.29 3.15 17.4 Angle leg connected to the column failed 2L1 400 0.50 0.92 15.8 Angle leg connected to the column failed 2L2 482 -0.33 -0.50 20.2 Beam web edge distance tearing 2L3 574 -0.45 -0.56 14.6 Beam web edge distance tearing 2L4 551 -0.39 -0.39 31.3 Beam web edge distance tearing 2L5 542 1.31 1.31 12.6 Beam web crippling under the load point 2L6 377 1.59 0.25 16.9 Angle leg connected to the column failed 2L7 347 -0.08 -0.11 13.5 Beam web tension and shear block failure 2L1a 476 -0.30 0.30 39.4 Beam web edge distance tearing 2L5a 620 0.16 0.18 17.0 Beam web edge distance tearing 2L6a 463 -0.72 -0.90 24.1 Beam web edge distance tearing 2L8a 415 -0.09 -0.20 15.0 Beam web tension and shear block failure
Notes: 1 Rotation about axis of the beam
2 Positive angle of twist indicates twist in the direction of eccentricity 3 At angle end tearing

Tab
le 4
-2 M
ater
ial P
rope
rtie
s
Sect
ion
Size
U
sed
in
Tes
t H
eat
Cou
pon
ID
Cou
pon
Mar
k E
last
ic
Mod
ulus
Upp
er
Yie
ldSt
ress
Low
er
Yie
ld
Stre
ss
Mea
n St
atic
Y
ield
Stre
ss,
F y 1
Stat
ic
Ulti
mat
e St
ress
, F u
R
uptu
re
Stre
ss
Stra
in-
hard
enin
g St
rain
Stra
in a
t U
ltim
ate
Stre
ss
Rup
ture
St
rain
R
educ
tion
of A
rea
MPa
M
Pa
MPa
M
Pa
MPa
M
Pa
%
%
%
%
(1)
(2)
(3)
(4)
(5)
(6)
(7)
(8)
(9)
(10)
(1
1)
(12)
(1
3)
(14)
(1
5)
(16)
B
eam
W41
0x46
2L
2 1
A
1 21
4000
41
0 38
9 37
9 49
2 42
9 2.
75
22.9
32
.3
56.4
2 21
2000
42
2 38
9 38
1 49
3 42
3 2.
89
18.7
31
.3
57.4
3 21
4000
41
5 38
3 36
8 50
0 42
4 2.
55
17.3
30
.2
51.6
Mea
n21
3300
41
6 38
7 37
6 49
5 42
5 2.
73
19.6
31
.3
55.1
W41
0x46
2L
4, 2
L5
1 B
1
2080
00
419
391
370
486
418
2.94
20
.1
32.5
53
.5
2
2125
00
415
389
374
487
433
2.72
21
.3
31.6
53
.5
3
2080
00
413
394
374
485
423
2.61
22
.1
32.5
54
.4
M
ean
2095
00
416
391
373
486
425
2.76
21
.1
32.2
53
.8
W
410x
46
2L7
1 C
1
2090
00
423
398
383
495
472
2.63
19
.9
31.4
53
.4
2
2110
00
420
401
382
496
427
2.82
20
.9
31.6
54
.9
3
2105
00
410
400
389
500
476
2.72
21
.5
28.8
49
.3
M
ean
2100
00
418
400
385
497
458
2.72
20
.8
30.6
54
.2
W
410x
74
2L3
2 D
1
2070
00
455
436
430
526
482
2.90
17
.3
21.1
48
.6
2
2090
00
462
444
429
527
482
2.92
17
.2
19.5
52
.3
3
2170
00
462
433
430
518
478
2.94
16
.2
21.4
51
.8
M
ean
2110
00
460
438
430
524
481
2.92
16
.9
20.7
50
.9
W
410x
46
1L2a
3
E
1 21
3500
44
6 42
3 41
1 47
8 44
4 3.
78
21.6
28
.6
41.6
2 21
4000
43
5 41
8 40
4 47
0 39
4 4.
03
18.6
32
.1
49.4
3 21
3500
44
3 41
8 40
3 47
3 47
8 4.
42
19.3
26
.0
36.1
Mea
n21
3500
44
1 42
0 40
6 47
4 43
9 4.
08
19.9
28
.9
42.3
Not
e: 1 F
rom
two
indi
vidu
al re
adin
gs
63

Tab
le 4
-2 M
ater
ial P
rope
rtie
s (co
nt’d
)
Se
ctio
n Si
ze
Use
d in
T
est
Hea
t Cou
pon
ID
Cou
pon
Mar
k E
last
ic
Mod
ulus
Upp
er
Yie
ldSt
ress
Low
er
Yie
ldSt
ress
Mea
n St
atic
Y
ield
Stre
ss,
F y 1
Stat
ic
Ulti
mat
e St
ress
, F u
R
uptu
re
Stre
ss
Stra
in-
hard
enin
g St
rain
Stra
in a
t U
ltim
ate
Stre
ss
Rup
ture
St
rain
R
educ
tion
of
Are
a
M
Pa
MPa
M
Pa
MPa
MPa
M
Pa
%
%
%
%
(1)
(2)
(3)
(4)
(5)
(6)
(7)
(8)
(9)
(10)
(1
1)
(12)
(1
3)
(14)
(1
5)
(16)
W41
0x10
0 1L
3a
3 F
1 21
5500
446
419
413
481
409
4.40
18
.4
32.6
57
.1
2
2160
0045
2 41
7 41
0.5
483
407
3.76
18
.4
35.0
57
.2
3
2085
0044
1 41
6 40
3 48
0 41
5 3.
95
19.7
32
.1
55.7
Mea
n21
3000
446
417
409
481
410
4.04
18
.8
33.3
56
.7
Bea
m W
410x
46 2
L1a,
2L6
a 4
G
1 20
9000
438
413
401
513
461
2.79
17
.8
30.5
49
.7
2
2090
0045
0 41
6 40
6 50
9 46
8 2.
82
19.8
29
.7
48.0
3 21
2500
442
422
409
520
463
2.70
19
.0
28.2
50
.0
M
ean
2100
0044
3 41
7 40
5 51
4 46
4 2.
77
18.9
29
.4
48.8
W41
0x46
2L5
a, 2
L8a
4 H
1
2095
0043
6 41
2 39
7 50
9 44
3 2.
47
19.4
30
.9
52.3
2 22
0500
459
427
418
530
453
2.63
16
.7
32.4
56
.4
3
2105
0043
7 41
1 40
0 51
0 47
8 2.
72
17.8
27
.7
44.4
Mea
n21
3500
444
417
405
516
458
2.61
18
.0
30.3
54
.3
Not
e: 1 F
rom
two
indi
vidu
al re
adin
gs
64

Tab
le 4
-2 M
ater
ial P
rope
rtie
s (co
nt’d
)
Sect
ion
Use
d in
Tes
t C
oupo
n ID
C
oupo
n M
ark
Ela
stic
M
odul
us
Upp
er
Yie
ld
Stre
ss
Low
er
Yie
ld
Stre
ss
Mea
n St
atic
Y
ield
St
ress
, F y
1
Stat
ic
Ulti
mat
e St
ress
, F u
R
uptu
re
Stre
ss
Stra
in-
hard
enin
g St
rain
Stra
in a
t U
ltim
ate
Stre
ss
Rup
ture
St
rain
R
educ
tion
of A
rea
M
Pa
MPa
M
Pa
MPa
M
Pa
MPa
%
%
%
%
(1
) (2
) (3
) (4
) (5
) (6
) (7
) (8
) (9
) (1
0)
(11)
(1
2)
(13)
(1
4)
(15)
A
ngle
L
102x
102x
6.4
1LA
, 1LB
V
1
2330
00
—
—
5482
583
478
—
3.6
4.4
51.0
2
1980
00
—
—
4622
541
539
—
3.5
3.6
50.0
3
1915
00
—
—
4242
518
496
—
4.0
4.6
54.0
4
2035
00
—
—
4012
511
516
—
6.2
6.4
57.0
5
1840
00
—
—
4212
520
415
—
8.3
18.0
58
.0
Mea
n20
2000
—
—
45
1 53
5 48
9 —
5.
1 7.
4 54
.0
L
102x
102x
9.5
1L1
to 1
L10
W
1 20
7000
34
7 31
3 31
1 47
6 39
2 1.
52
20.1
34
.8
57.0
2L
1 to
2L7
2 20
0000
33
5 31
8 30
9 47
7 39
1 1.
50
18.0
34
.1
58.0
3
2095
00
348
325
312
474
402
1.85
16
.7
34.2
56
.0
Mea
n20
5500
34
3 31
9 31
1 47
6 39
5 1.
62
18.3
34
.4
57.0
L15
2x10
2x9.
5 1L
1a to
1L1
1a
X
1 19
8500
34
3 30
8 29
3 44
7 34
6 2.
84
23.6
37
.8
65.5
1L
2aE
2
2090
00
330
311
296
449
345
2.21
21
.1
36.1
64
.2
2L1a
, 2L5
a
3 21
0500
32
8 30
6 29
0 44
1 33
9 2.
08
22.6
38
.6
63.3
2L
6a, 2
L8a
M
ean
2060
00
334
308
293
446
343
2.38
22
.4
37.5
64
.3
L
102x
102x
6.4
1LA
a, 1
LBa
Y
1 20
6500
35
5 33
8 32
4 46
9 37
0 2.
81
20.8
36
.8
60.9
2
2055
00
357
331
317
469
371
2.45
21
.8
36.1
60
.4
3 20
4000
37
2 33
3 31
8 47
1 38
0 2.
25
22.6
32
.4
60.3
M
ean
2050
00
361
334
320
470
374
2.50
21
.7
35.1
60
.5
L
102x
102x
9.5
1L12
to 1
L14
Z
1 20
9500
34
7 34
0 32
5 52
1 42
1 0.
79
16.3
29
.1
57.3
2
2020
00
—
—
4442
551
445
—
7.8
19.5
52
.5
3 21
2000
34
1 33
5 32
7 52
1 43
1 0.
95
18.0
28
.4
56.8
M
ean
2080
00
344
338
365
531
432
0.87
14
.0
25.7
55
.5
Not
es:
1 Fro
m tw
o in
divi
dual
read
ings
2
0.2%
off
set y
ield
stre
ngth
65

66
Table 4-3 As-built Dimensions of Test Specimens IV and V from Franchuk et al. (2002)
es1 p1 p2 es2 eg dslot lslot t Test Specimen (mm) (mm) (mm) (mm) (mm) (mm) (mm) (mm)
(1) (2) (3) (4) (5) (6) (7) (8) (9) IV 24.8 102.3 101.8 22.7 27.4 20.3 31.4 6.477 V 31.7 103.3 102.2 33.0 33.8 26.8 42.1 6.342
Table 4-4 Material Properties of Angle from Franchuk et al. (2002)
Coupon ID Modulus of Elasticity
Mean Static Yield
Static Ultimate Strength
(MPa) (MPa) (MPa) (1) (2) (3) (4) 1 203300 357 489 2 207400 360 495
Table 4-5 Summary of Franchuk et al. (2002) Tests Results IV and V
Test specimen Peak test capacity
Displacement of bottom of connection
at peak load
Beam end twist at
peak load1
Rotation of angle at peak load1
(kN) (mm) (degrees) (degrees) (1) (2) (3) (4) (5) IV 240 10.2 -0.54 -0.06 V 269 10.1 0.04 -0.09
1 Positive angle of twist indicates twist in the direction of eccentricity

67
Table 4-6 Summary of Test Parameters - Current Test Program
Constants in each comparison
Parameter Test
Specimen
Nominal Values of
Parameters Bolt pitch
Slot Length Beam
Plate Washer
(1) (2) (3) (4) (5) (6) (7) (8) (9) Bottom end distance 1L2a 1L2aE 32 47 Large Long Uncoped No Plate washer 1L2a 1L4a No Yes Large Long Uncoped 2L2 2L4 No Yes Large Long Uncoped Slot length (mm) 1L2a 1L9a 55 28 Large Uncoped No Pretension 1L5a 1L6a Yes No Large Long Coped No 2L4 2L5a No Yes Large Long Uncoped Yes Torsion brace 1L1a 1L11a No Yes Standard Long Uncoped No Bolt pitch (mm) 1L1a 1L2a 76 102 Long Uncoped No 1L8a 1L6a 76 102 Long Coped No 2L1a 2L2 76 102 Long Uncoped No 2L7 2L8a 76 102 Long Coped No Coped flange 1L2a 1L6a Uncoped Coped Large Long 1L1a 1L8a Uncoped Coped Standard Long No 2L1a 2L7 Uncoped Coped Standard Long No 2L2 2L8a Uncoped Coped Large Long No Beam end rotation (o) 1L1a 1L7a -0.41 1 3.5 1 Standard Long Uncoped No 2L1a 2L6a -0.25 1 3.5 1 Standard Long Uncoped No Web thickness (mm) 1L3a 1L6a 10.0 7.0 Large Long Coped No 2L2 2L3 7.0 9.7 Large Long Uncoped No Bolt diameter (mm) IV V 19.1 25.4 Large Long 2 Coped No 1LAa 1LBa 19.1 25.4 Large Long 2 Coped Yes
Notes: 1 Measured beam end rotation at peak load 2 1.65 times of bolt diameter
• Nominal large bolt pitch = 102 mm • Nominal standard bolt pitch = 76 mm • Nominal long slot length = 55 mm • Nominal short slot length = 28 mm • Nominal plate washer thickness = 9.5 mm • All bolts are 22.2 mm (7/8 in.) diameter ASTM A325 bolts unless noted otherwise

68
Table 4-7 Summary of Test Parameters for Specimens that Failed at Angle Leg Connected
to the Column
Parameter Test Specimen Nominal Values of Parameters (1) (2) (3) (4) (5)
Thickness (mm) Group 11 Group 3 3 6.4 9.5 Top end distance, es3 (mm) Group 2 2 Group 3 3 32 58 Edge distance, eg1 (mm) 1L12 1L13 32 50 No. of bolts 1L12 1L14 2 3 No. of angles Group 2 2 Group 4 4 Single Double
Notes: 1 Group 1 includes test specimens: 1LB (capacity = 288 kN) 2 Group 2 includes test specimens: 1L1, 1L7, 1L8 and 1L10 (average capacity = 291 kN) 3 Group 3 includes test specimens: 1L2 to 1L6 and 1L9 (average capacity = 374 kN) 4 Group 4 includes test specimens: 2L1 and 2L6 (average capacity = 389 kN)
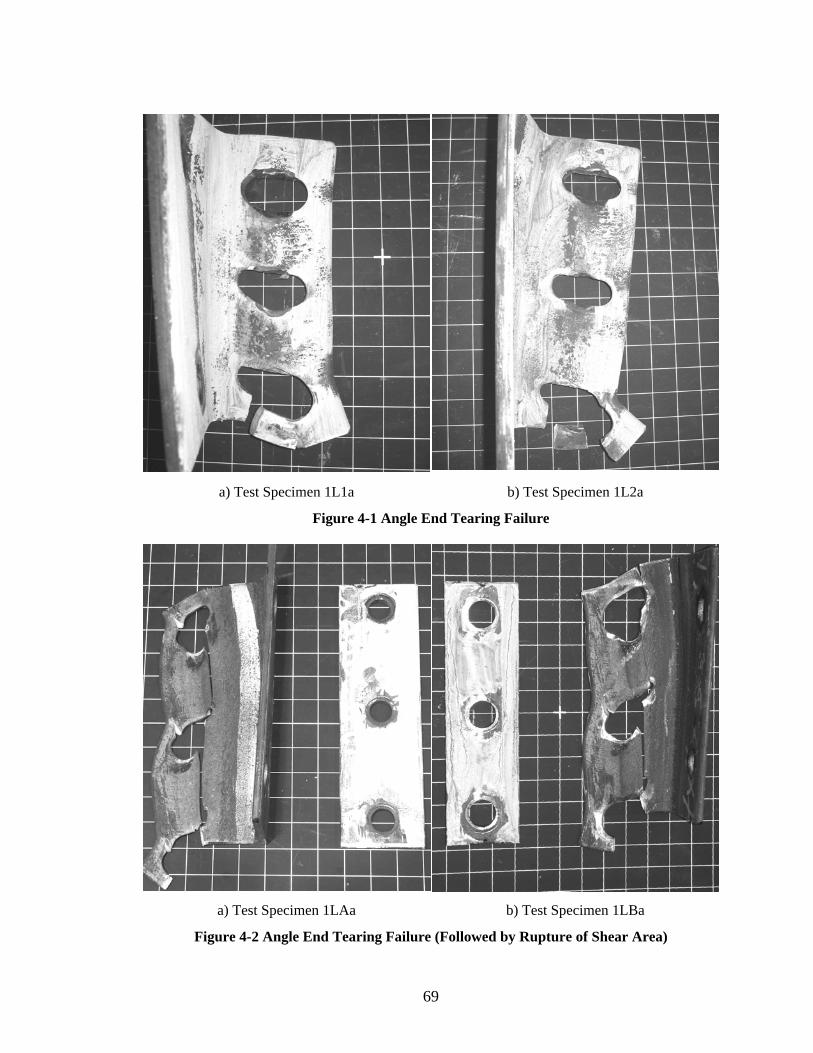
69
a) Test Specimen 1L1a b) Test Specimen 1L2a
Figure 4-1 Angle End Tearing Failure
a) Test Specimen 1LAa b) Test Specimen 1LBa
Figure 4-2 Angle End Tearing Failure (Followed by Rupture of Shear Area)

70
a) Test Specimen 2L1a b) Test Specimen 2L2
Figure 4-3 Beam Web Edge Distance Tearing Failure
a) Test Specimen 2L7 b) Test Specimen 2L8a
Figure 4-4 Tension and Shear Block Failure of Coped Beam Web

71
a) Test Specimen 1L1 b) Test Specimen 1L7
Figure 4-5 Failure of Angle Leg Connected to the Column (Top End Distance Tearing)
a) Test Specimen 1LB b) Test Specimen 1L2
Figure 4-6 Failure of Angle Leg Connected to the Column (Top Corner Tearing)

72
a) Test Specimen 1L12 b) Test Specimen 1L13 c) Test Specimen 1L14
Figure 4-7 Failure of Angle Leg Connected to the Column (Top End Distance Tearing)
Test Specimen 2L5
Figure 4-8 Failure by Web Crippling

73
a) Beam Material (Coupon A1)
b) Tested Angles (Coupon V1)
Figure 4-9 Typical Tension Stress vs. Strain Response

74
c) Virgin Angles (Coupon Y1)
Figure 4-9 Typical Tension Stress vs. Strain Response (cont’d)

75
Figure 4-10 Connection Reaction vs. Bottom Flange Displacement – Effect of Plate Washer
Figure 4-11 Connection Reaction vs. Bottom Flange Displacement – Effect of Plate Washer

76
Figure 4-12 Connection Reaction vs. Bottom Flange Displacement – Effect of Plate Washer
Figure 4-13 Connection Reaction vs. Bottom Flange Displacement – Effect of Plate Washer

77
Figure 4-14 Connection Reaction vs. Bottom Flange Displacement – Effect of Bottom End Distance
Figure 4-15 Connection Reaction vs. Bottom Flange Displacement – Effect of Slot Length

78
Figure 4-16 Connection Reaction vs. Bottom Flange Displacement – Effect of Bolt Pretension
Figure 4-17 Connection Reaction vs. Bottom Flange Displacement – Effect of Bolt Pretension

79
Figure 4-18 Connection Reaction vs. Bottom Flange Displacement – Effect of Torsion Bracing
Figure 4-19 Connection Reaction vs. Bottom Flange Displacement – Effect of Bolt Pitch

80
Figure 4-20 Connection Reaction vs. Bottom Flange Displacement – Effect of Bolt Pitch
Figure 4-21 Connection Reaction vs. Bottom Flange Displacement – Effect of Bolt Pitch

81
Figure 4-22 Connection Reaction vs. Bottom Flange Displacement – Effect of Bolt Pitch
Figure 4-23 Connection Reaction vs. Bottom Flange Displacement – Effect of Flange Cope

82
Figure 4-24 Connection Reaction vs. Bottom Flange Displacement – Effect of Flange Cope
Figure 4-25 Connection Reaction vs. Bottom Flange Displacement – Effect of Flange Cope

83
Figure 4-26 Connection Reaction vs. Bottom Flange Displacement – Effect of Flange Cope
Figure 4-27 Connection Reaction vs. Bottom Flange Displacement – Effect of End Rotation

84
Figure 4-28 Connection Reaction vs. Bottom Flange Displacement – Effect of End Rotation
Figure 4-29 Connection Reaction vs. Bottom Flange Displacement – Effect of Web Thickness

85
Figure 4-30 Connection Reaction vs. Bottom Flange Displacement – Effect of Web Thickness
Figure 4-31 Connection Reaction vs. Bottom Flange Displacement – Effect of Bolt Diameter

86
Figure 4-32 Connection Reaction vs. Bottom Flange Displacement – Effect of Bolt Diameter
Figure 4-33 Effect of Angle Thickness on Capacity of Connection
that Failed in the Leg Connected to the Column

87
Figure 4-34 Effect of Top End Distance on Capacity of Connection
that Failed in the Leg Connected to the Column
Figure 4-35 Effect of Edge Distance on Capacity of Connection
that Failed in the Leg Connected to the Column

88
Figure 4-36 Effect of Number of Bolts on Capacity of Connections
that Failed in the Leg Connected to the Column
Figure 4-37 Effect of Number of Angles on Capacity of Connections
that Failed in the Leg Connected to the Column

89
5 Prediction of Test Results This section presents the predicted capacities for the test specimens in the
experimental program. A wide range of failure modes were observed: shear failure of
angle leg connected to the beam, beam web tension and shear block failure, edge distance
tearing of the beam web, angle loaded end tearing, failure of angle leg connected to the
column, and crippling of the beam web under the load point. A total of 40 tests were
conducted in this research program. In predicting the capacities of the specimens, test
specimen 2L5 is not included due to the fact that it did not fail at the connection. The
beam web crippled under the load point before the connection failed.
Assessments of current North American steel design standards, namely,
CAN/CSA–S16–01 (CSA, 2001) and AISC 2005 (AISC, 2005) are presented. Both their
ability to predict the observed failure modes and the load carrying capacities are assessed.
The capacities predicted from various design equations are based on as-built
dimensions and measured material properties for the test specimens included in this test
program. The as-built dimensions and measured material properties can be found in
Table 3-1 and Table 4-2, respectively. The holes in the beam web were drilled and the
long slotted holes in the angles were sub-punched and reamed to the required size.
However, the short slots and circular holes on the angles were punched. In order to be
consistent with current design practice, a 2 mm allowance is made for punched holes in
the net area calculations. In all cases, the resistance factor is taken as 1.0.
5.1 Prediction Models
5.1.1 Angle End Tearing Failure
Of all the 29 single angle specimens in the current test program, 13 specimens
failed by angle end tearing. As discussed in sections 4.1 and 4.3, five of these specimens
were able to carry more load after the angle end tearing failure. In predicting the capacity
of the connections, the angle end tearing load will be considered as the connection
capacity since very large deformations (about 35 mm of bottom flange deflection) were
required for these specimens to reach the higher capacity observed in the tests.

90
A description of this failure mode and photographs of failed specimens are
presented in Chapter 4. Failure of the angle took the form of bending and tearing of the
angle end distance. No sign of beam web failure was observed in any of these test
specimens when the angle failed by end tearing, except for some localized yielding near
the bearing area.
Three possible related failure modes predicted by the current North American
steel design standards are investigated, namely, shear rupture of the angle through the
slotted holes, yielding of gross area, and bolt bearing on the beam web and angle leg.
According to CSA–S16–01 and AISC 2005, the shear capacity of web framing angles is
equal to the lesser of:
u gv yV = 0.6 A F [5-1]
u nv uV = 0.6 A F [5-2]
where,
Vu is the nominal connection shear capacity,
gv A is the gross shear area, taken as the product of total length of the angle and the
angle thickness,
nv A is the net shear area, taken as the product of the vertical net length across the
centres of the bolt holes and the angle thickness,
yF is the material yield strength, and
uF is the material tensile strength.
The shear capacity is governed by either yielding of the gross shear area
(Equation [5-1]) or rupture through the net shear section (Equation [5-2]).
The bearing capacity of bolted connections predicted by CSA–S16–01 can be
expressed as:
u uB = 3.0 t n d F [5-3]

91
where,
uB is the nominal bearing capacity,
t is the thickness of connected material,
n is the number of bolts in bearing, and
d is the bolt diameter.
Although it is possible that one bolt in a bolt group may have a smaller capacity
(e.g., the bolt closest to a free end), the current version of CSA–S16 does not specifically
address this issue. According to CSA–S16–01, all bolts in a bolt group have the same bolt
bearing capacity. Furthermore, the bearing capacity is the same for all types of holes,
including standard holes, oversized holes, short slots and long slots.
The bearing provisions of AISC 2005 vary with the type of bolt hole. The
nominal bearing capacity of a bolt in a standard hole or short slot, where deformation of
the bolt holes at service load is not a design consideration is given as:
u c u uB = 1.5 l t F 3.0 d t F≤ [5-4]
where,
cl is the clear distance, in the direction of applied force, between the bolt holes or to
the edge of the material.
The left part of Equation [5-4] consists of the shear tearing resistance of the clear
distance between the bolt holes or between the outer bolt and the unloaded end of the
connected plate. The upper limit expressed in Equation [5-4] is identical to the bearing
capacity used in CSA–S16–01. From Equation [5-4], it can be seen that the full bearing
capacity of a bolt is not developed until the clear distance is at least 2.0 times the bolt
diameter, d.
The bearing capacity for a plate with a long slotted hole perpendicular to the
direction of the force is given as:

92
u c u uB 1.0 l t F 2.0 d t F= ≤ [5-5]
All the angles used in the experimental program were fabricated with the
minimum bottom end distance, es2, specified in CSA–S16–01 and AISC 2005 for ASTM
A325 bolts, except for specimen 1L2aE. The minimum end distance requirement in
CSA–S16–01 and AISC 2005 for is approximately 1.75 times the bolt diameter for
sheared edges, and 1.25 times the bolt diameter for rolled, sawn, or gas-cut edges.
Moreover, for beam-framing angles with sheared edges installed with 7/8 in. (22.2 mm)
and 1 in. (25.4 mm) bolts, an end distance of 32 mm is allowed by both standards. This is
the case for the specimens in the current test program that failed by angle end tearing.
Kulak et al. (1987) proposed a minimum end distance for bolts as a function of
the applied bearing stress, bσ , as follows:
e b
u
l σ0.5 + 0.715
d F≥ [5-6]
where el is the end distance from the centre of the fastener to the unloaded end and bσ is
the bearing stress exerted on the plate material by the fastener. According to
Equation [5-6], the end distance requirements of 1.75 times the bolt diameter for sheared
edges and 1.25 times the bolt diameter for rolled, sawn or gas-cut edges, as described in
CSA–S16–01, correspond to a ratio of bearing stress to material tensile strength of 1.75
and 1.0, respectively.
Kulak et al. (1987) also report various requirements that must be satisfied for the
end distance of bolted connections in limit states design. One of the requirements relates
to the minimum end distance of 1.5 times the bolt diameter for any type of edge
connections. This represents the average of 1.75 times the bolt diameter for sheared edges
and 1.25 times the bolt diameter for rolled, sawn, or gas-cut edges as specified in the
current North American design standards. Another requirement consists of satisfying
Equation [5-6] at the end zone of a connection. Lastly, a limit of 3.0 times of the material
ultimate tensile strength, Fu, is placed on the bearing strength of the plate material in
contact with the bolt.

93
Although the end and edge distance requirements in CSA–S16–01 and AISC
2005 also apply to connections with slotted holes, the failure mechanism at the end of
connections with slotted holes is different from the failure mechanism for standard holes.
As shown in the photographs of failed specimen in Figures 4-1a and 4-1b, the end
distance did not fail by shear and tension splitting: they failed by bending and bearing
failure of the end distance. In contrast, tests on connections with standard holes have
shown that failure occurs by splitting out of the fastener through the end of the plate due
to insufficient end distance (Kulak et al., 1987). Tests by Wald et al. (2002) also showed
that the end distance failure results in a lower strength for slotted holes than for standard
holes.
5.1.1.1 Proposed Prediction Method for Angle End Tearing Failure
It was observed that the bottom end distance below a slotted hole did not fail by
shear and splitting, as is usually observed with circular holes. Instead, the bottom end
distance failed in a combined bending and bearing mode with eventual tearout below the
bolt. Moreover, as discussed later, the current design standards do not provide a good
prediction of the failure mode and the capacity for the test specimens that failed by angle
end tearing. To address these issues, a new prediction model is proposed to predict the
bearing capacity for a bolt in a slotted hole connection.
The method proposed here combines the bearing capacity of bolts on the
connected material, shear resistance of the clear distance or the collapse capacity of the
clear distance below the bolt. The capacity of each bolt in a connection is taken as the
least of the above capacities. A prediction model for the end distance of a connection
with slotted holes was derived based on the plastic collapse mechanism illustrated in
Figure 5-1. Figure 5-1a shows the definition of slot length, slotl , the diameter of the ends
of the slot, slotd , and the clear end distance, cl . From the collapse mechanism shown in
Figure 5-1b, the collapse load Pc can be readily obtained from:
pc
slot slot
8 MP =
(l - d ) [5-7]

94
where,
Pc is the collapse load of end distance at the end of angle,
slotl is the slot length, and
slotd is the diameter of the slot.
pM is the plastic moment capacity of the clear end distance, given as:
2c
p yl t
M = F4
[5-8]
Substitution of Equation [5-8] into Equation [5-7] leads to the following
expression for the bolt force required to cause plastic collapse of the clear end distance,
cl :
2c y
cslot slot
2 l t FP =
(l - d ) [5-9]
Equation [5-9] provides an upper limit to the bearing capacity of the bolt closest
to the end of the member. The capacity of an end bolt can be limited either by the plastic
collapse or shear failure of the clear distance below the bolt. The shear strength is taken
as 60% of the tensile strength of the material. The capacity of the clear distance below the
bolt is therefore taken as the lesser of:
u cB = P [5-10]
u c uB = 1.2 l t F [5-11]
The upper limit of the bearing capacity of the bolts in slotted holes is taken as:
u uB = 1.5 d t F [5-12]
This limit is similar to the existing AISC 2005 provisions, except that a
coefficient of 1.5 is used instead of 2.0 for connections with long slots. The coefficient of

95
1.5 is chosen so that the mean test-to-predicted ratio is close to 1.0 and the coefficient of
variation (COV) is minimized for the tests conducted in this research program. It is
suspected that the end distance of the single angle specimens failed before the rest of the
connection mobilized the full bearing strength. The capacity of the connection can be
taken as the sum of the capacity of individual bolts in the connection. The general
expression for the bearing capacity of a single bolt can therefore be expressed as:
2c y
u c u uslot slot
2 l t FB = 1.2 l t F 1.5d t F
(l - d )≤ ≤ [5-13]
5.1.2 Beam Web Edge Distance Tearing
Six of the test specimens with double angles and uncoped beam, namely, 2L1a,
2L2, 2L3, 2L4 and 2L6a, failed by tearing of the edge distance at or near the peak load.
Although this mode of failure is different from bolt bearing failure, bolt bearing is still a
possible failure mode for this type of connection. CSA–S16–01 and AISC 2005 use
Equation [5-3] and Equation [5-4], respectively, as the bearing capacity of bolts in
standard circular holes. As seen in Section 5.1.1, the AISC 2005 provisions for slotted
holes are a function of deformation requirements.
5.1.2.1 Failure Mechanism
Bearing failure in a bolted connection can be characterized by the splitting of the
bolted plate in the end zone due to insufficient end distance, or piling up of material in
front of the fastener hole with excessive deformation, or often a combination of the above
two failure modes (Kulak et al., 1987). It is assumed that the bearing stress exerted by the
bolt on a circular bolt hole or short slots reaches three times of the material tensile
strength for the second type of failure to occur. The bearing strength is limited to 2 times
material tensile strength for connection with long slots to account for the larger
deformation of connection with long slots than the one with short slots and circular holes.
These are reflected in Equation [5-3] for standard holes and short slots, and the second
part of Equation [5-5] for long slots. However, specimens in the current test program
failed by tearing of the beam web edge distance, rather than failing in bearing. The

96
minimum edge distance used for the fabrication of the steel beams is not sufficient to
develop the full bearing capacity of the bolt. It is suspected that the beam web edge
distance ruptured and the full bearing strength of beam web was not reached.
5.1.3 Tension and Shear Block Failure of Beam Web
Two double angle specimens with a coped beam (2L7 and 2L8a) failed by tension
and shear block failure of beam web. Three prediction models are being compared,
namely CSA–S16–01, AISC 2005 and a model proposed by Franchuk et al. (2002),
which was developed from the analysis of test results from coped beams.
5.1.3.1 Prediction Models
According to CSA–S16–01 the tension and shear block failure of coped beams is
taken as the lesser of the following two equations:
r nt u gv yP = 0.5A F + 0.6A F [5-14]
r nt u nv uP = 0.5A F + 0.6A F [5-15]
where:
ntA is the net tensile area, gvA is the gross shear area, and nvA is the net shear area.
The constant 0.5 preceding the first term of both equations reflects the non-
uniform stress observed on the tension face of the failure plane.
The tension and shear block model in AISC 2005 is taken as the least of the
following two equations:
r bs nt u gv yP = U A F + 0.6A F [5-16]
r bs nt u nv uP = U A F + 0.6A F [5-17]
where:

97
bsU is the tension stress correction factor, taken as 1.0 for coped beams with only
one line of bolts.
The equations combine rupture of the net tension area and yielding of the gross
shear area, with a limitation on the latter to the rupture capacity on the net shear area.
Franchuk et al. (2002) proposed an equation for the calculation of the tension and
shear block capacity based on a series of tests on coped beams. It combines effective
stresses on the net tension area and the gross shear area. It takes the following form:
y ur t nt u v gv
F +FP = R A F + R A
2 3⎛ ⎞⎜ ⎟⎝ ⎠
[5-18]
where:
tR is a stress correction factor for the tension face, taken as 0.9 for connections with
one-line of bolts, and
vR is a stress correction factor for the shear face, taken as 1.0 for coped beams and
0.9 for shear angles.
The effective shear stress acting on the gross area is taken as the average of the
shear yield strength and the shear rupture strength acting on the gross shear area.
5.1.4 Failure of Angle Leg Connected to the Column
5.1.4.1 Description of Failure Mode
Several test specimens (1LA, 1LB, 1L1 to 1L10, 2L1, 2L6 and 1L10a) failed at
the angle leg connected to the column. This failure mode was associated with the
eccentric loading in the single angle connections, combined with the minimum end or
edge distances selected for the top bolt hole in the angle leg. Because of the load
eccentricity on the single angle connection, a moment is created in the plane of the
supporting column flange as the angle is loaded. It was observed that the top end and
edge distance at the top hole of the angle leg connected to the column can affect the
connection capacity.

98
Three test specimens, namely 1L12, 1L13 and 1L14, were designed to investigate
the effect of end and edge distances and the number of bolts on the strength of the single
angle connection. The top end distance, es3, and edge distance, eg1, are defined in
Figure 3-1.
5.1.4.2 Current Design Practice
Provisions for the type of failure observed in specimen 1LA, 1LB, 1L1 to 1L10,
2L1, 2L6 and 1L10a are provided in the current CISC Handbook of Steel Construction
(CISC, 2004) and the AISC Manual of Steel Construction (AISC, 1999) under design of
eccentrically loaded bolt groups. The procedure for designing eccentrically loaded bolt
groups is based on the instantaneous centre of rotation (ICR) method proposed by
Crawford and Kulak (1971). Based on the method proposed by Crawford and Kulak,
design tables were derived and presented in the CISC Handbook of Steel Construction
and AISC Manual of Steel Construction. The design tables were obtained based on bolt
data obtained from 3/4 in. diameter ASTM A325 bolts with ultimate tensile strength of
329 kN and ultimate deformation of 8.64 mm. The strength of a bolt group is reached
when the bolt farthest from the ICR reaches its ultimate deformation. However, for the
specimens in the test program that failed at the leg connected to the column, the
connected material failed by rupture and tearing before the bolt reached its ultimate
deformation. Therefore, there is a need for a new design model that addresses this issue.
The new design model assumes that the ultimate limit state of the connection is reached
when the connected material around the fastener farthest from the ICR fails by a
combination of shear and tension rupture.
5.1.4.3 Proposed Modified Instantaneous Centre of Rotation Method
Since current provisions for failure of eccentrically loaded bolt groups are based
on bolt failure in shear rather than plate tearing failure, a new model is proposed to
predict the capacity of the test specimens that failed in the angle leg connected to the
column. The ICR method will be utilized to compute the connection resistance, but it will
be modified so that the ultimate limit state is failure of the connected material rather than
shearing of the bolts.

99
When calculating the force in each bolt, the procedure is similar to that of ICR
method. At the ultimate limit state, the ICR is located outside of the bolt group. The force
in each bolt is assumed to act along a line perpendicular to the radial line joining the bolt
to the instantaneous centre. A diagram illustrating the load eccentricity, the location of
the ICR and the bolt forces is shown in Figure 5-2. The following assumptions are made
in the formulation of the ICR method for eccentrically loaded single shear angles:
1) The vertical load acts through the centre of the beam web.
2) The vertical load is shared equally by all bolts.
3) The capacity of the connection is reached when the top corner of the angle leg
connected to the column reaches the tension and shear block limit state.
The data for calculation of ICR for the specimens is shown in Table 5-1. The
calculation of the location of the ICR, ro, defined in Figure 5-2, is illustrated in Table 5-2.
The procedure consists of the following steps:
1) From the assumed location of the ICR, ro, the direction of each bolt force, θ ,
defined in Figure 5-2, is determined. The direction of the bolt forces are
perpendicular to the radial distance between the ICR and the centre of the bolts,
namely, r1, r2 and r3 as shown in column (6), (7) and (8) of Table 5-2, respectively.
2) The tension and shear areas of the tension and shear block failure plane are
determined and the capacity at the critical bolt, R1, is determined, as shown in
Table 5-3 for various predicted failure models. R1 is taken as the sum of Tr and Sr
calculated using the various predicted failure models described in section 5.1.4.4.
Tr and Sr are the tension and shear contribution, respectively, to the calculated
tension and shear block failure capacity. Note that the tension area is
perpendicular to the bolt force and intersects the edge of the angles whereas the
shear area is parallel to the direction of the bolt force and intercepts either the
edge or the loaded end of the angle.
3) For a symmetrical joint, the force in the bottom bolt, R2, will be equal to R1 and
oriented as shown in Figure 5-2. The force in the middle bolt is now defined from
the first assumption above.

100
4) The ratio of P/ R1 is determined from equilibrium of vertical forces, as shown in
column (9) of Table 5-2.
5) The ratio of P/ R1 is also determined from equilibrium of moments about the ICR,
as shown in column (10) of Table 5-2.
6) If the ratio P/ R1 determined in step 4 is in good agreement with the ratio P/ R1
determined in step 5, the location of ICR, or , is correct. Otherwise, the location of
the ICR is adjusted and the procedure is repeated.
The value of 1R is computed in section 5.1.4.4 using various predicted failure
models. Different magnitude of effective stress is assigned to the net area and the gross
area on the tension and shear block failure planes. Once the force in each bolt is known,
the connection capacity, P, can be computed.
The orientation of the shear and tension planes depends on the orientation of the
bolt force, θ . The shear plane will be parallel to the force in the top bolt and the tension
plane will be perpendicular to the shear plane. Whether the line of action of the bolt force
crosses the edge or the top end of the angle depends on the angle θ , illustrated in
Figure 5-3, the top end distance of the angle, es3, and the edge distance of the angle, eg1.
It should be noted that for some specimens the calculated line of action of the bolt force
intersects the vertical edge of the angle, instead of the top end of angle, as shown in
Figure 5-3a. The shear face intercepts the bolt hole and the side edge of the angle, and the
tension face intercepts the bolt hole and the top end of the angle for an inclined tension
and shear block failure to occur. This is the case for specimens 1LA, 1LB, 1L2 to 1L6,
1L9 and 1L14. The corresponding failure model is illustrated in Figures 5-4e, 5-4g, 5-4i
and 5-4k. For the remaining specimens, the line of action of the bolt force intersects the
top end of the angle as shown in Figure 5-3b. Thus, the tension face intercepts the bolt
hole and the edge of the angle. The corresponding failure model is illustrated in Figures
5-4d, 5-4f, 5-4h, and 5-4j. In all cases, the corner of the angle is included within the
block. The ratio of the capacity of the connection to the force in the critical bolt (top bolt)
is tabulated in columns (9) and (10) of Table 5-2. The force magnitude in the top bolt
depends on the failure capacity of the connected material, i.e., the tension and shear block

101
tear out capacity of the angle around the top bolt, which can be determined using the
procedure in the following section.
5.1.4.4 Calculation of Limiting Bolt Force for the ICR Method
The calculation of the limiting bolt force, 1R , and the predicted capacity of the
connection, P, is illustrated in Table 5-3. rT and rS are the tension and shear block
contributions to the tension and shear block resistance. The sum of rT and rS represents
the limiting bolt force, R1. P is computed by multiplying the ratio of 1P R in columns
(9) and (10) of Table 5-2 by the sum of rT and rS . Various failure models are illustrated
and discussed in the following.
5.1.4.4.1 CSA–S16–01 Tension and Shear Block Model
The observed failure planes for test specimens with a large top end distance, es3,
of 58 mm, (specimens 1L2 to 1L6 and 1L9) suggests a tension and shear block failure
analogous to the failure mode observed in connections with coped beams. Therefore, the
tension and shear block equation from CSA–S16–01 (CSA, 2001) is used to predict the
limiting force on the top bolt required to carry out the calculation outlined in section
5.1.4.3. The tension and shear block resistance given in CSA–S16–01 was presented in
Equations [5-14] and [5-15]. The direction of the bolt force and the ratio of the applied
joint load to the bolt force are obtained using the modified ICR method as described in
the section 5.1.4.3.
Equation [5-14] consists of net tension area fracture plus gross shear yielding,
whereas Equation [5-15] consists of net tension area fracture plus net shear area fracture.
The failure model predicted by Equation [5-14] is depicted as models D and E in
Figure 5-4, whereas the failure model predicted by Equation [5-15] is depicted as models
F and G in Figure 5-4. The various failure models presented in the following differ in
magnitude of the shear and normal stress assigned to the shear face and the tension face.
The observed failure paths in the test specimens and some possible failure paths that were
not observed in the specimens tested in this program are also illustrated in Figure 5-4 and
Table 5-3.

102
5.1.4.4.2 Modified Franchuk et al. (2002) Model
Equation [5-18], from Franchuk et al. (2002), represents a failure mode similar to
that of Equation [5-14]. For a coped beam with a single line of bolt, the stress correction
factors, Rt and Rv, are taken as 0.9 and 1.0, respectively, leading to the following
expression for the tension and shear block capacity:
y ur nt u gv
F +FP = 0.9 A F + 1.0 A
2 3⎛ ⎞⎜ ⎟⎝ ⎠
[5-19]
The capacity based on the failure models depicted as failure models H and I in
Figure 5-4 can be predicted by Equation [5-19].
A modified version of Equation [5-18], with tR and vR taken as 0.4 and 1.0,
respectively, is also proposed. The stress factors were selected so that the calculated
mean test-to-predicted ratio is as close as possible to 1.0, while minimizing the
coefficient of variation. The equation takes the following form:
y ur nt u gv
F +FP = 0.4 A F + 1.0 A
2 3⎛ ⎞⎜ ⎟⎝ ⎠
[5-20]
The failure model predicted by this method is depicted as models J and K in
Figure 5-4.
5.2 Comparison of Test Results with Various Prediction Models
In this section, the test results presented in Chapter 4 are compared to the various
prediction models presented above. The mean test-to-predicted ratio calculated using
CSA–S16–01, AISC 2005 and the proposed prediction models will be assessed in order
to determine their adequacy as prediction models. The COV of the test-to-predicted
values are also presented. A mean test-to-predicted ratio close to unity with a low COV
indicates the design model or equation is a good predictor of the test results.
In the following, the predicted capacities of the test specimens are grouped
according to the observed failure mode. The predicted capacities based on possible

103
failure modes and models from CSA–S16–01 and other models presented above are
tabulated for each group of specimens. Finally, a comparison of all the test results with
all the various failure modes considered in this chapter is made to assess whether the
actual failure mode can be predicted.
5.2.1 Angle End Tearing
The capacity of specimens that failed by angle end tearing was predicted using
CSA–S16–01 and AISC 2005 for various failure modes, including rupture of the web
framing angle on the net shear area, yielding of the gross shear area, bolt bearing, and
tension and shear block failure in the beam. The results of these calculations are
presented in Table 5-4. The capacity predicted using Equation [5-18] for angle shear
capacity, and Equation [5-13] for the angle end tearing capacity are also shown in the
table.
The procedures used in CSA–S16–01 would consider either bolt bearing failure,
assuming all bolts in the connection have the same capacity, or shear failure of the angle.
This approach can result in a significant overestimate of the capacity as shown in
Table 5-4. On the other hand, AISC 2005 provisions account for different capacity of an
exterior bolt and interior bolts within a bolt group. However, it overestimates the capacity
for all the specimens that failed by angle end tearing. The mean test-to-predicted ratios
calculated using the CSA–S16–01 and AISC 2005 standard are both 0.88. The COV of
the test-to-predicted values calculated using CSA–S16–01 and AISC 2005 are 0.13 and
0.15, respectively. Equation [5-18] gives a mean test-to-predicted ratio of 0.78, with a
COV of 0.14 for predicting angle shear failure capacity. It should be noted that Equation
[5-18] is not intended to predict the angle end tearing failure mode, but it will be used to
predict the capacity of specimens with tension and shear block failure as shown in section
5.2.3.
The proposed plastic collapse model (Equation [5-13]) is based on the sum of the
plastic collapse capacity of the clear bottom end distance, with the upper limit equal to
the shear failure along the clear length of the connection, and the bearing capacity of the
bolts on the slotted holes. Equation [5-13] gives a test-to-predicted ratio of 1.01 and a

104
COV of 0.18. As shown in Table 5-4, the low values of test-to-predicted ratio predicted
by Equation [5-13] are 0.80, 0.83, 0.85 and 0.86 for test specimens 1L7a, 1L8a, 1L11a
and 1L1a, respectively. All of these four specimens had long slotted holes with standard
bolt pitch (76 mm) and without plate washer in the outer plies of the joint. It has been
shown that the observed capacities of single angle test specimens with standard pitch
failed by angle end tearing had slightly lower capacities than their large pitch (102 mm)
counterparts. The highest test-to-predicted ratio is 1.33 for specimen 1LAa, which is a
thin single angle specimen (6.4 mm) with plate washer on the outer ply. The next largest
test-to-predicted ratio is 1.25, obtained for a connection with plate washer on the outer
ply but with thicker angles (9.5 mm). The large scatter (COV = 0.18) observed in the test-
to-predicted values is likely caused by the effect of many parameters on the connection
capacities. For instance, the specimen with plate washer on the outer ply and an uncoped
beam (1L4a) had a capacity 41% higher than the one without plate washer (1L2a). The
effect of plate washer is not accounted for in calculation of angle end tearing capacities. It
is also assumed that all the bolts in the connection reach their capacity simultaneously.
However, the bottom end of single angles with minimum end distance is more flexible
and possibly has lower strength than the rest of the connection. In fact, the bolts in the
connection may not reach their individual capacity simultaneously. Therefore, assuming
the bolts reach their capacity at the same time is possibly an unconservative assumption.
Although the COV of 0.18 predicted by Equation [5-13] is higher than the ones
predicted by CSA–S16-01 (0.13), AISC 2005 (0.15) and Equation [5-18] (0.14),
Equation [5-13] has several advantages compared to the other prediction models. First,
the mean test-to-predicted ratio of 1.01 is very close to unity and it is higher than the one
predicted by other prediction models. Second, it addresses the end distance failure below
the bottom slotted hole correctly, which is something not achieved by other models. The
observed failure mode is a combination of bending and bearing failure of end distance.
Moreover, Equation [5-13] is able to predict the correct failure mode of the angle end
tearing, i.e. collapse of the end distance and bearing of bolt on the slot in the loading
direction.

105
5.2.2 Beam Web Edge Distance Tearing
Six of the specimens failed in the beam web by edge distance tearing, namely,
specimens 2L1a, 2L2, 2L3, 2L4, 2L5a and 2L6a. The possible failure mode of bolt
bearing on the beam web and the corresponding capacity are investigated. As shown in
Table 5-5, both North American design standards underestimate the observed capacity of
the test specimen that failed by tearing of the edge distance. The bolt bearing capacity
governs for all cases, except for specimen 2L6a for which rupture on the angle net area
governs. The mean test-to-predicted ratio of 0.71 and COV of 0.14 predicted by both
standards indicate a poor correlation between the observed capacity and the predicted
capacity. Since these specimens were fabricated with uncoped beams, it is assumed that
they would fail by bolt bearing on the web. However, the low average test-to-predicted
ratio and high COV indicate that the bolt bearing model does not describe well the
observed edge distance tearing failure mode for cases where the minimum permissible
edge distance is used.
5.2.3 Tension and Shear Block Failure of Beam Web
Table 5-5 also presented the predicted capacity of tension and shear block failure
by the North American standards and Equation [5-18]. The tension and shear block
capacities predicted by CSA–S16–01 are conservative, with a mean test-to-predicted ratio
of 1.15 and COV of 0.16. The mean test-to-predicted ratio obtained using the AISC 2005
model is 1.06 and COV of 0.14. Although the two specimens showed a slight difference
in tension and shear block failure (different location of tensile failure), the mean test-to-
predicted ratios obtained from both standards are both higher than unity.
The test-to-predicted ratio obtained using Equation [5-18] has a mean value of
0.90 and a COV of 0.08. The details about this proposed equation can be found in
Franchuk et al. (2002). Among all the prediction models, CSA–S16–01 is the most
conservative, followed by AISC 2005 and Equation [5-18]. However, Equation [5-18]
provides the lowest COV of predicted values, followed by AISC 2005 and CSA–S16–01.
It appears that the minimum edge distance used on the beam web prevented the higher
shear capacity in Equation [5-18] to be mobilized fully.

106
5.2.4 Failure of Angle Leg Connected to the Column
The capacities predicted by CSA–S16–01, AISC 2005, Equation [5-18] for angle
shear capacity and Equation [5-13] for the specimens that failed in the leg connected to
the column are shown in Table 5-6. CSA–S16–01 and AISC 2005 do not have provisions
for this type of failure. The failure mode for single angle shear connections considered by
these two standards are rupture of the net shear area, yielding of the gross shear area, bolt
bearing on the angle, and tension and shear block failure. The mean test-to-predicted
ratios obtained using the equations in CSA–S16–01 and AISC 2005 were 0.75 and 0.78,
respectively. The two current steel design standards overestimate the capacity of the
specimens by a considerably large margin.
The predicted capacities by the four new proposed models are presented in Table
5-3. Equation [5-14] gives a mean test-to-predicted ratio of 1.02 and a COV of 0.16.
Equation [5-15] gives a mean test-to-predicted ratio of 1.00 and COV of 0.17. The large
COV indicates a wide scatter of test-to-predicted values. It should be noted that the test-
to-predicted ratios for specimens 1L10a, 2L1 and 2L6 are substantially lower than the
average of the remaining test specimens. This is due to the fact that only specimen 1L10a
with this failure mode has a larger angle leg size (152 mm) connected to the column so
that the contribution of the tension area was larger than for the specimens with a smaller
leg size (102 mm), thus resulting in a larger predicted capacity. On the other hand,
specimens 2L1 and 2L6 are double angle connections. The predicted capacities of these
two specimens by the above four models are shown for completeness. The same
procedure is used to compute the predicted capacity of these two connections. The
predicted capacity of the double-angle specimens is taken as the sum of the capacity of
each angle in the connection. As a result, the predicted capacities of these two specimens
are approximately twice as much as their single angle counterpart, namely 1L1 and 1L7.
It should also be noted that the test-to-predicted ratio for specimen 1L14 is larger than the
rest of the other specimens. This is possibly attributed to the assumption that all bolts
carry the same amount of vertical load. For a connection with three bolts, this simplifying
assumption might not represent the actual behaviour of the connection. The location of
the ICR depends partly on the distribution of the vertical load among the bolts. Therefore,

107
the distribution of vertical load affects the connection capacity based on the proposed
prediction models. Nevertheless, the predicted capacity is on the conservative side. As
shown in Table 5-3, the mean test-to-predicted ratio calculated by Equation [5-19], which
uses a value of tR intended for coped beams with one line of bolt, is 0.67 and COV is
0.17. The predicted capacities are all on the unconservative side. Therefore,
Equation [5-19] is modified to improve the prediction.
Equation [5-20] is essentially identical to Equation [5-19], except that the tension
stress correction factor, Rt, is taken as 0.4, instead of 0.9. This reduction results in a
higher mean value of test-to-predicted ratio (1.05) and a lower COV (0.15), indicating a
better prediction than Equation [5-19]. A graphical comparison of test-to-predicted ratios
of the four new prediction models is shown in Figure 5-5. Of the four of the prediction
models, Equation [5-20] gives a mean test-to-predicted ratio very close to unity and a
smallest value of COV, which indicates a better predictor of the test results.
5.3 Summary of All Prediction Models
Table 5-7 presents a summary of the predicted capacities for all the test specimens
by CSA–S16–01 as well as proposed equations. The possible failure modes being
investigated are bolt bearing, angle shear failure, beam web tension and shear block
failure, angle bottom end tearing and failure of angle leg connected to the column. In this
summary, all the predicted capacities are predicted using proposed new equations. The
tension and shear block and angle shear capacities are calculated using Equation [5-18],
which was proposed by Franchuk et al. (2002) based on an analysis of test results on
coped beams. The angle end tearing capacities are calculated using Equation [5-13]. The
capacities at which that angle failed at the leg connected to the column are predicted
using Equation [5-20]. Since there are no newly developed prediction models for the bolt
bearing failure, the bolt bearing capacities are calculated using the design equation from
CSA–S16–01.
As shown in Table 5-7, the bolt bearing capacity of angle and beam web is
presented in column (2) and column (3), respectively. The angle shear capacity and beam
web tension and shear block capacities predicted using Equation [5-18] are presented in

108
columns (4) and (5), respectively. The capacity of the web framing angle predicted by
Equation [5-13] for angle end tearing capacity is presented in column (6). The tension
and shear block capacity of the web framing angle corner tear out as predicted by
Equation [5-20] is shown in column (7). The governing capacity predicted by all the
prediction models and the corresponding failure mode is shown in columns (8) and (9),
respectively. The observed capacity and the observed failure mode are presented in
columns (10) and (11), respectively.
The equations from the current design standards and the proposed new models are
able to predict the correct failure mode for 32 of the 41 test specimens. Of the nine
specimens for which the failure mode was not predicted correctly, six of them are double
angle connections with an uncoped beam. The observed failure mode for these six
specimens was beam web edge distance tearing. As discussed previously, the current
design standards do not have provisions for edge distance tearing of beam webs. The
predicted failure modes in these cases are bolt bearing failure against the beam web,
angle end tearing and failure of angle leg connected to the column. As shown in
Table 5-5, CSA–S16–01 over-predicts the capacity of these specimens by as much as
41% based on the bearing strength of bolt on the beam web. This large discrepancy
between the test capacity and the predicted bearing capacity indicates that the current
minimum edge distance used in design standards is not sufficient to develop full beam
web bearing strength. The predicted failure mode for test specimen V by Franchuk et al.
(2002) is failure of angle leg connected to the column, but the observed failure mode is
angle end tearing. Another two of the nine specimens, namely, 1LA and 1L10a, failed in
the leg connected to the column, but the predicted failure mode for both specimens is
angle end tearing as predicted by Equation [5-13]. Nevertheless, the predicted capacity is
within 5% of the observed capacities for these two specimens.
A combination of new prediction models and the design equation from current
design standard provides the tool to predict the capacity and the failure mode for most of
the specimen (32 out of 41) being investigated. However, the bearing resistance for bolts
in the beam web can be limited by edge distance tearing. There is a need for a new
prediction model for this type of failure. An increase in the minimum permissible edge
distance is required if the bearing capacity of the bolts in contact with the beam web to be

109
reached. Similarly, an increase in minimum edge distance is required if the full tension
and shear block capacity predicted by Equation [5-18] for coped beam is to be mobilized.

Tab
le 5
-1 D
ata
for
Inst
anta
neou
s Cen
ter
of R
otat
ion
Cal
cula
tion A
ngle
mat
eria
l pr
oper
ties
Tes
t sp
ecim
en
Ang
le
(eas
t/wes
t ) t
d h1
d h2
e g1
e g2
e s3
p 3
w
F y
F u
Obs
erve
d ca
paci
ty
(mm
) (m
m)
(mm
)(m
m)
(mm
)(m
m)
(mm
)(m
m(M
Pa)
(MPa
)(k
N)
(1)
(2)
(3)
(4)
(5)
(6)
(7)
(8)
(9)
(10)
(11)
(12)
(13)
1LA
—
6.
59
27.0
027
.30
36.5
136
.57
50.1
715
2.5
7.32
431
535
280
1LB
—
6.
56
27.2
0 27
.20
36.8
7 36
.77
58.2
2 15
2.3
6.91
431
535
288
1L1
—
9.88
26
.60
26.8
0 37
.09
36.9
3 31
.87
151.
7 7.
2131
1 47
5 30
6 1L
2 —
9.
63
27.1
0 27
.20
36.4
0 36
.68
57.4
9 15
2.4
6.98
311
475
346
1L3
—
9.83
26
.80
26.9
0 37
.46
37.5
1 58
.06
152.
0 8.
9831
1 47
5 43
0 1L
4 —
9.
66
27.0
0 26
.90
36.6
3 36
.58
57.4
7 15
2.3
7.05
311
475
378
1L5
—
9.59
27
.10
27.4
0 36
.34
36.4
9 57
.34
152.
7 7.
0231
1 47
5 36
2 1L
6 —
9.
69
26.7
0 26
.70
36.5
2 36
.52
56.6
1 15
1.9
7.08
311
475
368
1L7
—
9.94
26
.80
26.7
0 36
.32
36.2
7 32
.80
151.
8 7.
0931
1 47
5 27
6 1L
8 —
9.
90
27.0
0 27
.10
37.0
2 37
.07
31.8
3 15
1.9
6.91
311
475
290
1L9
—
9.63
26
.70
26.8
0 36
.04
36.0
9 57
.46
151.
8 7.
0631
1 47
5 36
0 1L
10
—
9.59
26
.70
26.8
0 36
.49
36.5
4 32
.91
152.
2 7.
2631
1 47
5 29
1 1L
12
—
9.50
27
.21
27.3
9 34
.51
33.7
9 32
.24
152.
6 6.
9336
5 53
1 29
9 1L
13
—
9.51
27
.05
27.0
7 50
.24
50.0
2 31
.89
152.
4 6.
8536
5 53
1 37
2 1L
14
—
9.43
27
.32
27.3
5 33
.00
32.9
6 34
.06
76.2
76.
5 1
6.93
365
531
362
1L10
a —
9.
44
27.4
8 27
.54
85.9
5 86
.25
47.3
6 15
3.0
6.92
293
446
376
East
ang
le
9.72
26
.99
26.9
6 36
.90
36.7
8 32
.20
151.
9 7.
0431
1 47
5 2L
1 W
est a
ngle
9.
87
26.8
0 26
.70
36.5
0 36
.40
32.4
0 15
2.3
7.04
311
475
400
East
ang
le
9.77
26
.30
26.5
0 36
.45
36.2
5 31
.92
151.
8 6.
9831
1 47
5 2L
6 W
est a
ngle
9.
80
26.6
0 26
.80
36.8
0 36
.40
31.9
0 15
1.9
6.98
311
475
377
Not
e:
Ref
er to
Fig
ure
3-1
for d
escr
iptio
n of
the
dim
ensi
ons
1 Bol
t pitc
h be
twee
n th
e m
iddl
e an
d bo
ttom
bol
t hol
e
110

Tab
le 5
-2 L
ocat
ion
of In
stan
tane
ous C
entr
e of
Rot
atio
n an
d R
atio
of V
ertic
al L
oad
to B
olt F
orce
V
ertic
al fo
rce
equi
libriu
m
Mom
ent
equi
libriu
m
T
est S
peci
men
L
r o
θ
θ r 1
r 2
r 3
P/
R1
P/R
1 re
sidu
al
(mm
) (m
m)
(rad
) (d
egre
es)
(mm
)(m
m)
(mm
)
(1)
(2)
(3)
(4)
(5)
(6)
(7)
(8)
(9)
(10)
(1
1)
1LA
69
.2
83.7
0.73
7 42
.2
113.
211
3.2
—
1.48
09
1.48
09
3.09
E-08
1LB
68
.6
84.2
0.73
4 42
.1
113.
511
3.5
—
1.48
44
1.48
44
4.82
E-09
1L1
68.5
84
.40.
733
42.0
11
3.5
113.
5—
1.
4865
1.
4865
3.
84E-
081L
2 69
.1
83.6
0.73
8 42
.3
113.
111
3.1
—
1.47
98
1.47
98
1.99
E-07
1L3
68.0
84
.90.
730
41.8
11
3.9
113.
9—
1.
4901
1.
4901
7.
16E-
081L
4 68
.9
83.9
0.73
6 42
.2
113.
311
3.3
—
1.48
20
1.48
20
1.11
E-08
1L5
69.2
83
.50.
738
42.3
11
3.1
113.
1—
1.
4792
1.
4792
2.
40E-
071L
6 69
.0
83.7
0.73
7 42
.2
113.
011
3.0
—
1.48
10
1.48
10
3.21
E-08
1L7
69.2
83
.50.
738
42.3
11
2.9
112.
9—
1.
4790
1.
4790
7.
10E-
091L
8 68
.4
84.4
0.73
3 42
.0
113.
511
3.5
—
1.48
58
1.48
58
2.20
E-08
1L9
69.5
83
.20.
740
42.4
11
2.6
112.
6—
1.
4763
1.
4763
9.
72E-
081L
10
69.1
83
.70.
737
42.2
11
3.1
113.
1—
1.
4807
1.
4807
1.
55E-
081L
12
71.0
81
.40.
751
43.0
11
1.5
111.
5—
1.
4615
1.
4615
7.
07E-
101L
13
55.2
10
4.5
0.62
9 36
.0
129.
312
9.3
—
1.61
76
1.61
76
4.01
E-11
1L14
70
.5
55.8
0.93
1 53
.3
94.5
94
.3
55.8
1.
7756
1.
7756
2.
77E-
071L
10a
69.5
83
.00.
741
42.5
11
2.9
112.
9—
1.
4754
1.
4754
1.
34E-
09Ea
st a
ngle
68
.5
84.2
0.73
4 42
.1
113.
411
3.4
—
1.48
46
1.48
46
2.67
E-08
2L1
Wes
t ang
le
69.0
83
.70.
737
42.2
11
3.2
113.
2—
1.
4808
1.
4808
1.
47E-
08Ea
st a
ngle
69
.0
83.6
0.73
8 42
.3
112.
911
2.9
—
1.48
02
1.48
02
7.48
E-08
2L6
Wes
t ang
le
68.7
84
.10.
735
42.1
11
3.3
113.
3—
1.
4837
1.
4837
1.
06E-
10
111

Tab
le 5
-3 P
redi
cted
Cap
aciti
es o
f Spe
cim
ens w
ith F
ailu
re o
f Ang
le L
eg C
onne
cted
to th
e C
olum
n
Equa
tion
[5-1
4]
Equa
tion
[5-1
5]
Equa
tion
[5-1
9]
Equa
tion
[5-2
0]
rT
rS
P rT
rS
P rT
rS
P T r
S r
P
Te
st
Spec
imen
Obs
erve
d Fa
ilure
Pa
th
Failu
re
Mod
el
(kN
) (k
N)
(kN
)te
st/
pred
.Failu
re
Mod
el(k
N)
(kN
)(k
N)
test
/ pr
ed.
Fa
ilure
M
odel
(k
N)
(kN
) (k
N)
test
/pr
ed.
Fa
ilure
M
odel
(kN
)(k
N)
(kN
)te
st/
pred
.(1
) (2
) (3
) (4
) (5
) (6
) (7
) (8
) (9
) (1
0)(1
1)(1
2)(1
3)
(14)
(1
5)
(16)
(17)
(18)
(1
9)(2
0)
(21)
(22)
1LA
A
E
107.
8 92
.6
297
0.94
G
107.
886
.328
70.
97I
194.
099
.8
435
0.64
K
86.2
99.8
27
61.
021L
B
A
E 12
8.4
93.2
32
90.
88G
12
8.4
87.1
320
0.90
I 23
1.1
100.
549
20.
59K
10
2.7
100.
530
20.
951L
1 B
D
85
.9
79.0
24
51.
25F
85.9
83.3
251
1.22
H
154.
596
.1
373
0.82
J 68
.796
.1
245
1.25
1L2
C
E 16
4.4
97.2
38
70.
89G
16
4.4
111.
340
80.
85I
295.
911
8.2
613
0.56
K
131.
511
8.2
369
0.94
1L3
C
E 17
1.9
103.
0 41
01.
05G
17
1.9
119.
843
50.
99I
309.
412
5.2
648
0.66
K
137.
512
5.2
391
1.10
1L4
C
E 16
5.3
98.3
39
10.
97G
16
5.3
113.
041
20.
92I
297.
511
9.5
618
0.61
K
132.
211
9.5
373
1.01
1L5
C
E 16
3.1
96.6
38
40.
94G
16
3.1
110.
540
50.
89I
293.
611
7.4
608
0.60
K
130.
511
7.4
367
0.99
1L6
C
E 16
3.1
98.2
38
70.
95G
16
3.1
113.
240
90.
90I
293.
511
9.4
612
0.60
K
130.
511
9.4
370
0.99
1L7
B
D
84.3
82
.3
246
1.12
F 84
.387
.725
41.
08H
15
1.8
100.
037
20.
74J
67.4
100.
024
81.
111L
8 B
D
85
.4
79.1
24
41.
19F
85.4
82.8
250
1.16
H
153.
796
.2
371
0.78
J 68
.396
.2
244
1.19
1L9
C
E 16
4.3
96.0
38
40.
94G
16
4.3
110.
040
50.
89I
295.
711
6.7
609
0.59
K
131.
411
6.7
366
0.98
1L10
B
D
81
.8
79.5
23
91.
22F
81.8
85.0
247
1.18
H
147.
396
.7
361
0.81
J 65
.596
.7
240
1.21
1L12
B
D
84
.8
91.8
25
81.
16F
84.8
92.3
259
1.16
H
152.
610
8.4
381
0.78
J 67
.810
8.4
258
1.16
1L13
B
D
12
2.7
82.1
33
11.
12F
122.
778
.532
51.
14H
22
0.8
97.0
51
40.
72J
98.1
97.0
31
61.
181L
14
B
E 69
.0
84.9
27
31.
32G
69
.082
.526
91.
35I
124.
110
0.3
399
0.91
K
55.2
100.
327
61.
311L
10a
B
D
218.
4 10
7.5
481
0.78
F 21
8.4
128.
751
20.
73H
39
3.1
130.
577
30.
49J
174.
713
0.5
450
0.83
2L1
B
D
83.6
78
.7
485
0.83
F 83
.682
.849
80.
80H
15
0.5
95.7
73
50.
54J
66.9
95.7
48
60.
822L
6 B
D
83
.7
78.6
48
20.
78F
67.0
83.5
446
0.85
H
120.
695
.6
642
0.59
J 67
.095
.6
483
0.78
Mea
n
1.02
1.00
0.67
1.05
CO
V
0.
16
0.
17
0.
17
0.
15
* R
efer
to F
igur
e 5-
4 fo
r a
desc
ript
ion
of v
ario
us fa
ilure
pat
hs
112

Tab
le 5
-4 P
redi
cted
Cap
aciti
es o
f Tes
t Spe
cim
ens w
ith A
ngle
End
Tea
ring
Fai
lure
CSA
–S16
–01
AIS
C 2
005
A
ngle
B
eam
Ang
le
Bea
m
Equa
tion
[5-1
8]
Prop
osed
plas
tic
colla
pse
load
for
end
dist
ance
be
arin
g
Net
se
ctio
n ru
ptur
e
Gro
ss
area
yi
eldi
ng
Bol
t be
arin
g
Tens
ion
and
shea
r bl
ock
Bol
t be
arin
gTe
st/
Pred
.
Net
se
ctio
n ru
ptur
e
Gro
ss
area
yi
eldi
ngB
olt
bear
ing
Tens
ion
and
shea
r bl
ock
Bol
t be
arin
gTe
st/
Pred
.
Ang
le
shea
r ca
paci
tyTe
st/
Pred
.
Ang
le
bear
ing
capa
city
Test
/ Pr
ed.
Test
Sp
ecim
en O
bser
ved
Cap
acity
[5
-2]
[5-1
] [5
-3]
[5-1
4],
[5-1
5]
[5-3
]
[5-2
] [5
-1]
[5-5
] [5
-16]
,[5
-17]
[5-4
]
[5-1
8]
[5
-13]
(k
N)
(kN
) (k
N)
(kN
) (k
N)
(kN
)
(kN
) (k
N)
(kN
) (k
N)
(kN
)
(kN
)
(kN
)
(1)
(2)
(3)
(4)
(5)
(6)
(7)
(8)
(9)
(10)
(1
1)
(12)
(1
3)
(14)
(1
5)
(16)
(1
7)
(18)
1L
Aa
299
349
314
517
371
562
0.95
34
9 31
4 27
3 39
6 56
2 1.
10
336
0.89
22
4 1.
33
1LB
a 34
2 32
9 33
0 68
7 36
0 75
0 1.
04
328
330
358
391
750
1.04
35
3 0.
97
290
1.18
1L
1a
312
388
383
839
—
655
0.81
38
8 38
3 45
9 —
65
5 0.
81
419
0.75
36
3 0.
86
1L2a
32
1 52
7 47
0 84
3 —
68
2 0.
68
527
470
465
—
682
0.69
51
4 0.
62
366
0.88
1L
2aE
490
568
500
847
—
693
0.98
56
8 50
0 51
9 —
69
3 0.
98
546
0.90
45
4 1.
08
1L3a
34
5 52
9 47
1 84
1 57
3 93
9 0.
73
529
471
464
617
939
0.74
51
5 0.
67
368
0.94
1L
4a
452
521
468
836
—
683
0.97
52
1 46
8 45
9 —
68
3 0.
98
511
0.88
36
1 1.
25
1L5a
39
2 53
3 47
4 84
6 42
1 68
6 0.
93
533
474
467
452
686
0.87
51
8 0.
76
366
1.07
1L
6a
331
532
475
847
420
684
0.79
53
2 47
5 46
9 45
0 68
4 0.
74
519
0.64
37
1 0.
89
1L7a
28
8 38
4 37
8 83
5 —
66
1 0.
76
384
378
457
—
661
0.76
41
3 0.
70
362
0.80
1L
8a
306
390
386
842
299
653
1.02
39
0 38
6 46
1 32
8 65
3 0.
93
421
0.73
36
8 0.
83
1L9a
45
4 52
3 47
3 84
6 —
69
2 0.
96
523
473
551
—
692
0.96
51
6 0.
88
382
1.19
1L
11a
327
389
386
842
—
662
0.85
38
9 38
6 46
8 —
66
2 0.
85
422
0.77
38
4 0.
85
Mea
n
0.
88
0.
88
0.
78
1.
01
CO
V
0.13
0.15
0.1
4
0.18
N
ote:
Th
e nu
mbe
rs in
the
squa
re b
rack
ets a
re th
e eq
uatio
n nu
mbe
rs.
The
high
light
ed c
apac
ities
are
the
gove
rnin
g fa
ilure
cap
acity
pre
dict
ed b
y ea
ch d
esig
n st
anda
rd.
113

Tab
le 5
-5 P
redi
cted
Cap
aciti
es o
f Tes
t Spe
cim
ens w
ith B
eam
Web
Edg
e D
ista
nce
Tea
ring
Fai
lure
and
Bea
m W
eb T
ensi
on a
nd S
hear
Blo
ck F
ailu
re
CSA
–S16
–01
AIS
C 2
005
A
ngle
B
eam
Ang
le
Bea
m
Equ
atio
n [5
-18]
Prop
osed
pla
stic
co
llaps
e lo
ad fo
r en
d di
stan
ce
bear
ing
Net
se
ctio
n ru
ptur
e
Gro
ss
area
yi
eldi
ng
Bol
t be
arin
g
Tens
ion
and
shea
r bl
ock
Bol
t be
arin
gTe
st/
Pred
.
Net
se
ctio
n ru
ptur
e
Gro
ss
area
yi
eldi
ngB
olt
bear
ing
Tens
ion
and
shea
r bl
ock
Bol
t be
arin
gTe
st/
Pred
.
Tens
ion
and
shea
r bl
ock
Test
/ Pr
ed.
Ang
le
bear
ing
capa
city
Test
/ Pr
ed.
Test
Sp
ecim
en O
bser
ved
Cap
acity
[5-2
] [5
-1]
[5-3
] [5
-14]
, [5
-15]
[5
-3]
[5
-2]
[5-1
] [5
-5]
[5-1
6],
[5-1
7][5
-4]
[5
-18]
[5-1
3]
(k
N)
(kN
) (k
N)
(kN
) (k
N)
(kN
)
(kN
) (k
N)
(kN
) (k
N)
(kN
)
(kN
)
(kN
)
(1)
(2)
(3)
(4)
(5)
(6)
(7)
(8)
(9)
(10)
(1
1)
(12)
(1
3)
(14)
(1
5)
(16)
(1
7)
(18)
Sp
ecim
ens f
aile
d by
bea
m w
eb e
dge
dist
ance
tear
ing
2L1a
47
6 71
1 71
9 16
79—
70
6 0.
67
711
719
913
—
706
0.67
—
—
70
8 0.
67
2L2
472
1076
98
2 18
60—
69
6 0.
69
1076
98
2 10
15
—
696
0.69
—
—
78
7 0.
60
2L3
574
1068
97
3 18
42—
97
3 0.
59
1068
97
3 10
13
—
973
0.59
—
—
79
2 0.
72
2L4
551
1072
97
7 18
53—
69
0 0.
80
1072
97
7 10
13
—
690
0.80
—
—
78
6 0.
70
2L5a
62
0 97
8 89
1 16
78—
71
4 0.
87
978
891
912
—
714
0.87
—
—
70
9 0.
87
2L6a
46
3 70
6 72
1 16
87—
71
0 0.
66
706
721
910
—
710
0.66
—
—
70
3 0.
66
Mea
n
0.
71
0.
71
0.
70
CO
V
0.14
0.14
0.13
Sp
ecim
ens f
aile
d by
bea
m w
eb te
nsio
n an
d sh
ear b
lock
2L
7 34
7 78
5 78
8 18
5427
1 65
3 1.
28
785
788
1005
30
0 —
1.
16
364
0.95
77
2 0.
45
2L8a
41
5 96
2 88
5 16
6940
6 71
4 1.
02
962
885
906
439
—
0.95
48
9 0.
85
706
0.59
M
ean
1.15
1.06
0.90
0.52
C
OV
0.
16
0.
14
0.
08
0.
19
114

Tab
le 5
-6 P
redi
cted
Cap
aciti
es o
f Tes
t Spe
cim
ens F
aile
d at
the
Ang
le L
eg C
onne
cted
to th
e Su
ppor
ting
Col
umn
CSA
–S16
–01
AIS
C 2
005
A
ngle
B
eam
Ang
le
Bea
m
Equ
atio
n [5
-18]
Prop
osed
pla
stic
co
llaps
e lo
ad fo
r en
d di
stan
ce
bear
ing
Net
se
ctio
n ru
ptur
e
Gro
ss
area
yi
eldi
ng
Bol
t be
arin
g
Tens
ion
and
shea
r bl
ock
Bol
t be
arin
gTe
st/
Pred
.
Net
se
ctio
n ru
ptur
e
Gro
ss
area
yi
eldi
ngB
olt
bear
ing
Tens
ion
and
shea
r bl
ock
Bol
t be
arin
gTe
st/
Pred
.
Ang
le
shea
r ca
paci
tyTe
st/
Pred
.
Ang
le
bear
ing
capa
city
Test
/ Pr
ed.
Test
Sp
ecim
en O
bser
ved
Cap
acity
[5-2
]*
[5-1
] [5
-3]
[5-1
4],
[5-1
5]
[5-3
]
[5-2
] [5
-1]
[5-5
] [5
-16]
,[5
-17]
[5-4
]
[5-1
8]
[5
-13]
(k
N)
(kN
) (k
N)
(kN
) (k
N)
(kN
)
(kN
) (k
N)
(kN
) (k
N)
(kN
)
(kN
)
(kN
)
(1)
(2)
(3)
(4)
(5)
(6)
(7)
(8)
(9)
(10)
(1
1)
(12)
(1
3)
(14)
(1
5)
(16)
(1
7)
(18)
1L
A
280
406
433
604
404
618
0.69
406
433
323
431
618
0.87
420
0.67
267
1.05
1LB
28
8 38
8 45
3 80
137
177
60.
7838
845
342
1 40
077
60.
7444
00.
6534
50.
831L
1 30
6 39
3 39
9 93
7—
707
0.78
393
399
509
—70
70.
7843
60.
7039
40.
781L
2 34
6 53
6 48
2 91
3—
685
0.72
536
482
502
—68
50.
7252
70.
6639
10.
891L
3 43
0 54
4 49
2 93
3—
940
0.87
544
492
510
—94
00.
8753
90.
8039
61.
091L
4 37
8 53
2 48
4 91
6—
692
0.78
532
484
507
—69
20.
7853
00.
7140
10.
941L
5 36
2 52
5 48
0 91
0—
688
0.75
525
480
503
—68
80.
7552
60.
6939
90.
911L
6 36
8 53
0 48
6 91
9—
695
0.76
530
486
508
—69
50.
7653
20.
6940
40.
911L
7 27
6 39
9 40
5 94
3—
696
0.69
399
405
511
—69
60.
6944
30.
6239
40.
701L
8 29
0 38
9 39
9 93
927
667
81.
0538
939
951
1 30
767
80.
9443
60.
6639
60.
731L
9 36
0 52
7 48
3 91
4—
692
0.74
527
483
607
—69
20.
7452
90.
6842
40.
851L
10
291
382
393
910
—71
20.
7438
239
350
5 —
712
0.74
430
0.68
424
0.69
1L12
29
9 55
8 53
1 10
06—
656
0.56
558
531
652
—65
60.
7456
50.
53—
—1L
13
372
563
535
1007
—64
90.
7056
353
565
4 —
649
0.92
568
0.65
——
1L14
36
2 55
9 53
1 10
04—
656
0.68
559
531
650
—65
60.
9056
50.
64—
—1L
10a
376
374
389
849
—68
31.
0037
438
946
9 —
683
1.00
425
0.88
393
0.96
2L1
400
800
793
1860
—69
10.
5880
079
310
17
—69
10.
5886
70.
4678
50.
512L
6 37
7 79
2 79
1 18
57—
685
0.55
792
791
1020
—
685
0.55
866
0.44
792
0.48
Mea
n
0.
75
0.78
0.66
0.82
CO
V
0.18
0.
150.
160.
21N
ote:
Th
e hi
ghlig
hted
cap
aciti
es a
re th
e go
vern
ing
failu
re c
apac
ity p
redi
cted
by
each
des
ign
stan
dard
.
115

Tab
le 5
-7 S
umm
ary
of P
redi
cted
Cap
aciti
es b
y V
ario
us D
esig
n M
odel
s
C
SA–S
16–0
1 E
quat
ion
[5-1
8]
Bol
t bea
ring
capa
city
Te
st
spec
imen
A
ngle
B
eam
web
Ang
le
shea
r fa
ilure
Bea
m w
eb
tens
ion
and
shea
r blo
ck
Equa
tion
[5-1
3]
Ang
le e
nd
tear
ing
Equa
tion
[5-2
0]
Ang
le le
g co
nnec
ted
to th
e co
lum
n fa
iled
Pred
icte
d go
vern
ing
capa
city
Pred
icte
d go
vern
ing
failu
re
mod
e O
bser
ved
capa
city
Obs
erve
d fa
ilure
mod
e
(kN
) (k
N)
(kN
) (k
N)
(kN
) (k
N)
(kN
)
(kN
)
(1)
(2)
(3)
(4)
(5)
(6)
(7)
(8)
(9)
(10)
(1
1)
IV 1
546
600
2 36
046
223
024
723
0an
gle
end
tear
ing
240
end
dist
ance
tear
ing
V 1
713
800
2 37
8 48
7 31
1 27
1 27
1 A
LF
269
end
dist
ance
tear
ing
1LA
a 51
7 56
2 33
6 44
3 22
4 26
6 22
4 an
gle
end
tear
ing
299
angl
e en
d te
arin
g 1L
Ba
687
750
353
468
290
303
290
angl
e en
d te
arin
g34
2 an
gle
end
tear
ing
1L1a
83
9 65
5 41
9 —
36
3 44
4 36
3 an
gle
end
tear
ing
312
angl
e en
d te
arin
g 1L
2a
843
682
514
—
366
528
366
angl
e en
d te
arin
g32
1 an
gle
end
tear
ing
1L2a
E 84
7 69
3 54
6 —
45
4 56
0 45
4 an
gle
end
tear
ing
490
angl
e en
d te
arin
g 1L
3a
841
939
515
700
368
527
368
angl
e en
d te
arin
g34
5 an
gle
end
tear
ing
1L4a
83
6 68
3 51
1 —
36
1 52
6 36
1 an
gle
end
tear
ing
452
angl
e en
d te
arin
g 1L
5a
846
686
518
515
366
531
366
angl
e en
d te
arin
g39
2 an
gle
end
tear
ing
1L6a
84
7 68
4 51
9 51
2 37
1 53
2 37
1 an
gle
end
tear
ing
331
angl
e en
d te
arin
g 1L
7a
835
661
413
—
362
432
362
angl
e en
d te
arin
g28
8 an
gle
end
tear
ing
1L8a
84
2 65
3 42
1 39
6 36
8 44
5 36
8 an
gle
end
tear
ing
306
angl
e en
d te
arin
g 1L
9a
846
692
516
—
382
547
382
angl
e en
d te
arin
g45
4 an
gle
end
tear
ing
1L11
a 84
2 66
2 42
2 —
38
4 44
6 38
4 an
gle
end
tear
ing
327
angl
e en
d te
arin
g 1 Te
st sp
ecim
ens f
rom
Fra
nchu
k et
al.
(200
2)
2 Cal
cula
ted
assu
min
g be
am w
eb m
ater
ial p
rope
rties
: Fu =
500
MPa
and
Fy =
400
MPa
*N
ote:
A
LF–a
ngle
leg
conn
ecte
d to
the
colu
mn
failu
re
116

T
able
5-7
Sum
mar
y of
Pre
dict
ed C
apac
ities
by
Var
ious
Des
ign
Mod
els (
cont
’d)
C
SA–S
16–0
1 E
quat
ion
[5-1
8]
Bol
t bea
ring
capa
city
Te
st
spec
imen
A
ngle
B
eam
web
Ang
le
shea
r fa
ilure
Bea
m w
eb
tens
ion
and
shea
r blo
ck
Equa
tion
[5-1
3]
Ang
le e
nd
tear
ing
Equa
tion
[5-2
0]
Ang
le le
g co
nnec
ted
to th
e co
lum
n fa
iled
Pred
icte
d go
vern
ing
capa
city
Pred
icte
d go
vern
ing
failu
re
mod
e O
bser
ved
capa
city
Obs
erve
d fa
ilure
mod
e
(kN
) (k
N)
(kN
) (k
N)
(kN
) (k
N)
(kN
)
(kN
)
(1)
(2)
(3)
(4)
(5)
(6)
(7)
(8)
(9)
(10)
(1
1)
2L1a
16
79
706
785
—
708
680
680
ALF
47
6 be
am w
eb e
dge
dist
ance
tear
ing
2L2
1860
69
6 10
75
—
787
727
696
bolt
bear
ing
on
beam
web
47
2 be
am w
eb e
dge
dist
ance
tear
ing
2L3
1842
97
3 10
65
—
792
707
707
ALF
57
4 be
am w
eb e
dge
dist
ance
tear
ing
2L4
1853
69
0 10
70
—
786
720
690
bolt
bear
ing
on
beam
web
55
1 be
am w
eb e
dge
dist
ance
tear
ing
2L5a
16
78
714
973
—
709
875
709
angl
e en
d te
arin
g62
0 be
am w
eb e
dge
dist
ance
tear
ing
2L6a
16
87
706
787
—
703
683
683
ALF
46
3 be
am w
eb e
dge
dist
ance
tear
ing
2L7
1858
65
3 86
2 36
4 77
2 49
0 36
4 be
am w
eb te
nsio
n an
d sh
ear b
lock
347
beam
web
tens
ion
an
d sh
ear b
lock
2L8a
16
69
714
967
489
706
865
489
beam
web
tens
ion
and
shea
r blo
ck41
5 be
am w
eb te
nsio
n
and
shea
r blo
ck
*Not
e:
ALF
—an
gle
leg
conn
ecte
d to
the
supp
ortin
g co
lum
n fa
ilure
117

Tab
le 5
-7 S
umm
ary
of P
redi
cted
Cap
aciti
es b
y V
ario
us D
esig
n M
odel
s (co
nt’d
)
C
SA–S
16–0
1 E
quat
ion
[5-1
8]
Bol
t bea
ring
capa
city
Te
st
spec
imen
A
ngle
B
eam
web
Ang
le
shea
r fa
ilure
Bea
m w
eb
tens
ion
and
shea
r blo
ck
Equa
tion
[5-1
3]
Ang
le e
nd
tear
ing
Equa
tion
[5-2
0]
Ang
le le
g co
nnec
ted
to th
e co
lum
n fa
iled
Pred
icte
d go
vern
ing
capa
city
Pred
icte
d go
vern
ing
failu
re
mod
e O
bser
ved
capa
city
Obs
erve
d fa
ilure
mod
e
(kN
) (k
N)
(kN
) (k
N)
(kN
) (k
N)
(kN
)
(kN
)
(1)
(2)
(3)
(4)
(5)
(6)
(7)
(8)
(9)
(10)
(1
1)
1LA
60
4 61
8 42
0 46
8 26
7 27
6 26
7 an
gle
end
tear
ing
280
ALF
1L
B
801
776
440
457
345
302
302
ALF
28
8 A
LF
1L1
937
707
436
—
394
245
245
ALF
30
6 A
LF
1L2
913
685
527
—
391
369
369
ALF
34
6 A
LF
1L3
933
940
539
—
396
391
391
ALF
43
0 A
LF
1L4
916
692
530
—
401
373
373
ALF
37
8 A
LF
1L5
910
688
526
—
399
367
367
ALF
36
2 A
LF
1L6
919
695
532
—
404
370
370
ALF
36
8 A
LF
1L7
943
696
443
—
394
248
248
ALF
27
6 A
LF
1L8
939
678
436
368
396
244
244
ALF
29
0 A
LF
1L9
914
692
529
—
424
366
366
ALF
36
0 A
LF
1L10
91
0 71
2 43
0 —
42
4 24
0 24
0 A
LF
291
ALF
1L
12
1006
65
6 56
5 —
—
25
8 25
8 A
LF
299
ALF
1L
13
1007
64
9 56
8 —
—
31
6 31
6 A
LF
372
ALF
1L
14
1004
65
6 56
5 —
—
27
6 27
6 A
LF
362
ALF
1L
10a
842
683
425
—
393
450
393
angl
e en
d te
arin
g37
6 A
LF
2L1
1860
69
1 86
7 —
78
5 48
6 48
6 A
LF
400
ALF
2L
6 18
57
685
866
—
792
483
483
ALF
37
7 A
LF
*Not
e:
ALF
—an
gle
leg
conn
ecte
d to
the
supp
ortin
g co
lum
n fa
ilure
118

119
a) End Distance Failure
b) Collapse Load Mechanism
Figure 5-1 Collapse Load Capacity of End Distance in a Slotted Hole Connection

120
Figure 5-2 Typical Eccentrically Loaded Single Angle Shear Connection

121
a) Bolt Force Crosses the Edge b) Bolt Force Crosses the Top End
Figure 5-3 Direction of Bolt Force

122
a) Observed Failure Path A
(observed in specimen 1LA, 1LB)b) Observed Failure Path B (observed in specimen 1L1,
1L7, 1L8, 1L10, 1L12 to 1L14, 1L10a, 2L1 and 2L6)
c) Observed Failure Path C (observed in specimen 1L2 to
1L6 and 1L9)
d) Predicted Failure Model D e) Observed Failure Model E f) Predicted Failure Model F
Figure 5-4 Observed Failure Paths and Predicted Failure Model

123
g) Predicted Failure Model G h) Predicted Failure Model H i) Predicted Failure Model I
j) predicted Failure Model J k) Predicted Failure Model K
Figure 5-4 Observed Failure Paths and Predicted Failure Models (cont’d)

124
Figure 5-5 Comparison of Proposed Prediction Models for Specimens Failed at the Leg Connected to the Column

125
6 Summary and Conclusions
6.1 Summary
It has been shown that research in the past few decades on single and double
angle connections has emphasized the moment-rotation behaviour of connections, rather
than the shear capacity or the ultimate limit state of the connections. Moreover, no tests
had been conducted on slotted hole connections with the slots on the outer plies. The
current North American steel design standards, namely CSA–S16–01 and AISC 2005,
require that plate washers with standard size holes have to be installed on the outer plies
of joints in a connection with long slots to completely cover the slots with the loading
direction perpendicular to the length of slot. The purpose of the plate washer is to prevent
bolt pull-out in a bearing type connection. However, bolt pull-out has not been identified
as an ultimate limit state in the past. The effects of a plate washer on the strength and
behaviour of connections with slotted holes are not clearly identified yet. Therefore, a
research program was initiated to assess the effect of plate washers as well as other
parameters on the strength and behaviour of the connections.
An experimental research program consisting of 40 tests on full-scale
beam-to-column connections was carried out to investigate the strength and behaviour of
connections with slotted holes. A wide range of parameters were investigated: bottom
end distance, plate washer, slot length, bolt pretension, torsion brace, bolt pitch, coped
flange, beam end rotation, web thickness and bolt diameter. In assessing the effect of the
above parameters, the load vs. deformation response and load carrying capacity were
used as bases for comparison. Two of the test specimens from the current research
program were compared with two single angle specimens tested by Franchuk et al.
(2002) to investigate the effect of plate washers on single angle connections further. In
addition, a failure mode that consisted of failure of the angle leg connected to the column
was observed. The failure mode was similar to the tension and shear block failure in
coped beams, except that the tension and shear block was inclined to the line of action of
the applied force. In order to investigate this failure mode further, parameters related to
the angle leg connected to the column were varied. These parameters included: top end

126
distance and edge distance, thickness of angle, number of bolts and the effect of single or
double angles.
A comparison between the test results and capacities predicted by the current
North American steel design standards, namely, CSA–S16–01 and AISC 2005, as well as
Equation [5-18] was presented. In addition, new prediction models were developed for
failure by angle bottom end tearing and failure of the angle leg connected to the
supporting column.
6.2 Conclusions
The following conclusions are drawn from this research program:
1. Plate washers are beneficial to slotted holes connections with 6.4 mm thick single
angles. The thin single angle specimens without plate washers (IV and V from
Franchuk et al. (2002)) failed by tearing of bottom end of the angle and top edge
of the beam web, followed by tilting of the middle bolt. In contrast, the specimens
with plate washers failed by bottom end distance tearing, followed by shear
failure of angle. The capacities of specimens with plate washers showed an
increase in capacity of 24% to 27% over the ones without plate washers.
2. Specimens with 9.5 mm thick angles with plate washers also showed increased
capacity compared to the ones without plate washers. The single angle specimen
(1L2a) without a plate washer showed a 29% lower angle end tearing capacity
compared to the specimen with a plate washer (1L4a). The double angle specimen
with plate washers (2L4) showed a 14% higher capacity over the one without
plate washers (2L2). Both of the specimens without plate washers did not reach
the expected capacity predicted by the current North American steel design
standards. Specimen 1L2a had a test-to-predicted ratio of 0.68 and 0.69 predicted
by CSA–S16–01 and AISC 2005, respectively, and specimen 2L2 had a ratio of
0.69 predicted by both CSA–S16–01 and AISC 2005. Only the single angle
specimen with plate washer (1L4a) reached the expected capacity (test-to-
predicted ratio of 0.97 and 0.98 predicted by CSA–S16–01 and AISC 2005,
respectively). The double angle connection with plate washer (2L4) did not reach

127
the expected capacity (test-to-predicted ratio of 0.80 predicted by both standards).
It is likely due to the failure of the edge distance, and the bearing strength of the
beam web was not fully developed.
3. It was found that the size of the loaded bottom end distance in single angle
connections has a significant effect on angle end tearing capacity. An increase in
as-built bottom end distance by from 34.0 mm to 46.3 mm resulted in an increase
in the angle end tearing capacity of 53%.
4. Single angles with short slots (1L9a) showed 41% higher end tearing capacity
than its long slot counterpart (1L2a).
5. It was found that increasing the bolt pitch did not lead to a significant increase in
capacity for the single angle connections (3% to 8% increase) and double angle
connections with uncoped beam (1% increase). That is because the former failed
by angle end tearing and the latter by beam web edge distance tearing. Double
angle connections with a coped beam failed by tension and shear block of the
beam web. The increase of bolt pitch (from 76 mm to 102 mm) and the associated
increased shear area led to a 20% increase in capacity for double angle specimens
with coped beams (2L7 and 2L8a) that failed in a tension and shear block mode.
6. Single web framing angles with minimum bottom end distances that failed by end
tearing showed a resistance as low as 68% of the capacity predicted using CSA–
S16–01 and AISC 2005.
7. The beam web edge distance used in the research program was 30 mm, which is
close to the minimum requirement of 28 mm. The test specimens with an uncoped
beam and double angles failed by beam web edge distance tearing. The possible
failure mode of bolt bearing on the beam web was investigated. It was observed
that the edge distance tearing failure resulted in a reduction in capacity of as much
as 41%. None of the test specimens with double angles and an uncoped beam
reached the bolt bearing capacity.
8. Connections with pretensioned bolts showed higher stiffness (about 50%) and
higher capacity (18% increase in angle end tearing capacity for single angle

128
specimens and 13% increase in beam web failure capacity for double angle
specimens) than the ones with snug tight bolts, possibly due to some load transfer
by friction between the faying surfaces at the connection.
9. Torsionally braced specimens showed only a 5% increase in web framing angle
capacity. However, torsion bracing reduced twisting of the beam by as much as 7o
at peak load (at about 25 mm bottom flange deflection).
10. For specimens that failed in the angle leg connected to the column, it was found
that top end distance, edge distance and number of bolts connecting the angle to
the column affect the connection capacity. Increasing the top end distance from
32 mm to 58 mm resulted in an increase in capacity of 29% on average. An
increase in edge distance from 32 mm to 50 mm resulted in an increase of 24% in
the connection capacity. For the same size of angle, an increase in the number of
bolts from two to three connecting to the column also results in an increase of
21% in the capacity. The double angle connection with this failure mode also
showed a 34% higher capacity than its single angle counterpart.
11. The current North American steel design standards, namely, CSA–S16–01 and
AISC 2005, have provisions for the following failure modes: fracture at the net
section of web-framing angles, tension and shear block failure of beam web and
web crippling failure under a concentrated load. In the current test program, the
test-to-predicted ratio of the test specimens with the above failure modes was
found to range from 0.87 to 1.28 calculated using CSA–S16–01 and range from
0.87 to 1.16 calculated using AISC 2005. However, CSA–S16–01 does not have
provisions for angle end tearing failure, and neither North American standards has
provisions for the failure of the angle leg connected to the column that failed by
corner tearing of the connected material, as well as tearing of the beam web edge
distance.
12. Equation [5-13] is proposed for the prediction of capacity of web framing angles
failing by end tearing and bearing. The equation combines the failure of the end
distance by plastic collapse or shear failure with the bearing strength of the
remaining interior bolts. For 13 specimens that failed by angle bottom end

129
distance tearing, Equation [5-13] resulted in a mean test-to-predicted ratio of 1.01
and a COV of 0.18, compared to a mean of 0.88 and a COV of 0.13 predicted by
CSA–S16–01, and a mean of 0.88 and a COV of 0.15 predicted by AISC 2005.
13. A calculation procedure was proposed to predict the capacity of eccentrically
loaded angles failing by loaded end tearing. The formulation is based on a tension
and shear block failure mode limiting the strength of the critical bolt in the
eccentrically loaded connection. The resulting Equation [5-20] results in a mean
test-to-predicted ratio of 1.05 and a COV of predicted values of 0.15 for 18
specimens that failed in this manner. Other possible failure modes predicted by
CSA–S16–01 and AISC 2005, such as rupture of net shear area of angle, yielding
of gross shear area of angle, bolt bearing on beam and angle, and tension and
shear block failure of coped beams, were investigated. Neither design standard
has provisions for corner tearing of angle leg connected to the column. The mean
test-to-predicted ratio obtained from CSA–S16–01 is 0.75 and COV of 0.18, and
the mean test-to-predicted ratio obtained from AISC 2005 is 0.78, with a COV
of 0.15.
6.3 Design Recommendations
From the results of this research program, several recommendations are made for
the design of connections with slotted holes:
1. Angle thickness – It was found that the single angle connections with thinner
angles (6.4 mm) and without plate washer (specimens IV and V from Franchuk
et al. (2002)) could fail by tearing of the loaded end distance followed by bolt-
tilting. The test-to-predicted ratios for these two specimens were substantially
lower than expected (0.69 and 0.76). The bolt-tilting phenomenon was not
observed on the single angle connections with thicker angles (9.5 mm). It is
suspected that the angle used in specimens IV and V was too flexible. Moreover,
the minimum recommended thickness suggested in AISC Manual of Steel
Construction (AISC, 1999) is 9.5 mm. Therefore, it is recommended that the
minimum angle thickness used in web-framing angles be at least 9.5 mm.

130
2. Plate washers for connections with slotted holes – It was found that connections
with plate washers had higher capacities than the one without plate washers. This
is likely caused by the increased rigidity and confinement within the connections
with plate washers. Although no bolt pull-out was observed in this research
program, the plate washers are required in both single and double angle slotted
hole connections in order to reach the predicted capacity. It should be noted that
an increase in end and edge distances might be sufficient to waive the requirement
for plate washers in double angle connections. This was not investigated in this
research program.
3. Edge distance requirements – In this research program, the edge distance used on
beam web was 30 mm, which satisfies the edge distance requirement of 28 mm
for 7/8 in. diameter A325 bolts as described in CSA–S16–01. The failure mode of
beam web edge distance tearing was likely caused by the small edge distance used
in the beam web. The test-to-predicted ratio for specimens that failed by rupture
of the edge distance ranged from 0.59 to 0.87, as predicted by the bolt bearing
capacity equation in CSA–S16–01. The bolt bearing strength on beam web was
not reached for all the specimens with edge distance tearing. It is suspected that
the edge distance has to be larger in order to develop the bearing strength on the
beam web. According to CSA–S16–01, the bearing strength, bσ , is taken as three
times material the tensile strength at the ultimate limit state. To achieve
equilibrium of forces and assuming the edge distance on either side of the bolt
shares equal loads at the ultimate limit state, the clear edge distance has to be at
least 1.5 times the bolt diameter in order to develop the bearing stress of 3 times
the material tensile strength. Therefore, it is recommended that a minimum clear
edge distance of 1.5 times the bolt diameter, or a minimum edge distance (from
center of bolt to the edge of material) of 2.0 times the bolt diameter, if the
connection is designed for bolt bearing on the beam web. Validation of this
increased edge distance is recommended.
4. End distance requirements – All the angles in the test program were fabricated
with minimum end distance as required by CSA–S16–01 for ASTM high strength

131
bolts, except for specimen 1L2aE, which was fabricated with 47 mm bottom end
distance. As shown in Kulak et al. (1987), the relationship between the bearing
stress, end distance and bolt diameter can be expressed as:
e b
u
l σ0.5 + 0.715
d F≥ [6-1]
In terms of clear end distance, cl :
c b
u
l σ0.715
d F≥ [6-2]
If the bearing strength of 3.0 Fu has to be achieved at the end distance, the clear
end distance has to be about 2.0 times the bolt diameter. For instance, the clear
end distance has to be 45 mm for a 7/8 in. diameter bolt. Therefore, a minimum
clear end distance of 2.0 times the bolt diameter is recommended.
6.4 Recommendations for Future Research
From the result of this research program, the understanding of the behaviour of
connections with slotted holes had been improved significantly. However, further
research is required in the following areas:
1. It was found that the loaded end distance had significant effect on the connection
capacity. However, only one test specimen (1L2aE) had a loaded end distance
greater than the minimum permitted, whereas the remaining specimens had
minimum loaded end distances. It seems that the minimum end distance currently
used in design standards may be too small to develop the full capacity of a
connection. Further testing is recommended to determine the minimum end
distance required to develop the full connection potential.
2. Several of the test specimens with a double angle shear connection and uncoped
beam failed by edge distance tearing. However, only one edge distance (30 mm)
was investigated in this test program. Therefore, the effect beam edge distance on
the connection capacity should be investigated. The bolt bearing capacity was not

132
reached in any of these specimens. It is therefore expected that a larger edge
distance would result in a significant increase in connection shear capacity.
3. A reliability analysis is recommended to assess the level of safety of the
connections as designed by current North American steel design standards, as
well as the newly proposed prediction models. In this research program, only the
test-to-predicted ratios and the COV of test-to-predicted values by various
prediction models are presented. A wide range of failure modes were observed in
the test program. As a result, there are only a few specimens under each group of
failure mode. There is a need to expand the pool of experimental data for
specimens with the same failure mode. The information on angle end tearing and
beam web edge distance failure is the most deficient in this respect. More
experimental work is recommended in this area. A reliability analysis is also
recommended to assess the level of safety provided by the newly developed
prediction models in this research program.
4. For double angle connections with coped or uncoped beams, the location of beam
web edge distance tearing varied. The specimens with a large bolt pitch failed by
beam web edge distance tearing at the middle bolt hole, whereas the specimens
with standard pitch failed at the bottom bolt hole. This phenomenon should be
investigated further. The effects of parameters that affect the location of edge
distance tearing need to be identified.
5. The use of plate washers resulted in a significant increase in shear capacity of
connections with slotted holes in the outer plies. The possible causes were a
change in failure mode and increased rigidity at the connection. However, the
failure mechanism of angle end tearing with plate washer on the outer plies of the
joint and how the plate washer increased the rigidity of the connection is not
clearly identified yet. More experimental testing and numerical analyses are
recommended to investigate the effect of plate washers on connections with
slotted holes further.

133
References AISC (1999). “Manual of Steel Construction - Load and Resistance Factor Design
(LRFD), Second Edition, Vol. 2, Connections,” American Institute of Steel Construction (AISC), Chicago, Illinois.
AISC (2005). “Specification for Structural Steel Buildings,” American Institute of Steel
Construction, Chicago, IL. ASTM (1997). “A370-97 Standard Test Methods and Definitions for Mechanical Testing
of Steel Products,”American Society for Testing and Materials, Philadelphia, PA, USA.
Allan, R.N. and Fisher, J.W. (1968). “Bolted Joints with Oversized or Slotted Holes,”
Proceedings of the ASCE, No. ST9, pp. 2061-2080. Astaneh, A., Call, S.M., and McMullin, K.M. (1989). “Design of Single Plate Shear
Connections,” Engineering Journal, AISC, First Quarter, pp. 21-32. Bergson, P.M. and Galambos, T.V. (1998). “Experimental Tests on Bolted Single-Angle
Connections with Horizontal Short-Slotted Holes,” Structural Engineering Report No. ST-98-3, Department of Civil Engineering, University of Minnesota, Minneapolis, MN.
Birkemoe, P.C. and Gilmor, M.I. (1978). “Behavior of Bearing Critical Double-Angle
Beam Connections,” Engineering Journal, AISC, Vol. 15, No. 4, Fourth Quarter, pp. 109-115.
CISC (2004). “Handbook of Steel Construction,” Eighth Edition, CISC, Toronto, Ontario. Crawford, S.F. and Kulak, G.L. (1971). “Eccentrically Loaded Bolted Connections,”
Proceedings of the ASCE, Journal of Structural Division, ST3, March 1971, pp. 765-783.
Crocker, J.P. and Chambers, J.J. (2004). “Single Plate Shear Connection Response to
Rotation Demands Imposed by Frames Undergoing Cyclic Lateral Displacements,” Journal of Structural Engineering, ASCE, Vol. 130, No. 6, pp. 934-941.
CSA (1998). “CAN/CSA–G40.21–98 Structural Quality Steel,” Canadian Standards
Association, Toronto, ON, Canada. CSA (2001). “CSA–S16–01 Limit State Design of Steel Structures,” Canadian Standards
Assocation, Toronto, ON.

134
Franchuk, C.R., Driver, R.G. and Grondin, G.Y. (2002) “Block Shear Behavior of Coped Steel Beams,” Structural Engineering Report no. 244, Department of Civil and Environmental Engineering, University of Alberta, Edmonton, AB, Canada.
Hormby, D.E., Richard, R.M. and Kriegh, J.D. (1984). “Single Plate Framing
Connections with Grade-50 Steel and Composite Construction,” Engineering Journal, AISC, Third Quarter, pp. 125-138.
Kulak, G. L., Fisher, J. W., and Struik, J. H. A. (1987). “Guide to Design Criteria for
Bolted and Riveted Joints,” Second Edition, Wiley-Interscience, New York, New York.
Lipson, S.L. (1968), “Single-Angle and Single-Plate Beam Framing Connections,”
Proceedings, Canadian Structural Engineering Conference, Toronto, Ontario, Canada, Feb., 1968, pp. 141-162.
Lipson, S.L. (1977) “Single-Angle Welded-Bolted Connections,” Journal of Structural
Engineering, ASCE, Vol. 103, No. ST3, pp. 559-570. Munse, W.H., Bell, W.G., and Chesson, E. Jr.(1961). “Behavior of Beam-to-Column
Connections,” Transactions, ASCE, Vol. 126, Part II, Paper No. 3241, pp. 729-749.
Rathbun, J.C. (1936), “Elastic Properties of Riveted Connections,” Transactions, ASCE,
Vol. 101, Paper No. 1933, pp. 524-563. RCRBSJ (1976), “Specifications for Structural Joints Using ASTM A325 or A490 Bolts,”
Research Council on Riveted and Bolts Structural Joints, Feb., 1976. Richard, R. M., Gillett, P.E., Kriegh, J. D. and Lewis, B.A. (1980). “The Analysis and
Design of Single Plate Framing Connections.” AISC Engineering Journal, American Institute of Steel Construction, Second Quarter, pp. 38-52.
Ricles, J.M., and Yura, J.A. (1983). “Strength of Double-Row Bolted-Web Connections,”
Journal of Structural Engineering, ASCE, Vol. 109, No. 1, pp. 126-142. Shneur, V. (2003). “57 tips for Reducing Connection Costs,” Modern Steel Construction,
July, 2003, pp. 20-22. Wald, F., Mazura, V., Moal, M. and Sokol, Z. (2002). “Experiments of Bolted Cover
Plate Connections with Slotted Holes,” CTU Reports, Vol. 6, 2/2002, pp. 79-96. Yura, J.A., Birkemoe, P.C., and Ricles, J.M. (1982). “Beam Web Shear Connections: An
Experimental Study,” Journal of the Structural Division, ASCE, Vol. 108, No. ST2, pp. 311-325.

135
Appendix A Photos of Failed Specimens

136
Beam Angle leg on connection side Angle leg connected to the column
Figure A-1 Test Specimen 1LA
Beam Angle leg on the connection side
Angle leg connected to the column
Figure A-2 Test Specimen 1LB

137
Beam Angle and the plate washer Side view of beam web
Figure A-3 Test specimen 1LAa
Beam Angle and the plate washer Side view of beam web
Figure A-4 Test Specimen 1LBa

138
Beam Angle Angle leg connected to the column
Figure A-5 Test specimen 1L1
Beam Angle leg on connection side Angle leg connected to the column
Figure A-6 Test specimen 1L2

139
Beam Angle Angle leg connected to the column
Figure A-7 Test specimen 1L3
Beam Angle Angle leg connected to the column
Figure A-8 Test specimen 1L4

140
Beam Angle and the plate washer Angle leg connected to the column
Figure A-9 Test specimen 1L5
Beam Angle Angle leg connected to the column
Figure A-10 Test specimen 1L6

141
Beam Angle on connection side Angle leg connected to the column
Figure A-11 Test specimen 1L7
Beam Angle on connection side Angle leg connected to the column
Figure A-12 Test specimen 1L8

142
Beam Angle on connection side Angle leg connected to the column
Figure A-13 Test specimen 1L9
Beam Angle on connection side Angle leg connected to the column
Figure A-14 Test specimen 1L10

143
Beam Angle on connection side Distorted beam web at connection
Figure A-15 Test specimen 1L1a
Beam Angle on connection side Distorted beam web at connection
Figure A-16 Test specimen 1L2a

144
Beam Angle Distorted beam web at connection
Figure A-17 Test specimen 1L2aE
Beam Angle Distorted beam web at connection
Figure A-18 Test specimen 1L3a

145
Beam Angle and plate washer Distorted beam web at connection
Figure A-19 Test specimen 1L4a
Beam Angle and plate washer Distorted beam web at connection
Figure A-20 Test specimen 1L5a

146
Beam Angle Distorted beam web at connection
Figure A-21 Test specimen 1L6a
Beam Angle Distorted beam web at connection
Figure A-22 Test specimen 1L7a

147
Beam Angle Distorted beam web at connection
Figure A-23 Test specimen 1L8a
Beam Angle Distorted beam web at connection
Figure A-24 Test specimen 1L9a

148
Beam Angle leg on the connection side
Angle leg connected to the column
Figure A-25 Test specimen 1L10a
Beam Angle leg on the connection side Beam web
Figure A-26 Test specimen 1L11a

149
Beam Angle leg on the connection side
Angle leg connected to the column
Figure A-27 Test specimen 1L12
Beam Angle leg on the connection side
Angle leg connected to the column
Figure A-28 Test specimen 1L13

150
Beam Angle leg on the connection side
Angle leg connected to the column
Figure A-29 Test specimen 1L14
Beam Angle leg on the connection side
Angle leg connected to the column
Figure A-30 Test specimen 2L1

151
Beam Angle leg on the connection side
Figure A-31 Test specimen 2L2
Beam Angle leg on the connection side
Figure A-32 Test specimen 2L3

152
Beam Angle leg on the connection side
Plate washers after testing
Figure A-33 Test specimen 2L4
Beam Crushed beam web under the
load point
Figure A-34 Test specimen 2L5
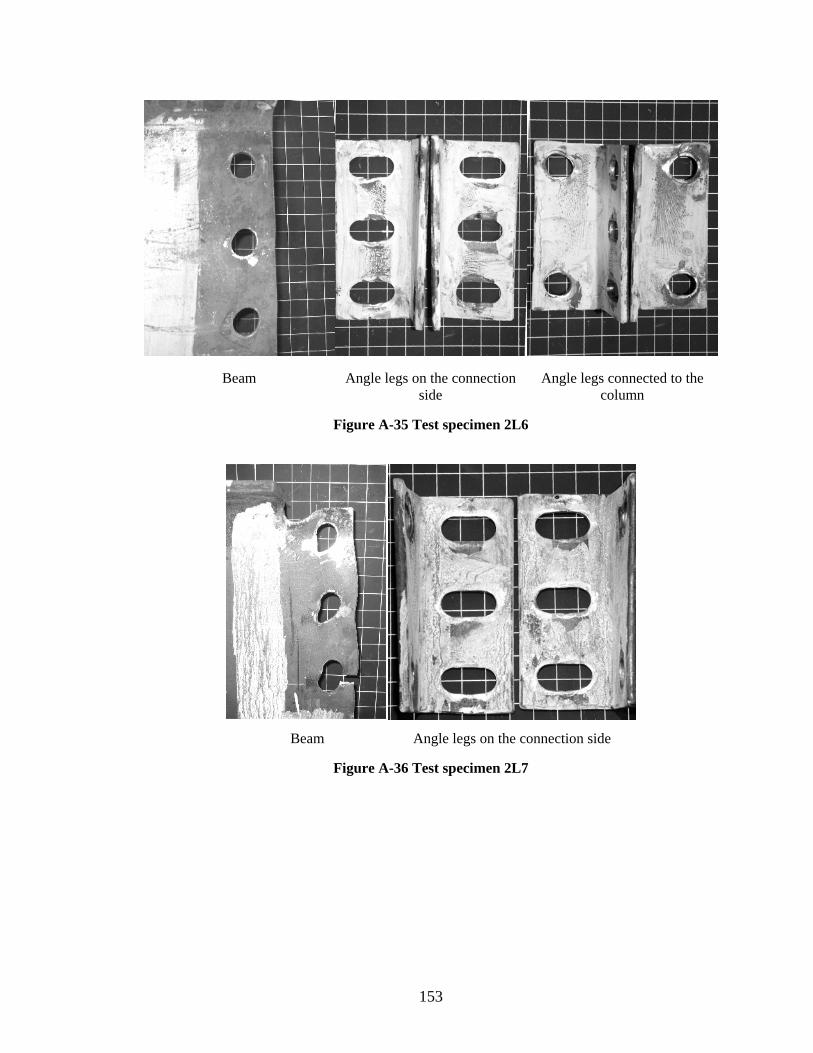
153
Beam Angle legs on the connection side
Angle legs connected to the column
Figure A-35 Test specimen 2L6
Beam Angle legs on the connection side
Figure A-36 Test specimen 2L7

154
Beam Angle legs on the connection side
Figure A-37 Test specimen 2L1a
Beam Angle legs on the connection side
Plate washers after testing
Figure A-38 Test specimen 2L5a

155
Beam Angle legs on the connection side
Figure A-39 Test specimen 2L6a
Beam Angle legs on the connection side
Figure A-40 Test specimen 2L8a

156
Appendix B Load vs. Deformation Response and
Twist of Connection vs. Deformation of Test Specimens

157
Figure B-1 Connection Reaction vs. Bottom Flange Displacement, Test Specimen IV (Franchuk et al., 2002)
Figure B-2 Twist vs. Bottom Flange Displacement, Test Specimen IV (Franchuk et al., 2002)

158
Figure B-3 Connection Reaction vs. Bottom Flange Displacement, Test Specimen V (Franchuk et al., 2002)
Figure B-4 Twist vs. Bottom Flange Displacement, Test Specimen V (Franchuk et al., 2002)

159
Figure B-5 Connection Reaction vs. Bottom Flange Displacement, Test Specimen 1LA
Figure B-6 Twist vs. Bottom Flange Displacement, Test Specimen 1LA

160
Figure B-7 Connection Reaction vs. Bottom Flange Displacement, Test Specimen 1LB
Figure B-8 Twist vs. Bottom Flange Displacement, Test Specimen 1LB

161
Figure B-9 Connection Reaction vs. Bottom Flange Displacement, Test Specimen 1LAa
Figure B-10 Twist vs. Bottom Flange Displacement, Test Specimen 1LAa

162
Figure B-11 Connection Reaction vs. Bottom Flange Displacement, Test Specimen 1LBa
Figure B-12 Twist vs. Bottom Flange Displacement, Test Specimen 1LBa

163
Figure B-13 Connection Reaction vs. Bottom Flange Displacement, Test Specimen 1L1
Figure B-14 Twist vs. Bottom Flange Displacement, Test Specimen 1L1

164
Figure B-15 Connection Reaction vs. Bottom Flange Displacement, Test Specimen 1L2
Figure B-16 Twist vs. Bottom Flange Displacement, Test Specimen 1L2

165
Figure B-17 Connection Reaction vs. Bottom Flange Displacement, Test Specimen 1L3
Figure B-18 Twist vs. Bottom Flange Displacement, Test Specimen 1L3

166
Figure B-19 Connection Reaction vs. Bottom Flange Displacement, Test Specimen 1L4
Figure B-20 Twist vs. Bottom Flange Displacement, Test Specimen 1L4

167
Figure B-21 Connection Reaction vs. Bottom Flange Displacement, Test Specimen 1L5
Figure B-22 Twist vs. Bottom Flange Displacement, Test Specimen 1L5

168
Figure B-23 Connection Reaction vs. Bottom Flange Displacement, Test Specimen 1L6
Figure B-24 Twist vs. Bottom Flange Displacement, Test Specimen 1L6

169
Figure B-25 Connection Reaction vs. Bottom Flange Displacement, Test Specimen 1L7
Figure B-26 Twist vs. Bottom Flange Displacement, Test Specimen 1L7

170
Figure B-27 Connection Reaction vs. Bottom Flange Displacement, Test Specimen 1L8
Figure B-28 Twist vs. Bottom Flange Displacement, Test Specimen 1L8

171
Figure B-29 Connection Reaction vs. Bottom Flange Displacement, Test Specimen 1L9
Figure B-30 Twist vs. Bottom Flange Displacement, Test Specimen 1L9

172
Figure B-31 Connection Reaction vs. Bottom Flange Displacement, Test Specimen 1L10
Figure B-32 Twist vs. Bottom Flange Displacement, Test Specimen 1L10

173
Figure B-33 Connection Reaction vs. Bottom Flange Displacement, Test Specimen 1L1a
Figure B-34 Twist vs. Bottom Flange Displacement, Test Specimen 1L1a

174
Figure B-35 Connection Reaction vs. Bottom Flange Displacement, Test Specimen 1L2a
Figure B-36 Twist vs. Bottom Flange Displacement, Test Specimen 1L2a

175
Figure B-37 Connection Reaction vs. Bottom Flange Displacement, Test Specimen 1L2aE
Figure B-38 Twist vs. Bottom Flange Displacement, Test Specimen 1L2aE

176
Figure B-39 Connection Reaction vs. Bottom Flange Displacement, Test Specimen 1L3a
Figure B-40 Twist vs. Bottom Flange Displacement, Test Specimen 1L3a

177
Figure B-41 Connection Reaction vs. Bottom Flange Displacement, Test Specimen 1L4a
Figure B-42 Twist vs. Bottom Flange Displacement, Test Specimen 1L4a

178
Figure B-43 Connection Reaction vs. Bottom Flange Displacement, Test Specimen 1L5a
Figure B-44 Twist vs. Bottom Flange Displacement, Test Specimen 1L5a

179
Figure B-45 Connection Reaction vs. Bottom Flange Displacement, Test Specimen 1L6a
Figure B-46 Twist vs. Bottom Flange Displacement, Test Specimen 1L6a

180
Figure B-47 Connection Reaction vs. Bottom Flange Displacement, Test Specimen 1L7a
Figure B-48 Twist vs. Bottom Flange Displacement, Test Specimen 1L7a

181
Figure B-49 Connection Reaction vs. Bottom Flange Displacement, Test Specimen 1L8a
Figure B-50 Twist vs. Bottom Flange Displacement, Test Specimen 1L8a

182
Figure B-51 Connection Reaction vs. Bottom Flange Displacement, Test Specimen 1L9a
Figure B-52 Twist vs. Bottom Flange Displacement, Test Specimen 1L9a

183
Figure B-53 Connection Reaction vs. Bottom Flange Displacement, Test Specimen 1L10a
Figure B-54 Twist vs. Bottom Flange Displacement, Test Specimen 1L10a

184
Figure B-55 Connection Reaction vs. Bottom Flange Displacement, Test Specimen 1L11a
Figure B-56 Twist vs. Bottom Flange Displacement, Test Specimen 1L11a

185
Figure B-57 Connection Reaction vs. Bottom Flange Displacement, Test Specimen 1L12
Figure B-58 Twist vs. Bottom Flange Displacement, Test Specimen 1L12

186
Figure B-59 Connection Reaction vs. Bottom Flange Displacement, Test Specimen 1L13
Figure B-60 Twist vs. Bottom Flange Displacement, Test Specimen 1L13

187
Figure B-61 Connection Reaction vs. Bottom Flange Displacement, Test Specimen 1L14
Figure B-62 Twist vs. Bottom Flange Displacement, Test Specimen 1L14

188
Figure B-63 Connection Reaction vs. Bottom Flange Displacement, Test Specimen 2L1
Figure B-64 Twist vs. Bottom Flange Displacement, Test Specimen 2L1

189
Figure B-65 Connection Reaction vs. Bottom Flange Displacement, Test Specimen 2L2
Figure B-66 Twist vs. Bottom Flange Displacement, Test Specimen 2L2

190
Figure B-67 Connection Reaction vs. Bottom Flange Displacement, Test Specimen 2L3
Figure B-68 Twist vs. Bottom Flange Displacement, Test Specimen 2L3

191
Figure B-69 Connection Reaction vs. Bottom Flange Displacement, Test Specimen 2L4
Figure B-70 Twist vs. Bottom Flange Displacement, Test Specimen 2L4

192
Figure B-71 Connection Reaction vs. Bottom Flange Displacement, Test Specimen 2L5
Figure B-72 Twist vs. Bottom Flange Displacement, Test Specimen 2L5

193
Figure B-73 Connection Reaction vs. Bottom Flange Displacement, Test Specimen 2L6
Figure B-74 Twist vs. Bottom Flange Displacement, Test Specimen 2L6

194
Figure B-75 Connection Reaction vs. Bottom Flange Displacement, Test Specimen 2L7
Figure B-76 Twist vs. Bottom Flange Displacement, Test Specimen 2L7

195
Figure B-77 Connection Reaction vs. Bottom Flange Displacement, Test Specimen 2L1a
Figure B-78 Twist vs. Bottom Flange Displacement, Test Specimen 2L1a

196
Figure B-79 Connection Reaction vs. Bottom Flange Displacement, Test Specimen 2L5a
Figure B-80 Twist vs. Bottom Flange Displacement, Test Specimen 2L5a

197
Figure B-81 Connection Reaction vs. Bottom Flange Displacement, Test Specimen 2L6a
Figure B-82 Twist vs. Bottom Flange Displacement, Test Specimen 2L6a

198
Figure B-83 Connection Reaction vs. Bottom Flange Displacement, Test Specimen 2L8a
Figure B-84 Twist vs. Bottom Flange Displacement, Test Specimen 2L8a