BEAM EXPERIMENTS WITH STATE SELECTED Ne(3 P0 ,3 ...
191
IKIS-mf—9453 A// BEAM EXPERIMENTS WITH STATE SELECTED Ne( 3 P 0 , 3 P 2 ) METASTABLE ATOMS M.J. Verheijen
-
Upload
khangminh22 -
Category
Documents
-
view
2 -
download
0
Transcript of BEAM EXPERIMENTS WITH STATE SELECTED Ne(3 P0 ,3 ...
IKIS-mf—9453 A//
BEAM EXPERIMENTS WITH STATE SELECTED
N e ( 3 P 0 , 3 P 2 ) METASTABLE ATOMS
M.J. Verheijen

BEAM EXPERIMENTS WITH STATE SELECTED
Ne ( 3 P 0 , 3 P 2 ) METASTABLE ATOMS
PROEFSCHRIFT
ter verkrijging van de graad van doctor in de
technische wetenschappen aan de Technische
Hogeschool Eindhoven, op gezag van de rector
magnificus, prof.dr. S.T.M. Ackermans,
voor een commissie aangewezen door het college
van dekanen in het openbaar te verdedigen op
dinsdag 20 maart 1984 te 16.00 uur
door
Martinus Joannes Verheijen
geboren te Nederweert

Dit proefschrift is goedgekeurd door
de promotoren
Prof.Dr. N.F. Verster
en
Prof.Dr.Ir. D.C. Schram
Co-promotor Dr. H.C.W. Beijerinck
Druk: Dissertatie Drukkerij Wibro. Helmond, Telefoon 04920-23981.

De beste uitweg uit een moeilijkheid is er doorheen.
Anoniem, Spectrum citaten boek.
Aan Ineke
Aan mijn ouders

Receptie na afloop van de promotiein het Auditorium van deTechnische Hogeschool Eindhoven
MARTIN VERMEDENINEKE AARTS
Poorterstraat 225663 CH Geldrop

Table of contents
1 Introduction
2 Excited neon atoms and diatomic molecules
2.1 The excited states of Nel 32.2 Elastic collisions with excited neon atoms 72.3 Inelastic collisions with excited neon atoms 132.4 Studies planned at our laboratory 15
3 Penning ionisation
3.1 Introduction 173.2 A qualitative description of Penning ionisation 173.3 Semiclassical inelastic scattering theory 20
4 The dye laser system
4.1 Introduction 354.2 Absolute stabilisation of the laser frequency 374.3 Accurate perpendicular alignment of laser beam 46
and atomic beam
5 Experimental
5.1 Introduction 555.2 The primary beam 565.2.1 Translation energies of beams of metastable 56
atoms5.2.2 A discharge excited thermal beam source 59
of metastable atoms5.3 The secondary beam 795.4 Detectors for elastic and inelastic scattering 83
products5.5 Automisation of the experiment 855.6 State selective total inelastic cross section 96
measurements
6 Experimental natural lifetimes of the Nel (2p) levels 109
7 Laser probing of the plasma source 115
8 State selected total Penning ionisation cross sections 149
Summary 175Samenvat ting 178Nawoord 181Levensbericht 183

This thesis is based upon the work presented in the followingpapers:
4.2: M J Verheijen, E C U Beijerlnck, and N F VersterAn atomic beam set-up for 0.5 MHz absolute frequencystabilisation of a single -mode CM dye laser.J.Phys.E: Sci.Instrum. 15 (1982) 1198-1206
4.3: M J Verheijen, H C W Beijerlnck, and N F VersterAccurate (0.25 mrad) perpendicular alignment of a CWsingle-mode dye laser beam and an atomic beam.Rev.Sci.Instrum.: submitted for publication
5.2.2: M J Verheijen, H C H Beijerinck, L H A M van Moll,J Driessen, and N F VersterA discharge excited supersonic source of metastablerare gas atoms.J.Phys.E: Sci.Instrum.: submitted for publication
5.3: M J Verheijen, H C W Beijerinck, W A Renes, and N F VersterA quantitative description of skimmerinteraction in supersonicsecondary beams: calibration of absolute beam intensities.Chem.Phys.: accepted for publication
5.3: M J Verheijen, H C W Beijerinck, W A Renes, and N F VersterA double differentially pumped supersonic secondary beam.J.Phys.E: Sci.Instrum.: submitted for publication
6: M J Verheijen, H C W Beijerinck, P J Eenshuistra,J P C Kroon, and N F VersterLifetimes of the Ne 2p fine structure states by measurements oflinewidths of the laser induced fluorescence of an atomic beam.Opt.Comm. 45 (1983) 336-341
7: H J Verheijen, H C W Beijerinck, P W E Berkers, D C Schram,and N F VersterA hollow cathode arc in neon: simultaneous laser probing andmolecular beam sampling of metastable atoms as a plasmadiagnostic.J.Appl.Phys.: submitted for publication

Chapter I Introduction
1.1 Me tastable atoms
Me tastable rare gas atoms play an important role in all types of
plasmas and gas discharges, e.g. in fluorescent lamps and in laser
discharges (helium-neon laser or excimer lasers). In the molecular beam
group at the Eindhoven University of Thechnology a few years ago the
research field has been shifted from the interaction between ground
state atoms (elastic) to the interaction between metastable rare gas
atoms with ground state atoms and molecules involving elastic,
inelastic, and reactive collision processes. During 1983 the first
experimental results on elastic and inelastic scattering with metastable
rare gas atoms have been obtained.
1.2 Guide for the reader
The results of four years of research is set down in this thesis.
Because the research field was new for our laboratory much effort has
been put in the development of experimental facilities, which are
described in the chapters four (the dye laser system) and five (the beam
machine with a new secondary beam). For the same reason the experimental
results have the character of a triple jump through the field of beam
experiments with metastable atoms, as is demonstrated by comparing the
chapters 6, 7, and 8. The common aspect is that a beam of metastable
neon atoms is used in all three experiments. In chapter 6 the
experimental results for the natural lifetimes of the 2p fine structure
states of Ne I are presented and compared to theoretical results and
other experimental results obtained with fully independent methods. In

chapter 7 a plasma diagnostic is presented which we have applied to the
external plasma column of a hollow cathode arc in neon. Chapter 8,
finally, describes a crossed beam scattering experiment with state
selected metastable atoms. For this measurement all experimental
facilities described in the chapters 4 and 5 have been used. In
chapter 3 a summary is given of the optical potential model, which we
use to calculate total Penning ionisation cross sections in chapter 8.
Because of the variety of subjects in this thesis the reader will
probably have some problems to obtain a complete overview of the whole
work. Therefore the sections that are published or submitted for
publication in the form presented here (section 5.3 excepted) are listed
below. These sections are self consistent and can be read separately.
Because we have used directly several reprints of published papers
or manuscripts of submitted papers, the references and the numbering of
figures, tables, and equations is not consistent throughout this thesis.
The figures and tables of the published or submitted sections and the
equations of all sections are numbered separately, starting in each
section with number one. Referring to an equation of another section is
done by adding the section number to the equation number, e.g.
"eq. 5.6.27" refers to eq. 27 of section 5.6 and "eq. 27" refers to
eq. 27 of the current section. Figures and tables in all unpublished
sections consist allways of the section number followed by the table or
figure number, e.g. "table 5.5.1" or "figure 8.4". The references in the
published (or submitted) sections are according the prescriptions of the
editors. Each section of this thesis has its own list of references,
which implies that one reference can be given in more than one reference
list, even in different forms.
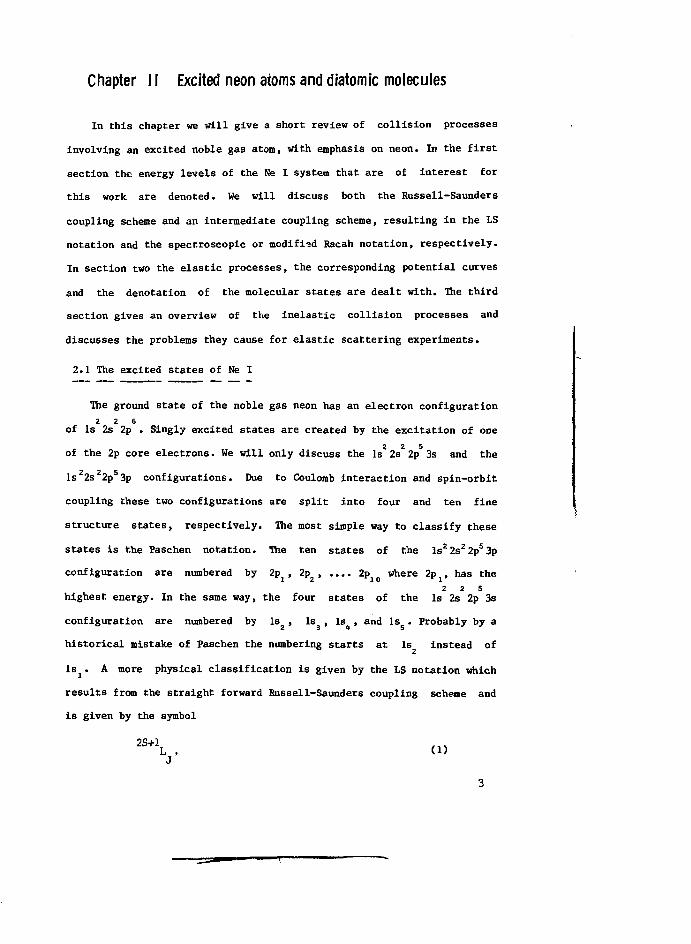
Chapter 11 Excited neon atoms and diatomic molecules
In this chapter we will give a short review of collision processes
involving an excited noble gas atom, with emphasis on neon. In the first
section the energy levels of the Re 1 system that are of interest for
this work are denoted. We will discuss both the Russell-Saunders
coupling scheme and an intermediate coupling scheme, resulting in the LS
notation and the spectroscopie or modified Racah notation, respectively.
In section two the elastic processes, the corresponding potential curves
and the denotation of the molecular states are dealt with. The third
section gives an overview of the inelastic collision processes and
discusses the problems they cause for elastic scattering experiments.
2.1 The excited states of He I
The ground state of the noble gas neon has an electron configuration
2 2 6of Is 2s 2p . Singly excited states are created by the excitation of one
2 2 5
of the 2p core electrons. We will only discuss the Is 2s 2p 3s and the
Is22s22p53p configurations. Due to Coulomb interaction and spin-orbit
coupling these two configurations are split into four and ten fine
structure states, respectively. The most simple way to classify these
states is the Paschen notation. The ten states of the Is22s22ps3p
configuration are numbered by 2$^, 2p2 2p where 2p , has the
2 2 5
highest energy. In the same way, the four states of the Is 2s 2p 3s
configuration are numbered by Is , Is , Is , and Is . Probably by a
historical mistake of Paschen the numbering starts at Is instead of
lsj. A more physical classification is given by the LS notation which
results from the straight forward Russell-Saunders coupling scheme and
is given by the symbol
2S+1 ,,.L , (1)J

where the q-oantum numbers S and L characterise the total spin S and the
total orbital angular momentum L, respectively, of all electrons. The
term 2S+1 gives the multiplicity of the fine structure state and the
states with L = 0, 1, 2 are according to international nomenclature
denoted b> S,P,D, respectively. The quantum number J characterises the->•
total angular momentum J of all electrons, which is obtained by the•+• •+
coupling of L and S. Each fine structure state has a degeneracy of 2J+1.•+ -* -*-
In order to give a physically correct notation L, S, and J have to be
constants of motion. This always holds for J, but in the case of excited
neon atoms this is not fully true for S and L, because the excited
electron is much looser bound than the other electrons in the core.
It is generally accepted that an intermediate coupling scheme
(between LS coupling and jj coupling) gives better constants of motion
for the excited states of neon. In this scheme first the core electrons
are coupled according the above mentioned LS coupling scheme resulting
2SC+1in a *- Lc state where Sc and Lc are the quantum numbers for the
total spin and total orbital angular momentum of all core electrons and
J (quantum number J ) is the total angular momentum of the core
electrons. Now the orbital angular momentum % and the spin s of the
excited electron are coupled with Jc» Because the spin-orbit interaction
is much smaller for the excited electron than for the 2p electrons,
first the orbital angular momentum is coupled with J , resulting in a
"total angular momentum apart from spin" K with quantum number K that
can assume the values
K - Jc+L, Jc+L-1, |JC~LI- <2>
Next K and s are coupled to the total angular momentum J with
J - K ± 1/2 • <3>

The fine structure states now are described by the quantum numbers Lc,
S , J , K, J and given by the spectroscopie notationc c
2S +1 ,,sc Lc n2 (X) . (*)
with n the principal quantum number of the excited electron. For singly2 2 s
excited neon the core electrons (Is 2s 2p configuration) result in a
2 2F or P state. A shorthand notation of eq. 2.4 now is given by the3/2 1/2
modified Kacah notation
2where the prime above & indicates a core with a P1/9configuration. The
2J+1 fold degeneracy of the fine structure states can be resolved with a
magnetic field for example. The pure states that then result are
classified by one more quantum number m, characterising the component of
•+
J along the quantisation axis (m » J, J-l, .... -J). A recent
investigation by Verhaar and Martens [Mar83] surprisingly shows that
the quantum numbers of the Russell-Saunders coupling scheme are even
better than those of the intermediate coupling scheme for the four Is
states. The ten 2p states are equally well described by the quantum
numbers of the Russell-Saunders and the intermediate coupling scheme.
Table 2.1 gives the above mentioned notations for the Is 2s 2p 3s and
2 2 5
Is 2s 2p 3p fine structure states of neon. However, for the heavier
noble gases it still is to be expected that the intermediate coupling
scheme gives better results.
Throughout this thesis we will use the Faschen notation where we
will omit the subscript when we only want to indicate a group of fine
structure states. We indicate an atom in an excited state by an asterisk
as superscript, while for the ground state atoms no asterisk is used.

Table 2.1 The denotation of the excited Nel fine structure states. One
of the 2p electrons is excited to a 3s or 3p orbit.
Paschen
ls2
ls3
ls4
ls5
2P7
2p8
2P9
2Pl0
LS coupling
Russell Saunders
LJ
XX
XX\XXXXXX -X3s1
Spectroscopie
2 Sc + 1L c nJc [K]
2P, 3s [1/2].
Pi 3s U-/2]Q
P 3s b/2]2
2P 3 3s [3/2]22"
Pi 3p [l/2]n2 {J
2Pi 3p d/2]1
2P, 3p [l/2]n2
2P^ 3p [3/2 ] 2
2P^ 3p [3/2 ]j
2P 3 3p [3/2]22
2P 3 3p [3/2] 1
2P 3 3p [5/2]22
2P 3 3p [5/2]32
2P 3 3p [1/2] 12
Modified Racah
3SÓ1
3sÓ0
3s n
3s12
3póo
Hl
Ho
3pi2
3pii
3p12
3P U
3p22
3p23
3pQ1
2p3 "To T 3p [1/2JO 3p00 |

2.2 Elastic collisions with excited neon atoms
Much theoretical and experimental effort has already been put into
the investigation of the interactions between excited noble gas atoms
and, like or unlike, ground state atoms. Most of the work is done for
the metastable states of helium. Potential curves for the molecular
states of Is neon with ground state neon have been calculated by Cohen
and Schneider [Coh74], with ground state argon by Morgner [Mor83], and
with ground state helium and neon by Hennecart [Hen82], who has also
calculated the potential curves for the molecular states of 2p neon with
ground state helium and neon. Figures 2.1 and 2.2 give the results of
Cohen and Schneider [Coh74] and of Morgner [Mor83] for Ne - Ne*(ls) and
Ar - Ne*(ls), respectively.
The molecular states are classified by
g/u '
where the quantum number fi corresponds to the component of the total
angular momentum J along the internuclear axis [Her50]. When the two
nuclei have the same charge the midpoint of the internuclear axis is a
centre of symmetry and the electronic eigen-functions remain either
unchanged or only change sign when reflected at the origin, this results
in an even or odd symmetry which is indicated by the subscripts g and u,
respectively. For the case ÏÏ = 0 there is always a plane of symmetry
through the internuclear axis, also resulting in an even-odd symmetry
which is indicated by the superscript + and -, respectively. All states
with & 4 0 have a twofold degeneracy. Now, for example, the interaction
of a Is neon atom with a ground state neon atom results in six states,
®o' ^n• *o» *n» ^ > 2 four of which are twofold degenerate. TheJj U g U g U

Figure 2.1 Potential curves for the Ne-Ne*(ls5) system [Coh74]
Figure 2.2 Potential curves for the Ar-Ne*(ls5) system [Mor83]

interaction with a ground state argon atom, however, results in three
states, 0~, 1, 2, two of which are twofold degenerate. Figure 2.1 and
2.2 give the results of Cohen and Schneider [Coh74] and of Morgner
[Mor83] for He - Ne*(ls) and Ar - Ne*(ls), respectively. The like
system, Ne - Ne*(ls), has a few molecular states with a deep well
( 0.5 eV), while the unlike system, Ar - Ne*(lf>), shows only shallow,
van der Waals type, potential wells with a depth of 0.01 eV. This is
caused by the g-u symmetry in the like system, which splits some of the
states into one strongly repulsive and one strongly attractive
potential, as can be seen in figures 2.1 and 2.2
These theoretical potential curves can be verified experimentally
only in scattering experiments with a beam of excited atoms, because
bulk and transport gaseous properties are much more difficult to measure
for excited species than for ground state species. All elastic beam
experiments with excited atoms, however, can only be performed with
metastable atoms because the natural lifetimes of all other excited
species are too short to perform elastic beam scattering experiments.
State selection and even polarisation (m selection) of this beam is
possible with a dye laser beam, but most experiments up till now have
been performed with a mixed beam of ls3 and Is,, metastable atoms and all
potential curves will contribute coherently. The only way to observe
elastic scattering on only one potential is by selection of the Is.
atoms, a non-degenerate state. After polarisation one potential will
contribute preferentially to the scattering process, however, there will
always be a contribution of some other potentials. Up till now there are
no experimental results available on the differences between the fl-
potential curves.

Each type of beam experiment probes only a specific part of the
potential and is rather insensitive for the shape of the potential
elsewhere. Total elastic cross section measurements are sensitive for
the long range interaction, i.e. the van der Waals constants. Total
cross section measurements at higher energies, in the transition region
where attractive and repulsive forces are equal, give information on the
attractive and repulsive part of the potential. Measurements of the
glory structure in the total cross section give information of the
potential well. Differential cross section measurement probe the
repulsive part and the well of the potential but generally are performed
in a very limited energy range. Therefore the theoretically calculated
potentials are still a good starting point to analyse experimental
results.
Only few total cross section measurements with metastable neon atoms
are performed up till now [Rot65] at discrete energies of 68 meV (Ne*-
Ne) and 83 meV (Ne*-Ar), while there have been many more differential
cross section measurements. Winnicur et al. [Win76] have measured the
differential scattering of metastable neon on krypton. The scattering on
neon has been investigated by Gillen and coworkers [Spi77] (7 - 17 eV).
Differential scattering measurements on helium (60 and 110 meV), argon,
krypton, and xenon (30 and 60 meV) have been performed by the group of
Siska [Gre81, Fuk76], Differential cross section measurements at 68 meV
with a beam of state selected metastable atoms have been performed by
the group of Haberland [Bey83] using neon, argon, krypton and xenon as
collision partners. However, a final analysis is not available as yet.
For scattering experiments involving more potential curves generally
only one potential curve is used to describe the data. This is a good
10

approximation because the ft-pplitf.ing is generally small and appears in
the repulsive part of the potential, i.e. at short internuclear
distances. For Ne*-Ar this splitting starts even at energies above the
experimental energies used up till now (0.5 eV) (figure 2.2). Even for
a mixed beam experiment where two metastable species are in the beam
(Is 3 and ls5) , this is a good approximation because the differences
between the potential curves are only small while the contribution of
the ls3 metastable state to the total signal is only 17%. Parametrised
numerical expressions are generally used consisting of different
functional relations for the different regions. An example is given by
the Horse-Morse-Spline-van der Waals (MMSV) function
V (r) - ez(z-2) (7a)o
z - expl -e^r /r j - l ] °<r<rm (7b)
z - exp[-e2(r/rm)-l] rm<r<ri <7c>
V (r) » cubic spline polynomial r <r<r (7d)
VQ(r) - -C6/r6-C8/re-C io/r10 r?<r . (7e)
For the analysis of their differential scattering data Gregor and Siska
[Gre81] use an Ion-Atom-Morse-Morse-Spline-Van der Waals (IAMMSV)
function
Vo(r)« [l-f(r)] V+(r) + f(r) V!(!(r)( (8)
with V (r) a core (Ne+ - rare gas) ion-atom potential represented by a
Morse-Spline-Van der Waals(MSV) function
V+(r) - e+ z(z-2) (9a)
z - exp[-0+(r/r*-l)] 0<r<rj (9b)
V+(r) - cubic spline polynomial r <r<r (9c)
11

V+(r) - -Cjrk
The switch over function is given by
f(r) - {l+exp[(r -r)/d]}"1
r <r .2
<9d)
(10)
and V^r) is an MMSV function with e* and r* the depth and position of
the well, respectively. The switchover to the ion-atom potential takes
place where the internuclear distance becomes smaller than the radial
expansion of the wave function of the excited electron. This effect is
even more pronounced for short lived excited states, with an electron at
larger distances, e.g. the 2p states and Rydberg states. Because
scattering features are always expressed in the position and depth of
the well in the interaction potential VQ(r) (eq. 8), one uses generally
e and r as free parameters instead of E* and r*. Gregor and Siska have
fitted their data by varying only £ , 3 , and 3 , while all other
parameters have been fixed to theoretical values or results of other
Figure 2.3 The IAMMSV potential for the He*(2 %)-Ar system as proposed
by Haberland and Schmidt [Hab77].
12

types of experiments. This is fully justified because their experimental
information has a limited energy range and is insensitive for the long
range attractive parameters and the parameters of the ion—atom
potential, which contributes only at short internuclear distances, i.e.
at high energies. Therefore these parameters can be fixed to their
theoretical values. This means that in the analysis of other types of
beam experiments these prameters can be treated as fully free, While £,
Bj, and ^2 can only be varied in a very small range.
Due to the two contributions, tha IAMMSV potential possibly has a
hump in the repulsive wall or even a second well. This is demonstrated
in figure 2.3 where the IAMMSV potential for the He*(2 1S)-Ar system is
given as proposed by Haberland and Schmidt [Hab77].
2.3 Inelastic collisions with excited neon atoms.
Different types of inelastic collisions between an excited atom and
a ground state atom are possible. First there are fine structure
changing collisions. For both the neon Is and neon 2p states these are
studied in gas cell experiments [e.g. Ste79, Hen78, Sie79] and in a
flowing afterglow [Cha80]. For the metastable neon Is atoms fine
structure changing collisions have already been studied in a beam-beam
scattering experiment [C0I8I]. Another type of inelastic collisions is
the Penning ionisation and associative ionisation of the ground state
atom
R* + M -> R + M + + e~ PI (Ha)
R* + M -> RM+ + e~ AI . (lib)
This is only possible if the excited R atom has enough internal energy
to ionise the ground state atom M. In general, the Penning ionisation
and associative ionisation are overwhelmingly preferred to other
13

electronically inelastic channels. An overview of inelastic beam
scattering experiments of this type is given by Niehaus [Nie81] and in
chapter 3 we will return to these processes and their value in probing
the internuclear potential.
If the internal energy of the excited atom does not reach to ionise
the collision partner, an important inelastic process is the transfer of
the excitation energy, which is very efficient when the process is near
resonant. This type of process is responsible for the population of the
upper state of the laser transition in a He-Ne laser
He* + Ne -> He + Ne*(3s) . (12)
Another type of excitation transfer is the formation of excimers and
exciplexes
Ar* + Ar + Ar -> Ar* + Ar (13a)
Kr*+F 2 -> (KrF)* + F . (13b)
Only the latter can be studied in beam experiments, because the former
is a three body collisions.
Because inelastic collision processes are studied in beam scattering
experiments by detecting the newly formed products, these experiments
can be performed not only with the metastable atoms, like in the elastic
beam scattering experiments, but also with the short lived 2p atoms,
which have to be produced at the scattering centre by optically pumping.
Because all these inelastic processes occur most likely at small
impact parameters, the experimental results of differential cross
section measurements at large en scattering angles corresponding to
small impact parameters will be lower thant expected from only the
elastic potential, due to the irreversibillty of the inelastic
processes. This means that in the analysis of differential cross section
14

data these effects have to be included by combined fitting of the
differential scattering data, the energy dependence of the total
ionisation cross sections and the quenching rate constants [6re81].
2.4 Planned studies in our laboratory.
We have build a molecular beam machine with the final aim to study
the fine structure changing collisions within the neon 2p decaplet with
ground state helium and neon atoms as collision partners in a beam-beam
experiment
N e ^ p p + Ne/He -> Ne*(2pj) + Ne/He . (14)
The short lived neon 2p states are produced by optical pumping of a neon
Is beam with a c.w. dye laser beam in the scattering center. Transitions
of the type of eq.14 then are detected by the wavelength resolved
detection of the visible photons emitted by the short lived neon 2p.
atoms. The centre of mass collision energies range from 10 meV (thermal)
to 10 eV (superthermal) with a gap between 0.15 and 0.6 eV. With a
spiraltron near the scattering centre we have the possibility to study
also total ionisation cross sections with state selected and polarised
neon Is or 2p atoms, while this detector also can be used to measure
fine structure changing collisions in the neon Is quadruplet by
detection of the resonance u.v. photons produced by the spontaneous
decay of the Is and Is states.2 *
15

References
Bey83 W Beyer, H Haberland and D Hausamann, Int. Symp. on Mol. BeamsIX, Freiburg (1983), Book of abstracts,229.
ChaSO R Chang and D Setser, J. Chem. Phys. 72 (1980) 4099
Coh74 J S Cohen and B Schneider, J. Chem. Phys. 61 (1974) 3230
Coh78 J S Cohen, L A Collins and N F Lane, Phys. Rev. A 17 (1978) 1343
Col81 J Colomb de Daunant, G Vassilev, M Dumont, and J Baudon, Phys.Rev. Letters 46 (1981) 1322
Fuk76 T Fukuyama and P E Siska, Chem. Phys. Letters 39 (1976) 418
Gre81 R W Gregor and P E Siska, J.Chem.Phys. 74 (1981) 1078
Hab77 H Haberland and K Schmidt, J.Phys.B: At.Mol.phys. 10 (1977) 695
Hab81 H Haberland, Y T Lee, and P E Siska in "The excited state inchemical physics", chapter 6, (ed. J Wm McGowan), John Wiley andSons, New York (1981)
Hen78 D Hennecart, J. Physique 39 (1978) 1065
Hen82 D Hennecart, thesis (1982), University of Caen
Her50 G Herzberg "Spectra of diatomic molecules" van Nostrand Reinhold,New York (1950)
Mar83 J M Martens and B J Verhaar, private communication
Mor83 H Morgner preliminary results, to be published
Nie81 A Niehaus in "The excited state in chemical physics" chapter 5,(ed. J Wm McGowan), John Wiley and Sons, New York, (1981)
Rot65 E W Rothe and R H Neynaber, J. Chem. Phys. 42 (1965) 3306
Sie79 R A Sierra, J D Clark, and A J Cunningham J. Phys. B: At. Mol.Phys. 12 (1979) 4113
Spi77 G Spiess, K T Gillen, and R P Saxon, J. Phys. B: At. Mol. Phys.10 (1977) 899
Ste79 L W G Steenhuysen, Thesis (1979) Eindhoven University ofTechnology.
Win76 D H Winnicur, J L Fraites and J Bentley, J. Chem. Phys. 64 (1976)1757
16

Chapter 111 Penning ionisation
3.1 Introduction
An atomic or molecular system that is excited to a state above its
first ionisation limit is unstable against the spontaneous emission of
an electron. During a collision process of particles A and B a molecular
system (A + B) is temporarily formed and when one of the collision
partners, say A, is in an excited state A* with energy E (A) larger than
the ionisation energy E^(B) of collision partner B, spontaneous emission
of an electron may occur during the collision, according to
A* + B + A + B+ + e" , (la)
A* + B + (AB)+ + e~ . (lb)
Process la, resulting in a free system A + B is known as Penning
ionisation [Pen27] while process lb, resulting in a bound system (AB)
is known as associative Penning ionisation. A unified physical picture
including these processes is given by Niehaus [Nie81]. In section 2 of
this chapter a qualitative description of Penning ionisation is given
and section 3 gives the semiclassical calculation of the total cross
section for Penning ionisation from given interaction potentials, using
the optical potential model.
3.2 A qualitative description of Penning ionisation.
When the relative velocity of the collision partners is "not too
large", the movements of the electrons and the nuclei are separated,
which corresponds to the Born-Oppenheimer approximation. Generally this
condition is fulfilled and all theoretical descriptions are given in the
Born-Oppenheimer approximation. The collision process now can be
17

described by adiabatic potential curves which can be calculated in
electronic-structure calculations at fixed internuclear distances r. The
transition rate for spontaneous ionisation depends only on the
-1internuclear distance. Instead of the transition rate W(r) (s ) one
uses the corresponding energy width T(r) (J) given by
T(r) = R W(r) (2)
A generally assumed shape for the energy width is given by
T(r) -v exp(-3r) (3)
with a characteristic length 1/3. Hie spontaneous ionisation process can
be understood qualitatively from the potential curves of figure 3.1. The
potential curves for the excited system A*+ B and the ionised system
Figure 3.1 The potential curve model of Penning ionisation [Nie81].
18

(AB) , the energy width IXr) and the initial relative kinetic energy
E- = Ej oo) of the incoming particles are given. The potential energy is
given by the functions V(r) + E^ and V+(r) + E+, with V(°°) - V+(a>) - 0.
In the Born-Oppenheimer approximation a spontaneous ionisation at
position R. is a "vertical" transition between the two potential curves
V(r) and V, (r) at r - R. . The energy of the electron then is given by
e . V(R ) - V (R ) + E* - E <«>
We see that the electron energy is the sum of the nominal value E -E,
and the .difference potential V(R.) - V+(R.) which depends on the
position R± where ionisation takes place. When the recoil transferred to
the heavy particles on electron ejection is neglected both the relative
kinetic energy E. of the heavy particles and the angular momentum i are
conserved during the spontaneous ionisation, given by
Ek(R.) = E'CR.) I = V (5)
where the prime denotes the situation after the spontaneous ionisation.
The total energy E will always be conserved, resulting in
tot E * + E
o = \ + E ; + e
and we see, with eq. 4, that the value of E ' « EjlC°») is fully determined
by the position R. where ionisation takes place for a given value of E
and by the given potential curves. The processes resulting in EQ< 0
correspond to associative Penning ionisation (eq. lb) and those with
EQ> 0 to Penning ionisation (eq. la).
Because of the irreversibility of the process, due to the rapid
departure of the Penning electron, the total cross section for a
spontaneous ionisation is determined by the potential curve of the
19

excited system and the transition probability W(r) and does not depend
on the potential curve of the ionised system. Information on the latter
potential curve can be obtained by measurements of the energy
distribution of the Penning electrons and of the ratio of Penning to
associative Penning ionisation.
3.3 Scattering theory for an optical potential
3.3.1 Probability current density
A collision process at a spherically symmetric potential V(r) at
relative kinetic energy E o in a centre of mass frame is quantum
mechanically described by a wave function *(r,9) which satisfies the
Schroedinger equation
{A + k2 + 2U/R2 V(r)} ¥(r,e) = 0 (7)
2 2 2with k » (Ug/lï) » 2\iEc/h the squared wave number of the incident
wave, V the reduced mass of the system, g the relative velocity and ©
the scattering angle.
_3The probability density is normalised at l(m ) at infinity:
»*(».8) ¥(«.O) = 1 (8)
The flux or probability current density J(r,9) (m s ) at position
(r,8) is given by
3(r,6) = J L {V*(r,6) vnr.6) - f(r,6) fa*(r,e)} (9)2m
and its divergence becomes
v'-J(r.e) = J L {/(r.6) &V(r,e) - V(r,e) A-Ar.6)} (10)2yi
The outgoing probability current or flow 4|.(R) (s ) through a sphere
20

with radius R is given by
* (R) = J7J(r,e)-nR2d2n UD
= Iltf'%,B) d3V (12)
where n is the unit normal vector at surface el_jient R aü and d V is a
volume element.
The divergence of the probability current density can be calculated
by replacing AH* and its complex conjugate from eq. 7 resulting In
V-J(r,6) = (2/E) Im{V(r)} if(r,e)|2 (13)
Equations 12 and 13 show that for a real potential the flow is zero,
corresponding to conservation of particles. However, a complex potential
with Lu V(r) < 0 results in a negative flow or loss of particles and
with Im V(r) > 0 in a positive flow or gain of particles. A complex
potential now, with In V(r) < 0 , generally is used to describe elastic
scattering with one or more inelastic channels that are open. The
imaginairy part describes the loss of particles in terms of absorption
of flow. This is called the optical potential model because of its
analogy with optics where light absorption is described by the
imaginairy part of the index of refraction. The imaginary part of
potential is proportional to the absorption function W(r) or energy
width F(r) introduced in 3.2 according to
Im{V(r)} = -4r(r) = -§H W(r) (14)
Although all open inelastic channels are included in this one absorption
function, this model can be used very well to describe total cross
sections for Penning ionisation because this is far out the most
favoured inelastic process.
21

3.3.2 Cross sections
The general solution of the Schroedinger equation (eq. 7) behaves
asymptotically (r-xx>) as
*(r,e> = ^(r.6) + V2(r,8)
^ exp(ikr cos9) + 1 exp(ikr)
where f. is the incoming plane wave parallel to the z-axis and ^ Is the
outgoing spherical wave with the so-called scattering amplitude f(6)
which is determined by the Schroedinger equation. The flux now is given
by
Jt(r,e) = J M(r.6) + J2i2(r.6) + J1|2(r,6) + J2jl(r,6) (17)
and the outgoing flow of a sphere with radius R by
•t(R) = »ltl(R) + *2,2(R) + *1,2(R) + *2,1(R)< U 8 )
The first term corresponds to a flux (i.e. current per area) equal to
J^n • g « fik/u and describes the incoming homogeneous probability
current. The flow corresponding to the second term describes the
2outgoing intensity (i.e. current per solid angle) equal to g |f(6)| .It
can be shown that the flux corresponding to the rapidly oscillating
cross terms averages to zero for all directions except the forward
direction. Therefore the differential elastic cross section, i.e. the
outgoing intensity per incoming flux is given by
The total ingoing flow into a sphere with R -»• °° corresponds to the
total absorption cross section,
Qabs<8> - " *t/g <20>
22
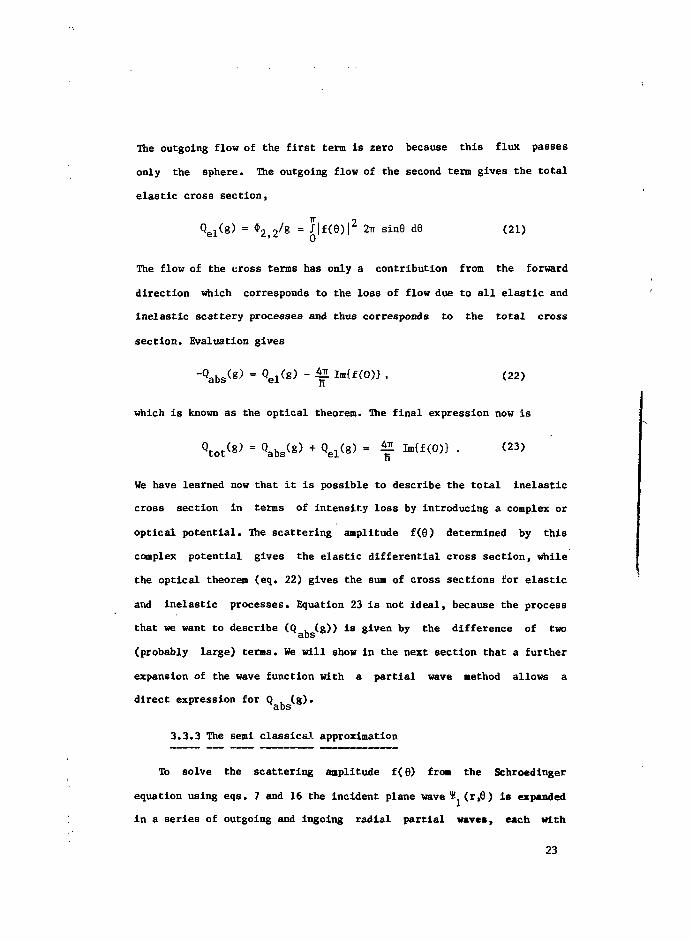
The outgoing flow of the first term is zero because this flux passes
only the sphere. The outgoing flow of the second term gives the total
elastic cross section,
Q (g) = $, „/g = 7|f(6)|2 2TT sin6 d9 (21)ex z,z Q
The flow of the cross terns has only a contribution from the forward
direction which corresponds to the loss of flow due to all elastic and
inelastic scattery processes and thus corresponds to the total cross
section. Evaluation gives
-Qabs(g) = Qel(g) - &L Im{f(0)} , (22)
which is known as the optical theorem. The final expression now is
Qtot(8) - Qabs(8) + Qel(g) = 4jL Im{f(0)> . (23)
We have learned now that it is possible to describe the total inelastic
cross section in terms of intensity loss by introducing a complex or
optical potential. The scattering amplitude f(6) determined by this
complex potential gives the elastic differential cross section, while
the optical theorem (eq. 22) gives the sum of cross sections for elastic
and inelastic processes. Equation 23 is not ideal, because the process
that we want to describe (Q (g)) is given by the difference of two
(probably large) terns. We will show in the next section that a further
expansion of the wave function with a partial wave method allows a
direct expression for Q , (g).abs
3.3.3 The semi classical approximation
To solve the scattering amplitude f(6) from the Schroedinger
equation using eqs. 7 and 16 the incident plane wave ¥ (r,9) is expanded
in a series of outgoing and ingoing radial partial waves, each with
23

orbital angular momentum * and the scattered outgoing wave (r,6) is
expanded in a series of outgoing radial partial waves. The effect of the
scattering potential V(r) is a phase shift 21^ of each outgoing partial
wave,, i.e. an undisturbed wave V u n d i s t u r b e d is disturbed to * disturb(, •
according to
Undisturbed * 7 COs(kr) = £ { e x p (" i k r ) + exP<ikr>} (24)
'disturbed 1>'i{«P(-ikr) + exp(lkr+21Hjl)} (25)
A complex potential will moreover attenuate the outgoing wave with a
complex phase shift
\ = ^ +i?j), (26)
with i p>0. The result for f(6) is a partial wave sum or Rayleigh sum
[Lan59]
f(6) = - -L. 1(2)1+1) {exp(2in„) - 1} P„(«>se) (27)2k i X. x,
with P. the £'th Legendre polynomial. Substitution of the Rayleigh sum
(eq. 27) in eqs. 21 and 16, 10 and 20 gives for the elastic and
inelastic total cross sections
Qel ( 8 ) = ^2 t(2Z+1) |exp(2i€r2?Jl) - l\2 (28)
0abs(8) - L 1(21+1) {1 - expC-4^)} (29)
Qtot(8) " "7 ï(2fc+1) *2 ~ 2cos2^ «P(-2C£)} (30)
Equation 29 gives the fractional absorption A, of each partial wave
AA - 1 - exp(-4CJl) (31)
As usual in this field the calculation of the total cross sections in a
seaiclassical treatment results in a high accuracy. The asymptotic or
24

JWKB approximation for real potentials can as well be used for the
complex potentials, resulting in the semi classical complex phase shifts
[Wan76, Mic76]
oofioo
Ho = èT(£+i) - kz + 12VJL {(E - V(z) - H (A+i) /2ur ) - E*} dz (32)
zcwith the complex classical turning point z and the complex potential
V(z) given by
(33)
Equation 32 can be expanded in a perturbation series for [Mic76]
ir(r) « E Q - VQ(r) - R2(«,+i)2/2yr2 (3«)
resulting in separate formulae for £, and C, . The first terms are given
by oo
^ = W + i ) - krc + lM è |{(Eo - VQ(r) - E2(A+i)2/2ur2)* - E*} dr
dr (36)
- Vo(r) -
The real part £, is identical to the phase shift calculated with eq. 32
for only the real part of the potential, V (r). Ihis also follows
directly from the condition in eq. 34 which says that the imaginary part
of the potential plays no role in the trajectory of the particle. In a
better approximation one should compare a complex potential VQ and a
real potential V with V - Re(V*), as follows from optics.R R C
With the radial velocity v»(r) of the system moving in the effective
potential V e f f(r),
èuv2(r) = Eo- Veff(r) = EQ- VQ(r) - h2(£+i)2/2yr2 (37)
we get
25

(38)
With this result the fractional absorption A given in eq. 31JO
corresponds exactly to the classical opacity function A(b), given by the
rate interpretation of T(r),
(39)
where b is the impact parameter and dr/v^Cr) is a time increment.
3.3.3.1 Numerical calculation
We calculate the absorption cross sections according to eq. 29 with
the imaginary part of the phase shift ?„ given by the approximation of
eq. 36. All distances and energies are scaled to the position and the
depth of the well of the real part of the potential Vrl(r), r and E," m
respectively. The potential is given by
Vo(r) = s f(x)
with x - r/r , g(l) - 1, and f(l) - -1. Equation 36, now, is given by am
numerical factor and by an integral involving the two shape functions,
resulting in
g(x) dx
V 'm
with M the reduced mass number, and u the atomic mass unit. The
singularity of the integrand at the classical turning point can be
removed by transforming the integration variable x to
X= (x - xJ* (43)
26

with x « r /r the scaled classical turning point.c cm
The classical turning point is determined numerically with a
relative error 10 . To avoid square roots of negative values of EQ-V ff(r), due to the error in xc, we perform an analytical integration
2from x to x +6 using a linear approximation for v^(r) - EQ - Veff(r).
-4With 0 - 1 0 x this analytical contribution to ?£ is less than 3%.
b/rm
Figure 3.2 The imaginairy part of the complex phase shift ?« (upper
part) and the contribution of the partial waves to the total
absorption cross section (lower part) for four collision
energies as a function of the reduced impact parameter. The
partial wave number I is given by (£+i) - krm b/rm. The Ne*-
Ar potential proposed by Gregor and Siska [Gre81] is used
with eq. 36 and 31.
27

0.1-
0.001 r
1-0 Cb-0)Figure 3.3 The contribution to
5j,of the region with r > R,
£/,(R) for two impact parameters:
b = 0 (Jl=0) and b = r , and two
energies: E =0.1 and E = leV.
For comparison the straight li-
nes give an exponential decay
with characteristic length
0.5 1.0
28
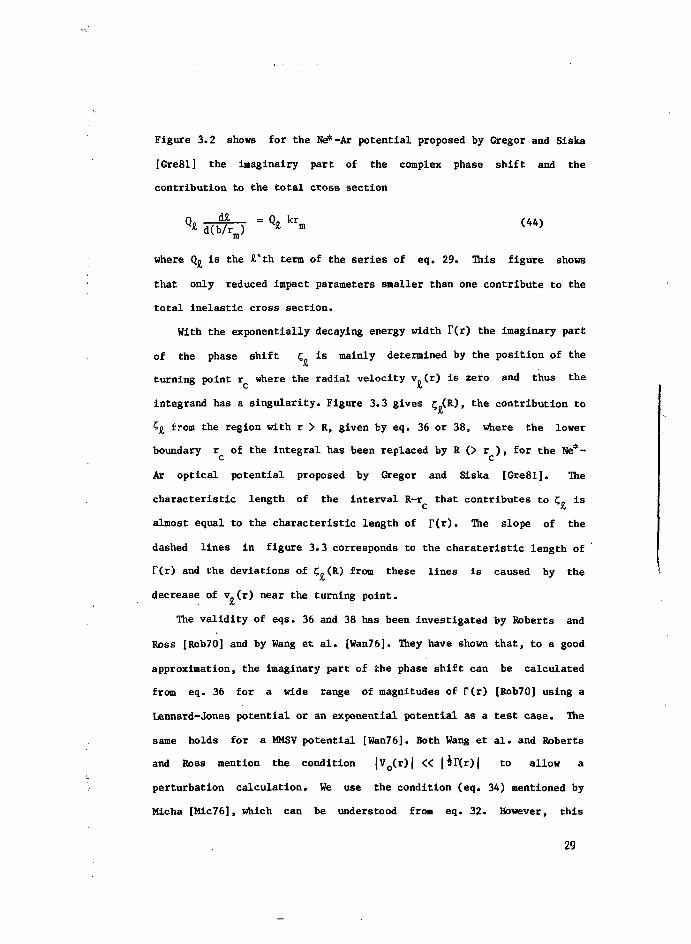
Figure 3.2 shows for the Ne*-Ar potential proposed by Gregor and Si ska
[Gre81] the imaginairy part of the complex phase shift and the
contribution to the total cross section
= Qi k rm <**>
where Q^ is the £*th term of the series of eq. 29. This figure shows
that only reduced impact parameters smaller than one contribute to the
total inelastic cross section.
With the exponentially decaying energy width T(r) the imaginary part
of the phase shift C, is mainly determined by the position of the
J6turning point r where the radial velocity v„(r) is zero and thus the
C At
integrand has a singularity. Figure 3.3 gives £0(R), the contribution to
?£ from the region with r > R, given by eq. 36 or 38, where the lower
boundary r of the integral has been replaced by R (> r ) , for the Ne*-
Ar optical potential proposed by Gregor and Siska [Gre81]. The
characteristic length of the interval R-r that contributes to ?„ isc a,
almost equal to the characteristic length of T(r). The slope of the
dashed lines in figure 3.3 corresponds to the charateristic length of
T(r) and the deviations of S,,(R) from these lines is caused by the
decrease of v.(r) near the turning point.
The validity of eqs. 36 and 38 has been investigated by Roberts and
Ross [Rob70] and by Wang et al. [Wan76]. They have shown that, to a good
approximation, the imaginary part of the phase shift can be calculated
from eq. 36 for a wide range of magnitudes of T(r) [Rob70] using a
Lennard-Jones potential or an exponential potential as a test case. The
same holds for a MMSV potential [Wan76]. Both Wang et al. and Roberts
and Ross mention the condition |VQ(r)| « |ir(r)| to allow a
perturbation calculation. We use the condition (eq. 34) mentioned by
Micha [Mic76], which can be understood from eq. 32. However, this29

condition is surely not fulfilled in a small region from the turning
point r to r +6r where vo(r) is small, and here the trajectory willC C C X,
probably be influenced by the imaginary part of the potential. Because
it is just this region that gives the largest contribution to C^
(figure 3.3), we have checked the possible systematic error due to the
approximation by the first term of the pertubation series expansion in
this region. We have used v.(r) (eq. 37) to determine 6rc for which
èr(r +ór ) - 0.10 iuv„(r +ör ) (eq. 34) and calculated the relativeCC X» C C
contribution of this region to £.. Table 3.1 gives the results for two
impact parameters b - 0 (£-0) and b - r . Ihe value of <Sr_ is always
less than 0.06 r and the contribution to Cj is generally much smaller
Table 3.1 The characteristics at the position R » r +6r wherec c
$F(R) -0.1 èuv^(R) for three collision energies and two
impact parameters: b » 0 (£»0) and b * r .
(meV)
(meV)
(meV)
(aeV)
1000
0
1000
399
0.412 0.998
0.0007 <0.0001
5.5% 2.8%
2.28 0.031
9887 -5.45
12.3 0.20
100
0
100
126
0.550 0.976
0.004 0.0008
15% 8%
0.803 0.036
96.2 -5.35
3.79 0.18
10
0
10
40
0.784 0.895
0.004 0.004
16% 15%
0.144 0.064
9.29 -3.05
0.72 0.33
30

than 20Z. We may expect that only this contribution to t,^ will be not
very reliable and the resulting values of S^ and Qa^s will still have an
accury of better than 1%.
The real part of the phase shift of a full quantum mechanical
calculation shows a significant deviation from eq. 35 when the imaginary
part of the potential is "turned on". Wang et al. [Wan76] have found a
simple relationship between the relative deviation of the real part of
the phase shift and the opacity A . This relation is nearly independentAt
of the magnitude of T(r). The relative deviation is larger than 10Z for
opacities above 0.8.
The description of inelastic collisions with an optical potential
(i.e. absorption of flow) is a rather crude picture which gives good
insight in the loss of flow, i.e. the total inelastic cross sections.
However, it does not give any insight in the transition process itself.
In general the optical potential model is used to describe the influence
on the experiment of all inelastic processes, which are not under
investigation, and the investigated process is treated individually,
e.g. by a coupled channel calculation. All rearrangements of electrons
are transitions between two discrete potential curves with a transition
probability that has a maximum where the distance between the potentials
is minimal. Penning ionisation is a transition to the continuum of the
ion-atom system plus a free electron. So, if the channel of Penning
ionisation is open it is always the most favoured inelastic channel and
is well described by an optical potential. As we have shown in
figure 3.2 these transitions take place most likely near the turning
point. Iherefore total Penning ionisation cross section measurements are
very sensitive to the shape of the repulsive wall of the real potential.
Especially small radial shifts of the repulsive wall, like the ft
splitting for the Ne*-Ar (figure 2.2) potential curves will result in
31

different value for the total ionisation cross section. Large angle
differential cross section measurements Which also probe the repulsive
wall, have to be corrected for loss of particles by ionisation. Only a
simultaneous analysis of these two types of measurements will give a
good description of the repulsive wall of the real and imaginairy part
of the potential.
In the optical potential model all physics of the spontaneous
transition is included in the imaginary part of the potential. Generally
F(r) is assumed to be an exponentially decaying function, given by
èr(r) = £. exp{-S. (r/r -1)} (*5>lm ïm m
with e i m (J) the value at the well of the real part of the potential and
& (m ) the inverse characteristic distance. The energy width F(r) is
thought to depend mainly on the atomic orbital overlap, resulting in an
exponential increase with decreasing distance. However, at short
internuclear distances an effect of saturation can be expected. The
internuclear distance r . where this saturation starts will beim
determined by the radial extension of the atomic orbitals just as the
position r where switch over takes place from the atom-atom potential
to the ion-atom potential in the IAMMSV potential (section 2.3).
References
Con79 J N l Connor in "Semiclassical methods in molecular scatteringand spectroscopy", Proc.Nato ASI, Cambridge, England (1979)ed. M S Child, D Reide1 Publishing Compancy, Dordrecht Holland.
Gre81 R W Gregor and P E Siska'J.Chem.Phys. 74 (1981) 1078-1092
Hab81 H Haberland, Y T Lee, and P E Siska in "The excited state inChemical Physics", chapter 6, ed. J Win McGowan (1981) John Wileyand Sons, New York.
Lan59 L D Landau and E M Lifshitz "Quantum Mechanics" (1959) PergamonPress, London.
32

Mic76 D A Micha In "Modern Theoretical Chemistry" (1976) Vol. II,ed. W H Miller, Plenum, New York 81-129
Mil70 W H Miller Chem.Phys.Lett. 4 (1970) 627
Nie81 A Niehaus in "The excited state in Chemical Physics" chapter 5,ed. J Wm Mc Gowan (1981) John Wiley and Sons, New York.
Pen27 F M Penning Naturwissenschaften 15 (1927) 181
Rob70 R E Roberts and J Ross J.Chem.Phys. 52 (1970) 1464-1466
Wan76 Z F Wang, A P Hickman, K Shobatake, and Y T Lee J.Chem.Phys. 65(1976) 1250-1255
33
Chapter IV The dye laser system
4.1 Introduction
In all our measurements state selection of the beam of metastable
neon atoms is obtained by optically pumping with a c.w. single node dye
laser beam (Spectra Physics 580). The tuning of the laser frequency to
the atomic transition under investigation with the (near) natural
linewidth of 15 MHz (1:3 10 ) in the beam machine is performed stepwise.
In the first step the wavelength is measured with a wavelength meter
with a relative accuracy of l:105 [Cot79]. In the next step an abso-
lute value within 150 MHz (1:3 10 ) can be reached by observation of the
Doppler broadened fluorescence signal (1500 MHz) in a glow discharge,
the 15 MHz wide fluorescence signal in the beam machine can be found.
During all steps scanning of the laser frequency is performed manually.
Because atomic beam scattering experiments are generally complex and
take long measuring times of typically 2 to 24 hours, much effort has
been put in a sound design of the absolute frequency stabilisation of
the dye laser frequency on the atomic transition within 0.5 MHz, i.e. 5%
of the natural linewidth or 1:10 . The design, as described in detail in
the next section has been improved further with the possibility to reset
the analog control loop (figure 2, section 4.2) with the computer after
detection of a mode hop of the laser frequency. To avoid acoustic
coupling with the surroundings, the dye laser is mounted in a heavy
brass box (wall thickness 20 mm). Drift of the reference Fabry-Perot
(section 4.2 and chapter 6) is avoided by a thermal stabilisation
[Sme82]. With these improvements it was possible to perform continuus
35

measurements during 18 hours without any (human) readjustment of the
laser system. The longest run without any mode hop was 8 hours.
Typically there was one mode hop in two hours. In section 4.3 the
accurate semi-automatic alignment procedures are described to obtain a
perpendicular orientation of laser beam and atomic beam.
References
Cot79 W Cottaar, Eindhoven University of Technology,Int. Rep. VDF-NO-79-06 (in Dutch)
Sme82 R Smeets, Eindhoven university of Technology,Int. Rep. VDF-NO-82-06 (in Dutch)
36

J. Phys. E: Sci. Instrum.. Vol. IS. 1982. Printed in Great Britain
4.2
An atomic-beam set-up for 0.5 MHzabsolute frequency stabilisation of asingle-mode cw dye laser
M J Vertegen, H C W Bcjjerinck and N F VersierPhysics Department, Eindhoven University of Technology,Eindhoven, The Netherlands
Received 4 January 1982. in final form 10 June 1982
Abstract. Absolute frequency stabilisation of a cw single-modedye laser on a metastable Ne*( ls-2p) transition is obtained witha RMS error of 0.5 MHz using a crossed laser-beam-atomic-beam apparatus. The combination of a low-intensity (butlong-lived) Ne* beam source with a very large solid-anglecollection efficiency of the fluorescence photons results insufficiently high count rates for simple stabilisation schemes.
A hollow-cathode discharge is used as a Ne* beam source,with a centre-line intensity of 10" s"' sr"'. The typical lifetimeof this source is 300 h. The Nft* beam and the laser beam arecrossed at the focus of an ellipsoidal mirror. With apholomultiplier at the second focus the collection efficiency ofthe direct fluorescence photons (A % 600 nm) is 75%. Carefuldesign results in scattered light at a level 5 x JO"' lower than Dielaser-beam power without using colour filters.
By correcting for the small line broadening (30%) due to theDoppler effect and saturation, the natural linewidth of the Ne*(1 S5-2pj) transition has been measured, resulting in a decay rate/ l»=(6.6±0.4)x 10's"1.This result is 10-20% larger thanthat reported by other authors.
I. IntroductionFor the application of a single-mode cw dye laser in amolecular-beam experiment the frequency should in general bestabilised to the absolute frequency of the optical transitioninvestigated, with a stability of a few per cent of the naturallinewidth Ac. For the Ne* (ls-2p) transitions (Paschen
.notation; see figure 1) with linewidths ApaiOMHz thisrequires an absolute stability of 0.5 MHz. A conventionalsolution is to use the experimental set-up itself for thisstabilisation scheme (Grove et at 1977). However, in manycases the coupling of a stabilisation set-up with a scatteringexperiment is rather unfavourable because quite differentexperimental conditions are required.
For stabilisation purposes a Doppler-free fluorescence signalwithout any saturation is necessary. This results in a low-velocity atomic beam with a narrow velocity distribution andsmall divergences of both the atomic beam and the laser beam.The intensity requirements for both beams are also rather low.Therefore a simple atomic-beam source with a long lifetime canbe used, resulting in a minimum of maintenance.
In a crossed-beam scattering experiment the demands on theatomic-beam source are much higher. Depending on the kind ofexperiment, we hare to optimise the experimental set-up, whichmay result in, for example, high-intensity beams (to optimise thesignal-to-noise ratio), superthermal beams (to measure over awide energy range), atomic beams with a wide velocitydistribution (to measure the velocity dependence of thescattering process investigated using a time-of-flight method), ora combination of these requirements. In general these more
OO22-3735/82/111198 + 09 S02.00 © 1982 The Institute of Physics
wwwwF
-*-•*,Figure I. Energy level diagram of the Ne* (ls-2p) transitions(Paschen notation).
complicated beam sources have a short lifetime and requiresophisticated maintenance. When using optical pumping toprepare an atomic beam in a particular state (or to modulate thepopulation of one particular state) a velocity- and position-independent interaction of the photon beam with the atomicbeam is necessary. Also, small frequency errors of the photonbeam should have only negligible influence on this interaction.This can be achieved by using a photon beam with largedivergence and high power, which saturates the transition.
We describe the construction and performance of a simpleatomic-beam apparatus, which we use only for the absolutefrequency stabilisation of the dye laser. The laser frequency isstabilised on the maximum of the near-Doppler-frcc fluorescencesignal of a Ne* atomic beam crossing the laser beam. Differentdetection techniques to optimise the signal-to-background ratiohave been investigated. Optical fibres are used to transport thelaser beam to the atomic-beam apparatus, which isadvantageous in comparison with direct transport by mirrors(Kroon el al 1981, Bergmann el al 1979), especially in our casewhere the reproducibility of the laser frequency depends only onthe alignment of both beams. Using a computer-controlledstabilisation loop a flexible stabilisation scheme is obtainedwhich gives the possibility of performing measurements atslightly shifted frequencies and to interrupt the computer-controlled main experiment after detection of a mode hop.
2. The «tabiliiation KhemeThe method of stabilisation is shown in figure 2. The first loopstabilises the laser frequency to within 0.5 MHz of the resonancefrequency of a Fabry-Perot interferometer by control of theend-mirror and fine-tuning etalon of the dye laser (Wu andEzekiel 1977, Muller 1979, 1980, van Hout 1979, SpectraPhysics 1977). The second loop performs the stabilisation of theresonance frequency of an atomic transition by measuring thefluorescence signal of an atomic beam crossing the laser beam atright angles.
The probability of exciting an atom when it crosses the laserbeam is given by
K(iO=l-exp(-<n>fc>r) (I)
with djiUm') the cross section for absorption of a photon(Svelto 1976), v the frequency of the photon as seen by themoving atom, v(m "2 s "') the photon flux and r the transit timethrough the laser beam. The absorption cross section off) of a
37

0.5 MHz frequency stabilisation of a cw dye laser
Figure 2. Diagram ofthc fast ( < 100 Hz) control loop (1) forthe relative frequency stabilisation and the slow, computer-controlled loop for the absolute frequency stabilization. (2) Thereference Fabry-Perot interferometer for ihe relative frequencystabilisation: (3) photodiodes with preamplifier; (4) light traps;(5) etalon control (1 kHz lock-in); (6) end-mirror control
= constant); (7) optical fibre.
transition with full width at half-maximum Ai> is Lorentzian(natural line), given by
<n»=oi>{l + 4 [ ( c - i / 0 ) / A c | 2 r ' = OoU»':i'o,Af). (2)
The maximum value Go is given by (Svelto 1976)
(3)
with X the wavelength of the transition, A «(s ~') the decay rate ofthe upper level to the lower level and A »(s " ' ) the total decay rateof the upper level.
The count rate AnV) (s~') of fluorescence photons for thecase of two beams without divergence and crossing at rightangles is given by
ArKx)=«KXn./4!t)i;<WVd2o) (4)
with fii the solid-angle acceptance of the photon detector with aquantum efficiency rfr, and /(0)** and dJw the centre-lineintensity and the solid angle of the atomic beam. In equation (4)we have neglected the effect of stimulated emission, whichresults in a lower value of K(v). The contribution of a secondphoton per atom when the upper level decays to the originalstate, which increases the number of direct photons, is also nottaken into account.
The absorption probability K(t>) is fully determined by thesaturation parameter
M. = o&T (5)
and the natural linewidth Ac. The full width at half-maximumWMi) of A W is given by
SI/2-I>0 Sftöu/c
with the total RMS divergence Sfi={Sfil + êfi})shift is given by
with V'Q the position of the maximum of JVrff).To minimise the total Doppler broadening
For Mt < 1 we can approximate equation (6) by
)=(I + 0.25M0) Al/ (7)
with an error less than 0.8% for Mo< I We conclude that asaturation parameter M o « I gives an optimal signal Niiv) forstabilisation. For JM0 = I we already have K(«o)=0.6, i.e. we use60% of all atoms, and the broadening due to the onset ofsaturation is only Ae(l)/Ac=1.3. For the Ne* (lsj-2p:)transition with Oo = 1.2x 10~ l4m2 . the power requirement forMo= 1 is only 37 /JW using a circular laser beam of diameter2 mm and assuming a mean velocity a = 8 0 0 m s " ' for the N e 'beam.
3. Doppler broadeningIn an actual experiment we have to take into account theangular distribution of both beams with RMS divergences S/Jt forthe atomic beam and 6flf for the photon beam, which will causeDoppler broadening of the line. A small misalignment ft withrespect to a perpendicular crossing of the beams <^= 0) willcause a Doppler shift and also a Doppler broadening incombination with the RMS velocity width Su of the atomic beam.
The three contributions to the Doppler broadening are
(8)
"1. The Doppler
(9)
(10)
we must use a low-velocity atomic beam with a high-speed ratioS=u/\/2óu and small beam divergence. For a Ne* (Is-2p)transition the condition <5i'<jAi> can be fulfilled, assumingequal contributions lv„ by
Sv,c/v^=SPu=SfiSu=fi3u)^\.lx lO'mradms-'. (11)For a supersonic Ne* beam with « = 800 m s ' 1 and S=i thisresults in | / JK5mrad and <S/}<2mrad. For a circular beamwith a uniform distribution this RMS divergence corresponds to ahalf-top angle of 2.8 mrad for each beam.
4. The experimeMal «et-u* for MaWliiationA schematic view of the experimental set-up for the stabilisationis shown in figures 3 and 4. A hollow-cathode discharge is usedas a source for the Ne* beam, which is collimated with amovable diaphragm with a choice of diameters of 1.5. 1.0.0.7and 0.5 mm. The vacuum box is divided into two differentiallypumped sections with a skimmer of 3 mm diameter.
A metastable Ne* atom which is excited to a 2p upper levelgives direct fluorescence (visible) by decay to the Is group andcascade fluorescence (vv) by successive decay to the groundstate (figure 1). We have investigated the detection of both thedirect and the cascade fluorescence photons to determine themerits of both methods. The first method requires a very highsuppression of the photons of the laser beam and the gasdischarge and other stray light in the visible region. The secondmethod requires only a good suppression of the uv resonanceradiation from the discharge.
The laser beam enters the vacuum box via an optical fibrewhich is glued into a vacuum feedthrough. This beam iscollirnated with a lens (f=25 mm), resulting in a half-top angleof 2.9S mrad or Sfi, = 1.70 mrad. At the first intersection withIhe Ne* beam, where the photon-beam diameter is 2 mm, thedirect fluorescence photons are detected with a photomuhiplier.
38

MJ VerheljeiuHCWBeijerinckandNF Verster
Light trap tFluorescence Movable
centre IT photodiode
Figure 3. Schematic view of the atomic-beam set-up for the absolute frequency stabilisation. All distances are in mm.Distances for the path of the photon beam are: lens-fluorescence centre 1,7 IS mm; lens-fluorescence centre II, 255 mm.
Figure 4. Detailed view of fluorescence centre I with the ellipsoidal mirror for collection of the direct fluorescence photons.(1) photon beam; (2) atomic beam; (3) light traps for stray light; (4) light trap for photon beam; (5) labyrinth light seal;(6) cathode area of EMI 9862/35 linear focused photomultiplier; (7) movable atomic-beam collimator;(8) window; (9) mirror surface.
The cascade fluorescence photons are detected at the secondintersection with the Ne* beam, where the photon-beamdiameter is 4 mm.
Typical conditions are a 1.5 mm diameter collimator for theNe* beam for measurements at fluorescence centre I, resulting incV?a = 1.28 mrad. For measurements at fluorescence centre II a0.7 mm coilimator is used, resulting in <5/?« —0.80 mrad.
The power of the photon beam can be measured inside thevacuum system with a movable photodiode, which can also beused to block off the photon beam during a measurement withthe spiraltron. This is necessary because the Ne* density isotherwise depleted by optical pumping in fluorescence centre I(Kroon et al 19S1), In the remaining part of this section we will
discuss the beam source, the optical fibre and the merits of bothphoton detection techniques.
4.1. The hollow-cathode dischargeA hollow-cathode discharge is a long-lived stable beam sourcewith a number density of metastable atoms ff„»sïlO~*«#, with>io the source density (De Hoog et al 1977). A diagram of thesource is given in figure 5. Typical operating pressures are400 P«. The sampling orifice is chosen with radius R=0.3 mmto limit the total flow rate GV<5 x 10" s"'). Typical operatingconditions are 10mA (B,a5 .3x 10"m~') and 250V. Thelifetime of the source is 300 h, determined by erosion of thesampling orifice by sputtering.
39

OJ MHz frequency stabilisation of a cwdye laser
Figure 5. The hollow-cathode discharge source Tor the Ne*beam. (I) cathode (diameter 3 mm. height 6 mm); (2) samplingorifice (diameter 0.6 mm); (3) anode; (4) gas Teed line; (5) glassshield Tor discharge confinement; (6) water cooling line.
Figure 6. The centre-line intensity /(0).. of the Ne* bean- asa function of the electron density n, (n, —10" m"1 correspondsto ƒ « 20 mA), assuming a detection efficiency of 1.0 for the Ne*atoms in the time-of-flight experiment. The experimentalconditions are; A, R=0.25 mm, # = 2 . 8 x 10" s~';D,/J=0.3Omm,A'=4.1 x 10"s- ' ;O, / !=0 .35 mm,A' = 5.5 x 10" s ~'. These flow rates correspond to anapproximately equal source density n o = 6 x 10" m~'.
The centre-line intensity /(0),< and velocity distributionF{v) dp of the metastable atoms have been investigated in a time-of-flight experiment described by Theuws (1981) and Theuws etal (1982). The measured centre-line intensities for Ne* areshown in figure 6 for different source conditions assuming anefficiency of 1.0 for the detection of the metastable atoms in thetime-of-flight experiment, using Auger ejection of an electronfrom a stainless-steel surface and an electron multiplier(Dunning and Smith 1971, Dunning et al 1971). The curves arecalculated with a simple model which accounts for diffusionlosses of Ne* to the wall of the cathode and the sampling orifice(Verheijen 1979). The input is « , = 3.0 x 10"'n0(DeHooge/o/1977) and the diffusion rate to the wall is D = 5 x l 0 M
(m-1 s-tyito (Steenhuijsen 1979, Phelps 1959). With increasingorifice radius /i we see a sharp increase of the centre-lineintensity due to the decrease of the diffusion losses to the wallnear the orifice.
The time-of-flight spectra have been analysed with asupersonic velocity distribution (Anderson 1974) multiplied by adeformation function (1 + T(v)) (Beijerinck et al 1979) given by
Hv) iv =IAv/u)\nma,)"' expj - [(u -u) /a , ) 2 |
I ' \* ' + Z !•"«.«»'-»V<*t) dt- (12)
* «-3 '
with Hermite polynomials ƒƒ.. A least-squares analysis is usedto determine the intensity parameter /„•, the mean velocity u. thespeed ratio S=u/as and the shape parameters yj and }•«. Thesource temperature To corresponding to each spectrum has beencalculated using conservation of enthalpy (Habets 1977.Anderson 1974)
and assuming that T,. = To. At a fixed flow rate N the sourcetemperature 7o is proportional to the discharge current ƒ. Atypical result is 7"0 = 288 + 0.9 (KmA"1)/ in the range 5 < /(mA)<50at J V = 2 . 8 X 10"( j - ' ) . With increasingfiwe alwayssee an increase in 7"0. These temperatures have to be comparedwith r = 2 8 3 K of the water-cooled copper cathode. The sourcedensity n0 can be calculated using the relation between the flowrate Ü and the source conditions (Beijerinck and Verster 1981).
f/=0.Sl3n0a07tR1(14)
with ao=(2kTt/m)m the characteristic velocity, resulting in«o = 5.7x 1 0 a n r J for *=2 .Bx IO"s - ' . The increase in T„with increasing source density can be explained qualitatively bythe decreasing boundary layer between the 'hot' discharge andthe water-cooled cathode.
A curve fit of the experimental values of S as a function ofthe source parameter (Beijerinck and Verster 1981)
S=1.62ncR(C,/kT*,)m (15)
with C«/t=0.455 x 10"" (K m') the Van der Waals constantfor neon results in S = 2 .66S"" using about 100 data points inthe range 0 . 2 < 2 < 3 . This is in excellent agreement with theexperimental results of Menger (1978) S=2.SSS"" for thecase of the whole virtual source and an analysis with the modelfunction of equation (12). The values of our shape parameters ftand y< are in good agreement with the results of Beijerinck et al(1979) and Menger (1978). Habets t id Menger have bothperformed experiments for an undisturbed expansion of argonwithout a discharge. The extrapolation of Habets' results(Habets 1977, Beijerinck and Verster 1981) to our range of 2values is 30% lower than our results.
4.J. Tie optical fibreThe laser beam is transported to the experimental set-up by an
40

M J Verheijen. HCWBeijerinckandNF Versier
optical fibre with a core diameter d=S0pm, a numericalaperture a = 0 . II and an attenuation of 4.2 dB km "' at 860 nm.In this way the laser and the atomic-beam set-up are decoupledmechanically and a vibration-free mounting of the dye laser set-up is allowed. Problems of re-alignment are also avoided in thisway, because after an adjustment of the dye laser only thealignment of the input coupler of the fibre on the same opticaltable has to be checked. In the case of a large distance betweenboth devices (10—150 m) the use of a fibre is even compulsory.
In a multimode fibre the phase coherence and the overallpolarisation are lost. The transmitted beam consists of manyintense spots, each with a well defined polarisation. In our casethis is advantageous because all Am=0, +1 transitions betweenmagnetic substates are pumped optically, resulting in amaximuim fluorescence signal (Kroon et al 1981). A secondeffect is the loss ofluminosity
L=P/y(W m-'sr-') (16)
of the transmitted beam due mainly to the increase of the phase-space volume V (m~2 sr~') (Siegman 1971, Yariv 1975). For aTEMoo Gaussian beam we have
V^^X*. (17)
Because of the many reflections in the fibre this volume will besmeared out over the phase-space volume of the fibre with upperbound
For our optical fibre we find Ynn/Vi*« = 200 at A=600nm.With this increase in volume a beam of, for example, 2 mmdiameter and a divergence of S mrad half-top angle can still beobtained, which is quite acceptable for our application. Thisvolume can only be decreased by collimating the beam. Thisresults in a proportional decrease of the power because it is notpossible to change the luminosity.
By using fibres with smaller values of a and d this effect canbe diminished or even eliminated using a single-mode fibreC W ~ U but in that case the luminosity will decrease dueto power losses.
4.S. Detection of direct fluorescence photonsFluorescence centre I is situated at the focus of an ellipsoidalmirror as shown in figure 4. The direct fluorescence photons arecounted at the other focus with a large solid-angle efficiency. AMonte-Carlo calculation with a scattering volume of diameter2 mm gives an efficiency tlt/4n=0.n, which is a factor of fivelarger than can be obtained with direct detection with a full topangle of 90°.
The design criteria of the ellipsoidal mirror are given in theappendix. The half-axes are 40 and 50 mm, respectively. Themirror is machined with a copying lathe in a preformed brasspart using a two-dimensional metal ellipse as a model. Afterpolishing with polishing paste an aluminium layer is vacuumdeposited on the surface, resulting in a reflection coefficientequal to 0.95. The shape of the mirror is not critical becauseonly a rather crude focusing of the 2 mm diameter fluorescencevolume on the 9 mm diameter cathode is needed and no imagequality is required. The optimal position of the photomultiph'er isdetermined by eye. A perspex rod (with a roughened surface) isinserted in the position of the atomic beam and illuminatedthrough the afomic-beam source with a He-Ne laser beam. Thescattered laser light is intense enough to cast a clear 'image1 ofthe fluorescence volume on an opaque screen. In our case thesecond focus was 10 mm lower than predicted by thedimensions of the ellipse.
A linear focused photomuhiplier, EMI 9862/35 (EMI 1979),with a small cathode diameter of 9 mm is used. This diameter is
perfectly matched to the 'image' of the fluorescence volume,with an adequate tolerance. Due to the smali cathode area thenumber of dark counts and the background from the photonbeam are small. Scattered laser photons are eliminated usingseveral collimators. The photon beam and the light from thedischarge are both dumped in a light trap. By using a long-passcolour filter (RG 610) with 50% transmission at A=6I0 nm, thebackground from the photon beam should be reduced by afactor of 0.02 or more and the signal by only a factor of O.7 forthe Ne*{ls s-2p2) transition (A = 588.2 nm), resulting in amuchbetter signal-to-background ratio. Measurements are performedfor the Ne* (lsi-2pi) transition (X=588.2 nm) with «id withoutthe colour filter, resulting in signal-to-b«ckground ratios of 13and 0.3, respectively, for conditions with M o = 1. With a colourfilter and P-SO^iW (Af„= 1) the background due to stray lightfrom the photon beam is typically twice the value fo the darkcounts of the photomultiplier (250 Hz).
At high photon beam intensities (Ma>l) the fluorescencesignal (equation (4)) saturates to
./(0),, d2tt). (18)
The contribution of asecond photon per atom, when the upperstate decays to the original level, is taken into account in theconversion efficiency ti=, which gives the number of detectablefluorescence photons per atom. For direct fluorescence detectedwithout the colour filter IJC is given by
l-Aa/At)-'. (19)
Measurements are performed up to Mt =10 . Table 1 gives acomparison between the expected values of N,,m from thecentre-line intensity measurements of the Ne* beam source andthe values of the measurements extrapolated to Mo— co. Bothvalues are in good agreement, considering the difficult absolutecalibration of an optical detection system.
4.4. Detection of the cascade fluorescence photonsAt fluorescence centre II the cascade uv fluorescence photonsare detected with a Spiraltron Electron Multiplier of Galileo, theSEM 4219, which is described in detail by Wolbcr and Klettke(1970). A SEM has a high gain (10*), simple electronics, a lowrate of dark counts (<0.SHz) and a small physical sizecompared with a photomultiplier.
The entrance cone is at —3000 V. The beams are crossedinside a metal box at the same potential to avoid Auger electronsleaving the cone and to suppress ions and uv photons from thedischarge. The typical count rate of uv photons and ions is400 Hz.
Measurements are performed for the Ne* (lSi-2pj)transition (X=597.6 nm) and the result is given in table 1. In thisconfiguration the detection of the cascade fluorescence photonsresults in a smaller signal-to-background ratio of 8 (A/o = 1 ) anda smaller count rate compared with the detection of the directfluorescence photons at fluorescence centre I using a long-passcolour filter. The count rate of the cascade fluorescence can beincreased by enlarging the solid angle of the atomic beam, butthis will not increase the signal-to-background ratio. By using ametal box at a lower potential compared with the cone (Rinn elal 1982), the solid-angle efficiency of the detector will beincreased due to the acceleration of the Auger electrons from themetal box into the cone. We can expect an increase in the countrate and the signal-to-background ratio by at kast a factor oftwo, resulting in similar conditions as in fluorescence centre Iwith the photomultiplier. In this case care must be taken that nouv photons from the discharge source can hit the inner wall ofthe metal box.
41

0.S MHzfrequency stabilisation of a cw dye laser
Table 1. Comparison of calculated and experimental values of N,.„ = N,{"o)ric at Mo P 1 for direct andcascade fluorescence photons.
Solid angle ofatomic beamSolid-angle efficiencyQuantum YieldConversion efficiency
Fluorescence countratecalculatedexperimental
Fluorescence centre 1(direct)
Ne*(lsj-2p2) transitionk= 588.2 nm
No Filterfilter RG 610
d'uHsr) 1.06x10"' 1.06xl0"J
fV4n 0.77 0.77Vd 0.075 0.075r/0 1.27 1.00
A'r.»i (kHz) 68 55* , . „ (kHz)' 50 ± 5 35 ± 3
* Full acceptance angle 90°." Errors indicate reproducibility without re-alignment of beams.
Fluorescence centre II(cascade)
Ne*( lss-2p<) transitionA = 594.5 nm
0.23 x 10"'
0.15"0.221.00
77 ± 2
5. The software of UKKaWKutionThe absolute frequency stabilisation in the second loop (figure 2)is computer controlled. In one stabilisation sequence thefluorescence signal Jv> is measured at the initial centralfrequency and two neighbouring points at a distance of + it±t>and — i&i'. Depending on the ordering of the three valuesmeasured different actions are taken. I f the count rate of thecentral point is significantly larger than that of the neighbouringpoints, the laser is tuned to the position of the maximum of theparabola curve fitted through the three measured points. In allother cases the laser frequency is changed with a fixed frequencystep of i&v or iAc in the direction of the neighbouring pointwith the largest signal. This action is immediately followed by anew stabilisation sequence. I f the three measured values do notdiffer significantly the procedure is stopped and an alarm is set.This happens in the case of a mode hop of the laser (typicallytwice per hour). Differences are called significant if they arelarger than twice the RMS error in the pulse count. After eachstabilisation procedure a fixed time is used to run the mainexperiment before the next procedure is executed.
A LSI 11/02 processor is used with the interpreter-basedPascal-like language PEP (program and editor processor),developed by Verhelst and Verster (1980). In rap thestabilisation program is executed as a parallel task of the mainmeasuring program. A software stabilisation loop has manyadvantages. The possibility to interrupt the main experimentduring the execution of the stabilisation procedure or after analarm, for example by intercepting the trigger pulses of thechopper in a time-of-flight experiment, is very attractive. In thisway the experimental data from the main experiment are takenonly at the correct laser frequency. The normal routine in thecase of an alarm is to retune the laser and to continue the mainexperiment when the stabilisation procedure has reached thecorrect frequency. Measurements at a small, fixed-frequencydistance from the resonance frequency of the transition caneasily be performed by adding an offset after each stabilisationprocedure. This can be used to correct for a small misalignmentof the atomic beam and laser beam in the main experiment. Inour case we use a fast atomic beam with a = 5000 m s - ' ,corresponding to a Doppler shift of 8.5 M H z mrad~' (equation(9)), and this feature is very attractive. Parameters of the
stabilisation sequence such as the measuring time or delay timecan be changed dynamically in PEP without interrupting thestabilisation program.
The typical measuring time fcr each data point is 250 ms.The software for one stabilisation sequence takes 1.0 s. Therepetition rate depends on the thermal stability of theFabry-Perot interferometer used as a short-term frequencystandard for the analogue stabilisation loop (figure 2). With acommercially available, not thermally stabilised, Fabry-Perotinterferometer the repetition rate is 0.5-0.1 Hz, depending onthe desired accuracy. Wish a better-quality Fabry-Perotinterferometer the repetition rate can easily be decreased to0.1-0.02 Hz or less.
With our software stabilisation procedure we have measuredthe frequency drift of our Fabry-Perot interferometer withrespect to the absolute frequency standard of the Ne* ( ls s -2p<)transition. For this purpose the software stabilisation procedureis performed for 100 s at a repetition rate of 0.5 Hz and with ameasuring time of 250 ms per data point. By curve fitting thisresult we obtain both the thermal drift of 0.16 M H z s " ' of the1.5 G H z Fabry-Perot interferometer and the 0.5 M H z RMSdeviation of the absolute set-point of our stabilisation process.The reproducibility and long-term stability of the laser frequencyare now determined only by the beam alignment in the atomic-beam set-up for stabilisation.
6. MeaiurtmeMsofUKlirKwldtki
Lineshapes of the fluorescence signal have been measured withthis experimental set-up as a function of the power P of thephoton beam (figure 7). A least-squares analysis of the measuredlineshapes with a Lcrentzian (equation (2)) results in a value forthe linewidth A r w . The results for A p w differ within 3%depending on the number of data points used for the analysis.The main problem is the determination of the correct value forthe background. This is not possible by taking the average valueof ihe data points in the far wings of the signal. We have usedthe following procedure. Firstly we use all data points anddetermine the position p, and height of the line centre, thelinewidth A i < _ and the background by curve fitting aLorentzian lineshape with a least-squares analysis. In the nextstep the background is fixed at this value and only the
42

MJ t'erheijm. H C W Beijerinck andNF Versier
100Loser frequency (MHzl
Figure 7. The fluorescence signal for the Ne* (lsj-2pi)transition (A = 588.2 nm) measured at fluorescence centre I witha long-pass colour filter (RG 610). Experimental conditions area measuring time of 0.5 s per data point, a frequency step of0.706 MHz per data point and P= 16 uW. The full curve is thecurve lit ofthe experimental data points with a Lorentz function.Each data point given in the figure is the mean of fiveexperimental data points.
data points with |r—PoK I Ar 1^ are used for a second least-squares analysis with only three parameters.
The fluorescence signal is measured twice at each power ofthe photon beam, scanning the reference Fabry-Perotinterferometer in two opposite directions. From the resulting twovalues of Afart the thermal drift of the Fabry-Perotinterferometer and the corrected value of &>,,„ can be derived.The drift always had the same direction for the duration ofone series of measurements. A typical value of the drift is0.1 MHz s~', which corresponds to a relative drift of 8% perdata point ofthe line profile.
The resulting values of APE,* are shown in figure 8. Curvefitting of these results gives the relation
Ae„„ = 14.25(1 + cP) MHz (20)
with c = 5 x 10"' W ' . From equations (20) and (7) we derive
Figure 8. The linewidths Ai'„„ ofthe measured lineshapes as afunction ofthe photon beam power P. The straight linerepresents the curve fit to the data points.
that the power P= 50 /lW corresponds to Mo = 1. This is in fairagreement with the estimate P= 37 juW for Mo = 1 by assuminga circular photon beam of diameter 2 mm. The extrapolatedvalue for Ai/Clpl = 14.25 MHz at P=0 is the width of theDoppler-broadened natural line. The calculated RMS Dopplerwidth is (table 2, equations (8) and (10))
&/=3.0±O.2MHz. (21)
If we correct for this Doppler contribution we find a naturallinewidth (Abramowitz and Stegun 1970)
Al'=10.5±0.5MHz. (22)
In table 3 the resulting At value is compared with otherexperimental data. Our value is 10-20% higher. Interpreting theerrors given as a RMS deviation S, we can conclude that allvalues coincide within error bounds of 36. The error in our/*,value is due mainly to the error in the Doppler width correction.
Future measurements on a larger set of Ne* (ls-2p)transitions will have to decide whether this difference issignificant or if our method has systematic errors. In equation(21) we have not taken the contribution ofthe misalignment fi tothe Doppler width (table 2) into account, which is only allowedfor /)< 5 rnrad. However, in the measurements presented here
T«ble 2. The Doppler broadening of the Ne*( lSs-2p2) transition U = 588.2 nm) atfluorescence centre I (direct) using a collimator of diameter 1.5 mm for the Ne* beam.
Source of contribution Doppler width (MHz)
Angular distribution of photon beamand mean velocity
Angular distribution of atomicbeam and mean velocity
Angular distribution of photon beamand velocity distribution
Angular distribution of atomicbeam and velocity distribution
Misalignment and velocity distribution
i>olfi,u/c 2.31
Vo Sfl. u/c 1.74
n„ S0, Su/c 0.55
e0 SB, Su/c 0.41
Co fi Su/c 0.32 (mrad "') x 0
Total RMS Doppler width* 2.97 ±0.18"
1 Assuming ^ = 0 .h Assuming 5% errors in u and all ö values.
43

0.5 MHzfrequency stabilisation of a cw dye laser
Table 3. Experimental values for the spontaneous decay rates^,oftheNe«(2pi) level.
/4»(10 's- ' ) Method
This workWiese etal (1966)Inatsugu and Holmes
(1975)
0.66 ±0.040.60 ±0.060.55 ±0.04
LinewidthDecay lifetimeRelative intensities
The solid angle Our, lost by using only the half of the ellipsoid(figure 5). is given by
O. (A.2)
The solid angle (I*** covering a beam hole with reduced radiusr* = r/f at the same height as the fluorescence focus can beapproximated by
l / r * \ ' /« *+ l \ J rM
The solid-angle efficiency nt/4n is given by
»V*r= 1 - — = J ~ [uu, + £«,,). (A.4)471 47T \ , . | ƒ
For good suppression of scattered light and suitable tolerancefor beam alignment the beam holes must have radii of at least2.5 mm. Therefore the scaling length must be as large aspossible, as can be seen in figure 9.
The upper bound for the scaling length is given by thedimensions of the vacuum system. We have chosen ƒ = 3 0 mm.With beam entrance and exit holes with r = 2 . 5 m m and r =7.5 mm, respectively, a suitable choice for the design parameteris 0 .6<e*<0.8 . We have chosen e* = i with a = 50 mm,6 = 4 0 mm and a solid-angle efficiency fid/4it = 77%. This lossholds in the point-source approximation. The finite dimensionsof the fluorescence volume will cause an extra loss of effiicency.This effect and the tolerances in the positioning of thefluorescence volume and cathode area are given by a Monte-Carlo simulation of the optical geometry. The input is a uniformdistribution in a spherical fluorescence volume with radius r,.The solid-angle efficiency (ld/47r is constant for r, < 1 mm and isstill 50% at rr=2.5 mm. With tolerances of 2 mm in all threedirections of the positioning of both cathode and fluorescencecentre, the efficiency loss is always less than 5%.
Figure 9. The loss solid angle QIM/4K as a function of the designparameter e* in the case of four beam holes with equal reducedradius r* (see equation (A.4)).
this assumption could not be checked and the rather large valueor Ac could be due to this effect.
We have already developed a method to measure and adjustP by looking at the direct fluorescence signal using twoantiparaliei photon beams, resulting in an alignment error of|/7|< 0.2mrad. The Doppler contribution will also be decreasedby further collimating the atomic beam and decreasing thedivergence of the photon beam. The Doppler width correctionwill be more accurate by using a model function for the curvefitting, which takes the influence of the beam divergences and thevelocity distribution into account in the correct way (Verheijento be published).
AppcwKx. TheeH|Moid*la*rarAn ellipsoid with cylindrical symmetry is fully determined bytwo parameters, the half-axes a and b. Using one parameter as ascaling length, all dimensions can be expressed by a singleparameter. Our choice for the scaling length is the distance ƒbetween the centre and a focus. As the free parameter we use«*=«/ƒ with e=a—f. The reduced half-axes a* and b* are thengiven by
«•=«•(A.1)
Abramowitz M and Stegun I A 1970 Handbook ofMathematical Functions (New York: Dover)
Anderson J B 1974 Molecular Beams and Low Density GasDynamics (New York: Dekker)
Beijerinck H C W, Menger P and Verster N F 1979 Shapeanalysis of non-Maxwell-Boltzmann parallel velocitydistributions in supersonic expansions of noble gasesProc. 12th Symp. on Rarefied Gas Dynamics vol. IIed. R Campargue (Paris: CEA) pp 871-84
Beijerinck H C W and Verster N F 1981 Absolute intensitiesand perpendicular temperatures of supersonic beams ofpolyatomic gasesPhysicaC 111 327-52
Bergmann K, Engelhard! R, Hefter U and Witt J 1979 Adetector for state-resolved molecular beam experiments usingoptical fibresJ. Phys. E: Sri. lustrum. 12 507-14
DeHoog F J , McNeil J R, Collins G J and Persson K B 1979Discharge studies of the Ne-Cu laserJ.Appl.Phys. 413701-4Dunning F B and Smith A C H 1971 Secondary electronejection from metal surfaces by metastable atoms.I: Measurements of secondary emission coefficients using acrossed beam methodJ. Phys. B: At. Mol. Phys. 4 1683-95
Dunning F B, Smith A C H and Stebbings R F 1971 Secondaryelectron ejection from metal surfaces by metastable atoms.
44

MJVerheijen,HCW Beijerinck and N F Ver ster
II: Measurements of secondary emission coefficients using a gascell methodJ. Phys. B:At. Mol. Phys. 4 1696-710
EMI 1979 Photomultipliers (Middlesex: EMI IndustrialElectronics Ltd)
Grove R E, Wu F Y and Ezeklel S 1977 Measurements ofthespectrum of resonance fluorescence from a two-level atom in anintense monochromatic fieldPhys. Rev. A 15 227-33
Habets A H M 1977 Supersonic expansion of Argon intovacuum
PhD Thesis Eindhoven University of Technology
van Hout C H J M 1979 Frequency stabilization ofthe etalon ofa dye laser (in Dutch)Eindhoven University of Technology Report VDF/NO 79-02
Inatsugu S and Holmes J R 1975 Transition probabilities ofthe3p-3s transitions of Ne 1*Phys. Rev. A II 26-38
Kroon J P C, Beijerinck H C W and Verster N F 1981 TOFanalysis of an optically pumped metastable neon beamJ.Chem.Phys. 74 6528-9
Menger P 1978 Non equilibrium effects in supersonicexpansions (in Dutch)Eindhoven University of Technology Report VDF/NO 78-7
Muller T J 1979 Frequency stabilization of a cw dye laser (inDutch)Eindhoven University of Technology Report VDF/NO 79-03
Muller T J 1980 Frequency stabilization of a cw dye laser (inDutch)Polytechnisch Tijdschrift 35 534-6
Phelps A V 1959 Diffusion, de-excitation, and three bodycollision coefficients for excited neon atomsPhys. Rev. 114 1011-25
Rinn K. Muller A, Eichenauer H and Salzborn E 1982Development of single particle detectors for keV ionsRei: Sci. Instrum. 53 829-37
Siegman A E 1971 An Introduction to Lasers and Masers (NewYork: McGraw-Hill)
Spectra Physics 1977 Frequency stabilization techniques forsingle frequency dye lasers
Steenhuijsen L W G 1979 Investigations on afterglows of neongas dischargesPhD Thesis Eindhoven University of Technology
Svelto O 1976 Principles of Lasers (New York: Plenum)
Theuws P G A 1981 Molecular beam sampling of a hollowcathode arcPhD Thesis Eindhoven University of Technology
Theuws P G A , Beijerinck H C W, Verster N F andSchram D C 1982 A hollow cathode arc as a high intensitybeam source for ground state and metastable noble gas atoms inthe eV translational energy rangeJ. Phys. E: Sci. lustrum. 15 573-9
Verheijen M J 1979 A single mode c.w. dye laser system formolecular beam experiments (in Dutch)Eindhoven University of Technology Report VDF/NO 79-11
Verhelst P W and Versier N F I980 PEP, an interpreter for anAlgol-like languageDECUSProc. 7(1) 197-202
Wiese W L, Smith M W and Glennon B M 1966 AtomicTransition Probabilities. Volume I: Hydrogen through Neon
(National Standard Reference Data Series» National Bureau ofStandards 4) (Washington, DC: US Government PrintingOffice)
Wolber W G and Klettke B D 1970 The preamplined spiraltronelectron multiplierRev. Sci. Instrum. 41 724-8
Wu F Y and Ezekiel S 1977 Wide-bandwidth feedback loop cutsjitter in output of a commercial cw dye laserLaser Focus 78-80
Yariv A 1975 Quantum Electronics (New York: Wiley)
45

4.3 ACCURATE (0.25 mrad) PERPENDICULAR ALIGNMENT OF A c.w. SINGLE
MODE DYE LASER BEAM AND AN ATOMIC BEAM
M J Verheijen, H C W Beijerinck, and N F Verster
Physics Department, Eindhoven University of Technology, The
Netherlands
(submitted for publication to Rev. Sci. Instrum.)
Abstract
We describe two simple methods for an accurate
perpendicular alignment of a laser beam and an atomic beam,
which is necessary for a velocity independent, i.e. Doppler
free Interaction of the laser beam with the atomic beam. With
the first method a free running single mode c.w. dye laser beam
and an atomic beam are aligned perpendicular with an accuracy
of 0.25 mrad. This alignment takes typically two hours. The
second method needs a laser beam that is absolutely stabilised ,
to the investigated atomic transition. With this method a 0.2 i
mrad accurate perpendicular alignment is obtained within only 5
minutes.
Introduction
Nowadays, many experiments are performed with crossed laser
beam-atomic beam set-ups, e.g. Doppler free observations of the
interactions between atoms and photons [I], state selection
[2,3,4] or state sensitive detection of the atomic beam [2,3],
or collision experiments with atoms that are excited by the
46

laser beam [5]. The linewidths of the interaction of laser beam
and atomic beam are almost Doppler free and range from the
natural llnewidth up to a few times this natural lineuidth.
Therefore a frequency stabilisation of the laser beam at the
resonance frequency of the transition within a few percent of
the natural linewidtb is necessary. Often the laser frequency
is stabilised at the maximum number of fluorescence photons
produced at the interaction centre of laser beam and atonic
beam. This method guarantees an almost optimal interaction
between laser beam and atomic beam. However, to obtain a
velocity independant interaction an accurate perpendicular
alignment of both beams is necessary. For a thermal atomic beam
Figure 1.
A schematic view of the auxilliary beam machine with the
retroreflected laser beam. The visible fluorescence photons are
detected with a photomultiplier placed along the axis
perpendicular to both beams. I: fiber holder with focussing
lens and collimator, 2: 90 degree mirror, 3: vacuum window, 4:
computer controlled beam flag, 5: retroreflecting optics (flat
mirror near the focus of a lens), 6: stepper motor driven
atomic beam collimator, 7: beam source for thermal metastable
rare gas atoms.
47

with a velocity of e.g. 800 m/s and an atomic transition at 600
nm with a natural linewldth of 10 MHz (FWHM) both beams have to
be aligned perpendicular within 2 mrad to satisfy this
requirement. This accuracy cannot be obtained by optimizing the
total fluorescence signal because of the flat maximum of the
fluorescence profile as a function of the misalignment angle 8 ,
which is caused by the fact that the angular misalignment will
be compensated by a frequency shift of the laser due to the
Doppler effect. A measurement of the width of the fluorescence
profile is also very insensitive to the angular misalignment,
because this misalignment gives only a second order
contribution to the Increase of the llnewidth.
Alignment with a free running laser beam.
We have developed a simple method for an accurate
perpendicular alignment of a free running laser beam and an
atomic beara. The broadening of the fluorescence signal in our
auxilliary atomic beam set-up due to the Doppler effect is only
3 MHz, i.e. 30% of the natural linewidth of the Ne(ls-2p)
transitions investigated. To align both beams we use a second
antlparallel retroreflected laser beam (fig. 1) and measure the
fluorescence signal during a frequency scan of the laser. The
misalignment angle g between laser beams and atomic beam is
varied by scanning the atomic beam collimator with a stepper
motor in a direction parallel to the laser beam, i.e.
perpendicular to the atomic beam. Due to the opposite sign of
the Doppler shift for the two laser beams, the increase of the

«WO
3000
2000
1000
n
-
-
1 1
t
• •
ooo •*
10 20
•
•
Jm
i
i
•
•
• • •
40
1
"<*
1
SI)
-
"""ooooo
The fluorescence profiles with ( Q ) and without (Q)
retroreflected laser beam. Only the full datapoints (above the
horizontal lines) are used for the calculation of the
centroid indicated by the full vertical lines. The value of the
misalignment 8 = 6.3 mrad.
Figure 3
-2-
z <mm>
The frequency distance M T T - M between the centroid of the1 , 1 1 i , 1
fluorescence signals of one photon beam (I) and two photon
beams (II) as a function of the position z of the atomic beam
collima tor. A displacement of 1.0 mm corresponds with an angle
P = 2.44 mrad. The resulting accuracy of the alignment is
typically |B| £ 0.25 mrad.

linewidth of the fluorescence profile depends in first order on
the misalignment g . For angles p » 5 mrad already .Two maxima
can be seen. The alignment is performed by calculating the
frequency distance between the centroid Mj of the
fluorescence profiles measured with and without retroreflected
laser beam (fig. 2), with the centroid Mj of a fluorescence
profile defined by
M. = ?(v. S.) / ?S. (!)I 1 1 1 x 1
with v and S. the (relative) laser frequency and thei i
fluorescence signal of the equidistant datapoints, respec-
tively. The position of the collinator where this difference is
zero now corresponds to g = 0 mrad (fig. 3).
By using a combination of a lens and a flat mirror near the
focus of the lens as retroreflecting optics, the waists of both
laser beams coincide and the angle between the original and the
retroreflected laser beam is a factor of 7 to 10 smaller than
the misalignment angle of the flat mirror, which we define by
the angle at the mirror between the incoming and reflected
laser beams. This misalignment angle of the mirror will be
smaller than 1 mrad when the mirror is adjusted to let the
retroreflected laser beam pass through the laser beam
collimator near the fiber exit. To eliminate the drift of the
laser frequency both fluorescence profiles are measured during
the same frequency scan. At each frequency the fluorescence
signal with the retroreflected laser beam is measured with a
full sampling tine, sandwiched between two measurements with
half sampling time of the fluorescence signal without
retroreflected beam. The alignment procedure can be performed
50

in a short time, because only 60 datapoints are needed for each
fluorescence profile. In this way the whole alignment, i.e. the
collection of all data, the adjustment of the angle and a
control measurement, typically takes two hours. We apply this
method in our auxilliary atomic beam set-up, which we use for
the absolute frequency stabilisation at an atonic transition by
monitoring the total fluorescence signal [6].
Alignment with an absolutely frequency stabilised laser beam.
We perform measurements at our main experiment with a beam
of fast (2000 - 10000 m/s) metastable neon atoms. In this
A
L
d
\l
r
Figure 4
A schematic view of the main experiment with the atomic beam
(A) that intersects the laser beam (L) at S. The mirror (M)
rotates around the axis through P and translates along the z
axis as indicated by the two arrows.
. 51

experiment we use also a flat mirror (fig. 4 ) . The position
parallel to the atomic beam axis z , of this mirror and the
angle $ can be adjusted with two gtepper motor driven
micrometers, iisins computer control we optimise (z , * ) to B =m m
0 rarad at a fixed position z of the interaction point S, e.g.s
in the focus of the photon collection optics. This is done by
coupling z to •_ according to Az = d AB = d A* /2.m m m m
In this experiment the perpendicular alignment of the beams
is performed by measuring the intensity oE the beam of
metastable neon atoms, which will be attenuated due to the
optical pumping to the short lived 2p states which cascade
partially to the ground state that is not detected [4], The
alignment procedure, which optimizes this attenuation as a
function of the an,-,le g, is fully under computer control and
only takes five minutes elapsed time. Different runs give the
same alignment within error bounds of 0.2 mrad.
Ey performing a time-of-flight analysis of the optically
pumped atomic beam and the original atomic beam [4] we have an
extra check on the alignment of the beams, by looking at the
velocity dependency of the beam attenuation. A slight
misalignment results in a readily observable maximum in the
attenuation, which coincides with the maximum in the velocity
distribution of the atomic beam. This occurs when the frequency
of the laser beam has an offset Av = v - u with respect to theo
atomic transition. This offset now will be compensated by the
Doppler shift due to a misalignment angle 3 - A V / ( V Q V / C ) and
for velocities unequal to the average velocity v in the beam
the optical pumping will be less effective.
52

Conclusions
The first method, which can be used for a free running
single mode laser beam, results in a very accurate alignment
within 0.25 mrad (fig. 2) but takes two hours. One should be
carefull if the direct laser beam is used, because after each
readjustment of the laser cavity the alignment may have
changed. By using an optical fibre to transport the laser beam
the alignment of the beams and the alignment of the laser
cavity are decoupled [6] and this alignment can be performed
once and for all.
The second method is only applicable If the frequency of
the laser beam is already stabilised to the absolute frequency
of the Doppler-free atomic transition. This method is very fast
and can be performed very accurate. The only requirement is a
mechanical support for the mirror with a good reproducihility.
The first method we have used to measure accurate life times of
the neon 2p states with our auxilliary atomic beam set-up [)]•
We use the combination of the two methods, the first one for
our auxilliary beam set-up which provides the absolute
frequency stabilisation and the second at our main experiment,
for all our measurements that require the interaction of the
atomic beam and the laser beam. For example, we have performed
Penning ionisatlon cross section measurement with a beam of
state selected metastable neon atoms [7], we have probed the
plasma beam source which produces the fast tnetastable atoms
[8], and we have measured the Rabi oscillations in the velocity
dependence of the attenuation of ths beam of fast metastable
atoms [9], The application of these alignment techniques is
53

very general for all laser beam-atomic beam experiments and
becomes even more important for beam experiments with the very
fast (above 10 eV) metastable atoms that are produced by charge
exchange of an ion beam in an alkali vapour [10].
References
[1] Verheijen M J, Beijerinck H C W, Eenshuistra p E, Kroon J F C,
and Verster N F
Optics Communications 45 (1983) 336-341
[2J Bergmann K, Engelhardt R, Hef ter U, and Witt J
J. Phys. E: Sci. Instrum. 12 (1979) 507-514
[3] Beyer W, Haberland H, and Hausamann D
IX Int. Syrap. on Mol. Beams (Freiburg 1983)
Book of abstracts 229
[4] Kroon J P C, Beijerinck 11 C W, and Verster N F
J. Chera. Phys. 74 (1981) 1198-1207
[5] Mestdagh J M, Berland J, Cuvellier J, de Pujo P, and Binet A
J.Phys. B: At. Mol. Phys. 15 (1982) 439
[6] Verheijen M J, Beijerinck H C W, and Verster H F
J. Phys. E: Sci. Instrum. 15 (19R2) 1198-1207
[7] Verheijen M J, Beijerinck H C W, and Verster N F
to be published
[8] Verheijen M J, Beijerinck H C W, N F Verster, and D C Schram
to be published
19] Kroon J P C, Senhorst H, Beijerinck H C W, and Verster N F
submitted for publication to Phys. Rev. A.
ilO]Kandela S A and Schmoranzer H
Phys. Lett. 86A (1981) 101-105
54

Chapter V Experimental
5.1 Introduction
In this chapter a description of the experimental facilities (apart
from the laser) is given with emphasis on the atomic beam machine. In
section 5.2 the primary beam sources for metastable atoms are described
with emphasis on the discharge source for thermal metastable atoms. For
the secondary beam we use a double differentially pumped system which
requires only moderate pumping speeds. The centre line intensities and
the density length-product in the scattering centre are well calibrated
(section 5.3). Section 5.4 deals with the detection systems for photons
(both u.v. and visible), metastable atoms and positive ions. Emphasis is
put on the spiraltron, which is a detector for u.v. photons and charged
particles. The computer facilities are given in section 5.5 and in the
last section we describe the method for the analysis of inelastic
scattering experiments with state selection of the beam of metastable
atoms.
55

5.2 Primary beam sources
5.2.1 Translational energies of beams of metastable atoms.
Already many elastic and inelastic beam experiments have been
performed with netastable noble gas atoms. Generally, two fully
different types of beam sources are used for these metastable atoms. One
type, the thermal sources, generate beams of metastable atoms with
translational energies ranging from 10 - 250 meV typically, i.e. in the
thernal energy range. Hie other type, accelerator sources, produce
metastable atoms with translational energies larger than 10 eV and there
is a gap between 1 and 10 eV, the super thermal energy range. Neither of
the two sources mentioned above can be modified to this energy range.
In a thermal source, generally, the ground state atoms of a
supersonic expansion are excited by electron impact and the
translational energy of the metastable atoms is determined by the
velocity of the parent ground state atoms, which in turn is determined
by the nozzle temperature. The upper limit is determined by the melting
point of the nozzle material which is typically 3000 K for refractory
materials, corresponding to a translational energy of 650 meV in the
beam.
In an accelerator source the metastable atoms are produced by near
resonant charge exchange reactions of an ion beam of the noble gas while
it passes through an oven containing an alkali vapour. The translational
energy of the metastable atoms will be almost equal to the translational
energy of the parent ion. The lower limit is typically 10 eV, mainly
determined by difficulties in generating a high intensity low energy ion
beam and by increasing lab scattering angles for the charge exchange
collisions for low ion velocities.
The hollow cathode arc beam source for metastable atoms, developed
14 -1 -1by Theuws [The81], produces a high intensity (10 s sr ) beam of
56

metastable noble gas atoms (He, Ne, Ar, and Kr) in the super thernal
energy range, i.e. in the gap between the two conventional beam sources
of metastable atoms. We use this beam source for elastic and inelastic
crossed beam scattering experiments, providing valuable supplementary
data on interaction potentials. However, to calibrate our beam machines
and give a better comparison of these super thermal data with the known
thermal or accelerator energy ranges, we have developed a simple and
reliable thermal beam source with approximately the same centre line
intensity. We use the design of Fahey et al. [Fah80], which we have
modified slightly, making a quick change between the two beam sources
possible without disturbing the vacuum conditions of the beam machine.
In paragraph 2 of this section we will describe this thermal beam source
and its performance in detail. Figure 5.2.1 gives the velocity
distribution of both the thermal source and the plasma source, showing
3r
10" 10velocity (m/s)
Figure 5.2.1 The velocity distribution of the thermal beam source and
the plasma beam source for helium. The intensities are
given in arbitrary units with different scales for the two
sources.
57

chat a wide velocity range is covered with these two sources, with only
a snail gap between 0.16 and 0.4 eV, which can be filled partially by a
seeded beam from the thermal source.
References
Fah80 D W Fahey, W F Parks, and L D Schearer J.Phys.E: Sci.Instrum. 13
(1980) 381-383
The81 P G A Theuws, Thesis (1981) Eindhoven University of Technology.
58

5.2.2
A DISCHARGE EXCITED SUPERSONIC SOURCE OF METASTABLE RARE GAS ATOMS.
M J Verheijen, H C W Beijerinck, L H A M v.Moll, J Driessen, and
N F Verster
Physics Department, Eindhoven University of Technology, Eindhoven, the
Netherland s.
(Submitted for publication: J.Phys.E: Sci.Instrum. )
1 Introduction
The basic process for the production of thermal metastable atoms is
excitation of ground state atoms by electron collisions. All different
types of metastable atom beam sources are based upon this process. Three
types of beam sources are used nowadays: excitation of a supersonic beam
of ground state atoms by electron impact, sampling an atomic beam from a
gas discharge, and a discharge through a nozzle of insulating material.
The latter type can be regarded as a combination of the two former
types.
In a discharge the relative density of metastable atoms can reach
values up to a few times 10 (de Hoog 1977). However, during the
expansion through the sampling orifice the quenching rate is still high
while there is no production, so the relative intensity of metastable
atoms in the atomic beam will be much lower. We have found a typical
_gfraction of 3 10 for a beam of metastable neon atoms from a hollow
cathode discharge (Verheijen 1979 and Verheijen et al. 1982). The
intensity of metastable atoms strongly depends on the discharge
pressure, showing a sharp maximum. This type of beam source results in
an atomic beam with limited possibilities of bean intensities. The
59

typical lifetime of the source is 200 hours, while showing a constant
decrease of intensity. These features are both due to erosion of the
sampling orifice.
Excitation of a supersonic beam of ground state atoms by electron
impact has several advantages compared to the sampled discharge sources.
One needs not to bother about loss in the continuum region of the
-3expansion while a relative excitation of 10 for helium can be reached
according to Haberland et al. (1981). However, because of too large
scattering angles, only a relative intensity of 10 is obtained. The
velocity distribution is mainly determined by the expansion process and
thus can be adjusted independently. This type of source in general gives
the highest intensities, however the shape of the original velocity
distribution can be destroyed by momentum transfer, especially when
electrons and atoms cross at right angles. By using a parallel
arrangment of the beams a large improvement is obtained by Brutschy and
Haberland (1977).
In the third type of source, the discharge excited supersonic
expansion, a discharge is sustained through the nozzle of a supersonic
expansion as described by Fahey et al. (1980) and can be regarded as a
combination of the former two (figure 1). There is now also production
of metastable atoms in the continuum region of the expansion and this
production takes place by a parallel electron beam which has a very high
current density inside the nozzle. This type of source has proved to
have a very long lifetime with a very stable performance. The maximum
intensity lies somewhat below that of the excitation source, but the
whole source is very compact and can be operated very easily, compared
to an excitation source.
To calibrate measurements of total inelastic cross sections in the
superthermal energy range, as obtained with a plasma beam source (Theuws
60

et al 1981), the construction of a thermal beam source was necessary.
We have chosen the compact discharge excited supersonic expansion, which
we have implemented inside the plasma chamber making it possible to
perform alternately measurements in the thermal and superthermal energy
range without disturbing the vacuum conditions. This source was also in
favour because its velocity distribution seems to be rather independent
of the operating conditions of the discharge. We have slightly modified
the source described by Fahey et al. (1980). Furthermore, in this paper
a detailed description is given of the intensity and the velocity
distribution. We use the theory given by Beijerinck and Verster (1981)
for an undisturbed isentropic expansion from a reservoir through a
nozzle followed by the transition to (almost) free molecular flow. Such
a quantitative description is necessary for a better understanding and
for a further optimisation of its performance.
2 Model
2.1 Velocity distribution.
The parallel velocity distribution of a supersonic expansion, of
which the whole virtual source is seen by the detector,is given by
Habets (1977)
P Q(V) dv = b a,"1 (v/u) exp{-(v-u)2/a|} dv , (1)
with b a normalisation constant, v the velocity, u the flow velocity,
and a,,- (2kWm) the characteristic velocity, giving the width of the
velocity distribution, with k and m the Boltzmann constant and atomic
mass, respectively, and T« the parallel temperature. Instead of the
characteristic width of the velocity distribution a.,, one uses the
61

speedratio S, defined by
S = u/o,/ • (2)
A further refinement of eq. 1 is possible by correcting it with Hermite
polynomials (Abramowitz 1970) of order three and higher as proved by
Beijerinck et al. (1983), resulting in
P(v) dv = Po(v) {1 + Y^CCv-u)^)} dv , (3)
where P(v) is the normaliEed velocity distribution and H^(x) and Y^ are
the i-th order Hermite polynomial and its coefficient, respectively.
Because the perpendicular temperature is negligible only the
parallel velocity distribution contributes to the enthalpy of the atoms
in the beam. Conservation of enthalpy now gives
ho = 7 kTo = ϙ2 + IkT// ' <4)
where h Q and To are the enthalpy per particle and the reservoir
temperature, respectively. Equation 4 can be used to calculate an
equivalent reservoir temperature from experimental results on the
parallel velocity distribution. An upper limit for the flow velocity is
given by (Ty « TQ )
Uoo = (2ho/m)* = (Y/(Y-1))* ao , (5)
with O Q the characteristic velocity in the reservoir and Y « c_/cv the
ratio of specific heats ( Y " 5/3 for a monoatomic gas).
The supersonic expansion of a gas through a nozzle can be
characterised according to Beijerinck and Verster (1981) by two
parameters, z , and S. The first one,
zref " a Rn (6)
62

is the scaling length along the axis of the expansion and proportional
to the nozzle radius Rn< The constant a depends on the ratio of the
specific heats (a - 0.802 for a monoatomic gas). The non-dimensional
parameter 5 is given by
S = 3.19 {(Y-l)M* {C6/(kTo)}+ n0 zref , (7)
where n and T are the reservoir density and reservoir temperature,
respectively. The parameter H is proportional to an inverse Knudsen
number for the source, using a low energy extrapolation of the mean free
path, which is dominated by the long range attractive forces described
by the van der Waals constant C,. At a fixed source temperature a gas
dependent numerical factor -relates E to the often used p Dn product,
with p the reservoir pressure and D the nozzle diameter. Using this
parameter, both the parallel velocity distribution and the virtual
source distribution (Beijerinck and Verster 1981) ( - perpendicular
velocity distribution) can be described gas independently. The
experimental results for an undisturbed' argon expansion for 10 < H < 300
(Beijerinck 1981) give
S = 19.3 (S/100)0-495. (8)
2.2 The centre line intensity.
The centre line intensity of the beam of metastable atoms will be
proportional to the centre line intensity of the beam of ground state
atoms,
^°>expt,n* " E I(0)expt.n • «>
where I(0)expt (s sr ) is the centre line intensity beyond the skimmer
of the metastable atoms (n ) and ground state atoms (n) and where e is
63

the degree of excitation of the resulting beam. In first order the final
degree of excitation e «ill only depend on the electron density n and
the electron energy distribution, which are determined in first order by
the discharge. Therefore a good starting point to discuss the centre
line intensity of the beam of metastable atoms is the centre line
intensity of a normal supersonic expansion, i.e. of only ground state
atoms. A thorough description of the centre line intensity beyond the
skimmer is given by Verheijen et al. (1984), resulting in
I(0>expt,n " I(O)id,n
K(N/TT)
>y) dx dy\\ f(x>y
skim
Tres(N) = exp(-fresN) (13)
fres b
where 1(0) . is the centre line intensity of an undisturbed expansionid,n
(Habets 1977), determined by the flow rate N (s~ ) and the peaking
factor of the nozzle < (K « 2.08 for a monoatomic gas (Beijerinck and
Verster 1981)). Both transmission factors T are given by 0 < T < 1. The
fraction of the virtual source distribution f(x,y) that is seen by the
detector through the skimmer is given by T (N). The factor T (N)
gives the attenuation due to collisions with residual gas atoms between
nozzle and skimmer. The cross section for collisions with cm.
scattering angles large enough to remove an atom from the beam is given2
by Qeff (m ) and the mean effective density length product between
nozzle and skimmer by <cij.es g/vj> zs, where z s is the nozzle skiamer
distance, n_„ the density of residual gas atoms, Vi the velocity of theres •*•
beam particles and g the relative velocity between beam particles and
S4

residual gas particles. There are two contributions to the mean
effective residual gas density: the background density in the expansion
chamber and the density of beam particles that return from the skimmer,
which is known as skimmer interaction, and we get
. (15)
The skimmer interaction contribution to eq. 15 decreases with increasing
z , because the total gas load on the skimmer decreases rapidlys
(Verheijen et al 1984), while the background contribution increases
proportional to z . So we may expect an optimum intensity as a function
of z where eq. 15 is minimal.s
The degree of ionisation is rather low ( 10 , see below) and the
theory for an undisturbed isentropic expansion (Beijerlnck and Verster
1981) can still be applied in spite of the heat input due to the
discharge, because the whole expansion from reservoir conditions to3
(almost) free molecular flow is limited to a very small volume (<20 1^,).
Therefore we may expect that the same description as used for the
undisturbed expansions will hold also for the velocity distribution and
intensity of the beam of metastable atoms. However, the residual gas
density n will be determined by the ground state atoms and for CLff
res " i
we must take the cross section for collisions of metastable atoms with
ground state atoms. The large polarisability of a metastable atom and
thus the larger value of CK will result in a larger value of Qef j and we
expect a more pronounced influence of T .
3 Experimental set up
We have modified the design of the excited discharge source of Fahey
et al. (1980) to satisfy our requirements that this source oust be
65

implemented in the existing plasma source in a way that the plasma
source and the discharge excited source can be used alternately. We use
the end anode of the plasma source, which defines the atomic beam axis,
as skimmer of the excited discharge source. The axial dimension of the
excited discharge source is limited to 20 mm, while we also must have
0
Figure 1 The design of the discharge excited beam source for metastable
atoms. All cross hatched parts are insulators while all shaded
parts are of metal. 1: nozzle in boron-nitride (0.1 mm
diameter), 2: glas window, 3: needle, 4: insulated current
lead, 5: glass tube for insulation, 6: electrical vacuum
feedthrough insulated with araldit, 7: gas feed line connector,
8: skimmer (or flat plate) with a 1 mm diameter sampling hole,
9: metal tube that slides through an 0-ring seal.
66

the possibility to move this source to a position far from the beam axis
(150 mm) when the hot ( 3000 K) hollow cathode arc is used as beam
source. The final design of the discharge excited source is given in
figure 1. The source is cylinder symmetric around the axis perpendicular
to the atomic beam axis. The large translation of 150 mm is possible by
sliding the metal tube through an 0-ring sealed vacuum feedthrough. With
three micrometers this very compact source can be aligned and positioned
on the atomic beam axis, which is defined by the skimmer aperture and a
collimator in front of the beam detector.
The breakdown voltages at the densities used inside the reservoir
(4.7-27 kPa, 35-200 Torr) are very low (Knoll et al. 1935). Because a
starting voltage of 5000 V is needed breakdown in the electrical leads
to the reservoir housing is avoided by carefull insulation. The diameter
of the nozzle in the boron nitride housing is typically 0.10 mm. Due to
the high densities in the reservoir we expect that the electrons will be
accelerated up to an energy which is sufficient to excite or ionise a
ground state atom, loosing nearly all energy in this process.
Considering the energy level scheme of the rare gas atoms, we assume an
average drift velocity comparable to an energy of approximately 10 eV.
We use currents up to 15 mA and with the foregoing assumption for the
drift velocity of the electrons we can calculate the electron density in
1 o _o
the nozzle orifice, resulting in n g - 5 10 m . At reservoir pressures
of 4.7 kPa (35 Torr) this results in a degree of io/iisation ofn /n - 9 10"6.e n
It is our experience that the sharp needle is only important for the
ignition of the discharge (5000 V). During operation (300 V, 10 mA) the
discharge does not burn with the needle as cathode but generally finds a
small hole in the construction around the needle that operates as an
effective hollow cathode. In our case the spaces between the loose ends
67

of the high voltage lead act as hollow cathodes. The expansion chamber
is pumped by a 110 1/s turbo molecular pump. Measurements have been
performed with a time-of-flight machine (Verheijen 1984a). The flight
path from chopper to detector is 2.745 m and the distance between the
skimmer and the collimater (diameter 0.5 mm) is 2.613 mm.
3.1 Data analysis
The flight time spectra are analysed with a least squares analysis
using eq. 3 as a model function with four Hermite polynomials, H„ thru
H and also taking into account the convolution of the chopper gate6
function. The free parameters are 1(0), S, u, y , y,, y , and y,. The
speedratio S and the flow velocity u are used to calculate an effective
reservoir temperature T , according to eq. 4 where we assume thato
T = T , the temperature of the metastable atoms. This temperature ino n*
turn is used to calculate the dimensionless source parameter H (eq. 7),
using the C value for the interaction of ground state atoms because6
they dominate the expansion process.
4 Experimental results.
A typical flight-time spectrum for neon is given in figure 2. The
peak at zero flight-time is due to resonance (u.v.) photons from the
discharge and corresponds to the chopper gate function. The result of
the least squares analysis is given by the solid line while at the base
line the residue is given. This residue shows a clear structure which
disappears when the Hermite polynomials of order five and six are also
included in the model function, resulting in a very accurate description
of tha velocity distribution. However, the results for the free
parameters then show a strong correlation, while the ordering of the
68

coefficients of the Hermite polynomials does not correspond to that of
the moments of the Boltzmann equation in an undisturbed expansion
(Beijerinck et al. 1983).
4.1 Intensities
Table 1 gives the maximum centre line intensities that we have
obtained by optimising the nozzle skimmer distance zs and the reservoir
pressure p0. Our intensities are a factor of five to seven lower than
those reported by Fahey et al. (1980) at almost the same experimental
conditions. The only experimental differences were the pumping speed and
the nozzle radius, which were in our case three times and 302 lower,
1 2flighttime (ms)
I I i I i li i i i i i i i i2 3 1velocity (10 m/s)
Figure 2 Flight time spectrum for neon at p - 24.5 kPa (184 Torr),
Ic « 3.0 «A and z « 7.4 mm with a skimmer. The residue afters
analysis with the model function including the Hermite
polynomials of order three and four is shown at the base line.
69

Table 1 The optimum centre line intensities at a discharge current of
3 mA. For comparison the intensities reported by Fahey et al.
(1980) are given. The relative intensity of the beam of
metastable atoms is also given, where we use the ideal centre
line intensity (eq. 11) as reference value. The flow rates are
determined by a pressure drop method.
gas centre line intensity relative intensity
I(0)n!)!(1014s-1sr-1) 1(0)^/(2.08 N/TT)
Fahey
helium
neon
argon
expansion chamber
pump (1/s)
et al.
3.5
1.5
0.7
300
this work
0.73
0.20
0.14
110
2
0.6
2
IQ"5
io-5
IQ"5
respectively. How this lower pumping speed influences the intensity is
discussed in the next part of this section. An other reason for our
lower intensities is due to our assumption of a detection efficiency of
unity for our particle detector (Theuws 1981) (untreated stainless steel
surface), which may be a factor of two too optimistic (Dunning et al.
1971).
We have measured the centre line intensity 1(0). * as a functionGxpt$n
of the nozzle skimmer distance z and the reservoir pressure p to
investigate the transmission through the residual gas T (N) (eq. 13).
These measurements are performed also with a flat plate anode instead of
a skimmer shaped anode (figure 3). In both cases we observe a maximum in
70
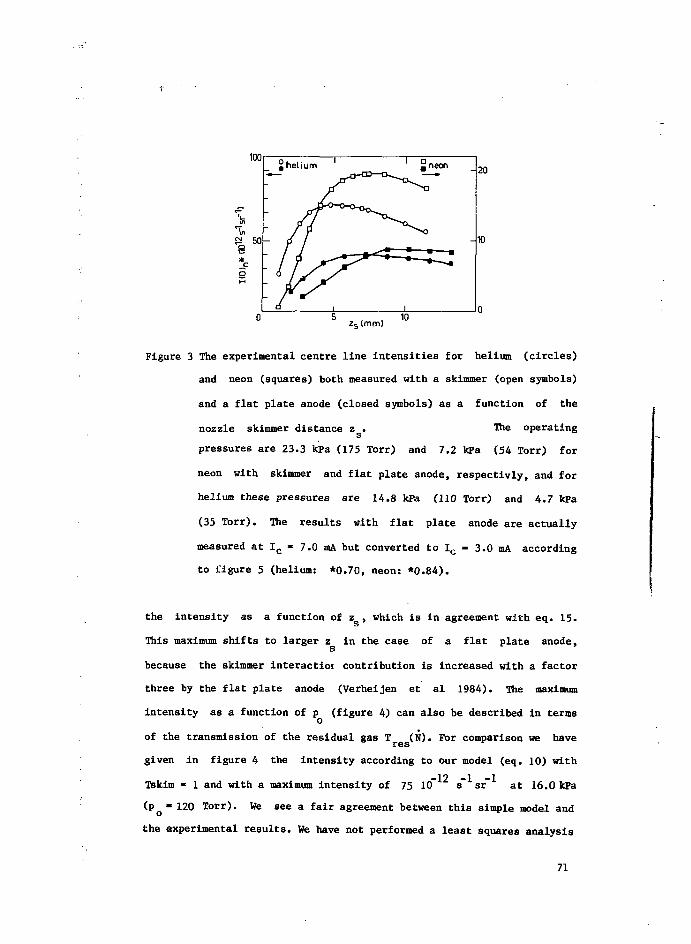
5 10zs(mm)
Figure 3 The experimental centre line intensities for helium (circles)
and neon (squares) both measured with a skimmer (open symbols)
and a flat plate anode (closed symbols) as a function of the
nozzle skimmer distance z . The operatings
pressures are 23.3 kPa (175 Torr) and 7.2 kPa (54 Torr) for
neon with skimmer and flat plate anode, respectivly, and for
helium these pressures are 14.8 kPa (110 Torr) and 4.7 kPa
(35 Torr). The results with flat plate anode are actually
measured at Ic - 7.0 mA but converted to Ic - 3.0 mA according
to ligure 5 (helium: *0.70, neon: *0.84).
the intensity as a function of z , which is in agreement with eq. 15.
This maximum shifts to larger z in the case of a flat plate anode,s
because the skimmer interactiot contribution is increased with a factor
three by the flat plate anode (Verheijen et al 1984). The maximum
intensity as a function of p (figure 4) can also be described in termso
of the transmission of the residual gas T (N). For comparison we haveres
given in figure 4 the intensity according to our model (eq. 10) with—12 —1 —1
Tskim - 1 and with a maximum intensity of 75 10 s sr at 16.0 kPa
(PQ • 120 Torr). We see a fair agreement between this simple model and
the experimental results. We have not performed a least squares analysis
71

because also the excitation rate e and the transmission of the skimmer
skim will depend on the flow rate. However, from figures 3 and 4 we may
conclude that the behaviour of the centre line intensity as a function
of pQ and zs is governed by the transmission through the residual gas
between nozzle and skimmer. The background density is of the same order
as the skimmer interaction, which means that we may expect higher
intensities when usirg a larger pumping speed. The maximum then will
shift to larger values of z .s
100-
200 300Po (Torr)
400
Figure 4 The centre line intensity as a function of the reservoir
pressure pQ. The experimental conditions are: I - 3.0 mA,
zs - 7.4 mm (skimmer) and 10 mm (flat plate anode) and symbols
according to figure 3. The dashed line corresponds to our
model (eq. 10) with T - 1 and a maximum intensity of
12 -1 -1 S l m
75 10 s sr at p Q - 16X)kPa (120 Torr) and has to be
72compared to the experimental results for helium with skimmer.

For helium we observe a maximum intensity as a function of the flow
rate. The position of this maximum gives a good approximation for f res.
Using a calculated value for the residual gas density between nozzle and
skimmer we find an effective cross section Qeff • 130 * for helium
which is in fair agreement with total cross section results of Brutschy
and Haberland (1979) and of Trujillo (1975).
We have also observed that for low reservoir pressures the discharge
becomes unstable as already mentioned by Fahey et al. (1980). For the
flat plate anode, with a higher residual gas density, this minimum
pressure is lower than for the skimmer. We conclude that the minimum
Ic(mA)
Figure 5 The centre line intensity as a function of the discharge
current I for the flat plate anode. The reservoir pressure
Po - 4.7 kPa (35 Torr) and pQ - 6.7 kPa (50 Torr) for helium
and neon, respectively, z » 10 mm and symbols according to
figure 3.
73

operating pressure of the source is governed by the residual gas density
between nozzle and skimmer. For both cases the residual gas density
between nozzle and skimmer is typicaly 0.1 Fa (10 Torr). Figure 5
gives the centre line intensity as a function of the discharge current
I , showing a less than linear increase which indicates an onset of
saturation.
4.2 Effective source temperatures
Figure 6 gives the effective reservoir temperatures calculated
with eq. 4 as a function of the discharge current Ic and of the
reservoir pressure p , resulting in typical values T % = 450 K. For
comparison with T we have determined the effective reservoir
temperature T by accurate measurements of the flow rate N witho
discharge on and off using a pressure drop methode (Beijerinck and
_iVerster 1981). With the temperature dependence of N <\i T at constant
Ic!mA>
Figure 6 The effective reservoir temperature of the beam of metastable
atoms T % as a function of the discharge current 1 and the
reservoir pressure pQ at z s « 10 mm with a flat plate anode.
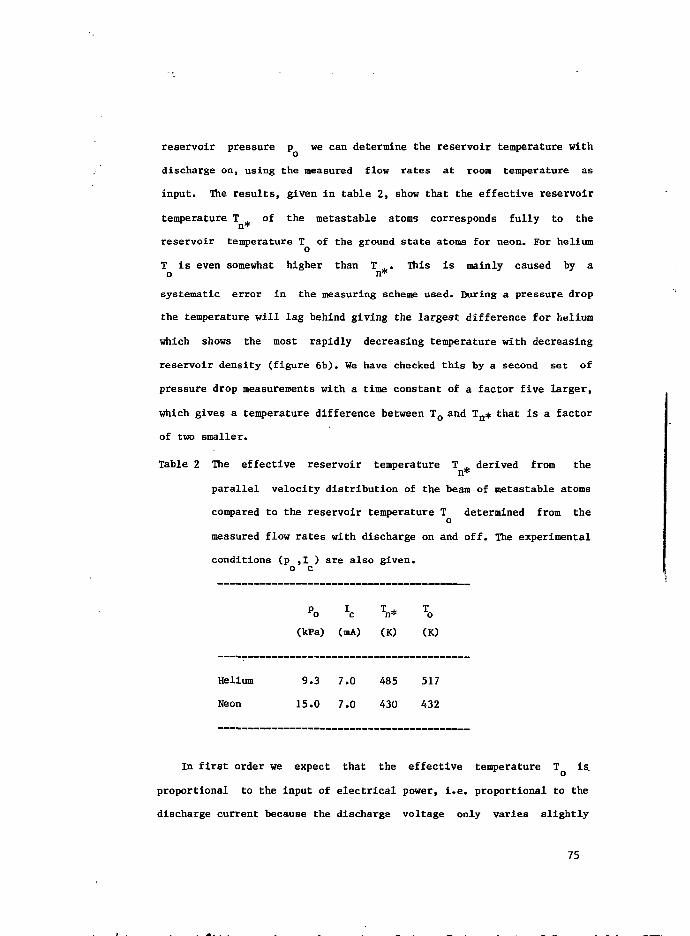
reservoir pressure p we can determine the reservoir temperature with
discharge on, using the measured flow rates at room temperature as
input. The results, given in table 2, show that the effective reservoir
temperature T of the metastable atoms corresponds fully to then*
reservoir temperature T of the ground state atoms for neon. For heliumo
T is even somewhat higher than T . . This is mainly caused by ao n*
systematic error in the measuring scheme used. During a pressure drop
the temperature will lag behind giving the largest difference for helium
which shows the most rapidly decreasing temperature with decreasing
reservoir density (figure 6b). We have checked this by a second set of
pressure drop measurements with a time constant of a factor five larger,
which gives a temperature difference between T o and Tn* that is a factor
of two smaller.
Table 2 The effective reservoir temperature T ^. derived from then*
parallel velocity distribution of the beam of metastable atoms
compared to the reservoir temperature T determined from theo
measured flow rates with discharge on and off. The experimental
conditions (p ,1 ) are also given,o c
p I T * Tro c n* o
(kPa) (mA) (K) (K)
Helium
Neon
9
15
.3
.0
7.0
7.0
485
430
517
432
In first order we expect that the effective temperature T is.
proportional to the input of electrical power, i.e. proportional to the
discharge current because the discharge voltage only varies slightly
75

with the operating conditions. This assumption is supported by the near
linear behaviour of T * (« TQ) as a function of the discharge current.
We also see an Increase of the temperature Tn* with increasing reservoir
pressure p , which is probably due to the increase of the heat
conductivity of the gas. This effect is most provounced for helium,
while the temperature for helium is clearly higher than for neon.
Assuming that the heat input to the expansion is delivered by the
conductance from the "hot" needle and the walls of the reservoir, which
are in good thermal contact with the needle, these effects can be
explained by the thermal conductivity, which is a factor of 4 higher for
helium than for neon.
4.3 The parallel speedratio
The experimental values of the speedratio S as a function of the
source parameter H are given in figure 7. Our experimental results are
approximately 25 % lower than the experimental results of a normal argon
expansion (eq. 8) (Beijerinck and Verster 1981). In our opinion this is
I 10 100
Figure 7 The speedratio S as a function of the non-dimensional source
parameter £ (symbols according to figure 3). The solid line
corresponds to the experimental results of Habets for an
undisturbed expansion of argon (Beijerinck and Verster 1981).
76

caused by some additional heat input into the parallel velocity
distribution beyond the transition region (Beijerinck and Verster 1981).
This heat input will also increase the virtual source radius
considerably and one has to make a carefull choice for the skimmer
diameter, otherwise the transmission of the skimmer Tskim(N) (eq. 12)
becomes important.
5 Concluding remarks
The beam of metastable atoms produced by the discharge excited
source can be fully described with the theory of undisturbed supersonic
expansions as given by Habets (1977), by Beijerinck and Verster (1981),
and by Verheijen et al. (1984). The intensity is governed by the
transmission of the centre line beam through the residual gas and the
degree of excitation inside the nozzle. According to our insight in
skimmer interaction an intensity gain of at least a factor five should
be feasible by only increasing the pumping speed and optimising the
skimmer geometry. In this case we expect that the flow rate has to be
increased for stable operation, to maintain the required residual gas
density between source and skimmer.
References
M Abramowitz and I StegunHandbook of Mathematical functions (1970) Dover New-York
H C W Beijerinck and N F VersterAbsolute intensities and perpendicular temperatures ofsupersonic beams of polyatomic gasesPhysica 111C (1981) 327-352
H C W Beijerinck, G H Kaashoek, J P M Beijers, and M J VerheijenKon-Maxwellian velocity distribution in the transition regionof supersonic expansions of the noble gases He, Ne, and ArPhysica 121C (1983) 425-436
B Brutschy and H HaberlandA high-intensity beam of metastable helium atomswith good velocity resolutionJ.Phys.E: Sci.Instr. 10 (1977) 90
77

B Brutschy and H HaberlandLong range helium excimer potentials from •, ohigh resolution differential cross sections for He(2 S, 2 S) + HePhys.Rev.A. 19 (1979) 2232-2248
D W Fahey, W F Parks, and L D ShearerHigh-flux beam source of thermal rare-gas metastable atomsJ.Phys.E: Sci.Instr. 13 (1980) 381
H Haberland, Y T Lee, and P E SlskaChapter 6 in "The excited state in Chemical Physics"(1981) (ed. J Wm Me Gowan) John Wiley and sons, New-York
A H M HabetsSupersonic expansion of argon into vacuumThesis (1977) Eindhoven University of Technology.
F J de Hoog, J R McNeil, G J Collins, and K B PerssonDischarge studies of the Ne-Cu laserJ.Appl.Phys. 48 (1977) 3701-3704
M Knoll, F Ollendorf, and R RompeGasentladungstabelle Springer-Verlag (1935)
P G A Theuws,Molecular beam sampling of a hollow cathode arcThesis, (1981) Eindhoven University of Technology
P G A Theuws, H C W Beijerinck, N F Verster, and D C SchramA hollow cathode arc as a high—intensity beam source for ground stateand metastable noble gas atoms in the eV translational enrgy rangeJ.Phys.E: Sci.Instr. 15 (1982) 573-579
S M Trujlllo 3
Absolute total velocity dependent scattering cross sections for He(2 S.)from He, Ne, Ar, and Kr for velocities between. 500 and 2.2 10 m/sProceedings of the 9th Int. Symp. on Phys.of Elec. and At. Coll.(University of Washington, Seattle, 1975) 437-438
M J Verheijen (1979)A single mode c.w. dye laser system for molecular beam experimentsEindhoven University of Technology, Report VDF-NO-79-09 (in Dutch)
M J Verheijen, H C W Beijerinck, and N F VersterAn atomic beam set-up for 0.5 MHz absolute frequencystabilisation of a c.w. dye laserJ.Phys.E: Sci.Instr. (1982) 1198-1206
M J Verheijen 3 3
Beam experiments with state selected Ne( P , P^ metastable atomsThesis (1984) Eindhoven University of Technology
M J Verheijen, H C W Beijerinck, W A Renes, and N F VersterA quantitative description of skimmerinteraction insupersonic secondary beam: calibration of absolute intensitiesChem.Phys. (1984) accepted for publication.
78
5.3 The double differentially pumped supersonic secondary bean
Experimental set-up
A schematic view of the secondary-beam part (primalrly designed for
helium and neon beams) of the experimental set-up is given in fig. 5.3.1.
The radius of the nozzle R * 47.0 (0*3) vim and is measured with a
pressure drop method. To avoid clustering the nozzle can be heated
electrically to a maximum temperature of 400 K, measured with a Cu-Cst
thermocouple. The skimmer is wedge shaped and 23 mm high. The skimmer
opening is a slit of 0.41 (0.01) mm wide and I.00 (0.05) ira high. The
collimator is mounted on the base of the skimmer. The differential stage
between skimmer slit and collimator is pumped with an oil diffusion pump
through the two triangular channels on the inside of the wedge with
o128 mm cross section area and 30 mm length each. The effective pumping
speed is 10 1/s for neon and 23 1/s for helium. The collimator is a 5 mm
high cone with a rectangular slit of 1*2.5 am2.
The combination of nozzle, skimmer, and collimator can be assembled
and aligned optically outside the vacuum chamber. The beam axis is
defined by the skimmer slit and collimator slit. The fine adjustment of
the nozzle onto this beam axis is performed with two stepper motors
inside the vacuum chamber, using two excenters with a 1 nun scanning
range each.
Beam profiles and centre-line intensities are measured with a
movable storage detector consisting of an ionization gauge with a
sampling slit of 1*5 mm2 in a 0.1 mm thick wall located 170 am beyond
79

the skimmer slit in front of the entrance to the buffer chamber. A
stepper motor inside the vacuum chamber scans the detector In a
direction perpendicular to the skimmer slit from 10 mm before the
central position to 30 mm beyond this position. The measuring routine
for beam profiles has been described by Beijerinck et al.(Bey83) and for
centre line intensities by Verheijen et al. (Ver84b).
Fig. 5.3.1 A schematic view of the double differentially pumped secondary
beam. 1: nozzle with R « 47 pm adjustable in the x-y plane at
z - 0 mm, 2: skimmer wedge with the triangular channel forming
the differential stage and a 0.41*1 war slit at z « 10 mm, 3:
conical shaped collimator with a 1*2.5 n»n2 slit as shown in the
insert at z « 32 mm, 4: storage detector with 1*5 mm2 entrance
slit at z « 180 mm, 5: primary beam at z » 53 mm 6: flow
resistance to buffer chamber with entrance at z * 230 mm. The
pumping speed of the three vacuum chambers and the conductance
of the triangular channels of the differential stage are
indicated.
80

Performance
Figure 5.3.2 shows two beam profiles for neon measured with the
storage detector. The residue after a least squares analysis is shown
separately. The dashed line corresponds to a beam profile with the same
virtual source distribution without collimator to show the influence of
the collimator. A detailed description of this double differentially
pumped supersonic secondary beam is given in [Ver84a]. The centre line
intensity of the beam is determined by a relative measurement of the
intensity as a function of the nozzle pressure. Analysis with the
virtual source model and the skimmer interaction model results in an
accurate absolute calibration of the secondary beam with only the
peaking factor of the nozzle (2.08) as further information. This method
has been described in detail in [Ver84b]. The optimum performance of
this secondary beam is given in table 5.3.1.
Table 5.3.1 The optimum performance of the secondary beam in terms of
the maximum density length product at the scattering centre,
<nl> , and the corresponding experimental centre linesc
intensities and densities at the scattering centre, 1(0)
and n , respectively.
helium neon argon krypton
Po
nsc
(Torr)
(1019 s^si
(1019 m-3)
(1016 m-2)
900
r ) 3.0
0.65
1.36
1050
1.4
0.65
1.44
670
0.39
0.26
0.56
450
0.15
0.14
0.31
81

002
Fig. 5.3.2 Typical neon beam profiles with collimator, one at a low flow
19 -1 —1rate (p0 = 100 Torr, TQ- 293 K, fi - 0.51 10 s sr ) and
one at maximum flow rate (p0 = 1050 Torr, TQ» 293 K,
19 -1 -1N - 6.0 10 s sr ). The non-dimensional reservoir
parameter [Bey81] H is 11.6 and 123, respectively. For the
maximum flow rate we have also shown the beam profile without
collimator with the same virtual source distribution and the
residue after the least squares analysis with all parameters
free at a five times enlarged scale.
References
Bey81 H C W Beijerinck and N F VersterAbsolute intensities and perpendicular temperatures ofsupersonic beams of polyatomic gases.Physica C HI (1981) 507-514
Bey83 H C V Beijerinck, G H Kaashoek, J P M Beijers, and M J VerheijenNbn-Maxwellian velocity distribution in the transition regionof supersonic expansions of the noble gases He, Ne, and Ar.Physica C 121 (1983) 425-436
Ver84a M J Verheijen, H C W Beijerinck, W A Renes, and H F VersterA double differentially pumped supersonic secondary beam.J.Phys.E: Sci.Instr.: submitted for publication
Ver84b M J Verheijen, E C » Beijerinck, W A Renes, and N F VersterA quantitative description of skimmerinteraction in super-sonic secondary beams: calibration of absolute intensities.Chem.Phys.: Accepted for publication.
82

5.4 Automation of the experiment and data processing.
All our experimental set-ups are automised to a large degree. The
computer group of the Physics Department of the Eindhoven University of
Technology has developed a network system (figure 5.4.1) around a
central PDP11/23 minicomputer with 15 Mbyte background memory on hard
disk and the RT-11 operating system which acts as a file server. At the
moment there are sixteen experimental stations connected to the central
computer by a 9600 baud series line and a local microcomputer. The local
microcomputers, of the type DEC LSI11/O2 with 64 kbyte work space or of
the type Motorola M68000 with n times 256 kbyte work space (0 < n < 17),
do not have a storage memory of their own, in general, but use the hard
disks of the central computer. The local computers are connected to the
experimental set-up by a modular interface system called Eurobus.
COMPUTING CENTRE OF T.H.E.
Figure 5.4.1 A schematic overview of the automation of the experiment
and the data flow.
83

The M68000 and its memory units of 256 kbyte are fully incorporated in
the Eurobus system, all developed by the computer group. The hardware of
the system has been described by Van Nijmweegen [Nij79]. Besides
standard (multiple channel) voltage measuring and generating devices
(ADC and DAC), logical outputs, and pulse counters, we use a preset
sealer as timing device, generally, and a multi sealer, consisting of a
dedicated counting and timing unit and of a general purpose dual port
memory. Very usefull is the logic unit which contains some logic
functions to control digital data.
The user programs controlling the experiment are developed and run
on the local computers. The software used is an Algol and Pascal like
language developed by Verhelst and Verster [Ver8 4]: PEP (Program Edi-
tor and processor). This is an interpreter based system. An interactive
editing program is available to create and change user programs and a
monitor program that starts execution and organises data transport. The
PEP system offers the possibility to create procedure libraries, which
keeps the final user programs very readible and short. At the local
computers the raw data are gathered and before they are stored at the
hard disk of the PDP 11/23 only a brief analysis is performed for a
first check. The final analysis, generally, is performed at the large
B77OO system of the computing centre.
References
Nij79 F van Nijmweegen University of Technology Eindhoven, Int.Rep.
VDF/NO-79-10
Ver84 P W Verhelst and N P Verster DECUS Proc.7 (1980) 197-202
Software Practise and Experience accepted for publication
84

5.5 Detectors for elastic and inelastic scattering products.
The detector for the metastable atoms of the primary beam has been
described in detail by Theuws [The81]. The metastable atoms are detected
by Auger ejection of an electron from an untreated stainless steel
surface followed by an electron multiplier and a pulse
amplifier/discriminator. The secondary electron emission coefficient Y
of a chemically cleaned stainless steel surface for metastable noble gas
atoms has been studied in detail by Dunning and coworkers [Dun71,
Dun71a, Dun75]. For a mixed beam of metastable neon atoms (IS5, IS3)
they give values for y between 0.5 and 1.5 using different experimental
techniques.
Inelastic collisions with the secondary beam atoms produce many
different inelastic scattering products: thermal metastable atoms due to
excitation transfer to the secondary beam atoms, resonance u.v. photons
due to inelastic transitions to the resonance states (1&2, ls^), charged
particles due to Penning ionisation, visible photons after excitation
transfer, and fluorescence photons when a laser beam is used as
secondary beam. At the moment we can detect visible photons, u.v.
resonance photons, positive ions, and metastable atoms produced at the
scattering centre. Figure 5.5.1 gives a view of the detection systems
around the scattering centre.
The detection system for visible photons has been described in
detail by Gaykema [Gay83]. We will only discuss the features that are
important for our experiments. The photons are collected and transported
to a vacuum window by a fiber bundle and counted with a photomultiplier
outside the vacuum system. Color selection is possible with color
filters (band-pass and cut-off) and a 0.25 m monochromator. The overall
85

O 10 20mm
Figure 5.5.1 The scattering centre with the detection systems (fiber
bundle and spiraltron) for inelastic scattering products.
The distances (mm) of the different parts to the scattering
centre are indicated. 1: collimator of the primary beam
(diameters: 2.0, 1.0, and 0.6 mm) the x-coordinate is fixed
and the y coordinate is scanned by a stepping motor,
2: collimator of secondary beam (this beam is perpendicular
to the plane of the drawing), 3: primary beam,
4: spiraltron SEM4219 with a cone with open area of 10 mm
diameter, 5: confining grid for secondary electrons in the
cone, 6: shielding grid, 7: grounded shield for the high
voltage leads to the spiraltron, 8: collector, 9: ion
repeller, 10: fiber bundle, 11: positive lens (makes an
image of the scattering centre on the entrance of the fiber
86

bundle), 12: spherical mirror reflects photons through the
scattering centre and increases detection efficiency with a
factor two (this mirror was not available during all our
experiments).
vis ~4estimated detection efficiency is n - 4.2 10 without color
selection, mainly determined by the solid angle acceptance
(r^is « 0.0182) and the quantun efficiency of the photoaultiplier
(nvis " 0.07 at a wavelength of A - 600 n«). The transmission of theqe
VISmonochromator (FWIM - 3 nm) is r| - 0.10 at A - 600 nm for the photon
mon r
beam that leaves the fiber bundle.
A spiraltron can be used to count charged particles, metastable
neutral particles and u.v. photons. This means that if one wants to
measure the signal of one of these particles care has to be taken that
background due to the other types of particles is sufficiently
suppressed. We use a spiraltron of the type SEM4219 [W6170] to count
resonance u.v. photons and positive ions. A Spiraltron (Spiral Electron
Multiplier) is a sophisticated type of a channeltron with a straight
line geometry. It consists of a preamplifier cone section followed by
six channel sections twisted around the multiplier axis. With the
preamplifier section a large and special shaped (if necessary)
geometrical open area is obtained while after preamplification all six
spiral sections are triggered with almost unit probability, resulting inQ
a narrow pulse height distribution with a gain above 10 . The count rate
of dark pulses is very low and lies well below lHz. Figure 5.5.2 gives
the quantum efficiency of a continuus electron multiplier for u.v.
photons, electrons, protons, and positive ions (lithium and helium). The
quantum efficiency for positive ions as a function of ion mass is
measured by Potter and Mauersberger [Fot72] for the spiraltron SEM4219
87

(figure 5.5.3) at ion energies between 3 and 4 keV. They observe an
asymptotically approach to the 90% efficiency line for increasing ion
masses, however, the heaviest atom they have used is argon. They claim
an accuracy of +/-5Z due to instrumental limitations.
The circuitry around the spiraltron is given in figure 5.5.4 The
collector for the output pulses of the spiraltron is biased to +200 V
with respect to the end of the spiral section. After a wide band
0.9
0.7
"cr 0.5
0.3
i HI in* |—i i iuiii|—i 11MINI—i • 111•••!—i i i inn
0.110
i iinml i ini/ll l i mniTN^n umi i iniiil
102 103
energy (eV)
I i i i i i 11 I i I
100
energy (eV)
Figure 5.5.2 Typical quantum efficiencies for electrons, protons,
positive ions, and u.v. photons [Tim71] for a continuus
electron multiplier.
20 30ion mass number
Figure 5.5.3 The quantum efficiency as a function of the positive ion
mass for two (#1,#2) spiraltrons of the type SEM4219
[Pot72].
88

(100 MHz) buffer amplifier (LH0033) inside the vacuum chamber with high
input impedance and low capacity close to the collector the output
pulses are transported with a coaxial line through a vacuum feedthrough
to an amplifier/discriminator.
•V- iOOV
ov
Figure 5.5.4 Circuitry around the spiraltron SEM4219. The parts are
numbered according to figure 5.5.1 The LHOO33 buffer
amplifier is mounted inside the vacuum chamber close to the
collector.
The confining grid (5), at the same potential as the cone, provides
that the secondary electrons are drawn further into the preamplifier
section and thus are counted without any loss. The positive ions
produced at the scattering centre are accelerated towards the cone by
the field of the confining grid. The shielding grid (6) (at +25 V)
combined with the earth shield (7) brings the scattering centre at a
positive potential and makes it possible to focus the positive ions,
produced at the scattering centre, onto the shielding grid (and thus
onto the spiraltron) by a positive (+400 V) voltage at the ion repeller
(9) or to focus them onto the repeller by a negative voltage (-400 V).
We can now discriminate the positive ion signal from the signal due to
u.v. photons and metastable atoms. The contribution of elastic scattered
metastable atoms from the primary beam is minimised by positioning the
89

spiraltron in the backward position with respect to the primary beam. In
this configuration the overall detection efficiency for u.v. photons is
r)u - 5.66 10 determined by the solid angle efficiency: n^« 7.27 10~ ,
the transmission of the two grids: rim - 0.37, the quantum efficiency
(figure 5.5.2): ri • 0.21. The overall detection efficiency for
positive ions is determined by the same efficiencies, rijj, HT, and n" of
which only the quantum efficiency is known (figure 5.5.3) nae • 0.90
while with optimum field configuration the solid angle efficiency will
be unity and the transmission of the grids will also be close to unity.
With a neon primary beam and an argon secondary beam the total count
rate for u.v. photons and mefastable atoms (V - -400 V) is less
ion,repthan 0.5% of the count rate when (Penning) ions are included
(V. - +400 V).ion,rep
It is very important that the scattering centre is fully accepted by
the detector and that only a limited part of the surrounding region is
seen, because with secondary beam on the background density in the
vacuum chamber will Increase slightly (approximately 1% of the density
of the secondary beam at the scattering centre) and inelastic collisions
with these background atoms also produce scattering products. Care has
to be taken that the density length product due to the increase of
background density along the path of the main beam that is seen by the
detector is small compared to that of the secondary beam. Otherwise,
absolute cross section measurements by calibration of the density length
product of the secondary beam are impossible. Also the flight path may
then vary over a large distance, which reduces the accuracy of the
velocity dependence of the measurements.
For the visible photon detection system this is done by using a lens
that makes an image of the scattering centre on the entrance of the
fiber bundle, while the view volume of the spiraltron for u.v. photons
90

is limited by the aperture (with shielding grid) in the earth shield.
However, charged particles follow (approximately) the electric field
lines and not straight line trajectories. We have optimised the field
configuration (i.e. V ,. l d and V. ) by measurements of the Penning
ion count rate, S , relative to the count rate of metastable atoms at
the metastable beam detector. We have measured the relative intensity
due to the normal background density, sj", the relative intensity with
increased background density by using an auxilliary calibrated gas flow
through a side flange of the vacuum chamber Sa, and the relative
intensity with the secondary beam on, S . Figure 5.5.5a gives the
experimental results. At V jj-eld " -400 V the results of S^ show that
the length of the primary beam (along the atom trajectories) that, is
seen by the spiraltron decreases when V. increases from 0 V to
400 V. Ihe results of S* as a function of V , . , , show that for
b shieldV « 0 V the view length increases in a very short voltage raneeion,rep
from almost zero (V . , « 0 V) to its maximum value (V . . , , « -80 V),shield shield
while for V • +400 V this range extends from V .. , , « +120 V toion,rep shield
-120 V. The results for S 1 saturate also in these same regions. However,o
for V. - +400 V we see a steep increase in the first part of thision,rep
region (from V « +120 V to +60 V) and a slow increase in theshield
remaining part (V . . , « +60 V to -120 V). This is more clearly shownshield
in figure 5.5.5b where S^S* and s V s 1 are given. For V • 0 V we° g b a b ion, rep
see no real saturation of SVS* at V - -400 V. This indicates thatg b shield
the spiraltron already for low negative voltages (Vg^-j^id < -100 V) sees
the maximum view length, but not yet the whole cross section of the
primary beam. The steep increase of Sj/Sb f o r v±On rep * +400 V from
Vshield * + 1 2 0 V t o + 1 0 ° V a n d t h e d e c r e a s e f r o a vshield - +60 V to
-120 V shows that the spiraltron sees almost instantaneously the whole
91
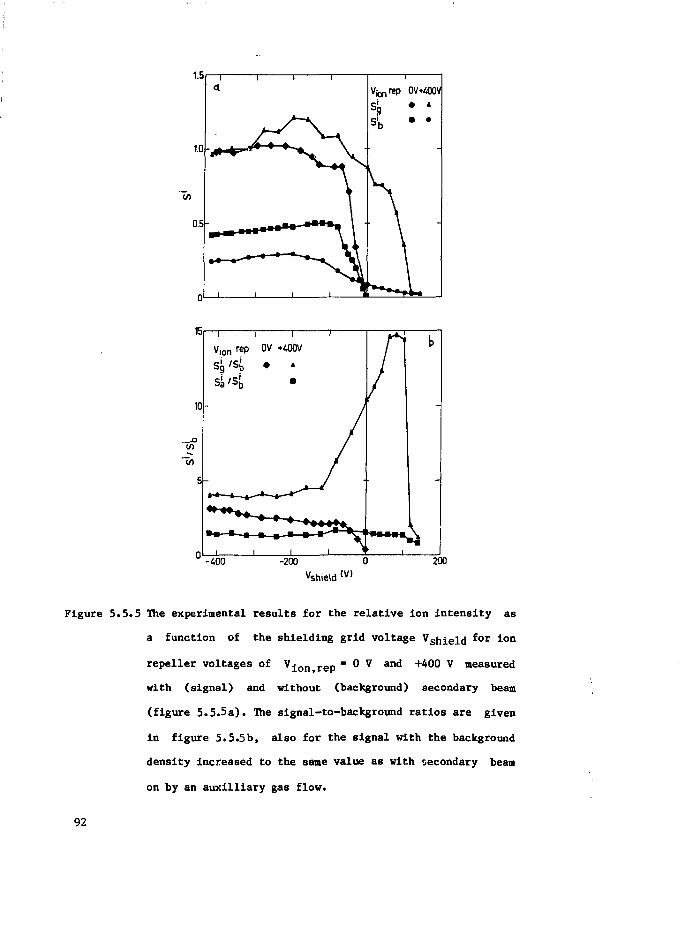
Figure 5.5.5 The experimental results for the relative ion intensity as
a function of the shielding grid voltage Vg^ield for ion
repeller voltages of V i o n rep • 0 V and +400 V measured
with (signal) and without (background) secondary beam
(figure 5.5.5a). The signal-to-background ratios are given
in figure 5.5.5b, also for the signal with the background
density increased to the same value as with secondary beam
on by an auxilliary gas flow.
92

cross section of the primary beam (+120 V to +100 V) and that the view
length increases between V s h ± e l d - +60 V and -120 V. We have chosen as
optimum field configuration V s h l e l d - +25 V and V i o n > r e p - +400 V, where
the signal to background ratio is S /S^ ~ 10 and the relative intensity
is already at 70% of its maximum value while it shows no steep
dependence of
The results for the relative intensities with extra gas flow sa/
st,
ate, as expected, independent of Vg^e]^* In first order this ratio is
proportional to the ratio of total background densities and a simple
correction of total Penning ionisation cross sections for the increase
of the background density due to the secondary beam is possible by
measuring the total background densities. If a more accurate correction
is desired one has to measure Penning ions with secondary beam on and
with an auxilliary gas flow. The auxilliary gas flow then must be equal
to the gas load of the secondary beam on the vacuum chamber, resulting
in equal background densities.
We have performed a check on the detection efficiencies of the
visible photon detection system, the u.v. detection by the spiralron,
and the metastable atom detector by optical pumping of the metastable
atoms of the primary beam at the scattering centre with a c.w. dye laser
[Kro81]. The decrease of the total count rate at the metastable beam
detector corresponds to both count rates for u.v. photons and visible
photons. The ratios of the three different count rates give the ratios
of the overall detection efficiencies apart from the branching ratios of
the upper level of the optical pumping scheme and the solid angle
acceptance of the primary beam at the metastable atom detector and at
the scattering centre. This experiment has been described in detail by
Gaykema [Gay83] and we will only discuss the final results, given in
93

Table 5.5.1 The ratios of the absolute detection efficiencies for the
three detection systems, the optical pumping of the Ne(ls^-
2p ) transition (X - 588 nm) is used and the visible
photons are detected with a monochrotnator to select the
X» 659 nm fluorescence line (2p2~ls„) and a cut-off color
filter to suppress scattered laser light. The input for the
theoretical ratios is 1 :659
n
thermal beam(500-1000 m/s)
superthermal beam(200-15000 m/s)
theory (n"1-!)
• 2.7 10~5
13.6 10~(0.5)
9.6 10"4
(0.1)-45.6 10
- i , nu - 5.
n65V
5.2 10(0.2)
4.2 KT*(0.4)
2.7 10~5
-47 10 ,
n65V
-23.8 10
(0.3)
4.4 10(0.4)
4.7 10~
table 5.5.1. We see a satisfactory agreement between the theoretically
expected and the two experimental ratios for the two optical detection
systems, r\ /r|U» which proves that the theoretically expected detection
efficiencies of the optical detection systems are good estimates for the
absolute detection efficiencies. The two experimental results (thermal
and superthermal) and the theoretically expected values for the ratios
including the detection efficiency of the metastable atom detector, are
not in mutual agreement. This means that the detection efficiency of the
metastable atom detector depends on the translational energy of the
metastable atoms and that the absolute detection efficiency is smaller
than unity with a typical value of f| " 0.5.
94

References
Dun71 F B Dunning, A C H Smith and R F Stebbings J. Phys.B:
At.Mol.Phys. 4 (1971) 1683-1695
Dun71a F B Dunning and A C H Smith J.Phys.B: At.Mol.Phys. 4 (1971) 1696-
1710
Dun75 F B Dunning, R D Rundell, and R F Stebbings Rev.Sci.Instr. 46
(1975) 697-701
Gay83 F J M Gaykema, Int.Rep. VDF-NO-83-21 Eindhoven University of
Technology (in Dutch)
Kro81 J P C Kroon, H C W Bfijerinck, and N F Verster J.Chem.Phys. 74
(1980) 6528-6529
Pot72 W E Potter and K Mauersberger Rev.Sci.Instr. 43 (1972) 1327-1330
The81 P G A Theuws, Thesis (1981) Eindhoven University of Technology.
Tim71 A F Timothy and J G Timothy Acta Electronica 14 (1971) 159-179
Wol70 W G Wolber, B D Klettke and P W Graves Rev.Sci.Instr. 41 (1970)
724-728
95

5.6 State selective total inelastic cross section measurements
Introduction
In this section we give a general description of a total inelastic
cross section measurement with our crossed-beam time-of-flight machine
with state selection (Is or Is.) of the primary beam. We will use the
description given here for the analysis of state selective Penning
ionisation cross section measurements, described in chapter 8.
Detector signals
First we will give the result for a measurement without state
selection of the main beam, followed by the result for a state selected
beam of metastable atoms where the modulation is measured with the
spiraltron by counting the resonance u.v. photons of the cascading
metastable atoms that are optically pumped. Figure 5.6.1 gives a
schematic view of the experimental set-up and defines the symbols that
we will use in this section. The number of metastable atoms that arrive
at the metastable atom detector during the time channel k centered at
the flight time t = (zm-zc)/v(tk)>with v(tk) the velocity of the atom
corresponding to t , is given by [Bey74]
N(tk) Tch = KO) P(vk)m c
(1)
where 1(0) (s sr ) is the centre line intensity, P(v) the normalised
2 2velocity distribution, fl- * (iTd„)/z„ the solid angle that is detected,
t. the open time of the chopper, t , the duration of one time channel,
and v k the velocity corresponding to the centre of time channel k (i.e.
an abbreviation for v(t )). The number of counts recorded in time

3 4 6 7
Figure 5.6.1 Schematic view of a total inelastic scattering experiment.
1: primary beam source at z = -1374.5 mm, 2: time-of-flight
chopper at z * z - -860.0 mm, 3: collimator 1 at z = z^ =
-73.5 mm with diameter d., 4: spiraltron, detector for
inelastic scattering products, 5: secondary beam at
z = z = 0 mm, 6: collimator 2 at z = z_ = +1265.5 mm with
diameter d„, 7: detector for metastable atoms at
z » z » +1884.7 mm, 8: laser beam, crosses the primary beam
at i « i , 9: alignment mirror, to vary z^. The spiraltron
is positioned in the plane perpendicular to the plane of the
atomic beams in the 45° backward poition with respect to the
primary beam and is shown here only schematically.
channel k. for each chopper period is given by
S™ = p T c h N(tk), (2)
with overall detection efficiency r\m for the registration of a
metastable atom.
In the same way the number of metastable atoms that arrive at the
scattering centre during time channel j is given by
97
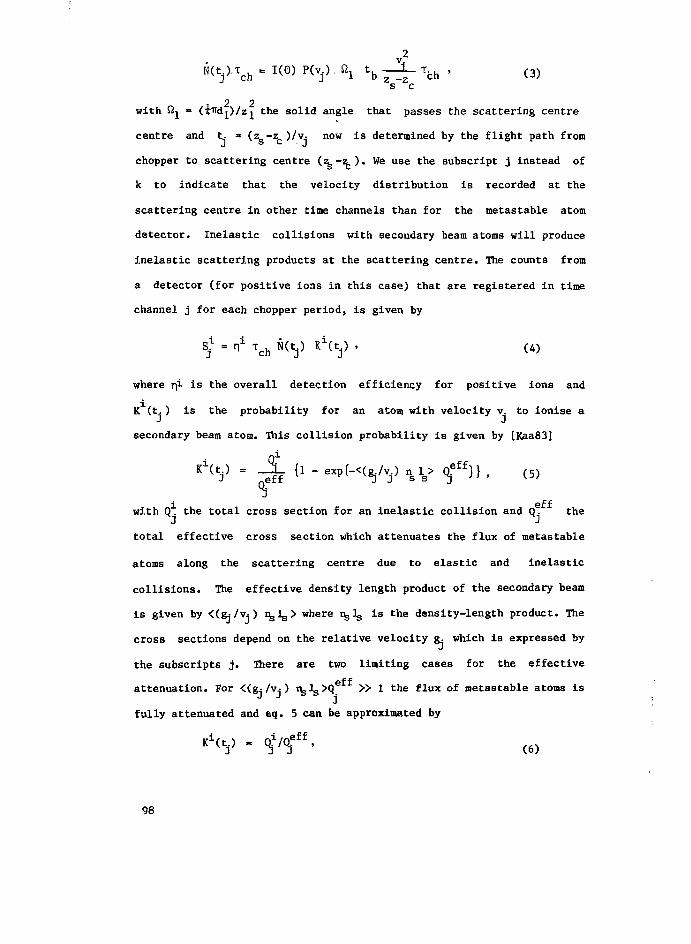
2v.
s c
2 2with fij = (twdp/zj the solid angle that passes the scattering centre
centre and t. = (zs-^)/v-j now is determined by the flight path from
chopper to scattering centre (%~^.)« We use the subscript j instead of
k to indicate that the velocity distribution is recorded at the
scattering centre in other time channels than for the metastable atom
detector. Inelastic collisions with secondary beam atoms will produce
Inelastic scattering products at the scattering centre. The counts from
a detector (for positive ions in this case) that are registered in time
channel j for each chopper period, is given by
gi- _ _! _ }i(t } K1(t ) i (A")
j ch j j *• >
where rji is the overall detection efficiency for positive ions and
K (t.) is the probability for an atom with velocity v. to ionise a
secondary beam atom. This collision probability is given by [Kaa83]
i O*K l ( y = -gjf i1 ~ «P(-<(g,/Vj) nls> Qj8")} , (5)
i effwith Q. the total cross section for an inelastic collision and Q. the
J J
total effective cross section which attenuates the flux of metastable
atoms along the scattering centre due to elastic and inelastic
collisions. The effective density length product of the secondary beam
is given by <(g_- /v^ ) n3ls> where i lg is the density-length product. The
cross sections depend on the relative velocity g. which is expressed by
the subscripts j. There are two limiting cases for the effective
attenuation. For <(gj/vj ) n3Js>Qe » 1 the flux of metastable atoms is
fully attenuated and eq. 5 can be approximated by
98

effwhile for the case <(gj/vj) ^ ^ ^ j << * the attenuation of the flux
of metastable atoms can be neglected and we get
n
effA first order approximation for Q . is given by the hard sphere total
cross section which is typically 50 8 for Ne*-Ar. We have chosen our
experimental conditions such that this effective attenuation is less
then 1% and eq. 7 can be used. The time-of-flight spectrum measured with
sm
Skthe metastable atom detector S, (eq, 2) can be transformed to a time-of-
~mflight spectrum with flight path from chopper to scattering centre, Sj ,
given by
^m=T1raTchN(tj). (8)
and the collision probability and the total inelastic cross section are
given by
Qi
K <V • £ f' (9)
é - £ A.
The deconvolution of the signal at the metastable atom detector before
transformation to the scattering centre and its convolution after
transformation have to be considered very carefully.
State selective measurements
In a state selective scattering experiment with a beam of metastable
atoms, the beam intensity is modulated by optical pumping with a c.w.
dye laser beam [Kro81]. With the dye laser beam the populations of the
99

me tastable states of only one isotope are modulated, because the
metastable species of other isotopes do not "see" the laser beam due to
20 22the isotope shift (1800 MHz for Ne- Ne). With the laser beam one
metastable state is optically pumped, and thus depleted, with a velocity
dependent efficiency T) and the transmission through the laser beam for
this metastable state is 1-1 . A fraction f^ of the pumped metastable
atoms cascades to the ground state, producing both a visible and an u.v.
photon. The remaining part (1-fO decays to the other metastable state
ot the pumped isotope. This means that the attenuation of the flow of
metastable atoms amounts tl f, • The fraction fi is fully determined by
the branching ratios of the upper level of the pumping scheme, which is
uniquely determined by the wavelength X of the pumped transition.
Therefore we separate the intensity of the beam of metastable atoms in
three contributions,
1(0) P(v) dv = 2I(0) 2P(v) dv + °I(0) °P(v) dv + rI(0) rP(v) dv .
The isotopes that are not modulated are denoted with a superscript r
(remaining). The Is. and ls„ states of the modulated isotope are
indicated by their total angular momentum quantum number J as
superscript, 2 and 0, respectively. The time-of-flight spectra measured
with the metastable atom detector and transformed to the scattering
centre, are given by
%«, - n Tch - v Mty d2b)
+ (°N(t.) + <l-f») J. 2N(t.))
+ rN(t.)} ,
100

for laser off with subscript o and laser on with subscript X,,
respectively. A state independent detection efficiency n is assumed and
the contribution ^(t.) corresponds to the partial intensities
1(0) P(v) dv according to eq. 3. The difference signal is given by
Sj,o - %l m n 'b N ^ } fX • (13)
x iThe cross section for inelastic collisions Qj is different for the
different states, where Qj and Qj are the cross sections for the
single Is and Is states of the modulated isotope, respectively, while
rQ^ is the mean cross section for the remaining states. This results in
x idifferent collision probabilities Kj and the time-of-flight spectra
with laser.off and laser on are given by
S^o = r)1 Tch {2N(t.) ¥(t.) + °N(t.) (t.) + rN(t.)rKtt.)}, (14a)
t i = n± Tch 2*(v **y <Ub)
+ (d-f") nj1 2N(t.) + °N(t.)) M t . )
+ rN(t.) rKtt.) }
and the difference signal is given by
to ~ii = *lh nf2* ) { % - a-fj^.as)
These equations hold for the optical pumping of the lsg state. In the
further part of this section we will deal with the optical pumping of
the ls5 state and for the optical pumping of the Is, state all
superscripts o and 2 have to be interchanged. Analogous to eq. 9 we
define an experimental collision probability and experimental cross
section determined by the optical pumping transition
101

si,°~sit* = M y - d-f^) °K\t.) », (16a)
sm sm '' '' ~-
i i (16b)
Y = nï \o ~ V
" "" X
where the superscript X is used to label the optical pumping transition.
These experimental cross sections are a result of an experiment at one
transition. A second experiment at another transition with a different
u 2 ifraction f is nepessary to obtain the state resolved cross sections Q .
and °Q:l:. For each optical pumping transition the fraction ^ is fullyJ A
determined by the upper state of the optical pumping scheme. The values
for f" and the composition of the experimental cross section are givenA
in table 5.6.1 for three transitions. For an optical pumping transition
between the ls^ (J=2) state and an upper state 2p^ (J=2), the fraction
Table 5.6.1 The fraction fV of the optically pumped metastable atoms,
that cascades to the ground state and the composition
(eq. 16b) of the experimental cross section
^Q1 • a-2*}1 + a °Qi for three optical pumping transitions ofj 2 j o j
neon metastable atoms. The branching ratios given by [Wie69]
are used as numerical input.
transition wavelength
1%~2% 588*2 ° * 6 6 1<51 ~0#51
Is -2D 594.5 1.00 1.0 05 4
ls-2p„ 616.3 0.71 -0.40 1.40
102

f, » 1 and this single measurement directly gives the state resolved
2 itotal cross section Q.. This is not possible for the Iso (J»0) state,
J
because each allowed upper level 2pi has J-l, due to the selection
rules, which will decay (partially) to the lsg (J«2) state. Four time-
of-flight spectra are required to obtain the cross section for one
metastable state. The modulation of the intensity of the beam of
metastable atoms sv -£> „ can be measured directly by counting the u.v.
photons that are produced when an optically pumped metastable atom
cascades to the ground state. These u.v. photons are counted with the
spiraltron and the laser beam has to cross the atomic beam at the
scattering centre. One further advantage of this technique is that the
flight-path for all time-of-flight spectra is equal. No measures have to
be taken to transform (including deconvolution and reconvolution) the
u.v. time-of-flight spectrum to the actual flux of metastable atoms at
the scattering centre. Of course, this is only true if the inelastic
scattering products and the u.v. photons are registered with a constant
time-delay. This requirement is surely fullfilled for Penning ions and
u.v. photons (i.e. within 1 ys after production). The time-of-flight
spectrum with u.v. photon detection is given by
where r)u is the overall detection efficiency for a u.v. photon. Besides
m uthe detection efficiencies 1 and 1 this is fully equal to eq.13. The
modulation of the intensity of metastable atoms and the experimental
cross section (eq. 16b) now is given by
V - JÜrf S«J
(18)
103
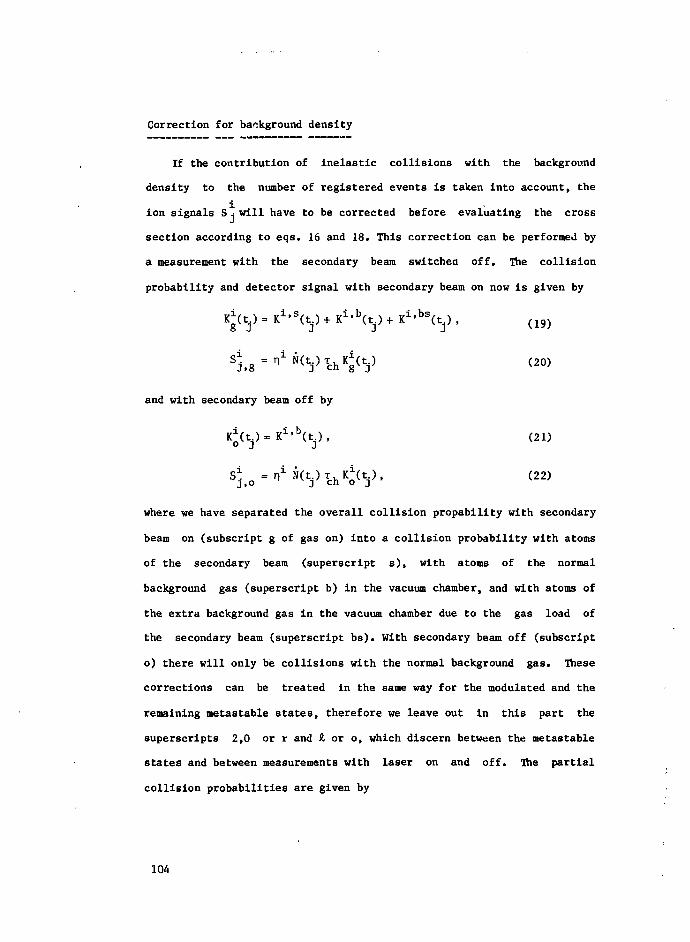
Correction for background density
If the contribution of inelastic collisions with the background
density to the number of registered events is taken into account, the
ion signals S -= will have to be corrected before evaluating the cross
section according to eqs. 16 and 18. This correction can be performed by
a measurement with the secondary beam switched off. The collision
probability and detector signal with secondary beam on now is given by
KJ(t.) = K^Ct.) + Kilb(tj) + ( t . ) ,
and with secondary beam off by
ij(tj)- K 1 ' 1 1 ^ ) , (21)
S L = ni" (VTchKo<V> <22>
where we have separated the overall collision propability with secondary
beam on (subscript g of gas on) into a collision probability with atoms
of the secondary beam (superscript s), with atoms of the normal
background gas (superscript b) in the vacuum chamber, and with atoms of
the extra background gas in the vacuum chamber due to the gas load of
the secondary beam (superscript bs). With secondary beam off (subscript
o) there will only be collisions with the normal background gas. These
corrections can be treated in the same way for the modulated and the
remaining metastable states, therefore we leave out in this part the
superscripts 2,0 or r and SL or o, which discern between the metastable
states and between measurements with laser on and off. The partial
collision probabilities are given by
104
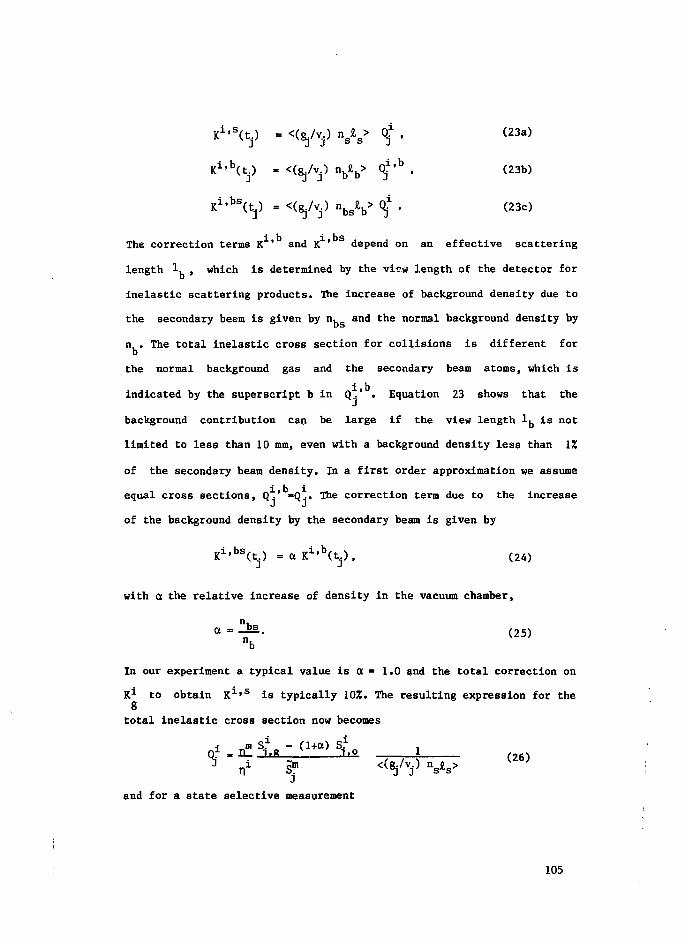
Ki>s(t.) = <(g./y.) ns£s> (j , (23a)
Ki>b(t.) - <(gJ/vJ) nbitb> C$'h , (23b)(t.) - <(gJ/vJ) nbitb> C$'
K i > b sKi>bs(t.) = <(gJ/vj) nbs£b> (23c)
The correction terms K1' and K.1' S depend on an effective scattering
length 1. , which is determined by the view length of the detector for
inelastic scattering products. The increase of background density due to
the secondary beam is given by n, and the normal background density by
n . The total inelastic cross section for collisions is different forb
the normal background gas and the secondary beam atoms, which is
indicated by the superscript b in Q.' . Equation 23 shows that the
J
background contribution can be large if the view length It is not
limited to less than 10 mm, even with a background density less than 1%
of the secondary beam density. In a first order approximation we assume
equal cross sections, Q .' »Q .. The correction term due to the increase
of the background density by the secondary beam is given by
Ki>bs(t.) = a K i ' b ( t j ) > (24)
with a the relative increase of density in the vacuum chamber,
« = 5*. (25)nb
In our experiment a typical value is a « 1.0 and the total correction on
K1 to obtain K i t S is typically 10Z. The resulting expression for theg
total inelastic cross section now becomes
± m S.1 - (1+a) S?-
j
and for a state selective measurement
105
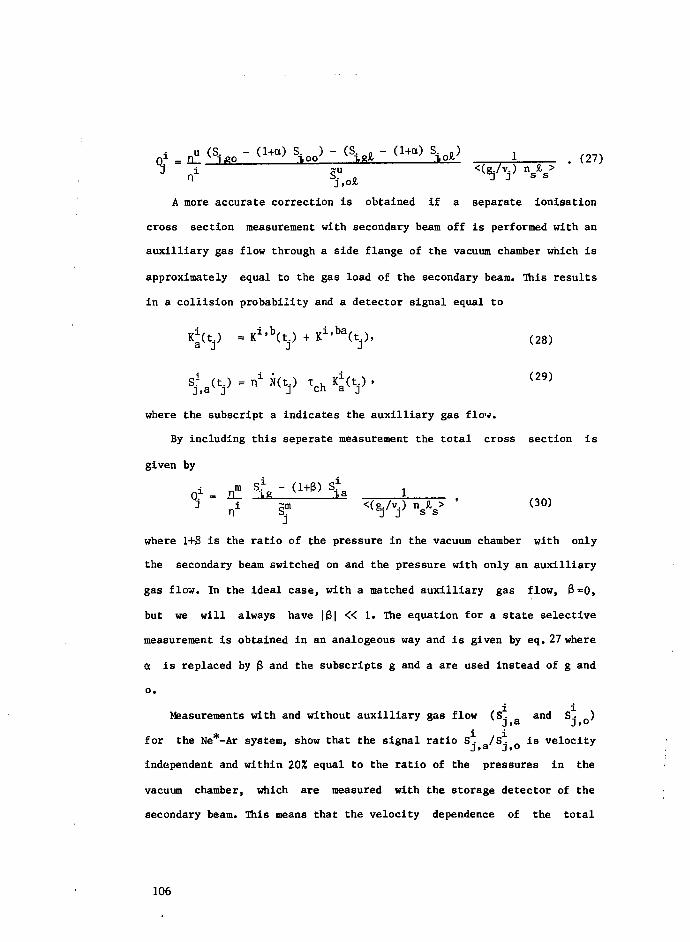
n" (S,m - <'«•> S . J - 'Strt " « ' Si.t> 1 (27)
A more accurate correction is obtained if a separate ionisation
cross section measurement with secondary beam off is performed with an
auxilliary gas flow through a side flange of the vacuum chamber which is
approximately equal to the gas load of the secondary beam. This results
in a collision probability and a detector signal equal to
K^t.) = K1'1^.) + K 1 ' 1 ^ . ) , ( 2 8 )
where the subscript a indicates the auxilliary gas flow-
By including this seperate measurement the total cross section is
given by
O _ £ L 4 1J " ni gm <(g./v.) n s V ' (30)
where 1+6 is the ratio of the pressure in the vacuum chamber with only
the secondary beam switched on and the pressure with only an auxilliary
gas flow. In the ideal case, with a matched auxilliary gas flow, 3=0,
but we will always have |3| « 1. The equation for a state selective
measurement is obtained in an analogeous way and is given by eq. 27 where
a is replaced by 3 and the subscripts g and a are used instead of g and
o.
Measurements with and without auxilliary gas flow (S. _ and S^ „)
* i ifor the Ne -Ar system, show that the signal ratio S. /S. is velocityj,a j ,o
independent and within 20% equal to the ratio of the pressures in the
vacuum chamber, which are measured with the storage detector of the
secondary beam. This means that the velocity dependence of the total
106

cross section can be measured accurately with a correction determined by
a measurement without gas load, S.= 0, while the contribution of this
correction to the accuracy of the absolute value of the total cross
section is only 2% when the total correction (1+a) S- Q is 10% of the
signal S- . However, this control measurement has to be performed for
each collision system investigated.
References
Bey74 H C W Beijerinck, E G J H Moonen, and N F Verster J.Phys.E:Sci.lnstr. 7 (1974) 31
Kaa83 G H Kaashoek Int.Rep. VDF-NO-83-08 Eindhoven University ofTechnology (in Dutch)
Kro81 J P C Kroon, H C W Beijerinck, and N F Verster J.Chem.Phys. 74(1981) 6528-6529
Wie69 W L Wiese, M W Smith, and B M Glennon "Atomic transitionprobabilities" Vol.1: Hydrogen through neon (1966) (NSRDS, NBS4)Washington, DC: US Government Printing Office.
107

Chapter VI Experimental natural lifetimes of the Ne I (2p) levels
Volume 45, number S OPTICS COMMUNICATIONS 1 May 1983
LIFETIMES OF THE Ne 2p FINE STRUCTURE STATES BY MEASUREMENTS OFLINEWIDTHS OF THE LASER INDUCED FLUORESCENCE OF AN ATOMIC BEAM
M.J. VERHEIJEN, H.C.W. BEIJERINCK, PJ. EENSHUISTRA, J.P.C. KROON and N.F. VERSTERPhysics Department, Eindhoven University of Technology. The Netherlands
Received 18 November 1982Revised manuscript received 3 January 1983
The laser induced fluorescence signal of a crossed atomic beam-photon beam is used to measure the natural lifetimes ofsix of the 2p fine structure states of Ne I. The excitation profiles are analysed with a model function consisting of an un-broadened lorentzian lineshape with the full-width at half-maximum Av (natural lineshape) as a free parameter, which isthen fully convoluted with the experimental conditions as Doppler effect, Zeeman splitting and saturation. The broaden-ing due to these effects is typically 3 MHz. To avoid strong correlations of the value of tui with an incorrect shape of themodel function, we only use the datapoints that are most sensitive to Av, Le. at the maximum and at half height. Theresulting lifetimes lie all within the la error bound (5%) from other experimental results. Our results add as independent setof data to these well investigated lifetimes.
1. Introduction
The width of an absorption line originating from ametastable level is a direct measure for the naturallifetime of the upper level, provided that broadeningof the line is small and accurately known. We havealready proved the possibility of this method using acarefully designed laser induced fluorescence experi-ment with a crossed laser beam-atomic beam set-up[1]. The natural linewidths of six fine structure statesof the well-investigated 2p (Paschen) configuration inNe I were determined with this method. These resultsobtained with an independent method, may furtherconfirm the available experimental and theoreticaldata, which show differences up to 8%. The mostelaborate theoretical calculations of Feneuille et al.[2] yield lifetimes smaller (up to 7%) than derivedfrom the line intensity measurements of Inatsugu andHolmes [3], whose results are given by the NBS asreference data with an accuracy of 10%. The cascade-free radiative lifetime measurements of Bennett andKindlmann [4] differ by up to plus or minus 3%from the results of Inatsugu and Holmes. The veryrecent high precision lifetime measurements ofKandela and Schmoranzer [5] with the beam—gas-
laser two-step excitation technique, yield results witha claimed accuracy better than 0.5%. Their data liein between the experimental results of Inatsugu andHolmes and the calculations of Feneuille et al.
2. Experimental set-up
The Hnewidth measurements are performed withthe atomic beam machine, which is in use for theabsolute frequency stabilization of a cw single-modedye-laser on an atomic transition. A detailed descrip-tion has been given elsewhere [1J.
The calibration of the frequency scale is given bya Fabry-Perot interferometer [6] of which the trans-mission profile is stored during each frequency scanof the dye-laser simultaneously with the excitationsignal. With a free spectral range of 150.0 (±0.1) MHzand a finesse of 2, an accurate value of the frequencydistance between two succeeding datapoints can bederived from a least squares analysis of a 200 MHzwide frequency scan of the transmission profile ofthe Fabry-Perot. The linearity of the frequency scancan easily be checked by inspection of the transmis-sion profiles of this low finesse Fabry-Perot. The tem-
0 030-4018/83/0000-0000/$ 03.00 ©1983 North-Holland
109
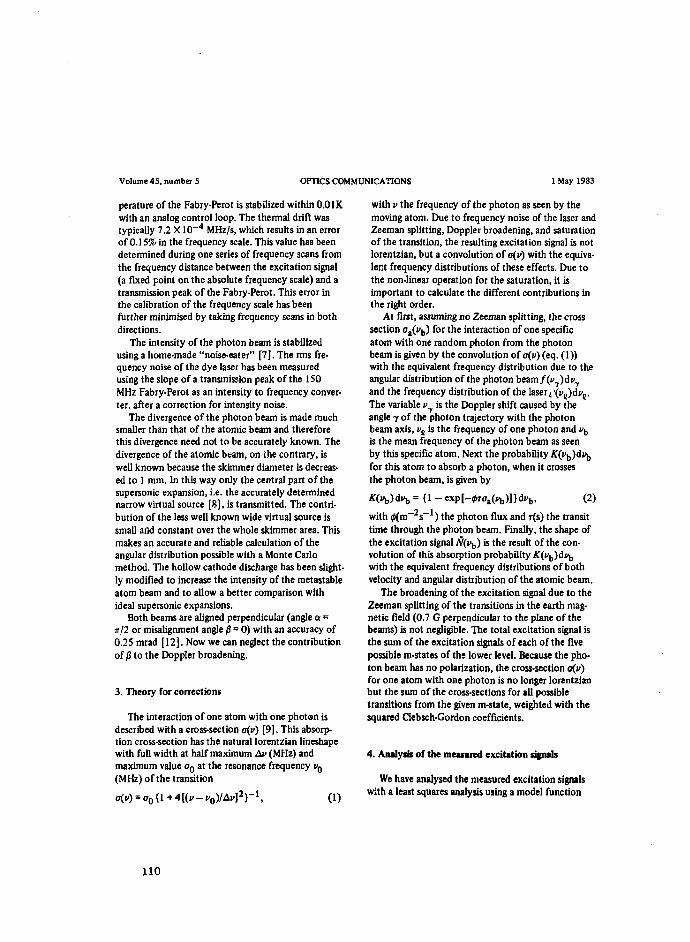
Volume 45, number 5 OPTICS COMMUNICATIONS 1 May 1983
perature of the Fabry-Perot is stabilized within 0.01Kwith an analog control loop. The thermal drift wastypically 7.2 X 10~4 MHz/s, which results in an errorof 0.15% in the frequency scale. This value has beendetermined during one series of frequency scans fromthe frequency distance between the excitation signal(a fixed point on the absolute frequency scale) and atransmission peak of the Fabry-Perot. This error inthe calibration of the frequency scale has beenfurther minimised by taking frequency scans in bothdirections.
The intensity of the photon beam is stabilizedusing a home-made "noise-eater" [7]. The rms fre-quency noise of the dye laser has been measuredusing the slope of a transmission peak of the 150MHz Fabry-Perot as an intensity to frequency conver-ter, after a correction for intensity noise.
The divergence of the photon beam is made muchsmaller than that of the atomic beam and thereforethis divergence need not to be accurately known. Thedivergence of the atomic beam, on the contrary, iswell known because the skimmer diameter is decreas-ed to 1 mm. In this way only the central part of thesupersonic expansion, i.e. the accurately determinednarrow virtual source [8], is transmitted. The contri-bution of the less well known wide virtual source issmall and constant over the whole skimmer area. Thismakes an accurate and reliable calculation of theangular distribution possible with a Monte Carlomethod. The hollow cathode discharge has been slight-ly modified to increase the intensity of the metastableatom beam and to allow a better comparison withideal supersonic expansions.
Both beams are aligned perpendicular (angle a =7r/2 or misalignment angle 0 = 0) with an accuracy of0.25 mrad [12]. Now we can neglect the contributionof P to the Doppler broadening.
3. Theory for corrections
The interaction of one atom with one photon isdescribed with a cross-section a(c) [9]. This absorp-tion cross-section has the natural lorentzian lineshapewith full width at half maximum Av (MHz) andmaximum value o 0 at the resonance frequency i>0
(MHz) of the transition
o(v) = o 0 { l + 4 [ ( . ; - V o ) / A W 2 r 1 , 0)
with v the frequency of the photon as seen by themoving atom. Due to frequency noise of the laser andZeeman splitting, Doppler broadening, and saturationof the transition, the resulting excitation signal is notlorentzian, but a convolution of o(e) with the equiva-lent frequency distributions of these effects. Due tothe non-linear operation for the saturation, it isimportant to calculate the different contributions inthe right order.
At first, assuming no Zeeman splitting, the crosssection o^v^) for the interaction of one specificatom with one random photon from the photonbeam is given by the convolution of o(e) (eq. (I))with the equivalent frequency distribution due to theangular distribution of the photon beam f(i>y)dvand the frequency distribution of the laser*'(i^di^.The variable vy is the Doppler shift caused by theangle y of the photon trajectory with the photonbeam axis, ve is the frequency of one photon and cb
is the mean frequency of the photon beam as seenby this specific atom. Next the probability Kiy^èv^,for this atom to absorb a photon, when it crossesthe photon beam, is given by
{1 - exp[-*raa(Vb)]}d^b, (2)
s""1) the photon flux and T(S) the transittime through the photon beam. Finally, the shape ofthe excitation signal N(vb) is the result of the con-volution of this absorption probability Kfv^ii^with the equivalent frequency distributions of bothvelocity and angular distribution of the atomic beam.
The broadening of the excitation signal due to theZeeman splitting of the transitions in the earth mag-netic field (0.7 G perpendicular to the plane of thebeams) is not negligible. The total excitation signal isthe sum of the excitation signals of each of the fivepossible m-states of the lower level. Because the pho-ton beam has no polarization, the cross-section o(i>)for one atom with one photon is no longer lorentzianbut the sum of the cross-sections for all possibletransitions from the given m-state, weighted with thesquared Clebsch-Gordon coefficients.
4. Analysis of the measured excitation signals
We have analysed the measured excitation signalswith a least squares analysis using a model function
110
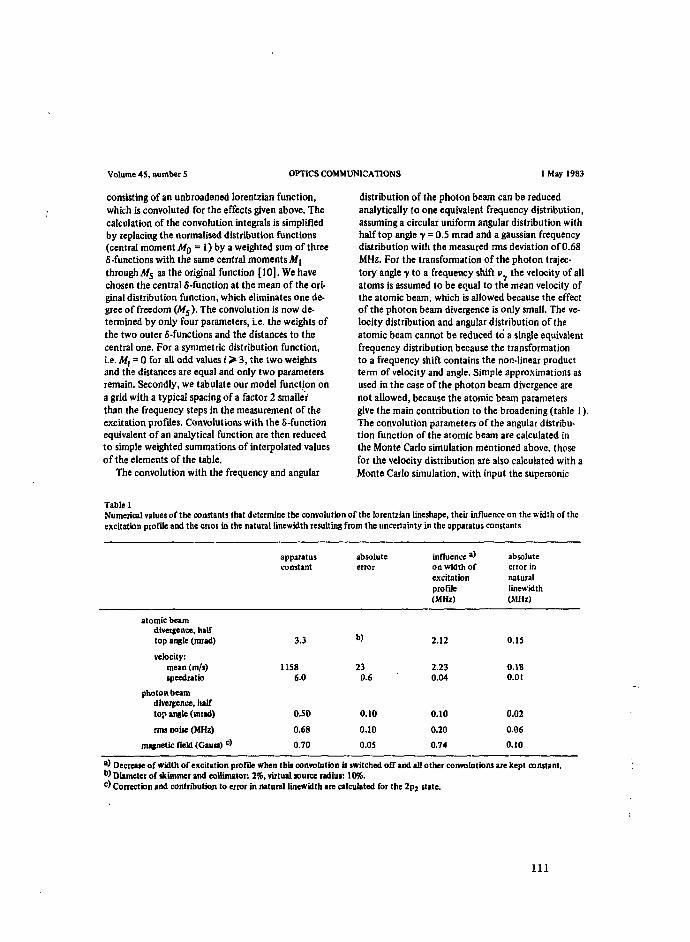
Volume 45, numbers OPTICS COMMUNICATIONS 1 May 1983
consisting of an unbroadened lorentzian function,which is convoluted for the effects given above. Thecalculation of the convolution integrals is simplifiedby replacing the normalised distribution functions(central moment MQ = 1) by a weighted sum of three£ -functions with the same central moments Mithrough Afj as the original function [10]. We havechosen the central 5-function at the mean of the ori-ginal distribution function, which eliminates one de-gree of freedom (M5). The convolution is now de-termined by only four parameters, i.e. the weights ofthe two outer S-functions and the distances to thecentral one. For a symmetric distribution function,i.e. Mf = 0 for all odd values i > 3, the two weightsand the distances are equal and only two parametersremain. Secondly, we tabulate our model function ona grid with a typical spacing of a factor 2 smallerthan the frequency steps in the measurement of theexcitation profiles. Convolutions with the 5-functionequivalent of an analytical function are then reducedto simple weighted summations of interpolated valuesof the elements of the table.
The convolution with the frequency and angular
distribution of the photon beam can be reducedanalytically to one equivalent frequency distribution,assuming a circular uniform angular distribution withhalf top angle y = 0.5 mrad and a gaussian frequencydistribution with the measured mis deviation of 0.68MHz. For the transformation of the photon trajec-tory angle 7 to a frequency shift i> the velocity of allatoms is assumed to be equal to the mean velocity ofthe atomic beam, which is allowed because the effectof the photon beam divergence is only small. The ve-locity distribution and angular distribution of theatomic beam cannot be reduced to a single equivalentfrequency distribution because the transformationto a frequency shift contains the non-linear productterm of velocity and angle. Simple approximations asused in the case of the photon beam divergence arenot allowed, because the atomic beam parametersgive the main contribution to the broadening (table 1).The convolution parameters of the angular distribu-tion function of the atomic beam are calculated inthe Monte Carlo simulation mentioned above, thosefor the velocity distribution are also calculated with aMonte Carlo simulation, with input the supersonic
Table 1Numerical values of the constants that determine the convolution of the lorentzian lineshape, their influence on the width of theexcitation profile and the enoi in the natural linewidth resulting from the uncertainty in the apparatus constants
atomic beamdivergence, halftop angle (mrad)
velocity:mean (m/s)speedratio
photon beamdivergence, halftop angle (mrad)
rms noise (MHz)
magnetic field (Gauss) c>
apparatusconstant
3.3
11586.0
0.50
0.68
0.70
absoluteerror
W
230.6
0.10
0.10
0.05
influence a)on width ofexcitationprofile(MHz)
2.12
2.230.04
0.10
0.20
0.74
absoluteerror innaturallinewidth(MHz)
0.15
0.180.01
0.02
0.06
0.10
*) Decrease of width of excitation profile when this convolution is switched off and all other convolutions are kept constant.b) Diameter of skimmer and collimator: 2%, virtual source radius: 10%.c ) Correction and contribution to error in natural linewidth are calculated for the 2p2 state.
I l l

Volume 45, number 5 OPTICS COMMUNICATIONS 1 May 1983
velocity distribution function:
F(v)dv~{v/u)3 exp{-[S(u/« - l)]2}du, (3)
with speedratio S = 6 and central velocity « = 1130m/s. The Zeeman splitting is calculated with theLande factors of Back and Lande [11]. The saturationis determined by one dimensionless parameter 4rra0
which is proportional to the photon beam powerPIJN). Therefore we introduce the saturation powerP ^ , defined by
(4)
with>4(m2) the area of the photon beam cross sec-tion. Eq. (2) now can be rewritten to
KOgd*,, = {1 - e x p h o ^ P / C a o / » ^ ) ] } d; t , (5)
which means that forP = P a t the maximum value ofthe exponent is almost one and the broadening of theexcitation signal at half maximum due to saturation is30% of the natural linewidth. To determine the valuesof this parameter, we have performed measurementsfor each transition with photon beam powers up toPBt (fig. 1). We have adjusted this parameter by trialand error with the criterium that the resulting naturallinewidths should be independent of the photonbeam power P. Because the extrapolation of a linearleast squares analysis of these natural linewidths tozero photon beam power is insensitive for changes in
Fig. 1. The natural linewidths A" as a function of the powerP of the photon beam for the I s 5 -2p 2 transition (k • 588.2nm). The straight line represents the linear least squares fitto the datapoints given by Av = 8.86-7.1S X10J (MHz/W)i>.
Pat, this value is used as the final result for the naturallinewidth.
Now, there are only four free parameters, thebackground B, the position v0 and the signal S of thecentre of the transition and the natural linewidth Av.The mean of the datapoints at the beginning and endof the frequency scan is not a correct value for thebackground because of the slowly decaying wings ofthe lorentzian. To limit calculation time we determinethe background from a least squares analysis of alldatapoints with an unconvoluted lorentzian modelfunction. This is a fully correct procedure if thewidth of the frequency scan is much larger than thenatural linewidth. In our case the scanning range istypically 200 MHz and this condition is fullfilled. Theremaining three parameters can now be determinedby a least squares analysis of the datapoints in therange \i> - vQ\ < 1.5 Av with the convoluted lorentz-ian. However, this resulted in a structured deviationbetween model function and datapoints (fig. 2), in-
1
/
i i
" V . •• . . * - • -
• " •"•
0
* o»
0
10 3020vo<MHz)
Fig. 2. The excitation profileert,) ° f the Iü5-2p2 transitionat P « 25 fiW with the results of the least squares analysiswith 70 datapoints within 1.5 Av of the resonance frequencywith both a convoluted (dotted line) and an unconvoluted(dashed line) lorentzian. The result of a curve fit with a con-voluted lorentzian with only 20 datapoints (full circles) isgiven by the full linepieces. Alto the deviations betweenmodel function and measured datapoints are given.
112

Volume 45, number 5 OPTICS COMMUNICATIONS 1 May 1983
dicating an incorrect shape of the model function.The curtosis of the model function is too large, whichmeans that the model function is too low at i>0, result-ing in a too large value for Ai\ This structure couldonly be diminished by omiting all Doppler- and theZeeman convolutions, which is rather unrealistic. Nointermediate optimum has been found.
The value of the natural linewidth is mainly deter-mined by the background signal and the maximumsignal, which determine the value of the "half maxi-mum", and by the position of the datapoints at halfmaximum, which determine the "full width". There-fore we have performed the second least squaresanalysis using 10 datapoints around the maximumand 5 datapoints on each side of the profile at halfhsight (see fig. 2 for results).
The statistical noise due to the finite number ofaccumulated counts in the single datapoints of a ex-citation profile results in a statistical error Avcount inthe natural linewidth derived from the least squaresanalysis of the profile, which is represented by theerror bars in fig. 1. From these errors a statistical errorof the extrapolated natural linewidths is derived,which is given in table 2. The scatter of the datapointsin fig. 1 with respect to the expected linear behaviourindicates that there is another, more important sourceof statistical noise in the width of the excitation pro-files. We denote this rms deviation by Ai>tota]. Thestatistical error in the extrapolated value of the natu-ral linewidth at P = 0 given by Av t0(a l is also listed intable 2.
An independent contribution to the final error isthe uncertainty in the apparatus constants of table 1.
The influences of these parameters on this error aregiven in table 1. The contribution to the final error,which is listed in table 2, is almost equal to the con-tribution of the statistical error.
5. Discussion
Other experimental lifetimes [ 3 - 5 ] lie within theIff error bound of our results (fig. 3). If we inspectfig. 3 we observe that all experimental datapoints forthe same level lie within a range of 1 ns, except forthe 2pj and 2p7 state. The conclusion that the life-times of the 2p 2 , 2p 4 , 2p 5 , 2p 6 , and the 2p8 stateare now determined within error bounds of ±0.5 ns(or 2.5%) is fully justified in our opinion, especiallyif we take into account the fully different experi-mental methods used. Further we conclude that thetheoretical talues of Feneuille et al. are significantlysmaller than the average of the experimental results.
A possible source of the unknown statistical errorin table 2 is a statistically varying polarization ofthe photon beam between +0.1 and - 0 . 1 , resultingin 1% statistical noise in the natural linewidths. Be-sides, the mean polarization for one atom trajectoryneed not to be equal for each trajectory. This maycause the structured deviation in fig. 2 between theexperimental results and the fit within a ±1.5 APinterval with the convoluted lorentzian. Therefore,the accuracy of this method can be increased bycompensating the magnetic field in the fluorescencecentre and by using a direct laser-beam with well de-fined polarization, which also eliminates the con-
Table 2Experimental natural linewidths for six 2p levels with their contributions to the final errors
state
2p22p«2ps2P62P72ps
lambda(nm)
588.2594.5597.6614.3621.7633.4
naturallinewidth(MHz)
8.868.758.058.408.948.11
statisticalerror frommeasureddatapoints(MHz)
0.080.120.150.110.330.10
totalstatisticalerror(MHz)
0.260.220.240.440.960.30
error fromconvolutionparameters(MHz)
0.260.260.280.250.300.26
final rmserror (lo)(MHz)
0.370.340.370.511.000.40
113
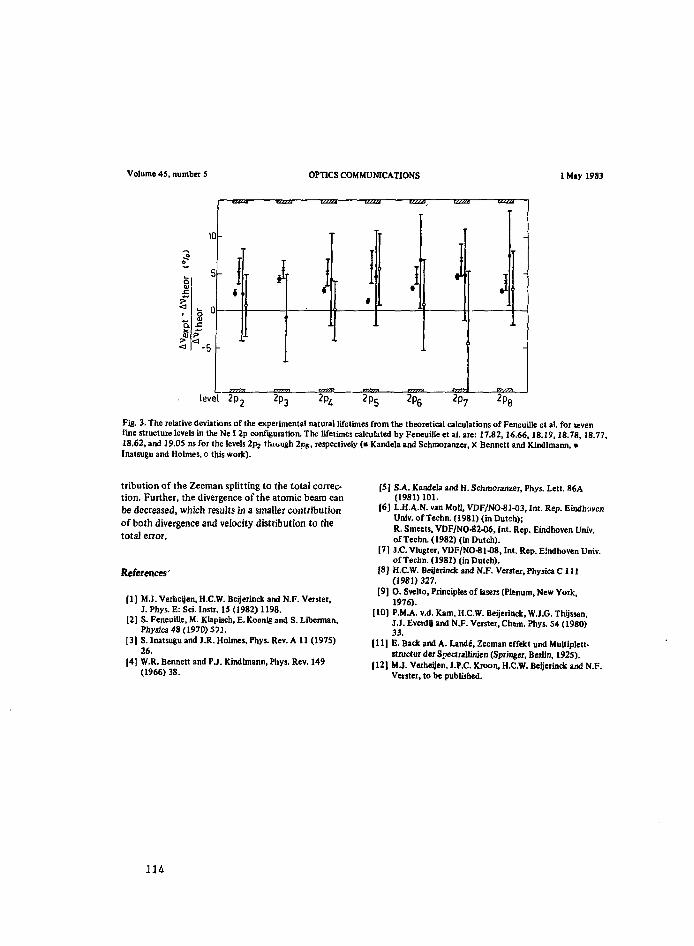
Volume 45, number 5 OPTICS COMMUNICATIONS 1 May 1983
8
10
5
i- n
I>
t li
i| i I } I --
level 2p2 2p3 2pL 2p& 2pg 2p? 2p8
Fig, 3. The relative deviations of the experimental natural lifetimes from the theoretical calculations of Feneuille et al. for sevenfine structure levels in the Ne I 2p configuration. The lifetimes calculated by Feneuille et al. are: 17.82,16.66,18.19,18.78, 18.77,18.62, and 19.05 ns for the levels 2p2 though 2p8 , respectively (• Kandela and Schmoranzer, X Bennett and Kindlmann, •Inatsugu and Holmes, o this work).
tribution of the Zeeman splitting to the total correc-tion. Further, the divergence of the atomic beam canbe decreased, which results in a smaller contributionof both divergence and velocity distribution to thetotal error.
References'
(1) MJ. Veiheijen, H.C.W. Beijerinck and N.F. Verster,] . Phys. E: Sci. Instr. 15 (1982) 1198.
[2] S. Feneuille, M. Klapisch, E. Koenig and S. Liberman,Physica48(1970)571.
[3) S. Inatsugu and J.R. Holmes, Phys. Rev. A 11 (1975)26.
[4] W.R. Bennett and P.J. Kindlmann, Phys. Rev. 149(1966) 38.
[5] S.A. Kandela and H. Schmoranzer, PJiys. Lett. 86A(1981) 101.
[6] L.H.A.N. van Moll, VDF/NO-81-03, Int. Rep. EindhovenUniv. of Techn. (1981) (in Dutch);R. Smeets, VDF/NO-82-06, Int. Rep. Eindhoven Univ.of Techn. (1982) (in Dutch).
|7] J.C. Vlugter, VDF/NO-81-08, Int. Rep. Eindhoven Univ.of Techn. (1981) (in Dutch).
[8] H.C.W. Beijerinck and N.F. Verster, PhysicaC 111(1981) 327.
[9] 0 . Svelto, Principles of Users (Plenum, New York,1976).
(10) P.M.A. v.d. Kam, H.C.W. Beijerinck, W.J.G. Thijssen,J.I. Everdij and N.F. Verster, Chem. Phys. 54 (1980)33.
[11] E. Back and A. Lande, Zeeman effekt und Multiple»-structurderSpectnllinien (Springer, Berlin, 192S).
[12] M.J. Veiheijen, J.P.C. Kroon, H.C.W. Beijerinck and N.F.Venter, to be published.
114

Chapter V I I Laser probing of the plasma beam source
A HOLLOW CATHODE ARC IN NEON: SIMULTANEOUS LASER PROBING AND MOLECULAR
BEAM SAMPLING OF METASTABLE ATOMS AS A PLASMA DIAGNOSTIC
M J Verheijen, H C W Beijerinck, P W E Berkers, D C Schram,
and N F Verster
Physics Department, Eindhoven University of Technology, Eindhoven, The
Netherlands
(submitted for publication to J.Appl.Phys.)
Abstract
The mean free path of metastable rare gas atoms in a plasma can be
determined by simultaneous sampling of a beam of metastable atoms
through an orifice in the wall and optically pumping of the metastable
atoms in the plasma with a c.w. dye laser beam perpendicular to the
atomic beam axis. This method gives very accurate results for the
absolute value and the velocity dependence (using a time-of-flight
detection technique) of this mean free path. With a simple model the
contributions of collisions with electrons and with heavy particles to
the experimental mean free path can be determined from the velocity
dependence. We have applied this method to the external plasma column of
a hollow cathode arc in neon. The experimentally determined mean free
path of 2 to 10 mm points unambiguously to a surprisingly low degree of
ionisation of 2Z or less. At these conditions the plasma column is fully
transparent for the background atoms in the vacuum chamber. This all
means that the character of the plasma of a hollow cathode arc in neon
is totally different from argon and helium, which is probably caused by
the isotope composition of neon.
115

1 Introduction
An atomic beam sampled from a plasma through a sampling orifice in
the wall consists of only neutral atoms and charged species in ground
state and metastable states. All higher excited species have decayed
spontaneously. The charged particles can be removed from the beam with a
deflection field. Using Auger ejection from a stainless steel surface
[1,2] as beam detection mechanism, only the metastable atoms are
detected, provided the translation energy does not exceed tens of eV. In
this way we measure the centre-line intensity and the velocity
distribution of the beam of metastable atoms with a time of flight
technique. By probing the plasma with a c.w. dye laser beam
perpendicular to the atomic beam axis and measuring the influence on the
metastable atoms in the effusing beam, we have investigated the
production and destruction processes of metastable atoms in the plasma.
With the laser tuned to the l^-ZPo transition (Paschen), we deplete a
small fraction of the population of the Is,, metastable state by optical
pumping [3] to the 2p level which cascades partially to the ground
state. This small fraction overlaps fully the sampled fraction of
metastable atoms. By measuring the modulation of the velocity
distribution of the beam of metastable atoms, we determine the mean free
path or "view depth" A, i.e. the effective length that contributes to
the atomic beam formation. First of all this technique gives an answer
to the question whether the fast metastable atoms of the beam are mainly
produced inside the hollow cathode or in the external plasma column near
the end anode. The lower detection limit of the view depth is determined
by the diameter of the probe laser beam.
116
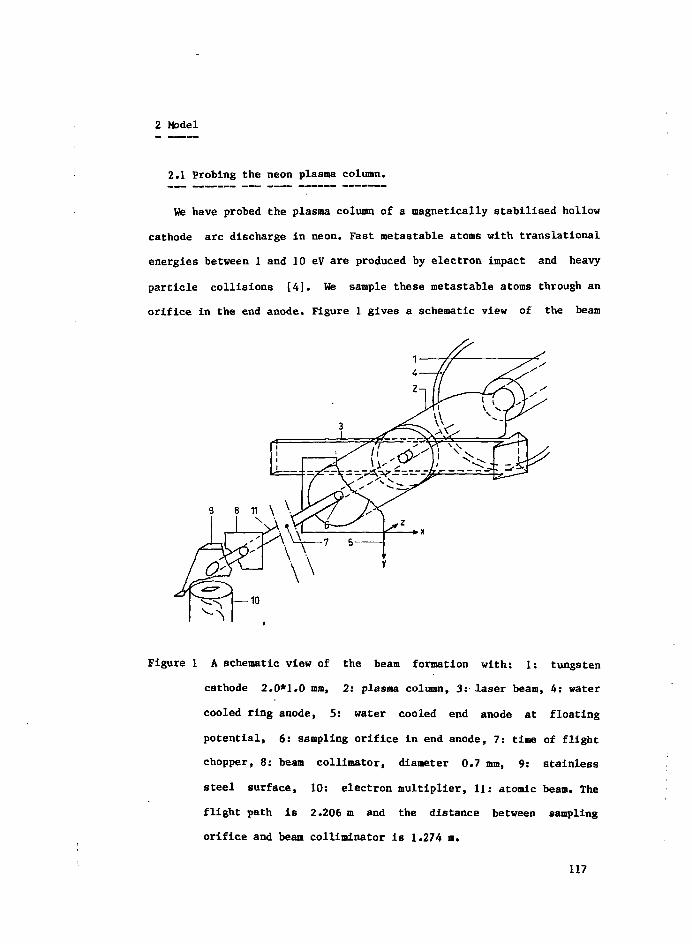
2 Model
2.1 Probing the neon plasma column.
We have probed the plasma column of a magnetically stabilised hollow
cathode arc discharge in neon. Fast metastable atoms with translational
energies between 1 and 10 eV are produced by electron impact and heavy
particle collisions [4]. We sample these metastable atoms through an
orifice in the end anode. Figure 1 gives a schematic view of the beam
Figure 1 A schematic view of the beam formation with: 1: tungsten
cathode 2.0*1.0 mm, 2: plasma column, 3: laser beam, 4: water
cooled ring anode, 5: water cooled end anode at floating
potential, 6: sampling orifice in end anode, 7: time of flight
chopper, 8: beam collimator, diameter 0.7 mm, 9: stainless
steel surface, 10: electron multiplier, 11: atomic beam. The
flight path is 2.206 m and the distance between sampling
orifice and beam colliminator is 1.274 a.
117

formation including the probe laser beam and the atomic beam detector.
The disturbance of the plasma, even in the intersection volume with the
laser beam, is negligible because only a very small part of the total
population of the metastable state can be pumped optically, namely the
part with velocities almost perpendicular to the laser beam axis. This
part of the velocity space is indicated in figure 2. The maximum angle
6, with the y-z plane that can be pumped is determined by the
divergence of the laser beam in the z-direction and the angle where
Doppler shift matches the natural linewidth of the pump transition. For
neon the natural linewidth is 10 MHz and an angle of 2 mrad at a
velocity of 2000 m/s already gives a Doppler shift of 6.7 MHz.
Saturaf1 'oadening will result in two to three times larger effective
linewidths. In figure 2 we have also indicated the part of velocity
Figure 2 Velocity space with the hole burned by the laser beam parallel
to the x axis given by the hatched area. A typical value is
9. - 7arad. The black dot i« the part that is «een by the
natomic beam detector with a typical diaaeter of 6^ - 0.50 arad.
118
space that is sampled from the plasma, i.e. that is seen by the atomic
beam detector. This part, with 0.3 mrad half top angle, lies well within
the pumped part of the velocity space.
We assume that the metastable density (in phase space) in the plasma
is homogeneous along the z-direction as a result of a (detailed) balance
between creation and destruction processes. With the c.w. laser beam a
very narrow hole is burned in this equilibrium distribution, i.e. we
remove neon atoms at the position z„ which are in the metastable Is 5
state and have a velocity vx of |vx| < 10 m/s, typically. By measuring
the intensity of the beam of metastable atoms as a function of the
distance z. between the laser beam and the sampling orifice, we can
determine the relaxation length X or the relaxation time T of this hole.
With the laser beam the balance of the plasma is not influenced, because
very few atoms are optically pumped. Therefore, the total relaxation
rate of the hole will be given by the sum of the individual rates in the
undisturbed plasma for each relaxation process,
1/T = E ( 1 / T . ) . (1)
However, the small group of pumped atoms overlaps the even smaller group
of all detected metastable atoms and the beam intensity attenuation will
be equal to the modulation depth at the centre of the hole. In the next
section we will derive an expression in terms of this relaxation length
starting fro» a general expression for the beam intensity. Now we will
first give an overview of the processes that determine the relaxation of
the hole.
All inelastic collision processes resulting in a metastable atom
uniformly fill the whole velocity space and thus also the hole that is
burned by the c.w. laser beam. The most important inelastic process is
excitation of the ground state atoas by an electron, while also charge
119

exchange between an ion and a metastable atom has to be considered as a
production process. In addition to these standard production processes,
i.e. inelastic collisions, the hole will also be repopulated by elastic
collisions of a metastable atom with a ground state atom or with an ion.
The effective cross sections for the repopulation by elastic collisions
will be determined by the small angle differential cross section and by
the geometry of the hole burned in the velocity space by the laser. A
good first order approximation for the effective elastic cross section
in our geometry is given by the hard sphere total cross section.
2.2 Beam formation
A general expression for the beam intensity is given by [4]
LP1
1(0) P(v) dv d2oo = Jn(z.v) T(z,v) A g o dz dv d w/4ir . (2)
0o
with A (m ) the effective area of the sampling orifice, L, (m) the
arc length, n(z,v) ( m s (m/s) ) the production rate of the
metastable atoms per velocity interval and per unit of volume, and
T(z,v) the transmission probability (0 < T(z,v) < 1 ) of a metastable
atom with velocity v through the plasma slice between the production
position z and the end anode (z » 0). In general these quantities are
determined by collisions between neutrals, ions and electrons. We have
to keep in mind that for each process that is considered as a production
process of a metastable atom, the inverse process results in destruction
of a metastable atom and has to be included in the transmission
probability.
If we assume a homogeneous plasma column in the region that
contributes to the production of the molecular beam, the production rate
becomes independent of the position z and the transmission probability
can be expressed in terms of a position independent mean free path or
120

relaxation length for the metastable atoms A(v) according to
T(z,v) = exp{-z/A(v)} . (3)
With the assumption that T(Lpl,v) « 1 eq. 2 now is given by
00
9 f 2 (L\1(0) P(v) dv d w = ii(v) lexp{-z/A(v)} dz A dv d (u/4ir . w
0
With the probe laser on we attenuate the contribution to the beam of
metastable atoms produced in the region z > z. and eq. 4 becomes
Io(O) Pj(v) dv d ü) = n(v) exp{-z/A(v)} dz A dv d2ü)/4ir
X* K J go
0CO
+{l-n(v)} n(v) |exp{-z/A(v)} dz A dv d2u)/4Tr. (5)J SOz£
The function n(v) is the velocity dependent efficiency for pumping
the metastable atoms with the laser beam. The modulation depth k(zo ,v)
is given by
k(2 v) _ {KO)P(v) - I&(O)P£(v)}l' KO)P(v) (6)
= n(v) exp{-z„/A(v)} . ^ '
Measurements of k(z ,v) as a function of z„ will give the velocity
dependent mean free path A(v) and pumping efficiency
In section 2.1 we have shown in a qualitative way that the
relaxation length to repopulate the hole in the velocity space burned
with the probe laser beam is measured. This relaxation length is
determined by the production processes of the metastable atoms. In this
section we have derived an expression (eq. 7) which gives the
experimental modulation depth in terms of the mean free path A(v) of the
matastable atoms in the plasma column. This mean free path is determined
121

by the destruction processes of a metastable atom. These destruction
processes are the inverse of the population processes, which determine
the relaxation length of the hole. Because the balance in the plasma is
not disturbed by the laser beam the relaxation rate of the hole and the
metastable atoms are equal, and thus the mean free path of the
metastable atoms and the relaxation length of the hole are also equal.
This means that the experimentally determined mean free path of
metastable atoms is determined by the processes that remove a metastable
atom out of the part of velocity space that has the same shape as the
hole burned with the laser beam. We will analyse our experimentally
determined mean free path in terms of these destruction processes and
not of the production pocesses that repopulate the hole.
2.3 The mean free path
The mean free path A(v) of the metastable atoms in the plasma column
is determined by different types of collision processes. Therefore we
introduce a partial mean free path X.(v) for each process denoted by
index j. From eq. 1 follows, with T.« X ./v for the apparant mean free
path
i i
(8)X(v)"1 = IX (v) 1 .j J
There are two types of collisions that mainly contribute to the apparent
mean free path. First there are collisions with electrons, resulting in
a partial mean free path X (v) given by
J(ge/v) fe(ve) Qe(ge) dve , (9)
where n (m~ ) is the electron density, f (v ) the normalised velocity)6 6 6
distribution of the electrons, g the relative velocity between the
electron and the metastable atom, and Q (g ) the total cross section for
a collision with an electron. Because v » v the relative velocity g
122

will be equal to the electron velocity v for all values of v involved
and eq. 10 can be simplified to
Xe(v) = v {ne
With the lifetime Te, given by
we can write A (v) as an explicit function of the velocity v of the
me tastable atom
The other type of collisions are those with heavy particles, i.e.
neutral atoms and ions. For these collisions the ratio of the relative
velocity g and the velocity of the metastable atom v is in good
approximation independent of v, resulting in a partial mean free path A±
and A that are also independent of the metastable velocity v and we get
A"1 - n. <Q.> , A^1 = nn <Qn> , (13)
where n. is the density of the ions and the neutrals, respectively,
a n d Qn „ t n e cross section for collisions with ions and neutrals,
respectively. The partial mean free path of a metastable atom with a
species of atomic weight, A now becomesa
1/Aa - 1/Ai + 1/An - ni<Q±> + nn<Qn>. (14)
Using eqs. 8, 12 and 14 we get for the inverse lifetime or relaxation
rate,
1/T(V) - 1/T + v/A, (15)
which represents a straight line with slope 1/X and offset 1/T •a e
123

2.4 Collisions with electrons
Elastic collisions with an electron do not contribute to the mean
free path X (v) of the metastable atoms because of the small momentum
transfer of these collisions. For the sane reason the excitation to a 2p
state followed by a spontaneous decay to one of the metastable states
(40 %) also does not contribute toX(v). However, by decay to a resonant
state with an efficiency of 60 % the excitation process is still the
main destruction process for collisions with electrons for T e > 1 eV as
can be seen in figure 15.
We have to take into account the effect of inelastic collisions of
the Is, state and the 2p states with electrons when the characteristic
time for these collisions becomes smaller than the natural lifetime of
these states, which is typically 20 ns. The important processes are
ionisation of the 2p states and the ls^-lSj transition. At all electron
temperatures up to 10 eV a reasonable estimate for an upper limit for
-12 3 -1the rate constant for these processes is 10 m s [5,6]. This means
that we have to reconsider these processes when we find electron
19 -3densities n > 5 10 m .
e
3 Experimental set up
Figure 1 gives a schematic view of the experimental set up.
Experiments have been performed with the hollow cathode arc developed by
Theuws [4,5]. We have used a neon arc which is characterised in table 1.
We use the Ne(ls5~2p2) (J-2 to J-1) transition (Paschen) with a
wavelength of 588.2 nm for the optical pumping. With the polarisation of
the laser beam parallel to the confining magnetic field B and using a
Z
laser beam with 5.4 mrad divergence in the z direction (full angle at
l/ez) we pump all three possible Am - 0 transitions, which lie 29 Mhz
124

Table 1
Charateristics of the hollow cathode arc used for the probe
measurements.
Characteristic symbol value unit
length external column
gasflow
background density(normal)
magnetic field
sampling orifice area
arc current
arc voltage(typ.)
cathode material
i.d., o.d.
yN
"n.back
\
^o
varc
28
193.36 10
203.36 10
0.0125
(TT/4) 0.25
5, 10, 15
60-100
tungsten
1.0, 2.0
mm
-1s
-3m
T2
mm
A
V
mm
apart due to the Zeeman splitting (figure 3) in the axial magnetic field
of B - 0.0125 Tz
The maximum attainable modulation depth of the intensity of the beam
of metastable neon atoms now is r) » 28.8 X. This rather lowmax
modulation is caused by the 90.9 X natural abundance of %e which is
the only isotope we pump optically, by the branching ratio of the upper
(2p ) level, which causes that 27 X of all excited 2%e(ls ) netastable
atoms decay to the Ne(ls3) metastable level, and by the Clebsch-Gordan
factors of the Ne(l85-2p2) transitions which cause that approximately
8.5 X of all excited 2C}je(ls5) aetastable atoms decay to the 2Sfe(ls-)
a « +2 or m » -2 substates which are not pumped (figure 1).
125

0.21 0.10
2 p 2 CJ-11
0.27
1s3<>0>
0.42
Figure 3 The optical pumping scheme of Ne(ls-) in a magnetic field of
0.0125 T parallel to the polarisation of the laser beam. Double
arrows indicate the excitation and single arrows spontaneous
decay. The Zeeman splitting is Av, - 263 MHz, AVj = 234 MHz.
The branching ratio of the 2p~ state is indicated.
We have used a laser beam with 0.5 mm width in the z direction and
21.6 mm height in the y direction (full width at l/e ). The frequency of
the laser is stabilised within 0.5 Mhz at the resonance frequency of the
undisturbed Ne(ls^-2po) transition with our auxilliary atomic beam
set-up [7]. With a computer controlled, steppermotor driven flat mirror
we align the laser beam perpendicular to the atomic beam with an
accuracy of 0.2 mrad [8]. We also use this mirror to scan the laser beam
reproducible along the z-axis, avoiding any disturbance of the angular
alignment of laser beam and atomic beam. This is rather difficult when
it haB to be done by hand. Due to the high velocity of the metastable
atoms (3000-10000 m/s) a misalignment in the. z-direction of 1 mrad
causes a Doppler shift of at least 5 MHz, which is already half the
natural linewidth. A misalignment of 1 mrad in the y direction
126

translates the interaction point of laser beam and plasma column 0.75 mm
in the y direction, which is already half the height of the laser beam.
The beam of metastable atoms is collimated 1274 mm downstream of the
sampling orifice with a collimator with 0.7 mm diameter. A time-of-
flight chopper is located 478 mm downstream of the sampling orifice and
the flight path from chopper to detector is 2206 mm. The metastable
atoms are detected by Auger ejection of an electron from a stainless
steel surface, which is counted by an open multiplier. The detection
efficiency lies close to unity [1,2,5], while the background signal is
very low (figure 4). The flight time spectra are accumulated in a multi
sealer with 5 US channel width.
3.1 Measuring routine
A probe measurement, which takes typically 2 to 3 hours, consists of
a set of attenuation measurements at typically 10 different positions z^
of the probe laser beam. Each attenuation measurement gives a pair of
flight time spectra, one spectrum with laser on, Ir>(0) Fo(v) dv, and one
with laser off, 1(0) P(v) dv. To eliminate the influence of drift in
beam intensity and detector efficiency, each attenuation measurement
(typically 15 minutes) is divided in 8 equal measuring periods,
alternately with laser on and off. The first five attenuation
measurements are performed for increasing values of z^ and the last five
measurements for decreasing values of z„ . This gives the possibility to
check the reproducibility and the stability of the scanning mechanism
and to check whether there is any effect of long term drift of the laser
power.
127

3.2 Data analysis
The relative attenuation k(z„,v.) is calculated according to eq. 7
from each pair of time of flight spectra for each velocity vi
corresponding with the flight time of time channel i. To save
calculation time we have accumulated the contents of three time
channels, which reduces the number of velocities with a factor of 3. The
results of k(z ,v. ) for each velocity v. are analysed with a least
squares method with eq. 7 as a model function and X (v. ) and n(v.) as
free parameters. The results for X(v.) are analysed further by a linear
^ ) and vit resulting in anleast squares analysis of 1/T(vi) (= v^/
offset 1/Tg and a slope 1/Ag according to eq. 15.
0.5 1.0flighttime (ms)
i . , i i i i i i
10000 50000velocity (m/s)
2000
Figure 4 Time-of-flight spectra of the atomic beam with the laser beam
switched on and off, respectively. Because the laser is close
to the end anode (z. * 0.5 mm) the attenuation of the atomic
beam is close to its maximum value.
128

4 Experimental results
One pair of time-of-flight spectra of an attenuation measurement is
given in figure 4 and a typical result of k ( ^ ,v^) as a function of ^
for two different velocities v. is given in figure 5. The full and open
data points, which are measured with increasing and decreasing values of
z., respectively, show that the translation of the laser beam along the
z-axis reproduces very well and is sufficiently stable. The good
correspondence of the data points to the result of the least squares
analysis with eq. 7 as a model function supports our assumption of a
position independent mean free path.
0.15
>^0.10
0.05
I
I I I | I I I
V
\
1
(m/s)Imm)
1 —.~-
i
1 i
A
3.770.198
I i
i i
0
85425.730.151
-
0 10^^ (mm)
Figure 5 The modulation k(z.,v) for v « 4404 m/s (AA) andAs
v - 8542 m/s fc») resulting in X(4404) - 3.77 mm,
X(8542) - 5.73 mm and n(4404) - 0.198, and n(8542) * 0.151.
A typical result of X(v) is shown in figure 6, where l/T(v) is given
as a function of v. This figure shows that the model function of eq. 15
is correct. In the experimentally accessible velocity range the slope
I/A and the offset 1/T can be determined very accurately. Typically,3 e
the contribution to the mean free path A(v) of collisions with electrons
(X ) is almost
particles (X ).3
(X ) is almost equal to the contribution of collisions with heavy
129

21 1 1 1 1 ~1 1 1
10000velocity (m/s)
Figure 6 The inverse lifetime 1/T(V) of a metastable atom as a function
of the velocity v„ The results of a least squares analysis with
eq. 16 (•_._.) and eq. 24 ( ) as a model function are
indicated.
-UU
0.20
0.10
1 1 1
- |L .F *
-1 1 1
1 1
o o 0 0
1
— 1 —
6
1
- • | • 1
-
10000velocity (rn/s)
Figure 7 The experimental results of the modulation depth f| (v). The
solid line represents the expected modulation depth according
to the values of 1(0,v) of figure 9.
130

The modulation depth f|(v), given in figure 7, shows no velocity
dependence up to 12000 m/s and has a typical value in this region of
25 X. This proves that the pumping transition is saturated in this
region, i.e. all three m-states (figure 3) are fully depleted by the
laser beam. The discrepancy between the experimental modulation depth of
25 Z and the theoretical limit of 27 X is most likely caused by a small
contribution to the production of metastable atoms inside and downstream
of the sampling orifice, which is a circular channel with 0.5 mm length
and 0.5 mm diameter. The experimental modulation depth of 25% also
proves that the characteristic length for coupling between the four fine
structure states of the Is group and between the five m-states of the
lSnj metastable atoms is large compared to the diameter of the laser
beam, otherwise the modulation will be much higher.
5 Analysis of the experimental results.
5.1 The character of the neon plasma column.
In this section we characterise the plasma by using the order of
magnitude of A and, moving one step further, by analysing the inverse
lifetime v/X(v) with the simple model of section 2.3. The large
experimental values for X of a few millimeters already indicate that the
neon plasma has a low electron density. As can be seen from figure 15
the rate constants for excitation and ionisation of a ground state atom
are always two orders of magnitude lower than the rate constant for
excitation of a metastable atom to a 2p state. This rate constant mainly
determines the partial mean free path X(v) for metastable atoms. Thus
the mean free path for ionisation (direct or stepwise) of a ground state
atom is always more than two orders of magnitude higher than our
experimental values of X for atoms in a metastable state. We may
131

conclude that the neon plasma column, which has a diameter of typically
1 mm, is fully transparent for background atoms and that the density of
neutral groundstate atoms at the axis of the neon plasma column nn will
be equal to the density in the vacuum chamber n^t^c^. This conclusion
is supported by the results for X of probe measurements where we have
increased the background density with a fixed amount by using an extra
calibrated gas flow through a side flange to the vacuum chamber. As can
be seen from figure 8 the inverse mean free path increases linearly with
the background density n n > b a c k which indicates also that n„ - n , , ^ ^ .
These conclusions support our assumption that the velocity ratio
(g/v) is close to unity for heavy particle collisions, because
collisions with atoms from the background with thermal velocities
dominate.
"n.backdO20!*3)
Figure 8 The inverse partial mean free path 1/X for collisions with
heavy particles as a function of the density n . , in the
vacuum chamber. The solid line represents the result of a
linear least squares analysis with
1/A.<Vtack> ' O.OOHmT1) + 0.5 10 m 3
132

With the model of section 2.3 the experimental results of A(v) give
a typical lifetime for collisions with electrons of T - 2 ps and a
velocity independent mean free path for collisions with heavy particles
of X « 10 mm (figure 6). The lifetime T « 2 us corresponds to an uppera s18 -3
limit for the electron density ng of ng m a x - 7 10 m or a degree of
ionisation g - 2 X. We have derived this limit by using the <<^ve>
product at Te « 26 meV for quenching to the ls^ state (figure 15). For
T > 1 eV the quenching rate will even be higher, because then it is
determined by excitation to the 2p states and by ionisation, resulting
in lower values for n and 3•
An upper limit for the rate constant for quenching by electrons is
<(^v > < 9 10~13 m3s"1 (figure 15), resulting in a lower limit for the
17 —3electron density of n . « 6 10 m corresponding to 3 > 0.2 X.
eioxn
A lower limit for the effective cross section for elastic collisions
with a ground state atom is determined by the classical turning point,
resulting in fl . - 30 A , corresponding to A « 1 0 mm. This indicatesTi.mxn n
that the contribution of X. to X is small and that the degree of
ionisation is very low, bearing in mind the large cross section for
charge exchange Q • 500 8 (appendix 2).
We can characterise the neon plasaa column:
- The high value of 2 to 6 mm of X means that the plasma column is
fully transparent for background atoms in the vacuum chamber of the
hollow cathode arc.
- The analysis of the inverse lifetime 1/Kv) with the simple model of
section 2.3 shows that the degree of ionisation has a maximum of 2 X.
133
The good correspondence of the data points for the modulation of the
beam intensity to the results of the least squares analysis in figure 5
proves our assumption of a position independent mean free path. The
contribution X to the mean free path is determined by the background
density and thus position independent. This all implies that the
contribution of A and thus of I is also position independent,
indicating that in good approximation the plasma is homogeneous along
the z-axis in the region probed by our experiment (z £ 12 mm).
6 Further analysis
In the foregoing section we have derived the boundaries for the
degree of ionisation 3(0.2 % < 0 < 2 /£) using only a simple analysis of
the experimental results for A. However, we now have to consider the
elastic collisions with ground state atoms in more detail, i.e. the
repopulation of the hole in the velocity space by small angle elastic
collisions.
6.1 Elastic collisions with ground state atoms.
The shape of the hole in velocity space is given by the absorption
probability n( 6 ,v) of a photon of the laser beam for a metastable atoma
with velocity v moving at an angle 6 with the y-z plane and the lasera
beam axis parallel to the x-axis. This absorption probability is given
by [7]
n(9a,v) = 1 - exp{-M(ea,v)}, (16)
with the saturation parameter M(6 ,v) determined by the geometry and
power of the laser beam and the natural lineshape of the transition.
When we assume a spherical wavefront of the laser beam this parameter is
given by
134
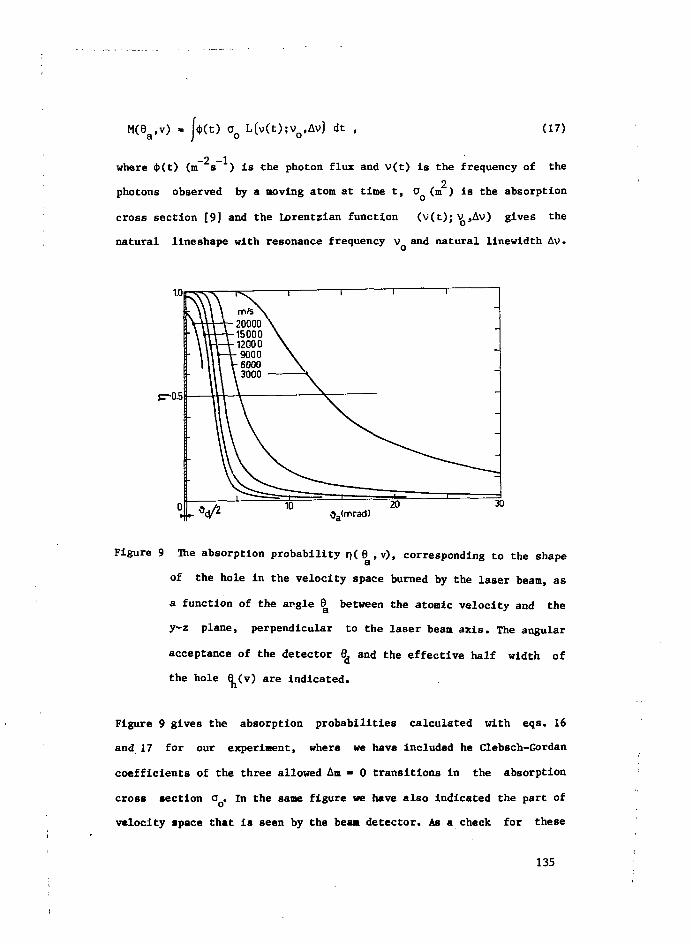
M(6a>v) L(v(t);vo,Av) dt , (17)
-2 -1where <J>(t) (m s ) is the photon flux and v(t) is the frequency of the
2photons observed by a moving atom at time t, a ( m > is the absorption
cross section [9] and the Lorentzian function (v(t)jV),Av) give6 the
natural lineshape with resonance frequency v and natural linewidth Av.
1.0
J-b
0•
VrtH\uP
l\\
V
. V 2
- 20000 \-15000b 12000V-9000\-600O\3000 -
—[— 1
\\
\\A
—i i
-
ii >
i i
20 30)
Figure 9 the absorption probability p(6 , v), corresponding to the shape
of the hole in the velocity space burned by the laser beam, as
a function of the angle 8 between the atomic velocity and the
y-z plane, perpendicular to the laser bean axis. The angular
acceptance of the detector 6. and the effective half width of
the hole ^(v) are indicated.
Figure 9 gives the absorption probabilities calculated with eqs. 16
and 17 for our experiment, where we have included he Clebsch-Gordan
coefficients of the three allowed An « 0 transitions in the absorption
cross section OQ. in the same figure we have also indicated the part of
velocity space that is seen by the beam detector. As a check for these
135

calculations we have measured the modulation of the integrated beam
intensity as a function of the laser frequency (figure 10). Scanning the
laser frequency corresponds to shifting the hole along the 6 axis witha.
an amount by which the frequency deviation is compensated by the Doppler
shift. The half width of the hole 6.(5500) - 6 mrad, with v - 5500 m/s
the velocity of the maximum of the flight time spectrum, corresponds to
a Dopplershift of 55 MHz. This value is in good agreement with the
measured half width at half maximum of the modulation of 70 MHz. Also
the experimental results of r)(v) (figure 7) start to decrease at
12000 m/s, which agrees very well with the theoretical curves of
figure 9. The cross section for the partial mean free path A to
repopulate the hole by elastic collisions with ground state atoms is
100 200•«((MHz)
Figure 10 The total count rate of metastable atoms as a function
of the (relative) laser frequency v. measured at z» - 0.5 an.
The full width at half maximum is 140 MHz.
136

given by the fraction of the total elastic cross section with lab
scattering angles 9 ,- , . > 9, , defined byerf,lab h
(18)V6eff.en,' QfXff.c'*) '
with Q (g) the quantum mechanical total elastic cross section and g theo
relative velocity. The parameter Qfr (0 < Qfr < 1 ) is equal to the
fraction of the total cross section that results in scattering angles
larger than 9eff. This fraction is a function of e
eff/9qm, with 6qm the
quantum mechanical scaling angle defined by [10]
e q m
k = Ug/R .
(19)
(20)
5000 10000
V(m/s)
15000
Figure 11 The quantum mechanical scaling angle 9 and the effective
c m . scattering angle 6 e f f
of the met
with g r e f - 1000 m/s.
29, as a function of then
velocity v of the metastable atoms. QQ(V> * 143 (g /v)°'3 X2
137

with atomic wavenumber k and relative mass ]i . Because the collision
partners have thermal velocities (background atoms) g/v > 1 and
0 ,, * 28 .- , K are very good approximations. In our energy range a
good approximation for Q(g) is given by
Qo(8> = V gref> (gvef/8)°"3. (21)
In figure 11 we show 9gff c m (v) (« 29h(v)) and Q (v) using
Q(g f) * 143 A as measured by Rothe and Neynaber [11] at
g - 1000 m/s. For velocities between 2000 and 15000 m/s we see that
the ratio 6 ,,. /9 ^ 2 . 5 resulting in a velocity independent fractioneff,cm qm
Q. % 0.48 [10]. The mean free path A , however, is still dependent on
the velocity, according to
lA n(v) = nnQn(v) = 0.48 nnQQ(gref) (gref/g)°-3. (22)
When we assume the same velocity dependence for X.(v), we get a model
function of the inverse lifetime given by (eq. 15)
i = i/xe + vu-' e r e f A a ( g r e f ) . (23)
The mean free path A (gref) for collisions with ground state atoms or
ions at grer * 1000 m/s is given by
lA aU r e f) = lA^Sref) + n ^ r e P (24)
1/X±,n(.Svef) - 0.48 n i n Q i > n(g r e f) . (25)
This model (eq. 23) is no longer a linear function of v.
6.2 Data analysis including small angle elastic scattering.
When we analyse the inverse lifetimes 1/T(V) with the model function
of eq. 23 we see a better agreement between experiment and model
138

n . , - 3.36 1020 m~3 as input we find \,(g ,) - 4.4 mm and
function (figure 6), resulting in Tfi - 4.4 ys and Ag (gref) - 4.3 mm.
When we compare these results to the previous results of the analysis
with the linear function of eq. 15, we see a higher value for Te,
corresponding to an even lower value for ng than derived in section 5.1.
With g - 1000 m/s, Q0(Sref> - 1*3 S , O ^ ^ e f ) - 500 X ,r e -3— Q it in i
"n.backX.(g f) " 200 mm (using eqs. 24 and 25), which correspond to
n - 10 1 8 m"3 or 6 - 0.3 Z.
7 Influence of external parameters
Up till now we have analysed the measurements at one fixed set of
external plasma parameters. We have also performed measurements as a
function of the arc current I . In this section we present the
arc
experimental lifetime for collisions with electrons, T , and the
experimental mean free path for collisions with heavy particles, X , as3
a function of the arc current and the background density in the vacuum
chamber. We have analysed the measurements with the linear model of
section 2.3, which gives already a very good insight in the behaviour of
these parameters.
In figure 12 the experimental results for T and A are given as a
function of I .By assuming that n "V I we expect that T Ji> I/I .3I*C fi 31TC 6 3iC
We see a rather good correspondence between the data points for t and
the I/I curve in figure 12a. Figure 12b shows that the mean free pathaiC
for collisions with heavy particles is independent of the arc current
and we may conclude again that the contribution of A^ (collisions with
ions) to Aa is negligible. We also see that n^, the density of ground
state atoms at the axis of the plasma, is not influenced by the change
in n . Both facts are in full agreement with the conclusions of
section 5.1 that the degree of ionisation is very low and that the139

plasma is fully transparent for background atoms.
The lifetime for collisions with electrons as a function of the
background density in the vacuum chamber is given in figure 13. If we
assume that the electon temperature is not influenced by n uacj, > w e m a v
10 20 0
Iarc (A)
10 20
Figure 12 The lifetime for collisions with electrons (figure 12a) and
the mean free path for collisions with a heavy particle
(figure 12b) as a function of the arc current. The lifetime and
the mean free path are determined with the linear model of
section 2.3. For comparison we also have given the relation
Te * i^arc'
! 3
2
1
-
-
-
V 1'nn,
\\
i i
back
\ ^
1
•
i
1 '
-
-
-
i i
"n.back "O 2 0"" 3'
Figure 13 The lifetime for collisions with electrons as a fuction of the
background density in the vacuum chamber. We have used the
linear model of section 2.3 to determine the lifetimes. For
comparison we also have shown the relation T- njj back*
140
expect a relation between i»n ^ and xe, given by T ^ nn>hack , with
0 < 01 < 1 and where a - 1 corresponds to a constant degree of ionisation
and a » 0 to a constant electron density. We see in figure 13 that a
will lie close to unity, which means that the degree of ionisation is
constant and this also points to a low degree of ionisation.
8 Conclusions
8.1 General
The technique of molecular beam sampling of a rare gas plasma
combined with optical pumping of one of the metastable states with a
c.w. dye laser beam in the plasma (perpendicular to the atomic beam
axis) gives very accurate results for the mean free path of the
metastable atoms in the plasma as a function of their velocity, the
laser beam power can be chosen to pump only a very small part of the
velocity space making the disturbance of the plasma by the laser beam
negligible. The width of the hole burned in the velocity space by the
laser is a very important parameter, because it determines a major
contribution of elastic scattering to the measured mean free path for
collisions with heavy particles. The width of the part of velocity space
that is seen by the beam detector is not important when using typical
atomic beam divergences of 1 mrad or less.
The values of the measured mean free path already gives a good
insight in the transparancy of the plasma for background atoms. With a
simple model for the velocity dependence of the mean free path it is
possible to determine the contributions of collisions with electrons and
collisions with heavy particles (i.e. ions and atoms) to the measured
mean free path, resulting in two velocity independent parameters: the
characteristic lifetime xg for collisions with electrons and the mean
141

free path A for collisions with atoms or ions. In principle it is
possible to determine with these two parameters both the degree of
ionisation and the electron temperature when accurate values of the
cross sections for these collisions are known. At this stage the
accuracy of our method is still limited by these cross section data.
However, considering the current large interest in beam experiments with
excited (metastable) atoms, it is likely that in the near future these
data will come available.
8.2 The plasma column of the neon hollow cathode arc.
The experimental mean free path is typically 2 - 8 mm. This is very
large compared to argon (0.02 - 0.2 mm) as calculated by Theuws [5]. The
analysis of T and X shows that the degree of ionisation of the neone a
plasma has an upper limit of 2 %, which is very low compared to hollow
cathode arcs in helium [12] and argon [5] (10 - 30 % ) . The electron
temperature is presumably not higher than 1 - 2 eV otherwise the degree
of ionisation has to be even much lower than 2 %. This temperature is
also lower than for argon where T - 3 - 4 eV. This degree ofionisation
and this electron temperature are much too low for a stable plasma.
Inside and rear the cathode the electron density and temperature have to
be higher and the region that we observe, which has about half the
length of the external plasma column, consists of a recombining plasma.
However, it is more likely that the electron energy distribution is not
Maxwellian and contains an extra fraction of high energy electrons, so
called beam electrons [13]. These electrons are much more effective for
production of excited atoms than for destruction and thus provide an
extra source of excited atoms. Van Veldhuizen [13] has evaluated an
increase of the density of metastable atoms from 2 10 «~ to
2 1016 m"3 in a hollow cathode discharge in neon by adding a fraction of
142

-4only 10 beam electrons, using a collision-radiation model. In our case
these electrons have to be produced inside the hot hollow cathode. This
U -1 -1assumption is supported by the high values 1(0) • 10 s sr of the
centre line intensity for metastable neon atoms.
The observed (by eye) diameter of the neon plasma column is
typically 10 - 20 mm which is very large compared to argon which gives a
diameter of 1 - 2 mm. However, the observed diameter of the plasma
column for the production of a beam of metastable atoms (figure 14),
obtained by scanning the samllng orifice over the plasma column, is
typically 1 mm, both for argon and neon. This also indicates that the
electrons that produce the metastable atoms originate from the hollow
cathode and are probably beam electrons.
All these results show that the character of the plasma column of a
hollow cathode arc for neon is very different from argon and helium.
This difference can not be explained by the ionisation energy of neon
because this lies in between those of argon and helium. A possible
explanation is given by the isotope composition. Many atomic data are
different for the isotopes. One of the most important is the isotope
- 2 - 1 0 1 2 3cathode position (mm)
Figure 14 The normalised beam intensity of metastable atoms as a
function of the radial position x of the hollow cathode for
neon (*) and argon (0).
143

shifts of the energy levels, resulting in a total mismatch of the
absorption for resonance photons emitted by the other isotope and a
possible mismatch (small cross section) for resonant collision processes
between the two isotopes. These differences will be largest for neon
because they are generally proportional to the relative mass difference
between the isotopes, which is one of the largest for neon of all rare
gases (only for helium it is larger), while the natural abundance of the
second isotope of neon is also very high ( Tfe/ Hfe - 10 X ,
3He/*He < 0.1 % ). The shift of the resonance lines of neon is expected
to be smaller than half the FWHM of the Doppler broadened absorption
lines at room temperature [14]. We may expect that these mismatches will
have the largest effect on the energy balance of a neon plasma by a
higher radial energy leakage out of the plasma column. The mean free
pathes for the heavier isotope (or for radiation emitted by this
isotope) will be larger,with an upper limit of a factor of ten for a
complete mismatch. Thus the different isotope composition can result in
a totally different character of the plasma.
The large influence of the isotope composition on the balance in the
plasma is clearly shown by the experimental results of van Veldhuizen
[13] for the opto-galvanic effect in a hollow cathode discharge in neon
with a natural isotope composition. For the opto-galvanic effect of the
20Is -2p„ transition (588 nm) he finds even different signs for the Ne
and Ne isotopes.
The charged particles, however, seem to be confined very well and so
the leakage of resonance photons could be an important effect, which
explains the low degree of ionisation, the rather low electron
temperature and the large diameter of the neon plasma column as observed
by eye. To confirm this isotope effect more theoretical and experimental
evidence is necessary. The first experiment to be performed is the

investigation of the hollow cathode arc in pure (or sufficiently
enriched) Tfe gas.
References
1 Dunning F B and Smith A C H ,J.Phys.B: At.Mol.Phys. 4 (1971) 1683-1695
2 Dunning F B, Smith A C H , and Stebbings R F,J.Phys.B: At.Mol.Phys. 4 (1971) 1696-1710
3 Kroon J P C, Beijerinck H C W, and Verster N F,J.Chem.Phys. 74 (1981) 6528-6529
4 Theuws P G A , Beijerinck H C W, Verster N F, and Schram D C,J.Phys.E: Sci.Instr. 15 (1982) 573-579
5 Theuws P G A , Thesis (1981) Eindhoven University of Technology
6 Phelps A V, Phys.Rev. 114 (1959) 1011-1025
7 Verheijen M J, Beijerinck H C W, and Verster N F,J.Phys.E: Sci.Instr. 15 (1982) 1198-1206
8 Verheijen M J, Beijerinck H C W, and Verster N F,Opt.Comm., submitted for publication
9 Svelto 0, "Principles of Lasers" (1976) Plenum, New-York
10 Verster N F, Beijerinck H C H , Henrichs J M, and v.d.Kam P M A,Chem.Phys. 55 (1981) 169-176
11 Rothe E W and Neynaber R H, J.Chem.Phys. 42 (1965) 3306-3309
12 W Kohsiek, Thesis (1974), Eindhoven University of Technology
13 Veldhuizen E M van, Thesis(1983), Eindhoven University of Technology
14 Westerveld W B and van Eek J,J.Phys.B: At.Mol.Phys. 12 (1979) 377-381
15 Hyman H A, Phys.Rev.A 24 (1981) 1094-1095
16 Ton-That D and Flannery M R, Phys.Rev.A 15 (1977) 517-526
17 Phillips M H, Anderson L W, and Lin C C,Phys.Rev.A 23 (1981) 2751-2753
18 Kieffer L J, Atomic Data 1 (1966) 19-120
19 Mitchner M and Kruger C H, Jr, "Partially Ionised Gases" (1973)John Wiley and Sons, New-York
145

A.I Electron excitation cross sections for the Nel system.
The cross section-velocity products, weighed over the electron
energy distribution, for the excitation processes in the Nel system are
shown in figure 15 as a function of Tg. We have used a triangular shape
for Q(v ) determined by three velocities v . v . and v
e e,start' e,max' e.endThe maximum of the cross section Q
V < V
Q(V ), while Q * 0 forG f D13X
e Ve,start and
literature values [6, 15, 16, 17, 18, 19]
> % end* T h 6 S e A Parameters are estimated from
10„16
Te<eV>10 15
Figure 15 The cross section velocity products weigthed over the electron
energy distribution (Maxwellian) for the excitation processes
in the Nel system as a function of the electron temperature T .
146
A.2 Ion-oetastable atom collisions
Measurements on the charge exchange cross section Q e x c n for Cs+ + Cs
have been performed by Bullis [18] over a wide energy range. At 1 eV ion
energy he finds Q , % 500 A and the cross section increases to
1000 5r for thermal energies.
Measurements on the same system have also been reported by Nienstadt
[19] for thermal energies. The Cs atoms are polarised by optical
pumping. Using nuclear magnetic resonance (nmr), the nuclear spin
polarisation in the charge exchanged Cs+ ions can be detected. The line
width of the nmr is determined by the charge exchange rate at the given
experimental conditions. With the assumption <Qv> « Q<v> he derives
^exch" 750 A, which is in reasonable agreement with the results of
Bullis.
These cross sections are a good estimate for the charge exchange
between a metastable rare gas atom and the corresponding rare gas ion.
147
Chapter VI11 State selected total Penning ionisation cross sections
Introduction
Ionising collisions involving 'metastable atoms have been studied by
several techniques in the past ten years. Total ionisation cross section
measurements with beams of unselected metastable Ne*(ls„, lsu) atoms
have been performed by Tang et al. [Tan72] (0.01 - 0.3 eV), by
Illenberger and Niehaus [11175] (0.01 - 0.6 eV), by West et al. [Wes75]
(0.04 eV), and by Neynaber and coworkers [Ney75,76] (0.01 - 1000 eV).
Illenberger and Niehaus have measured only the relative velocity
dependence for the Ne*-Kr system, which shows a perfect agreement with
the results of Tang et al. and of Neynaber and Magnusson. The absolute
values given by West, Neynaber, and Tang show differences up to a factor
of three.
Penning ionisation electron spectroscopy [Nie81] gives a detailed
insight in the ionisation process. Results are obtained at discrete
(averaged) collision energies, like differential cross section
measurements. State selected experiments with this technique have
recently been performed by Hotop et al [Hot81] with a thermal beam of
metastable neon atoms with an effective temperature of 370 K.
We have performed state selected measurements on the velocity
dependence of the total ionisation cross section in a wide energy range
(0.06 - 0.16 eV and 0.6 - 7 eV). Here we present our first experimental
results for the systems Ne*(lS3, lsj) + Ar, Kr, Xe, and N2> Our results
in the thermal energy range can be compared to the results of Hotop et
al. [Hot81] and in the super thermal energy range they will give new
information on the state dependence of the real part of the optical
interaction potentials in the repulsive wall. In this work we present a
preliminary analysis of our experimental results in terms of the optical
potentials involved.
149

Experimental
The details of the experimental set-up have been described in the
chapters 4 and 5 (figure 5.5.1 and 5.6.1). Collimator 1 has a diameter
of 2.0 mm, resulting in a flow of metastable neon atoms at the
scattering centre of typically 2 10 s~ and A 10 s for the thermal
and superthermal beam sources, respectively. The flight path from
chopper to scattering centre is 860 mm. With the flat collimator
2(2x4 mm ) of the secondary beam the density-length products at the
15 —2scattering centre are 4.3, 2.5, 1.8, and 1.8 10 m for Ar, Kr, Xe,
and N„, respectively. The laser beam has a diameter of 3.3 mm (1/e
intensity) and the laser beam power is 7 to 10 mW. The measuring routine
(section 5.6) to determine the state selected total ionisation cross
sections by modulating the beam of metastable atoms with two different
laser wavelengths is fully independent of the modulation depth of the
optically pumped metastable state. The only requirement is that the
modulation depth remains constant during the measurement. A full
modulation is not necessary. For an optimum signal-to noise ratio a
fraction of 75Z of the maximum attainable modulation is already
sufficient. This means that only moderate laser beam powers are
required. The state selected measurements described by Hotop et al.,
using two Penning ionisation electron spectra, one with laser on and one
with laser off, require a 100% modulation of one metastable species (lsg
or IS5) of all neon isotopes at once. This requires high laser powers
(300 mW) and a multiple pass interaction of the laser beam and the
atomic beam.
We analyse our experimental data as described in section 5.6 to
obtain an experimental cross section Q 1 (eq. 5.6.27). Each measurement
consists of five flight-time spectra. The flight-time spectrum of u.v.
150

photons gives the modulation of the beam of metastable atoms by the
laser beam and is measured with the intersection of laser beam and
atomic beam at the scattering centre, with secondary beam off and the
ion repeller on (V. « -400 V). The four (laser on and off,ion,rep
secondary beam on and off) ion flight-time spectra are measured with the
ion repeller off (V. - +400 V) and with the intersection of laserr ion,rep
beam and secondary beam 14 mm upstream of the scattering centre
(figure 5.5.1), to avoid that u.v. photons produced in the optical
pumping process are registered by the spiraltron.
Figure 8.1 gives the u.v. signal (relative to the modulation of the
total beam of metastable atoms) measured with the spiraltron as a
function of the position of the laser beam along the atomic beam axis.
Moving up-stream of the scattering centre (negative z. direction) the
u.v. signal first increases slightly due to the decreasing distance
between the production centre of u.v. photons and the spiraltron. The
solid line gives a first order approximation of the solid angle
acceptance of the spiraltron where the distance and the angle between
the open area of the spiraltron and the view direction are taken into *
account. This line is normalised to the datapoints with the laser beam
at the scattering centre (z. - 0) and the data points are in good
agreement with the slope of this line. The dashed line marks the
position of the laser beam where half the open area of the spiraltron
can be seen through the aperture (with shielding grid) in the grounded
shield (figure 5.5.1). This position is in good agreement with the
datapoints. At 14 mm upstream of the scattering centre the total count
rate of u.v. photons is less than \X of the ion count rate with both
secondary beam and laser beam on. We can not go further upstream because
of mechanical reasons.
151

Figure 8.1 The u.v. photon signal relative to the modulation of the
total beam of metastable atoms as a function of the position
of the laser beam along the atomic beam axis z^. Negative
values of z, correspond to a position between scattering
centre and beam source. The solid line is an approximation
for the solid angle acceptance of the spiraltron. The dashed
line marks the position where half the open area of the
spiraltron can be seen through the aperture in the grounded
shield.
First two ion flight-time spectra are measured with secondary beam
off, the first one with laser on and the second one with laser off. Next
the laser beam is moved to the scattering centre with the computer
controlled flat mirror (section 4.3) and the u.v. flight-time spectrum
is measured with laser on and secondary beam off. Finally two ion
flight-time spectra are measured with the laser beam back to its
original position and secondary beam on, the first one with laser on and
the second one with laser off. During one measurement this sequence is
repeated ten or more times, each sequence taking typically 15 minutes.
During the registration of the ion flight-time spectra the background
152

density in the vacuum chamber is measured with the storage detector
placed in its outer position (section 5.3) once every two seconds. The
ratio of mean values of the background density with secondary beam on
and secondary beam off is used as the correction factor 1 + a
(eq. 5.6.27).
Figure 8.2 gives the experimental total ionisatlon cross section Q
for three modulation transitions. (* - 588.2, 594.5, and 616.4 nm) for
the Ne*-Ar system. Figure 8.3 gives the total ionisation cross sections
^ and V" f o r t h e lso a n d lsc state, respectively, derived from the
experimental cross sections of figure 8.2. The cross section TJ1 is
equal to ^^J 1 because f59^ - 1 (section 5.6). When we combine the 5 9 4 Q i
cross section with the qr and Q1 cross sections, respectively, we
obtain two independent values for the °(f cross section. There is a
perfect agreement between the two Q1 cross sections measured with the
616 nm modulation transition (which attenuates the Is, population and
enhances the ls^ population) and with the 588 nm modulation transition,
(which enhances the ls3 population and attenuates the Is5 population).
This proves that there are no systematic errors introduced by the
detection of u.v. photons and the optical pumping for the different
transitions. We have performed the same check for the Ne*-Kr system
which shows also a perfect agreement between the two Q cross sections.
For the measurements of the state selected total ionisation cross
sections of the systems Ne*-Ar, Kr, Xe, and Ii> the IS3-2P2 (616 nm) and
the l8g-2p^ (594 nm) transitions are used.
Experimental results.
Figure 8.4 gives the experimental results for the state selected
total ionisation cross section for the four systems investigated. All
systems show larger cross section? for the Is, state than for the lst
153

Figure 8.2 The experimental total ionlsation cross section for three
modulation transitions for the Ne*-Ar system as a function
of the collision energy in the supertherraal energy range.
Figure 8.3 The state selected total ionisation cross sections Q and
nQ*. The cross section for the Is state ( Q1) is equal to
the experimental cross section Q of figure 8.2. The open
symbols for °Q1 are derived from the 6 I 6Q 1 and 5 9 V
experimental cross sections and the full syubols fro» the
^ ^ Q 1 and the ^ ^ Q 1 experimental cross sections of
figure 8.2
15A

Table 8.1 The coefficients a n (j? /eVn) of the polynomials
Qi(E ) = IL- 7{a (E -E f)"} determined by a least squares
analysis for the state selected 20Ne C'Q1 and 2Q 1) Penning
ionisation cross sections. The energy range Emin-En]ax of the
datapoints is given. The reference energy is given by
u i —4E r ef - Emax. The value of n /i is equal to 6.3 10
(- 5.67 10~4/0.9) f° r all systems.
The power of ten is given as superscript^
syst(
Ar
Kr
Xe
N 2
n u
°Q2Q
°Q2Q
°Q2Q
°Q2Q
°Q
Q
°Q2Q
°Q2Q
°Q2Q
E . -E (eV)n n max v
0.0569-0
0.6395-5
0.0541-0,
0.7673-7.
0.0522-0.
0.8203-7.
0.0499-0.
0.4110-3.
.1522
.838
.1724
.273
.1662
,830
1082
667
4
3
3
2
3
2
3,
1.
2.
1.
2.
1.
4.
3.
3.
2.
ao
.8694
.4674
.8044
.036
,3764
.1224
.0034
.4134
,5104
f.,7534
2304
,322*
8824
2464
2724
6814
5
9
-6
-1
6
2
8
5
8
-1,
-3.
7,
3.
1,
-1,
-5.
al
.9194
.651
.7763
.7533
.3104
.1684
,7582
.6522
.6274
f.
.094*
.1543
,7132
.1155
,5265
,2634
,9233
a
-6
-3
-2
-2
-8_1(
1,
9,
3,
-2,
2
.1075
.722:D
• 2613
.701
.8614
,6584
.8243
.1152
,8455
.868
-6.3572
6.
2.
1.
-1.
-5.
,584'i
2316
1246
1434
2233
uixaz:
-5
-1
3
1
-1.
1.
-6.
-3.9SB3!
a3 .
-
.7082
.060
_
_
.5182
.8812
_
_
,9532
,02r
-
3583
-3
0
2
1,
-1.
7.
-9.
-5.
a4
_
_
.8231
.3405
_
.7501
.7291
_
_
5051
,461
-
5242
4262
155

_ i r
••
• :
z
r >
'- . •• v»
1
••
» -
1 t
1 1
1 1
-
«-"ï
5»
>01
-
-
_ o- o- o
'-A
i
-1-
1 1•»$ Ol
°oo
o vQ
|
'
c
OoO
O
0
-
-
W-LU5
o I
O CM ~I
-
_
-
_
- ?" f~ UT
•
•
1
•<
~*1
• •'
•
•fk9-
t•
* -
1 — »
-
-
-
OLÜ
156

I—| | | I M l 1 1—I I I U i l 1 1 I I I II I
I i i I I I I I I I I I I I I I I I I I I I
• • " • • , ) • • . . .
.. 1.1-
Eo(eV)1.0
oei
30
20
10
8
6
Ne*-
•x
— ^
1
rN2
- - •
i
0
\
1 1
11
0
o°
ff_°
LaF
11
1
111
~r "i—i i i 111|—
f . o
1 1 1 1 1 1 111
_
S
I | V
E0(eV)
Figure 8.4 The state selected total ionisatlon cross sections for the systems Ne*-Ar, Kr, Xe, N2 as a function
of the collision energy E . The solid lines correspond to the curve fits of the potentials to the
results and the residue after the curve fits is given'separately for five systems. The dashed lines
are calculated with the optical potentials of Gregor and Siska. Open symbols: "Q 1, closed: Q .

state. The absolute scaling is discussed in the next section. To
represent these measurements in a way that they can be used for
comparison with other experimental results, we describe the cross
sections for each system with four polynomials. The two cross sections
in the thermal energy range are described by a second order polynomial
and the two cross sections in the supertheraal energy range by a
polynomial of order four. The coefficients are determined by a least
squares analysis with the model function
Q(Eo)-4Han(Eo-Eref)n}. (1)
nx a
where \ef is the maximum energy within the energy range used for the
least'squares analysis. The results are given in table 8.1 together with
the energy range used for the analysis. Within this energy range they
give an excellent description of the energy dependence of the total
cross section, but they should not be used for extrapolation outside
this energy range.
Absolute values
We have calculated absolute values for the total ionisation cross
sections directly from our measurements. For this we use an overall ion
detection efficiency of n - 0.9 (section 5.5) and an overall u.v.
u -4detection efficiency n - 5.7 10 (section 5.5). The density-length
products of the Ar, Kr, and N> secondary beams are determined from the
source conditions (pQ, TQ , and 1^) using the experimentally determined
attenuation parameters ([Ver84a] for Ar and Kr, [Ste84] for IL). The
attenuation parameters for Xe are calculated using an effective cm.
scattering angle of 17 mrad ([Ver84b], table 1) and the van der Waals
constant Cg given in the review paper by Scoles [Sco80].
158

Table 8.2 gives the absolute total lonisatlon cross sections Q and
I}1 at 0.10 eV and 2.0 eV (the midpoint of our thermal and superthermal
energy range, respectively). The reference values given for comparison
correspond to the total ionisation cross sections calculated with the
optical potentials of Gregor and Siska [Gre81] that are constrained to
fit the quenching rate constants of Ne*(ls^) + Ar, Kr, and Xe at 300 K
measured by Brom et al. [Bro78] in a flowing afterglow experiment.
Gregor and Siska have modified the quenching rate constants of Brom et
al., with a factor of 1.6 to correct for parabolic flow instead of plug
flow as was assumed by Brom et al. These cross section for Ne*-Ar
derived from quenching rate constants are accepted as to be most
Table 8.2 Absolute values of total ionisation cross sections in A .
The accuracy is calculated from the accuracy of the
(calibrated) density-length products of the secondary beam
only. Errors in the detection efficiencies are not taken
into account
system
Nex-Ar
Nex-Kr
Nex-Xe
Nex-N2
Ne* state
I83
ls5
1S3
lScj
1«3
1*3
our experiment
2.0 eV
19.8 ±232.4 ±3
14.0 ±228.8 ±3
12.4 ±425.3 ±6
21.2 ±228.0 ±3
0.1 eV
20.9 ±227.6 ±3
13.9 ±218.5 ±2
10.7 ±313.3 ±5
19.7 ±229.2 ±3
reference valuesa)
0.1 eV
14.8
16.7
17.5
b)18
a) Reference values according to [Gre81]. For the least squaresanalysis we have scaled our data to these values.
b) From [Bro78]
159

reliable [Hot83]. Our experimental total cross sections are in good
agreement with these reference values, especially when we consider that
other beam measurements of total ionisation cross sections show mutual
differences of a factor two to three [Ney80]. We observe a decreasing
cross section going from Ar to Xe while the quenching rate constants of
Brom et al. show the opposite. However, the error of 15Z in their rate
constants is larger than the differences between the three rate
constants. Our accuracy is determined by the density-length product of
the secondary beam which we know within 10Z for the calibrated Ar, Kr,
and N2 secondary beams. For Xe the error may be larger (up to 25Z)'
because we have estimated the attenuation parameters of the secondary
beam. Other sources of systematic errors may be the overal detection
efficiencies for ions and u.v. photons which we have not calibrated at
all. We have used the quantum efficiency for Ar as measured by Potter
and Mauersberger (figure 5.5.3) for all our systems. The comparison of
the detection systen for u.v. photons with the metastable atom detection
system and the detection system for photons in the visible part of the
spectrum (section 5.5) shows that the theoretically expected overall
detection efficiency for u.v. photons is reliable within 10%, but these
measurements do not give a real calibration.
For the analysis of the energy dependence of our data we did not use
our own absolute values, but we have scaled our measurements so that the
lSj results agree with the optical potential of Gregor and Siska at
0.1 eV (table 8.2). This is shown in figure 8.4. For all systems the
same normalisation constant was used for the thermal and supertheraal
IS3 and IS5 data. The only exception is for the Ne*-Kr system, where the
superthermal cross section were clearly too high. For this system we
have measured the thermal data two days earlier than the superthermal
data, while for all other systems these two measurements were performed
160

on a single day in the mixed sequence: the X - 594 nm transition thermal
and superthermal, followed by the X - 616 nm transition superthermal and
thermal. In order to obtain reasonable potential parameters we have
multiplied the superthermal Ne*-Kr cross sections with an extra factor
0.85. This correction of 15% corresponds to the increase of Ne*-Ar cross
sections that we measured as a reference before and after these Ne*-Kr
measurements. This is probably due to a change in the absolute detection
efficiencies.
Ratios of the state selected total ionisation cross sections.
Figure 8.5 gives the ratio Q 1 / ^ 1 of the total ionisation cross
sections for the four systems. The reference values of Hotop et al.
[Hot81] are in good agreement with our results in the thermal energy
range. For the Ne*-rare gas systems we see a decreasing ratio with
increasing collision energy. This effect is strongest in the thermal
energy range and saturates to approximately 0.5 in the superthermal
energy range. For the tfe*-N2 system we see an almost constant ratio of
0.70 in the thermal energy range and a slow increase in the superthermal
energy range. An interpretation of these results in terms of the
interaction potential is difficult because we have to deal with two
independent parts, i.e. the real potential curve (particle trajectory)
and the imaginary potential curve (absorption). We will explain these
results with the assumption that the shape of the imaginary part of the
potential is identical for the lso and lsr states. (3-m and r. (eq. 2)).J J ïm ïm
With this assumption the variation of the ratio with collision
energy for the Ne*-rare gas systems is fully due to the differences in
the repulsive wall of the real part of the potentials. This splitting
has to start at or before the thermal energy range, where the variation
161

I I I I I I 1 1 I I I I I I I
10E0(eV)
Figure 8.5 The ratios 2QX/°Q1 of the state selected cross sections for the four systems. The open square
gives the result of Hotop et al. (Hot8l) measured with a thermal beam with an effective
temperature of 370 K (0.05 eV).

of the ratio with collision energy Is strongest. This Is in fair
agreement with the potential curves for the Ne*-Ar and Ne*-Xe system as
calculated by Morgner (figure 2.2) and Gregor and Siska [Gre81],
respectively.
According to Morgner [Mor82] the ratios of 0.80 as measured by Hotop
et al. [Hot81] at E % 50 meV, where the real parts of the potential are
assumed to be equal, can be explained by symmetry effects in Penning
ionisation of closed shell atoms by metastable rare gas atoms. These
symmetry effects result in different absolute values for the imaginary
part of the IS3 and lsj potential. One should now expect that the ratio
has a limit of 0.80 in the low collision energy range. However, our
results in the thermal energy range indicate that the limit is reached
for E < 50 meV, while the asymptotic value presumably is higher than
0.80. This means that the repulsive parts of the potentials for the ls^
and Is5 systems are already different for collision energies below
50 meV and the ratio of 0.80 at 50 meV is not fully due to different
absolute values of the imaginary part of the potentials. Measurements
for lower collision energies will be necessary to prove this conclusion.
The energy dependence of the ratio for the Ne*-^ system is much
lias than for the Ne*-rare gas systems, while it also shows the inverse
behaviour. This can be explained by the fact that the quantum number ft,
which gives the projection of the total angular momentum of the system
along the internuclear axis, for the Ne*-rare gas systems is fully
determined by the Ne* atom (J«2 or J«0). The N2 molecule has an angular
momentum due to rotation of the molecule and this angular momentum has
to be combined with the total angular nonentua of the Ne* atom and there
will be more then one or three 0 contributions to the average IS3 and
ls^ potentials, respectively, resulting in a probably smaller difference
between the two averaged potential curves. This explanation does not
163

account for the slow increase of the ratio in the superthermal energy
range.
Analysis
To analyse our total Penning ionisation cross sections we use an
IAMMSV potential (chapter 2) for the Ne*(ls5) and the Ne*(lS3) data.
Although the two Ne*-N2 systems have more than one ^-potential curve and
the Ne*(lS5)-rare gas systems have three fl-potential curves, we use a
single central potential curve for all systems. The partial wave
expansion with JHKB complex phase shifts is used to evaluate total
ionisation cross sections (chapter 3, eq. 29).
To save calculation time we only use 5 and 7 "calculated" data
points in the thermal and superthermal energy range, respectively,
during the first trial and error curve fits. These points are chosen at
log-equidistant collision energies and are given by the polynomial fits.
After the least squares analysis with these "calculated" data points,
all with the same weighting factors, a final X— value is calculated for
all experimental data points. Finally a least squares analysis is
performed with all experimental data points. This resulted in only a
negligible improvement (from 77 to 76) of the X " value. The results of
all systems refer to the final least squares analysis with all the
experimental data points.
He have used the potential parameters of Gregor and Siska [Gre81]
for the three Ne*-rare gas systems. For want of something better we have
also used the Ne*-Ar potential parameters to analyse the Ne*-^ data. In
order to explain our experimental total ionisation cross section
measurements we have to modify the potentials as proposed by Gregor and
Siska, but only in the repulsive wall for VQ(r) > 70 raeV. In the region
below 70 meV we can not modify the potential drastically because Gregor
164

and Siska have probed this region of the repulsive wall in their
differential cross section measurements. We have treated the V
parameters, 3 + and r , and the switch position r as free parameters for
the real potential. We have always adjusted the ^ parameters e*and 3
to make our new potential equal to the potential of Gregor and Siska at
two internuclear distances, r « rm and r « 0.64 %,. In doing so, our new
potential is nearly equal to the potential proposed by Gregor and Siska
in the region up to 70 meV. Remaining small deviations can be neglected,
especially their influence on the total ionisation cross section.
For the imaginary part of the potential we use an exponentially
decaying function (chapter 3, eq. 45) which saturates abruptly to a
constant value for internuclear distances smaller than r. :
*r(r) - £ m exp{- %m(r/rm-l)} r > r±m (2a)
r(r) - G(ripl) r < (2b)
When we treat all six parameters ( &m, 3^, rim, 3 •, r*, and r ) as
free, the final results become rather unrealistic. Therefore we have
fixed r._ , r , and r at reasonable values and determined only e. ,3. ,im o' m ' im' ïm'
and 3 by a least squares analysis.
The dashed lines in figure 8.4 are calculated with the optical
potentials proposed by Gregor and Siska for mixed systems. They have
performed a multi property analysis of their own differential scattering
data at two energies for each Ne*-rare gas system (see also chapter 2),
of quenching rate-constant measurements [Bro78], and of the energy
dependence of the total ionisstion cross section measurements [Tan72.,
Ney75,76]. All the beam data (cross sections) were measured without
state selection. Comparison with this reference shows that our
experimental results for the ISL systems show a more pronounced maximum
located at a larger collision energy (approximately a factor 8). This
165

same feature, however less pronounced, Is seen when we compare the
experimental ionisation cross sections that Gregor and Siska have used
in their fits with the predictions of their potentials (figures 7, 8,
and 9 in [Gre81]). This is caused by the fact that they only have used
the data points between 8 and 80 meV to determine their potentials.
This shape of the ionisation cross section indicates that there will
be a pronounced hump or kink in the repulsive wall of the real
potentials between 0.1 and 1.0 eV. Such a kink or hump, which is not
unrealistic as is shown in chapter 2 (figure 2.3), can be obtained by a
modification of the V, potential and the switch-over function. The
decrease of the ionisation cross section at high OleV) collision
energies is due to the decreasing collision times. The slope in this
region is governed by the slope of the repulsive wall of the real
potential. We observe a rather steep slope in the cross section. It was
not sufficient to use a V, potential with a steeper repulsive wall but
we also had to introduce the saturation of the imaginary part of the
potential for small internuclear distances (eq. 2).
Results of analysis
The full lines in figure 8.4 correspond to the best-fit total
ionisation cross sections. In the same figure the residues after the
least squares analysis are shown for all ls^ systems and for the
Ne*(lSo)-Ar system. The corresponding real parts of the optical
potentials are shown in figure 8.6. The optical potential parameters
obtained are listed in table 8.3.
The Q cross sections
Our Ne*(lB_) measurements are well described by the IAMMSV
potentials as proposed by Gregor and Siska for the Ne*-rare gas systems,
166

after modification with a pronounced kink in the repulsive wall. This
kink lies well above the region that is probed in the scattering
experiments of Gregor and Siska. The extrapolation of the cross sections
to lower collision energies is also very reasonable. The residues of the
Ne*(ls5)-Ar and Ne*(ls5)-Xe data are almost free of structure. The
residue of the Ne*(ls^)-Kr data, however, shows a clear structure, but
this is possible because we had to renormalise the superthermal data
(see above).
The description of the Ne*(lsg)-N2 data by a modification of the
Ne*-Ar potential of Gregor and Siska clearly fails. The maximum in the
fitted cross section is too broad and appears at a too low collision
energy. Also the minimum in the cross section is shifted too far to the
low energy range. According to our experimental results the minimum . is
expected between 0.04 and 0.06 eV, near the lower boundary of our
experimental energy range.
The characteristic lengths of the imaginary parts of our optical
potentials for the rare gas systems are 25 to 40% smaller than those of
the Gregor and Siska potentials. We also obtain alsmost equal
characteristic lengths for Kr and Xe and a larger one for Ar, which is
in agreement with the results of Gregor and Siska. Due to the
normalisation of our cross sections to the same reference values as used
by Gregor and Siska, we can not compare the absolute values (eim) of the
imaginary part of our optical potentials. Because the total ionisation
cro3s section is proportional to £. (chapter 3, eq. 42), the absolute
values of the imaginary part will agree perfectly, because the total
ionisation cross section is proportional to e. . .
167

Table 8.3a The optical potential parameters of Gregor and Siska
[Gre81], that we did not modify.
Ne*-Ar Nex-Kr Nex-Xe Nex-N2 unltParameter
£ e 5.45 8.33 12.50 5.45 meV
S 9rffl 5.0 5.0 5.0 5.0 A
gj 5.333 5.389 5.220 5.333
r* 5.229 5.230 5.247 5.229 8ID
i C,/er6 1.436 1.407 1.491 1.436
? CQ/er8 0.955 0.934 0.978 0.959
I C10/Er^° 0.831 0.806 0.846 0.831
- v*( rl)/ £* 0.8 0.8 0.8 0.8
r„/r* 1.6 1.6 1.6 1.6z m
C. /e+r+* 1.284 1.272 1.381 1.284
*• -V ( r , ) / e 0.8 0.8 0.8 0.8 -
l r+/r+ 2.0 2.0 2.0 2.0IM e + 187 239 288 187 meV
0.69 0.69 0.69 0.69
The Q cross sections.
The description of the Ne*(lS3) data by only a modification of the
repulsive wall above 70 meV of the real part of the optical potential of
Gregor and Siska and of the inaginary part clearly fails up till now.
This can be seen in the analysis of the Ne*(l83) data in figure 8.4. A
better fit needs an unrealistic small radius of the repulsive wall. This
failure is most likely due to a different shape of the real part of the
168

Table 8.3b The optical potential parameters that we have modified. The values given by Gregor and Siska
are given for comparison. The parameters marked •+ were obtained by fitting (B , e.m, 3. ) or
by modification of the parameters of Gregor and Siska (r , r ,r. ). The parameters marked
were adjusted in order to leave the Gregor and Siska potential unmodified ar r = 0.64 r and at
r » r , resulting in an almost unmodified potential for V (r) < 70 meV.
para-meter
+• £ *
* B l
* * :
- B +
* Eim
* *i*
- rim
I s
5 .
3 .
2 .
34.(4.
1.
4.(0.
16.(0.
2.
Nex-
3
62
75
04
41)
14
549)
327)
6
Is
5.
3 .
2.
8.(0.
1.
20.(0.
9.(0.
2.
Ar
5
62
75
04
09)
14.
873)2407)
1
ref
4 .
5 .
2.
4.
3 .
30.
7
a)
17
98
65
83
6
27
35
Is
8.
3 .
1.
25.
0 .
12.(5.
14.(1.
2.
Nex-Kr
3
5855
54
4
86
547)65)6
I s
8 .
3 ,
2 .
16.(8.
1.
17.(1 .10.(0.
2.
5
57
58
04
02)
14
510)982)6
ref
6.
5.
2.
4 .
3 .
31.
8
a)
55
85
77
80
60
06
21
Nex-Xe
l s 3
12.943.46
1.54
25.4
0.86
12.90(13)14.6(3.5)
2.6
l s 5
12.933.50
2.04
17.26(9.6)
1.14
19.16(0.8)
11.3(0.2)
2.6
ref
9 .
5 .
2 .
4 .
3
34
8
a)
89
75
92
82
60
80
24
I s
5.
3 .
1.
28 .
0 .
14.
13.
2.
3
63
71
54
4
86
4
4
6
Nex-N2
l s 5
5.62
3.75
2.04
39.4(4.9)
1.14
8.23(0.3)
13.33(0.08)
2.6
unit
meV
-
—
yeV
—
a) (Gre8l)

170 8(A«JU)(J)°A

10'
Figure 8.6 The real parts of the optical potentials for the systems Ne*-Ar, Kr, Xe, and ^. The full lines
give the Ne*(ls5) systems and the dotted lines the Ne*(ls3) systems. The dashed lines are the
potentials as proposed by Gregor and Siska Gre81 . An extra figure is added for comparison of
the Ne*(ls_) potentials of the four systems.

optical potential at already lower energies. This is allowed for the
Ne*(ls3) systems, because the optical potentials given by Gregor and
Siska are obtained with mixed beams of IS3 and IS5 metastable atoms,
with statistical weight of approximately 1 : 5 . A multi property
analysis of state selected large angle differential cross section
measurements as performed at Freiburg [Bey83], of quenching rate
constants [Bro78], and of our accurate total ionisation cross section
measurements will be necessary to obtain the optical potentials for the
ls^ systems. It is not unlikely that the real parts of the optical
potentials for the Is3 systems differ already from the IS5 systens at
lower energies than generally accepted. The long range Cn coefficients,
calculated by Gregor and Siska, already show differences up to 102.
Concluding remarks
Carefull inspection of the residue of Ne*(lS3>-Ar ionisation cross
section shows an oscillatory structure in the superthermal energy range,
which is not seen in the ls^ ionisation cross sections. These
oscillations reproduce well in all our measurements on the Ne*-Ar and
Ne*-Kr systems. They are also observed in the Ne*(ls3 )-Ar,Kr ionisation
cross sections evaluated from the Q* and Q1 experimental data,
where in both experiments the ls^ state is optically pumped with the
laser beam. This can be seen in figure 8.3. As yet no explanation is
available for this effect. The fact that the oscillations are not
observed in the Is. cross sections might point to an interference effect
on a single potential, which will be damped by the multiple potentials
of the lsg states. The maxima and minima are, in good approximation,
equidistant in the inverse relative velocity. This means that the
oscillations are periodic with the collision time, which also indicates
that they are due to an interference on a single potential. These
172

oscillations can not be explained by the crude optical potential model,
not even by the introduction of an oscillatory structure in the
imaginary part of the potential. A more refined description of the
Penning ionisation, taking into account the transition between the V (r)
and V (r) potential (chapter 3, figure 1) [M1177], will be necessary to
explain these oscillations.
Only the Ne*(ls.,)-rare gas systems have a single potential, all
other five systems (that we have investigated) consist of three or more
^-potentials. The effect of these multiple potential curves has to be
considered carefully in a multi property analysis. Penning ionisation
will occur most likely on the potential with the most inward situated
repulsive wall, while large angle differential scattering will occur
most likely on the potential with the most outward repulsive wall. The
effect of these features will even be enhanced due to the symmetry
effects in Penning ionisation [Mor82]. These effects give the fi - 0
potential the largest imaginary part and this potential happens to have
the most inward repulsive wall [Gre81, Mor84]. These symmetry effects
have to be verified by future experiments with a beam of polarised lSc
metastable atoms. This polarisation can be obtained with a circularly
polarised laser beam.
173

References
Bey83 W Beyer, H Haberland and D Hausamann, Int. Syap. on Hoi. Beams IX,Freiburg (1983), Book of abstracts 229.
Bro78 J H Brom Jr., J H Kolts and D W Setser Chea.Phys.Lett. 55 (1978)44-48
Gre81 R W Gregor and P E Siska, J.Chem.Phys. 74 (1981) 1078-1092
Hot81 H Hotop, J Lorenzen and A Zastrow J. Electron Spectrosc. Relat.Phenom. 23 (1981) 347-365
Hot83 H Hotop (1983) private communication
11175 E Illenberger and A Niehaus, Z.Phys.B 20 (1975) 33-41
M1177 W H Miller and H Morgner, J.Chem.Phys. 67 (1977) 4923-4931
Mor82 H Morgner Comments At.Mol.Phys. 11 (1982) 271-285
Mor84 H Morgner, private communication
Ney75 R H Neynaber and G D Magnuson Phys.Rev.A 11 (1975) 865
Ney76 R H Neynaber and G D Magnuson Phys.Rev.A 14 (1976) 961-964
Ney80 R H Neynaber in Electronic and Atomic Collisions, Proc. Xlth Int.Conf. on the Physics of Electronic and Atomic Collisionseds. N Octa and K Takayanagi. North Holland, Amsterdam (1980) 287-300.
Nie81 A Niehaus in "The Excited State in Chemical Physics" (1981)chapter 2, ed. J.Wm. McGowan, Wiley New-York
Tan72 S Y Tang, A B Marcus, and E E Muschlitz Jr, J.Chem.Phys. 56 (1972)566-572
Sco80 G Scoles Ann.Rev.Phys.Chem. 31 (1980) 81-96
Ste83 H Steinbusch Int.Rep. VDF-NC-83-24, Eindhoven Univ. of Technology.
Ver84a M J Verheijen, H C W Beijerinck, W A Renes, and N F VersterJ.Phys.E: Sci.Instr. submitted for publication.
Ver84b M J Verheijen, H C W Beijerinck, W A Renes, and N F VersterChem.Phys (1984) accepted for publication.
Wes75 W P West, T B Cook, F B Dunning, R D Rundel, and R F StebbingsJ.Chem.Phys. 63 (1975) 1237-1242
174

Summary
This thesis deals with beam experiments with state selected
NeClSj.lSg) metastable atoms. These experiments give information on the
interactions between excited rare gas atoms and ground state atoms.
Chapter 2 gives a short overview of the state of the art in the field of
beam experiments with metastable neon atoms. Due to the, generally,
multiple potential surfaces and the fact that inelastic and elastic
processes occur simultaneously, the analysis of experimental data in
terms of the interaction potentials is complex and requires information
of different types of experiments. Our results on the total ionisation
cross section are an important contribution to the solution of this
problem.
In chapter 3 a summary is given of the optical potential model. We
have used this model to calculate total Penning ionisation cross
sections in chapter 8. Both the numerical calculation of the cross
sections from the optical potential and its validity for the desciption
of total Penning ionisation cross sections are discussed and checked.
The dye laser system that we use for the state selection of the
mixed beam of metastable neon atoms is described in chapter 4. A fully
automised absolute frequency stabilisation scheme has been developed.
This scheme enables us to perform measurements with an elapsed time of 18
hours or more with the laser frequency stabilised at an atomic
transition within 0.5 MHz. Mode hops in the laser frequency are detected
and the laser is reset automatically. Data gathered during this mode hop
in the main experiment are rejected. Typically one mode hop occurs each
two hours.
In chapter 5 a description of the atomic beam nachine is given. A
175

primairy beam source for thermal metastable rare gas atoms has been
developed. This source Is fully Incorporated In a plasma source, a
hollow cathode arc used as an Intense beam source for superthermsl
metastable rare gas atoms. This enables us to perform measurements in a
wide energy range. The performance of the thermal beam source can be
described with the virtual source model and the skimmer interaction
model, that are developed for an undisturbed supersonic expansion of
ground state atoms.
The density-length product of the secondary beam, which is double
differentially pumped, is well calibrated. Two detection systems for
inelastic scattering products formed at the scattering centre are
available. With a spiraltron u.v. photons and charged particles can be
detected, while photons in the visible part of the spectrum are
transported with a fiber bundle to a photo-multiplier outside the vacuum
chamber, which enables a flexible choice for color selection
(monochromator, band pass filters or only cutt-off filters).
Chapter 6 gives the experimental results for the natural lifetimes
of the Ne 2p fine structure states. These lifetimes are obtained by the
measurement of the linewidths of the laser induced fluorescence of an
atomic beam with a typical accuracy of 4Z. Other experimental lifetimes
for these states, obtained with fully independent methods lie within the
la error bound of our results. Compared to the best theoretical results,
the average of all experimental results is 5% smaller.
Chapter 7 descibes a new plasma diagnostic. The mean free path of
the metastable atoms in the plasma of a hollow cathode arc in neon is
determined by measuring the velocity distribution of the beam of
me tastable atoms sampled through an orifice in the wall and
176
simultaneously probing the metastable atoms in the plasma column with a
c.w. dye laser beam perpendicular to the atomic beam axis. The
experimental values for the mean free path of the meastable atons in the
plasma column of 2 to 10 on points unambiguously to a surprisingly low
degree of ionisation of 2Z or less. We conclude now that the neon plasma
column has a fully different character compared to a hollow cathode
arc in argon and helium.
Chapter 8, finally, gives the results on a crossed beam scattering
experiment with metastable neon atoms and collision partners in the
ground state. The state selected total Penning ionisation cross sections
are measured for the systems Ne*(lS3 ,lsg)-Ar, Kr, Xe, ( between 0.05
and 8 eV centre-of-mass collision energy. The absolute values of the
cross sections in the thermal energy range are in good agreement with
the total quenching rate constant measurements for metastable atoms
measured in a flowing afterglow. The cross sections for the Ne*(lS3>
systems are always larger than for the corresponding Is systems. This
difference is due to both symmetry effects in the transition and
differences in the real parts of the potentials involved. The energy
dependence of the cross sections points unambiguously to a pronounced
kink in the repulsive wall of the interaction potential at 0.1-0.2 eV. A
least squares analysis of the energy dependence has been used to
describe the data in terms of improved interaction potentials for these
systems.
177

Samenvatting
In dit proefschrift worden bundel experimenten met naar toestand
geselecteerde metastabiele neon atomen, Ne*(ls3 .lsg), beschreven. Deze
experimenten verschaffen informatie over de wisselwerkingen tussen
aangeslagen edelgas atomen en atomen In de grondtoestand. In hoofdstuk 2
wordt een kort overzicht gegeven van de stand van zaken op het gebied
van bundelexperimenten met netastabiele neon atomen. Door de meervoudige
potentiaal oppervlakken en door het feit dat er gelijktijdig elastische
en inelastische processen plaatsvinden, is het uitwerken van de
experimenteel verzamelde gegevens ingewikkeld. Uitwerking is alleen dan
goed mogelijk als tegelijk gebruik gemaakt wordt van experimentele
gegevens van verschillende soorten experimenten. Resultaten over de
totale botsingsdoorsnedes voor Penning ionisatie dragen in belangrijke
mate bij.
In hoofdstuk 3 wordt het optische potentiaal model kort samengevat.
We gebruiken dit model in hoofdstuk 8 voor de berekening van totale
botsingsdoorsnedes voor ionisatie. Zowel de numerieke berekening van
deze botsingsdoorsnedes als de geldigheid van dit model voor het
beschrijven van totale botsingsdoorsnedes voor ionisatie worden
besproken en nagegaan.
Een kleurstof laser wordt gebruikt voor de toestands selectie van de
gemengde bundel metastabiele neon atomen. De volledig geautomatiseerde
frequentie stabilisatie wordt beschreven in hoofdstuk 4. Het is nu
mogelijk om experimenten te doen met een meettijd van 18 uur of langer,
waarbij de laser frequentie binnen 0.5 MHz gestabiliseeerd blijft op een
atoaaire overgang. Sprongsgewijze veranderingen in de laser frequentie,
zogenaamde mode-hops, worden gedetecteerd en de laser frequentie wordt
automatisch teruggezet naar de gewenste waarde. Experimentele gegevens,
die tijdens zo'n mode-hop zijn verzameld, worden niet bewaard. Typisch
178
een keer per twee uur doet zich zo'n frequentie sprong voor.
De atoombundel machine wordt besproken in hoofdstuk 5. Er is een
bundelbron ontwikkeld voor metastabiele edelgas atomen met thermishe
snelheden. Deze thermische bron is volledig ingepast in de plasmabron.
Dit is een holle kathode boog, die gebruikt wordt als bundelbron voor
metastabiele edelgas atomen met superthermische snelheden. Het is nu
mogelijk om experimentele gegevens te verzamelen in een breed gebied van
botsings-energieen. Het gedrag van de thermische bundelbron kan worden
beschreven met het virtuele bron model en het skimmer interactie model,
die met succes ontwikkeld zijn voor de ongestoorde expansie uit een
nozzle van atomen in de grondtoestand.
Het produkt van lengte en dichtheid van de dubbel differentieel
gepompte dwarsbundel is goed geijkt. Er zijn twee systemen beschikbaar
voor detectie van de deeltjes, die gevormd worden door inelastische
botsingen in het strooicentrum, waar de twee bundels elkaar snijden. Met
een spiraltron kunnen u.v. fotonen en geladen deeltjes worden geteld.
Fotonen in het zichtbare gebied van het spectrum worden met behulp van
een fiberbundel naar een fotomultiplier buiten de vacuum opstelling
geleid. Zonder veel problemen kan nu een keus gemaakt worden uit
verschillende kleurselectoren, zoals een' monochromator, smalbandige
filters en afkapfliters.
De experimentele resultaten voor de natuurlijke levensduren. van de
Ne 2p fijn-structuur nivos worden besproken in hoofdstuk 6. Uit metingen
van de breedte van het laser geïnduceerde fluorescentie profielen van
een atoombundel kunnen deze levensduren bepaald worden met een
nauwkeurigheid van 4%. Andere experimentele resultaten, gemeten met
geheel onafhankelijke methoden, liggen binnen de 1 o foutengrens van onze
metingen. Vergeleken met de beste theoretische resultaten ligt het
gemiddelde van de experimenteel bepaalde levensduren 5£ lager.
179

In Hoofdstuk 7 wordt een nieuwe plasma diagnostiek beschreven. De
gemiddelde vrije weglengte van de metastabiele atomen In de externe
plasmakolom van een holle katode boog In neon wordt bepaald door de
snelheidsverdeling te meten van de bundel metastabiele atomen, die uit
een gaatje in de wand komt, en tegelijk het plasma te proben met een
kleurstof laserbundel loodrecht op de atoombundelas. De experimentele
waarde voor de gemiddelde vrije weglengte van de metastabiele neon
atomen is 2 tot 10 mm. Dit wijst ondubbelzinnig op een verrassend lage
ionisatie graad van 2% of zelfs lager. De conclusie is dan, dat het
karakter van de neon plasma kolom totaal anders is dan van een holle
katode boog in argon of helium.
De resultaten van een experiment met twee elkaar snijdende
atoombundels, respectievelijk bestaande uit metastabiele neon atomen en
atomen in de grondtoestand, wordt tenslotte beschreven in hoofdstuk 8.
De naar toestand geselecteerde totale botsingsdoorsnede voor Penning
ionisatie is gemeten voor de systemen Ne*(ls, ,ls_)-Ar, Kr, Xe, f., voor
massamiddelpunts energieën tussen 0.05 en 8 eV. De absolute waardes van
de gemeten botsingsdoorsnedes in het thermische energie gebied komen
goed overeen met de totale vernietigings snelheden voor metastabiele
atomen in een gasontlading. De botsingsdoorsnedes voor de Ne*(lsO
systemen zijn altijd groter dan die voor het overeenkomstige Ne*(lSg)
systeem. Dit verschil wordt zowel veroorzaakt door symmetry effecten in
de ionisatle-overgang als door verschillen in het reeele deel van de
wisselwerkingspotentiaal. Het gedrag als functie van de energie wijst
ondubbelzinnig op een scherpe knik in de repulsieve tak van de
potentiaal tussen 0.1 en 0.2 eV. Met een kleinste kwadraten analyse van
de energie afhankelijkheid van de botsingsdoorsnedes hebben we een
verbeterde wisselwerkingspotentiaal /oor dese systemen bepaald.
180

Nawoord
Nadat u dit alles gelezen hebt zult u begrijpen, dat dit niet het
werk van een, «aar van velen Is. Het veel plezier heb ik de afgelopen
vijf jaren doorgebracht in de gezellige sfeer van de groep Atomaire en
Optische Wisselwerkingen. Allen die een bijdrage hebben geleverd wil Ik
hartelijk danken, set name: Herman Beijerinck, de aanzet tot dit
onderzoek heb je gegeven door zes jaar geleden de beslissing voor de
aanschaf van een kleurstoflaser te nemen. Ik wil je natuurlijk niet
alleen hiervoor bedanken, «aar vooral voor je ontelbare suggesties,
stimulerende discussies, het nauwgezette bestuderen van de manuscripten
gevolgd door zeer opbouwend commentaar, en tenslotte voor alle raad in
de persoonlijke sfeer. Mijn collega, Jacques Kroon, voor je rust en
heldere ideeën. Je was terecht steeds bedachtzaam, als er weer eens een
wild idee was geboren. Wille» van Renen en Louis van Moll, de opbouw van
de apparatuur is jullie werk geweest, zonder jullie zou het er nog niet
gestaan hebben. Jullie hebben me ook de beginselen van het boren en
zagen bijgebracht. Piet Magendans, jij hebt met veel geduld al onze
moeilijke en vaak wisselvallige wensen uit weten te werken tot
duidelijke' en leesbare werktekeningen. Henk Bredee, de altijd goede
conditie van de kleurstoflaser is geheel aan jou te "wijten". Jij
verstaat de kunst om een geheel ontregelde verzameling spiegeltjes en
filtertjes af te regelen tot een kleurstoflaser in optima forma. Fred
van Nijmweegen, op jou kon ik altijd een beroep doen in geval van, vaak
vermeende, storingen in jouw interface systeem. Ik kon je zelfs
telefonisch om raad vragen ruim buiten jouw werktijd. Ronald van der
Wllk, Mark Wijnands, Peter Eenshuistra, Loet Heinemans, Erik Kaashoek,
Hans Bcijcrs, Piet Berken, Walter Renes, Jan Driesaen, Christ de Jong
181

en Harrie Steinbusch, jullie hebben als stageaire meegewerkt aan het
onderzoek. De apparatuur is op uitstekende wijze vervaardigd door de
werkplaatsen van de C.T.D., gedeeltelijk, en van de afdeling Technische
Natuurkunde, voor het merendeel en meestal met spoed. Ruth Gruyters, jij
moest op het laatste moment snel nog even veel tekeningen maken. Marijke
Teeven, jij toverde mijn half leesbare warrige manuscripten om in voor
iedereen leesbare, getypte, tekst op de B7700. Ineke, zonder jouw hulp
was het nooit gelukt, jij hebt ae geestelijk en lichamelijk op de been
gehouden, maar ook vele avonduren In correctiewerk en plakwerk gestoken.
182

Levensbericht
6 september 1955 Geboren te Nederweert
juni 1973 Eindexamen Gymnasium f3 ("oude stijl")Bisschoppelijk College te Weert
september 1973 Aanvang studie in de Technische Natuurkundeaan de Technische Hogeschool Eindhoven
1 september 1975- Student assistent college demonstraties31 augustus 1978
19 november 1979 Doccoraal examen in de Technische Natuurkundeaan de Technische Hogeschool Eindhoven (met lof)
1 december 1979- Wetenschappelijk assistent in de groep Atomaire en30 november 1983 Optische Wisselwerkingen, afdeling der Technische
Natuurkunde, Technische Hogeschool Eindhoven
1 december 1983- Wetenschappelijk assistent in tijdelijke dienstvan F.O.H in de werkgroep Al2 van de werkgemeen-schap Atoomfysica (groep Atomaire en OptischeWisselwerkingen), afdeling der Technische natuurkundeTechnische Hogeschool Eindhoven
183
Aantekeningen
18A

Stellingen behorende bij het proefschrift van M.J. Verheijen
"BEAM EXPERIMENTS WITH STATE SELECTED Ne*(3Pf),3P2) METASTABLE ATOMS"
1 Metingen van de glory-oscillaties in de totale botsingsdoorsnede en
van de differentiële botsingsdoorsnede bij een (grote) massamiddel-
punts strooihoek, belden in een breed gebied van botsingsenergieën,
voor systemen die Penning, ionisatie vertonen, geven belangrijke extra
informatie over de optische potentiaal, ieder bij een specifieke
internuclealre afstand.
2 Zowel theoretisch als experimenteel is aangetoond, dat in een groot
gedeelte van een atmosferisch spuit-plasma, n.l. daar waar de
electronen-dichtheid hoog is, het verband tussen electronen-dlchtheld
en -temperatuur dicht bij locaal thermisch evenwicht ligt.
P.J.M. VaeBsen, Proefschrift (1984),T.H. Eindhoven
3 De empirische nummering van energie nivo's volgens Paschen heeft het
nadeel, dat o.a. voor de edttlgassen de vertaling naar quantumgetallen
ni*t onafhankelijk van de gassoort is. Wieme houdt hier ten onrechte
geen rekening mee In zijn "vertalings-tabel".
W. Wieme, proefschrift (1980) tabel Al, Rijksuniversiteit Cent
4 Electronoverdracht in redox biochemie vindt alleen efficient plaats
bij een goede orbital overlap en dus bij kleine onderlinge afstanden
(ca 0.8 na of kleiner). Op grote onderlinge afstanden kan de
effectiviteit van de overdracht versterkt worden door middel van
tussenliggende chemische verbindingen, waarbij alleen de overlap van
de gewijzigde orbitals van donor en acceptor belangrijk is en de
redoxpotentiaal van deze verbinding geen rol hoeft te spelen.
C.T.W. Moonen and F. Mueller, Eur. J. Biochem., in druk.

5 Bij het gebruik van de techniek van fase modulatie van een
laserbundel voor het bepalen van de partiële dichtheden in een
gascel, moet de afst?""' tussen de fase modulator en de detector in
overeenstemming zijn met de modulatie golflengte.
J.C.Hall, L.Hollberg, T.Baer en H.G.Robinson
Appl.Phys.Lett. 39 (1981) 680
R.Leenen, Intern Rapp. T.H. Eindhoven, VDF/NK-83-09
6 Bij de berekening van absorptie-coefficienten van fundamentele
vibraties • van moleculen en radicalen met behulp van polaire Censoren
wordt ten onrechte geen rekening gehouden met het verschil tussen
gesloten en open electronenschillen.
J.H.Newton en J.B.Person, J.Chem.Phys. 68 (1978) 2799
7 Het gebruik van een computer in een routine-experiment is reeds een
tiental jaren een standaard techniek. Het gebruik van een computer in
de fase waarin nog geëxperimenteerd wordt met het experiment, met
hieraan verbonden de veel hogere eisen aan de flexibiliteit van de
hard- en soft-ware hulpmiddelen, is beperkt ontgonnen terrein. Een
ook voor deze fase goed systeem maakt de kostbare duplicatie van
automatische bediening door handbediening overbodig.

van een
eden in een
stector in
indanentele
e tensoren
dl tussen
reeds een
omputer in
Bent, met
eit van de
rein. Een
tcatie van
8 Het automatisch verzamelen en bewerken van meetgegevens moet gezien
worden als een verlengstuk van de experimentator, doch nooit als een
algehele vervanging. De aanpassing van de meetomstandigheden op basis
van reeds vekregen (en bewerkte) gegevens zal meestal sneller en
beter door de experimentator zelf kunnen (en dus moeten) worden
uitgevoerd.
9 Het vervangen van wekkers, spanningsregelaars in auto's, huisbellen
en andere demontabele zaken door electronische of dichtgefelste
hulpmiddelen is nadelig voor de technische opvoeding van de volgende
generatie.
10 Gelet op de toenemende hoeveelheid signaaltransport binnen
woonhuizen, is het gewenst dat bij de bouw een ruim toegankelijk
kabelgeleidingssysteem wordt voorzien.
11 Veel vooroordelen in de publieke opinie over rittensport berusten op
een gebrek aan kennis omtrent het verschil tussen een rally en een
oriëntatie- of kaartleesrit. Dit wordt nog versterkt door het
(verkeerde) woordgebruik van veel rittensporters zelf.
12 De huidige laserveiligheidsbrillen maken de laserbundel gevaarlijk
onzichtbaar.
13 Bij technische apparaten past niets op niets, tenzij het dwingend is
voorgeschreven.
Eindhoven, 20 maart 1984