Beachrock formation mechanism and its application ... - HUSCAP
389
Instructions for use Title Beachrock formation mechanism and its application to developing beach sand cementation method based on microbial induced carbonate precipitation (MICP) : Case study of Krakal-Sadranan, Yogyakarta, Indonesia Author(s) Lutfian, Rusdi Daryono Citation 北海道大学. 博士(工学) 甲第14250号 Issue Date 2020-09-25 DOI 10.14943/doctoral.k14250 Doc URL http://hdl.handle.net/2115/82723 Type theses (doctoral) File Information Lutfian_Rusdi_Daryono.pdf Hokkaido University Collection of Scholarly and Academic Papers : HUSCAP
-
Upload
khangminh22 -
Category
Documents
-
view
3 -
download
0
Transcript of Beachrock formation mechanism and its application ... - HUSCAP

Instructions for use
Title Beachrock formation mechanism and its application to developing beach sand cementation method based on microbialinduced carbonate precipitation (MICP) : Case study of Krakal-Sadranan, Yogyakarta, Indonesia
Author(s) Lutfian, Rusdi Daryono
Citation 北海道大学. 博士(工学) 甲第14250号
Issue Date 2020-09-25
DOI 10.14943/doctoral.k14250
Doc URL http://hdl.handle.net/2115/82723
Type theses (doctoral)
File Information Lutfian_Rusdi_Daryono.pdf
Hokkaido University Collection of Scholarly and Academic Papers : HUSCAP

Beachrock formation mechanism and its application to developing
beach sand cementation method based on microbial induced
carbonate precipitation (MICP): Case study of Krakal-Sadranan,
Yogyakarta, Indonesia
Laboratory of Biotechnology for Resources Engineering,
Division of Sustainable Resources Engineering,
Graduate School of Engineering,
Hokkaido University,
Japan
Lutfian R. Daryono

i
Declaration
I declare that, except where specific reference is made in the text to the work conducted
by other authors, this thesis is my own account of my research and contains as its main content
work that has not previously been submitted for a degree at any university.
Name: Lutfian Rusdi Daryono Signature: _______________
Date: 17/ 08/ 2020

ii
Acknowledgement
Foremost, I would like to express my deepest gratitude to my supervisors: Prof. Satoru
KAWASAKI and associate Prof. Kazunori NAKASHIMA for their generous cooperation.
Special thanks to Muhammad Hidayat, M. Zharfan Bimantoro, Reny Rafiqah, Dobrak Tirani,
Jum Satriani, Fathia Lutfiananda, and Enggar Suwandi as field geology and geophysics
exploration of UGM Indonesia for their constant assistance with the experiments; Dr. rer. nat.
Doni Eka Prakasa, Dr. Anastasia Dewi Titisari, Ph.D., and Dr. Didit Hadi Barianto, Ph.D., who
permitted access to the Get-In CICERO Laboratory that was supported by BMBF, Dept. of
Geological Engineering, UGM; Drs. Imam Suyanto, M.Si., and Professor Koichi Suzuki as
author’s supervisor in geophysical measurement, Arief Rahmadi as author’s partner in field
acquisition and grateful to Embassy of the Republic of Indonesia in Tokyo regarding the permit
letter-number B-00446/TOKYO/181227 for Access Benefit Sharing Knowledge Nagoya
Protocol April 2018 within Hokkaido University, Japan and UGM, Indonesia. I’m extremely
grateful to Mr. Ir. Arifin Tasrif (current Minister for Energy & Mineral Resources), Mr. Tri
Purnajaya (Deputy Chief Representative) and also Mr. Erry Soedewo, Mrs. Dr. Sri Nurwiyanti
as Agricultural Attaché and Mr. Alinda FM Zain as Education Attaché for permit
correspondence in the study. Also, special thanks to my laboratory partners at Hokkaido
University who made it a convivial place to work. I’d like to acknowledge the assistance to
Mrs. Hitomi Tada for her support during the years I have been working on this thesis. This
dissertation is dedicated to my wife Saputri Sapta Oktavianty of someone who always believe
in me, my beloved son Bramadanu Kaede Daryono, and also deeply indebted to the Daryono’s
big family.
iii
学 位 論 文 内 容 の 要 旨
DISSERTATION ABSTRACT
博士の専攻分野の名称 博士(工学) 氏名 Lutfian Rusdi Daryono
学 位 論 文 題 名
Title of dissertation submitted for the degree
Beachrock formation mechanism and its application to developing beach sand
cementation method based on microbial induced carbonate precipitation: Case study of
Krakal-Sadranan, Yogyakarta, Indonesia
ビーチロック形成機構と微生物による炭酸塩析出に基づく海浜砂セメンテーシ
ョン法の開発への応用:クラカル-サドラナン(ジョグジャカルタ,インドネシ
ア)における事例研究
The aim of this dissertation is to assess the feasibility of exploiting ureolytic microbial
adjustment activity in carbonate precipitation as a unique and novel grout, developing a
countermeasure for coastal erosion using biochemical methods to improve the ground.
Conducting research on the impact of direct morphology and erosional processes on in pristine
or reference beachrock toward could provide essential information on the natural mechanism
of the sediment and the function of microbial control in the carbonate. Microbial induced
carbonate precipitation (MICP) is an effective and eco-friendly technology that can be applied
to solve various environmental problems. Biominerals including calcium carbonate or calcium
phosphate are involved in production of complex multifunctional composites with organic
macromolecules. It is highly important to explore the multiple functionality of MICP and
upscale its implementation in different areas to fully realize its potential as a versatile
technique for soil improvement applications. This research framework was used to study the
biological, geophysical, and engineering aspects that could deepen the understanding of MICP
technology and push it closer towards field implementation.
Chapter 1 describes the research background, objectives, and originality of this thesis. A
comprehensive literature review is conducted relate to various aspects of natural beachrock
processes and the stability of the MICP process.
Chapter 2 presents a geophysical investigation of buried beachrock at Krakal-Sadranan
beach, Yogyakarta, Indonesia. The objective of the investigation was to evaluate the feasibility

iv
of constructing artificial beachrock using natural materials (e.g., microbes, sand, shell, pieces
of coral, and seaweed) within a short time, and to propose a method to use this for coastal
protection. A field survey on natural beachrock suggests that both resistivity and shear wave
velocity were higher in deep deposits than in the underlying unconsolidated sand layer within
a depth of approximately 1.5 m, and that this covered an area of 210.5 m3 for the α-section
and 76.9 m3 for the β-section of the beachrock deposit.
Chapter 3 presents a detailed laboratory analysis of the investigation of the characteristics
of beachrock sediment. Beachrock was also examined to determine the depositional conditions
and distribution of rare earth elements therein. An increased concentration of both heavy rare
earth elements (terbium, dysprosium, yttrium, holmium, erbium, thulium, ytterbium, and
lutetium) and light rare earth elements (lanthanum, cerium, praseodymium, neodymium,
samarium, europium, and gadolinium) suggests that the beachrock deposition process
occurred under oxidative environmental conditions. This study proposes a novel use of
ureolytic bacteria in a depositional environment to control the carbonate in a sedimentary
process to develop artificial rock with which to mitigate coastal erosion. The resulting
bacterial strains are highly homologous to the 16S rRNA nucleotide sequence of the species
Oceanobacillus profundus, Vibrio maritimus, and Pseudoalteromonas tetradonis.
Chapter 4 describes the culturing of ureolytic bacteria from the Indonesian tropical
shoreline, that was compared with that from the characteristic beachrock in Okinawa, Japan.
Okinawa beachrock was classified as a biotically induced precipitate because an organism set
the precipitation process in motion, although the latter then has a marginal or absent organic
influence. However, Indonesian beachrock is classified as a biotically controlled precipitate,
meaning that it is commonly precipitated by microorganisms, mostly bacteria and
cyanobacteria.
Chapter 5 described a beach sand treatment based on the MICP process; it produced a
result that mimicked the natural beachrock based on chemical compound and strength. The
results revealed that the bacteria could effectively mineralize calcium carbonate between 30 °C
and 40 °C, showing a more robust performance under tropical conditions. The effects of
various chemical compositions were also critically investigated to deepen the understanding
of the biochemical processes involved. The results of the sand solidification test in the
laboratory showed that treated sand achieved an unconfined compressive strength of up to

v
approximately 6 MPa after a treatment period of 14 days under optimum conditions. By adding
biopolymer polysaccharides, the reaction leads to crystal formation of vaterite instead of
calcite. The calcium carbonate crystals studied in this research were found to be orthorhombic,
rhombohedral, hexagonal, and spherical geometries.
Chapter 6 discusses the testing of durability of this material based on MICP for in the
development of a countermeasure for coastal disasters. An experiment was performed to
investigate the effects of environmental parameters on its long-term performance. As the
tropical regions experience frequent rainfall, wetting-drying tests were performed as a
potential indicator of durability. The results showed that there was significant wetting-drying
damage and that this would have the foremost effect on the long-term performance of the
MICP beach slope.
Chapter 7 suggests cost reduction purposes using cheap chemical reagents from cultured
media and cement solution for MICP treatment. The aim of that study was to determine the
feasibility of cultivating a strain of P. tetradonis in an economical food-grade yeast extract
(beer yeast and tempeh fungi) medium and investigate its effect on bacterial production, urease
activity, and biocalcification.
Chapter 8 outlines the proposal for a coastal prevention method in Indonesia based on
ureolytic bacteria. The results obtained from this study are used to summarize the application
guidelines for the optimal chemical compositions, suitable environmental conditions, and
ways to monitor the process.
Chapter 9 summarizes and provides a conclusion that may guide future work. In summary,
I have used biomechanics as a countermeasure against coastal erosion and other problems
considering the potential use of a biocementation MICP treatment to develop a shoreline or
beach slope. This will provide new knowledge about biotechnology and will greatly contribute
to the development of environmental resource engineering.

vi
TABLE OF CONTENTS
Declaration ........................................................................................................................... i
Acknowledgement ................................................................................................................ ii
Dissertation abstract ............................................................................................................. iii
Table of contents .................................................................................................................. vi
Chapter 1. Introduction
1.1 Research background ....................................................................................... 1
1.2 Literature review .............................................................................................. 3
1.2.1 Beachrock sedimentary mechanism ................................................................. 3
1.2.1.1 Direct cement precipitation .............................................................................. 5
1.2.1.2 Mixing of marine and the meteoric waters ...................................................... 5
1.2.1.3 Degassing of CO2 ............................................................................................. 5
1.2.1.4 Formation by biological activity ...................................................................... 6
1.2.2 Beachrock modes of carbonate precipitation ................................................... 8
1.2.2.1 Tropical factory .............................................................................................. 11
1.2.2.2 Cool-water carbonate factory ......................................................................... 12
1.2.2.3 Mud-mound factory ....................................................................................... 12
1.2.3 Artificial beachrock development based on microbial induced carbonate
precipitation (MICP) ...................................................................................... 13
1.2.3.1 Ureolytic bacteria as carbonate precipitation ................................................. 15
1.2.3.2 Different polymorphs and their effects in various calcium sources .............. 17
1.2.3.3 Isolation of ureolytic bacteria from various sources ...................................... 19
1.2.3.4 Recent status of MICP applications ............................................................... 20
1.3 Coastal erosion ............................................................................................... 22
1.4 Current hardened structure erosion mitigation methods ................................ 24
1.4.1 Seawalls, bulkheads, and other wall structures .............................................. 24
1.4.2 Breakwaters an alternative to wall-type structures are breakwaters. ............. 24
1.4.3 Groins and jetties ........................................................................................... 25
1.4.4 Riprap and shore armoring............................................................................. 25
1.4.5 Beach nourishment and dune benefits ........................................................... 26
1.5 Objectives ...................................................................................................... 26

vii
1.6 Scope and organization .................................................................................. 27
1.7 Originality and usefulness of the study .......................................................... 27
1.8 Originality of the thesis .................................................................................. 29
References ........................................................................................................................ 32
Chapter 2. Geophysical investigation of buried beachrock at Krakal-Sadranan beach,
Yogyakarta, Indonesia
2.1 Introduction .................................................................................................... 51
2.2 Regional geology ........................................................................................... 53
2.2.1 Physiography.................................................................................................. 53
2.2.2 Stratigraphy .................................................................................................... 54
2.2.3 Geological structure ....................................................................................... 54
2.2.4 Geology of the research area .......................................................................... 54
2.2.5 Site study ........................................................................................................ 56
2.3 Objectives ...................................................................................................... 57
2.4 Material and methods ..................................................................................... 57
2.4.1 Field Investigation ......................................................................................... 57
2.4.1.1 Drone photogrammetric data processing ....................................................... 58
2.4.1.2 Geological identification ................................................................................ 58
2.4.1.3 DC resistivity survey...................................................................................... 59
2.4.1.4 MASW (Multi Analysis of Seismic Surface) ................................................ 61
2.4.1.5 Seismic refraction .......................................................................................... 62
2.4.2 Laboratory tests .............................................................................................. 64
2.5 Results ............................................................................................................ 64
2.5.1 Lithostratigraphy of Krakal-Sadranan beachrock .......................................... 65
2.5.1.1 Trench AB ...................................................................................................... 65
2.5.1.2 Trench CD ...................................................................................................... 68
2.5.1.3 Trench EF....................................................................................................... 71
2.5.2 Geophysics measurements ............................................................................. 73
2.5.2.1 α-section ......................................................................................................... 73
2.5.2.2 β-section ......................................................................................................... 73
2.5.2.3 γ-section ......................................................................................................... 74
2.5.3 Three dimensional of subsurface model ........................................................ 74

viii
2.6 Discussions .................................................................................................... 77
2.6.1 Beachrock characteristics............................................................................... 77
2.6.2 Geophysical beachrock imagine .................................................................... 82
2.6.3 Rock characteristic of natural beachrock ....................................................... 83
2.7 Conclusions .................................................................................................... 84
References ........................................................................................................................ 85
Chapter 3. Sediment Characteristics of beachrock at Krakal-Sadranan beach,
Yogyakarta, Indonesia
3.1 Introduction .................................................................................................... 90
3.2 Objectives ...................................................................................................... 91
3.3 Materials and methods ................................................................................... 92
3.3.1 Sampling method ........................................................................................... 92
3.3.2 Laboratory analysis ........................................................................................ 92
3.3.2.1 Petrographic studies ....................................................................................... 92
3.3.2.2 Inductively coupled plasma-atomic emission spectroscopy and mass
spectrometry (ICP-AES and MS) .................................................................. 93
3.3.2.3 X-Ray diffraction (XRD) and total organic carbon (TOC) ........................... 93
3.3.2.4 Algae taxonomy ............................................................................................. 95
3.3.2.5 Isolation and identification of a suitable urease active bacterium ................. 95
3.3.2.6 Cultivation of bacteria and assessing the potential for microbial induced
carbonate precipitation (MICP) ..................................................................... 97
3.4 Results ............................................................................................................ 97
3.4.1 Stratigraphy of Krakal-Sadranan beachrock .................................................. 97
3.4.2 ICP-AES and MS analysis ............................................................................. 97
3.4.3 X-Ray diffraction (XRD) and total organic carbon (TOC) ......................... 101
3.4.4 Biodiversity observations............................................................................. 102
3.4.4.1 Algae taxonomy ........................................................................................... 102
3.4.4.2 Isolation of indigenous ureolytic bacteria .................................................... 103
3.4.4.3 Microbial population count and urease activity test .................................... 105
3.5 Discussions .................................................................................................. 106
3.5.1 Sediment characteristics............................................................................... 106
3.5.2 Post depositional diagenesis ........................................................................ 107
3.5.3 Temperature and evaporation conditions ..................................................... 108

ix
3.5.4 Redox condition ........................................................................................... 108
3.5.5 Terrigenous contaminant materials .............................................................. 109
3.5.6 Biotically controlled precipitation ............................................................... 112
3.5.6.1 Light ............................................................................................................. 112
3.5.6 Temperature ................................................................................................. 113
3.5.6 Latitudinal zonation of skeletal production ................................................. 114
3.5.6 Nutrients ....................................................................................................... 114
3.5.6 Salinity ......................................................................................................... 114
3.5.7 Ureolytic bacteria-controlled precipitation beachrock carbonate ................ 115
3.6 Conclusions .................................................................................................. 116
References ...................................................................................................................... 117
Chapter 4. Comparative characteristics of natural beachrock from Okinawa, Japan
and Yogyakarta, Indonesias
4.1 Introduction .................................................................................................. 124
4.2 Objectives .................................................................................................... 125
4.3 Methodology ................................................................................................ 126
4.3.1 Field work .................................................................................................... 126
4.3.2 Petrographic analysis ................................................................................... 126
4.3.3 Geochemical XRD and XRF ....................................................................... 127
4.3.4 Biodiversity microbial analysis.................................................................... 127
4.3.4.1 Isolation of ureolytic bacteria ...................................................................... 127
4.3.4.2 Microbial population count and urease activity test. ................................... 127
4.4 Results .......................................................................................................... 128
4.4.1 Sumuide beachrock sample, Okinawa, Japan. ............................................. 128
4.4.1.1 Geology of Okinawa, East China Sea .......................................................... 128
4.4.1.2 Petrographic analysis result. ........................................................................ 130
4.4.1.3 Indigenous ureolytic bacteria from Okinawa, Japan. ................................... 132
4.4.1.4 Geophysical mapping of beachrock in Okinawa, Japan .............................. 134
4.4.2 Krakal-Sadranan beachrock sample, Yogyakarta, Indonesia. ..................... 136
4.4.2.1 Geology of Gunungkidul regency, Yogyakarta. .......................................... 136
4.4.2.2 Petrographic analysis result. ........................................................................ 137
4.4.2.3 Indigenous ureolytic bacteria from Yogyakarta, Indonesia. ........................ 139

x
4.5 Discussion .................................................................................................... 141
4.5.1 Natural beachrock sedimentary.................................................................... 142
4.5.1.1 Cement characteristics ................................................................................. 142
4.5.1.2 Geophysical properties of natural beachrock ............................................... 143
4.5.2 Indigenous ureolytic bacteria from natural beachrock ................................. 144
4.5.2.1 Gram positive bacteria ................................................................................. 142
4.5.2.1 Gram negative bacteria ................................................................................ 147
4.5.2.3 Gram positive versus gram negative bacteria .............................................. 149
4.5.3 Sediment characteristics differences of Okinawa, Japan and Yogyakarta,
Indonesia natural beachrock. ....................................................................... 149
4.6 Conclusions .................................................................................................. 150
References ...................................................................................................................... 151
Chapter 5. Beach sand solidification test using MICP method
5.1 Introduction .................................................................................................. 158
5.2 Objectives .................................................................................................... 159
5.3 Materials and methods ................................................................................. 159
5.3.1 Sands ............................................................................................................ 159
5.3.2 Bacteria ........................................................................................................ 159
5.3.2.1 Method for urease activity test ..................................................................... 161
5.3.2.2 Genetic analysis of microorganisms ............................................................ 162
5.3.3 Ureolytic bacteria characteristics of Indonesian species in various culture
conditions ..................................................................................................... 163
5.3.4 Cementation media ...................................................................................... 164
5.4. Experimental method ................................................................................... 165
5.4.1 Syringe solidification test ............................................................................ 165
5.4.2 Shoreline slope solidification model test ..................................................... 166
5.4.3 Needle penetration test ................................................................................. 167
5.4.4 Experimental conditions .............................................................................. 168
5.5 Results .......................................................................................................... 170
5.5.1 Growth characteristics ................................................................................. 170
5.5.2 Optimum pH and temperature condition ..................................................... 171
5.5.3 Effect of bacterial species on solidification test .......................................... 172

xi
5.5.4 Effect of bacterial population based on OD600 on solidification test ........... 174
5.5.5 Effect of particle size and different sand samples on solidification test ...... 176
5.5.6 Effect of cementation ion solutions on strength .......................................... 176
5.5.7 Effect of carrageenan biopolymer on strength of MICP .............................. 182
5.5.8 Beach slope model solidification test .......................................................... 186
5.5.9 MICP of artificial rock properties ................................................................ 188
5.6 Discussions .................................................................................................. 190
5.6.1 Uniformity of cementation ........................................................................... 190
5.6.2 Field implication and associated limitations ................................................ 193
5.6.3 Permeability of cemented specimens ........................................................... 194
5.7 Conclusions .................................................................................................. 195
References ...................................................................................................................... 196
Chapter 6. Durability test of MICP beach sand treatment
6.1 Introduction .................................................................................................. 204
6.2 Objectives .................................................................................................... 205
6.3 Research methodology ................................................................................. 205
6.3.1 Beachrock and bacteria ................................................................................ 205
6.3.2 MICP treatment and reagents....................................................................... 208
6.3.3 Statistical analysis wetting-drying (WD) test .............................................. 209
6.3.4 XRD test methods ....................................................................................... 209
6.3.5 Rock properties evaluation of specimens .................................................... 209
6.4 Results and discussions ................................................................................ 210
6.4.1 Aggregate stability ....................................................................................... 210
6.4.2 Mechanical characteristics ........................................................................... 210
6.4.3 Strength deterioration ratio (SDR) ............................................................... 213
6.5 Conclusions .................................................................................................. 217
References ...................................................................................................................... 218
Chapter 7. MICP beach sand treatment using cheap chemical reagents
7.1 Introduction .................................................................................................. 221
7.2 Objectives .................................................................................................... 223
7.3 Materials and methods ................................................................................. 223

xii
7.3.1 Ureolytic bacteria and cultivation ................................................................ 223
7.3.2 Culture media ............................................................................................... 223
7.3.2.1 ZoBell2216 medium .................................................................................... 224
7.3.2.2 Beer yeast extract ......................................................................................... 210
7.3.2.3 Tempeh starter ............................................................................................. 211
7.3.3 Nutrient cementation solution ...................................................................... 211
7.3.3.1 Standard solution ......................................................................................... 211
7.3.3.2 Chalk powder extract ................................................................................... 212
7.3.3.3 Snow melting reagent extract....................................................................... 212
7.3.4 Growth and pH profilest .............................................................................. 213
7.3.5 Urease activity ............................................................................................. 214
7.3.6 Microbial CaCO3 precipitation test .............................................................. 214
7.3.7 Solidifications test ........................................................................................ 215
7.3.8 Needle penetration test ................................................................................. 216
7.3.9 Durability wet-drying test ............................................................................ 216
7.4 Results and discussion ................................................................................. 217
7.4.1 Culture media ............................................................................................... 217
7.4.2 Nutrient cementation solution on precipitation test ..................................... 218
7.4.2.1 Standard solution ......................................................................................... 218
7.4.2.2 Chalk powder extract ................................................................................... 219
7.4.2.3 Snow melting ............................................................................................... 219
7.4.3 Solidification test ......................................................................................... 220
7.4.4 MICP treated rock properties ....................................................................... 220
7.4.5 Durability wetting-drying test ...................................................................... 222
7.4.6 Cost feasibility of low-grade chemicals in MICP ........................................ 224
7.5 Conclusions .................................................................................................. 226
References ...................................................................................................................... 226
Chapter 8. Tentative proposal of coastal preservation method
8.1 Introduction .................................................................................................. 248
8.2 Objectives .................................................................................................... 249
8.3 Material and methods ................................................................................... 249
8.3.1 Ureolytic bacteria ......................................................................................... 249
xiii
8.3.2 Culture media ............................................................................................... 251
8.3.3 Cement solution ........................................................................................... 253
8.3.4 Soil/ sand ...................................................................................................... 254
8.3.4.1 Density ......................................................................................................... 254
8.3.4.2 Particle size .................................................................................................. 255
8.3.5 Treatment sand condition ............................................................................. 256
8.3.5.1 pH and temperature ...................................................................................... 256
8.3.5.2 Marine environment ..................................................................................... 257
8.3.5.3 Injection mode and rates .............................................................................. 258
8.4 Sustainability to the environment ................................................................ 258
8.4.1 Biosafety risk of indigenous ureolytic microorganisms .............................. 259
8.4.2 Biosafety risk of pure bacterial cultures ...................................................... 260
8.4.3 Undesired byproducts .................................................................................. 262
8.4.4 Nonuniform injection of microbes and cementation reagents ..................... 262
8.4.5 Limitations of microbes ............................................................................... 263
8.5 Conclusions .................................................................................................. 264
References ...................................................................................................................... 265
Chapter 9. General conclusions and future research
9.1 Summary of work presented and main conclusions .................................... 273
9.2 Suggestions for future works in MICP method ........................................... 277
9.2.1 Froude similarity of upscale MICP .............................................................. 277
9.2.2 The durability of the inexpensive chemical reagents ................................... 277
9.2.3 Mechanism of MICP in clayey mineral ....................................................... 277
APPENDIXES
Appendix A Coastal drone mapping of Yogyakarta shoreline ......................................... 279
Appendix B Measurement stratigraphy and petrographic analysis of Krakal-Sadranan
beachrock, Yogyakarta, Indonesia ............................................................... 302
Appendix C ICP-MS and -AES results of rare earth element (REE) in the beachrock ... 333
Appendix D Petrography analysis of Okinawa beachrock, Japan .................................... 334
Appendix E XRD results before and after durability wetting-drying test ....................... 358
Appendix F XRD results of the MICP beach sand treatment using cheap chemical reagents
...................................................................................................................... 363
xiv
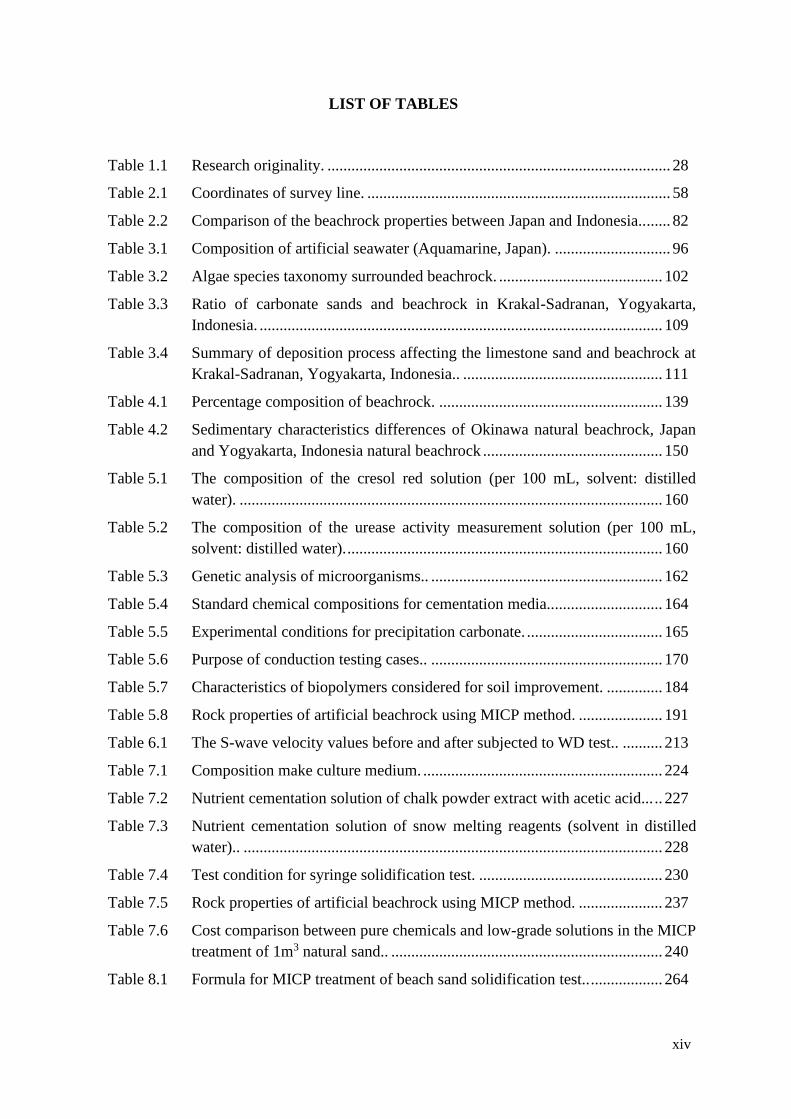
LIST OF TABLES
Table 1.1 Research originality. ...................................................................................... 28
Table 2.1 Coordinates of survey line. ............................................................................ 58
Table 2.2 Comparison of the beachrock properties between Japan and Indonesia........ 82
Table 3.1 Composition of artificial seawater (Aquamarine, Japan). ............................. 96
Table 3.2 Algae species taxonomy surrounded beachrock. ......................................... 102
Table 3.3 Ratio of carbonate sands and beachrock in Krakal-Sadranan, Yogyakarta,
Indonesia. ..................................................................................................... 109
Table 3.4 Summary of deposition process affecting the limestone sand and beachrock at
Krakal-Sadranan, Yogyakarta, Indonesia.. .................................................. 111
Table 4.1 Percentage composition of beachrock. ........................................................ 139
Table 4.2 Sedimentary characteristics differences of Okinawa natural beachrock, Japan
and Yogyakarta, Indonesia natural beachrock ............................................. 150
Table 5.1 The composition of the cresol red solution (per 100 mL, solvent: distilled
water). .......................................................................................................... 160
Table 5.2 The composition of the urease activity measurement solution (per 100 mL,
solvent: distilled water). ............................................................................... 160
Table 5.3 Genetic analysis of microorganisms.. .......................................................... 162
Table 5.4 Standard chemical compositions for cementation media............................. 164
Table 5.5 Experimental conditions for precipitation carbonate. .................................. 165
Table 5.6 Purpose of conduction testing cases.. .......................................................... 170
Table 5.7 Characteristics of biopolymers considered for soil improvement. .............. 184
Table 5.8 Rock properties of artificial beachrock using MICP method. ..................... 191
Table 6.1 The S-wave velocity values before and after subjected to WD test.. .......... 213
Table 7.1 Composition make culture medium. ............................................................ 224
Table 7.2 Nutrient cementation solution of chalk powder extract with acetic acid... .. 227
Table 7.3 Nutrient cementation solution of snow melting reagents (solvent in distilled
water).. ......................................................................................................... 228
Table 7.4 Test condition for syringe solidification test. .............................................. 230
Table 7.5 Rock properties of artificial beachrock using MICP method. ..................... 237
Table 7.6 Cost comparison between pure chemicals and low-grade solutions in the MICP
treatment of 1m3 natural sand.. .................................................................... 240
Table 8.1 Formula for MICP treatment of beach sand solidification test.. .................. 264

xv
Appendixes Table A.1 Wave height in Indian Ocean (Levitus, et al., 1994)... ................ 283
Appendixes Table A.2 Specification of unmanned aerial vehicle (UAV) drone... .......... 285
Appendixes Table A.3 Interval class of straightness density... ........................................ 292
Appendixes Table C. Standart normalization rare earth element (REE) results concentration
for sediment. The major element of beachrock (ppm), trace element result (in
ppm), and REE of beachrock (in ppm)... ..................................................... 318
xvi
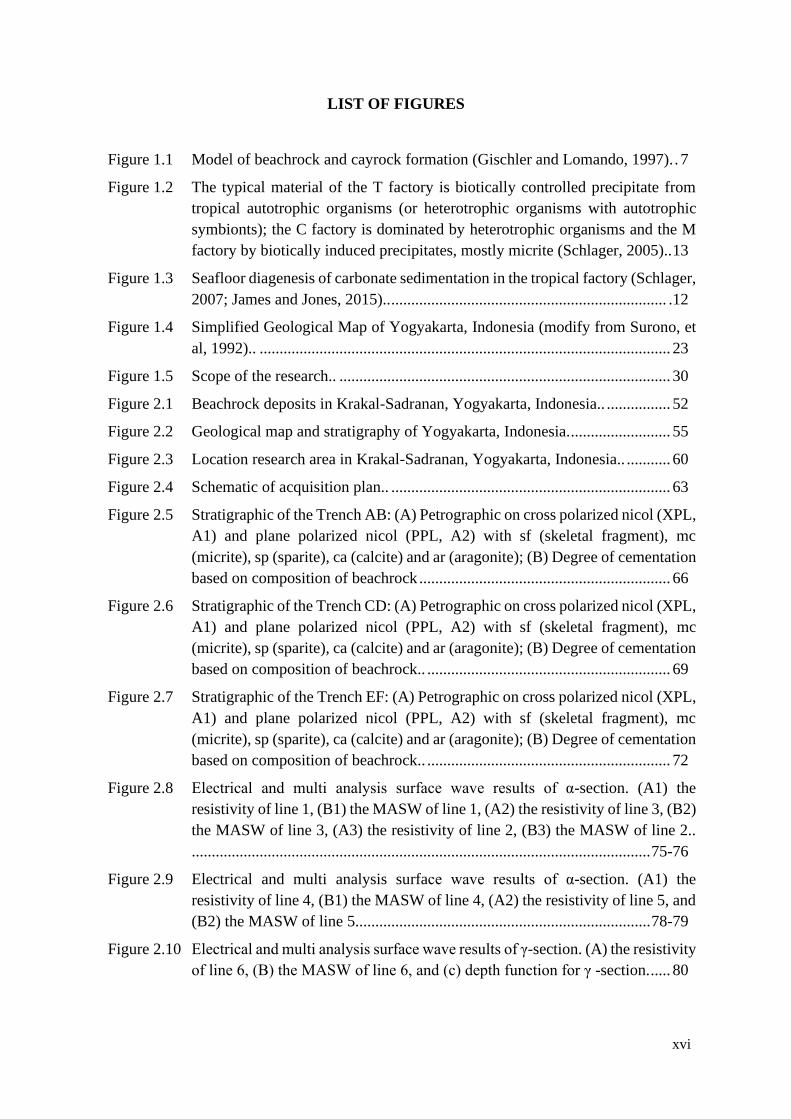
LIST OF FIGURES
Figure 1.1 Model of beachrock and cayrock formation (Gischler and Lomando, 1997). . 7
Figure 1.2 The typical material of the T factory is biotically controlled precipitate from
tropical autotrophic organisms (or heterotrophic organisms with autotrophic
symbionts); the C factory is dominated by heterotrophic organisms and the M
factory by biotically induced precipitates, mostly micrite (Schlager, 2005).. 13
Figure 1.3 Seafloor diagenesis of carbonate sedimentation in the tropical factory (Schlager,
2007; James and Jones, 2015).. ..................................................................... .12
Figure 1.4 Simplified Geological Map of Yogyakarta, Indonesia (modify from Surono, et
al, 1992).. ....................................................................................................... 23
Figure 1.5 Scope of the research.. ................................................................................... 30
Figure 2.1 Beachrock deposits in Krakal-Sadranan, Yogyakarta, Indonesia.. ................ 52
Figure 2.2 Geological map and stratigraphy of Yogyakarta, Indonesia. ......................... 55
Figure 2.3 Location research area in Krakal-Sadranan, Yogyakarta, Indonesia.. ........... 60
Figure 2.4 Schematic of acquisition plan.. ...................................................................... 63
Figure 2.5 Stratigraphic of the Trench AB: (A) Petrographic on cross polarized nicol (XPL,
A1) and plane polarized nicol (PPL, A2) with sf (skeletal fragment), mc
(micrite), sp (sparite), ca (calcite) and ar (aragonite); (B) Degree of cementation
based on composition of beachrock ............................................................... 66
Figure 2.6 Stratigraphic of the Trench CD: (A) Petrographic on cross polarized nicol (XPL,
A1) and plane polarized nicol (PPL, A2) with sf (skeletal fragment), mc
(micrite), sp (sparite), ca (calcite) and ar (aragonite); (B) Degree of cementation
based on composition of beachrock.. ............................................................. 69
Figure 2.7 Stratigraphic of the Trench EF: (A) Petrographic on cross polarized nicol (XPL,
A1) and plane polarized nicol (PPL, A2) with sf (skeletal fragment), mc
(micrite), sp (sparite), ca (calcite) and ar (aragonite); (B) Degree of cementation
based on composition of beachrock.. ............................................................. 72
Figure 2.8 Electrical and multi analysis surface wave results of α-section. (A1) the
resistivity of line 1, (B1) the MASW of line 1, (A2) the resistivity of line 3, (B2)
the MASW of line 3, (A3) the resistivity of line 2, (B3) the MASW of line 2..
................................................................................................................... 75-76
Figure 2.9 Electrical and multi analysis surface wave results of α-section. (A1) the
resistivity of line 4, (B1) the MASW of line 4, (A2) the resistivity of line 5, and
(B2) the MASW of line 5.......................................................................... 78-79
Figure 2.10 Electrical and multi analysis surface wave results of γ-section. (A) the resistivity
of line 6, (B) the MASW of line 6, and (c) depth function for γ -section. ..... 80

xvii
Figure 2.11 Three dimensional of beachrock model calculation based on geophysical
statistical anomaly data from electrical resistivity and multi analysis surface
wave of α-section. .......................................................................................... 81
Figure 2.12 Three dimensional of beachrock model calculation based on geophysical
statistical anomaly data from electrical resistivity and multi analysis surface
wave of β-section. .......................................................................................... 81
Figure 2.13 Comparison of the geophysical properties of the sedimentary rocks and
beachrocks based on P wave velocity and S wave velocity.. ......................... 84
Figure 3.1 Beachrock: (a) Baracoa, Cuba; (b) Salvador, Brazil, (c) Barcelona, Spain; (d)
Athitos, N. Greece; (e) Mykonos, Greece; (f) Morrocoy, Venezuela; (g) Sifnos,
Greece; (h) Attica, Greece (Vousdoukas, 2007).. .......................................... 91
Figure 3.2 Petrography of beachrock samples from Krakal-Sadranan, Yogyakarta,
Indonesia (a) the meniscus calcite cementation (Folk, 1962) and (b), (c)
morphology of meniscus cement beachrock. ................................................. 98
Figure 3.3 Spider diagrams of beachrock elements analysis (a) PAAS (Post-Archean
Australian Shale) normalized major oxide diagram for limestone samples of
beachrock, (b) Trace element normalizing based on Average Phaenerozoic
Limestone, (c) Rare elements analysis diagram of beachrock based on shale
normalization ............................................................................................... 100
Figure 3.4 Graphic XRD (a) and total organic carbon (b) from Beachrock, Krakal-
Sadranan, Yogyakarta. Within abbreviation Mg-C: Magnesium Calcite, C:
Calcite; A: Aragonite; SiO2: Silica; Fe: Iron; and Al: Alumina. ................. 101
Figure 3.5 Phylogenetic tree based on 16S rDNA nucleotide sequence of Vibrio maritimus,
Psedoalteromonas tetradonis, and Oceanobacillus profundus (red-frame). . 104
Figure 3.6 Microbial induced carbonate precipitation capacity of isolated strains. ...... 105
Figure 4.1 (A) Location map of Okinawa in Japan, (B) Research area in Sumuide, Okinawa
island, (C) Location map of Indonesia, and (D) Locations Sadranan area. . 125
Figure 4.2 Sumuide beachrock sampling area, Okinawa, Japan. .................................. 129
Figure 4.3 Sumuide beachrock cement vision using 100x (yellow pattern represented grain
matrix and orange pattern represented cement). .......................................... 131
Figure 4.4 Cell growth and urase activity of Pararodhobacter sp. (a) and Oceanisphaera
sp. (b). .......................................................................................................... 133
Figure 4.5 Effect of reaction temperature on urease activity of the whole cell at pH 7 (a)
and the effect of reaction pH on urease activity of the whole cell at 30°C (b).
Experiment were conducted in triplicate: data represented the average of three
experiments with error bars indicating the standard deviation. ................... 134
Figure 4.6 Results of the resistivity survey (A-, B-line) (Kubo, et al., 2014). .............. 135
Figure 4.7 Results of velocity and resistivity survey (C-, D-line) (Kubo, et al., 2014). 136
Figure 4.8 Sadranan beachrock sampling area, Yogyakarta, Indonesia. ....................... 137

xviii
Figure 4.9 Sadranan beachrock cement vision using 100x (yellow pattern represented grain
matrix and orange pattern represented cement). .......................................... 138
Figure 4.10 Cell growth and urase activity of Pseudoalteromonas tetradonis (a),
Oceanobacillus profundus (b), and Vibrio maritimus (c) ............................ 140
Figure 4.11 Illustration schemes of natural beachrock occurrences (after Danjo, 2014).142
Figure 4.12 Illustration of gram-positive bacteria (after Bailey, 2020). ......................... 147
Figure 4.13 Illustration of gram-negative bacteria (after Bailey, 2020) ......................... 148
Figure 5.1 Particle size distribution of local beach sand from Yogyakarta south coast,
Indonesia. ..................................................................................................... 160
Figure 5.2 Appearance of discoloration of the urease activity measurement solution
(yellow is neutral, purple is alkaline). .......................................................... 161
Figure 5.3 Syringe solidification test. ........................................................................... 166
Figure 5.4 Schematic diagram of the experimental arrangement of beach slope model
.................................................................................................................... ..167
Figure 5.5 General view of the Maruto (left, from Erguler and Ulusay (2008)) and modified
Eijkelkamp (right) penetrometers and their parts. (1) presser, (2) chuck, (3)
penetration,(4)load scale,(5)load indication ring,(6)UCS–NPR correlation chart
given by the manufacturer, (7) removable cap, (8) penetration needle produced
according to the Japan Civil Engineering Society's guideline, (9) indicator ring,
(10) penetrometer tube, (11) spring, (12) end cap, (13) scale, (14) extension rod,
and (15) needle block ................................................................................... 169
Figure 5.6 Effect of reaction temperature on urease activity of the whole cell at pH 7 (1
mM EDTA-disodium salt solution). Experiment were conducted in triplicate:
data represented the average of three experiments with error bars indicating the
standard deviation. ....................................................................................... 171
Figure 5.7 Effect of reaction pH on urease activity of the whole cell at 37 °C 1 mM EDTA-
disodium salt solution). Experiment were conducted in triplicate: data
represented the average of three experiments with error bars indicating the
standard deviation. ....................................................................................... 172
Figure 5.8 Microbial induced carbonate precipitation test using local strain ureolytic
bacteria after 14 days treatment. Black sample (left) is silica sand from
Parangtritis beach sand and white sample (right) is coral sand from Krakal-
Sadranan beach sand.. .................................................................................. 173
Figure 5.9 Results of MICP-treated sample catalyzed by P.tetradonis sp. under different
bacteria concentrations: (a) Estimated UCS value with the depth of the sample,
(b) pH with time and (c) Ca2+ concentration with time. .............................. 174
Figure 5.10 (a) Solidified sample with silica Parangtritis sand, (b) solidified sample with
coral Krakal-Sadranan sand, and (c) solidified sample with glass beads .... 175

xix
Figure 5.11 Estimated UCS value of MICP-treated sample catalyzed by P.tetradonis under
different particle size of sand samples. ........................................................ 177
Figure 5.12 Ions dependencies of MICP precipitation test ............................................. 178
Figure 5.13 Estimated UCS value of MICP-treated sample catalyzed by P.tetradonis under
different concentration of cement solution sand samples. ........................... 179
Figure 5.14 Precipitation test by P.tetradonis under different concentration of cement
solution sand samples. ................................................................................. 180
Figure 5.15 Graphic XRD analysis pattern using artificial beachrock. C: calcite; A:
aragonite, Q; Quartz (SiO2), V; Vaterite; Mg-Calcite ................................. 181
Figure 5.16 SEM image of CaCO3 solidification test on coral sand by P. tetradonis at (a) λ-
carrageenan and (b) κ-carrageenan at concentration 0.5% carrageenan.. .... 185
Figure 5.17 Estimated UCS values of solidification sand specimens at concentration 0.5%
carrageenan.. ................................................................................................ 186
Figure 5.18 Profile of the cemented beach slope model (a) 15° and (b) 30° .................. 187
Figure 5.19 Estimated UCS 3D profile along the beach slope models (t-z axis) of the treated
sands (measured by needle penetrometer), (a) 15° and (b) 30°.. ................. 187
Figure 5.20 Comparison of the UCS axial load between (a) natural beachrocks and (b)
artificial rock based on MICP method with x-ray chromatography scan images
of porosity.. .................................................................................................. 190
Figure 5.21 Relationship between estimated UCS versus calcium carbonate content of
MICP comparing with previous study. ........................................................ 193
Figure 6.1 Grain size distribution curve of sands and local beach sands from Krakal-
Sadranan site, Yogyakarta, Indonesia. ......................................................... 206
Figure 6.2 XRD pattern of (a) Krakal-Sadranan coral sands consist of CaCO3 and Mg-
Calcite; (b) Parangtritis sand with Ab (albite), Qtz (quartz), Mgh (maghemite),
and Mgn (magnetite); (c) Mizunami sand consist of quartz; and (d) Glass beads
with quartz consisted.................................................................................... 207
Figure 6.3 Conceptual illustration of MICP treatment by laboratory scale (columns
specimens).................................................................................................... 208
Figure 6.4 Average mass loss of the specimens subjected to WD cyclic treatments based
on (a) saltwater and (b) distilled fresh water. With Co = coral sand; Si = silica
sand; Mizu = Mizunami.. ............................................................................. 211
Figure 6.5 The variation of estimated UCS before and after the exposure of cyclic WD
tests. With Co = coral sand; Si = silica sand; Mizu = Mizunami. ............. ..212
Figure 6.6 The variation of estimated UCS before and after the exposure of cyclic WD
tests. ............................................................................................................. 214
Figure 6.7 Graphic XRD analysis pattern using artificial beachrock (a) before MICP
treatment, (b) after MICP treatment, (c) MICP treated after 21 WD cycle under

xx
distilled water, and (d) MICP treated after 21 WD cycle under saltwater. With
Ab (albite), Qtz (quartz), Mgh (maghemite), and Mgn (magnetite). ........... 215
Figure 6.8 Illustration scheme of WD damages mechanism ......................................... 216
Figure 6.9 Relationship between estimated UCS versus calcium carbonate content of
MICP treatment period ................................................................................ 217
Figure 7.1 Beer yeast composition (Asahi Group Research & Development, 2019) ... 225
Figure 7.2 The reaction formula of the indophenol blue method. ................................. 229
Figure 7.3 Cell growth and urase activity of Pseudoalteromonas tetradonis under different
culture medium ............................................................................................ 232
Figure 7.4 Amino acid content of each culture medium ............................................... 233
Figure 7.5 Influence of ratio of chalk powder to vinegar ............................................ ..234
Figure 7.6 Beach sand treatment test using microbial induced carbonate precipitation after
14 days treatment. Sample with nigrescent color (left) is Quartz silica sand from
Parangtritis beach and sample with whitish color (right) is carbonate coral sand
from Krakal-Sadranan beach sand.. ............................................................. 236
Figure 7.7 Average mass loss of the specimens subjected to WD cyclic treatments based
on (a) saltwater and (b) distilled fresh water. With Co = coral sand; Si = silica
sand; TM = tempeh medium; Std = standard chemical solutions ................ 238
Figure 8.1 Schematic illustration of MICP process of urease activity. ......................... 252
Figure 8.2 Conceptual design of coastal prevention with MICP method ..................... 261
APPENDIXES
Figure A.1 Simplified geological map of Yogyakarta, Indonesia. ................................. 280
Figure A.2 Tide Pattern of South Yogyakarta coast (Sadeng tide gauge station) .......... 284
Figure A.3 3D view of Parangtritis (Google earth) ........................................................ 288
Figure A.4 Shoreline change on Yogyakarta south coast since 1995-2015 (modified from
Pujotomo, 2009 and Mutaqin, 2017), (A) propagation in the Parangtritis area
and (B) Samas beach area.. .......................................................................... 290
Figure A.5 3D view of digital elevation model Krakal-Sadranan beaches, Yogyakarta.
.................................................................................................................... ..291
Figure A.6 Straightness density lineament of Krakal-Sadranan beach overlay with UAV
photogrammetric. ......................................................................................... 292
Figure A.7 Beachrock zonation in Krakal-Sadranan beaches, Yogyakarta (A) α-location
(B) β-location and (C) γ-location. ................................................................ 294
Figure A.8 Morphology of beachrock occurrences schemes (modified from Stull, 2000;
Harley, et al., 2017)...................................................................................... 296

xxi
Figure B.1 Measurement Stratigraphy and Petrographic Analysis of ABX1 and ABX2
samples. ........................................................................................................ 302
Figure B.2 Measurement Stratigraphy and Petrographic Analysis of ABY1 and ABY2
samples ......................................................................................................... 305
Figure B.3 Measurement Stratigraphy and Petrographic Analysis of ABZ1 and ABZ2
samples ......................................................................................................... 308
Figure B.4 Measurement Stratigraphy and Petrographic Analysis of CDX1, CDX2, and
CDX3 samples. ............................................................................................. 311
Figure B.5 Measurement Stratigraphy and Petrographic Analysis of CDY1 and CDY2
samples ....................................................................................................... ..316
Figure B.6 Measurement Stratigraphy and Petrographic Analysis of CDZ1 and CDZ2
samples ......................................................................................................... 319
Figure B.7 Measurement Stratigraphy and Petrographic Analysis of EFX1 and EFX2
samples. ........................................................................................................ 322
Figure B.8 Measurement Stratigraphy and Petrographic Analysis of EFY1 and EFY2
samples ......................................................................................................... 325
Figure B.9 Measurement Stratigraphy and Petrographic Analysis of EFZ1 and EFZ2
samples. ........................................................................................................ 328
Figure D.1 Petrographic Analysis of Yomitan A samples. ............................................ 334
Figure D.2 Petrographic Analysis of Yomitan B samples. ............................................ 336
Figure D.3 Petrographic Analysis of Yomitan C samples. ............................................ 338
Figure D.4 Petrographic Analysis of Yomitan D samples. ............................................ 340
Figure D.5 Petrographic Analysis of Gima A samples. ............................................... ..342
Figure D.6 Petrographic Analysis of Gima B samples. ................................................. 344
Figure D.7 Petrographic Analysis of Gima C samples.. ................................................ 346
Figure D.8 Petrographic Analysis of Gima D (weathered) samples. ............................. 348
Figure D.9 Petrographic Analysis of Sumuide A samples. ............................................ 350
Figure D.10 Petrographic Analysis of Sumuide B samples. ............................................ 352
Figure D.11 Petrographic Analysis of Sumuide C samples ............................................. 354
Figure D.12 Petrographic Analysis of Anthropogenic Beachrock (Synthetic). ............... 356
Figure E.1 Graphic XRD analysis pattern of Mikawa sand (a) before MICP treatment, (b)
after MICP treatment, (c) MICP treated after 21 WD cycle under distilled water,
and (d) MICP treated after 21 WD cycle under saltwater.. .................. 358-359
Figure E.2 Graphic XRD analysis pattern of Krakal-Sadranan coral sand (a) before MICP
treatment, (b) after MICP treatment, (c) MICP treated after 21 WD cycle under
distilled water, and (d) MICP treated after 21 WD cycle under saltwater………
............................................................................................................... 359-360

xxii
Figure E.3 Graphic XRD analysis pattern of glass beads (a) before MICP treatment, (b)
after MICP treatment, (c) MICP treated after 21 WD cycle under distilled water,
and (d) MICP treated after 21 WD cycle under saltwater. ................... 361-362
Figure F.1 Graphic XRD analysis of coral sands Krakal-Sadranan .............................. 363
Figure F.2 Graphic XRD analysis pattern of MICP treatment based on standard chemical
...................................................................................................................... 363
Figure F.3 Graphic XRD analysis pattern of MICP treatment based on snow-melting
reagent (a) sample A and (b) sample B. ....................................................... 364
Figure F.4 Graphic XRD analysis pattern of MICP treatment based on chalk extract (a)
sample A and (b) sample B .......................................................................... 365

1
CHAPTER 1
Introduction
1.1 Research background
Ureolytic bacteria which are ubiquitously abundant organisms and play important roles in
most aquatic environments, are generally known to influence CaCO3 precipitation by taking
up organic carbon via urea hydrolysis (Vousdoukas, 2007, DeJong, et al., 2013, Dhami, et al.,
2016). Although calcium carbonate formation mediated by microorganism such as
cyanobacteria and ureolytic bacteria is of great importance in sedimentary deposits, the
mechanisms involved are still controversial. In many cases, the precipitation of CaCO3 by
microbial activity has been invariably considered a noncontrolled process which raises the pH
adjacent to the bacteria cells (Riding, 2006), or induced by cell-surface properties for the
nucleation of CaCO3 minerals (Obst et al., 2009b). In contrast, Enzyme technology is a well-
established branch of biotechnology undergoing a development phase (Binod et al., 2013), and
their functional significance suggests many novel applications especially for environmentally
friendly industrial purposes (Binod et al., 2013). Enzymes from microorganisms are an
essential source of numerous industrially relevant enzymes (Ibrahim, 2008). Microbial
enzymes are relatively more stable and properties more diverse than other enzymes derived
from plants and animals (Alves et al., 2014). Enzymes produced from microorganisms can be
easily controlled physiologically, physio-chemically, have quantitative production and mostly
extracted with low production cost extracellularly using downstream processes (Ibrahim, 2008,
Pandey et al., 2011). The intracellular carbonate makes the mechanisms involved in
calcification more confusing (Cam et al., 2015, 2016, 2018; Li et al., 2016). Thus, new
pathways, in which some biological processes alter the carbonate system, are important to
evaluate.
The coastal zone comprises a narrow strip of coastal lowlands and a vast area of coastal
waters. It has become a major site for extensive and diverse economic activities. Many of the
countries developing on the coasts depend heavily on the scarce coastal resources for their
economic growth. Coastal resources are used and exploited for economic and social objectives:
urbanization, industry, tourism and recreation, fisheries and aquaculture, energy production
and transportation (Chua 1993). The dynamic and coastal constantly changing (Bird, 1980)

2
indicated that changes in the coast of Indonesia are consist of short term, medium term, and
long term. In an era of globalization, like other coastal countries, Indonesia is the world's largest
archipelagic state. By the latest official count, the archipelago consists of 18,108 islands where
approximately 60% of the population lives within 50 km of the coast. Increased storm intensity,
sea level rise, coastal erosion, ocean acidification, coral bleaching, and declining marine
fisheries are particular sources of vulnerability (Narayan et al., 2014; Thorne et al., 2007;
Zanuttigh, et al., 2013). Furthermore, the multiple drivers of change (e.g., climate change,
urbanization, tourism development, and marine resource exploitation) are producing
cumulative effects and conflicts that are complex, emergent, and cross-scale (Zhu, 2010; Pilkey
and Cooper, 2014; Jones and Phillips, 2011; Shi, et al., 2015; Barragán and de Andrés, 2015).
Considering natural hazard that drive medium term to long term changes in the coast of
Indonesia, Java Island due to tectonic setting is very vulnerable to natural hazard such as high
tidal and erosional beach sediment.
On other hand, Beachrock is an important feature of many tropical coastlines as it appears
to have an anchoring effect for dynamic islands and provides protection from erosion. Yet,
many things about its origin and properties remain unknown or debated hitherto. Beachrock
outcrops may be one of the few physical records of past climate information on low-lying reef
islands but research on their application as an indicator of paleo-environments in the Pacific is
underdeveloped (Vousdoukas et al., 2007). In addition, through understanding the beachrock
formation process, artificial rocks may be able to be formed at an accelerated speed of
consolidation (Danjo, 2014). Erosion that hit by the time will have damage impact for
development construction near/on the sea, such as highway, bridge concrete, and airport
building. the cement materials of beachrock are mainly high-magnesium calcite and aragonite
(Vousdoukas et al., 2007; Stasser, et al., 1989). In general, bedrock forms over a long period
of time, but it has been reported that the formation periods of some beachrocks were only a few
decades. It is assumed that if the formation periods are longer than the seismic wave velocities
and the unconfined compressive strength are larger, but the porosity and the permeability are
smaller. The most widely held the theory of beachrock formation involves the deposition of
CaCO3 between coral sand and gravel by evaporation of seawater (Neumeire, 1998; Danjo and
Kawasaki, 2011; Ginsburg, 1953; Stoddart and Cann, 1965; Kubo, et al, 2014). There is much
domestic and global literature on beachrock, but majority of this concern its geochemistry. In
particular, its underground structure is not yet well understood. One of the few studies of this
was by Psomiadis, who used electrical resistivity tomography to map the beachrock on the
3
island of Thassos, Greece (David, et al., 2009). On other hand, a direct current (DC) electrical
survey and a seismic surface wave were conducting on Yagaji Island, Okinawa, Japan with
results of the structure around the seashore to a depth of more than 10 m was obtained (Kubo,
et al., 2014). Limitation data in South East Asian country related with recent beachrock
sedimentary were challenged to study because of the weathering process in extremely rapid
especially in the tropical equator area.
In order to address the disadvantages of current coastal countermeasures technique one
could look at sustainable or “green” materials and processes using biomimetic in which lessons
learned from nature form the basis for evolution of novel technological materials for the
development of sustainable materials in the construction industry. When it comes to the field
of geotechnical engineering, the most common “green” practices are trying to be applied for
the beach’s sedimentary improvement. This thesis discusses about such sustainable coast
improvement techniques those are managed by science of biology, chemistry and physics
together and the potential of applying this knowledge to multifunctional geotechnical
engineering applications under two main topics named as sedimentary characteristic based on
ureolytic bacteria isolated from natural beachrock and evaluation of their efficiency in
biocementation based on microbial induced carbonate precipitation (hereafter, MICP) using
local indigenous strain from natural beachrock were found in Krakal-Sadranan, Yogyakarta,
Indonesia. This dissertation investigates the sustainability and effective techniques for coastal
protection methods based on mimicking beachrock sedimentary process, then artificial
beachrock development based on ureolytic bacteria strain were isolated from beachrock. In
addition, through understanding the beachrock formation process, artificial rocks may be able
to be formed at an accelerated speed of consolidation.
1.2 Literature review
1.2.1 Beachrock sedimentary mechanism
Beachrock are lithified coastal sedimentary formations consisting of various beach
sediments. Lithification occurs through the precipitation of (mainly) carbonate cements
(Vousdoukas et al., 2007). The beach may consist of any type of sediments, both of clastic and
biogenic origin (Russell, 1962), while the cements typically consist of High-Magnesian Calcite
(HMC) or Aragonite (Ar) (McKenzie, 1971). Chemical formula between HMC and Aragonite
is same, CaCO3, but their atoms are stacked in different configurations. Aragonite has an

4
orthorhombic structure and HMC a trigonal structure crystal. The first scientific mention of
these cemented beach deposits has been made by Chamisso in 1815 (Gischler, 2007) who
described the Radak and Ralik Island in the Pacific. Many famous 19th century scholar have
later reported beachrock occurrences, including Sir Francis Beauford in 1817 (Goudie, 1969),
Lyell who discovered human skeletons cemented into an “indurated beach” on the island of
Guadeloupe (Lyell, 1837) and Darwin (1841).
Beachrock exposures are quite conspicuous where they can be found as pseudo-linear,
elongated features in the intertidal or nearshore zone (Gischler, 2007). Given their origin on
the beach and relatively recent age, these exposures are often found parallel to the present
shoreline. Older beachrock exposures, in the form of isolated ridges, are thought to represent
ancient shorelines and are often used in sea-level studies. Beachrock exposures commonly slow
layering or sequences of bands, which may be associated with textural laminations. The bands
mostly dip gently seaward following the beach slope (Russell and McIntire, 1965). However,
some beachrock exposures have been found showing markedly different orientations than those
of the hosting beaches (e.g. Beier, 1985 in Rutten, 2011), which might in turn be caused by
diagenetic processes after cementation. Inherent to the location of origin, beachrock exposures
are usually subjected to continuous destruction by fracturing and mechanical erosion caused
by abrasion or erosion (e.g. McLean, 1967). During erosion-accretion cycle, older broken-off
fragments of beachrock might be incorporated into younger beachrock (Stasser and Davaud,
1986). The distinction between beachrock and other coastal cemented deposits can be difficult.
The term “cay sandstone” was coined for supratidal cemented deposits on reef islands (Kuenen,
1950). This cay sandstone (or cayrock) may be distinguished from beachrock based its
horizontal bedding, very good sorting and the predominance of meteoric calcite cements
(Ward, 1975). Similar to cayrock, cementation in this sediment is dominated by meteoric
calcite. Aeolianite can be distinguished from cayrock and beachrock by sedimentary structures
resulting from wind transport, such as cross-stratification (Gischler, 2007). However, very little
research exists on sedimentary structure of beachrocks (Scheffers, et al., 2009 in Rutten, 2011).
Other intertidal and subtidal cementation phenomena may prove more difficult to
distinguish from beachrock. Rampart and boulder rocks, consisting of cemented coral branches
and fragments larger than 10 cm, sometimes show inclined bedding similar to beachrock
(Scoffin and McLean, 1978). Elevated reefs and reef terraces can also be confused with
beachrock (Hopley, 1986). Cemented layers of sediment formed on tidal flats, on the shallow
seafloor and along lake coastlines show identical diagenetic marine-phreatic cement
5
characteristics to beachrock. However, they cannot, probably be regarded as beachrocks stricto
sensu (Vousdoukas et al., 2007). Beachrock origin mechanism occurrences in intertidal zone
still debatable many years until now, exposed beachrock and also buried or submerged
beachrock. The origin of tropical beachrock has been the subject of long-standing debate, with
several theories having been proposed that relate either to physiochemical or biological
mechanism (Scoffin and Stoddart, 1983; Vousdoukas et al., 2007). Formation mechanisms can
be classified into four main processes: direct cement precipitation, mixing of marine and the
meteoric waters, degassing of CO2, and formation by biological activity.
1.2.1.1 Direct cement precipitation
The most widely proposed mechanism for beachrock formation is by the direct
precipitation of cement from marine or fresh waters (Vousdoukas et al., 2007). Cement
precipitation from marine waters is considered to take place in or near the intertidal zone due
to the alternating wetting and drying of the sediments (Gischler and Lomando, 1997; Kelletat,
2006), aided by increased water temperatures due to warming of the beach during the day. This
theory is supported by the presence of aragonite cements, indicating a marine provenance,
within most beachrokcs.
1.2.1.2 Mixing of marine and the meteoric waters
An alternative theory is that cementation is due to the mixing of marine and meteoric
waters. This developed from the understanding that due to the decrease of solubility in water
of CaCO3 with decreasing salinity, mixing of marine and fresh water may result in carbonate
saturation and lead to precipitation of the cement (Schmalz, 1971). However, Hanor (1978)
showed through thermodynamically experimentation that precipitation of CaCO3 cannot be
induced through the mixing of marine and meteoric waters.
1.2.1.3 Degassing of CO2
Degassing of CO2 from groundwater can produce calcite crust similar to some cements
observed in the beach sediments (Hanor, 1978). Carbon dioxide is produced in the sediment
column by plants and subsequently washed seaward by the flux of groundwater. Therefore, the
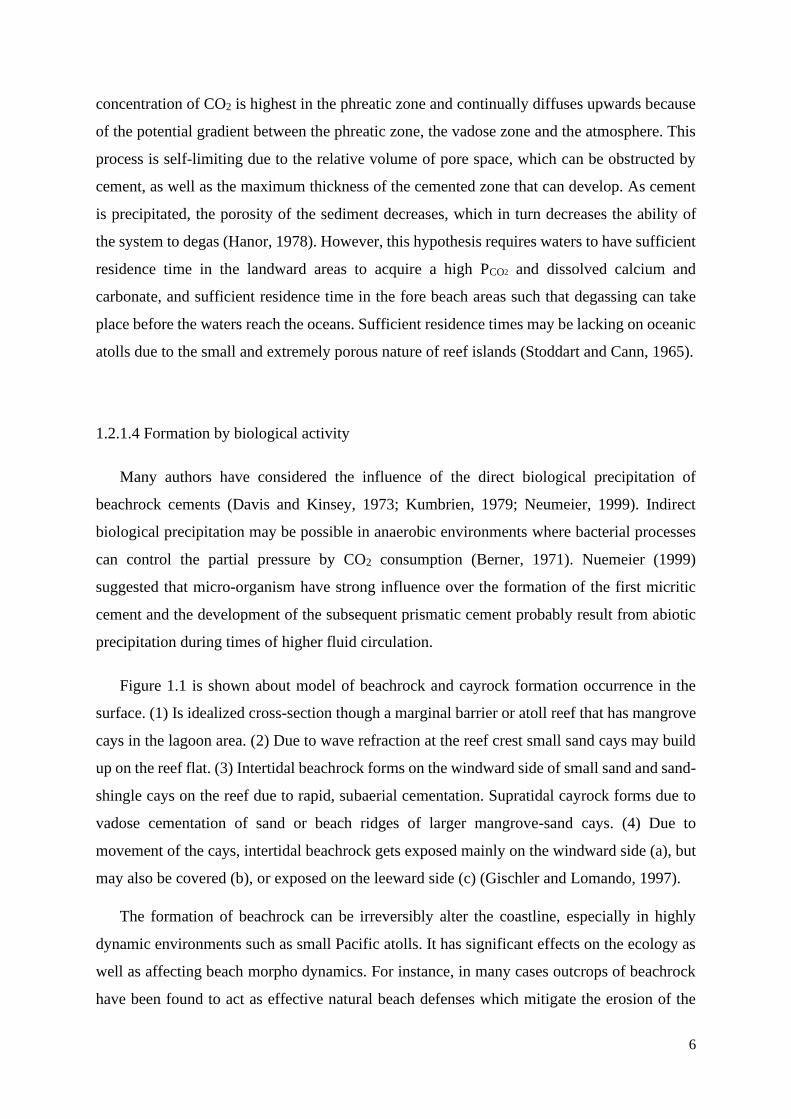
6
concentration of CO2 is highest in the phreatic zone and continually diffuses upwards because
of the potential gradient between the phreatic zone, the vadose zone and the atmosphere. This
process is self-limiting due to the relative volume of pore space, which can be obstructed by
cement, as well as the maximum thickness of the cemented zone that can develop. As cement
is precipitated, the porosity of the sediment decreases, which in turn decreases the ability of
the system to degas (Hanor, 1978). However, this hypothesis requires waters to have sufficient
residence time in the landward areas to acquire a high PCO2 and dissolved calcium and
carbonate, and sufficient residence time in the fore beach areas such that degassing can take
place before the waters reach the oceans. Sufficient residence times may be lacking on oceanic
atolls due to the small and extremely porous nature of reef islands (Stoddart and Cann, 1965).
1.2.1.4 Formation by biological activity
Many authors have considered the influence of the direct biological precipitation of
beachrock cements (Davis and Kinsey, 1973; Kumbrien, 1979; Neumeier, 1999). Indirect
biological precipitation may be possible in anaerobic environments where bacterial processes
can control the partial pressure by CO2 consumption (Berner, 1971). Nuemeier (1999)
suggested that micro-organism have strong influence over the formation of the first micritic
cement and the development of the subsequent prismatic cement probably result from abiotic
precipitation during times of higher fluid circulation.
Figure 1.1 is shown about model of beachrock and cayrock formation occurrence in the
surface. (1) Is idealized cross-section though a marginal barrier or atoll reef that has mangrove
cays in the lagoon area. (2) Due to wave refraction at the reef crest small sand cays may build
up on the reef flat. (3) Intertidal beachrock forms on the windward side of small sand and sand-
shingle cays on the reef due to rapid, subaerial cementation. Supratidal cayrock forms due to
vadose cementation of sand or beach ridges of larger mangrove-sand cays. (4) Due to
movement of the cays, intertidal beachrock gets exposed mainly on the windward side (a), but
may also be covered (b), or exposed on the leeward side (c) (Gischler and Lomando, 1997).
The formation of beachrock can be irreversibly alter the coastline, especially in highly
dynamic environments such as small Pacific atolls. It has significant effects on the ecology as
well as affecting beach morpho dynamics. For instance, in many cases outcrops of beachrock
have been found to act as effective natural beach defenses which mitigate the erosion of the
7
beach (Bird, 2000). This is particula rly true on the coasts of dynamic and fragile small islands
and atolls (e.g., Dickinson, et al., 1999). Once the beachrock has formed, it sets a limit to which
the beach bed can erode, in effect locking the beach profile. The expression of the beach is thus
controlled by the relationship between beachrock and the nearshore hydrodynamics
(Vousdoukas, et al., 2007). The nearshore hydrodynamics may also be affected by the presence
of beachrock outcrops which alter seabed roughness and subsequently change the friction of
the seabed (Hefegaard, et al., 1992). Additionally, outcrops of beachrock can have significant
effects on the transport and supply of sediment on beaches. Vousdoukas et al., (2009) showed
that submerged beachrock outcrops impede onshore transport of sediment and may act as
offshore transport conduits for beach sediments. Patches of beachrock may also act as traps for
sediment being transported by longshore drift (Vousdoukas et al., 2007). Beachrock may also
have erosional effects on the beach. The addition of impermeable beachrock layers can modify
the infiltration and extraction process of water percolation through beach sediments and
Figure 1.1. Model of beachrock and cayrock formation (Gischler and Lomando, 1997).

8
increase the volume of wetted, and thus more buoyant sediment in the swash zone that could
make the sea more prone to erosion (Vousdoukas et al., 2007).
1.2.2 Beachrock modes of carbonate precipitation
Three rules capture the peculiar nature of carbonate depositional systems – carbonate
sediments are largely of organic origin; they can form wave-resistant structures and they are
easily altered by diagenesis because the original minerals are metastable. Precipitation of solid
matter from the dissolved load of the sea occurs either abiotically, governed by inorganic
thermodynamics and reaction kinetics, or biotically as a consequence of the metabolism of
plants and animals. Precipitation of marine evaporites is an example of an abiotic process,
precipitation of marine opal by diatoms or radiolarian an example of a biotic one (Schlager,
2005). Marine carbonate precipitation proceeds along abiotic and biotic pathways, and this
makes it particularly diverse and complex. The interplay of abiotic and biotic processes of
organic evolution and environmental change has led to a stunning diversity of precipitation
mechanisms that are identify in this dissertation. However, even if one focuses on the
practically relevant aspects of carbonate precipitation, the subdivision into abiotic and biotic
precipitation is inadequate. Following Lowenstam and Weiner (1989) who recognized three
degrees of biotic influence on precipitation in general and on carbonates in particular:
A. Abiotic (or quasi-abiotic) precipitates where biotic effects are negligible.
The most conspicuous abiotic precipitate is cement formed in the pore space during the
early stages of diagenesis when the deposit was still in the depositional environment. Burial
cements are excluded from the abiotic carbonate factory because they are not derived from
sea water but largely from remobilized sedimentary material. The case for abiotic origins
particularly strong for acicular aragonite cements. Acicular magnesian calcites may be
biotically influenced (Morse and Mackenzie, 1990). Associated with tropical skeletal
carbonate we find abiotic precipitates in the form of ooids. Ooids form in high-energy
environments by stepwise accretion on a nucleus. Field observations and laboratory
experiments indicate a growth history of alternating phases of accretion and rest. The
degree of organic influence on the precipitation process remains a matter of debate.
However, two arguments tip the balance in favor of abiotic precipitation: (1) growth of
aragonitic, Bahama-type, ooids in the laboratory where the precipitation was essentially
abiotic and organic matter had only a modulating effect (Davies et al., 1978) and (2) the
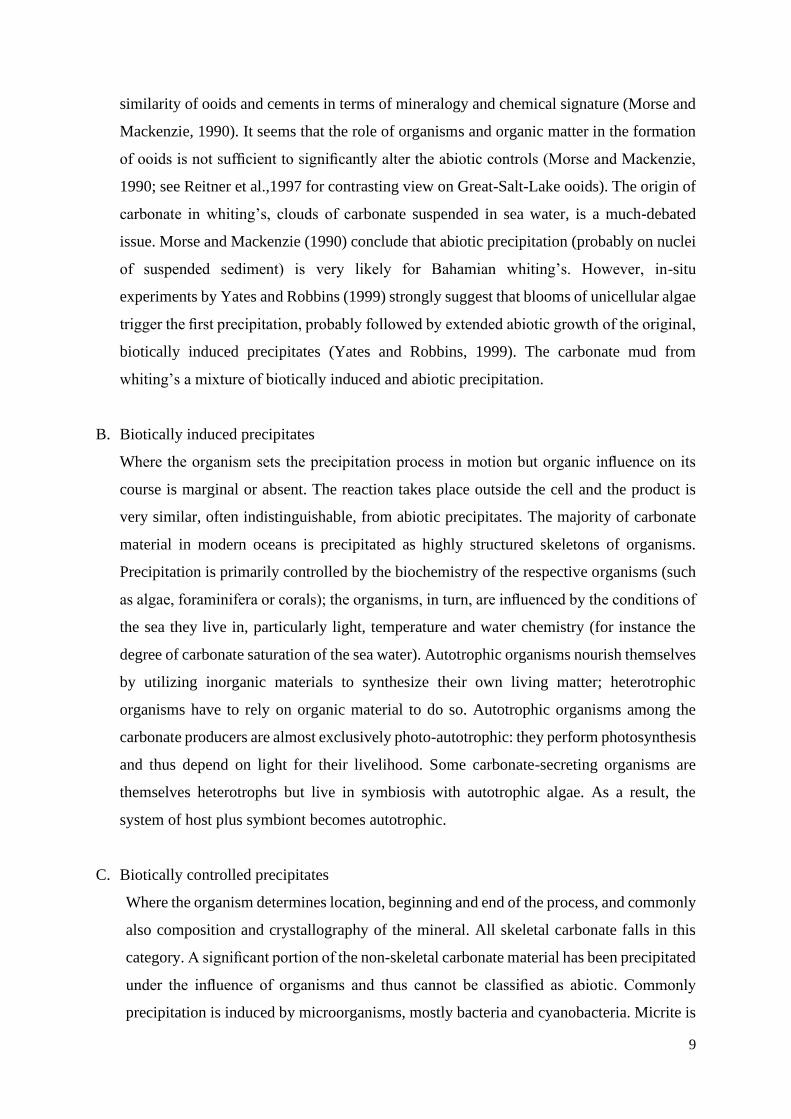
9
similarity of ooids and cements in terms of mineralogy and chemical signature (Morse and
Mackenzie, 1990). It seems that the role of organisms and organic matter in the formation
of ooids is not sufficient to significantly alter the abiotic controls (Morse and Mackenzie,
1990; see Reitner et al.,1997 for contrasting view on Great-Salt-Lake ooids). The origin of
carbonate in whiting’s, clouds of carbonate suspended in sea water, is a much-debated
issue. Morse and Mackenzie (1990) conclude that abiotic precipitation (probably on nuclei
of suspended sediment) is very likely for Bahamian whiting’s. However, in-situ
experiments by Yates and Robbins (1999) strongly suggest that blooms of unicellular algae
trigger the first precipitation, probably followed by extended abiotic growth of the original,
biotically induced precipitates (Yates and Robbins, 1999). The carbonate mud from
whiting’s a mixture of biotically induced and abiotic precipitation.
B. Biotically induced precipitates
Where the organism sets the precipitation process in motion but organic influence on its
course is marginal or absent. The reaction takes place outside the cell and the product is
very similar, often indistinguishable, from abiotic precipitates. The majority of carbonate
material in modern oceans is precipitated as highly structured skeletons of organisms.
Precipitation is primarily controlled by the biochemistry of the respective organisms (such
as algae, foraminifera or corals); the organisms, in turn, are influenced by the conditions of
the sea they live in, particularly light, temperature and water chemistry (for instance the
degree of carbonate saturation of the sea water). Autotrophic organisms nourish themselves
by utilizing inorganic materials to synthesize their own living matter; heterotrophic
organisms have to rely on organic material to do so. Autotrophic organisms among the
carbonate producers are almost exclusively photo-autotrophic: they perform photosynthesis
and thus depend on light for their livelihood. Some carbonate-secreting organisms are
themselves heterotrophs but live in symbiosis with autotrophic algae. As a result, the
system of host plus symbiont becomes autotrophic.
C. Biotically controlled precipitates
Where the organism determines location, beginning and end of the process, and commonly
also composition and crystallography of the mineral. All skeletal carbonate falls in this
category. A significant portion of the non-skeletal carbonate material has been precipitated
under the influence of organisms and thus cannot be classified as abiotic. Commonly
precipitation is induced by microorganisms, mostly bacteria and cyanobacteria. Micrite is

10
a major, often dominant component of these deposits. The term “(mud) mound” is
commonly used as a field-geologic term (Wilson, 1975; Langevin and Bourque, 1992). It
stands for autochthonous micrite as opposed to allochthonous micrite that was transported
and deposited as fine-grained sediment (Wolf, 1965). Whether the micrite formed as a
rigid precipitate can often be deduced from thin sections or polished slabs. The past decade
brought enormous progress on the origin of mud mounds and other automicrite deposits.
The combination of detailed field work, petrography and collaboration with biologists and
organic chemists has led to detailed insight in a geologically very important carbonate
precipitation mode that differs significantly from the more conspicuous skeletal mode
(Monty et al., 1995; Reitner et al., 1995a; 1995b; Neuweiler et al., 2003, Schlager, 2005).
While the categories themselves are well identifiable and useful, the designation of certain
products to one of the categories remains debatable. The controversy on the origin of ooids and
whiting is a case in point. In most carbonate depositional environments material is produced in
Figure 1.2. The typical material of the T factory is biotically controlled precipitate from tropical autotrophic
organisms (or heterotrophic organisms with autotrophic symbionts); the C factory is dominated by
heterotrophic organisms and the M factory by biotically induced precipitates, mostly micrite (Schlager, 2005).

11
all three modes, albeit in varying proportions (Figure 1.2). If one considers carbonate
precipitation not at the molecular or microscopic scale but at scales from mappable sediment
bodies (±102 m) to global facies realms, different production systems or 'carbonate factories'
may be distinguished. The boundaries between these systems are gradational and to some
extent arbitrary. Accordingly, the number of basic types is a matter of debate with little hope
of reconciling the views of lumpers and splitters. The differences from of the biotically induced
and biotically controlled could be identify based on enrichment frame of microorganism in the
carbonate sediment. Differences from those that are biologically induced and biologically
controlled can be identified based on the framework of enrichment of microorganisms found
in carbonate sediments, which are commonly found including ooids, handgrounds, cryptalgal
laminates, lime mud, bioclastics, stromatolite domes, and also the meniscus cement of high
magnesian calcite (HMC) or aragonite.
1.2.2.1 Tropical factory
T stands for “tropical” and “top-of-the-water-column”. Biotically controlled precipitates
dominate. Most abundant among them are photo-autotrophic organisms, for instance algae and
animals with photosynthetic symbiotic algae, such as hermatypic corals, certain foraminifer
sand certain molluscans. The other characteristic products are abiotic precipitates in the form
of marine cements and ooids. Clay-size precipitates, the “whitings”, are probably mixtures of
abiotic or biotically induced precipitates (Morse and Mackenzie, 1990; Yates and Robbins,
1999; Thompson, 2001). Heterotrophs devoid of photo-symbionts are common, but non-
diagnostic contributors. Construction of wave-resistant structures by organic frame building or
rapid marine cementation is common, particularly at the shelf slope break. The T factory is
restricted to the warm, sunlit waters of the ocean that are high in oxygen because of constant
equilibration with the atmosphere and low in nutrients because of intensive competition. In
modern oceans, the characteristic settings are the surface waters between 30◦ N and S of the
equator. The northern and southern limit of the T factory closely follows the line where the
mean temperature of the coldest month is about 20 ◦C. The T factory may also pass into the
cool-water factory downward in the water column, for instance at the boundary between the
warm surface layer of the ocean and the thermocline. Furthermore, transitions from T to C
factory occur in shallow tropical upwelling areas where cool, nutrient-rich water comes to the
surface (Lees and Buller, 1972; Pope and Read, 1997; Brandley and Krause, 1997; James,
1997; Schlager, 2005).

12
1.2.2.2 Cool-water carbonate factory
In the surface waters of the ocean, the cool- water factory extends poleward from the limit
of the tropical factory (at about 30 ~) to polar latitudes but it also occurs in the thermocline
waters of the low latitudes (Lees and Buller 1972; James 1997). Carbonate precipitation is
nearly always of the biotically controlled type. Heterotrophic organisms dominate; the
contribution of photoautotrophs in the form of red algae is highly variable but at times
significant (Lees & Buller 1972; Henrich et aI. 1995; James 1997). The sediment typically
consists of skeletal hash of sand-to- granule size. Cool-water carbonates lack herma- typic coral
reefs and ooids; carbonate mud and cement are scarce. The transition to the domain of the
tropical carbonate factory normally extends over more than 1000 km (Schlager 1981; Collins
et al. 1997). The cool-water factory substitutes for the tropical factory in the tropics if
environmental conditions are adverse. The cool-water factory extends pole ward from the limit
of the tropical factory (at about 30◦) to polar latitudes. The transition to the T factory is very
gradual (Betzler et al., 1997). The C factory also occurs at low latitudes in the thermocline
below the warm surface waters and in upwelling areas. The oceanic environments of the C
factory are photic or aphotic waters that are cool enough to exclude competition by the T
factory and sufficiently winnowed to prevent burial by terrigenous fines. Nutrient levels are
generally higher than in the tropical factory. These constraints set a wide depth window for the
cool-water factory from upper neritic to bathyal and even abyssal depths. The most common
setting is the outer neritic, current-swept part of continental shelves. The transition to the T
factory normally extends over more than thousand kilometers (Schlanger, 1981; Collins et al.,
1997, Schlager, 2005). Figure 1.3 is shown the seafloor diagenesis of carbonate in the tropical
reagent.
1.2.2.3 Mud-mound factory
Intensive work on ancient mud-mounds and micrite precipitates in the Recent has led to
two conclusions that underline the independent position of this system and the fundamental
differences from the tropical and cool-water factories (Langevin and Bourque, 1992; Monty
1995; Meyer, et al., 1995; Reitner and Neuweiler 1995). First, typical mud-mounds are formed
by in-situ pro- duction rather than sweeping together of fine sediment; they are fundamentally
different from hydrodynamic sediment accumulations such as lagoon mudbanks or the
contourite drifts of the deep sea. The micrite that constitutes the dominant component of the
mounds was firm or hard during or soon after formation and does not represent lithified soft
sediment. Second, the micrite is precipitated by a complex interplay of inorganic and organic
13
chemical reactions with microbes and decaying organic tissue playing a central role (Reitner
and Neuweiler 1995; Monty 1995).
1.2.3 Artificial beachrock development based on microbial induced carbonate precipitation
(MICP)
The most important environments where early marine cementation (mainly by high-
magnesian calcite and aragonite) occur, are intertidal beaches and tidal flats, subtidal sandflats
and reefs. Important factors controlling calcium carbonate cementation are the chemistry of the
seawater (the source of the cementing material) the physical conditions, in terms of hydraulic
energy, sedimentary parameters such as permeability, texture and composition of the sand, and
an initially stabilizer of the loose sediment. All these factors and the way in which they relate
to each other explain large variability in marine cement forms and the variability of the
geotechnical properties of the cemented calcareous sediments. The factors controlling early
Seafloor diagenesis: tropical realms
High aragonite and high magnesian calcite (HMC)
saturation
Beachrock
Mechanical-bioerosion→bioclastics
HMC-aragonite-micrite meniscus cements
Sabkha
Hardgrounds, cryptalgal laminates
HMC-aragonite-micrite; gypsum, halite meniscus, pendant cements
cryptalgal laminates
stromatolite domes Ooids, lime mud, bioclastics
Hardgrounds: aragonite, HMC isopachous
Reefs
Mechanical-bioerosion HMC-aragonite-micrite
Isopachous, intraskeletal, and cavity-fill
Botryoidal cements
Seawater-fresh water mixing
Destabilization of HMC, aragonite in near-
surface sediment
Sea level fall
Exposes inner platform to vadose diagenesis;
Mixing zone moves seaward
Sea level rise
Vadose zone become fully saturated;
Mixing zone moves landward
Shallow marine phreatic
Figure 1.3. Seafloor diagenesis of carbonate sedimentation in the tropical factory (Schlager, 2007; James
and Jones, 2015).

14
cementation in the shallow-marine environment are discussed in order to evaluate the boundary
conditions for a laboratory model used to produce artificially cemented and by simulating
natural subtidal cementation processes. The resulting cemented sands are shown to be
comparable with natural sandstones and to exhibit similar behavior during strain tests
(Molenaar and Venmans, 1993). Danjo and Kawasaki (2013) examined a formation mechanism
of beachrock in Okinawa, Japan, because understanding this mechanism is an important step
in making anthropogenic beachrock. They focused on the cement formation mechanism of
beachrock, which occurs in the intertidal zone. Cement type and content have the potential to
influence the strength of the material; hence, detailed knowledge of beachrock cements is
valuable for producing a man-made equivalent. Beachrocks are cemented by High Magnesian
Calcite (HMC) have been reported at 16 sites around the world (Danjo and Kawasaki, 2014;
Erginal, A.E. et al., 2010).
MICP is considered as an environmental and economical friendly technique to stabilize
soil, buildings, cracks, concrete and others. Many known ureolytic bacteria are used in different
applications. Bacillus cereus, Bacillus pasteurii, Shewanella, Sporosarcina pasteurii, Bacillus
sphaericus, Bacillus pseudofirmus, and Bacillus cohnii are known microorganisms used in
applications for fixing cracks, remediation and self-healing of buildings (Bang et al., 2001;
Ramachandran et al., 2001; Ghosh et al., 2005; Jonkers and Schlangen, 2008; De Belie et al.,
2010; Achal et al., 2011a; Achal et al., 2011b). Furthermore, the ureolytic bacterial strain
Sporosarcina pasteurii (NCIM 2477) is also used to manipulate the properties of brick by
improving its quality through precipitation of calcite that deposits in the void spaces which
causes reduction in the absorption of moisture (Sarda et al., 2009; Wong, 2015). Reduced
permeability is another outcome of biologically modified materials such as concrete or soil.
Calcium carbonate that precipitates due to biological activity deposits over the concrete
resulting in reduced permeability, thereby, increasing its life span (Nolan et al., 1999). Calcium
carbonate precipitation by MICP can act as an additive in decreasing the overall porosity of
building materials, thereby improving the durability, strength and quality of the material. This
can help to prevent the use of conventional chemicals that can be dangerous or hazardous to
improve the construction materials (Annamalai et al., 2012). The effect or impact of MICP on
soil properties could be at the macro-scale or micro-scale. The macro-scale behavior of soil is
affected by the content of calcium carbonate precipitated, including relative density, confining
stress and gradation of soil. On the other hand, micro-scale behavior of biologically treated soil
will allow to study the precipitation of calcium carbonate with respect to bacterial cells as well

15
as the interparticle bonds formed by the precipitation of calcium carbonates between the soil
grains (Lin et al., 2016).
1.2.3.1 Ureolytic bacteria as carbonate precipitation
Biologically induced mineralization is usually carried out in open environments and the
process is often linked to microbial cell surface structures and metabolic activities. Microbial
extracellular polymeric substances can trap and bind remarkable amounts of calcium to
facilitate calcium carbonate precipitation, and most likely also play an essential role in calcium
carbonate precipitation morphology and mineralogy (Arp et al., 1999; Braissant et al., 2007;
Dupraz et al., 2005). The mineralization process associated with microbial metabolic activities
usually leads to an increase in environmental alkalinity, thereby facilitating calcium carbonate
precipitation (Douglas and Beveridge, 1998; Castanier et al., 1999). Among these metabolic
activities, the most common is urea hydrolysis catalyzed by urease enzymes, which commonly
occurs in large varieties of microorganisms (Mobley and Hausinger, 1989). The microbial
urease enzyme hydrolyzes urea to produce carbonate and ammonia, increasing the pH and
carbonate concentration, which then combines with environmental calcium to precipitate as
calcium carbonate (Hammes et al., 2003; Muynck et al., 2010).
Calcite, aragonite and vaterite are three crystal polymorphs of calcium carbonate in
bacterial systems, with calcite being the most common and stable bacterial carbonate
polymorphs (Rodriguez-Navarro et al., 2012). Bacterial mineralization of aragonite, often
representing the metastable polymorph, has also been reported (Pedone et al., 2010). The
production of the polymorphs of calcite, aragonite and vaterite depend both on their growing
environments and bacterial strains. It was reported that different bacteria precipitated different
types of calcium carbonate and were mainly either spherical or polyhedral crystalline forms
(Sanz-Rubio, et al., 2001). Bacterial-induced carbonate minerals have often been reported in a
large number of bacteria, such as cyanobacteria (Jansson and Northen, 2010), sulphate-
reducing bacteria (Warthmann et al., 2000), Bacillus (Goddette et al., 1992; Bretzel et al., 1999;
Jørgensen et al., 2000), Myxococcus (Rodriguez-Navarro, et al., 2003; Gonzalez-Muñoz et al.,
2010), Halobacteria (Sánchez-Román, et al., 2011) and Pseudomonas (Jha et al., 2009). Groth
et al. (2001) tested the crystal-producing ability among cave bacteria and found that all
produced calcite except for Bacillus sp., which precipitated vaterites. Rodriguez-Navarro et al.
(2003) reported that M. xanthus was able to induce precipitation of calcite and vaterite.
Emerging evidence suggests that bacteria do not directly influence calcium carbonate

16
morphology or polymorph selection (Chekroun et al., 2004; Bosak et al., 2005; Rodriguez-
Navarro et al., 2012). The morphological features instead maybe influenced by the composition
of the culture medium, the specific bacterial outer structures and their chemical nature, which
might be crucial for the bacterial crystallization process (Gonzalez-Muñoz et al., 2010).
One of the most studied pathways of the microbial precipitation of calcite involves urea
hydrolyzing bacteria. The ureolytic process is straight forward. In the first step, urea
(CO(NH2)2) is hydrolyzed to ammonia (NH3) and carbonic acid (H2CO3) in the series of
reactions outlined below (Equations 1.1-1.4) (Burne and Chen, 2000). The ammonia and
carbonic acid equilibrate in water to form bicarbonate (HCO3−), ammonium (NH4+), and one
hydroxide ion (OH-) (Equations 1.5 and 1.6). It is at this step that the pH increase essential to
calcite precipitation occurs. This rise in pH shifts the bicarbonate equilibrium to form carbonate
ions (CO32−) (Equation 1.6) which, in the presence of soluble calcium (Ca2+), precipitates out
of solution as calcium carbonate (CaCO3) if saturation is exceeded (Burne and Chen, 2000;
Castanier et al., 1999). A high carbonate concentration induces CaCO3 precipitation around
the cells and the presence of calcium ions in the surrounding environment is described by
Equation 1.9.
𝐶𝑂(𝑁𝐻2)2 + 𝐻2𝑂 → 𝑁𝐻2𝐶𝑂𝑂𝐻 + 𝑁𝐻3 (Eq. 1.1)
𝑁𝐻2𝐶𝑂𝑂𝐻 + 𝐻2𝑂 → 𝑁𝐻3 + 𝐻2𝐶𝑂3 (Eq. 1.2)
𝐶𝑂(𝑁𝐻2)2 + 2𝐻2𝑂 → 2𝑁𝐻3 + 𝐻2𝐶𝑂3 (Eq. 1.3)
𝐻2𝐶𝑂3 ↔ 𝐻𝐶𝑂3− + 𝐻+ (Eq. 1.4)
2𝑁𝐻3 + 2𝐻2𝑂 ↔ 2𝑁𝐻4+ + 2𝑂𝐻− (Eq. 1.5)
2𝐻𝐶𝑂3− + 2𝐻+ + 2𝑂𝐻− + 2𝑁𝐻3 ↔ 2𝐶𝑂3
2−+ 2𝑁𝐻4+ + 2𝐻2𝑂 (Eq. 1.6)
𝐶𝑎2+ + 𝑐𝑒𝑙𝑙 ↔ 𝑐𝑒𝑙𝑙 ∶ 𝐶𝑎2+ (Eq. 1.7)
𝐶𝑂32− + 𝑐𝑒𝑙𝑙 ∶ 𝐶𝑎2+ ↔ 𝑐𝑒𝑙𝑙: 𝐶𝑎𝐶𝑂3 (Eq. 1.8)
𝐶𝑂(𝑁𝐻2)2 + 2𝐻2𝑂 + 𝐶𝑎2+ ↔ 2𝑁𝐻4+ + 𝐶𝑎𝐶𝑂3 (Eq. 1.9)
Under natural conditions, the precipitation of carbonates occurs very slowly. In this sense,
microorganisms would act as catalysts in the carbonate formation process. Carbonates,
especially calcite (CaCO3) and dolomite (CaMg(CO3)2) are found as limestones on the Earth’s
urease

17
surface, representing an important carbon stock in the lithosphere (Ehrlich and Newman, 2009;
Kumari, et al., 2016). The mechanisms through which the biological precipitation of carbonates
occurs are not fully described.
However, three mechanisms have been proposed to explain this process (Dhami, et al.,
2013): i) Biomineralization occurs as a bioproduct of the microbial metabolism; ii)
Extracellular molecules are involved in the carbonate mineralization process; iii) A nucleation
process of carbonates occurs in the cell wall of microorganisms. Based on the latter proposed
mechanism, the role of microorganisms in creating an alkaline environment through various
physiological activities is known. Under these circumstances, the bacterial surface plays an
important role in the precipitation of carbonates due to the presence of various negatively
charged groups at neutral pH, positive ions can bind to the bacterial surface favoring
heterogeneous nucleation (Dhami, et al., 2013). The microbiological precipitation of minerals
has several technological applications, such as the restoration of limestone monuments and
statues, biocement production, improvement of soil quality and removal of soluble pollutants
such as heavy metals and radioactive elements (Al-Thawadi, 2011). Additionally, this process
promoted specifically by the ureolytic capacity of bacterial species also allows the removal of
secondary ions such as calcium and magnesium present in seawater (Arias, et al., 2017).
Furthermore, the precipitation of calcium carbonates mediated by ureolytic bacteria is widely
described in the literature, mainly under the application of soil biocementation (Dick et al.,
2006; Phillips, et al., 2013; Silva-Castro, et al., 2015). Other uses are related to carbon dioxide
capture and remediation of soils and water (Dhami, et al., 2013; Achal, et al., 2015).
1.2.3.2 Different polymorphs and their effects in various calcium sources
Biomineralization can lead to produce different phases of CaCO3 anhydrous polymorphs
such as calcite, aragonite and vaterite, as well as hydrated crystalline phases such as
monohydrocalcite (CaCO3·H2O) and hexahydrocalcite or ikaite (CaCO3·6H2O) and
amorphous calcium carbonate (Krumbein 1979; Hammes et al. 2003a; Wei et al. 2003;
Chekroun et al. 2004; Xu et al. 2006; Chen et al. 2009; Sanchez-Navas et al. 2009; Gebauer
et al. 2010; Dhami et al. 2013). Among these, calcite and vaterite are the most common
polymorphs (Gonzalez-Munoz et al. 2010; Rodriguez-Navarro et al. 2007; Dhami et al. 2013,
2014). Vaterite is a minor, metastable and transitional phase during calcite formation (Tourney
and Ngwenya 2009). Calcite is the most thermodynamically stable polymorph of CaCO3 and
the primary product of CaCO3 in many MICPs (Spanos and Koutsoukos 1998; Stocks-Fischer

18
et al. 1999; Okwadha and Li 2010; Ganendra et al. 2014). In contrast, Rivadeneyra et al. (1996)
reported that aragonite is the predominant crystal formed by Deleya halophila. Chen et al.
(2009) found that CaCO3 produced by Proteus mirabilis has an unusual morphology and
structure, consisting of vaterite hollow spheres. Calcite and vaterite are different solid-state
phases of CaCO3. The precipitation of CaCO3 by mixing concentrated Ca2+ and CO32− solution
involves at least three steps namely formation of amorphous calcium carbonate which is a form
of CaCO3 with low stability and high solubility, transformation of amorphous CaCO3 into
vaterite, and subsequent transformation of thermodynamically unstable vaterite into stable
calcite (Spanos and Koutsoukos 1998; Wei et al. 2003; Shen et al. 2006; Hua et al. 2007).
Pouget et al. (2009) have proposed the template controlled the initial stages of CaCO3
formation i.e. before transformation of amorphous calcium carbonate into vaterite and calcite.
The initial stages of CaCO3 precipitation start with the formation of prenucleation clusters,
aggregation of the clusters to form amorphous calcium carbonate nanoparticles and association
of the nanoparticles with the template surface to initiate the amorphous calcium carbonate
growth.
Different calcium sources induce crystal with different shapes, with a rhombohedral shape
induced by calcium chloride being characteristic of the most stable form of CaCO3 (calcite)
(De Yoreo and Vekilov 2003; Favre et al. 2009; Gorospe et al. 2013). Other calcium sources
also induced different shape of CaCO3. For example, calcium acetate induces a lettuce like or
lamellar shape, (a metastable form of CaCO3) composed of vaterite, while calcium lactate and
calcium gluconate induce a more complex form with packing that leads to growth of vaterite
with a spherical shape (Tai and Chen 1998). The morphological differences in the crystal
formation may be strain-specific, owing to differences in urease activity (Hammes et al. 2003a;
Park et al. 2010). Alternatively, these differences could reflect the specific extracellular
polymeric substance protein produced by different bacterial types controlling calcite or
aragonite polymorph selection (Kawaguchi and Decho, 2002), because extracellular polymeric
substance proteins may specifically bind Ca2+ and promote carbonate precipitation (Dhami
et al. 2013b). The composition of the growth media or culture may also affect the crystal
morphology because different bacterial species are able to precipitate different amounts, shapes
and types of carbonate crystals from the same synthetic medium (Ferrer et al. 1988; Hammes
and Verstraete 2002; Dhami et al. 2013b). Examination of the cells by electron microscopy
reveals that calcium carbonate precipitation is closely associated with bacterial cells. Even
though, many researchers have used different calcium sources for the induction of CaCO3

19
precipitation, calcium chloride is the best source for induction of calcite precipitation (Achal
and Pan 2014). The effects of different calcium salts on biocementation were investigated and
blocks were formed in all samples treated using various calcium sources; however, the sand
blocks collapsed after the Petridish demolded in the control samples, because dead cells were
used (Gorospe et al. 2013). Our group has developed a simple method for testing
impermeability to determine the efficiency of MICP. Specifically, the degree of impermeability
was determined by measuring the migration distance of crystal violet. The activity of urease
and the amount of CaCO3 precipitation are based on several environmental factors. Indeed,
many factors affect urease activity and calcium precipitation including bacteria type, bacteria
cell concentrations, pH, temperature, urea and calcium concentrations (Hammes and Verstraete
2002; Mortensen et al. 2011; Ng et al. 2012; Qabany et al. 2012).
1.2.3.3 Isolation of ureolytic bacteria from various sources
The main task of the MICP technique is isolation and selection of potent urease producing
bacteria. To promote ureolysis–driven calcite precipitation, the microorganisms should
produce a sufficient amount of urease enzyme. Therefore, many investigators have isolated
ureolytic microorganisms from various sources (Dejong et al. 2006; Hammes et al. 2003a;
Achal and Pan 2014; Kang et al. 2014a). Ureolytic microorganisms that can induce CaCO3
precipitation have been studied for multiple applications such as remediation, consolidation
and cementation (Ivanov and Chu 2008; De Muynck et al. 2010; Phillips et al. 2013). Hammes
et al. (2003a) reported that CaCO3 precipitating strains were isolated from garden and landfill
soil from Ghent, Belgium. Achal et al. (2009a) developed a phenotypic mutant of Sporosarcina
pasterurii by UV irradiation and compared it with the wild type strain MTCC 1761. The mutant
strain (Bp-M3) was able to grow at higher pH (up to 11) than the wild type (up to 10) and to
produce high urease activity and calcite precipitation. The increase in pH is very important to
enhancement of the urease activity and calcium carbonate precipitation. The urease producing
bacteria Bacillus sp. CR2 was isolated from mine tailing soil of Urumgi, Xinjiang, China
(Achal and Pan 2014), and several Sporosarcina species were isolated from nursery garden
soil at Tsinghwa University, China (Li et al. 2013). Positive strains were identified by the pink
color formed upon hydrolysis of urea in urea test agar plates.
Dhami et al. (2013b) recently isolated the ureolytic bacterial strains from calcareous soil
samples collected in Andhra Pradesh, India. Five positive strains (B. megaterium, B.
thuringiensis, B. cereus, B. subtilis and L. fusiformis) were selected based on the urease
activity, and calcite precipitation. However, B. megaterium produced highest urease activity
20
(690 U/ml), and calcite precipitation (187 mg/100 ml). Other urease producing bacteria were
isolated from an abandoned express way and abandoned mining sites in Gangwondo, Korea
(Kang et al. 2014a), four of which showed urease activity and calcite production. However,
only two strains of Lysinibacillus sp. were able to produce high urease activity and calcite
precipitation. The same group isolated another strain of urease producing bacteria,
Sporosarcina pasteurii WJ-2 from abandoned express way sites, in Gangwondo, Korea
(Unpublished data). Sarda et al. (2009) screened three different microorganisms for urease
production and found that B. pasteurii could produce urease at levels approximately two-fold
higher than other tested microorganisms. Some investigators have also revealed ureolytic
activity in situ in natural soil and ground water systems (Nielsen et al. 1998; Fujita et al. 2008;
Tobler et al. 2011). All bacteria could produce various amounts of urease and calcite
precipitation, while some microorganisms could produce high levels of urease and were
involved in the hydrolysis of urea (Achal et al. 2009a; Dhami et al. 2013b, 2014). The
endospore forming bacteria Sporosarcina pasteurii ATCC 11859 and B. megaterium have been
shown to produce high levels of urease and have therefore been extensively studied. The urease
activity was determined by phenol-hypochloride assay (Natarajan 1995). One unit of urease is
defined as the amount of enzyme hydrolyzing 1 µmol urea/ min. Bachmeier et al. (2002)
investigated the role of nickel ions in the active site of the urease enzyme for its functional
activity and the structural integrity of the enzyme. They also demonstrated recombinant
transformation of the B. pasteurii urease gene to Escherichia coli HB101 containing pBU11
plasmid. However, the amount of calcite precipitation by recombinant strain E. coli HB101
was lower than that of the wild type (Bachmeier et al. 2002).
1.2.2.4 Recent status of MICP applications
The MICP process is an effective and eco-friendly technology that can be applied to solve
various environmental problems, including remediation of heavy metals and radionuclides,
bioconsolidation, biocement, CO2 sequestration and other applications (De Muynck et al. 2010;
Mitchell et al. 2010; Yoshida et al. 2010; Hamdan et al. 2011; Achal et al. 2012a). The MICP
method is an alternative method for the production of several materials. The biominerals of
calcium carbonate or calcium phosphate are involved in production of complex multifunctional
composites with organic macromolecules at extreme temperature and pressure (Wakayama
et al. 2005). Particularly, calcite formed by Geobacillus thermoglucosidasius has many
advantages when applied as filler in rubber and plastics, fluorescent particles in stationary ink
and stationary markers for western blotting and other biochemistry applications (Ling et al.

21
2009; Yoshida et al. 2010). Other alternative, MICP is able to produce a coating to seal
polychlorinated biphenyls (PCBs) contaminated areas. Indeed, MICP coated areas showed no
leaching and a reduction in permeability of 1–5 orders or magnitude (Okwadha and Li 2011).
High concentrations of calcium ions in industrial wastewater are problematic because of the
clogging of pipelines, boilers and heat exchangers through scaling or malfunctioning of aerobic
and anaerobic reactors (Yu et al. 2001; Hammes et al. 2003). MICP is an alternative technology
for removal of inorganic contaminants from the environment, and many researchers have
reported the use of MICP methods for removal of calcium from industrial wastewater (Van
Langerak et al. 1997; Hammes et al. 2003). Van Langerak et al. (1997) reported the removal
of calcium from industrial wastewater using a fluidized sand bed calcification reactor that
employed the alkalinity generated by microbes in a standard up-flow anaerobic sludge bed
reactor. Using the biocatalytic calcification reactor, approximately 85–90 % (w/v) of the
soluble calcium was precipitated as calcium carbonate and successfully removed through
sedimentation in the treatment reactor (Hammes et al. 2003). Therefore, this is an effective,
eco-friendly and simple method for removal of calcium from industrial wastewater.
Over the past 15 years, MICP has been tested for its potential as an innovative soil
improvement technique for different purposes. While most of these tests were under laboratory
conditions, the MICP technique has been proved to be suitable for use in applications such as
strengthening loose sand, liquefaction control in saturated fine sand and fugitive dust control
in desert areas (Montoya and Dejong, 2013). A few field trials of these applications were also
reported. However, MICP has not demonstrated yet that it is as competitive as traditional
mainstream technologies (i.e. able to achieve similar or better engineering effectiveness with
sufficient safety margin and lower costs). Therefore, in order to fully realize the potential of
MICP as a versatile technique for soil improvement applications, exploring its multi-
functionality and upscaling its implementation in different areas will be important. Recently,
an innovative bio- based granular geomaterial based on the MICP process has been developed,
which can mitigate sediment resuspension as a result of wind erosion and enhance lake
ecosystems by promoting aquatic plant growth (Hata, et al., 2019). In another case, MICP was
found to have the potential to simultaneously immobilize heavy metals in a brownfield soil as
well as strengthening the soil for construction purposes (Jiang, et al., 2019). Other multi-
functional applications of MICP including shoreline protection (Salifu, et al., 2016), geological
hazard mitigation (Jiang, et al., 2019), soil and water conservation, and pollution control for
radionuclides are also under active research, though mostly at a preliminary stage.
Nevertheless, more research effort is needed to develop multifaceted MICP protocols that could

22
address multidisciplinary engineering challenges by coupling soil engineering performance
enhancement with ecological, environmental and carbon footprint benefits. The promising
results on MICP feasibility for different applications now require that part of the effort is
focused on the investigation of application approaches in the field.
1.3. Coastal erosion
Coastal erosion issues become more critical because coastal zones are optimal places for
population concentration and the development of productive activities, such as, industry,
transportation, tourism, etc. (Barragan and Andreis, 2015). Coastal erosion is a common
problem affecting about 75% of the world's shorelines (Bird, 1987; Zhang et al., 2004; Pilkey
and Cooper, 2014; Rangel-Buitrago, et al., 2018). Adger et al. (2005) indicated that close to
20% of the world population (1409 million inhabitants) reside less than 25 km from the
coastline, and 40% (2818 million inhabitants) live less than 100 km inside a coastal strip
representing approximately 25% of the world total surface. Coastal zone monitoring based on
aerial data, satellite or field investigating is an important task in environmental protection and
fundamental coastal management (Figure 1.4). Yogyakarta beaches were consisting of two
different types of sands, whereas iron silica sand from Mt. Merapi volcanic sedimentary and
calcareous sand from the coral reef and/or limestone formation in the eastern Yogyakarta. As
a tourist destination, the beaches such as Parangtritis-Samas-Tisik-Pandansari (Silica sand -
south central Yogyakarta) and also Krakal-Sadranan-Baron-Kukup-Drini-Pok Tunggal until
Wediombo beaches (calcareous sand - south eastern Yogyakarta) has developed as an
economic center in the coastal shoreline of Yogyakarta province.
The geomorphology of south Yogyakarta coastal area and their problems is explained in
the appendixes A about the coastal drone mapping of Yogyakarta shoreline. As a potential
economically growing area, the Yogyakarta coast has attracted over time more and more people
to reside and has a good living condition. As a consequence, the growing number of people
needs more space and starts to utilize the coast which creating vulnerable areas from coastal
hazards despite the buffer zone of 200 m according to the spatial planning has been established.
On the other hand, the south coast of Java has been suffered from geologic and climatologic
events such as tsunami in July 2006 and storm-tidal wave, last moment is Oct 2018. Beach
erosion also reported in some parts of Yogyakarta’s south coast such as Samas beach and
Parangtritis beach (Pujotomo, 2009). Those natural phenomena were reported to cause
damages to infrastructure near the shore. The establishment of a buffer zone is one of several
efforts commonly taken to reduce risk in the framework of coastal disaster risk management.

23
Coastal zone management requires to the understanding of shoreline dynamic and consider the
potential future hazard such as enhanced sea-level rise due to global warming phenomenon.
Monitoring coastal changes over time needs a complete spatial-temporal data, which is difficult
to find in Indonesia. The integration of multi-source spatial and temporal data such as
topographic maps and also satellite imageries is considered to overcome the lack of data series
availability (Marfai, et al., 2008). This study is focused on the understanding of Java South
Wates formation and sand dunes Old and young Merapi volcanoes, Sleman and Yogyakarta
formation
Kepek formation
Wonosari formation
Jonggrang and Sentolo formation
Sambipitu and Oyo formation
Kebo, Butak, Semilir, and Nglanggran
formation
Legend:
SLEMAN
YOGYAKARTA
KULON
PROGO
GUNUNG
KIDUL BANTUL
Nanggulan formation and old andesite
Provincial boundary
Kabupaten boundary
Rivers
Contour (meters)
Figure 1.4. Simplified Geological Map of Yogyakarta, Indonesia (modify from Surono, et al, 1992).
Study area
24
coast characteristics particularly in Parangtritis beach and Krakal-Sadranan beach were
beachrock were found, further studies were carried out to (i) identification of beachrock deposit
occurrences in Krakal-Sadranan, Yogyakarta (ii) develop the biomineralization based on
ureolytic bacteria from natural beachrock using calcareous and iron-silica sands, and (iii)
explore biocementation for nearshore environments as an alternative technique for sand
stabilization.
1.4 Current hardened structure erosion mitigation methods
Over the years, several mitigation measures have been used in various attempts to mitigate
or prevent coastal erosion. While some of these measures are effective, each has its own
negative consequences. These traditional shoreline stabilization techniques are discussed
below:
1.4.1 Seawalls, bulkheads, and other wall structures
Seawalls, bulkheads, and other wall structures are the most common type of hard
stabilization structure against beach erosion within the state of Florida and are used to protect
shorelines from the impacts of normal wave action. Common building materials for these
structures include timber, steel, rock, concrete, or polymers. However, these structures are not
without their issues. First, under worst-case storm conditions, wall-type structures may
overtop, which could lead to failure. After Hurricanes Irma and Matthew, the National Science
Foundation (NSF) Geotechnical Extreme Events Reconnaissance (GEER) team noted that
performance was significantly affected continuity in the sense that any “holes” or “gaps” in
bulkheads tended to also lead to upland erosion and failure (Hudyma et al. 2018). Generally,
when walls are installed, the beach on the shoreside of the structure will erode and, in some
cases, shoreside beaches may be lost entirely. This may negatively affect beach-centric tourism
environment or result in destruction of wildlife habitats (Bush, et al., 2004).
1.4.2 Breakwaters an alternative to wall-type structures are breakwaters.
While their primary purpose is wave attenuation, an added benefit to breakwaters in the
context of beach protection is sediment accumulation between the beachfront and the
breakwater. Two specific types of breakwaters that have become increasingly popular are fixed
breakwaters and submerged breakwaters. An example of a submerged breakwater is an
artificial reef, or a structure built on the seafloor. As more of these breakwater structures are
25
put into place, many of their disadvantages have become apparent. Fixed breakwaters are
permanent structures that require continuous maintenance which can become expensive. In
addition, fixed breakwaters are typically a displeasing sight to a popular shoreline, ultimately
effecting the beachfront tourism industry. Alternatively, a submerged, artificial reef placed too
close to the shoreline may result in shoreline erosion (Ranasinghe, 2006). While breakwaters
can be best suited to protect port and harbor entrances from added silt build up, they provide
little benefit as an erosion control method to a pre-existing shoreline.
1.4.3 Groins and jetties
In many coastlines of the United States, jetties and groins are sometimes used to prevent
beach erosion. Groins are walls generally built perpendicular to the shoreline used to trap and
hold sediment flowing in the long shore current. Jetties and groins are also built as T-shaped,
Y-shaped, zigzag shaped, and angled from shore. They are typically placed in groin fields,
which are multiple groins that extend like fingers away from shore (Dean, 2003). Materials
used to build these structures include rock, concrete, wood, steel, and fabric bags filled with
sand. They are intended to combat the problem of existing sediment erosion. In the state of
Florida, these structures are typically found along the east coast. Many disadvantages exist with
the placement of groins or groin fields. Updrift beaches are widened by this method, while
downdrift beaches become starved of sediment. In addition, the entrapment of sediment on one
side of the groin intensifies erosion on the other (Bush, et al., 2004).
1.4.4 Riprap and shore armoring
Riprap is another man-made shore stabilization technique used to armor a shoreline against
wind and wave erosion and scour. Riprap is simply a method of layering rock across a
threatened area to prevent further erosion. Typically, riprap is made of angular rock, rubble, or
broken concrete slabs. Riprap can be strategically placed by hand or simply dumped in an area
to form a revetment and protect from erosion and scour (Brown and Clyde, 1989). Generally,
riprap revetments are designed to have an appropriate slope and rock size to adequately protect
an area from erosion, typical slope ratios are 1:2 (vertical to horizontal) or 1:3. Layers of
smaller stone or gravel are placed under and between the larger rock to help reinforcement.
Like other traditional shoreline stabilization techniques, riprap also has some negative issues.
Often, riprap projects along the coast are faced with ongoing repair and maintenance that
become expensive and potentially problematic. Research has shown that fewer aquatic species
and vegetation live in armored revetments than in natural coastal habitats (Massey, et al., 2017).

26
The limited vegetation degrades the wildlife and threatens the breeding areas for aquatic
species. Due to the low coefficient of friction, riprap tends to increase the wave celerity in the
water which ultimately increases erosion on adjacent shorelines and scour at the toe ends of
the embankment making it a counterintuitive shore stabilization method (Brookes, 2018).
Lastly, riprap has similar issues to wall-type structures in the sense that riprap often may replace
beaches and negatively affect beach tourism.
1.4.5 Beach nourishment and dune benefits
As noted above, each method of structural beach protection has its disadvantages. In recent
years, several communities have moved away from structural-type protection measures in favor
of beach nourishment (Dean, 2003). This leaves sand dunes as the primary line of protection
against erosion, upland flooding, and upland damage. Dunes are also excellent for the
environment. Sand dunes are the primary location for sea turtle nesting and the home of many
other wildlife species. Additionally, dunes and ongoing beach nourishment projects positively
impact beach tourism. However, dunes are highly erodible and overall are very susceptible to
failure during large-scale storm events. It would be beneficial if there were a sustainable,
rapidly deployable mechanism that could be used to strengthen dunes to make them less
susceptible to erosion and scour.
1.5 Objectives
The overall goal of this research was to quantify erodibility for MICP-treated specimens in
terms of beach sand treatment against the erosion. Specimens were treated using an in-low
syringes and surface-spray technique because under field conditions, such a technique would
appear to be the most realistic way to spread MICP solutions onto dunes. Optimization testing
was conducted both in terms of initial bacterial optical density and solution volume as a
function of pore space. Investigating the beachrock mechanism and mimicking to developing
artificial rock based on MICP will be presented in detail in Chapters 3 and 5, showed that
specimens were fully treated with MICP method, but even under these conditions, the treatment
samples were investigated under durability test based on wet-drying method to prove it will
sustain for longer period. As such, under laboratory conditions, it is unlikely that a one-time
MICP treatment of a dune system will significantly reduce erosion. In addition, through
understanding the beachrock formation process, artificial rocks may be able to be formed at an
accelerated speed of consolidation. Therefore, test pieces composed of sand cemented by MICP
27
were subjected to unconfined compressive strength (UCS) tests and observed by scanning
electron microscopy (SEM). This study’s aim was to evaluate the feasibility of using the unique
and novel grout by exploiting ureolytic microbial adjustment activity in carbonate
precipitation, respectively.
1.6 Scope and organization
The scope of this thesis is an investigation of different ground improvement techniques
using biochemical methods. Chapter 2, Chapter 3 and Chapter 4 are described under
investigated of natural beachrock sedimentary process toward mechanism and precipitation in
natural processes within case study in Sumuide, Okinawa and Krakal-Sadranan, Yogyakarta,
Indonesia. Chapter 5, Chapter 6, and Chapter 7 were mentioned under the soil improvement
with MICP and as proposal to treat beach sand in-situ or ex-situ based on the research will
described in Chapter 8. Last, the general summary of all this research were concluded in
Chapter 9. Chapters of this thesis are as follows:
In Chapter 1, research background, objectives, and originality of thesis were described.
Chapter 2 consisted with geophysical investigation of buried beachrock at Krakal-Sadranan
beach, Yogyakarta, Indonesia. In Chapter 3 consisted of detail laboratory analysis toward
beachrock sediment characteristics investigation. Other hand, Chapter 4 were established of
ureolytic bacteria from Indonesian tropical shoreline which will compare between
characteristic beachrock from Okinawa, Japan. Chapter 5 is consisting of beach sand treatment
based on MICP process to mimic the natural beachrock, achievement almost similar to natural
beachrock based on chemical compound and strength. Moreover, Chapter 6 is testing of
durability based on MICP for coastal disaster countermeasures development. Chapter 7
consisted of cost reduction purposes using cheap chemical reagent from the culture media and
also cement solution for MICP treatment and Chapter 8 is the proposal of the coastal prevention
method based on ureolytic bacteria especially in Indonesia. The last, Chapter 9 summarized
and provided a conclusion that may guide future work. This dissertation flowchart described
in Figure 1.5.
1.7 Originality and usefulness of the study
The novelty of our research resides in the characterization of the ureolytic bacterial
controlled in Natural Beachrock (case study: Krakal-Sadranan, Yogyakarta, Indonesia and

28
Sumuide, Okinawa, Japan) and the study of the biodiversity and distribution of such
populations in harsh environmental conditions that prevails, and in calcareous-iron silica from
local shoreline in Yogyakarta. Also, the native ureolytic bacteria isolated from beachrock will
Table 1.1 Research originality
Danjo and Kawasaki (2014, 2016) Pararhodobacter sp. strain from local beachrock
sedimentary from Sumuide, Gima, and Yomitan
(Okinawa, Japan)
G. G. N. N. Amarakoon and
Kawasaki (2016)
Development of sustainable ground improvement
methods using biochemical techniques based on
Pararhodobacter sp.
Nawarathna, et al. (2019) Effect of chitosan (organic compound) to enhances
MICP process using Pararhodobacter sp.
Nayanthara, et al. (2019) MICP using native inland bacterium Sporosarcina sp.,
within effect of magnesium mineral for beach sand
stabilization in nearshore area Sri Lanka.
This study Lack of beachrock information in Indonesia
concerning about distribution, mechanical properties,
and sediment characteristics based on geology,
chemical, mechanical, and biological perspective.
Identification of sedimentary mechanism natural
beachrock, Indigenous ureolytic bacteria strain from
Indonesian beachrock and their efficiency of MICP
biocement based on:
• Magnesium-sodium mineral (achievement to
natural beachrock)
• Effect of carrageenan (red algae) organic
compound to enhance strength of MICP
• Biocementation using low-cost chemical
compound to decreasing cost reduction
Durability test “wetting-drying” of treatment sand
using MICP method and cost reduction based on cheap
chemical reagents.

29
be used to bio-modify the soil. Furthermore, the significance of the research lies in the
establishment of screening method to investigate the potentialities of ureolytic bacteria for their
urease activity as well as to study the response of soil subjected to biomodification on small
laboratory and field scales.
In this study, ureolytic bacteria as key role sedimentary of beachrock were deep
investigated to develop artificial rocks based on microbial induce using native indigenous
strain. The usefulness of this study from the viewpoint of effectiveness, sedimentary
characteristics, and cost reduction may be one hint to promote this method as a large-scale
practical application in the future. Furthermore, previous studies related to the MICP have been
focused to obtain several MPa values of UCS. However, this study focused to obtain similar to
natural beachrock and identify the durability of artificial rocks to mitigate the coastal disaster
using biocementation.
1.8 Originality of the thesis
Many types of research as mentioned in the Section 1.3.1. were observed sand
solidification with MICP method by using common ureolytic bacteria such as Sporosarcina
pasteurii (formerly Bacillus pasteurii) and Bacillus sphaericus. From this research study, we
introduced a new uearlytic bacteria for the MICP process. The bacterium was Pararhodobacter
sp. which was found from Okinawa, Japan and local bacteria were isolated from Krakal-
Sadranan beach whereas Oceanobacillus profundus, Vibrio maritimus, and
Pseudoalteromonas tetradonis. It was originality of this research.
Moreover, previous researchers (Danjo and Kawasaki, 2016; Khan, et al., 2015)
conducted solidification using Pararhodobacter sp. for marine purposes and they used
artificial sea water for cultivation of bacteria and solidification process. However, in this
research solidification with ureolytic bacteria was used for land usage whilst distilled water
was introduced instead of artificial seawater. Also, another originality, we tried to find the
reaction mechanism in microbial activity based on glucose complex and protein that assumed
pathway of Ca2+ ion binding enzyme. The durability of materials after treated by MICP is
conducted to clarify the long-term feasibility improvement with soaked in fresh water and also
seawater to indicate this method are feasible in the shoreline areas. The cost reduction also
investigated based on cheap chemical reagents from cultured media and cement solution for
MICP treatment for economical feasibility of the MICP products. This will provide new
knowledge about biotechnology and will greatly contribute to the development of
environmental resource engineering.
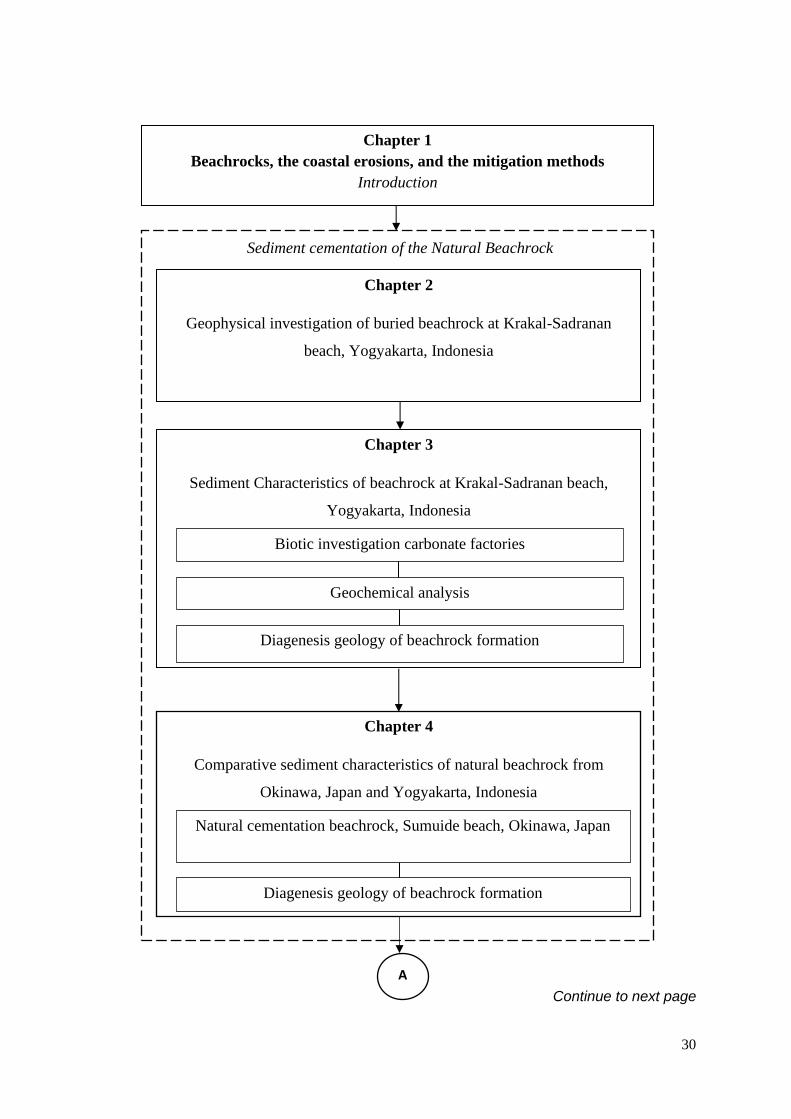
30
Continue to next page
Chapter 1
Beachrocks, the coastal erosions, and the mitigation methods Introduction
Chapter 2
Geophysical investigation of buried beachrock at Krakal-Sadranan
beach, Yogyakarta, Indonesia
Sediment cementation of the Natural Beachrock
Natural cementation beachrock, Sumuide beach, Okinawa, Japan
Chapter 4
Comparative sediment characteristics of natural beachrock from
Okinawa, Japan and Yogyakarta, Indonesia
Diagenesis geology of beachrock formation
Chapter 3
Sediment Characteristics of beachrock at Krakal-Sadranan beach,
Yogyakarta, Indonesia
Geochemical analysis
Diagenesis geology of beachrock formation
Biotic investigation carbonate factories
A

31
Figure 1.5. Flow chart of this research
A
0
Chapter 8
Tentative proposal of coastal preservation method
Chapter 5
Beach sand solidification test using MICP method
MICP based on local indigenous strain
Chapter 7
MICP beach sand treatment using cheap chemical reagents
Effect of polysaccharides biopolymers on strength
Effect of cementation ion solutions on strength
Chapter 6
Durability test of MICP beach sand treatment
Ureolytic isolation bacteria from natural beachrock
Shoreline model solidification test
Chapter 9
General conclusions and future research
Artificial beachrock

32
References
Achal, V. and Pan, X., 2011. Characterization of urease and carbonic anhydrase producing
bacteria and their role in calcite precipitation. Current microbiology, 62(3), pp.894-902.
Achal, V. and Pan, X., 2014. Influence of calcium sources on microbially induced calcium
carbonate precipitation by Bacillus sp. CR2. Applied biochemistry and biotechnology, 173(1),
pp.307-317.
Achal, V., Kumari, D. and Pan, X., 2011. Bioremediation of chromium contaminated soil
by a brown-rot fungus, Gloeophyllum sepiarium. Research Journal of Microbiology, 6(2),
pp.166-171.
Achal, V., Mukherjee, A., Basu, P.C. and Reddy, M.S., 2009. Strain improvement of
Sporosarcina pasteurii for enhanced urease and calcite production. Journal of industrial
microbiology & biotechnology, 36(7), pp.981-988.
Achal, V., Mukherjee, A., Kumari, D. and Zhang, Q., 2015. Biomineralization for
sustainable construction–A review of processes and applications. Earth-science reviews, 148,
pp.1-17.
Adger, W.N., Hughes, T.P., Folke, C., Carpenter, S.R. and Rockström, J., 2005. Social-
ecological resilience to coastal disasters. Science, 309(5737), pp.1036-1039.
Al-Thawadi, S.M., 2011. Ureolytic bacteria and calcium carbonate formation as a
mechanism of strength enhancement of sand. J. Adv. Sci. Eng. Res, 1(1), pp.98-114.
Alves, D. and Olívia Pereira, M., 2014. Mini-review: Antimicrobial peptides and enzymes
as promising candidates to functionalize biomaterial surfaces. Biofouling, 30(4), pp.483-499.
Amarakoon, G.G.N.N. and Kawasaki, S., 2016. Factors affecting the improvement of sand
properties treated with microbially-induced calcite precipitation. In Geo-Chicago 2016 (pp. 72-
83).
Annamalai, S.K., Arunachalam, K.D. and Sathyanarayanan, K.S., 2012. Production and
characterization of Bio Caulk by Bacillus pasteurii and its remediation properties with carbon
nano tubes on concrete fractures and fissures. Materials Research Bulletin, 47(11), pp.3362-
3368.
33
Arias, D., Cisternas, L.A. and Rivas, M., 2017. Biomineralization of calcium and
magnesium crystals from seawater by halotolerant bacteria isolated from Atacama Salar
(Chile). Desalination, 405, pp.1-9.
Arp, G., Reimer, A. and Reitner, J., 1999. Calcification in cyanobacterial biofilms of
alkaline salt lakes. European Journal of Phycology, 34(4), pp.393-403.
Bachmeier, K.L., Williams, A.E., Warmington, J.R. and Bang, S.S., 2002. Urease activity
in microbiologically-induced calcite precipitation. Journal of Biotechnology, 93(2), pp.171-
181.
Bang, S.S. and Ramakrishnan, V., 2001, November. Microbiologically-enhanced crack
remediation (MECR). In proceedings of the international symposium on industrial application
of microbial genomes (pp. 3-13).
Barragán, J.M. and de Andrés, M., 2015. Analysis and trends of the world's coastal cities
and agglomerations. Ocean & Coastal Management, 114, pp.11-20.
Beier, J.A., 1985. Diagenesis of Quaternary Bahamian beachrock; petrographic and
isotopic evidence. Journal of Sedimentary Research, 55(5), pp.755-761.
Berner, R.A., 1971. Principles of chemical sedimentology.
Betzler, C., Brachert, T.C. and Nebelsick, J., 1997. The warm temperate carbonate
province: a review of the facies, zonations, and delimitations. Courier Forschungsinstitut
Senckenberg, 201, pp.83-99.
Binod, P., Palkhiwala, P., Gaikaiwari, R., Nampoothiri, K.M., Duggal, A., Dey, K. and
Pandey, A., 2013. Industrial enzymes-present status and future perspectives for India.
Bird, E.C., 1994. Physical setting and geomorphology of coastal lagoons. Coastal lagoon
processes, 60, pp.9-37.
Bird, E.C.F., 1987. The modern prevalence of beach erosion. Marine Pollution Bulletin,
18(4), pp.151-157.
Bosak, T. and Newman, D.K., 2005. Microbial kinetic controls on calcite morphology in
supersaturated solutions. Journal of Sedimentary Research, 75(2), pp.190-199.
Braissant, O., Decho, A.W., Dupraz, C., Glunk, C., Przekop, K.M. and Visscher, P.T.,
2007. Exopolymeric substances of sulfate‐reducing bacteria: interactions with calcium at
34
alkaline pH and implication for formation of carbonate minerals. Geobiology, 5(4), pp.401-
411.
Brandley, R.T. and Krause, F.F., 1997. Cool-water carbonates. SEPM (Society for
Sedimentary Geology) Special Publication, 56, pp.365-390.
Bretzel, W., Schurter, W., Ludwig, B., Kupfer, E., Doswald, S., Pfister, M. and Van Loon,
A.P.G.M., 1999. Commercial riboflavin production by recombinant Bacillus subtilis: down-
stream processing and comparison of the composition of riboflavin produced by fermentation
or chemical synthesis. Journal of Industrial Microbiology and Biotechnology, 22(1), pp.19-26.
Brookes, A., 2018. Alternative channelization procedures. In Alternatives in regulated river
management (pp. 149-172). CRC Press.
Brown, S.A. and Clyde, E.S., 1989. Design of riprap revetment (No. FHWA-IP-89-016).
United States. Federal Highway Administration.
Burne, R.A. and Chen, Y.Y.M., 2000. Bacterial ureases in infectious diseases. Microbes
and Infection, 2(5), pp.533-542.
Bush, D.M., Longo, N.J., Neal, W.J., Lindeman, K.C., Pilkey, D.F., Esteves, L.S.,
Congleton, J. and Pilkey Jr, O.H., 2004. Living with Florida's Atlantic beaches: coastal hazards
from Amelia Island to Key West. Duke University Press.
Cam, N., Benzerara, K., Georgelin, T., Jaber, M., Lambert, J.F., Poinsot, M., Skouri‐Panet,
F., Moreira, D., López‐García, P., Raimbault, E. and Cordier, L., 2018. Cyanobacterial
formation of intracellular Ca‐carbonates in undersaturated solutions. Geobiology, 16(1), pp.49-
61.
Cam, N., Georgelin, T., Jaber, M., Lambert, J.F. and Benzerara, K., 2015. In vitro synthesis
of amorphous Mg-, Ca-, Sr-and Ba-carbonates: what do we learn about intracellular
calcification by cyanobacteria?. Geochimica et Cosmochimica Acta, 161, pp.36-49.
Castanier, S., Le Métayer-Levrel, G. and Perthuisot, J.P., 1999. Ca-carbonates precipitation
and limestone genesis—the microbiogeologist point of view. Sedimentary geology, 126(1-4),
pp.9-23.
Chekroun, K.B., Rodríguez-Navarro, C., Gonzalez-Munoz, M.T., Arias, J.M., Cultrone, G.
and Rodríguez-Gallego, M., 2004. Precipitation and growth morphology of calcium carbonate

35
induced by Myxococcus xanthus: implications for recognition of bacterial carbonates. Journal
of Sedimentary Research, 74(6), pp.868-876.
Chen, X., Qian, X. and An, X., 2011. Using calcium carbonate whiskers as papermaking
filler. BioResources, 6(3), pp.2435-2447.
Chua, T.E. and Garces, L.R., 1993. Regional efforts in the management of the coastal and
marine environments in the ASEAN region.
Collins, L.B., France, R.E., Zhu, Z.R. and Wyrwoll, K.H., 1997. Warm-water platform and
cool-water shelf carbonates of the Abrolhos Shelf, Southwest Australia.
Danjo, T. and Kawasaki, S., 2011, January. Property evaluation of beachrock based on field
investigation in Okinawa Island, Japan. In 12th ISRM Congress. International Society for Rock
Mechanics and Rock Engineering.
Danjo, T. and Kawasaki, S., 2013. A study of the formation mechanism of beachrock in
Okinawa, Japan: Toward Making Artificial Rock. Int. J. of Geomate, 5(1), pp.633-638.
Danjo, T. and Kawasaki, S., 2014. Characteristics of beachrocks: a review. Geotechnical
and Geological Engineering, 32(2), pp.215-246.
Danjo, T. and Kawasaki, S., 2014. Formation mechanisms of beachrocks in Okinawa and
Ishikawa, Japan, with a Focus on Cements. Materials Transactions, pp.M-M2013844.
Danjo, T. and Kawasaki, S., 2016. Microbially induced sand cementation method using
Pararhodobacter sp. strain SO1, inspired by beachrock formation mechanism. Materials
Transactions, 57(3), pp.428-437.
Darwin, C., 1841. XXXVII. On a remarkable bar of sandstone off Pernambuco, on the coast
of Brazil. The London, Edinburgh, and Dublin Philosophical Magazine and Journal of Science,
19(124), pp.257-260.
David, P., Panagiotis, T. and Konstantinos, A., 2009. Electrical resistivity tomography
mapping of beachrocks: application to the island of Thassos (N. Greece). Environmental Earth
Sciences, 59(1), p.233.
Davies, P.J. and Kinsey, D.W., 1973. Organic and inorganic factors in recent beach rock
formation, Heron Island, Great Barrier Reef. Journal of Sedimentary Research, 43(1), pp.59-
81.

36
Davies, P.J., Bubela, B. and Ferguson, J., 1978. The formation of ooids. Sedimentology,
25(5), pp.703-730.
De Muynck, W., De Belie, N. and Verstraete, W., 2010. Microbial carbonate precipitation
in construction materials: a review. Ecological Engineering, 36(2), pp.118-136.
De Yoreo, J.J. and Vekilov, P.G., 2003. Principles of crystal nucleation and growth.
Reviews in mineralogy and geochemistry, 54(1), pp.57-93.
Dean, R.G., 2003. Beach nourishment: theory and practice (Vol. 18). World Scientific
Publishing Company.
DeJong, J.T., Fritzges, M.B. and Nüsslein, K., 2006. Microbially induced cementation to
control sand response to undrained shear. Journal of Geotechnical and Geoenvironmental
Engineering, 132(11), pp.1381-1392.
DeJong, J.T., Soga, K., Kavazanjian, E., Burns, S., Van Paassen, L.A., Al Qabany, A.,
Aydilek, A., Bang, S.S., Burbank, M., Caslake, L.F. and Chen, C.Y., 2014. Biogeochemical
processes and geotechnical applications: progress, opportunities and challenges. In Bio-and
Chemo-Mechanical Processes in Geotechnical Engineering: Géotechnique Symposium in Print
2013 (pp. 143-157). Ice Publishing.
Dhami, N.K., Mukherjee, A. and Reddy, M.S., 2016. Micrographical, minerological and
nano-mechanical characterisation of microbial carbonates from urease and carbonic anhydrase
producing bacteria. Ecological engineering, 94, pp.443-454.
Dhami, N.K., Reddy, M.S. and Mukherjee, A., 2013. Bacillus megaterium mediated
mineralization of calcium carbonate as biogenic surface treatment of green building materials.
World Journal of Microbiology and Biotechnology, 29(12), pp.2397-2406.
Dhami, N.K., Reddy, M.S. and Mukherjee, A., 2014. Synergistic role of bacterial urease
and carbonic anhydrase in carbonate mineralization. Applied biochemistry and biotechnology,
172(5), pp.2552-2561.
Dick, J., De Windt, W., De Graef, B., Saveyn, H., Van der Meeren, P., De Belie, N. and
Verstraete, W., 2006. Bio-deposition of a calcium carbonate layer on degraded limestone by
Bacillus species. Biodegradation, 17(4), pp.357-367.

37
Dickinson, W.R., Burley, D.V. and Shutler Jr, R., 1999. Holocene paleoshoreline record in
Tonga: geomorphic features and archaeological implications. Journal of Coastal Research,
pp.682-700.
Douglas, S. and Beveridge, T.J., 1998. Mineral formation by bacteria in natural microbial
communities. FEMS microbiology ecology, 26(2), pp.79-88.
Dupraz, C. and Visscher, P.T., 2005. Microbial lithification in marine stromatolites and
hypersaline mats. Trends in microbiology, 13(9), pp.429-438.
Ehrlich, H.L. and Newman, D.K., 2009. Geomicrobiology of sulfur.
Geomicrobiology,(Boca Raton, FL: Taylor & Francis), pp.439-489.
Erginal, A.E., Kıyak, N.G. and Öztürk, B., 2010. Investigation of beachrock using
microanalyses and OSL dating: a case study from Bozcaada Island, Turkey. Journal of Coastal
research, pp.350-358.
Favre, N., Christ, M.L. and Pierre, A.C., 2009. Biocatalytic capture of CO2 with carbonic
anhydrase and its transformation to solid carbonate. Journal of Molecular Catalysis B:
Enzymatic, 60(3-4), pp.163-170.
Ferrer, M.R., Quevedo-Sarmiento, J., Rivadeneyra, M.A., Bejar, V., Delgado, R. and
Ramos-Cormenzana, A., 1988. Calcium carbonate precipitation by two groups of moderately
halophilic microorganisms at different temperatures and salt concentrations. Current
Microbiology, 17(4), pp.221-227.
Fujita, Y., Taylor, J.L., Gresham, T.L., Delwiche, M.E., Colwell, F.S., McLing, T.L.,
Petzke, L.M. and Smith, R.W., 2008. Stimulation of microbial urea hydrolysis in groundwater
to enhance calcite precipitation. Environmental science & technology, 42(8), pp.3025-3032.
Ganendra, G., De Muynck, W., Ho, A., Arvaniti, E.C., Hosseinkhani, B., Ramos, J.A.,
Rahier, H. and Boon, N., 2014. Formate oxidation-driven calcium carbonate precipitation by
Methylocystis parvus OBBP. Appl. Environ. Microbiol., 80(15), pp.4659-4667.
Gebauer, D., Gunawidjaja, P.N., Ko, J.P., Bacsik, Z., Aziz, B., Liu, L., Hu, Y., Bergström,
L., Tai, C.W., Sham, T.K. and Edén, M., 2010. Proto‐calcite and proto‐vaterite in amorphous
calcium carbonates. Angewandte Chemie International Edition, 49(47), pp.8889-8891.
Ghosh, P., Mandal, S., Chattopadhyay, B.D. and Pal, S., 2005. Use of microorganism to
improve the strength of cement mortar. Cement and Concrete Research, 35(10), pp.1980-1983.

38
Ginsburg, I., 1953. The taxonomic status and nomenclature of some Atlantic and Pacific
populations of yellowfin and bluefin tunas. Copeia, 1953(1), pp.1-10.
Gischler, E. and Lomando, A.J., 1997. Holocene cemented beach deposits in Belize.
Sedimentary Geology, 110(3-4), pp.277-297.
Gischler, E., 2007. Beachrock and intertidal precipitates. Geochemical Sediments and
Landscapes, pp.365-390.
Goddette, D.W., Paech, C., Yang, S.S., Mielenz, J.R., Bystroff, C., Wilke, M.E. and
Fletterick, R.J., 1992. The crystal structure of the Bacillus lentus alkaline protease, subtilisin
BL, at 1.4 Å resolution. Journal of molecular biology, 228(2), pp.580-595.
González-Muñoz, M.T., Rodriguez-Navarro, C., Martínez-Ruiz, F., Arias, J.M., Merroun,
M.L. and Rodriguez-Gallego, M., 2010. Bacterial biomineralization: new insights from
Myxococcus-induced mineral precipitation. Geological Society, London, Special Publications,
336(1), pp.31-50.
Gorospe, C.M., Han, S.H., Kim, S.G., Park, J.Y., Kang, C.H., Jeong, J.H. and So, J.S.,
2013. Effects of different calcium salts on calcium carbonate crystal formation by Sporosarcina
pasteurii KCTC 3558. Biotechnology and bioprocess engineering, 18(5), pp.903-908.
Gorospe, C.M., Han, S.H., Kim, S.G., Park, J.Y., Kang, C.H., Jeong, J.H. and So, J.S.,
2013. Effects of different calcium salts on calcium carbonate crystal formation by Sporosarcina
pasteurii KCTC 3558. Biotechnology and bioprocess engineering, 18(5), pp.903-908.
Goudie, A., 1969. Statistical laws and dune ridges in southern Africa. The Geographical
Journal, 135(3), pp.404-406.
Groth, P. Schumann, L. Laiz, S. Sanchez-Moral, JC Cañveras, C. Saiz-Jimenez, I., 2001.
Geomicrobiological study of the grotta dei cervi, Porto Badisco, Italy. Geomicrobiology
Journal, 18(3), pp.241-258.
Hamdan, N., Kavazanjian Jr, E. and Rittmann, B.E., 2011. Sequestration of radionuclides
and metal contaminants through microbially-induced carbonate precipitation. In Proc. 14th Pan
American Conf. Soil Mech. Geotech. Engng, Toronto.
Hammes, F. and Verstraete, W., 2002. Key roles of pH and calcium metabolism in
microbial carbonate precipitation. Reviews in environmental science and biotechnology, 1(1),
pp.3-7.

39
Hammes, F., Boon, N., Clement, G., de Villiers, J., Siciliano, S.D. and Verstraete, W.,
2003. Molecular, biochemical and ecological characterisation of a bio-catalytic calcification
reactor. Applied microbiology and biotechnology, 62(2-3), pp.191-201.
Hammes, F., Boon, N., de Villiers, J., Verstraete, W. and Siciliano, S.D., 2003. Strain-
specific ureolytic microbial calcium carbonate precipitation. Appl. Environ. Microbiol., 69(8),
pp.4901-4909.
Hanor, J.S., 1978. Precipitation of beachrock cements; mixing of marine and meteoric
waters vs. CO 2-degassing. Journal of Sedimentary Research, 48(2), pp.489-501.
Hata, T., Suetsugu, D., Kawachi, A. and Irie, M., 2019. Development of an eco-friendly
bio-based granular geomaterial for the environmental restoration of Ichkeul Lake, Tunisia.
Euro-Mediterranean Journal for Environmental Integration, 4(1), p.21.
Hedegaard, I.B., Deigaard, R. and Fredsøe, J., 1991. Onshore/offshore sediment transport
and morphological modelling of coastal profiles. In Coastal Sediments (pp. 643-657). ASCE.
Hopley, D., 1986. Beachrock as a sea-level indicator. In Sea-level research (pp. 157-173).
Springer, Dordrecht.
Hua, B., Deng, B., Thornton, E.C., Yang, J. and Amonette, J.E., 2007. Incorporation of
chromate into calcium carbonate structure during coprecipitation. Water, air, and soil pollution,
179(1-4), pp.381-390.
Hudyma, N., Davies, M., Crowley, R., Ellis, T.N. and Miller, J., 2018, August. Microbially
Induced Calcite Precipitation for the Improvement of Porous Building Stone. In 52nd US Rock
Mechanics/Geomechanics Symposium. American Rock Mechanics Association.
Ibrahim, C.O., 2008. Development of applications of industrial enzymes from Malaysian
indigenous microbial sources. Bioresource technology, 99(11), pp.4572-4582.
Ivanov, V. and Chu, J., 2008. Applications of microorganisms to geotechnical engineering
for bioclogging and biocementation of soil in situ. Reviews in Environmental Science and
Bio/Technology, 7(2), pp.139-153.
James, N.P., 1997. The cool-water carbonate depositional realm. Cool-water carbonate.

40
Jansson, C. and Northen, T., 2010. Calcifying cyanobacteria—the potential of
biomineralization for carbon capture and storage. Current Opinion in Biotechnology, 21(3),
pp.365-371.
Jha, B.K., Pragash, M.G., Cletus, J., Raman, G. and Sakthivel, N., 2009. Simultaneous
phosphate solubilization potential and antifungal activity of new fluorescent pseudomonad
strains, Pseudomonasaeruginosa, P. plecoglossicida and P. mosselii. World Journal of
Microbiology and Biotechnology, 25(4), pp.573-581.
Jiang, N.J., Liu, R., Du, Y.J. and Bi, Y.Z., 2019. Microbial induced carbonate precipitation
for immobilizing Pb contaminants: Toxic effects on bacterial activity and immobilization
efficiency. Science of The Total Environment, 672, pp.722-731.
Jiang, N.J., Tang, C.S., Yin, L.Y., Xie, Y.H. and Shi, B., 2019. Applicability of microbial
calcification method for sandy-slope surface erosion control. Journal of Materials in Civil
Engineering, 31(11), p.04019250.
Jones, A. and Phillips, M., 2011. Introduction-disappearing destinations: current issues,
challenges and polemics. Disappearing destinations: Climate change and future challenges for
coastal tourism, pp.1-9.
Jonkers, H.M. and Schlangen, E., 2008, May. Development of a bacteria-based self healing
concrete. In Proc. int. FIB symposium (Vol. 1, pp. 425-430).
Jørgensen, P.L., Tangney, M., Pedersen, P.E., Hastrup, S., Diderichsen, B. and Jørgensen,
S.T., 2000. Cloning and sequencing of an alkaline protease gene from Bacillus lentus and
amplification of the gene on the B. lentus chromosome by an improved technique. Appl.
Environ. Microbiol., 66(2), pp.825-827.
Kang, C.H., Han, S.H., Shin, Y., Oh, S.J. and So, J.S., 2014. Bioremediation of Cd by
microbially induced calcite precipitation. Applied biochemistry and biotechnology, 172(6),
pp.2907-2915.
Kawaguchi, T. and Decho, A.W., 2002. A laboratory investigation of cyanobacterial
extracellular polymeric secretions (EPS) in influencing CaCO3 polymorphism. Journal of
Crystal Growth, 240(1-2), pp.230-235.
Kelletat, D., 2006. Beachrock as sea-level indicator? Remarks from a geomorphological
point of view. Journal of Coastal Research, 2006(226), pp.1558-1564.

41
Khan, M.N.H., GGNN, A., Shimazaki, S. and Kawasaki, S., 2015. Coral sand solidification
test based on microbially induced carbonate precipitation using ureolytic bacteria. Materials
transactions, 56(10), pp.1725-1732.
Krumbein, W.E., 1979. Photolithotropic and chemoorganotrophic activity of bacteria and
algae as related to beachrock formation and degradation (Gulf of Aqaba, Sinai).
Geomicrobiology Journal, 1(2), pp.139-203.
Kubo, R., Kawasaki, S., Suzuki, K., Yamaguchi, S. and Hata, T., 2014. Geological
exploration of beachrock through geophysical surveying on Yagaji Island, Okinawa, Japan.
Materials Transactions, pp.M-M2013839.
Kuenen, P.H., 1950. Slump structures in the Waitemata Beds around Auckland. In
Transactions of the Royal Society of New Zealand (Vol. 78, pp. 467-475).
Kumari, D., Qian, X.Y., Pan, X., Achal, V., Li, Q. and Gadd, G.M., 2016. Microbially-
induced carbonate precipitation for immobilization of toxic metals. In Advances in applied
microbiology (Vol. 94, pp. 79-108). Academic Press.
Langevin, E.T. and Bourque, J.A., Thermo Electron Web Systems Inc, 1992.
Simultaneously controlled steam shower and vacuum apparatus and method of using same.
U.S. Patent 5,149,401.
Lees, A. and Buller, A.T., 1972. Modern temperate-water and warm-water shelf carbonate
sediments contrasted. Marine Geology, 13(5), pp.M67-M73.
Li, F., Wu, Y., Hutchins, D.A., Fu, F. and Gao, K., 2016. Physiological responses of coastal
and oceanic diatoms to diurnal fluctuations in seawater carbonate chemistry under two CO 2
concentrations. Biogeosciences, 13(22).
Li, J., Margaret Oliver, I., Cam, N., Boudier, T., Blondeau, M., Leroy, E., Cosmidis, J.,
Skouri-Panet, F., Guigner, J.M., Férard, C. and Poinsot, M., 2016. Biomineralization patterns
of intracellular carbonatogenesis in cyanobacteria: molecular hypotheses. Minerals, 6(1), p.10.
Li, M., Cheng, X. and Guo, H., 2013. Heavy metal removal by biomineralization of urease
producing bacteria isolated from soil. International Biodeterioration & Biodegradation, 76,
pp.81-85.

42
Lin, H., Suleiman, M.T., Brown, D.G. and Kavazanjian Jr, E., 2016. Mechanical behavior
of sands treated by microbially induced carbonate precipitation. Journal of Geotechnical and
Geoenvironmental Engineering, 142(2), p.04015066.
Ling, J., Huang, C.Z., Li, Y.F., Zhang, L., Chen, L.Q. and Zhen, S.J., 2009. Light-scattering
signals from nanoparticles in biochemical assay, pharmaceutical analysis and biological
imaging. TRAC Trends in Analytical Chemistry, 28(4), pp.447-453.
Lowenstam, H.A. and Weiner, S., 1989. On biomineralization. Oxford University Press on
Demand.
Lyell, C., 1837. Principles of geology: being an inquiry how far the former changes of the
earth's surface are referable to causes now in operation (Vol. 1). J. Kay, jun. & brother.
Marfai, M.A., King, L., Singh, L.P., Mardiatno, D., Sartohadi, J., Hadmoko, D.S. and Dewi,
A., 2008. Natural hazards in Central Java Province, Indonesia: an overview. Environmental
Geology, 56(2), pp.335-351.
Massey, W., 2017. Assessing the impact of riprap bank stabilization on fish habitat: A study
of Lowland and Appalachian streams in Southern Québec (Doctoral dissertation, Concordia
University).
McKenzie, R.M., 1971. The synthesis of birnessite, cryptomelane, and some other oxides
and hydroxides of manganese. Mineralogical magazine, 38(296), pp.493-502.
McLean, R.F., 1967. Origin and development of ridge-furrow systems in beachrock in
Barbados, West Indies. Marine Geology, 5(3), pp.181-193.
Meyer, D.L., Ausich, W.I., Bohl, D.T., Norris, W.A., Potter, P.E., Monty, C.L.V., Bosence,
D.W.J., Bridges, P.H. and Pratt, B.R., 1995. Carbonate mud-mounds in the Fort Payne
Formation (lower Carboniferous), Cumberland Saddle region, Kentucky and Tennessee, USA.
Carbonate Mud-Mounds. Their Origin and Evolution, pp.273-287.
Mitchell, A.C., Dideriksen, K., Spangler, L.H., Cunningham, A.B. and Gerlach, R., 2010.
Microbially enhanced carbon capture and storage by mineral-trapping and solubility-trapping.
Environmental science & technology, 44(13), pp.5270-5276.
Mobley, H.L. and Hausinger, R.P., 1989. Microbial ureases: significance, regulation, and
molecular characterization. Microbiology and Molecular Biology Reviews, 53(1), pp.85-108.

43
Molenaar, N. and Venmans, A.A.M., 1993. Calcium carbonate cementation of sand: a
method for producing artificially cemented samples for geotechnical testing and a comparison
with natural cementation processes. Engineering Geology, 35(1-2), pp.103-122.
Montoya, B.M. and Dejong, J.T., 2013. Healing of biologically induced cemented sands.
Geotechnique Letters, 3(3), pp.147-151.
Monty, C.L., 1995. The rise and nature of carbonate mud‐mounds: an introductory
actualistic approach. Carbonate Mud‐Mounds: Their Origin and Evolution, pp.11-48.
Morse, J.W. and Mackenzie, F.T., 1990. Geochemistry of sedimentary carbonates.
Elsevier.
Mortensen, B.M., Haber, M.J., DeJong, J.T., Caslake, L.F. and Nelson, D.C., 2011. Effects
of environmental factors on microbial induced calcium carbonate precipitation. Journal of
applied microbiology, 111(2), pp.338-349.
Narayan, S., Nicholls, R.J., Clarke, D., Hanson, S., Reeve, D., Horrillo-Caraballo, J., Le
Cozannet, G., Hissel, F., Kowalska, B., Parda, R. and Willems, P., 2014. The SPR systems
model as a conceptual foundation for rapid integrated risk appraisals: Lessons from Europe.
Coastal Engineering, 87, pp.15-31.
Natarajan, K.R., 1995. Kinetic study of the enzyme urease from Dolichos biflorus. Journal
of chemical education, 72(6), p.556.
Nawarathna, T.H.K., Nakashima, K. and Kawasaki, S., 2019. Chitosan enhances calcium
carbonate precipitation and solidification mediated by bacteria. International journal of
biological macromolecules, 133, pp.867-874.
Neumeier, U., 1998. Tidal dunes and sand waves in deep outer-shelf environments,
Bajocian, SE Jura, France. Journal of Sedimentary Research, 68(3), pp.507-514.
Neumeier, U., 1999. Experimental modelling of beachrock cementation under microbial
influence. Sedimentary geology, 126(1-4), pp.35-46.
Neuweiler, F., d'Orazio, V., Immenhauser, A., Geipel, G., Heise, K.H., Cocozza, C. and
Miano, T.M., 2003. Fulvic acid–like organic compounds control nucleation of marine calcite
under suboxic conditions. Geology, 31(8), pp.681-684.

44
Ng, W.S., Lee, M.L. and Hii, S.L., 2012. An overview of the factors affecting microbial-
induced calcite precipitation and its potential application in soil improvement. World Academy
of Science, Engineering and Technology, 62(2), pp.723-729.
Nielsen, K.M., Bones, A.M., Smalla, K. and van Elsas, J.D., 1998. Horizontal gene transfer
from transgenic plants to terrestrial bacteria–a rare event?. FEMS microbiology reviews, 22(2),
pp.79-103.
Nolan, B.T., 1999. Nitrate behavior in ground waters of the southeastern USA. Journal of
Environmental Quality, 28(5), pp.1518-1527.
Obst, M., Dynes, J.J., Lawrence, J.R., Swerhone, G.D.W., Benzerara, K., Karunakaran, C.,
Kaznatcheev, K., Tyliszczak, T. and Hitchcock, A.P., 2009. Precipitation of amorphous CaCO3
(aragonite-like) by cyanobacteria: a STXM study of the influence of EPS on the nucleation
process. Geochimica et Cosmochimica Acta, 73(14), pp.4180-4198.
Okwadha, G.D. and Li, J., 2010. Optimum conditions for microbial carbonate precipitation.
Chemosphere, 81(9), pp.1143-1148.
Okwadha, G.D. and Li, J., 2011. Biocontainment of polychlorinated biphenyls (PCBs) on
flat concrete surfaces by microbial carbonate precipitation. Journal of environmental
management, 92(10), pp.2860-2864.
Pandey, A. ed., 2011. Biofuels: alternative feedstocks and conversion processes. Academic
Press.
Park, S.S., 2010. Effect of wetting on unconfined compressive strength of cemented sands.
Journal of geotechnical and geoenvironmental engineering, 136(12), pp.1713-1720.
Pedone, V.A. and Folk, R.L., 1996. Formation of aragonite cement by nannobacteria in the
Great Salt Lake, Utah. Geology, 24(8), pp.763-765.
Phillips, A.J., Gerlach, R., Lauchnor, E., Mitchell, A.C., Cunningham, A.B. and Spangler,
L., 2013. Engineered applications of ureolytic biomineralization: a review. Biofouling, 29(6),
pp.715-733.
Phillips, A.J., Lauchnor, E., Eldring, J., Esposito, R., Mitchell, A.C., Gerlach, R.,
Cunningham, A.B. and Spangler, L.H., 2013. Potential CO2 leakage reduction through
biofilm-induced calcium carbonate precipitation. Environmental science & technology, 47(1),
pp.142-149.

45
Pilkey, O.H. and Cooper, J.A.G., 2014. Are natural beaches facing extinction?. Journal of
Coastal Research, 70(sp1), pp.431-436.
Pilkey, O.H. and Cooper, J.A.G., 2014. Are natural beaches facing extinction?. Journal of
Coastal Research, 70(sp1), pp.431-436.
Pope, M.C., Fred Read, J., Bambach, R. and Hofmann, H.J., 1997. Late Middle to Late
Ordovician seismites of Kentucky, southwest Ohio and Virginia: sedimentary recorders of
earthquakes in the Appalachian basin. Geological Society of America Bulletin, 109(4), pp.489-
503.
Pouget, E.M., Bomans, P.H., Goos, J.A., Frederik, P.M. and Sommerdijk, N.A., 2009. The
initial stages of template-controlled CaCO3 formation revealed by cryo-TEM. Science,
323(5920), pp.1455-1458.
Pujotomo, M.S. and Sudibyakto, H.A., 2009, February. Coastal changes assessment using
multi spatio-temporal data for coastal spatial planning Parangtritis Beach Yogyakarta
Indonesia. ITC.
Qabany, A.A. and Soga, K., 2014. Effect of chemical treatment used in MICP on
engineering properties of cemented soils. In Bio-and Chemo-Mechanical Processes in
Geotechnical Engineering: Géotechnique Symposium in Print 2013 (pp. 107-115). ICE
Publishing.
Ramachandran, S.K., Ramakrishnan, V. and Bang, S.S., 2001. Remediation of concrete
using micro-organisms. ACI Materials Journal-American Concrete Institute, 98(1), pp.3-9.
Ranasinghe, R. and Turner, I.L., 2006. Shoreline response to submerged structures: a
review. Coastal Engineering, 53(1), pp.65-79.
Rangel-Buitrago, N., Williams, A.T. and Anfuso, G., 2018. Hard protection structures as a
principal coastal erosion management strategy along the Caribbean coast of Colombia. A
chronicle of pitfalls. Ocean & Coastal Management, 156, pp.58-75.
Reitner, B., Herndl, G.J. and Herzig, A., 1997. Role of ultraviolet‐B radiation on
photochemical and microbial oxygen consumption in a humic‐rich shallow lake. Limnology
and oceanography, 42(5), pp.950-960.
46
Reitner, J. and Neuweiler, F., 1995. Supposed principal controlling factors of rigid micrite
buildups. Mud Mounds: a Polygenic Spectrum of Fine-grained Carbonate Buildup. Facies,
pp.62-64.
Reitner, J., Neuweiler, F. and Gautret, P., 1995a. Modern and fossil automicrites:
implications for mud mound genesis. Facies, 32, pp.4-17.
Riding, R., 2006. Microbial carbonate abundance compared with fluctuations in metazoan
diversity over geological time. Sedimentary Geology, 185(3-4), pp.229-238.
Rivadeneyra, M.A., Delgado, G., Soriano, M., Ramos-Cormenzana, A. and Delgado, R.,
2000. Precipitation of carbonates by Nesterenkonia halobia in liquid media. Chemosphere,
41(4), pp.617-624.
Rodriguez-Navarro, C., Jimenez-Lopez, C., Rodriguez-Navarro, A., Gonzalez-Muñoz,
M.T. and Rodriguez-Gallego, M., 2007. Bacterially mediated mineralization of vaterite.
Geochimica et Cosmochimica Acta, 71(5), pp.1197-1213.
Rodriguez-Navarro, C., Jroundi, F., Schiro, M., Ruiz-Agudo, E. and González-Muñoz,
M.T., 2012. Influence of substrate mineralogy on bacterial mineralization of calcium
carbonate: implications for stone conservation. Appl. Environ. Microbiol., 78(11), pp.4017-
4029.
Rodriguez-Navarro, C., Rodriguez-Gallego, M., Chekroun, K.B. and Gonzalez-Munoz,
M.T., 2003. Conservation of ornamental stone by Myxococcus xanthus-induced carbonate
biomineralization. Appl. Environ. Microbiol., 69(4), pp.2182-2193.
Russell, R.J. and McIntire, W.G., 1965. Southern hemisphere beach rock. Geographical
Review, 55(1), pp.17-45.
Russell, R.J., 1962. Beach rock: geological observations.
Rutten, G.L., 2011. Interactions between beachrock formations and shoreline evolution.
Case study: Togo.
Salifu, E., MacLachlan, E., Iyer, K.R., Knapp, C.W. and Tarantino, A., 2016. Application
of microbially induced calcite precipitation in erosion mitigation and stabilisation of sandy soil
foreshore slopes: a preliminary investigation. Engineering Geology, 201, pp.96-105.

47
Sánchez-Navas, A., Martín-Algarra, A., Rivadeneyra, M.A., Melchor, S. and Martín-
Ramos, J.D., 2009. Crystal-growth behavior in Ca− Mg carbonate bacterial spherulites. Crystal
Growth and Design, 9(6), pp.2690-2699.
Sánchez-Román, M., Romanek, C.S., Fernández-Remolar, D.C., Sánchez-Navas, A.,
McKenzie, J.A., Pibernat, R.A. and Vasconcelos, C., 2011. Aerobic biomineralization of Mg-
rich carbonates: Implications for natural environments. Chemical Geology, 281(3-4), pp.143-
150.
Sanz-Rubio, E., Sánchez-Moral, S., Cañaveras, J.C., Calvo, J.P. and Rouchy, J.M., 2001.
Calcitization of Mg–Ca carbonate and Ca sulphate deposits in a continental Tertiary basin
(Calatayud Basin, NE Spain). Sedimentary Geology, 140(1-2), pp.123-142.
Sarda, D., Choonia, H.S., Sarode, D.D. and Lele, S.S., 2009. Biocalcification by Bacillus
pasteurii urease: a novel application. Journal of industrial microbiology & biotechnology,
36(8), pp.1111-1115.
Scheffers, A., Scheffers, S., Kelletat, D. and Browne, T., 2009. Wave-emplaced coarse
debris and megaclasts in Ireland and Scotland: boulder transport in a high-energy littoral
environment. The Journal of Geology, 117(5), pp.553-573.
Schlager, W., 1981. The paradox of drowned reefs and carbonate platforms. Geological
Society of America Bulletin, 92(4), pp.197-211.
Schlager, W., 2005. Carbonate sedimentology and sequence stratigraphy (No. 8). SEPM
Soc for Sed Geology.
Schmalz, R.F., 1971. Beachrock formation at Eniwetok Atoll. In Carbonate Cements (pp.
17-24). Johns Hopkins University Press Baltimore, Md.
Scoffin, T.P. and McLean, R.F., 1978. Exposed limestones of the northern province of the
Great Barrier Reef. Philosophical Transactions of the Royal Society of London. Series A,
Mathematical and Physical Sciences, 291(1378), pp.119-138.
Scoffin, T.P. and Stoddart, D.R., 1983. Beachrock and intertidal cements. Chemical
Sediments and Geomorphology: precipitates and residua in the near-surface environment.
Academic Press, London, pp.401-425.

48
Shen, J., Song, Z., Qian, X. and Yang, F., 2010. Carboxymethyl cellulose/alum modified
precipitated calcium carbonate fillers: Preparation and their use in papermaking. Carbohydrate
Polymers, 81(3), pp.545-553.
Shi, P., Xu, W., Ye, T., Yang, S., Liu, L., Fang, W., Liu, K., Li, N. and Wang, M., 2015.
World atlas of natural disaster risk. In World Atlas of natural disaster risk (pp. 309-323).
Springer, Berlin, Heidelberg.
Silva-Castro, G.A., Uad, I., Gonzalez-Martinez, A., Rivadeneyra, A., Gonzalez-Lopez, J.
and Rivadeneyra, M.A., 2015. Bioprecipitation of calcium carbonate crystals by bacteria
isolated from saline environments grown in culture media amended with seawater and real
brine. BioMed research international, 2015.
Spanos, N. and Koutsoukos, P.G., 1998. Kinetics of precipitation of calcium carbonate in
alkaline pH at constant supersaturation. Spontaneous and seeded growth. The Journal of
Physical Chemistry B, 102(34), pp.6679-6684.
Stocks-Fischer, S., Galinat, J.K. and Bang, S.S., 1999. Microbiological precipitation of
CaCO3. Soil Biology and Biochemistry, 31(11), pp.1563-1571.
Stoddart, D.R. and Cann, J.R., 1965. Nature and origin of beach rock. Journal of
Sedimentary Research, 35(1), pp.243-247.
Strasser, A. and Davaud, E., 1986. Formation of Holocene limestone sequences by
progradation, cementation, and erosion; two examples from the Bahamas. Journal of
Sedimentary Research, 56(3), pp.422-428.
Strasser, A., Davaud, E. and Jedoui, Y., 1989. Carbonate cements in Holocene beachrock:
example from Bahiret et Biban, southeastern Tunisia. Sedimentary Geology, 62(1), pp.89-100.
Surono, B.T. and Sudirno, I., 1992. Peta Geologi Lembar Surakarta-Giritontro.
Jawa.(1408-3), Skala1, 100.
Tai, C.Y., Chen, F.B. and Chen, P.C., 1998. Control of polymorphism and morphology of
calcium carbonate using a constant-composition method. In World Congress on Particle
Technology 3 (p. 1998).
Thompson, R.C.A., 2017. Biology and systematics of Echinococcus. In Advances in
parasitology (Vol. 95, pp. 65-109). Academic Press.

49
Thorne, C., Thorne, C.R., Evans, E.P. and Penning-Rowsell, E.C. eds., 2007. Future
flooding and coastal erosion risks. Thomas Telford.
Tobler, D.J., Cuthbert, M.O., Greswell, R.B., Riley, M.S., Renshaw, J.C., Handley-Sidhu,
S. and Phoenix, V.R., 2011. Comparison of rates of ureolysis between Sporosarcina pasteurii
and an indigenous groundwater community under conditions required to precipitate large
volumes of calcite. Geochimica et Cosmochimica Acta, 75(11), pp.3290-3301.
Tourney, J. and Ngwenya, B.T., 2009. Bacterial extracellular polymeric substances (EPS)
mediate CaCO3 morphology and polymorphism. Chemical Geology, 262(3-4), pp.138-146.
Van Langerak, E.P.A., Hamelers, H.V.M. and Lettinga, G., 1997. Influent calcium removal
by crystallization reusing anaerobic effluent alkalinity. Water Science and Technology, 36(6-
7), pp.341-348.
Vousdoukas, M.I., Velegrakis, A.F. and Karambas, T.V., 2009. Morphology and
sedimentology of a microtidal beach with beachrocks: Vatera, Lesbos, NE Mediterranean.
Continental Shelf Research, 29(16), pp.1937-1947.
Vousdoukas, M.I., Velegrakis, A.F. and Plomaritis, T.A., 2007. Beachrock occurrence,
characteristics, formation mechanisms and impacts. Earth-Science Reviews, 85(1-2), pp.23-
46.
Wakayama, H., Hall, S.R. and Mann, S., 2005. Fabrication of CaCO 3–biopolymer thin
films using supercritical carbon dioxide. Journal of Materials Chemistry, 15(11), pp.1134-
1136.
Ward, W.C., 1975. Petrology and diagenesis of carbonate eolianites of northeastern
Yucatan Peninsula, Mexico.
Warthmann, R., Van Lith, Y., Vasconcelos, C., McKenzie, J.A. and Karpoff, A.M., 2000.
Bacterially induced dolomite precipitation in anoxic culture experiments. Geology, 28(12),
pp.1091-1094.
Wei, H., Shen, Q., Zhao, Y., Wang, D.J. and Xu, D.F., 2003. Influence of
polyvinylpyrrolidone on the precipitation of calcium carbonate and on the transformation of
vaterite to calcite. Journal of Crystal Growth, 250(3-4), pp.516-524.
Wilson, J.L., 1975. Carbonate facies in geologic history: Berlin.

50
Wolf, K.H., 1965. Gradational sedimentary products of calcareous algae. Sedimentology,
5(1), pp.1-37.
Wong, L.S., 2015. Microbial cementation of ureolytic bacteria from the genus Bacillus: a
review of the bacterial application on cement-based materials for cleaner production. Journal
of Cleaner Production, 93, pp.5-17.
Xu, H., Ai, L., Tan, L. and An, Z., 2006. Stable isotopes in bulk carbonates and organic
matter in recent sediments of Lake Qinghai and their climatic implications. Chemical Geology,
235(3-4), pp.262-275.
Yates, K.K. and Robbins, L.L., 1999. Radioisotope tracer studies of inorganic carbon and
Ca in microbially derived CaCO3. Geochimica et Cosmochimica Acta, 63(1), pp.129-136.
Yoshida, N., Higashimura, E. and Saeki, Y., 2010. Catalytic biomineralization of
fluorescent calcite by the thermophilic bacterium Geobacillus thermoglucosidasius. Appl.
Environ. Microbiol., 76(21), pp.7322-7327.
Yu, H.Q., Tay, J.H. and Fang, H.H., 2001. The roles of calcium in sludge granulation during
UASB reactor start-up. Water Research, 35(4), pp.1052-1060.
Zanuttigh, B. and Angelelli, E., 2013. Experimental investigation of floating wave energy
converters for coastal protection purpose. Coastal Engineering, 80, pp.148-159.
Zhang, K., Douglas, B.C. and Leatherman, S.P., 2004. Global warming and coastal erosion.
Climatic change, 64(1-2), p.41.
Zhu, X., Linham, M.M. and Nicholls, R.J., 2010. Technologies for climate change
adaptation-Coastal erosion and flooding. Danmarks Tekniske Universitet, Risø
Nationallaboratoriet for Bæredygtig Energi.
51
CHAPTER 2
Geophysical investigation of buried beachrock at Krakal-Sadranan beach,
Yogyakarta, Indonesia
2.1 Introduction
The human evolution always coincides with environmental change, and human activities
can be directly attributed to environmental degradation. Indonesia is the world's largest
archipelagic state, consists of 18,108 islands where approximately 60% of the population lives
within 50 km from the coast (Cribb and Ford, 2009a, b). Indonesia is an archipelago country
whose coastline is the fourth largest in the world after the United States, Canada, and Russia
respectively. As one of the countries with the longest coastline, Indonesian beaches have their
quirks and issues. As compounding effects and conflicts arise in a complex, emergent and
cross-scaled impact manner, a manifold of change drivers (e.g. climate change, urbanization,
tourism development, and marine resource exploitation) may be at fault (Zhu, et al., 2010;
Wilson, et al., 2011; Pilkey and Cooper, 2014). Beachrock (Figure 2.1) is an important feature
of many tropical coastlines as it appears to have an anchoring effect for dynamic islands and
provides protection from erosion. Yet, many things about its origin and properties remain
unknown or debated hitherto. Outcrops of beachrock sediment are valuable records of the past
climate of low-lying reef islands, despite the application beachrock sediment as an indicator of
paleo-environment in the Pacific is still underdeveloped (Vousdoukas et al., 2007). Coastal
zone monitoring based on aerial data, satellite or field investigating is an important task in
environmental protection and fundamental coastal management. Datasets produced by UAVs
have such a high spatial resolution of the characteristics and changes of the landscape, such as
morphology, coastal zone, and beach morphological characteristics into two dimensions (2D)
or three dimensions (3D) numerical models (Darmawan, et al., 2018). The beachrocks are
sediments formed as a result of calcium carbonate cementation in coastal sediments especially
around the tidal zone, generally found in the tropics and subtropics area and mostly warm
seawater (Avcıoğlu et al., 2016). Beachrock is a crucial element in tropical coastal
environments, mainly for its retaining effect on dynamic islands and its protecting properties
that prevent erosion in coastlines (Vousdoukas et al., 2007; Danjo and Kawasaki, 2014).
Beachrock studies are not only themed around its formation characteristics, but also on related
topics such as ecology of beachrock process occurs at lower latitudes (as noted in Turkey,

52
Bangladesh, Scotland, Japan, Greece, the Great Barrier Reef of Australia, Sri Lanka, Bahamas
Island, Brazil, South Africa, Indonesia and in Florida of the United States) (Danjo and
Kawasaki, 2014; Daryono, et al., 2019). Linear beachrock outcrop on the continental shelf
shows that it can promote the preservation and overstep of shoreline sediments during
transgression, particularly during meltwater pulses (Cooper, et al., 2016).
Similarly, beachrocks in that area have also never been a subject of study in any of the past
researches. The beachrocks found on Krakal-Sadranan Beach were spread locally, parallel to
the coastline with a coverage of around 10-30 m2. The most widely held theory of beachrock
formation involves the deposition of CaCO3 between coral sand and gravel by evaporation of
seawater (Kubo, et al, 2014). There has been numerous domestic and foreign literature on
beachrocks, but most only emphasized its geochemistry aspects. Meanwhile, its underground
structure in particular, is not yet well understood. One of the few studies of this was by
Psomiadis, who used electrical resistivity tomography to map the beachrock on the island of
Thassos, Greece (David, et al., 2009). On a separate case, a direct current (DC) electrical survey
0 15 cm
0 15 cm
Figure 2.1. Beachrock deposits in Krakal-Sadranan, Yogyakarta, Indonesia.
Buried Beachrock
Buried Beachrock
Exposed Beachrock

53
and a seismic surface wave were conducted to obtaining the structure around the seashore to a
depth of more than 10 m as the result (Kubo, et al., 2014). The geophysical measurement not
only conclude the subsurface structure but within combination with unmanned aerial vehicle
(UAV) drone also summarize the 3D model of subsurface and determine of beachrock
deposition for more further tectonic propagation in Indonesia based on this deposit. The lack
of reports in the tropical regions may be related to lack of relevant research. Beachrocks that
are found in the Krakal-Sadranan Beach, Yogyakarta (Figure 2.1) are spread locally, parallel
to the coastline and with a width of about 10-30 m2. The south coast of Java has been known
for large waves from the open Indian Ocean, causing a highly intensive process of abrasion,
which made Krakal-Sadranan Beach a very intriguing subject to examine of its characteristics.
2.2 Regional geology
An understanding of the natural parameters and the interactions of beachrock requires an
analysis of the genesis of all forms of beachrock. Figure 2.2 shown the stratigraphic of study
area, included in the Wonosari - Punung Formation of the Surakarta sheet - Giritontro (Surono
and Sudarno, 1992).
2.2.1 Physiography
Van Bemmelen (1949) divided eastern Java and Madura into 7 physiographic zones,
namely the Southern Mountain Zone, Solo Zone, Kendeng Zone, Randublatung Zone,
Rembang Zone, Alluvial Plain of North Java, and Quaternary Volcano. Of the seven zones, the
zone most relevant to the research area is the Southern Mountains Zone. The Southern
Mountains Zone is a block that is raised and tilted to the south. This zone stretches from
Parangtritis Beach to the west to Blambangan Peninsula in the east. The Southern Mountains
zone is bordered by complex swamps in the north and Indian Ocean in the south. The width of
the South Mountain Zone is around 25 km (south of Blitar) to 55 km (south of Surakarta) (Van
Bemmelen, 1949). Van Bemmelen (1949) divided the Southern Mountains Zone into 3 sub-
zones, namely the North Subzone, Central Subzone, and the South Subzone. The North
Subzone is a mountainous lane composed of strong-strength volcanic rocks, consisting of the
Baturagung lane, the Stage lane, the Plopoh lane, and the Kambengan lane. Central Subzona is
a plateau in the area of Wonosari and Baturetno. The South Subzona is composed of limestones
that form the Kars landscape or commonly referred to as Gunung Sewu. The Gunung Sewu
subzona is bordered in the south and is directly adjacent to the Indian Ocean. Meanwhile,
Gunung Sewu Subzone in the north is bordered by Wonosari Basin, Baturetno Basin, and Stage

54
lane. The Sewu Mountain subzone is dominated by carbonates from the Wonosari-Punung
Formation which form the hills of the southeast with the orientation of the southeast - west
northwest. Referring to the zone division and subzone, the research area can be categorized in
the Southern Mountain Subzone, southern part of Sewu Mountain.
2.2.2 Stratigraphy
According to Toha et al. (1994), the regional Southern Stratigraphy from the old to the
young are Kebo-Butak Formation, Besole Formation, Mandalika Formation, Semilir
Formation, Nglanggran Formation, Sambipitu Formation, Oyo Formation, Jaten Formation,
Wuni Formation, Nampol Formation, Wonosari-Punung Formation and Kepek Formation
(Figure 2.2). Referring to Toha et al. (1994) and on the regional geological map of Surakarta -
Giritontro (Surono et al., 1992), rock formations associated with conditions on Sradanan Beach
and its surroundings are the Wonosari - Punung Formation. This formation is composed of 2
facies, namely carbonate facies and clastic facies. Carbonate facies are composed of reef
limestones, bioclastic limestones, sandstone limestone, and marl. Carbonate facies is deposited
in the exposure environment at Middle Miocene - Late Miocene (N9 - N16). The clastic facies
are composed of tuff-sandstones, side sandstones, siltstone and shale. Clastic facies of Late
Miocene (N15) and deposited in external neritic metric (Sartono, 1964).
2.2.3 Geological structure
According to Sudarno (1997), the geological structure that developed in the Southern
Mountains consists of 4 patterns, namely the Meratus pattern, Sundanese pattern, Javanese
pattern, and Meratus antithetic pattern. The Meratus antithetic pattern is a group of geological
structures that have a northwest-southeast orientation. These structures are mostly in the form
of a deformed shear fault formed by compression forces at the age of Pliocene. While referring
to the Surakarta - Giritontro map (Surono et al., 1992), no regional geological structure
developed affected the study area.
2.2.4 Geology of the research area
The research area is located on the South coast of Java Island. When referring to the
regional geological map of the Surakarta - Giritontro (Surono, et al. 1992) sheet (Figure 2.2),
which has a scale of 1: 100,000, the study area is mapped as part of the Wonosari-Punung
Formation. If you look at the position of the research area on the map, the landscape in the
research area can be categorized as a coastal landscape. Whereas based on the geological
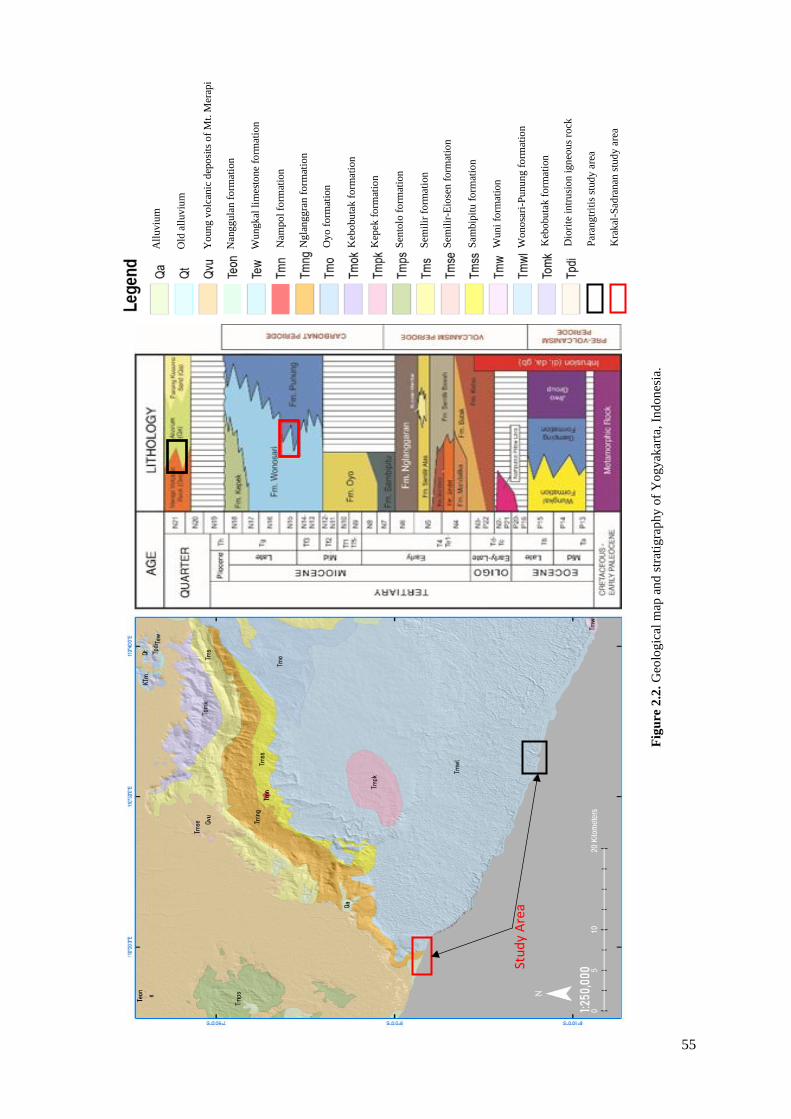
55
Fig
ure
2.2
. G
eolo
gic
al m
ap a
nd
str
atig
rap
hy
of
Yo
gy
akar
ta, In
don
esia
.
Stu
dy
Are
a
All
uviu
m
Old
all
uv
ium
Yo
ung
volc
anic
dep
osi
ts o
f M
t. M
erap
i
Nan
ggu
lan f
orm
atio
n
Wu
ngk
al l
imes
tone
form
atio
n
Ng
lang
gra
n f
orm
atio
n
Nam
po
l fo
rmat
ion
Oy
o f
orm
atio
n
Keb
obu
tak f
orm
atio
n
Kep
ek f
orm
atio
n
Sen
tolo
fo
rmat
ion
Sam
bip
itu
fo
rmat
ion
Sem
ilir
-Eio
sen
fo
rmat
ion
Sem
ilir
fo
rmat
ion
Wu
ni
form
atio
n
Wo
no
sari
-Punu
ng
fo
rmat
ion
Keb
obu
tak f
orm
atio
n
Dio
rite
in
tru
sio
n i
gn
eou
s ro
ck
Par
ang
trit
is s
tud
y a
rea
Kra
kal
-Sad
ranan
stu
dy a
rea

56
structure patterns in Figure 2.2, no visible geological structure developed in the study area.
Therefore, the landscape in the study area can be categorized as a coastal landscape. Whereas
based on geological structure patterns from coastal geomorphology in South Java, there is no
geological structure that develops in the study area (Verstappen, 2000). On other hand,
Yogyakarta also consist by recent sedimentation of Merapi Volcano on the middle part (Graben
Bantul) and several smaller parts in the form of Sentolo formation hill on the western part,
Aluvium formation, Andecite (Baturagung), Semilir formation, Kepek, and Nglangran on the
eastern part. Physiographycally, the landscape consists of the Merapi fluvio-volcanic plain, the
Baturagung Mountain Range, the Sentolo Hills Range, Progo River plain and the shore plain.
Bantul region which is consist of volcanic sedimentary is potential of coastal disaster then
eastern part were consist (mostly) limestone formation. Blackish silica sands were consisting
along the Parangtritis shoreline with the elevation of 0-35 m can be found especially in the
southern part which bordered directly by Indian Ocean.
2.2.5 Site study
The Wonosari-Punung Formation has been the subject of many geological studies,
including studies on the development of the Wonosari Formation in the Miocene era (Lokier,
2000), the reef facies of the Wonosari Formation (Siregar et al., 2004), the stratigraphic
sequences and diagenesis of the Wonosari Formation carbonate rocks (Jauhari and Toha,
2005), the environmental deposition of carbonate rocks in the Wonosari Formation in the
eastern region of Pacitan (Mukti et al., 2005), Puno-reef Punung (Premonowati et al., 2012),
the red limestone Wonosari-Punung Formation in Ponjong area (Titisari and Atmoko, 2015;
Atmoko et al., 2016), and the red limestones of Wonosari-Punung Formation on Siung beach
(Titisari and Hendrawan, 2017). However, research on beachrocks found on the Sadranan
Beach in the Wonosari-Punung Formation has never been the subject of a geological research.
Beaches of Gunungkidul Regency, Province of Special Region Yogyakarta (Prov. DIY),
Indonesia holds strong economic potentials for limestone mine deposits and as a tourist
attraction. The karst beaches in the Gunung Kidul Regency, such as Sadranan Beach for one,
have similarities in terms of geological conditions, methods, and geomorphologic processes
beach formation. The characteristics of the Karst Mountains of South Beach indicate steep
topography that rises to the east of Java Island (Drini Beach to Krakal to Sadranan). The coast
of Sadranan has a slope with a steepness of ~12,33° with the tidal range of 12 meters that makes
the sedimentary process in this coast thicker than the deeper slope. Grains of sediment along
Krakal and Sadranan beaches are largely bright-colored along most of the coastline as a result

57
of the erosion of seabed being deposited on the beach. Composition of this sediment is mainly
formed by coral, skeletal fragment, Foraminifera and Mollusca. Throughout the karst coast of
the DIY Prov., Gunungkidul Regency the soil is derived from limestone bedrock, similar to the
Mediterranean, i.e., the level of physical weathering is high (Daryono, et al., 2019). The
research area is located on the south coast of Java Island. When referring to Surakarta's regional
geological map - Giritontro (Surono, et al. 1992) with a scale of 1: 100.000, the study area is
part of the Wonosari-Punung Formation (Figure 2.2). Therefore, the landscape in the study area
can be categorized as a coastal landscape. Meanwhile, looking at the geological structure
patterns of the coastal geomorphology in South Java, there is no geological structure that
develops in the study area (Verstappen, 2000).
2.3 Objectives
This research will address: to (i) examine the underground structure of natural beachrock
based on a geophysical survey, (ii) develop a 3D beachrock structure, and (iii) identify the
physical and mechanical properties such as porosity, P wave velocity (Vp), S wave velocity
(Vs), and strength characteristics of beachrock. To comprehend the underground structure with
UAV drone photogrammetric overlay toward categorize the beachrock deposit as keyrole of
beach propagation in the tropical-rapid weathering area, especially in term of tectonic plate and
climate change. This research is considering beachrock as primary study to mimicking the
natural countermeasures of coastal problem especially erosional impact for development in
shoreline area.
2.4 Materials and methods
2.4.1 Field investigation
The field investigation was obtained from Krakal-Sadranan Beach area, Wonosari,
Yogyakarta, Indonesia, within correlation check with regional geology control and sedimentary
process in the section. The beachrock outcrops were found in the section and then divided into
three sections (Figure 2.3). The first section (α) is located in the E 455900.11; S 9099654.13;
there were three lines of both geophysical measurements conducted. The second section (β) is
located in E 456041.31; S 9099631.61 and two lines of resistivity and surface seismic
measurement in this section were conducted. The last section (γ) is in the E 456281.51; S
9099623.03 and conducted only one line in the outcrop of beachrock deposit. The azimuth

58
degree of this measurement in general are N334°E which is across to the shoreline beach and
N164°E which is linear with the shoreline. The detailed location of this study is shown in the
Table 2.1.
Table 2.1. Coordinates of survey line.
Conditions α-location
Line-1 Line-2 Line-3
GPS (49L)
(DC Resistivity)
Electrode interval
Line length
(Surface wave
survey)
Shot point Interval
Line length
(455905.11 E; 9099638.01 S) –
(455900.11 E; 9099654.13 S)
1 m
18 m
0.5 m
22 m
455914.28 E; 9099644.16 S) –
(455847.36 E; 9099623.57 S)
1 m
70 m
0.5 m
75 m
455864.19 E; 9099624.79 S) –
(455859.21 E; 9099641.04 S)
1 m
18 m
0.5 m
22 m
GPS (49L)
(DC Resistivity)
Electrode interval
Line length
(Surface wave
survey)
Shot point Interval
Line length
β-location γ-location
Line-4 Line-5 Line-6
456041.31 E; 9099631.61 S) –
(456042.79 E; 9099653.50 S)
1 m
22 m
0.5 m
20 m
456061.16 E; 9099644.31 S) –
(456026.50 E; 9099645.36. S)
1 m
35 m
0.5 m
32 m
456281.51 E; 9099623.03 S) –
(456275.66 E; 9099643.05 S)
1 m
21 m
0.5 m
3 m
2.4.1.1 Drone photogrammetric data processing
Aerial photos were obtained from selected sites in Krakal–Sadranan Beach (Appendixes
A). In this case, a GoPro HERO 6 camera attached to a DJI Phantom 3 and equipped with a 3D
gimbal to minimize shaking was used for the drone photogrammetry. The Agisoft software was
used to evaluate surface changes and conduct spatial analysis such as geomorphological
surfaces of south Yogyakarta shoreline (Figure 2.3; Appendixes Figure A5; Appendixes Figure
A7). Identification of the shoreline differences based on interactive 3D geospatial data find was
conducted and compared with the literature information (Brown and Arbogast, 1999; Varela-
González, et al., 2013). Further study may conclude the propagation of the intertropical
shoreline based on beachrock role by comparing the data from this research with present
geospatial data.
2.4.1.2 Geological identification
Fieldwork was carried out by making a ditch or horizontal section at several sections along
the coastline in the study area (as deep as <1 m), extended laterally towards the sea, then
sampled and mapped lithology facies in each ditch for analysis. In each section that has been

59
dug up, 19 samples were taken based on the horizontal and vertical position. Sampling were
decided based on the presence of beachrock along the trench. Then, from each sampling point,
lithology facies mapping was carried out based on rock composition on the samples taken.
Laboratory analysis carried out in this study included petrographic analysis, which aimed to
determine the texture and type of mineral constituent rocks. The section field investigation was
obtained from Krakal-Sadranan Beach area, Wonosari, Yogyakarta, Indonesia, within
correlation check with regional geology control and sedimentary process in the section. The
study section is located around E 455900.11; S 9099654.13 to E 456281.51; S 9099623.03, 49
S Indonesia region. The azimuth degree of beachrock deposit, in general, are N334°E which is
across to the shoreline beach and N164°E which is linear with the shoreline.
2.4.1.3 DC resistivity survey
Geophysical resistivity techniques are based on the Earth’s response to the flow of electrical
current to determine the rock body of beachrock based on resistivity behavior of rock and
mineral. By applying these methods, an electrical current is passed through the ground and two
potential electrodes allow us to record the resultant potential difference between them, giving
us a way to measure the electrical impedance of a subsurface material. The beachrock body, in
dimensional length and height will gave the assumption regarding the sedimentary process and
this deposit works as natural wave barrier in the shoreline area. The apparent resistivity is then
a function of the measured impedance (ratio of potential to current) and the geometry of the
electrode array. Comprehensive overviews of resistivity methods are presented in Telford
(1976) and Burger (1996).
The current flow lines and the equipotential lines will form an even more complex pattern
as the current flow lines will bend at boundaries, where the resistivity change. Geoelectrical
data are commonly expressed as apparent resistivity (Telford, 1976):
𝜌𝐴 =∆𝑉
𝐼𝐾 (Eq. 2.1)
where ∆V is the measured potential, I the transmitted current, and K the geometrical factor
expressed as:
𝐾 = 2𝜋 [1
|𝑟𝐴−𝑟𝑀|−
1
|𝑟𝐴−𝑟𝑁|−
1
|𝑟𝐵−𝑟𝑀|+
1
|𝑟𝐵−𝑟𝑁|]−1
(Eq. 2.2)
If there are two current (source) electrodes, the potential is the superposition of the effects from
both. In a practical experiment (figure 2.4), one electrode, A, is the positive side of a current ─

60
Kra
ka
l-S
ad
ran
an
Bea
chro
ck U
AV
Dro
ne
Ma
pp
ing
0 10
0
200
m
Geo
phy
sica
l m
easu
rem
ent
lin
es
Geo
log
ical
tre
nch
es
Fig
ure
2.3
. L
oca
tio
n r
esea
rch
are
a in
Kra
kal
-Sad
ran
an, Y
ogy
akar
ta,
Ind
on
esia
.

61
source, and the other electrode, B, is the negative side. The current into each electrode is equal,
but of opposite sign. For a practical survey, we need two electrodes to measure a potential
difference. These are M, the positive terminal of the voltmeter (the one closest to the A current
electrode), and N, the negative terminal of the voltmeter. The measured voltage is a potential
difference (VM - VN) in which each potential is the superposition of the effects from both current
sources. The apparent resistivity is defined so that it is equal to the true resistivity in a
homogeneous half-space (Telford, 1976).
In this survey, we used Syscal Junior (IRIS Instrument) within a 1-meter space of electrode
interval. The spikes as electrodes (about 5 mm in diameter and 15 cm in length) were driven
with a hammer to a depth of about ~10 cm in the outcrop of beachrocks along the shoreline.
There were 22 electrodes along line-1, 73 electrodes along line-2, and 21 electrodes along line-
3 that represented α-section. As for β-section, it was described with line-4 within 26 electrodes
and line-5 with 39 electrodes. However, γ-section was only represented by line-6 with 25
electrodes (Figure 2.4).
2.4.1.4 MASW (Multi Analysis of Seismic Surface)
The multichannel analysis of surface waves (MASW) method tries to utilize this dispersion
property of surface waves for the purpose of Vs profiling in 1D (depth) or 2D (depth and
surface location) format. Essentially, it is an engineering seismic method that deals with
frequencies in a few tens of Hz (e.g., 3-30 Hz) recorded by using a multichannel (24 or more
channels) recording system and a receiver array deployed over a few to a few hundred meters
of distance (e.g., 2-200 m). The active MASW method generates surface waves actively
through an impact source like a sledgehammer, whereas the passive method utilizes surface
waves generated passively by cultural (e.g., traffic) or natural (e.g., thunder and tidal motion)
activities. The investigation depth is usually shallower than 30 meters with the active method,
whereas it can reach a few hundred meters with the passive method. The multichannel analysis
of surface waves (MASW) method tries to utilize this dispersion property of surface waves for
the purpose of Vs profiling in 1D (depth) or 2D (depth and surface section) format (Figure 2.4).
The equipment for analysis MASW and seismic refraction were identical, we used Doremi
Seismograph (SARA Instrument) with 24 geophone channels in 2 wireline cables. This
measurement utilized the same procedure as DC Electricity. Therefore, the resulting data can
be compared and reinforced between one another. The geophones, 24 channels (4.5 Hz) were

62
deployed along each line (overlaying with resistivity line) at 0.5 m intervals. The source point
is located 1.0 ~2.0 meter from the rear geophone in the direction against the movement. The
ends of the survey lines were measured by shifting only the source point and also two-times
recording in the start-ends lines, each line, both methods used active and passive seismic to
minimize the noise from natural source or other factors. Assuming that the study site is
multilayered, the dispersion curve of the phase velocity obtained in this survey were analyzed
by 1D inversion technique using SeismicImager SW (OYO Corp., Japan).
2.4.1.5 Seismic refraction
One can study subsurface velocity and layer interface structure by analyzing the first arrival
times of P-waves (longitudinal or compressional waves) at the surface of the earth. This
technique is called seismic refraction. P-waves traveling through rock are analogous to sound
waves traveling through air. The speed of a P-wave propagates through a medium depends on
the physical properties (i.e. rigidity, density, saturation) and degree of homogeneity of the rock.
From Snell's Law, a ray path is dependent on the wave velocities through different layers. In
refraction seismology, the critical angle is the most important angle value to understand
(Burger, 1996; Fowler 1990).
In this survey, the seismic refraction was conducted with the same instrument that as
mentioned in the MASW methodology. The intervals obtained is the same as MASW methods
and processed the data manual using Microsoft Excel based on Snell's Law calculation from
the time arrival data (first break signal). Picking the first break (GeoGiga Software) is
conducted to determine the propagation time received by each geophone from energy using
seismic sources. Picking data is relatively tricky, especially for data whose noise level is high
enough. The results are 2D layered data that represent subsurface model by using seismicity of
rocks.
2.4.2 Laboratory tests
Further analysis, the beachrock sample will investigating inside laboratory to identify the
rock properties and strength of the sedimentary mechanism as parameter to develop artificial
beachrock. For laboratory tests, beachrock samples were gathered at two points: one about 0
m east from the western edge of the α-line (Sample 1), and the other between the β and γ-line
of the beachrock outcrop (Sample 2). The samples were then brought to the laboratory and
trimmed into rectangular parallelepipeds with a rock-cutting machine. Sample 1 was 3 cm

63
GP
S
Sei
mo
gra
ph
+co
ntr
oll
er
Geo
phon
es
Su
rfac
e w
ave
Body
wav
e
Sei
smic
sou
rce
DC
Res
isti
vity
M
ASW
Fig
ure
2.4
. S
chem
atic
of
acquis
itio
n p
lan
.
Kra
ka
l-S
ad
ran
an
Bea
chro
ck U
AV
Dro
ne
Ma
pp
ing
0 10
0
200
m
Geo
phy
sica
l m
easu
rem
ent
lin
es

64
diameter x 6 cm length and Sample 2 is the same size for coring. First, the specimens were
soaked in artificial sea water (Aquamarin: Yashima Pure Chemicals Co., Japan) for 24 h in a
vacuum. Then, the specimens were tested for P-wave velocity, S-wave velocity and mass
during a natural evaporation at room temperature (25°C). Once the evaporation process slowed
down, the tests were continued while the specimens were heated to and held at 40°C in a
constant-temperature drying oven. Finally, tests were concluded with the specimens heated to
110°C for 24 h. Three times at each water content, the saturated density of the specimen was
measured by the Test Method for Bulk Density of Rock and twice at each water content, the P-
and S-wave velocities were measured (SonicViewer-SX; OYO Corp., Japan).
Compressional wave velocity (P-wave velocity) and shear wave velocity (S-wave velocity)
were measured at room temperature and ambient pressure on cylindrical samples with a
diameter of around 2.5 cm and a length of up to 3.5 cm cut from the blocks with frequencies
of 500 kHz. The velocity of an ultrasonic wave in rock samples is related to its elastic
coefficients, internal structure and density. Moreover analysis, the typical shear wave velocities
of the soil states, ages, and behavior were compared to aid the design of the triaxial testing
program. Target shear wave velocities, Vp and Vs, were chosen to represent the following
different soil states, ages, and behavior of material (Montoya and DeJong, 2015; Feng and
Montoya, 2017). Sample of beachrock from natural and artificial also identify the strength and
stress with axial unconfined compression test (UCS).
2.5 Results
An understanding of the natural parameters and the interactions of characteristics
beachrock requires an analysis of the genesis of all forms. An understanding of the natural
parameters and the interactions of beachrock requires an analysis of the genesis of all forms of
beachrock. Various case studies were conducted based on Krakal-Sadranan Beach rock
samples, Yogyakarta, Indonesia. Final achievement for this research is establish the zonation
of beachrock sediment deposit for keyrole of natural barrier and beach propagation in the
tropical area.
2.5.1 Lithostratigraphy of Krakal-Sadranan beachrock
Lithostratigraphy and petrography analyses are important tools for the reconstruction of
depositional environments and the interpretation of coastal evolution. The most common
palaeontological analysis objects include mollusks, foraminifera skeletal fragments, mineral

65
and other rock fragments. Petrographic observations showed that Krakal-Sadranan beachrocks
were composed by several compositions, namely skeletal fragments which were dominated by
fossils of foraminifera Baculogypsina sphaerulata, calcite, aragonite minerals, micrite, and
sparite cement, respectively. Identifications of rock sample shows that abundance of coarse
coral sand size with the composition of limestone and skeletal fragments decreased at α-
location. It could be assumed that the reducing of limestone and skeletal fragments in the
western area of Sadranan beach is caused by intensive abrasion process, therefore no chance
for the fragments to be deposited more. Calcareous sand deposit shows whitish yellow colour,
grain size of 2 mm fragments and 1 mm matrix, subangular grain shape, unconsolidated, with
thickness of 70 cm, respectively. It consists of limestone fragments, skeletal fragments
dominated by Baculogypsina sphaerulata, and matrix of calcareous sand grain. In order to
reconstruct the palaeoenvironmental changes in the study area, macrofossils were recorded and
identified as well as Baculogypsina sphaerulata foraminifera (Figure 2.5). The detailed
explanation of measurement stratigraphic is on Appendixes B1-B9.
2.5.1.1 Trench AB
It has coordinates of 455863 E/ 9099624 S with dimensions of 5 m in length, 1 m in width,
and 1 m in depth. Stratigraphic columns that have been made in the Trench-AB (Figure 2.5)
include stratigraphic columns for ABX1 and ABX2 samples (Appendix B1), stratigraphic
columns for ABY1 and ABY2 samples (Appendix B2), and stratigraphic columns for ABZ1 and
ABZ2 samples (Appendix B3).
(a) Stratigraphic columns for ABX1 and ABX2 samples (Appendix B1).
• Carbonate sand deposits (ABX1)
Whitish yellow, fragment 2 mm in size and 1 mm base mass, subangular, unconsolidated
grain shape, and 80 cm thick. The identification of ABX1 sample showed the composition
of limestone fragments (30%) and fossil shell material (35%) which were dominated by
Baculogypsina sphaerulata, limestone sand material (35%).
• Sparse biomicrite (Folk, 1962) (ABX2)
Whitish yellow, 4 mm fragment size and base mass <1 mm, subangular grain shape, open
container, massive structure, about 20 cm in thickness. Identification of L-F samples
showed the composition of limestone fragments (10%) and fossil shell material (20%),

66
A.2
A.1 A
B
Figure 2.5. Stratigraphic of the Trench AB: (A) Petrographic on cross polarized nicol (XPL, A1)
and plane polarized nicol (PPL, A2) with sf (skeletal fragment), mc (micrite), sp (sparite), ca
(calcite) and ar (aragonite); (B) Degree of cementation based on composition of beachrock.
Unconsolidated Beachrock Well consolidated Beachrock

67
which were dominated by Baculogypsina sphaerulata, calcite minerals (30%) and
limestone sand material (40%).
(b) Stratigraphic columns for ABY1 and ABY2 samples (Appendix B2):
• Carbonate sand deposits (ABY1)
Whitish yellow, fragment 2 mm in size and 1 mm base mass, subangular, unconsolidated,
and 75 cm thick. The identification of ABY1 sample showed the composition of limestone
fragments (25%) and fossil shell material (45%) which were dominated by Baculogypsina
sphaerulata, limestone sand material (30%).
• Sparse biomicrite (Folk, 1962) (ABY2)
Whitish yellow, fragment 4 mm and base mass <1 mm, subangular grain shape, open
container, massive structure, about 25 cm in thickness. Identification of ABY2 sample
showed the composition of limestone fragments (15%) and fossil shell material (15%),
which were dominated by Baculogypsina sphaerulata, calcite minerals (35%) and
limestone sand material (35%).
(c) Stratigraphic columns for samples ABZ1 and ABZ2 samples (Appendix B3):
• Carbonate sand deposits (ABZ1)
Carbonate sand deposits show whitish yellow, 2 mm fragments and 1 mm matrix,
subangular, unconsolidated grains with thickness of 70 cm. ABZ1 samples were taken at
these layers. The sample constituents are limestone fragments (30%) and fossil skeletal
shell material (40%) which are dominated by Baculogypsina sphaerulata, limestone sand
material (30%).
• Sparse biomicrite (Folk, 1962) (ABZ2)
The layer below the sand deposit has been well consolidated with a layer about 30 cm in
thickness, showing whitish yellow, measuring 4 mm fragments and a base mass of less than
1 mm, subangular grain shape, open container, massive structure. In this layer ABZ2
samples were taken. Identification of ABZ2 samples showed samples composed of
limestone fragments (10%) and fossil shell material (20%) which were dominated by fossils
of foraminifera Baculogypsina sphaerulata, calcite minerals (40%) and limestone sand
material (30%).
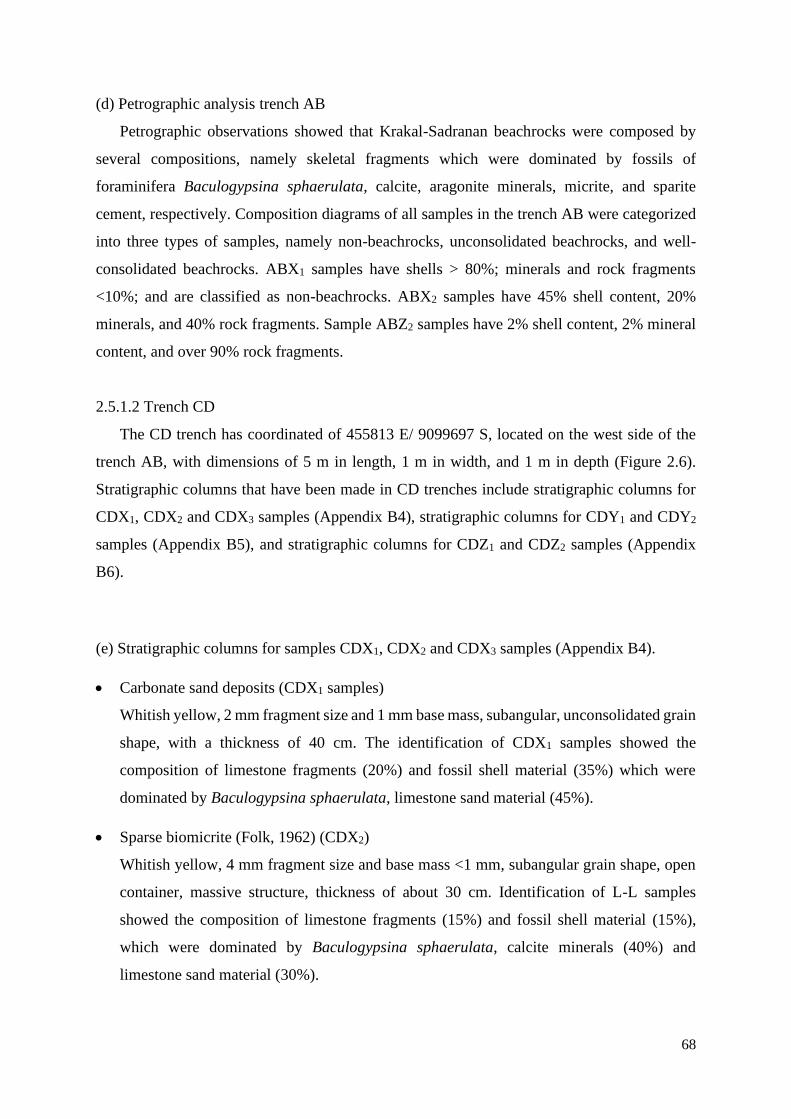
68
(d) Petrographic analysis trench AB
Petrographic observations showed that Krakal-Sadranan beachrocks were composed by
several compositions, namely skeletal fragments which were dominated by fossils of
foraminifera Baculogypsina sphaerulata, calcite, aragonite minerals, micrite, and sparite
cement, respectively. Composition diagrams of all samples in the trench AB were categorized
into three types of samples, namely non-beachrocks, unconsolidated beachrocks, and well-
consolidated beachrocks. ABX1 samples have shells > 80%; minerals and rock fragments
<10%; and are classified as non-beachrocks. ABX2 samples have 45% shell content, 20%
minerals, and 40% rock fragments. Sample ABZ2 samples have 2% shell content, 2% mineral
content, and over 90% rock fragments.
2.5.1.2 Trench CD
The CD trench has coordinated of 455813 E/ 9099697 S, located on the west side of the
trench AB, with dimensions of 5 m in length, 1 m in width, and 1 m in depth (Figure 2.6).
Stratigraphic columns that have been made in CD trenches include stratigraphic columns for
CDX1, CDX2 and CDX3 samples (Appendix B4), stratigraphic columns for CDY1 and CDY2
samples (Appendix B5), and stratigraphic columns for CDZ1 and CDZ2 samples (Appendix
B6).
(e) Stratigraphic columns for samples CDX1, CDX2 and CDX3 samples (Appendix B4).
• Carbonate sand deposits (CDX1 samples)
Whitish yellow, 2 mm fragment size and 1 mm base mass, subangular, unconsolidated grain
shape, with a thickness of 40 cm. The identification of CDX1 samples showed the
composition of limestone fragments (20%) and fossil shell material (35%) which were
dominated by Baculogypsina sphaerulata, limestone sand material (45%).
• Sparse biomicrite (Folk, 1962) (CDX2)
Whitish yellow, 4 mm fragment size and base mass <1 mm, subangular grain shape, open
container, massive structure, thickness of about 30 cm. Identification of L-L samples
showed the composition of limestone fragments (15%) and fossil shell material (15%),
which were dominated by Baculogypsina sphaerulata, calcite minerals (40%) and
limestone sand material (30%).

69
Figure 2.6. Stratigraphic of the Trench CD: (A) Petrographic on cross polarized nicol (XPL, A1)
and plane polarized nicol (PPL, A2) with sf (skeletal fragment), mc (micrite), sp (sparite), ca
(calcite) and ar (aragonite); (B) Degree of cementation based on composition of beachrock.
B
A A.1
A.2

70
• Sparse biomicrite (Folk, 1962) (CDX3)
Whitish yellow, 4 mm fragment size and base mass <1 mm, subangular grain shape, open
container, massive structure, thickness of about 30 cm. Identification of L-M samples
showed the composition of limestone fragments (15%) and fossil shell material (15%),
which were dominated by Baculogypsina sphaerulata, calcite minerals (30%) and
limestone sand material (40%).
(f) Stratigraphic columns for CDY1 and CDY2 samples (Appendix B5)
• Carbonate sand deposits CDY1 sample.
Whitish yellow, 2 mm fragment size and 1 mm base mass, subangular, unconsolidated grain
shape, with a thickness of 70 cm. Identification of CDY1 samples showed the composition
of limestone fragments (15%) and fossil shell material (45%) which were dominated by
Baculogypsina sphaerulata, limestone sand material (40%).
• Sparse biomicrite (Folk, 1962) (CDY2)
Whitish yellow, 4 mm fragment size and base mass <1 mm, subangular grain shape, open
container, massive structure, thickness of about 30 cm. The identification of CDY2 samples
showed the composition of fragments of limestone (10%) and fossil shell material (20%),
which were dominated by Baculogypsina sphaerulata, calcite minerals (35%) and
limestone sand material (35%).
(g) Stratigraphic columns for samples CDZ1 and CDZ2 samples (Appendix B6)
• Carbonate sand deposits CDZ1 sample.
Whitish yellow, 2 mm fragment size and 1 mm base mass, subangular, unconsolidated grain
shape, 60 cm thick. Identification of CDZ1samples showed the composition of limestone
fragments (20%) and fossil shell material (40%) which were dominated by Baculogypsina
sphaerulata, limestone sand material (40%).
• Sparse Biomicrite (Folk, 1962) (CDZ2)
Whitish yellow, 4 mm fragment size and base mass <1 mm, subangular grain shape, open
container, massive structure, thickness of about 40 cm. Identification of CDZ2 samples
showed the composition of limestone fragments (10%) and fossil shell material (20%),
which were dominated by Baculogypsina sphaerulata, calcite minerals (40%) and
limestone sand material (30%).

71
(h) Petrographic analysis trench CD
Composition diagram of all samples in the trench CD were categorized into three types of
samples, namely non-beachrock, unconsolidated beachrock, and well-consolidated beachrock.
Samples of CDX1, CDY1, CDZ1, have ~ 50% shell content, minerals and rock fragments <10%
and are classified as non-beachrock. CDX2 and CDX3 samples have 45% shell content, 55%
minerals and 10% rock fragments. CDY2 and CDZ2 samples have 2% shell content, 2% mineral
content, and over 90% rock fragments.
2.5.1.3 Trench EF
The EF trench has coordinates 456025 E/ 9099647 S, located on the west side of the trench
AB, with dimensions of 5 m in length, 1 m in width, and 1 m in depth (Figure 2.7). Stratigraphic
columns that have been made in EF trenches include stratigraphic columns for EFX1 and EFX2
samples (Appendix B7), stratigraphic columns for EFY1 and EFY2 samples (Appendix B8),
and stratigraphic columns for EFZ1 and EFZ2 samples (Appendix B9). This trenching is almost
similar to trenching AB because it is assuming one formation. Dominated with carbonate sand
deposits in the top within whitish yellow color, 2 mm fragments and 1 mm matrix, subangular,
unconsolidated grains with a thickness of 70 cm. EFZ1, EFY1, and EFX1 samples were taken
at top of EF trenching layers. The sample constituents are limestone fragments, fossil skeletal
shell materials which are dominated by Baculogypsina sphaerulata and limestone sand
materials. Next, the beachrocks were then classified as Sparse Biomicrite (Folk, 1962) (EFZ2,
EFY2, and EFX2) whitish yellow color, measuring 4 mm fragments and a base mass of less
than 1 mm, subangular grain shape, open container, massive structure. An identification of
limestone fragments and fossil shell materials found a domination of foraminifera
Baculogypsina sphaerulata, calcite minerals, and limestone sand materials.
2.5.2 Geophysics measurements
Geoelectrical data was processed based on resistivity value, true resistivity, and contrasts
resistivity interpreted lithology of sub-surface and structural sub-surface geology, based on
field acquisition in the α-, β-, and γ-section. Furthermore, the interpretation is carried out
quantitatively by determining the rock resistivity according to the depth indicated by the results
of refraction seismic processing. The resistivity section was derived from the measured data
using 2D inversion technique. This method involves numerical calculation of the electric field

72
A.1
A.2
A
B
Figure 2.7. Stratigraphic of the Trench EF: (A) Petrographic on cross polarized nicol (XPL, A1) and plane
polarized nicol (PPL, A2) with sf (skeletal fragment), mc (micrite), sp (sparite), ca (calcite) and ar
(aragonite); (B) Degree of cementation based on composition of beachrock.

73
and constrained smoothing by a nonlinear least-squares method (Sasaki, 1992; Kubo, et al.,
2014).
2.5.2.1 α-section
This section was constructed by three measurement lines, which were line-1, line-2, and
line 3. The analysis data of this research were explained by each line to make it detailed and
more comprehensible. The α-section (Figure 2.8) is a depth profile obtained from data
processing. If the elastic waves that propagate in the Earth’s medium meet the plane boundary
with different elasticity and density, then reflection and refraction of the wave will occur. This
high resistivity zone is a high resistivity anomaly, with resistivity values ranging from 27.6 –
78.7 Ωm. In this zone, the beachrock body is estimated. Based on the results of data processing
that have been done, the depth of beachrock occurs from surface until 1-1.5 m and it solidifies
un-uniform northward due to the proximity to a building foundation whose high resistivity is
similar. From the dispersion curve of S-wave propagation that represented frequencies, phase
velocity and amplitude was used. The graphic of S-velocity versus depth described that
penetrating of source wave were propagated around ~4.5 m beneath the surface of beachrock
within S-wave velocity around 500~600 m/s. In other word, toward reinforcing the thickness
of beachrock, based on the results of data processing that has been done, v1 is obtained for the
first layer of 209.67 m/s with a depth of 1.5 m. Meanwhile, v2 in the second layer obtained a
value of 647.77 m/s. From the results of data processing, it is interpreted that natural beachrock
has a thickness of 1-1.5m which is in the first layer.
2.5.2.2 β-section
This section was constructed by two measurement lines, which were line-4 and line-5. The
data analysis of this research was explained by each line to make it more comprehensible and
detailed. The β-section (Figure 2.9) is a depth profile obtained from data processing. If the
elastic waves that propagate in the Earth's medium meet the plane boundary with different
elasticity and density, then reflection and refraction of the wave will occur. Based on the results
of data processing that has been done, the depth of beachrock occur from surface until ~2.5 m
un-uniform. This high resistivity zone is a high resistivity anomaly, with resistivity values
ranging from 27.6 - 78.7 Ωm. Based on the results of data processing that has been done, the
depth of beachrock occur from surface until 1-1.5 m un-uniform that solid in the northern part
because of the building concrete (Figure 2.9, a). From the dispersion, curve of S-wave
propagation represented frequencies, phase velocity, and amplitude that were used. The graphic
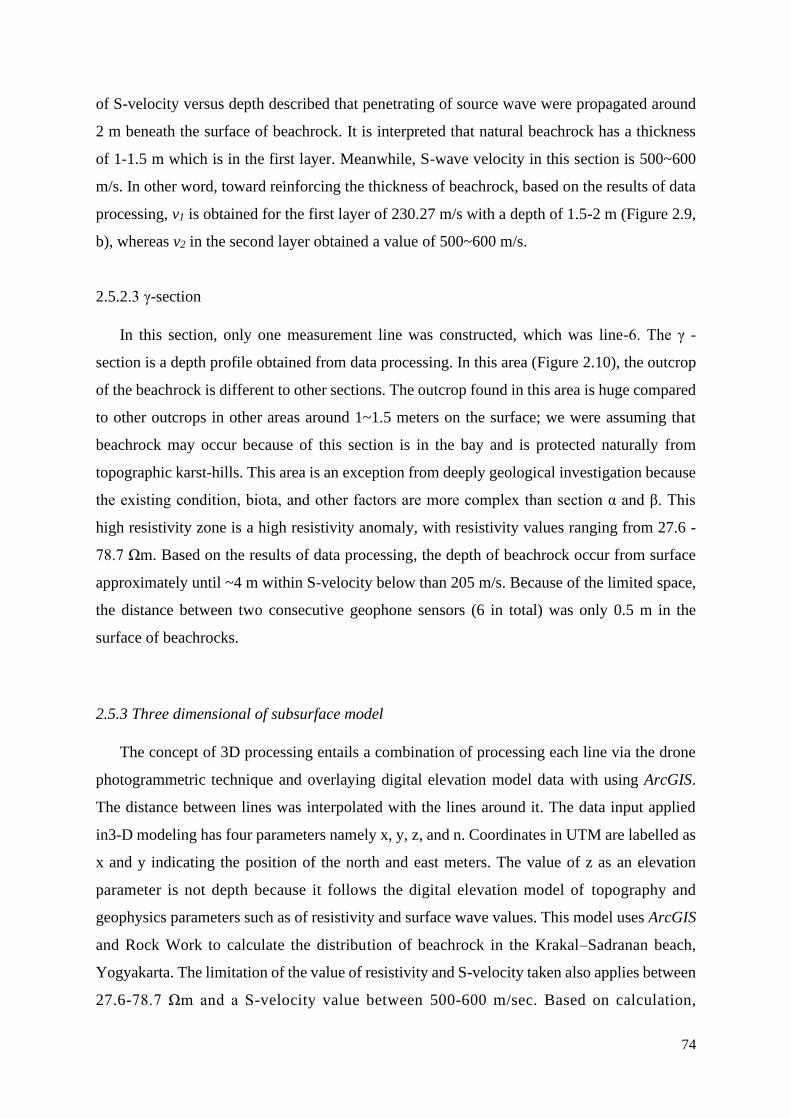
74
of S-velocity versus depth described that penetrating of source wave were propagated around
2 m beneath the surface of beachrock. It is interpreted that natural beachrock has a thickness
of 1-1.5 m which is in the first layer. Meanwhile, S-wave velocity in this section is 500~600
m/s. In other word, toward reinforcing the thickness of beachrock, based on the results of data
processing, v1 is obtained for the first layer of 230.27 m/s with a depth of 1.5-2 m (Figure 2.9,
b), whereas v2 in the second layer obtained a value of 500~600 m/s.
2.5.2.3 γ-section
In this section, only one measurement line was constructed, which was line-6. The γ -
section is a depth profile obtained from data processing. In this area (Figure 2.10), the outcrop
of the beachrock is different to other sections. The outcrop found in this area is huge compared
to other outcrops in other areas around 1~1.5 meters on the surface; we were assuming that
beachrock may occur because of this section is in the bay and is protected naturally from
topographic karst-hills. This area is an exception from deeply geological investigation because
the existing condition, biota, and other factors are more complex than section α and β. This
high resistivity zone is a high resistivity anomaly, with resistivity values ranging from 27.6 -
78.7 Ωm. Based on the results of data processing, the depth of beachrock occur from surface
approximately until ~4 m within S-velocity below than 205 m/s. Because of the limited space,
the distance between two consecutive geophone sensors (6 in total) was only 0.5 m in the
surface of beachrocks.
2.5.3 Three dimensional of subsurface model
The concept of 3D processing entails a combination of processing each line via the drone
photogrammetric technique and overlaying digital elevation model data with using ArcGIS.
The distance between lines was interpolated with the lines around it. The data input applied
in3-D modeling has four parameters namely x, y, z, and n. Coordinates in UTM are labelled as
x and y indicating the position of the north and east meters. The value of z as an elevation
parameter is not depth because it follows the digital elevation model of topography and
geophysics parameters such as of resistivity and surface wave values. This model uses ArcGIS
and Rock Work to calculate the distribution of beachrock in the Krakal–Sadranan beach,
Yogyakarta. The limitation of the value of resistivity and S-velocity taken also applies between
27.6-78.7 Ωm and a S-velocity value between 500-600 m/sec. Based on calculation,

75
A
(A.1
)
(A.2
)
(A.3
)
Bea
chro
ck
Co
ntin
ue
to n
ext
page

76
B
(B.1
)
(B.2
)
(B.3
)
Fig
ure
2.8
. E
lect
rica
l an
d m
ult
i an
aly
sis
surf
ace
wav
e re
sult
s o
f α
-sec
tio
n. (A
1)
the
resi
stiv
ity
of
lin
e 1
, (B
1)
the
MA
SW
of
lin
e 1
, (A
2)
the
resi
stiv
ity
of
lin
e 3
, (B
2)
the
MA
SW
of
lin
e 3
, (A
3)
the
resi
stiv
ity
of
lin
e 2
, (B
3)
the
MA
SW
of
lin
e 2
.
Hig
h V
eloci
ty Z
one
Hig
h V
elo
city
Zo
ne
77
the α-section covers 210.5 m3 of beachrock (Figure 2.11) while the β-section covers 76.9 m3
(Figure 2.12).
The wet density was 1.69 to 1.92 g/cm3 (average 1.95 g/cm3), porosity was 10 to 14 %
(average 12.3%), S wave velocity was 2.3 to 2.92 km/s (average 2.66 km/s), and the P wave
velocity was 3.35 to 4.41 km/s (average 4.18 km/s). The dynamic Poisson's ratio was 0.09 to
0.21 (average 0.16), respectively. Compared with the beach rock samples at other points shown
in Table 2.2, these results show a lower porosity and higher values for both P wave velocity
and S wave velocity compared to Okinawa, Japan samples (Danjo and Kawasaki, 2014). Figure
2.14 shows the results of comparing the properties of beach rocks with other rock types using
existing data. The relationship between P-wave velocity and S-wave velocity for sedimentary
rock samples in Japan (Suzuki, et al., 2013) and Indonesia in this research. It can be seen that
the elastic wave velocity of the beachrock at this point (2B, 1A, 1C, 2C, 1B and 2A in the
figure) show values similar to those of the early Paleogene until Cretaceous sedimentary rocks.
It shown the beachrock distribution in Indonesia have a compacted crystallization than
Japanese Okinawa beachrock, even though the pattern of beachrock samples from both sides
were sedimented in the same characteristics (based on dynamic Poisson ration ~0.2) which
mean it has a similar porosity. Based on the results, detail analysis of carbon dating is needed
to prove the actual dating of beachrock in Indonesia as the most suitable approach for further
analysis.
2.6 Discussions
2.6.1 Beachrock characteristics
Beachrock is generally cemented in the tidal zone with high amounts of aragonite, HMC,
and LMC. General carbonate cementation in the marine environment formed acicular-radial
and spacious types of cement texture, whereas the tidal zone is indicated by aragonite or HMC.
Meniscus and bridge cement indicate LMC composition (Vousdoukas et al., 2007; Mauz, et
al., 2015). Krakal-Sadranan Beaches, Indonesia happens to have the same pattern, which is
characteristics of cement solution are dominated by aragonite and calcite crystalline, soluble in
water. In contrast, the cement product of beachrock evolution based on field investigation (from
the sea to surface) is represented by aragonite crystalline that only occurs in the swash-zone
area, due to aragonite mineral being easily dissolvable in fresh water from rain or land rich of

78
(A.2
)
A
(A.1
)
Co
ntin
ue
to n
ext p
ag
e
Bea
chro
ck

79
B
(B.1
)
(B.2
)
Fig
ure
2.9
. E
lect
rica
l an
d m
ult
i an
aly
sis
surf
ace
wav
e re
sult
s o
f α
-sec
tio
n. (A
1)
the
resi
stiv
ity
of
lin
e 4
, (B
1)
the
MA
SW
of
lin
e 4
, (A
2)
the
resi
stiv
ity
of
lin
e 5
, an
d (
B2
)
the
MA
SW
of
lin
e 5
.

80
(B)
(C)
Fig
ure
2.1
0. E
lect
rica
l an
d m
ult
i an
aly
sis
surf
ace
wav
e re
sult
s o
f γ-
sect
ion
. (A
) th
e re
sist
ivit
y o
f li
ne
6,
(B)
the
MA
SW
of
lin
e 6
, an
d (
C)
dep
th f
un
ctio
n f
or
γ -s
ecti
on.
(A)
Ph
ase
vel
oci
ty (
m/s
ec)
Sourc
e 4
.0 m
Frequency (Hz)
S-v
elo
city
(m
/s)
Depth (m)
Bea
chro
ck
Tru
e dep
th

81
3D Beachrock Deposit
Subsurface Model
3D Beachrock Deposit
Subsurface Model
Figure 2.11. Three dimensional of beachrock model calculation based on geophysical statistical anomaly
data from electrical resistivity and multi analysis surface wave of α-section.
Figure 2.12. Three dimensional of beachrock model calculation based on geophysical statistical anomaly
data from electrical resistivity and multi analysis surface wave of β-section.
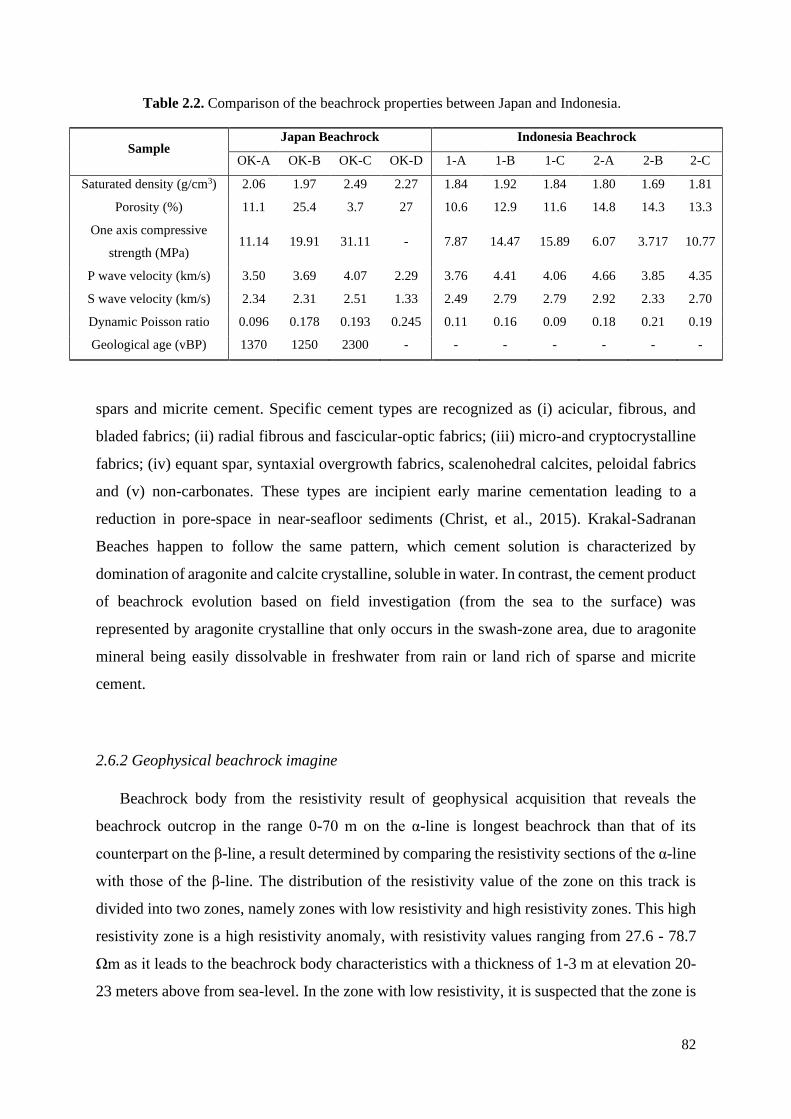
82
Table 2.2. Comparison of the beachrock properties between Japan and Indonesia.
Sample Japan Beachrock Indonesia Beachrock
OK-A OK-B OK-C OK-D 1-A 1-B 1-C 2-A 2-B 2-C
Saturated density (g/cm3) 2.06 1.97 2.49 2.27 1.84 1.92 1.84 1.80 1.69 1.81
Porosity (%) 11.1 25.4 3.7 27 10.6 12.9 11.6 14.8 14.3 13.3
One axis compressive
strength (MPa) 11.14 19.91 31.11 - 7.87 14.47 15.89 6.07 3.717 10.77
P wave velocity (km/s) 3.50 3.69 4.07 2.29 3.76 4.41 4.06 4.66 3.85 4.35
S wave velocity (km/s) 2.34 2.31 2.51 1.33 2.49 2.79 2.79 2.92 2.33 2.70
Dynamic Poisson ratio 0.096 0.178 0.193 0.245 0.11 0.16 0.09 0.18 0.21 0.19
Geological age (vBP) 1370 1250 2300 - - - - - - -
spars and micrite cement. Specific cement types are recognized as (i) acicular, fibrous, and
bladed fabrics; (ii) radial fibrous and fascicular-optic fabrics; (iii) micro-and cryptocrystalline
fabrics; (iv) equant spar, syntaxial overgrowth fabrics, scalenohedral calcites, peloidal fabrics
and (v) non-carbonates. These types are incipient early marine cementation leading to a
reduction in pore-space in near-seafloor sediments (Christ, et al., 2015). Krakal-Sadranan
Beaches happen to follow the same pattern, which cement solution is characterized by
domination of aragonite and calcite crystalline, soluble in water. In contrast, the cement product
of beachrock evolution based on field investigation (from the sea to the surface) was
represented by aragonite crystalline that only occurs in the swash-zone area, due to aragonite
mineral being easily dissolvable in freshwater from rain or land rich of sparse and micrite
cement.
2.6.2 Geophysical beachrock imagine
Beachrock body from the resistivity result of geophysical acquisition that reveals the
beachrock outcrop in the range 0-70 m on the α-line is longest beachrock than that of its
counterpart on the β-line, a result determined by comparing the resistivity sections of the α-line
with those of the β-line. The distribution of the resistivity value of the zone on this track is
divided into two zones, namely zones with low resistivity and high resistivity zones. This high
resistivity zone is a high resistivity anomaly, with resistivity values ranging from 27.6 - 78.7
Ωm as it leads to the beachrock body characteristics with a thickness of 1-3 m at elevation 20-
23 meters above from sea-level. In the zone with low resistivity, it is suspected that the zone is
83
a layer of sand saturated with sea water. In the case of the seismic surface-wave survey of the
beachrock, there was a great difference between the S-wave velocity in the laboratory tests
(about 2.6 km/s) and the S-wave velocity that had been assumed for detecting the beachrock in
the field (about 0.6 km/s). The cause of this discrepancy is suspected due to the area of highest
frequency (highest velocity) along the survey line which could not be detected, because the
high frequencies had been attenuated by putting all the geophones on the beachrock. Toward
reduce that noise because of attenuation frequency, the sensitive geophones be placed into
holes made in the ground (buried into compacted coarse coral sand). Another reasons, the
physical property of beachrock is not homogeneous in the site. The samples were probably
picked up from a solidified part where was relatively easy to collect which affected of the S-
wave velocity measured by laboratory tests is higher than that calculated by field data.
The geophysical prospecting, in which underground structures are surveyed without damaging
the landscape can be an extremely effective way to study the distribution of beachrock
especially in the tourism spot. This figure is a cross-section between geophysical data and the
digital surface model drone to give an overall impression of geophysical surveying applied to
geological exploration of beachrocks that is easily comprehensible (Radjawali and Pye, 2017;
Darmawan, et al., 2018). The integrated study based on aerial photogrammetric with
geophysics measurement gave better resolution and 3D image figure to reconstruct the sub-
surface model based on physics parameter from acquisition geophysics.
2.6.3 Rock characteristic of natural beachrock
Shear wave velocity (S-wave) test results were used to develop a correlation to the
precipitated calcite mass and this enables prediction of changes in porosity, density, and shear
modulus during treatment (Weil et al. 2012). Shear wave velocity is used to nondestructively
monitor the change in small-strain stiffness during shearing, which provides an indication of
cementation degradation as a function of strain level. Because shear wave velocity is influenced
by both the level of cementation and the change in effective mean stress during shearing, the
normalized shear modulus is used to evaluate the degradation of cementation during shearing
(Montoya and DeJong 2015). Biocementation in a change from a shear wave velocity of 140
m/s to an average of 600 m/s, compare with this research a shear wave around 510 m/s to 1330
m/s. Compression wave velocity (P-wave) measurements can be determined under different
saturation conditions and used in combination with S-wave measurements to observe how the
Poisson’s ratio evolved during treatment (Weil et al. 2012).

84
2.7 Conclusions
As a result of conducting electrical and surface wave surveys on sandy beaches, we found
the following:
1. Beachrock were found in this area precipitated beneath beach sand which is wave
erosional product and then solidify beneath that formation, floating, between limestone
bedrock and beach sands formation based on greater value from resistivity and S-wave
velocity in the formation layers.
2. Resistivity, thickness, and S-wave velocity of the beachrock increases as it gets closer
to the coastline. The maximum thickness of the beachrock at this point is about 1 m
(to be up to 3 m) based on calculations, the α-section covers 210.5 m3 while the β-
section covers 76.9 m3 of beachrock deposit.
Therefore, the sufficient immersion and evaporation of seawater is an important condition for
the solidification of sand to form a beachrock.
Japan beachrocks
Indonesia beachrocks
Figure 2.13. Comparison of the geophysical properties of the sedimentary rocks and beachrocks based on P-
wave velocity and S-wave velocity
P-wave velocity (km/s)
S-w
ave
vel
oci
ty (
km
/s)
85
References
Atmoko, D.D., Titisari, A.D. and Idrus, A., 2016. Mineralogi dan Geokimia Batugamping
Merah Ponjong, Gunungkidul, Daerah Istimewa Yogyakarta–Indonesia. RISET Geologi dan
Pertambangan, 26(1), pp.55-67.
Avcıoğlu, M., Yiğitbaş, E. and Erginal, A.E., 2016. Beachrock formation on the coast of
Gökçeada Island and its relation to the active tectonics of the region, northern Aegean Sea,
Turkey. Quaternary international, 401, pp.141-152.
Brown, D.G., and Arbogast, A.F. 1999. Digital photogrammetric change analysis as
applied to active coastal dunes in Michigan. Journal of Photogrammetric Engineering and
Remote Sensing 65: 467-474.
Burger, H.R. 1996. Exploration Geophysics of the Shallow Subsurface. Prentice Hall. 489
pp.
Christ, N., Immenhauser, A., Wood, R.A., Darwich, K. and Niedermayr, A., 2015.
Petrography and environmental controls on the formation of Phanerozoic marine carbonate
hardgrounds. Earth-science reviews, 151, pp.176-226.
Cooper, J.A.G., Green, A.N., Meireles, R.P., Klein, A.H., Souza, J. and Toldo, E.E., 2016.
Sandy barrier overstepping and preservation linked to rapid sea level rise and geological
setting. Marine Geology, 382, pp.80-91.
Cribb, R. and Ford, M., 2009b. Indonesia as an archipelago: Managing islands, managing
the seas. ISEAS-Yusof Ishak Institute.
Cribb, R.B. and Ford, M. eds., 2009a. Indonesia beyond the water's edge: managing an
archipelagic state. Institute of Southeast Asian Studies.
Danjo, T. and Kawasaki, S., 2014. Characteristics of beachrocks: a review. Geotechnical
and Geological Engineering, 32(2), pp.215-246.
Danjo, T. and Kawasaki, S., 2014. Formation mechanisms of beachrocks in Okinawa and
Ishikawa, Japan, with a Focus on Cements. Materials Transactions, pp.M-M2013844.
Darmawan, H., Walter, T.R., Brotopuspito, K.S. and Nandaka, I.G.M.A., 2018.
Morphological and structural changes at the Merapi lava dome monitored in 2012–15 using
86
unmanned aerial vehicles (UAVs). Journal of Volcanology and Geothermal Research, 349,
pp.256-267.
Daryono, L.R., Titisari, A.D., Warmada, I.W. and Kawasaki, S., 2019. Comparative
characteristics of cement materials in natural and artificial beachrocks using a petrographic
method. Bulletin of Engineering Geology and the Environment, 78(6), pp.3943-3958.
David, P., Panagiotis, T. and Konstantinos, A., 2009. Electrical resistivity tomography
mapping of beachrocks: application to the island of Thassos (N. Greece). Environmental Earth
Sciences, 59(1), p.233.
Dewi Titisari, A. and Hendrawan, A., 2017, September. Genesa batugamping merah di
daerah Siung dan sekitarnya, kecamatan Tepus dan Girisubo, kabupaten Gunungkidul. In
proceeding, seminar nasional kebumian ke-10 peran penelitian ilmu kebumian dalam
pembangunan infrastruktur di Indonesia 13–14 september 2017; Grha Sabha Pramana (In
Bahasa).
Feng, K. and Montoya, B.M., 2017. Quantifying level of microbial-induced cementation
for cyclically loaded sand. Journal of Geotechnical and Geoenvironmental Engineering,
143(6), p.06017005.
Folk, R.L., 1962. Spectral subdivision of limestone types.
Fowler, C.M.R., Fowler, C.M.R. and Fowler, M., 1990. The solid earth: an introduction to
global geophysics. Cambridge University Press.
Jauhari, U. and Toha, B., 2005. High Resolution Sequence Stratigraphy and Diagenesis in
Carbonate Rocks, Wonosari Formation, Yogyakarta: An Outcrop Analog for Modeling Chalky
Limestone Reservoir Distribution.
Kubo, R., Kawasaki, S., Suzuki, K., Yamaguchi, S. and Hata, T., 2014. Geological
exploration of beachrock through geophysical surveying on Yagaji Island, Okinawa, Japan.
Materials Transactions, pp.M-M2013839.
Lokier, S.W., 2000. The Development of the Miocene Wonosari Formation, South Central
Java.
Mauz, B., Vacchi, M., Green, A., Hoffmann, G. and Cooper, A., 2015. Beachrock: a tool
for reconstructing relative sea level in the far-field. Marine Geology, 362, pp.1-16.

87
Montoya, B.M. and DeJong, J.T., 2015. Stress-strain behavior of sands cemented by
microbially induced calcite precipitation. Journal of Geotechnical and Geoenvironmental
Engineering, 141(6), p.04015019.
Mukti, M.M.R., 2005. Carbonate depositional environment and platform morphology of
the Wonosari Formation in the area east of Pacitan. RISET Geologi dan Pertambangan, 15(2),
pp.29-38.
Pilkey, O.H. and Cooper, J.A.G., 2014. Are natural beaches facing extinction?. Journal of
Coastal Research, 70(sp1), pp.431-436.
Premonowati, P., Prastistho, B. and Firdaus, I.M., 2012. Allostratigraphy of Punung
Paleoreef based on Lithofacies Distributions, Jlubang Area, Pacitan Region-East Java.
Indonesian Journal on Geoscience, 7(2), pp.113-122.
Radjawali, I., Pye, O. and Flitner, M., 2017. Recognition through reconnaissance? Using
drones for counter-mapping in Indonesia. The Journal of Peasant Studies, 44(4), pp.817-833.
Sartono, S., 1964. Stratigraphy and sedimentation of the easternmost part of Gunung Sewu,
East Djawa (No. 1). Departemen Perindustrian Dasar/Pertambangan, Direktorat Geologi.
Sasaki, Y., 1992. Resolution of resistivity tomography inferred from numerical simulation
1. Geophysical prospecting, 40(4), pp.453-463.
Siregar, M.S., Kamtono, P. and Mukti, M.M., 2004. Reef facies of the Wonosari Formation,
south of Central Java. RISET-Geologi dan Pertambangan, 14(1), pp.1-17.
Sudarno, I., 1997. Petunjuk Adanya Reaktifasi Sesar di Sekitar Aliran Sungai Opak,
Perbukitan Jiwo dan Sisi Utara Kaki Pegunungan Selatan. Media Teknik, 19 (In Bahasa).
Surono, B.T. and Sudarno, I., 1992. Peta Geologi Lembar Surakarta-Giritontro, Jawa.
Bandung: Pusat Penelitian dan Pengembangan Geologi.
Surono, B.T., Sudarno, I. and Wiryosujono, S., 1992. Geology of the Surakarta-Giritontro
Quadrangles. Java: Bandung, Geological Research and Development Center, Indonesia, scale,
1(100,000), p.2.
Suzuki, K., Kawasaki, S., Kubo, R., Yamaguchi, S., and Hata, T. 2013. Geological structure
of beachrock using electrical resistivity and surface wave surveys – Application to the coastal
area of Yagaji Island in Nago-shi, Okinawa, Japan. SEGJ 128th, pp. 277-285.

88
Telford, W.M.L.P. and GELDART, L., P., SHERIFF, R, KEYS., D. 1976, Applied
geophysics.
Titisari, A.D., Titisari, A.D., Atmoko, D.D. and Atmoko, D.D., 2015, October. Genesis of
Ponjong Pink Limestone, Gunungkidul, Special Region of Yogyakarta–Indonesia (Genesa
Batugamping Merah Muda Ponjong, Gunungkidul, Daerah Istimewa Yogyakarta-Indonesia).
In proceeding, seminar nasional kebumian ke-8 Academia-Industry Linkage 15-16 Oktober
2015; Grha Sabha Pramana. Departmen Teknik Geologi (In Bahasa).
Toha, B., Resiwati, P., Sriyono, Soetoto, Rahardjo, W. and Pramumijoyo, S. (1994)
Geology of Southern Mountain: A contribution (in Indonesia). In: Proceedings of geology and
geotectonic of Java Island from Late Mesozoic – Quaternary, Teknik Geologi-UGM,
Yogyakarta, 19-36.
van Bemmelen, R.W., 1949. General Geology of Indonesia and adjacent archipelagoes.
The geology of Indonesia.
Varela-González, M., González-Jorge, H., Riveiro, B. and Arias, P. 2013. Performance
testing of LiDAR exploitation software. Computers & geosciences, 54, pp.122-129.
Verstappen, H.T., 2000. Outline of the geomorphology of Indonesia: a case study on
tropical geomorphology of a tectogene region: with a geomorphological map 1: 5,000,000 (No.
79). International Institute for Aerospace Survey and Earth Sciences.
Vousdoukas, M.I., Velegrakis, A.F. and Plomaritis, T.A., 2007. Beachrock occurrence,
characteristics, formation mechanisms and impacts. Earth-Science Reviews, 85(1-2), pp.23-
46.
Weil, M.H., DeJong, J.T., Martinez, B.C. and Mortensen, B.M., 2012. Seismic and
resistivity measurements for real-time monitoring of microbially induced calcite precipitation
in sand. Geotechnical Testing Journal, 35(2), pp.330-341.
Wilson, R.F., Turton, S.M., Jones, A. and Phillips, M., 2011. The impact of climate change
on reef-based tourism in Cairns, Australia: adaptation and response strategies for a highly
vulnerable destination. Disappear Destin: Climate Change Future Chall Coast Tour, pp.233-
53.

89
Zhu, X., Linham, M.M. and Nicholls, R.J., 2010. Technologies for climate change
adaptation-Coastal erosion and flooding. Danmarks Tekniske Universitet, Risø
Nationallaboratoriet for Bæredygtig Energi.
90
CHAPTER 3
Sediment characteristics of beachrock at Krakal-Sadranan beach,
Yogyakarta, Indonesia
3.1 Introduction
The precipitation of solid matter from dissolved substances in seawater occurs either
abiotically (governed by inorganic thermodynamics and reaction kinetics) or biotically (as a
metabolic consequence of living organisms). This process is primarily controlled by the
biochemistry of organisms including algae, foraminifera, cyanobacteria, and corals but is also
influenced by the marine conditions where they live. Beachrock (Figure 3.1) is a carbonate
sedimentary product with an anchoring effect for dynamic islands and provides protection from
erosion. The sedimentary characteristics of beachrock have been investigated; however, many
things about its origin and properties remain unknown or are subject to debate. Outcrops of
beachrock are valuable records of the past climate of the low-lying reef islands generally found
in tropical and subtropical areas with generally warm seawater (Turner, 2005; Vousdoukas,
2007; Russell and McIntire, 1965; McLean, 2011; Avcioğlu, et al., 2016). Carbonate cement
occurs as precipitation from interstitial seawater and or seawater waves (Ginsburg, 1953;
Kelletat, 2006), coastal aquifers featuring the mixture of saltwater and freshwater (Moore,
1999), or at sea level due to CO2 degassing (Vousdoukas, 2007), with biological activity as an
additional agent (Neumeier, 1998). Indonesia’s coastline is among the largest of any country,
and Indonesian beaches face unique issues. Compounding effects and conflicts arise in a
complex manner with emergent and cross-scaled impacts, including manifold potential change
drivers (e.g., climate change, urbanization, tourism development, and marine resource
exploitation) (Zhu, et al., 2010; Jones and Phillips, 2011; Pilkey and Cooper, 2014; Barragan
and Andreis, 2015; Shi and Kasperson, 2015).
Beachrock in some areas has not yet been subjected to study. The beachrock found on
Krakal-Sadranan Beach is distributed parallel to the coastline, with a coverage of around 10–
30 m2. The research area is located on a coastline that extends along the south of Java Island
(the South Coast). It is included in the Wonosari-Punung Formation according to the regional
geological map of the Surakarta-Giritontro sheet (van Bammelen, 1949). The authors chose
this particular location due to the unexplored sedimentary and diagenesis beachrock in the area

91
around Krakal-Sadranan Beach, as well as the lack of records on beachrock occurrence. The
aim of this study was to identify the ureolytic bacteria that induced the natural beachrock. This
study serves as an initial exploration of beachrock sedimentary processes in the area and as a
basis for future studies. These might include studies of the rocks’ age based on carbon dating
and the development of artificial beachrock using microbially induced carbonate precipitation
(MICP) to resolve coastal erosion or other issues. As an initial step towards achieving this goal,
native indigenous ureolytic strains were isolated from Indonesian beachrock and beach sand
and their bioaugmentation potential.
3.2 Objectives
Upon receiving more successful results for enhancing sedimentary of beachrock
mechanism based on MICP treatment using a marine ureolytic bacterium for the desired
engineering application. The lack of information about sediment in tropical area such as
Indonesia was makes background why such research must be carried out. Further studies were
carried out to (i) isolate a local strain of ureolytic bacteria from natural beachrock, (ii) optimize
Figure 3.1. Beachrock: (a) Baracoa, Cuba; (b) Salvador, Brazil, (c) Barcelona, Spain; (d) Athitos, N.
Greece; (e) Mykonos, Greece; (f) Morrocoy, Venezuela; (g) Sifnos, Greece; (h) Attica, Greece (Turner,
2005; Vousdoukas, 2007)
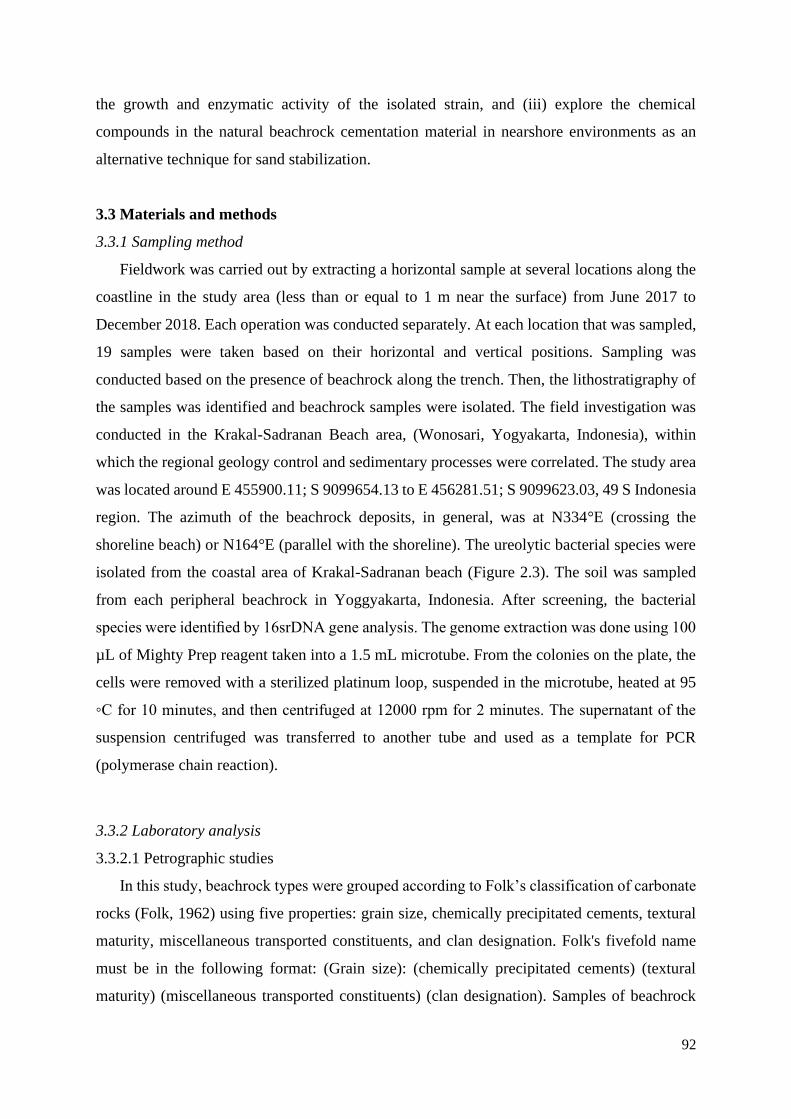
92
the growth and enzymatic activity of the isolated strain, and (iii) explore the chemical
compounds in the natural beachrock cementation material in nearshore environments as an
alternative technique for sand stabilization.
3.3 Materials and methods
3.3.1 Sampling method
Fieldwork was carried out by extracting a horizontal sample at several locations along the
coastline in the study area (less than or equal to 1 m near the surface) from June 2017 to
December 2018. Each operation was conducted separately. At each location that was sampled,
19 samples were taken based on their horizontal and vertical positions. Sampling was
conducted based on the presence of beachrock along the trench. Then, the lithostratigraphy of
the samples was identified and beachrock samples were isolated. The field investigation was
conducted in the Krakal-Sadranan Beach area, (Wonosari, Yogyakarta, Indonesia), within
which the regional geology control and sedimentary processes were correlated. The study area
was located around E 455900.11; S 9099654.13 to E 456281.51; S 9099623.03, 49 S Indonesia
region. The azimuth of the beachrock deposits, in general, was at N334°E (crossing the
shoreline beach) or N164°E (parallel with the shoreline). The ureolytic bacterial species were
isolated from the coastal area of Krakal-Sadranan beach (Figure 2.3). The soil was sampled
from each peripheral beachrock in Yoggyakarta, Indonesia. After screening, the bacterial
species were identified by 16srDNA gene analysis. The genome extraction was done using 100
µL of Mighty Prep reagent taken into a 1.5 mL microtube. From the colonies on the plate, the
cells were removed with a sterilized platinum loop, suspended in the microtube, heated at 95
◦C for 10 minutes, and then centrifuged at 12000 rpm for 2 minutes. The supernatant of the
suspension centrifuged was transferred to another tube and used as a template for PCR
(polymerase chain reaction).
3.3.2 Laboratory analysis
3.3.2.1 Petrographic studies
In this study, beachrock types were grouped according to Folk’s classification of carbonate
rocks (Folk, 1962) using five properties: grain size, chemically precipitated cements, textural
maturity, miscellaneous transported constituents, and clan designation. Folk's fivefold name
must be in the following format: (Grain size): (chemically precipitated cements) (textural
maturity) (miscellaneous transported constituents) (clan designation). Samples of beachrock

93
that were brittle and poorly sorted were easy to break into pieces. Resin was added to such
samples to solidify them, and they were cut to make thin sections for microscope slides. The
collected samples were then examined in the laboratory using an optical petrographic
microscope equipped for polarized light microscopy. The petrographic analysis was carried out
at the Optical Geology Laboratory to assess the biostratigraphy of the samples.
3.3.2.2 Inductively coupled plasma-atomic emission spectroscopy and mass spectrometry
(ICP-AES and MS)
Each prepared beachrock sample (10 g) was added to lithium metaborate/ lithium
tetraborate flux, well mixed, and fused in a furnace at 1000 °C. Then, each sample was cooled
and dissolved in 100 mL of 4% nitric acid and 2% hydrochloric acid for preparation and reduce
of organic compound of samples. This solution was then analyzed using ICP-AES in the
laboratory of ALS Canada Ltd. (North Vancouver, Canada). Major and trace elements were
analyzed by ALS Canada Ltd. (North Vancouver, BC) using the ICP-AES and ICP-MS
(method code ME-MS81L, iCAP 6000 Thermo Fischer Scientific) methods after aqua regia
digestion (ARD) for combined whole rock analysis, trace elements by fusion and aqua regia
digestion for the volatile trace elements, carbon and sulfur for combustion analysis, and several
detection limit options for base metals. Four certified reference materials, ME-ICP06, OA-
GRA05, ME-MS81, and TOT-ICP06, were measured using the same procedure as the samples
for data calibration (Nichols, 2009). The loss on ignition (LOI) was determined using the
gravimetric method. Each prepared beachrock sample (10 g) was placed in an oven at 1000 °C
for one hour, cooled, and then weighed. The resulting material was then cooled and dissolved
in an acid mixture containing nitric, hydrochloric, and hydrofluoric acids. Beachrock sample
was consisted of ~90% of the organic compound of microbial carbonate precipitation therefore
to eliminate the organic compound the samples have to dissolve in acid mixture. The
normalization values for plotting the trace element concentration of the limestone samples are
from the Average Phanerozoic Limestone (Martin, et al., 1994; Codie, et al., 1991), while Post-
Archean Australian Shale (PAAS) normalization (Guimaraes, et al., 2013) was used for
plotting major oxide and rare earth element (REE) concentrations in the samples (Rollinson,
2014).
3.3.2.3 X-Ray diffraction (XRD) and total organic carbon (TOC)
The research findings presented use geochemical analysis (XRD). This form of analysis is
usually used when trying to determine mineral composition and the enrichment of elements

94
that can be found in the beachrock. Each sample finding for different locations represented a
swash zone (intertidal, the narrow region of sediment between land and sea) in the different
locations. In the XRD experimental analysis using a MiniFlex™ (Rigaku Co., Ltd., Tokyo,
Japan), a natural beachrock sample was dried at 105°C and ground into powder manually. XRD
scans were recorded from 5 to 80° 2θ, at rate of 20° per minute. The crystalline phases were
identified using the International Center for Diffraction Data (ICDD) database and Match 3.4
(Putz and Brandenburg, 2015).
On other hand, since the evaluation process of these resources is essentially depending on
the determination of total organic carbon (TOC), hence, an accurate and continuous evaluation
of TOC is required. Direct measurement of TOC from core samples in the laboratory is accurate
but it is costly and time consuming. On the other hand, the current practice of TOC estimation
based on bulk density log alone or based on the conventional sonic (or density) logs and
resistivity log using empirical correlations is fast but not accurate enough due to the
assumptions implied in these correlations (Huang et al., 2015).Currently two proven techniques
of estimating TOC from well-log data are used; these methods are: the Schmoker density log
based technique (Schmoker, 1979, 1980) and Δlog R method (Passey et al.,1990). Schmoker
correlation was developed for Devonian shale formation, Eq.3.1, based on treating the
Devonian shale as a four-component system (matrix, interstitial pores, pyrite, and organic
matter). He considered the total density of the formation as a function of the densities and
fractional volumes of these four components, and setting the pyrite, organic matter and matrix
densities of 5.0, 1.0, and 2.69 g/cm3, respectively. The pyrite volume was assumed to increase
linearly with the increase of the organic matter.
Based on these assumptions, Sckmoker derived Eq.3.1 to calculate the organic content in
volume percent. TOC in wt% can be obtained by converting the volume to weight percent.
There is a well-established correlation between wt% and volume percent for Devonian shale
(Schmoker, 1979).
𝑇𝑂𝐶(𝑣𝑜𝑙%) =(𝜌𝐵 − 𝜌)
1.378⁄ (Eq. 3.1)
where TOC is the total organic carbon, ρB is the formation density in absence of organic matter
(g/cm3), ρ is the formation bulk density (g/cm3). The major disadvantage of Schmoker method
is that it assumes the formation bulk density and porosity are constant, and any change in the
bulk density is due to presence or absence of low-density organic kerogen.

95
3.3.2.4 Algae taxonomy
Macroalgae can be divided into three divisions based on their primary pigment color:
Chlorophyta (green algae), Rhodophyta (red algae), and Phaeophyta (brown algae) (Pratama,
et al., 2015). Green algae are abundant in warm (trophic) waters and at least 12 genera of green
algae were recorded (Romimohtarto, 2009). Algae were found in the intertidal zone of Krakal
Beach and samples were collected by purposive random sampling. Each sample was taken
completely from the substrate for identification. Samples taken by purposive random sampling
from each quadrat plot were stored in Ziplock plastic bags. Then, samples were cleaned and
photographed on millimeter block paper for identification. The identification results showed
the seaweed diversity based on identification using the FAO Species Identification Guide for
Fishery Purpose (Trono, 1998).
3.3.2.5 Isolation and identification of a suitable urease active bacterium
We hypothesized that there was likely to be a close biomineralization relationship between
algae and other agents in microbial mats. Moreover, to identify the microbial activity, a 5.0 g
sample of beachrock was mixed with 10 mL of autoclaved artificial seawater (Aquamarine,
Yashima Drug Company, Osaka, Japan; Table 3.1), then diluted 101104 times with artificial
seawater. Next, 10 µL of each dilution was added to ZoBell2216E agar medium (for marine
bacteria, pH 7.7) and NH4-YE agar medium for inland bacteria (20 g/L yeast extract; 10 g/L
di-ammonium sulfate (NH4)2SO4; 0.13 M Tris buffer for pH 8.0), and 20 g/L agar amended to
isolate micro bacteria resistant strains as target study of this research. To avoid contamination,
every step of the investigation was conducted inside a clean-bench. After incubation at 35 °C
for 3 d, about ~53 colonies from each location were isolated from the plates. A urease activity
test was then conducted on the colonies to identify ureolytic bacteria. Each selected colony
(diameter: 2–3 mm) was mixed with 20 mL of solution (20 mL/L cresol red solution, 0.4 g/L
cresol red with distilled water, and 25 g/L CO(NH2)2 with distilled water) in a 20 mL bottle.
The samples were then sealed, mixed by shaking, and then incubated at 45 °C for 2 h. To
determine whether or not the colonies have urease activity, we observed the color of the
solution after 2 h. There was a change in the cresol red, from yellow to purple as pH increased
from 7.2 to 8.8.
Gene amplification (16S rRNA) and sequencing was carried out for selected ureolytic
isolates. The analysis of the DNA sequences was performed using the DB-BA 12.0 and
International Nucleotide Sequence Database created by the Techno Suruga Laboratory,

96
Shizuoka, Japan. The ureolytic bacteria isolated were identified using 16S rRNA sequence
analysis. DNA extracts were amplified using two sets of primers targeting the region-specific
16S rRNA sequences for almost all bacterial 16S sequences: the F9 (5′-
GAGTTTGATCCTGGCTCAG-3′) and R1451 (5′-AAGGAGGTGATCCAGCC-3′) primers.
The PCR amplification cycle consisted of an initial denaturation step lasting 5 min at 94 °C,
followed by 25 cycles lasting 1 min at 94 °C, 2 min at 60 °C, 1 min at 72 °C, and a final
extension step of 30 min at 72 °C. The amplicons were separated through gel electrophoresis,
and the resulting DNA bands were extracted and purified using the FastGene™ PCR extraction
kit according to manufacturer instructions (Nippon Genetics Co., Ltd., Tokyo, Japan). The
extracted DNA was sent to the Eurofins Genomics Laboratory (Eurofins Genomics, Tokyo,
Japan) for sequencing. Subsequent phylogenetic analysis was conducted by TechnoSuruga
Laboratory (TechnoSuruga Laboratory Company Ltd., Tokyo, Japan). The latter used the
BLAST algorithm to find related sequences in the GeneBank Database, DNA Data Bank of
Japan, and the European Molecular Biology Laboratory. PCR sequencing was conducted to
identify the species of ureolytic bacteria isolated from the sites at Krakal-Sadranan.
Table 3.1. Composition of artificial seawater (Aquamarine, Japan)
Reagent (g/20 L)
MgCl2 . 6H2O
CaCl2 . 2H2O
SrCl2 . 6H2O
KCl
NaHCO3
KBr
H3BO3
NaF
NaCl
Na2SO4
222.23
30.7
0.85
13.89
4.02
2.01
0.54
0.06
490.68
81.88

97
3.3.2.6 Cultivation of bacteria and assessing the potential for microbial induced carbonate
precipitation (MICP)
Standard media (ZoBell2216E for marine bacteria and NH4-YE medium for land bacteria)
were used for culturing under sterile aerobic conditions. Cells were precultured separately in 5
mL of each medium at 37 °C and 160 rpm for 24 h. One mL of the preculture was inoculated
with 100 mL of the fresh medium and incubated under the same conditions. The microbial cell
growth of the isolates was determined based on optical density at a wavelength of 600 nm
(OD600) using a UV–vis spectrophotometer (V-730, JASCO Corporation, Tokyo, Japan).
Representative specimens were sampled at regular intervals of 24 h. Microbially induced
calcium carbonate precipitation tests were conducted in 10 mL tubes to evaluate the feasibility
of using isolated bacterial strains. Calcium chloride (CaCl2) reagent was chosen as the calcium
source, and 1 mL from equimolar concentrations (0.5 mol/L (M)) of CaCl2 and urea solutions
were used. One milliliter of the bacteria culture was added to the tube, and the total volume
was adjusted to 10 mL using distilled water. Samples were then placed in a shaking incubator
at 37 °C and shaken at 160 rpm for 48 h. Finally, the reaction mixtures were centrifuged,
precipitates were collected, and the amount of precipitate formed by each isolate were
gravimetrically compared. Based on the results, a single isolate was selected as the most
suitable for further analysis.
3.4 Results
3.4.1 Stratigraphy of Krakal-Sadranan Beachrock
The studied samples were categorized as non-beachrock, unconsolidated beachrock, and
well-consolidated beachrock, based on relative proportions of skeletal, mineral, and rock
fragments and degree of cementation. Limestone sand with sparse biomicrite cement dominates
most samples in the sampling/stratigraphic columns (e.g. EFX2 – see Appendixes B). Sample
X2, for example, contains limestone fragments (30%), fossil shell 16 fragments (35%), and
limestone sand (35%). Whereas the meniscus bridges inter- and intra-particle mainly consisted
of calcite-aragonite calcium carbonate (Figure 3.2).
3.4.2 ICP – AES and -MS Analysis Data
Geochemically, enrichment of some major oxide concentrations such as calcium oxide
(CaO) and magnesium oxide (MgO) shown in Table Appendixes C, indicates that the most
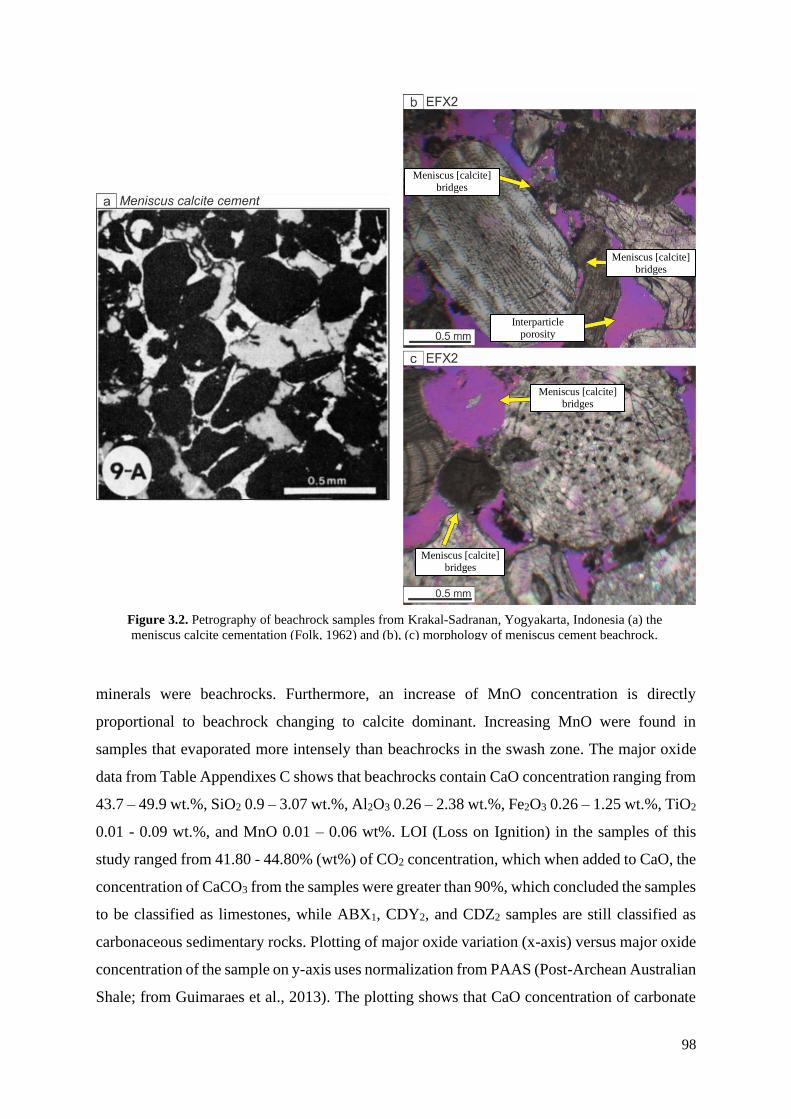
98
minerals were beachrocks. Furthermore, an increase of MnO concentration is directly
proportional to beachrock changing to calcite dominant. Increasing MnO were found in
samples that evaporated more intensely than beachrocks in the swash zone. The major oxide
data from Table Appendixes C shows that beachrocks contain CaO concentration ranging from
43.7 – 49.9 wt.%, SiO2 0.9 – 3.07 wt.%, Al2O3 0.26 – 2.38 wt.%, Fe2O3 0.26 – 1.25 wt.%, TiO2
0.01 - 0.09 wt.%, and MnO 0.01 – 0.06 wt%. LOI (Loss on Ignition) in the samples of this
study ranged from 41.80 - 44.80% (wt%) of CO2 concentration, which when added to CaO, the
concentration of CaCO3 from the samples were greater than 90%, which concluded the samples
to be classified as limestones, while ABX1, CDY2, and CDZ2 samples are still classified as
carbonaceous sedimentary rocks. Plotting of major oxide variation (x-axis) versus major oxide
concentration of the sample on y-axis uses normalization from PAAS (Post-Archean Australian
Shale; from Guimaraes et al., 2013). The plotting shows that CaO concentration of carbonate
Meniscus [calcite] bridges
Meniscus [calcite] bridges
Interparticle porosity
Meniscus [calcite] bridges
Meniscus [calcite] bridges
Figure 3.2. Petrography of beachrock samples from Krakal-Sadranan, Yogyakarta, Indonesia (a) the
meniscus calcite cementation (Folk, 1962) and (b), (c) morphology of meniscus cement beachrock.

99
sands is of a higher concentration than the beachrock samples (Figure 3.3, a). We observed a
gradual decrease of the CaO concentration from the beachrocks in the swash zone to the
carbonate sands in the land area. The CaO decrease was assumed to be on account of a nutrient
deposit from the sea among the sedimentary processes that resulted in a decrease from the
bottom to the top and linear from the land to the seashore (Porta, 2015; Avcioğlu, et al., 2016;
Karkani, et al., 2016; Daryono et al., 2019).
Figure 3.3 presents the concentration of quartz (SiO2), magnetite (Fe2O3), and ilmenite
(TiO2) of the samples that displays the impurities of aggregate minerals in the beachrocks. The
concentration of trace elements (Cr, Mn, Fe, Rb, Sr, Y, Zr, Nb, Ba, La, Ce, and Eu) including
rare earth elements (REE) of the beachrock samples increased as it shifts from the land to the
seashore as a mix of unconsolidated beachrocks-carbonaceous sands and beachrocks (Figures
3.3b, c). Note that the plotting of normalized trace element and rare earth element
concentrations was only performed on those 13 samples from this study which are summarized
as unconsolidated beachrocks-carbonate sands (ABX1, ABY1, ABZ1, CDX1, CDY1, CDZ1) and
beachrocks (ABX2, ABX3, ABY2, ABZ2, CDX2, CDY2, CDZ2) sample. Beachrock
sedimentary is unique compared to other sedimentary rocks. Its characteristics do fit with the
definition of a conglomerate with carbonate cement; however, most of the recent carbonate
cementations are still classified as carbonate rocks or even young limestone. Geochemical
evidence shows that beachrocks are rich of Sr elements, the complete opposite occurred to
crust-mantle beachrocks found in Arabian gulf and limestones in the same location in Java
Southern Mountain (Alshuaibi, et al., 2015; Atmoko, et al., 2018).
The rare earth element (REE) patterns of the various beachrocks vary consistently (Figure
3, c). However, all of the patterns in Figure 3.3,c showed depletion in light-REE (LREE) with
respect to heavy-REE (HREE). All of the samples exhibited negative cerium (Ce) anomalies
and positive Yttrium (Y) anomalies. In addition, the pattern of the normalized rare earth
element concentration of the limestone samples showed consistency with seawater (Figure 3.3,
c). Data of the seawater REE concentration was taken from Bolhar et al., (2004). A typical
seawater REE profile is smooth and coherent with progressive enrichment in heavy REE with
Ce negative anomaly and Y positive anomaly (Mauz, et al., 2015; Tostevin et al., 2016;
Atmoko, et al., 2018). CaO, MgO and LOI (loss on ignition, i.e. mainly CO2) represent the
main components identified by chemical analyzes (Figure 3.3). This is in concordance with

100
dominance of limestone-sand component in samples, and also suggest minor presence of Mg
in the carbonate phase (i.e. magnesian calcite, or mixture of calcite and dolomite).
AB Trench
AB Trench
AB Trench
CD Trench
CD Trench
CD Trench
Beachrock
Beachrock
Beachrock
Carbonate Sands
Carbonate Sands
Carbonate Sands
(a) Major Elements Normalization Based on PAAS
(b) Trace Elements Normalization Based on Average Phanerozoic Limestone
(c) REE Normalization Based on PAAS
Figure 3.3. Spider diagrams of beachrock elements analysis (a) PAAS (Post-Archean Australian Shale) normalized
major oxide diagram for limestone samples of beachrock, (b) Trace element normalizing based on Average Phaenerozoic
Limestone, (c) Rare elements analysis diagram of beachrock based on shale normalization.
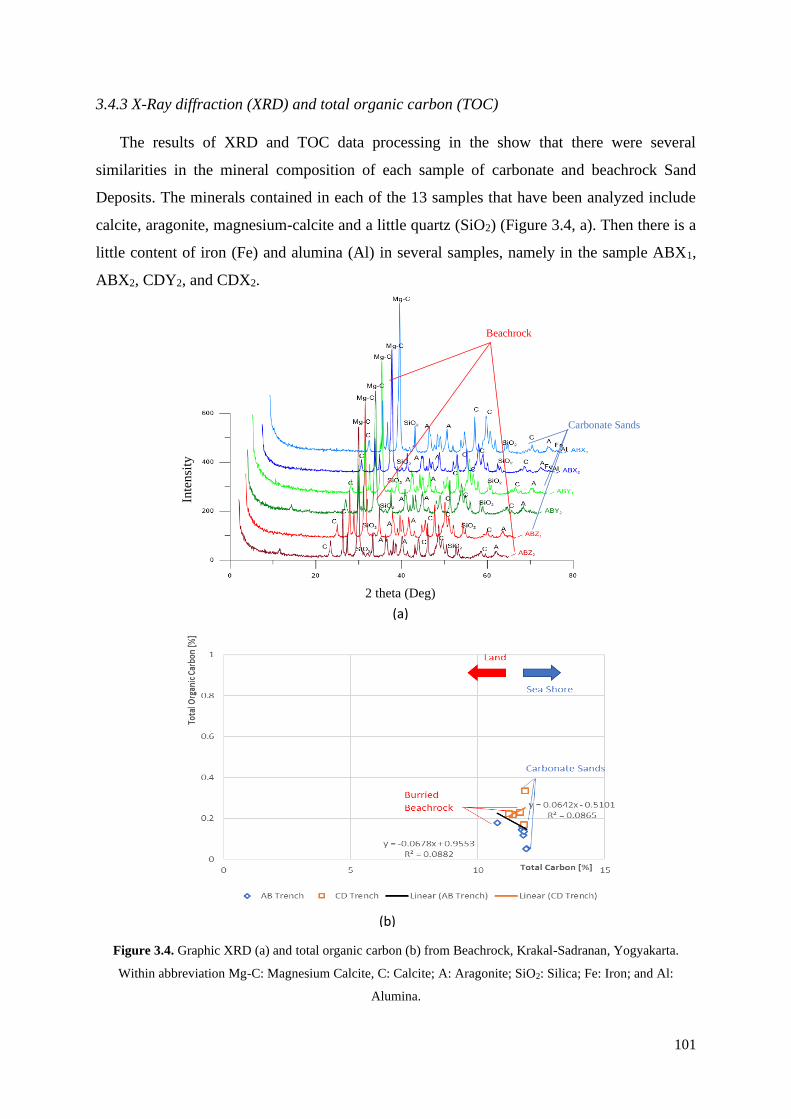
101
3.4.3 X-Ray diffraction (XRD) and total organic carbon (TOC)
The results of XRD and TOC data processing in the show that there were several
similarities in the mineral composition of each sample of carbonate and beachrock Sand
Deposits. The minerals contained in each of the 13 samples that have been analyzed include
calcite, aragonite, magnesium-calcite and a little quartz (SiO2) (Figure 3.4, a). Then there is a
little content of iron (Fe) and alumina (Al) in several samples, namely in the sample ABX1,
ABX2, CDY2, and CDX2.
Figure 3.4. Graphic XRD (a) and total organic carbon (b) from Beachrock, Krakal-Sadranan, Yogyakarta.
Within abbreviation Mg-C: Magnesium Calcite, C: Calcite; A: Aragonite; SiO2: Silica; Fe: Iron; and Al:
Alumina.
Beachrock
Carbonate Sands
(a)
(b)
2 theta (Deg)
Inte
nsi
ty

102
The TOC analysis yielded the organic carbon deposit supply during the sedimentary
process of the beachrocks. The data showed that the supply deposit is mostly from the seawater
deposition which is rich in carbon from biological activities. The TOC’s from sample near the
sea are ABZ1, ABZ2, CDZ1, and CDZ2 showed the highest amount of organic carbons which
are 0.147%; 0.159%; 0.334%; and 0.218 % with the total carbon of 11.726%; 11.763%;
11.859%; 11.378%. Although the result of total organic carbon and total carbon (Figure 3.4, b)
does not represent the ages of the sedimentary rocks, it still supports the fact that beachrocks
are the aftermath of marine sedimentary dominant, which in turn also proves that carbon-rich
components were more commonly found near sea, and less buried in the surface areas.
3.4.4 Biodiversity observations
3.4.4.1 Algae taxonomy
A total of six marine plant species were recorded across the six samples taken from the
Krakal-Sadranan Beach. The recorded algal species included one species of green algae, one
species of brown algae, and four species of red algae (Table 3.2). At macroscale, algae could
be home to macrobenthos, microbenthos, and microorganisms surrounding beachrock or coral
reef. In the end, those six species of algae were identified as being predominant in the Krakal-
Sadranan Beach study area and of close proximity to the beachrock.
Table 3.2. Algae species taxonomy surrounded beachrock.
No. Location E 455900.11; S 9099654.13 until E 456281.51; S 9099623.03
Division Class Ordo Familia Genus Species Name
1.
Rhodophyta
Florideophyceae
Ceramiales Rhodomelaceae Laurencia Laurencia pappilosa
(C. Agardh) Greville
2. Gelidiales Gelidiaceae Gelidium Gelidium corneum
(Hudson) Lam.
3. Rhodophyceae Gigartinales Gigartinaceae Gigartina Gigartina sp
4. Rhodymeniales Rhodymeniceae Rhodymenia Rhodymenia
pseudopalmata
(Lam.) P.Silva
5. Phaeophyta Phaeophyceae Fucales Sargassaceae Sargassum Sargassum
duplicatum Bory
6. Chlorophyta Chlorophyceae Ulotrichales Ulvaceae Ulva Ulva Lactuca L.

103
3.4.4.2 Isolation of indigenous ureolytic bacteria
The beachrock samples by the seashore and other outcrops found in Krakal-Sadranan were
placed in sterile tubes and identify the urealytic bacteria’s from inside of the rock samples. The
bacteria inside the tubes were then diluted 101-104 times with artificial seawater. Next, 10 μL
of each dilution was added to ZoBell2216E agar medium for marine bacteria. After incubation
at 37 °C for 3 d, the bacterial colonies were isolated from one plate. Before the fieldwork, cells
were cultured in ZoBell2216E and NH4-YE media, which also contained 5.0 /L polypeptone
(Nihon Seiyaku Co., Ltd., Tokyo, Japan), 1.0 g/L FePO4 (Junsei Chemical Co., Ltd., Tokyo,
Japan), and 1.0 g/L yeast extract (BD Bioscience Adv., Bioprocessing, Miami, Florida, USA).
These were prepared with artificial seawater with pH 7.6–7.8, adjusted using 1 M NaOH
(Fujita, et al., 2017).
After 72 h, medium-cultured colonies (aggregates of bacteria) were grown, and then
counted to determine which plates were populated with 20–100 medium colonies, which had
higher probability of being ureolytic bacteria. Using a sterilized toothpick, each colony from
the selected medium was moved into its own medium for the next step, which was to select
urease bacteria using a cresol red solution. Urease activity measured in a 10 mL solution was
put into a polystyrene screw bottle. Furthermore, transfer a certain number of bacteria in solid
medium using sterilized toothpick, then taken and added to a polystyrene screw bottle
containing the urease activity measurement solution. The total potential urease bacteria found
is less than 5% as the percentage ratio of ureolytic bacteria among the 527 colonies from the
total number isolated from the rock samples. The diversity of microbes known in beachrock
encompass three recognized ureolytic bacterial groups, most of which species are assorted
microbial eukaryotes. The most frequently isolated 16S rDNA gene sequences include those
from acid bacteria, Actinobacteria, and Chloroflexi (Oliver, et al., 2013; Elhadi, et al., 2004;
Danjo and Kawasaki, 2014). The results of a homology search in the GenBank/DDBJ/EMBL,
three group of bacteria that were highly homologous to the 16S rDNA nucleotide sequence of
the species whereas Oceanobacillus profundus, Vibrio maritimus, and Pseudoalteromonas
tetradonis. The strains in the 16S DNA gene sequences are shown in Figure 3.5. The O.
profundus is a gram-positive species that are motile, aerobic, rod-shaped (0.2–0.4 μm) and
classified as biosafety level 1 bacteria. The others, V. maritimus and P. tetradonis are gram-
negative. The former are motile bacilli 1 μm wide and 1.5–4.0 μm, whereas the latter are strictly
aerobic, motile with one polar flagellum, form either straight rods (or rod-shapes), 0.5–0.8 ×
1.0-1.5 μm when in exponential growth phase. Even though V. maritimus and P. tetradonis are

104
classified as biosafety level 1, but further analysis of Vibrio maritimus caused it to be
eliminated because of indicated pathogenic similarity to Vibrio cholerae (i.e., V. cholerae).
Vibrio brasiliensis LMG20546 T (HM771338)
Vibrio galatheae S2757 T (JXXV01000023)
83
Vibrio harveyi NBRC15634 T (AB680920)
27
Vibrio caribbeanicus N384 T (GU223601)
15
Vibrio nigripulchritudo ATCC27043 T (HM771352)
32
Vibrio hangzhouensis CN83 T (EU082035)
SIID26767
Vibrio maritimus R-40493 T (GU929925)
99
46
53
Vibrio proteolyticus NBRC13287 T (AB680395)
Vibrio xiamenensis G21 T (GQ397859)
0.01
SIID26861
Oceanobacillus profundus CIP109535 T (HQ595230)
100
Oceanobacillus polygoni SA9 T (AB750685)
99
Ornithinibacillus californiensis MB-9 T (AF326365)
85
Oceanobacillus rekensis PT-11 T (HQ620695)
Oceanobacillus indicireducens A21 T (AB623011)
0.01
Pseudoalteromonas paragorgicola KMM3548 T (AY040229)
Pseudoalteromonas elyakovii KMM162 T (AF082562)
60
Pseudoalteromonas distincta KMM638 T (AF082564)
75
SIID28116
Pseudoalteromonas tetraodonis KMM458 T (AF214729)
54
Pseudoalteromonas issachenkonii KMM3549 T (AF316144)
99
Pseudoalteromonas carrageenovora ATCC12662 T (X82136)
57
Pseudoalteromonas atlantica IAM12927 T (X82134)
Pseudoalteromonas espejiana NCIMB2127 T (X82143)
80
45
Pseudoalteromonas agarivorans KMM255 T (AJ417594)
50
53
Pseudoalteromonas nigrifaciens NCIMB8614 T (X82146)
27
Pseudoalteromonas aliena KMM3562 T (AY387858)
39
Pseudoalteromonas arctica A37-1-2 T (DQ787199)
Pseudoalteromonas fuliginea CIP105339 T (AF529062)
46
Pseudoalteromonas translucida KMM520 T (AY040230)
Pseudoalteromonas antarctica CECT4664 T (X98336)
65
71
Pseudoalteromonas lipolytica LMEB39 T (FJ404721)
0.01
P1.18
K1.4
P1.7
Samples code Taxonomy result
Figure 3.5. Phylogenetic tree based on 16S rDNA nucleotide sequence of Vibrio maritimus,
Psedoalteromonas tetradonis, and Oceanobacillus profundus (red-frame).

105
3.4.4.3 Microbial population count and urease activity test
The cell concentration increased for 2 d and then reached the stationary phase. The urease
activity of the cell culture increased with cell growth. Based on this result, the production of
urease would be a growth-associated system. Considering microbial-based sand solidification,
which should be sustained for relatively long duration for adequate solidification, the long-
term stability of the enzyme would be advantageous in the MICP process (Danjo and Kawasaki,
2014). Even though the bacterial strains are considered biosafety level one (safe for the human
body and environment), but some strains of V. maritimus are pathogenic (Kandianis, et al.,
2008; Zhu and Dittrich, 2016; Almajed, et al., 2018) therefore for further research, only O.
profundus and P. tetradonis were used to continue the deep research to develop the MICP
method. The P.tetradonis were used to continue the deep research to develop the MICP
method. The test tube precipitation test results are a good relative indication test tube
precipitation test results are a good relative indication of the potential of each strain for sand
solidification by MICP (Danjo and Kawasaki, 2014; Mwandira, et al., 2019; Marshall, et al.,
2015; Arrieta, et al., 2017). This is because the improvement in strength is proportional to the
amount of bio-precipitate formed. The results indicate that the strain belonging to P. tetradonis
shows the highest performance for microbial induced carbonate precipitation and the weight of
precipitate is approximately two times more than that from the others (Figure 3.6).
Figure 3.6. Microbial induced carbonate precipitation capacity of isolated strains.
0 0.02 0.04 0.06 0.08 0.1
O.profundus
(P1.18)
V. maritimus (K1.4)
P.tetradonis (P1.7)
Weight of the precipitate (g)

106
3.5 Discussions
Beachrock is generally cemented in the tidal zone with a large amount of aragonite, high-
magnesium calcite (HMC), and low-magnesium calcite (LMC). Carbonate cementation in the
marine environment forms acicular-radial and spacious types of cement texture, whereas the
tidal zone cement is indicated by aragonite or HMC. Meniscus bridge cement indicate LMC
composition (Vousdoukas, 2007; Avcioğlu, et al., 2006; Danjo and Kawasaki, 2014; Daryono,
et al., 2019). Beachrock found in Indonesia consisted of elements of calcium, magnesium,
sodium, and phosphorus according to the oxide major ICP-data, which proved it dissimilar to
those of limestone and/or other beachrock. Limestone generally consists of silica and
carbonate. Meanwhile, beachrock from Kuwait, Arabia Gulf consists of silica and carbonate.
(Karkani, et al., 2016; Porta, 2015). Hence, some authors have suggested that bacterial
metabolism is related to the precipitation of rocks (Danjo and Kawasaki, 2014; van Paassen, et
al., 2009; Almajed, et al., 2018) and that the end products lower the thermodynamic boundary
for cement nucleation and increases the rates of the physicochemical processes involved
(Bathurst, 1966). A technique for bio-cementation using microbial induced carbonate
precipitation (MICP) for calcium carbonate precipitation could be biologically controlled or
induced. Bacteria serve as a catalyst in urea hydrolysis through the generation of urease enzyme
to form calcium carbonate cement (Mwandira, et al., 2019; Danjo and Kawasaki, 2014;
Daryono, et al., 2018). Specific cement types are recognized as (i) acicular, fibrous, and bladed
fabrics; (ii) radial fibrous and fascicular-optic fabrics; (iii) micro-and cryptocrystalline fabrics;
(iv) equant spar, syntaxial overgrowth fabrics, scalenohedral calcites, and peloidal fabrics; and
(v) non-carbonates. These types indicate incipient early marine cementation leading to a
reduction in pore-space in near-seafloor sediments (Ng, et al., 2014). Krakal-Sadranan Beaches
happen to follow the same pattern, in which the meniscus cement solution is characterized by
domination by crystalline aragonite and magnesium-calcite, which are soluble in water.
3.5.1 Sediment characteristics
To summarize the petrographic analysis of all samples, the diagram splits the sedimentary
beachrocks in this area into four zones: unconsolidated beachrocks; well-consolidated
beachrocks; mineral-dominated beachrocks; and rock-dominated beachrocks. This lithofacies
consists of samples with codes ABX2, ABZ2, CDY2, CDZ2, EFZ1, EFX2, EFY2, and EFZ2
classified as Sparse Biomicrite. Therefore, sample ABY2, CDX2, dan CDX3 were classified as
Packed Biomicrite. Sparse biomicrite has an allochem bioclastic texture of 0.04-10 mm grain
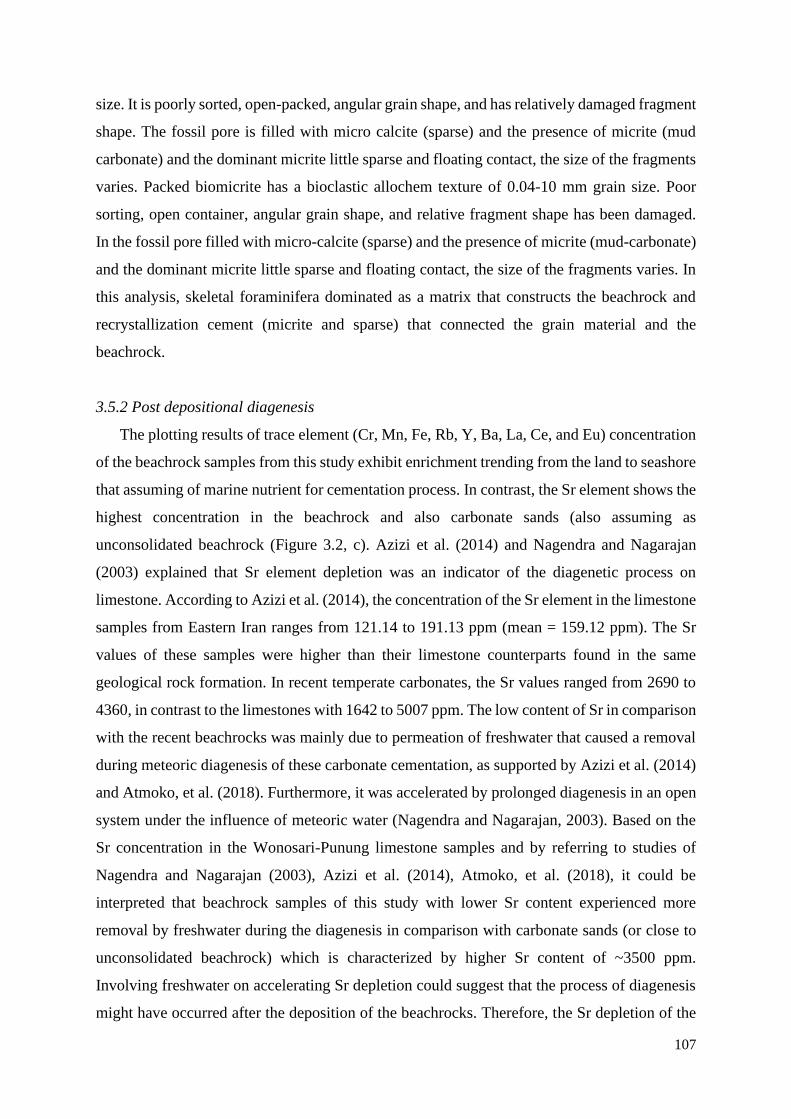
107
size. It is poorly sorted, open-packed, angular grain shape, and has relatively damaged fragment
shape. The fossil pore is filled with micro calcite (sparse) and the presence of micrite (mud
carbonate) and the dominant micrite little sparse and floating contact, the size of the fragments
varies. Packed biomicrite has a bioclastic allochem texture of 0.04-10 mm grain size. Poor
sorting, open container, angular grain shape, and relative fragment shape has been damaged.
In the fossil pore filled with micro-calcite (sparse) and the presence of micrite (mud-carbonate)
and the dominant micrite little sparse and floating contact, the size of the fragments varies. In
this analysis, skeletal foraminifera dominated as a matrix that constructs the beachrock and
recrystallization cement (micrite and sparse) that connected the grain material and the
beachrock.
3.5.2 Post depositional diagenesis
The plotting results of trace element (Cr, Mn, Fe, Rb, Y, Ba, La, Ce, and Eu) concentration
of the beachrock samples from this study exhibit enrichment trending from the land to seashore
that assuming of marine nutrient for cementation process. In contrast, the Sr element shows the
highest concentration in the beachrock and also carbonate sands (also assuming as
unconsolidated beachrock (Figure 3.2, c). Azizi et al. (2014) and Nagendra and Nagarajan
(2003) explained that Sr element depletion was an indicator of the diagenetic process on
limestone. According to Azizi et al. (2014), the concentration of the Sr element in the limestone
samples from Eastern Iran ranges from 121.14 to 191.13 ppm (mean = 159.12 ppm). The Sr
values of these samples were higher than their limestone counterparts found in the same
geological rock formation. In recent temperate carbonates, the Sr values ranged from 2690 to
4360, in contrast to the limestones with 1642 to 5007 ppm. The low content of Sr in comparison
with the recent beachrocks was mainly due to permeation of freshwater that caused a removal
during meteoric diagenesis of these carbonate cementation, as supported by Azizi et al. (2014)
and Atmoko, et al. (2018). Furthermore, it was accelerated by prolonged diagenesis in an open
system under the influence of meteoric water (Nagendra and Nagarajan, 2003). Based on the
Sr concentration in the Wonosari-Punung limestone samples and by referring to studies of
Nagendra and Nagarajan (2003), Azizi et al. (2014), Atmoko, et al. (2018), it could be
interpreted that beachrock samples of this study with lower Sr content experienced more
removal by freshwater during the diagenesis in comparison with carbonate sands (or close to
unconsolidated beachrock) which is characterized by higher Sr content of ~3500 ppm.
Involving freshwater on accelerating Sr depletion could suggest that the process of diagenesis
might have occurred after the deposition of the beachrocks. Therefore, the Sr depletion of the

108
beachrocks suggests that the diagenetic process has not yet occurred in the phase after
deposition.
3.5.3 Temperature and evaporation conditions
Figure 3.2 shows that beachrock and carbonate sand have relatively similar diagram
patterns. However, when viewed in detail the concentration of REE on beachrock is relatively
higher compared to carbonate sand. In addition, the anomaly of Tm elements negative for all
depleted beachrock and carbonate sand samples. Dauphas and Pourmand (2015) explain that
anomalies of negative Tm elements caused by high-temperature conditions (37°-50°C) cause
an intensive evaporation and condensation process which reduces the elemental content of Tm.
Therefore, it can be interpreted that the process of deposition of beachrock and carbonate sand
in the study area is at a high temperature (37°-50°C) and under conditions of evaporation and
condensation which is quite intensive.
3.5.4 Redox condition
Profiles of REE concentrations in the beachrock samples normalized by the PAAS (Post-
Archaean Australian Shale) present a trend of the lowest value for the beachrock and carbonate
sands near seashore then were found relative to the Figure 3.2, a Trench AB and CD. According
to Schieber (1988), possible co-precipitation of REE in carbonates from seawater is much too
small to account for the REE enrichment. Therefore, only the diagenetic REE enrichment has
to be considered. Referring to tables of trace elements and REE (Table Appendixes C), it can
be seen that beachrock samples have increased ∑REE, that is in ABY2 samples (24.03 ppm)
and CDZ2 samples (14.30 ppm). Therefore, in samples of carbonate sand deposits have
increased ∑REE in ABX1 samples (12.52 ppm) and CDX1 samples (6.56 ppm). Increased
concentration of ∑REE, both heavy REE (Tb, Dy, Y, Ho, Er, Tm, Yb, and Lu) and light REE
(La, Ce, Pr, Nd, Sm, Eu, and Gd) indicates that the condition of the beachrock deposition
process is at oxidative environmental conditions. This can be supported by the result of the
element ratio table (Table 3.3) showing that the value of Ce/ Ce* is less than 1. The Ce/ Ce*
value less than 1 indicates a negative Ce anomaly. The negative Ce anomaly indicates that the
beachrock deposition process originates from precipitation of seawater under oxidative
conditions.

109
Table 3.3. Ratio of carbonate sands and beachrock in Krakal-Sadranan, Yogyakarta, Indonesia.
Trench Name of rock Element ratio
Sample Mn* Ce/ Ce* Eu/ Eu* Y/ Ho
AB
Beachrock
ABZ1
ABY1
ABX1
ABZ2
ABY2
ABX2
0.45
0.51
0.71
0.33
0.36
0.31
-2.27
-1.71
-3.3
-1.63
-3.36
-2.5
3.76
2.16
3.07
3.1
6.2
2.02
40
34
40
40
32.3
32.22
CD
Beachrock
CDZ1
CDY1
CDX1
CDZ2
CDY2
CDX2
CDX3
0.49
0.41
0.45
0.43
0.4
0.12
0.32
-2.85
-2.16
-3.16
-3.57
-4
-4.63
-3.59
3.16
1.11
1.06
8.9
1.0
2.24
2.82
36.67
41.67
30.0
36.67
28.46
32.85
31.25
In addition, Table 3.3 shows the results of the calculation of a positive Mn* value. A positive
Mn* value indicates the condition of the deposition process of carbonate rock in an oxidative
environment. Machhour et al. (1994) and Bellanca et al. (1996) formulated Mn* as follow:
Mn* = log [(Mnsample/ Mnshale)/ (Fesample/ Feshale)] (Eq. 3.2)
with Mnshale and Feshale are 600 ppm and 46,150 ppm, respectively (Wedepohl, 1978).
The variations in the solubility of reduced manganese may lead to significant fractionation
of these metals across the redox boundaries, where manganese tends to be incorporated under
more oxygenated conditions above the redox boundary (e.g., Tribovillard et al., 2006;
Madhavaraju and Lee, 2009; Piper and Calvert, 2009; Neumeister et al., 2016). Additionally,
a study of Madhavaraju and Lee (2009) shows that positive Mn* values indicate an oxidative
condition in beachrock deposition.
3.5.5 Terrigenous contaminant materials
Madhavaraju and Lee (2009) mentioned a method to interpret the source of rare earth
elements using Eu anomaly {Eu/ Eu* = EuN/ (0.5*(SmN+GdN)}. The implementation of the
Carbonate
sands
Carbonate
sands

110
aforementioned formula on the beachrock samples of Krakal-Sadranan Beach showed that Eu
anomaly of the samples ranged from 1.00 to 8.90 (Table 3.3). The value of Eu anomaly, which
is higher than 1, means that the beachrocks have a positive Eu anomaly (Madhavaraju and Lee,
2009). Due to the result of Eu/ Eu* on the beachrock samples of the studied area being higher
than 1, it indicates positive Eu anomalies. These positive Eu anomalies are shown by the REE
plotting of PAAS -normalized on the beachrock samples from this study in the Figure 3.2 c,
Trench AB and CD. A positive Eu anomaly indicates that the beachrock was affected by
hydrothermal solutions (German et al., 1993; Kurian et al., 2008), intense diagenetic process
(MacRae et al., 1992), plagioclase (feldspar) content (Nath et al., 1992), or input of aeolian
sediment (Elderfield, 1988) close to recent limestone sedimentary (Atmoko, et al., 2018). In
some cases, the terrigenous materials are characterized by the remain of plagioclase. The
existence of feldspar (plagioclase) in beachrock samples, although in a very small quantity
shows consistency with the positive Eu anomaly. The suggestion of the diagenetic process in
the beachrock depositional environment is supported by values of Sr concentration, Mn*,
contamination of terrigenous (clastic) materials in the limestone depositional environment is
consistent with the suggestion of Ce/ Ce* values were in oxidative contamination with
terrigenous material, as discussed previously. Therefore, in relation to the positive Eu anomaly,
the Eu/ Eu* calculation, the presence of feldspar in the beachrock samples from the studied
area conforms to previous studies (German et al.,1993; Kurian et al., 2008; MacRae et
al.,1992), it can be interpreted that rare earth elements in the beachrock samples were possibly
derived from a diagenetic process, terrigenous materials, and/or hydrothermal activity. As for
the influence of the hydrothermal activity, it will be discussed later.
The interpretation of rare earth elements source can be further supported by Y/ Ho ratio as
proposed by Bolhar et al. (2004). The calculation of the trace element ratios on the limestone
samples yielded Y/ Ho ratios from 28.46 to 41.67 (Table 3.3). As terrestrial materials (i.e.,
felsic and basaltic crust) have a constant Y/ Ho ratio of ~26 and small admixtures of any
contaminants, they are supposed to prove seawater-like Y/ Ho ratios of >44 (Bolhar, 2004).
The limestones from the studied area showed high ratios of Y/ Ho (more than 26) by comparing
to the Bolhar’s ratios (2004). This may suggest that the limestone depositional environment
was slightly contaminated by terrestrial material or had only small admixtures of any
contaminants. The summary of mineralogy and geochemical characteristics of the various
beachrocks from the study area and the interpretation of beachrock depositional environment
and the source of trace elements are depicted in Table 3.4.
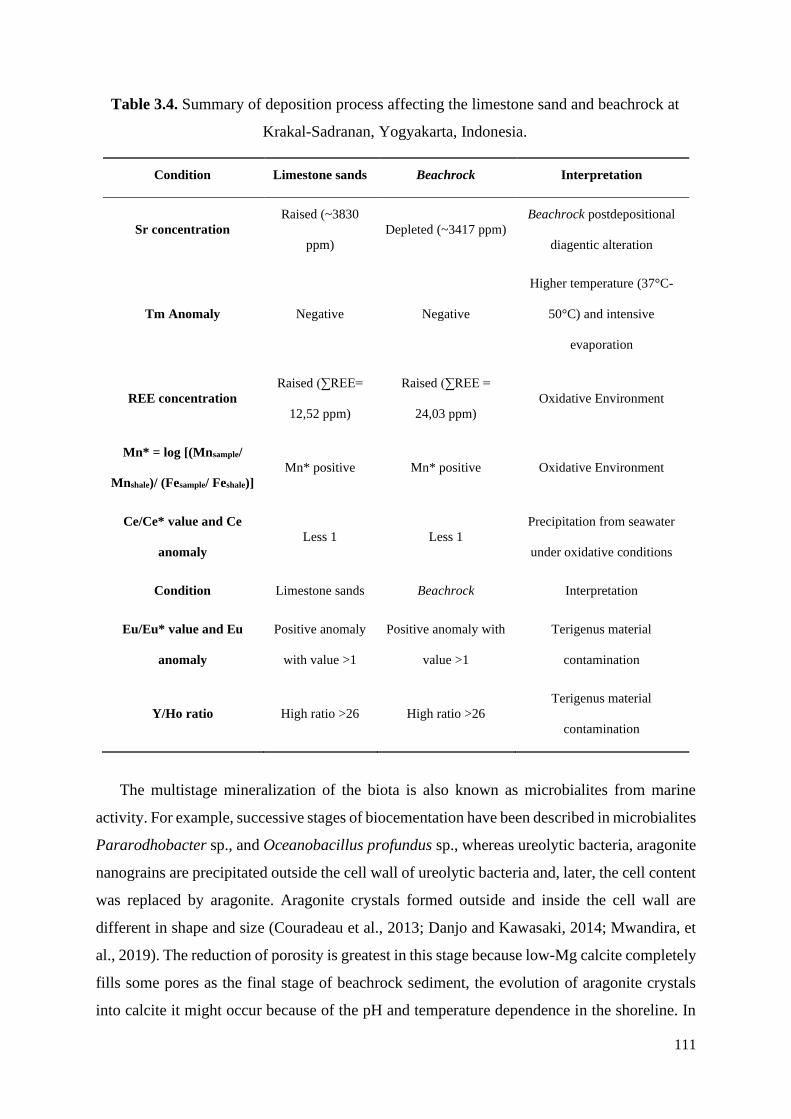
111
Table 3.4. Summary of deposition process affecting the limestone sand and beachrock at
Krakal-Sadranan, Yogyakarta, Indonesia.
Condition Limestone sands Beachrock Interpretation
Sr concentration
Raised (~3830
ppm)
Depleted (~3417 ppm)
Beachrock postdepositional
diagentic alteration
Tm Anomaly Negative Negative
Higher temperature (37°C-
50°C) and intensive
evaporation
REE concentration
Raised (∑REE=
12,52 ppm)
Raised (∑REE =
24,03 ppm)
Oxidative Environment
Mn* = log [(Mnsample/
Mnshale)/ (Fesample/ Feshale)]
Mn* positive Mn* positive Oxidative Environment
Ce/Ce* value and Ce
anomaly
Less 1 Less 1
Precipitation from seawater
under oxidative conditions
Condition Limestone sands Beachrock Interpretation
Eu/Eu* value and Eu
anomaly
Positive anomaly
with value >1
Positive anomaly with
value >1
Terigenus material
contamination
Y/Ho ratio High ratio >26 High ratio >26
Terigenus material
contamination
The multistage mineralization of the biota is also known as microbialites from marine
activity. For example, successive stages of biocementation have been described in microbialites
Pararodhobacter sp., and Oceanobacillus profundus sp., whereas ureolytic bacteria, aragonite
nanograins are precipitated outside the cell wall of ureolytic bacteria and, later, the cell content
was replaced by aragonite. Aragonite crystals formed outside and inside the cell wall are
different in shape and size (Couradeau et al., 2013; Danjo and Kawasaki, 2014; Mwandira, et
al., 2019). The reduction of porosity is greatest in this stage because low-Mg calcite completely
fills some pores as the final stage of beachrock sediment, the evolution of aragonite crystals
into calcite it might occur because of the pH and temperature dependence in the shoreline. In

112
the case of mineralized varieties, superficial crusts preserve as well as complicate the
morphology of the organisms, whereas biomineralized fabrics within skeletal, mollusk and
some thrombolites probably retain clearer details. In this environment, interference of the
organic process by algae and microbial activities may accelerate the process (Riding, 1991;
Henehan, et al., 2015; Arrieta, et al., 2017; Franchi, et al., 2018; Kishi, et al., 2018). The extent
of vadose and freshwater diagenetic features indicates that more ancient beachrocks had
occupied an inland position for a relatively long time.
3.5.6 Biotically controlled precipitation
The majority of carbonate material in modern oceans is precipitated as highly structured
skeletons of organisms. Precipitation is primarily controlled by the biochemistry of the
respective organisms (such as algae, foraminifera or corals); the organisms, in turn, are
influenced by the conditions of the sea they live in, particularly light, temperature and water
chemistry (for instance the degree of carbonate saturation of the sea water). To appreciate the
effects of various environmental factors we need to recall the two fundamental types of
metabolism. Autotrophic organisms nourish themselves by utilizing inorganic materials to
synthesize their own living matter; heterotrophic organisms have to rely on organic material to
do so. Autotrophic organisms among the carbonate producers are almost exclusively photo-
autotrophic: they perform photosynthesis and thus depend on light for their livelihood. Some
carbonate-secreting organisms are themselves heterotrophs but live in symbiosis with
autotrophic algae. As a result, the system of host plus symbiont becomes autotrophic.
3.5.6.1 Light
This is arguably the most important control on skeletal carbonate precipitation because of
the dominance of photoautotrophic organisms in carbonate production – at least in the
Cenozoic. Photosynthesis is a complex, and only partly understood process. The basic reaction
may be simplified as:
CO2 +H 2O + solar energy→ HCHO + O2 (Eq. 3.3)
where HCHO represents a simple summary formula for organic matter. The formula clearly
illustrates the link between photosynthesis and carbonate chemistry. Photosynthesis extracts

113
CO2 from the sea water, thus increasing its carbonate saturation and facilitating precipitation
of carbonate minerals. For the organisms themselves, precipitation of CaCO3 has the added
advantage that potentially deleterious Ca2+ ions can be removed from the system and a
protective skeleton can be constructed. The link between skeletal carbonate fixation,
photosynthesis and light explain the decrease of skeletal carbonate production with water depth
in tropical environments. Above sea level, carbonate production rapidly drops to zero in the
supratidal zone and becomes negative in most terrestrial environments as carbonate material
dissolves in rainwater and acidic soils. The euphotic zone is defined in the geologic record as
the interval where abundant growth of photosynthetic, carbonate secreting benthos is possible.
The zone of light saturation has not been defined in geological terms. Loosely speaking, it is
the interval where light has no recognizable control on the rates of growth and calcification of
organisms. The growth forms of corals indicate the zone of severe light limitation by a change
from massive to platy colonies. In the light-saturated zone, corals indicate the presence of a
very turbulent surface layer of the sea by dominance of branching growth forms.
3.5.6.2 Temperature
Rivals light in its effect on skeletal carbonate production. Generally, warmer is better, but
there exist upper temperature limits for the various carbonate-secreting organisms. Thus, the
temperature window of calcifying benthos is different for different organisms. Most
hermatypic (i.e. symbiotic) corals function in the range of 20-30 °C. The upper temperature
boundary sets important limits to carbonate production, particularly in restricted lagoons where
temperatures frequently exceed 30 °C. The most important effect of temperature, however, is
the global zonation of carbonate deposits by latitude. In spite of what has just been said about
the importance of light, the boundary northern and southern limit of coral reefs, and thus the
boundary of tropical and cool-water carbonates, in the modern oceans seems to be controlled
by winter temperature rather than radiation. This indicates that as one moves poleward in the
modern oceans, the temperature limit for hermatypic coral growth is reached before the light
limit. In the past, this need not always have been the case. The temperature limit and the light
limit may have shifted relative to one another during geologic history. The fairly stable position
of 30-35 °C latitude for the boundary of Phanerozoic tropical carbonates may reflect the joint
control by temperature and light.

114
3.5.6.3 Latitudinal zonation of skeletal production
Skeletal carbonate production changes very significantly with latitude. The differentiation
into tropical and cool-water carbonates is widely applied and often further subdivided (Lees,
1975; Tucker and Wright, 1990; James and Kendall, 1992; James, et al., 1997). Tropical
carbonates are dominated by photosynthetic organisms and usually include metazoan reefs,
abundant green algae and larger foraminifera. Cool-water carbonates lack these deposit sand
consist mainly of skeletal sand and gravel derived from molluscs, bryozoans, smaller
foraminers and red algae. The contribution of photoautotrophs to cool-water carbonate
production is limited to red algae that are normally not the dominant component. Consequently,
the depth window of cool-water carbonate production is much wider. It should be noted that
the zone of “tropical carbonates” reaches to 30-35 °C of latitude and thus extends from the
humid tropics to the desert belt of the horse latitudes. The cool-water realm extends over several
climate zones, reaching from the northern limit of the desert belt to the polar regions. The
differences of the tropical and the cool-water realm are not restricted to the skeletal material.
Cool-water carbonates also are distinct by the absence of mud, shallow reefs and oolitic sand
shoals with early cementation. The lack of reefs and cemented shoals has fundamental
implications for the depositional anatomy.
3.5.6.4 Nutrients
Contrary to common expectations, high-nutrient environments are unfavorable for many
carbonate systems. Nutrients, to be sure, are essential for all organic growth, including that of
carbonate-secreting benthos. However, the carbonate communities dominated by autotrophs,
such as reefs, are adapted to life in submarine deserts. They can produce their organic tissue
with the aid of sunlight from sea water with very low nutrient levels and are very efficient in
recycling nutrients within the system. In high nutrient settings, the carbonate producers are
outpaced by soft-bodied competitors such as fleshy algae, soft corals or sponges. Furthermore,
the destruction of reef framework by bio-erosion increases with increasing nutrient supply.
3.5.6.5 Salinity
Varies relatively little in the open-marine environment. The effects of these subtle
variations on carbonate production are not well known. Where access to the open ocean is

115
restricted, salinity varies greatly and significantly affects the diversity of the biota. The
combined effects of salinity and temperature variations allow one to subdivide carbonate
environments.
3.5.7 Ureolytic bacteria-controlled precipitation beachrock carbonate
The ureolytic bacteris identified and cultured from inside of natural beachrock samples.
The sediment characteristic of meniscus bridge carbonate assuming came from micro-
crystallization from the activity of ureolytic bacteria or also another microorganism. Based on
petrographic analysis, were found enrichment of skeletal fragments and also algae (as fossils)
which indicated this sedimentary controlled by microorganism in the shoreline areas. Further
analysis of geochemical ICP-MS and -AES were found these beachrocks are moderately
alkalo-tolerant bacteria, showing maximum growth and urease activity at an ambient
temperature of 37 °C, which is compatible with the tropical climate prevailing in the target
region. Microbial carbonate overriding environmental control is seen in the present day by
localization of microbial carbonates in calcareous streams and springs and in shallow tropical
seas, and in the past by temporal variation in the abundance of marine microbial carbonates.
Only ~ 4.7% of ureolytic bacteria and algae precipitation, respectively, were assumed to be
catalytic factors in beachrock precipitation. The beachrock of Krakal-Sadranan beach in the
studied area can be categorized into non-beachrock, unconsolidated beachrock (similar to
limestone sands), and well-consolidated beachrock consisting of mostly rock-mineral.
Beachrock has a fairly consolidated feature and consists of a mixture of gravel-sized deposits
of sand in the form of limestone fragments, calcite, and fossil minerals, and almost 50 % CaO
content (carbonaceous).
The interpretation of the cerium anomaly can be used to determine the source of the REEs
in this formation, indicating that the beachrock deposition processes originated from the
precipitation of seawater under oxidative conditions. This can be interpreted as the beachrock
derived from microbial process involving terrigenous materials under oxidative conditions.
Beachrock of Krakal-Sadranan beach in the studied area can be categorized into non-
beachrocks, unconsolidated beachrocks (or similar to carbonate sands), and well-consolidated
beachrocks consisting of rocks-mineral dominated. The beachrock has a fairly consolidated
feature, consists of a mixture of gravel-sized deposits of sand in the form of limestone
fragments, calcite and fossil minerals, and almost 50% CaO content (carbonaceous). The

116
beachrocks showed the positive paleo-redox condition of calculation Mn* values (0.12 – 0.51),
suggesting an oxidative environment. An increased concentration of total rare earth element
(∑REE), both heavy REE (Tb, Dy, Y, Ho, Er, Tm, Yb and Lu) and light REE (La, Ce, Pr, Nd,
Sm, Eu and Gd) signals that the beachrock deposition process happened at oxidative
environmental conditions. The interpretation of cerium calculation can be used to determine
the source of REE in this formation, a Ce/ Ce* and Eu/ Eu* value of less than 1 results in a
negative Ce anomaly indicating that the beachrock deposition processes originated from the
precipitation of seawater under oxidative conditions and it can be interpreted that beachrock
derived from a diagenetic process, terrigenous materials, and/or hydrothermal activity. REE
interpretation data of beachrock was done not have a correlation with ureolytic bacteria for
further research MICP, however, these results of beachrock normalization REE have a unique
pattern of carbonate sediment when comparing with limestone or another carbonate
sedimentary. Based on this data, beachrock has to decrease REE from light to heavy element
which is inconsistent with limestone precipitated. It is assuming beachrock still experience
mechanical and chemical enrichment in its formation process (Atmoko, et al., 2018; Daryono,
et al., 2020). Thus, the most favorable condition is to have the presence of oxygenated material
contamination. Beachrock occurrence in an area depends on highly geological factors that
contribute the matrix interior. Indonesian geological settings seem to be dominated by marine
activities of the Pacific Ocean and may be labeled as oxidative conditions.
3.6 Conclusions
As a result of identification, the beachrock, we found the following:
1. Isolated strains of native bacteria belonging to Psedoalteromonas tetradonis,
Oceanobacillus profundus, and Vibrio maritimus which have a potential for binding
biocement based on MICP.
2. Classified as biotically controlled precipitation carbonate rocks and dominances
with aragonite-HMC meniscus bridge binding skeletal fragment and also algae.
3. The major oxide results of the beachrock shown the characteristics sedimentary
consisted with calcium oxide, magnesium oxide, sodium oxide, and phosphorus
pentoxide for the cement material and/ or existing matrixes.
4. Beachrock precipitation of seawater under oxidative conditions with optimum
temperature of sedimentation between 37 ~ 50 °C.

117
References
Almajed, A., Khodadadi Tirkolaei, H. and Kavazanjian Jr, E., 2018, Baseline Investigation
on Enzyme-Induced Calcium Carbonate Precipitation. Journal of Geotechnical and
Geoenvironmental Engineering, 144 (11), 04018081.
https://doi.org/10.1061/(ASCE)GT.1943-5606.0001973.
Alshuaibi, A.A., Khalaf, F.I. and Al-Zamel, A., 2015, Calcareous thrombolitic crust on
Late Quaternary beachrocks in Kuwait, Arabian Gulf. Arabian Journal of Geosciences, 8 (11),
9721-9732. https://doi.org/10.1007/s12517-015-1869-5.
Arrieta, N.; Iturregui, A.; Martínez-Arkarazo, I.; Murelaga, X.; Baceta, J.I.; de Diego, A.;
Olazabal, M.Á.; Madariaga, J.M. Characterization of ferruginous cements related with
weathering of slag in a temperate anthropogenic beachrock. Sci. Total Environ. 2017, 581, 49–
65, doi:10.1016/j.scitotenv.2016.12.132.
Atmoko, D. D., Titisari, A. D., and Idrus, A., 2018, Geochemical Characteristics of
Limestone of Wonosari-Punung Formation, Gunungkidul Regency, Yogyakarta, Indonesia.
Indonesian Journal on Geoscience, 5 (2), 179-197. DOI: 10.17014/ijog.5.2.179-497
Avcıoğlu, M., Yiğitbaş, E. and Erginal, A.E., 2016. Beachrock formation on the coast of
Gökçeada Island and its relation to the active tectonics of the region, northern Aegean Sea,
Turkey. Quaternary international, 401, pp.141-152.
Avcioğlu, M., Yiğitbaş, E., and Erginal, A. E., 2016, Beachrock formation on the coast of
Gökçeada Island and its relation to the active tectonics of the region, northern Aegean Sea,
Turkey. Quaternary Int., 401, 141–152. https://doi.org/10.1016/j.quaint.2015.10.108.
Azizi, S. H. H., Shabestari, G. M. dan Khazaei, A., 2014, Petrography and Geochemistry
of Paelocene-Eocene Limestones in the Ching-dar Syncline, Eastern Iran. Geoscience
Frontiers, Vol. 5, 429-438. https://doi.org/10.1016/j.gsf.2013.08.002.
Bellanca, A., Claps, M., Erba, E., Masetti, D., Neri, R., Silva, I.P. and Venezia, F., 1996.
Orbitally induced limestone/marlstone rhythms in the Albian—Cenomanian Cismon section
(Venetian region, northern Italy): Sedimentology, calcareous and siliceous plankton
distribution, elemental and isotope geochemistry. Palaeogeography, Palaeoclimatology,
Palaeoecology, 126(3-4), pp.227-260.

118
Bolhar, R., Kamber, B. S., Moorbath, S., Fedo, C. M., Whitehouse, M. J., 2004,
Characterisation of Early Archaean Chemical Sediments by Trace Element Signatures. Earth
and Planetary Science Letters Vol. 222, 43-60. https://doi.org/10.1016/j.epsl.2004.02.016.
Condie, K.C., Wilks, M., Rosen, D.M. and Zlobin, V.L., 1991. Geochemistry of
metasediments from the Precambrian Hapschan series, eastern Anabar Shield, Siberia.
Precambrian Research, 50(1-2), 37-47. https://doi.org/10.1016/0301-9268(91)90046-D.
Couradeau, E., Benzerara, K., Gérard, E., Estève, I., Moreira, D., Tavera, R. and López-
Garcıa, P., 2013. Cyanobacterial calcification in modern microbialites at the submicrometer
scale.
Danjo, T.; Kawasaki, S. Formation Mechanism of Beachrock in Okinawa and Ishikawa,
Japan, with a Focus on Cements. Mater. Trans. 2014, 55, 493–500.
Daryono, L.R., Titisari, A.D., Warmada, I.W. and Kawasaki, S., 2019. Comparative
characteristics of cement materials in natural and artificial beachrocks using a petrographic
method. Bulletin of Engineering Geology and the Environment, Vol. 78, 6, 1-16.
https://doi.org/10.1007/s10064-018-1355-x.
Daryono, L.R., Nakashima, K., Kawasaki, S., Titisari, A.D. and Barianto, D.H., 2020.
Sediment Characteristics of Beachrock: A Baseline Investigation Based on Microbial Induced
Carbonate Precipitation at Krakal-Sadranan Beach, Yogyakarta, Indonesia. Applied Sciences,
10(2), p.520.
Dauphas, N. and Pourmand, A., 2015. Thulium anomalies and rare earth element patterns
in meteorites and Earth: Nebular fractionation and the nugget effect. Geochimica et
Cosmochimica Acta, 163, pp.234-261.
Elhadi, N.; Radu, S.; Chen, C.H.; Nishibuchi, M. Prevalence of potentially pathogenic
Vibrio species in the seafood marketed in Malaysia. J. Food Prot. 2004, 67, 1469–1475.
Folk, R. L., 1962, Spectral subdivision of limestone types. W.E. Ham (Ed.), Classification
of Carbonate Rocks, Am. Assoc. Pet. Geol., Mem., 1, pp. 62-84. DOI:
https://doi.org/10.1306/M1357
Franchi, F., Bergamasco, A., Da Lio, C., Donnici, S., Mazzoli, C., Montagna, P., Taviani,
M., Tosi, L. and Zecchin, M., 2018. Petrographic and geochemical characterization of the early
119
formative stages of Northern Adriatic shelf rocky buildups. Marine and Petroleum Geology,
91, pp.321-337.
Fujita, M., Nakashima, K., Achal, V. and Kawasaki, S., 2017. Whole-cell evaluation of
urease activity of Pararhodobacter sp. isolated from peripheral beachrock. Biochemical
engineering journal, 124, pp.1-5.
German, C.R., Hergt, J., Palmer, M.R. and Edmond, J.M., 1999. Geochemistry of a
hydrothermal sediment core from the OBS vent-field, 21 N East Pacific Rise. Chemical
Geology, 155(1-2), pp.65-75.
Ginsburg, R.N., 1953. Beachrock in south Florida. Journal of Sedimentary Research, 23(2),
pp.85-92.
Guimaraes, J.T.F., Cohen, M.C.L., Franca, M.C., Silva, A.K.T.D., and Rodrigues, S.F.S.,
2013. Mineralogical and Geochemical Influences on Sediment Color from Amazon Wetlands
Analyzed by Visible Spectrophotometry. Acta Amazonica, 43 (3), p.331-342. DOI: 10.1590/
S0044-59672013000300009.
Henehan, M.J., Foster, G.L., Rae, J.W., Prentice, K.C., Erez, J., Bostock, H.C., Marshall,
B.J. and Wilson, P.A., 2015. Evaluating the utility of B/C a ratios in planktic foraminifera as a
proxy for the carbonate system: A case study of G lobigerinoides ruber. Geochemistry,
Geophysics, Geosystems, 16(4), pp.1052-1069.
Huang, R., Wang, Y., Cheng, S., Liu, S. and Cheng, L., 2015. Selection of logging-based
TOC calculation methods for shale reservoirs: A case study of the Jiaoshiba shale gas field in
the Sichuan Basin. Natural Gas Industry B, 2(2-3), pp.155-161.
James, N.P., and Kendall, A.C. 1992. Introduction to carbonate and evaporite facies
models. In Facies Models: Response to Sea-Level Changes, Walker, R. Pp.265-275.
James, N.P., Bone, Y., Hageman, S.J., Feary, D. and Gostin, V.A., 1997. Cool-water
carbonate sedimentation during the terminal Quaternary sea-level cycle: Lincoln Shelf,
southern Australia.
Jones, A., Phillips, M., 2011. Disappearing Destinations: Climate Change and the Future
Challenges for Coastal Tourism. Cabi, London, 296 p.

120
Karkani, A., Evelpidou, N., Maroukian, H. and Kawasaki, S., 2016. Study of Beachrocks
in East Attica. Bulletin of the Geological Society of Greece, Vol.50, 1, 434-440.
http://dx.doi.org/10.12681/bgsg.11744.
Kelletat, D., 2006. Beachrock as sea-level indicator? Remarks from a geomorphological
point of view. Journal of Coastal Research, 2006(226), pp.1558-1564.
Kishi, M., Kawai, M., Koyama, K.T.M., Nagao, N. and Toda, T., 2018. Enhancement of
microalgal production through bacterial mineralization of ethylene glycol. Journal of
Environmental Biology, 39(5), pp.725-731.
Kurian, S., Nath, B.N., Ramaswamy, V., Naman, D., Rao, T.G., Raju, K.K., Selvaraj, K.
and Chen, C.T.A., 2008. Possible detrital, diagenetic and hydrothermal sources for Holocene
sediments of the Andaman backarc basin. Marine Geology, 247(3-4), pp.178-193.
Lees, A., 1975. Possible influence of salinity and temperature on modern shelf carbonate
sedimentation. Marine Geology, 19(3), pp.159-198.
Machhour, L., Philip, J. and Oudin, J.L., 1994. Formation of laminite deposits in
anaerobic—dysaerobic marine environments. Marine Geology, 117(1-4), pp.287-302.
MacRae, N.D., Nesbitt, H.W. and Kronberg, B.I., 1992. Development of a positive Eu
anomaly during diagenesis. Earth and Planetary Science Letters, 109(3-4), pp.585-591.
Madhavaraju, J. and Lee, Y.I., 2009. Geochemistry of the Dalmiapuram Formation of the
Uttatur Group (Early Cretaceous), Cauvery basin, southeastern India: Implications on
provenance and paleo-redox conditions. Revista Mexicana de Ciencias Geológicas, 26(2),
pp.380-394.
Marshall, J.; Barnhart, A.; Butcher, A.; Freimuth, C.; Khaw, F.; Lafromboise, E.; Landeros,
M.; Morrish, S.; Olson, E.; Ritzinger, B.; et al. Beachrock horizons of the Nicoya Peninsula,
Costa Rica: Geomorphology, petrology, and neotectonic significance. In Proceedings of the
Coastal Sediments, San Diego, CA, USA, 11–15 May 2015;
doi:10.1142/9789814689977_0252.
Martin, T.D.; Brockhoff, J.T.; Creed, J.T. Method 200.7 Determination of Metals and Trace
Elements in Water and
WastesbyInductivelyCoupledPlasmaeatomicEmissionSpectrometryRevision4.4EMMCVersio
n,200.7e1,58; U. S. EPA: Washington, DC, USA, 1994.
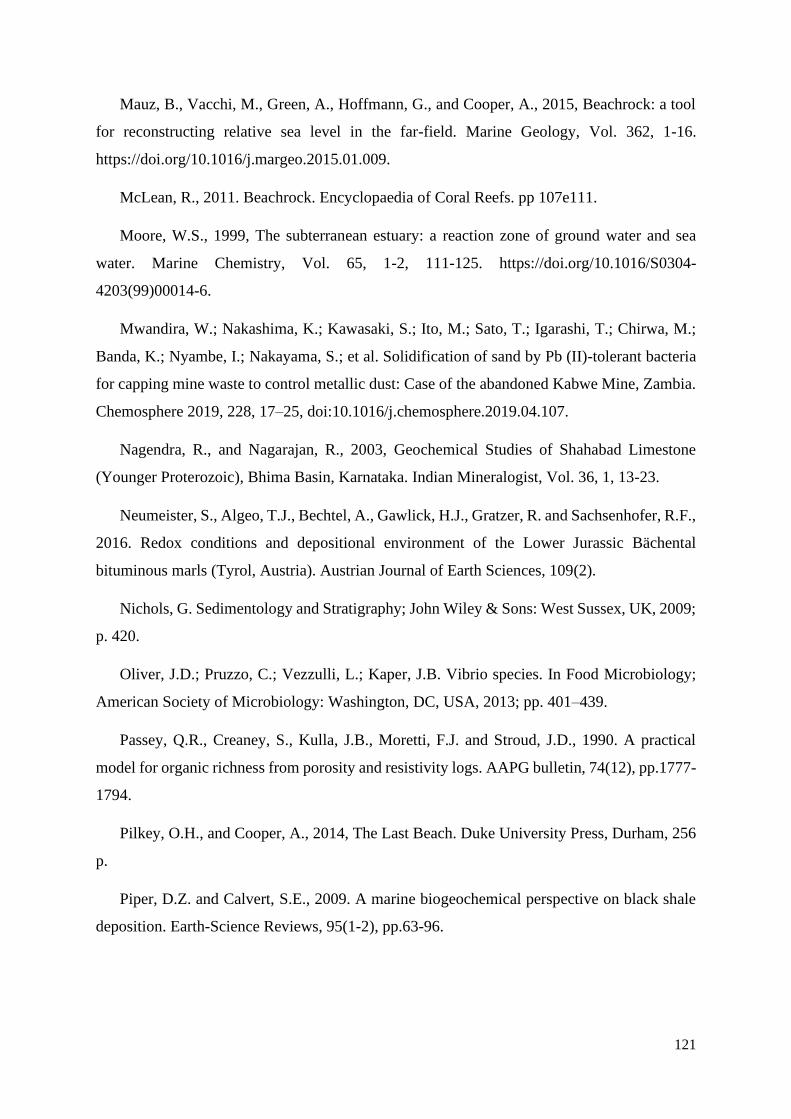
121
Mauz, B., Vacchi, M., Green, A., Hoffmann, G., and Cooper, A., 2015, Beachrock: a tool
for reconstructing relative sea level in the far-field. Marine Geology, Vol. 362, 1-16.
https://doi.org/10.1016/j.margeo.2015.01.009.
McLean, R., 2011. Beachrock. Encyclopaedia of Coral Reefs. pp 107e111.
Moore, W.S., 1999, The subterranean estuary: a reaction zone of ground water and sea
water. Marine Chemistry, Vol. 65, 1-2, 111-125. https://doi.org/10.1016/S0304-
4203(99)00014-6.
Mwandira, W.; Nakashima, K.; Kawasaki, S.; Ito, M.; Sato, T.; Igarashi, T.; Chirwa, M.;
Banda, K.; Nyambe, I.; Nakayama, S.; et al. Solidification of sand by Pb (II)-tolerant bacteria
for capping mine waste to control metallic dust: Case of the abandoned Kabwe Mine, Zambia.
Chemosphere 2019, 228, 17–25, doi:10.1016/j.chemosphere.2019.04.107.
Nagendra, R., and Nagarajan, R., 2003, Geochemical Studies of Shahabad Limestone
(Younger Proterozoic), Bhima Basin, Karnataka. Indian Mineralogist, Vol. 36, 1, 13-23.
Neumeister, S., Algeo, T.J., Bechtel, A., Gawlick, H.J., Gratzer, R. and Sachsenhofer, R.F.,
2016. Redox conditions and depositional environment of the Lower Jurassic Bächental
bituminous marls (Tyrol, Austria). Austrian Journal of Earth Sciences, 109(2).
Nichols, G. Sedimentology and Stratigraphy; John Wiley & Sons: West Sussex, UK, 2009;
p. 420.
Oliver, J.D.; Pruzzo, C.; Vezzulli, L.; Kaper, J.B. Vibrio species. In Food Microbiology;
American Society of Microbiology: Washington, DC, USA, 2013; pp. 401–439.
Passey, Q.R., Creaney, S., Kulla, J.B., Moretti, F.J. and Stroud, J.D., 1990. A practical
model for organic richness from porosity and resistivity logs. AAPG bulletin, 74(12), pp.1777-
1794.
Pilkey, O.H., and Cooper, A., 2014, The Last Beach. Duke University Press, Durham, 256
p.
Piper, D.Z. and Calvert, S.E., 2009. A marine biogeochemical perspective on black shale
deposition. Earth-Science Reviews, 95(1-2), pp.63-96.

122
Porta, G. D., 2015, Carbonate build-ups in lacustrine, hydrothermal and fluvial settings:
comparing depositional geometry, fabric types and geochemical signature. Geological Society,
London, Special Publications, Vol. 418, 1, 17-68. https://doi.org/10.1144/SP418.4.
Pratama, W.; Dewi, S.C.; Sari, I.Z.R.; Hardiyati, A.; Wajong, A.E. Distribution and
Abundance of Macroalgae in Intertidal Zone of Drini Beach, Gunung Kidul, DIY. KnE Life
Sci. 2015, 2, 514–515.
Putz, H. and Brandenburg, K., 2015. Match!-phase identification from powder diffraction.
Crystal Impact Software.
Riding, R., 1991. Classification of microbial carbonates. In Calcareous algae and
stromatolites (pp. 21-51). Springer, Berlin, Heidelberg.
Rollinson, H. R., 2014, Using geochemical data: Evaluation, Presentation, Interpretation.
Routledge, London, 73 p.
Romimohtarto,K.;Juwana,S.BiologiLaut: IlmuPengetahuanTentangBiotaLaut;Djambatan:
Jakarta,Indonesia, 2009.
Russell, R.J. and McINTIRE, W.G., 1965. Beach cusps. Geological Society of America
Bulletin, 76(3), pp.307-320.
Schieber, J., 1988. Redistribution of rare-earth elements during diagenesis of carbonate
rocks from the Mid-Proterozoic Newland Formation, Montana, USA. Chemical Geology, 69(1-
2), pp.111-126.
Schmoker, J.W., 1979. Determination of organic content of Appalachian Devonian shales
from formation-density logs: Geologic notes. AAPG Bulletin, 63(9), pp.1504-1509.
Schmoker, J.W., 1980. Organic content of Devonian shale in western Appalachian Basin.
AAPG Bulletin, 64(12), pp.2156-2165.
Shi, P., and Kasperson, R., 2015, World Atlas of Natural Disaster Risk. Springer-Verlag,
Berlin, Heidelberg, 368 p. DOI: 10.1007/978-3-662-45430-5.
Soon, N.W., Lee, L.M., Khun, T.C. and Ling, H.S., 2014. Factors affecting improvement
in engineering properties of residual soil through microbial-induced calcite precipitation.
Journal of Geotechnical and Geoenvironmental Engineering, 140(5), p.04014006.

123
Tostevin, R., Shields, G. A., and Tarbuck, G. M., 2016, Effective Use of Cerium Anomalies
as a Redox Proxy in Carbonate-dominated Marine Settings. Elsevier: Chemical Geology Vol.
438, p.146-162. https://doi.org/10.1016/j.chemgeo.2016.06.027.
Tribovillard, N., Algeo, T.J., Lyons, T. and Riboulleau, A., 2006. Trace metals as
paleoredox and paleoproductivity proxies: an update. Chemical geology, 232(1-2), pp.12-32.
Trono, G.C., Jr. Seaweed. In The Living Marine Resources of the Western Central Pacific.
Volume 1. Seaweed, Corals, Bivalves, and Gastropods; Carpenter, K.E., Niem, V.H., Eds.;
Food and Agriculture Organization of the United Nations: Rome, Italy, 1998; pp. 19–96.
Tucker, M.E. and Wright, V.P., 1990. Carbonate platforms: facies evolution and sequences.
Int Ass Sed, 2, p.328.
Turner, R.J., 2005. Beachrock. Encyclopedia of coastal science. Kluwer Academic
Publishers, The Netherlands, pp.183-186.
Van Bemmelen, R.W., 1949. General geology of Indonesia and adjacent archipelagoes.
The geology of Indonesia, Government Printing House, The Hague, 732 p.
Van Paassen, L. A., Ghose, R., Van der Linden, T. J. M., Van der Star, W. R. L., and Van
Loosdrecht, M. C. M., 2010, Quantifying biomediated ground improvement by ureolysis:
Large-scale biogrout experiment. Journal of Geotechnical and Geoenvironmental Engineering,
Vol. 136, 1721–1728. https://doi.org/10.1061/(ASCE)GT.1943-5606.0000382.
Van Paassen, L.A., Pieron, M., Mulder, A., Van der Linden, T.J.M., Van Loosdrecht,
M.C.M., and Ngan-Tillard, D.J.M., 2009, Strength and deformation of biologically cemented
sandstone. In Proceedings of the ISRM Regional conference EUROCK, Cavtat, Croatia, Oct.
29-31, p. 405-410. ISBN 978-0-415-80481-3.
Vousdoukas, M.I., Velegrakis, A.F. and Plomaritis, T.A., 2007. Beachrock occurrence,
characteristics, formation mechanisms and impacts. Earth-Science Reviews, 85(1-2), pp.23-
46.
Wedepohl, K.H., 1969. 1978. Handbook of geochemistry. An Arbor.
Zhu, X., Linham, M. M., and Nicholls, R. J., 2010, Technologies for Climate Change
Adaptation - Coastal Erosion and Flooding. Roskilde: Danmarks Tekniske Universitet, Risø
Nationallaboratoriet for Bæredygtig Energi. TNA Guidebook Series, University of
Southampton, England, 167 p.
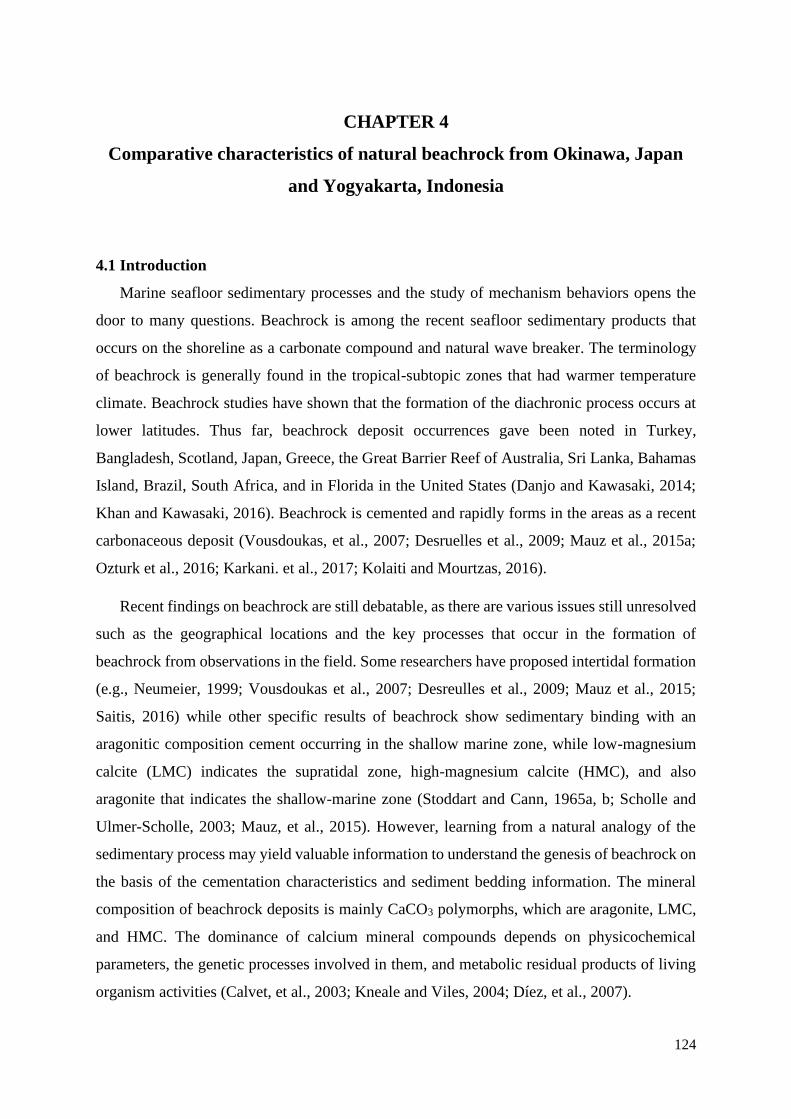
124
CHAPTER 4
Comparative characteristics of natural beachrock from Okinawa, Japan
and Yogyakarta, Indonesia
4.1 Introduction
Marine seafloor sedimentary processes and the study of mechanism behaviors opens the
door to many questions. Beachrock is among the recent seafloor sedimentary products that
occurs on the shoreline as a carbonate compound and natural wave breaker. The terminology
of beachrock is generally found in the tropical-subtopic zones that had warmer temperature
climate. Beachrock studies have shown that the formation of the diachronic process occurs at
lower latitudes. Thus far, beachrock deposit occurrences gave been noted in Turkey,
Bangladesh, Scotland, Japan, Greece, the Great Barrier Reef of Australia, Sri Lanka, Bahamas
Island, Brazil, South Africa, and in Florida in the United States (Danjo and Kawasaki, 2014;
Khan and Kawasaki, 2016). Beachrock is cemented and rapidly forms in the areas as a recent
carbonaceous deposit (Vousdoukas, et al., 2007; Desruelles et al., 2009; Mauz et al., 2015a;
Ozturk et al., 2016; Karkani. et al., 2017; Kolaiti and Mourtzas, 2016).
Recent findings on beachrock are still debatable, as there are various issues still unresolved
such as the geographical locations and the key processes that occur in the formation of
beachrock from observations in the field. Some researchers have proposed intertidal formation
(e.g., Neumeier, 1999; Vousdoukas et al., 2007; Desreulles et al., 2009; Mauz et al., 2015;
Saitis, 2016) while other specific results of beachrock show sedimentary binding with an
aragonitic composition cement occurring in the shallow marine zone, while low-magnesium
calcite (LMC) indicates the supratidal zone, high-magnesium calcite (HMC), and also
aragonite that indicates the shallow-marine zone (Stoddart and Cann, 1965a, b; Scholle and
Ulmer-Scholle, 2003; Mauz, et al., 2015). However, learning from a natural analogy of the
sedimentary process may yield valuable information to understand the genesis of beachrock on
the basis of the cementation characteristics and sediment bedding information. The mineral
composition of beachrock deposits is mainly CaCO3 polymorphs, which are aragonite, LMC,
and HMC. The dominance of calcium mineral compounds depends on physicochemical
parameters, the genetic processes involved in them, and metabolic residual products of living
organism activities (Calvet, et al., 2003; Kneale and Viles, 2004; Díez, et al., 2007).

125
Consequently, scientists in Japan have made an artificial “human-made” beachrock whose
composition is similar to the natural beachrock in order to protect the shoreline from erosion.
In addition, through understanding the beachrock formation process, artificial rocks may be
able to be formed at an accelerated speed of consolidation (Danjo and Kawasaki, 2014; 2016;
Khan, et al., 2016; Al Imran, et al., 2017; Daryono, et al., 2019; 2020). Several techniques and
research practices have been put forward to identify beachrock formation whilst characterizing
them. Petrographic analysis is an important method to identify specific aggregate minerals and
understand petrogenesis interpretations with a focus on the structures, textures, and
compositions of minerals inside rock samples.
4.2 Objectives
This study aims to investigate the cementation characteristics of natural beachrock from
tropical shoreline Krakal-Sadranan, Indonesia and sub-tropic shoreline Okinawa, Japan (Figure
4.1), using biodiversity of microbial controlled sedimentation, petrographic measurement, and
A
B
C
D
Sadranan
Figure 4.1. (A) Location map of Okinawa in Japan, (B) Research area in Sumuide, Okinawa island, (C)
Location map of Indonesia, and (D) Locations Sadranan area.

126
geochemical for the additional analysis. In this research were explained ureolytic bacteria strain
controlled from both locations within limitation of cultivation bacteria, such as temperature,
pH, medium, and marine environment. A comparison of natural and their cementation
characteristics are vital information when trying to decide the nature of beachrock with the
focus is to compare the characteristic cementation process. In this chapter were discussed about
sedimentary mechanism from Yogyakarta, Indonesia and Okinawa, Japan then bridging the
technology to develop artificial beachrock based on ureolytic bacteria similar methods with
Danjo and Kawasaki (2014; 2016) isolated from inner natural beachrock.
4.3 Methodology
The research was completed using geological research methods of identification of the
sedimentary environment using petrographic analysis which included observations, physical
characteristics, and data measurements using petrographic analysis and a geochemical
approach (Potter, 1967; Pozo, et al., 2016; Ayinla, et al., 2017; Nabhan and Yang, 2018). This
research was completed by observation and investigation from the geological field
investigation on December 2015 in Okinawa, Japan and Sadranan, Yogyakarta on May, 2018-
Dec, 2019. The identity of beachrock in the study area with an emphasis on the aspect of
sedimentation and cementation.
4.3.1 Field work
A total of 12 natural beachrock samples were collected from Okinawa, Japan and
Yogyakarta. Moreover, nine samples of artificial beachrock based on solidification tests of
calcium carbonate into syringe-tubes were studied.
4.3.2 Petrographic analysis
The thin-section samples were collected at different zones from tidal to onshore locations
to assess the degree of cementation and analyze under a microscope (Olympus CHA-P) to
determine the carbonate-composition types of the cement and the characteristics of natural
deposition. Qualitative analysis included an analysis of a thin section method with parallel and
crossing Nicol polarizations microscope to identify the texture, structure, and composition of
the thin-section samples. The point counting was conducted for classification of the
composition fossils, matrixes of carbonate (cemented materials) and carbonate cementation
(cement). The point-counting technique is based on grid lines from the microscope
petrographic analysis, and statistical measurement with different angles of thin-section images.

127
Petrographic studies have attempted to define the underlying reason for the composition,
cement materials, depositional environment, and the origin of clasts for beachrocks (Arrietta,
et al., 2011; Christ, et al., 2015; Avcioğlu, et al., 2016; McCutcheon, et al., 2016).
4.3.3 Biodiversity microbial analysis
On the other hand, the important factors controlling calcium carbonate cementation of
artificial beachrock are the chemistry of the seawater (the source of the cementing material);
the physical conditions, in terms of hydraulic energy; sedimentary parameters such as
permeability, texture, and composition of the sand; and an initial stabilizer of the loose
sediment.
4.3.4.1 Isolation of ureolytic bacteria
The ureolytic bacterial species were isolated from the coastal area of Krakal-Sadranan
beach, Indonesia and Sumuide, Okinawa, Japan (Figure 4.1). The soil was sampled from each
peripheral beachrock. After screening, the bacterial species were identified by 16s DNA gene
analysis. The genome extraction was done using 100 µL of Mighty Prep reagent taken into a
1.5 mL microtube. From the colonies on the plate, the cells were removed with a sterilized
platinum loop, suspended in the microtube, heated at 95C for 10 minutes, and then centrifuged
at 12000 rpm for 2 minutes. The supernatant of the suspension centrifuged was transferred to
another tube and used as a template for PCR (polymerase chain reaction). The bacteria inside
tubes diluted 101-104 times with artificial seawater, after that 10mL of each dilution was added
to ZoBell2216E agar medium for marine bacteria. After incubation at 30C for 3 days, the
bacteria colonies were isolated from one plate. Cells were cultured in ZoBell2216E medium,
which contained 5.0 /L hipolypeptone (Nihon Seiyaku Co., Ltd., Tokyo, Japan), 1.0 g/L FePO4
(Junsei Chemical Co., Ltd., Tokyo, Japan), and 1.0 g/L yeast extract (BD Bioscience Adv.,
Bioprocessing, Miami, FL., USA), prepared with artificial seawater with pH adjusted 7.6-7.8
using 1 M NaOH (Fujita, et al., 2017).
4.3.4.2 Microbial population count and urease activity test
Seawater, beachrock samples, and sand from both sites were collected in the sterile tubes
and isolation for colonies hybrids. Subsequently, isolated colonies from nature sand adjacent
to beachrock in Okinawa, Japan using ZoBell2216E medium containing Pararhodobacter sp.,
and Oceanisphaera sp., the time course of cell growth was determined based on the optical

128
density (OD) value 600nm by UV-vis spectrophotometer (V-730, Jasco International CO., Ltd.,
Tokyo, Japan for 14 days. The urease activity of bacterial cells was determined by monitoring
ammonium ions generated in urea hydrolysis using the indophenol blue method based on
Berthelot’sreaction in a water bath (Weatherburn, 1967; Natarajan, 1995). After bacterial
cultivation for 48 hours, a bacterial suspension (1mL) (OD600=1.0) was added to 0.1M
phosphate buffer containing 0.1 M urea. Samples were then collected at intervals of 5 minutes
(0, 5, 10, and 15 minutes) and passed through a 0.22 μm filter to remove cells. Next, 2 mL
aliquot of the filtered sample was mixed with phenol nitroprusside reagent (4mL) (0.25 M
phenol in 100 mL of deionized water containing 23 M of sodium nitroprusside) and
hypochlorite reagent (4mL) (0.05 M sodium hydroxide in 100 mL of deionized water
containing 7.5 mL bleach (5% NaOCl)). Each reaction mixture was vortexed and then
incubated at 60C for 10 minutes. The amount of ammonium ion released because of urea
hydrolysis was determined by referring to a previously prepared standard curve relating the
absorbance at 630 nm to ammonium ion concentration (0-10 mg/L). Using this curve, one unit
of urease activity (U) was fined as the amount of enzyme that would hydrolyze 1 mol of urea
per minute. The release of 2 mol of ammonia is equivalent to the hydrolysis of 1 mol of urea
(Mwandira, et al., 2017).
4.4 Results
An understanding of the natural parameters and the interactions of beachrock requires an
analysis of the genesis of all forms of beachrock. There is a lack of similarities in geology or
geography but there are occurrences of outcrops of beachrock at 7° South latitude, where there
is different climate, humidity, and source rocks compared to Indonesia which is mostly
siliciclastic rocks. The beaches of Okinawa are at 26° North latitude. Invariably, there are
advantages in comparing samples from different latitudes. In the following sections, one will
find comparisons between the Japanese and Indonesian beachrocks, whilst also comparing the
characteristics of both natural and artificial rocks.
4.4.1 Sumuide beachrock sample, Okinawa, Japan
4.4.1.1 Geology of Okinawa, East China Sea
The general geology of Ryukyu Island, Japan is summarized as a background to the
discussion of the stratigraphy of the fossiliferous Tertiary and Quaternary rocks. The
stratigraphic units are recognized as follows: the Shimajiri Formation, consisting of the

129
Yonabaru clay member (late Miocene) in the lower part of the exposed section, and the
Shinzato tuff member (Miocene or Pliocene) in the upper part; and the Ryukyu Group,
consisting of, in ascending order, the possibly contemporaneous Nakoshi sand (Pliocene) and
Chinen sand (Pliocene), the Naha limestone (Pliocene), the Yontan limestone (Pliocene), and
the Machinato limestone (Pliocene) (McNeil, 1960).
In Okinawa there is Group Formation that working on this geology system in Okinawa.
Shinjimari Group, Ryukyu Group, Uchihana Formation, and Holocene deposits such as alluvial
deposits, beach deposits, low- tide elevation (coral reef) and also reclaimed land. These ages
were from Neogene, Quaternary, and the youngest is Holocene product include beachrock
deposits. The Ryukyu Island form one of the island arcs of the western Pacific, extending from
southern Japan to the northern end of Formosa. The convex side of the island faces the
Philippine Sea and the shallow East China Sea lies behind them. The island of Okinawa lies
about midway in the Ryukyu Island. The Ryukyu Archipelago is 1046 km long and it consists
of 55 islands and islets with a total land area of 3090 km2. Beachrock has formed had an average
dip of 3.5° to the sea. The average altitude (above sea level) of the outcrops is 50 cm, with no
evidence regarding the vertical position provided by a channeled coastline (Tokashiki and
Aydan, 2010; Daryono, 2016).
Figure 4.2. Sumuide beachrock sampling area, Okinawa, Japan.
A B C

130
Sample of natural beachrock from Okinawa was taken in Sumuide coast area, whereas three
differences of sample that assumed fresh rocks and the weathered deposit (Figure 4.2). The
megascopic scale of geology, Sumuide have a characteristic as uniform grain composition as
material deposited. Solidified deposit and also non-solidified as beach sand deposit, rock
fragments in Sumuide were dominance with shell and coral that formed relatives rounded with
size 2 mm~2 cm grain sizes within carbonaceous cementation. In a sample from Sumuide A,
the grain size of the fragments is relatively large, > 3 mm to 3 cm, with a brown color; however,
it is not a compacted because of the lack of cement. Samples of beachrock Sumuide B have
similar characteristics to those of Sumuide A. The main differentiation is the granule which are
of dime size but have more pores. Samples of Sumuide C appear more compact when compared
to those of Sumuide A and B, possibly due to rare exposure to waves of ocean currents.
Therefore, the solidified version was seen as the process of carbonated precipitation.
4.4.1.2 Petrographic analysis result
Microscopic analysis of thin-section samples from Sumuide, Okinawa was conducted.
During microscopic examinations, it was clear that the grains mostly consisted of calcite,
quartz, and fragments which known as micritic cement HMC [(Ca, Mg) CO3]. In addition, the
cement can be found as a matrix which is composed of very fine sedimentary particles (5–20
m) and micritic HMC. During the sedimentary process of the experiment the organic materials
may have been affected. The most impacted would have been grain sediments, as can be seen
from the brownish color on their external surface. The textures can be characterized as micritic
with interclass (Folk, 1959). The results found occurrences of lytic fragments in the formed
quartz (metasedimentary) with many matrixes in the form of shell fragments and quartz or coral
opaque varying with size, where the fabric is grain-supported. Micritic or mud carbonate filling
contacts at carbonate or non-carbonate fragments produced mud during deposition. General
pore of Sumuide samples were filled with intra-granular microsparite as the cement, which
although the evolution in the dry zone as Sumuide C compacted then the Sumuide A sample
because the fragments, pore size, and lytic partially due had increased to the large amount of
cement. The name of the rock sample was based on the carbonate classification based on rock
sedimentary particles in the carbonate rock or limestone which is composed of ooids, termed,
oolitic limestone. The most widely used classifications are those of Folk (1959) and Dunham
(1962), regarding beachrock samples from Okinawa assumed to be namely poorly sorted

131
intracrine (Folk, 1959) and lithoclast grainstone (Dunham, 1962) beachrock for samples
Sumuide A and B, and for Sumuide C poorly sorted intramicrite (Folk, 1959) and lithoclast
packestone (Dunham, 1962) beachrock (lithified). These differences in name classification are
because of the different systems and cementation material inside beachrock from either the
supratidal zone or intertidal zone (Daryono, 2016). Refer the appendixes D for further
information about the petrographic of Okinawa beachrock.
Figure 4.3 explains the cementation process of peloidal micritic cement, cement needles of
aragonite, micritized granules, and the cover of micritic seen in the Sumuide beachrock, which
is a product of diagenesis in the phreatic environment of the sea. This cementation mineral as
micritization gathered on other materials such as coral, foraminifera, skeletons, and others as
solid rock. The exclusive presence of aragonitic cement (needle aragonite and micritic cement
peloidal) in rocks of sedimentary diagenesis indicates that the environment was mainly marine.
However, the presence of cement in beachrock peloidal micritic was very significant as it
presented that the micrite had played a vital role during the Sumuide beachrock sedimentary
process. Whilst all of the aforementioned can be argued in terms of the origin of cement micritic
peloidal, it remains uncertain. It can be suggested as precipitation occurring directly from
seawater or it could just be a product of biological activity. The presence of microborings,
however, may indicate that the micrites are also a product of biological activity. There is no
direct evidence of the influence of meteoric water on beachrock sedimentation. Some have
suggested that the process of diagenesis occurred much faster that meteoric; however, this is
open to debate as both were subjected to weathering conditions during the sedimentary process.
Sumuide A Sumuide B Sumuide C
Figure 4.3. Sumuide beachrock cement vision using 100x (yellow pattern represented grain matrix and orange
pattern represented cement).

132
4.4.1.3 Indigenous ureolytic bacteria from Okinawa, Japan
The results of isolated surface sand within assumption microbial enrichment then selected
the ureolytic bacteria species only from Okinawa, Japan revealed that Pararhodobacter sp.,
that increased pH solution to the highest value for calcium carbonate beachrock. On other hand,
in Japan also found beachrock deposits occurrences of silica mineral witch is Miyako-jima,
Japan revealed Oceanisphaera sp. The Pararhodobacter sp., are Gram-negative, rod-shaped,
aerobic, chemoorganotrophic bacteria, that are moderately halophilic with approximately 1 m
in diameter and 3 m in length (Foesel, et al., 2011; Danjo and Kawasaki, 2016). Meanwhile,
Oceanisphaera sp., had a spherical cell, 1.0-1.2 m in diameter and motile by means of flagella.
Gram-negative chemoorganotroph with absolute requirement for sodium ions, aerobic,
moderately halophilic, and oxidase-catalase-positive (Romanenko, et al., 2003). Based on the
research of Danjo and Kawasaki (2014), they analyzed the microorganism that worked on the
precipitated solid and used urease bacteria for the microorganism reagent that is famous from
an Okinawa sand sample termed Pararhodobacter sp. These types of species are strong during
solidification at the laboratory scale because this species has the highest urease activity. This
research tried to combine two species of urease bacteria, Pararhodobacter sp., and
Oceanisphaera sp., (Miyakojima bacteria-silica deposits) to precipitate artificial beachrock.
The time course of cell growth and urease activity by Pararhodobacter sp., and
Oceanisphaera sp., for 15 days are shown in Figure 4.4. Cell concentration increased up to 2
days and then reached stationary phase. The urease activity of the cell culture increased with
cell growth. Based on this result, the production of urease would be a growth-associated
system. Considering microbial-based sand solidification, which needs relatively long duration
for adequate solidification, the long-term stability of the enzyme would be advantageous in the
MICP process (Danjo and Kawasaki, 2016; Fujita, et al., 2017). The difference of temperature
environment is shown in Figure 4.5, a for both species. High activity was obtained in the range
temperatures of 30-70C, within the maximum temperature of urase activity was obtained 70C
in this study. Most of urease molecule is known to be composed of protein subunits and the
subunits of this urease would strongly bind each other to leads the high stability of urease
during long-term cultivation (Mobley and Island, 1995; Balasubramanian and Ponnuraj, 2010;
Fujita, et al., 2017). Urease activity under different pH is shown in Figure 4.5, b. The results
showed with the maximum activity around pH 7.0 – 8.0. For this temperature and pH
variations, the results were different with Fujita, et al. (2017), where he is mentioned the results
of maximum temperature exponential increasing toward environment temperature of the buffer

133
solution and the method for urease activity measurement, he used ammonia meter of Tris/HCl
buffer solution. Meanwhile, in this research, for measuring urease activity we used EDTA
buffer solution for indophenol blue method then detect with colorimeter changing with optical
density 630 nm. The results of Fujita, et al. (2017) and this research quite different but the
pattern of bacterial growth and urease activity, especially for Pararhodobacter sp., is almost
same (Daryono, 2016).
Figure 4.4. Cell growth and urase activity of Pararodhobacter sp. (a) and Oceanisphaera sp. (b).
-0.5
0
0.5
1
1.5
2
2.5
0
0.2
0.4
0.6
0.8
1
1.2
1.4
1.6
1.8
2
0 2 4 6 8 10 12 14 16
Ure
ase
acti
vit
y [
U.m
L-1
]
Cel
l co
nc.
(O
D600)
Culture time [days]
Pararhodobacter sp.
Urease activity
Cell conc.
-0.5
0
0.5
1
1.5
2
2.5
0
0.2
0.4
0.6
0.8
1
1.2
1.4
1.6
1.8
2
0 2 4 6 8 10 12 14 16
Ure
ase
acti
vit
y [
U.m
L-1
]
Cel
l co
nc.
(O
D600)
Culture time [days]
Oceanisphaera sp.
Urease activitty
Cell conc.
(a)
(b)
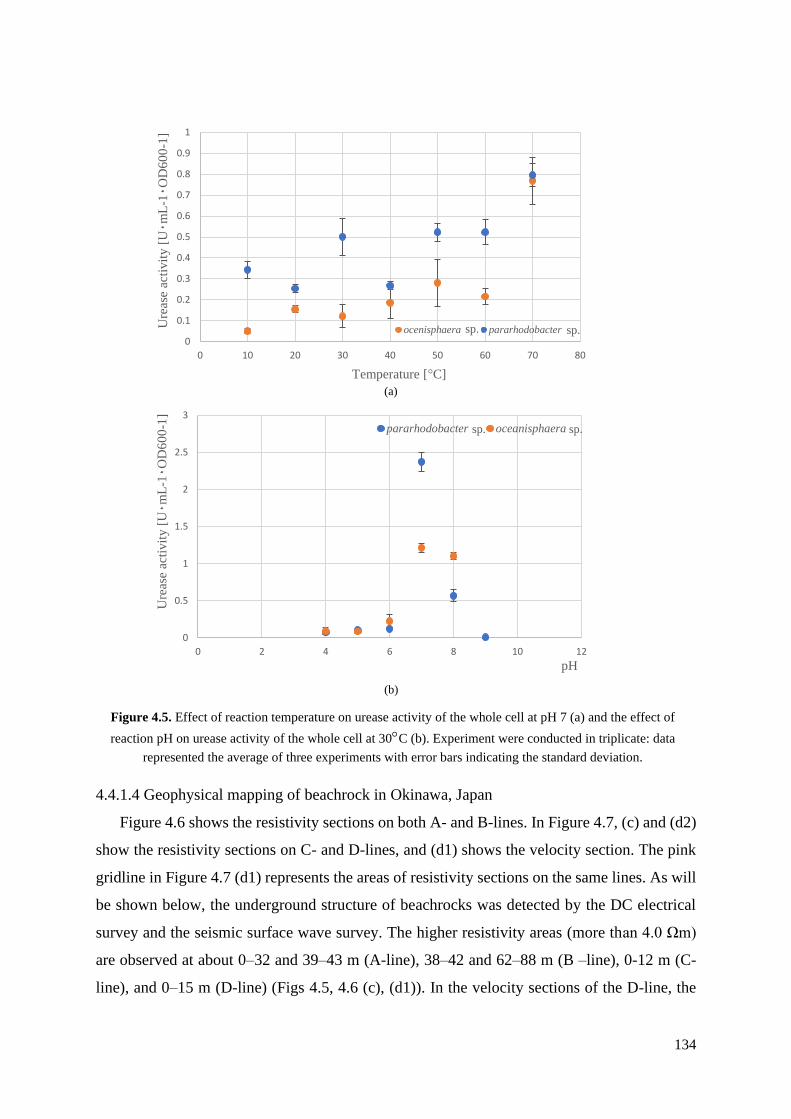
134
4.4.1.4 Geophysical mapping of beachrock in Okinawa, Japan
Figure 4.6 shows the resistivity sections on both A- and B-lines. In Figure 4.7, (c) and (d2)
show the resistivity sections on C- and D-lines, and (d1) shows the velocity section. The pink
gridline in Figure 4.7 (d1) represents the areas of resistivity sections on the same lines. As will
be shown below, the underground structure of beachrocks was detected by the DC electrical
survey and the seismic surface wave survey. The higher resistivity areas (more than 4.0 Ωm)
are observed at about 0–32 and 39–43 m (A-line), 38–42 and 62–88 m (B –line), 0-12 m (C-
line), and 0–15 m (D-line) (Figs 4.5, 4.6 (c), (d1)). In the velocity sections of the D-line, the
0
0.5
1
1.5
2
2.5
3
0 2 4 6 8 10 12
Ure
ase
acti
vit
y [
U٠
mL
-1٠
OD
60
0-1
]
pH
pararhodobacter oceanisphaera
0
0.1
0.2
0.3
0.4
0.5
0.6
0.7
0.8
0.9
1
0 10 20 30 40 50 60 70 80
Ure
ase
acti
vit
y [
U٠
mL
-1٠
OD
60
0-1
]
Temperature [°C]
ocenisphaera pararhodobacter
Figure 4.5. Effect of reaction temperature on urease activity of the whole cell at pH 7 (a) and the effect of
reaction pH on urease activity of the whole cell at 30C (b). Experiment were conducted in triplicate: data
represented the average of three experiments with error bars indicating the standard deviation.
sp. sp.
sp. sp.
(a)
(b)

135
near-surface areas showing the highest velocity (more than 325 m/s) are between about 12–14
m (Fig. 4.7 (d1)). As mentioned in Capture 3, the harder the rock, the higher both its resistivity
and S wave velocity. The high velocity areas coincide relatively well with the high resistivity
areas and the observed outcrops of beachrock (Fig. 4.7 (d1) and Capture 2). Furthermore, it
was very likely able to detect the buried beachrocks. The examples are the surface areas at
about 27–44.5 and 43–89 m on A- and B-lines, respectively. The area on the D-line is assumed
to be between about 7.25–12 m because the resistivity of the higher surface area (more than 16
Ωm) between 0–4 m is too high in spite of not observing a beachrock outcrop, and this is due
to the drying of sand by evaporation. The surface area be-tween 0-2 m on C-line is similar
(Kubo, et al., 2014).
From the above, it is believed that the two surveys detected beachrocks. Likewise, it was
assumed that the thickness of beachrock in this study area is about 1 m, its surface wave
velocity is about 300–350 m/s, and its resistivity is about 4–40 Ωm. In the next location, it was
assumed that the geological structure of this study area is as follows.
Figure 4.6. Results of the resistivity survey (A-, B-line) (Kubo, et al., 2014)

136
4.4.2 Krakal-Sadranan beachrock sample, Yogyakarta, Indonesia.
4.4.2.1 Geology of Gunung Kidul Regency, Yogyakarta.
Beaches of Gunung Kidul Regency, Province of Special Region Yogyakarta, Indonesia
have economic potential as limestone mine deposits and tourism. The karst beaches in Gunung
Kidul Regency, Krakal-Sadranan beach to be exact, have similarities in terms of geological
conditions, methods, and geomorphologic processes beach formation. The study area was
located around E 455900.11; S 9099654.13 to E 456281.51; S 9099623.03, 49 S Indonesia
region. However, for each of its shores, it is characteristically a coastal environment. The thin
line of the characteristics of the environment are based purely on the shape of the beach and
the diameter of the grains of sediment. This difference should also be noted as related to the
condition of waves, ocean currents, temperature, salinity, and pH at each beach.
The characteristics of the karst mountains of south beach indicate that there is steep
topography that rises to the east of Java Island. Continuing eastward hummocky valleys occur
(Drini beach to Krakal to Sadranan). The coast of Krakal-Sadranan have a slope were steep
~12,33° with the tidal range of 12 meter that makes the sedimentary process in this coast were
thickness than the deeper slope. The tidal reach of the littoral zone provides an opportunity for
strong sea wave energies to erode the beach. The energy comes from crashing ocean waves
Figure 4.7. Results of velocity and resistivity survey (C-, D-line) (Kubo, et al., 2014).

137
that break on the beach in the breaker zone that is not too far from the coastline. The result of
the wave energy as well as the sharp, heterogenous rocks is the formation of an irregularly
shaped beach at Krakal-Sadranan.
Throughout the karst coast of the Yogyakarta Special Prov., Gunung Kidul Regency the
soil is derived from limestone bedrock, similar to the Mediterranean, i.e., the level of physical
weathering is high. Grains of sediment along Krakal and Sadranan beaches are largely bright
colored along most of the coastline as a result of the erosion of seabed being deposited on the
beach. Composition of this sediment mainly formed by coral, skeletal fragment, Foraminifera
and Mollusca. It is evident that the megascopic Sadranan beachrock has the same grain
characteristics and the same grain composition as the non-solidified material along its beaches,
with a dominance of shell fragments, corals, Foraminifera, and relatively anhedral-shaped
grains varying from 2 mm to 4 cm. There is also carbonate cement. Figure 4.8 shows a sample
of Krakal-Sadranan beachrock that has fragments of relatively large size (> 3 mm to 3 cm) with
a grey to brownish grey color.
4.4.2.2 Petrographic analysis result
The presence of different quartz crystals created an abundance of lytic fragments and more
coral or shell-like fragments. The micrite or mud carbonate cement were filled the fragments
showed that the cement formed during deposition, such as quartz, coral, and another
Figure 4.8. Sadranan beachrock sampling area, Yogyakarta, Indonesia.
Krakal-Sadranan A Krakal-Sadranan B Krakal-Sadranan C

138
fragmented material. Whereas some of the opaque and quartz were formed as supported fabric
(Figure 4.9).
Based on the analysis, the cementation mineral came from aragonite within needle
crystalline fibrous, dark color micritized granules and cover a cryptocrystalline surrounded the
fragments. This represented the Sadranan beachrock is a product of diagenesis in the phreatic
environment of the sea sedimentation. The exclusive presence of aragonitic cement (needle
aragonite and peloidal micrite cement) in rocks of the sedimentary diagenesis indicated that the
coast occurred mainly within marine environments. The presence of cement found in the
peloidal beachrock micrite cement is very significant, as it is a rare form of cement that can be
found in rocks only along a coast, and therefore is very valuable. Research presenting some
samples of cement showed gaps within the pores of the rocks, or an internal sedimentary
intraparticle pore. The cement is comprised grains of round micritic and can be clearly observed
in thin section which indicates that micrite played an important role in Sadranan beachrock
cementation (Table 4.1).
In conclusion, it can be generalized that the Sadranan beachrock occurs mainly in sea
conditions with different cements of the Sumuide sample, while the Sadranan sample is
enriched in coral pores and pore-filling cement dominated by HMC. The names of the samples
from Sadranan, Yogyakarta, are based on carbonate classification and are termed poorly sorted
biomicrite (Folk, 1959) and bioclastic pack stone (Dunham, 1962) beachrock (lithified). In
Sadranan, microorganism activities were the main source of material cemented inside the rock
Krakal-Sadranan A Krakal-Sadranan B Krakal-Sadranan C
Figure 4.9. Sadranan beachrock cement vision using 100x (yellow pattern represented grain matrix and orange
pattern represented cement).

139
compared to that of the Okinawa beachrock that formed from geochemical dissolution and
reorganization followed by micritization of living organisms from the area.
Table 4.1. Percentage composition of beachrock
No Composition
type (%)
Name of samples
Sumuide A Sumuide B Sumuide C KR-A KR-B KR-C
1.
2.
3.
4.
5.
6.
7.
8.
9.
10.
Foraminifera
Skeletal
Coral
Lithic
Micrite
Sparite
Opaque
Pores
Quartz
Others
15.52
16.88
14
20.64
7.52
0.05
0.29
14
10.11
0.94
12.52
14
11.88
13.88
7.23
2.58
0.47
18.11
18.23
1.05
10.07
46.91
1.91
4.55
22.2
0
0.44
11.39
2.5
0
8.05
32.17
23.05
1.58
24.88
0
0.17
8.41
1.17
0.47
15.41
32.17
6.23
0
24.52
0
1.35
17.88
0.88
1.52
8.3
33.67
0
1.25
5.36
23.97
1.61
24.19
0
1.61
TOTAL 100 %
4.4.2.3 Indigenous ureolytic bacteria from Yogyakarta, Indonesia
The total potential urease bacteria found is less than 5% as the percentage ratio of ureolytic
bacteria among the 527 colonies from the total number isolated from the rock samples. The
diversity of microbes known in beachrock encompass three recognized ureolytic bacterial
groups, most of which species are assorted microbial eukaryotes. The most frequently isolated
16S rDNA gene sequences include those from acid bacteria, Actinobacteria, and Chloroflexi
(Janetzki, et al., 2015; Mauz, et al., 2015; Tostevin, et al., 2016). The results of a homology
search in the GenBank/DDBJ/EMBL, three group of bacteria that were highly homologous to
the 16S rDNA nucleotide sequence of the species whereas Oceanobacillus profundus, Vibrio
maritimus, and Pseudoalteromonas tetradonis. The others, V. maritimus and P. tetradonis are
gram-negative. The former are motile bacilli 1 μm wide and 1.5–4.0 μm, whereas the latter are
strictly aerobic, motile with one polar flagellum, form either straight rods (or rod-shapes), 0.5–
0.8 × 1.0-1.5 μm when in exponential growth phase. The bacteria expressed the highest urease
activity after 48 h incubation, with only appreciable levels at 24 and 72 h. Cell concentration
increased up to 2 days and then reached stationary phase.
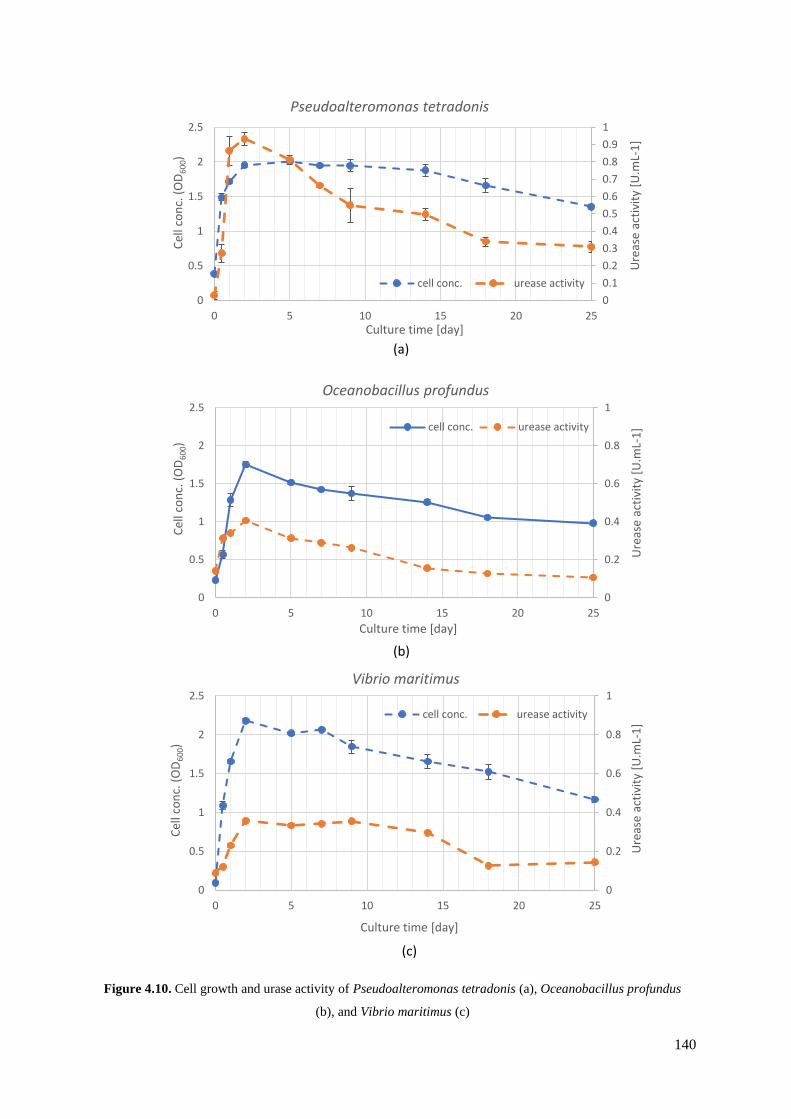
140
(a)
(b)
0
0.2
0.4
0.6
0.8
1
0
0.5
1
1.5
2
2.5
0 5 10 15 20 25
Ure
ase
acti
vity
[U
.mL-
1]
Cel
l co
nc.
(O
D6
00)
Culture time [day]
Oceanobacillus profundus
cell conc. urease activity
0
0.2
0.4
0.6
0.8
1
0
0.5
1
1.5
2
2.5
0 5 10 15 20 25
Ure
ase
acti
vity
[U
.mL-
1]
Cel
l co
nc.
(O
D6
00)
Culture time [day]
Vibrio maritimus
cell conc. urease activity
(c)
0
0.1
0.2
0.3
0.4
0.5
0.6
0.7
0.8
0.9
1
0
0.5
1
1.5
2
2.5
0 5 10 15 20 25
Ure
ase
acti
vity
[U
.mL-
1]
Cel
l co
nc.
(O
D6
00)
Culture time [day]
Pseudoalteromonas tetradonis
cell conc. urease activity
Figure 4.10. Cell growth and urase activity of Pseudoalteromonas tetradonis (a), Oceanobacillus profundus
(b), and Vibrio maritimus (c)

141
The urease activity of the cell culture increased with cell growth. Based on this result, the
production of urease would be a growth-associated system. The difference of temperature
environment is shown in Figure 4.10, a for all of Indonesian species compared with
Pararhodobacter sp. High activity was obtained in the range temperatures of 10-80 C, within
the maximum temperature of urase activity was obtained 80 C in this study. Most of urease
molecule is known to be composed of protein subunits and the subunits of this urease would
strongly bind each other to leads the high stability of urease during long-term cultivation
(Mobley and Island, 1995; Balasubramanian and Ponnuraj, 2010; Fujita, et al., 2017). Urease
activity under different pH is shown in Figure 4.10, b. The results showed with the maximum
activity around pH 2.0 – 13.0. For this temperature and pH variations, the results were different
with Fujita, et al. (2017), where he is mentioned the results of maximum temperature
exponential increasing toward environment temperature of the buffer solution and the method
for urease activity measurement, he used ammonia meter of Tris/HCl buffer solution.
Meanwhile, in this research, for measuring urease activity we used EDTA buffer solution for
indophenol blue method then detect with colorimeter changing with optical density 630 nm.
The results of Fujita, et al. (2017) and this research quite different but the pattern of bacterial
growth and urease activity, especially for Pararhodobacter sp., is almost same. Indonesian
ureolytic bacteria species proven have a higher activity then Okinawa species
(Pararhodobacter sp.) which mean the possibility of developing beach sand using this bacteria
strain in around tropical climate until room temperature is possible.
4.5 Discussions
Whilst the key aspect of mineral cementation is discussed, it is equally important to
recognize the presence of aragonite primarily formed in a phreatic, low-marine, vadose
environment. Aragonite formation has been related to the temperature of the solution; for
example, the higher the solution temperature, the faster aragonite precipitates around calcite
cement minerals (Burton and Walter, 1987) and the crystal form the cement takes is mostly
fibrous. After this, the interplay between the different carbonate phases occurs in the cement,
and the content of calcite, aragonite or Mg-calcite depends on the change in the water-table
elevation, the temperature or the pressure, with a trend toward chemical stability. One of the
most effective means to create a polymorph of calcite or dolomite is the infiltration of meteoric

142
water rich in dissolved CO2, depleting the cement in Mg, Sr, and Na and enriching it in other
elements.
Figure 4.11. Illustration schemes of natural beachrock occurrences (after Danjo, 2014)
The main parameters of beachrocks sediments are pH, temperature, salinity, and nutrient
from the sea (Figure 4.11). Other factors such as beach hydrodynamics, beach geomorphology,
and also the formation of sediments from the coast. The pH, Temperature, salinity and nutrients
in the surface layer of the sea are important controls on carbonate production. Their distribution
is mainly governed by the latitudinal differences of solar radiation and by the patterns of surface
circulation. The first-order trend is a decrease in temperature with increasing latitude and
salinity maxima in the horse latitudes that correspond to the desert belts on land. From the
horse latitudes, salinity decreases pole-ward and towards the equator where high rainfall dilutes
the surface water. The effects of gyre circulation are more varied as outlined below high salinity
because the gyre centers lie in the arid horse latitudes. In the equatorial belt, the opposed
direction of the Coriolis force in the two hemispheres lead to surface divergence and gentle
upwelling with moderately high nutrient levels. Upwelling and high rainfall lower the
salinities.

143
4.5.1 Natural beachrock sedimentary
4.5.1.1 Cement characteristics
Thin-section analysis from all of the Okinawa samples present results in one direction;
fossils are dominated by foraminifera and coral (skeletal grain particles), while other materials
depend on the genesis of the source rock (opaque) that cemented from micritic and sparite.
According to the theory of fossil marine paleontology, foraminifera are separated into two
groups following their life strategy, namely planktonic and benthonic foraminifera. All benthic
foraminifera occur in marine and neritic environmental zones, living largely in oligotrophic
reefs and carbonate shoals and confined mainly to low-latitude areas. The prolific in nutrient-
deficient of the nature, warm, shallow-water seas, often associated with coral reefs, an
important key in producing carbonate sediment (Boudagher-Fadel, 2008). In general, the
presence of benthic foraminifera (including larger foraminifera) indicates a warm environment,
as the minimum water temperature tolerated by a living foram is 18 °C, while the maximum
water depth at which they live is 35 m (Murray, 1973) as related to the photic zone.
Peloidal micrite cement, aragonite needled cementation, micritization, and micritic were
covered on the thin sections. The analysis concluded that natural beachrock was a product of a
diagenetic marine phreatic environment. The significant cost of aragonite cement (aragonite
needled and micrite peloidal cement) for cementation of beachrock was a key factor in
shoreline sedimentary diagenesis in the marine environmental system. It can be directly
precipitated from sea water or be a by-product of biological activities. Beachrock is generally
cemented in the tidal zone with high amounts of aragonite, HMC, and LMC (Daryono, 2016).
General carbonate cementation in the marine environment formed acicular-radial and spacious
types of cement texture whereas the tidal zone is indicated by aragonite or HMC. Meniscus and
bridge cement indicate LMC composition (Scholes and Ulmer-Scholes, 2003; Vousdoukas et
al., 2007; Mauz, et al., 2015; Avcioğlu, et al., 2016). Regarding the aforementioned
cementation processed related to microbial activity, it is commonly referred to as biogenic
cement. On the other hand, another author has suggested that the microbes of metabolic bacteria
are related to the precipitation of rocks (Danjo and Kawasaki, 2016; Khan, et al, 2018;
Tirkolaei, et al., 2018), and the end products lower the thermodynamic boundary for cement
nucleation and increase the rates of the physicochemical processes involved (Kandianis, et al.,
2008; Dupraz, et al., 2009). Bio-cementation using MICP technique of calcium carbonate
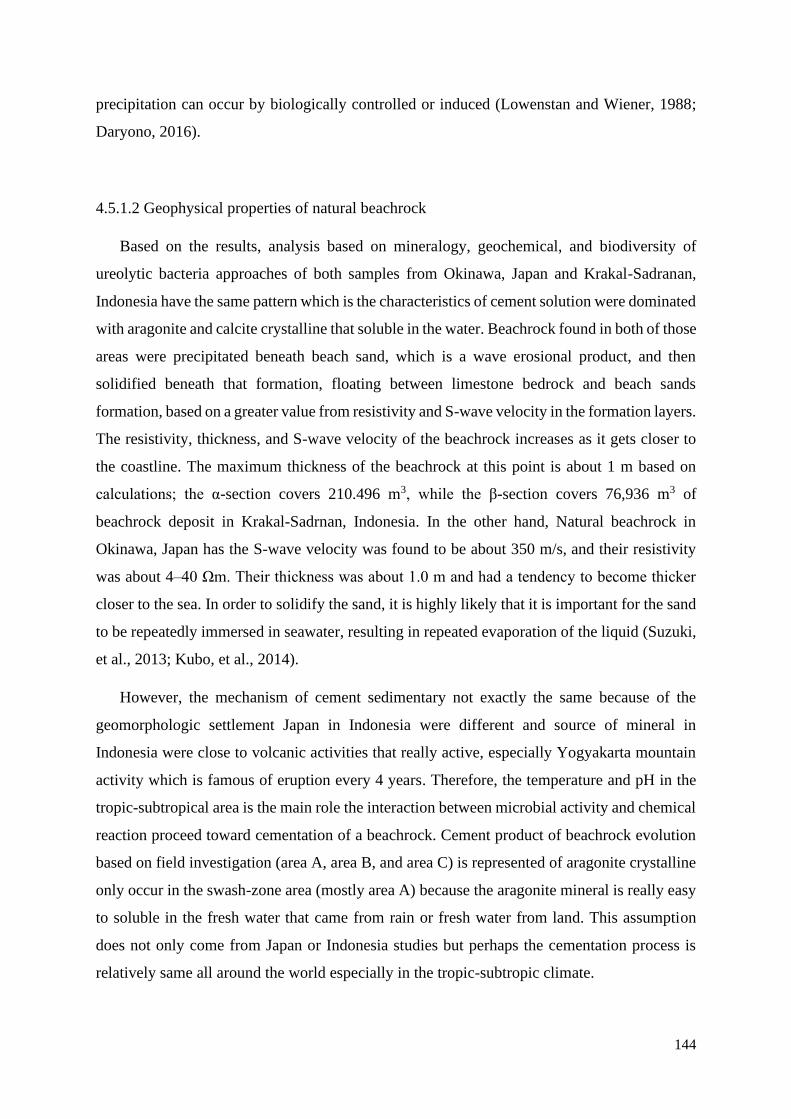
144
precipitation can occur by biologically controlled or induced (Lowenstan and Wiener, 1988;
Daryono, 2016).
4.5.1.2 Geophysical properties of natural beachrock
Based on the results, analysis based on mineralogy, geochemical, and biodiversity of
ureolytic bacteria approaches of both samples from Okinawa, Japan and Krakal-Sadranan,
Indonesia have the same pattern which is the characteristics of cement solution were dominated
with aragonite and calcite crystalline that soluble in the water. Beachrock found in both of those
areas were precipitated beneath beach sand, which is a wave erosional product, and then
solidified beneath that formation, floating between limestone bedrock and beach sands
formation, based on a greater value from resistivity and S-wave velocity in the formation layers.
The resistivity, thickness, and S-wave velocity of the beachrock increases as it gets closer to
the coastline. The maximum thickness of the beachrock at this point is about 1 m based on
calculations; the α-section covers 210.496 m3, while the β-section covers 76,936 m3 of
beachrock deposit in Krakal-Sadrnan, Indonesia. In the other hand, Natural beachrock in
Okinawa, Japan has the S-wave velocity was found to be about 350 m/s, and their resistivity
was about 4–40 Ωm. Their thickness was about 1.0 m and had a tendency to become thicker
closer to the sea. In order to solidify the sand, it is highly likely that it is important for the sand
to be repeatedly immersed in seawater, resulting in repeated evaporation of the liquid (Suzuki,
et al., 2013; Kubo, et al., 2014).
However, the mechanism of cement sedimentary not exactly the same because of the
geomorphologic settlement Japan in Indonesia were different and source of mineral in
Indonesia were close to volcanic activities that really active, especially Yogyakarta mountain
activity which is famous of eruption every 4 years. Therefore, the temperature and pH in the
tropic-subtropical area is the main role the interaction between microbial activity and chemical
reaction proceed toward cementation of a beachrock. Cement product of beachrock evolution
based on field investigation (area A, area B, and area C) is represented of aragonite crystalline
only occur in the swash-zone area (mostly area A) because the aragonite mineral is really easy
to soluble in the fresh water that came from rain or fresh water from land. This assumption
does not only come from Japan or Indonesia studies but perhaps the cementation process is
relatively same all around the world especially in the tropic-subtropic climate.

145
4.5.2 Indigenous ureolytic bacteria from natural beachrock
Furthermore, artificial beachrocks used microorganism activities significantly successfully
and were noted as man-made especially from Indonesia species strains. The aragonite
crystallization fibers formed between grain sand particles then interlocked with one another
until the precipitate over time became a solid rock. The solidification experiment by using in-
situ bacteria having urease activity and changing the composition of the solidification solution
based on Pararhodobacter sp. (Danjo and Kawasaki, 2014). Since 2014, microbial treatment
using Pararhodobacter sp., have a 75 published number of journals and proceedings.
Hardening of a substrate using calcium carbonate as cement materials, using calcite and
aragonite were valuable to consider how to make artificial beachrock. (Hata, et al., 2011; van
Passen, et al., 2010; Danjo and Kawasaki, 2014; Khan, et al., 2018). Therefore, based on
experiments of synthetic beachrock, it could mitigate erosion impacts in coastal areas subjected
to problematic erosional damage based on bio-cementation technology is promising technology
due to its suitability in an environment problem such as coastal erosional preventing
development in the future especially of indigenous Indonesian local strain bacteria’s.
Bacteria play a catalyzing role in urea hydrolysis through generation of urease enxyme to
formed calcium carbonate cement (van Passen, 2009; Tirkolaei, et al., 2018; Al Thawadi,
2008). Specific cement types are recognized as (i) acicular, fibrous, and bladed fabrics; (ii)
radial fibrous and fascicular-optic fabrics; (iii) micro-and cryptocrystalline fabrics; (iv) equant
spar, syntaxial overgrowth fabrics, scalenohedral calcites, peloidal fabrics and (v) non-
carbonates. These types are incipient early marine cementation leading to a reduction in pore-
space in near-seafloor sediments (Christ, et al., 2015). Hydrolysis of urease bacteria as a result
of increased total carbonate content through the production of dissolved inorganic carbon and
a pH increase through the production ammonia. The species were isolated from Okinawa
beachrock called Pararodhobacter sp., and Oceanisphaea sp., which are the Pararhodobacter
sp., are Gram-negative, rod-shaped, aerobic, chemoorganotrophic bacteria, that are moderately
halophilic with approximately 1 m in diameter and 3 m in length (Foesel, et al., 2011; Danjo
and Kawasaki, 2016). Meanwhile, Oceanisphaera sp., had a spherical cell, 1.0-1.2 m in
diameter and motile by means of flagella. Gram-negative chemoorganotroph with absolute
requirement for sodium ions, aerobic, moderately halophilic, and oxidase-catalase-positive
(Romanenko, et al., 2003). On other hand, Indonesian ureolytic bacteria strain were found are
Oceanobacillus profundus, Vibrio maritimus, and Pseudoalteromonas tetradonis. The others,
V. maritimus and P. tetradonis are gram-negative. The former are motile bacilli 1 μm wide and

146
1.5–4.0 μm, whereas the latter are strictly aerobic, motile with one polar flagellum, form either
straight rods (or rod-shapes), 0.5–0.8 × 1.0-1.5 μm when in exponential growth phase.
The differences between gram positive and gram-negative bacteria are primarily related to
their cell wall composition. Gram positive bacteria have cell walls composed mostly of a
substance unique to bacteria known as peptidoglycan, or murein. These bacteria stain purple
after gram staining. Gram negative bacteria have cell walls with only a thin layer of
peptidoglycan and an outer membrane with a lipopolysaccharide component not found in gram
positive bacteria. gram negative bacteria stain red or pink after gram staining.
4.5.2.1 Gram positive bacteria
The cell walls of gram-positive bacteria differ structurally from the cell walls of gram-
negative bacteria. The primary component of bacterial cell walls is peptidoglycan.
Peptidoglycan is a macromolecule composed of sugars and amino acids that are assembled
structurally like woven material. The amino sugar component consists of alternating molecules
of N-acetylglucosamine (NAG) and N-acetylmuramic acid (NAM). These molecules are
crosslinked together by short peptides which help give peptidoglycan strength and structure.
Peptidoglycan provides protection for bacteria and defines their shape. The gram-positive cell
wall has several layers of peptidoglycan. The thick layers of peptidoglycan help to support the
cell membrane and provide a place of attachment for other molecules. The thick layers also
enable gram positive bacteria to retain most of the crystal violet dye during gram staining
causing them to appear purple (Figure 4.12). Gram positive cell walls also contain chains of
teichoic acid that extend from the plasma membrane through the peptidoglycan cell wall. These
sugar-containing polymers assist in maintaining cell shape and play a role in proper cell
division. Teichoic acid helps some gram-positive bacteria to infect cells and cause disease.
Some gram-positive bacteria have an additional component, mycolic acid, in their cell
walls. Mycolic acids produce a waxy outer layer that provides additional protection for
mycobacteria, such as Mycobacterium tuberculosis. Gram positive bacteria with mycolic acid
are also called acid-fast bacteria because they require a special staining method, known as acid-
fast staining, for microscope observation. Pathogenic gram-positive bacteria cause disease by
the secretion of toxic proteins known as exotoxins. Exotoxins are synthesized within the
prokaryotic cell and released into the exterior of the cell. They are specific to certain bacterial

147
stains and can cause serious damage to body organs and tissues. Some gram-negative bacteria
also produce exotoxins.
Gram positive cocci refer to gram positive bacteria that are spherically shaped. Two genera
of gram-positive cocci noted for their role as human pathogens are Staphylococcus and
Streptococcus. Staphylococcus are spherical in shape and their cells appear in clusters after
they divide. Streptococcus cells appear as long chains of cells after division. Examples of gram-
positive cocci that colonize the skin include Staphylococcus epidermidis, Staphylococcus
aureus, and Streptococcus pyogenes. While all three are part of the normal human microbiota,
they can cause disease under certain conditions. Staphylococcus epidermidis form thick
biofilms and can cause infections associated with implanted medical devices. Some
Staphylococcus aureus strains, such as methicillin-resistant Staphylococcus aureus (MRSA),
have become resistant to antibiotics and can lead to the development of serious
illness. Streptococcus pyogenes can cause strep throat, scarlet fever, and flesh-eating disease.
4.5.2.2 Gram negative bacteria
Like gram positive bacteria, the gram-negative bacterial cell wall is composed of
peptidoglycan. However, the peptidoglycan is a single thin layer compared to the thick layers
in gram positive cells. This thin layer does not retain the initial crystal violet dye but picks up
the pink color of the counterstain during gram staining. The cell wall structure of gram-negative
bacteria is more complex than that of gram-positive bacteria. Located between the plasma
membrane and the thin peptidoglycan layer is a gel-like matrix called periplasmic space. Unlike
in gram positive bacteria, gram negative bacteria have an outer membrane layer that is external
Figure 4.12. Illustration of gram-positive bacteria (after Bailey, 2020)
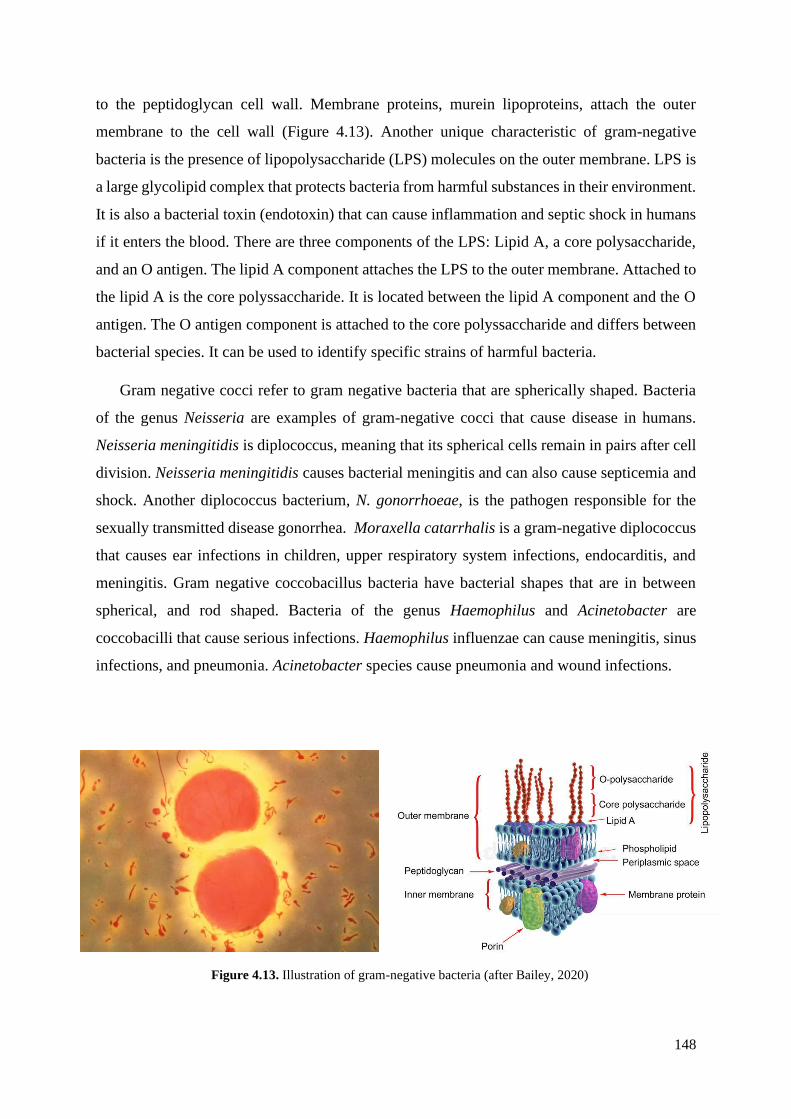
148
to the peptidoglycan cell wall. Membrane proteins, murein lipoproteins, attach the outer
membrane to the cell wall (Figure 4.13). Another unique characteristic of gram-negative
bacteria is the presence of lipopolysaccharide (LPS) molecules on the outer membrane. LPS is
a large glycolipid complex that protects bacteria from harmful substances in their environment.
It is also a bacterial toxin (endotoxin) that can cause inflammation and septic shock in humans
if it enters the blood. There are three components of the LPS: Lipid A, a core polysaccharide,
and an O antigen. The lipid A component attaches the LPS to the outer membrane. Attached to
the lipid A is the core polyssaccharide. It is located between the lipid A component and the O
antigen. The O antigen component is attached to the core polyssaccharide and differs between
bacterial species. It can be used to identify specific strains of harmful bacteria.
Gram negative cocci refer to gram negative bacteria that are spherically shaped. Bacteria
of the genus Neisseria are examples of gram-negative cocci that cause disease in humans.
Neisseria meningitidis is diplococcus, meaning that its spherical cells remain in pairs after cell
division. Neisseria meningitidis causes bacterial meningitis and can also cause septicemia and
shock. Another diplococcus bacterium, N. gonorrhoeae, is the pathogen responsible for the
sexually transmitted disease gonorrhea. Moraxella catarrhalis is a gram-negative diplococcus
that causes ear infections in children, upper respiratory system infections, endocarditis, and
meningitis. Gram negative coccobacillus bacteria have bacterial shapes that are in between
spherical, and rod shaped. Bacteria of the genus Haemophilus and Acinetobacter are
coccobacilli that cause serious infections. Haemophilus influenzae can cause meningitis, sinus
infections, and pneumonia. Acinetobacter species cause pneumonia and wound infections.
Figure 4.13. Illustration of gram-negative bacteria (after Bailey, 2020)

149
4.5.2.3 Gram positive versus gram negative bacteria
• Most bacteria can be broadly classified as gram positive or gram negative.
• Gram positive bacteria have cell walls composed of thick layers of peptidoglycan.
• Gram positive cells stain purple when subjected to a gram stain procedure.
• Gram negative bacteria have cell walls with a thin layer of peptidoglycan. The cell wall
also includes an outer membrane with lipopolysaccharide (LPS) molecules attached.
• Gram negative bacteria stain pink when subjected to a gram stain procedure.
• While both gram positive and gram-negative bacteria produce exotoxins, only gram-
negative bacteria produce endotoxins.
• Gram-negatives were commonly species strain were isolated from shoreline inside of
beachrock rather than gram positive which dominant with in-land bacteria, but some of
bacteria strain from shoreline also found as gram positive.
4.5.3 Sediment characteristics differences of Okinawa, Japan and Yogyakarta, Indonesia
natural beachrock
Some of the differences between those two samples of beachrock not only from the
characteristics but also the microbial which isolated inside the beachrock samples. Indonesian
beachrock were found is categorize as Biotically controlled precipitation which have an
enrichment of microbial activity such as algae, arthropods, and other foraminifera were
represented the environment is rich of nutrient of another biotic organism rather than in the
Okinawa site. Okinawa site is categorized as Biotically induced precipitation. Whichever, the
environmental controls on microbial precipitation are less well known than those of skeletal
precipitation. An important property of the microbial mode of precipitation is its near
independence of light. Microbial precipitates may form in the photic zone or below, certainly
to depths of 400 meters. On modern reefs, the microbial deposits are best developed in the
forereef environment. However, stromatolites in the uppermost photic zone (e.g. Reid et al.
2000) and auto micrite in the interstices of coral framework (Camoin, et al. 1999) demonstrate
that the microbial mode of carbonate fixation finds its niches even in the prime domains of
skeletal production. An important chemical requirement is supply of alkalinity in the form of
the anions HCO3− and CO3
2−. A likely source of alkalinity is sulfate reduction combined with
decay of organic matter in oxygen-deficient layers of the ocean such as the oxygen minimum
of the thermocline (Schlager, 2005). The estimated water depth and organic-rich ambient

150
sediments of many mud mounds support this assumption. Whether temperature sets practically
relevant limits for microbial carbonate precipitation is unclear. Mud mounds seem to be best
developed in low latitudes. However, the paleo-latitude of many Paleozoic mounds is not well
constrained and narrow latitudinal restriction is not to be expected with a production system
that demonstrably functions at low light levels and in intermediate water depths, i.e.at
temperatures significantly below tropical surface temperatures. To simplify the differences of
natural beachrock from Japan and Indonesia were expressed in the table 4.2 in the below.
Table 4.2. Sedimentary characteristics differences of Okinawa natural beachrock, Japan and
Yogyakarta, Indonesia natural beachrock
No. Classification Okinawa beachrock, Japan Yogyakarta beachrock, Indonesia
1.
2.
3.
4.
5.
6.
7.
8.
9.
10.
11.
Type of cementation
Zone
Geophysical properties
Thickness of beachrock
Ureolytic bacteria strains
P-wave and S-wave
comparison (see Figure 2.13)
Optimum temperature
Major oxide cement
pH
UCS uniaxial strength
Carbonate classification
Aragonite-HMC dominant
with skeletal fragment
Tropic-Subtropics
S wave velocity ~350 m/s
Resistivity around 4–40 Ωm
Around 1 meter, respectively
Pararhodobacter sp.
Identify sedimented around
Early Paleogene until Miocene
50-60 °C
CaO, MgO, Al2O3, and SiO2
7.2 ~ 8.8
3.4 ~ 28 MPa
Biotically induced precipitate
Aragonite-HMC dominant with
Baculogypsina sphaerulata
Tropic
S wave velocity 400-600 m/s
Resistivity around 9–78.7 Ωm
Around 1.5~2 meters, respectively
Oceanobacillus profundus, Vibrio
maritimus, and Pseudoalteromonas
tetradonis
Identify sedimented around
Cretaceous until Late Paleogene
30-40 °C
CaO, MgO, Na2O, and P2O5
7.2 ~ 8.8
3 ~ 16.4 MPa
Biotically controlled precipitate
6. Conclusions
The review analysis for both natural beachrock of Sumuide beach and Krakal-Sadranan
beach are as good as the result sample obtained by the presence of either intraparticle or
interparticle granules cement filling. On an average, the sample of natural beachrocks were
very similar to Okinawa beachrock and Yogyakarta beachrock where this type of cement
dominated by peloidal micritic and micritic dark granules that found in the same intertidal zone.
Okinawa beachrock contained more lytic granules with fragments of quartz result material
sediments there are predominantly with a fragment of coral shell, meanwhile Yogyakarta

151
beachrock was more sparite cement which had filling of pore interparticle, therefore that it
appears more compact and lower porosity. Micritization proceed in beachrock of Okinawa or
Yogyakarta is a product of diagenesis rock that formed on the phreatic environment of the sea
within the presence of cement on the beachrock is peloidal micritic. To sum up, the origin of
cement micritic peloidal is uncertain. It can be precipitated directly from seawater or it just be
a product of biological activity. Beachrock of Okinawa were classified as biotically induced
precipitate, because the organism sets the precipitation process in motion but organic influence
on its course is marginal or absent. The reaction takes place outside the cell and the product is
very similar, often indistinguishable, from abiotic precipitated. The majority of carbonate
material in modern oceans is precipitated as highly structured skeletons of organisms were
dominant in the cold water rather than tropical area. Whereas beachrock of Indonesia is
classified as biotically controlled precipitate which the common precipitation were induced by
microorganisms, mostly bacteria and cyanobacteria. Micrite is a major, often dominant
component of these deposits. Microalgae as mats were found enrichment inside Indonesia
beachrock site than Okinawa beachrock which mostly consist of skeletal shells.
References
Al Thawadi, S. 2008. High Strength In-situ Biocementation of Soil by Calcite Precipitating
Locally Isolated Ureolytic Bacteria. Doctor Dissertation, Murdoch University, Australia.
Al Imran, M., Nakashima, K. and Kawasaki, S., 2017. Combination technology of
geotextile tube and artificial beachrock for coastal protection. International Journal, 13(39),
pp.67-72.
Arietta. N., Goienaga, N., Martinez-Azkarazo, I., Murelaga, X., Baceta, J. I., Sarmiento,
A., and Madariaga, J. M. 2011. Beachrock Formation In Temperate Coastlines: Examples In
Sand-gravel Beaches Adjacent To The Nerbioi-Ibaizabal Estuary (Bilbao, Bay of Biscay, North
of Spain). Spectrochimica Acta Part A 80:55-65.
Avcioğlu, M., Yiğitbaş, E., and Erginal, A. E. 2016. Beachrock Formation On The Coast
Of Gökçeada Island and Its Relation To The Active Tectonics Of The Region, Northern Aegean
Sea, Turkey. Quaternary Int. 401, p.141-152.
Ayinla, H. A., Abdullah, W. H., Makeen, Y. M., Abubakar, M. B., Jaouro, A., Yandoka,
B. M. S., and Abidin, N. S. Z. 2017. Petrographic and Geochemical Characteristization Of The

152
Upper Cretaceous Coal and Mudstones of Gombe Formation, Gongola sub-basin, Nortehn
Benue Trough Nigeria: Implication For Organic Matter Preservation, Paleodepositional
Environment And Tectonic Settings. Int. Journal of Coal Geology, v. 180, pp. 67-82.
http://doi.org/10.1016/j.coal.2017.06.010.
Bailey, Regina. "Gram Positive vs. Gram Negative Bacteria." ThoughtCo, Feb. 11, 2020,
thoughtco.com/gram-positive-gram-negative-bacteria-4174239.
Balasubramanian, A., and Ponnuraj, K. 2010. Crystal Structure of the First Plant Urease
from Jack Bean: 83 years of journey its first crystal to molecular structure. J. Mol. Biol. 400,
pp. 274-283.
Bäuerlein, E. 2003. Biomineralization Of Unicellular Organism: An Unusual Membrane
Biochemistry for The Production of Inorganic Nano- and Microstructures. Angew. Chem. Int.
42, 614-641. Doi: 10.1002/anie.200390176.
Boudagher-Fadel, M. K. 2008. Evolution and Geological Significance of Larger Benthic
Foraminifera. Departement of Earth Science, University College London: Elsevier, 560p.
Burton, E. A., and Walter, L. M. 1987. Relative Precipitation Rates of Aragonite and Mg
Calcite from Seawater: Temperature Or Carbonate Ion Control? Geology 15, 111-114.
Christ, N., Immenhauser, A., Wood, R. A., Darwich, K., and Niedermayr, A. 2015.
Petrography and Environmental Control On The Formation Of Phanerozoic Marine Carbonate
Handgrounds. Earth-Science Reviews 151, p. 176-226.
Calvet, F., Cabrera, M. C., Carracedo, J. C., Mangas, J., Peréz-torrado, F. J., Recio, C., and
Travé, A. 2003. Beachrock from the island of La Palma (Canary Island, Spain). Mar Geol 197:
75-93.
Díez, B., Bauer, K., and Bergman, B. 2007. Ephilithic Cyanobacterial Communities Of A
Marine Tropical Beachrock (Heron Island, Great Barrier Reef): diversity and diazotrophy.
Appl Environ Microbiol 73(11):3656-3668.
Danjo, T., and Kawasaki, S. 2014. Formation Mechanism of Beachrocks in Okinawa and
Ishikawa, Japan, With a Focus on Cements. Materials Transaction Vol. 55: Japan, pp. 493-500.
Danjo, T., and Kawasaki, S. 2016. Microbially Induced Sand Cementation Method Using
Pararhodobacter sp., Strain S01, Inspired by Beachrok Formation Mechanism. Materials
Transaction Vol. 57: Japan, pp. doi:10.2320/matertrans.M-M2015842.

153
Desruelles, S., Fouache, E., Ciner, A., Dalongeville, R., Pavlopoulos, K., Kosun. E.,
Coquinot, Y., and Potdevin, J. L., 2009. Beachrock and Sea Level Changes since Middle
Holocene: Comparison between the Insular Groups of Mykonos-Delos-Rheina (Cyclades,
Greece) and the Southern Coast of Turkey. Glob. Planet. Chang. 66, 19-33.
Daryono, L. R. 2016. Comparison of natural beachrock and anthropogenic beachrock, case
study: Okinawa-jima, Japan. Master’s degree of Geological Engineering, Universitas Gadjah
Mada, Indonesia.
Daryono, L.R., Titisari, A.D., Warmada, I.W. and Kawasaki, S., 2019. Comparative
characteristics of cement materials in natural and artificial beachrocks using a petrographic
method. Bulletin of Engineering Geology and the Environment, 78(6), pp.3943-3958.
Daryono, L.R., Nakashima, K., Kawasaki, S., Titisari, A.D. and Barianto, D.H., 2020.
Sediment Characteristics of Beachrock: A Baseline Investigation Based on Microbial Induced
Carbonate Precipitation at Krakal-Sadranan Beach, Yogyakarta, Indonesia. Applied Sciences,
10(2), p.520.
Dhami, N. K., Reddy, M. S., and Mukherjee, A. 2013. Biomineralization of Calcium
Carbonate and Their Engineered Applications: A Review. Frontier In Microbiology.
Douglas, S., and Beveridge, T. J. 1998. Mineral Formation by Bacteria In Natural Microbial
Communities. FEMS Microbiol. Ecol. 26, 79-88. Doi: 10.1111/j.1574-6941.1998.tb00494.x.
Dunham, R. J. 1962. Classification of Carbonate Rocks According To Depositional
Texture. In: Ham, W. E. (ed.). Classification of Carbonate Rocks. American Association of
Petroleum Geologist Memoir, p.108-121.
Dupraz, C., Reid, R. P., Braissant, O., Decho, A. W., Sean, N. R., and Visscher, L. K. 2009.
Processes Of Carbonate Precipitation In Modern Microbial Mats. Earth-Sci. Rev. 96, pp. 141-
162.
Foesel, B. U., Drake, H. L., and Schramm, A. 2011. Defluviimonas denitricans gen. nov.,
sp. nov., and Pararhodobacter aggregans gen. nov., sp. nov., non-phototrophic
Rhodobacteraceae from the biofilter of a marine aquaculture. Systematic and Applied Microb.
Jour. Vol 34, 498-502. http://doi.org/10.1016.j.syapm.2011.08.006.

154
Fujita, M., Nakashima, K., Achal, V., and Kawasaki, S. 2017. Whole-cell Evaluation of
Urease Activity of Pararhodobacter sp., Isolated from Peripheral Beachrock. Biochem. Eng. J.
124, 1-5. http://dx.doi.org/10.1016/j.bej.2017.04.004.
Folk, R. L. 1959. Practical Petrographic Classification of Limestones. American
Association of Petroleum Geologist Bulletin, v.43, p.1-38.
Hata, T., Tateno, N., and Abe, H. 2011. Jpn. Geotchnical J.6 (2011) 305-315 (in Japanese).
Kardianis, M. T., Fouke, B. W., Johnson, R. W., Veysey, J., and Inskeep, W. I. 2008.
Microbial Biomass: A Catalys For CaCO3 Precipitation In Advection-dominated Transport
Regimes. Bulletin of The Geological Society of Amerika 120, p. 442-450.
Karkani, A., Evelpidou, N., Vacchi, M., Morhange, C., Tsukamoto, S., Frechen, M., and
Maroukian, H. 2017. Tracking Shoreline Evolution In The Central Cyclades (Greece) Using
Beachrocks. Marine Geology 388, 25-37. http://dx.doi.org/10.1016/j.margeo.2017.04.009.
Klaus, Putz, H.B. 2017. Match! – Phase Identification from Powder Diffraction, Crystal
Impact.
Khan, M. N. H., and Kawasaki, S. 2016. Formation of Artificial Beachrock Towards Inhibit
of Coastal Erosion in Bangladesh: A Review. The 15th Asian Reg. Conference on Soil
Mechanics and Geotechnical Engineering, Japan Geotechnical Society Special Publication.
DOI:10.3208/jgssp.TC303-01.
Khan, M. N. H., and Kawasaki, S. 2018. Making Artificial Beachrock Through Bio-
cementation: A Novel Technology to Inhibition of Coastal Erosion. Handbook of
Environmental Materials Management. http://doi.org/10.1007/978-3-319-58538-3_38-1.
Kneale, D., and Viles, H. A. 2000. Beach Cement: Incipient CaCO3- Cement Beachrock
Development In The Upper Intertidal Zone, North Uist, Scotland. Sediment Geol 132:165-170.
Kolaiti, E., and Mourtzas, N. D. 2016. Upper Holocene Sea Level Changes In The West
Saronic Gulf, Greece. Quant. Int. 401, 71-90.
Kubo, R., Kawasaki, S., Suzuki, K., Yamaguchi, S. and Hata, T., 2014. Geological
exploration of beachrock through geophysical surveying on Yagaji Island, Okinawa, Japan.
Materials Transactions, pp.M-M2013839.

155
Lowenstan, H. A., and Weiner, S. 1988. On Biomineralization. Oxford University Press,
New York.
Mauz, B., Vacchi, M., Green, A., Hoffmann, G., and Cooper, A. 2015a. Beachrock: A Tool
for Reconstructing Relative Sea Level in the Far-Field. Mar. Geol. 362, 1-16.
http://dx.doi.org/10.1016/j.margeo.2015.01.009.
McCutcheon, J., Nothdurft, L. D., Webb, G. E., Paterson, D., and Southam, G. 2016.
Beachrock Formation Via Microbial Dissolution and Re-precipitation Of Carbonate Minerals.
Marine Geology 382, p. 122-135.
McNeil, F. S. 1960. The Tertiary and Quaternary Gastropoda of Okinawa. Prof. Paper, U.S.
Geol. Surv, vol. 339, pp. 148.
Mobley, H. L. T., and Island, M. D. 1995. Molecular Biology of Microbial Ureases.
Microbiol. Rev. 59, pp. 451-480.
Murray, J. W. 1973. Distribution and Ecology of Living Benthic Foraminifera. Heinemann,
London, 274p.
Mwandira, W., Nakashima, K., and Kawasaki, S. 2017. Bioremediation of Lead-
contaminated Mine Waste by Pararhodobacter sp., Based on the Microbially Induced Calcium
Carbonate Precipitation Technique and Its Effects On Strength Of Coarse and Fine Grained
Sand. Eco. Eng. 109, 57-64. http://dx.doi.org/10.1016/j.ecoleng.2017.09.011.
Nabhan, A. I., and Yang, W. 2018. Modern Sedimentary Facies, Depositional
Environments, and Major Controlling Processes on an Arid Siliciclastic Coast, Al Qarmah, SE
Red Sea, Saudi Arabia. Journal of African Earth Science, v. 140, pp. 9-28.
http://doi.org/10.1016/j.jafrearsci.2017.12.014.
Natarajan, K. R. 1995. Kinetic Study of The Enzyme Urease from Dolichos biflorus. J.
Chem. Educ. 72, 556-557. http://dx.doi.org/10.1021/ed072p556.
Nuemeier, U. 1999. Experimental Modelling of Beachrock Cementation under Microbial
Influence. Sedimentary Geology. Vol. 126, pp. 35-46.
Ozturk, M. Z., Erginal, A. E., Kiyak, N. G., and Ozturk, T. 2016. Cement Fabrics and
Optical Luminescence Ages of Beachrock, North Cyprus: Implications for Holocene Sea-level
Changes. Quat. Int. 401, 132-140. http://dx.doi.org/10.2016/j.quaint.2015.03.024.
156
Potter, P. E. 1967. Sand Bodies and Sedimentary Environments: A Review. American
Association of Petroleum Geologist, Bulletin, v. 51, pp. 337-365.
Pozo, M., Carretero, M. I., and Galán, E. 2016. Approach to the Trace Element
Geochemistry of Non-Marine Sepiolite Deposits: Influence of the Sedimentary Environment
(Madrid Basin, Spain). Applied Clay Science, v. 131, pp. 27-43.
http://doi.org/10.1016/j.clay.2015.10.024.
Romanenko, L. A., Schumann, P., Zhukova, N. V., Rohde, M., Mikhailov, V. V., and
Stakebrant, E. 2003. Oceanisphaera litoralis gen. nov., sp. nov., A Novel Halophilic Bacterium
from Marine Bottom Sediments. Int. Jour. of Syst., and Evoluationary Microb., vol. 53, pp.
1885-1888. DOI 10.1099/ijs.0.02774-0.
Russell, R. J., and McIntire, W. G. 1965. Southern Hemisphere Beachrock. Geographical
Review, 55, pp. 17-45.
Saitis, G., 2016. The Development of Beachrocks and Their Significance for the Coastal
and Human Environment: Study of The Natural Formation and “In Viro” with the use of
Bacteria, Area of Study: Corinth, Salamis (Greece) and Okinawa (Japan). Faculty of Geology
and Geoenvironment, Natural and Kapodistrian, University of Athens: Greece.
Scholle, P. A., and Ulmer-Scholle, D. 2003. Cement and Cementation. In: Middleton, G.
V. (ed.), Encyclopedia of Sediments and Sedimentary Rocks. Kluwer Academic Publishers,
Dordrecht, The Netherlands, pp. 110-119.
Schlager, W., 2005. Carbonate sedimentology and sequence stratigraphy (No. 8). SEPM
Soc for Sed Geology.
Stoddart, D. R., and Cann, J. R. 1965a. Nature and Origin of Beachrock. Journal of
Sedimentary Petrology 35, 243-247.
Stoddart, D. R., and Cann, J. R. 1965b. Nature and Origin of Beachrock. Journal of
Sedimentary Petrology 35 (1), 243-247.
Tirkolaei, H. K., Kavazanjian, E., van Passen, L., and DeJong, J. 2018. Bio-grout Materials:
A Review. ASCE. http://doi.org/10.1061/9780784480793.001.
Tokashiki, N., and Aydan, O. 2010. The off-Okinawa Island earthquake of February 27th,
2010. Japan Society of Civil Engineering: Japan.

157
van Passen, L. 2009. Biogrout, Ground Improvement by Microbial Induced Carbonate
Precipitation. Doctor Dissertation. Delft University of Technology, Netherlands.
van Passen, L., Daza, C., Staal, M., Sorokin, D., van der Zon, W., and van Loosdrecht, M.
2010b. Potential Soil Reinforcement by Microbial Denitrification. 1st Int. Conf. on Bio-Geo-
Civil Engineering, 36(2), 168-175.
van Passen, L., Ghose, R., van der Linden, T., van der Star, W., and van Loosdrecht, M.
2010a. Quantifying Biomediated Ground Improvement by Ureolysis: Large-Scale Biogrout
Experiment. J. Geotech. Geoenviron. Eng., 136(12), 1721-1728.
Vousdoukas, M.I., Velegrakis, A.F. and Plomaritis, T.A. 2007. Beachrock occurences,
characteristics, formation mechanism and impacts. Earth-Science Review. Vol. 85, pp. 23-46.
Weatherburn, M. W. 1967. Phenol-hypochlorite Reaction for Determination of Ammonia.
Anal. Chem. 39, 971-974. http://dx.doi.org/10.1021/ac60252a045.
158
CHAPTER 5
Beach sand solidification test using MICP method
5.1 Introduction
Present soil improvement applications comprise soil replacement, preloading for
consolidation, chemical admixture, and grouting stabilization. These techniques are time-
consuming, expensive, and environmentally harmful (DeJong et al. 2010). In addition, coastal
erosion is a significant problem throughout the world. Breakwater construction is usedfor
preventing coastal erosion. Production of cement, which is a major construction material for
breakwater construction, is energy consuming and environmentally un-friendly. During the
process of cement production, it releases a large amount of CO2. In addition, the process is time
consuming. Therefore, additional studies into discovery alternative techniques for soil
improvement are vital to achieving optimum performance, economic viability, and
environmental sustainability.
Biomineralization is a promising and environmentally innocuous technology to improve
soil engineering properties. It naturally happens and is induced by nonpathogenic organisms
that are native to the soil environment (DeJong et al. 2006). One common biomineralization
process is microbially induced calcite precipitation (MICP), which can bond sand grains
together and improve the engineering properties of sand. Improvement of soil mechanical
properties by MICP is currently of particular interest to engineers, microbiologists, and has
been demonstrated by several researchers at varying scales (DeJong et al. 2006; Whiffin et al.
2007; Van Paassen et al. 2010). The technique can alter soil characteristics to increase shear
strength and stiffness, while maintaining adequate permeability (Burbank et al. 2011). The
technique involves introducing aerobically cultivated bacteria with highly active urease
enzyme into soil, harnessing the urease enzyme to catalyze the hydrolysis of urea to produce
ammonium and carbonate ions. The produced microbially induced CaCO3 precipitates bridge
adjacent soil particles by cementing the soil grains together to form cemented sand illustrative
of calcareous rock (DeJong et al. 2006).
The engineering properties of MICP-treated soil may vary because MICP is a complex
biochemical process, which can be effected by many factors. The MICP contains two key steps,
as above equations. The urea hydrolysis is mainly dependent on the concentration of ureolytic
bacteria and the available substrate (e.g., urea), whereas calcite precipitation relates to available
Ca2+ (Mortensen et al. 2011). In accordance with the growth of nutrient concentration and

159
incubation time, the CaCO3 content increases. The particle size also has aneffect on MICP
bonded soil. The efficiency of MICP is related to the permeability of the soil being sufficient
to allow chemicals to flow to the bacteria and also the cement effect of CaCO3 precipitation
away particles (Mitchell and Santamarina 2005; Rebata-Landa 2007). Rebata-Landa (2007)
showed a relation between grain size and CaCO3 content, and maximum carbonate deposition
observed on grains was approximately 100 μm in size. Qabany et al. (2012) also found well-
graded and coralr sands had a higher rate of precipitation than finer and poorly graded soils.
5.2 Objective
In this chapter, we conducted a solidification test on local beach sand using the ureolytic
bacteria isolated from the soil near beachrock in Krakal-Sadranan, Yogyakarta, Indonesia. The
goal of this paper is to perform solidification of the specimen having an estimated unconfined
compressive strength (UCS) of more than several MPa for soil improvement and preservation
of coastal erosion and/or healing of coastal concrete structures, and investigate the influence
of varies factors on engineering properties of treated soil catalyzed by Indonesian indigenous
ureolytic bacteria.
A series of laboratory experiments conducted for identifying parameters which were
affected for solidification of the sample. Syringe solidification method was used for the
solidifying sample. Needle penetration test was conducted to obtain estimated UCS value and
measured pH and Ca2+ concentration of the outlet solution.
5.3 Materials and methods
5.3.1 Sands
Physical properties of local beach sands which was used in the experiments are shown in
Figure 5.1. The local beach sand used in the experiments was uniformly graded with a mean
particle size of 0.9 mm for coral sand and 0.6 mm for fine sand. The sand was sterilized, and
hand packed into a 50-mL syringe (mean diameter, D50 = 3 cm and height, h = 10 cm).
5.3.2 Bacteria
To identify the microbial activity, a 5.0 g sample of beachrock was mixed with 10 mL of
autoclaved artificial seawater (Aquamarine, Yashima Drug Company, Osaka, Japan; see Table
3.1), then diluted 101–104 times with artificial seawater. Next, 10 µL of each dilution was added
to ZoBell2216E agar medium (for marine bacteria, pH 7.7) and NH4-YE agar medium for
inland bacteria (20 g/L yeast extract; 10 g/L di-ammonium sulfate (NH4)2SO4; 0.13 M Tris

160
buffer for pH 8.0), and 20 g/L agar amended to isolate micro bacteria resistant strains as target
study of this research. To avoid contamination, every step of the investigation was conducted
inside a clean bench. After incubation at 35 °C for 3 d, about ~53 colonies from each location
were isolated from the plates. A urease activity test was then conducted on the colonies to
identify ureolytic bacteria. Each selected colony (diameter: 2–3 mm) was mixed with 20 mL
of solution (20 mL/L cresol red solution, 0.4 g/L cresol red with distilled water, and 25 g/L
CO(NH2)2 with distilled water) in a 20 mL bottle. The samples were then sealed, mixed by
shaking, and then incubated at 45 °C for 2 h. To determine whether or not the colonies have
urease activity, we observed the color of the solution after 2 h. There was a change in the cresol
red, from yellow to purple as pH increased from 7.2 to 8.8. Cresol red solution, the composition
of the urease activity measurement solution is shown in Table 5.1 and Table 5.2.
Table 5.1. The composition of the cresol red solution (per 100 mL, solvent: distilled water).
Cresol red (powder) 0.1 g
Ethanol (concentration 95%) 20 mL
Table 5.2. The composition of the urease activity measurement solution (per 100 mL,
solvent: distilled water).
Urea 2.5 g
Cresol red solution 2 mL
Quartz Sands
Coral sands
Figure 5.1. Particle size distribution of local beach sand from Yogyakarta south coast,
Indonesia.
0
20
40
60
80
100
0.01 0.1 1 10
Per
centa
ge
pas
sing(
%)
Particle Diameter(mm)
Parangtritis sands
Krakal-Sadranan sands
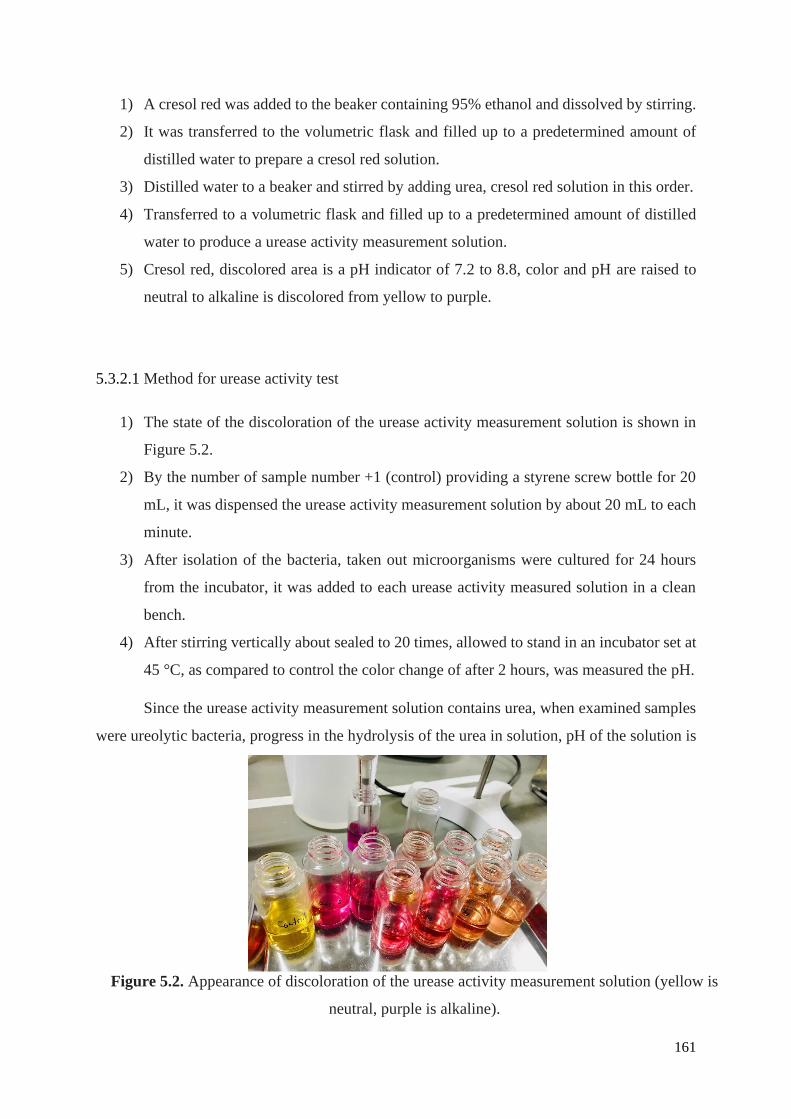
161
1) A cresol red was added to the beaker containing 95% ethanol and dissolved by stirring.
2) It was transferred to the volumetric flask and filled up to a predetermined amount of
distilled water to prepare a cresol red solution.
3) Distilled water to a beaker and stirred by adding urea, cresol red solution in this order.
4) Transferred to a volumetric flask and filled up to a predetermined amount of distilled
water to produce a urease activity measurement solution.
5) Cresol red, discolored area is a pH indicator of 7.2 to 8.8, color and pH are raised to
neutral to alkaline is discolored from yellow to purple.
5.3.2.1 Method for urease activity test
1) The state of the discoloration of the urease activity measurement solution is shown in
Figure 5.2.
2) By the number of sample number +1 (control) providing a styrene screw bottle for 20
mL, it was dispensed the urease activity measurement solution by about 20 mL to each
minute.
3) After isolation of the bacteria, taken out microorganisms were cultured for 24 hours
from the incubator, it was added to each urease activity measured solution in a clean
bench.
4) After stirring vertically about sealed to 20 times, allowed to stand in an incubator set at
45 °C, as compared to control the color change of after 2 hours, was measured the pH.
Since the urease activity measurement solution contains urea, when examined samples
were ureolytic bacteria, progress in the hydrolysis of the urea in solution, pH of the solution is
Figure 5.2. Appearance of discoloration of the urease activity measurement solution (yellow is
neutral, purple is alkaline).

162
increased. Along with this, because cresol red may change color to purple from yellow,
differences in the color of the control, and the difference between the measured values of pH,
it is possible to determine the presence and magnitude of urea resolution. The temperature of
the incubator (45 °C) is to facilitate the action of microorganisms.
5.3.2.1 Genetic analysis of microorganisms
For strains discoloration was seen of the indicator in the urease activity test. The genetic
analysis of microorganism is shown in Table 5.3 (Danjo, 2016).
Table 5.3. Genetic analysis of microorganisms.
Gene amplification (16S rRNA) and sequencing was carried out for selected ureolytic
isolates. The analysis of the DNA sequences was performed using the DB-BA 12.0 and
International Nucleotide Sequence Database created by the Techno Suruga Laboratory,
Shizuoka, Japan. The ureolytic bacteria isolated were identified using 16S rRNA sequence
analysis. DNA extracts were amplified using two sets of primers targeting the region-specific
DNA extraction Achromopeptidase (Wako Pure Chemical
Industries, Ltd., Osaka, Japan)
PCR amplification PrimeSTAR HS DNA Polymerase (Takara Bio, Shiga)
Cycle sequencing BigDye Terminator v3.1 Cycle Sequencing Kit
(Applied Biosystems, CA, USA)
Use primer PCR amplification: 9F, 1510R
Sequence: 9F, 785F, 802R, 1510R
Sequence ABI PRISM 3130 xl Genetic Analyzer System
(Applied Biosystems, CA, USA)
Sequencing ChromasPro 1.7 (Technelysium Pty Ltd., Tewantin,
AUS)
BLAST homology
search, and simple
molecular phylogenetic
analysis
Software
Apollon 2.0 (Techno Suruga Lab., Shizuoka)
Database
Apollon DB-BA9.0 (Techno Suruga Lab., Shizuoka)
International Nucleotide Sequence Database (GenBank
/ DDBJ / EMBL)

163
16S rRNA sequences for almost all bacterial 16S sequences: the F9 (5′-
GAGTTTGATCCTGGCTCAG-3′) and R1451 (5′-AAGGAGGTGATCCAGCC-3′) primers.
The PCR amplification cycle consisted of an initial denaturation step lasting 5 min at 94 °C,
followed by 25 cycles lasting 1 min at 94 °C, 2 min at 60 °C, 1 min at 72 °C, and a final
extension step of 30 min at 72 °C. The amplicons were separated through gel electrophoresis,
and the resulting DNA bands were extracted and purified using the FastGene™ PCR extraction
kit according to manufacturer instructions (Nippon Genetics Co., Ltd., Tokyo, Japan). The
extracted DNA was sent to the Eurofins Genomics Laboratory (Eurofins Genomics, Tokyo,
Japan) for sequencing. Subsequent phylogenetic analysis was conducted by TechnoSuruga
Laboratory (TechnoSuruga Laboratory Company Ltd., Tokyo, Japan). The latter used the
BLAST algorithm to find related sequences in the GeneBank Database, DNA Data Bank of
Japan, and the European Molecular Biology Laboratory. PCR sequencing was conducted to
identify the species of ureolytic bacteria isolated from the sites at Krakal-Sadranan.
The microorganism used was Oceanobacillus profundus, Vibrio maritimus, and
Pseudoalteromonas tetradonis. The strains in the 16S DNA gene sequences are shown in
Figure 3.5 (see Chapter 3). The O. profundus is a gram-positive species that are motile, aerobic,
rod-shaped (0.2–0.4 μm) and classified as biosafety level 1 bacteria. The others, V. maritimus
and P. tetradonis are gram-negative. The former are motile bacilli 1 μm wide and 1.5–4.0 μm,
whereas the latter are strictly aerobic, motile with one polar flagellum, form either straight rods
(or rod-shapes), 0.5–0.8 × 1.0–1.5 μm when in exponential growth phase. Even though V.
maritimus and P. tetradonis are classified as biosafety level 1, but further analysis of Vibrio
maritimus caused it to be eliminated because of similarity to Vibrio cholerae (i.e., V. cholerae).
The bacteria were cultivated in ZoBell2216E media, which also contained 5.0/L hipolypeptone
(Nihon Seiyaku Co., Ltd., Tokyo, Japan), 1.0 g/L FePO4 (Junsei Chemical Co., Ltd., Tokyo,
Japan), and 1.0 g/L yeast extract (BD Bioscience Adv., Bioprocessing, Miami, Florida, USA).
These were prepared with artificial seawater with pH 7.6–7.8, adjusted using 1 M NaOH. After
incubating aerobically at 30°C in a shaker at 160 rpm (revolutions/ min) for 72 hours, the
bacteria and growth media were centrifuged at 5000 rpm for 10 min.
5.3.3 Ureolytic bacteria characteristics of Indonesian species in various culture condition
Standard media (ZoBell2216E for marine bacteria and NH4-YE medium for land bacteria)
were used for culturing under sterile aerobic conditions. Cells were precultured separately in 5
mL of each medium at 37 °C and 160 rpm for 24 h. One milliliter of the preculture was
inoculated with 100 mL of the fresh medium and incubated under the same conditions. The

164
microbial cell growth of the isolates was determined based on optical density at a wavelength
of 600 nm (OD600) using a UV-vis spectrophotometer (V-730, JASCO Corporation, Tokyo,
Japan). Representative specimens were sampled at regular intervals of 24 h. Microbially
induced calcium carbonate precipitation tests were conducted in 10 mL tubes to evaluate the
feasibility of using isolated bacterial strains. Calcium chloride (CaCl2) reagent was chosen as
the calcium source, and 1 mL from equimolar concentrations (0.5 mol/L (M)) of CaCl2 and
urea solutions were used. One milliliter of the bacteria culture was added to the tube, and the
total volume was adjusted to 10 mL using distilled water. Samples were then placed in a
shaking incubator at 37 °C and shaken at 160 rpm for 48 h. Finally, the reaction mixtures were
centrifuged, precipitates were collected, and the amount of precipitate formed by each isolate
were gravimetrically compared. Based on the results, a single isolate was selected as the most
suitable for further analysis. In addition, the detail 16S rDNA (about 1500 bp) from the results
of homology using Apollon DB-BA9.0 database showed the highest homology of homology
95.6%.
5.3.4 Cementation media
Cementation media was used to provide chemical compositions for ureolysis, including
urea, CaCl2·2H2O, NH4Cl, NaHCO3, and nutrient broth (Mortensen et al. 2011). Table 5.4
shows the chemical compositions of cementation media for bacteria experiments.
Table 5.4. Standard chemical compositions for cementation media.
For the implementation of MICP for the desired application in nearshore environments,
attention has to be paid to the fact that target treatment environments will consist of a
considerable amount of magnesium and sodium ions. Therefore, a set of experiments were
conducted incorporating both Ca2+, Mg2+ and Na+ ions with various molar ratios from 0 to 1
Chemical Chemical Concentration (g/L) – 0.5M Ca
Nutrient Broth (g) 3
NH4Cl (g) 10
NaHCO3 (g) 2.12
(NH4)2CO (g) 30.03
CaCl2 (g) 55.49

165
(Table 5.5). The procedure to conduct precipitation test is same as above.
A solution of 5% carrageenan was obtained by dissolving the carrageenan powder in
distilled water solution. P.tetradonis cells were added to a substrate solution containing urea
(0.3 mol/L) and CaCl2 (0.3 mol/L), in the presence or absence of carrageenan. The reaction
mixture (10 mL) was shaken at 30°C and 160 rpm for 24 h. The samples were centrifuged
(24°C, 14200×g,10 min) to separate the CaCO3 precipitate from the supernatant. The
precipitates were dried in an oven at 90°C for 24 h, and then the dry weights of the precipitates
were determined. Experiments were conducted at various bacterial concentrations (OD600=
0.01–0.1) in the presence (0.03%) or absence of carrageenan. The same reaction was conducted
at various carrageenan concentrations (0–0.15%) with the bacterial concentration of OD600=
0.1. All experiments were done in triplicate and mean value was plotted. Standard deviation
was used to represent the error bars.
Table 5.5. Experimental conditions for precipitation carbonate
Test
Case
Mg2+
(M) Ca2+ (M) Na+ (M)
Sum of
ions
Urea
(M) Bacteria
Additional
Information
1
2
3
4
5
6
7
8
9
10
0
0.5
0.25
0
0.25
0.16
0.25
0.16
0.16
0.16
0.5
0
0.25
0.25
0
0.16
0.2
0.16
0.16
0.16
0
0
0
0.25
0.25
0.16
0.05
0.16
0.16
0.16
0.5
0.5
0.5
0.5
0.5
0.5
0.5
0.5
0.5
0.5
0.5
0.5
0.5
0.5
0.5
0.5
0.5
0.5
0.5
0.5
O
O
O
O
O
O
O
O
O
X
Case 8 and 9
only added
carrageenan
polysaccharides
λ-Carrageenan
κ -Carrageenan
5.4 Experimental method
5.4.1 Syringe solidification test
1) First, the pre-culture of bacterium V. maritimus and P. tetradonis sp. was shaken in
with 100 mL ZoBell2216E medium for 2 days at 30° C, same protocol of bacterium O.
profundus was shaken in with 100 mL NH4-YE.
2) Then, 80 g of local beach sands from Yogyakarta province, Indonesia dried at 110ºC
for more than 2 days, was placed in a 50 mL syringe.

166
3) Subsequently, 20 mL of a culture medium solution (ZoBell2216E and NH4-YE
solution) and 20 mL of the cementation media for consolidation (the compositions are
shown in Table 5.5) were injected into the syringe and drained off leaving about 2 mL
of solution above the top surface of the sand.
4) This solution for consolidation was then injected and drained once a day or once every
two days and the curing period was 14 days.
5) Ca2+, Mg2+ and Na+ ions concentration and pH value of outlet solution were measured.
6) The syringe solidification test is shown in Figure 5.3.
Figure 5.3. Syringe solidification test.
5.4.2 Beach slope model solidification test
1) First, the pre-culture of bacterium P. tetradonis was shaken in with 100 mL
ZoBell2216E medium for 2 days at 30° C.
2) The bacteria and growth media were centrifuged at 5000 rpm for 10 min.
3) The slope model (13 × 10 × 10 cm) was filled with slope soil by five layers, and each
layer was compacted evenly to a similar dry density used in column test. The gradient
of the slope was resolved to the standard gradient of expressway cut slope in accordance
with the road earthwork guidelines of Japan.
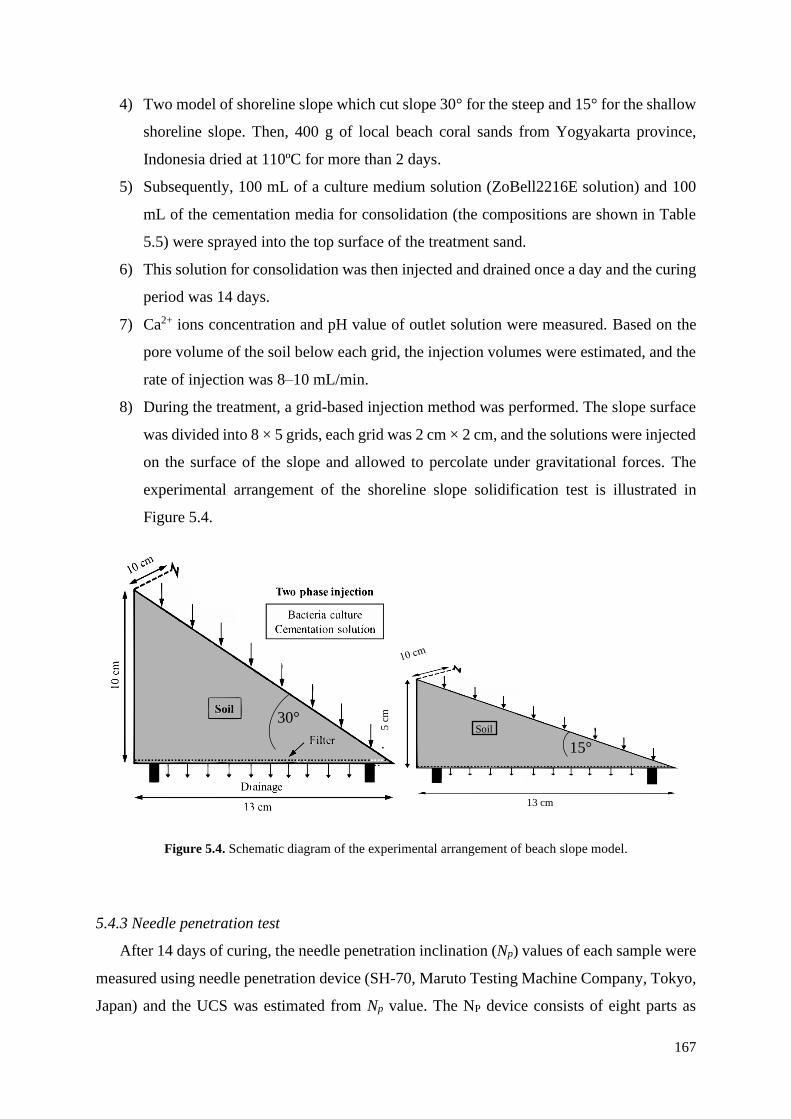
167
4) Two model of shoreline slope which cut slope 30° for the steep and 15° for the shallow
shoreline slope. Then, 400 g of local beach coral sands from Yogyakarta province,
Indonesia dried at 110ºC for more than 2 days.
5) Subsequently, 100 mL of a culture medium solution (ZoBell2216E solution) and 100
mL of the cementation media for consolidation (the compositions are shown in Table
5.5) were sprayed into the top surface of the treatment sand.
6) This solution for consolidation was then injected and drained once a day and the curing
period was 14 days.
7) Ca2+ ions concentration and pH value of outlet solution were measured. Based on the
pore volume of the soil below each grid, the injection volumes were estimated, and the
rate of injection was 8–10 mL/min.
8) During the treatment, a grid-based injection method was performed. The slope surface
was divided into 8 × 5 grids, each grid was 2 cm × 2 cm, and the solutions were injected
on the surface of the slope and allowed to percolate under gravitational forces. The
experimental arrangement of the shoreline slope solidification test is illustrated in
Figure 5.4.
Figure 5.4. Schematic diagram of the experimental arrangement of beach slope model.
5.4.3 Needle penetration test
After 14 days of curing, the needle penetration inclination (Np) values of each sample were
measured using needle penetration device (SH-70, Maruto Testing Machine Company, Tokyo,
Japan) and the UCS was estimated from Np value. The NP device consists of eight parts as
30°
15°
5 c
m
13 cm
Soil

168
shown and described in Figure 5.5. Before testing, the surface, on which the test would be
carried out, should be clean and smooth. The test doesn't require a specially prepared specimen.
The NP can be used in any direction both in the field and laboratory. Then by holding rather
tightly the removable cap and the main body, the load is perpendicularly and slowly applied to
the rock surface. If the test is carried out in the laboratory, the specimen should be fixed to
prevent its movement during penetration. For weak and saturated rocks, the needle may be
penetrated to a maximum depth of 10 mm. When this depth is reached, no more penetration
could be applied, and the needle is slowly pulled out. Where the rock is hard and the penetration
force has come up to 100 N before the needle penetrates for 10 mm, the needle is withdrawn.
After the test is completed, the needle is slowly pulled out and the penetration load and
penetration depth are read from the load scale (Fig.5.5, part 4) and the position of the presser
on the penetration scale (Fig.5.5, part 3), respectively. The strength of the sample (NPR value)
was calculated from the following equation (Eq. (5.1)).
NPR = F/D Eq. (5.1)
Where, F is the penetration load (N) and D is the depth of penetration (mm). The unit
of NPR is N/mm. From the chart of UCS-NPR correlation, estimated UCS value was observed.
5.4.4 Experimental conditions
The local beach sand used in the experiments was uniformly graded with a mean particle
size of 0.9 mm for coral sand and 0.6 mm for fine sand (Figure 5.1). The sand was sterilized,
and hand packed into a 50-mL syringe (mean diameter, D50 = 3 cm and height, h = 10 cm). The
bacterial suspension was injected first and allowed to stand in the column for 2 h; thereafter,
solidification solution was injected. This was repeated every 24 h for a period of 14 d. In
addition, two sets of biocementation experiments were conducted using conditions designed to
mimic the possible conditions for in situ injection of treatment solutions. The first set of
experiments involved using coral local sand of which the main content was skeletal shell
carbonate. The other set of experiments involved the use of silica fine sand (fluvio-volcanic
sand) of the Young Merapi deposit. In both injection conditions, 20 mL of cementation solution
was left above the surface of the sand to mimic saturated conditions, and this procedure was
called the immersed method. Control tests were also conducted following the same procedures
but without the addition of bacterial cells. First, 100 mL ZoBell2216E medium solution
(polypeptone 5.0 g/L, yeast extract 1.0 g/L, and FePO4 0.1 g/L with artificial seawater) was

169
inoculated with 0.1 g of the ureolytic bacterium isolated by the above test, then incubated at 37
°C with gentle shaking at 160 rpm for 3 d. Next, 80 g of coral sand and silica sand collected
from the Yogyakarta south coast was dried at 110 °C for 2 d and then placed in a 50 mL syringe
(diameter 3 cm). Subsequently, 16 mL (more than the estimated 14 mL initial pore volume in
the sample) of bacterial culture and 20 mL of the cementation solution (Table 5.4) were
sequentially added to the syringe and drained, leaving about 2 mL of solution above the surface
of the sand (saturated condition). This solidification test was conducted for 14 cementation
injections in 14 days. Toward considering the effect of conditions on the UCS of a specimen
Figure 5.5 General view of the Maruto (left, from Erguler and Ulusay (2008)) and modified Eijkel kamp
(right) penetrometers and their parts. (1) presser, (2) chuck, (3) penetration,(4)load scale,(5)load indication
ring,(6)UCS–NPR correlation chart given by the manufacturer, (7) removable cap, (8) penetration needle
produced according to the Japan Civil Engineering Society's guideline, (9) indicator ring, (10) penetrometer
tube, (11) spring, (12) end cap, (13) scale, (14) extension rod, and (15) needle block.

170
who depend on the bacterial species, the particle size of the sand, cementation ions solutions
and effect of the algae such as biopolymer product were investigating (as shown in Tables 5.5
and 5.6). The testing cases were summarized according to the investigation purpose.
Table 5.6. Purpose of conduction testing cases.
Case No. Purpose – How to effect for the solidification
1, 2, 3, 4, 5, 6, Effect of cementation ions solutions on coral sand
7, 8, 9 Effect of biopolymer algae product, λ- and κ -Carrageenan on coral sand
10, 11, 12 Effect of MICP using P. tetradonis, on coral sand for 14 days, 21 days and 28
days
13, 14, 15 Effect of MICP using V. maritimus, on coral sand for 14 days, 21 days and 28
days
16, 17, 18 Effect of MICP using O. profundus, on coral sand for 14 days, 21 days and 28
days
19, 20, 21 Effect of MICP using P. tetradonis, on fine silica sand for 14 days, 21 days and
28 days
22, 23, 24 Effect of MICP using V. maritimus, on fine silica sand for 14 days, 21 days and
28 days
25, 26, 27 Effect of MICP using O. profundus, on fine silica sand for 14 days, 21 days and
28 days
28, 29 Effect of MICP using P. tetradonis, on coral sand unsaturated treatment
condition for 14 days and 21 days
30, 31 Effect of MICP using V. maritimus, on coral sand unsaturated treatment
condition for 14 days and 21 days
32, 33 Effect of MICP using O. profundus, on coral sand unsaturated treatment
condition for 14 days and 21 days
34, 35 Effect of MICP using P. tetradonis, on fine silica sand unsaturated treatment
condition for 14 days and 21 days
36, 37 Effect of MICP using V. maritimus, on fine silica sand unsaturated treatment
condition for 14 days and 21 days
38, 39 Effect of MICP using O. profundus, on fine silica sand unsaturated treatment
condition for 14 days and 21 days
5.5 Results
5.5.1 Growth characteristics
The time course of cell growth and urease activity by Oceanobacillus profundus, Vibrio

171
maritimus, and Pseudoalteromonas tetradonis for 15 days are shown in Figure 4.10 (see
Chapter 4). Cell concentration increased up to 2 days and then reached stationary phase. The
urease activity of the cell culture increased with cell growth. Based on this result, the
production of urease would be a growth-associated system. Considering microbial-based sand
solidification, which needs relatively long duration for adequate solidification, the long-term
stability of the enzyme would be advantageous in the MICP process (Danjo and Kawasaki,
2016; Fujita, et al., 2017).
5.5.2 Optimum pH and temperature condition
In the MICP biocementation technique, urease activity of enzyme activity is the key of role
for bioindicator of artificial beachrock process success or not. The difference of temperature
environment is shown in Figure 5.6 for those three species. High activity was obtained in the
range temperatures of 10-80 C, within the maximum temperature of urase activity was
obtained 80 C in this study. Most of urease molecule is known to be composed of protein
subunits and the subunits of this urease would strongly bind each other to leads the high
stability of urease during long-term cultivation (Mobley and Island, 1995; Balasubramanian
and Ponnuraj, 2010; Fujita, et al., 2017).
Figure 5.6. Effect of reaction temperature on urease activity of the whole cell at pH 7 (1 mM EDTA-disodium
salt solution). Experiment were conducted in triplicate: data represented the average of three experiments with
error bars indicating the standard deviation.
High activity was obtained in the range 10–80 ºC, but the maximum urease activity was
obtained at 30-40 ºC in this study. Most of urease molecules are known to be composed of
0
0.2
0.4
0.6
0.8
1
1.2
1.4
0 10 20 30 40 50 60 70 80
Ure
ase
acti
vit
y [
U٠
mL
-1٠
OD
600-1
]
Temperature [°C]
T-variant
O. profundus V. maritimus P. tetradonis

172
protein subunits and the subunits of this urease bind strongly to each other. This leads to high
stability of the urease during long-term cultivation (Fujita, et al., 2017; Danjo and Kawasaki,
2014; Daryono, et al., 2019). Urease activity under different pH is shown in Figure 5.7. The
results showed with the maximum activity around pH 2.0 – 13.0. For this temperature and pH
variations, the results were different with Fujita, et al. (2017), where he is mentioned the results
of maximum temperature exponential increasing toward environment temperature of the buffer
solution and the method for urease activity measurement, he used ammonia meter of Tris/HCl
buffer solution. Meanwhile, in this research, for measuring urease activity we used EDTA
buffer solution for indophenol blue method then detect with colorimeter changing with optical
density 630 nm. The results of Fujita, et al. (2017) and this research quite different but the
pattern of bacterial growth and urease activity, especially for Pararodhobacter sp., is almost
same. The results of Fujita et al. (2017) and this research are quite different except for the
patterns of bacterial growth and urease activity.
Figure 5.7. Effect of reaction pH on urease activity of the whole cell at 37°C 1 mM EDTA-disodium salt
solution). Experiment were conducted in triplicate: data represented the average of three experiments with error
bars indicating the standard deviation.
5.5.3 Effect of bacterial species on solidification test
The reactant and the bacterial cell concentration are two primary factors that govern the
degree and the homogeneity of the strength increment over the treatment depth. The local
strength of the sand specimens underwent different treatment conditions with respect to the
aforementioned two parameters, which are illustrated in Figure 5.8. However, the cementation
reagent contained equimolar concentrations of urea and CaCl2 as in Ng et al., (2014). When
0
0.1
0.2
0.3
0.4
0.5
0.6
0.7
0.8
0.9
1
0 2 4 6 8 10 12 14
UR
EA
SE
A
CT
IVIT
Y [
U٠
mL
-1٠
OD
600-1
]
pH
pH-variant
O. profundus V. maritimus P. tetradonis
Ure
ase
acti
vit
y [
U·m
L-1
· O
D600
-1

173
two samples injected with 0.5 M cementation solution were considered, it was clear that the
specimen with bacteria injected twice showed significantly greater strength than that of the
specimen injected with bacteria only once (at the beginning). According to previous records, it
was deduced that higher concentrations of bacteria populations enhance the amount of CaCO3
precipitate and, thus, the results of MICP treatment (Daryono, et al., 2019; 2020). Generally,
bacteria play two key roles in the biocementation process: (i) catalysis of urea hydrolysis and
(ii) provision of nucleation sites (Kandianis, et al., 2008). The initial investigations on urease
activity of the isolated strain showed that enzymatic activity diminishes over time. Moreover,
there are several other factors that could gradually inhibit the bacteria from performing their
intended role as a catalyst for urea hydrolysis over the entire treatment time period. All the
samples were strongly cemented and the estimated average (as well as individual) UCS values
from two independent tests for all the cases were above 3 MPa.
Figure 5.8. Microbial induced carbonate precipitation test using local strain ureolytic bacteria after 14
days treatment. Black sample (left) is silica sand from Parangtritis beach sand and white sample (right) is
coral sand from Krakal-Sadranan beach sand.
V. maritimus
O. bacillus
P. tetradonis
Well solidification
Indicated pathogenic
Weak solidification
CONTROL
Biosafety Level 1
Biosafety Level 1
Biosafety Level 1

174
5.5.4 Effect of bacterial population based on OD600 on solidification test
Figure 5.9 (a) shows that the estimated UCS of the sample increased with the increase of
bacterial population. This finding indicates that bacteria plays a key role on MICP, i.e., (1)
producing an enzyme to hydrolyze urea, and (2) acting as nucleation sites for the formation of
calcium carbonate crystals (mainly calcite; Fujita et al. 2000). More bacteria in the solution can
promote more enzymes and provides more nucleation sites for the MICP. The pH value in
outlet solution was larger in high bacterial concentration sample than low bacterial
0
5000
10000
15000
20000
25000
30000
0 3 6 9 12 15
Ca2
+(m
g/L
)
Time (Day)
Ca2+
Case 1- 0.1g Bacteria with
centrifuge (OD600= 1.4)
Case 2- 0.3g Bacteria with
centrifuge (OD66= 1.5)
Case 3- 1.0g Bacteria with
centrifuge (OD600= 1.8)
0.0
2.0
4.0
6.0
8.0
0 2 4 6 8
Est
imat
ed U
CS
(M
Pa)
Length from top of the
sample (cm)
Estimated UCS
6.0
6.5
7.0
7.5
8.0
8.5
9.0
0 3 6 9 12 15
pH
Time (Day)
pH(a) (b)
Case 1- Bacteria with
centrifuge (OD600= 1.4)
Case 3- Bacteria with
centrifuge (OD600= 1.8)
Case 2- Bacteria with
centrifuge (OD600= 1.5)
Ca2+ concentration
(c)
(OD600 = 1.4)
(OD600 = 2.3)
(OD600 = 3.0)
Figure 5.9. Results of MICP-treated sample catalyzed by P. tetradonis under different bacteria concentrations:
(a) Estimated UCS value with the depth of the sample, (b) pH with time and (c) Ca2+ concentration with time.
Legend:
Maximum nutrient CaCl2

175
concentration sample. Although pH value decreased with the time for all testing cases. The
results of Ca2+ concentration in outlet solution were opposite to the results of pH value (Fig.5.9
(b) and 5.9 (c)).
Three different types of silica sand with three types of particle size were used MICP-treated
soil catalyzed by P. tetradonis Fig.5.10 (a), 5.10 (b) and 5.10 (c) show that the solidified
samples after catalyzed by P. tetradonis sp. for coral Krakal-Sadranan sand, fine silica
Parangtritis fine sand, and glass beads, respectively.
Psedoalteromonas tetradonis
Figure 5.10. (a) Solidified sample with fine silica Parangtritis sand, (b) solidified sample with coral Krakal-Sadranan
sand, and (c) solidified sample with glass beads
(a)
(b)
(c)
176
5.5.5 Effect of particle size and different sand samples on solidification test
The local beach sand used in the experiments was uniformly graded with a mean particle
size of 0.9 mm for coral Krakal-Sadranan sand, 0.6 mm for silica Parangtritis fine sand, and
microsphere glass beads varying from 0.25 mm to 0.6 mm in diameter. The sand was sterilized,
and hand packed into a 50-mL syringe (mean diameter, D50 = 3 cm and height, h = 10 cm).
Figure 5.11 shows the estimated UCS value at the top, middle and bottom of the sample.
From the results, estimated UCS value was larger in coral Krakal-Sadranan sand with 0.9 mm
mean diameter than silica Parangtritis fine sand sample which has mean diameter 0.6 mm and
estimated UCS value in glass beads sample with mean diameter 0.25 mm. The particle size of
fine sand is small than other two samples. Due to the very small particle size, the penetration
rate of cementation media can be low when compare with glass bead and coral Krakal-Sadranan
sand samples. This reason may cause for decreasing the bacterial process. Then the hydrolysis
process also getting slow. As a result of this, CaCO3 precipitation decreasing and UCS value
getting lower in fine sand sample than coral sand or glass bead sample. Therefore, the particle
size of the sample was mainly affected for solidification of the sample.
5.5.6 Effect of cementation ion solutions on strength
The inherent properties of MICP bio-cement treatment of aragonite and calcite, such as
specific gravity and Mohr hardness than those crystals. At the extreme, excessively high
concentrations of magnesium and sodium where the molar ratio was 1.0, the magnesium
resulted in a significant reduction in the unconfined compressive strength (UCS) using a soft
rock penetrometer (SH-70, Maruto Testing Machine Company, Tokyo, Japan). In other hand,
the sodium ions affect to accelerate the crystals amount production because of increased the
salinity environment during MICP treatment test. It is clearly deducted that the strength
declines in mainly due changed of the crystal morphology to a needle shaped crystal form with
lower bonding capacity than that of the well-interweaved and cross-linked rhombohedral
crystals produced in the absence of magnesium ion (Nawarathna, et al., 2018). However, the
effect will be negligible in the target environment where naturally available Mg2+ is
considerably lower compared to the concentration of Ca2+ supplied with the cement solution
(Figure 5.12).
In the evaporitic environments, the dissolved cations are simultaneously concentrated
through progressive of the evaporation seawater. Therefore, salinity is generally positively
correlated with the saturation index of the carbonate minerals. However, in our experiments,
the Na+ and Cl− concentrations increased independently of the concentrations of Ca2+ and Mg2+,

177
allowing the separate evaluation of the effect of salinity and the Mg2+ and Ca2+ ratio (Al Disi,
et al.,2019). The effect of salinity and ionic strength on the incorporation of magnesium and
sodium ions into the carbonate minerals are not fully resolved and existing studies show
contrasting results. The observation that different minerals (i.e. calcium carbonate, high
magnesium calcite, hydro magnesite) were formed simultaneously in the same pure culture is
consistent with mineralization under the influence of heterogenic present in the bacterial cell
walls. The relationship between the ionic strength and the Mg content in Mg-rich calcite
obtained abiotically. Organic molecules with different cation-adsorption properties would
indeed explain the occurrence of minerals with different morphologies and chemical
compositions.
Figure 5.13 shows the estimated UCS value at the top, middle and bottom of the sample.
From the results, estimated UCS value was larger in coral Krakal-Sadranan sand with 0.9 mm
mean diameter than silica Parangtritis fine sand sample which has mean diameter 0.6 mm. The
particle size of fine sand is small than other two samples. Due to the very small particle size,
the penetration rate of cementation media can be low when compare with coral Krakal-
Sadranan sand samples. This reason may cause for decreasing the bacterial process. Then the
hydrolysis process also getting slow. As a result of this, CaCO3 precipitation decreasing and
UCS value getting lower in fine sand sample than coral sand or glass bead sample. Therefore,
Figure 5.11. Estimated UCS value of MICP-treated sample catalyzed by P.tetradonis sp. under different
particle size of sand samples.
0
2
4
6
8
10
12
0 2 4 6 8
Est
imat
ed U
CS
(M
Pa)
Depth (cm)
Estimated UCS versus sample depth
coarse
silica
glass beads

178
the particle size of the sample was mainly affected for solidification of the sample. Based on
the investigation results, it shown the higher strength of MICP process is dominant with
calcium chloride then small amount of magnesium chloride and natrium chloride. The
precipitation behavior of the microbial activity somehow is not representing of the cementation
during treatment sands in the solidification test (Figure 5.14). The higher precipitation test of
carbonate precipitation was express in the term of magnesium chloride mixed with natrium
chloride rather than single ion solution, but the results of the solidification test is the opposite.
Strength of the material treatment is not strong enough to cement the beach sands after 14 days.
This phenomenon occurs because of magnesium chloride precipitation surrounding the
apparatus test, in this case cylinder tube 10mL. Nucleation of urase hydrolysis between calcium
ion and magnesium ion is different morphology of crystallization and behavior of crystal
occurrences, which is shown in Figure 5.12 the calcium bonding crystal bridges between intra
particle sands called meniscus bridges is solid and strong then magnesium carbonate that only
precipitated surrounding the particles.
Based on that Figure 5.19, mineral composition was found have a generally formed vaterite,
aragonite, calcite mineral, and other carbonate minerals complexes. Then using those
Figure 5.12. Ions dependencies of MICP precipitation test
MgCl2+NaCl CaCl2+MgCl2
CaCl2 MgCl2 CaCl2+NaCl
CaCl2+MgCl2+NaCl
Magnesian carbonate
Magnesian carbonate
Magnesian carbonate
Magnesian carbonate

179
0
2
4
6
8
10
12
0 2 4 6 8
Est
imat
ed U
CS
(M
Pa)
Depth (cm)
0.5M CaCl2
Coarse Sand
Fine-Silica Sand
0
2
4
6
8
10
12
0 2 4 6 8
Est
imat
ed U
CS
(M
Pa)
Depth (cm)
0.5M CaCl2 + 0.5M MgCl2
Coarse Sand
Fine-Silica Sand
0
2
4
6
8
10
12
0 2 4 6 8
Est
imat
ed U
CS
(M
Pa)
Depth (cm)
0.5M CaCl2 + 0.5M NaCl
Coarse Sand
Fine-Silica Sand
0
2
4
6
8
10
12
0 2 4 6 8
Est
imat
ed U
CS
(M
Pa)
Depth (cm)
[0.25M CaCl2; 0.2M MgCl2; 0.05M NaCl]
Coarse Sand
Fine-Silica Sand
0
2
4
6
8
10
12
0 2 4 6 8
Est
imat
ed U
CS
(M
Pa)
Depth (cm)
0.5M MgCl2
Coarse Sand
Fine-Silica Sand
0
2
4
6
8
10
12
0 2 4 6 8
Est
imat
ed U
CS
(M
Pa)
Depth (cm)
0.5M MgCl2 + 0.5M NaCl
Coarse Sand
Fine-Silica Sand
0
2
4
6
8
10
12
0 2 4 6 8
Est
imat
ed U
CS
(M
Pa)
Depth (cm)
0.5M CaCl2 + 0.5M MgCl2 + 0.5M NaCl
Coarse SandFine-Silica Sand
0
2
4
6
8
10
12
0 2 4 6 8
Est
imat
ed U
CS
(M
Pa)
Depth (cm)
[0.175M CaCl2; 0.175M MgCl2; 0.15M NaCl]
Coarse Sand
Fine-Silica Sand
Figure 5.13. Estimated UCS value of MICP-treated sample catalyzed by P.tetradonis under different
concentration of cement solution sand samples.

180
of these minerals, we tried to make a pattern from carbonate mineral which detected inside the
treatment sand samples. The pattern will be presented differentiation graphic based on mineral
parameters for eliminated diffraction wave in XRD analysis. The results shown of the treatment
sands behavior based on ions solutions dependencies have an effect of mineralogy and
crystallization intra-particles. The standard solution shown in table 5.4 will produce only
vaterite, aragonite and calcite which depend on the temperature and pressure during treatment
sands. Meanwhile, table 5.5 is representative of innovative carbonate solidification depends on
the source of mineral ions and other factor such as micro algae to mimic the natural processes.
The metastable vaterite of calcium carbonate were usually occur in the low density and
polymorphic forms. The crystal chemistry plays an important role in understanding the
behavior of minerals, in term of reactivity and stability. Crystal growth processes, whether in
the solid state or aqueous are influenced by arrangement of atoms in the crystal and constraints
by coordination and bonding particles. The common rhombohedral carbonate was produced by
MICP consist of calcite and dolomite, respectively. The structure of calcite is anhydrous such
a single carbonate including magnesite (MgCO3), siderite (FeCO3) or rhodochrosite (MnCO3).
The differences of minerals were found in the XRD results because of the atomic structure of
the CO3 group as fairly rigid structural unit. Such a viewpoint is reinforced by consideration of
the carbon-oxygen bond, which is generally regarded as strong covalent in character. The
carbon-oxygen bond will be considerably stronger than any other molecule-oxygen bond
typically found in carbonates. In calcite, for example, the carbon-oxygen bond strength using
Figure 5.14. Precipitation test by P. tetradonis under different concentration of cement solution sand samples.
0
10
20
30
40
50
60
70
80
90Precipitation test of ions mineral dependencies
Ion minerals
Wei
gh
t g
ram
/ L

181
CaCl2 MgCl2
CaCl2+MgCl2
CaCl2+NaCl
MgCl2+NaCl CaCl2+MgCl2+NaCl
Figure 5.15. Graphic XRD analysis pattern using artificial beachrock. C: calcite; A: aragonite, Q; Quartz
(SiO2), V; Vaterite
2 theta (Deg) 2 theta (Deg)
2 theta (Deg) 2 theta (Deg)
2 theta (Deg) 2 theta (Deg)
Inte
nsi
ty
Inte
nsi
ty
Inte
nsi
ty
Inte
nsi
ty
Inte
nsi
ty
Inte
nsi
ty

182
empirical Brown-Shannon method which is approximately four times greater than for the
calcium-oxygen bond. Same as the results SEM in Figure 5.12 the magnesium ions effect were
bridging surrounded of the material it seems natural concept of beachrock the magnesium is
sedimented after the deposition of vaterite-aragonite calcium carbonate were proven the
meniscus bridge in the natural beachrock (Chapters 2-4) were overlay time to time and
recrystallization commonly occur during the sediment process. The natural beachrock were
mostly consist of magnesian calcite (high – low) depend on the sedimentary location which
key role the natural beachrock can occur in the shore bay. Other minerals also found from XRD
results such as Anorthite; Omphacite; Dolomite; and Diopsite that might effect of SiO2 in the
materials.
5.5.7 Effect of carrageenan biopolymer on strength of MICP
The results are consistent with our previous study using ionic polysaccharides as
biopolymer carrageenan product. At higher cell concentrations, bacterial activity would be a
dominant factor than the effect of the biopolymer (Nawarathna, et al., 2018). The precipitate
with carrageenan was mainly composed of two components, precipitated CaCO3 and the
precipitated carrageenan hydrogel. Carrageenan is an ionic polysaccharide with pKa of
approximately 2.8~4.9. Most of the polysaccharide inhibit CaCO3 nucleation and growth, while
basic polysaccharide promotes the growth and nucleation of crystals (Xie, et al., 2005).
Carrageenan also promotes the CaCO3 nucleation and growth. Interaction between the
carrageenan and calcite is difficult to explain. The injection of the carrageenan simultaneously
with the bacteria gave negative results in the solidification and it appears that carrageenan is
mutualism symbiote for the bacteria to precipitation of CaCO3.
The most important finding of this research is the positive effect of the carrageenan on sand
solidification. By introducing carrageenan, well cemented sand specimens could be obtained,
and the effect is clearer at higher concentrations. By introducing carrageenan, UCS of the top
of the sample increased by ~40%, respectively, compared with the case without carrageenan.
To achieve better cementation during the sand solidification, the pore spaces between the sand
particles should be filled sufficiently by effective bridge between the sand particles
(Polowczyk, et, al., 2016). This point-to-point intraparticle contact is very important to achieve
higher strength (Harkes, et al., 2010). As mentioned before, carrageenan formed its hydrogel
under the neutral conditions. This hydrogel helped to form better bridge between the sand
particles. The higher carrageenan concentrations led to form thicker hydrogels, which

183
improved the formation of bridge. Hence, a better cementation and higher strength could be
achieved.
Biopolymers are organic polymers produced by biological organisms which are categorized
into three major classes: polynucleotides, polypeptides, and polysaccharides (Kalia and
Averous, 2011). Of the three, polysaccharides are the most common biopolymer type used in
various industry fields, including civil and construction engineering practices (Chang, et al.,
2016). Generally, polysaccharide-type biopolymers are hydrophilic due to the abundant surface
hydroxyl groups (OH-), which mainly form viscous hydrogels in the presence of water
(Dumitri, 2002; Clark and Ross-Murphy, 1987). The viscosity (or shear modulus) of
biopolymer hydrogels varies based on the biopolymer-to-water content (Kulicke and
Nottelmann, 1989; Imeson, 2010) and presence of counter-ions (alkali- or alkali earth metal
ions) (Kirchmajer, et al., 2014; Izawa and Kadokawa, 2010), where the increase of both
variables results in higher viscosity values of biopolymer hydrogels. Table 5.7 lists the typical
characteristics of biopolymers considered for soil improvement (Hassan, et al., 2005; Daniel,
et al., 2005; Wan, et al., 2004; Barrére, et al., 1986; Oliveira, et al., 2010; Imeson, 2012; Bacic,
et al., 2009)
The strengthening mechanism of biopolymer is governed by the rheology of biopolymer
hydrogels and the chemical (ionic-, hydrogen-) bonding between biopolymers and soil
particles, where soil type becomes an important parameter (Chang, et al., 2018). Figure 5.16
shows the scanning electron microscopy (SEM) images of dried biopolymer treated coral soils,
where mainly dehydrated biopolymer hydrogels form coats around electrically neutral silica-
based particle surfaces (Chang, et al., 2012; 2016). The spherical crystals most probably could
be vaterite. Vaterite is the least stable form of CaCO3 with the highest solubility, so it
precipitates first and then transforms into stable calcite, following the solution mediated
transformation (Kralj, et al., 1997; Nawarathna, et al., 2018). Hence, the morphology change
with the increase in the carrageenan concentration can be due to the conversion of
themetastable phase of the crystals into a more stable form. Initially, both the vaterite and
calcite phases precipitated simultaneously due to high solid content and limited diffusivity
(Kosanovic, et al., 2011). Then, the metastable phase started to dissolve and re-precipitated
upon the stable calcite crystals as shown in Figure 5.16(b). The dissolution of the vaterite starts
when the supersaturation drops below the value of its solubility. It appears that carrageenan
concentrations accelerate the conversion of the into a stable phase. Similarly, different
polymorphisms and morphologies have been obtained by chemical precipitation of CaCl2 and
sodium carbonate (Na2CO3) under different experimental conditions. Parakhonskiy et al.

184
Table 5.7. Characteristics of biopolymers considered for soil improvement
Biopolymer Chemical
composition Main characteristics References Applications
Cellulose (𝐶6𝐻10𝑂5)𝑛
• The bond angles in the beta acetal linkage
• Mostly a linear chain and water insoluble
• Properties depend on the chain length
(Hassan, et al.,
2005; Panarotto, et
al., 2005)
Soil strengthening,
erosion control and
surface stabilization
Starch (𝐶6𝐻10𝑂5)𝑛
• The alpha acetal linkage, starch-amylose
actually forms a spiral much like a coiled
spring.
• Solubility in water depending on
temperature
• Used as viscosity thickeners and stabilizers
(Daniel, et al.,
1994;
Kulshreshtha, et
al., 2017)
Soils strengthening,
erosion control and
surface stabilization
Chitosan
(cationic)
(𝐶6𝐻11𝑁𝑂4)𝑛 • Solubility increases with a decrease in pH
• Cationic nature mainly binds with
negatively charge surface
• 𝑁𝐻3+ amino group, positive charge
(Wan, et al., 2004;
Latifi, et al., 2016)
Soils strengthening,
erosion control and
surface stabilization
Carrageenan
λ and κ
(anionic)
(𝐶24𝐻36𝑂25𝑆2−2)𝑛
• Kappa forms strong, rigid gels in the
presence of potassium ions, and reacts with
dairy proteins.
• Kappa Carrageenan forms very firm and
elastic gels. Lambda Carrageenan will not
form a gel but can be used as a thickener.
• 𝑆𝑂3− sulfate group, negative charge
This research
Soils strengthening,
erosion control and
surface stabilization
Xanthan gum (𝐶35𝐻49𝑂29)𝑛
• Highly viscous and pseudoplastic rheology
• Commonly used in drilling muds and soil
treatment
(Barrare, et al.,
1986; Nugent, et
al., 2009; Orts, et
al., 2007; Plank, et
al., 2005; Bouazza,
et al., 2009;
Khachatoorian, et
al., 2003; Smitha,
et al., 2008; Chang,
et al., 2016)
Soils strengthening,
soil consistency
control, erosion
control and surface
stabilization, soil
hydraulic conductivity
control, seismic
resistance
improvement
Gellan gum (𝐶29𝐻43𝑂25)𝑛
• Temperature depend viscosity variation
(thermogelation)
• Irreversible gel formation once cooled
below 40°C
(Oliveira, et al.,
2010; Im, et al.,
2017; Smitha, et
al., 2008)
Soils strengthening,
erosion control and
surface stabilization,
soil hydraulic
conductivity control,
seismic resistance
improvement
Agarose (𝐶24𝐻38𝑂19)𝑛
• Reversible gelation with heating and
cooling
• Most common gelling agent in food
(Imeson, et al.,
2012; Zhan, et al.,
2012)
Soils strengthening,
soil hydraulic
conductivity control,
seismic resistance
improvement
Curdlan (𝐶6𝐻10𝑂5)𝑛
• Gel formation via heating in aqueous
solutions
• Applied to prevent material separation in
concrete mixture
(Ivanov, et al.,
2016; Bouazza, et
al., 2009)
Soils strengthening,
erosion control and
surface stabilization

185
(2014) successfully obtained the isotropic (spherical and cubic) and anisotropic (elliptical and
star-like) crystals by varying the salt concentration and slowdown the process by adding
ethylene glycol. For saturated conditions, biopolymer hydrogels in pore spaces are reported to
increase the apparent cohesion intercept with increasing biopolymer-to-water content, while
the friction angle remains constant, regardless of biopolymer content. Thus, it seems that the
biopolymer-to-water content and accompanying hydrogel viscosity become the main
strengthening factors for coral soils.
The estimated UCS values for the solidified samples are shown in Figure 5.17. According
to the measured UCS values, all of the sand specimens have strength in the range of 1–3 MPa.
Hence, all specimens can be classified as strongly cemented according to the classification
system proposed by Shafii and Clough (1982). In this classification system, the cemented soils
Figure 5.16. SEM image of CaCO3 solidification test on coarse sand by P. tetradonis at (a) λ-
carrageenan and (b) κ-carrageenan at concentration 0.5% carrageenan.
λ-carrageenan with P. tetradonis
Κ-carrageenan with P. tetradonis
(a)
(b)

186
with UCS value between 1 and 3 MPa are classified as strongly cemented soil and a UCS value
N3 are classified as soft rocks. For all the specimens, a higher strength could be achieved by
the reinjection of bacteria after 7 days compared to the single injection. In the case of
reinjection of bacteria 96% of strength increment was achieved for the top of the sample by
adding carrageenan. Without carrageenan strength increment was around 50%. In previous
studies found that amount of CaCO3 precipitated is directly related to the measured UCS value.
The formation of the larger size distorted-shape crystals with the increase in the carrageenan
concentration may be due to the adsorption of the functional groups of the carrageenan onto
the crystals surface.
5.5.8 Beach slope model solidification test
Beach slope model test is the scale-up version of soil column tests. Because the small
columns are limited by confinement and boundary effects, the model test was additionally
performed to demonstrate the feasibility of beach sand stabilization. After the 14 days of
treatment, the shoreline slope was flushed with about 5 L of tap water to remove all soluble
salts, followed by, slope specimen was carefully removed from the mold and submerged into
the water bath to eliminate the uncemented aggregates. The cemented profile is presented in
Figure 5.18.
The beach slope treatment sand based on MICP methods were successful to conduct
especially for 15° of the shore bays. This is because of percolation sand treatment accumulated
in the top and bottom level of the slope model. Figure 5.19 shown the 3D model of cementation
Figure 5.17. Estimated UCS values of solidification sand specimens at concentration 0.5% carrageenan.
0
2
4
6
8
10
Est
imat
edst
rength
(MP
a)
T M B
without carrageenan carrageenan κ carrageenan λ
without carrageenan
with carrageenan
T M B T M B

187
Figure 5.18. Profile of the cemented beach slope model (a) 15° and (b) 30°
(a) (b)
(a)
Cemente
(b)
Cemente
Cemente
MPa
MPa
Figure 5.19. Estimated UCS 3D profile along the beach slope models (t-z axis) of the treated
sands (measured by needle penetrometer), (a) 15° and (b) 30°
188
along the entire surface was achieved. However, cementation was not observed within the zone
below the top slope (Figure 5.19, a), remained as untreated soil. The surface UCS was used as
the indicator to evaluate the improvement of 15° beach slope, besides the UCS estimated by
the treated sands based on needle penetration tests. Figure 5.19, b, the treated results of 30°
beach slope which in the middle were not well solidified, compared the 15° beach slope.
Because of the bio-cementation were occur and accumulated in the surface and bottom of the
models. The bio-cemented slope surface had considerable estimated UCS between 2 and 8
MPa, and relatively lower estimated UCS values based on needle penetrometer test were
obtained below the surface of the slope.
5.5.9 MICP of artificial rock properties
Natural beachrock were found in nature mostly consist of carbonate bridged material
cementation, organic matter such as skeletal fragments and also other source of rock were
consist depends on geological settling in that area. Therefore, artificial cement formed by
mixing seawater and a solution containing CO(NH2)2 and CaCl2 were injected into sand with
culture bacteria as the solidification nutrient for cementation process (Cheng, et al., 2014).
Fifteen MICP treated specimens were subjected to undrained shear under different loading
paths including a mixture of both species, similar to the drained test series described previously.
The test results indicate that as with the drained specimens, the total stress path influences the
constitutive behavior of the cemented soil with small deviations in effective stress paths. A
column solidification test was conducted for the purpose achieve strength in megapascal (MPa)
which feasible as shoreline development method. A column solidification test is conducted
over a period of 25 days owing to the accumulation of carbonate cement which might get
clogged in the sample, under a 37°C curing temperature, and with injection of solidified
solution at one-day intervals which results in a 0.5-M Ca2+ concentration of solidified solution.
The results indicate that the UCS values increase with the decrease in particle size in the
uniformly graded sands. The average UCS axial load (Figure 5.20) estimated close to the
surface of fine sand and coral sands (D50 of 0.87 mm and 0.2 mm) are 2.87 MPa and 5.7 MPa
respectively. This experiment was conducted in laboratory of rocks mechanics in the
Engineering faculty, Hokkaido University using an Instron universal tester (manufactured by
INSTRON, 5586). The UCS values and the calcium carbonate content of coral sand and fine
silica sands reported herein are in a good agreement with the results reported by Cheng and

189
Cord-Ruwisch (2014). Basically, coral sands have high permeability that leads to the high
liquid infiltration compared to the fine sands. In contrast, fine sand exhibits significant
improvement in UCS with the depth, which could be due to the increased capillary effect along
the sample depth. The higher capillary forces in fine sand tended to retain certain amount of
cementation solutions close to particle contacts, resulting higher deposition of calcium
carbonate and exhibiting higher UCS.
The results of the tests on bioclogging and biocementation (Table 5.8) can be monitored in
real time using seismic velocity and resistivity measurements (Feng and Montoya, 2017;
Phillips, et al., 2015). Shear wave velocity (S-wave) test results were used to develop a
correlation to the precipitated calcite mass and this enables prediction of changes in porosity,
density, and shear modulus during treatment (Weil, et al., 2012). Shear wave velocity is used
to nondestructively monitor the change in small-strain stiffness during shearing, which
provides an indication of cementation degradation as a function of strain level. Because shear
wave velocity is influenced by both the level of cementation and the change in effective mean
stress during shearing, the normalized shear modulus is used to evaluate the degradation of
cementation during shearing (Montoya and DeJong, 2015). Biocementation in a change from
a shear wave velocity of 140 m/s to an average of 600 m/s, compare with this research a shear
wave around 510 m/s to 1330 m/s. Compression wave velocity (P-wave) measurements can be
determined under different saturation conditions and used in combination with S-wave
measurements to observe how the Poisson’s ratio evolved during treatment (Whiffin, 2004).
Permeability of the fractured rock after biotreatment decreased between 2 and 4 orders of
magnitude and the sandstone core withstood three times higher well bore pressure than during
the initial fracturing event showing that MICP is applicable for the bioclogging (biosealing) of
the fractured rocks (Phillips, et al., 2015). Porosity is the amount of voids in a material. The
porosity after MICP treatment have a porosity is larger than natural beachrock were found in
the site study, additional measurement of tomography scan beneath sands particle were
conducted to show the distribution of porosity of natural beachrock versus artificial rock based
on MICP (Figure 5.20). The porosity content of beachrock (10-15%, approximately) in
treatment sands significantly increases the number of particles in contact by bonding with the
sand grains (30~45%) because of the meniscus bridge crystallization not intents precipitation
as natural beachrock. It can be observed that the fine matrices content plays a very important
role in support by enabling intermediate support to form bridges among the carbonate crystals
that have grown in void spaces, thus, strengthening the force chain of the treated matrix. It
should also be stated here that the MICP technique is limited due to the limited rate of
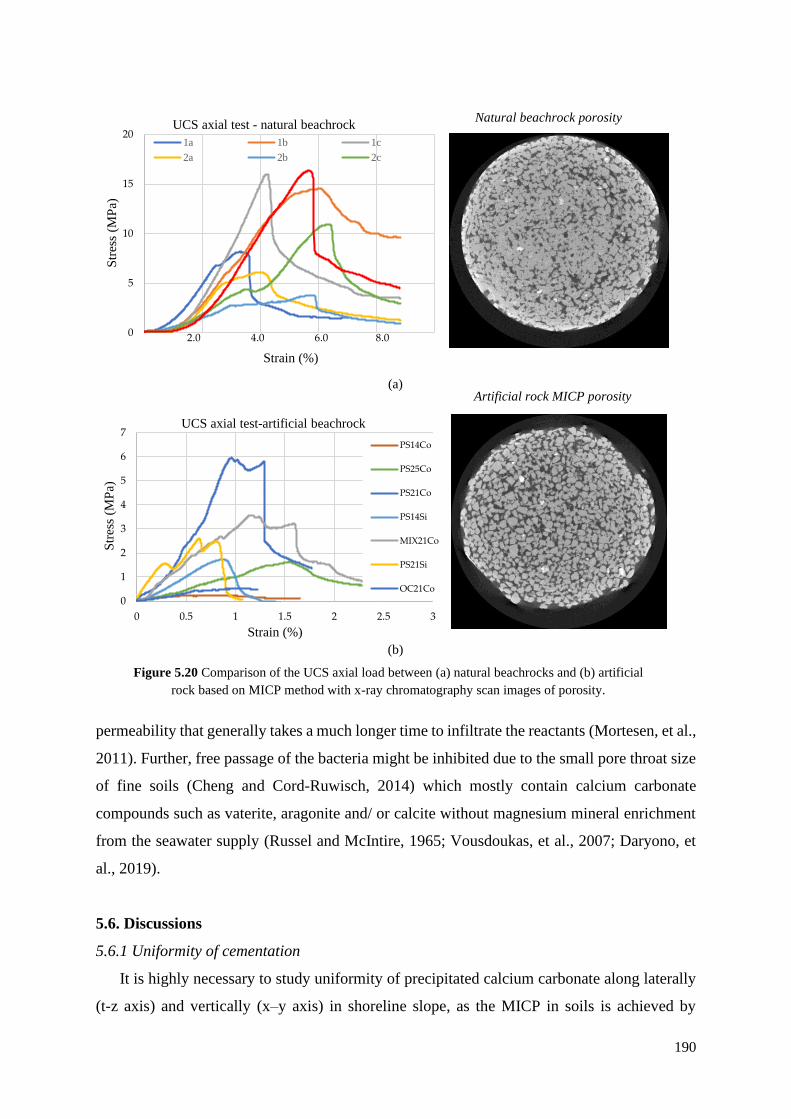
190
permeability that generally takes a much longer time to infiltrate the reactants (Mortesen, et al.,
2011). Further, free passage of the bacteria might be inhibited due to the small pore throat size
of fine soils (Cheng and Cord-Ruwisch, 2014) which mostly contain calcium carbonate
compounds such as vaterite, aragonite and/ or calcite without magnesium mineral enrichment
from the seawater supply (Russel and McIntire, 1965; Vousdoukas, et al., 2007; Daryono, et
al., 2019).
5.6. Discussions
5.6.1 Uniformity of cementation
It is highly necessary to study uniformity of precipitated calcium carbonate along laterally
(t-z axis) and vertically (x–y axis) in shoreline slope, as the MICP in soils is achieved by
Figure 5.20 Comparison of the UCS axial load between (a) natural beachrocks and (b) artificial
rock based on MICP method with x-ray chromatography scan images of porosity.
(a)
(b)
Natural beachrock porosity
Artificial rock MICP porosity
0
5
10
15
20
Str
ess
(MP
a)
Strain (%)
UCS axial test - natural beachrock
1a 1b 1c
2a 2b 2c
2.0 4.0 6.0 8.0
0
1
2
3
4
5
6
7
0 0.5 1 1.5 2 2.5 3
Str
ess
(MP
a)
Strain (%)
UCS axial test-artificial beachrock
PS14Co
PS25Co
PS21Co
PS14Si
MIX21Co
PS21Si
OC21Co

191
Table 5.8. Rock properties of artificial beachrock using MICP method
Sample Sand
Type
Saturated
density
(g/cm3)
Porosity
(%)
Expectation
strength
(MPa)
P wave
velocity
(km/s)
S wave
velocity
(km/s)
Dynamic
Poisson ratio
VB-14
Unsaturated
Quartz
Silica
Sands
1.60 37% 1.01 1.12 0.77 0.05
PS-14
Unsaturated 1.63 34% 2.33 1.20 0.84 0.01
MIX-14 1.56 30% 1.48 0.97 0.68 0.02
OC-21 1.56 38% 0.54 0.82 0.57 0.05
PS-14 1.53 30% 1.57 0.73 0.51 0.04
MIX-21 1.65 29% 3.19 1.00 0.69 0.06
PS-21 1.81 24% 3.73 1.78 1.24 0.02
PS-14
Unsaturated
Coral
Limestone
Sand
1.42 32% 2.40 1.31 0.88 0.09
PS-21
Unsaturated 1.74 28% 5.79 1.82 1.27 0.03
MIX-21 1.66 33% 3.20 1.94 1.33 0.05
OC-21 1.58 43% 1.78 1.07 0.72 0.07
PS-25 1.63 26% 1.39 1.68 1.13 0.09
PS-14 1.46 31% 1.58 1.04 0.73 0.01
PS-21 1.60 29% 2.46 1.48 1.01 0.07
biochemical injections. Before the measurements, it was anticipated that relatively a
homogeneous cementation could be attained along the surface (t-z) by the injection method.
However, Figure 5.18 and 5.19 suggests that the surface UCS increases along the distance (t)
measured from the top slope, and the highest surface UCS was obtained near bottom slope. The
average UCS at the bottom slope was about 7 MPa, whereas that of top is only 2 MPa. This
variation along the surface could be attributed to the localization of bacteria cells. The
consecutive injections of cementation solution (every 24 h) i.e. propagated flowlines would
possibly transport the bacteria cells towards downslope, results increase in cell concentration
in the direction of downslope; thus, more or less of the bacteria cells will in turn increase or
decrease the cementation and UCS. The Precipitated carbonate profile is not uniform along the
slope depth (x–y) similar to that observed in column specimens, suggesting higher calcium
carbonate content near to the injection port. The spatial distribution of calcium carbonate
generally follows the trend of microbe distributions along the specimen length/depth
(Gowthaman, et al., 2019). As previously discussed, higher concentration of bacteria cells was

192
filtered at the top zone, leading to higher deposition of carbonate content near the injection
surface. In order to confirm this postulation, soil samples were collected from three depths of
slope after performing the biological injection, and the number of existing bacteria cells were
measured by similar method used for isolation of bacteria. The measured locations are indicated
clearly in Figure 5.4.
In addition, surface zone closest to the injection port is generally in exposure to higher
concentrated reactants than the bottom zone (Whiffin, et al., 2007); therefore, higher carbonate
content was precipitated at surface zone. It also has been reported that the amount of urease,
precipitation rate and nutrient concentrations also have a great influence in carbonate
distribution and must be maintained at their minimum to achieve a homogeneous cementation
along the soil columns (Mortensen, et al., 2011; Cheng, et al., 2016). The measurements
indicate that the slope beach sand consists of very small amount (0.22–0.25%) natural
carbonate content. As reported by Mortensen et al. (2011), the soil particles consisted of
carbonate content could provide ideal surfaces and nucleation sites for the additional
precipitation of carbonate crystals. At the same time, the residual soil would consist of soil
particles in broad range of shapes, irregularities and with varying surface roughness, which
could provide additional effects in precipitation of carbonate. Future works should clearly
address the effect of particle shapes and surface roughness to improve the understanding on the
behavior of residual soils. The threshold calcium carbonate content required to provide
measurable UCS of slope beach sand was found to be around 3%. The carbonate content
reported herein is in a good agreement with the minimum carbonate content (3.5%, for the sand
with D50 of 165μm) reported by Whiffin et al. (2007). Soil cemented below the threshold
carbonate content exhibited an unsolidified loose matrix which was similar to the untreated
soil. However, small carbonate crystals on the particle surface were evidenced through SEM
analysis. At the same time, Feng and Montoya (2016) and Lin et al. (2018) have reported that
the minimum carbonate content required to increase the strength of sands (D50 of 0.6 mm and
0.9 mm respectively) was around 1%. Actually, the threshold carbonate content of a soil is
related to the number of particle contacts and grain size. Due to the increased number of particle
contacts in slope beach sand, relatively a higher amount of threshold carbonate content (3%)
(compared to that reported by Feng and Montoya (2016) and Lin et al. (2018)) was required to
provide the measurable strength. Figure 5.21 presents a compilation of all UCS results obtained
versus the measured calcium carbonate content. The UCS increases during MICP improvement
as calcium carbonate precipitates and cements the soil particles, as a result of void space
reduction. It is also clear that the UCS increases exponentially with the increase in calcium
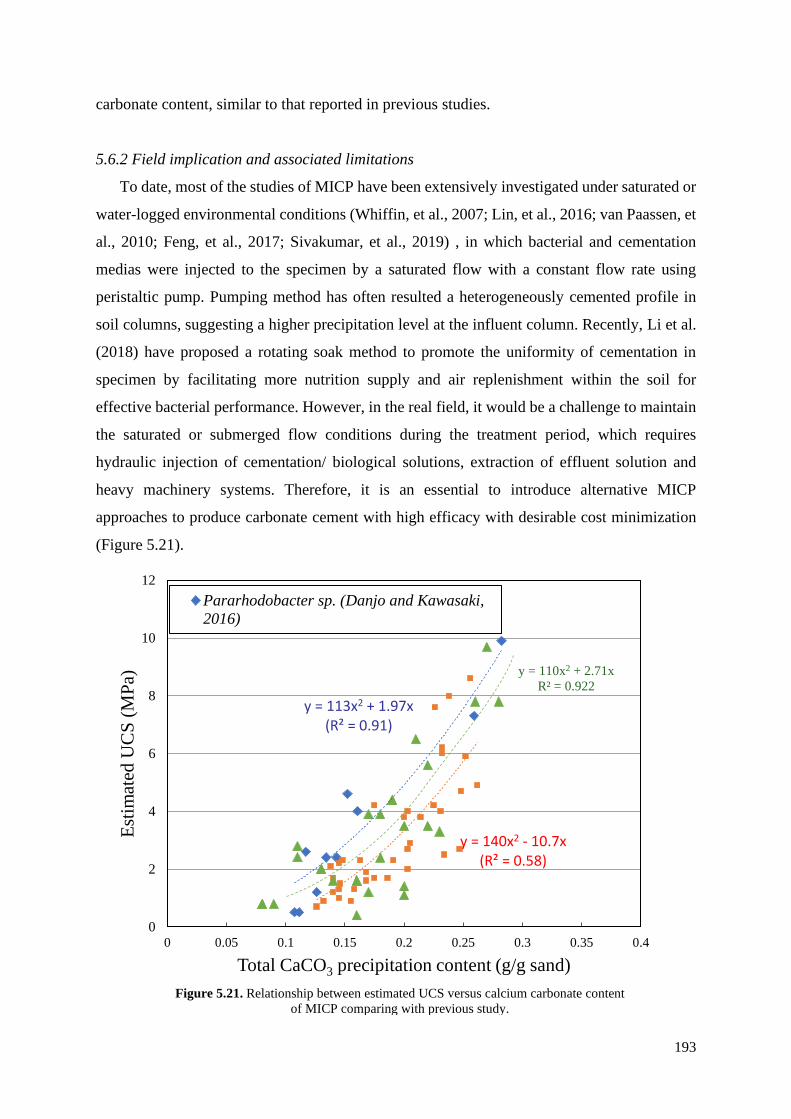
193
carbonate content, similar to that reported in previous studies.
5.6.2 Field implication and associated limitations
To date, most of the studies of MICP have been extensively investigated under saturated or
water-logged environmental conditions (Whiffin, et al., 2007; Lin, et al., 2016; van Paassen, et
al., 2010; Feng, et al., 2017; Sivakumar, et al., 2019) , in which bacterial and cementation
medias were injected to the specimen by a saturated flow with a constant flow rate using
peristaltic pump. Pumping method has often resulted a heterogeneously cemented profile in
soil columns, suggesting a higher precipitation level at the influent column. Recently, Li et al.
(2018) have proposed a rotating soak method to promote the uniformity of cementation in
specimen by facilitating more nutrition supply and air replenishment within the soil for
effective bacterial performance. However, in the real field, it would be a challenge to maintain
the saturated or submerged flow conditions during the treatment period, which requires
hydraulic injection of cementation/ biological solutions, extraction of effluent solution and
heavy machinery systems. Therefore, it is an essential to introduce alternative MICP
approaches to produce carbonate cement with high efficacy with desirable cost minimization
(Figure 5.21).
Figure 5.21. Relationship between estimated UCS versus calcium carbonate content
of MICP comparing with previous study.
y = 113x2 + 1.97x(R² = 0.91)
y = 140x2 - 10.7x(R² = 0.58)
y = 110x2 + 2.71x
R² = 0.922
0
2
4
6
8
10
12
0 0.05 0.1 0.15 0.2 0.25 0.3 0.35 0.4
Est
imat
ed U
CS
(M
Pa)
Total CaCO3 precipitation content (g/g sand)
Pararhodobacter sp. (Danjo and Kawasaki,
2016)

194
The simple surface percolation technique demonstrated in this study is more suitable for
field application, which eliminates the destruction of existing soil structure and reduces the
costs of required labor and machinery. However, it would be more effective, if the surface
percolation is promoted to spraying instead of injections, which is left for the future work to be
performed in the subsequent phase of this study. In civil engineering applications such as slope
surface stabilizations, it is highly important to immobilize the ureolytic bacteria within the
target surface zones, so that sufficient carbonate can be precipitated throughout the required
zone. The experimental observations discussed in this paper suggest well immobilization of
bacteria only within the surface zone, and the particle size distribution of slope soil limits the
distribution of bacteria to more deeper depths. Therefore, it is appropriate to recommend the
technique for slope surface stabilization i.e. stabilizing the slope by enhancing the surface cover
condition of the slope and promoting high aggregate stability at the surface zone, which could
be enabled against surface erosion. The results also indicate, treating the soil by surface
percolation method could strengthen the soil significantly by forming more effective crystals
at free-draining environmental conditions and can be highly applicable on unsaturated or
partially saturated natural slopes and embankments. In the injection method investigated
herein, grain size distribution highly governs the efficiency of MICP. Fine sands, well graded
soils and soils consisting of certain number of fine particles have less permeability (compared
to the coral soils) leading to low infiltration rate, that often increases the risk regarding local
clogging. In order to avoid the risk of clogging, Whiffin et al. (2007) have suggested a faster
injection/flow rates of reactants by allowing less reaction time along the path. Afterwards,
Cheng and Cord-Ruwisch (2014) have reported the observation of non-clogged fine and coral
sand columns treated under higher infiltration rates (7–28.5 cm/min). They have also reported
that severe clogging occurred in fine sand when it was treated under low infiltration rate less
than 0.25 cm/ min. Therefore, a moderate infiltration rate of 2–4 mL/min was maintained
during the treatment period (no clogging occurred during the treatment).
5.6.3 Permeability of cemented specimens
Permeability was measured separately for the specimens treated using regular bacteria
culture and segregated cell pellets by falling head method. Also, the permeability of the
untreated soil was measured to investigate the reduction caused by the calcium carbonate
precipitation. The permeability was significantly reduced (approximately by 90%) with the
surface percolation technique irrespective of using regular culture or segregated cell pellets.
However, a little more reduction was obtained in the specimen treated by using regular culture

195
due to higher deposition of calcium carbonate content as discussed in the previous section.
Generally, the permeability of the specimen linearly decreases with increase in precipitated
calcium carbonate content (Martinez et al., 2013). The results indicate that this surface
percolation treatment technique was attributed to reduce the permeability in slope, which would
help to control the infiltration of rainwater into the slope and enhance the surface sheet flow,
and thus preserves the slope from failures. However, the reduction in infiltration of storm water
might possibly result the water buildup on the bio-cemented stabilized slope surface, leading
to additional overburden and sheet flow with high energy. Therefore, additional consideration
regarding drainage is highly required. Facilitating the horizontal drains in slope is one of the
feasible methods to lower the excess surface flow, and that can be easily implied in certain
intervals (along the long edge) by using perforated metal or slotted plastic drainages.
5.7. Conclusions
The effects of the anionic polysaccharide carrageenan on CaCO3 crystallization and sand
solidification was analyzed by using the MICP method. It was found that chitosan has a positive
effect on CaCO3 crystallization and sand solidification. Higher amounts of the precipitate could
be obtained upon carrageenan addition than without added. Carrageenan also precipitated as
its hydrogel with the CaCO3 crystals. Increase of the supersaturation in a reaction mixture by
adding carrageenan leads to the formation of vaterite instead of calcite, which is the most
common type of polymorphism in MICP. At lower bacterial concentrations, the precipitate
consisted of good rhombohedral crystals and individual carrageenan hydrogel. However, the
higher concentrations, distorted the crystal shape, and crystal agglomerates were produced.
Carrageenan act as a template for the CaCO3 crystals to nucleate due to adsorption of the Ca2+
ions onto hydrogel. In contrast, in the case of without chitosan bacteria cells themselves act as
nucleation site for CaCO3 crystals to nucleate and growth. Even though without carrageenan
also CaCO3 can nucleate and grow efficiently but process could be accelerated effectively by
adding carrageenan. The higher carrageenan concentrations accelerate the conversion of
metastable phase of vaterite into the stable phase of calcite. In addition, the carrageenan
hydrogel assisted in the formation of better bridge between the sand particles. Hence, by adding
carrageenan better cementation and strength could be achieved than the conventional method.
Finally, carrageenan can be used to produce good organic-inorganic hybrid green materials,
which can be used in a number of civil engineering applications. On other hand, the ions NaCl
and MgCl2 concentrations on MICP is higher than those of average seawater favor microbially
mediated formation of Mg-rich carbonates, which are often considered as potential dolomite

196
precursors. Even though the process deemed to negatively affect the desired engineering
properties of the treated specimens. It is clearly deduced that the strength decline is mainly due
to the change in crystal morphology (rather than the quantity of precipitate) to a needle shaped
crystal form with lower bonding capacity than that of the well-interweaved and cross-linked
rhombohedral crystals produced in the absence of magnesium.
The effect of carbonate precipitation on the process of strengthening in slope soil was
investigated by comparing the behavior of three uniformly graded sands. Microstructure of the
soils treated by surface percolation shows the formation of effective crystals at particle
contacts. Presence of fine content governs the behavior of residual slope soil significantly. It
increases the number of particle contacts by bonding with the sand grains and participates in
the force chain of the treated matrix. The fine content provides the matrix support effectively
by facilitating intermediate supports to form bridges between carbonate crystals. However,
grain size distribution tends to filter more bacteria at surface zone of slope, results high
cementation at the surface level and relatively a long linear reduction in carbonate precipitation
along the profile is observed. This preliminary investigation suggests that the technique can be
implemented for stabilizing the slope by enhancing the cover condition of the slope, and the
results obtained from this investigation would be highly beneficial to promote the study to the
large scale.
References
A. Bacic, G.B. Fincher, B.A. Stone, Chemistry, biochemistry, and biology of (1–3)-[beta]-
glucans and related polysaccharides, 1st, ed, Academic, Amsterdam,2009.
A. Bouazza, W. Gates, P. Ranjith, Hydraulic conductivity of biopolymertreated silty sand,
Géotechnique 59 (1) (2009) 71–72.
A. Clark, S. Ross-Murphy, Structural and mechanical properties of biopolymer gels,
Biopolymers, Springer, Berlin Heidelberg (1987) 57–192.
A. Imeson, Food stabilisers, thickeners and gelling agents, Wiley-Blackwell Pub.,
Chichester, U.K.; Ames, Iowa, 2010.
A.P. Imeson, Thickening and gelling agents for food, Springer Science & Business Media,
2012.
Amarakoon GGNN, Kawasaki S (2018) Factors affecting sand solidification using MICP
with Pararhodobacter sp. Mater Trans 59:72–81. https ://doi.org/10.2320/mater trans .M-
M2017 849
ASTM D2487–17 (2017) Standard practice for classification of soils for engineering
197
purposes (unified soil classification system). ASTM International, West Conshohocken
Bauerfeind P, Garner R, Dunn BE, Mobley HL (1997) Synthesis and activity of
Helicobacter pylori urease and catalase at low pH. Gut 40:25–30
Bolleter WT, Bushman CJ, Tidwell PW (1961) Spectrophotometric determination of
ammonia as indophenol. Anal Chem 33:592– 594. https ://doi.org/10.1021/ac601 72a03 4
Carlson, W.D., 1983. Polymorphs of CaCO3 and the Aragonite-Calcite transformation.
Reviews in Mineralogy, 11, pp.191-225.
Chen YYM, Anne Clancy K, Burne RA (1996) Streptococcus salivarius urease: genetic
and biochemical characterization and expression in a dental plaque streptococcus. Infect
Immun 64:585–592
Cheng L, Cord-Ruwisch R (2014) Upscaling effects of soil improvement by microbially
induced calcite precipitation by surface percolation. Geomicrobiol J 31:396–406. https ://doi.
Cheng L, Cord-Ruwisch R, Shahin MA (2013) Cementation of sand soil by microbially
induced calcite precipitation at various degrees of saturation. Can Geotech J 50:81–90. https
://doi.org/10.1139/cgj-2012-0023
Cheng L, Cord-Ruwisch R. 2014. Upscaling effects of soil improvement by microbially
induced calcite precipitation by surface percolation. Geomicrobiol J 31:396–406. https ://doi.
org/10.1080/01490 451.2013.83657 9
Cheng L, Shahin MA, Mujah D (2016) Influence of key environmental conditions on
microbially induced cementation for soil stabilization. J Geotech Geoenviron Eng
143:04016083. https :// doi.org/10.1061/(asce)gt.1943-5606.00015 86
Chu J, Stabnikov V, Ivanov V (2012) Microbially induced calcium carbonate precipitation
on surface or in the bulk of soil. Geomicrobiol J 29:544–549. https ://doi.org/10.1080/01490
451.2011.59292 9
Ciurli S, Marzadori C, Benini S et al (1996) Urease from the soil bacterium Bacillus
pasteurii: immobilization on Ca- polygalacturonate. Soil Biol Biochem 28:811–817. https
://doi. org/10.1016/0038-0717(96)00020 -X
D. Mujah, M.A. Shahin, L. Cheng, State-of-the-art review of biocementation by
microbially induced calcite precipitation (MICP) for soil stabilization, Geomicrobiol J. 34 (6)
(2017) 524–537.
D.M. Kirchmajer, B. Steinhoff, H. Warren, R. Clark, M. in het Panhuis, Enhanced gelation
properties of purified gellan gum, Carbohydr. Res. 388 (2014) 125–129.
Danjo T, Kawasaki S (2016) Microbially induced sand cementation method using
Pararhodobacter sp. Strain SO1, inspired by Beachrock formation mechanism. Mater Trans

198
57:428–437. https ://doi.org/10.2320/mater trans .M-M2015 842
Daryono, L. R. 2016. Comparison of natural beachrock and anthropogenic beachrock, case
study: Okinawa-jima, Japan. Published thesis. Master’s degree of Geological Engineering,
Universitas Gadjah Mada, Indonesia.
Daryono, L.R., Nakashima, K., Kawasaki, S., Titisari, A.D. and Barianto, D.H., 2020.
Sediment Characteristics of Beachrock: A Baseline Investigation Based on Microbial Induced
Carbonate Precipitation at Krakal-Sadranan Beach, Yogyakarta, Indonesia. Applied Sciences,
10(2), p.520.
DeJong JT, Martinez BC, Mortensen BM, et al (2009) Upscaling of bio-mediated soil
improvement upscaling of bio-mediated soil improvement. In: 17th International conference
on soil mechanics and geotechnical engineering. Netherlands, pp 2300–2303
DeJong JT, Mortensen BM, Martinez BC, Nelson DC (2010) Biomediated soil
improvement. Ecol Eng 36:197–210. https ://doi. org/10.1016/j.ecole ng.2008.12.029
Feng K, Montoya BM (2016) Influence of confinement and cementation level on the
behavior of microbial-induced calcite precipitated sands under monotonic drained loading. J
Geotech Geoenviron Eng 142:04015057. https ://doi.org/10.1061/(ASCE) GT.1943-
5606.00013 79
Feng, K. and Montoya, B.M. 2017. Quantifying level of microbial-induced cementation for
cyclically loaded sand. Journal of Geotechnical and Geoenvironmental Engineering, 143(6),
p.06017005.
Fujita M, Nakashima K, Achal V, Kawasaki S (2017) Whole-cell evaluation of urease
activity of Pararhodobacter sp. isolated from peripheral beachrock. Biochem Eng J 124:1–5.
https ://doi. org/10.1016/j.bej.2017.04.004
Fujita Y, Grant Ferris F, Daniel Lawson R et al (2000) Calcium carbonate precipitation by
ureolytic subsurface bacteria. Geomicrobiol J 17:305–318. https ://doi.org/10.1080/78219
8884
Fukue M, Nakamura T, Kato Y (2001) A method for determining carbonate content for
soils and evaluation of the results. Soils Found 49–2:9–12 (in Japanese)
Fukue M, Ono S-I, Sato Y (2011) Cementation of sands due to microbiologically-induced
carbonate precipitation. Soils Found 51:83–93. https ://doi.org/10.3208/sandf .51.83
G.C. Barrére, C.E. Barber, M.J. Daniels, Molecular cloning of genes involved in the
production of the extracellular polysaccharide xanthan by Xanthomonas campestris pv.
campestris, Int. J. Biol. Macromol. 8 (6) (1986) 372–374.
Gat D, Ronen Z, Tsesarsky M (2016) Soil bacteria population dynamics following

199
stimulation for ureolytic microbial-induced CaCO3 precipitation. Environ Sci Technol 50:616–
624. https :// doi.org/10.1021/acs.est.5b040 33
Gomez MG, Martinez BC, DeJong JT et al (2015) Field-scale bio-cementation tests to
improve sands. Proc Inst Civ Eng – Gr Improv 168:206–216. https
://doi.org/10.1680/grim.13.00052
Gowthaman S, Mitsuyama S, Nakashima K et al (2019) Biogeotechnical approach for slope
soil stabilization using locally isolated bacteria and inexpensive low-grade chemicals: a
feasibility study on Hokkaido expressway soil, Japan. Soils Found 59:484–499. https
://doi.org/10.1016/j.sandf .2018.12.010
H. Hassan, S. Al-Oraimi, R. Taha, Evaluation of open-graded friction course mixtures
containing cellulose fibers and styrene butadiene rubber polymer, J. Mater. Civ. Eng. 17 (4)
(2005) 416–422.
H. Izawa, J.-I. Kadokawa, Preparation and characterizations of functional ionic liquid-gel
and hydrogel materials of xanthan gum, J. Mater. Chem. 20 (25) (2010) 5235–5241.
H.D. Shin, M.K. Son, B.R. Park, C.W. Son, H.J. Jang, Composition containing Beta-glucan
for prevention and treatment of osteoporosis, in: D.D. Mckay (Ed.) Glucan Corporation, United
States, 2004, p. 6.
I. Chang, A.K. Prasidhi, J. Im, G.-C. Cho, Soil strengthening using thermo gelation
biopolymers, Constr. Build. Mater. 77 (2015) 430–438.
I. Chang, G.-C. Cho, Shear strength behavior and parameters of microbial gellan gum-
treated soils: from sand to clay, Acta Geotech. (2018) 1–15.
I. Chang, G.-C. Cho, Strengthening of Korean residual soil with b-1,3/1,6-glucan
biopolymer, Constr. Build. Mater. 30 (2012) 30–35.
I. Chang, J. Im, G.-C. Cho, Geotechnical engineering behaviors of gellan gum biopolymer
treated sand, Can. Geotech. J. (2016) 1–13.
Ivanov, V. and Chu, J., 2008. Applications of microorganisms to geotechnical engineering
for bioclogging and biocementation of soil in situ. Reviews in Environmental Science and
Bio/Technology, 7(2), pp.139-153.
J. Daniel, R.L. Whistler, A.C.J. Voragen, W. Pilnik, Starch and other polysaccharides,
VCH Verlagsgesellschaft mbH, Weinheim, Ullmann’s Encyclopedia of Industrial Chemistry,
1994.
J. Im, A.T.P. Tran, I. Chang, G.-C. Cho, Dynamic properties of gel-type biopolymer-treated
sands evaluated by Resonant Column (RC) tests, Geomechanics and Engineering 12 (5) (2017)
815–830.

200
J. Plank, Applications of biopolymers in construction engineering, Biopolymers Online,
Wiley-VCH Verlag GmbH & Co. KGaA, 2005.
J.T. Oliveira, L. Martins, R. Picciochi, P.B. Malafaya, R.A. Sousa, N.M. Neves, J.F. Mano,
R.L. Reis, Gellan gum: a new biomaterial for cartilage tissue engineering applications, J.
Biomed. Mater. Res. Part A 93 (3) (2010) 852–863.
Jahns T (1992) Urea uptake by the marine bacterium Deleya venusta HG1. J Gen Microbiol
138:1815–1820. https ://doi.org/10.1099/00221 287-138-9-1815
L. Cheng, M. Shahin, Bacteria induced cementation for soil stabilization, in: Proceedings
of the 19th International Conference on Soil Mechanics and Geotechnical Engineering, 2017,
pp. 2371–2374.
Li C, Yao D, Liu S et al (2018) Improvement of geomechanical properties of bio-
remediated Aeolian sand. Geomicrobiol J 35:132–140. https ://doi.org/10.1080/01490
451.2017.13387 98
Li H, Li C, Zhou T et al (2018) An improved rotating soak method for MICP-treated fine
sand in specimen preparation. Geotech Test J 41:20170109. https ://doi.org/10.1520/GTJ20
17010 9
Lin H, Suleiman MT, Brown DG, Kavazanjian E (2016) Mechanical behavior of sands
treated by microbially induced carbonate precipitation. J Geotech Geoenviron Eng
142:04015066-1–13.https ://doi.org/10.1061/(ASCE)GT.1943-5606.00013 83
M. McIntosh, B.A. Ston, V.A. Stanisich, Curdlan and other bacterial (1->3)-beta-D-
glucans, Applied Microbiol. Biotechnol. 68 (2) (2005) 163–173.
M.W. Wan, I.G. Petrisor, H.T. Lai, D. Kim, T.F. Yen, Copper adsorption through chitosan
immobilized on sand to demonstrate the feasibility for in situ soil decontamination, Carbohydr.
Polym. 55 (3) (2004) 249–254.
Martinez BC, DeJong JT, Ginn TR et al (2013) Experimental optimization of microbial-
induced carbonate precipitation for soil improvement. J Geotech Geoenviron Eng 139:587–
598. https :// doi.org/10.1061/(ASCE)GT.1943-5606.00007 87
Mobley HL, Island MD, Hausinger RP (1995) Molecular biology of microbial ureases.
Microbiol Rev 59:451–480
Montoya BM, DeJong JT, Boulanger RW (2013) Dynamic response of liquefiable sand
improved by microbial-induced calcite precipitation. Géotechnique 63:302–312. https ://doi.
org/10.1680/geot.sip13 .p.019
Montoya, B.M. and DeJong, J.T. 2015. Stress-strain behavior of sands cemented by
microbially induced calcite precipitation. Journal of Geotechnical and Geoenvironmental

201
Engineering, 141(6), p.04015019.
Mortensen BM, Haber MJ, Dejong JT et al. 2011. Effects of environmental factors on
microbial induced calcium carbonate precipitation. J Appl Microbiol 111:338–349. https
://doi.org/10.111 1/j.1365-2672.2011.05065.
Moyo CC, Kissel DE, Cabrera ML (1989) Temperature effects on soil urease activity. Soil
Biol Biochem 21:935–938. https ://doi. org/10.1016/0038-0717(89)90083 -7
N. Latifi, S. Horpibulsuk, C.L. Meehan, M.Z. Abd Majid, M.M. Tahir, E.T. Mohamad,
Improvement of problematic soils with biopolymer an environmentally friendly soil stabilizer,
J. Mater. Civ. Eng. 29(2) (2016)04016204.
Nawarathna, T.H.K., Nakashima, K. and Kawasaki, S., 2019. Chitosan enhances calcium
carbonate precipitation and solidification mediated by bacteria. International journal of
biological macromolecules, 133, pp.867-874.
Omoregie AI, Khoshdelnezamiha G, Senian N et al (2017) Experimental optimisation of
various cultural conditions on urease activity for isolated Sporosarcina pasteurii strains and
evaluation of their biocement potentials. Ecol Eng 109:65–75. https ://doi. org/10.1016/j.ecole
ng.2017.09.012
Omoregie AI, Palombo EA, Ong DEL, Nissom PM (2019) Biocementation of sand by
Sporosarcina pasteurii strain and technicalgrade cementation reagents through surface
percolation treatment method. Constr Build Mater 228:116828. https ://doi.
org/10.1016/j.conbu ildma t.2019.11682 8
org/10.1080/01490 451.2013.8365794.
Osinubi KJ, Eberemu AO, Gadzama EW, Ijimdiya TS (2019) Plasticity characteristics of
lateritic soil treated with Sporosarcina pasteurii in microbial-induced calcite precipitation
application. SN Appl Sci 1:829. https ://doi.org/10.1007/s4245 2-019-0868-7
Panarotto, C.T., Cabral, A.R. and Lefebvre, G., 2005. Environmental, geotechnical, and
hydraulic behaviour of a cellulose-rich by-product used as alternative cover material. Journal
of environmental engineering and science, 4(2), pp.123-138.
Phang IRK, Chan YS, Wong KS, Lau SY (2018) Isolation and characterization of urease-
producing bacteria from tropical peat. Biocatal Agric Biotechnol 13:168–175. https
://doi.org/10.1016/j. bcab.2017.12.006
Phillips, A.J., Eldring, J.J., Hiebert, R., Lauchnor, E., Mitchell, A.C., Cunningham, A.,
Spangler, L. and Gerlach, R. 2015. Design of a meso-scale high pressure vessel for the
laboratory examination of biogeochemical subsurface processes. Journal of Petroleum Science
and Engineering, 126, pp.55-62.

202
R. Khachatoorian, I.G. Petrisor, C.-C. Kwan, T.F. Yen, Biopolymer plugging effect:
laboratory-pressurized pumping flow studies, J. Petrol. Sci. Eng. 38 (1–2) (2003) 13–21.
R.A. Nugent, G. Zhang, R.P. Gambrell, Effect of exopolymers on the liquid limit of clays
and its engineering implications, Transp. Res. Rec. 2101 (2009) 34–43.
Reeder, R.J., 1983. Crystal chemistry of the rhombohedral carbonates. Reviews in
Mineralogy, 11, pp.1-47.
Russell, R. J., and McIntire, W. G. 1965. Beach cusps. Geological Society of America
Bulletin, Vol. 76, 3, 307-320. https://doi.org/10.1130/0016-7606(1965)76[307:BC]2.0.CO;2.
S. Dumitriu, Polymeric biomaterials, 2nd ed., Marcel Dekker Inc, New York, 2002.
S. Kalia, L. Averous, Biopolymers: Biomedical and Environmental Applications, Wiley,
2011.
S. Smitha, A. Sachan, Use of agar biopolymer to improve the shear strength behavior of
sabarmati sand, Int. J. Geotech. Eng. 10 (4) (2016) 387–400.
Sensoy T, Bozbeyoglu NN, Dogan NM, et al (2017) Characterization of calcium carbonate
produced by ureolytic bacteria (Sporocarcina pasteurii ATCC 6453 and Bacillus aerius U2)
and effect of environmental conditions on production of calcium carbonate. In: 15th
International conference on environmental science and technology. Rhodes, Greece
Soon NW, Lee LM, Khun TC, Ling HS (2014) Factors affecting improvement in
engineering properties of residual soil through microbial-induced calcite precipitation. J
Geotech Geoenviron Eng 140:04014006. https ://doi.org/10.1061/(ASCE)GT.1943-
5606.00010 89
Stabnikov V, Naeimi M, Ivanov V, Chu J (2011) Formation of water-impermeable crust on
sand surface using biocement. Cem Concr Res 41:1143–1149. https ://doi.org/10.1016/j.cemco
nres.2011.06.017
Ulusay R (2014) The ISRM suggested methods for rock characterization, testing and
monitoring: 2007–2014. Springer, Berlin
van Paassen LA (2011) Bio-Mediated Ground Improvement: From Laboratory Experiment
to Pilot Applications. Geo-frontiers 2011. American Society of Civil Engineers, Reston, pp
4099–4108
Van Paassen, L. A. et al., 2010. Quantifying Biomediated Ground Improvement by
Ureolysis: Large-Scale Biogrout Experiment. J. Geotech. Geoenvirn. Eng. 136: 1721-1728.
Vousdoukas, M. I., Velegrakis, A. F., and Plomaritis, T. A. 2007. Beachrock occurrence,
characteristics, formation mechanisms and impacts. Earth-Science Reviews, Vol. 85, 1–2, 23–
46. https://doi.org/10.1016/j.earscirev.2007.07.002.
203
W.J. Orts, R.E. Sojka, G.M. Glenn, Biopolymer additives to reduce erosion induced soil
losses during irrigation, Ind. Crops Prod. 11 (1) (2000) 19–29.
W.M. Kulicke, H. Nottelmann, Structure and Swelling of Some Synthetic, Semisynthetic,
and Biopolymer Hydrogels, Polymers in Aqueous Media, American Chemical Society,
Washington, DC, 1989, pp. 15-44.
Weil MH, DeJong JT, Martinez BC, Mortensen BM, Waller JT (2012) Seismic and
resistivity measurements for real-time monitoring of microbially induced calcite precipitation
in sand. ASTM Geotech Test J 35:1–12
Whiffin VS, van Paassen LA, Harkes MP (2007) Microbial carbonate precipitation as a soil
improvement technique. Geomicrobiol J 24:417–423. https: //doi.org/10.1080/01490 450701
4365 05
Whiffin, V.S. 2004. Microbial CaCO3 precipitation for the production of biocement
(Doctoral dissertation, Murdoch University).
Yang Y, Zhu G, Wang G et al (2016) Robust glucose oxidase with a Fe3O4@C-silica
nanohybrid structure. J Mater Chem B 4:4726– 4731. https ://doi.org/10.1039/c6tb0 1355d
204
CHAPTER 6
Durability test of MICP beach sand treatment
6.1 Introduction
For many decades, stability of slope soils is one of the serious concerns in the field of
geotechnical Engineering. This is mainly because of the fact that sturdiness of most of the
transportation structures is highly reliant on the stability of the slopes by which they are
supported. During the construction of those structures (e.g. expressways, roads and railways),
the natural slopes are modified in a way to fit the construction and design requirements, which
often causes the clearance of vegetations and topographical amendments in natural slopes
(Guerra et al., 2017; Zhang et al., 2018). Consequently, the slope surfaces become more
vulnerable to the climatic measures and associated degradations, posing several risks regarding
safety and sustainability. It is very clear that proper stabilization is essential to a slope to sustain
its intrinsic characteristics against the varying nature and accompanied degradation processes.
In the past, numerous methods were proposed and investigated to improve the cover condition
of slopes. The most cost-effective and eco-friendliest method for stabilizing the slope is
establishment of vegetation such as grass, weeds, plants and etc. (Chirico et al., 2013). The
vegetation as an engineering material, serves as a crust layer between atmosphere and surface,
enduring the slope from the direct contact of climatic measures such as rainfalls, snowfalls, etc.
Also, their roots reinforce the surface, enhancing the stability of slope substrates.
However, to achieve the fullest benefits, it takes quite a long time, and the growth and
survival of vegetation are limited to certain regions such as subarctic and arid zones (Jiang et
al., 2019). Some of other methods widely in application stage are mechanical compactions,
geosynthetic applications and chemical stabilizations (Gowthaman et al., 2019; Kumar and
Das, 2018). Majority of these stabilization techniques utilize mechanical energy and artificial
materials, both of which required substantial energy for manufacture and installation. Chemical
grouts (such as cements, epoxy, acrylamide, phenoplasts, silicates, and polyurethane) are also
found to be reliable, could enhance the surface by filling pore spaces and binding soil particles
(Arya et al., 2018; DeJong et al., 2010). However, almost all these materials are reported to be
toxic and hazardous, causing pollutions and influx of dangerous substances to the geo-
environment; therefore, their applications to the field scale are extensively under the scrutiny
of public policy (DeJong et al., 2010; Gowthaman et al., 2018). Confluence of these drawbacks
in the conventional methods necessitates the exploration and development of new methods for

205
stabilizing the slope soil more effectively. As an emerging technique, MICP (microbial induced
carbonate precipitation) has drawn substantial attentions in the past decade. MICP is a
biochemical process which persuades the calcium carbonate bio-cement within the embedded
soil matrix as a consequence of metabolic activity.
In the recent past, few studies have demonstrated that the MICP can be potentially applied
to stabilize the slope soil (Gowthaman et al., 2019; Jiang et al., 2019). Similar to the
conventional grouting techniques, MICP has also been proposed for surficial treatment
(Gowthaman et al., 2019), which tends to promote the cover condition of the slope, so that to
withstand various degradation processes. Rainfall induced surface erosion is one of the factors
threatening the stability (Zhang et al., 2018). By investigating sets of MICP treated slope
models, Jiang et al. (2019) have recently concluded that treating the slopes by 1 mol/L
cementation solution would give optimum resistance against erosion induced by artificial
rainfall. It is worth noting that despite of the considerable interests on MICP, the available
information on the durability and performance are very limited. Processes of wetting-drying
are also other serious concerns in Geotechnical Engineering, affecting the long-term
performances. After the treatment, sooner or later, the slope surfaces are exposed to varying
climates and environment conditions. During the rainfalls and subsequent evaporations,
surfaces are subjected to periodical wetting-drying process (Tang et al., 2016), which might
cause progressive damages in MICP surfaces. However, the effects of wetting-drying have not
been extensively investigated in the past.
6.2 Objectives
In this chapter, we conducted after treatment test of solidification samples on local beach
sand within statistical analysis of wetting-drying test. Therefore, the main objective of this
study is to investigate the influence of variable wetting-drying cycles on the physical and
mechanical characteristics of MICP treated slope beach sand, representing the erosion
shoreline slope in the coastal area. The goal of this paper is to perform the durability of the
specimen having an estimated unconfined compressive strength (UCS) of more than several
MPa after wetting-drying cycles using fresh water and saltwater to compare the efficiency of
treatment samples.
6.3 Research methodology
6.3.1 Beachrock and bacteria
The ureolytic bacterium, Pseudoalteromonas tetradonis isolated by Daryono, et al. (2019,

206
2020) from beachrock sample from Indonesia shoreline was used in this study due to its high
urease activity which classified as gram-negative. The strain were motile bacilli 1 μm wide and
1.5–4.0 μm, aerobic, motile with one polar flagellum, rods (or rod-shapes) with 0.5–0.8 × 1.0–
1.5 μm when in exponential growth phase was used in this study. Standard media
(ZoBell2216E for marine bacteria medium) were used for culturing under sterile aerobic
conditions. Cells were precultured separately in 5 mL of each medium at 37°C and 160 rpm
for 24 h. One milliliter of the preculture was inoculated with 100 mL of the fresh medium and
incubated under the same conditions.
The microbial cell growth of the isolates was determined based on optical density at a
wavelength of 600 nm (OD600) using a UV-vis spectrophotometer (V-730, JASCO
Corporation, Tokyo, Japan). The local beach sand used in the experiments was uniformly
graded with a mean particle size of 0.6 mm for fine sand, 0.9 mm for coral sands, Mizunami
sands the standard laboratory sands with mean particle sizes (D50) of 0.87 mm, and microsphere
glass beads varying from 0.25 mm to 0.6 mm in diameter, respectively. The sands were
sterilized, and hand packed into a 50-mL syringe (mean diameter, D50 = 3 cm and height, h =
10 cm). Figure 6.1 is shown the characteristic grain size distribution curves of the soils studied
in this work and X-Ray diffraction data (Figure 6.2) of before the treatment with MICP. These
XRD data will facilitate the comparison before and after beach sand treatment.
0
20
40
60
80
100
0.01 0.1 1 10
Per
centa
ge
pas
sing(%)
Particle Diameter(mm)
Parangtritis sands
Krakal-Sadranan sands
Mizunami sand
Glass beads
Figure 6.1. Grain size distribution curve of sands and local beach sands from Krakal-Sadranan site,
Yogyakarta, Indonesia

207
Kra
kal
-Sad
ran
an c
ora
l sa
nd
s P
aran
gtr
itis
fin
e si
lica
san
ds
Miz
un
ami
san
ds
Gla
ss b
ead
s
Fig
ure
6.2
. X
RD
pat
tern
of
(a)
Kra
kal
-Sad
ranan
cora
l sa
nd
s co
nsi
st o
f C
aCO
3 a
nd
Mg
-Cal
cite
; (b
) P
aran
gtr
itis
san
d w
ith A
b (
alb
ite)
, Q
tz (
qu
artz
), M
gh
(mag
hem
ite)
, an
d M
gn
(m
agnet
ite)
; (c
) M
izu
nam
i sa
nd
co
nsi
st o
f q
uar
tz;
and
(d)
Gla
ss b
ead
s w
ith
qu
artz
con
sist
ed.
(a)
(b)
(c)
(d)

208
6.3.2 MICP treatment and reagents
The columns specimens were prepared using syringe molds (diameter of 3 cm, height of 6
cm) at a relative density of around 60%. As conceptually illustrated in Figure 6.3, the column
specimens are considered to be simulating the slope surface (real field) to be treated. The MICP
treatment was performed to the sand by using a simple two-phase surface percolation technique
as proposed in the previous work (Cheng and Cord-Ruwisch, 2014). The MICP set up is also
graphically depicted in Figure 6.3, together with the image of treated columns. At the first
phase, the bacteria which had been cultivated in ZoBell2216E agar medium for marine bacteria
and being incubated at 30 °C for 3 days. The cells cultured were ureolytic bacteria in
ZoBell2216E media, which also contained 5.0/L hipolypeptone (Nihon Seiyaku Co., Ltd.,
Tokyo, Japan), 1.0 g/L FePO4 (Junsei Chemical Co., Ltd., Tokyo, Japan), and 1.0 g/L yeast
extract (BD Bioscience Adv., Bioprocessing, Miami, Florida, USA). These were prepared with
artificial seawater with pH 7.6–7.8, adjusted using 1 M NaOH under shaking incubation (30°C,
160 rpm) were harvested at the OD600 of 1.8 – 2.6, and applied on the surface of the specimens
to percolate under the gravitational and capillary forces. Around 2 – 3 hours were given to a
better immobilization of bacteria cells with sand grains.
At the second phase, the cementation solution comprised of CaCl2 (55.5 g/L), urea (60 g/L)
and nutrient broth (6 g/L) was injected under the saturated conditions. The treatment was
performed for 14 days, in which the cementation solution was injected every 24 hours. As the
performance of the bacteria decrease gradually with the time (typically become insignificant
after 14 days) (Martinez et al., 2013), the biological injection was once again performed after
7 days of the treatment. In this study, different treatment levels were achieved by controlling
50 ml syringes
Filter papers
Sand compacted in the column
Silicon tube outlet
Figure 6.3. Conceptual illustration of MICP treatment by laboratory scale (columns specimens)
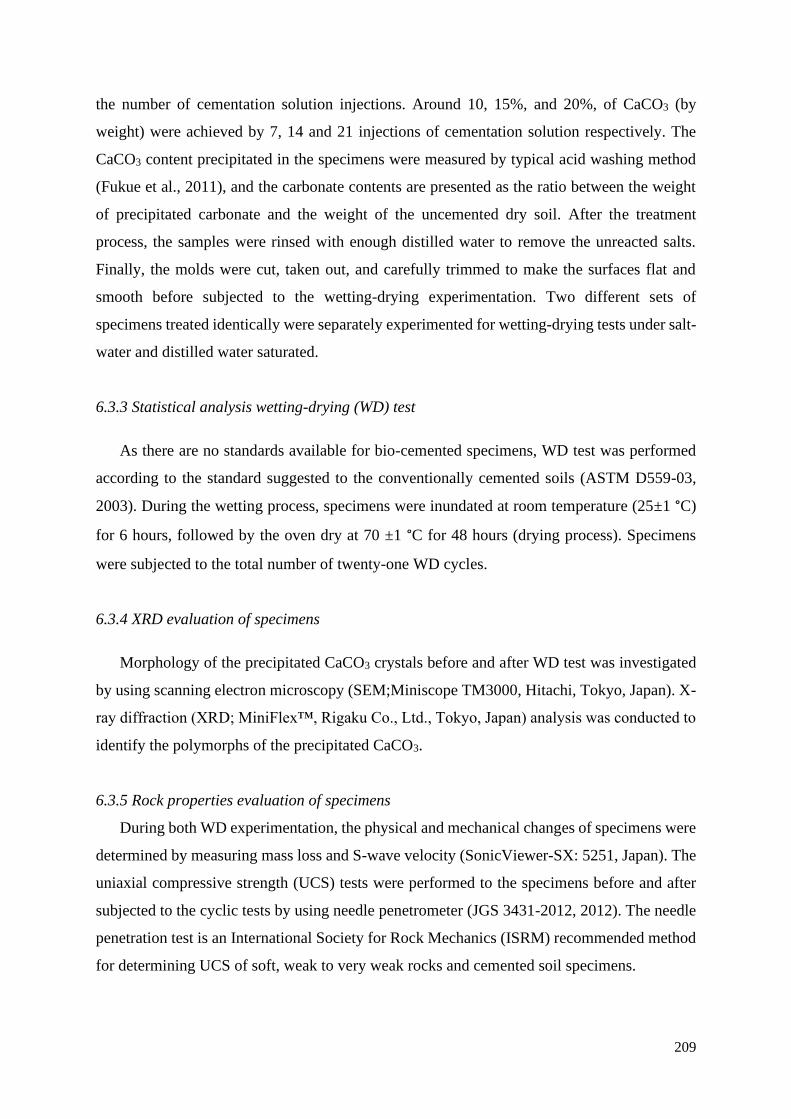
209
the number of cementation solution injections. Around 10, 15%, and 20%, of CaCO3 (by
weight) were achieved by 7, 14 and 21 injections of cementation solution respectively. The
CaCO3 content precipitated in the specimens were measured by typical acid washing method
(Fukue et al., 2011), and the carbonate contents are presented as the ratio between the weight
of precipitated carbonate and the weight of the uncemented dry soil. After the treatment
process, the samples were rinsed with enough distilled water to remove the unreacted salts.
Finally, the molds were cut, taken out, and carefully trimmed to make the surfaces flat and
smooth before subjected to the wetting-drying experimentation. Two different sets of
specimens treated identically were separately experimented for wetting-drying tests under salt-
water and distilled water saturated.
6.3.3 Statistical analysis wetting-drying (WD) test
As there are no standards available for bio-cemented specimens, WD test was performed
according to the standard suggested to the conventionally cemented soils (ASTM D559-03,
2003). During the wetting process, specimens were inundated at room temperature (25±1 °C)
for 6 hours, followed by the oven dry at 70 ±1 °C for 48 hours (drying process). Specimens
were subjected to the total number of twenty-one WD cycles.
6.3.4 XRD evaluation of specimens
Morphology of the precipitated CaCO3 crystals before and after WD test was investigated
by using scanning electron microscopy (SEM;Miniscope TM3000, Hitachi, Tokyo, Japan). X-
ray diffraction (XRD; MiniFlex™, Rigaku Co., Ltd., Tokyo, Japan) analysis was conducted to
identify the polymorphs of the precipitated CaCO3.
6.3.5 Rock properties evaluation of specimens
During both WD experimentation, the physical and mechanical changes of specimens were
determined by measuring mass loss and S-wave velocity (SonicViewer-SX: 5251, Japan). The
uniaxial compressive strength (UCS) tests were performed to the specimens before and after
subjected to the cyclic tests by using needle penetrometer (JGS 3431-2012, 2012). The needle
penetration test is an International Society for Rock Mechanics (ISRM) recommended method
for determining UCS of soft, weak to very weak rocks and cemented soil specimens.

210
6.4 Results and discussions
6.4.1 Aggregate stability
The physical damage during cyclic tests was evaluated by the mass loss of the specimens.
The mass loss was carefully measured after every cycle with neither any structural damages
nor considerable changes in temperature. Figure 6.4 shows the mass loss of the specimens
subjected to cyclic WD action. The results suggest that the mass loss by the end of 21 WD
cycles is less than 40% in all three levels of cementation, and the influence of precipitated
calcium carbonate content against WD effects is likely to be not very significant. Case of WD
based on distilled water is less than 25% in all three levels of cementation. It is clearly perceived
that the degradation mechanisms of MICP specimens under WD cycles is different. During the
WD test, regardless of cementation levels, rate of mass loss was high at the beginning (within
couple of WD cycles) and remained relatively stable during subsequent cycles. This could
possibly be attributed to the suspension of feeble deposits of calcium carbonates. During the
MICP treatment, the calcium carbonate is precipitated in various forms such as primary bonds
(strongly forms at particle contacts), individual crystals and accumulation (on the grain
surface), amorphous and powdery deposits (Lin et al., 2016; Wang et al., 2019). In fact, these
powdery bonds are often formed when the carbonates are deposited at its early stage of the
crystallization. When the specimens are submerged during the wetting, the water penetrates the
specimen and drives the powdery deposits to fall into suspension. This corrosion mechanism
is similar to that reported to the calcarenite rocks (Ciantia, et al., 2015). The MICP treated soils
have porous structure. In fact, the resultant stress acting on soil particles are distributed to the
connections around them i.e. to the calcium carbonate bonds. When the acting tensile stresses
exceed the maximum tensile strength of carbonate bonds, the bonds would start cracking. For
the specimens cemented to ~10% carbonate, the bonds were weak, resulted the highest
disintegration of aggregates (around 50%). But, for the specimens treated to 20% carbonate,
the contact strength could be adequate to resist the stresses developed during WD, resulted
negligible loss of aggregates (around 5%). But conversely, severe erodibility of MICP slope
soil is evidenced under cyclic WD effects. However, the WD induced erosion could be
controlled by treating the soil with appropriate quantity of calcium carbonate cement.
6.4.2 Mechanical characteristics
The influence of WD action on the mechanical behavior of MICP specimens was evaluated
through S-wave velocity and UCS. Previous researchers have demonstrated that the S-wave
velocity is a credible measure which can be used to assess particularly the particle connections

211
in MICP specimens (Feng and Montoya, 2017). Table 6.1 presents the S-wave velocity values
of the specimens before and after subjecting to WD cycles. Overall, it can be seen that the S-
wave velocity reduced significantly in both WD action, suggesting that particle connections
have been deteriorated in both cases. It should be noted that the S-wave velocity of untreated
slope soil ranges between 150 and 200 m/s (Gowthaman, et al., 2019). Meanwhile the natural
beachrock in the shore bay ranges between 1330 to 2920 m/s (Daryono, et al., 2020). When the
soil particles are connected by calcium carbonate bio-cement, the transmission of S-waves
increases, leading to the increase in S-wave velocity values with respect to the level of
cementation. However, when the connections are degraded and/or deformed under the both
0
4
8
12
16
20
24
28
32
36
40
44
0 5 10 15 20 25
Lo
ose
s o
f m
ass
(%)
Number of wetting-drying cycles
Co21
Mizu21
Si14
Si21
Mizu7
Mizu14
Co14
Co7
0
4
8
12
16
20
24
28
0 5 10 15 20 25
Lo
ose
s o
f m
ass
(%)
Number of wetting-drying cycles
Co21
Mizu21
Si14
Si21
Mizu7
Mizu14
Co14
Co7
Figure 6.4. Average mass loss of the specimens subjected to WD cyclic treatments based on (a) saltwater
and (b) distilled fresh water. With Co = coral sand; Si = silica sand; Mizu = Mizunami.
(a)
(b)

212
cyclic treatments, the velocity values tended to decrease. The UCS measurements, illustrated
in Figure 6.5, also show the similar tendency of S-wave velocity. It can be observed that the
decrease in UCS values is lower when exposed to WD cycles under saltwater condition (red
bars) compared to that under distilled water (grey bars). As explained in the previous section,
the corrosion of powdery and weak deposits caused the mass loss, and that would also
considerably affect the mechanical responses. Regardless of weak or strong, if the carbonates
deposit at or near particle contacts, they contribute to the strengthening of MICP soil skeleton
by supporting primary bonds.
When the suspension of those weak deposits occurs, there would be a weakening in primary
chains in sand particles, leading to the decrease in UCS and S-wave velocities (Figure 6.5 and
Table 6.1, respectively). Mechanical damage of MICP specimens appears to be higher under
the exposure to WD cycles under saltwater condition. As explained in the previous section,
when the porewater undergoes freezing process, uneven tensile stresses are developed around
the soil particles, leading to the formation and the growth of microcracks. Consequently, the
MICP skeleton gets weakened, could be able to withstand only lower compression stresses
compared to that of unexperimented. In fact, the resistance to the WD damage depends on the
porosity of the soil matrix. Higher porosity permits more and rapid transfer of water through
the soil matrix, which could aid to prevent the damages WD effects. However, in the case of
MICP, soils of less porosity i.e. fine-grained soils were more durable against the WD actions
compared to that of coral-grained soils i.e. soils of higher porosity (Cheng et al., 2016). This is
UCS (Before)
UCS (After – saltwater) UCS (After – distilled water)
Sample code
Est
imat
ed U
CS
(M
Pa)
0
1
2
3
4
5
6
7
8
9
Co21 Si21 Mizu7 Co14 Mizu21 Mizu14 Si14 Co7
Figure 6.5. The variation of estimated UCS before and after the exposure of cyclic WD tests. With Co =
coral sand; Si = silica sand; Mizu = Mizunami.

213
due to the fact that the number of contacts of each soil grain increase with the decrease in
porosity. In the case of fine-grained soils, higher number of particle contact points facilitated
to increased MICP bridges, which reduce the acting tensile stresses per connection,
withstanding long WD cycles. The soil investigated herein also fine-grained soil. And, the
specimens were investigated herein up to its possible optimum cementation level in order to
assess the fullest feasibility. It also should be noted that when the specimens were treated over
20 – 23% by calcium carbonate, bio-clogging stage was frequently achieved similar to that
reported by (Cheng and Cord-Ruwisch, 2014).
Table 6.1. The S-wave velocity values before and after subjected to WD test.
Average
S-wave
velocity
(m/s)
21 WD cycles
Code sample Before After (saltwater) After (distilled water
Co21
Si21
Mizu7
Co14
Mizu21
Mizu14
Si14
Co7
1960
1765
1200
1440
2090
1970
1125
1282
1355
1135
932
1013
1435
1135
789
613
1120
960
600
1000
1000
900
870
770
6.4.3 Strength deterioration ratio (SDR)
In order to better understand the effect of precipitated calcium carbonate content against
mechanical degradation, SDR values under cyclic treatments are computed by using the
following relationship (Eq. 6.1).
𝑆𝐷𝑅 = 1 −𝑈𝐶𝑆(𝑓)
𝑈𝐶𝑆(𝑖) (Eq. 6.1)
SDR is the simplified measure, typically used to explain the deterioration of specimens exposed
to cyclic treatments and had been broadly used by researchers for soft to hard rock materials
(Hale and Shakoor, 2003; Khanlari and Abdilor, 2015). The UCS(f) represents the compressive
strength at the end of the cyclic treatment and UCS(i) represents the compressive strength of
virgin MICP specimens. The SDR varies between “0” and “1”. A rating of “1” is allotted to the
weakest specimen, reveals complete degradation at the end of the cyclic treatment. For the
strongest specimens, which do not show any damages after the treatment, a rating value of “0”
is allotted. The calculated SDR values of the samples subjected to cyclic WD cycles are plotted
in Figure 6.6, together with the SDR values of various sandstones material obtained from the
literature (Khanlari and Abdilor, 2015). The SDRWD values of sandstones (subjected to 30 WD
cycles) range between around 0.1 and 0.2. Comparatively, MICP specimens show higher

214
deterioration under WD cycles (SDRWD of 0.53 – 0.82 for saltwater and 0.43 – 0.81 for distilled
water), suggesting that MICP cemented soils are more susceptible than sandstones. It can also
be seen that the SDRWD values increase with the increase in calcium carbonate content. This
can be explained by the high deposition of weaker carbonates at heavy treatment. As explained
earlier, MICP treatment results the formation of both strong and weak carbonates. Longer
treatment to achieve high cementation level not only strengthens the primary bonds, but also
increase the deposition of weak and powdery carbonates. However, the WD effects cause the
suspension and disintegration of such weak deposits which had been supporting the primary
bonds. Moreover, as suggested by Li et al. (2019), the fatigue stresses developed during the
cycles could also affect the mechanical responses. As the thermal expansion coefficients of
calcium carbonate and slope soil are different, irregular internal stresses could be developed,
which possibly led to the deformations in particle contacts and deteriorated the specimens.
When the specimens are cemented heavily (~20% of CaCO3), the particle connections become
stronger, which provide significant resistance to the tensile stresses developed during the
freezing of porewater. However, the formation of microcracks and ruptures at sand-calcium
carbonate tended to decrease the mechanical behaviors of the MICP specimens.
The natural beachrock were mostly consist of magnesian calcite (high – low) depend on
the sedimentary location which key role the natural beachrock can occur in the shore bay. Other
minerals also found from XRD results such as Anorthite; Omphacite; Dolomite; and Diopsite
0.21
0.2 0.17
0.11
0.19
0.56
0.66
0.54
Str
eng
th d
eter
iora
tio
n r
atio
Wet
tin
g-D
ryin
g
Increase in CaCO3
0
0.1
0.2
0.3
0.4
0.5
0.6
0.7
0.8
0.9
0.65
0.59 0.59
0.53
0.82
0.70
0.75
0.81
0.66
0.80
0.75
0.43
0.71
Sandstone SDR30 (Khandari and Abdilor, 2015)
MICP beach sand SDR21 (this study – saltwater)
MICP beach sand SDR21 (this study – distilled
water)
Figure 6.6. The variation of estimated UCS before and after the exposure of cyclic WD tests.

215
Par
ang
titi
s si
lica
san
d b
efo
re t
reat
men
t
Par
ang
titi
s si
lica
san
d a
fter
MIC
P
trea
tmen
t
Par
ang
titi
s si
lica
san
d M
ICP
aft
er W
D t
est
– s
altw
ater
Par
ang
titi
s si
lica
san
d M
ICP
aft
er W
D t
est
– d
isti
lled
wat
er
Fig
ure
6.7
. G
rap
hic
XR
D a
nal
ysi
s p
atte
rn u
sin
g a
rtif
icia
l b
each
rock
(a)
bef
ore
MIC
P t
reat
men
t, (
b)
afte
r M
ICP
tre
atm
ent,
(c)
MIC
P t
reat
ed a
fter
21
WD
cy
cle
un
der
dis
till
ed w
ater
, an
d (
d)
MIC
P t
reat
ed a
fter
21
WD
cy
cle
und
er s
altw
ater
. W
ith
Ab
(al
bit
e),
Qtz
(q
uar
tz),
Mg
h (
mag
hem
ite)
, an
d M
gn
(m
agn
etit
e).
(a)
(b)
(c) (d
)

216
that might effect of the SiO2 in the materials. Figure 6.7 shown the XRD results of original
silica sand, after MICP treatment, and after WD test for 21 cycles. The mineralogy inside the
samples was found almost similar than before WD test was conducted, the significant
difference especially strength of materials which is crystals bonding intra particles were loses
than before because of WD cycle test. The higher damage was found in the fine material sands
(11~28 %, respectively) with 0.6 mm, it is easily diluted in the water. Other results under
different sand materials were similar as silica sands, which is not affect significantly the WD
cycles for the mineralogy of the material (see Appendixes E for XRD results of other material).
WD cycles might cause deionized of the calcium carbonate chain (reverse reactions of Eqs. 6.1
and 6.2) which came from the evaporation process of H2O presence. Heavy damage found in
the saltwater WD test because of H2O ions and Na+ (NaCl and Na2SO4) were found in the
saltwater (Chierici and Fransson, 2009; Shahidzadeh-Bonn, et al., 2010) (Figure 6.8).
The relationship between number of samples were shown in the Figure 6.9 regarding the
estimated UCS versus calcium carbonate content of MICP using indigenous ureolytic bacteria
were isolated from natural beachrock in Krakal-Sadranan, Indonesia. The samples was treated
Figure 6.8. Illustration scheme of WD damages mechanism
CaCO3(s)+CH2O(org)+O2→Ca2++2HCO−
Na+ (NaCl and Na2SO4)

217
with MICP period 7 days equal with the calcium carbonate content less than 0.15 g/ g sands
materials, also for 14 days of curing MICP with the calcium carbonate content around 0.15 –
0.2 g/ g sand materials, and for the last 21 days of MICP treatment were consist with the
calcium carbonate content more than 0.2 g/g sand materials. This total of the calcium carbonate
content also can be mention as percentage of calcium carbonate based on gram of CaCO3 ratio
with original gram of sand materials.
6.5 Conclusions
Experimental work presented in this paper investigated the physical and mechanical
characteristics of MICP treated slope soil subjected to WD cyclic action. Based on the results,
it can be concluded that the damages were higher to the specimens subjected to WD cycles
under saltwater condition compared to those subjected to distilled WD cycles. The saltwater
WD induced erosion is highly reliant on the level of cementation. The increase in precipitated
calcium carbonate content substantially increased the aggregate stability of specimens under
the exposure of WD cycles. On the other hand, the level of cementation was not significantly
influencing the WD induced erosion, which is less than 40% for saltwater condition and less
than 30% for distilled water condition. SDR values suggest that the MICP specimens
0
2
4
6
8
10
12
0 0.05 0.1 0.15 0.2 0.25 0.3 0.35 0.4
Est
imat
ed U
CS
(M
Pa)
Total CaCO3 precipitation content (g/g sand)
P. tetradonis (this research)
Figure 6.9. Relationship between estimated UCS versus calcium carbonate content
of MICP treatment period
21 days of curing 14 days
of curing
7 days of
curing y = 110x2 + 2.71x
R² = 0.922

218
underwent severe degradation under saltwater WD cycles (over 40%). Comparatively, the
reduction of UCS is low under WD cycles (between around 40 – 55%). Under both WD cycles,
the strength deterioration likely to be in a relationship with the precipitated calcium carbonate
content. The period of MICP treatment and source of sand material have a significant influence
for durability after treated by MICP. Roughly hypothesis, the WD durability tested is
represented the real-field implementation period indicated with wet-dry raining season.
However, although, MICP for drowned system in the shoreline is necessarily deep
investigation in the future to achieve sustainable and feasible material for against the coastal
erosion problems. Minimum calcium carbonate content for ground improvement in the coastal
areas should have a limit of no more than 15 % of the calcium carbonate cement material.
References
Achal, V., Kawasaki, S., 2016. Biogrout: A novel binding material for soil improvement
and concrete repair. Front. Microbiol. 7.
Arya, I.W., Wiraga, I.W., Suryanegara, I.G.A.G., 2018. Effect of cement injection on sandy
soil slope stability, case study: Slope in Petang district, Badung regency. J. Phys. Conf. Ser.
953.
ASTM D559-03, 2003. Standard Test Methods for Wetting and Drying Compacted Soil-
Cement Mixtures. In: ASTM International, West Conshohocken, PA, West Conshohocken PA,
United States.
Cheng, L., Cord-Ruwisch, R., 2014. Upscaling Effects of Soil Improvement by Microbially
Induced Calcite Precipitation by Surface Percolation. Geomicrobiol. J. 31, 396–406.
Cheng, L., Shahin, M.A., Mujah, D., 2016. Influence of Key Environmental Conditions on
Microbially Induced Cementation for Soil Stabilization. J. Geotech. Geoenvironmental Eng.
143, 04016083.
Chierici, M. and Fransson, A., 2009. Calcium carbonate saturation in the surface water of
the Arctic Ocean: undersaturation in freshwater influenced shelves. Biogeosciences, 6(11).
Chirico, G.B., Borga, M., Tarolli, P., Rigon, R., Preti, F., 2013. Role of Vegetation on Slope
Stability under Transient Unsaturated Conditions. Procedia Environ. Sci. 19, 932–941.
Ciantia, M.O., Castellanza, R., Crosta, G.B., Hueckel, T., 2015. Efects of mineral
suspension and dissolution on strength and compressibility of soft carbonate rocks. Eng. Geol.
184, 1–18.
Daryono, L.R., Nakashima, K., Kawasaki, S., Titisari, A.D. and Barianto, D.H., 2020.
Sediment Characteristics of Beachrock: A Baseline Investigation Based on Microbial Induced

219
Carbonate Precipitation at Krakal-Sadranan Beach, Yogyakarta, Indonesia. Applied Sciences,
10(2), p.520.
Daryono, L.R., Titisari, A.D., Warmada, I.W. and Kawasaki, S., 2019. Comparative
characteristics of cement materials in natural and artificial beachrocks using a petrographic
method. Bulletin of Engineering Geology and the Environment, 78(6), pp.3943-3958.
DeJong, J.T., Mortensen, B.M., Martinez, B.C., Nelson, D.C., 2010. Bio-mediated soil
improvement. Ecol. Eng. 36, 197–210.
Feng, K., Montoya, B.M., 2017. Quantifying Level of Microbial-Induced Cementation for
Cyclically Loaded Sand. J. Geotech. Geoenvironmental Eng. 143, 06017005.
Fukue, M., Ono, S.-I., Sato, Y., 2011. Cementation of Sands Due to Microbiologically
Induced Carbonate Precipitation. Soils Found. 51, 83–93.
Gowthaman, S., Iki, T., Nakashima, K., Ebina, K., Kawasaki, S., 2019. Feasibility study
for slope soil stabilization by microbial induced carbonate precipitation (MICP) using
indigenous bacteria isolated from cold subarctic region. SN Appl. Sci. 1, 1480.
Gowthaman, S., Mitsuyama, S., Nakashima, K., Komatsu, M., Kawasaki, S., 2019.
Biogeotechnical approach for slope soil stabilization using locally isolated bacteria and
inexpensive low-grade chemicals: A feasibility study on Hokkaido expressway soil, Japan.
Soils Found. 59, 484–499.
Gowthaman, S., Nakashima, K., Kawasaki, S., 2018. A state-of-the-art review on soil
reinforcement technology using natural plant fiber materials: Past findings, present trends and
future directions. Materials. 11, 553.
Guerra, A.J.T., Fullen, M.A., Jorge, M. do C.O., Bezerra, J.F.R., Shokr, M.S., 2017. Slope
Processes, Mass Movement and Soil Erosion: A Review. Pedosphere 27, 27–41.
Hale, P.A., Shakoor, A., 2003. A laboratory investigation of the effects of cyclic heating
and cooling, wetting and drying, and freezing and thawing on the compressive strength of
selected sandstones. Environ. Eng. Geosci. 9, 117–130.
JGS 3431-2012, 2012. Japanese Standards and Explanations of Geotechnical and
Geoenvironmental Investigation Methods, No. 1. In: JGS Publication (in Japanese), Tokyo,
426–432.
Jiang, N.-J., Tang, C.-S., Yin, L.-Y., Xie, Y.-H., Shi, B., 2019. Applicability of Microbial
Calcification Method for Sandy-Slope Surface Erosion Control. J. Mater. Civ. Eng. 31,
04019250.
Khanlari, G., Abdilor, Y., 2015. Influence of wet–dry, freeze–thaw, and heat–cool cycles
on the physical and mechanical properties of Upper Red sandstones in central Iran. Bull. Eng.

220
Geol. Environ. 74, 1287–1300.
Kumar, N., Das, D., 2018. Nonwoven geotextiles from nettle and poly (lactic acid) fibers
for slope stabilization using bioengineering approach. Geotext. Geomembranes 46, 206–213.
Li, Y., Shi, T., Li, Y., Bai, W., Lin, H., 2019. Damage of magnesium potassium phosphate
cement under dry and wet cycles and sulfate attack. Constr. Build. Mater. 210, 111–117.
Lin, H., Suleiman, M.T., Brown, D.G., Kavazanjian, E., 2016. Mechanical Behavior of
Sands Treated by Microbially Induced Carbonate Precipitation. J. Geotech. Geoenvironmental
Eng. 142, 04015066-1–13.
Martinez, B.C., DeJong, J.T., Ginn, T.R., Montoya, B.M., Barkouki, T.H., Hunt, C., Tanyu,
B., Major, D., 2013. Experimental Optimization of Microbial-Induced Carbonate Precipitation
for Soil Improvement. J. Geotech. Geoenvironmental Eng. 139, 587–598.
Shahidzadeh-Bonn, N., Desarnaud, J., Bertrand, F., Chateau, X. and Bonn, D., 2010.
Damage in porous media due to salt crystallization. Physical Review E, 81(6), p.066110.
Tang, C.S., Wang, D.Y., Shi, B., Li, J., 2016. Effect of wetting-drying cycles on profile
mechanical behavior of soils with different initial conditions. Catena 139, 105– 116.
van Paassen, L.A., Ghose, R., van der Linden, T.J.M., van der Star, W.R.L., van
Loosdrecht, M.C.M., 2010. Quantifying Biomediated Ground Improvement by Ureolysis:
Large-Scale Biogrout Experiment. J. Geotech. Geoenvironmental Eng. 136, 1721–1728.
Wang, Y., Soga, K., Dejong, J.T., Kabla, A.J., 2019. Microscale Visualization of
Microbial-Induced Calcium Carbonate Precipitation Processes. J. Geotech. Geoenvironmental
Eng. 145, 1–13.
Zhang, X., Hu, M., Guo, X., Yang, H., Zhang, Z., Zhang, K., 2018. Effects of topographic
factors on runoff and soil loss in Southwest China. Catena 160, 394–402.

221
CHAPTER 7
MICP beach sand treatment using cheap chemical reagents
7.1 Introduction
Up to now, many studies have focused on MICP based soil stabilization in order to mitigate
the potential of erodibility. Most of them have been performed based on a bioaugmentation
strategy by introducing non-native ureolytic bacteria to the soil or sand. Among them,
Sporosarcina pasteurii is the most researched bacterium: it enables a highly active urease
enzyme associated with urea hydrolysis (Gomez et al., 2013). The solidification of sand using
S. pasteurii allows for significant control of surficial sediment erosion (Bao et al., 2017; Salifu
et al., 2016) and reduces hydraulic conductivity while increasing the confined compressive
strength (Jiang and Soga, 2017; Whiffin et al., 2007). Also, S. pasteurii was shown to form an
impermeable stiff crust with a thickness of 2.5 cm which increases resistance to erosion (Gomez
et al., 2013). Cheng et al. (2014) reported that Bacillus sphaericus can enhance the strength of
silica sand with relatively retained permeability when 10 mM urea concentrated artificial sea
water was used as cementation solution.
Despite numerous attainable outcomes of this technology at laboratory-scale, MICP is still
considered expensive for commercial implementation or field-scale applications (Mujah et al.,
2017). One of the reasons is due to the nutrient medium used in the biotechnological process
for bacteria cultivation (Achal et al., 2009). The use of laboratory-grade growth media (i.e.
nutrient broth, yeast extract and tryptic soy broth) are a major cost factor for bacterial
cultivation due to their high cost that can reach up to 60% of the total production cost
(Kristiansen, 2006).To date, only limited studies in the literature have reported the use of
alternative nutritional sources to cultivate ureolytic bacteria for MICP application. The use of
waste materials such as chicken manure effluent, corn steep liquor, lactose mother liquor and
activated sludge from agricultural, dairy and bakery industries have been the focus of
alternative nutritional source (Achal et al., 2010, 2009; Cuzman et al.,2015a; Joshi et al., 2018;
Whiffin, 2004; Yoosathaporn et al., 2016).These attempts are mostly performed to limit the
economic challenges faced for cultivating ureolytic bacterial in large volume (Anbu et
al.,2016). Irrespective of the promising findings which have been reported in the
aforementioned studies for bacterial cultivation and also help minimize accumulative
environmental wastes through recycling (Yoosathaporn et al., 2016). Unfortunately, most
recent contemporary studies on MICP still make use of conventional growth media to grow

222
various ureolytic bacterial species.
However, the bio-augmentation of exogenous bacteria which have not been adapted to
native environment is associated with uncertainties in bacterial survival and performance
(Sensoy et al., 2017). On the other hand, a very few studies have been attempted to investigate
the feasibility of bio-augmentation using indigenous bacteria (Danjo and Kawasaki, 2016;
Khan et al., 2016; Stabnikov et al., 2011). Actually, bio-augmentation (the process includes the
isolation of bacteria, culture enrichment, and supply back into the ground) conceptionally
differs from bio-stimulation strategy in which the indigenous ureolytic bacteria are stimulated
in situ. Danjo and Kawasaki (2016) and Khan et al. (2016) investigated the feasibility of
artificial beach rock formation as the mitigation measure for coastal erosion by augmenting
native Pararhodobactor sp. isolated from the native sand of Okinawa, Japan. Similarly, using
native Bacillus sp. VS1, relatively impermeable biocemented crust (maximum flexural strength
of 35.9 MPa; permeability of 1.6 10 7 m/s) has been achieved on the native sand surface for
aquaculture pond construction (Stabnikov et al., 2011). The use of natively adapted bacteria is
likely to be both more effective and more appropriate in regions with fluctuating cold climatic
conditions, as the urease enzymes of most of the bacteria are temperature-sensitive and can
readily be denatured by changes in the environmental temperature. However, due to the uneven
presence of ureolytic bacteria in natural soil, stimulating the indigenous bacteria has been
reported to result in diffuse zones of improvement with high variability even within the same
region (Gomez et al., 2017). At the same time, augmentation has been shown to result in more
uniform improvement on a more localized scale due to the reduction in soluble calcium
concentrations transported to greater distances (Danjo and Kawasaki, 2016; Gomez et al.,
2017). As this research aims for the uniform surface stabilization of slopes, the
bioaugmentation of indigenous bacteria is likely to be the better choice among the strategies
discussed above.
In fact, the feasibility of MICP does not depend on technical aspects regarding conditions
of treatment alone but accompanies by economical and legislative issues as well. It has been
reported that the discharging of vigorous chemicals and ammonium by-products to the soil-
ecosystem in the MICP causes many harmful effects, and the subsequent removal of such
harmful products must be taken into account (Soon et al., 2014). The cost of the required
substances remains another contest in assessing the complete feasibility of the process (van
Paassen et al., 2010). There are some suggestive drawbacks that can hinder the use of waste
materials for MICP applications which includes: (i) limited quality control and processing
(Williams et al., 2016); (ii) unavailability in localized regions; (iii) insufficient bulk quantity

223
(i.e. large volume) and (iv) transportation to site. Hence, there is a need to explore other types
of nutrition sources which are easily accessible at low or no cost suitable for MICP application.
7.2 Objectives
The aim of this present study was to determine the feasibility of cultivating P.tetradonis
strain in an economical food-grade yeast extract (Beer yeast and tempeh starter) medium and
investigate its effect on bacterial production, urease activity and biocalcification. The
performance of cheap chemical reagents was compared with laboratory-grade growth media,
same protocol also conducted for cementation solution whereas laboratory-grade cementation
solution with low-grade chemical reagents (snow melting agent and chalk powder extract).
XRD analysis was further used to determine the elemental compositions and identify the
polymorphs of CaCO3 precipitates after biocalcification test. In the same way, we conducted
after treatment test of solidification samples with low-grade chemicals treatment within
statistical analysis of wetting-drying test to enhance the possibility of materials durability
strength. Therefore, the influence of variable wet-dry cycles on the physical and mechanical
characteristics of MICP treated slope beach sand, representing the erosion shoreline slope in
the coastal area. The goal of this paper is to perform the efficiency of low-grade chemical
solution and durability of the specimens in term of cost reduction the treatment soil/ sands.
7.3 Materials and methods
7.3.1 Ureolytic bacteria and cultivation
Ureolytic bacteria P. tetradonis isolated by Daryono, et al. (2020) from beachrock sample
from Indonesia shoreline was used in this study due to its high urease activity. The bacterium
was revived in Petri dishes containing sterile ZoBell2216E agar medium (for marine bacteria,
pH 7.7). The Petri dishes were incubated at 30°C for 48 h under aerobic conditions and the
grown colonies were subsequently sub-cultured until pure isolates were obtained. P. tetradonis
are gram-negative specified with the former are motile bacilli 1 μm wide and 1.5–4.0 μm,
whereas the latter are strictly aerobic, motile with one polar flagellum, form either straight rods
(or rod-shapes), 0.5–0.8 × 1.0–1.5 μm when in exponential growth phase.
7.3.2 Culture medium
Is also called as nutrient broth, solution freed of all microorganisms by sterilization (usually
in an autoclave, where it undergoes heating under pressure for a specific time) and containing

224
the substances required for the growth of microorganisms such as bacteria, protozoans, algae,
and fungi. The medium may be solidified by the addition of agar. Some media consist of
complex ingredients such as extracts of plant or animal tissue (e.g., peptone, meat extract, yeast
extract); others contain exact quantities of known inorganic salts and one or more organic
compounds (synthetic or chemically defined media).
7.3.2.1 Zobell2216 medium marine broth
Microorganisms in an aquatic environment may occur at all depths ranging from the surface
region to the very bottom of the ocean trenches. The top layers and the bottom sediments harbor
higher concentration of microorganisms (Pelezar, et al., 1977). Marine microorganisms are
vital to ecological cycles because they form the foundations of many food chains (Alcamo,
2001). Zobell Marine Broth formulated by Zobell (1941), has a composition that mimics
seawater (Lyman and Fleming, 1940) and thus helps the marine bacteria to grow abundantly.
This medium has been used for the growth of marine bacteria (Sizemore and Stevenson, 1970;
Weiner, et al., 1985). Zobell Marine Broth contains the nutrients, which are required for the
growth of marine bacteria. These media have minerals as in seawater (Zobel, 1940) and peptone
and yeast extract as the sources of nutrients for the marine bacteria as reported by Jones (1960).
High amount of salt content is used to simulate seawater. Other minerals are used to mimic the
mineral composition of seawater. The composition of Zobell2216 medium marine broth were
described in the Table 7.1.
Table 7.1. Composition make culture medium
Composition (solvent by artificial seawater) for 1L Medium
Chemical Compose Concentration Solution Unit
Polypeptone
Yeast extract
FePO4 Phospate Tetrahedraite
Agar (solidify the medium)
5.0 g/ L
1.0 g/ L
197 g/ L
15.0 g/ L
7.3.2.2 Beer yeast extract
Beer production is an important economic activity in many countries, especially in Japan.
Consequently, plenty of beer yeasts, being the second major by-product from brewing industry,
is generated and either thrown out or fed to livestock and fowl. This not only results in a series
of environmental problems, but also causes an enormous waste of resources (Yang et al., 2006).
In general, beer yeast is mainly composed of 48–55% protein, 23–28% carbohydrate, 6–8%
RNA, 1% glutathione, and 2% vitamin B. Moreover, they are rich in P, K, Ca, Fe, P and Mg

225
(Liu et al.,2012). The detail composition of beer yeast is shown in the figure 7.1. The culture
with this reagent made with 30 gr of beer yeast mixed into 1L of the artificial seawater solution
(See table 5.1).
Figure 7.1. Beer yeast composition (Asahi Group Research & Development, 2019)
7.3.2.3 Tempeh starter
Tempeh (pronounced TEM-pay) is a mold-fermented soybean food. Occasionally other
legumes, seeds, and cereal grains are also used along with soybeans. The mold fermentation
results in a matrix of dense, cottony, mycelia in which cooked soybeans are embedded, forming
a compact greyish-white cake. Tempeh possesses a pleasant aroma which can be described as
nutty, cheesy, mushroom, etc. Tempeh is a popular fermented food of Indonesia. However, in
the last two decades it has attracted the attention of the Western world, particularly North
America. Tempeh starter is a dried mixture of live Rhizopus spores with substrate, which can
be soybeans or rice. With most fermented food products, the starter to push the process in the
desired direction. In the latter case there is a risk of contamination with other bacteria, a risk
which increases with every successive batch. The same principle applies to tempeh
fermentation: to produce good quality tempeh you need a tempeh starter with a very high count
of desirable Rhizopus molds. The same protocol within this tempeh starter to made 1L liquid
culture solution mixed with 30 gram of tempeh starter (Sivakumar, et al., 2019).

226
7.3.3 Nutrient cementation solution
The applicability of MICP technique under various complicated environments, attempt of
using the technique to reinforce soil under sea environment was made recently (Harianto et al.
2013; Cheng, Shahin, and Cord-Ruwisch 2014; Cheng et al. 2014; Jiang et al. 2016). Cheng,
Shahin, and Cord-Ruwisch (2014) and Cheng et al. (2014) proposed a novel approach to treat
sandy soils under marine environments by modifying the promising MICP technique and using
seawater as a calcium resource to facilitate the MICP process. Most studies using MICP involve
feeding bacteria with nutrient cementation solution every several hours or day by injecting
more nutrient cementation solution contained with urea into the soil, the enhancing of the
hydrolysis of ureolytic bacteria. With a surface-spray technique like the one used during this
study, the bacteria are being fed only once and consume urea until they either run out or die.
Investigators hypothesized that it may be possible to use fewer bacteria than the 1:1 ratio,
culture solution of the bacterium culture media with nutrient cementation solution. Presumably,
under these conditions, there should be less competition for food, or more food per bacteria.
As such, maybe with more food, each bacteria cell could live longer and produce more calcite
over time.
7.3.3.1 Standard solution
The test liquid media used for chemical injections contained an equimolar amount of urea
and calcium chloride, in addition to 3 g nutrient broth as a nutrient source for bacteria, 10 g
ammonium chloride (NH4Cl), and 2.12 g sodium bicarbonate (NaHCO3) per litre of deionised
water or artificial seawater for stabilization of the pH of the solution before injections. The
0.5M urea–calcium chloride concentrations were used in order to assess the effect permeability
with cementation and nutrient solution-urea–calcium chloride concentration was added to this
range for the strength tests. Chemical retention time in the samples (time between injections)
was determined based on the conclusion of a previous study to ensure full chemical reaction
(Al Qabany et al., 2012) and the retention times adopted were 24 h for the 0.5 M urea–calcium
200 chloride solutions, respectively. This was assuming that all injected urea and calcium
chloride precipitated as calcium carbonate, which was verified by measuring the amount of
precipitation. This was done by adding hydrochloric acid (HCl) and calculating the weight
difference of the sample before and after dissolving the precipitated calcium carbonate.
7.3.3.2 Chalk powder extract
Chalk, either source of calcium carbonte product which contains more than 94% of calcium
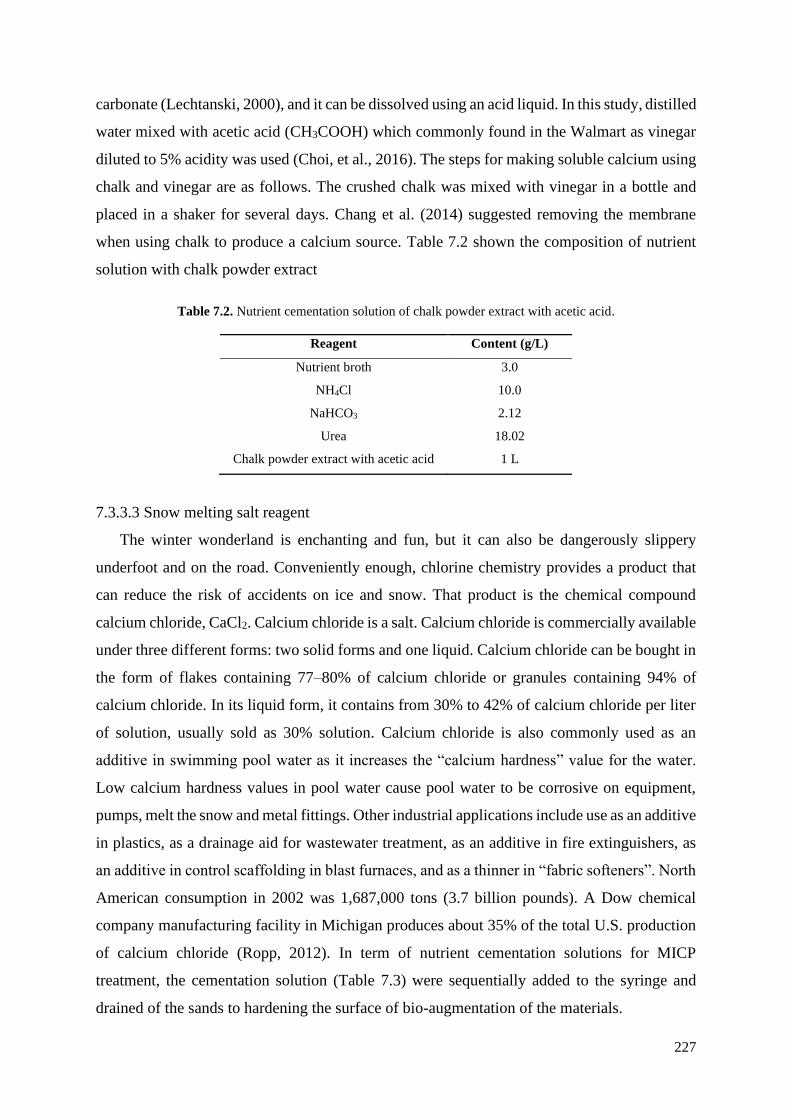
227
carbonate (Lechtanski, 2000), and it can be dissolved using an acid liquid. In this study, distilled
water mixed with acetic acid (CH3COOH) which commonly found in the Walmart as vinegar
diluted to 5% acidity was used (Choi, et al., 2016). The steps for making soluble calcium using
chalk and vinegar are as follows. The crushed chalk was mixed with vinegar in a bottle and
placed in a shaker for several days. Chang et al. (2014) suggested removing the membrane
when using chalk to produce a calcium source. Table 7.2 shown the composition of nutrient
solution with chalk powder extract
Table 7.2. Nutrient cementation solution of chalk powder extract with acetic acid.
Reagent Content (g/L)
Nutrient broth 3.0
NH4Cl 10.0
NaHCO3 2.12
Urea 18.02
Chalk powder extract with acetic acid 1 L
7.3.3.3 Snow melting salt reagent
The winter wonderland is enchanting and fun, but it can also be dangerously slippery
underfoot and on the road. Conveniently enough, chlorine chemistry provides a product that
can reduce the risk of accidents on ice and snow. That product is the chemical compound
calcium chloride, CaCl2. Calcium chloride is a salt. Calcium chloride is commercially available
under three different forms: two solid forms and one liquid. Calcium chloride can be bought in
the form of flakes containing 77–80% of calcium chloride or granules containing 94% of
calcium chloride. In its liquid form, it contains from 30% to 42% of calcium chloride per liter
of solution, usually sold as 30% solution. Calcium chloride is also commonly used as an
additive in swimming pool water as it increases the “calcium hardness” value for the water.
Low calcium hardness values in pool water cause pool water to be corrosive on equipment,
pumps, melt the snow and metal fittings. Other industrial applications include use as an additive
in plastics, as a drainage aid for wastewater treatment, as an additive in fire extinguishers, as
an additive in control scaffolding in blast furnaces, and as a thinner in “fabric softeners”. North
American consumption in 2002 was 1,687,000 tons (3.7 billion pounds). A Dow chemical
company manufacturing facility in Michigan produces about 35% of the total U.S. production
of calcium chloride (Ropp, 2012). In term of nutrient cementation solutions for MICP
treatment, the cementation solution (Table 7.3) were sequentially added to the syringe and
drained of the sands to hardening the surface of bio-augmentation of the materials.
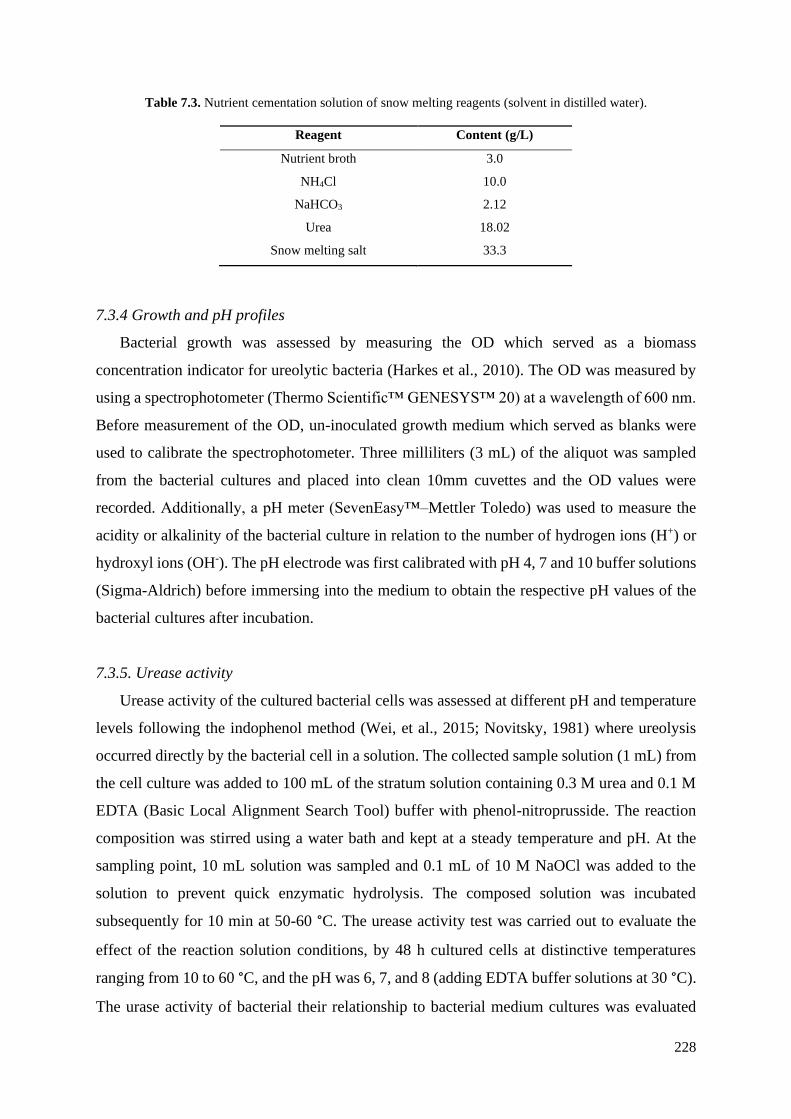
228
Table 7.3. Nutrient cementation solution of snow melting reagents (solvent in distilled water).
Reagent Content (g/L)
Nutrient broth 3.0
NH4Cl 10.0
NaHCO3 2.12
Urea 18.02
Snow melting salt 33.3
7.3.4 Growth and pH profiles
Bacterial growth was assessed by measuring the OD which served as a biomass
concentration indicator for ureolytic bacteria (Harkes et al., 2010). The OD was measured by
using a spectrophotometer (Thermo Scientific™ GENESYS™ 20) at a wavelength of 600 nm.
Before measurement of the OD, un-inoculated growth medium which served as blanks were
used to calibrate the spectrophotometer. Three milliliters (3 mL) of the aliquot was sampled
from the bacterial cultures and placed into clean 10mm cuvettes and the OD values were
recorded. Additionally, a pH meter (SevenEasy™–Mettler Toledo) was used to measure the
acidity or alkalinity of the bacterial culture in relation to the number of hydrogen ions (H+) or
hydroxyl ions (OH-). The pH electrode was first calibrated with pH 4, 7 and 10 buffer solutions
(Sigma-Aldrich) before immersing into the medium to obtain the respective pH values of the
bacterial cultures after incubation.
7.3.5. Urease activity
Urease activity of the cultured bacterial cells was assessed at different pH and temperature
levels following the indophenol method (Wei, et al., 2015; Novitsky, 1981) where ureolysis
occurred directly by the bacterial cell in a solution. The collected sample solution (1 mL) from
the cell culture was added to 100 mL of the stratum solution containing 0.3 M urea and 0.1 M
EDTA (Basic Local Alignment Search Tool) buffer with phenol-nitroprusside. The reaction
composition was stirred using a water bath and kept at a steady temperature and pH. At the
sampling point, 10 mL solution was sampled and 0.1 mL of 10 M NaOCl was added to the
solution to prevent quick enzymatic hydrolysis. The composed solution was incubated
subsequently for 10 min at 50-60 °C. The urease activity test was carried out to evaluate the
effect of the reaction solution conditions, by 48 h cultured cells at distinctive temperatures
ranging from 10 to 60 °C, and the pH was 6, 7, and 8 (adding EDTA buffer solutions at 30 °C).
The urase activity of bacterial their relationship to bacterial medium cultures was evaluated

229
(Figure 7.2).
Figure 7.2. The reaction formula of the indophenol blue method.
7.3.6 Microbial CaCO3 precipitation test
The P. tetradonis strains were cultured with a different culture with a controlled pH of 7.6–
8.2, until the maximum cell growth was observed. The cell growth (OD600) was measured by a
UV-VIS spectrophotometer (V-730, JASCO Corporation, Tokyo, Japan). In the meantime, the
standard nutrient solution (0.5 M CaCl2), chalk powder extract, and snow-melting salt mixed
with 0.5 M urea were put in a test tube up to 10 mL. The bacterial culture solution was
centrifuged (12,000 rpm) for 10 min. The supernatant and cell pellets were divided and the
bacterial cell concentration (OD600) was adjusted using distilled water. The adjusted bacterial
cell concentration was then added to the test tube and put in a shaker at 30°C for 48 h. Finally,
the precipitation (white crystals) was observed and the precipitated crystals (centrifuged at
12,000 rpm for 10 min) was separated from the culture solution by a filter paper. Precipitated
crystal tubes were kept in an oven drier for 24 h at 100°C and then the final weight was taken
to calculate the total crystal precipitation amount.
7.3.7 Solidifications test
The local beach sand used in the experiments was uniformly graded with a mean particle
size of 0.9 mm for coral sand and 0.6 mm for fine sand. The sand was sterilized, and hand
packed into a 50-mL syringe (mean diameter, D50 = 3 cm and height, h = 10 cm). This was
followed by gentle injection of bacteria and solidification solution, as illustrated in Figure 7.3.
The bacterial suspension was injected first and allowed to stand in the column for 2 h;
thereafter, solidification solution was injected. This was repeated every 24 h for a period of 14
d. In addition, two sets of biocementation experiments were conducted using conditions

230
designed to mimic the possible conditions for in situ injection of treatment solutions. The first
set of experiments involved using coral local sand of which the main content was skeletal shell
carbonate. The other set of experiments involved the use of iron-silica fine sand (fluvio-
volcanic sand) of the Young Merapi deposit. In both injection conditions, 20 mL of cementation
solution was left above the surface of the sand to mimic saturated conditions, and this procedure
was called the immersed method. Control tests were also conducted following the same
procedures but without the addition of bacterial cells. First, 100 mL bacteria medium solution
(ZoBell2216E, beer yeast extract, and tempeh starter solution) was inoculated with 0.1 g of the
ureolytic bacterium isolated by the above test, then incubated at 30 °C with gentle shaking at
160 rpm for 3 d. Next, 80 g of coral sand and silica sand collected from the Yogyakarta south
coast was dried at 110 °C for 2 d and then placed in a 50 mL syringe (diameter 3 cm).
Subsequently, 16 mL (more than the estimated 14 mL initial pore volume in the sample) of
bacterial culture and 20 mL of the nutrient cementation solutions (Laboratory-standard-grade;
chalk powder extract, and snow melting salt reagent) were sequentially added to the syringe
and drained, leaving about 2 mL of solution above the surface of the sand (saturated condition).
This solidification test was conducted for 14 cementation injections in 14 d. In order to
investigate the effect of different factors in solidification of soil, twelve cases were conducted.
Each of them is clearly summarized in Table 7.4.
Table 7.4. Test condition for syringe solidification test
Case No. Soil material Culture
solution
Cementation
solution
Temperature
(°C)
Test
duration
(days)
1
2
3
4
5
6
7
8
9
10
11
12
13
14
Coral sand
Coral sand
Coral sand
Coral sand
Coral sand
Coral sand
Coral sand
Fine silica sand
Fine silica sand
Fine silica sand
Fine silica sand
Fine silica sand
Fine silica sand
Fine silica sand
ZoBell2216E
ZoBell2216E
ZoBell2216E
Beer yeast
Beer yeast
Tempeh starter
Tempeh starter
ZoBell2216E
ZoBell2216E
ZoBell2216E
Beer yeast
Beer yeast
Tempeh starter
Tempeh starter
Lab. Grade
Snow melting salt
Chalk extract
Snow melting salt
Chalk extract
Snow melting salt
Chalk extract
Lab. Grade
Snow melting salt
Chalk extract
Snow melting salt
Chalk extract
Snow melting salt
Chalk extract
30
30
30
30
30
30
30
30
30
30
30
30
30
30
14
14
14
14
14
14
14
14
14
14
14
14
14
14
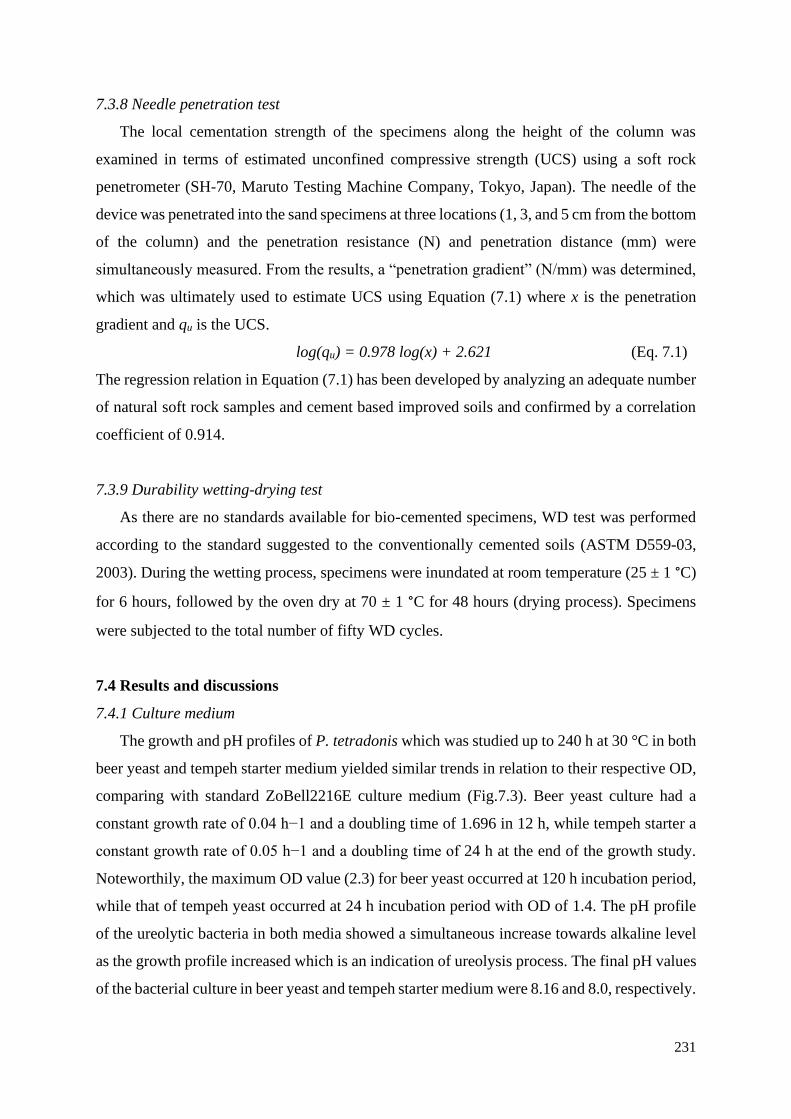
231
7.3.8 Needle penetration test
The local cementation strength of the specimens along the height of the column was
examined in terms of estimated unconfined compressive strength (UCS) using a soft rock
penetrometer (SH-70, Maruto Testing Machine Company, Tokyo, Japan). The needle of the
device was penetrated into the sand specimens at three locations (1, 3, and 5 cm from the bottom
of the column) and the penetration resistance (N) and penetration distance (mm) were
simultaneously measured. From the results, a “penetration gradient” (N/mm) was determined,
which was ultimately used to estimate UCS using Equation (7.1) where x is the penetration
gradient and qu is the UCS.
log(qu) = 0.978 log(x) + 2.621 (Eq. 7.1)
The regression relation in Equation (7.1) has been developed by analyzing an adequate number
of natural soft rock samples and cement based improved soils and confirmed by a correlation
coefficient of 0.914.
7.3.9 Durability wetting-drying test
As there are no standards available for bio-cemented specimens, WD test was performed
according to the standard suggested to the conventionally cemented soils (ASTM D559-03,
2003). During the wetting process, specimens were inundated at room temperature (25 ± 1 °C)
for 6 hours, followed by the oven dry at 70 ± 1 °C for 48 hours (drying process). Specimens
were subjected to the total number of fifty WD cycles.
7.4 Results and discussions
7.4.1 Culture medium
The growth and pH profiles of P. tetradonis which was studied up to 240 h at 30 °C in both
beer yeast and tempeh starter medium yielded similar trends in relation to their respective OD,
comparing with standard ZoBell2216E culture medium (Fig.7.3). Beer yeast culture had a
constant growth rate of 0.04 h−1 and a doubling time of 1.696 in 12 h, while tempeh starter a
constant growth rate of 0.05 h−1 and a doubling time of 24 h at the end of the growth study.
Noteworthily, the maximum OD value (2.3) for beer yeast occurred at 120 h incubation period,
while that of tempeh yeast occurred at 24 h incubation period with OD of 1.4. The pH profile
of the ureolytic bacteria in both media showed a simultaneous increase towards alkaline level
as the growth profile increased which is an indication of ureolysis process. The final pH values
of the bacterial culture in beer yeast and tempeh starter medium were 8.16 and 8.0, respectively.

232
The bacteria growth and urase activity still lower value compare with ZoBell2216E
standard medium. There were noticeable slight differences between the growth profile of the
ureolytic bacteria when grown beer yeast and tempeh starter, it is possible this could be
influenced by the yeast extract components such as amino acid complexes additive present in
the medium (Figure 7.4, after Anggriawan, 2017 and Munedata, 2020). Yeast extract typically
contains abundant of amino acids, peptides, carbohydrates, salts, vitamins and minerals which
are necessary for microbial cell cultivation (Li et al., 2011). Commercially manufactured yeast
extract for bakery and cooking purposes often contains other ingredients such as flavoring
agent in soup, snacks and canned foods for food industry containing (Milić et al., 2007).
Nevertheless, the growth and pH profile showed that the ureolytic bacteria could adapt in the
slow-cost media. In contrast to Zobell medium and beer's yeast, tempeh starter contains
Rhizopus where the extract from the mushroom as a media material therefore that it needs to
be sterilized first to avoid contamination from the effects of fungus or other organisms.
7.4.2 Nutrient cementation solution on precipitation test
7.4.2.1 Standard solution
A large community of bacteria has the ability to precipitate calcium carbonate through
different mechanisms or pathways. MICP plays a significant role in the cementation of the
earth’s natural systems, such as caves, soils, sediments, etc. The Ca2+ concentrations (urea and
0
0.1
0.2
0.3
0.4
0.5
0.6
0.7
0.8
0.9
1
0
0.5
1
1.5
2
2.5
0 2 4 6 8 10
Ure
ase
acti
vit
y [
U.m
L-1
]
Cel
l co
nc.
(O
D600)
Culture time [day]
Pseudoalteromonas tetradonis
Cell conc. BY Urease activity BY
cell conc. cell conc. Tempeh Yeast
urease activity Tempeh Yeast urease activity
Figure 7.3. Cell growth and urase activity of Pseudoalteromonas tetradonis under different culture
medium

233
CaCl2 concentrations) in the cementation solution pure product from FUJIFILM Wako Pure
Chemical Corporation. The treatment conditions such as temperature and curing interval were
selected based on simplification and efficiency of the sand cementation technique, as well as
the environment around the beachrock. It was expected that temperature would affect bacterial
growth and metabolism, injection interval, Ca2+ concentration, and test period would be
correlated with the amount of CaCO3 precipitation, and magnesium chloride and sodium
chloride would stimulate the precipitation of magnesian calcite, which is the cement of
beachrock in the area from which the bacteria were isolated. Moreover, the 0.5M Ca2+
concentration of the injectate (cementation solution) was about 20,000 ppm, respectively.
7.4.2.2 Chalk powder extract
The calcium concentrations of the soluble calcium solution made from chalk were
measured using the ASTM D511-14 (ASTM 2014b) method and the results are shown in
Fig.7.5. It can be seen that there is little difference in terms of production of soluble calcium
between the use of chalk diluted solution. Intuitively, one would think the size of the powder
made from eggshell will affect the production of soluble calcium. The results shown in Fig.7.5
were carried out using a chalk to vinegar ratio of 1∶4 by weight. To check the effect of the
chalk-to-vinegar ratio, tests with other chalk to vinegar ratios of 1∶8 and 1∶12 were also
conducted. In general, a sufficient amount of vinegar should be used, but too much may not
help in producing more soluble calcium. The data shown indicate that chalk to vinegar ratio of
Figure 7.4. Amino acid content of each culture medium.
0
0.2
0.4
0.6
0.8
1
1.2
1.4
Am
ino
Aci
d [
mm
ol/
10
0 m
L]
Yeast extract-std solution
Beer yeast
Tempeh starter (Anggriawan, 2017)
(Munetada, 2020)

234
1∶8 appears to produce the highest calcium concentration. The data in all the tests in Fig.7.5
also show that the production of calcium reaches a peak in three days but the pH value still
under acidic condition, after four days the chalk-vinegar solution became a neutral pH which
safe to conduct further purposes. Thus, four days were taken as the duration for the production
of calcium using chalk or chalk waste.
Figure 7.5. Influence of ratio of chalk powder to vinegar
Moreover, the Ca2+ concentration of 1∶8 ratio cementation solution was about 14,000 ppm,
respectively.
7.4.2.3 Snow melting
For low grade cementation solutions, the solidification effect of natural soil was
investigated by incorporating commercially available low-grade chemicals. Basically, purity is
the prime difference between standard pure chemicals and low-grade chemicals. The snow
melting agent/de-icing salt consists of calcium (34.87%), chloride (61.89%), sodium (1.70%)
and potassium (1.53%). The purity of calcium chloride is 74% in the de-icing salt commonly
applied as bulk to melt the ice deposited on roads and pavements in winter seasons all over the
world. The MICP feasibility of these low-grade chemicals was investigated since they are
inexpensive and less harmful to the geo-environment than pure chemicals. Moreover, the Ca2+
concentration of the cementation solution was about 12,000 ppm, respectively.
7.4.3 Solidification tests
Natural beachrock were found in nature mostly consist of carbonate bridged material
0
0.1
0.2
0.3
0.4
0.5
0.6
0.7
0.8
0.9
1
0 1 2 3 4 5 6 7 8
0
1
2
3
4
5
6
7
8
9
Mo
l/ m
L
Days
pH
1/12 pH 1/8 pH 1/4 pH
1/12 Ion 1/8 Ion 1/4 Ion
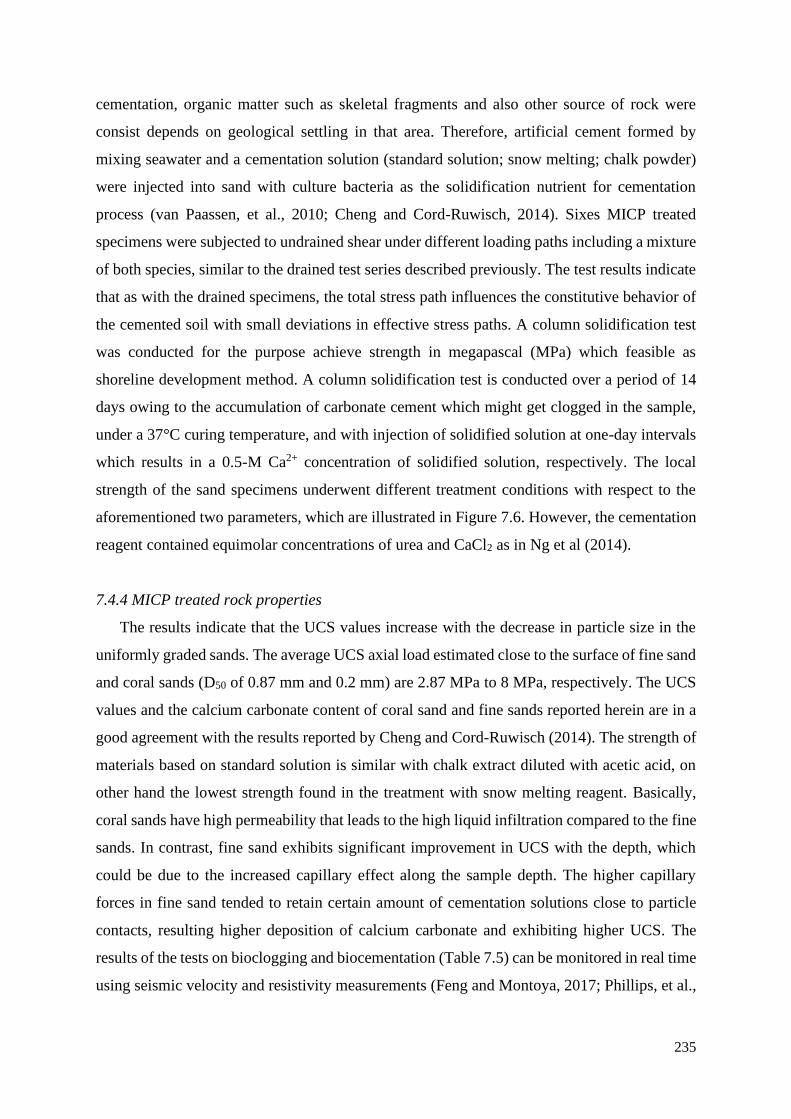
235
cementation, organic matter such as skeletal fragments and also other source of rock were
consist depends on geological settling in that area. Therefore, artificial cement formed by
mixing seawater and a cementation solution (standard solution; snow melting; chalk powder)
were injected into sand with culture bacteria as the solidification nutrient for cementation
process (van Paassen, et al., 2010; Cheng and Cord-Ruwisch, 2014). Sixes MICP treated
specimens were subjected to undrained shear under different loading paths including a mixture
of both species, similar to the drained test series described previously. The test results indicate
that as with the drained specimens, the total stress path influences the constitutive behavior of
the cemented soil with small deviations in effective stress paths. A column solidification test
was conducted for the purpose achieve strength in megapascal (MPa) which feasible as
shoreline development method. A column solidification test is conducted over a period of 14
days owing to the accumulation of carbonate cement which might get clogged in the sample,
under a 37°C curing temperature, and with injection of solidified solution at one-day intervals
which results in a 0.5-M Ca2+ concentration of solidified solution, respectively. The local
strength of the sand specimens underwent different treatment conditions with respect to the
aforementioned two parameters, which are illustrated in Figure 7.6. However, the cementation
reagent contained equimolar concentrations of urea and CaCl2 as in Ng et al (2014).
7.4.4 MICP treated rock properties
The results indicate that the UCS values increase with the decrease in particle size in the
uniformly graded sands. The average UCS axial load estimated close to the surface of fine sand
and coral sands (D50 of 0.87 mm and 0.2 mm) are 2.87 MPa to 8 MPa, respectively. The UCS
values and the calcium carbonate content of coral sand and fine sands reported herein are in a
good agreement with the results reported by Cheng and Cord-Ruwisch (2014). The strength of
materials based on standard solution is similar with chalk extract diluted with acetic acid, on
other hand the lowest strength found in the treatment with snow melting reagent. Basically,
coral sands have high permeability that leads to the high liquid infiltration compared to the fine
sands. In contrast, fine sand exhibits significant improvement in UCS with the depth, which
could be due to the increased capillary effect along the sample depth. The higher capillary
forces in fine sand tended to retain certain amount of cementation solutions close to particle
contacts, resulting higher deposition of calcium carbonate and exhibiting higher UCS. The
results of the tests on bioclogging and biocementation (Table 7.5) can be monitored in real time
using seismic velocity and resistivity measurements (Feng and Montoya, 2017; Phillips, et al.,
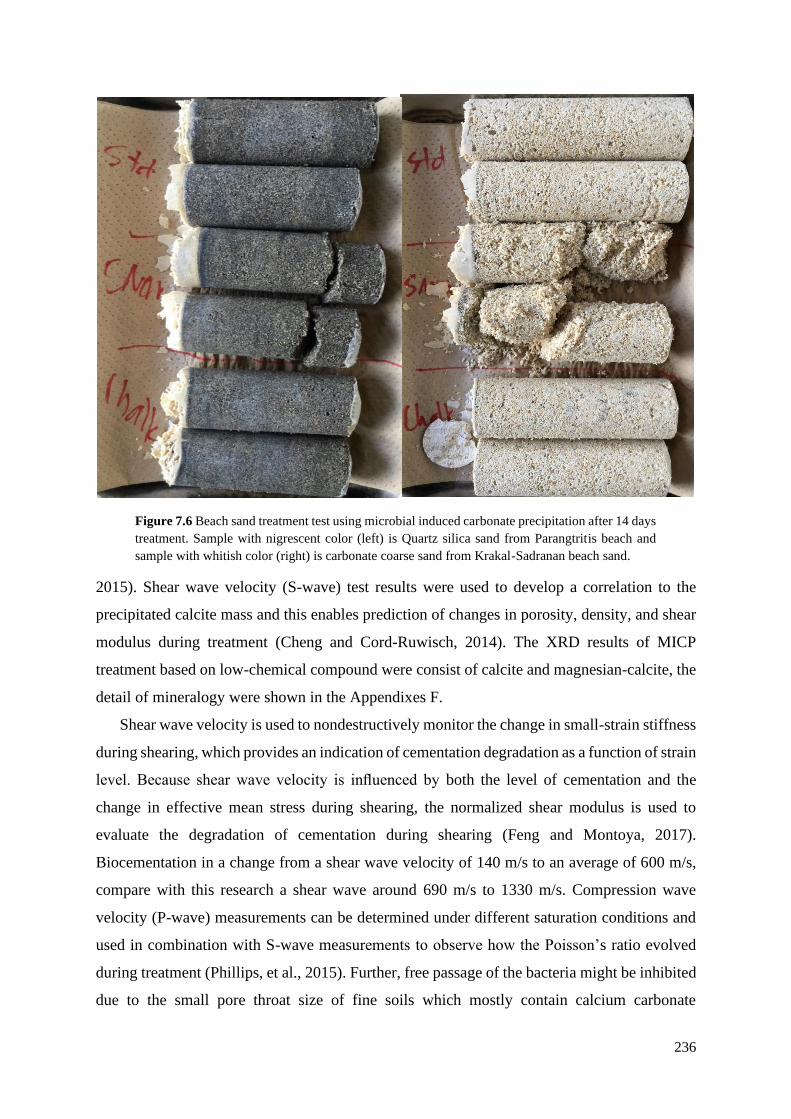
236
2015). Shear wave velocity (S-wave) test results were used to develop a correlation to the
precipitated calcite mass and this enables prediction of changes in porosity, density, and shear
modulus during treatment (Cheng and Cord-Ruwisch, 2014). The XRD results of MICP
treatment based on low-chemical compound were consist of calcite and magnesian-calcite, the
detail of mineralogy were shown in the Appendixes F.
Shear wave velocity is used to nondestructively monitor the change in small-strain stiffness
during shearing, which provides an indication of cementation degradation as a function of strain
level. Because shear wave velocity is influenced by both the level of cementation and the
change in effective mean stress during shearing, the normalized shear modulus is used to
evaluate the degradation of cementation during shearing (Feng and Montoya, 2017).
Biocementation in a change from a shear wave velocity of 140 m/s to an average of 600 m/s,
compare with this research a shear wave around 690 m/s to 1330 m/s. Compression wave
velocity (P-wave) measurements can be determined under different saturation conditions and
used in combination with S-wave measurements to observe how the Poisson’s ratio evolved
during treatment (Phillips, et al., 2015). Further, free passage of the bacteria might be inhibited
due to the small pore throat size of fine soils which mostly contain calcium carbonate
Figure 7.6 Beach sand treatment test using microbial induced carbonate precipitation after 14 days
treatment. Sample with nigrescent color (left) is Quartz silica sand from Parangtritis beach and
sample with whitish color (right) is carbonate coarse sand from Krakal-Sadranan beach sand.
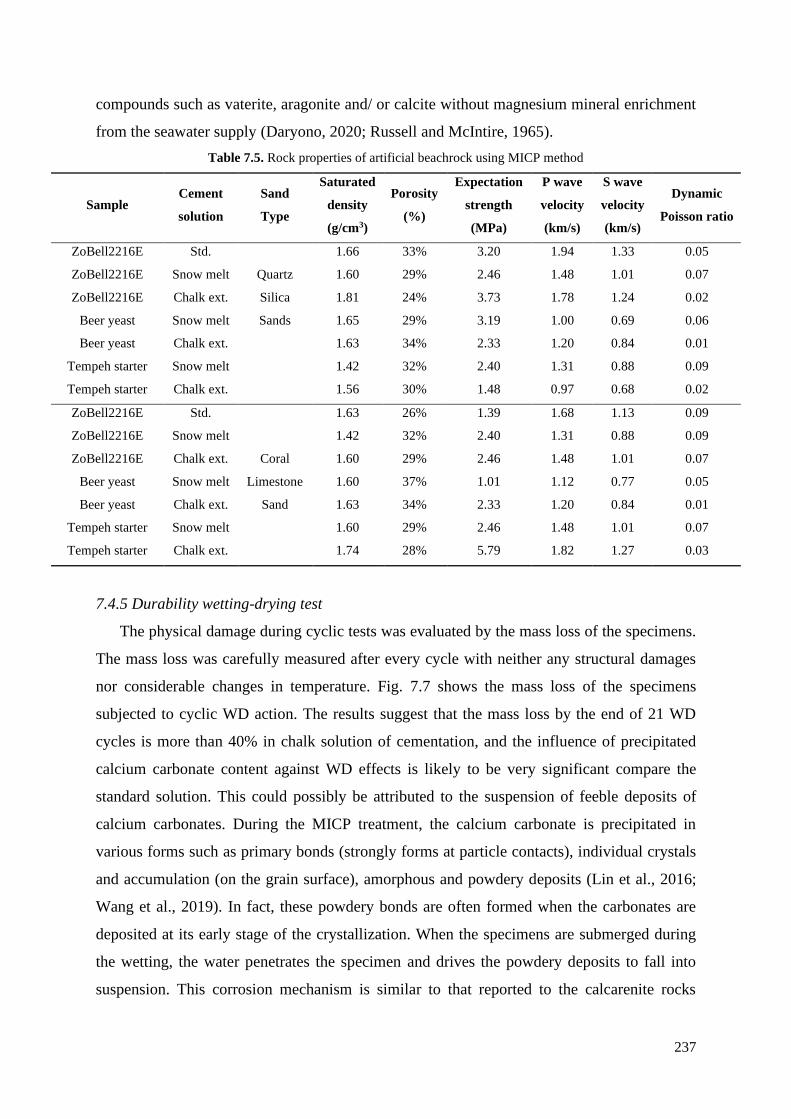
237
compounds such as vaterite, aragonite and/ or calcite without magnesium mineral enrichment
from the seawater supply (Daryono, 2020; Russell and McIntire, 1965).
Table 7.5. Rock properties of artificial beachrock using MICP method
Sample Cement
solution
Sand
Type
Saturated
density
(g/cm3)
Porosity
(%)
Expectation
strength
(MPa)
P wave
velocity
(km/s)
S wave
velocity
(km/s)
Dynamic
Poisson ratio
ZoBell2216E Std.
Quartz
Silica
Sands
1.66 33% 3.20 1.94 1.33 0.05
ZoBell2216E Snow melt 1.60 29% 2.46 1.48 1.01 0.07
ZoBell2216E Chalk ext. 1.81 24% 3.73 1.78 1.24 0.02
Beer yeast Snow melt 1.65 29% 3.19 1.00 0.69 0.06
Beer yeast Chalk ext. 1.63 34% 2.33 1.20 0.84 0.01
Tempeh starter Snow melt 1.42 32% 2.40 1.31 0.88 0.09
Tempeh starter Chalk ext. 1.56 30% 1.48 0.97 0.68 0.02
ZoBell2216E Std.
Coral
Limestone
Sand
1.63 26% 1.39 1.68 1.13 0.09
ZoBell2216E Snow melt 1.42 32% 2.40 1.31 0.88 0.09
ZoBell2216E Chalk ext. 1.60 29% 2.46 1.48 1.01 0.07
Beer yeast Snow melt 1.60 37% 1.01 1.12 0.77 0.05
Beer yeast Chalk ext. 1.63 34% 2.33 1.20 0.84 0.01
Tempeh starter Snow melt 1.60 29% 2.46 1.48 1.01 0.07
Tempeh starter Chalk ext. 1.74 28% 5.79 1.82 1.27 0.03
7.4.5 Durability wetting-drying test
The physical damage during cyclic tests was evaluated by the mass loss of the specimens.
The mass loss was carefully measured after every cycle with neither any structural damages
nor considerable changes in temperature. Fig. 7.7 shows the mass loss of the specimens
subjected to cyclic WD action. The results suggest that the mass loss by the end of 21 WD
cycles is more than 40% in chalk solution of cementation, and the influence of precipitated
calcium carbonate content against WD effects is likely to be very significant compare the
standard solution. This could possibly be attributed to the suspension of feeble deposits of
calcium carbonates. During the MICP treatment, the calcium carbonate is precipitated in
various forms such as primary bonds (strongly forms at particle contacts), individual crystals
and accumulation (on the grain surface), amorphous and powdery deposits (Lin et al., 2016;
Wang et al., 2019). In fact, these powdery bonds are often formed when the carbonates are
deposited at its early stage of the crystallization. When the specimens are submerged during
the wetting, the water penetrates the specimen and drives the powdery deposits to fall into
suspension. This corrosion mechanism is similar to that reported to the calcarenite rocks
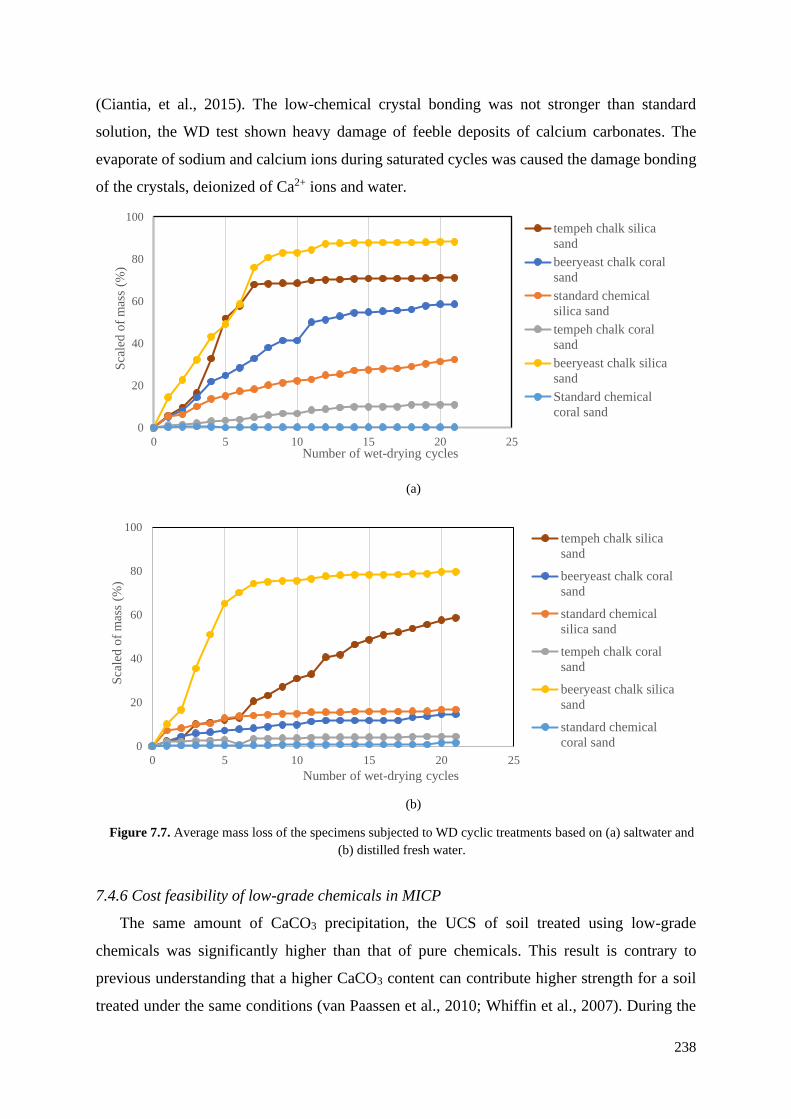
238
(Ciantia, et al., 2015). The low-chemical crystal bonding was not stronger than standard
solution, the WD test shown heavy damage of feeble deposits of calcium carbonates. The
evaporate of sodium and calcium ions during saturated cycles was caused the damage bonding
of the crystals, deionized of Ca2+ ions and water.
7.4.6 Cost feasibility of low-grade chemicals in MICP
The same amount of CaCO3 precipitation, the UCS of soil treated using low-grade
chemicals was significantly higher than that of pure chemicals. This result is contrary to
previous understanding that a higher CaCO3 content can contribute higher strength for a soil
treated under the same conditions (van Paassen et al., 2010; Whiffin et al., 2007). During the
0
20
40
60
80
100
0 5 10 15 20 25
Sca
led
of
mas
s (%
)
Number of wet-drying cycles
tempeh chalk silica
sand
beeryeast chalk coral
sand
standard chemical
silica sand
tempeh chalk coral
sand
beeryeast chalk silica
sand
Standard chemical
coral sand
(a)
(b)
Figure 7.7. Average mass loss of the specimens subjected to WD cyclic treatments based on (a) saltwater and
(b) distilled fresh water.
0
20
40
60
80
100
0 5 10 15 20 25
Sca
led
of
mas
s (%
)
Number of wet-drying cycles
tempeh chalk silica
sand
beeryeast chalk coral
sand
standard chemical
silica sand
tempeh chalk coral
sand
beeryeast chalk silica
sand
standard chemical
coral sand
239
MICP process, precipitated carbonate crystals deposit at particle contacts, coat the exposed
surface of soil particles, fill the voids and provide a matrix to support to the soils, as was clearly
explained by Lin et al. (2016). Using shear wave velocity measurements, it has been proven
that the distribution of CaCO3 at the particle contacts of MICP treated specimens can vary at
the equivalent precipitated CaCO3 content (Feng and Montoya, 2017; Qabany et al., 2011; Weil
et al., 2012). Thus, the strength response is governed by not the average CaCO3 precipitated,
but the effective CaCO3 precipitated at the particle contacts (Feng and Montoya, 2017), and
the amount of effective CaCO3 is influenced by the number of bacteria attached at particle
contact during treatment (DeJong et al., 2010). Moreover, Cheng et al. (2014) reported that
crystals formed under the unfavorable bacterial condition were inadequate and incapable of
efficiently forming effective bridges at particle contacts. In this study, although the precipitated
crystal content is low in the specimen treated using low-grade chemicals, crystals were driven
to support the soil matrix effectively and contributed higher UCS compared to the soil treated
using pure chemicals.
However, the matrix supporting mechanism is not clear toward the cost differences, a
detailed cost comparison was performed based on the market price of reagents (in Japan), and
the results are presented in Table 7.6. The total reagent cost of the 14 days of MICP treatment
for the 1 m3 soil using pure chemicals and low-grade chemicals is estimated as 13.134 USD
for the former and 1647 to 2144 USD for the latter, which is a 25-fold difference. The difference
price is depending on the solution were used, chalk powder extract has a 500 USD higher price
than snow melting reagent but stronger results of the cementation product. As well as resulting
in an 83.6%~ 87.5% cost reduction, the approach improves the strength significantly.
Considering the economic aspects of this soil improvement technique, Ivanov and Chu (2008)
gave a raw material cost estimate for microbial grouting of US $0.5/m3 to US $9.0/m3, while
the total cost of the MICP treatment (i.e., material, equipment, and installation) in saturated
soils was reported to range from US $25/m3 to US $75/m3 (DeJong, et al., 2013). However,
similar studies (Cheng and Cord-Ruwisch, 2012) have shown that materials and costs can be
reduced through more effective cementation, while Karol (2003) reported that the cost of
placement for chemical grouting can be a major part of the total cost. Apart from the
greenhouse effect associated with the production of cement, the cost of producing materials
needed in biogrout is far cheaper when compared with the cost of cement production (Naeimi
and Haddad, 2018; Suer, et al., 2009). The MICP technique is based on natural processes that
require less energy; it can be carried out at ambient temperature, beneath existing structures
without disturbing them, and can allow improvement over a large area. Studies (van Paassen,

240
et al., 2010; Martinez, et al., 2013; Achal and Pan, 2011; Osinubi, et al., 2017; Chiet, et al.,
2016) have also shown that MICP treatment of soil results in a substantial increase in its
strength, stiffness, and dilative behavior, resulting in improved geotechnical properties of the
soil in order to solve several engineering problems. This would certainly be a considerable
advantage for future industrial level MICP advancements.
Table 7.6. Cost comparison between pure chemicals and low-grade solutions in the MICP treatment of
1m3 natural sand (after Gowthaman, et al., 2019)
Reagents
Pure Chemicals
Substance Required amount (kg) Unit price (JPY/kg) Price
(JPY)
Cementation solution Urea (Wako Chem.) 64.3 1580 101572
CaCl2 118.9 5600 666000
Nutrient Broth 6.4 36600 235286
Culture solution Yeast extract 7.14 34580 246902
Artificial seawater 357 434 154938
Estimation TOTAL 1404697
(13134 USD)
Reagents
Low-grade reagents I
Substance Required amount (kg) Unit price (JPY/kg) Price
(JPY)
Cementation solution Urea (fertilizer)
Chalk powder+acetic acid
64.3
118.9
150
572
9643
68010.8
Tempeh starter 6.4 500 3200
Culture solution Tempeh starter 7.15 500 3575
Artificial seawater 357 434 154938
Estimation TOTAL 239366.8
(2222 USD)
Reagents Low-grade reagents II
Substance Required amount (kg) Unit price (JPY/kg) Price
(JPY)
Cementation solution Urea (fertilizer)
Snow melting
64.3
118.9
150
124
9643
14747
Tempeh starter 6.4 500 3200
Culture solution Tempeh starter 7.15 500 3575
Artificial seawater 357 434 154938
Estimation TOTAL 186103
(1728 USD)
*prices are subject to change

241
7.5 Conclusions
In this research study, the feasibility of using the emerging MICP technique for the
stabilization of natural soil/sand in order to mitigate the erosion potential of beach slope was
investigated. Sand samples treated under different conditions were subjected to a needle
penetration test and WD test for durability of the materials. Introducing low-grade chemicals
rather than laboratory-grade pure chemicals resulted in a remarkable enhancement in strength.
The UCS value was similar value obtained while using pure chemicals. This innovative
alternation amounts to an 83~87% reduction in the material cost and allows the leaching of
harmful chemicals to be avoided. There was a relationship between the surface strength of the
treated samples and the global average calcium carbonate content precipitated in samples of
slope. However, the durability results of the low-grade chemical show that it has huge damage
when treated for 21 cycles of WD test, it is shown the bonding particles of biocement was not
as stronger as treated with pure standard chemical solutions. Future research related to the
enhancement of the low-grade chemical is necessary for suitable products in the long-term
application. It can be used as a strategy for the prevention of beach slope erosion and promises
to be an economically feasible alternative after the appropriate scale-up experimentations and
environmental impact analysis are complete.
References
Achal, V. and Pan, X., 2011. Characterization of urease and carbonic anhydrase producing
bacteria and their role in calcite precipitation. Current microbiology, 62(3), pp.894-902.
Achal, V., Mukherjee, A., Basu, P.C., Reddy, M.S., 2009. Lactose mother liquor as an
alternative nutrient source for microbial concrete production by Sporosarcina pasteurii. J. Ind.
Microbiol. Biotechnol. 36, 433–438. https://doi.org/10.1007/s10295-008-0514-7.
Achal, V., Mukherjee, A., Reddy, M.S., 2010. Biocalcification by Sporosarcina pasteurii
using corn steep liquor as the nutrient source. Ind. Biotechnol. 6, 170–174.
https://doi.org/10.1089/ind.2010.6.170.
Alcamo E.I.,2001, Fundamentals of Microbiology, 6th Ed., Jones AND Barlett Publishers
Anbu, P., Kang, C.H., Shin, Y.J., So, J.S., 2016. Formations of calcium carbonate minerals
by bacteria and its multiple applications. Springerplus 5, 1–26. https://doi.org/10.1186/s40064-
016-1869-2 Australia.
Anggriawan, R. 2017. Microbiological and Food Safety Aspects of Tempeh Production in
Indonesia. Published dissertation. Doctoral degree in the International Ph.D. Program for

242
Agricultural Sciences in Göttingen (IPAG), Georg-August-University Göttingen, Germany.
Bao, R., Li, J., Li, L., Cutright, T.J., Chen, L., 2017. Effect of microbialinduced calcite
precipitation on surface erosion and scour of granular soils proof of concept. J. Transp. Res.
Board 2657, 10–18 https://doi.org/https://doi.org/10.3141/2657-02.
Cheng L, Cord-Ruwisch R. 2014. Upscaling effects of soil improvement by microbially
induced calcite precipitation by surface percolation. Geomicrobiol J 31:396–406. https ://doi.
org/10.1080/01490 451.2013.83657 9
Cheng, L. and Cord-Ruwisch, R., 2012. In situ soil cementation with ureolytic bacteria by
surface percolation. Ecological Engineering, 42, pp.64-72
Cheng, L., Shahin, M.A., Addis, M., Hartanto, T., Elms, C., 2014. Soil stabilisation by
Microbial-Induced Calcite Precipitation (MICP): investigation into some physical and
environmental aspects. In: 7th International Congress on Environmental Geotechnics.
Melbourne,
Chiet, K.T.P., Kassim, K.A., Chen, K.B., Martula, U., Yah, C.S., Arefnia, A., 2016. Effect
of reagents concentration on biocementation of tropical residual soil. IOP Conf. Ser. Mater.
Sci. Eng. 136. https://doi.org/10.1088/1757-899X/136/1/012030.
Choi, S.G., Wu, S. and Chu, J., 2016. Biocementation for sand using an eggshell as calcium
source. Journal of Geotechnical and Geoenvironmental Engineering, 142(10), p.06016010.
Ciantia, M.O., Castellanza, R., Crosta, G.B., Hueckel, T., 2015. Efects of mineral
suspension and dissolution on strength and compressibility of soft carbonate rocks. Eng. Geol.
184, 1–18.
Cuzman, O.A., Rescic, S., Richter, K., Wittig, L., Tiano, P., 2015a. Sporosarcina pasteurii
use in extreme alkaline conditions for recycling solid industrial wastes. J. Biotechnol. 214, 49–
56. https://doi.org/10.1016/j.jbiotec.2015.09.011.
Danjo, T., Kawasaki, S., 2016. Microbially induced sand cementation method using
Pararhodobacter sp. strain SO1, inspired by Beachrock formation mechanism. Mater. Trans.
57, 428–437. https://doi.org/ 10.2320/matertrans.M-M2015842.
Daryono, L.R., Nakashima, K., Kawasaki, S., Titisari, A.D. and Barianto, D.H., 2020.
Sediment Characteristics of Beachrock: A Baseline Investigation Based on Microbial Induced
Carbonate Precipitation at Krakal-Sadranan Beach, Yogyakarta, Indonesia. Applied Sciences,
10(2), p.520.
DeJong, J.T., Mortensen, B.M., Martinez, B.C., Nelson, D.C., 2010. Biomediated soil
improvement. Ecol. Eng. 36, 197–210. https://doi.org/ 10.1016/j.ecoleng.2008.12.029.
DeJong, J.T., Soga, K., Kavazanjian, E., Burns, S., Van Paassen, L.A., Al Qabany, A.,

243
Aydilek, A., Bang, S.S., Burbank, M., Caslake, L.F. and Chen, C.Y., 2014. Biogeochemical
processes and geotechnical applications: progress, opportunities and challenges. In Bio-and
Chemo-Mechanical Processes in Geotechnical Engineering: Géotechnique Symposium in Print
2013 (pp. 143-157). Ice Publishing.
Feng, K. and Montoya, B.M., 2017. Quantifying level of microbial-induced cementation
for cyclically loaded sand. Journal of Geotechnical and Geoenvironmental Engineering,
143(6), p.06017005.
Gomez, M.G., Anderson, C.M., Graddy, C.M.R., DeJong, J.T., Nelson,D.C., Ginn, T.R.,
2017. Large-scale comparison of bioaugmentation and biostimulation approaches for
biocementation of sands. J.Geotech. Geoenviron. Eng. 143, 4016124.
https://doi.org/10.1061/(ASCE)GT.1943-5606.0001640.
Gomez, M.G., DeJong, J.T., Martinez, B.C., Hunt, C.E., DeVlaming, L. A., Major, D.W.,
Dworatzek, S.M., 2013. Bio-mediated soil improvement field study to stabilize mine sands. In:
Proceedings of GeoMontreal, Montreal, Canada.
Gowthaman, S., Mitsuyama, S., Nakashima, K., Komatsu, M. and Kawasaki, S., 2019.
Biogeotechnical approach for slope soil stabilization using locally isolated bacteria and
inexpensive low-grade chemicals: A feasibility study on Hokkaido expressway soil, Japan.
Soils and Foundations, 59(2), pp.484-499.
Ivanov, V. and Chu, J., 2008. Applications of microorganisms to geotechnical engineering
for bioclogging and biocementation of soil in situ. Reviews in Environmental Science and
Bio/Technology, 7(2), pp.139-153.
Jiang, N.-J., Soga, K., 2017. The applicability of microbially induced calcite precipitation
(MICP) for internal erosion control in gravel–sand mixtures. Ge´otechnique 67, 42–55.
https://doi.org/10.1680/jgeot.15.P.182.
Jones, 1960, Bact. Proc. Pg. 36 (A29)
Joshi, S., Goyal, S., Reddy, M.S., 2018. Corn steep liquor as a nutritional source for
biocementation and its impact on concrete structural properties. J. Ind. Microbiol. Biotechnol.
https://doi.org/10.1007/s10295-018-2050-4.
Karol, R.H., 2003. Chemical grouting and soil stabilization revised and expanded (Vol. 12).
Crc Press.
Khan, M.N.H., Shimazaki, S., Kawasaki, S., 2016. Coral sand solidification test through
microbial calcium carbonate precipitation using Pararhodobacter sp. Int. J. Geomate 11, 2665–
2670.
Kristiansen, B., 2006. Process economics. In: Ratledge, C., Kristiansen, B. (Eds.), Basic

244
Biotechnology. Cambridge University Press, Cambridge, pp. 271–286. https://doi.
org/10.1017/CBO9780511802409.013.
Lechtanski, V. L. (2000). “Calcium carbonate content of eggshell.” Inquirybased
experiments in chemistry, Oxford, New York, 159–165.
Li, M., Liao, X., Zhang, D., Du, G., Chen, J., 2011. Yeast extract promotes cell growth and
induces production of polyvinyl alcohol-degrading enzymes. Enzym. Res.
https://doi.org/10.4061/2011/179819.
Lin, H., Suleiman, M.T., Brown, D.G., Kavazanjian, E., 2016. Mechanical Behavior of
Sands Treated by Microbially Induced Carbonate Precipitation. J. Geotech. Geoenvironmental
Eng. 142, 04015066-1–13.
Liu, M., Zhang, M., Lin, S., Liu, J., Yang, Y. and Jin, Y., 2012. Optimization of extraction
parameters for protein from beer waste brewing yeast treated by pulsed electric fields (PEF).
Afr J Microbiol Res, 6, pp.4739-4746.
Lyman J. and Fleming R. H., 1940, J. Mar. Res. 3:134.
Martinez, B.C., DeJong, J.T., Ginn, T.R., Montoya, B.M., Barkouki, T.H., Hunt, C., Tanyu,
B. and Major, D., 2013. Experimental optimization of microbial-induced carbonate
precipitation for soil improvement. Journal of Geotechnical and Geoenvironmental
Engineering, 139(4), pp.587-598.
Milić, T.V., Rakin, M., Šiler-Marinković, S., 2007. Utilization of baker's yeast
(Saccharomyces cerevisiae) for the production of yeast extract: Effects of different enzymatic
treatments on solid, protein and carbohydrate recovery. J. Serb. Chem. Soc. 72, 451–457.
https://doi.org/10.2298/JSC0705451V.
Mital, B.K. and Garg, S.K., 1990. Tempeh—technology and food value. Food Reviews
International, 6(2), pp.213-224.
Mortensen BM, Haber MJ, Dejong JT et al. 2011. Effects of environmental factors on
microbial induced calcium carbonate precipitation. J Appl Microbiol 111:338–349. https
://doi.org/10.111 1/j.1365-2672.2011.05065.
Mujah, D., Shahin, M.A., Cheng, L., 2017. State-of-the-art review of biocementation by
Microbially Induced Calcite Precipitation (MICP) for soil stabilization. Geomicrobiol. J.
https://doi.org/10.1080/01490451.2016.1225866.
Munetada, S. 2020. Proposal for preservation technology of highway slopes in Hokkaido
using MICP method. Published thesis. Master’s degree of the Graduate School of Engineering,
Hokkaido University and Kyushu University, Japan.
Naeimi, M. and Haddad, A., 2018, May. Investigation on the environmental impact of soil

245
improvement techniques: comparison of cement grouting and biocement. In GeoShanghai
International Conference (pp. 483-490). Springer, Singapore.
Ng, W., Lee, M., Hii, S., 2012. An overview of the factors affecting microbial-induced
calcite precipitation and its potential application in soil improvement. World Acad. Sci. Eng.
Technol. 62, 723–729.
Oliveira, P.J.V., Freitas, L.D., Carmona, J.P.S.F., 2016. Effect of soil type on the enzymatic
calcium carbonate precipitation process used for soil improvement. J. Mater. Civ. Eng. 29, 1–
7. https://doi.org/10.1061/(ASCE)MT.1943-5533.0001804.
Osinubi, K.J., Eberemu, A.O., Ijimdiya, S.T., Yakubu, S.E. and Sani, J.E., 2017,
September. Potential use of B. Pumilus in microbial-induced calcite precipitation improvement
of lateritic soil. In Proceedings of the 2nd symposium on coupled phenomena in environmental
geotechnics (CPEG2), session: clean-ups, paper (Vol. 64, pp. 1-6).
Pelczar M.J..Jr., Reid R.D., Chan E.C.S., 1977, Microbiology, 4th Edi, Tata McGraw-Hill
Publishing Company Ltd,New Delhi
Phillips, A.J., Eldring, J.J., Hiebert, R., Lauchnor, E., Mitchell, A.C., Cunningham, A.,
Spangler, L. and Gerlach, R. 2015. Design of a meso-scale high pressure vessel for the
laboratory examination of biogeochemical subsurface processes. Journal of Petroleum Science
and Engineering, 126, pp.55-62.
Qabany, A.A., Mortensen, B., Martinez, B., Soga, K. and DeJong, J., 2011. Microbial
carbonate precipitation: correlation of S-wave velocity with calcite precipitation. In Geo-
Frontiers 2011: Advances in Geotechnical Engineering (pp. 3993-4001).
Ropp, R.C., 2012. Encyclopedia of the alkaline earth compounds. Newnes.
Russell, R. J., and McIntire, W. G. 1965. Beach cusps. Geological Society of America
Bulletin, Vol. 76, 3, 307-320. https://doi.org/10.1130/0016-7606(1965)76[307:BC]2.0.CO;2.
Salifu, E., MacLachlan, E., Iyer, K.R., Knapp, C.W., Tarantino, A., 2016. Application of
microbially induced calcite precipitation in erosion mitigation and stabilisation of sandy soil
foreshore slopes: a preliminary investigation. Eng. Geol. 201, 96–105.
https://doi.org/10.1016/j.enggeo.2015.12.027.
Sensoy, T., Bozbeyoglu, N.N., Dogan, N.M., Bozkaya, O., Akyol, E., 2017.
Characterization of calcium carbonate produced by ureolytic bacteria (Sporocarcina pasteurii
ATCC 6453 and Bacillus aerius U2) and effect of environmental conditions on production of
calcium carbonate. In: 15th International Conference on Environmental Science and
Technology. Rhodes, Greece.
Sizemore R. K. and Stevenson L. H., 1970, Appl. Microbiol., 20:991.

246
Soon, N.W., Lee, L.M., Khun, T.C., Ling, H.S., 2014. Factors affecting improvement in
engineering properties of residual soil through microbial-induced calcite precipitation. J.
Geotech. Geoenviron. Eng.140, 4014006. https://doi.org/10.1061/(ASCE)GT.1943-
5606.0001089.
Stabnikov, V., Naeimi, M., Ivanov, V., Chu, J., 2011. Formation of waterimpermeable crust
on sand surface using biocement. Cem. Concr. Res.41, 1143–1149.
https://doi.org/10.1016/j.cemconres.2011.06.017.
Suer, P., Hallberg, N., Carlsson, C., Bendz, D. and Holm, G., 2009. Biogrouting compared
to jet grouting: environmental (LCA) and economical assessment. Journal of Environmental
Science and Health Part A, 44(4), pp.346-353.
van Paassen, L.A., Ghose, R., van der Linden, T.J.M., van der Star, W.R.L., van
Loosdrecht, M.C.M., 2010. Quantifying biomediated ground improvement by ureolysis: large-
scale biogrout experiment. J. Geotech. Geoenviron. Eng. 136, 1721–1728.
https://doi.org/10.1061/(ASCE) GT.1943-5606.0000382.
Wang, Y., Soga, K., Dejong, J.T., Kabla, A.J., 2019. Microscale Visualization of
Microbial-Induced Calcium Carbonate Precipitation Processes. J. Geotech. Geoenvironmental
Eng. 145, 1–13.
Warnock., D.W. 2015. Manual of Clinical Microbiology, 11th Edition. Vol. 1.
Weil, M.H., DeJong, J.T., Martinez, B.C. and Mortensen, B.M., 2012. Seismic and
resistivity measurements for real-time monitoring of microbially induced calcite precipitation
in sand. Geotechnical Testing Journal, 35(2), pp.330-341.
Weiner R. M., Segall A. M. and Colwell R. R., 1985, Appl. Environ. Microbiol., 49:83.
Whiffin, V.S., 2004. Microbial CaCO3 Precipitation for the Production of Biocement (Ph.
D. Thesis). 1–162. http://researchrepository.murdoch.edu.au/399/2/02Whole. pdf⟩.
Whiffin, V.S., Van Paassen, L.A. and Harkes, M.P., 2007. Microbial carbonate
precipitation as a soil improvement technique. Geomicrobiology Journal, 24(5), pp.417-423.
Williams, S.L., Kirisits, M.J., Ferron, R.D., 2016. Optimization of growth medium for
Sporosarcina pasteurii in bio-based cement pastes to mitigate delay in hydration kinetics. J.
Ind. Microbiol. Biotechnol. 43, 567–575. https://doi.org/10.1007/ s10295-015-1726−2.
Yang, C.Z., LI, Y., Ruan, N., Mou, D.H. and Kang, M.L., 2006. Study and applications of
technology about breaking yeast cell wall [J]. Food Science and Technology, 7.
Yoosathaporn, S., Tiangburanatham, P., Bovonsombut, S., Chaipanich, A., Pathom-aree,
W., 2016. A cost-effective cultivation medium for biocalcification of Bacillus pasteurii KCTC
3558 and its effect on cement cubes properties. Microbiol. Res. 186–187, 132–138.

247
https://doi.org/10.1016/j.micres.2016.03.010.
Zobell C. E., 1940, J. Marine Research, 3:134

248
CHAPTER 8
Tentative proposal of coastal prevention method
8.1 Introduction
The multidisciplinary research between geotechnical engineers and microbiologists has
paved a way into a new frontier of knowledge called geobiology. This realization came to
provide engineers opportunities to consider soil as a living ecosystem rather than an inert
construction material. The use of microorganisms as a potential catalyst in soil biocementation
was first suggested by Whiffin (2004) and Mitchell and Santamarina (2005). Since then,
countless research has advanced considerably high in this field. In recent years, conducting
interdisciplinary research shows a strong capability in dealing with some hot and critical issues.
With the development of interdisciplinary cooperation among biological engineering, chemical
engineering and civil engineering, microbial induced carbonate precipitation (MICP) technique
has been widely used in various engineering applications, such as evolution of water resources
and rehabilitation of old buildings. In addition, this method has been applied to ground
improvement as well. For example, Zhou, Luo, and Wang (1997) found that the physical and
chemical changes of organic matter and micro-organisms induced by the environmental change
will have an impact on the properties of geomaterials. Xu, Zhang, and Zhou (2009) extracted
carbonate mineralization bacteria and polysaccharide of the adhesive bacteria from soils to
improve the related engineering properties of silty soils. Al-Thawadi (2008) and Burbank et al.
(2011) isolated the original ecological urease-producing bacteria that provide bacteria species
for the application of MICP technique. The bacteria were then used to improve the geotechnical
properties of sandy soils successfully. In addition, the broad application of MICP technique
and the potential benefits of the microbial reinforced soils attract more scholars to participate
in this research area (Mujah, Shahin, and Cheng 2017).
The feasibility of MICP does not depend on technical aspects regarding conditions of
treatment alone but accompanies by economical and legislative issues as well. It has been
reported that the discharging of vigorous chemicals and ammonium by-products to the soil
ecosystem in the MICP causes many harmful effects, and the subsequent removal of such
harmful products must be taken into account (Soon et al., 2014). The cost of the required
substances remains another contest in assessing the complete feasibility of the process (van
Paassen et al., 2010). The previous chapter was concern about nutrition sources that are easily
accessible at low or no cost suitable for MICP application. The results were remarkable in the

249
low-cost reagents, not only for culture medium but also for the cementation solution based on
snow melting or chalk powder extract. However, this product has a heavy damage to the
durability test based on the wetting-drying method compared with the standard chemical
solution.
8.2 Objectives
In this chapter, the goal is to propose of the prevention method based on MICP by
indigenous ureolytic bacteria. The bacteria strains were isolated from the natural of beachrock
along the shoreline in Krakal-Sadranan, Yogyakarta south coast, Indonesia. Future research
related to the enhancement of the low-grade chemical is necessary for suitable products in the
long-term application. Moreover, envisioned applications, potential advantages and limitations
of MICP in beach sand improvement are presented and addressed. The current challenges and
future work on biocementation by MICP are also outlined.
8.3 Materials and methods
One of the most emerging and promising biological soil improvement techniques, i.e.
MICP or biocementation, is reviewed and discussed in some detail.
MICP is a biologically driven calcium carbonate (calcite or CaCO3) precipitation
technology, which includes the following two mechanisms of biologically controlled and
biologically induced CaCO3 precipitation. In the biologically controlled mechanism, the
organism controls the nucleation and growth of the mineral particles, and independently
synthesizes minerals in a form that is unique to the species regardless of the environmental
conditions. Hence, several factors key role of the mechanism MICP were succeeded or not such
as ureolytic bacteria, culture media, cementation solution, sand, and treatment sand condition.
8.3.1 Ureolytic bacteria
Microbial activities can change the appearance of soil/sand and increase its ability to
withstand applied forces/loads by precipitating calcite, which binds soil particles (Sari, 2015).
According to Reichle (1977), microbes constitute between 70% and 85% of the living
component within soil systems, but a good understanding of their metabolic rate is essential to
forecast correctly how microorganisms will act under different conditions (Epelde, et al.,
2008). The number of organisms in kjbkjba single kilogram of soil at the surface is between
109 and 1012 (Mitchell and Santamarina, 2005; Umar, et al., 2016). It was reported by Dejong
and his research team (2014) that a gram of soil could be home to 1012 bacteria, and over 106
250
bacteria could be present in a single gram of poorly graded soil. Yargicoglu and Reddy (2015)
also reported approximately 109 cells within a gram of soil. Research has shown that
microorganisms, especially bacteria, are linked to the formation of carbonate minerals, as they
also play an important role in carbon cycling (Hamdan, et al., 2011). Bacteria can differ in
shape; they can be rod like, almost round or spiral, and the range of their cell thickness is
between 0.5 and 3 μm (DeJong, et al., 2013, 2014; Umar, et al., 2016; Soon, et al., 2012). Their
thickness can be reduced under stress settings to around 0.2 μm; they reproduce by fission
naturally. Bacteria can withstand unfavorable conditions, and at low to elevated acidity or
salinity some are spore-forming organisms, allowing them to withstand/survive in harsh
conditions such as high pressures of several hundred bar and equally at temperatures from
below the freezing to above the boiling point of water (Madigan, et al., 2008).
Microorganisms, in general, can reproduce very rapidly by fission, and their growth rate is
exponential. The generation (reproduction) time for bacteria is 10 min, but 1 h is typically used;
For example, starting with bacteria with a reproduction time of 1 h under an ideal condition,
they could multiply to 224. With this high reproduction rate, microbial activity can be
anticipated everywhere. In soil pore fluid, bacteria with size of 1 μm could reach approximately
108 bacteria/ml (Mitchell and Santamaria, 2005). The presence of microorganisms in the soil
may not cause any harm to the soil environment, as the majority are native species of the soil.
The ureolytic bacterium, Pseudoalteromonas tetradonis isolated by Daryono, et al. (2019,
2020) from beachrock sample from Indonesia shoreline was used in this study due to its high
urease activity which classified as gram-negative. The strain were motile bacilli 1 μm wide and
1.5–4.0 μm, aerobic, motile with one polar flagellum, rods (or rod-shapes) with 0.5–0.8 × 1.0–
1.5 μm when in exponential growth phase was used in this study. Standard media
(ZoBell2216E for marine bacteria medium) were used for culturing under sterile aerobic
conditions. Cells were precultured separately in 5 mL of each medium at 37°C and 160 rpm
for 24 h. One milliliter of the preculture was inoculated with 100 mL of the fresh medium and
incubated under the same conditions. The microbial cell growth of the isolates was determined
based on optical density at a wavelength of 600 nm (OD600) using a UV-vis spectrophotometer
(V-730, JASCO Corporation, Tokyo, Japan).
Urease, a member of the hydrolases group, is a nickel-containing metalloenzyme that
catalyzes the hydrolysis of urea into ammonia and carbonate, initiating the reaction chain of
the calcium carbonate precipitation described above (Hwang, et al., 2013). Meanwhile,
carbonic anhydrase, like urease, plays a vital role in the MICP process, but it still needs more
detailed studies on how it works at MICP. Carbonic anhydrase is also a metalloenzyme, but
251
during stage 9 uses zinc in the catalytic nodes with carbon dioxide (CO2) and bicarbonate
(HCO3-). In the carbonic anhydrase pathway, after the production of bicarbonate, hydrogen
ions (H+) promote the precipitation of calcium carbonate in the form of calcite plus the output
of water and carbon dioxide (Jiménez-López, et al., 2017). Hwang et al. (2013) reported the
action of carbonic anhydrase in biomineralization and the fact that the morphology of calcium
carbonate (calcite) depends on the constant pressure of CO2 and the addition of polymers that
affect the growth and nucleation of the precipitate. The CaCO3 precipitated in the presence of
carbonic anhydrase can take three forms: ellipsoidal, polygonal, or rhombohedron. The same
process in the absence of carbonic anhydrase only precipitates CaCO3 in the form of a
rhombohedron, a less rigid morphology. The activities of urease are interdependent and guide
the stages of calcite precipitation (Fig.8.1). The activity of urease depends on the incorporation
of nickel in its nucleation site, which is regulated by the chemical reaction between carbon
dioxide and bicarbonate catalyzed (Wong, 2015). The characteristics of the ion’s nucleation
site define the morphology of the calcium carbonate precipitates such as calcite, vaterite, or
other metastable polymorphs which may not only enzyme dependency but also the source of
minerals. The polymorph of calcium carbonate which has different stability due to its
micromorphology proceeds in different reactivities with the surface of its environment. Calcite,
for example, is thermodynamically stabilized and has a hexagonal-rhombohedral crystal
structure; aragonite is metastable and has an orthorhombic crystalline structure, usually in the
form of a needle; and vaterite (precursor to calcite and aragonite) is a metastable hexagonal
crystalline structure in spherulitic or disc-like form. This identification of the formation of
structures and the level of reactivity of precipitated calcium carbonate is vital to define whether
this procedure is a potential bioremediation technique for aquifer contamination (Portugal, et
al., 2020).
8.3.2 Culture media
The solution freed of all microorganisms by sterilization (usually in an autoclave, where it
undergoes heating under pressure for a specific time) and containing the substances required
for the growth of microorganisms such as bacteria, protozoans, algae, and fungi. The medium
may be solidified by the addition of agar. Some media consist of complex ingredients such as
extracts of plant or animal tissue (e.g., peptone, meat extract, yeast extract); others contain
exact quantities of known inorganic salts and one or more organic compounds (synthetic or
chemically defined media). In this research, the author used Zobell2216 medium marine broth
as a standard medium for cultivated bacteria, beer yeast extract which yeast is mainly composed
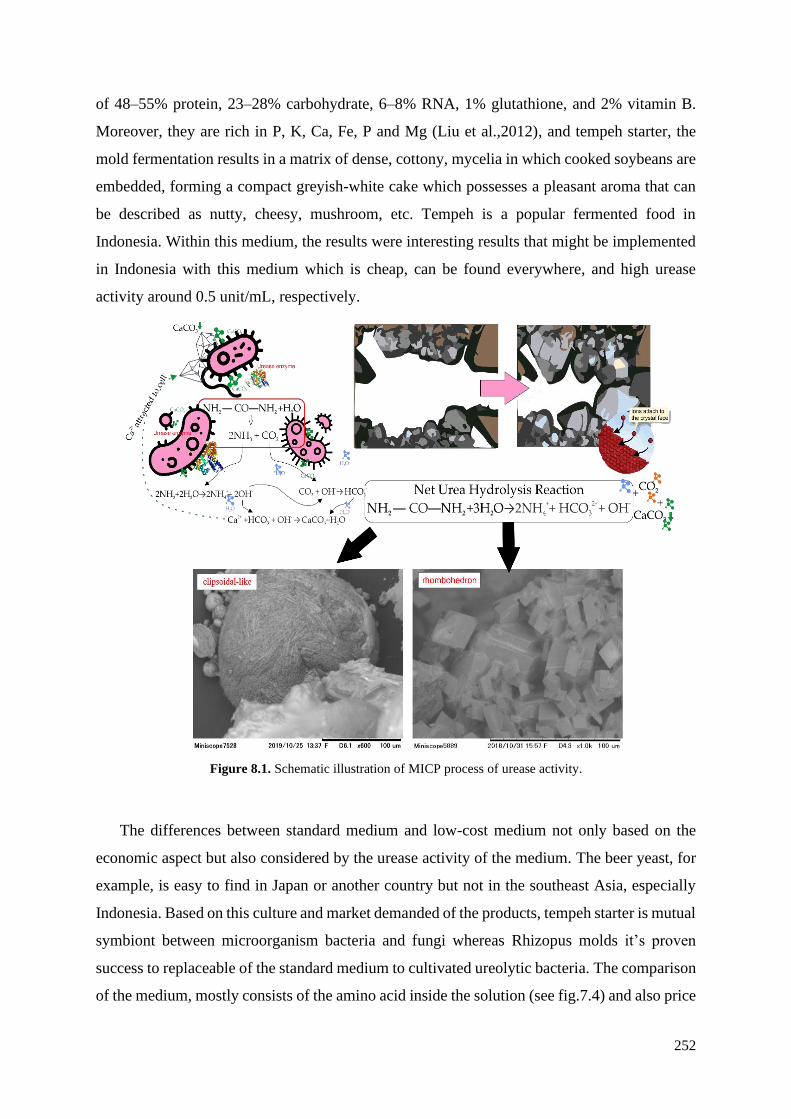
252
of 48–55% protein, 23–28% carbohydrate, 6–8% RNA, 1% glutathione, and 2% vitamin B.
Moreover, they are rich in P, K, Ca, Fe, P and Mg (Liu et al.,2012), and tempeh starter, the
mold fermentation results in a matrix of dense, cottony, mycelia in which cooked soybeans are
embedded, forming a compact greyish-white cake which possesses a pleasant aroma that can
be described as nutty, cheesy, mushroom, etc. Tempeh is a popular fermented food in
Indonesia. Within this medium, the results were interesting results that might be implemented
in Indonesia with this medium which is cheap, can be found everywhere, and high urease
activity around 0.5 unit/mL, respectively.
The differences between standard medium and low-cost medium not only based on the
economic aspect but also considered by the urease activity of the medium. The beer yeast, for
example, is easy to find in Japan or another country but not in the southeast Asia, especially
Indonesia. Based on this culture and market demanded of the products, tempeh starter is mutual
symbiont between microorganism bacteria and fungi whereas Rhizopus molds it’s proven
success to replaceable of the standard medium to cultivated ureolytic bacteria. The comparison
of the medium, mostly consists of the amino acid inside the solution (see fig.7.4) and also price
Figure 8.1. Schematic illustration of MICP process of urease activity.

253
comparison at the price of the tempeh starter with standard Zobell2216 medium is 69:1 cheaper
of tempeh yeast (see table 7.6).
8.3.3 Cement solution
In the MICP protocols, the cementation solution certainly provides the basic chemicals for
MICP process (as urea and Ca2+ source). Sometimes, it also includes components like pH
stabilizer (NaHCO3), a carbon source or nutrients (nutrient broth, yeast) to maintain the
bacteria. Concentration of cement solution refers to the concentration of urea and Ca2+ in the
cement solution. It is an important parameter when designing a MICP protocol (DeJong et al.,
2013). Many authors have conducted laboratory experiments by using different concentrations
of cement solution (either equimolar or non-equimolar concentrations of urea and Ca2+, usually
< 2 M) to different soils, and tried to find out the optimal concentration for their experimental
conditions. Even though the low-chemical crystal bonding was not stronger than the standard
solution it’s still a feasible solution to reduce the cost of production. The WD test of low-
chemical reagents shown heavy damage to feeble deposits of calcium carbonates. The
evaporate of sodium and calcium ions during saturated cycles was caused by the damage
bonding of the crystals, deionized Ca2+ ions and water. It means the low-chemical reagent is
working well to treat the soil/sand in the dry area, such as biogrouting for liquefaction
countermeasures. In this case of coastal prevention, future research related to the enhancement
of the low-grade chemical is necessary for suitable products in the long-term application.
The efficiency of CaCO3 crystals formation is believed to be affected by various
cementation solution concentrations. This is attributed to the fact that more homogeneous
CaCO3 crystals distribution along the sand matrix is usually observed at lower cementation
solution concentration. On the other hand, the precipitated CaCO3 crystals at higher
cementation solution concentration are usually randomly formed in the soil voids due to the
faster precipitation induced by the higher cementation solution concentration (Okwadha and
Li 2010). The CaCO3 formation was also found to be more effective at lower cementation
solution concentration. For example, Al Qabany and Soga (2013) conducted an experiment
using sand samples treated under different cementation reagents of 0.1, 0.25, 0.5 and 1 M urea-
calcium chloride solution and found that the treated sand with lower reagent concentration gave
higher strength compared to that treated with higher reagent concentration. The lower
concentration led to more homogeneous CaCO3 crystals formation at the particle contact points
which contributed to the strength improvement with minimum soil disturbance and
permeability reduction. This is consistent with the findings of Ng et al. (2014) who claimed
254
that biocementation was found to be more effective on the residual soil treated with 0.5 M
cementation reagent compared to that treated with 1 M cementation reagent. Cheng et al.
(2014) even produced biocemented sand columns using low concentration of Ca2+ source (i.e.
10 mM) from seawater; however, a greater number of injections were required to achieve the
same amount of CaCO3 crystals precipitation when lower cementation reagent concentration
was used.
8.3.4 Soil/ sand
Soil/ sand properties, such as density, grading, saturation, have a vital impact on bio-
treatment efficiency. Studying soils with different characteristics are beneficial to understand
the use of MICP in various sites. Soil/sand samples preparation should consider the aim of the
research. Studying the effect of soil characteristics makes the protocol more feasible and
efficient in varying conditions of geological sites. Some of these parameters are considered
below.
8.3.4.1 Density
Density of sand has a great impact on its mechanical behavior. The density state is also
characterized by the relative density Dr, calculated by:
𝐷𝑟(%) = 𝑒𝑚𝑎𝑥−𝑒
𝑒𝑚𝑎𝑥−𝑒𝑚𝑖𝑛 (Eq. 8.1)
where emax, emin represent the standardized maximum and minimum void ratios, and e, the
actual void ratio of the sand. For similar MICP treatments, increasing density (40%, 70%, 80%)
resulted in a reduction of CaCO3 production and an increase in strength (Rowshanbakht et al.,
2016). Bahmani et al. (2017) conducted a series of experiments with various soil densities
(1.86, 1.93, 2.11, 2.23, 2.36 gr/cm3, corresponding to relative densities of 0%, 17%, 56%, 78%,
100%). Results indicated that the treated soil sample with a density of 2.11 gr/cm3 had the
highest value of stiffness and compressive strength. It shows that the highest density does not
necessarily lead to the highest strength. Rowshanbakht et al. (2016) used poorly graded silica
sand (Dmax = 0.4 mm, Cu = 1.46, Cc =0.83, D50 = 0.2 mm) with no shape description, Bahmani
et al. (2017) used poorly graded angular to sub-angular quartz grains (Dmax = 1 mm, Cu = 2.2,
Cc = 0.77, D50 = 0.18 mm). Both of them used ASTM Standards. The results obtained by
Rowshanbakht et al. (2016) and Bahmani et al. (2017) are conflicting, maybe because Bahmani
used a sand with a higher fines content (20% < 0.1 mm) whereas, in the study of Rowshanbakht
et al., the fines content (<0.1 mm) was 1%. When the relative density increases from 56% to

255
higher values, the smaller pore throats inhibited the transport of bacteria, thereby decreasing
the efficiency of MICP.
Gao et al. (2019) used Ottawa sand (ASTM poorly graded round quartz sand), with grain
sizes ranging from 0.2 to 0.5 mm, and a mean size of 0.36 mm, similar with fine silica from
Parangtritis in this research. For loose (Dr = 30%) and medium dense (Dr = 50%) sands, a light
bio-treatment gave a strength improvement comparable to, or exceeding, that of untreated
dense sand (Dr = 90%) (Gao et al., 2019). Xiao et al. (2019) applied cyclic loadings to MICP-
treated calcareous sand (angular, with no fines, D10 = 0.19 mm, D50 = 0.38 mm) and untreated
sand with different relative densities (10%, 50%, 80%) and different degrees of bio-
cementation. From this research, the fine particle size (Parangtritis silica sand D50 of 0.2 mm)
and coral sands (Krakal-Sadranan D50 of 0.87 mm) were successfully treated with MICP, fine
material it will rapid cementation period rather than coral beach sand because of bonding
particle intraparticle smaller and less of pores. Comparing treated and untreated sands, with the
same increment in dry unit weight, they showed that treated sand samples had gained a larger
increase in cyclic resistance, which indicates that the MICP treatment method is more efficient
in promoting cyclic resistance of calcareous sand than densification.
8.3.4.2 Particle size
Many studies have been carried out using sands (e.g. Ottawa silica sand, Fontainebleau
sand) with grain diameters smaller than 2mm (Choi et al., 2016; Gao et al., 2019; Hamdan et
al., 2013; O’Donnell & Kavazanjian, 2015; Zhao et al., 2014). Under the consideration of free
passage of bacteria, as well as limit of injectability in-situ, very fine grains are usually not used.
For example, DeJong et al. (2006) used Ottawa 50–70 sand to represent loose natural deposit,
which is sufficient for the bacteria in the size range of 1–3 mm. Bahmani et al. (2017) used a
soil with a particle size ranged between 50 and 400 mm, which was sufficient for the
transportation of bacteria. Hataf and Jamali (2018) tried to determine the maximum fine content
(i.e. in a clay with low plasticity) that did not influence the effect of MICP. For that, a fine-
grained soil (100% finer than 75 mm, 25.6% finer than 2 mm) and a coral-grained soil (0.4mm–
5 mm) were mixed at different percentages, and consolidated drained direct shear tests were
carried out before and after the MICP treatment. Results showed that the higher the fine
content, the lower the strength increase due to MICP. A fine content up to 20% did not affect
the efficiency of MICP. Few studies include larger grains in soil preparation. However, in the
study of Mahawish et al. (2018), Pakenham Blue Metal (Old Basalt) coral grain (2.36–16 mm)
and relatively fine grains (0.075–9.5 mm) were mixed at different percentages to conduct

256
column cementation experiments. As a result, in comparison with other groups of materials,
materials with 25% fine grains resulted in a better distribution of CaCO3 and a relatively higher
value of unconfined compressive strength.
8.3.5 Treatment sand condition
In order to ensure a successful ground improvement by MICP, the introduction and
retention of ureolytic bacteria or urease enzyme inside the soil matrix is crucial. The retained
bacteria can induce CaCO3 precipitation through the supply of injecting a cementation solution.
Improper bacteria retention could lead to the bacteria being flushed away or detached by a
subsequent injection of the cementation solution, leading to uneven distribution of bacteria and
resulting in non-uniform CaCO3 precipitation and strength within the biocemented soil. Figure
8.2 is shown the conceptual design of coastal prevention with the MICP method of this entire
research.
8.3.5.1 pH and temperature
pH and temperature have a direct bearing on the growth and urease activity of the bacteria.
P. tetradonis is sensitive to pH and temperature during the cementation process as some studies
have shown (Kim et al., 2018; Sun et al., 2019). pH and temperature also have an impact on
the equilibria of dissolution and precipitation during the MICP process. Here we mainly talk
about the influence of microbial activity caused by these parameters. pH has a crucial
biochemical effect on the activity of urease produced by P. tetradonis (Whiffin, 2004;
Daryono, et al., 2020a, 2020b). Optimal pH for bacteria growth and urease activity is not the
same. For the cultivation of the bacteria, the optimal pH is around 9, while the optimum pH for
urease activity is usually near neutral for P. tetradonis (Mobley et al., 1995; Daryono, et al.,
2020a, 2020b). According to Whiffin (2004), pH in the range of 6.25–7.7 gives a urease activity
higher than 40 mM urea/min and the maximum (around 43 mM urea/min) occurs around pH =
7. Cheng et al. (2014) found that pH lower than 3.5 and higher than 9.5 is averse to the
cementation process. During the MICP process, Stocks-Fischer et al. (1999) determined that
MICP starts at pH = 8.3, and its rate increases up to pH 9 of the S.pasteurii strain. Kim et al.
(2018) studied the effect of the pH (in the range of 6–10) of a urea-CaCl2 solution and found
that pH = 7 was the optimal condition for biocementation. Temperature affects microbial
growth and urease activity. Bahmani et al. (2017) studied the urease activity of S. pasteurii at
different temperatures (10, 15, 21, 35, 50, 60, and 80 °C), and found that urease activity
increased with temperature up to an optimum temperature of 60 °C. Another researcher, Fujita

257
et al., (2017) and Daryono, et al., (2020a) was conducted the study of urease activity of
ureolytic bacteria from beachrock at different temperatures. During the process of cultivation
of bacteria, the optimal temperature for different strains of P. tetradonis to reach the maximum
specific urease activity is 30°C to 40°C, record from the geochemical analysis were mentioned
beachrock occurred at 37 °C (Daryono, et al., 2020a; 2020b). Cheng et al. (2014) found that
increasing temperature could increase the production of calcite; however, the strength was
smaller than that obtained at room temperature. For the cementation of relatively coral
materials (1–3 mm), the moderate temperature of 20 °C was optimal (Mahawish et al., 2018).
In Sun et al. (2019) study, 30 °C resulted in the highest rate of CaCO3 precipitation. Kim et al.
(2018) studied the influence of temperatures between 20 and 50 °C and found that 20, 25, 30
°C were the optimal temperatures for different strains.
8.3.5.2 Marine environment
Most previous studies regarding the MICP improved soils were performed on granular
sandy soils under simple ionic environment in freshwater (Mujah, Shahin, and Cheng 2017).
However, there could be many different ions existing in practice. For example, ionic
concentrations of K+, Na+, Ca2+, Mg2+, Cl-, SO32-, and HCO3
2- in seawater are much higher than
those in freshwater. Due to the difference of sedimentation environment, the mechanism of
using urease producing micro-organisms to improve dredged sediments under marine
environment is different from that for sandy soils (Li, Chu, and Whittle 2016). To validate the
applicability of MICP technique under various complicated environments, attempt of using the
technique to reinforce soil under sea environment was made recently (Harianto et al. 2013;
Cheng, Shahin, and Cord-Ruwisch 2014; Cheng et al. 2014; Jiang et al. 2016). Cheng, Shahin,
and Cord-Ruwisch (2014) and Cheng et al. (2014) proposed a novel approach to treat sandy
soils under marine environments by modifying the promising MICP technique and using
seawater as a calcium resource to facilitate the MICP process. It is found that the amount of
microbial induced CaCO3 was the highest under alkaline condition and the lowest under acidic
condition. In addition, the unconfined compressive strength of treated specimen under neutral
condition can reach 300 kPa, which was greater than that under acidic and alkaline conditions.
The results also reveal that the strength of sand columns can be significantly increased by the
MICP technique from repeated treatment using seawater. The application of MICP technique
using seawater can possibly offer a cost-effective and sustainable way to improve ground under
marine and coastal environments for sustainable development.

258
8.3.5.3 Injection mode and rates
Injection methods are quite different from one study to another. Mixing the bacteria and
cement solution before injection gives rise to an instant reaction, producing CaCO3
precipitation and bacteria flocculation immediately. This injection method is appropriate for
the treatment of coral sand materials (van Paassen, 2009) that need higher reaction rates and
larger amounts of precipitates. And it is also used in surface stabilization, because it only needs
to cement the soil to a limited depth. Because this method needs less injection time, it makes
the process easier and reduces cost in real works. In recent studies, this method has been
improved to prevent the occurrence of an immediate reaction by prolonging the lag period of
the reaction. It has been applied successfully to lab column experiments, either by lowering
concentration of bacteria and adjusting the initial pH of the mixture to pH = 4 (Cheng et al.,
2019), or by refrigerating the bacteria and cement solution at low temperature (4 °C) before
mixing (Xiao, et al., 2019). Another method is two-phase injection (by first injecting the
bacterial cell solution followed by the cement solution). This method is expected to prevent
clogging and give a more homogeneous distribution of CaCO3 crystals (Whiffin, et al., 2007).
It is widely used by many researchers.
For strengthening soil surface, injection is usually realized by surface percolation. For
ground improvement, Whiffin, et al. (2007) used 0.35 L/h (for a column 5m long, ϕ=66 mm),
Mortensen et al. (2011) used 10 mL/min (column: 100/50mm long, ϕ=50 mm), Cheng, et al.,
(2013) used1 L/h (column: 160mm long, ϕ=55 mm). They all obtained good cementation
results in their samples of various sizes (<1 mm) with the mentioned injection rates. To make
the results clearer, seepage velocity (the velocity through the bulk of the porous medium) is
calculated using the following equation to unify the units, v = Q/A, where v is the seepage
velocity (m/day), Q is the total volume flowing through the corresponding cross-sectional area
per time unit (m3/day), A is the cross-section area of the flow (m2). The results are 2.5 m/ day,
7.3 m/day and 10.1 m/day for Whiffin et al., (2007), Mortensen, et al., (2011) and Cheng et al.,
(2013), respectively. Whiffin, et al., (2007) concluded that relatively low flow rates (<10
m/day) were desirable. However, if the urea hydrolysis is quite fast, to prevent clogging near
the inlet, a higher injection rate is expected to deliver precipitates to further locations.
8.4 Sustainability to the environment
Applying MICP for soil improvement results in a significant change in indigenous
microbial populations. While this is unavoidable as part of the MICP process, the potential risk
to the ecological balance must be properly assessed. Recent studies have started to investigate

259
microbial dynamics during MICP implementation (Gat, et al., 2016), but a complete life-cycle
analysis from an ecological perspective is not yet available and the capability of MICP-treated
soil to sustain life (i.e. as habitats for organisms) is not known. Traditionally, terrestrial
ecologists view ecological restoration as an indispensable part of an engineered land system.
This perspective, unfortunately, is often ignored in geotechnical design practice (DeJong, et
al., 2015). Meanwhile, the most popular ureolysis process to achieve MICP generates ammonia
as a by-product, which could cause harm to different environments. Thus, researchers might
consider utilizing alternative greener bio-mineralization processes. For example, the microbial
iron reduction process is responsible for the formation of coastal and continental shelf
sediments in geological history. Hydroxyapatite, which can be synthesized through bio-
mineralization, has been exploited in medical science for bone grafting and bone building.
Currently, it is not clear whether these alternative bio-mineralization processes are technically
feasible for soil improvement applications and, therefore, effective collaborations among
geochemists, biomaterial scientists and engineers are required. Moreover, ongoing MICP
research and development efforts have overlooked possible long-term deterioration of MICP-
treated soils. Although researchers have recently started to look into the dissolution of formed
precipitates as a result of evolving bio-geochemical processes (Gat, et al., 2016), the
degradation of engineering performance has not been fully evaluated over long time scales and
under severe adverse environments. In addition, further efforts are needed to lower the energy
requirements of MICP technique, as the currently used nutrient media and multi-treatment
regime are both high in embodied energy. This can be potentially achieved by optimizing the
raw materials and technological process so as to make it an energy-saving soil improvement
method.
8.4.1 Biosafety risk of indigenous ureolytic microorganisms
There is popular construction biotechnology that is based on “stimulation of indigenous
(native) microorganisms” (Burbank, et al., 2011; 2012; Gomez, et al., 2017; Hammes, et al.,
2003; Kiasari, et al., 2018; Rajasekar, et al., 2017). This technology is based on opinion that
there will be no harm for people and environment if native microorganisms of soil are used.
However, it is well known that soil microbial community is concentrated in the upper layer of
10–30 cm of fertile soil and there is almost no microbial activity in soil deeper than a few
meters from the soil surface, as well as in the cracks of the rocks, or in the desert sand (Ivanov,
2015; Ivanov and Stabnikov, 2017). Therefore, construction biotechnology with indigenous
microorganisms is applicable only for the upper layer of soil, which is fertilized by urea and

260
therefore containing a lot of urease-producing microorganisms. Soil microbial community is
very complex and there will be obviously present ureolytic indigenous microorganisms because
urea is released into environment by mammals. An addition of urea to soil will increase its pH
and stimulate growth of indigenous alkaliphilic ureolytic bacteria. Additionally, soil will be
enhanced by amino acids and carbohydrates due to lysis of soil non-alkaliphilic
microorganisms. Due to these processes, the soil community of indigenous microorganisms
will be replaced by enrichment culture of alkaliphilic halotolerant microorganisms with
undefined biosafety risk. The short-list of soil-born alkaliphilic halotolerant pathogens include
bacteria B. anthracis causing deadly disease anthrax, Clostridium tetani causing tetanus,
Clostridium perfringens causing gas gangrene, B. cereus causing gastroenteritis, Listeria
monocytogenes causing meningitis, Burkholderia pseudomallei causing melioidosis, fungi
Blastomyces dermatitidis causing blastomycosis, and fungi Coccidioides associated with
alkaline, saline sandy soils and causing pneumonia (Baumgardner, 2012; Ivanov, 2015; Ivanov
and Stabnikov, 2017). Therefore, it is not safe to stimulate growth of indigenous urease
producing soil microorganisms because even the high pH and salinity of soil do not prevent
growth of both “native” ureolytic and non-ureolytic pathogenic microorganisms. Enhancement
of soil with pathogens during MICP could cause infections due to direct contact of the workers
with soil or spread of microbial pathogens into environment with the soil dust and the MICP
effluent.
8.4.2 Biosafety risk of pure bacterial cultures
A major point for the use of pure bacterial culture for MICP is biosafety requirements for
cultivation of cells, production and storage of biocement, its injection into or spraying onto
soil, persistence of introduced microorganisms in soil, effect of introduced microorganisms on
human and environment, and fate of these microorganisms in environment. It requires
expensive studies that will complicate use of living bacterial cells in construction
biotechnologies. Additionally, a lot of formal approvals and permissions are needed for release
of living bacteria in environment (Ball, 2015). Therefore, to eliminate the point of biosafety at
all and to avoid obtaining of approvals for industrial scale MICP, the new technology of MICP
was proposed. The main point of this technology is the use of dead but urease active cells of
urease-producing bacteria (Ivanov and Stabnikov, 2017). The best treatment of bacterial cells
was incubation in 0.5% solution of the surfactant sodium dodecyl sulfate (SDS) for 2 h. This
treatment killed all cells of micrococci Yaniella sp. but decreased urease activity of bacterial
suspension just from 4.9 to 3.2 mM of hydrolyzed urea/min. SEM showed only the remainders

261
of cell wall of Yaniella sp. cells after this incubation. However, biomass of alkali tolerant,
halophilic, ureolytic Gram-positive micrococci was killed by surfactant but enzyme urease
remains still active. The dead bacterial biomass with urease activity is just a chemical matter
and will not require biosafety risk evaluation.
Similar treatment did not kill all cells of S. pasteurii, probably because of the presence of
spores, which are more resistant to the surfactants than the vegetative cells. Bioclogging with
dead but urease active cells of Yaniella sp. urease decreased the hydraulic conductivity of sand
from 5.2·10−4 m/s to 7.7·10−9 m/s (Stabnikov, et al., 2016). Probably, biomass of culture
collection strains, for example Yaniella halotolerans DSM 15476 or Yaniella flava DSM 16377
from Group Risk 1, also can be used for bioclogging/ biocementation after growth in the
medium with urea and killing cells by surfactants. There may be another hypothetical way to
increase biosafety of MICP with any pure culture. It could be selection and use of
psychrophilic, alkaliphilic, halotolerant microorganisms for biocementation with optimum
temperature for growth about 15–20 °C and maximum temperature 25 °C, so that these
microorganisms will die at temperature 30 °C (Ivanov, 2015).
Therefore, they will be not dangerous for humans with temperature 36.6 °C. Psychrophilic
microorganisms with optimum temperature for growth 20 °C and their urease could be more
Region to concern
vertical exaggeration
Figure 8.2. Conceptual design of coastal prevention with MICP method

262
suitable for underground geotechnical works than mesophilic microorganisms with optimum
temperature for growth of 30 °C because underground temperature in sites deeper than 20 m
from surface is about 10–15 °C in Europe, North America, and north of Asia, and 20–25 °C in
the tropical zone. Psychrophilic microorganisms could be also useful for the soil surface
bioclogging/biocementation during spring and autumn seasons in Europe, North America and
north of Asia, where only 3 months of the summer season are suitable for the soil biotreatment
using mesophilic microorganisms. Psychrophilic microorganisms were not studied for use in
construction biotechnology yet, but they are used in industrial biotechnology (Banerjee, et al.,
2016). This research was concluded the three urrolytic bacteria strain from local beachrock in
Krakal-Sadranan, whereas one of them is same genus with Vibrio cholera and indicated it have
a pathogenic strain even though it is biosafety level 1.
8.4.3 Undesired byproducts
Soil improvement using MICP is a novel and innovative technique compared with the
conventional methods that have been in use for environmental applications. Undesired
byproducts (e.g., ammonium, ammonia, hydrogen sulfite, nitrite, nitrous oxide, and carbon
dioxide) generated during the various MICP processes may pose environmental and health
risks (Reeburgh, 2007; Erşan, et al., 2005; Hommel, et al., 2016; Paul, et al., 2017; González-
Muñoz, et al., 2010; De Muynck, 2013). For example, ammonium (the byproduct of ureolysis)
is very costly to treat in groundwater. van Paassen (2010) reported that, if an incomplete
reaction occurs during denitrification (a method used in MICP), greenhouse gases such as
nitrite and nitrous oxide will be produced. Solomon, et al., (2007) reported that nitrous oxide
has an atmospheric lifespan of 114 years and is a dominant greenhouse gas, having a 300- fold
greater potential for global warming effects compared with carbon dioxide. Another undesired
byproduct of the MICP process is the toxic and combustible H2S gas released by sulfate-
reducing bacteria, which results in many environmental and health issues (Kirk, et al., 2015).
However, undesired byproducts can be mitigated by: (1) identifying other strategies or
techniques to prevent their generation, (2) using the byproducts for other applications nearby,
or (3) adopting treatments to eliminate the byproducts (Zhu and Dittrich, 2016).
8.4.4 Nonuniform injection of microbes and cementation reagents
The presence of microorganisms, sufficient nutrients, and cementation reagents in a soil
medium is required for the beneficial application of the MICIP technique (Zhu and Dittrich,
2016). Dejong, et al., (2014) reported that both the nutrients and cementation reagents can

263
rapidly be exhausted due to: (1) the flow rates through the soil medium being too fast for
reaction to occur, (2) nutrients not being provided in sufficient quantity, or (3) nutrients being
exhausted over time. To overcome some of these challenges, studies (Barkouki, et al., 2011;
Martinez, et al., 2012; 2013; Rowshanbakht, et al., 2016; Inagaki, et al., 2011) have been
conducted to determine or optimize the quantities of injection of the microbes, nutrients, and
cementation reagents. Some of the reported findings of the studies are: (1) The stop-flow
injection method is preferred over continuous and recirculation methods of injection, as it
provides an even and more uniform distribution of calcite when compared with the other two
methods, which either result in greater filling of voids near the injection points or flushing of
some of the microbes, preventing their participation in the precipitation process; (2) A
maximum of two-thirds of the pore volume should be used as the injection volume for the
microbes, nutrients, and cementation reagents (Rowshanbakht, et al., 2016): (3) It is
recommended that a maximum of one-third of the pore volume should be used for the injection
of microbes, an approach that yielded positive results with tropical residual soils (Osinubi, et
al., 2018; 2019)
8.4.5 Limitations of microbes
Most MICP laboratory studies have been carried out under nutrient-rich conditions
(Lauchnor, et al., 2013), while in practical applications, such as soil reinforcement, metal
remediation, repair of cracks in concrete, etc., such conditions are quite rare. Furthermore,
microbes may be exposed to unfavorable conditions such as high pH, high temperature and
pressure, desiccation, evaporation, oxygen and nutrient deficiency, salt concentration, etc. in
the field. Field conditions limit the bacterial strains within the soil, which is a requirement for
MICP to occur. Although several reported field studies were conducted at high pressure, most
bacteria used in MICP have been cultured at ambient temperature and pressure (Okyay, et al.,
2015). However, it is difficult for bacteria cultured in the ambient temperature range of 20–37
°C to survive or maintain their microbial activities at a temperature of 120 °C (Kumar, et al.,
2011). Finally, better understanding of fundamental, multifunctional and sustainable characters
of MICP requires an extensive deployment of monitoring facilities. Thanks to recent advances
in monitoring technologies, we now have the capabilities to obtain more timely and refined
data. Researchers could seek solutions from interdisciplinary technological breakthroughs such
as sensors for multi-physical measurements, robotics for automated real-time data collection
and artificial intelligence (AI) tools for establishing robust predictive models (Osinubi, et al.,
2020).
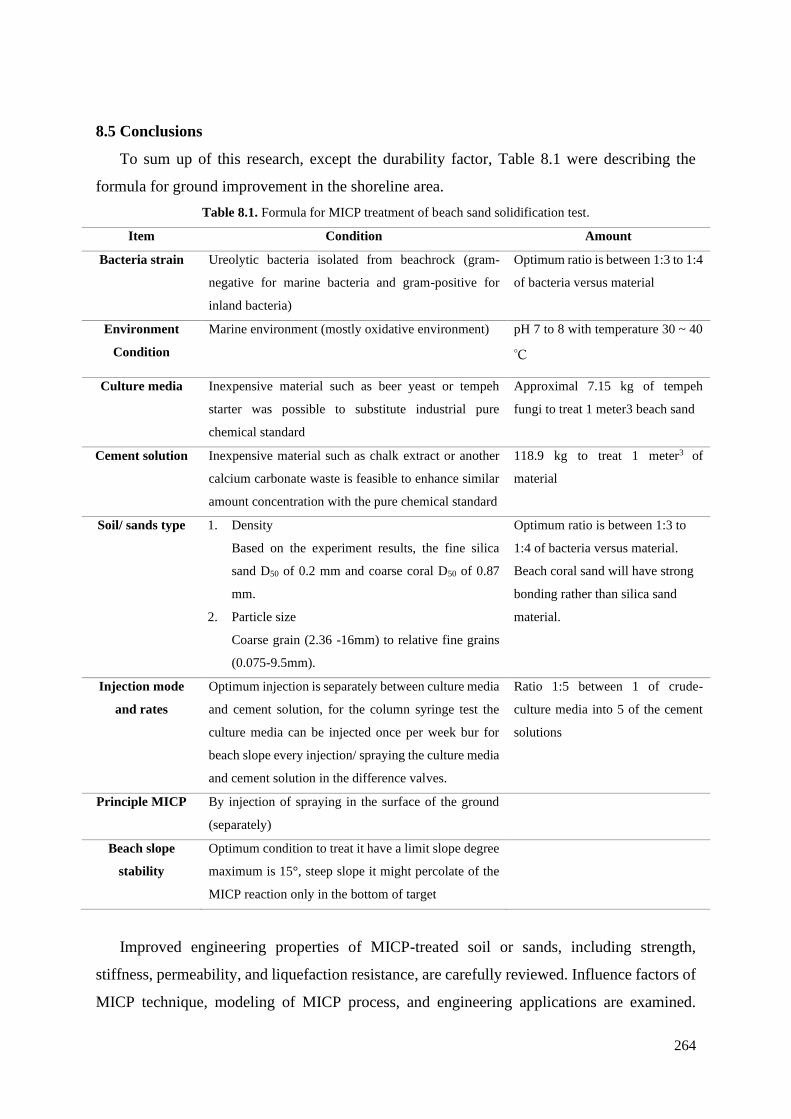
264
8.5 Conclusions
To sum up of this research, except the durability factor, Table 8.1 were describing the
formula for ground improvement in the shoreline area.
Table 8.1. Formula for MICP treatment of beach sand solidification test.
Item Condition Amount
Bacteria strain
Ureolytic bacteria isolated from beachrock (gram-
negative for marine bacteria and gram-positive for
inland bacteria)
Optimum ratio is between 1:3 to 1:4
of bacteria versus material
Environment
Condition
Marine environment (mostly oxidative environment) pH 7 to 8 with temperature 30 ~ 40
℃
Culture media Inexpensive material such as beer yeast or tempeh
starter was possible to substitute industrial pure
chemical standard
Approximal 7.15 kg of tempeh
fungi to treat 1 meter3 beach sand
Cement solution Inexpensive material such as chalk extract or another
calcium carbonate waste is feasible to enhance similar
amount concentration with the pure chemical standard
118.9 kg to treat 1 meter3 of
material
Soil/ sands type 1. Density
Based on the experiment results, the fine silica
sand D50 of 0.2 mm and coarse coral D50 of 0.87
mm.
2. Particle size
Coarse grain (2.36 -16mm) to relative fine grains
(0.075-9.5mm).
Optimum ratio is between 1:3 to
1:4 of bacteria versus material.
Beach coral sand will have strong
bonding rather than silica sand
material.
Injection mode
and rates
Optimum injection is separately between culture media
and cement solution, for the column syringe test the
culture media can be injected once per week bur for
beach slope every injection/ spraying the culture media
and cement solution in the difference valves.
Ratio 1:5 between 1 of crude-
culture media into 5 of the cement
solutions
Principle MICP By injection of spraying in the surface of the ground
(separately)
Beach slope
stability
Optimum condition to treat it have a limit slope degree
maximum is 15°, steep slope it might percolate of the
MICP reaction only in the bottom of target
Improved engineering properties of MICP-treated soil or sands, including strength,
stiffness, permeability, and liquefaction resistance, are carefully reviewed. Influence factors of
MICP technique, modeling of MICP process, and engineering applications are examined.
265
Finally, limitation and cost analyses of the technique are discussed. Some recommendations
have also been provided for future development. Urea hydrolysis is the most preferred CaCO3
precipitation mechanism because it can be easily controlled and possesses about 90% of CaCO3
production efficiency in a short period of time. The most favorable bacteria for soil
biocementation come from, but not limited to, highly urease active bacteria (e.g.
Psedoalteromonas tetradonis). It is vital to know the effective mechanism of CaCO3
precipitation because it translates to a lower cost of MICP treatment and achieves strong
material in the long-term periods. In return, this can pave the way into possible
commercialization of the technique in the near future. Some important key factors of the MICP
determined to include ureolytic bacteria, culture media, cement solution, soil/sand, and
treatment sand condition such as pH and also temperature during the treatment. The treated
reason based on local indigenous bacteria because for real implementation the treatment
condition factor could be eliminate based on their natural condition.
References
Al Qabany A, Soga K. 2013. Effect of chemical treatment used in micp on engineering
properties of cemented soils. Geotechnique 63(4):331–339.
Al-Thawadi, S. 2008. High strength in-situ biocementation of soil by calcite precipitating
locally isolated ureolytic bacteria. Western Australia: Murdoch University.
Amini Kiasari, M., Pakbaz, M.S. and Ghezelbash, G.R., 2018. Increasing of soil urease
activity by stimulation of indigenous bacteria and investigation of their role on shear strength.
Geomicrobiology Journal, 35(10), pp.821-828.
Bachmeier, K.L., Williams, A.E., Warmington, J.R. and Bang, S.S., 2002. Urease activity
in microbiologically-induced calcite precipitation. Journal of Biotechnology, 93(2), pp.171-
181.
Bahmani, M., Noorzad, A., Hamedi, J. and Sali, F., 2017. The role of bacillus pasteurii on
the change of parameters of sands according to temperatur compresion and wind erosion
resistance. Journal CleanWAS, 1(2), pp.1-5.
Ball, A.S., 2015. The intentional release of micro-organisms into the environment:
challenges to commercial use. In Biosafety and the environmental uses of micro-organisms:
conference proceedings, OECD Publishing, Paris (pp. 115-126).
Banerjee, R., Halder, A. and Natta, A., 2016. Psychrophilic microorganisms: Habitats and
exploitation potentials. Eur J Biotechnol Biosci, 4, pp.16-24.
Barkouki, T.H., Martinez, B.C., Mortensen, B.M., Weathers, T.S., De Jong, J.D., Ginn,

266
T.R., Spycher, N.F., Smith, R.W. and Fujita, Y., 2011. Forward and inverse bio-geochemical
modeling of microbially induced calcite precipitation in half-meter column experiments.
Transport in Porous Media, 90(1), p.23.
Burbank, M. B., T. J. Weaver, T. L. Green, B. C. Williams, and R. L. Crawford. 2011.
Precipitation of calcite by indigenous microorganisms to strengthen liquefiable soils.
Geomicrobiology Journal 28 (4):301–312. doi:10.1080/01490451.2010.499929
Burbank, M.B., Weaver, T.J., Williams, B.C. and Crawford, R.L., 2012. Urease activity of
ureolytic bacteria isolated from six soils in which calcite was precipitated by indigenous
bacteria. Geomicrobiology Journal, 29(4), pp.389-395.
Cheng, L. and Cord-Ruwisch, R., 2012. In situ soil cementation with ureolytic bacteria by
surface percolation. Ecological Engineering, 42, pp.64-72.
Cheng, L., Cord-Ruwisch, R. and Shahin, M.A., 2013. Cementation of sand soil by
microbially induced calcite precipitation at various degrees of saturation. Canadian
Geotechnical Journal, 50(1), pp.81-90.
Cheng, L., Shahin, M.A. and Chu, J., 2019. Soil bio-cementation using a new one-phase
low-pH injection method. Acta Geotechnica, 14(3), pp.615-626.
Cheng, L., Shahin, M.A. and Cord-Ruwisch, R., 2014. Bio-cementation of sandy soil using
microbially induced carbonate precipitation for marine environments. Géotechnique, 64(12),
pp.1010-1013.
Choi, S.G., Wang, K. and Chu, J., 2016. Properties of biocemented, fiber reinforced sand.
Construction and building materials, 120, pp.623-629.
Daryono, L.R., Nakashima, K., Kawasaki, S., Titisari, A.D. and Barianto, D.H., 2020a.
Sediment Characteristics of Beachrock: A Baseline Investigation Based on Microbial Induced
Carbonate Precipitation at Krakal-Sadranan Beach, Yogyakarta, Indonesia. Applied Sciences,
10(2), p.520.
Daryono, L.R., Nakashima, K., Kawasaki, S., Suzuki, K., Suyanto, I. and Rahmadi, A.,
2020b. Investigation of Natural Beachrock and Physical–Mechanical Comparison with
Artificial Beachrock Induced by MICP as a Protective Measure against Beach Erosion at
Yogyakarta, Indonesia. Geosciences, 10(4), p.143.
Daryono, L.R., Titisari, A.D., Warmada, I.W. and Kawasaki, S., 2019. Comparative
characteristics of cement materials in natural and artificial beachrocks using a petrographic
method. Bulletin of Engineering Geology and the Environment, 78(6), pp.3943-3958.
De Muynck, W., Verbeken, K., De Belie, N. and Verstraete, W., 2013. Influence of
temperature on the effectiveness of a biogenic carbonate surface treatment for limestone

267
conservation. Applied microbiology and biotechnology, 97(3), pp.1335-1347.
Dejong, J. T., Proto, C., Kuo, M., and Gomez, M. 2014. Bacteria, bio-films and
invertebrates… the next generation of geotechnical engineers. In: Proceedings of geo-congress
2014: technical papers, ASCE, Geotechnical Special Publication, vol 234, pp 3959–3968
DeJong, J., Tibbett, M. and Fourie, A., 2015. Geotechnical systems that evolve with
ecological processes. Environmental earth sciences, 73(3), pp.1067-1082.
DeJong, J.T., Soga, K., Kavazanjian, E., Burns, S., Van Paassen, L.A., Al Qabany, A.,
Aydilek, A., Bang, S.S., Burbank, M., Caslake, L.F. and Chen, C.Y., 2014. Biogeochemical
processes and geotechnical applications: progress, opportunities and challenges. In Bio-and
Chemo-Mechanical Processes in Geotechnical Engineering: Géotechnique Symposium in Print
2013 (pp. 143-157). Ice Publishing.
Epelde, L., Becerril, J. M., Hernández-Allica, J., Barrutia, O., and Garbisu, C. 2008.
Functional diversity as indicator of the recovery of soil health derived from Thlaspi
caerulescens growth and metal phytoextraction. Appl Soil Ecol 39(3):299–310. https ://doi.
org/10.1016/j.apsoi l.2008.01.005
Erşan, Y.Ç., De Belie, N. and Boon, N., 2015. Microbially induced CaCO3 precipitation
through denitrification: an optimization study in minimal nutrient environment. Biochemical
Engineering Journal, 101, pp.108-118.
Fujita, M., Nakashima, K., Achal, V. and Kawasaki, S., 2017. Whole-cell evaluation of
urease activity of Pararhodobacter sp. isolated from peripheral beachrock. Biochemical
engineering journal, 124, pp.1-5.
Gao, Y., Hang, L., He, J. and Chu, J., 2019. Mechanical behaviour of biocemented sands
at various treatment levels and relative densities. Acta Geotechnica, 14(3), pp.697-707.
Gat, D., Ronen, Z. and Tsesarsky, M., 2016. Soil bacteria population dynamics following
stimulation for ureolytic microbial-induced CaCO3 precipitation. Environmental science &
technology, 50(2), pp.616-624.
Gomez, M.G., Graddy, C.M., DeJong, J.T., Nelson, D.C. and Tsesarsky, M., 2018.
Stimulation of native microorganisms for biocementation in samples recovered from field-
scale treatment depths. Journal of Geotechnical and Geoenvironmental Engineering, 144(1),
p.04017098.
González-Muñoz, M.T., Rodriguez-Navarro, C., Martínez-Ruiz, F., Arias, J.M., Merroun,
M.L. and Rodriguez-Gallego, M., 2010. Bacterial biomineralization: new insights from
Myxococcus-induced mineral precipitation. Geological Society, London, Special Publications,
336(1), pp.31-50.

268
Hamdan, N., Kavazanjian Jr, E. and O’Donnell, S., 2013, September. Carbonate
cementation via plant derived urease. In Proceedings of the 18th International Conference on
Soil Mechanics and Geotechnical Engineering (pp. 2-6).
Hamdan, N., Kavazanjian, J., Rittman, B.E., and Karatas, I. 2011. Carbonate mineral
precipitation for soil improvement through microbial denitrification. In: Proceedings of geo-
frontiers 2011: advances in geotechnical engineering, Dallas TX, ASCE, Geotechnical Special
Publication, vol 211, pp 3925–3934
Hammes, F., Boon, N., de Villiers, J., Verstraete, W. and Siciliano, S.D., 2003. Strain-
specific ureolytic microbial calcium carbonate precipitation. Appl. Environ. Microbiol., 69(8),
pp.4901-4909.
Harianto, T., Hamzah, S., Nur, S.H., Abdurrahman, M.A., Latief, R.U., Fadliah, I. and
Walenna, A., 2013, September. Biogrouting stabilization on marine sandy clay soil. In The 7th
International Conference on Asian and Pacific Coasts (Vol. 848, p. 52).
Hataf, N. and Jamali, R., 2018. Effect of fine-grain percent on soil strength properties
improved by biological method. Geomicrobiology journal, 35(8), pp.695-703.
He, J., Chu, J. and Liu, H., 2014. Undrained shear strength of desaturated loose sand under
monotonic shearing. Soils and Foundations, 54(4), pp.910-916.
Hommel, J., Lauchnor, E., Gerlach, R., Cunningham, A.B., Ebigbo, A., Helmig, R. and
Class, H., 2016. Investigating the influence of the initial biomass distribution and injection
strategies on biofilm-mediated calcite precipitation in porous media. Transport in Porous
Media, 114(2), pp.557-579.
Hwang, E.T., Gang, H. and Gu, M.B., 2013. CO2 bioconversion using carbonic anhydrase
(CA): effects of PEG rigidity on the structure of bio-mineralized crystal composites. Journal
of biotechnology, 168(2), pp.208-211.
Inagaki, Y., Tsukamoto, M., Mori, H., Sasaki, T., Soga, K., Qabany, A.A. and Hata, T.,
2011. The influence of injection conditions and soil types on soil improvement by microbial
functions. In Geo-Frontiers 2011: Advances in Geotechnical Engineering (pp. 4021-4030).
Ivanov, V. and Stabnikov, V., 2017. Bioclogging and biogrouts. In Construction
Biotechnology (pp. 139-178). Springer, Singapore.
Ivanov, V., 2015. Environmental microbiology for engineers. CRC press.
Jiang, N.J., Yoshioka, H., Yamamoto, K. and Soga, K., 2016. Ureolytic activities of a
urease-producing bacterium and purified urease enzyme in the anoxic condition: Implication
for subseafloor sand production control by microbially induced carbonate precipitation
(MICP). Ecological engineering, 90, pp.96-104.
269
Jiménez-López, C., Rodriguez-Navarro, C., Piñar, G., Carrillo-Rosúa, F.J., Rodriguez-
Gallego, M. and Gonzalez-Muñoz, M.T., 2007. Consolidation of degraded ornamental porous
limestone stone by calcium carbonate precipitation induced by the microbiota inhabiting the
stone. Chemosphere, 68(10), pp.1929-1936.
Kim, G., Kim, J. and Youn, H., 2018. Effect of temperature, pH, and reaction duration on
microbially induced calcite precipitation. Applied Sciences, 8(8), p.1277.
Kirk, G.J., Versteegen, A., Ritz, K. and Milodowski, A.E., 2015. A simple reactive-
transport model of calcite precipitation in soils and other porous media. Geochimica et
Cosmochimica Acta, 165, pp.108-122.
Kumar, K., Dasgupta, C.N., Nayak, B., Lindblad, P. and Das, D., 2011. Development of
suitable photobioreactors for CO2 sequestration addressing global warming using green algae
and cyanobacteria. Bioresource technology, 102(8), pp.4945-4953.
Lauchnor, E.G., Schultz, L.N., Bugni, S., Mitchell, A.C., Cunningham, A.B. and Gerlach,
R., 2013. Bacterially induced calcium carbonate precipitation and strontium coprecipitation in
a porous media flow system. Environmental science & technology, 47(3), pp.1557-1564.
Li, B., Chu, J. and Whittle, A., 2016. Biotreatment of fine-grained soil through the
bioencapsulation method. In Geo-Chicago 2016 (pp. 25-32).
Liu, M., Zhang, M., Lin, S., Liu, J., Yang, Y. and Jin, Y., 2012. Optimization of extraction
parameters for protein from beer waste brewing yeast treated by pulsed electric fields (PEF).
Afr J Microbiol Res, 6, pp.4739-4746.
Madigan, M. T., Martinko, J. M., Dunlap, P. V., and Clark, D. P. 2008. Brock biology of
microorganisms, 12th edn. Benjamin Cummings, San Francisco
Mahawish, A., Bouazza, A. and Gates, W.P., 2018. Effect of particle size distribution on
the bio-cementation of coral aggregates. Acta Geotechnica, 13(4), pp.1019-1025.
Martinez, B.C., 2012. Up-scaling of microbial induced calcite precipitation in sands for
geotechnical ground improvement. University of California, Davis.
Martinez, B.C., DeJong, J.T., Ginn, T.R., Montoya, B.M., Barkouki, T.H., Hunt, C., Tanyu,
B. and Major, D., 2013. Experimental optimization of microbial-induced carbonate
precipitation for soil improvement. Journal of Geotechnical and Geoenvironmental
Engineering, 139(4), pp.587-598.
Mitchell, J.K., and Santamarina, J.C. 2005. Biological considerations in geotechnical
engineering. J Geotech Geoenviron Eng 131(10):11222–11233. https ://doi.org/10.1061/
(ASCE)1090-0241(2005)131:10(1222)
Mortensen, B.M., Haber, M.J., DeJong, J.T., Caslake, L.F. and Nelson, D.C., 2011. Effects

270
of environmental factors on microbial induced calcium carbonate precipitation. Journal of
applied microbiology, 111(2), pp.338-349.
Mujah, D., Shahin, M.A. and Cheng, L., 2017. State-of-the-art review of biocementation
by microbially induced calcite precipitation (MICP) for soil stabilization. Geomicrobiology
Journal, 34(6), pp.524-537.
Ng WS, Lee ML, Tan CK, Hii SL. 2014. Factors affecting improvement in engineering
properties of residual soil through microbial-induced calcite precipitation. J Geotech
Geoenviron Eng 140(5):04014006. doi: 10.1061/(ASCE)GT.1943-5606.0001089.
Okwadha GD, Li J. 2010. Optimum conditions for microbial carbonate precipitation.
Chemosphere 81(9):1143–1148.
Okyay, T.O. and Rodrigues, D.F., 2015. Biotic and abiotic effects on CO2 sequestration
during microbially-induced calcium carbonate precipitation. FEMS microbiology ecology,
91(3), p.fiv017.
Osinubi, K.J., Eberemu, A.O., Ijimdiya, T.S., Yakubu, S.E., Gadzama, E.W., Sani, J.E. and
Yohanna, P., 2020. Review of the use of microorganisms in geotechnical engineering
applications. SN Applied Sciences, 2(2), pp.1-19.
Osinubi, K.J., Sani, J.E., Eberemu, A.O., Ijimdiya, T.S. and Yakubu, S.E., 2018, October.
Unconfined compressive strength of Bacillus Pumilus treated lateritic soil. In The International
Congress on Environmental Geotechnics (pp. 410-418). Springer, Singapore.
Osinubi, K.J., Yohanna, P., Eberemu, A.O. and Ijimdiya, T.S., 2019, October. Evaluation
of hydraulic conductivity of lateritic soil treated with Bacillus Coagulans for use in waste
containment applications. In The International Congress on Environmental Geotechnics (pp.
401-409). Springer, Singapore.
Paul, V.G., Wronkiewicz, D.J. and Mormile, M.R., 2017. Impact of elevated CO2
concentrations on carbonate mineral precipitation ability of sulfate-reducing bacteria and
implications for CO2 sequestration. Applied geochemistry, 78, pp.250-271.
Portugal, C.R.M., Fonyo, C., Machado, C.C., Meganck, R. and Jarvis, T., 2020.
Microbiologically Induced Calcite Precipitation biocementation, green alternative for roads–is
this the breakthrough? A critical review. Journal of Cleaner Production, p.121372.
Rajasekar, A., Moy, C.K. and Wilkinson, S., 2017, May. Stimulation of indigenous
carbonate precipitating bacteria for ground improvement. In IOP Conference Series: Earth and
Environmental Science (Vol. 68, No. 1, p. 012010). IOP Publishing.
Reeburgh, W.S., 2007. Oceanic methane biogeochemistry. Chemical reviews, 107(2),
pp.486-513.
271
Reichle, D. E. 1977. The role of soil invertebrates in nutrient cycling. Ecol Bull 25:145–
156
Rowshanbakht, K., Khamehchiyan, M., Sajedi, R.H. and Nikudel, M.R., 2016. Effect of
injected bacterial suspension volume and relative density on carbonate precipitation resulting
from microbial treatment. Ecological engineering, 89, pp.49-55.
Sari, Y. D. 2015. Soil strength improvement by microbial cementation. Mar Georesour
Geotechnol 33(6):567–571. https ://doi. org/10.1080/10641 19X.2014.95323 4
Solomon, S., Manning, M., Marquis, M. and Qin, D., 2007. Climate change 2007-the
physical science basis: Working group I contribution to the fourth assessment report of the
IPCC (Vol. 4). Cambridge university press.
Soon, N. W., L. M. Lee, T. C. Khun, and H. S. Ling. 2013. Improvements in engineering
properties of soils through microbial-induced calcite precipitation. KSCE Journal of Civil
Engineering 17 (4):718–728. doi:10.1007/s12205-013-0149-8
Soon, N., Lee, L., Khun, T., and Ling, H. 2012. An overview of the factors affecting
microbial-induced calcite precipitation and its potential application in soil improvement. Int J
Civ Environ Struct Constr Archit Eng 6(2):188–194
Stabnikov, V., Ivanov, V. and Chu, J., 2016. Sealing of sand using spraying and percolating
biogrouts for the construction of model aquaculture pond in arid desert. International Aquatic
Research, 8(3), pp.207-216.
Stocks-Fischer, S., Galinat, J.K. and Bang, S.S., 1999. Microbiological precipitation of
CaCO3. Soil Biology and Biochemistry, 31(11), pp.1563-1571.
Sun, X., Miao, L., Tong, T. and Wang, C., 2019. Study of the effect of temperature on
microbially induced carbonate precipitation. Acta Geotechnica, 14(3), pp.627-638.
Thomas O’Donnell, S. and Kavazanjian Jr, E., 2015. Stiffness and dilatancy improvements
in uncemented sands treated through MICP. Journal of Geotechnical and Geoenvironmental
Engineering, 141(11), p.02815004.
Umar, M., Kassim, K. A., Tiong, K., and Chiet, P. 2016. Biological process of soil
improvement in civil engineering: a review. J Rock Mech Geotech Eng. https
://doi.org/10.1016/j.jrmge .2016.02.004
Van Paassen, L. A., C. M. Daza, M. Staal, D. Y. Sorokin, W. van der Zon, and M. C. M.
van Loosdrecht 2010. Potential soil reinforcement by biological denitrification. Ecological
Engineering 36 (2):168–175. doi:10.1016/j.ecoleng.2009.03.026
Van Paassen, L.A., 2009. Biogrout, ground improvement by microbial induced carbonate
precipitation [Ph. D. thesis]. Delft University of Technology, Delft, The Netherlands.

272
Whiffin, V. 2004. CaCO3 precipitation for the production of biocement. Doctoral
dissertation, Murdoch Univ., Perth, Western Australia.
Whiffin, V.S., Van Paassen, L.A. and Harkes, M.P., 2007. Microbial carbonate
precipitation as a soil improvement technique. Geomicrobiology Journal, 24(5), pp.417-423.
Wong, L.S., 2015. Microbial cementation of ureolytic bacteria from the genus Bacillus: a
review of the bacterial application on cement-based materials for cleaner production. Journal
of Cleaner Production, 93, pp.5-17.
Xiao, P., Liu, H., Stuedlein, A.W., Evans, T.M. and Xiao, Y., 2019. Effect of relative
density and biocementation on cyclic response of calcareous sand. Canadian Geotechnical
Journal, 56(12), pp.1849-1862.
Xu, Z. Y., L. Zhang, and J. Zhou. 2009. Effect of microorganisms on some engineering
properties of silt. Journal of Civil, Architectural & Environmental Engineering 31 (2):80–84
(in Chinese).
Yargicoglu, E.N., and Reddy, K. R. 2015. Review of biological tools and their applications
in geoenvironmental engineering. Rev Environ Sci Biotechnol 14:161–194. https
://doi.org/10.1007/s1115 7-014-9358-y
Zhao, Q., Li, L., Li, C., Li, M., Amini, F. and Zhang, H., 2014. Factors affecting
improvement of engineering properties of MICP-treated soil catalyzed by bacteria and urease.
Journal of Materials in Civil Engineering, 26(12), p.04014094.
Zhou, F. Q., H. X. Luo, and Y. S. Wang. 1997. The effect of microbes on some geotechnical
engineering properties. Rock and Soil Mechanics 18 (2):17–22 (in Chinese).
Zhu, T. and Dittrich, M., 2016. Carbonate precipitation through microbial activities in
natural environment, and their potential in biotechnology: a review. Frontiers in bioengineering
and biotechnology, 4, p.4.

273
CHAPTER 9
General conclusions and future research
9.1 Summary of work presented and main conclusions
This research investigated the natural beachrock and identify the durability of artificial
rocks to mitigate coastal disaster using biocementation which are environment-friendly and
economic feasible techniques for ground improvement. Biochemical methods introduced in
this thesis. Furthermore, previous studies related to the MICP have been focused to obtain
several MPa values of UCS. However, this study focused to mimic the natural beachrock and
identify the durability of artificial rocks to mitigate the coastal disaster using biocementation.
It consists of two major sections, which are:
1) Sedimentation mechanism and the properties of natural beachrock
2) Beach sand improvement with microbial induced carbonate precipitation (MICP) of the
indigenous local bacteria from beachrock
In Chapter 1, research background, objectives and originality of thesis were described. A
comprehensive literature review was carried out on various aspects related to natural coast rock
processes and the stability of the MICP process was considered.
Chapter 2 consisted of geophysical investigation of the buried beachrock at Krakal-
Sadranan beach, Yogyakarta, Indonesia. The objective was to evaluate the feasibility of
constructing artificial beachrocks using natural materials (e.g., microbes, sand, shell, pieces of
coral, and seaweed etc.) within a short time, and to propose the method as a novel strategy for
coastal protection. Beachrock were found in this area in precipitated beneath beach sand which
is wave erosional product and then solidify beneath that formation, floating, between limestone
bedrock and beach sands formation based on greater value from resistivity and S wave velocity
in the formation layers. The field survey on natural beachrocks suggests that both resistivity
and shear wave velocity were higher in the deeper deposits compared to the underlying
unconsolidated sand layer within a depth of approximately 1.5 m and covering an area of 210.5
m3 for the α-section and 76.9 m3 for the β-section of beachrock deposit.
Chapter 3 consisted of detail laboratory analysis toward beachrock sediment characteristics
investigation. The beachrock was also examined to determine the depositional conditions and
distribution of rare earth elements. An increased concentration of total rare earth elements, both
heavy rare earth elements (terbium, dysprosium, yttrium, holmium, erbium, thulium,
ytterbium, and lutetium) and light rare earth elements (lanthanum, cerium, praseodymium,

274
neodymium, samarium, europium, and gadolinium) indicate that the beachrock deposition
process happened under oxidative environmental conditions. This study proposes the novel use
of ureolytic bacteria in a depositional environment for carbonate control of a sedimentary
process for the development of artificial rock to mitigate coastal erosion. Isolated strains of
native bacteria association to Psedoalteromonas tetradonis, Oceanobacillus profundus, and
Vibrio maritimus were identified and cultured. These moderately alkalo-tolerant bacteria were
showing maximum growth and urease activity at an ambient temperature of 37 °C (based on
geochemistry results), which is compatible with the tropical climate prevailing in the target
region. Microbial carbonate overriding environmental control is seen in the present day by
localization of microbial carbonates in calcareous streams and springs and in shallow tropical
seas, and in the past by temporal variation in the abundance of marine microbial carbonates.
Only ~4.7% of ureolytic bacteria and algae precipitation, respectively, were assumed to be
catalytic factors in beachrock precipitation. The beachrock of Krakal-Sadranan beach in the
studied area can be categorized into non-beachrock, unconsolidated beachrock (similar to
limestone sands), and well-consolidated beachrock consisting of mostly rock-mineral.
Beachrock has a fair consolidated feature and consists of a mixture of gravel-sized deposits of
sand in the form of limestone fragments, calcite, and fossil minerals, and almost 50% CaO
content (carbonaceous). The interpretation of the cesium anomaly can be used to determine the
source of the REEs in this formation, indicating that the beachrock deposition processes
originated from the precipitation of seawater under oxidative conditions. This can be
interpreted as the beachrock derived from microbial process involving terrigenous materials
under oxidative conditions. Thus, the most favorable condition is to have the presence of
oxygenated material contamination. Beachrock occurrence in an area depends on highly
geological factors that contribute the matrix interior. Indonesian geological settings seem to be
dominated by marine activities of the Pacific Ocean and may be labeled as oxidative conditions.
Chapter 4 were determined of ureolytic bacteria from Indonesian tropical shoreline which
will compare between characteristic beachrock from Okinawa, Japan. Okinawa beachrock
contained more lytic granules with fragments of quartz result material sediments there are
predominantly with a fragment of coral shell, meanwhile Yogyakarta beachrock was more like
sparite cement which had filling of pore interparticle, therefore that it appears more compact
and lower porosity. Micritization proceed in Okinawa beachrock or Yogyakarta is a product of
diagenesis rock that formed on the phreatic environment of the sea within the presence of
cement on the beachrock occur peloidal micritic. To conclude, the origin of cement micritic
peloidal is uncertain. It can be precipitated directly from seawater or it just be a product of
275
biological activity. Okinawa beachrock were classified as biotically induced precipitates,
because the organism sets the precipitation process in motion but organic influence on its
course is marginal or absent. The reaction takes place outside the cell and the product is very
similar, often indistinguishable, from abiotic precipitates. The majority of carbonate material
in modern oceans is precipitated as highly structured skeletons of organisms were dominant in
the cold water rather than tropical area. Whereas Indonesia beachrocks is classified as
biotically controlled precipitates which commonly the precipitation is induced by
microorganisms, mostly bacteria and cyanobacteria. Micrite is a major, often dominant
component of these deposits. Microalgae as mats were found enrichment inside Indonesia
beachrock site than Okinawa beachrock which mostly consist of skeletal shells.
Chapter 5 consisted of beach sand treatment based on MICP process to mimic the natural
beachrock, achievement identical with natural beachrock based on chemical compound and
strength. The results revealed that the bacteria could effectively mineralize the calcium
carbonate between 30 to 40 ℃, showing in more robust performance under tropical conditions.
Natural beachrock and artificial beachrock bore similar results following the MICP process
examining properties such as chemical compounds, meniscus carbonate bridges, and rock
properties. However, the strength and porosity of artificial bedrocks were significantly different
from those of natural beachrocks which intensified carbonate precipitation processes. The
results of the sand solidification test in the laboratory showed that treated sand achieved
unconfined compressive strength of up to around 6 MPa, determined after a treatment period
of 14 days under optimum conditions. The calcium carbonate crystals which found in this
research were amorphic condition which has an orthorhombic, rhombohedron, hexagonal, and
spherical geometry of the calcium carbonate complexes. By adding biopolymer
polysaccharides, the reaction leads the crystallization formation of vaterite instead of calcite
which common type of polymorphism in MICP without changing the morphology of the
crystals (anionic polysaccharides). On other hand, the ions NaCl and MgCl2 concentrations on
MICP is higher than those of average seawater favors microbially mediated formation of Mg-
rich carbonates, which are often considered as potential dolomite precursors. Even though the
process deemed to negatively affect the desired engineering properties of the treated specimens.
It is clearly deduced that the strength decline is mainly due to the change in crystal morphology
(rather than the quantity of precipitate) to a needle shaped crystal form with lower bonding
capacity than that of the well-interweaved and cross-linked rhombohedral crystals produced in
the absence of magnesium.

276
Chapter 6 delivers the testing of durability based on MICP for coastal disaster
countermeasures development. Experimental work presented in this paper investigated the
physical and mechanical characteristics of MICP treated slope soil subjected to WD cyclic
action. Based on the results, it can be concluded that the damages were higher to the specimens
subjected to WD cycles under saltwater condition compared to those subjected to distilled WD
cycles. The saltwater WD induced erosion is highly reliant on the level of cementation. The
increase in precipitated calcium carbonate content substantially increased the aggregate
stability of specimens under the exposure of WD cycles. On the other hand, the level of
cementation was not significantly influencing the WD induced erosion, which is less than 40%
for saltwater condition and less than 30% for distilled water condition. SDR values suggest that
the MICP specimens underwent severe degradation under saltwater WD cycles (over 40%).
Comparatively, the reduction of UCS is low under WD cycles (between around 40 – 55%).
Under both WD cycles, the strength deterioration likely to be in a relationship with the
precipitated calcium carbonate content.
Chapter 7 consisted of cost reduction purposes using inexpensive chemical reagent from
the culture media and cement solution for MICP treatment. Sand samples treated under
different conditions were subjected to a needle penetration test and WD test for durability of
the materials. Introducing low-grade chemicals rather than laboratory-grade pure chemicals
resulted in a remarkable enhancement in strength. The UCS value was similar value obtained
while using pure chemicals. This innovative alternation amounts to an 83% up to 87%
reduction in the material cost and allows the leaching of harmful chemicals to be avoided.
However, the durability results of the low-grade chemical show that it has huge damage when
treated for 21 cycles of WD test, it is shown the bonding particles of biocement was not as
strong as treated with pure standard chemical solutions. Further investigation is needed to
achieve sustainable MICP material by mixing solution ratio with standard material for coastal
development. Inexpensive material could be an alternative solution for inland biocementation
and also maintenance of the material.
Chapter 8 is the proposal of the coastal prevention method based on ureolytic bacteria
especially in Indonesia. The most favorable bacteria for soil biocementation come from, but
not limited to, highly urease active bacteria (e.g. Psedoalteromonas tetradonis). It is vital to
know the effective mechanism of CaCO3 precipitation because it translates to a lower cost of
MICP treatment and achieves strong material in the long-term periods. In return, this can pave
the way into possible commercialization of the technique in the near future. Some important
key factors of the MICP determined to include ureolytic bacteria, culture media, cement
277
solution, soil/sand, and treatment sand condition such as pH and temperature during the
treatment.
Overall, the results of this study were contributed to the application of a new technique for
soil improvement and bio-stimulation. Therefore, to summaries of this research were
described in this chapter including suggestions for the next future research regarding MICP
treatment in the coastal areas. For obtaining the achievement of a uniformly homogenous
sample and getting several MPa of average strength from the solidified sample, the small size
of lab model tests was conducted as described in this chapter. The result obtained from each
chapter point out that the solidification using indigenous ureolytic bacteria strain for MICP
method and stand as promising techniques for beach slope improvement.
9.2 Suggestions for future works in MICP method
The field of biocementation involves multidisciplinary research at the confluence of
geotechnical engineering, microbiology, ecology, and chemical engineering. Despite the fact
that several types of surface improvement research fields have developed main sets of data and
interpretations, currently, no study has yet attempted to determine the optimum MICP process
in terms of the cost and factors involved, for potential commercial implementation.
9.2.1 Froude similarity of upscale MICP
Specific challenges ahead to MICP upscaling include controlling the flow and transport
through heterogeneous media, dynamic movement of sedimentary transport the treated
material, the permanence of the mixing technique, and the Froude similarity prototype example
are necessarily needed to minimize the failure of treated material especially in the coastal area.
9.2.2 Hydrodynamic test and wave erosion test of beach treatment by MICP
Testing methods by using model for artificial beachrock against the marine environment
system such as hydrodynamic test and wave erosion test. After treatment of the prototype
example are necessarily needed to minimize the failure of treated material.
9.2.3 Further research for durability of saltwater resistance
Further study should be carried out to develop methods that could extract Ca from waste
material or to reduce the usage of urea and broaden the scope of MICP applications, not just in
terms of strengthening and improving soils but also harnessing the soil's ability to self-heal
using the premixed microorganisms in the soil matrix. One method to use chalk waste and

278
agriculture by-products (vinegars-acetic acid or folic acid) to produce biogrout to remove the
need for calcium chloride or other types of calcium. However, the durability of long-term
MICP product especially for marine environment which have a fully saturated condition.
Inexpensive material has a Ca2+ ion similar to a pure standard from industrial products but the
durability wetting-drying tests shown the material is not resistant with the water and saltwater.
The sodium and H2O ions evaporated the meniscus bridge of calcium carbonate crystals. The
mixing composition of cement solution will achieve to develop water-resistant materials in the
next future research.

279
APPENDIXES A
Coastal drone mapping of Yogyakarta shoreline
A.1 Introduction
Unmanned Aerial Vehicles (UAVs) technology nowadays were effective for monitoring of large
area and existing of infrastructure, farm mapping, or other purposes. With recent advances in aerial data
acquisition technologies from UAVs (Harwin and Lucieer,2012; Turner et al., 2012), it is now possible
to capture high-resolution rock surface images and analyses geological structures within those data sets
digitally. Very large digital data sets can be collected rapidly, covering significant surface areas with
centimeter-scale resolution. Photogrammetry is a technique that captures 3D information of features
from two or more photographs of the same object, obtained from different angles (Donovan and
Lebaron, 2009; Haneberg, 2008; Behan, 2010). In particular, structure from motion, is a
photogrammetric technique, where the camera positions and orientation are solved automatically, in
contrast to conventional photogrammetry where a priori knowledge of these parameters is required
(Goesele, et al.,2007; Vasuki, et al., 2014). The UAV survey equipment and data processing methods
are now readily available and suitable for use by coastal engineers, managers and scientists. At its core,
UAVs use autonomous flight technology combined with recent advances in computer vision techniques,
to extend the very familiar and already extensive use of aerial photogrammetry applied to coastal
surveying (Turner, et al., 2016; Warren, et al, 2018; Cawood, et al., 2017).
Coastal erosion issues become more critical because coastal zones are optimal places for population
concentration and the development of productive activities, such as, industry, transportation, tourism,
etc. (Barragan and Andreis, 2015). Coastal erosion is a common problem affecting about 75% of the
world's shorelines (Bird, 1985; Zhang et al., 2004; Pilkey and Cooper, 2014; Rangel-Buitrago, et al.,
2018). Adger et al. (2005) indicated that close to 20% of the world population (1409 million inhabitants)
reside less than 25 km from the coastline, and 40% (2818 million inhabitants) live less than 100 km
inside a coastal strip representing approximately 25% of the world total surface. Coastal zone
monitoring based on aerial data, satellite or field investigating is an important task in environmental
protection and fundamental coastal management. Datasets produced by UAV’s have such a high spatial
resolution that characteristics and changes of the landscape, such as morphology, coastal zone, and
beach morphological characteristics into two dimensions (2D) or three dimensions (3D) numerical
models (Yastikli, et al., 2013; Mancini, et al., 2013; Nex and Remondino, 2014; Topouzelis, et al.,
2015). However, a coastline is defined as the line that forms the boundary between the land and the sea,
the detection of a coastline in high resolution includes recognizing several discontinuities. For the
proper study of a coastal areas, the four typical beach zones should be examined. These beach zone

280
include the swash zone, beach face, wrack line, and berm (Papakonstantinou, et al., 2016). The
movement of the shoreline position due to accretion or erosion is a great concern in coastal zone
management. Morton (1977) after Moran (2004) stated that mapping shoreline changes and predicting
future shoreline positions have to be an important scientific and coastal management objective.
Therefore, the accurate measures of the historic shoreline position and prediction of future locations are
essential for coastal planning and management. In this research were explained only measurement of
UAV to identifying into 3D elevation model and classifying of the area toward beachrock investigation
in Krakal-Sadranan beach area, beachrock as a key for coastal propagation mapping identification
outcome for final result.
A.1.1 Problem statement
Yogyakarta beaches were consisting of two different types of sands, whereas iron silica sand from
Mt. Merapi volcanic sedimentary and calcareous sand from the coral reef and/or limestone formation
in the eastern Yogyakarta. As a tourist destination, the beaches such as Parangtritis-Samas-Tisik-
Pandansari (Silica sand - south central Yogyakarta) and also Krakal-Sadranan-Baron-Kukup-Drini-Pok
Tunggal until Wediombo beaches (Calcareous sand - south eastern Yogyakarta) has developed as an
economic center in the coastal shoreline of Yogyakarta province (Figure A.1). As a potential
economically growing area, the Yogyakarta coast has attracted over time more and more people to
reside and has a good living condition. As a consequence, the growing number of people needs more
space and starts to utilize the coast which creating vulnerable areas from coastal hazards despite the
buffer zone of 200 m according to the spatial planning has been established.
Figure A.1. Simplified geological map of Yogyakarta, Indonesia.
Study area

281
On the other hand, the south coast of Java has been suffered from geologic and climatologic events
such as tsunami in July 2006 and storm-tidal wave, last moment is Oct 2018. Beach erosion also
reported in some parts of Yogyakarta’s south coast such as Samas beach and Parangtritis beach (Tijaya,
2008; Pujotomo, 2009). Those natural phenomena were reported to cause damages to infrastructure
near the shore. The establishment of a buffer zone is one of several efforts commonly taken to reduce
risk in the framework of coastal disaster risk management. Coastal zone management requires to the
understanding of shoreline dynamic and consider the potential future hazard such as enhanced sea-level
rise due to global warming phenomenon. Monitoring coastal changes over time needs a complete
spatial-temporal data, which is difficult to find in Indonesia. The integration of multi-source spatial and
temporal data such as topographic maps and also satellite imageries is considered to overcome the lack
of data series availability (Marfai and King, 2007). This study is focused on the understanding of Java
South coast characteristics particularly in Parangtritis beach and Krakal-Sadranan beach were
beachrock were found, further studies were carried out to (i) identification of beachrock deposit
occurrences in Krakal-Sadranan, Yogyakarta (ii) develop the biomineralization based on ureolytic
bacteria from natural beachrock using calcareous and iron-silica sands, and (iii) explore biocementation
for nearshore environments as an alternative technique for sand stabilization.
A.1.2 Overview of Beach Sediment
The beach system includes the dry (subaerial) beach, the wet beach (swash or intertidal zone), the
surf zone, and the nearshore zone lying beyond the breakers (Short, 2006). Mostly the nearshore zone
is defined as the area beginning from the low-water line extending seaward. The surf zone is part of the
nearshore zone. The subaerial beach has a gentle seaward slope, typically with a concave profile, and
extends from the low-water mark landward to a place where there is a change in material or
physiography (such as a dune, bluff, or cliff, or even a sea wall) or to the line of permanent vegetation
marked by the limit of highest storm waves or surge. If the area beginning from the low-water line is
regarded, the profile is not concave when looking to a beach with a certain tidal range. The dry beach
is concave, but at low water when including the wet beach, the morphology switches from a concave
beach (dry part) to a convex beach (wet part). Nearshore bars and troughs (in the subtidal domain) are
often present in the surf zone, but are obscured by waves and surf, as is the always submerged nearshore
zone (Short, 2006). Beach morphology refers to the shape of the beach, surf, and nearshore zone. The
beach per se contains numerous morphological– processual subunits such as berms, storm ridges (e.g.,
Pethick, 1984; Hesp, 1988; Komar, 1998; Davis and FitzGerald, 2009), cusps, beach face, shoreface
(e.g., Swift et al., 1985), plunge step (Davis and Fox, 1971), scarp, etc.

282
A.1.2.1 Parangtritis beach
The geological formation in Bantul region are formed by recent sedimentation of Merapi Volcano
on the middle part (graben Bantul) and several parts were form of Sentolo formation hill on the western
part consist of alluvium, andesite (Baturagung), Semilir formation, Kepek and Nglanggran formation
on the eastern Yogyakarta (Figure 1.4 – see chapter 1). Physiographical, the landscape consists of the
Mt. Merapi fluvio-volcanic plain, the Baturagung mountain range, the Sentolo hills, Progo river plain
and the shore plain. The elevation between 0 – 35 m above mean sea level which bordered directly by
the Indian Ocean. Most of the beach topography is almost flat and gradually steeper toward the west
near Opak river. Landward of the beach, one finds large areas with sand dune of several types such as
barchan and longitudinal dunes (Bronto, 1989; Pujotomo, 2009).
A.1.2.2 Krakal-Sadranan beach
Beaches of Gunungkidul Regency, Province of Special Region Yogyakarta (Prov. DIY), Indonesia
have economic potential as limestone mine deposits and tourism. The karst beaches in Gunungkidul
Regency, Sadranan Beach to be exact, have similarities in terms of geological conditions, methods, and
geomorphologic processes beach formation. The characteristics of the Karst Mountains of South Beach
indicate that there is steep topography that rises to the east of Java Island. Continuing eastward
hummocky valleys occur (Drini Beach to Krakal to Sadranan). The coast of Sadranan have a slope were
steep ~12,33° with the tidal range of 12 meter that makes the sedimentary process in this coast were
thickness than the deeper slope. Grains of sediment along Krakal and Sadranan beaches are largely
bright colored along most of the coastline as a result of the erosion of seabed being deposited on the
beach. Figure 1.4 (see chapter 1) is described the composition of this sediment mainly formed by coral,
skeletal fragment, Foraminifera and Mollusca. Throughout the karst coast of the DIY Prov.,
Gunungkidul Regency the soil is derived from limestone bedrock, similar to the Mediterranean, i.e., the
level of physical weathering is high (Daryono, et al., 2019).
A.1.3 Coastal disaster
According to the Indonesian disaster management bill, disaster is defined as an event or series of
events that threaten or disturb community life caused by natural, non-natural, or human factors that
bringing losses of properties even the lives of the community. Coastal disasters caused by the coastal
dynamic that damaging the coastal environment. Coastal dynamic understanding is the changes by the
interaction of seven factors that operate interactively and interdependently, whereas called
astrodynamics, aerodynamic, hydrodynamic, morphodynamic, eco dynamic, and anthropodynamic
(Marfai and Permana, 2014). The coastal disaster classified into (1) Natural Disaster which consists of

283
storm waves, tidal waves, tsunami, marine erosion, and sedimentation; (2) Non-natural Disaster which
consist of coastal structures failures, coastal spatial planning failure, deprived of coastal ecosystem and
coast; (3) Social Disaster such as social conflict and crime. To alleviate the consequences of being
threatened by coastal disasters, the mitigation effort should be considered. Indonesia Disaster
Management Bill defined mitigation as a series to reduce disaster risk utilizing structural or physical
development of the building capacity. Further, the bill described that mitigation consists of spatial
planning, building code, and community building capacity through education, information, and training.
A.1.1.4 Oceanography of the Java south coast
Yogyakarta beaches were directly facing Indian Ocean and therefore subjected to Indian Ocean’s
high waves energy. Data derived from US Navy Marine Climate Atlas of the World Vol. 3 Indian Ocean
(1976) reported by JICA (1988) cited in Triatmojo (1999), based on 120-year statistic pointed out that
wave from south direction with 1-2 m in height has dominated about 20% of waves occurrences (shown
in Table A.1).
Table A.1. Wave height in Indian Ocean (Levitus, et al., 1994)
Wave height Percentage (%) of occurrences
H (m) Southeast South Southwest
0 – 1
1 – 2
2 – 3
> 3
4.67
9.89
4.48
0.56
3.02
20.27
7.54
1.89
2.54
7.79
5.07
1.13
South and southeast waves in relation to general orientation of the shoreline has generated alongshore
currents toward the west direction. Indications of this area that material deposited in the mouth of Opak
river form coastal gradation to the west direction. The pattern of surface current along the south coast
of Java has been recorded by Wyrtki (1961) in Pujotomo (2009), showing that during the months
December – June surface current is directed to the east while during August – October it changed to the
west. Tide pattern in South Yogyakarta coast is mixed predominantly semidiurnal type. This type of
tide has high and low tides twice a day. Water level between successive high tides separated
approximately by 12-hour time period. Figure A.2 is described the tide pattern in Yogyakarta, Java
south coast which is mixed-predominantly semidiurnal.

284
Figure A.2. Tide pattern of South Yogyakarta coast (Sadeng tide gauge station)
A. 2 Materials and methods
A.2.1 UAV photogrammetric data
Photogrammetry is a science of performing measurements from photographs. The key problem is
to find a 3D position of points of a scene from overlapping images. Normally, site measured by UAS
cannot be taken with one photo, so it demands that the pictures are taken with proper forward and side
overlap so that they can be later processed. This process is based on collinearity condition, in which a
line originates from central projection of a camera and goes through a point in sensor plane (on the
image) to the object point in the ground coordinate system. The intersection of many lines determines
the location of three-dimensional points of a scene.
Image orientation and camera calibration are essential for reconstructing metric model from images.
They can be achieved by two approaches: classical photogrammetric workflow or computer vision (CV)
technique. The former relies on known camera positions and resolves the model by triangulation. If the
camera positions are unknown, the solution is to place a set of reference markers with known 3D
coordinates, identify them manually in the images and use re-sectioning to get camera positions. The
challenges with the acquisition of data using a UAV on coastal zone environmental parameter such as

285
wind and cloud coverage. The UAV photogrammetry in this case we used DJI Phantom 3 which carried
a GoPro HERO 7 camera and 3D gimbal to reduce shaking. The lens of the GoPro camera was replaced
with a distortion-free lens to reduce the lens distortion effect. In this context, aerial photos were obtained
from selected sites aiming to a) study and map in detail particular shoreline features and b) facilitate the
reconstruction of the coastal environment. The details specification of the photogrammetric
measurement using UAV are given in Table A.2. Three locations were selected for Krakal-Sadranan
beach with corresponding aerial photographs. In order to carry out the aerial photography at each site,
it was necessary to locate a wide flat space for the take-off and landing of the UAV. Using special
software, the desired area to cover is defined, along with required ground resolution and image overlap,
and a full flight plan is generated with flight lines.
Table A.2. Specification of unmanned aerial vehicle (UAV) drone
Characteristic Detail description Specifications
UAV
Sensor
Survey
Flying height
Relative total flight time
Coverage area
Estimated speed
Auto pilot
Distance from launch pad
Size
Camera
Touch Display
GPS
Waterproof
Video modes
Image dimension
Focal length (mm)
Number of images
Images overlay
Error tie points (pixels)
Format
Pixel size (μm)
Angular field of view
Ground sampling distance
(m/ pix)
80 m
20 min
1 km2
2 m/s
No
10 m
11.4” x 11.4” x 7.7”
GoPro 6
12 MP/ 30 fps Burst Time Lapse
2 inches with pinch zoom
Provided
33 ft to 10 m
4K40/ 1440p120/ 1080p240
4096 x 3072
2.77
359
90%
1.47
Jpg
1.597 x 1.957
Horizontal: 49.1°
Vertical: 58.5°
0.034

286
A.2.2 Photogrammetric data processing
We generated 3D dense point clouds representing the digital terrain and photomosaic of Krakal-
Sadranan beach using the structure from motion and multi view stereo (SfMMVS) workflows (Szeliski,
2010). The workflow consists of 3 main processing steps. First, the same ground features are detected
and matched in different camera perspectives; then, a three-dimensional (3D) scene structure is
reconstructed by solving the intrinsic and extrinsic orientation parameters of the camera and generating
a sparse point cloud. In the last step, a 3D dense point cloud is produced by calculating a depth map for
each camera frame using the MVS image-matching algorithm (Carrivick et al., 2016).
Automatic aerial triangulation (AAT) to determine the orientation of the captured images usually
is the first step of photogrammetric evaluation. Commercially software systems to solve this task are
available for more than a decade (Tang et.al., 1997). As a central component, these systems contain
image matching tools for the generation of tie points. The required automatic measurement is usually
realized at sufficient accuracy and reliability by a combination of standard feature and intensity based
matching approaches. Primitives suitable for image matching are extracted in a first step, while in a
second step their correspondences are determined by some similarity and consistency measures
(Förstner, 1993). In order to efficiently transfer the extracted feature points to the respective neighbor
images, usually a priori information is additionally integrated in order to speed up the required search
effort. For this purpose, the respective image overlap is provided from the so-called block configuration.
By these means, suitable search areas can be defined, which considerably speeds up the matching step.
For standard aerial image flights this block configuration is usually derived from the respective camera
stations as provided from GPS measurements. In principle, camera orientation can additionally be used,
if for example measured by an integrated GPS/inertial system. However, for block configuration of
photogrammetric flights with large format cameras, the assumption of nadir views is usually sufficient.
This initial guess holds especially true if the camera is mounted in a stabilized platform. An addition
problem for block configuration results from the fact that the consumer cameras used for aerial image
collection have a much smaller format footprint than digital airborne cameras. Both high flight
dynamics and relatively small image footprint result in considerable deviations in mutual image
overlaps. As a consequence, standard assumptions and implications used during standard AAT do not
hold true anymore. This will frequently aggravate the successful block configuration and thus hinder
processing of UAV imagery by such software tools.
A.2.3 Digital elevation models and volume calculations
High-resolution DEMs were used to analyze the surface of the lava dome before and after the six-
explosion episode and to calculate the losses and gains in volume. We measured the length, width, and
depth of the main fissure by creating cross-section profiles of the beachrock in Krakal-Sadranan beach,
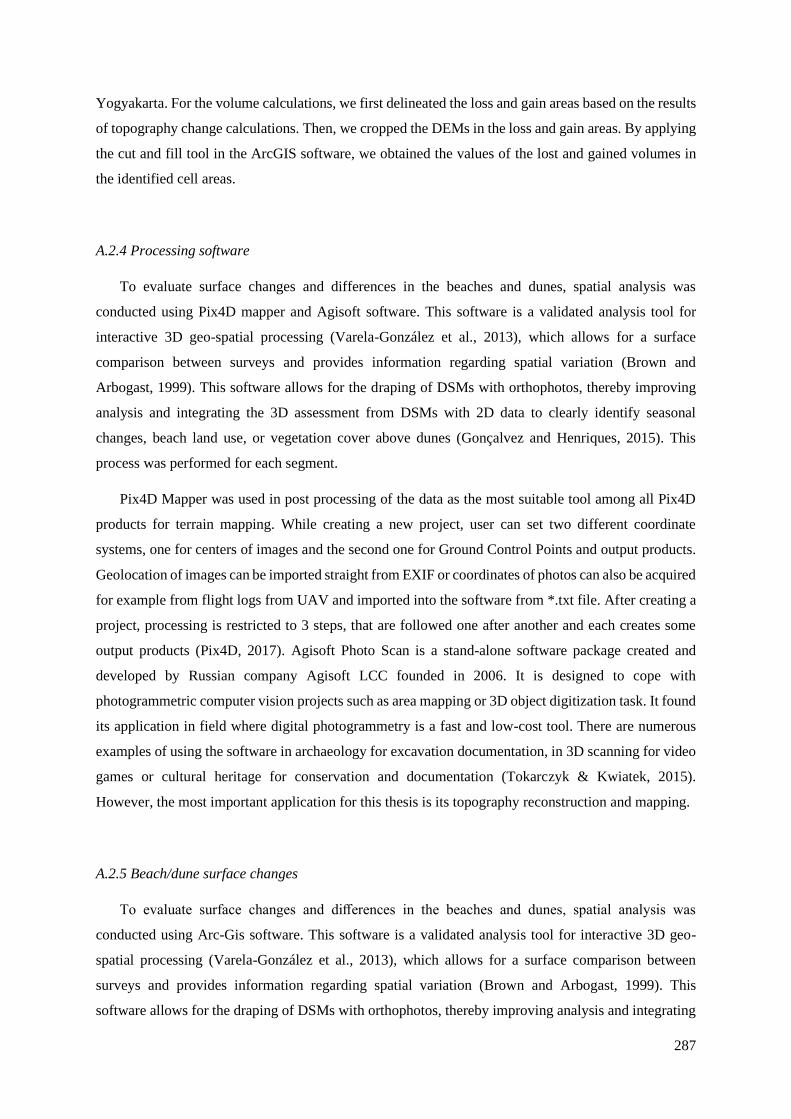
287
Yogyakarta. For the volume calculations, we first delineated the loss and gain areas based on the results
of topography change calculations. Then, we cropped the DEMs in the loss and gain areas. By applying
the cut and fill tool in the ArcGIS software, we obtained the values of the lost and gained volumes in
the identified cell areas.
A.2.4 Processing software
To evaluate surface changes and differences in the beaches and dunes, spatial analysis was
conducted using Pix4D mapper and Agisoft software. This software is a validated analysis tool for
interactive 3D geo-spatial processing (Varela-González et al., 2013), which allows for a surface
comparison between surveys and provides information regarding spatial variation (Brown and
Arbogast, 1999). This software allows for the draping of DSMs with orthophotos, thereby improving
analysis and integrating the 3D assessment from DSMs with 2D data to clearly identify seasonal
changes, beach land use, or vegetation cover above dunes (Gonçalvez and Henriques, 2015). This
process was performed for each segment.
Pix4D Mapper was used in post processing of the data as the most suitable tool among all Pix4D
products for terrain mapping. While creating a new project, user can set two different coordinate
systems, one for centers of images and the second one for Ground Control Points and output products.
Geolocation of images can be imported straight from EXIF or coordinates of photos can also be acquired
for example from flight logs from UAV and imported into the software from *.txt file. After creating a
project, processing is restricted to 3 steps, that are followed one after another and each creates some
output products (Pix4D, 2017). Agisoft Photo Scan is a stand-alone software package created and
developed by Russian company Agisoft LCC founded in 2006. It is designed to cope with
photogrammetric computer vision projects such as area mapping or 3D object digitization task. It found
its application in field where digital photogrammetry is a fast and low-cost tool. There are numerous
examples of using the software in archaeology for excavation documentation, in 3D scanning for video
games or cultural heritage for conservation and documentation (Tokarczyk & Kwiatek, 2015).
However, the most important application for this thesis is its topography reconstruction and mapping.
A.2.5 Beach/dune surface changes
To evaluate surface changes and differences in the beaches and dunes, spatial analysis was
conducted using Arc-Gis software. This software is a validated analysis tool for interactive 3D geo-
spatial processing (Varela-González et al., 2013), which allows for a surface comparison between
surveys and provides information regarding spatial variation (Brown and Arbogast, 1999). This
software allows for the draping of DSMs with orthophotos, thereby improving analysis and integrating
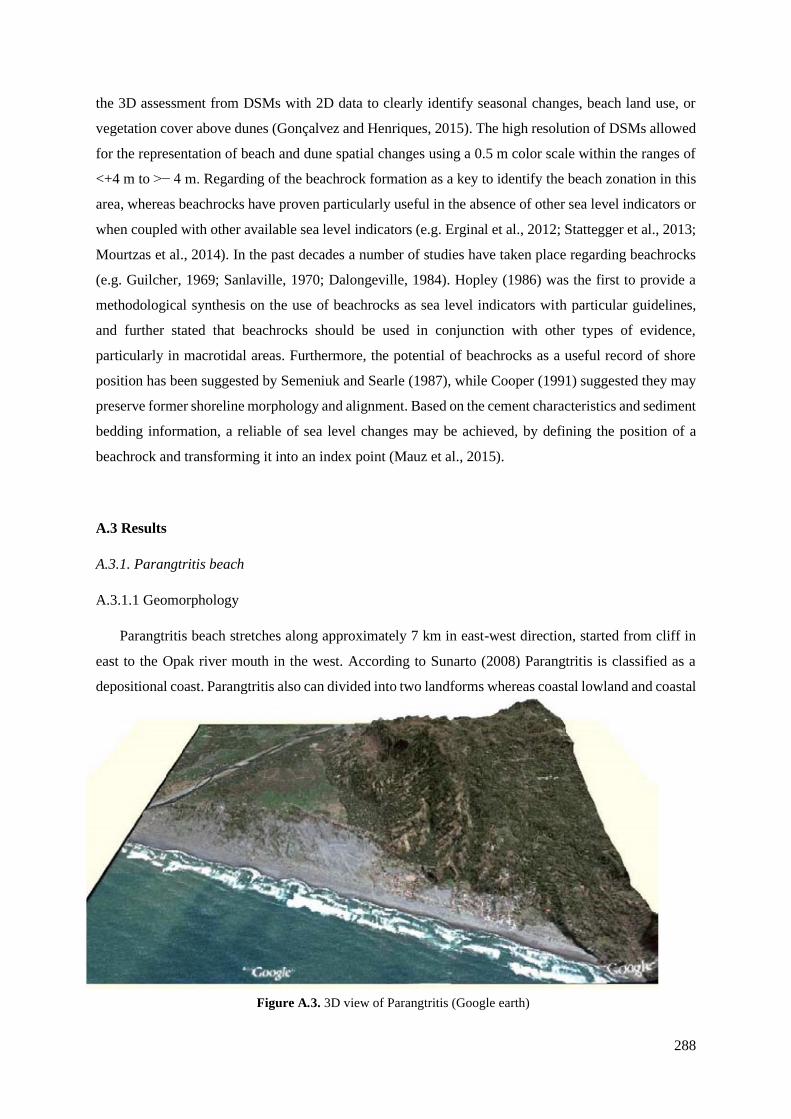
288
the 3D assessment from DSMs with 2D data to clearly identify seasonal changes, beach land use, or
vegetation cover above dunes (Gonçalvez and Henriques, 2015). The high resolution of DSMs allowed
for the representation of beach and dune spatial changes using a 0.5 m color scale within the ranges of
<+4 m to >− 4 m. Regarding of the beachrock formation as a key to identify the beach zonation in this
area, whereas beachrocks have proven particularly useful in the absence of other sea level indicators or
when coupled with other available sea level indicators (e.g. Erginal et al., 2012; Stattegger et al., 2013;
Mourtzas et al., 2014). In the past decades a number of studies have taken place regarding beachrocks
(e.g. Guilcher, 1969; Sanlaville, 1970; Dalongeville, 1984). Hopley (1986) was the first to provide a
methodological synthesis on the use of beachrocks as sea level indicators with particular guidelines,
and further stated that beachrocks should be used in conjunction with other types of evidence,
particularly in macrotidal areas. Furthermore, the potential of beachrocks as a useful record of shore
position has been suggested by Semeniuk and Searle (1987), while Cooper (1991) suggested they may
preserve former shoreline morphology and alignment. Based on the cement characteristics and sediment
bedding information, a reliable of sea level changes may be achieved, by defining the position of a
beachrock and transforming it into an index point (Mauz et al., 2015).
A.3 Results
A.3.1. Parangtritis beach
A.3.1.1 Geomorphology
Parangtritis beach stretches along approximately 7 km in east-west direction, started from cliff in
east to the Opak river mouth in the west. According to Sunarto (2008) Parangtritis is classified as a
depositional coast. Parangtritis also can divided into two landforms whereas coastal lowland and coastal
Figure A.3. 3D view of Parangtritis (Google earth)

289
highland. Parangtritis coastal lowland is characterized by sandy volcanic beach, while coastal highland
is marked by limestone cliff coast and andesite cliff coast. The beach profile in the coastal lowland
shows the existence of foreshore, backshore, and dune. Parangtritis beach grain size distribution
gradually change in diameter from east to west (Bronto, 1989; Pujotomo, 2009). At the east part, the
beach has relatively fine sand and gentle slope while in the west part, grain size is relatively coarse and
steep slope. Near the mouth Opak river and surroundings, very coarse sand to gravel were found which
is interfere from the river sedimentation source (Figure A.3).
A.3.1.2 Shoreline changes analysis
Shoreline change is analyzed statistically using ArcGIS software which is the powerful option
software for analyzing shoreline change data. These options are, for example, shoreline change
envelope (SCE), net shoreline movement (NSM), end point rate (EPR), and linear regression (LRR).
SCE and NSM provide a shoreline distance at each transect; however, their results do not include
information on the rate at which the shoreline changes. SCE calculates the greatest distance between all
shorelines without factoring in the year of the shoreline, while NSM represents a total distance between
the oldest and the most recent shoreline, i.e. 2006 and 2015, respectively. EPR and LRR provide the
rate of shoreline change at each transect. EPR is the distance of shoreline shift divided by the time
elapsed between the 2006 and 2015 shorelines. Meanwhile, LRR is determined by fitting a least squares
regression line to all shoreline points for a particular transect. Even though LRR uses all available
shorelines and provides a statistically robust analysis, it is susceptible to outlier effect. Therefore, this
research uses EPR to analyze the rate of shoreline change. In NSM and EPR, positive values refer to
accretion, while negative values indicate erosion.
The 1995 shoreline data is used as a baseline because the shoreline data from the existing high-
resolution imagery (2006–2015) did not meet the requirements for the baseline, i.e. the baseline should
be established adjacent to the series of shoreline positions and cannot place entirely onshore or offshore
with respect to the other shorelines. Furthermore, 29 transects spaced at 50-meter intervals along the
shoreline stretch 100 meters landward and perpendicularly to the baseline (Mutaqin, 2017). The rate of
shoreline change (meter/year) is obtained technically by dividing the distance of shoreline displacement
(meters) by the time elapsed between the years of satellite images used in the analysis (years). Table 2
shows the rate of shoreline change, as measured using EPR, in South Yogyakarta coastal area in 2006–
2015. A zero lowest rate in 2006–2015, found at transect number 23, does not represent any shoreline
movement because the result of SCE at the same transect shows that the greatest distance between the
shorelines is 41.0 m. The zero lowest rate is caused by one variable used in EPR, i.e. the very short
distance of shoreline movement (< 0.5 m) at transect number 23 (Figure A.4). In general, the average
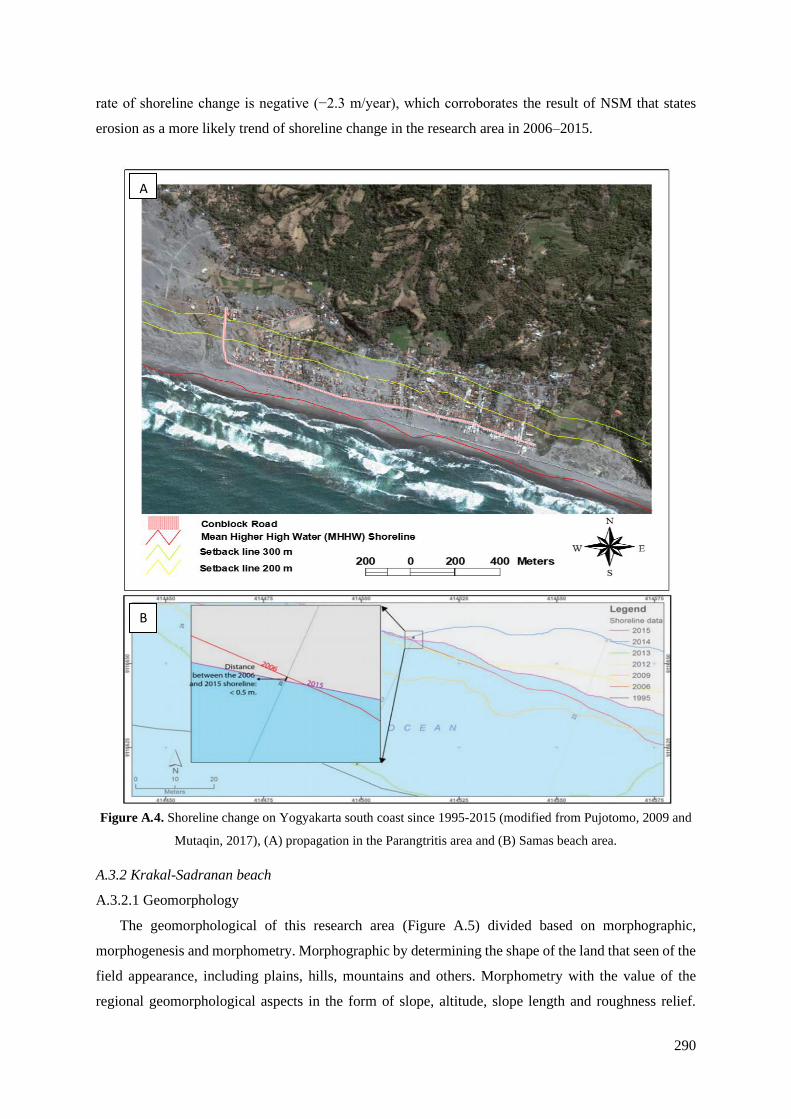
290
rate of shoreline change is negative (−2.3 m/year), which corroborates the result of NSM that states
erosion as a more likely trend of shoreline change in the research area in 2006–2015.
Figure A.4. Shoreline change on Yogyakarta south coast since 1995-2015 (modified from Pujotomo, 2009 and
Mutaqin, 2017), (A) propagation in the Parangtritis area and (B) Samas beach area.
A.3.2 Krakal-Sadranan beach
A.3.2.1 Geomorphology
The geomorphological of this research area (Figure A.5) divided based on morphographic,
morphogenesis and morphometry. Morphographic by determining the shape of the land that seen of the
field appearance, including plains, hills, mountains and others. Morphometry with the value of the
regional geomorphological aspects in the form of slope, altitude, slope length and roughness relief.
A
B
291
Morphogenesis by determining the processes that become the cause of the morphology that exists in
the mapping area. This research area is in the form of a karst landscape and a beach, namely the karst
hill, the karst valley and the coast. While the morphometry is related to the slope and point slope height.
The slope is one of the controlling factors that influence mass movement in determining the
susceptibility zone of mass movement. From the results of the analysis of the geomorphological data of
the study area with an approach. The geomorphology of the study area is divided into five
geomorphological units which are the Kars sloping hill unit, the steep Kars hill unit, the steep Kars hill
unit, the Kars valley unit, and the beach unit.
Figure A.5. 3D view of digital elevation model Krakal-Sadranan beaches, Yogyakarta
A.3.2.2 Straightness density
The geological structure is one of the controlling factors that cause the occurrence of mass
movements. This lineament density is in the form of lineaments that exist in the area of research
identified based on appearance on the map contour and digital elevation model (DEM). The use of this
straightness density is because it is difficult for the discovery of clear structures in the field. The
straightness pattern that is around the research area is southwest-northeast and southeast-northwest. The
classification of the density of this structure is based on the classification according to Baskoro and
Rifai (2015) where the number of lineages per 1 km2 is calculated. The division of lineament density is
based on the number of straightness in the research area. The research area is divided into three parts
with a width of 500 meters each part. In western research, the area has 4 straightness were shown in
table A.3. In the study area, the middle section has 9 lineaments. In the eastern area of the study has 5
lineaments. From the amount of straightness, therefore, this research area is divided into three units of
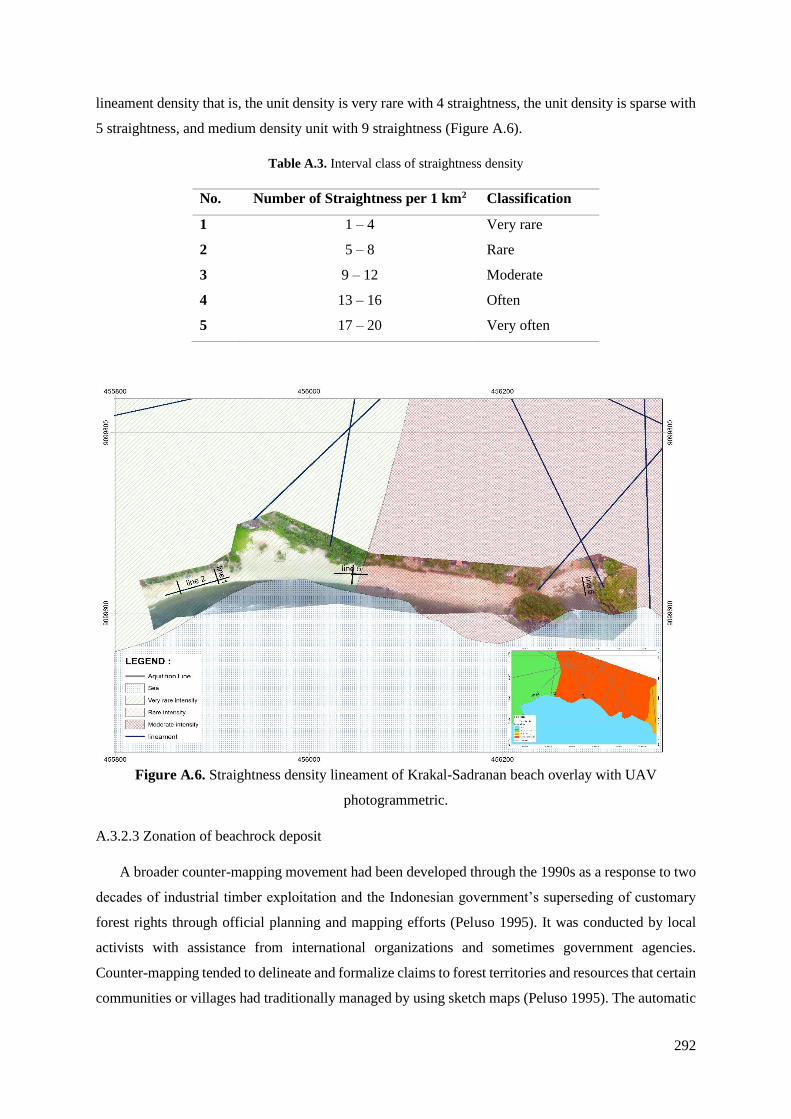
292
lineament density that is, the unit density is very rare with 4 straightness, the unit density is sparse with
5 straightness, and medium density unit with 9 straightness (Figure A.6).
Table A.3. Interval class of straightness density
No. Number of Straightness per 1 km2 Classification
1
2
3
4
5
1 – 4
5 – 8
9 – 12
13 – 16
17 – 20
Very rare
Rare
Moderate
Often
Very often
Figure A.6. Straightness density lineament of Krakal-Sadranan beach overlay with UAV
photogrammetric.
A.3.2.3 Zonation of beachrock deposit
A broader counter-mapping movement had been developed through the 1990s as a response to two
decades of industrial timber exploitation and the Indonesian government’s superseding of customary
forest rights through official planning and mapping efforts (Peluso 1995). It was conducted by local
activists with assistance from international organizations and sometimes government agencies.
Counter-mapping tended to delineate and formalize claims to forest territories and resources that certain
communities or villages had traditionally managed by using sketch maps (Peluso 1995). The automatic
293
aerial triangulation (AAT) method which is used to determine the orientation of captured images is
usually the first step of a photogrammetric evaluation. Commercial software systems to solve this task
have been available for more than a decade (Tang et.al., 1997; Szeliski, 2010; Carrivick et al., 2016).
As a central component, these systems contain image matching tools for the generation of tie points.
The required automatic measurement is usually realized at sufficient accuracy and reliability by a
combination of standard features and intensity-based matching approaches. The first step of image
marching has extracted the data which is the primitive’s suitable step, and then for a second step are
determined by similarity and consistency measures from the data (Förstner, 1993). To efficiently
transfer the extracted feature points to the respective neighbor images, usually, a priori information is
additionally integrated in order to speed up the required search effort. For this purpose, the respective
image overlap is provided from the so-called block configuration. By these means, suitable search areas
can be defined, which considerably speeds up the matching step.
The gap between technologies also promotes this method that is applicable to support the
acceleration of data procurement because it offers many advantages, including the ease of operation
and low operational cost. Due to the main vehicle used for acquiring aerial photo data, UAV is relatively
cheap (Radjawali, I. and O. Pye. 2017). The risk of flying UAV for aerial mapping is also very small
such as the risk of falling, misconduct, safety factor, and others. Compared to the conventional
photogrammetric method, UAV method is more effective, especially in small mapping areas. The
constraints of this method are the inability to covers large mapping area. The battery endurance of the
UAV is limited, so it takes several flight missions to cover the whole area. Strong wind and wireless
interference are also limiting the flexibility of UAV mobilization. The highest resolution of coastal
mapping with this method to identify the distribution of beachrock and classify the zonation of
beachrock might be powerful enough to conduct further researches such as coastal propagation in the
tropical country, paleo-tsunami based on beachrock, and perhaps disaster mitigation in the coastal area
especially in Indonesia. Based on the image processing, we classified the shoreline as coarse sand, fine
sand, seawater, wet sand (swash zone), and shoreline itself. The distribution of a beachrock seems to
only occur in the fine-sand zone that is represented by white-cream color for the α- and β-location. On
the other hand, the γ-location is only dominant with the beachrock (purple color) whereas the
distribution of this rock well sediment is in this bay only (Figure A.7).
To evaluate surface changes and differences in the beaches and dunes, spatial analysis was
conducted using Agisoft software. This software is a valid analysis tool for interactive 3D geo-spatial
processing (Varela-González et al., 2013), which allows a surface comparison among surveys and
provides information regarding spatial variation (Brown and Arbogast, 1999). This software allows for
the draping of DSMs with orthophotos, thereby improving analysis and integrating the 3D assessment
from DSMs with 2D data to identify seasonal changes, beach land use, or vegetation cover above dunes
(Gonçalvez and Henriques, 2015). This process was performed for each segment. The measurement
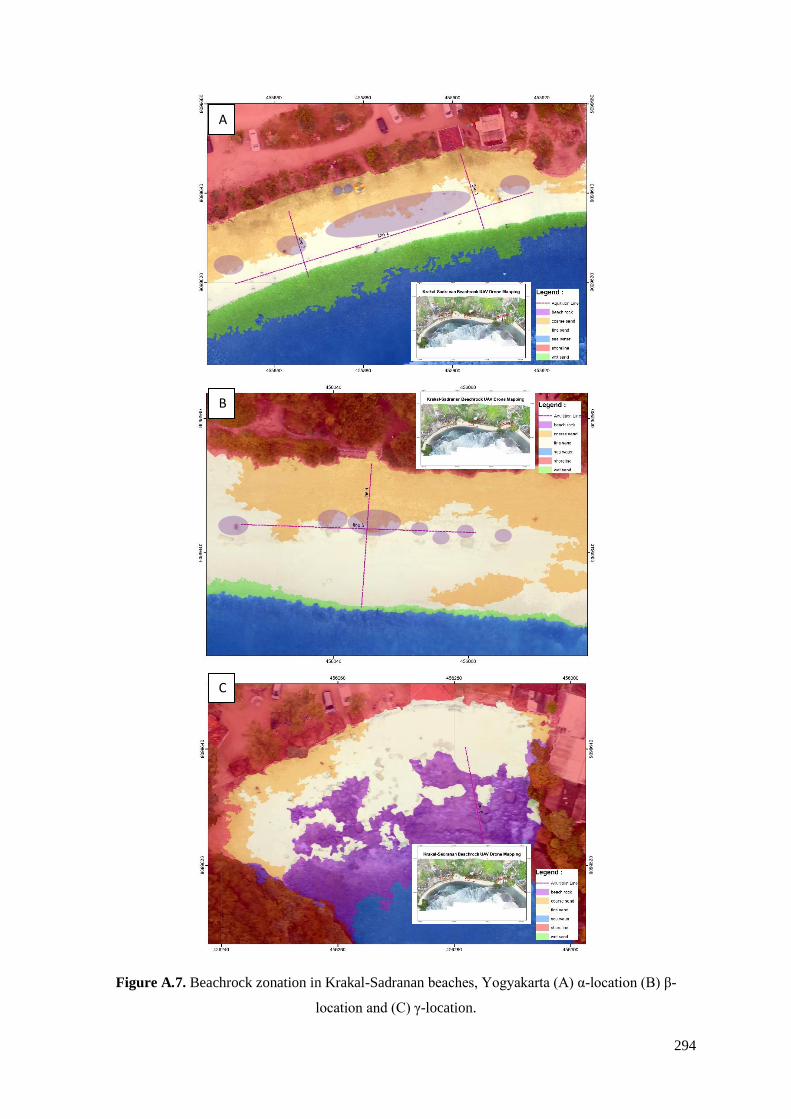
294
Figure A.7. Beachrock zonation in Krakal-Sadranan beaches, Yogyakarta (A) α-location (B) β-
location and (C) γ-location.
A
B
C

295
location is represented by beachrock sedimentary deposit which is the same location the geophysical
measurement will be conducted to identify the sub-surface structure of beachrock body. Ultimate goals
of UAV photogrammetric and geophysical measurement for the 3D cross-section model of beachrock
body will explain more detail in Chapter 3.
A.4 Discussions
Coastal dynamics is a natural process that occurs as a result of seasonal weather variability and
hydro-oceanographic factors. However, at certain times, it has a destructive nature that potentially
damages public facilities and infrastructures and leads to environmental damage. Aside from tsunami,
shoreline change is one of the major issues on the southern coast of Java Island in Indonesia. In the last
20 years, shoreline change in Southern Yogyakarta coastal area has been a concern of the local
government since it caused severe impacts on the environment and human activity, and from an
economic aspect. Based on the analysis results, during the period 2006–2015 coastal erosion has
occurred in Parangtritis with an average shoreline distance of −20.0 m and at an average rate of −2.3
m/year. The coastal erosion is influenced by several factors, some of which are wave activity, sediment
material, coastal protection, and landuse. The predominant factor of the coastal dynamics is wave
activity. Wave is one of the forces that cause sediment erosion and transport in coastal areas. Waves
that arrive on a coast are generated by winds that transfer their energy into the water. Wind
measurements on August 27, 2013 and June 2–6, 2014 present a temporal variation of wind speeds. For
example, the wind speed on June 5, 2014 was 5.1 m/s in the morning, which then increased linearly in
the afternoon (8.6 m/s) and in the evening (12.4 m/s). In dry season, the waves in Parangtritis are
normally classified as swells and constructive waves; however, in extreme weather (e.g. storms), the
energy of wind and wave increases. Consequently, a destructive wave is formed. Destructive waves
have a weak swash but strong backwash that is powerful enough to remove sediment material at the
coast. The coast is eroded away over time. Several previous extreme conditions that led to destructive
waves in low-land coastal area such as Parangtritis to the west of Yogyakarta coast. There were no
casualties; however, various losses and damages were caused to buildings, coastal vegetation, and
public facilities. In July 2011, the access road to the beach eroded up to 20 m and the distance between
the fish auction place and the beach was diminished by up to 150 m. The destructive wave that occurred
in April 2012 with a height of 5–7 m resulted in a number of inundated stalls and many fishermen
securing their boats and nets. In September 2013 and June 2016, due to the high waves Disaster Relief
Agency of Bantul urged people to evacuate and avoid activities near the beach.
The local government provides a new location for stalls that are threatened and damaged by coastal
erosion. However, the stall owners refuse to relocate and prefer to stay in the affected area rather than
leave to the new location. Interviews to stall owners reveal that this preference is provoked by the
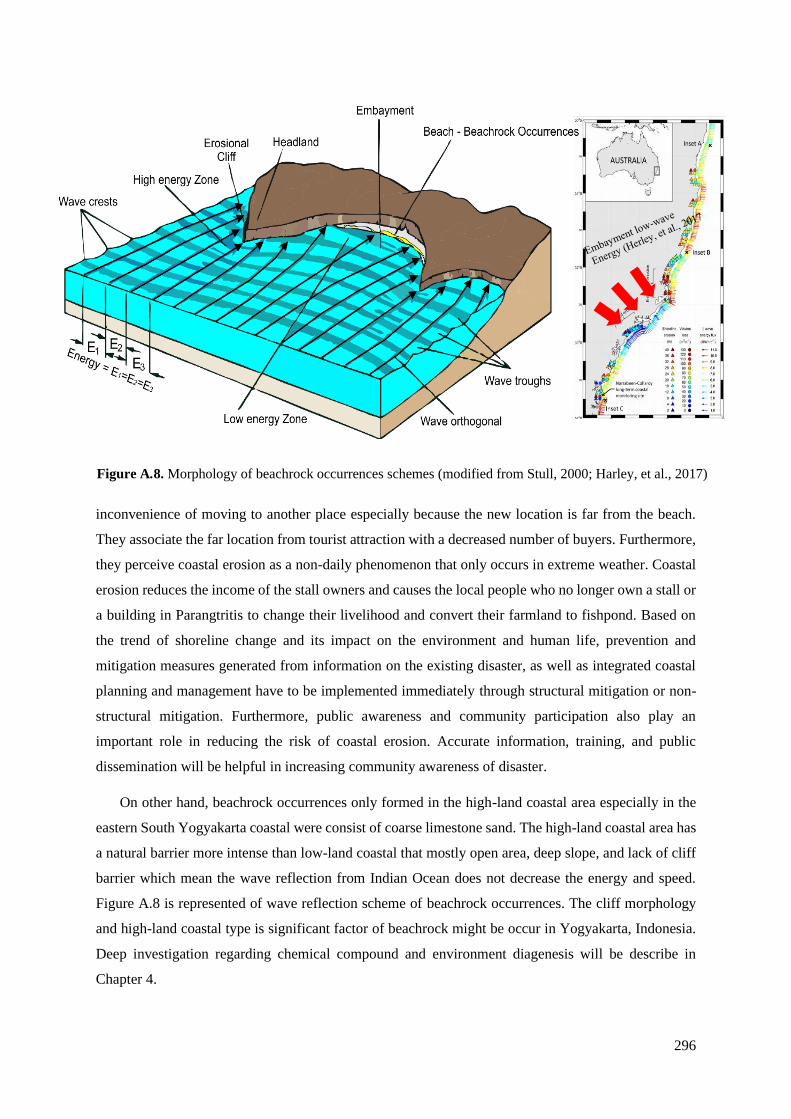
296
inconvenience of moving to another place especially because the new location is far from the beach.
They associate the far location from tourist attraction with a decreased number of buyers. Furthermore,
they perceive coastal erosion as a non-daily phenomenon that only occurs in extreme weather. Coastal
erosion reduces the income of the stall owners and causes the local people who no longer own a stall or
a building in Parangtritis to change their livelihood and convert their farmland to fishpond. Based on
the trend of shoreline change and its impact on the environment and human life, prevention and
mitigation measures generated from information on the existing disaster, as well as integrated coastal
planning and management have to be implemented immediately through structural mitigation or non-
structural mitigation. Furthermore, public awareness and community participation also play an
important role in reducing the risk of coastal erosion. Accurate information, training, and public
dissemination will be helpful in increasing community awareness of disaster.
On other hand, beachrock occurrences only formed in the high-land coastal area especially in the
eastern South Yogyakarta coastal were consist of coarse limestone sand. The high-land coastal area has
a natural barrier more intense than low-land coastal that mostly open area, deep slope, and lack of cliff
barrier which mean the wave reflection from Indian Ocean does not decrease the energy and speed.
Figure A.8 is represented of wave reflection scheme of beachrock occurrences. The cliff morphology
and high-land coastal type is significant factor of beachrock might be occur in Yogyakarta, Indonesia.
Deep investigation regarding chemical compound and environment diagenesis will be describe in
Chapter 4.
Figure A.8. Morphology of beachrock occurrences schemes (modified from Stull, 2000; Harley, et al., 2017)

297
A.5 Conclusions
South Yogyakarta coast has very dynamic coastal areas whose average distance and rate of
shoreline change) were −20.0 m and −2.3 m/year in the last 9 years (2006–2015), respectively. Instead,
the eastern Yogyakarta coast system which consists of coarse limestone is difficult to measure erosional
degree because of natural wave breaker also beachrock occurrences in several locations. Due to the
severe impacts of shoreline change, coastal mitigation efforts that factor in the dynamics of coastal
processes have to be implemented immediately through structural mitigation, non-structural mitigation,
and the improvement of public awareness and community participation in the research area. Beachrock
could be one of the optional for coastal countermeasures for high tidal and marine erosion however
beachrock occurrences still debatable based on geomorphology, geology settling and also the
sedimentary process. Future research for this experiment to deeper investigates beachrock to develop
coastal mitigation.
References
Adger, W.N., Hughes, T.P., Folke, C., Carpenter, S.R. and Rockström, J., 2005. Social-ecological
resilience to coastal disasters. Science, 309(5737), pp.1036-1039.
Barragán, J.M. and de Andrés, M., 2015. Analysis and trends of the world's coastal cities and
agglomerations. Ocean & Coastal Management, 114, pp.11-20.
Baskoro, A.A. and Rifa’i, I.A., 2015. Pemetaan Risiko Tanah Longsor di Kecamatan Samigaluh
Kabupaten Kulon progo (Doctoral dissertation, Universitas Gadjah Mada – In Bahasa).
Behan, A., 2010. Digital photogrammetry: A practical course. The Photogrammetric Record,
132(25), pp.476-477.
Bird, E.C.F., 1985. Coastline changes. A global review.
Bronto, S., 1989. Volcanic geology of Galunggung, west java, Indonesia.
Brown, D.G. and Arbogast, A.F., 1999. Digital photogrammetric change analysis as applied to
active coastal dunes in Michigan. Photogrammetric Engineering and Remote Sensing, 65, pp.467-474.
Carrivick, J.L., Smith, M.W. and Quincey, D.J., 2016. Structure from Motion in the Geosciences.
John Wiley & Sons.
Cawood, A.J., Bond, C.E., Howell, J.A., Butler, R.W. and Totake, Y., 2017. LiDAR, UAV or
compass-clinometer? Accuracy, coverage and the effects on structural models. Journal of Structural
Geology, 98, pp.67-82.

298
Cooper, J.A.G., 1991. Beachrock formation in low latitudes: implications for coastal evolutionary
models. Marine Geology, 98(1), pp.145-154.
Dalongeville, R. and Sanlaville, P., 1984. Essai de synthèse sur le beach-rock. MOM Éditions, 8(1),
pp.161-167.
Daryono, L.R., Titisari, A.D., Warmada, I.W. and Kawasaki, S., 2019. Comparative characteristics
of cement materials in natural and artificial beachrocks using a petrographic method. Bulletin of
Engineering Geology and the Environment, 78(6), pp.3943-3958.
Davis Jr, R.A. and FitzGerald, D.M., 2009. Beaches and coasts. John Wiley & Sons.
Davis Jr, R.A. and Fox, W.T., 1971. Beach and Nearshore Dynamics in Eastern Lake Michigan
(No. WMU-1). Western Michigan Univ. Kalamazoo.
Donovan, J. and Lebaron, A., 2009, January. A comparison of photogrammetry and laser scanning
for the purpose of automated rock mass characterization. In 43rd US Rock Mechanics Symposium &
4th US-Canada Rock Mechanics Symposium. American Rock Mechanics Association.
Erginal, A.E., 2012. Beachrock as evidence of sea-level lowstand during the classical period, Parion
antique city, Marmara Sea, Turkey. Geodinamica Acta, 25(1-2), pp.96-103.
Förstner, W., 1993. A future of photogrammetric research. NGT geodesia, 93(8), pp.372-383.
Goesele, M., Snavely, N., Curless, B., Hoppe, H. and Seitz, S.M., 2007, October. Multi-view stereo
for community photo collections. In 2007 IEEE 11th International Conference on Computer Vision (pp.
1-8). IEEE.
Gonçalves, J.A. and Henriques, R., 2015. UAV photogrammetry for topographic monitoring of
coastal areas. ISPRS Journal of Photogrammetry and Remote Sensing, 104, pp.101-111.
Guilcher, A., 1969. Pleistocene and Holocene sea level changes. Earth-Science Reviews, 5(2),
pp.69-97.
Haneberg, W.C., 2008. Using close range terrestrial digital photogrammetry for 3-D rock slope
modeling and discontinuity mapping in the United States. Bulletin of Engineering Geology and the
Environment, 67(4), pp.457-469.
Harwin, S. and Lucieer, A., 2012. Assessing the accuracy of georeferenced point clouds produced
via multi-view stereopsis from unmanned aerial vehicle (UAV) imagery. Remote Sensing, 4(6),
pp.1573-1599.
Hesp, P., 1988. Morphology, dynamics and internal stratification of some established foredunes in
southeast Australia. Sedimentary Geology, 55(1-2), pp.17-41.
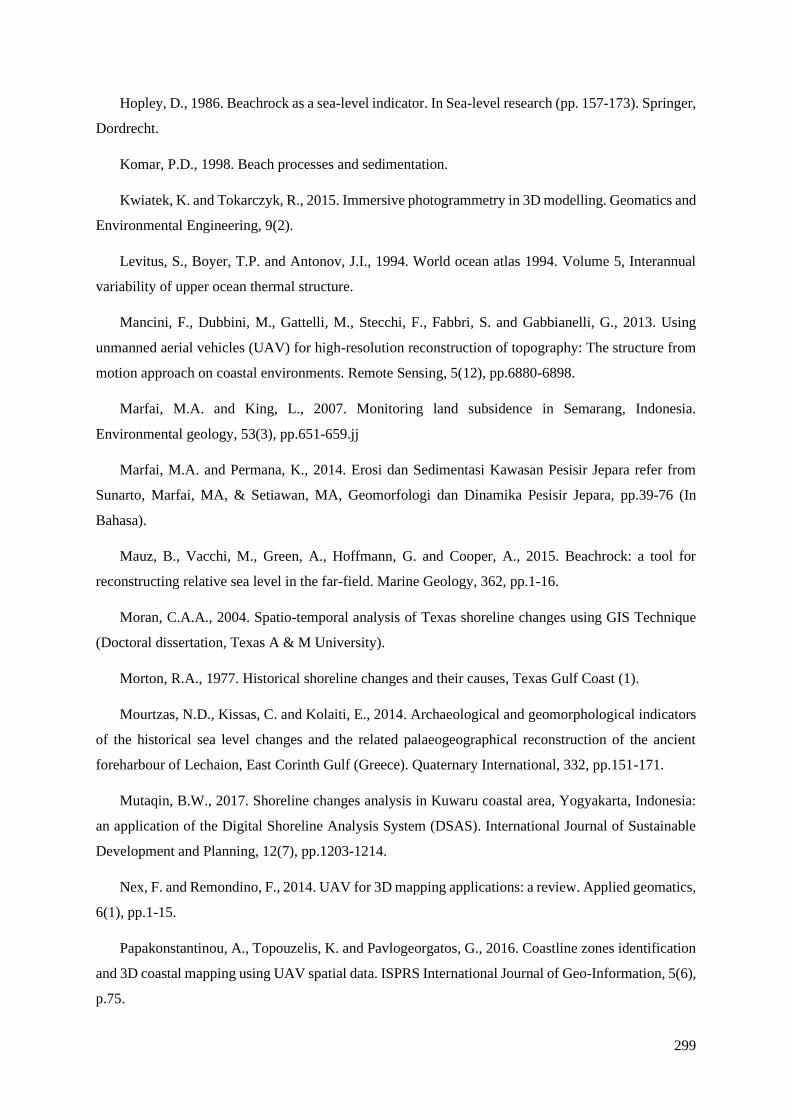
299
Hopley, D., 1986. Beachrock as a sea-level indicator. In Sea-level research (pp. 157-173). Springer,
Dordrecht.
Komar, P.D., 1998. Beach processes and sedimentation.
Kwiatek, K. and Tokarczyk, R., 2015. Immersive photogrammetry in 3D modelling. Geomatics and
Environmental Engineering, 9(2).
Levitus, S., Boyer, T.P. and Antonov, J.I., 1994. World ocean atlas 1994. Volume 5, Interannual
variability of upper ocean thermal structure.
Mancini, F., Dubbini, M., Gattelli, M., Stecchi, F., Fabbri, S. and Gabbianelli, G., 2013. Using
unmanned aerial vehicles (UAV) for high-resolution reconstruction of topography: The structure from
motion approach on coastal environments. Remote Sensing, 5(12), pp.6880-6898.
Marfai, M.A. and King, L., 2007. Monitoring land subsidence in Semarang, Indonesia.
Environmental geology, 53(3), pp.651-659.jj
Marfai, M.A. and Permana, K., 2014. Erosi dan Sedimentasi Kawasan Pesisir Jepara refer from
Sunarto, Marfai, MA, & Setiawan, MA, Geomorfologi dan Dinamika Pesisir Jepara, pp.39-76 (In
Bahasa).
Mauz, B., Vacchi, M., Green, A., Hoffmann, G. and Cooper, A., 2015. Beachrock: a tool for
reconstructing relative sea level in the far-field. Marine Geology, 362, pp.1-16.
Moran, C.A.A., 2004. Spatio-temporal analysis of Texas shoreline changes using GIS Technique
(Doctoral dissertation, Texas A & M University).
Morton, R.A., 1977. Historical shoreline changes and their causes, Texas Gulf Coast (1).
Mourtzas, N.D., Kissas, C. and Kolaiti, E., 2014. Archaeological and geomorphological indicators
of the historical sea level changes and the related palaeogeographical reconstruction of the ancient
foreharbour of Lechaion, East Corinth Gulf (Greece). Quaternary International, 332, pp.151-171.
Mutaqin, B.W., 2017. Shoreline changes analysis in Kuwaru coastal area, Yogyakarta, Indonesia:
an application of the Digital Shoreline Analysis System (DSAS). International Journal of Sustainable
Development and Planning, 12(7), pp.1203-1214.
Nex, F. and Remondino, F., 2014. UAV for 3D mapping applications: a review. Applied geomatics,
6(1), pp.1-15.
Papakonstantinou, A., Topouzelis, K. and Pavlogeorgatos, G., 2016. Coastline zones identification
and 3D coastal mapping using UAV spatial data. ISPRS International Journal of Geo-Information, 5(6),
p.75.

300
Peluso, N.L., 1995. Whose woods are these? Counter‐mapping forest territories in Kalimantan,
Indonesia. Antipode, 27(4), pp.383-406.
Pethick, J.S., 1984. An introduction to coastal geomorphology. Dept. of Geography, Univ. of Hull.
Pilkey, O.H. and Cooper, J.A.G., 2014. The last beach. Duke University Press.
Pix4D, S.A., 2017. Pix4Dmapper 4.1 User Manual. Pix4D SA: Lausanne, Switzerland.
Pujotomo, M.S. and Sudibyakto, H.A., 2009, February. Coastal changes assessment using multi
spatio-temporal data for coastal spatial planning Parangtritis Beach Yogyakarta Indonesia. ITC.
Radjawali, I. and Pye, O., 2017. Drones for justice: inclusive technology and river-related action
research along the Kapuas. Geographica Helvetica, 72(1), p.17.
Rangel-Buitrago, N., de Jonge, V.N. and Neal, W., 2018. How to make integrated coastal erosion
management a reality. Ocean & Coastal Management, 156, pp.290-299.
Sanlaville, P., Dalongeville, R., Bernier, P. and Evin, J., 1997. The Syrian coast: a model of
Holocene coastal evolution. Journal of Coastal Research, pp.385-396.
Semeniuk, V. and Searle, D.J., 1987. Beach rock ridges/bands along a high-energy coast in
Southwestern Australia: Their significance and use in coastal history. Journal of Coastal Research,
pp.331-342.
Short, A.D., 2006. Australian Beach System: Nature and Distribution. Journal of Coastal Research,
pp.11-161.
Stattegger, K., Tjallingii, R., Saito, Y., Michelli, M., Thanh, N.T. and Wetzel, A., 2013. Mid to late
Holocene sea-level reconstruction of Southeast Vietnam using beachrock and beach-ridge deposits.
Global and Planetary Change, 110, pp.214-222.
Swift, D.J., Niederoda, A.W., Vincent, C.E. and Hopkins, T.S., 1985. Barrier island evolution,
middle Atlantic shelf, USA Part I: Shoreface dynamics. Marine Geology, 63(1-4), pp.331-361.
Szeliski, R., 2010. Computer vision: algorithms and applications. Springer Science & Business
Media.
Tang, L.Q., Chassapis, C. and Manoochehri, S., 1997. Optimal cooling system design for multi-
cavity injection molding. Finite Elements in Analysis and Design, 26(3), pp.229-251.
Topouzelis, K., Papakonstantinou, A. and Pavlogeorgatos, G., 2015. Coastline change detection
using UAV, Remote Sensing, GIS and 3D reconstruction. In 5th Int. Conf. Environ. Manag. Eng. Plan.
Econ. SECOTOX Conf..

301
Triatmodjo, B., 1999. Teknik pantai. Beta Offset, Yogyakarta, 397 (In Bahasa).
Trijaya, D. W. 2008. Abrasi pantai Samas semakin mengkhawatirkan. http://okezone.com (In
Bahasa)
Turner, D., Lucieer, A. and Watson, C., 2012. An automated technique for generating georectified
mosaics from ultra-high resolution unmanned aerial vehicle (UAV) imagery, based on structure from
motion (SfM) point clouds. Remote sensing, 4(5), pp.1392-1410.
Turner, I.L., Harley, M.D. and Drummond, C.D., 2016. UAVs for coastal surveying. Coastal
Engineering, 114, pp.19-24.
Varela-González, M., González-Jorge, H., Riveiro, B. and Arias, P., 2013. Performance testing of
LiDAR exploitation software. Computers & geosciences, 54, pp.122-129.
Vasuki, Y., Holden, E.J., Kovesi, P. and Micklethwaite, S., 2014. Semi-automatic mapping of
geological Structures using UAV-based photogrammetric data: An image analysis approach.
Computers & Geosciences, 69, pp.22-32.
Warren, M., Paton, M., MacTavish, K., Schoellig, A.P. and Barfoot, T.D., 2018. Towards visual
teach and repeat for GPS-denied flight of a fixed-wing UAV. In Field and Service Robotics (pp. 481-
498). Springer, Cham.
Wyrtki, K., 1961. Physical oceanography of the Southeast Asian waters (Vol. 2). University of
California, Scripps Institution of Oceanography.
Yastıklı, N., Bagci, I. and Beser, C., 2013. The processing of image data collected by light UAV
systems for GIS data capture and updating. International Archives of the Photogrammetry, Remote
Sensing and Spatial Information Sciences, 7, p.W2.
Zhang, R.S., Shen, Y.M., Lu, L.Y., Yan, S.G., Wang, Y.H., Li, J.L. and Zhang, Z.L., 2004.
Formation of Spartina alterniflora salt marshes on the coast of Jiangsu Province, China. Ecological
Engineering, 23(2), pp.95-105.

302
APPENDIXES B
Appendix B.1. Measurement Stratigraphy and Petrographic Analysis of ABX1 and ABX2
samples

303
Sample: ABX2 Name: Sparse Biomicrite (Folk, 1962);
Beachrock
Location: Trench AB, Krakal-Sadranan beach 455865/ 9099626
PP
L 1 2 3 4 5 6 7 8 9 10 11 Texture:
Allochem bioclastic with the grain size 0,04-10
mm. Bad sorted, open packed, angular grain
shape and fragments relatively damaged.
Microcalcite (Sparitee) cementation found re-
crystallization inside fragment, micrite (mud
carbonate), less spars with floating contact
matrix, and variative fragment size.
Main composition:
➢ Coral Fragment [10%] with size 0,5 - 4 mm
(C3).
➢ Skeletal Fragment [30%]: matrix fragment
with random size and aragonite mineral (G3,
B7, D8).
➢ Micrite [30%]: Clay grainsize when occurred
in depositional process. Size <0,04 mm
whereas smooth aggregate between matrix
fragments. Brown color shown there is
erosional process and weathered from this
section (D3).
➢ Spars [30%]: microcalcite cement (G9).
A
B
C
D
E
F
G
H
I
J
XP
L 1 2 3 4 5 6 7 8 9 10 11
A
B
C
D
E
F
G
H
I
J
aasas
a
(XPL within gips chip)
100 μm

304

305
Appendix B.2. Measurement Stratigraphy and Petrographic Analysis of ABY1 and ABY2
samples
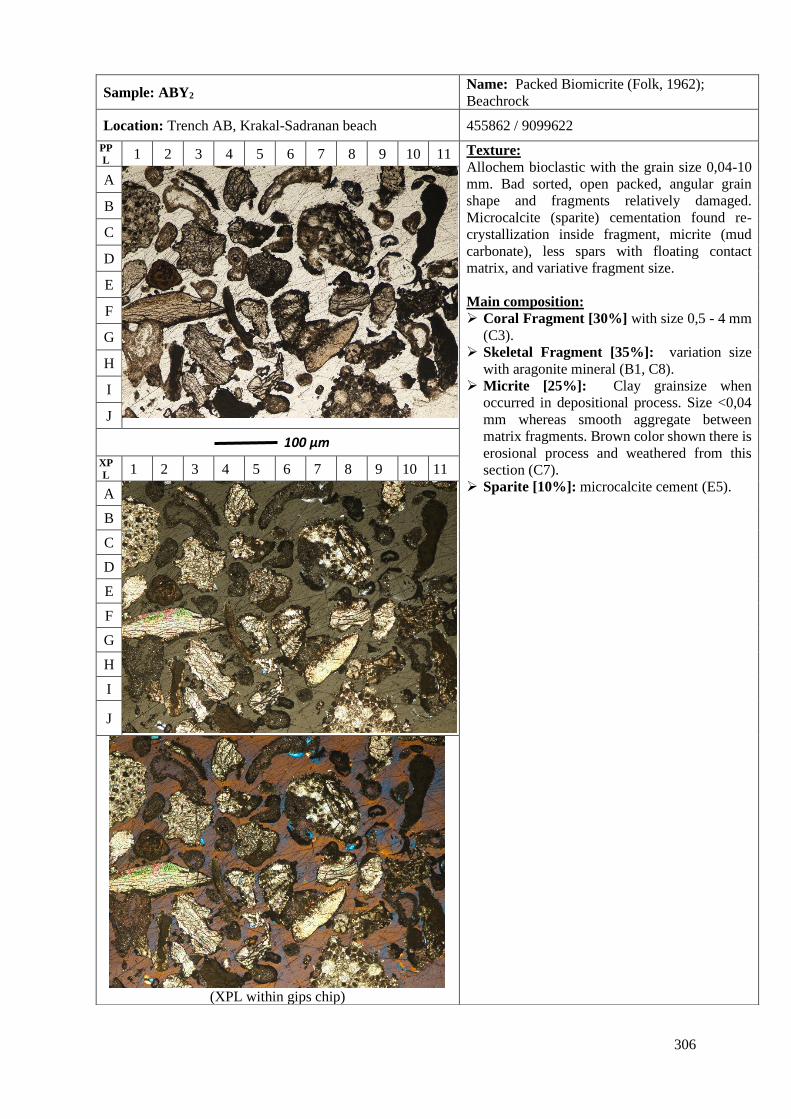
306
Sample: ABY2 Name: Packed Biomicrite (Folk, 1962);
Beachrock
Location: Trench AB, Krakal-Sadranan beach 455862 / 9099622
PP
L 1 2 3 4 5 6 7 8 9 10 11 Texture:
Allochem bioclastic with the grain size 0,04-10
mm. Bad sorted, open packed, angular grain
shape and fragments relatively damaged.
Microcalcite (sparite) cementation found re-
crystallization inside fragment, micrite (mud
carbonate), less spars with floating contact
matrix, and variative fragment size.
Main composition:
➢ Coral Fragment [30%] with size 0,5 - 4 mm
(C3).
➢ Skeletal Fragment [35%]: variation size
with aragonite mineral (B1, C8).
➢ Micrite [25%]: Clay grainsize when
occurred in depositional process. Size <0,04
mm whereas smooth aggregate between
matrix fragments. Brown color shown there is
erosional process and weathered from this
section (C7).
➢ Sparite [10%]: microcalcite cement (E5).
A
B
C
D
E
F
G
H
I
J
XP
L 1 2 3 4 5 6 7 8 9 10 11
A
B
C
D
E
F
G
H
I
J
(XPL within gips chip)
100 μm

307
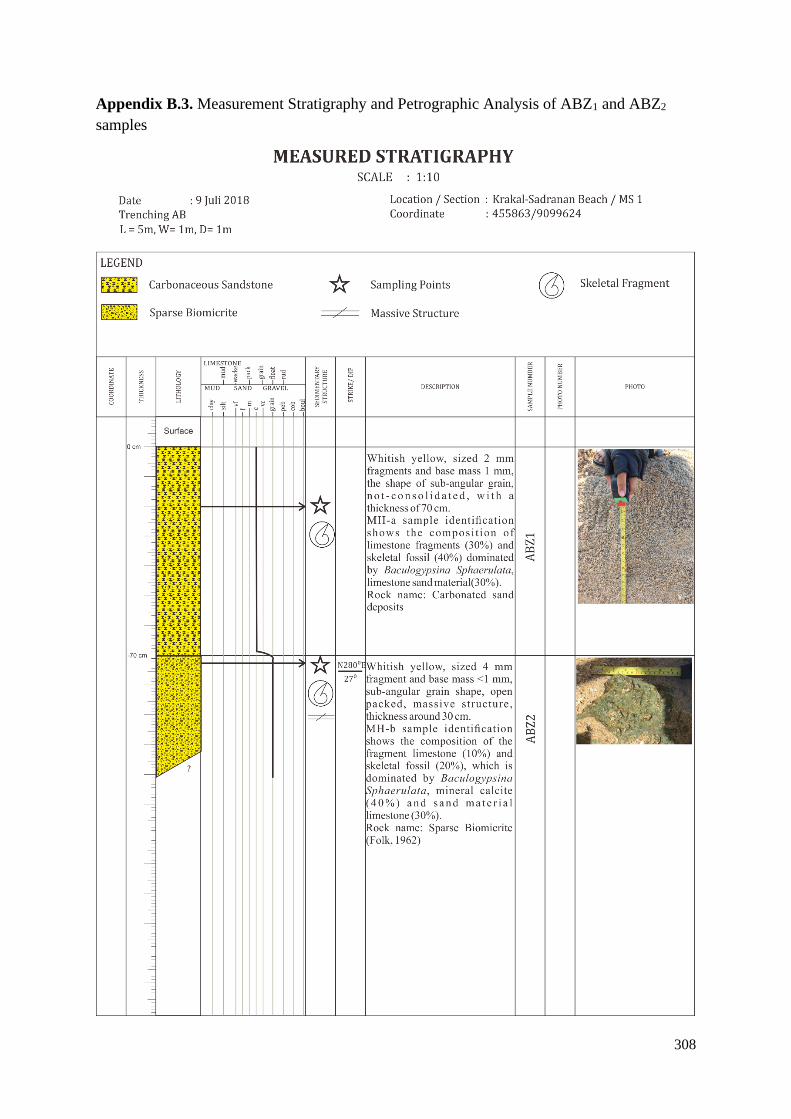
308
Appendix B.3. Measurement Stratigraphy and Petrographic Analysis of ABZ1 and ABZ2
samples

309
Sample: ABZ2 Name: Sparse Biomicrite (Folk, 1962);
Beachrock
Location: Trench AB, Krakal-Sadranan beach 455863/ 90099624
PP
L 1 2 3 4 5 6 7 8 9 10 11 Texture:
Allochem bioclastic with the grain size 0,04-10
mm. Bad sorted, open packed, angular grain
shape and fragments relatively damaged.
Microcalcite (Sparite) cementation found re-
crystallization inside fossil fragment, micrite
(mud carbonate), less spars with floating contact
matrix, and variative fragment size.
Main composition:
➢ Coral Fragment [10%] with size 0,5 - 4 mm
(C3).
➢ Skeletal Fragment [30%]: %]: matrix
fragment with random size and aragonite
mineral
➢ Micrite [30%]: Clay grainsize when
occurred in depositional process. Size <0,04
mm whereas smooth aggregate between
matrix fragments. Brown color shown there is
erosional process and weathered from this
section (D5).
➢ Sparite [30%]: microcalcite cement (G9).
A
B
C
D
E
F
G
H
I
J
XP
L 1 2 3 4 5 6 7 8 9 10 11
A
B
C
D
E
F
G
H
I
J
100 μm

310
Unconsolidated Beachrock Well consolidated Beachrock

311
Appendix B.4. Measurement Stratigraphy and Petrographic Analysis of CDX1, CDX2 and
CDX3 samples
CD
X3
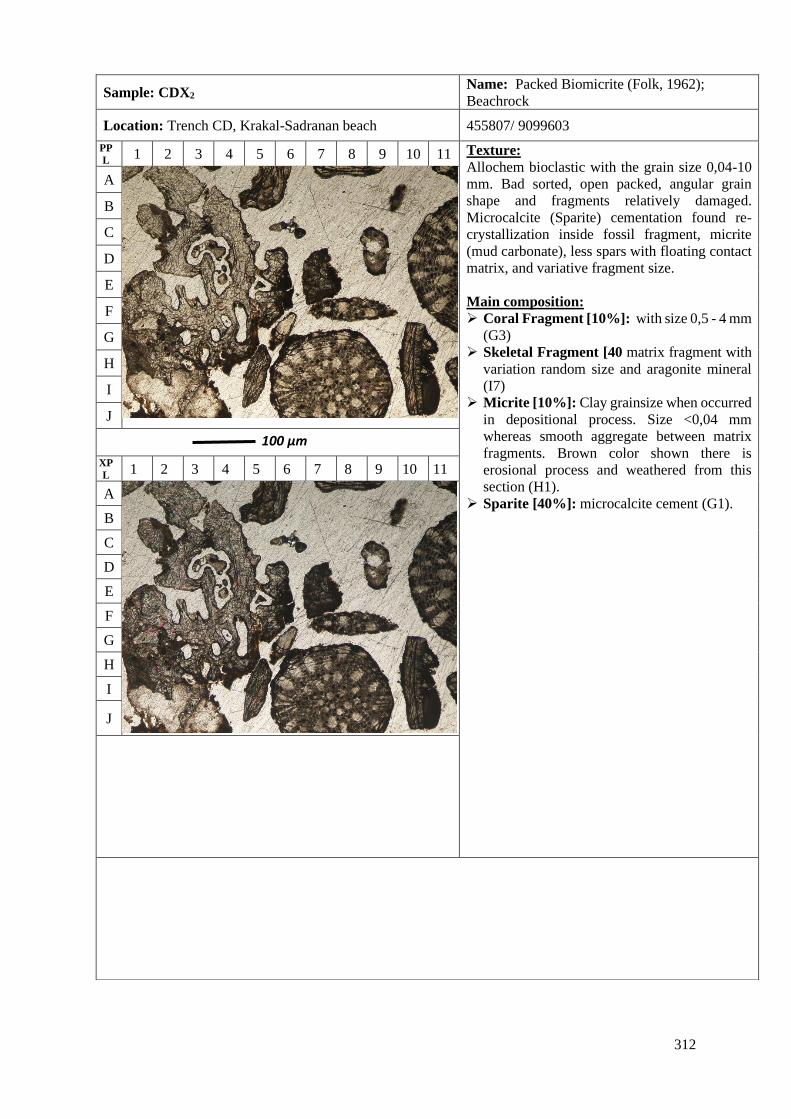
312
Sample: CDX2 Name: Packed Biomicrite (Folk, 1962);
Beachrock
Location: Trench CD, Krakal-Sadranan beach 455807/ 9099603
PP
L 1 2 3 4 5 6 7 8 9 10 11 Texture:
Allochem bioclastic with the grain size 0,04-10
mm. Bad sorted, open packed, angular grain
shape and fragments relatively damaged.
Microcalcite (Sparite) cementation found re-
crystallization inside fossil fragment, micrite
(mud carbonate), less spars with floating contact
matrix, and variative fragment size.
Main composition:
➢ Coral Fragment [10%]: with size 0,5 - 4 mm
(G3)
➢ Skeletal Fragment [40 matrix fragment with
variation random size and aragonite mineral
(I7)
➢ Micrite [10%]: Clay grainsize when occurred
in depositional process. Size <0,04 mm
whereas smooth aggregate between matrix
fragments. Brown color shown there is
erosional process and weathered from this
section (H1).
➢ Sparite [40%]: microcalcite cement (G1).
A
B
C
D
E
F
G
H
I
J
XP
L 1 2 3 4 5 6 7 8 9 10 11
A
B
C
D
E
F
G
H
I
J
100 μm

313
Unconsolidated Beachrock Well consolidated Beachrock

314
Sample: CDX3 Name: Packed Biomicrite (Folk, 1962);
Beachrock
Location: Trench CD, Krakal-Sadranan beach 455807/ 9099603
PP
L 1 2 3 4 5 6 7 8 9 10 11 Texture:
Allochem bioclastic with the grain size 0,04-10
mm. Bad sorted, open packed, angular grain
shape and fragments relatively damaged.
Microcalcite (Sparite) cementation found re-
crystallization inside fossil fragment, micrite
(mud carbonate), less spars with floating contact
matrix, and variative fragment size.
Main composition:
➢ Coral Fragment [20%]: with size 0,5 - 4 mm
(G5)
➢ Skeletal Fragment [40%]: matrix fragment
with variation random size and aragonite
mineral (C9)
➢ Micrite [10%]: Clay grainsize when
occurred in depositional process. Size <0,04
mm whereas smooth aggregate between
matrix fragments. Brown color shown there is
erosional process and weathered from this
section (F6).
➢ Sparite [20%]: microcalcite cement (G1).
➢ Calcite Mineral [10%] (D6)
A
B
C
D
E
F
G
H
I
J
XP
L 1 2 3 4 5 6 7 8 9 10 11
A
B
C
D
E
F
G
H
I
J
(XPL within gips chip)
100 μm

315
Unconsolidated Beachrock Well consolidated Beachrock
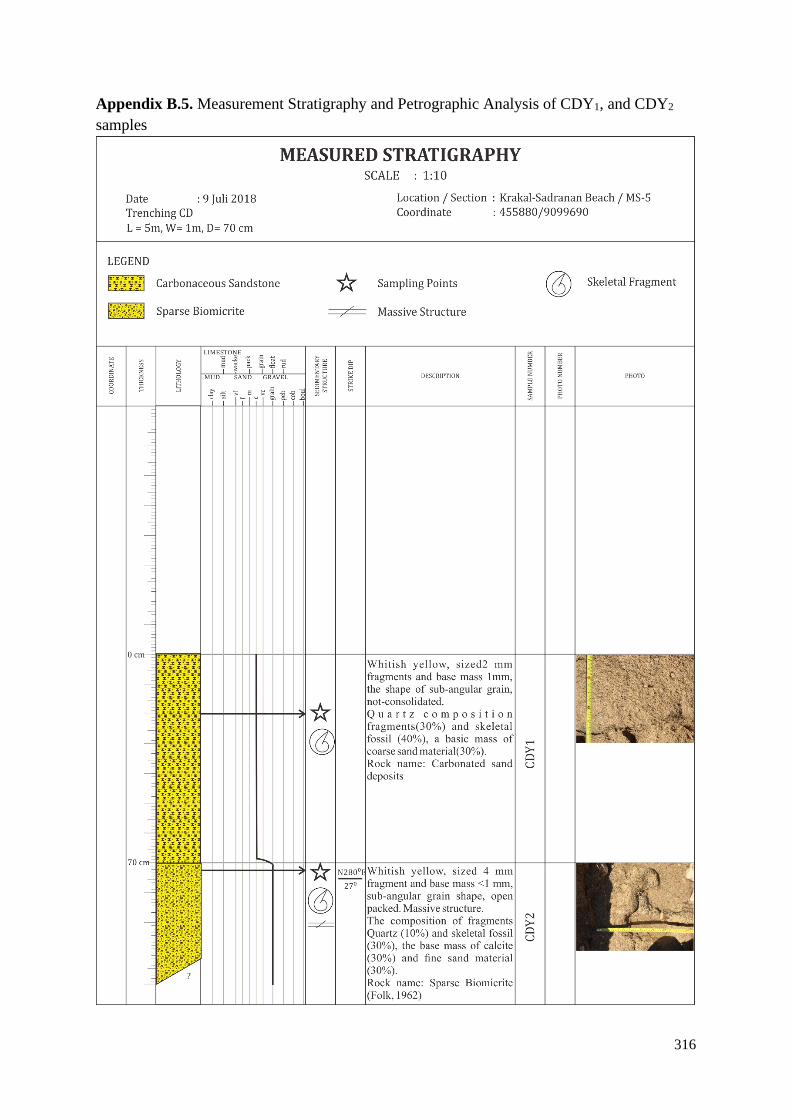
316
Appendix B.5. Measurement Stratigraphy and Petrographic Analysis of CDY1, and CDY2
samples
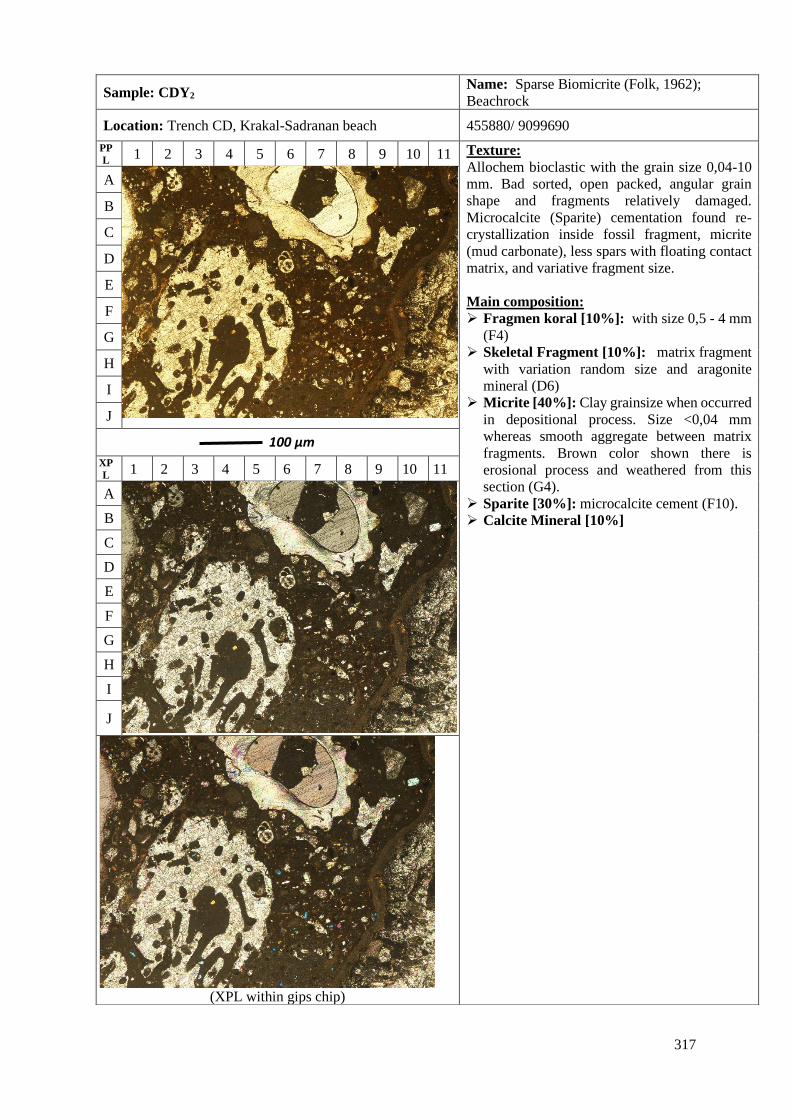
317
Sample: CDY2 Name: Sparse Biomicrite (Folk, 1962);
Beachrock
Location: Trench CD, Krakal-Sadranan beach 455880/ 9099690
PP
L 1 2 3 4 5 6 7 8 9 10 11 Texture:
Allochem bioclastic with the grain size 0,04-10
mm. Bad sorted, open packed, angular grain
shape and fragments relatively damaged.
Microcalcite (Sparite) cementation found re-
crystallization inside fossil fragment, micrite
(mud carbonate), less spars with floating contact
matrix, and variative fragment size.
Main composition:
➢ Fragmen koral [10%]: with size 0,5 - 4 mm
(F4)
➢ Skeletal Fragment [10%]: matrix fragment
with variation random size and aragonite
mineral (D6)
➢ Micrite [40%]: Clay grainsize when occurred
in depositional process. Size <0,04 mm
whereas smooth aggregate between matrix
fragments. Brown color shown there is
erosional process and weathered from this
section (G4).
➢ Sparite [30%]: microcalcite cement (F10).
➢ Calcite Mineral [10%]
A
B
C
D
E
F
G
H
I
J
XP
L 1 2 3 4 5 6 7 8 9 10 11
A
B
C
D
E
F
G
H
I
J
(XPL within gips chip)
100 μm

318
Unconsolidated Beachrock Well consolidated Beachrock

319
Appendix B.6. Measurement Stratigraphy and Petrographic Analysis of CDZ1, and CDZ2
samples

320
Sample: CDZ2 Name: Sparse Biomicrite (Folk, 1962);
Beachrock
Location: Trench CD, Krakal-Sadranan beach 455813 / 9099597
PP
L 1 2 3 4 5 6 7 8 9 10 11 Texture:
Allochem bioclastic with the grain size 0,04-10
mm. Bad sorted, open packed, angular grain
shape and fragments relatively damaged.
Microcalcite (Sparite) cementation found re-
crystallization inside fossil fragment, micrite
(mud carbonate), less spars with floating contact
matrix, and variative fragment size.
Main composition:
➢ Coral Fragment [15%] %]: with size 0,5 -
4 mm (C11).
➢ Skeletal Fragment [10%]: matrix fragment
with variation random size and aragonite
mineral (E6).
➢ Micrite [45%]: Clay grainsize when occurred
in depositional process. Size <0,04 mm
whereas smooth aggregate between matrix
fragments. Brown color shown there is
erosional process and weathered from this
section (F2).
➢ Sparite [20%]: microcalcite cement (I1).
➢ Calcite Mineral [10%] (J8)
A
B
C
D
E
F
G
H
I
J
XP
L 1 2 3 4 5 6 7 8 9 10 11
A
B
C
D
E
F
G
H
I
J
100 μm

321
Unconsolidated Beachrock Well consolidated Beachrock

322
Appendix B.7. Measurement Stratigraphy and Petrographic Analysis of EFX1, and EFX2
samples

323
Sample: EFX2 Name: Sparse Biomicrite (Folk, 1962);
Beachrock
Location: Trench EF, Krakal-Sadranan beach 456021/ 9099640
PP
L 1 2 3 4 5 6 7 8 9 10 11 Texture:
Allochem bioclastic with the grain size 0,04-10
mm. Bad sorted, open packed, angular grain
shape and fragments relatively damaged.
Microcalcite (Sparite) cementation found re-
crystallization inside fossil fragment, micrite
(mud carbonate), less spars with floating contact
matrix, and variative fragment size.
Main composition:
➢ Coral Fragment [20%] with size 0,5 - 4 mm
(J6).
➢ Skeletal Fragment [20%]: matrix fragment
with variation random size and aragonite
mineral (G2).
➢ Micrite [20%]: Clay grainsize when
occurred in depositional process. Size <0,04
mm whereas smooth aggregate between
matrix fragments. Brown color shown there is
erosional process and weathered from this
section (I4).
➢ Sparite [30%]: microcalcite cement (C2).
➢ Calcite Mineral [10%] (C10)
A
B
C
D
E
F
G
H
I
J
XP
L 1 2 3 4 5 6 7 8 9 10 11
A
B
C
D
E
F
G
H
I
J
(XPL within gips chip)
100 μm
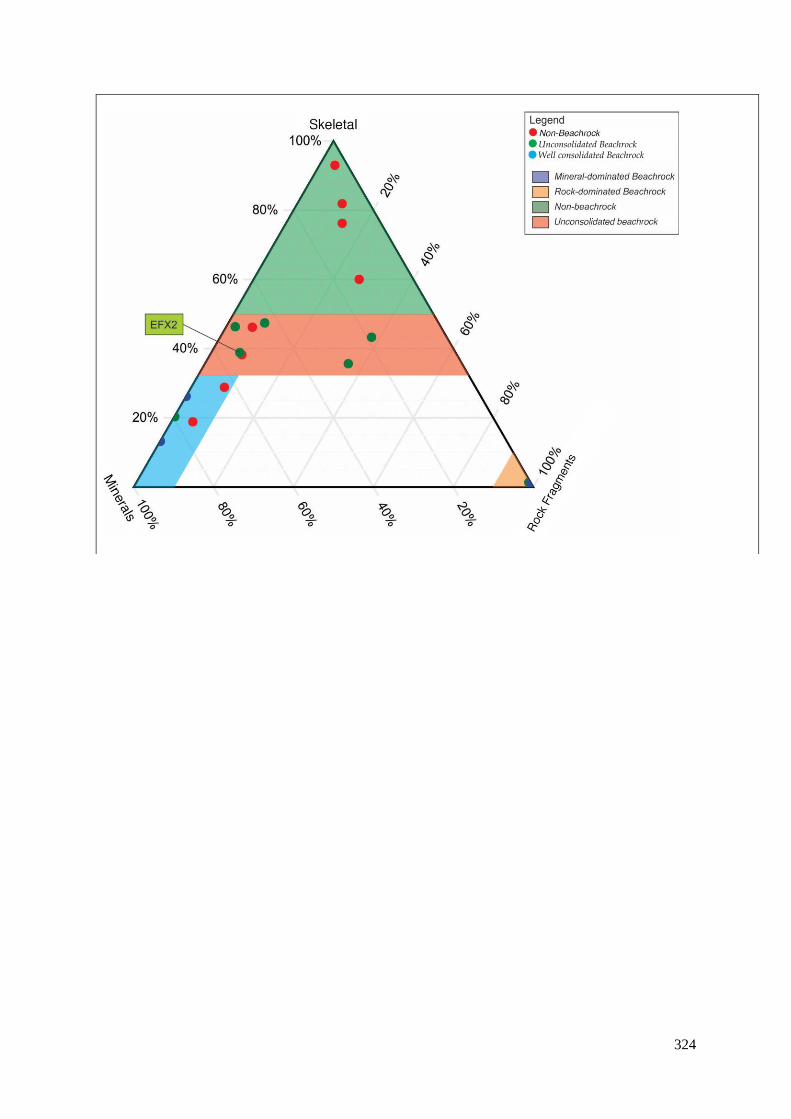
324
Unconsolidated Beachrock Well consolidated Beachrock

325
Appendix B.8. Measurement Stratigraphy and Petrographic Analysis of EFY1, and EFY2
samples

326
Sample: EFY2 Name: Sparse Biomicrite (Folk, 1962);
Beachrock
Location: Trench EF, Krakal-Sadranan beach 456024 / 9099638
PPL 1 2 3 4 5 6 7 8 9 10 11 Texture:
Allochem bioclastic with the grain size 0,04-10
mm. Bad sorted, open packed, angular grain
shape and fragments relatively damaged.
Microcalcite (Sparite) cementation found re-
crystallization inside fossil fragment, micrite
(mud carbonate), less spars with floating contact
matrix, and variative fragment size.
Main composition:
➢ Coral Fragment [5%] with size 0,5 - 4 mm
(J6).
➢ Skeletal Fragment [25%]: matrix fragment
with variation random size and aragonite
mineral (G2).
➢ Micrite [30%]: Clay grainsize when occurred
in depositional process. Size <0,04 mm
whereas smooth aggregate between matrix
fragments. Brown color shown there is
erosional process and weathered from this
section (I4).
➢ Sparite [30%]: microcalcite cement (C2).
➢ Calcite Mineral [10%] (F2)
A
B
C
D
E
F
G
H
I
J
XPL 1 2 3 4 5 6 7 8 9 10 11
A
B
C
D
E
F
G
H
I
J
(XPL within gips chip)
100 μm
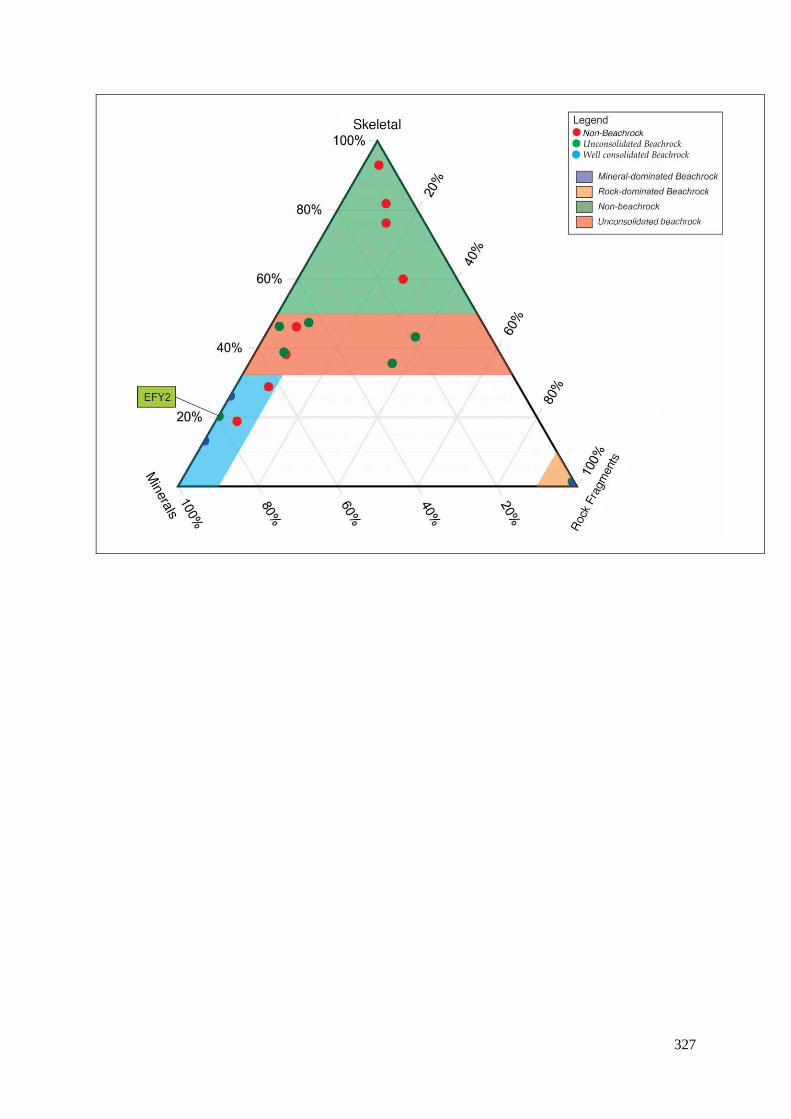
327
Unconsolidated Beachrock Well consolidated Beachrock

328
Appendix B.9. Measurement Stratigraphy and Petrographic Analysis of EFZ1, and EFZ2
samples

329
Sample: EFZ1 Name: Sparse Biomicrite (Folk, 1962);
Beachrock
Location: Trench EF, Krakal-Sadranan beach 456025/ 9099647
PP
L 1 2 3 4 5 6 7 8 9 10 11 Texture:
Allochem bioclastic with the grain size 0,04-10
mm. Bad sorted, open packed, angular grain
shape and fragments relatively damaged.
Microcalcite (Sparite) cementation found re-
crystallization inside fossil fragment, micrite
(mud carbonate), less spars with floating contact
matrix, and variative fragment size.
Main composition:
➢ Coral Fragment [10%] with size 0,5 - 4 mm
(D2).
➢ Skeletal Fragment [10%]: matrix fragment
with variation random size and aragonite
mineral (H7).
➢ Micrite [40%]: Clay grainsize when occurred
in depositional process. Size <0,04 mm
whereas smooth aggregate between matrix
fragments. Brown color shown there is
erosional process and weathered from this
section (H5).
➢ Sparite [30%]: microcalcite cement (C8).
➢ Calcite Mineral [10%] (F5)
A
B
C
D
E
F
G
H
I
J
XP
L 1 2 3 4 5 6 7 8 9 10 11
A
B
C
D
E
F
G
H
I
J
100 μm

330
(XPL within gips chip)
Unconsolidated Beachrock Well consolidated Beachrock

331
Sample: EFZ2 Name: Sparse Biomicrite (Folk, 1962);
Beachrock
Location: Trench EF, Krakal-Sadranan beach 456025 / 9099647
PP
L 1 2 3 4 5 6 7 8 9 10 11 Texture:
Allochem bioclastic with the grain size 0,04-10
mm. Bad sorted, open packed, angular grain
shape and fragments relatively damaged.
Microcalcite (Sparite) cementation found re-
crystallization inside fossil fragment, micrite
(mud carbonate), less spars with floating contact
matrix, and variative fragment size.
Main composition:
➢ Coral Fragment [15%] with size 0,5 - 4 mm
➢ Skeletal Fragment [20%]: matrix fragment
with variation random size and aragonite
mineral (G4, F9).
➢ Micrite [35%]: Clay grainsize when
occurred in depositional process. Size <0,04
mm whereas smooth aggregate between
matrix fragments. Brown color shown there is
erosional process and weathered from this
section (F10).
➢ Sparite [20%]: microcalcite cement (F7).
➢ Calcite Mineral [10%] (D9)
A
B
C
D
E
F
G
H
I
J
XP
L 1 2 3 4 5 6 7 8 9 10 11
A
B
C
D
E
F
G
H
I
J
100 μm

332
(XPL within gips chip)
Unconsolidated Beachrock Well consolidated Beachrock
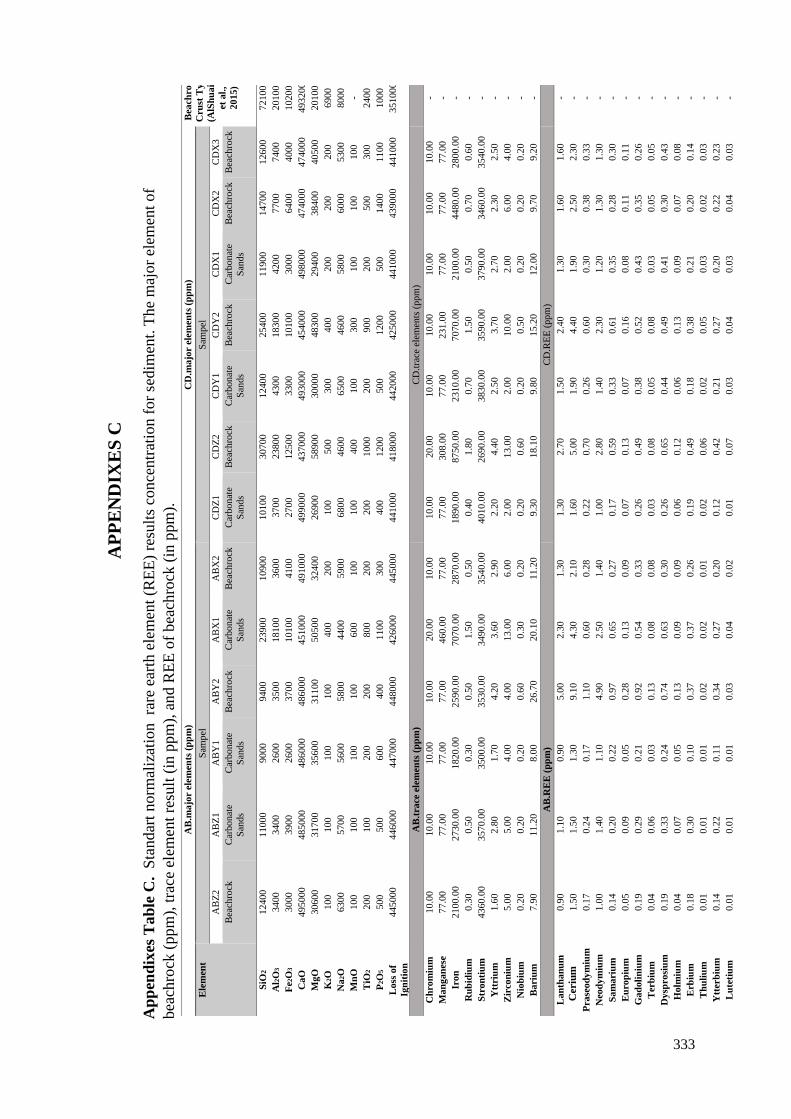
Ap
pen
dix
es T
ab
le C
. S
tandar
t norm
aliz
atio
n
rare
ear
th e
lem
ent
(RE
E)
resu
lts
conce
ntr
atio
n f
or
sedim
ent.
The
maj
or
elem
ent
of
bea
chro
ck (
ppm
), t
race
ele
men
t re
sult
(in
ppm
), a
nd R
EE
of
bea
chro
ck (
in p
pm
).
A
B.m
ajo
r el
em
ents
(p
pm
) C
D.m
ajo
r el
em
ents
(p
pm
) B
each
rock
Cru
st T
yp
e
(AlS
hu
aib
i,
et a
l.,
2015)
Pin
k
Lim
esto
ne
sam
e are
a
(Atm
ok
o,
et a
l.,
2018)
Ele
men
t S
ampel
S
ampel
AB
Z2
A
BZ
1
AB
Y1
A
BY
2
AB
X1
A
BX
2
CD
Z1
C
DZ
2
CD
Y1
C
DY
2
CD
X1
C
DX
2
CD
X3
Bea
chro
ck
Car
bonat
e
San
ds
Car
bonat
e
San
ds
Bea
chro
ck
Car
bonat
e
San
ds
Bea
chro
ck
Car
bonat
e
San
ds
Bea
chro
ck
Car
bonat
e
San
ds
Bea
chro
ck
Car
bonat
e
San
ds
Bea
chro
ck
Bea
chro
ck
SiO
2
12400
11000
9000
9400
23900
10900
10100
30700
12400
25400
11900
14700
12600
72100
8100
Al2
O3
3400
3400
2600
3500
18100
3600
3700
23800
4300
18300
4200
7700
7400
20100
3100
Fe2
O3
3000
3900
2600
3700
10100
4100
2700
12500
3300
10100
3000
6400
4000
10200
1600
CaO
495000
485000
486000
486000
451000
491000
499000
437000
493000
454000
498000
474000
474000
493200
540000
MgO
30600
31700
35600
31100
50500
32400
26900
58900
30000
48300
29400
38400
40500
20100
3100
K2O
100
100
100
100
400
200
100
500
300
400
200
200
200
6900
100
Na
2O
6300
5700
5600
5800
4400
5900
6800
4600
6500
4600
5800
6000
5300
8000
400
Mn
O
100
100
100
100
600
100
100
400
100
300
100
100
100
- 100
TiO
2
200
100
200
200
800
200
200
1000
200
900
200
500
300
2400
100
P2O
5
500
500
600
400
1100
300
400
1200
500
1200
500
1400
1100
1000
100
Loss
of
Ign
itio
n
445000
446000
447000
448000
426000
445000
441000
418000
442000
425000
441000
439000
441000
351000
431000
AB
.tra
ce e
lem
ents
(p
pm
) C
D.t
race
ele
men
ts (
ppm
)
Ch
rom
ium
10.0
0
10.0
0
10.0
0
10.0
0
20.0
0
10.0
0
10.0
0
20.0
0
10.0
0
10.0
0
10.0
0
10.0
0
10.0
0
- 30
Man
gan
ese
77.0
0
77.0
0
77.0
0
77.0
0
460.0
0
77.0
0
77.0
0
308.0
0
77.0
0
231.0
0
77.0
0
77.0
0
77.0
0
- 9254.7
7
Iron
2100.0
0
2730.0
0
1820.0
0
2590.0
0
7070.0
0
2870.0
0
1890.0
0
8750.0
0
2310.0
0
7070.0
0
2100.0
0
4480.0
0
2800.0
0
- 2483
Ru
bid
ium
0.3
0
0.5
0
0.3
0
0.5
0
1.5
0
0.5
0
0.4
0
1.8
0
0.7
0
1.5
0
0.5
0
0.7
0
0.6
0
- 0.4
Str
on
tiu
m
4360.0
0
3570.0
0
3500.0
0
3530.0
0
3490.0
0
3540.0
0
4010.0
0
2690.0
0
3830.0
0
3590.0
0
3790.0
0
3460.0
0
3540.0
0
- 159.5
Ytt
riu
m
1.6
0
2.8
0
1.7
0
4.2
0
3.6
0
2.9
0
2.2
0
4.4
0
2.5
0
3.7
0
2.7
0
2.3
0
2.5
0
- 3.3
Zir
con
ium
5.0
0
5.0
0
4.0
0
4.0
0
13.0
0
6.0
0
2.0
0
13.0
0
2.0
0
10.0
0
2.0
0
6.0
0
4.0
0
- <
2
Nio
biu
m
0.2
0
0.2
0
0.2
0
0.6
0
0.3
0
0.2
0
0.2
0
0.6
0
0.2
0
0.5
0
0.2
0
0.2
0
0.2
0
- 4.7
Bari
um
7.9
0
11.2
0
8.0
0
26.7
0
20.1
0
11.2
0
9.3
0
18.1
0
9.8
0
15.2
0
12.0
0
9.7
0
9.2
0
- 8.3
AB
.RE
E (
pp
m)
CD
.RE
E (
ppm
)
Lan
than
um
0.9
0
1.1
0
0.9
0
5.0
0
2.3
0
1.3
0
1.3
0
2.7
0
1.5
0
2.4
0
1.3
0
1.6
0
1.6
0
- 2.3
0
Ces
ium
1.5
0
1.5
0
1.3
0
9.1
0
4.3
0
2.1
0
1.6
0
5.0
0
1.9
0
4.4
0
1.9
0
2.5
0
2.3
0
- 2.5
0
Pra
seod
ym
ium
0.1
7
0.2
4
0.1
7
1.1
0
0.6
0
0.2
8
0.2
2
0.7
0
0.2
6
0.6
0
0.3
0
0.3
8
0.3
3
- 0.4
7
Neo
dy
miu
m
1.0
0
1.4
0
1.1
0
4.9
0
2.5
0
1.4
0
1.0
0
2.8
0
1.4
0
2.3
0
1.2
0
1.3
0
1.3
0
- 1.9
0
Sam
ari
um
0.1
4
0.2
0
0.2
2
0.9
7
0.6
5
0.2
7
0.1
7
0.5
9
0.3
3
0.6
1
0.3
5
0.2
8
0.3
0
- 0.4
1
Eu
rop
ium
0.0
5
0.0
9
0.0
5
0.2
8
0.1
3
0.0
9
0.0
7
0.1
3
0.0
7
0.1
6
0.0
8
0.1
1
0.1
1
- 0.1
2
Gad
oli
niu
m
0.1
9
0.2
9
0.2
1
0.9
2
0.5
4
0.3
3
0.2
6
0.4
9
0.3
8
0.5
2
0.4
3
0.3
5
0.2
6
- 0.4
0
Ter
biu
m
0.0
4
0.0
6
0.0
3
0.1
3
0.0
8
0.0
8
0.0
3
0.0
8
0.0
5
0.0
8
0.0
3
0.0
5
0.0
5
- 0.0
6
Dysp
rosi
um
0.1
9
0.3
3
0.2
4
0.7
4
0.6
3
0.3
0
0.2
6
0.6
5
0.4
4
0.4
9
0.4
1
0.3
0
0.4
3
- 0.3
7
Holm
ium
0.0
4
0.0
7
0.0
5
0.1
3
0.0
9
0.0
9
0.0
6
0.1
2
0.0
6
0.1
3
0.0
9
0.0
7
0.0
8
- 0.0
8
Erb
ium
0.1
8
0.3
0
0.1
0
0.3
7
0.3
7
0.2
6
0.1
9
0.4
9
0.1
8
0.3
8
0.2
1
0.2
0
0.1
4
- 0.1
9
Th
uli
um
0.0
1
0.0
1
0.0
1
0.0
2
0.0
2
0.0
1
0.0
2
0.0
6
0.0
2
0.0
5
0.0
3
0.0
2
0.0
3
- 0.0
5
Ytt
erb
ium
0.1
4
0.2
2
0.1
1
0.3
4
0.2
7
0.2
0
0.1
2
0.4
2
0.2
1
0.2
7
0.2
0
0.2
2
0.2
3
- 0.1
9
Lu
teti
um
0.0
1
0.0
1
0.0
1
0.0
3
0.0
4
0.0
2
0.0
1
0.0
7
0.0
3
0.0
4
0.0
3
0.0
4
0.0
3
- 0.0
3
333
AP
PE
ND
IXE
S C
Ceriu
m
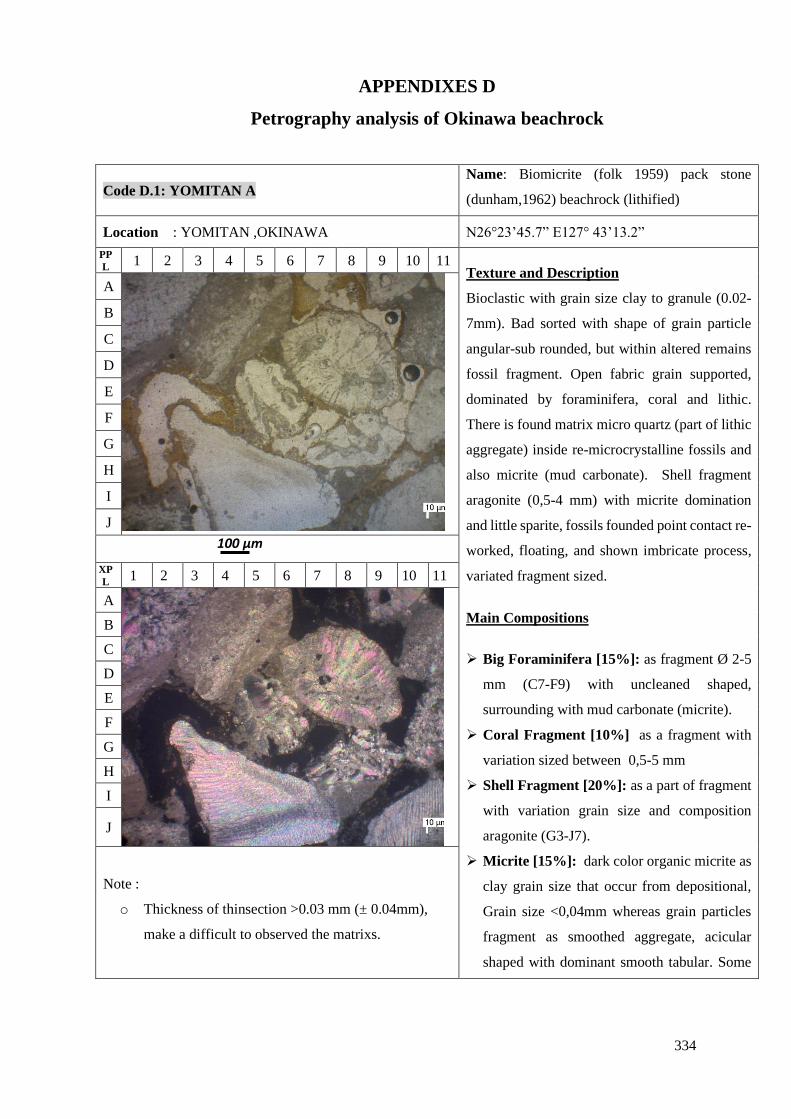
334
APPENDIXES D
Petrography analysis of Okinawa beachrock
Code D.1: YOMITAN A Name: Biomicrite (folk 1959) pack stone
(dunham,1962) beachrock (lithified)
Location : YOMITAN ,OKINAWA N26°23’45.7” E127° 43’13.2”
PP
L 1 2 3 4 5 6 7 8 9 10 11
Texture and Description
Bioclastic with grain size clay to granule (0.02-
7mm). Bad sorted with shape of grain particle
angular-sub rounded, but within altered remains
fossil fragment. Open fabric grain supported,
dominated by foraminifera, coral and lithic.
There is found matrix micro quartz (part of lithic
aggregate) inside re-microcrystalline fossils and
also micrite (mud carbonate). Shell fragment
aragonite (0,5-4 mm) with micrite domination
and little sparite, fossils founded point contact re-
worked, floating, and shown imbricate process,
variated fragment sized.
Main Compositions
➢ Big Foraminifera [15%]: as fragment Ø 2-5
mm (C7-F9) with uncleaned shaped,
surrounding with mud carbonate (micrite).
➢ Coral Fragment [10%] as a fragment with
variation sized between 0,5-5 mm
➢ Shell Fragment [20%]: as a part of fragment
with variation grain size and composition
aragonite (G3-J7).
➢ Micrite [15%]: dark color organic micrite as
clay grain size that occur from depositional,
Grain size <0,04mm whereas grain particles
fragment as smoothed aggregate, acicular
shaped with dominant smooth tabular. Some
A
B
C
D
E
F
G
H
I
J
XP
L 1 2 3 4 5 6 7 8 9 10 11
A
B
C
D
E
F
G
H
I
J
Note :
o Thickness of thinsection >0.03 mm (± 0.04mm),
make a difficult to observed the matrixs.
100 μm

335
of part with brownie color represented
weathering process.
➢ Pore [30%]: as pores inside the rock because
of interparticle grain contacted and
intraparticle fossil, really rare with cement
material (sparite).
➢ Lithic (quartz) [10%]: as a lithic fragment
and matrix with size <0,3mm whereas
birefringence ordo 1, anhedral. Matrix sub
angular (0,1- 0,5 mm).
Assessor Compositions [< 1%]:
➢ Opaque: as lithic that filled inside fossil
with size <0,1 mm, magnetite?
Microfacies :
Assuming as intertidal zone sedimentary and spray zone coasts
Diagenesis characteristics:
Dominant by compaction process ,first phase lithification, cemented
Pore system:
Interparticle and intra particle (Choquette and pray 1970)
Interpretation:
Shell fragment dominant with aragonite and coral whereas mud carbonate (micrite) filled non-carbonate lithic
cavity that have a high pores. Interparticle type and intra particle high permeability not much as strong enough
based on grain particle contact.

336
Code D.2: YOMITTAN B Name: Biomicrite (folk 1959) pack stone
(dunham,1962) beachrock (lithified)
Location : YOMITAN ,OKINAWA N26°23’45.7” E127° 43’13.2”
PP
L 1 2 3 4 5 6 7 8 9 10 11
Texture and Description
Bioclastic allochem with grain size clay to sand
(0,02-20mm). Bad sorted with shape of grain
particle angular-sub rounded, but within altered
remains fossil fragment. Open fabric grain
supported, dominated by foraminifera, coral and
lithic. There is found matrix micro quartz (part of
lithic aggregate) inside re-microcrystalline
fossils and also micrite (mud carbonate). Shell
fragment aragonite (0,5-4 mm) with micrite
domination and little sparite, fossils founded
point contact re-worked, floating, and shown
imbricate process, variated fragment sized.
Main Compositions
➢ Foraminifera [15%]: as a fragment Ø 2-5
mm (F1-H3) with uncleaned shaped,
surrounding with mud carbonate (micrite).
➢ Coral Fragment [10%] as a fragment with
variation sized between 0,5-4 mm
➢ Shell Fragment [15%]: as a part of fragment
with variation grain size and composition
aragonite
A
B
C
D
E
F
G
H
I
J
XP
L 1 2 3 4 5 6 7 8 9 10 11
A
B
C
D
E
F
G
H
I
J
100 μm
337
Note :
o Thickness of thinsection >0.03 mm (± 0.04mm),
make a difficult to observed the matrixs.
➢ Micrite [25%]: as clay grain size that occur
from depositional, Grain size <0,04mm
whereas grain particles fragment as smoothed
aggregate, several found with brownie color
represented weathered process.
➢ Pore [15%]: as pores inside the rock because
of interparticle grain contacted and
intraparticle fossil, really rare with cement
material (sparite).
➢ Lithic (quartz) [10%]: as a lithic fragment
and matrix with size <0,3mm whereas
birefringence ordo 1, anhedral. Matrix sub
angular (0,1- 0,5 mm).
Assessor Compositions [< 5%]:
➢ Opaque: as lithic muscovite fragment with
grain size <0,1 mm.
Microfacies :
Assuming as intertidal zone sedimentary and spray zone coasts
Diagenesis characteristics:
Dominant by compaction process ,first phase lithification, cemented
Pore system:
Interparticle and intra particle (Choquette and pray 1970)
Interpretation:
Shell fragment dominant with aragonite and coral whereas mud carbonate (micrite) filled non-carbonate lithic
cavity that have a high pores. Interparticle type and intra particle high permeability not much as strong enough
based on grain particle contact, Amount of micrite is bigger than Yomitan A sample.

338
Code D.3: YOMITTAN C
Name: Biomicrite (folk 1959) pack stone
(dunham) beachrock(lithified)
Location : YOMITAN ,OKINAWA N26°23’45.7” E127° 43’13.2”
PP
L 1 2 3 4 5 6 7 8 9 10 11 Texture and Description
Grain size clay to granule (0,03 – 14mm). Bad
sorted with shape of grain particle angular-sub
rounded, but within altered remains fossil
fragment. Open fabric grain supported,
dominated by foraminifera, coral and lithic.
There is found matrix micro quartz (part of lithic
aggregate) inside re-microcrystalline fossils and
also micrite (mud carbonate). Shell fragment
aragonite (0,5-5 mm) with micrite domination
and little sparite, fossils founded point contact re-
worked, floating, and shown imbricate process,
variated fragment sized between 0,1-7 mm.
Main Compositions
➢ Foraminifera [15%]: as a fragment Ø 2-5
mm (F8-I10) with uncleaned shaped,
surrounding with mud carbonate (micrite) and
also point contact between grained particles.
➢ Coral Fragment [10%] as a fragment (A8-
B10) with variation sized between 0,2-5 mm.
➢ Shell Fragment [15%]: as a part of fragment
with variation sized of aragonite dominant.
➢ Micrite [25%]: as clay grain size that occur
from depositional, Grain size <0,04mm
whereas grain particles fragment as smoothed
aggregate, some of part with a brownies color
represented weathering process
➢ Sparite [10%]: as a smooth tabular micro
calcite that filled pores between grain particle
(>0,04mm)
➢ Pore [15%]: as pore inside the rock sample
because of interparticle grain contacted and
intraparticle fossil, really rare with cement
A
B
C
D
E
F
G
H
I
J
XP
L 1 2 3 4 5 6 7 8 9 10 11
A
B
C
D
E
F
G
H
I
J
Note :
o Thickness of thinsection >0.03 mm (± 0.04mm),
make a difficult to observed the matrixs.
100 μm

339
material (sparite). Only several part of particle
size are connected.
➢ Lithic (quartz) [4%]: as a lithic fragment
and matrix with size <0,3mm whereas
birefringence ordo 1, anhedral. Matrix sub
angular (0,1- 0,5 mm).
Assessor Compositions [< 1%]:
➢ Opaque: as lithic whereas muscovite
fragment with size <0,1 mm.
Microfacies :
Assuming as intertidal zone sedimentary and spray zone coasts
Diagenesis characteristics:
Dominant by compaction process ,first phase lithification, cemented
Pore system:
interparticle and intra particle (Choquette and pray 1970)
Interpretation:
Shell fragment dominant with aragonite, foraminifera, and coral whereas mud carbonate (micrite) filled non-
carbonate lithic cavity pores. Interparticle type and intra particle low permeability not much as strong enough
based on grain particle contact, Amount of micrite is bigger than Yomitan B sample.

340
Code D.4: YOMITTAN D
Name: Biomicrite (folk 1959) pack stone
(dunham) beachrock (lithified)
Location : YOMITAN ,OKINAWA N26°23’45.7” E127° 43’13.2”
PP
L 1 2 3 4 5 6 7 8 9 10 11 Texture and Description
Grain size clay to granule. Bad sorted with shape
of grain particle angular-sub rounded, but within
altered remains fossil fragment. Open fabric
grain supported, dominated by foraminifera,
coral and lithic. There is found matrix micro
quartz (part of lithic aggregate) inside re-
microcrystalline fossils and also micrite (mud
carbonate). Shell fragment aragonite (0,5-5 mm)
with micrite domination and little sparite, fossils
founded point contact re-worked, floating, and
shown imbricate process, variated fragment sized
between 0,1-5 mm.
Main Compositions
➢ Foraminifera [15%]: as a fragment Ø 2-5
mm (F8-I10) with uncleaned shaped,
surrounding with mud carbonate (micrite) and
also point contact between grained particles.
➢ Coral Fragment [10%] as a fragment (A8-
B10) with variation sized between 0,2-5 mm.
➢ Shell Fragment [15%]: as a part of fragment
with variation sized of aragonite dominant.
➢ Micrite [25%]: as clay grain size that occur
from depositional, Grain size <0,04mm
whereas grain particles fragment as smoothed
aggregate, some of part with a brownies color
represented weathering process
➢ Sparite [10%]: as a smooth tabular micro
calcite that filled pores between grain particle
(>0,04mm)
➢ Pore [15%]: as pore inside the rock sample
because of interparticle grain contacted and
intraparticle fossil, really rare with cement
A
B
C
D
E
F
G
H
I
J
XP
L 1 2 3 4 5 6 7 8 9 10 11
A
B
C
D
E
F
G
H
I
J
Note :
o Thickness of thinsection >0.03 mm (± 0.04mm),
make a difficult to observed the matrixs.
100 μm

341
material (sparite). Only several part of particle
size are connected.
➢ Lithic (quartz) [4%]: as a lithic fragment
and matrix with size <0,3mm whereas
birefringence ordo 1, anhedral. Matrix sub
angular (0,1- 0,5 mm).
Assessor Compositions [< 1%]:
➢ Opaque : as lithic whereas muscovite
fragment with size <0,1 mm.
Microfacies :
Assuming as intertidal zone sedimentary and spray zone coasts
Diagenesis characteristics:
Dominant by compaction process ,first phase lithification, cemented
Pore system:
interparticle and intra particle (Choquette and pray 1970)
Interprets:
Shell fragment dominant with aragonite, foraminifera, and coral whereas mud carbonate (micrite) filled non-
carbonate lithic cavity pores. Interparticle type and intra particle low permeability not much as strong enough
based on grain particle contact, Amount of micrite and sparite is bigger than the other samples.

342
Code D.5: GIMA A
Name: biomicrite (folk 1959) pack stone
(dunham,1962), beachrock (lithified)
Location : GIMA ,OKINAWA N26°25’2.8”; E127°42’48.9”
P
P
L
1 2 3 4 5 6 7 8 9 10 11 Texture and Description
Grain size clay to granule (0.03-7mm), with
shape of grain particle angular-sub rounded, but
within altered remains fossil (relatively). Open
fabric grain supported, dominated by big
foraminifera. High pores inside fossils
recrystallized with micro-calcite and also mud
carbonate. Shell fragment aragonite (0.5-2mm)
with micrite domination and little sparite, fossils
founded reworked and not strong solidification
yet.
Main Compositions
➢ Big Foraminifera [35%]: as mega-
phenocryst Ø 1 – 3.2 mm (F8-G10) with
uncleaned shaped, surrounding with mud
carbonate (micrite) and also point contact
between grained particles.
➢ Coral Fragment [15%] as a fragment with
variation sized between 0,5-3mm
➢ Micrite [15%]: dark color organic micrite as
clay grain size that occur from depositional,
Grain size <0,04mm whereas grain particles
fragment as smoothed aggregate, acicular
shaped with dominant smooth tabular.
➢ Sparite [5%]: as cement filled by calcite.
➢ Pore [20%]: as pore inside the rock because
of interparticle grain contacted and
intraparticle fossil, really rare with cement
material (sparite). Only several part of particle
size are connected.
Assessor Compositions [< 1%]:
➢ Opaque: as lithic that filled inside fossil with
size <0,1 mm, magnetite (?)
A
B
C
D
E
F
G
H
I
J
X
P
L
1 2 3 4 5 6 7 8 9 10 11
A
B
C
D
E
F
G
H
I
J
Note :
o Thickness of thinsection >0.03 mm (± 0.04mm),
make a difficult to observed the matrixs.
100 μm

343
Analysis :
Not strong connection between grain particle and
some of it still floated (mud carbonate) or maybe
point contact, dominant by micrite from
depositional process with minimum altered
remains fossil. Assuming because of strong sea
wave
Microfacies :
Assuming as intertidal zone sedimentary
Diagenesis characteristics:
Dominant by compaction process ,first phase lithification, cemented
Pore system:
interparticle and intra particle (Choquette and pray 1970)

344
Code D.6: GIMA B
Name: biomicrite (folk ,1959), Pickstone
(dunham,1962), beachrock (lithified)
Location : GIMA ,OKINAWA N26°25’2.8”; E127°42’48.9”
P
P
L
1 2 3 4 5 6 7 8 9 10 11 Texture and Description
Grain size 0.03-10 mm with angular-sub rounded
shaped with altered remains fossil. Open grain
supported fabric, dominant big foraminifera.
Pores found not so much than sample A, inside
the fossil are filled by micro calcite and micrite
(mud carbonate). Shell fragment aragonite (0.5 -
4 mm) with micrite dominant, less sparite and a
little altered remain fossils. More strong lithified
than Gima A, within convex concave contact
between particles shown imbricate process, size
of grain particles more variation than before but
bigger than Gima A sample.
Main Compositions
➢ Big Foraminifera [30%]: as mega-
phenocryst Ø 2-5 mm (A7-G11) with
uncleaned shaped, surrounding with mud
carbonate (micrite).
➢ Coral Fragment [10%] as a fragment with
variation sized between 0,5-2 mm
➢ Shell Fragment [20%]: as matrixes but
smaller with variation size.
➢ Micrite [15%]: dark color organic micrite as
clay grain size that occur from depositional,
Grain size <0,04mm whereas grain particles
fragment as smoothed aggregate, acicular
shaped with dominant smooth tabular.
➢ Sparite [5%] as cement filled by calcite.
➢ Pore [20%]: as pores inside the rock because
of interparticle grain contacted and
intraparticle fossil, really rare with cement
material (sparite).
.
Assessor Compositions [< 1%]:
A
B
C
D
E
F
G
H
I
J
X
P
L
1 2 3 4 5 6 7 8 9 10 11
A
B
C
D
E
F
G
H
I
J
Note :
o Thickness of thinsection >0.03 mm (± 0.04mm),
make a difficult to observed the matrixs.
100 μm

345
➢ Opaque : as lithic that filled inside fossil
with size <0,1 mm.
Microfacies :
Assuming as intertidal zone sedimentary
Diagenesis characteristics:
Dominant by compaction process ,first phase lithification, cemented
Pore system:
Interparticle and intra particle (Choquette and pray 1970)
Interpretation:
Stronger solidified than Gima A whereas convex concave contact between grain particles (mud carbonate),
micrite dominant when depositions process with minimum altered because of strong wave impact.

346
Code D.7: GIMA C
Name: biomicrite (folk 1959) pack stone
(dunham) beachrock (lithified)
Location : GIMA ,OKINAWA N26°25’2.8”; E127°42’48.9”
P
P
L
1 2 3 4 5 6 7 8 9 10 11 Texture and Description
Grain size clay to granule (0,03-7mm), with
shape of particle angular-sub rounded and fossils
is little bit broke (relatively). Open grain
supported fabric, dominant coral fragment. Pores
size are small, with inside fossils filled by micro
calcite and micrite (mud carbonate). Grain shell
particle are from aragonite (0,5-5 mm) dominant
with micrite and less sparite altered remain
fossils are solidified really strong with concave
convex contact between particles and cemented
uniform shown imbricate process. Fragment size
are variations but bigger than Gima A with
uncleaned the contact limit degree.
Main Compositions
➢ Big Foraminifera [20 as mega-phenocryst Ø
2-5 mm (A9-D11) with uncleaned shaped,
surrounding with mud carbonate (micrite).
➢ Coral Fragment [30%] as a fragment with
variation sized between >0,5 cm, some of
fossil changed to be calcite.
➢ Shell Fragment [20%]: as an aragonite
fragment (D6-G9) but more smaller size of
particle grain but variated.
➢ Micrite [25%]: dark color organic micrite as
clay grain size that occur from depositional,
Grain size <0,04 mm whereas grain particles
fragment as smoothed aggregate, acicular
shaped with dominant smooth tabular.
➢ Sparite [5%]: as a cement that filled by micro
calcite with tabular shaped surrounding the
fragments.
A
B
C
D
E
F
G
H
I
J
X
P
L
1 2 3 4 5 6 7 8 9 10 11
A
B
C
D
E
F
G
H
I
J
Note :
o Thickness of thinsection >0.03 mm (± 0.04mm),
make a difficult to observed the matrixs.
100 μm

347
➢ Pore [10%]: as a pore inside the rock because
of interparticle grain contacted and
intraparticle fossil, really rare with cement
material (sparite).
Assessor Compositions [< 10%]:
➢ Opaque: as a lithic that filled inside fossils
with size <0,1 mm.
➢ Quartz: as a matrix (0,1mm) anhedral
Microfacies :
Assuming as intertidal zone sedimentary and spray zone coasts
Diagenesis characteristics:
Dominant by compaction process ,first phase lithification, cemented
Pore system:
interparticle and intra particle (Choquette and pray 1970)
Interpretation:
More compacted better than Gima A and B samples which have convex concave contact between grain
particles (mud carbonate), dominant with micrite based on depositional process riches altered remain fossils
but some of fossils are broken (uncleaned shape) because of strong tidal wave. Grain size coral fragments
bigger than Gima A and B samples.
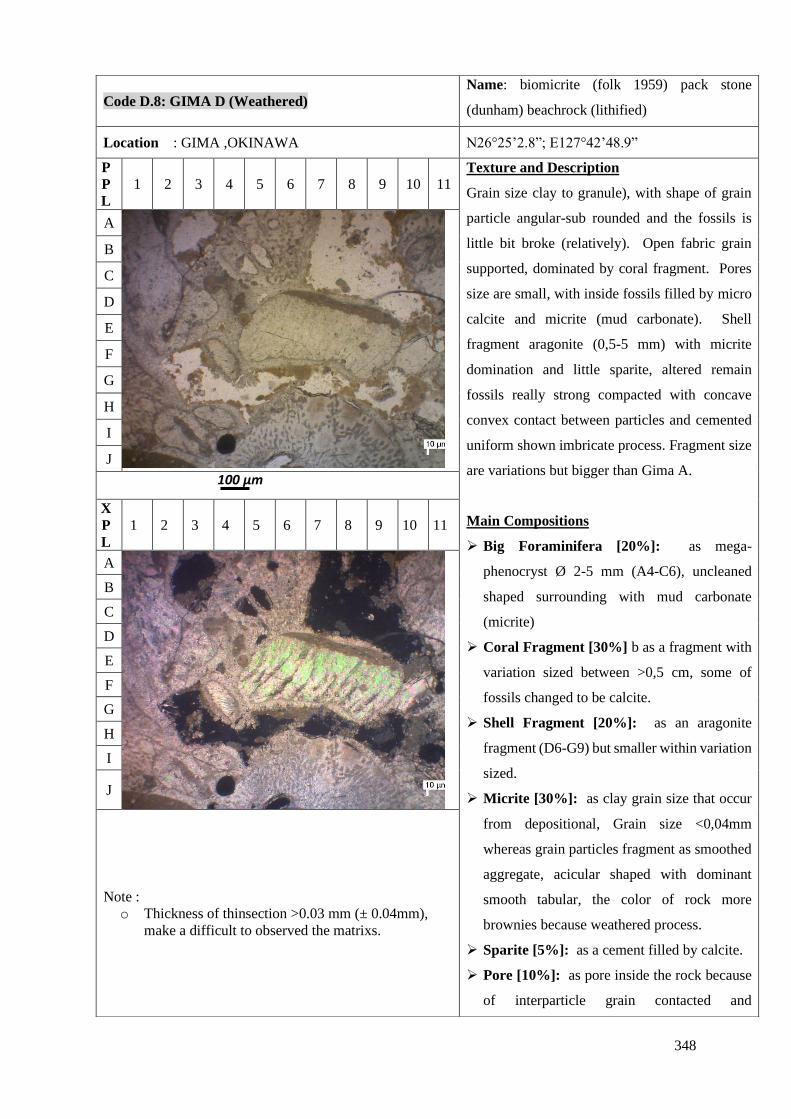
348
Code D.8: GIMA D (Weathered)
Name: biomicrite (folk 1959) pack stone
(dunham) beachrock (lithified)
Location : GIMA ,OKINAWA N26°25’2.8”; E127°42’48.9”
P
P
L
1 2 3 4 5 6 7 8 9 10 11 Texture and Description
Grain size clay to granule), with shape of grain
particle angular-sub rounded and the fossils is
little bit broke (relatively). Open fabric grain
supported, dominated by coral fragment. Pores
size are small, with inside fossils filled by micro
calcite and micrite (mud carbonate). Shell
fragment aragonite (0,5-5 mm) with micrite
domination and little sparite, altered remain
fossils really strong compacted with concave
convex contact between particles and cemented
uniform shown imbricate process. Fragment size
are variations but bigger than Gima A.
Main Compositions
➢ Big Foraminifera [20%]: as mega-
phenocryst Ø 2-5 mm (A4-C6), uncleaned
shaped surrounding with mud carbonate
(micrite)
➢ Coral Fragment [30%] b as a fragment with
variation sized between >0,5 cm, some of
fossils changed to be calcite.
➢ Shell Fragment [20%]: as an aragonite
fragment (D6-G9) but smaller within variation
sized.
➢ Micrite [30%]: as clay grain size that occur
from depositional, Grain size <0,04mm
whereas grain particles fragment as smoothed
aggregate, acicular shaped with dominant
smooth tabular, the color of rock more
brownies because weathered process.
➢ Sparite [5%]: as a cement filled by calcite.
➢ Pore [10%]: as pore inside the rock because
of interparticle grain contacted and
A
B
C
D
E
F
G
H
I
J
X
P
L
1 2 3 4 5 6 7 8 9 10 11
A
B
C
D
E
F
G
H
I
J
Note :
o Thickness of thinsection >0.03 mm (± 0.04mm),
make a difficult to observed the matrixs.
100 μm

349
Analysis samples GIMA A, GIMA B and GIMA C
Sample Gima A more sparite filled crystallize better than Gima B with grain size particle smaller and
pores much more than Gima B. Gima B have a little calcite and also aragonite (shell) whereas cement
aggregate is, mud carbonate less than Gima A. Gima C sample much more compacted than the others
maybe based on contact precipitated calcium more intense and found big amount of cement micrite. In
sample Gima C found more foraminifera fragments, altered remain fossils became log Mg Carbonate
from aragonite.
intraparticle fossil, really rare with cement
material (sparite).
.
Assessor Compositions [< 5%]:
➢ Opaque: as a lithic with filled inside fossils,
size <0,1 mm
➢ Quartz: as a matrix (0,1mm) anhedral
Microfacies :
Assuming as intertidal zone sedimentary and spray zone coasts
Diagenesis characteristics:
Dominant by compaction process ,first phase lithification, cemented
Pore system:
interparticle and intra particle (Choquette and pray 1970)
Interpretation:
More compacted better than Gima A and B samples which have convex concave contact between grain
particles (mud carbonate), dominant with micrite based on depositional process riches altered remain fossils
but some of fossils are broken (uncleaned shape) because of strong tidal wave. Grain size coral fragments
bigger than Gima A and B samples.

350
Code D.9: SUMUIDE A
Name: intra micrite (folk ,1959) pack stone
(dunham,1962), beachrock(lithified)
Location : SUMUIDE ,OKINAWA N26°40’43.8” E128°00’44.6”
PP
L 1 2 3 4 5 6 7 8 9 10 11
Texture and Description
Grain size clay to granule. Bad sorted with shape
of grain particle angular-sub rounded, but within
altered remains fossil fragment. Open fabric
grain supported, dominated by foraminifera,
coral and lithic. There is found matrix micro
quartz (part of lithic aggregate) inside re-
microcrystalline fossils and also micrite (mud
carbonate). Shell fragment aragonite (0,5-4 mm)
with micrite domination and little sparite, fossils
founded point contact re-worked, floating, and
shown imbricate process, variated fragment
sized.
Main Compositions
➢ Big Foraminifera [15%]: as a fragment Ø 2-
5 mm (F3-J6) with uncleaned shaped,
surrounding with mud carbonate (micrite)
➢ Coral Fragment [10%] as a fragment with
variation sized between 0,5-2 mm
➢ Shell Fragment [30%]: as a part of fragment
with variation sized of aragonite dominant
(B7-H11).
➢ Micrite [15%]: as clay grain size that occur
from depositional, Grain size <0,04mm
whereas grain particles fragment as smoothed
aggregate, some of part with a brownies color
represented weathering process
➢ Sparite [3%]: as a micro calcite cement that
filled pore.
➢ Pore [20%]: as pore inside the rock sample
because of interparticle grain contacted and
intraparticle fossil, really rare with cement
material (sparite).
A
B
C
D
E
F
G
H
I
J
XP
L 1 2 3 4 5 6 7 8 9 10 11
A
B
C
D
E
F
G
H
I
J
Note :
o Thickness of thinsection >0.03 mm (± 0.04mm),
make a difficult to observed the matrixs.
100 μm

351
➢ Lithic (quartz)[15%] : as a lithic fragment
and matrix with size (D2) 0,3 mm whereas
birefringence ordo 1, anhedral. Matrix sub
angular (0,1- 0,5 mm).
Assessor Compositions [< 1%]:
➢ Opaque: as lithic filled the fossils with size
<0,1 mm, magnetite (?)
Microfacies :
Assuming as intertidal zone sedimentary and spray zone coasts and spray zone coasts
Diagenesis characteristics:
Dominant by compaction process ,first phase lithification, cemented
Pore system:
interparticle and intra particle (Choquette and pray 1970)
Interpretation:
Aragonite shell fragment and lithic (as quartz-metasedimentary) are dominant whereas depositional process,
micrite (mud carbonate) filled cavity pores of non-carbonate lithic between grain particles.

352
Code D.10: SUMUIDE B
Name: Intra micrite (folk 1959) pack stone
(dunham,1962), beachrock (lithified)
Location : SUMUIDE ,OKINAWA N26°40’43.8” E128°00’44.6”
PP
L 1 2 3 4 5 6 7 8 9 10 11
Texture and Description
Grain size clay to granule (0.03-10mm). Bad
sorted with shape of grain particle angular-sub
rounded, but within altered remains fossil
fragment. Open fabric grain supported,
dominated by foraminifera, coral and lithic.
There is found matrix micro quartz (part of lithic
aggregate) inside re-microcrystalline fossils and
also micrite (mud carbonate). Shell fragment
aragonite (0.5-5 mm) with micrite domination
and little sparite, fossils founded point contact re-
worked, floating, and shown imbricate process,
variated fragment sized.
Main Compositions
➢ Big Foraminifera [15%]: as a fragment Ø 2-
5 mm (F3-J6) with uncleaned shaped,
surrounding with mud carbonate (micrite).
➢ Small Foraminifera [5%]: Benthonic
biserial with low mg carbonate (calcite)
composition.
➢ Coral Fragment [10%] as a fragment with
variation sized between 0,5-5 mm, unaltered
fossil remains.
➢ Shell Fragment [15%]: as a part of fragment
with variation sized of aragonite dominant (I9-
J10).
➢ Micrite [15%]: as clay grain size that occur
from depositional, Grain size <0,04mm
whereas grain particles fragment as smoothed
aggregate, some of part with a brownies color
represented weathering process
➢ Sparite [5%]: as a smooth tabular micro
calcite that filled pores between grain particle.
A
B
C
D
E
F
G
H
I
J
XP
L 1 2 3 4 5 6 7 8 9 10 11
A
B
C
D
E
F
G
H
I
J
Note :
o Thickness of thinsection >0.03 mm (± 0.04mm),
make a difficult to observed the matrixs.
100 μm
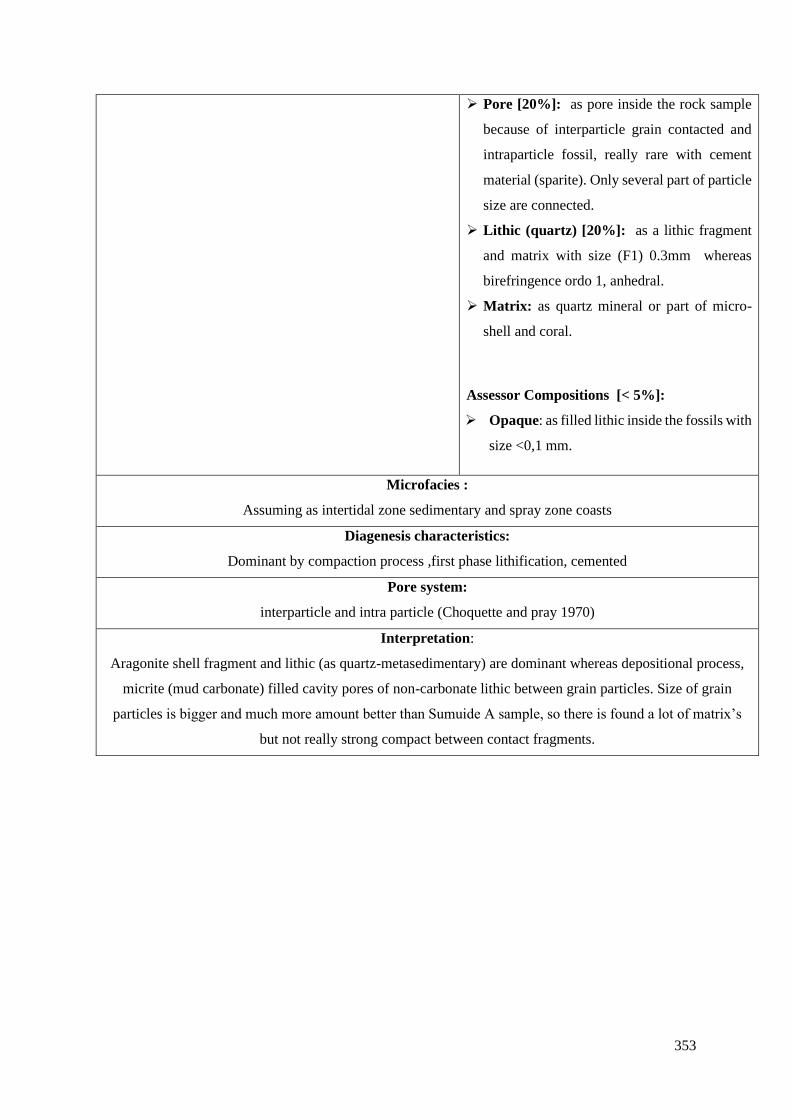
353
➢ Pore [20%]: as pore inside the rock sample
because of interparticle grain contacted and
intraparticle fossil, really rare with cement
material (sparite). Only several part of particle
size are connected.
➢ Lithic (quartz) [20%]: as a lithic fragment
and matrix with size (F1) 0.3mm whereas
birefringence ordo 1, anhedral.
➢ Matrix: as quartz mineral or part of micro-
shell and coral.
Assessor Compositions [< 5%]:
➢ Opaque: as filled lithic inside the fossils with
size <0,1 mm.
Microfacies :
Assuming as intertidal zone sedimentary and spray zone coasts
Diagenesis characteristics:
Dominant by compaction process ,first phase lithification, cemented
Pore system:
interparticle and intra particle (Choquette and pray 1970)
Interpretation:
Aragonite shell fragment and lithic (as quartz-metasedimentary) are dominant whereas depositional process,
micrite (mud carbonate) filled cavity pores of non-carbonate lithic between grain particles. Size of grain
particles is bigger and much more amount better than Sumuide A sample, so there is found a lot of matrix’s
but not really strong compact between contact fragments.

354
Code D.11: SUMUIDE C
Name: Intra micrite (folk 1959) pack stone
(dunham,1962) beachrock (lithified)
Location: SUMUIDE, OKINAWA N26°40’43.8” E128°00’44.6”
PP
L 1 2 3 4 5 6 7 8 9 10 11 Texture and Description
Grain size clay to granule (0.02-9mm). Bad
sorted with shape of grain particle sub-angular
rounded, but within altered remains fossil
fragment. Open fabric grain supported,
dominated by foraminifera, coral and lithic.
There is found matrix micro quartz (part of lithic
aggregate) inside re-microcrystalline fossils and
also micrite (mud carbonate). Shell fragment
aragonite (0.4-5 mm) dominant with micrite and
foraminifera fossil altered convex concave
contact between grain particles, sized of particles
are variated.
Main Compositions
➢ Big Foraminifera [15%]: as a fragment Ø 2-
5 mm with uncleaned shaped, surrounding
with mud carbonate (micrite).
➢ Small Foraminifera [5%]: Benthonic
biserial with low mg carbonate (calcite)
composition.
➢ Coral Fragment [10%] as a fragment with
variation sized between 0,5-5 mm, filled by
calcite.
➢ Shell Fragment [15%]: as a part of fragment
with variation sized of aragonite dominant.
(D9-E11).
➢ Micrite [20%]: as clay grain size that occur
from depositional, Grain size <0,04mm
whereas grain particles fragment as smoothed
aggregate, some of part with a brownies color
represented weathering and erosion process.
➢ Sparite [5%]: as a micro calcite lithic that
filled intra particles with tabular shaped.
A
B
C
D
E
F
G
H
I
J
XP
L 1 2 3 4 5 6 7 8 9 10 11
A
B
C
D
E
F
G
H
I
J
Note :
o Thickness of thinsection >0.03 mm (± 0.04mm),
make a difficult to observed the matrixs.
100 μm
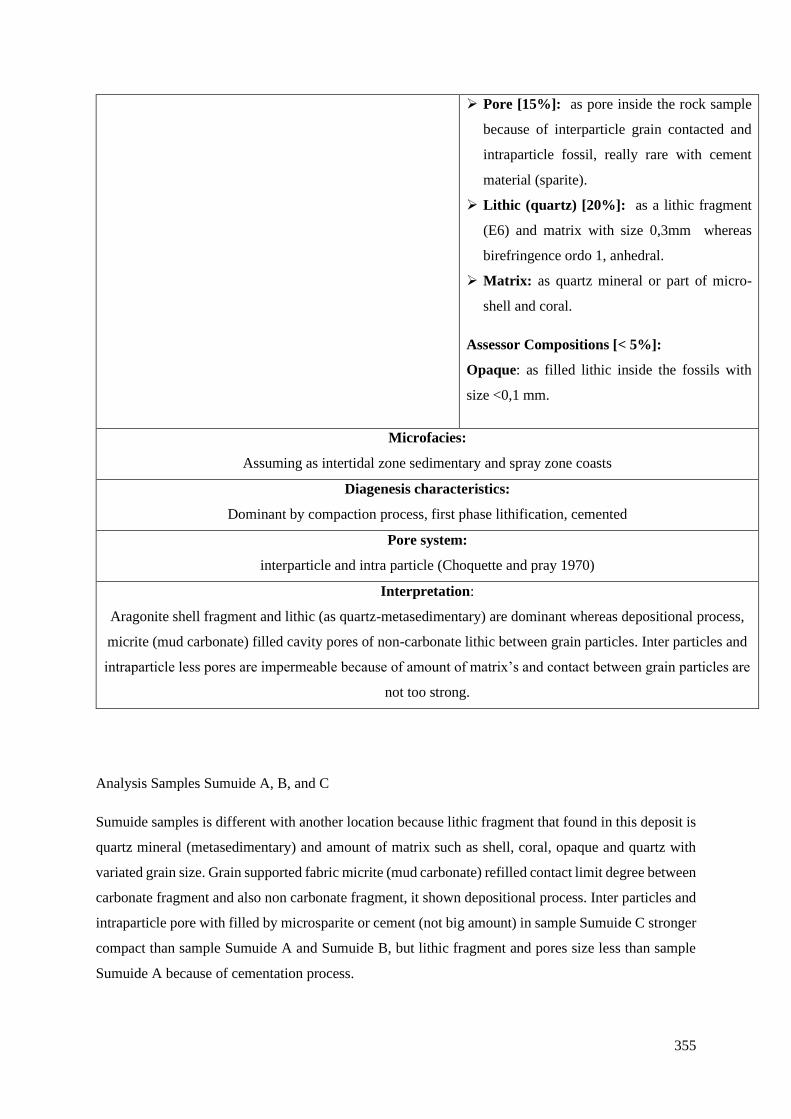
355
Analysis Samples Sumuide A, B, and C
Sumuide samples is different with another location because lithic fragment that found in this deposit is
quartz mineral (metasedimentary) and amount of matrix such as shell, coral, opaque and quartz with
variated grain size. Grain supported fabric micrite (mud carbonate) refilled contact limit degree between
carbonate fragment and also non carbonate fragment, it shown depositional process. Inter particles and
intraparticle pore with filled by microsparite or cement (not big amount) in sample Sumuide C stronger
compact than sample Sumuide A and Sumuide B, but lithic fragment and pores size less than sample
Sumuide A because of cementation process.
➢ Pore [15%]: as pore inside the rock sample
because of interparticle grain contacted and
intraparticle fossil, really rare with cement
material (sparite).
➢ Lithic (quartz) [20%]: as a lithic fragment
(E6) and matrix with size 0,3mm whereas
birefringence ordo 1, anhedral.
➢ Matrix: as quartz mineral or part of micro-
shell and coral.
Assessor Compositions [< 5%]:
Opaque: as filled lithic inside the fossils with
size <0,1 mm.
Microfacies:
Assuming as intertidal zone sedimentary and spray zone coasts
Diagenesis characteristics:
Dominant by compaction process, first phase lithification, cemented
Pore system:
interparticle and intra particle (Choquette and pray 1970)
Interpretation:
Aragonite shell fragment and lithic (as quartz-metasedimentary) are dominant whereas depositional process,
micrite (mud carbonate) filled cavity pores of non-carbonate lithic between grain particles. Inter particles and
intraparticle less pores are impermeable because of amount of matrix’s and contact between grain particles are
not too strong.

356
Code D.12: Anthropogenic Beachrock (Synthetic) Name: Anthropogenic Beachrock
Location : -
PP
L 1 2 3 4 5 6 7 8 9 10 11
Texture and Description
Grain size clay to sand (0,04 -3mm). Bad sorted
with shape of grain particle angular-sub
rounded, but within altered remains fossil
fragment. Open fabric grain supported,
dominated by foraminifera, coral and lithic.
There is found matrix micro quartz (part of
lithic aggregate) inside re-microcrystalline
fossils and also micrite (mud carbonate).
Main Compositions
➢ Foraminifera [15%]: as fragment Ø 2-5 mm
(F1-H3 with uncleaned shaped, surrounding
with cement.
➢ Coral Fragment [10%] %] as a fragment
with variation sized between 0,5-4 mm.
➢ Shell Fragment [15%]: as a part of
fragment.
➢ Micrite [10%]: dark color organic micrite as
clay grain size that occur from depositional,
Grain size <0,04mm whereas grain particles
fragment as smoothed aggregate.
➢ Pore [30%]: as pores inside the rock because
of interparticle grain contacted and
intraparticle fossil, really rare with cement
material (sparite).
➢ Lithic (quartz) [5%]: as a lithic fragment
and matrix with size 0,3-0,5 mm whereas
birefringence ordo 1, anhedral.
A
B
C
D
E
F
G
H
I
J
XP
L 1 2 3 4 5 6 7 8 9 10 11
A
B
C
D
E
F
G
H
I
J
Note :
o Thickness of thinsection >0.03 mm (± 0.04mm),
make a difficult to observed the matrixs.
Microfacies :
-
Diagenesis characteristics:
Dominant with cementation process
100 μm

357
Pore system:
Interparticle and intra particle (Choquette and pray 1970)
Interpretation:
Interparticle type and intra particle high permeability not much as strong enough based on grain particle
contact. For making anthropogenic beachrock, is made from coral sand so in this thin section contain with
fragment of foraminifera and also coral, cement process as aragonite not only filled inside carbonate particle
pores but also non carbonate particles. The cementation process using microbial activities precipitated
surrounding the fragment particles.

358
uyutuytAPPENDIXES E
XRD results before and after durability wetting-drying test
E.1 Mikawa sand
Aragonite
After MICP treatment
After 21 cycles of WD test using distilled water
(a)
(b) Continue to next page

359
E.2 Krakal-Sadranan coral sand
After 21 cycles of WD test using saltwater
(c)
Figure E.1. Graphic XRD analysis pattern of Mikawa sand (a) before MICP treatment, (b) after MICP treatment,
(c) MICP treated after 21 WD cycle under distilled water, and (d) MICP treated after 21 WD cycle under saltwater.
With Ab (albite), Qtz (quartz), Mgh (maghemite), and Mgn (magnetite).
After MICP treatment
(a)
2 theta (Deg) Continue to next page

360
(b)
(c)
Figure E.2. Graphic XRD analysis pattern of Krakal-Sadranan coral sand (a) before MICP treatment, (b) after
MICP treatment, (c) MICP treated after 21 WD cycle under distilled water, and (d) MICP treated after 21 WD
cycle under saltwater.
After 21 cycles of WD test using saltwater
After 21 cycles of WD test using distilled water

361
E.3 Glass beads
After MICP treatment
Calcite
After 21 cycles of WD test using distilled water
(a)
(b)
Continue to next page

362
After 21 cycles of WD test using saltwater
(c)
Figure E.3. Graphic XRD analysis pattern of glass beads (a) before MICP treatment, (b) after MICP treatment, (c)
MICP treated after 21 WD cycle under distilled water, and (d) MICP treated after 21 WD cycle under saltwater.
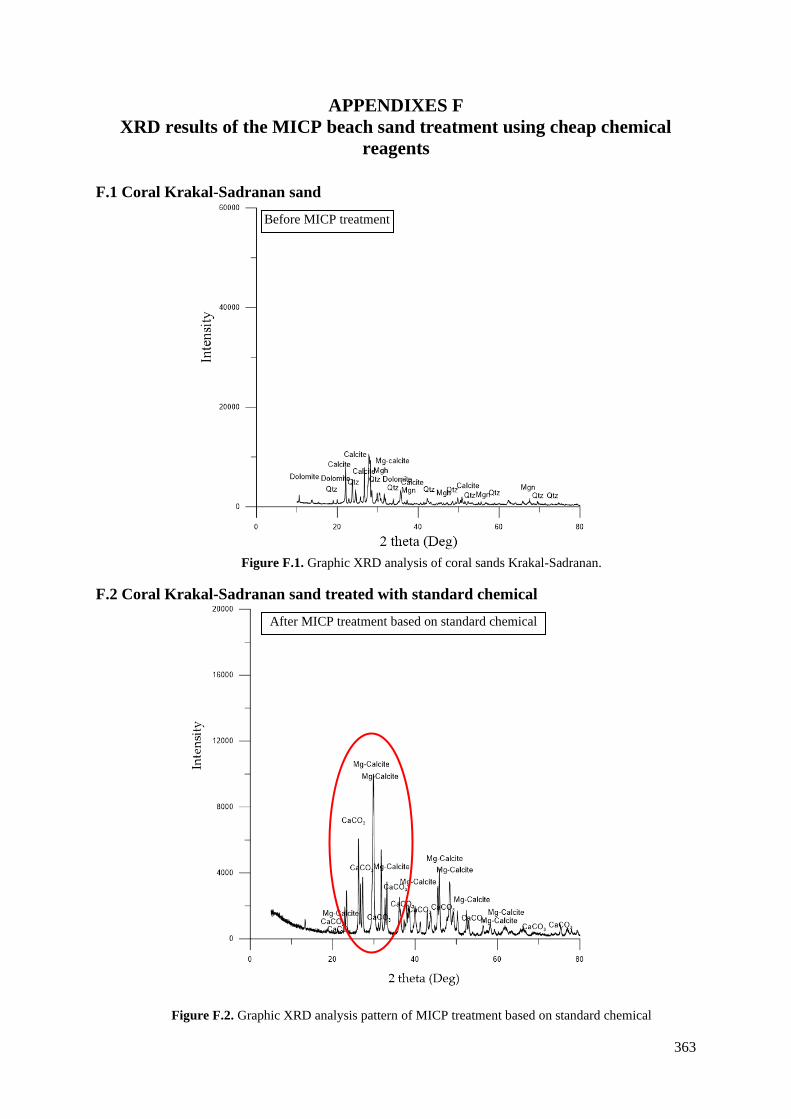
363
APPENDIXES F
XRD results of the MICP beach sand treatment using cheap chemical
reagents
F.1 Coral Krakal-Sadranan sand
F.2 Coral Krakal-Sadranan sand treated with standard chemical
Before MICP treatment
Figure F.2. Graphic XRD analysis pattern of MICP treatment based on standard chemical
Figure F.1. Graphic XRD analysis of coral sands Krakal-Sadranan.
After MICP treatment based on standard chemical

364
F.3 Krakal-Sadranan coral sand treated with snow-melting reagent
After treated based on snow-melting reagent
(a)
After treated based on snow-melting reagent
(b)
Figure F.3. Graphic XRD analysis pattern of MICP treatment based on snow-melting reagent (a)
sample A and (b) sample B.

365
F.4 Krakal-Sadranan coral sand treated with chalk extract
After MICP treatment based on chalk extract
Calcite
(a)
(b)
After MICP treatment based on chalk extract
Figure F.4. Graphic XRD analysis pattern of MICP treatment based on chalk extract (a) sample A and
(b) sample B.