BC-5380 - Operation Manual V4 0 EN
596
BC-5380 Auto Hematology Analyzer Operator’s Manual
-
Upload
independent -
Category
Documents
-
view
0 -
download
0
Transcript of BC-5380 - Operation Manual V4 0 EN

BC-5380 Auto Hematology Analyzer
Operator’s Manual

I
© 2008-2012 Shenzhen Mindray Bio-medical Electronics Co., Ltd. All rights Reserved. For this Operator’s Manual, the issued Date is 2012-11. Intellectual Property Statement
SHENZHEN MINDRAY BIO-MEDICAL ELECTRONICS CO., LTD. (hereinafter called Mindray) owns the intellectual property rights to this Mindray product and this manual. This manual may refer to information protected by copyright or patents and does not convey any license under the patent rights or copyright of Mindray, or of others. Mindray intends to maintain the contents of this manual as confidential information. Disclosure of the information in this manual in any manner whatsoever without the written permission of Mindray is strictly forbidden.
Release, amendment, reproduction, distribution, rental, adaptation, translation or any other derivative work of this manual in any manner whatsoever without the written permission of Mindray is strictly forbidden.
, , are the trademarks, registered or otherwise, of Mindray in China and other countries. All other trademarks that appear in this manual are used only for informational or editorial purposes. They are the property of their respective owners.
Responsibility on the Manufacturer Party
Contents of this manual are subject to changes without prior notice. All information contained in this manual is believed to be correct. Mindray shall not be liable for errors contained herein nor for incidental or consequential damages in connection with the furnishing, performance, or use of this manual. Mindray is responsible for the effects on safety, reliability and performance of this product, only if:
all installation operations, expansions, changes, modifications and repairs of this product are conducted by Mindray authorized personnel.
the electrical installation of the relevant room complies with the applicable national and local requirements.
the product is used in accordance with the instructions for use.

II
It is important for the hospital or organization that employs this equipment to carry out a reasonable service/maintenance plan. Neglect of this may result in machine breakdown or injury of human health.
Be sure to operate the analyzer under the situation specified in this manual; otherwise, the analyzer will not work normally and the analysis results will be unreliable, which would damage the analyzer components and cause personal injury.
This equipment must be operated by skilled/trained clinical professionals.

III
Warranty THIS WARRANTY IS EXCLUSIVE AND IS IN LIEU OF ALL OTHER WARRANTIES, EXPRESSED OR IMPLIED, INCLUDING WARRANTIES OF MERCHANTABILITY OR FITNESS FOR ANY PARTICULAR PURPOSE. Exemptions
Mindray's obligation or liability under this warranty does not include any transportation or other charges or liability for direct, indirect or consequential damages or delay resulting from the improper use or application of the product or the use of parts or accessories not approved by Mindray or repairs by people other than Mindray authorized personnel. This warranty shall not extend to:
Malfunction or damage caused by improper use or man-made failure.
Malfunction or damage caused by unstable or out-of-range power input.
Malfunction or damage caused by force majeure such as fire and earthquake.
Malfunction or damage caused by improper operation or repair by unqualified or unauthorized service people.
Malfunction of the instrument or part whose serial number is not legible enough.
Others not caused by instrument or part itself.

IV
Company Contact
Manufacturer: Shenzhen Mindray Bio-Medical Electronics Co., Ltd. E-mail Address: [email protected]
Tel: +86 755 26582479 26582888
Fax: +86 755 26582934 26582500
EC-Representative: Shanghai International Holding Corp. GmbH(Europe)
Address: Eiffestraβe 80, Hamburg 20537, Germany
Tel: 0049-40-2513175
Fax: 0049-40-255726
1
Table of Contents
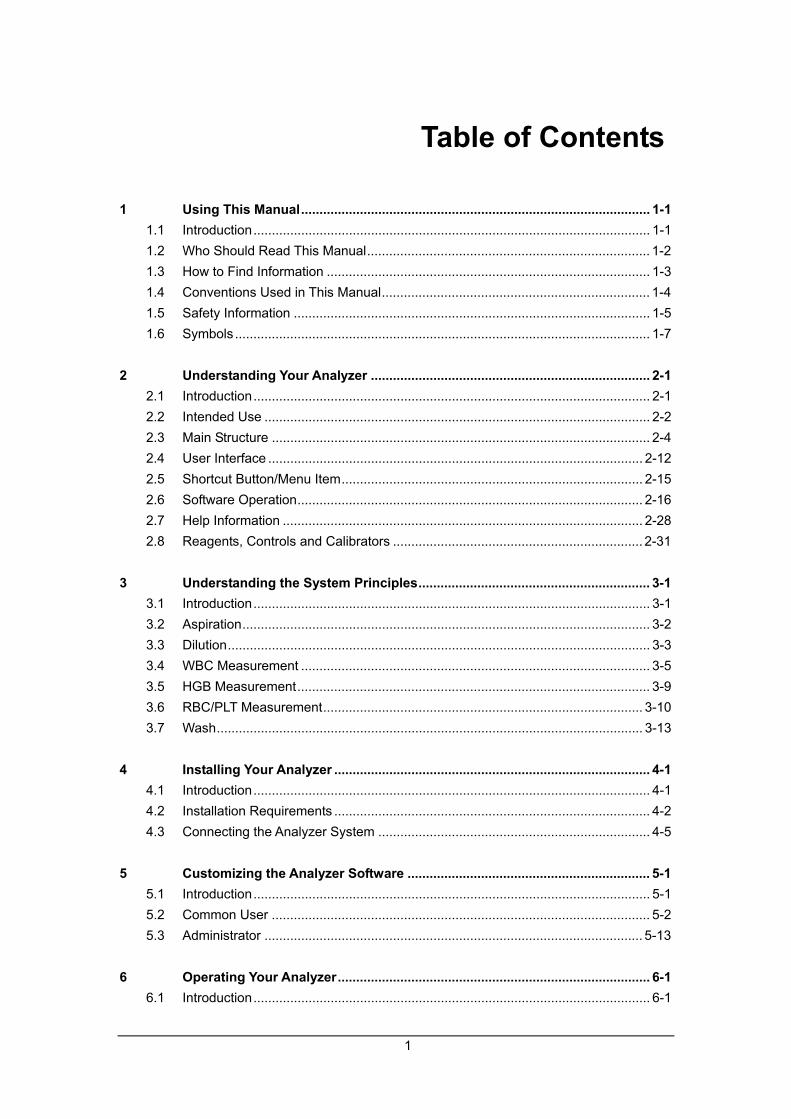
1 Using This Manual............................................................................................... 1-1 1.1 Introduction............................................................................................................ 1-1 1.2 Who Should Read This Manual............................................................................. 1-2 1.3 How to Find Information ........................................................................................ 1-3 1.4 Conventions Used in This Manual......................................................................... 1-4 1.5 Safety Information ................................................................................................. 1-5 1.6 Symbols ................................................................................................................. 1-7
2 Understanding Your Analyzer ............................................................................ 2-1 2.1 Introduction............................................................................................................ 2-1 2.2 Intended Use ......................................................................................................... 2-2 2.3 Main Structure ....................................................................................................... 2-4 2.4 User Interface ...................................................................................................... 2-12 2.5 Shortcut Button/Menu Item.................................................................................. 2-15 2.6 Software Operation.............................................................................................. 2-16 2.7 Help Information .................................................................................................. 2-28 2.8 Reagents, Controls and Calibrators .................................................................... 2-31
3 Understanding the System Principles............................................................... 3-1 3.1 Introduction............................................................................................................ 3-1 3.2 Aspiration............................................................................................................... 3-2 3.3 Dilution................................................................................................................... 3-3 3.4 WBC Measurement ............................................................................................... 3-5 3.5 HGB Measurement................................................................................................ 3-9 3.6 RBC/PLT Measurement....................................................................................... 3-10 3.7 Wash.................................................................................................................... 3-13
4 Installing Your Analyzer ...................................................................................... 4-1 4.1 Introduction............................................................................................................ 4-1 4.2 Installation Requirements ...................................................................................... 4-2 4.3 Connecting the Analyzer System .......................................................................... 4-5
5 Customizing the Analyzer Software .................................................................. 5-1 5.1 Introduction............................................................................................................ 5-1 5.2 Common User ....................................................................................................... 5-2 5.3 Administrator ....................................................................................................... 5-13
6 Operating Your Analyzer..................................................................................... 6-1 6.1 Introduction............................................................................................................ 6-1

Table of Contents
2
6.2 Initial Checks ......................................................................................................... 6-2 6.3 Startup and Login .................................................................................................. 6-4 6.4 Daily Quality Control.............................................................................................. 6-7 6.5 Sample Collection and Handling ........................................................................... 6-8 6.6 Closed-tube Sampling Analysis........................................................................... 6-12 6.7 Autoloader Sampling Analysis............................................................................. 6-29 6.8 Worklist ................................................................................................................ 6-51 6.9 Auto-Sleep........................................................................................................... 6-57 6.10 Shutdown............................................................................................................. 6-58
7 Reviewing Sample Results ................................................................................. 7-1 7.1 Introduction............................................................................................................ 7-1 7.2 Graph Review........................................................................................................ 7-2 7.3 Table Review ....................................................................................................... 7-13 7.4 Data Backup ........................................................................................................ 7-31 7.5 Data Export.......................................................................................................... 7-34 7.6 Auto-Backup ........................................................................................................ 7-37 7.7 Auto-Restore ....................................................................................................... 7-38 7.8 Compare .............................................................................................................. 7-39 7.9 Statistics............................................................................................................... 7-45 7.10 History.................................................................................................................. 7-49
8 Using the QC Programs...................................................................................... 8-1 8.1 Introduction............................................................................................................ 8-1 8.2 L-J Quality Control................................................................................................. 8-2 8.3 X mean QC Program........................................................................................... 8-72 8.4 X mean R QC Program ..................................................................................... 8-122 8.5 X-B QC Program ............................................................................................... 8-163
9 Using the Calibration Programs ........................................................................ 9-1 9.1 Introduction............................................................................................................ 9-1 9.2 When to Calibrate.................................................................................................. 9-2 9.3 How to Calibrate .................................................................................................... 9-3
10 Maintaining Your Analyzer................................................................................ 10-1 10.1 Introduction.......................................................................................................... 10-1 10.2 Maintenance ........................................................................................................ 10-2 10.3 System Status.................................................................................................... 10-43 10.4 Version and Config. Information ........................................................................ 10-50 10.5 Self-test.............................................................................................................. 10-52 10.6 Counter .............................................................................................................. 10-60 10.7 Log..................................................................................................................... 10-63
11 Troubleshooting Your Analyzer........................................................................ 11-1
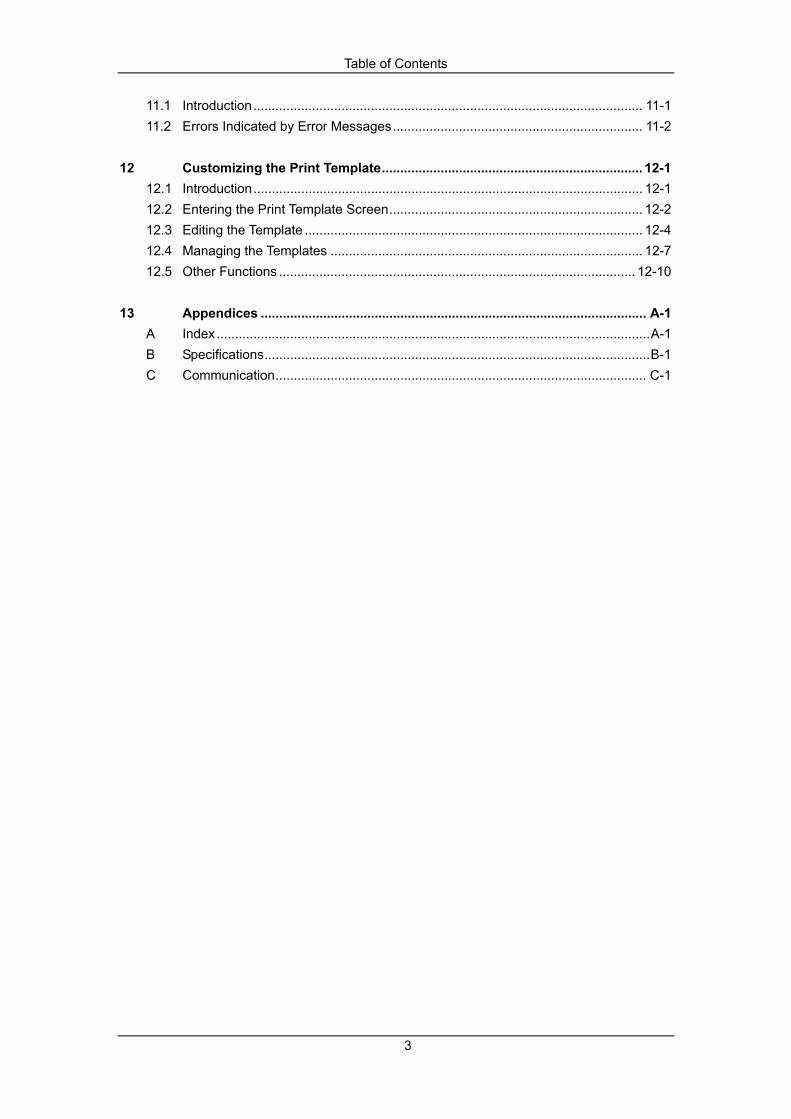
Table of Contents
3
11.1 Introduction.......................................................................................................... 11-1 11.2 Errors Indicated by Error Messages.................................................................... 11-2
12 Customizing the Print Template....................................................................... 12-1 12.1 Introduction.......................................................................................................... 12-1 12.2 Entering the Print Template Screen..................................................................... 12-2 12.3 Editing the Template ............................................................................................ 12-4 12.4 Managing the Templates ..................................................................................... 12-7 12.5 Other Functions ................................................................................................. 12-10
13 Appendices ......................................................................................................... A-1 A Index......................................................................................................................A-1 B Specifications.........................................................................................................B-1 C Communication..................................................................................................... C-1


1-1
1 Using This Manual
1.1 Introduction This chapter explains how to use your BC-5380 operator’s manual, which is shipped with your BC-5380 AUTO HEMATOLOGY ANALYZER and contains reference information about the BC-5380 and procedures for operating, troubleshooting and maintaining the analyzer. Read this manual carefully before operating your analyzer and operate your analyzer strictly as instructed in this manual.
Using This Manual
1-2
1.2 Who Should Read This Manual
This manual contains information written for clinical laboratory professionals to:
learn about the BC-5380 hardware and software.
customize system settings.
perform daily operating tasks.
perform system maintenance and troubleshooting.

Using This Manual
1-3
1.3 How to Find Information
This operator’s manual comprises 12 chapters and 3 appendices. Refer to the table below to find the information you need.
If you want to … See …
learn about the intended use and parameters of the BC-5380 Chapter 2 Understanding Your Analyzer
learn about the hardware, interface and software of the BC-5380
Chapter 2 Understanding Your Analyzer
learn about how the BC-5380 works Chapter 3 Understanding the System Principles
learn about the installation requirements of the BC-5380 Chapter 4 Installing Your Analyzer
learn about how to define/adjust system settings Chapter 5 Customizing the Analyzer Software
learn about the process of sample collection and analysis Chapter 6 Operating Your Analyzer
learn about how to use the BC-5380 to perform your daily operating tasks
Chapter 6 Operating Your Analyzer
review sample results Chapter 7 Reviewing Sample Results
learn about how to use the quality control programs Chapter 8 Using the QC Programs
learn about how to calibrate the BC-5380 Chapter 9 Using the Calibration Programs
learn about how to maintain/service the BC-5380 Chapter 10 Maintaining Your Analyzer
learn about how to solve the problems of the BC-5380 Chapter 11 Troubleshooting Your Analyzer
learn about how to customize the print template of the BC-5380
Chapter 12 Customizing the Print Template
learn about the technical specifications of the BC-5380 Appendix B Specifications learn about the communication protocol of the BC-5380 Appendix C Communication
Using This Manual
1-4
1.4 Conventions Used in This Manual This manual uses certain typographical conventions to clarify meaning in the text:
all capital letters enclosed in [ ] indicate a key name on the analyzer or external keyboard, such as [ENTER].
bold letters included in “ “ indicate text you can find on the screen, such as “Clean”.
bold letters indicate chapter titles, such as Chapter 1 Using This Manual.
All illustrations in this manual are provided as examples only. They may not necessarily reflect your analyzer setup or data displayed.

Using This Manual
1-5
1.5 Safety Information The following symbols are used to indicate danger and alert information in this manual.
When you see… Then…
read the statement below the symbol. The statement is alerting you to a potentially biohazardous condition.
read the statement below the symbol. The statement is alerting you to an operating hazard that can cause personnel injury.
read the statement below the symbol. The statement is alerting you to a possibility of analyzer damage or unreliable analysis results.
read the statement below the symbol. The statement is alerting you to information that requires your attention.
All the samples, controls, calibrators, reagents, wastes and areas contacted them are potentially biohazardous. Wear proper personal protective equipment (e.g. gloves, lab coat, etc.) and follow safe laboratory procedures when handling them and the contacted areas in the laboratory.
If leak happens to the analyzer, the leak liquid is potentially biohazardous.
Please check the firmness of all the doors and covers before running the analyzer.
Make sure all the safety measurements are adopted. Disable any safety device or sensor is prohibited.
Please take action to any alarm and problem indication immediately.
Do not touch the moving parts.
Contact Mindray or Mindray-authorized distributors in time if any damaged part is found.
Be careful when opening/closing and removing/installing the doors, covers and boards of the analyzer.
Discard the analyzer according to government regulations.

Using This Manual
1-6
Please use the analyzer strictly according to this manual.
Make sure only Mindray-authorized software is installed on the computer.
Please install the original edition software to prevent the computer from being infected by virus.
Please adopt proper measurements to prevent the reagents from being polluted.
It is recommended that the anti-virus software should be installed on the computer and run regularly.
Using This Manual
1-7
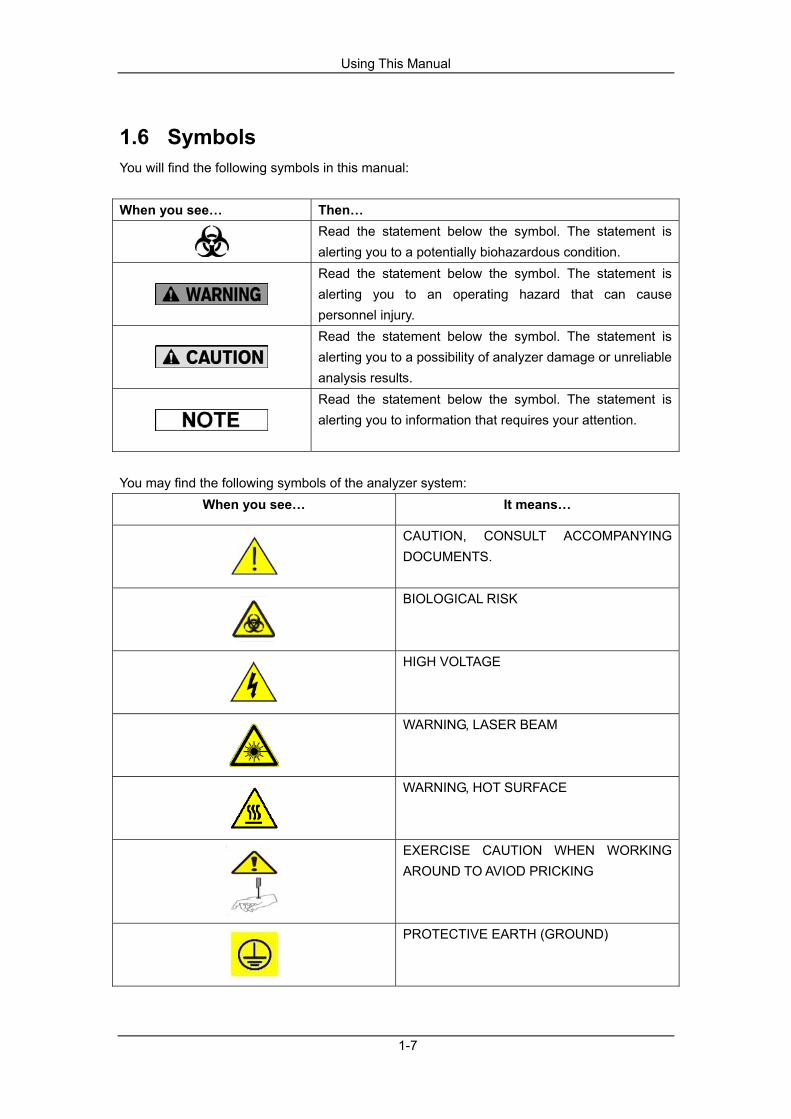
1.6 Symbols You will find the following symbols in this manual:
When you see… Then…
Read the statement below the symbol. The statement is alerting you to a potentially biohazardous condition.
Read the statement below the symbol. The statement is alerting you to an operating hazard that can cause personnel injury.
Read the statement below the symbol. The statement is alerting you to a possibility of analyzer damage or unreliable analysis results.
Read the statement below the symbol. The statement is alerting you to information that requires your attention.
You may find the following symbols of the analyzer system:
When you see… It means…
CAUTION, CONSULT ACCOMPANYING DOCUMENTS.
BIOLOGICAL RISK
HIGH VOLTAGE
WARNING, LASER BEAM
WARNING, HOT SURFACE
EXERCISE CAUTION WHEN WORKING AROUND TO AVIOD PRICKING
PROTECTIVE EARTH (GROUND)
Using This Manual
1-8
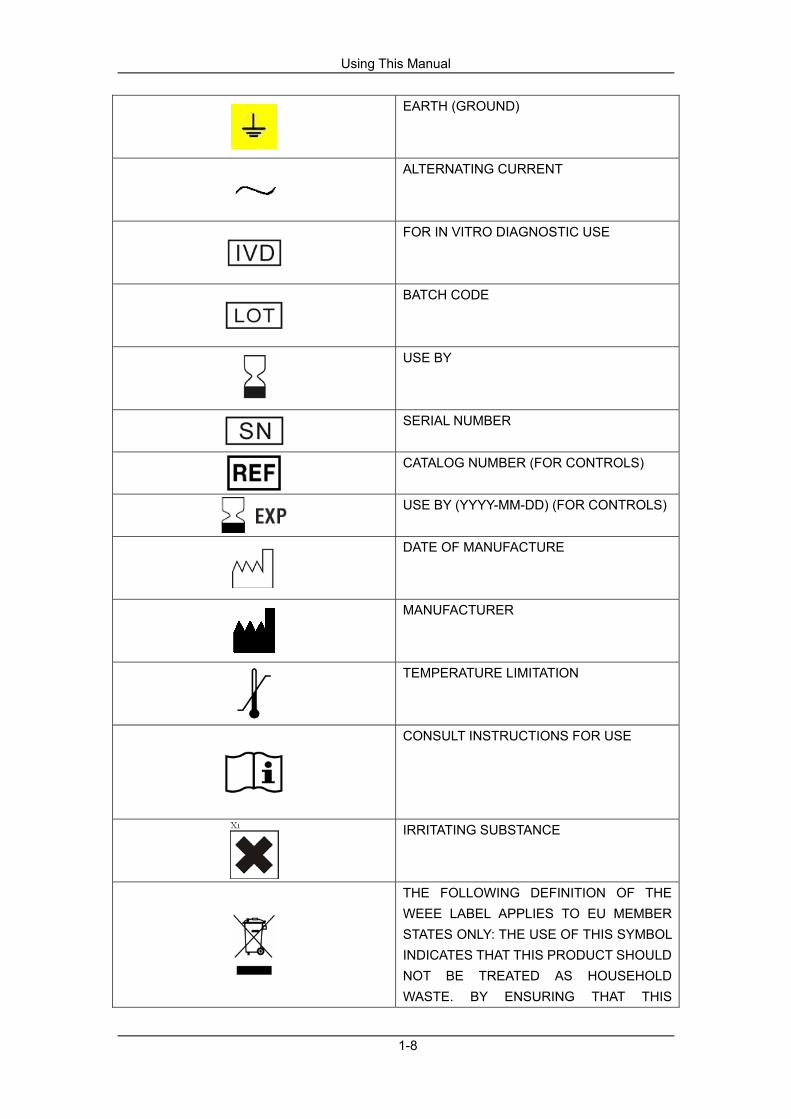
EARTH (GROUND)
ALTERNATING CURRENT
FOR IN VITRO DIAGNOSTIC USE
BATCH CODE
USE BY
SERIAL NUMBER
CATALOG NUMBER (FOR CONTROLS)
USE BY (YYYY-MM-DD) (FOR CONTROLS)
DATE OF MANUFACTURE
MANUFACTURER
TEMPERATURE LIMITATION
CONSULT INSTRUCTIONS FOR USE
IRRITATING SUBSTANCE
THE FOLLOWING DEFINITION OF THE WEEE LABEL APPLIES TO EU MEMBER STATES ONLY: THE USE OF THIS SYMBOL INDICATES THAT THIS PRODUCT SHOULD NOT BE TREATED AS HOUSEHOLD WASTE. BY ENSURING THAT THIS

Using This Manual
1-9
PRODUCT IS DISPOSED OF CORRECTLY, YOU WILL HELP PREVENT BRINGING POTENTIAL NEGATIVE CONSEQUENCES TO THE ENVIRONMENT AND HUMAN HEALTH. FOR MORE DETAILED INFORMATION WITH REGARD TO RETURNING AND RECYCLING THIS PRODUCT, PLEASE CONSULT THE DISTRIBUTOR FROM WHOM YOU PURCHASED THE PRODUCT.
THE DEVICE IS FULLY CONFORMANCE WITH THE COUNCIL DIRECTIVE CONCERNING IN VITRO DIAGNOSTIC MEDICAL DEVICES 98/79/EC.
AUTHORISED REPRESENTATIVE IN THE EUROPEAN COMMUNITY
Using This Manual
1-10
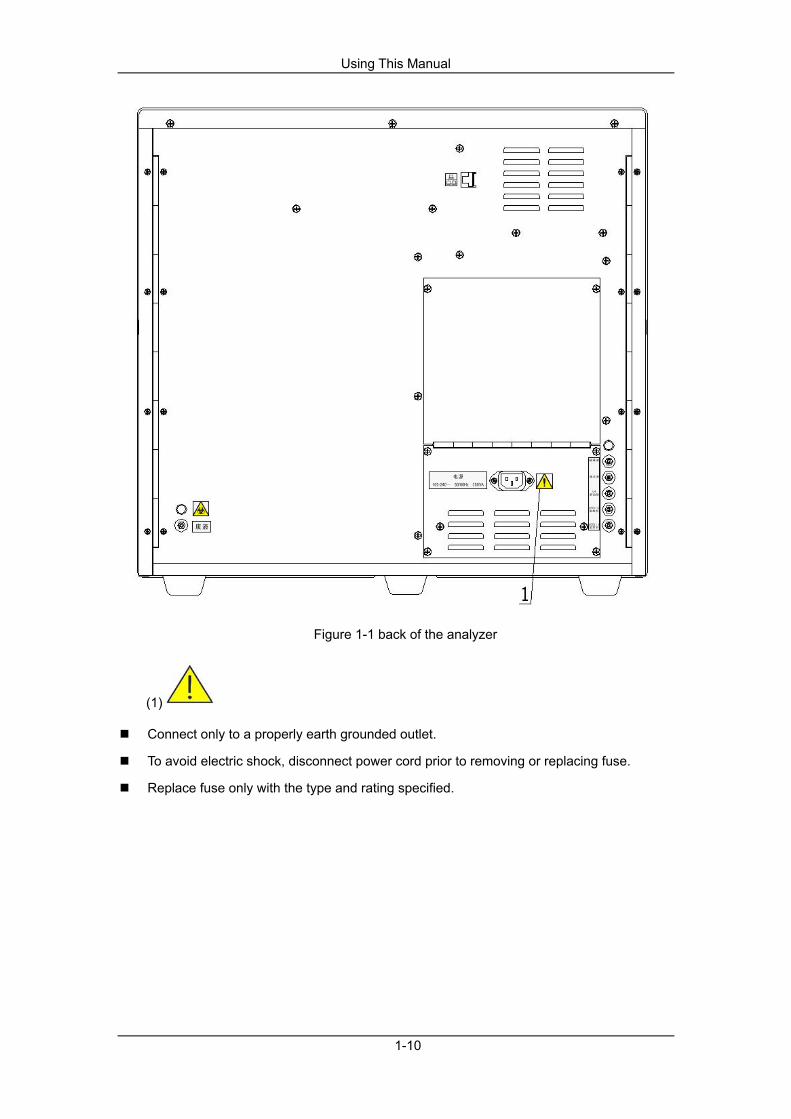
Figure 1-1 back of the analyzer
(1)
Connect only to a properly earth grounded outlet.
To avoid electric shock, disconnect power cord prior to removing or replacing fuse.
Replace fuse only with the type and rating specified.
Using This Manual
1-11
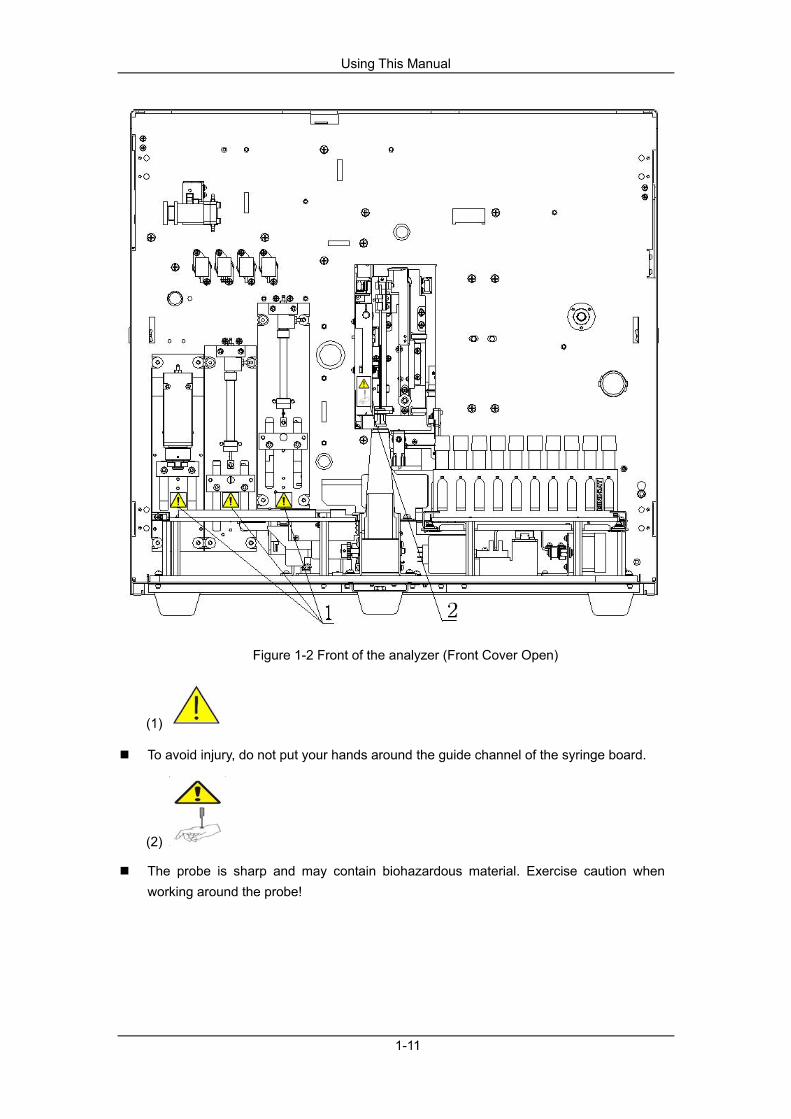
Figure 1-2 Front of the analyzer (Front Cover Open)
(1)
To avoid injury, do not put your hands around the guide channel of the syringe board.
(2)
The probe is sharp and may contain biohazardous material. Exercise caution when working around the probe!

Using This Manual
1-12
Figure 1-3 Left side of the analyzer
(1)
To avoid injury, do not put your hands around the guide channel of the syringe board.

Using This Manual
1-13
Figure 1-4 Right side of the analyzer
(1)
Laser radiation when opening, avoid direct eye exposure.


2-1
2 Understanding Your Analyzer
2.1 Introduction BC-5380 AUTO HEMATOLOGY ANALYZER is a quantitative, automated hematology analyzer and 5-part differential counter for in Vitro Diagnostic Use in clinical laboratories.

Understanding Your Analyzer
2-2
2.2 Intended Use
The purpose of this analyzer is to identify the normal patient, with all normal system-generated parameters, and to flag or identify patient results that require additional studies.
The BC-5380 is a quantitative, automated hematology analyzer and 5-part differential counter used in clinical laboratories. It provides the following 23 basic parameters, 4 parameters for research use, 3 histograms and 1 scattergram of blood samples. It supports 2 measurement modes: CBC and CBC+DIFF. Parameter Name Abbr. CBC CBC + DIFF White Blood Cell count WBC * * Neutrophils percentage Neu% / * Lymphocytes percentage Lym% / * Monocytes percentage Mon% / * Eosinophils percentage Eos% / * Basophils percentage Bas% / * Neutrophils number Neu# / * Lymphocytes number Lym# / * Monocytes number Mon# / * Eosinophils number Eos# / * Basophils number Bas# / * Abnormal Lymphocytes percentage ALY% (RUO) / * Large Immature Cells percentage LIC% (RUO) / * Abnormal Lymphocytes number ALY# (RUO) / * Large Immature Cells number LIC# (RUO) / * RBC RBC * * Hemoglobin Concentration HGB * * Mean Corpuscular Volume MCV * * Mean Corpuscular Hemoglobin MCH * * Mean Corpuscular Hemoglobin Concentration
MCHC * *
Red Blood Cell Distribution Width Coefficient of Variation
RDW-CV * *
Red Blood Cell Distribution Width Standard Deviation
RDW-SD * *
Hematocrit HCT * * Platelet count PLT * *
Understanding Your Analyzer
2-3
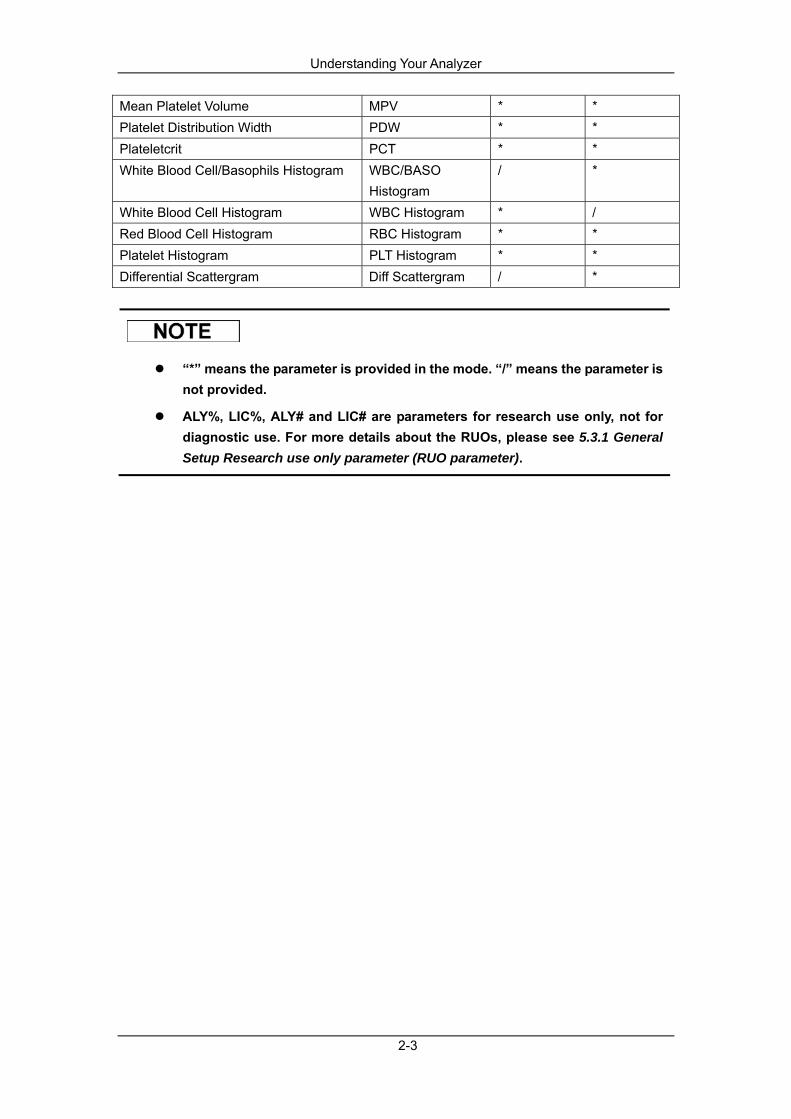
Mean Platelet Volume MPV * * Platelet Distribution Width PDW * * Plateletcrit PCT * * White Blood Cell/Basophils Histogram WBC/BASO
Histogram / *
White Blood Cell Histogram WBC Histogram * / Red Blood Cell Histogram RBC Histogram * * Platelet Histogram PLT Histogram * * Differential Scattergram Diff Scattergram / *
“*” means the parameter is provided in the mode. “/” means the parameter is not provided.
ALY%, LIC%, ALY# and LIC# are parameters for research use only, not for diagnostic use. For more details about the RUOs, please see 5.3.1 General Setup Research use only parameter (RUO parameter).
Understanding Your Analyzer
2-4
2.3 Main Structure The BC-5380 consists of the main unit (analyzer) and accessories.
Please check the firmness of all the doors, covers and boards before running the analyzer.
The analyzer is heavy, to move it by one person may cause injury. It is advisable for two people move it together when transport is needed, and make sure you follow the instructions and use the proper tools.
Installing other software on the analysis system computer, using mobile storage devices or using the computer for other purposes (e.g. playing games, logging on the internet, etc.) may lead to virus infection, system damage and/or data error. Therefore, please make sure the computer is used for analysis system only.
Understanding Your Analyzer
2-5
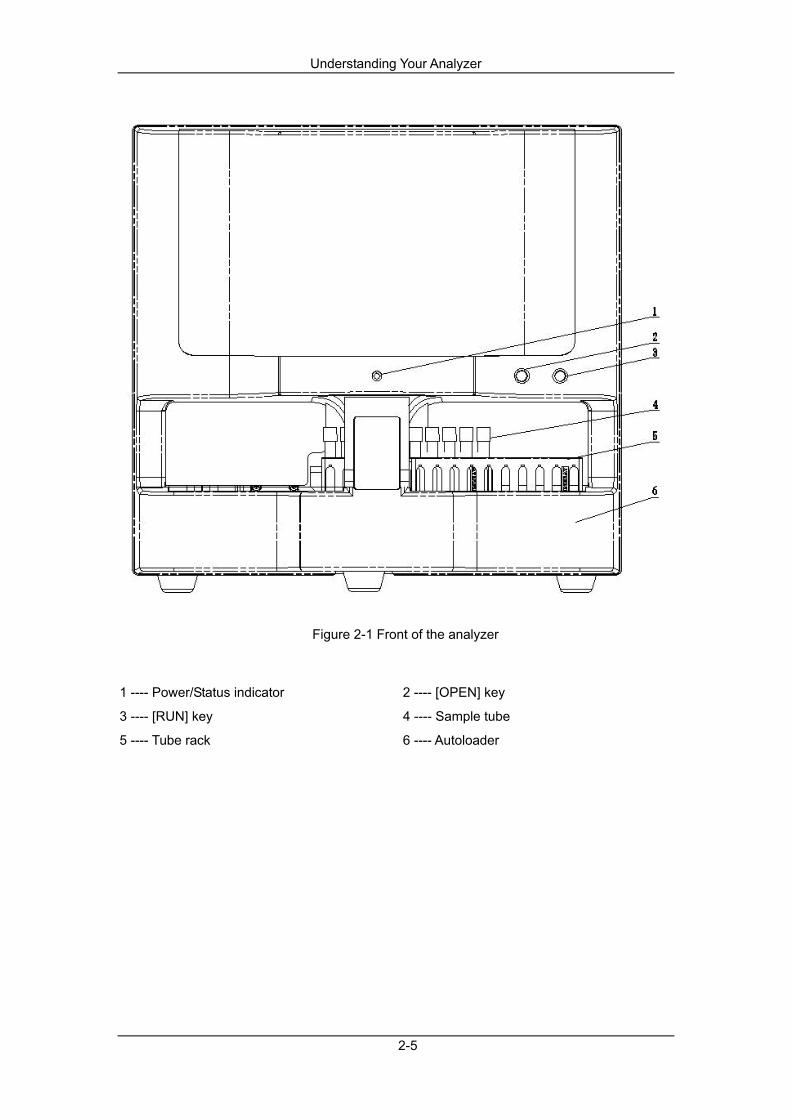
Figure 2-1 Front of the analyzer
1 ---- Power/Status indicator 2 ---- [OPEN] key
3 ---- [RUN] key 4 ---- Sample tube
5 ---- Tube rack 6 ---- Autoloader
Understanding Your Analyzer
2-6
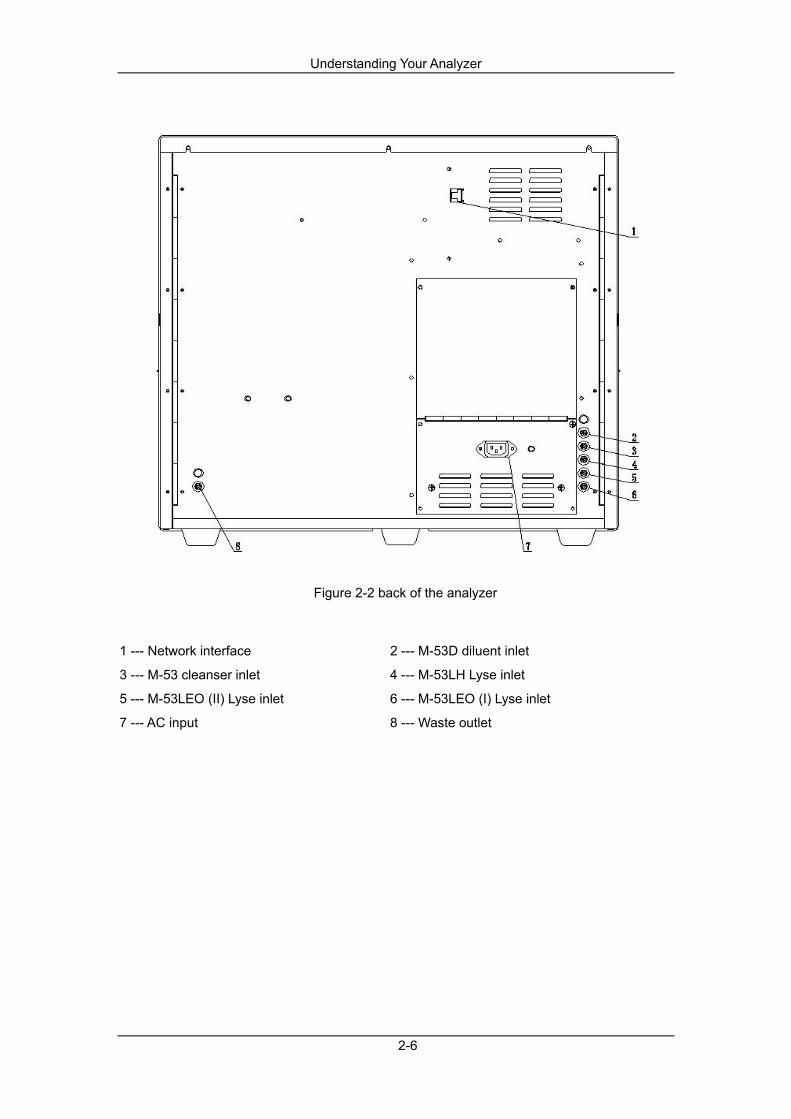
Figure 2-2 back of the analyzer
1 --- Network interface 2 --- M-53D diluent inlet
3 --- M-53 cleanser inlet 4 --- M-53LH Lyse inlet
5 --- M-53LEO (II) Lyse inlet 6 --- M-53LEO (I) Lyse inlet
7 --- AC input 8 --- Waste outlet
Understanding Your Analyzer
2-7
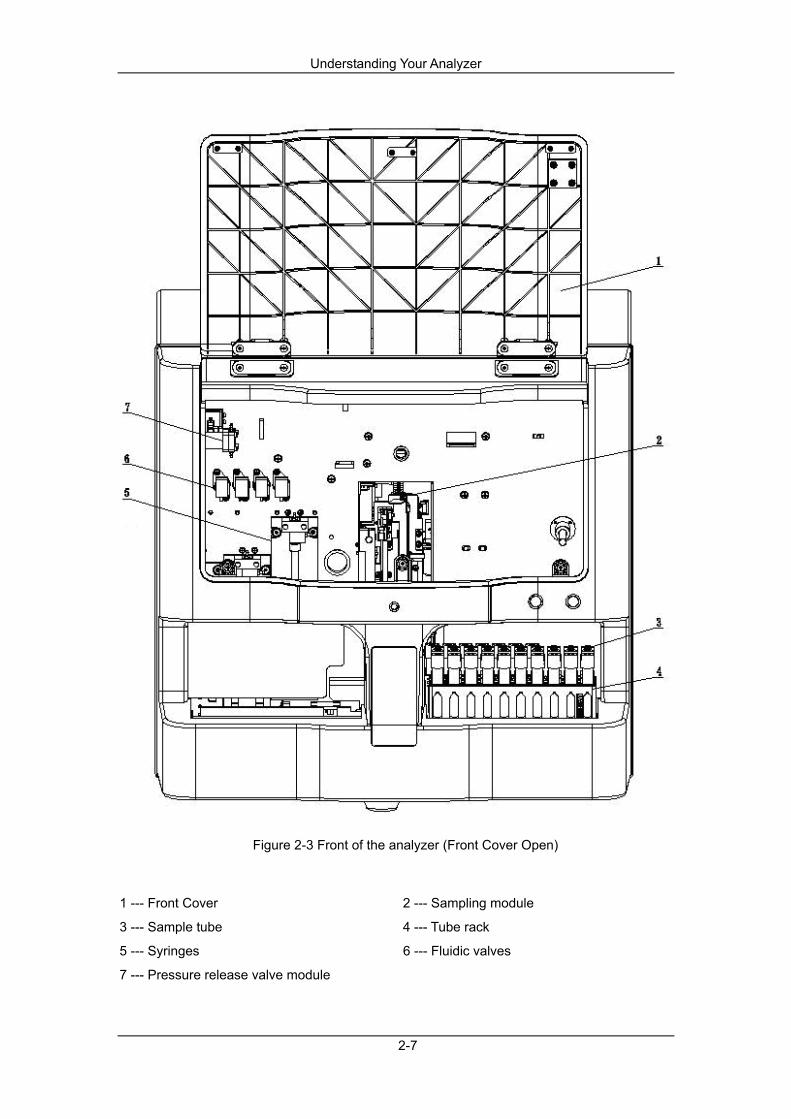
Figure 2-3 Front of the analyzer (Front Cover Open)
1 --- Front Cover 2 --- Sampling module
3 --- Sample tube 4 --- Tube rack
5 --- Syringes 6 --- Fluidic valves
7 --- Pressure release valve module

Understanding Your Analyzer
2-8
Figure 2-4 Angle shot of the analyzer (compartment door open)
1 --- Adapter 2 --- Tube holder
3 --- Sample compartment door

Understanding Your Analyzer
2-9
Figure 2-5 Right side of the analyzer (right door open)
1 --- Optical system 2 --- Sampling module
3 --- Metric unit 4 --- Vacuum chamber
5 --- Vacuum pump/Waste pump 6 --- Fluidic valves
7 --- Bath
Understanding Your Analyzer
2-10
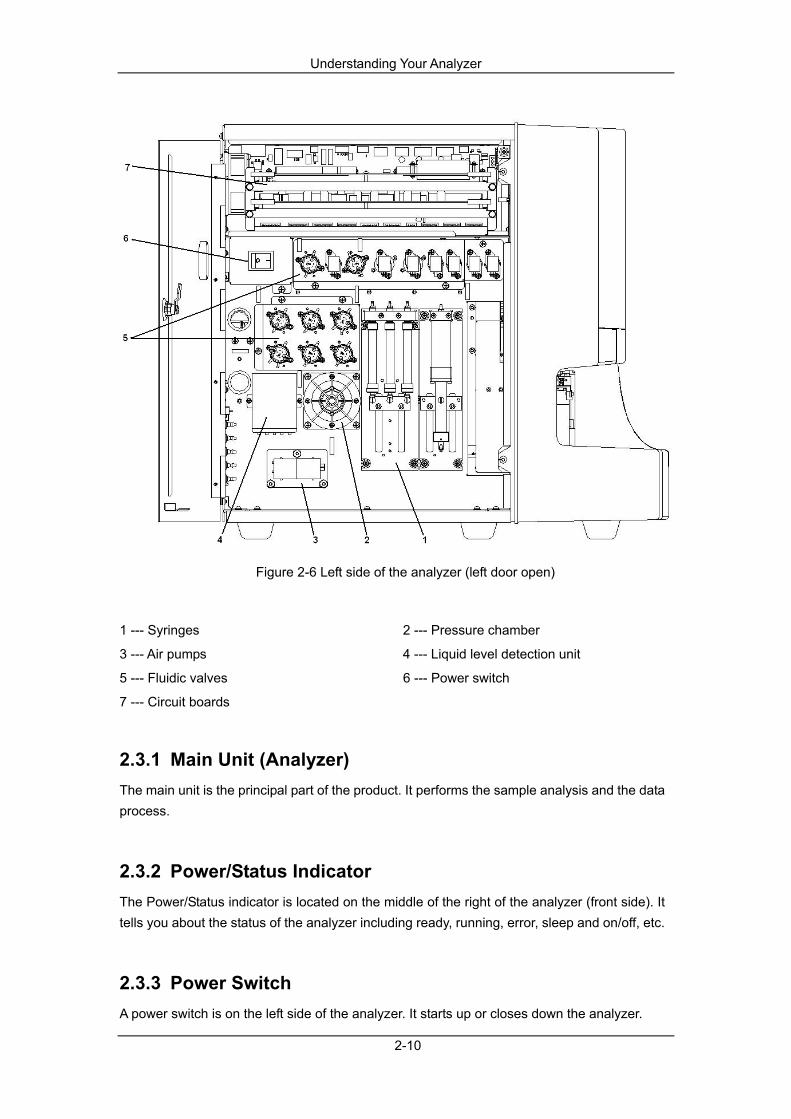
Figure 2-6 Left side of the analyzer (left door open)
1 --- Syringes 2 --- Pressure chamber
3 --- Air pumps 4 --- Liquid level detection unit
5 --- Fluidic valves 6 --- Power switch
7 --- Circuit boards
2.3.1 Main Unit (Analyzer) The main unit is the principal part of the product. It performs the sample analysis and the data process.
2.3.2 Power/Status Indicator The Power/Status indicator is located on the middle of the right of the analyzer (front side). It tells you about the status of the analyzer including ready, running, error, sleep and on/off, etc.
2.3.3 Power Switch A power switch is on the left side of the analyzer. It starts up or closes down the analyzer.

Understanding Your Analyzer
2-11
To avoid damage, do not turn on/off the power of the analyzer continually in a short time.
2.3.4 [RUN] Key The [RUN] key is located on the middle of the right front side (the right one). You can press the key to start the selected analysis cycle, dispense diluent or wake up the system from sleep.
2.3.5 [OPEN] Key The [OPEN] key is located on middle of the right front side (the left one). You can press the key to open/close the compartment door.
2.3.6 Network Interface A network interface is located on the back of the analyzer. It connects the external computer.

Understanding Your Analyzer
2-12
2.4 User Interface After the starting procedure, you will enter the user interface.
Figure 2-7 User interface
The interface can be divided into several areas as follows according to their functions: 1. Screen title area The screen title area on the top left corner displays the title of the current screen. The figure shown above indicates the current screen is “Standby screen”.
2. Analysis status It indicates the current analysis status and displays in the same way as the Power/Status indicator on the main unit. Green icon: it means you can proceed to analyze the sample. Flickering green icon: it means the analyzer is not ready for analyze yet. Red icon: it means you can not proceed to analyze the sample but not due to an error happened. (e.g. the analyzer is in sleep status) Flickering red icon: it means you can not proceed to analyze the sample and it is due to an error happened. Yellow icon: it means you can proceed to analyze the sample under the emergency mode.

Understanding Your Analyzer
2-13
Flickering yellow icon: it means the analyzer is not ready for analyze yet under the emergency mode.
3. Information area of the next sample This area displays the information about the sample ID, sample position, sampling mode (autoloader/closed-tube), blood mode (whole blood/predilute) and measurement mode (CBC/CBC+DIFF) of the next sample.
4. Status area The area is on the top right of the screen. There are three items from left to right, namely:
LIS/HIS status
Gray icon: disconnected Color icon: connected Flickering arrow above the icon: uploading Flickering arrow below the icon: downloading
The two arrows flickering at the same time: uploading and downloading are processing at the same time.
Connection status between the analyzer and the computer:
Gray icon: The computer is not connected to the analyzer yet. Gray icon: The computer is connected to the analyzer.
Print status:
Gray icon: The printer is not connected to the analyzer yet. Color icon: The printer is connected to the analyzer. Flickering icon: The printer is printing.
5. Minimize button You can click the button to minimize the interface to the taskbar of the operation system.
Click the interface icon displayed on the taskbar, you can get the display of the interface back after minimizing it.
6. Function screen area It displays the selected screen and the corresponding function buttons. 7. System time It displays the time of the operation system. When you move the mouse to this area, the tips will pop up to display the current system time. See Chapter 5 Customizing the Analyzer

Understanding Your Analyzer
2-14
Software for ways to modify the time format. 8. Input mode button It displays the current input mode and you can change the input mode through it. Click the input mode button to open the input languages menu, and then you can switch to the desired input language by clicking on the menu. 9. Error message area When error(s) is reported, the error message area will pop up a help information message box and displays error messages one by one. The severity levels are discriminated from high to low by 4 background colors: red, orange, blue, and green. See Chapter 12 Troubleshooting Your Analyzer for details. 10. Operation/status information area The area displays the information about the current operation of the analyzer/computer, or the current status of the analyzer/computer. 11. Information area of the user logged on This area displays the name and access level of the current user. 12. Menu button You can click the “Menu” button on the left bottom corner to open the system menu. Click a menu option, a relevant screen or message box will appear if the option is not followed by the symbol “ ”; whereas a submenu will appear if the option is followed by the symbol “ ”.Click the submenu, a relevant screen or message box will appear. 13. Shortcut button area The left side of the screen is the shortcut button area. When clicking a certain button, you can enter the relevant screen or a message box will pop up.
Understanding Your Analyzer
2-15
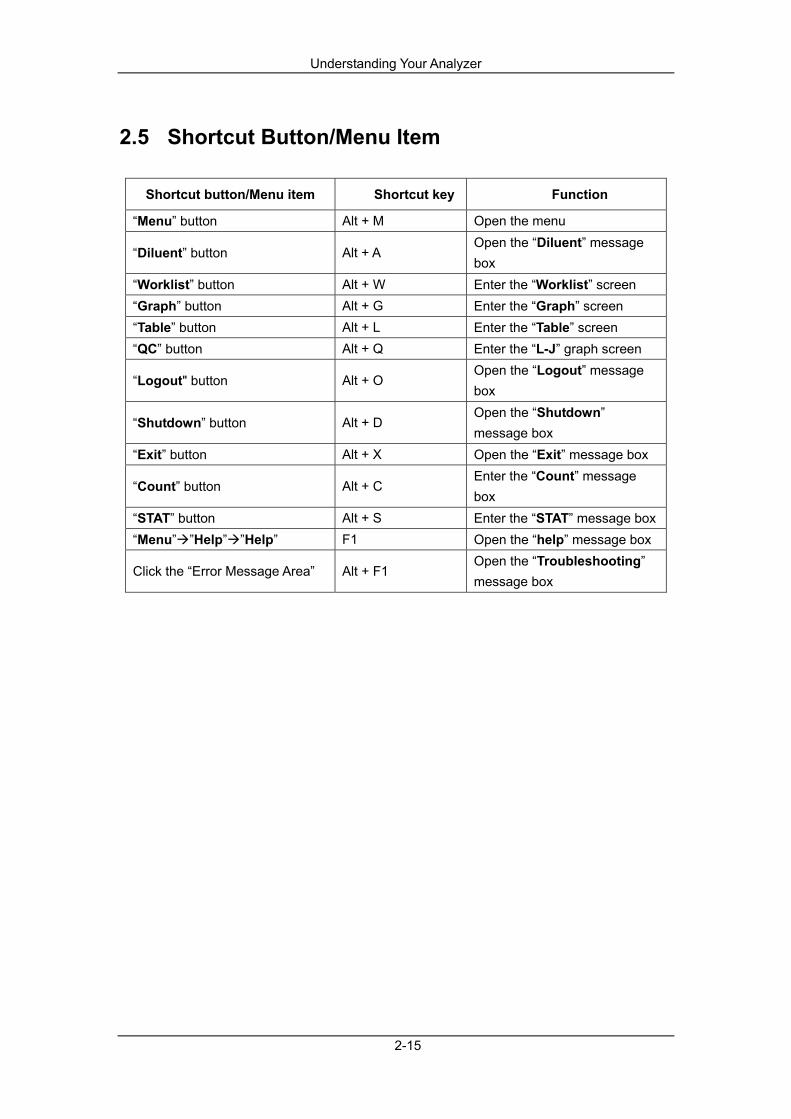
2.5 Shortcut Button/Menu Item
Shortcut button/Menu item Shortcut key Function
“Menu” button Alt + M Open the menu
“Diluent” button Alt + A Open the “Diluent” message box
“Worklist” button Alt + W Enter the “Worklist” screen “Graph” button Alt + G Enter the “Graph” screen “Table” button Alt + L Enter the “Table” screen “QC” button Alt + Q Enter the “L-J” graph screen
“Logout" button Alt + O Open the “Logout” message box
“Shutdown” button Alt + D Open the “Shutdown” message box
“Exit” button Alt + X Open the “Exit” message box
“Count” button Alt + C Enter the “Count” message box
“STAT” button Alt + S Enter the “STAT” message box“Menu” ”Help” ”Help” F1 Open the “help” message box
Click the “Error Message Area” Alt + F1 Open the “Troubleshooting” message box

Understanding Your Analyzer
2-16
2.6 Software Operation Please make sure you fully understand the meaning of the following operations or interfaces before you start operating the software of the analyzer.
2.6.1 Move the Pointer Move the pointer displayed on the interface by operating the mouse.
2.6.2 Click Move the pointer to the desired content; left click the mouse then release.
Repeat the operation if failed to choose the content; check the connection of the mouse if necessary. If the problem still exists, please contact Mindray customer service department or your local distributor immediately.
2.6.3 Double Click Move the pointer to the desired content, left click the mouse twice rapidly then release.
Repeat the operation if failed to choose the content; check the connection of the mouse if necessary. If the problem still exists, please contact Mindray customer service department or your local distributor immediately.
2.6.4 Right Click Move the pointer to the desired content; right click the mouse then release.
Repeat the operation if failed to choose the content; check the connection of the mouse if necessary. If the problem still exists, please contact Mindray customer service department or your local distributor immediately.
Understanding Your Analyzer
2-17
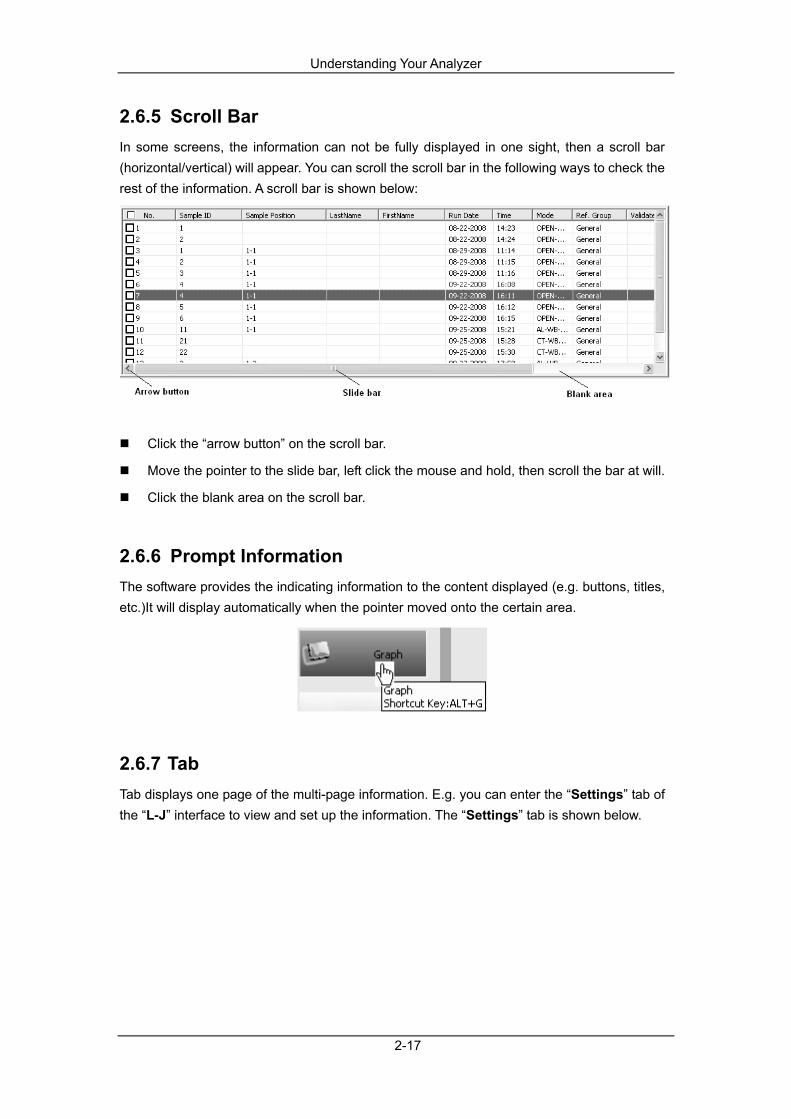
2.6.5 Scroll Bar In some screens, the information can not be fully displayed in one sight, then a scroll bar (horizontal/vertical) will appear. You can scroll the scroll bar in the following ways to check the rest of the information. A scroll bar is shown below:
Click the “arrow button” on the scroll bar.
Move the pointer to the slide bar, left click the mouse and hold, then scroll the bar at will.
Click the blank area on the scroll bar.
2.6.6 Prompt Information The software provides the indicating information to the content displayed (e.g. buttons, titles, etc.)It will display automatically when the pointer moved onto the certain area.
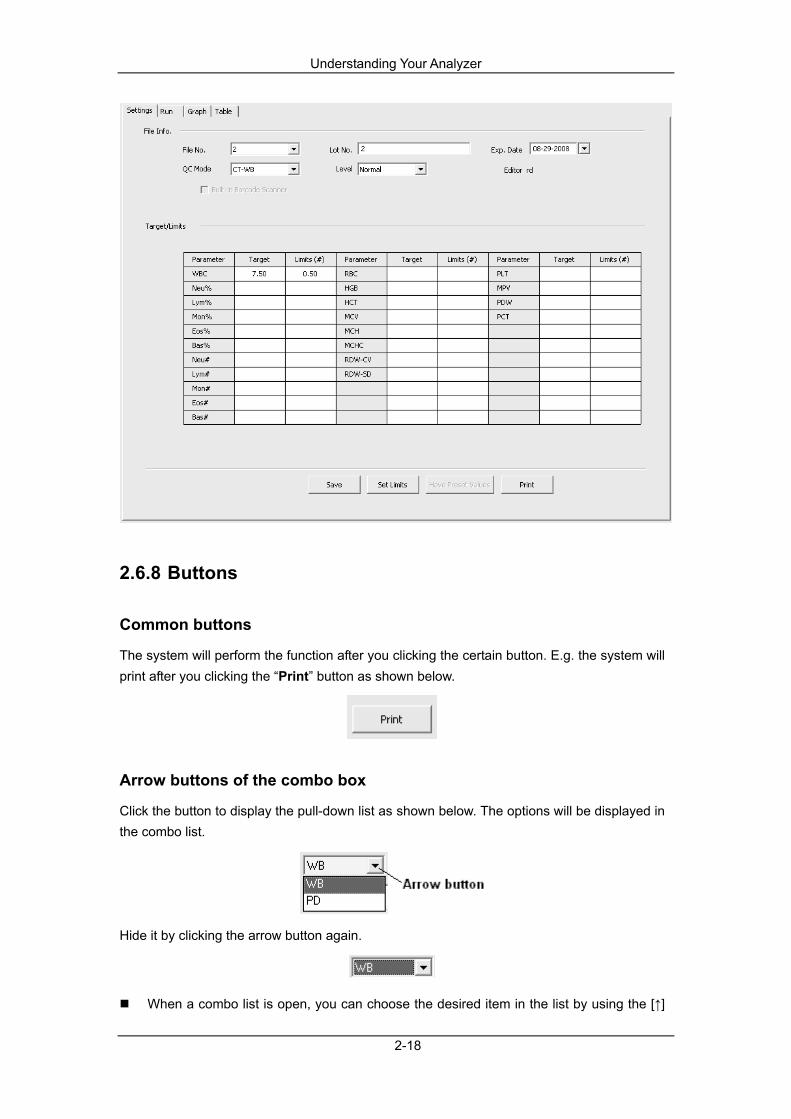
2.6.7 Tab Tab displays one page of the multi-page information. E.g. you can enter the “Settings” tab of the “L-J” interface to view and set up the information. The “Settings” tab is shown below.
Understanding Your Analyzer
2-18
2.6.8 Buttons
Common buttons
The system will perform the function after you clicking the certain button. E.g. the system will print after you clicking the “Print” button as shown below.
Arrow buttons of the combo box
Click the button to display the pull-down list as shown below. The options will be displayed in the combo list.
Hide it by clicking the arrow button again.
When a combo list is open, you can choose the desired item in the list by using the [↑]

Understanding Your Analyzer
2-19
and [↓] keys on the keyboard.
When a combo list is open, you can hide it by pressing the [Enter] key on the keyboard or clicking a certain option. Then, the original content in the combo box will be replaced by the current chosen one.
When a combo list is open, you can hide it by pressing the [Esc] key on the keyboard. Then, no change to the combo box.
The scroll bar will appear if the content of the list can not be displayed in one sight of a screen. You can scroll or use the [PgUp] and [PgDn] keys on the keyboard to view the information fully.
Arrow button of the date control
The date control is shown below:
After clicking the arrow button on the date control, a date box will pop up.
Select the year: click the displayed year, arrows will appear on its right side. Then, choose the desired year by clicking the arrow button.
Select the month:
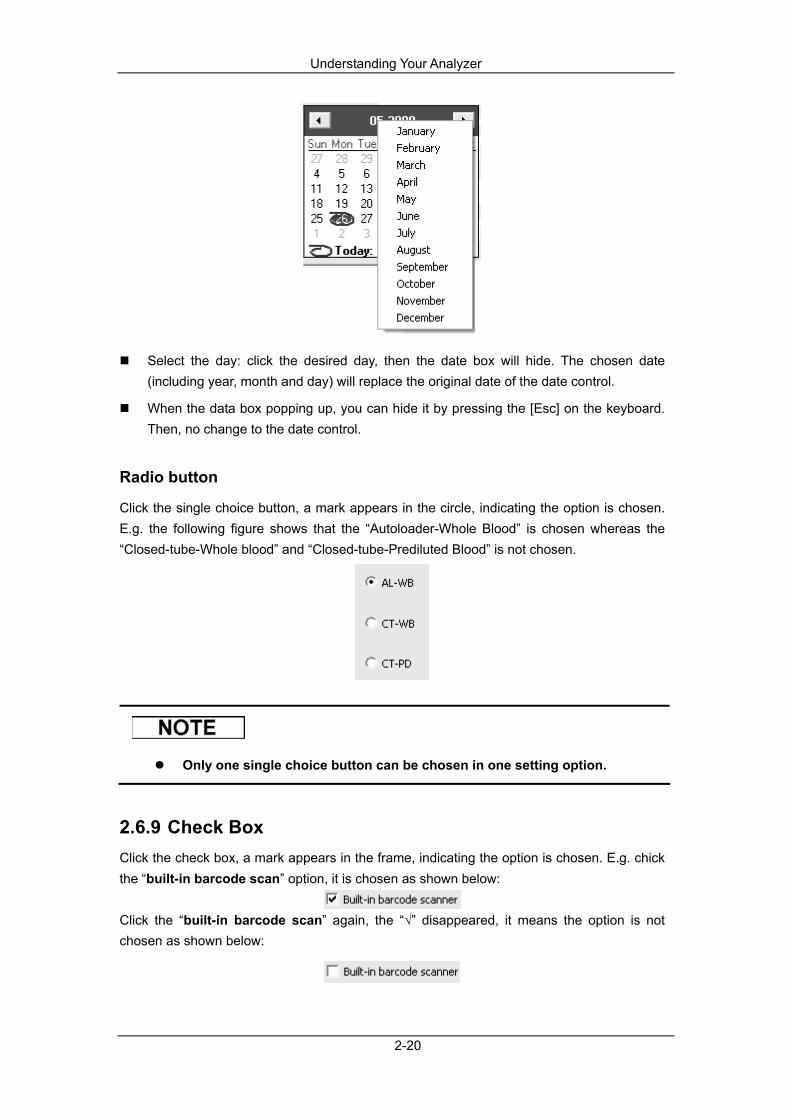
Method 1: click the arrow button on the both sides of the date box to switch and choose the desired month. Method 2: click the displayed month, then click the desired month from the list appeared as shown below.
Understanding Your Analyzer
2-20
Select the day: click the desired day, then the date box will hide. The chosen date (including year, month and day) will replace the original date of the date control.
When the data box popping up, you can hide it by pressing the [Esc] on the keyboard. Then, no change to the date control.
Radio button
Click the single choice button, a mark appears in the circle, indicating the option is chosen. E.g. the following figure shows that the “Autoloader-Whole Blood” is chosen whereas the “Closed-tube-Whole blood” and “Closed-tube-Prediluted Blood” is not chosen.
Only one single choice button can be chosen in one setting option.
2.6.9 Check Box Click the check box, a mark appears in the frame, indicating the option is chosen. E.g. chick the “built-in barcode scan” option, it is chosen as shown below:
Click the “built-in barcode scan” again, the “√” disappeared, it means the option is not chosen as shown below:

Understanding Your Analyzer
2-21
More than one check box can be chosen at the same time in one setting option.
2.6.10 Edit Box Click the edit box; you can start editing when the cursor appears. You can enter the characters from the location of the cursor and the cursor moves to the right at the time. Enter the first name into the edit boxes as shown below:
You can also proceed to the following operations in the edit box:
Move the cursor to the left or right by using the [←] and [→] keys on the keyboard.
Move the cursor to the left of the initial character or the right or the end character by pressing the [Home] and [End] key on the keyboard.
Delete the character on the right of the cursor by using the [Delete] on the keyboard.
Delete the character on the left of the cursor by using the [Backspace] key on the keyboard.
Switch to other edit box by using the [Tab] key on the keyboard.
Edit boxes of different use require different entered characters.
You don’t have to enter the separators in the date box and the IP box.
The scroll bar (horizontal/vertical) will appear if the content of the edit box can not be displayed in one sight of a screen. You can scroll or use the [PgUp] and [PgDn] keys on the keyboard to view the information fully.
2.6.11 Information Box The content in the information box can only be browsed:

Understanding Your Analyzer
2-22
The scroll bar (horizontal/vertical) will appear if the content of the information box can not be displayed in one sight of a screen. You can scroll or use the [PgUp] and [PgDn] keys on the keyboard to view the information fully.
2.6.12 Combo Box The combo box consists of an edit box and an arrow button, which is shown below:
See “Arrow button of the combo box” section for details to complete selecting. See “Edit box” section for details to complete editing if the combo box is editable.
2.6.13 Form The form contains several cells and check box (sometimes). Click the certain cell, it is chosen as shown below:

Understanding Your Analyzer
2-23
Then, you can proceed to the following operations:
Select the cell by using the [↑], [↓], [←] and [→] keys on the keyboard.
Select the initial or end cell of the current row by using the [Home] and [End] keys on the keyboard.
Select the next cell of the current line by using the [Enter] key on the keyboard.
Select the next cell of the current row by using the [Tab] key on the keyboard(can not switch to a new row).
Move the mouse to the boundary line between the rows or lists, then left click the mouse and hold, drawing the line to change the height/width of the row/list, but the height/width of the whole form remains.
For an editable cell, a cursor will appear in it if it is double clicked. You can enter the characters from the location of the cursor and the cursor moves to the right at the time. A edited form is shown below:
You can proceed to the following operations in the cell:
Move the cursor to the left or right in the cell by using the [←] and [→] keys on the keyboard.
Move the cursor to the left of the initial character or the right or the end character by pressing the [Home] and [End] key on the keyboard.
Delete the character on the right of the cursor by using the [Delete] on the keyboard.
Understanding Your Analyzer
2-24
Delete the character on the left of the cursor by using the [Backspace] key on the keyboard.
Hide the cursor and quit editing by using the [Enter] key on the keyboard.
If a check box exists in the form, you can operate according to the instructions of the check box before. The selected check boxes in the forms will not be cleared when you switching among the screens unless you exit the software.
If a check box exists in the form, then when you click the check box, it will be ticked and the record will also be highlighted.
If you wish to choose several continuous records in a form, click the initial record and a “√” mark appears, the click the end of the desired record while pressing and holding the [Shift] key on the keyboard, then a set of records are chosen conveniently.
If you wish to select several consecutive records, click the first record and then hold and drag the mouse to the last one, and then release the mouse to select them all.
The scroll bar (horizontal/vertical) will appear if the content of the form can not be displayed in one sight of a screen. You can scroll or use the [PgUp] and [PgDn] keys on the keyboard to browse the information of the form fully.
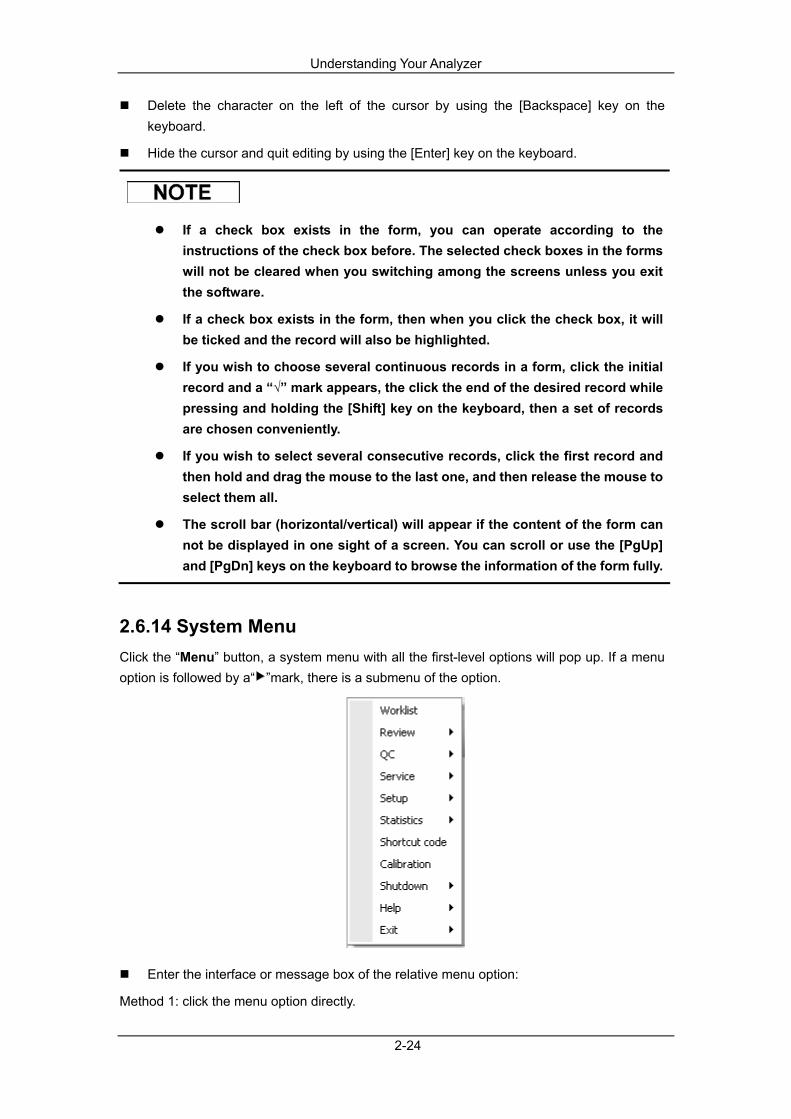
2.6.14 System Menu Click the “Menu” button, a system menu with all the first-level options will pop up. If a menu option is followed by a“ ”mark, there is a submenu of the option.
Enter the interface or message box of the relative menu option:
Method 1: click the menu option directly.
Understanding Your Analyzer
2-25
Method 2: move to the desired option by using the [↑] and [↓] keys on the keyboard and then enter it by using the [Enter] key on the keyboard.
Enter the interface or message box of the relative submenu option:
Method 1: click the first-level menu to open the submenu, then click the desired option on it. Method 2: first, move to the submenu option on the first-level menu by using the [↑] and [↓] keys on the keyboard and open it by using the [→]or [Enter] key, then move to the desired option by the [↑] and [↓] keys, at last open the interface or message box by pressing the [Enter] key.
Close the menu:
Method 1: click the “menu” button to close the system menu. Method 2: close different level of menus one by one by using the [←] or [Esc] key on the keyboard.
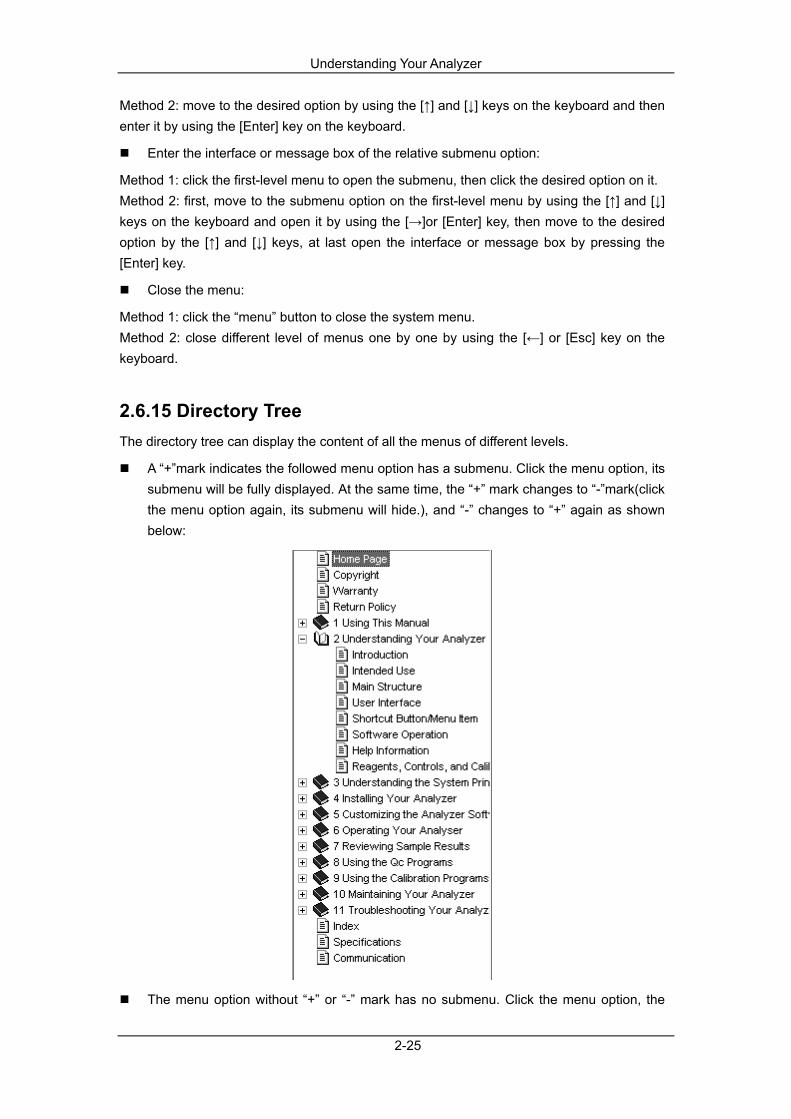
2.6.15 Directory Tree The directory tree can display the content of all the menus of different levels.
A “+”mark indicates the followed menu option has a submenu. Click the menu option, its submenu will be fully displayed. At the same time, the “+” mark changes to “-”mark(click the menu option again, its submenu will hide.), and “-” changes to “+” again as shown below:
The menu option without “+” or “-” mark has no submenu. Click the menu option, the

Understanding Your Analyzer
2-26
information will display directly.
Use the [↑] and [↓] keys on the keyboard to move the highlight bar to the desired menu option.
Use the [Home] and [End] keys on the keyboard to move the highlight bar to the initial or ending option.
Use the [Enter] key on the keyboard to display the submenu of a menu option. If the menu option has no submenu, the relative information will display directly.
If the submenu of a menu option has displayed, you can hide it by using the [Enter] key on the keyboard.
The scroll bar (horizontal/vertical) will appear if the content of the directory tree can not be displayed in one sight of a screen. You can scroll or use the [PgUp] and [PgDn] keys on the keyboard to view the information fully.
2.6.16 Message Box According to different function buttons, message boxes can be divide into “Ok”, “Ok/Cancel”, “Yes/No”,” Yes/No/Cancel” and special indication message boxes. A message box consists of the title area, information area and function button. Take the following “Ok/Cancel” message box for example:
After choosing the data you want to delete, click the “Ok” button to close the message box and completing the deletion; click the “Cancel” button to close the message box without any operation.
Click the button on the right side of the title area to close the message box without
any operation.

Understanding Your Analyzer
2-27
2.6.17 Record Switch Column The current record and the total number of the records are shown in the form “current number/ total numbers” in the record switch column. It is shown below:
The “2/79” in the above figure indicates the total number of the records is 79, and the current record is the second one.
If you wish to switch to the previous or the next record, click or button.
If you wish to switch to the first or the last record, click or button.
Click the edit box of the record switch column, enter the desired number of the record, and then switch to the relative interface by using the [Enter] key on the keyboard.
Understanding Your Analyzer
2-28
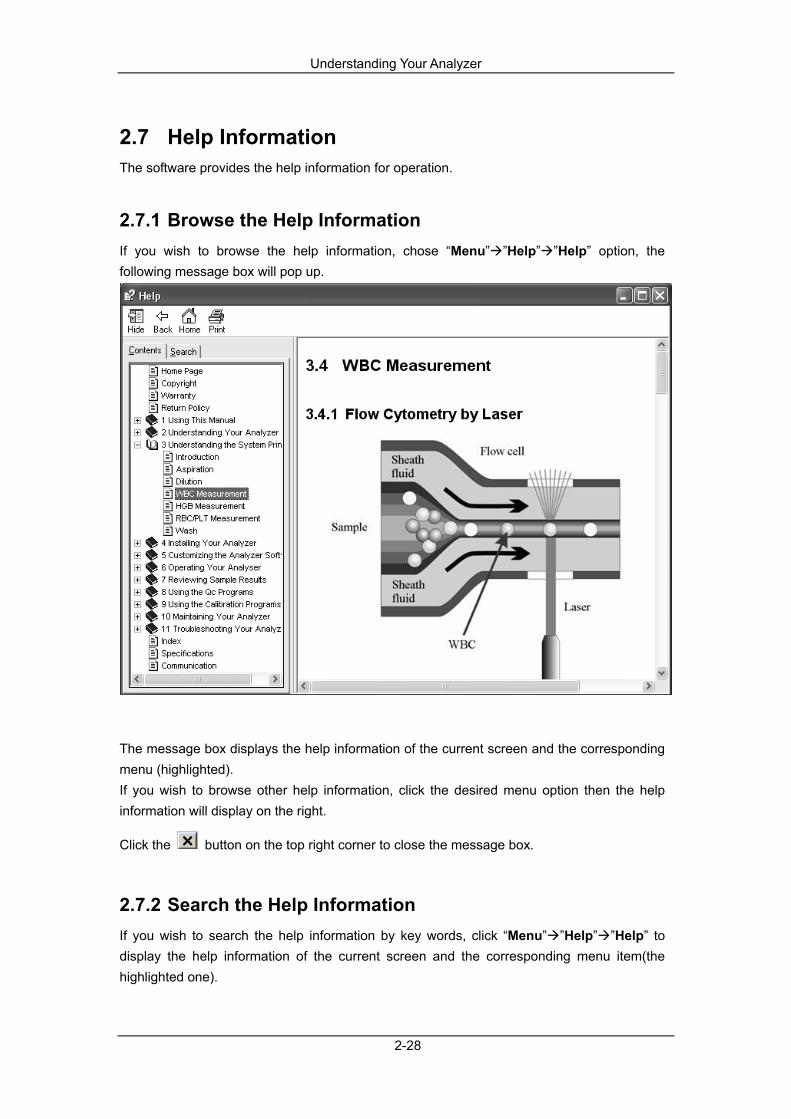
2.7 Help Information The software provides the help information for operation.
2.7.1 Browse the Help Information If you wish to browse the help information, chose “Menu” ”Help” ”Help” option, the following message box will pop up.
The message box displays the help information of the current screen and the corresponding menu (highlighted). If you wish to browse other help information, click the desired menu option then the help information will display on the right.
Click the button on the top right corner to close the message box.
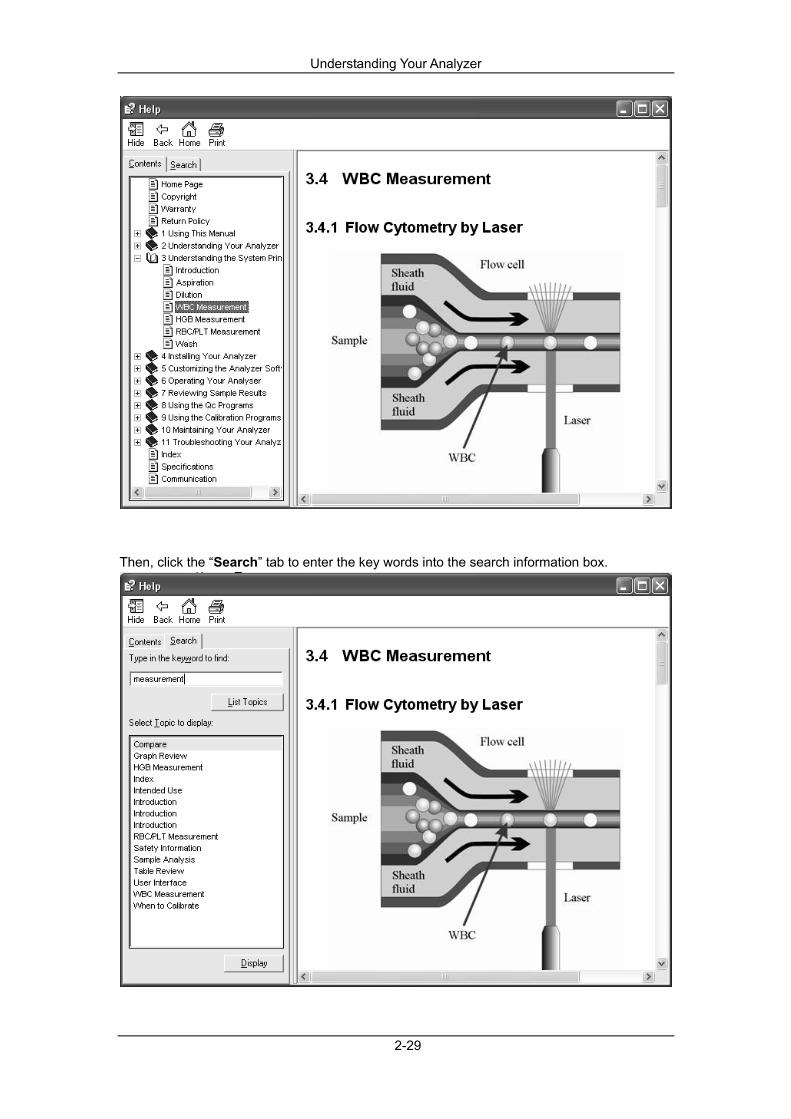
2.7.2 Search the Help Information If you wish to search the help information by key words, click “Menu” ”Help” ”Help” to display the help information of the current screen and the corresponding menu item(the highlighted one).
Understanding Your Analyzer
2-29
Then, click the “Search” tab to enter the key words into the search information box.

Understanding Your Analyzer
2-30
After entering the key words, click the “Search” button or press the [Enter] key on the keyboard to start searching.
You can stop searching by clicking the “Stop” button. Then, the obtained result displays.
When the search is finished, all the related menu items will be displayed in the left corner and the corresponding help information will be displayed at the right side screen. You can click the menu item to check the corresponding help information.
2.7.3 Print You can click the “Print” button to print the current displayed help information.

Understanding Your Analyzer
2-31
2.8 Reagents, Controls and Calibrators Because the analyzer, reagents (diluent, rinse, lyses, probe cleanser and E-Z cleanser), controls, and calibrators are components of a system, performance of the system depends on the combined integrity of all components. You should only use the Mindray-specified reagents (see Appendix B Specifications), which are formulated specifically for the fluidic system of your analyzer in order to provide optimal system performance. Do not use the analyzer with reagents from multiple suppliers. In such use, the analyzer may not meet the performance specified in this manual and may provide unreliable results. All references related to reagents in this manual refer to the reagents specifically formulated for this analyzer. Each reagent package must be examined before use. Inspect the package for signs of leakage or moisture. Product integrity may be compromised in packages that have been damaged. If there is evidence of leakage or improper handling, do not use the reagent.
Store and use the reagents as instructed by instructions for use of the reagents.
When you have changed the diluent, cleansers or lyses, run a background to see if the results meet the requirement.
Pay attention to the expiration dates and open-container stability days of all the reagents. Be sure not to use expired reagents.
After installing a new container of reagent, keep it still for a while before use.
2.8.1 Reagents M-53D Diluent It provides a stable environment for counting and sizing blood cells. M-53LEO (I) Lyse It breaks down red blood cell walls and cooperates with the M-53LEO (II) lyse to 4-differentiate WBCs. M-53LEO (II) Lyse It cooperates with the M-53LEO (I) lyse to 4-differentiate WBCs, and dyes Eosinophils. M-53LH Lyse It breaks down red blood cell walls and converts hemoglobin to a hemoglobin complex to determine the HGB. It 2-differentiates WBCs to Basophils and other WBCs, and determines WBC amount.
M-53 Cleanser
Understanding Your Analyzer
2-32
It is a cleaning solution formulated to prime and clean the fluidic channels and tubing and get rid of blood albumin and sediment. M-53P Probe Cleanser It is used to clean the analyzer regularly.
2.8.2 Controls and Calibrators The controls and calibrators are used to verify accurate operation of and calibrate the analyzer. The controls are commercially prepared whole-blood products used to verify that the analyzer is functioning properly. They are available in low, normal, and high levels. Daily use of all levels verifies the operation of the analyzer and ensures reliable results are obtained. The calibrators are commercially prepared whole-blood products used to calibrate the analyzer. Read and follow the instructions for use to use the controls and calibrators.

3-1
3 Understanding the System Principles
3.1 Introduction The measurement methods used in this analyzer are: the Electrical Impedance method for determining the WBC/BAS, RBC and PLT data; the colorimetric method for determining the HGB; flow cytometry by laser for determining the WBC data. During each analysis cycle, the sample is aspirated, diluted and mixed before the determination for each parameter is performed.

Understanding the System Principles
3-2
3.2 Aspiration According to different configurations, the analyzer offers two types of sampling mode: autoloader mode or closed-tube mode, the closed-tube mode supports two types of blood samples – whole blood samples and prediluted blood samples, and the autoloader mode supports whole blood samples. If you are to analyze a whole blood sample under closed-tube mode, the analyzer will aspirate 16µL of the sample. If you are to analyze a capillary blood sample under closed-tube mode, you should first manually dilute the sample (20µL of capillary sample needs to be diluted by 180µL of diluent) and then present the pre-diluted sample to the analyzer, which will aspirate 80µL(CBC+DIFF) or 40µL(CBC) of the sample. If you are to analyze a whole blood sample under autoloader mode, the analyzer will aspirate 16µL of the sample.
Understanding the System Principles
3-3
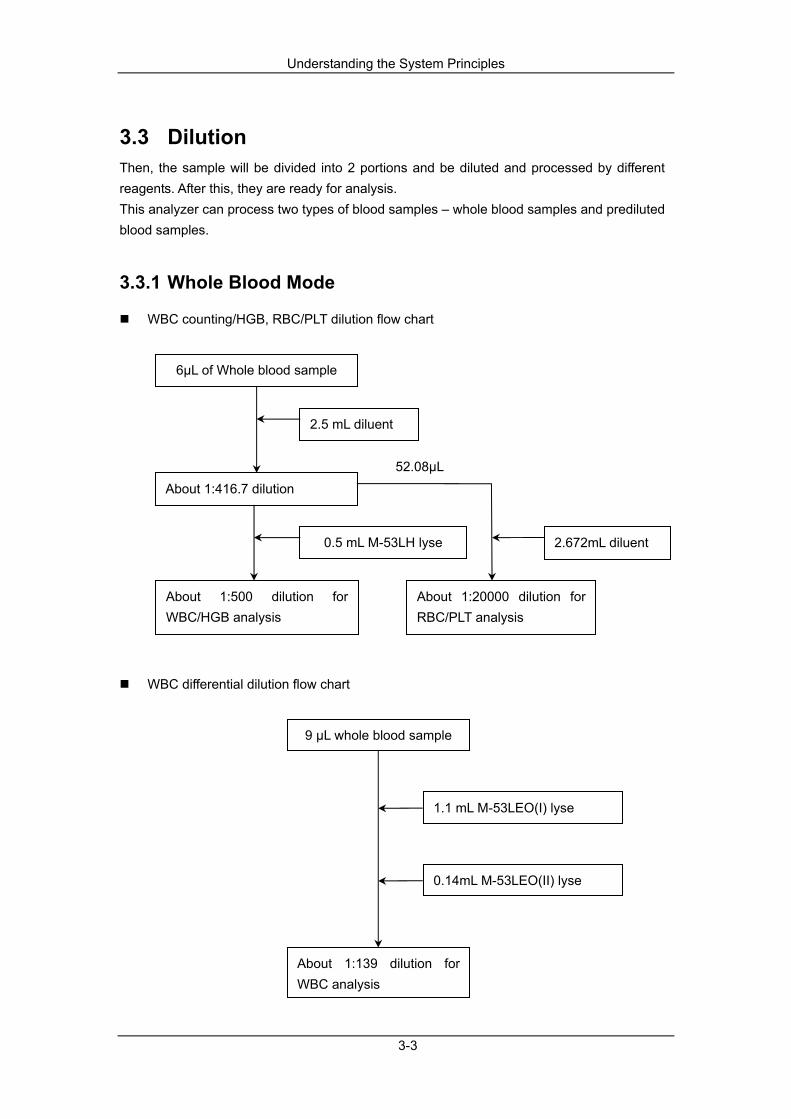
3.3 Dilution Then, the sample will be divided into 2 portions and be diluted and processed by different reagents. After this, they are ready for analysis. This analyzer can process two types of blood samples – whole blood samples and prediluted blood samples.
3.3.1 Whole Blood Mode
WBC counting/HGB, RBC/PLT dilution flow chart
WBC differential dilution flow chart
About 1:139 dilution for WBC analysis
9 µL whole blood sample
1.1 mL M-53LEO(I) lyse
0.14mL M-53LEO(II) lyse
0.5 mL M-53LH lyse
52.08µL
About 1:416.7 dilution
About 1:500 dilution for WBC/HGB analysis
6µL of Whole blood sample
2.5 mL diluent
About 1:20000 dilution for RBC/PLT analysis
2.672mL diluent

Understanding the System Principles
3-4
3.3.2 Predilute Mode
WBC counting/HGB, RBC/PLT dilution flow chart
WBC differential dilution flow chart
40µL
1.1 mL M-53LEO(I) lyse
About 1:320 dilution for WBC analysis
180 µL diluent
20 µL capillary blood
About 1:10 dilution
0.14 mL M-53LEO(II) lyse
60µL
40µL
About 1:26000 dilution for RBC/PLT analysis
2.44 mL diluent
About 1:625 dilution
2.46 mL diluent
About 1:750 dilution for WBC/HGB analysis
180 µL diluent
About 1:10 dilution
20 µL capillary blood
0.5 mL M-53LH lyse

Understanding the System Principles
3-5
3.4 WBC Measurement
3.4.1 Flow Cytometry by Laser
Figure 3-1 WBC Measurement
After a predetermined volume of blood is aspirated and diluted by a certain amount of reagent, it is injected into the flow cell. Surrounded with sheath fluid (diluent), the blood cells pass through the center of the flow cell in a single column at a faster speed. When the blood cells suspended in the diluent pass through the flow cell, they are exposed to a laser beam. The intensity of scatter light reflects the blood cell size and intracellular density. The low-angle scattered light reflects cell size, and the high-angle scattered light reflects intracellular density (nucleus size and density). The optical detector receives this scatter light and converts it into electrical pulses. Pulse data collected can be used to draw a 2-dimensional distribution (scattergram). As shown in Figure 3-2 , X-axis represents the intracellular density and Y-axis the blood cell size. Various types of analysis data can then be obtained from the scattergrams.
Understanding the System Principles
3-6
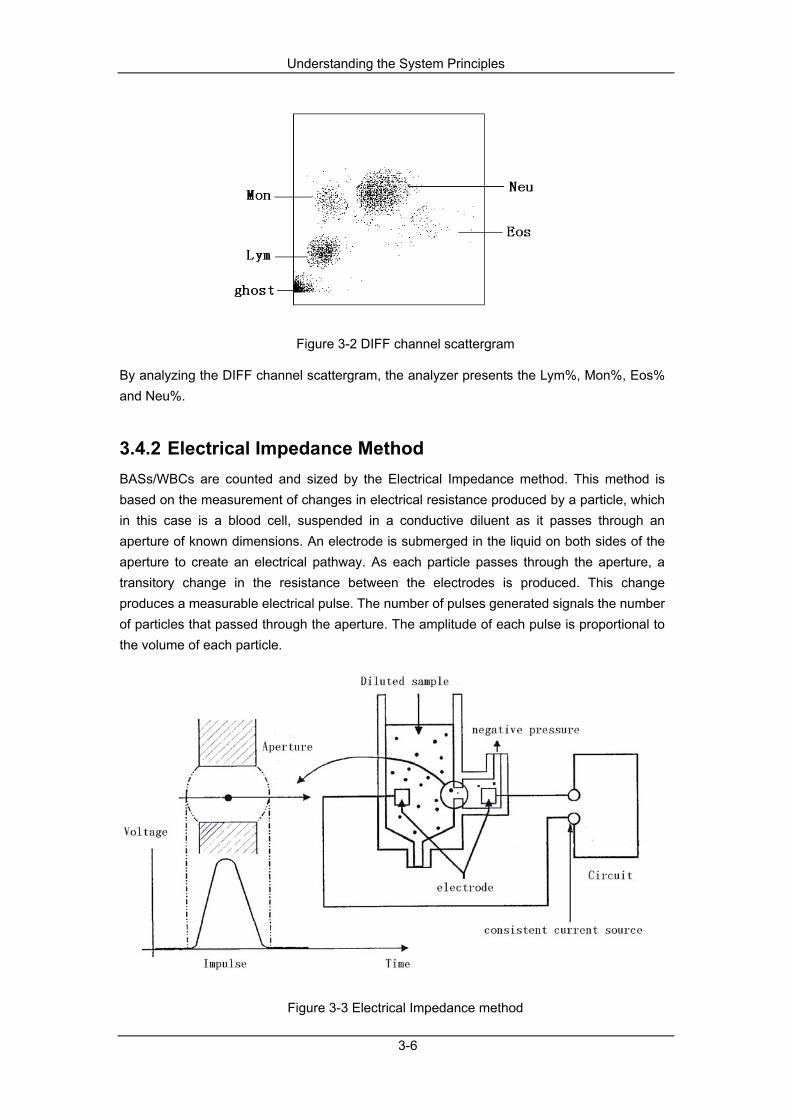
Figure 3-2 DIFF channel scattergram
By analyzing the DIFF channel scattergram, the analyzer presents the Lym%, Mon%, Eos% and Neu%.
3.4.2 Electrical Impedance Method BASs/WBCs are counted and sized by the Electrical Impedance method. This method is based on the measurement of changes in electrical resistance produced by a particle, which in this case is a blood cell, suspended in a conductive diluent as it passes through an aperture of known dimensions. An electrode is submerged in the liquid on both sides of the aperture to create an electrical pathway. As each particle passes through the aperture, a transitory change in the resistance between the electrodes is produced. This change produces a measurable electrical pulse. The number of pulses generated signals the number of particles that passed through the aperture. The amplitude of each pulse is proportional to the volume of each particle.
Figure 3-3 Electrical Impedance method

Understanding the System Principles
3-7
Each pulse is amplified and compared to the internal reference voltage channel, which only accepts the pulses of a certain amplitude. If the pulse generated is above the WBC/BAS lower threshold, it is counted as a WBC/BAS. The analyzer presents the WBC/BAS histogram, whose x-coordinate represents the cell volume (fL) and y-coordinate represents the number of the cells.
3.4.3 Derivation of WBC-Related Parameters Based on the analysis of the DIFF channel scattergram and the Lym region, Neu region, Mon region and Eos region, the analyzer calculates the Lym%, Mon%, Eos% and Neu%. Having achieved the WBC, the analyzer proceeds to calculate Lym#, Neu#, Mon# and Eos# per the following equations while Bas# is obtained directly by the Electrical Impedance method and express them in 109/L.
White Blood Cell count WBC is the number of leukocytes measured directly by counting the leukocytes passing through the aperture..
Basophils number
Bas# is the number of Basophils measured directly by counting the Basophils passing through the aperture.
Basophils percentage
%100WBCBas#%Bas ×=
Lymphocytes percentage
%100regionGhost in seexcept tho channel Diffin particles all of Sum
channel Diffof region Lymin Particles%Lym ×=
Neutrophils percentage
%100regionGhost in seexcept tho channel Diffin particles all of Sum
channel Diff ofregion Neu in ParticlesNeu% ×=
Monocytes percentage
%100regionGhost in seexcept tho channel Diffin particles all of Sum
channel Diffof region Monin Particles%Mon ×=

Understanding the System Principles
3-8
Eosinophils percentage
%100regionGhost in seexcept tho channel Diffin particles all of Sum
channel Diffof region Eosin Particles%Eos ×=
Lymphocytes number
%LymWBC#Lym ×=
Neutrophils number
%NeuWBC#Neu ×=
Monocytes number
%MonWBC#Mon ×=
Eosinophils number
%EosWBC#Eos ×=
Understanding the System Principles
3-9
3.5 HGB Measurement
3.5.1 Colorimetric Method HGB is determined by the colorimetric method. The WBC/HGB dilution is delivered to the HGB bath where it is bubble mixed with a certain amount of lyse, which converts hemoglobin to a hemoglobin complex that is measurable at 525 nm. An LED is mounted on one side of the bath and emits a beam of monochromatic light, whose central wavelength is 525nm. The light passes through the sample and is then measured by an optical sensor that is mounted on the opposite side. The signal is then amplified and the voltage is measured and compared to the blank reference reading (readings taken when there is only diluent in the bath).
3.5.2 HGB The HGB is calculated per the following equation and expressed in g/L.
⎟⎟⎠
⎞⎜⎜⎝
⎛×=
ent PhotocurrSampleocurrentBlank Phot LnConstantHGB(g/L)
Understanding the System Principles
3-10
3.6 RBC/PLT Measurement
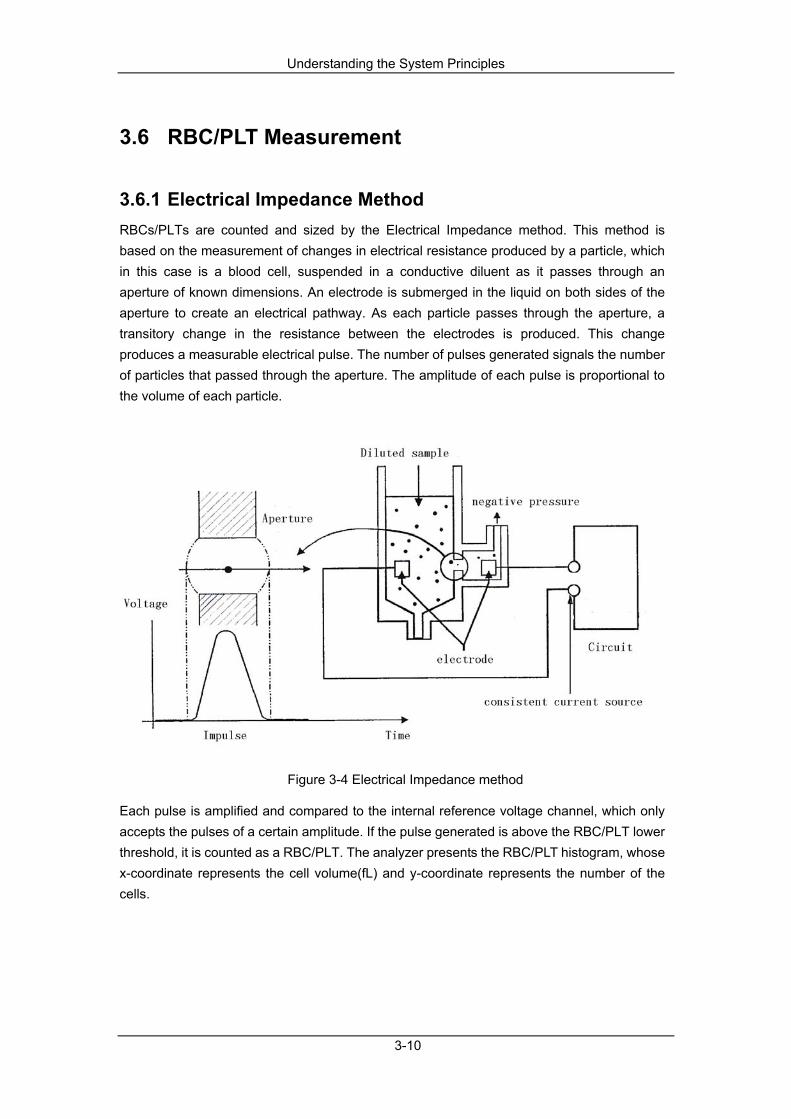
3.6.1 Electrical Impedance Method RBCs/PLTs are counted and sized by the Electrical Impedance method. This method is based on the measurement of changes in electrical resistance produced by a particle, which in this case is a blood cell, suspended in a conductive diluent as it passes through an aperture of known dimensions. An electrode is submerged in the liquid on both sides of the aperture to create an electrical pathway. As each particle passes through the aperture, a transitory change in the resistance between the electrodes is produced. This change produces a measurable electrical pulse. The number of pulses generated signals the number of particles that passed through the aperture. The amplitude of each pulse is proportional to the volume of each particle.
Figure 3-4 Electrical Impedance method
Each pulse is amplified and compared to the internal reference voltage channel, which only accepts the pulses of a certain amplitude. If the pulse generated is above the RBC/PLT lower threshold, it is counted as a RBC/PLT. The analyzer presents the RBC/PLT histogram, whose x-coordinate represents the cell volume(fL) and y-coordinate represents the number of the cells.

Understanding the System Principles
3-11
3.6.2 RBC
RBC
RBC (1012/L) is the number of erythrocytes measured directly by counting the erythrocytes passing through the aperture.
Mean Corpuscular Volume
Based on the RBC histogram, this analyzer calculates the mean cell volume (MCV) and expresses the result in fL. This analyzer calculates the HCT (%), MCH (pg) and MCHC (g/L) as follows, where the RBC is expressed in 1012/L, MCV in fL and HGB in g/L.
Red Blood Cell Distribution Width Coefficient of Variation
Based on the RBC histogram, this analyzer calculates the CV (Coefficient of Variation, %) of the erythrocyte distribution width.
Red Blood Cell Distribution Width Standard Deviation
RDW-SD (RBC Distribution Width – Standard Deviation, fL) is obtained by calculating the standard deviation of the red blood cell size distribution.
3.6.3 PLT
Platelet count
PLT (109/L) is measured directly by counting the platelets passing through the aperture.
Mean Platelet Volume
Based on the PLT histogram, this analyzer calculates the mean platelet volume (MPV, fL).
Platelet Distribution Width
Platelet distribution width (PDW) is the geometric standard deviation (GSD) of the platelet size distribution. Each PDW result is derived from the platelet histogram data and is reported as 10(GSD).
10MCVRBCHCT ×
=
RBCHGBMCH =
100HCTHGBMCHC ×=

Understanding the System Principles
3-12
PCT
This analyzer calculates the PCT as follows and express it in %, where the PLT is expressed in 109/L and the MPV in fL.
10000
MPVPLTPCT ×=

Understanding the System Principles
3-13
3.7 Wash After each analysis cycle, each element of the analyzer is washed.


4-1
4 Installing Your Analyzer
4.1 Introduction
Installation by personnel not authorized or trained by Mindray may cause personal injury or damage your analyzer. Do not install your analyzer without the presence of Mindray-authorized personnel.
Your analyzer is tested before it is shipped from the factory. International symbols and special handling instructions tell the carrier how to treat this electronic instrument. When you receive your analyzer, carefully inspect the carton. If you see any signs of mishandling or damage, contact Mindray customer service department or your local distributor immediately

Installing Your Analyzer
4-2
4.2 Installation Requirements
Do not install the software and database in the system disk.
4.2.1 Installation Requirements Check the site for proper space allocation. In addition to the space required for the analyzer itself, arrange for
at least 100 cm on each side, which is the preferred access to perform service procedures.
at least 50 cm behind the back side for cabling and ventilation.
enough room on and below the countertop to accommodate the diluent and waste containers.
The supporting table where the analyzer is placed shall be able to withstand at least 60kg of weight.
4.2.2 Power Requirements
Connect only to a properly earth grounded outlet.
Before turning on the analyzer, make sure the input voltage meets the requirements.
Using pinboard may bring the electrical interference and the analysis results may be unreliable. Please place the analyzer near the electrical outlet to avoid using the plug-board.
Please use the original electrical wire shipped with the analyzer. Using other electrical wire may damage the analyzer or cause unreliable analysis results.
Voltage Input power Frequency Analyzer A.C. 100V-240V ≤300 VA 50/60 Hz
Installing Your Analyzer
4-3
NOTE
Main supply voltage fluctuations up to ±10% of the nominal voltage.
4.2.3 General Environment
Optimal operating temperature: 15 ℃ - 30 ℃
Optimal operating humidity: 30 % - 85 %
Operating atmospheric pressure: 70 kPa - 106 kPa.
The environment should be as free as possible from dust, mechanical vibrations, loud noises, pollution and electrical interference.
It is advisable to evaluate the electromagnetic environment prior to operation of this analyzer.
Do not use this analyzer in close proximity to sources of strong electromagnetic radiation (e.g. unshielded intentional RF sources), as these may interfere with the proper operation.
Do not place the analyzer near brush-type motors, flickering fluorescent lights, and electrical contacts that regularly open and close.
Do not place the analyzer in direct sunlight or in front of a source of heat or drafts.
The environment should be good ventilation.
Do not place the analyzer on a slope.
4.2.4 Transport and Installation
Transport or installation by personnel not authorized or trained by Mindray may cause personal injury or damage your analyzer. Do not install your analyzer without the presence of Mindray-authorized personnel.
To avoid damage during the transportation, the sampling assembly of the analyzer is fixed with a plastic cable tie and a clamp. Do remove them before using the analyzer.
The transport and installation shall be conducted by Mindray-authorized personnel. Do not

Installing Your Analyzer
4-4
transport or install the analyzer without contacting Mindray customer service department or your local distributor.
Installing Your Analyzer
4-5
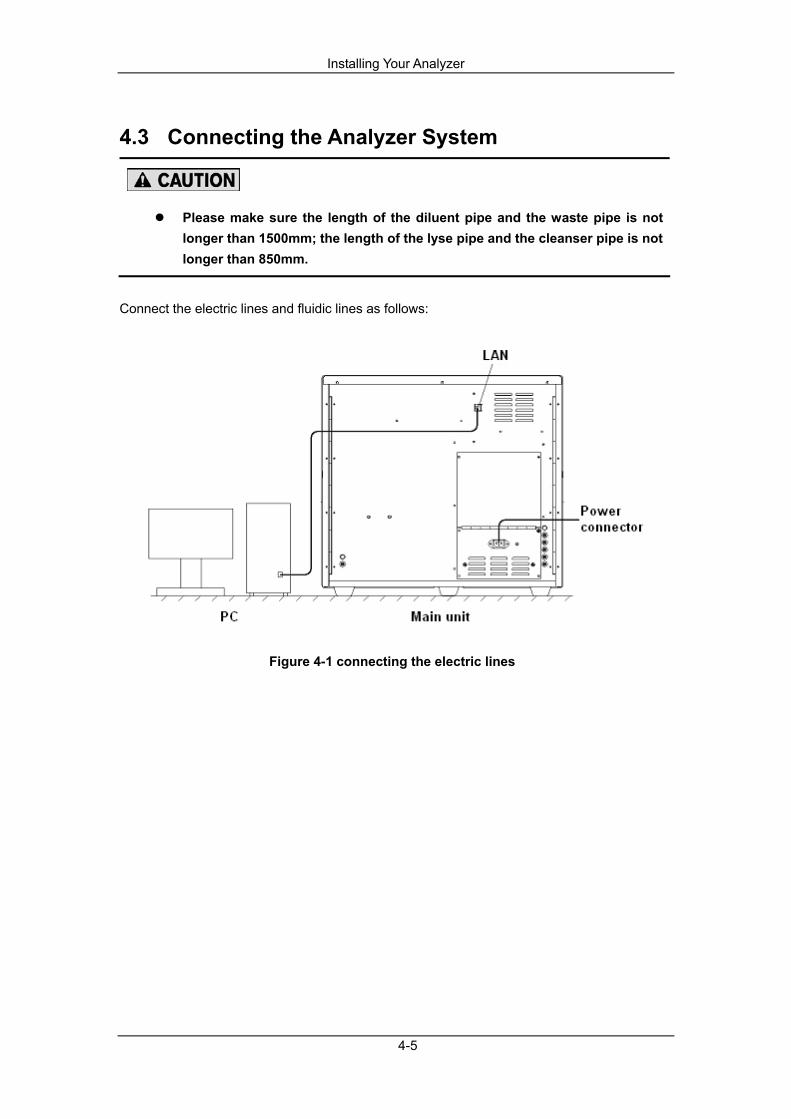
4.3 Connecting the Analyzer System
Please make sure the length of the diluent pipe and the waste pipe is not longer than 1500mm; the length of the lyse pipe and the cleanser pipe is not longer than 850mm.
Connect the electric lines and fluidic lines as follows:
Figure 4-1 connecting the electric lines

Installing Your Analyzer
4-6
Figure 4-2 Connecting the Fluidic Lines
5-1
5 Customizing the Analyzer Software
5.1 Introduction The BC-5380 is a flexible laboratory instrument that can be tailed to your work environment. You can use the “Setup” program to customize the software options as introduced in this chapter. The analyzer divides the operators into two levels, common user and administrator. Note that an administrator can access all the functions open to a common user. This chanter introduces how to customize your analyzer respectively as a common user level and as an administrator.
Customizing the Analyzer Software
5-2
5.2 Common User
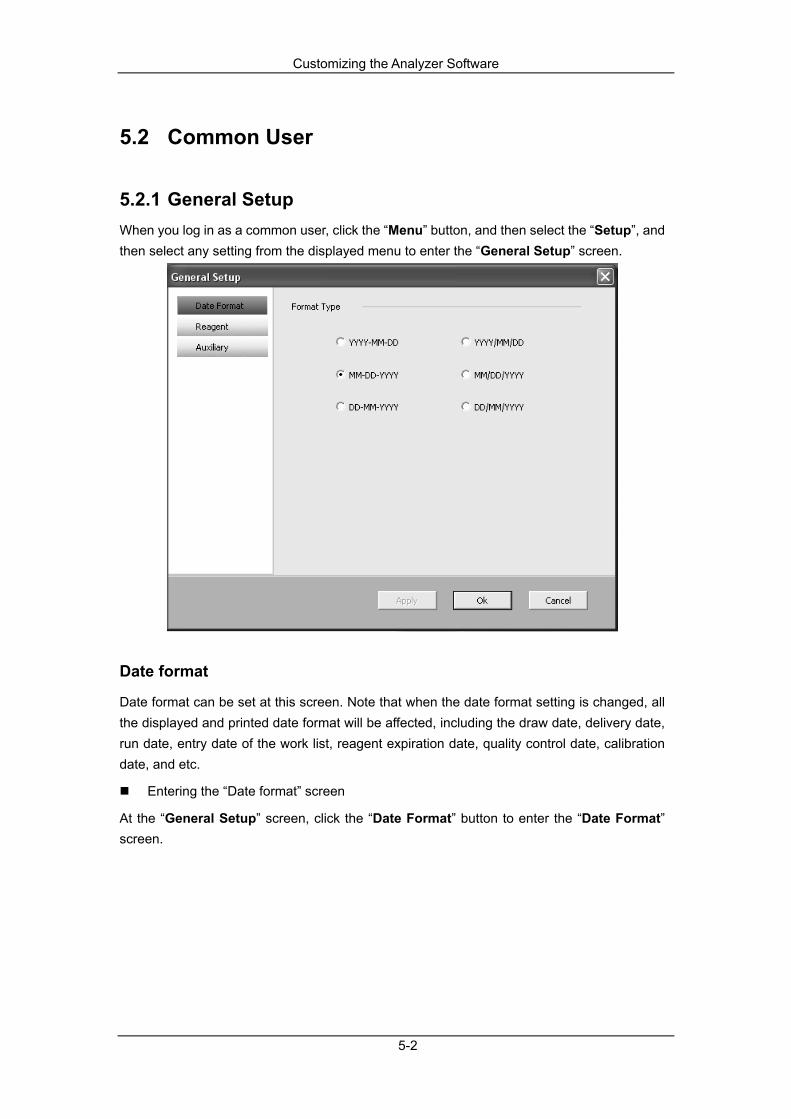
5.2.1 General Setup When you log in as a common user, click the “Menu” button, and then select the “Setup”, and then select any setting from the displayed menu to enter the “General Setup” screen.
Date format
Date format can be set at this screen. Note that when the date format setting is changed, all the displayed and printed date format will be affected, including the draw date, delivery date, run date, entry date of the work list, reagent expiration date, quality control date, calibration date, and etc.
Entering the “Date format” screen
At the “General Setup” screen, click the “Date Format” button to enter the “Date Format” screen.

Customizing the Analyzer Software
5-3
Selecting date format
Six date formats are available: “YYYY-MM-DD”, “YYYY/MM/DD”, “MM-DD-YYYY”, “MM/DD/YYYY”, “DD-MM-YYYY” and “DD/MM/YYYY”. To select the desired format, click the corresponding radio button.
Apply
Click the “Apply” button to save all the changes without closing the setup screen.
Ok
Click the “Ok” button to save all the settings and close the setup screen.
Cancel
Click the “Cancel” button to close the setup screen without saving the changes.
Exiting the setup screen
Click another setup button to switch to the corresponding screen.
You will not lose the new changes by switching to another screen. But the new changes will only be saved after you click the “Apply” or “Ok” button.

Customizing the Analyzer Software
5-4
Reagents
Be sure to set the reagent expiration date before the first use of the analyzer or after a new container of reagent is installed.
You can set the expiration date of the diluent, LEO (I) lyse, LEO (II) lyse, LH lyse and cleanser at the “Reagent” screen.
Entering the “Reagent” screen
At the “General Setup” screen, click the “Reagent” button to enter the “Reagent” screen.
Selecting whether to set the expiration date
If you wish to set the expiration date for the reagents, you can click the check box “Exp. Date” to select it. This option is selected as default.
If the “Exp. Date” check box is not selected, then the “Reagent Expired” will not be alarmed.
Setting the expiration date
Customizing the Analyzer Software
5-5
After selecting the check box of “Exp. Date”, you can click the arrow button of the edit box to set the expiration date of each reagent by using the date control.
The range of the expiration date is from the current system date to 2099-12-31.
You can not edit the open-container expiration date for it is calculated automatically by the software and displayed in the form of text.
If the current system date exceeds the displayed expiration date or the open-container expiration date whichever is earlier, then the “Reagent Expired” will be alarmed.
When the reagent is expired, you can check the expiration date of the sealed container and the open container here to determine which one led to the expiration alarm.
When the reagent is expired, you can not run any samples.
If an external barcode scanner is connected, you can click the “Use Barcode Scanner” check box to enable it. Scan the barcode with the external barcode scanner. If the scan is successful, the expiration date of the reagent will be displayed in the corresponding box.
If “Use Barcode Scanner” is selected, then the date control will be unavailable for you to enter the expiration date manually.
Selecting whether to set the lot No.
If you wish to set the lot No. for the reagents, you can click the check box “Lot No.” to select it. This option is selected as default.
Setting the lot number
Enter the lot number into “Lot No.” box.
Apply
Click the “Apply” button to save all the changes without closing the setup screen.
Ok
Click the “Ok” button to save all the settings and close the setup screen.

Customizing the Analyzer Software
5-6
Cancel
Click the “Cancel” button to close the setup screen without saving the changes.
Exiting the setup screen
Click another setup button to switch to the corresponding screen.
You will not lose the new changes by switching to another screen. But the new changes will only be saved after you click the “Apply” or “Ok” button.
Auxiliary
Entering the “Auxiliary” screen
At the “General Setup” screen, click the “Auxiliary” button to enter the “Auxiliary” screen.
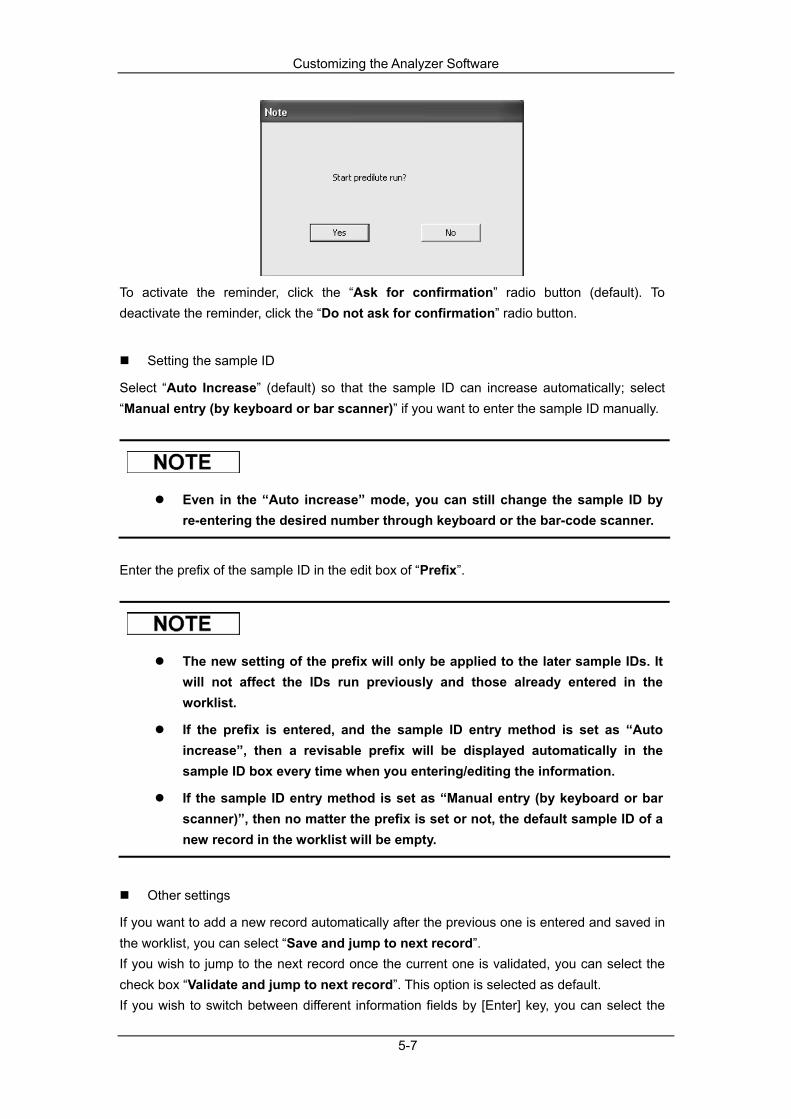
Selecting reminder of the predilute mode
If you have activated the reminder and selected the predilute mode, a message box will pop up to ask for confirmation every time you try to analyze a sample in the predilute mode.
Customizing the Analyzer Software
5-7
To activate the reminder, click the “Ask for confirmation” radio button (default). To deactivate the reminder, click the “Do not ask for confirmation” radio button.
Setting the sample ID
Select “Auto Increase” (default) so that the sample ID can increase automatically; select “Manual entry (by keyboard or bar scanner)” if you want to enter the sample ID manually.
Even in the “Auto increase” mode, you can still change the sample ID by re-entering the desired number through keyboard or the bar-code scanner.
Enter the prefix of the sample ID in the edit box of “Prefix”.
The new setting of the prefix will only be applied to the later sample IDs. It will not affect the IDs run previously and those already entered in the worklist.
If the prefix is entered, and the sample ID entry method is set as “Auto increase”, then a revisable prefix will be displayed automatically in the sample ID box every time when you entering/editing the information.
If the sample ID entry method is set as “Manual entry (by keyboard or bar scanner)”, then no matter the prefix is set or not, the default sample ID of a new record in the worklist will be empty.
Other settings
If you want to add a new record automatically after the previous one is entered and saved in the worklist, you can select “Save and jump to next record”. If you wish to jump to the next record once the current one is validated, you can select the check box “Validate and jump to next record”. This option is selected as default. If you wish to switch between different information fields by [Enter] key, you can select the
Customizing the Analyzer Software
5-8
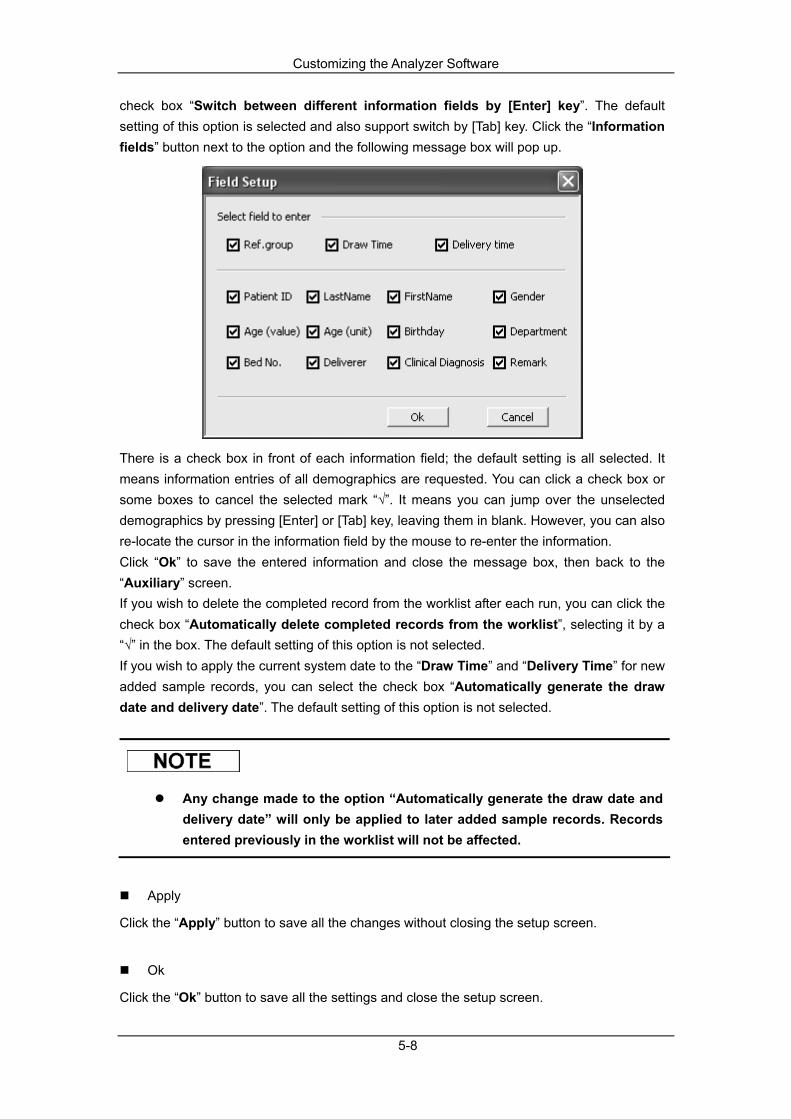
check box “Switch between different information fields by [Enter] key”. The default setting of this option is selected and also support switch by [Tab] key. Click the “Information fields” button next to the option and the following message box will pop up.
There is a check box in front of each information field; the default setting is all selected. It means information entries of all demographics are requested. You can click a check box or some boxes to cancel the selected mark “√”. It means you can jump over the unselected demographics by pressing [Enter] or [Tab] key, leaving them in blank. However, you can also re-locate the cursor in the information field by the mouse to re-enter the information. Click “Ok” to save the entered information and close the message box, then back to the “Auxiliary” screen. If you wish to delete the completed record from the worklist after each run, you can click the check box “Automatically delete completed records from the worklist”, selecting it by a “√” in the box. The default setting of this option is not selected. If you wish to apply the current system date to the “Draw Time” and “Delivery Time” for new added sample records, you can select the check box “Automatically generate the draw date and delivery date”. The default setting of this option is not selected.
Any change made to the option “Automatically generate the draw date and delivery date” will only be applied to later added sample records. Records entered previously in the worklist will not be affected.
Apply
Click the “Apply” button to save all the changes without closing the setup screen.
Ok
Click the “Ok” button to save all the settings and close the setup screen.

Customizing the Analyzer Software
5-9
Cancel
Click the “Cancel” button to close the setup screen without saving the changes.
Exiting the setup screen
Click another setup button to switch to the corresponding screen.
You will not lose the new changes by switching to another screen. But the new changes will only be saved after you click the “Apply” or “Ok” button.
5.2.2 User/Lab management User and Password
When you log in as a common user, click the “Menu” button, and then select “Setup”, then select “User and Password” from the pop up menu to enter the information list of all the administrators and common users.
Change password

Customizing the Analyzer Software
5-10
The current login user can change his/her password:
1. Highlight the current login user in the list, and then click the “Change password” button,
the following message box will pop up.
2. Enter the current login password in the edit box “Old password”, and then enter the new
password in the “New password” and “Confirm new password” box.
3. Finish entering; click “Ok”, then a message box will pop up.
4. Click “Ok” to close the message box and back to the previous screen.
The new password could be empty.
Exit
Click the “Close” button to exit the “User and Password” screen.
Customizing the Analyzer Software
5-11
Lab Information
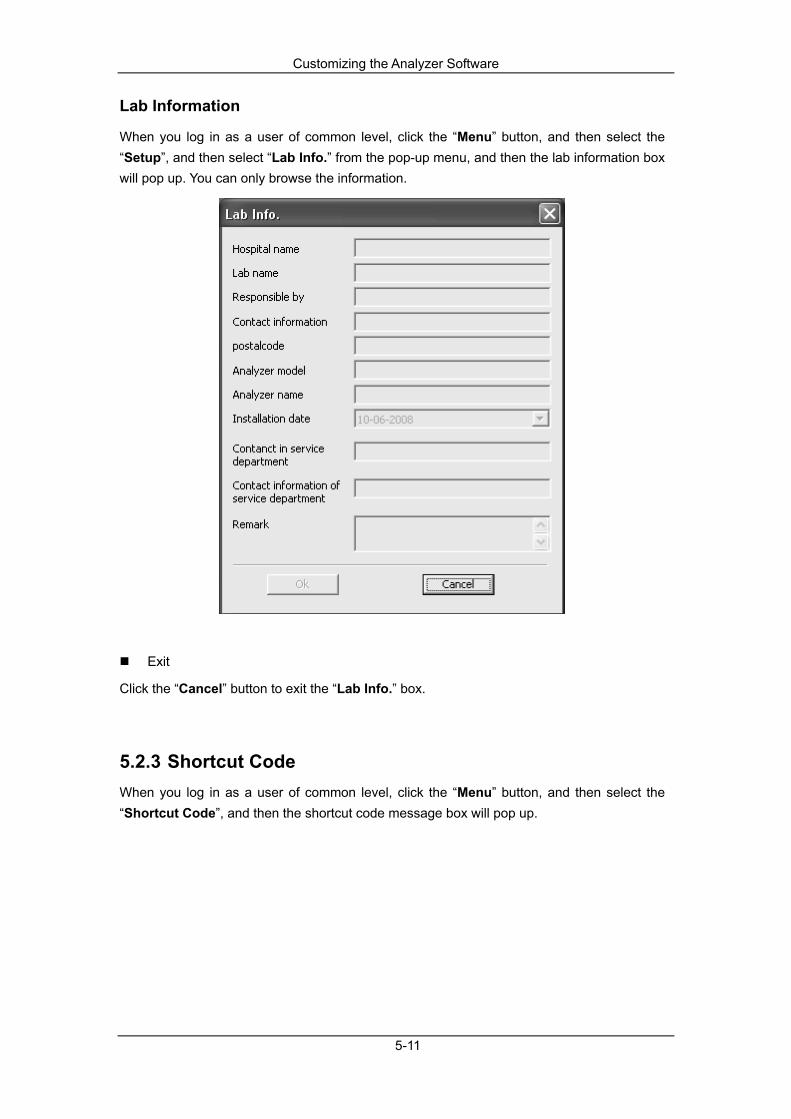
When you log in as a user of common level, click the “Menu” button, and then select the “Setup”, and then select “Lab Info.” from the pop-up menu, and then the lab information box will pop up. You can only browse the information.
Exit
Click the “Cancel” button to exit the “Lab Info.” box.
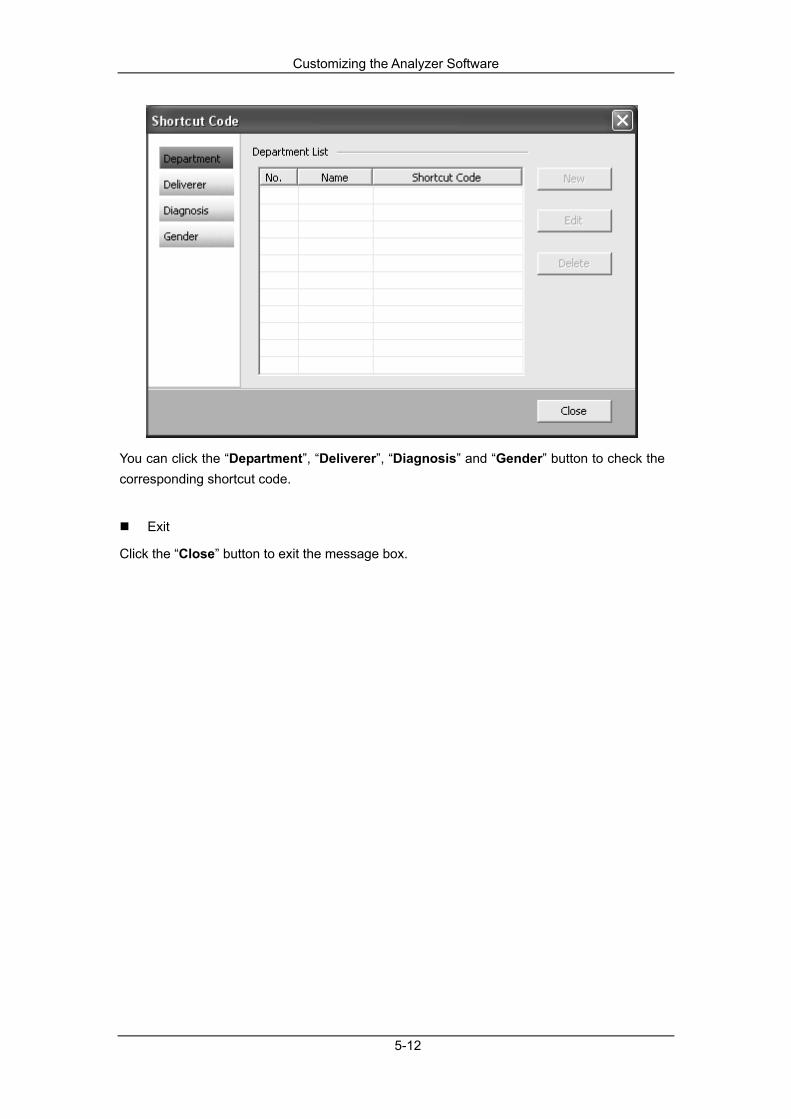
5.2.3 Shortcut Code When you log in as a user of common level, click the “Menu” button, and then select the “Shortcut Code”, and then the shortcut code message box will pop up.
Customizing the Analyzer Software
5-12
You can click the “Department”, “Deliverer”, “Diagnosis” and “Gender” button to check the corresponding shortcut code.
Exit
Click the “Close” button to exit the message box.

Customizing the Analyzer Software
5-13
5.3 Administrator
5.3.1 General Setup When you log in as a user of administrator level, click the “Menu” button, and then select the “Setup”, and then select any setting from the displayed menu to enter the “General Setup” screen. Besides the authorities of common level, a user of administrator level is enabled the following authorities.
Auxiliary
Entering the “Auxiliary” screen
At the “General Setup” screen, click the “Auxiliary” button to enter the “Auxiliary” screen.

Customizing the Analyzer Software
5-14
Authority setup
To allow common users to edit the ID of the sample run already in the review screen, you can select the check box “Edit ID of sample run already”. The default setting of this option is not selected. If you wish to enable users of common level the authority of editing/restoring the sample result, you can select the check box “Edit sample result”. This option is not selected as default. If you wish to enable the users of common level the authority of validating the sample result, you can click the check box “Validate sample”. This option is not selected as default.
Apply
Click the “Apply” button to save all the changes without closing the setup screen.
Ok
Click the “Ok” button to save the changes and close the setup screen.
Cancel
Customizing the Analyzer Software
5-15
Click the “Cancel” button to close the setup screen without saving the changes.
Exiting the setup screen
Click another setup button to switch to the corresponding screen.
You will not lose the new changes by switching to another screen. But the new changes will only be saved after you click the “Apply” or “Ok” button.
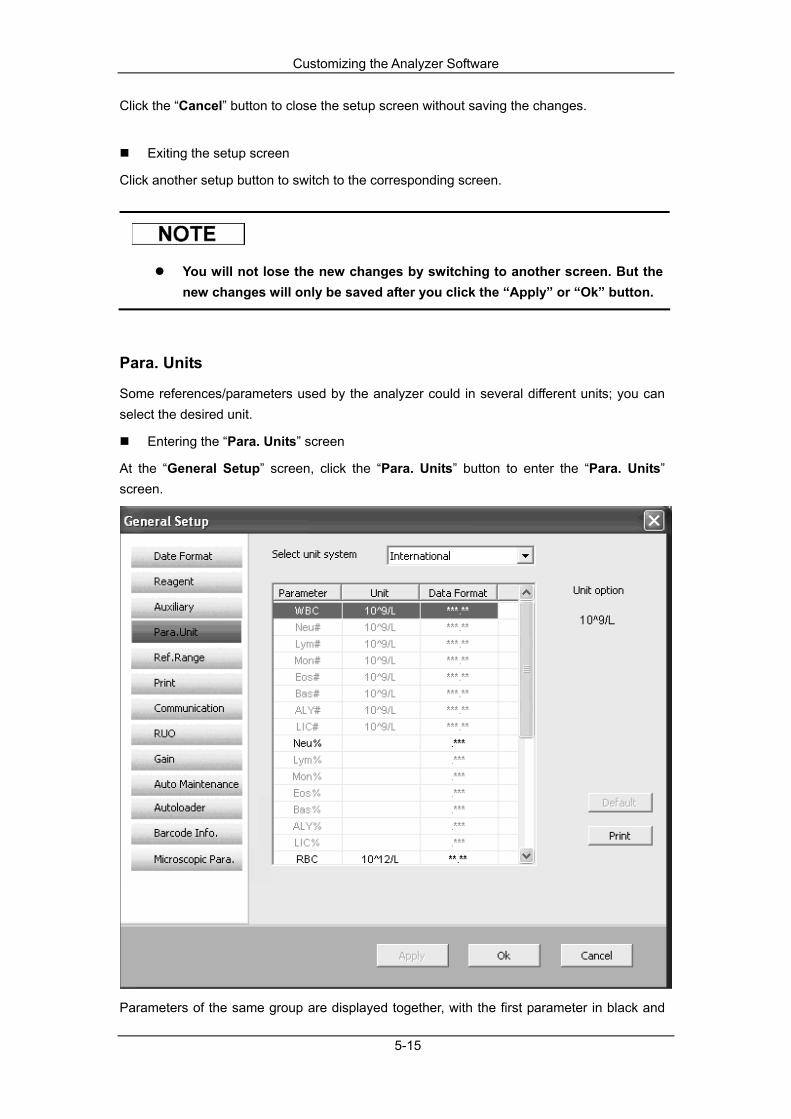
Para. Units
Some references/parameters used by the analyzer could in several different units; you can select the desired unit.
Entering the “Para. Units” screen
At the “General Setup” screen, click the “Para. Units” button to enter the “Para. Units” screen.
Parameters of the same group are displayed together, with the first parameter in black and

Customizing the Analyzer Software
5-16
the rest in gray.
Unit standard
Click the check box “Select unit system” to select the desired unit standard form the following seven ones: Customized, China, International (default), USA, Canada, Netherlands and Britain.
When selecting different unit standard, the corresponding unit list and unit option will be displayed differently.
If “Customized” is selected, then you can modify the unit of each parameter.
If other option is selected except the “Customized”, then the unit of each parameter can only be browsed.
Para. units Setup
When “Customized” is selected, click the desired parameter, and then click the unit options provided on the right to select a new unit for the parameter.
For parameters in a same group, if the unit of any parameter changes, the units of the rest parameters change accordingly.
The unit of MCH changes according to MCHC and HGB, the operator can not modify it.
If the parameters units change, the format of the data displayed in the list will change accordingly.
Default
When “Customized” is selected, click the “Default” button to have the default units (International) of all parameters displayed in the corresponding cell.
Click the “Print” button to print all the parameters’ units in the current screen. If you haven’t saved the settings when clicking the “Print” button, a message box will pop up.

Customizing the Analyzer Software
5-17
Click “Yes” to save the new settings and print them; click “No” to print the content of the original settings without saving.
Apply
Click the “Apply” button to save all the changes without closing the setup screen.
Ok
Click the “Ok” button to save all the settings and close the setup screen.
Cancel
Click the “Cancel” button to close the setup screen without saving the changes.
Exiting the setup screen
Click another setup button to switch to the corresponding screen.
You will not lose the new changes by switching to another screen. But the new changes will only be saved after you click the “Apply” or “Ok” button.
Ref. Range
The “Ref. Range” screen is where you view and set the high and low limits for your patients. The analyzer flags any parameter value above (H) or below (L) these limits. This analyzer divides patients into 5 demographic groups: General, Man, Woman, Child and Neonate. You can also customize another 5 groups. The default setting is “General”. The recommended limits are provided for your reference only. To avoid misleading parameter flags, be sure to set the patient limits according to the characteristics of your local population.
Entering the “Ref. Range” screen
At the “General Setup” screen, click the “Ref. Range” button to enter the “Ref. Range” screen.

Customizing the Analyzer Software
5-18
Set ref. group
Click the “Set ref. group” button, a message box will pop up.

Customizing the Analyzer Software
5-19
You can not modify the names and corresponding information of the five fixed reference groups in the list.
You can modify the names, age range (including age value and unit) and gender of the five customized reference groups.
Double click the “Ref. Group” cell of the five customized reference group to modify the name of the group.
The reference group title can not be empty.
The group title entered can not use General, Man, Woman, Child and Neonate. The group title can not be the same as existing ones.
Double click the “Age” cell of the customized reference group to modify the age; double click the age unit cell to open a combo box with different age units for you to choose from: Year, Month, Day, and Hour. Double click the “Gender” cell of the customized reference group to open a combo box with different options for you to choose from: Not defined, Male, Female, Empty.

Customizing the Analyzer Software
5-20
Click the check box of “Automatically match the customized ref. group according to age and gender” to select it. The option is not selected as default.
If “Automatically match the customized ref. group according to age and gender” is not selected, then the five fixed ref. groups will be used to match according to patient’s age and gender automatically.
If “Automatically match the customized ref. group according to age and gender” is selected but the customized ref. groups have not been edited, then the five fixed ref. groups will be used to match according to patient’s age and gender automatically.
If “Automatically match the customized ref. group according to age and gender” is selected and the customized ref. groups have been edited, then the customized ref. groups will be used to match firstly. If matching is failed, and then the five fixed ref. group will be used to match according to patient’s age and gender automatically.
When the customized ref. groups are used to match, the matching will be performed from top down according to the customized ref. groups displayed in the screen.
Click one of the reference groups to highlight it, and then click the “Set to be default ref. group” button to set the group as the default group when entering the worklist. Click one of the reference groups to highlight it, and then click the “Default” button to display the default information including group title, age limit, age unit and gender in the corresponding cell. Click “Print” to print out the settings in accordance with the age and gender of the reference group. If the previous settings are not saved when you click the “Print” button, a message box will pop up.
Click “Yes” to save the new settings and print them; click “No” to print the content of the original settings without saving. Click the “Ok” button to save and refresh the settings and close the “Set ref. group” message box.
Setup the Ref. range
1. Click the “Ref. Group” combo box, and then select the desired group from the options:
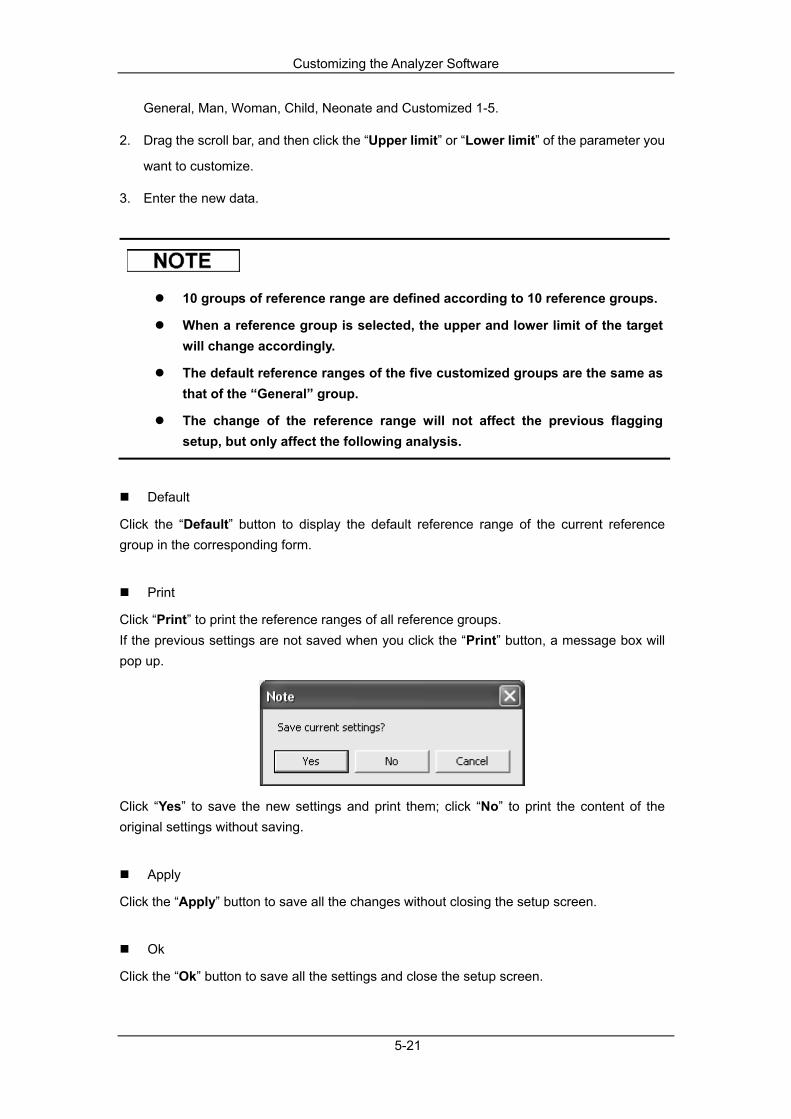
Customizing the Analyzer Software
5-21
General, Man, Woman, Child, Neonate and Customized 1-5.
2. Drag the scroll bar, and then click the “Upper limit” or “Lower limit” of the parameter you
want to customize.
3. Enter the new data.
10 groups of reference range are defined according to 10 reference groups.
When a reference group is selected, the upper and lower limit of the target will change accordingly.
The default reference ranges of the five customized groups are the same as that of the “General” group.
The change of the reference range will not affect the previous flagging setup, but only affect the following analysis.
Default
Click the “Default” button to display the default reference range of the current reference group in the corresponding form.
Click “Print” to print the reference ranges of all reference groups. If the previous settings are not saved when you click the “Print” button, a message box will pop up.
Click “Yes” to save the new settings and print them; click “No” to print the content of the original settings without saving.
Apply
Click the “Apply” button to save all the changes without closing the setup screen.
Ok
Click the “Ok” button to save all the settings and close the setup screen.

Customizing the Analyzer Software
5-22
Cancel
Click the “Cancel” button to close the setup screen without saving the changes.
Exiting the setup screen
Click another setup button to switch to the corresponding screen.
You will not lose the new changes by switching to another screen. But the new changes will only be saved after you click the “Apply” or “Ok” button.
Entering the “Print” screen
At the “General Setup” screen, click the “Print” button to enter the “Print” screen.
Setting the print title
Enter the print title in the “Title” box. The default title is “Hematology Analysis Report”.

Customizing the Analyzer Software
5-23
Selecting paper type
Click the “Paper type” box, select the desired paper type from the five types: A5 (default), A4, continuous paper, B6 and B5.
Setting number of copies
If you want multiple copies of the same patient report to be printed, you can enter the desired number (1 - 100) into the “Copies” field. The default number is 1.
Setting print format
Click the “Format” combo box to display the report format options for you to select from. The report format in the combo box differs according to the selected paper type. The relationships are shown in the following list:
Paper type Format Note Whole page, all para., with graph
Half page, all para., without graph
Half page, compact
Half page, no diff para., with graph
microscopic exam results report
A4
Common Microscopic Exam. Para.
All para., with graph The same as “Half page, compact” of A4
All para., without graph The same as “Half page, all para., without graph” of A4
No diff para., with graph The same as “Half page, no diff para., with graph” of A4
A5, continuous paper, B5
Common Microscopic Exam. Para.
All para., with graph The same as “Half page, compact” of A4
All para., without graph The same as “Half page, all para., without graph” of A4
B6
No diff para., with graph The same as “Half page, no diff para., with graph” of A4
Print Preview
Click the “Print Preview” button to preview the print report.

Customizing the Analyzer Software
5-24
After editing the print setup, you should preview the report before printing to make sure the setup is correct.
Customizing report format
You can click the “Customize” button to enter the “PrintTemplate” screen, and then customize the print template. See Chapter 12 Customizing the Print Template for details of how to customize.
Autoprint
The analyzer can auto-print the report in the set format once the analysis result is obtained. Click “On” to enable the autoprint function; click “Off” to disable the autoprint function. The default setting is “Off”.
Autoprint after validation
If “Autoprint” is “On”, then the “Autoprint after validation” check box will be activated. Select the “Autoprint after validation” to autoprint the report only after the sample is validated; otherwise, the report will be printed once the running is finished.
Print Flag
If the Flag information is needed in the printed report, you can select the “Print Flag” check box .The default setting of this option is not selected.
If the default report template that you selected can display the flag information, then the “Print Flag” box here will be available for you to select.
If the default report template that you selected can not display the flag information, or the selected template is a customized one, then the “Print Flag” box here will be unavailable for you to select.
Print suspect flags “?”
If the suspect flags “?” are needed in the printed report, you should select the “Print suspect flags “?”” check box. This option is selected as default.
Print ref. range
If the reference range is needed in the printed report, you should select the “Print ref. range” check box. This option is selected as default.
Customizing the Analyzer Software
5-25
Print ref. range flags
If the ref. range flags (“H” or “L”) are needed in the printed report, you should select the “Print ref. range flags” check box. This option is selected as default.
If “Print ref. range” is selected, then the “Print ref. range flags” option will also be enabled and unavailable for you to edit. The ref. range and the ref. range flags (“H” or “L”) will be printed in the report together.
If you want to de-select the “Print ref. range flags” option when “Print ref. range” is selected (print the ref. range in the report only), please contact Mindray customer service department or your local distributor.
If “Print ref. range” is not selected, then you can select whether to print the ref. range flags (“H” or “L”) in the report at will.
Print result edited flags
If the result edited flags (“E” or “e”) are needed in the printed report, you should select the “Print result edited flags” check box. This option is selected as default. For details of how to edit result, please see Edit Result section in 7.2.3 or 7.3.3 Function of the Buttons
Print ambient temp. abnormal flags
If the ambient temp. abnormal flags (“T”) are needed in the printed report, you should select the “Print ambient temp. abnormal flags” check box. This option is selected as default.
Print QC graph time
If the test date of each QC point needs to be printed out when printing QC graphs, you can select the “Print QC graph time” check box.
Setting default printer
Click the “Default printer” check box to display the printers available to the current system, and then you can select one type from them as the default printer to perform all the print tasks.
For operating system of Windows Vista, the right of using network printer is restricted by users' access level. To enable the network printer, you should log on the system as administrator, and then right click the shortcut icon of

Customizing the Analyzer Software
5-26
the terminal software and run it as administrator.
If you change the default printer here, the default printer of the current system will also change.
If you change the default printer in the operation system, then the printer name in this check box will also change.
Apply
Click the “Apply” button to save all the changes without closing the setting screen.
Ok
Click the “Ok” button to save all the settings and close the setting screen.
Cancel
Click the “Cancel” button to close the setup screen without saving the changes.
Exiting the setup screen
Click another setup button to switch to the corresponding screen.
You will not lose the new changes by switching to another screen. But the new changes will only be saved after you click the “Apply” or “Ok” button.
Communication
Entering the “Communication” screen
At the “General Setup” screen, click the “Communication” button to enter the “Communication” screen.

Customizing the Analyzer Software
5-27
The settings here are applied to the communication between the analyzer and the external (i.e. LIS), but not between the analyzer and the terminal software.
Setting IP address
Enter the IP address into the empty (default) “IP address” box.
Setting Port
Enter the port number into the empty (default) “Port” box.
Auto-communication
The function is used for automatically transmitting the sample result to the external data management software or LIS/HIS system. Click “On” to enable the auto-communication; click “Off” to disable the auto-communication. The default setting is “Off”.
Customizing the Analyzer Software
5-28
Bidirectional LIS/HIS communication
The function is used for automatically obtaining the sample/patient information from the LIS/HIS system after the sample ID is entered or scanned, and automatically transmitting the sample result to the LIS/HIS system. Click “On” to enable the bidirectional LIS/HIS communication; click “Off” to disable it. The default setting is “Off”.
Histogram transmission method
The function is used to select the histogram transmission method. Click “Not Transmit” to disable the transmission of the 3 histograms while transmitting sample records. Click “Bitmap” (default), then the 3 histograms will be transmitted in the form of graphs to the LIS/HIS system. Click “Data”, then the 3 histograms will be transmitted in the form of data to the LIS/HIS system.
Scattergram transmission method
The function is used to select the scattergram transmission method. Click “Not transmit” to disable the transmission of the scattergram while transmitting sample records. Click “Bitmap” (default), then the scattergram will be transmitted in the form of graph to the LIS/HIS system.
Communication Acknowledgement
Select “On”: when IPU software is communicating with LIS/HIS, the HL7 protocol must be strictly followed. After receiving the ACK acknowledgement from LIS/HIS, the communication can be deemed successful; otherwise the communication fails, a communication failure notice will pop up. Select “Off”: when IPU software is communicating with LIS/HIS, even if no ACK acknowledgement from LIS/HIS is received, the communication can be deemed successful; no failure notice will pop up. Communication flag “T” is recorded in the communication column in Table Review screen.
Apply
Click the “Apply” button to save all the changes without closing the setup screen.
Ok
Click the “Ok” button to save all the settings and close the setup screen.
Cancel
Click the “Cancel” button to close the setup screen without saving the changes.

Customizing the Analyzer Software
5-29
Exiting the setup screen
Click another setup button to switch to the corresponding screen.
You will not lose the new changes by switching to another screen. But the new changes will only be saved after you click the “Apply” or “Ok” button.
Research Use Only Parameter (RUO parameter)
The RUOs include ALY%, LIC%, ALY# and LIC#.
The RUO parameters are for research use only, not for diagnostic use.
Entering the “RUO” screen
At the “General Setup” screen, click the “RUO” button to enter the “RUO” screen.

Customizing the Analyzer Software
5-30
Setting display
If you wish to display the RUO parameters, select the “Display RUO parameters” check box. This option is selected as default. If “Display RUO parameters” is selected and you also wish to display the “*” mark, you can select the “Display “*” mark” check box. This option is selected as default. If “Display RUO parameters” and “Display “*” mark” are selected and you also wish to display declaration (“*” means “research use only, not for diagnostic use”), you can select the “Display declaration” check box. This option is selected as default.
Setting print
If you wish to print the RUO parameters, you can select the “Print RUO parameters” check box. This option is selected as default. If “Print RUO parameters” is selected and you also wish to print the “*” mark, you can select the “Print “*” mark” check box. This option is selected as default. If “Print RUO parameters” and “Print “*” mark” are selected and you also wish to print declaration (“*” means “research use only, not for diagnostic use”), you can select the “Print declaration” check box. This option is selected as default.
Any change made to the settings of displaying or printing the RUO parameters, the “*” mark and the declaration will be applied to all the RUO parameters (before and after the change is made).
Apply
Click the “Apply” button to save all the changes without closing the setup screen.
Ok
Click the “Ok” button to save all the settings and close the setup screen.
Cancel
Click the “Cancel” button to close the setup screen without saving the changes.
Exiting the setup screen
Click another setup button to switch to the corresponding screen.
You will not lose the new changes by switching to another screen. But the
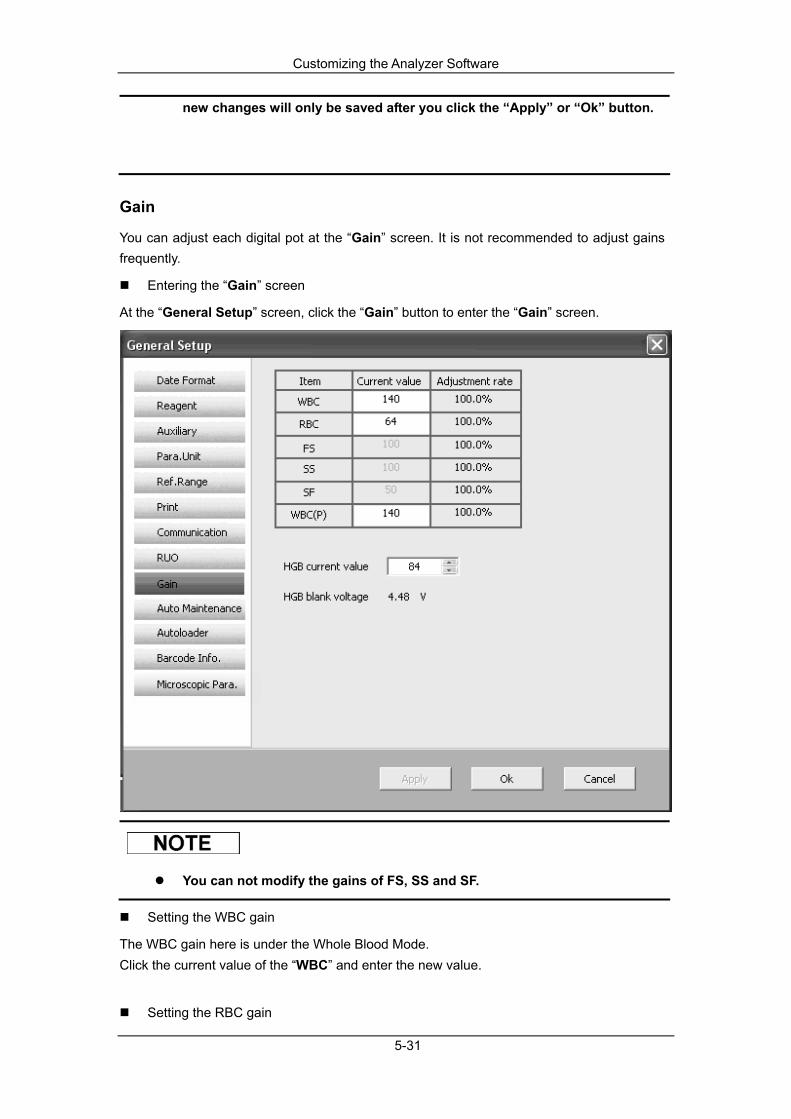
Customizing the Analyzer Software
5-31
new changes will only be saved after you click the “Apply” or “Ok” button.
Gain
You can adjust each digital pot at the “Gain” screen. It is not recommended to adjust gains frequently.
Entering the “Gain” screen
At the “General Setup” screen, click the “Gain” button to enter the “Gain” screen.
You can not modify the gains of FS, SS and SF.
Setting the WBC gain
The WBC gain here is under the Whole Blood Mode. Click the current value of the “WBC” and enter the new value.
Setting the RBC gain
Customizing the Analyzer Software
5-32
Click the current value of the “RBC” and enter the new value.
Setting the WBC(P) gain
The WBC gain here is under the Predilute Mode. Click the current value of the “WBC (P)” and enter the new value.
Setting the HGB gain
You can adjust the HGB blank voltage by adjusting the HGB gain. You can enter the value directly in the edit box or click the adjusting button to adjust the HGB gain.
Apply
Click the “Apply” button to save all the changes without closing the setup screen.
Ok
Click the “Ok” button to save all the settings and close the setup screen.
Cancel
Click the “Cancel” button to close the setup screen without saving the changes.
Exiting the setup screen
Click another setup button to switch to the corresponding screen.
You will not lose the new changes by switching to another screen. But the new changes will only be saved after you click the “Apply” or “Ok” button.
Auto Maintenance
Entering the “Auto Maintenance” screen
Click the “Auto Maintenance” button to enter the “Auto Maintenance” screen.

Customizing the Analyzer Software
5-33
Setting the “Auto-sleep”
You can set here when to start the auto-maintain procedure after the relevant fluidic operation stops. Enter the desired time ranging from 15 to 120 minutes into the “Wait” box.
Setting “Time-based maintenance”
You can enter the desired time in the “Preset time” or click the adjusting button to set the preset time for time-based maintenance ranging from [0:00(default) – 23:59]. You can enter the desired time in the “Pre-reminding” or click the adjusting button to set the pre-reminding time for time-based maintenance. The setting range is [0 minute, 2 hours], the default time is 1 hour. You can enter the desired time in the "Soak for" box to set the duration of the time-based maintenance. The range for the entry is [2 hours, 72 hours], and the default time is 4 hours.
Apply
Click the “Apply” button to save all the changes without closing the setup screen.
Ok
Click the “Ok” button to save all the settings and close the setup screen.
Customizing the Analyzer Software
5-34
Cancel
Click the “Cancel” button to close the setup screen without saving the changes.
Exiting the setup screen
Click another setup button to switch to the corresponding screen.
You will not lose the new changes by switching to another screen. But the new changes will only be saved after you click the “Apply” or “Ok” button.
Autoloader
When the autoloader is adopted, you can set the conditions when to stop the autoloader, the rules to arrange the sample ID and whether to display statistics.
In order to avoid personal injury and damage to the analyzer, it is recommended that you set the conditions when to stop the autoloader.
Entering the setup screen
At the “General Setup” screen, click the “Autoloader” button to enter the “Autoloader” screen.
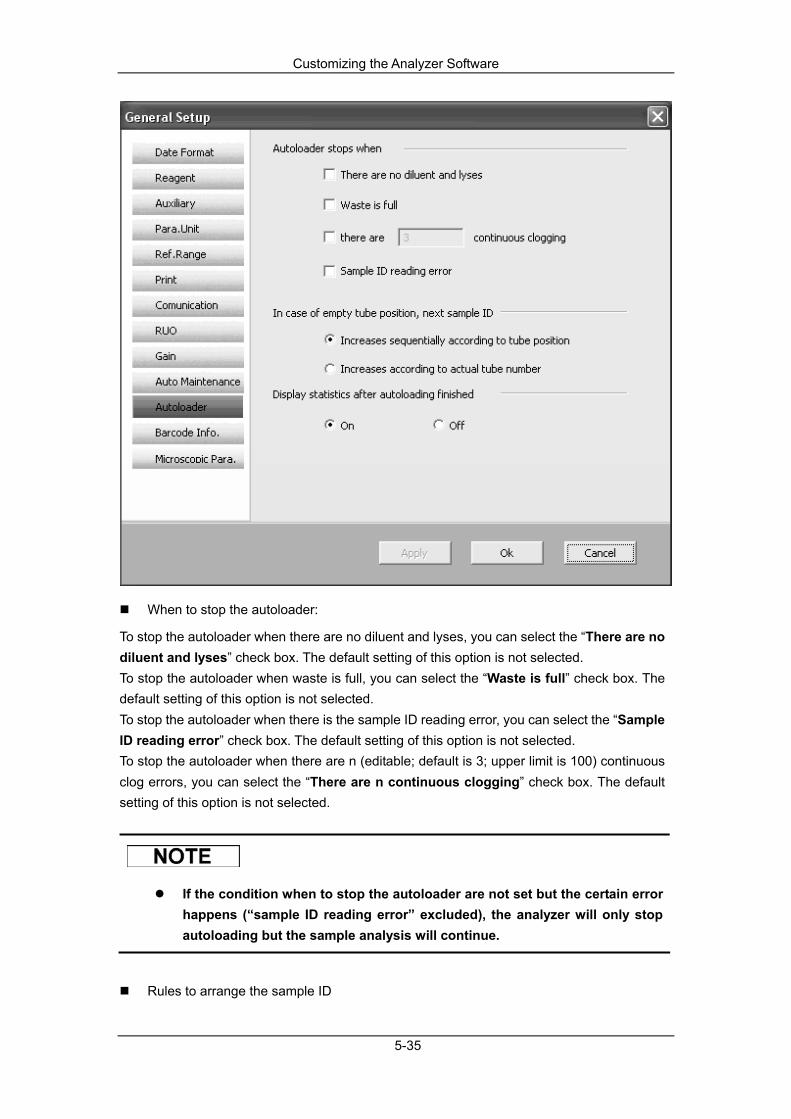
Customizing the Analyzer Software
5-35
When to stop the autoloader:
To stop the autoloader when there are no diluent and lyses, you can select the “There are no diluent and lyses” check box. The default setting of this option is not selected. To stop the autoloader when waste is full, you can select the “Waste is full” check box. The default setting of this option is not selected. To stop the autoloader when there is the sample ID reading error, you can select the “Sample ID reading error” check box. The default setting of this option is not selected. To stop the autoloader when there are n (editable; default is 3; upper limit is 100) continuous clog errors, you can select the “There are n continuous clogging” check box. The default setting of this option is not selected.
If the condition when to stop the autoloader are not set but the certain error happens (“sample ID reading error” excluded), the analyzer will only stop autoloading but the sample analysis will continue.
Rules to arrange the sample ID

Customizing the Analyzer Software
5-36
You can click the “Increases sequentially according to tube position” radio button to have the sample ID increased sequentially even an empty tube position is detected. You can click the “Increases according to actual tube number” radio button to have the sample ID increased according to actual tube number (i.e. the empty tube position will be excluded). The default setting of this option is “increases sequentially according to tube position”.
Statistics
Click “On” to enable the statistics after the autoloading is finished every time. Click “Off” to disable the function (default).
Apply
Click the “Apply” button to save all the changes without closing the setup screen.
Ok
Click the “Ok” button to save all the changes and close the setup screen.
Cancel
Click the “Cancel” button to close the setup screen without saving the changes.
Exiting the setup screen
Click another setup button to switch to the corresponding screen.
You will not lose the new changes by switching to another screen. But the new changes will only be saved after you click the “Apply” or “Ok” button.
Barcode
You can set the symbology for the analyzer. Totally 6 code systems are supported by the analyzer, namely, CODE39, CODE93, CODEBAR, CODE128, UPC/EAN and ITF (chiasmatic 25 code).
Entering the setup screen
At the “General Setup” screen, click the “Barcode Info.” button to enter the “Barcode Info.” screen.

Customizing the Analyzer Software
5-37
Removing restriction on the number of digits
If any of the 4 code systems (CODE39, CODE93, CODEBAR and CODE128) are selected, you can set to remove the restriction on the number of digits. Select the “Unlimited number of digits” check box, and the “Digits” edit boxes of the selected code systems turn gray; you are not able to edit the number of digits, and barcodes of any length of the selected code systems can be scanned.
It is suggested not select more than one symbology and the “Unlimited number of digits” box at the same time, which may cause misreading of barcodes.
When “Unlimited number of digits” is selected, and digit number of the barcode scanned is more than 20, the barcode will be cut automatically without any alarm message.
Setting the code system and digits
Customizing the Analyzer Software
5-38
Select the check box of the desired code system and enter the digits of the code into the “Digits” box. For CODE39, CODE93, CODEBAR and CODE128, the digits range is 1-20. For ITF, the digits range is the evens between 1 to 20.For UPC/EAN, the digits range is controlled by the analyzer automatically.
Be sure that the symbology and the character length set match the actual bar-code in use, and it is suggested not select the symbology not used on site, which may cause misreading of barcodes.
Apply
Click the “Apply” button to save all the changes without closing the setup screen.
Ok
Click the “Ok” button to save all the changes and close the setup screen.
Cancel
Click the “Cancel” button to close the setup screen without saving the changes.
Exiting the setup screen
Click another setup button to switch to the corresponding screen.
You will not lose the new changes by switching to another screen. But the new changes will only be saved after you click the “Apply” or “Ok” button.
Microscopic Para.
You can set the microscopic parameters for the display of the "Microscopic Exam. And Others" tab at the "Review" screen and the printout template for reports.
Entering the setup screen
At the “General Setup” screen, click the “Microscopic Para.” button to enter the “Microscopic Para.” screen.
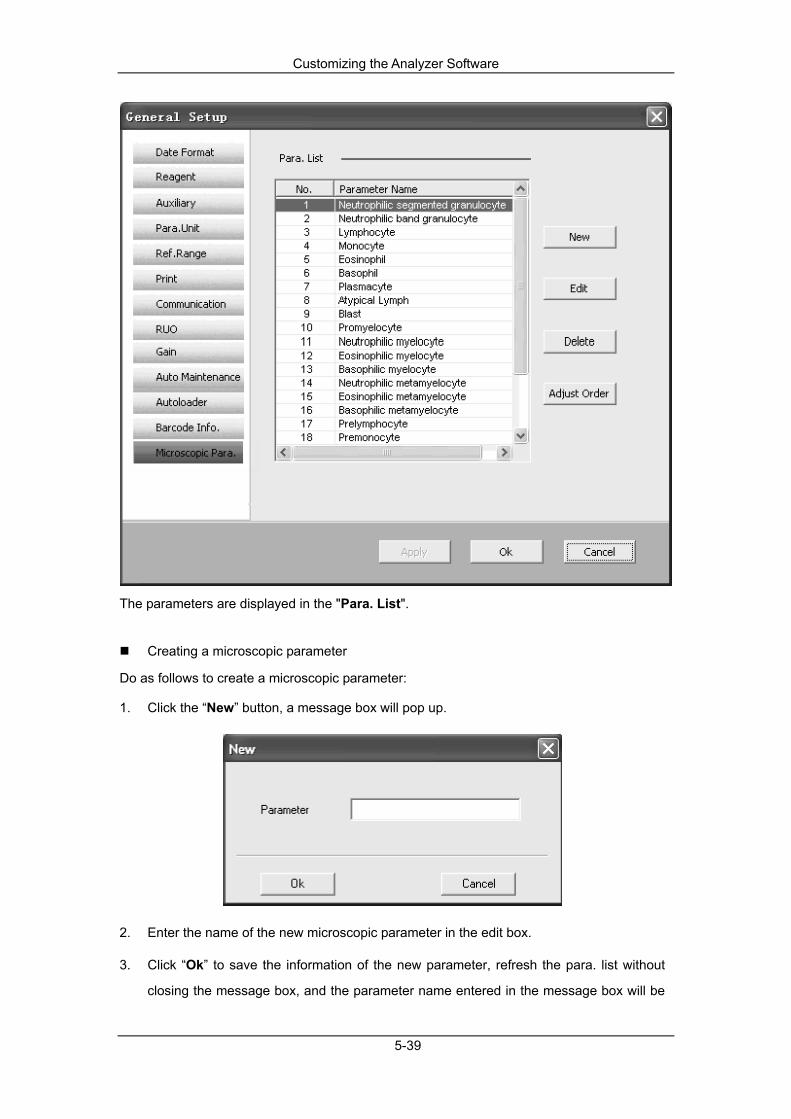
Customizing the Analyzer Software
5-39
The parameters are displayed in the "Para. List".
Creating a microscopic parameter
Do as follows to create a microscopic parameter:
1. Click the “New” button, a message box will pop up.
2. Enter the name of the new microscopic parameter in the edit box.
3. Click “Ok” to save the information of the new parameter, refresh the para. list without
closing the message box, and the parameter name entered in the message box will be
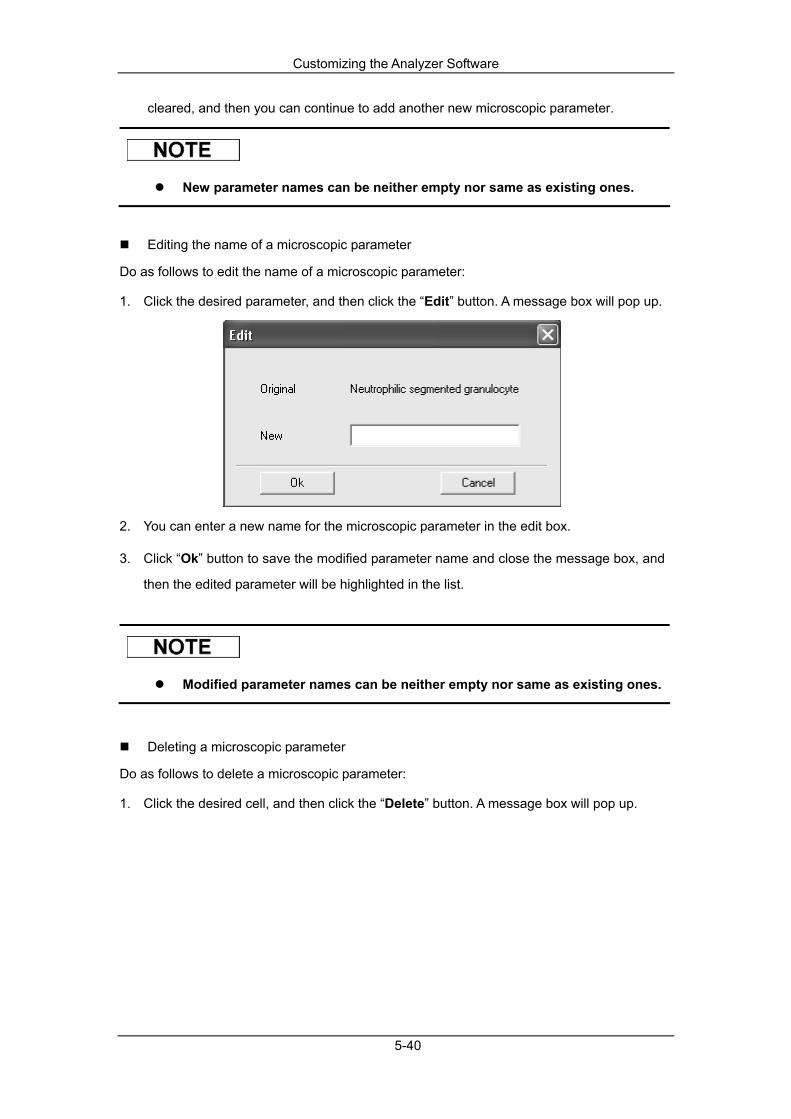
Customizing the Analyzer Software
5-40
cleared, and then you can continue to add another new microscopic parameter.
New parameter names can be neither empty nor same as existing ones.
Editing the name of a microscopic parameter
Do as follows to edit the name of a microscopic parameter:
1. Click the desired parameter, and then click the “Edit” button. A message box will pop up.
2. You can enter a new name for the microscopic parameter in the edit box.
3. Click “Ok” button to save the modified parameter name and close the message box, and
then the edited parameter will be highlighted in the list.
Modified parameter names can be neither empty nor same as existing ones.
Deleting a microscopic parameter
Do as follows to delete a microscopic parameter:
1. Click the desired cell, and then click the “Delete” button. A message box will pop up.
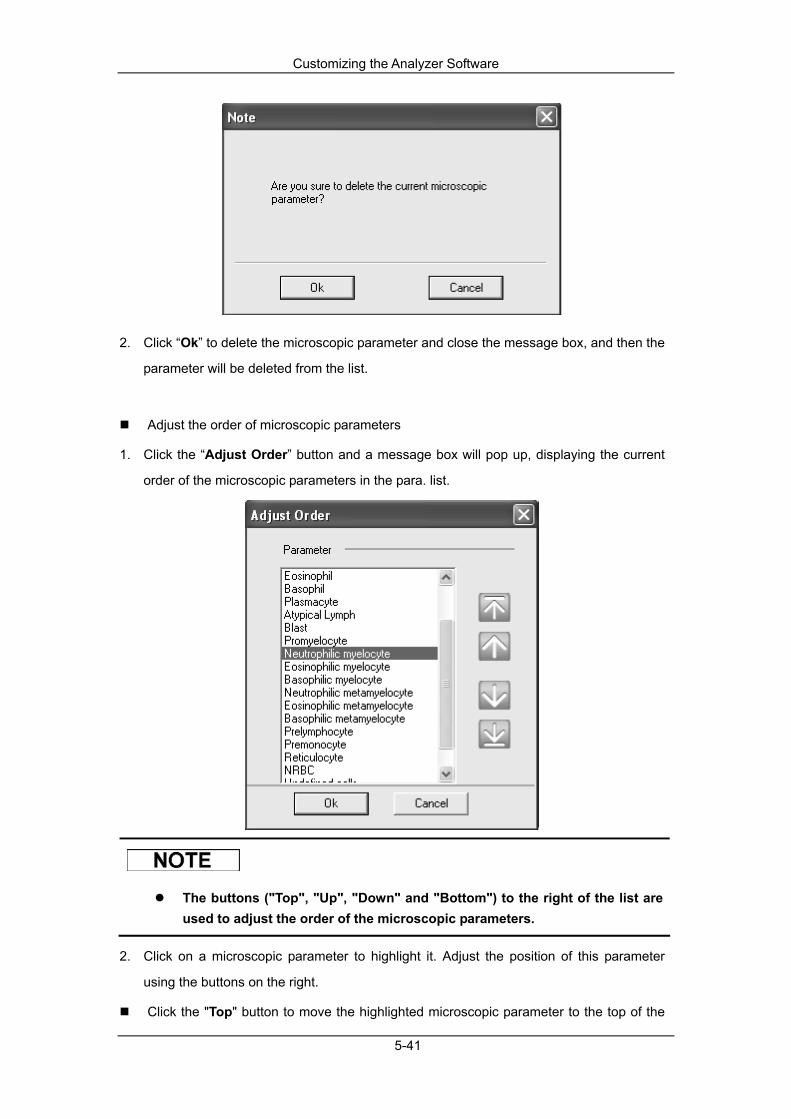
Customizing the Analyzer Software
5-41
2. Click “Ok” to delete the microscopic parameter and close the message box, and then the
parameter will be deleted from the list.
Adjust the order of microscopic parameters
1. Click the “Adjust Order” button and a message box will pop up, displaying the current
order of the microscopic parameters in the para. list.
The buttons ("Top", "Up", "Down" and "Bottom") to the right of the list are used to adjust the order of the microscopic parameters.
2. Click on a microscopic parameter to highlight it. Adjust the position of this parameter
using the buttons on the right.
Click the "Top" button to move the highlighted microscopic parameter to the top of the
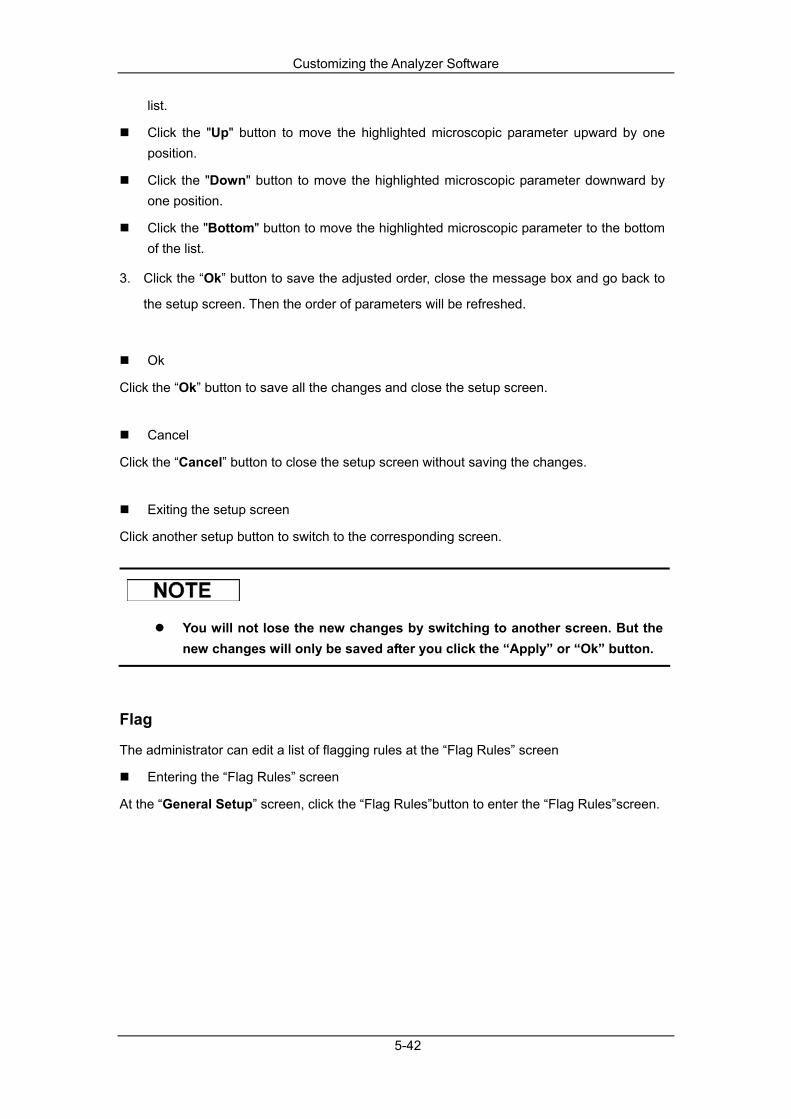
Customizing the Analyzer Software
5-42
list.
Click the "Up" button to move the highlighted microscopic parameter upward by one position.
Click the "Down" button to move the highlighted microscopic parameter downward by one position.
Click the "Bottom" button to move the highlighted microscopic parameter to the bottom of the list.
3. Click the “Ok” button to save the adjusted order, close the message box and go back to
the setup screen. Then the order of parameters will be refreshed.
Ok
Click the “Ok” button to save all the changes and close the setup screen.
Cancel
Click the “Cancel” button to close the setup screen without saving the changes.
Exiting the setup screen
Click another setup button to switch to the corresponding screen.
You will not lose the new changes by switching to another screen. But the new changes will only be saved after you click the “Apply” or “Ok” button.
Flag
The administrator can edit a list of flagging rules at the “Flag Rules” screen
Entering the “Flag Rules” screen
At the “General Setup” screen, click the “Flag Rules”button to enter the “Flag Rules”screen.
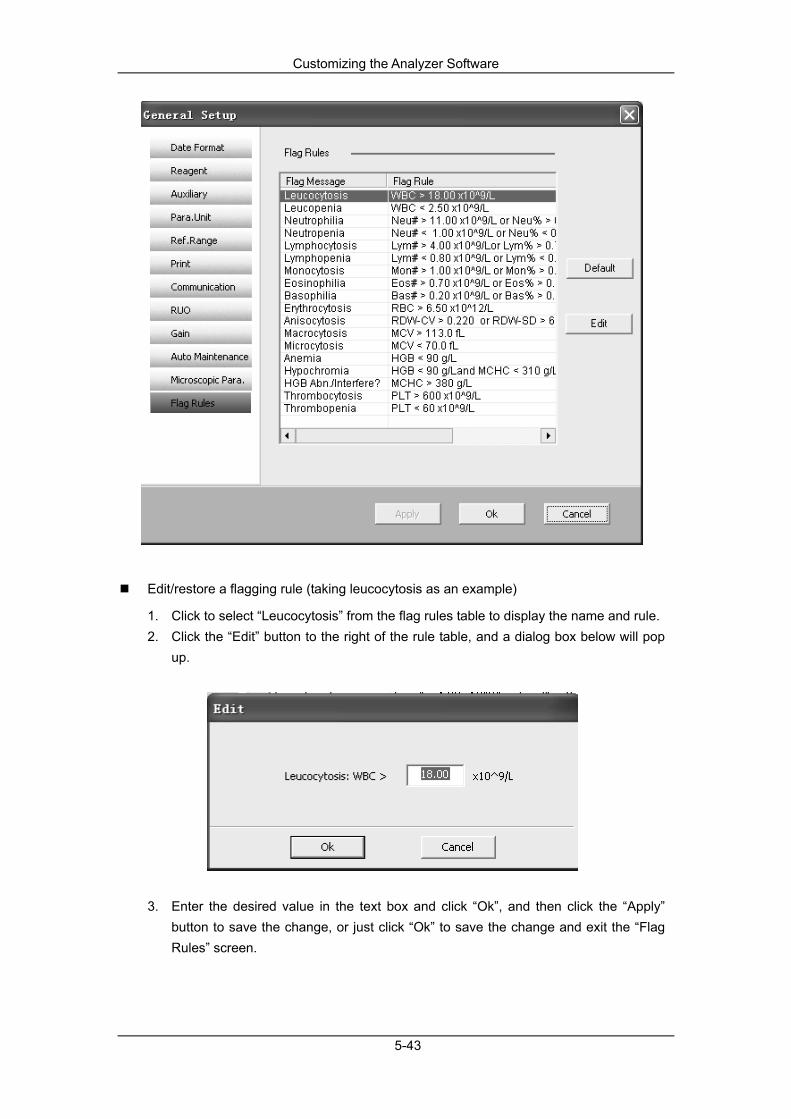
Customizing the Analyzer Software
5-43
Edit/restore a flagging rule (taking leucocytosis as an example)
1. Click to select “Leucocytosis” from the flag rules table to display the name and rule. 2. Click the “Edit” button to the right of the rule table, and a dialog box below will pop
up.
3. Enter the desired value in the text box and click “Ok”, and then click the “Apply” button to save the change, or just click “Ok” to save the change and exit the “Flag Rules” screen.

Customizing the Analyzer Software
5-44
The flag rule entered should be within the display range; otherwise, a dialog box will prompt “Invalid entry.”
Two digits are allowed after the decimal point for the entered value.
4. Click the “Default” button to the right of the rule table to restore the default rules, and
then click “Apply” to save the change, or just click “Ok” to save the change and exit the setting.
5.3.2 User/Lab management User and Password
When you log in as a common user, click the “Menu” button, and then select the “Setup”, then select “User and Password” from the pop up menu to enter the information list of all the administrators and common users.
Creating a user
Do as follows to create a user:
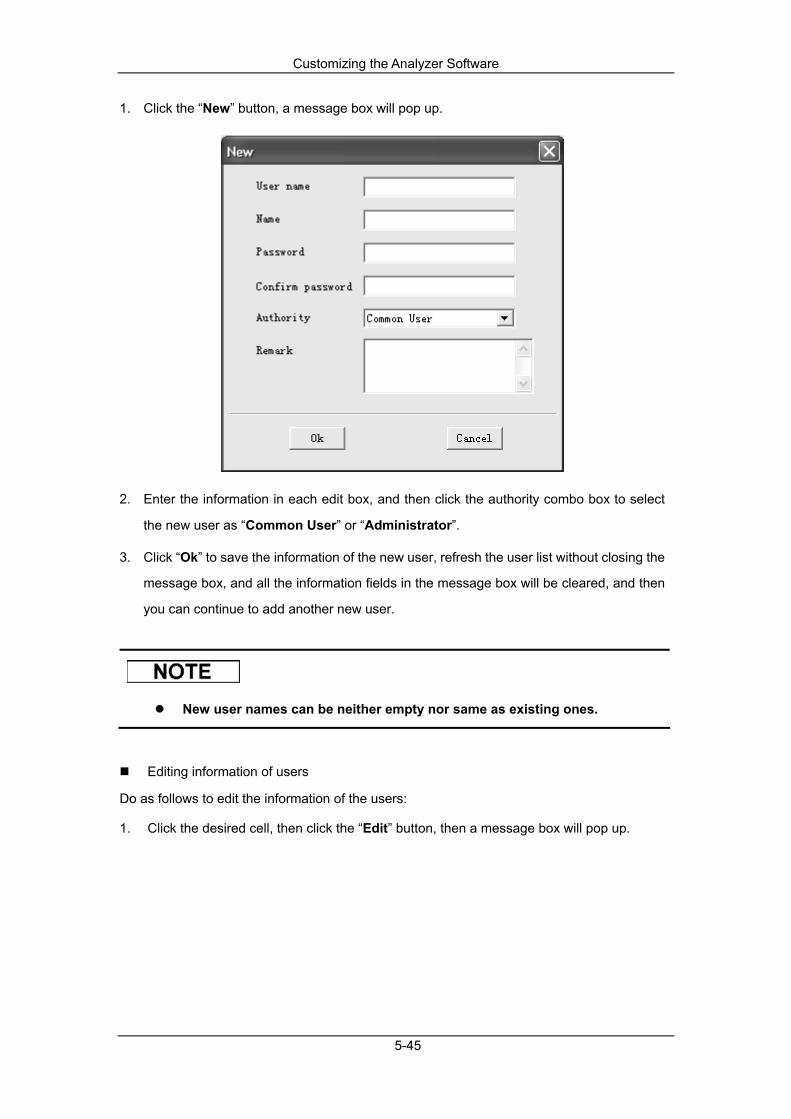
Customizing the Analyzer Software
5-45
1. Click the “New” button, a message box will pop up.
2. Enter the information in each edit box, and then click the authority combo box to select
the new user as “Common User” or “Administrator”.
3. Click “Ok” to save the information of the new user, refresh the user list without closing the
message box, and all the information fields in the message box will be cleared, and then
you can continue to add another new user.
New user names can be neither empty nor same as existing ones.
Editing information of users
Do as follows to edit the information of the users:
1. Click the desired cell, then click the “Edit” button, then a message box will pop up.

Customizing the Analyzer Software
5-46
2. You can change the content of each item in the edit box or change the users’ authority
level by clicking the authority combo box.
3. Click “Ok” button to save the modified users’ information and close the message box,
then the edited record will be highlighted in the list of users.
Modified user names can be neither empty nor same as existing ones.
If the current login administrator changes the user level into “common user”, it takes effect only after logging out and then re-login.
Deleting a user
Do as follows to delete a user:
1. Click the desired cell, then click the “Delete” button, a message box will pop up.
2. Click “Ok” to delete the user and close the message box, then the user will be deleted
from the list of users.
You can not delete the current login user.

Customizing the Analyzer Software
5-47
Reset password
You can reset a new password for users who forgot the password to log into the system:
1. Click the desired cell, and then click the “Reset password” button, a message box will
pop up.
2. Enter the new password in the “New password” and “Confirm new password” box.
3. Click “Ok” button to save the new password and close the message box.
You can not reset the password for the current login user.
Change password
Do as follows to change the password of the current user: 1. Highlight the current login user in the list, and then click the “Change password” button,
the following message box will pop up.
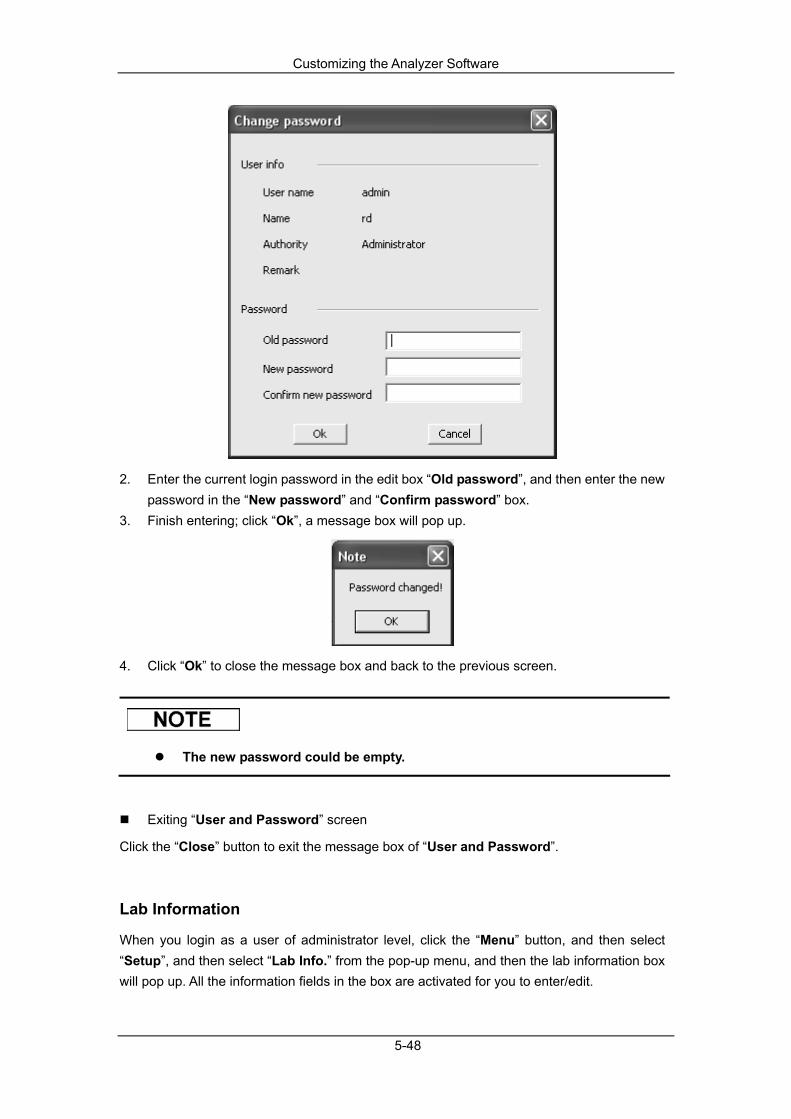
Customizing the Analyzer Software
5-48
2. Enter the current login password in the edit box “Old password”, and then enter the new password in the “New password” and “Confirm password” box.
3. Finish entering; click “Ok”, a message box will pop up.
4. Click “Ok” to close the message box and back to the previous screen.
The new password could be empty.
Exiting “User and Password” screen
Click the “Close” button to exit the message box of “User and Password”. Lab Information
When you login as a user of administrator level, click the “Menu” button, and then select “Setup”, and then select “Lab Info.” from the pop-up menu, and then the lab information box will pop up. All the information fields in the box are activated for you to enter/edit.
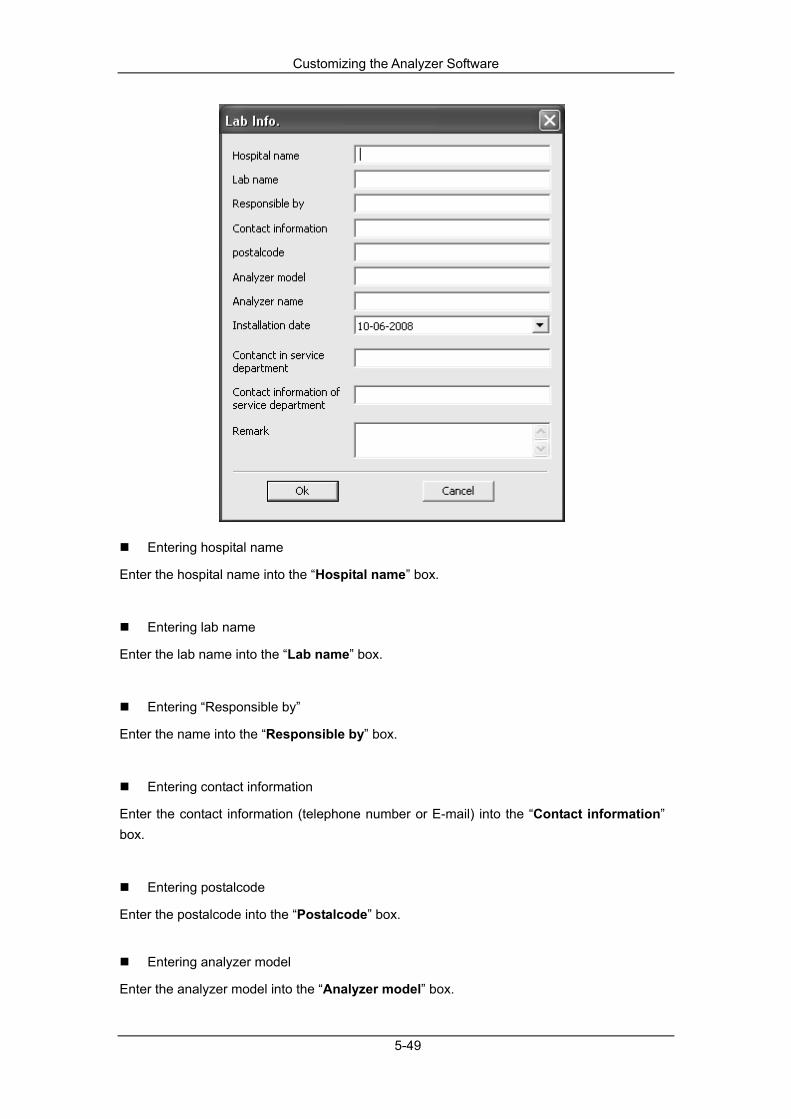
Customizing the Analyzer Software
5-49
Entering hospital name
Enter the hospital name into the “Hospital name” box.
Entering lab name
Enter the lab name into the “Lab name” box.
Entering “Responsible by”
Enter the name into the “Responsible by” box.
Entering contact information
Enter the contact information (telephone number or E-mail) into the “Contact information” box.
Entering postalcode
Enter the postalcode into the “Postalcode” box.
Entering analyzer model
Enter the analyzer model into the “Analyzer model” box.
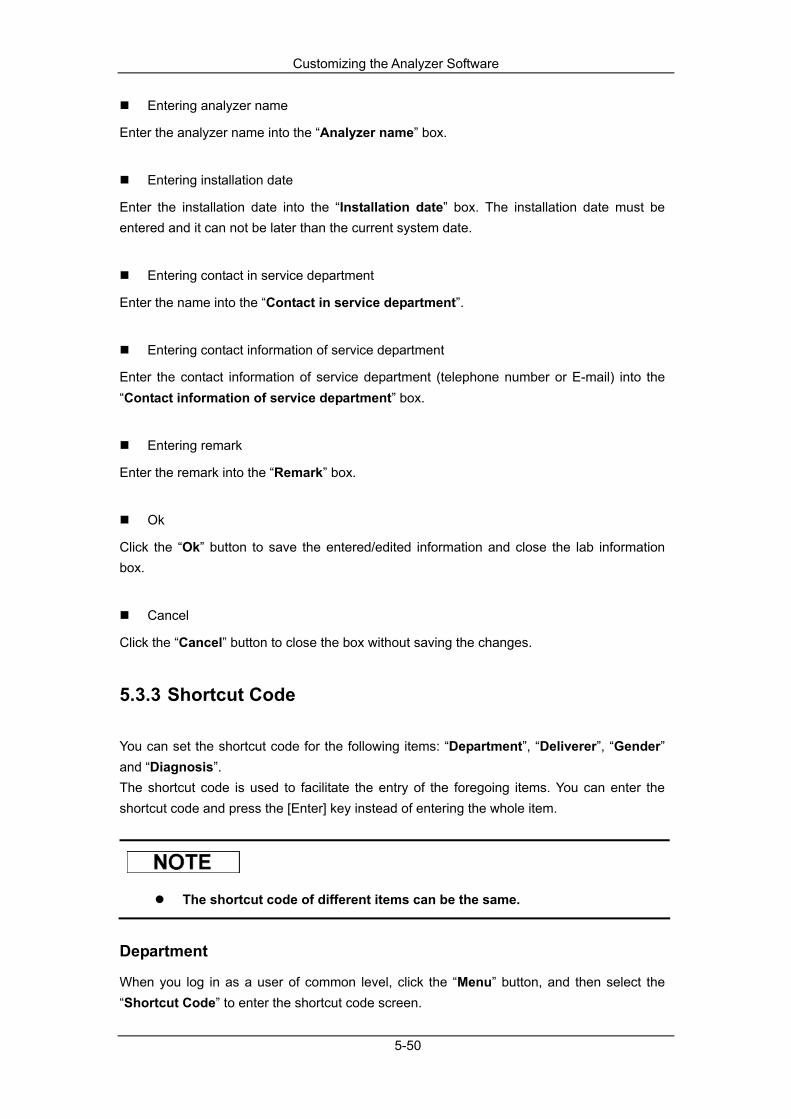
Customizing the Analyzer Software
5-50
Entering analyzer name
Enter the analyzer name into the “Analyzer name” box.
Entering installation date
Enter the installation date into the “Installation date” box. The installation date must be entered and it can not be later than the current system date.
Entering contact in service department
Enter the name into the “Contact in service department”.
Entering contact information of service department
Enter the contact information of service department (telephone number or E-mail) into the “Contact information of service department” box.
Entering remark
Enter the remark into the “Remark” box.
Ok
Click the “Ok” button to save the entered/edited information and close the lab information box.
Cancel
Click the “Cancel” button to close the box without saving the changes.
5.3.3 Shortcut Code You can set the shortcut code for the following items: “Department”, “Deliverer”, “Gender” and “Diagnosis”. The shortcut code is used to facilitate the entry of the foregoing items. You can enter the shortcut code and press the [Enter] key instead of entering the whole item.
The shortcut code of different items can be the same.
Department
When you log in as a user of common level, click the “Menu” button, and then select the “Shortcut Code” to enter the shortcut code screen.
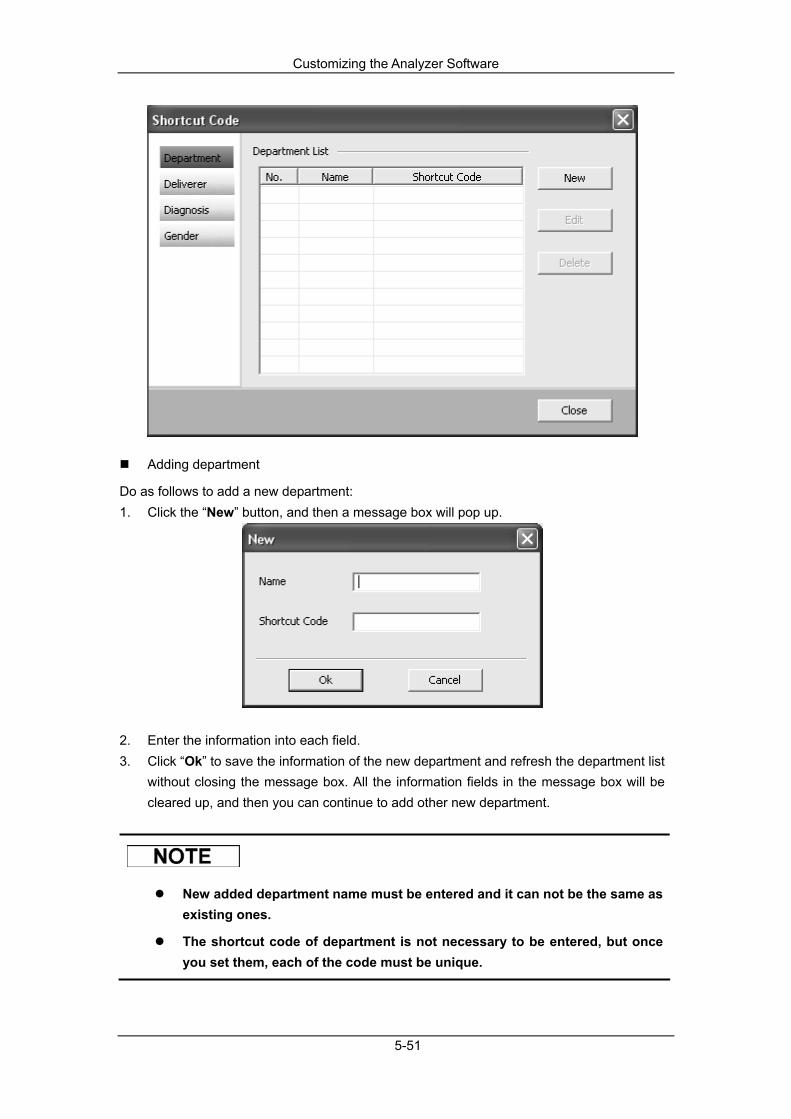
Customizing the Analyzer Software
5-51
Adding department
Do as follows to add a new department: 1. Click the “New” button, and then a message box will pop up.
2. Enter the information into each field. 3. Click “Ok” to save the information of the new department and refresh the department list
without closing the message box. All the information fields in the message box will be cleared up, and then you can continue to add other new department.
New added department name must be entered and it can not be the same as existing ones.
The shortcut code of department is not necessary to be entered, but once you set them, each of the code must be unique.

Customizing the Analyzer Software
5-52
Editing department
Do as followings to edit the department information:
1. Click the desired form cell and click the “Edit” button, and then the box shown below will pop up.
2. Enter the information into each field.
3. Click “Ok” to save the information and close the message box, and then the edited record will be highlighted in the list of department.
New added department name must be entered and it can not be the same as existing ones.
The shortcut code is not necessary to be entered, but once you set them, each of the code must be unique.
Deleting department
Do as follows to delete department: 1. Click the desired cell of the department, then click the “Delete” button, and then a message box will pop up.
2. Click “Ok” to delete the department and close the message box, and then it will also be deleted from the list of department.
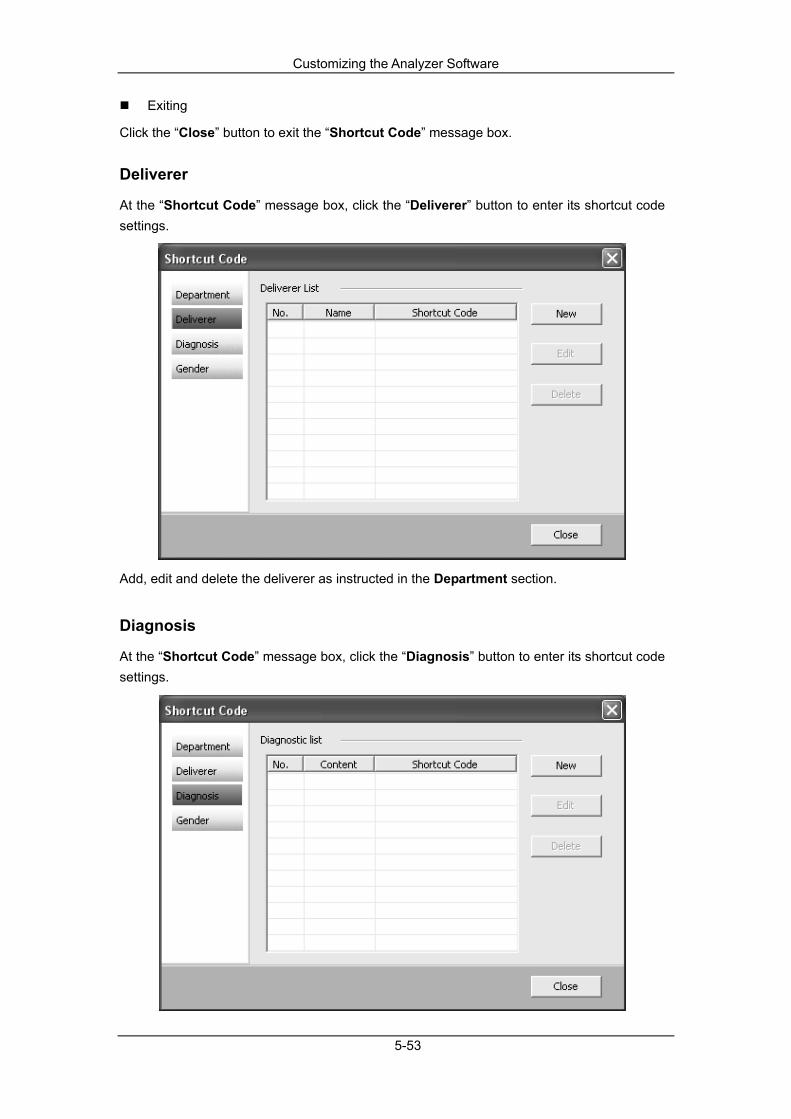
Customizing the Analyzer Software
5-53
Exiting
Click the “Close” button to exit the “Shortcut Code” message box. Deliverer
At the “Shortcut Code” message box, click the “Deliverer” button to enter its shortcut code settings.
Add, edit and delete the deliverer as instructed in the Department section.
Diagnosis
At the “Shortcut Code” message box, click the “Diagnosis” button to enter its shortcut code settings.

Customizing the Analyzer Software
5-54
Add, edit and delete the clinical diagnosis as instructed in the Department section. Gender
At the “Shortcut Code” message box, click the “Gender” button to enter its shortcut code settings.
Add, edit and delete the Gender as instructed in the “Department” section.
The existed shortcut code settings for gender can not be modified.

6-1
6 Operating Your Analyzer
6.1 Introduction This chapter provides step-by-step procedures for operating your analyzer on a daily basis. A flow chart indicating the common daily operating process is presented below.

Operating Your Analyzer
6-2
6.2 Initial Checks Perform the following checks before turning on the analyzer.
All the samples, controls, calibrators, reagents, wastes and areas contacted them are potentially biohazardous. Wear proper personal protective equipment (e.g. gloves, lab coat, etc.) and follow safe laboratory procedures when handling them and the contacted areas in the laboratory.
Be sure to dispose of reagents, waste, samples, consumables, etc. according to government regulations.
The reagents are irritating to eyes, skin and diaphragm. Wear proper personal protective equipment (e.g. gloves, lab coat, etc.) and follow safe laboratory procedures when handling them in the laboratory.
If the reagents accidentally spill on your skin, wash them off with plenty of water and if necessary, go see a doctor; if the reagents accidentally spill into your eyes, wash them off with plenty of water and immediately go see a doctor.
Keep you clothed, hairs and hands away from the moving parts to avoid injury.
You should only use the Mindray-specified reagents. Store and use the reagents as instructed by instructions for use of the reagents.
Check if the reagents are connected correctly before using the analyzer.
After installing a new container of reagent, keep it still for a while before use.
Checking the waste container
Check and make sure the waste container is empty.
Checking tubing and power connections
Check and make sure the reagents and waste tubing are properly connected and not bent. Check and make sure the power cord of the analyzer is properly plugged into the power outlet.

Operating Your Analyzer
6-3
Checking the printer (optional)
Check and make sure enough printer paper is installed. Check and make sure the power cord of the printer is properly plugged into power outlet. Check and make sure the printer is properly connected to the external computer.
Keyboard, mouse and external computer
Check and make sure the network cable of the external computer is connected to the analyzer properly. Check and make sure the keyboard and the mouse are well connected to the external computer.
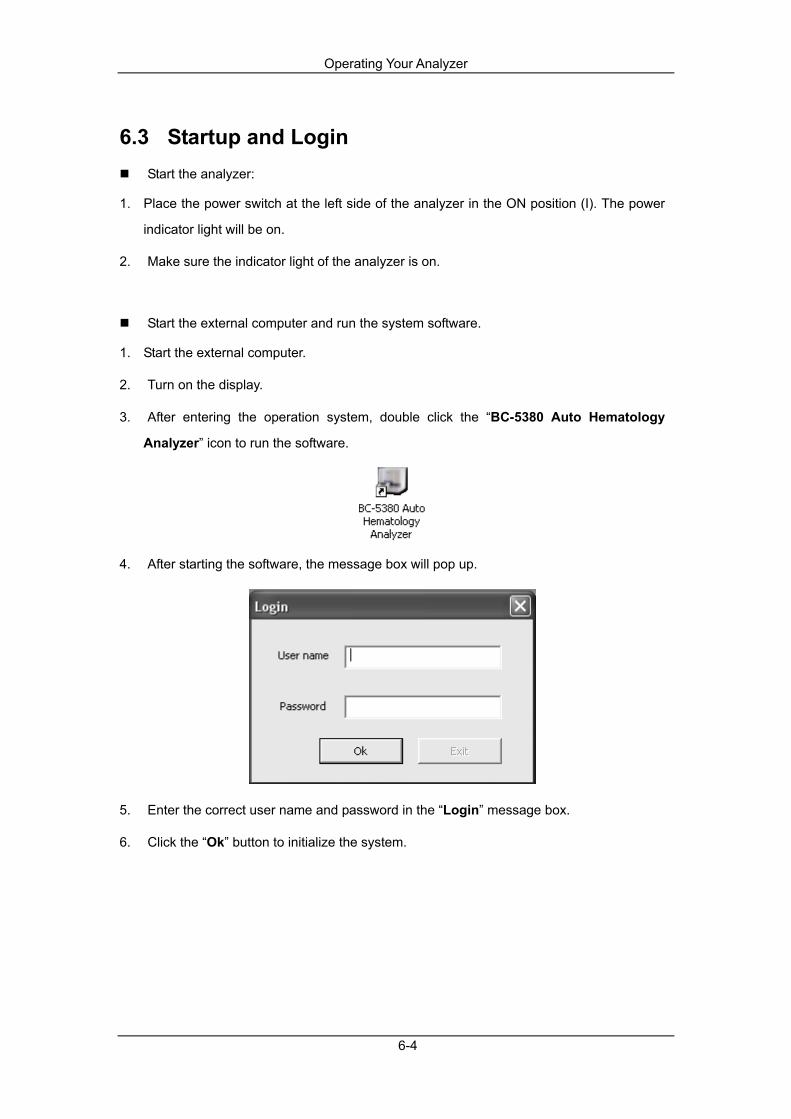
Operating Your Analyzer
6-4
6.3 Startup and Login Start the analyzer:
1. Place the power switch at the left side of the analyzer in the ON position (I). The power
indicator light will be on.
2. Make sure the indicator light of the analyzer is on.
Start the external computer and run the system software.
1. Start the external computer.
2. Turn on the display.
3. After entering the operation system, double click the “BC-5380 Auto Hematology
Analyzer” icon to run the software.
4. After starting the software, the message box will pop up.
5. Enter the correct user name and password in the “Login” message box.
6. Click the “Ok” button to initialize the system.

Operating Your Analyzer
6-5
Before running the software, make sure the network cable of the external computer is connected to the analyzer properly. The analyzer starts to initialize only when the connection are detected.
If you failed to run the software continuously, please contact Mindray customer service department or your local distributor immediately.
After startup, please make sure the data/time of the computer is correct.
The initial user name and password of administrator are “ADMIN”, which was set by service engineer.
1 to 12 numeric digits can be entered for the user name and the password. No Chinese character is allowed. There could be no password.
7. During the Initialization, the startup information will be displayed in the operation/status
information area at the bottom of the interface.
8. The whole process lasts 4 to 12 minutes. The time needed for initializing the system
depends on how the analyzer was shut down previously.
9. After the initialization process, you can enter the “Graph” screen to check the
background result.
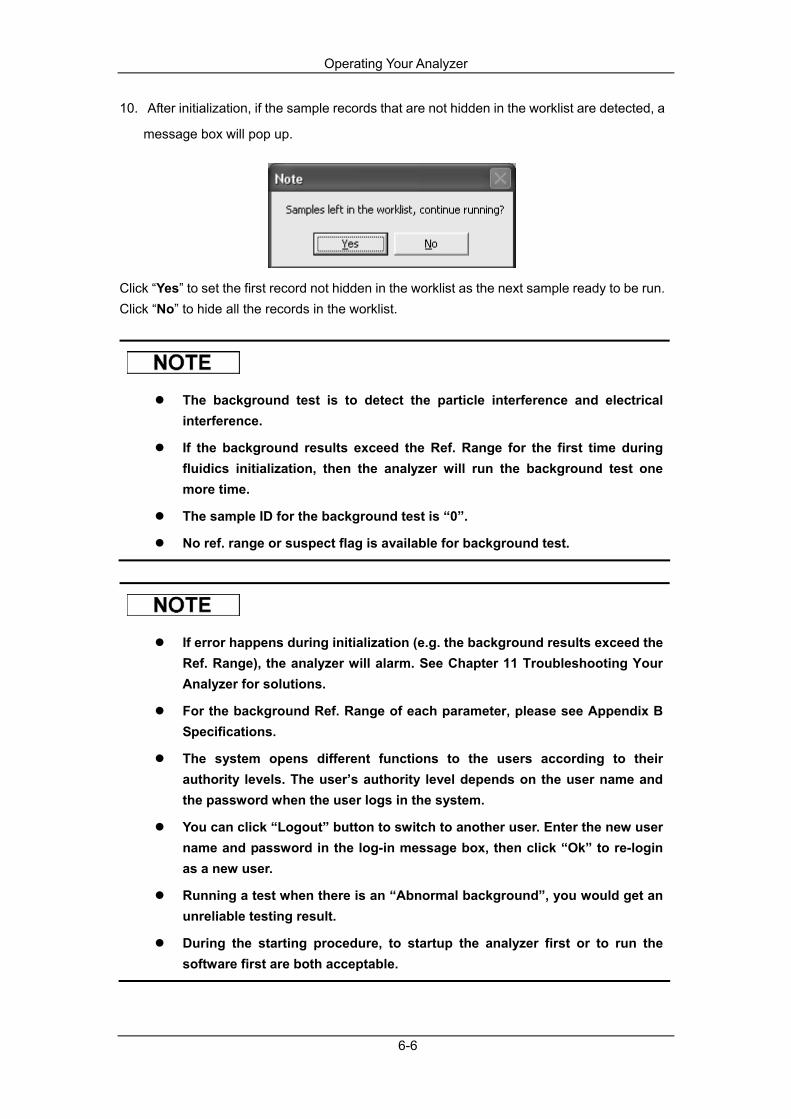
Operating Your Analyzer
6-6
10. After initialization, if the sample records that are not hidden in the worklist are detected, a
message box will pop up.
Click “Yes” to set the first record not hidden in the worklist as the next sample ready to be run. Click “No” to hide all the records in the worklist.
The background test is to detect the particle interference and electrical interference.
If the background results exceed the Ref. Range for the first time during fluidics initialization, then the analyzer will run the background test one more time.
The sample ID for the background test is “0”.
No ref. range or suspect flag is available for background test.
If error happens during initialization (e.g. the background results exceed the Ref. Range), the analyzer will alarm. See Chapter 11 Troubleshooting Your Analyzer for solutions.
For the background Ref. Range of each parameter, please see Appendix B Specifications.
The system opens different functions to the users according to their authority levels. The user’s authority level depends on the user name and the password when the user logs in the system.
You can click “Logout” button to switch to another user. Enter the new user name and password in the log-in message box, then click “Ok” to re-login as a new user.
Running a test when there is an “Abnormal background”, you would get an unreliable testing result.
During the starting procedure, to startup the analyzer first or to run the software first are both acceptable.

Operating Your Analyzer
6-7
6.4 Daily Quality Control Before running any samples, run the controls. See Chapter 8 Using the QC Programs for details.
Operating Your Analyzer
6-8
6.5 Sample Collection and Handling
All the samples, controls, calibrators, reagents, wastes and areas contacted them are potentially biohazardous. Wear proper personal protective equipment (e.g. gloves, lab coat, etc.) and follow safe laboratory procedures when handling them and the contacted areas in the laboratory.
Do not contact the patients’ sample blood directly.
Do not re-use such disposable product as collection tubes, test tubes, capillary tubes, etc.
Be sure to use clean K2EDTA anticoagulant collection tubes, fused silica glass/plastic test tubes, centrifugal tubes and borosilicate glass capillary tubes.
Be sure to use the evacuated blood collection tubes as specified in the appendix.
Be sure to use the Mindray-specified disposable products including evacuated blood collection tube, anticoagulant collection tubes and capillary tubes etc.
If you click the “Diluent” button under the “AL-WB” mode, the analyzer will first switch to the “CT-WB” mode and then dispense the diluent.
6.5.1 Whole Blood Samples
1. Use clean K2EDTA (1.5 - 2.2mg/mL) anticoagulant collection tubes to collect venous
blood samples.
2. Mix the sample according to your laboratory’s protocol.

Operating Your Analyzer
6-9
Be sure to collect at least 1mL of whole blood sample in the closed-tube sampling mode and autoloader mode.
For the whole blood samples to be used for WBC differential or PLT count, you shall store them at the room temperature and run them within 8 hours after collection.
If you do not need the PLT, MCV and WBC differential results, you can store the samples in a refrigerator (2℃ - 8℃) for 24 hours. You need to warm the refrigerated samples at room temperature for at least 30 minutes before running them.
Be sure to mix any sample that has been prepared for a while before running it.
6.5.2 Prediluted Samples
Be sure to use the Ф11×40 (mm) adapter when collecting and handling the prediluted samples. For details of how to install the adapter, please see 6.6.4 Replacing the adapter.
1. At the shortcut button area, click the “Diluent” button, then the compartment door will
open automatically and a message box will pop up.
2. Present a clean centrifugal tube into the sample compartment with the cap opened.
Press the [RUN] key to dispense 180µL of diluent into the tube. During dispensing the
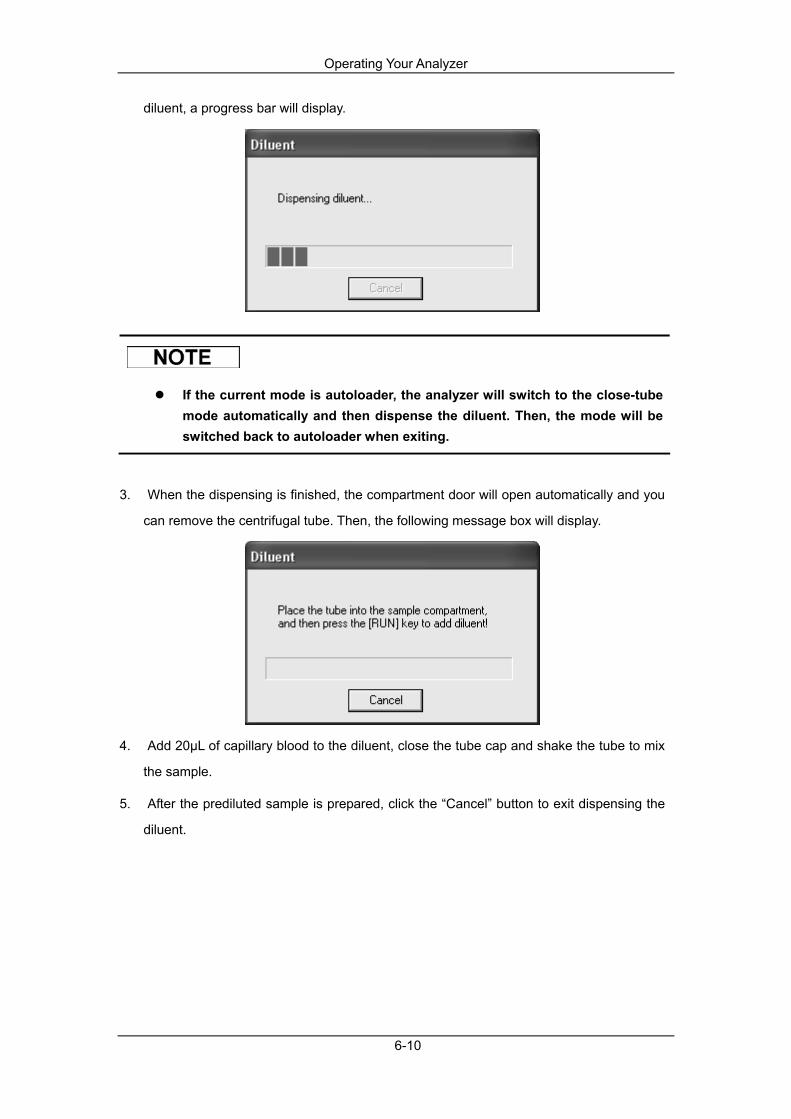
Operating Your Analyzer
6-10
diluent, a progress bar will display.
If the current mode is autoloader, the analyzer will switch to the close-tube mode automatically and then dispense the diluent. Then, the mode will be switched back to autoloader when exiting.
3. When the dispensing is finished, the compartment door will open automatically and you
can remove the centrifugal tube. Then, the following message box will display.
4. Add 20µL of capillary blood to the diluent, close the tube cap and shake the tube to mix
the sample.
5. After the prediluted sample is prepared, click the “Cancel” button to exit dispensing the
diluent.
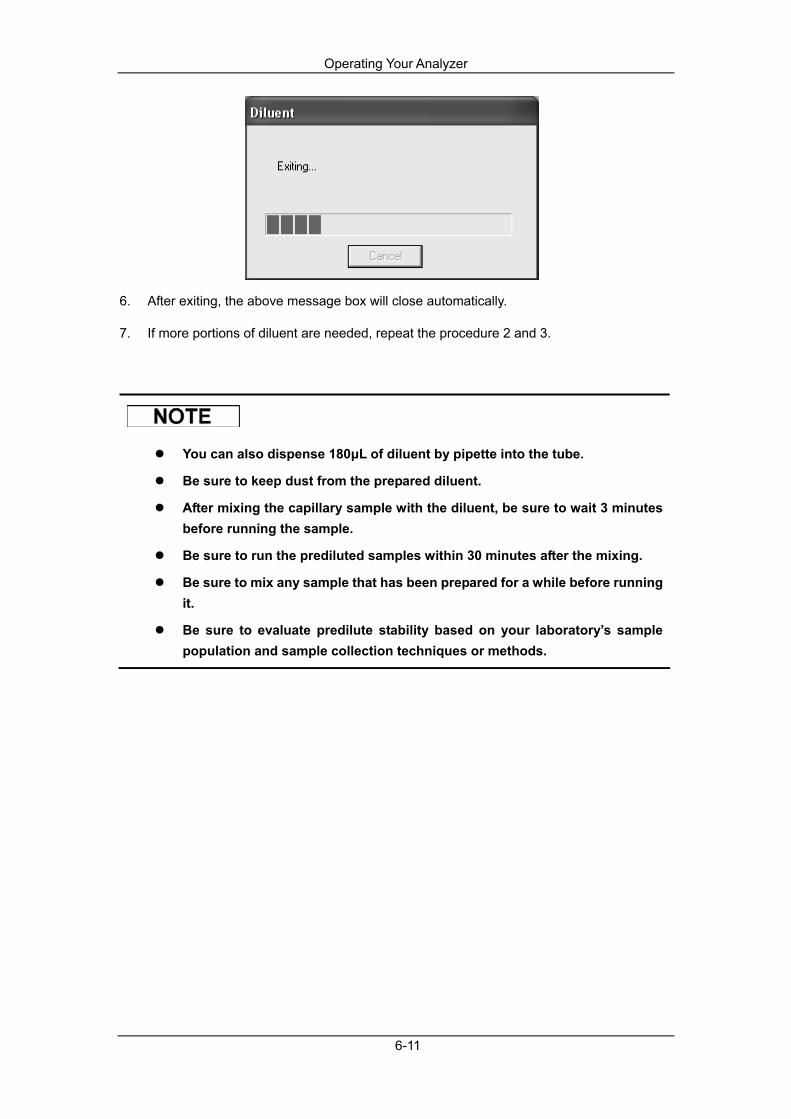
Operating Your Analyzer
6-11
6. After exiting, the above message box will close automatically.
7. If more portions of diluent are needed, repeat the procedure 2 and 3.
You can also dispense 180µL of diluent by pipette into the tube.
Be sure to keep dust from the prepared diluent.
After mixing the capillary sample with the diluent, be sure to wait 3 minutes before running the sample.
Be sure to run the prediluted samples within 30 minutes after the mixing.
Be sure to mix any sample that has been prepared for a while before running it.
Be sure to evaluate predilute stability based on your laboratory’s sample population and sample collection techniques or methods.

Operating Your Analyzer
6-12
6.6 Closed-tube Sampling Analysis
The closed-tube sampling mode requests a closed-tube loader.
6.6.1 Entering Work List Information Under the closed-tube mode, you can enter the work list information for the next sample before running it.
If the analyzer is shut down abnormally, you will lose the worklist information of the samples that have not been saved yet.
If you want to complete the worklist information after the analysis, see Chapter 7 Reviewing Sample Results for details.
Click the “Worklist” button on the shortcut area or click “Menu”, then select “Worklist” to enter the “Worklist” screen.

Operating Your Analyzer
6-13
Click the “New” button, then a new record will be added at the bottom of the worklist and this blank record is highlighted. All the fields in the information entry area are displayed in defaults and are activated.
The Run Status of a new record is “To Be Run”.
You can switch between options in the Sample Info./Patients Info area by the [Tab] key. You can also use the [Enter] key to switch after setting, see details in General Setup section of Chapter 5 Customizing the Analyzer Software.
You can skip the options that do not need the entry when switching by [Tab] or [Enter], see the setup details in General Setup section of Chapter 5 Customizing the Analyzer Software.
Entering the sample ID
Enter the sample ID in the “Sample ID” box.
The sample ID could be letters, numbers and all the keyboard-supported characters (including special characters).
The sample ID must be entered and its acceptable length is [1, 20].
Sample ID being all “0” will be considered invalid.
If the Sample ID ends with a non-numeric letter, the sample ID will not increase automatically.
Selecting analysis mode
Select the loading mode as “closed -tube”, sample mode (“Whole Blood” or “Predilute”) and the measurement mode (“CBC” or “CBC+DIFF”) from the three pull-down lists respectively.
In the “CBC” measurement mode, the analyzer only counts the blood cells without further differentiating the white blood cells. 13 parameters and histograms of WBC, RBC and PLT are provided in this mode. In the “CBC+DIFF” mode, the analyzer counts the blood cells and further differentiates the white blood cells into 5 sub-populations. 23 basic parameters, 4 RUO parameters, scattergrams and histograms of
Operating Your Analyzer
6-14
WBC/BASO, RBC and PLT are provided in this mode.
Setting ref. group
Select the reference group for the sample from the “Ref. Group” pull-down list. The analyzer will judge the test results according to the reference range of the Ref. group. When the results exceed the reference range, the analyzer will flag.
If you have entered the gender and age of the patient, then the system will provide a matching Ref. Group automatically.
If the auto-matching Ref. Group is different from the one that you selected before (excluding the 5 customized Ref. Groups), then the system will adopt the auto-matching Ref. Group.
Entering the draw time
Select the draw date from the date control; enter the draw time into the time edit box.
Entering the delivery time
Select the delivery date from the date control and then enter the delivery time into the time edit box.
The delivery date/time can not be earlier than the draw date/time.
The draw and delivery date/time can not be later than the current system date/time.
Entering the patient ID
Enter the patient ID into the “Patient ID” box.
In the Uni-directional LIS/HIS mode, after you entering the patient ID and pressing the [Enter] key, the matched patient information (including “Last Name”, “First Name”, “Gender”, “Age”, “Birthday”, “Department” and “Bed
Operating Your Analyzer
6-15
No.”) will be displayed in the screen automatically if there is any. You can also proceed to edit the information.
In the Bi-directional LIS/HIS mode, the patient information will adopt those downloaded from the LIS/HIS as default.
Entering the patient name
Enter the patient name into the “Last Name” and “First Name” boxes.
Entering the patient gender
Enter the gender of the patient into the “Gender” box or select it from the “Gender” pull-down list.
Entering the patient age
The analyzer provides four ways for you to enter the patient age – in years, in months, in days and in hours. The first way is designed for the adult or pediatric patients older than one year; the second for the infant patients one month to one year; the third for the neonatal patients no older than one month and the fourth for the neonatal no older than 24 hours. You can choose only one of the four ways to enter the patient age. The “Age” pull-down list provides four ways for you to enter the patient age– in years, in months, in days and in hours, and you can enter the patient age in the box followed by the age unit.
Entering the birthday
Select the patient birthday from the date control.
After entering the birthday, the age field will calculate automatically according to the difference between the current system date and the “Birthday”, and then a new result of age and the corresponding unit will be displayed in the age edit box and the unit combo box respectively. Then, the age box will be unavailable to edit unless the “Birthday” is cleared.
If the entered birthday is later than the current system, then it is considered invalid.
Entering the name of the department
Enter the name of the department, from which the sample came, into the “Department” box or select it from the “Department” pull-down list.
Operating Your Analyzer
6-16
Entering the Bed No.
Enter the bed No. of the patient into the “Bed No.” box.
Entering the name of the deliverer
Enter the name of the deliverer into the “Deliverer” box or select it from the “Deliverer” pull-down list (if there are previously saved deliverers’ names in the list).
Entering the content of clinical diagnosis
Enter the suspect information of diagnosis into the “Clinical Diagnosis” box.
Entering the remarks
Enter the remarks in the “Remark” box.
Save
When finish entering the work list information, you can click the “Save” button or the shortcut key [F2] to save all the information.
The “Sample ID + Mode” of the current record can not be the same as the unhidden records in the following status: “To Be Run”, “Running” and “Error”.
6.6.2 Running the Samples
All the samples, controls, calibrators, reagents, wastes and areas contacted them are potentially biohazardous. Wear proper personal protective equipment (e.g. gloves, lab coat, etc.) and follow safe laboratory procedures when handling them and the contacted areas in the laboratory.
The sample probe tip is sharp and may contain biohazardous materials. Exercise caution to avoid contact with the probe when working around it.

Operating Your Analyzer
6-17
Do not re-use such disposable product as collection tubes, test tubes, capillary tubes, etc.
Repeat piercing the evacuated blood collection tube may break the rubber tube cap. The fragments produced may lead to incorrect analysis result. It is recommended that do not pierce each tube for more than three times.
Proper reference range shall be selected at the “Setup” screen before analysis. Otherwise, the results may be flagged erroneously.
If the sample mode is switched from the “Predilute” to “Whole Blood”, the analyzer will perform the switching sequence automatically and a progress bar will be displayed on the screen.
When running as per the worklist, then the next sample ID will always be the first unhide (or error) sample to be run in the worklist (in closed-tube mode) till there is no unhide sample left or the worklist is empty; the ID of the latter sample will increase by 1 automatically. If you set the method of entry for the sample ID as “Auto Increase”, the ID of the latter sample will increase by 1 automatically. If the Sample ID ends with a non-numeric letter, the sample ID will not increase automatically.
If you do not run as per the worklist, then no actions will be taken to the records in the worklist.
If the Bi-directional LIS/HIS mode is selected, then after the sample ID is entered/scanned and saved, all the corresponding information will be obtained from the LIS/HIS, and then the analyzer starts running per the obtained information. Once the running is finished, the result, graph and sample/patient information will be uploaded to the LIS/HIS.
CT-WB Sampling Analysis
Run as per the worklist.
1. When it is ready to run samples (i.e. the analysis status icon and analyzer indicator is
green), shake the whole blood sample as shown below to well mix it.

Operating Your Analyzer
6-18
2. Press the [OPEN] key to open the compartment door, and then present the whole blood
sample into the compartment.
3. Close the compartment door by pushing it.
4. Click the shortcut button “Run”, the “Run” message box will pop up.
5. Click the “CT-WB” button, and then select the “Run as per the worklist” option.
6. After finishing setting, press [Enter] from keyboard or click the "Run" or “Ok” from the
dialog box, and then press the [Aspirate] key to start the analysis.
7. The sample probe will automatically aspirate the sample. Then, the analyzer will
automatically run the sample while the compartment door will open automatically and the
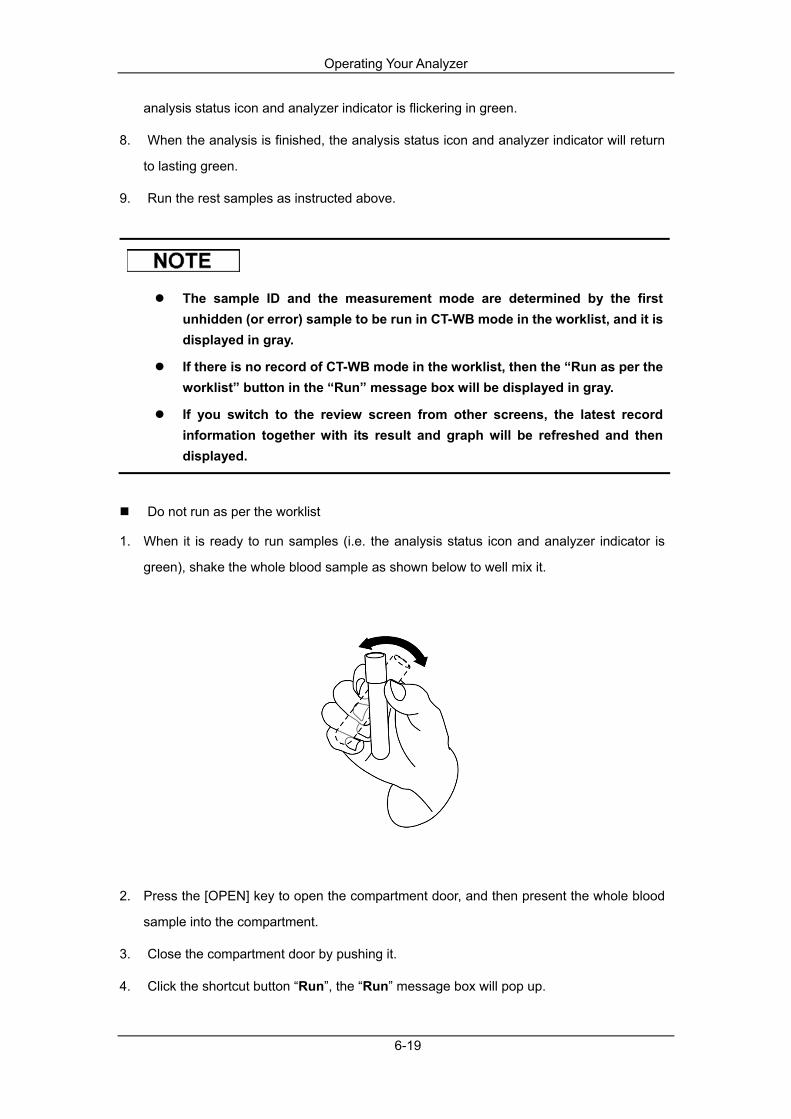
Operating Your Analyzer
6-19
analysis status icon and analyzer indicator is flickering in green.
8. When the analysis is finished, the analysis status icon and analyzer indicator will return
to lasting green.
9. Run the rest samples as instructed above.
The sample ID and the measurement mode are determined by the first unhidden (or error) sample to be run in CT-WB mode in the worklist, and it is displayed in gray.
If there is no record of CT-WB mode in the worklist, then the “Run as per the worklist” button in the “Run” message box will be displayed in gray.
If you switch to the review screen from other screens, the latest record information together with its result and graph will be refreshed and then displayed.
Do not run as per the worklist
1. When it is ready to run samples (i.e. the analysis status icon and analyzer indicator is
green), shake the whole blood sample as shown below to well mix it.
2. Press the [OPEN] key to open the compartment door, and then present the whole blood
sample into the compartment.
3. Close the compartment door by pushing it.
4. Click the shortcut button “Run”, the “Run” message box will pop up.

Operating Your Analyzer
6-20
5. Click the “CT-WB” button but do not select the “Run as per the worklist” option.
6. You can enter the starting sample ID of the sample to be run and the analysis mode in
the “Run” message box.
7. Click the "Run" button or press the [Aspirate] key after clicking “Ok” to start the analysis.
8. The sample probe will automatically aspirate the sample. Then, the analyzer will
automatically run the sample while the compartment door will open automatically and the
analysis status icon and analyzer indicator is flickering in green.
9. When the analysis is finished, the analysis status icon and analyzer indicator will return
to lasting green.
10. Run the rest samples as instructed above.
If you switch to the review screen from other screens, the latest record information together with its result and graph will be refreshed and then displayed.

Operating Your Analyzer
6-21
CT-PD Sampling Analysis
When running sample under the CT-PD mode, be sure to use the Ф11×40 (mm) adapter. For details of how to install the adapter, please see 6.6.4 Replacing the adapter.
Run as per the worklist
1. When it is ready to run (i.e. the analysis status icon and analyzer indicator is green),
press the [OPEN] key to open the compartment door, then present the prediluted sample
(uncapped) into the compartment.
2. Close the compartment door by pushing it.
3. Click the shortcut button “Run”, the “Run” message box will pop up.
4. Click the “CT-PD” button and select the “Run as per the worklist” option.
5. After finishing setting, press [Enter] from keyboard or click the "Run" or “Ok” from the
dialog box, and then press the [Aspirate] key to start the analysis.

Operating Your Analyzer
6-22
6. Click “Yes” to close the message box and start running.
You can disable the pop-up message box before the predilute run, see General Setup section in chapter 5 Customizing the Analyzer Software for details.
7. The sample probe will automatically aspirate the sample. Then, the analyzer will
automatically run the sample while the compartment door will open automatically and the
analysis status icon and analyzer indicator is flickering in green.
8. When the analysis is finished, the analysis status icon and analyzer indicator will return to
lasting green.
9. Run the rest samples as instructed above.
The sample ID and the measurement mode are determined by the first unhidden (or error) sample to run in CT-PD mode in the worklist, and it is displayed in gray.
If there is no record of CT-PD mode in the worklist, then the “Run as per the worklist” button in the “Run” screen will be displayed in gray.
If you switch to the review screen from other screens, the latest record information together with its result and graph will be refreshed and then displayed.
Do not run as per the worklist
1. When it is ready to run (i.e. the analysis status icon and analyzer indicator is green),

Operating Your Analyzer
6-23
press the [OPEN] key to open the compartment door, then present the prediluted sample
(uncapped) into the compartment.
2. Close the compartment door by pushing it.
3. Click the shortcut button “Run”, the “Run” message box will pop up.
4. Click the “CT-PD” button but do not select the “Run as per the worklist” option.
5. You can enter the starting sample ID of the sample to be run and the analysis mode in the
“Run” message box.
6. Click the "Run" button or press the [Aspirate] key after clicking “Ok”, then a message box
will pop up.
7. Click “Yes” to close the message box and start running.

Operating Your Analyzer
6-24
You can disable the pop-up message box before the predilute run, see General Setup section in chapter 5 Customizing the Analyzer Software for details.
8. The sample probe will automatically aspirate the sample. Then, the analyzer will
automatically run the sample while the compartment door will open automatically and the
analysis status icon and analyzer indicator is flickering in green.
9. When the analysis is finished, the analysis status icon and analyzer indicator will return to
lasting green.
10. Run the rest samples as instructed above.
When the analyzer is running, you can perform any operation (including new, edit and cancel, etc.) to other “To Be Run” or “Error” samples in the work list.
When the analyzer is running, you can switch to Graph/Table Review Screen to perform operations including data browsing, validating, sample information editing and printing, etc., and you can also switch to other screens.
If “Automatically delete completed records from the worklist.” is selected, then the completed records will be deleted automatically from the worklist.
When the analyzer is running, all the functions related to the fluidics sequence are not available.
If you switch to the review screen from other screens, the latest record information together with its result and graph will be refreshed and then displayed.
6.6.3 Dealing with the Analysis Results
Automatic saving of analysis results
This analyzer automatically saves sample results. When the maximum number has been reached, the newest result will overwrite the oldest (already backup).The maximum number of the automatic saving results is 40,000.
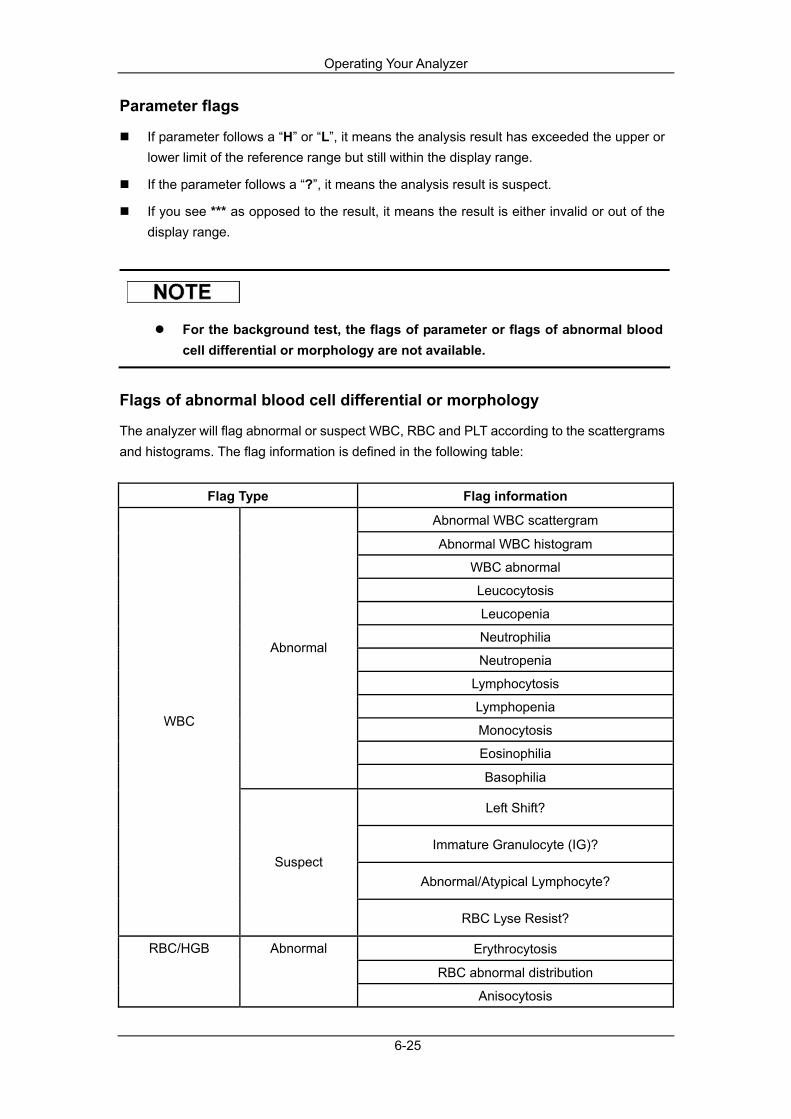
Operating Your Analyzer
6-25
Parameter flags
If parameter follows a “H” or “L”, it means the analysis result has exceeded the upper or lower limit of the reference range but still within the display range.
If the parameter follows a “?”, it means the analysis result is suspect.
If you see *** as opposed to the result, it means the result is either invalid or out of the display range.
For the background test, the flags of parameter or flags of abnormal blood cell differential or morphology are not available.
Flags of abnormal blood cell differential or morphology
The analyzer will flag abnormal or suspect WBC, RBC and PLT according to the scattergrams and histograms. The flag information is defined in the following table:
Flag Type Flag information
Abnormal WBC scattergram
Abnormal WBC histogram
WBC abnormal
Leucocytosis
Leucopenia
Neutrophilia
Neutropenia
Lymphocytosis
Lymphopenia
Monocytosis
Eosinophilia
Abnormal
Basophilia
Left Shift?
Immature Granulocyte (IG)?
Abnormal/Atypical Lymphocyte?
WBC
Suspect
RBC Lyse Resist?
Erythrocytosis
RBC abnormal distribution
RBC/HGB
Abnormal
Anisocytosis

Operating Your Analyzer
6-26
Macrocytosis
Microcytosis
Dimorphologic
Anemia
Hypochromia
Suspect HGB Abn/Interfere?
PLT Abnormal Distribution
Thrombocytosis Abnormal
Thrombopenia PLT
Suspect PLT Clump?
The analyzer will flag abnormal or suspect WBC, RBC and PLT according to the scattergrams and histograms. The following table shows how the flags affect parameter results:
Whole Blood Predilute Type Flag
CBC CBC
+5DIFFCBC
CBC +5DIFF
WBC abnormal? × √ × ×
RBC Lyse Resist? × √ × ×
Abnormal WBC scattergram × √ √ √
Abnormal WBC histogram × √ √ √
Left Shift? × √ × ×
Immature Granulocyte (IG)? × √ × ×
Abnormal/Atypical Lymphocyte? × √ × ×
Leucocytosis √ √ √ √
Leucopenia √ √ √ √
Neutrophilia × √ × ×
Neutropenia × √ × ×
Lymphocytosis × √ × ×
WBC
Lymphopenia × √ × ×

Operating Your Analyzer
6-27
Monocytosis × √ × ×
Eosinophilia × √ × ×
Basophilia × √ × ×
Dimorphologic √ √ × ×
HGB Abn/Interfere? √ √ × ×
Anisocytosis √ √ × ×
Microcytosis √ √ √ √
Macrocytosis √ √ √ √
Erythrocytosis √ √ √ √
Anemia √ √ √ √
Hypochromia √ √ √ √
RBC/HGB
RBC abnormal distribution √ √ × ×
PLT Clump? √ √ × ×
Thrombocytosis √ √ √ √
Thrombopenia √ √ √ √ PLT
PLT Abnormal Distribution √ √ × ×
When the PLT value is less than 100 × 109 / L, a manual count by the microscope is recommended.
6.6.4 Replacing the Adapter In closed-tube sampling mode, the model of the tubes and the corresponding adapters are the followings:
Ф12×75(mm)(without the cap) evacuated blood collection tube, used for Ф13×75 (mm) adapter.
Ф13×75(mm)(without the cap) evacuated blood collection tube, used for Ф13×75 (mm) adapter.
Ф14×75(mm)(without the cap) evacuated blood collection tube, used for Ф15×75 (mm) adapter.
Ф15×75(mm)(without the cap) evacuated blood collection tube, used for Ф15×75 (mm) adapter.

Operating Your Analyzer
6-28
Ф11×40(mm)centrifugal tube, used for Ф11×40 (mm) adapter.
Different adapters should be replaced according to the model of the tubes.

Operating Your Analyzer
6-29
6.7 Autoloader Sampling Analysis
The autoloader mode requests an autoloader.
6.7.1 Entering Work List Information In the autoloader mode, you can enter the work list information for the next sample before running it.
If the analyzer is shut down abnormally, you will lose the work list information of the samples that have not been saved yet.
If you want to complete the work list information after the analysis, see Chapter 7 Reviewing Sample Results for details.
Click the “Worklist” button on the shortcut area or click “Menu”, then select “Worklist” to enter the “Worklist” screen.

Operating Your Analyzer
6-30
Click the “New” button, then a new record will be added at the bottom of the worklist and this blank record is highlighted. All the fields in the information entry area are displayed in defaults and are activated.
The Run Status of a new record is “To Be Run”.
You can switch between options in the Sample Info./Patients Info area by the [Tab] key. You can also use the [Enter] key to switch after setting, see the setup details in General Setup section of Chapter 5 Customizing the Analyzer Software.
You can skip the options that do not need the entry when switching by [Tab] or [Enter], see the setup details in General Setup section of Chapter 5 Customizing the Analyzer Software.
Entering the sample ID
Enter the sample ID in the “Sample ID” box.
Operating Your Analyzer
6-31
The sample ID could be letters, numbers and all the keyboard-supported characters (including special characters).
The sample ID must be entered and its acceptable length is [1, 20].
Sample ID being all “0” will be considered invalid.
If the Sample ID ends with a non-numeric letter, the sample ID will not increase automatically.
Selecting analysis mode
Select the sampling mode as “AL” and the measurement mode as “CBC” or “CBC+DIFF” from the pull-down lists respectively.
If the autoloader mode is selected, then the blood sample mode can only be “whole blood”.
In the “CBC” measurement mode, the analyzer only counts the blood cells without further differentiating the white blood cells. 13 parameters and histograms of WBC, RBC and PLT are provided in this mode. In the “CBC+DIFF” mode, the analyzer counts the blood cells and further differentiates the white blood cells into 5 sub-populations. 23 basic parameters, 4 RUO parameters, scattergrams and histograms of WBC/BASO, RBC and PLT are provided in this mode.
Setting ref. group
Select the reference group for the sample from the “Ref. Group” pull-down list. The analyzer will judge the test results according to the reference range of the Ref. group. When the results exceed the reference range, the analyzer will flag.
If you have entered the gender and age of the patient, then the system will provide a matching Ref. Group automatically.
If the auto-matching Ref. Group is different from the one that you selected before (excluding the 5 customized Ref. Groups), then the auto-matching Ref. Group will be adopted by the system.
Entering the draw time

Operating Your Analyzer
6-32
Select the draw date from the date control; enter the draw time into the time edit box.
Entering the delivery time
Select the delivery date from the date control and then enter the delivery time into the time edit box.
The delivery date/time can not be earlier than the draw date/time.
The draw and delivery date/time can not be later than the current system date/time.
Entering the Rack No. and Tube No.
Enter the rack No. and tube No. into the “Rack No.” and “Tube No.” box respectively.
The entry range of the rack No. is [1, 100]; the entry range of the tube No. is [1, 10].The rack No. and tube No. can not be empty.
Entering the patient ID
Enter the patient ID into the “Patient ID” box.
In the Uni-directional LIS/HIS mode, after you entering the patient ID and pressing the [Enter] key, the matched patient information (including “Last Name”, “First Name”, “Gender”, “Age”, “Birthday”, “Department” and “Bed No.”) will be displayed in the screen automatically if there is any. You can also proceed to edit the information.
In the Bi-directional LIS/HIS mode, the patient information will adopt those downloaded from the LIS/HIS as default.
Entering the patient name
Enter the patient name into the “Last Name” and “First Name” boxes.
Entering the patient gender
Enter the gender of the patient into the “Gender” box or select it from the “Gender” pull-down

Operating Your Analyzer
6-33
list.
Entering the patient age
The analyzer provides four ways for you to enter the patient age – in years, in months, in days and in hours. The first way is designed for the adult or pediatric patients older than one year; the second for the infant patients one month to one year; the third for the neonatal patients no older than one month and the fourth for the neonatal no older than 24 hours. You can choose only one of the four ways to enter the patient age. The “Age” pull-down list provides four ways for you to enter the patient age– in years, in months, in days and in hours, and you can enter the patient age in the box followed by the age unit.
Entering the birthday
Select the patient birthday from the date control.
After entering the birthday, the age field will calculate automatically according to the difference between the “current system date” and the “birthday”, and then a new result of age and the corresponding unit will be displayed in the age edit box and the unit combo box respectively.
If the entered birthday is later than the current system, then it is considered invalid.
Entering the name of the department
Enter the name of the department, from which the sample came, into the “Department” box or select it from the “Department” pull-down list.
Entering the Bed No.
Enter the bed No. of the patient into the “Bed No.” box.
Entering the name of the deliverer
Enter the name of the deliverer into the “Deliverer” box or select it from the “Deliverer” pull-down list (if there are previously saved deliverers’ names in the list).
Entering the content of clinical diagnosis
Enter the suspect information of diagnosis into the “Clinical Diagnosis” box.
Entering the remarks

Operating Your Analyzer
6-34
Enter the remarks into the “Remark” box.
Save
When finish entering the work list information, you can click the “Save” button to save all the information.
The “Sample ID + Mode” or “Rack No. +Tube No.” of the current record can not be the same as the unhide records in the following status: “To Be Run”, “Running” and “Error”.
If the Bi-directional LIS/HIS is selected, the terminal software will obtain the corresponding information from LIS/HIS after you clicking the “Save” button and display them in the right field.
6.7.2 Running the Samples
All the samples, controls, calibrators, reagents, wastes and areas contacted them are potentially biohazardous. Wear proper personal protective equipment (e.g. gloves, lab coat, etc.) and follow safe laboratory procedures when handling them and the contacted areas in the laboratory.
The sample probe tip is sharp and may contain biohazardous materials. Exercise caution to avoid contact with the probe when working around it.
Do not re-use such disposable product as collection tubes, test tubes, capillary tubes, etc.
Repeat piercing the evacuated blood collection tube may break the rubber tube cap. The fragments produced may lead to incorrect analysis result. It is recommended that do not pierce each tube for more than three times.
Be sure that the entered sample ID, rack No., tube No. and the analysis

Operating Your Analyzer
6-35
mode are strictly in accordance with the sample to be run.
Proper reference range shall be selected at the “Setup” screen before analysis. Otherwise, the results may be flagged erroneously.
If the sample mode is switched from the “Predilute” to “Whole Blood”, the analyzer will perform the switching sequence automatically and a progress bar will be displayed on the screen.
If the Bi-directional LIS/HIS mode is selected, then after the sample ID is entered/scanned and saved, all the corresponding information will be obtained from the LIS/HIS, and then the analyzer starts running per the obtained information. Once the running is finished, the result, graph and sample/patient information will be uploaded to the LIS/HIS.
Do not scan the sample ID or rack No. and do not run as per the worklist
1. When it is ready to run (i.e. the analysis status icon and analyzer indicator is green), click
the shortcut button “Run”, the “Run” message box will pop up.
2. Select the “AL-WB” mode in the message box, but do not select the “Run as per the
worklist”, "Automatically scan sample ID" or "Automatically scan rack No." option.
3. Select the desired analysis mode, enter the starting sample ID, rack No. and tube No.
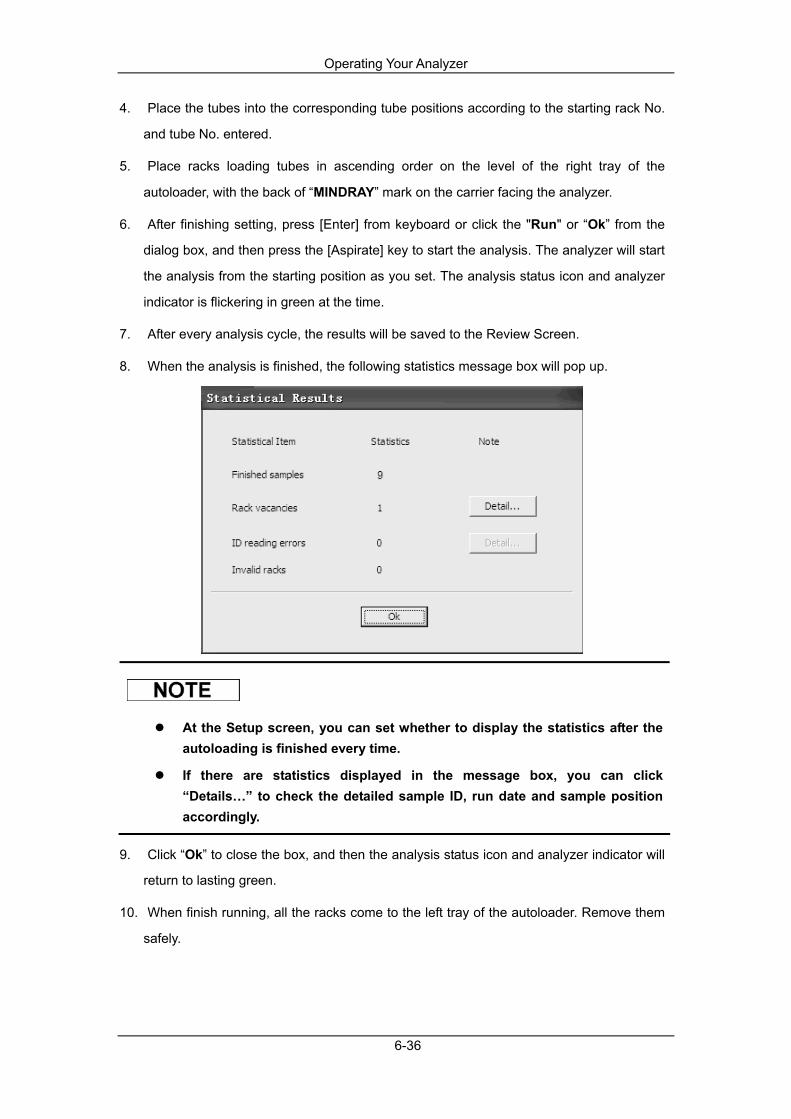
Operating Your Analyzer
6-36
4. Place the tubes into the corresponding tube positions according to the starting rack No.
and tube No. entered.
5. Place racks loading tubes in ascending order on the level of the right tray of the
autoloader, with the back of “MINDRAY” mark on the carrier facing the analyzer.
6. After finishing setting, press [Enter] from keyboard or click the "Run" or “Ok” from the
dialog box, and then press the [Aspirate] key to start the analysis. The analyzer will start
the analysis from the starting position as you set. The analysis status icon and analyzer
indicator is flickering in green at the time.
7. After every analysis cycle, the results will be saved to the Review Screen.
8. When the analysis is finished, the following statistics message box will pop up.
At the Setup screen, you can set whether to display the statistics after the autoloading is finished every time.
If there are statistics displayed in the message box, you can click “Details…” to check the detailed sample ID, run date and sample position accordingly.
9. Click “Ok” to close the box, and then the analysis status icon and analyzer indicator will
return to lasting green.
10. When finish running, all the racks come to the left tray of the autoloader. Remove them
safely.
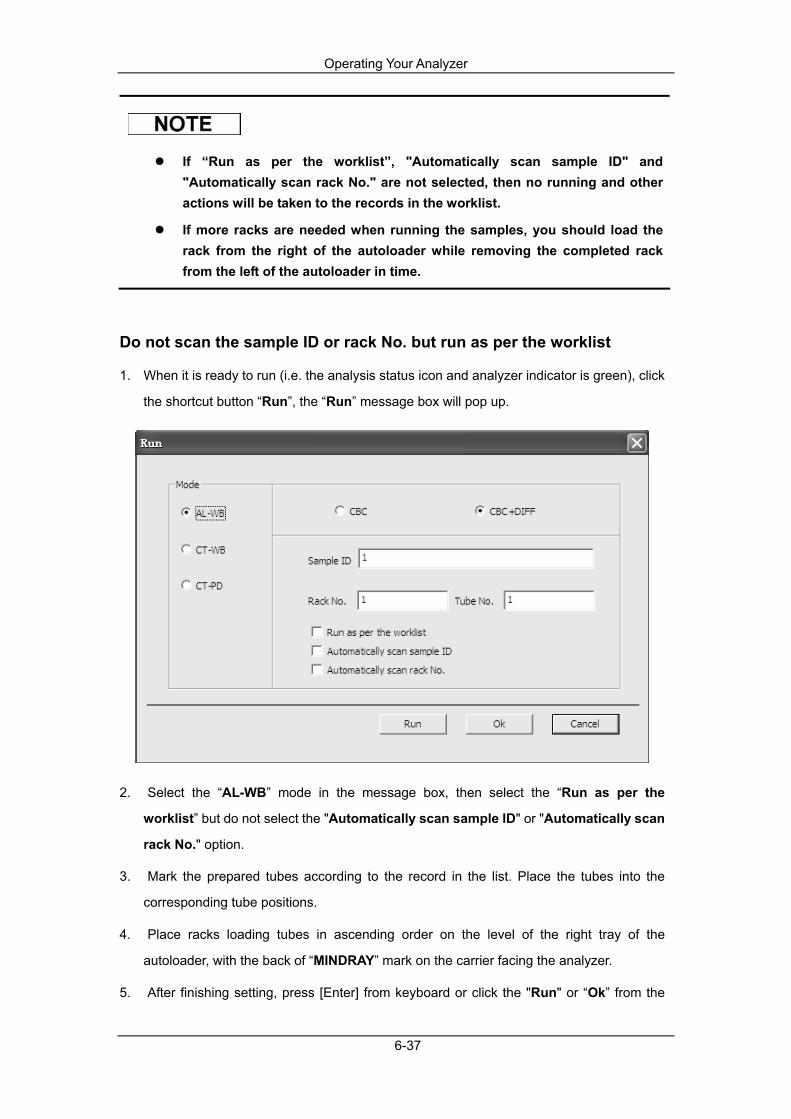
Operating Your Analyzer
6-37
If “Run as per the worklist”, "Automatically scan sample ID" and "Automatically scan rack No." are not selected, then no running and other actions will be taken to the records in the worklist.
If more racks are needed when running the samples, you should load the rack from the right of the autoloader while removing the completed rack from the left of the autoloader in time.
Do not scan the sample ID or rack No. but run as per the worklist
1. When it is ready to run (i.e. the analysis status icon and analyzer indicator is green), click
the shortcut button “Run”, the “Run” message box will pop up.
2. Select the “AL-WB” mode in the message box, then select the “Run as per the
worklist” but do not select the "Automatically scan sample ID" or "Automatically scan
rack No." option.
3. Mark the prepared tubes according to the record in the list. Place the tubes into the
corresponding tube positions.
4. Place racks loading tubes in ascending order on the level of the right tray of the
autoloader, with the back of “MINDRAY” mark on the carrier facing the analyzer.
5. After finishing setting, press [Enter] from keyboard or click the "Run" or “Ok” from the
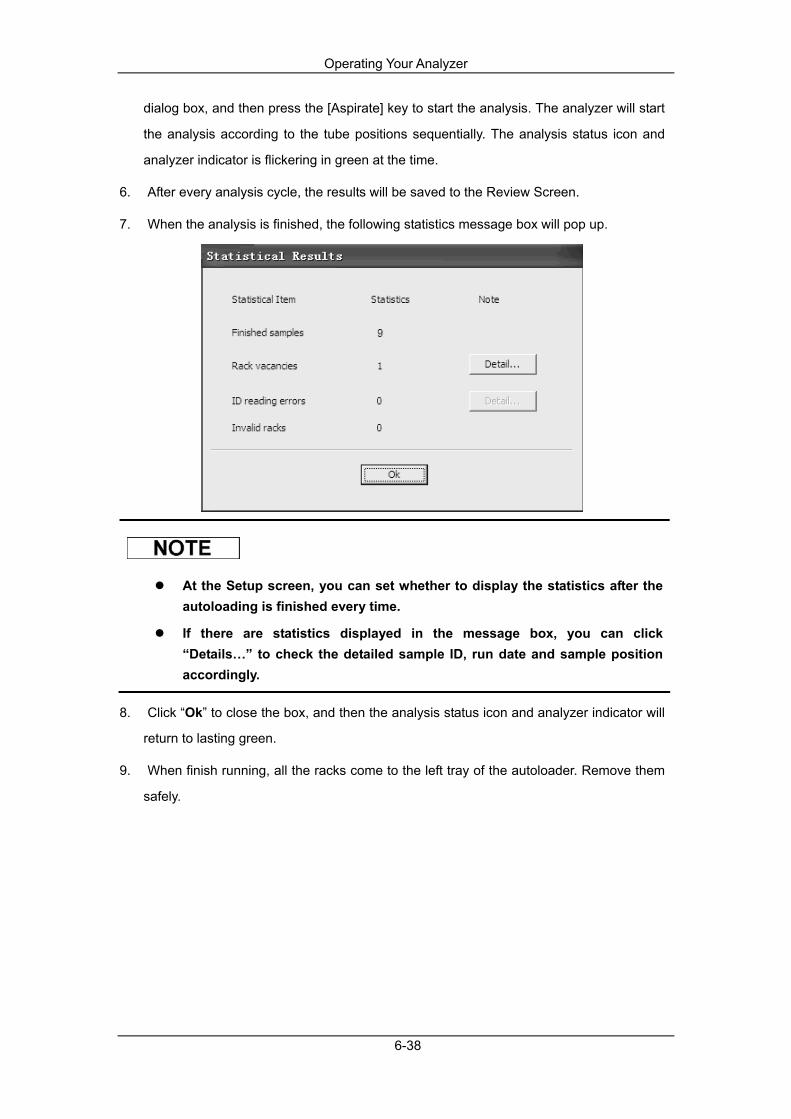
Operating Your Analyzer
6-38
dialog box, and then press the [Aspirate] key to start the analysis. The analyzer will start
the analysis according to the tube positions sequentially. The analysis status icon and
analyzer indicator is flickering in green at the time.
6. After every analysis cycle, the results will be saved to the Review Screen.
7. When the analysis is finished, the following statistics message box will pop up.
At the Setup screen, you can set whether to display the statistics after the autoloading is finished every time.
If there are statistics displayed in the message box, you can click “Details…” to check the detailed sample ID, run date and sample position accordingly.
8. Click “Ok” to close the box, and then the analysis status icon and analyzer indicator will
return to lasting green.
9. When finish running, all the racks come to the left tray of the autoloader. Remove them
safely.
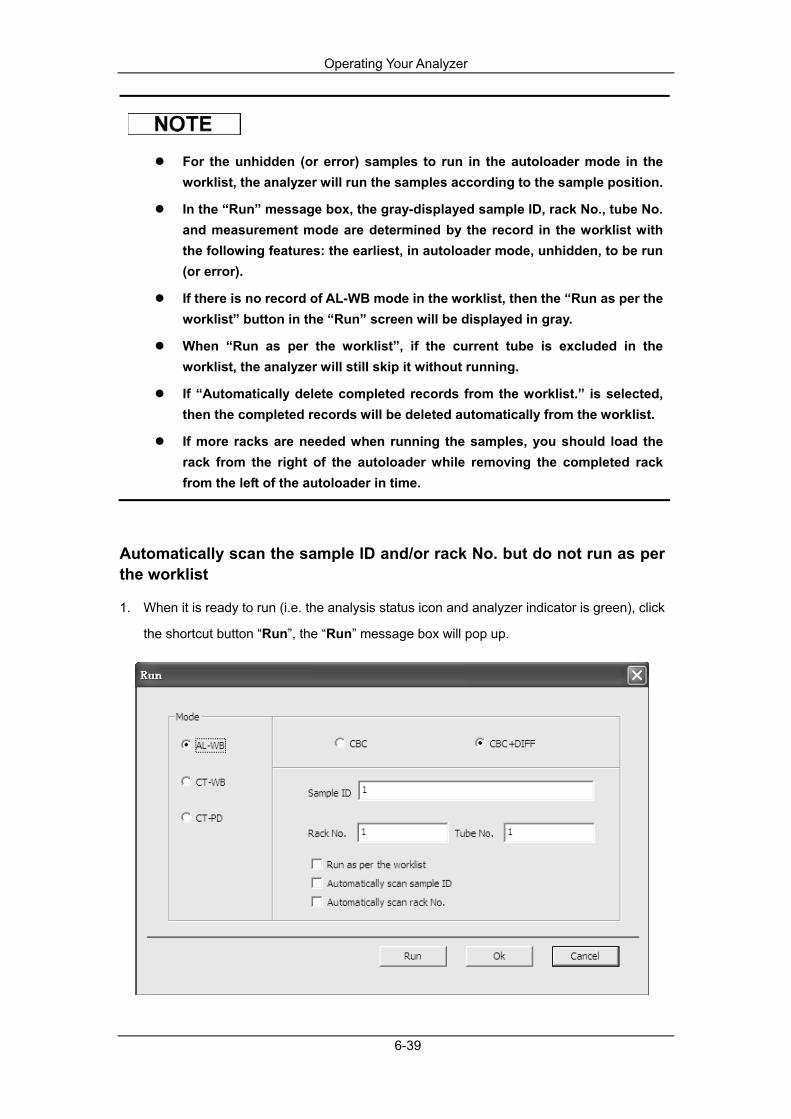
Operating Your Analyzer
6-39
For the unhidden (or error) samples to run in the autoloader mode in the worklist, the analyzer will run the samples according to the sample position.
In the “Run” message box, the gray-displayed sample ID, rack No., tube No. and measurement mode are determined by the record in the worklist with the following features: the earliest, in autoloader mode, unhidden, to be run (or error).
If there is no record of AL-WB mode in the worklist, then the “Run as per the worklist” button in the “Run” screen will be displayed in gray.
When “Run as per the worklist”, if the current tube is excluded in the worklist, the analyzer will still skip it without running.
If “Automatically delete completed records from the worklist.” is selected, then the completed records will be deleted automatically from the worklist.
If more racks are needed when running the samples, you should load the rack from the right of the autoloader while removing the completed rack from the left of the autoloader in time.
Automatically scan the sample ID and/or rack No. but do not run as per the worklist
1. When it is ready to run (i.e. the analysis status icon and analyzer indicator is green), click
the shortcut button “Run”, the “Run” message box will pop up.

Operating Your Analyzer
6-40
2. Select the “AL-WB” mode in the message box, then select "Automatically scan
sample ID" and/or "Automatically scan rack No." but do not select the “Run as per the
worklist” option.
3. Then select the desired analysis mode. If "Automatically scan sample ID" is not
selected, enter the sample ID; if "Automatically scan rack No." is not selected, enter the
starting rack No. and tube No; if both of the two check box are selected, you can not enter
in these edit boxes.
4. If "Automatically scan sample ID" is selected, place labels on the tubes, and then
place them into the corresponding tube positions.
5. Place racks loading tubes in ascending order on the level of the right tray of the
autoloader, with the back of “MINDRAY” mark on the carrier facing the analyzer.
6. After finishing setting, press [Enter] from keyboard or click the "Run" or “Ok” from the
dialog box, and then press the [Aspirate] key to start the analysis. The analyzer will scan
the sample ID and/or rack No. from the starting position as you set, then start the analysis.
The analysis status icon and analyzer indicator is flickering in green at the time.
7. After every analysis cycle, the results will be saved to the Review Screen.
8. If "Automatically scan rack No." is selected, when invalid rack No. is scanned during
counting, the following message box will pop up. Click “Ok” to close it, and the analyzer
will skip the tubes on this rack and continue with other tubes.
9. When the analysis is finished, the following statistics message box will pop up.
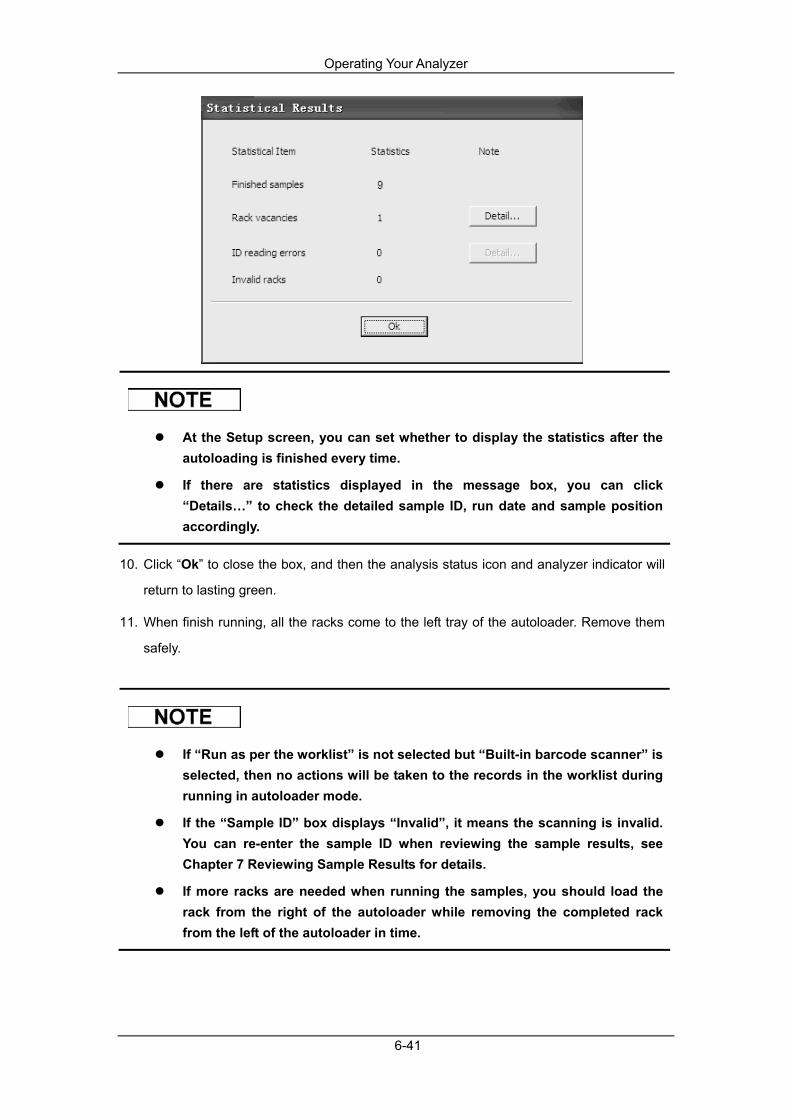
Operating Your Analyzer
6-41
At the Setup screen, you can set whether to display the statistics after the autoloading is finished every time.
If there are statistics displayed in the message box, you can click “Details…” to check the detailed sample ID, run date and sample position accordingly.
10. Click “Ok” to close the box, and then the analysis status icon and analyzer indicator will
return to lasting green.
11. When finish running, all the racks come to the left tray of the autoloader. Remove them
safely.
If “Run as per the worklist” is not selected but “Built-in barcode scanner” is selected, then no actions will be taken to the records in the worklist during running in autoloader mode.
If the “Sample ID” box displays “Invalid”, it means the scanning is invalid. You can re-enter the sample ID when reviewing the sample results, see Chapter 7 Reviewing Sample Results for details.
If more racks are needed when running the samples, you should load the rack from the right of the autoloader while removing the completed rack from the left of the autoloader in time.
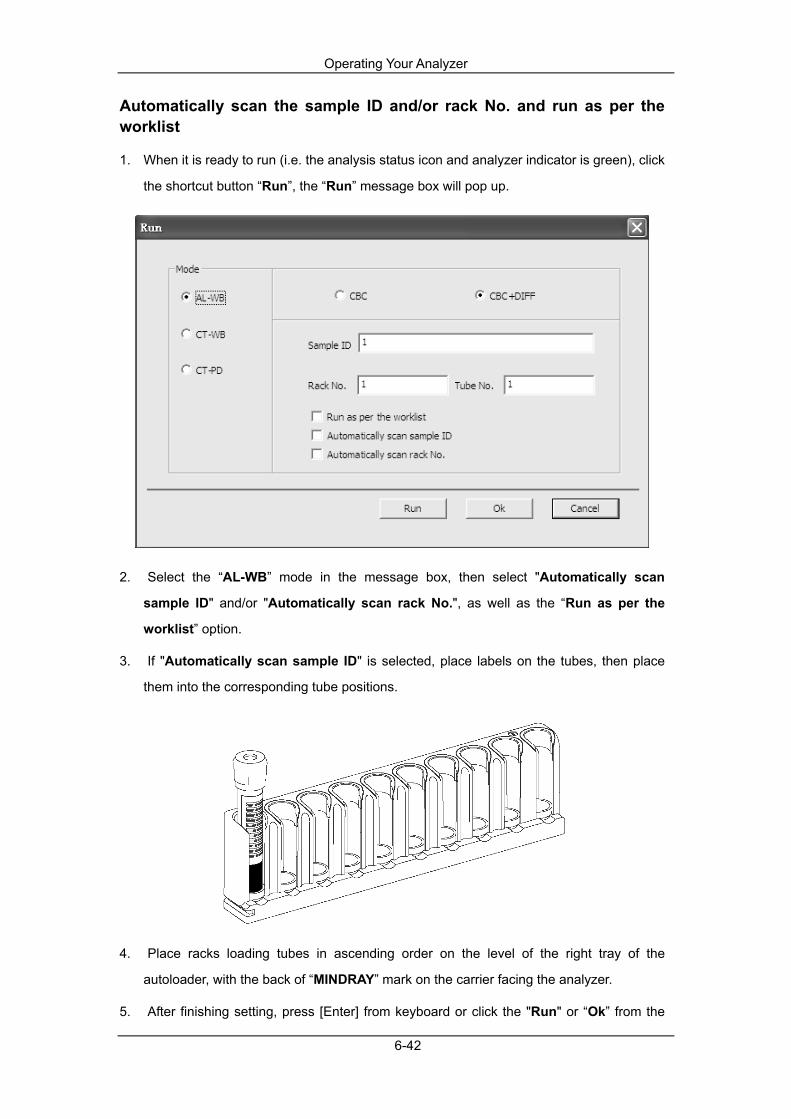
Operating Your Analyzer
6-42
Automatically scan the sample ID and/or rack No. and run as per the worklist
1. When it is ready to run (i.e. the analysis status icon and analyzer indicator is green), click
the shortcut button “Run”, the “Run” message box will pop up.
2. Select the “AL-WB” mode in the message box, then select "Automatically scan
sample ID" and/or "Automatically scan rack No.", as well as the “Run as per the
worklist” option.
3. If "Automatically scan sample ID" is selected, place labels on the tubes, then place
them into the corresponding tube positions.
4. Place racks loading tubes in ascending order on the level of the right tray of the
autoloader, with the back of “MINDRAY” mark on the carrier facing the analyzer.
5. After finishing setting, press [Enter] from keyboard or click the "Run" or “Ok” from the

Operating Your Analyzer
6-43
dialog box, and then press the [Aspirate] key to start the analysis. The analyzer will start
scanning sample IDs and/or rack No., and running samples according to the matched
sample in the worklist sequentially. The analysis status icon and analyzer indicator is
flickering in green at the time.
6. After every analysis cycle, the results will be saved to the Review Screen.
7. If "Automatically scan rack No." is selected, when invalid rack No. is scanned during
counting, the following message box will pop up. Click “Ok” to close it, and the analyzer
will skip the tubes on this rack and continue with other tubes.
8. When the analysis is finished, the following statistics message box will pop up.
At the Setup screen, you can set whether to display the statistics after the autoloading is finished every time.
If there are statistics displayed in the message box, you can click “Details…” to check the detailed sample ID, run date and sample position accordingly.
9. Click “Ok” to close the box, and then the analysis status icon and analyzer indicator will
return to lasting green.

Operating Your Analyzer
6-44
10. When finish running, all the racks come to the left tray of the autoloader. Remove them
safely.
If there is no record of AL-WB mode in the worklist, then the “Run as per the worklist” button in the “Run” screen will be displayed in gray.
If "Automatically scan rack No." is not selected, the system will search for the matching record in the worklist according to the scanned sample ID, and then the rack No. and tube No. will be overwritten. The run status of the record will be changed from “To Be Run” to “Running”.
If no matching record is found in the worklist or a scanning error happens, the analyzer will skip the sample without running.
If “Automatically delete completed records from the worklist.” is selected, then the completed records will be deleted automatically from the worklist.
If more racks are needed when running the samples, you should load the rack from the right of the autoloader while removing the completed rack from the left of the autoloader in time.
6.7.3 Special functions
Stop
During running, the “Run” button at the shortcut buttons area will be replaced by “Stop”. . Click the “Stop” button, after the previously analyzing cycle is finished, the system stops the analysis and the current sample carrier will be pushed out.
STAT
If there is STAT sample requires running first during the autoloader sampling analysis.
Insert STAT
1. Click the shortcut button “STAT”, the message box will pop up.
2. Click “Yes”. After the previously analyzing of the pierced sample is finished, the analysis
stops and the system switch the autoloader mode to the CT-WB sampling mode and
Operating Your Analyzer
6-45
open the compartment door automatically.
3. Present the whole blood sample into the compartment, push the compartment door to
close it.
4. When the STAT run is ready (i.e. the analysis status icon and analyzer indicator is in
yellow), you can run the STAT sample in ways as the closed tube sampling mode, see
details in Closed Tube Sampling Analysis.
STAT samples can only be run in CT-WB or CT-PD mode.
When the current sample is being run, the massage box “Please finish the current sample then perform STAT operation. Please wait!” will pop up. You can click the “Ok” button to close it.
When a STAT is inserted, the system will switch to the worklist screen automatically and add a new STAT record at the first line of the worklist and it is displayed in yellow background.
When a STAT is inserted, the “STAT” button will be replaced by “Cancel”.
You can start the STAT analysis only by pressing the [RUN] key on the analyzer.
After running a STAT sample, you can switch to the graph or table review screen to edit the corresponding information.
Cancel
After the running is finished, you can click the “Cancel” button to cancel the SATA, and then the analyzer will judge whether to switch to the analysis mode before the inserted STAT accordingly, and then proceed with autoloading.
If you click the “Cancel” button when there are unfinished samples left in the worklist, a message box will pop up and then you can select whether to delete the unfinished STAT sample.
After exiting the SATA mode, the background of all the SATA samples will return to normal color.

Operating Your Analyzer
6-46
6.7.4 Dealing with the Analysis Results
Automatic saving of analysis results
This analyzer automatically saves sample results. When the maximum number has been reached, the newest result will overwrite the oldest (already backup).The maximum number of automatic saving results is 40,000.
Parameter flags
If the parameter follows a “H” or “L”, it means the analysis result has exceeded the upper or lower limit of the reference range, but still within the display range
If the parameter follows a “?”, it means the analysis result obtained is suspect.
If you see *** as opposed to the result, it means the result is either invalid or out of the display range.
For the background test, the flags of parameter or flags of abnormal blood cell differential or morphology are not available.
Flags of abnormal blood cell differential or morphology
The analyzer will flag abnormal or suspect WBC, RBC and PLT according to the scattergrams and histograms. The flag information is defined in the following table:
Flag Type Flag information
Abnormal WBC scattergram
Abnormal WBC histogram
WBC abnormal
Leucocytosis
Leucopenia
Neutrophilia
Neutropenia
Lymphocytosis
Lymphopenia
Monocytosis
Eosinophilia
WBC
Abnormal
Basophilia
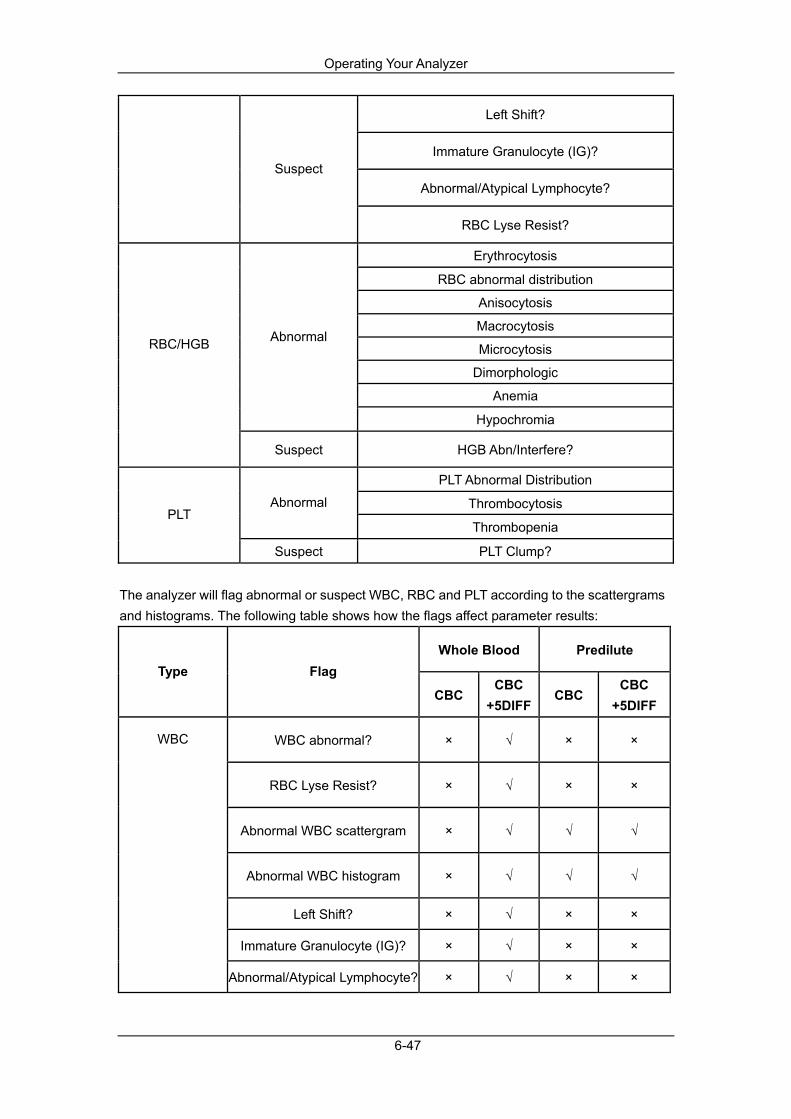
Operating Your Analyzer
6-47
Left Shift?
Immature Granulocyte (IG)?
Abnormal/Atypical Lymphocyte? Suspect
RBC Lyse Resist?
Erythrocytosis
RBC abnormal distribution
Anisocytosis
Macrocytosis
Microcytosis
Dimorphologic
Anemia
Abnormal
Hypochromia
RBC/HGB
Suspect HGB Abn/Interfere?
PLT Abnormal Distribution
Thrombocytosis Abnormal
Thrombopenia PLT
Suspect PLT Clump?
The analyzer will flag abnormal or suspect WBC, RBC and PLT according to the scattergrams and histograms. The following table shows how the flags affect parameter results:
Whole Blood Predilute Type Flag
CBC CBC
+5DIFFCBC
CBC +5DIFF
WBC abnormal? × √ × ×
RBC Lyse Resist? × √ × ×
Abnormal WBC scattergram × √ √ √
Abnormal WBC histogram × √ √ √
Left Shift? × √ × ×
Immature Granulocyte (IG)? × √ × ×
WBC
Abnormal/Atypical Lymphocyte? × √ × ×

Operating Your Analyzer
6-48
Leucocytosis √ √ √ √
Leucopenia √ √ √ √
Neutrophilia × √ × ×
Neutropenia × √ × ×
Lymphocytosis × √ × ×
Lymphopenia × √ × ×
Monocytosis × √ × ×
Eosinophilia × √ × ×
Basophilia × √ × ×
Dimorphologic √ √ × ×
HGB Abn/Interfere? √ √ × ×
Anisocytosis √ √ × ×
Microcytosis √ √ √ √
Macrocytosis √ √ √ √
Erythrocytosis √ √ √ √
Anemia √ √ √ √
Hypochromia √ √ √ √
RBC/HGB
RBC abnormal distribution √ √ × ×
PLT Clump? √ √ × ×
Thrombocytosis √ √ √ √
Thrombopenia √ √ √ √ PLT
PLT Abnormal Distribution √ √ × ×
When the PLT value is less than 100 × 109 / L, a manual count by the microscope is recommended.

Operating Your Analyzer
6-49
6.7.5 Barcode Labels
CAUTION
The following errors may cause misreading of barcodes:
The barcode is not stuck upright; Use of unqualified barcodes; There is blood, powder or other contaminators on the surface of the barcode.
To ensure good readability of barcodes, do as follows:
Stick the barcode correctly, as shown below. Use qualified barcodes mentioned in Appendix B.16 Barcode Specifications. Keep the surface of the barcode clean and free of dust.
To ensure the correct barcode can be read, you must place labels right on the region as shown below, and place the label correctly.
Where to place the barcode label
NOTE
If several labels are stuck to one tube, or the label is misplaced, peeled or wrinkled, it may cause autoloading error. To avoid such error, the notes below shall be followed:
The label shall be stuck properly. Do not stick several labels to one tube. The surface of the label shall not be wrinkled, Do not use barcode label which is easily peeled to prevent the label from
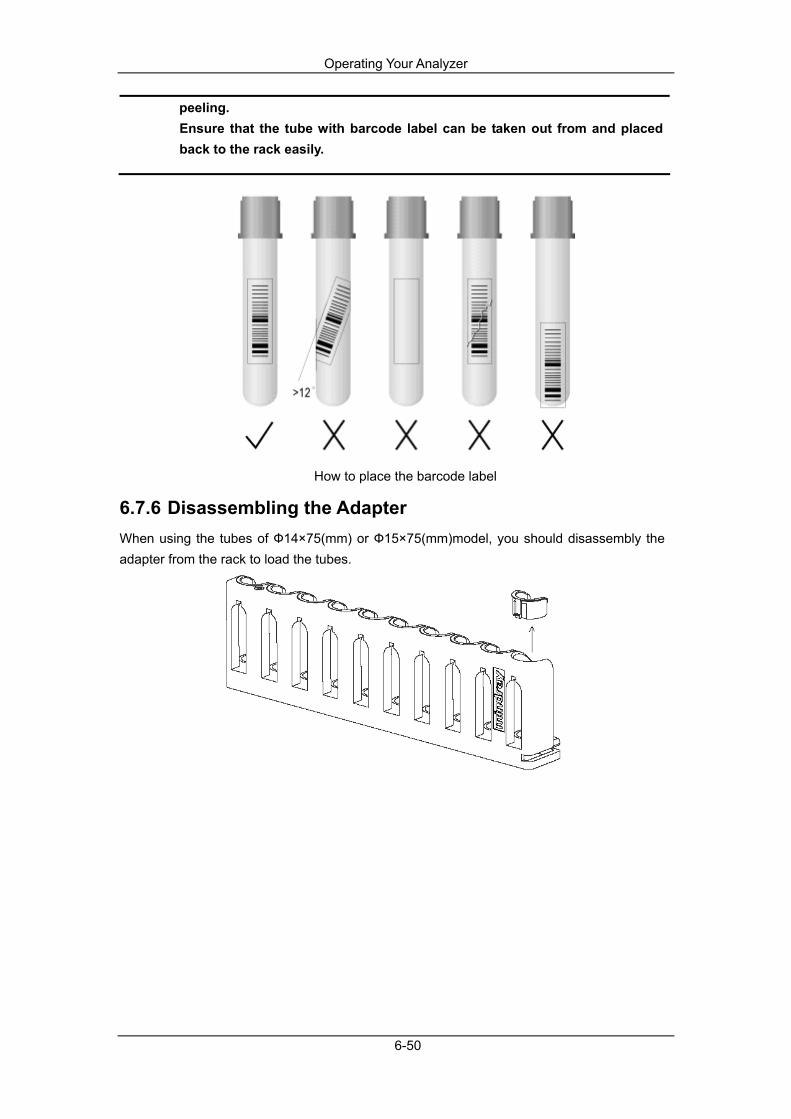
Operating Your Analyzer
6-50
peeling. Ensure that the tube with barcode label can be taken out from and placed back to the rack easily.
How to place the barcode label
6.7.6 Disassembling the Adapter When using the tubes of Ф14×75(mm) or Ф15×75(mm)model, you should disassembly the adapter from the rack to load the tubes.

Operating Your Analyzer
6-51
6.8 Worklist Click the “Worklist” button on the shortcut area or click “Menu”, then select “Worklist” to enter the “Worklist” screen.
The upside of the interface is the worklist; the downside is information entry area including Sample Info. and Patient Info. The bottom of the screen is the function button area.
The worklist can save a maximum of 2000 records.
All the information fields in the worklist are entered through the information entry area except the “No.”, “Run Status” and “Entry Time”.
If the worklist is empty, all the information fields in the information entry area are blank and displayed in gray.
If a record in the worklist is highlighted, the corresponding information of the record will display in the information entry area.
In the “Worklist” screen, you can perform the following operations to the worklist in the upside of the screen.
Adjusting the position of each column
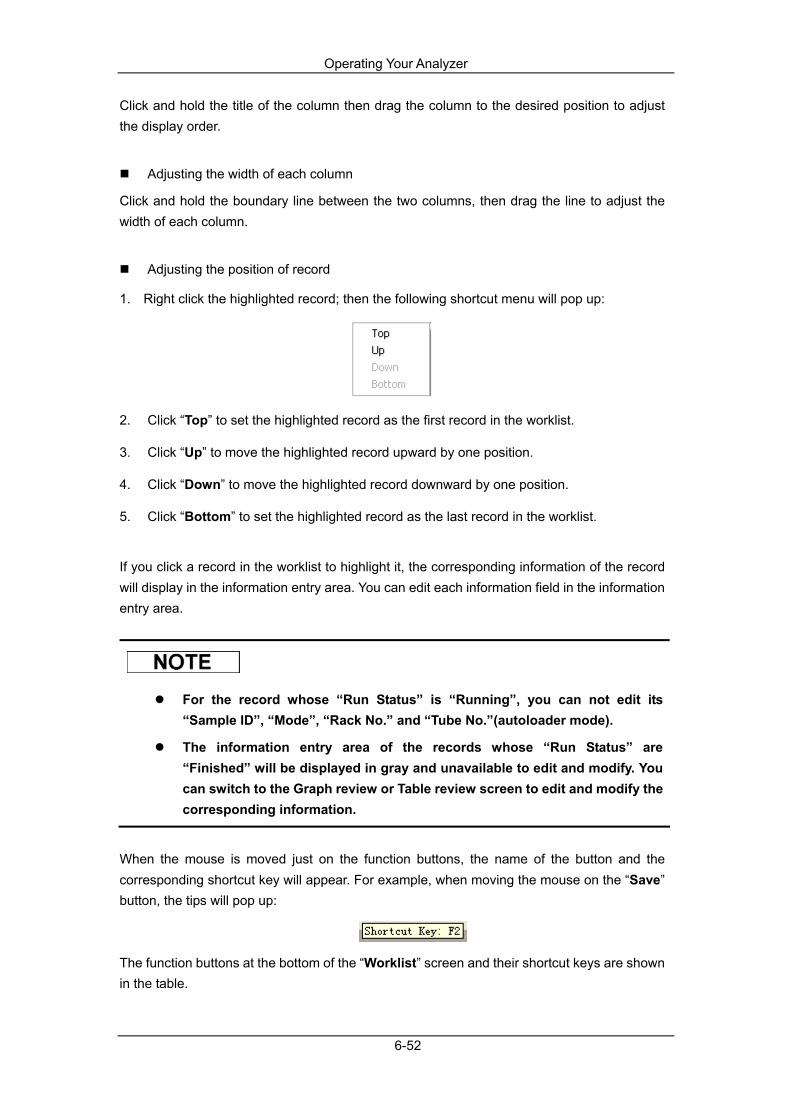
Operating Your Analyzer
6-52
Click and hold the title of the column then drag the column to the desired position to adjust the display order.
Adjusting the width of each column
Click and hold the boundary line between the two columns, then drag the line to adjust the width of each column.
Adjusting the position of record
1. Right click the highlighted record; then the following shortcut menu will pop up:
2. Click “Top” to set the highlighted record as the first record in the worklist.
3. Click “Up” to move the highlighted record upward by one position.
4. Click “Down” to move the highlighted record downward by one position.
5. Click “Bottom” to set the highlighted record as the last record in the worklist.
If you click a record in the worklist to highlight it, the corresponding information of the record will display in the information entry area. You can edit each information field in the information entry area.
For the record whose “Run Status” is “Running”, you can not edit its “Sample ID”, “Mode”, “Rack No.” and “Tube No.”(autoloader mode).
The information entry area of the records whose “Run Status” are “Finished” will be displayed in gray and unavailable to edit and modify. You can switch to the Graph review or Table review screen to edit and modify the corresponding information.
When the mouse is moved just on the function buttons, the name of the button and the corresponding shortcut key will appear. For example, when moving the mouse on the “Save” button, the tips will pop up:
The function buttons at the bottom of the “Worklist” screen and their shortcut keys are shown in the table.
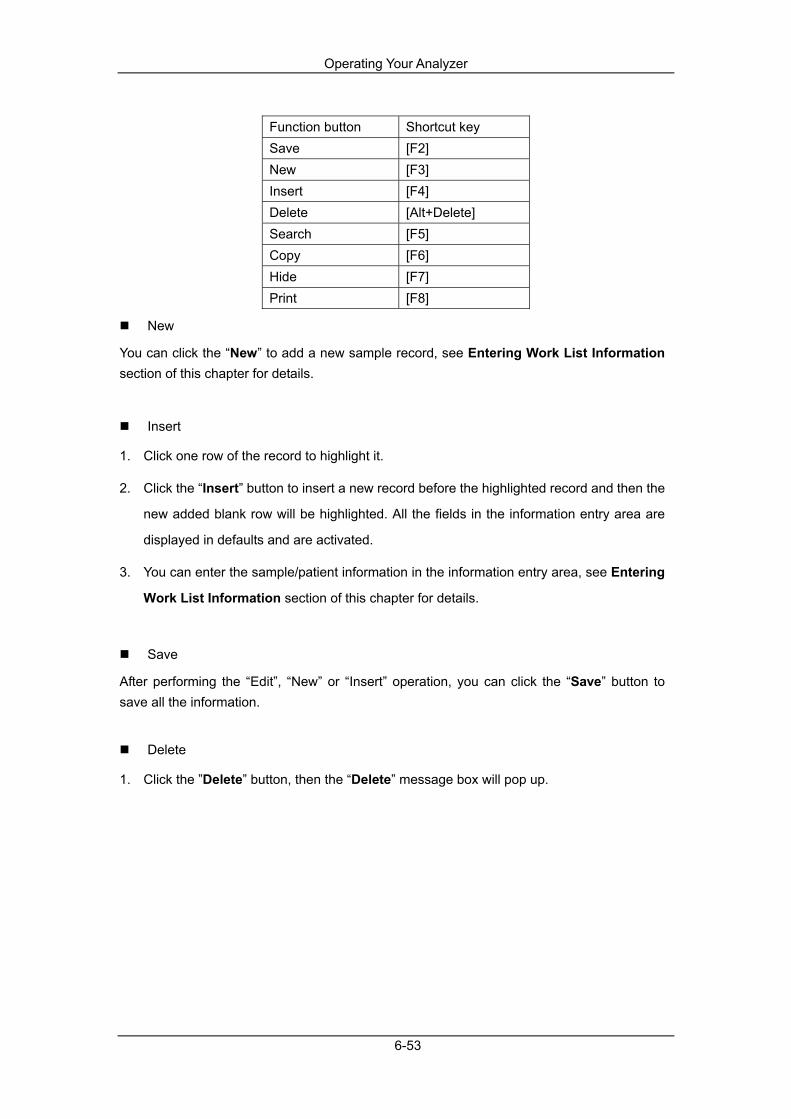
Operating Your Analyzer
6-53
Function button Shortcut key Save [F2] New [F3] Insert [F4] Delete [Alt+Delete] Search [F5] Copy [F6] Hide [F7] Print [F8]
New
You can click the “New” to add a new sample record, see Entering Work List Information section of this chapter for details.
Insert
1. Click one row of the record to highlight it.
2. Click the “Insert” button to insert a new record before the highlighted record and then the
new added blank row will be highlighted. All the fields in the information entry area are
displayed in defaults and are activated.
3. You can enter the sample/patient information in the information entry area, see Entering
Work List Information section of this chapter for details.
Save
After performing the “Edit”, “New” or “Insert” operation, you can click the “Save” button to save all the information.
Delete
1. Click the ”Delete” button, then the “Delete” message box will pop up.

Operating Your Analyzer
6-54
2. Click the radio button “Selected Samples”, “All finished records” or “All records” to
select the records you want to delete.” Selected Samples” are those selected with “√”
marks in the worklist.
3. Click “Ok” to perform the deletion and refresh the worklist.
The records whose “Run Status” are “Running” can not be deleted.
Search
1. Click the ”Search” button, then the “Search” message box will pop up.
2. Click one or more check boxes to define the desired search condition(s).
3. Enter the search content in the edit box of the desired search condition.

Operating Your Analyzer
6-55
4. If you wish to perform the precise search, you can select the “Whole Words Only”
check box; if you wish to perform the fuzzy search (means to search the related records
which contain the content that you entered), you should leave the check box in blank.
5. Click the “Previous”/”Next” button to start searching upwards/downwards from the
highlighted record. The matching record found will be highlighted. Then you can click the
“Previous”/”Next” button to continue searching.
If the first/last record is reached, then the searching circle will start again from the last/first record upwards/downwards.
6. A searching circle will be completed when backing to the initial record. If there is no
matching record found, the prompt message box “No record found!” will pop up at the
screen; otherwise, the prompt message box “Search finished!” will pop up.
7. Click “Ok” button to close the message box.
8. You can repeat procedure 2 to 6 to search for other content; or click the “Close” button to
finish searching and close the message box.
Copy
1. Click the desired record in the worklist to highlight it.
2. Click the “Copy” button to add a new record in the worklist and highlight it. The sample ID
of this new added record is empty or will automatically increase by 1 based on the last
sample ID in the worklist, the other information remains the same as the record copied
from. For the autoloader samples, the “Rack No.-Tube No.” of this new copied record will
increase by 1 based on the greatest “Rack No.-Tube No.” existed in the worklist.
If the Sample ID ends with a non-numeric letter, the sample ID will not increase automatically.
Hide
1. Select the check box of the desired record in the worklist.

Operating Your Analyzer
6-56
2. Click the “Hide” button to hide the selected record and display it in gray.
If the selected records include both hidden and unhidden records, when you click the “Hide” button, all of them will be hidden.
The records whose “Run Status” are “Running” or “Finished” can not be hidden.
You can edit and delete the hidden record.
Cancel
1. Select the check box of the hidden record in the worklist.
2. Click the “Cancel” button to cancel the hide and gray display status of the record.
If the selected records are all hidden records, the “Hide” button will replaced by the “Cancel” button.
1. Select the check box of the desired record in the worklist.
2. Click the “Print” button, and then a message box will pop up.
3. Click “Ok” to start printing.
Operating Your Analyzer
6-57
6.9 Auto-Sleep When the time for which the analyzer is free from fluidic operations reaches the value you have set at the "Auto Maintenance" screen, a dialog box will pop up, prompting “Preparing to sleep, please wait...”. After the preparation, the dialog box closes automatically and the analyzer is in the auto-sleep status. In this mode, you can still perform any other operations which do not involve fluidic operations.
NOTE
To change the time when to start the auto-sleep, see 5.3.1 General Setup for
details.
If it is time for auto-sleep, current operations will pause. When the analyzer
is in the auto-sleep status, you can continue the operations.
To cancel the auto-sleep, press the aspirate key and a dialog box of “Canceling the sleeping mode. Please wait...” will pop up. After the auto-sleep is canceled, the dialog box will close automatically.

Operating Your Analyzer
6-58
6.10 Shutdown
All the samples, controls, calibrators, reagents, wastes and areas contacted them are potentially biohazardous. Wear proper personal protective equipment (e.g. gloves, lab coat, etc.) and follow safe laboratory procedures when handling them and the contacted areas in the laboratory.
The sample probe is sharp and potentially biohazardous, Exercise caution to avoid contact with the probe when working around it.
To ensure stable analyzer performance and accurate analysis results, be sure to perform the “Shutdown” procedure to shut down the analyzer after it has been running continuously for 24 hours.
Be sure to shut down the analyzer strictly as instructed below.
The shutdown procedure includes closing the analyzer and exiting the software. The following content will introduce the two procedures respectively.
Shutting down the analyzer
1. Click the shortcut button “Shutdown”, or select “Menu” “Shutdown” “Shutdown”
option, the following message box will pop up.
2. Click the “Ok” button to shutdown the analyzer.

Operating Your Analyzer
6-59
3. During the shutdown procedure, the shutdown information will be displayed in the
information indicating area at the bottom of the interface.
4. After the shutdown is finished, a message box will pop up.
5. Place the power switch at the left side of the analyzer in the OFF position (O). The
message box will be closed automatically.
6. Empty the waste container and dispose of the waste properly.
Be sure to dispose of reagents, waste, samples, consumables, etc. according to government regulations.
If the analyzer disconnects with the computer, you can not perform the shutdown procedure.
When the analyzer is running or performing other fluidics sequence, do not shutdown the analyzer forcibly.
If error happens during shutdown procedure, the analyzer will return to the status before the shutdown procedure is performed, and then alarm. See Chapter 11 Troubleshooting Your Analyzer for details to remove the error.
You can click the “Restart” button to restart the analyzer and perform startup initialization.
You will not exit the software after the shutdown of the analyzer, and you can still perform operations that are available without the cooperation of the analyzer.
Exiting the system software
1. Click the shortcut button “Exit”, or select “Menu” “Exit” “Exit” option, the following
message box will pop up.

Operating Your Analyzer
6-60
2. Click the “Ok” button to exit the system software.
You must shut down the analyzer before exiting the software.
Turning off the external computer
1. Close the external computer according to the shutdown procedures of the operation
system.
2. Turn off the display.
You should exit the terminal software first and then turn off the external computer according to standard procedures. Otherwise, the database of the terminal software might be lost!

7-1
7 Reviewing Sample Results
7.1 Introduction The analyzer automatically saves analysis results. Totally 40,000 results can be saved, including sample information, parameters, flag prompts, scattergrams and histograms. You can browse sample results either in the table or graph mode.

Reviewing Sample Results
7-2
7.2 Graph Review Click the shortcut button “Graph” or click the “Menu” button, and then select the “Review”, and then select “Graph” to enter the “Graph” review screen:
The “Graph” screen consists of three parts. The upside displays the Sample/Patient Info. The downside displays the Results, Scattergrams, Histograms, Flags, DIFF Graphs, Microscopic Exam Results and Blood Type/ESR results in accordance with the Sample/Patient Info. in the form of tabs including “Data/Graph”, “DIFF”, “Microscopic Exam. and Others” and “Research”. The bottom displays the functional buttons available in the current screen.
7.2.1 Sample/Patient Information You can use the record switch column in the down right of the screen to browse the sample records one by one. You can see the Sample/Patient Info. in the upside of the screen. You can edit all the patient information except the “Operator” and the “Validater”. For details of editing information, see Editing work list information in Chapter 6 Operating Your Analyzer.

Reviewing Sample Results
7-3
You can enable users of common level to edit the sample ID by setting in the “Setup” screen, see chapter 5 Customizing the Analyzer Software for details.
You can edit all the information of the sample except the Mode and Run Time.
7.2.2 Tabs After selecting a sample record, you can click the tab at the downside of the screen to see the corresponding information. Data/Graph
Click the “Data/Graph” tab to see the data/graph information of the record.
You can select whether to display the four RUOs, the “*” mark and the corresponding declarations (“*” means “research use only, not for diagnostic use”) in “Setup” screen, see Chapter 5 Customizing the Analyzer Software for details.
When the results of Bas% and Bas# are expressed in “*”, the second histogram discriminator will not be displayed.
For details of how to edit and restore the result, please see the following Edit Result and

Reviewing Sample Results
7-4
Restore Result section of this chapter. When moving the mouse to any graph of the scattergram/histogram, an icon of magnifier will appear. Click the icon, a box of enlarged graph will pop up and you can drag the box at will.
When finish browsing, you can click “X” on the top right of the box to close it.
DIFF
You can click the “DIFF” tab to check the WBC differential information of the record.
The DIFF tab is unavailable in CBC mode.
You can select whether to display the four RUOs, the “*” mark and the corresponding declarations (“*” means “research use only, not for diagnostic use”) in “Setup”, see Chapter 5 Customizing the Analyzer Software for details.
When the results of Bas% and Bas# are expressed in “*”, the second histogram discriminator will not be displayed.

Reviewing Sample Results
7-5
For details of how to edit and restore the result, please see the following Edit Result and Restore Result section of this chapter. When moving the mouse to any graph of the scattergram/histogram, an icon of magnifier will appear. Click the icon, a box of enlarged graph will pop up and you can drag the box at will.
When finish browsing, you can click “X” on the top right of the box to close it.
Microscopic Exam. and Others
Click the “Microscopic Exam. and Others” tab, you can browse and enter the microscopic exam and blood type/ESR information of the record.
Entering the Microscopic Exam. Information
1. Selecting the Sample Type
Click the “Sample Type” combo box; select the sample type as “Venous blood” (default) or “Capillary Blood”.

Reviewing Sample Results
7-6
2. Entering the date and time of the microscopic exam
Click the “Microscopic exam. time” edit box, enter the date and time of microscopic exam.
The Microscopic exam. time can not exceed the current system time.
3. Entering the Microscopic Description
You can enter the morphology information for WBC, RBC and PLT respectively into the
multi-line edit box.
4. Entering the Cell Differential
You can enter the percentage or other form of differential result of each cell differential into
the edit box next to the cell differential name respectively.
You can enter a value within the range [0.0-100.0] and the unit is “%”.
Entering the Blood Type information
You can select the blood type of the patient in the “Blood Type/ESR” column. Click the first combo box next to the blood type, you can select from “Blank”, “A”, “B”, “O” and “AB”; click the second combo box, you can select from “Blank”, “RH+” and “RH-”.
Entering the Blood ESR information
You can enter the blood ESR value into the edit box follows the “ESR”. If the value exceeds the Ref. Range, the flags “H” or “L” will appear to indicate the value exceeds the upper limit or lower limit. You can modify the reference range of Blood ESR by the following steps:
1. Click “Set Reference Range” button, a message box will pop up. Enter the upper limit
and lower limit of the blood ESR in the edit box “Upper limit” and “Lower limit”
respectively.
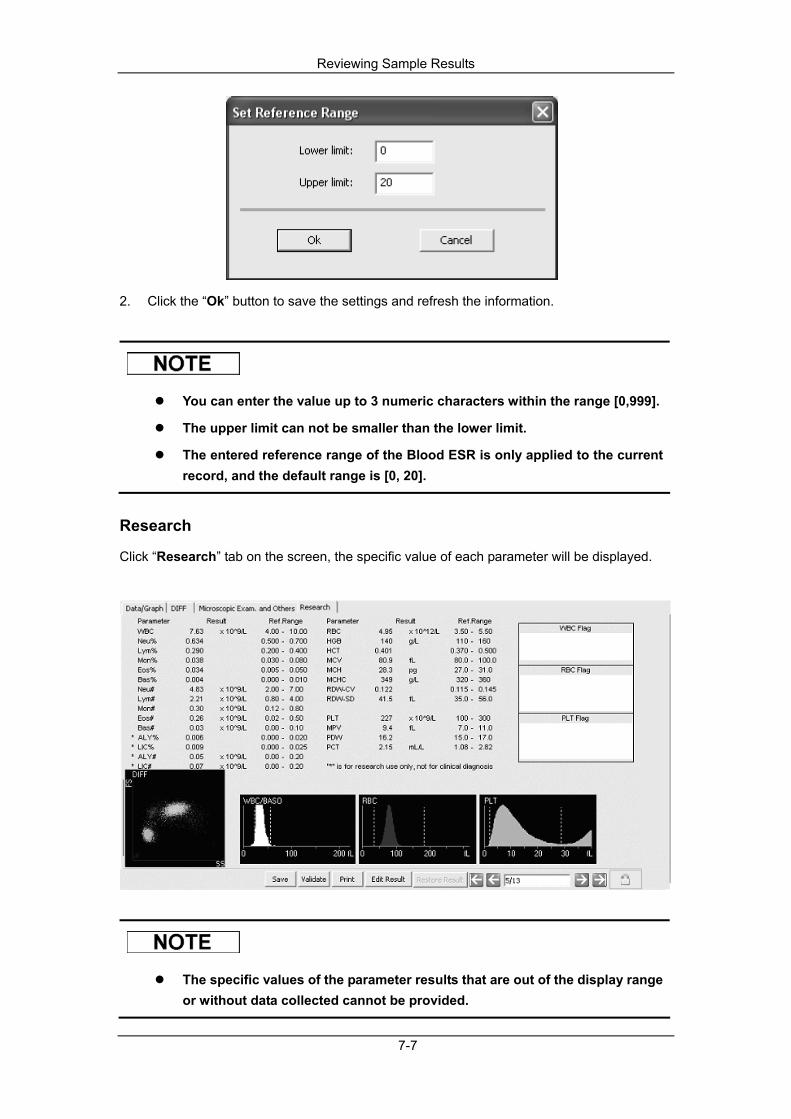
Reviewing Sample Results
7-7
2. Click the “Ok” button to save the settings and refresh the information.
You can enter the value up to 3 numeric characters within the range [0,999].
The upper limit can not be smaller than the lower limit.
The entered reference range of the Blood ESR is only applied to the current record, and the default range is [0, 20].
Research
Click “Research” tab on the screen, the specific value of each parameter will be displayed.
The specific values of the parameter results that are out of the display range or without data collected cannot be provided.
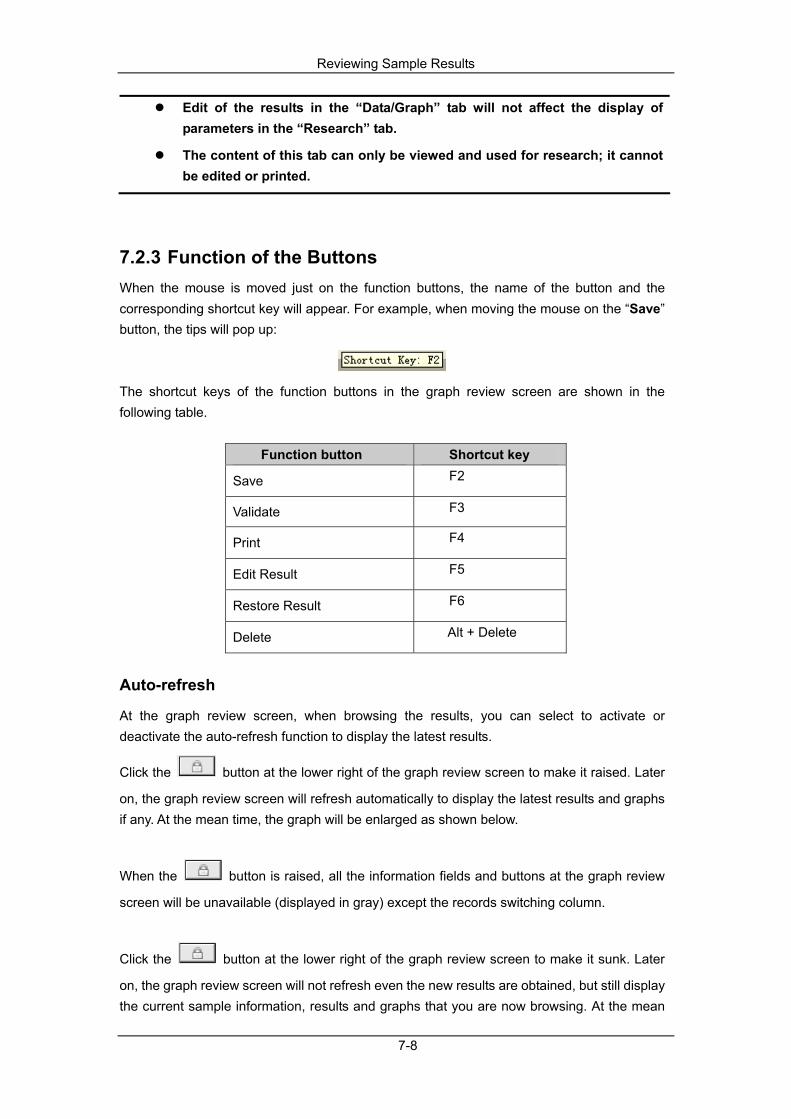
Reviewing Sample Results
7-8
Edit of the results in the “Data/Graph” tab will not affect the display of parameters in the “Research” tab.
The content of this tab can only be viewed and used for research; it cannot be edited or printed.
7.2.3 Function of the Buttons When the mouse is moved just on the function buttons, the name of the button and the corresponding shortcut key will appear. For example, when moving the mouse on the “Save” button, the tips will pop up:
The shortcut keys of the function buttons in the graph review screen are shown in the following table.
Function button Shortcut key
Save F2
Validate F3
Print F4
Edit Result F5
Restore Result F6
Delete Alt + Delete
Auto-refresh
At the graph review screen, when browsing the results, you can select to activate or deactivate the auto-refresh function to display the latest results.
Click the button at the lower right of the graph review screen to make it raised. Later
on, the graph review screen will refresh automatically to display the latest results and graphs if any. At the mean time, the graph will be enlarged as shown below.
When the button is raised, all the information fields and buttons at the graph review
screen will be unavailable (displayed in gray) except the records switching column.
Click the button at the lower right of the graph review screen to make it sunk. Later
on, the graph review screen will not refresh even the new results are obtained, but still display the current sample information, results and graphs that you are now browsing. At the mean

Reviewing Sample Results
7-9
time, the graph will be displayed in normal size as shown below.
When the button is sunk, all the operations are available to the current displayed
records.
The default status of the button at the graph review screen is sunk.
The status of the button keeps still when you return to the graph
review screen after exiting.
When you browsing records at the graph review screen by using the
switching column, the status of the button automatically changes
into suck.
Save
Click the “Save” button to save the modified information on all tabs of the current result.

Reviewing Sample Results
7-10
Click the “Print” button to print the information, result, histogram and scattergram of the current sample.
You can set the amount of copies for the printed report in the “Setup” screen.
At the “Setup” screen, you can select whether to print the Flag information in the report.
Delete
1. Click the “Delete” button, a message box will pop up.
2. Click “Ok” to delete the current displayed sample record in the “Graph” screen.
The “Delete” button and the corresponding deleting operation are not available to users of common-level.
Validate
Click the “Validate” button to perform the validating operation.
You can enable the users of common level to validate by setting in the “Setup” screen. Otherwise, the user name and the pass word of administrator level are required.
After validating, you can not edit the Sample/Patient Info. and result.

Reviewing Sample Results
7-11
You can not validate the background record.
Cancel (validate)
Click the “Cancel” button to cancel the validating operation.
If the current sample result is validated, the “Validate” button will be replaced by the “Cancel” button.
The users of common level is enabled the authority of “Cancel” together with “Validate” when you setting in the “Setup” screen. Otherwise, the user name and the pass word of administrator level are required.
After canceling, you can edit the Sample/Patient Info. and result.
Edit Result
1. Click the “Edit Result” button, then the result of each parameter and WBC DIFF results will be displayed in an edit box for you to edit.
2. After editing, click the “Save” button to save the change and the edit box disappears.
You can enable the users of common level to edit result by setting in the “Setup” screen. Otherwise, the user name and the pass word of administrator level are required.
If the result of one parameter is modified, then the result of other related parameter(s) will be changed accordingly and the high or low/suspect flags will also be refreshed.
Only the result of the measurement parameters (WBC, RBC, HGB, HCT and PLT) and WBC DIFF results can be modified.
After editing and then saving WBC DIFF results, the absolute value of each DIFF result will be re-calculated and then refreshed.
If the sum of the DIFF results does not equal to 100.00% after being edited, then the message box “The sum of the DIFF results is not 100.00%!” will pop up when you clicking the “Save” button.
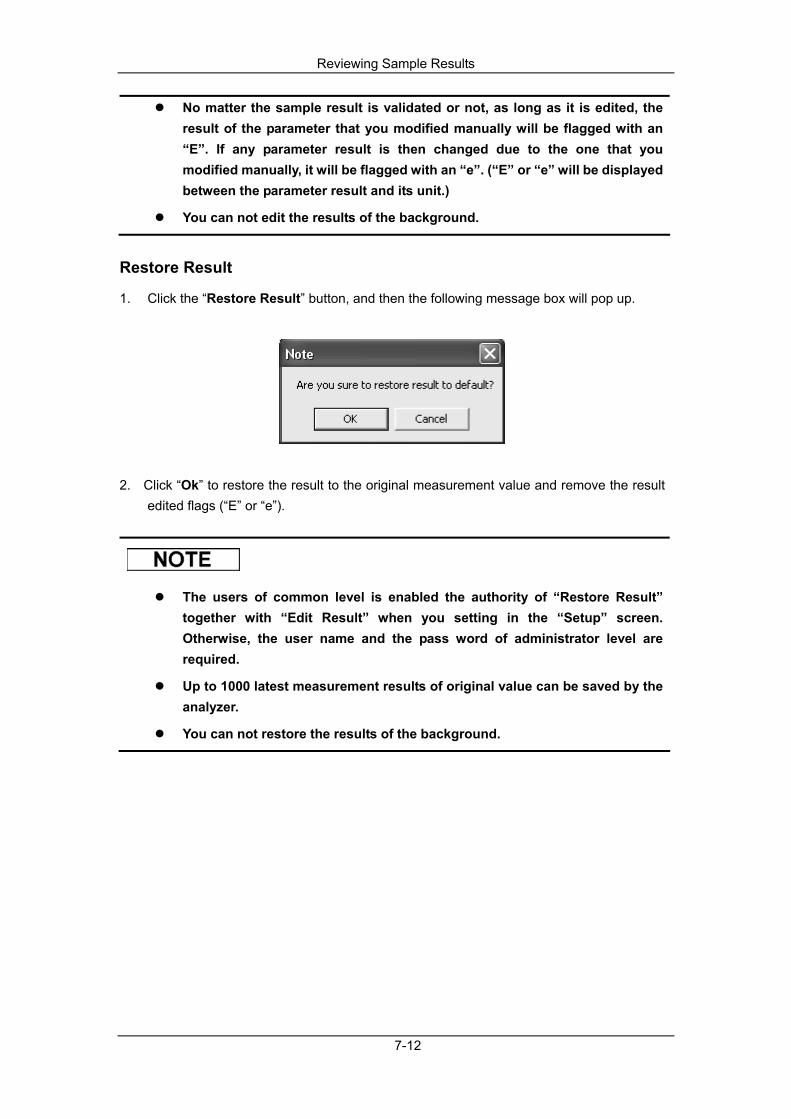
Reviewing Sample Results
7-12
No matter the sample result is validated or not, as long as it is edited, the result of the parameter that you modified manually will be flagged with an “E”. If any parameter result is then changed due to the one that you modified manually, it will be flagged with an “e”. (“E” or “e” will be displayed between the parameter result and its unit.)
You can not edit the results of the background.
Restore Result
1. Click the “Restore Result” button, and then the following message box will pop up.
2. Click “Ok” to restore the result to the original measurement value and remove the result
edited flags (“E” or “e”).
The users of common level is enabled the authority of “Restore Result” together with “Edit Result” when you setting in the “Setup” screen. Otherwise, the user name and the pass word of administrator level are required.
Up to 1000 latest measurement results of original value can be saved by the analyzer.
You can not restore the results of the background.
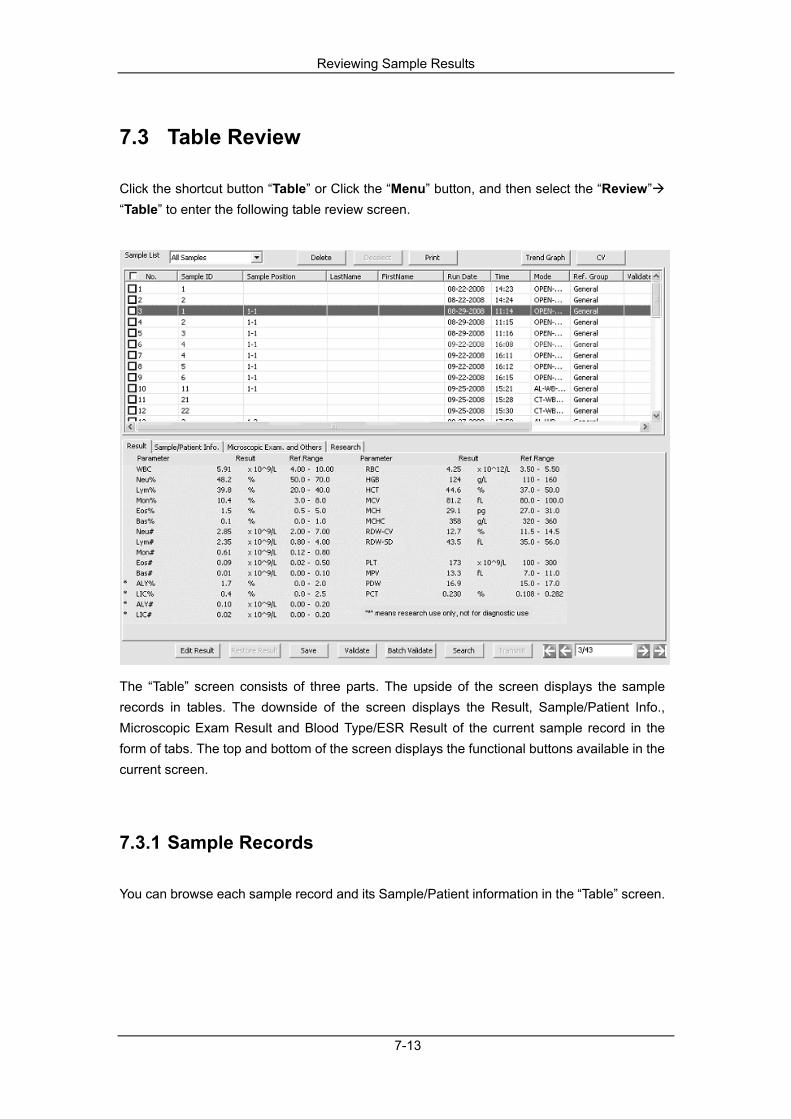
Reviewing Sample Results
7-13
7.3 Table Review Click the shortcut button “Table” or Click the “Menu” button, and then select the “Review” “Table” to enter the following table review screen.
The “Table” screen consists of three parts. The upside of the screen displays the sample records in tables. The downside of the screen displays the Result, Sample/Patient Info., Microscopic Exam Result and Blood Type/ESR Result of the current sample record in the form of tabs. The top and bottom of the screen displays the functional buttons available in the current screen.
7.3.1 Sample Records You can browse each sample record and its Sample/Patient information in the “Table” screen.

Reviewing Sample Results
7-14
For the error sample record, the content of each information field is displayed in red.
For the printed sample, its cell in the “Print” column displays “P”. For the unprinted sample, its cell in the “Print” column is blank.
For the validated sample, its cell in the “Validate” column displays “V”; for the sample not validated, its cell is blank.
For the transmitted sample, its cell in the “Transmission” column displays “T”; for the sample not transmitted, its cell is blank.
In the sample records table area, you can perform the following operations:
Selecting the sample table
Click the “Sample List” combo box, then you can select “Samples within today” (default), “All Samples” and ”Samples found”. The Review List will display different records according to the different options:
Record option Records displayed
Samples within today Display only the sample records within today
All Samples Display all the saved sample records.
Samples found Display all the sample records met the search requirements.
Adjusting the position of each column
Click and hold the title of the column then drag the column to the desired position to adjust the display order.
Ranking the records
1. Right click the “Run Date” title, and then a shortcut menu will pop up:
2. Click “Ascending” to rank the records in ascending order of “Run Date + Time” (i.e. the
latest testing sample ranks last in the list).
3. Click “Descending” to rank the records in descending order of “Run Date + Time” (i.e.
the latest testing sample ranks the first in the list).

Reviewing Sample Results
7-15
The records in the graph screen will be ranked the same way as the table screen, in ascending/descending order of “Run Date + Time”.
Switching
Double click a record in the list; the screen will switch to the graph review screen of the record automatically.
7.3.2 Tabs
Result
You can click the “Result” tab to see all the results of the highlighted record.
You can select whether to display the four RUOs, the “*” mark and the corresponding declarations (“*” means “research use only, not for diagnostic use”) in “Setup”, see Chapter 5 Customizing the Analyzer Software for details.

Reviewing Sample Results
7-16
For details of how to edit and restore the result, please see the following Edit Result and Restore Result section of this chapter.
Sample/Patient Information
You can click the “Sample/Patient Info.” tab to see the sample information and patient information of the highlighted record in the list.
For details to edit information, see Editing work list information section in Chapter 6 Operating Your Analyzer.
Microscopic Exam. and Others
Click the “Microscopic Exam. and Others” tab, you can browse and enter the microscopic exam and blood type/ESR information of the record.
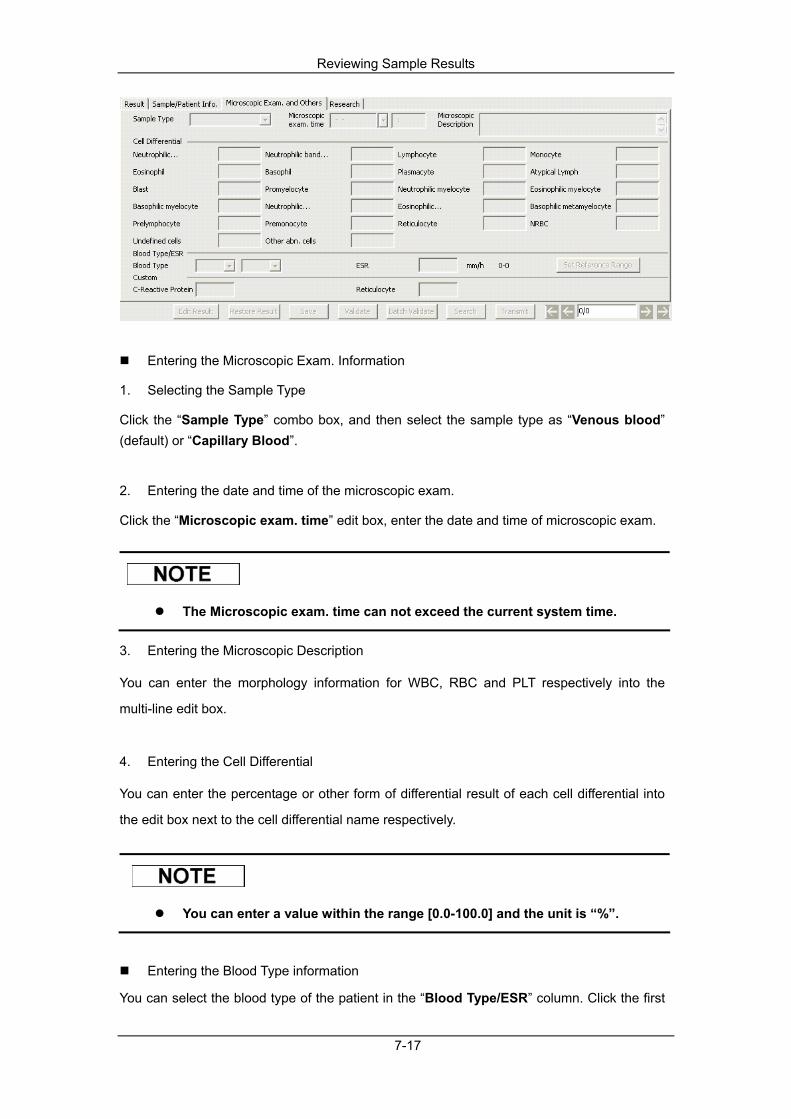
Reviewing Sample Results
7-17
Entering the Microscopic Exam. Information
1. Selecting the Sample Type
Click the “Sample Type” combo box, and then select the sample type as “Venous blood” (default) or “Capillary Blood”.
2. Entering the date and time of the microscopic exam.
Click the “Microscopic exam. time” edit box, enter the date and time of microscopic exam.
The Microscopic exam. time can not exceed the current system time.
3. Entering the Microscopic Description
You can enter the morphology information for WBC, RBC and PLT respectively into the
multi-line edit box.
4. Entering the Cell Differential
You can enter the percentage or other form of differential result of each cell differential into
the edit box next to the cell differential name respectively.
You can enter a value within the range [0.0-100.0] and the unit is “%”.
Entering the Blood Type information
You can select the blood type of the patient in the “Blood Type/ESR” column. Click the first

Reviewing Sample Results
7-18
combo box next to the blood type, you can select from “Blank”, “A”, “B”, “O” and “AB”; click the second combo box, you can select from “Blank”, “RH+” and “RH-”.
Entering the Blood ESR information
Enter the blood ESR value in the edit box follows the “ESR”. If the value exceeds the Ref. Range, the mark “H” or ”L” will appear to indicate the value exceeds the upper limit or the lower limit. You can modify the reference range of Blood ESR by the following steps:
1. Click “Set Reference Range” button, and then a message box will pop up. Enter the
upper limit and lower limit of the blood ESR into the edit box “Lower limit” and “Upper
limit” respectively.
2. Click the “Ok” button to save all the settings and refresh the information.
You can enter the value up to 3 numeric characters within the range [0,999].
The upper limit can not be smaller than the lower limit.
The entered reference range of the Blood ESR is only applied to the current record, and the default range is [0, 20].
Research
Click “Research” tab on the screen, the specific value of each parameter will be displayed.

Reviewing Sample Results
7-19
The specific values of the parameter results that are out of the display range or without data collected cannot be provided.
Edit of the results in the “Data/Graph” tab will not affect the display of parameters in the “Research” tab.
The content of this tab can only be viewed and used for research; it cannot be edited or printed.
7.3.3 Function of the Buttons When the mouse is moved just on the function buttons, the name of the button and the corresponding shortcut key will appear. For example, when moving the mouse on the “Save” button, the tips will pop up:
The shortcut keys of the function buttons in the table review screen are shown in the following
table:
Function button Shortcut key
Save F2
Validate F3
Print F4
Edit Result F5
Restore Result F6
Batch Validate F7
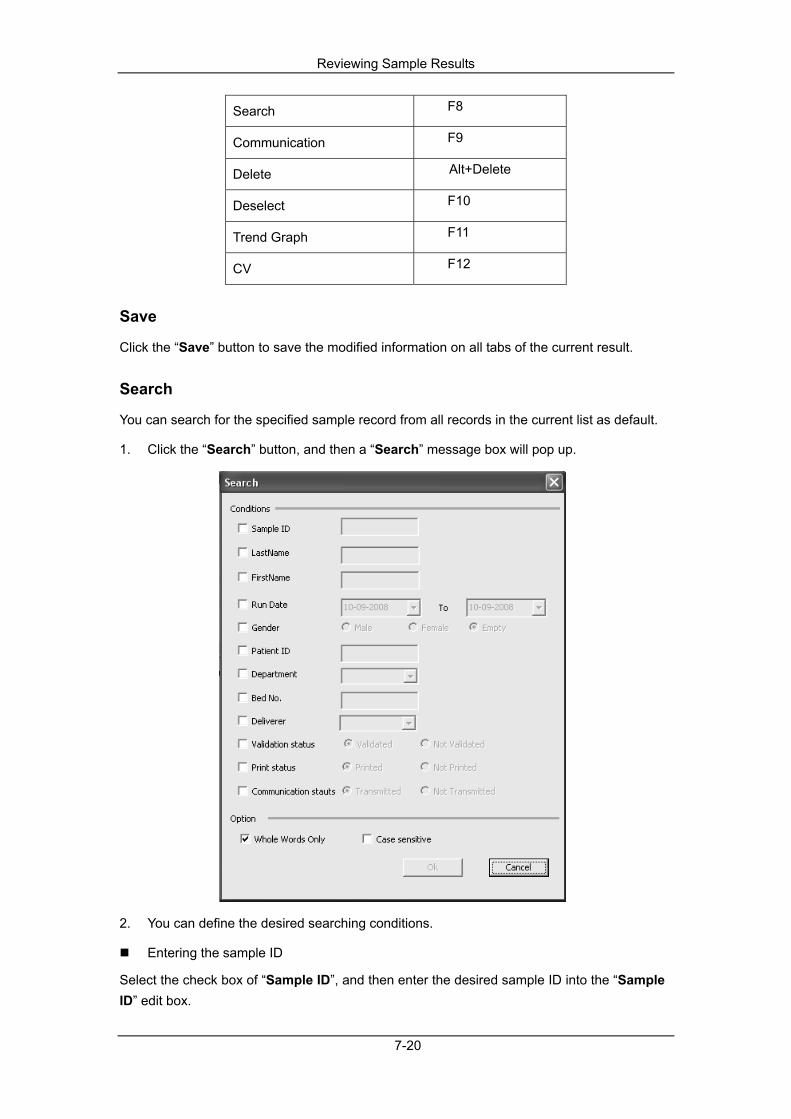
Reviewing Sample Results
7-20
Search F8
Communication F9
Delete Alt+Delete
Deselect F10
Trend Graph F11
CV F12
Save
Click the “Save” button to save the modified information on all tabs of the current result.
Search
You can search for the specified sample record from all records in the current list as default.
1. Click the “Search” button, and then a “Search” message box will pop up.
2. You can define the desired searching conditions.
Entering the sample ID
Select the check box of “Sample ID”, and then enter the desired sample ID into the “Sample ID” edit box.
Reviewing Sample Results
7-21
Entering the patient name
Select the check boxes of “Last Name” and “First Name”, and then enter the desired patient name into the boxes.
Selecting the run date
Select the check box of “Run Date”, and then select the limits of the run date.
Selecting the patient gender
Select the check box of “Gender”, and then click the radio button “Male”, “Female” or “Empty” to select the patient gender.
Entering the patient ID
Select the check box of “Patient No.”, and then enter the desired patient No. into the “Patient No.” edit box.
Entering the department name
Select the check box of “Department”, and then enter the desired department name in the “Department” edit box.
Entering the bed No.
Select the check box of “Bed No.”, and then enter the desired bed No. into the “Bed No.” edit box.
Entering the deliverer
Select the check box of “Deliverer”, and then enter the desired deliverer into the “Deliverer” edit box.
Selecting the validate status
Select the check box of the “Validate Status”, and then click the radio button “Validated” or “Not Validated” to select the validate status.
Selecting the print status
Select the check box of “Print Status”, and then click the radio button “Printed” or “Not Printed” to select the print status.
Selecting the communicate status
Select the check box of the “Communication Status”, and then click the radio button
Reviewing Sample Results
7-22
“Transmitted” or “Not Transmitted” to select the communication status.
Selecting the matching type
Select the check box of “Whole Words Only”, and then the precise search will be performed; otherwise, the fuzzy search (means to search the related records which contain the content that you entered) will be preformed.
Selecting the case sensitive
Select the check box of “Case Sensitive”, and then the capital letters and small letters in the edit box will be distinguished when searching; otherwise, the search will be insensitive to the form the letters (i.e. the capita letters and small letters will not be distinguished).
3. Click “Ok” to perform the search and switch to the “Samples found” list of the “Table”
screen, and the searching results will display..
The desired record is searched from all the sample records as default.
Validate
Click the “Validate” button to validate the current highlighted record in the list.
You can enable the users of common level to validate by setting in the “Setup” screen. Otherwise, the user name and the password of administrator level are required.
After validating, you can not edit the sample/patient information and the result
You can not validate the background record.
Batch Validate
1. Click the “Batch Validate” button, and then the following message box will pop up.

Reviewing Sample Results
7-23
2. Click the radio button “Selected Samples” or “Specified Samples” to select the records
you want to validate.” Selected Samples” are those selected with “√” marks in the
review list.
3. Click the “Specified Samples” radio button to specify the starting and finishing time of
the Run Date for the record to be validated.
4. Click “Ok” to start validating.
The users of common level is enabled the authority of “Batch Validate” together with “Validate” when setting in the “Setup” screen. Otherwise, the user name and the pass word of administrator level are required.
For the validated record, you can not edit the sample/patient information and the result.
The validated record can also be selected in bath validation.
You can select whether automatically de-select validated records or not.
Cancel (validate)
Click the “Cancel” button to cancel the validating operation.
If the current highlighted record is validated, the “Validate” button will be replaced by the “Cancel” button.

Reviewing Sample Results
7-24
The “Cancel” button is only available to the highlighted record in the list.
The users of common level is enabled the authority of “Cancel” together with “Validate” when setting in the “Setup” screen. Otherwise, the user name and the pass word of administrator level are required.
After canceling, you can edit the sample/patient Information and the result.
You can not validate the background record.
1. Click the “Print” button, and then a message box will pop up.
2. Click the radio button “Selected Samples” or “Specified Samples” to select the record
you want to export.” Selected Samples” are those selected with “√” marks in the review
list.
3. Click the “Specified Samples” radio button to set the starting and finishing run date of
the records to be printed.
4. Click the “Report” or “List” radio button to select the print format.
5. When “List” is selected, you can continue to select one of the four print templates, the
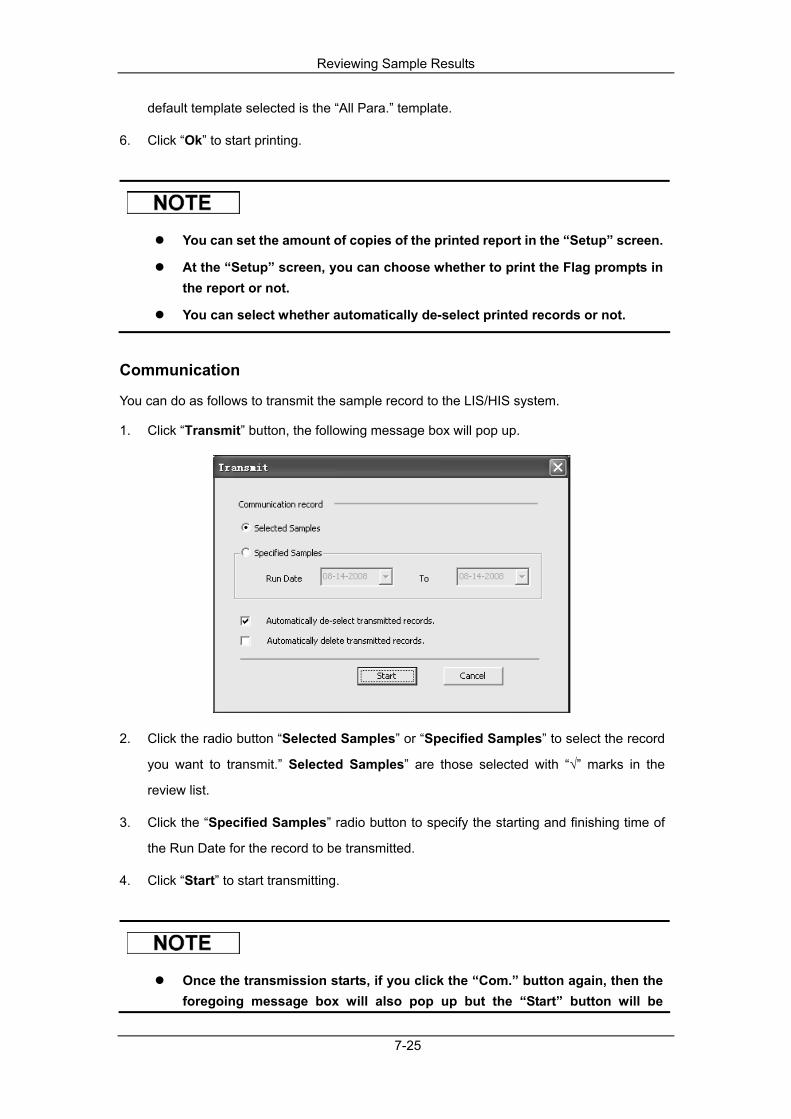
Reviewing Sample Results
7-25
default template selected is the “All Para.” template.
6. Click “Ok” to start printing.
You can set the amount of copies of the printed report in the “Setup” screen.
At the “Setup” screen, you can choose whether to print the Flag prompts in the report or not.
You can select whether automatically de-select printed records or not.
Communication
You can do as follows to transmit the sample record to the LIS/HIS system.
1. Click “Transmit” button, the following message box will pop up.
2. Click the radio button “Selected Samples” or “Specified Samples” to select the record
you want to transmit.” Selected Samples” are those selected with “√” marks in the
review list.
3. Click the “Specified Samples” radio button to specify the starting and finishing time of
the Run Date for the record to be transmitted.
4. Click “Start” to start transmitting.
Once the transmission starts, if you click the “Com.” button again, then the foregoing message box will also pop up but the “Start” button will be
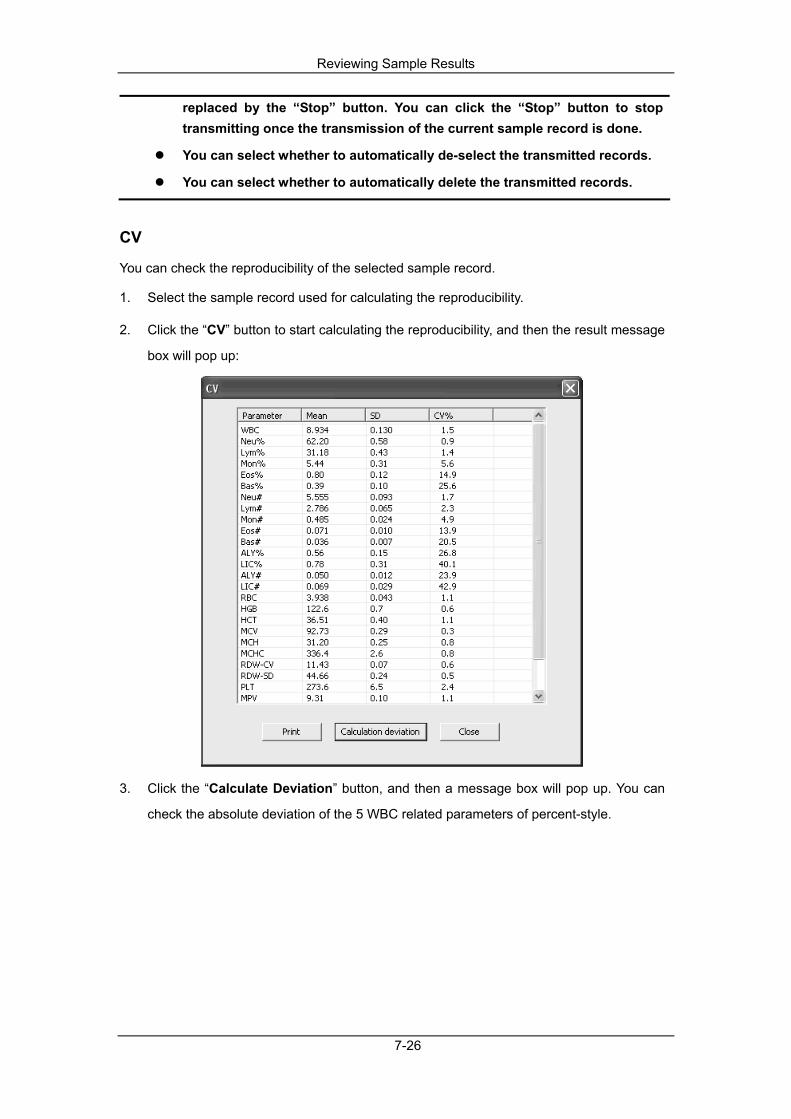
Reviewing Sample Results
7-26
replaced by the “Stop” button. You can click the “Stop” button to stop transmitting once the transmission of the current sample record is done.
You can select whether to automatically de-select the transmitted records.
You can select whether to automatically delete the transmitted records.
CV
You can check the reproducibility of the selected sample record.
1. Select the sample record used for calculating the reproducibility.
2. Click the “CV” button to start calculating the reproducibility, and then the result message
box will pop up:
3. Click the “Calculate Deviation” button, and then a message box will pop up. You can
check the absolute deviation of the 5 WBC related parameters of percent-style.
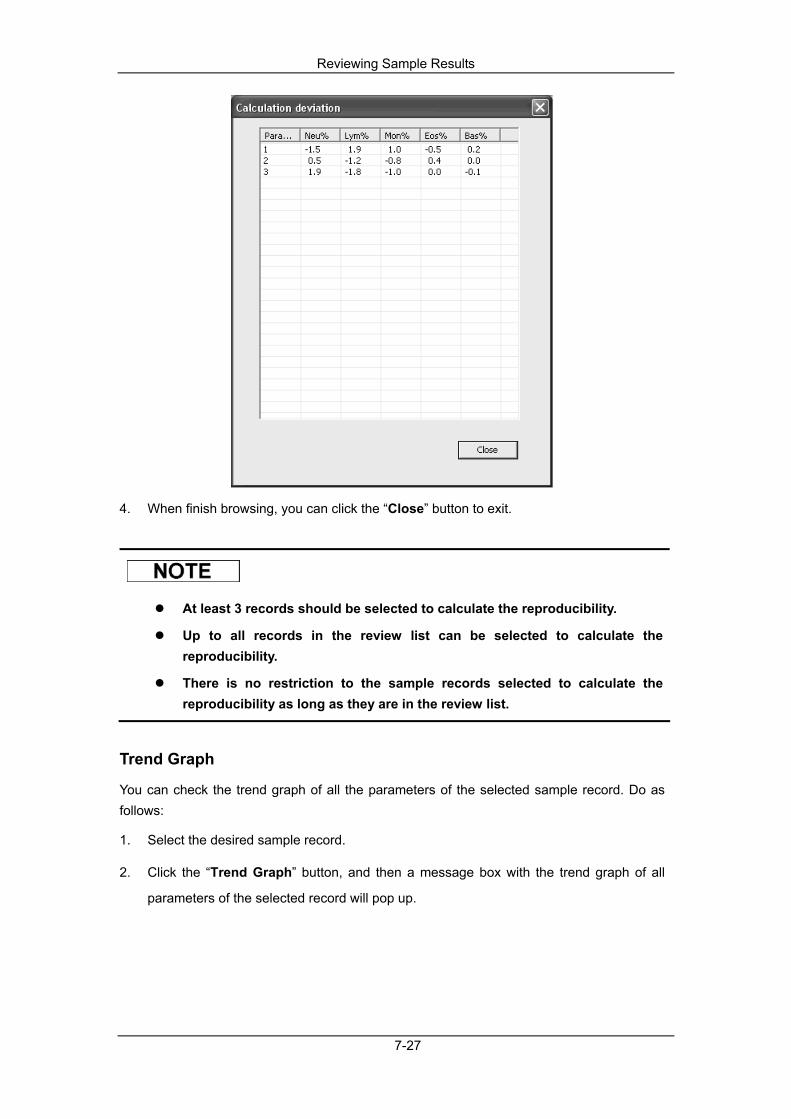
Reviewing Sample Results
7-27
4. When finish browsing, you can click the “Close” button to exit.
At least 3 records should be selected to calculate the reproducibility.
Up to all records in the review list can be selected to calculate the reproducibility.
There is no restriction to the sample records selected to calculate the reproducibility as long as they are in the review list.
Trend Graph
You can check the trend graph of all the parameters of the selected sample record. Do as follows:
1. Select the desired sample record.
2. Click the “Trend Graph” button, and then a message box with the trend graph of all
parameters of the selected record will pop up.

Reviewing Sample Results
7-28
At least 3 records or at most all records in the review list can be selected.
There is no restriction when selecting the sample records as long as they are in the review list.
Checking data
Method 1: click the certain data group to move the green line to the place, and then you can check the data of this group. Method 2: click the arrow buttons on the “Pos./Total” control to move the green line and check the data of each group. Method 3: when the green line is located, you can press the [←] and [→] key on the keyboard to move the green line and check the data of each group. Method four: when the green line is located, you can press the [Home] or [End] key on the keyboard to check the first or the last group of data on the graph.
Modifying the range
Method 1: click the arrow buttons next to the range to adjust it. The trend graph will refresh immediately once the range is changed. Method 2: click the edit box of the range and enter the value into it. After entering, press the [Enter] key or switch to other focus to refresh the trend graph.
The modified range will also be saved after closing the trend graph.

Reviewing Sample Results
7-29
Delete
The “Delete” button and the corresponding deleting operation are not available for users of common-level.
1. Select the sample record you want to delete.
2. Click the “Delete” button, and then a message box will pop up.
3. Click “Ok” to delete the selected records.
Edit Result
1. Click the “Edit Result” button, and then in the “Result” tab, you can edit the result of
each parameter and WBC DIFF results in the activated edit box.
2. After editing, click the “Save” button to save the changes.
You can enable the users of common level to edit result by setting in the “Setup” screen. Otherwise, the user name and the pass word of administrator level are required.
If the result of one parameter is modified, then the result of other related parameter(s) will be changed accordingly and the high or low/suspect flags will also be refreshed.
Only the result of the measurement parameters (WBC, RBC, HGB, HCT and PLT) and WBC DIFF results can be modified.
After editing and then saving WBC DIFF results, the absolute value of each DIFF result will be re-calculated and then refreshed.
If the sum of the DIFF results does not equal to 100.00% after being edited, then the message box “The sum of the DIFF results is not 100.00%!” will pop
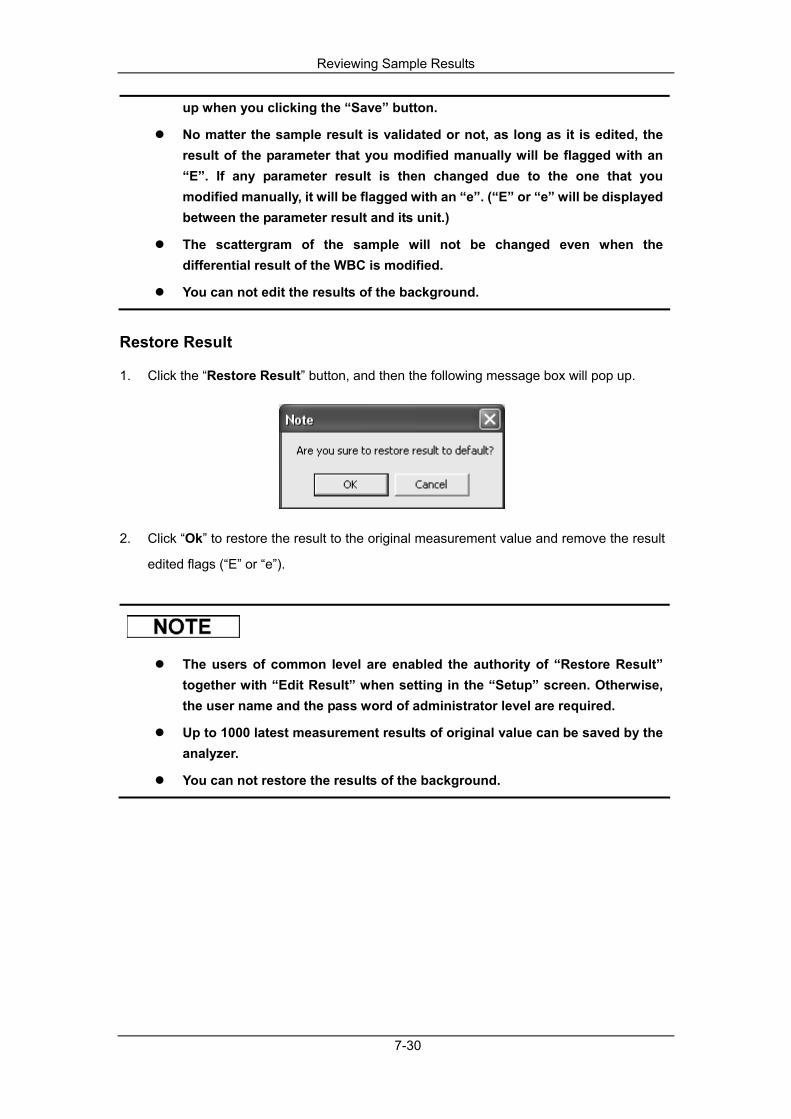
Reviewing Sample Results
7-30
up when you clicking the “Save” button.
No matter the sample result is validated or not, as long as it is edited, the result of the parameter that you modified manually will be flagged with an “E”. If any parameter result is then changed due to the one that you modified manually, it will be flagged with an “e”. (“E” or “e” will be displayed between the parameter result and its unit.)
The scattergram of the sample will not be changed even when the differential result of the WBC is modified.
You can not edit the results of the background.
Restore Result
1. Click the “Restore Result” button, and then the following message box will pop up.
2. Click “Ok” to restore the result to the original measurement value and remove the result
edited flags (“E” or “e”).
The users of common level are enabled the authority of “Restore Result” together with “Edit Result” when setting in the “Setup” screen. Otherwise, the user name and the pass word of administrator level are required.
Up to 1000 latest measurement results of original value can be saved by the analyzer.
You can not restore the results of the background.

Reviewing Sample Results
7-31
7.4 Data Backup
For operating system of Windows Vista, the right of copying database file is restricted by users' access level. To enable the data backup function, you should log on the system as administrator, and then right click the shortcut icon of the terminal software and run it as administrator.
You can back up the data of the sample base in the external computer. Do as follows:
1. At the table review screen, click the “Menu” button, then select “Review” “Data
Backup” on the pop-up menu, and then a message box will pop up.
2. Click the radio button “Selected Samples” or “Specified Samples” to select the record
you want to backup.” Selected Samples” are those selected with “√” marks in the review
list.
3. Click the “Specified Samples” radio button to specify the starting and finishing time of
the Run Date for the record to be backed up.
4. Click “Ok” button, the following dialog box will pop up.

Reviewing Sample Results
7-32
5. Select the directory and enter the file name.
6. Click the “Save” button, and then a progress bar will pop up.
7. When the backup is finished, click “Ok” to exit.
Reviewing Sample Results
7-33
You can not choose the file format when backing up.
The backup sample record can not be edited and can only be reviewed in “History”.
The histograms and scattergram will be backed up in the folder of “Bmp” at the selected location.
You can select whether automatically de-select the backed up records or not.
You can select whether to automatically delete the backed up records.
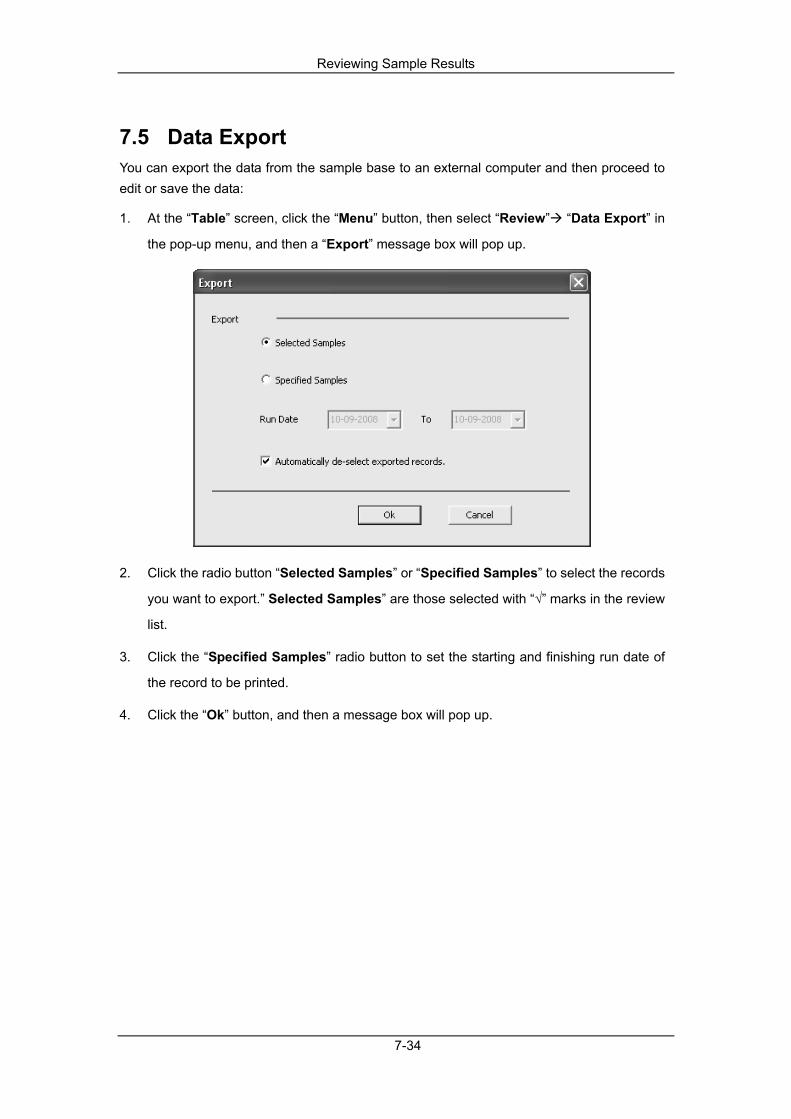
Reviewing Sample Results
7-34
7.5 Data Export You can export the data from the sample base to an external computer and then proceed to edit or save the data:
1. At the “Table” screen, click the “Menu” button, then select “Review” “Data Export” in
the pop-up menu, and then a “Export” message box will pop up.
2. Click the radio button “Selected Samples” or “Specified Samples” to select the records
you want to export.” Selected Samples” are those selected with “√” marks in the review
list.
3. Click the “Specified Samples” radio button to set the starting and finishing run date of
the record to be printed.
4. Click the “Ok” button, and then a message box will pop up.

Reviewing Sample Results
7-35
5. Select the directory and format and enter name for the exported file.
6. Click the “Save” button, and then a process bar will pop up.
7. After the export is finished, click “Ok” to exit.
Reviewing Sample Results
7-36
The default format of the exported files is “.csv” and you can also choose the “.txt” format.
The exported sample record will keep the same order as displayed in the table review screen (run time ascending/descending).
You can not review the exported files in “History”, but you can perform the operations including editing and deleting, etc. to the exported files on an external computer.
The histograms and scattergram will be exported in the folder of “Bmp” at the selected location.
You can select whether automatically de-select exported records or not.
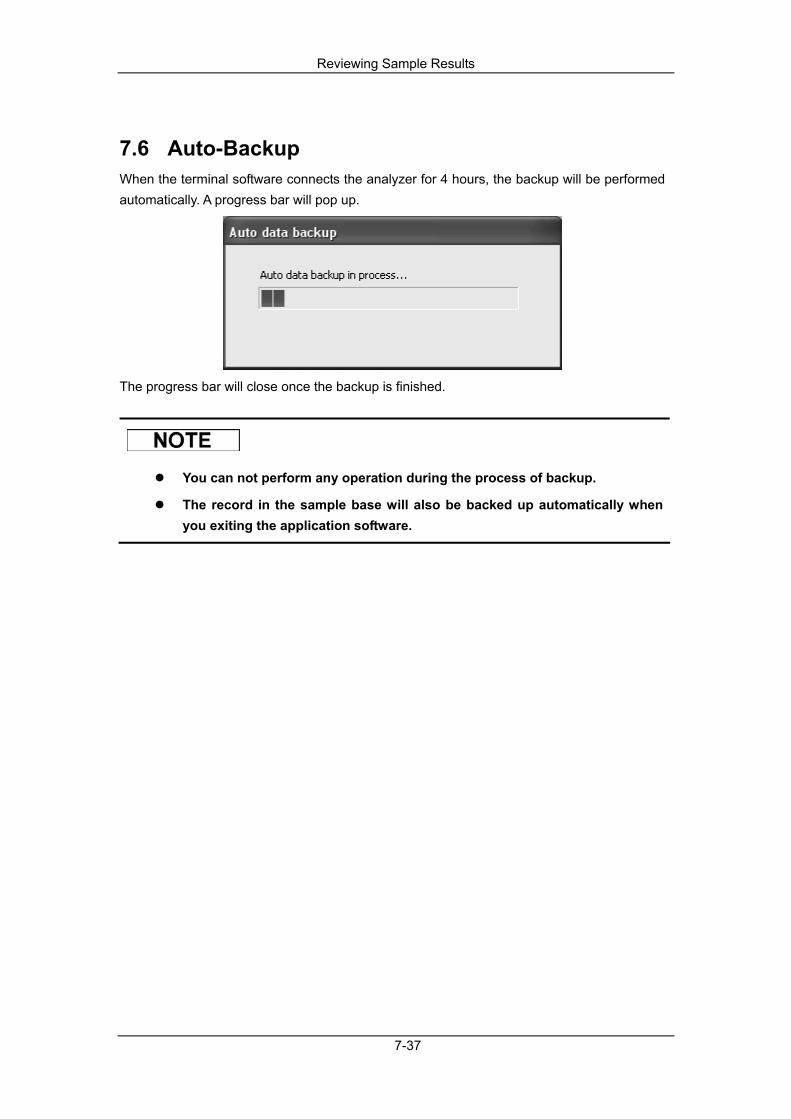
Reviewing Sample Results
7-37
7.6 Auto-Backup When the terminal software connects the analyzer for 4 hours, the backup will be performed automatically. A progress bar will pop up.
The progress bar will close once the backup is finished.
You can not perform any operation during the process of backup.
The record in the sample base will also be backed up automatically when you exiting the application software.

Reviewing Sample Results
7-38
7.7 Auto-Restore If the data is damaged in the sample base, but the corresponding auto-backed up data is fine, then a message box will pop up.
Click “Yes” to close the box and display the auto-backed up data into the sample list.
If you choose not to restore the auto-backed up data and running no new samples, then the foregoing message box will still pop up when you run the program again.
A progress bar will be displayed on the screen during auto-restoring.

Reviewing Sample Results
7-39
7.8 Compare Click the “Menu” button, and then select “Review” “Compare” from the pop-up menu to enter the following “Compare” screen.
The “Compare” screen consists of three parts. The top of the screen displays the search conditions: “Patient ID”, “Last Name”, “First Name” and “Run Date”. The middle of the screen displays the tab of the patient’s test results and the trend graphs. The available function buttons are also displayed in the screen.
7.8.1 Tabs Comparison Summary
Click the “Comparison Summary” tab in the screen to check the test results of the patient.

Reviewing Sample Results
7-40
If “Display RUO parameters” is not selected in the “Setup” screen, then the ALY%, LIC%, ALY# and LIC# will not be displayed in the list.
A blank cell of “Result” means no measurement result.
The red flags (“?”, “H” or “L”) indicate the result is either out of limit or suspect.
The yellow background indicates an edited result.
Result Trend
Click the “Result Trend” tab in the screen to check the trend graphs of the patient.

Reviewing Sample Results
7-41
You can click the “Select Parameter” combo box at top-left of the screen to select the desired the trend graph.
If “Display RUO parameters” is not selected in the “Setup” screen, then the ALY%, LIC%, ALY# and LIC# will not be displayed in the pull-down list of the combo box.
The x-axis of the “Parameter Trend” shows the No. of the test and the y-axis shows the result of each test. Up to 30 data points can be displayed in the trend graph. If the matched data are more than 30 groups, then only the latest 30 ones will be displayed. The data points in the trend graph are displayed from left to right in the ascending order of “Run Date /Time”. Thus, the latest data point places the last.
The scale on the x-axis of the trend graph changes according to the number of the result.
The scale on the y-axis of the trend graph changes according to the value of the result.

Reviewing Sample Results
7-42
The down side of the tab displays the result of the single parameter in the form of list. The corresponding No., run date/time and result are displayed in the list.
The data in the list corresponds with the data point in the trend graph one by one.
The red flags (“?”, “H” or “L”) indicate the result is either out of limit or suspect.
The yellow background indicates an edited result.
7.8.2 Function of the buttons Search
You can search for the certain result of the patient by entering the search condition in the top of the screen.
1. You can define the desired search conditions.
Entering the patient ID
Enter the patient ID into the “Patient ID” box.
Entering the patient name
Enter the patient name into the “Last Name” and “First Name” boxes.
Selecting the Run Date
Use the date control to specify the range for the run date.
The “Patient ID” must be entered.
You can leave the “Patient Name” in blank.
An empty entry of run date indicates the whole database will be searched for the certain result and there is no restriction to the run date.
2. Click the “Search” button to start searching the specified record and the result will be
displayed in the two tabs. You can switch between the two tags to check the result.

Reviewing Sample Results
7-43
Re-fill
You can click the “Re-fill” button to clear all the entered search conditions and then re-fill.
Adjust Parameter Order
You can use the “Adjust Parameter Order” function to adjust the following parameter order.
The display order of the parameter in the “Comparison Summary” tab and the parameter order when printing
The display order of the parameter in the combo list of the “Result Trend” tab
Do as follows to adjust parameter order:
1. Click the “Adjust Parameter Order” button, then the following box with the list of the
parameter order will pop up
The right of the parameter list displays the order-adjusting buttons: “Top”, “Up”, “Down” and “Bottom”.
Reviewing Sample Results
7-44
2. Click one parameter in the list to highlight it.
Click the “Top” button to move the parameter to the top of the list.
Click the “Up” button to move the parameter upward by one position.
Click the “Down” button to move the parameter downward by one position.
Click the “Bottom” button to move the parameter to the bottom of the list
3. Click “Ok” to save the changes and close the box.
When the current tab is “Comparison Summary”, you can click the “Print” button to print all the contents of the summary. When the current tab is “Result Trend”, you can click the “Print” button to print the displayed result trend and the result list.

Reviewing Sample Results
7-45
7.9 Statistics You can select or enter the “Statistical Condition” to realize the statistics of the workload.
7.9.1 Calculate Workload Click the “Menu” button, and then select “Statistics” “Calculate Workload” from the pop-up menu to enter the following “Workload Summary” screen.
The top of the screen displays the “Statistical Item”, namely, “Department”, “Deliverer”, “Operator” and “Run Date”. Below the “Statistical Item”, it displays the corresponding “Statistical Condition”. The corresponding records are displayed in the workload summary together with the workload statistics. The available function buttons are also displayed in the screen. Workload Summary
All the records that match the statistical conditions will be displayed in the Workload Summary and be included to calculate the total workload. The records of the same category (i.e. those with the same field in the first column) will be taken to calculate the subtotal workload. The default information fields in the workload summary are “Department”, “Deliverer”, “Operator”, “Run Date” and “Sample Load”.

Reviewing Sample Results
7-46
The cell of the un-selected “Statistical Item” displays blank.
For several results of the same item, they will be displayed in ascending order by run date. Be aware that not all the statistics results in the summary are displayed in ascending order by run date. In the workload summary, the subtotal workload will be displayed below the records of the same category, and the total workload will be displayed in the last. Function of the buttons
Statistics
You can select the desired statistical item and enter the statistical condition to check the statistics of the workload of the matched record.
1. You can select the desired statistical item by clicking the check box.
2. After selecting the statistical item, the corresponding statistical condition will be activated
for you to enter.
Entering the Department
Enter the department into the “Department” box or select it from the “Department” pull-down list.
Entering the Deliverer
Enter the name of the deliverer into the “Deliverer” box or select it from the “Deliverer” pull-down list.
Entering the Operator
Enter the name of the operator into the “Operator” box or select it from the “Operator” pull-down list.
Selecting the Run Date
Use the date control to specify the range for the run date.
The shortcut code entry is supported.
When selecting “All”, it means all the available options of this field will be calculated.
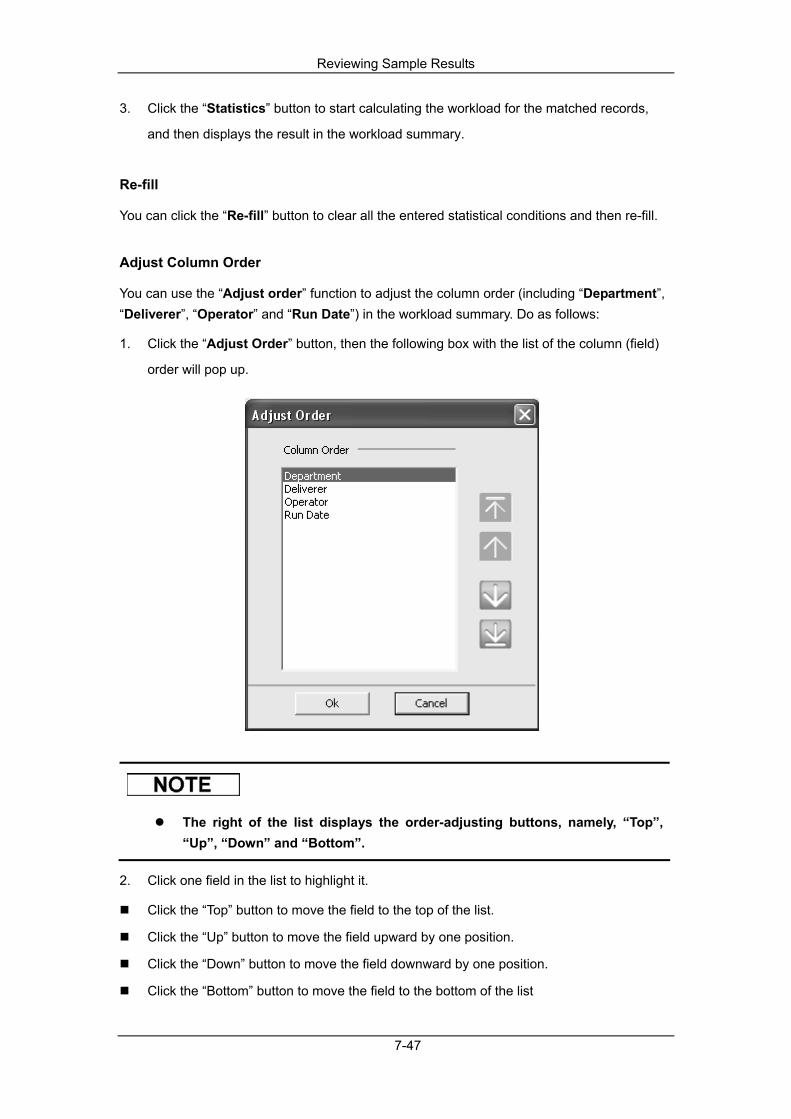
Reviewing Sample Results
7-47
3. Click the “Statistics” button to start calculating the workload for the matched records,
and then displays the result in the workload summary.
Re-fill
You can click the “Re-fill” button to clear all the entered statistical conditions and then re-fill.
Adjust Column Order
You can use the “Adjust order” function to adjust the column order (including “Department”, “Deliverer”, “Operator” and “Run Date”) in the workload summary. Do as follows:
1. Click the “Adjust Order” button, then the following box with the list of the column (field)
order will pop up.
The right of the list displays the order-adjusting buttons, namely, “Top”, “Up”, “Down” and “Bottom”.
2. Click one field in the list to highlight it.
Click the “Top” button to move the field to the top of the list.
Click the “Up” button to move the field upward by one position.
Click the “Down” button to move the field downward by one position.
Click the “Bottom” button to move the field to the bottom of the list

Reviewing Sample Results
7-48
3. Click “Ok” to save the changes, close the box and back to the “Calculate Workload”
screen. Then, the column order in the workload summary refreshes.
The statistical result will also be refreshed together with the column order.
1. Click the “Print” button, and then a message box will pop up.
2. Click the “Print Summary” or the “Print statistics only” radio button to select the
content you want to print.
“Print Summary” means to print out all the records and statistical results in the workload summary.
“Print statistics only” means to print out the statistical results only (including subtotal and total).
3. Click “Ok” to start printing.
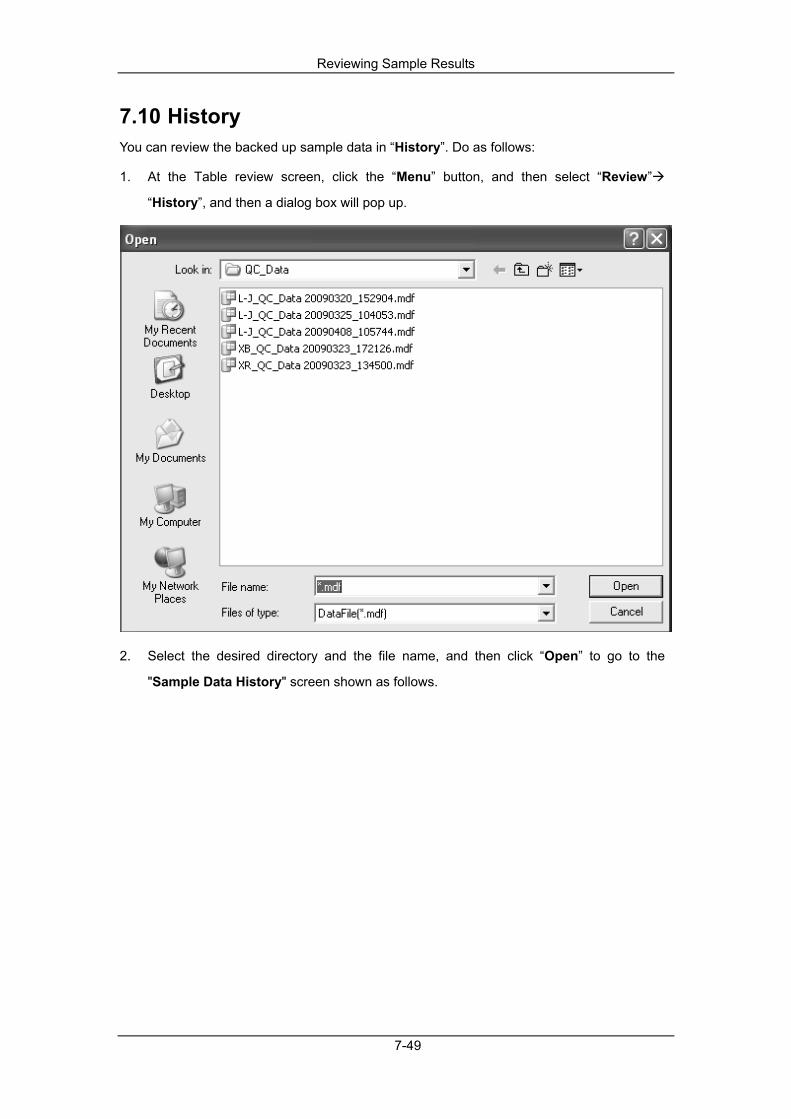
Reviewing Sample Results
7-49
7.10 History You can review the backed up sample data in “History”. Do as follows:
1. At the Table review screen, click the “Menu” button, and then select “Review”
“History”, and then a dialog box will pop up.
2. Select the desired directory and the file name, and then click “Open” to go to the
"Sample Data History" screen shown as follows.

Reviewing Sample Results
7-50
If you select another backed up file, then the history data displayed in the list will be refreshed.

8-1
8 Using the QC Programs
8.1 Introduction Quality Control (QC) consists of strategies and procedures that measure the precision and stability of the analyzer. The results imply the reliability of the sample results. QC involves measuring materials with known, stable characteristics at frequent intervals. Analysis of the results with statistical methods allows the inference that sample results are reliable. Mindray recommends you run the QC program daily with low, normal and high level controls. A new lot of controls should be analyzed in parallel with the current lot prior to their expiration dates. This may be accomplished by running the new lot of controls twice a day for five days using any empty QC file. The QC files calculate the mean, standard deviation and coefficient of variation for each selected parameter. The instrument-calculated means of these ten runs should be within the expected ranges published by the manufacturer. The analyzer provides 4 QC programs: L-J QC, X mean QC, X mean R QC and X-B QC.
You should only use the Mindray-specified controls and reagents. Store and use the controls and reagents as instructed by instructions for use of the controls and reagents.
Using the QC Programs
8-2
8.2 L-J Quality Control
8.2.1 Editing L-J settings
All the samples, controls, calibrators, reagents, wastes and areas contacted them are potentially biohazardous. Wear proper personal protective equipment (e.g. gloves, lab coat, etc.) and follow safe laboratory procedures when handling them and the contacted areas in the laboratory.
Only users of administrator-level can edit the L-J settings.
For the QC files with saved QC results, if any change is made to the target or the limits, the changed data will be highlighted in yellow, and the change will be recorded into the system log.
Before analyzing the new lot of controls, you should set a QC file for each lot of controls and you can edit the QC settings in the QC file by one of the following ways:
Reading the information provided by the manufacturer
Manual entry
Reading the saved preset values
Reading the information provided by the manufacturer
1. You can enter the graph screen in one of the following ways:
Click the shortcut button “QC”.
Click the “Menu” button on the screen; then select “QC” ”L-J” on the pop-up menu.
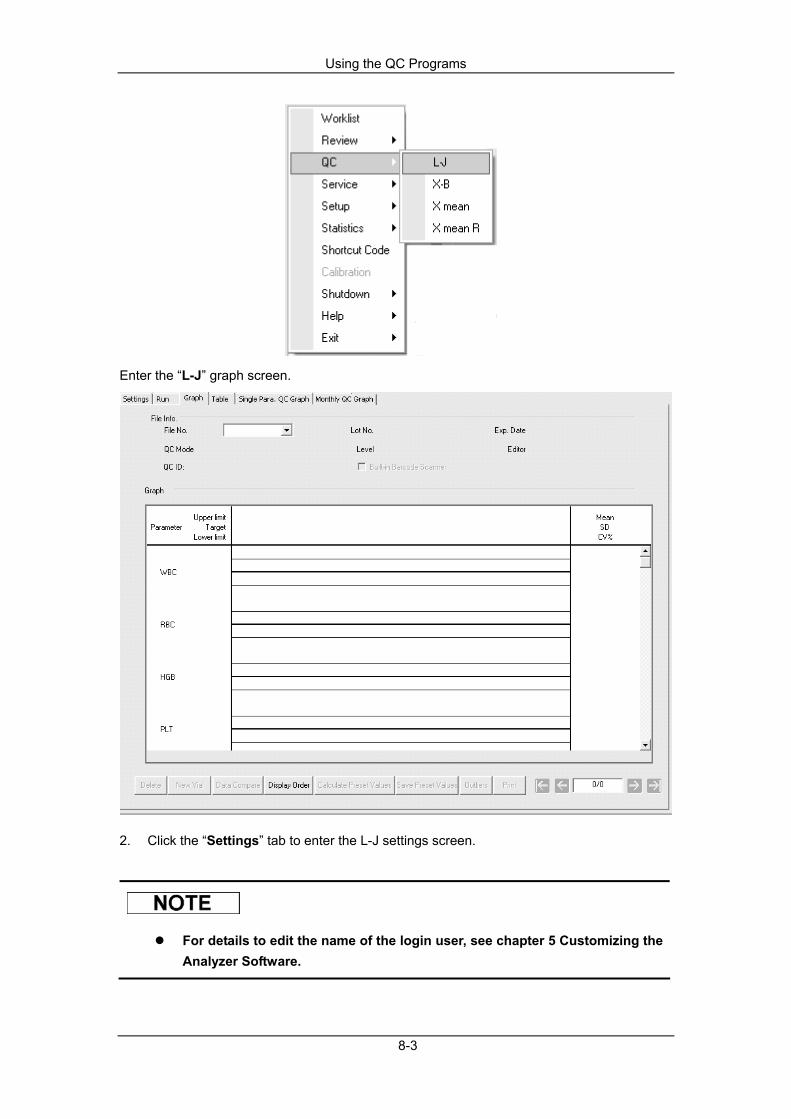
Using the QC Programs
8-3
Enter the “L-J” graph screen.
2. Click the “Settings” tab to enter the L-J settings screen.
For details to edit the name of the login user, see chapter 5 Customizing the Analyzer Software.

Using the QC Programs
8-4
3. Select a QC File No. with empty QC information.
You can select the file No. within the range [1, 60].
4. Select the QC mode.
Different QC files can not have the same lot No. and QC mode.
In the "AL-WB" QC mode, you can perform analysis to more than one tube of control by selecting "Build-in Barcode Scanner".
5. Set QC ID: if you like to run control in the interval of running blood samples, you can set
a specific ID for the control. If such ID is recognized when the analyzer is running blood
samples, it will identify the sample as control automatically. When the running ends, the
result will be stored in the QC file of the corresponding ID.

Using the QC Programs
8-5
Letters, numbers and all characters that can be entered through the keyboard (including special characters) are allowed for the QC ID, but the number must end with a nonzero number. Chinese and other languages (such as Japanese, Korean, etc) are not supported.
6. Click the “Read File” button, a message box will pop up for you to select the directory.
7. Click the “Browse” button to select the directory of the QC information.
8. Click the “Ok” button to close the message box shown above, and the following
message box will pop up.
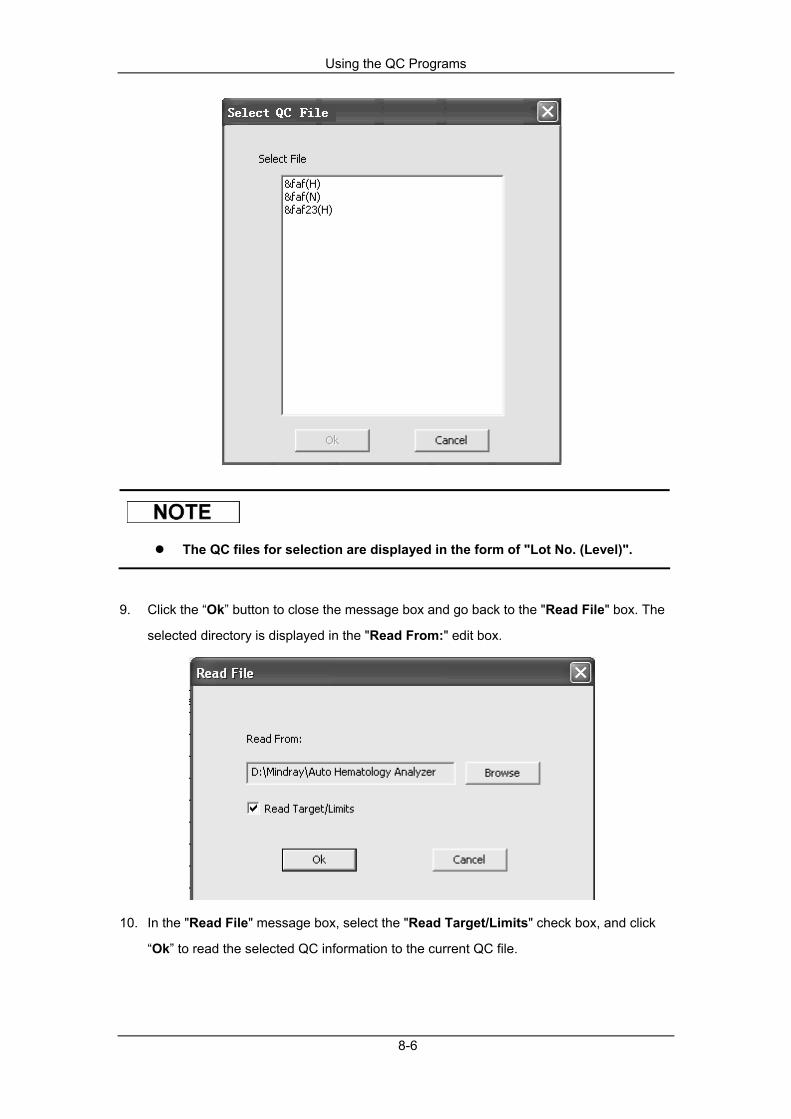
Using the QC Programs
8-6
The QC files for selection are displayed in the form of "Lot No. (Level)".
9. Click the “Ok” button to close the message box and go back to the "Read File" box. The
selected directory is displayed in the "Read From:" edit box.
10. In the "Read File" message box, select the "Read Target/Limits" check box, and click
“Ok” to read the selected QC information to the current QC file.

Using the QC Programs
8-7
If the “Read Target/Limits” is not selected, you have to enter the target and limits manually.
11. Click the “Save” button to save the QC information.
The expiration date can not be earlier than the current system date.
Different QC files can not have the same lot No. and QC mode.
Manual entry
You can enter the graph screen by one of the following ways:
Click the shortcut button “QC”.
Click the “Menu” button on the screen; then select “QC” ”L-J” on the pop-up menu.
Enter the “L-J” graph screen.
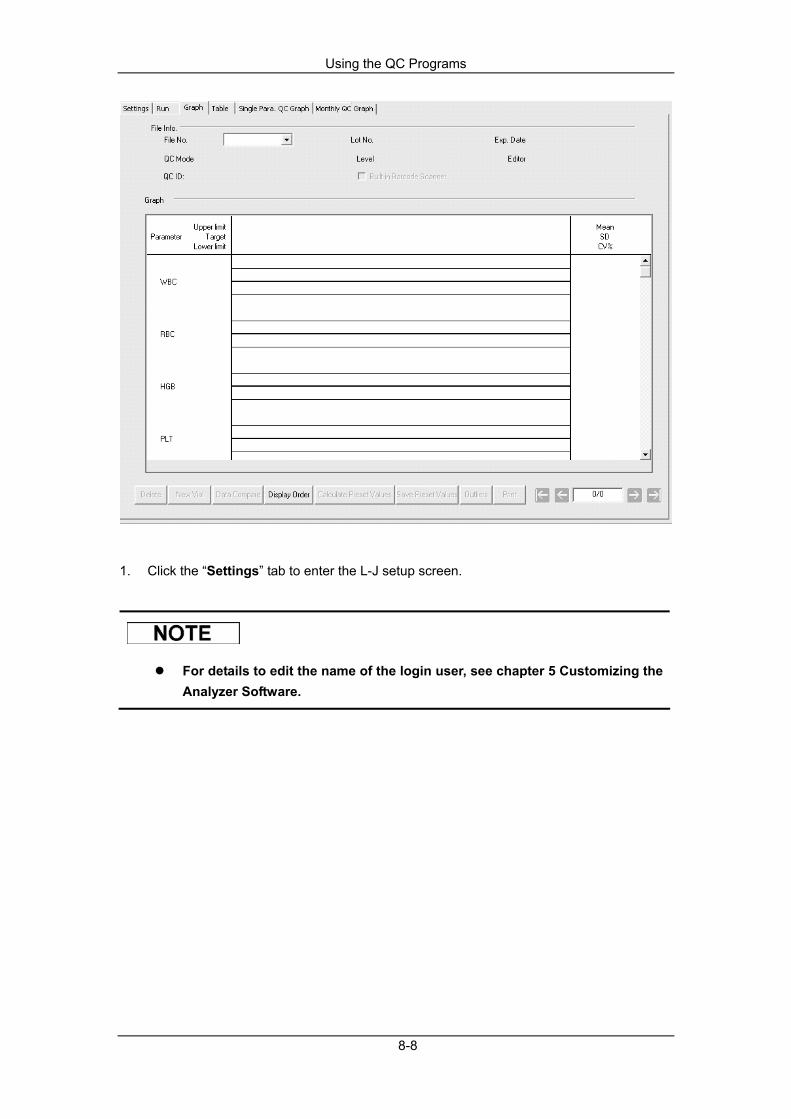
Using the QC Programs
8-8
1. Click the “Settings” tab to enter the L-J setup screen.
For details to edit the name of the login user, see chapter 5 Customizing the Analyzer Software.

Using the QC Programs
8-9
2. Select a QC File No. with empty QC information.
You can select the file No. within the range [1, 60].
3. You can enter the lot No. of the controls by one of the following ways:
Manual entry
Entering by external barcode scanner
The lot No. can not be empty and up to 16 digits can be entered. You can enter characters, numbers, letters and special characters, but no Chinese characters are allowed.
Different QC files can not have the same lot No. and QC mode.
4. Enter the batch expiration date of the controls.

Using the QC Programs
8-10
You must enter the expiration date, and the entry range is [current system date, 2099-12-31].
5. Select the QC mode.
Different QC files can not have the same lot No. and QC mode.
6. Select the control level.
When the QC mode is “AL-WB”, if you wish to run several controls in a single running, you should select “Built-in barcode scanner”.
7. Set QC ID: if you like to run control in the interval of running blood samples, you can set
a specific ID for the control. If such ID is recognized when the analyzer is running blood
samples, it will identify the sample as control automatically. When the running ends, the
result will be stored in the QC file of the corresponding ID.
Letters, numbers and all characters that can be entered through the keyboard (including special characters) are allowed for the QC ID, but the number must end with a nonzero number. Chinese and other languages (such as Japanese, Korean, etc) are not supported.
8. According to the target list of the corresponding lot No., enter the target and limits into
the edit boxes of the parameters to be included in the QC run.
9. Click the “Save” button to save all the settings of the QC.
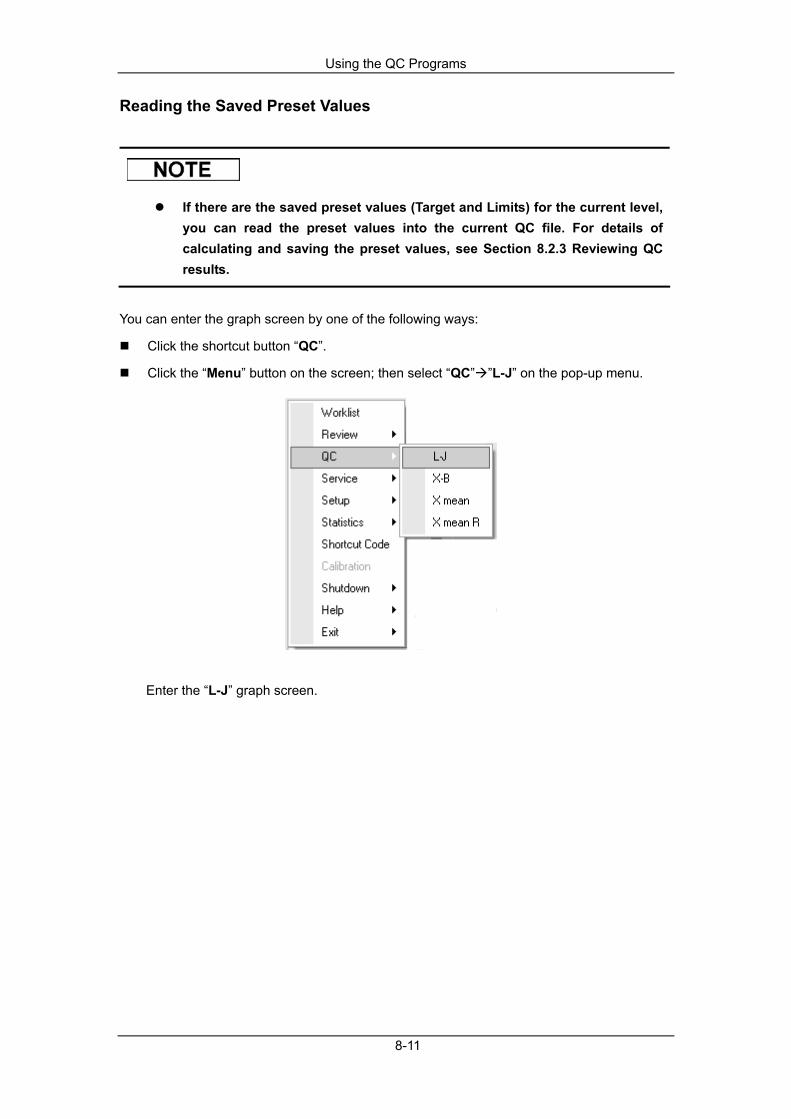
Using the QC Programs
8-11
Reading the Saved Preset Values
If there are the saved preset values (Target and Limits) for the current level, you can read the preset values into the current QC file. For details of calculating and saving the preset values, see Section 8.2.3 Reviewing QC results.
You can enter the graph screen by one of the following ways:
Click the shortcut button “QC”.
Click the “Menu” button on the screen; then select “QC” ”L-J” on the pop-up menu.
Enter the “L-J” graph screen.

Using the QC Programs
8-12
1. Click the “Settings” tab to enter the L-J setup screen.
For details to edit the name of the login user, see chapter 5 Customizing the Analyzer Software.
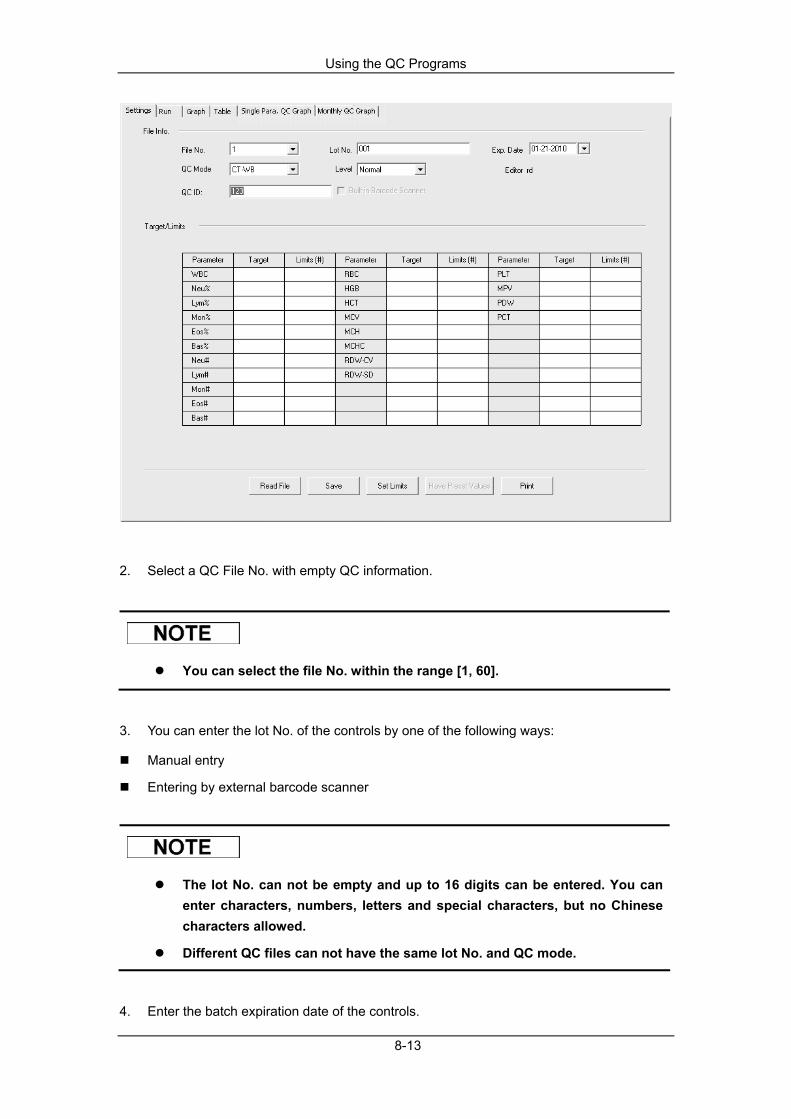
Using the QC Programs
8-13
2. Select a QC File No. with empty QC information.
You can select the file No. within the range [1, 60].
3. You can enter the lot No. of the controls by one of the following ways:
Manual entry
Entering by external barcode scanner
The lot No. can not be empty and up to 16 digits can be entered. You can enter characters, numbers, letters and special characters, but no Chinese characters allowed.
Different QC files can not have the same lot No. and QC mode.
4. Enter the batch expiration date of the controls.
Using the QC Programs
8-14
You must enter the expiration date, and the entry range is [current system date, 2099-12-31].
5. Select the QC mode.
Different QC files can not have the same lot No. and QC mode.
6. Select the control level.
When the QC mode is “AL-WB”, if you wish to run several controls in a single running, you should select “Built-in barcode scanner”.
7. Set QC ID: if you like to run control in the interval of running blood samples, you can set
a specific ID for the control. If such ID is recognized when the analyzer is running blood
samples, it will identify the sample as control automatically. When the running ends, the
result will be stored in the QC file of the corresponding ID.
Letters, numbers and all characters that can be entered through the keyboard (including special characters) are allowed for the QC ID, but the number must end with a nonzero number. Chinese and other languages (such as Japanese, Korean, etc) are not supported.
8. Click the “Have Preset Values” button to read the saved preset target and limits
(correspond to the current level) into the current QC file.

Using the QC Programs
8-15
If some parameters to be included in the QC run have no preset values, you should enter the target and limits for them manually; if you don’t want some parameters with preset values to be included in the QC run, you can cancel the target and limits of them manually after read-in the preset values.
9. Click the “Save” button to save all the settings of the QC.
Setting Limits
You can take the following steps to adjust the display format of the limits and the calculation method of the preset limits.
1. Click the “Set Limits” button, and then the following message box will pop up.
2. Click “By SD” to display the limits in the form of absolute value; click “By CV” to display
the limits in the form of percentage.
3. If “By SD” is selected, click the “2SD” or “3SD” to select either double or triple standard
deviation to be the limits; if “By CV” is selected, click the “2CV” or “3CV” to select either
double or triple coefficient of variation to be the limits.
4. Click the “Ok” button to save all the settings for the limits.
Click the “Print” button to print the setting information of the current QC file.

Using the QC Programs
8-16
8.2.2 Running controls You can choose from below two methods to run controls:
Run controls under QC “Run” screen
Run controls in the interval of running blood samples under sample count screen
Run Controls under QC “Run” Screen
After editing the QC information, you can start one of the following QC analyses according to the selected QC mode.
CT-WB
CT-PD
AL-WB (without built-in barcode scanner)
AL-WB (with built-in barcode scanner)
Running Controls (CT-WB)
All the samples, controls, calibrators, reagents, wastes and areas contacted them are potentially biohazardous. Wear proper personal protective equipment (e.g. gloves, lab coat, etc.) and follow safe laboratory procedures when handling them and the contacted areas in the laboratory.
The sample probe is sharp and potentially biohazardous, Exercise caution to avoid contact with the probe when working around it.
The sample may spill from the unclosed collection tubes and cause biohazard. Exercise caution to the unclosed collection tubes.
Be sure to avoid reversing the collection tube when loading, otherwise, the collection tube may be broken and cause biohazard.
Be sure to place the collection tubes in the right adapter before running, otherwise, the collection tubes may be broken and cause biohazard.
Collection tubes broken may cause personal injury and/or biohazard. Exercise caution when loading the collection tubes to the rack or getting the collection tubes from the rack, be sure not to break the tubes.
Keep you clothed, hairs and hands away from the moving parts to avoid
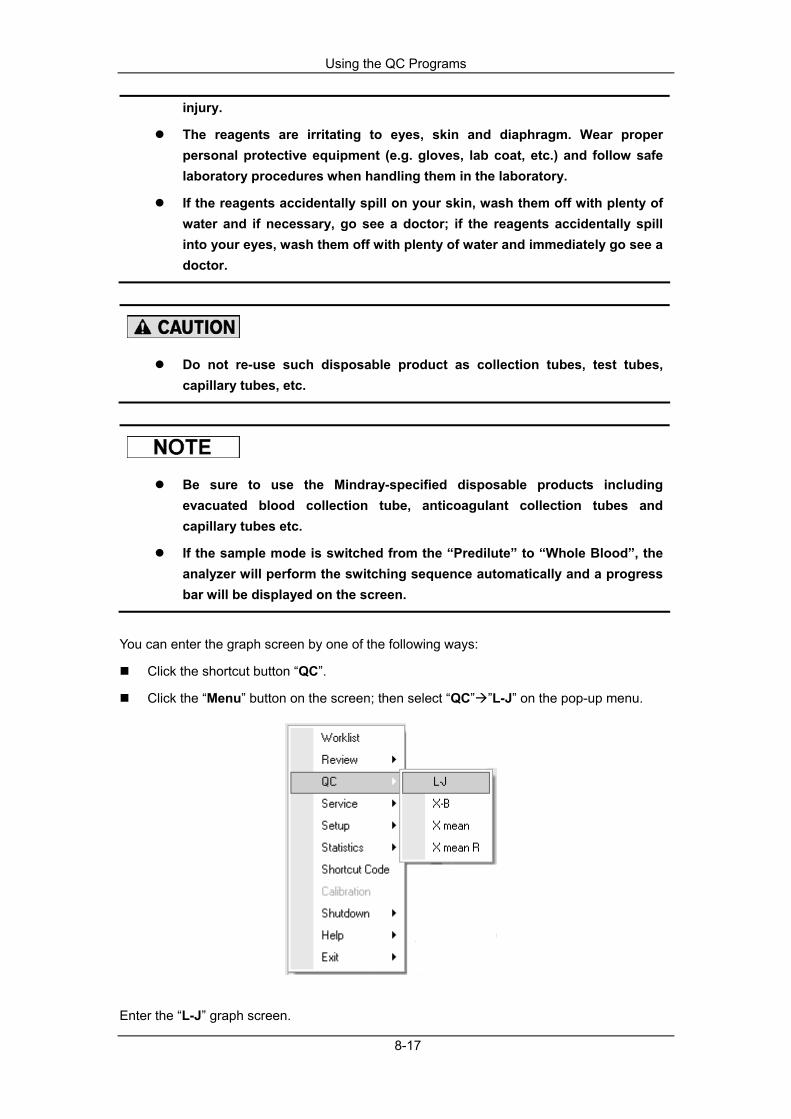
Using the QC Programs
8-17
injury.
The reagents are irritating to eyes, skin and diaphragm. Wear proper personal protective equipment (e.g. gloves, lab coat, etc.) and follow safe laboratory procedures when handling them in the laboratory.
If the reagents accidentally spill on your skin, wash them off with plenty of water and if necessary, go see a doctor; if the reagents accidentally spill into your eyes, wash them off with plenty of water and immediately go see a doctor.
Do not re-use such disposable product as collection tubes, test tubes, capillary tubes, etc.
Be sure to use the Mindray-specified disposable products including evacuated blood collection tube, anticoagulant collection tubes and capillary tubes etc.
If the sample mode is switched from the “Predilute” to “Whole Blood”, the analyzer will perform the switching sequence automatically and a progress bar will be displayed on the screen.
You can enter the graph screen by one of the following ways:
Click the shortcut button “QC”.
Click the “Menu” button on the screen; then select “QC” ”L-J” on the pop-up menu.
Enter the “L-J” graph screen.

Using the QC Programs
8-18
1. Click the “Run” tab to enter the L-J run screen.
For details to edit the name of the login user, see chapter 5 Customizing the Analyzer Software.
Be sure to use the adapter of Ф13x75 (mm) model when running the QC in CT-WB mode. For details to install the adapter, see Chapter 6 Operating Your Analyzer.

Using the QC Programs
8-19
2. Select the QC file No. to be run; the screen displays the corresponding file information.
3. Be sure that the level of the control to be run is the same with the current QC file.
4. Be sure that the control to be run is not expired.
5. Prepare the control as instructed by instructions for use of the controls.
6. Run the controls:
1) Make sure the QC mode is “CT-WB” and the analysis status icon and analyzer indicator is green. 2) Shake the prepared control as shown below to well mix it.

Using the QC Programs
8-20
3) Click the “Start” button.
4) Press the [OPEN] key to open the compartment door. 5) Present the prepared control into the tube holder and then close the compartment door. 6) Press the [Run] key or click the “Run” button on the message box to start running. 7) When the running is finished, the compartment door will open automatically and you can remove the control.
7. When finish running, the QC results will be displayed in the current screen and be saved
in the QC file automatically.
Up to 300 QC results can be saved for each QC file.
8. Do the above procedures to continue running the controls if necessary.
Using the QC Programs
8-21
Running Controls (CT-PD)
All the samples, controls, calibrators, reagents, wastes and areas contacted them are potentially biohazardous. Wear proper personal protective equipment (e.g. gloves, lab coat, etc.) and follow safe laboratory procedures when handling them and the contacted areas in the laboratory.
The sample probe is sharp and potentially biohazardous, Exercise caution to avoid contact with the probe when working around it.
The sample may spill from the unclosed collection tubes and cause biohazard. Exercise caution to the unclosed collection tubes.
Be sure to avoid reversing the collection tube when loading, otherwise, the collection tube may be broken and cause biohazard.
Be sure to place the collection tubes in the right adapter before running, otherwise, the collection tubes may be broken and cause biohazard.
Collection tubes broken may cause personal injury and/or biohazard. Exercise caution when loading the collection tubes to the rack or getting the collection tubes from the rack, be sure not to break the tubes.
Keep you clothed, hairs and hands away from the moving parts to avoid injury.
The reagents are irritating to eyes, skin and diaphragm. Wear proper personal protective equipment (e.g. gloves, lab coat, etc.) and follow safe laboratory procedures when handling them in the laboratory.
If the reagents accidentally spill on your skin, wash them off with plenty of water and if necessary, go see a doctor; if the reagents accidentally spill into your eyes, wash them off with plenty of water and immediately go see a doctor.
Do not re-use such disposable product as collection tubes, test tubes, capillary tubes, etc.

Using the QC Programs
8-22
Be sure to use the Mindray-specified disposable products including evacuated blood collection tube, anticoagulant collection tubes and capillary tubes etc.
You can enter the graph screen by one of the following ways:
Click the shortcut button “QC”.
Click the “Menu” button on the screen; then select “QC” ”L-J” on the pop-up menu.
Enter the “L-J” graph screen.
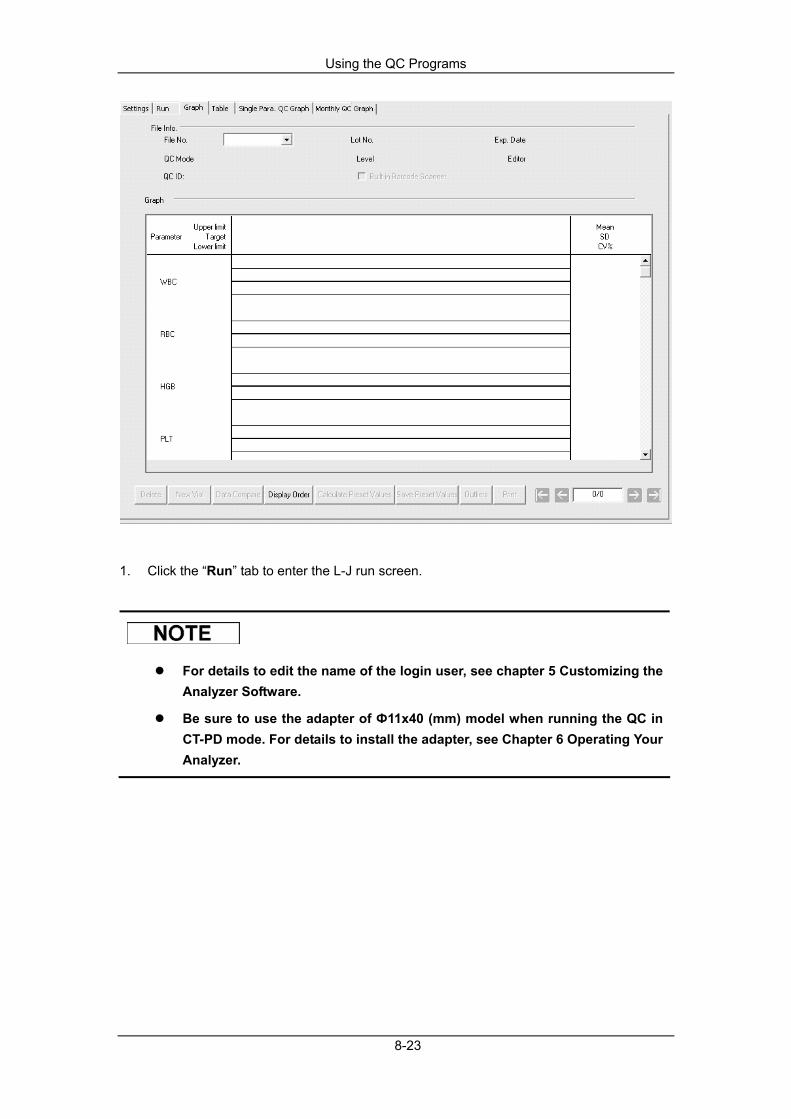
Using the QC Programs
8-23
1. Click the “Run” tab to enter the L-J run screen.
For details to edit the name of the login user, see chapter 5 Customizing the Analyzer Software.
Be sure to use the adapter of Ф11x40 (mm) model when running the QC in CT-PD mode. For details to install the adapter, see Chapter 6 Operating Your Analyzer.
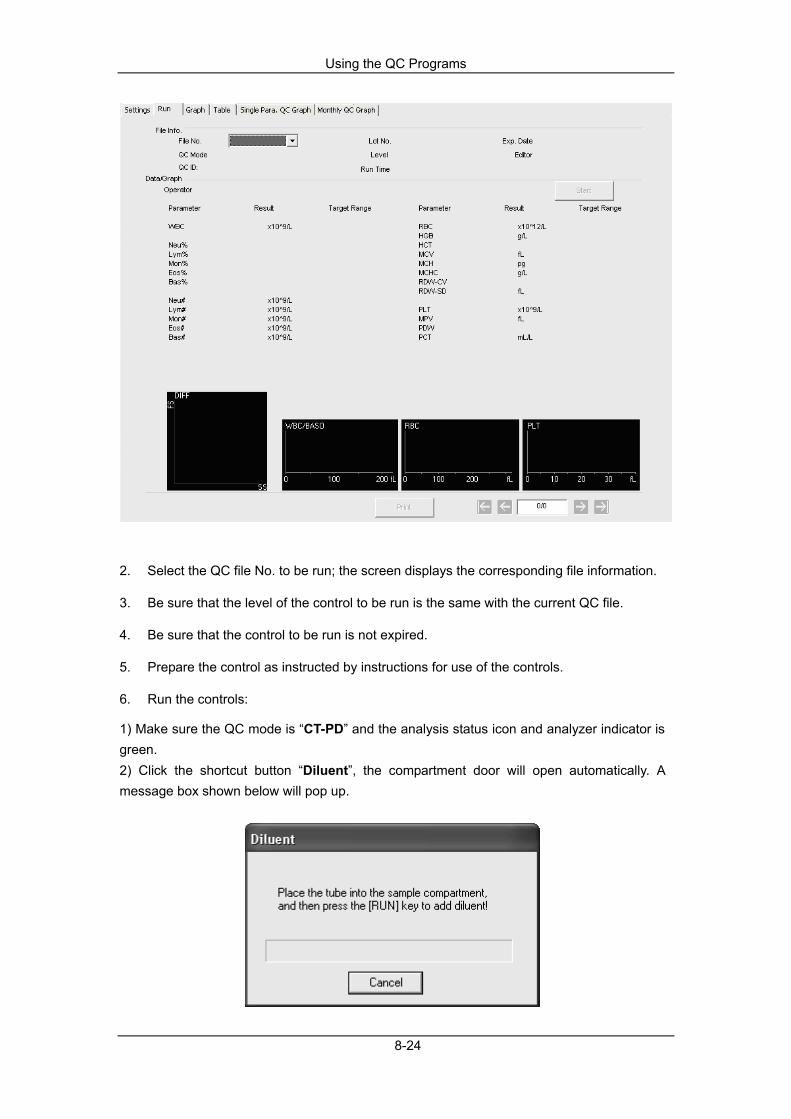
Using the QC Programs
8-24
2. Select the QC file No. to be run; the screen displays the corresponding file information.
3. Be sure that the level of the control to be run is the same with the current QC file.
4. Be sure that the control to be run is not expired.
5. Prepare the control as instructed by instructions for use of the controls.
6. Run the controls:
1) Make sure the QC mode is “CT-PD” and the analysis status icon and analyzer indicator is green. 2) Click the shortcut button “Diluent”, the compartment door will open automatically. A message box shown below will pop up.

Using the QC Programs
8-25
3)Present a clean centrifugal tube into the sample compartment with the cap opened. Press the [RUN] key to dispense 180µL of diluent into the tube. During dispensing the diluent, a progress bar will display.
If the current mode is autoloader, the analyzer will switch to the close-tube mode automatically and then dispense the diluent. Then, the mode will be switched back to autoloader when exiting.
4)When the dispensing is finished, the compartment door will open automatically and you can remove the centrifugal tube. Then, the following message box will display.
5) Add 20µL of control to the diluent, close the tube cap and shake the tube to mix the sample. 6) Click the “Cancel” button to exit the “Diluent” message box.
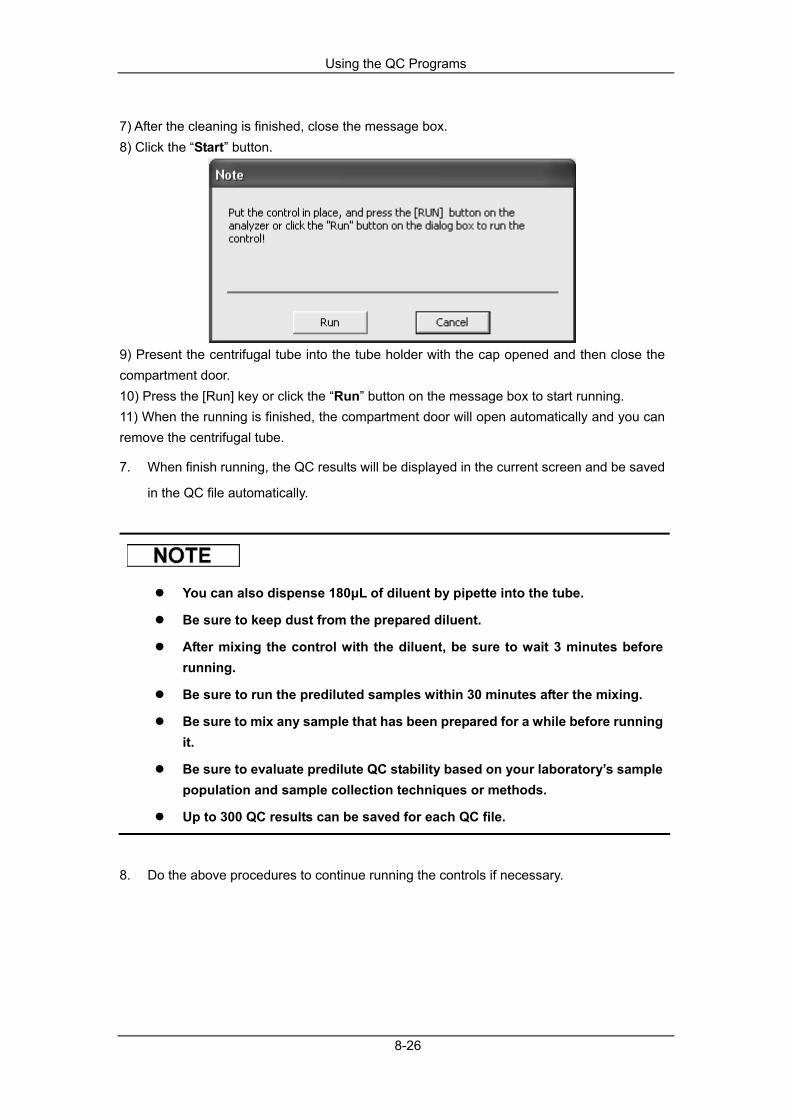
Using the QC Programs
8-26
7) After the cleaning is finished, close the message box. 8) Click the “Start” button.
9) Present the centrifugal tube into the tube holder with the cap opened and then close the compartment door. 10) Press the [Run] key or click the “Run” button on the message box to start running. 11) When the running is finished, the compartment door will open automatically and you can remove the centrifugal tube.
7. When finish running, the QC results will be displayed in the current screen and be saved
in the QC file automatically.
You can also dispense 180µL of diluent by pipette into the tube.
Be sure to keep dust from the prepared diluent.
After mixing the control with the diluent, be sure to wait 3 minutes before running.
Be sure to run the prediluted samples within 30 minutes after the mixing.
Be sure to mix any sample that has been prepared for a while before running it.
Be sure to evaluate predilute QC stability based on your laboratory’s sample population and sample collection techniques or methods.
Up to 300 QC results can be saved for each QC file.
8. Do the above procedures to continue running the controls if necessary.

Using the QC Programs
8-27
Running Controls (AL-WB without built-in barcode scanner)
All the samples, controls, calibrators, reagents, wastes and areas contacted them are potentially biohazardous. Wear proper personal protective equipment (e.g. gloves, lab coat, etc.) and follow safe laboratory procedures when handling them and the contacted areas in the laboratory.
The sample probe is sharp and potentially biohazardous, Exercise caution to avoid contact with the probe when working around it.
The sample may spill from the unclosed collection tubes and cause biohazard. Exercise caution to the unclosed collection tubes.
Be sure to avoid reversing the collection tube when loading, otherwise, the collection tube may be broken and cause biohazard.
Collection tubes broken may cause personal injury and/or biohazard. Exercise caution when loading the collection tubes to the rack or getting the collection tubes from the rack, be sure not to break the tubes.
Collection tubes broken may cause personal injury and/or biohazard. Exercise caution when loading the collection tubes to the autoloader or getting the collection tubes from the autoloader, be sure not to break the tubes.
The pusher will push the rack inside the autoloader. Be sure you hand is away from the rack before starting the autoloader.
Keep you clothed, hairs and hands away from the moving parts to avoid injury.
The reagents are irritating to eyes, skin and diaphragm. Wear proper personal protective equipment (e.g. gloves, lab coat, etc.) and follow safe laboratory procedures when handling them in the laboratory.
If the reagents accidentally spill on your skin, wash them off with plenty of water and if necessary, go see a doctor; if the reagents accidentally spill into your eyes, wash them off with plenty of water and immediately go see a doctor.

Using the QC Programs
8-28
Do not re-use such disposable product as collection tubes, test tubes, capillary tubes, etc.
Be sure to use the Mindray-specified disposable products including evacuated blood collection tube, anticoagulant collection tubes and capillary tubes etc.
You can enter the graph screen by one of the following ways:
Click the shortcut button “QC”.
Click the “Menu” button on the screen; then select “QC” ”L-J” on the pop-up menu.
Enter the “L-J” graph screen.
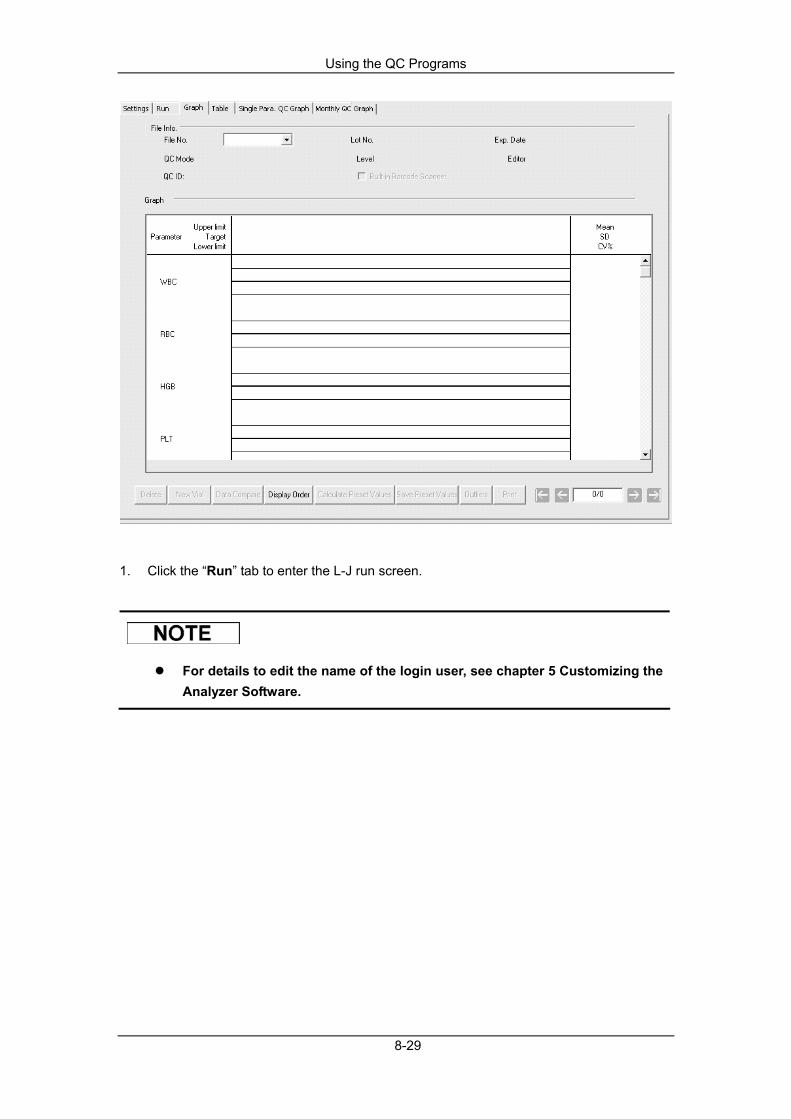
Using the QC Programs
8-29
1. Click the “Run” tab to enter the L-J run screen.
For details to edit the name of the login user, see chapter 5 Customizing the Analyzer Software.
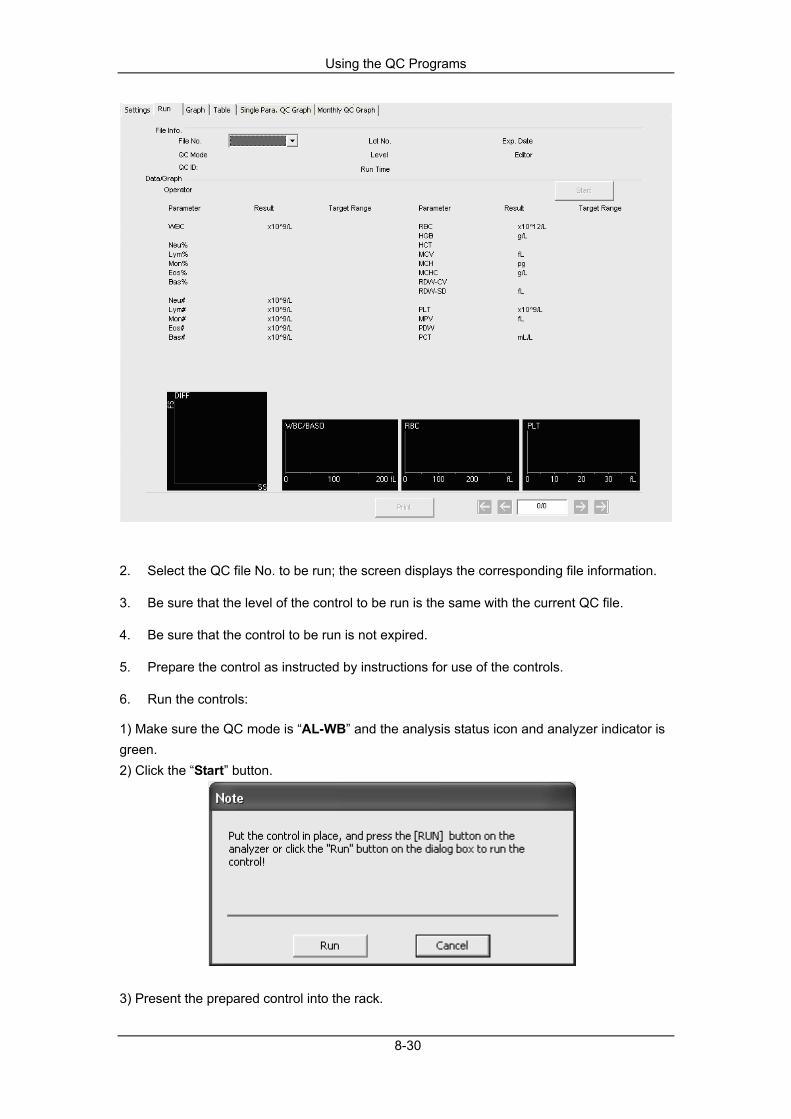
Using the QC Programs
8-30
2. Select the QC file No. to be run; the screen displays the corresponding file information.
3. Be sure that the level of the control to be run is the same with the current QC file.
4. Be sure that the control to be run is not expired.
5. Prepare the control as instructed by instructions for use of the controls.
6. Run the controls:
1) Make sure the QC mode is “AL-WB” and the analysis status icon and analyzer indicator is green. 2) Click the “Start” button.
3) Present the prepared control into the rack.
Using the QC Programs
8-31
4) Place racks loading controls on the level of the right tray of the autoloader, with the back of “MINDRAY” mark on the carrier facing the analyzer. 5) Press the [Run] key or click the “Run” button on the message box to start running. 6) When finish running, you can remove the racks from the left of the autoloader.
Without built-in barcode scanner, only one control can be run in single running.
7. When finish running, the QC results will be displayed in the current screen and be saved
in the QC file automatically.
Up to 300 QC results can be saved for each QC file.
8. Do the above procedures to continue running the controls if necessary.
Running Controls (AL-WB with built-in barcode scanner)
All the samples, controls, calibrators, reagents, wastes and areas contacted them are potentially biohazardous. Wear proper personal protective equipment (e.g. gloves, lab coat, etc.) and follow safe laboratory procedures when handling them and the contacted areas in the laboratory.

Using the QC Programs
8-32
The sample probe is sharp and potentially biohazardous, Exercise caution to avoid contact with the probe when working around it.
The sample may spill from the unclosed collection tubes and cause biohazard. Exercise caution to the unclosed collection tubes.
Be sure to avoid reversing the collection tube when loading, otherwise, the collection tube may be broken and cause biohazard.
Collection tubes broken may cause personal injury and/or biohazard. Exercise caution when loading the collection tubes to the rack or getting the collection tubes from the rack, be sure not to break the tubes.
Collection tubes broken may cause personal injury and/or biohazard. Exercise caution when loading the collection tubes to the autoloader or getting the collection tubes from the autoloader, be sure not to break the tubes.
The pusher will push the rack inside the autoloader. Be sure you hand is away from the rack before starting the autoloader.
Keep you clothed, hairs and hands away from the moving parts to avoid injury.
The reagents are irritating to eyes, skin and diaphragm. Wear proper personal protective equipment (e.g. gloves, lab coat, etc.) and follow safe laboratory procedures when handling them in the laboratory.
If the reagents accidentally spill on your skin, wash them off with plenty of water and if necessary, go see a doctor; if the reagents accidentally spill into your eyes, wash them off with plenty of water and immediately go see a doctor.
Do not re-use such disposable product as collection tubes, test tubes, capillary tubes, etc.
Be sure to use the Mindray-specified disposable products including evacuated blood collection tube, anticoagulant collection tubes and capillary tubes etc.
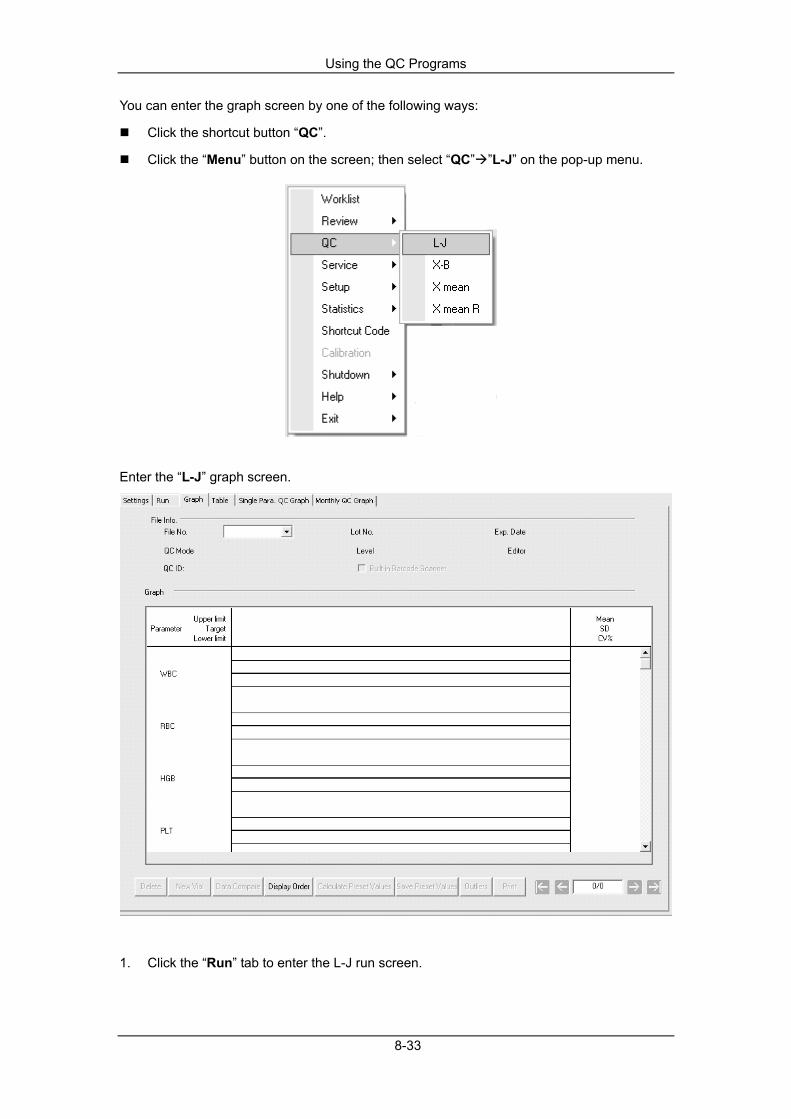
Using the QC Programs
8-33
You can enter the graph screen by one of the following ways:
Click the shortcut button “QC”.
Click the “Menu” button on the screen; then select “QC” ”L-J” on the pop-up menu.
Enter the “L-J” graph screen.
1. Click the “Run” tab to enter the L-J run screen.
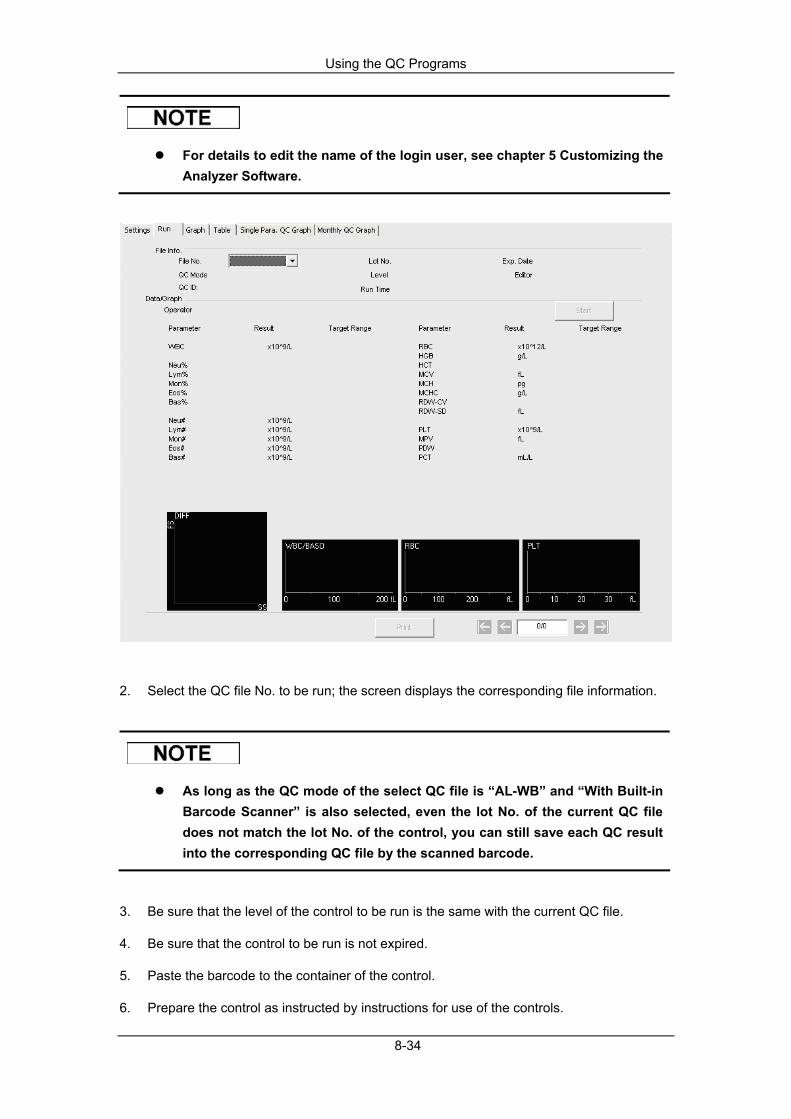
Using the QC Programs
8-34
For details to edit the name of the login user, see chapter 5 Customizing the Analyzer Software.
2. Select the QC file No. to be run; the screen displays the corresponding file information.
As long as the QC mode of the select QC file is “AL-WB” and “With Built-in Barcode Scanner” is also selected, even the lot No. of the current QC file does not match the lot No. of the control, you can still save each QC result into the corresponding QC file by the scanned barcode.
3. Be sure that the level of the control to be run is the same with the current QC file.
4. Be sure that the control to be run is not expired.
5. Paste the barcode to the container of the control.
6. Prepare the control as instructed by instructions for use of the controls.

Using the QC Programs
8-35
7. Run the controls:
For details to paste the barcode, see Chapter 6 Operating Your Analyzer.
Be sure that the barcode of the lot No. of the controls is readable by the built-in barcode scanner, for details to set the symbology, see Chapter 5 Customizing the Analyzer Software; for details to test the built-in barcode scanner, see Chapter 10 Maintenance.
1) Make sure the QC mode is “AL-WB” and the analysis status icon and analyzer indicator is green. 2) Be sure “Built-in Barcode Scanner” is selected for all the corresponding QC files, and the barcode labels are pasted to the containers of the controls. 3) Click the “Start” button.
4) Present the prepared control into the rack. 5) Place racks loading controls on the level of the right tray of the autoloader, with the back of “MINDRAY” mark on the carrier facing the analyzer. 6) Press the [Run] key or click the “Run” button on the message box to start running. 7) When finish running, you can remove the racks from the left of the autoloader.
With built-in barcode scanner, more than one control can be run together in a single running.
When the barcode of the control is scanned by the built-in barcode scanner, the screen will switch to the corresponding QC file automatically.
If nothing is scanned or no matching lot No. is found, the analyzer will jump over the certain control without analyzing, and proceed to the later barcode scanning and QC analyzing.

Using the QC Programs
8-36
8. When finish running, the newest QC results will be displayed in the current screen and
be saved in the QC file automatically.
If any control is jumped over without being analyzed, a prompt will pop up when the analysis cycle is completed. Click the “Ok” button to close the prompt.
Up to 300 QC results can be saved for each QC file.
9. Do the above procedures to continue running the controls if necessary.
Browse the QC Result
You can click the arrow button in the bottom of the screen to browse the QC result saved in the current QC file.
You can click the button or button to switch to the pervious or the next QC result.
You can click the button or button to switch to the earliest or the latest QC result
saved in the QC file.
The running result of the expired control will begin with an “O” mark.
The flag prompt “H” or “L” will appear in front of the result that out of the limits.
The enlarging function is available to the scattergrams and histograms of the screen. See details for operation in Chapter 7 Reviewing Sample Results.
For the QC files with saved QC results, if any change is made to the target or the limits, the changed data will be highlighted in yellow.
Click the “Print” button to print the results of the current QC Run screen.
Using the QC Programs
8-37
Run controls in the interval of running blood samples under sample count screen
After setting special “QC ID” for controls under the “Settings” screen, you can run controls in the intervals of running blood samples under sample count screen. Before running blood samples, when you are editing worklist or entering information for the next sample in the “Run” message box, be sure to enter the special “QC ID” as “sample ID”. (Refer to 6.6.1 or 6.7.1 Entering Work List Information for the way to enter sample IDs) You can start one of the following QC analyses according to the selected QC mode.
CT-WB
CT-PD
AL-WB (without built-in barcode scanner)
AL-WB (with built-in barcode scanner)
Running Controls (CT-WB)
All the samples, controls, calibrators, reagents, wastes and areas contacted them are potentially biohazardous. Wear proper personal protective equipment (e.g. gloves, lab coat, etc.) and follow safe laboratory procedures when handling them and the contacted areas in the laboratory.
The sample probe is sharp and potentially biohazardous, Exercise caution to avoid contact with the probe when working around it.
The sample may spill from the unclosed collection tubes and cause biohazard. Exercise caution to the unclosed collection tubes.
Be sure to avoid reversing the collection tube when loading, otherwise, the collection tube may be broken and cause biohazard.
Be sure to place the collection tubes in the right adapter before running, otherwise, the collection tubes may be broken and cause biohazard.
Collection tubes broken may cause personal injury and/or biohazard. Exercise caution when loading the collection tubes to the rack or getting the collection tubes from the rack, be sure not to break the tubes.
Keep you clothed, hairs and hands away from the moving parts to avoid injury.
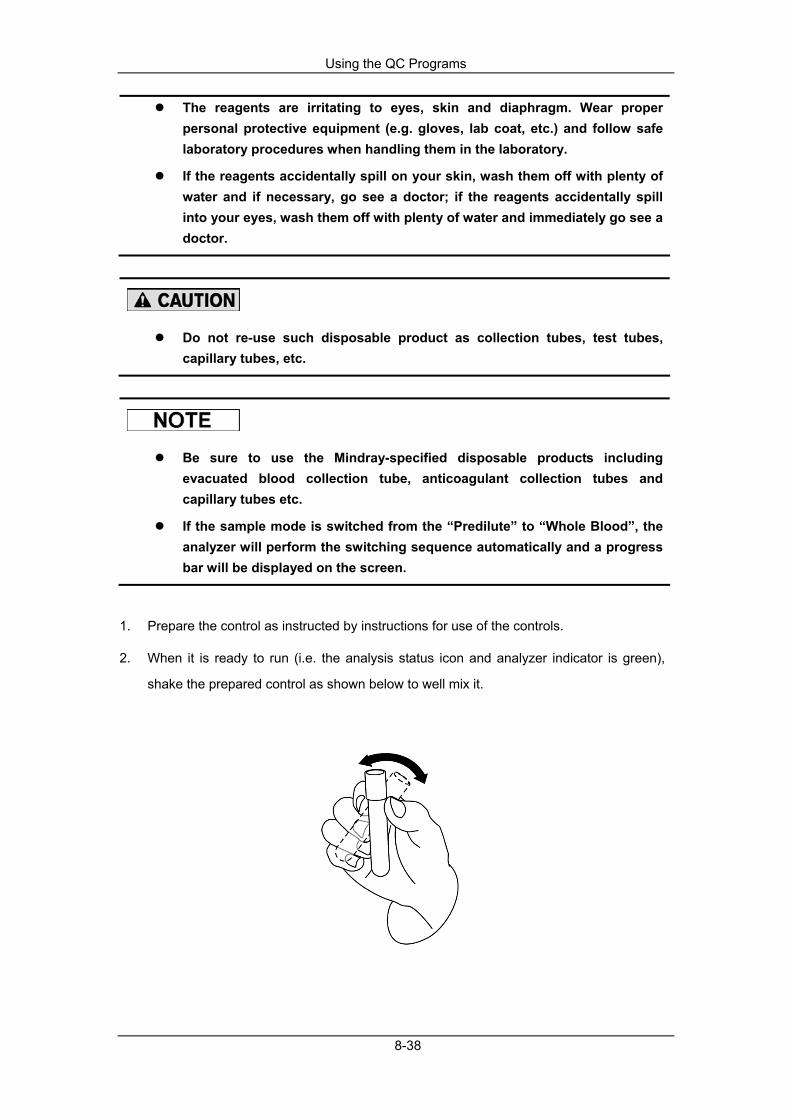
Using the QC Programs
8-38
The reagents are irritating to eyes, skin and diaphragm. Wear proper personal protective equipment (e.g. gloves, lab coat, etc.) and follow safe laboratory procedures when handling them in the laboratory.
If the reagents accidentally spill on your skin, wash them off with plenty of water and if necessary, go see a doctor; if the reagents accidentally spill into your eyes, wash them off with plenty of water and immediately go see a doctor.
Do not re-use such disposable product as collection tubes, test tubes, capillary tubes, etc.
Be sure to use the Mindray-specified disposable products including evacuated blood collection tube, anticoagulant collection tubes and capillary tubes etc.
If the sample mode is switched from the “Predilute” to “Whole Blood”, the analyzer will perform the switching sequence automatically and a progress bar will be displayed on the screen.
1. Prepare the control as instructed by instructions for use of the controls.
2. When it is ready to run (i.e. the analysis status icon and analyzer indicator is green),
shake the prepared control as shown below to well mix it.

Using the QC Programs
8-39
3. Press the [OPEN] key to open the compartment door.
4. Present the prepared control into the tube holder and then close the compartment door.
5. Press the [Run] key or click the “Run” button on the message box to start running.
6. When the running is finished, the compartment door will open automatically and you can
remove the control.
7. When finish running, the QC results will be automatically saved in the corresponding QC
file of the QC ID
Up to 300 QC results can be saved for each QC file.
8. Do the above procedures to continue running the controls if necessary.
Running Controls (CT-PD)
All the samples, controls, calibrators, reagents, wastes and areas contacted them are potentially biohazardous. Wear proper personal protective equipment (e.g. gloves, lab coat, etc.) and follow safe laboratory procedures when handling them and the contacted areas in the laboratory.
The sample probe is sharp and potentially biohazardous, Exercise caution to avoid contact with the probe when working around it.
The sample may spill from the unclosed collection tubes and cause biohazard. Exercise caution to the unclosed collection tubes.
Be sure to avoid reversing the collection tube when loading, otherwise, the collection tube may be broken and cause biohazard.
Be sure to place the collection tubes in the right adapter before running, otherwise, the collection tubes may be broken and cause biohazard.
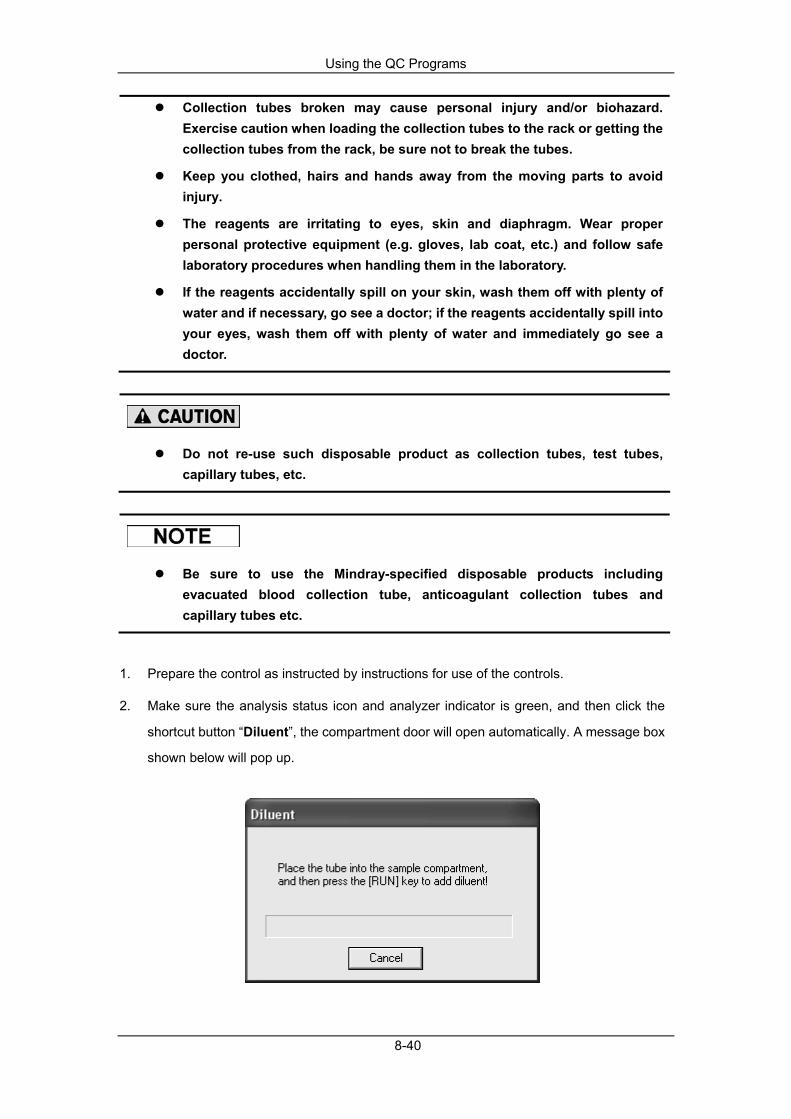
Using the QC Programs
8-40
Collection tubes broken may cause personal injury and/or biohazard. Exercise caution when loading the collection tubes to the rack or getting the collection tubes from the rack, be sure not to break the tubes.
Keep you clothed, hairs and hands away from the moving parts to avoid injury.
The reagents are irritating to eyes, skin and diaphragm. Wear proper personal protective equipment (e.g. gloves, lab coat, etc.) and follow safe laboratory procedures when handling them in the laboratory.
If the reagents accidentally spill on your skin, wash them off with plenty of water and if necessary, go see a doctor; if the reagents accidentally spill into your eyes, wash them off with plenty of water and immediately go see a doctor.
Do not re-use such disposable product as collection tubes, test tubes, capillary tubes, etc.
Be sure to use the Mindray-specified disposable products including evacuated blood collection tube, anticoagulant collection tubes and capillary tubes etc.
1. Prepare the control as instructed by instructions for use of the controls.
2. Make sure the analysis status icon and analyzer indicator is green, and then click the
shortcut button “Diluent”, the compartment door will open automatically. A message box
shown below will pop up.
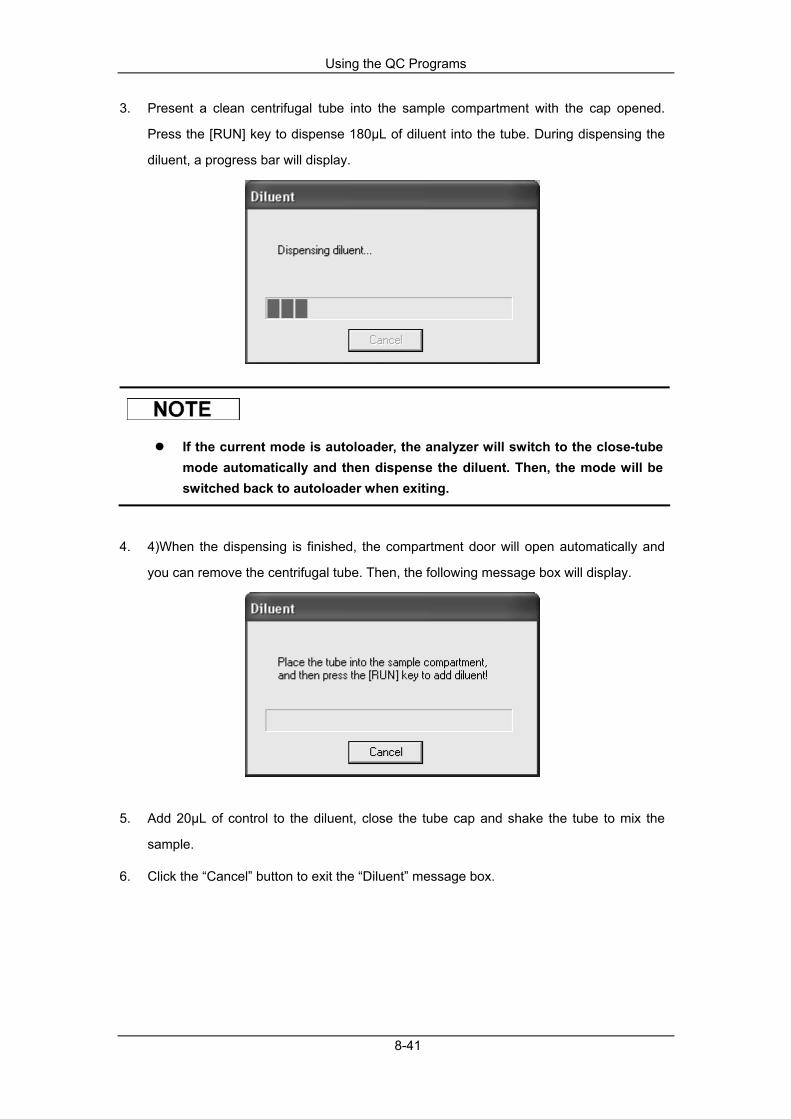
Using the QC Programs
8-41
3. Present a clean centrifugal tube into the sample compartment with the cap opened.
Press the [RUN] key to dispense 180µL of diluent into the tube. During dispensing the
diluent, a progress bar will display.
If the current mode is autoloader, the analyzer will switch to the close-tube mode automatically and then dispense the diluent. Then, the mode will be switched back to autoloader when exiting.
4. 4)When the dispensing is finished, the compartment door will open automatically and
you can remove the centrifugal tube. Then, the following message box will display.
5. Add 20µL of control to the diluent, close the tube cap and shake the tube to mix the
sample.
6. Click the “Cancel” button to exit the “Diluent” message box.

Using the QC Programs
8-42
7. After the cleaning is finished, close the message box.
8. Present the centrifugal tube into the tube holder with the cap opened and then close the
compartment door.
9. 1Press the [Run] key or click the “Run” button on the message box to start running.
10. 1When the running is finished, the compartment door will open automatically and you
can remove the centrifugal tube.
11. When finish running, the QC results will be automatically saved in the corresponding QC
file of the QC ID.
You can also dispense 180µL of diluent by pipette into the tube.
Be sure to keep dust from the prepared diluent.
After mixing the control with the diluent, be sure to wait 3 minutes before running.
Be sure to run the prediluted samples within 30 minutes after the mixing.
Be sure to mix any sample that has been prepared for a while before running it.
Be sure to evaluate predilute QC stability based on your laboratory’s sample population and sample collection techniques or methods.
Up to 300 QC results can be saved for each QC file.
12. Do the above procedures to continue running the controls if necessary.
Using the QC Programs
8-43
Running Controls (AL-WB without built-in barcode scanner)
All the samples, controls, calibrators, reagents, wastes and areas contacted them are potentially biohazardous. Wear proper personal protective equipment (e.g. gloves, lab coat, etc.) and follow safe laboratory procedures when handling them and the contacted areas in the laboratory.
The sample probe is sharp and potentially biohazardous, Exercise caution to avoid contact with the probe when working around it.
The sample may spill from the unclosed collection tubes and cause biohazard. Exercise caution to the unclosed collection tubes.
Be sure to avoid reversing the collection tube when loading, otherwise, the collection tube may be broken and cause biohazard.
Collection tubes broken may cause personal injury and/or biohazard. Exercise caution when loading the collection tubes to the rack or getting the collection tubes from the rack, be sure not to break the tubes.
Collection tubes broken may cause personal injury and/or biohazard. Exercise caution when loading the collection tubes to the autoloader or getting the collection tubes from the autoloader, be sure not to break the tubes.
The pusher will push the rack inside the autoloader. Be sure you hand is away from the rack before starting the autoloader.
Keep you clothed, hairs and hands away from the moving parts to avoid injury.
The reagents are irritating to eyes, skin and diaphragm. Wear proper personal protective equipment (e.g. gloves, lab coat, etc.) and follow safe laboratory procedures when handling them in the laboratory.
If the reagents accidentally spill on your skin, wash them off with plenty of water and if necessary, go see a doctor; if the reagents accidentally spill into your eyes, wash them off with plenty of water and immediately go see a doctor.
Using the QC Programs
8-44
Do not re-use such disposable product as collection tubes, test tubes, capillary tubes, etc.
Be sure to use the Mindray-specified disposable products including evacuated blood collection tube, anticoagulant collection tubes and capillary tubes etc.
1. Prepare the control as instructed by instructions for use of the controls.
2. Make sure the analysis mode is “AL-WB” and the analysis status icon and analyzer
indicator is green.
3. Present the prepared control into the rack.
4. Place racks loading controls on the level of the right tray of the autoloader, with the back
of “MINDRAY” mark on the carrier facing the analyzer.
5. Press the [Run] key or click the “Run” button on the message box to start running.
6. When finish running, you can remove the racks from the left of the autoloader.
Without built-in barcode scanner, only one control can be run in single running.
7. When finish running, the QC results will be automatically saved in the corresponding QC
file of the QC ID.
Up to 300 QC results can be saved for each QC file.
8. Do the above procedures to continue running the controls if necessary.
Using the QC Programs
8-45
Running Controls (AL-WB with built-in barcode scanner)
All the samples, controls, calibrators, reagents, wastes and areas contacted them are potentially biohazardous. Wear proper personal protective equipment (e.g. gloves, lab coat, etc.) and follow safe laboratory procedures when handling them and the contacted areas in the laboratory.
The sample probe is sharp and potentially biohazardous, Exercise caution to avoid contact with the probe when working around it.
The sample may spill from the unclosed collection tubes and cause biohazard. Exercise caution to the unclosed collection tubes.
Be sure to avoid reversing the collection tube when loading, otherwise, the collection tube may be broken and cause biohazard.
Collection tubes broken may cause personal injury and/or biohazard. Exercise caution when loading the collection tubes to the rack or getting the collection tubes from the rack, be sure not to break the tubes.
Collection tubes broken may cause personal injury and/or biohazard. Exercise caution when loading the collection tubes to the autoloader or getting the collection tubes from the autoloader, be sure not to break the tubes.
The pusher will push the rack inside the autoloader. Be sure you hand is away from the rack before starting the autoloader.
Keep you clothed, hairs and hands away from the moving parts to avoid injury.
The reagents are irritating to eyes, skin and diaphragm. Wear proper personal protective equipment (e.g. gloves, lab coat, etc.) and follow safe laboratory procedures when handling them in the laboratory.
If the reagents accidentally spill on your skin, wash them off with plenty of water and if necessary, go see a doctor; if the reagents accidentally spill into your eyes, wash them off with plenty of water and immediately go see a doctor.

Using the QC Programs
8-46
Do not re-use such disposable product as collection tubes, test tubes, capillary tubes, etc.
Be sure to use the Mindray-specified disposable products including evacuated blood collection tube, anticoagulant collection tubes and capillary tubes etc.
1. Paste the barcode to the container of the control.
2. Prepare the control as instructed by instructions for use of the controls.
For details to paste the barcode, see Chapter 6 Operating Your Analyzer.
Be sure that the barcode of the lot No. of the controls is readable by the built-in barcode scanner, for details to set the symbology, see Chapter 5 Customizing the Analyzer Software; for details to test the built-in barcode scanner, see Chapter 10 Maintenance.
3. Make sure the analysis mode is “AL-WB” and the analysis status icon and analyzer
indicator is green.
4. Be sure “Built-in Barcode Scanner” is selected for all the corresponding QC files, and the
barcode labels are pasted to the containers of the controls.
5. Present the prepared control into the rack.
6. Place racks loading controls on the level of the right tray of the autoloader, with the back
of “MINDRAY” mark on the carrier facing the analyzer.
7. Press the [Run] key or click the “Run” button on the message box to start running.
8. When finish running, you can remove the racks from the left of the autoloader.
Using the QC Programs
8-47
With built-in barcode scanner, more than one control can be run together in a single running.
When the barcode of the control is scanned by the built-in barcode scanner, the screen will switch to the corresponding QC file automatically.
If nothing is scanned or no matching lot No. is found, the analyzer will jump over the certain control without analyzing, and proceed to the later barcode scanning and QC analyzing.
9. When finish running, the QC results will be automatically saved in the corresponding QC
file of the QC ID.
If any control is jumped over without being analyzed, a prompt will pop up when the analysis cycle is completed. Click the “Ok” button to close the prompt.
Up to 300 QC results can be saved for each QC file.
10. Do the above procedures to continue running the controls if necessary.
Browse the QC Result
You can click the arrow button in the bottom of the screen to browse the QC result saved in the current QC file.
You can click the button or button to switch to the pervious or the next QC result.
You can click the button or button to switch to the earliest or the latest QC result
saved in the QC file.

Using the QC Programs
8-48
The running result of the expired control will begin with an “O” mark.
The flag prompt “H” or “L” will appear in front of the result that out of the limits.
The enlarging function is available to the scattergrams and histograms of the screen. See details for operation in Chapter 7 Reviewing Sample Results.
For the QC files with saved QC results, if any change is made to the target or the limits, the changed data will be highlighted in yellow.
Click the “Print” button to print the results of the current QC Run screen.
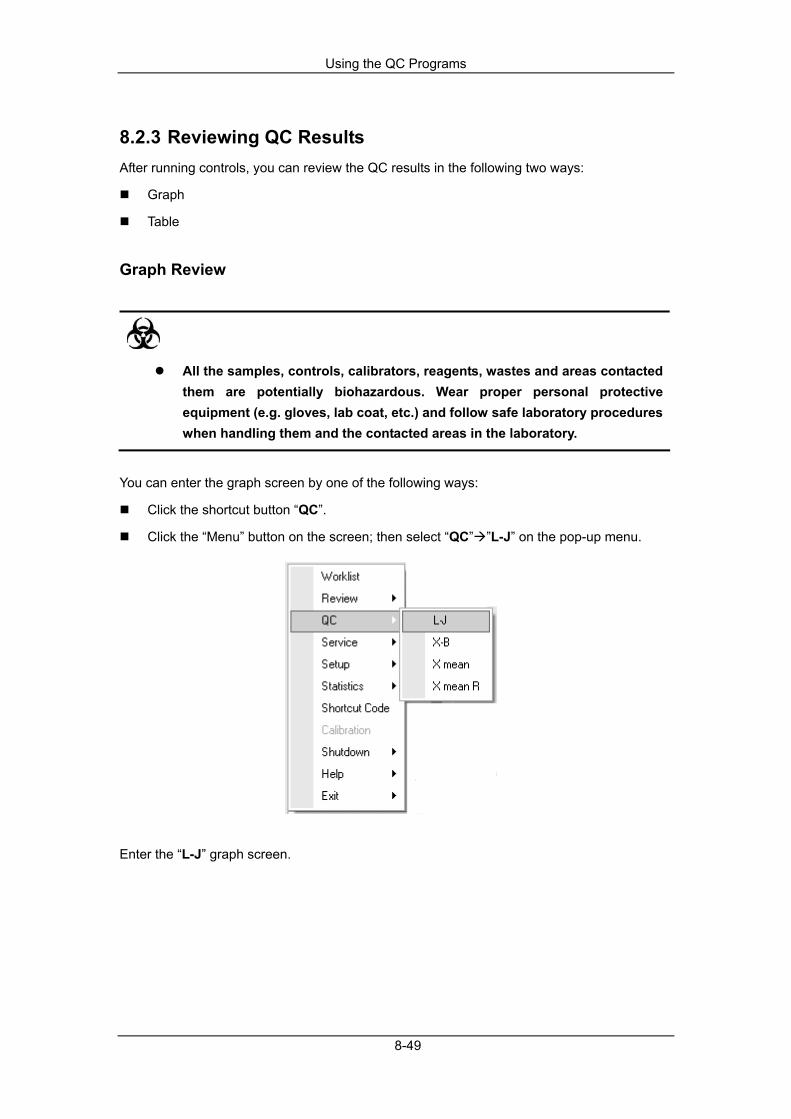
Using the QC Programs
8-49
8.2.3 Reviewing QC Results After running controls, you can review the QC results in the following two ways:
Graph
Table
Graph Review
All the samples, controls, calibrators, reagents, wastes and areas contacted them are potentially biohazardous. Wear proper personal protective equipment (e.g. gloves, lab coat, etc.) and follow safe laboratory procedures when handling them and the contacted areas in the laboratory.
You can enter the graph screen by one of the following ways:
Click the shortcut button “QC”.
Click the “Menu” button on the screen; then select “QC” ”L-J” on the pop-up menu.
Enter the “L-J” graph screen.

Using the QC Programs
8-50
1. Select the QC file No. you want to review, and then the screen will display the
corresponding information and the graph.
2. You can drag the scroll bar on the right of the graph to browse the desired graph of the
parameter. You can drag the scroll bar down to the graph horizontally to browse all the
QC results.
Introduction to the “Graph” Screen

Using the QC Programs
8-51
1- The Mean, SD and CV% of all the QC results of each parameter in the current graph. 2- The saving date and time of the QC points located on the green line. 3- The operator who run the QC analysis and obtained the QC points located on the green line. 4- The QC results of the parameters that correspond to the QC points located on the green line. 5- The QC points in each graph are displayed from left to right according to the sequence from the earliest to the latest. The QC points are connected by a line to illustrate the distribution trend. 6- The QC point corresponds to each QC result. Only the selected QC point displays its value under the parameter. The black QC point indicates the value is within the limit; the red QC point indicates the value is out of the limit. 7- When you clicking a QC point in the graph, the QC points of other parameters that saved together with this one will be marked by a green line. 8- The relative position of the QC point located on the green line and the total QC points saved currently.
The outliers are excluded from the calculation of Mean, SD and CV%.
For the QC files with saved QC results, if any change is made to the target or the limits, the changed data will be highlighted in yellow.

Using the QC Programs
8-52
Browse the QC Result
You can click the arrow button in the bottom of the screen to browse the QC result saved in the current QC file.
You can click the button or button to move the green line to the pervious or the
next QC point; you can click the button or button to move the green line to the first
or the last QC point in the graph. When the location of the green line is selected, you can check the QC results of the QC points located on the green line under each parameter.
New Vial
If the reviewed QC results are obtained by analyzing a new vial of control of the same batch, you should mark the QC points of the new vial to distinguish the QC results from the old.
1. Move the green line to the first QC point of the new vial.
2. Click the “New Vial” button, and then a blue line appears at the QC point of the new vial.
3. After another new vial of control (of the same batch) is run and its QC results are saved,
you can continue to mark the current QC point of the new vial according to step 1 and 2.
4. If the current QC point is marked with the blue line, the “New Vial” button will turn into
“Cancel”; you can click the button to remove the blue line, and then the “Cancel” button
will turn back to “New Vial”.
Data Compare
If you wish to compare the graphs of the certain parameter obtained by running controls of different lot No., do as follows:
1. Click the “Data Compare” button to start selecting the desired graph.

Using the QC Programs
8-53
2. Select the desired QC file No. into the “File No.” box (3 files can be selected at most).
Then, the graph of the selected QC file will be displayed below together with its lot No.,
QC mode and level.
3. Select the desired parameter into the “Parameter” box.
Browse the graph here the same way as instructed in the “Graph” screen. Be aware that, for controls of different level, their graphs will be distinguished by the color of orange, black and blue.
4. Click the “Print” button to print the current comparison if necessary.
5. Click the “Close” button to exit.
Display Order
Do as follows to adjust the display order of different graphs.
1. Click the “Display Order” button to check the current display order of the graphs.
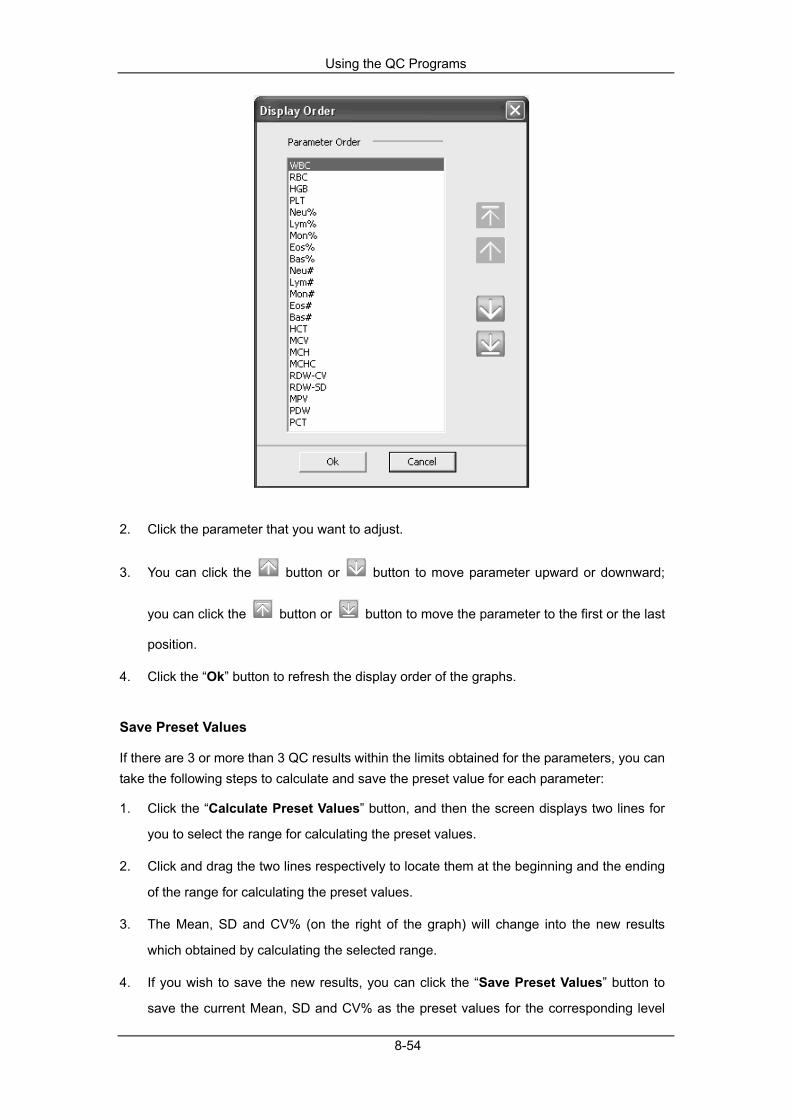
Using the QC Programs
8-54
2. Click the parameter that you want to adjust.
3. You can click the button or button to move parameter upward or downward;
you can click the button or button to move the parameter to the first or the last
position.
4. Click the “Ok” button to refresh the display order of the graphs.
Save Preset Values
If there are 3 or more than 3 QC results within the limits obtained for the parameters, you can take the following steps to calculate and save the preset value for each parameter:
1. Click the “Calculate Preset Values” button, and then the screen displays two lines for
you to select the range for calculating the preset values.
2. Click and drag the two lines respectively to locate them at the beginning and the ending
of the range for calculating the preset values.
3. The Mean, SD and CV% (on the right of the graph) will change into the new results
which obtained by calculating the selected range.
4. If you wish to save the new results, you can click the “Save Preset Values” button to
save the current Mean, SD and CV% as the preset values for the corresponding level
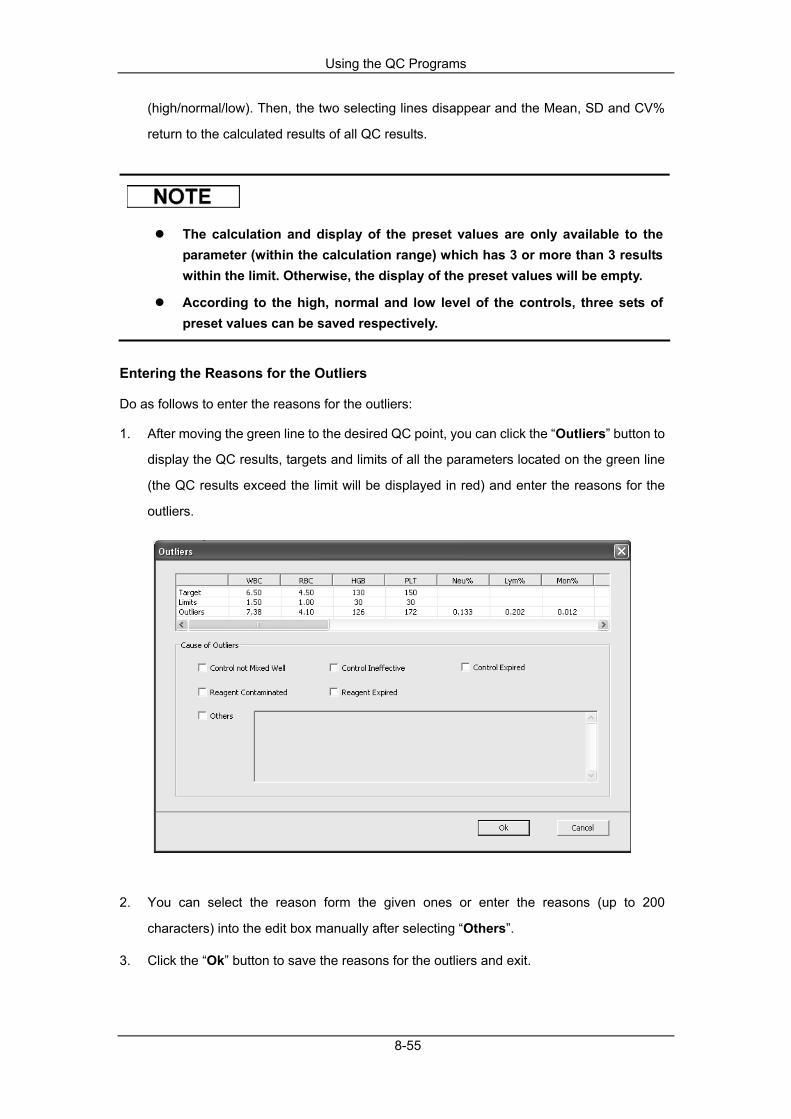
Using the QC Programs
8-55
(high/normal/low). Then, the two selecting lines disappear and the Mean, SD and CV%
return to the calculated results of all QC results.
The calculation and display of the preset values are only available to the parameter (within the calculation range) which has 3 or more than 3 results within the limit. Otherwise, the display of the preset values will be empty.
According to the high, normal and low level of the controls, three sets of preset values can be saved respectively.
Entering the Reasons for the Outliers
Do as follows to enter the reasons for the outliers:
1. After moving the green line to the desired QC point, you can click the “Outliers” button to
display the QC results, targets and limits of all the parameters located on the green line
(the QC results exceed the limit will be displayed in red) and enter the reasons for the
outliers.
2. You can select the reason form the given ones or enter the reasons (up to 200
characters) into the edit box manually after selecting “Others”.
3. Click the “Ok” button to save the reasons for the outliers and exit.

Using the QC Programs
8-56
If you enter the reason for the group of QC points whose results are actually within the limits, then their corresponding QC data both in the QC Graph and QC Table will be displayed in the color of red. And the data will return in the color of black if you cancel the reason and then save the changes.
Delete
The administrator can delete the QC results by the following steps:
1. If you wish to delete a single QC result, move the green line to the desired QC result; if
you wish to delete all the data, perform step 2 directly.
2. Click the “Delete” button to select “Current Data” or “All Data”.
3. Click the data you want to delete.
4. Click the “Ok” button and then confirm to delete the selected data.
The operation of deletion will be recorded in the log.
Click the “Print” button to print all the file information and graphs of the parameters of the current QC file.
The green line and the corresponding values of the QC points will not be printed.
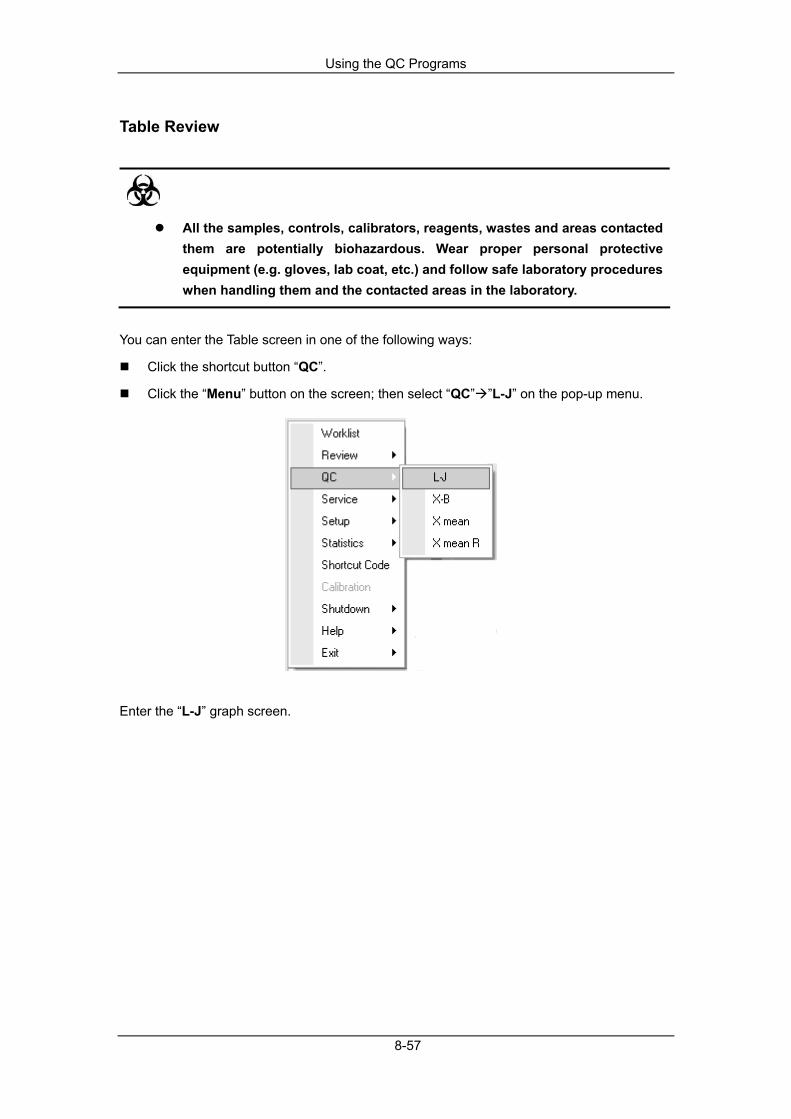
Using the QC Programs
8-57
Table Review
All the samples, controls, calibrators, reagents, wastes and areas contacted them are potentially biohazardous. Wear proper personal protective equipment (e.g. gloves, lab coat, etc.) and follow safe laboratory procedures when handling them and the contacted areas in the laboratory.
You can enter the Table screen in one of the following ways:
Click the shortcut button “QC”.
Click the “Menu” button on the screen; then select “QC” ”L-J” on the pop-up menu.
Enter the “L-J” graph screen.
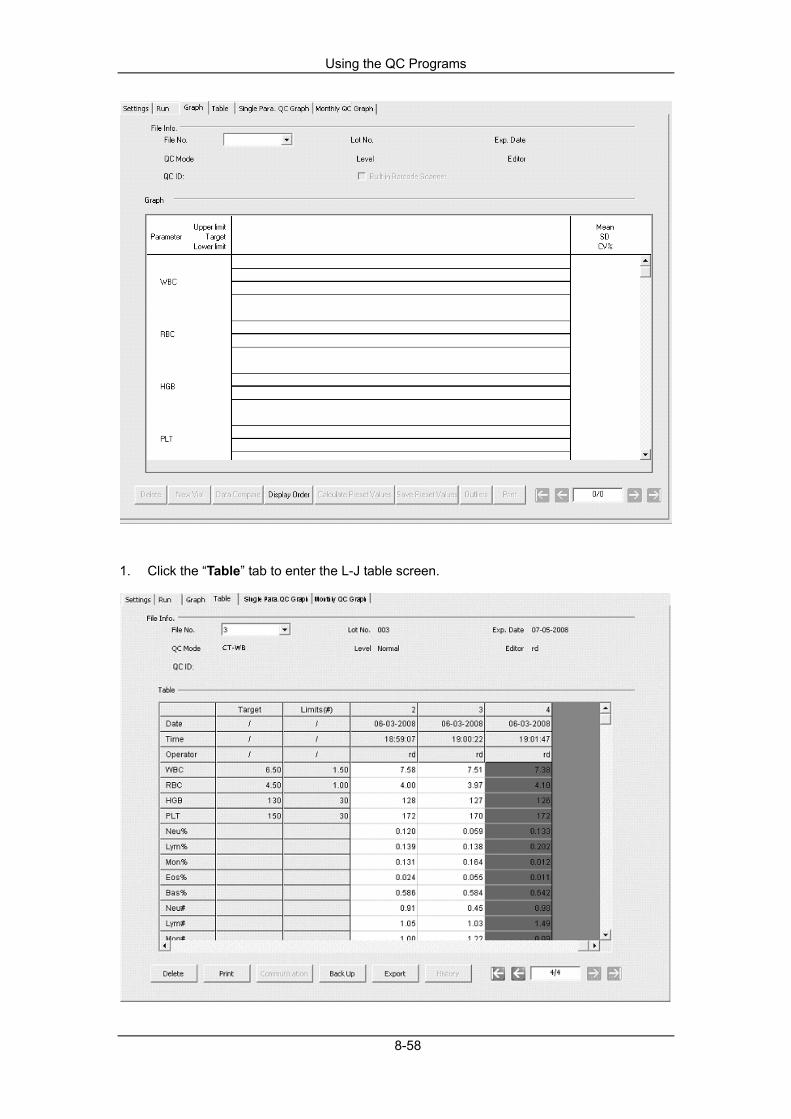
Using the QC Programs
8-58
1. Click the “Table” tab to enter the L-J table screen.

Using the QC Programs
8-59
2. Select the QC file No. you want to review, and then the screen will display the
corresponding information and the table.
3. You can drag the scroll bar on the right of the table vertically to browse the desired table
of the parameter. You can drag the scroll bar down to the table horizontally to browse all
the QC results.
Introduction to the “Table” Screen
1- The No. of the QC result saved in the QC file (arranged from left to right in the order that from the earliest to the latest) 2- QC Result 3- QC parameters (displayed in the same order as the Graph screen) 4- QC flag: The flag “H” or “L” will be used to prompt the result that out of the limits 5- The relative position of the highlighted QC point and the total QC points saved currently.
For the QC files with saved QC results, if any change is made to the target or the limits, the changed data will be highlighted in yellow.
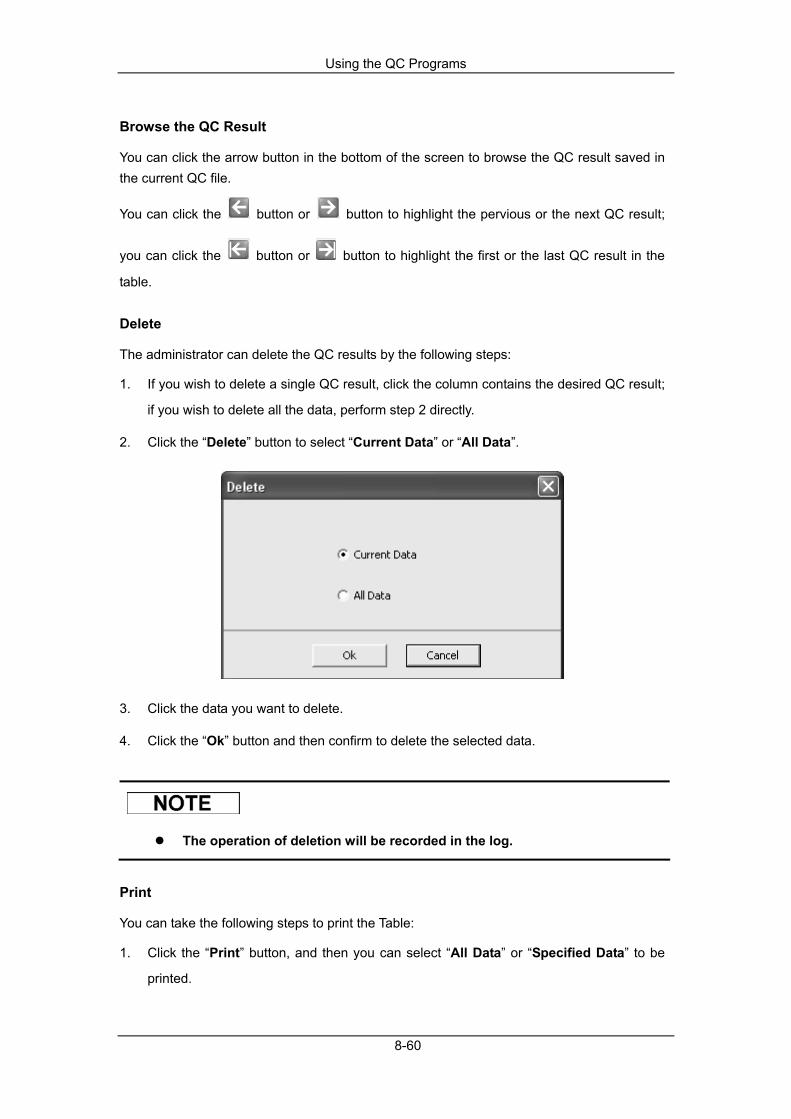
Using the QC Programs
8-60
Browse the QC Result
You can click the arrow button in the bottom of the screen to browse the QC result saved in the current QC file.
You can click the button or button to highlight the pervious or the next QC result;
you can click the button or button to highlight the first or the last QC result in the
table.
Delete
The administrator can delete the QC results by the following steps:
1. If you wish to delete a single QC result, click the column contains the desired QC result;
if you wish to delete all the data, perform step 2 directly.
2. Click the “Delete” button to select “Current Data” or “All Data”.
3. Click the data you want to delete.
4. Click the “Ok” button and then confirm to delete the selected data.
The operation of deletion will be recorded in the log.
You can take the following steps to print the Table:
1. Click the “Print” button, and then you can select “All Data” or “Specified Data” to be
printed.
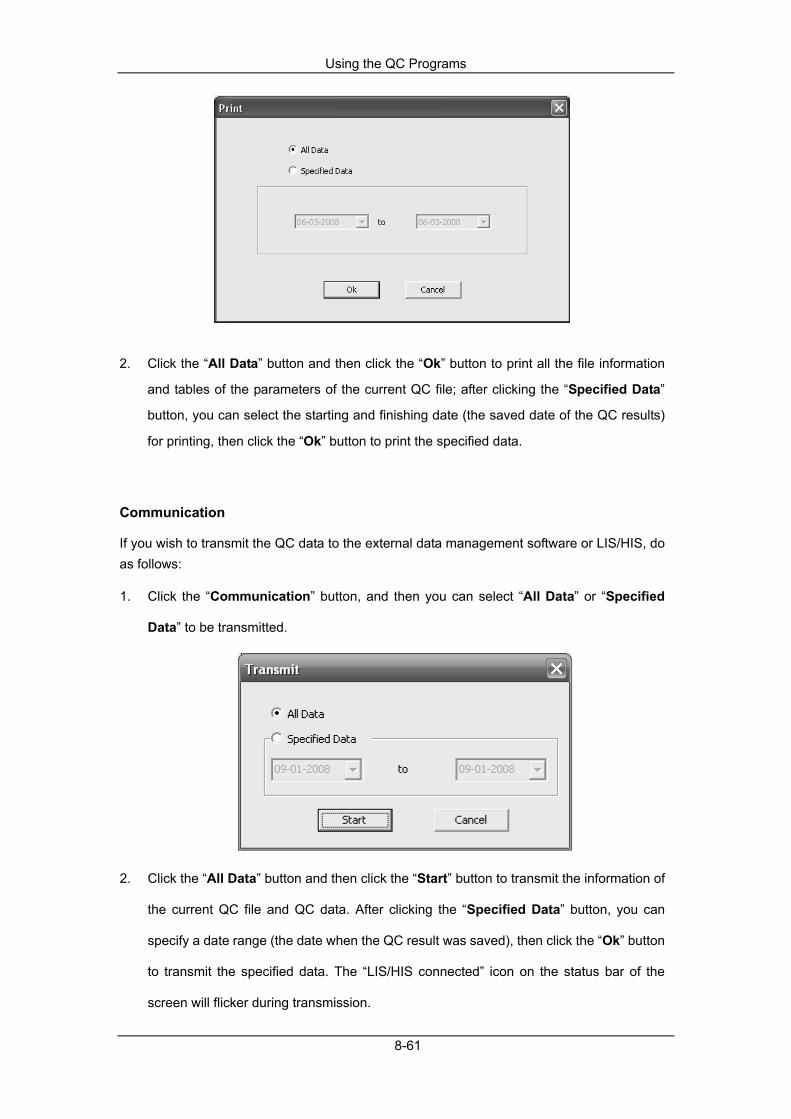
Using the QC Programs
8-61
2. Click the “All Data” button and then click the “Ok” button to print all the file information
and tables of the parameters of the current QC file; after clicking the “Specified Data”
button, you can select the starting and finishing date (the saved date of the QC results)
for printing, then click the “Ok” button to print the specified data.
Communication
If you wish to transmit the QC data to the external data management software or LIS/HIS, do as follows:
1. Click the “Communication” button, and then you can select “All Data” or “Specified
Data” to be transmitted.
2. Click the “All Data” button and then click the “Start” button to transmit the information of
the current QC file and QC data. After clicking the “Specified Data” button, you can
specify a date range (the date when the QC result was saved), then click the “Ok” button
to transmit the specified data. The “LIS/HIS connected” icon on the status bar of the
screen will flicker during transmission.

Using the QC Programs
8-62
3. While transmitting, the “Start” button in the pop-up message box will be replaced by
“Stop”. You can click the “Stop” button to stop transmitting.
If auto-communication is enabled and a sample is ran during the transmission of the QC data, then only when the QC data transmission finished will the auto-communication of the sample result starts.
The QC data saved in the process of transmission will not be transmitted.
Data Backup
For operating system of Windows Vista, the right of copying database file is restricted by users' access level. To enable the data backup function, you should log on the system as administrator, and then right click the shortcut icon of the terminal software and run it as administrator.
If you wish to backup the information and the result of the current QC file, do as follows:
1. Click the “Data Backup” button, a message box will pop up.
2. Select the backup directory (the default directory is the folder of “QC Data” under the

Using the QC Programs
8-63
installation location of the terminal software).
3. Enter the name for the backup data (the default name is [L-J_QC_date saved_time
saved]).
4. Click the “Save” button to start backing up.
5. When the backup is finished, a message box will pop up, and then click “Ok” to exit.
The backup data can not be modified. You can review the data in “History” screen.
You can click the “Cancel” button to cancel backup when it is in process.
Be sure to backup data regularly.
Data Export
If you wish to export the information and the result of the current QC file, do as follows:
1. Click the “Data Export” button, and then a message box will pop up.
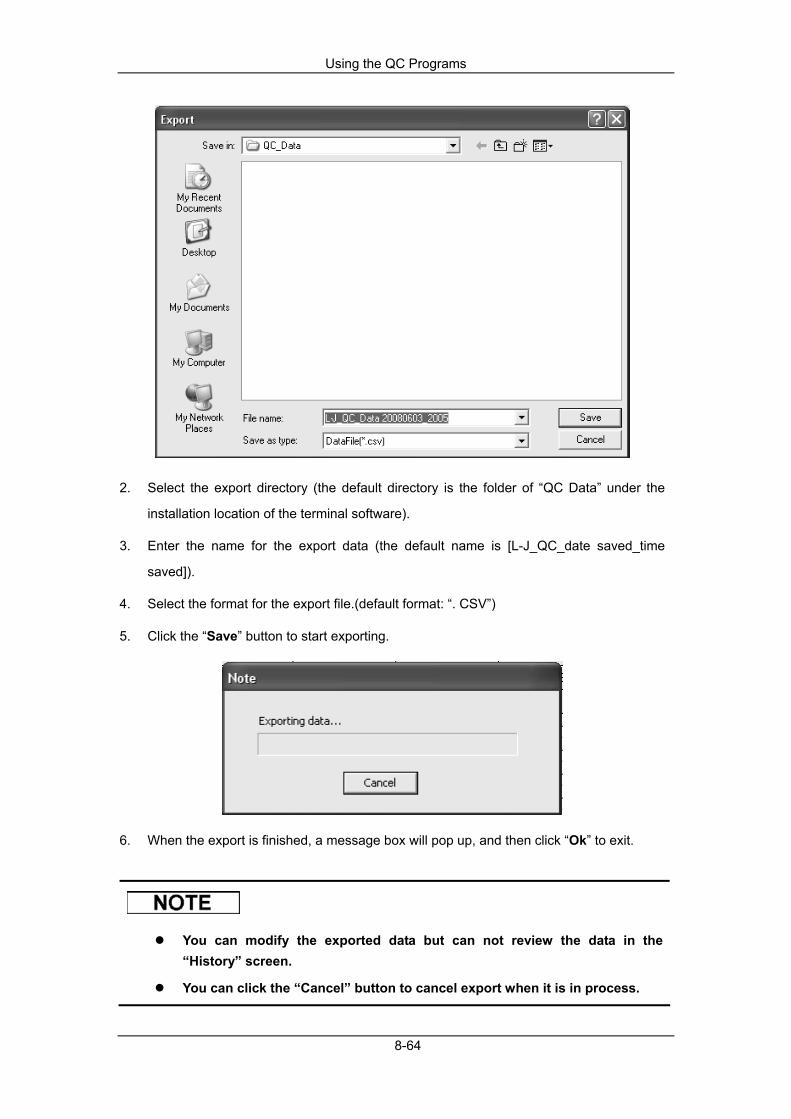
Using the QC Programs
8-64
2. Select the export directory (the default directory is the folder of “QC Data” under the
installation location of the terminal software).
3. Enter the name for the export data (the default name is [L-J_QC_date saved_time
saved]).
4. Select the format for the export file.(default format: “. CSV”)
5. Click the “Save” button to start exporting.
6. When the export is finished, a message box will pop up, and then click “Ok” to exit.
You can modify the exported data but can not review the data in the “History” screen.
You can click the “Cancel” button to cancel export when it is in process.

Using the QC Programs
8-65
History
For operating system of Windows Vista, the right of copying database file is restricted by users' access level. To enable the history function, you should log on the system as administrator, and then right click the shortcut icon of the terminal software and run it as administrator.
If you wish to review the backed up data, do as follows:
1. Click the “History” button, and then a message box will pop up.
2. Locate and then select the desired backup data.
3. Click the “Open” button to display the data in “History” screen.
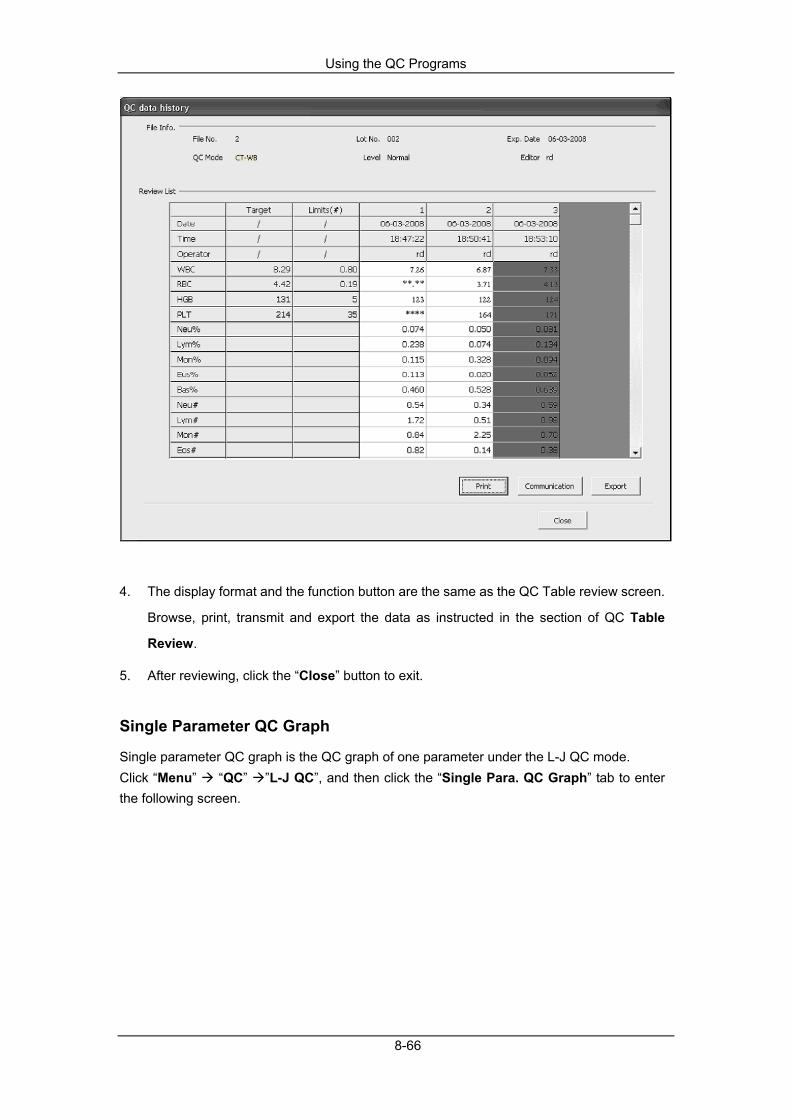
Using the QC Programs
8-66
4. The display format and the function button are the same as the QC Table review screen.
Browse, print, transmit and export the data as instructed in the section of QC Table
Review.
5. After reviewing, click the “Close” button to exit.
Single Parameter QC Graph
Single parameter QC graph is the QC graph of one parameter under the L-J QC mode. Click “Menu” “QC” ”L-J QC”, and then click the “Single Para. QC Graph” tab to enter the following screen.

Using the QC Programs
8-67
Single para. QC graph screen
The single para. QC graph screen consists of the file information area, QC graph area and the comments area.
File information area
You can select among all valid QC file No. from the “File No.” pull-down list. The default file No. is the L-J QC file used by the current operator, and the file No. cannot be null. The lot No, level, exp. date, QC mode, editor and QC sample ID will be displayed automatically after you select the QC file No..
QC graph area
You can select the parameter to plot QC graph from the “Parameter” pull-down list, and select the plotting mode from the “Plotting” pull down list: “By QC Date”, “1/Day”, “All”. The default values of the “Mean” and “SD” boxes are calculated from all the valid QC points on the graph of the selected parameter in the current QC file by the default plotting mode. You can edit the values manually.
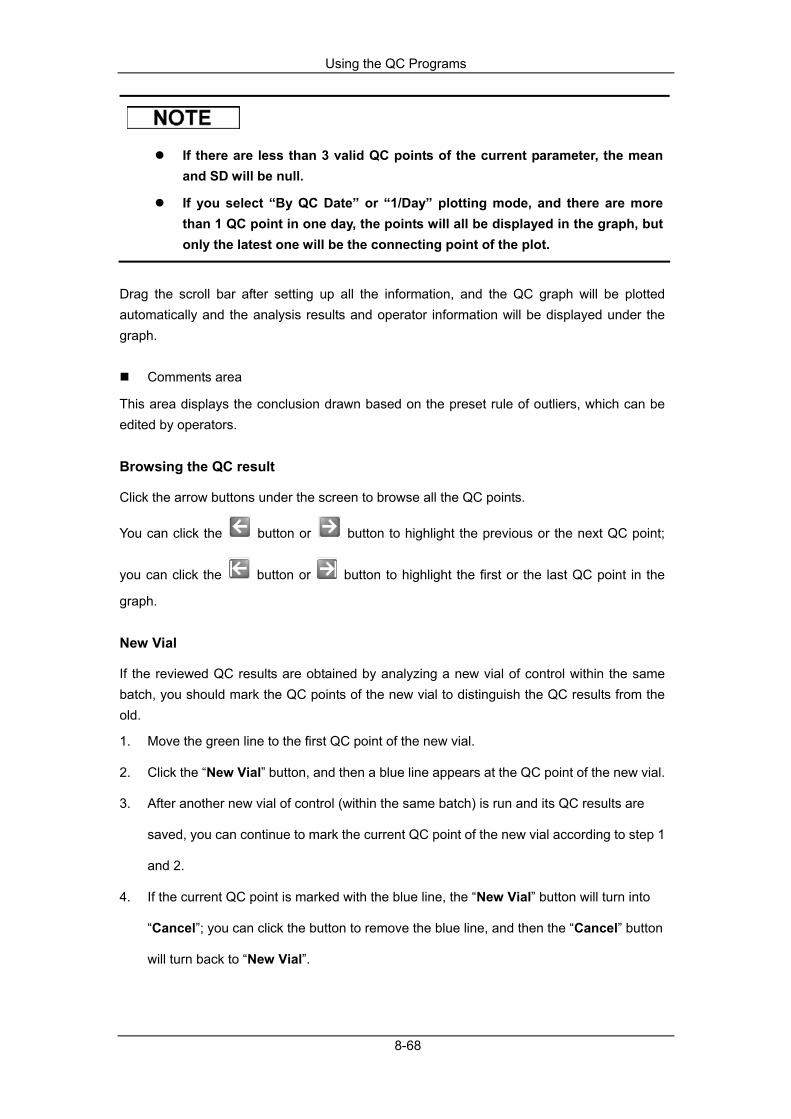
Using the QC Programs
8-68
If there are less than 3 valid QC points of the current parameter, the mean and SD will be null.
If you select “By QC Date” or “1/Day” plotting mode, and there are more than 1 QC point in one day, the points will all be displayed in the graph, but only the latest one will be the connecting point of the plot.
Drag the scroll bar after setting up all the information, and the QC graph will be plotted automatically and the analysis results and operator information will be displayed under the graph.
Comments area
This area displays the conclusion drawn based on the preset rule of outliers, which can be edited by operators.
Browsing the QC result
Click the arrow buttons under the screen to browse all the QC points.
You can click the button or button to highlight the previous or the next QC point;
you can click the button or button to highlight the first or the last QC point in the
graph.
New Vial
If the reviewed QC results are obtained by analyzing a new vial of control within the same batch, you should mark the QC points of the new vial to distinguish the QC results from the old.
1. Move the green line to the first QC point of the new vial.
2. Click the “New Vial” button, and then a blue line appears at the QC point of the new vial.
3. After another new vial of control (within the same batch) is run and its QC results are
saved, you can continue to mark the current QC point of the new vial according to step 1
and 2.
4. If the current QC point is marked with the blue line, the “New Vial” button will turn into
“Cancel”; you can click the button to remove the blue line, and then the “Cancel” button
will turn back to “New Vial”.

Using the QC Programs
8-69
Calculate Target
Click the “Calculate” button, the following screen will pop up.
After selecting the date range, the mean, SD and CV will be calculated and displayed in to the corresponding boxes automatically. Click “Apply” to enter the calculated target into the single para. QC graph screen, and then click “OK” to save the target and close the dialog box. Click “Cancel” to exit the “Calculate” screen without saving the calculated target.
If there are no data in the selected date range, a prompt will be displayed: “Not enough data! Reselect a date range and make sure there are more than 5 groups of valid data.”
Save
Click “Save” to save the mean and SD (including the manually edited values and the values obtained by calculating target) and display them on the bottom left of the QC graph. Print
Click “Print” to print the QC graph and data on the screen. Monthly QC Graph
Monthly QC graph is the QC graph of one parameter of the high, normal and low levels within one month. Click “Menu” “QC” ”L-J QC”, and then click the “Monthly QC Graph” tab to enter the following screen.
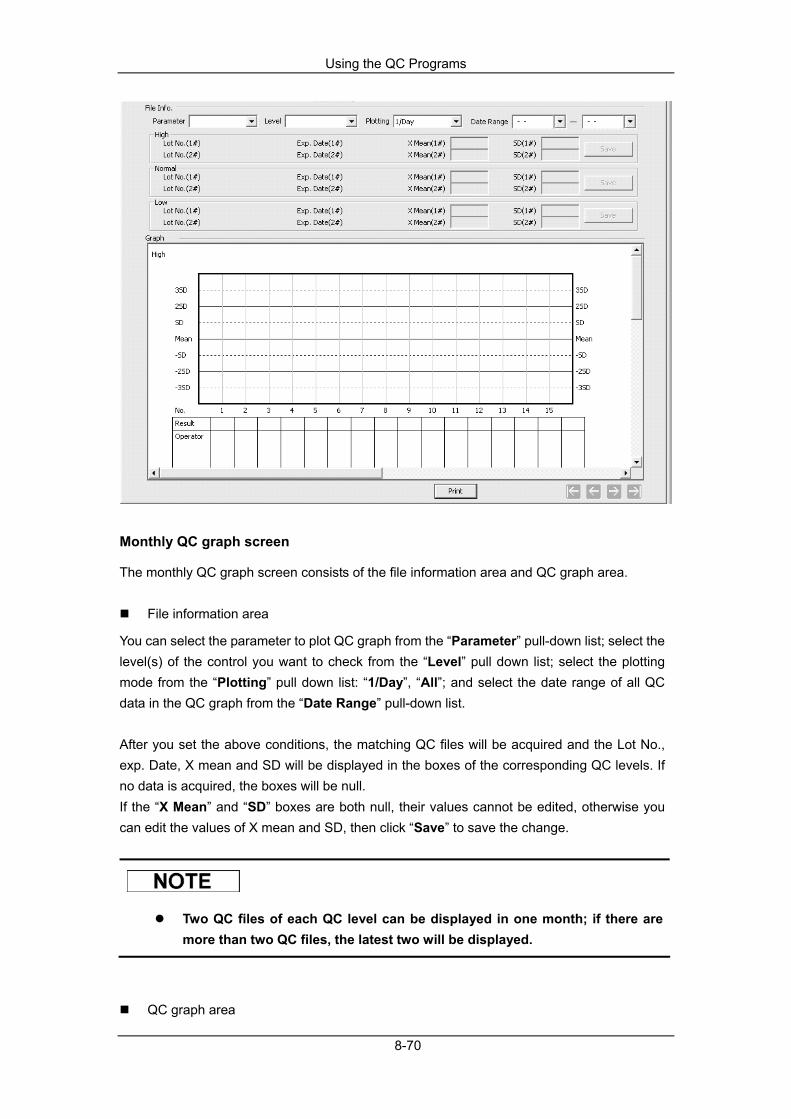
Using the QC Programs
8-70
Monthly QC graph screen
The monthly QC graph screen consists of the file information area and QC graph area.
File information area
You can select the parameter to plot QC graph from the “Parameter” pull-down list; select the level(s) of the control you want to check from the “Level” pull down list; select the plotting mode from the “Plotting” pull down list: “1/Day”, “All”; and select the date range of all QC data in the QC graph from the “Date Range” pull-down list.
After you set the above conditions, the matching QC files will be acquired and the Lot No., exp. Date, X mean and SD will be displayed in the boxes of the corresponding QC levels. If no data is acquired, the boxes will be null. If the “X Mean” and “SD” boxes are both null, their values cannot be edited, otherwise you can edit the values of X mean and SD, then click “Save” to save the change.
Two QC files of each QC level can be displayed in one month; if there are more than two QC files, the latest two will be displayed.
QC graph area

Using the QC Programs
8-71
Drag the scroll bar after setting up all the information, the QC graph will be plotted automatically and the QC point No., analysis results and operator information will be displayed under the QC graph. If there are QC points in the graph, the Lot No., X mean, SD and CV% will be displayed above the graph. Each screen of the QC graph can display 31 groups of QC data. To view more QC data, drag the horizontal scroll bar.
Browsing the QC result
Click the arrow button under the screen to browse all the QC points.
You can click the button or button to highlight the previous or the next QC point;
you can click the button or button to highlight the first or the last QC point in the
graph. Print
Click “Print” to print the QC graph and data on the screen.

Using the QC Programs
8-72
8.3 X mean QC Program
8.3.1 Editing X mean Settings
All the samples, controls, calibrators, reagents, wastes and areas contacted them are potentially biohazardous. Wear proper personal protective equipment (e.g. gloves, lab coat, etc.) and follow safe laboratory procedures when handling them and the contacted areas in the laboratory.
Only administrators can edit the X mean QC settings.
For the QC files with saved QC results, if changing and then saving the reference range or limits caused the change of target and limits, then the changed data will be displayed in yellow background and recorded in the system log.
Before analyzing a new batch of controls, you should set a QC file for each lot of controls and edit the QC settings in the QC file by one of the following ways:
Reading the information provided by the manufacturer
Manual entry
Reading the saved preset values.
Reading the information provided by the manufacturer
1. You can enter the graph screen in one of the following ways:
Click the shortcut button “QC”.
Click the “Menu” button on the screen; then select “QC” ”X mean” on the pop-up menu.

Using the QC Programs
8-73
Enter the "X mean" graph screen.
2. Click the “Settings” tab to enter the X mean settings screen.
For details to edit the name of the login user, see chapter 5 Customizing the Analyzer Software.

Using the QC Programs
8-74
3. Select a QC File No. with empty QC information.
You can select the file No. within the range [1, 60].
4. Select the QC mode.
Different QC files can not have the same lot No. and QC mode.
5. Click the “Read File” button, a message box will pop up for you to select the directory.
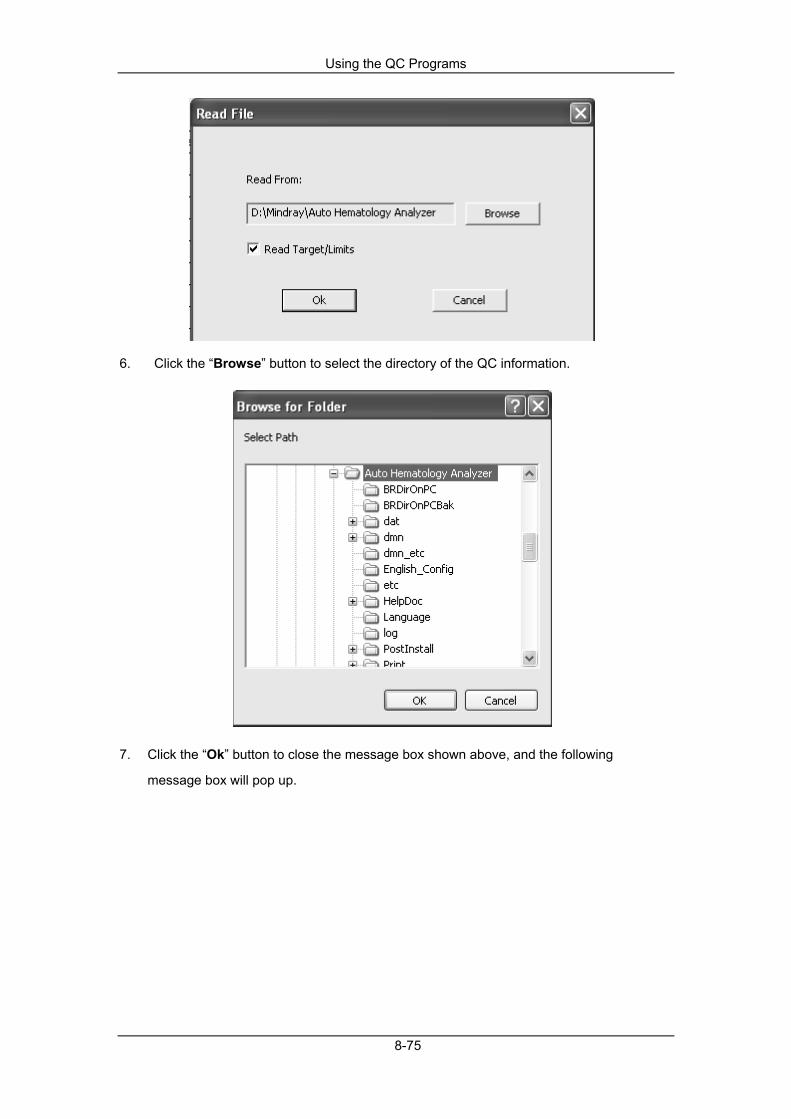
Using the QC Programs
8-75
6. Click the “Browse” button to select the directory of the QC information.
7. Click the “Ok” button to close the message box shown above, and the following
message box will pop up.

Using the QC Programs
8-76
The QC files for selection are displayed in the form of "Lot No. (Level)".
8. Click the “Ok” button to close the message box and go back to the "Read File" box. The
selected directory is displayed in the "Read From:" edit box.
9. In the "Read File" message box, select the "Read Target/Limits" check box, and click
“Ok” to read the selected QC information to the current QC file.

Using the QC Programs
8-77
If the “Read Target/Limits” is not selected, you have to enter the target and limits manually.
10. Click the “Save” button to save the QC information.
The expiration date can not be earlier than the current system date.
Different QC files can not have the same lot No. and QC mode.
Manual Entry
You can enter the graph screen by one of the following ways:
Click the shortcut button “QC”.
Click the “Menu” button on the screen, and then select “QC” ”X mean” on the pop-up menu.
Enter the “X mean” graph screen.

Using the QC Programs
8-78
1. Click the “Settings” tab to enter the X mean setup screen.
For details to edit the name of the login user, see chapter 5 Customizing the Analyzer Software.
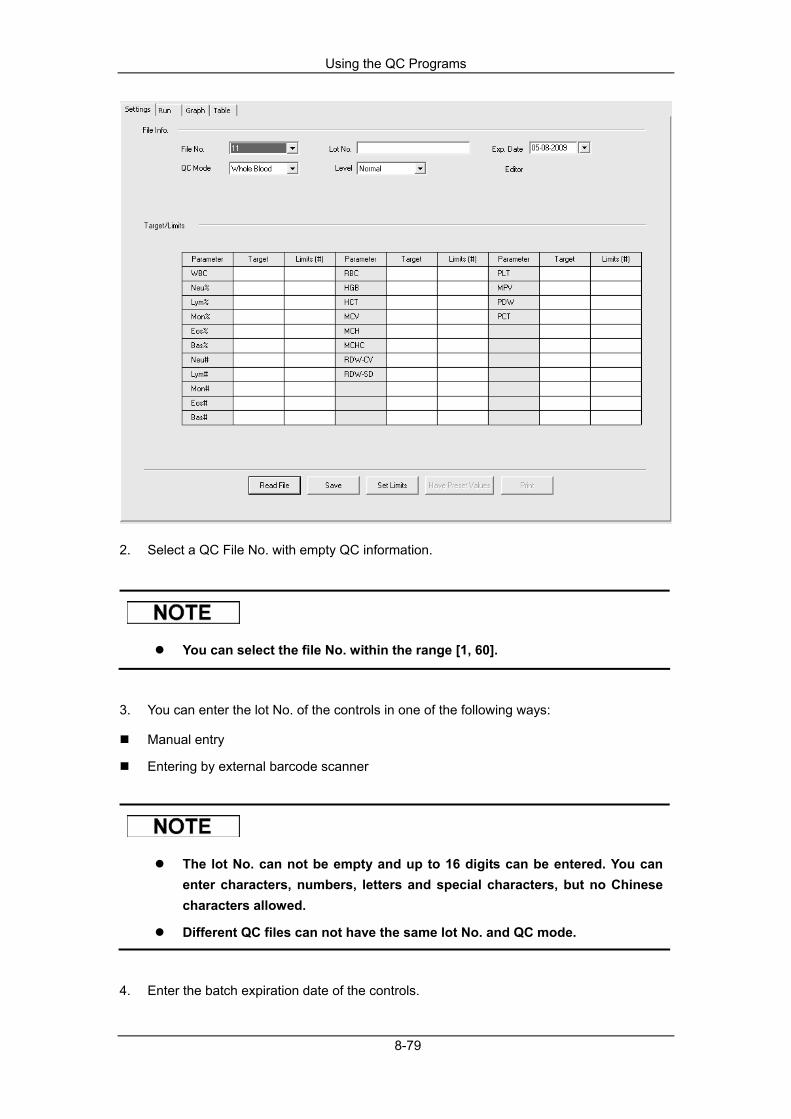
Using the QC Programs
8-79
2. Select a QC File No. with empty QC information.
You can select the file No. within the range [1, 60].
3. You can enter the lot No. of the controls in one of the following ways:
Manual entry
Entering by external barcode scanner
The lot No. can not be empty and up to 16 digits can be entered. You can enter characters, numbers, letters and special characters, but no Chinese characters allowed.
Different QC files can not have the same lot No. and QC mode.
4. Enter the batch expiration date of the controls.

Using the QC Programs
8-80
You must enter the expiration date, and the entry range is [current system date, 2099-12-31].
5. Select the QC mode.
Different QC files can not have the same lot No. and QC mode.
6. Select the control level.
7. According to the target list of the corresponding lot No., enter the target and limits into
the edit boxes of the parameters to be included in the QC run.
8. Click the “Save” button to save all the settings of the QC.
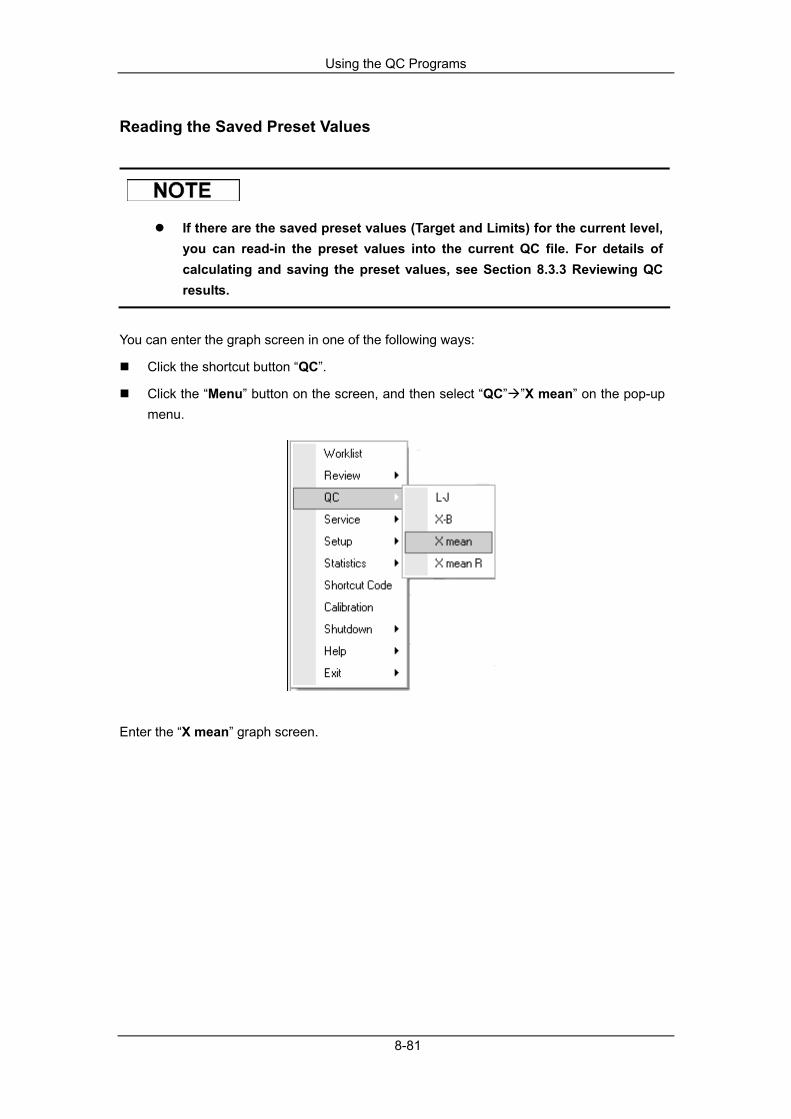
Using the QC Programs
8-81
Reading the Saved Preset Values
If there are the saved preset values (Target and Limits) for the current level, you can read-in the preset values into the current QC file. For details of calculating and saving the preset values, see Section 8.3.3 Reviewing QC results.
You can enter the graph screen in one of the following ways:
Click the shortcut button “QC”.
Click the “Menu” button on the screen, and then select “QC” ”X mean” on the pop-up menu.
Enter the “X mean” graph screen.
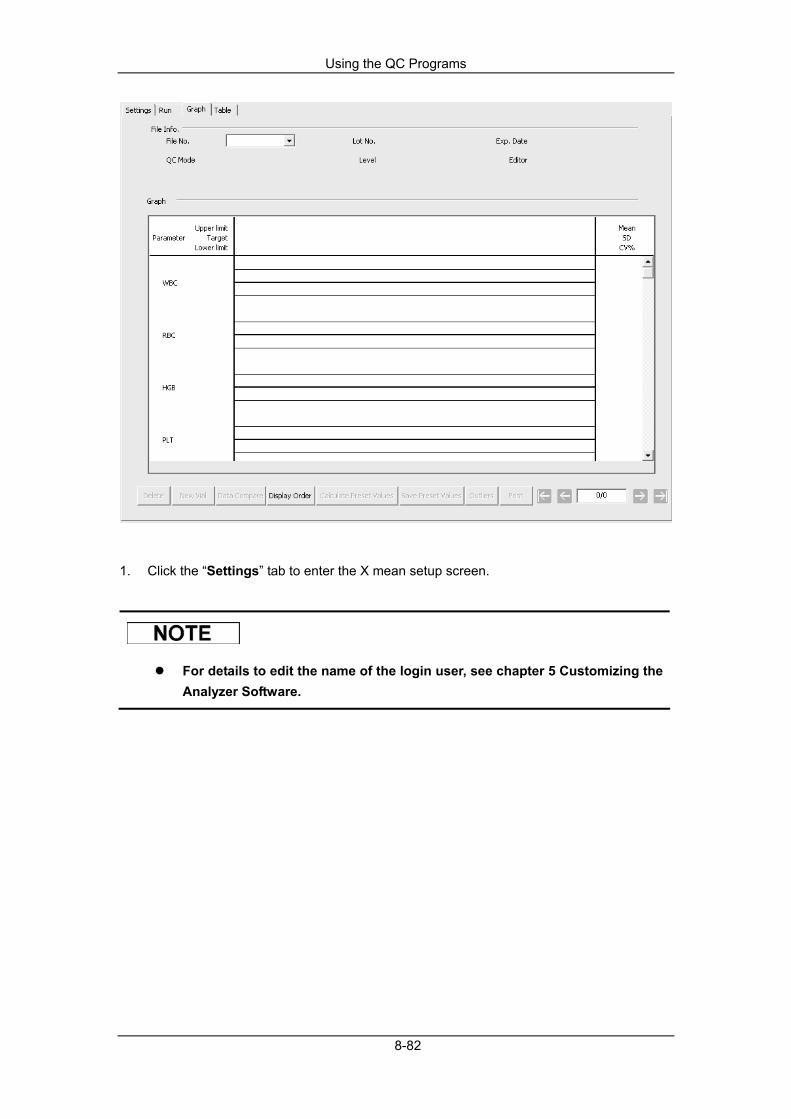
Using the QC Programs
8-82
1. Click the “Settings” tab to enter the X mean setup screen.
For details to edit the name of the login user, see chapter 5 Customizing the Analyzer Software.
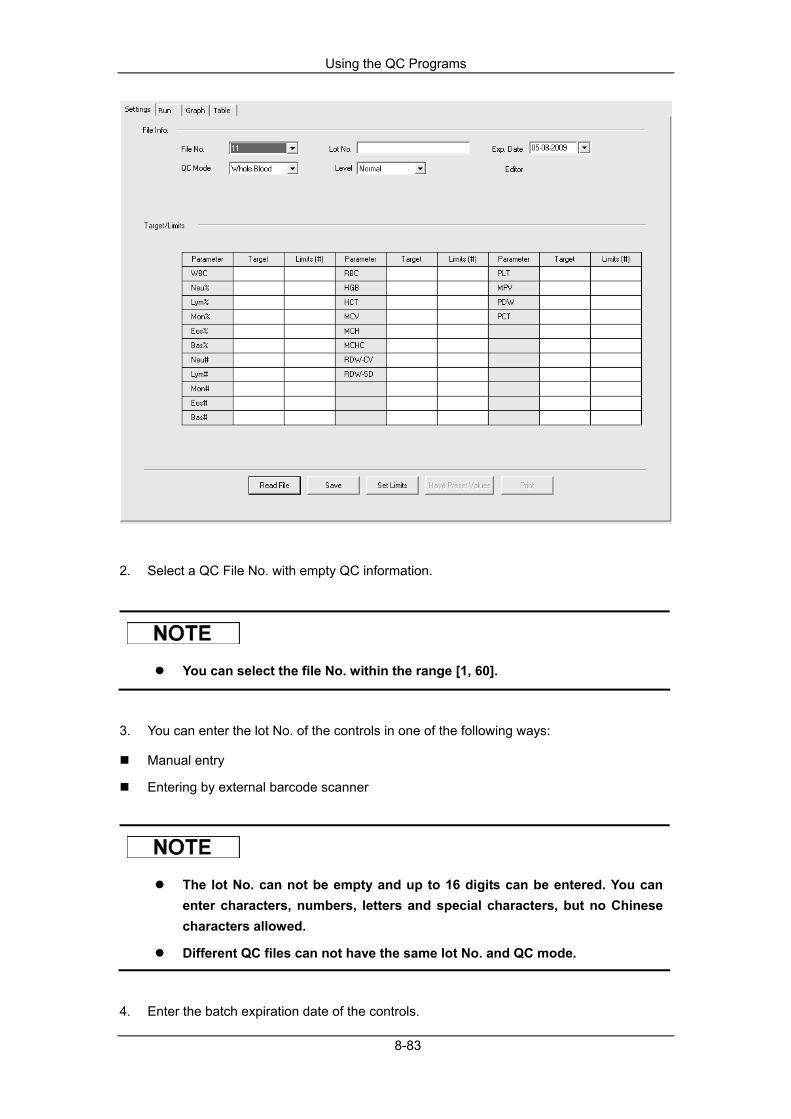
Using the QC Programs
8-83
2. Select a QC File No. with empty QC information.
You can select the file No. within the range [1, 60].
3. You can enter the lot No. of the controls in one of the following ways:
Manual entry
Entering by external barcode scanner
The lot No. can not be empty and up to 16 digits can be entered. You can enter characters, numbers, letters and special characters, but no Chinese characters allowed.
Different QC files can not have the same lot No. and QC mode.
4. Enter the batch expiration date of the controls.
Using the QC Programs
8-84
You must enter the expiration date, and the entry range is [current system date, 2099-12-31].
5. Select the QC mode.
Different QC files can not have the same lot No. and QC mode.
6. Select the control level.
7. Click the “Have Preset Values” button to read-in the saved preset target and limits
(correspond to the current level) into the current QC file.
If some parameters to be included in the QC run have no preset values, you should enter the target and limits for them manually; if you don’t want some parameters already with preset values to be included in the QC run, you can cancel the target and limits of those parameters manually after read-in the preset values.
8. Click the “Save” button to save all the settings of the QC.
Setting Limits
Do as followings to adjust the display format of the limits and the calculation method of the preset limits.
1. Click the “Set Limits” button, and then the following message box will pop up.

Using the QC Programs
8-85
2. Click “By SD” to display the limits in the form of absolute value; click “By CV” to display
the limits in the form of percentage.
3. If “By SD” is selected, click the “2SD” or “3SD” to select either double or triple standard
deviation to be the limits; if “By CV” is selected, click the “2CV” or “3CV” to select either
double or triple coefficient of variation to be the limits.
4. Click the “Ok” button to save all the settings for the limits.
Click the “Print” button to print the setting information of the current QC file.
Using the QC Programs
8-86
8.3.2 Running Controls After editing the QC information, you can start one of the following QC analyses according to the selected QC mode.
CT-WB
CT-PD
AL-WB
Running Controls (CT-WB)
All the samples, controls, calibrators, reagents, wastes and areas contacted them are potentially biohazardous. Wear proper personal protective equipment (e.g. gloves, lab coat, etc.) and follow safe laboratory procedures when handling them and the contacted areas in the laboratory.
The sample probe is sharp and potentially biohazardous, Exercise caution to avoid contact with the probe when working around it.
The sample may spill from the unclosed collection tubes and cause biohazard. Exercise caution to the unclosed collection tubes.
Be sure to avoid reversing the collection tube when loading, otherwise, the collection tube may be broken and cause biohazard.
Be sure to place the collection tubes in the right adapter before running, otherwise, the collection tubes may be broken and cause biohazard.
Collection tubes broken may cause personal injury and/or biohazard. Exercise caution when loading the collection tubes to the rack or getting the collection tubes from the rack, be sure not to break the tubes.
Keep you clothed, hairs and hands away from the moving parts to avoid injury.
The reagents are irritating to eyes, skin and diaphragm. Wear proper personal protective equipment (e.g. gloves, lab coat, etc.) and follow safe laboratory procedures when handling them in the laboratory.
If the reagents accidentally spill on your skin, wash them off with plenty of water and if necessary, go see a doctor; if the reagents accidentally spill into your eyes, wash them off with plenty of water and immediately go see a doctor.

Using the QC Programs
8-87
Do not re-use such disposable product as collection tubes, test tubes, capillary tubes, etc.
Be sure to use the Mindray-specified disposable products including evacuated blood collection tube, anticoagulant collection tubes and capillary tubes etc.
If the sample mode is switched from the “Predilute” to “Whole Blood”, the analyzer will perform the switching sequence automatically and a progress bar will be displayed on the screen.
You can enter the graph screen in one of the following ways:
Click the shortcut button “QC”.
Click the “Menu” button on the screen, and then select “QC” ”X mean” on the pop-up menu.
Enter the “X mean” graph screen.

Using the QC Programs
8-88
1. Click the “Run” tab to enter the X mean run screen.
For details to edit the name of the login user, see chapter 5 Customizing the Analyzer Software.
Be sure to use the adapter of Ф13x75 (mm) model when running the QC in CT-WB mode. For details to install the adapter, see Chapter 6 Operating Your Analyzer.

Using the QC Programs
8-89
2. Select the QC file No. to be run; the screen displays the corresponding file information.
3. Be sure that the level of the control to be run is the same with the current QC file.
4. Be sure that the control to be run is not expired.
5. Prepare the control as instructed by instructions for use of the controls.
6. Run the controls:
1) Make sure the QC mode is “CT-WB” and the analysis status icon and analyzer indicator is green. 2) Shake the prepared control as shown below to well mix it.

Using the QC Programs
8-90
3) Click the “Start” button.
4) Press the [OPEN] key to open the compartment door. 5) Present the prepared control into the tube holder and then close the compartment door. 6) Press the [Run] key or click the “Run” button on the message box to start running. 7) When the running is finished, the compartment door will open automatically and you can remove the control. 8) After the analyzing is finished, the QC result of the first analysis will be displayed on the screen.
9) Mix the control well again, and then to run the control for the second time according to the prompt.
Using the QC Programs
8-91
You can click the “Cancel” button in the message box to cancel the second run and the results obtained in the first run will not be saved as well.
10) When the running is finished, the compartment door will open automatically and you can remove the control.
7. When finish running, the QC results (values of the two QC runs and the X mean) will be
displayed in the current screen and be saved in the QC file automatically.
When the QC result of the second QC run is obtained, the screen will refresh the displayed histograms and scattergrams according to the second QC run.
Up to 300 QC results (X mean) can be saved for each QC file.
8. Do the above procedures to continue running the controls if necessary.
Using the QC Programs
8-92
Running Controls (CT-PD)
All the samples, controls, calibrators, reagents, wastes and areas contacted them are potentially biohazardous. Wear proper personal protective equipment (e.g. gloves, lab coat, etc.) and follow safe laboratory procedures when handling them and the contacted areas in the laboratory.
The sample probe is sharp and potentially biohazardous, Exercise caution to avoid contact with the probe when working around it.
The sample may spill from the unclosed collection tubes and cause biohazard. Exercise caution to the unclosed collection tubes.
Be sure to avoid reversing the collection tube when loading, otherwise, the collection tube may be broken and cause biohazard.
Be sure to place the collection tubes in the right adapter before running, otherwise, the collection tubes may be broken and cause biohazard.
Collection tubes broken may cause personal injury and/or biohazard. Exercise caution when loading the collection tubes to the rack or getting the collection tubes from the rack, be sure not to break the tubes.
Keep you clothed, hairs and hands away from the moving parts to avoid injury.
The reagents are irritating to eyes, skin and diaphragm. Wear proper personal protective equipment (e.g. gloves, lab coat, etc.) and follow safe laboratory procedures when handling them in the laboratory.
If the reagents accidentally spill on your skin, wash them off with plenty of water and if necessary, go see a doctor; if the reagents accidentally spill into your eyes, wash them off with plenty of water and immediately go see a doctor.
Do not re-use such disposable product as collection tubes, test tubes, capillary tubes, etc.
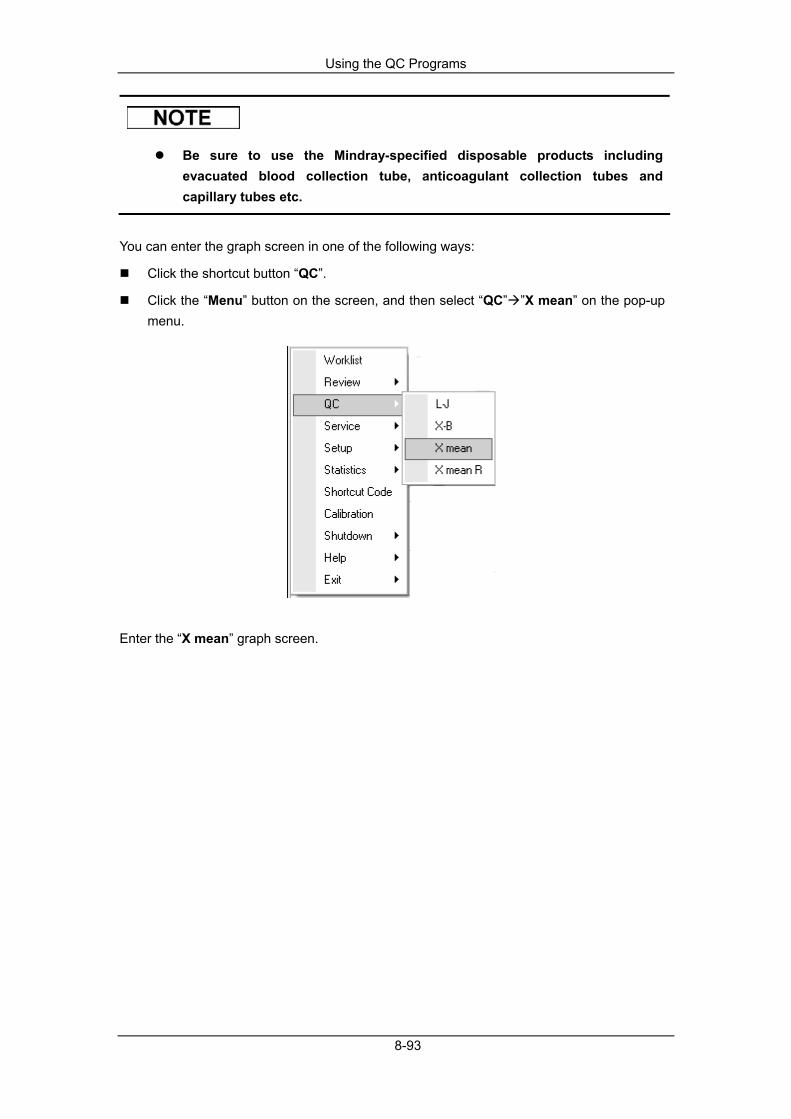
Using the QC Programs
8-93
Be sure to use the Mindray-specified disposable products including evacuated blood collection tube, anticoagulant collection tubes and capillary tubes etc.
You can enter the graph screen in one of the following ways:
Click the shortcut button “QC”.
Click the “Menu” button on the screen, and then select “QC” ”X mean” on the pop-up menu.
Enter the “X mean” graph screen.

Using the QC Programs
8-94
1. Click the “Run” tab to enter the X mean run screen.
For details to edit the name of the login user, see chapter 5 Customizing the Analyzer Software.
Be sure to use the adapter of Ф11x40 (mm) model when running the QC in CT-PD mode. For details to install the adapter, see Chapter 6 Operating Your Analyzer.

Using the QC Programs
8-95
2. Select the QC file No. to be run; the screen displays the corresponding file information.
3. Be sure that the level of the control to be run is the same with the current QC file.
4. Be sure that the control to be run is not expired.
5. Prepare the control as instructed by instructions for use of the controls.
6. Run the controls :
1) Make sure the QC mode is “CT-PD” and the analysis status icon and analyzer indicator is green. 2) Click the shortcut button “Diluent”, the compartment door will open automatically. A message box shown below will pop up.
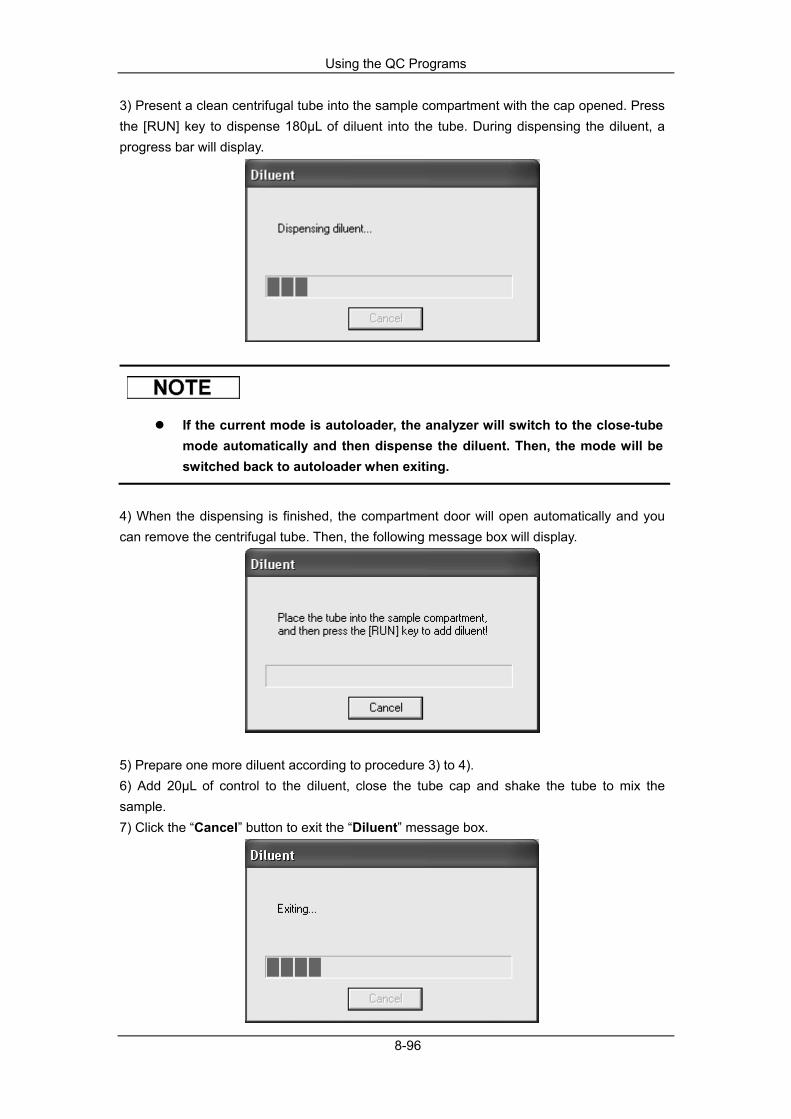
Using the QC Programs
8-96
3) Present a clean centrifugal tube into the sample compartment with the cap opened. Press the [RUN] key to dispense 180µL of diluent into the tube. During dispensing the diluent, a progress bar will display.
If the current mode is autoloader, the analyzer will switch to the close-tube mode automatically and then dispense the diluent. Then, the mode will be switched back to autoloader when exiting.
4) When the dispensing is finished, the compartment door will open automatically and you can remove the centrifugal tube. Then, the following message box will display.
5) Prepare one more diluent according to procedure 3) to 4). 6) Add 20µL of control to the diluent, close the tube cap and shake the tube to mix the sample. 7) Click the “Cancel” button to exit the “Diluent” message box.
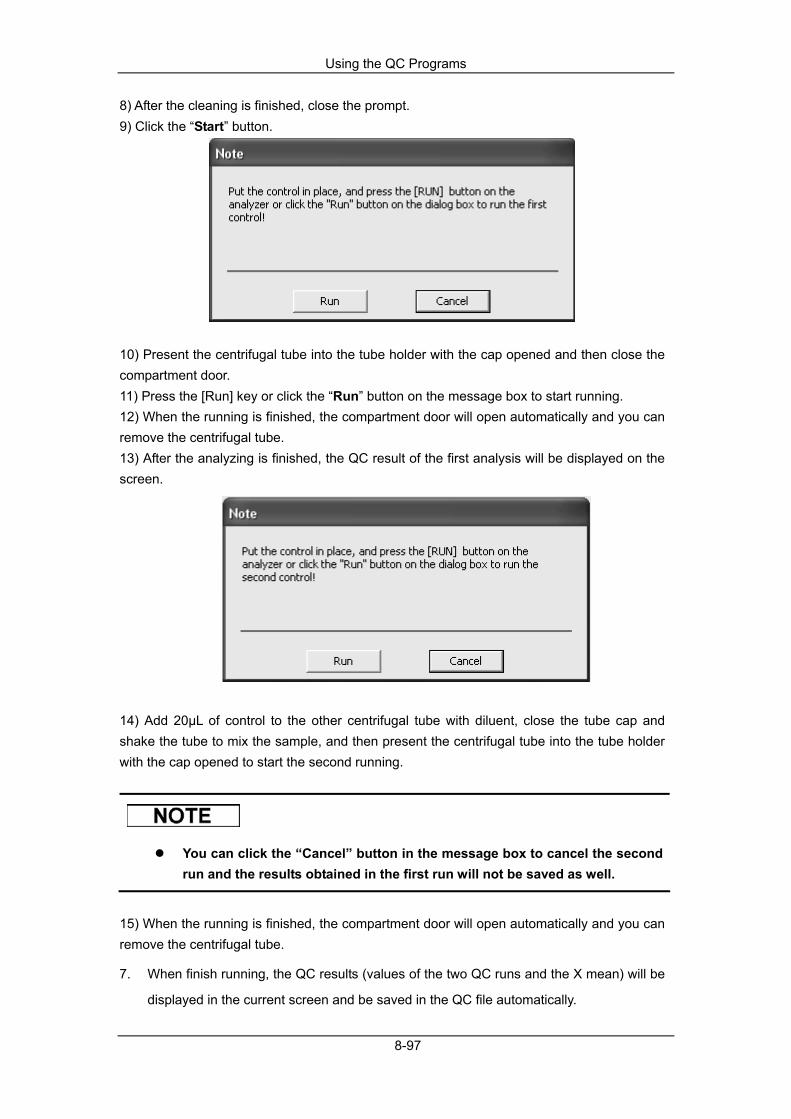
Using the QC Programs
8-97
8) After the cleaning is finished, close the prompt. 9) Click the “Start” button.
10) Present the centrifugal tube into the tube holder with the cap opened and then close the compartment door. 11) Press the [Run] key or click the “Run” button on the message box to start running. 12) When the running is finished, the compartment door will open automatically and you can remove the centrifugal tube. 13) After the analyzing is finished, the QC result of the first analysis will be displayed on the screen.
14) Add 20µL of control to the other centrifugal tube with diluent, close the tube cap and shake the tube to mix the sample, and then present the centrifugal tube into the tube holder with the cap opened to start the second running.
You can click the “Cancel” button in the message box to cancel the second run and the results obtained in the first run will not be saved as well.
15) When the running is finished, the compartment door will open automatically and you can remove the centrifugal tube.
7. When finish running, the QC results (values of the two QC runs and the X mean) will be
displayed in the current screen and be saved in the QC file automatically.

Using the QC Programs
8-98
You can also dispense 180µL of diluent by pipette into the tube.
Be sure to keep dust from the prepared diluent.
After mixing the control with the diluent, be sure to wait 3 minutes before running.
Be sure to run the prediluted samples within 30 minutes after the mixing.
Be sure to mix any sample that has been prepared for a while before running it.
Be sure to evaluate the predilute QC stability based on your laboratory’s sample population and sample collection techniques or methods.
Up to 300 QC results can be saved for each QC file.
When the QC result of the second QC run is obtained, the screen will refresh the displayed histograms and scattergrams according to the second QC run.
Up to 300 QC results (X mean) can be save for each QC file.
8. Do the above procedures to continue running the controls if necessary.
Using the QC Programs
8-99
Running Controls (AL-WB)
All the samples, controls, calibrators, reagents, wastes and areas contacted them are potentially biohazardous. Wear proper personal protective equipment (e.g. gloves, lab coat, etc.) and follow safe laboratory procedures when handling them and the contacted areas in the laboratory.
The sample probe is sharp and potentially biohazardous, Exercise caution to avoid contact with the probe when working around it.
The sample may spill from the unclosed collection tubes and cause biohazard. Exercise caution to the unclosed collection tubes.
Be sure to avoid reversing the collection tube when loading, otherwise, the collection tube may be broken and cause biohazard.
Collection tubes broken may cause personal injury and/or biohazard. Exercise caution when loading the collection tubes to the rack or getting the collection tubes from the rack, be sure not to break the tubes.
Collection tubes broken may cause personal injury and/or biohazard. Exercise caution when loading the collection tubes to the autoloader or getting the collection tubes from the autoloader, be sure not to break the tubes.
The pusher will push the rack inside the autoloader. Be sure your hand is away from the rack before starting the autoloader.
Keep you clothed, hairs and hands away from the moving parts to avoid injury.
The reagents are irritating to eyes, skin and diaphragm. Wear proper personal protective equipment (e.g. gloves, lab coat, etc.) and follow safe laboratory procedures when handling them in the laboratory.
If the reagents accidentally spill on your skin, wash them off with plenty of water and if necessary, go see a doctor; if the reagents accidentally spill into your eyes, wash them off with plenty of water and immediately go see a doctor.

Using the QC Programs
8-100
Do not re-use such disposable product as collection tubes, test tubes, capillary tubes, etc.
Be sure to use the Mindray-specified disposable products including evacuated blood collection tube, anticoagulant collection tubes and capillary tubes etc.
You can enter the graph screen in one of the following ways:
Click the shortcut button “QC”.
Click the “Menu” button on the screen, and then select “QC” ”X mean” on the pop-up menu.
Enter the “X mean” graph screen.

Using the QC Programs
8-101
1. Click the “Run” tab to enter the X mean run screen.
For details to edit the name of the login user, see chapter 5 Customizing the Analyzer Software.

Using the QC Programs
8-102
2. Select the QC file No. to be run; the screen displays the corresponding file information.
3. Be sure that the level of the control to be run is the same with the current QC file.
4. Be sure that the control to be run is not expired.
5. Prepare the control as instructed by instructions for use of the controls.
6. Run the controls:
1) Make sure the QC mode is “AL-WB” and the analysis status icon and analyzer indicator is green. 2) Click the “Start” button.
3) Present the prepared control into the rack.
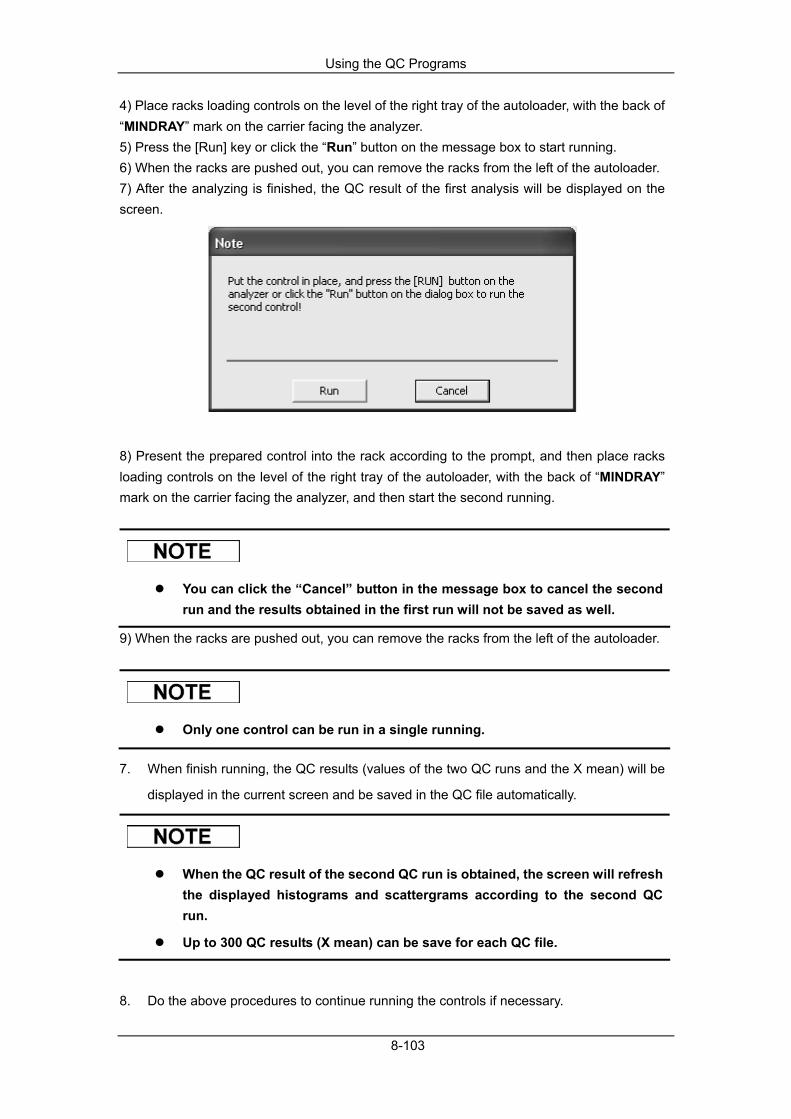
Using the QC Programs
8-103
4) Place racks loading controls on the level of the right tray of the autoloader, with the back of “MINDRAY” mark on the carrier facing the analyzer. 5) Press the [Run] key or click the “Run” button on the message box to start running. 6) When the racks are pushed out, you can remove the racks from the left of the autoloader. 7) After the analyzing is finished, the QC result of the first analysis will be displayed on the screen.
8) Present the prepared control into the rack according to the prompt, and then place racks loading controls on the level of the right tray of the autoloader, with the back of “MINDRAY” mark on the carrier facing the analyzer, and then start the second running.
You can click the “Cancel” button in the message box to cancel the second run and the results obtained in the first run will not be saved as well.
9) When the racks are pushed out, you can remove the racks from the left of the autoloader.
Only one control can be run in a single running.
7. When finish running, the QC results (values of the two QC runs and the X mean) will be
displayed in the current screen and be saved in the QC file automatically.
When the QC result of the second QC run is obtained, the screen will refresh the displayed histograms and scattergrams according to the second QC run.
Up to 300 QC results (X mean) can be save for each QC file.
8. Do the above procedures to continue running the controls if necessary.
Using the QC Programs
8-104
Browse the QC Result
You can click the arrow button in the bottom of the screen to browse the QC result saved in the current QC file.
You can click the button or button to switch to the pervious or the next QC result.
You can click the button or button to switch to the earliest or the latest QC result
saved in the QC file.
The running result of the expired control will begin with an “O” mark.
The flag prompt “H” or “L” will appear in front of the X mean that out of the limits.
The enlarging function is available to the scattergrams and histograms of the screen. See details for operation in Chapter 7 Reviewing Sample Results.
For the QC files with saved QC results, if any change is made to the target or the limits, the changed data will be highlighted in yellow.
Click the “Print” button to print the results of the current QC Run screen.
8.3.3 Reviewing QC Results After running controls, you can review the QC results in the following two ways:
Graph
Table
Graph Review
All the samples, controls, calibrators, reagents, wastes and areas contacted them are potentially biohazardous. Wear proper personal protective equipment (e.g. gloves, lab coat, etc.) and follow safe laboratory procedures when handling them and the contacted areas in the laboratory.

Using the QC Programs
8-105
You can enter the graph screen in one of the following ways:
Click the shortcut button “QC”.
Click the “Menu” button on the screen, and then select “QC” ” X mean” on the pop-up menu.
Enter the “X mean” graph screen.
1. Select the QC file No. you want to review, and then the screen will display the
corresponding information and the graph.
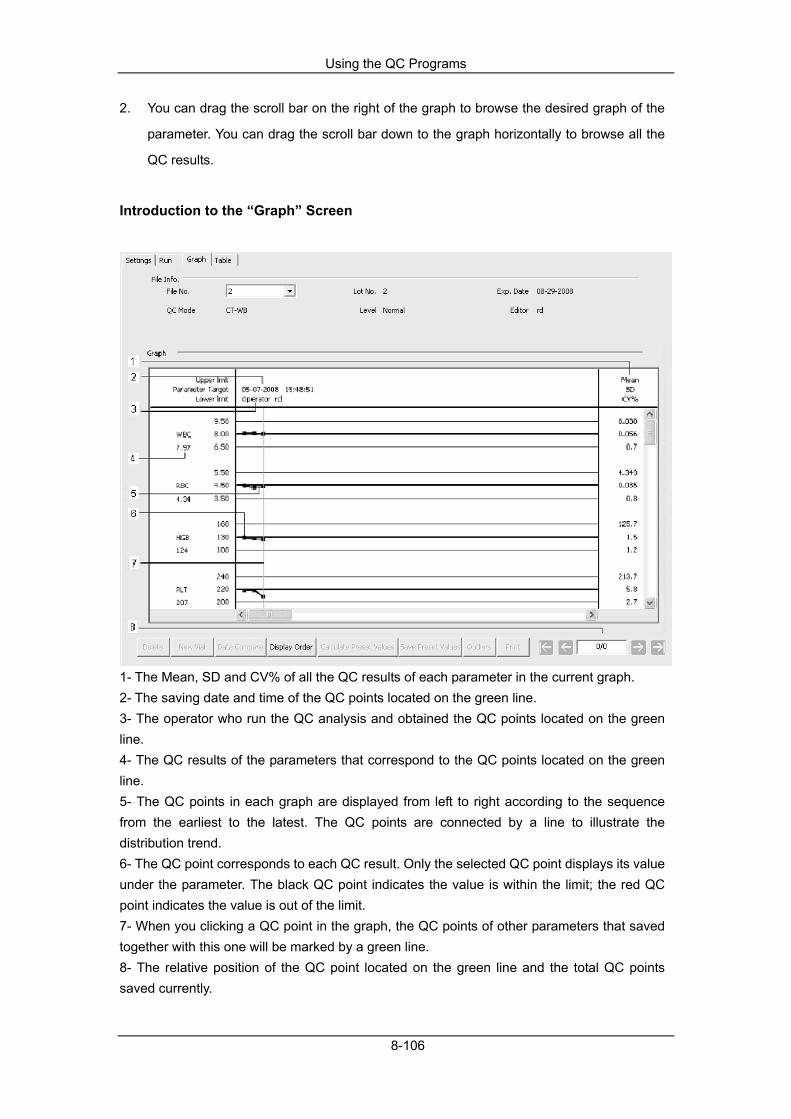
Using the QC Programs
8-106
2. You can drag the scroll bar on the right of the graph to browse the desired graph of the
parameter. You can drag the scroll bar down to the graph horizontally to browse all the
QC results.
Introduction to the “Graph” Screen
1- The Mean, SD and CV% of all the QC results of each parameter in the current graph. 2- The saving date and time of the QC points located on the green line. 3- The operator who run the QC analysis and obtained the QC points located on the green line. 4- The QC results of the parameters that correspond to the QC points located on the green line. 5- The QC points in each graph are displayed from left to right according to the sequence from the earliest to the latest. The QC points are connected by a line to illustrate the distribution trend. 6- The QC point corresponds to each QC result. Only the selected QC point displays its value under the parameter. The black QC point indicates the value is within the limit; the red QC point indicates the value is out of the limit. 7- When you clicking a QC point in the graph, the QC points of other parameters that saved together with this one will be marked by a green line. 8- The relative position of the QC point located on the green line and the total QC points saved currently.
Using the QC Programs
8-107
The value of the QC point is the X mean of each group of QC results.
The outliers are excluded from the calculation of Mean, SD and CV%.
For the QC files with saved QC results, if any change is made to the target or the limits, the changed data will be highlighted in yellow.
Browse the QC Result
You can click the arrow button in the bottom of the screen to browse the QC result saved in the current QC file.
You can click the button or button to move the green line to the pervious or the
next QC point; you can click the button or button to move the green line to the first
or the last QC point in the graph. When the location of the green line is selected, you can check the QC results of the QC points located on the green line under each parameter.
New Vial
If the reviewed QC results are obtained by analyzing a new vial of control of the same batch, you should mark the QC points of the new vial to distinguish the QC results from the old.
1. Move the green line to the first QC point of the new vial.
2. Click the “New Vial” button, and then a blue line appears at the QC point of the new vial.
3. After another new vial of control (of the same batch) is run and its QC results are saved,
you can continue to mark the current QC points of the new vial according to step 1 and 2.
4. If the current QC point is marked with the blue line, the “New Vial” button turns into
“Cancel”, you can click the button to remove the blue line, then the “Cancel” button will
turn back to “New Vial”.
Data Compare
If you wish to compare the graphs of the certain parameter obtained by running controls of different lot No., do as follows:
1. Click the “Data Compare” button to start selecting the desired graph.
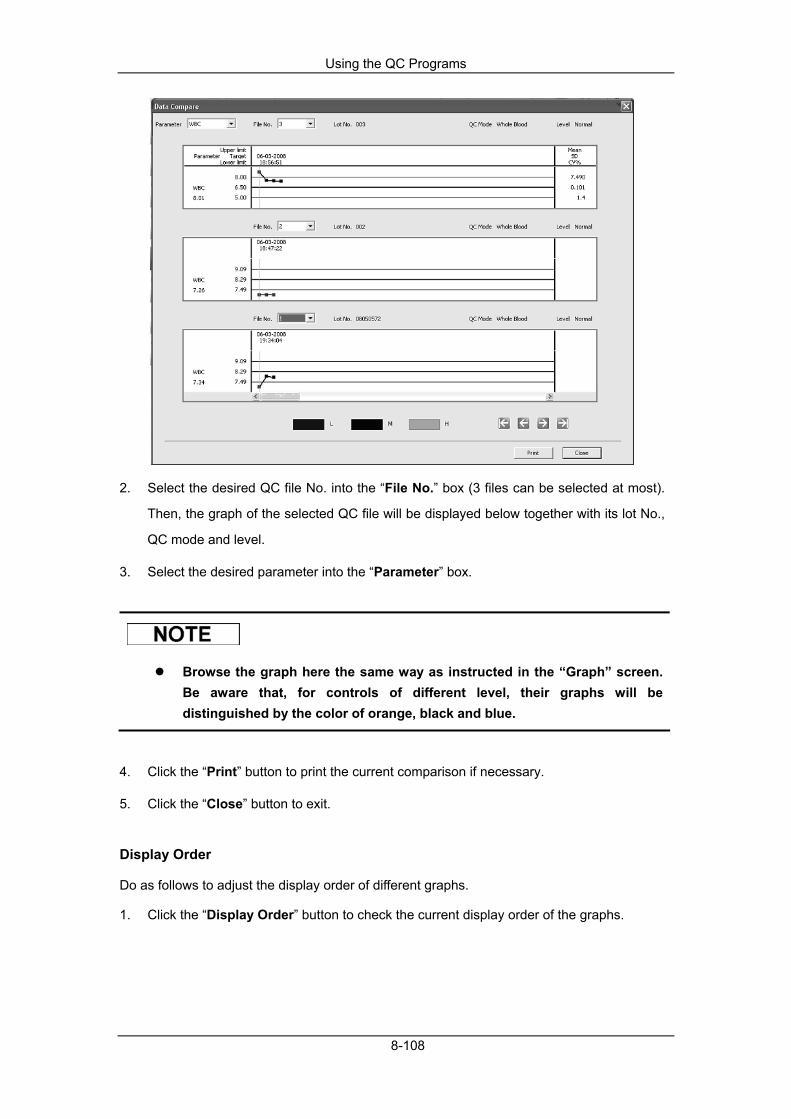
Using the QC Programs
8-108
2. Select the desired QC file No. into the “File No.” box (3 files can be selected at most).
Then, the graph of the selected QC file will be displayed below together with its lot No.,
QC mode and level.
3. Select the desired parameter into the “Parameter” box.
Browse the graph here the same way as instructed in the “Graph” screen. Be aware that, for controls of different level, their graphs will be distinguished by the color of orange, black and blue.
4. Click the “Print” button to print the current comparison if necessary.
5. Click the “Close” button to exit.
Display Order
Do as follows to adjust the display order of different graphs.
1. Click the “Display Order” button to check the current display order of the graphs.
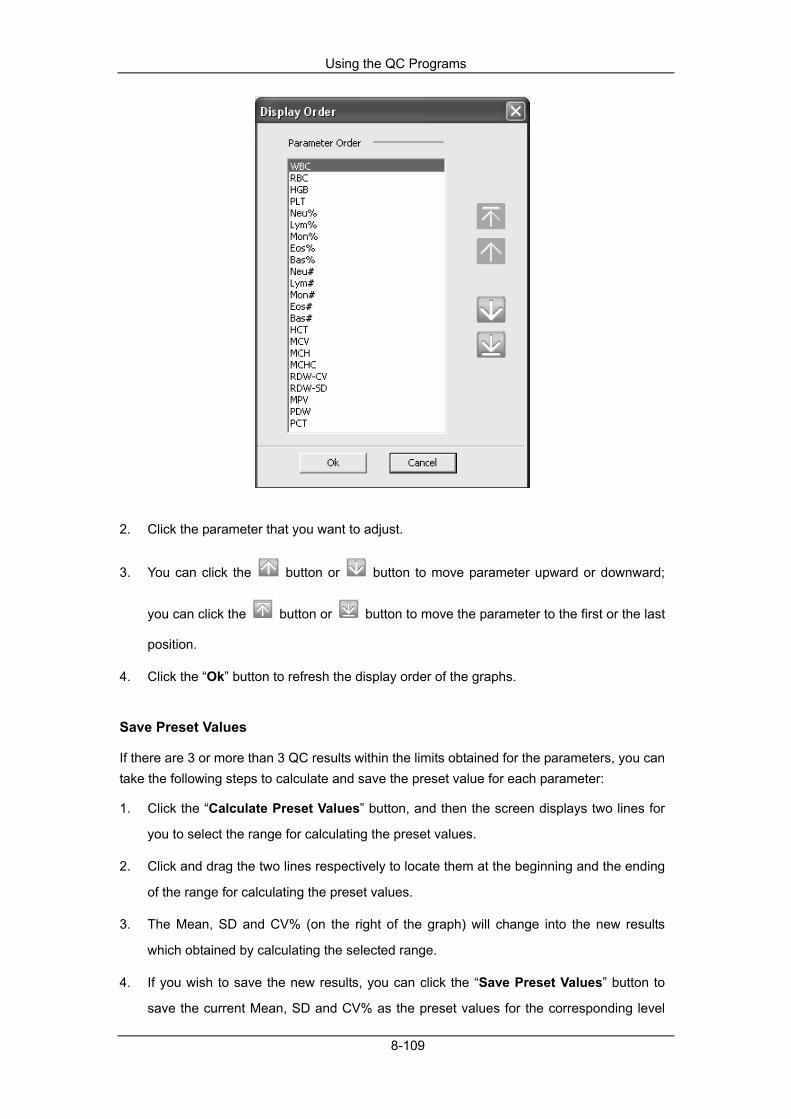
Using the QC Programs
8-109
2. Click the parameter that you want to adjust.
3. You can click the button or button to move parameter upward or downward;
you can click the button or button to move the parameter to the first or the last
position.
4. Click the “Ok” button to refresh the display order of the graphs.
Save Preset Values
If there are 3 or more than 3 QC results within the limits obtained for the parameters, you can take the following steps to calculate and save the preset value for each parameter:
1. Click the “Calculate Preset Values” button, and then the screen displays two lines for
you to select the range for calculating the preset values.
2. Click and drag the two lines respectively to locate them at the beginning and the ending
of the range for calculating the preset values.
3. The Mean, SD and CV% (on the right of the graph) will change into the new results
which obtained by calculating the selected range.
4. If you wish to save the new results, you can click the “Save Preset Values” button to
save the current Mean, SD and CV% as the preset values for the corresponding level
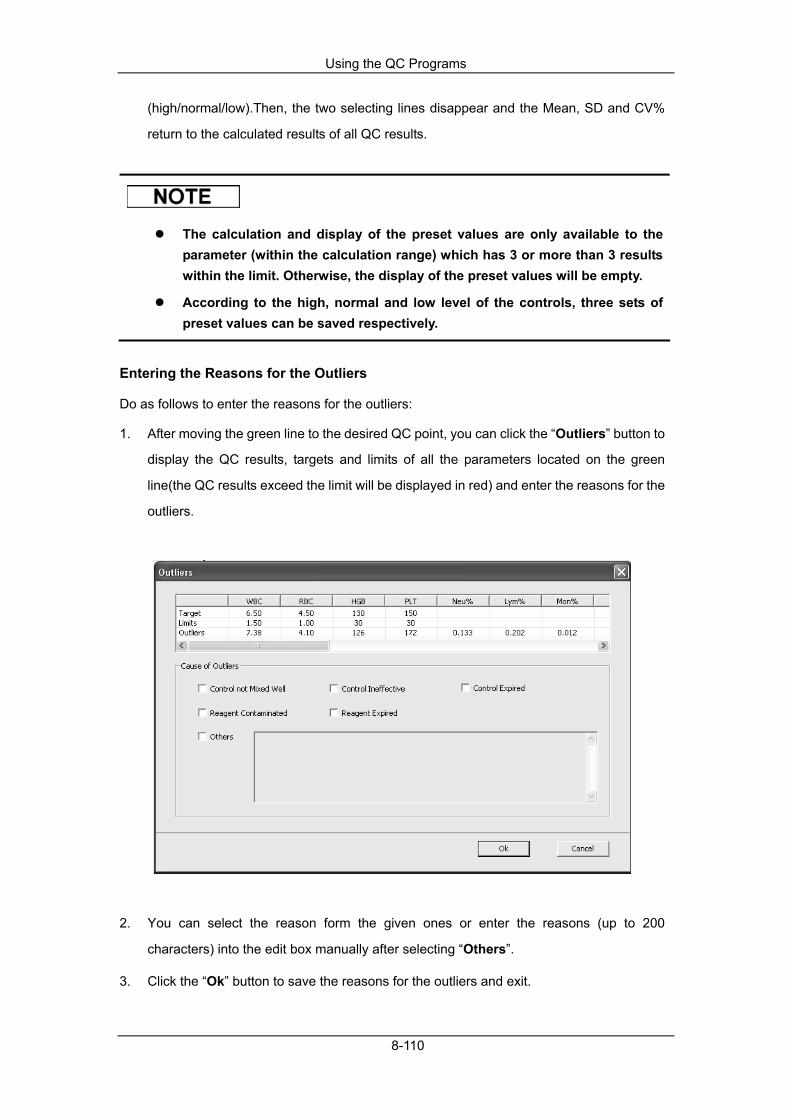
Using the QC Programs
8-110
(high/normal/low).Then, the two selecting lines disappear and the Mean, SD and CV%
return to the calculated results of all QC results.
The calculation and display of the preset values are only available to the parameter (within the calculation range) which has 3 or more than 3 results within the limit. Otherwise, the display of the preset values will be empty.
According to the high, normal and low level of the controls, three sets of preset values can be saved respectively.
Entering the Reasons for the Outliers
Do as follows to enter the reasons for the outliers:
1. After moving the green line to the desired QC point, you can click the “Outliers” button to
display the QC results, targets and limits of all the parameters located on the green
line(the QC results exceed the limit will be displayed in red) and enter the reasons for the
outliers.
2. You can select the reason form the given ones or enter the reasons (up to 200
characters) into the edit box manually after selecting “Others”.
3. Click the “Ok” button to save the reasons for the outliers and exit.
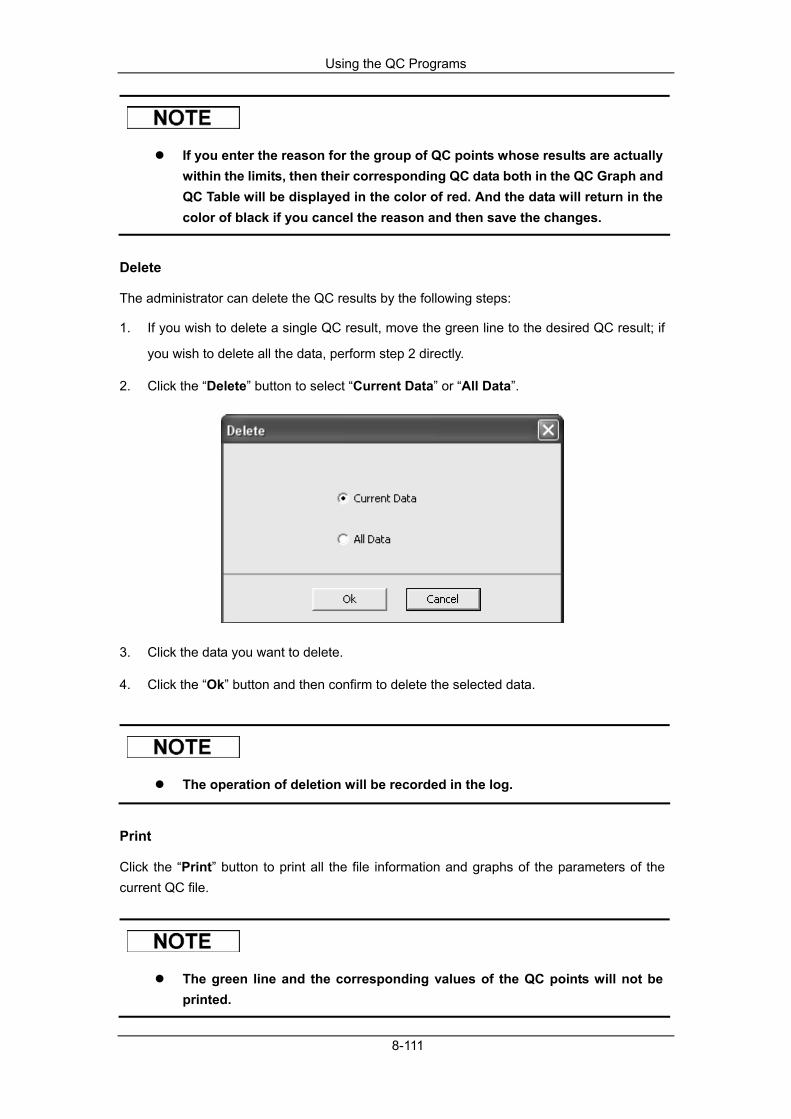
Using the QC Programs
8-111
If you enter the reason for the group of QC points whose results are actually within the limits, then their corresponding QC data both in the QC Graph and QC Table will be displayed in the color of red. And the data will return in the color of black if you cancel the reason and then save the changes.
Delete
The administrator can delete the QC results by the following steps:
1. If you wish to delete a single QC result, move the green line to the desired QC result; if
you wish to delete all the data, perform step 2 directly.
2. Click the “Delete” button to select “Current Data” or “All Data”.
3. Click the data you want to delete.
4. Click the “Ok” button and then confirm to delete the selected data.
The operation of deletion will be recorded in the log.
Click the “Print” button to print all the file information and graphs of the parameters of the current QC file.
The green line and the corresponding values of the QC points will not be printed.

Using the QC Programs
8-112
Table Review
All the samples, controls, calibrators, reagents, wastes and areas contacted them are potentially biohazardous. Wear proper personal protective equipment (e.g. gloves, lab coat, etc.) and follow safe laboratory procedures when handling them and the contacted areas in the laboratory.
You can enter the Table screen in one of the following ways:
Click the shortcut button “QC”.
Click the “Menu” button on the screen, and then select “QC” ” X mean” on the pop-up menu.
Enter the “X mean” graph screen.

Using the QC Programs
8-113
1. Click the “Table” tab to enter the X mean table screen.

Using the QC Programs
8-114
2. Select the QC file No. you want to review, and then the screen will display the
corresponding information and the table.
3. You can drag the scroll bar on the right of the table vertically to browse the desired table
of the parameter. You can drag the scroll bar down to the table horizontally to browse all
the QC results.
Introduction to the “Table” Screen
1- The No. of the QC result saved in the QC file (arranged from left to right in the order that from the earliest to the latest) 2- QC Result 3- QC parameters (displayed in the same order as the Graph screen) 4- QC flag: The flag “H” or “L” will be used to prompt the result (X mean) that out of the limits 5- The relative position of the highlighted QC point and the total QC points saved currently.
The value of the QC result is the X mean of each group of QC results.
For the QC files with saved QC results, if any change is made to the target or the limits, the changed data will be highlighted in yellow.

Using the QC Programs
8-115
Browse the QC Result
You can click the arrow button in the bottom of the screen to browse the QC result saved in the current QC file.
You can click the button or button to highlight the pervious or the next QC result;
you can click the button or button to highlight the first or the last QC result in the
table.
Delete
The administrator can delete the QC results by the following steps:
1. If you wish to delete a single QC result, click the column contains the desired QC result;
if you wish to delete all the data, perform step 2 directly.
2. Click the “Delete” button to select “Current Data” or “All Data”.
3. Click the data you want to delete.
4. Click the “Ok” button and then confirm to delete the selected data.
The operation of deletion will be recorded in the log.
You can take the following steps to print the Table:
1. Click the “Print” button, and then you can select “All Data” or “Specified Data” to be
printed.

Using the QC Programs
8-116
2. Click the “All Data” button and then click the “Ok” button to print all the file information
and tables of the parameters of the current QC file; after clicking the “Specified Data”
button, you can select the starting and finishing date (the saved date of the QC results)
for printing, then click the “Ok” button to print the specified data.
Communication
If you wish to transmit the QC data to the external data management software or LIS/HIS, do as follows:
1. Click the “Communication” button, and then you can select “All Data” or
“Specified Data” to be transmitted.
2. Click the “All Data” button and then click the “Start” button to transmit the
information of the current QC file and QC data. After clicking the “Specified Data”
button, you can specify a date range (the date when the QC result was saved), then
click the “Ok” button to transmit the specified data. The “LIS/HIS connected” icon on
the status bar of the screen will flicker during transmission.

Using the QC Programs
8-117
3. While transmitting, the “Start” button in the pop-up message box will be replaced by
“Stop”. You can click the “Stop” button to stop transmitting.
If auto-communication is enabled and a sample is ran during the transmission of the QC data, then only when the QC data transmission finished will the auto-communication of the sample result starts.
The QC data saved in the process of transmission will not be transmitted.
Data Backup
For operating system of Windows Vista, the right of copying database file is restricted by users' access level. To enable the data backup function, you should log on the system as administrator, and then right click the shortcut icon of the terminal software and run it as administrator.
If you wish to backup the information and the result of the current QC file, do as follows:
1. Click the “Data Backup” button, a message box will pop up.
2. Select the backup directory (the default directory is the folder of “QC Data” under the
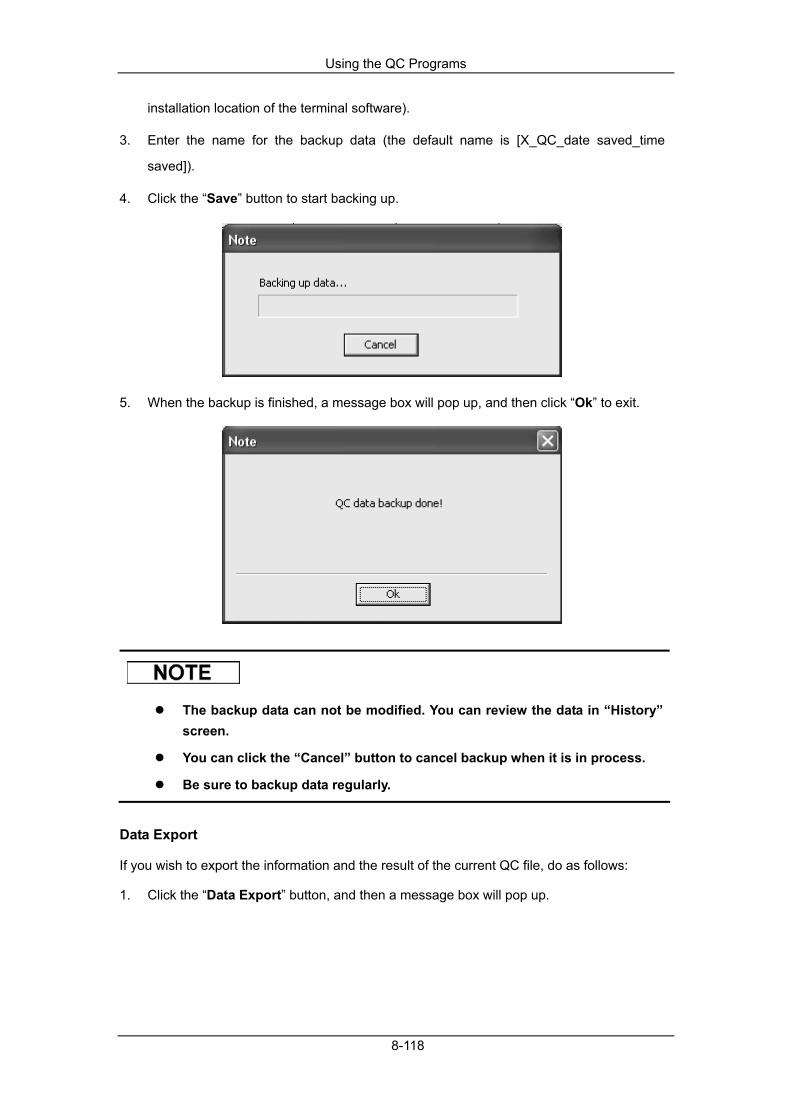
Using the QC Programs
8-118
installation location of the terminal software).
3. Enter the name for the backup data (the default name is [X_QC_date saved_time
saved]).
4. Click the “Save” button to start backing up.
5. When the backup is finished, a message box will pop up, and then click “Ok” to exit.
The backup data can not be modified. You can review the data in “History” screen.
You can click the “Cancel” button to cancel backup when it is in process.
Be sure to backup data regularly.
Data Export
If you wish to export the information and the result of the current QC file, do as follows:
1. Click the “Data Export” button, and then a message box will pop up.

Using the QC Programs
8-119
2. Select the export directory (the default directory is the folder of “QC Data” under the
installation location of the terminal software).
3. Enter the name for the export data (the default name is [X_QC_date saved_time
saved]).
4. Select the format for the export file.(default format: “. CSV”)
5. Click the “Save” button to start exporting.
6. When the export is finished, a message box will pop up, and then click “Ok” to exit.
You can modify the exported data but can not review the data in the “History” screen.
You can click the “Cancel” button to cancel export when it is in process.

Using the QC Programs
8-120
History
For operating system of Windows Vista, the right of copying database file is restricted by users' access level. To enable the history function, you should log on the system as administrator, and then right click the shortcut icon of the terminal software and run it as administrator.
If you wish to review the backed up data, do as follows:
1. Click the “History” button, and then a message box will pop up.
2. Locate and then select the desired backup data.
3. Click the “Open” button to display the data in “History” screen.
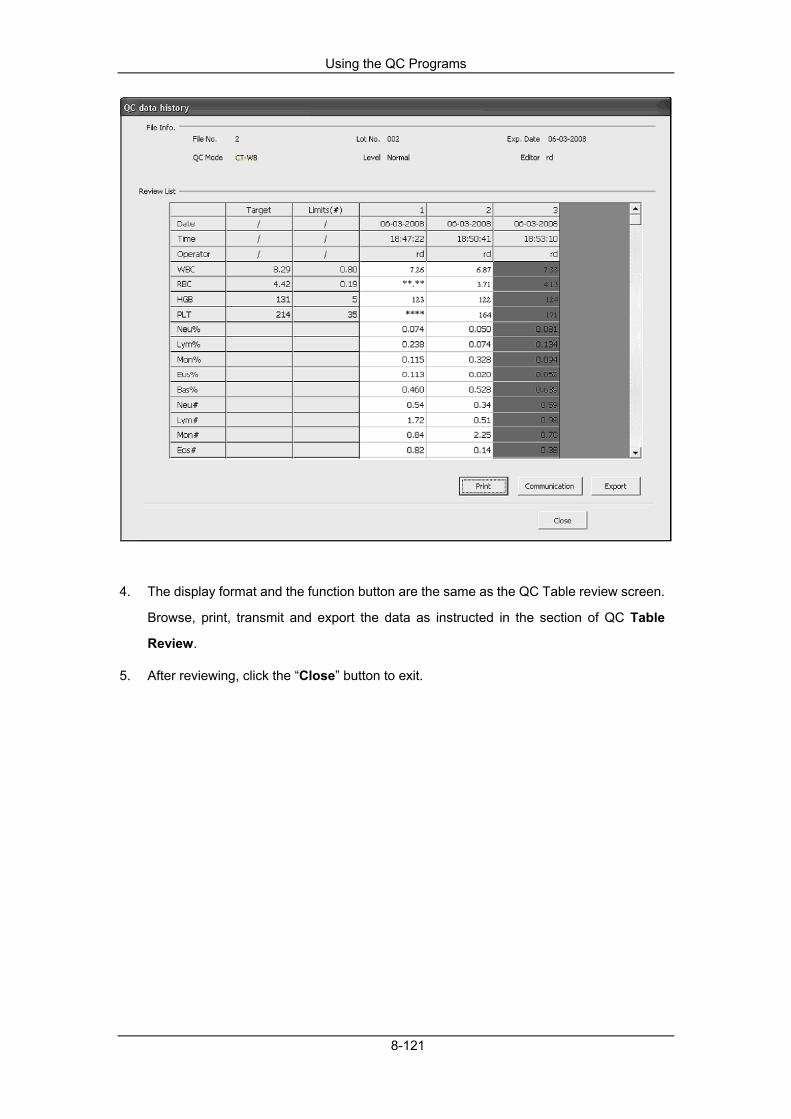
Using the QC Programs
8-121
4. The display format and the function button are the same as the QC Table review screen.
Browse, print, transmit and export the data as instructed in the section of QC Table
Review.
5. After reviewing, click the “Close” button to exit.

Using the QC Programs
8-122
8.4 X mean R QC Program
8.4.1 Editing the X mean R Settings
All the samples, controls, calibrators, reagents, wastes and areas contacted them are potentially biohazardous. Wear proper personal protective equipment (e.g. gloves, lab coat, etc.) and follow safe laboratory procedures when handling them and the contacted areas in the laboratory.
Only administrators can edit the X mean R QC settings.
Before analyzing the new lot of controls, you should set a QC file for each lot of controls and you can edit the QC settings in the QC file by the following way:
Manual entry
Manual Entry
You can enter the graph screen in one of the following ways:
Click the shortcut button “QC”.
Click the “Menu” button on the screen, and then select “QC” ”X mean R” on the pop-up menu.
Enter the “ X mean R” graph screen.

Using the QC Programs
8-123
1. Click the “Settings” tab to enter the X mean R setup screen.
For details to edit the name of the login user, see chapter 5 Customizing the Analyzer Software.
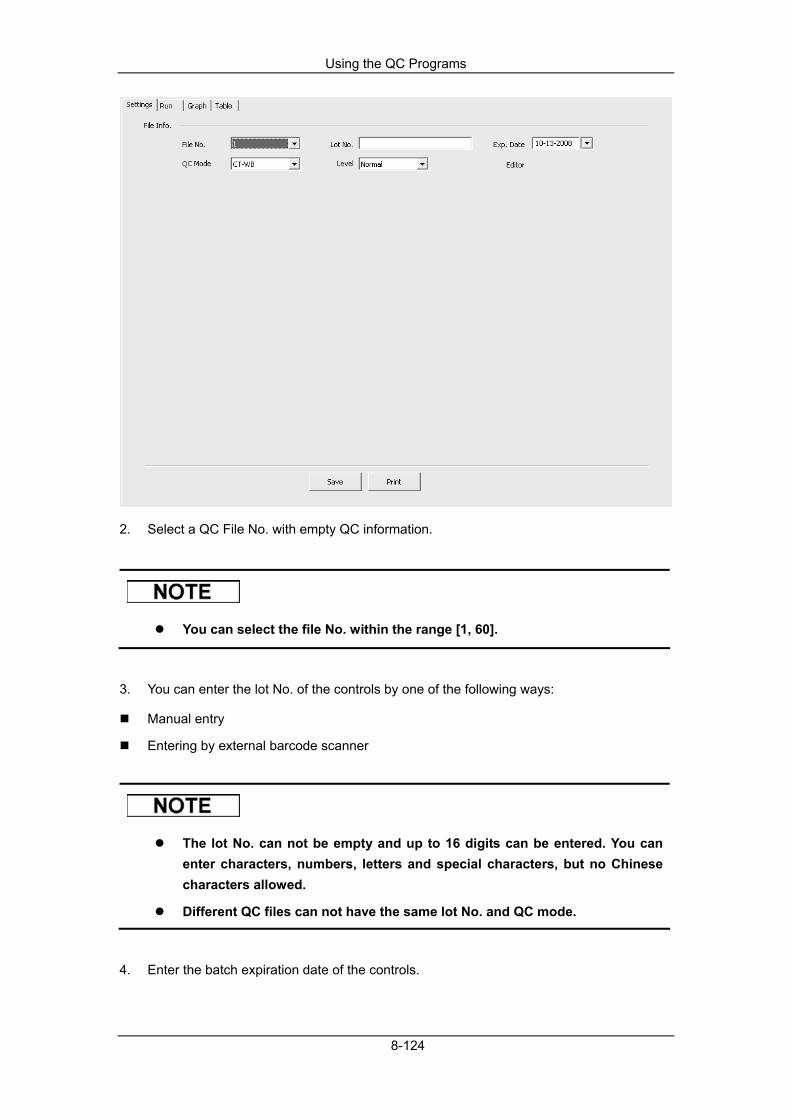
Using the QC Programs
8-124
2. Select a QC File No. with empty QC information.
You can select the file No. within the range [1, 60].
3. You can enter the lot No. of the controls by one of the following ways:
Manual entry
Entering by external barcode scanner
The lot No. can not be empty and up to 16 digits can be entered. You can enter characters, numbers, letters and special characters, but no Chinese characters allowed.
Different QC files can not have the same lot No. and QC mode.
4. Enter the batch expiration date of the controls.

Using the QC Programs
8-125
You must enter the expiration date, and the entry range is [current system date, 2099-12-31].
5. Select the QC mode.
Different QC files can not have the same lot No. and QC mode.
6. Select the control level.
7. Click the “Save” button to save all the settings of the QC.
Click the “Print” button to print the setting information of the current QC file.

Using the QC Programs
8-126
8.4.2 Running Controls After editing the QC information, you can start one of the following QC analyses according to the selected QC mode.
CT-WB
CT-PD
AL-WB
Running Controls (CT-WB)
All the samples, controls, calibrators, reagents, wastes and areas contacted them are potentially biohazardous. Wear proper personal protective equipment (e.g. gloves, lab coat, etc.) and follow safe laboratory procedures when handling them and the contacted areas in the laboratory.
The sample probe is sharp and potentially biohazardous, Exercise caution to avoid contact with the probe when working around it.
The sample may spill from the unclosed collection tubes and cause biohazard. Exercise caution to the unclosed collection tubes.
Be sure to avoid reversing the collection tube when loading, otherwise, the collection tube may be broken and cause biohazard.
Be sure to place the collection tubes in the right adapter before running, otherwise, the collection tubes may be broken and cause biohazard.
Collection tubes broken may cause personal injury and/or biohazard. Exercise caution when loading the collection tubes to the rack or getting the collection tubes from the rack, be sure not to break the tubes.
Keep you clothed, hairs and hands away from the moving parts to avoid injury.
The reagents are irritating to eyes, skin and diaphragm. Wear proper personal protective equipment (e.g. gloves, lab coat, etc.) and follow safe laboratory procedures when handling them in the laboratory.
If the reagents accidentally spill on your skin, wash them off with plenty of water and if necessary, go see a doctor; if the reagents accidentally spill into your eyes, wash them off with plenty of water and immediately go see a doctor.
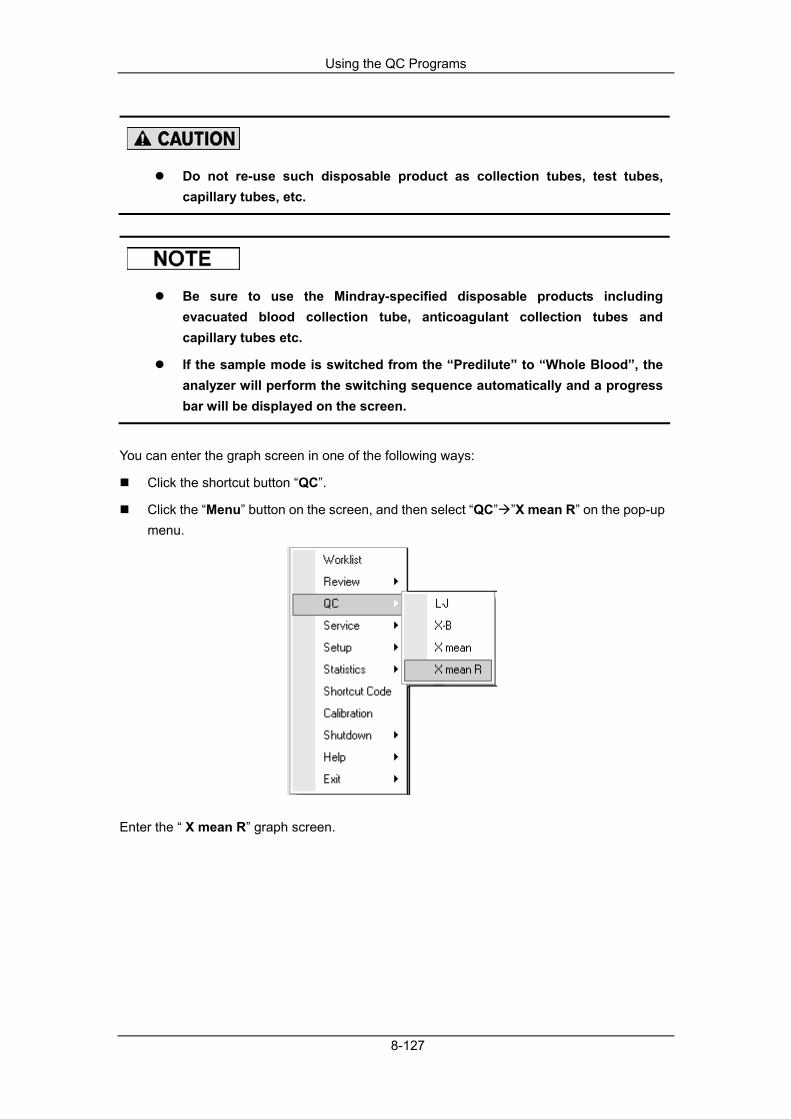
Using the QC Programs
8-127
Do not re-use such disposable product as collection tubes, test tubes, capillary tubes, etc.
Be sure to use the Mindray-specified disposable products including evacuated blood collection tube, anticoagulant collection tubes and capillary tubes etc.
If the sample mode is switched from the “Predilute” to “Whole Blood”, the analyzer will perform the switching sequence automatically and a progress bar will be displayed on the screen.
You can enter the graph screen in one of the following ways:
Click the shortcut button “QC”.
Click the “Menu” button on the screen, and then select “QC” ”X mean R” on the pop-up menu.
Enter the “ X mean R” graph screen.

Using the QC Programs
8-128
1. Click the “Run” tab to enter the X mean R run screen.
For details to edit the name of the login user, see chapter 5 Customizing the Analyzer Software.
Be sure to use the adapter of Ф13x75 (mm) model when running the QC in CT-WB mode. For details to install the adapter, see Chapter 6 Operating Your Analyzer.

Using the QC Programs
8-129
2. Select the QC file No. to be run; the screen displays the corresponding file information.
3. Be sure that the level of the control to be run is the same with the current QC file.
4. Be sure that the control to be run is not expired.
5. Prepare the control as instructed by instructions for use of the controls.
6. Run the controls:
1) Make sure the QC mode is “CT-WB” and the analysis status icon and analyzer indicator is green. 2) Shake the prepared control as shown below to well mix it.
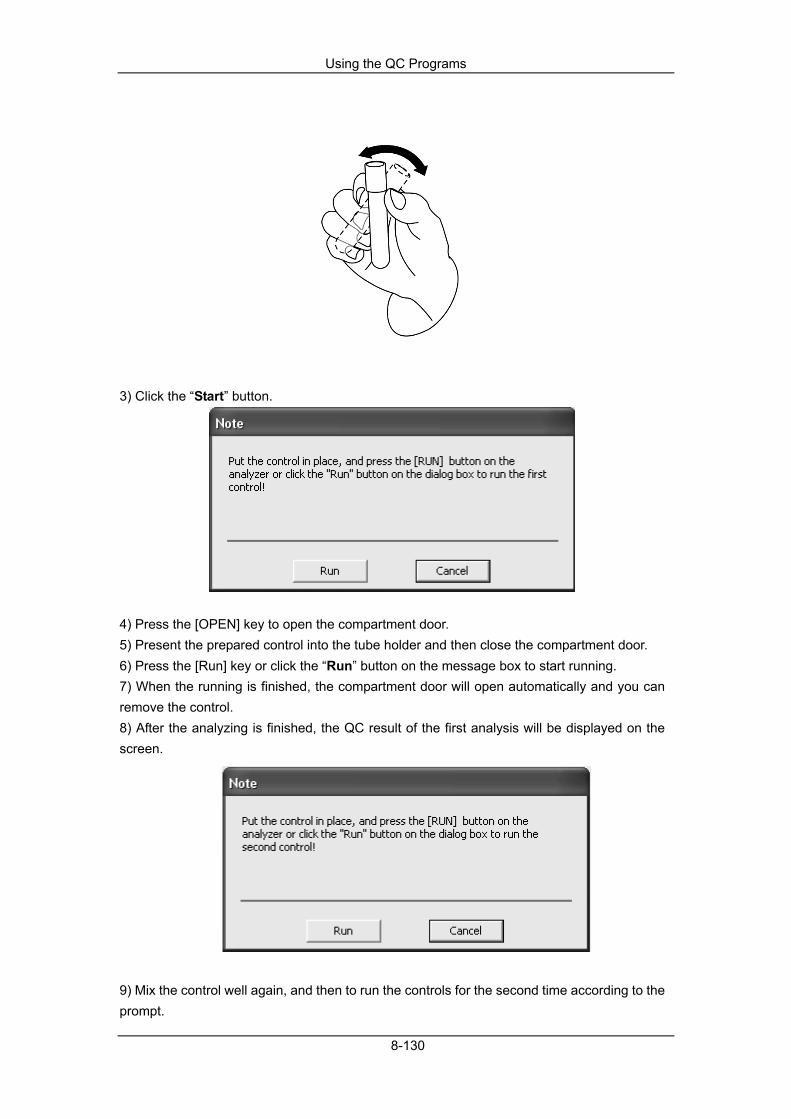
Using the QC Programs
8-130
3) Click the “Start” button.
4) Press the [OPEN] key to open the compartment door. 5) Present the prepared control into the tube holder and then close the compartment door. 6) Press the [Run] key or click the “Run” button on the message box to start running. 7) When the running is finished, the compartment door will open automatically and you can remove the control. 8) After the analyzing is finished, the QC result of the first analysis will be displayed on the screen.
9) Mix the control well again, and then to run the controls for the second time according to the prompt.
Using the QC Programs
8-131
You can click the “Cancel” button in the message box to cancel the second run and the results obtained in the first run will not be saved as well.
10) When the running is finished, the compartment door will open automatically and you can remove the control.
7. When finish running, the QC results (values of the two QC runs, X mean and range R)
will be displayed in the current screen and be saved in the QC file automatically.
When the QC result of the second QC run is obtained, the screen will refresh the displayed histograms and scattergrams according to the second QC run.
Up to 300 QC results (X mean and range R) can be saved for each QC file.
8. Do the above procedures to continue running the controls if necessary.

Using the QC Programs
8-132
Running Controls (CT-PD)
All the samples, controls, calibrators, reagents, wastes and areas contacted them are potentially biohazardous. Wear proper personal protective equipment (e.g. gloves, lab coat, etc.) and follow safe laboratory procedures when handling them and the contacted areas in the laboratory.
The sample probe is sharp and potentially biohazardous, Exercise caution to avoid contact with the probe when working around it.
The sample may spill from the unclosed collection tubes and cause biohazard. Exercise caution to the unclosed collection tubes.
Be sure to avoid reversing the collection tube when loading, otherwise, the collection tube may be broken and cause biohazard.
Be sure to place the collection tubes in the right adapter before running, otherwise, the collection tubes may be broken and cause biohazard.
Collection tubes broken may cause personal injury and/or biohazard. Exercise caution when loading the collection tubes to the rack or getting the collection tubes from the rack, be sure not to break the tubes.
Keep you clothed, hairs and hands away from the moving parts to avoid injury.
The reagents are irritating to eyes, skin and diaphragm. Wear proper personal protective equipment (e.g. gloves, lab coat, etc.) and follow safe laboratory procedures when handling them in the laboratory.
If the reagents accidentally spill on your skin, wash them off with plenty of water and if necessary, go see a doctor; if the reagents accidentally spill into your eyes, wash them off with plenty of water and immediately go see a doctor.
Do not re-use such disposable product as collection tubes, test tubes, capillary tubes, etc.
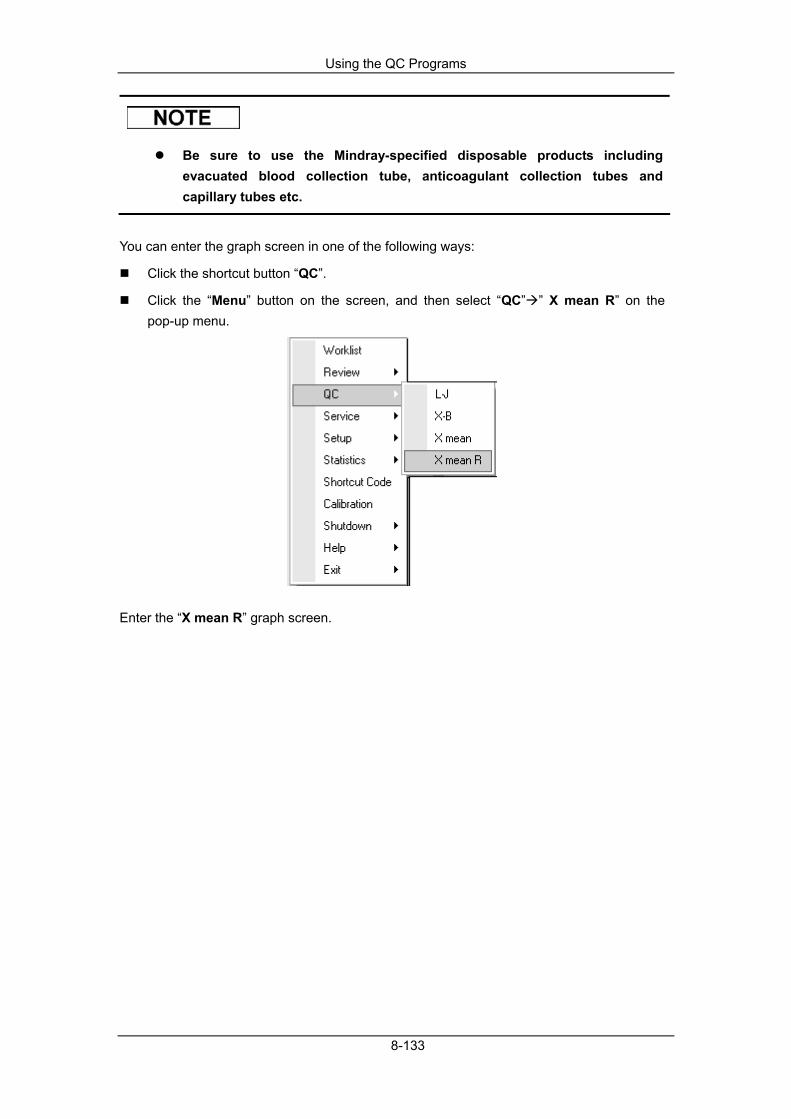
Using the QC Programs
8-133
Be sure to use the Mindray-specified disposable products including evacuated blood collection tube, anticoagulant collection tubes and capillary tubes etc.
You can enter the graph screen in one of the following ways:
Click the shortcut button “QC”.
Click the “Menu” button on the screen, and then select “QC” ” X mean R” on the pop-up menu.
Enter the “X mean R” graph screen.
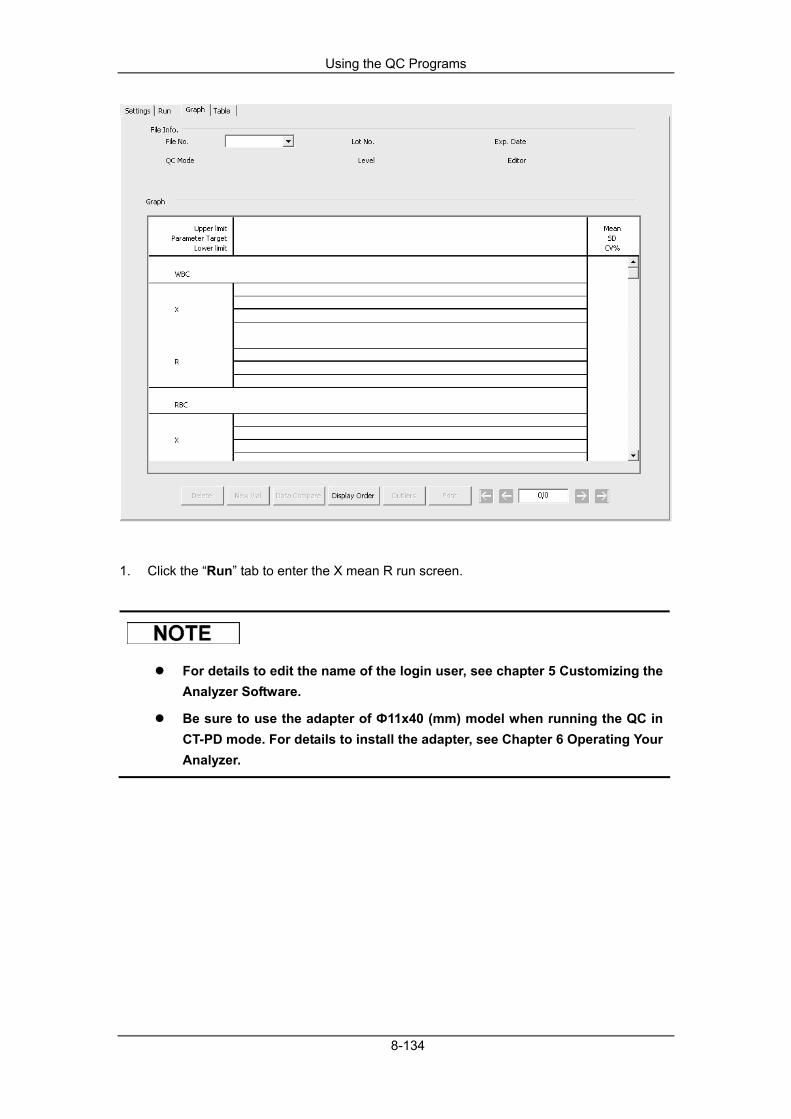
Using the QC Programs
8-134
1. Click the “Run” tab to enter the X mean R run screen.
For details to edit the name of the login user, see chapter 5 Customizing the Analyzer Software.
Be sure to use the adapter of Ф11x40 (mm) model when running the QC in CT-PD mode. For details to install the adapter, see Chapter 6 Operating Your Analyzer.

Using the QC Programs
8-135
2. Select the QC file No. to be run; the screen displays the corresponding file information.
3. Be sure that the level of the control to be run is the same with the current QC file.
4. Be sure that the control to be run is not expired.
5. Prepare the control as instructed by instructions for use of the controls.
6. Run the controls:
1) Make sure the QC mode is “CT-PD” and the analysis status icon and analyzer indicator is green. 2) Click the shortcut button “Diluent”, the compartment door will open automatically. A message box shown below will pop up.

Using the QC Programs
8-136
3) Present a clean centrifugal tube into the sample compartment with the cap opened. Press the [RUN] key to dispense 180µL of diluent into the tube. During dispensing the diluent, a progress bar will display.
If the current mode is autoloader, the analyzer will switch to the close-tube mode automatically and then dispense the diluent. Then, the mode will be switched back to autoloader when exiting.
4) When the dispensing is finished, the compartment door will open automatically and you can remove the centrifugal tube. Then, the following message box will display.
5) Prepare one more diluent according to procedure 3) to 4). 6) Add 20µL of control to the diluent, close the tube cap and shake the tube to mix the sample. 7) Click the “Cancel” button to exit the “Diluent” message box.

Using the QC Programs
8-137
8) After the cleaning is finished, close the prompt. 9) Click the “Start” button.
10) Present the centrifugal tube into the tube holder with the cap opened and then close the compartment door. 11) Press the [Run] key or click the “Run” button on the message box to start running. 12) When the running is finished, the compartment door will open automatically and you can remove the centrifugal tube. 13) After the analyzing is finished, the QC result of the first analysis will be displayed on the screen.
14) Add 20µL of control to the other centrifugal tube with diluent, close the tube cap and shake the tube to mix the sample, and then present the centrifugal tube into the tube holder with the cap opened to start the second running.
You can click the “Cancel” button in the message box to cancel the second run and the results obtained in the first run will not be saved as well.
15) When the running is finished, the compartment door will open automatically and you can remove the centrifugal tube.
7. When finish running, the QC results (values of the two QC runs, X mean and range R)
will be displayed in the current screen and be saved in the QC file automatically.
Using the QC Programs
8-138
You can also dispense 180µL of diluent by pipette into the tube.
Be sure to keep dust from the prepared diluent.
After mixing the control with the diluent, be sure to wait 3 minutes before running.
Be sure to run the prediluted samples within 30 minutes after the mixing.
Be sure to mix any sample that has been prepared for a while before running it.
Be sure to evaluate predilute QC stability based on your laboratory’s sample population and sample collection techniques or methods.
Up to 300 QC results can be saved for each QC file.
When the QC result of the second QC run is obtained, the screen will refresh the displayed histograms and scattergrams according to the second QC run.
Up to 300 QC results (X mean and range R) can be saved for each QC file.
8. Do the above procedures to continue running the controls if necessary.

Using the QC Programs
8-139
Running Controls (AL-WB)
All the samples, controls, calibrators, reagents, wastes and areas contacted them are potentially biohazardous. Wear proper personal protective equipment (e.g. gloves, lab coat, etc.) and follow safe laboratory procedures when handling them and the contacted areas in the laboratory.
The sample probe is sharp and potentially biohazardous, Exercise caution to avoid contact with the probe when working around it.
The sample may spill from the unclosed collection tubes and cause biohazard. Exercise caution to the unclosed collection tubes.
Be sure to avoid reversing the collection tube when loading, otherwise, the collection tube may be broken and cause biohazard.
Collection tubes broken may cause personal injury and/or biohazard. Exercise caution when loading the collection tubes to the rack or getting the collection tubes from the rack, be sure not to break the tubes.
Collection tubes broken may cause personal injury and/or biohazard. Exercise caution when loading the collection tubes to the autoloader or getting the collection tubes from the autoloader, be sure not to break the tubes.
The pusher will push the rack inside the autoloader. Be sure your hand is away from the rack before starting the autoloader.
Keep you clothed, hairs and hands away from the moving parts to avoid injury.
The reagents are irritating to eyes, skin and diaphragm. Wear proper personal protective equipment (e.g. gloves, lab coat, etc.) and follow safe laboratory procedures when handling them in the laboratory.
If the reagents accidentally spill on your skin, wash them off with plenty of water and if necessary, go see a doctor; if the reagents accidentally spill into your eyes, wash them off with plenty of water and immediately go see a doctor.
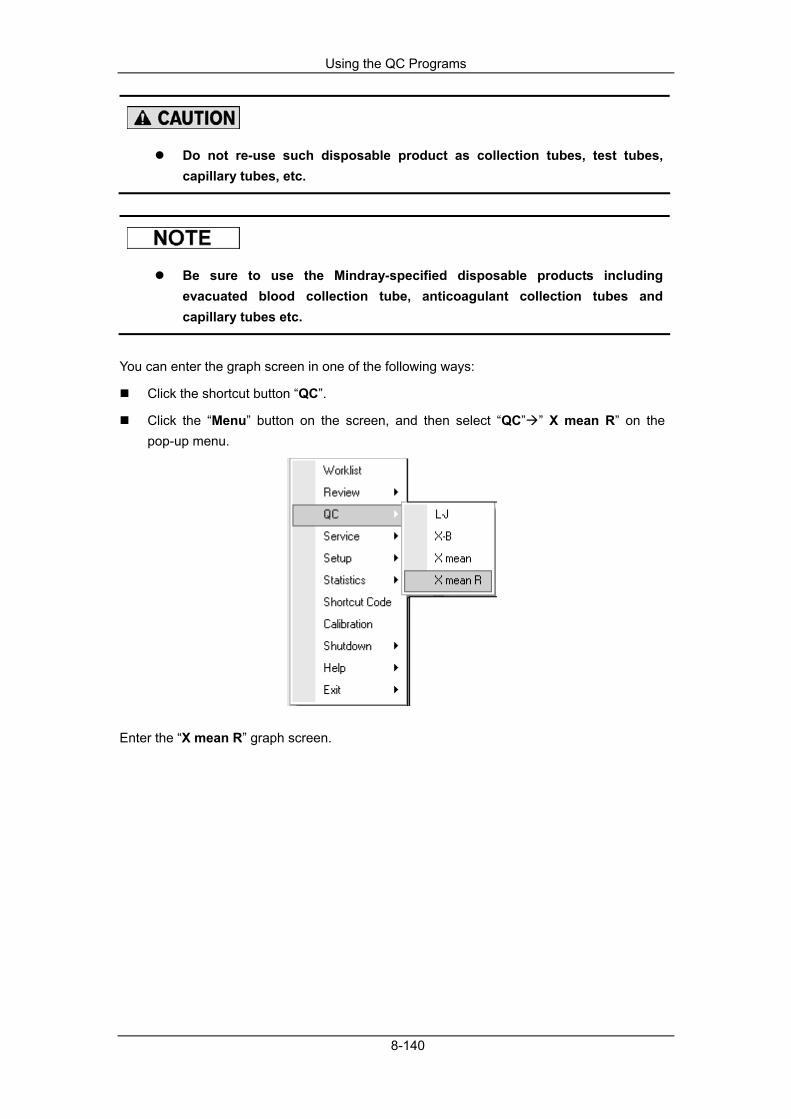
Using the QC Programs
8-140
Do not re-use such disposable product as collection tubes, test tubes, capillary tubes, etc.
Be sure to use the Mindray-specified disposable products including evacuated blood collection tube, anticoagulant collection tubes and capillary tubes etc.
You can enter the graph screen in one of the following ways:
Click the shortcut button “QC”.
Click the “Menu” button on the screen, and then select “QC” ” X mean R” on the pop-up menu.
Enter the “X mean R” graph screen.
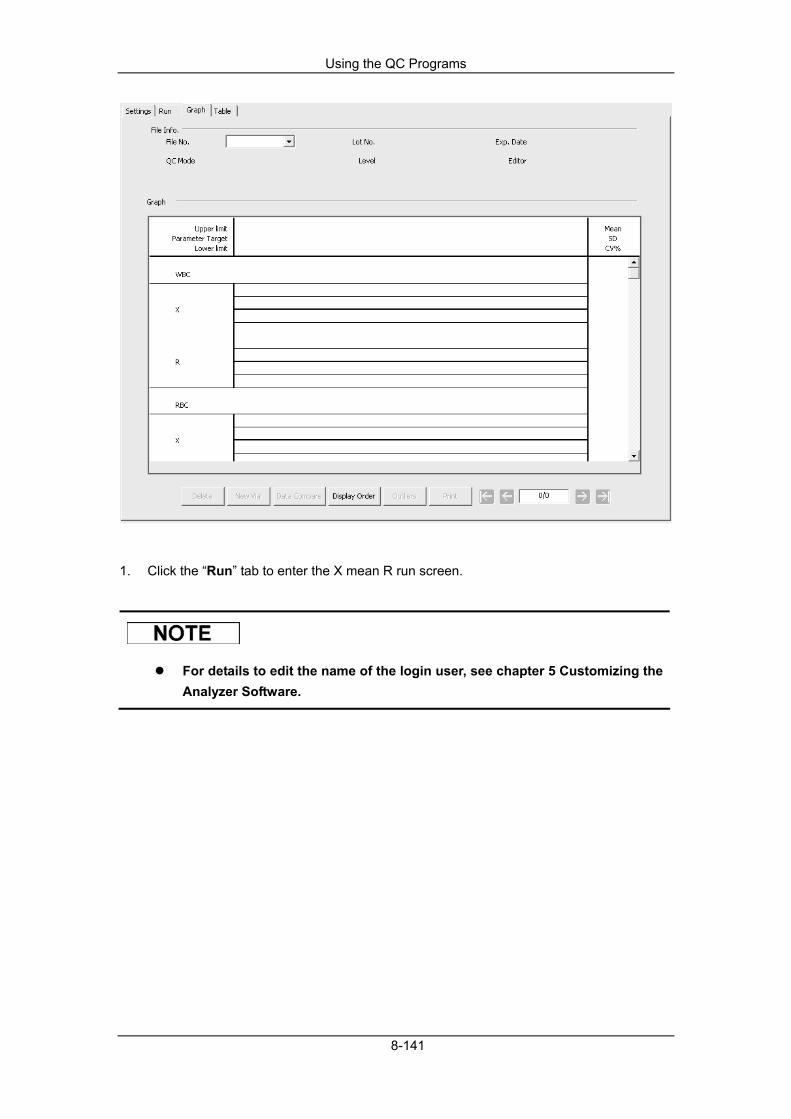
Using the QC Programs
8-141
1. Click the “Run” tab to enter the X mean R run screen.
For details to edit the name of the login user, see chapter 5 Customizing the Analyzer Software.

Using the QC Programs
8-142
2. Select the QC file No. to be run; the screen displays the corresponding file information.
3. Be sure that the level of the control to be run is the same with the current QC file.
4. Be sure that the control to be run is not expired.
5. Prepare the control as instructed by instructions for use of the controls.
6. Run the controls:
1) Make sure the QC mode is “AL-WB” and the analysis status icon and analyzer indicator is green. 2) Click the “Start” button.
3) Present the prepared control into the rack.

Using the QC Programs
8-143
4) Place racks loading controls on the level of the right tray of the autoloader, with the back of “MINDRAY” mark on the carrier facing the analyzer. 5) Press the [Run] key or click the “Run” button on the message box to start running. 6) When the racks are pushed out, you can remove the racks from the left of the autoloader. 7) After the analyzing is finished, the QC result of the first analysis will be displayed on the screen.
8) Present the prepared control into the rack according to the prompt, and then place racks loading controls on the level of the right tray of the autoloader, with the back of “MINDRAY” mark on the carrier facing the analyzer, and then start the second running.
You can click the “Cancel” button in the message box to cancel the second run and the results obtained in the first run will not be saved as well.
9) When the racks are pushed out, you can remove the racks from the left of the autoloader.
Only one control can be run in a single running.
7. When finish running, the QC results (values of the two QC runs, X mean and range R)
will be displayed in the current screen and be saved in the QC file automatically.
When the QC result of the second QC run is obtained, the screen will refresh the displayed histograms and scattergrams according to the second QC run.
Up to 300 QC results (X mean and range R) can be saved for each QC file.

Using the QC Programs
8-144
8. Do the above procedures to continue running the controls if necessary.
Browse the QC Result
You can click the arrow button in the bottom of the screen to browse the QC result saved in the current QC file.
You can click the button or button to switch to the pervious or the next QC result.
You can click the button or button to switch to the earliest or the latest QC result
saved in the QC file.
The running result of the expired control will begin with an “O” mark.
If 10 batches of QC results (20 times of QC runs) are obtained, the flag prompt “H” or “L” will appear in front of the X mean and R that are out of the limits.
The enlarging function is available to the scattergrams and histograms of the screen. See details for operation in Chapter 7 Reviewing Sample Results.
Click the “Print” button to print the results of the current QC Run screen.
8.4.3 Reviewing QC Results After running controls, you can review the QC results in the following two ways:
Graph
Table
Graph Review
All the samples, controls, calibrators, reagents, wastes and areas contacted them are potentially biohazardous. Wear proper personal protective equipment (e.g. gloves, lab coat, etc.) and follow safe laboratory procedures when handling them and the contacted areas in the laboratory.

Using the QC Programs
8-145
You can enter the graph screen in one of the following ways:
Click the shortcut button “QC”.
Click the “Menu” button on the screen, and then select “QC” ” X mean R” on the pop-up menu.
Enter the “ X mean R” graph screen.
1. Select the QC file No. you want to review, and then the screen will display the
corresponding information and the graph.

Using the QC Programs
8-146
2. You can drag the scroll bar on the right of the graph to browse the desired graph of the
parameter. You can drag the scroll bar down to the graph horizontally to browse all the
QC results.
Introduction to the “Graph” Screen
1- The Mean, SD and CV% of all the QC results of each parameter in the current graph. 2- The saving date and time of the QC points located on the green line. 3- The operator who run the QC analysis and obtained the QC points located on the green line 4- The QC results of the parameters that correspond to the QC points located on the green line. 5- The QC points in each graph are displayed from left to right according to the sequence from the earliest to the latest. The QC points are connected by a line to illustrate the distribution trend. 6- The QC point corresponds to each QC result. Only the selected QC point displays its value under the parameter. The black QC point indicates the value is within the limit; the red QC point indicates the value is out of the limit. 7- When you clicking a QC point in the graph, the QC points of other parameters that saved together with this one will be marked by a green line.

Using the QC Programs
8-147
8- The relative position of the QC point located on the green line and the total QC points saved currently.
The graphs for different parameters will be provided only after 10 batches of QC results (20 times of QC runs) are obtained.
The values of the QC point are the X mean and range R of each batch of QC results.
The outliers are excluded from the calculation of Mean, SD and CV%.
Browsing the QC Result
You can click the arrow button in the bottom of the screen to browse the QC result saved in the current QC file.
You can click the button or button to move the green line to the pervious or the
next QC point; you can click the button or button to move the green line to the first
or the last QC point in the graph. When the location of the green line is selected, you can check the QC results of the QC points located on the green line under each parameter.
New Vial
If the reviewed QC results are obtained by analyzing a new vial of control of the same batch, you should mark the QC points of the new vial to distinguish the QC results from the old.
1. Move the green line to the first QC point of the new vial.
2. Click the “New Vial” button, and then a blue line appears at the QC point of the new vial.
3. After another new vial of control (of the same batch) is run and its QC results are saved,
you can continue to mark the current QC points of the new vial according to step 1 and 2.
4. If the current QC point is marked with the blue line, the “New Vial” button turns into
“Cancel”, you can click the button to remove the blue line, then the “Cancel” button will
turn back to “New Vial”.
Data Compare
If you wish to compare the graphs of the certain parameter obtained by running controls of different lot No., do as follows:
1. Click the “Data Compare” button to start selecting the desired graph.

Using the QC Programs
8-148
2. Select the desired QC file No. into the “File No.” box (3 files can be selected at most).
Then, the graph of the selected QC file will be displayed below together with its lot No.,
QC mode and level.
3. Select the desired parameter into the “Parameter” box.
Browse the graph here the same way as instructed in the “Graph” screen. Be aware that, for controls of different level, their graphs will be distinguished by the color of orange, black and blue.
4. Click the “Print” button to print the current comparison if necessary.
5. Click the “Close” button to exit.
Display Order
Do as follows to adjust the display order of different graphs.
1. Click the “Display Order” button to check the current display order of the graphs.
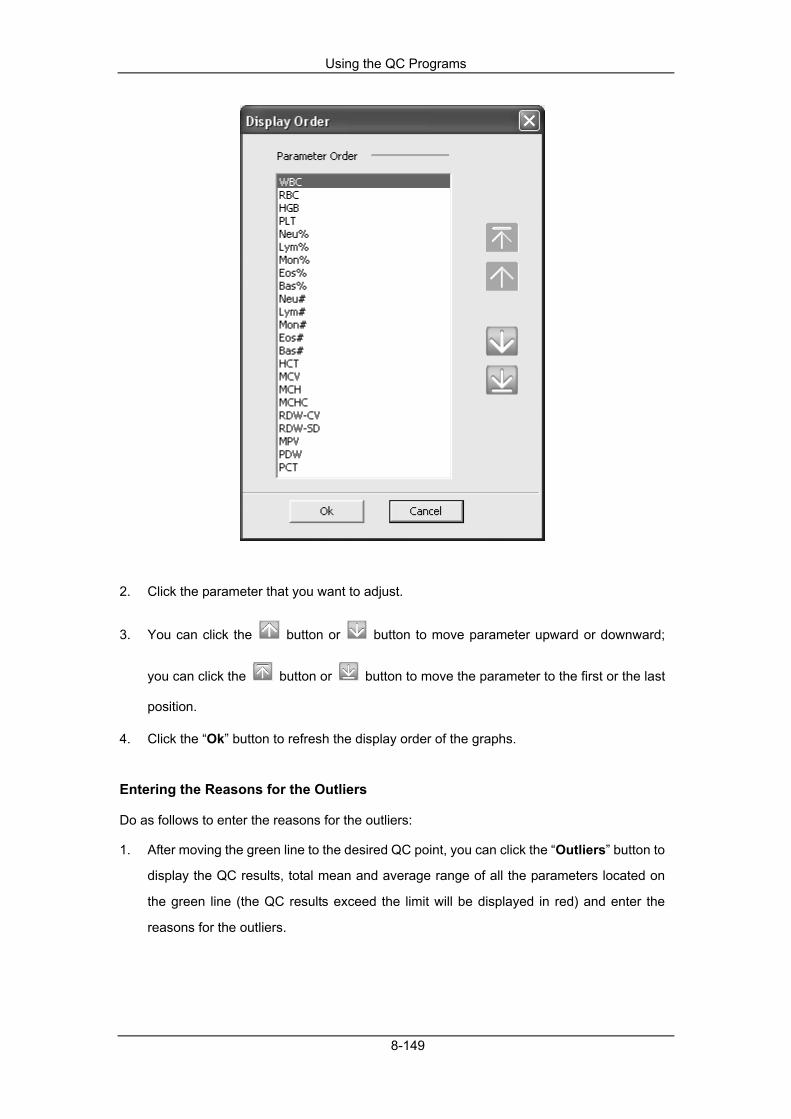
Using the QC Programs
8-149
2. Click the parameter that you want to adjust.
3. You can click the button or button to move parameter upward or downward;
you can click the button or button to move the parameter to the first or the last
position.
4. Click the “Ok” button to refresh the display order of the graphs.
Entering the Reasons for the Outliers
Do as follows to enter the reasons for the outliers:
1. After moving the green line to the desired QC point, you can click the “Outliers” button to
display the QC results, total mean and average range of all the parameters located on
the green line (the QC results exceed the limit will be displayed in red) and enter the
reasons for the outliers.
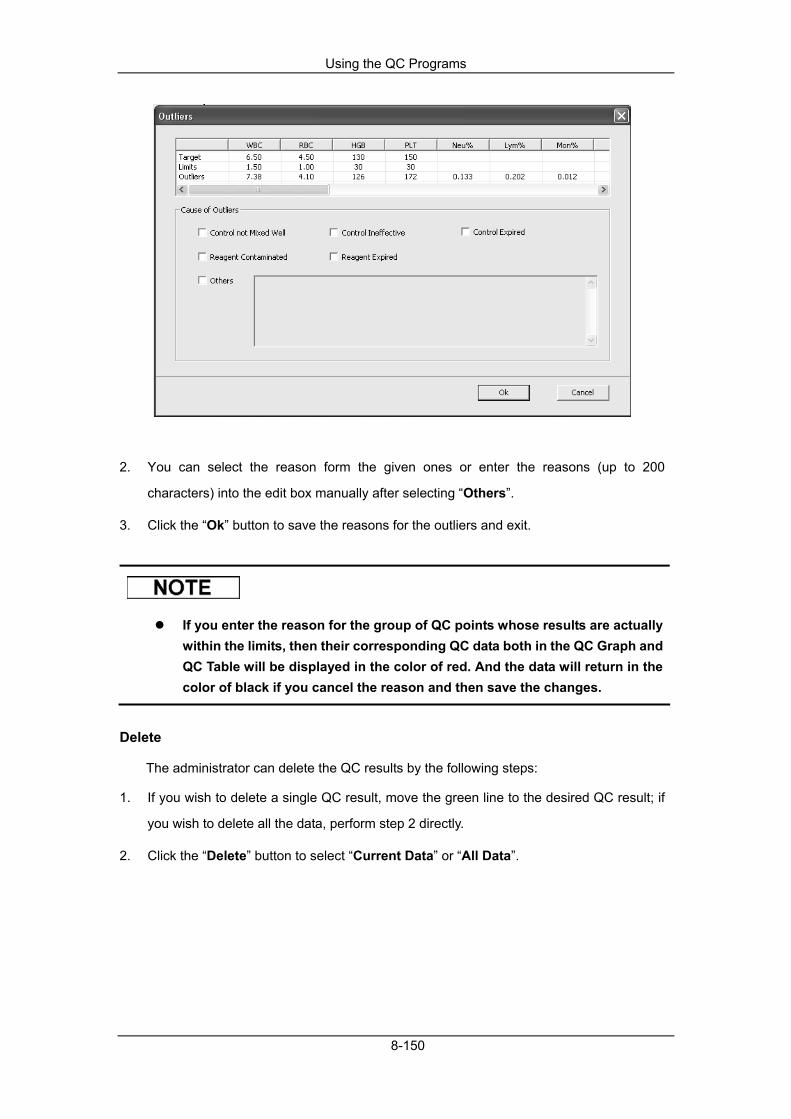
Using the QC Programs
8-150
2. You can select the reason form the given ones or enter the reasons (up to 200
characters) into the edit box manually after selecting “Others”.
3. Click the “Ok” button to save the reasons for the outliers and exit.
If you enter the reason for the group of QC points whose results are actually within the limits, then their corresponding QC data both in the QC Graph and QC Table will be displayed in the color of red. And the data will return in the color of black if you cancel the reason and then save the changes.
Delete
The administrator can delete the QC results by the following steps:
1. If you wish to delete a single QC result, move the green line to the desired QC result; if
you wish to delete all the data, perform step 2 directly.
2. Click the “Delete” button to select “Current Data” or “All Data”.

Using the QC Programs
8-151
3. Click the data you want to delete.
4. Click the “Ok” button and then confirm to delete the selected data.
The operation of deletion will be recorded in the log.
Click the “Print” button to print all the file information and graphs of the parameters of the current QC file.
The green line and the corresponding values of the QC points will not be printed.

Using the QC Programs
8-152
Table Review
All the samples, controls, calibrators, reagents, wastes and areas contacted them are potentially biohazardous. Wear proper personal protective equipment (e.g. gloves, lab coat, etc.) and follow safe laboratory procedures when handling them and the contacted areas in the laboratory.
You can enter the Table screen in one of the following ways:
Click the shortcut button “QC”.
Click the “Menu” button on the screen, and then select “QC” ” X mean R” on the pop-up menu.
Enter the “X mean R” graph screen.
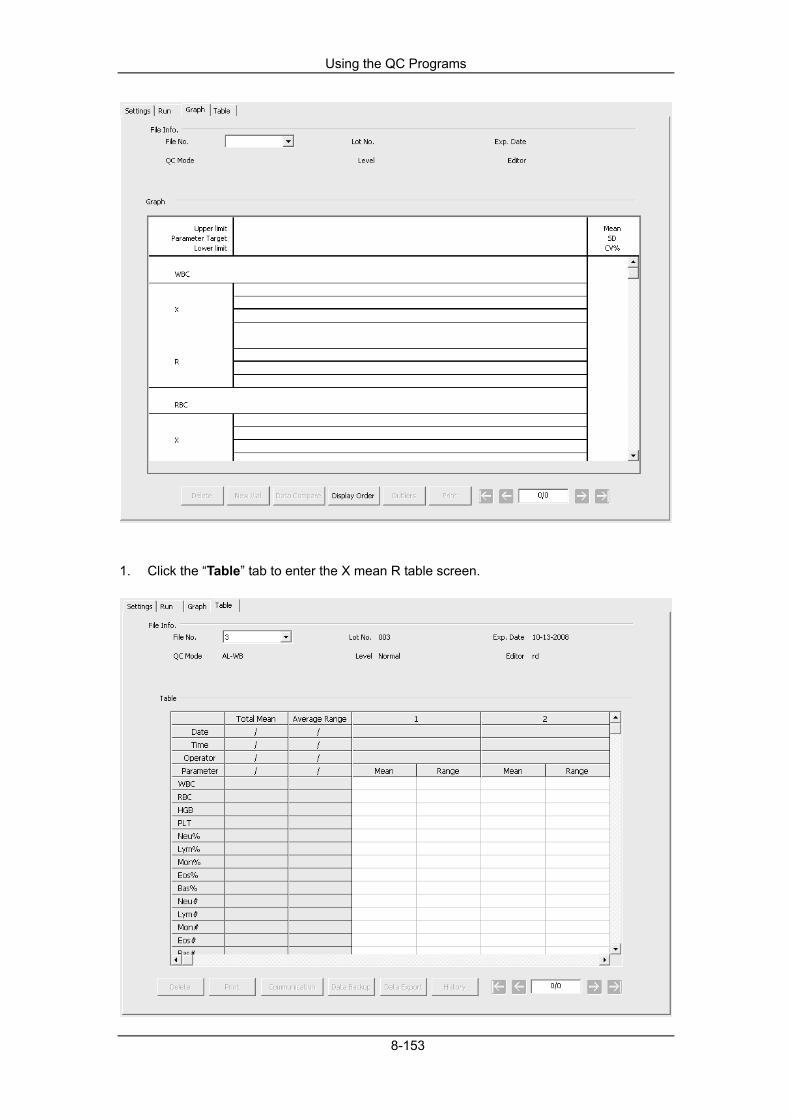
Using the QC Programs
8-153
1. Click the “Table” tab to enter the X mean R table screen.

Using the QC Programs
8-154
2. Select the QC file No. you want to review, and then the screen will display the
corresponding information and the table.
3. You can drag the scroll bar on the right of the table vertically to browse the desired table
of the parameter. You can drag the scroll bar down to the table horizontally to browse all
the QC results.
Introduction to the “Table” Screen
1- The No. of the QC result saved in the QC file (arranged from left to right in the order that from the earliest to the latest) 2- QC Result 3- QC parameters (displayed in the same order as the Graph screen) 4- QC flag: If 10 batches of QC results (20 times of QC runs) are obtained, the flag “H” or “L” will be used to prompt the result (X mean) that out of the limits 5- The relative position of the highlighted QC point and the total QC points saved currently.

Using the QC Programs
8-155
The total mean, average range and flag prompt for the parameters will be provided only after 10 batches of QC results (20 times of QC runs) are obtained.
The values of the QC result are the X mean and the range R of each batch of QC results.
Browsing the QC Result
You can click the arrow button in the bottom of the screen to browse the QC result saved in the current QC file.
You can click the button or button to highlight the previous or the next QC result;
you can click the button or button to highlight the first or the last QC result in the
table.
Delete
The administrator can delete the QC results by the following steps:
1. If you wish to delete a single QC result, click the column contains the desired QC result;
if you wish to delete all the data, perform step 2 directly.
2. Click the “Delete” button to select “Current Data” or “All Data”.
3. Click the data you want to delete.
4. Click the “Ok” button and then confirm to delete the selected data.
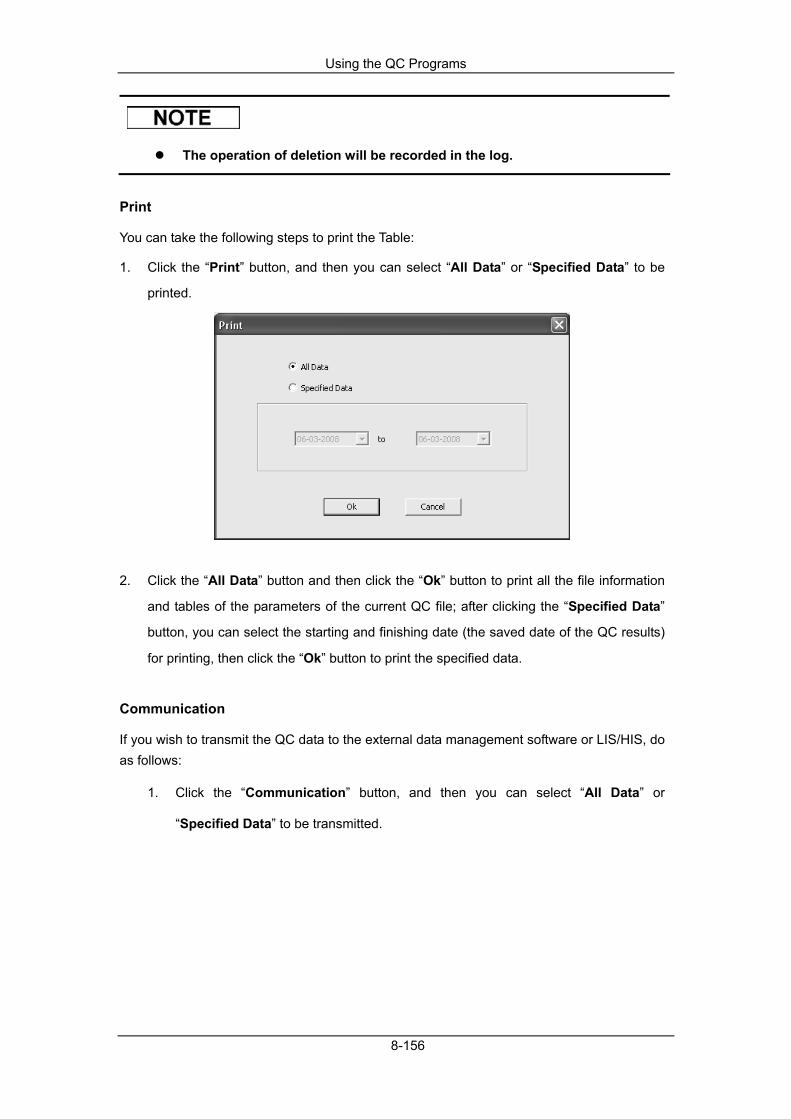
Using the QC Programs
8-156
The operation of deletion will be recorded in the log.
You can take the following steps to print the Table:
1. Click the “Print” button, and then you can select “All Data” or “Specified Data” to be
printed.
2. Click the “All Data” button and then click the “Ok” button to print all the file information
and tables of the parameters of the current QC file; after clicking the “Specified Data”
button, you can select the starting and finishing date (the saved date of the QC results)
for printing, then click the “Ok” button to print the specified data.
Communication
If you wish to transmit the QC data to the external data management software or LIS/HIS, do as follows:
1. Click the “Communication” button, and then you can select “All Data” or
“Specified Data” to be transmitted.

Using the QC Programs
8-157
2. Click the “All Data” button and then click the “Start” button to transmit the
information of the current QC file and QC data. After clicking the “Specified Data”
button, you can specify a date range (the date when the QC result was saved), then
click the “Ok” button to transmit the specified data. The “LIS/HIS connected” icon on
the status bar of the screen will flicker during transmission.
3. While transmitting, the “Start” button in the pop-up message box will be replaced by
“Stop”. You can click the “Stop” button to stop transmitting.
If auto-communication is enabled and a sample is ran during the transmission of the QC data, then only when the QC data transmission finished will the auto-communication of the sample result starts.
The QC data saved in the process of transmission will not be transmitted.
Data Backup
For operating system of Windows Vista, the right of copying database file is restricted by users' access level. To enable the data backup function, you should log on the system as administrator, and then right click the shortcut icon of the terminal software and run it as administrator.
If you wish to backup the information and the result of the current QC file, do as follows:
1. Click the “Data Backup” button, a message box will pop up.
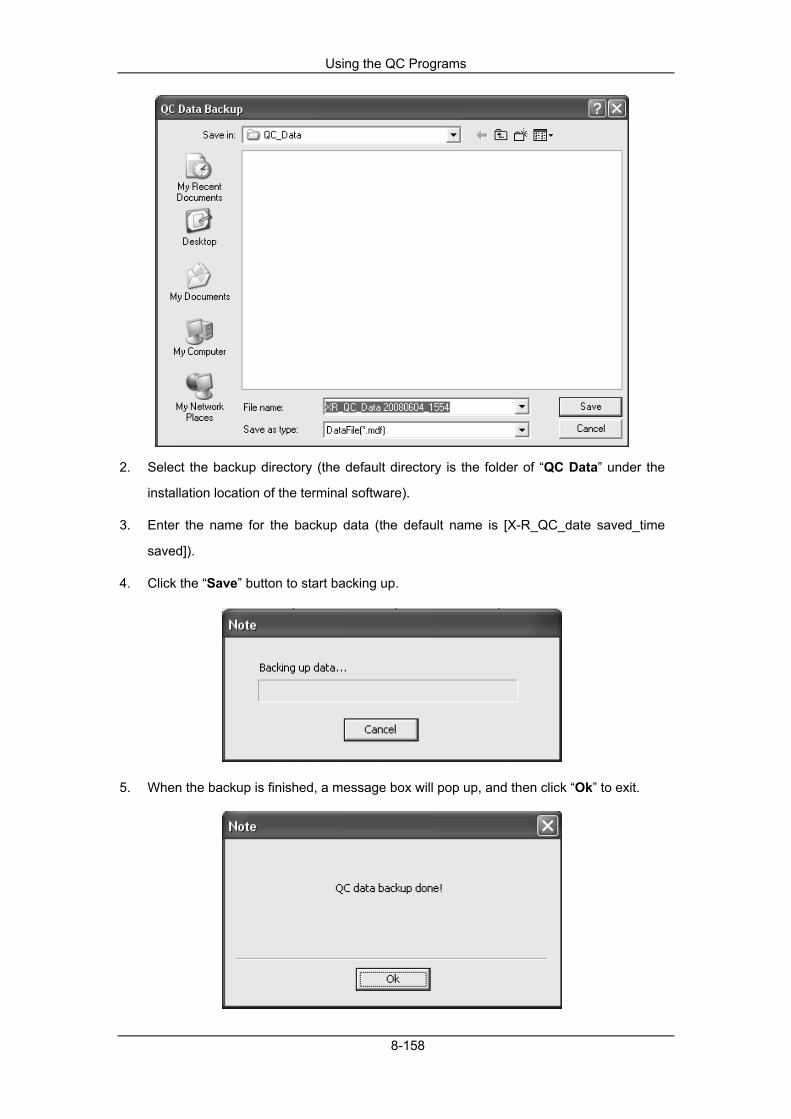
Using the QC Programs
8-158
2. Select the backup directory (the default directory is the folder of “QC Data” under the
installation location of the terminal software).
3. Enter the name for the backup data (the default name is [X-R_QC_date saved_time
saved]).
4. Click the “Save” button to start backing up.
5. When the backup is finished, a message box will pop up, and then click “Ok” to exit.
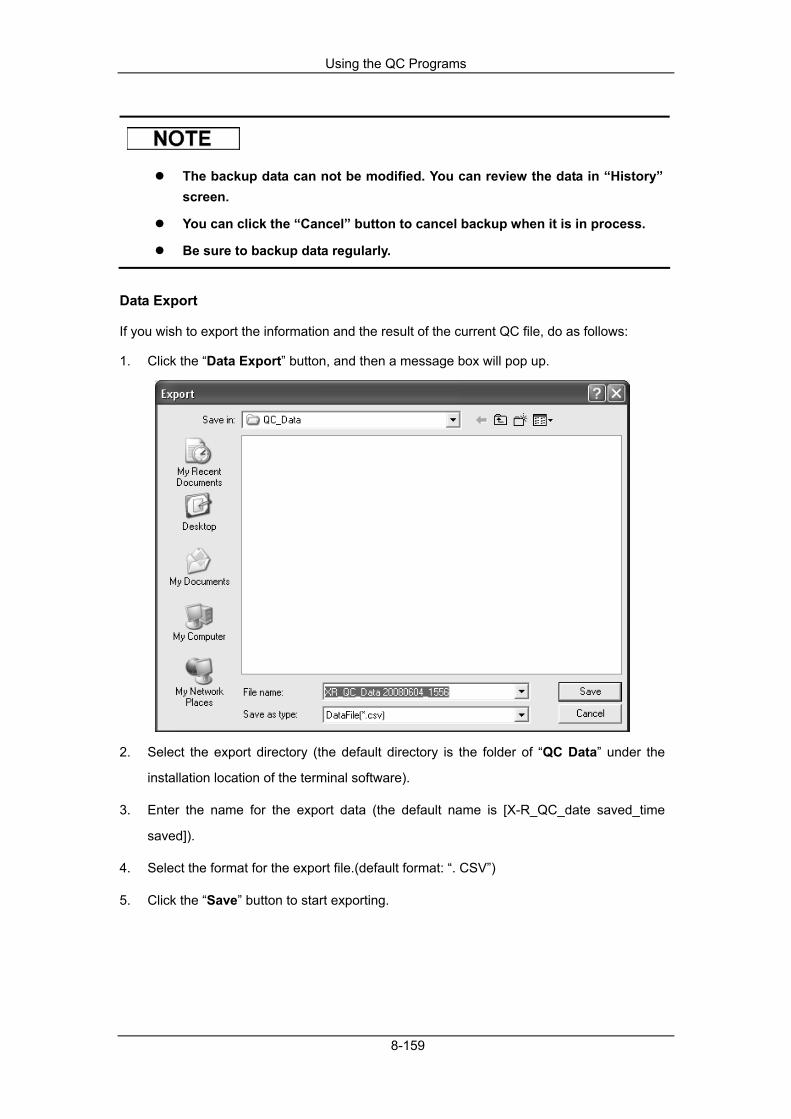
Using the QC Programs
8-159
The backup data can not be modified. You can review the data in “History” screen.
You can click the “Cancel” button to cancel backup when it is in process.
Be sure to backup data regularly.
Data Export
If you wish to export the information and the result of the current QC file, do as follows:
1. Click the “Data Export” button, and then a message box will pop up.
2. Select the export directory (the default directory is the folder of “QC Data” under the
installation location of the terminal software).
3. Enter the name for the export data (the default name is [X-R_QC_date saved_time
saved]).
4. Select the format for the export file.(default format: “. CSV”)
5. Click the “Save” button to start exporting.
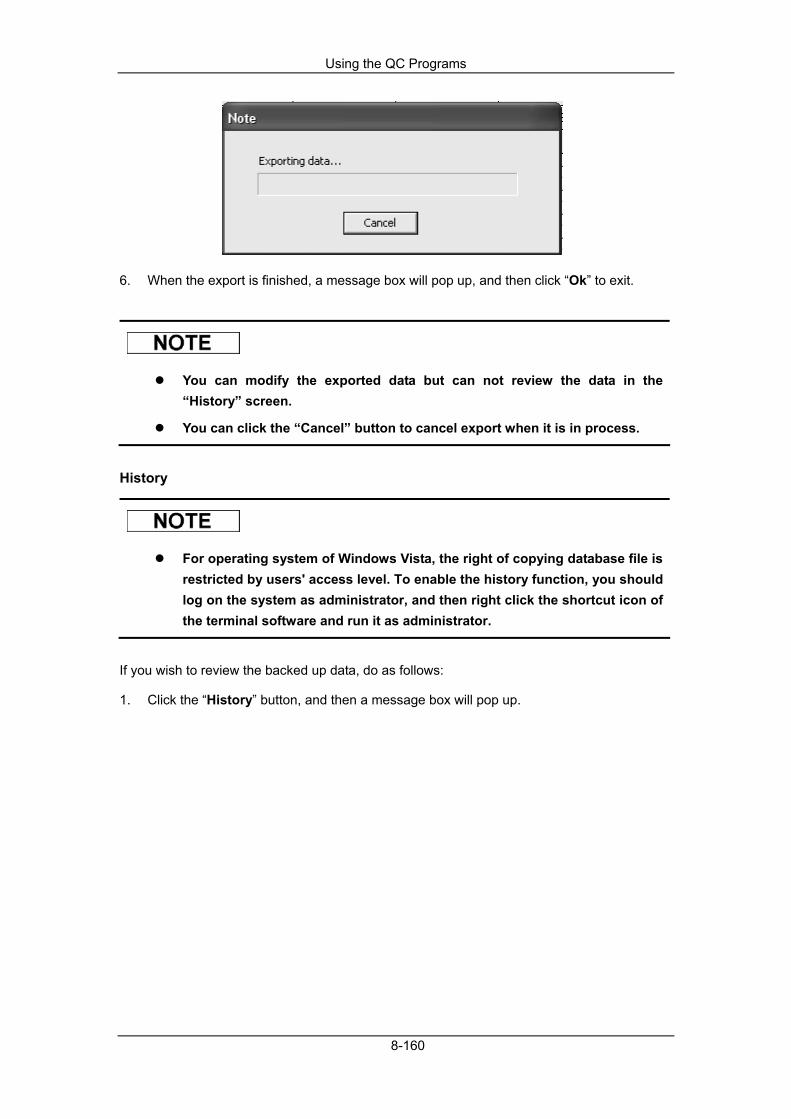
Using the QC Programs
8-160
6. When the export is finished, a message box will pop up, and then click “Ok” to exit.
You can modify the exported data but can not review the data in the “History” screen.
You can click the “Cancel” button to cancel export when it is in process.
History
For operating system of Windows Vista, the right of copying database file is restricted by users' access level. To enable the history function, you should log on the system as administrator, and then right click the shortcut icon of the terminal software and run it as administrator.
If you wish to review the backed up data, do as follows:
1. Click the “History” button, and then a message box will pop up.

Using the QC Programs
8-161
2. Locate and then select the desired backup data.
3. Click the “Open” button to display the data in “History” screen.

Using the QC Programs
8-162
4. The display format and the function button are the same as the QC Table review screen.
Browse, print, transmit and export the data as instructed in the section of QC Table
Review.
5. After reviewing, click the “Close” button to exit.
Using the QC Programs
8-163
8.5 X-B QC Program
8.5.1 X-B QC Principles The X-B analysis is a weighted moving average analysis that uses values obtained from patient samples. It uses the 3 red cell indices, MCV, MCH and MCHC to indicate the hematology instrument performance. Effective use of X-B requires randomization of samples and a normal cross section of patients to prevent skewing of indices. It is recommended the X-B analysis be activated when the sample volume of your laboratory is greater then 100 samples per day. The analyzer can save maximum 500 X-B QC results. When the saved QC results have reached the maximum number, the newest result will overwrite the oldest.
8.5.2 Editing X-B Settings
All the samples, controls, calibrators, reagents, wastes and areas contacted them are potentially biohazardous. Wear proper personal protective equipment (e.g. gloves, lab coat, etc.) and follow safe laboratory procedures when handling them and the contacted areas in the laboratory.
Only administrators can edit the X-B QC settings.
At the X-B QC setting screen, you can edit the QC information and configure the sample validity setup.
Editing the QC information
Before the X-B analysis, you should finish editing the QC information by one of the following ways:
Manual entry
Reading the saved preset values
Manual Entry
You can enter the graph screen in one of the following ways:
Click the shortcut button “QC”.

Using the QC Programs
8-164
Click the “Menu” button on the screen; then select “QC” ”X-B” on the pop-up menu.
Enter the “X-B” graph screen.
1. Click the “Settings” tab to enter the X-B setup screen.
For details to edit the name of the login user, see chapter 5 Customizing the Analyzer Software.
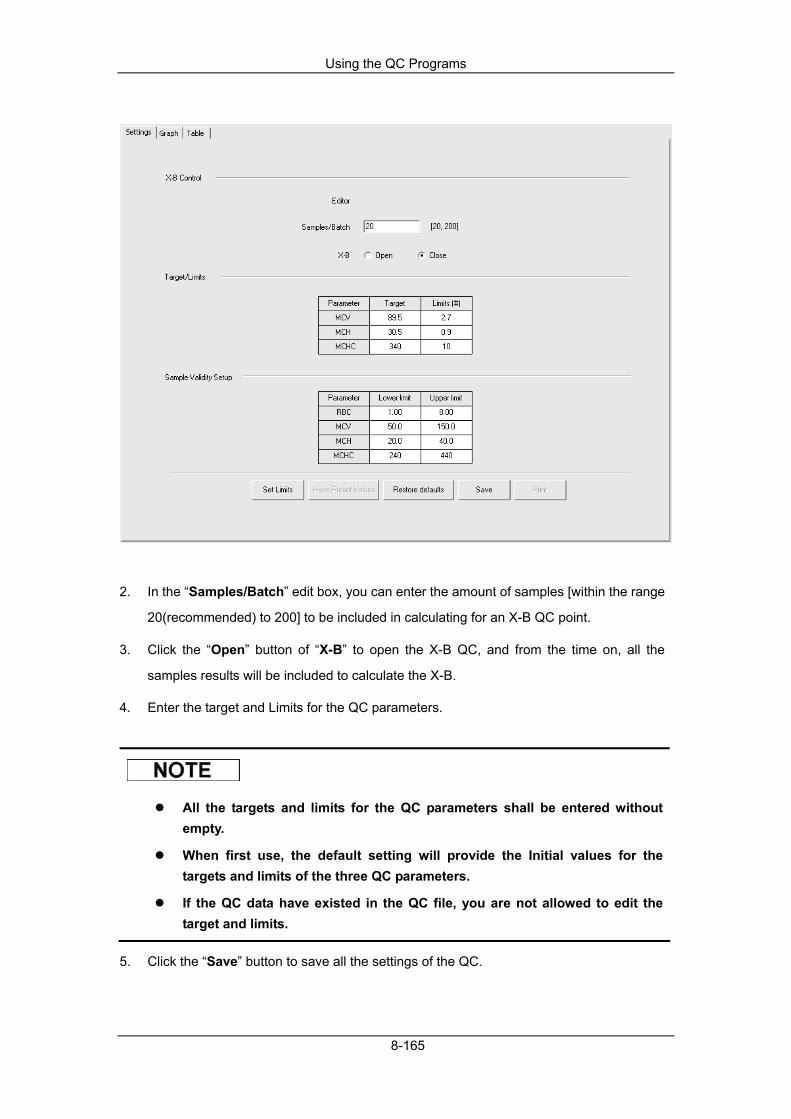
Using the QC Programs
8-165
2. In the “Samples/Batch” edit box, you can enter the amount of samples [within the range
20(recommended) to 200] to be included in calculating for an X-B QC point.
3. Click the “Open” button of “X-B” to open the X-B QC, and from the time on, all the
samples results will be included to calculate the X-B.
4. Enter the target and Limits for the QC parameters.
All the targets and limits for the QC parameters shall be entered without empty.
When first use, the default setting will provide the Initial values for the targets and limits of the three QC parameters.
If the QC data have existed in the QC file, you are not allowed to edit the target and limits.
5. Click the “Save” button to save all the settings of the QC.

Using the QC Programs
8-166
Reading the Saved Preset Values
If there are the saved preset values (Target and Limits) for the X-B QC, you can read-in the preset values into the X-B QC file. For details of calculating and saving the preset values, see Section 8.5.3 Reviewing QC results.
You can enter the graph screen in one of the following ways:
Click the shortcut button “QC”.
Click the “Menu” button on the screen; then select “QC” ”X-B” on the pop-up menu.
Enter the “X-B” graph screen.

Using the QC Programs
8-167
1. Click the “Settings” tab to enter the X-B setup screen.
For details to edit the name of the login user, see chapter 5 Customizing the Analyzer Software.
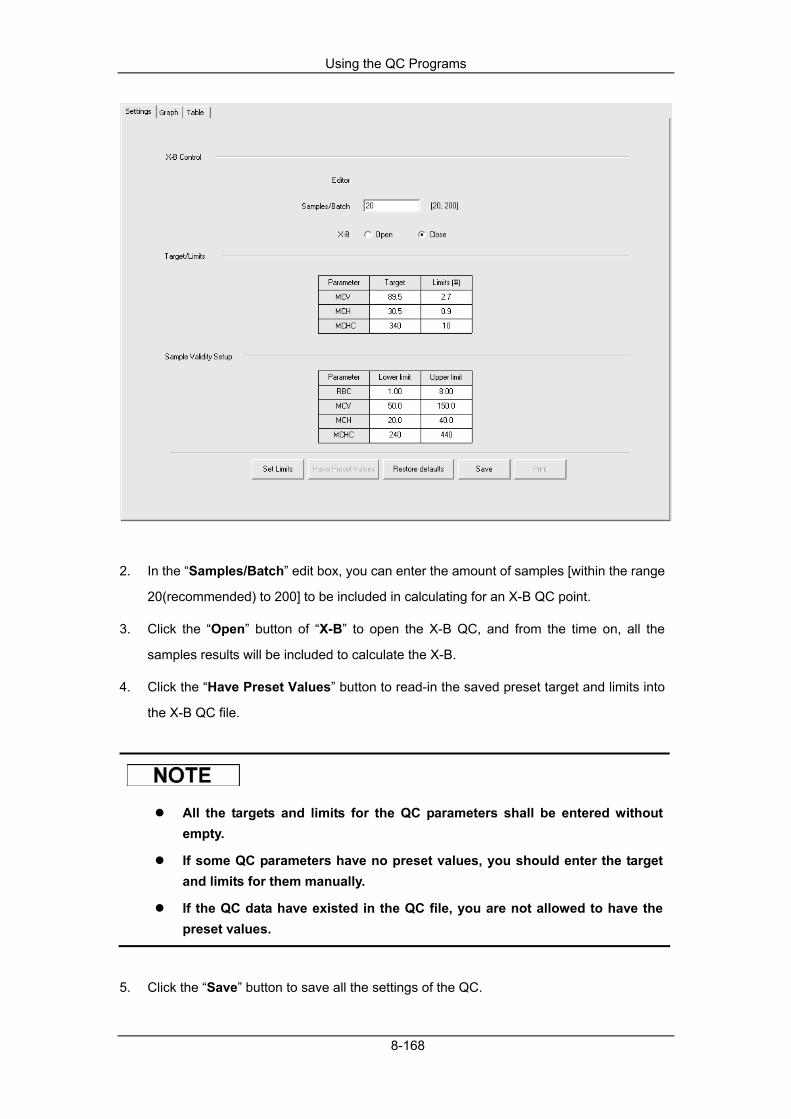
Using the QC Programs
8-168
2. In the “Samples/Batch” edit box, you can enter the amount of samples [within the range
20(recommended) to 200] to be included in calculating for an X-B QC point.
3. Click the “Open” button of “X-B” to open the X-B QC, and from the time on, all the
samples results will be included to calculate the X-B.
4. Click the “Have Preset Values” button to read-in the saved preset target and limits into
the X-B QC file.
All the targets and limits for the QC parameters shall be entered without empty.
If some QC parameters have no preset values, you should enter the target and limits for them manually.
If the QC data have existed in the QC file, you are not allowed to have the preset values.
5. Click the “Save” button to save all the settings of the QC.

Using the QC Programs
8-169
Setting Limits
Do as followings to adjust the display format of the limits and the calculation method of the preset limits.
1. Click the “Set Limits” button, and then the following message box will pop up.
2. Click “By SD” to display the limits in the form of absolute value; click “By CV” to display
the limits in the form of percentage.
3. If “By SD” is selected, click the “2SD” or “3SD” to select either double or triple standard
deviation to be the limits; if “By CV” is selected, click the “2CV” or “3CV” to select either
double or triple coefficient of variation to be the limits.
4. Click the “Ok” button to save all the settings for the limits.
Restoring Defaults
When editing the QC settings, if you wish to restore the target and limits to the defaults, you can click the “Restore Default” button to read-in the defaults to the X-B QC file.
The default target for each parameter:
MCV: 89.5fL MCH: 30.5pg MCHC: 340g/L
The default limits for each parameter:
MCV: 2.7 fL MCH: 0.9 pg MCHC: 10 g/L
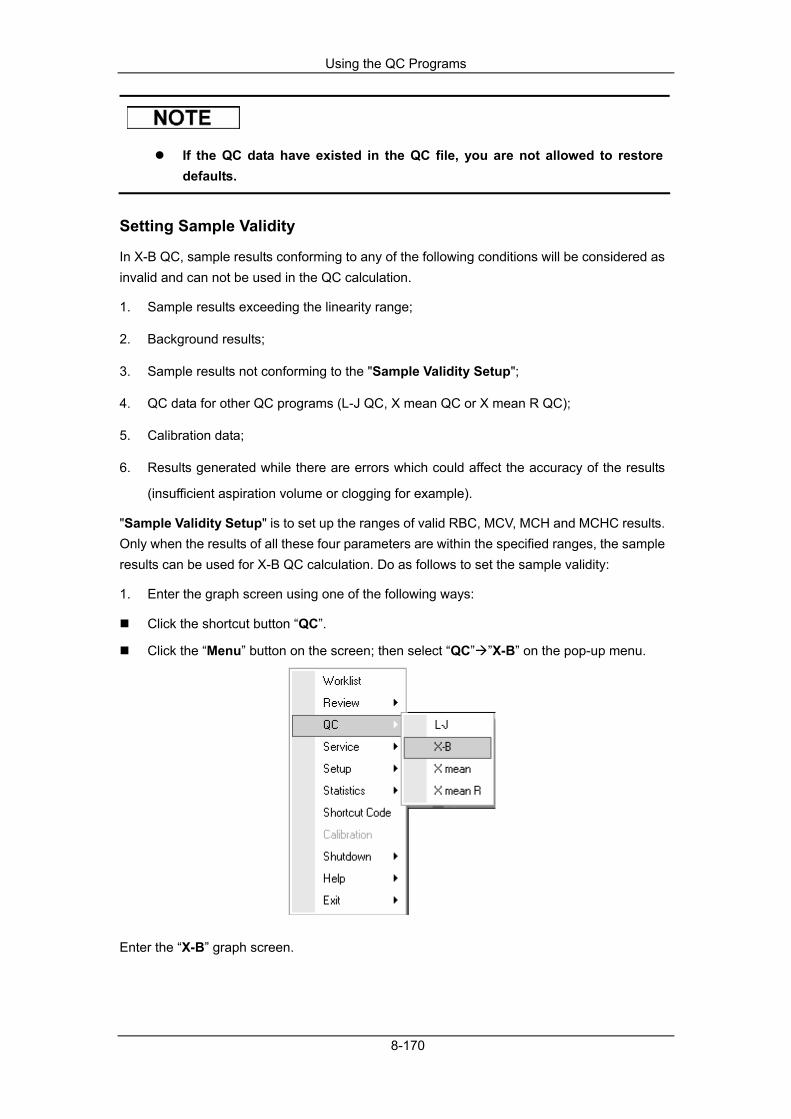
Using the QC Programs
8-170
If the QC data have existed in the QC file, you are not allowed to restore defaults.
Setting Sample Validity
In X-B QC, sample results conforming to any of the following conditions will be considered as invalid and can not be used in the QC calculation.
1. Sample results exceeding the linearity range;
2. Background results;
3. Sample results not conforming to the "Sample Validity Setup";
4. QC data for other QC programs (L-J QC, X mean QC or X mean R QC);
5. Calibration data;
6. Results generated while there are errors which could affect the accuracy of the results
(insufficient aspiration volume or clogging for example).
"Sample Validity Setup" is to set up the ranges of valid RBC, MCV, MCH and MCHC results. Only when the results of all these four parameters are within the specified ranges, the sample results can be used for X-B QC calculation. Do as follows to set the sample validity:
1. Enter the graph screen using one of the following ways:
Click the shortcut button “QC”.
Click the “Menu” button on the screen; then select “QC” ”X-B” on the pop-up menu.
Enter the “X-B” graph screen.

Using the QC Programs
8-171
2. Click the “Settings” tab to enter the X-B setup screen.
For details to edit the name of the login user, see chapter 5 Customizing the Analyzer Software.
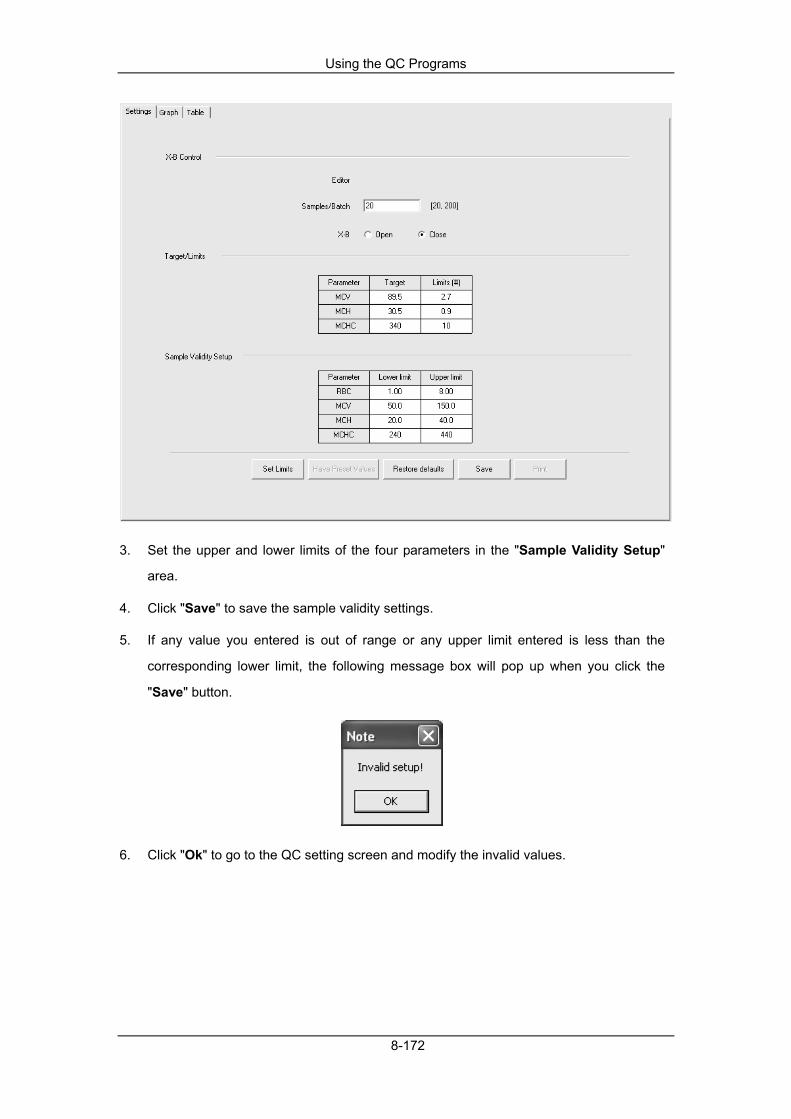
Using the QC Programs
8-172
3. Set the upper and lower limits of the four parameters in the "Sample Validity Setup"
area.
4. Click "Save" to save the sample validity settings.
5. If any value you entered is out of range or any upper limit entered is less than the
corresponding lower limit, the following message box will pop up when you click the
"Save" button.
6. Click "Ok" to go to the QC setting screen and modify the invalid values.

Using the QC Programs
8-173
The default validity ranges for the four parameters are:
1.0×10¹²/L≤RBC≤8.0×1012/L
50fL≤MCV≤150fL
20pg≤MCH≤40pg
240g/L≤MCHC≤440g/L
The validity entry range for RBC is its linearity range, and the validity entry ranges for other three parameters are those of their display ranges.
All the entries should be numbers with only one decimal point, and the entries should be restricted to the length of the edit boxes.
Once the validity range is changed, the previous results will not be used in the QC calculation as valid results, for example, if 20 valid samples are needed for the X-B QC calculation, when you change the validity range after 10 groups of valid sample results have been acquired, these 10 groups of results will be discarded, and only valid sample results generated afterwards will be used in the QC calculation.
Click the “Print” button to print the setting information of the current QC file.
8.5.3 Running Controls
All the samples, controls, calibrators, reagents, wastes and areas contacted them are potentially biohazardous. Wear proper personal protective equipment (e.g. gloves, lab coat, etc.) and follow safe laboratory procedures when handling them and the contacted areas in the laboratory.
After editing the X-B settings, the system will start the X-B run automatically. After every 20~200 results (determined by the setting) are obtained, the system will perform the X-B calculation once automatically. You can review the result in X-B graph or X-B table.
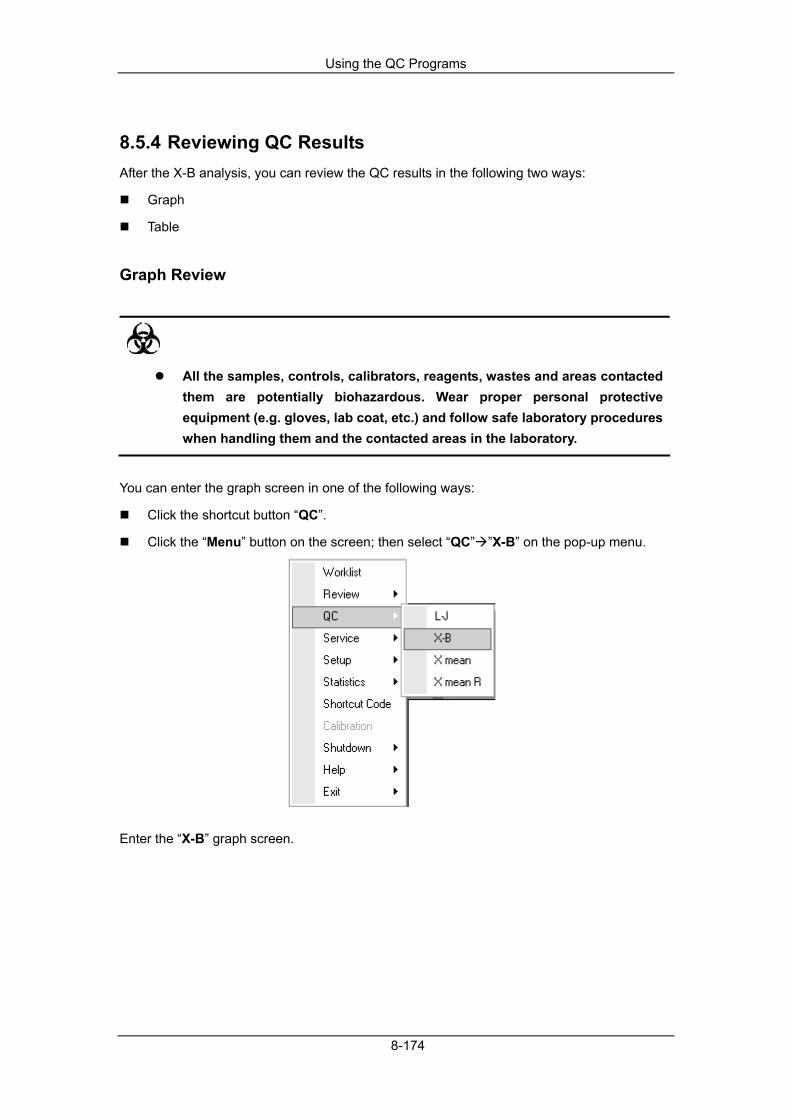
Using the QC Programs
8-174
8.5.4 Reviewing QC Results After the X-B analysis, you can review the QC results in the following two ways:
Graph
Table
Graph Review
All the samples, controls, calibrators, reagents, wastes and areas contacted them are potentially biohazardous. Wear proper personal protective equipment (e.g. gloves, lab coat, etc.) and follow safe laboratory procedures when handling them and the contacted areas in the laboratory.
You can enter the graph screen in one of the following ways:
Click the shortcut button “QC”.
Click the “Menu” button on the screen; then select “QC” ”X-B” on the pop-up menu.
Enter the “X-B” graph screen.
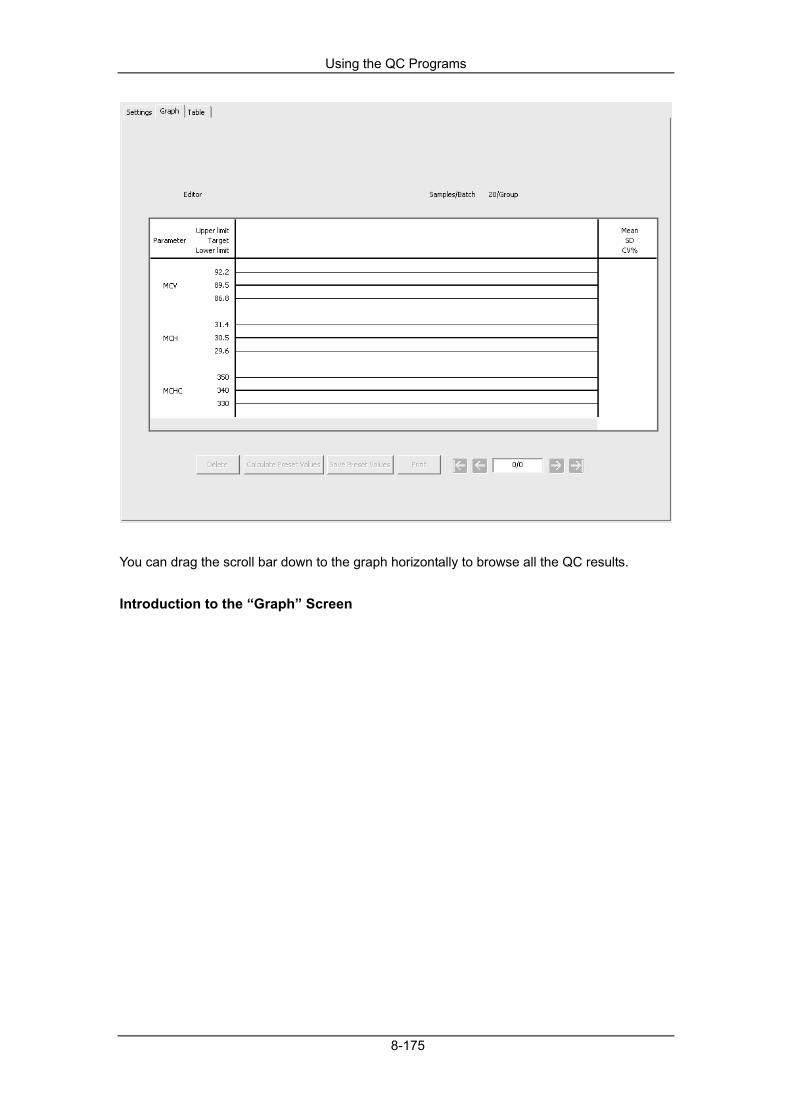
Using the QC Programs
8-175
You can drag the scroll bar down to the graph horizontally to browse all the QC results.
Introduction to the “Graph” Screen

Using the QC Programs
8-176
1- The Mean, SD and CV% of all the QC results of each parameter in the current graph. 2- The saving date and time of the QC points located on the green line 3- The QC points in each graph are displayed from left to right according to the sequence from the earliest to the latest. The QC points are connected by a line to illustrate the distribution trend. 4- The QC results of the parameters that correspond to the QC points located on the green line. 5- When you clicking a QC point in the graph, the QC points of other parameters that saved together with this one will be marked by a green line. 6- The QC point corresponds to each QC result. Only the selected QC point displays its value under the parameter. The black QC point indicates the value is within the limit; the red QC point indicates the value is out of the limit. 7- The relative position of the QC point located on the green line and the total QC points saved currently.
The value of the outlier is the X-B result of each batch of samples.
The outliers are excluded from the calculation of Mean, SD and CV%.
Using the QC Programs
8-177
Browsing the QC Result
You can click the arrow button in the bottom of the screen to browse the QC result saved in the current QC file.
You can click the button or button to move the green line to the previous or the
next QC point; you can click the button or button to move the green line to the first
or the last QC point in the graph. When the location of the green line is selected, you can check the QC results of the QC points located on the green line under each parameter.
Saving Preset Values
If there are 3 or more than 3 QC results within the limits obtained for the parameters, you can take the following steps to calculate and save the preset value for each parameter:
1. Click the “Calculate Preset Values” button, and then the screen displays two lines for
you to select the range for calculating the preset values.
2. Click and drag the two lines respectively to locate them at the beginning and the ending
of the range for calculating the preset values.
3. The Mean, SD and CV% (on the right of the graph) will change into the new results
which obtained by calculating the selected range.
4. If you wish to save the new results, you can click the “Save Preset Values” button to
save the current Mean, SD and CV% as the preset values for the corresponding level
(high/normal/low). Then, the two selecting lines disappear and the Mean, SD and CV%
return to the calculated results of all QC results.
The calculation and display of the preset values are only available to the parameter (within the calculation range) which has 3 or more than 3 results within the limit. Otherwise, the display of the preset values will be empty.
Delete
The administrator can delete the QC results by the following steps:
1. If you wish to delete a single QC result, move the green line to the desired QC result; if
you wish to delete all the data, perform step 2 directly.
2. Click the “Delete” button to select “Current Data” or “All Data”.
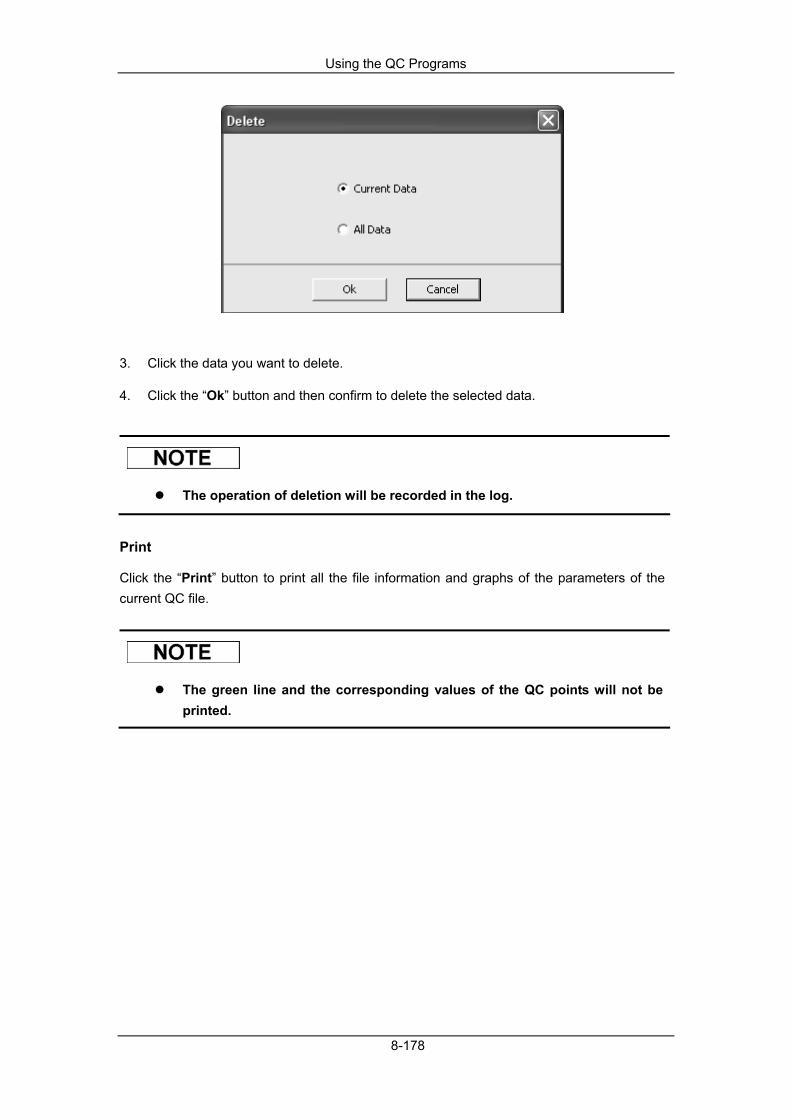
Using the QC Programs
8-178
3. Click the data you want to delete.
4. Click the “Ok” button and then confirm to delete the selected data.
The operation of deletion will be recorded in the log.
Click the “Print” button to print all the file information and graphs of the parameters of the current QC file.
The green line and the corresponding values of the QC points will not be printed.

Using the QC Programs
8-179
Table Review
All the samples, controls, calibrators, reagents, wastes and areas contacted them are potentially biohazardous. Wear proper personal protective equipment (e.g. gloves, lab coat, etc.) and follow safe laboratory procedures when handling them and the contacted areas in the laboratory.
You can enter the Table screen in one of the following ways:
Click the shortcut button “QC”.
Click the “Menu” button on the screen; then select “QC” ”X-B” on the pop-up menu.
Enter the “X-B” graph screen.
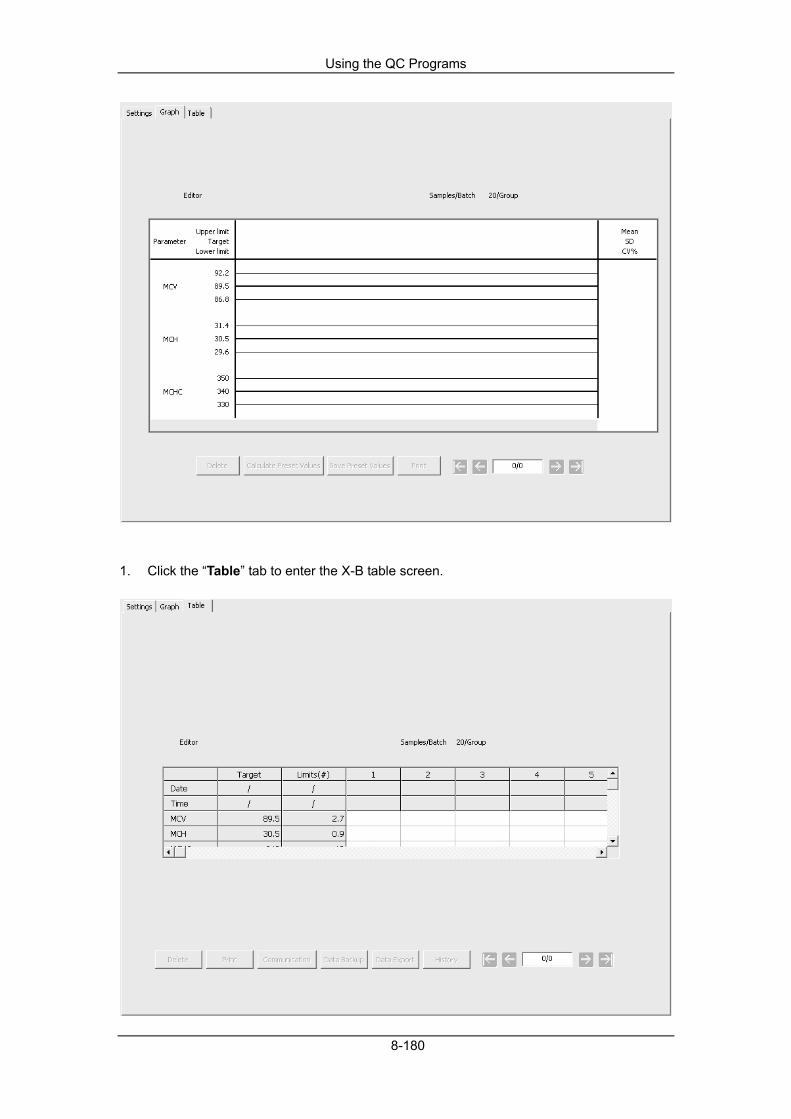
Using the QC Programs
8-180
1. Click the “Table” tab to enter the X-B table screen.

Using the QC Programs
8-181
2. You can drag the scroll bar down to the table horizontally to browse all the QC results.
Introduction to the “Table” Screen
1- QC Result 2- The No. of the QC result saved in the QC file (arranged from left to right in the order that from the earliest to the latest) 3- QC parameters (displayed in the same order as the Graph screen) 4- QC flag: The flag “H” or “L” will be used to prompt the result that out of the limits 5- The relative position of the highlighted QC point and the total QC points saved currently.
The value of the QC result is the X-B result of each batch of samples.
Browsing the QC Result
You can click the arrow button in the bottom of the screen to browse the QC result saved in the current QC file.
You can click the button or button to highlight the previous or the next QC result;
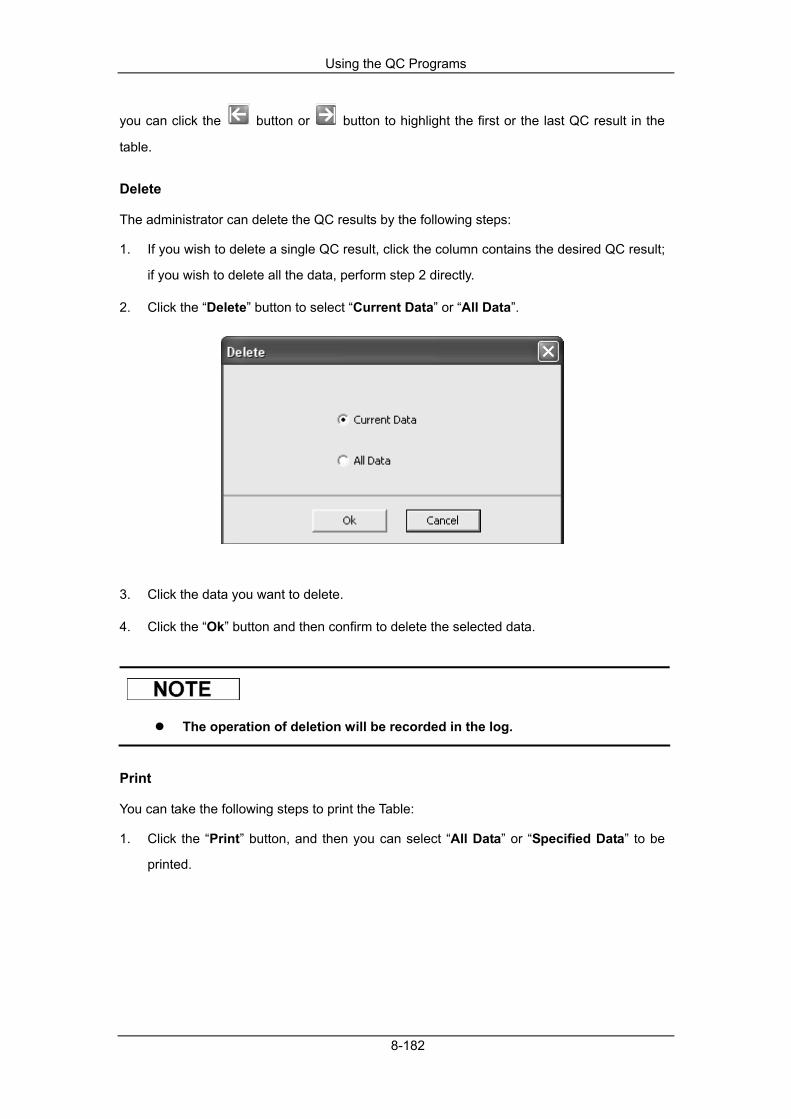
Using the QC Programs
8-182
you can click the button or button to highlight the first or the last QC result in the
table.
Delete
The administrator can delete the QC results by the following steps:
1. If you wish to delete a single QC result, click the column contains the desired QC result;
if you wish to delete all the data, perform step 2 directly.
2. Click the “Delete” button to select “Current Data” or “All Data”.
3. Click the data you want to delete.
4. Click the “Ok” button and then confirm to delete the selected data.
The operation of deletion will be recorded in the log.
You can take the following steps to print the Table:
1. Click the “Print” button, and then you can select “All Data” or “Specified Data” to be
printed.

Using the QC Programs
8-183
2. Click the “All Data” button and then click the “Ok” button to print all the file information
and tables of the parameters of the current QC file; after clicking the “Specified Data”
button, you can select the starting and finishing date (the saved date of the QC results)
for printing, then click the “Ok” button to print the specified data.
Communication
If you wish to transmit the QC data to the external data management software or LIS/HIS, do as follows:
1. Click the “Communication” button, and then you can select “All Data” or
“Specified Data” to be transmitted.
2. Click the “All Data” button and then click the “Start” button to transmit the
information of the current QC file and QC data. After clicking the “Specified Data”
button, you can specify a date range (the date when the QC result was saved), then
click the “Ok” button to transmit the specified data. The “LIS/HIS connected” icon on
the status bar of the screen will flicker during transmission.

Using the QC Programs
8-184
3. While transmitting, the “Start” button in the pop-up message box will be replaced by
“Stop”. You can click the “Stop” button to stop transmitting.
If auto-communication is enabled and a sample is ran during the transmission of the QC data, then only when the QC data transmission finished will the auto-communication of the sample result starts.
The QC data saved in the process of transmission will not be transmitted.
Data Backup
For operating system of Windows Vista, the right of copying database file is restricted by users' access level. To enable the data backup function, you should log on the system as administrator, and then right click the shortcut icon of the terminal software and run it as administrator.
If you wish to backup the information and the result of the current QC file, do as follows:
1. Click the “Data Backup” button, a message box will pop up.
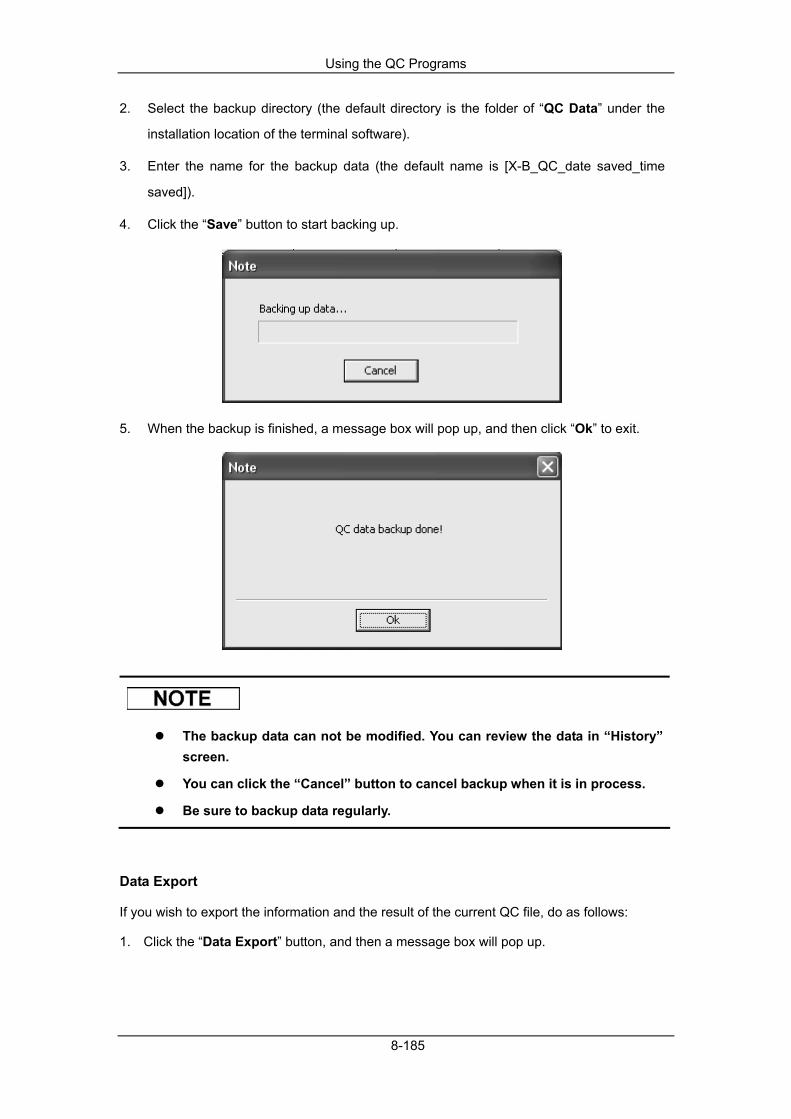
Using the QC Programs
8-185
2. Select the backup directory (the default directory is the folder of “QC Data” under the
installation location of the terminal software).
3. Enter the name for the backup data (the default name is [X-B_QC_date saved_time
saved]).
4. Click the “Save” button to start backing up.
5. When the backup is finished, a message box will pop up, and then click “Ok” to exit.
The backup data can not be modified. You can review the data in “History” screen.
You can click the “Cancel” button to cancel backup when it is in process.
Be sure to backup data regularly.
Data Export
If you wish to export the information and the result of the current QC file, do as follows:
1. Click the “Data Export” button, and then a message box will pop up.

Using the QC Programs
8-186
2. Select the export directory (the default directory is the folder of “QC Data” under the
installation location of the terminal software).
3. Enter the name for the export data (the default name is [X-B_QC_date saved_time
saved]).
4. Select the format for the export file. (Default format: “. CSV”)
5. Click the “Save” button to start exporting.
6. When the export is finished, a message box will pop up, and then click “Ok” to exit.
You can modify the exported data but can not review the data in the “History” screen.
You can click the “Cancel” button to cancel export when it is in process.

Using the QC Programs
8-187
History
For operating system of Windows Vista, the right of copying database file is restricted by users' access level. To enable the history function, you should log on the system as administrator, and then right click the shortcut icon of the terminal software and run it as administrator.
If you wish to review the backed up data, do as follows:
1. Click the “History” button, and then a message box will pop up.
2. Locate and then select the desired backup data.
3. Click the “Open” button to display the data in “History” screen.
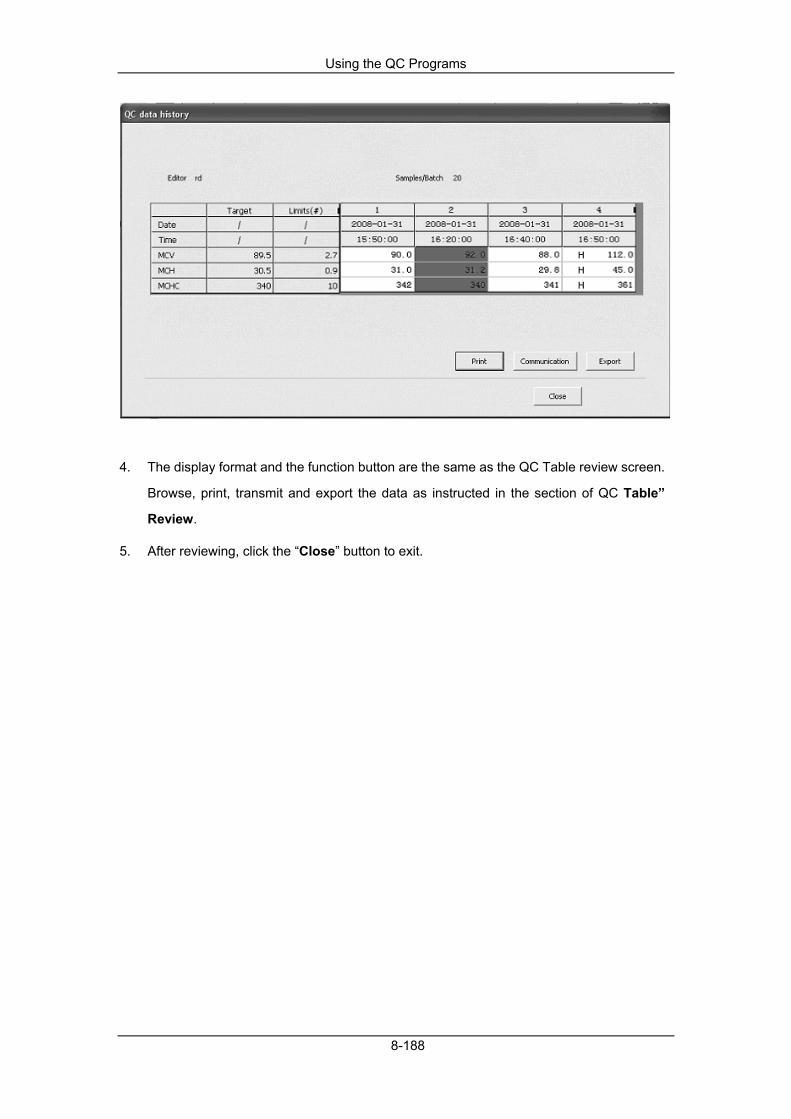
Using the QC Programs
8-188
4. The display format and the function button are the same as the QC Table review screen.
Browse, print, transmit and export the data as instructed in the section of QC Table”
Review.
5. After reviewing, click the “Close” button to exit.

9-1
9 Using the Calibration Programs
9.1 Introduction Calibration is a procedure to standardize the analyzer by determining its deviation, if any, from calibration references and to apply any necessary correction factors. There are three calibration programs available on this analyzer: manual calibration, auto calibration using calibrators and auto calibration using fresh blood samples. All the parameters or part of the parameters of WBC, RBC, HGB, MCV and PLT can be calibrated by the calibration procedure.
Calibration procedures can only be performed by users of the administrator-level.
You should only use the Mindray-specified calibrations and reagents. Store and use the calibrations and reagents as instructed by instructions for use of the calibrations and reagents.
The analyzer identifies a sample as a calibration sample only if the analysis is started from the “Calibration” screen.
The calculation of reproducibility is included in the calibration procedure.

Using the Calibration Programs
9-2
9.2 When to Calibrate This analyzer is calibrated at the factory just before shipment. It is electronically stable and does not require frequent recalibration if you operate and maintain it as instructed by this manual. You only need to recalibrate this analyzer if:
it is the first time this analyzer has been used (usually done by a Mindray-authorized representative when installing the analyzer).
an analytical component has been changed.
you are going to re-use the analyzer after a long-term storage.
the quality control results indicate there may be a problem.
All of the measured parameters must be calibrated before readings of this analyzer can be used as valid analysis results.
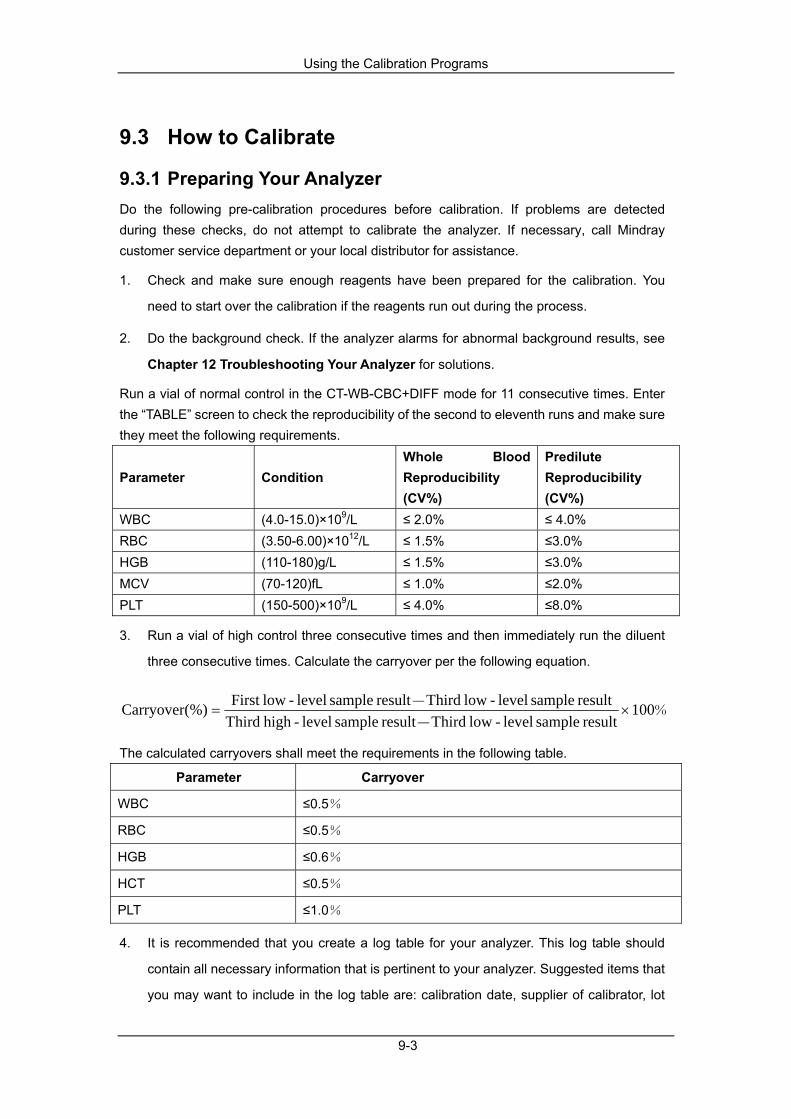
Using the Calibration Programs
9-3
9.3 How to Calibrate
9.3.1 Preparing Your Analyzer Do the following pre-calibration procedures before calibration. If problems are detected during these checks, do not attempt to calibrate the analyzer. If necessary, call Mindray customer service department or your local distributor for assistance.
1. Check and make sure enough reagents have been prepared for the calibration. You
need to start over the calibration if the reagents run out during the process.
2. Do the background check. If the analyzer alarms for abnormal background results, see
Chapter 12 Troubleshooting Your Analyzer for solutions.
Run a vial of normal control in the CT-WB-CBC+DIFF mode for 11 consecutive times. Enter the “TABLE” screen to check the reproducibility of the second to eleventh runs and make sure they meet the following requirements.
Parameter Condition Whole Blood Reproducibility (CV%)
Predilute Reproducibility (CV%)
WBC (4.0-15.0)×109/L ≤ 2.0% ≤ 4.0% RBC (3.50-6.00)×1012/L ≤ 1.5% ≤3.0% HGB (110-180)g/L ≤ 1.5% ≤3.0% MCV (70-120)fL ≤ 1.0% ≤2.0% PLT (150-500)×109/L ≤ 4.0% ≤8.0%
3. Run a vial of high control three consecutive times and then immediately run the diluent
three consecutive times. Calculate the carryover per the following equation.
%-- 100
result sample level-low hirdTresult sample level-high hirdTresult sample level-low hirdTresult sample level-lowFirst (%)Carryover ×=
The calculated carryovers shall meet the requirements in the following table.
Parameter Carryover
WBC ≤0.5%
RBC ≤0.5%
HGB ≤0.6%
HCT ≤0.5%
PLT ≤1.0%
4. It is recommended that you create a log table for your analyzer. This log table should
contain all necessary information that is pertinent to your analyzer. Suggested items that
you may want to include in the log table are: calibration date, supplier of calibrator, lot

Using the Calibration Programs
9-4
number, expected results and limits, and result of background check.
All the samples, controls, calibrators, reagents, wastes and areas contacted them are potentially biohazardous. Wear proper personal protective equipment (e.g. gloves, lab coat, etc.) and follow safe laboratory procedures when handling them and the contacted areas in the laboratory.
The sample probe is sharp and potentially biohazardous, Exercise caution to avoid contact with the probe when working around it.
The reagents are irritating to eyes, skin and diaphragm. Wear proper personal protective equipment (e.g. gloves, lab coat, etc.) and follow safe laboratory procedures when handling them in the laboratory.
If the reagents accidentally spill on your skin, wash them off with plenty of water and if necessary, go see a doctor; if the reagents accidentally spill into your eyes, wash them off with plenty of water and immediately go see a doctor.
Keep you clothed, hairs and hands away from the moving parts to avoid injury.
Be sure to dispose of reagents, waste, samples, consumables, etc. according to government regulations.
Do not re-use such disposable product as collection tubes, test tubes, capillary tubes, etc.
You should only use the Mindray-specified controls and reagents. Store and use the controls and reagents as instructed by instructions for use of the controls and reagents.
Be sure to use the Mindray-specified disposable products including evacuated blood collection tube, anticoagulant collection tubes and capillary tubes etc.
Be sure to use the evacuated blood collection tubes as specified in the appendix.

Using the Calibration Programs
9-5
9.3.2 Manual Calibration Do as follows to calibrate the analyzer:
1. Click “Menu”, select “Calibration” to enter the ”Calibration Factors” screen. The
calibration factors of whole blood mode and predilute mode are displayed at the
“Calibration Factors” screen.
The login users of common-level can not perform the calibration procedures but only browse the calibration factors at the current screen. To perform the calibration, please logout and then login as users of administrator-level.
2. Enter the “Calibration Factors” screen to check the calibration factors and calculate the
new factors per the following equation.
Mean valueReferencefactorn calibratioCurrent factorn calibratio New ×
=
For example: Supposed the WBC reference value of a calibrator is 8.4, and the current calibration factor of the whole blood mode is 98.9%

Using the Calibration Programs
9-6
Run the calibrator in the whole blood mode for 11 consecutive times and take the WBC results of the 2nd to 11th runs (n=10) to calculate: 8.1, 8.0, 8.1, 8.1, 8.3, 8.3, 8.2, 8.0, 8.1, 8.3. The obtained CV is 1.5% and Mean is 8.16, which meet the requirements. The new calibration factor is obtained:
%81.10116.8
4.8%90.98factorn calibratio New ==×
The calculated calibration factors shall be between 75% - 125%.In case of an invalid calibration factor, try to find out the reason (e.g. calibration material not thoroughly mixed misoperation, etc.).Then recalibrate the analyzer and recalculate the calibration factors.
The entered calibration factors shall be between 75.0% - 125.0% (calculate to two decimal places).
3. Enter the new calibration factors into the factor cell of the parameter that requires
calibration.
4. After the entry, click the “Save” button at the bottom of the screen. If the new calibration
factors are valid and different from the originals, a message box shown below will pop
up.
Click “Yes” to save the news calibration factors and the calibration date of the corresponding parameter changes to the current system date. Then, close the message box and return to the “Calibration Factors” screen without any cell being highlighted. If the new calibration factors are invalid, the message box will pop up.
Click “Ok” to close the message box and the cell of the first invalid calibration factors is
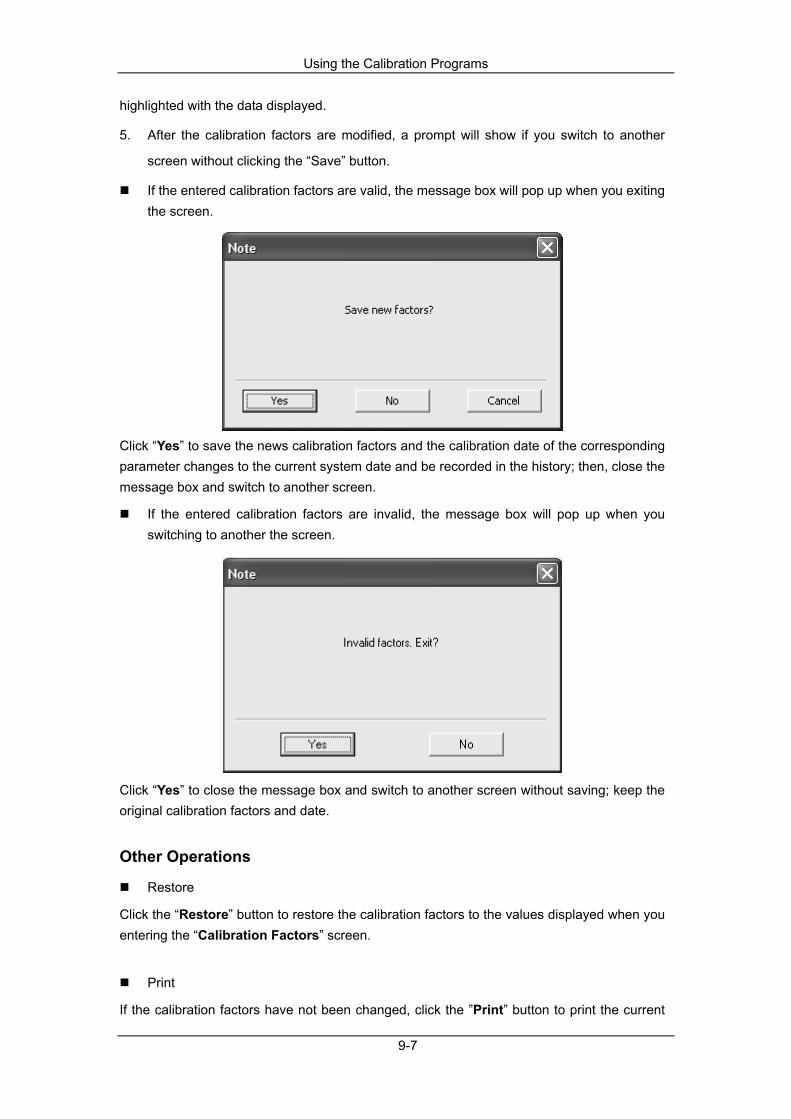
Using the Calibration Programs
9-7
highlighted with the data displayed.
5. After the calibration factors are modified, a prompt will show if you switch to another
screen without clicking the “Save” button.
If the entered calibration factors are valid, the message box will pop up when you exiting the screen.
Click “Yes” to save the news calibration factors and the calibration date of the corresponding parameter changes to the current system date and be recorded in the history; then, close the message box and switch to another screen.
If the entered calibration factors are invalid, the message box will pop up when you switching to another the screen.
Click “Yes” to close the message box and switch to another screen without saving; keep the original calibration factors and date.
Other Operations
Restore
Click the “Restore” button to restore the calibration factors to the values displayed when you entering the “Calibration Factors” screen.
If the calibration factors have not been changed, click the ”Print” button to print the current
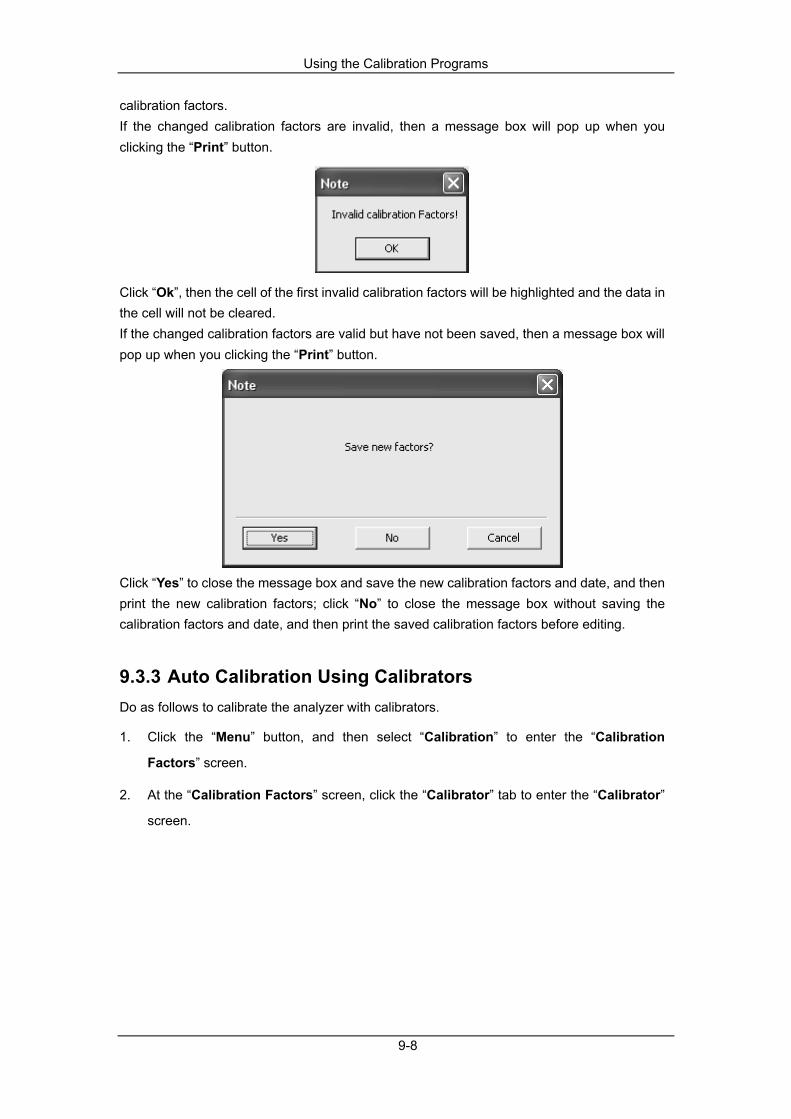
Using the Calibration Programs
9-8
calibration factors. If the changed calibration factors are invalid, then a message box will pop up when you clicking the “Print” button.
Click “Ok”, then the cell of the first invalid calibration factors will be highlighted and the data in the cell will not be cleared. If the changed calibration factors are valid but have not been saved, then a message box will pop up when you clicking the “Print” button.
Click “Yes” to close the message box and save the new calibration factors and date, and then print the new calibration factors; click “No” to close the message box without saving the calibration factors and date, and then print the saved calibration factors before editing.
9.3.3 Auto Calibration Using Calibrators Do as follows to calibrate the analyzer with calibrators.
1. Click the “Menu” button, and then select “Calibration” to enter the “Calibration
Factors” screen.
2. At the “Calibration Factors” screen, click the “Calibrator” tab to enter the “Calibrator”
screen.
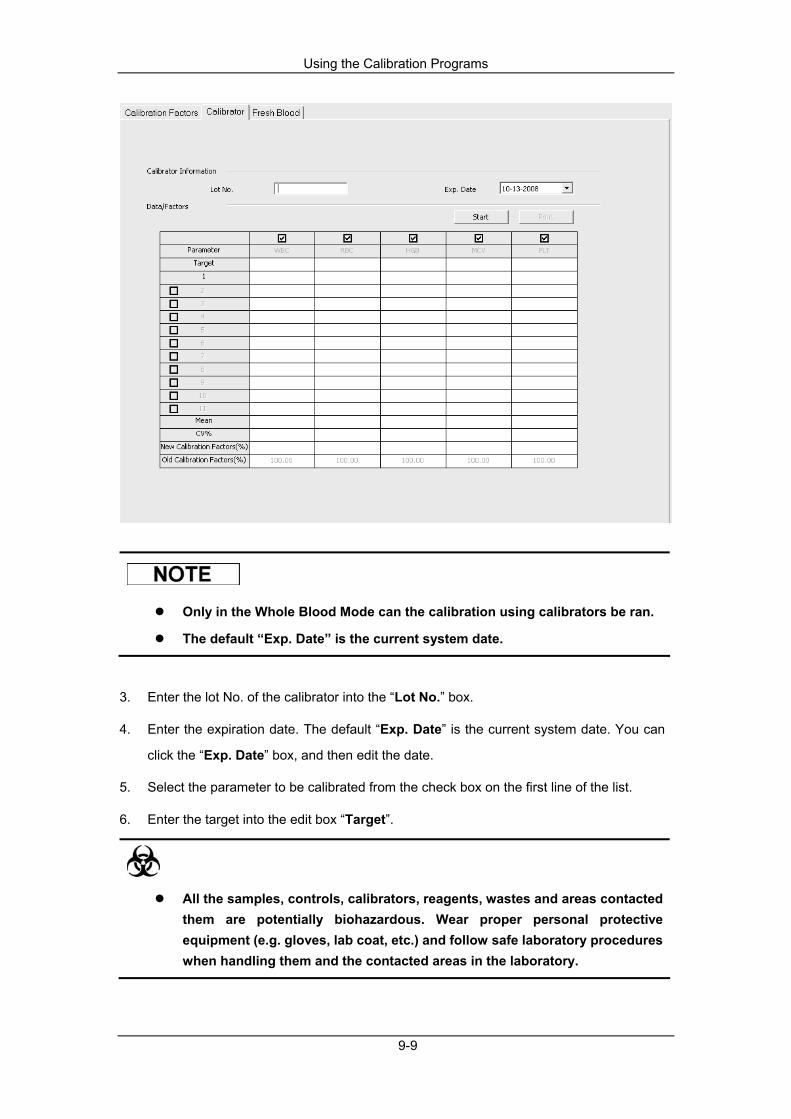
Using the Calibration Programs
9-9
Only in the Whole Blood Mode can the calibration using calibrators be ran.
The default “Exp. Date” is the current system date.
3. Enter the lot No. of the calibrator into the “Lot No.” box.
4. Enter the expiration date. The default “Exp. Date” is the current system date. You can
click the “Exp. Date” box, and then edit the date.
5. Select the parameter to be calibrated from the check box on the first line of the list.
6. Enter the target into the edit box “Target”.
All the samples, controls, calibrators, reagents, wastes and areas contacted them are potentially biohazardous. Wear proper personal protective equipment (e.g. gloves, lab coat, etc.) and follow safe laboratory procedures when handling them and the contacted areas in the laboratory.
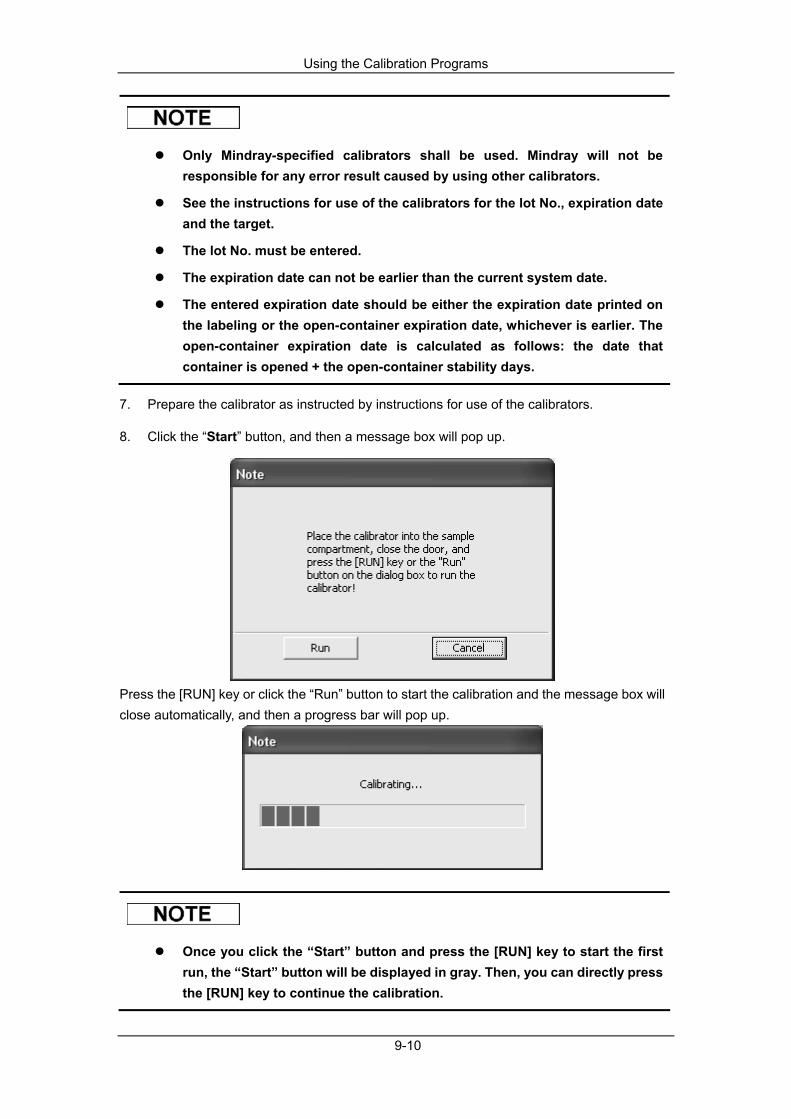
Using the Calibration Programs
9-10
Only Mindray-specified calibrators shall be used. Mindray will not be responsible for any error result caused by using other calibrators.
See the instructions for use of the calibrators for the lot No., expiration date and the target.
The lot No. must be entered.
The expiration date can not be earlier than the current system date.
The entered expiration date should be either the expiration date printed on the labeling or the open-container expiration date, whichever is earlier. The open-container expiration date is calculated as follows: the date that container is opened + the open-container stability days.
7. Prepare the calibrator as instructed by instructions for use of the calibrators.
8. Click the “Start” button, and then a message box will pop up.
Press the [RUN] key or click the “Run” button to start the calibration and the message box will close automatically, and then a progress bar will pop up.
Once you click the “Start” button and press the [RUN] key to start the first run, the “Start” button will be displayed in gray. Then, you can directly press the [RUN] key to continue the calibration.

Using the Calibration Programs
9-11
9. After every calibration run, the progress bar will close automatically and the analyzer will
have different responses according to different analysis results.
When the current running is done, if there is a parameter whose calibration data is out of its linear range but still within the display range, then the calibration data will be displayed in the list and a message box will also pop up.
Click “Ok” to close the message box and delete the data from the table without saving.
When the running is done, if there is a parameter whose calibration data is out of the display rage, then the non-numeric parameter values “***” will be displayed in the list and a message box will pop up.
Click “Ok” to close the message box and delete the data from the table without saving.
The valid results within the linear range will be displayed directly.
When the valid result is obtained, it will be selected to be included in the calculation for the calibration factors.
10. If the calibration factors have not been calculated but you switch to another screen, then
a message box will pop up.
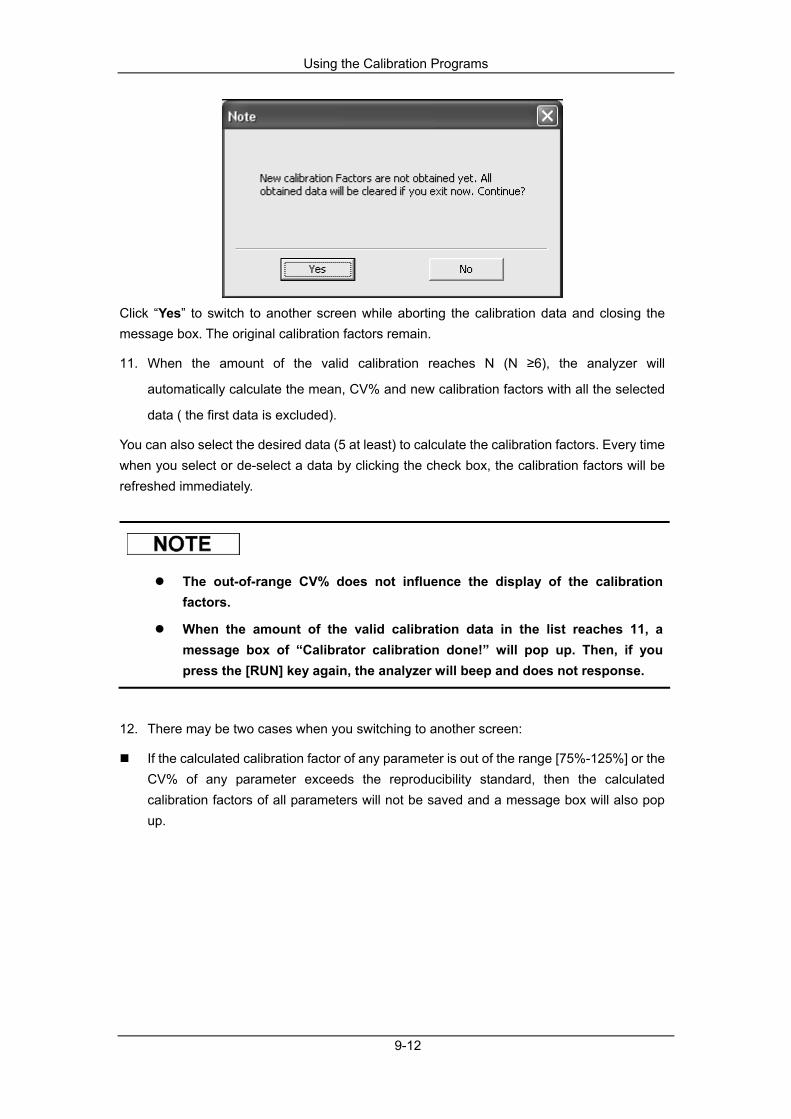
Using the Calibration Programs
9-12
Click “Yes” to switch to another screen while aborting the calibration data and closing the message box. The original calibration factors remain.
11. When the amount of the valid calibration reaches N (N ≥6), the analyzer will
automatically calculate the mean, CV% and new calibration factors with all the selected
data ( the first data is excluded).
You can also select the desired data (5 at least) to calculate the calibration factors. Every time when you select or de-select a data by clicking the check box, the calibration factors will be refreshed immediately.
The out-of-range CV% does not influence the display of the calibration factors.
When the amount of the valid calibration data in the list reaches 11, a message box of “Calibrator calibration done!” will pop up. Then, if you press the [RUN] key again, the analyzer will beep and does not response.
12. There may be two cases when you switching to another screen:
If the calculated calibration factor of any parameter is out of the range [75%-125%] or the CV% of any parameter exceeds the reproducibility standard, then the calculated calibration factors of all parameters will not be saved and a message box will also pop up.

Using the Calibration Programs
9-13
Click “Yes” to close the message box and switch to another screen without changing the original calibration factors and the calibration date.
If the calculated calibration factors of all parameter are within the range [75%-125%] and the CV% of all parameter are also within the reproducibility standard, then a message box will pop up.
Click “Yes” to save the new calibration factors while closing the message box and switching to another screen.
Other Operations
If the calibration factors are invalid, then a message box will pop up when you clicking the “Print” button.
Click “Ok”, then the cell of the first invalid calibration factors will be highlighted and the data in the cell will not be cleared. If the calibration factors are valid, then a message box will pop up when you clicking the “Print” button.
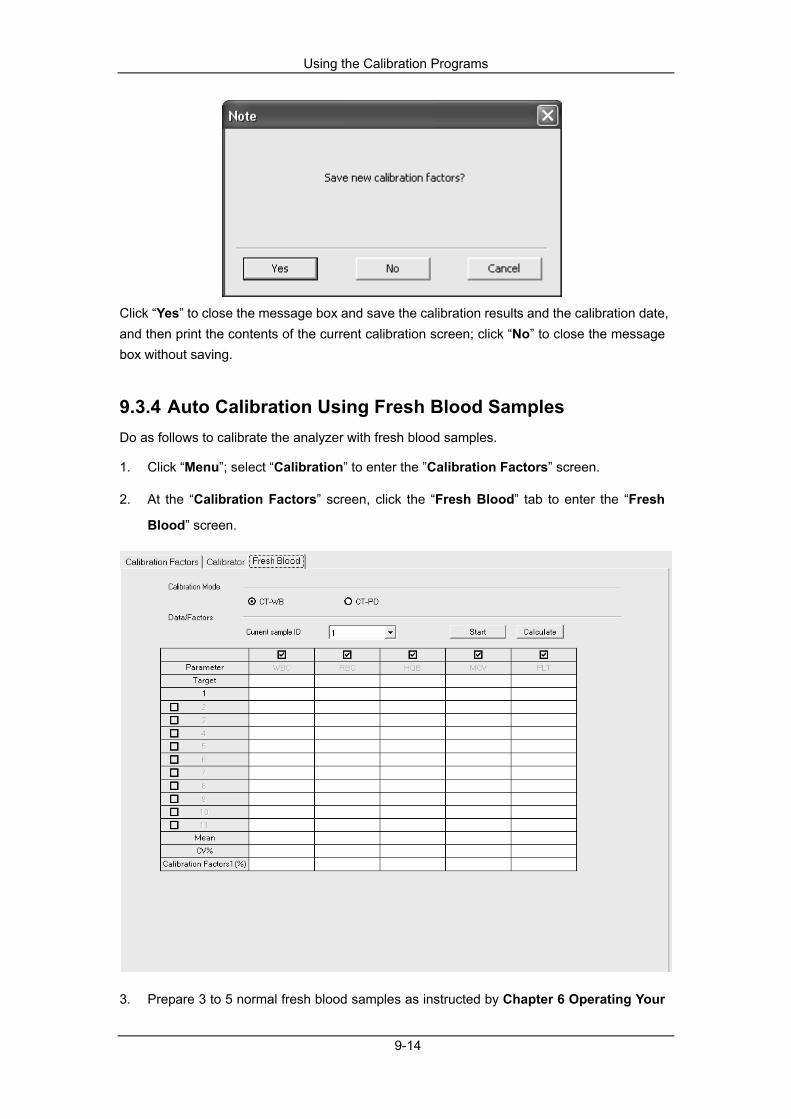
Using the Calibration Programs
9-14
Click “Yes” to close the message box and save the calibration results and the calibration date, and then print the contents of the current calibration screen; click “No” to close the message box without saving.
9.3.4 Auto Calibration Using Fresh Blood Samples Do as follows to calibrate the analyzer with fresh blood samples.
1. Click “Menu”; select “Calibration” to enter the ”Calibration Factors” screen.
2. At the “Calibration Factors” screen, click the “Fresh Blood” tab to enter the “Fresh
Blood” screen.
3. Prepare 3 to 5 normal fresh blood samples as instructed by Chapter 6 Operating Your

Using the Calibration Programs
9-15
Analyzer.
4. Run each of the prepared samples on the reference instrument (or by the reference
method) three times at least. Average the results for your reference values
5. Click the radio button “CT-WB” or “CT-PD” on the screen to select the desired calibration
mode.
If you run the sample in the “Predilute” mode, and then the blood mode is switched from the “Predilute” to “Whole Blood”, the analyzer will switch modes automatically and a progress bar will be displayed on the screen.
Be sure to use the adapter of Ф11x40 (mm) model when calibrating in CT-PD mode. For details to install the adapter, see Chapter 6 Operating Your Analyzer.
6. Select the sample ID of the current sample from the “Current sample ID” pull-down list.
7. Select the parameter to be calibrated from the check box on the first line of the list.
8. Enter the target into the “Target” cells.
9. Prepare the whole blood or predilute fresh blood sample ready for calibration.
10. Click the “Start” button, a message box will pop up.
Press the [Run] key or click the “Run” button, and then the message box will close automatically and a process bar will pop up.

Using the Calibration Programs
9-16
Be sure to put an uncapped centrifugal tube into the sample compartment when calibrating in CT-PD mode.
After you click the “Start” button and press the [RUN] key to start the first run, the “Start” button will display in gray. Then, you can press the [RUN] key to continue the calibration.
11. After the analysis, the progress bar will close and the compartment door will open
automatically. The analyzer will have different responses to different analysis results.
If the results are out of the linear range but still within the display range, the message box will pop up at the same time the results are displayed in the table.
Click “Ok” to close the message box and delete the results from the table without saving.
If the results are out of the display rage, the non-numeric parameter values “***” are obtained and the message box will pop up.
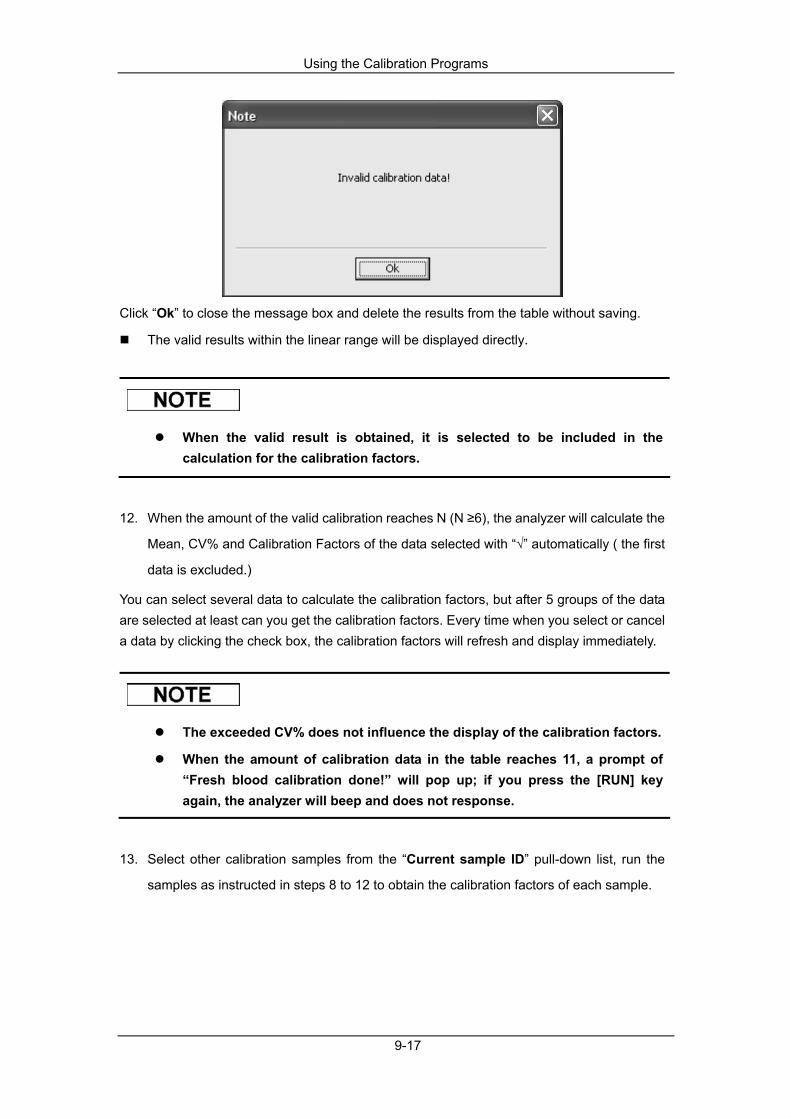
Using the Calibration Programs
9-17
Click “Ok” to close the message box and delete the results from the table without saving.
The valid results within the linear range will be displayed directly.
When the valid result is obtained, it is selected to be included in the calculation for the calibration factors.
12. When the amount of the valid calibration reaches N (N ≥6), the analyzer will calculate the
Mean, CV% and Calibration Factors of the data selected with “√” automatically ( the first
data is excluded.)
You can select several data to calculate the calibration factors, but after 5 groups of the data are selected at least can you get the calibration factors. Every time when you select or cancel a data by clicking the check box, the calibration factors will refresh and display immediately.
The exceeded CV% does not influence the display of the calibration factors.
When the amount of calibration data in the table reaches 11, a prompt of “Fresh blood calibration done!” will pop up; if you press the [RUN] key again, the analyzer will beep and does not response.
13. Select other calibration samples from the “Current sample ID” pull-down list, run the
samples as instructed in steps 8 to 12 to obtain the calibration factors of each sample.

Using the Calibration Programs
9-18
If some parameters have been selected to be calibrated, the column of the parameters will still display in gray when you switch to another blood sample.
14. There may be several cases when switching to another blood sample:
If the calibration factors of the blood sample are invalid or the CV% of any parameter exceeds the reproducibility standard, a message box will pop up when you switching to another blood sample.
Click “Yes” to clear the entered target of the current sample, all the calibration data obtained and each calculated value including calibration factors, then close the message box and switch to another blood sample.
If the calibration factors have not been calculated, the message box will pop up.
Click “Yes” to empty the entered target of the current sample and all the calibration data obtained, then close the message box and switch to another blood sample.
If the calibration factors of the sample are valid and the CV% of all the parameters do not exceed the reproducibility standard, you can switch to another blood sample directly.
15. After calibration factors of at least 3 fresh blood samples are obtained, click the
“Calculate” button to enter the screen of calibration calculation.

Using the Calibration Programs
9-19
Select or cancel the calibration factors of a blood sample to calculate for the Mean calibration factors by click the relevant check box. When the selected calibration factors reaches 3 or more than 3, the CV% will be calculated over again according to the selected calibration factors.
The exceeded CV% does not influence the display of the calibration factors.
When the selected calibration factors reaches 3 or more than 3, the mean calibration factors will be calculated over again according to the selected calibration factors. If the deviation of the calibration factor involved in the mean calibration factor calculation from the previous calibration factor equals to or is greater than 5%, this calibration factor will be considered as invalid, and the following message box will pop up when you try to exit the fresh blood calibration screen.
Click "Yes" to close the message box, clear current calibration data, and switch to the corresponding screen. Click "No" to go back to the current screen. The invalid calibration factor(s) will be marked with "?" and highlighted in red.
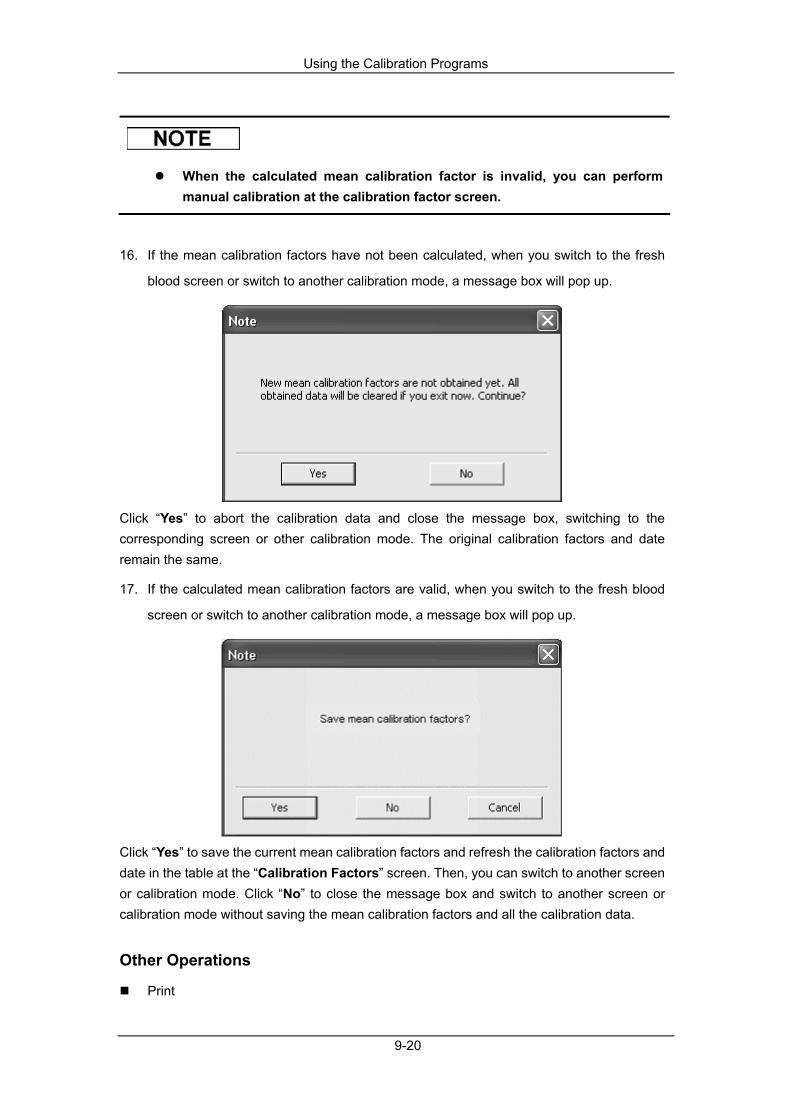
Using the Calibration Programs
9-20
When the calculated mean calibration factor is invalid, you can perform manual calibration at the calibration factor screen.
16. If the mean calibration factors have not been calculated, when you switch to the fresh
blood screen or switch to another calibration mode, a message box will pop up.
Click “Yes” to abort the calibration data and close the message box, switching to the corresponding screen or other calibration mode. The original calibration factors and date remain the same.
17. If the calculated mean calibration factors are valid, when you switch to the fresh blood
screen or switch to another calibration mode, a message box will pop up.
Click “Yes” to save the current mean calibration factors and refresh the calibration factors and date in the table at the “Calibration Factors” screen. Then, you can switch to another screen or calibration mode. Click “No” to close the message box and switch to another screen or calibration mode without saving the mean calibration factors and all the calibration data.
Other Operations
Using the Calibration Programs
9-21
If the mean calibration factors are invalid, then a message box will pop up when you clicking the “Print” button.
Click “OK”, then the cell of the first invalid calibration factor will be highlighted and the data in the cell will not be cleared. If the mean calibration factors are valid, click the “Print” button to print the following data in the form of list, namely, the calibration factors of the sample in the “Calculated Result” table, the results included in calculating the calibration factors and the mean calibration factors.
9.3.5 Verifying Calibration Factors It is recommended that you take the following steps to verify the calibration factors:
1. Run the calibrator at least three times and check whether the means of the obtained
results are within the expected ranges.
2. Run the low, normal and high level controls each for three times at least, and check
whether the means of the obtained results are within the expected ranges.
3. Run at least three fresh blood samples with known reference values, each for six times
at least, and check whether the means of the obtained results are within the expected
ranges.
9.3.6 Calibration History Click the “History” tab to enter the calibration history screen.
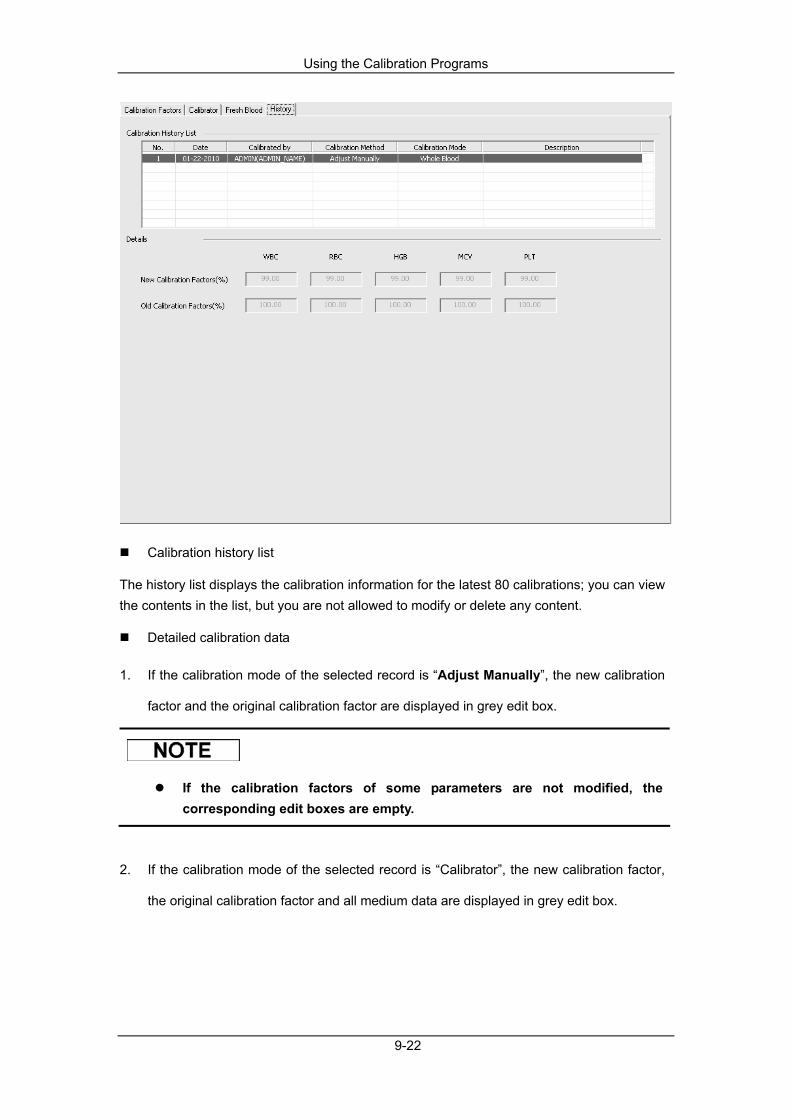
Using the Calibration Programs
9-22
Calibration history list
The history list displays the calibration information for the latest 80 calibrations; you can view the contents in the list, but you are not allowed to modify or delete any content.
Detailed calibration data
1. If the calibration mode of the selected record is “Adjust Manually”, the new calibration
factor and the original calibration factor are displayed in grey edit box.
If the calibration factors of some parameters are not modified, the corresponding edit boxes are empty.
2. If the calibration mode of the selected record is “Calibrator”, the new calibration factor,
the original calibration factor and all medium data are displayed in grey edit box.

Using the Calibration Programs
9-23
The calibration data marked with “√” are used for calculation of calibration factors.
3. If the calibration mode of the selected record is “Fresh Blood”, the calibration factor,
mean calibration factor and original calibration factor of each sample are displayed in
grey edit box.

Using the Calibration Programs
9-24
The calibration factors marked with “√” are used for calculation of mean calibration factor.
If the calibration factor of a sample is displayed, you can click the “Detail…” button to display all medium data.

Using the Calibration Programs
9-25
Click “Close” to close the dialog box and return to the “History” screen.
The calibration data marked with “√” are used for calculation of sample calibration factors.
Click the “Print” button down to the screen to print all calibration history records in table format.

10-1
10Maintaining Your Analyzer
10.1 Introduction Preventive and corrective maintenance procedures are required to keep the analyzer in a good operating condition. This analyzer provides multiple maintenance functions for this purpose. This chapter introduces how to use the provided functions to maintain and troubleshoot your analyzer.
All the analyzer components and surfaces are potentially infectious, take proper protective measures for operation or maintenance.
Performing unauthorized maintenance procedures can damage your analyzer. Do not perform any maintenance procedures that are not described in this chapter.
In case of problems not specified in this manual, contact Mindray customer service department or your local distributor for assistance.
Only Mindray-supplied parts can be used for maintenance. For any questions, contact Mindray customer service department or your local distributor.
Exercise caution to avoid contact with the sharp sample probe when performing maintenance.

Maintaining Your Analyzer
10-2
10.2 Maintenance
10.2.1 Manual Sleep You can start the sleep function if stop using the analyzer for a long time.
At the “Motor” and “Valve” tabs of the “Self-test” screen and the “Status” screen, the analyzer can not sleep.
If any influential error happens, the analyzer can not sleep.
Click the “Menu” button on the screen, then select “Shutdown” ”Sleep” on the pop-up menu.
The following message box will pop up.
Click the “Ok” button to get ready to sleep.
Maintaining Your Analyzer
10-3
After the preparation is complete, the progress bar closes automatically and the analyzer enters the sleep status.
When the analyzer is sleeping, the analysis status icon at the screen displays in red. The indicator on the analyzer displays in red at the same time.
You can not run any sample when the analyzer is sleeping.
You can perform the operations without the cooperation of the analyzer when it is sleeping, namely, communication and print etc.
If any error happens during the process of entering the sleep status, the analyzer will not sleep but alarm for the error. See Chapter 11 Troubleshooting Your Analyzer for solutions.
10.2.2 Exiting Sleep Mode
Different maintenances will be performed by the analyzer automatically when exiting the sleep mode, and the exiting time depends on how long the analyzer was in the sleep mode.
The following two ways are available to wakeup the analyzer.
The “Cancel” button
Click the “Menu” button on the screen, then select “Shutdown” ”Cancel” on the pop-up menu.
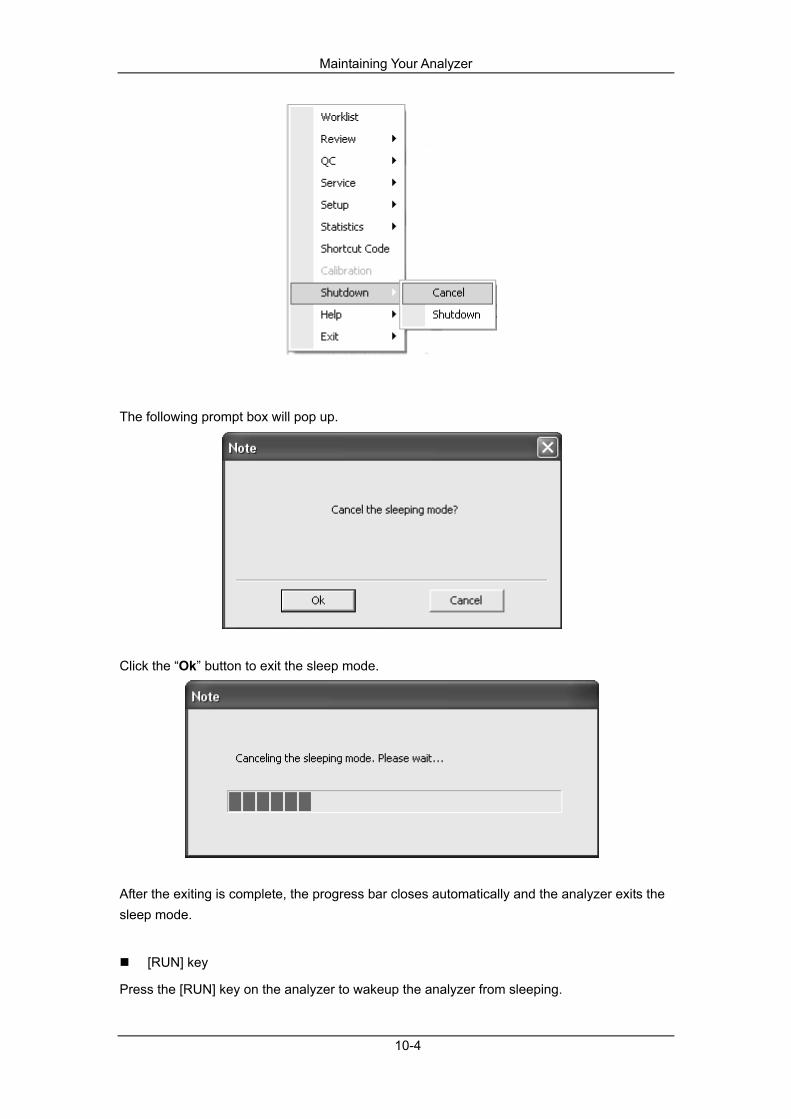
Maintaining Your Analyzer
10-4
The following prompt box will pop up.
Click the “Ok” button to exit the sleep mode.
After the exiting is complete, the progress bar closes automatically and the analyzer exits the sleep mode.
[RUN] key
Press the [RUN] key on the analyzer to wakeup the analyzer from sleeping.
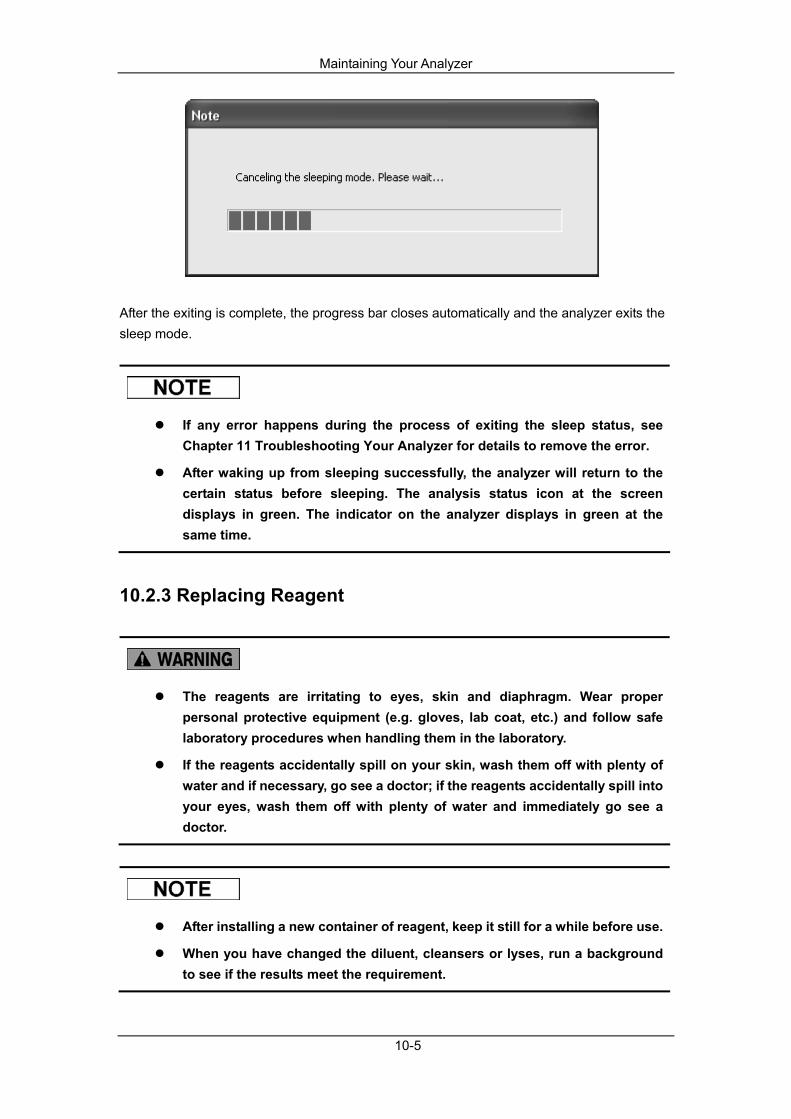
Maintaining Your Analyzer
10-5
After the exiting is complete, the progress bar closes automatically and the analyzer exits the sleep mode.
If any error happens during the process of exiting the sleep status, see Chapter 11 Troubleshooting Your Analyzer for details to remove the error.
After waking up from sleeping successfully, the analyzer will return to the certain status before sleeping. The analysis status icon at the screen displays in green. The indicator on the analyzer displays in green at the same time.
10.2.3 Replacing Reagent
The reagents are irritating to eyes, skin and diaphragm. Wear proper personal protective equipment (e.g. gloves, lab coat, etc.) and follow safe laboratory procedures when handling them in the laboratory.
If the reagents accidentally spill on your skin, wash them off with plenty of water and if necessary, go see a doctor; if the reagents accidentally spill into your eyes, wash them off with plenty of water and immediately go see a doctor.
After installing a new container of reagent, keep it still for a while before use.
When you have changed the diluent, cleansers or lyses, run a background to see if the results meet the requirement.

Maintaining Your Analyzer
10-6
You should change the reagents when:
a new container of reagent is installed.
the reagent is contaminated
WBC/RBC bubbles are reported.
Click the “Menu” button on the screen, and then select “Service” ”Maintenance” on the pop-up menu.
Click the “Replace Reagent” tab to enter the “Replace Reagent” screen.
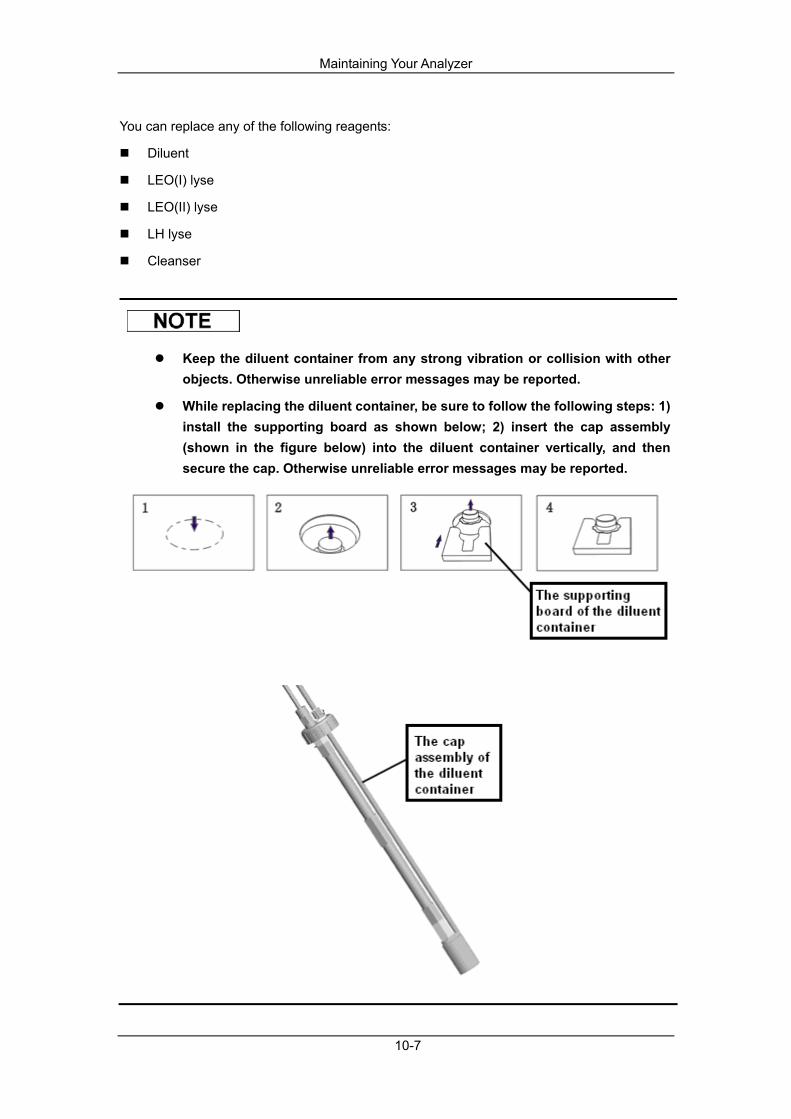
Maintaining Your Analyzer
10-7
You can replace any of the following reagents:
Diluent
LEO(I) lyse
LEO(II) lyse
LH lyse
Cleanser
Keep the diluent container from any strong vibration or collision with other objects. Otherwise unreliable error messages may be reported.
While replacing the diluent container, be sure to follow the following steps: 1) install the supporting board as shown below; 2) insert the cap assembly (shown in the figure below) into the diluent container vertically, and then secure the cap. Otherwise unreliable error messages may be reported.
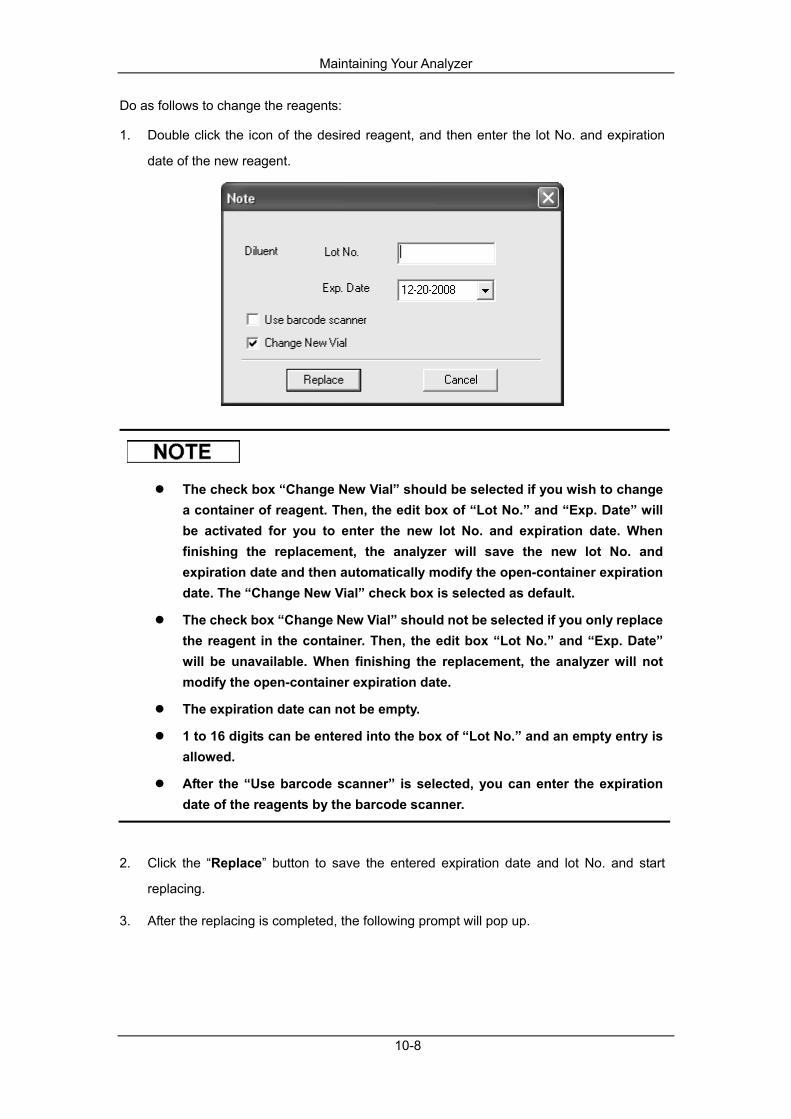
Maintaining Your Analyzer
10-8
Do as follows to change the reagents:
1. Double click the icon of the desired reagent, and then enter the lot No. and expiration
date of the new reagent.
The check box “Change New Vial” should be selected if you wish to change a container of reagent. Then, the edit box of “Lot No.” and “Exp. Date” will be activated for you to enter the new lot No. and expiration date. When finishing the replacement, the analyzer will save the new lot No. and expiration date and then automatically modify the open-container expiration date. The “Change New Vial” check box is selected as default.
The check box “Change New Vial” should not be selected if you only replace the reagent in the container. Then, the edit box “Lot No.” and “Exp. Date” will be unavailable. When finishing the replacement, the analyzer will not modify the open-container expiration date.
The expiration date can not be empty.
1 to 16 digits can be entered into the box of “Lot No.” and an empty entry is allowed.
After the “Use barcode scanner” is selected, you can enter the expiration date of the reagents by the barcode scanner.
2. Click the “Replace” button to save the entered expiration date and lot No. and start
replacing.
3. After the replacing is completed, the following prompt will pop up.
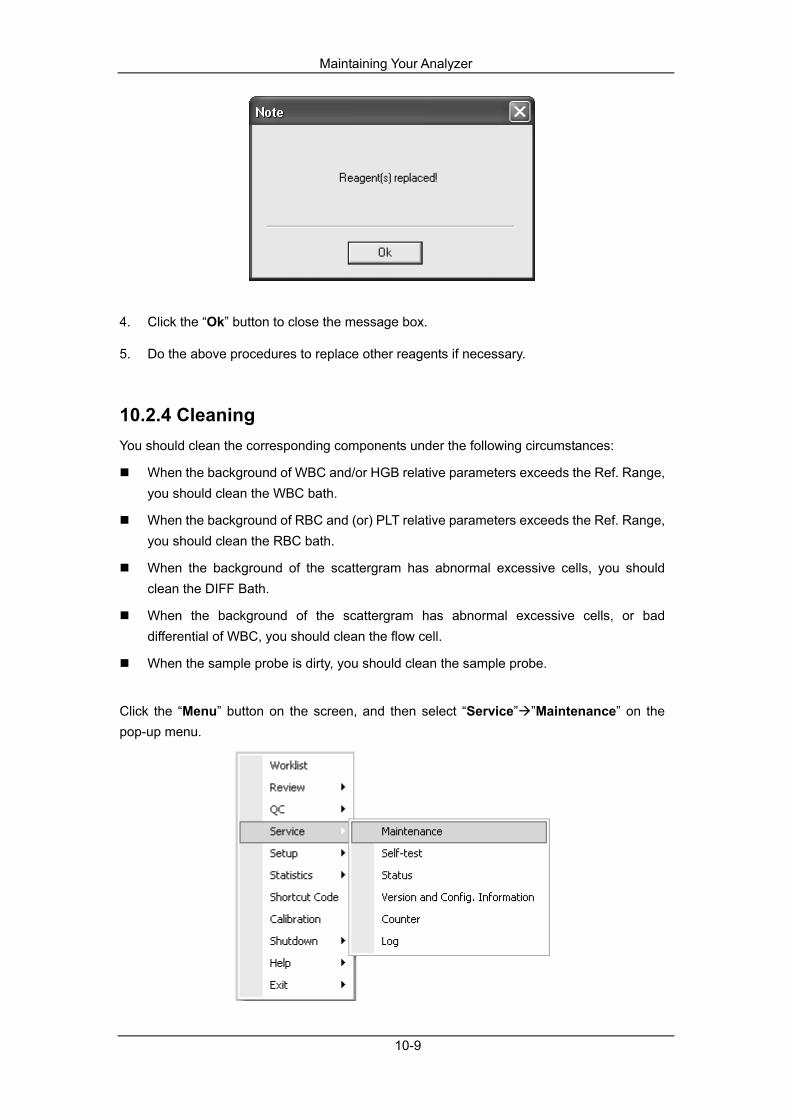
Maintaining Your Analyzer
10-9
4. Click the “Ok” button to close the message box.
5. Do the above procedures to replace other reagents if necessary.
10.2.4 Cleaning You should clean the corresponding components under the following circumstances:
When the background of WBC and/or HGB relative parameters exceeds the Ref. Range, you should clean the WBC bath.
When the background of RBC and (or) PLT relative parameters exceeds the Ref. Range, you should clean the RBC bath.
When the background of the scattergram has abnormal excessive cells, you should clean the DIFF Bath.
When the background of the scattergram has abnormal excessive cells, or bad differential of WBC, you should clean the flow cell.
When the sample probe is dirty, you should clean the sample probe.
Click the “Menu” button on the screen, and then select “Service” ”Maintenance” on the pop-up menu.

Maintaining Your Analyzer
10-10
Then, click the “Clean” tab to enter the “Clean” screen.
You can clean any of the following components:
WBC bath
RBC bath
DIFF bath
Flow cell
Sample probe
Do as follows to clean:
1. Double click the icon of the desired part to start cleaning.
2. After the cleaning is completed, a message box will pop up.
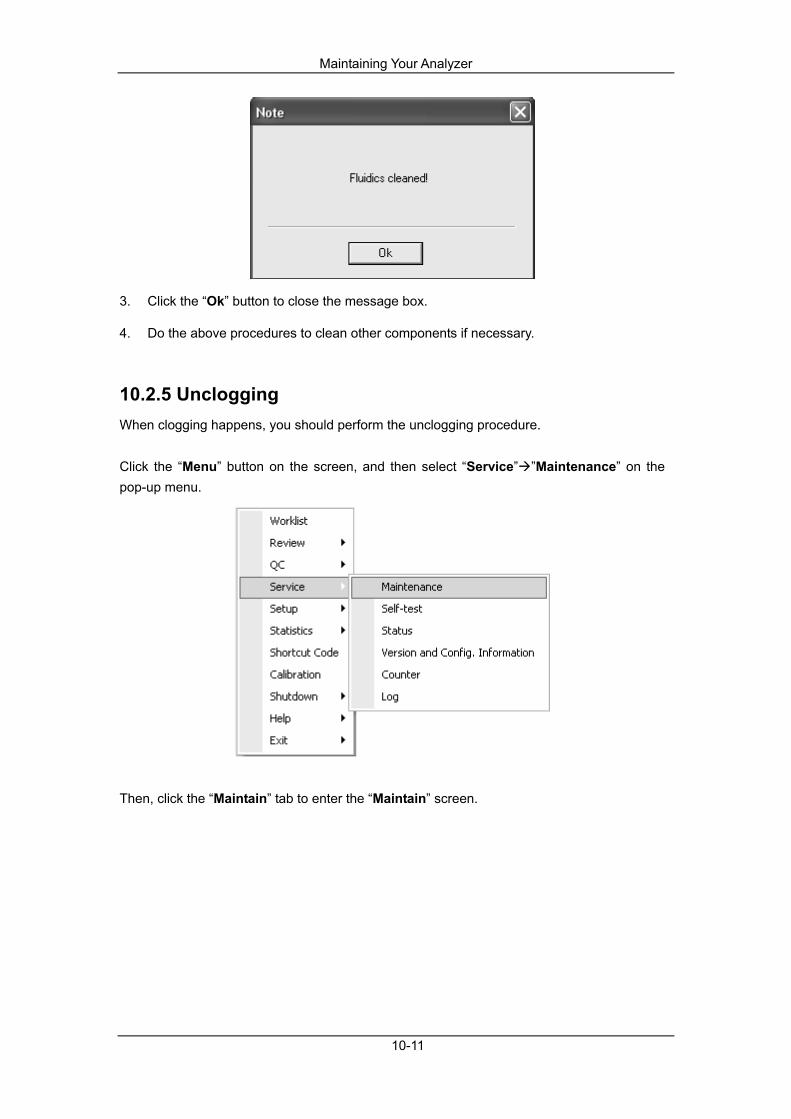
Maintaining Your Analyzer
10-11
3. Click the “Ok” button to close the message box.
4. Do the above procedures to clean other components if necessary.
10.2.5 Unclogging When clogging happens, you should perform the unclogging procedure. Click the “Menu” button on the screen, and then select “Service” ”Maintenance” on the pop-up menu.
Then, click the “Maintain” tab to enter the “Maintain” screen.
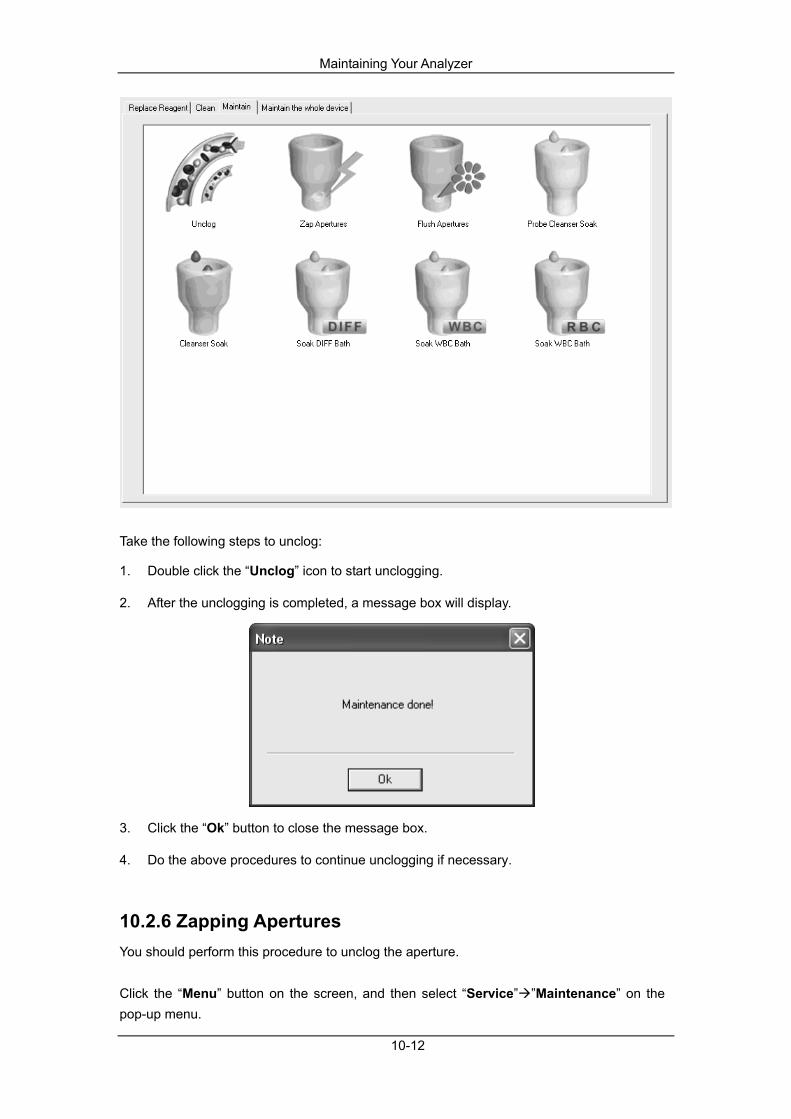
Maintaining Your Analyzer
10-12
Take the following steps to unclog:
1. Double click the “Unclog” icon to start unclogging.
2. After the unclogging is completed, a message box will display.
3. Click the “Ok” button to close the message box.
4. Do the above procedures to continue unclogging if necessary.
10.2.6 Zapping Apertures You should perform this procedure to unclog the aperture. Click the “Menu” button on the screen, and then select “Service” ”Maintenance” on the pop-up menu.

Maintaining Your Analyzer
10-13
Then, click the “Maintain” tab to enter the “Maintain” screen.
Do as follows to zap apertures:
1. Double click the “Zap Apertures” icon to start zapping.
2. After the zapping is completed, a message box will pop up.
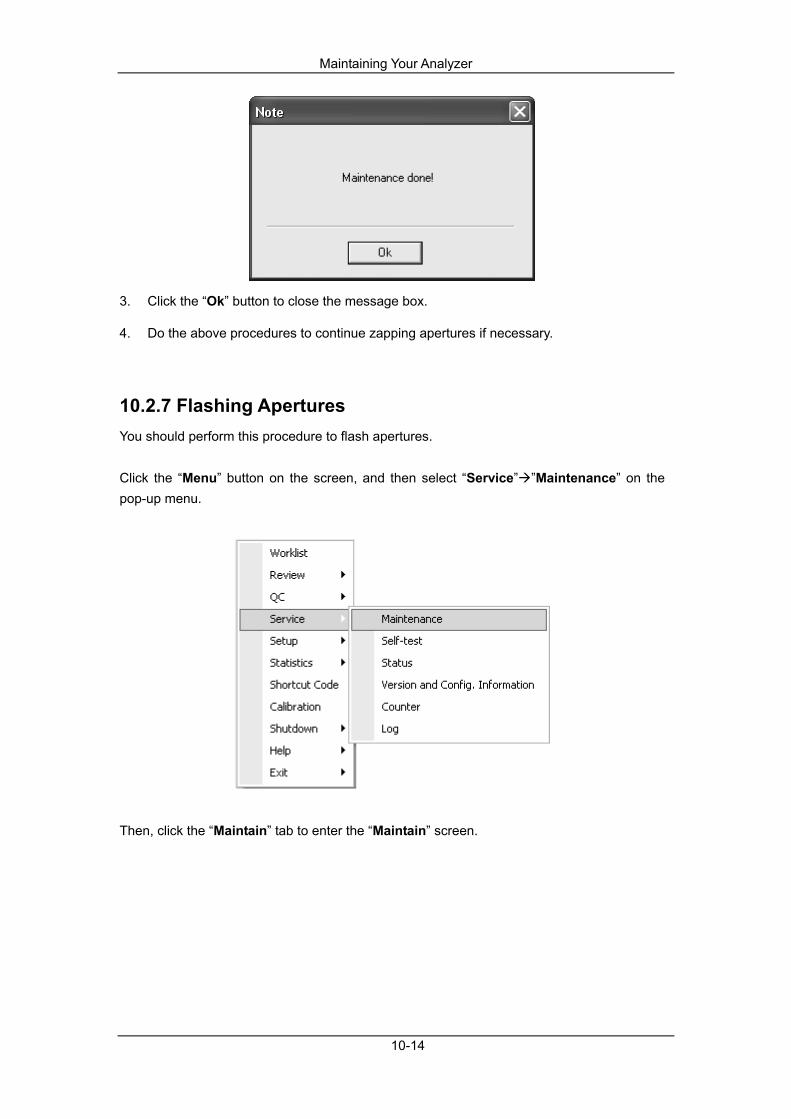
Maintaining Your Analyzer
10-14
3. Click the “Ok” button to close the message box.
4. Do the above procedures to continue zapping apertures if necessary.
10.2.7 Flashing Apertures You should perform this procedure to flash apertures. Click the “Menu” button on the screen, and then select “Service” ”Maintenance” on the pop-up menu.
Then, click the “Maintain” tab to enter the “Maintain” screen.

Maintaining Your Analyzer
10-15
Do as follows to flash apertures:
1. Double click the “Flash Apertures” icon to start flashing.
2. After the flashing is complete, a message box will pop up.
3. Click the “Ok” button to close the message box.
4. Do the above procedures to continue flashing apertures if necessary.
10.2.8 Probe Cleanser Soak You should perform the probe cleanser soak under the following circumstances:
When the problems including the background results exceeds the Ref. Range, bad differential of scattergram and clogging still exist after other maintenances have been
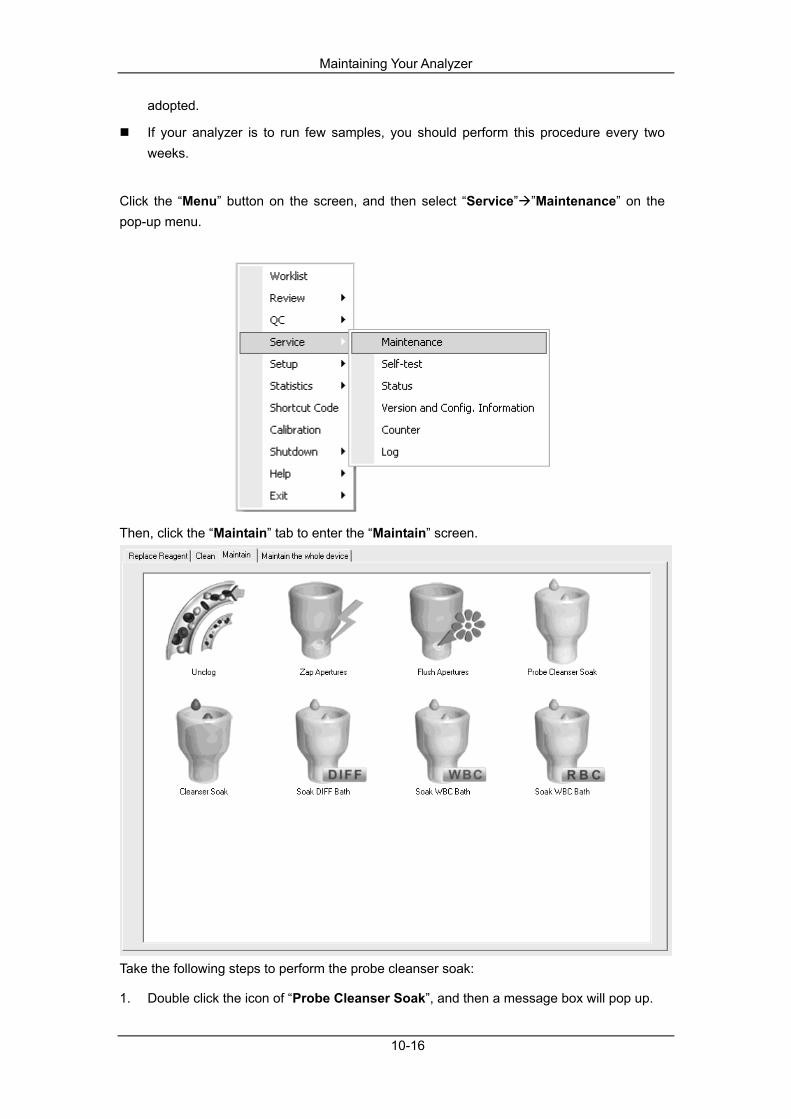
Maintaining Your Analyzer
10-16
adopted.
If your analyzer is to run few samples, you should perform this procedure every two weeks.
Click the “Menu” button on the screen, and then select “Service” ”Maintenance” on the pop-up menu.
Then, click the “Maintain” tab to enter the “Maintain” screen.
Take the following steps to perform the probe cleanser soak:
1. Double click the icon of “Probe Cleanser Soak”, and then a message box will pop up.
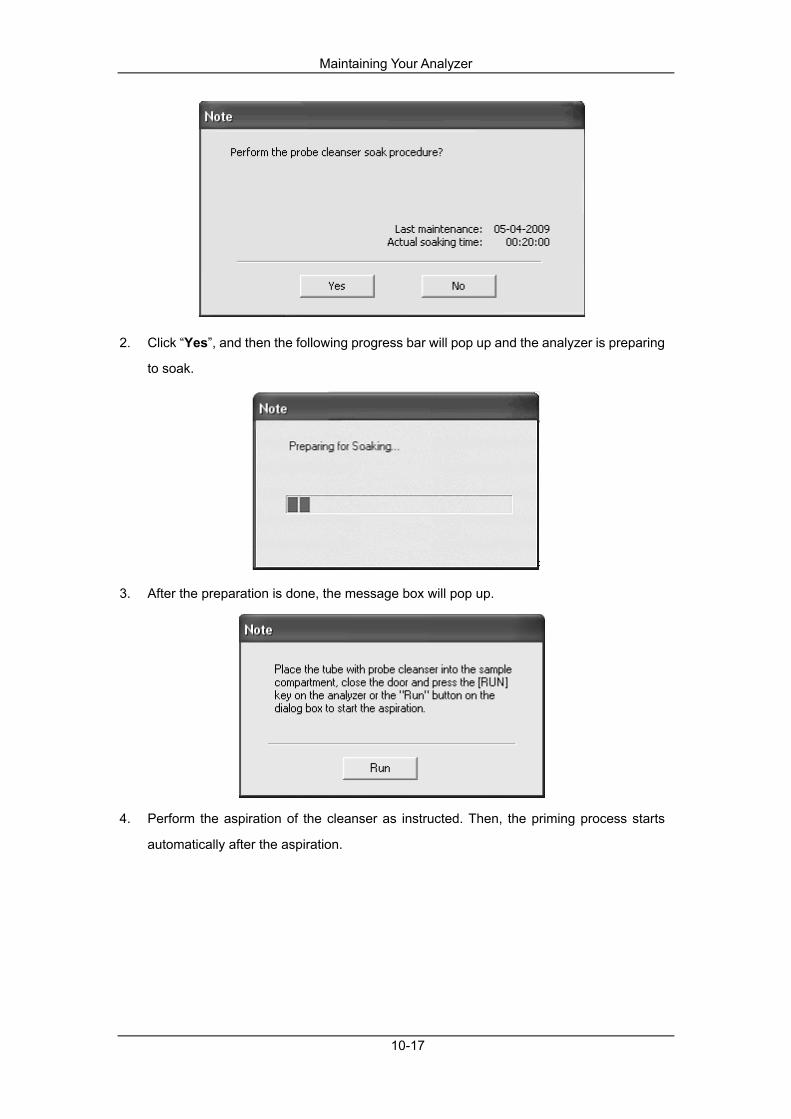
Maintaining Your Analyzer
10-17
2. Click “Yes”, and then the following progress bar will pop up and the analyzer is preparing
to soak.
3. After the preparation is done, the message box will pop up.
4. Perform the aspiration of the cleanser as instructed. Then, the priming process starts
automatically after the aspiration.

Maintaining Your Analyzer
10-18
5. When the priming is completed, the progress bar closes and a count-down box will pop
up. The soaking process starts.
6. The soaking process will last about 20 minutes. You may click the “Stop Soaking”
button in the message box to stop it. If you stop soaking in less than 5 minutes, the
following message box will pop up.
7. The cleaning process starts after the soaking progress is done.

Maintaining Your Analyzer
10-19
8. After the cleaning is completed, a message box will pop up.
9. Click the “Ok” button to close the message box.
10. Do the above procedures to perform the probe cleanser soak if necessary.
10.2.9 Probe Cleanser Soak for Single Channel Probe cleanser soaking for DIFF channel, WBC channel and RBC channel, when the aperture clogs or the abnormal scattergram occurs, can be used to remove the errors. Click the “Menu” button on the screen, and then select “Service” ”Maintenance” on the pop-up menu.

Maintaining Your Analyzer
10-20
Then, click the “Maintain” tab to enter the “Maintain” screen.
Take the following steps to perform the probe cleanser soak (DIFF bath): 1. Double click the “Soak DIFF Bath” icon, and then a message box will pop up.
2. Click “Yes”, and then the progress bar shown below will pop up and the analyzer is preparing.
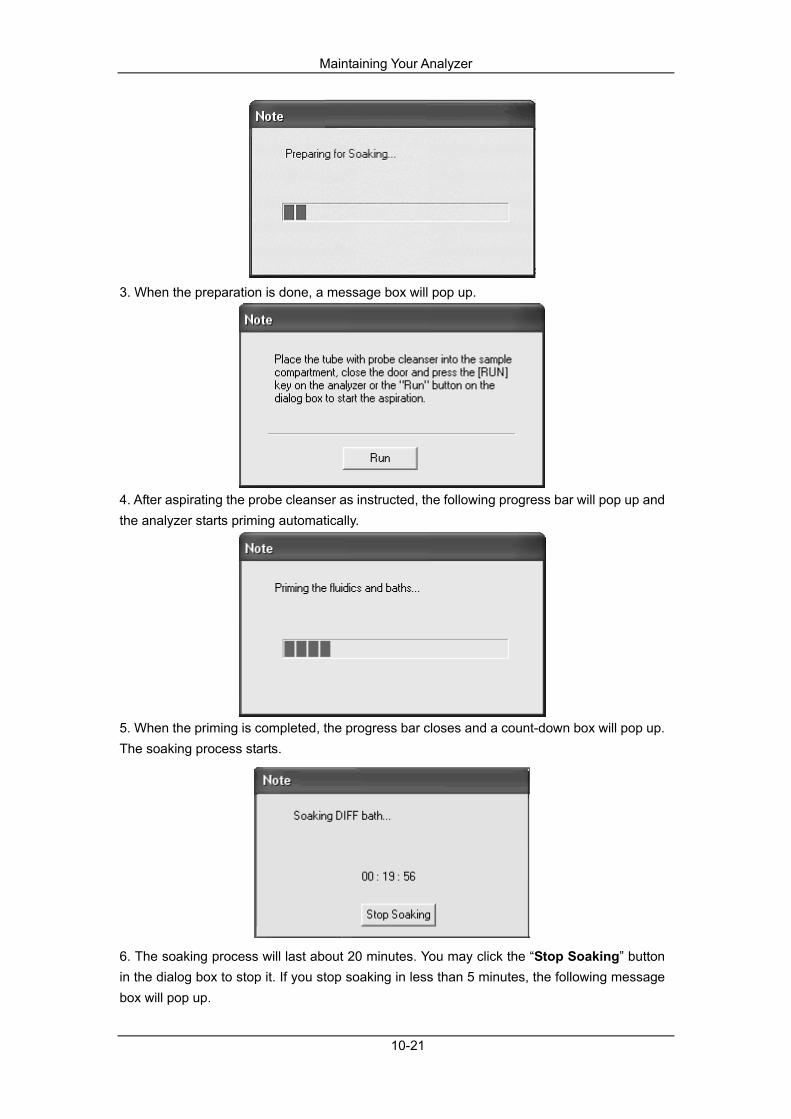
Maintaining Your Analyzer
10-21
3. When the preparation is done, a message box will pop up.
4. After aspirating the probe cleanser as instructed, the following progress bar will pop up and the analyzer starts priming automatically.
5. When the priming is completed, the progress bar closes and a count-down box will pop up. The soaking process starts.
6. The soaking process will last about 20 minutes. You may click the “Stop Soaking” button in the dialog box to stop it. If you stop soaking in less than 5 minutes, the following message box will pop up.
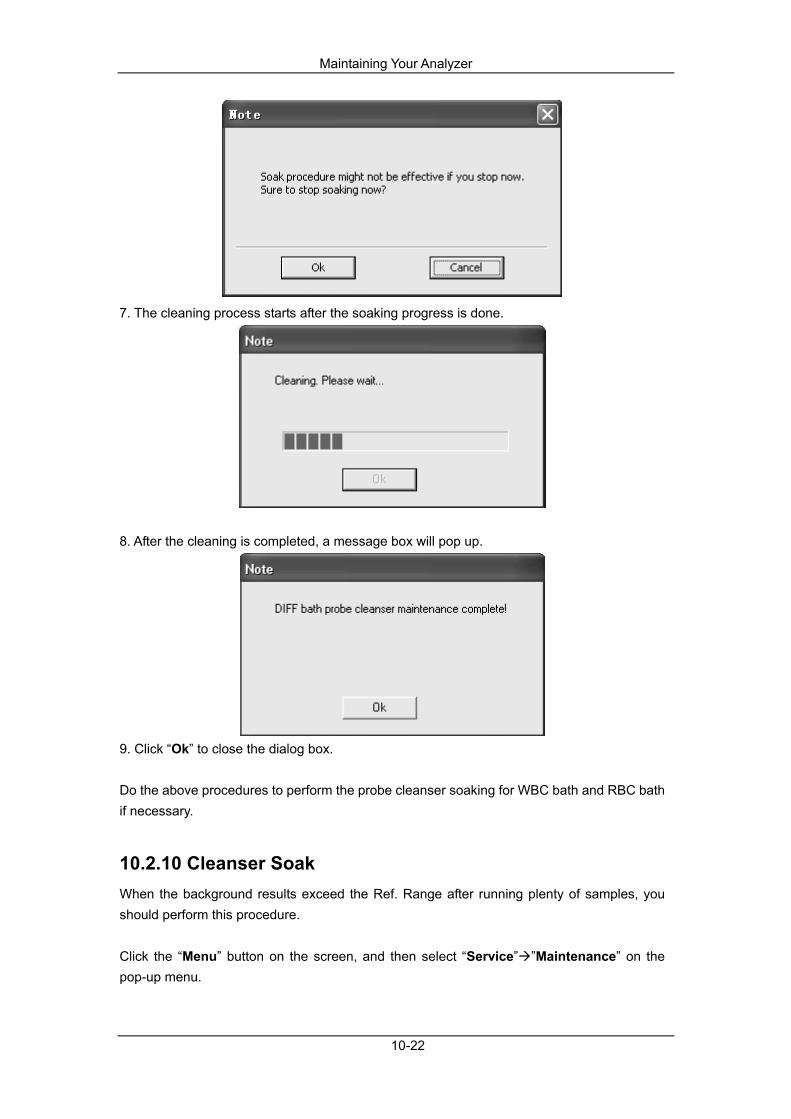
Maintaining Your Analyzer
10-22
7. The cleaning process starts after the soaking progress is done.
8. After the cleaning is completed, a message box will pop up.
9. Click “Ok” to close the dialog box. Do the above procedures to perform the probe cleanser soaking for WBC bath and RBC bath if necessary.
10.2.10 Cleanser Soak When the background results exceed the Ref. Range after running plenty of samples, you should perform this procedure.
Click the “Menu” button on the screen, and then select “Service” ”Maintenance” on the pop-up menu.

Maintaining Your Analyzer
10-23
Then, click the “Maintain” tab to enter the “Maintain” screen.
Take the following steps to perform the cleanser soak: 1. Double click the “Cleanser Soak” icon, and the following message box will pop up.

Maintaining Your Analyzer
10-24
The duration of the soaking process can be configured at the Auto Maintenance Setup screen (4 hours by default). See Chapter 5 Customizing the Analyzer Software for how to configure.
2. Click “Ok” and then the progress bar shown below will pop up and the analyzer is preparing.
3. When the preparation is done, the progress bar closes and a count-down box will pop up. The soaking process starts.
4. You may click the “Stop Soaking” button in the dialog box to stop the soaking process. If you stop soaking in less than 4 hours, the following message box will pop up.
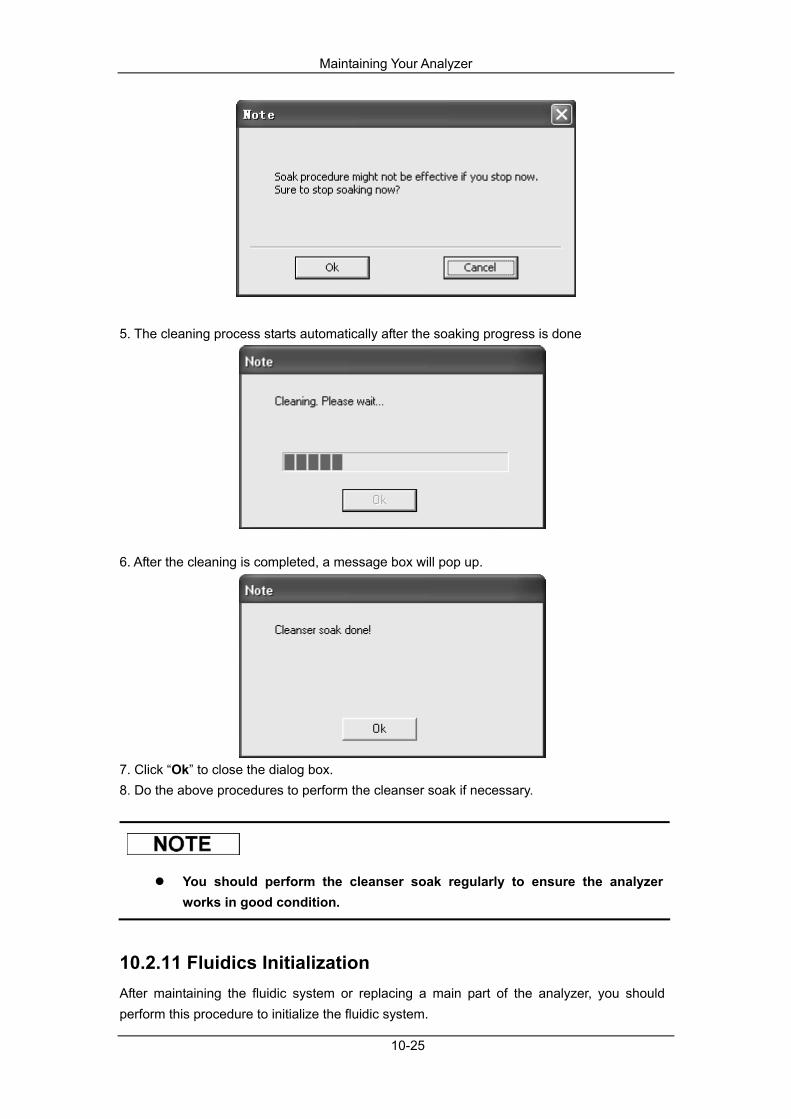
Maintaining Your Analyzer
10-25
5. The cleaning process starts automatically after the soaking progress is done
6. After the cleaning is completed, a message box will pop up.
7. Click “Ok” to close the dialog box. 8. Do the above procedures to perform the cleanser soak if necessary.
You should perform the cleanser soak regularly to ensure the analyzer works in good condition.
10.2.11 Fluidics Initialization After maintaining the fluidic system or replacing a main part of the analyzer, you should perform this procedure to initialize the fluidic system.
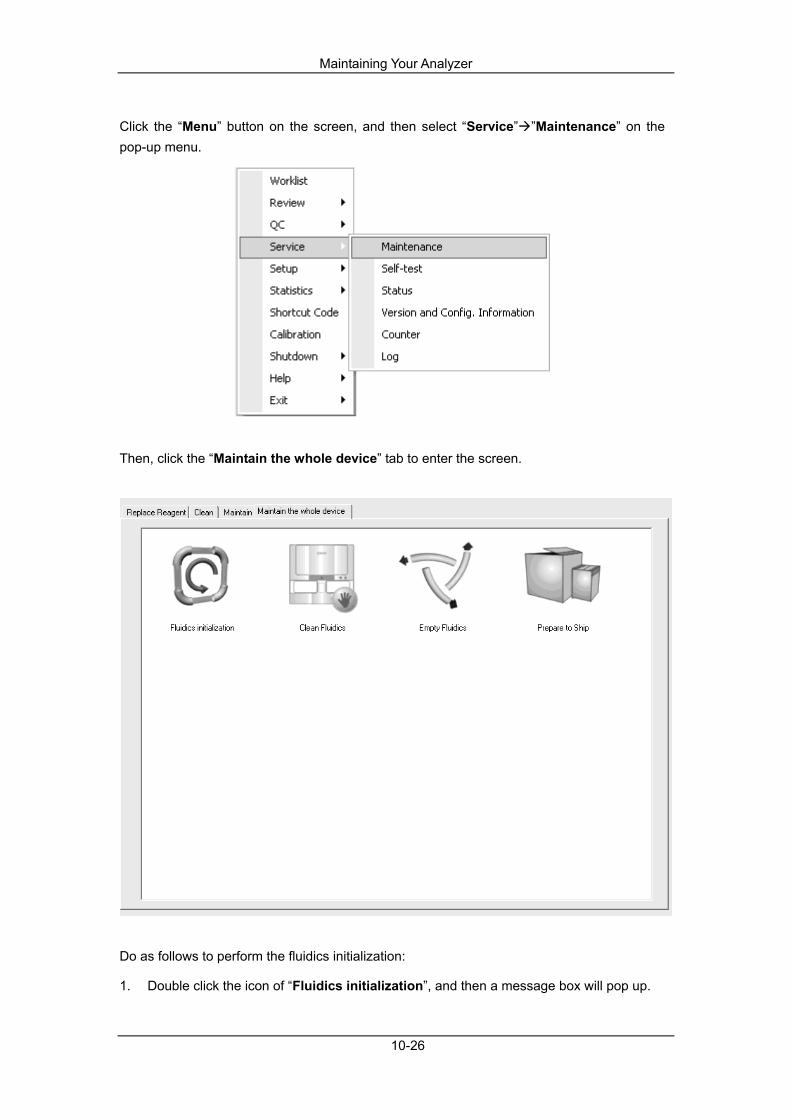
Maintaining Your Analyzer
10-26
Click the “Menu” button on the screen, and then select “Service” ”Maintenance” on the pop-up menu.
Then, click the “Maintain the whole device” tab to enter the screen.
Do as follows to perform the fluidics initialization:
1. Double click the icon of “Fluidics initialization”, and then a message box will pop up.
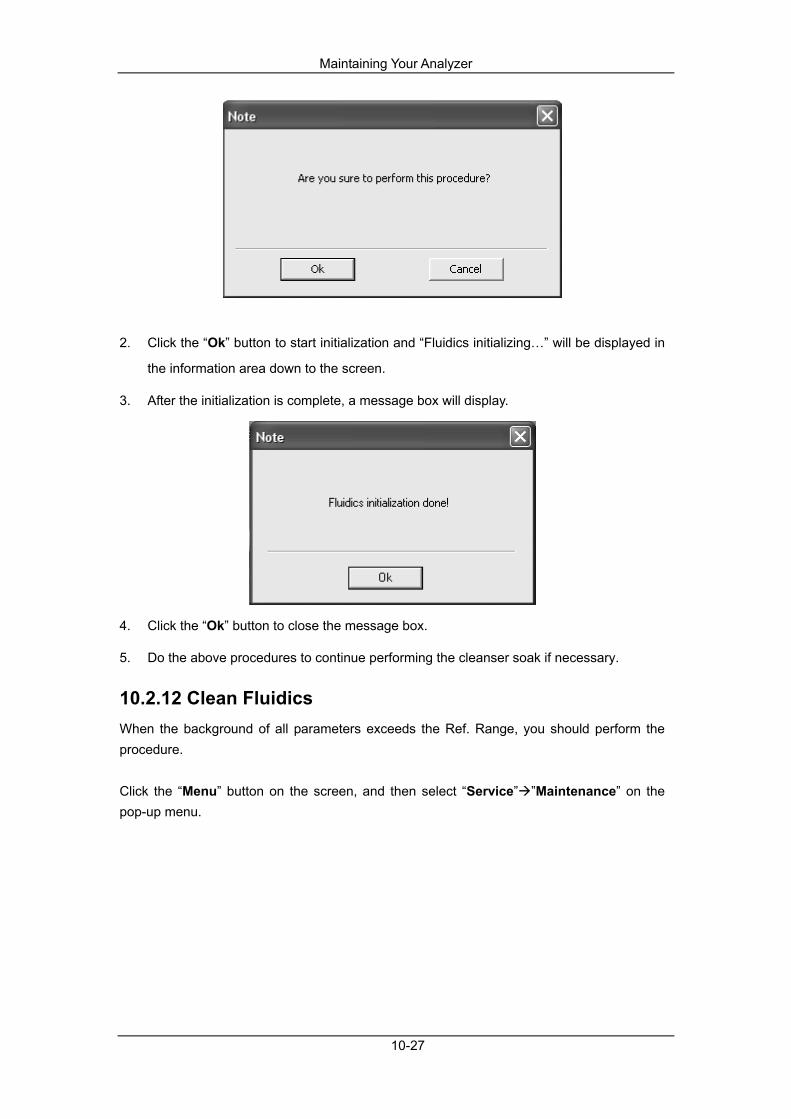
Maintaining Your Analyzer
10-27
2. Click the “Ok” button to start initialization and “Fluidics initializing…” will be displayed in
the information area down to the screen.
3. After the initialization is complete, a message box will display.
4. Click the “Ok” button to close the message box.
5. Do the above procedures to continue performing the cleanser soak if necessary.
10.2.12 Clean Fluidics When the background of all parameters exceeds the Ref. Range, you should perform the procedure. Click the “Menu” button on the screen, and then select “Service” ”Maintenance” on the pop-up menu.
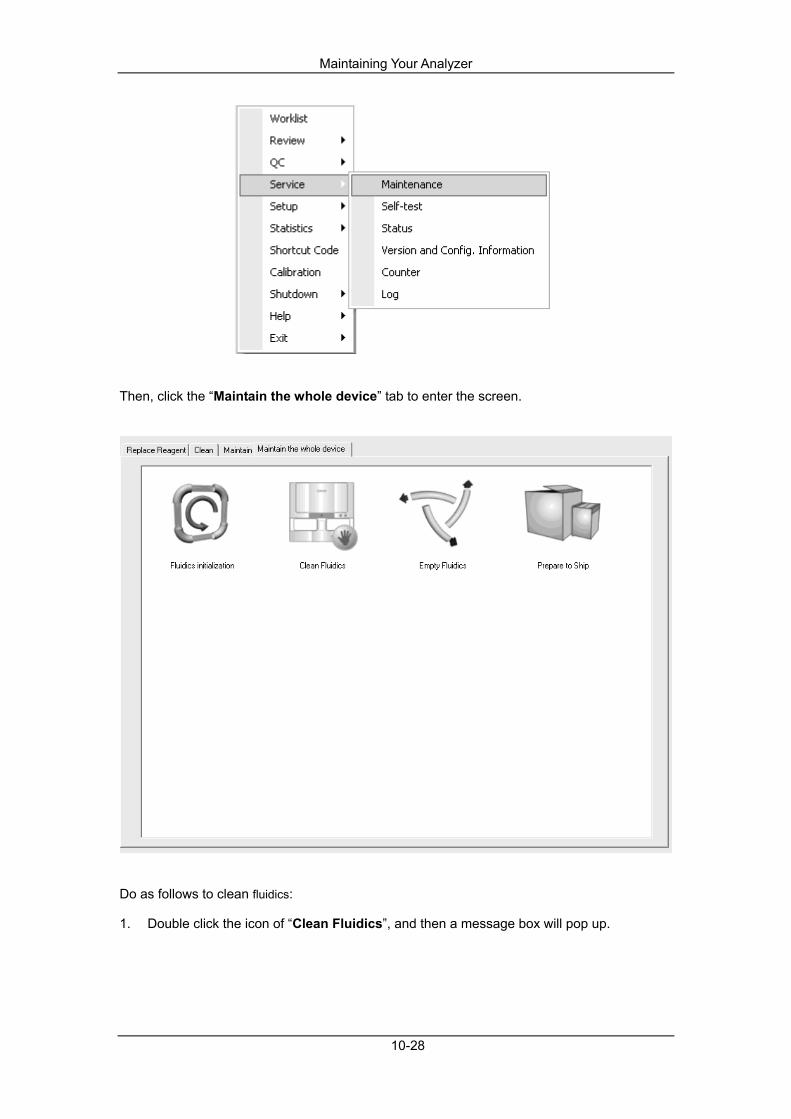
Maintaining Your Analyzer
10-28
Then, click the “Maintain the whole device” tab to enter the screen.
Do as follows to clean fluidics:
1. Double click the icon of “Clean Fluidics”, and then a message box will pop up.
Maintaining Your Analyzer
10-29
2. Click the “Yes” button to start cleaning and “Fluidics cleaning…” will be displayed in the
information area down to the screen.
3. After the cleaning is complete, a message box will display.
4. Click the “Ok” button to close the message box.
5. Do the above procedures to continue cleaning fluidics if necessary.
10.2.13 Empty Fluidics Before a short distance transport of the analyzer (transporting time<2h), you should perform this procedure to empty the fluidic system. Click the “Menu” button on the screen, and then select “Service” ”Maintenance” on the pop-up menu.

Maintaining Your Analyzer
10-30
Then, click the “Maintain the whole device” tab to enter the screen.
Do as follows to empty fluidics:
1. Double click the icon of “Empty Fluidics”, and then a message box will pop up.

Maintaining Your Analyzer
10-31
2. Click the “Yes” button to start emptying, and a message box shown below will display.
3. Remove all reagent pickup tube assemblies according to the prompt, and then click “OK”
to start emptying the fluidic system.
4. After the emptying is complete, a message box will display. You should turn off the power
switch according to the prompt displayed on the screen.
After the fluidic system is emptied, you can still use the software.
In the message box of “Please power off the analyzer!”, you can click the “Restart” button to restart the analyzer.
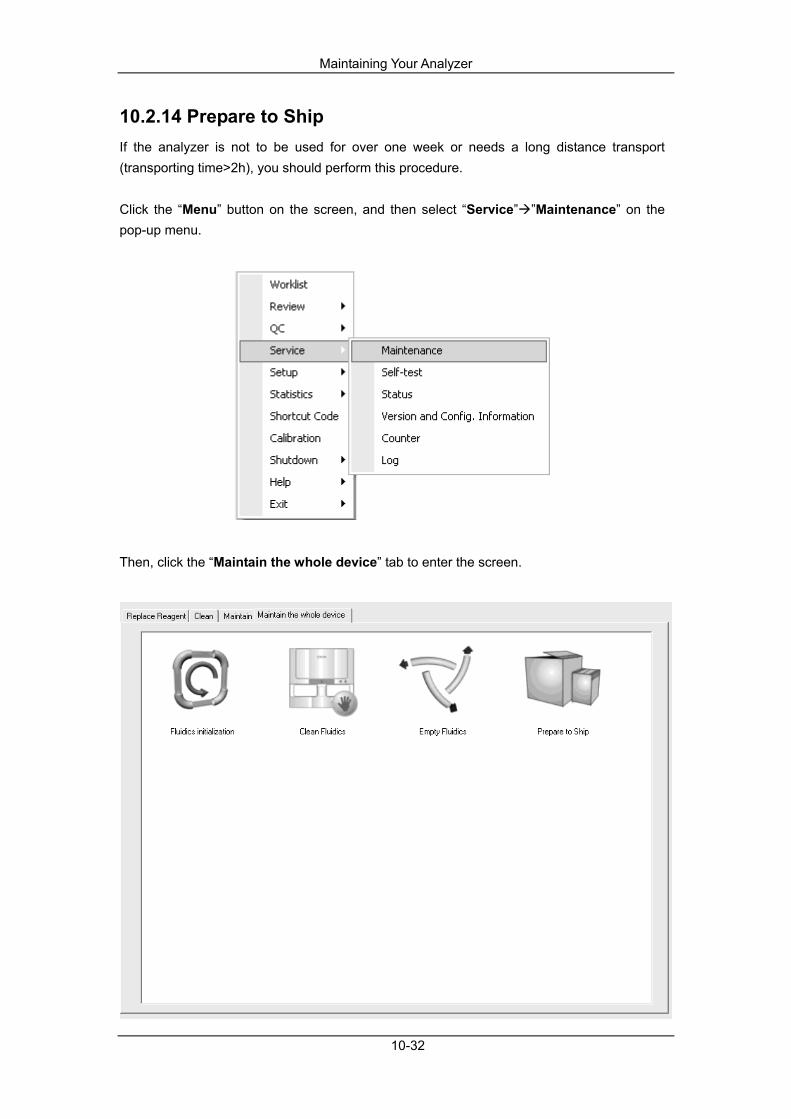
Maintaining Your Analyzer
10-32
10.2.14 Prepare to Ship If the analyzer is not to be used for over one week or needs a long distance transport (transporting time>2h), you should perform this procedure. Click the “Menu” button on the screen, and then select “Service” ”Maintenance” on the pop-up menu.
Then, click the “Maintain the whole device” tab to enter the screen.

Maintaining Your Analyzer
10-33
Do as follows to perform the prepare-to-ship procedure:
1. Double click the icon of “Prepare to Ship”, and then a message box will pop up.
2. Click the “Yes” button to perform the packing up and a message box shown below will
display.
3. Remove all reagent pickup tube assemblies according to the prompt, and then click the
“OK” button to start emptying the fluidic system.
4. After the emptying is complete, a message box will pop up.
5. Place all reagent pickup tube assemblies into the distilled water, and then click the “Ok”
button to start priming.
6. After the cleaning is done, a message box will display.
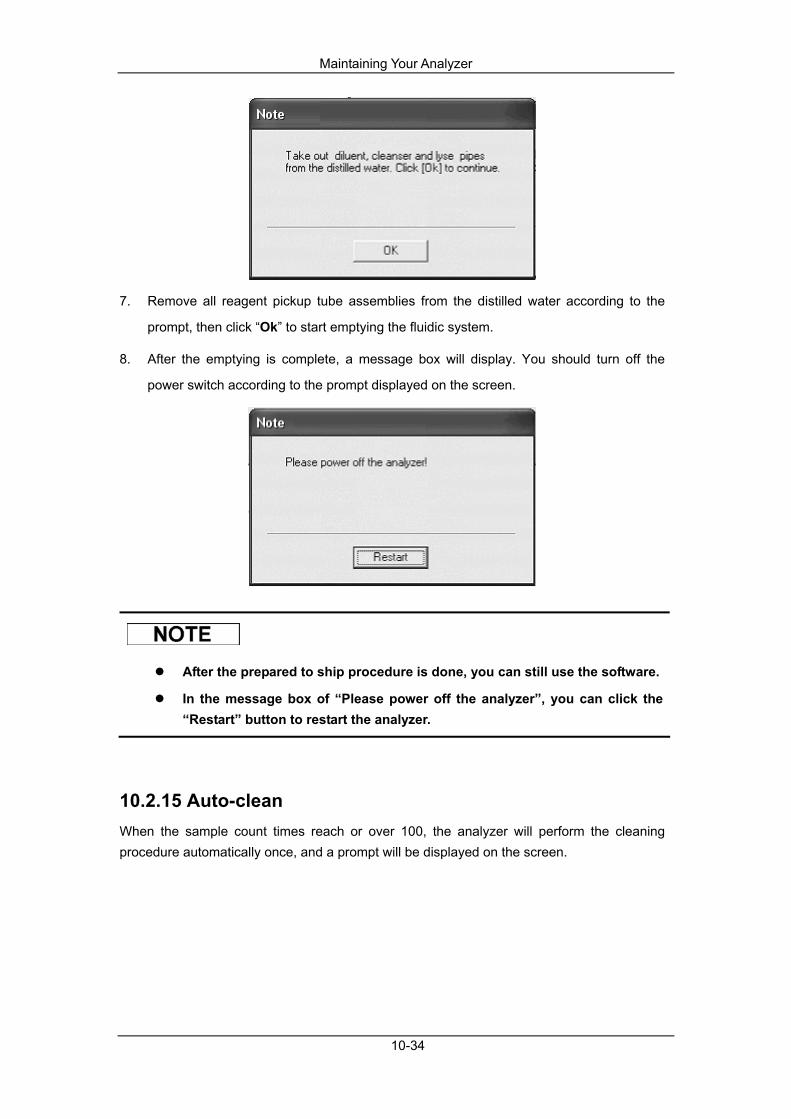
Maintaining Your Analyzer
10-34
7. Remove all reagent pickup tube assemblies from the distilled water according to the
prompt, then click “Ok” to start emptying the fluidic system.
8. After the emptying is complete, a message box will display. You should turn off the
power switch according to the prompt displayed on the screen.
After the prepared to ship procedure is done, you can still use the software.
In the message box of “Please power off the analyzer”, you can click the “Restart” button to restart the analyzer.
10.2.15 Auto-clean When the sample count times reach or over 100, the analyzer will perform the cleaning procedure automatically once, and a prompt will be displayed on the screen.
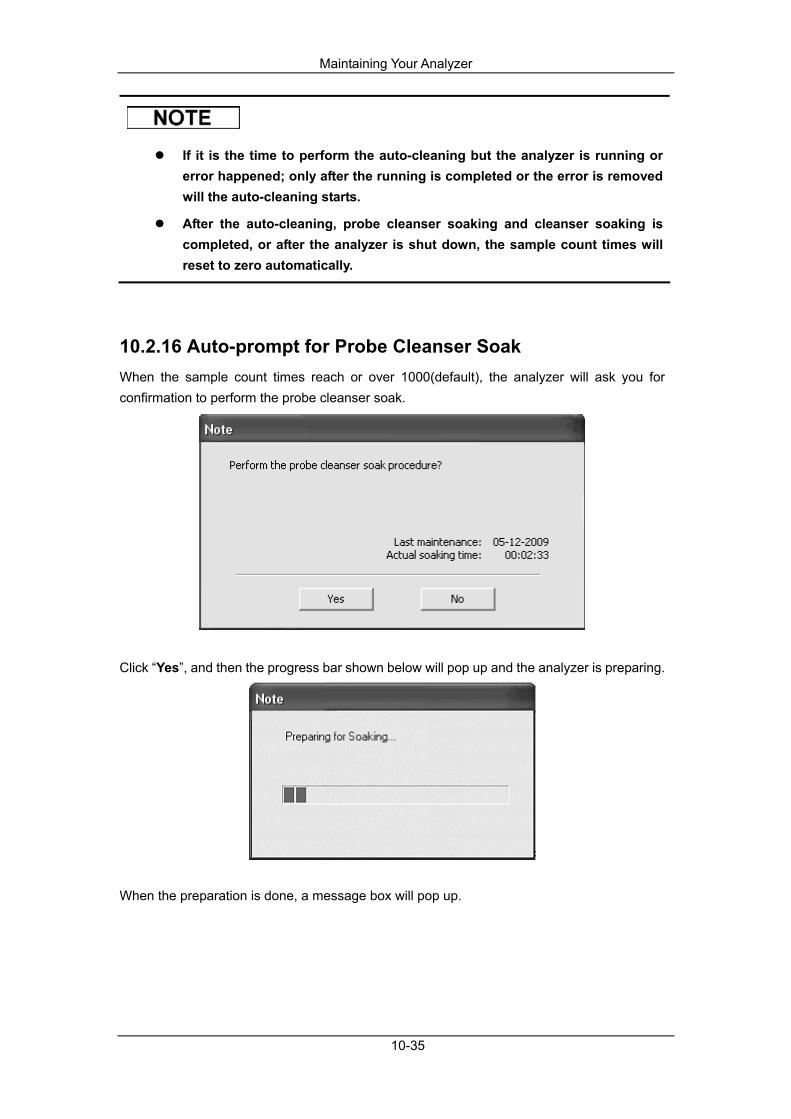
Maintaining Your Analyzer
10-35
If it is the time to perform the auto-cleaning but the analyzer is running or error happened; only after the running is completed or the error is removed will the auto-cleaning starts.
After the auto-cleaning, probe cleanser soaking and cleanser soaking is completed, or after the analyzer is shut down, the sample count times will reset to zero automatically.
10.2.16 Auto-prompt for Probe Cleanser Soak When the sample count times reach or over 1000(default), the analyzer will ask you for confirmation to perform the probe cleanser soak.
Click “Yes”, and then the progress bar shown below will pop up and the analyzer is preparing.
When the preparation is done, a message box will pop up.

Maintaining Your Analyzer
10-36
After aspirating the probe cleanser as instructed, the following progress bar will pop up and the analyzer starts the priming automatically.
When the priming is complete, the progress bar closes and a count-down box will pop up. The soaking process starts.
The soaking process will last about 20 minutes. You may click the “Stop Soaking” button in the dialog box to stop it after five minutes. The cleaning process starts after the soaking progress is done.
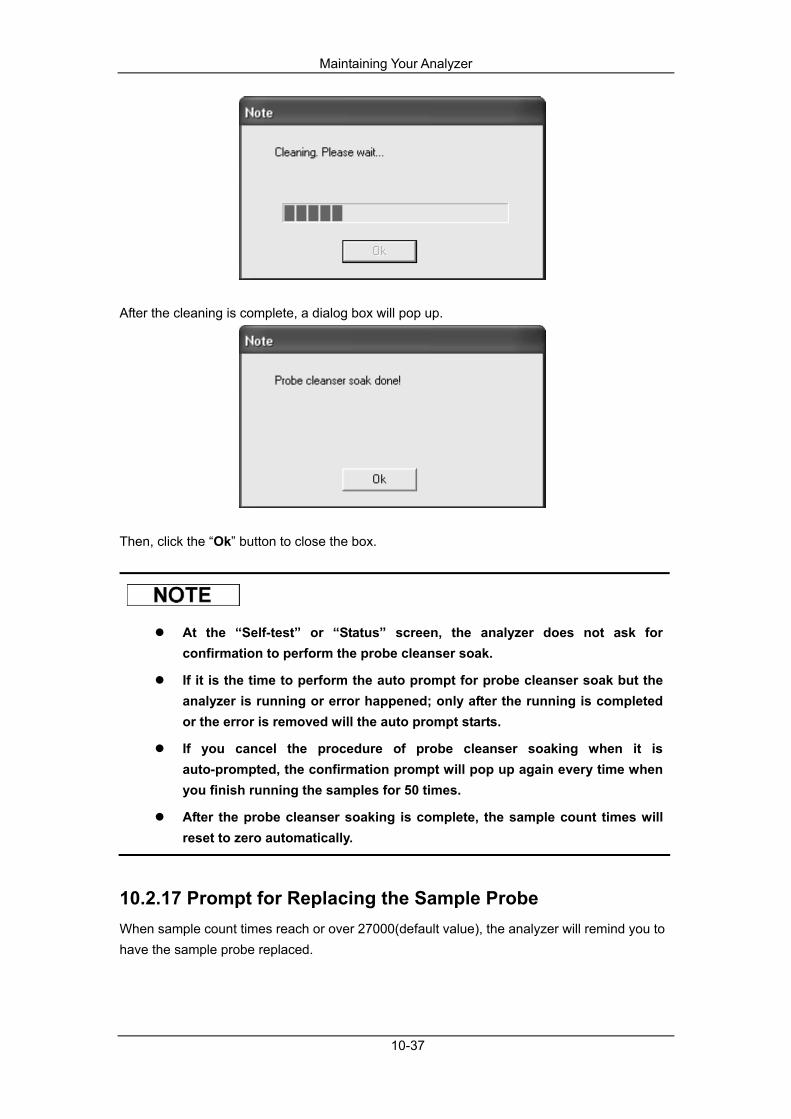
Maintaining Your Analyzer
10-37
After the cleaning is complete, a dialog box will pop up.
Then, click the “Ok” button to close the box.
At the “Self-test” or “Status” screen, the analyzer does not ask for confirmation to perform the probe cleanser soak.
If it is the time to perform the auto prompt for probe cleanser soak but the analyzer is running or error happened; only after the running is completed or the error is removed will the auto prompt starts.
If you cancel the procedure of probe cleanser soaking when it is auto-prompted, the confirmation prompt will pop up again every time when you finish running the samples for 50 times.
After the probe cleanser soaking is complete, the sample count times will reset to zero automatically.
10.2.17 Prompt for Replacing the Sample Probe When sample count times reach or over 27000(default value), the analyzer will remind you to have the sample probe replaced.
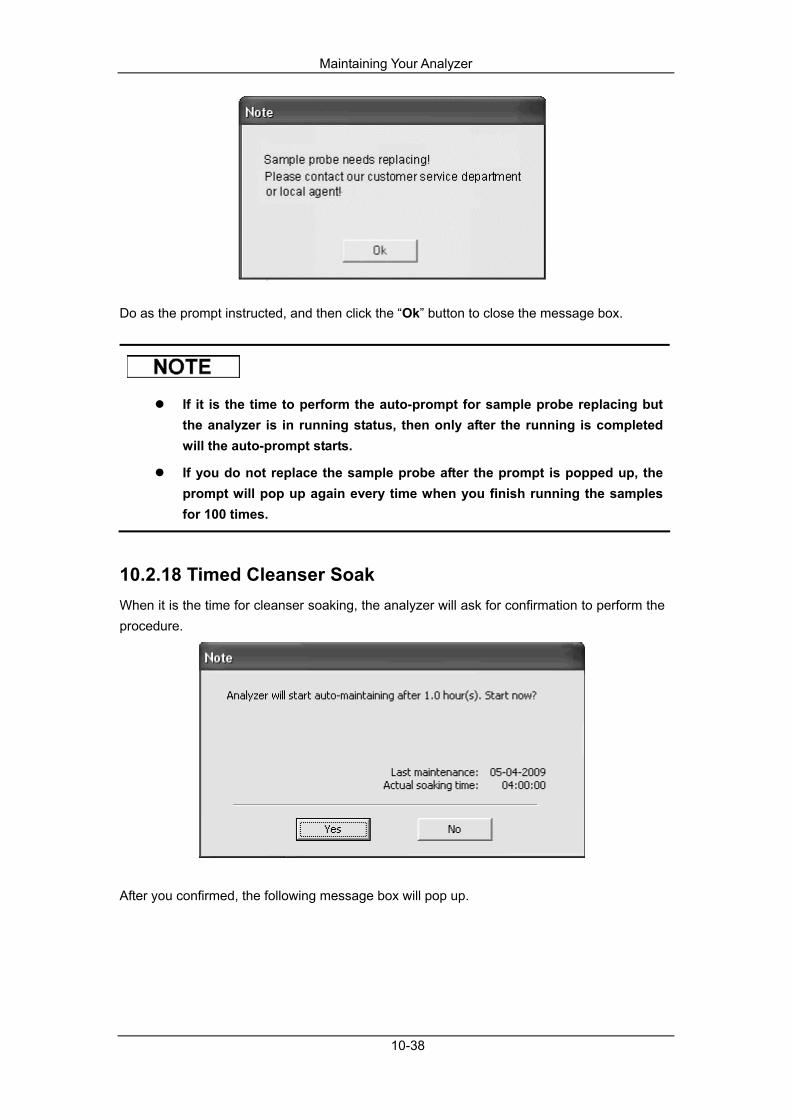
Maintaining Your Analyzer
10-38
Do as the prompt instructed, and then click the “Ok” button to close the message box.
If it is the time to perform the auto-prompt for sample probe replacing but the analyzer is in running status, then only after the running is completed will the auto-prompt starts.
If you do not replace the sample probe after the prompt is popped up, the prompt will pop up again every time when you finish running the samples for 100 times.
10.2.18 Timed Cleanser Soak When it is the time for cleanser soaking, the analyzer will ask for confirmation to perform the procedure.
After you confirmed, the following message box will pop up.
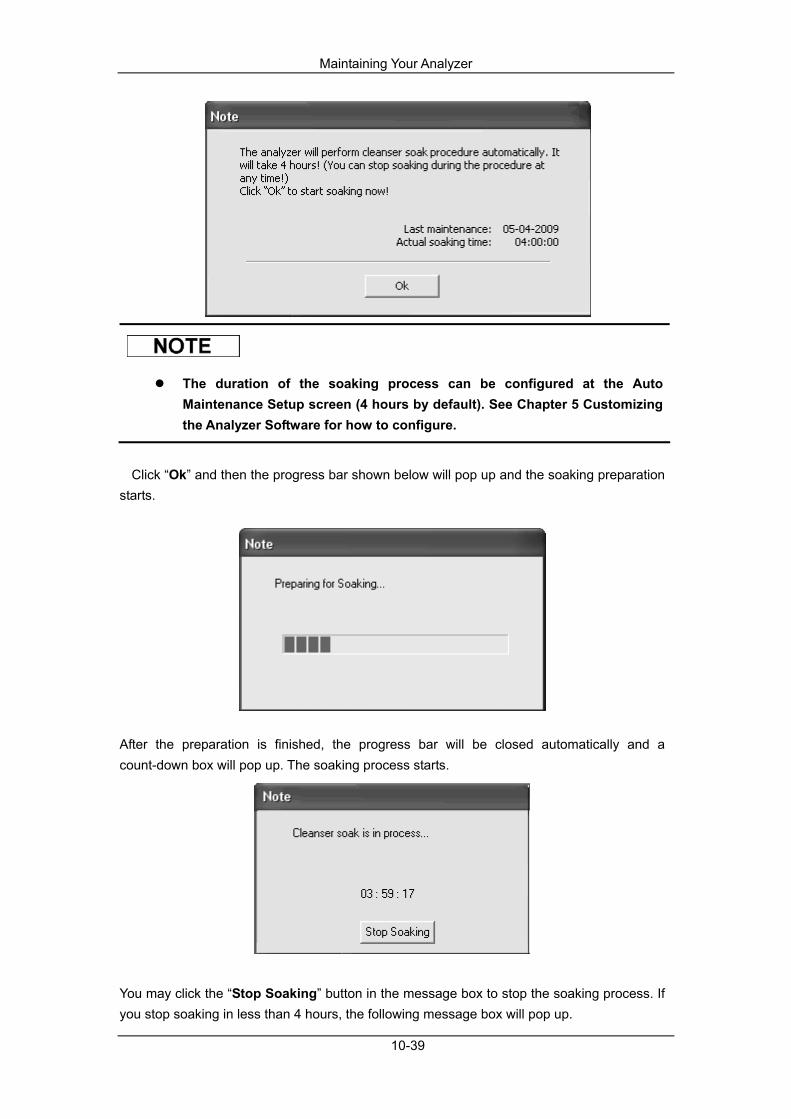
Maintaining Your Analyzer
10-39
The duration of the soaking process can be configured at the Auto Maintenance Setup screen (4 hours by default). See Chapter 5 Customizing the Analyzer Software for how to configure.
Click “Ok” and then the progress bar shown below will pop up and the soaking preparation
starts.
After the preparation is finished, the progress bar will be closed automatically and a count-down box will pop up. The soaking process starts.
You may click the “Stop Soaking” button in the message box to stop the soaking process. If you stop soaking in less than 4 hours, the following message box will pop up.

Maintaining Your Analyzer
10-40
The cleaning process starts automatically after the soaking progress is done.
After the cleaning is complete, a message box will pop up. Click the “OK” button to close the message box.
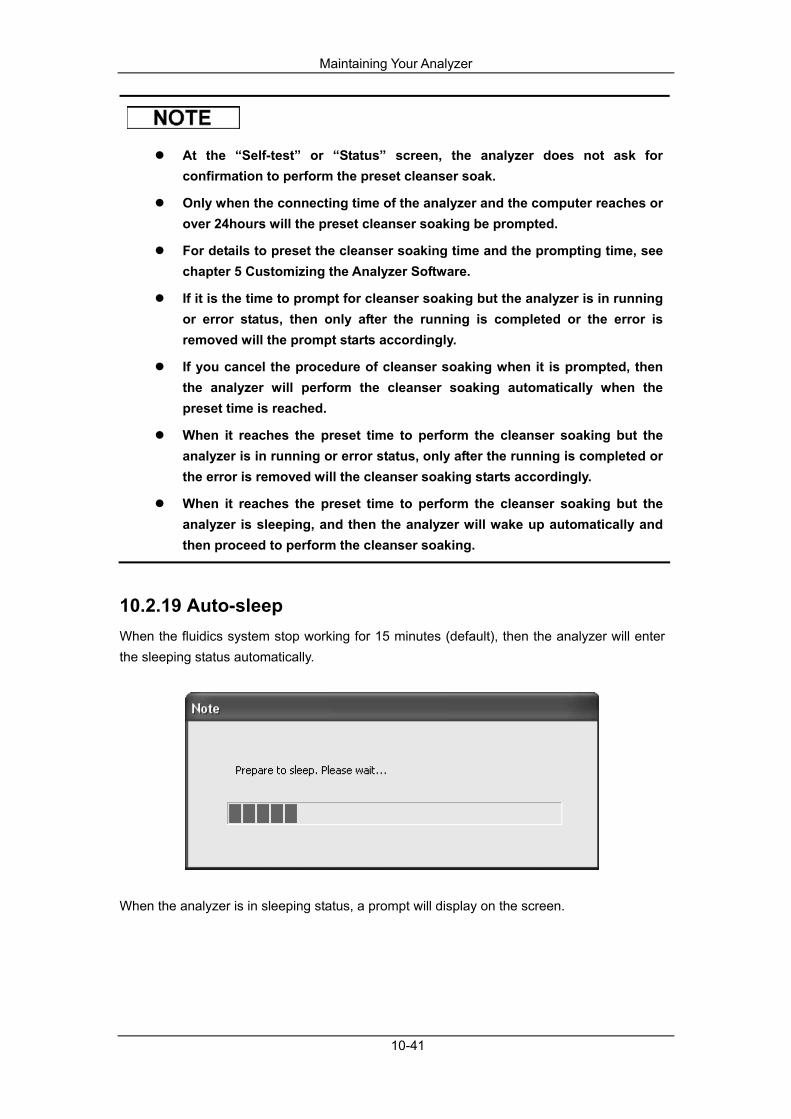
Maintaining Your Analyzer
10-41
At the “Self-test” or “Status” screen, the analyzer does not ask for confirmation to perform the preset cleanser soak.
Only when the connecting time of the analyzer and the computer reaches or over 24hours will the preset cleanser soaking be prompted.
For details to preset the cleanser soaking time and the prompting time, see chapter 5 Customizing the Analyzer Software.
If it is the time to prompt for cleanser soaking but the analyzer is in running or error status, then only after the running is completed or the error is removed will the prompt starts accordingly.
If you cancel the procedure of cleanser soaking when it is prompted, then the analyzer will perform the cleanser soaking automatically when the preset time is reached.
When it reaches the preset time to perform the cleanser soaking but the analyzer is in running or error status, only after the running is completed or the error is removed will the cleanser soaking starts accordingly.
When it reaches the preset time to perform the cleanser soaking but the analyzer is sleeping, and then the analyzer will wake up automatically and then proceed to perform the cleanser soaking.
10.2.19 Auto-sleep When the fluidics system stop working for 15 minutes (default), then the analyzer will enter the sleeping status automatically.
When the analyzer is in sleeping status, a prompt will display on the screen.
Maintaining Your Analyzer
10-42
You can set the waiting time for auto-sleeping, see chapter 5 Customizing the Analyzer Software for details.
At the “Self-test” or “Status” screen, the analyzer can not sleep.
If it is the time to auto-sleep but the analyzer is error status, then only after the error is removed will the auto-sleeping starts accordingly.
You can perform the operations without the cooperation of the analyzer when it is sleeping, namely, communication and print etc.
10.2.20 Sterilization The user shall perform daily cleaning and sterilization to the cover of the analyzer. Use the specified materials to sterilize the equipment only. For damage or accident caused by using other materials, Mindray will not provide any guarantee. Mindray bears no responsibility of the validity of the listed chemicals as the infection control solution. For the methods to control infection, please consult the Infection Prevention Department of the hospital or the epidemic experts. The sterilization may damage the analyzer to some extent. It is recommended to perform sterilization only necessary in your hospital service plan. Clean the equipment before sterilizing. Recommended disinfectant: 70% ethanol, 70% isopropyl alcohol and Cidex 2% Glutaral + Activator.
Prohibited disinfectant: 3% hydrogen peroxide, Aerodesin 2000, Cidex OPA.

Maintaining Your Analyzer
10-43
10.3 System Status
If the results of the status testing exceed the normal range, they will be highlighted by the red background.
10.3.1 Temperature and Pressure Click the “Menu” button on the screen, and then select “Service” ”Status” on the pop-up menu.
Then, click the “Temperature&Pressure” tab and a message box will pop up.
When the sequence is complete, the message box closes automatically and you will enter the following screen.
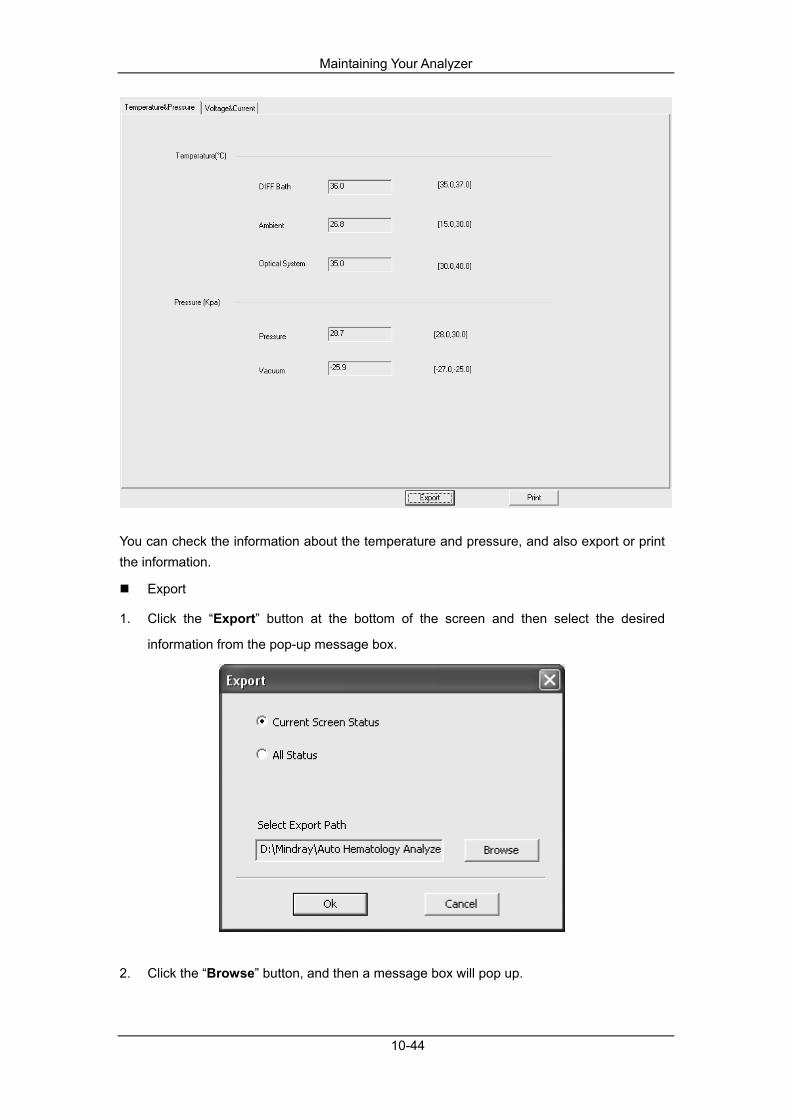
Maintaining Your Analyzer
10-44
You can check the information about the temperature and pressure, and also export or print the information.
Export
1. Click the “Export” button at the bottom of the screen and then select the desired
information from the pop-up message box.
2. Click the “Browse” button, and then a message box will pop up.
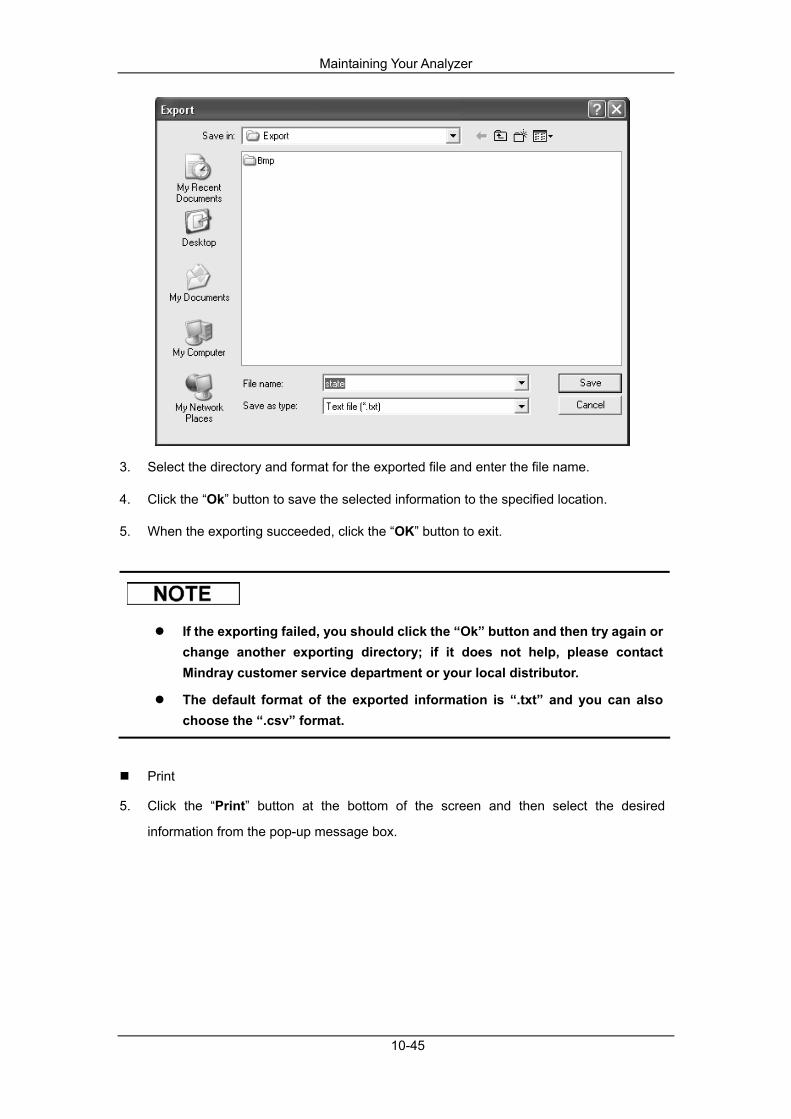
Maintaining Your Analyzer
10-45
3. Select the directory and format for the exported file and enter the file name.
4. Click the “Ok” button to save the selected information to the specified location.
5. When the exporting succeeded, click the “OK” button to exit.
If the exporting failed, you should click the “Ok” button and then try again or change another exporting directory; if it does not help, please contact Mindray customer service department or your local distributor.
The default format of the exported information is “.txt” and you can also choose the “.csv” format.
5. Click the “Print” button at the bottom of the screen and then select the desired
information from the pop-up message box.
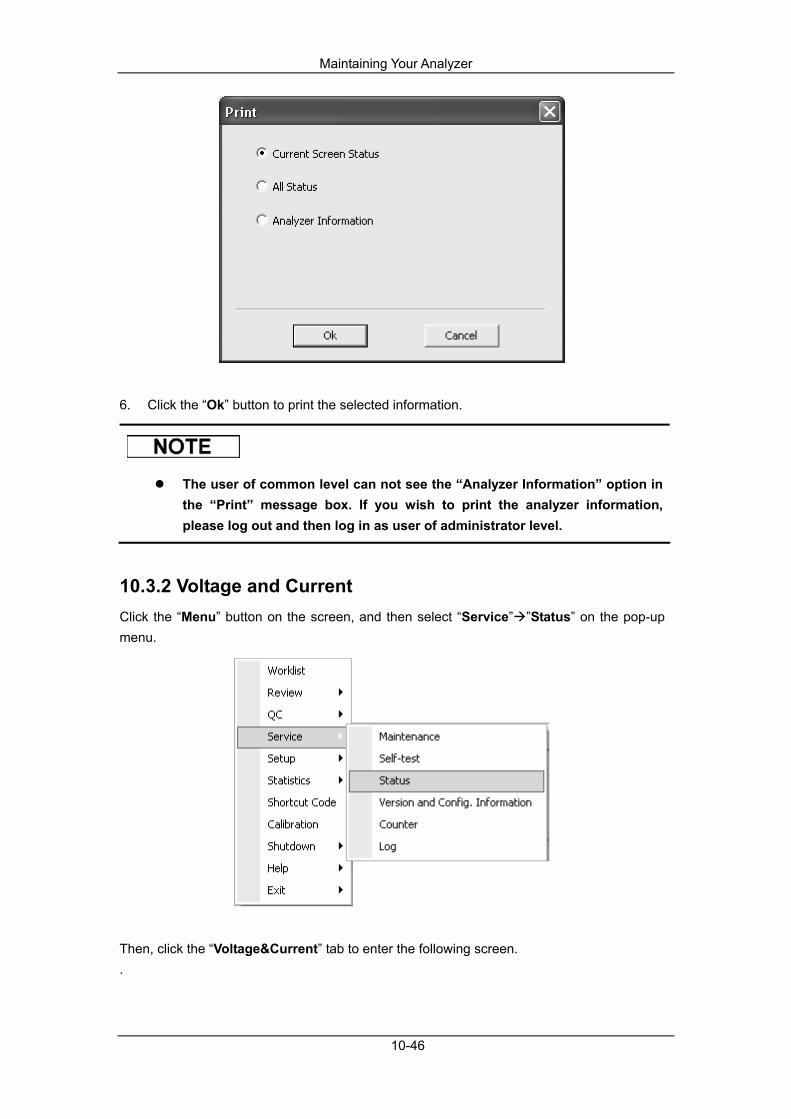
Maintaining Your Analyzer
10-46
6. Click the “Ok” button to print the selected information.
The user of common level can not see the “Analyzer Information” option in the “Print” message box. If you wish to print the analyzer information, please log out and then log in as user of administrator level.
10.3.2 Voltage and Current Click the “Menu” button on the screen, and then select “Service” ”Status” on the pop-up menu.
Then, click the “Voltage&Current” tab to enter the following screen. .
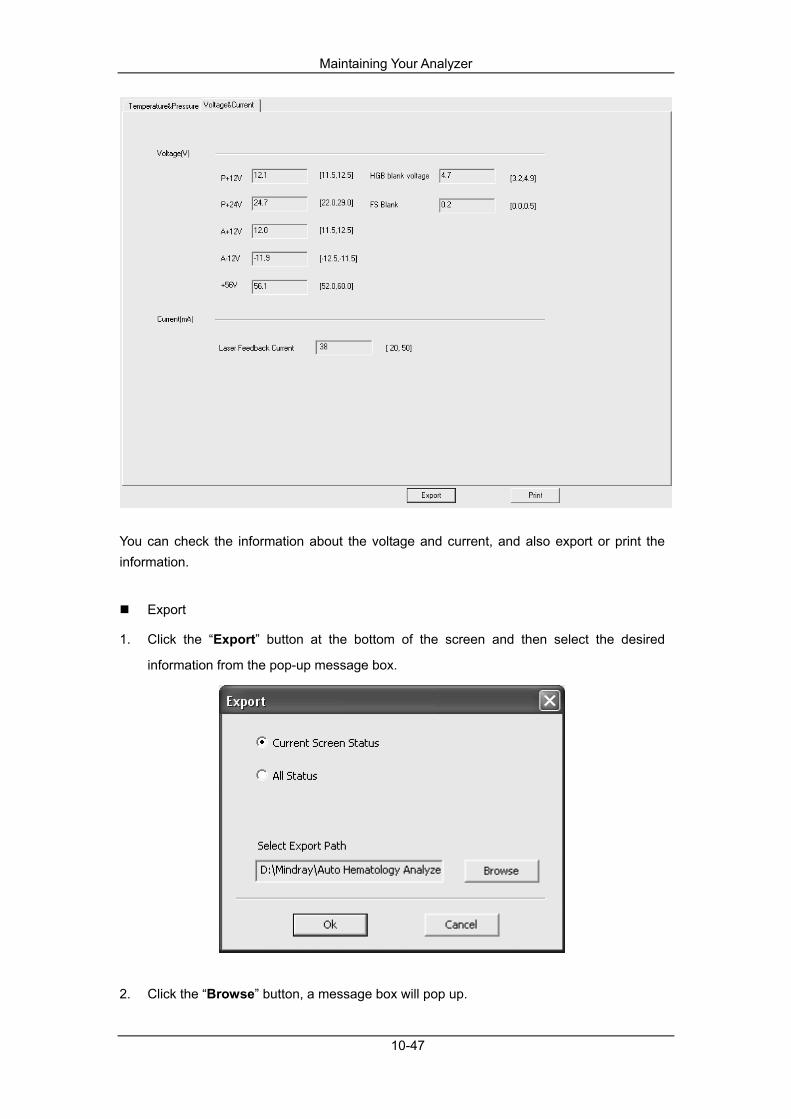
Maintaining Your Analyzer
10-47
You can check the information about the voltage and current, and also export or print the information.
Export
1. Click the “Export” button at the bottom of the screen and then select the desired
information from the pop-up message box.
2. Click the “Browse” button, a message box will pop up.
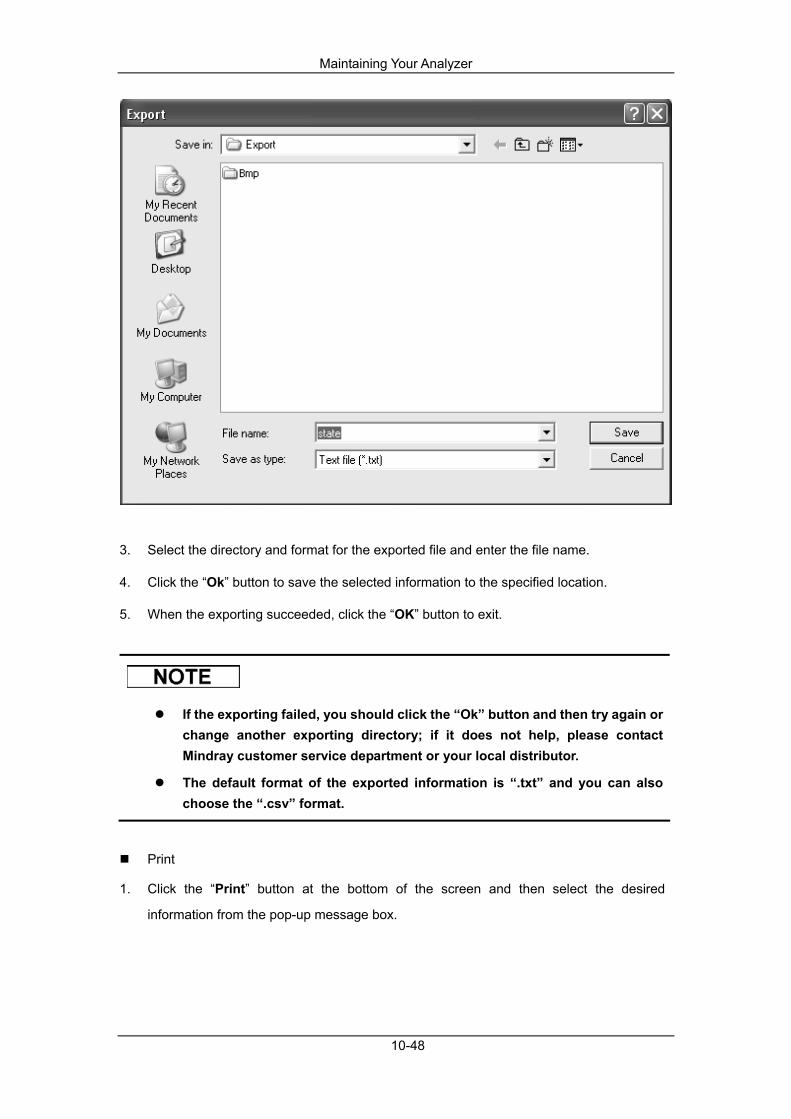
Maintaining Your Analyzer
10-48
3. Select the directory and format for the exported file and enter the file name.
4. Click the “Ok” button to save the selected information to the specified location.
5. When the exporting succeeded, click the “OK” button to exit.
If the exporting failed, you should click the “Ok” button and then try again or change another exporting directory; if it does not help, please contact Mindray customer service department or your local distributor.
The default format of the exported information is “.txt” and you can also choose the “.csv” format.
1. Click the “Print” button at the bottom of the screen and then select the desired
information from the pop-up message box.

Maintaining Your Analyzer
10-49
2. Click the “Ok” button to print the selected information.
The user of common level can not see the “Analyzer Information” option in the “Print” message box. If you wish to print the analyzer information, please log out and then log in as user of administrator level.

Maintaining Your Analyzer
10-50
10.4 Version and Config. Information Click the “Menu” button, select “Service” “Version and Config. Information” on the menu.
Then you will enter the following screen.
You can check the information about the version and configuration, and export or print them.
Export
1. Click the “Export” button, and then the following message box will pop up.
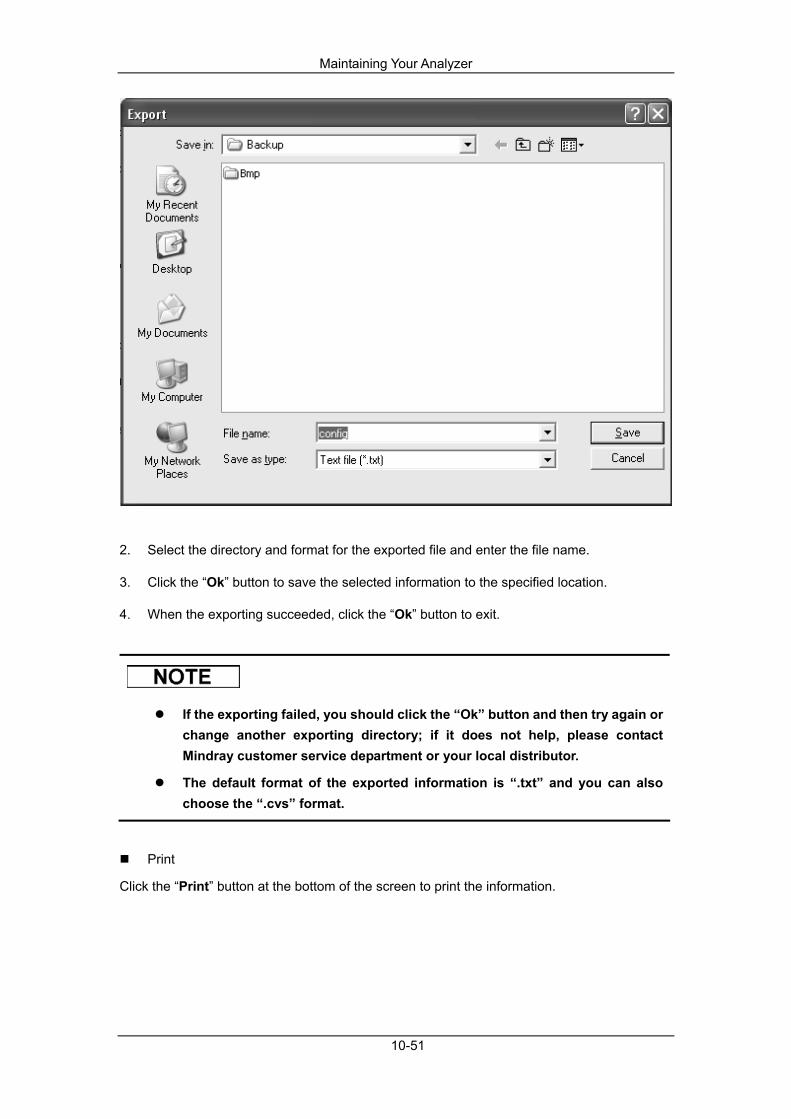
Maintaining Your Analyzer
10-51
2. Select the directory and format for the exported file and enter the file name.
3. Click the “Ok” button to save the selected information to the specified location.
4. When the exporting succeeded, click the “Ok” button to exit.
If the exporting failed, you should click the “Ok” button and then try again or change another exporting directory; if it does not help, please contact Mindray customer service department or your local distributor.
The default format of the exported information is “.txt” and you can also choose the “.cvs” format.
Click the “Print” button at the bottom of the screen to print the information.

Maintaining Your Analyzer
10-52
10.5 Self-test
10.5.1 Syringe and Sampling Mechanism Click the “Menu” button on the screen, and then select “Service” ”Self-test” on the pop-up menu.
Then, click the “Syringe and Sampling Mechanism Self-test” tab to enter the following screen.

Maintaining Your Analyzer
10-53
You can check the status of all items and print the results.
Self-test
1. Double click the desired icon to start self-testing.
2. When the self-testing is finished, a message box will pop up to inform you the normal
testing results. Then, click the “Ok” button to close the message box.
If the testing result is abnormal, you should click the “Ok” button and try again for several times; if it does not help, please contact Mindray customer service department or your local distributor.
3. Do the above procedures to test other items if necessary.
Click the “Print” button at the bottom of the screen to print the latest testing results of all items.

Maintaining Your Analyzer
10-54
10.5.2 Autoloader Assembly Click the “Menu” button on the screen, and then select “Service” ”Self-test” on the pop-up menu.
Click the “Autoloader Assembly Self-test” tab to enter the following screen.
You can check the status of all the items and print the results.

Maintaining Your Analyzer
10-55
Self-test
1. Double click the desired icon to start self-testing.
2. When the self-testing is finished, a message box will pop up to inform you the normal
testing results. Then, click the “Ok” button to close the message box.
If the testing result is abnormal, you should click the “Ok” button and try again for several times; if it does not help, please contact Mindray customer service department or your local distributor.
3. Do the above procedures to test other items if necessary.
Click the “Print” button at the button of the screen to print the latest testing results of all items.
10.5.3 Valve Click the “Menu” button on the screen, and then select “Service” ”Self-test” on the pop-up menu.

Maintaining Your Analyzer
10-56
Then, click the “Valve” tab to enter the following screen.
You can check the status of a single valve or all valves.
Single valve
Click the desired Valve No. (e.g. “1”), then identify whether it works well by judging its sound when opening and closing.
All valves
After clicking the “All Valves” button, all valves will be tested according to their No. one by
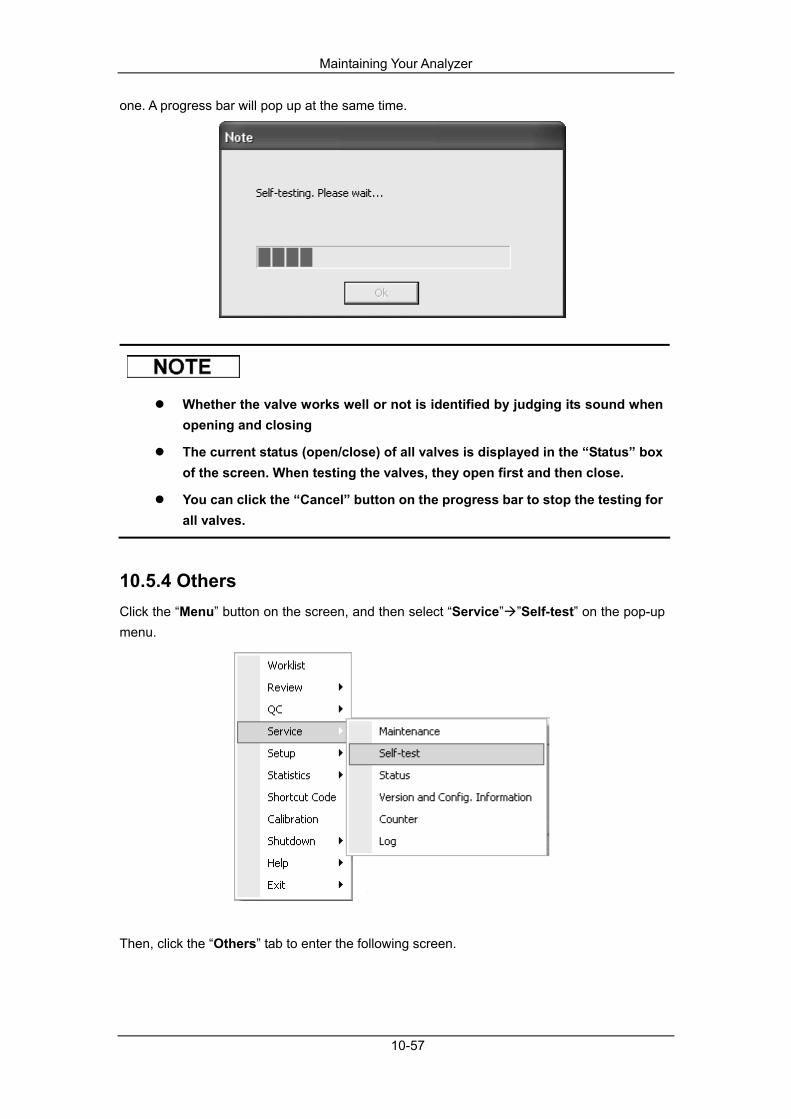
Maintaining Your Analyzer
10-57
one. A progress bar will pop up at the same time.
Whether the valve works well or not is identified by judging its sound when opening and closing
The current status (open/close) of all valves is displayed in the “Status” box of the screen. When testing the valves, they open first and then close.
You can click the “Cancel” button on the progress bar to stop the testing for all valves.
10.5.4 Others Click the “Menu” button on the screen, and then select “Service” ”Self-test” on the pop-up menu.
Then, click the “Others” tab to enter the following screen.
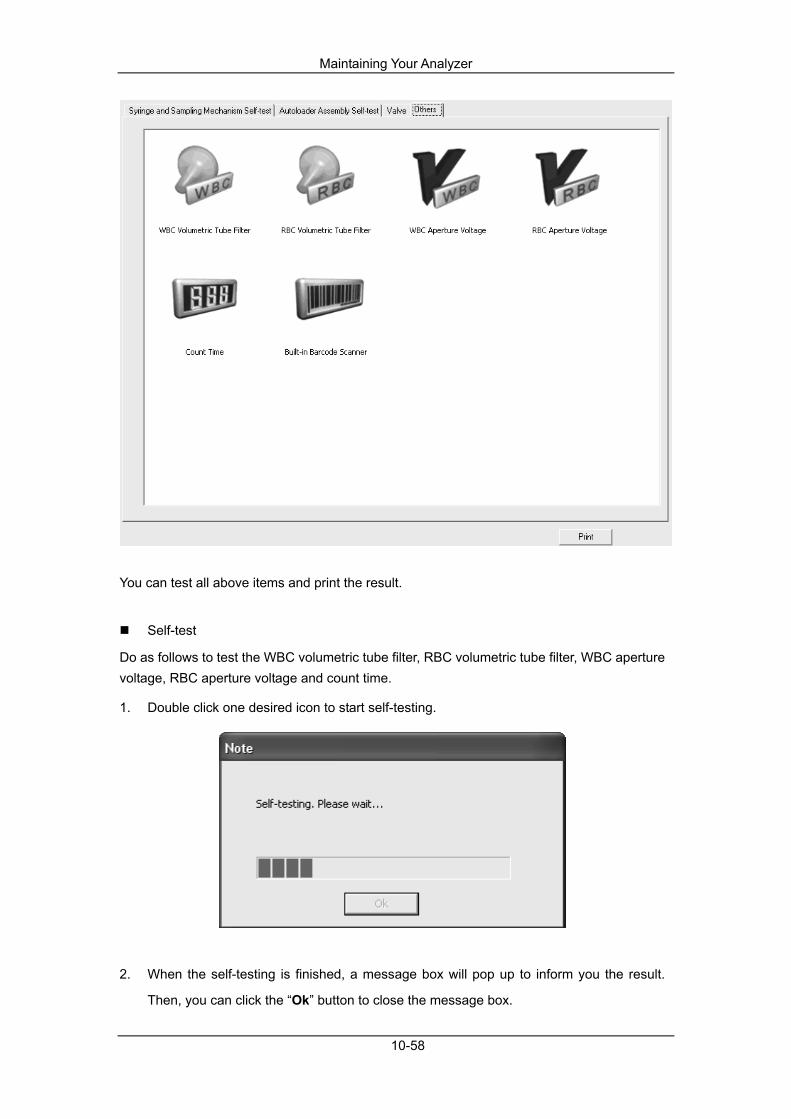
Maintaining Your Analyzer
10-58
You can test all above items and print the result.
Self-test
Do as follows to test the WBC volumetric tube filter, RBC volumetric tube filter, WBC aperture voltage, RBC aperture voltage and count time.
1. Double click one desired icon to start self-testing.
2. When the self-testing is finished, a message box will pop up to inform you the result.
Then, you can click the “Ok” button to close the message box.

Maintaining Your Analyzer
10-59
If the testing result is abnormal, you should click the “Ok” button and try again for several times; if it does not help, please contact Mindray customer service department or your local distributor.
3. Do the above procedures to test other items if necessary.
You can do as follows to test the built-in barcode scanner.
1. Double-click the “Built-in Barcode Scanner” button, and a message box will pop up.
2. The test starts and a progress bar will appear. When the test is completed, a message
will pop up.
3. Check the sample ID as prompted in the message box. Then, click the “Ok” button to
close the box.
Click the “Print” button at the button of the screen to print the latest testing results of the items.
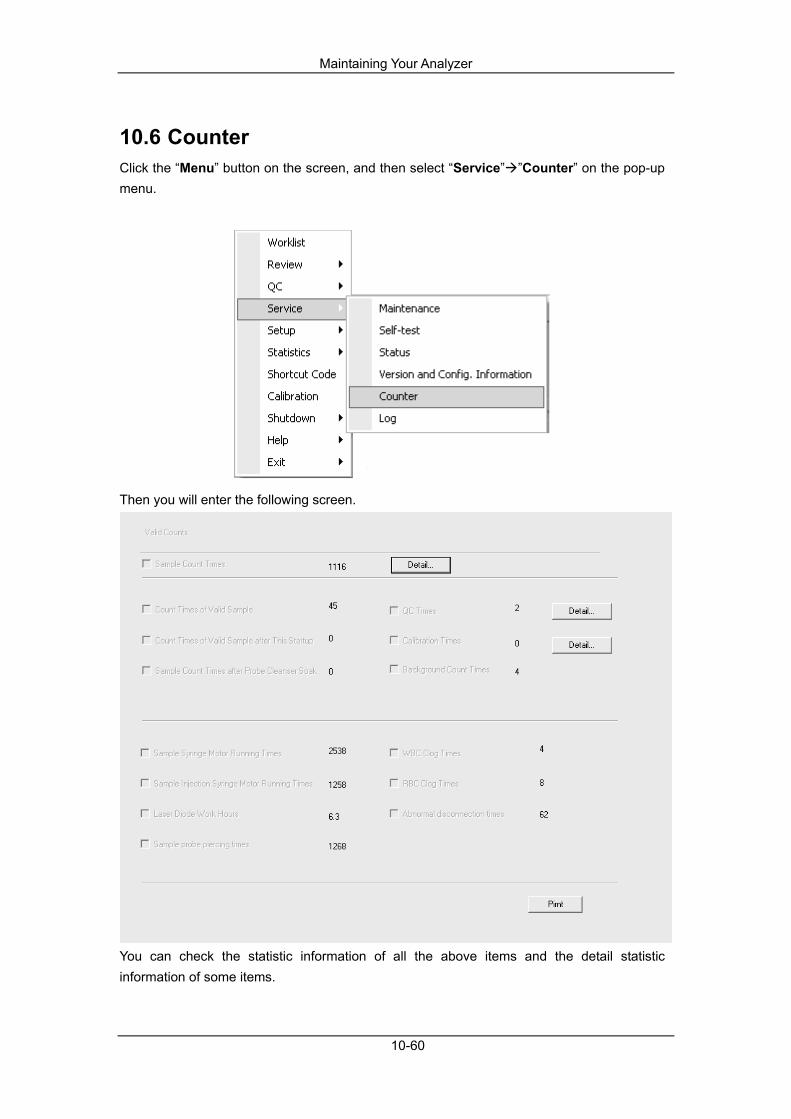
Maintaining Your Analyzer
10-60
10.6 Counter Click the “Menu” button on the screen, and then select “Service” ”Counter” on the pop-up menu.
Then you will enter the following screen.
You can check the statistic information of all the above items and the detail statistic information of some items.

Maintaining Your Analyzer
10-61
Checking the detail information
You can check the detail information for the sample count times, QC times and calibration times. You can click the “Detail…” button next to the “Sample Count Times” to display the detail statistic information about the sample count times.
You can click the “Detail…” button next to the “QC Times” to display the detail statistic information about the QC times.
You can click the “Detail…” button next to the “Calibration Times” to display the detail
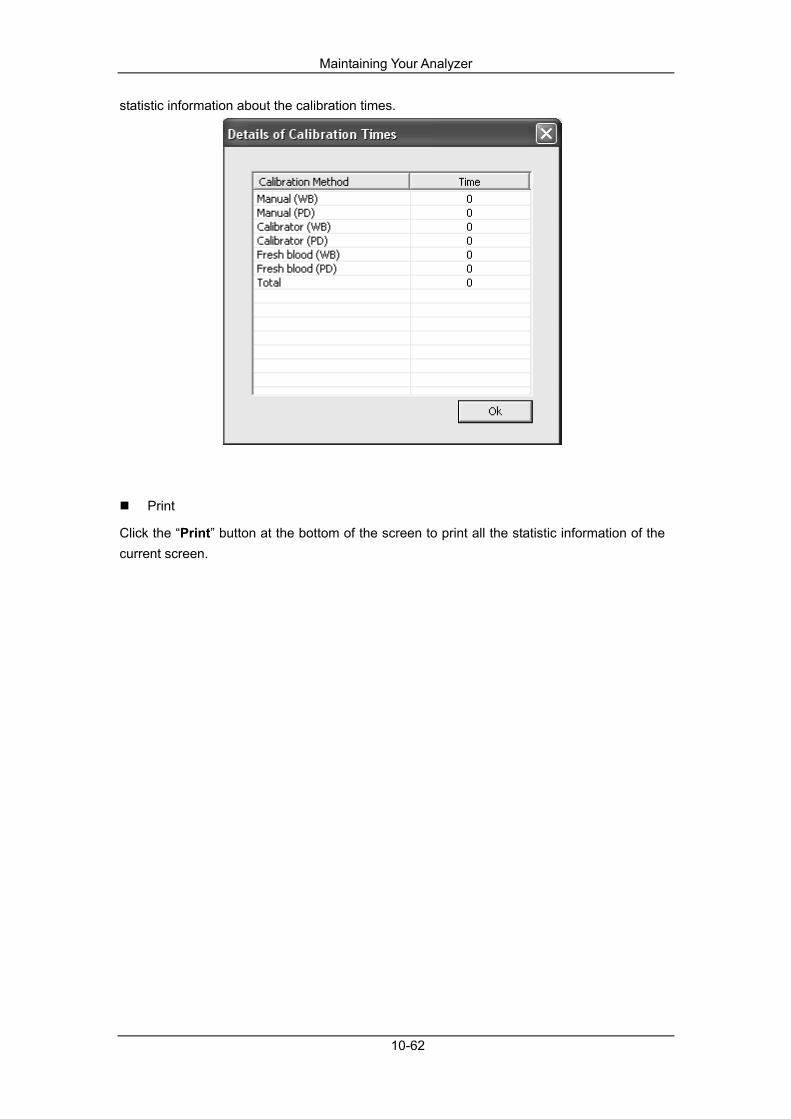
Maintaining Your Analyzer
10-62
statistic information about the calibration times.
Click the “Print” button at the bottom of the screen to print all the statistic information of the current screen.
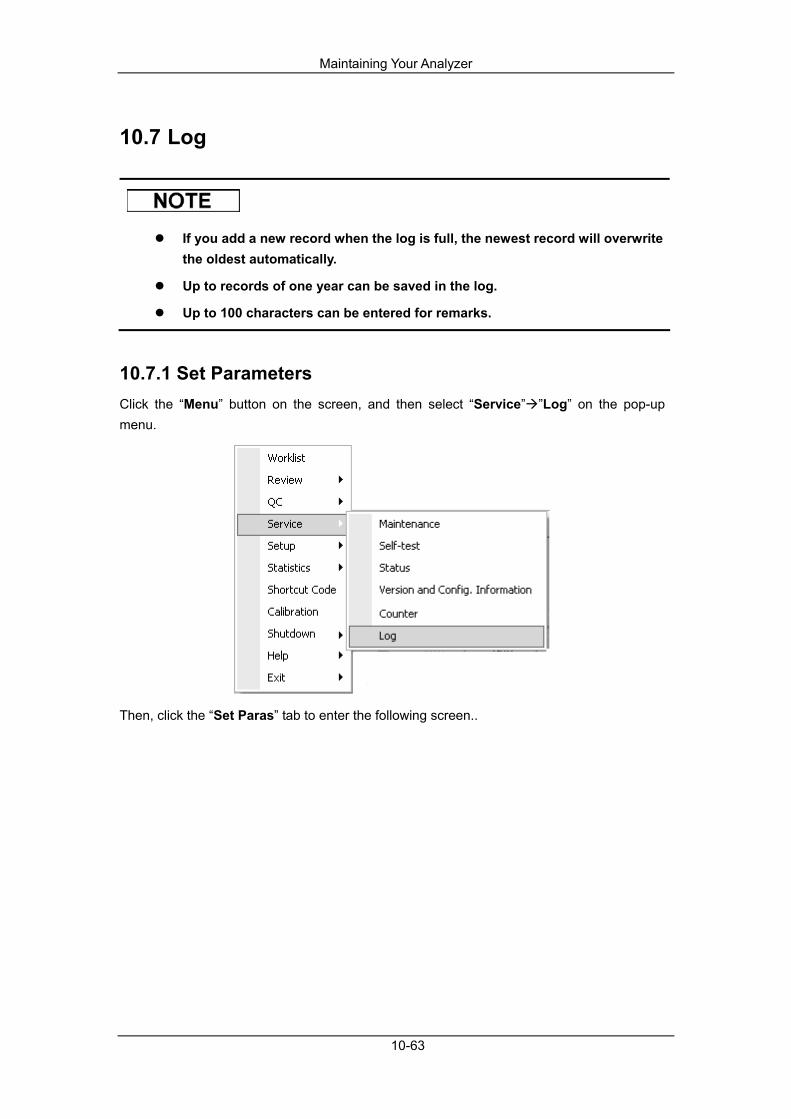
Maintaining Your Analyzer
10-63
10.7 Log
If you add a new record when the log is full, the newest record will overwrite the oldest automatically.
Up to records of one year can be saved in the log.
Up to 100 characters can be entered for remarks.
10.7.1 Set Parameters Click the “Menu” button on the screen, and then select “Service” ”Log” on the pop-up menu.
Then, click the “Set Paras” tab to enter the following screen..

Maintaining Your Analyzer
10-64
You can check the log information, enter remark information and also export and print the information.
Remark
1. Enter the remark information in the “Remark” box of the desired log record.
2. Click the “Save” button at the bottom of the screen to save the remark.
Click the “Print” button at the bottom of the screen. You can select “Date Range” or “No. Range” to determine the print range.

Maintaining Your Analyzer
10-65
Print by date range
1) Enter the starting date and finishing date of the records you want to print. 2) Click “Ok” button to print the selected log.
Print by No. range
1) Enter the starting date and finishing date of the log you want to print. 2) Click the “Ok” button to print the selected log.
Detail
Click the “Detail…” button to check the details of the highlighted record.
10.7.2 Other Logs Click the “Menu” button on the screen, and then select “Service” ”Log” on the pop-up menu.
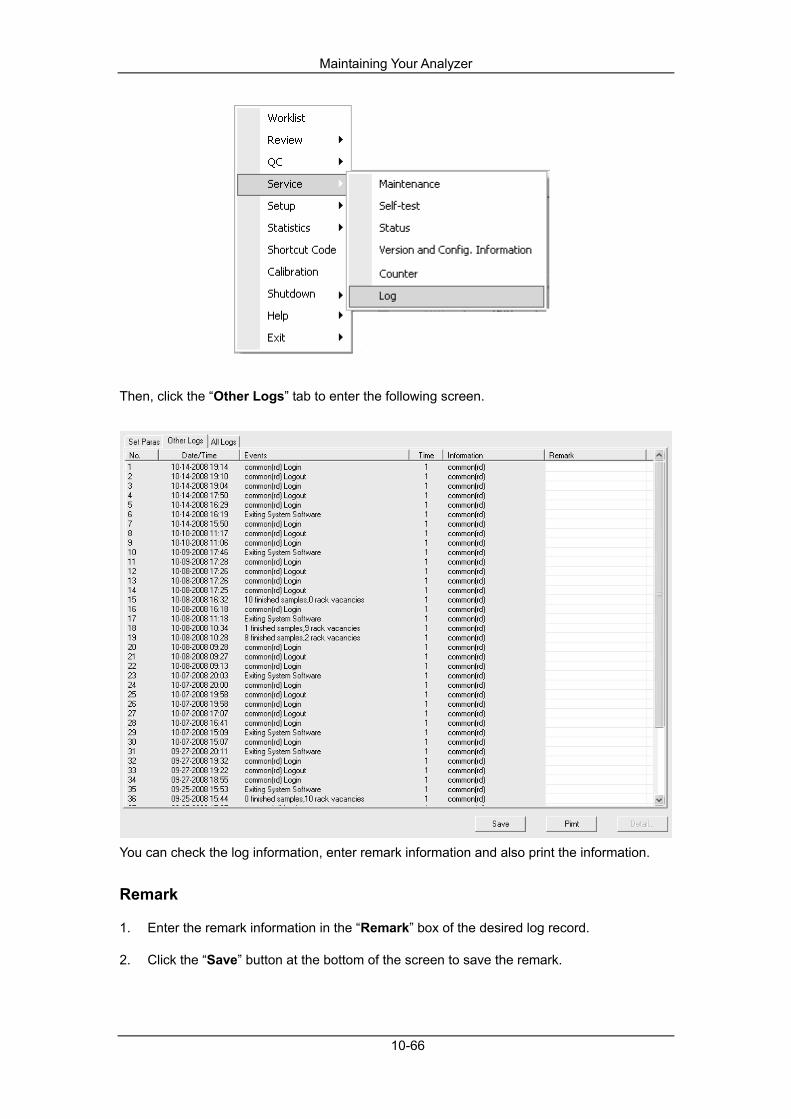
Maintaining Your Analyzer
10-66
Then, click the “Other Logs” tab to enter the following screen.
You can check the log information, enter remark information and also print the information.
Remark
1. Enter the remark information in the “Remark” box of the desired log record.
2. Click the “Save” button at the bottom of the screen to save the remark.
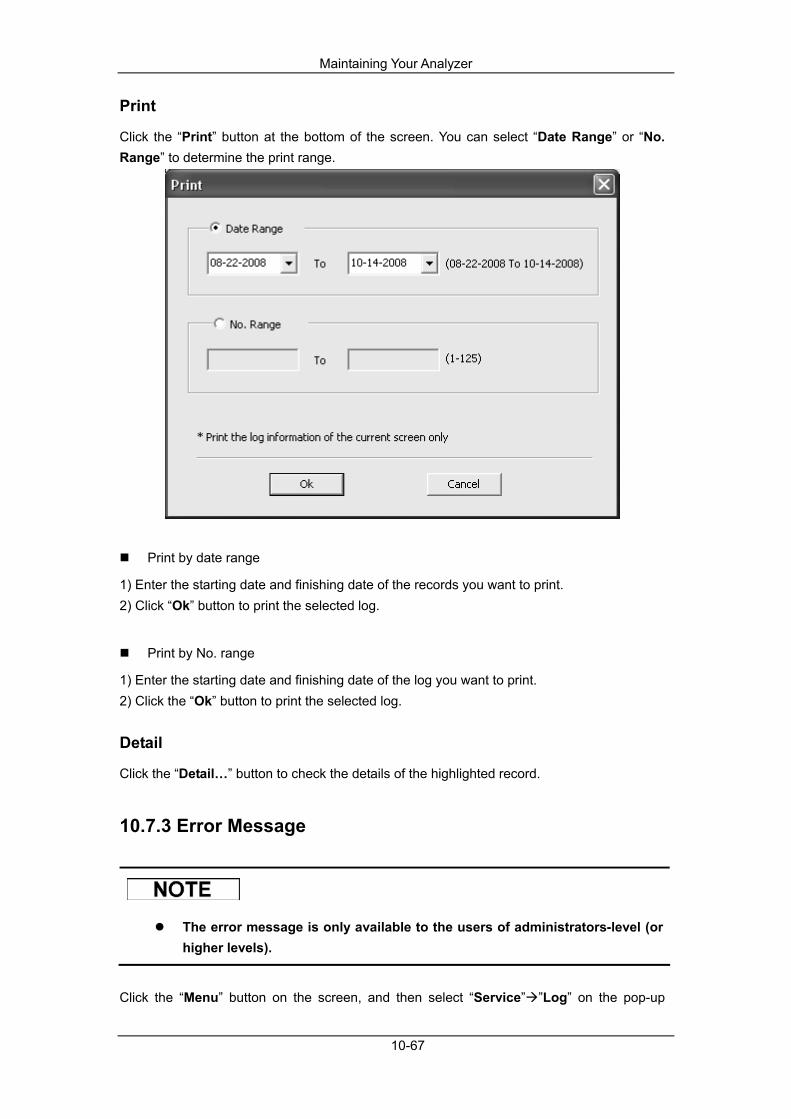
Maintaining Your Analyzer
10-67
Click the “Print” button at the bottom of the screen. You can select “Date Range” or “No. Range” to determine the print range.
Print by date range
1) Enter the starting date and finishing date of the records you want to print. 2) Click “Ok” button to print the selected log.
Print by No. range
1) Enter the starting date and finishing date of the log you want to print. 2) Click the “Ok” button to print the selected log.
Detail
Click the “Detail…” button to check the details of the highlighted record.
10.7.3 Error Message
The error message is only available to the users of administrators-level (or higher levels).
Click the “Menu” button on the screen, and then select “Service” ”Log” on the pop-up
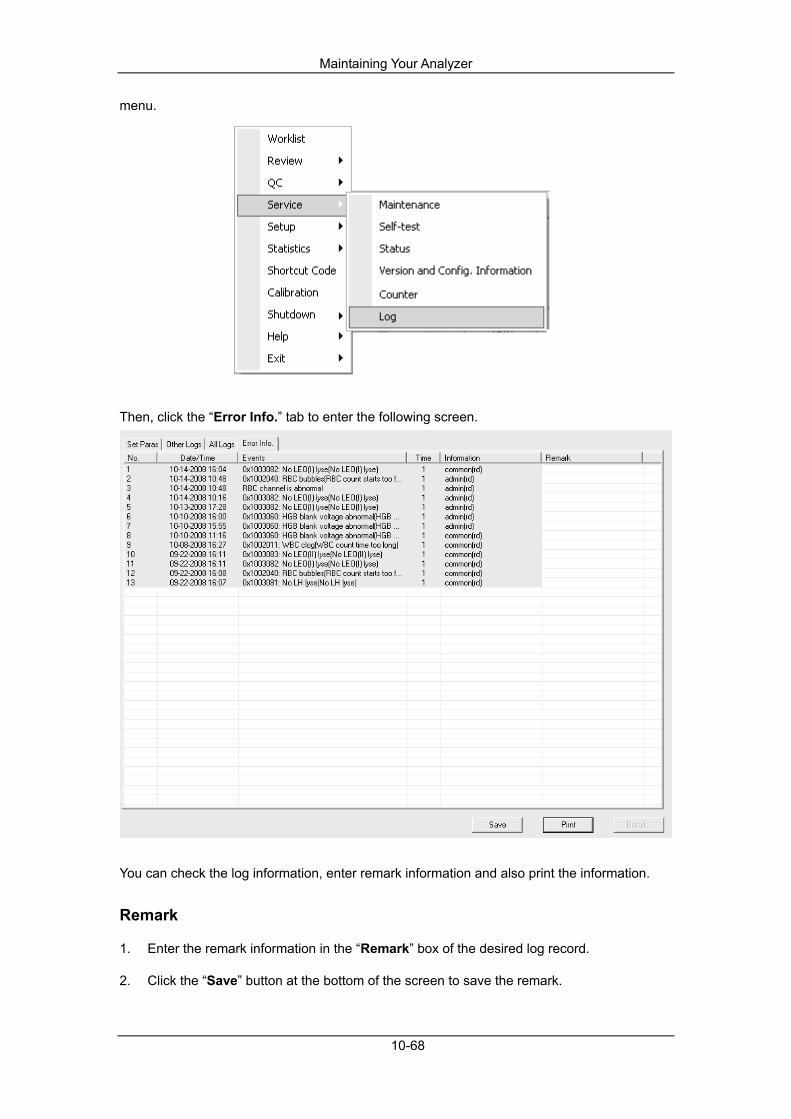
Maintaining Your Analyzer
10-68
menu.
Then, click the “Error Info.” tab to enter the following screen.
You can check the log information, enter remark information and also print the information. Remark
1. Enter the remark information in the “Remark” box of the desired log record.
2. Click the “Save” button at the bottom of the screen to save the remark.
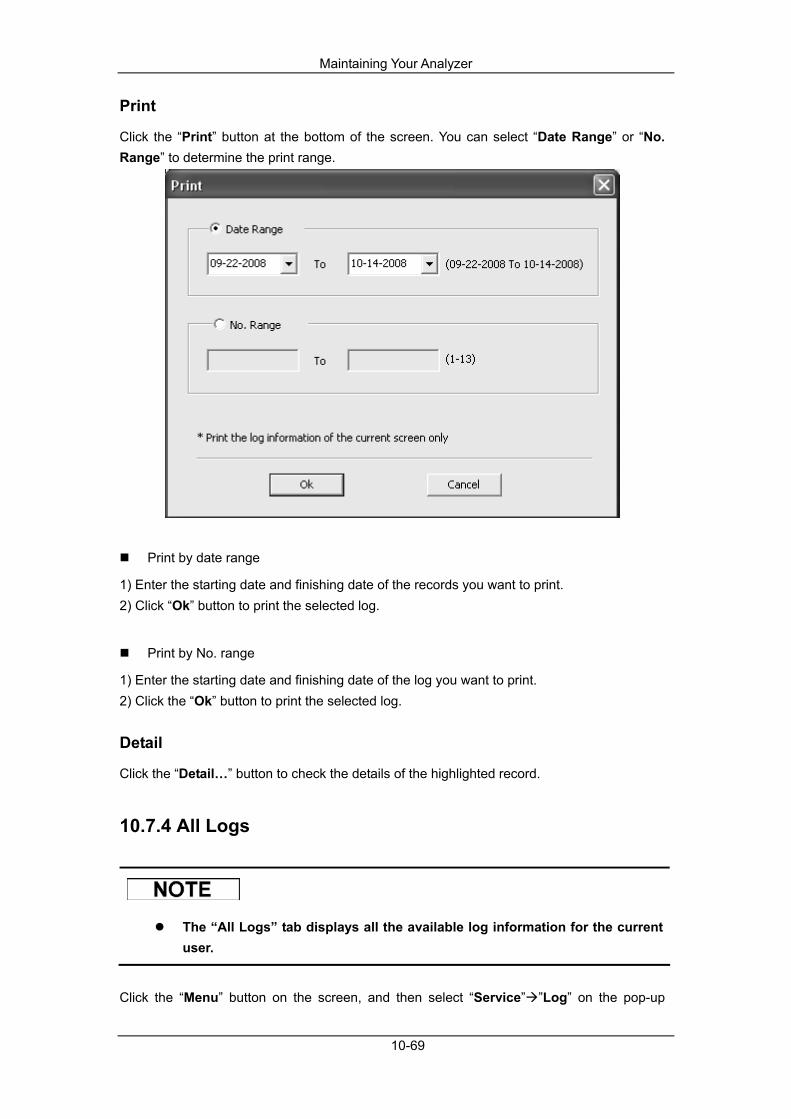
Maintaining Your Analyzer
10-69
Click the “Print” button at the bottom of the screen. You can select “Date Range” or “No. Range” to determine the print range.
Print by date range
1) Enter the starting date and finishing date of the records you want to print. 2) Click “Ok” button to print the selected log.
Print by No. range
1) Enter the starting date and finishing date of the log you want to print. 2) Click the “Ok” button to print the selected log.
Detail
Click the “Detail…” button to check the details of the highlighted record.
10.7.4 All Logs
The “All Logs” tab displays all the available log information for the current user.
Click the “Menu” button on the screen, and then select “Service” ”Log” on the pop-up

Maintaining Your Analyzer
10-70
menu.
Then, click the “All Logs” tab to enter the following screen.
You can check the log information, enter remark information and also print the information.
Remark
1. Enter the remark information in the “Remark” box of the desired log record.
2. Click the “Save” button at the bottom of the screen to save the remark.

Maintaining Your Analyzer
10-71
Click the “Print” button at the bottom of the screen. You can select “Date Range” or “No. Range” to determine the print range.
Print by date range
1) Enter the starting date and finishing date of the records you want to print. 2) Click “Ok” button to print the selected log.
Print by No. range
1) Enter the starting date and finishing date of the log you want to print. 2) Click the “Ok” button to print the selected log.
Detail
Click the “Detail…” button to check the details of the highlighted record.


11-1
11Troubleshooting Your Analyzer
11.1 Introduction This chapter contains information that is helpful in locating and correcting problems that may occur during operation of your analyzer.
This chapter is not a complete service manual and is limited to problems that are readily diagnosed and/or corrected by the user of the analyzer. If the recommended solution fails to solve the problem, contact Mindray customer service department or your local distributor.

Troubleshooting Your Analyzer
11-2
11.2 Errors Indicated by Error Messages During the operation, if error(s) is detected, the analyzer will beep and display the corresponding error message in the pop-up message box. In the error message area, the severity levels are discriminated from high to low by background colors in the order of red, orange, blue, and green.
The red error message means that the analyzer will terminate the current action immediately and you can not perform any operation.
The orange error message means that the analyzer will terminate the current action immediately.
The blue error message means that the analyzer can still proceed with the current action, but other operations related to the error(s) of this kind will be restricted.
The green error message means that the analyzer can still proceed with the current action and other operations will not be restricted.
The following error message box will pop up.
Figure 12-1 Error messages box
You can see the error name(s) and the corresponding troubleshooting information in the pop-up message box. The error names are displayed in order.
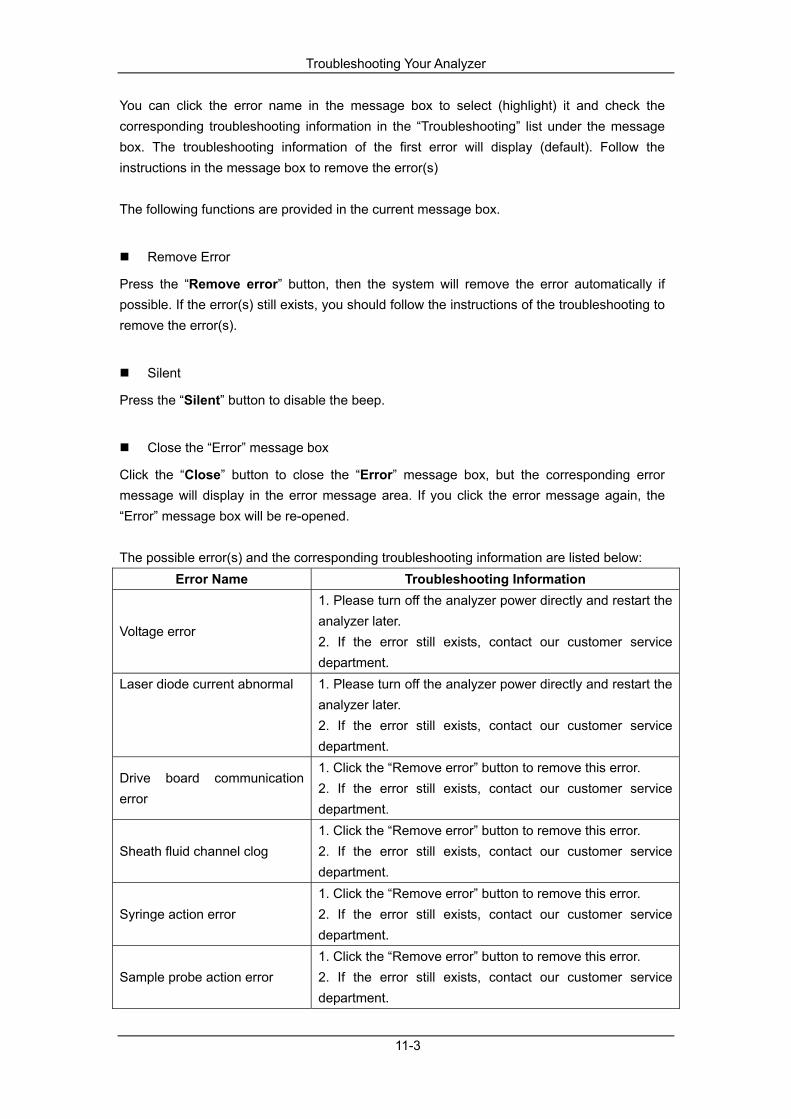
Troubleshooting Your Analyzer
11-3
You can click the error name in the message box to select (highlight) it and check the corresponding troubleshooting information in the “Troubleshooting” list under the message box. The troubleshooting information of the first error will display (default). Follow the instructions in the message box to remove the error(s) The following functions are provided in the current message box.
Remove Error
Press the “Remove error” button, then the system will remove the error automatically if possible. If the error(s) still exists, you should follow the instructions of the troubleshooting to remove the error(s).
Silent
Press the “Silent” button to disable the beep.
Close the “Error” message box
Click the “Close” button to close the “Error” message box, but the corresponding error message will display in the error message area. If you click the error message again, the “Error” message box will be re-opened. The possible error(s) and the corresponding troubleshooting information are listed below:
Error Name Troubleshooting Information
Voltage error
1. Please turn off the analyzer power directly and restart the analyzer later. 2. If the error still exists, contact our customer service department.
Laser diode current abnormal 1. Please turn off the analyzer power directly and restart the analyzer later. 2. If the error still exists, contact our customer service department.
Drive board communication error
1. Click the “Remove error” button to remove this error. 2. If the error still exists, contact our customer service department.
Sheath fluid channel clog 1. Click the “Remove error” button to remove this error. 2. If the error still exists, contact our customer service department.
Syringe action error 1. Click the “Remove error” button to remove this error. 2. If the error still exists, contact our customer service department.
Sample probe action error 1. Click the “Remove error” button to remove this error. 2. If the error still exists, contact our customer service department.
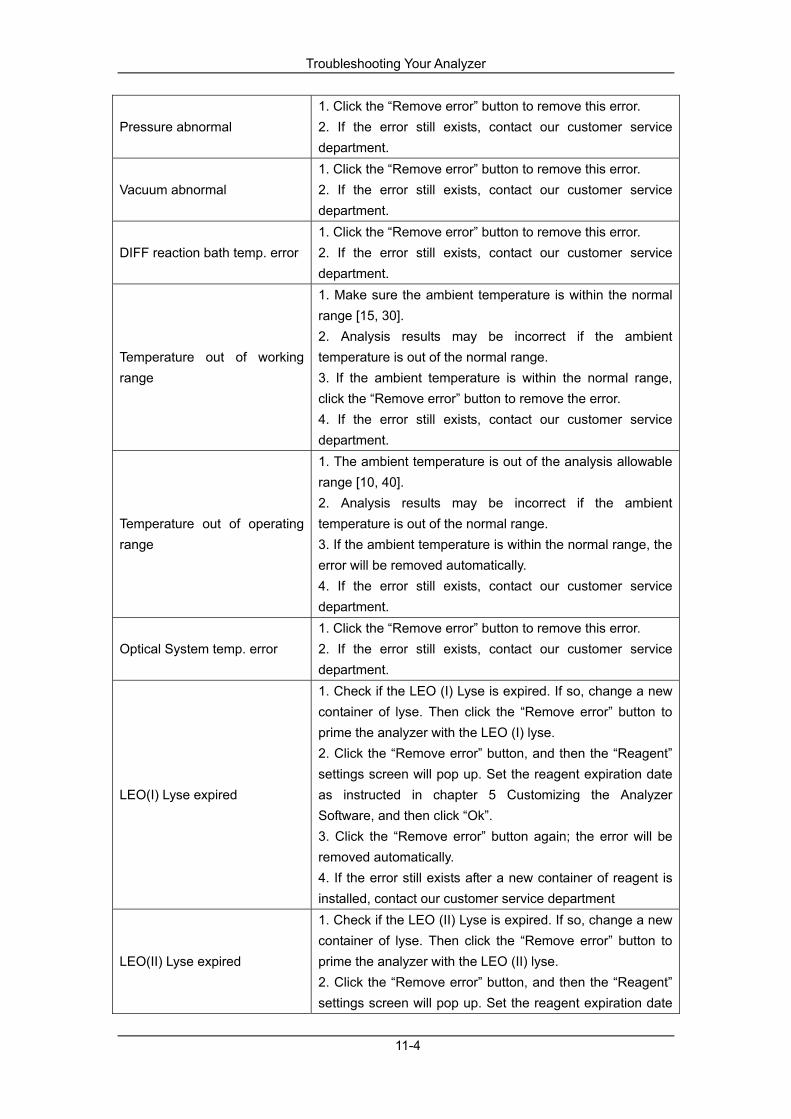
Troubleshooting Your Analyzer
11-4
Pressure abnormal 1. Click the “Remove error” button to remove this error. 2. If the error still exists, contact our customer service department.
Vacuum abnormal 1. Click the “Remove error” button to remove this error. 2. If the error still exists, contact our customer service department.
DIFF reaction bath temp. error 1. Click the “Remove error” button to remove this error. 2. If the error still exists, contact our customer service department.
Temperature out of working range
1. Make sure the ambient temperature is within the normal range [15, 30]. 2. Analysis results may be incorrect if the ambient temperature is out of the normal range. 3. If the ambient temperature is within the normal range, click the “Remove error” button to remove the error. 4. If the error still exists, contact our customer service department.
Temperature out of operating range
1. The ambient temperature is out of the analysis allowable range [10, 40]. 2. Analysis results may be incorrect if the ambient temperature is out of the normal range. 3. If the ambient temperature is within the normal range, the error will be removed automatically. 4. If the error still exists, contact our customer service department.
Optical System temp. error 1. Click the “Remove error” button to remove this error. 2. If the error still exists, contact our customer service department.
LEO(I) Lyse expired
1. Check if the LEO (I) Lyse is expired. If so, change a new container of lyse. Then click the “Remove error” button to prime the analyzer with the LEO (I) lyse. 2. Click the “Remove error” button, and then the “Reagent” settings screen will pop up. Set the reagent expiration date as instructed in chapter 5 Customizing the Analyzer Software, and then click “Ok”. 3. Click the “Remove error” button again; the error will be removed automatically. 4. If the error still exists after a new container of reagent is installed, contact our customer service department
LEO(II) Lyse expired
1. Check if the LEO (II) Lyse is expired. If so, change a new container of lyse. Then click the “Remove error” button to prime the analyzer with the LEO (II) lyse. 2. Click the “Remove error” button, and then the “Reagent” settings screen will pop up. Set the reagent expiration date
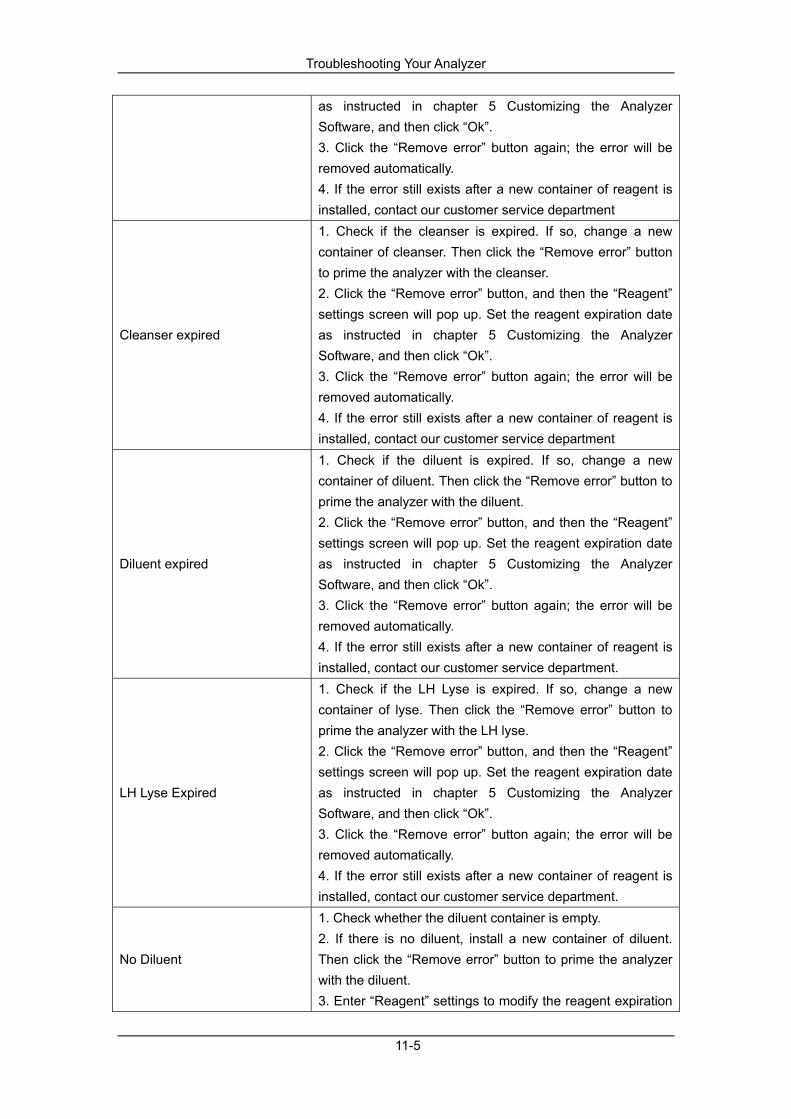
Troubleshooting Your Analyzer
11-5
as instructed in chapter 5 Customizing the Analyzer Software, and then click “Ok”. 3. Click the “Remove error” button again; the error will be removed automatically. 4. If the error still exists after a new container of reagent is installed, contact our customer service department
Cleanser expired
1. Check if the cleanser is expired. If so, change a new container of cleanser. Then click the “Remove error” button to prime the analyzer with the cleanser. 2. Click the “Remove error” button, and then the “Reagent” settings screen will pop up. Set the reagent expiration date as instructed in chapter 5 Customizing the Analyzer Software, and then click “Ok”. 3. Click the “Remove error” button again; the error will be removed automatically. 4. If the error still exists after a new container of reagent is installed, contact our customer service department
Diluent expired
1. Check if the diluent is expired. If so, change a new container of diluent. Then click the “Remove error” button to prime the analyzer with the diluent. 2. Click the “Remove error” button, and then the “Reagent” settings screen will pop up. Set the reagent expiration date as instructed in chapter 5 Customizing the Analyzer Software, and then click “Ok”. 3. Click the “Remove error” button again; the error will be removed automatically. 4. If the error still exists after a new container of reagent is installed, contact our customer service department.
LH Lyse Expired
1. Check if the LH Lyse is expired. If so, change a new container of lyse. Then click the “Remove error” button to prime the analyzer with the LH lyse. 2. Click the “Remove error” button, and then the “Reagent” settings screen will pop up. Set the reagent expiration date as instructed in chapter 5 Customizing the Analyzer Software, and then click “Ok”. 3. Click the “Remove error” button again; the error will be removed automatically. 4. If the error still exists after a new container of reagent is installed, contact our customer service department.
No Diluent
1. Check whether the diluent container is empty. 2. If there is no diluent, install a new container of diluent. Then click the “Remove error” button to prime the analyzer with the diluent. 3. Enter “Reagent” settings to modify the reagent expiration

Troubleshooting Your Analyzer
11-6
date as instructed in chapter 5 Customizing the Analyzer Software. 4. If there is still plenty of diluent, or if the error still exists after a new container of diluent is installed, contact our customer service department.
No LH lyse
1. Check whether the LH lyse container is empty. 2. If there is no LH lyse, change a new container of LH lyse. Then click the “Remove error” button to prime the analyzer with the lyse. 3. Enter “Reagent” settings to modify the reagent expiration date as instructed in chapter 5 Customizing the Analyzer Software. 4. If there is still plenty of reagent, or if the error still exists after a new container of reagent is installed, contact our customer service department.
No LEO(I) lyse
1. Check whether the LEO (I) lyse container is empty. 2. If there is no LEO (I) lyse, change a new container of LEO(I)lyse. Then click the “Remove error” button to prime the analyzer with the lyse. 3. Enter “Reagent” settings to modify the reagent expiration date as instructed in chapter 5 Customizing the Analyzer Software. 4. If there is still plenty of reagent, or if the error still exists after a new container of reagent is installed, contact our customer service department.
No LEO(II) lyse
1. Check whether the LEO (II) lyse container is empty. 2. If there is no LEO(II) lyse, change a new container of LEO(II) lyse. Then click the “Remove error” button to prime the analyzer with the lyse. 3. Enter “Reagent” settings to modify the reagent expiration date as instructed in chapter 5 Customizing the Analyzer Software. 4. If there is still plenty of reagent, or if the error still exists after a new container of reagent is installed, contact our customer service department.
No Cleanser
1. Check whether the cleanser container is empty. 2. If there is no cleanser, change a new container of cleanser. Then click the “Remove error” button to prime the analyzer with the cleanser. 3. Enter “Reagent” settings to modify the reagent expiration date as instructed in chapter 5 Customizing the Analyzer Software. 4. If there is still plenty of reagent, or if the error still exists after a new container of reagent is installed, contact our
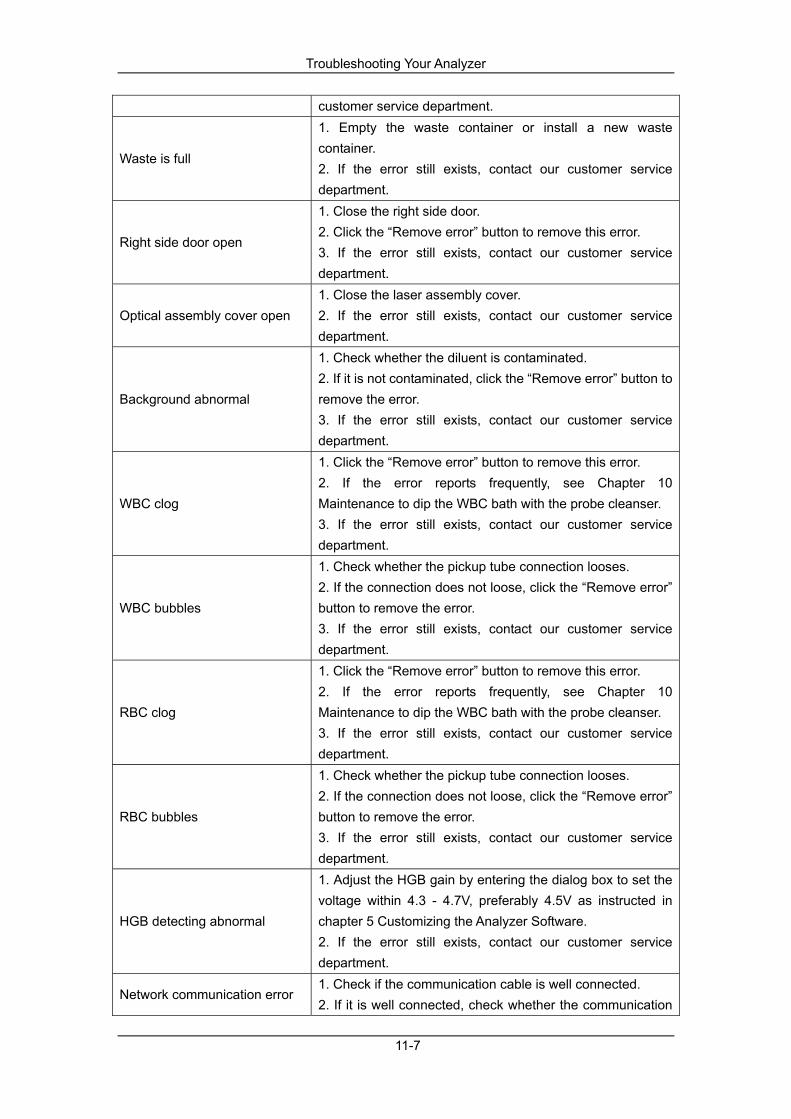
Troubleshooting Your Analyzer
11-7
customer service department.
Waste is full
1. Empty the waste container or install a new waste container. 2. If the error still exists, contact our customer service department.
Right side door open
1. Close the right side door. 2. Click the “Remove error” button to remove this error. 3. If the error still exists, contact our customer service department.
Optical assembly cover open 1. Close the laser assembly cover. 2. If the error still exists, contact our customer service department.
Background abnormal
1. Check whether the diluent is contaminated. 2. If it is not contaminated, click the “Remove error” button to remove the error. 3. If the error still exists, contact our customer service department.
WBC clog
1. Click the “Remove error” button to remove this error. 2. If the error reports frequently, see Chapter 10 Maintenance to dip the WBC bath with the probe cleanser. 3. If the error still exists, contact our customer service department.
WBC bubbles
1. Check whether the pickup tube connection looses. 2. If the connection does not loose, click the “Remove error” button to remove the error. 3. If the error still exists, contact our customer service department.
RBC clog
1. Click the “Remove error” button to remove this error. 2. If the error reports frequently, see Chapter 10 Maintenance to dip the WBC bath with the probe cleanser. 3. If the error still exists, contact our customer service department.
RBC bubbles
1. Check whether the pickup tube connection looses. 2. If the connection does not loose, click the “Remove error” button to remove the error. 3. If the error still exists, contact our customer service department.
HGB detecting abnormal
1. Adjust the HGB gain by entering the dialog box to set the voltage within 4.3 - 4.7V, preferably 4.5V as instructed in chapter 5 Customizing the Analyzer Software. 2. If the error still exists, contact our customer service department.
Network communication error 1. Check if the communication cable is well connected. 2. If it is well connected, check whether the communication

Troubleshooting Your Analyzer
11-8
cable is damaged. 3. If the cable is not damaged, click the “Remove error” button to remove the error. 4. If the error still exists, contact our customer service department.
Autoloader board communication error
1. Click the “Remove error” button to remove this error. 2. If the error still exists, contact our customer service department.
Mix mechanism action error 1. Click the “Remove error” button to remove this error. 2. If the error still exists, contact our customer service department.
Autoloader mechanism action error
1. Click the “Remove error” button to remove this error. 2. If the error still exists, please try to remove the tube rack from the autoloader and then click the “Remove error” button again. 3. If the error still exists, contact our customer service department.
Unloading tray is full 1. Remove the rack(s) from the unloading tray. 2. If the error still exists, contact our customer service department.
Scanner error
1. Check whether the barcode is pasted incorrectly, damaged, or illegible. 2. If there is nothing wrong with the barcode, click the “Remove error” button to check the built-in barcode scanner.3. If the error still exists, contact our customer service department.
Closed-tube sampler door open failed
1. Check if the sample compartment door is unexpectedly open. 2. Click the “Remove error” button to remove this error. 3. If the error still exists, contact our customer service department.
12-1
12Customizing the Print Template
12.1 Introduction You can modify the print template based on the default one provided by the software in order to customize the format of the report.
After customizing and saving a template, you can select the newly customized one in the print setup. And then, the report will be printed in the customized template.
Users of common level have no authority to customize report.

Customizing the Print Template
12-2
12.2 Entering the Print Template Screen Log in as an administrator, and then click "Menu" "Setup" "Print" to go to the print setup screen.
1. Click the “Customize” button to enter the “PrintTemplate” screen, and the following message box will pop up.
2. Enter the correct user name and password in the message box, and go to the print
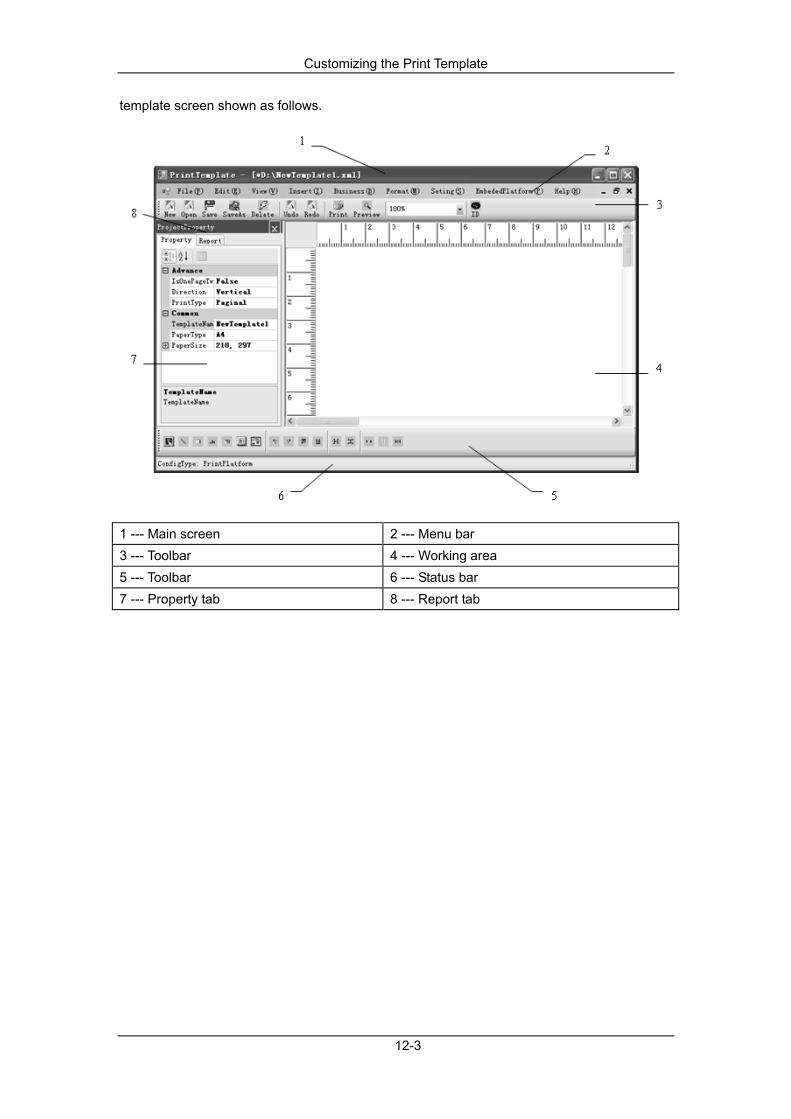
Customizing the Print Template
12-3
template screen shown as follows.
1 --- Main screen 2 --- Menu bar 3 --- Toolbar 4 --- Working area 5 --- Toolbar 6 --- Status bar 7 --- Property tab 8 --- Report tab

Customizing the Print Template
12-4
12.3 Editing the Template
12.3.1 Opening a Template
You can open a template by one of the following ways:
Click on the "Report" tab in the "ProjectProperty" area to display all existing templates in the current template library. Click one of the template names and the corresponding template will be displayed in the working area.
Click "File" "Open" on the menu bar or the button on the toolbar, and then
specify the directory and select the template file. Click "Open" to open the template.
12.3.2 Editing the Template Property
After you open a template, the properties of this template will be displayed under the "Property" tab on the left of the screen. Click the cell to the right of the property name box to edit the property. If the cell is an edit box, modify the property directly; if the cell is a pull-down list, choose the desired value in the list.
12.3.3 Inserting Controls or Businesses
Inserting a Control Click "Insert" on the menu bar and choose the control you want to insert; or select a control in the tool bar on the bottom left, and drag it to the desired place in the working area.
You can click the button (line control) to draw a straight line or an oblique line in the
working area.
You can click the button (title control) to add a title in the working area.
You can click the button (label control) to add the fixed text information in the
working area.
You can click the button (edit control) to add details associated with the print
template and the changeable information in the working area.
You can click the button (picture control) to arrange the location and size of the
graph in the working area.

Customizing the Print Template
12-5
You can click the button (table control) to add a table in the working area.
Inserting a Business A business is a set of controls which can be inserted in the template to facilitate the editing process. Do as follows to insert a business:
1. Click "Insert" on the menu bar and choose "Head", "Body" or "Tail". The following message box will pop up.
2. Select the desired business name in the pull-down list. Click the "Ok" button to close the message box and insert the selected business.
12.3.4 Editing the Control(s)
You should select the control(s) you want to edit before start editing.
Click on the control to select it.
You can select multiple controls by one of the following ways:
Press and hold the "Ctrl" key on the keyboard, and at the same time, click on the controls you want to select.
Click on the template in the working area and drag the mouse to enclose the controls you want to select in the rectangular box displayed.
Moving the Control(s) You can move the control(s) by one of the following ways:
Select the control(s) you want to move. Left click and hold the mouse, and then move the control to the destination and release.
Select the control(s) you want to move. Press and hold the "Ctrl" key, and move the control using the arrow keys on the keyboard.
Aligning the Control(s) Select the control(s), and select the desired alignment options in the "Format" menu or the
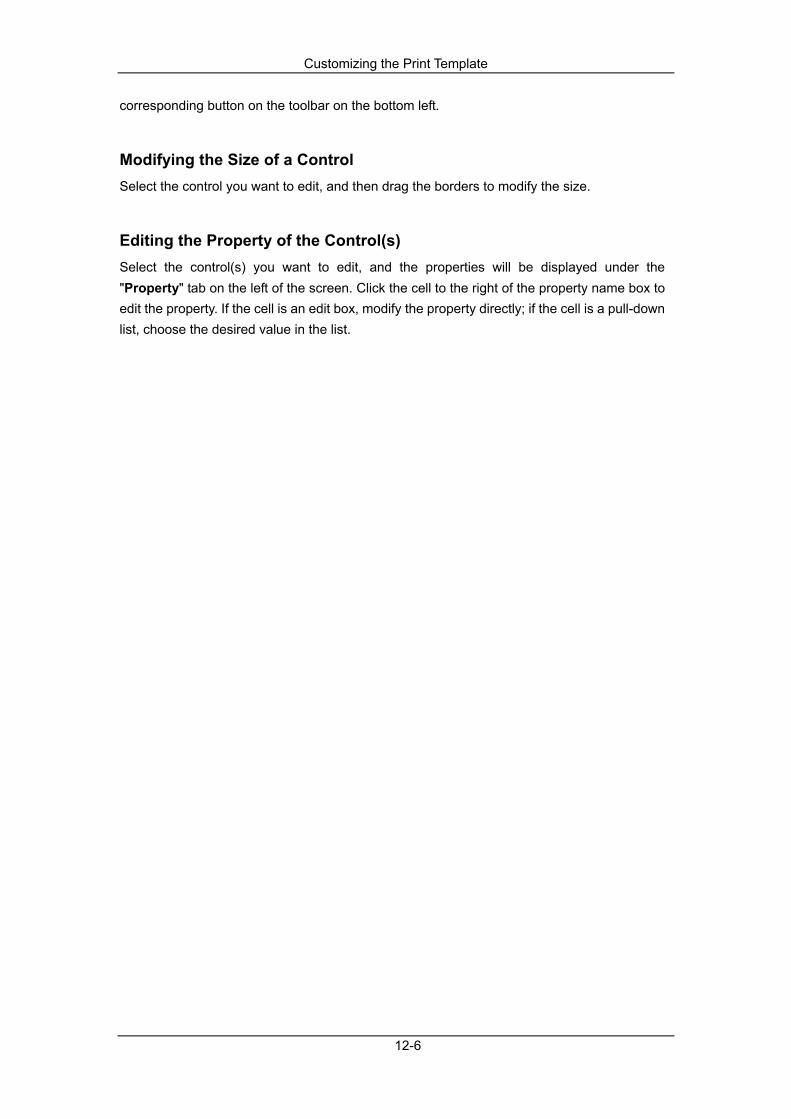
Customizing the Print Template
12-6
corresponding button on the toolbar on the bottom left.
Modifying the Size of a Control Select the control you want to edit, and then drag the borders to modify the size.
Editing the Property of the Control(s) Select the control(s) you want to edit, and the properties will be displayed under the "Property" tab on the left of the screen. Click the cell to the right of the property name box to edit the property. If the cell is an edit box, modify the property directly; if the cell is a pull-down list, choose the desired value in the list.

Customizing the Print Template
12-7
12.4 Managing the Templates
12.4.1 Importing a Template
When you enter the main screen, you can see all the imported templates under the "Report" tab in the "ProjectProperty" area.
Do as follows to import a new template to the current template library:
1. On the menu bar, click "File" "Import", and the following message box will pop up.
2. Choose the import type and click "Ok". Then the following message box will pop up.
3. Select the template file you want to import and click "Open" to import the template into the current library. The name of the imported template will be displayed under the "Report" tab, shown as follows.
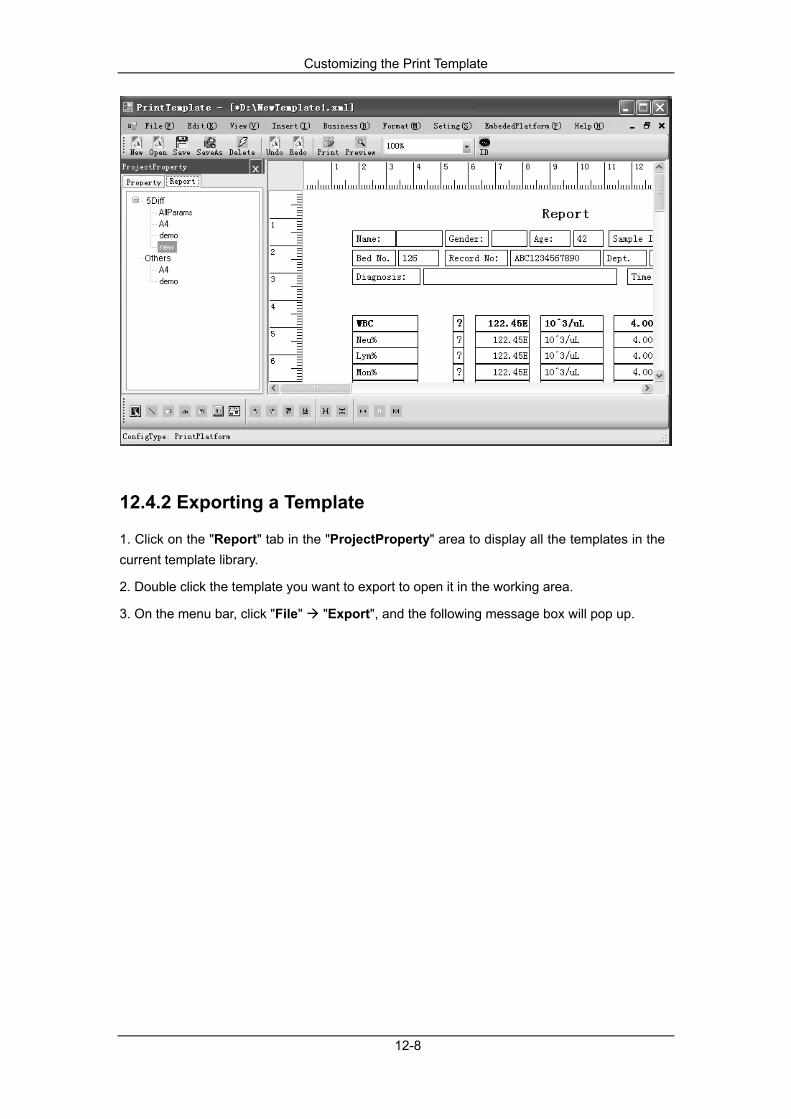
Customizing the Print Template
12-8
12.4.2 Exporting a Template
1. Click on the "Report" tab in the "ProjectProperty" area to display all the templates in the current template library.
2. Double click the template you want to export to open it in the working area.
3. On the menu bar, click "File" "Export", and the following message box will pop up.
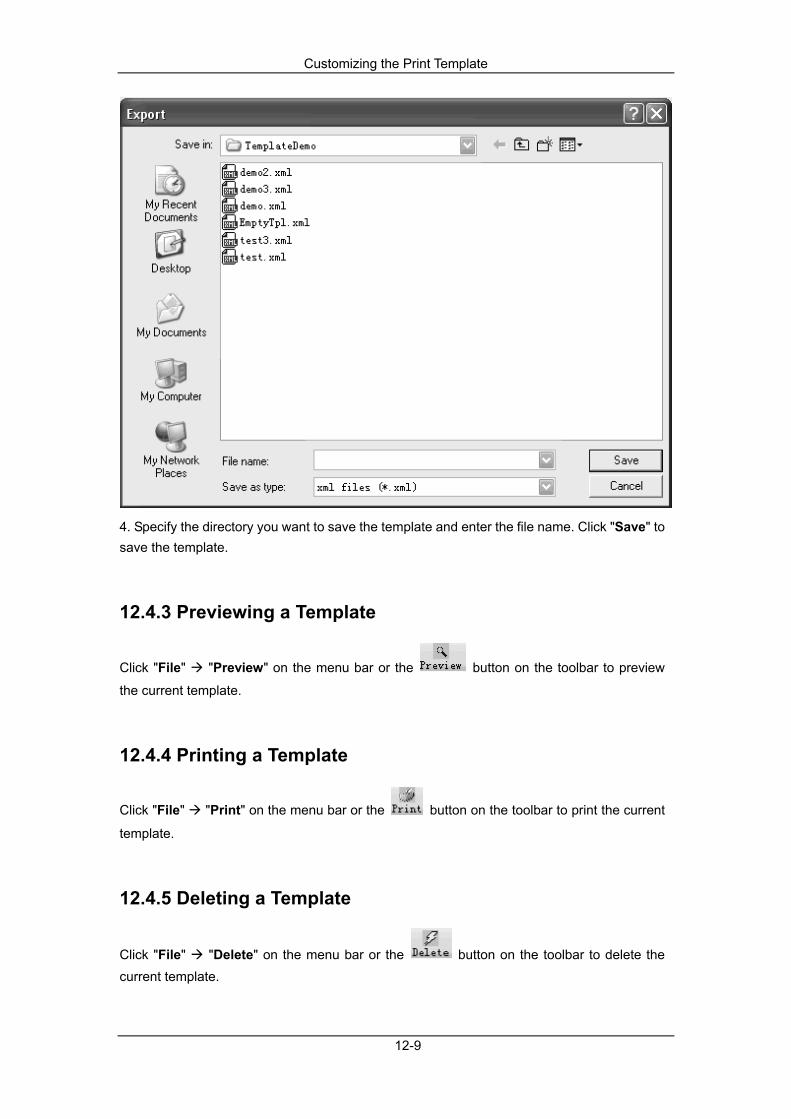
Customizing the Print Template
12-9
4. Specify the directory you want to save the template and enter the file name. Click "Save" to save the template.
12.4.3 Previewing a Template
Click "File" "Preview" on the menu bar or the button on the toolbar to preview
the current template.
12.4.4 Printing a Template
Click "File" "Print" on the menu bar or the button on the toolbar to print the current
template.
12.4.5 Deleting a Template
Click "File" "Delete" on the menu bar or the button on the toolbar to delete the current template.

Customizing the Print Template
12-10
12.5 Other Functions
12.5.1 Creating a New Business
1. Click "Business" "New" on the menu bar to open a blank template.
2. Insert the desired controls and modify their properties.
3. Click "Business" "Save" on the menu bar, and the following message box will pop up. Enter the information of the business in corresponding boxes and click "Ok" to save the business.
12.5.2 Loading the Template Library
1. Click "Setting" "LoadTemplateLib" on the menu bar, and the following message box will pop up.
2. Select the right machine model and click "Ok" to load the template library for this model.
3. When the loading is completed, all the templates in the loaded library will be displayed under the "Report" tab.
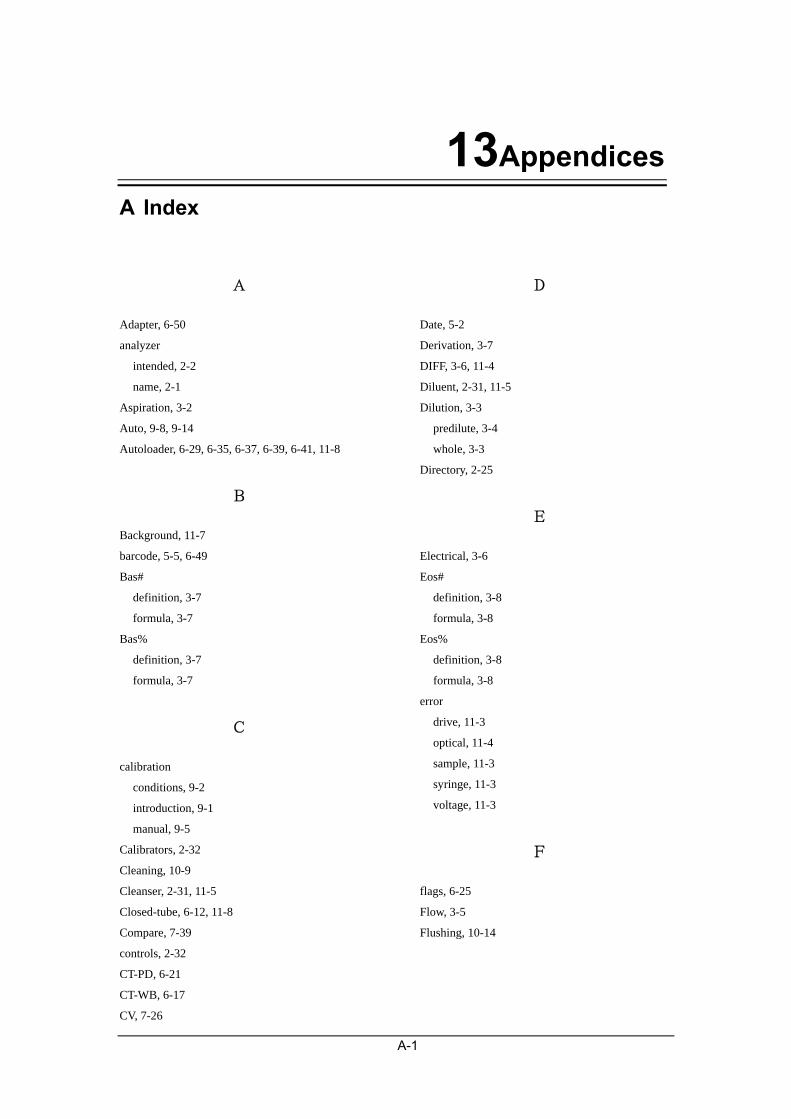
A-1
13Appendices A Index
A
Adapter, 6-50
analyzer
intended, 2-2
name, 2-1
Aspiration, 3-2
Auto, 9-8, 9-14
Autoloader, 6-29, 6-35, 6-37, 6-39, 6-41, 11-8
B
Background, 11-7
barcode, 5-5, 6-49
Bas#
definition, 3-7
formula, 3-7
Bas%
definition, 3-7
formula, 3-7
C
calibration
conditions, 9-2
introduction, 9-1
manual, 9-5
Calibrators, 2-32
Cleaning, 10-9
Cleanser, 2-31, 11-5
Closed-tube, 6-12, 11-8
Compare, 7-39
controls, 2-32
CT-PD, 6-21
CT-WB, 6-17
CV, 7-26
D
Date, 5-2
Derivation, 3-7
DIFF, 3-6, 11-4
Diluent, 2-31, 11-5
Dilution, 3-3
predilute, 3-4
whole, 3-3
Directory, 2-25
E
Electrical, 3-6
Eos#
definition, 3-8
formula, 3-8
Eos%
definition, 3-8
formula, 3-8
error
drive, 11-3
optical, 11-4
sample, 11-3
syringe, 11-3
voltage, 11-3
F
flags, 6-25
Flow, 3-5
Flushing, 10-14
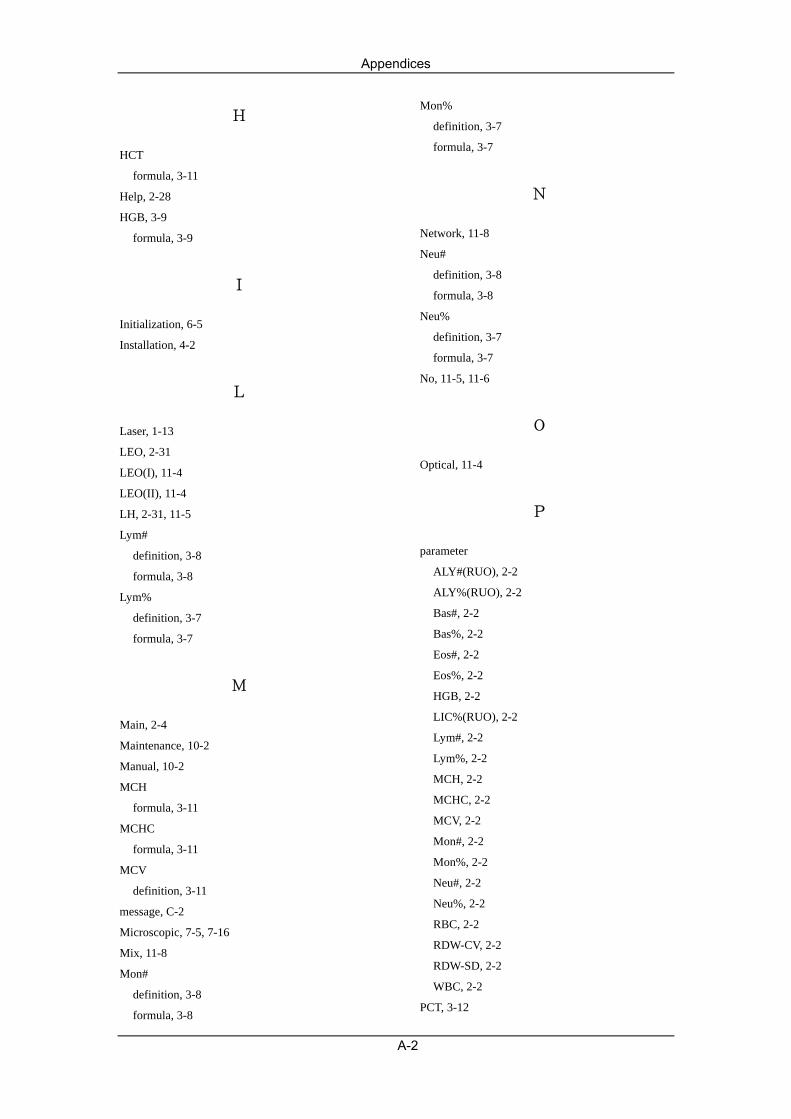
Appendices
A-2
H
HCT
formula, 3-11
Help, 2-28
HGB, 3-9
formula, 3-9
I
Initialization, 6-5
Installation, 4-2
L
Laser, 1-13
LEO, 2-31
LEO(I), 11-4
LEO(II), 11-4
LH, 2-31, 11-5
Lym#
definition, 3-8
formula, 3-8
Lym%
definition, 3-7
formula, 3-7
M
Main, 2-4
Maintenance, 10-2
Manual, 10-2
MCH
formula, 3-11
MCHC
formula, 3-11
MCV
definition, 3-11
message, C-2
Microscopic, 7-5, 7-16
Mix, 11-8
Mon#
definition, 3-8
formula, 3-8
Mon%
definition, 3-7
formula, 3-7
N
Network, 11-8
Neu#
definition, 3-8
formula, 3-8
Neu%
definition, 3-7
formula, 3-7
No, 11-5, 11-6
O
Optical, 11-4
P
parameter
ALY#(RUO), 2-2
ALY%(RUO), 2-2
Bas#, 2-2
Bas%, 2-2
Eos#, 2-2
Eos%, 2-2
HGB, 2-2
LIC%(RUO), 2-2
Lym#, 2-2
Lym%, 2-2
MCH, 2-2
MCHC, 2-2
MCV, 2-2
Mon#, 2-2
Mon%, 2-2
Neu#, 2-2
Neu%, 2-2
RBC, 2-2
RDW-CV, 2-2
RDW-SD, 2-2
WBC, 2-2
PCT, 3-12

Appendices
A-3
PDW, 3-11
PLT, 3-11
Power, 4-2
Prediluted, 6-9
Print, 5-22
Probe, 2-32
Q
Quality, 8-2, 8-72, 8-122, 8-163
R
RBC, 11-7
definition, 3-11
RDV-CV
definition, 3-11
RDW-SD
definition, 3-11
Reading, 8-11, 8-81
Reagents, 2-31
Record, 2-27
Ref., 5-17
Remove, 11-3
Replacing, 10-5
reviewing
graph, 7-2
table, 7-13
Right, 11-7
Running, 8-16, 8-86, 8-126, 8-173
S
Scanner, 11-8
Self-test, 10-52
settings
auto, 5-32
communication, 5-26
gain, 5-31
Para., 5-15
print, 5-22
ref., 5-17
RUO, 5-29
Sheath, 11-3
Shortcut, 2-15
Shutdown, 6-58
Special, 6-44
Startup, 6-4
STAT, 6-44
Statistics, 7-45
System, 10-43
T
Tab, 2-17
Table, 7-13
Temperature, 10-43
Transport, 4-3
troubleshooting, 11-1, 12-1
U
Unclogging, 10-11
User, 2-12
User/Lab, 5-9, 5-44
V
Vacuum, 11-4
Validate
graph, 7-10
table, 7-22
Verifying, 9-21
W
Wash, 3-13
Waste, 11-7
WBC, 3-5, 11-7
definition, 3-7
Worklist, 6-51
Z
Zapping, 10-12

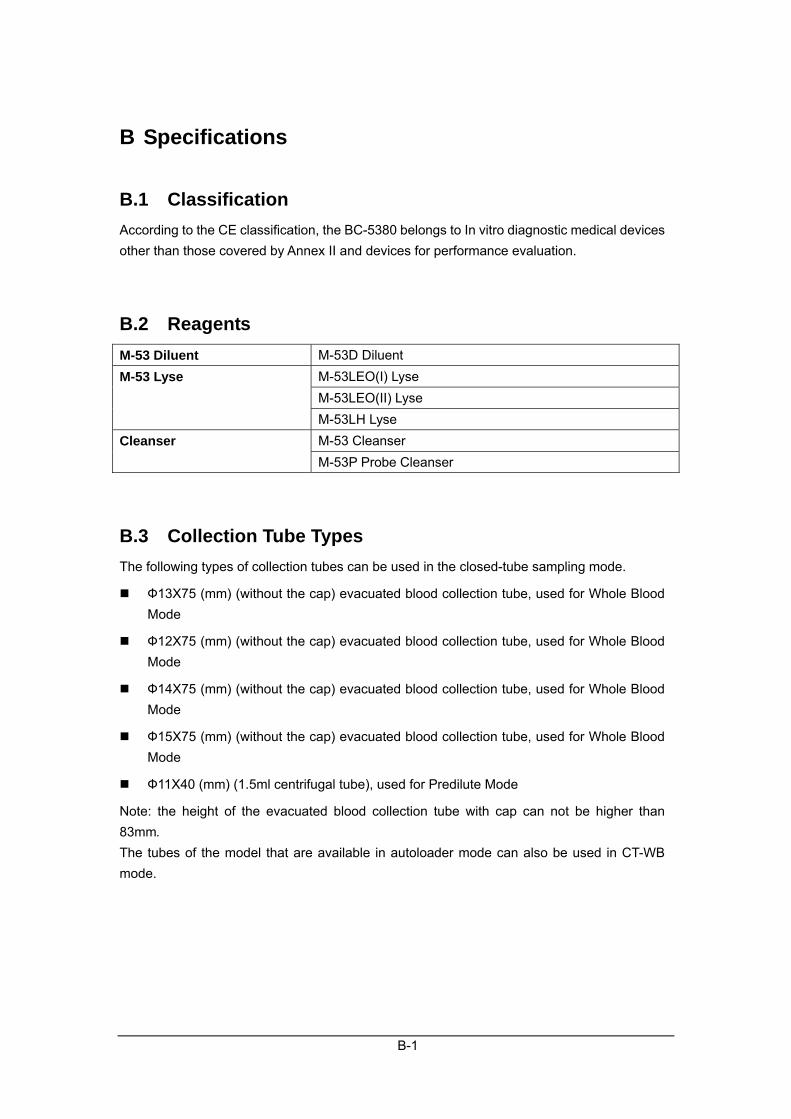
B-1
B Specifications
B.1 Classification According to the CE classification, the BC-5380 belongs to In vitro diagnostic medical devices other than those covered by Annex II and devices for performance evaluation.
B.2 Reagents M-53 Diluent M-53D Diluent
M-53LEO(I) Lyse M-53LEO(II) Lyse
M-53 Lyse
M-53LH Lyse M-53 Cleanser Cleanser M-53P Probe Cleanser
B.3 Collection Tube Types The following types of collection tubes can be used in the closed-tube sampling mode.
Ф13X75 (mm) (without the cap) evacuated blood collection tube, used for Whole Blood Mode
Ф12X75 (mm) (without the cap) evacuated blood collection tube, used for Whole Blood Mode
Ф14X75 (mm) (without the cap) evacuated blood collection tube, used for Whole Blood Mode
Ф15X75 (mm) (without the cap) evacuated blood collection tube, used for Whole Blood Mode
Ф11X40 (mm) (1.5ml centrifugal tube), used for Predilute Mode
Note: the height of the evacuated blood collection tube with cap can not be higher than 83mm. The tubes of the model that are available in autoloader mode can also be used in CT-WB mode.
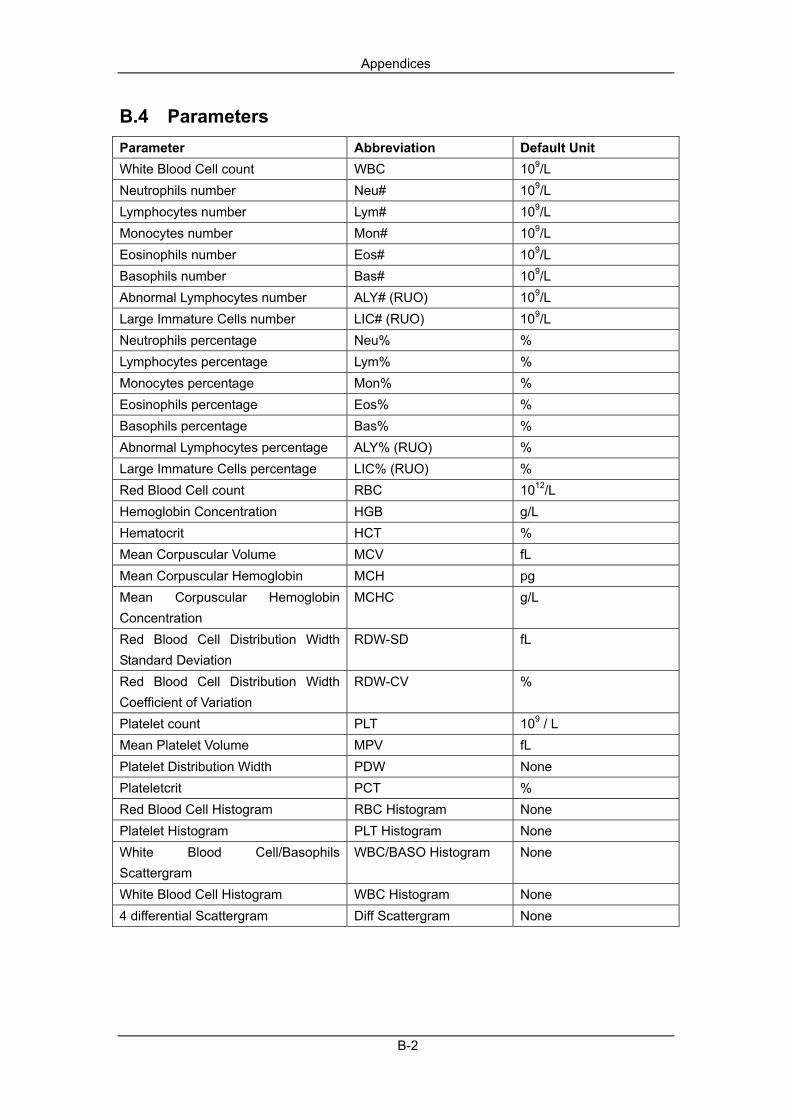
Appendices
B-2
B.4 Parameters Parameter Abbreviation Default Unit White Blood Cell count WBC 109/L Neutrophils number Neu# 109/L Lymphocytes number Lym# 109/L Monocytes number Mon# 109/L Eosinophils number Eos# 109/L Basophils number Bas# 109/L Abnormal Lymphocytes number ALY# (RUO) 109/L Large Immature Cells number LIC# (RUO) 109/L Neutrophils percentage Neu% % Lymphocytes percentage Lym% % Monocytes percentage Mon% % Eosinophils percentage Eos% % Basophils percentage Bas% % Abnormal Lymphocytes percentage ALY% (RUO) % Large Immature Cells percentage LIC% (RUO) % Red Blood Cell count RBC 1012/L Hemoglobin Concentration HGB g/L Hematocrit HCT % Mean Corpuscular Volume MCV fL Mean Corpuscular Hemoglobin MCH pg Mean Corpuscular Hemoglobin Concentration
MCHC g/L
Red Blood Cell Distribution Width Standard Deviation
RDW-SD fL
Red Blood Cell Distribution Width Coefficient of Variation
RDW-CV %
Platelet count PLT 109 / L Mean Platelet Volume MPV fL Platelet Distribution Width PDW None Plateletcrit PCT % Red Blood Cell Histogram RBC Histogram None Platelet Histogram PLT Histogram None White Blood Cell/Basophils Scattergram
WBC/BASO Histogram None
White Blood Cell Histogram WBC Histogram None 4 differential Scattergram Diff Scattergram None

Appendices
B-3
B.5 Sampling Features
B.5.1 Sample Volumes Required for Each Analysis Whole Blood Mode ≤ 20 µL
Predilute Mode ≤ 20 µL
B.5.2 Throughput
Autoloader mode ≥ 60 samples/ 1 hour
Closed-tube Mode ≥ 50 samples/ 1 hour
B.6 Performance Specifications
B.6.1 Display Range
B.6.2 Normal Background Parameter Background result WBC ≤ 0.3 × 10⁹ / L RBC ≤ 0.03× 10¹²/ L HGB ≤ 1 g / L HCT ≤ 0.5 % PLT ≤ 10 × 109/ L
B.6.3 Linearity Range
Parameter Display range WBC 0-200.0×10⁹/L RBC 0-18.00.0×109/L HGB 0-300g/L PLT 0-2000×109/L HCT 0%~80%
Parameter Linearity range Deviation range (Whole blood mode)
Deviation range (Predilute Mode)
WBC 0.00-99.99×10⁹/L ±0.30×10⁹/L or ±5% ±0.60×10⁹/L or ±6% RBC 0.00-8.00×10¹²/L ±0.05×10¹²/L or ±5% ±0.10×10¹²/L or ±10% HGB 0-250g/L ±2g/L or ±2% ±4g/L or ±4% PLT 0-1000×109/L(RBC≤7.0) ±10×109/L or ±8% ±20×109/L or ±16% HCT 0-67% ±2%(HCT value) or ±3%
(deviation percent) ±4%(HCT value) or ±6% (deviation percent)
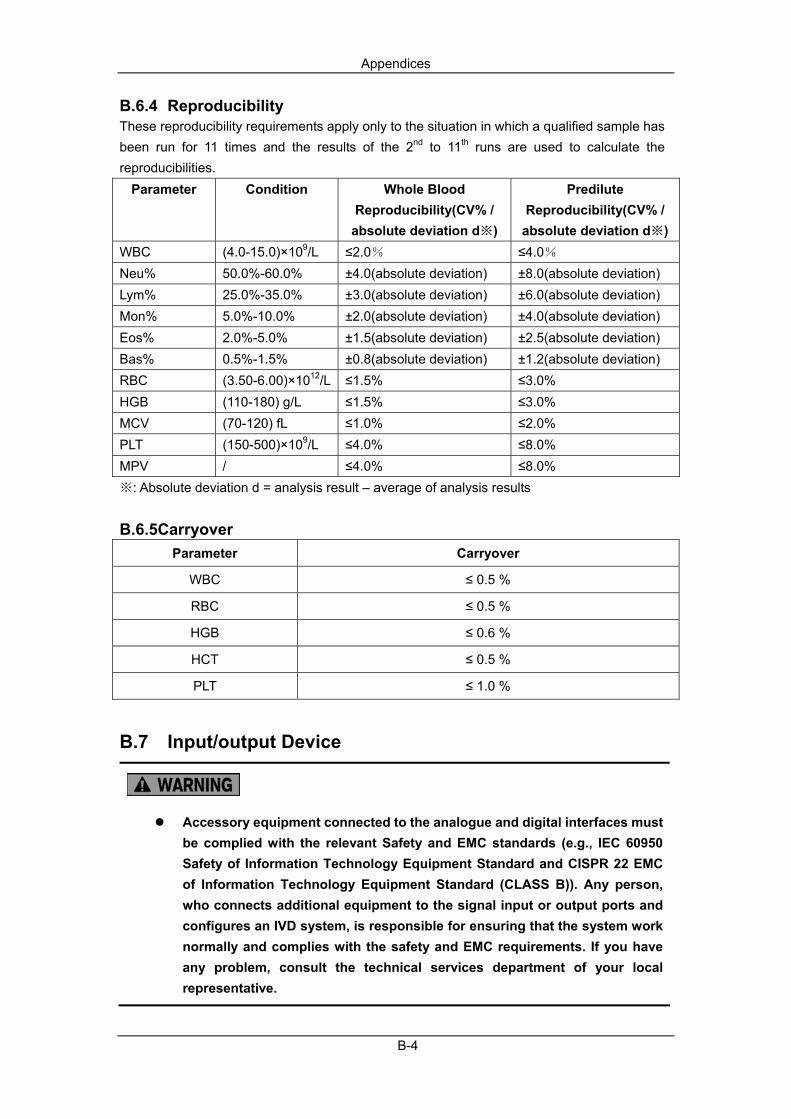
Appendices
B-4
B.6.4 Reproducibility These reproducibility requirements apply only to the situation in which a qualified sample has been run for 11 times and the results of the 2nd to 11th runs are used to calculate the reproducibilities.
Parameter Condition Whole Blood Reproducibility(CV% /
absolute deviation d※)
Predilute Reproducibility(CV% /
absolute deviation d※)WBC (4.0-15.0)×109/L ≤2.0% ≤4.0% Neu% 50.0%-60.0% ±4.0(absolute deviation) ±8.0(absolute deviation) Lym% 25.0%-35.0% ±3.0(absolute deviation) ±6.0(absolute deviation) Mon% 5.0%-10.0% ±2.0(absolute deviation) ±4.0(absolute deviation) Eos% 2.0%-5.0% ±1.5(absolute deviation) ±2.5(absolute deviation) Bas% 0.5%-1.5% ±0.8(absolute deviation) ±1.2(absolute deviation) RBC (3.50-6.00)×1012/L ≤1.5% ≤3.0% HGB (110-180) g/L ≤1.5% ≤3.0% MCV (70-120) fL ≤1.0% ≤2.0% PLT (150-500)×109/L ≤4.0% ≤8.0% MPV / ≤4.0% ≤8.0% ※: Absolute deviation d = analysis result – average of analysis results B.6.5Carryover
Parameter Carryover
WBC ≤ 0.5 %
RBC ≤ 0.5 %
HGB ≤ 0.6 %
HCT ≤ 0.5 %
PLT ≤ 1.0 %
B.7 Input/output Device
Accessory equipment connected to the analogue and digital interfaces must be complied with the relevant Safety and EMC standards (e.g., IEC 60950 Safety of Information Technology Equipment Standard and CISPR 22 EMC of Information Technology Equipment Standard (CLASS B)). Any person, who connects additional equipment to the signal input or output ports and configures an IVD system, is responsible for ensuring that the system work normally and complies with the safety and EMC requirements. If you have any problem, consult the technical services department of your local representative.

Appendices
B-5
The external computer must meet the requirements specified in B.7.1.
If LIS communication is required, the external computer must have two network interface cards.
B.7.1 External Computer (Optional)
PC (IBM compatible)
RAM: ≥256 MB
Hard disk space: ≥4G
Operation system: Windows 2000 Professional + SP4, XP Home/XP Professional + SP2, Windows Vista Home Basic*32, Windows Vista Ultimate*32, Windows 7 Home Basic*32, Windows 7 Ultimate*32
B.7.2 Keyboard (Optional) 101-Key alpha-numeric keyboard
B.7.3 Mouse (Optional)
B.7.4 Bar-code Scanner External bar-code scanner (optional) Built-in bar-code scanner
B.7.5 Printer
B.8 Interfaces One LAN interface
B.9 Power Supply Voltage Input power Frequency
Analyzer A.C. 100V-240V ≤300 VA 50/60 Hz
NOTE
Main supply voltage fluctuations up to ±10% of the nominal voltage.

Appendices
B-6
B.10 EMC Description
Do not use this device in close proximity to sources of strong electromagnetic radiation (e.g. unshielded intentional RF sources), as these may interfere with the proper operation.
This equipment complies with the emission and immunity requirements of the EN 61326-1:2006 and EN 61326-2-6:2006.
NOTE
It is the manufacturer's responsibility to provide equipment electromagnetic compatibility information to the customer or user.
It is the user's responsibility to ensure that a compatible electromagnetic environment for the equipment can be maintained in order that the device will perform as intended.
B.11 Sound Maximal sound: 67.7 dBA
Be sure to use and store the analyzer in the specified environment.
B.12 Operating Environment
Optimal operating temperature: 15 ℃ - 30 ℃
Optimal operating humidity: 30 % - 85 %
Atmospheric pressure: 70 kPa - 106 kPa.
B.13 Storage Environment
Ambient temperature: -10 ℃ - 40 ℃
Relative humidity: 10 % - 90 %
Atmospheric pressure: 50 kPa - 106 kPa.

Appendices
B-7
B.14 Running Environment
Ambient temperature: 10 ℃ - 40 ℃
Relative humidity: 10 % - 90 %
Atmospheric pressure: 70 kPa - 106 kPa.
B.15 Dimensions and Weight
Analyzer
Width(mm) ≤590
Height(mm) ≤525
Depth(mm) ≤570
Weight(Kg) ≤58
B.16 Barcode Specifications See table below for the barcode symbologies and the character length supported by the built-in barcode scanner.
Code type Check digit Digits
CODE128 Self-checking(check ditgit is always included) No more than 20 characters (Sample ID)
Width
Height
Depth
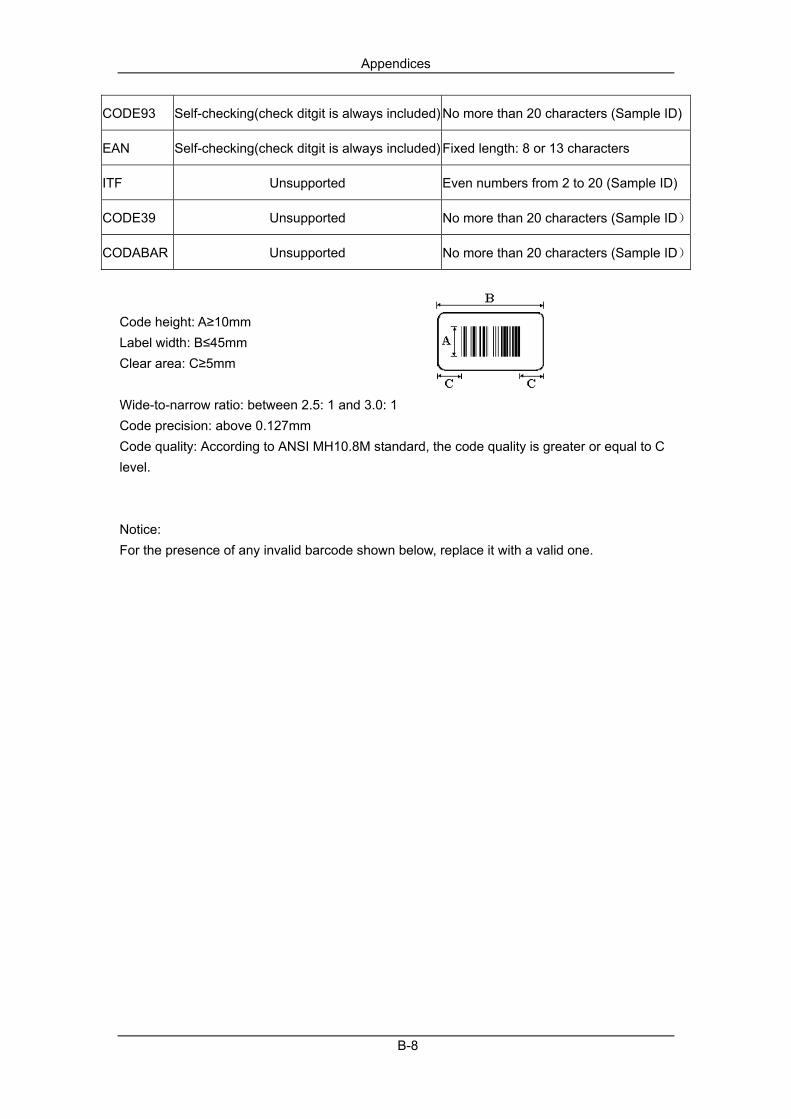
Appendices
B-8
CODE93 Self-checking(check ditgit is always included) No more than 20 characters (Sample ID)
EAN Self-checking(check ditgit is always included) Fixed length: 8 or 13 characters
ITF Unsupported Even numbers from 2 to 20 (Sample ID)
CODE39 Unsupported No more than 20 characters (Sample ID)
CODABAR Unsupported No more than 20 characters (Sample ID)
Code height: A≥10mm Label width: B≤45mm Clear area: C≥5mm Wide-to-narrow ratio: between 2.5: 1 and 3.0: 1 Code precision: above 0.127mm Code quality: According to ANSI MH10.8M standard, the code quality is greater or equal to C level. Notice: For the presence of any invalid barcode shown below, replace it with a valid one.

Appendices
B-9

Appendices
B-10
B.17 Contraindications None
B.18 Safety Classification Level of transient overvoltage: Category II. Rated pollution degree: 2.

C-1
C Communication C.1 Introduction of communication protocol of the auto hematology analyzers
C.1.1 Messages supported by the HL7 interface protocol The IPU software of the auto hematology analyzers and the LIS system enable the connection
between the analyzer and the computer of the lab through the Ethernet. The analyzer could
send the analysis results to the lab computer and receive the worklist information from it.
This communication protocol is defined based on the HL7 standard. HL7 is the digital data
switching standard used in the medical field. It is firstly defined by America and now adopted
by many countries. The definition is based on HL7 v2.3.1. For details of the HL7, please see
HL7 Interface Standards Version 2.3.1.
C.1.2 Bottom transmitting layer protocol The IPU software sends messages through TCP connection and the communication
procedures consist of 3 phases:
Connecting
After starting up, the IPU software connects the LIS server actively according to the settings. If
the connecting is failed, it retries; if the connecting is successful, it keeps the connection to
make sure the data can be sent at any time. If the connection is found disconnected during
operating, it retries to connect.
Data transmitting
Besides batch sending the data at the List Review and QC screen, if auto-communication is
enabled, the IPU software will send the message while the new sample results are obtained.
Sending and receiving the message are synchronous both for batch communication and
auto-communication. i.e. when every message is sent, it will wait for the confirmation. If the
confirmation is received within 10s, then a complete message is sent and the next message
will be sent; if the confirmation is not received within the 10s, then it is regarded that the
sending is failed and it will skip to the sending of the next message.
The communication of QC data records is similar to that of the analysis results: send
messages at the QC screen or QC History screen. Wait for the confirmation after sending each
QC data. If the confirmation is received within 10s, then the message has been sent
successfully; if the confirmation is not received within 10s, then it is regarded that the sending
is failed and it will skip to the sending of the next message.
The bidirectional LIS inquiry communication is different from the processes mentioned above.
The IPU software will send an inquiry (including the sample ID) every time it opens the

Appendices
C-2
bidirectional LIS communication, saves worklists or before counting. The LIS will respond with
a HL7 message based on the message it received, and then IPU will fill in the worklist or
perform counting according to the response. If there is no response within 10s after the inquiry
was sent, it is regarded that the inquiry is failed.
Disconnecting
When exiting the IPU software, the connection will be closed actively. When changing the
communication settings, the connection will also be disconnected and then re-connect
according to the new settings.
C.1.3 HL7 message layer protocol
HL7 top message protocol
The data of sample results etc. are transmitted in the form of UTF-8 coding strings.
The message strings are composed as per the HL7 standard. A message consists of several
segments, each segment consists of several fields, a field consists of several components,
and component consists of several sub components. The segment, field, component and sub
component are divided by separators. The structure of the message is shown in Figure 1.
Figure 1 Structure of the message
A part of the HL7 message is shown below:
MSH|^~\&|BC-5380|Mindray|||20080617143943||ORU^R01|1|P|2.3.1||||||UNICODE
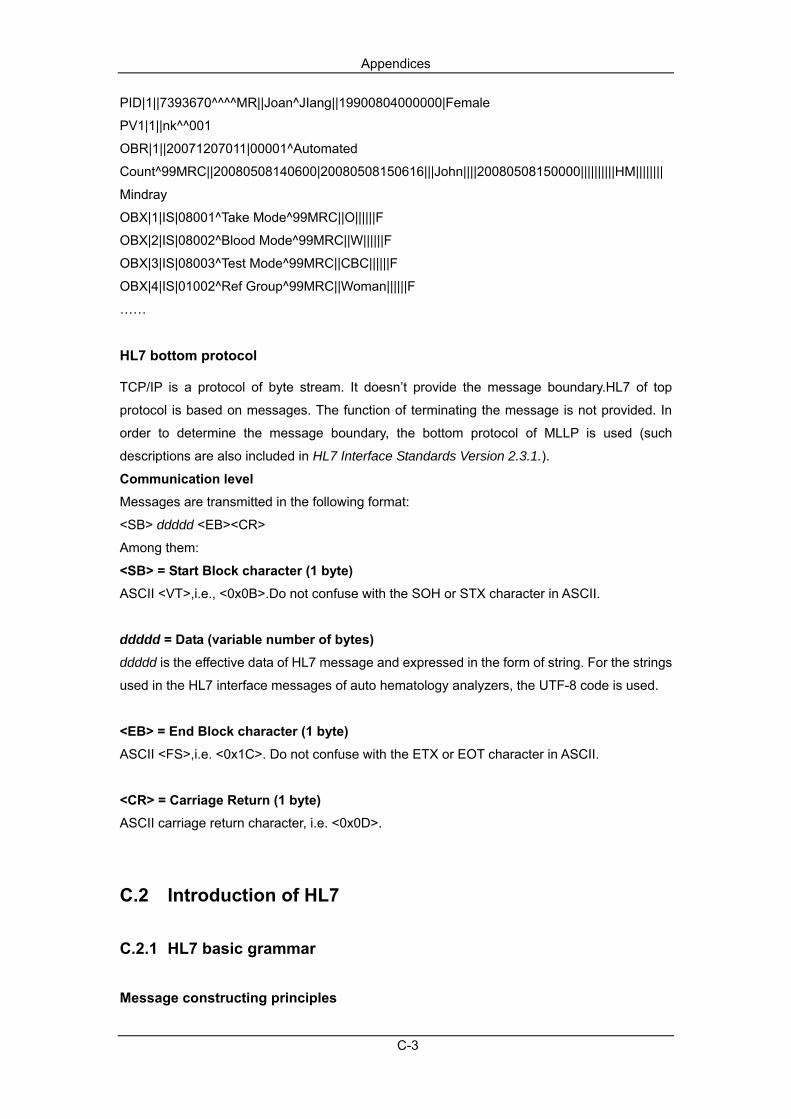
Appendices
C-3
PID|1||7393670^^^^MR||Joan^JIang||19900804000000|Female
PV1|1||nk^^001
OBR|1||20071207011|00001^Automated
Count^99MRC||20080508140600|20080508150616|||John||||20080508150000||||||||||HM||||||||
Mindray
OBX|1|IS|08001^Take Mode^99MRC||O||||||F
OBX|2|IS|08002^Blood Mode^99MRC||W||||||F
OBX|3|IS|08003^Test Mode^99MRC||CBC||||||F
OBX|4|IS|01002^Ref Group^99MRC||Woman||||||F
……
HL7 bottom protocol
TCP/IP is a protocol of byte stream. It doesn’t provide the message boundary.HL7 of top
protocol is based on messages. The function of terminating the message is not provided. In
order to determine the message boundary, the bottom protocol of MLLP is used (such
descriptions are also included in HL7 Interface Standards Version 2.3.1.).
Communication level Messages are transmitted in the following format:
<SB> ddddd <EB><CR>
Among them:
<SB> = Start Block character (1 byte) ASCII <VT>,i.e., <0x0B>.Do not confuse with the SOH or STX character in ASCII.
ddddd = Data (variable number of bytes) ddddd is the effective data of HL7 message and expressed in the form of string. For the strings
used in the HL7 interface messages of auto hematology analyzers, the UTF-8 code is used.
<EB> = End Block character (1 byte) ASCII <FS>,i.e. <0x1C>. Do not confuse with the ETX or EOT character in ASCII.
<CR> = Carriage Return (1 byte) ASCII carriage return character, i.e. <0x0D>.
C.2 Introduction of HL7
C.2.1 HL7 basic grammar
Message constructing principles

Appendices
C-4
Every HL7 message consists of several segments and ends up with the <CR> character.
Each segment consists of the segment name of three characters and field of changeable
characters, and each field consists of the component and subcomponent. For each message,
the separators of the field, component and subcomponent are defined in the MSH segment.
For example:
MSH|^~\&|BC-5380|Mindray|||20080617143943||ORU^R01|1|P|2.3.1||||||UNICODE
In this message:
The five characters following MSH define the separators to distinguish each field, component
and subcomponent. Although they can be any non-text characters, HL7 standard recommends
the characters in the table below:
Character Meaning
| Field separator
^ Component separator
& Subcomponent separator
~ Repetition separator
\ ESC
The first field of MSH includes every separator. Some field behind are empty because they are
optional and not used by Mindray HL7 interface. Detailed field definition and selection will be
stated in the following contents.
For message of any type, the segments behind MSH appear in the fixed order. The order will
be described in the following contents and the grammar is used to organize the segments
order.
The segment appeared in [] is optional.
The segment appeared in {} can be repeated once or more.
String transferring principles
For the field data of ST, TX, FT, and CF, etc., separators may be contained in the string data
like remark, clinical diagnosis and customized gender etc. When coding, the separators in the
original strings shall be transferred into transferred character sequence; then, restore them
when decoding. The transferring principles are shown in the table:
Transferred character Original character
\F\ Field separator
\S\ Component separator
\T\ Subcomponent separator
\R\ Repetition separator
\E\ Transferred separator
\.br\ <CR>,i.e. end character of segment

Appendices
C-5
Note: “\” in the transferred character sequence represents the transferred separator. Its value
is defined in MSH segment.
C.2.2 HL7 data types
All the data information can be expressed by different types of HL7 fields. Only part of the HL7
standard is used in the communication protocol, see D4 Appendix for details.
C.3 Duplex communication
C.3.1 HL7 message supported
Process of duplex communication
1. The main unit directly sends the test results (or QC data) to LIS as Figure 2 shows.
Figure 2 Test results (QC data) communication process
2. Worklist information searching
Worklist belongs to the Order message. Thus, the corresponding HL7 messages:
ORM(General Order Message) and ORR(General Order Response Message) can be used.
The communication process is shown in Figure 3.
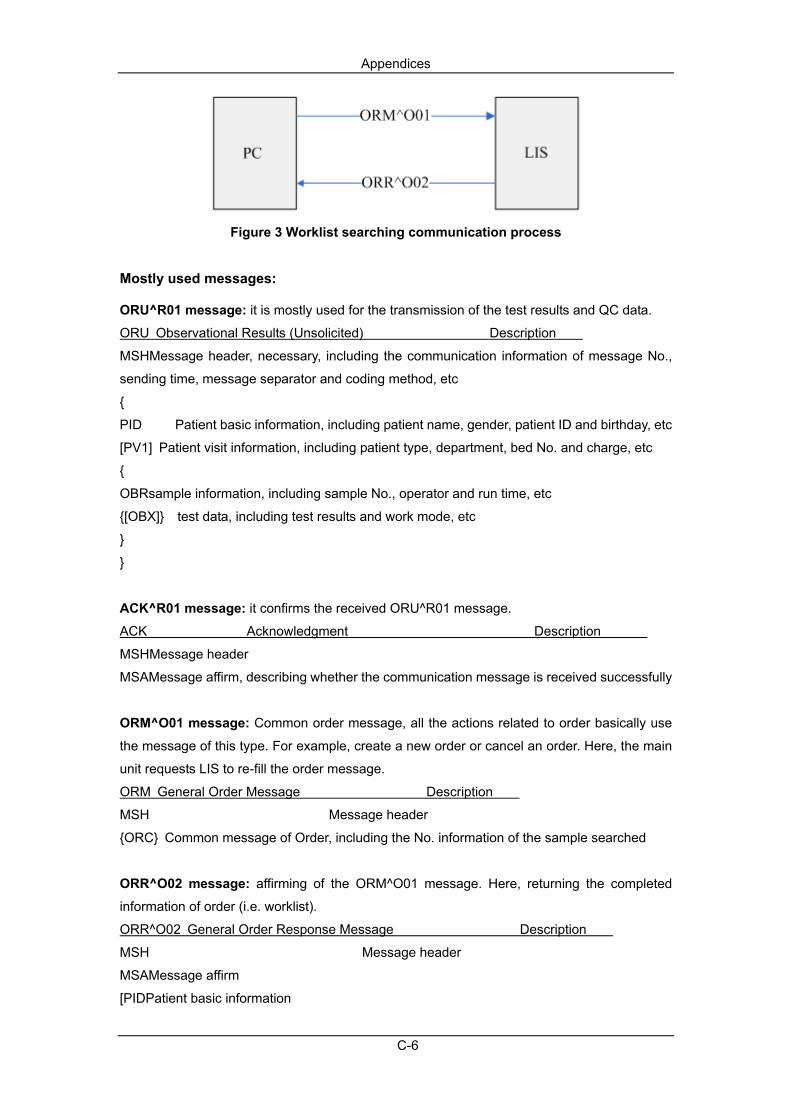
Appendices
C-6
Figure 3 Worklist searching communication process
Mostly used messages:
ORU^R01 message: it is mostly used for the transmission of the test results and QC data.
ORU Observational Results (Unsolicited) Description
MSHMessage header, necessary, including the communication information of message No.,
sending time, message separator and coding method, etc
{
PID Patient basic information, including patient name, gender, patient ID and birthday, etc
[PV1] Patient visit information, including patient type, department, bed No. and charge, etc
{
OBRsample information, including sample No., operator and run time, etc
{[OBX]} test data, including test results and work mode, etc
}
}
ACK^R01 message: it confirms the received ORU^R01 message.
ACK Acknowledgment Description
MSHMessage header
MSAMessage affirm, describing whether the communication message is received successfully
ORM^O01 message: Common order message, all the actions related to order basically use
the message of this type. For example, create a new order or cancel an order. Here, the main
unit requests LIS to re-fill the order message.
ORM General Order Message Description
MSH Message header
{ORC} Common message of Order, including the No. information of the sample searched
ORR^O02 message: affirming of the ORM^O01 message. Here, returning the completed
information of order (i.e. worklist).
ORR^O02 General Order Response Message Description
MSH Message header
MSAMessage affirm
[PIDPatient basic information

Appendices
C-7
[PV1]]Patient visit information
{
ORCCommon message of Order, including the sample No.
[
OBRsample information
{[OBX]}Data of other sample information, including work mode, etc.
]
}
C.3.2 HL7 segment definition involved Detailed definition of fields contained in each segment will be listed in the table below. The
meaning of each column is explained below.
1. No.: the HL7 message initiates with the segment name of 3 characters. The following each
field will follow a separator, and the No. is the position order of the field.
For example:
PID |1 | |7393670^^^^MR||Joan^JIang||19900804000000|Female
↑ ↑ ↑
Segment name filed 1 filed 3
Note: the MSH message is a little different. The separator following the segment name is
regarded as the first field and used to describe the value of the separators used in the
message.
2. Field name: the logical meaning of the field
3. Data type: the HL7 standard type of the data, the structure will be described in Appendix A;
4. Recommended max length: the HL7 standard recommended length. But, during the actual
transmitting, the length may exceed the length, so the separators should be identified to read
the message when decoding the message.
5. Note: the note for the actual value of the fields
6. Samples: the sample of actual field value
MSH
The MSH(Message Header)segment contains basic information of HL7 message including
separators’ value, message type and coding method etc. It is the first field of every HL7
message.
Message used for example:
MSH|^~\&|BC-5380|Mindray|||20080617143943||ORU^R01|1|P|2.3.1||||||UNICODE
See Table 1 for definition of each field used in MSH segment.
Table 1 MSH field definitions
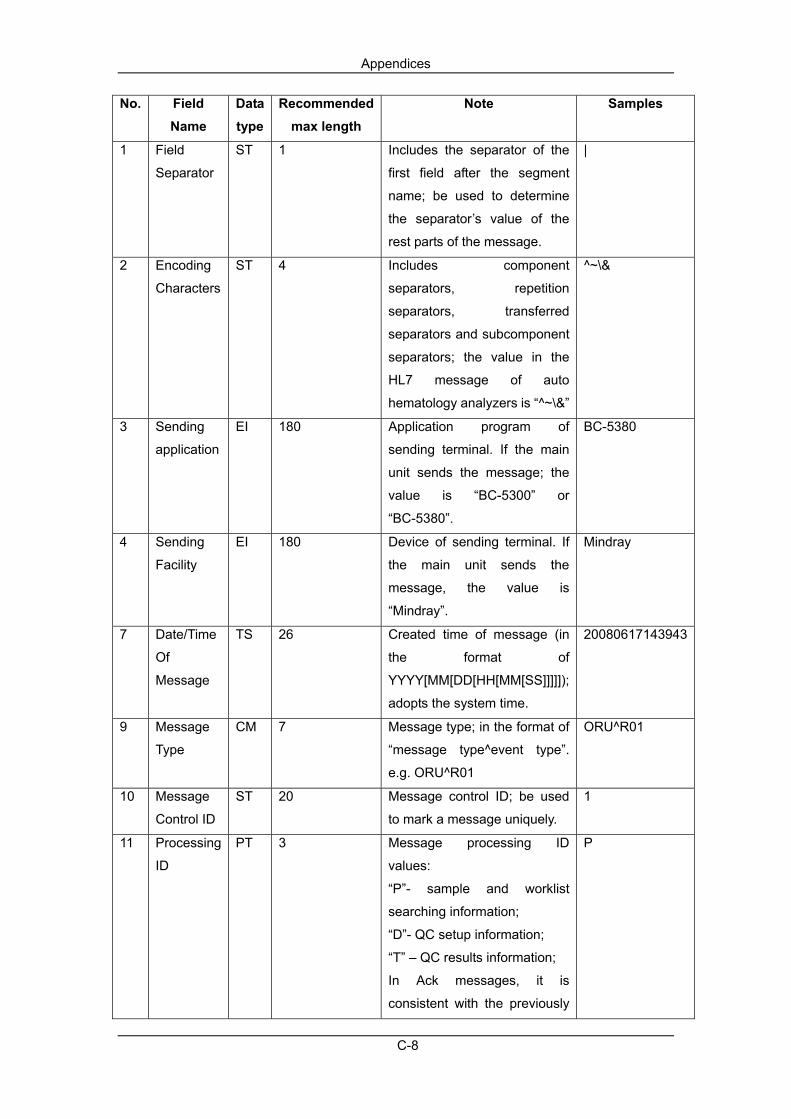
Appendices
C-8
No. Field Name
Data type
Recommended max length
Note Samples
1 Field
Separator
ST 1 Includes the separator of the
first field after the segment
name; be used to determine
the separator’s value of the
rest parts of the message.
|
2 Encoding
Characters
ST 4 Includes component
separators, repetition
separators, transferred
separators and subcomponent
separators; the value in the
HL7 message of auto
hematology analyzers is “^~\&”
^~\&
3 Sending
application
EI 180 Application program of
sending terminal. If the main
unit sends the message; the
value is “BC-5300” or
“BC-5380”.
BC-5380
4 Sending
Facility
EI 180 Device of sending terminal. If
the main unit sends the
message, the value is
“Mindray”.
Mindray
7 Date/Time
Of
Message
TS 26 Created time of message (in
the format of
YYYY[MM[DD[HH[MM[SS]]]]]);
adopts the system time.
20080617143943
9 Message
Type
CM 7 Message type; in the format of
“message type^event type”.
e.g. ORU^R01
ORU^R01
10 Message
Control ID
ST 20 Message control ID; be used
to mark a message uniquely.
1
11 Processing
ID
PT 3 Message processing ID
values:
“P”- sample and worklist
searching information;
“D”- QC setup information;
“T” – QC results information;
In Ack messages, it is
consistent with the previously
P
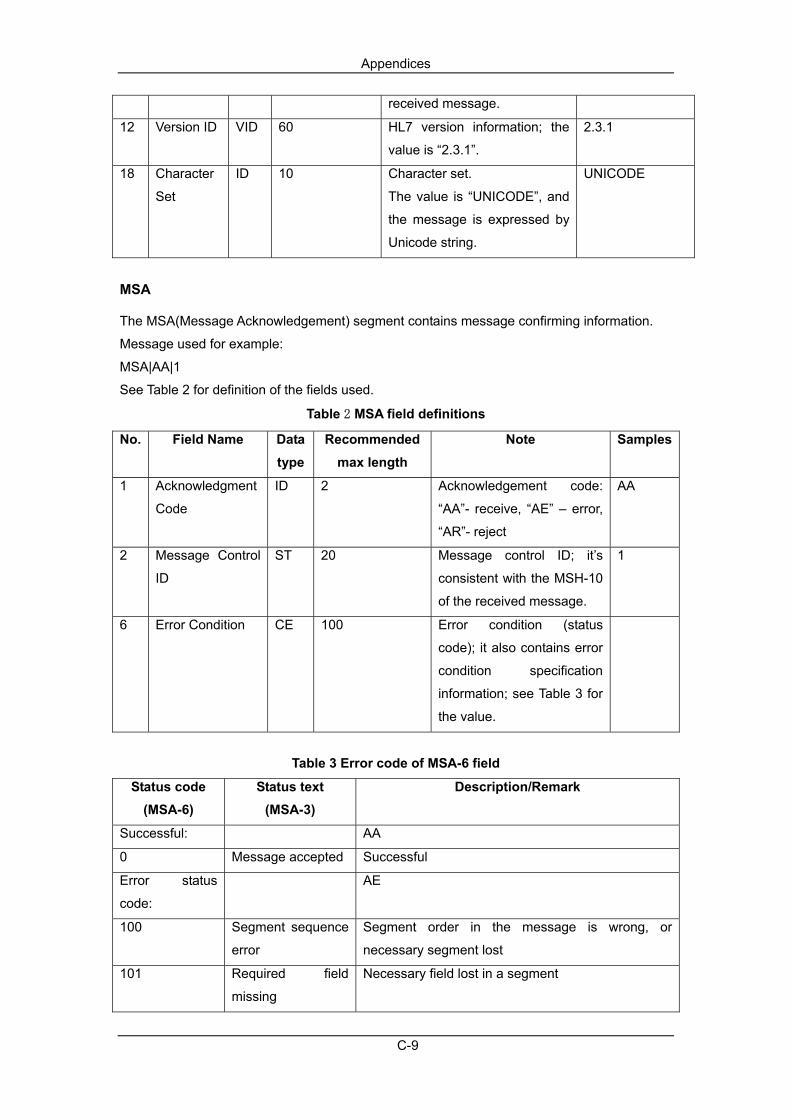
Appendices
C-9
received message.
12 Version ID VID 60 HL7 version information; the
value is “2.3.1”.
2.3.1
18 Character
Set
ID 10 Character set.
The value is “UNICODE”, and
the message is expressed by
Unicode string.
UNICODE
MSA
The MSA(Message Acknowledgement) segment contains message confirming information.
Message used for example:
MSA|AA|1
See Table 2 for definition of the fields used.
Table 2 MSA field definitions
No. Field Name Data type
Recommended max length
Note Samples
1 Acknowledgment
Code
ID 2 Acknowledgement code:
“AA”- receive, “AE” – error,
“AR”- reject
AA
2 Message Control
ID
ST 20 Message control ID; it’s
consistent with the MSH-10
of the received message.
1
6 Error Condition CE 100 Error condition (status
code); it also contains error
condition specification
information; see Table 3 for
the value.
Table 3 Error code of MSA-6 field
Status code (MSA-6)
Status text (MSA-3)
Description/Remark
Successful: AA
0 Message accepted Successful
Error status
code:
AE
100 Segment sequence
error
Segment order in the message is wrong, or
necessary segment lost
101 Required field
missing
Necessary field lost in a segment
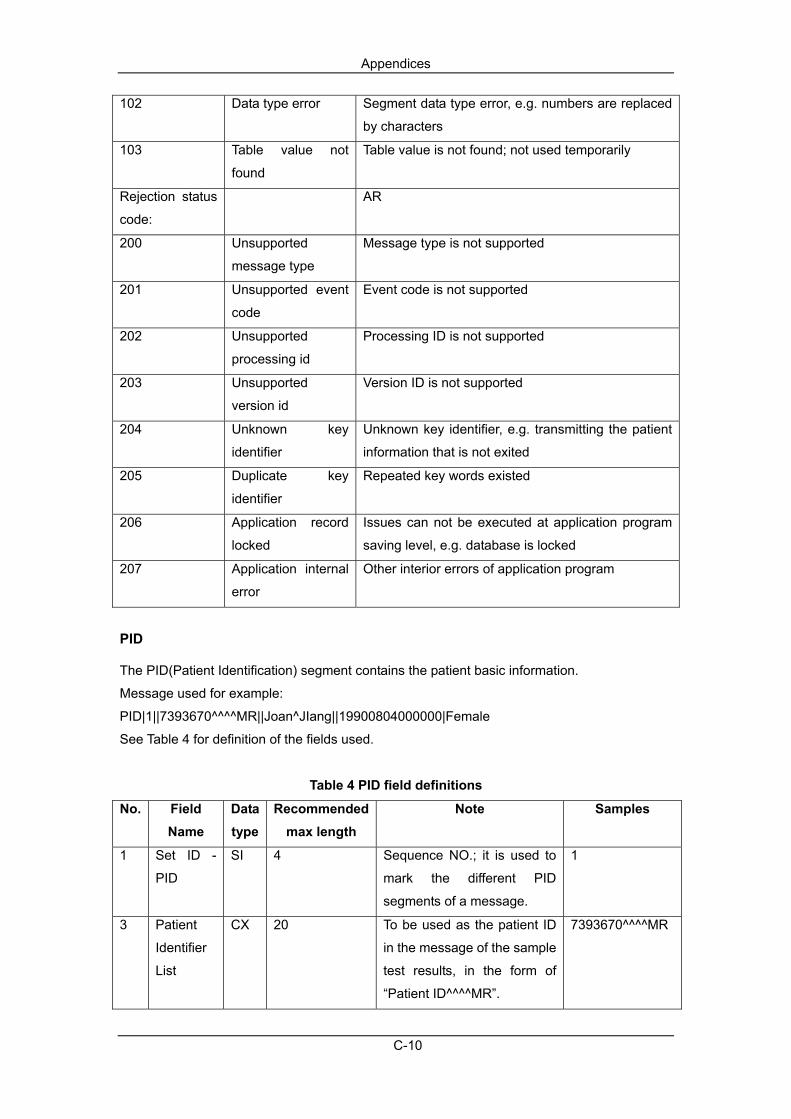
Appendices
C-10
102 Data type error Segment data type error, e.g. numbers are replaced
by characters
103 Table value not
found
Table value is not found; not used temporarily
Rejection status
code:
AR
200 Unsupported
message type
Message type is not supported
201 Unsupported event
code
Event code is not supported
202 Unsupported
processing id
Processing ID is not supported
203 Unsupported
version id
Version ID is not supported
204 Unknown key
identifier
Unknown key identifier, e.g. transmitting the patient
information that is not exited
205 Duplicate key
identifier
Repeated key words existed
206 Application record
locked
Issues can not be executed at application program
saving level, e.g. database is locked
207 Application internal
error
Other interior errors of application program
PID
The PID(Patient Identification) segment contains the patient basic information.
Message used for example:
PID|1||7393670^^^^MR||Joan^JIang||19900804000000|Female
See Table 4 for definition of the fields used.
Table 4 PID field definitions
No. Field Name
Data type
Recommended max length
Note Samples
1 Set ID -
PID
SI 4 Sequence NO.; it is used to
mark the different PID
segments of a message.
1
3 Patient
Identifier
List
CX 20 To be used as the patient ID
in the message of the sample
test results, in the form of
“Patient ID^^^^MR”.
7393670^^^^MR

Appendices
C-11
To be used as QC lot No. in
the message of QC.
5 Patient
Name
XPN 48 Patient name (dividing into
two parts when sending:
“FirstName” and
“LastName”), e.g.
“LastName^FirstName”.
Joan^JIang
7 Date/Time
of Birth
TS 26 To be used as birthday in the
message of sample results
To be used as expiration date
in the message of QC
In the form of
YYYY[MM[DD[HH[MM[SS]]]]]
19900804000000
8 Sex IS 1 Gender, string. Female
PV1
The PV1(Patient Visit) segment contains the patient visit information.
Message used for example:
PV1|1||nk^^001
See Table 5 for definition of the fields used.
Table 5 PV1 field definitions
No. Field Name Data type
Recommended max length
Note Samples
1 Set ID - PV1 SI 4 Sequence NO.; it is used to
mark the different PV1
segments of a message.
1
3 Assigned
Patient
Location
PL 80 Patient location information;
in the form of “Department^
^Bed No.”
nk^^001
OBR
The OBR(Observation Request) segment contains the test report information.
Message used for example:
OBR|1||20071207011|00001^Automated
Count^99MRC||20080508140600|20080508150616|||John||||20080508150000||||||||||HM||||||||
Mindray
See Table 6 for definition of the fields used.

Appendices
C-12
Table 6 OBR field definitions
No. Field Name Data type
Recommended max length
Note Samples
1 Set
ID - OBR
SI 10 Sequence NO.; it is
used to indicate the
different OBR
segments of a
message.
1
2 Placer Order
Number
EI 22 To be used as
sample ID in the
message of worklist
searching
response, i.e.
ORC^O02
3 Filler Order
Number +
EI 22 To be used as
sample ID in the
message of test
results
To be used as file
No. in the QC
message
20071207011
4 Universal
Service ID
CE 200 Universal service
ID, to identify
different types of
test results. See
Appendix B for
detailed values.
00001^Automated
Count^99MRC
6 Requested
Date/time
TS 26 Requested
Date/time
To express the
sampling date and
time.
20080508140600
7 Observation
Date/Time #
TS 26 Run Time 20080508150616
10 Collector
Identifier *
XCN 60 Sample collector
To indicate the
deliverer
John
13 Relevant
Clinical Info.
ST 300 Relevant clinical
information.
It can be used as

Appendices
C-13
the clinical
diagnostic
information in the
patient info.
14 Specimen
Received
Date/Time *
TS 26 Sample received
time
To express the
delivery time.
20080508150000
15 Specimen
Source *
CM 300 Sample source
Its value in HL7
message on the
auto hematology
analyzers:
“BLDV”- Venous
blood
“BLDC”- Capillary
blood
22 Results
Rpt/Status
Chng -
Date/Time +
TS 26 Results
report/Status
Change -
Date/Time
To be used as
validating time.
24 Diagnostic
Serv Sect ID
ID 10 Diagnostic ID, the
value is “HM”,
means Hematology.
HM
28 Result Copies
To
XCN 60 Result copies to
To indicate the
validater.
32 Principal
Result
Interpreter +
CM 200 Principal result
interpreter
To be used as
tester in the sample
message
To be used as “set
by” in the QC
message
To be used as
“Operator” in the
QC run message
Mindray

Appendices
C-14
OBX
The OBX(Observation/Result) segment contains the parameter information of each test result.
Message used for example:
OBX|6|NM|6690-2^WBC^LN||9.81|10*9/L|4.00-10.00|N|||F||E
See Table 7 for definition of the fields used.
Table 7 OBX field definitions
No. Field Name Data type
Recommended max length
Note Samples
1 Set ID -
OBX
SI 10 Sequence NO.; it is used
to mark the different OBX
segments of a message.
6
2 Value Type ID 3 Data type of test results;
the values can be “ST”,
“NM”, “ED” and “IS”, etc.
NM
3 Observation
Identifier
CE 590 Test item mark
Form:
“ID^Name^EncodeSys”.
The “ID is the test item
mark; “Name” the
description information of
the test item;
“EncodeSys” is the
coding system of the test
item. For the values of the
code of each test item,
please see configuration
file and Appendix B.
Note: “ID” and
“EncodeSys” are used to
identify a unique
parameter, but “Name” is
used for description only.
6690-2^WBC^LN
5 Observation
Value
* 65535 Test results data. It can
be numbers, strings,
enumeration values and
binary data, etc., see
Appendix B for their
9.81

Appendices
C-15
values (for the binary
data, they are transferred
by the Base64 coding
method, see Appendix C
for details).
6 Units CE 90 Units of test items. ISO
standard units are used.
The units used for
communication are listed
in Appendix B.
10*9/L
7 References
Range
ST 90 Reference range; in the
form of “lower limit-upper
limit”, “< upper limit” or “>
lower limit”.
4.00-10.00
8 Abnormal
Flags
ID 5 Result flags:
“N”- Normal
“A”- Abnormal
“H”- higher than upper
limit
“L”- lower than lower limit
Note: The flag for normal
or abnormal and that for
high or low result may be
displayed in this field at
the same time. In this
case, the two flags should
be connected with a “~”,
e.g.: “H~A”
N
11 Observ
Result
Status
ID 1 Test result status. The
value is “F” - (Final
Result);it means the final
result.
F
13 User
Defined
Access
Checks
ST 20 Customized contents. It
stands for reagent
expiration and
modification mark, etc.
The form is “mark 1-mark
2”.
There are 3 kinds of
marks in all:
E
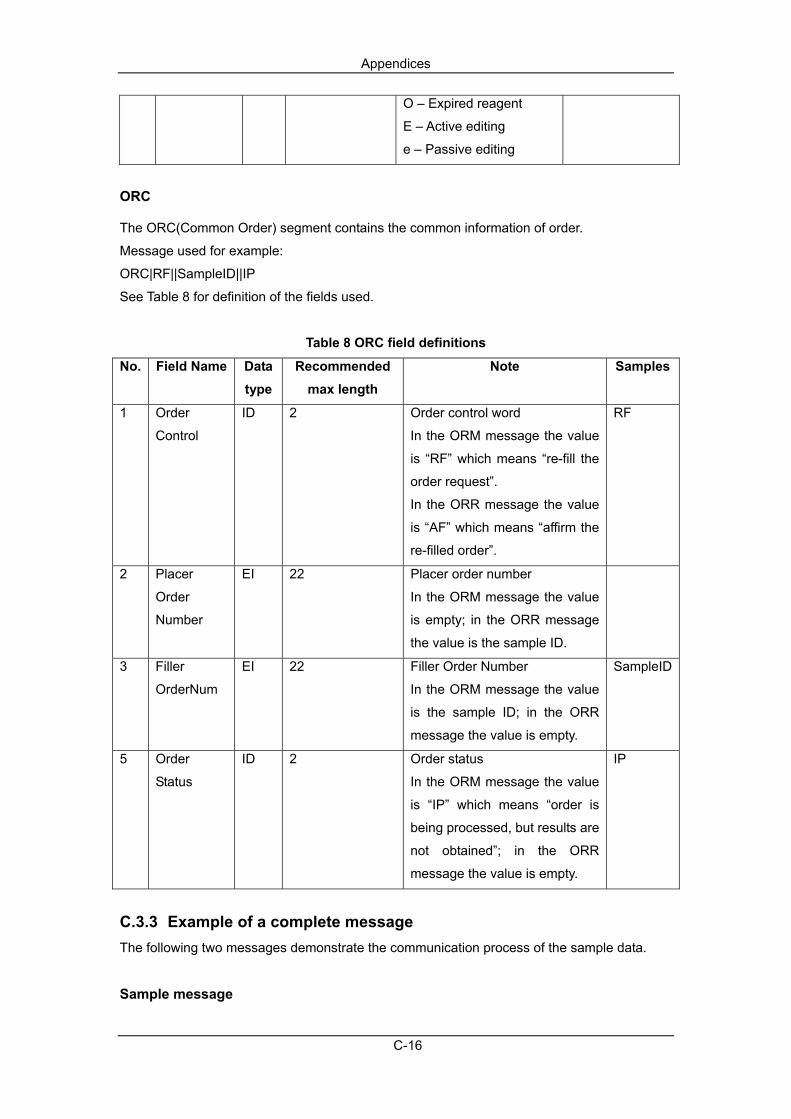
Appendices
C-16
O – Expired reagent
E – Active editing
e – Passive editing
ORC
The ORC(Common Order) segment contains the common information of order.
Message used for example:
ORC|RF||SampleID||IP
See Table 8 for definition of the fields used.
Table 8 ORC field definitions
No. Field Name Data type
Recommended max length
Note Samples
1 Order
Control
ID 2 Order control word
In the ORM message the value
is “RF” which means “re-fill the
order request”.
In the ORR message the value
is “AF” which means “affirm the
re-filled order”.
RF
2 Placer
Order
Number
EI 22 Placer order number
In the ORM message the value
is empty; in the ORR message
the value is the sample ID.
3 Filler
OrderNum
EI 22 Filler Order Number
In the ORM message the value
is the sample ID; in the ORR
message the value is empty.
SampleID
5 Order
Status
ID 2 Order status
In the ORM message the value
is “IP” which means “order is
being processed, but results are
not obtained”; in the ORR
message the value is empty.
IP
C.3.3 Example of a complete message The following two messages demonstrate the communication process of the sample data.
Sample message
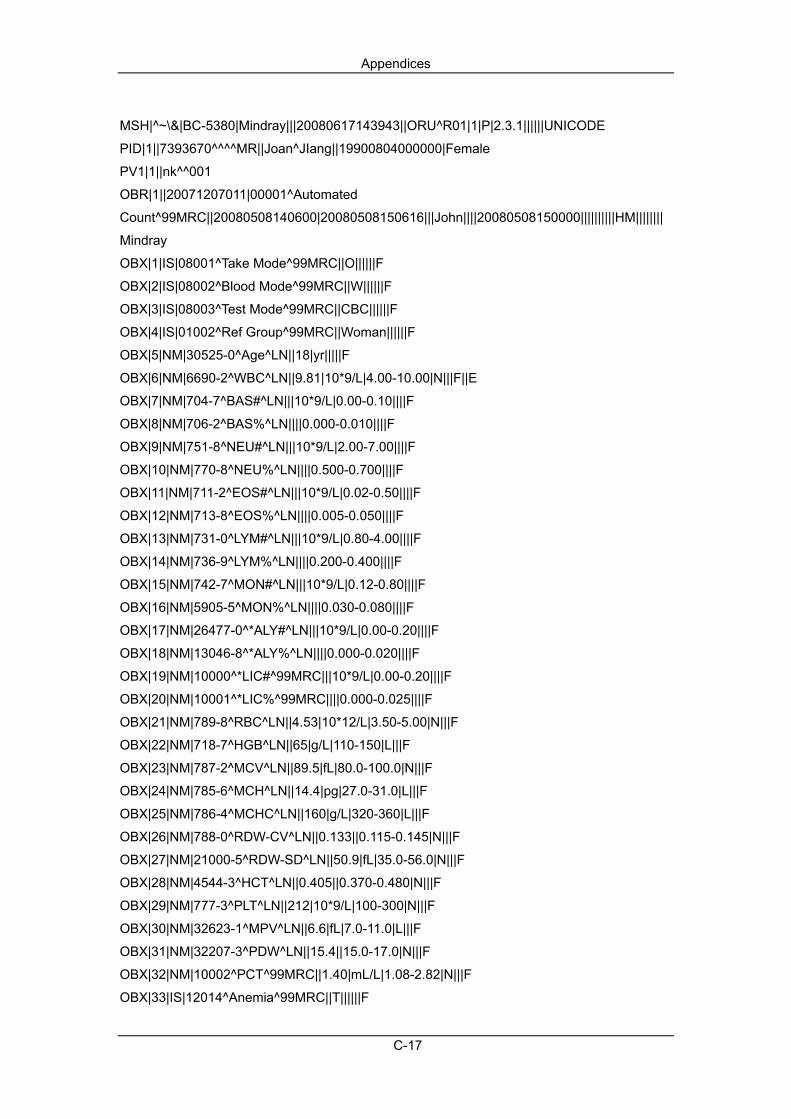
Appendices
C-17
MSH|^~\&|BC-5380|Mindray|||20080617143943||ORU^R01|1|P|2.3.1||||||UNICODE
PID|1||7393670^^^^MR||Joan^JIang||19900804000000|Female
PV1|1||nk^^001
OBR|1||20071207011|00001^Automated
Count^99MRC||20080508140600|20080508150616|||John||||20080508150000||||||||||HM||||||||
Mindray
OBX|1|IS|08001^Take Mode^99MRC||O||||||F
OBX|2|IS|08002^Blood Mode^99MRC||W||||||F
OBX|3|IS|08003^Test Mode^99MRC||CBC||||||F
OBX|4|IS|01002^Ref Group^99MRC||Woman||||||F
OBX|5|NM|30525-0^Age^LN||18|yr|||||F
OBX|6|NM|6690-2^WBC^LN||9.81|10*9/L|4.00-10.00|N|||F||E
OBX|7|NM|704-7^BAS#^LN|||10*9/L|0.00-0.10||||F
OBX|8|NM|706-2^BAS%^LN||||0.000-0.010||||F
OBX|9|NM|751-8^NEU#^LN|||10*9/L|2.00-7.00||||F
OBX|10|NM|770-8^NEU%^LN||||0.500-0.700||||F
OBX|11|NM|711-2^EOS#^LN|||10*9/L|0.02-0.50||||F
OBX|12|NM|713-8^EOS%^LN||||0.005-0.050||||F
OBX|13|NM|731-0^LYM#^LN|||10*9/L|0.80-4.00||||F
OBX|14|NM|736-9^LYM%^LN||||0.200-0.400||||F
OBX|15|NM|742-7^MON#^LN|||10*9/L|0.12-0.80||||F
OBX|16|NM|5905-5^MON%^LN||||0.030-0.080||||F
OBX|17|NM|26477-0^*ALY#^LN|||10*9/L|0.00-0.20||||F
OBX|18|NM|13046-8^*ALY%^LN||||0.000-0.020||||F
OBX|19|NM|10000^*LIC#^99MRC|||10*9/L|0.00-0.20||||F
OBX|20|NM|10001^*LIC%^99MRC||||0.000-0.025||||F
OBX|21|NM|789-8^RBC^LN||4.53|10*12/L|3.50-5.00|N|||F
OBX|22|NM|718-7^HGB^LN||65|g/L|110-150|L|||F
OBX|23|NM|787-2^MCV^LN||89.5|fL|80.0-100.0|N|||F
OBX|24|NM|785-6^MCH^LN||14.4|pg|27.0-31.0|L|||F
OBX|25|NM|786-4^MCHC^LN||160|g/L|320-360|L|||F
OBX|26|NM|788-0^RDW-CV^LN||0.133||0.115-0.145|N|||F
OBX|27|NM|21000-5^RDW-SD^LN||50.9|fL|35.0-56.0|N|||F
OBX|28|NM|4544-3^HCT^LN||0.405||0.370-0.480|N|||F
OBX|29|NM|777-3^PLT^LN||212|10*9/L|100-300|N|||F
OBX|30|NM|32623-1^MPV^LN||6.6|fL|7.0-11.0|L|||F
OBX|31|NM|32207-3^PDW^LN||15.4||15.0-17.0|N|||F
OBX|32|NM|10002^PCT^99MRC||1.40|mL/L|1.08-2.82|N|||F
OBX|33|IS|12014^Anemia^99MRC||T||||||F

Appendices
C-18
OBX|34|IS|15180-3^Hypochromia^LN||T||||||F
OBX|35|NM|15001^WBC Histogram. Left Line^99MRC||7||||||F
OBX|36|NM|15002^WBC Histogram. Right Line^99MRC||65||||||F
OBX|37|NM|15003^WBC Histogram. Middle Line^99MRC||30||||||F
OBX|38|ED|15008^WBC Histogram. BMP^99MRC||^Image^BMP^Base64^ … … WBC
Histogram bmp data……||||||F
OBX|39|NM|15051^RBC Histogram. Left Line^99MRC||26||||||F
OBX|40|NM|15052^RBC Histogram. Right Line^99MRC||164||||||F
OBX|41|ED|15056^RBC Histogram. BMP^99MRC||^Image^BMP^Base64^ … … RBC
Histogram bmp data……||||||F
OBX|42|NM|15111^PLT Histogram. Left Line^99MRC||3||||||F
OBX|43|NM|15112^PLT Histogram. Right Line^99MRC||43||||||F
OBX|44|ED|15116^PLT Histogram. BMP^99MRC||^Image^BMP^Base64^……PLT Histogram
bmp data……||||||F
OBX|45|ED|15200^WBC DIFF Scattergram. BMP^99MRC||^Image^BMP^Base64^……WBC
Diff Scattergram bmp data……||||||F
OBR|2||20071207011|00002^Manual Count^99MRC|||||||||||BLDV
OBX|46|NM|747-6^Myeloblasts%. Manual^LN||0.0|%|||||F
OBX|47|NM|783-1^Promyelocytes%. Manual^LN||0.0|%|||||F
OBX|48|NM|749-2^Myelocytes%. Manual^LN||0.0|%|||||F
OBX|49|NM|740-1^Metamyelocyte%. Manual^LN||0.0|%|||||F
OBX|50|NM|764-1^Neuts Band%. Manual^LN||0.0|%|||||F
OBX|51|NM|769-0^Neuts Seg%. Manual^LN||0.0|%|||||F
OBX|52|NM|714-6^Eosinophils%. Manual^LN||0.0|%|||||F
OBX|53|NM|707-0^Basophils%. Manual^LN||0.0|%|||||F
OBX|54|NM|33831-9^Lymphoblasts%. Manual^LN||0.0|%|||||F
OBX|55|NM|6746-2^Prolymphocytes%. Manual^LN||0.0|%|||||F
OBX|56|NM|737-7^Lymphocytes%. Manual^LN||0.0|%|||||F
OBX|57|NM|29261-5^Abnormal Lymphs%. Manual^LN||0.0|%|||||F
OBX|58|NM|33840-0^Monoblasts%. Manual^LN||0.0|%|||||F
OBX|59|NM|13599-6^Promonocytes%. Manual^LN||0.0|%|||||F
OBX|60|NM|744-3^Monocytes%. Manual^LN||0.0|%|||||F
OBX|61|NM|18309-5^NRBCs%. Manual^LN||0.0|%|||||F
OBX|62|NM|31112-6^Reticulocytes%. Manual^LN||0.0|%|||||F
OBX|63|NM|11000^Undefined Cells%. Manual^99MRC||0.0|%|||||F
OBX|64|NM|11001^Other Abnormal Cells%. Manual^99MRC||0.0|%|||||F
Sample response message
Every time a sample result is received, a sample response message composed of two
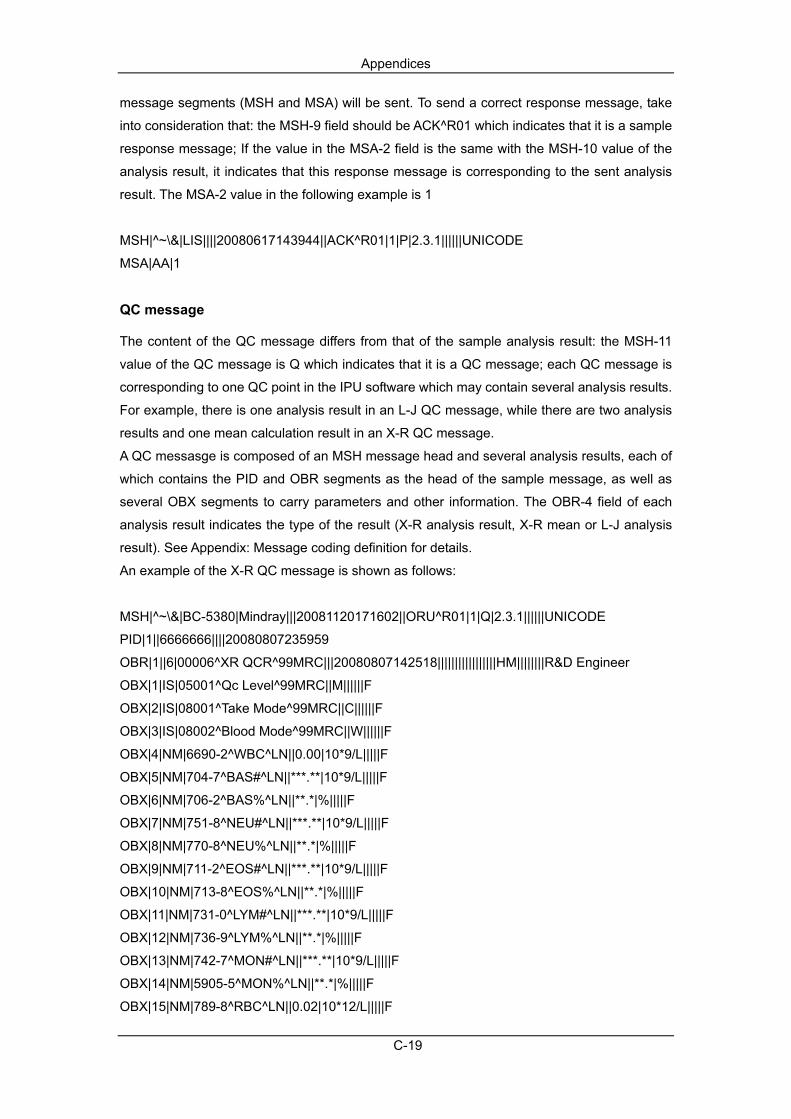
Appendices
C-19
message segments (MSH and MSA) will be sent. To send a correct response message, take
into consideration that: the MSH-9 field should be ACK^R01 which indicates that it is a sample
response message; If the value in the MSA-2 field is the same with the MSH-10 value of the
analysis result, it indicates that this response message is corresponding to the sent analysis
result. The MSA-2 value in the following example is 1
MSH|^~\&|LIS||||20080617143944||ACK^R01|1|P|2.3.1||||||UNICODE
MSA|AA|1
QC message
The content of the QC message differs from that of the sample analysis result: the MSH-11
value of the QC message is Q which indicates that it is a QC message; each QC message is
corresponding to one QC point in the IPU software which may contain several analysis results.
For example, there is one analysis result in an L-J QC message, while there are two analysis
results and one mean calculation result in an X-R QC message.
A QC messasge is composed of an MSH message head and several analysis results, each of
which contains the PID and OBR segments as the head of the sample message, as well as
several OBX segments to carry parameters and other information. The OBR-4 field of each
analysis result indicates the type of the result (X-R analysis result, X-R mean or L-J analysis
result). See Appendix: Message coding definition for details.
An example of the X-R QC message is shown as follows:
MSH|^~\&|BC-5380|Mindray|||20081120171602||ORU^R01|1|Q|2.3.1||||||UNICODE
PID|1||6666666||||20080807235959
OBR|1||6|00006^XR QCR^99MRC|||20080807142518|||||||||||||||||HM||||||||R&D Engineer
OBX|1|IS|05001^Qc Level^99MRC||M||||||F
OBX|2|IS|08001^Take Mode^99MRC||C||||||F
OBX|3|IS|08002^Blood Mode^99MRC||W||||||F
OBX|4|NM|6690-2^WBC^LN||0.00|10*9/L|||||F
OBX|5|NM|704-7^BAS#^LN||***.**|10*9/L|||||F
OBX|6|NM|706-2^BAS%^LN||**.*|%|||||F
OBX|7|NM|751-8^NEU#^LN||***.**|10*9/L|||||F
OBX|8|NM|770-8^NEU%^LN||**.*|%|||||F
OBX|9|NM|711-2^EOS#^LN||***.**|10*9/L|||||F
OBX|10|NM|713-8^EOS%^LN||**.*|%|||||F
OBX|11|NM|731-0^LYM#^LN||***.**|10*9/L|||||F
OBX|12|NM|736-9^LYM%^LN||**.*|%|||||F
OBX|13|NM|742-7^MON#^LN||***.**|10*9/L|||||F
OBX|14|NM|5905-5^MON%^LN||**.*|%|||||F
OBX|15|NM|789-8^RBC^LN||0.02|10*12/L|||||F
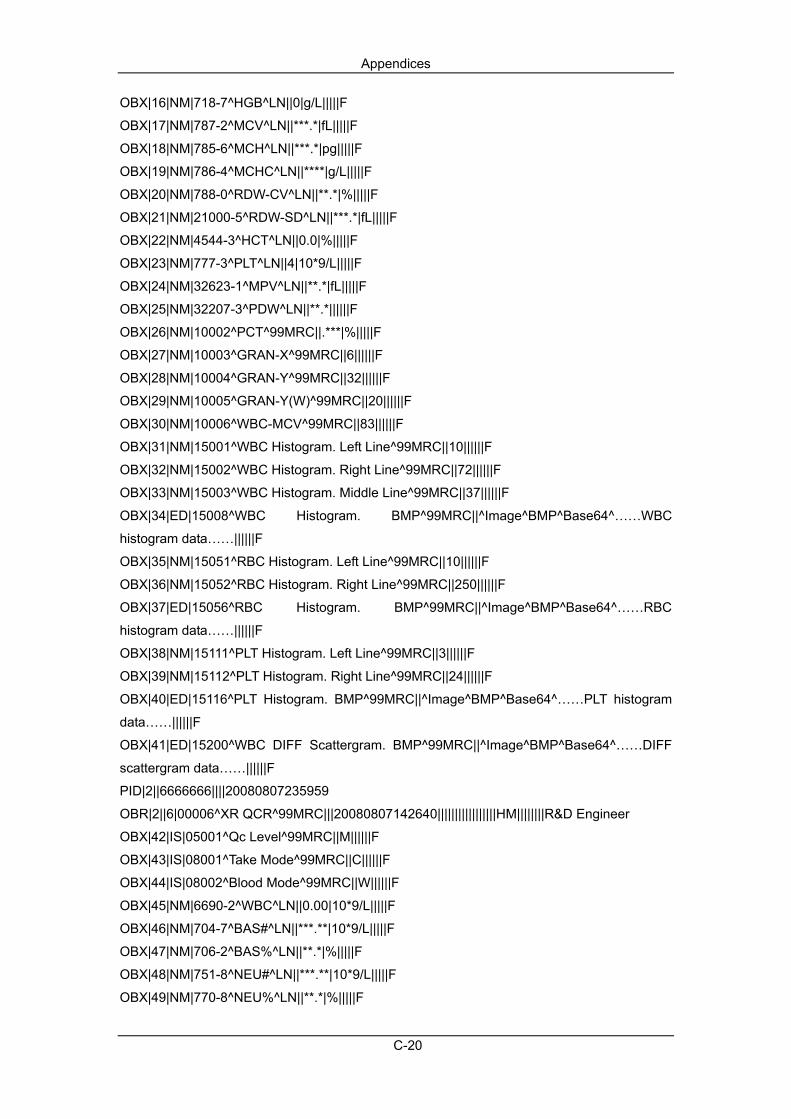
Appendices
C-20
OBX|16|NM|718-7^HGB^LN||0|g/L|||||F
OBX|17|NM|787-2^MCV^LN||***.*|fL|||||F
OBX|18|NM|785-6^MCH^LN||***.*|pg|||||F
OBX|19|NM|786-4^MCHC^LN||****|g/L|||||F
OBX|20|NM|788-0^RDW-CV^LN||**.*|%|||||F
OBX|21|NM|21000-5^RDW-SD^LN||***.*|fL|||||F
OBX|22|NM|4544-3^HCT^LN||0.0|%|||||F
OBX|23|NM|777-3^PLT^LN||4|10*9/L|||||F
OBX|24|NM|32623-1^MPV^LN||**.*|fL|||||F
OBX|25|NM|32207-3^PDW^LN||**.*||||||F
OBX|26|NM|10002^PCT^99MRC||.***|%|||||F
OBX|27|NM|10003^GRAN-X^99MRC||6||||||F
OBX|28|NM|10004^GRAN-Y^99MRC||32||||||F
OBX|29|NM|10005^GRAN-Y(W)^99MRC||20||||||F
OBX|30|NM|10006^WBC-MCV^99MRC||83||||||F
OBX|31|NM|15001^WBC Histogram. Left Line^99MRC||10||||||F
OBX|32|NM|15002^WBC Histogram. Right Line^99MRC||72||||||F
OBX|33|NM|15003^WBC Histogram. Middle Line^99MRC||37||||||F
OBX|34|ED|15008^WBC Histogram. BMP^99MRC||^Image^BMP^Base64^……WBC
histogram data……||||||F
OBX|35|NM|15051^RBC Histogram. Left Line^99MRC||10||||||F
OBX|36|NM|15052^RBC Histogram. Right Line^99MRC||250||||||F
OBX|37|ED|15056^RBC Histogram. BMP^99MRC||^Image^BMP^Base64^……RBC
histogram data……||||||F
OBX|38|NM|15111^PLT Histogram. Left Line^99MRC||3||||||F
OBX|39|NM|15112^PLT Histogram. Right Line^99MRC||24||||||F
OBX|40|ED|15116^PLT Histogram. BMP^99MRC||^Image^BMP^Base64^……PLT histogram
data……||||||F
OBX|41|ED|15200^WBC DIFF Scattergram. BMP^99MRC||^Image^BMP^Base64^……DIFF
scattergram data……||||||F
PID|2||6666666||||20080807235959
OBR|2||6|00006^XR QCR^99MRC|||20080807142640|||||||||||||||||HM||||||||R&D Engineer
OBX|42|IS|05001^Qc Level^99MRC||M||||||F
OBX|43|IS|08001^Take Mode^99MRC||C||||||F
OBX|44|IS|08002^Blood Mode^99MRC||W||||||F
OBX|45|NM|6690-2^WBC^LN||0.00|10*9/L|||||F
OBX|46|NM|704-7^BAS#^LN||***.**|10*9/L|||||F
OBX|47|NM|706-2^BAS%^LN||**.*|%|||||F
OBX|48|NM|751-8^NEU#^LN||***.**|10*9/L|||||F
OBX|49|NM|770-8^NEU%^LN||**.*|%|||||F

Appendices
C-21
OBX|50|NM|711-2^EOS#^LN||***.**|10*9/L|||||F
OBX|51|NM|713-8^EOS%^LN||**.*|%|||||F
OBX|52|NM|731-0^LYM#^LN||***.**|10*9/L|||||F
OBX|53|NM|736-9^LYM%^LN||**.*|%|||||F
OBX|54|NM|742-7^MON#^LN||***.**|10*9/L|||||F
OBX|55|NM|5905-5^MON%^LN||**.*|%|||||F
OBX|56|NM|789-8^RBC^LN||0.02|10*12/L|||||F
OBX|57|NM|718-7^HGB^LN||0|g/L|||||F
OBX|58|NM|787-2^MCV^LN||***.*|fL|||||F
OBX|59|NM|785-6^MCH^LN||***.*|pg|||||F
OBX|60|NM|786-4^MCHC^LN||****|g/L|||||F
OBX|61|NM|788-0^RDW-CV^LN||**.*|%|||||F
OBX|62|NM|21000-5^RDW-SD^LN||***.*|fL|||||F
OBX|63|NM|4544-3^HCT^LN||0.0|%|||||F
OBX|64|NM|777-3^PLT^LN||5|10*9/L|||||F
OBX|65|NM|32623-1^MPV^LN||**.*|fL|||||F
OBX|66|NM|32207-3^PDW^LN||**.*||||||F
OBX|67|NM|10002^PCT^99MRC||.***|%|||||F
OBX|68|NM|10003^GRAN-X^99MRC||28||||||F
OBX|69|NM|10004^GRAN-Y^99MRC||19||||||F
OBX|70|NM|10005^GRAN-Y(W)^99MRC||20||||||F
OBX|71|NM|10006^WBC-MCV^99MRC||60||||||F
OBX|72|NM|15001^WBC Histogram. Left Line^99MRC||10||||||F
OBX|73|NM|15002^WBC Histogram. Right Line^99MRC||72||||||F
OBX|74|NM|15003^WBC Histogram. Middle Line^99MRC||37||||||F
OBX|75|ED|15008^WBC Histogram. BMP^99MRC||^Image^BMP^Base64^……WBC
histogram data……||||||F
OBX|76|NM|15051^RBC Histogram. Left Line^99MRC||10||||||F
OBX|77|NM|15052^RBC Histogram. Right Line^99MRC||250||||||F
OBX|78|ED|15056^RBC Histogram. BMP^99MRC||^Image^BMP^Base64^ ……RBC
histogram data……||||||F
OBX|79|NM|15111^PLT Histogram. Left Line^99MRC||3||||||F
OBX|80|NM|15112^PLT Histogram. Right Line^99MRC||24||||||F
OBX|81|ED|15116^PLT Histogram. BMP^99MRC||^Image^BMP^Base64^ ……PLT histogram
data……||||||F
OBX|82|ED|15200^WBC DIFF Scattergram. BMP^99MRC||^Image^BMP^Base64^ ……DIFF
scattergram data……||||||F
PID|3||6666666
OBR|3||6|00008^XR QCR Mean^99MRC||||||||||||||||||||HM
OBX|83|NM|6690-2^WBC^LN||0.00|10*9/L|||||F

Appendices
C-22
OBX|84|NM|704-7^BAS#^LN||***.**|10*9/L|||||F
OBX|85|NM|706-2^BAS%^LN||**.*|%|||||F
OBX|86|NM|751-8^NEU#^LN||***.**|10*9/L|||||F
OBX|87|NM|770-8^NEU%^LN||**.*|%|||||F
OBX|88|NM|711-2^EOS#^LN||***.**|10*9/L|||||F
OBX|89|NM|713-8^EOS%^LN||**.*|%|||||F
OBX|90|NM|731-0^LYM#^LN||***.**|10*9/L|||||F
OBX|91|NM|736-9^LYM%^LN||**.*|%|||||F
OBX|92|NM|742-7^MON#^LN||***.**|10*9/L|||||F
OBX|93|NM|5905-5^MON%^LN||**.*|%|||||F
OBX|94|NM|789-8^RBC^LN||0.02|10*12/L|||||F
OBX|95|NM|718-7^HGB^LN||0|g/L|||||F
OBX|96|NM|787-2^MCV^LN||***.*|fL|||||F
OBX|97|NM|785-6^MCH^LN||***.*|pg|||||F
OBX|98|NM|786-4^MCHC^LN||****|g/L|||||F
OBX|99|NM|788-0^RDW-CV^LN||**.*|%|||||F
OBX|100|NM|21000-5^RDW-SD^LN||***.*|fL|||||F
OBX|101|NM|4544-3^HCT^LN||0.0|%|||||F
OBX|102|NM|777-3^PLT^LN||5|10*9/L|||||F
OBX|103|NM|32623-1^MPV^LN||**.*|fL|||||F
OBX|104|NM|32207-3^PDW^LN||**.*||||||F
OBX|105|NM|10002^PCT^99MRC||.***|%|||||F
OBX|106|NM|10003^GRAN-X^99MRC||17||||||F
OBX|107|NM|10004^GRAN-Y^99MRC||26||||||F
OBX|108|NM|10005^GRAN-Y(W)^99MRC||20||||||F
OBX|109|NM|10006^WBC-MCV^99MRC||72||||||F
QC response message
The only difference between the QC response message and the analysis result response
message is that the MSH-11 value of the QC response message is Q.
An example of the ACK X-R QC message is shown as follows:
MSH|^~\&|LIS||||20081120171602||ACK^R01|1|Q|2.3.1||||||UNICODE
MSA|AA|1
Bidirectional LIS inquiry message
A bidirectional LIS inquiry message contains a sample ID. After the LIS received the inquiry
message, it will search for the corresponding patient and sample information to provide a
response.
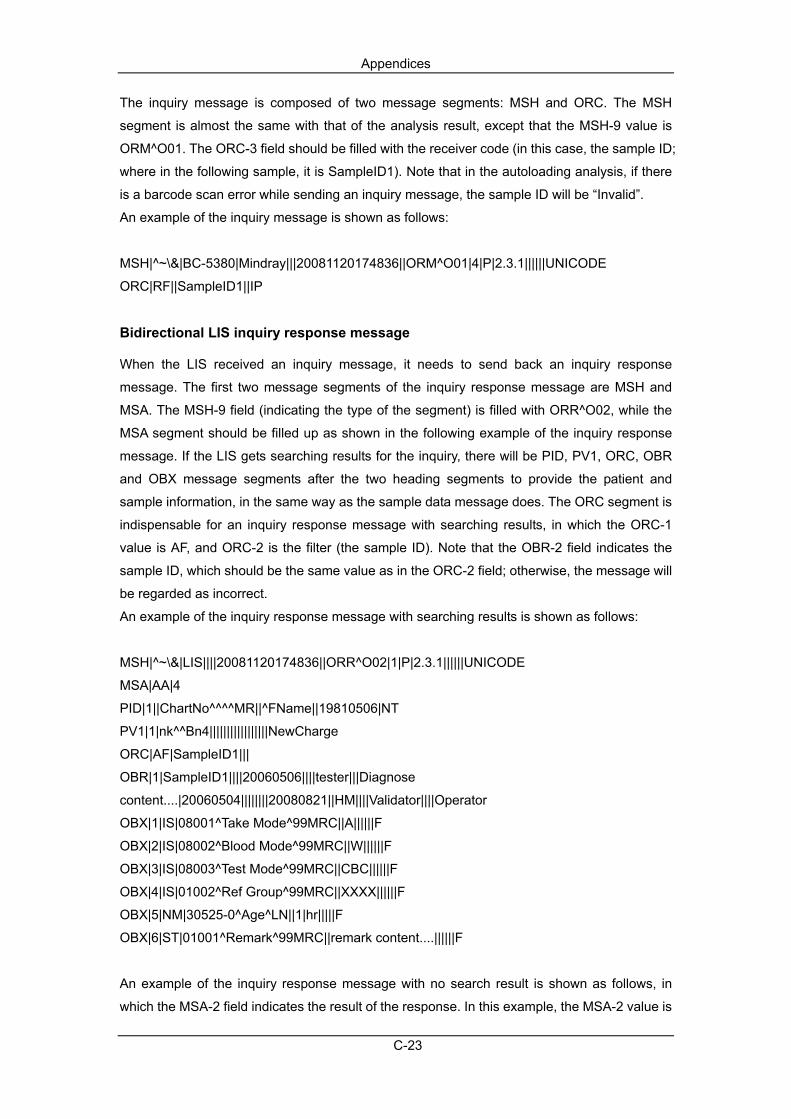
Appendices
C-23
The inquiry message is composed of two message segments: MSH and ORC. The MSH
segment is almost the same with that of the analysis result, except that the MSH-9 value is
ORM^O01. The ORC-3 field should be filled with the receiver code (in this case, the sample ID;
where in the following sample, it is SampleID1). Note that in the autoloading analysis, if there
is a barcode scan error while sending an inquiry message, the sample ID will be “Invalid”.
An example of the inquiry message is shown as follows:
MSH|^~\&|BC-5380|Mindray|||20081120174836||ORM^O01|4|P|2.3.1||||||UNICODE
ORC|RF||SampleID1||IP
Bidirectional LIS inquiry response message
When the LIS received an inquiry message, it needs to send back an inquiry response
message. The first two message segments of the inquiry response message are MSH and
MSA. The MSH-9 field (indicating the type of the segment) is filled with ORR^O02, while the
MSA segment should be filled up as shown in the following example of the inquiry response
message. If the LIS gets searching results for the inquiry, there will be PID, PV1, ORC, OBR
and OBX message segments after the two heading segments to provide the patient and
sample information, in the same way as the sample data message does. The ORC segment is
indispensable for an inquiry response message with searching results, in which the ORC-1
value is AF, and ORC-2 is the filter (the sample ID). Note that the OBR-2 field indicates the
sample ID, which should be the same value as in the ORC-2 field; otherwise, the message will
be regarded as incorrect.
An example of the inquiry response message with searching results is shown as follows:
MSH|^~\&|LIS||||20081120174836||ORR^O02|1|P|2.3.1||||||UNICODE
MSA|AA|4
PID|1||ChartNo^^^^MR||^FName||19810506|NT
PV1|1|nk^^Bn4|||||||||||||||||NewCharge
ORC|AF|SampleID1|||
OBR|1|SampleID1||||20060506||||tester|||Diagnose
content....|20060504||||||||20080821||HM||||Validator||||Operator
OBX|1|IS|08001^Take Mode^99MRC||A||||||F
OBX|2|IS|08002^Blood Mode^99MRC||W||||||F
OBX|3|IS|08003^Test Mode^99MRC||CBC||||||F
OBX|4|IS|01002^Ref Group^99MRC||XXXX||||||F
OBX|5|NM|30525-0^Age^LN||1|hr|||||F
OBX|6|ST|01001^Remark^99MRC||remark content....||||||F
An example of the inquiry response message with no search result is shown as follows, in
which the MSA-2 field indicates the result of the response. In this example, the MSA-2 value is
Appendices
C-24
“AR”, indicating the inquiry was rejected; if it is “AE", then there is an error in the inquiry
process.
MSH|^~\&|LIS||||20081120175238||ORR^O02|1|P|2.3.1||||||UNICODE
MSA|AR|9
C.4 Appendix: Definition of the HL7 data type used
CE - Code Element
<identifier (ST)> ^ <text (ST)> ^ <name of coding system (ST)> ^ <alternate identifier (ST)> ^
<alternate text (ST)> ^ <name of alternate coding system (ST)>
CM - Composite
The format is defined by the specific field.
CX - Extended composite ID with check digit
<ID (ST)> ^ <check digit (ST)> ^ <code identifying the check digit scheme employed (ID)> ^ <
assigning authority (HD)> ^ <identifier type code (IS)> ^ < assigning facility (HD)>
ED – Encapsulate Data
<source application(HD)> ^ <type of data(ID)> ^ <data sub type(ID)> ^ <encoding(ID)> ^
<data(ST)>
EI - Entity Identifier
<entity identifier (ST)> ^ <namespace ID (IS)> ^ <universal ID (ST)> ^ <universal ID type (ID)>
FC – Financial Class
<financial class(IS)> ^ <effective date(TS)>
HD - Hierarchic designator
<namespace ID (IS)> ^ <universal ID (ST)> ^ <universal ID type (ID)>
Used only as part of EI and other data types.
FT - Formatted text
This data type is derived from the string data type by allowing the addition of embedded
formatting instructions. These instructions are limited to those that are intrinsic and
independent of the circumstances under which the field is being used.
IS - Coded value for user-defined tables
The value of such a field follows the formatting rules for an ST field except that it is drawn from
a site-defined (or user-defined) table of legal values. There shall be an HL7 table number
associated with IS data types.
ID - Coded values for HL7 tables
Appendices
C-25
The value of such a field follows the formatting rules for an ST field except that it is drawn from
a table of legal values. There shall be an HL7 table number associated with ID data types.
NM - Numeric
A number represented as a series of ASCII numeric characters consisting of an optional
leading sign (+ or -), the digits and an optional decimal point.
PL - Person location
<point of care (IS )> ^ <room (IS )> ^ <bed (IS)> ^ <facility (HD)> ^ < location status (IS )> ^
<person location type (IS)> ^ <building (IS )> ^ <floor (IS )> ^ <location description (ST)>
PT - Processing type
<processing ID (ID)> ^ <processing mode (ID)>
SI - Sequence ID
A non-negative integer in the form of an NM field. The uses of this data type are defined in the
chapters defining the segments and messages in which it appears.
ST – String
TS - Time stamp
YYYY[MM[DD[HHMM[SS[.S[S[S[S]]]]]]]][+/-ZZZZ] ^ <degree of precision>
XCN - Extended composite ID number and name
In Version 2.3, use instead of the CN data type. <ID number (ST)> ^ <family name (ST)> &
<last_name_prefix (ST) ^ <given name (ST)> ^ <middle initial or name (ST)> ^ <suffix (e.g., JR
or III) (ST)> ^ <prefix (e.g., DR) (ST)> ^ <degree (e.g., MD) (ST)> ^ <source table (IS)> ^
<assigning authority (HD)> ^ <name type code (ID)> ^ <identifier check digit (ST)> ^ <code
identifying the check digit scheme employed (ID)> ^ <identifier type code (IS)> ^ <assigning
facility (HD)> ^ <name representation code (ID)>
XPN - Extended person name
In Version 2.3, replaces the PN data type. <family name (ST)> ^ <given name (ST)> &
<last_name_prefix (ST)> ^ <middle initial or name (ST)> ^ <suffix (e.g., JR or III) (ST)> ^
<prefix (e.g., DR) (ST)> ^ <degree (e.g., MD) (IS)> ^ <name type code (ID) > ^ <name
representation code (ID)>
VID - Version identifier
<version ID (ID)> ^ <internationalization code (CE)> ^ <international version ID (CE)>
C.5 Appendix: Message coding definition
1. In the HL7 message, the OBR-4(Universal Serview ID) field is used for identifying the type
Appendices
C-26
of the test results, for example, to identify the results as sample results, microscope exam
results or QC results in the form of “ID^Name^EncodeSys”. The coding values of the field are
listed in the table below.
Table 9 OBR-4 Coding
Data Coding (ID) Name EncodeSys
Analysis result 00001 Automated Count 99MRC
Microscope exam result 00002 Manual Count 99MRC
LJ QC result 00003 LJ QCR 99MRC
X QC result 00004 X QCR 99MRC
XB QC result 00005 XB QCR 99MRC
XR QC result 00006 XR QCR 99MRC
X QC result mean 00007 X QCR Mean 99MRC
XR QC result mean 00008 XR QCR Mean 99MRC
2. Each OBX segment contains one test parameter or information of other data and consists of
the following fields: OBX-2, it indicates the HL7 type of the data contained; OBX-3, it is the
mark of the data in the form of “ID^Name^EncodeSys”; OBX-5, it contains the value of the data;
OBX-6, it contains the unit for the parameter, expressing in the ISO standard.
The HL7 types and coding marks of all the communication data are listed in Table 10. The
units of all the communication data are listed in table 11.
Table 10 HL7 types and coding marks
Data HL7 Type
(OBX-2)
Coding
(ID) Name EncodeSys
OBX-3 field example
Other data
Take Mode IS 08001 Take Mode 99MRC 08001^Take
Mode^99MRC
Blood Mode IS 08002 Blood Mode 99MRC 08002^Blood
Mode^99MRC
Test mode IS 08003 Test Mode 99MRC 08003^Test
Mode^99MRC
Age NM 30525-
0 Age LN
30525-0^Age^LN
Remark ST 01001 Remark 99MRC 01001^Remark^99M
RC
Ref Group IS 01002 Ref Group 99MRC 01002^Ref
Group^99MRC

Appendices
C-27
QC Level IS 05001 Qc Level 99MRC 05001^Qc
Level^99MRC
Analysis results data
WBC NM 6690-2 WBC LN 6690-2^WBC^LN
BAS NM 704-7 BAS# LN 704-7^BAS#^LN
BAS_PER NM 706-2 BAS% LN 706-2^BAS%^LN
NEU NM 751-8 NEU# LN 751-8^NEU#^LN
NEU_PER NM 770-8 NEU% LN 770-8^NEU%^LN
EOS NM 711-2 EOS# LN 711-2^EOS#^LN
EOS_PER NM 713-8 EOS% LN 713-8^EOS%^LN
LYM NM 731-0 LYM# LN 731-0^LYM#^LN
LYM_PER NM 736-9 LYM% LN 736-9^LYM%^LN
MON NM 742-7 MON# LN 742-7^MON#^LN
MON_PER NM 5905-5 MON% LN 5905-5^MON%^LN
ALY NM 26477-
0 *ALY# LN
26477-0^*ALY#^LN
ALY_PER NM 13046-
8 *ALY% LN
13046-8^*ALY%^LN
LIC NM 10000 *LIC# 99MRC 10000^*LIC#^99MRC
LIC_PER NM 10001 *LIC% 99MRC 10001^*LIC%^99MR
C
RBC NM 789-8 RBC LN 789-8^RBC^LN
HGB NM 718-7 HGB LN 718-7^HGB^LN
MCV NM 787-2 MCV LN 787-2^MCV^LN
MCH NM 785-6 MCH LN 785-6^MCH^LN
MCHC NM 786-4 MCHC LN 786-4^MCHC^LN
RDW_CV NM 788-0 RDW-CV LN 788-0^RDW-CV^LN
RDW_SD NM 21000-
5 RDW-SD LN
21000-5^RDW-SD^L
N
HCT NM 4544-3 HCT LN 4544-3^HCT^LN
PLT NM 777-3 PLT LN 777-3^PLT^LN
MPV NM 32623-
1 MPV LN
32623-1^MPV^LN
PDW NM 32207-
3 PDW LN
32207-3^PDW^LN
PCT NM 10002 PCT 99MRC 10002^PCT^99MRC
GRAN-X NM 10003 GRAN-X 99MRC 10003^GRAN-X^99M
RC
GRAN-Y NM 10004 GRAN-Y 99MRC 10004^GRAN-Y^99M
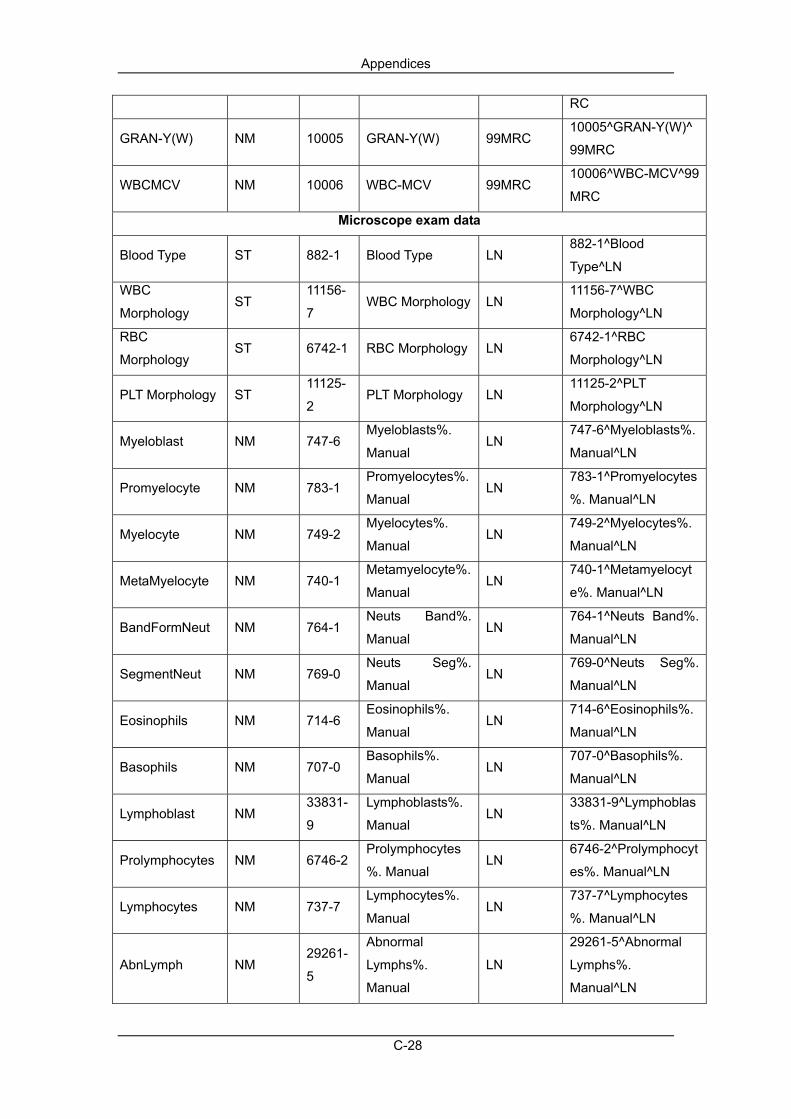
Appendices
C-28
RC
GRAN-Y(W) NM 10005 GRAN-Y(W) 99MRC 10005^GRAN-Y(W)^
99MRC
WBCMCV NM 10006 WBC-MCV 99MRC 10006^WBC-MCV^99
MRC
Microscope exam data
Blood Type ST 882-1 Blood Type LN 882-1^Blood
Type^LN
WBC
Morphology ST
11156-
7 WBC Morphology LN
11156-7^WBC
Morphology^LN
RBC
Morphology ST 6742-1 RBC Morphology LN
6742-1^RBC
Morphology^LN
PLT Morphology ST 11125-
2 PLT Morphology LN
11125-2^PLT
Morphology^LN
Myeloblast NM 747-6 Myeloblasts%.
Manual LN
747-6^Myeloblasts%.
Manual^LN
Promyelocyte NM 783-1 Promyelocytes%.
Manual LN
783-1^Promyelocytes
%. Manual^LN
Myelocyte NM 749-2 Myelocytes%.
Manual LN
749-2^Myelocytes%.
Manual^LN
MetaMyelocyte NM 740-1 Metamyelocyte%.
Manual LN
740-1^Metamyelocyt
e%. Manual^LN
BandFormNeut NM 764-1 Neuts Band%.
Manual LN
764-1^Neuts Band%.
Manual^LN
SegmentNeut NM 769-0 Neuts Seg%.
Manual LN
769-0^Neuts Seg%.
Manual^LN
Eosinophils NM 714-6 Eosinophils%.
Manual LN
714-6^Eosinophils%.
Manual^LN
Basophils NM 707-0 Basophils%.
Manual LN
707-0^Basophils%.
Manual^LN
Lymphoblast NM 33831-
9
Lymphoblasts%.
Manual LN
33831-9^Lymphoblas
ts%. Manual^LN
Prolymphocytes NM 6746-2Prolymphocytes
%. Manual LN
6746-2^Prolymphocyt
es%. Manual^LN
Lymphocytes NM 737-7 Lymphocytes%.
Manual LN
737-7^Lymphocytes
%. Manual^LN
AbnLymph NM 29261-
5
Abnormal
Lymphs%.
Manual
LN
29261-5^Abnormal
Lymphs%.
Manual^LN

Appendices
C-29
Monoblast NM 33840-
0
Monoblasts%.
Manual LN
33840-0^Monoblasts
%. Manual^LN
Promonocytes NM 13599-
6
Promonocytes%.
Manual LN
13599-6^Promonocyt
es%. Manual^LN
Monocyte NM 744-3 Monocytes%.
Manual LN
744-3^Monocytes%.
Manual^LN
NRBCS NM 18309-
5
NRBCs%.
Manual LN
18309-5^NRBCs%.
Manual^LN
Reticulocyte NM 31112-
6
Reticulocytes%.
Manual LN
31112-6^Reticulocyte
s%. Manual^LN
UndefinedCells NM 11000 Undefined
Cells%. Manual 99MRC
11000^Undefined
Cells%.
Manual^99MRC
OtherAbnormalC
ells NM 11001
Other Abnormal
Cells%. Manual 99MRC
11001^Other
Abnormal Cells%.
Manual^99MRC
ESR NM 30341-
2 ESR LN
Analysis results medium data(WBC, RBC, PLT histogram and scattergram data, etc.)
WBC Histogram
Binary Data ED 15000
WBC Histogram.
Binary 99MRC
15000^WBC
Histogram
Binaray^99MRC
WBC Histogram
Left
Discriminator
NM 15001 WBC Histogram.
Left Line 99MRC
15001^WBC
Histogram. Left
Line^99MRC
WBC Histogram
Right
Discriminator
NM 15002 WBC Histogram.
Right Line 99MRC
15002^WBC
Histogram. Right
Line^99MRC
WBC Histogram
Middle
Discriminator
NM 15003 WBC Histogram.
Middle Line 99MRC
15003^WBC
Histogram. Middle
Line^99MRC
WBC Histogram
Original Data
Length
NM 15004 WBC Histogram.
Meta Length 99MRC
15004^WBC
Histogram. Meta
Length^99MRC
WBC Histogram
Left
Discriminator
Adjusted Mark
IS 15005 WBC Histogram.
Left Line Adjusted99MRC
15005^WBC
Histogram. Left Line
Adjusted^99MRC
WBC Histogram IS 15006 WBC Histogram. 99MRC 15006^WBC
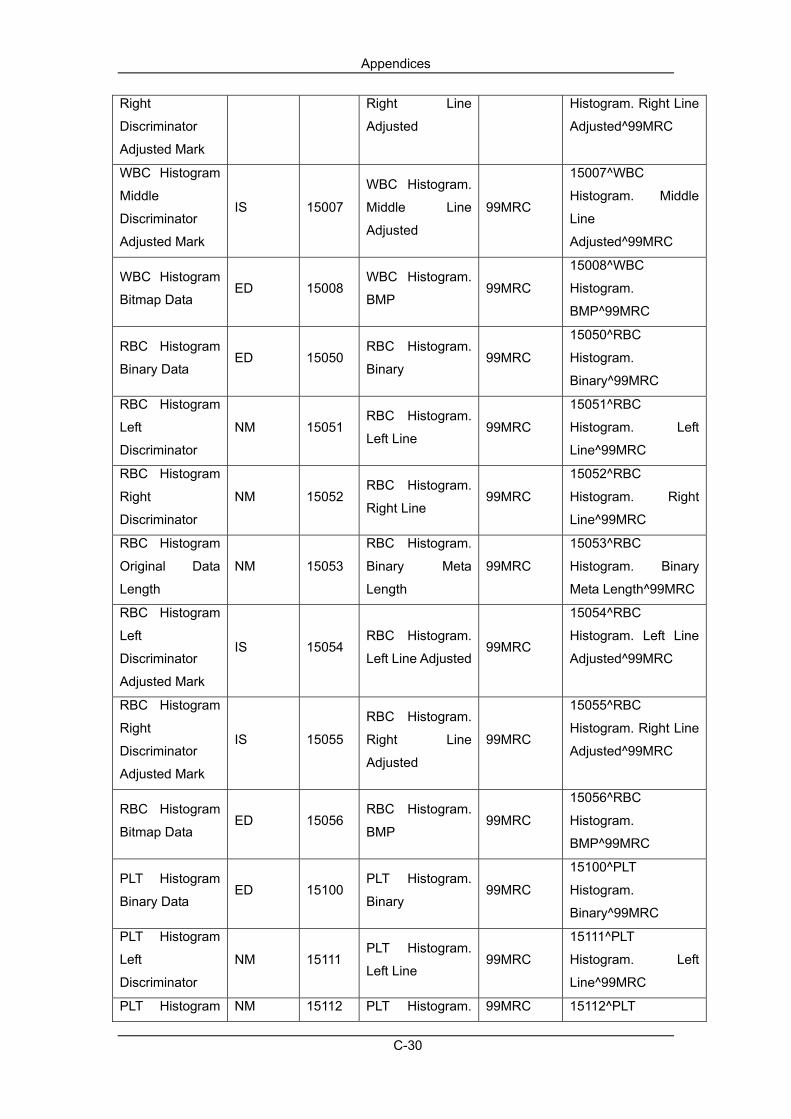
Appendices
C-30
Right
Discriminator
Adjusted Mark
Right Line
Adjusted
Histogram. Right Line
Adjusted^99MRC
WBC Histogram
Middle
Discriminator
Adjusted Mark
IS 15007
WBC Histogram.
Middle Line
Adjusted
99MRC
15007^WBC
Histogram. Middle
Line
Adjusted^99MRC
WBC Histogram
Bitmap Data ED 15008
WBC Histogram.
BMP 99MRC
15008^WBC
Histogram.
BMP^99MRC
RBC Histogram
Binary Data ED 15050
RBC Histogram.
Binary 99MRC
15050^RBC
Histogram.
Binary^99MRC
RBC Histogram
Left
Discriminator
NM 15051 RBC Histogram.
Left Line 99MRC
15051^RBC
Histogram. Left
Line^99MRC
RBC Histogram
Right
Discriminator
NM 15052 RBC Histogram.
Right Line 99MRC
15052^RBC
Histogram. Right
Line^99MRC
RBC Histogram
Original Data
Length
NM 15053
RBC Histogram.
Binary Meta
Length
99MRC
15053^RBC
Histogram. Binary
Meta Length^99MRC
RBC Histogram
Left
Discriminator
Adjusted Mark
IS 15054 RBC Histogram.
Left Line Adjusted99MRC
15054^RBC
Histogram. Left Line
Adjusted^99MRC
RBC Histogram
Right
Discriminator
Adjusted Mark
IS 15055
RBC Histogram.
Right Line
Adjusted
99MRC
15055^RBC
Histogram. Right Line
Adjusted^99MRC
RBC Histogram
Bitmap Data ED 15056
RBC Histogram.
BMP 99MRC
15056^RBC
Histogram.
BMP^99MRC
PLT Histogram
Binary Data ED 15100
PLT Histogram.
Binary 99MRC
15100^PLT
Histogram.
Binary^99MRC
PLT Histogram
Left
Discriminator
NM 15111 PLT Histogram.
Left Line 99MRC
15111^PLT
Histogram. Left
Line^99MRC
PLT Histogram NM 15112 PLT Histogram. 99MRC 15112^PLT
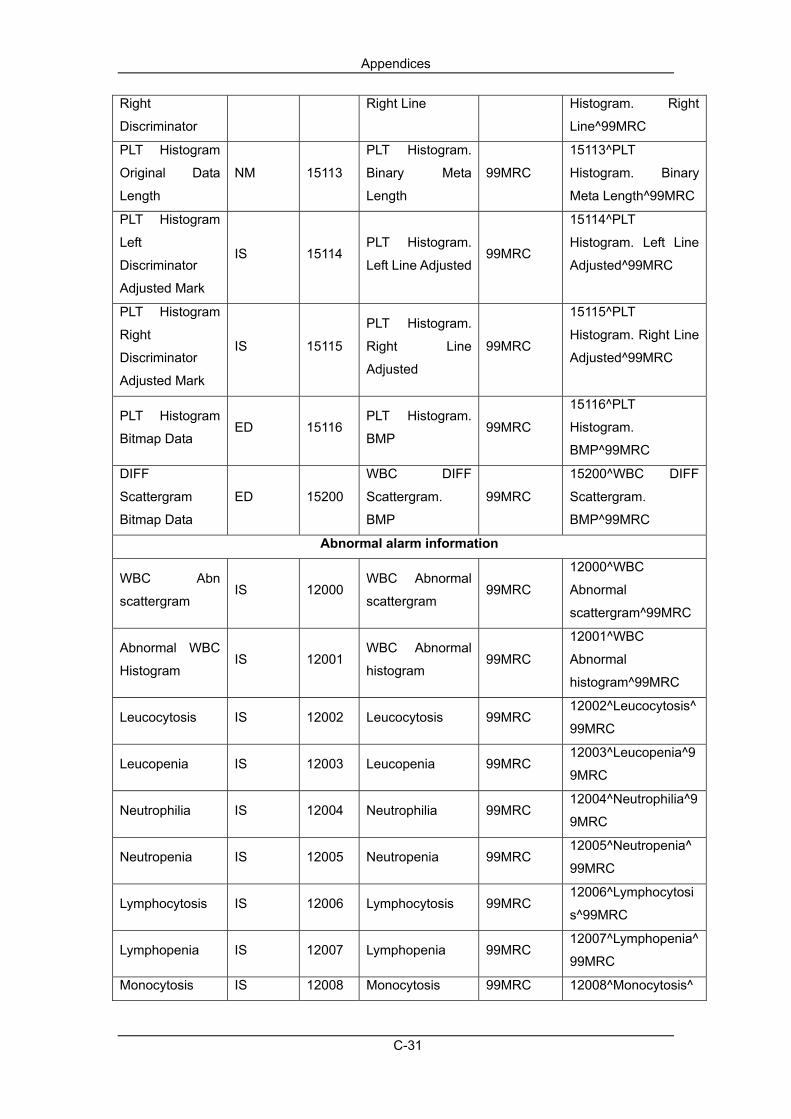
Appendices
C-31
Right
Discriminator
Right Line Histogram. Right
Line^99MRC
PLT Histogram
Original Data
Length
NM 15113
PLT Histogram.
Binary Meta
Length
99MRC
15113^PLT
Histogram. Binary
Meta Length^99MRC
PLT Histogram
Left
Discriminator
Adjusted Mark
IS 15114 PLT Histogram.
Left Line Adjusted99MRC
15114^PLT
Histogram. Left Line
Adjusted^99MRC
PLT Histogram
Right
Discriminator
Adjusted Mark
IS 15115
PLT Histogram.
Right Line
Adjusted
99MRC
15115^PLT
Histogram. Right Line
Adjusted^99MRC
PLT Histogram
Bitmap Data ED 15116
PLT Histogram.
BMP 99MRC
15116^PLT
Histogram.
BMP^99MRC
DIFF
Scattergram
Bitmap Data
ED 15200
WBC DIFF
Scattergram.
BMP
99MRC
15200^WBC DIFF
Scattergram.
BMP^99MRC
Abnormal alarm information
WBC Abn
scattergram IS 12000
WBC Abnormal
scattergram 99MRC
12000^WBC
Abnormal
scattergram^99MRC
Abnormal WBC
Histogram IS 12001
WBC Abnormal
histogram 99MRC
12001^WBC
Abnormal
histogram^99MRC
Leucocytosis IS 12002 Leucocytosis 99MRC 12002^Leucocytosis^
99MRC
Leucopenia IS 12003 Leucopenia 99MRC 12003^Leucopenia^9
9MRC
Neutrophilia IS 12004 Neutrophilia 99MRC 12004^Neutrophilia^9
9MRC
Neutropenia IS 12005 Neutropenia 99MRC 12005^Neutropenia^
99MRC
Lymphocytosis IS 12006 Lymphocytosis 99MRC 12006^Lymphocytosi
s^99MRC
Lymphopenia IS 12007 Lymphopenia 99MRC 12007^Lymphopenia^
99MRC
Monocytosis IS 12008 Monocytosis 99MRC 12008^Monocytosis^

Appendices
C-32
99MRC
Eosinophilia IS 12009 Eosinophilia 99MRC 12009^Eosinophilia^9
9MRC
Basophilia IS 12010 Basophilia 99MRC 12010^Basophilia^99
MRC
WBC abnormal IS 12011 WBC Abnormal 99MRC 12011^WBC
Abnormal^99MRC
Left Shift? IS 17790-
7 WBC Left Shift? LN
17790-7^WBC Left
Shift?^LN
Immature
Granulocyte? IS
34165-
1
Imm
Granulocytes? LN
34165-1^Imm
Granulocytes?^LN
Abnormal/Atypic
al Lymphocyte? IS
15192-
8 Atypical Lymphs? LN
15192-8^Atypical
Lymphs?^LN
RBC Lyse
Resist? IS
34525-
6 rstRBC LN
34525-6^rstRBC^LN
Erythrocytosis IS 12012 Erythrocytosis 99MRC 12012^Erythrocytosis
^99MRC
RBC abnormal
distribution IS 12013
RBC Abnormal
distribution 99MRC
12013^RBC
Abnormal
distribution^99MRC
Anisocytosis IS 15150-
6 Anisocytosis LN
15150-6^Anisocytosis
^LN
Macrocytosis IS 15198-
5 Macrocytes LN
15198-5^Macrocytes
^LN
Microcytosis IS 15199-
3 Microcytes LN
15199-3^Microcytes^
LN
Dimorphologic IS 10379-
6 RBC Dual Pop LN
10379-6^RBC Dual
Pop^LN
Anemia IS 12014 Anemia 99MRC 12014^Anemia^99M
RC
Hypochromia IS 15180-
3 Hypochromia LN
15180-3^Hypochromi
a^LN
HGB
Abn/Interfere? IS 12015 HGB Interfere 99MRC
12015^HGB
Interfere^99MRC
PLT Abnormal
Distribution IS 12016
PLT Abnormal
Distribution 99MRC
12016^PLT Abnormal
Distribution^99MRC
Thrombocytosis IS 12017 Thrombocytosis 99MRC 12017^Thrombocytos
is^99MRC
Thrombopenia IS 12018 Thrombopenia 99MRC 12018^Thrombopenia

Appendices
C-33
^99MRC
PLT Clump? IS 7796-6 Platelet Clump? LN 7796-6^Platelet
Clump?^LN
Table 11 Units of communication data
Parameters’ units displayed on the screen of the BC-5380
Units of communication data (OBX-6)
10^12/L 10*12/L
10^9/L 10*9/L
10^6/uL 10*6/uL
10^4/uL 10*4/uL
10^3/uL 10*3/uL
10^2/uL 10*2/uL
mL/L mL/L
/nL /nL
/pL /pL
g/L g/L
g/dL g/dL
L/L L/L
mmol/L mmol/L
% %
fL fL
um^3 um3
pg pg
fmol fmol
amol amol
Year (age unit) yr
Month (age unit) mo
Day (age unit) d
Hour (age unit) hr
3. Part of the OBX messages adopt the customized enumeration values listed in the following
table.
Data item Enumeration values
Take Mode The values are the following enumerations:
“O” – open vial
“A” – autoloading
“C” – closed vial

Appendices
C-34
Blood Mode The values are the following enumerations:
“W”- whole blood
“P” – prediluted
Test Mode The values are the following enumerations:
“CBC”
“CBC+DIFF”
Age The values are the numeric data and the units
are the following enumerations:
“yr” - year
“mo” – month
“d” - day
“hr” - hour
Blood Type ABO The values are the following enumerations:
“A”
“B”
“O”
“AB”
Blood Type RH The values are the following enumerations:
“RH+”
“RH-”
Qc Level The values are the following enumerations:
“L”- low
“M”- normal
“H”- high
Adjusting marks of histogram discriminators
and flags
OBX-2 data type is “IS”; the values are the
following enumerations:
“T”- true
“F”- false
4. Histogram data: according to the software setup, there are several cases for the
communication of the histogram data.
(1)Do not transmit the histogram data.
(2)Transmit histogram data in the form of bitmap. In the OBX segment, the value of the data
type field is “ED”; the value of data is in the form of “^Image^BMP^Base64^……histogram data
in the form of bitmap……”, the “image” herein indicates the image data is transmitted; the
“BMP” is the customized sub-data type, it indicates the BMP bitmap is transmitted; “Base64”
indicates the coding method of the data.
(3)Transmit binary histogram data. In the OBX segment, the value of the data type field is “ED”;
the value of data is in the form of “^Application^Octet-stream^Base64^……histogram
data……”; “Application^Octer-stream” herein is the sub-data of HL7 standard, indicating the
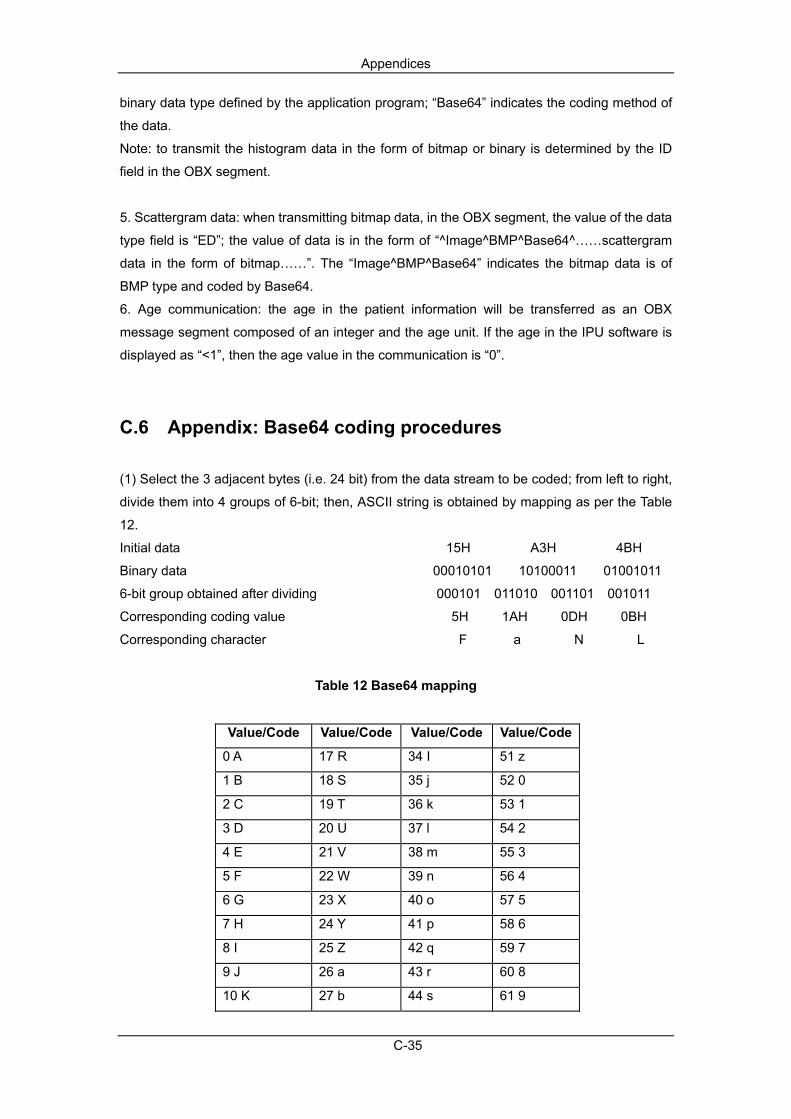
Appendices
C-35
binary data type defined by the application program; “Base64” indicates the coding method of
the data.
Note: to transmit the histogram data in the form of bitmap or binary is determined by the ID
field in the OBX segment.
5. Scattergram data: when transmitting bitmap data, in the OBX segment, the value of the data
type field is “ED”; the value of data is in the form of “^Image^BMP^Base64^……scattergram
data in the form of bitmap……”. The “Image^BMP^Base64” indicates the bitmap data is of
BMP type and coded by Base64.
6. Age communication: the age in the patient information will be transferred as an OBX
message segment composed of an integer and the age unit. If the age in the IPU software is
displayed as “<1”, then the age value in the communication is “0”.
C.6 Appendix: Base64 coding procedures
(1) Select the 3 adjacent bytes (i.e. 24 bit) from the data stream to be coded; from left to right,
divide them into 4 groups of 6-bit; then, ASCII string is obtained by mapping as per the Table
12.
Initial data 15H A3H 4BH
Binary data 00010101 10100011 01001011
6-bit group obtained after dividing 000101 011010 001101 001011
Corresponding coding value 5H 1AH 0DH 0BH
Corresponding character F a N L
Table 12 Base64 mapping
Value/Code Value/Code Value/Code Value/Code
0 A 17 R 34 I 51 z
1 B 18 S 35 j 52 0
2 C 19 T 36 k 53 1
3 D 20 U 37 l 54 2
4 E 21 V 38 m 55 3
5 F 22 W 39 n 56 4
6 G 23 X 40 o 57 5
7 H 24 Y 41 p 58 6
8 I 25 Z 42 q 59 7
9 J 26 a 43 r 60 8
10 K 27 b 44 s 61 9

Appendices
C-36
11 L 28 c 45 t 62 +
12 M 29 d 46 u 63 /
13 N 30 e 47 v
14 O 31 f 48 w (pad) =
15 P 32 g 49 x
16 Q 33 h 50 y
(2) Repeat the coding of procedure (1) continuously till finish coding the data stream.
When the data left is less than 3 bytes, 0 is used to complement to the right. If the whole 6-bit
group obtained is composed of 0, then it is mapped to the “=” character. When one byte is left,
then the obtained coding string consists of two “=” characters; when two bytes are left, then the
obtained coding string consists of one “=” character. The two cases are demonstrated below:
Initial data ① 0AH
00001010
Data obtained after complementing 00001010 00000000 00000000
6-bit groups obtained after dividing 000010 100000 000000 000000
Corresponding values 02H 20H 00H 00H
Corresponding characters C g = =
② Initial data 0AH 0BH
00001010 00001011
Data obtained after complementing 00001010 00001011 00000000
6-bit groups obtained after dividing 000010 100000 101100 000000
Corresponding values 02H 20H 2CH 00H
Corresponding characters C g s =


P/N: 046-001572-00 (4.0)