Bathymetric Profile off the Waters of Limasawa Island in ...
8
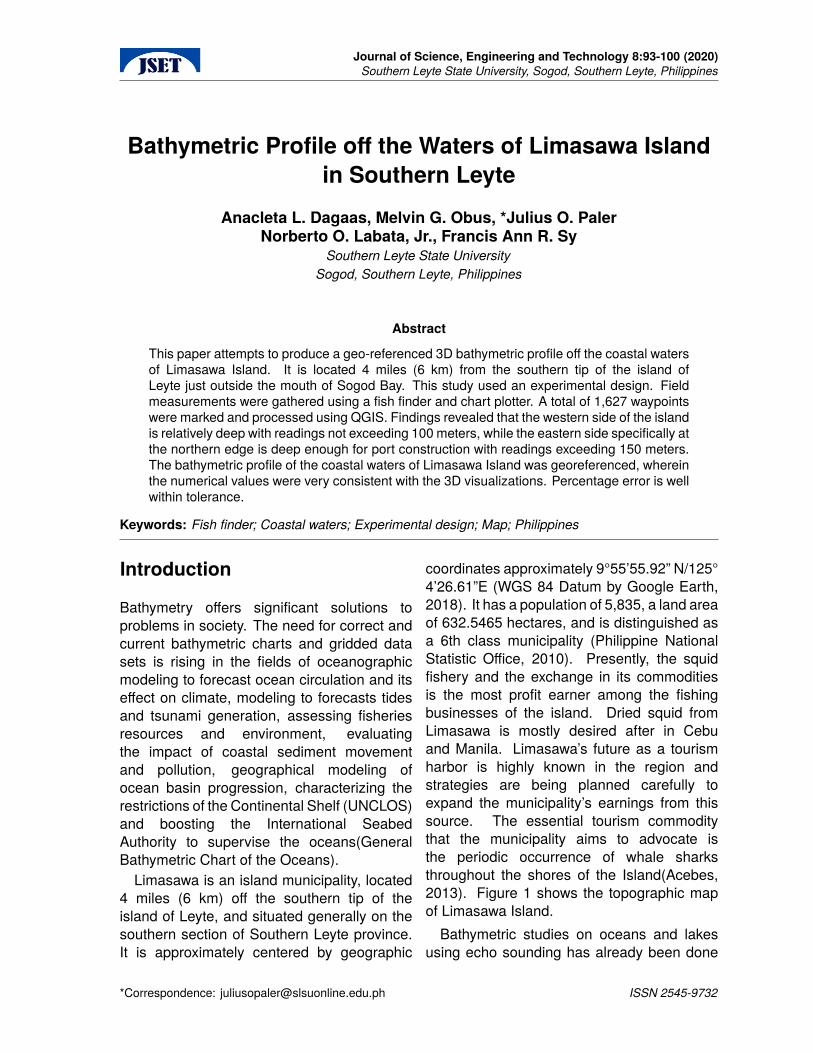
Journal of Science, Engineering and Technology 8:93-100 (2020) Southern Leyte State University, Sogod, Southern Leyte, Philippines Bathymetric Profile off the Waters of Limasawa Island in Southern Leyte Anacleta L. Dagaas, Melvin G. Obus, *Julius O. Paler Norberto O. Labata, Jr., Francis Ann R. Sy Southern Leyte State University Sogod, Southern Leyte, Philippines Abstract This paper attempts to produce a geo-referenced 3D bathymetric profile off the coastal waters of Limasawa Island. It is located 4 miles (6 km) from the southern tip of the island of Leyte just outside the mouth of Sogod Bay. This study used an experimental design. Field measurements were gathered using a fish finder and chart plotter. A total of 1,627 waypoints were marked and processed using QGIS. Findings revealed that the western side of the island is relatively deep with readings not exceeding 100 meters, while the eastern side specifically at the northern edge is deep enough for port construction with readings exceeding 150 meters. The bathymetric profile of the coastal waters of Limasawa Island was georeferenced, wherein the numerical values were very consistent with the 3D visualizations. Percentage error is well within tolerance. Keywords: Fish finder; Coastal waters; Experimental design; Map; Philippines Introduction Bathymetry offers significant solutions to problems in society. The need for correct and current bathymetric charts and gridded data sets is rising in the fields of oceanographic modeling to forecast ocean circulation and its effect on climate, modeling to forecasts tides and tsunami generation, assessing fisheries resources and environment, evaluating the impact of coastal sediment movement and pollution, geographical modeling of ocean basin progression, characterizing the restrictions of the Continental Shelf (UNCLOS) and boosting the International Seabed Authority to supervise the oceans(General Bathymetric Chart of the Oceans). Limasawa is an island municipality, located 4 miles (6 km) off the southern tip of the island of Leyte, and situated generally on the southern section of Southern Leyte province. It is approximately centered by geographic coordinates approximately 9°55’55.92” N/125° 4’26.61”E (WGS 84 Datum by Google Earth, 2018). It has a population of 5,835, a land area of 632.5465 hectares, and is distinguished as a 6th class municipality (Philippine National Statistic Office, 2010). Presently, the squid fishery and the exchange in its commodities is the most profit earner among the fishing businesses of the island. Dried squid from Limasawa is mostly desired after in Cebu and Manila. Limasawa’s future as a tourism harbor is highly known in the region and strategies are being planned carefully to expand the municipality’s earnings from this source. The essential tourism commodity that the municipality aims to advocate is the periodic occurrence of whale sharks throughout the shores of the Island(Acebes, 2013). Figure 1 shows the topographic map of Limasawa Island. Bathymetric studies on oceans and lakes using echo sounding has already been done *Correspondence: [email protected] ISSN 2545-9732
-
Upload
khangminh22 -
Category
Documents
-
view
0 -
download
0
Transcript of Bathymetric Profile off the Waters of Limasawa Island in ...
Journal of Science, Engineering and Technology 8:93-100 (2020)Southern Leyte State University, Sogod, Southern Leyte, Philippines
Bathymetric Profile off the Waters of Limasawa Islandin Southern Leyte
Anacleta L. Dagaas, Melvin G. Obus, *Julius O. PalerNorberto O. Labata, Jr., Francis Ann R. Sy
Southern Leyte State UniversitySogod, Southern Leyte, Philippines
Abstract
This paper attempts to produce a geo-referenced 3D bathymetric profile off the coastal watersof Limasawa Island. It is located 4 miles (6 km) from the southern tip of the island ofLeyte just outside the mouth of Sogod Bay. This study used an experimental design. Fieldmeasurements were gathered using a fish finder and chart plotter. A total of 1,627 waypointswere marked and processed using QGIS. Findings revealed that the western side of the islandis relatively deep with readings not exceeding 100 meters, while the eastern side specifically atthe northern edge is deep enough for port construction with readings exceeding 150 meters.The bathymetric profile of the coastal waters of Limasawa Island was georeferenced, whereinthe numerical values were very consistent with the 3D visualizations. Percentage error is wellwithin tolerance.
Keywords: Fish finder; Coastal waters; Experimental design; Map; Philippines
Introduction
Bathymetry offers significant solutions toproblems in society. The need for correct andcurrent bathymetric charts and gridded datasets is rising in the fields of oceanographicmodeling to forecast ocean circulation and itseffect on climate, modeling to forecasts tidesand tsunami generation, assessing fisheriesresources and environment, evaluatingthe impact of coastal sediment movementand pollution, geographical modeling ofocean basin progression, characterizing therestrictions of the Continental Shelf (UNCLOS)and boosting the International SeabedAuthority to supervise the oceans(GeneralBathymetric Chart of the Oceans).
Limasawa is an island municipality, located4 miles (6 km) off the southern tip of theisland of Leyte, and situated generally on thesouthern section of Southern Leyte province.It is approximately centered by geographic
coordinates approximately 9°55’55.92” N/125°4’26.61”E (WGS 84 Datum by Google Earth,2018). It has a population of 5,835, a land areaof 632.5465 hectares, and is distinguished asa 6th class municipality (Philippine NationalStatistic Office, 2010). Presently, the squidfishery and the exchange in its commoditiesis the most profit earner among the fishingbusinesses of the island. Dried squid fromLimasawa is mostly desired after in Cebuand Manila. Limasawa’s future as a tourismharbor is highly known in the region andstrategies are being planned carefully toexpand the municipality’s earnings from thissource. The essential tourism commoditythat the municipality aims to advocate isthe periodic occurrence of whale sharksthroughout the shores of the Island(Acebes,2013). Figure 1 shows the topographic mapof Limasawa Island.
Bathymetric studies on oceans and lakesusing echo sounding has already been done
*Correspondence: [email protected] ISSN 2545-9732

Dagaas, Obus, Paler, Labata and Sy JSET Vol.8, 2020
for quite some time now, producing 2Dmaps(Renard & Allenou, 1979; Moreno-Amich& Garcia-Berthou, 1989). Lately, bathymetricstudies on oceans, stream depths and riversalready uses remote sensing techniques(Dierssen et al., 2003, Fonstad & Marcus,2005). Many studies have been conductedin Southern Leyte. There was a studyon Southern Leyte Coral Reef Conservation(Coral Cay, 2003). Another study was on thesustainability of small-scale fisheries(Muallil etal., 2012; Perez et al., 2012). But bathymetricprofiling of the coastal waters in Sogod Bayhas never been done before; hence this study.
Bathymetry is the inquiry of the deepnessof beds or the basement of water bodies,as well as the ocean, rivers, streams,and lakes(National Oceanic and AtmosphericAdministration USDC, National GeographicSociety). On the other hand, georeferencingrefers to the inherent coordinate structure of amap or an aerial picture can be associated witha ground structure of geographic coordinates(United States Geological Society).
Figure 1. Topographic map of LimasawaIsland(Source:NAMRIA)
This study intends to produce a 3Dbathymetric profile of the coastal waters ofLimasawa Island using echo-sounding whichin the future can be a guide for urban planningsuch as sea reclamation, ports, seawall, andcauseway constructions.
Materials and MethodsThis study made use of experimental design.A fish finder and chart plotter was usedin determining the depth of the water at aparticular point as shown in Figure 2. Thetransducer was placed below a small boat,at its center as shown in Figure 3. Thetransducer generates sound waves, and whenit hits the seafloor bounce back to the receiver.The fishfinder/chart plotter will record thedepth, together with its GPS coordinates andtime through an external storage device.
Figure 2. Fishfinder and chartplotter
Figure 3. Depth sounding setup
The depth soundings in Limasawa weretaken randomly, an interval of 20 metersalong the coast and 10 meters offshore ata maximum distance of 100 meters from theshoreline. Within the 100 meter line from theshoreline is the coral cover. Figures 5a and5b show Limasawa Island and the 100-meterdemarcation line.
The measurements were transferred to acomputer for processing. The bathymetric
94

Dagaas, Obus, Paler, Labata and Sy JSET Vol.8, 2020
Figure 4. Depth soundings at Limasawa island
Figure 5a. Top view of Limasawa Island with the100-meter demarcation line
profile was generated using QGIS. Figure 6shows the flow of the data process.
Results and Discussion
Depth readings were taken at the site. A totalof 1627 waypoints were marked. Figures 7aand 7b show the top view waypoints takenwithin the 100-meter limit off the coast ofLimasawa Island.
Figure 5b. Tilted 3D view of Limasawa Island withthe 100-meter demarcation line.
Figure 6. Simplified data process flow
Every waypoint has a depth reading, GPScoordinates, and time. Shown in the table aresome of the readings taken at the western andeastern sides of the island.
Waypoints 1 to 30 are readings taken fromthe western side of the island. Results showedthat the readings within the 100-meter limitare quite deep, with a depth not exceeding 70meters. Waypoints 637 to 655 are readingstaken at the eastern side of the island. Results
95

Dagaas, Obus, Paler, Labata and Sy JSET Vol.8, 2020
Table 1. Sample depth readings of coastal waters of Limasawa Island within 100 – mdemarcation line
WaypointNumber
Latitude Longitude Date and Time Depth(m)
1 9.91692 125.0717 2015-05-18T13:23:19Z 4.3542112 9.91692 125.0712 2015-05-18T13:23:19Z 4.4742913 9.91692 125.0711 2015-05-18T13:23:19Z 5.1542114 9.91693 125.0708 2015-05-18T13:23:19Z 5.5548115 9.917 125.0699 2015-05-18T13:23:19Z 4.5542116 9.91702 125.0695 2015-05-18T13:23:19Z 6.4280787 9.91703 125.0692 2015-05-18T13:23:19Z 5.6927648 9.91702 125.0691 2015-05-18T13:23:19Z 9.6065379 9.91702 125.0691 2015-05-18T13:23:19Z 9.820015
10 9.91702 125.0689 2015-05-18T13:23:19Z 12.5952411 9.91703 125.0686 2015-05-18T13:23:19Z 17.2206112 9.91704 125.0681 2015-05-18T13:23:19Z 27.3015413 9.91705 125.068 2015-05-18T13:23:19Z 31.6897114 9.91706 125.0677 2015-05-18T13:23:19Z 37.7382715 9.91706 125.0676 2015-05-18T13:23:19Z 40.6558116 9.91706 125.0675 2015-05-18T13:23:19Z 41.8655317 9.91708 125.0671 2015-05-18T13:23:19Z 47.9615318 9.91713 125.0665 2015-05-18T13:23:19Z 58.4219819 9.91713 125.0665 2015-05-18T13:23:19Z 60.6990820 9.9171 125.0662 2015-05-18T13:23:19Z 63.3319921 9.91709 125.0661 2015-05-18T13:23:19Z 63.1896622 9.91632 125.066 2015-05-18T13:23:19Z 62.0985523 9.91613 125.0664 2015-05-18T13:23:19Z 60.2958524 9.91612 125.0664 2015-05-18T13:23:19Z 59.4656525 9.91601 125.0667 2015-05-18T13:23:19Z 57.4020326 9.91571 125.0674 2015-05-18T13:23:19Z 41.3911327 9.91556 125.0677 2015-05-18T13:23:19Z 25.0718728 9.91535 125.068 2015-05-18T13:23:19Z 17.69529 9.91518 125.0683 2015-05-18T13:23:19Z 12.4054830 9.915 125.0686 2015-05-18T13:23:19Z 9.155861
637 9.93884 125.078 2015-05-18T13:23:20Z 63.68778638 9.93895 125.0782 2015-05-18T13:23:20Z 78.22804639 9.93908 125.0784 2015-05-18T13:23:20Z 81.54883640 9.93927 125.0786 2015-05-18T13:23:20Z 67.07971641 9.93956 125.0789 2015-05-18T13:23:20Z 94.57101642 9.93972 125.0791 2015-05-18T13:23:20Z 104.1301643 9.94017 125.0794 2015-05-18T13:23:20Z 164.1202644 9.94044 125.079 2015-05-18T13:23:20Z 220.642645 9.94027 125.0786 2015-05-18T13:23:20Z 165.7543646 9.94008 125.0782 2015-05-18T13:23:20Z 131.1233
96

Dagaas, Obus, Paler, Labata and Sy JSET Vol.8, 2020
Figure 7a. Top view of Limasawa Island with thewaypoints
Figure 7b. Limasawa Island displaying theenlarged waypoints on the grid of the western and
eastern sides.
reveal that the eastern side of the islandis really deep with readings exceeding 150meters.
As these data are processed using QGIS,the bathymetric map and the 3D maps weregenerated. Figure 8 shows the contour map;Fig. 9 shows the 3D view of the western sideof the island while Fig.10 shows the 3D viewof the eastern side of the island.
Figure 8. Limasawa Island showing the contourlines 200 m from the shoreline.
Figure 9. Figure showing Limasawa Island in a 3Dmap on the grid with contour lines at 20m
intervals. Contour uses lines of equal elevation toshow depth.
The white color represents Limasawa Islandwhile the reddish and bluish color representsthe coastal waters of the island. The reddishcolor indicates shallow water while the bluishcolor indicates deep water. Contour useslines of equal elevation to show depth. Thisbathymetric map shows that the northeasternside of the island is really deep.
97

Dagaas, Obus, Paler, Labata and Sy JSET Vol.8, 2020
Figure 10. 3D view of the eastern side ofLimasawa Island
The 3D view portrayed in Fig. 7 shows arelatively deep gradual sloping of the seafloor,with depth reading not exceeding 70 meters onthe 100-meter mark limit from the shore.
Figure 8 reveals how deep the sloping of theeastern side of the island particularly at thenorthern tip with a depth exceeding 150 meterswithin 100 – meter limit from the shoreline.
ConclusionThe bathymetric profile of Limasawa Islandgenerated in this study is georeferenced, veryconsistent with the numerical values gatheredfrom the site, and the 3D visualizationsgenerated using QGIS. In as much as this isthe first bathymetric study conducted in thecoastal waters of Limasawa Island, there isnothing to make a comparison to. Thoughthe perfect accuracy of this profile cannot beclaimed at this time, the percentage error ofthe output of this study would surely be wellwithin acceptable values.
Refences CitedAarninkhof, S. G. ., Turner, I. L., Dronkers,
T. D. ., Caljouw, M., & Nipius, L.(2003): A video-based technique for
mapping intertidal beach bathymetry.Coastal Engineering, 49(4), 275–289.http://dx.doi.org/10.1016/s0378-3839(03)00064-4
Acebes, J.M.V. (2013). Hunting bigfish: A marine environmentalhistory of a contested fishery inthe bohol sea. Retrieved fromhttps://www.researchgate.net/publication/264277210
Brando, V. E., Anstee, J. M., Wettle, M.,Dekker, A. G., Phinn, S. R., & Roelfsema,C. (2009). A physics based retrieval andquality assessment of bathymetry fromsuboptimal hyperspectral data. RemoteSensing of Environment, 113(4), 755–770.http://dx.doi.org/10.1016/j.rse.2008.12.003
Becker, J. J., Sandwell, D. T., Smith, W.H. F., Braud, J., Binder, B., Depner,J.,. . . Weatherall, P. (2009). Globalbathymetry and elevation data at 30 arcseconds resolution: SRTM30 PLUS.Marine Geodesy, 32(4), 355–371.https://doi.org/10.1080/01490410903297766
Carmack, E., & Chapman, D. C. (2003).Wind-driven shelf/basin exchange onan Arctic shelf: The joint roles of icecover extent and shelf-break bathymetry.Geophysical Research Letters, 30(14).http://dx.doi.org/10.1029/2003gl017526
Dekker, A. G., Phinn, S. R., Anstee, J.,Bissett, P., Brando, V. E., Casey, B., . . .Roelfsema, C. (2011). Intercomparison ofshallow water bathymetry, hydro-optics,and benthos mapping techniques inAustralian and Caribbean coastalenvironments. Limnology andOceanography: Methods, 9(9), 396–425.http://dx.doi.org/10.4319/lom.2011.9.396
Dierssen, H. M., Zimmerman, R. C., Leathers,R. A., Downes, T. V., & Davis, C. O.
98

Dagaas, Obus, Paler, Labata and Sy JSET Vol.8, 2020
(2003). Ocean color remote sensingof seagrass and bathymetry in thebahamas banks by high-resolutionairborne imagery. Limnology andOceanography, 48(1part2), 444–455.http://dx.doi.org/10.4319/lo.2003.48.1 part
2.0444
Fonstad M.A., & Marcus W.A. (2005). Remotesensing of stream depths with hydraulicallyassisted bathymetry (HAB) Models.Geomorphology, 72(1-4): 320-339.https//doi.org/10.1016/j.goemorph.2005.06.005
General Bathymetric Chart of theOceans (2016). Retrieved fromhttps://www.gebco.net/about us/presentations and publications/documents/scar2016 dorschel.pdf
Hilldale, R. C., & Raff, D. (2008). Assessingthe ability of airborne LiDAR to map riverbathymetry. Earth Surface Processesand Landforms, 33(5), 773–783https//doi.org/10.1002/esp.1575
Jakobsson, M., Cherkis, N., Woodward,J., Macnab, R., & Coakley, B.(2011). New grid of Arctic bathymetryaids scientists and mapmakers.EOS, Transactions AmericanGeophysical Union, 81(9), 89-96.https://doi.org/10.1029/00EO00059
Lejot, J., Delacourt, C., Piegay, H., Fournier,T., Tremelo, M.-L., & Allemand, P. 2007.Very high spatial resolution imageryfor channel bathymetry and topographyfrom an unmanned mapping controlledplatform. Earth Surface Processesand Landforms, 32(11), 1705–1725.https://doi.org/10.1002/esp.1595
Lyzenga, D. R., Malinas, N. P., & Tanis, F. J.(2006). Multispectral bathymetry usinga simple physically based algorithm.IEEE Transactions on Geoscience and
Remote Sensing, 44(8), 2251–2259.https://doi.org/10.1109/tgrs.2006.872909
Moreno-Amich R., & Garcia-Berthou E.(1989). A new bathymetric map basedon echo-sounding and morphometricalcharacterization of the lake of banyoles(NE-Spain). Hydrobiologia, 185(1), 83-90.https://doi.org/10.1007/BF00006070
Muallil,R.N., Mamauag, S.S., Cabral, R.B.,Celeste-Dizon, E.O., & Alino, P.M.(2014). Status, trends, and challengesin the sustainability of small-scalefisheries in the philippines: Insightsfrom FISHDA (Fishing Industries’ Supportin Handling Decisions Application)Model. Marine Policy, 44, 212-221.https://doi.org/10.1016/j.marpol.2013.08.026
National Oceanic and AtmosphericAdministration, United StatesDepartment of Commerce (2015).What is Bathymetry? Retrieved from:http://oceanservice.noaa.gov/facts/bathymetry.html
Perez, M.L. Pido, M.D. Garces, L.R. &Salayo, N.D. (2012). WorldFish,Penang, Malaysia. Lessons learnedbrief towards sustainable development ofsmall-scale fisheries in the philippines:Experiences and lessons learned fromeight regional sites. Retrieved fromhttp://pubs.iclarm.net/resource centre/WF
3225.pdf
Pittman, S. J., Costa, B. M., & Battista, T.A. (2009). Using lidar bathymetry andboosted regression trees to predict thediversity and abundance of fish and corals.Journal of Coastal Research, 53(6), 27-38.https://doi.org/10.2112/si53-004.1
Renard V. & Allenou, JP. (1979). Seabeam, multi-beam echo-sounding in “jean
99

Dagaas, Obus, Paler, Labata and Sy JSET Vol.8, 2020
charcot”- Description, evaluation andfirst results. International HydrographicReview , 56(1), 35-67. Retrieved fromhttps://journals.lib.unb.ca/index.php/ihr/article/download/23653/27426/0
Resource Library, Encyclopedic Entry,Bathymetry. (2011). Retrieved from:http://education.nationalgeographic.org/encyclopedia/bathymetry/
Taylor, J., O’Farrel S., Walker, R., Fenner,D., & Raines, P. (2004). Southernleyte coral reef conservation project –Second year report and coral specieslist for Sogod Bay. Retrieved fromhttps://cdn.editor.net/cb566b060ee24165a572354db625b9d8/files/uploaded/LRCP Phase I 2nd Annual Report 2004.pdf
Wilson, M. F. J., O’Connell, B., Brown,C., Guinan, J. C., & Grehan, A. J.(2007). Multiscale terrain analysis ofmultibeam bathymetry data for habitatmapping on the continental slope.]textitMarine Geodesy, 30(1-2), 3–35.https://doi.org/10.1080/0149041070129592
100