Basics of Fan Noise - AMCA
67
Basics of Fan Noise AMCA insite ™ Webinar Series | AMCA International | www.amca.org
-
Upload
khangminh22 -
Category
Documents
-
view
2 -
download
0
Transcript of Basics of Fan Noise - AMCA

Basics of Fan NoiseAMCA insite™ Webinar Series | AMCA International | www.amca.org

Scott Arnold
Content Manager, AMCA International
Webinar Moderator
• Joined AMCA in 2017
• Leads development and publication of technical articles, white papers and educational materials.
• Editor-in-chief of the award-winning AMCA inmotionmagazine.

Introductions & Guidelines• Participation Guidelines:
• Audience will be muted during the webinar.
• Questions can be submitted anytime via the GoToWebinar platform and will be addressed at the end of the presentation.
• Reminder: This webinar is being recorded!
• To earn PDH credit for today, please stay clicked onto the webinar for the entire hour.
• A post-webinar evaluation will be emailed to everyone within one day, and it must be completed to qualify for today’s PDH credit.
• Every person that wants to receive PDH credit must be individually registered. If people are watching in a group and want credit, please contact Lisa Cherney ([email protected]) for a group sign-in sheet.

Q & ATo submit questions:
- From the attendee panel on the side of the screen, select the “Questions” drop down option.
- Type your question in the box and click “Send”.
- Questions will be answered at the end of the program.

AMCA International has met the standards and requirements of the Registered Continuing Education Program. Credit earned on completion of this program will be reported to RCEP at RCEP.net. A certificate of completion will be issued to each participant. As such, it does not include content that may be deemed or construed to be an approval or endorsement by the RCEP.
Attendance for the entire presentation
AND a completed evaluation are required
for PDH credit to be issued.
COPYRIGHT MATERIALS
This educational activity is protected by U.S. and International copyright laws. Reproduction,
distribution, display and use of the educational activity without written permission of the presenter is
prohibited.
© AMCA International 2020

Rad GaneshDirector, Product Applications, AMCA Member Company
• Over 32 years of experience in the Movement (HVAC and Fan) industries.
• Currently has 6 patents and 5 pending patent applications.
• Very actively involved with AMCA and ASHRAE, on committees, contributing to publications and giving presentations.
• Earned Ph.D. in Mechanical Engineering and is a registered P.E. in Wisconsin.

Basics of Fan NoisePurpose and Learning Objectives
The purpose of this presentation is to educate industry professionals about the Basics of Fan Noise and the ratings published by various fan manufacturers. This session complements the previous AMCA webinar on ‘Environmental Noise due to Fans and Equipment’.
At the end of this presentation you will be able to:
1. Explain the basic definitions related to fan noise.
2. Identify the AMCA standards used for testing and rating fan noise.
3. Outline the difference between Sound Power Level (Lw), Sound Pressure Levels (Lp), and ‘A’ Weighting (dBA).
4. Describe the noise characteristics of various fan types.

Elements of Sound or Noise• When air is moved, small, repetitive pressure disturbances are
imparted to the air.
• When these pressure disturbances are sensed by a hearing
mechanism (your ear), sound is created.
SourcePath Receiver

Sound vs. Noise – Expectations• In general, undesirable sound is called noise.
• Perception of sound ranges from ‘voodoo’ or ‘black magic’ to a
perfect science by acousticians.
• Only definitions and basics of sound will be covered here.
– AMCA Sound Seminar, by Dr. Ralph T. Muehleisen

Sound vs. Vibration
• The phenomena of sound and vibration are closely related.
• Sound is caused by pressure disturbances in an air or gas.
• Vibration is caused by disturbance of motion in a solid.
• Sound impacting a solid can impart a vibration
➢ Ex: Rocket Launch vibrating windows and structures.
• The vibration of a solid can also result in sound.
➢ Ex: Low Frequency Fan rumble

Sound Hearing Limits and Levels, dB(decibel)
Decibel, dB = 10 * log
(dimensionless ratio of power
or ‘power like’ quantities)
◼ dB = 10 log10 ( W / Wref )
Lower hearing Limit =• 0.0000000002 bar =
• 0.0002 µbar =
• 0.00002 Pa =
• 0.0000000029 psi =
• 0.00000008 inches w.g.
Upper hearing Limit =• 1.0 bar =
• 1,000,000 µbar =
• 100,000 Pa =
• 14.5 psi =
• 401 inches w.g.

Sound Amplitude
Amplitude
Wavelength
Mean Atmospheric
Pressure
• Amplitude – Amount pressure oscillations deviate about the mean.
• Wavelength – Distance from peak-to-peak (or trough-to-trough)
–Mean atmospheric pressure at standard conditions at sea level is
29.92 inches of Hg (~407 inches w.c. or 1,013,250 microbar)

Sound Frequency
FREQUENCY 100 Hz
1000 Hz
10,000 Hz
( )f
3.5 m,
0.35 m,
0.035 m,
~10 ft.
~1 ft.
~0.1 ft.
Frequency, f
• Number of pressure peaks per second t
• Measured in Hertz (Hz)
= c/ f
Speed of Sound,
c ~ 1100 ft/sec
Wavelength, λ

Sound Frequency
• Sound spectrum: The human ear is sensitive to frequencies
between 20 and 20,000 Hz.
• For fans, frequencies between 45 and 11,000 Hz are of interest.
• Reasons the frequency characteristic of sound ratings is used:
– Sound at different frequencies behaves differently
– Human ear responds differently to different frequencies of
sound

Octave Band Frequencies
• Audible sound is divided into 8 octave bands.
• Starting at 63 Hz, each succeeding octave band
has a center frequency twice the previous band.
• Sound Level is defined for every fan operating point
by a spectrum of frequencies as below:
Octave Bands 1 2 3 4 5 6 7 8
Frequency Range
(Hz)
45
to
90
90
to
180
180
to
355
355
to
700
710
to
1400
1400
to
2800
2800
to
4600
5600
to
11200
Center Frequency (Hz) 63 125 250 500 1000 2000 4000 8000
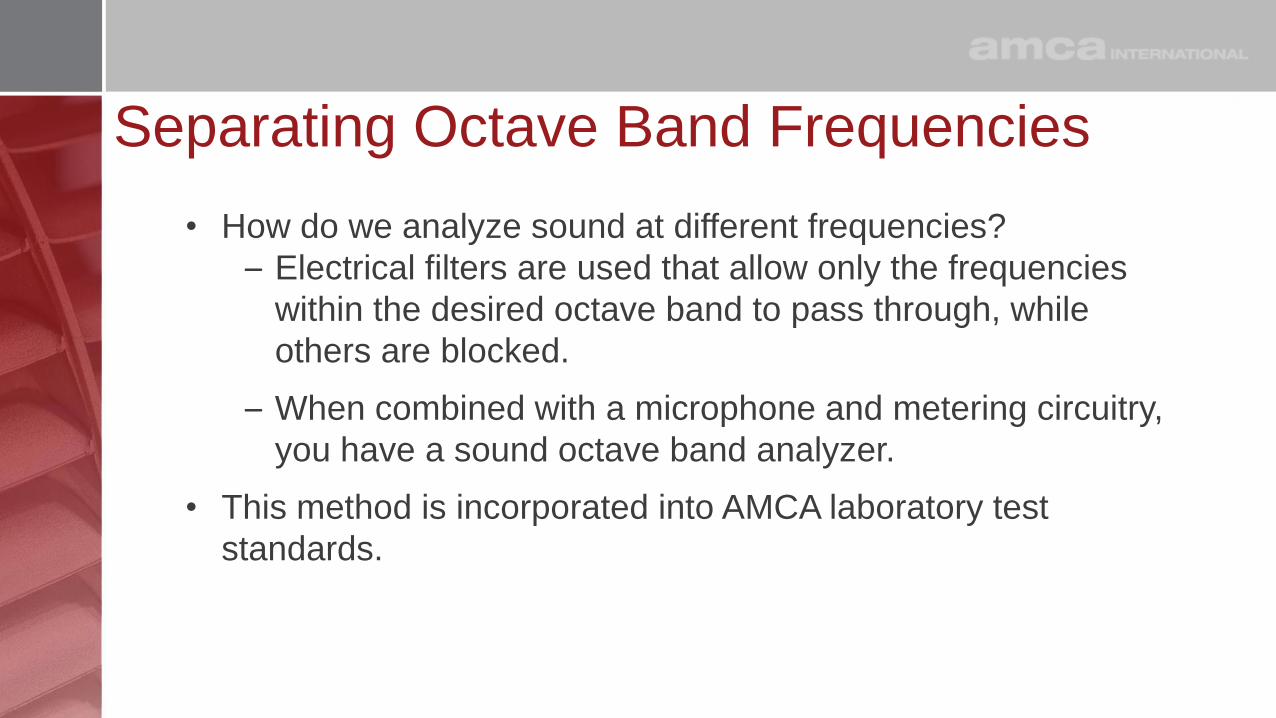
Separating Octave Band Frequencies
• How do we analyze sound at different frequencies?
– Electrical filters are used that allow only the frequencies
within the desired octave band to pass through, while
others are blocked.
– When combined with a microphone and metering circuitry,
you have a sound octave band analyzer.
• This method is incorporated into AMCA laboratory test
standards.

Sound Power Level, Lw dB
Lw (dB) = 10log10 (W / Wref)
Where, Wref = 1 pW = 10-12 Watts
Sound Power Level
• The acoustic power radiating from a source (often compared to the
wattage of a light bulb).
• This value is NOT dependent on:
– Location
–Distance
–Environment
• Sound power cannot be measured directly.
• Sound power is expressed in decibels with a reference level to 10–12
watts (or 1 Picowatt). It is the logarithmic ratio of 2 ‘power like’
quantities:

Sound Power
Note that maximum wattage difference is 12 orders of magnitude!
Source Typical Sound Power Level, Lw
(dB re 1 pW)
Power
(W)
Saturn Rocket 180 1,000,000
Turbojet engine with afterburner 170 100,000
Turbojet engine, 7000 lb thrust 160 10,000
4 Engine Propeller aircraft 140 100
75 piece orchestra 130 10
Large chipping hammer 120 1
Auto horn 110 .1
Radio 100 .01
Shouting voice 90 .001
Open Office 80 .0001
Conversational voice 70 .00001
Bedroom 60 .000001
Whisper 50 .0000001

Sound Pressure Level, Lp dBSound Pressure Level
• The amplitude of pressure oscillations at some location.
• Describes the loudness level of the sound
(often compared to the brightness of a light bulb)
• This value IS dependent on:
– Location
– Distance
– Environment
• Sound pressure CAN be measured directly using a handheld meter.
• Sound pressure is expressed in decibels with a reference level of 20
µPa:
Lp (dB) = 10log10 (P 2 / Pref 2) = 20log10 (P / Pref )
Where, Pref = 20 m Pa
Sound Pressure
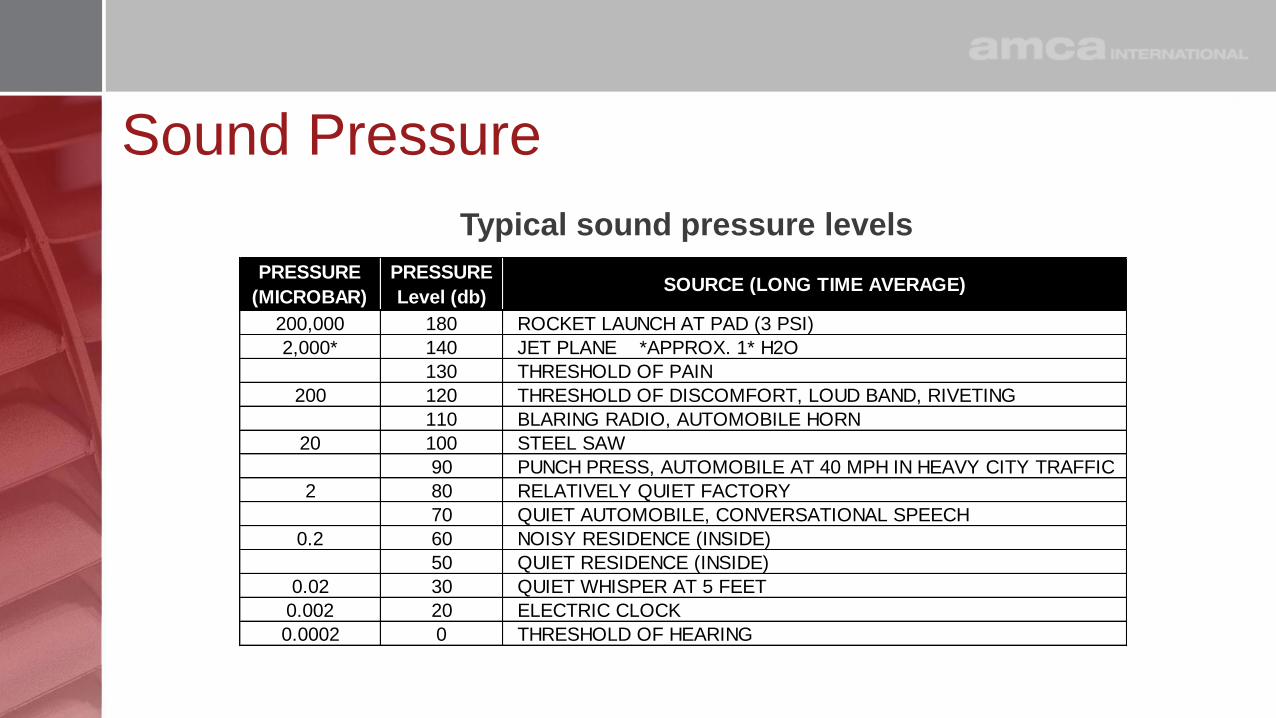
Typical sound pressure levels
200,000 180 ROCKET LAUNCH AT PAD (3 PSI)
2,000* 140 JET PLANE *APPROX. 1* H2O
130 THRESHOLD OF PAIN
200 120 THRESHOLD OF DISCOMFORT, LOUD BAND, RIVETING
110 BLARING RADIO, AUTOMOBILE HORN
20 100 STEEL SAW
90 PUNCH PRESS, AUTOMOBILE AT 40 MPH IN HEAVY CITY TRAFFIC
2 80 RELATIVELY QUIET FACTORY
70 QUIET AUTOMOBILE, CONVERSATIONAL SPEECH
0.2 60 NOISY RESIDENCE (INSIDE)
50 QUIET RESIDENCE (INSIDE)
0.02 30 QUIET WHISPER AT 5 FEET
0.002 20 ELECTRIC CLOCK
0.0002 0 THRESHOLD OF HEARING
SOURCE (LONG TIME AVERAGE)PRESSURE
(MICROBAR)
PRESSURE
Level (db)

A-Weighting• A human’s ability to perceive sound varies with its frequency.
• ‘A’ weighting adjusts the sound power level for the response
of the human ear – LwA.
• ‘A’ weighting is also used in the calculation of sound pressure
levels – LpA.

A-Weighting Corrections

What is dB(A) or dBA?• A-weighted dB:
– A single value of the estimated sound level in a space (most
commonly sound pressure)
– Logarithmically combines all octave bands
– At a given distance
– Using a given directivity factor (Q=1, 2, 4, 8, etc.)

What is LwA?
Row Octave Band 1 2 3 4 5 6 7 8 LwA
1 Lw at Inlet 99 98 94 91 88 84 79 73
2 A weighting -26.2 -16.1 -8.6 -3.2 0 1.2 1 -1.1
3 Lw A weighted 72.8 81.9 85.4 87.8 88 85.2 80 71.9 93
Note: Although Lw (row 1) in bands 1-3 are significantly higher than
Lw A weighted (row 3) the human ear will always perceive the sound
as LwA = 93. Thus it does not make too much sense in saying band 1
is 26 dB ‘lower’ or ‘quieter’ when 2 fans are compared.
• The 8-octave band sound power levels can be reduced to one
number (LwA).
• The LwA value represents the logarithmic summation of all 8 octave
band values, ‘A weighted’ to account for the response of the human
ear.
– Log summation: Lw = 10 log (10Lw1/10 + .. 10Lw8/10)

Chart for Combining Decibels
Sound Levels (dB) are combined by logarithmic addition
50 + 50 = 53 50 + 56 = 57 50 + 70 = 70

Point of Operation – LwA
Size 24” dia, backward inclined centrifugal, 1500 RPM
LwA is commonly lowest at the most efficient operation point.
What is a Sone?
• A sone is a unit of loudness and refers to Sound Pressure (Lp)
– 1 sone is the loudness of Lp = 40 dB re 20µPa at 1KHz
• A value in sones doubles when the sound is perceived as
twice as loud.
• An increase in sound pressure of 9-10 dB doubles the sone
rating.
• Useful for comparing relative sound output of two fans
• Converts sound to a linear scale

Calculating Sones – Loudness Index• From Lw determine Lp at 5 ft
in a hemispherical free field
using Lp=Lw-11.5
• For this Lp determine
loudness indices from table
for each octave band (s1-8)
• Overall Sone Level =
0.3*(s1+s2+s3+s4+s5+
s6+s7+s8)+0.7* sm
• Where sm = max. level from
s1 to s8

Fan Sound Ratings• Fan sound ratings are normally based on sound power levels.
– These ratings are independent of the environment.
– ANSI/AMCA test standard (300-14) and rating calculations
(301-14) are used to establish sound power levels.
CFM
SP
Stall line

Example of AMCA Standard 300-14 Test Output

AMCA 300-14 Test Configurations• Typical Test Setups
– Total Sound (1)
– Inlet Sound (2)
– Outlet Sound (3)
– Casing-Radiated Sound (SPECIAL)
• Typical Test Installations
– A - Free Inlet, Free Outlet
– B - Free Inlet, Ducted Outlet
– C - Ducted Inlet, Free Outlet
– D - Ducted Inlet, Ducted Outlet

Fan Sound Ratings – Example
PERFORMANCE CURVE
Fan Sound Specifications
• Fan sound specifications are normally based on sound pressure
levels.
– This value varies with the distance from the sound source
and the environment surrounding the source.
• Sound specifications are intended to:
– Limit annoyances
– Prevent hearing and health damage
– OSHA limit of 85 dBA for 8 hours is a pressure level
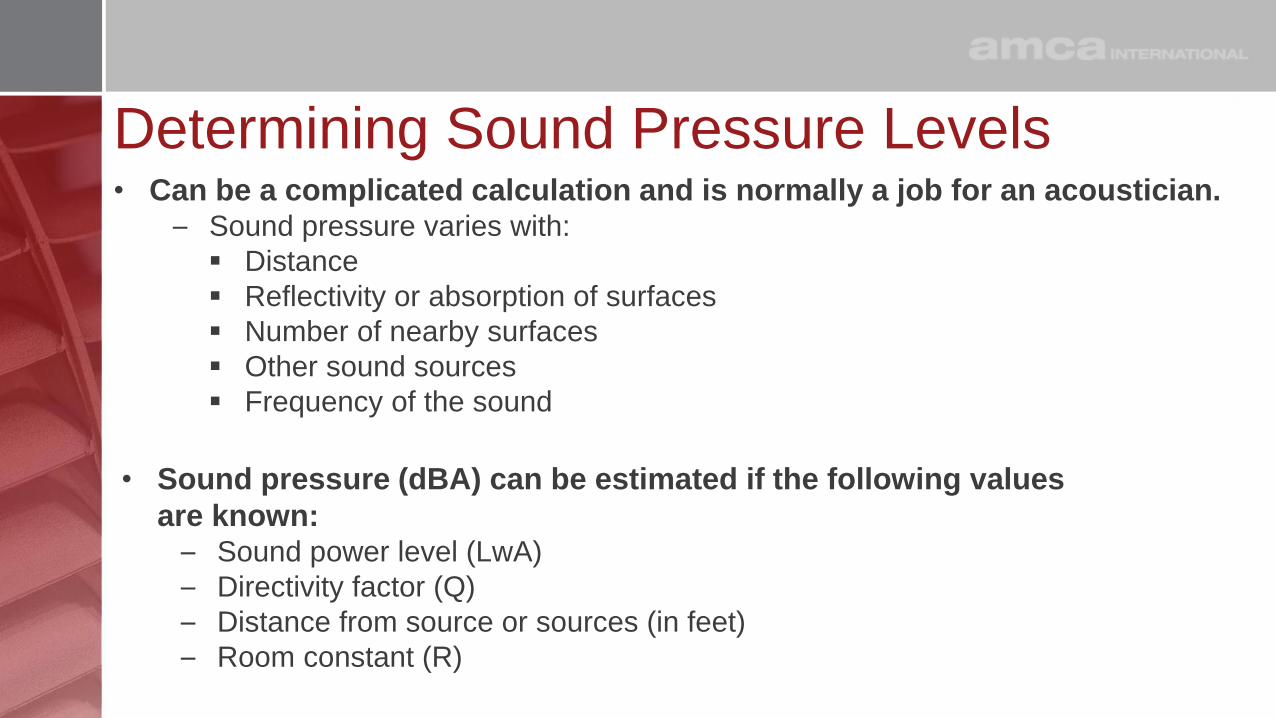
Determining Sound Pressure Levels• Can be a complicated calculation and is normally a job for an acoustician.
– Sound pressure varies with:
▪ Distance
▪ Reflectivity or absorption of surfaces
▪ Number of nearby surfaces
▪ Other sound sources
▪ Frequency of the sound
• Sound pressure (dBA) can be estimated if the following values
are known:– Sound power level (LwA)
– Directivity factor (Q)
– Distance from source or sources (in feet)
– Room constant (R)
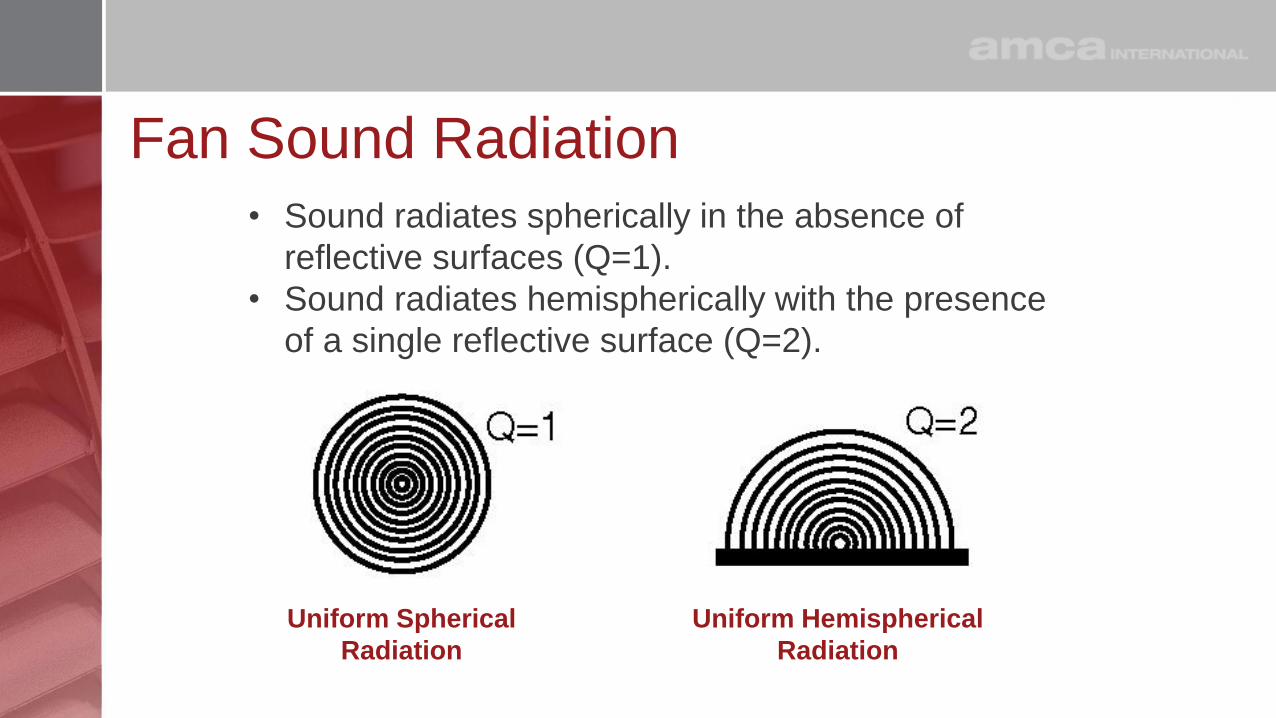
Fan Sound Radiation
Uniform Spherical
Radiation
Uniform Hemispherical
Radiation
• Sound radiates spherically in the absence of
reflective surfaces (Q=1).
• Sound radiates hemispherically with the presence
of a single reflective surface (Q=2).
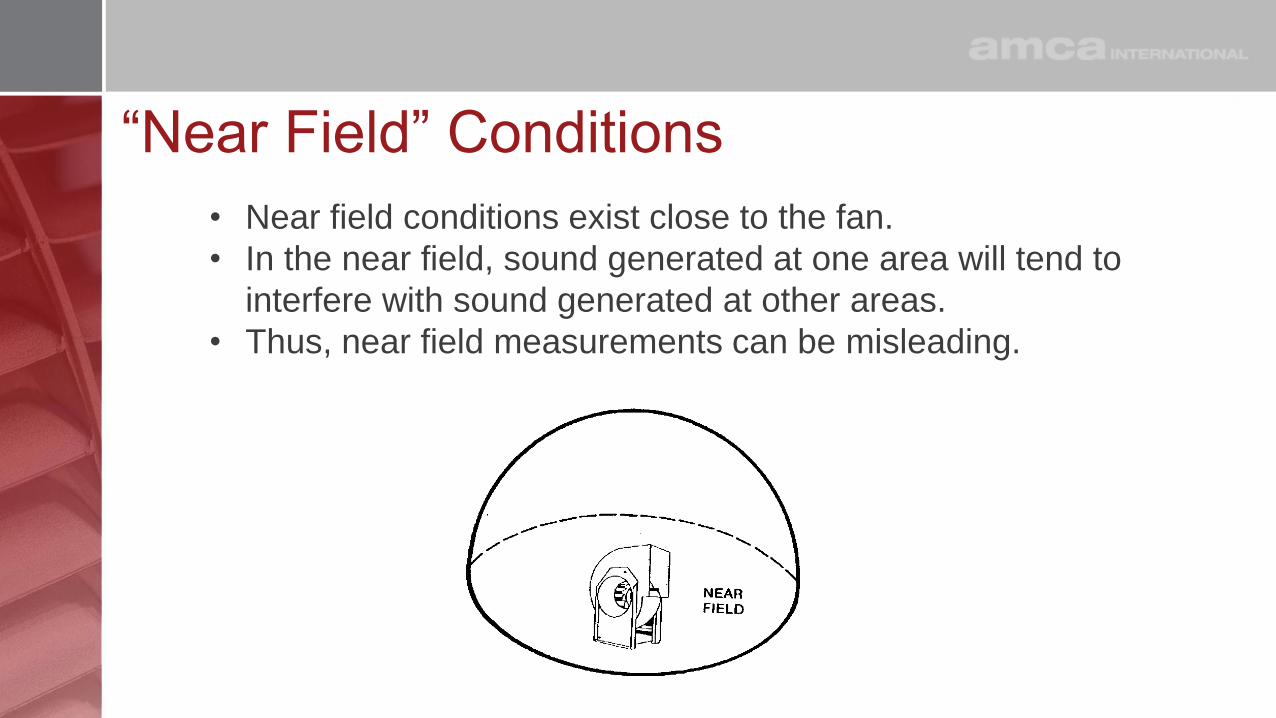
“Near Field” Conditions
• Near field conditions exist close to the fan.
• In the near field, sound generated at one area will tend to
interfere with sound generated at other areas.
• Thus, near field measurements can be misleading.

“Free Field” Conditions• Free field conditions exist beyond the near field, considered
to begin at least one wavelength away from fan.
• Free field sound radiates in a hemispherical pattern.

Sound Pressure
4r, x-6-6 dB
2r, x-6 dB
r, x dB
Sound pressure level will decay 6dB for each doubling of the
distance from the fan.

“Reverberant Field” Conditions• In a room, there are multiple reflective surfaces.
• The pressure will cease to decrease significantly beyond a certain
distance.
• This area of relatively constant pressure is called the “reverberant
field”.
• ANSI/AMCA Standard 300-14 Lp measurements require a
reverberant field - similar to a sound lab.
• Lw (fan) is calculated from Lp (fan) by the method of substitution by
using a calibrated reference sound source (RSS):
Lw (fan) = Lp (fan) + Lw (RSS) – Lp (RSS)

DirectivityLocation
• Fans radiate varying sounds at different locations, despite being
the same distance away.
• Being 3 feet in front of a speaker is louder than being 3 feet
behind it.
• However, this effect is difficult to measure and usually ignored.
Reflective Surfaces
• Hard surfaces near the fan also affect directivity and are included
in sound power estimates.
• It is usually assumed that all sound reflects, and that each
additional wall doubles the pressure (adds 3 dB).

Directivity FactorNumber of reflective surfaces:
Q = 1 No reflecting surfaces (floating in ‘free space’)
Q = 2 One surface (commonly the floor)
Q = 4 Two surfaces (‘floating’ corner)
Q = 8 Three surfaces (‘fixed’ in a corner)
Uniform Spherical
RadiationUniform Radiation over
1/4 of Sphere
Uniform Hemispherical
Radiation

Typical Fan Application Installations
• Four types of typical fan application installations used for
sound measurement reference: AMCA Publication 303-79):
- Type A
- Type B
- Type C
- Type D
• Note differences from test installations (AMCA 300-14).
• Sound critical applications require more refined methods.

Installation Type A

Installation Type B

Installation Type C

Installation Type D

Estimating Sound Pressure From Sound Power
Where:
Lp = sound pressure (dB)
Lw = sound power (dB)
Q = directivity factor
r = radius from source (feet)
R = room construction = [S / (1- )]
S = surface area (square feet)
= average sabine absorption coefficient
Equation for estimating sound pressure levels (ref AMCA 303-79):
Lp = Lw - 10 log10 [ 1 / {(Q / 4r2) + (4 / R)}] + 10.5

Sound Pressure Is NOT Guaranteed
• Sound pressure levels are NOT guaranteed.
• Best estimation requires values for “Q”, “r” and “R”
• Q = directivity factor
• r = distance from source (feet)
• R = room constant (where possible)
• Installed sound pressure levels will depend on many factors of the
environment which cannot be predicted.
• Even acousticians will not guarantee the Sound Pressure predicted
from Sound Power.

Sound Sources

Noise Problems
Two types of noise problems:
• Those that we anticipate from our sound ratings
• Those emanating from some abnormal condition
Cures for noise anticipated from sound ratings:
• Select a different fan (Tip: Select fans with lower tip speed)
• Relocate the fan to where the noise is not a problem
• Add vibration isolators and/or flexible connectors
• Insulate or acoustically enclose the fan
• Add silencers or duct lining to the inlet and/or discharge

Noise ProblemsCommon sources of abnormal or unanticipated noise:• Fan wheel unbalance• Resonance of fan or attached components• Rotating components rubbing on stationary parts• Failing, misaligned or contaminated bearings (on fan or motor)• Air leakage - Can allow sound leakage and also generate a
whistle or hiss

Noise ProblemsCommon sources of abnormal or unanticipated noise:• Belts slipping
• Coupling misalignment
• Motor noise, especially with improper power supply and inverter drives
• Air turbulence
• Operation in surge
• Loose components
• High velocity air blowing over fixed components which are not part of the fan

Blade Pass Frequency• A pure tone produced when the blades of the fan wheel
(impeller) rotate past a stationary object (housing cut-off in
centrifugal fans, turning vanes in axial fans or a structural
member).
• Calculation: (Number of blades x fan RPM) / 60 Hz
• If blade pass frequency matches the natural frequency of the
ductwork it can excite the ductwork.
• This phenomena is called resonance, which will increase the
noise level.

Blade Pass Frequency – Example
Octave Bands 1 2 3 4 5 6 7 8
Level at Inlet 91 92 94 93 90 82 77 74
Frequency Range
(Hz)
45
to
90
90
to
180
180
to
355
355
to
700
710
to
1400
1400
to
2800
2800
to
4600
5600
to
11200
Center Frequency (Hz) 63 125 250 500 1000 2000 4000 8000
Sound Power Level in dB ref 10-12 watts
• Size 24”, tubeaxial fan (7 blades)
• 9,000 CFM, 1.5” SP, 1939 RPM
• BPF = (1939 RPM x 7 blades) / 60 = 226 Hz
226 Hz BPF falls into the 3rd octave band
Noise Control Methods
• Source – Often most cost effective but must be considered as
part of the whole.
• Path – Adds cost to product; examples are:
– Silencer - This reduction of sound is also referred to as
“dynamic insertion loss”
– Barriers or enclosures (better unit casing, duct walls)
– Vibration isolators, etc.
• Receiver – Least effective, less likely to be accepted by others
– Earplugs, earmuffs, etc.
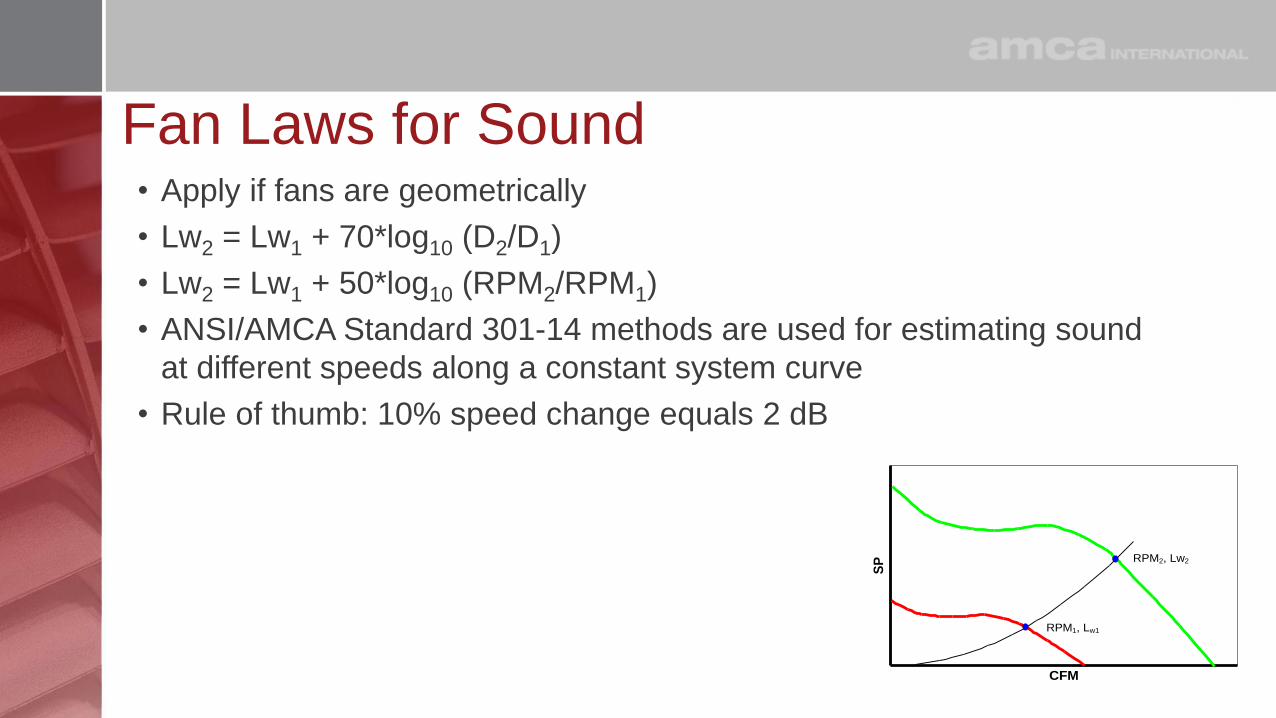
Fan Laws for Sound
CFM
SP
RPM1, Lw1
RPM2, Lw2
• Apply if fans are geometrically
• Lw2 = Lw1 + 70*log10 (D2/D1)
• Lw2 = Lw1 + 50*log10 (RPM2/RPM1)
• ANSI/AMCA Standard 301-14 methods are used for estimating sound
at different speeds along a constant system curve
• Rule of thumb: 10% speed change equals 2 dB

Example of AMCA 301-14 Calculations
3.75m
417rpm
1.00m
1333rpm
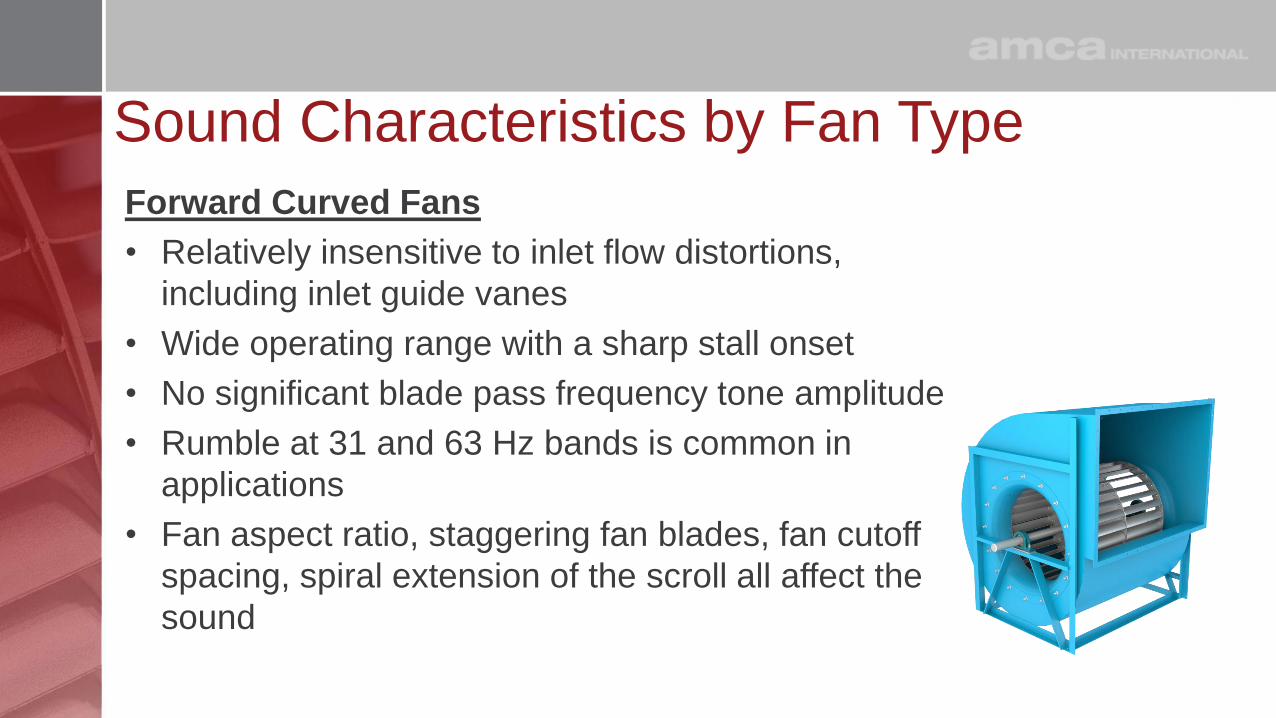
Sound Characteristics by Fan Type
Forward Curved Fans
• Relatively insensitive to inlet flow distortions,
including inlet guide vanes
• Wide operating range with a sharp stall onset
• No significant blade pass frequency tone amplitude
• Rumble at 31 and 63 Hz bands is common in
applications
• Fan aspect ratio, staggering fan blades, fan cutoff
spacing, spiral extension of the scroll all affect the
sound

Sound Characteristics by Fan Type
Airfoil & Backward Inclined Fans
• Louder than forward curve fans at mid and high
frequency
• More sensitive to inlet flow distortions including
inlet guide vanes
• More significant blade pass frequency tone
• Narrower useful operating range (when compared
to FC) with a ‘soft’ stall onset
• Usually has less low frequency rumble

Plug/Plenum Fans
• Less turbulence and lower pressure
fluctuations entering the discharge duct than
housed airfoil and backward inclined fans
• Generally require more power than housed
centrifugal fans and generate higher sound
levels, especially at lower frequencies
• Other characteristics are similar to
conventional housed centrifugal
Sound Characteristics by Fan Type

Vaneaxial Fans
• Lowest amplitude at low frequency of any fan type
• Higher amplitudes at high frequency - can be easily
attenuated
• Most sensitive fan type to inlet flow obstructions
• Blade pass frequency tone is relatively high
amplitude
• Sharply defined stall region with greatly increased
amplitudes
Sound Characteristics by Fan Type

Sample Selection of Multiple Fan Types
All fans selected at peak SE (Static Efficiency) for
Airflow=10,000 cfm, Static Pressure (SP)~2 iwc
Table below will change based on different operating point.
TypeDia.
(in)
Speed
(rpm)BHP
SE %
(Static
Efficiency)
LwiA
(Inlet Sound
Power ‘A’)
1Forward
Curved- SW
(Centrifugal)
30 476 5.09 61.7 89
2Backward
Airfoil – SW
(Centrifugal)
36.5 650 3.82 80.0 77
3 Plenum 33 800 4.25 74.0 80
4Tubular Mixed
Flow27 1074 4.48 70.2 81
5Tubular
Vaneaxial28 1438 4.77 65.9 86
6Propeller
(Axial)30 1998 4.92 54.4 103

Resources
• AMCA International: www.amca.org
• ANSI/AMCA Standards (Available for purchase): www.amca.org/store> 300-14: Reverberant Room Method for Sound Testing of Fans
> 301-14: Methods for Calculating Fan Sound Ratings from Laboratory Test
Data
• AMCA Publications (Available for purchase): www.amca.org/store
> 303-79 (R2012): Application of Sound Power Level Ratings for Fans
> 311-16: Certified Ratings Program — Product Rating Manual for Fan Sound Performance

Thank you for your time!
To receive PDH credit for today’s program, you must complete the online evaluation, which will be sent via email following this webinar.
If you viewed the webinar as a group and only one person registered for the webinar link, please email Lisa Cherney ([email protected]) for a group sign-in sheet today. Completed sheets must be returned to Lisa by tomorrow, October 15.
PDH credits and participation certificates will be issued electronically within 30 days, once all attendance records are checked and online evaluations are received.
Attendees will receive an email at the address provided on your registration, listing the credit hours awarded and a link to a printable certificate of completion.

Questions?

NEXT PROGRAM
Join us for our next AMCA insite™ Webinar:
- Wednesday, October 28
- 1:00-2:00pm CT
- TOPIC: Vibration Isolation, Wind, and Seismic Restraint for Mechanical Equipment
- Presenter: Lee Chiddention, HVAC Market Manager, AMCA Member Company
>> For additional webinar dates go to: www.amca.org/webinar