BASIC ELECTRICAL ENGINEERING -GE1002 A-INTRODUCTION TO OSCILLOSCOPE AND AUDIO GENERATOR
20
1 BASIC ELECTRICAL ENGINEERING - GE1002 EXPERIMENT -01 A- INTRODUCTION TO OSCILLOSCOPE AND AUDIO GENERATOR Student's Name : E.M.L.R.B.EKANAYAKE Reg. No. : 12026 Group No : B Date of submission : 2013/01/05
Transcript of BASIC ELECTRICAL ENGINEERING -GE1002 A-INTRODUCTION TO OSCILLOSCOPE AND AUDIO GENERATOR

1
BASIC ELECTRICAL ENGINEERING - GE1002
EXPERIMENT -01
A- INTRODUCTION TO OSCILLOSCOPE AND AUDIO GENERATOR
Student's Name : E.M.L.R.B.EKANAYAKE
Reg. No. : 12026
Group No : B
Date of submission : 2013/01/05
2
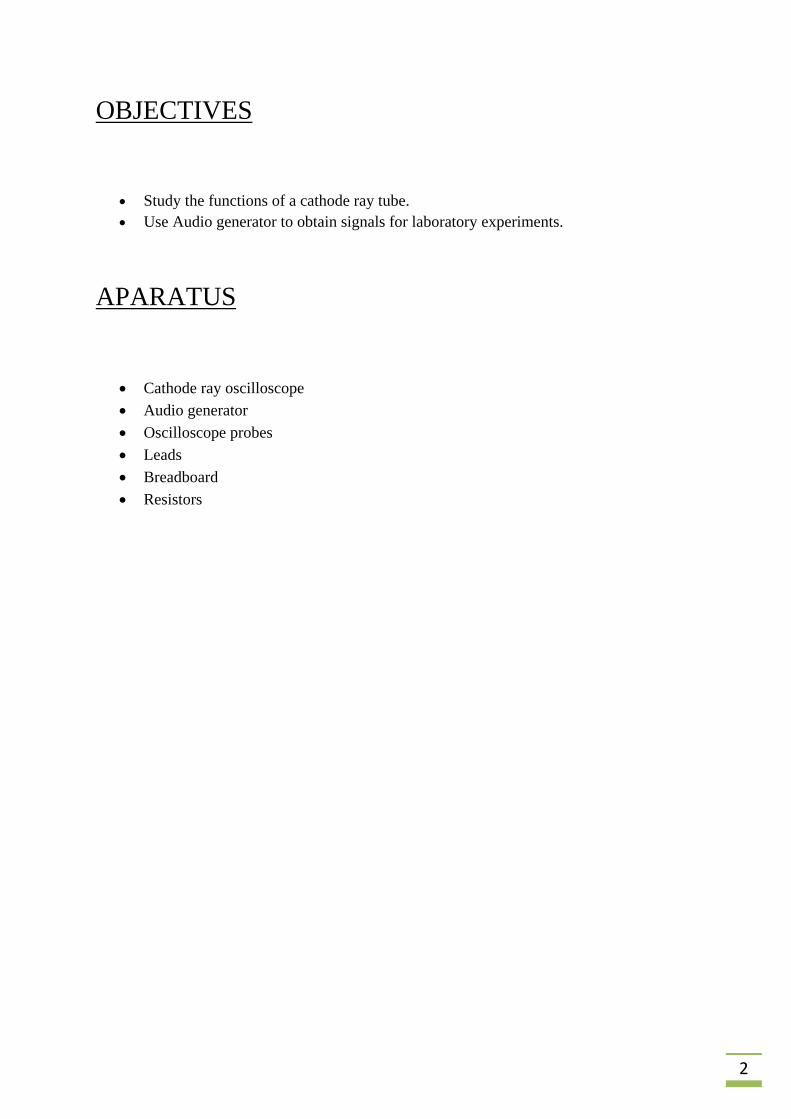
OBJECTIVES
• Study the functions of a cathode ray tube. • Use Audio generator to obtain signals for laboratory experiments.
APARATUS
• Cathode ray oscilloscope • Audio generator • Oscilloscope probes • Leads • Breadboard • Resistors

3
THEORY Introduction to cathode ray oscilloscope
Down here in the Figure: 01 shows a front view of the Cathode ray oscilloscope. It consists of various types of controlling knobs and sliders . It has a two display which gives us the information of all the things we do with the device. It gives us the details of signals that we input by the terminals. these devices comes with 2,3 or even 4 terminal inputs available. But figure:01 shows a oscilloscope which has 2 terminals.
Figure: 01
Figure: 02 shows the basic controls and switches of a cathode ray oscilloscope and down here are listed in which way and how they are used.
Figure: 02
4
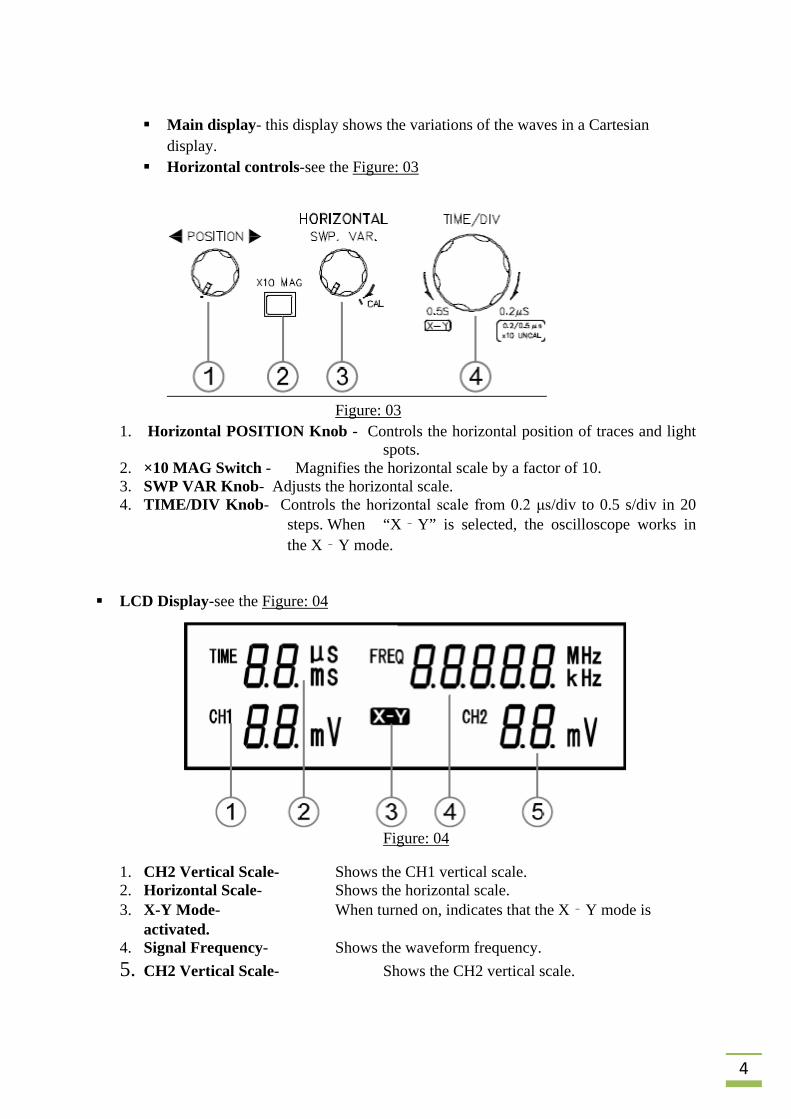
Main display- this display shows the variations of the waves in a Cartesian
display. Horizontal controls-see the Figure: 03
Figure: 03
1. Horizontal POSITION Knob - Controls the horizontal position of traces and light spots.
2. ×10 MAG Switch - Magnifies the horizontal scale by a factor of 10. 3. SWP VAR Knob- Adjusts the horizontal scale. 4. TIME/DIV Knob- Controls the horizontal scale from 0.2 μs/div to 0.5 s/div in 20
steps. When “X‐Y” is selected, the oscilloscope works in the X‐Y mode.
LCD Display-see the Figure: 04
Figure: 04
1. CH2 Vertical Scale- Shows the CH1 vertical scale. 2. Horizontal Scale- Shows the horizontal scale. 3. X-Y Mode- When turned on, indicates that the X‐Y mode is
activated. 4. Signal Frequency- Shows the waveform frequency. 5. CH2 Vertical Scale- Shows the CH2 vertical scale.

5
Trigger controls- see the Figure: 04
Figure: 04
1. Trigger ALT Switch- When pressed, the TRIG ALT switch constantly toggles the trigger source between CH1 and CH2 signal, so that both signals can be clearly viewed. The TRIG ALT switch works when the vertical mode is in the DUAL position and also the trigger source is in the CH1 or CH2 position.
2. Trigger MODE Switch- The TRIGGER MODE switch selects when the oscilloscope
responds to the trigger conditions. AUTO -The oscilloscope sweeps regardless of the existence of trigger conditions. NORM -The oscilloscope sweeps only when a trigger condition occurs.
5. Trigger SOURCE Switch- Selects the signal on which the oscilloscope sweeps. CH1- CH1 signal becomes the trigger source. CH2- CH2 signal becomes the trigger source.
Vertical controls-see the Figure: 05
Figure: 05

6
1. VOLTS/DIV Knob- Controls the CH1/CH2 vertical scale from 1mV/DIV to 5V/DIV
in 12 steps.
2. Vertical POSITION Knob- Controls the vertical position of traces and light spots for CH1/CH2.
4. Vertical MODE Switch- Selects CH1 and CH2 display modes. CH1/CH2 The CH1
or CH2 signal is displayed independently. DUAL The CH1 and CH2 signals are displayed simultaneously. ADD The CH1 and CH2 signals are added or subtracted, and then the result is displayed.
5. VAR Knob- Adjusts the vertical scale. At the minimum position, the vertical scale
becomes 2.5 times wider than the original value selected by the VOLTS/DIV knob. For example, if the original scale is 1mV/DIV, the adjusted scale becomes 2.5mV/DIV. At the maximum (CAL) position, there is no change in the vertical scale.
Input terminals-see the Figure: 06
Figure: 06
1. CH 1 (X) Input Terminal(BNC connector)- Accepts the CH1 input signal. In X-Y mode, the CH1 input signal becomes the X‐axis.
2. AC/GND/DC Switch- Selects the coupling mode for the input signal. AC -The oscilloscope block DC components included in the input signal. GND- Shows the ground (zero volt) level on the display. This mode is only for checking the reference level; input signal does not appear on the display. DC- The oscilloscope displays all of the input signal.
3. GND Terminal- The GND terminal is connected to the oscilloscope mainframe. 4. CH 2 (Y) Input Terminal(BNC connector)- Accepts the CH2 input signal. In X‐Y
mode, the CH2 input signal becomes the Y‐axis.

7
Display controls- see the Figure: 07
Figure: 07
1. CAL Output- Generates the probe compensation signal; 2Vp‐p, 1kHz, positive square wave.
2. INTEN Knob- Controls the brightness of a light spot or trace in the display. 3. FOCUS Knob- Controls the focus (sharpness) of the waveforms in the display. 4. POWER Switch- Turns on or off the oscilloscope's main power. When the power is
on, the LED lights.
8
PROCEDURE o All the controls and switches of the cathode ray oscilloscope were identified.
o Switched on the oscilloscope and connected the probes to the BNC
connectors(terminals)in front of the panel.
o Then to get a horizontal line in the display, first the TIME/DIV knob was turned round clock wise and then the running dot on the display became a horizontal line. Then the intensity of the line was tuned by INTENSITY knob and sharpness of the line was tuned by the FOCUS knob. After that the horizontal line was adjusted upward and downward to place it in the X axis by vertical position knob and horizontal position was tuned by that knob.
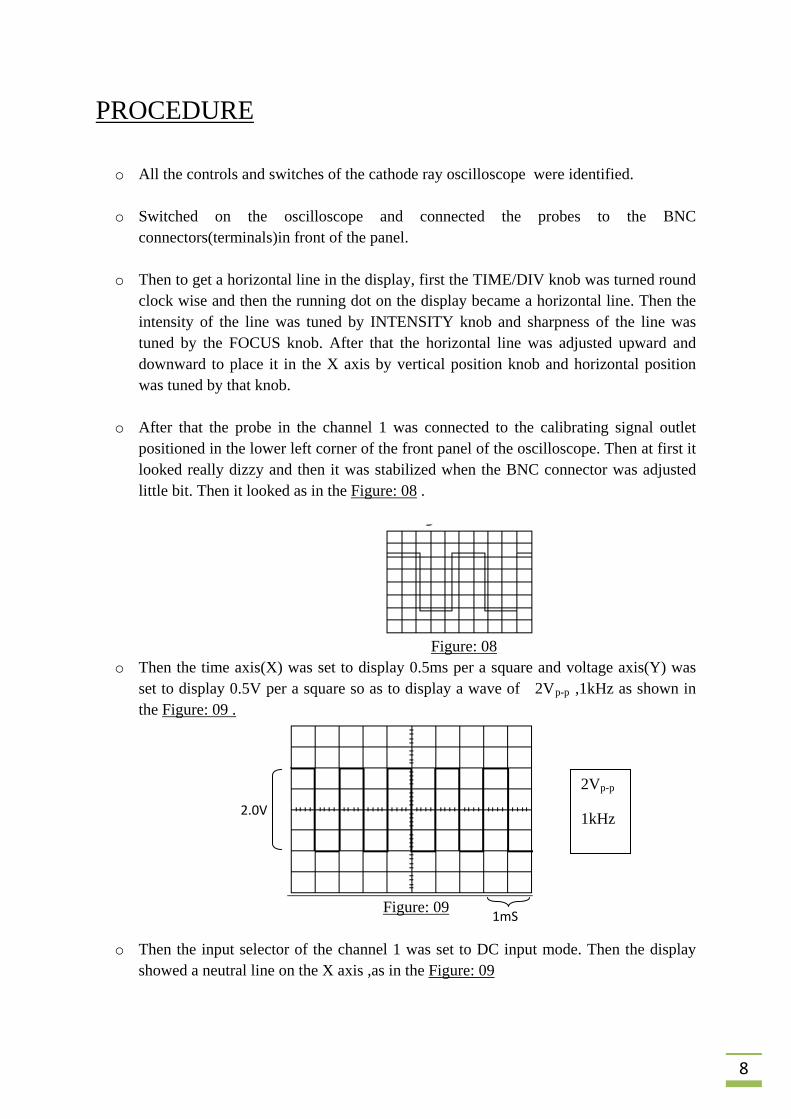
o After that the probe in the channel 1 was connected to the calibrating signal outlet positioned in the lower left corner of the front panel of the oscilloscope. Then at first it looked really dizzy and then it was stabilized when the BNC connector was adjusted little bit. Then it looked as in the Figure: 08 .
Figure: 08
o Then the time axis(X) was set to display 0.5ms per a square and voltage axis(Y) was set to display 0.5V per a square so as to display a wave of 2Vp-p ,1kHz as shown in the Figure: 09 .
Figure: 09
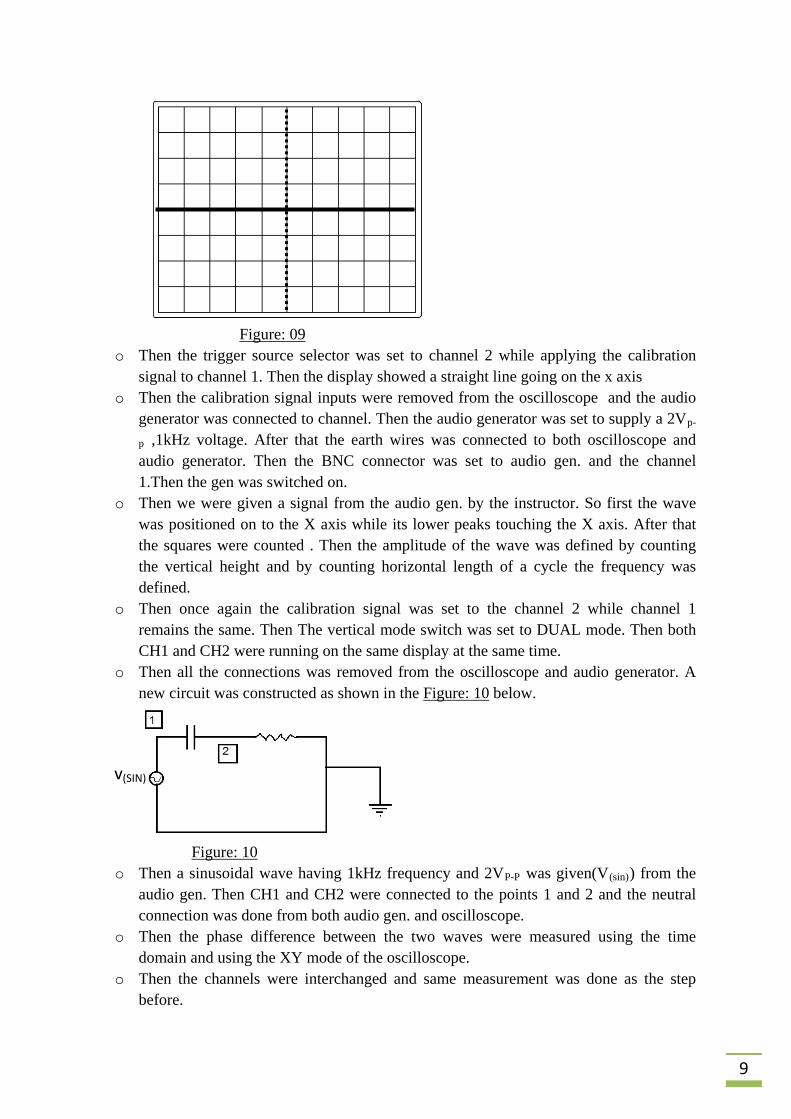
o Then the input selector of the channel 1 was set to DC input mode. Then the display showed a neutral line on the X axis ,as in the Figure: 09
1mS
2.0V
2Vp-p
1kHz
9
Figure: 09
o Then the trigger source selector was set to channel 2 while applying the calibration signal to channel 1. Then the display showed a straight line going on the x axis
o Then the calibration signal inputs were removed from the oscilloscope and the audio generator was connected to channel. Then the audio generator was set to supply a 2Vp-
p ,1kHz voltage. After that the earth wires was connected to both oscilloscope and audio generator. Then the BNC connector was set to audio gen. and the channel 1.Then the gen was switched on.
o Then we were given a signal from the audio gen. by the instructor. So first the wave was positioned on to the X axis while its lower peaks touching the X axis. After that the squares were counted . Then the amplitude of the wave was defined by counting the vertical height and by counting horizontal length of a cycle the frequency was defined.
o Then once again the calibration signal was set to the channel 2 while channel 1 remains the same. Then The vertical mode switch was set to DUAL mode. Then both CH1 and CH2 were running on the same display at the same time.
o Then all the connections was removed from the oscilloscope and audio generator. A new circuit was constructed as shown in the Figure: 10 below.
Figure: 10
o Then a sinusoidal wave having 1kHz frequency and 2VP-P was given(V(sin)) from the audio gen. Then CH1 and CH2 were connected to the points 1 and 2 and the neutral connection was done from both audio gen. and oscilloscope.
o Then the phase difference between the two waves were measured using the time domain and using the XY mode of the oscilloscope.
o Then the channels were interchanged and same measurement was done as the step before.
v(SIN)
10
OBSERVATIONS
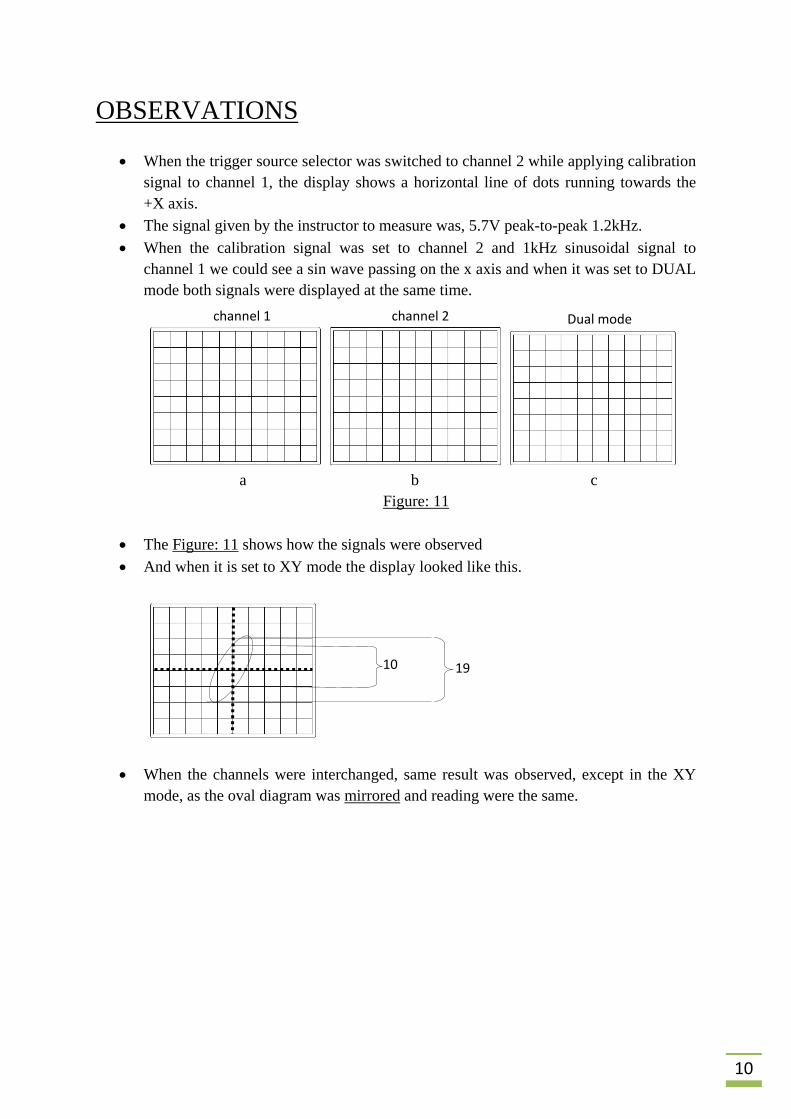
• When the trigger source selector was switched to channel 2 while applying calibration signal to channel 1, the display shows a horizontal line of dots running towards the +X axis.
• The signal given by the instructor to measure was, 5.7V peak-to-peak 1.2kHz. • When the calibration signal was set to channel 2 and 1kHz sinusoidal signal to
channel 1 we could see a sin wave passing on the x axis and when it was set to DUAL mode both signals were displayed at the same time.
a b c Figure: 11
• The Figure: 11 shows how the signals were observed • And when it is set to XY mode the display looked like this.
• When the channels were interchanged, same result was observed, except in the XY mode, as the oval diagram was mirrored and reading were the same.
channel 1 channel 2 Dual mode
10 19
11
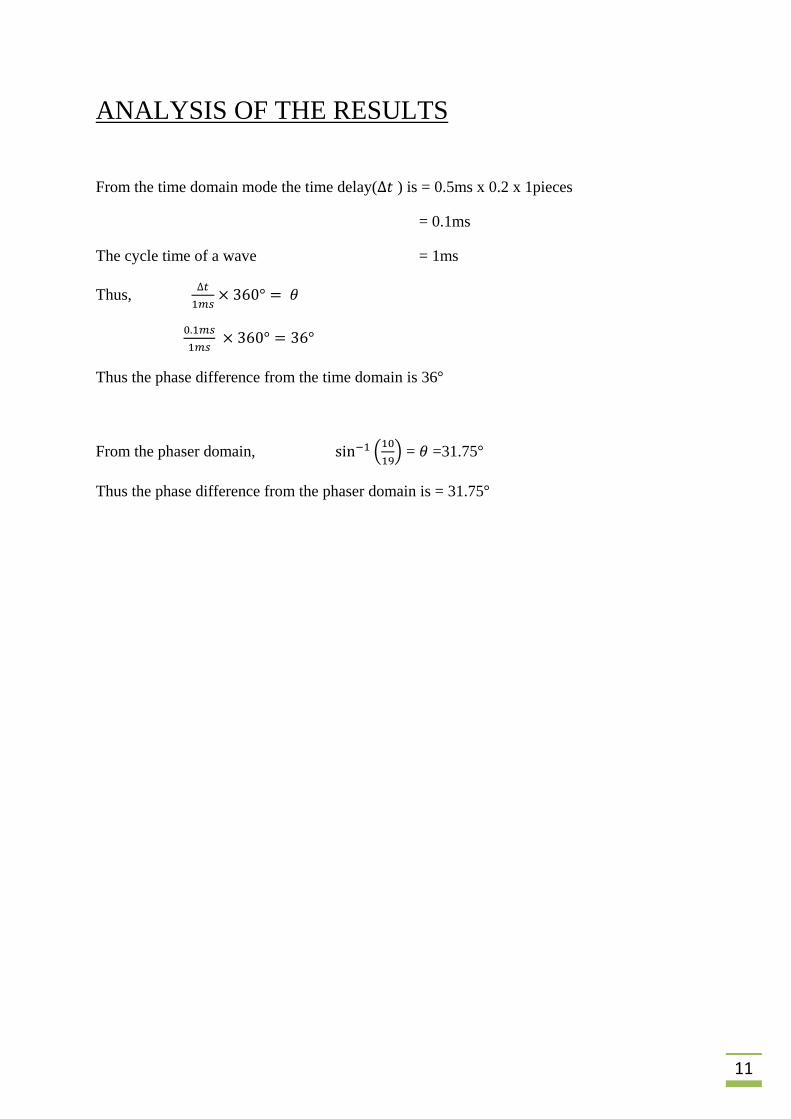
ANALYSIS OF THE RESULTS
From the time domain mode the time delay(∆𝑡 ) is = 0.5ms x 0.2 x 1pieces
= 0.1ms
The cycle time of a wave = 1ms
Thus, ∆𝑡1𝑚𝑠
× 360° = 𝜃
0.1𝑚𝑠1𝑚𝑠
× 360° = 36°
Thus the phase difference from the time domain is 36°
From the phaser domain, sin−1 1019 = 𝜃 =31.75°
Thus the phase difference from the phaser domain is = 31.75°
12
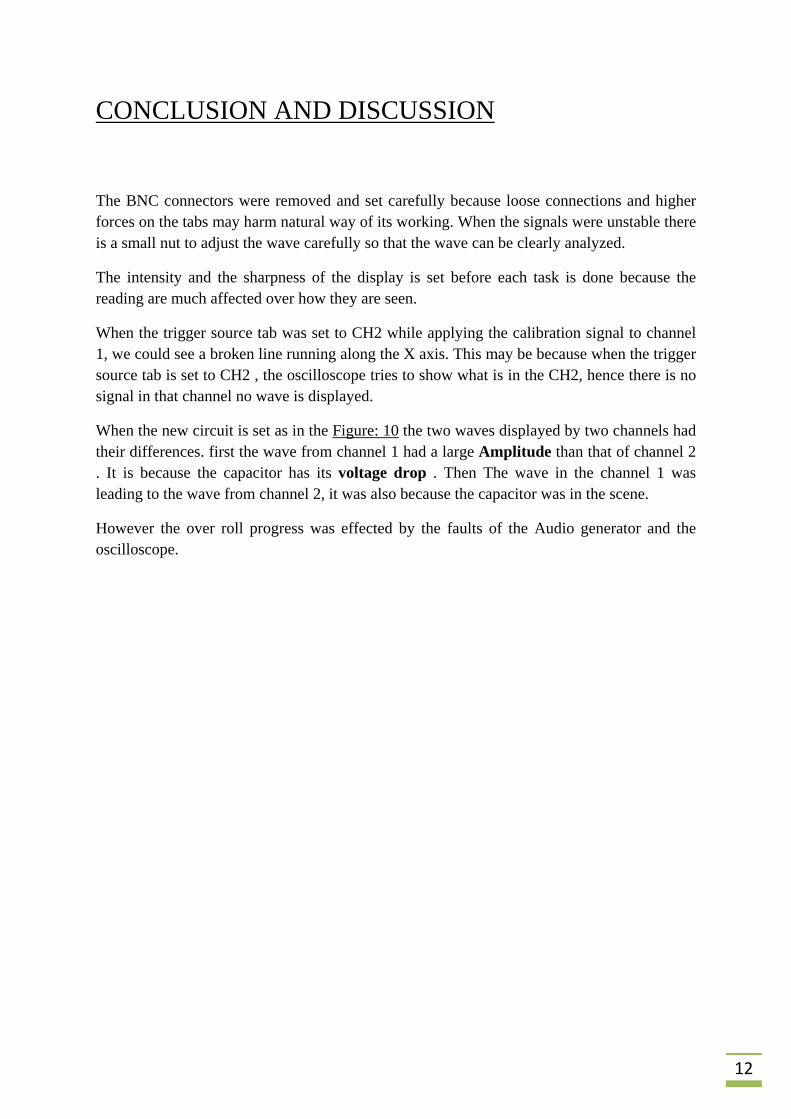
CONCLUSION AND DISCUSSION
The BNC connectors were removed and set carefully because loose connections and higher forces on the tabs may harm natural way of its working. When the signals were unstable there is a small nut to adjust the wave carefully so that the wave can be clearly analyzed.
The intensity and the sharpness of the display is set before each task is done because the reading are much affected over how they are seen.
When the trigger source tab was set to CH2 while applying the calibration signal to channel 1, we could see a broken line running along the X axis. This may be because when the trigger source tab is set to CH2 , the oscilloscope tries to show what is in the CH2, hence there is no signal in that channel no wave is displayed.
When the new circuit is set as in the Figure: 10 the two waves displayed by two channels had their differences. first the wave from channel 1 had a large Amplitude than that of channel 2 . It is because the capacitor has its voltage drop . Then The wave in the channel 1 was leading to the wave from channel 2, it was also because the capacitor was in the scene.
However the over roll progress was effected by the faults of the Audio generator and the oscilloscope.
13
BASIC ELECTRICAL ENGINEERING - GE1002
EXPERIMENT -01
B- RESONANCE FREQUENCY OF A SERIES LCR CIRCUIT
Student's Name : E.M.L.R.B.EKANAYAKE
Reg. No. : 12026
Group No : B
Date of submission : 2013/01/05
14
OBJECTIVES • To study the effect of frequency on impedance and current of a series LCR circuit and
determine the resonance frequency experimentally.
APARATUS • Cathode ray oscilloscope • Audio generator • Oscilloscope probes • Leads • Breadboard • Digital multi meter • Resistors (100Ω,330 Ω,560 Ω) • Inductor (30mH) • Capacitor (0.022µF)

15
THEORY Inductor
It is a device which has a reactance(X) depending on the frequency of the current that flows through it (XL = ɷL ). Both DC and AC currents are followed through them.
Capacitor
It is a device which has a (-) reactance(X) depending on the frequency of the current that flows
through it (XC = 1ɷ𝐿
). Capacitors do not conduct DC electricity hence only AC currents are
flowed through them
impedance(Z)
It is the magnitude of both reactance and the resistance of the circuit written as
impedance(Z) =jXL - jXC + R
So in a RLC circuit when XL, XC are equal in magnitude they will cut off each other due to opposing directions. At this stage this state is called resonance. The frequency at which two of the reactances are equal is called the Resonant frequency.
So for a series RLC circuit ,
XC= 1
2𝜋𝑓𝐶 XL = 2𝜋𝑓𝐿 𝑓 = resonant frequency
At resonance; XC = XL 𝐿 = inductance
Thus; 1
2𝜋𝑓𝐶 = 2𝜋𝑓𝐿 𝐶 = capacitance
Hence; 𝑓 = 1
2𝜋√𝐿𝐶
The phase drift(Phase difference) of two waves is calculated by two ways.
1. Counting the number of parts of the X axis over a cycle and counting the number of parts of the X axis of the difference(Drift) of both waves over a cycle , then the phase shift is Drift(t)Cycle(T)
X 3600 = Phase shift see the Figure:01
16
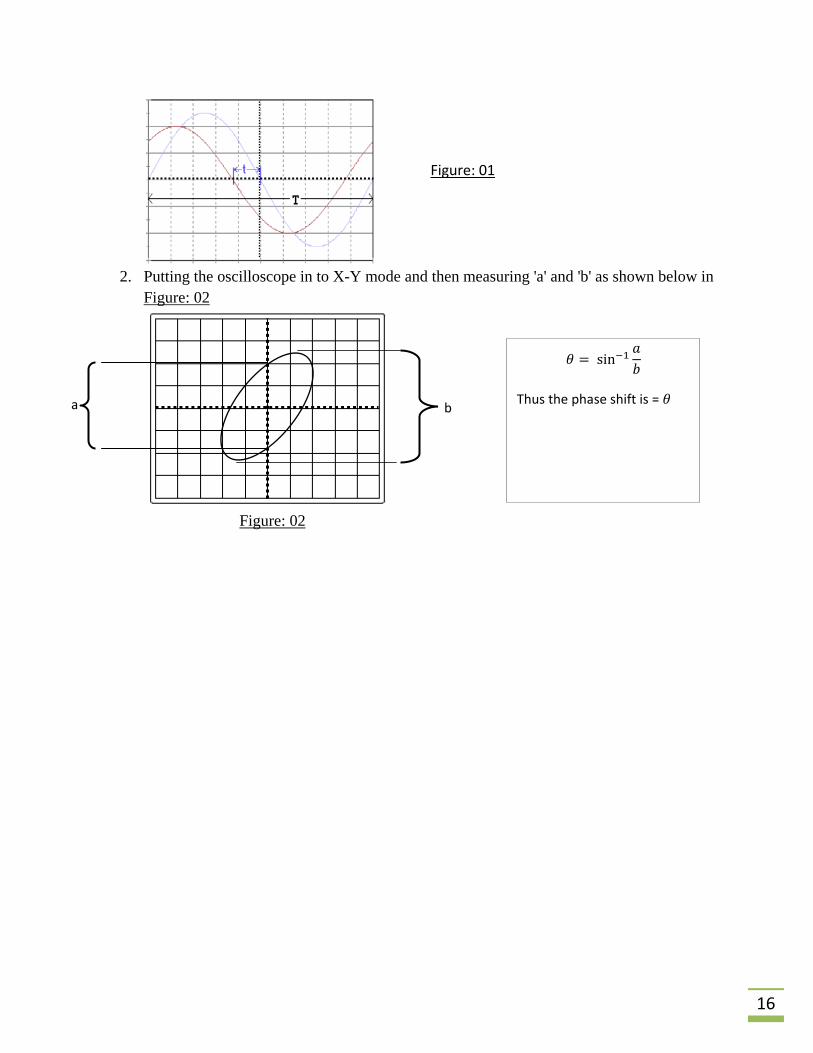
2. Putting the oscilloscope in to X-Y mode and then measuring 'a' and 'b' as shown below in
Figure: 02
Figure: 02
a b
𝜃 = sin−1𝑎𝑏
Thus the phase shift is = 𝜃
Figure: 01
17
PROCEDURE
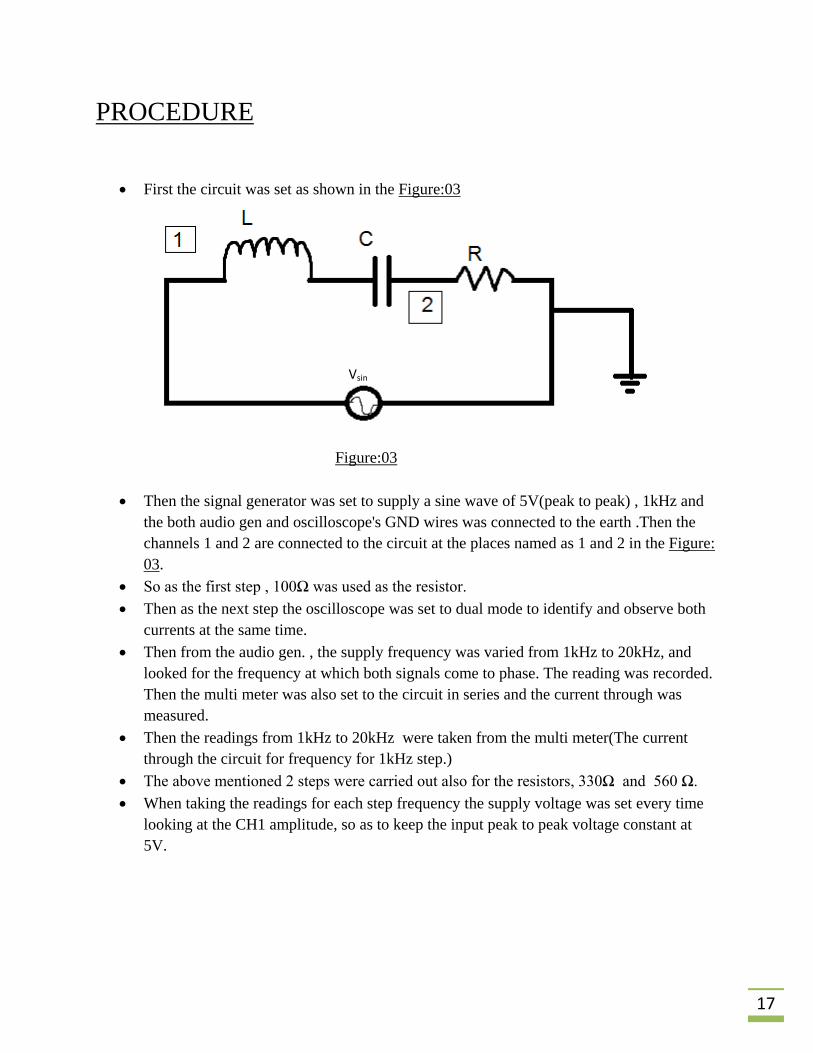
• First the circuit was set as shown in the Figure:03
Figure:03
• Then the signal generator was set to supply a sine wave of 5V(peak to peak) , 1kHz and the both audio gen and oscilloscope's GND wires was connected to the earth .Then the channels 1 and 2 are connected to the circuit at the places named as 1 and 2 in the Figure: 03.
• So as the first step , 100Ω was used as the resistor. • Then as the next step the oscilloscope was set to dual mode to identify and observe both
currents at the same time. • Then from the audio gen. , the supply frequency was varied from 1kHz to 20kHz, and
looked for the frequency at which both signals come to phase. The reading was recorded. Then the multi meter was also set to the circuit in series and the current through was measured.
• Then the readings from 1kHz to 20kHz were taken from the multi meter(The current through the circuit for frequency for 1kHz step.)
• The above mentioned 2 steps were carried out also for the resistors, 330Ω and 560 Ω. • When taking the readings for each step frequency the supply voltage was set every time
looking at the CH1 amplitude, so as to keep the input peak to peak voltage constant at 5V.
Vsin

18
ANALYSIS OF RESULTS
The calculated value of resonance frequency is;
𝑓 =1
2𝜋√𝐿𝐶
𝑓 =1
2𝜋√30 × 10−3 × 0.022 × 10−6
𝑓 = 6.195 kHz
The R.M.S value of the peak to peak voltage is ;
VRMS =Vp−p2√2
VRMS = 52√2
R = 1.7678V
The calculated impedance values for each frequency is listed in the observation sheet.
GRAPH DATA
X axis ⇒ 1 square ⇔ 1.25kHz
Y axis ⇒ 1 square ⇔ 0.6mA

19
DISCUSSION AND CONCLUSION
If we look at the calculated value and the experiment result of the resonant frequency we see a difference in the experimental one. It is because in the calculation we only take to account the capacitance and the inductance of the given elements only, but when we come to the reality it is not the only thing that add a reactance to the circuit. The oscilloscope and the audio generator are also the devices that are made of the circuital elements. They also has inductors and capacitors in their circuits. So when the current flows through them that reactances are also added to the reading . Another way that adds reactance is that when long wires are used in the circuits and when they are rolled and kept together, they also makes a small amount of inductances to the circuit. Even though the amount is small it could also affect the readings.
When we look at the graph of frequency Vs current circuit we see that when the resistance of the circuit is high the current through the circuit has decreased rapidly. It is obvious that when the resistance is law the current becomes higher but the point is that it has decreased rapidly than in the natural conditions. see the table 1
at resonance ;
R I Voltage across 100Ω 14.9mA 1.49 330Ω 5.05mA 1.665 560Ω 3.13mA 1.75 table 1
The voltage across each resistor in the resonant frequency has increased slightly. But it is almost barely same . This barely proves that at resonance the current through the circuit is dependable only of the resistance of the circuit
when we see the graph only at the resonance, the current through the circuit is high. thus this effect can be used as a BAND PASS filter. If we can use a variable capacitor or a variable inductor in the case we can set the value of the capacitance or inductance to gain a needed resonant frequency and can be identified from the other frequencies by using a transistor in between to cut off other currents and select the needed frequency, since the resistor is unchanged the resonant current is the same for even different frequencies.
We can see that when the resistance used is lower the current passed through the circuit at the resonance is high thus when we use this as a band pass filter it make it more happening since the selecting of the current is easy when the variation is large for a given gap of frequencies.

20
At last we can see that the experiment was done by performing few steps to prevent damage to the instruments and to get the readings with a higher accuracy .As so when the circuit was constructed the multi meter was set before the power supply was switched on to protect the multi meter from larger currents. When the BNC connectors plugged in to the devises, they were done with good care handling them from the metal bolt piece to prevent damage to the connector and also some of the connecters were loose as they needed to be tuned before the reading were taken. Multi meter, Audio generator and the oscilloscope were switched off when they were not in use. The readings were taken as soon as possible to prevent heat buildup in the circuit as it may increase the resistance of the circuit. When taking readings from the multi meter they were taken only when the reading was stable and also each reading was checked twice to get the most appropriate value .another important point is that when taking readings of the resistors, the input voltage was checked each time when the frequency changed to keep the input in a constant value. These steps helped the experiment to be a more accurate one though some issues were there that can't be cured like internal resistances of the devices. If there was a possibility that we could get them too, the reding would have been much more accurate.