
BASED SWOT ANALYSIS IN THE CROATIAN HOTEL ...
46
429 TOP MANAGEMENT'S ATTITUDES - BASED SWOT ANALYSIS IN THE CROATIAN HOTEL INDUSTRY The purpose of the research is to provide an enhanced understanding of the top management team (TMT) members’ attitudes about the Croatian hotel industry environment in 1999 and in 2005. Field research was carried out in 1999 and in 2005 utilizing questionnaires. The surveys examined the TMT members’ attitudes to the companies’ external and internal environ- ments. SWOT analyses, correlation matrixes, reliability analyses and regres- sion analysis were used to examine the perceived situations and tendencies in this industry. The authors’ viewpoint is that it is more appropriate to stop at the SWOT analysis and to suggest that top management of hotel companies focus on improving the internal factors in the category neither strengths nor weak- nesses instead of focusing on the strategies according to the TOWS matrix. This is an essential supposition for the company’s effectiveness at building and gaining of competitive positions from which to act on the threat factors from the external environment. Scale reliability analysis has shown that the scales are reliable. Re- gression analysis and testing by means of partial correlation coefficients, used in testing the relation between the environment and the TMT dynamics, have shown that in 1999 there is no significant linear relation between the Marli Gonan Božac* Darko Tipurić** * M. Gonan Božac, izvanredna profesorica na Fakultetu ekonomije i turizma “Dr. Mijo Mirković”, Pula, e-mail: [email protected] ** D. Tipurić, redoviti profesor na Ekonomskom fakultetu, Zagreb, e-mail: [email protected]. Rad primljen u uredništvo: 1. 6. 2006. UDK 338.48 (497.5) JEL Classification L83 Izvorni znanstveni rad
-
Upload
khangminh22 -
Category
Documents
-
view
2 -
download
0
Transcript of BASED SWOT ANALYSIS IN THE CROATIAN HOTEL ...

M. GONAN BOŽAC, D. TIPURIĆ: Top Management's Attitudes - Based SWOT Analysis... EKONOMSKI PREGLED, 57 (7-8) 429-474 (2006) 429
TOP MANAGEMENT'S ATTITUDES - BASED SWOT ANALYSIS IN THE CROATIAN HOTEL INDUSTRY
The purpose of the research is to provide an enhanced understanding of the top mana gement team (TMT) members’ attitudes about the Croatian hotel industry environment in 1999 and in 2005. Field research was carried out in 1999 and in 2005 utilizing questionnaires. The surveys examined the TMT members’ attitudes to the companies’ external and internal environ-ments.
SWOT analyses, correlation matrixes, reliability analyses and regres-sion analysis were used to examine the perceived situations and tendencies in this industry.
The authors’ viewpoint is that it is more appropriate to stop at the SWOT analysis and to suggest that top management of hotel companies focus on improving the internal factors in the category neither strengths nor weak-nesses instead of focusing on the strategies according to the TOWS matrix. This is an essential supposition for the company’s effectiveness at building and gaining of competitive positions from which to act on the threat factors from the external environment.
Scale reliability analysis has shown that the scales are reliable. Re-gression analysis and testing by means of partial correlation coeffi cients, used in testing the relation between the environment and the TMT dynamics, have shown that in 1999 there is no signifi cant linear relation between the
Marli Gonan Božac*Darko Tipurić**
* M. Gonan Božac, izvanredna profesorica na Fakultetu ekonomije i turizma “Dr. Mijo Mirković”, Pula, e-mail: [email protected]
** D. Tipurić, redoviti profesor na Ekonomskom fakultetu, Zagreb, e-mail: [email protected]. Rad primljen u uredništvo: 1. 6. 2006.
UDK 338.48 (497.5) JEL Classifi cation L83 Izvorni znanstveni rad
M. GONAN BOŽAC, D. TIPURIĆ: Top Management's Attitudes - Based SWOT Analysis... EKONOMSKI PREGLED, 57 (7-8) 429-474 (2006)430
external environment and the TMT dynamics, but that the relation is indirect through the internal environment. In 2005 the same analyses indicates that there is a signifi cant statistical relation between the external and internal environment and the TMT dynamics.
Key words: Top management team, Attitudes, Hotel industry, SWOT analysis, Statistical analysis
Introduction
Situation and tendencies in Croatian hotel industry between 1999 and 2005
The World Tourism Organisation (WTO) estimates that in 2020 the number of international tourist arrivals in the world will reach the fi gure of 1.56 billion with 717 million international tourist arrivals in Europe1. This means that Europe will remain the main tourist destination. For the twenty-one Mediterranean coun-tries WTO predicts the number of international tourists to increase to 346 million by 2020 with the Eastern Mediterranean having the highest rate of growth of 4.6% per year2. The WTO’s forecasts suggest that Croatia is faced with a period of ei-ther an increase in accommodation or an extension of the tourist season, and this will defi ne the future corporative strategies of the hotel companies on the Adriatic. The predicted fi gures also indicate that half of all the overnights in hotel accom-modation in Europe are domestic tourism (793 million overnights or 55%), while foreign tourism represents 45% or 659 million overnights. However, a particularly high share of foreign overnights (about 90%) is recorded by Lichtenstein, Luxem-burg, Cyprus and Croatia. As to foreign overnights in hotel accommodation, the leaders on the European markets are Spain (with a market share of 20%) then Italy (14%) and France (10%) while Croatia holds the 11th position3.
The tourist potential of the Republic of Croatia is primarily in its coastal zone on the Adriatic, where the hotel industry and its competitiveness have a di-rect impact on the attractiveness of the tourist supply of products and services offered. Croatian tourism, and especially the hotel industry as its most important
1 The World Tourism Organisation: «Tourism 2020 Vision», www.world tourism,org/facts/eng/vision.htm [Accessed 25.10.2005 ]
2 Louis Berger, S.A. (2005): «The European Union’s CARDS Programme for Croatia, Ma-ster and marketing tourism plan: Region Šibenik-Knin», Section II, (January 2005): 2
3 Hendija, Z.(2005): « Nights spent in hotels in Europe (1993 to 2003)», Tourism (March 2005): 298-299
M. GONAN BOŽAC, D. TIPURIĆ: Top Management's Attitudes - Based SWOT Analysis... EKONOMSKI PREGLED, 57 (7-8) 429-474 (2006) 431
segment, should focus on increasing business competitiveness; on its re-position-ing on the international market; and on the development and diversifi cation of the products and services offered to tourists. The main goal of the national tourist strategy is directing and adjusting all the tourist supply to a higher quality level. One of the priorities is to change the structure of accommodation capacities, and there are Governmental directives to raise the quality level of the existing basic accommodation facilities (hotels, motels, apartment villages) to a minimum of 3 stars and if possible to 5 stars. These directives also require a higher level of complementary accommodation facilities (campsites, private accommodations) at a destination4. Moreover, the development strategy of the Republic of Croatia highlights the role of the government which, with its initiatives including creat-ing of favourable legal conditions for investing in hotel real estate and manage-ment, will stimulate the entry of international recognized hotel “brands” into the Croatian tourist market. Despite the efforts invested in improving the standard, the Croatian hotel supply, in quality and quantity, is well below that of its Mediterra-nean competitors. Croatian summer-resort hotels rarely offer an up-to-date selec-tion of types of holiday product and services, but they do offer something which many tourist destinations in Spain, Tunisia and Greece lack, and that is large areas with beautiful scenery with a seaside location5.
During the period going from 1999 to 2005, Croatia increased the number of overnights from 27.126.000 in 1999 to 51.105.407 in 2005 (fi gures available for I-XI 2005), (table 1).
The comparison of the Bureau of Statistics data and those published in the Eurostat Yearbook suggests that of the total number of tourists’ overnights real-ized in the1999 to 2003 period, from 48% of overnights in 1999 to 42.2% in 2003 occurred in hotels and similar establishments. According to Eurostat Yearbook6, the share of foreign overnights in hotels and similar establishments in the Repub-lic of Croatia increased from 75.12% in 1999 to 85.57% in 2003.
4 Čačić, I. and Ilišković, S. (2003) «Development strategy of Croatian tourism up to the year 2010», Ministry of sea, tourism, transport and development, Final version, Zagreb, 2003, pp. 32
5 Louis Berger, S.A. (2005): «The European Union’s CARDS Programme for Croatia, Ma-ster and marketing tourism plan: Region Šibenik-Knin» Section I, (January 2005): 20
6 Europe in Figures, Eurostat Yearbook 2005, authors’ analysis, (2005):256-257

M. GONAN BOŽAC, D. TIPURIĆ: Top Management's Attitudes - Based SWOT Analysis... EKONOMSKI PREGLED, 57 (7-8) 429-474 (2006)432
Table 1
TOURIST TURNOVER IN CROATIA FROM 1999 TO 2005
Year Tourists’ arrivals
Share of foreign tourists in the number of arrivals (in %)
Tourists’ overnights
(in 000)1999 5.127 74.20 27.1262000 7.137 81.70 39.1832001 7.860 83.26 43.4052002 8.320 83.46 44.6922003 8.878 83.45 46.6352004 9.412 84.00 47.797
2005 (I-XI) 9.857 85.24 51.105Source: Bureau of Statistics (CROSTAT) RC; data processing of author’s research
If this trend continues, Croatia will remain one of several countries with a high share of foreign overnights in the total tourist turnover of the country.
In 1999, in the Republic of Croatia 68.22% of all medium-size and 78.26% of all large companies in the category (section) “Hotels and restaurants”7 were situated by the sea. Those companies realized 2.965.226.029 HRK (302.986.429 EUR)8 which was 72.9% of the total revenue of the category. The profi t before taxation was of 19.083.188 HRK (2.517.697 EUR) or 42.58% of the total profi t before taxation in relation to the declared loss before taxation of 930.126.729 HRK (92.61% of the total loss of the category). The group of medium-size and large companies with a seaside location had in 1999 an average of 17.753 employ-ees, which made 77.3% of the employed in this category on average for medium-size and large companies.
By comparison in 2004, in the Republic of Croatia, 69.89% of all medi-um-size and 84.85% of all large companies in the category “Hotels and restau-rants” were situated by the sea. These companies realized 5.684.310.461 HRK (758.396.570 EUR)9of the total revenue, which represents an increase of 91,7% in relation to the year 1999. The realized total revenue contributed was 82.47% of the category total revenue for medium-size and large companies. The profi t
7 National Classifi cation of Economic Activities, NCEA section: «Hotels and restaurants», Levels of subclasses, NN 98/94, NN 52/03
8 Midpoint Exchange rate for Euro of the Croatian National Bank for 1999 (period average, 1 EUR = 7,579622 kn), www.hnb.hr/public/bilten/statisticki_pregfl ed/h9.xls, [ Accessed 17.02.2006]
9 Midpoint Exchange rate for Euro of the Croatian National Bank for 2004 (period average, 1 EUR= 7,495169 kn), www.hnb.hr/public/bilten/statisticki_pregled/h9.xls, [ Accessed 17.02.2006]

M. GONAN BOŽAC, D. TIPURIĆ: Top Management's Attitudes - Based SWOT Analysis... EKONOMSKI PREGLED, 57 (7-8) 429-474 (2006) 433
before taxation increased by 3.17 in relation to the year 1999 while the loss before taxation in 2004 was of 574.299.150, that is, it was reduced by 61.74% in rela-tion to 1999. In the period observed the average number of employees had not changed signifi cantly in relation to 1999, and in 2004 it was of 17.747 employ-ees. In 2004, investments for medium-size and large companies observed totalled 1.257.831.494 HKN which was 39.53% of the total investments in the category “Hotels and restaurants”.10
SWOT analysis as a tool for a situation analysis
A SWOT analysis has been used here as a means for “unfreezing” the situ-ation, as an analytical methods for a better understanding of the situation in the Croatian hotel industry. The SWOT analysis is a tool for a situation analysis and when used in an appropriate way, it can be a good foundation for strategy formula-tion. Its basic aim is to identify the opportunities and threats in the external envi-ronment and strengths and weaknesses in the internal environment. After the men-tioned factors are identifi ed, an internal and an external evaluation are carried out. The internal evaluation examines all the aspects of the organization and deals with for example, strategies and objectives, personnel, facilities, organizational struc-ture, location, products and services in order to identify the company’s strengths and weaknesses. The external evaluation focuses on the economical, technologi-cal, social, political, legislative, ecological, ethical and competitive environment in order to scan for opportunities and threats within which the company acts. The challenge for the authors of this research was to fi nd ways of integrating some of the most important elements of External Analysis (Costa, Theare: 1994)11 into the traditional SWOT framework and apply it to the hotel industry in Croatia.
A variation of SWOT analysis is a TOWS matrix where after the various factors are identifi ed, an external factor is paired with an internal one, e.g. an op-portunity with strength, in order to stimulate a new strategic initiative. Thus, four possible strategic guidelines of a company are developed.12
The SWOT analysis has its origins in the 1960s and in the following period it became the traditional means of searching for insights into ways of realizing the
10 Data recorded by Croatian Chamber of Economy, Subsidiary Pula, author’s data proces-sing
11 Costa, J. and Teare, R. (1994): “Environmental scanning and the Portuguese hotel sector”, International Journal of Contemporary Hospitality (6/1994):4-8
12 Dyson, R.G. (2002): «Strategic development and SWOT analysis at the University of Warwick», European Journal of Operational Research (152 / 2004): 632

M. GONAN BOŽAC, D. TIPURIĆ: Top Management's Attitudes - Based SWOT Analysis... EKONOMSKI PREGLED, 57 (7-8) 429-474 (2006)434
necessary alignments. It was particularly popular in the 1970s for its assumption that managers can plan the alignment of the company’s resources with its envi-ronment.13 In more recent years resource-based planning and competence-based planning have taken the place of the SWOT analysis. Barney (1991)14 then fur-ther develops the resource-based view and recreates SWOT as the foundation for linking the company’s resources to a sustained competitive advantage. Although the resource–based view and competence-based view have outlined SWOT as an outdated method, we consider it is possible to view it as a starting point for resource-based view and competence-based planning. Similarly, scenario plan-ning can be superfi cially considered a different technique. However, the scenario analysis focuses on the external environment and identifi es key factors in a similar way to the evaluation of external factors as the SWOT analysis. In conclusion, in recent years SWOT is still used in companies as the recommended framework for case analysis, and can be found in many of the leading strategic management and marketing texts.
The purpose of applying the SWOT analysis in this research is to help un-derstand the external and internal environment factors. The fi nal objective of this analysis is therefore to provide a conceptual framework (which is based on a ra-tional approach, intuition and experience) for the elaboration of future strategic options of hotel companies with a seaside location.
TMT role and characteristics
The strategy and the organizational structure following it can be the refl ec-tion of the characteristics of the top management in the company. The importance of the top management team-TMT (chief executive offi cers-CEO and TMT mem-bers) is mainly in their direct responsibility for setting the company’s strategic objectives as well as for allocating the resources necessary for implementing the strategies. The company’s external and internal environments have infl uence on the CEO and the TMT members who, on the basis of their knowledge and avail-ability, should perceive the environment realistically and gain insights into the company’s situation. The ability to perceive the company’s situation realistically is based on the company’s culture and its members’ set of values and leads to re-
13 Novicevic, M.M. and Harvey, M.(2004): «Dual-perspective SWOT: a synthesis of marke-ting intelligence and planning», Marketing Intelligence & Planning ( 2004):86
14 Barney, J.B. (1991): “Firm resources and sustained competitive advantage”, Journal of Management (1991): 99-120
M. GONAN BOŽAC, D. TIPURIĆ: Top Management's Attitudes - Based SWOT Analysis... EKONOMSKI PREGLED, 57 (7-8) 429-474 (2006) 435
quired actions, which then depend on the availability and ability of the managers to act and are directed towards the organizational structure.
The TMT, besides interpreting the changes in the environment, are respon-sible for the entire strategic management process (through its three phases: strat-egy formulation, implementation, and monitoring and evaluation), for defi ning the basic directions of development, and for setting up the communication system and organizational structure which consequently impacts on the nature and style of decision making within the company. The TMT size is the CEO and the team members and they are actively responsible for the company’s “direction”. Ex-cept for the size, the TMT characteristics have been examined through: the TMT dynamics which is an average appraisal of attributive features and also the TMT demography which is an average value of the years of service.
Research Methods
The primary research was carried out in May and June 1999 and then in Oc-tober and November 2005 on the sample of Croatian hotel companies related to tourism by the sea. In the mentioned periods the same research instruments were used with some minimal additions to the questions, which had no infl uence on the answers to the questions and on the interpretation of the results obtained.
Respondents to the 1999 sample included the, the CEOs, and their TMT members from 30 medium size and large hotel companies chosen after consulta-tion with recognized specialists and on examination of databases from all Region-al subsidiaries of the Croatian Chamber of Economy. That year the research was carried out in all the 30 companies; in 2 companies the TMT members’ surveys were returned but not those of the CEOs, while in 8 of the companies questioned there were no TMT, that is, in the top management there was only one person (the CEO). Altogether 28 CEOs and 91 TMT members responded to the question-naire.
The 2005 sample respondents included the CEOs and the TMT members of the same 30 companies with the difference that two of the companies merged and the questionnaires were therefore sent to 29 companies. The research was carried out in 24 companies of which in 2 companies there were no TMT members, in the top management there was only the CEO. Altogether 24 CEOs and 72 TMT members responded to the questionnaire.
The number of the companies examined in the category “Hotels and res-taurants” in 1999 represented 31% of the population, while in 2005 it represent-ed 26% of the population.

M. GONAN BOŽAC, D. TIPURIĆ: Top Management's Attitudes - Based SWOT Analysis... EKONOMSKI PREGLED, 57 (7-8) 429-474 (2006)436
In 1999, according to article 16 of the Croatian Law on Account - keeping15, 46.4% of the companies were medium-size and 53.6% were large companies. In 2005, 41.7% of the companies where the research was carried out were of me-dium-size, while 58.3% were large companies.
Considering the share in the companies’ total revenue 69.4% of the companies in 1999, compared to 74.3% of the companies in 2005, realized in the hotel industry (Chart 1).
The research instruments were two structured questionnaires which had been developed on the basis of literature study, the descriptive-exploring research car-ried out and the authors’ interest and observations. The fi rst questionnaire devel-oped for the CEOs contained four sections:
A. The company and its orientation - 5 questions (6 questions in 2005)B. Strategic objectives and strategies - 8 questionsC. Top management - 6 questionsD. Organization - 13 questionsThe second questionnaire for the TMT members contained of three sec-
tions:
15 Law on Account – keeping, NN 90/92 (UG, Uffi cial Gazette)

M. GONAN BOŽAC, D. TIPURIĆ: Top Management's Attitudes - Based SWOT Analysis... EKONOMSKI PREGLED, 57 (7-8) 429-474 (2006) 437
A. The company environment - 5 questions (6 questions in 2005)B. Management - 4 questions (5 questions in 2005)C. Objectives and strategies - 8 questions (10 questions in 2005)The TMT members were chosen by applying the theoretical approach where
by the CEO’s indicated who the TMT members were (Bantel, Jakson, 1989; Sut-clife, 1994 and others)16. A letter appealing for cooperation was fi rstly sent to the CEOs, it contained an explanation of the purpose and the objectives of the research; the method of contact; and the expected duration of the research. In the telephone call which followed the letter the method of contact was agreed accord-ing to the CEOs’ evaluation, they decided whether they wanted to answer it on their own or to do it in an interview. After that the CEO gave to the researchers the names of the TMT members, orally or in writing, and the questionnaire was then mailed to them.
The purpose of this research is to provide an enhanced understanding of the TMT members’ attitudes regarding the Croatian hotel industry environment in 1999 and in 2005.
The objectives of this work are:• The situation analysis in hotel companies related to tourism by the sea in
the Republic of Croatia on the basis of the TOWS matrix in the years 1999 and 2005, and the comparison of the stated.
• The TMT characteristics and role of an interpreter and moderator of the changes in the environment.
The following hypothesis is tested:• The external environment has no infl uence on the TMT dynamics. The
internal environment has no infl uence on the TMT dynamics.
Research Result
External environment factors
The following external environment factors have been examined:• The fi scal and tax environment (fi scal and tax policies of the Republic of
Croatia)
16 Bantel, K., Jakson, S. (1989): Top Management and Innovations in Banking: Does the Composition of the Top Team Make a Difference? Strategic Management Journal (10/1989): 107-124; Sutclife, K. M. (1994): “What executives notice: Accurate perceptions in top management teams”, Academy of Management Journal (37/ 1994): 1360-1378

M. GONAN BOŽAC, D. TIPURIĆ: Top Management's Attitudes - Based SWOT Analysis... EKONOMSKI PREGLED, 57 (7-8) 429-474 (2006)438
• The economic environment - the capital (availability of capital, cost of capital)
• Labour (availability of managers, cost of managers, quality of managers, availability of seasonal workers, quality of seasonal workers, availability of permanent workers, cost of permanent workers, quality of permanent workers),
• Price levels (levels of purchasing wholesale prices),• Competitors (facilities in terms of contents and space available in competi-
tive countries)• Political and legislative environment (political and state leaders’ attitudes
and actions, laws, regulations and court decisions at the state level, deci-sions at the level of state government and self-government),
• Natural environment (the state of environmental preservation, the impact of industrial plants, "green" associations),
• Social environment (business moral, domestic population's attitudes, do-mestic population's expectations, guests' expectations, guests' set of val-ues).
Utilizing Likert's scales 1-7 (with the fi rst scale: 1-strong threat, 2-moder-ate threat, 3-weak threat, 4-neither threat nor opportunity, 5-weak opportunity, 6-moderate opportunity, 7-strong opportunity; and the second scale: 1-strong unfavourable impact, 2-moderate unfavourable impact, 3-weak unfavourable im-pact, 4-neither unfavourable nor favourable impact, 5-weak favourable impact, 6-moderate favourable impact, 7-strong favourable impact) the stated factors of the company's external environment have been evaluated by the research respondents as follows (Table 2):

M. GONAN BOŽAC, D. TIPURIĆ: Top Management's Attitudes - Based SWOT Analysis... EKONOMSKI PREGLED, 57 (7-8) 429-474 (2006) 439
Table 2
EXTERNAL ENVIRONMENT FACTORS OF CROATIAN HOTEL COMPANIES BY THE SEA IN 1999 AND 2005
External environment factors Mean
1999 2005State of environmental preservation (VAR18) 5,94 5,65Guests’ expectations (VAR24) 5,33 5,57Guests’ set of values (VAR25) 5,08 5,14Domestic population’s expectations (VAR23) 4,90 4,69Availability of permanent workers (VAR10) 4,78 4,08Domestic population’s attitudes (VAR22) 4,73 4,51Green “associations” (VAR20) 4,65 4,35Availability of seasonal workers (VAR 7) 4,63 3,40Permanent workers’ quality (VAR12) 4,14 4,14Business moral (VAR21) 4,09 4,53Availability of managers (VAR4) 4,07 3,83Managers’ quality (VAR6) 3,96 3,75Industrial plants impact (VAR19) 3,92 3,76Cost of seasonal workers (VAR8) 3,90 3,93Cost of managers (VAR5) 3,87 3,81Cost of permanent workers (VAR11) 3,75 3,81Seasonal workers’ quality (VAR9) 3,25 3,03Availability of capital (VAR2) 3,09 4,42
Decisions at local government and self-government level (VAR17) 2,52 2,90Laws, regulations and other decisions at state level (VAR16) 2,33 2,69Political and state leaders’ attitudes and actions (VAR15) 2,29 2,99Facilities in terms of contents and space available in competitive countries (VAR14) 2,15 2,58
Level of purchasing wholesale prices (VAR13) 2,10 3,76Cost of capital (VAR3) 1,67 3,84The state fi scal and tax policies (VAR1) 1,49 1,97
Source: Data processing of authors’ research
In order to more clearly understand the results of the overall TMT members’ ratings as detailed in table 2 it is useful to breakdown these results into several categories as noted below.
Rated as a moderate opportunity factor in both 1999 and 2005 was the fol-lowing:
• State of environmental preservation (VAR 18) - this is the only factor eval-uated as the best strategic opportunity thereby indicating an attitude that Croatia has a well preserved natural environment.
M. GONAN BOŽAC, D. TIPURIĆ: Top Management's Attitudes - Based SWOT Analysis... EKONOMSKI PREGLED, 57 (7-8) 429-474 (2006)440
Rated as weak opportunity factors in 1999 were the following:• Guests’ expectations (VAR24)• Guests' set of values (VAR25) and • Domestic population’s expectations (VAR23)• Domestic population’s attitudes (VAR22)These four factors of the social environment are viewed as in harmony with
what the companies can offer guests.• Availability of permanent workers (VAR10) • Availability of seasonal workers (VAR7) These two factors of labor market representing high unemployment.• Green associations (VAR20) – taking care of environmental preservation By 2005 the TMT members’ ratings of weak opportunity factors changed to
the following:• Guests' set of values (Val25)• Domestic population’s expectations (VAR23)• Business moral (VAR21)• Domestic population’s attitudes (VAR22)The two domestic population factors indicate support or backing for the ho-
tel companies and suggests that the population that directly or indirectly lives with tourism will not become an obstruction to further development.
These four factors together can be viewed as support for the hotel industry's goals and business strategies. However, they also indicate few exceptional pos-sibilities for development.
Rated as neither threat nor opportunities by TMT members in 1999 were:• Availability of managers (VAR4)• Managers' quality (VAR6)• Cost of managers (VAR5)• Permanent workers' quality (VAR12)• Cost of seasonal workers (VAR8)• Cost of permanent workers (VAR11)• Industrial plants' impact (VAR19) and • Business moral (VAR21)By 2005 the neither threat nor opportunities ratings by TMT members in-
cluded all of the above factors less Business moral (VAR21) but added were the followings:
M. GONAN BOŽAC, D. TIPURIĆ: Top Management's Attitudes - Based SWOT Analysis... EKONOMSKI PREGLED, 57 (7-8) 429-474 (2006) 441
• Availability of permanent workers (VAR10)• Availability of capital (VAR2)• Cost of capital (VAR3)• Level of purchasing wholesale prices (VAR13) and• Green associations (VAR20)The above ratings of neutral factors include several that can be viewed as
Labour related. This leads to several possible viewpoints such as:• Are poor recruitment of managers and low coeffi cient of managers' fl uc-
tuation the reasons for the neutral ratings?• Or, do managers believe that the level of their own knowledge and abilities
is so superior that recruiting new managers is not viewed as an opportu-nity?
• Similarly, that recruiting new employees in order to take advantage of de-velopment possibilities is not viewed as a realistic opportunity.
Rated by TMT members as weak threat factors in 1999 were:• Quality of seasonal workers (VAR9)• Availability of capital (VAR2)• Decision at the level of local government and self-government level
(VAR17)By 2005 TMTs continued to rate the above two factors (VAR9 and VAR17)
as weak threats and also included:• Availability of seasonal workers (VAR7)• Laws, regulations and other decision at state level (VAR17)• Political and state leaders’ attitudes and actions (VAR15)• Facilities in terms of contents and space available in competitive countries
(VAR14)These factors have often been pointed out as problem areas for Croatian
tourism.Rated as moderate threats in 1999 but weak threats by 2005 are:• Laws, regulations and other decisions at state level (VAR16)• Political and State leaders’ attitudes and actions (VAR15)• Facilities in terms of content and space available in competitive countries
(VAR14)This lower TMT members’ rating of the factors from the political and legis-
lative environment as from the industrial environment can be viewed as positive development movement during the time period of the research.

M. GONAN BOŽAC, D. TIPURIĆ: Top Management's Attitudes - Based SWOT Analysis... EKONOMSKI PREGLED, 57 (7-8) 429-474 (2006)442
Rated as moderate threats in 1999 but neither threat nor opportunity in 2005 were:
• Level of purchasing wholesale prices (VAR13)• Cost of capital (VAR3)This possibly indicates positive developments during the time period of the
research.Rated as a strong threat in 1999 but a moderate threat in 2005 was:• The state fi scal and tax policies (VAR1)This may be another indication of positive developments.
Legislative and political environment factors
The CEOs’ attitudes towards the components of the legislative and political environment are detailed in Table 3. The Likert’s scale 1-7 has been used (1- ex-plicitly disagree , 2- disagree, 3- partly disagree, 4- neither agree nor disagree, 5- partly agree, 6- agree, 7- explicitly agree).
Table 3
CROATIAN HOTEL COMPANIES BY THE SEA: CEOS’ ATTITUDES TOWARDS THE REACHED LEVEL OF TOURISM DEVELOPMENT
IN COASTAL PLACES IN 1999 AND 2005
Statements Mean1999 2005
It is necessary to modernize and reconstruct the existing hotel capacities 6,22 6,21
Direct investments of capital are needed 6,07 5,79A distinguishing “Croatian tourist product” should be created 6,07 6,17The tourist product requires new forms and contents 6,04 6,42Coastal tourism should be re-directed towards the middle and up to a higher quality level 5,64 5,71
Tourism development in coastal places is not defi ned well enough 5,31 5,13The present and future segments of guests are determined by the actual tourist supply 4,93 5,00
It is necessary to build smaller hotels of higher quality 4,63 5,33In is necessary to transform the large corporations by buying and selling the present ones 3,38 3,25
Source: Data processing of authors’ research

M. GONAN BOŽAC, D. TIPURIĆ: Top Management's Attitudes - Based SWOT Analysis... EKONOMSKI PREGLED, 57 (7-8) 429-474 (2006) 443
In order to more clearly understand the results of the TMT members ratings as detailed in table 3 it is useful to breakdown these results into several categories as noted below.
In 1999 and 2005 the CEOs agree on the following statements: • It is necessary to modernize and reconstruct the existing hotel capacities,• Capital needs to be invested directly,• A distinguishing "Croatian tourist product" should be created,• The tourist product requires new forms and contents,• Coastal tourism should be re-directed towards the middle and up to a high-
er quality level.At the same time they partly agree, in 1999 and 2005, with the following
statements:• Tourism development in coastal places is not defi ned well enough,• The present and future segments of guests are determined by the actual
tourist supply,• It is necessary to build smaller hotels of higher quality.They partly disagree, in 1999 and 2005, on the statement that it is necessary
to transform the large corporations by buying and selling the present ones. Furthermore, the CEOs hold that the company’s external environment in
1999, which they have evaluated through the previous elements (Table 4), is mainly unsafe, unstable and risky. It can be observed, as shown in the sequence by means of a SWOT matrix, that the economic, political and legislative environ-ment that have been evaluated as a threat infl uenced the managers’ valuation that the companies operate in a mainly unsafe, unstable and risky environment.
The perception of the environment changes signifi cantly in 2005 (Table 4): even 58% of the managers evaluate the external environment as dynamic and 33% of the managers as stable, while between 17% and 27% of the managers evaluate it as unsafe, unstable and risky.

M. GONAN BOŽAC, D. TIPURIĆ: Top Management's Attitudes - Based SWOT Analysis... EKONOMSKI PREGLED, 57 (7-8) 429-474 (2006)444
Table 4
CROATIAN HOTEL COMPANIES BY THE SEA: TMT MEMBERS’ EVALUATION OF THE EXTERNAL ENVIRONMENT
IN 1999 AND 2005
External environment External environment evaluation in %1999 2005
unsafe 73.0 26.4unstable 70.8 27.8risky 68.5 16.7turbulent 50.6 25.0dynamic 15.7 58.3stable 11.2 33.3safe 6.7 20.8simple 3.4 6.9
Source: Data processing of authors’ research
Internal environment factors
The following factors of the internal environment have been evaluated by TMT members (also by applying the Likert’s scale 1-7: 1-extremely weak, 2-moderately weak, 3-insignifi cantly weak, 4-neither weak nor strong, 5-insignifi -cantly strong, 6-moderately strong, 7-extremely strong):
• Objectives (the procedure of setting objectives, the quality of setting objec-tives, the possibility of controlling objectives),
• Strategies (the process of strategies formulation, the strategies' quality, co-ordination between strategies and the organizational structure),
• Technology (the technical-technological conditions of own hotel capaci-ties),
• The company size• Life cycle (a stage in the company's life cycle),• Human resources (competence of the managerial structure, permanent
workers' motivation, seasonal workers’ competence),• The product (the tourist supply quality, the tourist supply variety, the facili-
ties in terms of contents),• Location (the facilities in terms of space).

M. GONAN BOŽAC, D. TIPURIĆ: Top Management's Attitudes - Based SWOT Analysis... EKONOMSKI PREGLED, 57 (7-8) 429-474 (2006) 445
It is important to note that the highest scores of hotel companies in 1999 and 2005 receive following internal environment factors (table 5):
• The company size (VAR33)• Facilities in terms of space (VAR41)• Managerial structure competence (VAR35)• Quality of setting objectives (VAR27), and • Quality of strategies (VAR30). However on own scale these internal factors are evaluated as insignifi cantly
strong aspects. The group of factors which have been evaluated as neither weak nor strong
aspects in 1999, is extensive and worrying, and they are: • Procedure of setting objectives (VAR26)• Possibility of controlling objectives (VAR28)• The process of strategies formulation (VAR29)• Coordination between strategies and the organizational structure (VAR31)• Stage in the corporation's life cycle (VAR34)• The tourist supply quality (VAR38)• Technical-technological conditions of own hotel capacities (VAR32).
Table 5
INTERNAL ENVIRONMENT FACTORS OF CROATIAN HOTEL COMPANIES BY THE SEA IN 1999 AND 2005
Internal environment factors Mean1999 2005
The company size (VAR33) 5,02 5,01Facilities in terms of space (VAR41) 4,99 5,28Managerial structure competence (VAR35) 4,95 5,26Quality of setting objective (VAR27) 4,82 4,88Strategies quality (VAR30) 4,63 4,60Procedure of setting objective (VAR26) 4,40 4,61Possibility of controlling objectives (VAR28) 4,34 4,85The process of strategies formulation (VAR29) 4,32 4,46Coordination between strategies and the organizational structure (VAR31) 4,12 4,08Stage in the company’s life cycle (VAR34) 4,06 4,54The tourist supply quality (VAR38) 3,75 4,44Technical-technological conditions of own hotel capacities (VAR32) 3,71 4,00The facilities in terms of contents (VAR40) 3,38 3,85The tourist supply variety (VAR39) 3,32 4,13Permanent workers’ motivation (VAR36) 3,30 4,35Seasonal workers’ competence (VAR37) 3,05 3,58
Source: Data processing of authors’ research

M. GONAN BOŽAC, D. TIPURIĆ: Top Management's Attitudes - Based SWOT Analysis... EKONOMSKI PREGLED, 57 (7-8) 429-474 (2006)446
While the group of neutral aspects for 1999 which actually “moved” to the one of the insignifi cantly strong aspects in 2005 are:
• Possibility of controlling objectives (VAR28)• Procedure of setting objectives (VAR26)• Stage in the company's life cycle (VAR34).Here goes the subsection of factors which “moved” from weaknesses in 1999
into neither strengths nor weaknesses in 2005: • Permanent workers' motivation (VAR36)• The tourist supply variety (VAR39)• The facilities in terms of contents (VAR40)• Seasonal workers' competence (VAR37).
Application of the SWOT analysis
Figure 1 shows the TOWS matrix of the Croatian hotel companies related to tourism by the sea in 1999. Considering the stated strengths, weaknesses, oppor-tunities and threats, the following strategies are set:
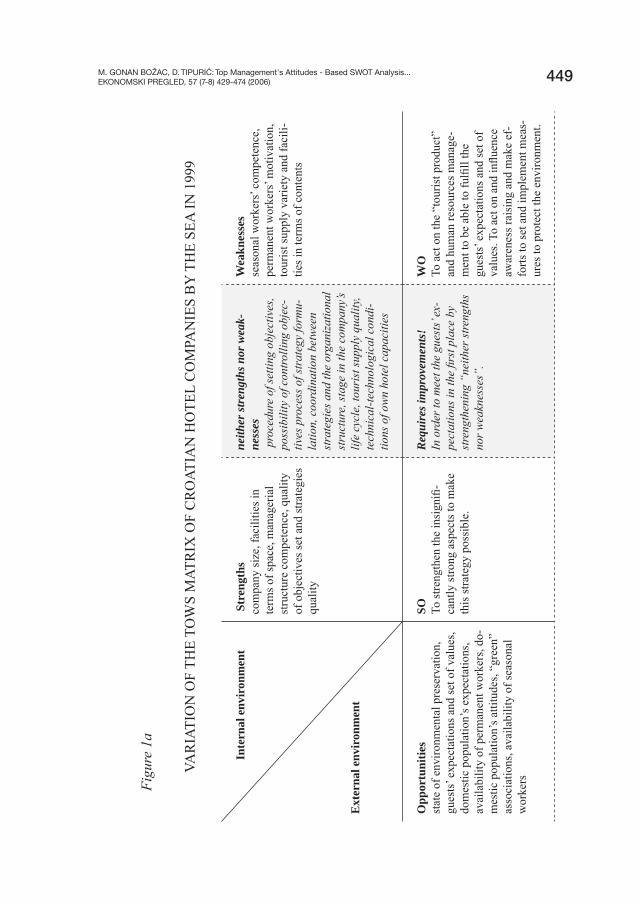
• SO strategy – It is necessary to strengthen the insignifi cantly strong aspects to make this strategy possible.
• ST strategy - The threats in the economic, political and legislative environ-ment are such that the existing strengths are insuffi cient to be able to act on them.
• WO strategy – It is necessary to act on the "tourist product" and human resources management in order to meet the guests' expectations and set of values. It is also necessary to act on and infl uence the awareness raising and make efforts to set and implement measures to protect the environ-ment.
• WT strategy - The weaknesses are such to require investments and better human resources management, but at the same time the cost of capital, its availability as well as the fi scal and tax policies measures are threats on the market.
Figure 1a shows the variation of the TOWS matrix of the Croatian hotel com-panies related to tourism by the sea in 1999. The factors in the categories neither strengths nor weaknesses and neither opportunities nor threats are included.
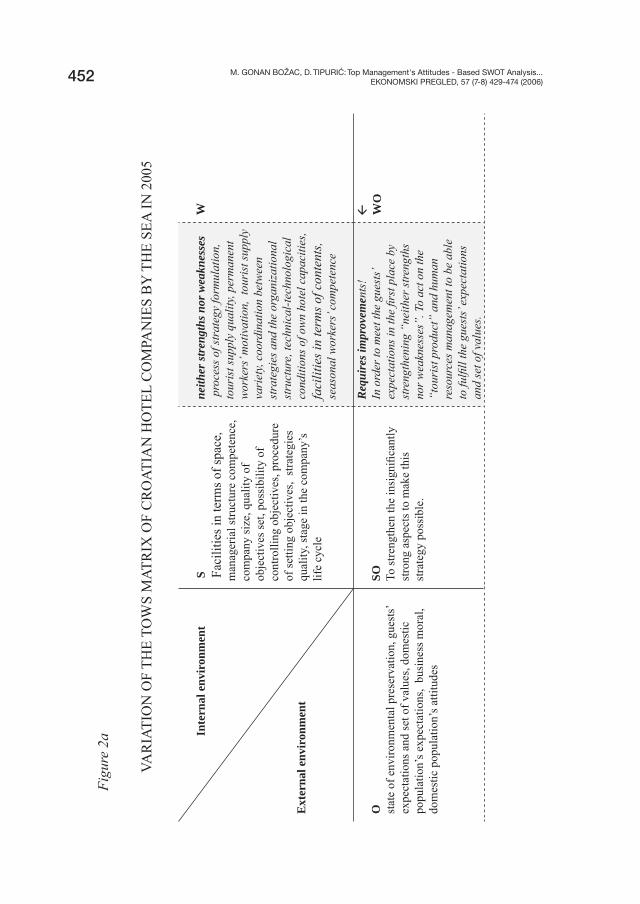
Figure 2 shows TOWS matrix of the Croatian hotel companies related to tourism by the sea in 2005. Considering the stated strengths, weaknesses, oppor-tunities and threats, the following strategies are set:

M. GONAN BOŽAC, D. TIPURIĆ: Top Management's Attitudes - Based SWOT Analysis... EKONOMSKI PREGLED, 57 (7-8) 429-474 (2006) 447
• SO strategy - To strengthen the insignifi cantly strong aspects to make this strategy possible
• ST strategy - The threats in the economic, political and legislative environ-ment are such that the existing strengths are insuffi cient to act on.
The major difference between TOWS matrix in 1999 and 2005 is that in 2005 the TMT members indicated that hotel companies did not have any major weaknesses. As result, the only possible strategies according to the TOWS matrix in 2005 are SO and ST.
Figure 2a shows the variation of the TOWS matrix of the Croatian hotel companies related to tourism by the sea in 2005. The authors’ viewpoint is that in this situation it is more appropriate to stop at the SWOT analysis and to suggest that management focus on improving the factors in the category neither strengths nor weaknesses instead of focusing on the strategies according to the TOWS ma-trix. This is an essential supposition for the company’s effectiveness at building and gaining of competitive positions from which to act on the threat factors from the external environment.

M. GONAN BOŽAC, D. TIPURIĆ: Top Management's Attitudes - Based SWOT Analysis... EKONOMSKI PREGLED, 57 (7-8) 429-474 (2006)448
Figu
re 1
TOW
S M
ATR
IX O
F C
RO
ATIA
N H
OTE
L C
OM
PAN
IES
BY
TH
E SE
A IN
199
9
Int
erna
l env
iron
men
t
Ext
erna
l env
iron
men
t
Str
engt
hsco
mpa
ny si
ze, f
acili
ties i
n te
rms
of sp
ace,
man
ager
ial s
truct
ure
com
pete
nce,
qua
lity
of o
bjec
tives
set
and
stra
tegi
es q
ualit
y
Wea
knes
ses
seas
onal
wor
kers
’ com
pete
nce,
pe
rman
ent w
orke
rs’ m
otiv
atio
n, to
uris
t su
pply
var
iety
and
faci
litie
s in
term
s of
cont
ents
Opp
ortu
nitie
sst
ate
of e
nviro
nmen
tal p
rese
rvat
ion,
gue
sts’
expe
ctat
ions
an
d se
t of v
alue
s, do
mes
tic p
opul
atio
n’s e
xpec
tatio
ns,
avai
labi
lity
of p
erm
anen
t wor
kers
, dom
estic
pop
ulat
ion’
s at
titud
es, “
gree
n” a
ssoc
iatio
ns, a
vaila
bilit
y of
seas
onal
w
orke
rs
SO To st
reng
then
the
insi
gnifi
cant
ly st
rong
as
pect
s to
mak
e th
is st
rate
gy p
ossi
ble.
WO
To a
ct o
n th
e “t
ouris
t pro
duct
” an
d hu
man
re
sour
ces m
anag
emen
t to
be a
ble
to fu
lfi ll
the
gues
ts’ e
xpec
tatio
ns a
nd se
t of v
alue
s. To
act
on
and
infl u
ence
aw
aren
ess r
aisi
ng
and
mak
e ef
forts
to
set
and
impl
emen
t m
easu
res t
o pr
otec
t the
env
ironm
ent.
Thr
eats
fi sca
l and
tax
polic
ies o
f the
Rep
ublic
of C
roat
ia, c
ost o
f ca
pita
l, le
vel o
f pur
chas
ing
who
lesa
le p
rices
, fac
ilitie
s in
term
s of c
onte
nts a
nd sp
ace
avai
labl
e in
com
petit
ive
coun
tries
, pol
itica
l and
stat
e le
ader
s’ at
titud
es a
nd
actio
ns, l
aws,
regu
latio
ns a
nd d
ecis
ions
at t
he st
ate
leve
l, de
cisi
ons a
t the
loca
l gov
ernm
ent a
nd se
lf-go
vern
men
t le
vel,
avai
labi
lity
of c
apita
l, se
ason
al w
orke
rs’ q
ualit
y
ST The
thre
ats i
n th
e ec
onom
ic, p
oliti
cal
and
legi
slat
ive
envi
ronm
ent a
re
such
that
the
exis
ting
stre
ngth
s are
in
suffi
cien
t to
act o
n.
WT
The
wea
knes
ses
are
such
to
re
quire
in
vest
men
ts a
nd b
ette
r hu
man
res
ourc
es
man
agem
ent,
but a
t the
sam
e tim
e the
cost
of
cap
ital,
its a
vaila
bilit
y an
d th
e fi s
cal
and
tax
polic
ies
mea
sure
s ar
e th
reat
s on
th
e m
arke
t.
M. GONAN BOŽAC, D. TIPURIĆ: Top Management's Attitudes - Based SWOT Analysis... EKONOMSKI PREGLED, 57 (7-8) 429-474 (2006) 449
Figu
re 1
a
VAR
IATI
ON
OF
THE
TOW
S M
ATR
IX O
F C
RO
ATIA
N H
OTE
L C
OM
PAN
IES
BY
TH
E SE
A IN
199
9
Inte
rnal
env
iron
men
t
Ext
erna
l env
iron
men
t
Str
engt
hsco
mpa
ny si
ze, f
acili
ties i
n te
rms o
f spa
ce, m
anag
eria
l st
ruct
ure
com
pete
nce,
qua
lity
of o
bjec
tives
set a
nd st
rate
gies
qu
ality
neith
er st
reng
ths n
or w
eak-
ness
es p
roce
dure
of s
ettin
g ob
ject
ives
, po
ssib
ility
of c
ontro
lling
obj
ec-
tives
pro
cess
of s
trat
egy
form
u-la
tion,
coo
rdin
atio
n be
twee
n st
rate
gies
and
the
orga
niza
tiona
l st
ruct
ure,
sta
ge in
the
com
pany
’s lif
e cy
cle,
tour
ist s
uppl
y qu
ality
, te
chni
cal-t
echn
olog
ical
con
di-
tions
of o
wn
hote
l cap
aciti
es
Wea
knes
ses
seas
onal
wor
kers
’ com
pete
nce,
pe
rman
ent w
orke
rs’ m
otiv
atio
n,
tour
ist s
uppl
y va
riety
and
faci
li-tie
s in
term
s of c
onte
nts
Opp
ortu
nitie
sst
ate
of e
nviro
nmen
tal p
rese
rvat
ion,
gu
ests
’ exp
ecta
tions
and
set o
f val
ues,
dom
estic
pop
ulat
ion’
s exp
ecta
tions
, av
aila
bilit
y of
per
man
ent w
orke
rs, d
o-m
estic
pop
ulat
ion’
s atti
tude
s, “g
reen
” as
soci
atio
ns, a
vaila
bilit
y of
seas
onal
w
orke
rs
SO To st
reng
then
the
insi
gnifi
-ca
ntly
stro
ng a
spec
ts to
mak
e th
is st
rate
gy p
ossi
ble.
Requ
ires i
mpr
ovem
ents!
In o
rder
to m
eet t
he g
uest
s’ ex
-pe
ctat
ions
in th
e fi r
st p
lace
by
stre
ngth
enin
g “n
eith
er s
treng
ths
nor
wea
knes
ses”
.
WO
To a
ct o
n th
e “t
ouris
t pro
duct
” an
d hu
man
reso
urce
s man
age-
men
t to
be a
ble
to fu
lfi ll
the
gues
ts’ e
xpec
tatio
ns a
nd se
t of
valu
es. T
o ac
t on
and
infl u
ence
aw
aren
ess r
aisi
ng a
nd m
ake
ef-
forts
to se
t and
impl
emen
t mea
s-ur
es to
pro
tect
the
envi
ronm
ent.

M. GONAN BOŽAC, D. TIPURIĆ: Top Management's Attitudes - Based SWOT Analysis... EKONOMSKI PREGLED, 57 (7-8) 429-474 (2006)450
neith
er o
ppor
tuni
ties n
or th
reat
spe
rman
ent w
orke
rs’ q
ualit
y, b
usin
ess
mor
al, a
vaila
bilit
y of
man
ager
s, m
an-
ager
s’ qu
ality
, ind
ustr
ial p
lant
s im
-pa
ct, c
ost o
f sea
sona
l wor
kers
, cos
t of
man
ager
s, c
ost o
f per
man
ent w
orke
rs
Requ
ires i
mpr
ovem
ents!
It is
nec
essa
ry to
focu
s on
the
impo
rtan
ce a
nd ro
le o
f “ne
utra
l fa
ctor
s” in
the
man
agem
ent
proc
ess
itsel
f and
“m
ove”
them
to
war
ds s
treng
ths,
whi
ch is
di
rect
ly re
late
d to
the
dem
ands
to
war
ds th
e la
bour
s m
arke
t and
its
feat
ures
.
Thr
eats
fi sca
l and
tax
polic
ies o
f the
Rep
ublic
of
Cro
atia
, cos
t of c
apita
l, le
vel o
f pu
rcha
sing
who
lesa
le p
rices
, fac
ilitie
s in
term
s of c
onte
nts a
nd sp
ace
avai
l-ab
le in
com
petit
ive
coun
tries
, pol
itica
l an
d st
ate
lead
ers’
attit
udes
and
ac-
tions
, law
s, re
gula
tions
and
dec
isio
ns
at th
e st
ate
leve
l, de
cisi
ons a
t the
lo-
cal g
over
nmen
t and
self-
gove
rnm
ent
leve
l, av
aila
bilit
y of
cap
ital,
seas
onal
w
orke
rs’ q
ualit
y
ST The
thre
ats i
n th
e ec
onom
ic,
polit
ical
and
legi
slat
ive
envi
-ro
nmen
t are
such
that
the
ex-
istin
g st
reng
ths a
re in
suffi
cien
t to
act
on.
Requ
ires i
mpr
ovem
ents!
To b
e ab
le to
act
on
thre
ats,
es
peci
ally
thos
e fro
m th
e le
gisl
a-tiv
e an
d po
litic
al e
nviro
nmen
t th
roug
h a
syst
em o
f fee
dbac
k an
d on
the
basi
s of
a b
ette
r co
m-
petit
ive
posi
tion.
.
WT
The
wea
knes
ses a
re su
ch to
re
quire
inve
stm
ents
and
bet
ter
hum
an re
sour
ces m
anag
emen
t, bu
t at t
he sa
me
time
the
cost
of
capi
tal,
its a
vaila
bilit
y an
d th
e fi s
cal a
nd ta
x po
licie
s mea
sure
s ar
e th
reat
s on
the
mar
ket.

M. GONAN BOŽAC, D. TIPURIĆ: Top Management's Attitudes - Based SWOT Analysis... EKONOMSKI PREGLED, 57 (7-8) 429-474 (2006) 451
Figu
re 2
TOW
S M
ATR
IX O
F C
RO
ATIA
N H
OTE
L C
OM
PAN
IES
BY
TH
E SE
A IN
200
5
Int
erna
l env
iron
men
t
Ext
erna
l env
iron
men
t
S Fac
ilitie
s in
term
s of s
pace
, man
ager
ial
stru
ctur
e co
mpe
tenc
e, c
ompa
ny si
ze, q
ualit
y of
ob
ject
ives
set,
poss
ibili
ty o
f con
trolli
ng o
bjec
tives
, pr
oced
ure
of se
tting
obj
ectiv
es,
stra
tegi
es q
ualit
y,
stag
e in
the
com
pany
’s li
fe c
ycle
W
O stat
e of
env
ironm
enta
l pre
serv
atio
n, g
uest
s’ ex
pect
atio
ns a
nd
set o
f val
ues,
dom
estic
pop
ulat
ion’
s exp
ecta
tions
, bu
sine
ss
mor
al, d
omes
tic p
opul
atio
n’s a
ttitu
des
SO To st
reng
then
the
insi
gnifi
cant
ly st
rong
asp
ects
to
mak
e th
is st
rate
gy p
ossi
ble.
WO
T fi sca
l and
tax
polic
ies o
f the
Rep
ublic
of C
roat
ia, f
acili
ties
in te
rms o
f con
tent
s and
spac
e av
aila
ble
in c
ompe
titiv
e co
untri
es, l
aws,
regu
latio
ns a
nd d
ecis
ions
at t
he st
ate
leve
l, de
cisi
ons a
t the
loca
l gov
ernm
ent a
nd se
lf-go
vern
men
t lev
el,
polit
ical
and
stat
e le
ader
s’ at
titud
es a
nd a
ctio
ns, q
ualit
y an
d av
aila
bilit
y of
seas
onal
wor
kers
ST The t
hrea
ts in
the e
cono
mic
, pol
itica
l and
legi
slat
ive
envi
ronm
ent a
re su
ch th
at th
e in
sign
ifi ca
ntly
stro
ng
aspe
cts
are
insu
ffi ci
ent
to a
ct i
n th
e sh
ort
perio
d on
.
WT
M. GONAN BOŽAC, D. TIPURIĆ: Top Management's Attitudes - Based SWOT Analysis... EKONOMSKI PREGLED, 57 (7-8) 429-474 (2006)452
Figu
re 2
a
VAR
IATI
ON
OF
THE
TOW
S M
ATR
IX O
F C
RO
ATIA
N H
OTE
L C
OM
PAN
IES
BY
TH
E SE
A IN
200
5
Int
erna
l env
iron
men
t
Ext
erna
l env
iron
men
t
S Fac
ilitie
s in
term
s of s
pace
, m
anag
eria
l stru
ctur
e co
mpe
tenc
e,
com
pany
size
, qua
lity
of
obje
ctiv
es se
t, po
ssib
ility
of
cont
rolli
ng o
bjec
tives
, pro
cedu
re
of se
tting
obj
ectiv
es,
stra
tegi
es
qual
ity, s
tage
in th
e co
mpa
ny’s
lif
e cy
cle
neith
er st
reng
ths n
or w
eakn
esse
s p
roce
ss o
f str
ateg
y fo
rmul
atio
n,
tour
ist s
uppl
y qu
ality
, per
man
ent
wor
kers
’ mot
ivat
ion,
tou
rist
sup
ply
vari
ety,
coo
rdin
atio
n be
twee
n st
rate
gies
and
the
orga
niza
tiona
l st
ruct
ure,
tech
nica
l-tec
hnol
ogic
al
cond
ition
s of
ow
n ho
tel c
apac
ities
, fa
cilit
ies
in te
rms
of c
onte
nts,
seas
onal
wor
kers
’ com
pete
nce
W
O stat
e of
env
ironm
enta
l pre
serv
atio
n, g
uest
s’ ex
pect
atio
ns a
nd se
t of v
alue
s, do
mes
tic
popu
latio
n’s e
xpec
tatio
ns,
busi
ness
mor
al,
dom
estic
pop
ulat
ion’
s atti
tude
s
SO To st
reng
then
the
insi
gnifi
cant
ly
stro
ng a
spec
ts to
mak
e th
is
stra
tegy
pos
sibl
e.
Requ
ires i
mpr
ovem
ents
!In
ord
er to
mee
t the
gue
sts’
expe
ctat
ions
in th
e fi r
st p
lace
by
stre
ngth
enin
g “n
eith
er s
treng
ths
nor
wea
knes
ses”
. To
act o
n th
e “t
ouri
st p
rodu
ct”
and
hum
an
reso
urce
s m
anag
emen
t to
be a
ble
to fu
lfi ll
the
gues
ts’ e
xpec
tatio
ns
and
set o
f val
ues.
WO

M. GONAN BOŽAC, D. TIPURIĆ: Top Management's Attitudes - Based SWOT Analysis... EKONOMSKI PREGLED, 57 (7-8) 429-474 (2006) 453
neith
er o
ppor
tuni
ties n
or th
reat
sav
aila
bilit
y of
cap
ital,
“gre
en”
asso
ciat
ions
, qu
ality
and
ava
ilabi
lity
of p
erm
anen
t w
orke
rs, c
ost o
f sea
sona
l wor
kers
, cos
t of
capi
tal,
avai
labi
lity
of m
anag
ers,
cos
t of
man
ager
s an
d pe
rman
ent w
orke
rs, l
evel
s of
w
hole
sale
pri
ces,
indu
stri
al p
lant
s im
pact
, m
anag
ers’
qual
ity
Requ
ires i
mpr
ovem
ents!
It is
nec
essa
ry to
focu
s on
the
impo
rtan
ce a
nd ro
le o
f “ne
utra
l fa
ctor
s” in
the
man
agem
ent
proc
ess
itsel
f and
“m
ove”
them
to
war
ds s
treng
ths,
whi
ch is
dire
ctly
re
late
d to
the
dem
ands
tow
ards
the
labo
ur m
arke
t and
its
feat
ures
.
T fi sca
l and
tax
polic
ies o
f the
Rep
ublic
of
Cro
atia
, fac
ilitie
s in
term
s of c
onte
nts a
nd
spac
e av
aila
ble
in c
ompe
titiv
e co
untri
es,
law
s, re
gula
tions
and
dec
isio
ns a
t the
stat
e le
vel,
deci
sion
s at t
he lo
cal g
over
nmen
t and
se
lf-go
vern
men
t lev
el, p
oliti
cal a
nd st
ate
lead
ers’
attit
udes
and
act
ions
, qua
lity
and
avai
labi
lity
of se
ason
al w
orke
rs
ST The t
hrea
ts in
the e
cono
mic
, pol
itica
l an
d le
gisl
ativ
e en
viro
nmen
t ar
e su
ch th
at th
e in
sign
ifi ca
ntly
stro
ng
aspe
cts a
re in
suffi
cien
t to
act i
n th
e sh
ort p
erio
d on
.
Requ
ires i
mpr
ovem
ents!
To b
e ab
le to
act
on
thre
ats
espe
cial
ly th
ose
from
the
legi
slat
ive
and
polit
ical
en
viro
nmen
t thr
ough
a s
yste
m o
f fe
edba
ck a
nd o
n th
e ba
sis
of a
be
tter
com
petit
ive
posi
tion.
WT

M. GONAN BOŽAC, D. TIPURIĆ: Top Management's Attitudes - Based SWOT Analysis... EKONOMSKI PREGLED, 57 (7-8) 429-474 (2006)454
The SWOT analysis was relatively little used in 1999: 18% of the companies examined used the SWOT analysis, and 40% of the companies using it completed it once a year. The situation is different in 2005 when 63% of the companies ex-amined use SWOT, and 53% of them complete it once a year (Table 6, Table7).
Table 6
SWOT ANALYSIS APPLICATION IN THE CROATIAN HOTEL COMPANIES BY THE SEA IN 1999 AND 2005
SWOT 1999 2005Applied 5 15Not applied 15 8In the process of development 8 1
Source: Data processing of authors’ research
Table 7
FREQUENCY OF SWOT ANALYSIS APPLICATION IN THE CROATIAN HOTEL COMPANIES BY THE SEASIDE IN 1999 AND 2005
Frequency Number of companies1999 2005
Twice a year - 2Once a year 2 8According to need 1 1Every 2 years - 2Every 2-3 years - 1Every 5 years 1 -Do not know 1 1
Source: Data processing of authors’ research
M. GONAN BOŽAC, D. TIPURIĆ: Top Management's Attitudes - Based SWOT Analysis... EKONOMSKI PREGLED, 57 (7-8) 429-474 (2006) 455
Top management team characteristics
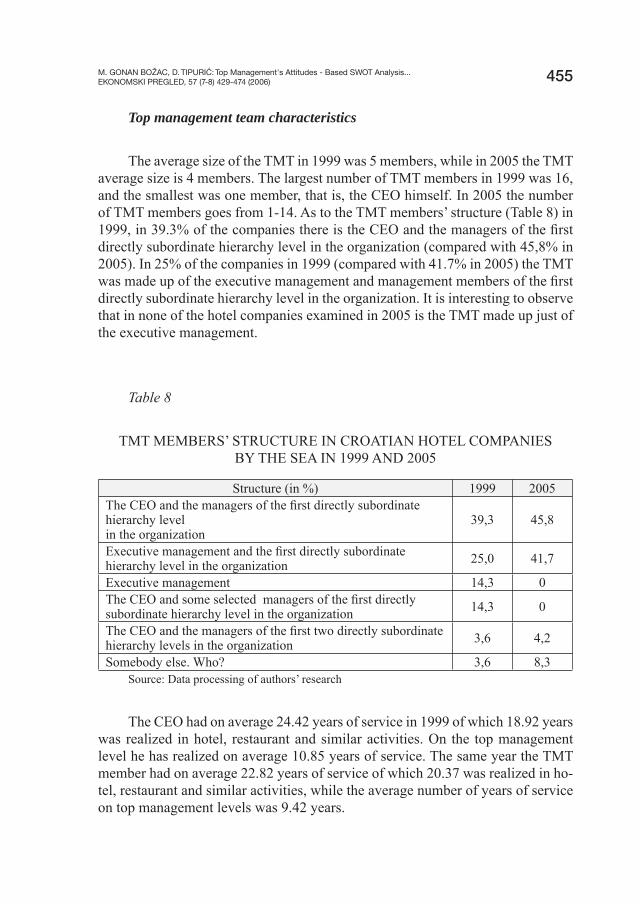
The average size of the TMT in 1999 was 5 members, while in 2005 the TMT average size is 4 members. The largest number of TMT members in 1999 was 16, and the smallest was one member, that is, the CEO himself. In 2005 the number of TMT members goes from 1-14. As to the TMT members’ structure (Table 8) in 1999, in 39.3% of the companies there is the CEO and the managers of the fi rst directly subordinate hierarchy level in the organization (compared with 45,8% in 2005). In 25% of the companies in 1999 (compared with 41.7% in 2005) the TMT was made up of the executive management and management members of the fi rst directly subordinate hierarchy level in the organization. It is interesting to observe that in none of the hotel companies examined in 2005 is the TMT made up just of the executive management.
Table 8
TMT MEMBERS’ STRUCTURE IN CROATIAN HOTEL COMPANIES BY THE SEA IN 1999 AND 2005
Structure (in %) 1999 2005The CEO and the managers of the fi rst directly subordinate hierarchy levelin the organization
39,3 45,8
Executive management and the fi rst directly subordinate hierarchy level in the organization 25,0 41,7
Executive management 14,3 0The CEO and some selected managers of the fi rst directly subordinate hierarchy level in the organization 14,3 0
The CEO and the managers of the fi rst two directly subordinate hierarchy levels in the organization 3,6 4,2
Somebody else. Who? 3,6 8,3Source: Data processing of authors’ research
The CEO had on average 24.42 years of service in 1999 of which 18.92 years was realized in hotel, restaurant and similar activities. On the top management level he has realized on average 10.85 years of service. The same year the TMT member had on average 22.82 years of service of which 20.37 was realized in ho-tel, restaurant and similar activities, while the average number of years of service on top management levels was 9.42 years.

M. GONAN BOŽAC, D. TIPURIĆ: Top Management's Attitudes - Based SWOT Analysis... EKONOMSKI PREGLED, 57 (7-8) 429-474 (2006)456
In comparison with this, in 2005 the CEO has on average 24.71 years of service of which 21.71 realized in hotel, restaurant and similar activities and 11.08 on top management levels. The same year the TMT member has on average 21.88 years of service of which 19.82 realized in hotel, restaurant and similar activities and 9.81 on top management levels. In conclusion, the top management of the Croatian hotel companies related to tourism on the seaside is made up of manag-ers with a considerable number of years of service realized mostly in the present activity and with an average of 10 years’ service in the top management.
The team dynamics has been evaluated by means of the features stated in table 9. The following is the scale the question has been based on: 1-does not de-scribe the situation at all, 4-does not describe the situation entirely, 7-describes the situation in its entirety. The TMT dynamics has been evaluated through 7 features of which the strongest evaluation goes to the feature that the profession authority is to be respected in the team.
Table 9
TMT DYNAMICS IN CROATIAN HOTEL COMPANIES BY THE SEA IN 1999 AND 2005
Structure (in %) 1999 2005The professional authority is respected in the team 5,13 5,54There is a high level of tolerance among team members 5,06 5,29The arguments are the main point in decision making 5,03 5,35Team members willingly cooperate with each other 4,93 5,43There is a high level of mutual trust among team members 4,91 5,15Confl ict is dealt with openly and effectively 4,71 4,92Interaction among team members leads to comprehensive results 4,54 4,75The team is well balanced as for the responsibility and competence of its members 4,44 4,74
Source: Data processing of authors’ research
Correlation
Correlation coeffi cients of external environment factors
The table of coeffi cients (Appendix A, table 12) shows that many variables are signifi cantly correlated among themselves at the level of signifi cance of 5% and at the level of 1%. A stronger linear relation between VAR15 (political and
M. GONAN BOŽAC, D. TIPURIĆ: Top Management's Attitudes - Based SWOT Analysis... EKONOMSKI PREGLED, 57 (7-8) 429-474 (2006) 457
state leaders’ attitudes and actions) and VAR 16 (laws, regulations and decisions at the state level) with a correlation coeffi cient of 0.759 can be singled out in 1999. White the year 2005 (Appendix A, table 13) the relation between VAR7 (avail-ability of seasonal workers) and VAR9 (seasonal workers’ quality) can be singled out with a correlation coeffi cient of 0.680.
Coeffi cients of internal environment factors correlation
Among the correlation coeffi cients important at the signifi cance level of 1%, the correlation between VAR29 (the process of strategy formulation) and VAR30 (strategies quality) with a correlation coeffi cient of 0.832 can be singled out in 1999 (Appendix A, table 14). Regarding the year 2005, the strongest linear rela-tion appears between VAR29 and VAR30 with a correlation coeffi cient of 0.883 (Appendix A, table 15).
Scale analysis
Testing the external environment scale reliability
The scale reliability analysis of a series of statements describing the external environment in 1999 and 2005 has showed that the scale is reliable (Cronbach’s alpha is 0,883 for 1999, that is 0.867 for 2005). From the analysis for 1999, VAR19 (industrial plants impact)is left out fi rst and then VAR20 (“green” associations), with that there remained 23 to 25 statements describing best the external environ-ment of Croatian hotel companies by the seaside (Appendix B, table 16). Improv-ing alpha is next and for 2005 the fi nal Cronbach’s alpha is 0.883, with that there are left 21 to 25 statements describing best the external environment of Croatian hotel companies by the sea. Then VAR19 (industrial plants impact), VAR18 (the state of environmental preservation), VAR 1 (the state fi scal and tax policies) and VAR15 (political and state leaders’ attitudes and actions) are left out, Appendix B, table 17.
Testing the internal environment scale reliability
The scale describing the internal environment in 1999 is reliable (Cronbach’s alpha is 0.881). By leaving out the items in the following order: VAR41 (the fa-

M. GONAN BOŽAC, D. TIPURIĆ: Top Management's Attitudes - Based SWOT Analysis... EKONOMSKI PREGLED, 57 (7-8) 429-474 (2006)458
cilities in terms of space), VAR32 (technical-technological conditions of the ca-pacities) and VAR40 (the facilities in terms of contents), the Cronbach’s alpha is improved to 0.889 (Appendix B, table 18).
The scale describing the internal environment in 2005 is reliable. The Chron-bach’s alpha is 0.879. By leaving out the items: VAR37 (seasonal workers’ com-petence), VAR32 (technical-technological conditions of the capacities) and VAR 41 (the facilities in terms of space), the fi nal Cronbach’s alpha is 0,891 (Appendix, table 19).
Testing the TMT dynamics scale reliability
The scale describing the TMT dynamics in 1999 is reliable; the Cronbach’s alpha is 0.961. The next step is to improve alpha by leaving out the items in the following order: VAR42 (the team is well balanced as for the responsibility and competence of its members) and VAR43 (Interaction among team members leads to expected results). The fi nal Cronbach’s alpha is 0.966 (Appendix B, table 20)
The scale describing the TMT dynamics in 2005 is reliable. The Cronbach’s alpha is 0.940. Improving the scale is next and the items are left out as follows: VAR42 (the team is well balanced as for the responsibility and competence of its members) and VAR43 (interaction among team members leads to expected results). The fi nal Cronbach’s alpha is 0.950 for 6 items describing the observed phenomenon (Appendix B, table 21).
Regression analysis
The following hypothesis is tested: The external environment does not infl u-ence the TMT dynamics. The internal environment does not infl uence the TMT dynamics.
To test the relation between the environment and the management role, re-gression analysis and the method of least squares are used. The dependent variable is the TMT dynamics, and the independent variables are the external and internal environment.
The table 10 shows that the internal environment is important for the ex-planation of the TMT dynamics with a high t value of 5.661, which says that we can with 99% reliability, reject the hypothesis that the coeffi cient related to this variable is zero. On the other hand, the external environment has a low t value (-

M. GONAN BOŽAC, D. TIPURIĆ: Top Management's Attitudes - Based SWOT Analysis... EKONOMSKI PREGLED, 57 (7-8) 429-474 (2006) 459
1.044) and from p>0.05 (0.299) it can be concluded that the external environment is not important for the explanation of the motion of the TMT dynamics variable. Such a situation is also possible because of the multicolinear relation between the external and internal environments, that is why the model leaving out the external environment has been approached. The model indicates that the internal environ-ment is important for the explanation of the TMT dynamics. Furthermore, the coeffi cients have not undergone bigger changes in relation to the previous model, thus the hypothesis about a multicolinear relation between the internal and ex-ternal environment can be rejected. A comparison of the year 2005 with the year 1999 shows that in 2005 the external environment becomes important to manag-ers for the TMT dynamics. The t value of the coeffi cient related to the external environment is (2.077), and from its p value it can be concluded that the
Table 10
TESTING THE RELATION BETWEEN THE ENVIRONMENT AND THE TMT DYNAMICS WITH T VALUES IN BRACKETS
Model99 1 Model99 2 Model 2005Constant
t
p
1.742
(2.17)
(0.033)
1.236
(1.926)
(0.057)
1.153
(1.462)
(0.148)External environment
t
p
-0.199
(-1.044)
(0.299)
0.308
(2.077)
(0.0.42)Internal environment
t
p
0.900
(5.661)
(0.000)
0.849
(5.611)
(0.000)
0.641
(4.948)
(0.000)Adjusted R2 0.254 0.253 0.321F
p
16.304
(0.000)
31.486
(0.000)
15.868
(0.000)
hypothesis that this coeffi cient is zero cannot be rejected. The conclusion is there-fore that the external environment variable is statistically important at the reliabil-ity level of 95%. Other coeffi cients, as well as the indicators of regression quality, have not changed signifi cantly in relation to the year 1999.

M. GONAN BOŽAC, D. TIPURIĆ: Top Management's Attitudes - Based SWOT Analysis... EKONOMSKI PREGLED, 57 (7-8) 429-474 (2006)460
The adjusted determination coeffi cient (R2) is relatively low with both mod-els (25.4%), but in this kind of analysis even lower values are common. High t-values are essential.
Additional testing has been done by means of partial correlation coeffi cient between the TMT dynamics and the internal environment for the year 1999, with the external environment under control, and the testing between the TMT dynam-ics and the external environment with the internal environment under control. The table below confi rms the results obtained with regression analysis, that is, there is no signifi cant relation between the external environment and the TMT dynamics when the internal environment is under control. However, there is a signifi cant statistical relation (p<0.01) between the TMT dynamics and the internal environ-ment when the external environment variable is controlled.
In 2005 the partial correlation coeffi cients also confi rm the results obtained by regression, and with 95% reliability we can argue that both, the external and the internal environment, have a signifi cant linear relation with the TMT dynam-ics.
Table 11
PARTIAL CORRELATION BETWEEN THE TMT DYNAMICS, THE EXTERNAL AND INTERNAL ENVIRONMENT
WITH P VALUES IN PARENTHESIS
Partial correlation coeffi cient with the TMT dynamicsExternal environment Internal environment
1999 2005 1999 2005-0.111
(0.299)
0.246
(0.042)
0.517
(0.000)
0.517
(0.000)
Conclusion
In an attempt to verify the purpose of existence of the Croatian seaside hotel companies and their strategic objectives, the CEOs and his TMT members should observe the external and internal environment in order to be able to carry out ap-propriate adjustments, meet the guests’ requirements and expectations and, as a key issue, achieve and retain competitive advantages.

M. GONAN BOŽAC, D. TIPURIĆ: Top Management's Attitudes - Based SWOT Analysis... EKONOMSKI PREGLED, 57 (7-8) 429-474 (2006) 461
The majority of Croatian accommodation capacities are seaside location and they require qualitative and quantitative improvements compared to competitive Mediterranean countries.
The fi eld research was carried out by means of a questionnaire in 1999, when 119 managers were examined, and in 2005 when 96 were examined. The integra-tion of the most important elements of the external and internal environment and their interpretation sets up a good starting position to underline the importance of the government’s role as well as to gain insights into the situation of companies in order to choose appropriate corporation strategies. With external factors it is necessary to focus basic attention on the state fi scal and tax policies, and with the internal environment on the group of so called “neutral factors”.
The correlation coeffi cients table shows that many variables are signifi cantly correlated at the level of signifi cance of 5% and at the level of 1%.
Scale reliability analysis has shown that the scales, by means of which the testing had been carried out, are reliable.
Regression analysis and testing by means of partial correlation coeffi cients, used in testing the relation between the environment and the TMT dynamics, have shown that in 1999 there is no signifi cant linear relation between the external environment and the TMT dynamics, but that the relation is indirect through the internal environment. In 2005 the same analyses indicates that there is a signifi -cant statistical relation between the external and internal environment and the TMT dynamics.
In conclusion, with the TOWS matrix the theoretical approach to time di-mension has been confi rmed, that is, there can be observed “the moving or slight shifting” like the moving of factors in the same picture taken in 1999. The regres-sion analysis indicates that in relation to the year 1999, except for the internal environment factors and the TMT dynamics, there is a statistically signifi cant rela-tion between the external environment and the TMT dynamics as well.
BIBLIOGRAPHY
1. Barney, J.B. (1991). “Firm resources and sustained competitive advantage”, Journal of Management 17: 99-129.
2. Bantel K., Jakson, S. (1989). Top Management and Innovations in Banking: Does the Composition of the Top Team Make a Difference? Strategic Man-agement Journal, 10: 107-124.
3. Costa, J. and Teare, R. (1994). “Environmental scanning and the Portuguese hotel sector”, International Journal of Contemporary Hospitality, (6), 5: 4-8.
M. GONAN BOŽAC, D. TIPURIĆ: Top Management's Attitudes - Based SWOT Analysis... EKONOMSKI PREGLED, 57 (7-8) 429-474 (2006)462
4. Čačić, I. and Ilišković, S. (2003). “Development strategy of Croatian tourism up to the year 2010”, Ministry of sea, tourism, transport and development, Final version, Zagreb, str. 32.
5. Daft, R.L., Bettenhausen K.R., Tyler B.B. (1985). Implication of Top Man-agers’ Communications Choices for Strategic Decision. In Organizational Change and Redesign, Hrber G. P., Glick W.H. (Editors), New York: Oxford University Press.
6. Dyson, R.G. (2002). “Strategic development and SWOT analysis at the Univer-sity of Warwick”, European Journal of Operational Research, 152: 631-640.
7. Europe in Figures, Eurostat Yearbook 2005, Chapter 6 8. Finkelstein, S. and Hambrick, D.C. (1990). “Top Management Team Tenure
and Organizational Outcomes: the Moderating Role of Managerial Discre-tion”, Administrative Science Quarterly, (35), 3: 484-503.
9. Gonan Božac, M. (2001). “Interdependences between strategies and organi-sational structure”, Ph D thesis, University of Zagreb, Faculty of Economics Zagreb.
10. Hendija, Z.(2005). “Nights spent in hotels in Europe (1993 to 2003)”, Turi-zam, March: 298-299.
11. Hitt, A.M. (2005). “Spotlight on strategic management”, Business Horizonts, 48: 371-377.
12. Keck, S. L., Tushman, M. L. (1993). “Environmental and Organisational Context and Executive Team Characteristics“, Academy of Management Journal, 36: 1314-1344.
13. Louis Berger S.A. (2005). “The European Union’s CARDS Programme for Croatia, Master and marketing tourism plan: Region Šibenik-Knin“, Section I and II, January.
14. Novicevic, M.M. and Harvey, M. (2004). “Dual-perspective SWOT: a syn-thesis of marketing intelligence and planning“, Marketing Intelligence & Planning, (22), 1: 84-94.
15. Radnić, A. at all. (2002). Development strategy of the Republic of Croatia “Croatia in the 21st century”, The Institute for Tourism, Zagreb, 2002, str. 7.
16. Sutclife, K. M. (1994). “What executives notice: Accurate perceptions in top management teams”, Academy of Management Journal 37: 1360-1378.
17. Tipurić, D. (2006). Nadzorni odbor i korporativno upravljanje, First edition, Zagreb: Sinergija
18. The World Tourism Organisation: “Tourism 2020 Vision“, www.world tourism,org/facts/eng/vision.htm [Accessed 25.10.2005]
19. Valentin, E.K. (2001). “SWOT analysis from a resource-based view”, Jour-nal of Marketing Theory and Practice, (9), 2:54-70

M. GONAN BOŽAC, D. TIPURIĆ: Top Management's Attitudes - Based SWOT Analysis... EKONOMSKI PREGLED, 57 (7-8) 429-474 (2006) 463
SWOT ANALIZA TEMELJENA NA STAVOVIMA MENADŽERA TRGOVAČKIH DRUŠTAVA IZ PODRUČJA “HOTELI I RESTORANI”
U REPUBLICI HRVATSKOJ
Sažetak
Svrha istraživanja je razumijevanje stavova timova vrhovnih menadžera o okruženju trgovačkih društava iz djelatnosti Hoteli i restorani u Republici Hrvatskoj u 1999. i 2005. godini. Empirijska istraživanja provedena su 1999. i 2005. godine pomoću upitnika. Istraživanjima su ispitani stavovi članova timova vrhovnih menadžera o vanjskom i unu-tarnjem okruženju. U radu je korištena SWOT analiza, korelacija, analiza pouzdanosti skale i regresijska analiza kako bi se ispitala situacija i tendencije u ovoj djelatnosti.
Argumentira se stajalište autora o primjerenosti “zaustavljanja” na SWOT analizi i savjetuje se usmjeravanje vrhovnog menadžmenta dioničkih društava iz ove djelatnosti na ojačavanje unutarnjih čimbenika u grupi ni snage ni slabosti umjesto fokusiranja na strategije po TOWS matrici. Ovo je ključna pretpostavka za gradnju i stjecanje konkurent-nih prednosti temeljem kojih se može djelovati na prijetnje iz vanjskog okruženja. Analiza pouzdanosti skale pokazala je da su skale korištene u radu pouzdane. Regresijska analiza i koefi cijenti parcijalne korelacije korišteni za ispitivanje povezanosti između okruženja i dinamike članova tima vrhovnih menadžera pokazali su da u 1999. godini nije bilo statistički značajne veze između vanjskog okruženja i dinamike, ali je veza bila indirektna - preko unutarnjeg okruženja. Ista je analiza 2005. godine pokazala da i vanjsko i un-utarnje okruženje imaju statistički značajnu linearnu vezu s dinamikom tima vrhovnih menadžera.
Ključne riječi: tim vrhovnih menadžera, stavovi, djelatnost Hoteli i restorani, statistička analiza

M. GONAN BOŽAC, D. TIPURIĆ: Top Management's Attitudes - Based SWOT Analysis... EKONOMSKI PREGLED, 57 (7-8) 429-474 (2006)464
App
endi
x A
Tabl
e 12
CO
RR
ELAT
ION
CO
EFFI
CIE
NTS
OF
EXTE
RN
AL
ENV
IRO
NM
ENTS
FA
CTO
RS
IN C
RO
ATIA
N H
OTE
L C
OM
PAN
IES
BY
TH
E SE
A IN
199
9
VAR
1VA
R2
VAR
3VA
R4
VAR
5VA
R6
VAR
7VA
R8
VAR
9VA
R10
VAR
11
VAR
12VA
R13
VAR
14VA
R1
1.00
00VA
R2
.379
**1.
0000
VAR
3.5
86**
.346
**1.
0000
VAR
4.0
99.1
98.1
941.
0000
VAR
5.3
22**
.115
.343
**.3
99**
1.00
00VA
R6
.271
**.2
38*
.329
**.5
94**
.496
**1.
0000
VAR
7.2
08*
.133
.249
*.4
67**
.379
**.3
13**
1.00
00VA
R8
.132
.126
.164
.233
*.5
11**
.300
**.4
84**
1.00
00VA
R9
.130
.149
.224
*.2
23*
.350
**.3
26**
.503
**.5
60**
1.00
00VA
R10
.192
.169
.253
*.3
32**
.247
*.4
56**
.439
**.2
91**
.422
**1.
0000
VAR
11.2
56*
.108
.287
**.2
83**
.300
**.3
87**
.424
**.6
09**
.441
**.3
78**
1.00
00VA
R12
.349
**.2
95**
.343
**.4
86**
.408
**.5
03**
.518
**.4
05**
.507
**.4
81**
.402
**1.
0000
VAR
13.6
23**
.207
*.7
13**
.104
.325
**.2
30*
.324
**.1
97.1
16.2
63*
.302
**.3
20**
1.00
00VA
R14
.382
**.0
66.3
39**
.024
.325
**.2
33*
.123
.166
.179
.022
.193
.186
.399
**1.
0000
VAR
15.4
61**
.121
.511
**.0
56.2
84**
.376
**.1
81.0
91.0
82.2
63*
.101
.280
**.5
25**
.470
**VA
R16
.580
**.1
30.5
44**
.082
.257
*.3
26**
.198
.154
.092
.219
*.3
15**
.313
**.5
34**
.431
**VA
R17
.428
**.1
51.5
37**
.223
*.3
18**
.324
**.2
30*
.033
.038
.192
.166
.310
**.4
35**
.399
**VA
R18
.005
.153
.079
.201
.056
.069
.336
**-.0
30.0
37.2
16*
.072
.145
-.001
.000
VAR
19.0
38.0
68.1
53.0
07.0
63.0
71.2
25*
.083
.126
.041
.012
.106
.089
-.003
VAR
20.1
01.0
14.1
21.0
92.0
51.0
85.0
72.1
67.1
40.1
73.1
43.1
80.0
35-.0
19VA
R21
.282
**.1
79.2
73**
.170
.233
*.2
48*
.163
.178
.226
*.0
97.2
53*
.376
**.1
71.3
05**
VAR
22.2
32*
.330
**.2
97**
.181
.155
.145
.174
.031
.143
.032
.064
.304
**.2
49*
.065
VAR
23.2
58*
.318
**.3
00**
.210
*.2
36*
.179
.269
**.0
83.1
81.1
44.1
54.4
17**
.284
**.1
00VA
R24
.171
.220
*.2
06*
.259
*.1
74.1
38.1
05.0
97.1
55.0
92.0
28.2
81**
.100
.012
VAR
25.1
88.2
56*
.207
*.2
10*
.156
.238
*.1
04.1
80.2
15*
.301
**.1
55.2
94**
.176
.118

M. GONAN BOŽAC, D. TIPURIĆ: Top Management's Attitudes - Based SWOT Analysis... EKONOMSKI PREGLED, 57 (7-8) 429-474 (2006) 465
VAR
15VA
R16
VAR
17VA
R18
VAR
19VA
R20
VAR
21VA
R22
VAR
23VA
R24
VAR
25VA
R15
1.00
00VA
R16
.759
**1.
0000
VAR
17.6
14**
.694
**1.
0000
VAR
18.0
92.0
62.1
991.
0000
VAR
19.1
09.0
83.2
74**
.098
1.00
00VA
R20
-.018
.021
.082
.230
*-.0
321.
0000
VAR
21.2
24*
.322
**.3
69**
.350
**-.1
19.3
31**
1.00
00VA
R22
.062
.016
.091
.332
**.0
60.1
48.5
44**
1.00
00VA
R23
.083
.144
.238
*.3
42**
.164
.199
.443
**.6
65**
1.00
00VA
R24
.009
.067
.153
.295
**.0
75.2
44*
.413
**.4
50**
.623
**1.
0000
VAR
25.2
08*
.187
.143
.242
*-.1
20.2
79**
.326
**.1
95.3
49**
573*
*1.
0000
n =
91
*p<0
,05
**p<
0,01

M. GONAN BOŽAC, D. TIPURIĆ: Top Management's Attitudes - Based SWOT Analysis... EKONOMSKI PREGLED, 57 (7-8) 429-474 (2006)466
Tabl
e 13
CO
RR
ELAT
ION
CO
EFFI
CIE
NTS
OF
EXTE
RN
AL
ENV
IRO
NM
ENTS
FA
CTO
RS
IN C
RO
ATIA
N H
OTE
L C
OM
PAN
IES
BY
TH
E SE
A IN
200
5
VAR
1VA
R2
VAR
3VA
R4
VAR
5VA
R6
VAR
7VA
R8
VAR
9VA
R10
VAR
11
VAR
12VA
R13
VAR
14VA
R1
1.00
00VA
R2
.192
1.00
00VA
R3
.150
.641
**1.
0000
VAR
4.0
12.1
48.1
351.
0000
VAR
5.1
35.3
44**
.314
**.4
30**
1.00
00VA
R6
-.009
.152
.117
.597
**.4
16**
1.00
00VA
R7
.194
.291
*.3
24**
.503
**.4
41**
.508
**1.
0000
VAR
8.1
45.2
55*
.305
**.3
30**
.611
**.5
18**
.648
**1.
0000
VAR
9.0
23.2
57*
.363
**.4
46**
.466
**.5
13**
.685
**.6
10**
1.00
00VA
R10
.074
.095
.113
.485
**.2
65*
.379
**.5
79**
.402
**.4
04**
1.00
00VA
R11
-.104
.242
*.3
82**
.347
**.5
72**
.377
**.3
92**
.562
**.4
83**
.446
**1.
0000
VAR
12.0
86.1
87.1
65.3
32**
.386
**.3
93**
.440
**.5
06**
.363
**.6
36**
.483
**1.
0000
VAR
13.0
89.3
17**
.206
.059
.260
*.2
26.1
60.2
63*
.113
.036
.068
.279
*1.
0000
VAR
14.0
61.1
27.2
59*
.264
*.2
47*
.300
*.3
84**
.275
*.3
07**
.305
**.1
64.3
16**
.479
**1.
0000
VAR
15.2
30.0
79.0
97.0
45-.1
80-.0
19.0
91.0
31-.0
11.1
72-.0
68.1
10.2
58*
.293
*VA
R16
.170
.105
.274
*.2
26.1
83.3
06**
.270
*.2
54*
.256
*.1
09.0
39.2
15.4
98**
.618
**VA
R17
.264
*.1
25.2
74*
.023
.135
.225
.343
**.3
61**
.308
**.2
57*
.158
.202
.327
**.3
47**
VAR
18.0
70.0
37.0
46-.0
46.1
00.0
29.1
60.1
12.1
27-.0
19-.0
31-.0
76.0
89.1
95VA
R19
.034
-.038
.026
.257
*.1
11.2
59*
.139
.198
.083
.049
.157
-.136
-.031
.008
VAR
20-.1
89-.0
08.0
51.3
28**
.285
*.2
59*
.285
*.2
64*
.259
*.2
45*
.266
*.2
18.1
51.1
64VA
R21
.012
.127
.031
.232
*.1
48.2
31.3
21**
.311
**.2
22.1
82.1
46.2
24.2
05.1
71VA
R22
-.013
-.037
-.070
.264
*.0
78.2
12.3
05**
.207
.201
.135
-.128
.089
.175
.137
VAR
23-.1
12-.1
12-.1
15.2
65*
.071
.256
*.3
68**
.235
*.2
32*
.223
.045
.192
.193
.024
VAR
24.0
56.0
80.0
65.1
74.1
68.1
92.0
89.1
68.1
44-.0
40.0
30.1
35.3
27**
.239
*VA
R25
.086
.241
*.2
26.1
33.1
98.1
65.1
56.1
85.1
90.0
16.0
74.1
31.3
17**
.095

M. GONAN BOŽAC, D. TIPURIĆ: Top Management's Attitudes - Based SWOT Analysis... EKONOMSKI PREGLED, 57 (7-8) 429-474 (2006) 467
VAR
15VA
R16
VAR
17VA
R18
VAR
19VA
R20
VAR
21VA
R22
VAR
23VA
R24
VAR
25VA
R15
1.00
00VA
R16
.585
**1.
0000
VAR
17.4
91**
.612
**1.
0000
VAR
18.2
71*
.308
**.2
59*
1.00
00VA
R19
-.031
-.116
-.102
-.082
1.00
00VA
R20
.024
.232
*.1
13.0
74.0
051.
0000
VAR
21.3
55**
.407
**.3
78**
.146
-.025
327*
*1.
0000
VAR
22.3
01*
.419
**.2
96*
.116
-.044
.493
**.6
66**
1.00
00VA
R23
.212
.222
.092
.046
-.045
.455
**.5
53**
.672
**1.
0000
VAR
24.1
29.2
75*
.012
.239
*-.0
31.3
00*
.508
**.5
00**
.531
**1.
0000
VAR
25-.0
59.0
47-.0
05.0
63-.0
35.2
47*
.247
*.1
99.2
22.5
77**
1.00
00
n =
72
*p<0
,05
**p<
0,01

M. GONAN BOŽAC, D. TIPURIĆ: Top Management's Attitudes - Based SWOT Analysis... EKONOMSKI PREGLED, 57 (7-8) 429-474 (2006)468
Tabl
e 14
CO
RR
ELAT
ION
CO
EFFI
CIE
NTS
OF
INTE
RN
AL
ENV
IRO
NM
ENTS
FA
CTO
RS
IN C
RO
ATIA
N H
OTE
L C
OM
PAN
IES
BY
TH
E SE
A IN
199
9
VAR
26VA
R27
VAR
28VA
R29
VAR
30VA
R31
VAR
32VA
R33
VAR
34VA
R35
VAR
36VA
R37
VAR
38VA
R39
VAR
40VA
R41
VAR
261.
0000
VAR
27.7
54**
1.00
00VA
R28
.642
**.6
36**
1.00
00VA
R29
.770
**.7
75**
.662
**1.
0000
VAR
30.6
59**
.733
**.5
87**
.832
**1.
0000
VAR
31.6
93**
.670
**.9
3**
.788
**.6
56**
1.00
00VA
R32
.143
.207
*.1
46.1
98.2
59*
.219
*1.
0000
VAR
33.2
59*
.319
**.1
74.1
51.1
79.3
57**
.278
**1.
0000
VAR
34.1
99.2
46*
.308
**.3
48**
.264
*45
4**
.377
**.4
75**
1.00
00VA
R35
.206
.388
**.2
68*
.301
**.3
07**
.384
**.2
71**
.237
*.2
59*
1.00
00VA
R36
.313
**.3
19**
.316
**.2
82**
.316
**.3
76**
.188
.293
**.2
71**
.234
*1.
0000
VAR
37.2
19*
.288
**.2
17*
.314
**.3
62**
.359
**.2
35*
.317
**.4
69**
.242
*.5
75**
1.00
00VA
R38
.160
.309
**.1
44.3
39**
.478
**.2
48*
.319
**.1
02.2
66*
.224
*.2
62*
.421
**1.
0000
VAR
39.1
80.3
07**
.134
.325
**.3
31**
.293
**.1
69.2
10*
.344
**.2
03.3
27**
.320
**.7
84**
1.00
00VA
R40
.071
.212
*-.0
62.1
97.2
83**
.140
.247
*.1
40.1
31.1
75.1
82.3
69**
.687
**55
7**
1.00
00VA
R41
.063
.190
.096
.097
.214
*.1
14.1
38.2
36*
.093
.068
.143
.042
.229
*.1
12.3
19**
1.00
00
n=91
*p <
0,05
**p<
0,01

M. GONAN BOŽAC, D. TIPURIĆ: Top Management's Attitudes - Based SWOT Analysis... EKONOMSKI PREGLED, 57 (7-8) 429-474 (2006) 469
Tabl
e 15
CO
RR
ELAT
ION
CO
EFFI
CIE
NT
OF
INTE
RN
AL
ENV
IRO
NM
ENTS
IN C
RO
ATIA
N H
OTE
L C
OM
PAN
IES
BY
TH
E SE
A IN
200
5
VAR
26VA
R27
VAR
28VA
R29
VAR
30VA
R31
VAR
32VA
R33
VAR
34VA
R35
VAR
36VA
R37
VAR
38VA
R39
VAR
40VA
R41
VAR
261.
0000
VAR
27.7
91**
1.00
00VA
R28
.667
**.7
93**
1.00
00VA
R29
.744
**.7
64**
.657
**1.
0000
VAR
30.6
58**
.825
**.6
98**
.883
**1.
0000
VAR
31.5
82**
.657
**.6
46**
.738
**.7
62**
1.00
00VA
R32
-.010
.000
.006
.026
-.059
.221
1.00
00VA
R33
.114
.045
.021
.212
.177
.073
.238
*1.
0000
VAR
34.2
82*
.339
**.2
56*
.369
**.4
09**
.410
**.1
76.2
291.
0000
VAR
35.2
95*
.358
**.3
20**
.393
**.3
54**
.314
**.3
19**
.340
**.2
77*
1.00
00VA
R36
.385
**.3
04**
.310
**.4
43**
.406
**.4
35**
.126
.256
**.1
77.4
48**
1.00
00VA
R37
-.087
-.070
-.042
.070
.054
.045
.242
*.3
90**
.047
.434
**.3
61**
1.00
00VA
R38
.131
.293
*.0
95.2
64*
.304
**.3
04**
.322
**.2
95*
.239
*.3
66**
.279
*.2
48*
1.00
00VA
R39
.169
.244
*.1
40.2
80*
.257
*.3
30**
.392
**.3
32**
.319
**.3
52**
.270
*.2
69*
.867
**1.
0000
VAR
40.1
28.3
17**
.145
.283
*.3
13**
.240
*.4
85**
.297
*.3
05**
.409
**.2
89*
.240
*.7
31**
.721
**1.
0000
VAR
41.0
65.1
93.0
41.0
92.2
45*
.072
.083
.238
*.2
24.2
55*
.229
.059
.408
**.3
56**
.510
**1.
0000
n=72
*p <
0,05
**p<
0,01

M. GONAN BOŽAC, D. TIPURIĆ: Top Management's Attitudes - Based SWOT Analysis... EKONOMSKI PREGLED, 57 (7-8) 429-474 (2006)470
Appendix B
Table 16
THE EXTERNAL ENVIRONMENTS SCALE RELIABILITY ANALYSIS OF CROATIAN HOTEL COMPANIES BY THE SEA IN 1999
– FINAL RESULT
External environment factors Scale Mean if Item Deleted
Scale Variance if
Item Deleted
Corrected Item-Total Correlation
Cronbach’s Alpha if Item
DeletedThe state fi scal and tax policies 81.6154 362.106 .547 .883Availability of capital 80.0549 358.430 .360 .888Cost of capital 81.4725 350.674 .611 .881Availability of managers 79.1319 358.227 .449 .885Cost of managers 79.2527 358.035 .535 .883Managers’ quality 79.2308 345.891 .568 .881Availability of seasonal workers 78.4725 349.585 .535 .882Cost of seasonal workers 79.2088 362.745 .425 .885Seasonal workers’ quality 79.8571 357.924 .451 .885Availability of permanent workers 78.3846 356.639 .471 .884
Cost of permanent workers 79.4396 355.916 .479 .884Permanent workers’ quality 79.0330 340.966 .680 .878Levels of purchasing wholesale prices 81.0659 354.573 .542 .882
The facilities in terms of contents and space available in competitive countries
80.9890 364.300 .369 .887
Political and state leaders’ attitudes and actions 80.8352 357.406 .483 .884
Laws, regulations and other decisions at state level 80.8022 356.116 .532 .883
Decisions at local government and self-government level 80.6044 356.042 .523 .883
State of environmental preservation 77.2857 368.006 .273 .890
Business moral 79.0989 351.046 .510 .883Domestic population’s attitudes 78.3626 364.456 .399 .886Domestic population’s expectations 78.2308 358.024 .505 .883
Guests’ expectations 77.7802 365.084 .386 .886Guests’ set of values 78.2088 358.967 .419 .886

M. GONAN BOŽAC, D. TIPURIĆ: Top Management's Attitudes - Based SWOT Analysis... EKONOMSKI PREGLED, 57 (7-8) 429-474 (2006) 471
Table 17
THE EXTERNAL ENVIRONMENTS SCALE RELIABILITY ANALYSIS OF CROATIAN HOTEL COMPANIES BY THE SEA IN 2005
– FINAL RESULT
External environment factors Scale Mean if Item Deleted
Scale Variance if
Item Deleted
Corrected Item-Total Correlation
Cronbach’s Alpha if Item
DeletedAvailability of capital 78.3611 324.938 .336 .883Cost of capital 78.9306 323.446 .383 .881Availability of managers 78.9444 321.941 .521 .877Cost of managers 78.9722 319.971 .557 .876Managers’ quality 79.0278 313.858 .578 .875Availability of seasonal workers 79.3750 300.153 .694 .870 Cost of seasonal workers 78.8472 312.526 .679 .872Seasonal workers’ quality 79.7500 308.725 .633 .873Availability of permanent workers 78.6944 322.525 .484 .878
Cost of permanent workers 78.9722 321.661 .475 .878Permanent workers’ quality 78.6389 314.178 .538 .876Levels of purchasing wholesale prices 79.0139 323.648 .422 .880
The facilities in terms of contents and space available in competitive countries
80.1944 320.018 .477 .878
Laws, regulations and other decisions at state level 80.0833 321.852 .505 .877
Decisions at local government and self-government level 79.8750 324.702 .418 .880
Green «association» 78.4306 328.277 .434 .879Business moral 78.2500 318.134 .497 .877Domestic population’s attitudes 78.2639 326.620 .415 .880Domestic population’s expectations 78.0833 330.303 .405 .880
Guests’ expectations 77.2083 328.083 .394 .880Guests’ set of values 77.6389 327.220 .325 .883

M. GONAN BOŽAC, D. TIPURIĆ: Top Management's Attitudes - Based SWOT Analysis... EKONOMSKI PREGLED, 57 (7-8) 429-474 (2006)472
Table 18
THE INTERNAL ENVIRONMENT SCALE RELIABILITY ANALYSIS OF CROATIAN HOTEL COMPANIES BY THE SEA IN 1999
– FINAL RESULT
Internal environment factorsScale Mean
if Item Deleted
Scale Variance if
Item Deleted
Corrected Item-Total Correlation
Cronbach’s Alpha if Item
DeletedProcedure of setting objective 49.1648 149.161 .662 .876Quality of setting objectives 48.8022 145.849 .757 .871Possibility of controlling objectives 49.2637 149.219 .608 .879The process of strategy formulation 49.2308 142.913 .781 .869Strategies quality 49.0110 144.967 .753 .871Coordination between strategies and the organizational structure 49.3736 148.126 .772 .871
The company size 48.4945 163.942 .376 .889Stage in the company’s life cycle 49.5055 156.875 .479 .886Managerial structure competence 48.6813 159.708 .404 .889Permanent workers’ motivation 50.2198 156.951 .480 .885Seasonal workers’ competence 50.4615 158.962 .512 .884The tourist supply quality 49.7802 157.484 .467 .886The tourist supply variety 50.2088 157.389 .468 .886
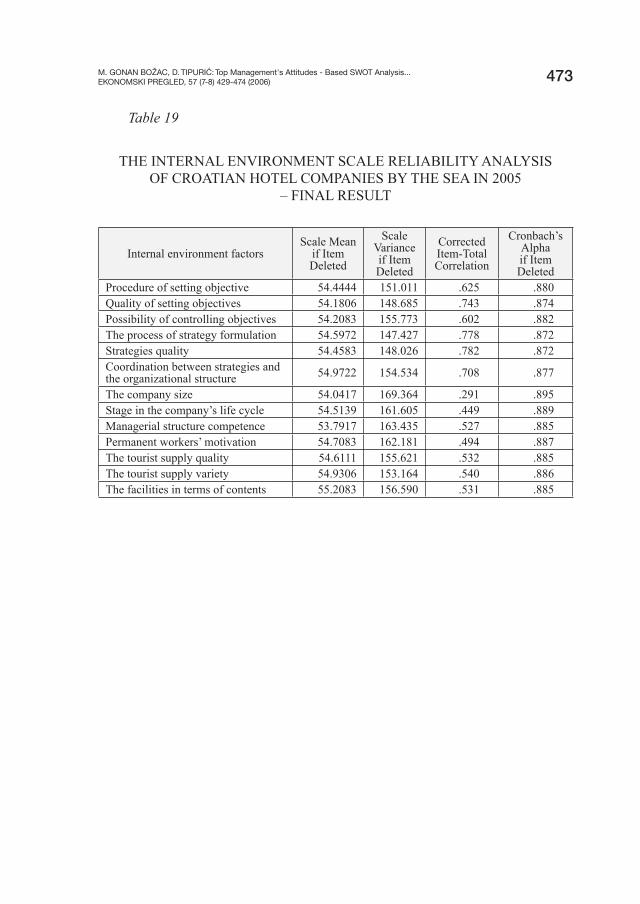
M. GONAN BOŽAC, D. TIPURIĆ: Top Management's Attitudes - Based SWOT Analysis... EKONOMSKI PREGLED, 57 (7-8) 429-474 (2006) 473
Table 19
THE INTERNAL ENVIRONMENT SCALE RELIABILITY ANALYSIS OF CROATIAN HOTEL COMPANIES BY THE SEA IN 2005
– FINAL RESULT
Internal environment factorsScale Mean
if Item Deleted
Scale Variance if Item Deleted
Corrected Item-Total Correlation
Cronbach’s Alpha if Item Deleted
Procedure of setting objective 54.4444 151.011 .625 .880Quality of setting objectives 54.1806 148.685 .743 .874Possibility of controlling objectives 54.2083 155.773 .602 .882The process of strategy formulation 54.5972 147.427 .778 .872Strategies quality 54.4583 148.026 .782 .872Coordination between strategies and the organizational structure 54.9722 154.534 .708 .877
The company size 54.0417 169.364 .291 .895Stage in the company’s life cycle 54.5139 161.605 .449 .889Managerial structure competence 53.7917 163.435 .527 .885Permanent workers’ motivation 54.7083 162.181 .494 .887The tourist supply quality 54.6111 155.621 .532 .885The tourist supply variety 54.9306 153.164 .540 .886The facilities in terms of contents 55.2083 156.590 .531 .885

M. GONAN BOŽAC, D. TIPURIĆ: Top Management's Attitudes - Based SWOT Analysis... EKONOMSKI PREGLED, 57 (7-8) 429-474 (2006)474
Table 20
THE TMT DYNAMICS SCALE RELIABILITY ANALYSIS OF CROATIAN HOTEL COMPANIES BY THE SEA IN 1999 – FINAL RESULT
Statements Scale Mean if Item Deleted
Scale Variance if Item Deleted
Corrected Item-Total Correlation
Cronbach’s Alpha if Item Deleted
Team members willingly cooperate with each other 23.6593 74.894 .885 .960
Confl ict is dealt with openly and effectively 23.9560 71.820 .836 .966
The arguments are the main point in decision making 23.5604 73.182 .887 .959
There is a high level of mutual trust among team members 23.6813 73.220 .902 .958
There is a high level of tolerance among team members 23.5385 73.407 .919 .956
The professional authority is respected in the team. 23.4725 72.185 .917 .956
Table 21
THE TMT DYNAMICS SCALE RELIABILITY ANALYSIS OF CROATIAN HOTEL COMPANIES BY THE SEA IN 2005 – FINAL RESULT
StatementsScale Mean
if Item Deleted
Scale Variance if Item Deleted
Corrected Item-Total Correlation
Cronbach’s Alpha if Item Deleted
Team members willingly cooperate with each other 26.2500 44.359 .790 .947
Confl ict is dealt with openly and effectively 26.7639 42.549 .809 .945
The arguments are the main point in decision making 26.3333 42.732 .866 .938
There is a high level of mutual trust among team members 26.5278 42.196 .896 .934
There is a high level of tolerance among team members 26.3889 45.030 .866 .939
The professional authority is respected in the team. 26.1389 42.966 .861 .939


![Hrvatski jezik među Australcima hrvatskog podrijetla [Croatian language maintenance amongst Croatian-Australians]](https://static.fdokumen.com/doc/165x107/6331ed57b6829c19b80bb897/hrvatski-jezik-medu-australcima-hrvatskog-podrijetla-croatian-language-maintenance.jpg)


