
Aristotle's 'Cosmic Nose' Argument for the Uniqueness of the World
Upload
independentCategory
view
0download
0
Bank Borrowers and Loan Sales: New Evidence on the Uniqueness of Bank Loans
Sandeep Dahiya*, Manju Puri †, Anthony Saunders‡
July 2000
Abstract
This paper examines the information content of the announcement of the sale of a borrower’s loan by its bank. A large body of research has documented the positive impact on a firm’s stock price around the announcement of formation and renewal of bank lending relationships. In light of these findings it would seem natural that when a bank chooses to sell off its loans, the stock returns of the borrower would be adversely affected. Our paper is the first study to test this hypothesis. We find that the stock returns of these borrowers are significantly negatively impacted on average for the period surrounding the announcement of a loan sale. The post-loan sale period is also marked by a large incidence of bankruptcy filings by the borrowers whose loans are sold. Overall, the evidence supports the hypothesis that the news of a bank loan sale has a negative certification impact, which is validated by the subsequent performance of the firm whose loan is sold. We conduct similar event study tests for those banks that engage in loan sales and find that the stock returns of the selling banks are not significantly impacted on average. Cross-sectional tests reveal that loan sales were made by banks that emphasized trading income and had relatively large Commercial and Industrial loan portfolios. For our sample period, a bank’s capital adequacy position did not appear to have a material effect on a bank’s decision to sell its loans.
JEL classification: G14, G21 Keywords: Loan sales, Lending relationship, Commercial banks.
* McDonough School of Business, Georgetown University, G-04 Old North, Washington DC 20057. Tel. (202) 687 3832, Email: [email protected] † Graduate School of Business, Stanford University, Stanford, CA 94305, Tel: (650) 723 3402, Email: [email protected] ‡ Stern School of Business, New York University, 44 West 4th Street, New York, NY 10012, Tel: (212) 998 0711, Email: [email protected] We would like to thank Linda Allen for helpful comments.

"An original lender on a $150 million Bradlees credit reportedly sold a $5 million piece of the revolver in a hurry last week, according to traders familiar with the situation, sending the message to some traders that the lenders most familiar with Bradlees are not comfortable with the company's situation. Because a long-term lender dumped the paper, and urgently, traders said they suspect the lender knew something they did not."
-Bank Letter dated 6/19/1995
1. Introduction
The secondary loan market for loans has been growing in recent times. While a
number of reasons for loan sales have been identified in the previous literature,1 there
have been no empirical studies of the effects of such sales on the returns of those bank
borrowers whose loans are sold or on the banks selling loans.
Conventional wisdom has long held that loan sales by banks -- especially loans of
customers who have established long-term customer relationships with that bank -- would
have a negative information effect regarding the borrowing firm. This effect would result
from the special or unique role of banks2 as “insiders” to the borrower firms, such that a
decision to sell a customer’s loan would be taken as revealing to the market hitherto
private (negative) information regarding a borrower’s financial condition. Indeed, while
the effect of loan sales on borrowers has been untested prior to this paper, such an effect
might be expected given the findings of James (1987), Lummer and McConnell (1989),
Best and Zhang (1993), Billett, Flannery and Garfinkel (1995) among others, that new
loans and loan renewals carry (positive) private information to the outside equity market
about a borrowing firm’s financial condition.3 Indeed, in a recent paper, James and 1 See for example Pennacchi (1988) and James (1988) who model the effects of loan sales on a bank’s capital position and its underinvestment problem. 2 The special information producing and monitoring functions of banks have been discussed by Campbell and Kracaw (1980), Diamond (1984) and Fama (1985). 3 James (1987) finds a significant positive impact of announcement of bank loan agreements; Lummer and McConnell (1989) document a positive impact of favorable loan renewals while non-renewals are accompanied by negative returns for the borrowers. Billet, Flannery, and Garfinkel (1995) show that the impact of loan announcements is positively related to the quality of the lender. Best and Zhang (1993) document evidence that the stock market reaction is strongest for those borrowers where the quality of

3
Smith (2000) provide a comprehensive review of the past and recent research on the
special nature of bank loan financing. Overall, they show that research to date finds a
robust, favorable, impact of bank loan announcements on borrowers' stock returns in
contrast to the insignificant or negative response of investors to the announcement of
most other forms of new security issuance (e.g. public debt and equity).
While the positive impact of news announcing the formation of a bank lending
relationship is well established, there is a paucity of studies examining the impact of the
termination of a banking relationship on a borrower's stock returns.4 In this paper we
employ a previously unutilized information source to identify loan sale events and test
the effects of such sales on borrowers. We conduct two tests. First, we test for and find a
significant negative impact of loan sale announcements on the stock returns of borrowers,
which is a mirror image of the established finding that the announcement of new lending
relationships (or their continuation) have a positive effect on a borrower's stock returns.
Our finding is both consistent with and extends the existing literature on this dimension.
Second, we examine if the negative information contained in the loan sale announcement
is validated in the long-term performance of firms whose loans are sold. We find that
almost half of these firms file for bankruptcy within three years of the loan sale
announcement.
We are also interested in the factors that influence a bank’s decision to sell its loans.
One possibility identified in the theoretical literature is that bank loan sales are motivated
by a bank's desire to mitigate “regulatory taxes” such as capital requirements. (see, for
example, Pennacchi (1988)). Moreover, loan sales may reflect the loan origination and
publicly available information is the poorest. Related to this evidence, Puri (1996), and Gande, et. al (1997), find a positive effect for the prices of new securities when the bank is both the lender and underwriter, suggesting that the bank’s certification role exists even in situations where there may be confounding effects due to the bank’s multiple roles. 4 Slovin, Shuska and Polonchek (1993) examine the impact of possible termination of lending relationships by examining the stock returns of borrowers of Continental Illinois Bank during the bank’s financial problems. Dahiya (2000) examines the impact of borrower distress on the lending bank when the lending relationship is likely to terminate following announcement of default or bankruptcy filing by the borrower of the bank.
4
distribution abilities of a bank. Consequently, we examine the motivation for a bank to
sell loans as well as the effect of a loan sale announcement on the selling bank's equity
returns. While cross sectional tests over our sample period revealed no significant
relationship between a bank's probability of selling a loan and its capital adequacy
position, the probability of a bank selling a loan does appear to be positively related to
the size of the bank’s commercial and industrial loan portfolio as well as its trading
income as a proportion of its assets. Finally, on average, loan sales appear to have had
little direct (net) impact on a bank’s equity return.
The outline of the paper is as follows: Section 2 discusses data sources and sample
selection. Section 3 presents the results of the tests relating the effects of loan sales on
borrower returns and the long run viability of the firm. Section 4 presents tests analyzing
the effects of loan sales on selling banks’ returns and characteristics. Section 5 is a
summary and conclusion.
2. Data and sample selection
The bank loan sales market is an over-the-counter, wholesale market in which
transactions are arranged through a network of dealers. Historically, trades took many
weeks to complete, however, dealers now work for completion of trades with a T+10 day
horizon.5 Typical sellers of bank loans are large wholesale money center (e.g. Citibank)
and overseas banks (e.g. ING Barings). Typical buyers of bank loans are smaller
regional banks, foreign banks, vulture funds (including hedge funds) as well as insurance
companies. (See, for example, Miller (1998)). Key sources of information about the
market are trade newsletters and screen services such as Bloomberg that list and identify
loan sales. In our study we use one market newsletter, Bank Letter, to identify the
5 Interviews with loan traders reveal an increased standardization in the custody, settlement and payment procedures surrounding loan sales in recent years.
5
secondary market sale of a bank loan by one of the original lenders. Bank Letter is a
weekly publication, and from our discussions with traders is one of the most widely
followed newsletters in the secondary loan market.6
As a first step in developing a sample of loan sales, all announcements of loan sales
published in Bank Letter for the period 1994 to 1998 were tabulated. This step yielded a
total of 107 loan sale announcements, including some sales of loans of non-US
borrowers. This list also included multiple sale announcements for the same borrower.
For example, there were 11 separate loan sale announcements for Mobilemedia in the
period 8/12/96 to 8/18/97. We then searched the CRSP daily price database for a match
to those firms whose loans had been sold, so as to determine the availability of an equity
price history around the date of announcement of a loan sale. This procedure yielded a
final sample of 29 firms for which a total of 57 loan announcements were reported in
Bank Letter.
As a second step we conducted an event study on the whole sample of 57 loan sale
announcements to examine the impact of such announcements on a borrower’s stock
return. To get a better understanding of how multiple announcements of loan sales (if
any), for the same borrower, affected a borrower’s stock price, we also conducted an
event study for the first loan sale announcement, second loan sale announcement and
third loan sale announcement of loans of the same borrower.
In order to examine the operating performance of the firms in the period before the
loan sale was made we compute financial characteristics (performance measures) of these
firms using data for the year prior to the year in which the loan sale took place. In
particular, we calculate a borrowing firm’s return on assets by dividing EBITDA
(Compustat data item # 13) by the book value total assets (Compustat data item # 6), total
6 Bank Letter has recently been renamed as Loan Market Week. It is published by Institutional Investor, Inc., which publishes a number of other well-known newsletters such as Bond Week, Derivatives Week and Corporate Financing Week.
6
leverage, computed by dividing book value of current liabilities and long term debt (sum
of Compustat item # 5 and # 9) by the book value of total assets, and investment
intensity, which is the ratio of capital expenditure (Compustat data item # 128) divided
by book value of total assets.
The borrowing firms whose loans were sold come from a number of industries; in
order to account for industry wide effects we adjust each borrowing firm’s performance
measures by median industry performance. For example, to calculate the industry-
adjusted return on assets we calculate this ratio for all firms in the Compustat files that
have the same 2-digit SIC code as the sample firm and take the median of these ratios.
This median return on assets for the industry is then subtracted from the return on assets
for the sample firm (for the same year). This procedure is carried out for all 29 firms
whose loans were sold so as to compute the industry-adjusted return on assets for every
firm in the sample.
To analyze the long-term performance of the sample of loan sale firms (in the post-
loan sale period) we focus on the survival rate of these firms after an announcement of
sale of their loan is made. To determine if any of the 29 firms in our sample filed for
bankruptcy after a bank announced the sale of a firm's loan we follow a two step
procedure. As a first step we match all the firms whose loans were sold against the list of
firms filing for Chapter 11 in the Bankruptcy Datasource.7 This step allowed us to
identify the firms that went bankrupt subsequent to the loan sale announcement. As a
second step, we searched the Dow Jones News Retrieval Service for any stories that
contained the sample firm’s name and the words "Chapter 11" or "bankruptcy" to confirm
if the news of the bankruptcy was reported in the public media. This step is a robustness
check to ensure that we identify all firms that file for bankruptcy after a loan sale.
7 The Bankruptcy Datasource is a database produced by New Generation Research, Boston. It is available through Securities Data Corporation as well as Lexis-Nexis. It is a comprehensive source of data on Chapter 11 filings (since 1988) by all firms that have public securities (debt and/or equities) outstanding and have more than 10 million in assets. All the 29 firms in our sample meet these criteria.

7
3. Test methodology and results
We employ the event study methodology of Dodd and Warner (1983) to estimate the
impact of a bank loan sale announcement on the stock return of the borrowing firm.8 The
abnormal returns are computed using the market model. The parameters of the market
model are estimated by regressing the firm’s common stock returns for the period 200
days before the event date (defined as the date of publication of Bank Letter announcing
the loan sale) to 50 days before the event date on the rate of return on CRSP’s dividend
inclusive, value-weighted index for NYSE/AMEX/Nasdaq stocks. The abnormal return
is computed as the difference between the observed return and the estimated return from
the market model. Cumulative abnormal return (CAR) is the sum of abnormal returns for
the days in the relevant event window.
The results for the event study are reported in Table 1. Panel A reports the
cumulative abnormal returns (CAR) for the entire sample of 57 loan sale announcements.
Panel B, Panel C and panel D, respectively, focus on the impact of the first loan sale
announcement and any subsequent second and third announcements of the sale of loans
of the same borrower. As can be seen, for various event windows (11 days, 7 days, 5
days and 3 days) the results reported in Table 1 provide strong evidence of a negative
news effect surrounding a bank loan sale announcement. From Table 1, Panel A, for a 3
day window surrounding the full sample of 57 loan sale announcements, the abnormal
return for the borrowers whose loans were sold are on average – 4.6%, significant at the
1% level. Moreover, as shown in panels B, C, and D, this abnormal return effect is not
8 For firms with multiple loan sale announcements there is an empirical issue of what estimation period should be used to obtain parameters of the market model. We use a 150-day period starting 200 days before the event date to 50 days before the event date as the estimation period. For the firms with multiple announcements the estimation period of sales after the first announcement may overlap with the event window of the preceding loan sale. For these firms we use the 150-day period before the first announcement to market model parameters and use these for subsequent announcements. The results are essentially unchanged if we do not use this modification and treat each announcement as an independent announcement.

8
only significant for the first loan sale announcement but also for the second. The third
loan sale announcement, for the same borrowers, shows mixed results and is based on a
very small sample of loan sales (N=7). Overall, these results are consistent with a bad
news (information) effect arising from loan sales of any given borrower’s loans, i.e., the
converse of the good news effect of new loan announcements or renewals (see, James
(1987), for example).
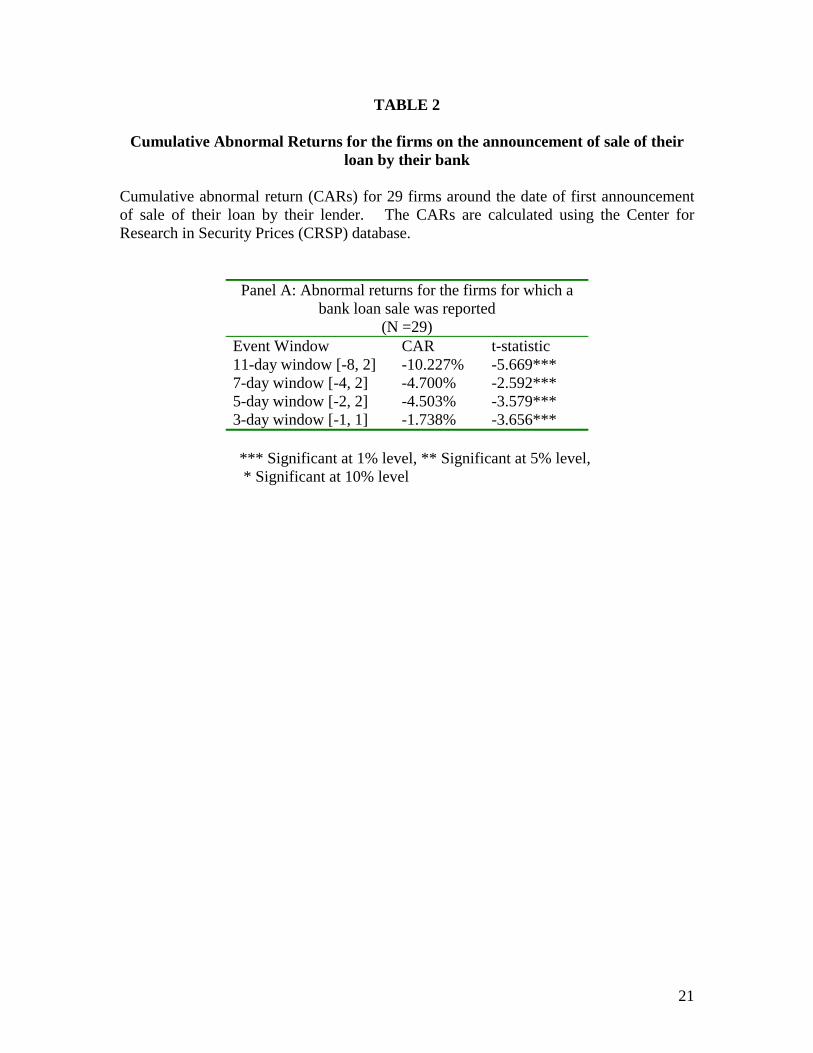
Table 2 focuses on the first announcement (29 out of 57) of a loan sale. For our
sample of 29 firms, we find an average abnormal return of -1.738 % for borrowers for the
3-day window around the day that the news of a bank loan sale is announced, significant
at the 1% level (see also Table 1, panel B).
Our next test comprises of examining whether the negative information that the
market surmises from the loan sale announcement is validated by the borrowing firm’s
subsequent performance. If the market perceives that the bank’s inside information about
the firm’s future prospects is unfavorable since the bank has decided to sell the loan
rather than continue its lending relationship with the firm at its current level, then a
logical consequence would be that such firms should see a decline in their performance
subsequent to the loan sale.
Perhaps the starkest and simplest measure of poor performance is whether or not a
firm goes bankrupt. We collect data on if and when a firm filed for bankruptcy under
Chapter 11 of the U.S. Bankruptcy code over a period of three years from the date of the
loan sale announcement. We find that a large number of our sample firms (close to half
of the firms for whom loan sales occurred) file for bankruptcy within three years from the
date of the loan sale announcement. Table 3 shows that 28% of these firms filed for
bankruptcy within a year of the bank loan sale announcement, an additional 10% within
two years, and a further 7% within three years. In aggregate, 45% of our sample firms
filed for bankruptcy within three years of their loan being announced for sale.

9
These results of subsequent poor performance, combined with our results of the
negative stock price reaction at the time of the loan sale announcement, are consistent
with the role of banks as monitors (or corporate insiders) and the uniqueness of bank
loans in conveying hitherto private information to the capital market at large.
A natural question, however, is whether the ex-post performance of these firms is
correlated to their ex-ante performance prior to the loan sale, i.e., whether we could have
anticipated the poor performance of these firms even without the announcement of the
sale of a loan. Related to this is the question: what are the (publicly available) financial
characteristics of those firms whose loans are sold at the time of the loan sale? To
answer this question, we collate information on the financial characteristics of those firms
whose loans are sold in the most recent year prior to the loan sale.
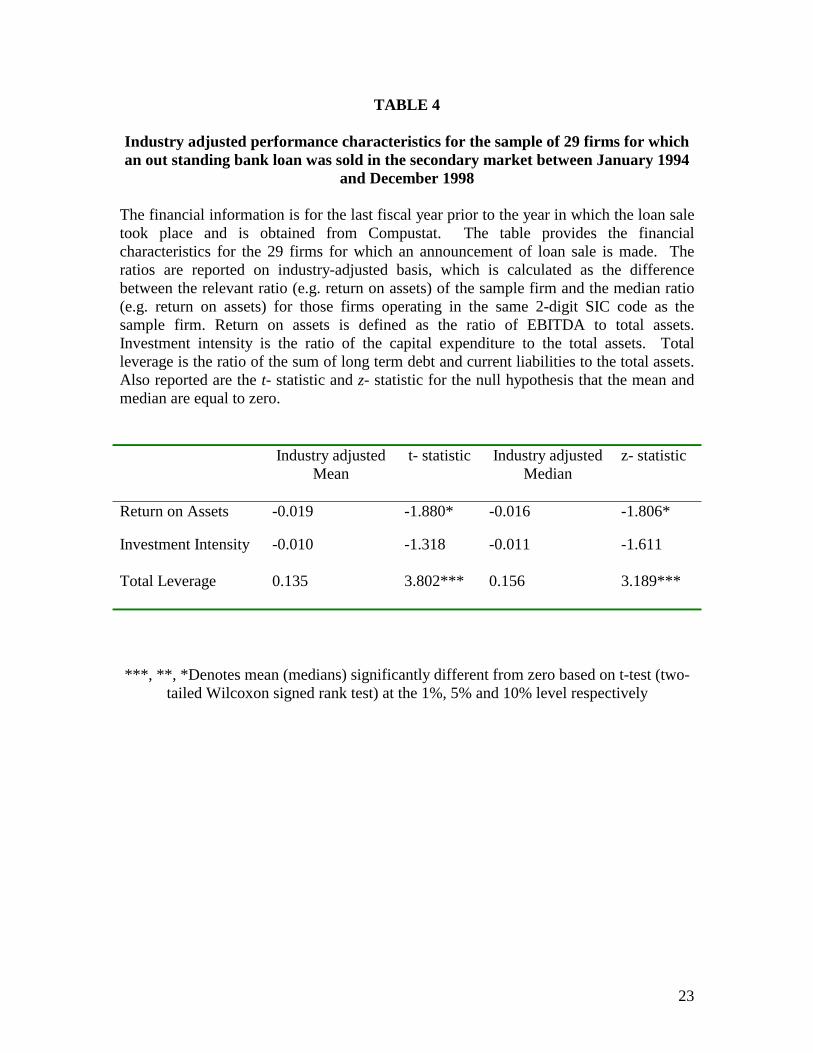
Table 4 provides some financial and operating performance measures for the sample
of borrowing firms whose loans were sold over the 1994-1998 period. These
performance measures are for the year prior to the year in which the loan sale was
reported in Bank Letter, and are reported on an industry adjusted (median) basis.
Specifically, financial ratios were calculated for all firms with the same 2-digit SIC code
as that of borrowing firm whose loan was sold and the median financial ratio (for the
industry) was then subtracted from the financial ratio of the borrowing firm. Three such
financial ratios are reported in Table 4. It can be seen that firms whose loans were sold
appear to have performed below the industry median in the year preceding the loan sale.
In particular, they had a lower return on assets, a higher level of debt (as measured by the
ratio of book liabilities to total assets) and a lower degree of investment intensity
(measured by capital expenditures to total assets) compared to the median firm in the
same industry.
Nevertheless, we want to examine further whether these are the poorest performing
firms in their industry, i.e., whether, on an ex-ante basis, we would have expected these
firms to have little future viability. For example, if our loan sale sample firms were in the

10
bottom 5 percentile of their industry, one might anticipate that some of these firms would
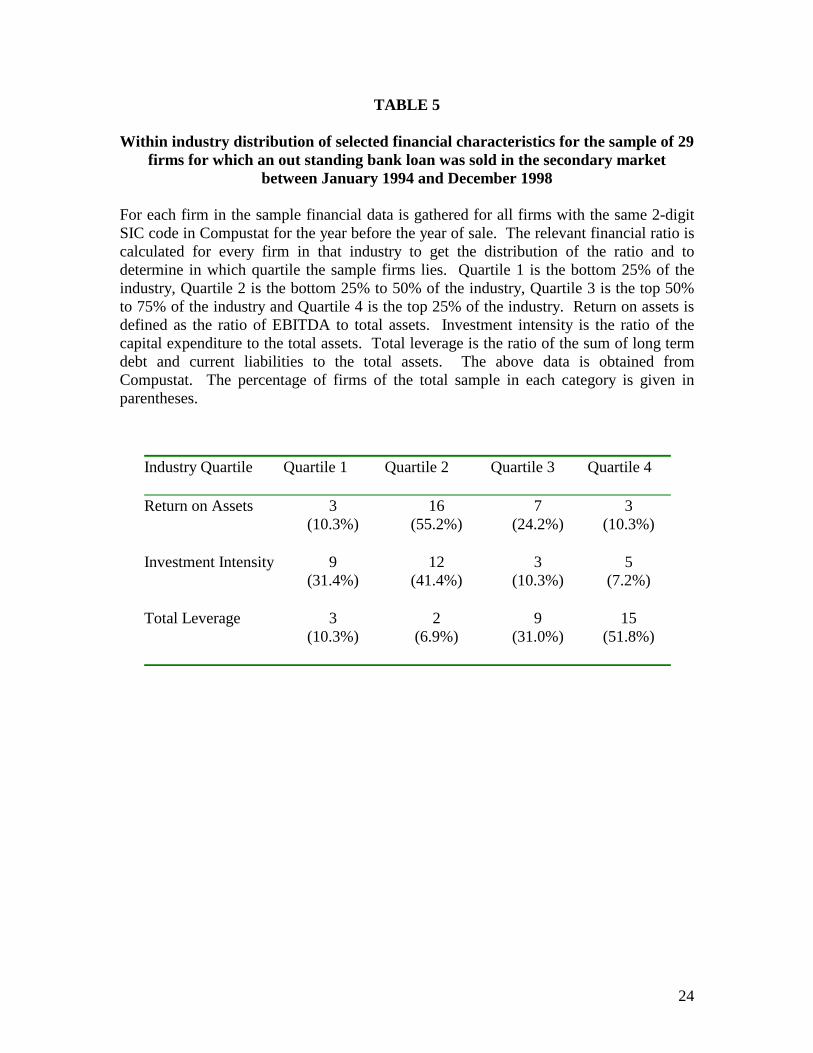
go bankrupt and/or exit the industry. Table 5 compares the financial performance of the
sample of 29 firms, whose loans were sold, to their respective peer industry groups.
Specifically, for the year immediately preceding the loan sale announcement, we
calculate a set of financial ratios (as publicly available proxy measures of performance),
for all firms that have the same 2-digit SIC codes as each borrower whose loan was sold.
This allows us to generate a distribution for each financial ratio within the loan sale firm's
industry. Surprisingly we find that the firms whose loans are sold are not the worst
performers in their respective industries nor are they concentrated in the bottom decile or
even the bottom 25% (quartile). As Table 5 shows, for proxies such as return on assets,
the majority of the sample firms lie in the 25 to 50 percentile. This suggests that publicly
available financial information alone may have been insufficient for investors to clearly
distinguish, or pre-identify, the degree of weakness of the firms whose loans were sold
and that publicly announced loan sale decisions by banks appear to have provided
valuable (hitherto private) information to outside investors regarding the true financial
condition of these firms.
To further corroborate these results we create a control group of a matched sample of
29 firms that had a loan outstanding, but for whom no loan sale was reported at the time
of the loan sale for the borrowers in our sample. This matched sample was constructed
on the basis of industry and size matching as described by Barber and Lyons (1997).9
Table 6 examines the financial characteristics that affect a bank's decision to sell
loans. Specifically, we took the sample of 29 firms that had their loans sold and the size
9 The matching was done in the following way: For each firm that had its bank loan sold we generated a list of firms that not only had the same 2-digit SIC industry code classification but also had loans outstanding and reported total assets within a range of 70% to 130% of the total assets of the firm whose loans were sold. From this list we picked one firm at random. This procedure was repeated for each of the 29 firms in the original sample, thus producing an industry and size matched sample of 29 borrowing whose loans were not sold as a control group.
11
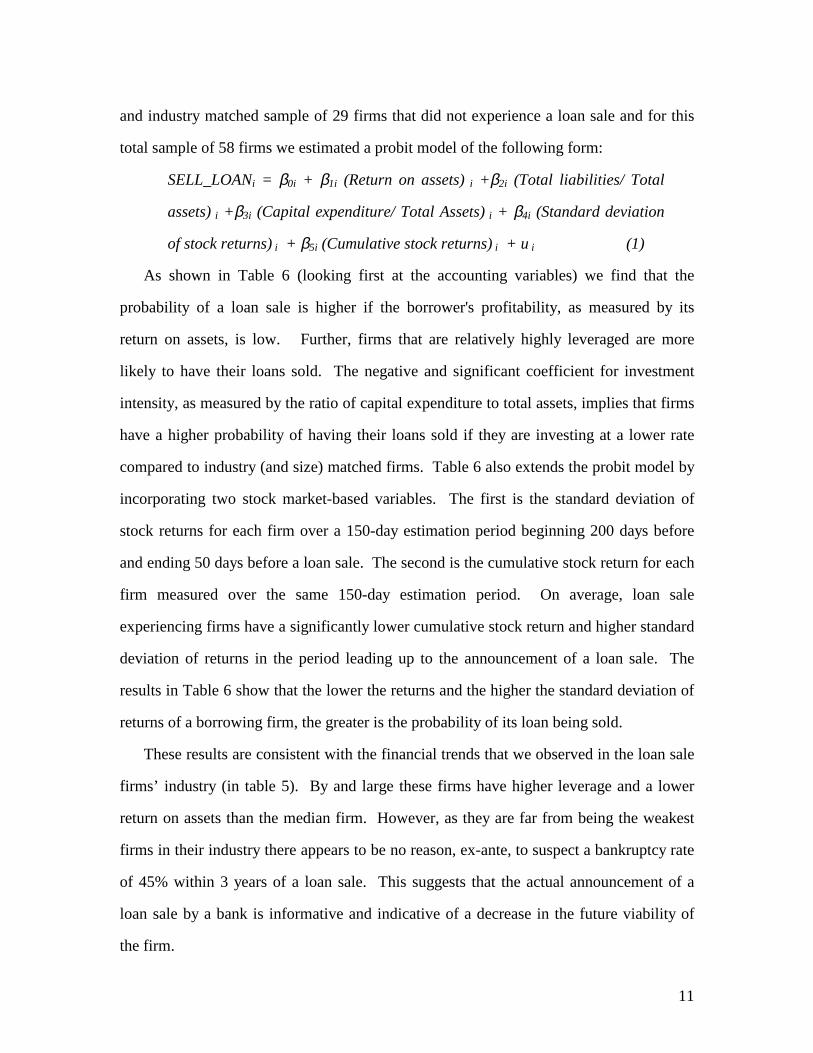
and industry matched sample of 29 firms that did not experience a loan sale and for this
total sample of 58 firms we estimated a probit model of the following form:
SELL_LOANi = β0i + β1i (Return on assets) i +β2i (Total liabilities/ Total
assets) i +β3i (Capital expenditure/ Total Assets) i + β4i (Standard deviation
of stock returns) i + β5i (Cumulative stock returns) i + u i (1)
As shown in Table 6 (looking first at the accounting variables) we find that the
probability of a loan sale is higher if the borrower's profitability, as measured by its
return on assets, is low. Further, firms that are relatively highly leveraged are more
likely to have their loans sold. The negative and significant coefficient for investment
intensity, as measured by the ratio of capital expenditure to total assets, implies that firms
have a higher probability of having their loans sold if they are investing at a lower rate
compared to industry (and size) matched firms. Table 6 also extends the probit model by
incorporating two stock market-based variables. The first is the standard deviation of
stock returns for each firm over a 150-day estimation period beginning 200 days before
and ending 50 days before a loan sale. The second is the cumulative stock return for each
firm measured over the same 150-day estimation period. On average, loan sale
experiencing firms have a significantly lower cumulative stock return and higher standard
deviation of returns in the period leading up to the announcement of a loan sale. The
results in Table 6 show that the lower the returns and the higher the standard deviation of
returns of a borrowing firm, the greater is the probability of its loan being sold.
These results are consistent with the financial trends that we observed in the loan sale
firms’ industry (in table 5). By and large these firms have higher leverage and a lower
return on assets than the median firm. However, as they are far from being the weakest
firms in their industry there appears to be no reason, ex-ante, to suspect a bankruptcy rate
of 45% within 3 years of a loan sale. This suggests that the actual announcement of a
loan sale by a bank is informative and indicative of a decrease in the future viability of
the firm.

12
4. The effect of loan sales on bank stock returns
The decision to sell a loan may also contain information about the quality of bank
loan portfolios. Indeed, loan sales may be interpreted favorably by the market as a
reflection that the average quality of a bank's remaining portfolio will improve -- given
its incentive to sell-off, or divest, its poor quality loans. However, in selling such loans it
has to assess the potential cost of such sales on its relationship with the borrower whose
loan is sold, potential borrowers who may be concerned that their loans will be sold in the
future10, its reputation with investors who buy the loans sold by the bank (should they
deteriorate further), as well as the fact that it might signal that the bank in general has
exhibited poor management quality in its lending decisions and/or its capital position is
weak. To examine the effects of a loan sale on a selling bank, we conducted an event
study for those banks announcing the sale of loans. We are limited by the fact that Bank
Letter news stories announcing loan sales do not always mention the identity of the
selling bank. The quote below provides a typical loan sale announcement:
"A Musicland lender auctioned off $11 million in bank debt late last week, with bids
in the high 70s, according to market sources."
Bank Letter dated 1/27/1997
For the 107 total loan sale announcement originally collected from Bank Letter, we
were able to identify the loan selling institution in 58 cases. Of these, 25 sale
announcements were made by foreign financial institutions and 33 were made by US
financial institutions. The lenders mentioned in these 33 US financial institution
announcements were then matched to the CRSP daily stock price database. Two lenders
did not have stock price information11 and two announcements involving Fleet bank were
10 It is not unusual for borrowers to attempt curtailment of secondary trading in their loans, in an extreme case one borrower made it a part of the loan agreement by specifying eleven past lenders that it did not want its loan to be sold to. (See “Nextel Blackballs 11 Banks”, Bank Letter, March 16, 1998) 11 These were non-banking firms (Goldman Sachs and Heller Financial).

13
made on the same day and thus were included as a single announcement, leaving us with
30 bank loan sale announcement dates. Finally, we removed the 3 loan sales made by
investment banks leaving 27 US commercial bank loan sellers.12 The results of the event
study on selling banks' returns are reported in Panel A of table 7. We also looked at the
subset of first loan sale announcements involving the 29 borrowers that were examined in
the "borrower"-related tests described in Tables 2 through 5. This subset yielded 11
clearly identifiable US bank lenders from the 29 first loan sales sub-sample. The loan
sale announcement effects for these 11 banks are reported in Panel B of Table 7.
The results of Table 7 indicate that, on average, the sale of loans by banks do not
appear to have any net (new) impact on the selling banks stock returns (i.e. there is no
evidence of any net costs or benefits to the selling banks' shareholders). This result holds
true for the whole sample where the bank seller could be identified (Panel A) as well as
the sub-sample of first loan sales (Panel B).
Nevertheless, it is of interest to examine the characteristics that differentiate between
those banks that engage in loan sales and those that do not, especially as some have
argued that an important motivation for loan sales is to improve a bank's solvency
position such as the bank's regulatory capital ratio (see for example Pennacchi, 1988).
As discussed above, for the event study examining a bank’s own share price reaction to a
sale of a loan, we were able to identify 27 unique loan sale event dates. Since some
banks announced multiple sales in the same year, these multiple loan selling banks were
treated as a single observation in the same year. This resulted in a final sample of 19
distinct bank loan sale years. We obtained key financial characteristics for each of the
selling banks for the year before the loan sale announcement from a variety of sources
including Bank Compustat, Annual reports and 10-K filings. We then constructed a
matched portfolio of 19 banks that did not announce a loan sale during the same year as
12 Results remain unchanged if we include the three investment banks. The results for the sub sample of 3 Investment banks are similar to those reported for the sample of 27 banks.

14
our sample of banks. Since banks involved in loan sales are usually large national banks,
we constructed a list of all banks on Bank Compustat that reported total assets greater
than $ 15 billion in 1997, which generated a total of 41 US banking institutions. This list
included 18 of the 19 sample banks that had sold loans for which we had stock return
data. For each bank involved in a loan sale transaction we matched it with a bank that
did not report a loan sale that year and which was closest in asset size to the loan-selling
bank.
To examine the hypothesis as to whether a selling bank had different financial
characteristics to a bank that did not sell loans we estimated a probit model of the
following form:
SELL_LOAN = f (Bank Size, Bank Asset composition, Bank Liability
composition, Bank Capital adequacy position, and Bank profitability
characteristics) (2)
where:
SELL_LOAN is equal to 1 if the bank sold a loan and 0 otherwise; and the other bank
variables used in the probit tests are defined in Table 8.
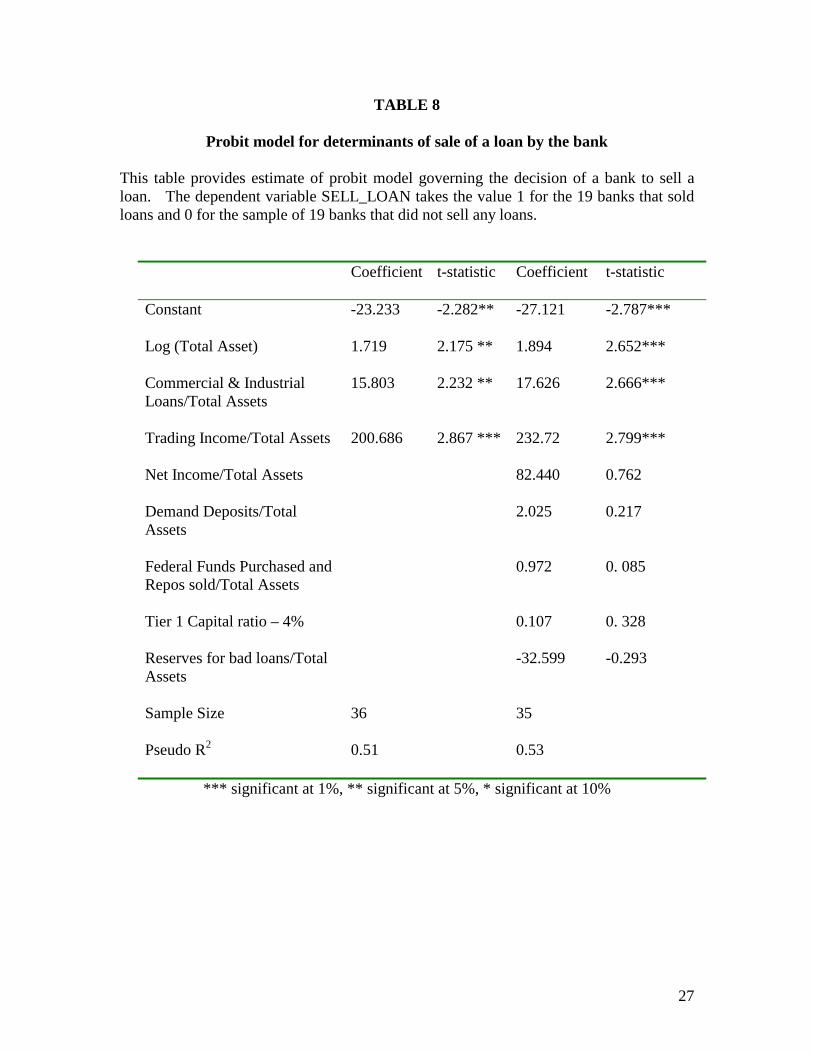
The results reported in Table 8 show that banks involved in loan sales earn a
significant amount of trading income, i.e., have a trading network and trading
infrastructure in place that helps them conduct loan sales. Loan selling banks also have a
larger proportion of their assets in Commercial and Industrial (C&I) loans. The degree of
capital reserves (measured by the size of a bank's Tier 1 capital ratio relative to its 4%
tier-1 regulatory minimum) and its relative dependence on borrowed funds are not
significantly related to the probability of a bank undertaking a loan sale.
The finding for the capital ratio is interesting, in that as discussed above, one potential
motivation for loans sales is to enable banks to improve their solvency positions -- at
15
least as measured by regulators.13 The finding of insignificance for the capital variable
for our sample period, (1994-1998) in which most banks were profitable and capital
ratios were at contemporary highs, suggests that capital constraints and regulatory
pressures relating to loan sales were not important in this period.
5. Summary and conclusion
This is the first paper to evaluate empirically the effects of loan sales on both
borrowers as well as bank stock returns. Using loan sales announcements reported in the
publication Bank Letter we find evidence of a strong negative effect of loan sales by
banks on borrowers’ returns. This result is consistent with a strong certification effect of
loan sales that may be reinforced by a reluctance of banks to sell loans for fears of
harming existing and future customer relationships. Moreover, the sale of a loan appears
to carry a signal to the capital market that is the mirror image of the findings of James
(1987), Lummer and McConnell (1989) and others regarding the (positive) news effect of
loan initiation and loan renewals. This result adds support to the view that banks play a
special role in diffusing hitherto private information to outside investors. We also find
that 45% of the firms whose loans are sold file for bankruptcy within 3 years of the
announcement of a loan sale by their bank lender. While, cross-sectional tests confirmed
that borrowers whose loans are sold are generally in a weaker financial and operating
condition than a matched control group of firms whose loans were not sold, the sale of a
loan appears to convey to the market additional (material) news about the relative degree
of weakness of the borrowing firm whose loan is sold.
Finally, we examined the effects of loan sales on the selling bank itself, since the sale
of a loan may convey new information to the market regarding the quality of a selling
bank's loan portfolio as well as impacting among other things, its reputation and
13 We also conducted a robustness check where a bank’s actual tier 1 capital ratio was used instead of its deviation from the 4% minimum ratio.

16
relationships with other loan customers and investors. Interestingly, the sale of loans by
banks carried no significant impact on a selling bank's stock return. Cross-sectional
probit tests revealed that bank loan sales were made by banks that emphasized trading
and had relatively large commercial and industrial loan portfolios. For our sample
period, a bank’s capital adequacy (or solvency) position did not appear to have a material
effect on the probability of a bank selling its loans.

17
References
Barber, B. and J. Lyon, 1997, Detecting abnormal operating performance: The empirical power and specification of test statistics, Journal of Financial Economics 41, 359-399. Best, R. and H. Zhang, 1993, Alternative Information Sources and the Information Content of Bank Loans, Journal of Finance 48, 1507-1522. Billet, M. T., M. J. Flannery, and J. A. Garfinkel, 1995, The effect of lender identity on a borrowing firm's equity return, Journal of Finance 50, 699-718. Campbell, T. and W. Kracaw G., 1980, Information Production, market signaling, and the theory of intermediation, Journal of Finance 35, 863-882. Dahiya, S., 2000 The Effect of Borrower's Financial Distress on the Lead Bank, Working Paper, Georgetown University. Diamond, D. W., 1984, Financial intermediation and delegated monitoring, Review of Economics Studies 51, 393-414. Dodd, P. and J. Warner, 1983, On corporate governance: A study of proxy contests, Journal of Financial Economics 11, 401-438. Fama, E. 1985, What’s different about banks, Journal of Monetary Economics 15, 29-36. Gande, A., M. Puri, A. Saunders, I. Walter, Bank underwriting of debt securities: Modern evidence, Review of Financial Studies, 1997, 10(4), 1175-1202. James, C., 1987, Some evidence of the uniqueness of bank loans, Journal of Financial Economics 19, 217-235. James, C., 1988, The use of loan sales and standby letters of credit buy commercial banks, Journal of Monetary Economics 22, 395-422. James, C. and D. C. Smith 2000, Are banks still special? New evidence on their role in the corporate capital-raising process, Journal of Applied Corporate Finance 13, 395-422. Lummer, S., and J. McConnell, 1989, Further evidence on bank lending process and capital market response to bank loan agreements, Journal of Financial Economics 25, 52-63. Miller S., 1998, The development of the leveraged loan asset class. In Fabozzi, F. (Ed.), Bank Loans: Secondary Market and Portfolio Management, Frank J. Fabozzi Associates, New Hope, PA, pp. 1-23. Pennacchi, G., 1988, Loan sales and cost of bank capital, Journal of Finance 43, 375-396.

18
Puri, Manju, 1996, Commercial banks in investment banking: Conflict of interest or certification role?" Journal of Financial Economics, 1996, 40(3), 373-401. Slovin, M. B., M. A. Shuska, and J. A. Polonchek, 1993, The value of bank durability: Borrowers as the bank stakeholders, Journal of Finance 48, 247-266.

19
TABLE 1
Cumulative Abnormal Returns for the firms on the announcement of sale of their loan by their bank
Cumulative abnormal return (CARs) for 57 announcements of loan sale for the firms whose loans were sold by their lender. Panel A reports the CARs for all announcements. Panel B reports the CAR for the first time a firm’s Loan is sold. Panel C reports the CAR for the second announcement of loan sale of a firm and Panel D reports the CAR for third announcement of loan sale of a firm.
Panel A: Abnormal returns for all announcements of bank
loan sale (N =57)
Event Window CAR t-statistic 11-day window [-8, 2] -8.555% -6.943*** 7-day window [-4, 2] -5.88700% -5.843*** 5-day window [-2, 2] -4.777% -6.032*** 3-day window [-1, 1] -4.5922% -8.886***
Panel B: Abnormal returns for the first loan sale announcement loan sale was reported
(N =29) Event Window CAR t-statistic 11-day window [-8, 2] -10.227% -5.669*** 7-day window [-4, 2] -4.700% -2.592*** 5-day window [-2, 2] -4.503% -3.579*** 3-day window [-1, 1] -1.738% -3.656***
Panel C: Abnormal returns for the second loan sale announcement loan sale was reported
(N =11) Event Window CAR t-statistic 11-day window [-8, 2] -6.5207% -2.463*** 7-day window [-4, 2] -5.001% -2.592*** 5-day window [-2, 2] -3.242% -2.223** 3-day window [-1, 1] -5.725% -4.250***

20
Panel D: Abnormal returns for the third loan sale
announcement loan sale was reported (N =7)
Event Window CAR t-statistic 11-day window [-8, 2] -4.371% -1.231 7-day window [-4, 2] -4.761% -1.686* 5-day window [-2, 2] -2.253% -0.8396 3-day window [-1, 1] -3.771% -1.829*
*** Significant at 1% level, ** Significant at 5% level, * Significant at 10% level
21
TABLE 2
Cumulative Abnormal Returns for the firms on the announcement of sale of their loan by their bank
Cumulative abnormal return (CARs) for 29 firms around the date of first announcement of sale of their loan by their lender. The CARs are calculated using the Center for Research in Security Prices (CRSP) database.
Panel A: Abnormal returns for the firms for which a bank loan sale was reported
(N =29) Event Window CAR t-statistic 11-day window [-8, 2] -10.227% -5.669*** 7-day window [-4, 2] -4.700% -2.592*** 5-day window [-2, 2] -4.503% -3.579*** 3-day window [-1, 1] -1.738% -3.656***
*** Significant at 1% level, ** Significant at 5% level, * Significant at 10% level

22
TABLE 3 Post - loan sale period incidence of financial distress for the sample of 29 firms for
which an out standing bank loan was sold in the secondary market between January 1994 and December 1998
The information on filing for Chapter 11 is obtained from Bankruptcy Datasource and Dow Jones News Retrieval Services.
Incidence of Chapter 11 filing
Less then 12 months after the loan sale announcement
12 months to 24 months after the loan sale announcement
24 months to 36 months after the loan sale announcement
More than 36 months after the loan sale announcement
Number of firms (for which financial data is available)
24 18 11 2
Number of firms filing for Chapter 11 (% of sample)
8 (28 %)
3 (10%)
2 (7%)
0 (0%)
23
TABLE 4 Industry adjusted performance characteristics for the sample of 29 firms for which an out standing bank loan was sold in the secondary market between January 1994
and December 1998
The financial information is for the last fiscal year prior to the year in which the loan sale took place and is obtained from Compustat. The table provides the financial characteristics for the 29 firms for which an announcement of loan sale is made. The ratios are reported on industry-adjusted basis, which is calculated as the difference between the relevant ratio (e.g. return on assets) of the sample firm and the median ratio (e.g. return on assets) for those firms operating in the same 2-digit SIC code as the sample firm. Return on assets is defined as the ratio of EBITDA to total assets. Investment intensity is the ratio of the capital expenditure to the total assets. Total leverage is the ratio of the sum of long term debt and current liabilities to the total assets. Also reported are the t- statistic and z- statistic for the null hypothesis that the mean and median are equal to zero. Industry adjusted
Mean
t- statistic Industry adjusted Median
z- statistic
Return on Assets -0.019 -1.880* -0.016 -1.806*
Investment Intensity
-0.010
-1.318
-0.011
-1.611
Total Leverage
0.135
3.802***
0.156
3.189***
***, **, *Denotes mean (medians) significantly different from zero based on t-test (two-
tailed Wilcoxon signed rank test) at the 1%, 5% and 10% level respectively
24
TABLE 5 Within industry distribution of selected financial characteristics for the sample of 29
firms for which an out standing bank loan was sold in the secondary market between January 1994 and December 1998
For each firm in the sample financial data is gathered for all firms with the same 2-digit SIC code in Compustat for the year before the year of sale. The relevant financial ratio is calculated for every firm in that industry to get the distribution of the ratio and to determine in which quartile the sample firms lies. Quartile 1 is the bottom 25% of the industry, Quartile 2 is the bottom 25% to 50% of the industry, Quartile 3 is the top 50% to 75% of the industry and Quartile 4 is the top 25% of the industry. Return on assets is defined as the ratio of EBITDA to total assets. Investment intensity is the ratio of the capital expenditure to the total assets. Total leverage is the ratio of the sum of long term debt and current liabilities to the total assets. The above data is obtained from Compustat. The percentage of firms of the total sample in each category is given in parentheses.
Industry Quartile Quartile 1
Quartile 2
Quartile 3
Quartile 4
Return on Assets 3 (10.3%)
16 (55.2%)
7 (24.2%)
3 (10.3%)
Investment Intensity
9 (31.4%)
12 (41.4%)
3 (10.3%)
5 (7.2%)
Total Leverage
3 (10.3%)
2 (6.9%)
9 (31.0%)
15 (51.8%)

25
TABLE 6
Probit model for determinants of sale of a loan by the bank
This table provides estimate of probit model governing the decision of a bank to sell a loan. The dependent variable SELL_LOANi which takes the value 1 for 29 firms that had their blank loans sold and 0 for the industry and size matched sample of 29 firms where no loan sale took place. Return on assets is defined as the ratio of EBITDA to total assets. Investment intensity is the ratio of the capital expenditure to the total assets. Total leverage is the ratio of the sum of long term debt and current liabilities to the total assets. Standard Deviation is the standard deviation of the daily returns of the firm during the period of 150 days starting 200 days before the loan sale event and up to 50 days before the loan sale. Estimation period return is the continuously compounded return for the same estimation period. Coefficient t-statistic Coefficient t-statistic Coefficient t-statistic
Constant
-0.044 -0.062
-1.204 -1.365 -.0980 -0.136
Return on Assets
-6.192 -2.216**
-4.319 -1.475 -6.119 -2.169**
Total Leverage
2.356 2.344**
2.488 2.459** 2.176 2.112**
Investment Intensity
-9.297 -2.441**
-7.332 -2.011** -6.628 -2.305**
Standard Deviation
26.427 1.696*
Estimation period return
-1.504 -2.838***
Sample Size 58
58
58
Pseudo R2 0.24
0.30
0.32
*** significant at 1%, ** significant at 5%, * significant at 10%

26
TABLE 7
Cumulative Abnormal Returns for the Banks on the announcement of sale of their loan
In Panel A we report the Cumulative abnormal return (CARs) for 27 loan sale announcements by US banks. Panel B focuses on the lenders to the 29 firms studied in tables 1 through 6 whose loans were sold. It presents the Cumulative abnormal return (CARs) for 11 loan sale announcements by US banks for these borrowers. The CARs are calculated using the Center for Research in Security Prices (CRSP) database.
Panel A: Abnormal returns for the Banks
(All announcements) (N =27)
Event Window CAR t-statistic 11-day window [-8, 2] -0.0121% 0.027 7-day window [-4, 2] -0.0948 % -0.096 5-day window [-2, 2] -0.0504% -0.112 3-day window [-1, 1] 0.5940% 1.4174
Panel B: Abnormal returns for the Banks of 29 firms studied earlier
(N =11) Event Window CAR t-statistic 11-day window [-8, 2] 0.7146% 0.626 7-day window [-4, 2] 0.6572% 0.702 5-day window [-2, 2] 0.8272% 0.966 3-day window [-1, 1] 0.9539% 1.389
*** Significant at 1% level, ** Significant at 5% level, * Significant at 10% level
27
TABLE 8
Probit model for determinants of sale of a loan by the bank This table provides estimate of probit model governing the decision of a bank to sell a loan. The dependent variable SELL_LOAN takes the value 1 for the 19 banks that sold loans and 0 for the sample of 19 banks that did not sell any loans.
Coefficient t-statistic Coefficient t-statistic
Constant -23.233 -2.282**
-27.121 -2.787***
Log (Total Asset) 1.719 2.175 **
1.894 2.652***
Commercial & Industrial Loans/Total Assets
15.803 2.232 **
17.626 2.666***
Trading Income/Total Assets
200.686 2.867 ***
232.72 2.799***
Net Income/Total Assets
82.440 0.762
Demand Deposits/Total Assets
2.025 0.217
Federal Funds Purchased and Repos sold/Total Assets
0.972 0. 085
Tier 1 Capital ratio – 4%
0.107 0. 328
Reserves for bad loans/Total Assets
-32.599 -0.293
Sample Size 36
35
Pseudo R2 0.51
0.53
*** significant at 1%, ** significant at 5%, * significant at 10%
Copyright © 2022 FDOKUMEN