Badlands National Park - IIS Windows Server
90
National Park Service | U.S. Department of the Interior Badlands National Park BADLANDS WILDERNESS BUILDING BLOCKS FOR WILDERNESS STEWARDSHIP DECEMBER 2017
-
Upload
khangminh22 -
Category
Documents
-
view
1 -
download
0
Transcript of Badlands National Park - IIS Windows Server

N a t i o n a l P a r k S e r v i c e | U . S . D e p a r t m e n t o f t h e I n t e r i o r
Badlands National Park
BADLANDS WILDERNESSBUILDING BLOCKS FOR WILDERNESS STEWARDSHIP
DECEMBER 2017

BADLANDS WILDERNESSBUILDING BLOCKS FOR WILDERNESS STEWARDSHIP
Badlands National Park National Park Service 25216 Ben Reifel Road Interior, SD 57750
Prepared by Jessica Millman Interagency Wilderness Fellow National Park Service December 2017
Photo on Cover: Badlands Wall Photo by Jacob Gaposhkin
41
2
2
2
2
33
27
27
40
44
44
44
44
590
502
509
590
589
240
240
377
14
90
90
9
0 1 Mile
0 1
5
5 Kilometers
North
White RiverVisitor Center
(open seasonally)
Ben ReifelVisitor Center(Park Headquarters)
PINE RIDGE INDIAN RESERVATION
8mi13km
16mi25.5km
15mi24km
20mi32km
14mi22km
5mi7.5km
23mi37km
13.5mi22km
5mi7.5km 2mi
3km
8.5mi13.5km
10mi16km
9mi15km
3mi5km
19mi30km
8.5mi13.5km
12mi19km
2.5mi3.5km
20mi32km
15mi24km
20mi32km
4mi6.5km
Northeast Entrance
Pinnacles Entrance
Interior Entrance
Badlands Loop Road
See Cedar Passdetail map
BADLANDS NATIONAL PARK
BADLANDS WILDERNESS AREA
Minuteman MissileNational Historic SiteVisitor Center
Minuteman MissileNational Historic Site
Delta-09
NORTH UNITNORTH UNIT
STRONGHOLD UNIT(within Pine Ridge Indian Reservation)
PALMER CREEK UNIT(within Pine Ridge Indian Reservation)
BADLANDS NATIONAL PARK
Minuteman MissileNational Historic SiteDelta-01
Medicine R
oo
t Creek
Bear - in - the - Lo
dg
e Creek
Potato C
reek
Cain Creek
Palmer C
reek
Cedar Creek
French Creek
Battle Creek
Rapid Creek
Bear Creek
Beaver Creek
Sage Creek
Sou
th Fork
Middle Fork
Spring Creek
Cottonwood Creek
White
River
Che
yenn
e
River
White R
iver
Battle Creek
Porcupine Creek
Woun
ded
Kn
ee
Creek
Che
yenn
e
River
White
River
BUFFALO GAP NATIONAL GRASSLAND
BUFFALO GAP NATIONAL GRASSLAND
BUFFALO GAP NATIONAL GRASSLAND
Cactus Flat
Hay ButteOverlook
Sage CreekBasin Overlook
BadlandsWildernessOverlook
Red Shirt TableOverlook
PinnaclesOverlook
Prairie WindOverlook
Yellow MoundsOverlook
Burns BasinOverlook
White RiverValley Overlook
PanoramaPoint
Conata Basin Overlook
Homestead Overlook
Ancient Hunters Overlook
Cottonwood
Wall
Exit 131
Exit 110
Exit 116
Exit 127
Quinn
Farmingdale
Sharps Corner
Scenic
Kyle
Potato Creek
Interior
Red Shirt
CedarButte
2443ft745m
Cedar Pass Lodge(open seasonally)
Big Badlands Overlook
PrairieHomestead
Conata
Big Foot Pass Overlook
Fossil Exhibit Trail
To Rapid City
To Hermosa
To Martin To Martin
CUNY TABLE
To Wounded Knee
To Oglala
To Wounded Knee
To Wanblee
To Kadoka
To Buffalo Gapand Hot Springs
3247ft990m
RobertsPrairie Dog Town
Sage Creek Road
Co
nata R
oad
DillonPass
Big FootPass
Medicine RootTrail
Sage Creekno water
3282ft1000m
SHEEP M
TN TA
BLE
GA
LIGO
TABLE
BLIND
MA
N TA
BLE
RED SH
IRT TABLE
PLENTY
STAR
TABLE
CONATABASIN Castle Trail
Sage Creek Rim Road
Sage Creek
R
oad
US Forest ServiceThe Grassland is interspersed with privately owned land.Check at the Grassland headquarters in Wall for details.
QU
INN TABLE
STRO
NG
HO
LD
TAB
LE
Unpaved road(may be impassablewhen wet)
Unpaved road(high-clearancevehicles only)
Wilderness area
Trail
Overlook
Ranger station
Picnic area
Restrooms
Self-guiding trail
Campground
Primitive campground

ACKNOWLEDGEMENTS
A special thank you to the following staff for offering their assistance and knowledge throughout the production of this report:
Rachel Benton, PhD, Paleontologist at Badlands National Park
Mike Carlbom, Supervisory Forestry Technician at Badlands National Park
Megan Cherry, Museum Collections Manager
Eddie Childers, Wildlife Biologist at Badlands National Park
Erin Drake, Communications and Outreach Specialist at NPS Wilderness Stewardship Division
Sarah Hayes, General Ranger and Wilderness Assistant at Denali National Park and Preserve
Chris Holbeck, Regional Wilderness Coordinator at Midwest Regional Office
Tyson Nehring, Law Enforcement Officer at Badlands National Park
Kristin Pace, Wilderness Planning Coordinator at Denali National Park and Preserve
Kara Paintner, Network Coordinator at NPS Northern Great Plains Inventory & Monitoring Network
Mike Pflaum, Superintendent at Badlands National Park
Matt Roland, Acting Chief of Law Enforcement at Badlands National Park
Roger Semler, Chief of Wilderness Stewardship at NPS Wilderness Stewardship Division
Mark Slovek, Lead Bio-Tech at Badlands National Park
Wayne Thompson Ph.D., Physical Science Technician at Badlands National Park
Phil Varela, Physical Science Technician at Badlands National Park
i

“Wilderness is the raw material out of which man has hammered the artifact called civilization. Wilderness was
never a homogeneous raw material. It was very diverse. The differences in the product are known as cultures. The rich
diversity of the worlds cultures reflects a corresponding diversity. In the wilds that gave them birth.”ALDO LEOPOLD, A SAND COUNTY ALMANAC
ii

Contents
ACKNOWLEDGEMENTS . . . . . . . . . . . . . . . . . . . . . . . . . . . . . . . . . . i
Introduction . . . . . . . . . . . . . . . . . . . . . . . . . . . . . . . . . . . . . . . . 1
Wilderness Character in the National Park Service . . . . . . . . . . . . . . . . . . . . 5
Historical and Administrative Setting of the Badlands Wilderness . . . . . . . . . . . . 7
Wilderness Character Narrative . . . . . . . . . . . . . . . . . . . . . . . . . . . . . 9Untrammeled . . . . . . . . . . . . . . . . . . . . . . . . . . . . . . . . . . . . . .11Natural . . . . . . . . . . . . . . . . . . . . . . . . . . . . . . . . . . . . . . . . .12Undeveloped . . . . . . . . . . . . . . . . . . . . . . . . . . . . . . . . . . . . . .13Solitude or Primitive and Unconfined Recreation . . . . . . . . . . . . . . . . . . . . .14Other Features of Value . . . . . . . . . . . . . . . . . . . . . . . . . . . . . . . . .15
Scenic Features . . . . . . . . . . . . . . . . . . . . . . . . . . . . . . . . . . . . . . 15Geologic Features . . . . . . . . . . . . . . . . . . . . . . . . . . . . . . . . . . . . . 15Paleontology . . . . . . . . . . . . . . . . . . . . . . . . . . . . . . . . . . . . . . . 16
Wilderness Character Monitoring . . . . . . . . . . . . . . . . . . . . . . . . . . . 19Process Used for Identifying Measures . . . . . . . . . . . . . . . . . . . . . . . . . .20Overview of Wilderness Character Monitoring Measures . . . . . . . . . . . . . . . .21
Untrammeled . . . . . . . . . . . . . . . . . . . . . . . . . . . . . . . . . . . . . . 25Untrammeled Quality . . . . . . . . . . . . . . . . . . . . . . . . . . . . . . . . . .26
Actions That Manipulate Vegetation Communities . . . . . . . . . . . . . . . . . . . . 26Actions That Manage or Restore Native Animal Species . . . . . . . . . . . . . . . . . . 28Percentage of Naturally Ignited Fires that are Suppressed . . . . . . . . . . . . . . . . . 32Number of Reported Illegal Activity in Wilderness . . . . . . . . . . . . . . . . . . . . . 33
Natural Quality . . . . . . . . . . . . . . . . . . . . . . . . . . . . . . . . . . . . . 35Natural Quality — Plants . . . . . . . . . . . . . . . . . . . . . . . . . . . . . . . .36Natural Quality — Animals . . . . . . . . . . . . . . . . . . . . . . . . . . . . . . .39
Rocky Mountain Bighorn Sheep . . . . . . . . . . . . . . . . . . . . . . . . . . . . . . 39Black-Tailed Prairie Dogs . . . . . . . . . . . . . . . . . . . . . . . . . . . . . . . . . 40Black-Footed Ferrets . . . . . . . . . . . . . . . . . . . . . . . . . . . . . . . . . . . 40Swift Fox . . . . . . . . . . . . . . . . . . . . . . . . . . . . . . . . . . . . . . . . . 40
Natural Quality — Air and Water . . . . . . . . . . . . . . . . . . . . . . . . . . . .43Visibility . . . . . . . . . . . . . . . . . . . . . . . . . . . . . . . . . . . . . . . . . . 43
Natural Quality — Air and Water . . . . . . . . . . . . . . . . . . . . . . . . . . . .44Concentration of Nitrogen in Wet Deposition . . . . . . . . . . . . . . . . . . . . . . . 44
Natural Quality — Air and Water . . . . . . . . . . . . . . . . . . . . . . . . . . . .46Concentration of Sulfur in Wet Deposition . . . . . . . . . . . . . . . . . . . . . . . . 46
Natural Quality — Air and Water . . . . . . . . . . . . . . . . . . . . . . . . . . . .47Ozone . . . . . . . . . . . . . . . . . . . . . . . . . . . . . . . . . . . . . . . . . . 47
Natural Quality — Ecological Processes . . . . . . . . . . . . . . . . . . . . . . . . .48Acoustic Conditions . . . . . . . . . . . . . . . . . . . . . . . . . . . . . . . . . . . . 48
iii

Undeveloped . . . . . . . . . . . . . . . . . . . . . . . . . . . . . . . . . . . . . . 51Undeveloped Quality — Presence of Nonrecreational Structures, Installations,
and Development . . . . . . . . . . . . . . . . . . . . . . . . . . . . . . . .51Nonrecreational Structures, Installations, and Developments . . . . . . . . . . . . . . . 51
Undeveloped Quality — Presence Of Inholdings . . . . . . . . . . . . . . . . . . . . .54Number of Inholdings . . . . . . . . . . . . . . . . . . . . . . . . . . . . . . . . . . . 54
Undeveloped Quality — Use of Motor Vehicles, Motorized Equipment, or Mechanical Transport . . . . . . . . . . . . . . . . . . . . . . . . . . . . .55Number of Authorized Uses of Motor Vehicles, Motorized Equipment, or Mechanical Transport for SAR-related events . . . . . . . . . . . . . . . . . . . . . . 55
Solitude or Primitive and Unconfined Recreation . . . . . . . . . . . . . . . . . . . 57Solitude or Primitive and Unconfined Recreation Quality — Remoteness From
Sights and Sounds of Human Activity Inside Wilderness . . . . . . . . . . . . .58Visitor Traffic in the Sage Creek Unit . . . . . . . . . . . . . . . . . . . . . . . . . . . 58
Solitude or Primitive and Unconfined Recreation Quality — Remoteness From Sights and Sounds of Human Activity Outside Wilderness . . . . . . . . . . . .59Length of Noise-Free Intervals . . . . . . . . . . . . . . . . . . . . . . . . . . . . . . . 59
Solitude or Primitive and Unconfined Recreation Quality — Facilities That Decrease Self-Reliant Recreation . . . . . . . . . . . . . . . . . . . . . . . . .60Number of Developed Trails . . . . . . . . . . . . . . . . . . . . . . . . . . . . . . . . 60
Solitude or Primitive and Unconfined Recreation Quality — Management Restrictions on Visitor Behavior . . . . . . . . . . . . . . . . . . . . . . . . . .61Restrictions on Visitor Behavior . . . . . . . . . . . . . . . . . . . . . . . . . . . . . . 61
Other Features of Value . . . . . . . . . . . . . . . . . . . . . . . . . . . . . . . . . 63Other Features of Value Quality — Deterioration or Loss of Integral Cultural Features . .63
Paleontological Disturbances . . . . . . . . . . . . . . . . . . . . . . . . . . . . . . . 63
Other Features of Value Quality — Deterioration or Loss of Integral Site Specific Features of Value . . . . . . . . . . . . . . . . . . . . . . . . . . . . . . . . .66Condition of Visual Resources Based on Scenic Quality and View Importance Ratings for Wilderness Views . . . . . . . . . . . . . . . . . . . . . . . . . . . . . . . 66
CONCLUSIONS . . . . . . . . . . . . . . . . . . . . . . . . . . . . . . . . . . . . .68
Future Planning . . . . . . . . . . . . . . . . . . . . . . . . . . . . . . . . . . . . . 69Natural Quality . . . . . . . . . . . . . . . . . . . . . . . . . . . . . . . . . . . . .69
Black-Footed Ferrets . . . . . . . . . . . . . . . . . . . . . . . . . . . . . . . . . . . 69
Undeveloped Quality . . . . . . . . . . . . . . . . . . . . . . . . . . . . . . . . . .69Search and Rescue Activities and Training . . . . . . . . . . . . . . . . . . . . . . . . . 69
Solitude and Unconfined Recreation . . . . . . . . . . . . . . . . . . . . . . . . . . .69Overflights in Wilderness . . . . . . . . . . . . . . . . . . . . . . . . . . . . . . . . . 69
Other Features of Value Quality . . . . . . . . . . . . . . . . . . . . . . . . . . . . .69Condition of Visual Resources Based On Scenic Quality and View Importance Ratings for Wilderness Views . . . . . . . . . . . . . . . . . . . . . . . . . . . . . . . 69
References Cited . . . . . . . . . . . . . . . . . . . . . . . . . . . . . . . . . . . . 71
Appendixes . . . . . . . . . . . . . . . . . . . . . . . . . . . . . . . . . . . . . . . 75Appendix A: Overview of the Framework for Wilderness Character Monitoring . . . . .75Appendix B: What is a Trammeling Action? . . . . . . . . . . . . . . . . . . . . . . .77
iv

Tables
Table 1. Overview of Badlands Wilderness Character Monitoring Measures . . . . . . . . . . . . .21
Table 2. Data Quantity and Quality Definitions . . . . . . . . . . . . . . . . . . . . . . . . . . . .23
Table 3. Suggested Scoring for Data Adequacy . . . . . . . . . . . . . . . . . . . . . . . . . . . .23
Table 4. General Guidance for Counting Trammeling Actions . . . . . . . . . . . . . . . . . . . . .25
Table 5. Untrammeled Quality. . . . . . . . . . . . . . . . . . . . . . . . . . . . . . . . . . . . .25
Table 6. Authorized Annual Actions That Manipulate Wildlife . . . . . . . . . . . . . . . . . . . . .29
Table 7. Natural-Start Fire Suppression History 2012–2017 . . . . . . . . . . . . . . . . . . . . . .33
Table 8. Number of Violations in Wilderness . . . . . . . . . . . . . . . . . . . . . . . . . . . . .34
Table 9. Natural Quality . . . . . . . . . . . . . . . . . . . . . . . . . . . . . . . . . . . . . . . .35
Table 10. Priority Exotic Species . . . . . . . . . . . . . . . . . . . . . . . . . . . . . . . . . . . .37
Table 11. Native Animal Species Killed or Infected by Invasive Insects or Pathogens . . . . . . . . .41
Table 12. Nitrogen Wet Deposition Condition Categories . . . . . . . . . . . . . . . . . . . . . . .45
Table 13. Sulfur Wet Deposition Condition Categories . . . . . . . . . . . . . . . . . . . . . . . .46
Table 14. Undeveloped Quality . . . . . . . . . . . . . . . . . . . . . . . . . . . . . . . . . . . .51
Table 15. Mapped Dams in Badlands Wilderness . . . . . . . . . . . . . . . . . . . . . . . . . . .52
Table 16. Authorized Uses of Motorized Equipment or Mechanical Transport . . . . . . . . . . . . .56
Table 17. Solitude or Primitive nnd Unconfined Recreation Quality . . . . . . . . . . . . . . . . . .57
Table 18. Summary of Acoustic Observer Log Data: Sage Creek Wilderness Zone (Site Id B02) . . . .59
Table 19. Visitor Use Restriction Event . . . . . . . . . . . . . . . . . . . . . . . . . . . . . . . .62
Table 20. Visitor Use Restriction Index . . . . . . . . . . . . . . . . . . . . . . . . . . . . . . . .62
Table 21. Other Features of Value Quality . . . . . . . . . . . . . . . . . . . . . . . . . . . . . . .63
Table 22. Number of Paleontological Incident Reports Per Year . . . . . . . . . . . . . . . . . . . .65
Table 23. Scenic Inventory Value Matrix. . . . . . . . . . . . . . . . . . . . . . . . . . . . . . . .67
Table 24. Visual Resources Condition Category Criteria . . . . . . . . . . . . . . . . . . . . . . . .67
v

Photo: Jacob Gaposchkin
vi

INTRODUCTIONThe Wilderness Act of 1964 (Public Law No. 88-577, 78 Stat. 890) was passed by a nearly unanimous vote in the United States Congress to protect natural lands from the seemingly endless threats of “expanding settlement and growing mechanization.” The primary mandate of the Wilderness Act is given in section 4(b) and states that “each agency administering any area designated as wilderness shall be responsible for preserving the wilderness character of the area” [emphasis added]. In order to establish a common understanding of this directive, wilderness character was formally defined by an interagency monitoring team representing the US Forest Service (USFS), (Department of Agriculture), as well as the US Fish and Wildlife Service (USFWS), National Park Service (NPS), and Bureau of Land Management (BLM) (Department of the Interior [USDI]):
Wilderness character is a holistic concept based on the interaction of (1) biophysical environments primarily free from modern human manipulation and impact; (2) personal experiences in natural environments relatively free from the encumbrances and signs of modern society; and (3) symbolic meanings of humility, restraint, and interdependence that inspire human connection with nature. Taken together, these tangible and intangible values define wilderness character and distinguish wilderness from all other lands. (Landres et al. 2015) Photo: Rheanna Kautzman
Wilderness character encompasses intangible and tangible qualities, including five tangible qualities that are described in the definition of wilderness from section 2(c)) of the Wilderness Act. Together, these five tangible qualities are used to monitor how stewardship actions, impacts from modernization, and other changes occurring outside of a given wilderness area, affect said wilderness over time. The five tangible qualities apply nationally to all wilderness areas—regardless of their size, location, administering federal agency, or other unique place-specific attributes—because they are based on the legal definition of wilderness. Descriptions of these qualities as derived from section 2(c) of the Wilderness Act are listed below.
UntrammeledWilderness is “…an area where the earth and its community of life are untrammeled by man”
Wilderness ecological systems are essentially unhindered and free from the actions of modern human control or manipulation when the untrammeled quality is preserved.
NaturalWilderness “…is protected and managed so as to preserve its natural conditions”
Wilderness ecological systems are substantially free from the effects of modern civilization when the natural quality is preserved.
UndevelopedWilderness is “…an area of undeveloped Federal land … without permanent improvements or human habitation”
Wilderness retains its primeval character and influence, and is essentially without permanent improvement or modern human occupation when the undeveloped quality is preserved.
Solitude or Primitive and Unconfined RecreationWilderness “…has outstanding opportunities for solitude or a primitive and unconfined type of recreation”
Wilderness provides outstanding opportunities for solitude or primitive and unconfined recreation when the quality of solitude or primitive and unconfined recreation is preserved.
Other Features of ValueWilderness “…may also contain ecological, geological, or other features of scientific, educational, scenic, or historical value”
Other tangible features of scientific, educational, scenic, or historical value in wilderness preserve wilderness character when they are preserved.
1

In addition to these five tangible qualities of wilderness character, wilderness also has important intangible aspects that are difficult or impossible to quantify or monitor. These intangible aspects are diverse and can include the scenic beauty; spiritual experiences; immensity of an area; and opportunities for self-discovery, self-reliance, and challenge that come from wilderness settings. Currently, these intangible aspects of wilderness can only be addressed in narrative form.
Wilderness character may change over time, and may be improved or diminished by the actions or inaction of managers. The challenge of wilderness stewardship is that decisions and management actions taken to protect one quality of wilderness character may degrade another quality. In addition, the accumulated result of seemingly small decisions and actions may cause a significant gain or loss of wilderness character over time. Because of this complexity, preserving wilderness character requires that agency staff document decisions made in wilderness and the impacts of those decisions.
In 2008, an interagency team published a national strategy for monitoring trends in wilderness character titled Keeping It Wild: An Interagency Strategy for Monitoring Trends in Wilderness Character Across the National Wilderness Preservation System (Landres et al. 2008). The monitoring strategy described in Keeping It Wild was implemented nationally from 2008 to 2014, and has proved to be an effective tool for wilderness
managers with limited resources. Based on lessons learned during this initial implementation of wilderness character monitoring, the framework was revised and updated; the changes made are reflected in Keeping It Wild 2: An Updated Interagency Strategy to Monitor Trends in Wilderness Character Across the National Wilderness Preservation System (Landres et al. 2015). The wilderness character monitoring strategy for the Badlands Wilderness contained in this document reflects the revised monitoring strategy described in Keeping It Wild 2.
The framework of wilderness character monitoring is based on the qualities defined above. Each quality is divided into a hierarchical set of monitoring questions, indicators, and measures to assess trends in wilderness character over time. Monitoring questions frame wilderness character monitoring to answer particular management questions; indicators are distinct and important elements in each monitoring question; and measures are a specific aspect of wilderness on which data are collected to assess trend in an indicator (Landres et al. 2008, 2015). Expanded definitions of wilderness character monitoring qualities, monitoring questions, indicators, and measures are available in appendix A. While the qualities, monitoring questions, and indicators are nationally consistent, measures are specific and sometimes unique to individual wilderness areas (figure 1).
Figure 1. Keeping It Wild Hierarchical Framework
Locally Relevant
Nationally Consistent
Measures
Indicators
Monitoring Questions
Qualities
WildernessCharacter
2

Photo: Jacob Gaposchkin
This framework balances national and local needs for monitoring by defining locally relevant measures whose trends can be compiled at higher levels for national or regional reporting. This interagency monitoring strategy
• provides on-the-ground information to assess trends and make defensible decisions;
• provides valuable information on wilderness on regional and national scales;
• provides a set of key wilderness stewardship goals;
• communicates a common definition of wilderness character;
• communicates a tangible vision of wilderness within the agency and to the public;
• clarifies how stewardship decisions and actions influence wilderness;
• evaluates and documents the effects of actions taken inside the wilderness and effects from threats outside the wilderness;
• synthesizes data into a single, holistic assessment of wilderness character;
• creates a legacy of staff experience and knowledge of a wilderness; and
• improves on-the-ground wilderness stewardship.
This monitoring strategy offers a consistent means for documenting the status and trends in wilderness character and wilderness management within a wilderness. Under this monitoring strategy, trends in wilderness character are classified as upward (positive), downward (negative), or stable. These trends are both nationally consistent and independent of the unique aspects specific to any given wilderness; therefore, trends
in wilderness character can be compared between wildernesses or across regions. These trends cannot be used to “rate” or “grade” stewardship, however, because they are meaningless when taken out of the context of wilderness character monitoring—wilderness character monitoring is a tool to holistically assess the preservation of wilderness character, not to place judgment on managers. Similarly, while trends can be compared between wildernesses, comparing wilderness character itself among different wildernesses is inappropriate. Each wilderness is unique in its legislative and administrative direction, and in its social and biophysical setting; therefore, wilderness character in a particular wilderness cannot, and will not, be compared to that of another wilderness.
The purpose of this report and the measures of wilderness character is to improve wilderness stewardship by informing managers’ understanding of the wilderness they manage, how wilderness character is changing over time, and why changes may have occurred. The following report establishes a baseline condition and monitoring strategy for the Badlands Wilderness based on the five qualities of wilderness character, as well as the measures that are specific to the Badlands Wilderness and indicative of local trends in wilderness character. An online Wilderness Character Monitoring Database (at https://wc.wilderness.net/) accompanies this document and includes entries for all measures and baseline data specific to this wilderness where trends in wilderness character can be monitored. To assure that data will be collected and entered into the Wilderness Character Monitoring Database in the future, it is recommended that wilderness character monitoring be added to annual workload planning.
3

Photo: Sarah Conlin
4

Photo: Jacob Gaposchkin
WILDERNESS CHARACTER IN THE NATIONAL PARK SERVICEPreserving wilderness character in the National Park Service is vital to national wilderness preservation. The National Park Service administers 40% (over 44 million acres) of designated wilderness in the National Wilderness Preservation System. Of all lands managed by the National Park Service, more than 80% have been designated as wilderness or are formally eligible, proposed, recommended, or potential wilderness—more total land and a greater proportion of land than any other wilderness management agency.
NPS policy affirms the mandate of the Wilderness Act to preserve wilderness character. The NPS Management Policies 2006 on Wilderness Preservation and Management assert preservation of wilderness character as one of the first and foremost directives and cite wilderness character as a consideration for a range of actions spanning resource management, environmental compliance, analysis of minimum requirements, cultural resource protection, management of facilities and signs, and interpretation and education.
Spurred by NPS policy and building on the framework of Keeping It Wild, the National Park Service Wilderness Character Integration Team published Keeping It Wild in the National Park Service: A User Guide to Integrating Wilderness Character into Park Planning, Management, and Monitoring (hereafter referred to as the NPS User Guide) in 2014. The purpose of the NPS User Guide is to provide a NPS-specific reference tool to help managers “integrate wilderness character into park planning, management, and monitoring” while serving as a companion document to the 2014 Wilderness Stewardship Plan Handbook: Planning to Preserve
Wilderness Character. Both documents are included as part of Reference Manual 41: Wilderness Stewardship, which acts as the primary level 3 guidance for wilderness stewardship in the National Park Service.
Director’s Order 41: Wilderness Stewardship, signed in 2013, provides specific direction for the preservation of wilderness character, stating that each wilderness park:
• “will integrate the concept of wilderness character into park planning, management, and monitoring
• “should develop a wilderness character narrative, which describes what is unique and special about a specific wilderness
• “will conduct a wilderness character assessment, which includes identifying what should be measured, establishing baseline data, and conducting ongoing monitoring of trends”
Director’s Order 41 also references the five qualities of wilderness character in Keeping It Wild, which form the basis of this document, and directs managers to the NPS User Guide to inform the implementation of these wilderness character directives.
This report is intended to fulfill two parts of the directive in Director’s Order 41 through the development of a wilderness character narrative and the completion of a wilderness character monitoring baseline assessment. Additionally, this document is intended to fulfill the NPS User Guide recommendation that encourages every park with wilderness resources “to identify any immediate concerns in wilderness, and to inform managers and the public about the current status of wilderness character.”
5

6

HISTORICAL AND ADMINISTRATIVE SETTING OF THE BADLANDS WILDERNESSBadlands National Monument was first authorized in 1929, followed by establishment in 1939. The monument encompassed approximately 110,000 acres of the South Dakota Badlands. In 1968, the monument was expanded by 133,000 acres in creation of the south unit of the park, which comprises tribal lands that are part of the Pine Ridge Reservation. The monument was redesignated as Badlands National Park in 1978.
Sponsored by Rep. John P. Saylor (P-12) in March of 1973, a bill was introduced to the House Committee on Interior and Insular Affairs with a purpose to designate the Badlands Wilderness along with other specified lands as wilderness areas in the national park system and national forest system. This bill was never voted
on. In March of 1975, Senator Henry M. Jackson (WA) introduced another bill to designate a wilderness area in Badlands National Monument. This bill passed the Senate but was never voted on in the House. Finally, in October of 1976, President Gerald Ford signed into law the addition of almost 900,000 acres of wilderness into the National Wilderness Preservation System, one of these areas being the Badlands Wilderness (Public Law 94-567). The Badlands Wilderness, located on the west side of the north unit of the park, preserves 64,250 acres of designated wilderness. The Badlands Wilderness is separated into two units—the Sage Creek unit and Conata unit.
>
Sage Creek Unit
Conata Unit
£¤I 90 E£¤I 90 W
£¤SD
HW
Y 24
0
£¤Q
UIN
N R
D
£¤SD HWY 44
£¤B
IG FO
OTE R
D
£¤SAGE CREEK RIM RD
£¤C
ON
ATA
BA
SIN
RD
£¤HORTON RD
£¤180 A
VE
£¤HUETHER RD
£¤245 ST
£¤248TH ST
£¤SA
GE C
REEK
RD
£¤SD HWY 44
£¤SD HWY 44
FGuptill
Inholding
LegendDamSage Creek Wilderness AreaConata Basin Wilderness AreaStreamsRoadsNPS BoundaryForest Service
0 4.5 92.25Miles
National Park ServiceBadlands National Park
Map Produced by:W. ThompsonPhysical Science TechnicianPaleontologyBadlands National Park Y:\GISProjects\J millman Wilderness Maps
Sage Creek Unit and Conata unit of Badlands Wilderness
7

Photo: Sarah Conlin
8

Photo: Mike Pflaum
WILDERNESS CHARACTER NARRATIVEThis wilderness character narrative qualitatively describes what is unique and special about the Badlands Wilderness in terms of the intangible and tangible qualities of wilderness character. It is a foundational document intended to convey the current and foreseeable future condition of the wilderness, describe the fundamental wilderness resource, and acknowledge important intangible values associated with the wilderness.
The Badlands Wilderness ignites deep human connections to a land that has played host to numerous ecosystems and occupants. Beyond the prolific geological story mapped into the layers of the badlands formations, visitors attain humility and reverential respect from the emergence stories of the American Indians navigating this bewildering terrain by following bison across the landscape, thriving in secluded valleys and atop the high grounds of the Badlands Wall. Today, the Lakota, a compilation of tribes in addition to Nakota and Dakota that comprise the Oceti Sakowin Oyate, People of the Seven Council Fires, celebrate the pride of their hunter-gatherer heritage and spiritual connection to the land and
its resources. Deep canyons and ravines cut into the cliffs and buttes across the barren landscape, creating an area that the Lakota people refer to as the Makosica (Mah-koh shee-jah) meaning “badlands.” This term does not reflect an ill-fated omen across the land, but speaks more to the inherited skill required in navigating the variegated topography of the area.
Intrinsic reflection apart from a contemporary culture dominated by technological developments is granted through traversing an incomparable prairie setting unique to Badlands National Park and the Badlands Wilderness, which comprises about 26% of the park. Scrambling along what was once an ancient seabed and coming upon a fossil embedded in the side of a sod table, is synonymous with the instantaneous sensation of glimpsing a world beyond what the modern visitor could fathom today. The tactile link to time through paleontology is one of the most captivating wonders visitors seek here. Moving in and out of the ancient formations, banded sediment layers are set aglow by the sun’s radiant illumination revealing a kaleidoscopic scene that transforms by the second.
9

Concealed in the park’s sharply eroded buttes, pinnacles, and spires are rich geologic deposits that attract crowds from all over the world. Ancient sedimentary rock layers reveal that this unique landscape has been crafted by the forces of nature for some 75 million years. In these layers of sediment are revealed the largest assemblage of known late Eocene and Oligocene epoch mammal fossils. These fossils have immeasurably contributed to the science of vertebrate paleontology. As the Rocky Mountains and Black Hills rose up, the inland sea began to retreat. Over 500,000 years ago, the Cheyenne River began to flow around the Black Hills, capturing the streams and rivers that flowed from this area into the Badlands. Sediments that were once transported into the Badlands were now trapped. Wind and erosion took over, creating the landscape we see today. The White River to the south of the park, the Cheyenne River to the west, and the Bad River to the northeast created what is now the Badlands Wall. Due to the rapid rate of erosion, 1.0 in/yr (2.54cm/yr), geologists and other scientists believe that the life of the badlands as we know them is half over.
In a place where history is as intriguing as it is diverse, so are the plants and wildlife that live and thrive here today. Blistering temperatures, sometimes rising above
100 degrees Fahrenheit (°F) (38°Celsius [C]) to well below 0°F (-18°C), require hardy species with unique adaptations to tolerate such extreme conditions. Songs of western meadowlarks and sandhill cranes drift through the wind under the wings of red-tailed hawks, bald eagles, golden eagles, and turkey vultures patrolling the sky. Meanwhile magpies, great horned owls, and burrowing owls occupy the trees, buttes, and mounds of the prairie. Seeds of western wheatgrass, prairie coneflower, white milkwort, needle-and-thread grass, and prairie dropseed are distributed about the soil from the coats of the hundreds of bison that roam the vast wilderness area. Rocky Mountain bighorn sheep thrive near the Pinnacles formations, expertly making their way through Cedar Pass and into the deep reaches of the park. Rattlesnakes emerge from their underground winter homes to bask in the long hours of summer sunlight. Prairie dogs, an important keystone species, scurry through their towns in search of new tunnels to build, always on the alert for coyotes in search of their next meal. The elusive swift fox and the black-footed ferret, the most endangered land mammal in North America, remain hidden from the public eye, adding to the unseen mysteries of this rugged wilderness landscape.
10

UntrammeledWilderness is essentially unhindered and free from modern human actions that control or manipulate the community of life.
The unique biodiversity of wildlife is, for the most part, free to roam, reproduce, forage, and die without human intervention. Food availability fluctuates between seasons, challenging native and migrating species to adapt their diets and habitat dependency, free of management manipulation in the Badlands Wilderness.
There are several trammeling actions that threaten the wilderness character of this renowned area. The untrammeled quality is degraded by nonnative and invasive plant control often deployed to restore and revive species richness using nonmechanized means, simultaneously degrading this quality while improving the natural quality. The park manages the native plant populations by controlling the spread of nonnative plant species such as annual bromes, Kentucky bluegrass, and yellow sweet clover. Fire suppression and management ignited prescribed fire also degrades this quality of wilderness character due to the interruption of natural fire regimes. Efforts to restore native vegetation, like implementing prescribed fire proposals, interrupt the delicate ecological processes that were initially
in place before these intervening management practices were employed.
Wildlife management does occur in the Badlands Wilderness, but is done rarely and performed after using a minimum required analysis (MRA). Bison herd management, including round-ups and culls and fence-based grazing confinement, reduces the opportunity for bison to freely roam the landscape. Increased wildlife research that calls for the capture and collaring of wildlife diminishes the freedom of wild animals from human contact. The reintroduction of the swift fox and black-footed ferret took place in the wilderness area in efforts to revive native species in the mixed-grass prairie ecosystem. Although the Badlands Wilderness has much to offer in scientific discovery, research that involves the intentional manipulation of wildlife constitutes a trammeling to wilderness character. Lastly, an activity not authorized by the federal land managers, such as reported illegal activity that intentionally manipulates the biophysical environment, degrades the untrammeled quality of wilderness character. Resource poaching and illegal grazing are examples of this type of illegal activity.
Photo: Mike Pflaum
11

Photo: Jacob Gaposchkin
NaturalWilderness maintains ecological systems that are substantially free from the effects of modern civilization.
The transitional zone between tallgrass prairie to the east and barren shortgrass prairie to the west reflect a textured mural of never ending horizons. Encompassing one of the largest protected and undisturbed prairie ecosystems in the United States, elements in this unparalleled ecological community include a rich biodiversity of wildlife and vegetation.
The mixed-grass prairie is home to many species of animals. Scientists have documented 39 mammal species, 9 reptile species, 6 amphibian species, 206 bird species, and 69 butterfly species. The decimation of the bison populations around the country in the late 1800s ignited the movement to protect current herds. The bison herd is in excellent health—productive, disease-free, and genetically diverse. The bison primarily occupy the north unit of the Badlands Wilderness. Rocky mountain bighorn sheep were reintroduced to the wilderness area in 1964 and are the healthiest population in South Dakota. Mule and white-tailed deer move across the prairie into the wind that provides protection from parasitic insects. Prairie dogs are a keystone species in the wilderness, meaning that much of the prairie biota depend on prairie dogs as prey, or they use the habitat that prairie dogs occupy. They were all but eliminated from the wilderness when sylvatic plague infected the population in 2007. Plague is not native to North America, originating in Europe, and was transported to the Americas in the late 1800s. The loss of prairie dogs has had a significant adverse effect on the black-footed ferret, swift fox, raptor, reptiles, rodents, and every organism that depends on prairie dog colonies. The prairie dog colonies of the Badlands Wilderness were vast, innumerable, and thriving with biodiversity. Today, they are mostly prairie dog ghost towns, with scant colonies scattered around the area. Prairie dogs are not recolonizing the vacant dog towns to any measurable
degree because of the long distances dispersing animals must travel among the few remaining resident colonies. In return, the swift fox and black-footed ferret populations are affected and fluctuate dramatically in size, causing concern and near intervention from wildlife managers. Black-footed ferrets are the most endangered land mammals in North America. Efforts by park managers to preserve a healthy population of the species improve the natural quality of the wilderness area at the expense of the untrammeled quality.
Seasonal streams and ponds create the perfect breeding habitat for the small populations of amphibians in the wilderness. Mating calls of the chorus frog are the first to be heard after a long winter of hibernation. In June and July, the Great Plains toad, woodhouse’s toad, and plains spadefoot can be heard across the expanse of prairie. Intermittently, a tiger salamander may appear to investigate the area.
The composition of natural life cycles in the wilderness is threatened by long-term disruption of the natural fire regime and abundance in variety of nonnative plant species; an example being the spread of sweet clover and Canadian thistle in the prairie dog towns due to the lack of prairie dogs. The creation of stock ponds contribute to the degradation of the natural quality of wilderness by interrupting the seasonal free flow of water, in addition to introducing atrazine contamination with monitored ramifications on surface and groundwater sources. Past and current grazing impacts also degrade the natural quality. Although Badlands National Park is currently ranked as a class 1 area for air quality under the Clean Air Act, pollution from nearby urban centers creates moderate concern for future trends contributing to the degradation of natural quality.
12

UndevelopedWilderness retains its primeval character and influence and is essentially without permanent improvements or modern human occupation.
Encompassing views of the untamable Badlands Wilderness invigorates the curiosity for a distant world alive with a variety of lifeforms that are nearly unimaginable to today’s visitors. Views and encounters in the wilderness are distinctly primitive due to the absence of significant modern human development. Visitors are able to escape the intrusion of freeway noise, agricultural obstructions, and modern transmission lines connecting them to the stress of present-day technological advancement. Coyotes howling in the distance harmonize with the rustle of prairie grasses in the wind, uninterrupted for miles around. An endless horizon drapes across the sky, unimpeded by modern installations
Although there are no present-day authorized or unauthorized nonrecreational installations (e.g., weather stations, radio repeaters, stream gauges, enclosures), pre-wilderness homestead foundations and trash dumps from old wells and discarded household items remain scattered about the wilderness. These items include pottery, bed springs, vegetation plots, and unmarked gravesites. A historic gravesite from 1916 marks the resting place of twin infants. Several Civilian Conservation Corps (CCC) stock ponds, dams, and other features associated with homesteads are located
in both units of Badlands Wilderness. Although these artifacts are important to the cultural history of the area, their presence is degrading to the undeveloped quality of wilderness.
When helicopter transport, administrative use of motorized equipment, or other instances that require motorized tools are used, their presence in wilderness is isolated and short lived. Visitors are prohibited from using forms of mechanical transport, including bikes, snowmobiles, and off-road vehicles. Visitors can access the wilderness on foot or on horseback.
From 1942 through 1945 as part of the war effort, the US Air Force (USAF) took possession of 337 acres of Badlands National Monument as air-to-air and air-to-ground gunnery ranges. Precision and demolition bombing exercises were common during this time period. Pilots in practice, operating out of Ellsworth Air Force Base near Rapid City, found it a challenge to determine the exact boundaries of the bombing range. After the war, portions of the range were used as an artillery range by the South Dakota National Guard. Although this land is no longer used by the air force, spent and discarded bomb shells and bullets can still be found scattered throughout the wilderness area.
Photo: Jacob GaposchkinBadlands Wall
13

Photo: Jacob GaposchkinVisitor Viewshed
Solitude or Primitive and Unconfined RecreationWilderness provides outstanding opportunities for solitude or primitive and unconfined recreation.
Wild places provide a sense of awe-inspiring solitude coupled with unconventional freedom. The Badlands Wilderness provides these moments through an endless sky layered with iridescent pinks, purples, and oranges streaked across the fading blues and violets of the evening sky, soon to be replaced by the Milky Way spreading across the horizon. Multitudes of stars fill the dark sky as the howls of coyotes in the distance complement the wilderness experience. The darkest nights accompanied by the hint of winter in the air display hints of the aurora borealis. Sunrise brings a new day and new experiences accompanied by the many and varied songs of the awakening prairie songbirds.
Located less than two hours from Rapid City, this wilderness offers an intriguingly wild experience to those self-reliant explorers who seek the power of primitive, remote hiking and camping. This unconfined type of recreation allows visitors to choose their own adventure in a refuge from the stress of city living.
Visitors can choose from a variety of nonmotorized means of transport; from horseback riding to hiking, they have the freedom to stay overnight without the
requirement of a permit. Due to limited use by the public, the Badlands Wilderness offers numerous isolated camping sites that are undeveloped and undesignated. Within the two units of the wilderness area, there are no designated trails, toilets, shelters, or waysides. For safety reasons, wilderness visitors are encouraged, but not required, to register in one of three locations. The occasional sound of commercial aircraft flying overhead and views of fencing across the wilderness boundary, or powerlines outside the wilderness, slightly degrade the true primitive quality of visitor discovery. Sage Creek Campground, located outside wilderness but at its edge, concentrates visitors and overnight campers in proximity to wilderness. The sights and sounds of a large campground may adversely affect solitude in the Sage Creek unit. The primitive self-reliance this wilderness offers is a challenge to those who aspire to an adventure similar to the first people who attempted homesteading this empty wild landscape. The wilderness will leave them enthralled by the undeniable and awesome beauty of a true prairie experience.
14

Photo: Jacob Gaposchkin
Other Features of ValueWilderness may also contain other features of scientific, educational, scenic, or historical value.
Scenic FeaturesThe Badlands Wilderness endures and yields to unforgiving climatic conditions in a race against time. The resilience of this wilderness is evident through the striking spectacle of precipitous buttes and sharp ridgelines emerging from the soft consistency of prairie grassland. Standing like weathered castles scattered amongst the hillsides, the walls of this wilderness are painted with ribbons of red, bronze, yellow, white, gray, and black. The scenic peculiarity of the badlands formations is a main attraction of the park, revealing to visitors a stunningly natural view that is unlike anywhere else in the country. On days with ideal weather conditions, visitors are graced with an unhindered view of the rugged ambience and expansive panorama of the Badlands Wilderness. Amended in 1977, the Clean Air Act mandates the elimination of visible air pollution throughout the country. Parkwide air quality is considered satisfactory, and air pollution poses little or no risk to the wilderness. On the clearest days, the visibility is about 140 miles, approaching the 180-mile visual range seen under natural conditions.
Geologic FeaturesComparison of ancient soils to modern soils under specific climatic events revealed the regional shift from a thriving marine ecosystem that was in place 70 million years ago to the prairie grasslands we see today. Each ribbon represents chronological sedimentation events that geologists are able to stitch together through paleosol analysis and paleomagnetism studies. Analysis of magnetic orientation of tiny magnetic minerals in rocks in the walls of the Badlands holds records of global plate tectonics, geodynamics, and thermal history of Earth throughout time.
Badlands National Park is in the Bad, Middle Cheyenne-Elk, Middle Cheyenne-Spring, Upper White, and Middle White River drainage basins. Each river flows east into the powerful Missouri River. The White River runs south of the north unit. The Badlands Wall, a scenic attraction in wilderness, represents the strength of the ancient biophysical forces at work over this volatile area. The Cheyenne River to the north continues to erode what is left of the remnants of prehistoric landscapes. The White
15

River to the south exposes the terrain of the lower prairie as it flows from the west to east. Together, in collaboration with dynamic weather events such as heat waves, violent wind storms, fire, rain, and freezing blizzards, the rapid erosion rate stuns the mind of modern scientists. The repeated contraction and expansion of ash-derived clays from large variations in seasonal temperature impedes the rooting of plants, allowing intense summer storms to erode the landscape in a short span of time. The malleable and sponge-like nature of these soft soils soaks up precipitation during sudden, heavy rain showers. These clays then dry up leaving exposed, loose rubble that eventually washes away during the next storm. Lack of vegetation and root systems leave the landscape vulnerable to high erosion rates and even higher chances of fossil exposure. Although the annual rainfall at Badlands is around 16 inches per year, the hydrophobic nature of the clay sediment escalates the intensity of summer rain events. These events have written primitive stories within the surface and subsurface strata of the Great Plains, creating intriguing studies and insights to many different paleoenvironments that show evidence of subtropical seaways, marsh and swamp lands, transitioning to North America’s first grasslands.
PaleontologyInvaluable information on climate change and ecological shift during major global temperature drops throughout the Cenozoic era is exposed by the sedimentary layers of the White River Badlands. The oldest exposed strata in the wilderness, known as the Pierre Shale, dates back to the late Cretaceous period, approximately 70 million years ago. This black, carbon-rich shale was created by sediment filtration through seawater that was deposited on the sea floor. Numerous marine fossils such as ammonites, baculites, nautiloids, mosasaurs, sharks, and giant sea turtles have been found in these strata. The Pierre Shale represents a subtropical environment where the shallow Western Interior Seaway dominated the central part of North America, stretching from the Gulf of Mexico to the Arctic Ocean.
After the retreat of the Western Interior Seaway, a 30 million year gap in the geologic record occurred due to a prolonged episode of erosion and nondeposition. The uplift of the Black Hills to the east and the Rocky Mountains to the west during the Paleocene and early Eocene epochs, ultimately caused the gradual retreat of the Western Interior Seaway. Humid tropical environments, similar to a modern-day rainforest,
Photo: Sarah Conlin
16

persisted after the Cretaceous into the early half of the Cenozoic, or “Age of Mammals.” A period of intense soil formation in the Eocene Epoch (>40 million years ago) created paleosols with bright yellow and purple strata known as the Yellow Mounds near Dillon Pass, a sight sought out by most visitors.
The Chamberlain Pass Formation, recognized by thin layers of red mudstone and bright white sandstone, marks the return of deposition 30 million years after the retreat of the Western Interior Seaway. This transition to the late Eocene epoch reveals a subtropical, swampy woodland climate with dry seasons and the Chadronian North American Land Mammal Age is established by the characteristic fauna found in the Chadron Formation. Fauna that are typical for this formation are fossils of large, rhino-like creatures known as brontotheres. Fossils of oreodonts, an extinct group of artiodactyls with a digitigrade stance unlike any living mammal group in physical structure or appearance, have been discovered in this formation along with many of the earliest appearance of several modern mammal groups.
As the badlands region transitioned into the early Oligocene epoch (33.7 to 32 million years ago), the landscape transformed into a forested riparian environment surrounded by open grassy woodland and shrubland. During this time period, the first appearance of the rare false saber-toothed cats occurred in addition to other carnivorous mammals, and documented lineages of the oldest known rodent family. The formation these fossils, along with the dog-like Hesperocyon and camel, Poebrotherium, reside in what is called the Brule Formation.
Due to the geologic phenomenon that resides here, scientists have documented over 300 paleontological localities, which has inspired over 150 years of field studies to discover the ancient life of Badlands National Park. Although the importance of paleontological education is vital to the preservation of this geologically significant region, unchecked physical processes such as erosion and redeposition remain the principal features of the landscape. Significant understanding of comprehensive fossil fauna and paleoecology in the
Photo: Dwayne TravisFossil Locality
17

Photo: Mike PflaumSubhydracodon Fossil
South Dakota White River Group were conducted in the wilderness area. The best resources for understanding the Late Cretaceous Western Interior Seaway in the confines of Badlands National Park are nearly exclusive to the Sage Creek Wilderness Area.
Park staff continues to enlighten visitors by showing them how fossils are prepared for exhibit and study, discuss important paleontological topics, new discoveries, and instruct visitors on how to respond when finding a fossil in the park. On average, the park receives over 200 visitor site reports (VSRs) per summer season. Proper procedural forms have been created for visitors to document their findings so scientists have accurate information regarding a fossil site. Visitors are encouraged to use correct scientific methods in verifying the location of a fossil, including GPS coordinates, to indicate the fossil’s location, photographs of the site, and topographical descriptions of the area. In addition to instructing visitors in the proper documentation of their find, the importance of leaving the fossil in place is emphasized in order to preserve the contextual data associated with it. Once a fossil is removed, data such as orientation, associated skeletal elements, and exact stratigraphic occurrence that could otherwise be obtained from a fossil left in place, is already lost without proper documentation. The uniqueness of every fossil comes from not only its occurrence in the Badlands, but
also with its rarity in space and time, permitting us to see a snapshot from deep within the ebb and flow of time in the wilderness.
Paleontological resource theft is a major concern. Unlawful fossil collecting can take on many forms. Outside educational programs, experienced poachers, and well-meaning park visitors are the cause of countless fossils leaving the park without a research permit. Experienced poachers often destroy fossil sites by using a smash and grab method of collection that inhibits park paleontologists from properly collecting relevant fossils and collateral data. This also takes away from education opportunities that would have been beneficial with any fossils regardless of their completeness. Modern technology enables visitors to navigate to the most remote portions of the wilderness area with relative ease. Because of this, visitors may come across perfectly preserved fossil sites, collect the fossil with intentions to help the park, but end up permanently damaging the site, the fossil remains, and any valuable contextual data associated with it.
The hidden spirit of the Badlands Wilderness transcends time through the richness of cultural and paleontological significance. This significance gives voice to a past that inspires humility and understanding to any of those who would take the time to listen.
18

WILDERNESS CHARACTER MONITORINGThis wilderness character monitoring assessment describes the wilderness character monitoring strategy for the Badlands Wilderness based on the monitoring framework of Keeping it Wild 2. It discusses the measures selected for monitoring the Badlands Wilderness and provides quantitative baseline data for each. In contrast to the qualitative descriptions found in the wilderness
character narrative, this is a quantitative assessment of the area’s wilderness character. The measures selected for the Badlands Wilderness, and the corresponding data compiled and analyzed for each, establish a foundation for continued monitoring of the wilderness character of the Badlands Wilderness into the future.
Photo: Matt RolandBighorn Sheep in Conata Wilderness
19

Process Used for Identifying MeasuresThe process used to identify and select measures to monitor wilderness character is outlined below. All actions were carried out by the Wilderness Fellow unless otherwise specified.
Gather InformationBackground information was gathered to understand the wilderness, including its history, ecosystems, and potential future threats. This information was gathered by reading background and guiding documents for the wilderness and park, interviews with park staff, and visiting the wilderness.
Create List of Possible MeasuresPreliminary measures were identified and compiled for all indicators based on the information gathered and interviews with park staff. Several measures were based on measures described in wilderness character monitoring documents such as the Common Measures Library or measures developed for other wilderness areas and adapted to suit the Badlands Wilderness.
Refine MeasuresMeasures were prioritized and refined through discussing measures with staff and evaluating the significance, feasibility, vulnerability, and reliability of measures (appendix B). Availability of reports and scientific information was also considered.
Approval of MeasuresThe final list of measures was developed and submitted to communications and outreach specialist, Erin Drake (NPS Wilderness Stewardship Division).
Locate and Synthesize DataAvailable data for each measure was collected by contacting relevant individuals and pulling information from national databases, shared drives, and GIS or paper files. Data were processed and analyzed as necessary.
Write ReportBackground information, collection protocol, data adequacy, data source, and significant change were described for each measure. All measures were written into the final report and the report was submitted to supervisors.
Enter DataData were entered into the Wilderness Character Monitoring Database at https://wc.wilderness.net/.
Incorporate CommentsChanges, edits, and feedback from park staff and wilderness supervisors were received by the Wilderness Fellow. Edits were incorporated into the final draft.
Approval of Final ReportReport was finalized and approved by supervisors.
20

Overview of Wilderness Character Monitoring MeasuresThe table below provides a basic overview of the Badlands Wilderness character monitoring measures selected for monitoring the Badlands Wilderness. Each measure is described in more detail in its respective section later in the report.
Table 1. Overview of Badlands Wilderness Character Monitoring Measures
Indicator Measure
Untrammeled: Actions authorized by the federal land manager that intentionally manipulate the biophysical environment
• Actions that manipulate vegetation communities• Actions that manage or restore native animal species• Percentage of natural fire starts that are suppressed
Untrammeled: Actions not authorized by the federal land manager that intentionally manipulate the biophysical environment
• Number of reported illegal activity
Natural: Plants • Priority exotic plant species
Natural: Animals• Estimated percentage of animals killed or infected by invasive
insects or pathogens
Natural: Air and water
• Visibility• Concentration of nitrogen in wet deposition• Concentration of sulfur in wet deposition• Ozone
Natural: Ecological processes • Acoustic conditions
Undeveloped: Presence of nonrecreational structures, installations, and developments
• Number of nonrecreational structures, installations, and developments
Undeveloped: Presence of inholdings • Number of inholdings
Undeveloped: Use of motor vehicles, motorized equipment, or mechanical transport
• Number of Authorized uses of Motor Vehicles, Motorized Equipment, or Mechanical Transport for SAR related events
Solitude or Primitive and Unconfined Recreation: Remoteness from sights and sounds of human activity inside wilderness
• Visitor traffic in the Sage Creek unit
Solitude or Primitive and Unconfined Recreation: Remoteness from sights and sounds of human activity outside of wilderness
• Length of noise-free interval (time between noise events)
Solitude or Primitive and Unconfined Recreation: Facilities that decrease self-reliant recreation
• Number of developed trails
Solitude or Primitive and Unconfined Recreation: Management restrictions on visitor behavior
• Restrictions on visitor behavior/access
Other Features: Deterioration or loss of integral cultural features • Paleontological disturbances
Other Features: Deterioration or loss of other integral site-specific features of value
• Condition of visual resources based on scenic quality and view importance ratings for park/wilderness views
For each measure, this report includes the following subsections: measure baseline data value, 2017 data value, year(s) of data collection, background and context, measure description and collection protocol, data source, data adequacy, data frequency, and significant change. The content and purpose of each of these subsections is described below.
Measure Baseline Data ValueSpecifies the earliest data value that exists for a measure. Although the overall baseline year for wilderness character monitoring in the Badlands Wilderness is 2018 (the first year for which all selected measures have data), the baseline year for a measure may predate this when historical data exist for that measure. Historical data used
21

for a measure can include any data collected from 1976 (the year of wilderness designation) onward. Trends for each measure are calculated by comparing the most recent data value with the data value for the measure baseline year.
2018 Data ValueSpecifies the data value entered into the Wilderness Character Monitoring Database for 2018 (the overall baseline year for Badlands Wilderness Character Monitoring). If 2018 is the measure baseline year, 2018 (Measure Baseline) Data Value is used in place of “Measure Baseline Data Value” and “2018 Data Value.” Note that the Wilderness Character Monitoring Database uses “year measured” to refer to the year of any given data value (e.g., the “year measured” of the “2018 data value” is 2018).
Year(s) of Data CollectionSpecifies the year(s) the data for a measure’s data value was/were collected. For some measures, the protocol may be to report the most recent available data, regardless of when the data was specifically collected. For example, if data pulled from a national website is only available to the public two years after data collection, the data year corresponding with the 2018 data value would be 2016. Measures that use data collected over the course of a year (as opposed to instantaneously collected data) note
whether fiscal years or calendar years should be used. Fiscal years are recorded as the secondary year—for example, the fiscal year from October 2014 to September 2015 would be recorded as “2015 (fiscal year).”
Background and ContextDefines the context and relevance for the measure at an individual wilderness and addresses why the measure was selected.
Measure Description and Collection ProtocolDefines what is being measured and how, including the process through which data is compiled or gathered. “Collection protocol” is defined and used in this document to refer to the process by which data is gathered from existing sources and does not include in-the-field data collection instructions. If field data collection protocols are relevant to a measure and available, a location of where the protocol can be found is included. Additional instructions for completing GIS analyses and simple linear regressions accompany this report as separate documents.
Data SourceDefines where baseline information for the measure can be found in the future. The intent of this section is to encourage written documentation of wilderness character so that information is accessible into the future.
22

Data AdequacyDefines the reliability of the data to assess trends in the measure. Data adequacy is based on both data quantity and data quality. Data quantity refers to the level of confidence that all appropriate data records have been gathered. Data quality refers to the level of confidence about the source(s) of data and whether the data are of sufficient quality to reliably identify trends in the measure. Further information on the role of data quantity and quality in wilderness character monitoring
is available in the Forest Service Technical Guide (Landres et al. 2009, p. 26). These two aspects of data adequacy are subjectively evaluated according to the categories described in table 2. Data adequacy (scored as high, medium, or low) must be determined on a case-by-case basis from the assessments of data quality and quantity; however, a general scoring framework (table 3) can be used as a starting point for this determination. Note that the Wilderness Character Monitoring Database refers to data adequacy as “data confidence.”
Table 2. Data Quantity and Quality Definitions
Data Quantity Data Quality
Complete: There is a high degree of confidence that all data records have been gathered . For example, to assess the occurrence of nonindigenous invasive plants, a complete inventory of the wilderness was conducted or all likely sites were visited .
High: There is a high degree of confidence that the quality of the data can reliably assess trends in the measure . For example, data on the occurrence of nonindigenous invasive plants are from ground-based inventories conducted by qualified personnel; for visitor use, data would come from visitor permit data .
Partial: Some data is available, but the data are generally considered incomplete (such as with sampling) . For example, to assess the occurrence of nonindigenous invasive plants, a partial inventory was conducted or a sampling of sites was conducted where these plants are likely to occur .
Moderate: There is a moderate degree of confidence about the quality of the data . For example, data on invasive plants could come from national or regional databases; for visitor use, data could come from direct visitor contacts .
Insufficient: Even fewer data records have been gathered, or perhaps this measure is not dependent on actual field data . For example, no inventory for nonindigenous invasive plants has been conducted, and visitor use was not assessed anywhere .
Low: There is a low degree of confidence about the quality of the data . For example, data on invasive plants and visitor use could come from professional judgment .
Table 3. Suggested Scoring for Data Adequacy
Data Quantity + Data Quality = Data Adequacy
Complete 3 + High 3 = High 6
Partial 2 + Moderate 2 = Medium 4–5
Insufficient 1 + Low 1 = Low ≤3
Data FrequencyDefines how often data for this measure should be entered into the Wilderness Character Monitoring Database. Frequency is typically determined by the timeframe in which data becomes available under existing monitoring protocols for use in wilderness monitoring purposes.
Significant ChangeDefines how much the data must change to indicate a changing trend in the measure. “Significant Change” is defined and used in this document differently than definitions used by other departments within the
National Park Service and is not intended to mean “statistically significant change” or to imply use of the environmental impact statement process under the National Environmental Policy Act. In most cases, significant change was determined by the Wilderness Fellow and approved by park staff.
Together, these subsections provide a comprehensive overview of each measure, provide transparency into the wilderness character monitoring measures selected at the park, and form the basis of the wilderness character monitoring strategy of the Badlands Wilderness.
23

Photo: Mike Pflaum
24

UNTRAMMELEDWilderness is essentially unhindered and free from modern human control or manipulation.
The untrammeled quality monitors the actions of humans in wilderness that intentionally manipulate the biophysical environment. Actions that intentionally manipulate or control ecological systems inside wilderness degrade the untrammeled quality regardless of what instigated the action or if benefits to other qualities of wilderness character are gained by the action. Withholding action is a key concept for
understanding this quality; management of wilderness, in contrast to management of other types of land, should be approached with restraint and humility. When monitoring the untrammeled quality we can track either the decision to manipulate the biophysical environment or the opportunity for humans to let natural processes occur without intervention.
Table 4. General Guidance for Counting Trammeling Actions
• Only count actions that are of sufficient scale (that cross the threshold) .• All actions above the threshold are counted equally .• Actions are counted once per year the action occurs .• Minimum requirements analyses or other National Environmental Policy Act analyses
can often (though not always) be used to indicate the extent of possible trammeling actions in wilderness .
*See appendix B for detailed guidance about how to count trammeling action.
Table 5. Untrammeled Quality
Indicator MeasureFrequency in
YearsData
AdequacySignificant
Change
Measure Baseline
Data Value
2018 Data Value
Actions authorized by the federal land manager that intentionally manipulate the biophysical environment
Actions that manipulate vegetation communities
1 High (6) Any 23 1
n/a
Actions that manage or restore native animal species
1 High (6) Any 71 6
n/a
Percentage of natural fire starts that are suppressed
1 High (6) ≥ 10% 50% 50%
Actions not authorized by the federal land manager that intentionally manipulate the biophysical environment
Number of reported illegal activity
1 Med (4) Any 9 3
25

Untrammeled QualityActions authorized by the federal land manager that intentionally manipulate the biophysical environment.
Actions That Manipulate Vegetation Communities
Measure Baseline Data Value: 23 Year(s) of Data Collection: 1994–2017
2018 Data Value: 1Year(s) of Data Collection: 2017
Background and Context:Badlands National Park is home to the largest protected expanses of mixed-grass prairie in the United States. Wildlife habitats and natural ecosystem processes depend on the health of vegetation composition to be primarily native both in and outside the wilderness area. In order to preserve a healthy ecosystem balance, actions to manipulate vegetation and control the spread of invasive species are implemented by federal land managers.
In a transitional zone between the more moist tallgrass prairie to the east and the shortgrass prairie to the west, Badlands National Park encompasses a wide variety of over 400 plant species that have adapted to an environment of extremes. The native western wheatgrass (Agropyron smithii); largely dominates the prairie, favoring the clay soils Badlands has to
offer. Prairie coneflower (Ratibida columnifera), white milkwort (Polygala alba), needle-and-thread grass (Stipa comate), and prairie dropseed (Sporobolus heterolepis) supplement the native population across the landscape. There are a number of nonnative species in abundance in the park that were introduced through human actions and grazing. These species include yellow sweet clover (Melilotus officinalis), brome grass (Bromus sp.), Canada thistle (Circium arvense), Kentucky bluegrass (Poa pratensis), crested wheatgrass (Agropyron cristatum), and knapweeds (Centaurea sp.). Approximately 109,715 acres of the park are unvegetated or sparsely vegetated. Sparse vegetation can also be found in areas of established prairie dog towns, which cover approximately 2% of the park.
26

Mangers use a variety of methods like chemical, mechanical, biological, and prescribed fire to reestablish a native prairie ecosystem. Invasive yellow sweet clover is one of the main species vegetation crews are concerned about in wilderness due to its widespread distribution and its nitrogen-fixing abilities in a naturally nitrogen-poor environment and its shading effects in a native prairie dominated by short stature plants. Regulated funding and available staff limit seasonal projects and force managers to carefully evaluate the most efficient method while being economically conscious. As a result, most of these projects take place along roadways and developed areas outside wilderness. The use of prescribed fire for fuel reduction, removal of weeds, and rejuvenation of native prairie is a common alternative to herbicide treatment. In the Badlands Wilderness, not more than 10,000 contiguous acres of suppression, prescribed fire, and wildland fire use acres combined would be allowed in a given growing season in order to assure adequate forage during the winter season for the park’s bison herd (BADL Weed Management Plan 2003).
In 2016, the vegetation crew of the park has been successfully treating Canadian thistle with chemical herbicide using helicopters, a common method of native vegetation restoration. The park’s most recent three-year plan for controlling nonnative plants in wilderness is building an adaptive management framework to control cheatgrass. Stands of cheatgrass are not only fire prone, but also turn what should be a seasonally changing, diverse mix of grasses and wildflowers into a uniform carpet that is brown most f the year. This brown carpet suppresses the growth and decreases the nutritional content of native grasses like western wheatgrass. This brown carpet is also unpalatable to wildlife, specifically bison, a species that will have an expanded grazing range in wilderness. Taking action to restore native plants through removal of nonnative plants may be beneficial to the natural quality of wilderness, however, is counted as a trammeling action and degrades the untrammeled quality of wilderness.
Measure Description and Collection Protocol: Data value is a count of the number of actions that were taken to treat or restore vegetation, on a broad scale, in wilderness. An action counts as an overall project rather than supplementary actions like mechanical removal of hazard trees or a few invasive plants. The goal is to document actions that manipulate vegetation on a larger
scale. For example, projects that are required to uphold aspects of wilderness character or any research-related actions of a significant scale are to be counted as data for this measure. Prescribed burning and fuel reduction projects are counted in this measure. See appendix B for detailed information about how to count trammeling actions. The goal of this measure is to track whether management programs are trending toward more or less human manipulation in the wilderness. Unlike measures in the natural quality that focus on the magnitude of trammeling effects, untrammeled quality measures focus on the decision to trammel. An increase in the number of authorized actions that manipulate vegetation would contribute to a downward trend for this indicator of the untrammeled quality.
Definitions: Native Species. All species that have occurred or now occur as a result of natural processes on lands designated as units of the national park system.
Nonnative or “Exotic” Species. Species that occupy or could occupy parklands directly or indirectly as the result of deliberate or accidental human activities. Because an exotic species did not evolve in concert with the species native to the place, the exotic species is not a natural component of the natural ecosystem at that place.
Prescribed Fire. Defined as any fire ignited by management actions to meet specific objectives. These fires are conducted under prescription, and on a predetermined area that will produce the intensity of heat and rate of spread required to accomplish specific management objectives.
Data Source: Mark Slovek, Exotic Plant Coordinator, Badlands National Park
Data Adequacy: High (6)
Data quantity is high because all vegetation-management actions taken are well-documented and new actions typically require an MRA. Data quality is high for the same reasons.
Frequency: Annually
Significant Change:Any change in number of actions from the baseline data value is considered significant.
27

Actions That Manage or Restore Native Animal Species
Measure Baseline Data Value: 71 Year(s) of Data Collection: 1976–2015
2018 Data Value: 6Year(s) of Data Collection: 2017
Background and Context: The wilderness management planning of Badlands National Park requires the National Park Service to reevaluate traditional wildlife restoration and manipulation in order to preserve powerful ecological forces on the Great Plains and assure that wilderness character is being upheld to the highest standard possible. Oftentimes, actions taken to preserve wildlife in the Badlands Wilderness, although necessary, disturb the untrammeled quality of wilderness. Restraint is to be exercised whenever actions to trammel cannot take place outside of wilderness.
Bison (Bison bison) are a vital component to retaining a healthy native ecosystem in the Badlands Wilderness. They were reintroduced to Badlands National Park when it was a national monument in 1963. Herd numbers are controlled through the annual bison roundup held opportunistically in the fall of most years. Bison are pushed into special catch pens located on the Robert’s prairie dog town using four-wheel-drive vehicles, where they are then moved into the designated corral area to be processed. Each bison is then run through a squeeze chute and head gate to be aged and have its unique PIT (Passive Internal Transponder) tag read. Any bison that are processed and do not already have a PIT tag will be injected with one behind the right ear. Biological samples will then be taken from that bison—these include tail hair and blood. Physiological information such as age defined by tooth wear is also recorded. To manipulate the herd numbers a set amount of bison are removed during each roundup. This number is determined based on the previous years estimated herd size. Only yearlings and dry cows (cow without a calf) are culled from the herd. The culled animals are then donated and distributed to the Intertribal Buffalo Council or the neighboring Oglala Sioux Tribe.
At Badlands National Park, bison roam the 64,250-acre wilderness area in the western side of the north unit. Visitors to the park can view them from the Sage Creek Rim Road. The 2008 USDI Bison Conservation Initiative and the 2011 National Park Service initiative, A Call to Action, reaffirmed what the Midwest Region has been doing for decades and raises bison restoration to a major
national conservation issue. The conservation initiative sets a target of 1,000 animals for department herds in order to preserve long-term genetic integrity. Badlands National Park is currently pursuing land acquisitions and an exchange with the US Forest Service and a private landowner, which would allow the park to expand bison range in the north unit to meet the 1,000 animal USDI Bison Conservation Initiative goal. A north unit Bison Resource Stewardship Plan and Environmental Assessment were completed in 2016; projects to achieve these plans are currently underway. The plan examined the potential impacts of expanding the current geographic bison range to other areas in the north unit of Badlands National Park. The selected alternative will add an additional 22,553 acres to the current bison range in the park. Expanding the bison range will enable the National Park Service to protect the genetic integrity and health of the conservation bison herd in the north unit, support the health of the mixed-grass prairie ecosystem, and provide appropriate visitor opportunities to view
Photo: Dwayne Travis
28

the herd and understand its ecological and cultural importance. Although this may be an ecological and genetic benefit to bison, the upkeep and maintenance of the fence along the wilderness boundary poses risk to the untrammeled quality of the area. Due to this, managers will have to exercise extreme caution when implementing fence maintenance projects.
Susceptible to disease, the Rocky Mountain bighorn sheep (Ovis canadensis), black-footed ferrets (Mustela nigripes), and black-tailed prairie dogs (Cynomys ludovicianus), are just a few species, in addition to bison, that are monitored closely by researchers in the park. Preservation of these species is done through research monitoring and occasional manipulation, such as vaccine administration, in order to understand trends in population. These trammeling actions ensure the longevity of these species in the wilderness. All current management actions for the past 15 years that manipulate wildlife in the Badlands Wilderness are listed below in table 6.
The ecosystem of Badlands National Park is not intact due to the absence of two apex predators that occupied this area in the past: wolves (Canis lupus) and grizzly bears (Ursus arctos). In fear of predation on cattle and other livestock, wolves were eliminated from South Dakota by 1934. Grizzly bears were extirpated from South Dakota by 1890 (Johnsgard 2003). It is not currently feasible to restore these species to the park.
Measure Description and Collection Protocol: Data value is the number of annual actions that are authorized by the National Park Service that manipulate, hinder, restrict, and/or control the biophysical
environment. Actions occurring as part of research projects or administrative actions that have foreseeable impacts on the ecological community are considered trammeling actions. Examples of these actions that managers can attentively monitor would be wildlife collaring, aerial rabies vaccination baiting, tagging, culling, and bison roundup. Consult with wildlife biologists, relevant staff, NEPA and research permitting records to obtain a description and count of all actions that manipulate wildlife. See appendix B for detailed information about how to count trammeling actions. An increase in the number of actions that manipulate animals would contribute to a downward trend for this indicator of the untrammeled quality.
Data Source: Eddie Childers, Wildlife Biologist, Badlands National Park
Resource Management Division Public Server Drive
Data Adequacy: High (6)
Data quantity is complete because authorized wildlife-related trammeling actions are well documented by park managers and typically require completion of an NPS research permit or MRA. Data quality is high for the same reasons.
Frequency: Annually
Significant Change: Any change in number of actions from the baseline data value is considered significant.
Table 6. Authorized Annual Actions That Manipulate Wildlife
Manipulating Action Purpose of Action
1976: 52 bison removed during roundup Annual bison roundup
1977: 32 bison removed during roundup Annual bison roundup
1979: 219 bison removed during roundup Annual bison roundup
1980: 70 bison removed during roundup Annual bison roundup
1981: 43 bison removed during roundup Annual bison roundup
1983: 20 bison introduced from Colorado National Monument Genetic diversity for current herd
1987: 3 bison removed during roundup Annual bison roundup
1988: 222 bison removed during roundup Annual bison roundup
29

Manipulating Action Purpose of Action
1989: 276 bison removed during roundup Annual bison roundup
1990: 226 bison removed during roundup Annual bison roundup
1991: 302 bison removed during roundup Annual bison roundup
1992: 181 bison removed during roundup Annual bison roundup
1994: Black-footed ferrets introduced to Conata Basin Black-footed ferret study
1995: Bighorn sheep biological samples taken Annual bighorn sheep study done – present day
1995: Bighorn sheep translocation Annual bighorn sheep study – present day
1995: 216 bison removed during roundup Annual bison roundup
1996: Black-footed ferret introduced to other areas around the park Black-footed ferret study
1996: 189 bison removed during roundup Annual bison roundup
1998: Roundup of 119 bison with 40 removed Annual bison roundup
2002: Roundup of 495 bison with 141 removed Annual bison roundup
2003: Reintroduction of 30 swift foxes Swift fox study
2003: Roundup of 550 bison with 132 removed Annual bison roundup
2004: 84 swift foxes released from CO and WY between 2004–2006 Swift fox study
2004: 23 Bighorn sheep introduced from Wheeler Peak, NM Bighorn sheep study
2004: Dusting of prairie dog towns using deltamethrin Annual sylvatic plague control
2004: Roundup of 480 bison with 181 removed Annual bison roundup
2005: Roundup of 660 bison with 271 removed Annual bison roundup
2005: Dusting of prairie dog towns using deltamethrin Annual sylvatic plague control
2005: 84 swift foxes released from CO and WY between 2004-2006 Swift fox study
2005: Black-footed ferrets individually administered sylvatic plague vaccine shot Sylvatic plague control
2006: Roundup of 657 bison with 226 removed Annual bison roundup
2006: Dusting of prairie dog towns using deltamethrin Annual sylvatic plague control
2006: 84 swift foxes released from CO and WY between 2004-2006 Swift fox study
2006: Black-footed ferrets individually administered sylvatic plague vaccine shot Sylvatic plague control
2007: 6 bighorn sheep relocated to South Dakota State University Wildlife Research Facility
Bighorn sheep study
2007: Dusting of prairie dog towns using deltamethrin Annual sylvatic plague control
2007: Roundup of 441 with 153 removed Annual bison roundup
2008: Dusting of prairie dog towns using deltamethrin Annual sylvatic plague control
2008: Black-footed ferrets individually administered sylvatic plague vaccine shot Sylvatic plague control
2009: Dusting of prairie dog towns using deltamethrin Annual sylvatic plague control
2009: Black-footed ferrets individually administered sylvatic plague vaccine shot Sylvatic plague control
2010: Roundup of 776 with 213 removed Annual bison roundup
30

Manipulating Action Purpose of Action
2010: Dusting of prairie dog towns using deltamethrin Annual sylvatic plague control
2010: Black-footed ferrets individually administered sylvatic plague vaccine shot Sylvatic plague control
2011: Dusting of prairie dog towns using deltamethrin Annual sylvatic plague control
2011: Black-footed ferrets individually administered sylvatic plague vaccine shot Sylvatic plague control
2012: Roundup of 853 with 421 removed Annual bison roundup
2012: Dusting of prairie dog towns using deltamethrin Annual sylvatic plague control
2012: Black-footed ferrets individually administered sylvatic plague vaccine shot Sylvatic plague control
2013: Dusting of prairie dog towns using deltamethrin Annual sylvatic plague control
2013: Black-footed ferrets individually administered sylvatic plague vaccine shot Sylvatic plague control
2014: Roundup of 1003 bison with 426 removed Annual bison roundup
2014: Dusting of prairie dog towns using deltamethrin Annual sylvatic plague control
2014: Tagging, collaring, and biological sampling of 48 swift foxes between 2014-2016
Swift fox study
2014: Black-footed ferrets individually administered sylvatic plague vaccine shot Sylvatic plague control
2015: Roundup of 900 bison with 274 removed Annual bison roundup
2015: Collared 25 bison during roundup Bison study
2015: Dusting of prairie dog towns using deltamethrin Annual sylvatic plague control
2015: New insecticides distributed where deltamethrin was not used Sylvatic plague control
2015: Prairie dog flea sampling Sylvatic plague control
2015: Tagging, collaring, and biological sampling of 48 swift foxes between 2014–2016
Swift fox study
2015: Black-footed ferrets individually administered sylvatic plague vaccine shot Sylvatic plague control
2016: Prairie dog flea sampling Sylvatic plague control
2016: Dusting of Prairie dog towns using deltamethrin Sylvatic plague control
2016: 50 Black-footed ferrets individually administered sylvatic plague vaccine shot
Sylvatic plague control
2016: Tagging, collaring, and biological sampling of 48 swift foxes between 2014–2016
Swift fox study
2016: Black-footed ferrets individually administered sylvatic plague vaccine shot Sylvatic plague control
2017 (YTD): 15 Bison collared during roundup Annual bison roundup
2017 (YTD): Roundup of 532 bison with 181 removed Annual bison roundup
2017 (YTD): 24 Bighorn sheep collaring analysis (17 lambs) and bio sampling Bighorn sheep study
2017 (YTD): Prairie dog flea sampling Sylvatic plague control
2017 (YTD): Dusting of prairie dog towns using deltamethrin Sylvatic plague control
2017 (YTD): Black-footed ferrets individually administered sylvatic plague vaccine shot
Sylvatic plague control
31

Photo: Mike Pflaum
Percentage of Naturally Ignited Fires that are Suppressed
Measure Baseline Data Value: 50% Year(s) of Data Collection: 2001–2012
2018 Data Value: 50%Year(s) of Data Collection: 2017
Background and Context:A natural fire regime has been shown to lower fuel loads, diversify and renew vegetation structure, create wildlife habitat, renew soil nutrients, and limit the growth of subsequent fires. Although the ecological benefit is of great value to the wilderness area, the threat of naturally ignited fires spreading to nonwilderness areas and potentially harming the general public and nearby resources is also prevalent in wildland fire management. While fire managers may choose to suppress fire inside or outside of wilderness, it is also federal policy to use fire “to protect, maintain, and enhance resources and, as nearly as possible, be allowed to function in its natural ecological role” (Federal Wildland Fire Management Policy). Badlands Wilderness, like many wilderness areas, is remote with rugged terrain and therefore is oftentimes difficult for firefighters to approach directly when suppressing fires in this area. The Wilderness Act allows fire suppression and managers are careful to make sure the least alteration or disturbance to the land surface,
air quality, and visitor solitude occurs. The action of fire suppression is a violation of the untrammeled quality of wilderness character and decisions to do so in wilderness should be taken when necessary.
As European settlers made their way west in the late 1800s, the introduction of grazing practices to the Great Plains decimated native grasses and introduced nonnative plant species that outcompeted vegetation diversity. Prior to the 20th century, fire in Badlands National Park was mostly natural process with frequent low to moderate intensity fires that served to maintain the prairie ecosystem. American Indians of the region recognized this aspect of the prairie ecosystem and occasionally employed fire to their advantage around lodges and hunting grounds. Today, naturally ignited fires are monitored carefully and if there is not a threat to resources outside the wilderness or to the general public, these fires are allowed to burn naturally for 5,000 acres before active suppression occurs. Table 7 shows a list of recent wildfires in the Badlands Wilderness since 2001.
32

Measure Description and Collection Protocol:Data value is the percent of naturally occurring wilderness fires that are suppressed over a five-year period. To determine the data value, isolate all naturally occurring fires in wilderness and calculate percentage value. Data were collected dating back from 2001 to 2017 (shown in table 7, below). Allowing naturally ignited fires to burn without suppression would increase the percentage of fires not receiving a suppression response and contribute to an upward trend for this indicator of the untrammeled quality.
Definitions:Fire Regime. Pattern, frequency, and intensity of the bushfires and wildfires that prevail in an area over long periods of time. It is an integral part of fire ecology and renewal for certain types of ecosystems.
Wildland Fire. Any nonstructure fire, other than prescribed fire, that occurs in the wildland.
Data Source:Mike Carlbom, Fire Ecologist, Badlands National Park
Data Adequacy:High (6)
Data quantity is complete because all fires and fire suppression actions in Badlands National Park are documented by fire management and the US Forest Service. Data quality is high for the same reasons.
Frequency:Five years
Significant Change:Any change of 10% or more from the baseline data value is considered significant.
Table 7. Natural-Start Fire Suppression History 2012–2017
Year Fire Name / Location Suppressed?
2001 Battleship No
2001 Rodeo Point Yes
2006 Monica Yes
2010 Red Butte No
2012 Cab No
2012 Rim Road Yes
2017 Dogs No
2017 Antler Yes
Number of Reported Illegal Activity in Wilderness
Measure Baseline Data Value: 9 Year(s) of Data Collection: 2009–2012
2018 Data Value: 4Year(s) of Data Collection: 2017
Background and Context:The Badlands Wilderness is home to not only an extensive variety of wildlife, but the richest accumulations of terrestrial vertebrate fossils of the late Eocene and early Oligocene age in North America, possibly the world. Collectively, these treasures are in a constant threat of illegal poaching and violations that harm the biological process of the wilderness. Reported violations are rare to document in Badlands, leaving room for hundreds of undocumented cases where people could be on the constant search for fossils, wildlife, or
other native resources. Limited staffing is detrimental to protecting these resources, which explains the lack of reported incidents 2013–2016.
Difficult terrain and long distance into the wilderness have protected fossil localities, wildlife, and restoration sites from poachers, but today’s internet advancements have allowed hikers to live stream their wilderness treks, and all of the resources they find along the way. This new technology has created a guided map to anyone looking to violate the wilderness. Sensitive wildlife populations and rare fossil localities in wilderness make protection
33

the top priority of Badlands National Park. In order to do this, law enforcement staff and resource management staffing needs to be consistent with increased numbers of visitors, online park presence, and intensified drive to unlawfully capture what makes the wilds of Badlands National Park remarkable. Table 8 lists the most current reported violations in wilderness.
Measure Description and Collection Protocol:Data value is the number of annual actions that manipulate biological processes of the Badlands Wilderness through violations, warnings, or law enforcement that is involved. A general categorization of actions that would be counted in this measure includes any unauthorized action by another agency, a citizen group, or an individual citizen that intentionally manipulates the biophysical environment. Unintentional actions such as an accidental ignition of human-caused fire are not trammeling actions because the intent of the action is not based on manipulating the biophysical environment in the wilderness. Examples of actions that could be counted under this measure include use of herbicides or mechanical means to eradicate any plant species, seeding or planting of any plant species, arson, collection of wildlife and plants, damage or removal of fossils, and intentional release of a native or nonnative wildlife species.
Consult with law enforcement officers and science and resource managers to determine whether any illegal activity has occurred within wilderness that would qualify as a trammeling action. See appendix B for detailed information about how to count trammeling actions. An increase in unauthorized trammeling actions would contribute to downward trend in the Untrammeled Quality.
Data Source:Matt Roland, Law Enforcement, Badlands National Park
Rachel Benton, Paleontologist, Badlands National Park
Data Adequacy:Medium (4)
Data quantity is partial because events may occur in wildernesses that are not detected or reported. Data quality is moderate for this same reason.
Frequency:Five Years
Significant Change:Any change in number of actions from the baseline data value is considered significant.
Table 8. Number of Violations in Wilderness
Violation Area of wilderness
Theft of minerals (Agate) Sage Creek Wilderness – 2009
Civilian driving off road Sage Creek Wilderness – 2009
Unknown animals (2) poached – proven by remaining entails Sage Creek Wilderness –2009
Coyote poached Sage Creek Wilderness – 2009
Bison poached Sage Creek Wilderness – 2010
White-tailed deer poached Sage Creek Wilderness – 2010
Pronghorn poached Sage Creek Wilderness – 2010
Target shooting affecting soundscape Sage Creek Wilderness – 211
Two mule deer poached Conata Wilderness – 2012
Off-road driving Sage Creek Wilderness – 2017
Mule deer poached Conata Wilderness – 2017
Arson Sage Creek Wilderness – 2017
34

Photo: Mike Pflaum
NATURAL QUALITYWilderness ecological systems are substantially free from the effects of modern civilization.
The natural quality assesses the integrity of local ecosystems and their freedom to change and develop without human manipulation. The natural quality tracks the effects of human actions and modern civilization on natural ecosystems (in contrast to the untrammeled quality which tracks the actions themselves). Ecosystems include all living and nonliving things in an area, as well
as the interactions between them. In wilderness, changes to the natural quality can be caused directly or indirectly, and intentionally or unintentionally. While some aspects of the natural quality may be under the control of wilderness managers, other aspects (such as air quality or the effects of climate change) may not be.
Table 9. Natural Quality
Indicator MeasureFrequency
in YearsData
AdequacySignificant
Change
Measure Baseline
Data Value2018
Plants Priority Exotic Species 1 High (6) Any 17 17
Animals
Estimated % of animals killed or infected by invasive insects or pathogens
1 Medium (4) ≥10% ≥88% 0%
Air and water Visibility 5 High (6) 1 dv 9 .7 dv 9 .7 dv
Air and waterConcentration of Nitrogen in Wet Deposition
5 Medium (5) 0 .5 kg/ha/yr 3 .3 kg/ha/yr 3 .3 kg/ha/yr
Air and waterConcentration of Sulfur in Wet Deposition
5 Medium (5) 0 .5 kg/ha/yr 0 .8 kg/ha/yr 0 .8 kg/ha/yr
Air and water Ozone 5 High (6) 2 ppm-hrs 6 .4 ppm-hrs 6 .4 ppm-hrs
Ecological processes
Acoustic Conditions 5 High (6) ≥ 3 dBA 39 .3 dBA 39 .3 dBA
35

Photo: Mike Pflaum
Natural Quality — PlantsPriority Exotic Plant Species
Measure Baseline Data Value: 1998 Year(s) of Data Collection: 18
2018 Data Value: Year(s) of Data Collection: 2011–2015
Background and Context: The northern Great Plains is one of the most threatened ecosystems in the United States due to the spread of nonnative plant species. Extensively plowed croplands, roads, trails, and historical grazing routes have contributed greatly to the spread of nonnative species and are prone to having the highest intensity and diversity of these infestations. Nonnative plants are detrimental to the overall health of a native ecosystem through modifying natural and seminatural habitats by replacing a diverse system with single species stands, altering the water or fire regime, changing the nutrient status of the soil, removing a food source (for wildlife), or altering sedimentation processes. In order to understand trends in native vegetation richness, long-term monitoring provides information on environmental quality and condition, benchmarks of ecological integrity, and early warning of declines in ecosystem health.
NPS vegetation managers have identified 76 species of nonnative plants. Vegetation monitoring began in the park in 1998 by the Northern Great Plains Fire Ecology Program. The Northern Great Plains Inventory and Monitoring Program (NGPN) began vegetation monitoring in the park in 2011. The NGPN visits
previously designated plant community monitoring plots in the north unit of the park every year using a rotating sampling scheme. The NGPN has found no significant trend in native species richness or evenness from 1998–2017, but both are threatened by an increasing cover of nonnative species. Table 10, below, is a list of nonnative species surveyed at Badlands National Park with species of management concern noted with an asterisk from the Natural Resource Report NPS/NGPN/NRR-2016/1244).
Measure Description and Collection Protocol: Data value is the number of species identified as “priority exotic plant species” by vegetation management staff. Consult with vegetation management staff to obtain an updated list of priority species. Although this is not wilderness specific, each of the species counted in this measure are present in wilderness, and any future admittances to this list will have similarly significant impacts on park and wilderness lands. If future admittances to Badlands National Park’s list of “priority exotic plant species” are determined to have no impact on wilderness lands they should not be counted in the data value. An increase in number of “priority exotic plant species” targeted for removal would contribute to a downward trend for this indicator of the Natural Quality.
36

Definitions:Exotic Plant Species: Also known as nonnative, exotics, aliens, nonindigenous harmful species, weeds, etc. Plants that have been introduced into an environment in which they did not evolve, resulting in no natural enemies to limit their reproduction and spread.
Data Source: Brennan Hauk, Vegetation Ecologist, National Park Service
Mark Sloveck¸ Exotic Plant Coordinator, Badlands National Park
Data Adequacy: High (6)
Data quantity is complete because vegetation crews keep accurate records of noxious weed locations and proliferation, and the priority list is updated by vegetation managers accordingly. Data quality is high for the same reasons
Frequency: Five Years
Significant Change: Any change from the baseline data value for this measure is considered significant.
Table 10. Priority Exotic Species
Species Name Description
Bull thistle (Cirsium vulgare)
Native to Europe, western Asia, and northern Africa, bull thistle was introduced to the eastern United States during colonial times and the western United States in the 1800s . Currently inhabiting all 50 states, bull thistle can invade almost any type of disturbed area such as forest clear cuts, riparian areas, and pastures . Plants can form dense thickets, displacing other vegetation . The spiny nature of the plant renders it unpalatable to wildlife and livestock and reduces the forage potential of pastures (Swearingen and Bargeron 2016) .
Canada thistle (Cirsium arvense)
Canada thistle is most commonly found in agricultural and disturbed sites, or sites that are undergoing restoration . It is shade intolerant and therefore is rarely found in wooded sites, except in clearings . It is found in some dry, sandy sites, but more commonly on the edges of wet habitats such as streambanks and lake shores . In the western and northern US it presents a significant problem in prairie and riparian habitats (Swearingen and Bargeron 2016) .
Dames rocket (Hesperis matronalis)
Introduced from Europe as an ornamental around the time of European settlement, it continues to be widely used as an ornamental and can be found throughout North America . Habitats invaded by this plant include open woodlands, prairies, roadsides, ditches, and other disturbed areas where native plants are crowded out (Swearingen and Bargeron 2016) .
Japanese brome grass (Bromus japonicas)
Japanese brome grass is a native Eurasian winter annual that has been introduced into the United States where it ranges from Vermont to the state of Washington, south to North Carolina and California . Commonly a problem in wheat fields; in grass and alfalfa seed fields; and in pastures, meadows, and overgrazed range lands (Baskin and Baskin 1981) .
Mezereon (Spurge flax) (Thymelaea passerine)
Spurge flax is native to Northern Africa, Europe, and Asia where it is considered a common weed of dry soils and grain fields . This plant was first recorded In 1989 by Craig Freeman and Ralph E . Brooks in Tripp County, South Dakota, followed by a summer study performed in 2008 by Grace Kostel that studied 1,000 individual plants scattered throughout several acres of Conata Basin around Badlands National Park (Kostel 2009) .
Downy brome (cheat grass) (Bromus tectorum)
Although the origin of this plant is obscure, it is speculated that cheat grass came over from Europe and spread quickly toward the Midwest through livestock and agricultural advancements . This plant is versatile in being able to survive in soils low in nitrogen while also having successful growth in the most fertile soils . Cheat grass has the ability to draw down soil moisture and nutrients to very low levels, making it difficult for other species to compete . Due to its tendency to mature early and then dry out, it gains a competitive advantage through the promotion of fire (Swearingen and Bargeron 2016) .
Smooth brome (Bromus inermis)
Smooth brome is a cool season, sod-forming, perennial grass that was introduced to the United States from Eurasia during the 1880s . Its distribution via seed and rhizomes make it a highly competitive and aggressive species (Blankespoor and Larson 1994) .
37

Species Name Description
Crested wheatgrass (Agropyron cristatum)
Crested wheatgrass was introduced to the United States from Russia and Siberia . After studies in the early 1900s revealed that this grass grew well under cold, dry conditions due to its deep fibrous root system, it became a key role in revegetation of the northern Great Plains following the dust bowl years . It has been planted as forage on 10 to 26 million acres in North America (Holechek 1981) .
Kentucky bluegrass (Poa pratensis)
Native to Europe, Asia, North America, and northern Africa, Kentucky bluegrass grows in lawns, roadsides, and ditches . This grass can stifle plant diversity by crowding out other plants . In many prairies degraded by years of overgrazing and/or broadcast herbicide use (Swearingen and Bargeron 2016) .
Russian knapweed (Rhaponticum repens)
Russian knapweed was introduced into the United States in the early 1900s from Eurasia . Known to cause chewing disease in horses, this plant is a rhizomatous perennial forb with spreading black roots that make it incredibly hard to control . It can displace desirable vegetation through a combination of competition and allelopathy (Laufenberg et al . 2005) .
Russian olive (Elaeagnus angustifolia)
Considered invasive to the western part of the United States, Russian olive grows especially well in riparian zones and is known to out-compete the native plains cottonwood (Populus deltoids) . In addition to drought and salt tolerance, nitrogen-fixing nodules allow this plant to survive in harsh conditions (Swearingen and Bargeron 2016) .
Smooth brome (Bromus inermis)
Introduced from Europe in the late 1800s, smooth brome prefers sunny areas along roadsides, fields, and prairies . In areas where the presence of native grasses is either important, necessary, or mandated, knowledge of how to control this aggressive species is vital . This makes Badlands National Park’s prairie ecosystem the prime location for smooth brome takeover (Stacy et al . 2005) .
Yellow toadflax (Linaria vulgaris)
Yellow toadflax is commonly seen in fields, pastures, roadsides, undisturbed prairies, and rangelands . Introduced to the United States in the mid-1600s from Europe as a ornamental perennial, this species is known by its persistence and quick spread . This is due to the ability to reproduce sexually and asexually (Volenberg 1999) .
Tamarisk (Tamarix L. spp .)
Several species are considered invasive in the United States and distinguishing the species can often be difficult . Tamarix chinensis invades streambanks, sandbars, lake margins, wetlands, moist rangelands, and saline environments . It can crowd out native riparian species, diminish early successional habitat, and reduce water tables and interferes with hydrologic process . Tamarix chinensis is native to Eurasia and Africa and was introduced into the western United States as an ornamental in the early 1800s . It occurs throughout the western and central United States, but is most problematic in the Southwest (Swearingen and Bargeron 2016) .
Yellow sweet clover (Melotius officinalis)
Native to Europe and Asia, this plant can be found in prairies, fields, vacant lots, along roadsides, and in wastelands . Sweet clover is the most drought tolerant of the commercially available legumes . It is also highly tolerant of frost and cold temperatures due to contractile roots, which pull the plant to survive cold winter temperatures (Ogle, St . John, and Tilley 2008) .
Musk thistle (Carduus nutans)
Musk thistle is a plant native to Europe and Asia, and was introduced to the United States 75 years ago . Terminal heads are born slightly on a relatively leaf-free stem and are usually at right angles to the stem . In addition to clasping, spiny leaves, the stout, spreading involucre distinguishes this plant from other thistles . This plant can survive in a wide range of environments, from sea level to 8,000-foot elevation with high or low amounts of rainfall (Hull and Evans 1973) .
Common mullein (Verbascum Thapsus)
Mullein was brought to the United States as a medicinal herb in the late 1630s, but eventually moved west with settlers . This plant was also used as a useful piscicide (fish poison) . This biennial forb has a deep taproot along with a fibrous root system that enables it to out compete native plants (Swearingen and Bargeron 2016) .
Spotted knapweed (Centaurea stoebe ssp . Micranthos)
Spotted knapweed, an aggressive, introduced perennial forb, is replacing native perennial grasses throughout the northern Rocky Mountain region . Introduced to the United States around 1900, the plant has spread rapidly, infesting millions of hectares of private and public rangelands in western North America . Spotted knapweed reduces forage production from 60% to 90%, which impairs wildlife populations (Sheley and Celestine et al . 2000) .
38

Photo: Mike Pflaum
Natural Quality — AnimalsAnimals Killed or Infected by Invasive Insects or Pathogens
Measure Baseline Data Value: ≥ 88% BFF, PD, swift fox Year(s) of Data Collection: 2008–2013
2018 Data Value: 0% for all speciesYear(s) of Data Collection: 2014–2017
Background and Context:
Rocky Mountain Bighorn SheepAudubon’s bighorn (Ovis canadensis auduboni), a subspecies of bighorn sheep, once inhabited various landscapes from the upper Midwest and Rocky Mountain regions. Introduction of domestic sheep and uncontrolled subsistence and trophy hunting, led to the extirpation of bighorn sheep around what is now Badlands National Park. In 1964, 22 Rocky Mountain bighorn sheep (Ovis canadensis) were translocated to Badlands National Park from Pikes Peak, Colorado. Population studies and translocations have been closely monitored since 1964. The Badlands National Park bighorn sheep population is currently divided into five sub-herds (Cedar Pass, Homestead Overlook, Pinnacles Overlook, Hay Butte, and south unit). After a widespread pasteurella infection wiped out nearly half of the bighorn sheep population in 1967, monitoring invasive pathogens and disease became critical. A recent analysis
of bighorn genetics and overall health in 2008 concluded that the relative absence of disease (i.e., lungworms) from necropsied yearlings indicated that disease and predation of adults were not influencing bighorn sheep population. Bighorn sheep are highly susceptible to fatal pneumonia (pasteurellosis) caused by leukotoxin-producing strains of Mannheimia haemolytica. Other common invasive pathogens found in bighorn sheep are contagious ecthyma, psoroptic scabies, chronic sinusitis, paratuberculosis, mandibular osteomyelitis, and patuerella spp. epizootics ( Zimmerman 2008). In collaboration with South Dakota State University, Badlands National Park has been able to conduct studies regarding possible pathogens used in battling pneumonia in bighorn sheep. With 191 individuals across five sub-herds, the Rocky Mountain bighorn sheep do not currently have any disease present. Possible reinfection is being monitored through domestic sheep analysis from nearby herds.
39

Black-Tailed Prairie DogsThe black-tailed prairie dog (Cynomys ludovicianus) is considered a keystone species of the mixed-grass prairie due to its significance and impact on ecosystem structure, function, and composition. Their burrowing systems are ideal habitats for special status species in the park. These species include the state threatened swift fox and the federally endangered black-footed ferret, which are both part of reintroduction studies being conducted in the park. Burrowing owls also use the burrowing system of black-tailed prairie dogs for protection and survival (Matykiewicz 2017). Outside pest designation in 2001, prairie dogs are not only controlled for the safety of nearby grazing and croplands, but also closely monitored for plague infections. Park staff map prairie dog colonies using a Trimble Geo7x GPS units and GPS Pathfinder software to track successful and abandoned colonies. Recent data reveals a total of 146 separate prairie dog colonies covering 2,799.05 acres of land with a combined perimeter of 104.79 miles (Matykiewicz 2017). Most of these colonies reside in the Sage Creek Wilderness, while the rest reside outside the wilderness boundary near Heck Table and Sheep Mountain Table. Prairie dog population is gauged on an estimated ratio of number of prairie dogs per acre. Plague is regarded as the most serious biological impediment to black-tailed prairie dogs to those that rely on this species for survival. Sylvatic plague, including more widely known bubonic and pneumonic plague, is dangerous. Plague is a bacterial infection of rodents that may cause large die-offs of prairie dogs and other, similar rodents. It is transmitted from animal to animal and from animal to human by the bites of infected fleas. Plague invaded western South Dakota in 2005 and at the Pine Ridge Indian Reservation, causing devastating outbreaks (90%–100% mortality) among black-tailed prairie dogs. By 2007, plague had been found in Badlands National Park. Within five years, plague caused a 68% decline in black-tailed prairie dog
acreage. Park staff took action to protect the remaining prairie dog habitat through the use of DeltaDust, a pullicide that kills fleas and can stop the spread of plague (Childers 2010). Currently, there has not been any sign of disease in prairie dog populations. This is further proven by a 16% increase in habitat in 2017.
Black-Footed FerretsThe black-footed ferret (Mustela nigripes) has been identified as the only native ferret to North America. The ferret has been federally listed as an endangered species since 1967. The species was believed to be extinct until the accidental discovery in 1980 of a small population outside Meeteese, Wyoming. By 1986, the remaining 18 survivors were removed from the wild and bred in captivity. The Conata Basin of Badlands National Park is perceived as one of the highest potentials for black-footed ferret recovery sites in North America. Encompassing a near pristine mixed-grass prairie ecosystem with high-quality prairie dog habitat and historic presence of black-footed ferrets, the Conata Basin in Badlands National Park is ideal for reintroduction. Black-footed ferrets were introduced to the area in the fall of 1994.
With over 90% of a black-footed ferret’s diet being prairie dogs, the success or downfall of prairie dog towns directly affect black-footed ferret populations. These black-tailed prairie dog towns also provide burrows used by the ferrets for shelter from predators and inclement weather. Plague expanded to Badlands National Park / Contata Basin by 2008, causing an 88% decline in black-footed ferret abundance. The remaining population was vaccinated against plague and most of the remaining habitat for black-tailed prairie dogs had been treated with a pullicide to manage plague transmission through fleas.
Swift FoxHistorically, swift foxes (Vulpes velox) were distributed across the shortgrass and mixed-grass prairie of North
Photo: Layne vanRhijn/iStockSwift Fox
40

America, ranging from the southern portions of central Canada, south to Texas, and from central Colorado east to western Iowa and Minnesota (Shauster et al. 2002). The arrival of settlers in the late 1800s contributed to the swift fox population decline due to loss of prairie habitat, unregulated hunting and trapping, and rodent control initiatives. Competition with other canids in the area, such as the red fox (V. vulpes) and coyote (Canis latrans), also contributed to this decline.
In 2003, Badlands National Park began a swift fox restoration project with the release of 30 swift foxes from Colorado. An additional 84 foxes were released the following three years from Wyoming and Colorado. The initial success of this project resulted in a halt of swift fox releases after 2006. With over an estimated 200 litters and 750 pups since reintroduction, the project was deemed a success and monitoring efforts were reduced as monetary support for the project ended in 2010. Seeing that swift foxes depend on black-tailed prairie dogs as one of their main food sources, the massive five-year plague event that hit Conata Basin in 2008, led to a viability analysis of the swift fox populations. This analysis revealed that the swift fox was in danger of extinction. As a result, in 2015 South Dakota State University and Badlands National Park initiated a three-year graduate research project with graduate student Sarah Nevison to assess the current status of the reintroduced swift fox in southwestern South Dakota. Her research revealed that the swift fox in Badlands National Park and Buffalo Gap National Grassland have shown a reduced distribution, a decline in numbers, a decreased survival rate in pups, and a presence of plague. A population analysis revealed that the swift fox population around the park will be nonexistent by the year 2019 if trends do not change.
Measure Description and Collection Protocol: Data value is unique to individual species because disease
severity affects species independently and in different extremes. Data value is the estimated percent decrease in the populations of Rocky Mountain bighorn sheep, black-tailed prairie dogs, black-footed ferrets, and the swift fox. Monitoring diseases are to be done multiple times throughout the year in accordance with the plague monitoring protocol of the South Dakota Game, Fish and Parks. These surveillance methods include windshield surveys, collection of carcasses, collection of fleas, collections of fresh road-killed carcasses, and collection of blood samples. Isolated incidents of individual contamination is not considered detrimental to the biophysical process of a population unless this individual accounts for 10% of said population.
Definitions: Windshield Surveys. General observations of prairie dog towns to detect die-offs, with follow-up evaluations needed to confirm cause and status.
Contagious Ecthyma. Known as orf, sore mouth, scabby mouth, and contagious pustular dermatitis. It is viral disease found worldwide in countries that raise sheep. It causes sores and blisters on the lips, nose, ears, and/or eyelids.
Chronic Sinusitis. Condition in which the cavities around the nasal passages become inflamed and swollen. This interferes with drainage and causes mucus buildup.
Paratuberculosis. Also known as Johne’s disease. Primarily affects the small intestine of ruminants that causes consistent diarrhea and emaciation.
Mandibular Osteomyelitis. Inflammation of the bone marrow in the bones of the jaw (maxilla or mandible).
Data Source: Eddie Childers, Wildlife Biologist, Badlands National Park
Table 11. Native Animal Species Killed or Infected by Invasive Insects or Pathogens
Native Animal Species YearPathogen or Insect
InfestationEstimated population affected
Rocky Mountain bighorn sheep 2017 None found 0%
Black-tailed prairie dog 2008–2013 Plague 99% (50% habitat loss by 2009)
n/a 2014–2017 None found 0%
Black-footed ferret 2008–2013 Plague 88% extirpated (335 adults to 45)
Swift fox 2017 Plague ≥ 95%
41

Data Adequacy: Medium (4)
Data quantity is partial because exact population documentation for black-tailed prairie dog and swift fox is harder to come by to due vast numbers of prairie dogs below ground and infrequency of swift fox sightings. Data quality is moderate because modern technology makes disease testing accurate and reliable, but lack of staff and time is detrimental to thorough monitoring and testing.
Frequency: Annually
Significant Change:Trend analysis will be analyzed by each individual species. Any change of 10% or more in decrease of a population size from current population numbers (2018) from any of the above listed species is considered significant and a downward trend in the natural quality.
Figure 2. Conata Basin / Badlands Plague Area Map
IJ589
UV377
UV240
UV44
£¤14
Wall Quinn
Cottonwood
Interior
Scenic
Created by R. Griebel, 10 July 2012
Conata Basin/Badlands Plague Area Map 7/10/2012
Plague Expansion Area 7_10_2012 (327 acres: includes BNP)
Plague Expansion Area 5_10_2012 (195 acres)
Plague Area 2011 (4,206 acres: includes BNP)
Plague Area 2010 (1,771 acres: includes BNP)
Plague Area 2009 (6,435 acres: includes BNP)
Plague Area 2008 (9,710 acres)
Plague Area in BNP (1,584 acres: probably plagued-out in 2009 or 2010)
Waterbodies
Colonies Dusted to Date for 2012 (11,700 acres)
2012 Active P. Dog Colonies
2007 Active P. Dog Colonies
Private Owner
NPS
State
FS
5.5 0 5.52.75 Miles
±Plague area acres are reported as prairie dog acres impacted.Total acres impacted by plague since 2008 = 24,228 acres. Includes BNP acreage.
NewPlagueAreas
42

Natural Quality — Air and WaterVisibility
Measure Baseline Data Value: 9.7 deciviews Year(s) of Data Collection: 2011–2015
2018 Data Value: 9.7 deciviewsYear(s) of Data Collection: 2011–2015
Background and Context: Surrounded by a land lost in time, visitors of Badlands National Park become engulfed in views of geologically unique landscapes and colorful buttes that rest against a prairie grassland backdrop. On clear days, visitors can sometimes see up to 140 miles away, catching glimpses of the Black Hills to the North (NPS 2015). Badlands National Park is a designated class I air quality area under the Clean Air Act, which provides special protection for air quality and sensitive ecosystems. A variety of monitoring techniques exist to document visibility conditions and to make quantitative measurements of the atmospheric properties that affect visibility. The Badlands IMPROVE (Interagency Monitoring of Protected Visual Environments) site was one of the earliest sites to be established and began operating March 2, 1988. Badlands National Park’s remote location and priority airshed
class ensure spectacular views on clear days; however, good visibility in the park is impacted by several outside sources that are increasingly changing day-to-day visitor experience.
The Badlands Wilderness is impaired by both local and regional pollution sources. These sources include oil and gas production, power plants, agriculture, and vehicles. These air pollutants can harm the park’s natural scenic resources such as soils, surface waters, vegetation, and visibility. Pollution reduces the average natural visual range from about 140 miles (without pollution) to about 90 miles. On high pollution days, this visual range can drop to below 50 miles (IMPROVE 2013). Some pollutants that form haze (sulfates, nitrates, organics, elemental carbon, and soil) have been linked to serious health effects and environmental damage.
43

Measure Description and Collection Protocol: Data value is the five-year average estimated visibility on mid-range days for Badlands National Park, reported from the NPS Air Quality Conditions and Trends database referenced below. Visibility is monitored throughout the United States in the IMPROVE network. Currently, 24-hour particulate samples are collected every third day and analyzed for chemical composition. These data are used to calculate total visibility impairment as expressed by the Haze Index in deciviews (dv). Visibility worsens as the haze index increases (NPS 2011b). Annual average measurements for visibility on mid-range days are averaged over a five-year period at each IMPROVE monitoring site with at least three years of complete annual data. These values are then interpolated across all monitoring locations using an Inverse Distance Weighting (IDW) method to estimate five-year average values for the contiguous United States. The estimated five-year average for the individual parks is the maximum value within park boundaries derived from this national analysis. The 2017 value reported here represents the five-year average between 2011 and 2015. For the next data collection period in 2022, the most
recent rolling five-year average available should be used. Over time, a decrease in the haze index would signify an improvement in visibility, contributing to an upward trend for this indicator of the natural quality.
Data Source: NPS Air Quality Conditions and Trends database: https://www.nature.nps.gov/air/data/products/parks/
Data Adequacy: High (6)
Data quantity is complete because air quality data were recorded regularly during and prior to the five-year reporting span. Data quality is high because there is a visibility monitoring station nearby.
Frequency: Five Years
Significant Change: Any change of one dv or more is either direction from the baseline data value is considered significant. This threshold was developed by the NPS Air Resources Division (ARD).
Natural Quality — Air and WaterConcentration of Nitrogen in Wet Deposition
Measure Baseline Data Value: 3.3 kg/ha/yr Year(s) of Data Collection: 2011–2015
2018 Data Value: 3.3 kg/ha/yrYear(s) of Data Collection: 2011–2015
Background and Context: Most visitors who come to Badlands National Park experience the park from their car, resulting in unchecked concentrations of nitrogen deposition from increased visitor traffic that can damage the pristine prairie ecosystem. Wet nitrogen deposition occurs when nitrogen is dissolved in cloud droplets and deposited during precipitation, commonly known as acid rain. This is becoming more vital to monitor due to the large influx of visitation ( ≥ 1 million visitors annually). Nitrogen deposition from mobile source emissions can substantially increase the nitrogen delivery to an ecosystem in proximity of roadways. In the United States, mobile sources such as highway vehicles (cars and trucks) and off-highway vehicles (construction equipment, planes, boats, etc.) are the single largest source of emissions, accounting for 37% of the total amount of nitrogen emitted. In the United States, nitrogen deposition estimates are made using “wet deposition”
(i.e., nitrogen in rainfall and snow) (Bettez et al. 2013). Acidic deposition can cause physical and biological changes in rivers, ponds, and soils due to unnatural nutrient enrichment. As a result, biological processes drift away from natural interactions. Badlands National Park’s concentration of nitrogen in wet deposition is of significant concern, and will most likely be of increased concern by 2022. To prevent this, management needs to evaluate routes to control the concentration levels of nitrogen in the park.
Measure Description and Collection Protocol: Data value is the five-year average estimated wet deposition of nitrogen for Interior, South Dakota, reported from the NPS Air Quality Conditions and Trends database referenced below. Wet deposition is used as a surrogate for total deposition. Atmospheric wet deposition is monitored across the United States as part of the National Atmospheric Deposition Program/
44

National Trends Network (NADP/NTN). Wet deposition in kilograms per hectare per year (kg/ha/yr) in the contiguous US was calculated by multiplying measured nitrogen concentrations in precipitation from monitoring sites by a 30-year normalized precipitation. Annual nitrogen wet deposition measurements are averaged over a five-year period at all NADP-NTN monitoring sites with at least three years of annual data. Five-year averages are then interpolated across all monitoring locations using an IDW method to estimate five-year average values for the contiguous United States. The estimated five-year average for individual parks is the maximum value within park boundaries derived from this national analysis. The 2017 value reported here represents the five-year average between 2011 and 2015. For the next data collection period in 2022, the most recent rolling five-year average available should be used. Over time, a decrease in wet nitrogen deposition would contribute to an upward trend for this indicator of the natural quality.
Data Source: NPS Air Quality Conditions and Trends database: https://www.nature.nps.gov/air/data/products/parks/
Data Adequacy: Medium (5)
Data quantity is complete because air quality data were recorded regularly during and prior to the five-year reporting span. Data quality is medium because estimates are based on interpolated data from deposition monitors outside the wilderness.
Frequency: Five Years
Significant Change: Any change of 0.5 kg/ha/yr or more in either direction from the baseline data value is considered significant. This threshold was developed by the NPS Air Resources Division.
Table 12. Nitrogen Wet Deposition Condition Categories
Deposition Condition Wet Deposition Nitrogen kg/ha/yr)
Good < 1
Moderate Concern 1-3
Significant Concern >3
45

Natural Quality — Air and WaterConcentration of Sulfur in Wet Deposition
Measure Baseline Data Value: 0.8 kg/ha/yr Year(s) of Data Collection: 2011–2015
2018 Data Value: 0.8 kg/ha/yrYear(s) of Data Collection: 2011–2015
Background and Context: Wet sulfur deposition occurs when sulfur is dissolved in cloud droplets and deposited during precipitation, commonly known as acid rain. Similar to nitrogen, wet deposition of atmospheric sulfur onto the landscape through rain, snow, or other precipitation puts ecosystems at risk through ecosystem acidification and alteration of nutrient balances. The effects of nitrogen and sulfur deposition can result in an inherent ecosystem sensitivity and exposure to acid deposition. Sensitivity is primarily governed by surficial geology, topography, and interactions between drainage water and soil (Greaver 2012).Levels of sulfur in wet deposition can be affected by a range of local and long-range emission sources. Concentration levels of sulfur in wet deposition are good for the park.
Measure Description and Collection Protocol: Data value is the five-year average estimated wet deposition of sulfur for Interior, South Dakota, reported from the NPS Air Quality Conditions and Trends database referenced below. While ecosystems respond to total (wet and dry) deposition together, assessment of sulfur atmospheric deposition is based on wet deposition. Wet deposition is used as a surrogate for total deposition, because wet deposition is the most widely available monitored source of nitrogen and sulfur deposition data. Atmospheric wet deposition is monitored across the United States as part of the National Atmospheric Deposition Program / National Trends Network (NADP/NTN). Wet deposition in kilograms per hectare per year (kg/ha/yr) in the contiguous United States was calculated by multiplying measured sulfur concentrations in precipitation from monitoring sites by a 30-year
normalized precipitation. Annual sulfur wet deposition measurements are averaged over a five-year period at all NADP-NTN monitoring sites with at least three years of annual data. Five-year averages are then interpolated across all monitoring locations using an IDW method to estimate five-year average values for the contiguous United States. The estimated five-year average for individual parks is the maximum value within park boundaries derived from this national analysis. The 2017 value reported here represents the five-year average between 2011 and 2015. For the next data collection period in 2022, the most recent rolling five-year average available should be used. Over time, a decrease in wet sulfur deposition would contribute to an upward trend for this indicator of the natural quality.
Data Source: NPS Air Quality Conditions and Trends database: https://www.nature.nps.gov/air/data/products/parks/
Data Adequacy: Medium (5)
Data quantity is complete because air quality data were recorded regularly during and prior to the five-year reporting span. Data quality is medium because estimates are based on interpolated data from deposition monitors outside the wilderness.
Frequency: Five Years
Significant Change: Any change of 0.5 kg/ha/yr or more in either direction from the baseline data value is considered significant. This threshold was developed by the NPS Air Resources Division.
Table 13. Sulfur Wet Deposition Condition Categories
Deposition Condition Wet Deposition Nitrogen kg/ha/yr)
Good < 1
Moderate Concern 1-3
Significant Concern >3
46

Photo: Sarah Conlin
Natural Quality — Air and WaterOzone
Measure Baseline Data Value: 6.4 ppm-hrs Year(s) of Data Collection: 2011–2015
2018 Data Value: 6.4 ppm-hrsYear(s) of Data Collection: 2011–2015
Background and Context: Tropospheric, or ground level ozone, is not emitted directly into the air, but is created by chemical reactions between oxides of nitrogen (NOx) and volatile organic compounds (VOC). These reactions occur when pollutants emitted by cars, power plants, industrial boilers, refineries, chemical plants, and other sources chemically react in the presence of sunlight. Harmful pollutants from increased ozone in the ground level ozone has become a major resource to monitor in fear of its adverse effects to human, animal, and plant welfare. For humans, breathing ozone can trigger a variety of health problems including chest pain, coughing, throat irritation, airway inflammation, and other respiratory complications.
Ozone also affects sensitive vegetation and ecosystems, including forests, parks, wildlife refuges, and wilderness areas. Damaging effects for plants from ozone are a reduction in photosynthesis, slow plant growth, and an increased risk of disease, damage from insects, and harm from severe weather. Ozone concentrations could be the most harmful during the growing season of the Badlands Wilderness due to the common drastic weather events. As a result, species diversity decreases along with habitat quality and changes to water and nutrient cycles.
Measure Description and Collection Protocol: Data value is the five-year average estimated three-month maximum 12-hour W126 Index for Interior, South Dakota, reported from the NPS Air Quality
47

Conditions and Trends database referenced below. The W126 metric is a biologically relevant measure that focuses on plant response to ozone exposure. The W126 metric equation preferentially weights the higher ozone concentrations that are more likely to cause plant damage and sums all of the weighted concentrations during daylight hours. Ozone is monitored across the United States through air quality monitoring networks operated by the National Park Service, Environmental Protection Agency (EPA), states, and others. Aggregated hourly ozone concentration data are acquired from the EPA Air Quality System (AQS) database. Annual W126 values in parts per million-hours (ppm-hrs) are averaged over a five-year period at all monitoring sites with at least three years of annual data. Five-year averages are then interpolated across all monitoring locations using an IDW method to estimate five-year average values for the contiguous United States. The estimated five-year average for individual parks is the maximum value within park boundaries derived from this national analysis. The 2017 value reported here represents the five-year average between 2011 and 2015. For the next data collection
period in 2022, the most recent rolling five-year average available should be used. Over time, a decrease in ozone concentration would contribute to an upward trend for this indicator of the Natural Quality.
Data Source: NPS Air Quality Conditions and Trends database: https://www.nature.nps.gov/air/data/products/parks/
Data Adequacy:High (6)
Data quantity is complete because air quality data were recorded regularly during and prior to the five-year reporting span. Data quality is high because there is an ozone monitoring station nearby.
Frequency: Five Years
Significant Change:Any change of 2 ppm-hrs or more in either direction from the baseline data value is considered significant. This threshold was developed by the NPS Air Resources Division.
Natural Quality — Ecological ProcessesAcoustic Conditions
Measure Baseline Data Value: 39.3 dBA Year(s) of Data Collection: 2003
2018 Data Value: 39.3 dBAYear(s) of Data Collection: 2003
Background and Context: Acoustical resources are vital to protect in wilderness because they are essential to park ecology and central to visitor experience. While background sounds levels
in parks are considered relatively low by community standards, levels of noise audibility in wilderness areas are remarkably high. Most of the noise sources, like major highways or air traffic, originate outside park boundaries
Photo: Tatiana Marquez
48

and beyond the management jurisdiction of the National Park Service (Lynch 2011). Acoustical stewardship is one of the many resources protected under the National Park Service Organic Act of 1916, which stated that the purpose of the national parks is “...to conserve the scenery and the natural and historic objects and the wild life therein and to provide for the enjoyment of the same in such manner and by such means as will leave them unimpaired for the enjoyment of future generations.” This “natural quiet” was first referenced in the Grand Canyon Enlargement Act of 1975. Since then, acoustic conditions have been closely monitored alongside scenic vistas, clean air, night skies, etc.
Wildlife relies greatly on auditory communication for environmental information. Where some sounds alert attentive listeners to the location, identity, and behavior of other animals; other sounds describe physical environmental features like changing weather, flowing water, and fire (Lynch 2011). Human-induced noise interferes with this process and decreases acoustical awareness for native wildlife. This “masking” adds energy to existing sound levels, reducing signal range and reliable identification. As a result, prolonged exposure of noise causes wildlife to retreat to areas of smaller noise concentrations, which shrinks viable habitat. For endangered species like the black-footed ferret in the Badlands Wilderness area, habitat is already predetermined by successful prairie dog colonies. If these colonies are shifting to new locations to better improve communication for protection, all species that depend on the prairie dog colonies for food or habitat are affected. In time, vegetation goes unchecked and native plant species are competing for survival and land cover diversity decreases. This ripple effect expands out to all aspects of the prairie ecosystem. Studies reveal that pronghorn, mule deer, sage grouse, and several species of songbirds prefer habitat with less noise from human activity. An increase of 3 dBA will reduce listening area for wildlife by 50%. This negatively affects functions such as predator/prey relationships, reproduction, and overall fitness.
Measure Description and Collection Protocol: The Federal Aviation Administration, with assistance of the Volpe Center’s Environmental Measurement
and Modeling Division, and the National Park Service conducted a baseline ambient sound level measurement during September 2003—approximately two weeks of acoustical and meteorological data were measured at three sites in the park. These sites were selected during multiple discussions between the Federal Aviation Administration, the National Park Service, the Volpe Center, and Badlands NPS personnel. The primary goal of the site selection process was to identify the minimum number of field-measurement sites, which would allow for characterization of the baseline ambient sound levels throughout the entire park. This was accomplished by identifying acoustically representative regions for which data could be collected and stratified, i.e., “acoustic zones.” These data could then be applied to other regions in the park possessing similar attributes, which will affect acoustics such as land cover, wind conditions, and wildlife habitats. A continuation of inventory is planned to take place during the 2018 summer season. Any increase from the baseline data value is a downward trend for the natural quality.
Data Source: Many parks have individualized acoustic inventories: https://irma.nps.gov/DataStore/
Further, an acoustic model can be used to predict sound levels at every park. This data is in a georeferenced sound model intended for use with ArcGIS: https://irma.nps.gov/DataStore/Reference/Profile/2217356
Data Adequacy:Medium (3)
Data Quantity is low due to the lack of continued sampling since 2003. Data quality is partial because acoustic conditions have not been assessed since 2003 and visitation has greatly increased since then so this data would not accurately represent the park’s current soundscapes; however, publication of this data on the NPS DataStore website ensures reliability.
Frequency: Five Years
Significant Change:Any change from the baseline measure data value is significant.
49

Photo: Sarah Conlin
50

UNDEVELOPEDWilderness retains its primeval character and influence, and is essentially without permanent improvement or modern human occupation
The undeveloped quality is the most familiar and recognizable quality of wilderness for many people. Without buildings, roads, evidence of other people, or improvements on the landscape, the undeveloped quality speaks to the idea that humans are visitors that do not remain. The Wilderness Act of 1964 makes the following allusions to the undeveloped quality of wilderness character:
• The National Wilderness Preservation System was created “in order to assure that an increasing population, accompanied by expanding settlement and growing mechanization, does not occupy all areas in the United States” (2a).
• Wilderness is “in contrast with those areas where man and his own works dominate the landscape” (2c).
• Wilderness should be managed in such a way that “the imprint of man’s work is substantially unnoticeable” (2c).
• And that “there shall be no permanent road within any wilderness area…no temporary road, no use of motor vehicles, motorized equipment or motorboats, no landing of aircraft, no other form of mechanical transport, and no structure or installations within any such area” (4c).
Table 14. Undeveloped Quality
Indicator MeasureFrequency
in YearsData
AdequacySignificant
Change
Measure Baseline
Data Value
2018 Data Value
Presence of nonrecreational structures, installations, and developments
Nonrecreational structures, installations, and developments
1 year Med (5) Any84 (weighted score)
84 (weighted score)
Presence of inholdings
Number of inholdings 5 years High (6) Any 1 1
Use of motor vehicles, motorized equipment, or mechanical transport
Number of authorized uses of motor vehicles, motorized equipment, or mechanical transport for SAR-related events
5 years High (6) Any 1 event 1 event
Undeveloped Quality — Presence of Nonrecreational Structures, Installations, and DevelopmentNonrecreational Structures, Installations, and Developments
Measure Baseline Data Value: 84 (weighted score) Year(s) of Data Collection: 2003
2018 Data Value: 84 (weighted score)Year(s) of Data Collection: 2003
Background and Context: Remnants of the first homesteaders that tried to tame this wild landscape are still scattered amongst the wilderness. In addition to these artifacts and their contribution to the cultural character of this land, other nonrecreational structures, installations, and developments also remain as
items that degrade the undeveloped quality of wilderness. The Wilderness Act defines wilderness as an area “with the imprint of man’s work substantially unnoticeable… where man himself is a visitor who does not remain” (2c). Although the majority of developments and structures in the Badlands Wilderness are few in number, most of
51

them are unmapped or inventoried. Smaller installments like wildlife cameras, vegetation plot markers, reburial site markers, and noticeable rebar stakes are present, but not documented. Larger structures like culverts, wells, and dams are regularly inventoried in wilderness. The mapped dams in wilderness are described below in table 15.
Measure Description and Collection Protocol: The only remnants of nonrecreational structures in the Badlands Wilderness that are mapped are dams, dugouts, and wells. Large artifacts (cars, trucks, wagons, stills, etc.) are in wilderness, but are largely unmapped. Currently, there are no plans to install nonrecreational structures in wilderness except markers for a couple of reburials that need to take place. Data value is a weighted score that reflects the extent of all nonrecreational physical developments in wilderness. Weight values of structures are derived loosely from the “Development Index” published in the BLM document titled Measuring Attributes of Wilderness Character: BLM Implementation Guide 1.5. Developments in place for less than six months are not counted. Archeological sites and structures are not counted in this measure; the presence of archeological structures are an integral part of the Badlands Wilderness experience that blends well with the natural environment and add value to wilderness character. Collared wildlife occasionally inhabits
wilderness lands, though these animals are transient rather than full-time wilderness residents and are not counted in this measure. If collared or banded animals are introduced or become regular wilderness residents, they would be counted as “mobile installations” and given an inherent weight of 0.1 points per animal.
Data Source: Wayne Thompson, Physical Science Technician; Megan Cherry, Museum Collections Manager
Data Adequacy: Medium (5)
Data quantity is partial because some installations and developments are likely present in wilderness but unaccounted for in this measure. Nonetheless, this list has been reviewed by relevant park staff and all structures present on the list have been verified. Data quality is moderate because no official inventory of structures in wilderness has been completed, and some numbers, like those for rebar plot markers have been estimated using best judgments.
Frequency: Five Years
Significant Change: Any addition of nonrecreational structures to the baseline data value would be significant and a downward trend for the undeveloped quality of wilderness.
Table 15. Mapped Dams in Badlands Wilderness
Name Survey Date Area (sq ft) Acres
Hamm Dam 11/24/2001 1730 0
Kocher 41 7/4/2001 1221 0
Willow 56 7/4/2001 4831 1
Larsen 16 7/4/2001 4893 1
Mallard 15 7/16/2001 0 0
No Hole 6 7/16/2001 9531 2
Upper No Hole 6 7/16/2001 3106 1
Mistake 42 7/16/2001 969 0
Miginty 8 7/17/2001 26659 7
Miginty South 7/17/2001 884 0
Eureka 17 7/23/2001 536 0
YCC 5 7/23/2001 4065 1
52

Name Survey Date Area (sq ft) Acres
Sunflower 37 7/23/2001 410 0
Hocking Y9 7/24/2001 601 0
Hocking Y9 7/24/2001 309 0
Island Dam 19 7/31/2001 2931 1
Lone Tree 24 7/31/2001 122 0
Miss Fire 18 7/31/2001 3105 1
Surprise Dam 8/1/2001 734 0
Battleship 50 8/1/2001 2802 1
Kalenbrenner Dam 13 8/1/2001 1367 0
Sedge Dam 8/1/2001 438 0
Sage 45 8/1/2001 5862 1
White Butte Dam 8/12/2001 1060 0
Trespass Dam 40 11/23/2001 5840 1
Conata Dug Out 11/23/2001 0 0
Bighorn Sheep Dam 11/23/2001 2217 1
Vetch Dam Unknown 0 0
>
Te x t
Miginty 8
Sage 45
NO HOLE 6
YCC 5
LARSEN 16WILLOW 56 Trespass Dam 40
Miss Fire 18
Battleship 50
Island Dam 19
MALLARD 15
HAMM DAM
Mistake 42
BIGHORN SHEEP DAM
Eureka 17
KALKBRENNER DAM 13
Hocking Y 9
WHITE BUTTE DAM
SUPRISE DAM
Sunflower 37
VETCH DAM
Sage Creek Unit
Conata Unit
±
Guptill Inholding
0 5 102.5Miles
National Park ServiceBadlands National ParkSouth Dakota
Map Produced by:W. Thompson and PauL RoghairPhysical Science TechniciansBadlands National Park Y:\GISProjects\J millman Wilderness Maps
Location of Impoundments Within Sage Creek and Conata Units of Badlands Wilderness
LegendWilderness Dams and Impoundments
Wilderness Area
Roads
NPS Boundary
CCC Well
53

Undeveloped Quality — Presence Of InholdingsNumber of Inholdings
Measure Baseline Data Value: 1 Year(s) of Data Collection: 2016 (most recent survey)
2018 Data Value: 1Year(s) of Data Collection: 2016
Background and Context: Inholdings in wilderness are not subject to the same laws and policies as wilderness lands. Inholdings pose a problem for wilderness managers as activities and developments that take place within inholdings are often incompatible with wilderness character. Access to inholdings can encourage future developments or mechanized use in the wilderness via access roads or aircraft flights through wilderness areas.
The single inholding in the wilderness area is the Huether property. The Huethers were one of the first homesteaders to come to the area in the hope of putting down new roots out West and are one of the last remaining strongholds of a time before Badlands National Park existed.
Measure Description and Collection Protocol: Data value is the number of inholdings in wilderness. To collect data on inholdings, consult local staff knowledge and current GIS files. Report each inholding as a
separate entity. The reported value is this number of individual inholdings. An increase of inholdings would contribute to a downward trend in this indicator of the undeveloped quality.
Data Source: Wayne Thompson, Physical Science Technician; Megan Cherry, Museum Collections Manager
Data Adequacy: High (6)
Data quantity is complete because all necessary files have been gathered and staff consulted. Data quality is high reflecting the high level of certainty in data accuracy.
Frequency: Five years
Significant Change: Any change from the baseline data value for this measure is considered significant.
Te x t
Sage Creek Unit
Conata Unit
±
Guptill Inholding
LegendWilderness AreaRoadsNPS Boundary
Inholding OwnerHuether
0 5 102.5Miles
National Park ServiceBadlands National ParkSouth Dakota
Map Produced by:W. Thompson and PauL RoghairPhysical Science TechniciansBadlands National Park Y:\GISProjects\J millman Wilderness Maps
Location of Inholdings Within Sage Creek and Conata Units of Badlands Wilderness
54

Photo: Mike Pflaum
Undeveloped Quality — Use of Motor Vehicles, Motorized Equipment, or Mechanical TransportNumber of Authorized Uses of Motor Vehicles, Motorized Equipment, or Mechanical Transport for SAR-related events
Measure Baseline Data Value: 1 event Year(s) of Data Collection: 2015
2018 Data Value: 1 event (2015)Year(s) of Data Collection: 1976–2017
Background and Context: The Wilderness Act specifically prohibits the use of motorized equipment in wilderness areas in order to provide refuge from growing mechanization in a busy modern society. This act reads: “there shall be no temporary road, no use of mechanical transport, and no structure or installation within any such area” (Sec 4. C, Wilderness Act 1964). This measure attempts to
track the use of motor vehicles, motorized equipment, aircraft, and other forms of mechanical transport necessary for emergency and SAR-related events. The park may choose to use this measure in the future to document other sources of potential users including: fire management in efforts to manage wildfires or prescribed burns, resource management in allowing motorized use for scientific sampling or other wildlife-related projects.
55

Any and all use of motor vehicles, motorized equipment, or mechanical transport in the wilderness should be documented with MRA support.
When a search and rescue is performed in the Badlands Wilderness, motorized vehicles and aircraft are deployed in emergency situations such as the search and rescue from 2015 where a visitor went missing in the wilderness area. While permitted, if necessary, aircraft use—like all motorized use in wilderness—diminishes the undeveloped quality of wilderness character. Aircraft noise can also disturb wildlife and hamper visitor solitude, thus impacting both the natural and solitude or primitive and unconfined recreation qualities. In life-threatening emergencies where visitors have to be evacuated from the wilderness, motorized use of UTVs in the wilderness area are common. The treacherous terrain of the Badlands Wilderness make aircraft use an important and vital tool in search and rescue operations. Frequent fossil poaching and undocumented backcountry use often necessitates the use of aerial patrols. Examining the patterns of authorized administrative flight operations over a period of time will enable managers to be aware of trends in aircraft use and make well-informed decisions regarding the necessity of authorizing motorized use in wilderness.
Measure Description and Collection Protocol: Until the park management team decides to expand this measure to include any and all use of motorized
equipment beyond emergency and SAR-related events, the only data collected for this measure will be aligned solely with emergency and SAR-related events. To collect data for this measure, contact the Law Enforcement Division each year to count their use of motor vehicles, motorized equipment, or mechanical transport in wilderness. Note, while only landing aircraft is forbidden by the law, this measure includes helicopters authorized to fly over wilderness regardless of whether they land due to their impact on wilderness character. Because the aviation requests do not record the number of trips the helicopter might take, each request counts as a single use, even if it covers multiple trips for the same purpose. This should be done annually for accuracy.
Data Source: Casey Osback, Law Enforcement Officer at Badlands National Park
Data Adequacy: Medium (4)
Data Quantity is partial because the number of days motorized vehicles and equipment were used
Frequency: Five years
Significant Change: Any change from the measure baseline data value is considered significant.
Table 16. Authorized Uses of Motorized Equipment or Mechanical Transport
YearAnnual
UsesUse Type Action
2015 1 SAR1 UTV with track system
South Dakota Guard Helicopter for low altitude search
Photo: Mike Pflaum
56

Photo: Mike Pflaum
SOLITUDE OR PRIMITIVE AND UNCONFINED RECREATIONWilderness provides outstanding opportunities for solitude or primitive and unconfined recreation.
As populations increase and technology advances, wilderness provides opportunities for solitude and for a primitive or unconfined types of recreation that are not available in many other places. Wilderness is unique in that its’ managers are mandated to provide outstanding opportunities for a specific type of recreational experience. Although managers cannot guarantee or require that visitors experience solitude or primitive and unconfined recreation, they must protect and uphold
the opportunity to have said experiences. The solitude or primitive and unconfined recreation quality focuses on the tangible aspects of the setting that affect visitor experience, and not on the subjective nature of the visitor experience itself. There are many intangible aspects of wilderness recreation (challenge, self-reliance, self-discovery, etc.) that are not included under this quality but that are still integral to the wilderness experience.
Table 17. Solitude or Primitive nnd Unconfined Recreation Quality
Indicator MeasureFrequency
in YearsData
AdequacySignificant
Change
Measure Baseline
Data Value
2018 Data Value
Remoteness from sights and sounds of human activity inside wilderness
Visitor traffic in the Sage Creek unit
1 Medium (4)
Estimated data analysis to be concluded in 2020
n/a n/a
Remoteness from sights and sounds of human activity outside wilderness
Length of noise-free interval (time between noise events)
2 Medium (4) 15% 2 .22% 2 .22%
Facilities that decrease self-reliant recreation
No . of developed trails 5 High (6) Any 0 0
Management restrictions on visitor behavior
Restrictions on visitor behavior
5 High (6) Any 26% 26%
57

Solitude or Primitive and Unconfined Recreation Quality — Remoteness From Sights and Sounds of Human Activity Inside WildernessVisitor Traffic in the Sage Creek Unit
2018 (Measure Baseline) Data Value: Estimated data analysis to be concluded in 2020Year(s) of Data Collection: 2012–2017
Background and Context: A parkwide open hike policy offers visitors an unhindered freedom to explore a wilderness that is devoid of modern-day stressors and toxicity. Seven of the common entry points into the Badlands Wilderness area are equipped with an optional backcountry registration podium. Although visitors are not required to fill out a backcountry form before entering wilderness, this information helps managers understand how people are experiencing wilderness. Seeing that the Sage Creek Wilderness is the most commonly accessed area of the park for backcountry explorations, park staff decided that it would be best to analyze the current logs from the Sage Creek Wilderness access points to better understand current and future monitoring strategies for visitor experience in wilderness. The interpretation division has electronically entered data from all seven access points into an excel spreadsheet. The data was organized by month, day of the week, day use versus overnight use, and number in party. Basic statistical analysis will be performed by Dave Pettebone, Applied Research Coordinator under the NPS Social Science Program. This data will be used as background information for the 2020 Sage Creek Campground Visitor Use Study. The park is most interested in popular days of the week visitors enter the wilderness area, most frequented entry points, average overnight use, and average group size.
Measure Description and Collection Protocol: Using statistical analysis provided by Dave Pettebone, a wilderness committee composed of park staff will be called to decide how to proceed in specifying visitor traffic in wilderness for monitoring purposes. Data processing is predicted to be complete in 2019.
Data Source: Christine Czazasty , Chief of Interpretation, Badlands National Park
Data Adequacy: Medium (4):
Data quantity may only account for the past five years; however, visitors appear to have been attentive in recording their backcountry experiences due to the large volume of reports. Data quality is low due to the unreliability of the backcountry reports accounting for ALL visitor experiences in the backcountry.
Frequency: Annually
Significant Change: To be determined
Photo: Mike Pflaum
58

Solitude or Primitive and Unconfined Recreation Quality — Remoteness From Sights and Sounds of Human Activity Outside WildernessLength of Noise-Free Intervals
Measure Baseline Data Value: 2.22% Year(s) of Data Collection: 2003
2018 Data Value: 2.22%Year(s) of Data Collection: 2003
Background and Context: Sounds are a perpetual and dynamic property of all landscapes. Animals conversing over the sounds of running water and rustling wind vibrate off the land, resonating with those trying to understand an ancient language lost to man through urbanization and modern development. Urban landscapes, a stark contrast, are radiating sounds crashing into people from clunky machines and tires rotating on pavement. Wilderness offers a retreat into the song of environmental harmony. Visitors find peace in the stillness and quiet of the Badlands Wilderness. In a society where moments of silence are correlated with devastation, wilderness offers silence as a healing answer and reprieve from the daily stressors of noise and chaos.
Vehicle noise and air traffic most significantly affect soundscapes in the Badlands Wilderness. The Loop Road is a 28-mile, two-lane asphalt road that extends from the northeast entrance to the Pinnacles entrance, and is the main artery into the park, providing access to many overlooks and trails in the north unit. It is also a regional “farm-to-market” road that is used by local residents in the town of Interior, South Dakota, to connect to Highway I-90 north of the park. This road is also used by larger cattle freighting rigs and trucks that pass through the area. This kind of traffic is extremely detrimental to the visitor experience in wilderness when it comes to exploring landscapes. Increased visitation to the park has also increased requests for flight tours across Badlands National Park. Combined, these factors, in addition to construction and other noises, need to be closely monitored to protect the balance of wilderness character.
Measure Description and Collection Protocol: Data value is the percentage of time observed to be noise-free, averaged from the Sage Creek Wilderness zone sampled by the NPS Natural Sounds and Night Skies Division (NSNSD) as outlined in table 18, below. Consult with NSNSD to obtain updated information. An increase in the percentage of time noise-free would contribute to an upward trend in the solitude or primitive and unconfined recreation quality.
Data Source: Emma Brown, Acoustical Resource Specialist - NPS Natural Sounds and Night Skies Division
National Park Service, Department of the Interior. 2016. Acoustical Monitoring Report – Badlands National Park, 2003. Natural Sounds and Night Skies Division. Fort Collins, Colorado
Data Adequacy: Medium (5):
Data quantity is complete because acoustical monitoring samples were taken at four separate locations by regional experts. Data quality would be improved if additional monitoring sites were placed in the Conata unit of wilderness.
Frequency: Five years, or when new data become available thereafter.
Significant Change: Any change of 15% or more in either direction from the baseline data value is considered significant.
Table 18. Summary of Acoustic Observer Log Data: Sage Creek Wilderness Zone (Site Id B02)
Number of Periods/Events: 45
Mean Time (minutes): 0:02:44
Minimum Time (minutes): 0:00:09
Maximum Time (minutes): 00:15:05
Total Time (minutes): 2:03:11
59

Solitude or Primitive and Unconfined Recreation Quality — Facilities That Decrease Self-Reliant RecreationNumber of Developed Trails
2018 (Measure Baseline) Data Value: 0Year(s) of Data Collection: 1976–2017
Background and Context: Part of what makes the Badlands Wilderness incredibly pristine and unique, is the complete lack of developed trails. With accordance to the open hike policy, visitors are in charge of their own exploration and safety. Overnight users are responsible for their own routes, waste removal, and campsite set up. Although the informal trails resulting from bison and other wildlife are commonly used by visitors, they are not designated trails put in by the National Park Service. Designated trails are defined by trails marked on the park map and annually maintained by park staff. Staff recommends not using these social trails in order to preserve the landscape and scenic vistas.
Self-guided exploration in this hard to navigate wilderness raises safety concerns for unexperienced hikers. Extreme weather events can make the landscape difficult to maneuver and has caused injury to or the demise of some visitors in the past. Situational awareness is key and increased injury or safety concerns might trigger management to intervene with a designated trail or interpretive signage.
Measure Description and Collection Protocol: Data value is the number of developed trails in wilderness. Commonly used social trails are not counted
in this measure, but should be taken note of when recording data. Over time, an increase in the number of developed trails in wilderness would contribute to a downward trend in this indicator of the solitude and unconfined recreation quality.
Data Source: Matt Roland, Acting Chief of Law Enforcement at Badlands National Park
Data Adequacy: High (6)
Data quantity is complete because park regulations and staff ensure that there are no plans or implementation of trails in wilderness. Data quality is good because NPS managers keep track of possible developed trail planning through excessive social trail use at main entries to the wilderness area.
Frequency: Five Years
Significant Change: Any change from the measure baseline data is considered significant
60

Photo: Mike Pflaum
Solitude or Primitive and Unconfined Recreation Quality — Management Restrictions on Visitor BehaviorRestrictions on Visitor Behavior
2018 (Measure Baseline) Data Value: 26% Year(s) of Data Collection: 1976–2017
Background and Context: Use and behavior restrictions are important tools used by park managers to achieve a balance between the sometimes conflicting qualities inherent to wilderness management. There are very few restrictions that visitors need to adhere to in the Badlands Wilderness. Prohibited fire use is parkwide and protects the environment from unregulated fire events, especially during dry seasons. Regulations on human waste disposal ensure that the wilderness will remain clean and unmarred for future visitors. Continued reassessment of the effectiveness, relevance, and enforceability of these visitor use restrictions will be important as the number and nature of wilderness visits change, and as park management strives to preserve the wilderness value of unconfined recreation while preserving other wilderness qualities. Repercussions of inappropriate visitor behavior can be degrading to the wilderness character, natural landscape, and overall biological processes of the ecosystem.
Measure Description and Collection Protocol: Data value for this measure is calculated using a numerical scale where low numbers represent the lowest amount of restriction and high numbers represent the
highest amount of restriction. Use the index in table 20 to develop a score for each restriction category; multiply that score by the value listed for the restriction’s geographic extent (table 19) to develop a final score for each restriction type. Sum the scores for all applicable restriction types and report the value as a percentage of all possible points. If the resulting value is a decimal, round to the nearest whole percent. A percentage is used rather than a straight total to facilitate reporting consistency if restrictions are added to or removed from the list of user restrictions. An increase in the percentage value of user restrictions would contribute to a downward trend in this indicator of the solitude or primitive and unconfined recreation quality.
Data Source: Matt Roland, Acting Chief of Law Enforcement at Badlands National Park
Data Adequacy: High (6)
Data quantity is complete because visitor use restrictions are clearly defined in park policy. Data quality is high for this same reason.
61

Frequency: Five years
Significant Change: Any change from the baseline data value is considered significant.
Table 19. Visitor Use Restriction Event
Score Geographic Extent
1 Applies to a subarea of the wilderness
2 Applies to the entire wilderness
Table 20. Visitor Use Restriction Index
Category Type of Restriction and ScoreGeographic
ExtentRestriction
RatingTOTAL
SCORE*
CampfiresNo Regulation – 0 Designated sites only – 1 Total Prohibition – 3
2 3 6
Campsite Location
No regulation – 0 Mandatory setback or other general regulation – 1 Designated site – 2 Total prohibition – 3
2 0 0
PermitsNo permits required – 0 Permits required for overnight use – 1 Permits required for day use – 2
2 0 0
Length of StayNo restriction on length of stay – 0 Length of stay limited – 1
2 1 2
Area ClosureNone – 0 Area closed seasonally/ temporarily – 1 Area closed year-round – 2
2 0 0
Group Size LimitNo restriction – 0 Overnight group size limit – 1 Day use group size limit – 2
2 0 0
Domesticated Animals No Regulation – 0 Restricted to limited areas – 1 Prohibited – 2
2 2 4
Horses and Pack AnimalsNo regulation – 0 Restricted to limited areas – 1 Prohibited – 2
2 0 0
Human WasteNo regulation – 0 Catholes or toilet facilities – 1 Carry-out required – 2
2 0 0
Rock ClimbingNo Regulation – 0 Permit Required – 1 Total Prohibition – 2
2 2 4
* Total: 12 (26% of possible points [46])
62

OTHER FEATURES OF VALUEWilderness may also contain other tangible features of scientific, educational, scenic, or historical value.
Wilderness areas may possess tangible, site-specific features that are integral to wilderness character and whose presence adds value to the wilderness resource. These features may
• Be specifically identified in the enabling legislation for the wilderness, be on the National Register of Historic Places, on a state register, or part of a national historic trail, or be identified as a priority heritage asset;
• Contribute to making the area’s meaning and significance clear and distinct, or help define how people think about and value an area;
• Help tell a broader story of a distinctive human relationship with the land; or
• Contain additional educational, scientific, or scenic value.
The Other Features of Value Quality is different from the other four qualities in that it may not be relevant for all wildernesses. Even if a feature fits in one or more of the above categories, it may not necessarily be considered under this quality; ultimately, it is up to local resource specialists and wilderness managers to determine if any other features of value are present and should be included in wilderness character monitoring. Features included in this quality are also counted under other qualities if relevant. For example, a building that is in the National Register of Historic Places could add value to wilderness character under the other features of value quality for its historic or cultural significance, but as a structure in wilderness it would also be counted under the undeveloped quality.
Table 21. Other Features of Value Quality
Indicator MeasureFrequency
in YearsData
AdequacySignificant
Change
Measure Baseline
Data Value
2018 Data Value
Deterioration or loss of integral cultural features
Paleontological disturbances
Annually High (6) Any 75 0
Deterioration or loss of other integral site-specific features of value
Condition of visual resources based on scenic quality and view importance ratings for park/ wilderness views
Every 5–10 years
High (6) Any Very Good Very Good
Other Features of Value Quality — Deterioration or Loss of Integral Cultural FeaturesPaleontological Disturbances
Measure Baseline Data Value: 75 Year(s) of Data Collection: 1977-2009
2018 Data Value: 0Year(s) of Data Collection: 2010–2017
Background and Context: The Badlands of South Dakota are unique landforms containing some of the most abundant vertebrate fossils of any rocks of the Age of Mammals (Cenozoic era) in North America. Badlands National Park was established to protect these spectacular landforms and the treasure of rich paleontological discovery that
lies within the geological formations across the area. Badlands National Park’s mission statement refers to this area as, “…a blend of the best know Oligocene fossil deposits contained within the archetypal Big Badlands formations” (NPS 2006).
63

Paleontological research made the Big Badlands of South Dakota a focus of research since 1846, when the first scientific report of a partial fossil jaw from the White River Badlands was discovered. The past 167 years of research and fossil diversity analysis from strata that spans 9 million years of Earth’s history has provided valuable data on the evolution of North American mammals during the late Eocene and Oligocene epochs. These geological formations and fossils have also provided in-depth information on climate change during one of the greatest global drops in temperature during the Cenozoic era.
Today, the South Dakota School of Mines Museum has the largest collection of fossil vertebrates from this area in the entire United States. Rachel Benton, the park paleontologist, organized one of the most significant scientific studies in the park: the Big Pig Dig. This was a massive fossil locality discovered in 1993 near the Conata Picnic Ground. This site gave way to 15 field seasons and over 19,000 bones, teeth, and skulls that were excavated from the site for further research. A few years later, in 1977, the Brian Maebius site was found. This site is in the Badlands Wilderness area and is stratigraphically positioned in the Scenic Member of the Brule Formation just below the Hay Butte marker. This dense accumulation of fossil bone and preserved environments gave way to further insight to mammalian evolution and the transformation of the landscape.
Luckily, there are guidelines in place by the NPS Geological Resources Program that provides inventory
and monitoring, enhancing visitor understanding and enjoyment of the fossil resource and ensuring the protection of the parks paleontological resources. With visitation increasing to over 1 million people annually, the impact the resources are taking are often detrimental to preservation of delicate fossil localities and unique geological phenomenon. The park has implemented a system to educate visitors about fossils while protecting the fossils. This is done through an on-site lab where visitors can see preparators attending to fossils brought in by field staff and education in visitor site reports. These reports are a way for visitors to correctly enjoy the resource without extracting valuable fossils from the landscape and damaging them. This helps to reiterate the importance in prohibiting casual collecting in the park, while educating visitors on the significance of their impact in the park.
With easy access to fossils and constant technological advancements such as backpacker’s magazine mapping fossil locality sites, it is difficult to keep up with the illegal poaching activity in the park. Poaching can take many forms; from the casual visitor to researchers without permits to professional poachers hoping to sell fossils at auction houses. In 1999, four college students were caught with over 2,000 fossils they had illegally collected in the span of four days. Professional poachers will use motorized equipment to quickly and discreetly access fossil sites all over the park, including in wilderness. Lack of staff and increased poaching led Badlands National Park to explore any and all alternatives to cease this
Photo: Sarah Conlin
64

devastating activity. Partnering with the Department of Earth and Environmental Science at Temple University in Philadelphia, Pennsylvania, in order to develop a method to chemically “fingerprint” fossil bone material, is one way the park is trying to strengthen legal cases against suspected fossil poachers. The Paleontological Resource Preservation Act (PRPA) provides the National Park Service with important mandates to enhance paleontological stewardship and involves clarification of criminal penalties (Benton et al. 2015). Today, a very small staff of paleontologists and law enforcement rangers stand between this extraordinary resource and poachers hoping to exploit it. If the wilderness character of this resource is to be preserved, sufficient staffing and education to the public must be made a priority in wilderness management.
Measure Description and Collection Protocol: Data value is the number of paleontological incident reports documented annually. This is very sensitive information and specific locations or descriptions
WILL NOT be released without permission from law enforcement and the Badlands National Park paleontologist. Any and all information regarding these reports shall be discussed directly with previously specified personnel.
Data Source: Ellen Stark, Badlands National Park’s Paleontologist
Casey Osback, Chief of Law Enforcement
Data Adequacy: High (6)
Data quantity is complete from fossil incidents reports collected by law enforcement over there years. Data quality is high for the same reason.
Frequency: Annually
Significant Change: Any change from the baseline assessment is considered significant.
Table 22. Number of Paleontological Incident Reports Per Year
Year Number of Reports
1977 1
1978 1
1979 0
1980 6
1981 2
1982 0
1983 0
1984 0
1985 3
1986 7
1987 4
1988 2
1989 3
1990 5
1991 3
1992 8
1993 5
Year Number of Reports
1994 1
1995 2
1996 0
1997 1
1998 0
1999 1
2000 1
2001 6
2002 0
2003 0
2004 0
2005 1
2006 7
2007 0
2008 0
2009 5
TOTAL 75
65

Other Features of Value Quality — Deterioration or Loss of Integral Site Specific Features of ValueCondition of Visual Resources Based on Scenic Quality and View Importance Ratings for Wilderness Views
2018 (Measure Baseline Data Value): 90% of views have a scenic inventory value (SIV) of very high or high (2016) resulting in a visual resources condition of “very good”
Year(s) of Data Collection: 2018
Background and Context: Visitors often come to parks to take in spectacular views and marvel at the unique scenery of diverse areas. However, the views are sometimes obscured by air pollutants or spoiled by unsightly development. Visual resources are the visible physical features such as topography and landform, vegetation, water, structures, and other features that combine to create the visual landscape. Scenery is the combination of visual resources that creates a view that is often, but not always, pleasing to the viewer.
The Organic Act of 1916, which created the National Park Service, states that the agency’s mission is “to conserve the scenery…and wild life therein and to provide for the enjoyment of the same in such manner and by such means as will leave them unimpaired for the enjoyment of future generations.”
Scenery is key to the purpose and significance of many park units. Protecting natural landscapes is important for ecological, cultural, and aesthetic reasons. Visual resources are valued both for their pleasing aesthetic characteristics—often spectacular views—and also as an important means of enhancing visitor connections to cultural resources associated with historic or even prehistoric landscapes. Some important landscapes may not be considered highly scenic but still have visual resources that require management to protect desired characteristics.
Important park views may extend beyond park managed property. For this reason, it is essential for the National Park Service to look beyond its boundaries when considering visual resources. People don’t “see” management boundaries when they visit parks. It is the responsibility of the National Park Service to document and evaluate visual resources in a way that reflects visitor experience. Considering views that extend beyond NPS boundaries informs engagement with other agencies, neighboring communities, and stakeholders.
When development is proposed in shared viewsheds, the National Park Service has an opportunity to engage in local, regional, and national regulatory and planning processes. Engaging with others to advance park protection is also consistent with the direction of NPS Management Policies 2006 in section 1.6 on Cooperative Conservation Policies Beyond Park Boundaries (pages 13–14). Information about existing visual resources, the level of visitation to park viewpoints, and the potential for changes in the visual setting to alter visitor experience can inform external planning and development proposals and may help protect park scenic views (NPS 2018).
Badlands National Park is well known for awe-inspiring views of rugged badlands formations painted with bands of varying sedimentary soil and ancient paleosols in the middle of a mixed grass prairie landscape. In rough contrast to vast skies and endless horizons, this place holds mystery and intrigue as the steep canyons, sod tables, hoodoos, and buttes transform before the eye under different angles of the sun. Among the most popular overlooks spanning across the wilderness area from the Badlands Loop Scenic Byway are: White River, Panorama Point, Burns Basin, Homestead, and Pinnacles. A threat that may affect the aesthetics of Badlands National Park viewscapes is the possibility of cell phone tower construction on land adjacent to the park.
Measure Description and Collection Protocol:In February 2018, Badlands National park conducted a visual resource inventory at the park. During the inventory, 20 views were identified that represent a cross section of park visitor experiences, landscape types, and level of visitation. Half of the views overlook wilderness.
Views were assessed for scenic quality and view importance. Scenic quality rating factors include landscape character integrity, vividness, and visual harmony. The ratings result in a score ranging from highest (A) to lowest (E) indicating the relative scenic quality of the view.
66

View importance rating factors include viewpoint importance, viewed landscape importance, and viewer concern. The ratings result in a score ranging from highest (1) to lowest (5) indicating the relative value of the view to the park and its visitors.
The visual resource inventory results for each view can be summarized using a scenic inventory value (SIV), which combines scenic quality and view importance using the matrix below. The SIV scale ranges from very high (VH) to very low (VL).
Table 23. Scenic Inventory Value Matrix
View Importance Rating
Scenic Quality 1 2 3 4 5
A VH VH VH H M
B VH VH H M L
C H H M L L
D H M L VL VL
E M L VL VL VL
Data values are based on visual resource inventory results and criteria identified in NPS Guidance for Evaluating Visual Resources in Wilderness Character Assessments (figure 2; NPS ARD 2018).
Table 24. Visual Resources Condition Category Criteria
Category Criteria
Very Good 90% or more views have a Scenic Inventory Value (SIV) of very high or high
Good 75% to 90% views have a SIV of very high or high
Fair 50% to 75% of views have a SIV of very high or high
Poor 50% to 74% of views have a SIV of moderate, low, or very low
Very Poor 75% or more views have a SIV of low or very low
Data Source: Melanie Peters, Natural Resource Specialist Air Resources Division
https://irma.nps.gov/ETV/Viewpoint/ListUnitViewpoints/BADL
Data Adequacy: High (6)
Data quantity is Complete (3) because visual resources inventory data were collected for more than 80% of the views identified as important views to inventory in the park. Data quality is High (3) because indicator ratings were based on inventory data. For an overall data adequacy of High.
Frequency: Every five years
Significant Change: After the initial baseline determination, significant change should be determined on a five-year frequency using the reassessment form. Any change in the scenic quality or the view importance rating in either direction from the baseline data value is considered significant. This threshold was developed by the NPS Visual Resources Program.
67

CONCLUSIONSAs mandated by Director’s Order 41, this document has provided Badlands National Park with an official Wilderness Character Narrative, the establishment of baseline wilderness character measures and data, and a framework for continuing this monitoring to assess changes and trends in wilderness character far into the future. Beyond fulfilling a policy requirement, this report seeks to empower park managers to make carefully weighed wilderness stewardship decisions with the ultimate goal of facilitating the preservation of wilderness character.
It must be noted that the measures selected for wilderness character monitoring by this assessment are not all-inclusive or comprehensive. Future monitoring should continue to revisit the adequacy of these measures and their data sources, and new measures should be incorporated if new issues become relevant to wilderness character or new data become available. The results of this assessment are not intended to score or judge the character of the Badlands Wilderness against any other wilderness area, as all wilderness areas have their own distinct and incomparable character. Rather, this report should illuminate an on-the-ground understanding of the current condition and major threats to wilderness
character, while instilling a sense of pride in and responsibility for this unique wilderness landscape.
Significant wilderness-related datasets were generated through this project, including an inventory of all physical developments and installations in wilderness, a count of all trammeling actions and environmental manipulations that have occurred in wilderness in recent years, an inventory of all motorized use and mechanized transport that has been authorized in wilderness, and the aggregation of wilderness-specific datasets from local, regional, and national sources. The information generated by this assessment has applications far beyond wilderness character monitoring and should serve as a resource for future park planning as a whole, as park staff continues the process of drafting a Wilderness Study and Wilderness / Backcountry Management Plan.
The completion of this assessment does not automatically ensure the preservation of wilderness character or the longevity of wilderness character monitoring. Park managers will be responsible for continuing wilderness character monitoring efforts and updating data values in the Interagency Wilderness Character Monitoring Database at: https://wc.wilderness.net/.
Photo: Mike Pflaum
68

FUTURE PLANNINGThe future planning section outlines suggestions for efforts or actions whose initiation would increase the efficiency of wilderness character reporting, improve the accuracy of wilderness character data, or more effectively capture important aspects of the wilderness environment in the wilderness character monitoring framework.
Natural QualityBlack-Footed FerretsAt Conata Basin black-footed ferrets selected areas with both high and low densities of active burrow openings. Female ferrets seem to produce more kits when inhabiting such areas; thus conservation and restoration of colonies with high densities of burrow openings and prairie dogs are needed to promote continued recovery of the black-footed ferret. Such actions also would aid in conservation of prairie dogs, a keystone species of the Great Plains. Management practices can be directed toward increasing prairie dog densities in all areas thus increasing the number of burrows and prey potentially available to ferrets. Restoration practices, including translocations and plague control, can be used to increase densities of prairie dogs and active burrow openings and thus facilitate ferret recovery.
Undeveloped QualitySearch and Rescue Activities and TrainingThe National Park Service collaborates with local law enforcement authorities and fire departments on search and rescue operations in the park. In some instances, motorized utility task vehicles are used for transport in wilderness. This motorized travel is generally a nonconforming use in wilderness and should be mitigated.
Solitude and Unconfined RecreationOverflights in WildernessThe Redwoods Act of 1978 addressed potential conflicts between visitor use and resource protection by affirming that, ‘‘the protection, management, and administration of these areas shall be conducted in light of the high value and integrity of the national park system and shall not be
exercised in derogation of the values and purposes for which these various areas have been established, except as may have been or shall be directly and specifically provided by Congress.’’ In 1987, Congress focused specific attention on aircraft flights over park lands when it passed the National Parks Overflights Act (Public Law 100-91). This act mandated that the National Park Service conduct a number of studies related to the effects of overflights on parks, and to report the results to Congress. The Natural Sounds Program, a national NPS office, was established in 2000, with the passing of the National Parks Air Tour Management Act. The act mandated that the Federal Aviation Administration and the National Park Service jointly develop Air Tour Management Plans for more than 106 parks where commercial air tours operate.
Other Features of Value QualityCondition of Visual Resources Based On Scenic Quality and View Importance Ratings for Wilderness ViewsOther items to consider monitoring for this measure would include highlighting the implications of existing land management plans, zoning ordinances, or other regulations that would allow land uses that could alter the visual landscape beyond park boundaries. Also, assess the implications of proposed changes from known projects. Consider scale, type of project, and other factors that would result in changes inconsistent with the existing visual landscape beyond park boundaries that is important to the experience of park visitors. The assessment of implications for the visual landscape can be based on available information from public records, park plans, park staff knowledge, and other sources (NPS 2016).
69

70

REFERENCES CITEDBaskin, J., and C. Baskin
1981 “Ecology of Germination and Flowering in the Weedy Winter Annual Grass Bromus japonicus.” Journal of Range Management, 34(5), 369-372.
Benton, R., D. O. Terry, E. Evanoff, and H. G. McDonald2015 The White River Badlands: Geology and Paleontology. Bloomington: Indiana University Press.
Bettez, N., R. Marino, R. Howarth, and E. Davidson2013 “Roads as Nitrogen Deposition Hot Spots.” Biogeochemistry, 114, 149-163.
Blankespoor, G. and E. Larson1994 “Response of Smooth Brome (Bromus inermis Leyss) to Burning under Varying Soil Moisture
Conditions.” The American Midland Naturalist, 131(2), 266-272.
Center for Food Security and Public Health2006 Contagious Ecthyma Fast Facts[Pamphlet]. Iowa: Iowa State University.
Childers, E.2016 Climate Change and the Shifting Status of Plague in Badlands National Park [PMIS 235831].
Badlands National Park, Interior, SD, November 21.
2010 Develop a Method to Field-Validate Disease Transmission in the Badlands NP Bighorn Sheep Population[PMIS Project 165691]. Badlands National Park, Interior, SD. July 15.
Eads, D., J. Millspaugh, D. Biggins, T. Livieri, D. Jachowski, and B. Blake2011 “Postbreeding Resource Selection By Adult Black-Footed Ferrets in the Conata Basin, South
Dakota. Journal of Mammalogy, 92(4), 760-770.
Greaver, T., T. Sullivan, J. Herrick, M. Barber, J. Baron, B. Cosby, K. Novak2012 “Ecological Effects of Nitrogen and Sulfur Air Pollution in the US: What Do We Know?”
Frontiers in Ecology and the Environment, 10(7), 365-372.
Holechek, J.1981 “Crested Wheatgrass.” Rangelands, 3(4), 151-153.
Hull, A., and John O. Evans1973 “Musk Thistle (Carduus nutans): An Undesirable Range Plant.” Journal of Range Management,
26(5), 383-385.
Johnsgard, P. A.2003 South Dakota and North Dakota Summary of Route and Major Biological Discoveries. University
of Nebraska Press Center for Great Plains Studies. University of Nebraska, Lincoln and London.
Jordahl, L.2017 Wupatki Eligible Wilderness: Wilderness Character Narrative and Baseline Monitoring
Assessment (pp. 15–99).
2015 Big Bend Recommended and Potential Wilderness: Building Blocks for Wilderness Stewardship(pp. 14-104)
71

Kostel, G.2009 Thymelaea Passerina (Thymelaeaceae) in South Dakota. Journal of the Botanical Research
Institute of Texas, 3(2), 901–903.
Landres, P., C. Barns, S. Boutcher, T. Devine, P. Dratch, A. Lindholm, L. Merigliano, N. Roeper, and E. Simpson2015 Keeping it Wild 2: An Updated Interagency Strategy to Monitor Trends in Wilderness Character
Across the National Wilderness Preservation System. USDA Forest Service, Rocky Mountain Research Station, General Technical Report RMRS-GTR-340, Fort Collins, CO.
Landres, P., C. Barns, J. G. Dennis, T. Devine, P. Geissler, C. S. McCasland, L. Merigliano, J. Seastrand, and R. Swain2008 Keeping It Wild: An interagency strategy to monitor trends in wilderness character across the
National Wilderness Preservation System. General Technical Report RMRS-GTR-212. Fort Collins, CO: U.S. Department of Agriculture, Forest Service, Rocky Mountain Research Station.
Landres, P., S. Boutcher, L. Dean, T. Hall, T. Blett, T. Carlson, A. Mebane, C. Hardy, S. Rinehart, L. Merigliano, D. N. Cole, A. Leach, P. Wright, D. Bumpus
2009 Technical guide for monitoring selected conditions related to wilderness character. USDA Forest Service General Technical Report WO-80, 282 pp.
Lee, C. S. and Others2016 Badlands National Park: Baseline Ambient Sound Levels 2003.
Lynch, E., D. Joyce, and K. Fristrup2011 An Assessment of Noise Audibility and Sound Levels in U.S. National Parks (2011 ed.,
Vol. Landscape Ecology, 26: 1297–1309, pp. 1297–1309, Publication). Springer Science Business Media B.V.
Matykiewicz, B.2017 Badlands National Park Resource Management/Wildlife Report (pp. 3-25, Rep. No. 2017 Annual
Report). Interior, SD: Badlands National Park.
McDonald, Peter M. and G. Plumb1996 “Black-Footed Ferret Reintroduction in the Conata Basin/Badlands of Southwestern South
Dakota.” Rangelands, 18(6), 222–224.
National Park Service (NPS)2006 Final General Management Plan, Environmental Impact Statement: Badlands National Park,
North Unit (pp. 10-25) (United States, Department of the Interior). Washington, D.C.: National Park Service, US Department of the Interior.
National Park Service, Air Resources Division2018 Guidance for Evaluating Visual Resources in Natural Resource Conditions Assessments. https://
irma.nps.gov/DataStore/Reference/Profile/2254702.
National Park Service, Department of the Interior2013 Director’s Order 41: Wilderness Stewardship. Washington, D.C.
Nevison, S., Hughes Berheim, E. 2017 Badlands National Park Resource Management/Wildlife Report (pp. 20–23, Rep No. 2017 Annual
Report). Interior, SD: Badlands National Park.
72

Ogle, D., L. St. John, D. Tilley2008 Plant Guide for yellow sweet clover (Melilotus officinalis (L.) Lam. And white sweet clover (M.
alba Medik. USDA-Natural Resources Conservation Service, Idaho Plant Materials Center, Aberdeen, ID 83210.
Pijanowski, B., L. Villanueva-Rivera, S. Dumyahn, A. Farina, B. Krause, B. Napoletano, N. Pieretti2011 “Soundscape Ecology: The Science of Sound in the Landscape.” BioScience, 61(3), 203–216.
Rackliffe, Riley D.2016 “Lassen Volcanic Wilderness Character Assessment.” (pp. 29–96).
Schauster, E., E. Gese, and A. Kitchen2002 An Evaluation of Survey Methods for Monitoring Swift Fox Abundance. Wildlife Society Bulletin
(1973–2006), 30(2), 464–477.
Sheley, R., Celestine A. Duncan, Mary B. Halstvedt, and James S. Jacobs2000 “Spotted Knapweed and Grass Response to Herbicide Treatments.” Journal of Range
Management, 53(2), 176–182.
Stacy, M. Dean, Barry L. Perryman, P. Stahl, and M. Smith2005 Brome Control and Microbial Inoculation Effects in Reclaimed Cool-Season Grasslands.
Rangeland Ecology & Management, 58(2), 161–166.
Stephen M. Laufenberg, Sheley, R., James S. Jacobs, and John Borkowski2005 “Herbicide Effects on Density and Biomass of Russian Knapweed (Acroptilon repens) and
Associated Plant Species.” Weed Technology, 19(1), 62–72.
Swearingen, J., C. Bargeron2016 Invasive Plant Atlas of the United States. University of Georgia Center for Invasive Species and
Ecosystem Health. http://www.invasiveplantatlas.org/.
Volenberg, Dean S., Herbert J. Hopen, and Gaetano Campobasso1999 “Biological Control of Yellow Toadflax (Linaria vulgaris) by Eteobalea Serratella in Peppermint
(Mentha piperita).” Weed Science, 47(2), 226-232.
Zimmerman, T. J.2008 Evaluation of an augmentation of Rocky Mountain bighorn sheep at Badlands National Park,
South Dakota(unpublished doctoral dissertation). South Dakota State University.
73

Photo: Rheanna Kautzman
74

APPENDIXES
Appendix A: Overview of the Framework for Wilderness Character MonitoringAn excerpt from Keeping it Wild 2 (Landres et al. in press)
This interagency monitoring strategy is organized around a hierarchical framework that divides wilderness character into successively finer elements. These elements, starting from wilderness character, are:
• Qualities. Qualities are the primary elements of wilderness character that link directly to the statutory language of the 1964 Wilderness Act. The same set of qualities applies nationwide to all wildernesses managed by all agencies. In this framework, the untrammeled, natural, undeveloped, and solitude or primitive and unconfined recreation qualities are all necessary to assess trend in wilderness character and each wilderness would report the trend in each of these qualities. Where other features of value exist in and are integral to a wilderness, the other features of value quality would also be reported.
• Monitoring Questions. Monitoring questions capture essential components of each quality that are significantly different from one another and address particular management questions and goals. The same set of monitoring questions applies nationwide to all wildernesses, although some agencies do not use these questions and instead go directly from qualities to indicators.
• Indicators. Indicators are distinct and important elements under each monitoring question. In nearly all cases there is more than one indicator under a monitoring question. Each wilderness and agency would be responsible for reporting the trend in all indicators. The same set of indicators applies nationwide to all wildernesses managed by all agencies.
• Measures. Measures are the specific elements under each indicator on which data are collected to assess trend in an indicator. Each agency is responsible for determining how their measures will be selected (that is, whether by a national or regional team, or by each wilderness). Examples of measures for each indicator are given in the chapters that describe each quality in detail.
This hierarchical framework …allows managers to look at the overall trend in wilderness character and drill down through the various levels to understand how this trend was derived, including how change in an individual measure contributes to the overall trend in wilderness character.
75

Photo: Mike Pflaum
76

Appendix B: What is a Trammeling Action?Appendix extracted from Keeping it Wild 2 (Landres et al. 2015).
This appendix provides guidelines and examples to clarify what is and is not a trammeling action. These are intended to capture about 90% of the cases and provide sufficient guidance for local staff to figure out the novel and rarer cases as they occur. A trammeling action is defined as an action that intentionally manipulates “the earth and its community of life” inside a designated wilderness or inside an area that by agency policy is managed as wilderness.
The following terms and phrases clarify this definition above:
• Intentional: Done on purpose; deliberate; willful.
• Manipulation: An action that alters, hinders, restricts, controls, or manipulates “the earth and its community of life” including the type, amount, or distribution of plants, animals, or physical resources.
• Intentional manipulation: An action that purposefully alters, hinders, restricts, controls, or manipulates “the earth and its community of life.”
Two concepts are crucial for understanding what is and is not a trammeling action: restraint and intention. Restraining our power to manipulate or control the earth and its community of life is at the core of the untrammeled quality of wilderness character. Trammeling actions occur when opportunities for restraint are ignored or bypassed; when there is no opportunity for restraint, there is no opportunity to trammel. Wilderness legislation and policies mandate that managers exercise restraint when authorizing actions that interfere with or control wilderness ecological systems. While other agencies, organizations, and the public are not beholden to these same restrictions, activities that have not been authorized by the federal land manager and that manipulate the wilderness environment are counted as trammeling actions.
The second concept central to the idea of trammeling is intentionality. Actions that deliberately interfere with, manage, or control an aspect of wilderness ecological systems are intentional and clear instances of trammeling. As explained in the chapter on the untrammeled quality, intentional actions are counted
as a trammeling regardless of the magnitude of their effects (including areal extent, intensity, frequency, and duration). For pragmatic reasons, however, some actions are not monitored if they fall below a minimum practical threshold of scale and scope (for example, hand pulling a few individual noxious plants). Much more complex and nuanced is determining whether to include actions whose purpose is not to manipulate the earth and its community of life, but some manipulation of the environment is required to produce the desired outcome. These types of actions can be confusing because the biophysical environment is intentionally manipulated even though it is not the purpose behind the action. In general, when such actions have substantial and foreseeable effects on the wilderness ecosystem, they are counted as a trammeling.
The following sections describe three types of activities: those that are trammeling actions, those that are not trammeling actions, and those that may be trammeling actions. Following these sections, a flowchart provides general guidance for making these determinations.
Activities that are trammeling actions:There are two broad classes of trammeling actions: those that are authorized by the federal wilderness manager, and those that are not. Three subclasses under each of these reflect whether the action is taken on a biological resource, on a physical resource, or on a resource outside the wilderness with the intent to manipulate biophysical resources in the wilderness.
Agency authorized trammeling actions. These are actions that are authorized by the federal wilderness manager as well as actions by other agencies, organizations, or individuals that have been approved or permitted by the federal land manager.
1. Actions taken inside the wilderness on a biological resource to intentionally affect “the earth and its community of life.” Examples include:
a. Removing or killing indigenous or nonindigenous vegetation or fish and wildlife.
b. Adding or restoring indigenous or nonindigenous vegetation or fish and wildlife.
c. Using chemicals or biocontrol agents to control
77

indigenous or nonindigenous vegetation or fish and wildlife.
d. Collecting, capturing, or releasing plants and animals under a research permit.
e. Enclosing or excluding fish and wildlife from an area.
2. Actions taken inside the wilderness on a physical resource or natural process to intentionally affect “the earth and its community of life.” Examples include:
a. Suppressing naturally-ignited fire.
b. Lighting fire (under management prescription) for any purpose.
c. Constructing or maintaining a dam, water diversion, guzzler, or other persistent installation intended to continuously alter wilderness hydrology; each agency will need to determine their counting rules for monitoring such installations.
d. Adding acid-buffering limestone to water to neutralize the effects of acid deposition.
3. Actions taken outside the wilderness on a physical or biological resource or process to intentionally affect “the earth and its community of life” inside a wilderness. Examples include:
a. Cloud seeding to intentionally increase precipitation inside the wilderness.
b. Damming a river outside a wilderness to intentionally alter the hydrology inside the wilderness.
c. Killing fish and wildlife outside the wilderness, or planting or stocking fish or wildlife outside the wilderness, to intentionally affect the population or distribution of this species inside the wilderness.
Unauthorized trammeling actions. These are citable or other actions taken by other agencies, organizations, or individuals that have not been authorized, approved, or permitted by the federal wilderness land manager.
1. Actions taken inside the wilderness on a biological resource to intentionally affect “the earth and its community of life.” Examples include:
a. Adding or removing plants or fish and wildlife.
b. Other direct manipulation of plants or fish and wildlife.
c. Indirect manipulation of fish and wildlife, such
as changing hunting regulations with the goal of decreasing predator populations within the wilderness.
2. Actions taken inside the wilderness on a physical resource or natural process to intentionally affect “the earth and its community of life.” Examples include:
a. Setting arson fire.
b. Modifying water resources to provide water for wildlife, or otherwise store water or alter the timing of water flow.
3. Actions taken outside the wilderness on a physical or biological resource to intentionally affect “the earth and its community of life” inside a wilderness. Examples include:
a. Releasing or killing species outside of the wilderness with the intention to affect populations whose ranges expand into the wilderness.
In some situations, staff may assume that they do not have the opportunity for restraint because an action is required to comply with other laws or agency policies, or to protect human life or property. Examples of such situations include restoring habitat for a listed endangered species, spraying herbicides to eradicate an invasive nonindigenous plant that is degrading wildlife habitat, transplanting an extirpated species back into the wilderness, or suppressing a naturally ignited fire. These are still considered trammeling actions because even in these situations staff are deciding to take action as well as deciding the type and intensity of action.
Activities that are not trammeling actions: Actions for which there is no opportunity for managerial or individual restraint are not considered a trammeling. For example, climate change, air pollutants wafting into a wilderness, and the presence of nonindigenous species that naturally dispersed into a wilderness are not intentional decisions or actions, and therefore do not provide an opportunity for management restraint. Accidental unauthorized actions, such as escaped campfires and oils spills, similarly lack an opportunity to restrain our power over the landscape. Past actions that manipulated the biophysical environment before the area was designated as wilderness are not considered a trammeling because the provisions of the 1964 Wilderness Act did not apply to the area prior to designation.
78

Another group of examples that are not a trammeling encompass those small-scale actions with no intent to manipulate the earth and its community of life, such as installing meteorological or other science instrumentation, landing a helicopter for search and rescue operations, and removing trash. Camping violations, unauthorized motorized incursions, and other illegal activities that are not intended to manipulate the biophysical environment are also not counted as trammeling actions; legality is irrelevant in determining whether an action is a trammeling.
Hunting, for sport or subsistence, has provoked an enormous amount of discussion about whether it degrades the untrammeled quality. The consensus from the Lessons Learned Workshop was that hunting is generally not a trammeling action because individual hunters are taking individual animals without the intention to manipulate the wildlife population. However, if a state wildlife agency manipulates hunting quotas (or takes other management action) to alter the predator/
prey relationship in order to maximize certain hunting opportunities, this manipulation of the “community of life” would degrade the untrammeled quality (see above).
Activities that may be trammeling actions:There are two types of actions that may or may not be considered trammeling actions. The first includes intentional manipulations that interfere with or control an aspect of wilderness ecosystems but are too small in scale or scope to be practically monitored. The second type encompasses those nuanced cases where the primary purpose of the action is not to manipulate the ecosystem but a foreseeable and substantial effect on the earth and its community is required to achieve this purpose. As shown in the table below, several hypothetical situations illustrate how an action may or may not be a trammeling depending on the extent of the action and its effects. Each bullet in the table presents a situation where the action being taken likely would, or would not, be considered a trammeling.
Table B-1. Examples of Actions that Likely are not and Likely are Trammeling Actions Based on the Scale and Scope of the Action and its Effects on the Earth and its Community of Life
Action Likely Not a Trammeling Likely a Trammeling
Treating nonindigenous invasive plants
Hand pulling a small area of nonindigenous invasive plants .
Spraying herbicide .
Permitting scientific activities
Installing research plot monumentation, such as rebar stakes or nails . Installing most scientific instrumentation . Collecting a limited number of voucher specimens with no impact on species distribution or abundance .
Installing enclosures or exclosures . Installing instrumentation that disrupts the movement or behavior of plants, or fish and wildlife . Capturing, collaring, and releasing wildlife .
Building system trail
Routing a trail around a rock slide . Building a bridge across a stream to prevent streambank erosion . Installing a small section of corduroy across a wet area . Installing in water bars or building rockcribbing .
Routing a trail through an area of sensitive alpine butterfly habitat . Building a large amount of trail to go around a section of river or cliff . Building a trail that requires extensive earth movement or tree cutting .
Obliterating nonsystem trailPiling vegetation or rocks at the beginning and end of trail sections that cut a switchback .
Obliterating a large section of nonsystem trail that requires extensive earth movement .
Restoring campsites
Restoring a single, isolated campsite Restoring a number of campsites that do not require disrupting the soil or vegetation in the surrounding area .
Restoring a number of campsites that requires moving a significant amount of soil or number of plants in the surrounding area .
Removing hazard treesRemoving one or a few hazard trees that threaten designated campsites or that are along a trail .
Removing all hazard trees over a large area .
79
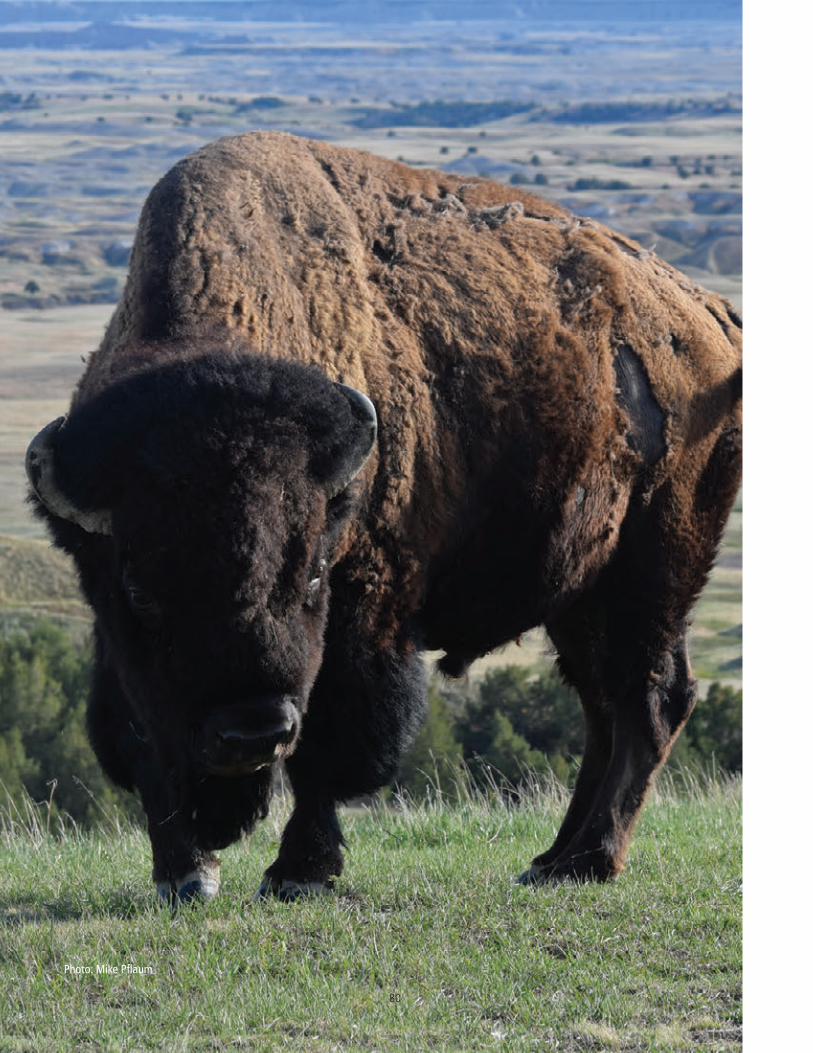
Photo: Mike Pflaum
80

Approved by:
Mike Pflaum, Superintendent, Badlands National Park Date
As the nation’s principal conservation agency, the Department of the Interior has responsibility for most of our nationally owned public lands and natural resources. This includes fostering sound use of our land and water resources; protecting our fish, wildlife, and biological diversity; preserving the environmental and cultural values of our national parks and historic places; and providing for the enjoyment of life through outdoor recreation. The department assesses our energy and mineral resources and works to ensure that their development is in the best interests of all our people by encouraging stewardship and citizen participation in their care. The department also has a major responsibility for American Indian reservation communities and for people who live in island territories under U.S. administration.
BADL 137/161313 DECEMBER 2017

Badlands Wilderness | Building Blocks for Wilderness Stewardship