Bacterivory of a mudflat nematode community under different environmental conditions
32
Please note that this is an author-produced PDF of an article accepted for publication following peer review. The definitive publisher-authenticated version is available on the publisher Web site 1 Marine Biology June 2008, Volume 154, Number 4 : Pages 671-682 http://dx.doi.org/10.1007/s00227-008-0960-9 © Springer-Verlag 2008 The original publication is available at http://www.springerlink.com Archimer, archive institutionnelle de l’Ifremer http://www.ifremer.fr/docelec/ Bacterivory of a mudflat nematode community under different environmental conditions Pierre-Yves Pascal 1, * , Christine Dupuy 1 , Pierre Richard 1 , Jadwiga Rzeznik-Orignac 2 , Nathalie Niquil 1 1 Littoral, Environnement et Sociétés (LIENSS) UMR 6250 CNRS-Université de La Rochelle, 2 Rue Olympe de Gouges, 17042 La Rochelle cedex, France 2 Biologie des organismes marins et écosystèmes (BOME) UMR-CNRS 5178–USM 0401– MNHN, 61 Rue Buffon, 75231 Paris, France *: Corresponding author : Pascal P. Y., email address : [email protected] Abstract: The fate of the benthic bacterial biomass is a topic of major importance in understanding how soft- bottom environments function. Because of their high abundance, production and nutritional value, benthic bacteria may constitute an important food resource for benthic fauna. The trophic role of bacteria for a nematode community on the Brouage mudflat (Marennes-Ole´ron-France), dominated by three species: Chromadora macrolaima (64% of the abundance), Daptonema oxycerca (15%) and Ptycholaimellus jacobi (8%), was determined in grazing experiments using 15 N pre-enriched bacteria. On intertidal flats, seasonal, tidal and circadian cycles induce strong variations in environmental conditions. Grazing experiments were performed in order to measure the effects of abiotic (temperature, salinity and luminosity) and biotic (bacterial and algal abundances) factors on assimilation rates of bacteria by nematodes. In order to assess simultaneously bacteria and algal assimilation rates, algal abundances were modified adding 13 C pre-enriched Navicula phyllepta. Assimilation rate was significantly lower at 5°C; moreover, general trend shows a prominent temperature effect with an optimum around 30°C. Assimilation at salinity 18 was not significantly different from the assimilation at salinity 31. Assimilation was higher under light conditions than in the dark. Above 10 9 bacteria ml -1 , assimilation of bacteria remained unaffected by bacterial abundance. However, assimilation of algae increased with the algal concentration. Nematode kept feeding under conditions of stress, which are typical of the surficial sediment habitat and they appeared to be principally dependent on the algal resource. Keywords: Nematode, bacteria, grazing, environmental factor, mudflat
Transcript of Bacterivory of a mudflat nematode community under different environmental conditions
Ple
ase
note
that
this
is a
n au
thor
-pro
duce
d P
DF
of a
n ar
ticle
acc
epte
d fo
r pub
licat
ion
follo
win
g pe
er re
view
. The
def
initi
ve p
ublis
her-a
uthe
ntic
ated
ver
sion
is a
vaila
ble
on th
e pu
blis
her W
eb s
ite
1
Marine Biology June 2008, Volume 154, Number 4 : Pages 671-682 http://dx.doi.org/10.1007/s00227-008-0960-9 © Springer-Verlag 2008 The original publication is available at http://www.springerlink.com
Archimer, archive institutionnelle de l’Ifremer http://www.ifremer.fr/docelec/
Bacterivory of a mudflat nematode community under different environmental conditions
Pierre-Yves Pascal1, *, Christine Dupuy1, Pierre Richard1, Jadwiga Rzeznik-Orignac2, Nathalie Niquil1
1 Littoral, Environnement et Sociétés (LIENSS) UMR 6250 CNRS-Université de La Rochelle, 2 Rue Olympe de Gouges, 17042 La Rochelle cedex, France 2 Biologie des organismes marins et écosystèmes (BOME) UMR-CNRS 5178–USM 0401– MNHN, 61 Rue Buffon, 75231 Paris, France *: Corresponding author : Pascal P. Y., email address : [email protected]
Abstract: The fate of the benthic bacterial biomass is a topic of major importance in understanding how soft-bottom environments function. Because of their high abundance, production and nutritional value, benthic bacteria may constitute an important food resource for benthic fauna. The trophic role of bacteria for a nematode community on the Brouage mudflat (Marennes-Ole´ron-France), dominated by three species: Chromadora macrolaima (64% of the abundance), Daptonema oxycerca (15%) and Ptycholaimellus jacobi (8%), was determined in grazing experiments using 15N pre-enriched bacteria. On intertidal flats, seasonal, tidal and circadian cycles induce strong variations in environmental conditions. Grazing experiments were performed in order to measure the effects of abiotic (temperature, salinity and luminosity) and biotic (bacterial and algal abundances) factors on assimilation rates of bacteria by nematodes. In order to assess simultaneously bacteria and algal assimilation rates, algal abundances were modified adding 13C pre-enriched Navicula phyllepta. Assimilation rate was significantly lower at 5°C; moreover, general trend shows a prominent temperature effect with an optimum around 30°C. Assimilation at salinity 18 was not significantly different from the assimilation at salinity 31. Assimilation was higher under light conditions than in the dark. Above 109 bacteria ml-1, assimilation of bacteria remained unaffected by bacterial abundance. However, assimilation of algae increased with the algal concentration. Nematode kept feeding under conditions of stress, which are typical of the surficial sediment habitat and they appeared to be principally dependent on the algal resource. Keywords: Nematode, bacteria, grazing, environmental factor, mudflat
Ple
ase
note
that
this
is a
n au
thor
-pro
duce
d P
DF
of a
n ar
ticle
acc
epte
d fo
r pub
licat
ion
follo
win
g pe
er re
view
. The
def
initi
ve p
ublis
her-a
uthe
ntic
ated
ver
sion
is a
vaila
ble
on th
e pu
blis
her W
eb s
ite
2
Introduction Bacteria play a major role in cycling organic matter in marine sediments through the
remineralization of nutrients and organic matter and production of particulate and
dissolved carbon (e.g. Legendre and Rassoulzadegan 1996; Rivkin et al. 1996).
Although bacterial abundance remains stable, around 109 cells ml-1 (review in
Schmidt et al. 1998), bacterial production rates vary greatly (Sander and Kalff 1993).
This discrepancy between abundance and production may be induced by bottom-up,
biochemical and top-down control (van Oevelen et al. 2006a). In the top-down control
situation, bacterial carbon is assumed to be regulated by higher trophic levels of
benthic food webs. The majority of animals feeding on sedimentary deposits are
more dependent on attached bacteria than on nonliving organic debris (e. g. Fenchel
1972). Models of benthic ecosystems emphasize the role of bacteria and their
immediate grazers as a major route through which organic material is processed (e.
g. Kuipers et al. 1981). Consequently, quantitative data dealing with the link between
bacteria and benthic fauna are essential for understanding the extent to which this
trophic link structures energy and material fluxes in the communities. Results
concerning the impact of meiofaunal grazing on bacteria are conflicting (Kemp 1990).
Montagna (1984b) suggested that meiofaunal grazing pressure (principally through

3
polychaetes) represents a significant stimulatory effect on the microbial community and may 49
be important in sandy sediments (Montagna and Bauer 1988). However, quantitative studies 50
on meiobenthos bacterivory are sparse. 51
Although they are small and inconspicuous, nematodes are consistently the most abundant 52
meiobenthic taxon in mudflat sediments. Their average densities of 106 ind m
-2 represents a 53
biomass of roughly 0.2 to 2 gC m-2
and some authors have suggested that their ecological 54
significance is great in terms of food-web relationships (review in Platt and Warwick 1980; 55
Heip et al. 1985). 56
Benthic bacteria can constitute a significant food source for nematodes (Lopez et al. 1979; 57
Tietjen 1980; Montagna 1984b; Montagna 1995; Moens et al. 1999b). According to Wieser 58
(1960), there are four different feeding groups of nematodes: selective deposit feeders (1A), 59
non-selective deposit feeders (1B), epigrowth feeders (2A) and omnivore-predators (2B). 60
Nematodes of each feeding groups are potential bacterivores, even predacious may benefit 61
directly from bacterial carbon (Moens et al. 1999b). Deposit and epigrowth feeders feed on 62
bacteria and unicellular eukaryotes in different ways. Deposit-feeding species have no teeth 63
and generally swallow the food whole and undamaged. They feed predominantly on bacteria 64
associated with detritus. The epigrowth feeding species puncture the cell membrane with their 65
teeth and ingest only the cell contents (juice feeders). Diatoms and other benthic microalgae 66
are known to be important trophic sources for many epigrowth feeders but the importance of 67
bacteria as a food source remains poorly documented (Moens and Vincx 1997). The aim of 68
this study was to experimentally assess rates of bacteria uptake by a nematode community 69
from an intertidal mudflat using 15
N enriched bacteria as tracers. The intertidal habitat studied 70
is subject to a wide range of environmental varying factors. Three relevant time scales drive 71
these environmental variations: long-term (seasonal cycle), medium-term (lunar cycle) and 72
short-term (solar and tidal cycles) (Guarini et al. 1997). Variations concern both biotic (i.e. 73

4
temperature, salinity and luminosity) and abiotic factors (i.e. bacterial and algal abundances). 74
As those variations may influence the feeding behavior of nematodes, one aim of the present 75
study is to determine if nematodes bacterivory is constant in the mudflat or influenced by 76
environmental factors. Other aim is to describe feeding behavior of nematodes when an 77
alternative algal resource is available. 78
For this purpose, a mudflat nematode community from surficial sediment was put in 79
microcosms, in contact with labeled preys: a bacterial community and one algal species. 80
Grazing experiments were performed in order to evaluate effects of abiotic (temperature, 81
salinity and luminosity) and biotic (bacterial and algal abundances) factors on rates of prey 82
uptake. We focused on the surficial mudflat sediment nematode community because the 83
surficial sediment (i) has high bacterial production, (ii) contains the highest nematodes 84
densities and (iii) undergoes faster and more wide-ranging changes in environmental factors 85
than do the deeper layers. 86
Material and methods 87
Study site 88
The Brouage intertidal mudflat is located in the eastern part of the Marennes-Oléron Bay 89
(Atlantic coast of France). Meteorological conditions exhibit a strong seasonality typical of a 90
temperate climate. Temperature and salinity of emerged sediments are more extreme during 91
summer tidal cycles (Guarini et al. 1997). Minimum and maximum mud temperatures are 5°C 92
and 34°C respectively. The maximum daily range of mud temperature due to emersion and 93
immersion cycle reaches 18°C (Guarini et al. 1997). Salinity of overlaying water is controlled 94
by the river Charente freshwater input, ranging from 25 to 35 over the year (Héral et al. 95
1982). Salinity of the upper layers of sediment may also decrease with rainfall. The sediment 96
surface irradiance shifts from dark during submersion and night emersions to high levels of 97
incident light during daytime emersions. This irradiance can reach 2000 µM of photons m-2
s-1
98

5
(Underwood and Kromkamp 2000). Details of numerous benthic organisms and processes are 99
available concerning this intertidal zone (gathered in Leguerrier et al. 2003; Leguerrier et al. 100
2004; Degré et al. 2006). 101
15N enriched bacteria and
13C enriched algae as tracer 102
The method used was described in Pascal et al. (2008). This method is based on the 103
assumption that grazers ingest unselectively enriched and natural bacteria. Briefly, one 104
centimeter-depth of surficial sediment was sampled during ebb tide in the Brouage mudflat 105
(45°55N, 1°06W) (Fig. 1). Bacteria from surficial sediment were cultured in a liquid bacterial 106
culture medium containing 15
NH4Cl 1 g l-1
(99% 15
N-enriched NH4Cl CortecNet), rinsed by 107
centrifugation and frozen until the grazing experiments. An axenic clone of the Navicula 108
phyllepta diatom (CCY 9804, Netherlands Institute of Ecology NIOO-KNAW, Yerseke, The 109
Netherlands) was cultured in a liquid medium containing NaH13
CO3, then rinsed and freeze-110
dried until the grazing experiments. Isotopic composition of enriched prey was assessed using 111
mass spectrometer. For these experiments, labeled preys were mixed with sediment from the 112
Brouage mudflat that had been previously sieved through a 50 !m mesh. The abundance of 113
bacteria and algae in the slurry was estimated in order to determine the ratio between enriched 114
and unenriched prey. 115
Grazing experiments 116
The top centimeter of sediment was collected on March 13, 2006. At the time of sampling, 117
sediment presented a temperature of 7°C and a salinity of 29. Sediment sampled was first 118
sieved through a 500 !m mesh to remove macrofauna, then through a 50 !m mesh to extract 119
meiofauna. One ml of the sediment remaining in the mesh was put into each microcosm 120
(Pyrex beakers, ø = 4.5 cm) and the fraction which passed through the mesh was mixed with 121
15N enriched bacteria. This slurry contained 10.5 ! 10
8 bacteria ml
-1, with the
15N enriched 122
bacteria being twice as abundant as unenriched ones. Four ml of this slurry were put into each 123

6
microcosm. Each experiment was carried out in triplicate. Control samples were frozen (-124
80°C) in order to kill any nematodes. 125
A kinetic study was performed to validate its linear or hyperbolic shape in order to 126
calculate the grazing rate. Incubations for this kinetic study were run for 1 to 12 hours, 127
including the 3 hours run that was used for all other experiments. Incubations were made 128
under the following standardized conditions that were close to the year-round mean values 129
recorded on the study site: temperature (20°C), salinity (31), luminosity (darkness), bacterial 130
abundance (10.5 ! 108 bacterial cell ml
-1) and algal abundance (15 !gChla g
-1). 131
For each other experiment one environmental incubation factor was modified. In order to 132
decrease salinity, cultured bacteria were rinsed with 0.2 !m filtered-sea-water diluted with 0.2 133
!m filtered water (final salinity of 18). The light effect was tested with a light intensity of 83 134
µM photons m-2
s-1
. Bacterial abundances (total enriched and non-enriched) tested were 4, 7 135
and 17 cells ml wt sed-1 with respectively the following ratio between abundance of total and 136
enriched bacteria: 6.1, 2.0 and 1.3. Algal abundance was modified by adding various 137
quantities of cultured N. phyllepta enriched in 13
C while bacterial abundances (total enriched 138
and non-enriched) were kept constant at 10 ! 108 cells ml
-1. Using two isotopes for labeling 139
bacterial (15
N) and algal food (13
C) offers the opportunity to assess bacterial and algal 140
ingestion rates simultaneously. Algal abundance (total enriched and non-enriched) were 26, 141
64 and 114 !gChla g dry sed-1
with respectively the following ratio between abundance of 142
total and enriched algae: 2.4, 1.3 and 1.2. 143
Incubations were halted by freezing the microcosms at -80°C. Samples were thawed and 144
nematodes were extracted from the sediment using Ludox TM (Heip et al. 1985). For each 145
sample, at least 700 nematode specimens were picked up randomly and individually with 146
Pasteur pipette, rinsed twice in Milli-Q water to remove adhering particle and transferred in 147
aluminium cup. 148
7
Isotope analysis and calculations 149
"15
N and "13
C of prey (bacteria and algae) and grazers (nematodes) were measured using 150
an EA-IRMS (Isoprime, Micromass, UK). Nitrogen isotope composition is expressed in the 151
delta notation ("15
N) relative to air N2: "15
N = [(15N/
14N)sample / (
15N/
14N)reference)-1] ! 1000. 152
Carbon isotope composition is expressed in the delta notation ("13
C) relative to Vienna Pee 153
Dee Belemnite (VPDB): "13
C = [(13C/
12C)sample / (
13C/
12C)reference)-1] ! 1000. 154
The 15
N incorporated was defined as excess (above the background level) 15
N and is 155
expressed in terms of specific uptake (I). I was calculated as the product of excess 15
N (E) and 156
the biomass of N per grazer. E is the difference between the background (Fbackground) and the 157
sample (Fsample) 15
N fraction: E = Fsample - Fbackground, with F = 15
N / (15
N + 14
N) = R / (R + 2) 158
and R = the nitrogen isotope ratio. For the Fbackground, we used highest control values (#15
N = 159
11.78 and #13
C = -16.34) measured using killed (frozen) grazers. R was derived from the 160
measured "15
N values as: R = (("15
N/1000)+1) ! RairN2 where RairN2 = 7.35293 10-3
161
(Mariotti 1982). The uptake of bacterial carbon was calculated as Uptake = (I ! (% Cenriched 162
bacteria / % Nenriched bacteria ) / (Fenriched bacteria ! incubation time). This uptake was multiplied by 163
the ratio between the abundance of total and enriched bacteria determined by DAPI counts. 164
Incorporation of 13
C was calculated analogously, with F = 13
C / (13
C + 12
C) = R / (R + 1), 165
RairN2 is replaced by RVPDB = 0.0112372 and Uptake = I / (Fenriched bacteria ! incubation time). 166
The uptake measured was multiplied by the ratio between the abundance of total and enriched 167
diatom, determined from fluorometrical measurements. 168
Enriched N. phyllepta-produced carbon consisted of 22.95 ± 0.54% 13
C. The C/N ratio of 169
enriched bacteria was 3.49 and bacterial nitrogen consisted of 2.88 ± 0.03% 15
N. The average 170
weight of nematodes was 0.33 ± 0.18 µg DW and each nematode was composed on average 171
of 0.11 ± 0.05 µgC and 22.28 ± 5.82 ngN (N = 72 samples of at least 700 specimens each). 172
8
Uptake expressed as gCbacteria gCnematode-1
h-1
was obtained by dividing the uptake of bacteria 173
(gC ind-1
h-1
) by the mean nematode weight (gC ind-1
). 174
Variations of assimilation rates with respect to the salinity and luminosity were tested 175
using two-tailed test. One-way analysis of variance (ANOVA) was used in order to test the 176
impact of temperature and algal and bacterial abundance on the uptake rates of bacteria and 177
algae. The Tukey test was used for post-hoc comparisons. 178
Nematode community composition 179
Nematode communities used in the grazing experiments were extracted from sediment 180
with Ludox TM (Heip et al. 1985). In order to determine the taxonomic composition of the 181
community studied, 303 nematodes were collected at random, determined to species or 182
generic level under the microscope and sorted by feeding group as indicated by Wieser (1953; 183
1960). 184
Results 185
Composition of the nematode community 186
In the sample collected for the taxonomy of the nematode community, 19 species 187
belonging to 18 genera were observed (Tab. 1). Three species made up more than 87 % of the 188
community: Chromadora macrolaima (64%), Daptonema oxycerca (15%) and 189
Ptycholaimellus jacobi (8%). The other species were much less abundant, 11 representing less 190
than 1 %. 191
The community was dominated by epigrowth feeders 2A (75%) due to high abundances of 192
C. macrolaima and P. jacobi. Non-selective deposit feeders 1B (21%) were the second most 193
abundant trophic group due to high abundance of D. oxycerca. Selective deposit feeders 1A 194
(2%) and omnivores/predators 2B (1%) exhibited marginal abundances in the community 195
studied. 196
Uptake of microbes by nematodes 197
9
Nematodes isotopic compositions and rates of bacterial ad algal uptakes are presented in 198
Table 2. 199
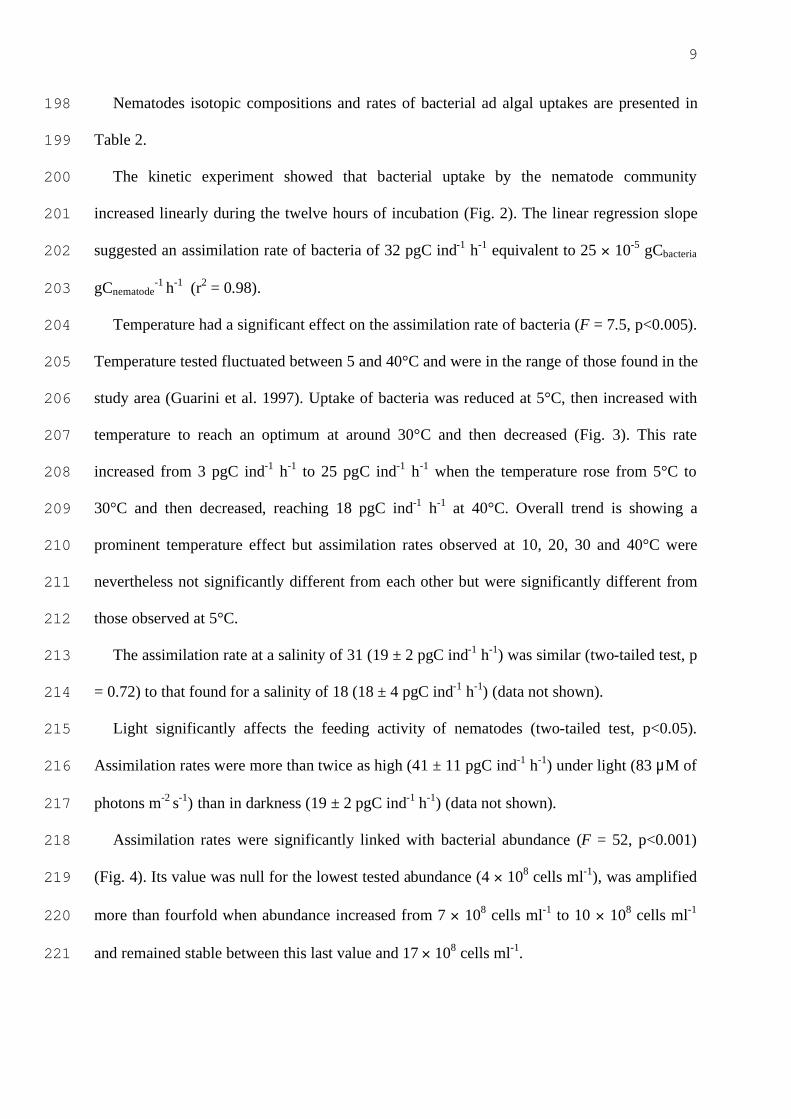
The kinetic experiment showed that bacterial uptake by the nematode community 200
increased linearly during the twelve hours of incubation (Fig. 2). The linear regression slope 201
suggested an assimilation rate of bacteria of 32 pgC ind-1
h-1
equivalent to 25 ! 10-5
gCbacteria 202
gCnematode-1
h-1
(r2 = 0.98). 203
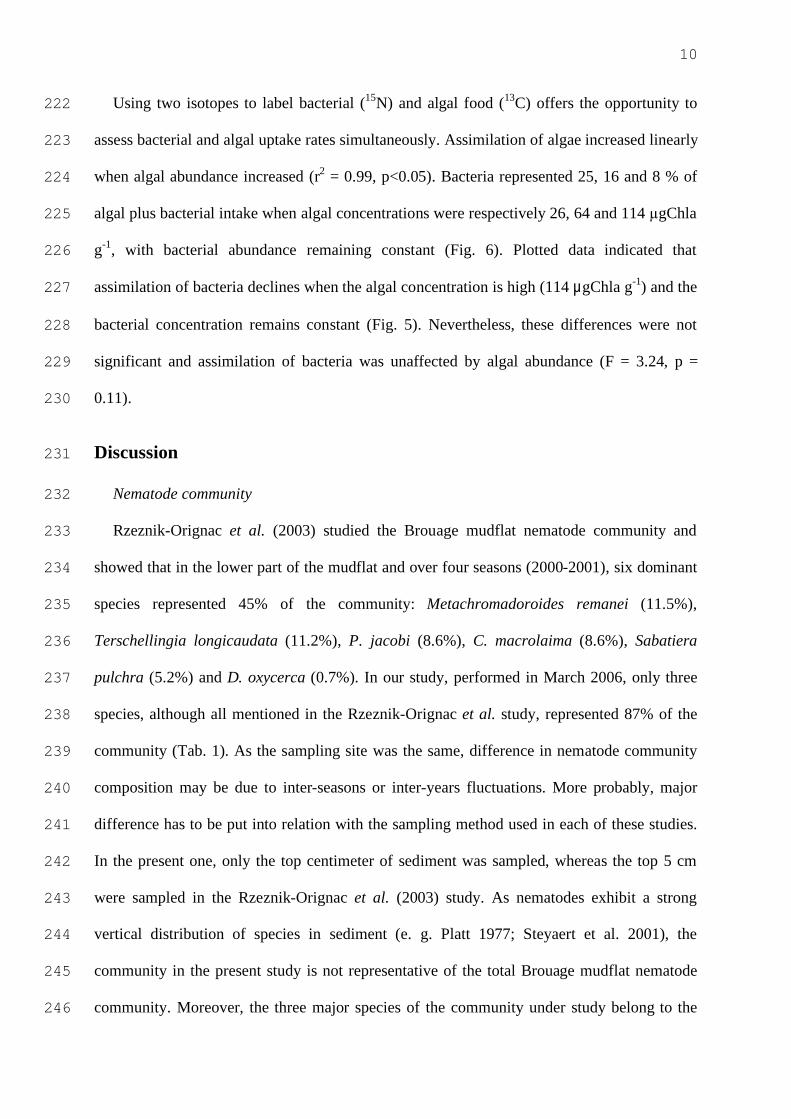
Temperature had a significant effect on the assimilation rate of bacteria (F = 7.5, p<0.005). 204
Temperature tested fluctuated between 5 and 40°C and were in the range of those found in the 205
study area (Guarini et al. 1997). Uptake of bacteria was reduced at 5°C, then increased with 206
temperature to reach an optimum at around 30°C and then decreased (Fig. 3). This rate 207
increased from 3 pgC ind-1
h-1
to 25 pgC ind-1
h-1
when the temperature rose from 5°C to 208
30°C and then decreased, reaching 18 pgC ind-1
h-1
at 40°C. Overall trend is showing a 209
prominent temperature effect but assimilation rates observed at 10, 20, 30 and 40°C were 210
nevertheless not significantly different from each other but were significantly different from 211
those observed at 5°C. 212
The assimilation rate at a salinity of 31 (19 ± 2 pgC ind-1
h-1
) was similar (two-tailed test, p 213
= 0.72) to that found for a salinity of 18 (18 ± 4 pgC ind-1
h-1
) (data not shown). 214
Light significantly affects the feeding activity of nematodes (two-tailed test, p<0.05). 215
Assimilation rates were more than twice as high (41 ± 11 pgC ind-1
h-1
) under light (83 µM of 216
photons m-2
s-1
) than in darkness (19 ± 2 pgC ind-1
h-1
) (data not shown). 217
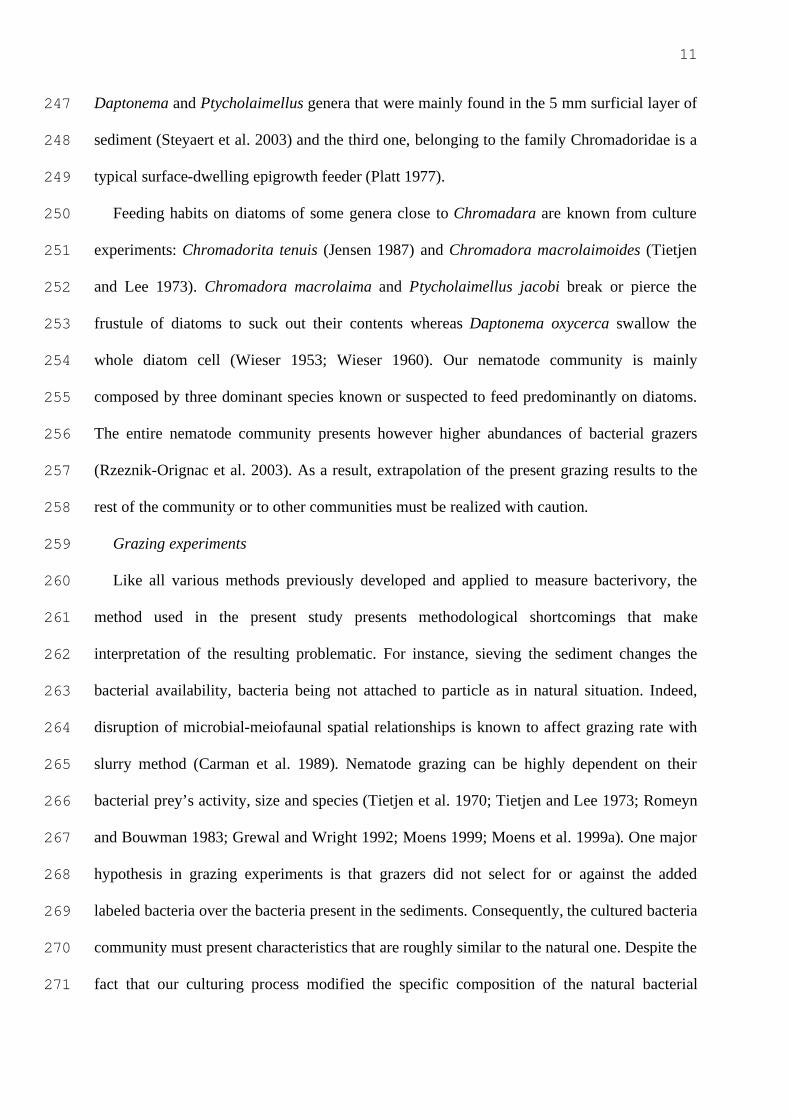
Assimilation rates were significantly linked with bacterial abundance (F = 52, p<0.001) 218
(Fig. 4). Its value was null for the lowest tested abundance (4 ! 108 cells ml
-1), was amplified 219
more than fourfold when abundance increased from 7 ! 108 cells ml
-1 to 10 ! 10
8 cells ml
-1 220
and remained stable between this last value and 17 ! 108 cells ml
-1. 221
10
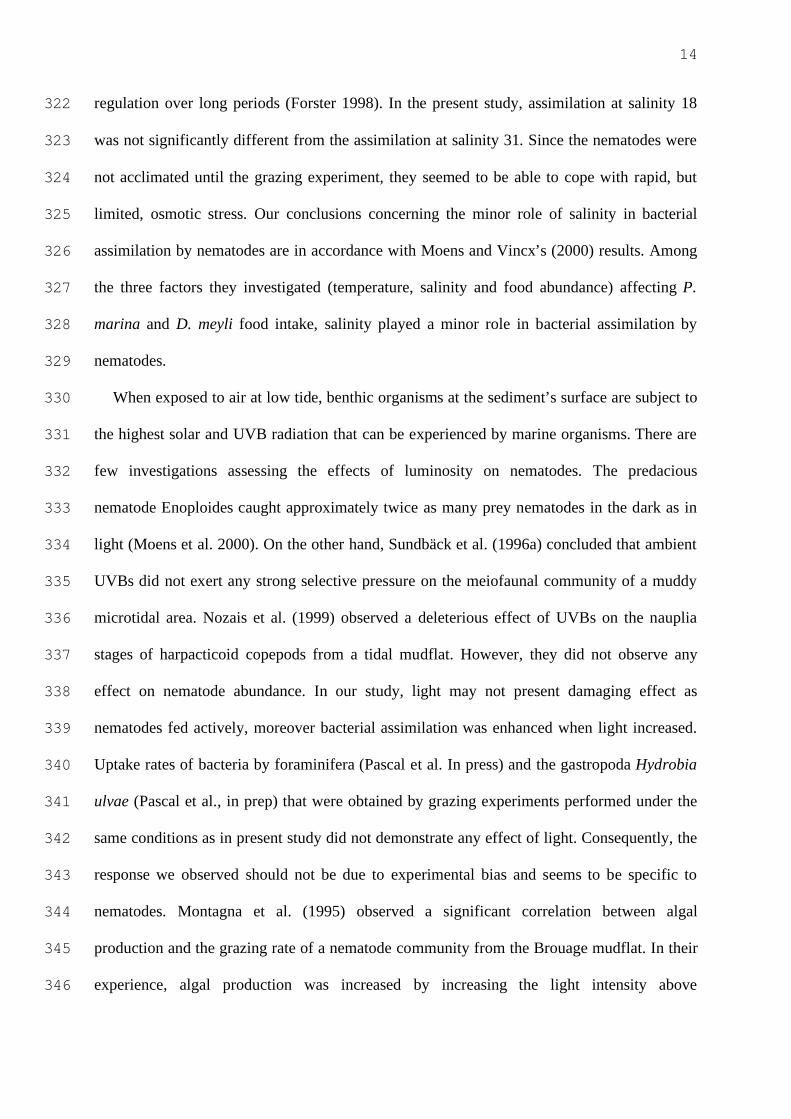
Using two isotopes to label bacterial (15
N) and algal food (13
C) offers the opportunity to 222
assess bacterial and algal uptake rates simultaneously. Assimilation of algae increased linearly 223
when algal abundance increased (r2 = 0.99, p<0.05). Bacteria represented 25, 16 and 8 % of 224
algal plus bacterial intake when algal concentrations were respectively 26, 64 and 114 !gChla 225
g-1
, with bacterial abundance remaining constant (Fig. 6). Plotted data indicated that 226
assimilation of bacteria declines when the algal concentration is high (114 µgChla g-1
) and the 227
bacterial concentration remains constant (Fig. 5). Nevertheless, these differences were not 228
significant and assimilation of bacteria was unaffected by algal abundance (F = 3.24, p = 229
0.11). 230
Discussion 231
Nematode community 232
Rzeznik-Orignac et al. (2003) studied the Brouage mudflat nematode community and 233
showed that in the lower part of the mudflat and over four seasons (2000-2001), six dominant 234
species represented 45% of the community: Metachromadoroides remanei (11.5%), 235
Terschellingia longicaudata (11.2%), P. jacobi (8.6%), C. macrolaima (8.6%), Sabatiera 236
pulchra (5.2%) and D. oxycerca (0.7%). In our study, performed in March 2006, only three 237
species, although all mentioned in the Rzeznik-Orignac et al. study, represented 87% of the 238
community (Tab. 1). As the sampling site was the same, difference in nematode community 239
composition may be due to inter-seasons or inter-years fluctuations. More probably, major 240
difference has to be put into relation with the sampling method used in each of these studies. 241
In the present one, only the top centimeter of sediment was sampled, whereas the top 5 cm 242
were sampled in the Rzeznik-Orignac et al. (2003) study. As nematodes exhibit a strong 243
vertical distribution of species in sediment (e. g. Platt 1977; Steyaert et al. 2001), the 244
community in the present study is not representative of the total Brouage mudflat nematode 245
community. Moreover, the three major species of the community under study belong to the 246
11
Daptonema and Ptycholaimellus genera that were mainly found in the 5 mm surficial layer of 247
sediment (Steyaert et al. 2003) and the third one, belonging to the family Chromadoridae is a 248
typical surface-dwelling epigrowth feeder (Platt 1977). 249
Feeding habits on diatoms of some genera close to Chromadara are known from culture 250
experiments: Chromadorita tenuis (Jensen 1987) and Chromadora macrolaimoides (Tietjen 251
and Lee 1973). Chromadora macrolaima and Ptycholaimellus jacobi break or pierce the 252
frustule of diatoms to suck out their contents whereas Daptonema oxycerca swallow the 253
whole diatom cell (Wieser 1953; Wieser 1960). Our nematode community is mainly 254
composed by three dominant species known or suspected to feed predominantly on diatoms. 255
The entire nematode community presents however higher abundances of bacterial grazers 256
(Rzeznik-Orignac et al. 2003). As a result, extrapolation of the present grazing results to the 257
rest of the community or to other communities must be realized with caution. 258
Grazing experiments 259
Like all various methods previously developed and applied to measure bacterivory, the 260
method used in the present study presents methodological shortcomings that make 261
interpretation of the resulting problematic. For instance, sieving the sediment changes the 262
bacterial availability, bacteria being not attached to particle as in natural situation. Indeed, 263
disruption of microbial-meiofaunal spatial relationships is known to affect grazing rate with 264
slurry method (Carman et al. 1989). Nematode grazing can be highly dependent on their 265
bacterial prey’s activity, size and species (Tietjen et al. 1970; Tietjen and Lee 1973; Romeyn 266
and Bouwman 1983; Grewal and Wright 1992; Moens 1999; Moens et al. 1999a). One major 267
hypothesis in grazing experiments is that grazers did not select for or against the added 268
labeled bacteria over the bacteria present in the sediments. Consequently, the cultured bacteria 269
community must present characteristics that are roughly similar to the natural one. Despite the 270
fact that our culturing process modified the specific composition of the natural bacterial 271

12
community, the size, activity and diversity of the bacterial consortium used in the present 272
study would be more representative of the natural community than in most previous grazing 273
experiments (Pascal et al. 2008). 274
Bacterial and algal uptake 275
15N accumulation in nematodes was linear over the 12-hour incubation period (Fig. 2). The 276
constant accumulation of labeled food in nematodes had already been observed with 277
comparable incubation times (Herman and Vranken 1988; Moens et al. 1999c). Since the 278
nematode defecation intervals are very short (e. g. Thomas 1989) and since the gut is emptied 279
completely with each defecation (Duncan et al. 1974), the gut contents would thus be renewed 280
every few minutes. For these reasons, it has been suggested that during long incubation times, 281
the linear accumulation of the label indicates assimilation rather than ingestion (Schiemer 282
1987; Moens et al. 1999c). The slope of this linear curve gives an assimilation rate of 32 pgC 283
ind-1
h-1
. Assuming an assimilation rate of 25% (Herman and Vranken 1988; Somerfield et al. 284
2005), the ingestion rate would be four times higher, at 128 pgC ind-1
h-1
. As all other grazing 285
experiments were run for 3 hours, they provided the assimilation rate of food. 286
Abiotic factors 287
Behavioral responses of plant-parasites and terrestrial nematodes to several stimuli such as 288
electrical, mechanical and chemical stimuli and physical factors such as temperature and light 289
have been well described (review in Croll 1970). However, similar studies concerning the 290
effect of environmental conditions on the feeding behavior of marine or brackish-water 291
nematodes are scarce and limited in scope. 292
Temperature has received attention as a factor influencing the growth and reproduction of 293
estuarine and marine nematodes (review in Heip et al. 1985). The influence of temperature on 294
feeding has only been studied in the predacious nematode Enoploides (Moens et al. 2000), the 295
epigrowth feeder Chromadora macrolaimoides (Tietjen and Lee 1973) and in two brackish-296

13
water bacterivorous species: Pellioditis marina and Diplolaimelloides meyli (Moens et al. 297
1996; Moens and Vincx 2000). In the present study, nematodes exhibited a classical response 298
which was more or less related to a bell-shaped function also observed by Moens and Vincx 299
(2000). The assimilation rate of bacteria rose when the temperature increased and reached its 300
upper value at 30°C before declining. As assimilation rates recorded for the tested 301
temperatures were statistically different at 5°C, it may be suggested that the nematode grazing 302
rate is lower in winter when the temperature drops to under 5°C. However, nematodes may 303
adjust their optimum temperature conditions along seasons (Gee 1985). Studied nematodes 304
were probably adapted to low temperature as sediment temperature was 7°C at the time of the 305
sampling. Montagna (1984b) did not observe different grazing rates between winter and 306
summer, but the temperature range in his study area was small (18 and 23°C). 307
Salinity plays a major role in determining the spatial structure of the nematode community 308
along permanent gradients (Soetaert et al. 1995) or in its seasonal variations (Chatterji et al. 309
1995). However nematodes can also be affected by short-term variations in salinity (Forster 310
1998) and intertidal habitats are subject to major changes in interstitial salinity over short time 311
periods. During low tide, raindrops implode into fine sediments, disturbing and mixing the 312
surface sediment of mudflats. Moreover, freshwater run-off passively diffuses into the 313
interstitial pores of the sediment. In their review of marine nematode ecology, Heip et al. 314
(1985) compiled an extensive list of marine and estuarine species with their salinity 315
tolerances. C. macrolaima, the most abundant species in the present study, is found in areas 316
with salinities ranging from 35 to 24 whereas D. oxycerca, the second most abundant species, 317
is found in area ranging from 35 to 0.9. This species seemed to be able to tolerate gradual 318
changes in salinity but not rapid ones. After exposure to salinity of 3.33 for 10 min and 48 h, 319
Forster (1998) recorded adult mortalities of 10-35% and 70% respectively. This species from 320
the lower level of the intertidal zone is able to osmoregulate but unable to sustain water 321
14
regulation over long periods (Forster 1998). In the present study, assimilation at salinity 18 322
was not significantly different from the assimilation at salinity 31. Since the nematodes were 323
not acclimated until the grazing experiment, they seemed to be able to cope with rapid, but 324
limited, osmotic stress. Our conclusions concerning the minor role of salinity in bacterial 325
assimilation by nematodes are in accordance with Moens and Vincx’s (2000) results. Among 326
the three factors they investigated (temperature, salinity and food abundance) affecting P. 327
marina and D. meyli food intake, salinity played a minor role in bacterial assimilation by 328
nematodes. 329
When exposed to air at low tide, benthic organisms at the sediment’s surface are subject to 330
the highest solar and UVB radiation that can be experienced by marine organisms. There are 331
few investigations assessing the effects of luminosity on nematodes. The predacious 332
nematode Enoploides caught approximately twice as many prey nematodes in the dark as in 333
light (Moens et al. 2000). On the other hand, Sundbäck et al. (1996a) concluded that ambient 334
UVBs did not exert any strong selective pressure on the meiofaunal community of a muddy 335
microtidal area. Nozais et al. (1999) observed a deleterious effect of UVBs on the nauplia 336
stages of harpacticoid copepods from a tidal mudflat. However, they did not observe any 337
effect on nematode abundance. In our study, light may not present damaging effect as 338
nematodes fed actively, moreover bacterial assimilation was enhanced when light increased. 339
Uptake rates of bacteria by foraminifera (Pascal et al. In press) and the gastropoda Hydrobia 340
ulvae (Pascal et al., in prep) that were obtained by grazing experiments performed under the 341
same conditions as in present study did not demonstrate any effect of light. Consequently, the 342
response we observed should not be due to experimental bias and seems to be specific to 343
nematodes. Montagna et al. (1995) observed a significant correlation between algal 344
production and the grazing rate of a nematode community from the Brouage mudflat. In their 345
experience, algal production was increased by increasing the light intensity above 346
15
microcosms. They concluded that nematode’s ingestion rate increases with algal production. 347
In intertidal mudflats, benthic diatoms migrate in the surface sediment along the diurnal cycle 348
(e. g. Serôdio et al. 1997). The nematode community under study was dominated by 349
epigrowth feeders (Tab. 1), with a diet mainly composed of benthic diatoms. Those 350
nematodes may graze when luminosity is high during low tide in order to graze in algal 351
biofilm and maximize their algal intake. This feeding behavior has not been documented for 352
nematodes, but harpaticoid copepods were shown to graze at a higher rate just after the 353
mudflat became exposed (Decho 1988). Buffan-Dubau and Carman (2000) also observed a 354
midday feeding peak by ostracods and harpaticoid copepods. This result suggests that 355
nematodes would have a feeding behavior principally controlled by algae and that bacteria 356
may be taken up accidentally with algae. 357
Biotic factors 358
For nematodes, the effects of bacterial concentration on growth, fecundity, population 359
development and feeding rates have been studied (Nicholas et al. 1973; Schiemer et al. 1980; 360
Schiemer 1982a; Schiemer 1982b; Schiemer 1983; Vranken et al. 1988; Moens and Vincx 361
2000). Nematode ingestion rates are generally proportional to food availability (Nicholas et 362
al. 1973; Schiemer et al. 1980; Moens et al. 1996). However, the relationship between 363
assimilation rate and food concentration is not linear and have been described by a Michaelis-364
Menten function (Schiemer 1982b). This function is consistent with Holling’s prey-dependent 365
type II functional response (Holling 1959). Assimilation rates depend on the amount of 366
ingested food and efficiency with which the material is assimilated. The assimilation 367
efficiency have been found to decrease when food concentration increases: at a high food 368
concentration Plectus palustris presented a low assimilation efficiency (12%) (Duncan et al. 369
1974) whereas at a food concentration one order of magnitude lower, the assimilation 370
efficiency reached 57% (Schiemer et al. 1980). A similar conclusion was drawn by Moens et 371
16
al. (2006) on the marine bacterivore Pellioditis marina. Low efficiencies at high 372
concentrations appear to result from short gut retention times, with the gut transit being too 373
fast for effective digestion (Taghon et al. 1978). In the present study, it is not possible to 374
determine if assimilation rates fluctuations are due to variations of ingestion rates or 375
assimilation efficiencies. The number of bacterial concentrations tested was limited, however 376
the response observed could be described by a sigmoid function. This function is consistent 377
with Holling’s prey-dependent type III functional response (Holling 1959). The threshold 378
value for significant assimilation appeared to fall between 4 and 7 ! 108 cells ml
-1 and the 379
threshold value for constant assimilation appeared to be between 7 and 10 ! 108 cells ml
-1. 380
Those values are in the range of data provided by literature for fast growing opportunistic 381
bacterivores nematodes typical of plant material or root systems: an optimal grazing rate was 382
obtained for Caenorhabditis briggsae (Nicholas et al. 1973) and P. marina and D. meyli 383
(Moens and Vincx 2000) at a bacterial concentration of 5, 25 and 5 ! 108
cells ml-1
384
respectively. Our study, dealing with tidal flat microalgal grazers community, suggests that 385
the optimal level of bacterial foraging is also reached at high bacterial density, when bacterial 386
concentrations attain 1 ! 109 cells ml
-1. As bacterial concentrations are rarely lower in marine 387
sediments, (Hondeveld et al. 1992; Schmidt et al. 1998; Hamels et al. 2004), bacterial 388
assimilation rates would seldom be lower than 18 pgC ind-1
h-1
. 389
The relationship between the assimilation rate of algae and the algal concentration is 390
poorly documented. Montagna et al. (1995) observed a proportional rise in the algal grazing 391
rate with increasing algal concentration. In the present study, algal assimilation increased 392
linearly without reaching a plateau. This function may be consistent with Holling’s prey-393
dependent type I functional response (Holling 1959). Thus, the algal concentration threshold 394
was not reached and maximal algal assimilation may be higher than those we obtained. Under 395
natural conditions, the chlorophyll a content of the first centimeter of sediment varies between 396

17
0 and 50 !gChla g-1
(review in MacIntyre et al. 1996). However, through vertical migration, 397
benthic microalgae were concentrated near the surface during diurnal low tides and produced 398
a biofilm with an average thickness of 50 !m (Herlory et al. 2004). In this thin layer of algal 399
mat, the concentration of chlorophyll a can reach 150 !gChla g-1
(Serôdio et al. 1997) and 400
even 300 !gChla g-1
(Kelly et al. 2001). Thus, the higher algae abundance used in the present 401
study (114 !gChla g-1
) is not representative of conditions occurring in the natural 402
environment and the nematode community feeding on the algal biofilm could thus present a 403
higher assimilation rate of algae. 404
In our experiment, algal assimilation by nematodes always represented more than three 405
times the bacterial assimilation. Nematodes are able to select potential food items. 406
Chromadora macrolaimoides have a preference for diatoms and chlorophytes whereas they 407
assimilate fewer bacteria (Tietjen and Lee 1973). D. oxycerca is able to swallow particles of 408
different sizes and large frustules of diatoms (Boucher 1974). The three dominant species of 409
the community studied, i.e. C. macrolaima, D. oxycerca and P. jacobi, were found to 410
dominate the Brouage nematode community during spring diatom blooms (Rzeznik-Orignac 411
et al. 2003) indicating that they are highly dependent on algal resources. The use of natural 412
stable isotopic analyses led to a similar conclusion elsewhere, that the microphytobenthos 413
constitutes the main food source for the nematode community dwelling in the surficial 414
centimeter of mud in the study area (Riera et al. 1996). Montagna et al. (1984b), looking at 415
the grazing rates of a nematode community from a saltmarsh, found that diatoms are selected 416
14 more times than bacteria. Algal carbon accounted on average for more than 90% of carbon 417
grazed by a nematode community from a microtidal sandy sediment (Sundbäck et al. 1996b). 418
In the present study, nematodes also ingested algae at a higher rate than bacteria. Depending 419
on the algal concentration, the nematode community assimilates 3 to 11 times more diatoms 420
than bacteria. 421

18
Nematode production can be estimated on the basis of the P/B ratio, bearing in mind that 422
the choice of this ratio may be inaccurate (Heip et al. 1982). With an individual biomass of 423
0.11 µgC ind-1
, the estimation of production yielded 0.11 ngC ind-1
h-1
, given a P/B ratio of 9 424
as often advocated (Gerlach 1971; Warwick and Price 1979; Bouvy 1988). Using a 10% 425
factor for energy conversion efficiency (Bouvy 1988), a nematode carbon demand of 1.13 426
ngC ind-1
h-1
can be calculated. In the present study, the maximum ingestion rate of bacteria 427
measured would represent 4% of this energy demand. On the other hand, the maximum algal 428
ingestion measured would correspond to 15% of this demand. To get 100% of their energy 429
needs, nematodes may graze at a higher rate on the algal compartment, as discussed above. 430
Nematodes may also be dependent on other food sources such as detritus, protozoa, 431
oligochaetes or nematodes (Moens and Vincx 1997). The role of Dissolved Organic Matter in 432
nematode nutrition also remains elusive, although it is likely to be highly relevant (Lopez et 433
al. 1979; Meyer-Reil and Faubel 1980; Montagna 1984a; Jensen 1987). Bacterial carbon was 434
found to constitute 6% of the total carbon requirement of a mudflat nematode community 435
(van Oevelen et al. 2006b). On the other hand, using inverse modeling, Van Oevelen et al. 436
(2006c) suggested that mudflat community of nematodes relied for 50 % on algae and 39 % 437
on bacteria. Variations between studies can be due to differences in methodology and to 438
nematode community composition. 439
In the brouage mudflat, nematode present a mean densities of 2112 ind 10 cm-2
(Rzeznik-440
Orignac et al. 2003) whereas biomasses of benthic bacteria represent 0.846 gC m-2
(Degré et 441
al. 2006). If nematodes grazing rates measured in the present study are representative of those 442
of total community, it would imply that 0.02 % of bacterial biomass is assimilated by 443
nematodes each day. This extrapolation is debatable, as studied nematodes feed 444
predominantly on diatoms whereas total community may be more dependent on bacterial 445
resource, consequently grazing of bacteria is probably underestimated. 446

19
Conclusion 447
Caution must be taken in interpreting our results, since the impact of each environmental 448
factor on the feeding behavior of the nematode community was studied separately, whereas in 449
natural environment all these factors covary greatly. The combination of temperature and 450
salinity factors was found to have a higher impact than each factor taken alone (Tietjen and 451
Lee 1972; Tietjen and Lee 1977). Moreover, nematodes may respond to environmental 452
changes at a seasonal scale, by physiological adjustment and shifting of their optimum 453
conditions (Gee 1985). However, the nematode community studied appeared to have adapted 454
to the highly variable environment constituted by the surficial sediment of intertidal mudflats, 455
except at low temperatures (5°C), and their feeding activity is only slightly decreased by 456
temperature, salinity or light stress. Due to high abundance of bacteria in the marine sediment, 457
nematodes may never be food limited with bacteria. Nematodes kept feeding under conditions 458
of stress which were typical of the surficial sediment habitat, moreover they appeared to be 459
principally dependent on the algal resource. Consequently, the community of nematodes 460
dwelling in the top centimeter of the Brouage mudflat may also have a feeding strategy which 461
is strongly linked to the formation of algal biofilm during the diurnal ebb. 462
Acknowledgements 463
We thank Prescilla Perrichon and Stéphanie Bollard for their help in sample preparation, 464
Gaël Guillou for isotopic analyses, Utte Wollenzien from NIOO-CEMO for giving us a N. 465
phyllepta strain and Janet Heard Carnot for English corrections. This work was financially 466
supported by the “Conseil Général de Charente Maritime”, the ANR-VASIREMI and ECCO 467
and “PNEC Chantier Littoral Atlantique”. 468
Experiments of the present study comply with current laws of French country. 469
20
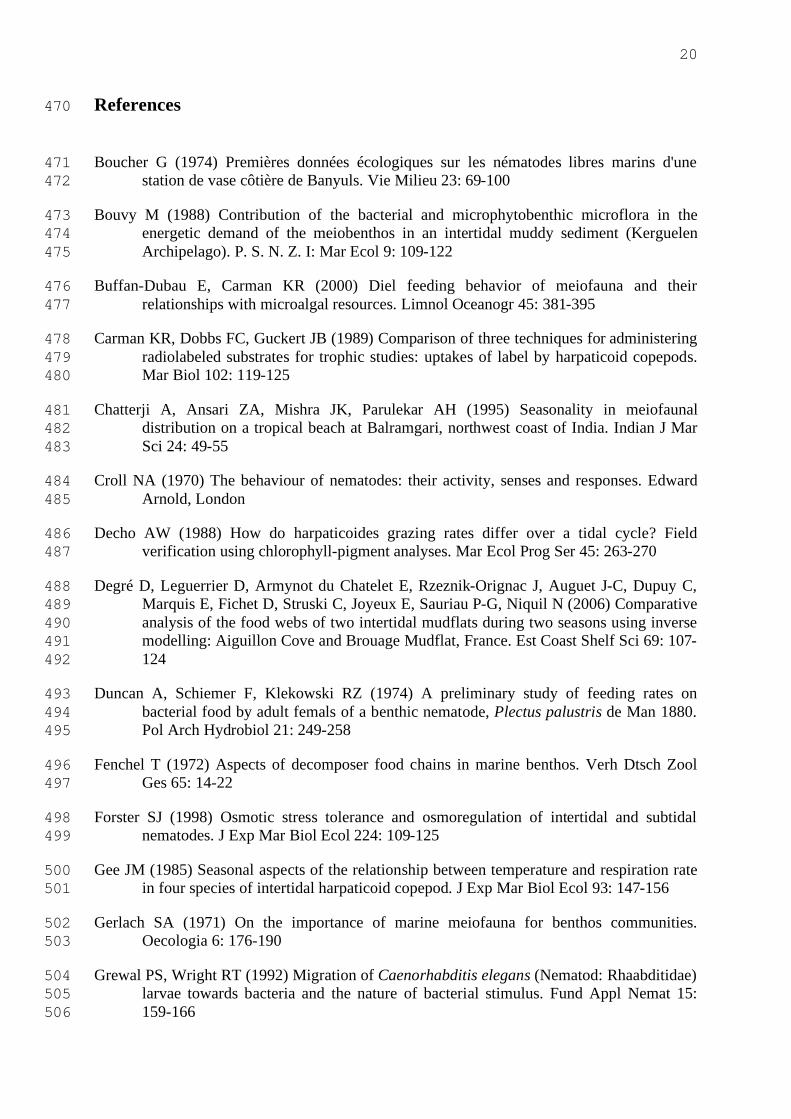
References 470
Boucher G (1974) Premières données écologiques sur les nématodes libres marins d'une 471
station de vase côtière de Banyuls. Vie Milieu 23: 69-100 472
Bouvy M (1988) Contribution of the bacterial and microphytobenthic microflora in the 473
energetic demand of the meiobenthos in an intertidal muddy sediment (Kerguelen 474
Archipelago). P. S. N. Z. I: Mar Ecol 9: 109-122 475
Buffan-Dubau E, Carman KR (2000) Diel feeding behavior of meiofauna and their 476
relationships with microalgal resources. Limnol Oceanogr 45: 381-395 477
Carman KR, Dobbs FC, Guckert JB (1989) Comparison of three techniques for administering 478
radiolabeled substrates for trophic studies: uptakes of label by harpaticoid copepods. 479
Mar Biol 102: 119-125 480
Chatterji A, Ansari ZA, Mishra JK, Parulekar AH (1995) Seasonality in meiofaunal 481
distribution on a tropical beach at Balramgari, northwest coast of India. Indian J Mar 482
Sci 24: 49-55 483
Croll NA (1970) The behaviour of nematodes: their activity, senses and responses. Edward 484
Arnold, London 485
Decho AW (1988) How do harpaticoides grazing rates differ over a tidal cycle? Field 486
verification using chlorophyll-pigment analyses. Mar Ecol Prog Ser 45: 263-270 487
Degré D, Leguerrier D, Armynot du Chatelet E, Rzeznik-Orignac J, Auguet J-C, Dupuy C, 488
Marquis E, Fichet D, Struski C, Joyeux E, Sauriau P-G, Niquil N (2006) Comparative 489
analysis of the food webs of two intertidal mudflats during two seasons using inverse 490
modelling: Aiguillon Cove and Brouage Mudflat, France. Est Coast Shelf Sci 69: 107-491
124 492
Duncan A, Schiemer F, Klekowski RZ (1974) A preliminary study of feeding rates on 493
bacterial food by adult femals of a benthic nematode, Plectus palustris de Man 1880. 494
Pol Arch Hydrobiol 21: 249-258 495
Fenchel T (1972) Aspects of decomposer food chains in marine benthos. Verh Dtsch Zool 496
Ges 65: 14-22 497
Forster SJ (1998) Osmotic stress tolerance and osmoregulation of intertidal and subtidal 498
nematodes. J Exp Mar Biol Ecol 224: 109-125 499
Gee JM (1985) Seasonal aspects of the relationship between temperature and respiration rate 500
in four species of intertidal harpaticoid copepod. J Exp Mar Biol Ecol 93: 147-156 501
Gerlach SA (1971) On the importance of marine meiofauna for benthos communities. 502
Oecologia 6: 176-190 503
Grewal PS, Wright RT (1992) Migration of Caenorhabditis elegans (Nematod: Rhaabditidae) 504
larvae towards bacteria and the nature of bacterial stimulus. Fund Appl Nemat 15: 505
159-166 506

21
Guarini JM, Blanchard GF, Gros P, Harrison SJ (1997) Modeling the mud surface 507
temperature on intertidal flats to investigate the spatio-temporal dynamics of the 508
benthic microalgal photosynthetic capacity. Mar Ecol Prog Ser 153: 25-36 509
Hamels I, Sabbe K, Muylaert K, Vyverman W (2004) Quantitative importance, composition, 510
and seasonal dynamics of protozoan communities in polyhaline versus freshwater 511
intertidal sediments Microb Ecol 47: 18-29 512
Heip CHR, Herman P, Coomans A (1982) The productivity of marine meiobenthos. 513
Academia Analecta 44: 1-20 514
Heip CHR, Vincx M, Vranken G (1985) The ecology of marine nematodes. Oceanogr Mar 515
Biol Annu Rev 23: 399-489 516
Héral M, Razet D, Deslous-Paoli JM, Bertome JP, Garnier J (1982) Caractéristiques 517
saisonnières de l'hydrologies du complexe estuarien de Marennes-Oléron (France). 518
Revue des travaux de l'institut des pêches maritimes 46: 97-119 519
Herlory O, Guarini JM, Richard P, Blanchard GF (2004) Microstructure of 520
microphytobenthos biofilm and its spatio-temporal dynamics in an intertidal mudflat 521
(Aiguillon Bay, France). Mar Ecol Prog Ser 282: 33-44 522
Herman PMJ, Vranken G (1988) Studies of the life history and energetics of marine and 523
brackish water nematodes. II. Production, respiration and food-uptake by Monhystera 524
disjuncta. Oecologia 77: 457-463 525
Holling CS (1959) Some characteristics of simple types of predation and parasistism. 526
Canadian Entomologist 91: 385-398 527
Hondeveld BMJ, Bak RPM, van Duyl FC (1992) Bacterivory by heterotrophic nanoflagellates 528
in marine sediments measured by uptake of fluorescently labeled bacteria. Mar Ecol 529
Prog Ser 89: 63-71 530
Jensen KT (1987) Feeding ecology of free-living aquatic nematodes. Mar Ecol Prog Ser 35: 531
187-196 532
Kelly JA, Honeywill C, Paterson DM (2001) Microscale analysis of chlorophyll-a in cohesive 533
intertidal sediments: the implications of microphytobenthos distribution. J Mar Biol 534
Ass U K 81: 151-162 535
Kemp PF (1990) The fate of benthic bacterial production. Rev Aquat Sci 2: 109-124 536
Kuipers BR, de Wilde PAWJ, Creutzberg F (1981) Energy flow in a tidal flat ecosystem. Mar 537
Ecol Prog Ser 5: 215-221 538
Legendre L, Rassoulzadegan F (1996) Food-web mediated export of biogenic carbon in 539
oceans: hydrodynamic control. Mar Ecol Prog Ser 145: 179-193 540
Leguerrier D, Niquil N, Boileau N, Rzeznik J, Sauriau PG, Le Moine O, Bacher C (2003) 541
Numerical analysis of the food web of an intertidal mudflat ecosystem on the Atlantic 542
coast of France. Mar Ecol Prog Ser 246: 17-37 543
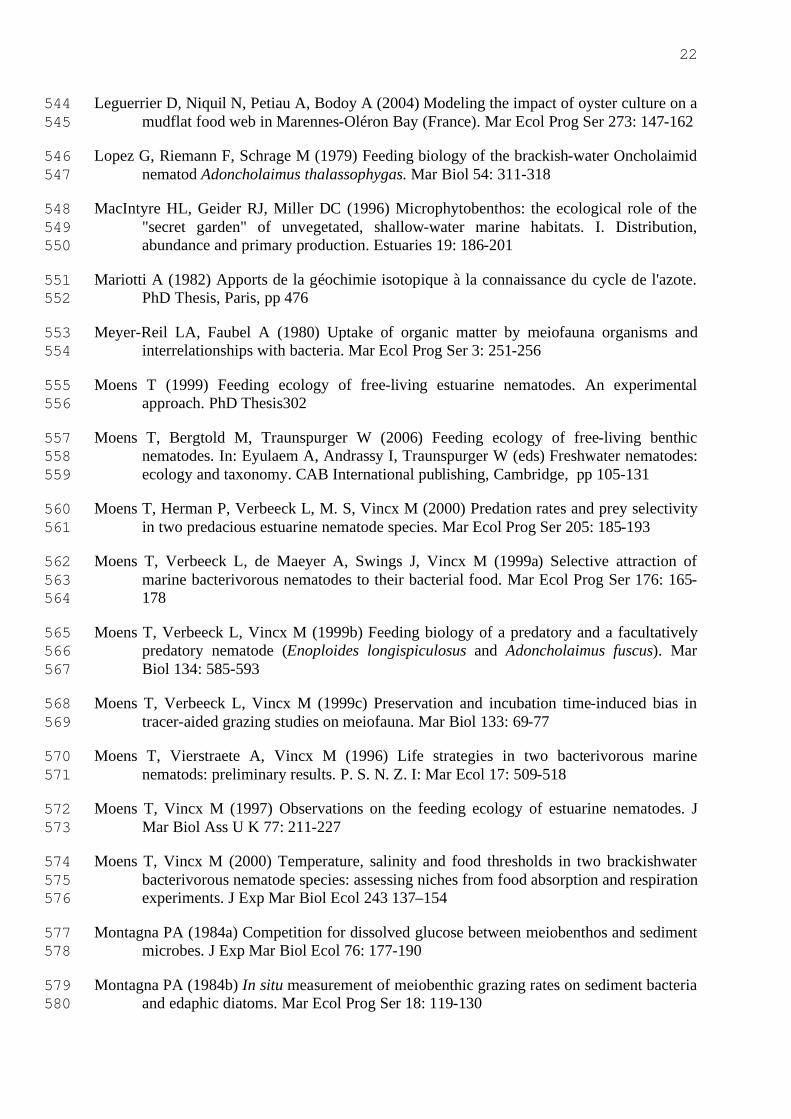
22
Leguerrier D, Niquil N, Petiau A, Bodoy A (2004) Modeling the impact of oyster culture on a 544
mudflat food web in Marennes-Oléron Bay (France). Mar Ecol Prog Ser 273: 147-162 545
Lopez G, Riemann F, Schrage M (1979) Feeding biology of the brackish-water Oncholaimid 546
nematod Adoncholaimus thalassophygas. Mar Biol 54: 311-318 547
MacIntyre HL, Geider RJ, Miller DC (1996) Microphytobenthos: the ecological role of the 548
"secret garden" of unvegetated, shallow-water marine habitats. I. Distribution, 549
abundance and primary production. Estuaries 19: 186-201 550
Mariotti A (1982) Apports de la géochimie isotopique à la connaissance du cycle de l'azote. 551
PhD Thesis, Paris, pp 476 552
Meyer-Reil LA, Faubel A (1980) Uptake of organic matter by meiofauna organisms and 553
interrelationships with bacteria. Mar Ecol Prog Ser 3: 251-256 554
Moens T (1999) Feeding ecology of free-living estuarine nematodes. An experimental 555
approach. PhD Thesis302 556
Moens T, Bergtold M, Traunspurger W (2006) Feeding ecology of free-living benthic 557
nematodes. In: Eyulaem A, Andrassy I, Traunspurger W (eds) Freshwater nematodes: 558
ecology and taxonomy. CAB International publishing, Cambridge, pp 105-131 559
Moens T, Herman P, Verbeeck L, M. S, Vincx M (2000) Predation rates and prey selectivity 560
in two predacious estuarine nematode species. Mar Ecol Prog Ser 205: 185-193 561
Moens T, Verbeeck L, de Maeyer A, Swings J, Vincx M (1999a) Selective attraction of 562
marine bacterivorous nematodes to their bacterial food. Mar Ecol Prog Ser 176: 165-563
178 564
Moens T, Verbeeck L, Vincx M (1999b) Feeding biology of a predatory and a facultatively 565
predatory nematode (Enoploides longispiculosus and Adoncholaimus fuscus). Mar 566
Biol 134: 585-593 567
Moens T, Verbeeck L, Vincx M (1999c) Preservation and incubation time-induced bias in 568
tracer-aided grazing studies on meiofauna. Mar Biol 133: 69-77 569
Moens T, Vierstraete A, Vincx M (1996) Life strategies in two bacterivorous marine 570
nematods: preliminary results. P. S. N. Z. I: Mar Ecol 17: 509-518 571
Moens T, Vincx M (1997) Observations on the feeding ecology of estuarine nematodes. J 572
Mar Biol Ass U K 77: 211-227 573
Moens T, Vincx M (2000) Temperature, salinity and food thresholds in two brackishwater 574
bacterivorous nematode species: assessing niches from food absorption and respiration 575
experiments. J Exp Mar Biol Ecol 243 137–154 576
Montagna PA (1984a) Competition for dissolved glucose between meiobenthos and sediment 577
microbes. J Exp Mar Biol Ecol 76: 177-190 578
Montagna PA (1984b) In situ measurement of meiobenthic grazing rates on sediment bacteria 579
and edaphic diatoms. Mar Ecol Prog Ser 18: 119-130 580
23
Montagna PA (1995) Rates of metazoan meiofaunal microbivory: a review. Vie Milieu 45: 1-581
9 582
Montagna PA, Bauer JE (1988) Partitioning radiolabeled thymidine uptake by bacteria and 583
meiofauna using metabolic blocks and poisons in benthic feeding studies. Mar Biol 584
98: 101-110 585
Montagna PA, Blanchard GF, Dinet A (1995) Effect of production and biomass of intertidal 586
microphytobenthos on meiofaunal grazing rates. J Exp Mar Biol Ecol 185: 149-165 587
Nicholas WL, Grassia A, Viswanathan S (1973) The efficiency with which Caenorhabditis 588
briggsae (Rhabditinae) feeds on the bacterium Escherichia coli. Nematologica 19: 589
411-420 590
Nozais C, Desrosiers G, Gosselin M, Belzile C, Demers S (1999) Effect of ambient UVB 591
radiation in a meiobenthic community of a tidal. Mar Ecol Prog Ser 189: 149-158 592
Pascal PY, Dupuy C, Mallet C, Richard P, Niquil N (2008) Bacterivory by benthic organism 593
in sediment: quantification using-15
N enriched bacteria. J Exp Mar Biol Ecol 355: 18-594
26 595
Pascal PY, Dupuy C, Richard P, Niquil N (In press) Bacterivory in the common foraminifer 596
Ammonia tepida: isotope tracer experiment and the controlling factors. J Exp Mar Biol 597
Ecol 598
Platt HM (1977) Vertical and horizontal distribution of free-living marine nematodes from 599
Strangford Lough, Northern Ireland. Cah Biol Mar 18: 261-273 600
Platt HM, Warwick RM (1980) The significance of free-living nematodes to the littoral 601
ecosystem. In: Price JH, Irvine DEG, Farnham WF (eds) The shore environment, Vol 602
2. Academis Press, London and New-York, pp 729-759 603
Riera P, Richard P, Grémare A, Blanchard GF (1996) Food source of intertidal nematods in 604
the Bay of Marennes-Oléron (France), as determined by dual stable isotope analysis. 605
Mar Ecol Prog Ser 142: 303-309 606
Rivkin RB, Legendre L, Deibel D, Tremblay JE, Klein B, Crocker K, Roy S, Silverberg N, 607
Lovejoy C, Mesplé F, Romero N, Anderson MR, Matthews P, Savenkoff C, Vézina 608
AF, Therriault JC, Wesson J, Bérubé C, Ingram RG (1996) Vertical flux of biogenic 609
carbon in the ocean: Is there food web control? Science 272: 1163-1166 610
Romeyn K, Bouwman L (1983) Food selection and consumption by estuarine nematodes. 611
Hydrobiol Bull 17: 103-109 612
Rzeznik-Orignac J, Fichet D, Boucher G (2003) Spatio-temporal structure of the nematode 613
assemblages of the Brouage mudflat (Marennes Oléron, France). Est Coast Shelf Sci 614
58: 77-88 615
Sander BC, Kalff J (1993) Factors controlling bacterial production in marine and freshwater 616
sediments. Microb Ecol 26: 79-99 617
24
Schiemer F (1982a) Food dependence and energetics of freeliving nematodes. I. Respiration, 618
growth and reproduction of Caenorhabditis briggsae (Nematoda) at different levels of 619
food supply. Oecologia 54: 108-121 620
Schiemer F (1982b) Food dependence and energetics of freeliving nematodes. II. life history 621
parameters of Caenorhabditis briggsae (Nematoda) at different levels of food supply. 622
Oecologia 54: 122-128 623
Schiemer F (1983) Comparative aspects of food dependance and energetics of free living 624
nematodes. Oikos 41: 32-42 625
Schiemer F (1987) Nematoda. In: Pandian TJ, Vernberg FJ (eds) Animal energetic. Academic 626
Press, New York, pp 185-211 627
Schiemer F, Duncan A, Klekowski RZ (1980) A bioenergetic study of a benthic nematod, 628
Plectus palustris de Man 1880, throughout its life style. II Growth, fecundity and 629
energy budget at different levels of bacterial food and general ecological 630
considerations. Oecologia 44: 205-212 631
Schmidt JL, Deming JW, Jumars PA, Keil RG (1998) Constancy of bacterial abundance in 632
surficial marine sediments. Limnol Oceanogr 43: 976-982 633
Serôdio J, da Silva JM, Catarino F (1997) Nondestructive tracing of migratory rhythms of 634
intertidal benthic microalgae using in vivo chlorophyll a fluorescence. J Phycol 33: 635
542-553 636
Soetaert K, Vincx M, Wittoeck J, Tulkens M (1995) Meiobenthic distribution and nematode 637
community structure in five European estuaries. Hydrobiologia 311: 185-206 638
Somerfield PJ, Warwick RM, Moens T (2005) Methods for the study of marine benthos. In: 639
Eleftheriou A, McIntyre AD (eds) Meiofauna techniques. Blackwell Science, Oxford, 640
pp 229-272 641
Steyaert M, Herman PMJ, Moens T, Widdows J, Vincx M (2001) Tidal migration of 642
nematodes of an estuarine tidal flat (the Molenplaat, Schelde Estuary, SW 643
Netherlands). Mar Ecol Prog Ser 224: 299-304 644
Steyaert M, Vanaverbeke J, Vanreusel A, Barranguet C, Lucas C, Vincx M (2003) The 645
importance of fine-scale, vertical profiles in characterizing nematode community 646
structure. Est Coast Shelf Sci 58: 353-366 647
Sundbäck K, Nilsson C, Odmark S, Wulff A (1996a) Does ambient UV-B radiation influence 648
marine diatom-dominated microbial mats? A case study. Aquat Microb Ecol 11: 151-649
159 650
Sundbäck K, Nilsson P, Nilsson C, Jonsson B (1996b) Balance between autotrophic and 651
heterotrophic components and processes in microbenthic communities of sandy 652
sediments: a field study. Est Coast Shelf Sci 43: 689-706 653
Taghon GL, Self RLF, Jumars PA (1978) Predicting particle selection by deposit feeders: a 654
model an its implications. Limnol Oceanogr 23: 752-759 655
25
Thomas JH (1989) Genetic analysis of defecation in Caenorhabditis elegans. Genetics 124: 656
855-872 657
Tietjen JH (1980) Microbial-meiofaunal interrelationships: a review. Microbiology 110: 335-658
338 659
Tietjen JH, Lee JJ (1972) Life cycles of marine nematodes. Influence of temperature and 660
salinity on the development of Monhystera denticulata Timm. Oecologia 10: 167-176 661
Tietjen JH, Lee JJ (1973) Life history and feeding habits of the marine nematode 662
Chromadora macrolaimoides Steiner. Oecologia 12: 303-314 663
Tietjen JH, Lee JJ (1977) Life histories of marine nematodes. Influence of temperature and 664
salinity on the reproductive potential of Chromadorine germanica Bütschli. 665
Mikrofauna Meeresboden 61: 263-270 666
Tietjen JH, Lee JJ, Rullman J, Greengart A, Trompeter J (1970) Gnotobiotic culture and 667
culture physiological ecology of the marine nematode Rhabditis marina Bastian. 668
Limnol Oceanogr 15: 535-543 669
Underwood GJC, Kromkamp JC (2000) Primary production by phytoplancton and 670
microphytoplancton in estuaries. In: Nedwell DB, Raffaelli DG (eds) Estuaries, 671
Advances in Ecological Research. Academic Press, pp 93-153 672
van Oevelen D, Middelburg JJ, Soetaert K, Moodley L (2006a) The fate of bacterial carbon in 673
sediments: modeling an in situ isotope tracer experiment. Limnol Oceanogr 51: 1302-674
1314 675
van Oevelen D, Moodley L, Soetaert K, Middelburg JJ (2006b) The trophic significance of 676
bacterial carbon in a marine intertidal sediment: Results of an in situ stable isotope 677
labeling study. Limnol Oceanogr 51: 2349-2359 678
van Oevelen D, Soetaert K, Middelburg JJ, Herman PMJ, Moodley L, Hamels I, Moens T, 679
Heip CHR (2006c) Carbon flows through a benthic food web: integrating biomass, 680
isotope and tracer data. J Mar Res 64: 453-482 681
Vranken G, Herman PMJ, Heip CHR (1988) Studies of the life history and energetics of 682
marine and brackish-water nematodes I. Demography of Monhystera disjuncta at 683
different temperature and feeding conditions Oecologia 77: 296-301 684
Warwick RM, Price JH (1979) Ecological and metabolic studies on freeliving nematodes 685
from an estuarine mudflat. Est Coast Mar Sci 9: 257-271 686
Wieser W (1953) Die Beziehungen zwischen Mundhölengestalt, Ernährungsweise und 687
Vorkommen bei freilebenden marinen nematoden. Ein ökologisch-morphhlogische 688
studie. Arkiv fur Zoologi 4: 439-484 689
Wieser W (1960) Benthic studies in Buzzards Bay. II. The meiofauna. Limnol Oceanogr 5: 690
121-137 691
692
26
693
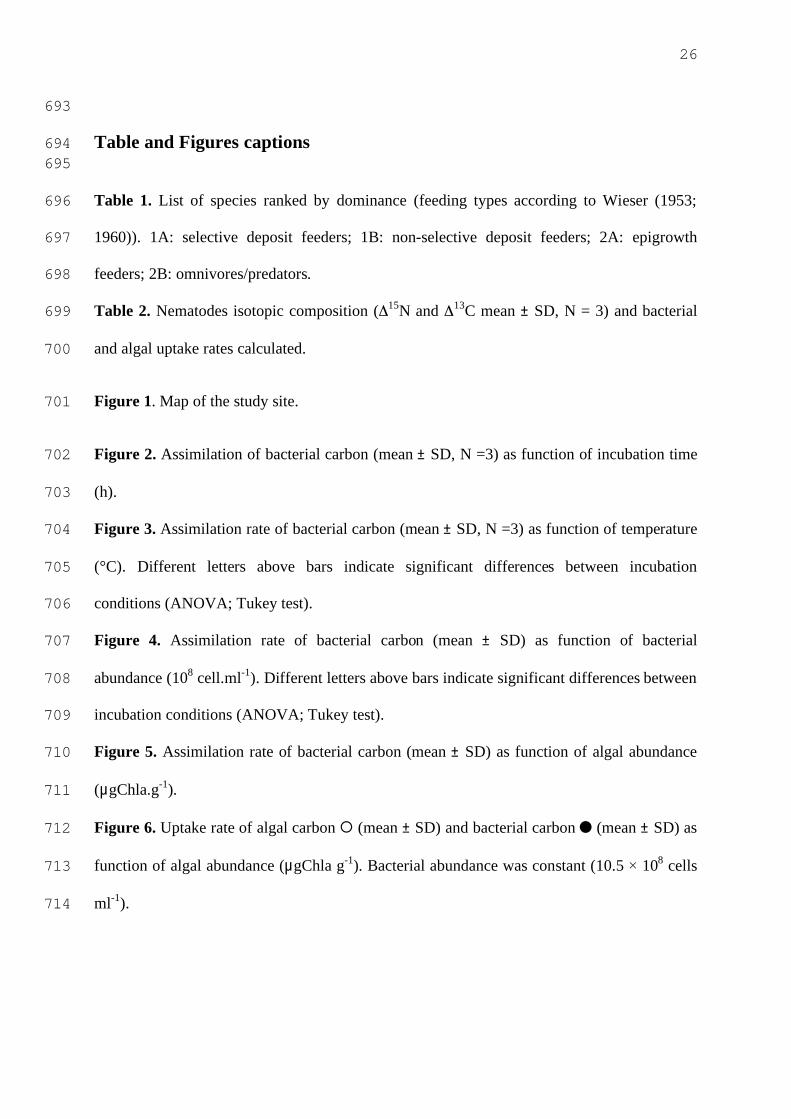
Table and Figures captions 694
695
Table 1. List of species ranked by dominance (feeding types according to Wieser (1953; 696
1960)). 1A: selective deposit feeders; 1B: non-selective deposit feeders; 2A: epigrowth 697
feeders; 2B: omnivores/predators. 698
Table 2. Nematodes isotopic composition (#15
N and #13
C mean ± SD, N = 3) and bacterial 699
and algal uptake rates calculated. 700
Figure 1. Map of the study site. 701
Figure 2. Assimilation of bacterial carbon (mean ± SD, N =3) as function of incubation time 702
(h). 703
Figure 3. Assimilation rate of bacterial carbon (mean ± SD, N =3) as function of temperature 704
(°C). Different letters above bars indicate significant differences between incubation 705
conditions (ANOVA; Tukey test). 706
Figure 4. Assimilation rate of bacterial carbon (mean ± SD) as function of bacterial 707
abundance (108 cell.ml
-1). Different letters above bars indicate significant differences between 708
incubation conditions (ANOVA; Tukey test). 709
Figure 5. Assimilation rate of bacterial carbon (mean ± SD) as function of algal abundance 710
(µgChla.g-1
). 711
Figure 6. Uptake rate of algal carbon ! (mean ± SD) and bacterial carbon ! (mean ± SD) as 712
function of algal abundance (µgChla g-1
). Bacterial abundance was constant (10.5 " 108 cells 713
ml-1
). 714
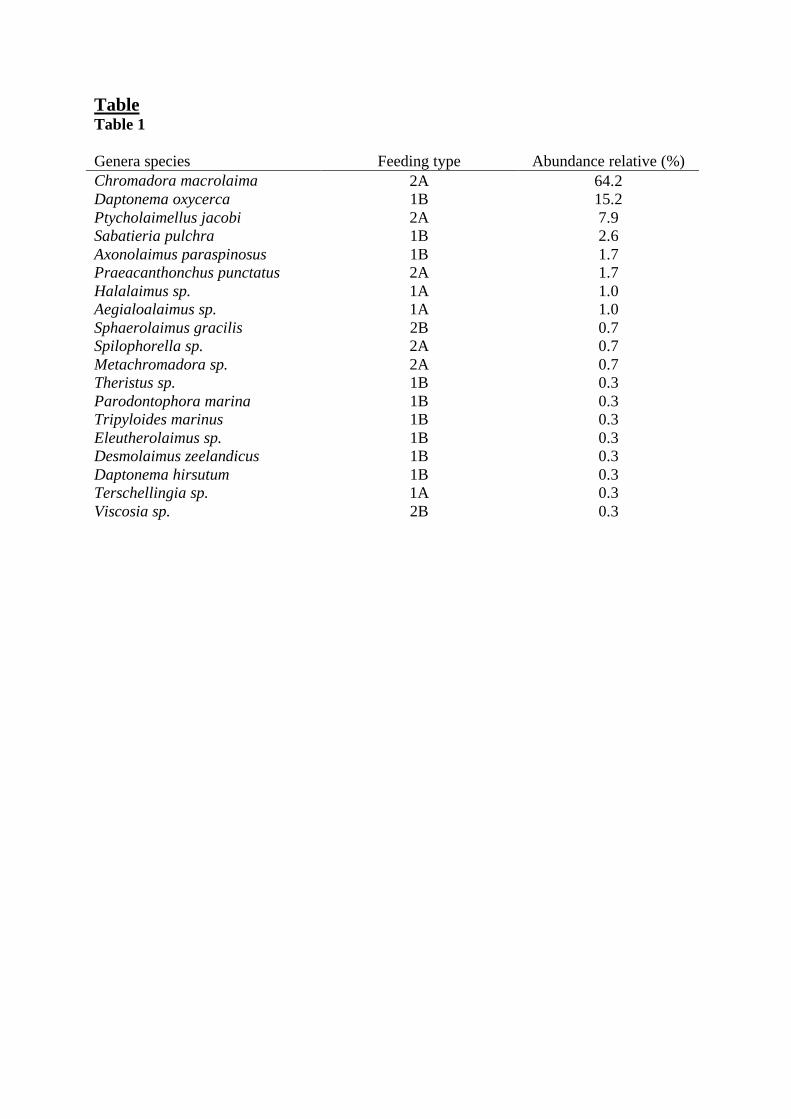
Table Table 1
Genera species Feeding type Abundance relative (%)
Chromadora macrolaima 2A 64.2 Daptonema oxycerca 1B 15.2 Ptycholaimellus jacobi 2A 7.9 Sabatieria pulchra 1B 2.6 Axonolaimus paraspinosus 1B 1.7 Praeacanthonchus punctatus 2A 1.7 Halalaimus sp. 1A 1.0 Aegialoalaimus sp. 1A 1.0 Sphaerolaimus gracilis 2B 0.7 Spilophorella sp. 2A 0.7 Metachromadora sp. 2A 0.7 Theristus sp. 1B 0.3 Parodontophora marina 1B 0.3 Tripyloides marinus 1B 0.3 Eleutherolaimus sp. 1B 0.3 Desmolaimus zeelandicus 1B 0.3 Daptonema hirsutum 1B 0.3 Terschellingia sp. 1A 0.3 Viscosia sp. 2B 0.3
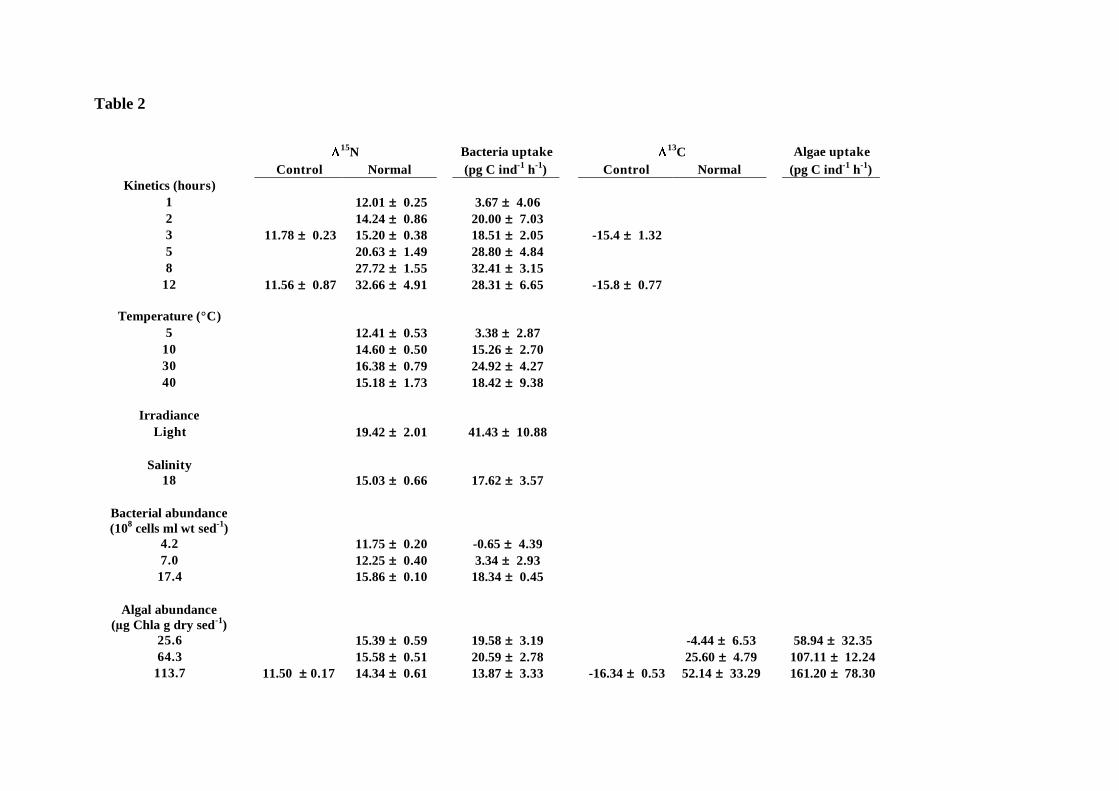
Table 2
15N Bacteria uptake 13
C Algae uptake
Control Normal (pg C ind-1
h-1
) Control Normal (pg C ind-1
h-1
)
Kinetics (hours)
1 12.01 ± 0.25 3.67 ± 4.06
2 14.24 ± 0.86 20.00 ± 7.03
3 11.78 ± 0.23 15.20 ± 0.38 18.51 ± 2.05 -15.4 ± 1.32
5 20.63 ± 1.49 28.80 ± 4.84
8 27.72 ± 1.55 32.41 ± 3.15
12 11.56 ± 0.87 32.66 ± 4.91 28.31 ± 6.65 -15.8 ± 0.77
Temperature (°C)
5 12.41 ± 0.53 3.38 ± 2.87
10 14.60 ± 0.50 15.26 ± 2.70
30 16.38 ± 0.79 24.92 ± 4.27
40 15.18 ± 1.73 18.42 ± 9.38
Irradiance
Light 19.42 ± 2.01 41.43 ± 10.88
Salinity
18 15.03 ± 0.66 17.62 ± 3.57
Bacterial abundance
(108 cells ml wt sed
-1)
4.2 11.75 ± 0.20 -0.65 ± 4.39
7.0 12.25 ± 0.40 3.34 ± 2.93
17.4 15.86 ± 0.10 18.34 ± 0.45
Algal abundance
(!g Chla g dry sed-1
)
25.6 15.39 ± 0.59 19.58 ± 3.19 -4.44 ± 6.53 58.94 ± 32.35
64.3 15.58 ± 0.51 20.59 ± 2.78 25.60 ± 4.79 107.11 ± 12.24
113.7 11.50 ± 0.17 14.34 ± 0.61 13.87 ± 3.33 -16.34 ± 0.53 52.14 ± 33.29 161.20 ± 78.30
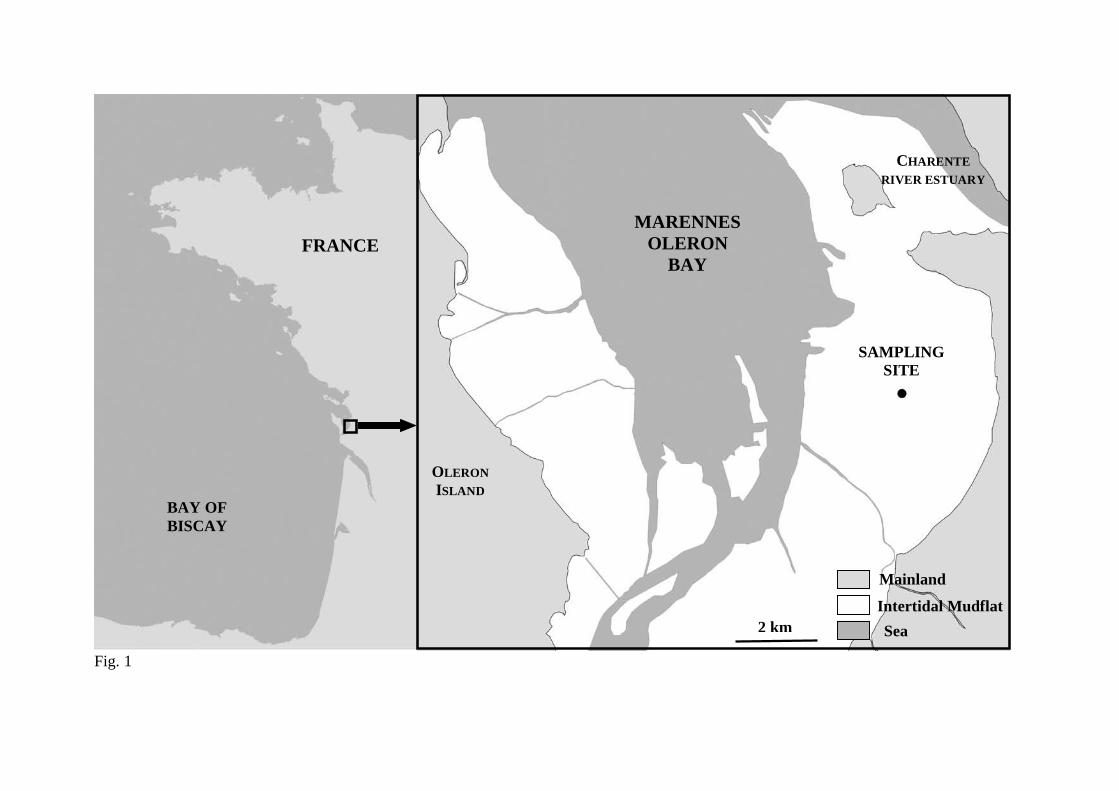
Fig. 1
SAMPLING
SITE
FRANCE
OLERON
ISLAND BAY OF
BISCAY
Mainland
Intertidal Mudflat
Sea 2 km
MARENNES
OLERON
BAY
CHARENTE
RIVER ESTUARY

Fig. 2
Fig. 3
y = 32x – 24
r2 = 0.98
a
ab
b
b b
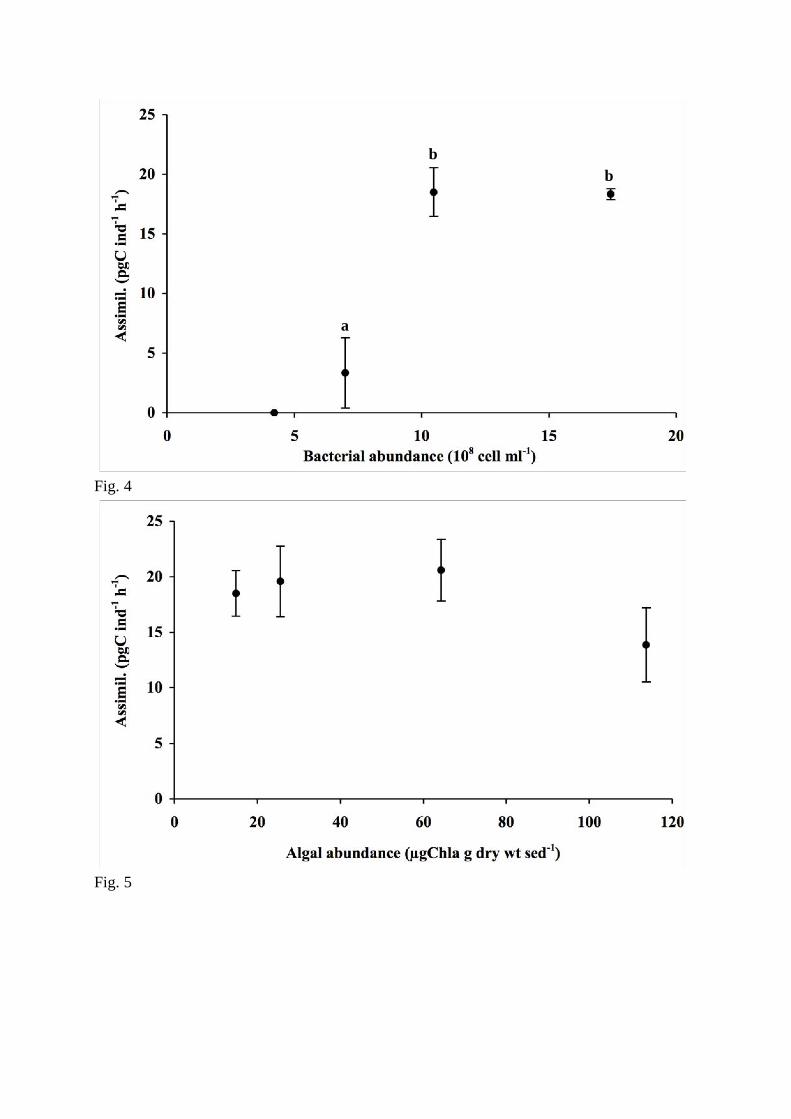
Fig. 4
Fig. 5
a
b
b

Fig. 6
y = 1.16x + 31
r2 = 0.99
y = -0.05 + 21