
Background analysis of the quality of the energy data to be ...
303
Background analysis of the quality of the energy data to be considered for the European Reference Life Cycle Database (ELCD) December 2013 Report: EUR 26431 EN
-
Upload
khangminh22 -
Category
Documents
-
view
0 -
download
0
Transcript of Background analysis of the quality of the energy data to be ...
Background analysis of the quality of the energy data to be considered for the European Reference Life Cycle Database (ELCD)
December 2013
Report: EUR 26431 EN
1
European Commission Joint Research Centre (JRC) Institute for Environment and Sustainability Contact information Fabrice Mathieux Address: Joint Research Centre, Via Enrico Fermi 2749, TP 270, 21027 Ispra (VA), Italy E-mail: [email protected] Tel.: +39 0332 78 9238 Fax: +39 0332 78 6645 http://lct.jrc.ec.europa.eu/ http://www.jrc.ec.europa.eu/ This publication is a book coming out as Reference Report by the JRC of the European Commission. Legal Notice: Neither the European Commission nor any person acting on behalf of the Commission is responsible for the use which might be made of this publication. Europe Direct is a service to help you find answers to your questions about the European Union Free phone number (*): 00 800 6 7 8 9 10 11 (*) Certain mobile telephone operators do not allow access to 00 800 numbers or these calls may be billed. A great deal of additional information on the European Union is available on the Internet. It can be accessed through the Europa server http://europa.eu/. JRC 87127 EUR 26431 ISBN 978-92-79-35071-9 ISSN 1831-9424 doi: 10.2788/5377 Luxembourg: Publications Office of the European Union, 2013 © European Union, 2013 Reproduction is authorised provided the source is acknowledged. Printed in Luxembourg
2
Background analysis of the quality of the energy data to be considered for the European Reference Life Cycle Database (ELCD)
Editors: Simone Fazio, Marco Recchioni, Fabrice Mathieux. (DG JRC – Ispra –Italy) Authors: Daniel Garraín, Cristina de la Rúa, Yolanda Lechón. (CIEMAT – Madrid - Spain) SUGGESTED CITATION
European Commission. 2013. Background analysis of the quality of the energy data to be considered for the European Reference Life Cycle Database (ELCD). Editors: Simone Fazio, Marco Recchioni, Fabrice Mathieux. Authors: Daniel Garrain, Cristina de la Rùa, Yolanda Lechòn. European Commission, Joint Research Centre, Institute for Environment and Sustainability.
3
Contents
Executive Summary ........................................................................................................................................ 4
Disclaimer ........................................................................................................................................................... 7
Acknowledgments ............................................................................................................................................ 7
1. Introduction ................................................................................................................................................... 8 1.1. Background ............................................................................................................................................................................................ 8 1.2. ELCD database..................................................................................................................................................................................... 8
Energy datasets ............................................................................................................................................................................................................ 8 GaBi database ............................................................................................................................................................................................................. 10
1.3. Objective ............................................................................................................................................................................................... 10 2. Methodology .............................................................................................................................................. 12
2.1. Selection of energy datasets ................................................................................................................................................... 12 2.2. Quality criteria indicators ........................................................................................................................................................... 16
Technological representativeness .................................................................................................................................................................... 17 Geographical representativeness ..................................................................................................................................................................... 18 Time-related representativeness ..................................................................................................................................................................... 18 Completeness .............................................................................................................................................................................................................. 19 Precision/uncertainty ............................................................................................................................................................................................... 25 Methodological appropriateness and consistency .................................................................................................................................. 25
3. Evaluation: Electricity datasets .......................................................................................................... 28 3.1. Electricity mix .................................................................................................................................................................................... 28
Evaluation: EU-27 ..................................................................................................................................................................................................... 28 Results, findings and recommendations ...................................................................................................................................................... 46
3.2. Electricity from hard coal, lignite and natural gas ..................................................................................................... 48 Evaluation: Hard coal (Germany) ...................................................................................................................................................................... 48 Evaluation: Lignite (Germany) ............................................................................................................................................................................ 66 Evaluation: Natural gas (United Kingdom) .................................................................................................................................................. 82 Results, findings and recommendations ...................................................................................................................................................... 96
3.3. Electricity from nuclear power ................................................................................................................................................ 98 Evaluation: France .................................................................................................................................................................................................... 98 Results, findings and recommendations ................................................................................................................................................... 113
3.4. Electricity from hydroelectric power ................................................................................................................................ 114 Evaluation: EU-27 .................................................................................................................................................................................................. 114 Results, findings and recommendations ................................................................................................................................................... 126
3.5. Electricity from wind power ................................................................................................................................................... 127 Evaluation: EU-27 .................................................................................................................................................................................................. 127 Results, findings and recommendations ................................................................................................................................................... 142
3.6. Electricity from biomass .......................................................................................................................................................... 144 Evaluation: Germany ............................................................................................................................................................................................ 144 Results, findings and recommendations ................................................................................................................................................... 155
3.7. Electricity from solar power (photovoltaic) .................................................................................................................. 156 Evaluation: Germany ............................................................................................................................................................................................ 156 Results, findings and recommendations ................................................................................................................................................... 174
4. Evaluation: Crude oil based fuels datasets ................................................................................ 175 4.1. Evaluation: Diesel mix EU-27 ............................................................................................................................................... 175 4.2. Results, findings and recommendations ....................................................................................................................... 194
5. Evaluation Natural gas mix based fuel dataset ...................................................................... 195 5.1. Evaluation: EU-27 ........................................................................................................................................................................ 195 5.2. Results, findings and recommendations ....................................................................................................................... 212
6. Evaluation: Biofuel dataset ............................................................................................................... 213 6.1. Evaluation: RME Germany ....................................................................................................................................................... 213 6.2. Results, findings and recommendations ....................................................................................................................... 227
7. Conclusions .............................................................................................................................................. 229
8. References and bibliography ............................................................................................................ 236
Annex 1 Pre-analyses............................................................................................................................... 256
Annex 2. Stakeholder‟s panel review ................................................................................................. 299
4
Executive Summary Context
The European Reference Life-Cycle Database (ELCD) has been developed by the European Commission‟s Joint Research Centre (DG JRC) and provides core Life Cycle Inventory (LCI) data from front-running EU-level business associations and, where not available, other sources. Within the ELCD, several energy-related data are provided, being energy a major input for almost all the environmental analyses of products or processes. This study presents a comprehensive analysis of LCI and other potential sources to be used as data providers, in order to assure the quality of the ELCD. Therefore, an analysis of the quality of energy data for European markets that are available in 3rd party life cycle databases and from authoritative sources that are, or could be, used to improve the ELCD has been carried out.
This work has been carried out by the Energy Systems Analysis (ASE) Unit of CIEMAT (Public Research Centre for Energy, Environment and Technology, Madrid, Spain), through a service contract (Service Contract Number 387533) awarded by the European Commission – Joint Research Centre – Institute for Environment and Sustainability (Tender Number IES/H/2011/01/13/NC).
Methods
The work consisted of an analysis and a comparison of energy datasets from several relevant databases (i.e. Ecoinvent1, E32, and GEMIS3). The ELCD database has been considered as the basis for this analysis in order to figure out the possibilities for improvement of the ELCD overall data quality.
The analysis was carried in two main phases: i) the selection of datasets, databases and quality standards (aimed at providing a justified list of datasets and databases to be considered in the subsequent analysis); ii) Analysis and qualitative comparison of the datasets (including a previous detailed study of the ELCD database as a basis for the comparison with other databases, according to the previously defined quality standards, in order to derive findings and recommendations for the potential improvements of ELCD energy data).
The methodological report, explaining the framework and the methods applied for the analysis has been disclosed with a large panel of relevant stakeholders, in order to collect feedbacks on the proposed approach (see annex 2).
The current ELCD energy datasets have been to a large extent originated from the GaBi4 database. Therefore, in order to analyse background information of the ELCD datasets, GaBi datasets from the last updated version (at the time when the study was initiated, i.e. 2009) have been analysed.
The main criteria for the other database selection were based on the availability of EU-related data, the inclusion of wide datasets on energy products and services
1 http://www.ecoinvent.ch/
2 http://www.e3database.com/
3 http://www.gemis.de/en/index.htm
4 http://www.gabi-software.com
5
(specially focusing on those matching the chosen energy patterns), and the broad acceptance by the scientific community.
24 energy datasets were chosen for the analysis with the aim of selecting a sufficiently representative sample of energy sources in the European context.
The evaluation has been based on the quality indicators developed within the ILCD handbook (EC-JRC-IES 2010a, 2010b, 2011): Technological representativeness, Geographical representativeness, Time-related representativeness, Completeness, Precision / Uncertainty, and Methodological appropriateness and consistency. These quality indicators have been refined in order to appropriately identify key aspects that are involved in both quality and methodological aspects of energy related LCI datasets. This refinement facilitates their use in the analysis of energy systems.
The quality of each dataset has been estimated for each indicator and then, compared among the different databases. The conclusions obtained in this analysis cannot be extrapolated to other type of datasets, nor can be used to compare databases among them.
Results
Results have shown that, in general terms the ELCD dataset analysed showed a very good performance in many of the identified quality criteria and especially in those related to technology representativeness, methodology and Completeness.
From the deep analysis conducted, it must be highlighted that the ELCD datasets have been modelled based on an extensive review of the most relevant literature and statistics. The documentation used to model the ELCD energy related datasets can be found in the Life Cycle Thinking Platform web-site5. ELCD datasets showed the best quality rating (meaning that the other databases ranked almost at the same level or lower) in the majority of the considered technologies. Some exceptions were found in the datasets of electricity from nuclear power, in which TiR and M criteria score worse than other databases, and PV dataset where M criterion also performs worse than in other databases.
Several aspects where improvements are considered necessary are highlighted through the analysis. For example, sources of data and information coming from authoritative sources, business associations or other sources are identified and proposed to be used (e.g. using also Eurostat data, where available, instead of only those from IEA, already used for the ELCD datasets).
One of the most relevant improvement opportunity of the ELCD is the lack of some datasets that model electricity produced by each technology in each European country. Currently, the ELCD includes electricity mix datasets for each country, modelled considering an established share of sources that might be different to the needs of the user.
Although the optimal solution to this limitation would be to model new datasets for electricity production by technology and for each country, this might not be feasible for the short term. An alternative solution would be to model datasets for each
5 http://lct.jrc.ec.europa.eu/
6
technology under a European context, and to introduce parameters in the electricity mix datasets to vary the shares of each technology.
In order to give response to any change or advance in technologies, and to be able to model new datasets and/or to modify the current ones if necessary, it is highly recommended to constantly review the evolution of advanced technologies and their share in the European market..
Business associations and other authoritative sources are considered relevant sources to update the status of these technologies. Along this study relevant sources have been identified.
Recommendations
The future versions of the ELCD should include new datasets for electricity production by technology and by country. Also, future electricity scenarios can be developed using to that end the output from reference energy models, developed by the European Commission at different levels, such as PRIMES6 or TIMES7. This is an important improvement of the database that could be very useful for prospective and consequential LCA studies.
Modelling the end of life of the energy systems appears to be a difficult task due to the novelty of some technologies and the lack of data from other technologies (solar PV, final repository for spent nuclear fuel and natural gas plant dismantling). Efforts on this challenge should be kept in the future.
Finally, deep analyses of the state of the art of different technologies are recommended, aimed to identify the level of maturity for each energy pattern, in order to better plan the periodical revision of each type of dataset.
6 http://ec.europa.eu/environment/air/pollutants/models/primes.htm
7 http://ipts.jrc.ec.europa.eu/activities/energy-and-transport/TIMES.cfm
7
Disclaimer The present report is not aiming to compare the overall quality of existing commercial databases, but just to point out the possible strengths of third party databases, as regards the data quality rating (DQR), in order to improve the quality of datasets included in the ELCD database8. It must be pointed out that the DQR evaluation has been carried out against the ILCD Handbook9 criteria, on this perspective, the overall ranking of third party databases that are produced according to different approaches, is of course lower compared to the other. However, even assumed the different framework, some strong points in terms of data quality can be highlighted, and followed as example for the improvement of the ELCD database.
Acknowledgments This report includes the methodology, discussions, conclusions and recommendations of the energy datasets comparison and evaluation in the framework of the requested tender by JRC-IES number IES/H/2011/01/13/NC titled „Background analysis of energy data to be considered for the European Reference Life Cycle Database (ELCD)‟. The report has been drafted by the Energy System Analysis Unit - Energy Department of CIEMAT (Madrid, Spain), and completed/edited by the unit H08 of the Jount Research Centre of the European Commission (Ispra, Italy). A stakeholder‟s panel review was arranged in order to check and review the quality of the methodological report and the final findings and recommendations of study itself. This stakeholder panel was planned to be made up of members of analysed databases and members of the utilities/petrol/electricity industry associations. See annex 2 for an extended list of the stakeholders involved.
8 http://elcd.jrc.ec.europa.eu/ELCD3/
9 EC-JRC-IES 2010a, 2010b, 2011
8
1. Introduction
1.1. Background In the Integrated Product Policy Communication of 2003 (COM 2003), the European Commission recognised Life Cycle Assessment (LCA) as “the best framework for assessing the potential environmental impacts of products”. Since then, life cycle approaches were further strengthened in EU policies through the Sustainable Production and Consumption / Sustainable Industry Policy Action Plan Communications that encompass various policies (e.g. Eco-design for Energy-related Products Directive, Footprint initiative, etc.). Within this context, there is an urgent “need to improve data availability and quality worldwide by internationally cooperating on LCA data and methods”.
The European Platform of Life Cycle Assessment (EPLCA), a project initiated by the Institute for Environment and Sustainability (IES), has the objective to promote Life Cycle Thinking (LCT) and to provide appropriate support to business and to public administrations within the European Union (EU), as well as in close coordination with international activities. This support is essential, and is being achieved through the development of a number of different deliverables. These include the European Reference Life Cycle Database (ELCD), that provides core Life Cycle Inventory (LCI) data from front-running EU-level business associations and, where not available, other sources. Within the ELCD, several energy-related data are provided, being energy a major input for almost all the environmental analyses of products or processes.
1.2. ELCD database Since its first release in 2006, the ELCD comprises LCI data from front-running EU-level business associations and other sources for key materials, energy carriers, transport, and waste management. The respective datasets are officially provided and approved by the named industry association.
The target users of ELCD datasets are experts/practitioners in LCA. The datasets are accessible free of charge and without access or use restrictions for all LCA practitioners. ELCD includes datasets that have not been published beforehand and datasets that were only collected for this purpose. They are foreseen to contribute key European data to the upcoming international ILCD Data Network and in complementation of other data sources, i.e. not in competition.
More info is provided at: http://lca.jrc.ec.europa.eu/lcainfohub/datasetArea.vm, and http://elcd.jrc.ec.europa.eu.
Energy datasets
ELCD datasets are normally provided and approved by the named industry association; some datasets are still under preparation and will be added subsequently. This is not the case of energy-related datasets that have been developed on demand for the ELCD database. Table 1 provides the list of energy datasets included in the ELCD database from JRC (December 2011).
9
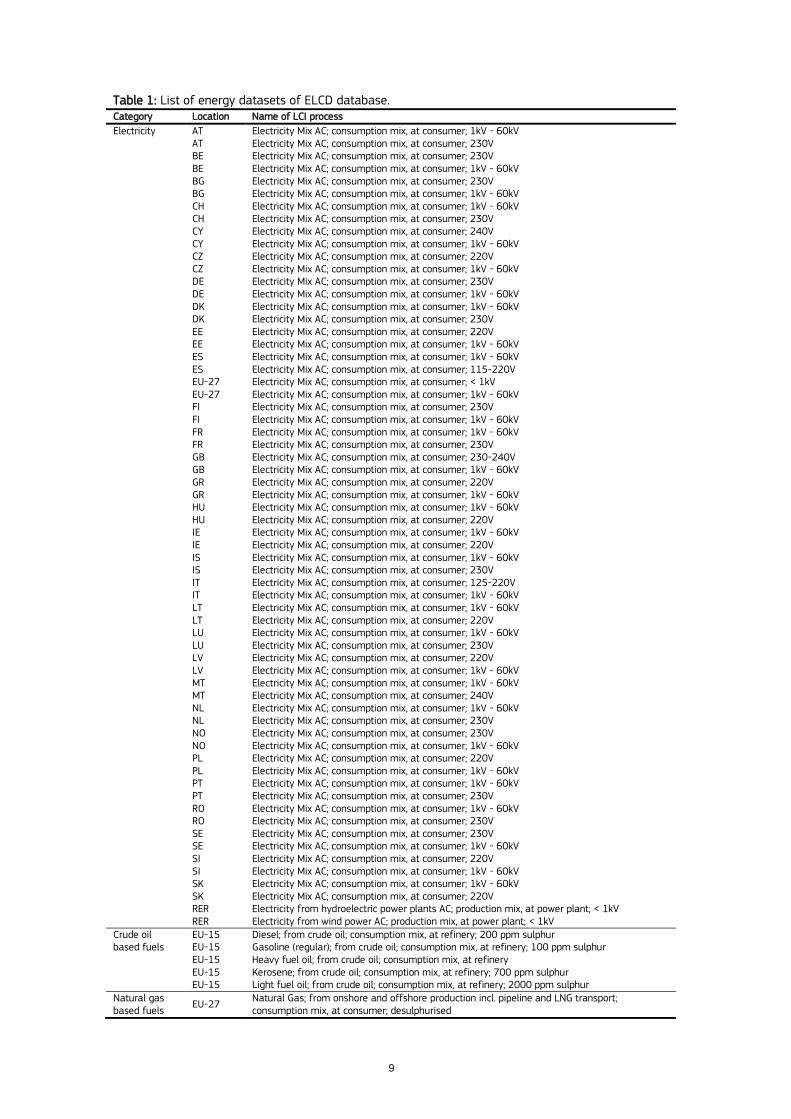
Table 1: List of energy datasets of ELCD database. Category Location Name of LCI process
Electricity AT Electricity Mix AC; consumption mix, at consumer; 1kV - 60kV AT Electricity Mix AC; consumption mix, at consumer; 230V BE Electricity Mix AC; consumption mix, at consumer; 230V BE Electricity Mix AC; consumption mix, at consumer; 1kV - 60kV BG Electricity Mix AC; consumption mix, at consumer; 230V BG Electricity Mix AC; consumption mix, at consumer; 1kV - 60kV CH Electricity Mix AC; consumption mix, at consumer; 1kV - 60kV CH Electricity Mix AC; consumption mix, at consumer; 230V CY Electricity Mix AC; consumption mix, at consumer; 240V CY Electricity Mix AC; consumption mix, at consumer; 1kV - 60kV CZ Electricity Mix AC; consumption mix, at consumer; 220V CZ Electricity Mix AC; consumption mix, at consumer; 1kV - 60kV DE Electricity Mix AC; consumption mix, at consumer; 230V DE Electricity Mix AC; consumption mix, at consumer; 1kV - 60kV DK Electricity Mix AC; consumption mix, at consumer; 1kV - 60kV DK Electricity Mix AC; consumption mix, at consumer; 230V EE Electricity Mix AC; consumption mix, at consumer; 220V EE Electricity Mix AC; consumption mix, at consumer; 1kV - 60kV ES Electricity Mix AC; consumption mix, at consumer; 1kV - 60kV ES Electricity Mix AC; consumption mix, at consumer; 115-220V EU-27 Electricity Mix AC; consumption mix, at consumer; < 1kV EU-27 Electricity Mix AC; consumption mix, at consumer; 1kV - 60kV FI Electricity Mix AC; consumption mix, at consumer; 230V FI Electricity Mix AC; consumption mix, at consumer; 1kV - 60kV FR Electricity Mix AC; consumption mix, at consumer; 1kV - 60kV FR Electricity Mix AC; consumption mix, at consumer; 230V GB Electricity Mix AC; consumption mix, at consumer; 230-240V GB Electricity Mix AC; consumption mix, at consumer; 1kV - 60kV GR Electricity Mix AC; consumption mix, at consumer; 220V GR Electricity Mix AC; consumption mix, at consumer; 1kV - 60kV HU Electricity Mix AC; consumption mix, at consumer; 1kV - 60kV HU Electricity Mix AC; consumption mix, at consumer; 220V IE Electricity Mix AC; consumption mix, at consumer; 1kV - 60kV IE Electricity Mix AC; consumption mix, at consumer; 220V IS Electricity Mix AC; consumption mix, at consumer; 1kV - 60kV IS Electricity Mix AC; consumption mix, at consumer; 230V IT Electricity Mix AC; consumption mix, at consumer; 125-220V IT Electricity Mix AC; consumption mix, at consumer; 1kV - 60kV LT Electricity Mix AC; consumption mix, at consumer; 1kV - 60kV LT Electricity Mix AC; consumption mix, at consumer; 220V LU Electricity Mix AC; consumption mix, at consumer; 1kV - 60kV LU Electricity Mix AC; consumption mix, at consumer; 230V LV Electricity Mix AC; consumption mix, at consumer; 220V LV Electricity Mix AC; consumption mix, at consumer; 1kV - 60kV MT Electricity Mix AC; consumption mix, at consumer; 1kV - 60kV MT Electricity Mix AC; consumption mix, at consumer; 240V NL Electricity Mix AC; consumption mix, at consumer; 1kV - 60kV NL Electricity Mix AC; consumption mix, at consumer; 230V NO Electricity Mix AC; consumption mix, at consumer; 230V NO Electricity Mix AC; consumption mix, at consumer; 1kV - 60kV PL Electricity Mix AC; consumption mix, at consumer; 220V PL Electricity Mix AC; consumption mix, at consumer; 1kV - 60kV PT Electricity Mix AC; consumption mix, at consumer; 1kV - 60kV PT Electricity Mix AC; consumption mix, at consumer; 230V RO Electricity Mix AC; consumption mix, at consumer; 1kV - 60kV RO Electricity Mix AC; consumption mix, at consumer; 230V SE Electricity Mix AC; consumption mix, at consumer; 230V SE Electricity Mix AC; consumption mix, at consumer; 1kV - 60kV SI Electricity Mix AC; consumption mix, at consumer; 220V SI Electricity Mix AC; consumption mix, at consumer; 1kV - 60kV SK Electricity Mix AC; consumption mix, at consumer; 1kV - 60kV SK Electricity Mix AC; consumption mix, at consumer; 220V RER Electricity from hydroelectric power plants AC; production mix, at power plant; < 1kV RER Electricity from wind power AC; production mix, at power plant; < 1kV
Crude oil based fuels
EU-15 Diesel; from crude oil; consumption mix, at refinery; 200 ppm sulphur EU-15 Gasoline (regular); from crude oil; consumption mix, at refinery; 100 ppm sulphur EU-15 Heavy fuel oil; from crude oil; consumption mix, at refinery EU-15 Kerosene; from crude oil; consumption mix, at refinery; 700 ppm sulphur EU-15 Light fuel oil; from crude oil; consumption mix, at refinery; 2000 ppm sulphur
Natural gas based fuels
EU-27 Natural Gas; from onshore and offshore production incl. pipeline and LNG transport; consumption mix, at consumer; desulphurised
10
The latest ELCD includes one dataset of European average electricity mix as well as electricity mix datasets from each EU-27 country. However, the unit processes used to build the datasets cannot be broken down into technologies. This limitation had to be solved, since the final objective of the study is to analyse the quality of the different energy datasets selected, focusing on the underlying models and data used.
GaBi database
Created by PE International, GaBi LCA database is one of the most used LCA databases on the market today and contains over 4,500 ready-to-use Life Cycle Inventory profiles based on primary industry data. It contains electricity-related datasets by EU-27 countries and mixes. They are classified by sources, such as electricity from hard coal, from nuclear power, from natural gas, etc. More information can be found at: http://www.gabi-software.com.
The current electricity mix datasets by country from the ELCD database have been originated from the GaBi database. Taking into account the above mentioned limitation, the use of specific datasets from GaBi for conducting the analysis seemed to be essential. Whenever ELCD database did not provide the required datasets, GaBi datasets from the last updated version were analysed. It must be noticed that GaBi provides these datasets for each EU-27 country, but does not include datasets for each technology referring to the European context10, i.e. electricity production from hard coal, European Mix. As a first approximation, in order to take into account the European energy market, the datasets by country were chosen from GaBi database considering only those countries that sum up 60%11 of the electricity produced in Europe for each technology. Hereinafter, the nomenclature of ELCD energy datasets will refer to GaBi datasets.
1.3. Objective The objective of this study is the identification of areas of potential improvement of the ELCD energy datasets quality. This study presents a complete analysis of LCI and other potential sources to be used as data providers, in order to assure the quality of the ELCD. So that, an analysis of the quality of energy data for European markets that are available in third party life cycle databases and from authoritative sources that are, or could be, used in the context of the ELCD, has been provided. The work has been carried out by the Energy Systems Analysis (ASE) Unit of CIEMAT (Public Research Centre for Energy, Environment and Technology) (Madrid, Spain). It has consisted of an analysis and a comparison of energy datasets from different databases, considering the ELCD database as the basis for this analysis.
The other databases that have been analysed are the following:
- Ecoinvent database (http://www.ecoinvent.ch/).
- GEMIS database (http://www.gemis.de/en/index.htm).
- E3 database (http://www.e3database.com/).
10
These datasets are available in the developer’s internal database (PE International), but so far not in the commercially available databases. 11
Value decided by the authors and agreed with JRC-IES members based on the expert judgement of the unit staff and considering that it will be representative enough for the European energy market.

11
This effort has been carried out in two stages, which are summarized below:
Selection of datasets, databases and quality standards. This part aimed at providing a justified list of datasets and databases (and other sources) to consider in the subsequent analysis. Moreover, justified criteria and quality standards list have been clearly defined in order to be used in the analytical comparison.
Analysis and qualitative comparison of the datasets. This section comprised several actions. Firstly, a previous detailed study of the ELCD database was carried out. Considering ELCD database as a basis for the comparison, each selected energy dataset was analysed according to the previously defined quality standards. Finally, findings and recommendations were derived in order to identify the potential improvements of ELCD energy database.
12
2. Methodology
2.1. Selection of energy datasets The following aspects were considered, in order to select representative energy datasets:
Related to electricity: The selected samples must represent a significant share (such as 40 to 60%) of the EU-27 electricity market and associated technology mixes/geographic origins.
Related to fuels: The selection must include at least four representative crude oil datasets and one natural gas dataset.
Other considerations support the inclusion of some minority energy sources such as some renewable sources whose contribution to the European energy mix has prospects to be more important in the future.
In order to select the sample of datasets, the most updated data in terms of electricity and fuels in the EU-27 context were deeply analysed.
Regarding electricity, and according to European statistics (Eurostat, EC-MOE 2011), the sources that contribute the most to electricity generation in 2011 were the following: Nuclear (27%), Coal (26%), Gas (23%), Hydro (13%) and Wind (4%). Other renewable energy sources have lower contribution to electricity generation in EU-27, such as biomass and waste, and solar energy (3% and 0.68%, respectively). However, due to their foreseen potentials, their contribution is expected to increase in the future. So, the electricity from these sources was considered for the analysis. An electricity mix for EU-27 was also taken into account.
Based on the statistics from European refineries studies (EC-MOE 2011) the main petroleum products produced in Europe were the following: Diesel (represents more than 37% of the refineries output), Gasoline (represents more than 20%), Residual fuel oil (represents more than 15%) and Kerosene (represents more than 6%). Due to their relevance in the share of fuel production, these products were considered for the analysis.
Additionally, an analysis of the gross heat generation in the EU-27 (Eurostat) pointed out the relevance of the natural gas as fuel, being its contribution to the heat generation around 44%. Based on this, Natural Gas was also considered as a selected dataset.
Finally, biofuels production has significantly increased during the last decade due to a favourable framework and the support of several policies. The contribution of Europe to biofuels production is expected to increase due to its high objectives. However, a substantial share of biofuels used in Europe is based on imported feedstock. Rapeseed oil seems to be one of the raw materials expected to contribute the most in the share of biodiesel. So, in order to cover this potential fuel in the analysis, biodiesel from rapeseed oil or Rapeseed Methyl Ester (RME) were also included.
In order to identify those countries that sum up more than 60% of the electricity produced in Europe by technology, data of electricity production by sources from Eurostat (access April 2012, data from 2010) were collected and analysed:
13
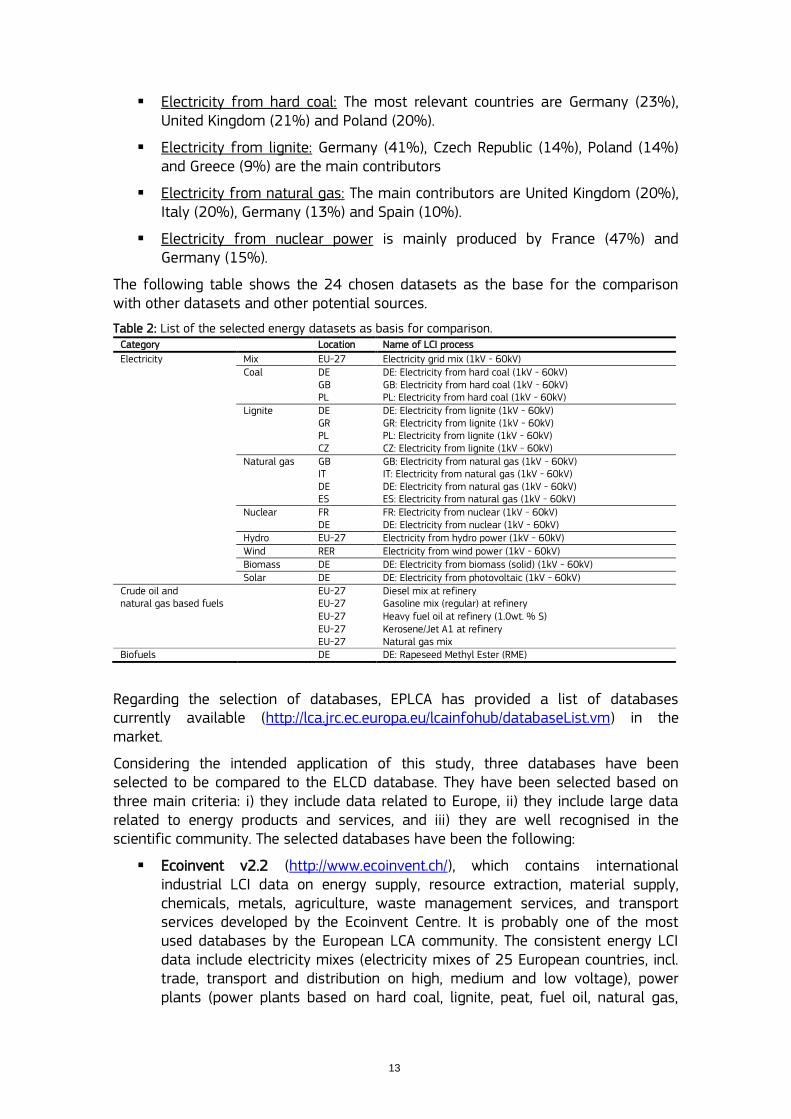
Electricity from hard coal: The most relevant countries are Germany (23%), United Kingdom (21%) and Poland (20%).
Electricity from lignite: Germany (41%), Czech Republic (14%), Poland (14%) and Greece (9%) are the main contributors
Electricity from natural gas: The main contributors are United Kingdom (20%), Italy (20%), Germany (13%) and Spain (10%).
Electricity from nuclear power is mainly produced by France (47%) and Germany (15%).
The following table shows the 24 chosen datasets as the base for the comparison with other datasets and other potential sources.
Table 2: List of the selected energy datasets as basis for comparison. Category Location Name of LCI process
Electricity Mix EU-27 Electricity grid mix (1kV - 60kV) Coal DE DE: Electricity from hard coal (1kV - 60kV)
GB GB: Electricity from hard coal (1kV - 60kV) PL PL: Electricity from hard coal (1kV - 60kV)
Lignite DE DE: Electricity from lignite (1kV - 60kV) GR GR: Electricity from lignite (1kV - 60kV) PL PL: Electricity from lignite (1kV - 60kV) CZ CZ: Electricity from lignite (1kV - 60kV)
Natural gas GB GB: Electricity from natural gas (1kV - 60kV) IT IT: Electricity from natural gas (1kV - 60kV) DE DE: Electricity from natural gas (1kV - 60kV) ES ES: Electricity from natural gas (1kV - 60kV)
Nuclear FR FR: Electricity from nuclear (1kV - 60kV) DE DE: Electricity from nuclear (1kV - 60kV)
Hydro EU-27 Electricity from hydro power (1kV - 60kV) Wind RER Electricity from wind power (1kV - 60kV) Biomass DE DE: Electricity from biomass (solid) (1kV - 60kV) Solar DE DE: Electricity from photovoltaic (1kV - 60kV)
Crude oil and natural gas based fuels
EU-27 Diesel mix at refinery EU-27 Gasoline mix (regular) at refinery EU-27 Heavy fuel oil at refinery (1.0wt. % S) EU-27 Kerosene/Jet A1 at refinery EU-27 Natural gas mix
Biofuels DE DE: Rapeseed Methyl Ester (RME)
Regarding the selection of databases, EPLCA has provided a list of databases currently available (http://lca.jrc.ec.europa.eu/lcainfohub/databaseList.vm) in the market.
Considering the intended application of this study, three databases have been selected to be compared to the ELCD database. They have been selected based on three main criteria: i) they include data related to Europe, ii) they include large data related to energy products and services, and iii) they are well recognised in the scientific community. The selected databases have been the following:
Ecoinvent v2.2 (http://www.ecoinvent.ch/), which contains international industrial LCI data on energy supply, resource extraction, material supply, chemicals, metals, agriculture, waste management services, and transport services developed by the Ecoinvent Centre. It is probably one of the most used databases by the European LCA community. The consistent energy LCI data include electricity mixes (electricity mixes of 25 European countries, incl. trade, transport and distribution on high, medium and low voltage), power plants (power plants based on hard coal, lignite, peat, fuel oil, natural gas,
14
industrial gas, nuclear energy, hydro, wind, solar, etc.), and fuel and heat supply (supply of hard coal, lignite, light and heavy fuel oil, petrol, diesel, kerosene, LPG, natural gas, wood, etc.).
GEMIS 4.7 (http://www.gemis.de/en/index.htm), a free LCA software and database for energy, material, and transport systems. The LCI database offers information on fossil fuels (hard coal, lignite, natural gas, and oil), renewables, nuclear, biomass (residuals, and wood from short-rotation forestry, miscanthus, rape oil, etc.), hydrogen (including fuel composition, and upstream data) and processes for electricity and heat (various power plants, co-generators, fuel cells, etc.).
E3 database (http://www.e3database.com/), which has been developed in the context of LCA and Well-to-Wheel Analyses, allows the modelling and comparison of all types of energy chains/pathways from primary energy source to final energy use. It is frequently used for modelling fuel pathways for transport systems with primary energy sources based on fossil energies, biomass, nuclear or renewable electricity. It has been used in the project and deliverables reported by CONCAWE, EUCAR, and JRC: „Well-to-Wheels Analysis of Future Automotive Fuels and Powertrains in the European Context‟.
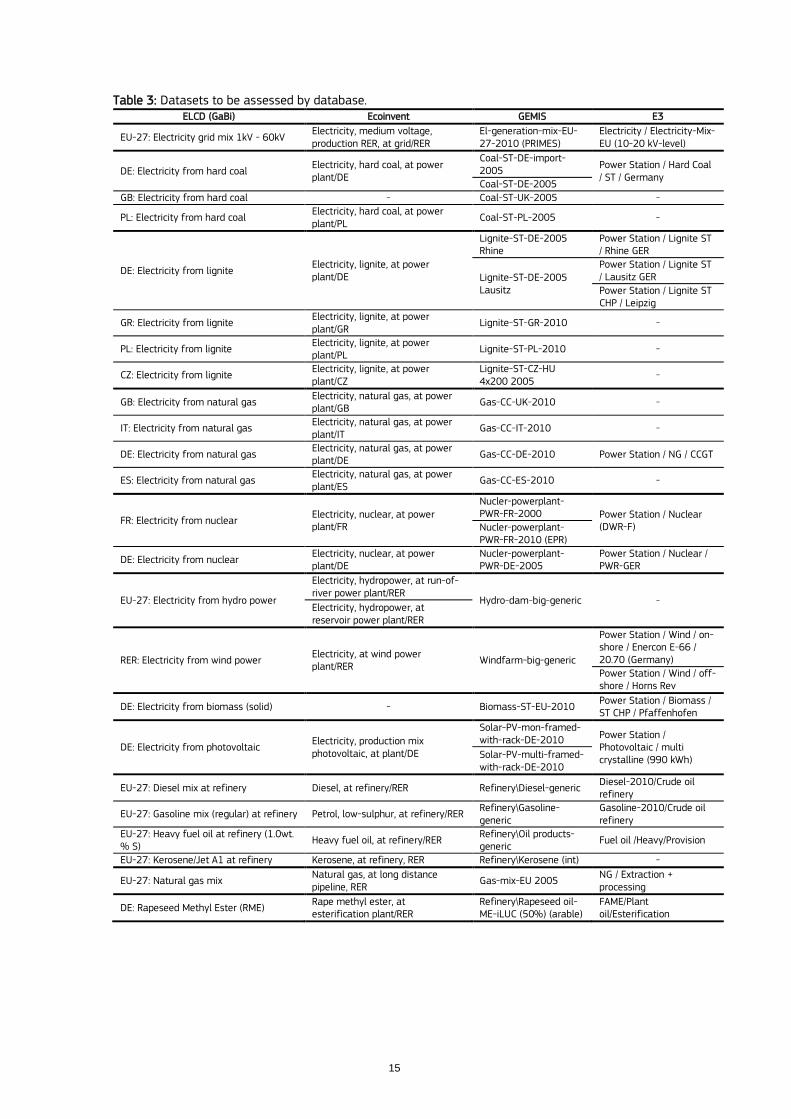
Considering theses databases and the availability of dataset, the following table presents the list of datasets to be analysed and compared.
15
Table 3: Datasets to be assessed by database. ELCD (GaBi) Ecoinvent GEMIS E3
EU-27: Electricity grid mix 1kV - 60kV Electricity, medium voltage, production RER, at grid/RER
El-generation-mix-EU-27-2010 (PRIMES)
Electricity / Electricity-Mix-EU (10-20 kV-level)
DE: Electricity from hard coal Electricity, hard coal, at power plant/DE
Coal-ST-DE-import-2005
Power Station / Hard Coal / ST / Germany
Coal-ST-DE-2005
GB: Electricity from hard coal - Coal-ST-UK-2005 -
PL: Electricity from hard coal Electricity, hard coal, at power plant/PL
Coal-ST-PL-2005 -
DE: Electricity from lignite Electricity, lignite, at power plant/DE
Lignite-ST-DE-2005 Rhine
Power Station / Lignite ST / Rhine GER
Lignite-ST-DE-2005 Lausitz
Power Station / Lignite ST / Lausitz GER
Power Station / Lignite ST CHP / Leipzig
GR: Electricity from lignite Electricity, lignite, at power plant/GR
Lignite-ST-GR-2010 -
PL: Electricity from lignite Electricity, lignite, at power plant/PL
Lignite-ST-PL-2010 -
CZ: Electricity from lignite Electricity, lignite, at power plant/CZ
Lignite-ST-CZ-HU 4x200 2005
-
GB: Electricity from natural gas Electricity, natural gas, at power plant/GB
Gas-CC-UK-2010 -
IT: Electricity from natural gas Electricity, natural gas, at power plant/IT
Gas-CC-IT-2010 -
DE: Electricity from natural gas Electricity, natural gas, at power plant/DE
Gas-CC-DE-2010 Power Station / NG / CCGT
ES: Electricity from natural gas Electricity, natural gas, at power plant/ES
Gas-CC-ES-2010 -
FR: Electricity from nuclear Electricity, nuclear, at power plant/FR
Nucler-powerplant-PWR-FR-2000 Power Station / Nuclear
(DWR-F) Nucler-powerplant-PWR-FR-2010 (EPR)
DE: Electricity from nuclear Electricity, nuclear, at power plant/DE
Nucler-powerplant-PWR-DE-2005
Power Station / Nuclear / PWR-GER
EU-27: Electricity from hydro power
Electricity, hydropower, at run-of-river power plant/RER
Hydro-dam-big-generic - Electricity, hydropower, at reservoir power plant/RER
RER: Electricity from wind power Electricity, at wind power plant/RER
Windfarm-big-generic
Power Station / Wind / on-shore / Enercon E-66 / 20.70 (Germany)
Power Station / Wind / off-shore / Horns Rev
DE: Electricity from biomass (solid) - Biomass-ST-EU-2010 Power Station / Biomass / ST CHP / Pfaffenhofen
DE: Electricity from photovoltaic Electricity, production mix photovoltaic, at plant/DE
Solar-PV-mon-framed-with-rack-DE-2010 Power Station /
Photovoltaic / multi crystalline (990 kWh) Solar-PV-multi-framed-
with-rack-DE-2010
EU-27: Diesel mix at refinery Diesel, at refinery/RER Refinery\Diesel-generic Diesel-2010/Crude oil refinery
EU-27: Gasoline mix (regular) at refinery Petrol, low-sulphur, at refinery/RER Refinery\Gasoline-generic
Gasoline-2010/Crude oil refinery
EU-27: Heavy fuel oil at refinery (1.0wt. % S)
Heavy fuel oil, at refinery/RER Refinery\Oil products-generic
Fuel oil /Heavy/Provision
EU-27: Kerosene/Jet A1 at refinery Kerosene, at refinery, RER Refinery\Kerosene (int) -
EU-27: Natural gas mix Natural gas, at long distance pipeline, RER
Gas-mix-EU 2005 NG / Extraction + processing
DE: Rapeseed Methyl Ester (RME) Rape methyl ester, at esterification plant/RER
Refinery\Rapeseed oil-ME-iLUC (50%) (arable)
FAME/Plant oil/Esterification

16
2.2. Quality criteria indicators The evaluation has been based on the quality indicators developed within the ILCD handbook (EC-JRC-IES 2010a, 2010b, 2011). These are the following:
Technological representativeness (TeR): Defines the degree to which the datasets reflect the true population of interest regarding technology, including for included background datasets, if any. (Comment: i.e. of the technological characteristics including operating conditions).
Geographical representativeness (GR): Defines the degree to which the datasets reflect the true population of interest regarding geography, including for included background datasets, if any. (Comment: i.e. of the given location / site, region, country, market, continent, etc.).
Time-related representativeness (TiR): Defines the degree to which datasets reflect the true population of interest regarding time/age of the data, including for included background datasets, if any. (Comment: i.e. of the given year (and – if applicable – of intra-annual or intra-daily differences).
Completeness (C): Defines the share of (elementary) flows that are quantitatively included in the inventory. Note that for product and waste flows, this need to be judged on a system‟s level. (Comment: i.e. degree of coverage of environmental impact; i.e. used cut-off criteria).
Precision / uncertainty (P): Defines the measure of the variability of the data values for each data expressed (e.g. low variance = high precision). Note that for product and waste flows, this need to be judged on a system‟s level. (Comment: i.e. variance of single data values and unit processes inventories).
Methodological appropriateness and consistency (M): Defines if the applied LCI methods and methodological choices (e.g. allocation, substitution, etc.) are in line with the goal and scope of the data set, especially its intended applications and decision support context. The methods also have been consistently applied across all data including for included processes, if any. (Comment: i.e. correct and consistent application of the recommended LCI modelling framework and LCI method approaches for the given situation A, B, or C).
Each of those has been evaluated according to the degree of accomplishment of the criterion with the defined data quality rating (DQR):
Very good (quality rating = 1): Meets the criterion to a very high degree, having or no relevant need for improvement.
Good (quality rating = 2): Meets the criterion to a high degree, having little yet significant need for improvement.
Fair (quality rating = 3): Meets the criterion to a still sufficient degree, while having the need for improvement.
Poor (quality rating = 4): Does not meet the criterion to a sufficient degree, having the need for relevant improvement.
17
Very poor (quality rating = 5): Does not at all meet the criterion, having the need for very substantial improvement.
It should be noticed that a single score indicator might lead to misleading interpretation of the results. Some datasets might not contain enough information to evaluate them against all criteria and summing all scores can be misunderstood. The review has been based on the available documentation/information of database providers. The unavailability of certain information does not automatically mean that a dataset is worse than other data. Finally, note that LCI datasets values has not been neither assessed nor reviewed under this project relative to ILCD Handbook or ISO compliance. Focus has been on the underlying models and data used.
In order to identify key aspects that are involved in both quality and methodological aspects of energy related LCI datasets, quality criteria have been redefined. This practice facilitates their use in the analysis of energy systems. The main features for assessing each criterion are detailed below. Finally, a summary table is presented which includes both quality criteria and DQR definitions considered.
Technological representativeness
According to the ILCD handbook (EC-JRC-IES, 2010a, chapter 6.8.2), the TeR of a process or system identifies how well the inventory data represents it regarding its true technological or technical characteristics.
Within each specific electricity generation source selected (e.g. electricity from coal, from gas etc.), the specific technology used to generate electricity as well as the operational parameters strongly influences the environmental impacts of the process. This applies to both the inputs as well as the outputs that can differ considerably among technologies producing electricity from the same source.
The number of aspects that can be decisive for the inventory is very extensive. The potentially most relevant aspects are the technology used, the raw material origin and consequently the required transport distances, the efficiency of the conversion process, the abatement techniques in place, or the load factor.
As far as oil derived fuel products are concerned (e.g. diesel, gasoline, etc.), several typologies of refineries exist with different level of complexity and they may differ in their environmental impacts according to the specific technical characteristics and process configurations. Potentially relevant aspects affecting the inventory can be the type of refinery being considered (simple refinery, complex refinery, and complex refinery with deep conversion), the overall efficiency of the refinery, the abatement technologies in place, the origin of the crude oil, or the venting and flaring emissions considered.
Regarding the natural gas dataset, there are many possible origins of the gas and extraction technologies may differ from one origin to another according to several technological and operational parameters. The aspects that have been identified as relevant are the origin of the gas, the energy use in the extraction process, the venting and flaring emissions, the transport processes and distances, and the liquefaction process, if any.
18
In order to evaluate this criterion, it should be related to the European market context. For that purpose a pre-analysis of the technology situation of the studied sectors in Europe was necessary. The highest score has been given to datasets that consider the European or country technology mix, meaning that the dataset has been modelled taking into account all technologies available in the area of study. Pre-analysis by technology can be consulted in the Annex 1.
Geographical representativeness
According to the ILCD handbook (EC-JRC-IES, 2010a, chapter 6.8.3), the GR of a process or system identifies how well the inventory data represents it regarding the location (e.g. market, site(s), region, country, etc.) that is documented in the descriptive information of the data set or report and where it is operated, produced, or consumed.
The geographical coverage of the LCI data should represent the smallest, appropriate geographical unit, depending on the goal of the LCI/LCA study and the intended applications.
According to the goal of this study, GR criterion should be also related to the European market context. In order to evaluate this criterion, pre-analyses of the situation in each of the studied energy technologies (electricity and fuels) in Europe was performed with the objective of selecting their corresponding geographical coverage.
Within each selected energy sources (e.g. electricity mix, electricity from wind power, diesel mix, etc.), the countries where energy is produced from different origins have been listed and sorted by importance. These pre-analyses state which countries have been considered in the analysis paying attention to their contribution to the European context.
When raw materials to produce electricity are imported (lignite, natural gas, coal, etc.) the origins of the imported fuels have also been listed for each country. In the case of crude oil based fuels, the countries where there are refineries have also been listed as well as the countries where the crude oil is imported from. In the case of natural gas, suppliers of the fuel to be consumed in Europe have been listed and sorted in the same way.
The score has been based on the appropriateness of the geographical coverage, considering the countries and the share of fullness (or raw material quantity). The full GR-related pre-analysis can be consulted in the Annex 1 as well.
Time-related representativeness
According to the ILCD handbook (EC-JRC-IES, 2010a, chapter 6.8.4), the TiR of a process or system identifies how well the data represent the declared time. The declared time appears in some dataset as the “expiry year”, and/or as the “period of validity”. The different data used to build the dataset usually come from several sources and therefore, it is difficult to determine how well the time is represented. In these cases, the expert judgement is a useful tool.
19
The definition of the TiR depends on the intended application of the dataset. Datasets from processes with a short time could have a short period of validity, where-as datasets used to answer strategic questions might require a longer period.
Due to the extremely difficulty to get an exact number of a year deviation and the subjectivity in declaring a period of validity in a particular dataset, the variable for assessing has been the „time validity‟ based on the references, defined as the year/s in which inventory was collected, with a deviation of ± 5 years.
Completeness
According to the ILCD handbook (EC-JRC-IES, 2010a, chapter 6.6.3), the C criterion is defined as the share of flows that are quantitatively included in the inventory, i.e. degree of coverage of overall environmental impact.
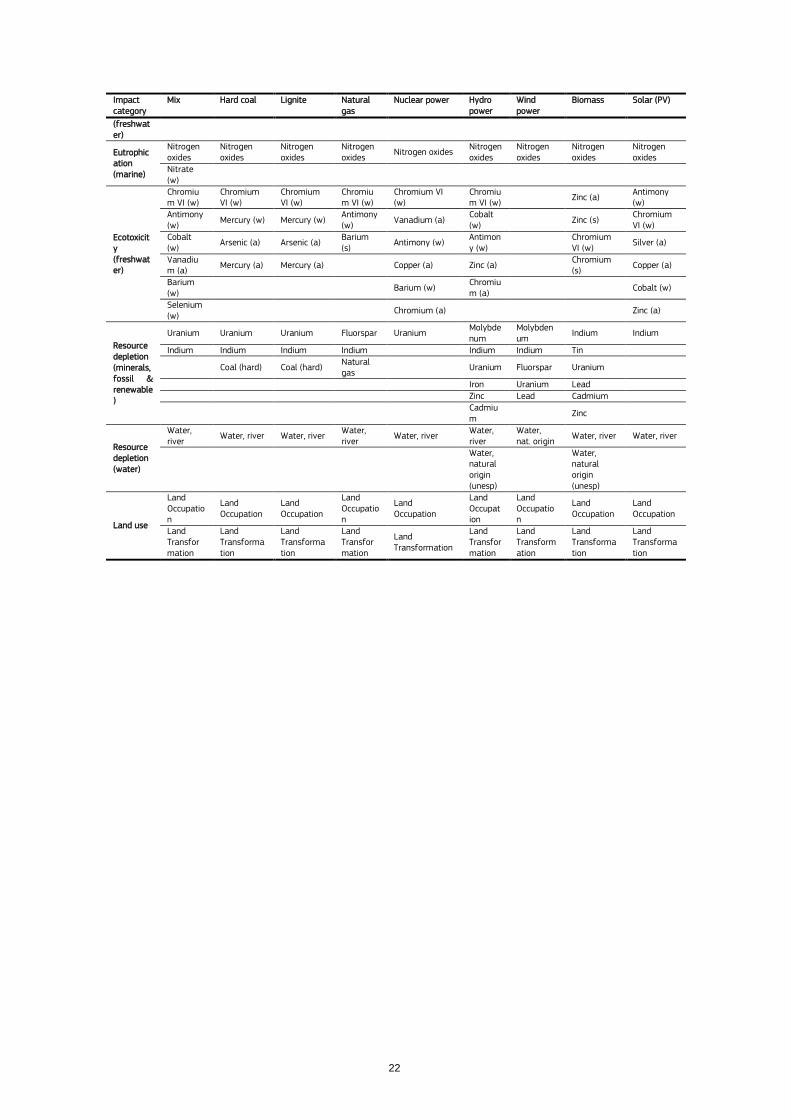
For that purpose, a pre-analysis to identify the elementary flows that allow the estimation of the 16 environmental impact categories mentioned at the mid-point level ILCD 2011 method has been done. Impact categories included have been the following: climate change, ozone depletion, human toxicity (cancer effects), human toxicity (non-cancer effects), particulate matters/respiratory inorganics, ionising radiation (human health HH), ionising radiation (ecosystems E), photochemical ozone formation, acidification, eutrophication (terrestrial), eutrophication (aquatic), eutrophication (marine) ecotoxicity (freshwater), land use, resource depletion (water), and resource depletion (mineral, fossil and renewable) (EC-JRC-IES, 2011).
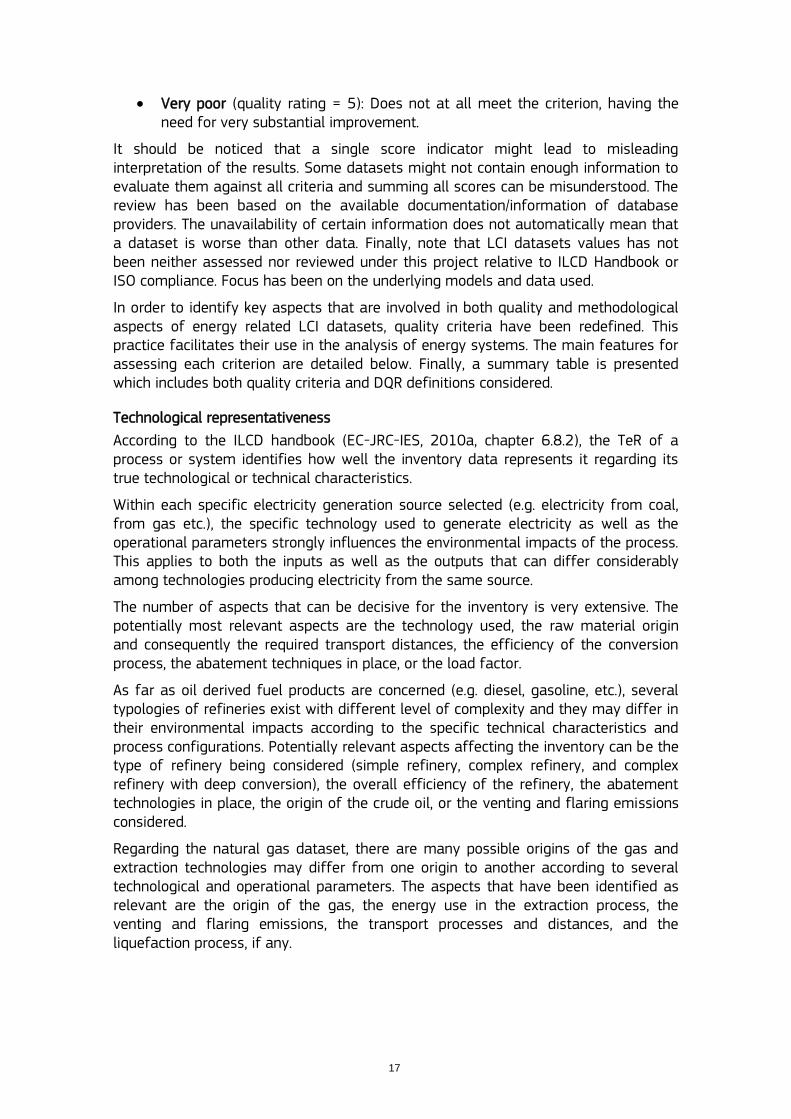
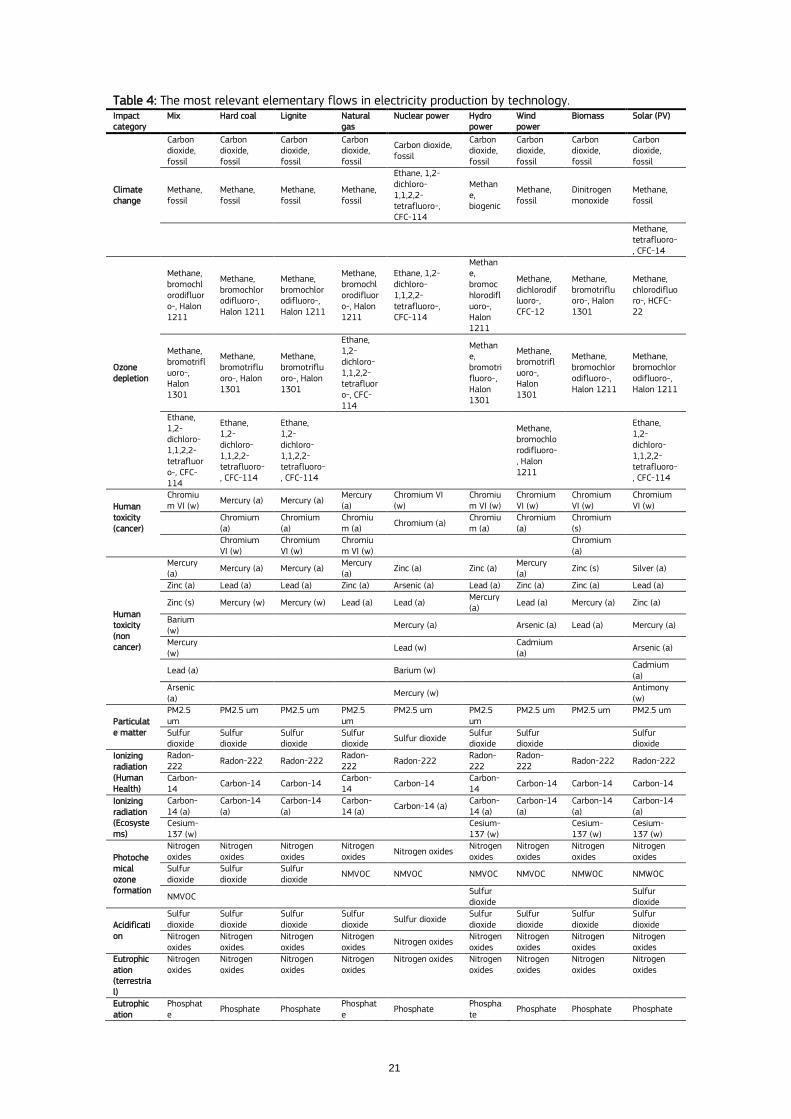
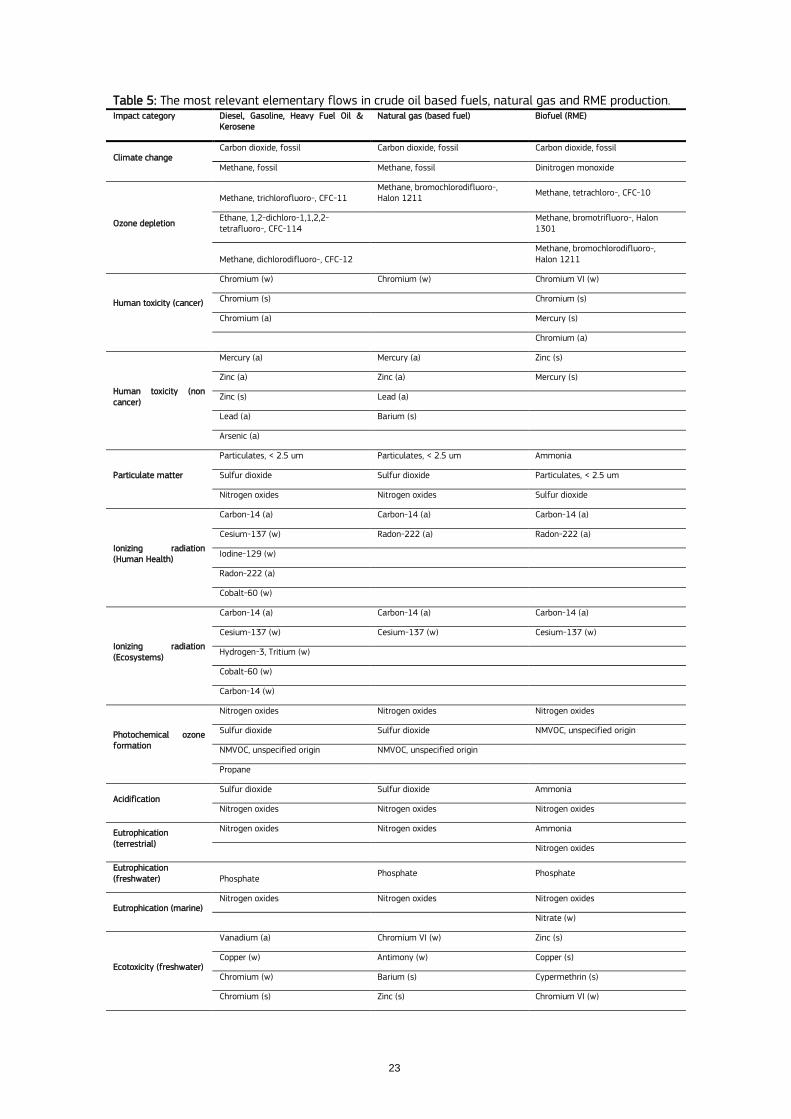
In order to evaluate the coverage of each impact, it is necessary to have an important knowledge of the analysed systems. The relevance of each elementary flow differs depending on the processes and therefore, it is not possible to create a unique list with elementary flows that could be applied to all datasets. Through a pre-analysis, a short list with the most relevant elementary flows for each impact and by technology has been developed. These flows have been identified considering their contribution in mass to the dataset and the contribution to the potential environmental impacts based on the characterization factors from the methods recommended by the ILCD. Table 4 and Table 5 show the list of the most relevant elementary flows by technology and impact category.
The modus operandi for scoring the criterion has been the following:
1) As preliminary level, has been based in the number of categories that can be assessed, as follows:
15-16 considered categories Rate 1 (very good).
12-14 considered categories Rate 2 (good).
9-12 considered categories Rate 3 (fair).
5-8 considered categories Rate 4 (poor).
< 5 considered categories Rate 5 (very poor).
2) Finally, the criterion should consider, not only how many impact categories can be analyzed based on the elementary flows, but also how well these flows cover each impact category. Then, in order to assure the rate regarding the inclusion of the most relevant elementary flows, the new score has been calculated as follows:
20
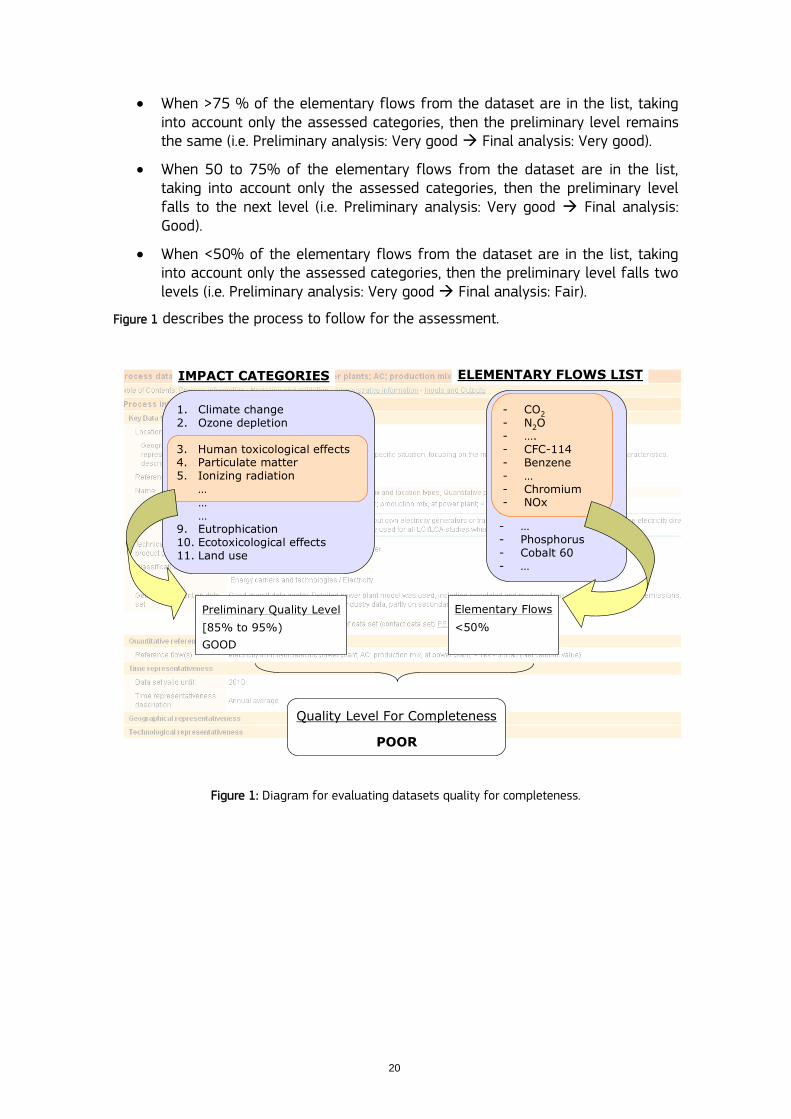
When >75 % of the elementary flows from the dataset are in the list, taking into account only the assessed categories, then the preliminary level remains the same (i.e. Preliminary analysis: Very good Final analysis: Very good).
When 50 to 75% of the elementary flows from the dataset are in the list, taking into account only the assessed categories, then the preliminary level falls to the next level (i.e. Preliminary analysis: Very good Final analysis: Good).
When <50% of the elementary flows from the dataset are in the list, taking into account only the assessed categories, then the preliminary level falls two levels (i.e. Preliminary analysis: Very good Final analysis: Fair).
Figure 1 describes the process to follow for the assessment.
1. Climate change2. Ozone depletion
1. Human toxicological effects2. Particulate matter/
respiratory inorganic3. Ionizing radiation
……
9. Eutrophication10. Ecotoxicological effects11. Land use
- CO2
- N2O- ….- CFC-114- Benzene- …- …- …- …- …- Phosphorus- Cobalt 60- …
3. Human toxicological effects4. Particulate matter5. Ionizing radiation
…
- CO2
- N2O- ….- CFC-114- Benzene- …- Chromium- NOx
Preliminary Quality Level
[85% to 95%)
GOOD
Elementary Flows
<50%
Quality Level For Completeness
POOR
IMPACT CATEGORIES ELEMENTARY FLOWS LIST
Figure 1: Diagram for evaluating datasets quality for completeness.
21
Table 4: The most relevant elementary flows in electricity production by technology. Impact category
Mix Hard coal Lignite Natural gas
Nuclear power Hydro power
Wind power
Biomass Solar (PV)
Climate change
Carbon dioxide, fossil
Carbon dioxide, fossil
Carbon dioxide, fossil
Carbon dioxide, fossil
Carbon dioxide, fossil
Carbon dioxide, fossil
Carbon dioxide, fossil
Carbon dioxide, fossil
Carbon dioxide, fossil
Methane, fossil
Methane, fossil
Methane, fossil
Methane, fossil
Ethane, 1,2-dichloro-1,1,2,2-tetrafluoro-, CFC-114
Methane, biogenic
Methane, fossil
Dinitrogen monoxide
Methane, fossil
Methane, tetrafluoro-, CFC-14
Ozone depletion
Methane, bromochlorodifluoro-, Halon 1211
Methane, bromochlorodifluoro-, Halon 1211
Methane, bromochlorodifluoro-, Halon 1211
Methane, bromochlorodifluoro-, Halon 1211
Ethane, 1,2-dichloro-1,1,2,2-tetrafluoro-, CFC-114
Methane, bromochlorodifluoro-, Halon 1211
Methane, dichlorodifluoro-, CFC-12
Methane, bromotrifluoro-, Halon 1301
Methane, chlorodifluoro-, HCFC-22
Methane, bromotrifluoro-, Halon 1301
Methane, bromotrifluoro-, Halon 1301
Methane, bromotrifluoro-, Halon 1301
Ethane, 1,2-dichloro-1,1,2,2-tetrafluoro-, CFC-114
Methane, bromotrifluoro-, Halon 1301
Methane, bromotrifluoro-, Halon 1301
Methane, bromochlorodifluoro-, Halon 1211
Methane, bromochlorodifluoro-, Halon 1211
Ethane, 1,2-dichloro-1,1,2,2-tetrafluoro-, CFC-114
Ethane, 1,2-dichloro-1,1,2,2-tetrafluoro-, CFC-114
Ethane, 1,2-dichloro-1,1,2,2-tetrafluoro-, CFC-114
Methane, bromochlorodifluoro-, Halon 1211
Ethane, 1,2-dichloro-1,1,2,2-tetrafluoro-, CFC-114
Human toxicity (cancer)
Chromium VI (w)
Mercury (a) Mercury (a) Mercury (a)
Chromium VI (w)
Chromium VI (w)
Chromium VI (w)
Chromium VI (w)
Chromium VI (w)
Chromium (a)
Chromium (a)
Chromium (a)
Chromium (a) Chromium (a)
Chromium (a)
Chromium (s)
Chromium VI (w)
Chromium VI (w)
Chromium VI (w)
Chromium (a)
Human toxicity (non cancer)
Mercury (a)
Mercury (a) Mercury (a) Mercury (a)
Zinc (a) Zinc (a) Mercury (a)
Zinc (s) Silver (a)
Zinc (a) Lead (a) Lead (a) Zinc (a) Arsenic (a) Lead (a) Zinc (a) Zinc (a) Lead (a)
Zinc (s) Mercury (w) Mercury (w) Lead (a) Lead (a) Mercury (a)
Lead (a) Mercury (a) Zinc (a)
Barium (w)
Mercury (a) Arsenic (a) Lead (a) Mercury (a)
Mercury (w)
Lead (w) Cadmium (a)
Arsenic (a)
Lead (a) Barium (w) Cadmium (a)
Arsenic (a)
Mercury (w) Antimony (w)
Particulate matter
PM2.5 um
PM2.5 um PM2.5 um PM2.5 um
PM2.5 um PM2.5 um
PM2.5 um PM2.5 um PM2.5 um
Sulfur dioxide
Sulfur dioxide
Sulfur dioxide
Sulfur dioxide
Sulfur dioxide Sulfur dioxide
Sulfur dioxide
Sulfur dioxide
Ionizing radiation (Human Health)
Radon-222
Radon-222 Radon-222 Radon-222
Radon-222 Radon-222
Radon-222
Radon-222 Radon-222
Carbon-14
Carbon-14 Carbon-14 Carbon-14
Carbon-14 Carbon-14
Carbon-14 Carbon-14 Carbon-14
Ionizing radiation (Ecosystems)
Carbon-14 (a)
Carbon-14 (a)
Carbon-14 (a)
Carbon-14 (a)
Carbon-14 (a) Carbon-14 (a)
Carbon-14 (a)
Carbon-14 (a)
Carbon-14 (a)
Cesium-137 (w)
Cesium-137 (w)
Cesium-137 (w)
Cesium-137 (w)
Photochemical ozone formation
Nitrogen oxides
Nitrogen oxides
Nitrogen oxides
Nitrogen oxides
Nitrogen oxides Nitrogen oxides
Nitrogen oxides
Nitrogen oxides
Nitrogen oxides
Sulfur dioxide
Sulfur dioxide
Sulfur dioxide
NMVOC NMVOC NMVOC NMVOC NMWOC NMWOC
NMVOC Sulfur dioxide
Sulfur dioxide
Acidification
Sulfur dioxide
Sulfur dioxide
Sulfur dioxide
Sulfur dioxide
Sulfur dioxide Sulfur dioxide
Sulfur dioxide
Sulfur dioxide
Sulfur dioxide
Nitrogen oxides
Nitrogen oxides
Nitrogen oxides
Nitrogen oxides
Nitrogen oxides Nitrogen oxides
Nitrogen oxides
Nitrogen oxides
Nitrogen oxides
Eutrophication (terrestrial)
Nitrogen oxides
Nitrogen oxides
Nitrogen oxides
Nitrogen oxides
Nitrogen oxides Nitrogen oxides
Nitrogen oxides
Nitrogen oxides
Nitrogen oxides
Eutrophication
Phosphate
Phosphate Phosphate Phosphate
Phosphate Phosphate
Phosphate Phosphate Phosphate
22
Impact category
Mix Hard coal Lignite Natural gas
Nuclear power Hydro power
Wind power
Biomass Solar (PV)
(freshwater)
Eutrophication (marine)
Nitrogen oxides
Nitrogen oxides
Nitrogen oxides
Nitrogen oxides
Nitrogen oxides Nitrogen oxides
Nitrogen oxides
Nitrogen oxides
Nitrogen oxides
Nitrate (w)
Ecotoxicity (freshwater)
Chromium VI (w)
Chromium VI (w)
Chromium VI (w)
Chromium VI (w)
Chromium VI (w)
Chromium VI (w)
Zinc (a) Antimony (w)
Antimony (w)
Mercury (w) Mercury (w) Antimony (w)
Vanadium (a) Cobalt (w)
Zinc (s) Chromium VI (w)
Cobalt (w)
Arsenic (a) Arsenic (a) Barium (s)
Antimony (w) Antimony (w)
Chromium VI (w)
Silver (a)
Vanadium (a)
Mercury (a) Mercury (a) Copper (a) Zinc (a) Chromium (s)
Copper (a)
Barium (w)
Barium (w) Chromium (a)
Cobalt (w)
Selenium (w)
Chromium (a) Zinc (a)
Resource depletion (minerals, fossil & renewable)
Uranium Uranium Uranium Fluorspar Uranium Molybdenum
Molybdenum
Indium Indium
Indium Indium Indium Indium Indium Indium Tin
Coal (hard) Coal (hard) Natural gas
Uranium Fluorspar Uranium
Iron Uranium Lead
Zinc Lead Cadmium
Cadmium
Zinc
Resource depletion (water)
Water, river
Water, river Water, river Water, river
Water, river Water, river
Water, nat. origin
Water, river Water, river
Water, natural origin (unesp)
Water, natural origin (unesp)
Land use
Land Occupation
Land Occupation
Land Occupation
Land Occupation
Land Occupation
Land Occupation
Land Occupation
Land Occupation
Land Occupation
Land Transformation
Land Transformation
Land Transformation
Land Transformation
Land Transformation
Land Transformation
Land Transformation
Land Transformation
Land Transformation
23
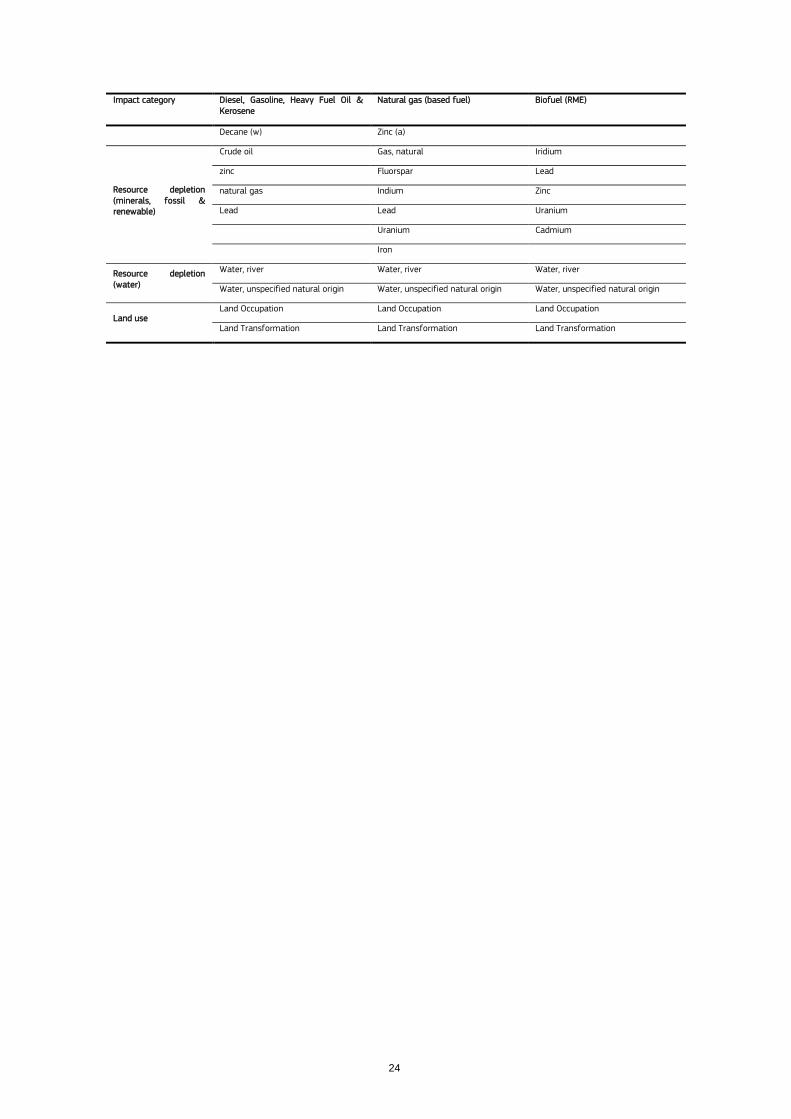
Table 5: The most relevant elementary flows in crude oil based fuels, natural gas and RME production. Impact category Diesel, Gasoline, Heavy Fuel Oil &
Kerosene Natural gas (based fuel) Biofuel (RME)
Climate change Carbon dioxide, fossil Carbon dioxide, fossil Carbon dioxide, fossil
Methane, fossil Methane, fossil Dinitrogen monoxide
Ozone depletion
Methane, trichlorofluoro-, CFC-11 Methane, bromochlorodifluoro-, Halon 1211
Methane, tetrachloro-, CFC-10
Ethane, 1,2-dichloro-1,1,2,2-tetrafluoro-, CFC-114
Methane, bromotrifluoro-, Halon 1301
Methane, dichlorodifluoro-, CFC-12
Methane, bromochlorodifluoro-, Halon 1211
Human toxicity (cancer)
Chromium (w) Chromium (w) Chromium VI (w)
Chromium (s) Chromium (s)
Chromium (a) Mercury (s)
Chromium (a)
Human toxicity (non cancer)
Mercury (a) Mercury (a) Zinc (s)
Zinc (a) Zinc (a) Mercury (s)
Zinc (s) Lead (a)
Lead (a) Barium (s)
Arsenic (a)
Particulate matter
Particulates, < 2.5 um Particulates, < 2.5 um Ammonia
Sulfur dioxide Sulfur dioxide Particulates, < 2.5 um
Nitrogen oxides Nitrogen oxides Sulfur dioxide
Ionizing radiation (Human Health)
Carbon-14 (a) Carbon-14 (a) Carbon-14 (a)
Cesium-137 (w) Radon-222 (a) Radon-222 (a)
Iodine-129 (w)
Radon-222 (a)
Cobalt-60 (w)
Ionizing radiation (Ecosystems)
Carbon-14 (a) Carbon-14 (a) Carbon-14 (a)
Cesium-137 (w) Cesium-137 (w) Cesium-137 (w)
Hydrogen-3, Tritium (w)
Cobalt-60 (w)
Carbon-14 (w)
Photochemical ozone formation
Nitrogen oxides Nitrogen oxides Nitrogen oxides
Sulfur dioxide Sulfur dioxide NMVOC, unspecified origin
NMVOC, unspecified origin NMVOC, unspecified origin
Propane
Acidification Sulfur dioxide Sulfur dioxide Ammonia
Nitrogen oxides Nitrogen oxides Nitrogen oxides
Eutrophication (terrestrial)
Nitrogen oxides Nitrogen oxides Ammonia
Nitrogen oxides
Eutrophication (freshwater) Phosphate
Phosphate Phosphate
Eutrophication (marine) Nitrogen oxides Nitrogen oxides Nitrogen oxides
Nitrate (w)
Ecotoxicity (freshwater)
Vanadium (a) Chromium VI (w) Zinc (s)
Copper (w) Antimony (w) Copper (s)
Chromium (w) Barium (s) Cypermethrin (s)
Chromium (s) Zinc (s) Chromium VI (w)
24
Impact category Diesel, Gasoline, Heavy Fuel Oil & Kerosene
Natural gas (based fuel) Biofuel (RME)
Decane (w) Zinc (a)
Resource depletion (minerals, fossil & renewable)
Crude oil Gas, natural Iridium
zinc Fluorspar Lead
natural gas Indium Zinc
Lead Lead Uranium
Uranium Cadmium
Iron
Resource depletion (water)
Water, river Water, river Water, river
Water, unspecified natural origin Water, unspecified natural origin Water, unspecified natural origin
Land use Land Occupation Land Occupation Land Occupation
Land Transformation Land Transformation Land Transformation
25
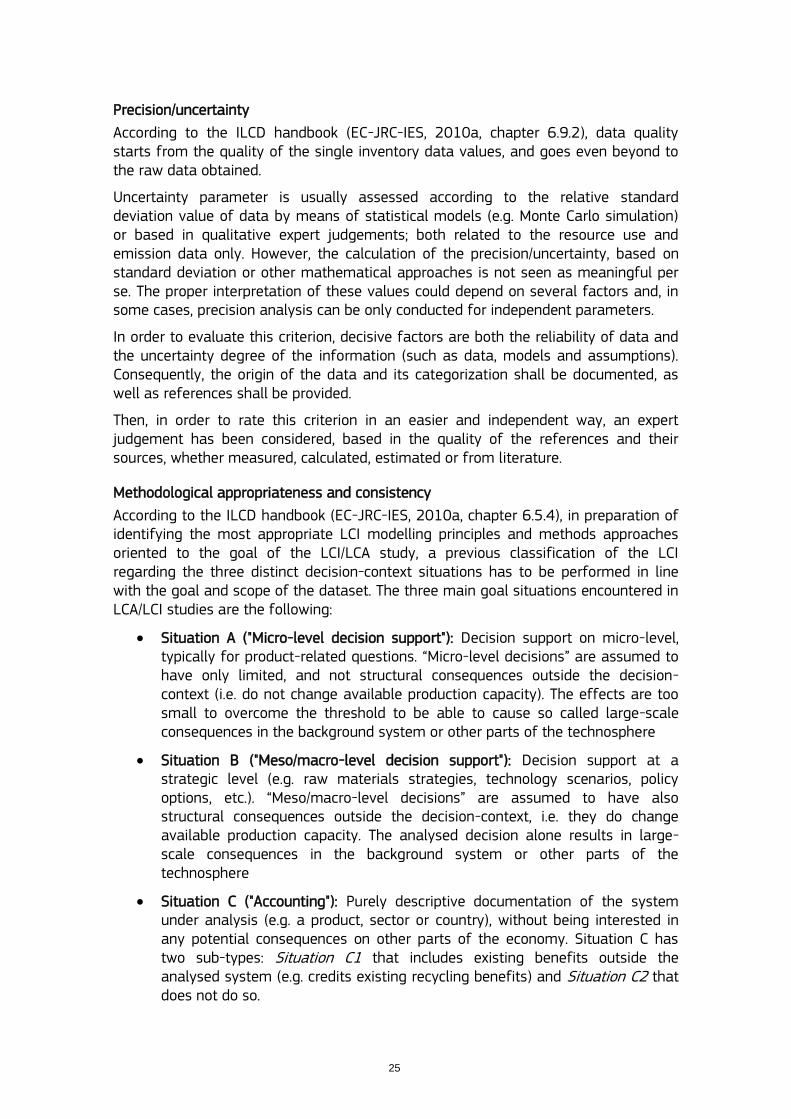
Precision/uncertainty
According to the ILCD handbook (EC-JRC-IES, 2010a, chapter 6.9.2), data quality starts from the quality of the single inventory data values, and goes even beyond to the raw data obtained.
Uncertainty parameter is usually assessed according to the relative standard deviation value of data by means of statistical models (e.g. Monte Carlo simulation) or based in qualitative expert judgements; both related to the resource use and emission data only. However, the calculation of the precision/uncertainty, based on standard deviation or other mathematical approaches is not seen as meaningful per se. The proper interpretation of these values could depend on several factors and, in some cases, precision analysis can be only conducted for independent parameters.
In order to evaluate this criterion, decisive factors are both the reliability of data and the uncertainty degree of the information (such as data, models and assumptions). Consequently, the origin of the data and its categorization shall be documented, as well as references shall be provided.
Then, in order to rate this criterion in an easier and independent way, an expert judgement has been considered, based in the quality of the references and their sources, whether measured, calculated, estimated or from literature.
Methodological appropriateness and consistency
According to the ILCD handbook (EC-JRC-IES, 2010a, chapter 6.5.4), in preparation of identifying the most appropriate LCI modelling principles and methods approaches oriented to the goal of the LCI/LCA study, a previous classification of the LCI regarding the three distinct decision-context situations has to be performed in line with the goal and scope of the dataset. The three main goal situations encountered in LCA/LCI studies are the following:
Situation A ("Micro-level decision support"): Decision support on micro-level, typically for product-related questions. “Micro-level decisions” are assumed to have only limited, and not structural consequences outside the decision-context (i.e. do not change available production capacity). The effects are too small to overcome the threshold to be able to cause so called large-scale consequences in the background system or other parts of the technosphere
Situation B ("Meso/macro-level decision support"): Decision support at a strategic level (e.g. raw materials strategies, technology scenarios, policy options, etc.). “Meso/macro-level decisions” are assumed to have also structural consequences outside the decision-context, i.e. they do change available production capacity. The analysed decision alone results in large-scale consequences in the background system or other parts of the technosphere
Situation C ("Accounting"): Purely descriptive documentation of the system under analysis (e.g. a product, sector or country), without being interested in any potential consequences on other parts of the economy. Situation C has two sub-types: Situation C1 that includes existing benefits outside the analysed system (e.g. credits existing recycling benefits) and Situation C2 that does not do so.

26
To evaluate this criterion, a consistent application of the recommended LCI modelling framework and LCI method approaches for the given situation, according to the ILCD Handbook, has been used. The assessment has been based on the following three issues:
System boundaries: Datasets must consider a „cradle-to-grave‟ scenario, that is to say, from raw materials extraction to electricity production at plant. The use of „grave‟ instead of „gate‟ is to consider the process of End of Life of the energy facilities.
End of Life (EoL) modelling: Datasets have to take into account the end of the useful life and the potential undergo, reuse, recycling or recovering. In case of these energy datasets, the EoL stage begins when the technology is discarded and the decommissioning of the facility is carried out.
Multifunctionality: The production of electricity, crude oil products, natural gas or biofuels, could be a multifunctionality process. According to the different situation contexts defined in the ILCD Handbook (EC-JRC-IES, 2010a), energy datasets have been classified as situation A, so, this procedure must be solved by means of allocation.
Depending of the type of dataset, allocation procedure can be different in each multifunctional-stage of the production process. As datasets correspond to energy production, the energy/exergy allocation method has been usually the most common assumed and valued. The following table resumes the considered allocations methods for each dataset, regarding the potential possibility of multifunctionality.
Table 6: Allocation procedures considered for each energy dataset.
Dataset Multifunctionality? Allocation procedure
Electricity mix YES: Heat Energy/exergy, economic , mass
Electricity from hard coal YES: Heat, mineral co-products
Energy/exergy, economic , mass
Electricity from lignite YES: Heat, mineral co-products
Energy/exergy, economic, mass
Electricity from natural gas YES: Heat, other co-products
Energy/exergy, economic , mass
Electricity from nuclear power NO -
Electricity from hydro power NO -
Electricity from biomass YES: Heat, other co-products
Energy/exergy, economic, mass
Electricity from wind power NO -
Electricity from solar power (PV) YES: Silica co-products Mass, economic
Crude oil based fuels YES: Refined products / electricity / heat
Energy/exergy
Natural gas based fuel YES: Heat Energy/exergy
Biofuel: Rapeseed Methyl Ester YES: Glycerin / meal Energy (as recommended in RED 2009)
Finally, Table 7 summarises the rating and the quality parameters defined for assessing each quality indicator.
In the following sections of the document, the results of the detailed analysis of the selected energy datasets are shown.
27
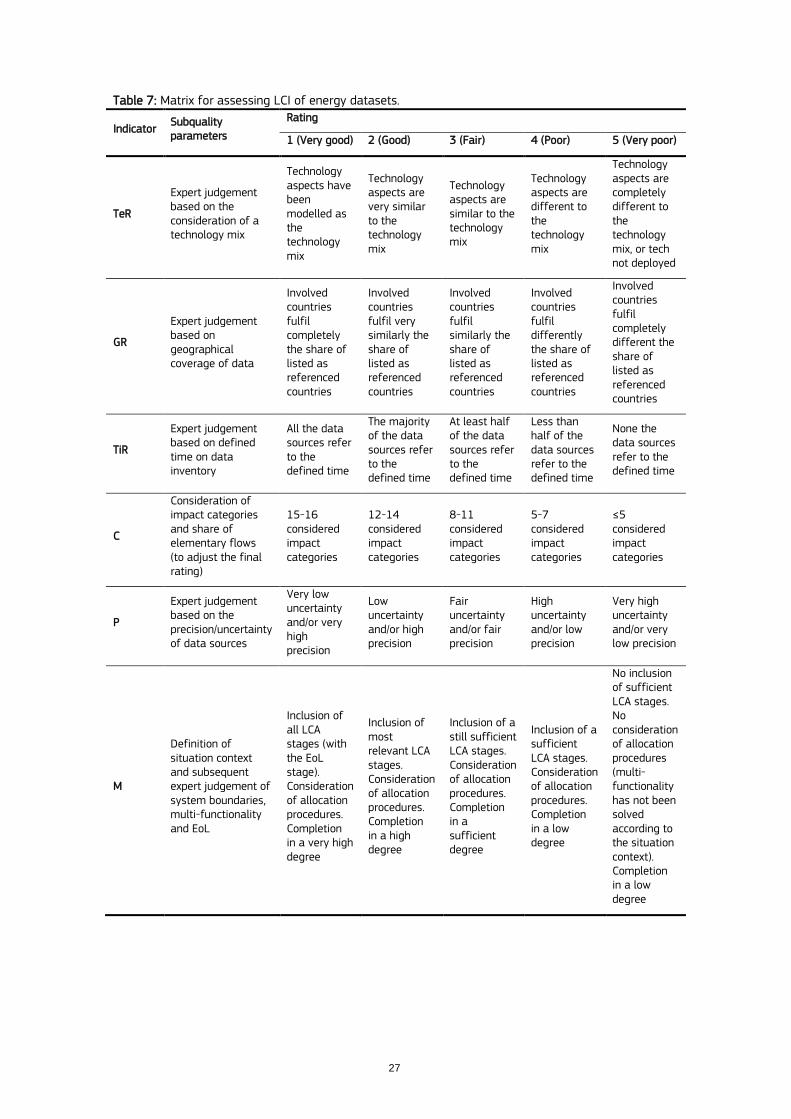
Table 7: Matrix for assessing LCI of energy datasets.
Indicator Subquality parameters
Rating
1 (Very good) 2 (Good) 3 (Fair) 4 (Poor) 5 (Very poor)
TeR
Expert judgement based on the consideration of a technology mix
Technology aspects have been modelled as the technology mix
Technology aspects are very similar to the technology mix
Technology aspects are similar to the technology mix
Technology aspects are different to the technology mix
Technology aspects are completely different to the technology mix, or tech not deployed
GR
Expert judgement based on geographical coverage of data
Involved countries fulfil completely the share of listed as referenced countries
Involved countries fulfil very similarly the share of listed as referenced countries
Involved countries fulfil similarly the share of listed as referenced countries
Involved countries fulfil differently the share of listed as referenced countries
Involved countries fulfil completely different the share of listed as referenced countries
TiR
Expert judgement based on defined time on data inventory
All the data sources refer to the defined time
The majority of the data sources refer to the defined time
At least half of the data sources refer to the defined time
Less than half of the data sources refer to the defined time
None the data sources refer to the defined time
C
Consideration of impact categories and share of elementary flows (to adjust the final rating)
15-16 considered impact categories
12-14 considered impact categories
8-11 considered impact categories
5-7 considered impact categories
≤5 considered impact categories
P
Expert judgement based on the precision/uncertainty of data sources
Very low uncertainty and/or very high precision
Low uncertainty and/or high precision
Fair uncertainty and/or fair precision
High uncertainty and/or low precision
Very high uncertainty and/or very low precision
M
Definition of situation context and subsequent expert judgement of system boundaries, multi-functionality and EoL
Inclusion of all LCA stages (with the EoL stage). Consideration of allocation procedures. Completion in a very high degree
Inclusion of most relevant LCA stages. Consideration of allocation procedures. Completion in a high degree
Inclusion of a still sufficient LCA stages. Consideration of allocation procedures. Completion in a sufficient degree
Inclusion of a sufficient LCA stages. Consideration of allocation procedures. Completion in a low degree
No inclusion of sufficient LCA stages. No consideration of allocation procedures (multi-functionality has not been solved according to the situation context). Completion in a low degree
28
3. Evaluation: Electricity datasets It should be noticed that only one dataset of each technology has been included in this report in order to show the full application of the evaluation method. After each evaluation, a section of findings and recommendations is presented, where a summary table of the assessment of all selected datasets is shown.
3.1. Electricity mix
Evaluation: EU-27
ELCD database Electricity grid mix 1kV - 60kV, EU-27 (AC, technology mix | consumption mix, at consumer)
General comments and/or relevant information
The functional unit of the dataset refers to the production of one kWh, and represents the average country or region specific electricity supply for final consumers, including electricity own consumption, transmission & distribution losses and electricity imports from neighbouring countries. The national energy carrier mixes used for electricity production, the power plant efficiency data, shares on direct to combined heat and power generation (CHP), as well as transmission/distribution losses and own consumption are taken from official statistics (International Energy Agency) for the corresponding reference year. Detailed power plant models were used, which combine measured (e.g. NOx) with calculated emission values (e.g. heavy metals). The inventory is partly based on primary industry data, partly on secondary literature data.
The coverage of the exploration and well installation data (crude oil, natural gas, natural gas liquids) are only 90% of mass and energy and 95% of the environmental relevance (according to expert judgment). End-of-Life of the PV-modules is not included in the LCA-model. Waste is entering the Waste-to-Energy product system without any environmental burden (burdens are allocated to the primary life cycle of the product in which the waste is generated, e.g. burdens of packing material becoming waste are allocated to the product).
Energy carrier specific power plants are modelled according to the national / regional firing and flue gas cleaning technology mix. Data measured at representative power plants and being published, have been used to represent the country / region mix of power plant technologies. Also for electricity from non-combustion renewable energy sources, like wind, hydro, solar (photovoltaic) and geothermal, specific LCA models are developed and used.
According to the dataset information and the document provided by the database developers (PE, 2012a), for the national grid mixes and the EU grid mix, the share of electricity from individual energy sources and the transmission system are taken from International Energy Agency (IEA) statistics (IEA 2010a, 2010b, 2010c), considered as an Authoritative Source.
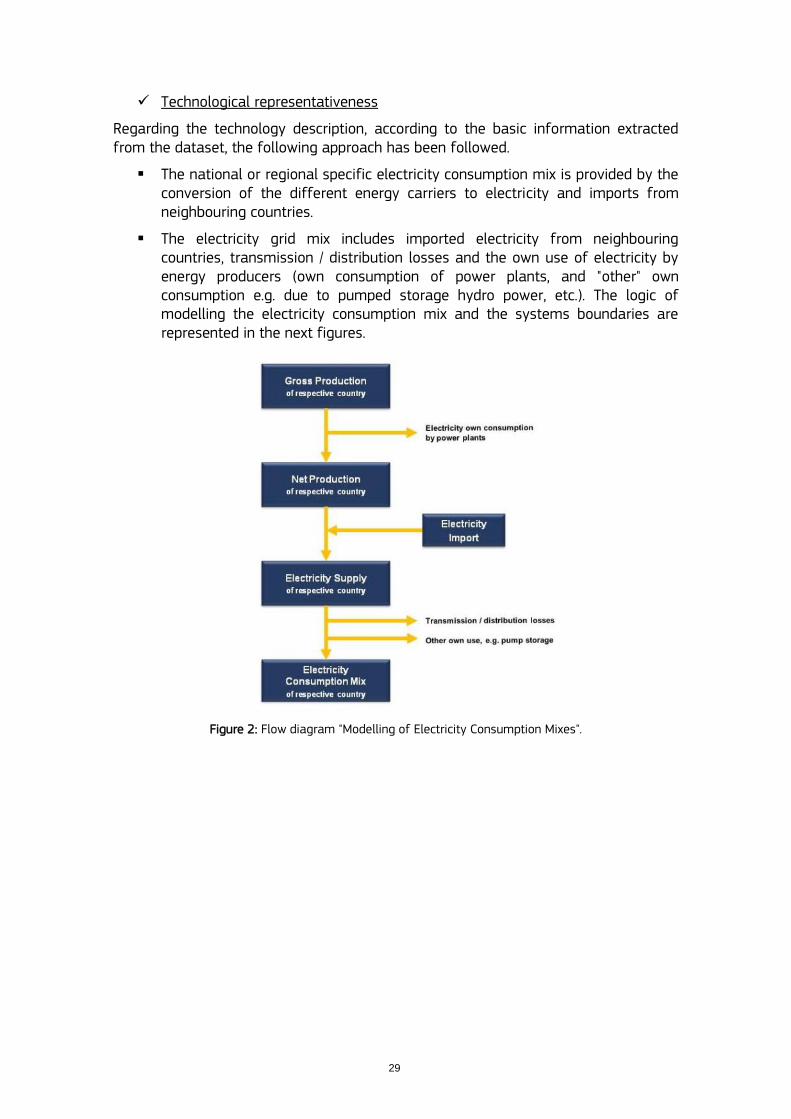
29
Technological representativeness
Regarding the technology description, according to the basic information extracted from the dataset, the following approach has been followed.
The national or regional specific electricity consumption mix is provided by the conversion of the different energy carriers to electricity and imports from neighbouring countries.
The electricity grid mix includes imported electricity from neighbouring countries, transmission / distribution losses and the own use of electricity by energy producers (own consumption of power plants, and "other" own consumption e.g. due to pumped storage hydro power, etc.). The logic of modelling the electricity consumption mix and the systems boundaries are represented in the next figures.
Figure 2: Flow diagram "Modelling of Electricity Consumption Mixes".
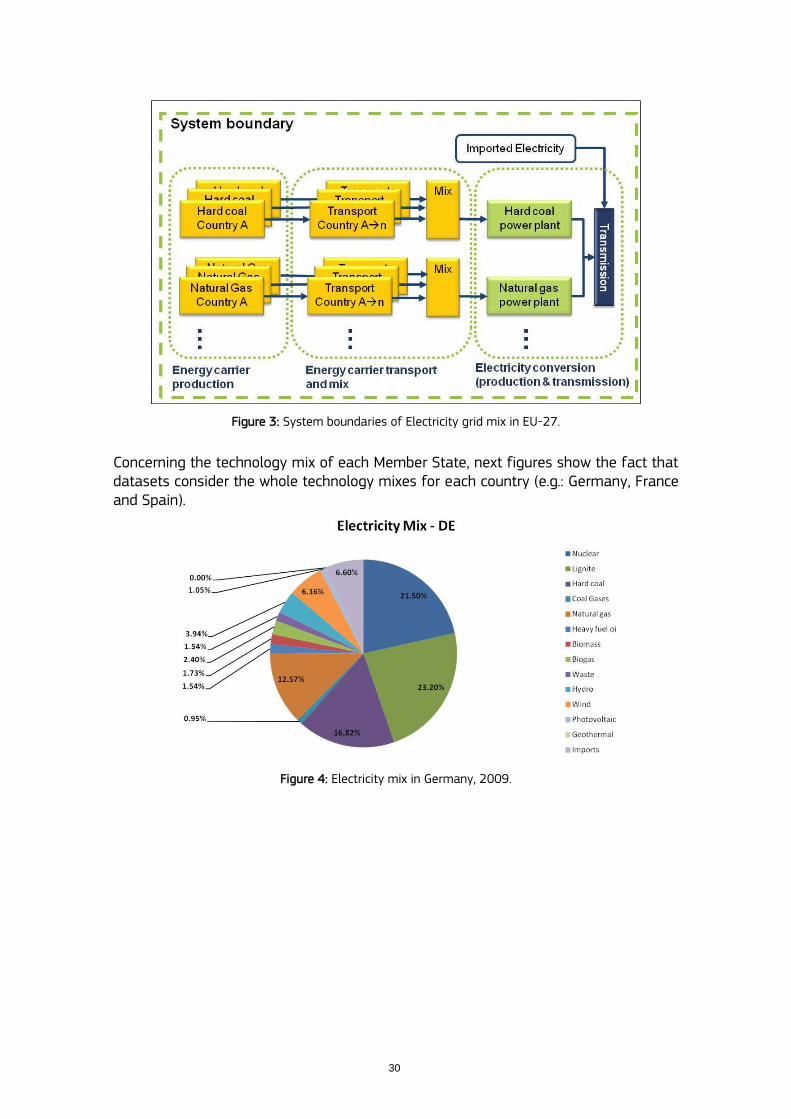
30
Figure 3: System boundaries of Electricity grid mix in EU-27.
Concerning the technology mix of each Member State, next figures show the fact that datasets consider the whole technology mixes for each country (e.g.: Germany, France and Spain).
Figure 4: Electricity mix in Germany, 2009.
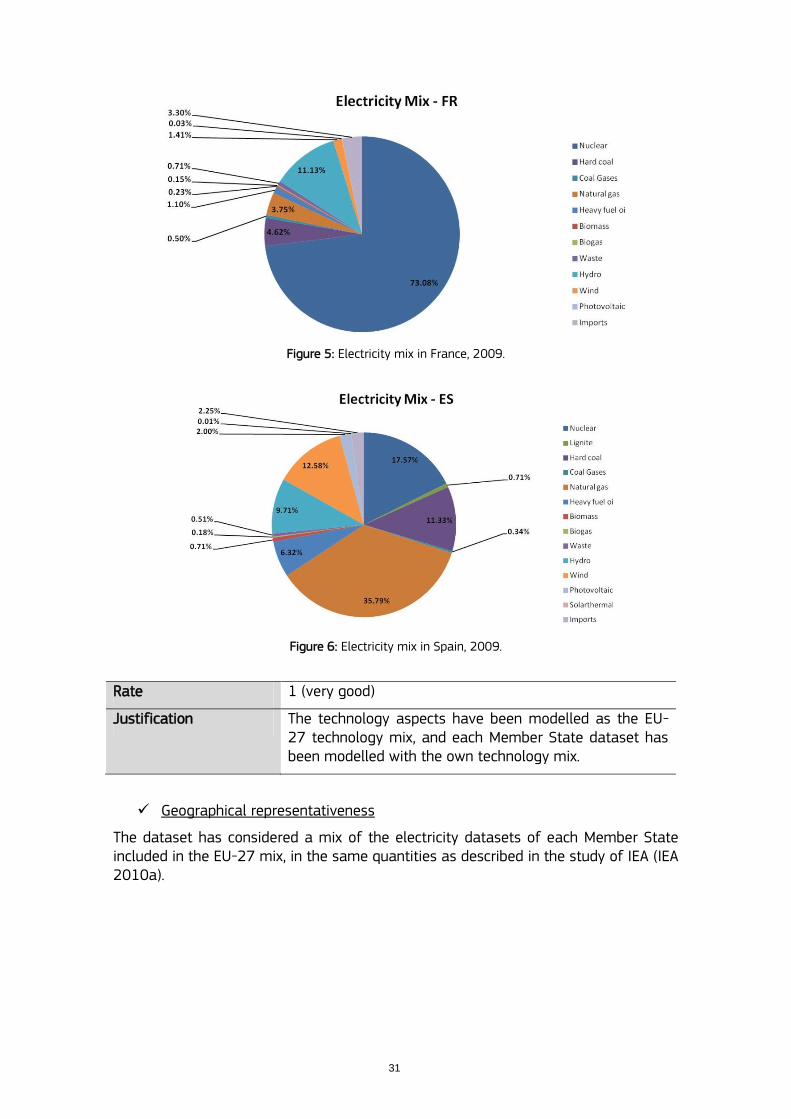
31
Figure 5: Electricity mix in France, 2009.
Figure 6: Electricity mix in Spain, 2009.
Rate 1 (very good)
Justification The technology aspects have been modelled as the EU-27 technology mix, and each Member State dataset has been modelled with the own technology mix.
Geographical representativeness
The dataset has considered a mix of the electricity datasets of each Member State included in the EU-27 mix, in the same quantities as described in the study of IEA (IEA 2010a).
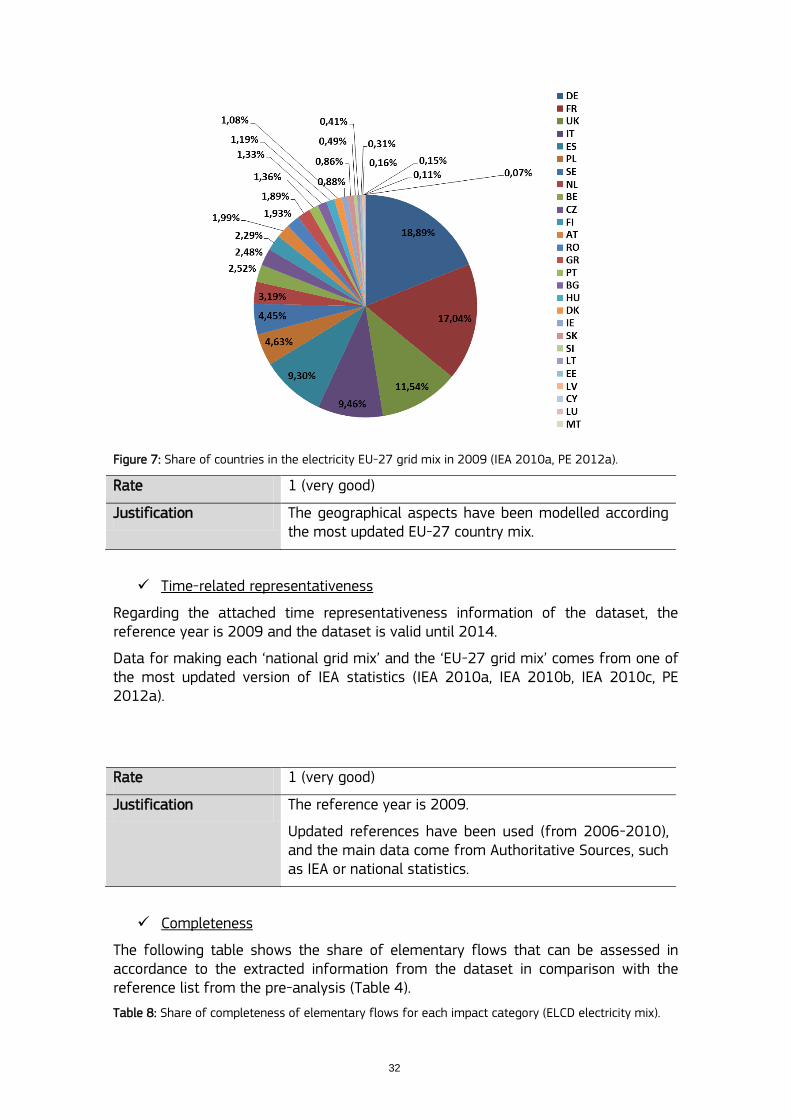
32
Figure 7: Share of countries in the electricity EU-27 grid mix in 2009 (IEA 2010a, PE 2012a).
Rate 1 (very good)
Justification The geographical aspects have been modelled according the most updated EU-27 country mix.
Time-related representativeness
Regarding the attached time representativeness information of the dataset, the reference year is 2009 and the dataset is valid until 2014.
Data for making each „national grid mix‟ and the „EU-27 grid mix‟ comes from one of the most updated version of IEA statistics (IEA 2010a, IEA 2010b, IEA 2010c, PE 2012a).
Rate 1 (very good)
Justification The reference year is 2009.
Updated references have been used (from 2006-2010), and the main data come from Authoritative Sources, such as IEA or national statistics.
Completeness
The following table shows the share of elementary flows that can be assessed in accordance to the extracted information from the dataset in comparison with the reference list from the pre-analysis (Table 4).
Table 8: Share of completeness of elementary flows for each impact category (ELCD electricity mix).
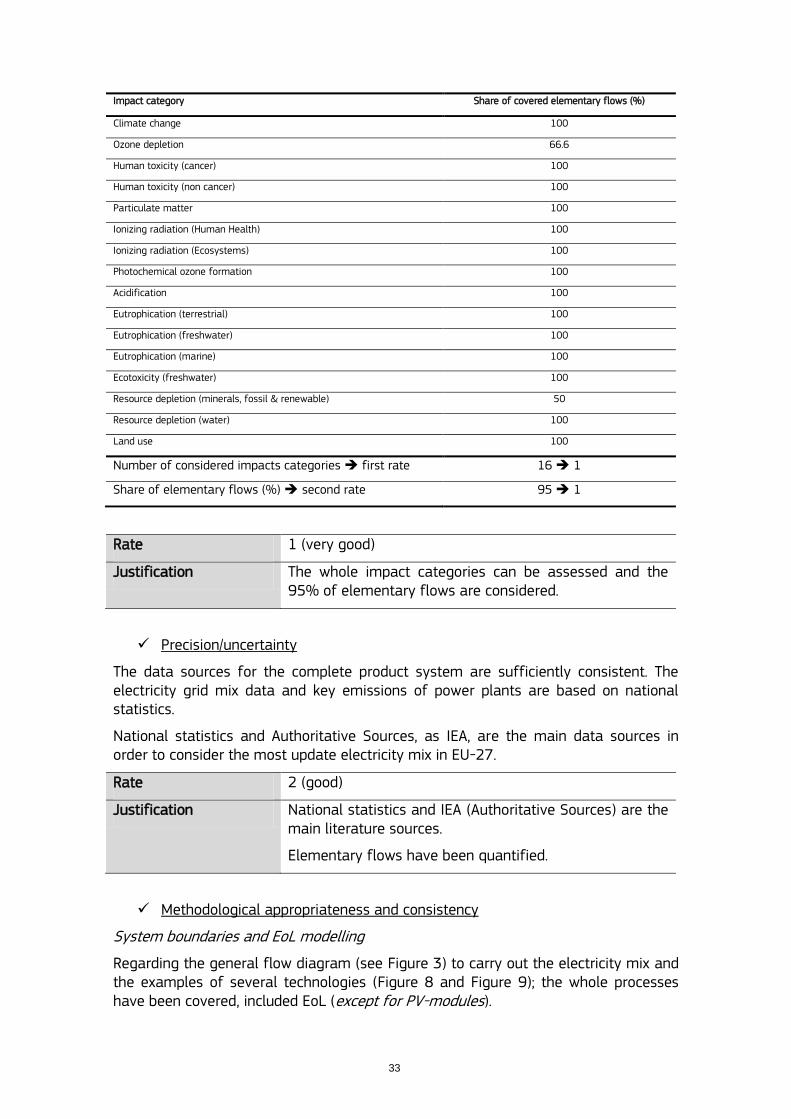
33
Impact category Share of covered elementary flows (%)
Climate change 100
Ozone depletion 66.6
Human toxicity (cancer) 100
Human toxicity (non cancer) 100
Particulate matter 100
Ionizing radiation (Human Health) 100
Ionizing radiation (Ecosystems) 100
Photochemical ozone formation 100
Acidification 100
Eutrophication (terrestrial) 100
Eutrophication (freshwater) 100
Eutrophication (marine) 100
Ecotoxicity (freshwater) 100
Resource depletion (minerals, fossil & renewable) 50
Resource depletion (water) 100
Land use 100
Number of considered impacts categories first rate 16 1
Share of elementary flows (%) second rate 95 1
Rate 1 (very good)
Justification The whole impact categories can be assessed and the 95% of elementary flows are considered.
Precision/uncertainty
The data sources for the complete product system are sufficiently consistent. The electricity grid mix data and key emissions of power plants are based on national statistics.
National statistics and Authoritative Sources, as IEA, are the main data sources in order to consider the most update electricity mix in EU-27.
Rate 2 (good)
Justification National statistics and IEA (Authoritative Sources) are the main literature sources.
Elementary flows have been quantified.
Methodological appropriateness and consistency
System boundaries and EoL modelling
Regarding the general flow diagram (see Figure 3) to carry out the electricity mix and the examples of several technologies (Figure 8 and Figure 9); the whole processes have been covered, included EoL (except for PV-modules).
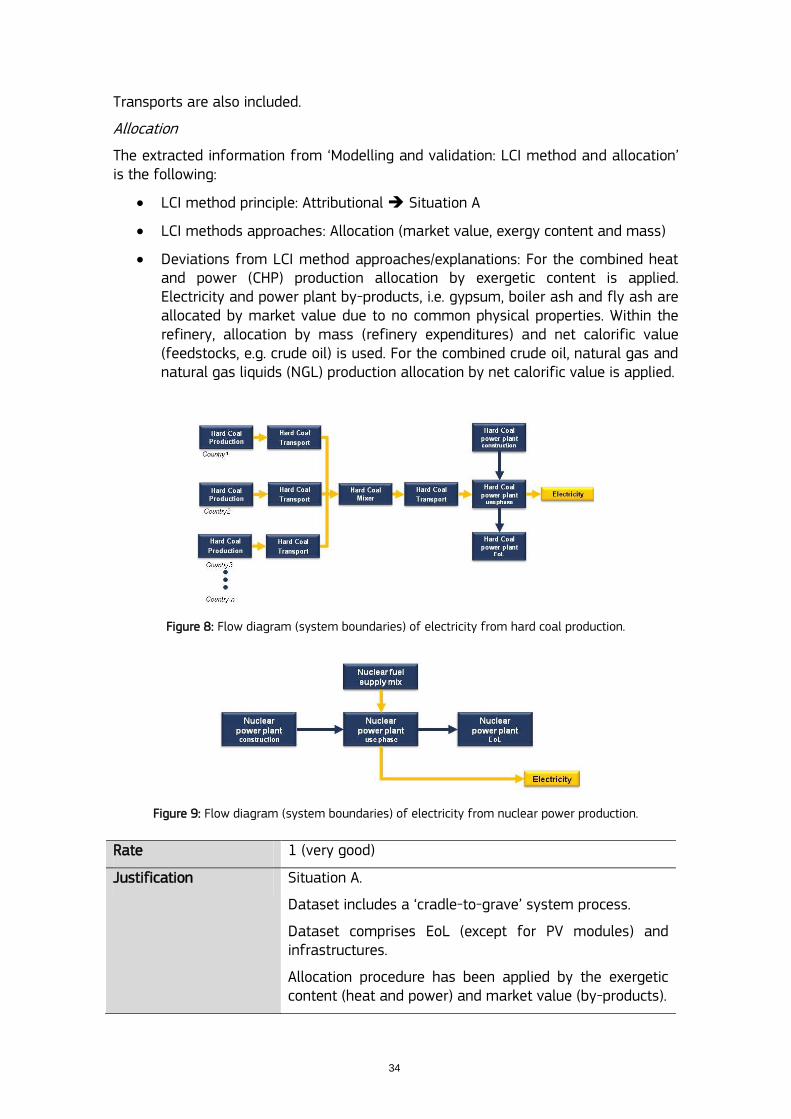
34
Transports are also included.
Allocation
The extracted information from „Modelling and validation: LCI method and allocation‟ is the following:
LCI method principle: Attributional Situation A
LCI methods approaches: Allocation (market value, exergy content and mass)
Deviations from LCI method approaches/explanations: For the combined heat and power (CHP) production allocation by exergetic content is applied. Electricity and power plant by-products, i.e. gypsum, boiler ash and fly ash are allocated by market value due to no common physical properties. Within the refinery, allocation by mass (refinery expenditures) and net calorific value (feedstocks, e.g. crude oil) is used. For the combined crude oil, natural gas and natural gas liquids (NGL) production allocation by net calorific value is applied.
Figure 8: Flow diagram (system boundaries) of electricity from hard coal production.
Figure 9: Flow diagram (system boundaries) of electricity from nuclear power production.
Rate 1 (very good)
Justification Situation A.
Dataset includes a „cradle-to-grave‟ system process.
Dataset comprises EoL (except for PV modules) and infrastructures.
Allocation procedure has been applied by the exergetic content (heat and power) and market value (by-products).
35
Ecoinvent database Electricity, medium voltage, production RER, at grid/kWh/RER (< 50 kV)
General comments and/or relevant information
The functional unit of the dataset refers to the production of one kWh.
This dataset describes the transformation from high to medium voltage as well as the transmission of electricity at medium voltage. It includes the shares of national electricity production of UCTE member countries (in 2000) at the busbar. It does not include transformation, transport nor distribution losses. Included processes are the electricity production in Europe, the transmission network and direct SF6-emissions to air. Electricity losses during medium-voltage transmission and transformation from high-voltage are accounted for.
Electricity net production shares by the member countries are based on annual averages. Total production does not exactly match with production reported in UCTE statistical yearbook 2000 because national statistics of individual countries are used.
The main data sources used to describe the mixes are national statistics and communications, and statistics of international organisations (such as CENTREL 2001; EURELECTRIC 2001; IEA 2001; IEA/OECD 2002; NORDEL 2001; UCTE 2001), considered as Authoritative Sources:
CENTREL was a cooperative group of four electricity transmission systems operators located in the formerly Soviet-held regions of Eastern Europe.
EURELECTRIC is the Union of the Electricity Industry-Eurelectric, a sector association that represents the interests of the European electrical power industry
IEA is the International Energy Agency.
OECD is the Organisation for Economic Cooperation and Development.
NORDEL is a body for cooperation between the transmission system operators in Denmark, Finland, Iceland, Norway and Sweden.
UCTE (Union for the Co-ordination of Transmission of Electricity) is the association of transmission system operators in continental Europe, providing a reliable market base by efficient and secure electric „power highways‟.
Technological representativeness
Regarding the technology description about electricity mix and network described in the LCI report (Ecoinvent, 2007) and the extracted information from the dataset description, the following approach has been considered:
Average technology used to transmit and distribute electricity. It includes underground and overhead lines, as well as air-, vacuum- and SF6-insulated high-to-medium voltage switching stations. No technology description is provided because the dataset just describes the power plant portfolio of the respective country using 2004 average technology per energy carrier.
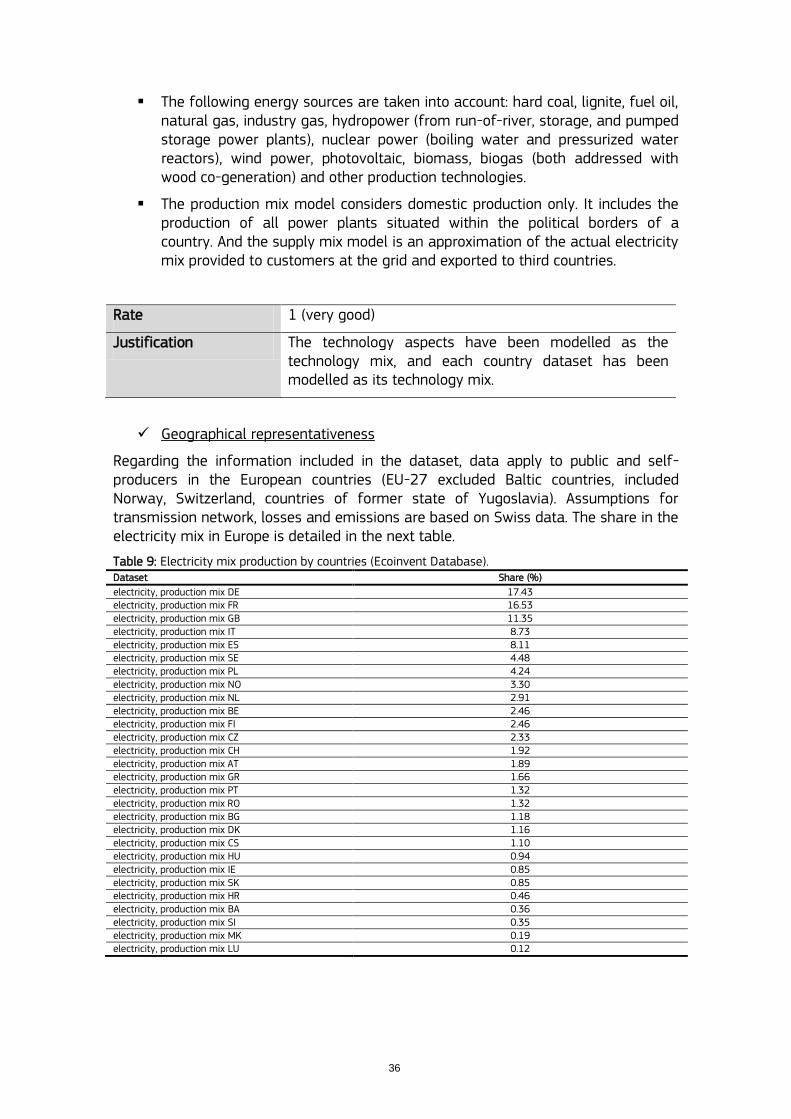
36
The following energy sources are taken into account: hard coal, lignite, fuel oil, natural gas, industry gas, hydropower (from run-of-river, storage, and pumped storage power plants), nuclear power (boiling water and pressurized water reactors), wind power, photovoltaic, biomass, biogas (both addressed with wood co-generation) and other production technologies.
The production mix model considers domestic production only. It includes the production of all power plants situated within the political borders of a country. And the supply mix model is an approximation of the actual electricity mix provided to customers at the grid and exported to third countries.
Rate 1 (very good)
Justification The technology aspects have been modelled as the technology mix, and each country dataset has been modelled as its technology mix.
Geographical representativeness
Regarding the information included in the dataset, data apply to public and self-producers in the European countries (EU-27 excluded Baltic countries, included Norway, Switzerland, countries of former state of Yugoslavia). Assumptions for transmission network, losses and emissions are based on Swiss data. The share in the electricity mix in Europe is detailed in the next table.
Table 9: Electricity mix production by countries (Ecoinvent Database). Dataset Share (%)
electricity, production mix DE 17.43 electricity, production mix FR 16.53 electricity, production mix GB 11.35 electricity, production mix IT 8.73 electricity, production mix ES 8.11 electricity, production mix SE 4.48 electricity, production mix PL 4.24 electricity, production mix NO 3.30 electricity, production mix NL 2.91 electricity, production mix BE 2.46 electricity, production mix FI 2.46 electricity, production mix CZ 2.33 electricity, production mix CH 1.92 electricity, production mix AT 1.89 electricity, production mix GR 1.66 electricity, production mix PT 1.32 electricity, production mix RO 1.32 electricity, production mix BG 1.18 electricity, production mix DK 1.16 electricity, production mix CS 1.10 electricity, production mix HU 0.94 electricity, production mix IE 0.85 electricity, production mix SK 0.85 electricity, production mix HR 0.46 electricity, production mix BA 0.36 electricity, production mix SI 0.35 electricity, production mix MK 0.19 electricity, production mix LU 0.12
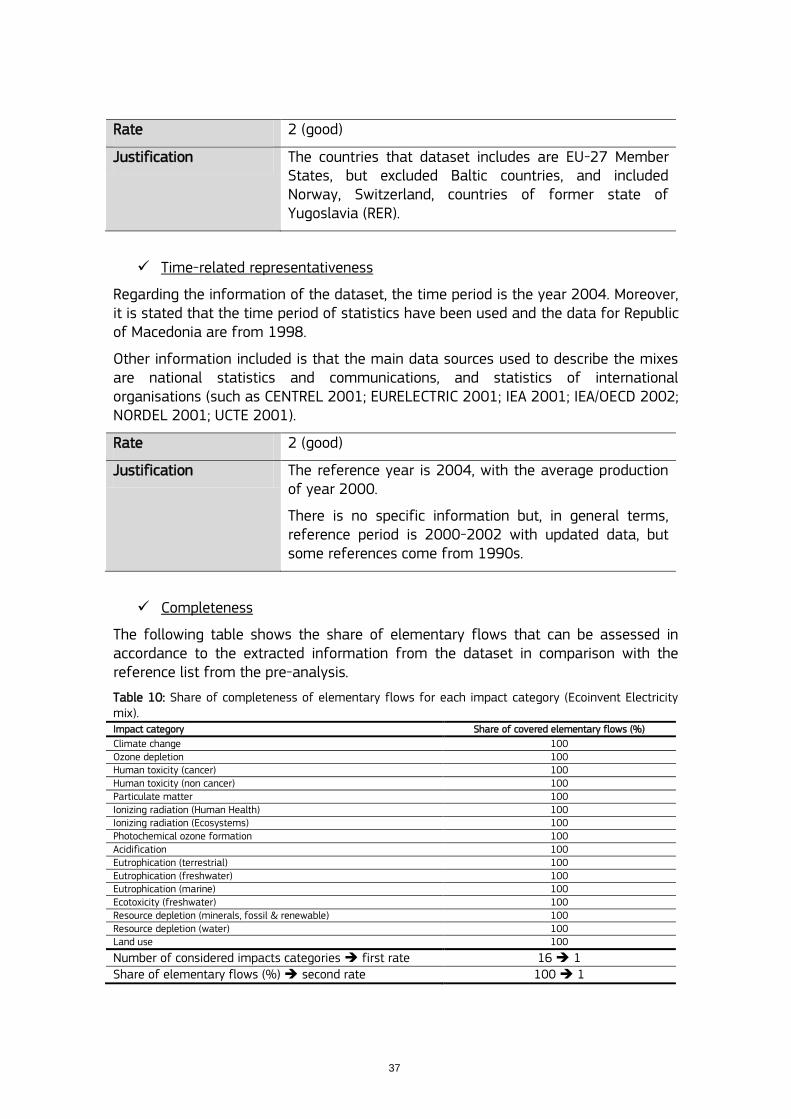
37
Rate 2 (good)
Justification The countries that dataset includes are EU-27 Member States, but excluded Baltic countries, and included Norway, Switzerland, countries of former state of Yugoslavia (RER).
Time-related representativeness
Regarding the information of the dataset, the time period is the year 2004. Moreover, it is stated that the time period of statistics have been used and the data for Republic of Macedonia are from 1998.
Other information included is that the main data sources used to describe the mixes are national statistics and communications, and statistics of international organisations (such as CENTREL 2001; EURELECTRIC 2001; IEA 2001; IEA/OECD 2002; NORDEL 2001; UCTE 2001).
Rate 2 (good)
Justification The reference year is 2004, with the average production of year 2000.
There is no specific information but, in general terms, reference period is 2000-2002 with updated data, but some references come from 1990s.
Completeness
The following table shows the share of elementary flows that can be assessed in accordance to the extracted information from the dataset in comparison with the reference list from the pre-analysis.
Table 10: Share of completeness of elementary flows for each impact category (Ecoinvent Electricity mix). Impact category Share of covered elementary flows (%)
Climate change 100 Ozone depletion 100 Human toxicity (cancer) 100 Human toxicity (non cancer) 100 Particulate matter 100 Ionizing radiation (Human Health) 100 Ionizing radiation (Ecosystems) 100 Photochemical ozone formation 100 Acidification 100 Eutrophication (terrestrial) 100 Eutrophication (freshwater) 100 Eutrophication (marine) 100 Ecotoxicity (freshwater) 100 Resource depletion (minerals, fossil & renewable) 100 Resource depletion (water) 100 Land use 100
Number of considered impacts categories first rate 16 1 Share of elementary flows (%) second rate 100 1
38
Rate 1 (very good)
Justification The whole impact categories can be assessed and the 100% of elementary flows are considered
Precision/uncertainty
Regarding the extracted information form the dataset, the sources are some measured, but most of them come from literature of Authoritative Sources, such as CENTREL, EURELECTRIC or IEA.
There is no information about each elementary flow.
Rate 3 (fair)
Justification Most of references come from Authoritative Sources (IEA, CENTREL, EURELECTRIC …).
There is no information about the emission factors or direct emissions.
Methodological appropriateness and consistency
System boundaries and EoL modelling
Dataset considers a mix of technologies. It includes the treatment of residues (ash) but not the EoL modelling of plan decommissioning. Infrastructures are included (from raw material to the plant).
Allocation
Situation A is assumed. Although electricity is a by-product in the case of waste incineration plants, in this dataset all environmental impacts are allocated to the waste rather than to the electricity.
Rate 3 (fair)
Justification Situation A.
Dataset includes a „cradle-to-grave‟ system process.
It does not comprise EoL modelling.
Infrastructure is included.
Allocation procedure has been applied to the waste rather to electricity (only in the case of waste incineration plants).
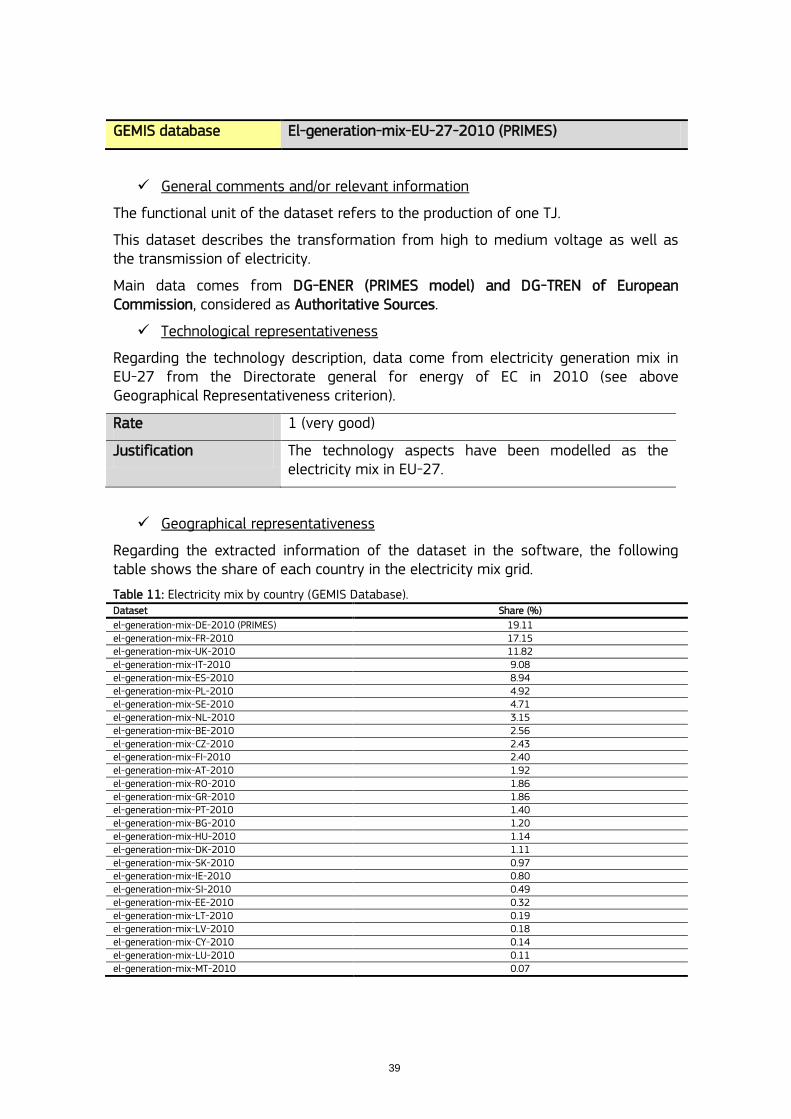
39
GEMIS database El-generation-mix-EU-27-2010 (PRIMES)
General comments and/or relevant information
The functional unit of the dataset refers to the production of one TJ.
This dataset describes the transformation from high to medium voltage as well as the transmission of electricity.
Main data comes from DG-ENER (PRIMES model) and DG-TREN of European Commission, considered as Authoritative Sources.
Technological representativeness
Regarding the technology description, data come from electricity generation mix in EU-27 from the Directorate general for energy of EC in 2010 (see above Geographical Representativeness criterion).
Rate 1 (very good)
Justification The technology aspects have been modelled as the electricity mix in EU-27.
Geographical representativeness
Regarding the extracted information of the dataset in the software, the following table shows the share of each country in the electricity mix grid.
Table 11: Electricity mix by country (GEMIS Database). Dataset Share (%)
el-generation-mix-DE-2010 (PRIMES) 19.11 el-generation-mix-FR-2010 17.15 el-generation-mix-UK-2010 11.82 el-generation-mix-IT-2010 9.08 el-generation-mix-ES-2010 8.94 el-generation-mix-PL-2010 4.92 el-generation-mix-SE-2010 4.71 el-generation-mix-NL-2010 3.15 el-generation-mix-BE-2010 2.56 el-generation-mix-CZ-2010 2.43 el-generation-mix-FI-2010 2.40 el-generation-mix-AT-2010 1.92 el-generation-mix-RO-2010 1.86 el-generation-mix-GR-2010 1.86 el-generation-mix-PT-2010 1.40 el-generation-mix-BG-2010 1.20 el-generation-mix-HU-2010 1.14 el-generation-mix-DK-2010 1.11 el-generation-mix-SK-2010 0.97 el-generation-mix-IE-2010 0.80 el-generation-mix-SI-2010 0.49 el-generation-mix-EE-2010 0.32 el-generation-mix-LT-2010 0.19 el-generation-mix-LV-2010 0.18 el-generation-mix-CY-2010 0.14 el-generation-mix-LU-2010 0.11 el-generation-mix-MT-2010 0.07
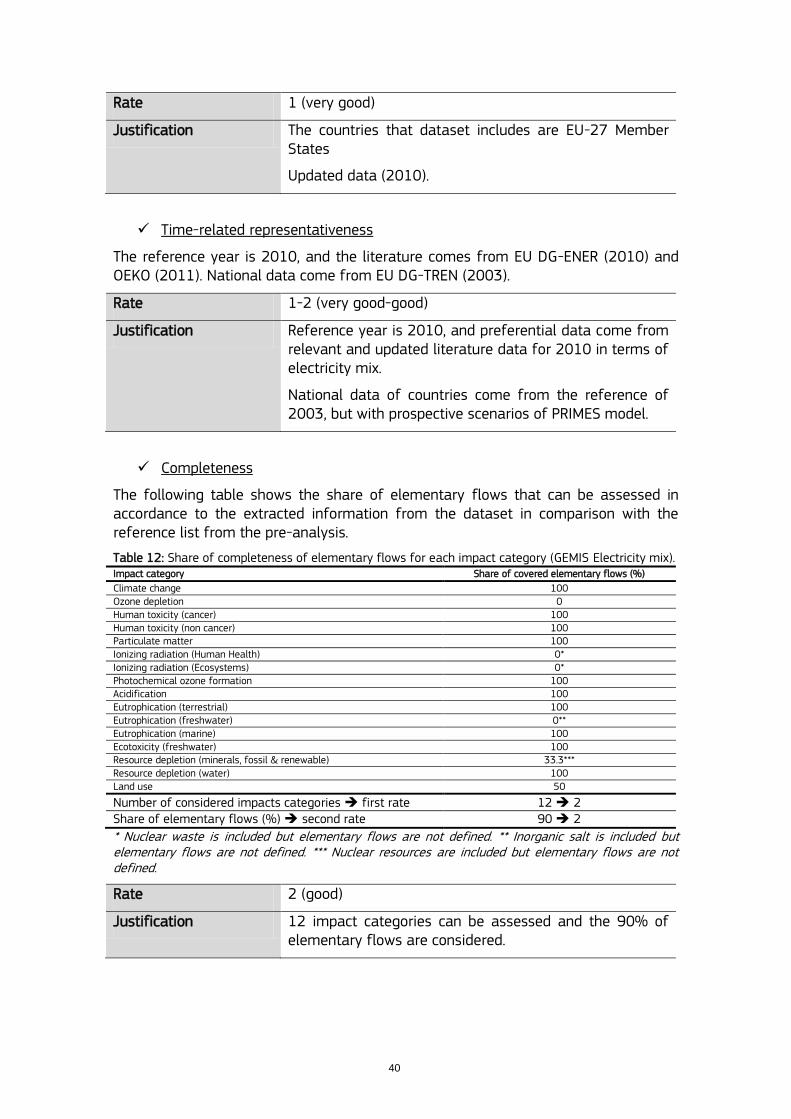
40
Rate 1 (very good)
Justification The countries that dataset includes are EU-27 Member States
Updated data (2010).
Time-related representativeness
The reference year is 2010, and the literature comes from EU DG-ENER (2010) and OEKO (2011). National data come from EU DG-TREN (2003).
Rate 1-2 (very good-good)
Justification Reference year is 2010, and preferential data come from relevant and updated literature data for 2010 in terms of electricity mix.
National data of countries come from the reference of 2003, but with prospective scenarios of PRIMES model.
Completeness
The following table shows the share of elementary flows that can be assessed in accordance to the extracted information from the dataset in comparison with the reference list from the pre-analysis.
Table 12: Share of completeness of elementary flows for each impact category (GEMIS Electricity mix). Impact category Share of covered elementary flows (%)
Climate change 100 Ozone depletion 0 Human toxicity (cancer) 100 Human toxicity (non cancer) 100 Particulate matter 100 Ionizing radiation (Human Health) 0* Ionizing radiation (Ecosystems) 0* Photochemical ozone formation 100 Acidification 100 Eutrophication (terrestrial) 100 Eutrophication (freshwater) 0** Eutrophication (marine) 100 Ecotoxicity (freshwater) 100 Resource depletion (minerals, fossil & renewable) 33.3*** Resource depletion (water) 100 Land use 50
Number of considered impacts categories first rate 12 2 Share of elementary flows (%) second rate 90 2
* Nuclear waste is included but elementary flows are not defined. ** Inorganic salt is included but elementary flows are not defined. *** Nuclear resources are included but elementary flows are not defined.
Rate 2 (good)
Justification 12 impact categories can be assessed and the 90% of elementary flows are considered.
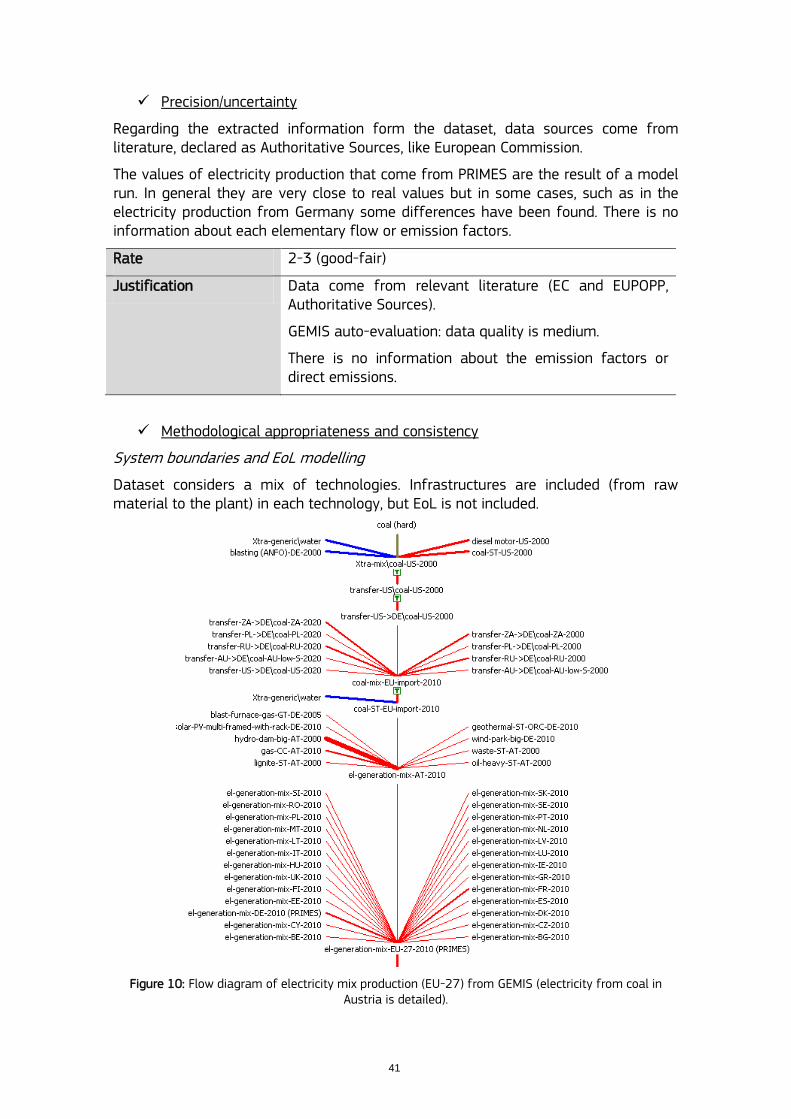
41
Precision/uncertainty
Regarding the extracted information form the dataset, data sources come from literature, declared as Authoritative Sources, like European Commission.
The values of electricity production that come from PRIMES are the result of a model run. In general they are very close to real values but in some cases, such as in the electricity production from Germany some differences have been found. There is no information about each elementary flow or emission factors.
Rate 2-3 (good-fair)
Justification Data come from relevant literature (EC and EUPOPP, Authoritative Sources).
GEMIS auto-evaluation: data quality is medium.
There is no information about the emission factors or direct emissions.
Methodological appropriateness and consistency
System boundaries and EoL modelling
Dataset considers a mix of technologies. Infrastructures are included (from raw material to the plant) in each technology, but EoL is not included.
Figure 10: Flow diagram of electricity mix production (EU-27) from GEMIS (electricity from coal in
Austria is detailed).
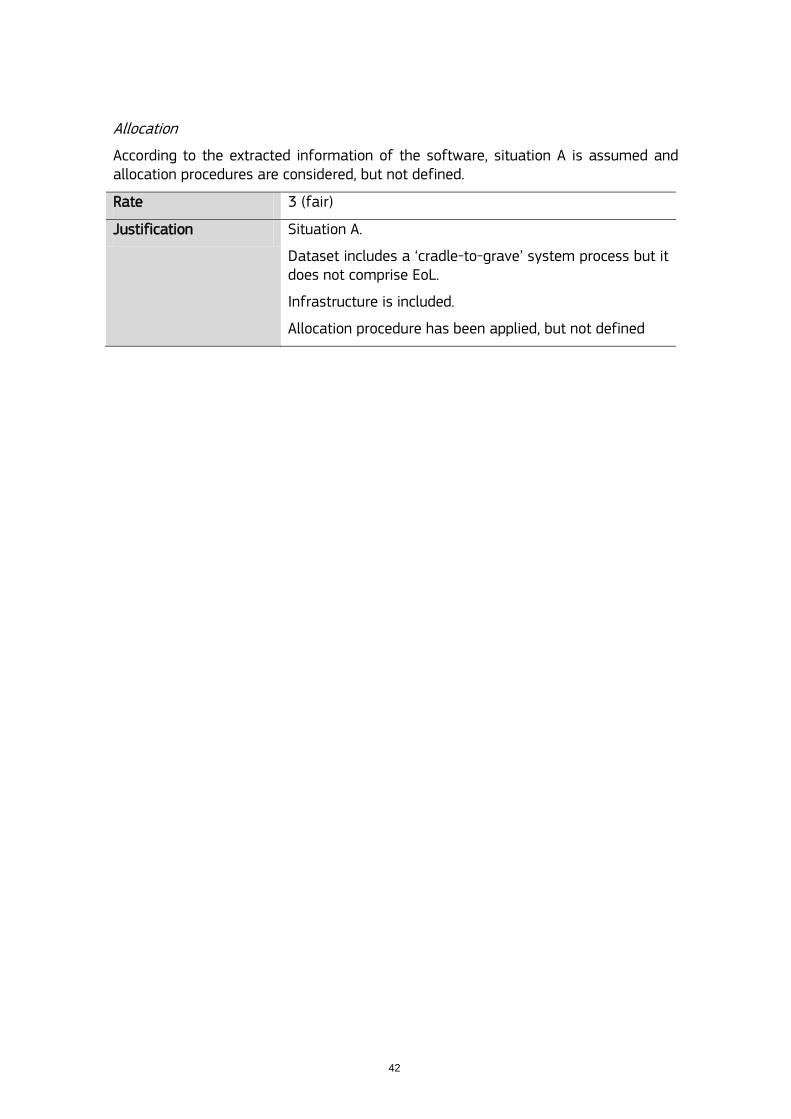
42
Allocation
According to the extracted information of the software, situation A is assumed and allocation procedures are considered, but not defined.
Rate 3 (fair)
Justification Situation A.
Dataset includes a „cradle-to-grave‟ system process but it does not comprise EoL.
Infrastructure is included.
Allocation procedure has been applied, but not defined
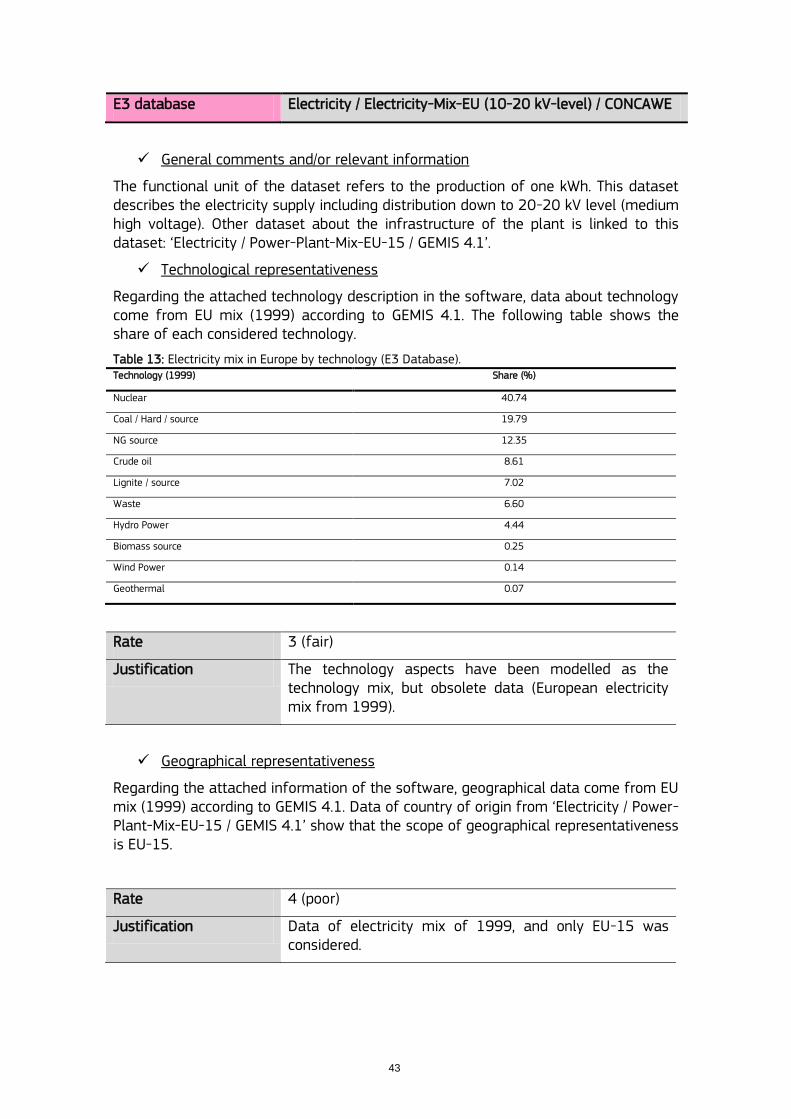
43
E3 database Electricity / Electricity-Mix-EU (10-20 kV-level) / CONCAWE
General comments and/or relevant information
The functional unit of the dataset refers to the production of one kWh. This dataset describes the electricity supply including distribution down to 20-20 kV level (medium high voltage). Other dataset about the infrastructure of the plant is linked to this dataset: „Electricity / Power-Plant-Mix-EU-15 / GEMIS 4.1‟.
Technological representativeness
Regarding the attached technology description in the software, data about technology come from EU mix (1999) according to GEMIS 4.1. The following table shows the share of each considered technology.
Table 13: Electricity mix in Europe by technology (E3 Database). Technology (1999) Share (%)
Nuclear 40.74
Coal / Hard / source 19.79
NG source 12.35
Crude oil 8.61
Lignite / source 7.02
Waste 6.60
Hydro Power 4.44
Biomass source 0.25
Wind Power 0.14
Geothermal 0.07
Rate 3 (fair)
Justification The technology aspects have been modelled as the technology mix, but obsolete data (European electricity mix from 1999).
Geographical representativeness
Regarding the attached information of the software, geographical data come from EU mix (1999) according to GEMIS 4.1. Data of country of origin from „Electricity / Power-Plant-Mix-EU-15 / GEMIS 4.1‟ show that the scope of geographical representativeness is EU-15.
Rate 4 (poor)
Justification Data of electricity mix of 1999, and only EU-15 was considered.
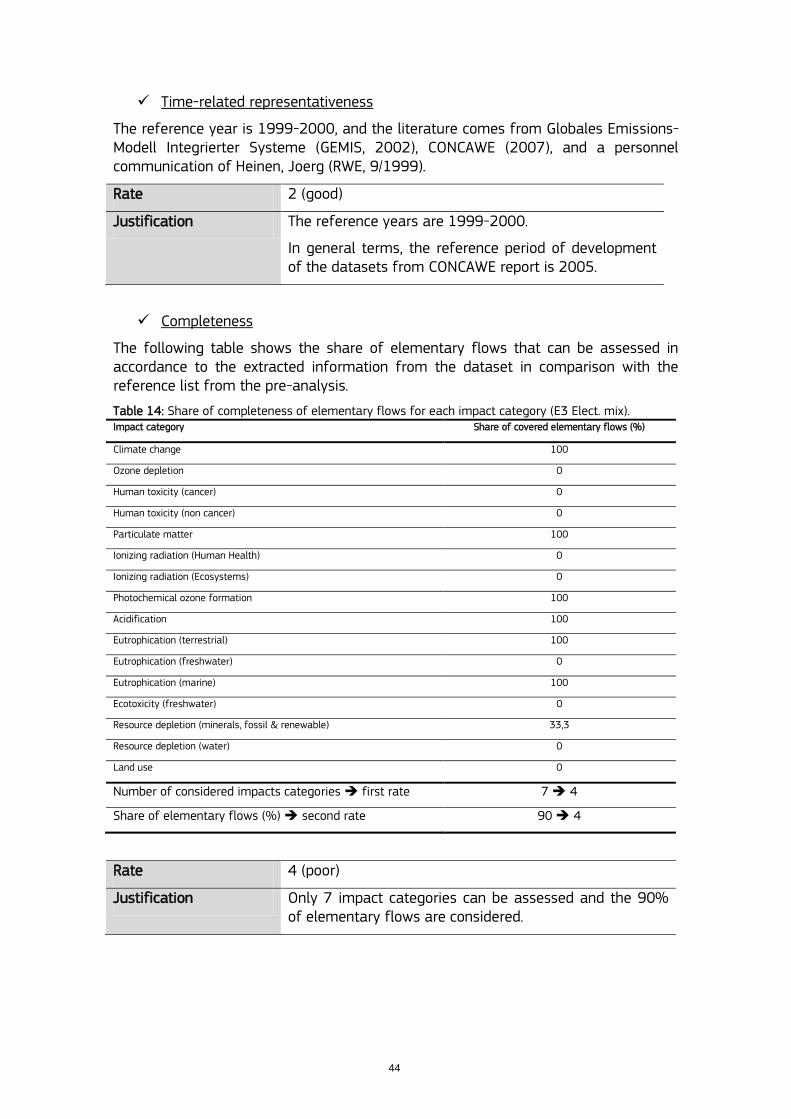
44
Time-related representativeness
The reference year is 1999-2000, and the literature comes from Globales Emissions-Modell Integrierter Systeme (GEMIS, 2002), CONCAWE (2007), and a personnel communication of Heinen, Joerg (RWE, 9/1999).
Rate 2 (good)
Justification The reference years are 1999-2000.
In general terms, the reference period of development of the datasets from CONCAWE report is 2005.
Completeness
The following table shows the share of elementary flows that can be assessed in accordance to the extracted information from the dataset in comparison with the reference list from the pre-analysis.
Table 14: Share of completeness of elementary flows for each impact category (E3 Elect. mix). Impact category Share of covered elementary flows (%)
Climate change 100
Ozone depletion 0
Human toxicity (cancer) 0
Human toxicity (non cancer) 0
Particulate matter 100
Ionizing radiation (Human Health) 0
Ionizing radiation (Ecosystems) 0
Photochemical ozone formation 100
Acidification 100
Eutrophication (terrestrial) 100
Eutrophication (freshwater) 0
Eutrophication (marine) 100
Ecotoxicity (freshwater) 0
Resource depletion (minerals, fossil & renewable) 33,3
Resource depletion (water) 0
Land use 0
Number of considered impacts categories first rate 7 4
Share of elementary flows (%) second rate 90 4
Rate 4 (poor)
Justification Only 7 impact categories can be assessed and the 90% of elementary flows are considered.
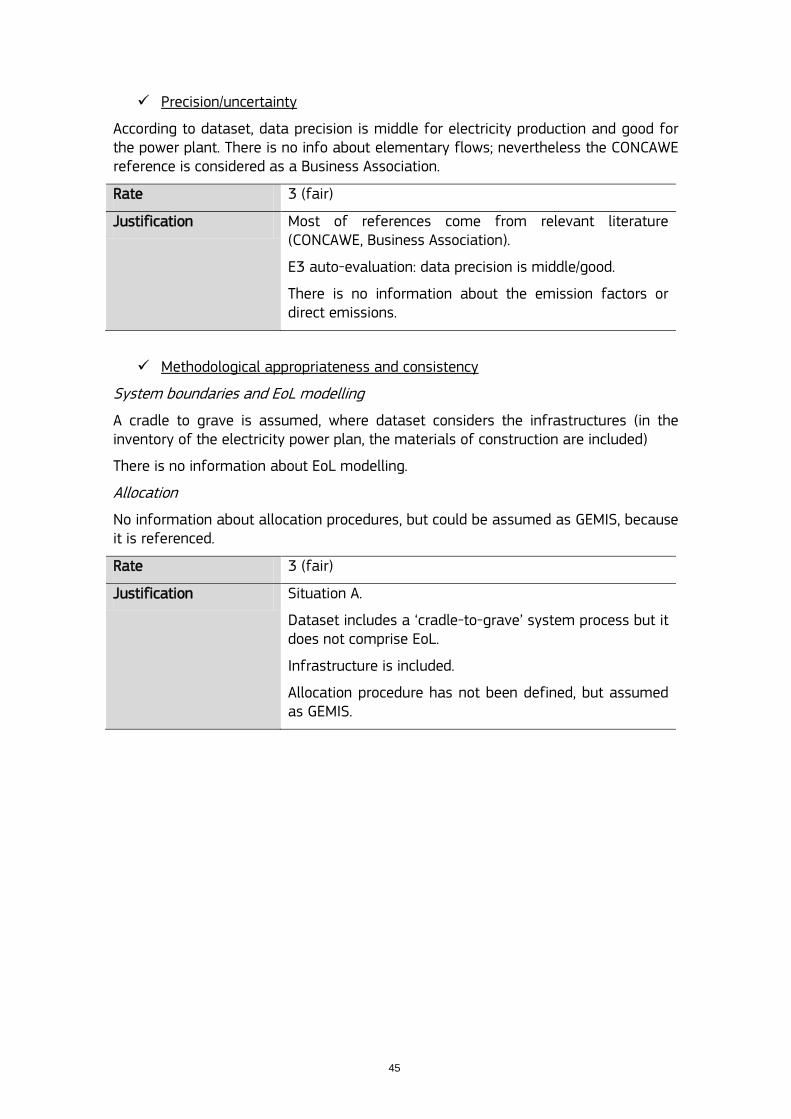
45
Precision/uncertainty
According to dataset, data precision is middle for electricity production and good for the power plant. There is no info about elementary flows; nevertheless the CONCAWE reference is considered as a Business Association.
Rate 3 (fair)
Justification Most of references come from relevant literature (CONCAWE, Business Association).
E3 auto-evaluation: data precision is middle/good.
There is no information about the emission factors or direct emissions.
Methodological appropriateness and consistency
System boundaries and EoL modelling
A cradle to grave is assumed, where dataset considers the infrastructures (in the inventory of the electricity power plan, the materials of construction are included)
There is no information about EoL modelling.
Allocation
No information about allocation procedures, but could be assumed as GEMIS, because it is referenced.
Rate 3 (fair)
Justification Situation A.
Dataset includes a „cradle-to-grave‟ system process but it does not comprise EoL.
Infrastructure is included.
Allocation procedure has not been defined, but assumed as GEMIS.
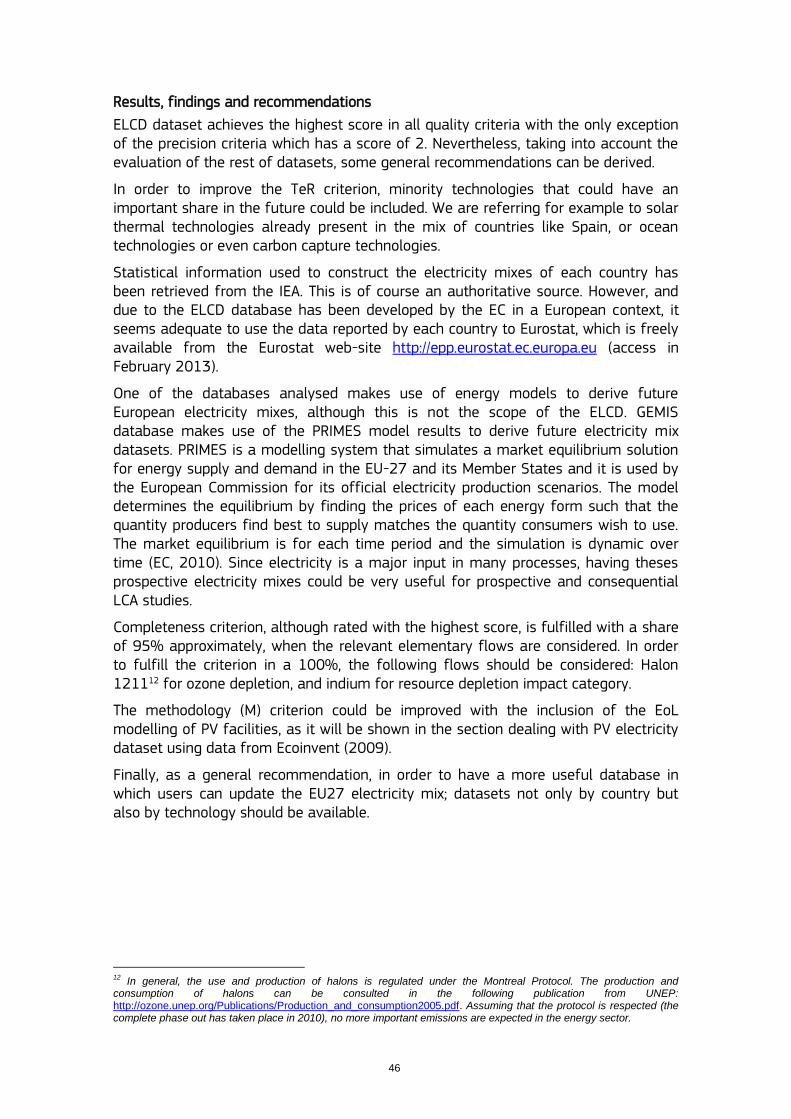
46
Results, findings and recommendations
ELCD dataset achieves the highest score in all quality criteria with the only exception of the precision criteria which has a score of 2. Nevertheless, taking into account the evaluation of the rest of datasets, some general recommendations can be derived.
In order to improve the TeR criterion, minority technologies that could have an important share in the future could be included. We are referring for example to solar thermal technologies already present in the mix of countries like Spain, or ocean technologies or even carbon capture technologies.
Statistical information used to construct the electricity mixes of each country has been retrieved from the IEA. This is of course an authoritative source. However, and due to the ELCD database has been developed by the EC in a European context, it seems adequate to use the data reported by each country to Eurostat, which is freely available from the Eurostat web-site http://epp.eurostat.ec.europa.eu (access in February 2013).
One of the databases analysed makes use of energy models to derive future European electricity mixes, although this is not the scope of the ELCD. GEMIS database makes use of the PRIMES model results to derive future electricity mix datasets. PRIMES is a modelling system that simulates a market equilibrium solution for energy supply and demand in the EU-27 and its Member States and it is used by the European Commission for its official electricity production scenarios. The model determines the equilibrium by finding the prices of each energy form such that the quantity producers find best to supply matches the quantity consumers wish to use. The market equilibrium is for each time period and the simulation is dynamic over time (EC, 2010). Since electricity is a major input in many processes, having theses prospective electricity mixes could be very useful for prospective and consequential LCA studies.
Completeness criterion, although rated with the highest score, is fulfilled with a share of 95% approximately, when the relevant elementary flows are considered. In order to fulfill the criterion in a 100%, the following flows should be considered: Halon 121112 for ozone depletion, and indium for resource depletion impact category.
The methodology (M) criterion could be improved with the inclusion of the EoL modelling of PV facilities, as it will be shown in the section dealing with PV electricity dataset using data from Ecoinvent (2009).
Finally, as a general recommendation, in order to have a more useful database in which users can update the EU27 electricity mix; datasets not only by country but also by technology should be available.
12
In general, the use and production of halons is regulated under the Montreal Protocol. The production and consumption of halons can be consulted in the following publication from UNEP: http://ozone.unep.org/Publications/Production_and_consumption2005.pdf. Assuming that the protocol is respected (the complete phase out has taken place in 2010), no more important emissions are expected in the energy sector.

47
Table 15: Findings and recommendations summary for „EU27: Electricity mix‟ dataset.
Indicator ELCD data quality rating Findings or recommendation for improving
TeR 1 Inclusion of minority technologies that could have an important share in the
future.
GR 1 -
TiR 1 Use of Eurostat or PRIMES modelling data in order to consider the most
updated data.
C 1 Consideration of more pollutants as Ecoinvent dataset: Halon 1211 and
indium.
P 2 Use of Eurostat or PRIMES modelling data in order to consider the most
updated data.
M 1 Consideration of EoL modelling of PV-modules from Ecoinvent dataset.
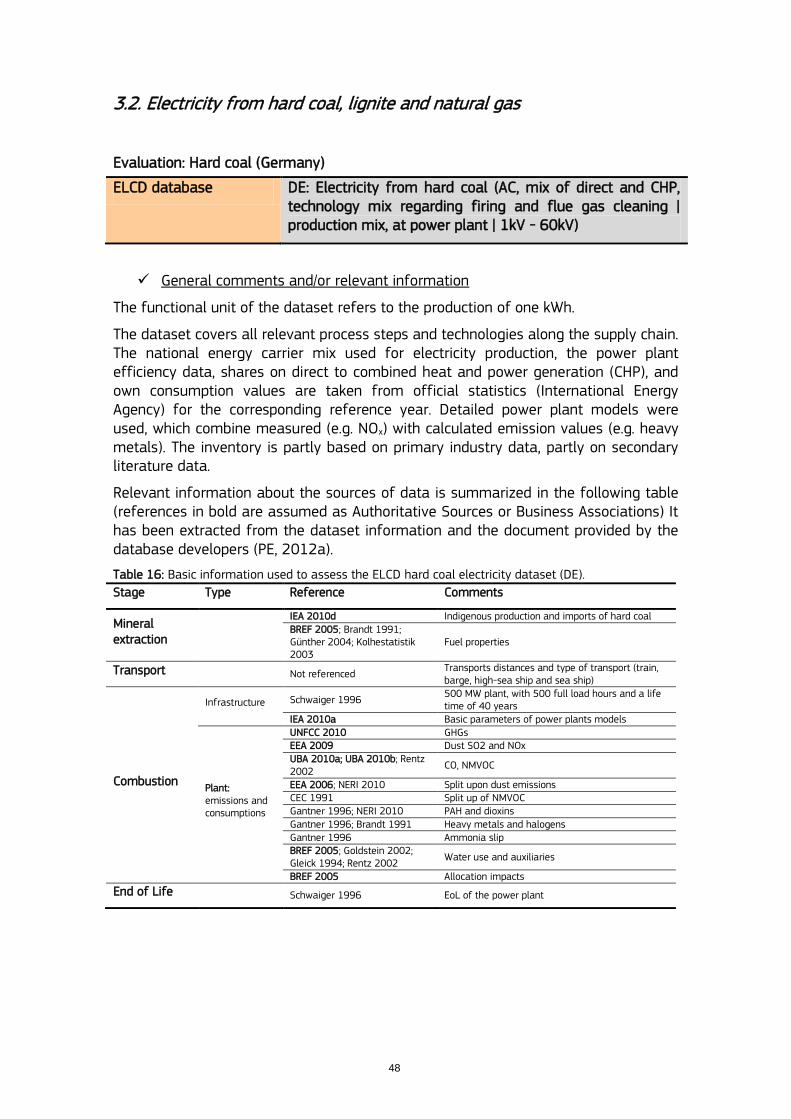
48
3.2. Electricity from hard coal, lignite and natural gas
Evaluation: Hard coal (Germany)
ELCD database DE: Electricity from hard coal (AC, mix of direct and CHP, technology mix regarding firing and flue gas cleaning | production mix, at power plant | 1kV - 60kV)
General comments and/or relevant information
The functional unit of the dataset refers to the production of one kWh.
The dataset covers all relevant process steps and technologies along the supply chain. The national energy carrier mix used for electricity production, the power plant efficiency data, shares on direct to combined heat and power generation (CHP), and own consumption values are taken from official statistics (International Energy Agency) for the corresponding reference year. Detailed power plant models were used, which combine measured (e.g. NOx) with calculated emission values (e.g. heavy metals). The inventory is partly based on primary industry data, partly on secondary literature data.
Relevant information about the sources of data is summarized in the following table (references in bold are assumed as Authoritative Sources or Business Associations) It has been extracted from the dataset information and the document provided by the database developers (PE, 2012a).
Table 16: Basic information used to assess the ELCD hard coal electricity dataset (DE).
Stage Type Reference Comments
Mineral extraction
IEA 2010d Indigenous production and imports of hard coal BREF 2005; Brandt 1991; Günther 2004; Kolhestatistik 2003
Fuel properties
Transport Not referenced Transports distances and type of transport (train, barge, high-sea ship and sea ship)
Combustion
Infrastructure Schwaiger 1996 500 MW plant, with 500 full load hours and a life time of 40 years
IEA 2010a Basic parameters of power plants models
Plant: emissions and consumptions
UNFCC 2010 GHGs EEA 2009 Dust SO2 and NOx UBA 2010a; UBA 2010b; Rentz 2002
CO, NMVOC
EEA 2006; NERI 2010 Split upon dust emissions CEC 1991 Split up of NMVOC Gantner 1996; NERI 2010 PAH and dioxins Gantner 1996; Brandt 1991 Heavy metals and halogens Gantner 1996 Ammonia slip BREF 2005; Goldstein 2002; Gleick 1994; Rentz 2002
Water use and auxiliaries
BREF 2005 Allocation impacts
End of Life Schwaiger 1996 EoL of the power plant
49
Technological representativeness
Regarding the technology description, the basic information extracted from the dataset, in order to evaluate this criterion, is the following:
The electricity is either produced in a hard coal specific power plants and/or combined heat and power plants (CHP). Also considered are the national and regional specific technology standards of the power plants in regard to efficiency, firing technology, flue-gas desulphurisation, NOx removal and de-dusting.
The hard coal supply considers the whole supply chain of the energy carrier from exploration, production, processing and transport of the fuels to the power plants. The supply chain is modelled in a specific national hard coal consumption mix (i.e. domestic production and imports), and considers national average hard coal properties (e.g. elemental composition and energy content).
According to the basic parameters of the power plant models, the dataset developer has provided the following information:
The share between electricity produced in electricity plants and CHP plants, the efficiencies, the own consumption as well as the share between electricity and heat output in CHP plants is calculated individually for each specific country using IEA statistics.
Rate 1 (very good)
Justification Consideration of both electricity and CHP plants for producing electricity from hard coal. Use of the technology mix.
Type of plants (PC, SCPC, IGCC, etc.) is not defined, but basic parameters settings have been considered.
Geographical representativeness
Regarding the information included in the dataset, the basic information, in order to evaluate this criterion, is the following.
The dataset represents the average national specific electricity production based on hard coal. Main technologies for firing, flue gas cleaning and electricity generation are considered according to the national specific situation.
This dataset includes „DE: Hard coal mix‟ dataset, which covers the entire supply chain of hard coal. Analogously to any dataset, a technology description is incorporated. The basic information extracted from it, in order to evaluate this criterion, is the following.
The dataset considers the whole supply chain from hard coal mining, hard coal upgrading, long distance transport, and regional distribution to the final consumer. The mix can be seen for a specific country / region as average hard coal consumed.
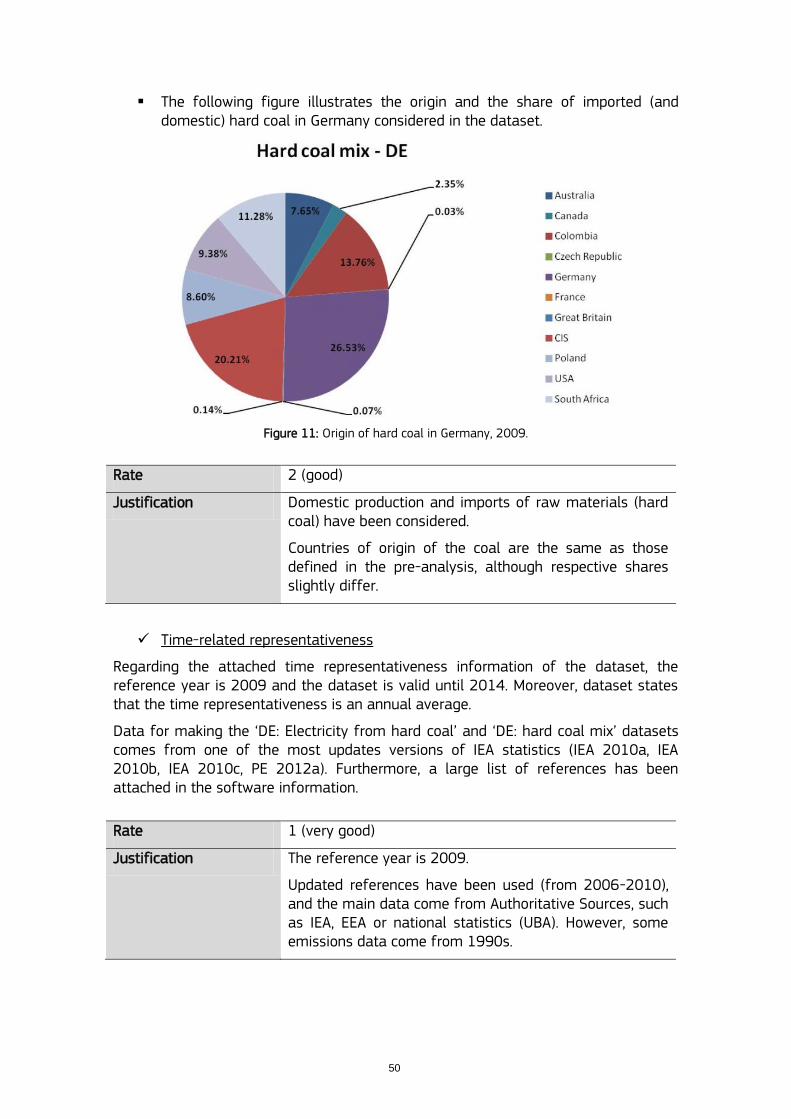
50
The following figure illustrates the origin and the share of imported (and domestic) hard coal in Germany considered in the dataset.
Figure 11: Origin of hard coal in Germany, 2009.
Rate 2 (good)
Justification Domestic production and imports of raw materials (hard coal) have been considered.
Countries of origin of the coal are the same as those defined in the pre-analysis, although respective shares slightly differ.
Time-related representativeness
Regarding the attached time representativeness information of the dataset, the reference year is 2009 and the dataset is valid until 2014. Moreover, dataset states that the time representativeness is an annual average.
Data for making the „DE: Electricity from hard coal‟ and „DE: hard coal mix‟ datasets comes from one of the most updates versions of IEA statistics (IEA 2010a, IEA 2010b, IEA 2010c, PE 2012a). Furthermore, a large list of references has been attached in the software information.
Rate 1 (very good)
Justification The reference year is 2009.
Updated references have been used (from 2006-2010), and the main data come from Authoritative Sources, such as IEA, EEA or national statistics (UBA). However, some emissions data come from 1990s.
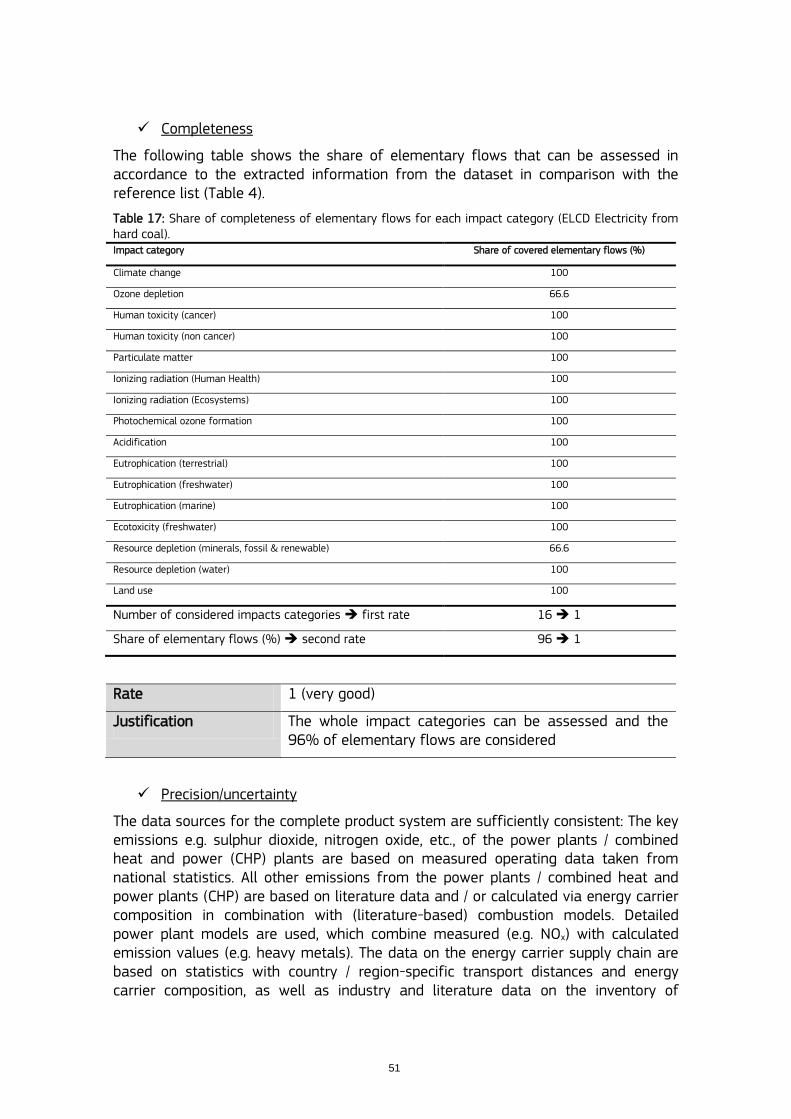
51
Completeness
The following table shows the share of elementary flows that can be assessed in accordance to the extracted information from the dataset in comparison with the reference list (Table 4).
Table 17: Share of completeness of elementary flows for each impact category (ELCD Electricity from hard coal). Impact category Share of covered elementary flows (%)
Climate change 100
Ozone depletion 66.6
Human toxicity (cancer) 100
Human toxicity (non cancer) 100
Particulate matter 100
Ionizing radiation (Human Health) 100
Ionizing radiation (Ecosystems) 100
Photochemical ozone formation 100
Acidification 100
Eutrophication (terrestrial) 100
Eutrophication (freshwater) 100
Eutrophication (marine) 100
Ecotoxicity (freshwater) 100
Resource depletion (minerals, fossil & renewable) 66.6
Resource depletion (water) 100
Land use 100
Number of considered impacts categories first rate 16 1
Share of elementary flows (%) second rate 96 1
Rate 1 (very good)
Justification The whole impact categories can be assessed and the 96% of elementary flows are considered
Precision/uncertainty
The data sources for the complete product system are sufficiently consistent: The key emissions e.g. sulphur dioxide, nitrogen oxide, etc., of the power plants / combined heat and power (CHP) plants are based on measured operating data taken from national statistics. All other emissions from the power plants / combined heat and power plants (CHP) are based on literature data and / or calculated via energy carrier composition in combination with (literature-based) combustion models. Detailed power plant models are used, which combine measured (e.g. NOx) with calculated emission values (e.g. heavy metals). The data on the energy carrier supply chain are based on statistics with country / region-specific transport distances and energy carrier composition, as well as industry and literature data on the inventory of
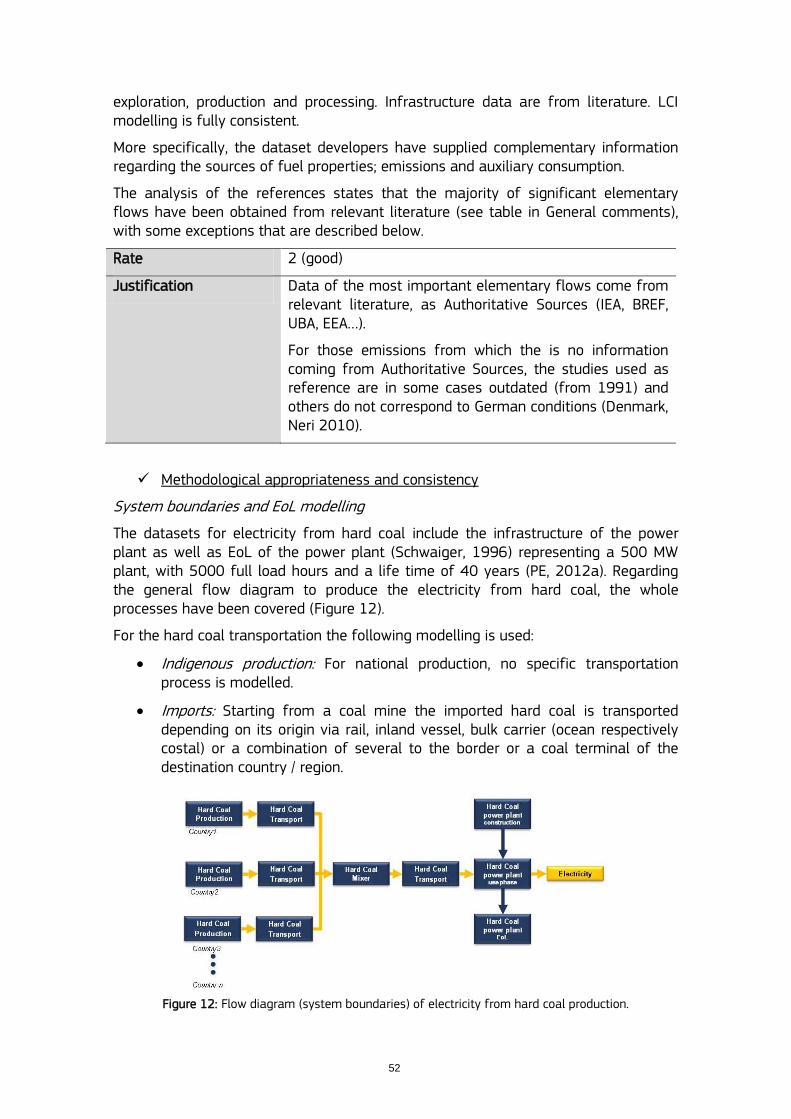
52
exploration, production and processing. Infrastructure data are from literature. LCI modelling is fully consistent.
More specifically, the dataset developers have supplied complementary information regarding the sources of fuel properties; emissions and auxiliary consumption.
The analysis of the references states that the majority of significant elementary flows have been obtained from relevant literature (see table in General comments), with some exceptions that are described below.
Rate 2 (good)
Justification Data of the most important elementary flows come from relevant literature, as Authoritative Sources (IEA, BREF, UBA, EEA…).
For those emissions from which the is no information coming from Authoritative Sources, the studies used as reference are in some cases outdated (from 1991) and others do not correspond to German conditions (Denmark, Neri 2010).
Methodological appropriateness and consistency
System boundaries and EoL modelling
The datasets for electricity from hard coal include the infrastructure of the power plant as well as EoL of the power plant (Schwaiger, 1996) representing a 500 MW plant, with 5000 full load hours and a life time of 40 years (PE, 2012a). Regarding the general flow diagram to produce the electricity from hard coal, the whole processes have been covered (Figure 12).
For the hard coal transportation the following modelling is used:
Indigenous production: For national production, no specific transportation process is modelled.
Imports: Starting from a coal mine the imported hard coal is transported depending on its origin via rail, inland vessel, bulk carrier (ocean respectively costal) or a combination of several to the border or a coal terminal of the destination country / region.
Figure 12: Flow diagram (system boundaries) of electricity from hard coal production.
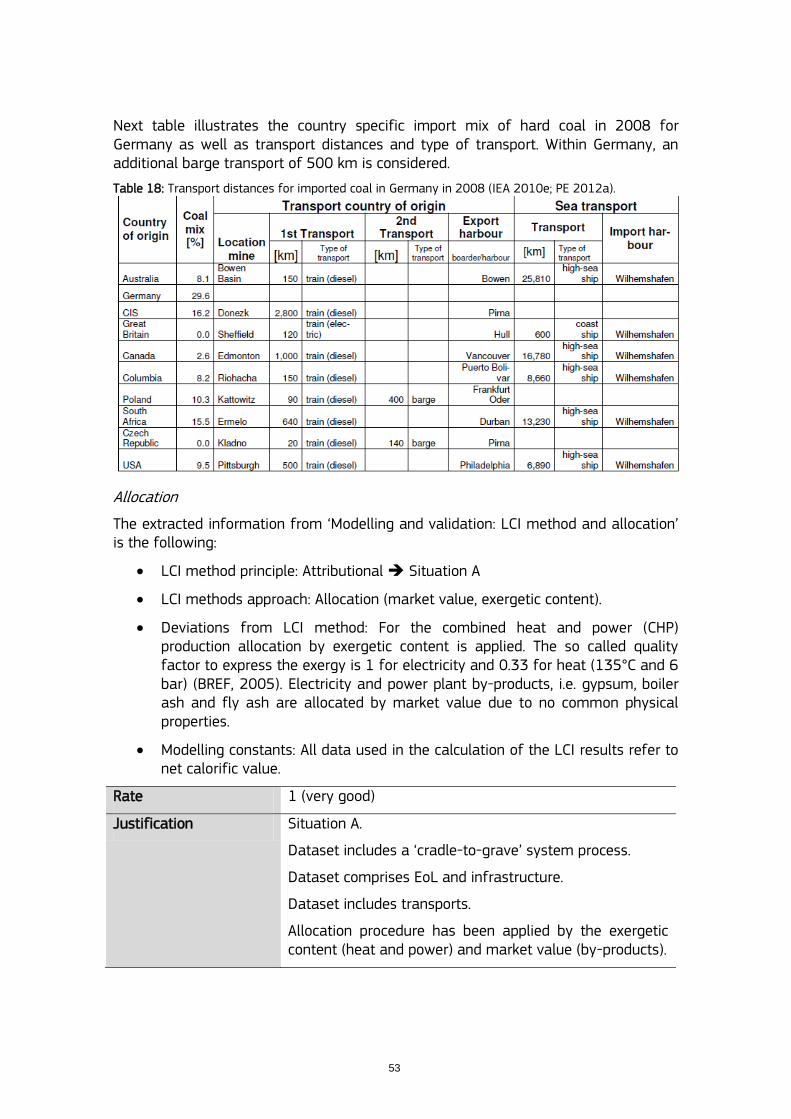
53
Next table illustrates the country specific import mix of hard coal in 2008 for Germany as well as transport distances and type of transport. Within Germany, an additional barge transport of 500 km is considered.
Table 18: Transport distances for imported coal in Germany in 2008 (IEA 2010e; PE 2012a).
Allocation
The extracted information from „Modelling and validation: LCI method and allocation‟ is the following:
LCI method principle: Attributional Situation A
LCI methods approach: Allocation (market value, exergetic content).
Deviations from LCI method: For the combined heat and power (CHP) production allocation by exergetic content is applied. The so called quality factor to express the exergy is 1 for electricity and 0.33 for heat (135°C and 6 bar) (BREF, 2005). Electricity and power plant by-products, i.e. gypsum, boiler ash and fly ash are allocated by market value due to no common physical properties.
Modelling constants: All data used in the calculation of the LCI results refer to net calorific value.
Rate 1 (very good)
Justification Situation A.
Dataset includes a „cradle-to-grave‟ system process.
Dataset comprises EoL and infrastructure.
Dataset includes transports.
Allocation procedure has been applied by the exergetic content (heat and power) and market value (by-products).
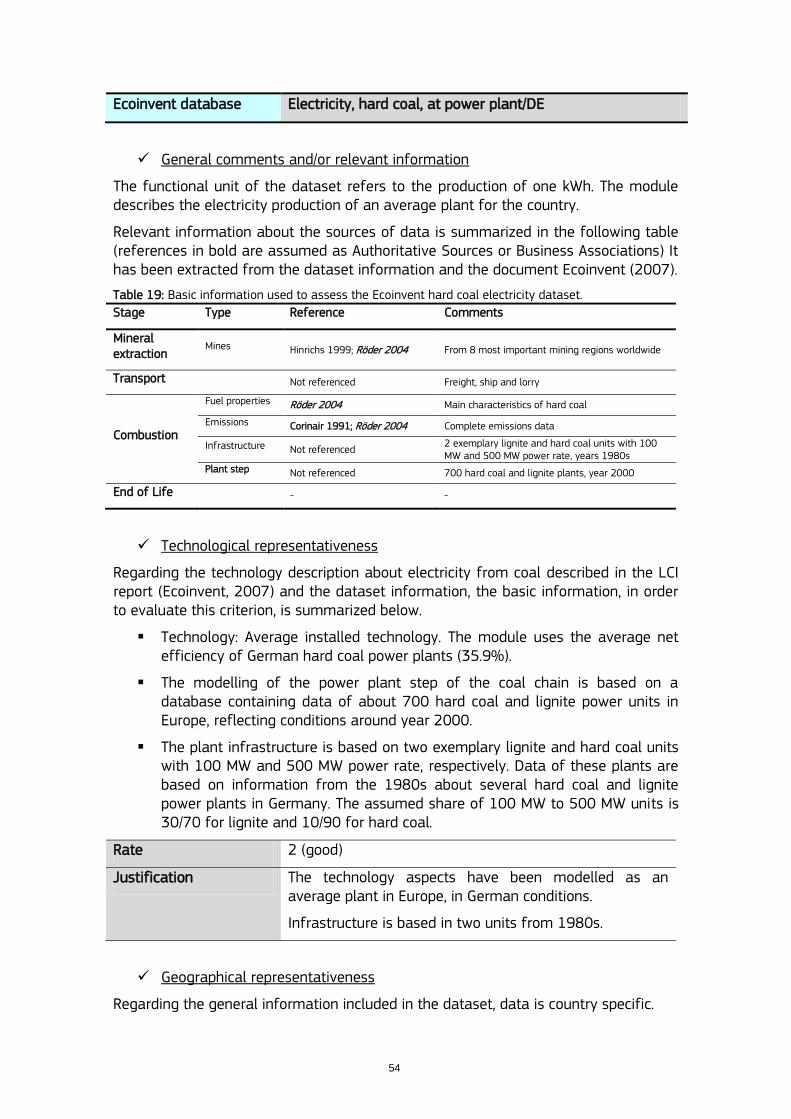
54
Ecoinvent database Electricity, hard coal, at power plant/DE
General comments and/or relevant information
The functional unit of the dataset refers to the production of one kWh. The module describes the electricity production of an average plant for the country.
Relevant information about the sources of data is summarized in the following table (references in bold are assumed as Authoritative Sources or Business Associations) It has been extracted from the dataset information and the document Ecoinvent (2007).
Table 19: Basic information used to assess the Ecoinvent hard coal electricity dataset.
Stage Type Reference Comments
Mineral extraction
Mines Hinrichs 1999; Röder 2004 From 8 most important mining regions worldwide
Transport Not referenced Freight, ship and lorry
Combustion
Fuel properties Röder 2004 Main characteristics of hard coal
Emissions Corinair 1991; Röder 2004 Complete emissions data
Infrastructure Not referenced 2 exemplary lignite and hard coal units with 100 MW and 500 MW power rate, years 1980s
Plant step Not referenced 700 hard coal and lignite plants, year 2000
End of Life - -
Technological representativeness
Regarding the technology description about electricity from coal described in the LCI report (Ecoinvent, 2007) and the dataset information, the basic information, in order to evaluate this criterion, is summarized below.
Technology: Average installed technology. The module uses the average net efficiency of German hard coal power plants (35.9%).
The modelling of the power plant step of the coal chain is based on a database containing data of about 700 hard coal and lignite power units in Europe, reflecting conditions around year 2000.
The plant infrastructure is based on two exemplary lignite and hard coal units with 100 MW and 500 MW power rate, respectively. Data of these plants are based on information from the 1980s about several hard coal and lignite power plants in Germany. The assumed share of 100 MW to 500 MW units is 30/70 for lignite and 10/90 for hard coal.
Rate 2 (good)
Justification The technology aspects have been modelled as an average plant in Europe, in German conditions.
Infrastructure is based in two units from 1980s.
Geographical representativeness
Regarding the general information included in the dataset, data is country specific.
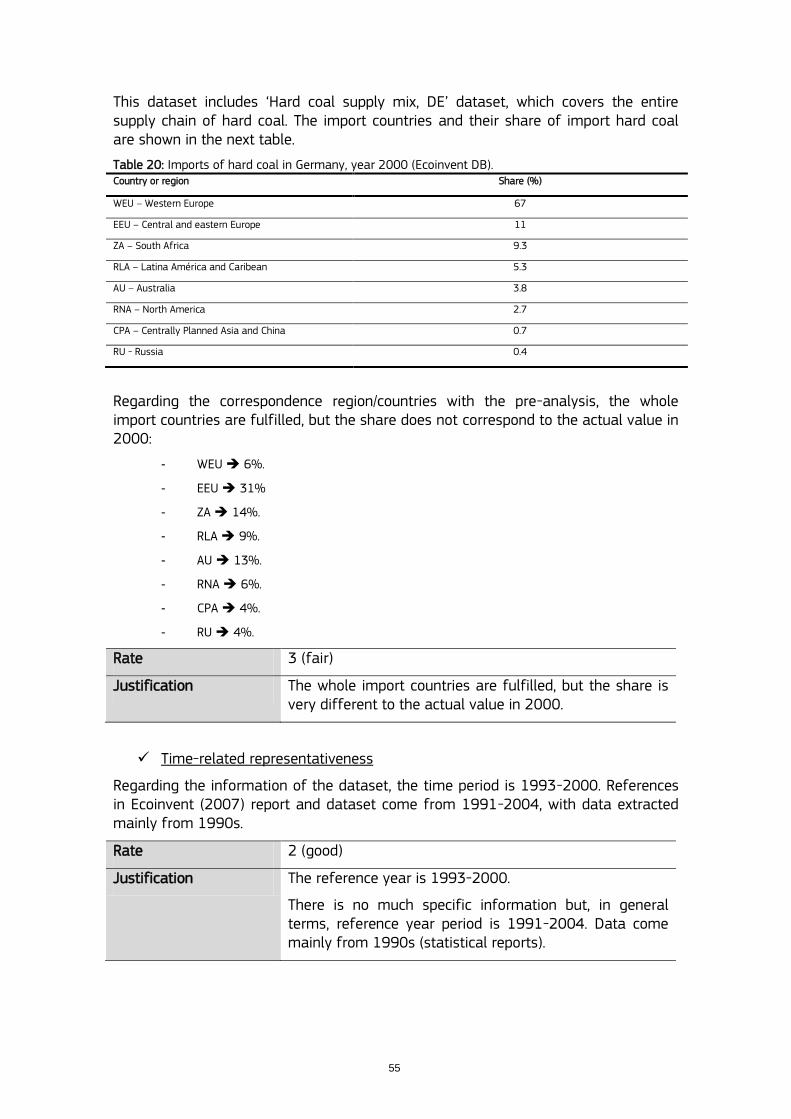
55
This dataset includes „Hard coal supply mix, DE‟ dataset, which covers the entire supply chain of hard coal. The import countries and their share of import hard coal are shown in the next table.
Table 20: Imports of hard coal in Germany, year 2000 (Ecoinvent DB). Country or region Share (%)
WEU – Western Europe 67
EEU – Central and eastern Europe 11
ZA – South Africa 9.3
RLA – Latina América and Caribean 5.3
AU – Australia 3.8
RNA – North America 2.7
CPA – Centrally Planned Asia and China 0.7
RU - Russia 0.4
Regarding the correspondence region/countries with the pre-analysis, the whole import countries are fulfilled, but the share does not correspond to the actual value in 2000:
- WEU 6%.
- EEU 31%
- ZA 14%.
- RLA 9%.
- AU 13%.
- RNA 6%.
- CPA 4%.
- RU 4%.
Rate 3 (fair)
Justification The whole import countries are fulfilled, but the share is very different to the actual value in 2000.
Time-related representativeness
Regarding the information of the dataset, the time period is 1993-2000. References in Ecoinvent (2007) report and dataset come from 1991-2004, with data extracted mainly from 1990s.
Rate 2 (good)
Justification The reference year is 1993-2000.
There is no much specific information but, in general terms, reference year period is 1991-2004. Data come mainly from 1990s (statistical reports).
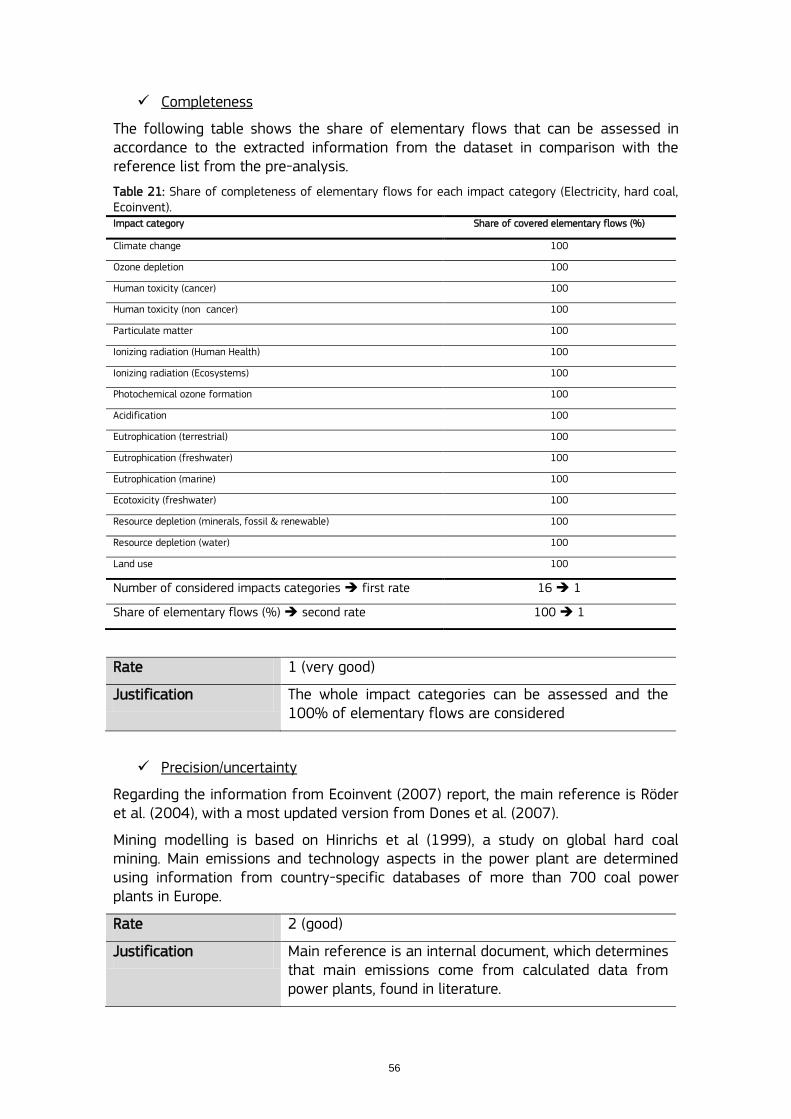
56
Completeness
The following table shows the share of elementary flows that can be assessed in accordance to the extracted information from the dataset in comparison with the reference list from the pre-analysis.
Table 21: Share of completeness of elementary flows for each impact category (Electricity, hard coal, Ecoinvent). Impact category Share of covered elementary flows (%)
Climate change 100
Ozone depletion 100
Human toxicity (cancer) 100
Human toxicity (non cancer) 100
Particulate matter 100
Ionizing radiation (Human Health) 100
Ionizing radiation (Ecosystems) 100
Photochemical ozone formation 100
Acidification 100
Eutrophication (terrestrial) 100
Eutrophication (freshwater) 100
Eutrophication (marine) 100
Ecotoxicity (freshwater) 100
Resource depletion (minerals, fossil & renewable) 100
Resource depletion (water) 100
Land use 100
Number of considered impacts categories first rate 16 1
Share of elementary flows (%) second rate 100 1
Rate 1 (very good)
Justification The whole impact categories can be assessed and the 100% of elementary flows are considered
Precision/uncertainty
Regarding the information from Ecoinvent (2007) report, the main reference is Röder et al. (2004), with a most updated version from Dones et al. (2007).
Mining modelling is based on Hinrichs et al (1999), a study on global hard coal mining. Main emissions and technology aspects in the power plant are determined using information from country-specific databases of more than 700 coal power plants in Europe.
Rate 2 (good)
Justification Main reference is an internal document, which determines that main emissions come from calculated data from power plants, found in literature.
57
Methodological appropriateness and consistency
System boundaries and EoL modelling
Figure 13 shows the flow charts with the modelled steps of the assessed hard coal system (including hard coal mix supply, DE).
Regarding the transport, in order to simplify the modelling, it is assumed that the extracted hard coal is stored at regional storages before it is transported to Europe. Afterwards, the coal is transported to the single European countries, where it assumed to be delivered to storage before being supplied to the power plants.
Regarding the final treatments, the dataset describing the operation of flue gas desulphurisation for hard coal plants takes into account the requirements of limestone and other materials, CO2 emissions to air, and emissions to water, which are based on emission limits for Germany. The wastewater from lignite flue gas desulphurisation is used for humidification of the ash; therefore no net water emissions are taken into account. The dataset describing the catalytic nitrogen reduction in de-NOx takes into account ammonia requirements and emissions to air. Coal ash is modelled using country-specific average production rates (per TJin) and compositions. Additionally, country-specific recycling rates are taken into account. Hard coal ash, which is not recycled, is assumed to be disposed of in residual material landfill, whereas lignite ash is assumed to be disposed of as mine backfill. The recycled part is not inventoried.
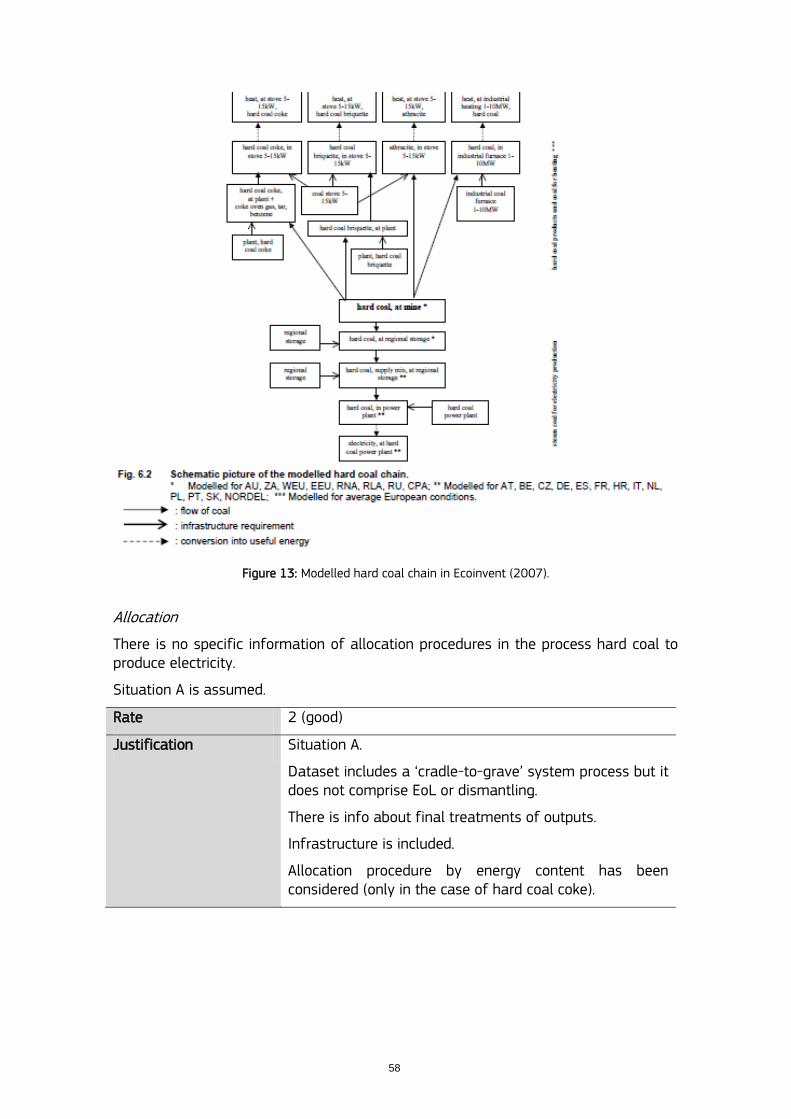
58
Figure 13: Modelled hard coal chain in Ecoinvent (2007).
Allocation
There is no specific information of allocation procedures in the process hard coal to produce electricity.
Situation A is assumed.
Rate 2 (good)
Justification Situation A.
Dataset includes a „cradle-to-grave‟ system process but it does not comprise EoL or dismantling.
There is info about final treatments of outputs.
Infrastructure is included.
Allocation procedure by energy content has been considered (only in the case of hard coal coke).
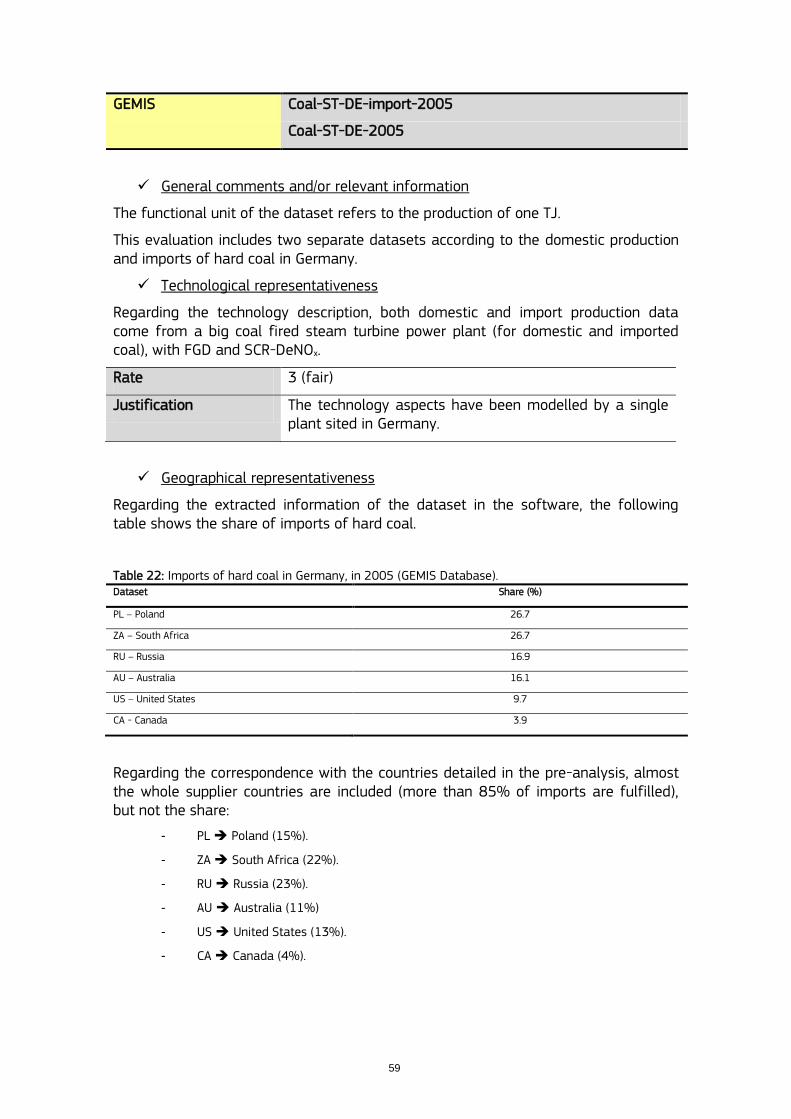
59
GEMIS Coal-ST-DE-import-2005
Coal-ST-DE-2005
General comments and/or relevant information
The functional unit of the dataset refers to the production of one TJ.
This evaluation includes two separate datasets according to the domestic production and imports of hard coal in Germany.
Technological representativeness
Regarding the technology description, both domestic and import production data come from a big coal fired steam turbine power plant (for domestic and imported coal), with FGD and SCR-DeNOx.
Rate 3 (fair)
Justification The technology aspects have been modelled by a single plant sited in Germany.
Geographical representativeness
Regarding the extracted information of the dataset in the software, the following table shows the share of imports of hard coal.
Table 22: Imports of hard coal in Germany, in 2005 (GEMIS Database). Dataset Share (%)
PL – Poland 26.7
ZA – South Africa 26.7
RU – Russia 16.9
AU – Australia 16.1
US – United States 9.7
CA - Canada 3.9
Regarding the correspondence with the countries detailed in the pre-analysis, almost the whole supplier countries are included (more than 85% of imports are fulfilled), but not the share:
- PL Poland (15%).
- ZA South Africa (22%).
- RU Russia (23%).
- AU Australia (11%)
- US United States (13%).
- CA Canada (4%).
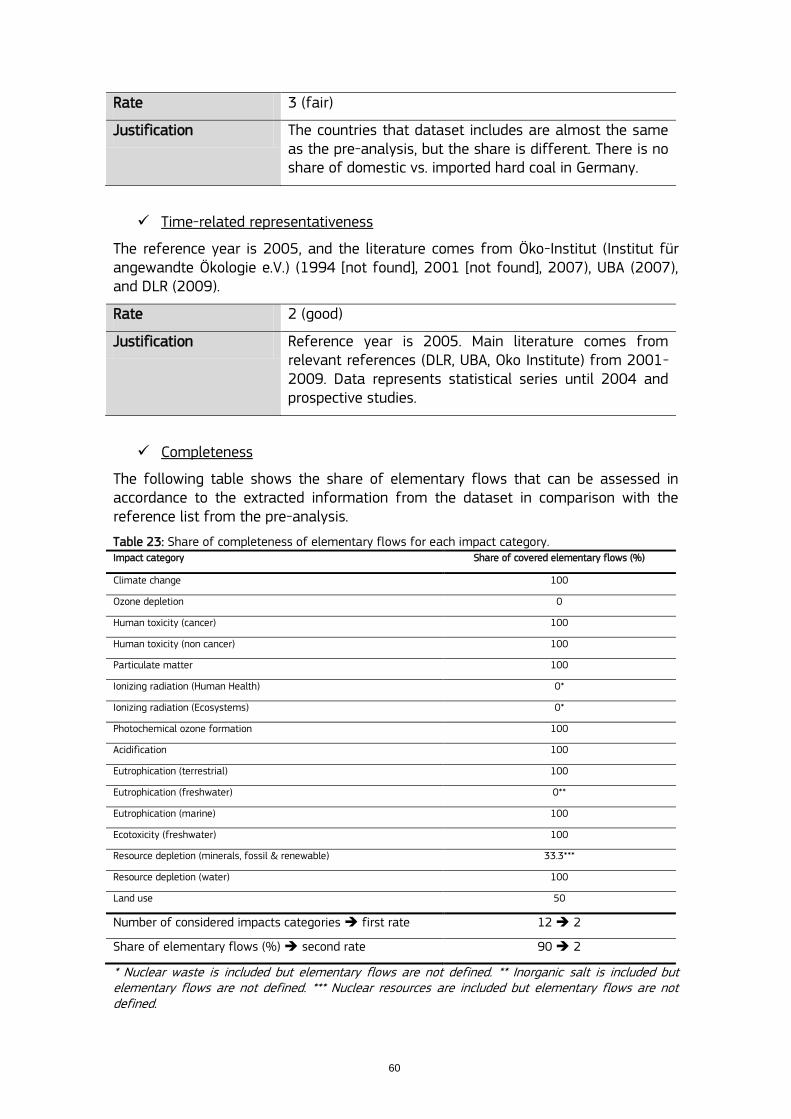
60
Rate 3 (fair)
Justification The countries that dataset includes are almost the same as the pre-analysis, but the share is different. There is no share of domestic vs. imported hard coal in Germany.
Time-related representativeness
The reference year is 2005, and the literature comes from Öko-Institut (Institut für angewandte Ökologie e.V.) (1994 [not found], 2001 [not found], 2007), UBA (2007), and DLR (2009).
Rate 2 (good)
Justification Reference year is 2005. Main literature comes from relevant references (DLR, UBA, Oko Institute) from 2001-2009. Data represents statistical series until 2004 and prospective studies.
Completeness
The following table shows the share of elementary flows that can be assessed in accordance to the extracted information from the dataset in comparison with the reference list from the pre-analysis.
Table 23: Share of completeness of elementary flows for each impact category. Impact category Share of covered elementary flows (%)
Climate change 100
Ozone depletion 0
Human toxicity (cancer) 100
Human toxicity (non cancer) 100
Particulate matter 100
Ionizing radiation (Human Health) 0*
Ionizing radiation (Ecosystems) 0*
Photochemical ozone formation 100
Acidification 100
Eutrophication (terrestrial) 100
Eutrophication (freshwater) 0**
Eutrophication (marine) 100
Ecotoxicity (freshwater) 100
Resource depletion (minerals, fossil & renewable) 33.3***
Resource depletion (water) 100
Land use 50
Number of considered impacts categories first rate 12 2
Share of elementary flows (%) second rate 90 2
* Nuclear waste is included but elementary flows are not defined. ** Inorganic salt is included but elementary flows are not defined. *** Nuclear resources are included but elementary flows are not defined.
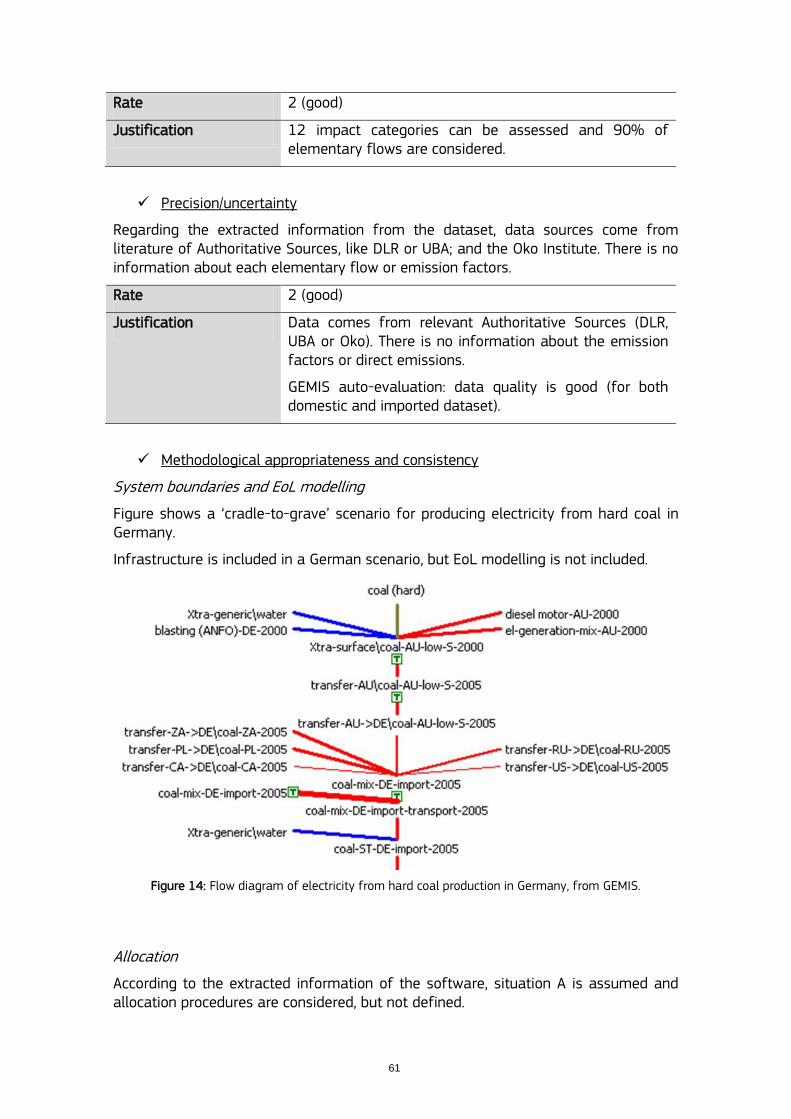
61
Rate 2 (good)
Justification 12 impact categories can be assessed and 90% of elementary flows are considered.
Precision/uncertainty
Regarding the extracted information from the dataset, data sources come from literature of Authoritative Sources, like DLR or UBA; and the Oko Institute. There is no information about each elementary flow or emission factors.
Rate 2 (good)
Justification Data comes from relevant Authoritative Sources (DLR, UBA or Oko). There is no information about the emission factors or direct emissions.
GEMIS auto-evaluation: data quality is good (for both domestic and imported dataset).
Methodological appropriateness and consistency
System boundaries and EoL modelling
Figure shows a „cradle-to-grave‟ scenario for producing electricity from hard coal in Germany.
Infrastructure is included in a German scenario, but EoL modelling is not included.
Figure 14: Flow diagram of electricity from hard coal production in Germany, from GEMIS.
Allocation
According to the extracted information of the software, situation A is assumed and allocation procedures are considered, but not defined.

62
Rate 3 (fair)
Justification Situation A.
Dataset includes a „cradle-to-grave‟ system process but it does not comprise EoL.
Infrastructure is included.
Allocation procedure has been applied, but not defined.
63
E3 database Power Station / Hard Coal / ST / Germany
General comments and/or relevant information
The functional unit of the dataset refers to the production of one kWh.
Technological representativeness
Regarding the attached technology description in the software, data about technology come from an average coal-fueled ST power station in Germany (efficiency 37.5%) in 2005, according to the Federal Environment Agency (UBA).
Rate 3 (fair)
Justification The technology aspects have been modelled by a single plant sited in Germany.
Geographical representativeness
Regarding the extracted information of the dataset in the software, data of imports of hard coal in Germany come from „Coal/Hard/Provision/mix EU/CONCAWE‟. The following table shows the share of imports (and domestic production):
Table 24: Imports (and domestic production) of hard coal in Germany (EU Mix 1999) (E3 DB). Dataset Share (%)
United Kingdom 18
Spain 6
Australia 12
Poland 7
USA 10
South Africa 16
Germany 21
Colombia 7
Russia 3
Regarding the correspondence with the countries detailed in the pre-analysis, a very high share of countries is included (more than 80% of imports are fulfilled) However the shares do not correspond to the actual figures for the year of reference of the database (2005) (E3 vs. pre-analysis, %):
- Germany 21 vs. -.
- Russia 3 vs. 21.
- South Africa 16 vs. 23.
- Poland 7 vs. 27.
- USA 10 vs. 3.
- Colombia 7 vs. 8.
- Australia 12 vs. 11.
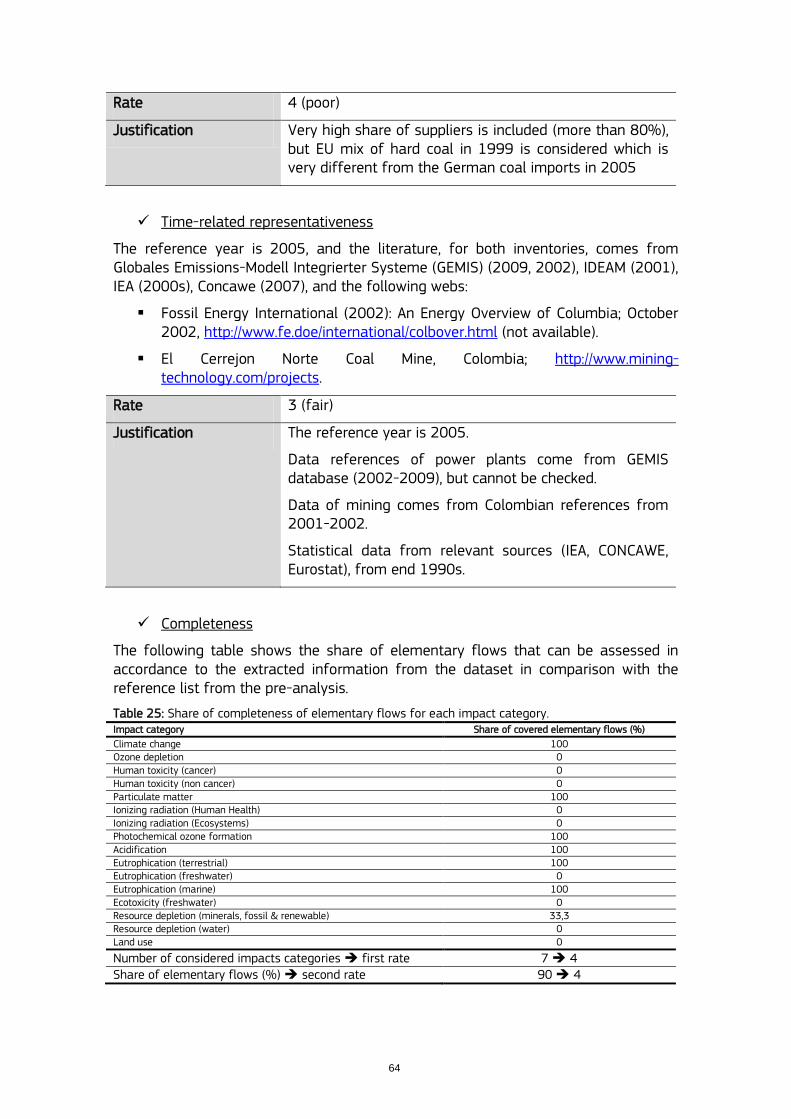
64
Rate 4 (poor)
Justification Very high share of suppliers is included (more than 80%), but EU mix of hard coal in 1999 is considered which is very different from the German coal imports in 2005
Time-related representativeness
The reference year is 2005, and the literature, for both inventories, comes from Globales Emissions-Modell Integrierter Systeme (GEMIS) (2009, 2002), IDEAM (2001), IEA (2000s), Concawe (2007), and the following webs:
Fossil Energy International (2002): An Energy Overview of Columbia; October 2002, http://www.fe.doe/international/colbover.html (not available).
El Cerrejon Norte Coal Mine, Colombia; http://www.mining-technology.com/projects.
Rate 3 (fair)
Justification The reference year is 2005.
Data references of power plants come from GEMIS database (2002-2009), but cannot be checked.
Data of mining comes from Colombian references from 2001-2002.
Statistical data from relevant sources (IEA, CONCAWE, Eurostat), from end 1990s.
Completeness
The following table shows the share of elementary flows that can be assessed in accordance to the extracted information from the dataset in comparison with the reference list from the pre-analysis.
Table 25: Share of completeness of elementary flows for each impact category. Impact category Share of covered elementary flows (%)
Climate change 100 Ozone depletion 0 Human toxicity (cancer) 0 Human toxicity (non cancer) 0 Particulate matter 100 Ionizing radiation (Human Health) 0 Ionizing radiation (Ecosystems) 0 Photochemical ozone formation 100 Acidification 100 Eutrophication (terrestrial) 100 Eutrophication (freshwater) 0 Eutrophication (marine) 100 Ecotoxicity (freshwater) 0 Resource depletion (minerals, fossil & renewable) 33,3 Resource depletion (water) 0 Land use 0
Number of considered impacts categories first rate 7 4 Share of elementary flows (%) second rate 90 4
65
Rate 4 (poor)
Justification Only 7 impact categories can be assessed and the 90% of elementary flows are considered.
Precision/uncertainty
According to dataset, data precision is middle for power plant and good for the hard coal supply. There is no info about elementary flows; nevertheless the CONCAWE, IEA, Eurostat or FEI references are considered as Authoritative Sources.
Rate 3 (fair)
Justification Most of references come from relevant literature, defined as Authoritative Sources (IEA, CONCAWE, Eurostat, FEI…).
Data of mining process from Colombia.
E3 auto-evaluation: data precision is middle/good.
There is no information about the emission factors or direct emissions.
Methodological appropriateness and consistency
System boundaries and EoL modelling
A cradle to gate system is assumed. There is no information about infrastructures, and there is no information about EoL procedures.
Allocation
No information about allocation procedures, but could be assumed as GEMIS, because of being the main reference.
Rate 5 (very poor)
Justification Cradle to gate system.
EoL modelling and infrastructures are, generally, not included. Allocation procedure has not been defined, but assumed as GEMIS.
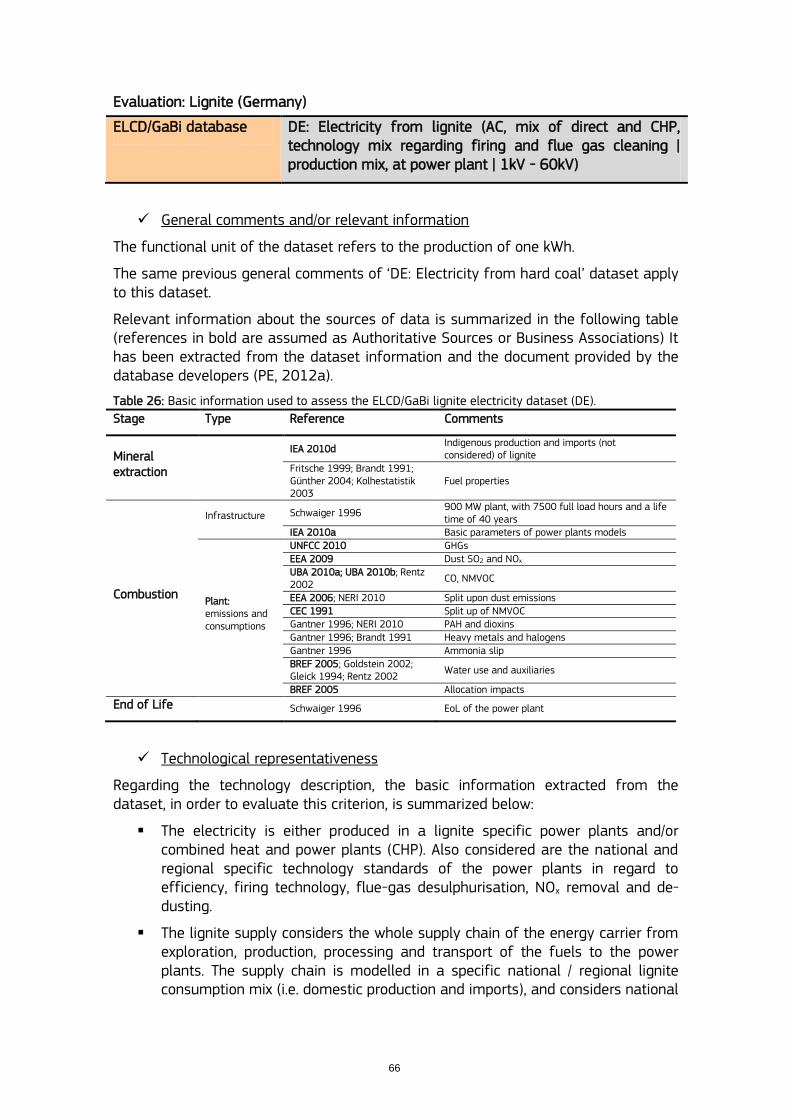
66
Evaluation: Lignite (Germany)
ELCD/GaBi database DE: Electricity from lignite (AC, mix of direct and CHP, technology mix regarding firing and flue gas cleaning | production mix, at power plant | 1kV - 60kV)
General comments and/or relevant information
The functional unit of the dataset refers to the production of one kWh.
The same previous general comments of „DE: Electricity from hard coal‟ dataset apply to this dataset.
Relevant information about the sources of data is summarized in the following table (references in bold are assumed as Authoritative Sources or Business Associations) It has been extracted from the dataset information and the document provided by the database developers (PE, 2012a).
Table 26: Basic information used to assess the ELCD/GaBi lignite electricity dataset (DE).
Stage Type Reference Comments
Mineral extraction
IEA 2010d Indigenous production and imports (not considered) of lignite
Fritsche 1999; Brandt 1991; Günther 2004; Kolhestatistik 2003
Fuel properties
Combustion
Infrastructure Schwaiger 1996 900 MW plant, with 7500 full load hours and a life time of 40 years
IEA 2010a Basic parameters of power plants models
Plant: emissions and consumptions
UNFCC 2010 GHGs EEA 2009 Dust SO2 and NOx UBA 2010a; UBA 2010b; Rentz 2002
CO, NMVOC
EEA 2006; NERI 2010 Split upon dust emissions CEC 1991 Split up of NMVOC Gantner 1996; NERI 2010 PAH and dioxins Gantner 1996; Brandt 1991 Heavy metals and halogens Gantner 1996 Ammonia slip BREF 2005; Goldstein 2002; Gleick 1994; Rentz 2002
Water use and auxiliaries
BREF 2005 Allocation impacts
End of Life Schwaiger 1996 EoL of the power plant
Technological representativeness
Regarding the technology description, the basic information extracted from the dataset, in order to evaluate this criterion, is summarized below:
The electricity is either produced in a lignite specific power plants and/or combined heat and power plants (CHP). Also considered are the national and regional specific technology standards of the power plants in regard to efficiency, firing technology, flue-gas desulphurisation, NOx removal and de-dusting.
The lignite supply considers the whole supply chain of the energy carrier from exploration, production, processing and transport of the fuels to the power plants. The supply chain is modelled in a specific national / regional lignite consumption mix (i.e. domestic production and imports), and considers national
67
/ regional average lignite properties (e.g. elemental composition and energy content).
Regarding basic parameters of the power plant models, the dataset developer has provided the following information:
The share between electricity produced in electricity plants and CHP plants, the efficiencies, the own consumption as well as the share between electricity and heat output in CHP plants is calculated individually for each specific country using IEA statistics.
Rate 1 (very good)
Justification Consideration of both the electricity and CHP plants for producing electricity from lignite using the technology mix.
Type of plants (PC, SCPC, IGCC, etc.) is not defined but basic parameters settings have been considered.
Geographical representativeness
Regarding the information included in the dataset, the basic information, in order to evaluate this criterion, is summarized below.
The data set represents the average national or region specific electricity production based on lignite. Main technologies for firing, flue gas cleaning and electricity generation are considered according to the national or region specific situation.
This dataset includes „DE: Lignite mix‟ dataset, which covers the entire supply chain of lignite. Analogously to any dataset, a technology description is incorporated. The basic information extracted from the dataset, in order to evaluate this criterion, is the following.
The dataset considers the whole supply chain from lignite mining, lignite upgrading, long distance transport, and regional distribution to the final consumer. Main technology such as open-pit mining, including parameters like energy consumption, transport distances, direct methane emissions are individually considered for each production country. All lignite delivering countries, including domestic production, contribute by their corresponding shares to the lignite mix. The mix can be seen for a specific country / region as average lignite consumed.
The lignite consumption mix consists nearly exclusively of indigenous production. Only in some countries/ regions a small amount is imported. The pie chart presented below represents the lignite consumption mix. The following figure illustrates that the origin of lignite is domestic.
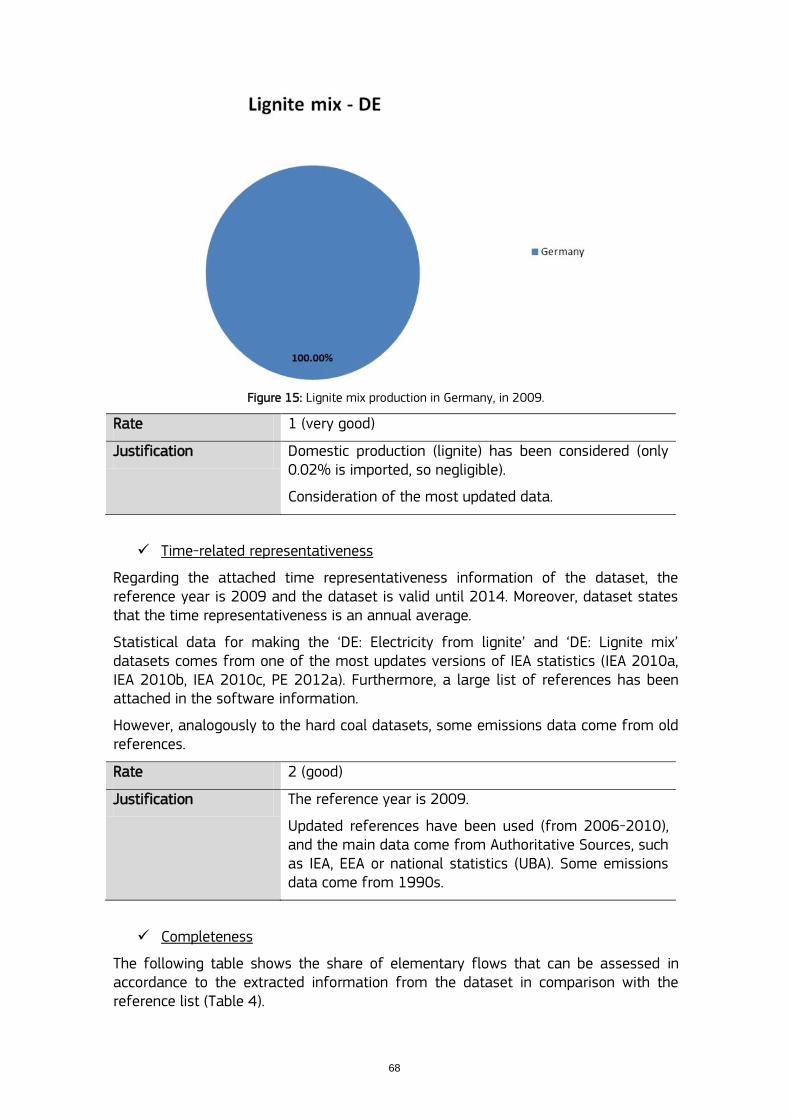
68
Figure 15: Lignite mix production in Germany, in 2009.
Rate 1 (very good)
Justification Domestic production (lignite) has been considered (only 0.02% is imported, so negligible).
Consideration of the most updated data.
Time-related representativeness
Regarding the attached time representativeness information of the dataset, the reference year is 2009 and the dataset is valid until 2014. Moreover, dataset states that the time representativeness is an annual average.
Statistical data for making the „DE: Electricity from lignite‟ and „DE: Lignite mix‟ datasets comes from one of the most updates versions of IEA statistics (IEA 2010a, IEA 2010b, IEA 2010c, PE 2012a). Furthermore, a large list of references has been attached in the software information.
However, analogously to the hard coal datasets, some emissions data come from old references.
Rate 2 (good)
Justification The reference year is 2009.
Updated references have been used (from 2006-2010), and the main data come from Authoritative Sources, such as IEA, EEA or national statistics (UBA). Some emissions data come from 1990s.
Completeness
The following table shows the share of elementary flows that can be assessed in accordance to the extracted information from the dataset in comparison with the reference list (Table 4).
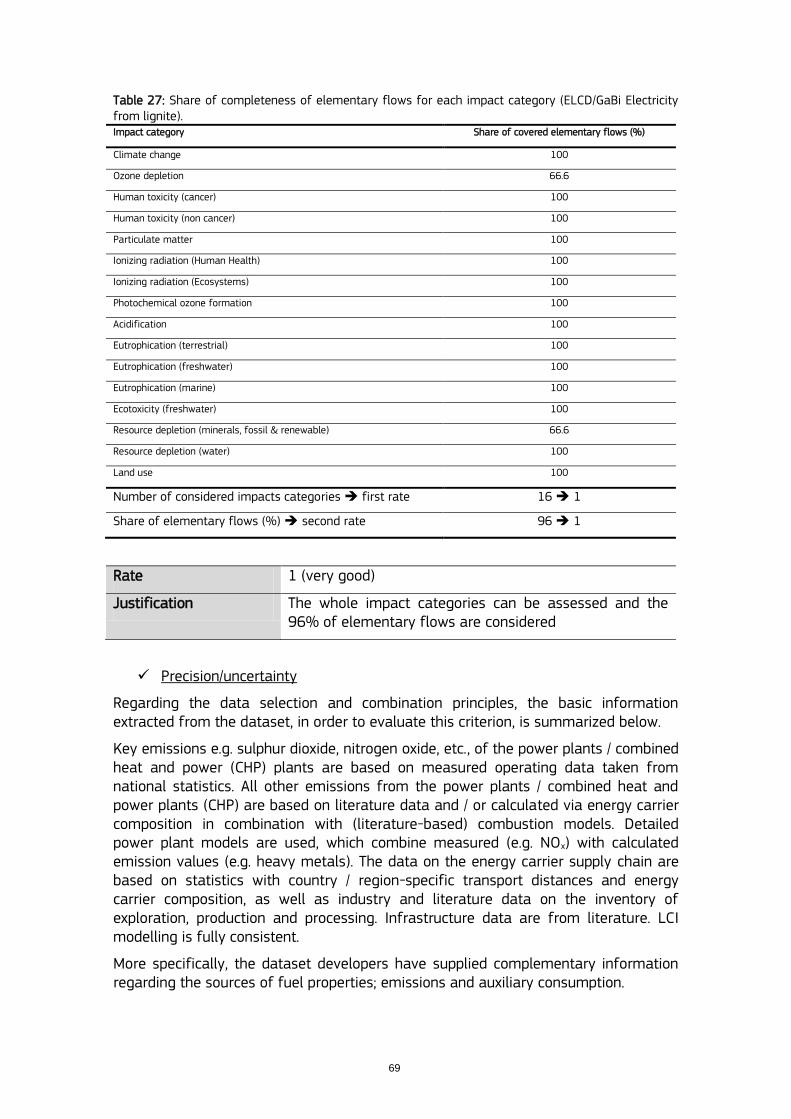
69
Table 27: Share of completeness of elementary flows for each impact category (ELCD/GaBi Electricity from lignite). Impact category Share of covered elementary flows (%)
Climate change 100
Ozone depletion 66.6
Human toxicity (cancer) 100
Human toxicity (non cancer) 100
Particulate matter 100
Ionizing radiation (Human Health) 100
Ionizing radiation (Ecosystems) 100
Photochemical ozone formation 100
Acidification 100
Eutrophication (terrestrial) 100
Eutrophication (freshwater) 100
Eutrophication (marine) 100
Ecotoxicity (freshwater) 100
Resource depletion (minerals, fossil & renewable) 66.6
Resource depletion (water) 100
Land use 100
Number of considered impacts categories first rate 16 1
Share of elementary flows (%) second rate 96 1
Rate 1 (very good)
Justification The whole impact categories can be assessed and the 96% of elementary flows are considered
Precision/uncertainty
Regarding the data selection and combination principles, the basic information extracted from the dataset, in order to evaluate this criterion, is summarized below.
Key emissions e.g. sulphur dioxide, nitrogen oxide, etc., of the power plants / combined heat and power (CHP) plants are based on measured operating data taken from national statistics. All other emissions from the power plants / combined heat and power plants (CHP) are based on literature data and / or calculated via energy carrier composition in combination with (literature-based) combustion models. Detailed power plant models are used, which combine measured (e.g. NOx) with calculated emission values (e.g. heavy metals). The data on the energy carrier supply chain are based on statistics with country / region-specific transport distances and energy carrier composition, as well as industry and literature data on the inventory of exploration, production and processing. Infrastructure data are from literature. LCI modelling is fully consistent.
More specifically, the dataset developers have supplied complementary information regarding the sources of fuel properties; emissions and auxiliary consumption.
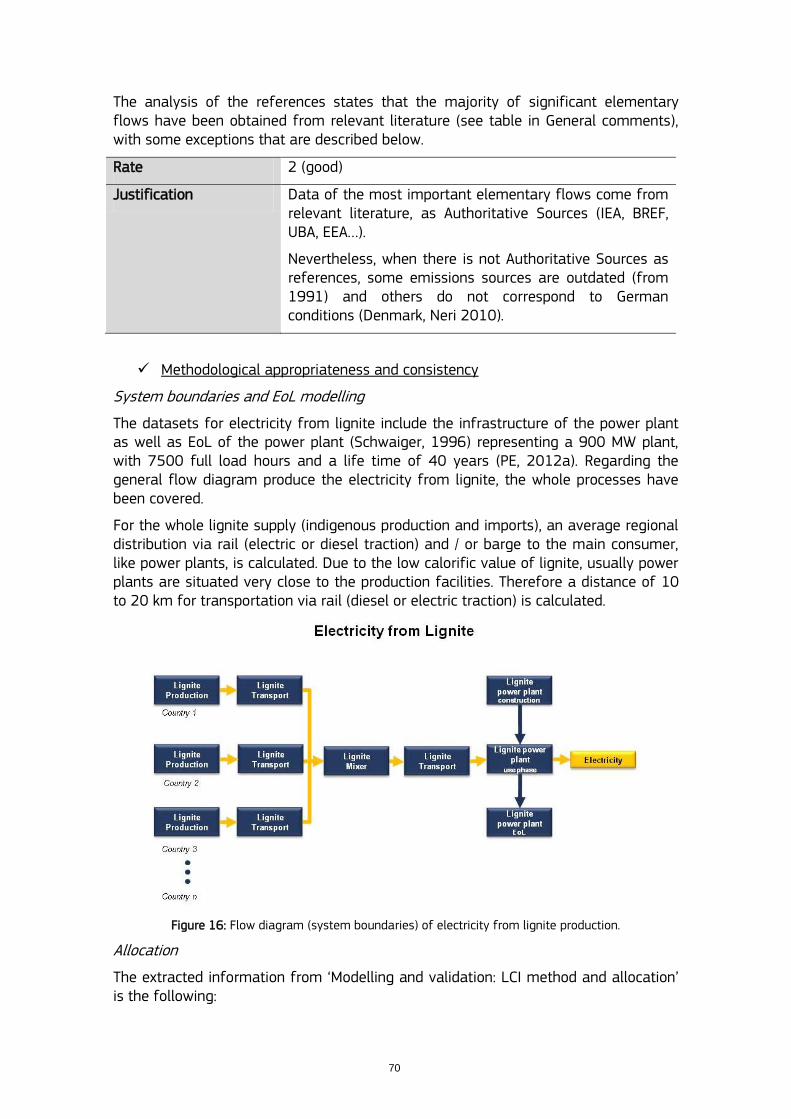
70
The analysis of the references states that the majority of significant elementary flows have been obtained from relevant literature (see table in General comments), with some exceptions that are described below.
Rate 2 (good)
Justification Data of the most important elementary flows come from relevant literature, as Authoritative Sources (IEA, BREF, UBA, EEA…).
Nevertheless, when there is not Authoritative Sources as references, some emissions sources are outdated (from 1991) and others do not correspond to German conditions (Denmark, Neri 2010).
Methodological appropriateness and consistency
System boundaries and EoL modelling
The datasets for electricity from lignite include the infrastructure of the power plant as well as EoL of the power plant (Schwaiger, 1996) representing a 900 MW plant, with 7500 full load hours and a life time of 40 years (PE, 2012a). Regarding the general flow diagram produce the electricity from lignite, the whole processes have been covered.
For the whole lignite supply (indigenous production and imports), an average regional distribution via rail (electric or diesel traction) and / or barge to the main consumer, like power plants, is calculated. Due to the low calorific value of lignite, usually power plants are situated very close to the production facilities. Therefore a distance of 10 to 20 km for transportation via rail (diesel or electric traction) is calculated.
Figure 16: Flow diagram (system boundaries) of electricity from lignite production.
Allocation
The extracted information from „Modelling and validation: LCI method and allocation‟ is the following:
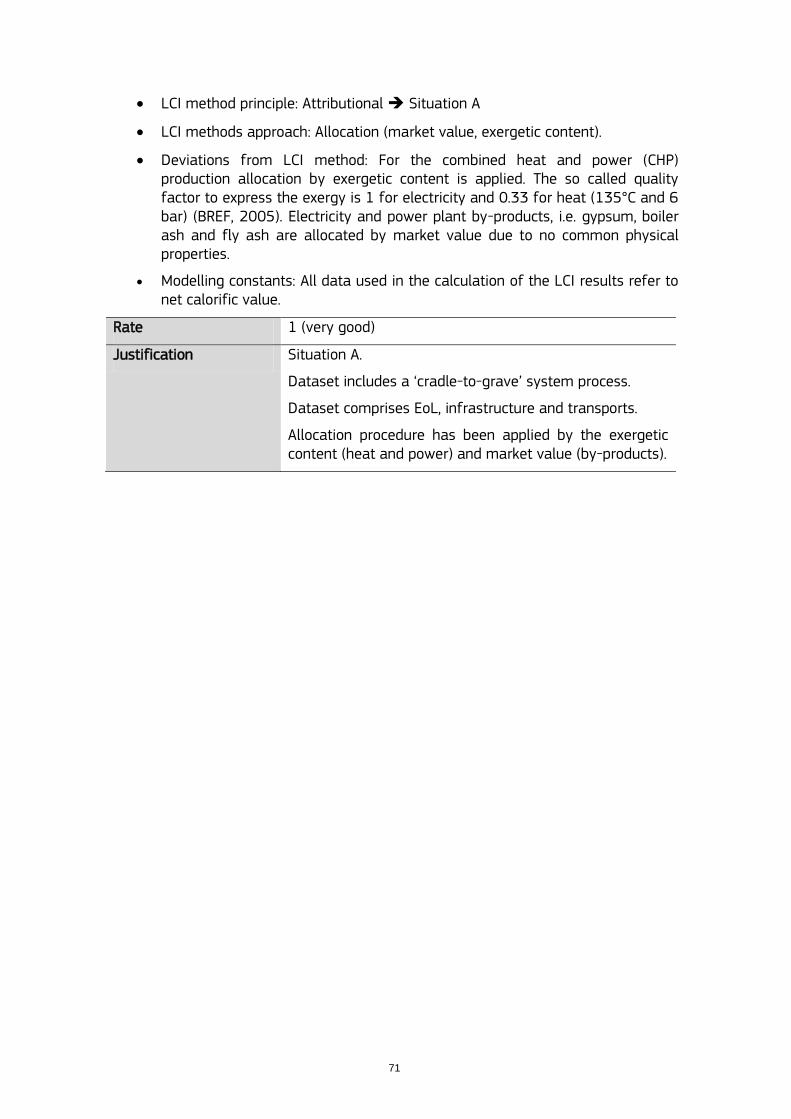
71
LCI method principle: Attributional Situation A
LCI methods approach: Allocation (market value, exergetic content).
Deviations from LCI method: For the combined heat and power (CHP) production allocation by exergetic content is applied. The so called quality factor to express the exergy is 1 for electricity and 0.33 for heat (135°C and 6 bar) (BREF, 2005). Electricity and power plant by-products, i.e. gypsum, boiler ash and fly ash are allocated by market value due to no common physical properties.
Modelling constants: All data used in the calculation of the LCI results refer to net calorific value.
Rate 1 (very good)
Justification Situation A.
Dataset includes a „cradle-to-grave‟ system process.
Dataset comprises EoL, infrastructure and transports.
Allocation procedure has been applied by the exergetic content (heat and power) and market value (by-products).
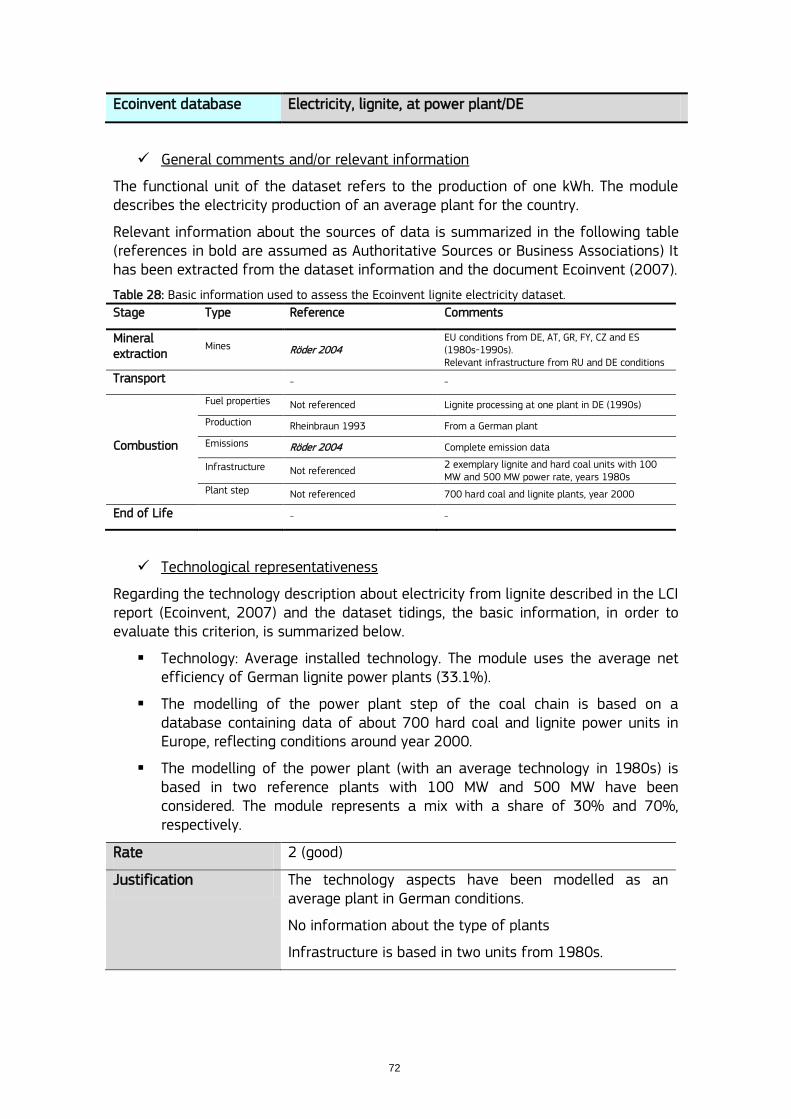
72
Ecoinvent database Electricity, lignite, at power plant/DE
General comments and/or relevant information
The functional unit of the dataset refers to the production of one kWh. The module describes the electricity production of an average plant for the country.
Relevant information about the sources of data is summarized in the following table (references in bold are assumed as Authoritative Sources or Business Associations) It has been extracted from the dataset information and the document Ecoinvent (2007).
Table 28: Basic information used to assess the Ecoinvent lignite electricity dataset.
Stage Type Reference Comments
Mineral extraction
Mines Röder 2004 EU conditions from DE, AT, GR, FY, CZ and ES (1980s-1990s). Relevant infrastructure from RU and DE conditions
Transport - -
Combustion
Fuel properties Not referenced Lignite processing at one plant in DE (1990s)
Production Rheinbraun 1993 From a German plant
Emissions Röder 2004 Complete emission data
Infrastructure Not referenced 2 exemplary lignite and hard coal units with 100 MW and 500 MW power rate, years 1980s
Plant step Not referenced 700 hard coal and lignite plants, year 2000
End of Life - -
Technological representativeness
Regarding the technology description about electricity from lignite described in the LCI report (Ecoinvent, 2007) and the dataset tidings, the basic information, in order to evaluate this criterion, is summarized below.
Technology: Average installed technology. The module uses the average net efficiency of German lignite power plants (33.1%).
The modelling of the power plant step of the coal chain is based on a database containing data of about 700 hard coal and lignite power units in Europe, reflecting conditions around year 2000.
The modelling of the power plant (with an average technology in 1980s) is based in two reference plants with 100 MW and 500 MW have been considered. The module represents a mix with a share of 30% and 70%, respectively.
Rate 2 (good)
Justification The technology aspects have been modelled as an average plant in German conditions.
No information about the type of plants
Infrastructure is based in two units from 1980s.
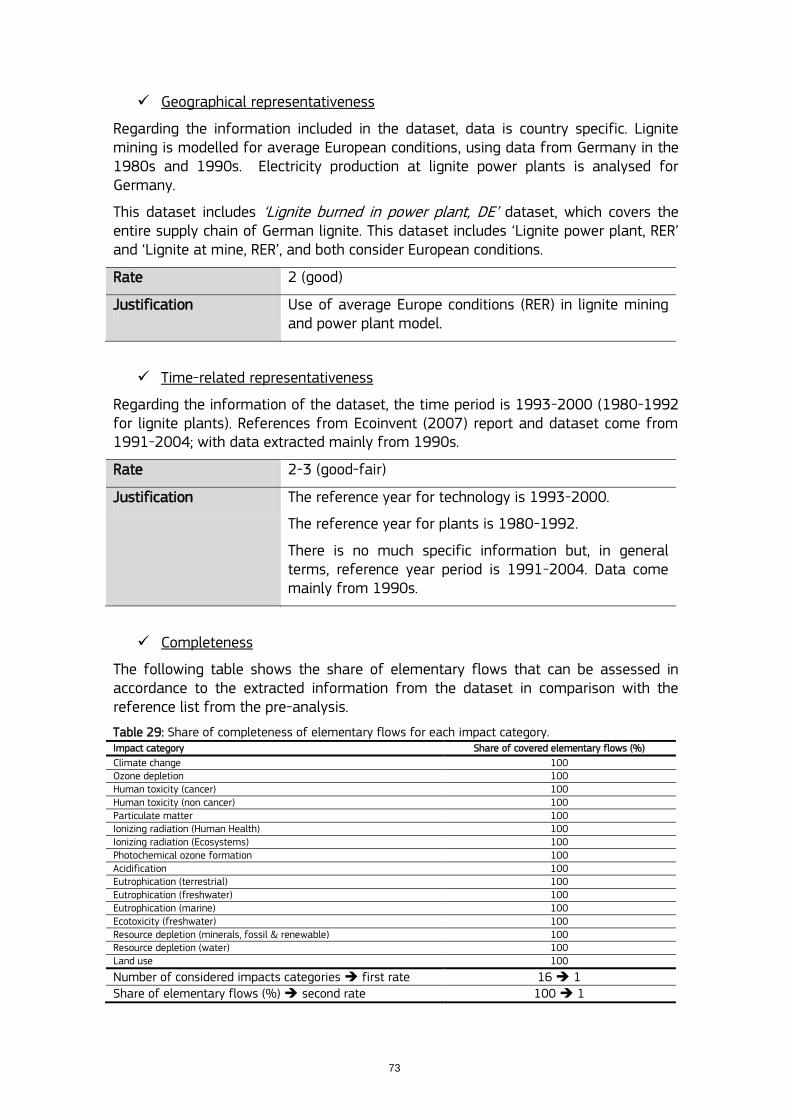
73
Geographical representativeness
Regarding the information included in the dataset, data is country specific. Lignite mining is modelled for average European conditions, using data from Germany in the 1980s and 1990s. Electricity production at lignite power plants is analysed for Germany.
This dataset includes „Lignite burned in power plant, DE‟ dataset, which covers the entire supply chain of German lignite. This dataset includes „Lignite power plant, RER‟ and „Lignite at mine, RER‟, and both consider European conditions.
Rate 2 (good)
Justification Use of average Europe conditions (RER) in lignite mining and power plant model.
Time-related representativeness
Regarding the information of the dataset, the time period is 1993-2000 (1980-1992 for lignite plants). References from Ecoinvent (2007) report and dataset come from 1991-2004; with data extracted mainly from 1990s.
Rate 2-3 (good-fair)
Justification The reference year for technology is 1993-2000.
The reference year for plants is 1980-1992.
There is no much specific information but, in general terms, reference year period is 1991-2004. Data come mainly from 1990s.
Completeness
The following table shows the share of elementary flows that can be assessed in accordance to the extracted information from the dataset in comparison with the reference list from the pre-analysis.
Table 29: Share of completeness of elementary flows for each impact category. Impact category Share of covered elementary flows (%)
Climate change 100 Ozone depletion 100 Human toxicity (cancer) 100 Human toxicity (non cancer) 100 Particulate matter 100 Ionizing radiation (Human Health) 100 Ionizing radiation (Ecosystems) 100 Photochemical ozone formation 100 Acidification 100 Eutrophication (terrestrial) 100 Eutrophication (freshwater) 100 Eutrophication (marine) 100 Ecotoxicity (freshwater) 100 Resource depletion (minerals, fossil & renewable) 100 Resource depletion (water) 100 Land use 100
Number of considered impacts categories first rate 16 1 Share of elementary flows (%) second rate 100 1
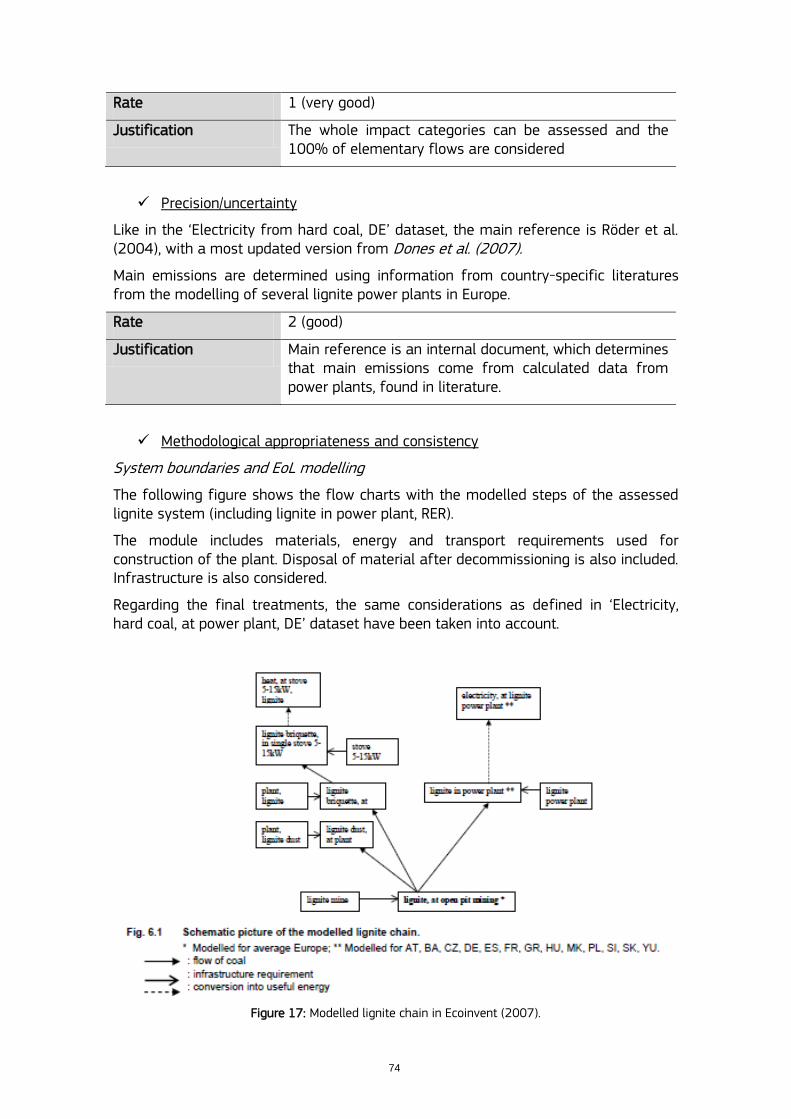
74
Rate 1 (very good)
Justification The whole impact categories can be assessed and the 100% of elementary flows are considered
Precision/uncertainty
Like in the „Electricity from hard coal, DE‟ dataset, the main reference is Röder et al. (2004), with a most updated version from Dones et al. (2007).
Main emissions are determined using information from country-specific literatures from the modelling of several lignite power plants in Europe.
Rate 2 (good)
Justification Main reference is an internal document, which determines that main emissions come from calculated data from power plants, found in literature.
Methodological appropriateness and consistency
System boundaries and EoL modelling
The following figure shows the flow charts with the modelled steps of the assessed lignite system (including lignite in power plant, RER).
The module includes materials, energy and transport requirements used for construction of the plant. Disposal of material after decommissioning is also included. Infrastructure is also considered.
Regarding the final treatments, the same considerations as defined in „Electricity, hard coal, at power plant, DE‟ dataset have been taken into account.
Figure 17: Modelled lignite chain in Ecoinvent (2007).
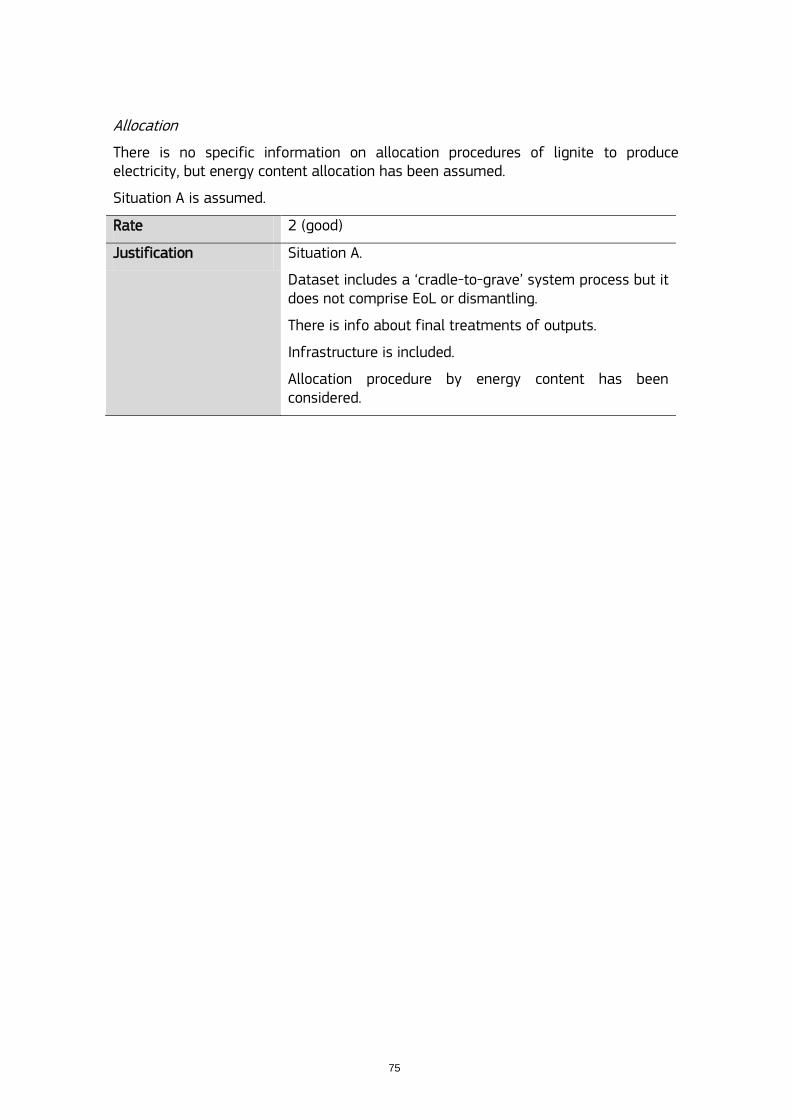
75
Allocation
There is no specific information on allocation procedures of lignite to produce electricity, but energy content allocation has been assumed.
Situation A is assumed.
Rate 2 (good)
Justification Situation A.
Dataset includes a „cradle-to-grave‟ system process but it does not comprise EoL or dismantling.
There is info about final treatments of outputs.
Infrastructure is included.
Allocation procedure by energy content has been considered.
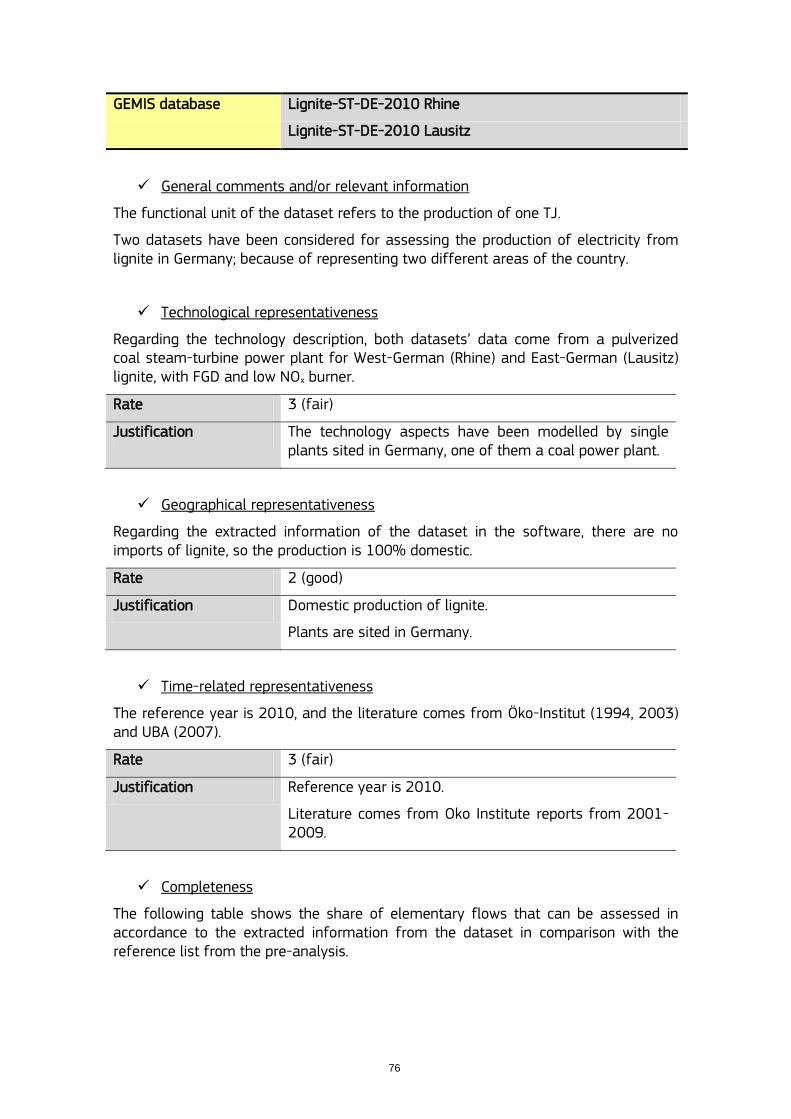
76
GEMIS database Lignite-ST-DE-2010 Rhine
Lignite-ST-DE-2010 Lausitz
General comments and/or relevant information
The functional unit of the dataset refers to the production of one TJ.
Two datasets have been considered for assessing the production of electricity from lignite in Germany; because of representing two different areas of the country.
Technological representativeness
Regarding the technology description, both datasets‟ data come from a pulverized coal steam-turbine power plant for West-German (Rhine) and East-German (Lausitz) lignite, with FGD and low NOx burner.
Rate 3 (fair)
Justification The technology aspects have been modelled by single plants sited in Germany, one of them a coal power plant.
Geographical representativeness
Regarding the extracted information of the dataset in the software, there are no imports of lignite, so the production is 100% domestic.
Rate 2 (good)
Justification Domestic production of lignite.
Plants are sited in Germany.
Time-related representativeness
The reference year is 2010, and the literature comes from Öko-Institut (1994, 2003) and UBA (2007).
Rate 3 (fair)
Justification Reference year is 2010.
Literature comes from Oko Institute reports from 2001-2009.
Completeness
The following table shows the share of elementary flows that can be assessed in accordance to the extracted information from the dataset in comparison with the reference list from the pre-analysis.
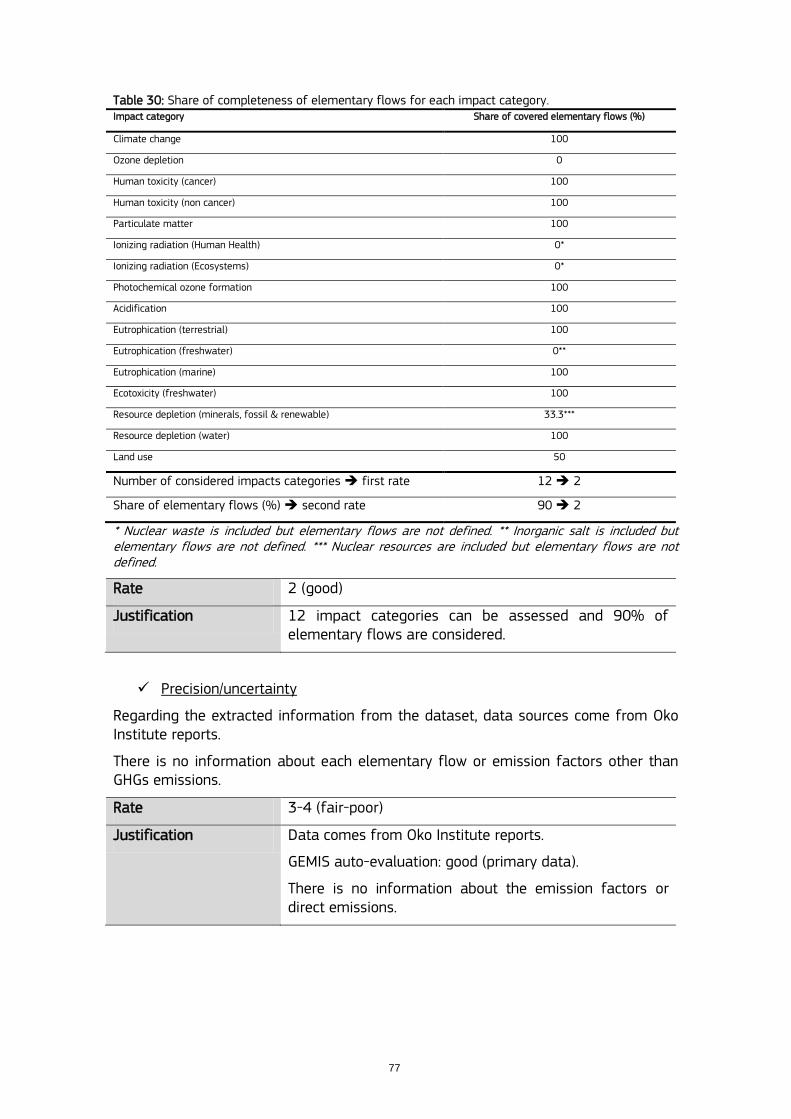
77
Table 30: Share of completeness of elementary flows for each impact category. Impact category Share of covered elementary flows (%)
Climate change 100
Ozone depletion 0
Human toxicity (cancer) 100
Human toxicity (non cancer) 100
Particulate matter 100
Ionizing radiation (Human Health) 0*
Ionizing radiation (Ecosystems) 0*
Photochemical ozone formation 100
Acidification 100
Eutrophication (terrestrial) 100
Eutrophication (freshwater) 0**
Eutrophication (marine) 100
Ecotoxicity (freshwater) 100
Resource depletion (minerals, fossil & renewable) 33.3***
Resource depletion (water) 100
Land use 50
Number of considered impacts categories first rate 12 2
Share of elementary flows (%) second rate 90 2
* Nuclear waste is included but elementary flows are not defined. ** Inorganic salt is included but elementary flows are not defined. *** Nuclear resources are included but elementary flows are not defined.
Rate 2 (good)
Justification 12 impact categories can be assessed and 90% of elementary flows are considered.
Precision/uncertainty
Regarding the extracted information from the dataset, data sources come from Oko Institute reports.
There is no information about each elementary flow or emission factors other than GHGs emissions.
Rate 3-4 (fair-poor)
Justification Data comes from Oko Institute reports.
GEMIS auto-evaluation: good (primary data).
There is no information about the emission factors or direct emissions.
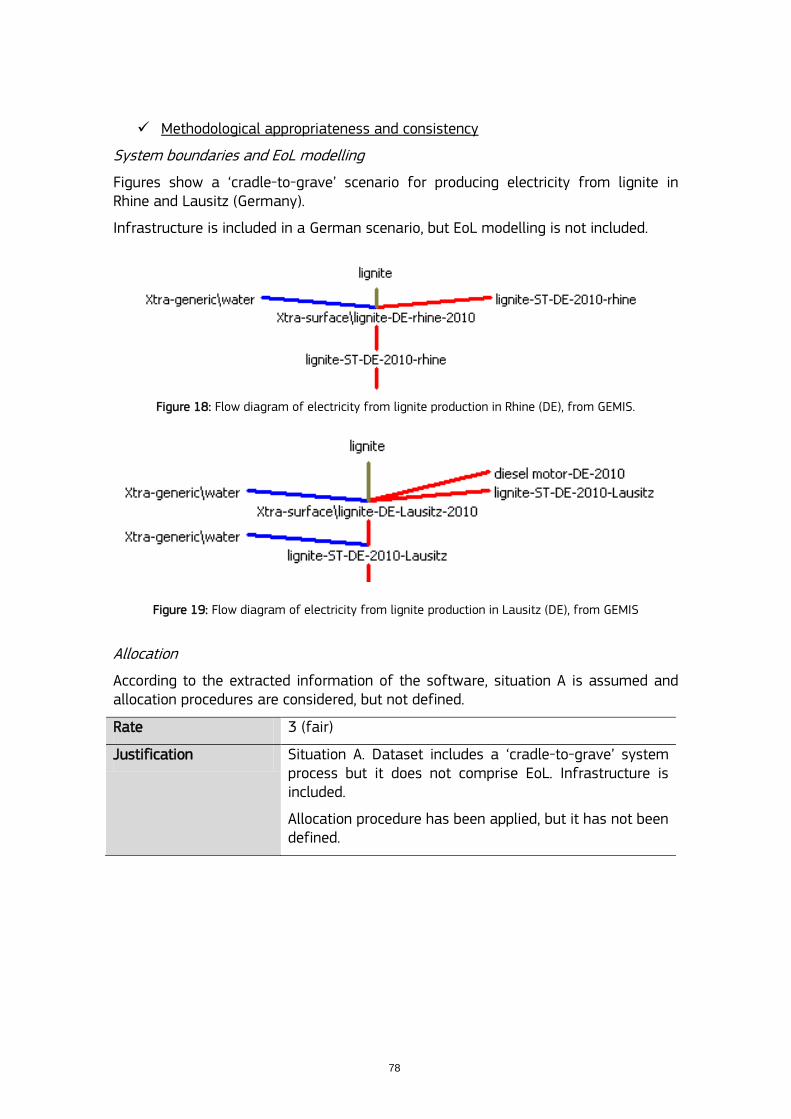
78
Methodological appropriateness and consistency
System boundaries and EoL modelling
Figures show a „cradle-to-grave‟ scenario for producing electricity from lignite in Rhine and Lausitz (Germany).
Infrastructure is included in a German scenario, but EoL modelling is not included.
Figure 18: Flow diagram of electricity from lignite production in Rhine (DE), from GEMIS.
Figure 19: Flow diagram of electricity from lignite production in Lausitz (DE), from GEMIS
Allocation
According to the extracted information of the software, situation A is assumed and allocation procedures are considered, but not defined.
Rate 3 (fair)
Justification Situation A. Dataset includes a „cradle-to-grave‟ system process but it does not comprise EoL. Infrastructure is included.
Allocation procedure has been applied, but it has not been defined.
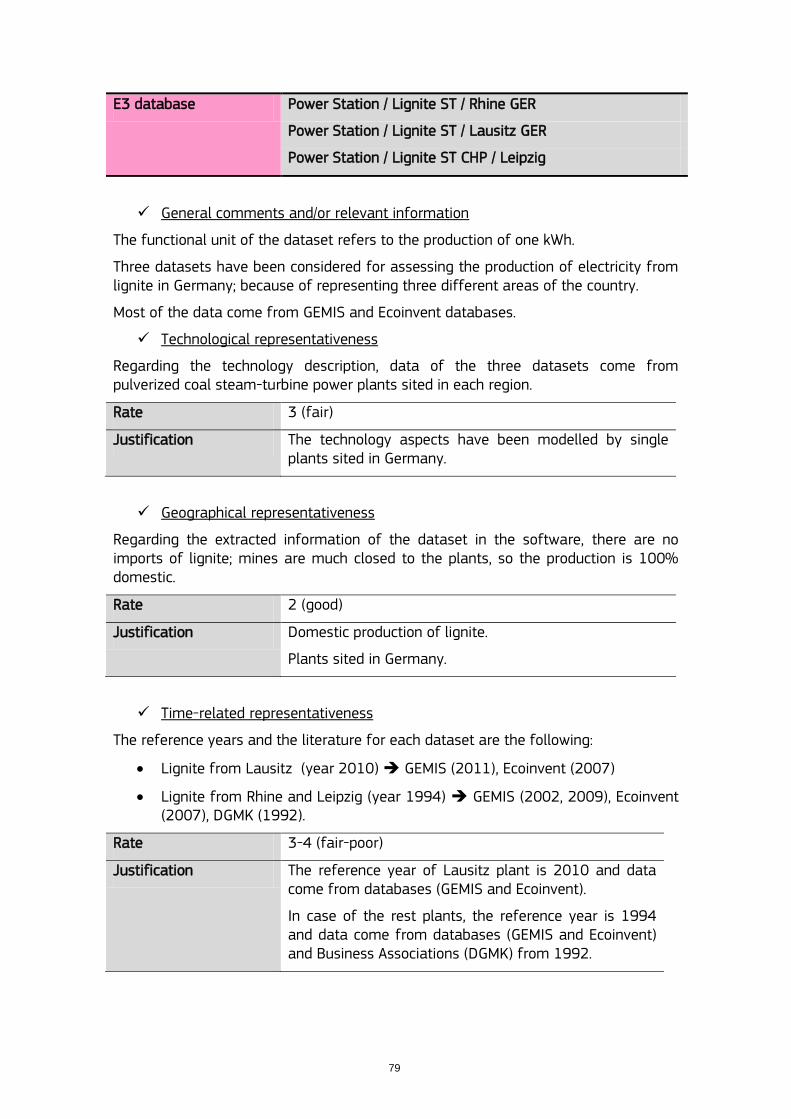
79
E3 database Power Station / Lignite ST / Rhine GER
Power Station / Lignite ST / Lausitz GER
Power Station / Lignite ST CHP / Leipzig
General comments and/or relevant information
The functional unit of the dataset refers to the production of one kWh.
Three datasets have been considered for assessing the production of electricity from lignite in Germany; because of representing three different areas of the country.
Most of the data come from GEMIS and Ecoinvent databases.
Technological representativeness
Regarding the technology description, data of the three datasets come from pulverized coal steam-turbine power plants sited in each region.
Rate 3 (fair)
Justification The technology aspects have been modelled by single plants sited in Germany.
Geographical representativeness
Regarding the extracted information of the dataset in the software, there are no imports of lignite; mines are much closed to the plants, so the production is 100% domestic.
Rate 2 (good)
Justification Domestic production of lignite.
Plants sited in Germany.
Time-related representativeness
The reference years and the literature for each dataset are the following:
Lignite from Lausitz (year 2010) GEMIS (2011), Ecoinvent (2007)
Lignite from Rhine and Leipzig (year 1994) GEMIS (2002, 2009), Ecoinvent (2007), DGMK (1992).
Rate 3-4 (fair-poor)
Justification The reference year of Lausitz plant is 2010 and data come from databases (GEMIS and Ecoinvent).
In case of the rest plants, the reference year is 1994 and data come from databases (GEMIS and Ecoinvent) and Business Associations (DGMK) from 1992.
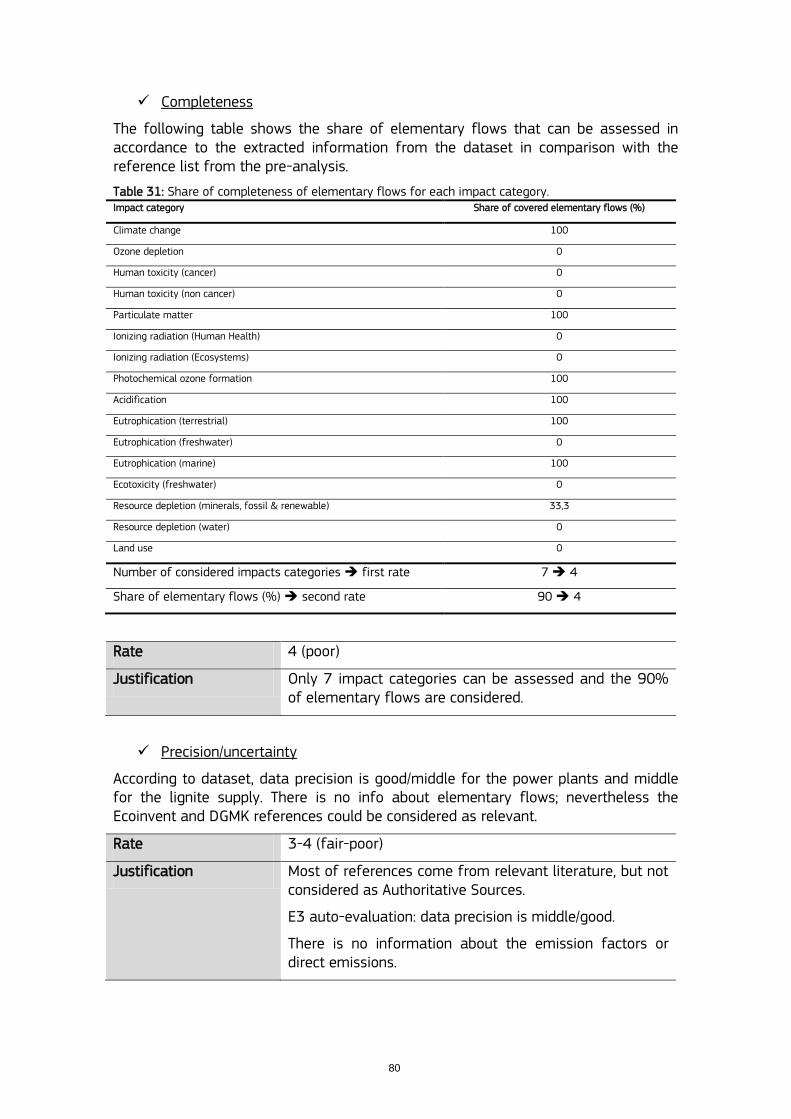
80
Completeness
The following table shows the share of elementary flows that can be assessed in accordance to the extracted information from the dataset in comparison with the reference list from the pre-analysis.
Table 31: Share of completeness of elementary flows for each impact category. Impact category Share of covered elementary flows (%)
Climate change 100
Ozone depletion 0
Human toxicity (cancer) 0
Human toxicity (non cancer) 0
Particulate matter 100
Ionizing radiation (Human Health) 0
Ionizing radiation (Ecosystems) 0
Photochemical ozone formation 100
Acidification 100
Eutrophication (terrestrial) 100
Eutrophication (freshwater) 0
Eutrophication (marine) 100
Ecotoxicity (freshwater) 0
Resource depletion (minerals, fossil & renewable) 33,3
Resource depletion (water) 0
Land use 0
Number of considered impacts categories first rate 7 4
Share of elementary flows (%) second rate 90 4
Rate 4 (poor)
Justification Only 7 impact categories can be assessed and the 90% of elementary flows are considered.
Precision/uncertainty
According to dataset, data precision is good/middle for the power plants and middle for the lignite supply. There is no info about elementary flows; nevertheless the Ecoinvent and DGMK references could be considered as relevant.
Rate 3-4 (fair-poor)
Justification Most of references come from relevant literature, but not considered as Authoritative Sources.
E3 auto-evaluation: data precision is middle/good.
There is no information about the emission factors or direct emissions.
81
Methodological appropriateness and consistency
System boundaries and EoL modelling
A cradle to gate system is assumed.
There is no information about infrastructures (only in case of Lausitz plant, the construction time is considered – 3 years-).
There is no information about EoL procedures.
Allocation
No information about allocation procedures, but could be assumed as GEMIS, because of the references.
Rate 4-5 (poor-very poor)
Justification Cradle to gate system.
EoL modelling and infrastructures are, generally, not included.
Allocation procedure has not been defined, but assumed as GEMIS.
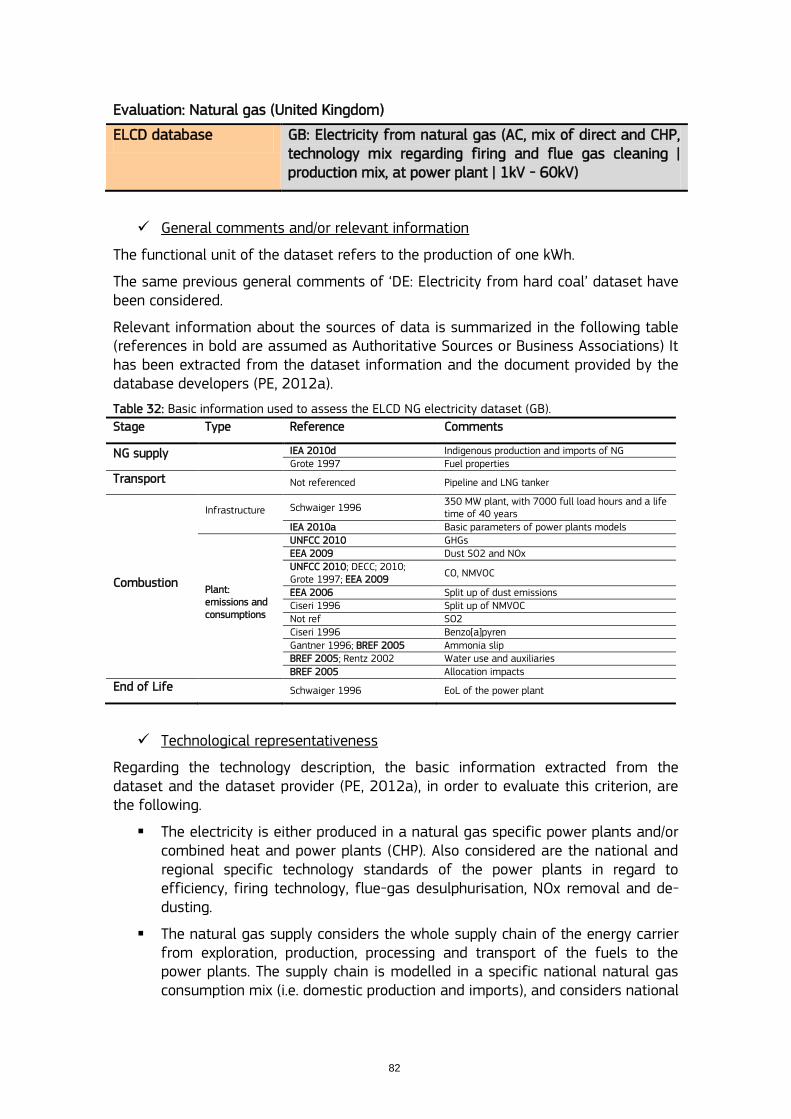
82
Evaluation: Natural gas (United Kingdom)
ELCD database GB: Electricity from natural gas (AC, mix of direct and CHP, technology mix regarding firing and flue gas cleaning | production mix, at power plant | 1kV - 60kV)
General comments and/or relevant information
The functional unit of the dataset refers to the production of one kWh.
The same previous general comments of „DE: Electricity from hard coal‟ dataset have been considered.
Relevant information about the sources of data is summarized in the following table (references in bold are assumed as Authoritative Sources or Business Associations) It has been extracted from the dataset information and the document provided by the database developers (PE, 2012a).
Table 32: Basic information used to assess the ELCD NG electricity dataset (GB).
Stage Type Reference Comments
NG supply IEA 2010d Indigenous production and imports of NG Grote 1997 Fuel properties
Transport Not referenced Pipeline and LNG tanker
Combustion
Infrastructure Schwaiger 1996 350 MW plant, with 7000 full load hours and a life time of 40 years
IEA 2010a Basic parameters of power plants models
Plant: emissions and consumptions
UNFCC 2010 GHGs EEA 2009 Dust SO2 and NOx UNFCC 2010; DECC; 2010; Grote 1997; EEA 2009
CO, NMVOC
EEA 2006 Split up of dust emissions Ciseri 1996 Split up of NMVOC Not ref SO2 Ciseri 1996 Benzo[a]pyren Gantner 1996; BREF 2005 Ammonia slip BREF 2005; Rentz 2002 Water use and auxiliaries BREF 2005 Allocation impacts
End of Life Schwaiger 1996 EoL of the power plant
Technological representativeness
Regarding the technology description, the basic information extracted from the dataset and the dataset provider (PE, 2012a), in order to evaluate this criterion, are the following.
The electricity is either produced in a natural gas specific power plants and/or combined heat and power plants (CHP). Also considered are the national and regional specific technology standards of the power plants in regard to efficiency, firing technology, flue-gas desulphurisation, NOx removal and de-dusting.
The natural gas supply considers the whole supply chain of the energy carrier from exploration, production, processing and transport of the fuels to the power plants. The supply chain is modelled in a specific national natural gas consumption mix (i.e. domestic production and imports), and considers national
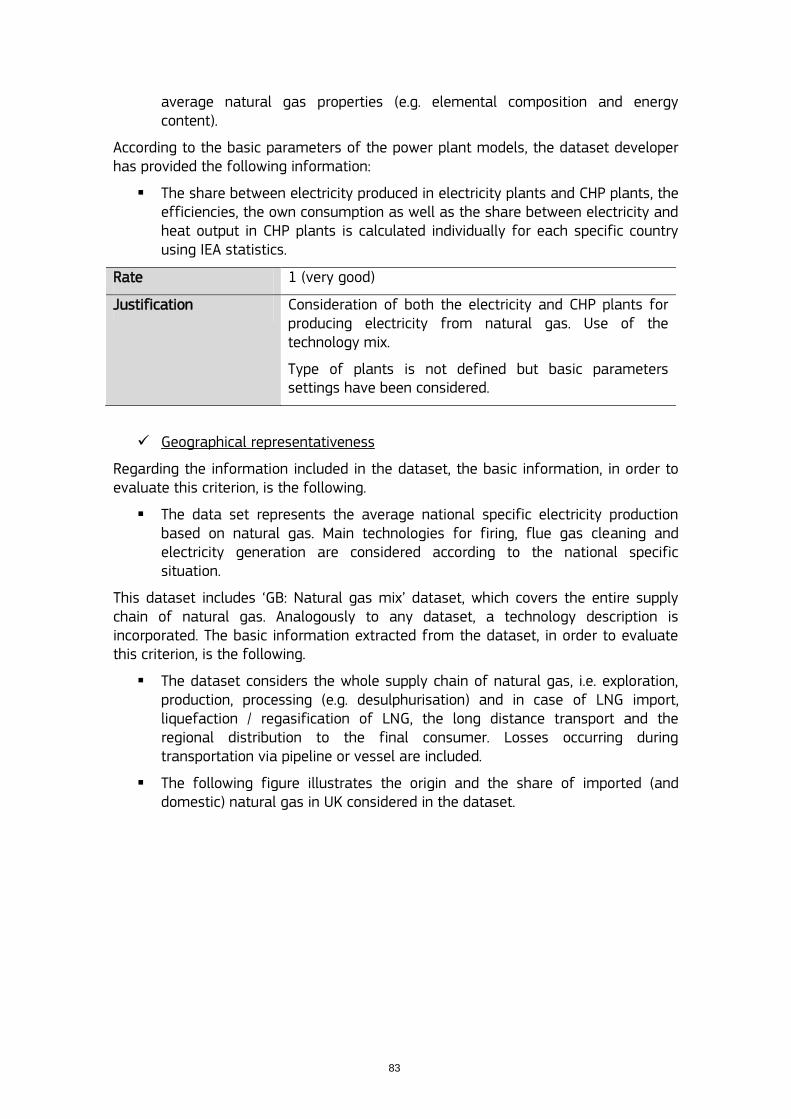
83
average natural gas properties (e.g. elemental composition and energy content).
According to the basic parameters of the power plant models, the dataset developer has provided the following information:
The share between electricity produced in electricity plants and CHP plants, the efficiencies, the own consumption as well as the share between electricity and heat output in CHP plants is calculated individually for each specific country using IEA statistics.
Rate 1 (very good)
Justification Consideration of both the electricity and CHP plants for producing electricity from natural gas. Use of the technology mix.
Type of plants is not defined but basic parameters settings have been considered.
Geographical representativeness
Regarding the information included in the dataset, the basic information, in order to evaluate this criterion, is the following.
The data set represents the average national specific electricity production based on natural gas. Main technologies for firing, flue gas cleaning and electricity generation are considered according to the national specific situation.
This dataset includes „GB: Natural gas mix‟ dataset, which covers the entire supply chain of natural gas. Analogously to any dataset, a technology description is incorporated. The basic information extracted from the dataset, in order to evaluate this criterion, is the following.
The dataset considers the whole supply chain of natural gas, i.e. exploration, production, processing (e.g. desulphurisation) and in case of LNG import, liquefaction / regasification of LNG, the long distance transport and the regional distribution to the final consumer. Losses occurring during transportation via pipeline or vessel are included.
The following figure illustrates the origin and the share of imported (and domestic) natural gas in UK considered in the dataset.
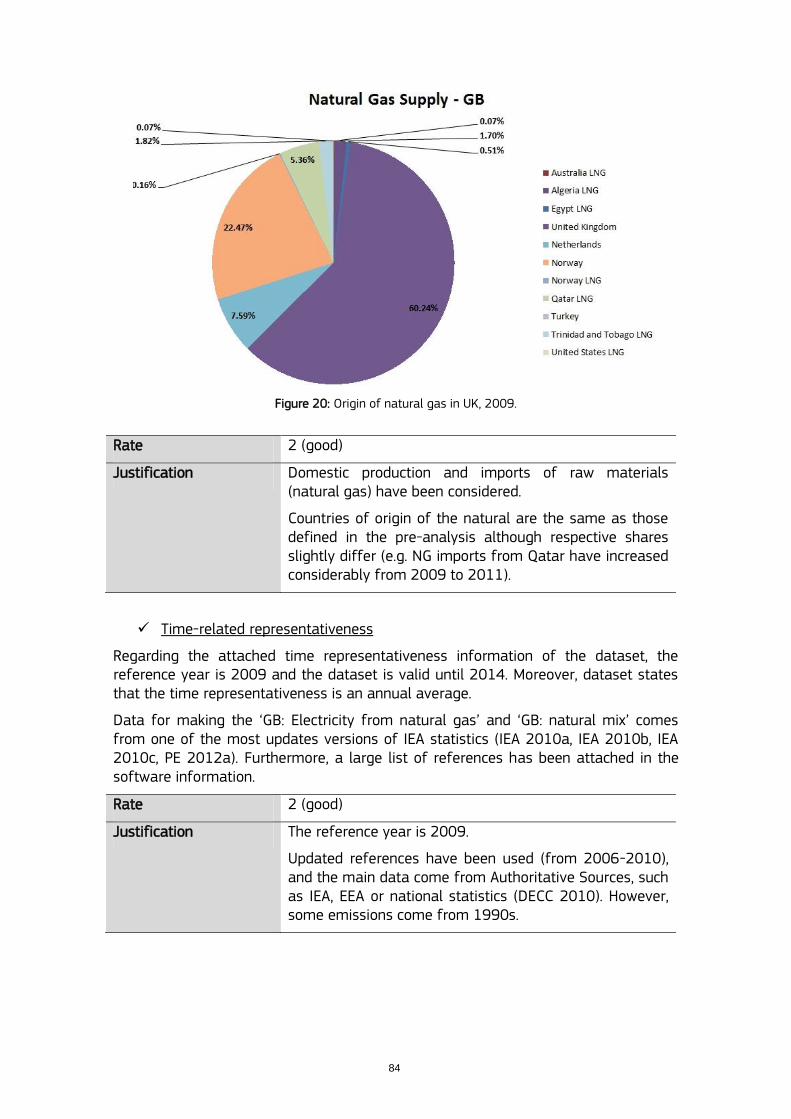
84
Figure 20: Origin of natural gas in UK, 2009.
Rate 2 (good)
Justification Domestic production and imports of raw materials (natural gas) have been considered.
Countries of origin of the natural are the same as those defined in the pre-analysis although respective shares slightly differ (e.g. NG imports from Qatar have increased considerably from 2009 to 2011).
Time-related representativeness
Regarding the attached time representativeness information of the dataset, the reference year is 2009 and the dataset is valid until 2014. Moreover, dataset states that the time representativeness is an annual average.
Data for making the „GB: Electricity from natural gas‟ and „GB: natural mix‟ comes from one of the most updates versions of IEA statistics (IEA 2010a, IEA 2010b, IEA 2010c, PE 2012a). Furthermore, a large list of references has been attached in the software information.
Rate 2 (good)
Justification The reference year is 2009.
Updated references have been used (from 2006-2010), and the main data come from Authoritative Sources, such as IEA, EEA or national statistics (DECC 2010). However, some emissions come from 1990s.

85
Completeness
The following table shows the share of elementary flows that can be assessed in accordance to the extracted information from the dataset in comparison with the reference list from Table 4.
Table 33: Share of completeness of elementary flows for each impact category (ELCD Electricity from NG). Impact category Share of covered elementary flows (%)
Climate change 100
Ozone depletion 66.6
Human toxicity (cancer) 100
Human toxicity (non cancer) 100
Particulate matter 100
Ionizing radiation (Human Health) 100
Ionizing radiation (Ecosystems) 100
Photochemical ozone formation 100
Acidification 100
Eutrophication (terrestrial) 100
Eutrophication (freshwater) 100
Eutrophication (marine) 100
Ecotoxicity (freshwater) 100
Resource depletion (minerals, fossil & renewable) 66.6
Resource depletion (water) 100
Land use 100
Number of considered impacts categories first rate 16 1
Share of elementary flows (%) second rate 96 1
Rate 1 (very good)
Justification The whole impact categories can be assessed and the 96% of elementary flows are considered
Precision/uncertainty
Regarding the data selection and combination principles, the general information extracted from the dataset, in order to evaluate this criterion, is the same as „DE: Electricity from hard coal‟ dataset.
Dataset developers have supplied complementary information regarding the sources of fuel properties; emissions and auxiliary consumption.
The analysis of the references states that the majority of significant elementary flows have been obtained from relevant literature (see table in General comments), with some exceptions that are described below.
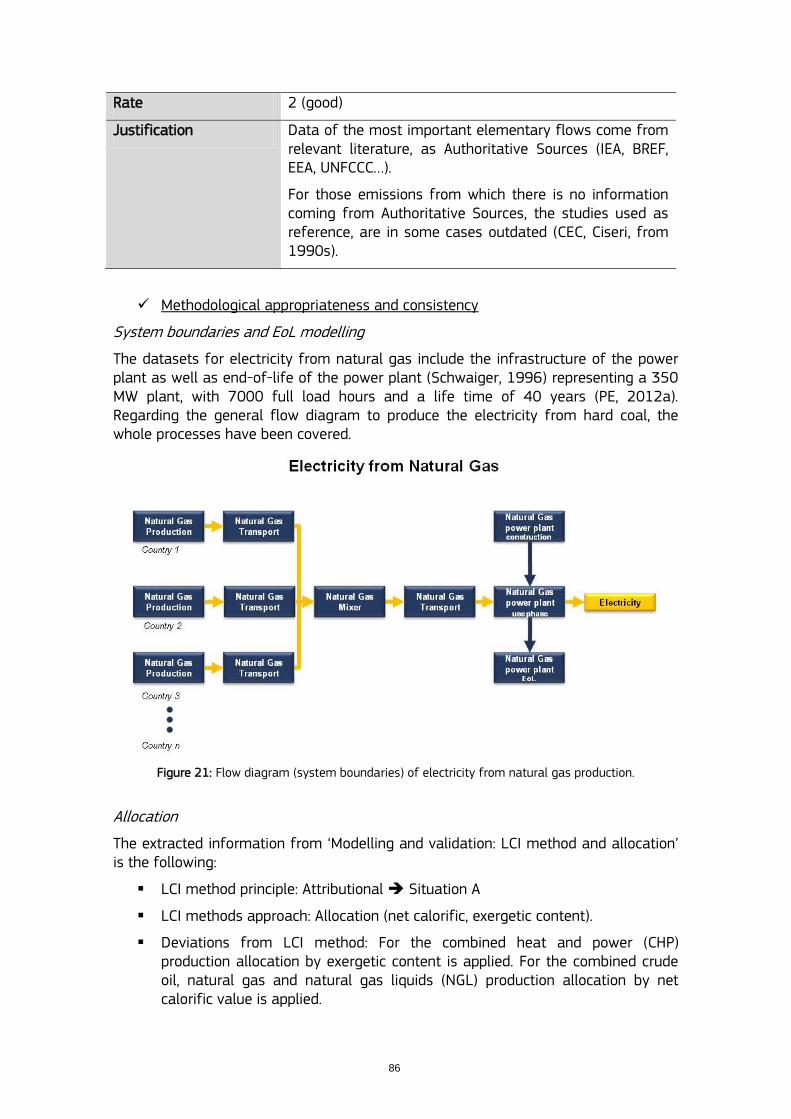
86
Rate 2 (good)
Justification Data of the most important elementary flows come from relevant literature, as Authoritative Sources (IEA, BREF, EEA, UNFCCC…).
For those emissions from which there is no information coming from Authoritative Sources, the studies used as reference, are in some cases outdated (CEC, Ciseri, from 1990s).
Methodological appropriateness and consistency
System boundaries and EoL modelling
The datasets for electricity from natural gas include the infrastructure of the power plant as well as end-of-life of the power plant (Schwaiger, 1996) representing a 350 MW plant, with 7000 full load hours and a life time of 40 years (PE, 2012a). Regarding the general flow diagram to produce the electricity from hard coal, the whole processes have been covered.
Figure 21: Flow diagram (system boundaries) of electricity from natural gas production.
Allocation
The extracted information from „Modelling and validation: LCI method and allocation‟ is the following:
LCI method principle: Attributional Situation A
LCI methods approach: Allocation (net calorific, exergetic content).
Deviations from LCI method: For the combined heat and power (CHP) production allocation by exergetic content is applied. For the combined crude oil, natural gas and natural gas liquids (NGL) production allocation by net calorific value is applied.

87
Modelling constants: All data used in the calculation of the LCI results refer to net calorific value.
Rate 1 (very good)
Justification Situation A.
Dataset includes a „cradle-to-grave‟ system process.
Dataset comprises EoL and infrastructure.
Dataset includes transports.
Allocation procedure has been applied by the exergetic content (heat and power) and market value (by-products).
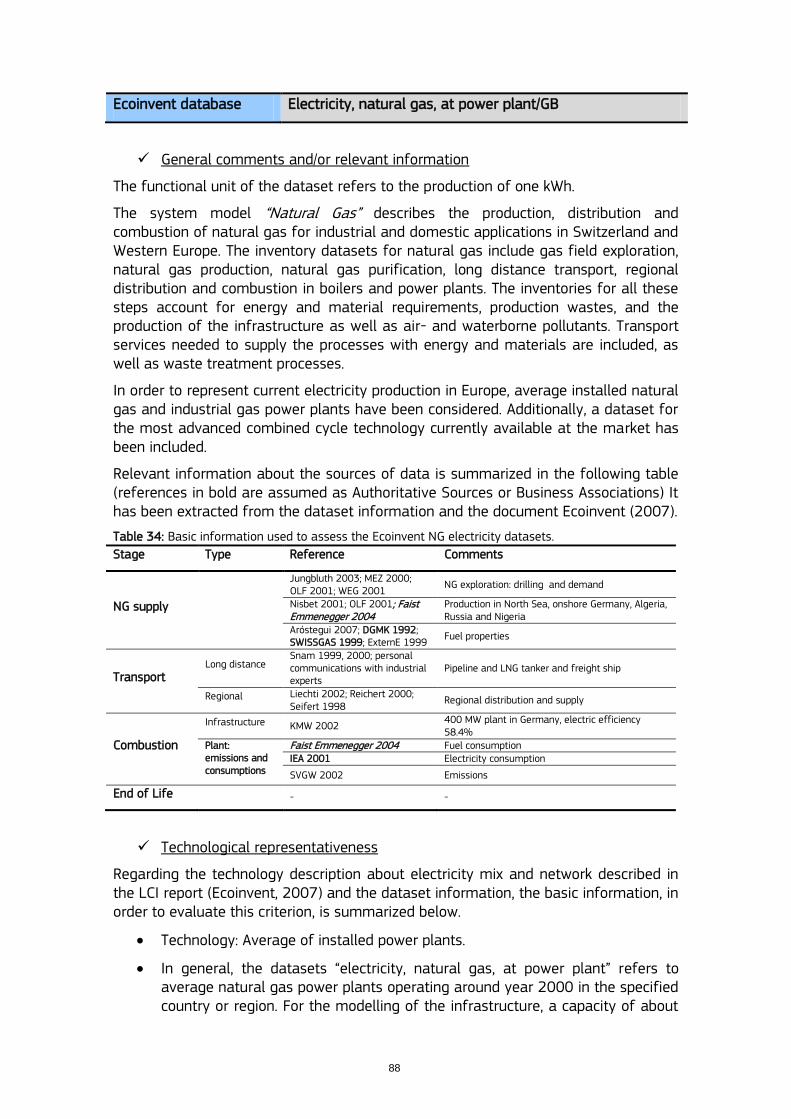
88
Ecoinvent database Electricity, natural gas, at power plant/GB
General comments and/or relevant information
The functional unit of the dataset refers to the production of one kWh.
The system model “Natural Gas” describes the production, distribution and combustion of natural gas for industrial and domestic applications in Switzerland and Western Europe. The inventory datasets for natural gas include gas field exploration, natural gas production, natural gas purification, long distance transport, regional distribution and combustion in boilers and power plants. The inventories for all these steps account for energy and material requirements, production wastes, and the production of the infrastructure as well as air- and waterborne pollutants. Transport services needed to supply the processes with energy and materials are included, as well as waste treatment processes.
In order to represent current electricity production in Europe, average installed natural gas and industrial gas power plants have been considered. Additionally, a dataset for the most advanced combined cycle technology currently available at the market has been included.
Relevant information about the sources of data is summarized in the following table (references in bold are assumed as Authoritative Sources or Business Associations) It has been extracted from the dataset information and the document Ecoinvent (2007).
Table 34: Basic information used to assess the Ecoinvent NG electricity datasets.
Stage Type Reference Comments
NG supply
Jungbluth 2003; MEZ 2000; OLF 2001; WEG 2001
NG exploration: drilling and demand
Nisbet 2001; OLF 2001; Faist Emmenegger 2004
Production in North Sea, onshore Germany, Algeria, Russia and Nigeria
Aróstegui 2007; DGMK 1992; SWISSGAS 1999; ExternE 1999
Fuel properties
Transport Long distance
Snam 1999, 2000; personal communications with industrial experts
Pipeline and LNG tanker and freight ship
Regional Liechti 2002; Reichert 2000; Seifert 1998
Regional distribution and supply
Combustion
Infrastructure KMW 2002 400 MW plant in Germany, electric efficiency 58.4%
Plant: emissions and consumptions
Faist Emmenegger 2004 Fuel consumption IEA 2001 Electricity consumption
SVGW 2002 Emissions
End of Life - -
Technological representativeness
Regarding the technology description about electricity mix and network described in the LCI report (Ecoinvent, 2007) and the dataset information, the basic information, in order to evaluate this criterion, is summarized below.
Technology: Average of installed power plants.
In general, the datasets “electricity, natural gas, at power plant” refers to average natural gas power plants operating around year 2000 in the specified country or region. For the modelling of the infrastructure, a capacity of about
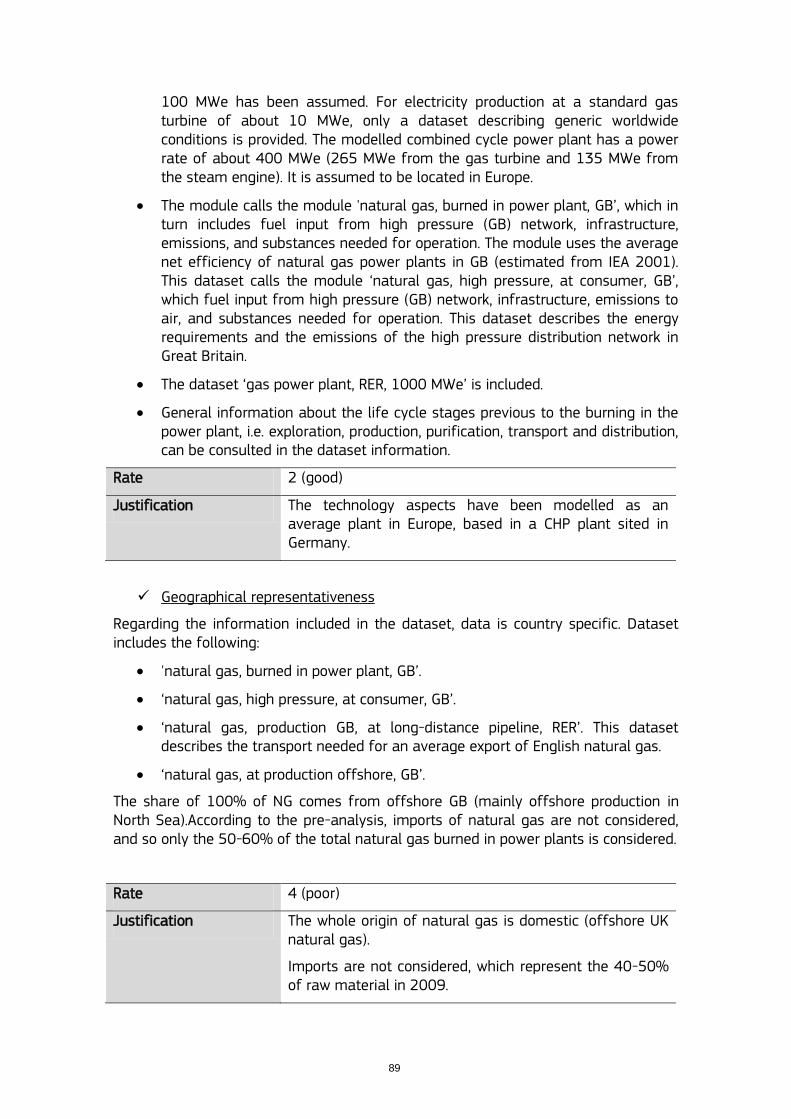
89
100 MWe has been assumed. For electricity production at a standard gas turbine of about 10 MWe, only a dataset describing generic worldwide conditions is provided. The modelled combined cycle power plant has a power rate of about 400 MWe (265 MWe from the gas turbine and 135 MWe from the steam engine). It is assumed to be located in Europe.
The module calls the module 'natural gas, burned in power plant, GB‟, which in turn includes fuel input from high pressure (GB) network, infrastructure, emissions, and substances needed for operation. The module uses the average net efficiency of natural gas power plants in GB (estimated from IEA 2001). This dataset calls the module „natural gas, high pressure, at consumer, GB‟, which fuel input from high pressure (GB) network, infrastructure, emissions to air, and substances needed for operation. This dataset describes the energy requirements and the emissions of the high pressure distribution network in Great Britain.
The dataset „gas power plant, RER, 1000 MWe‟ is included.
General information about the life cycle stages previous to the burning in the power plant, i.e. exploration, production, purification, transport and distribution, can be consulted in the dataset information.
Rate 2 (good)
Justification The technology aspects have been modelled as an average plant in Europe, based in a CHP plant sited in Germany.
Geographical representativeness
Regarding the information included in the dataset, data is country specific. Dataset includes the following:
'natural gas, burned in power plant, GB‟.
„natural gas, high pressure, at consumer, GB‟.
„natural gas, production GB, at long-distance pipeline, RER‟. This dataset describes the transport needed for an average export of English natural gas.
„natural gas, at production offshore, GB‟.
The share of 100% of NG comes from offshore GB (mainly offshore production in North Sea).According to the pre-analysis, imports of natural gas are not considered, and so only the 50-60% of the total natural gas burned in power plants is considered.
Rate 4 (poor)
Justification The whole origin of natural gas is domestic (offshore UK natural gas).
Imports are not considered, which represent the 40-50% of raw material in 2009.
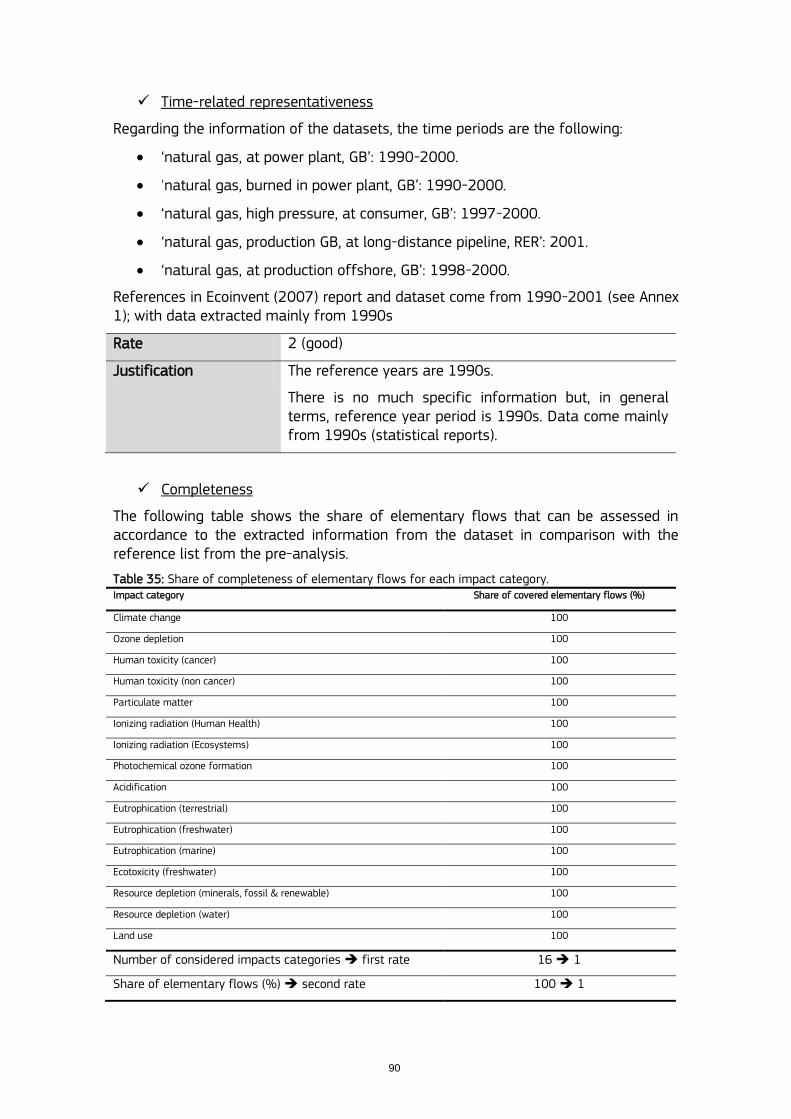
90
Time-related representativeness
Regarding the information of the datasets, the time periods are the following:
„natural gas, at power plant, GB‟: 1990-2000.
'natural gas, burned in power plant, GB‟: 1990-2000.
„natural gas, high pressure, at consumer, GB‟: 1997-2000.
„natural gas, production GB, at long-distance pipeline, RER‟: 2001.
„natural gas, at production offshore, GB‟: 1998-2000.
References in Ecoinvent (2007) report and dataset come from 1990-2001 (see Annex 1); with data extracted mainly from 1990s
Rate 2 (good)
Justification The reference years are 1990s.
There is no much specific information but, in general terms, reference year period is 1990s. Data come mainly from 1990s (statistical reports).
Completeness
The following table shows the share of elementary flows that can be assessed in accordance to the extracted information from the dataset in comparison with the reference list from the pre-analysis.
Table 35: Share of completeness of elementary flows for each impact category. Impact category Share of covered elementary flows (%)
Climate change 100
Ozone depletion 100
Human toxicity (cancer) 100
Human toxicity (non cancer) 100
Particulate matter 100
Ionizing radiation (Human Health) 100
Ionizing radiation (Ecosystems) 100
Photochemical ozone formation 100
Acidification 100
Eutrophication (terrestrial) 100
Eutrophication (freshwater) 100
Eutrophication (marine) 100
Ecotoxicity (freshwater) 100
Resource depletion (minerals, fossil & renewable) 100
Resource depletion (water) 100
Land use 100
Number of considered impacts categories first rate 16 1
Share of elementary flows (%) second rate 100 1
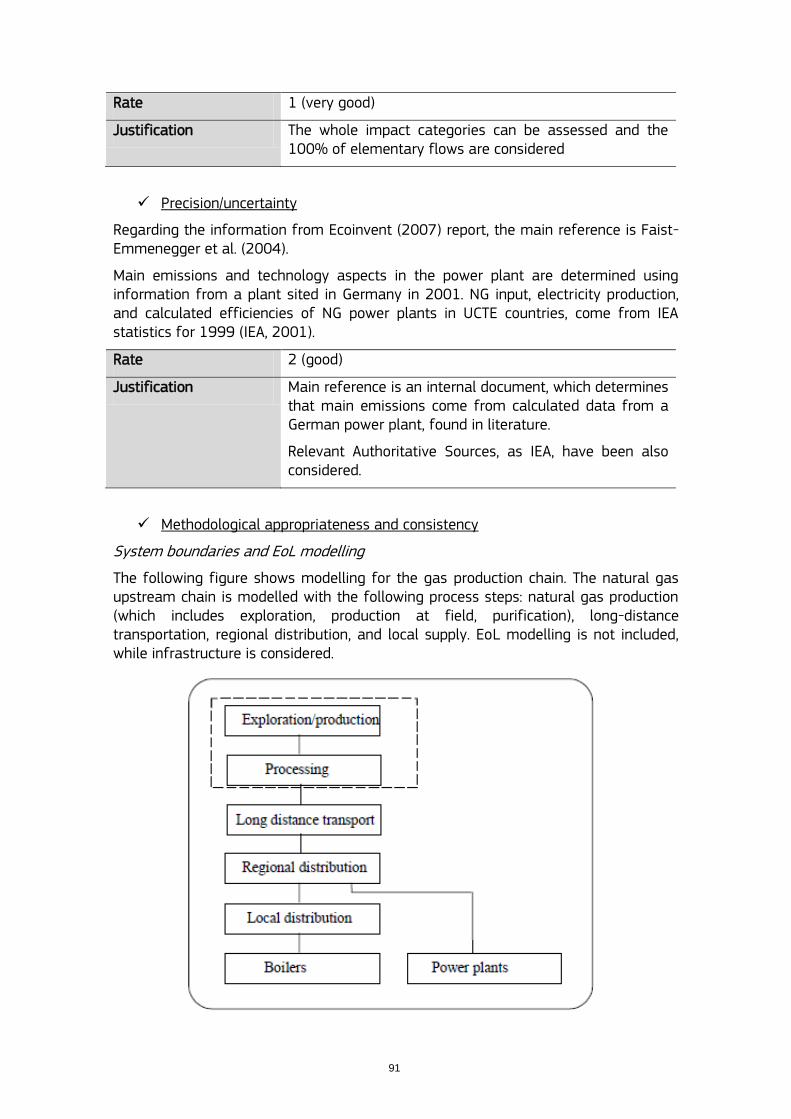
91
Rate 1 (very good)
Justification The whole impact categories can be assessed and the 100% of elementary flows are considered
Precision/uncertainty
Regarding the information from Ecoinvent (2007) report, the main reference is Faist-Emmenegger et al. (2004).
Main emissions and technology aspects in the power plant are determined using information from a plant sited in Germany in 2001. NG input, electricity production, and calculated efficiencies of NG power plants in UCTE countries, come from IEA statistics for 1999 (IEA, 2001).
Rate 2 (good)
Justification Main reference is an internal document, which determines that main emissions come from calculated data from a German power plant, found in literature.
Relevant Authoritative Sources, as IEA, have been also considered.
Methodological appropriateness and consistency
System boundaries and EoL modelling
The following figure shows modelling for the gas production chain. The natural gas upstream chain is modelled with the following process steps: natural gas production (which includes exploration, production at field, purification), long-distance transportation, regional distribution, and local supply. EoL modelling is not included, while infrastructure is considered.
92
Figure 22: Overview of the modelling for the gas production chain (Ecoinvent 2007).
Allocation
According to the Ecoinvent report (2007), the allocation for the combined oil and gas production (in CHPs) is based on the lower heating value (net calorific value) of crude oil and natural gas.
Situation A is assumed.
Rate 2 (good)
Justification Situation A.
Dataset includes a „cradle-to-grave‟ system process but it does not comprise EoL.
Infrastructure is included.
Allocation procedure by energy content has been considered, in case of CHPs.
93
GEMIS database Gas-CC-UK-2010
General comments and/or relevant information
The functional unit of the dataset refers to the production of one TJ.
Technological representativeness
Regarding the technology description, data come from a large gas-fired combined-cycle (CC) power plant, with a low-NOx burner.
Rate 3 (fair)
Justification The technology aspects have been modelled by a single plant.
Geographical representativeness
Regarding the extracted information of the dataset in the software, the following table shows the share of imports and the domestic production of natural gas.
Table 36: Imports and domestic production of NG in UK, in 2010 (GEMIS Database). Dataset Share (%)
UK – United Kingdom (Domestic) 86,5
NO – Norway (pipeline) 6
RU – Russia (pipeline) 5
DZ – Algeria (liquefaction) 2,5
Regarding the correspondence with the countries detailed in the pre-analysis, almost the most of supplier countries are considered (approx. 80% of production is fulfilled):
- UK United Kingdom (60-70%).
- NO Norway (20%).
- DZ Algeria (1%).
Rate 4 (fair)
Justification The countries that dataset includes almost fulfills the supply defined in the pre-analysis (approx.80%).
NG imports from Qatar have increased considerably from 2009 to 2011 and have not been taken into account.
No definition of the location of the plant.
Time-related representativeness
The reference year is 2010, and the literature comes from Öko-Institut (Institut für angewandte Ökologie e.V.) (1994 [not found], 2003) and BMU (2002 [not found]).
Rate 4 (poor)
Justification Reference year is 2010.
94
Main literature comes from Oko reports from 1994-2003. Data cannot be checked.
Completeness
The following table shows the share of elementary flows that can be assessed in accordance to the extracted information from the dataset in comparison with the reference list from the pre-analysis.
Table 37: Share of completeness of elementary flows for each impact category. Impact category Share of covered elementary flows (%)
Climate change 100 Ozone depletion 0 Human toxicity (cancer) 100 Human toxicity (non cancer) 100 Particulate matter 100 Ionizing radiation (Human Health) 0* Ionizing radiation (Ecosystems) 0* Photochemical ozone formation 100 Acidification 100 Eutrophication (terrestrial) 100 Eutrophication (freshwater) 0** Eutrophication (marine) 100 Ecotoxicity (freshwater) 100 Resource depletion (minerals, fossil & renewable) 33.3*** Resource depletion (water) 100 Land use 50
Number of considered impacts categories first rate 12 2 Share of elementary flows (%) second rate 90 2
* Nuclear waste is included but elementary flows are not defined.
** Inorganic salt is included but elementary flows are not defined.
*** Nuclear resources are included but elementary flows are not defined.
Rate 2 (good)
Justification 12 impact categories can be assessed and 90% of elementary flows are considered.
Precision/uncertainty
Regarding the extracted information from the dataset, main data sources come from Oko Institute reports, where data cannot be checked.
There is no information about each elementary flow or emission factors.
Rate 4 (fair)
Justification Main data comes from Oko Institute reports, which cannot be checked.
GEMIS auto-evaluation: secondary data.
There is no information about the emission factors or direct emissions.
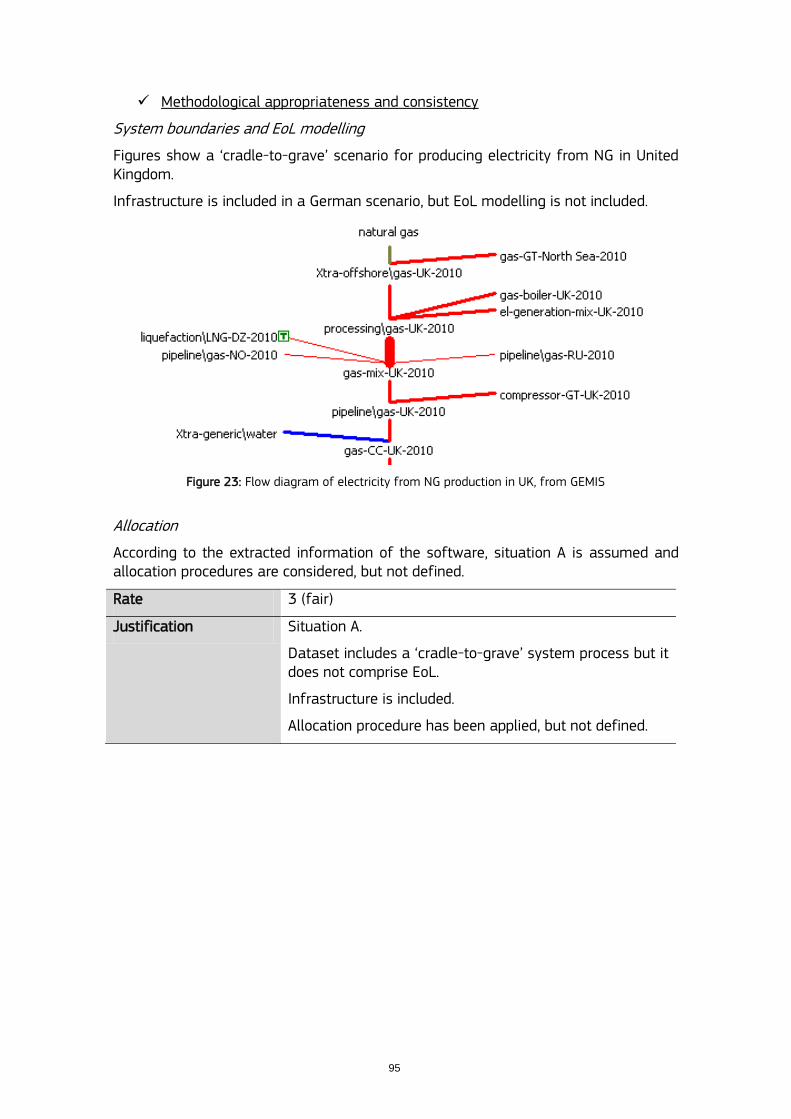
95
Methodological appropriateness and consistency
System boundaries and EoL modelling
Figures show a „cradle-to-grave‟ scenario for producing electricity from NG in United Kingdom.
Infrastructure is included in a German scenario, but EoL modelling is not included.
Figure 23: Flow diagram of electricity from NG production in UK, from GEMIS
Allocation
According to the extracted information of the software, situation A is assumed and allocation procedures are considered, but not defined.
Rate 3 (fair)
Justification Situation A.
Dataset includes a „cradle-to-grave‟ system process but it does not comprise EoL.
Infrastructure is included.
Allocation procedure has been applied, but not defined.
96
Results, findings and recommendations
ELCD fossil fuels datasets achieve the highest scores in the quality criteria related to technological representativeness, completeness and methodology. The other criteria are rated with a score of 2. Taking into account the analysis, some recommendations are derived. Regarding TeR criterion, as already mentioned in the electricity mix section, carbon capture and storage (CCS) technologies could be included due to the importance in future environmental scenarios, as stated in several studies (e.g. Koornneef et al 2008; Stanley et al 2012). Several prospective clean coal, lignite and natural gas electricity scenarios can be developed and included in the ELCD. This is made in other databases studied such as in GEMIS.
Similarly to what happened with the electricity mix dataset, completeness criterion is 95% fulfilled when looking at the relevant elementary flows. In order to fully meet the criterion the following elementary flows have to be considered: Halon 121113 for ozone depletion; and indium for resource depletion impact category. ELCD coal datasets make use of a kind of “top-down” approach to account for the emissions of the technology mixes. In this sense, nationally reported emissions from the coal and lignite sector are used to quantify a number of relevant emissions of the dataset. This is considered a good approach as it makes use of authoritative sources such as UNFCC reporting framework, the Directive 2001/80/EC reporting framework and the UNECE Convention on Long range Transboundary Air Pollution (CLRTAP) reporting frameworks. However, when elementary flows, direct emissions or emission factors cannot be reported using these relevant authoritative sources in ELCD datasets, data from literature are used. In some lignite datasets, even some relevant emissions (not reported by some countries under the above mentioned frameworks) have been extrapolated from other countries leading to a high degree of uncertainty. The use of some of the Ecoinvent reported emissions based on data from a large power plant database in Europe could improve the results.
ELCD uses as main source for pollutant emissions those established in the Directive 2001/80/EC on the limitation of emissions of certain pollutants into the air from large combustion plants. The European Pollutant Release and Transfer Register (E-PRTR) (http://prtr.ec.europa.eu/) is a Europe-wide register that provides easily accessible key environmental data from industrial facilities in European Union Member States and in Iceland, Liechtenstein, Norway, Serbia and Switzerland. It can be also highlighted that the ELCD also uses this relevant authoritative source to complete and cross check the inventories of fossil fuels electricity datasets.
Finally, Business Associations publications are useful for achieving precise and updated inventories. The European Association of Coal and Lignite (Euracoal, www.euracoal.be), the Union of Electricity Industry (Eurelectric, www.eurelectric.org) and the European Association of Gas Wholesale, Retails and Distribution Sectors (Eurogas, www.eurogas.be) publish EU data facts and statistics of raw material production and power generation that can be used. Other Authoritative Source that could be useful in future version is the Gas Infrastructure Europe (www.gie.eu.com), a European association representing the infrastructure industry of natural gas, such as the Transmission System Operators, Storage Systems Operator and Terminal Operators. Technical data can be also reviewed from the Technical Association of the European Natural Gas Industry MARCOGAZ (www.marcogaz.org).
13
See footnote 12
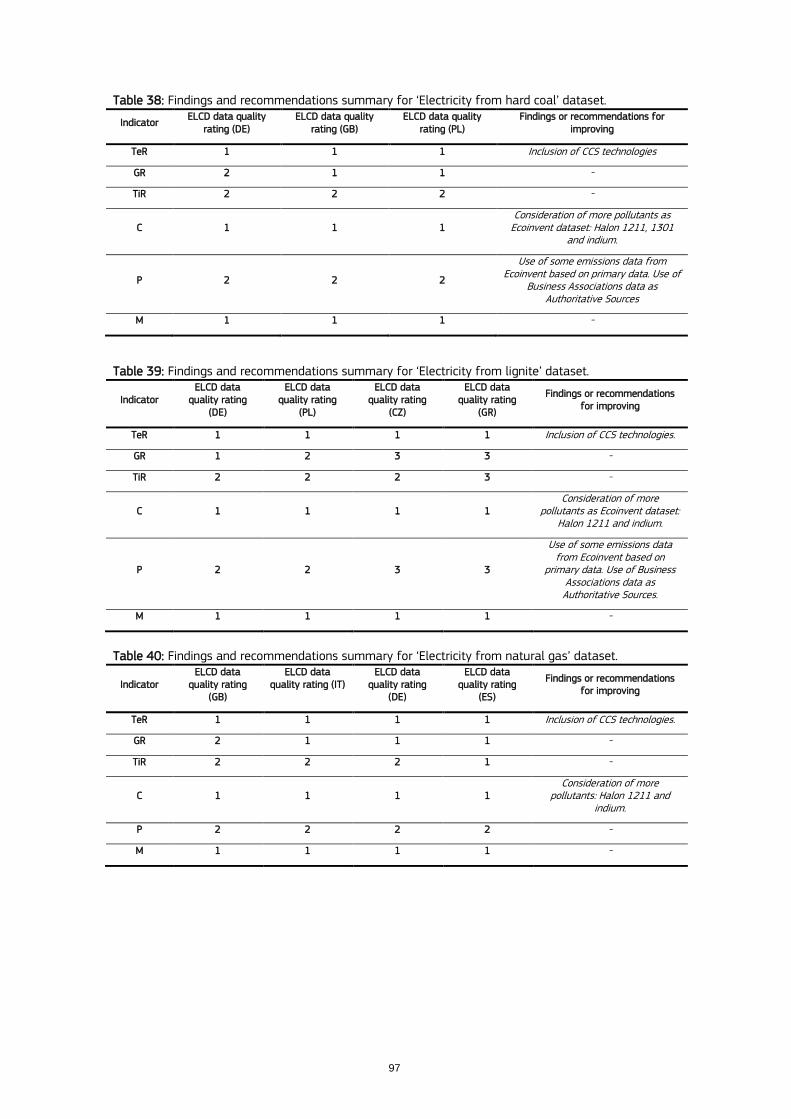
97
Table 38: Findings and recommendations summary for „Electricity from hard coal‟ dataset.
Indicator ELCD data quality
rating (DE) ELCD data quality
rating (GB) ELCD data quality
rating (PL) Findings or recommendations for
improving
TeR 1 1 1 Inclusion of CCS technologies
GR 2 1 1 -
TiR 2 2 2 -
C 1 1 1 Consideration of more pollutants as
Ecoinvent dataset: Halon 1211, 1301 and indium.
P 2 2 2
Use of some emissions data from Ecoinvent based on primary data. Use of
Business Associations data as Authoritative Sources
M 1 1 1 -
Table 39: Findings and recommendations summary for „Electricity from lignite‟ dataset.
Indicator ELCD data
quality rating (DE)
ELCD data quality rating
(PL)
ELCD data quality rating
(CZ)
ELCD data quality rating
(GR)
Findings or recommendations for improving
TeR 1 1 1 1 Inclusion of CCS technologies.
GR 1 2 3 3 -
TiR 2 2 2 3 -
C 1 1 1 1 Consideration of more
pollutants as Ecoinvent dataset: Halon 1211 and indium.
P 2 2 3 3
Use of some emissions data from Ecoinvent based on
primary data. Use of Business Associations data as Authoritative Sources.
M 1 1 1 1 -
Table 40: Findings and recommendations summary for „Electricity from natural gas‟ dataset.
Indicator ELCD data
quality rating (GB)
ELCD data quality rating (IT)
ELCD data quality rating
(DE)
ELCD data quality rating
(ES)
Findings or recommendations for improving
TeR 1 1 1 1 Inclusion of CCS technologies.
GR 2 1 1 1 -
TiR 2 2 2 1 -
C 1 1 1 1 Consideration of more
pollutants: Halon 1211 and indium.
P 2 2 2 2 -
M 1 1 1 1 -
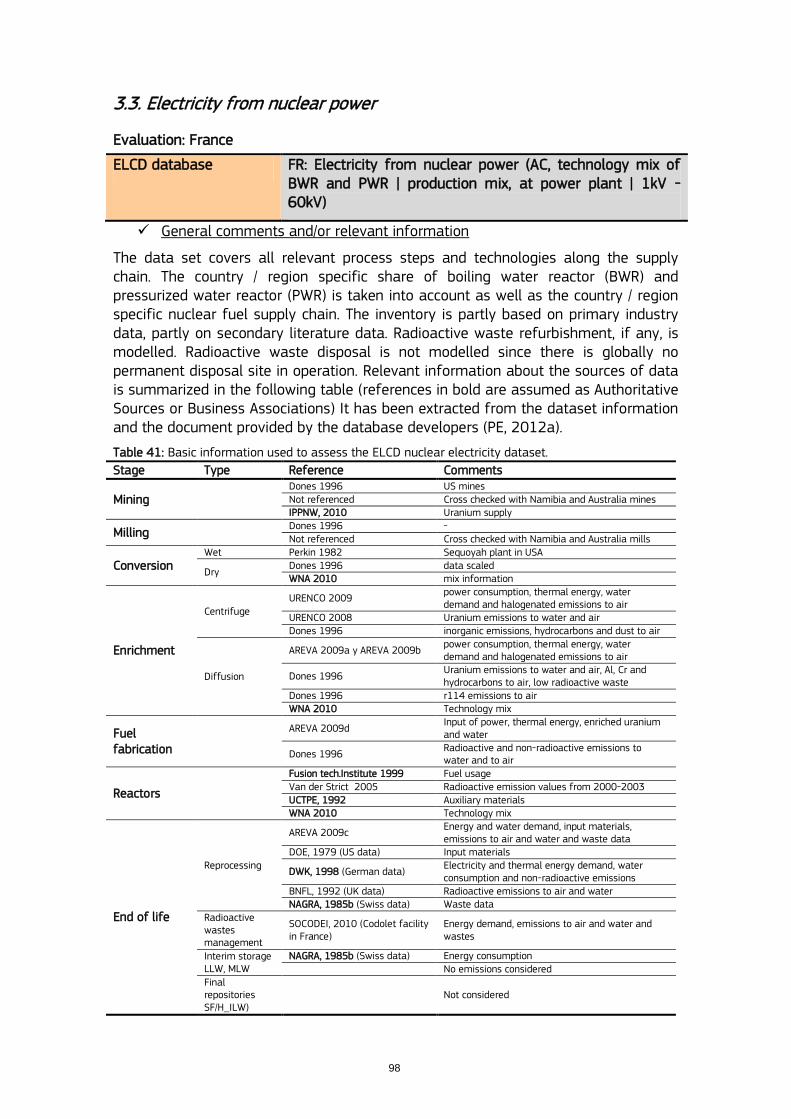
98
3.3. Electricity from nuclear power
Evaluation: France
ELCD database FR: Electricity from nuclear power (AC, technology mix of BWR and PWR | production mix, at power plant | 1kV - 60kV)
General comments and/or relevant information
The data set covers all relevant process steps and technologies along the supply chain. The country / region specific share of boiling water reactor (BWR) and pressurized water reactor (PWR) is taken into account as well as the country / region specific nuclear fuel supply chain. The inventory is partly based on primary industry data, partly on secondary literature data. Radioactive waste refurbishment, if any, is modelled. Radioactive waste disposal is not modelled since there is globally no permanent disposal site in operation. Relevant information about the sources of data is summarized in the following table (references in bold are assumed as Authoritative Sources or Business Associations) It has been extracted from the dataset information and the document provided by the database developers (PE, 2012a).
Table 41: Basic information used to assess the ELCD nuclear electricity dataset.
Stage Type Reference Comments
Mining Dones 1996 US mines Not referenced Cross checked with Namibia and Australia mines IPPNW, 2010 Uranium supply
Milling Dones 1996 - Not referenced Cross checked with Namibia and Australia mills
Conversion Wet Perkin 1982 Sequoyah plant in USA
Dry Dones 1996 data scaled WNA 2010 mix information
Enrichment
Centrifuge URENCO 2009
power consumption, thermal energy, water demand and halogenated emissions to air
URENCO 2008 Uranium emissions to water and air Dones 1996 inorganic emissions, hydrocarbons and dust to air
Diffusion
AREVA 2009a y AREVA 2009b power consumption, thermal energy, water demand and halogenated emissions to air
Dones 1996 Uranium emissions to water and air, Al, Cr and hydrocarbons to air, low radioactive waste
Dones 1996 r114 emissions to air WNA 2010 Technology mix
Fuel fabrication
AREVA 2009d
Input of power, thermal energy, enriched uranium and water
Dones 1996 Radioactive and non-radioactive emissions to water and to air
Reactors
Fusion tech.Institute 1999 Fuel usage Van der Strict 2005 Radioactive emission values from 2000-2003 UCTPE, 1992 Auxiliary materials WNA 2010 Technology mix
End of life
Reprocessing
AREVA 2009c Energy and water demand, input materials, emissions to air and water and waste data
DOE, 1979 (US data) Input materials
DWK, 1998 (German data) Electricity and thermal energy demand, water consumption and non-radioactive emissions
BNFL, 1992 (UK data) Radioactive emissions to air and water NAGRA, 1985b (Swiss data) Waste data
Radioactive wastes management
SOCODEI, 2010 (Codolet facility in France)
Energy demand, emissions to air and water and wastes
Interim storage LLW, MLW
NAGRA, 1985b (Swiss data) Energy consumption No emissions considered
Final repositories SF/H_ILW)
Not considered
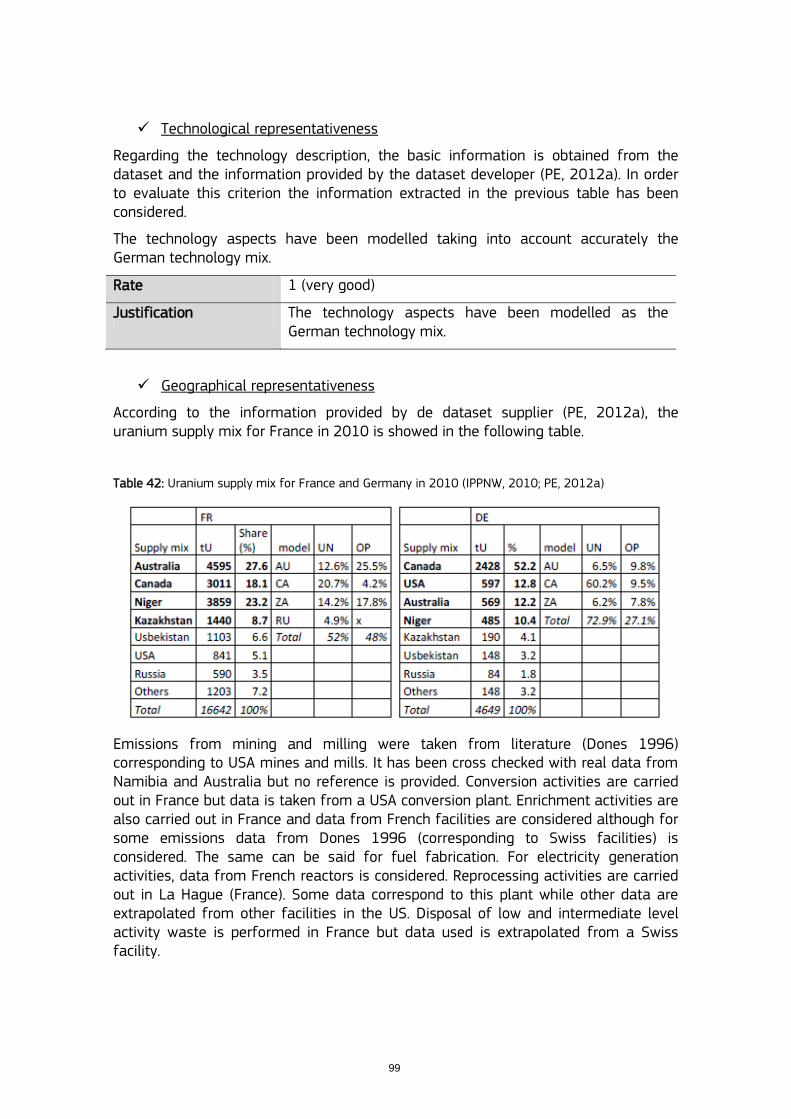
99
Technological representativeness
Regarding the technology description, the basic information is obtained from the dataset and the information provided by the dataset developer (PE, 2012a). In order to evaluate this criterion the information extracted in the previous table has been considered.
The technology aspects have been modelled taking into account accurately the German technology mix.
Rate 1 (very good)
Justification The technology aspects have been modelled as the German technology mix.
Geographical representativeness
According to the information provided by de dataset supplier (PE, 2012a), the uranium supply mix for France in 2010 is showed in the following table.
Table 42: Uranium supply mix for France and Germany in 2010 (IPPNW, 2010; PE, 2012a)
Emissions from mining and milling were taken from literature (Dones 1996) corresponding to USA mines and mills. It has been cross checked with real data from Namibia and Australia but no reference is provided. Conversion activities are carried out in France but data is taken from a USA conversion plant. Enrichment activities are also carried out in France and data from French facilities are considered although for some emissions data from Dones 1996 (corresponding to Swiss facilities) is considered. The same can be said for fuel fabrication. For electricity generation activities, data from French reactors is considered. Reprocessing activities are carried out in La Hague (France). Some data correspond to this plant while other data are extrapolated from other facilities in the US. Disposal of low and intermediate level activity waste is performed in France but data used is extrapolated from a Swiss facility.

100
Rate 2 (good)
Justification The geographical aspects have been modelled using data from the countries where the activities are happening but with some exceptions in important stages like milling and reprocessing.
Time-related representativeness
Regarding the attached time representativeness information of the dataset, the reference year is 2009 and the dataset is valid until 2014. Moreover, dataset states that the time representativeness is an annual average.
Data for making the „FR: Electricity from nuclear power‟ comes from a large list of references that has been attached in the software information. Some important sources of data are quite old documents such as Dones, 1996; Perkin, 1982; DWK, 1988; DOE, 1979; and NAGRA 1985a, 1985b. Rate 3 (fair)
Justification Reference year 2009. Main data from IEA (2010) (data for 2009). Some important references are documents with more than 20 years.
Completeness
The following table shows the share of elementary flows that can be assessed in accordance to the extracted information from the dataset in comparison with the reference list from the pre-analysis.
Table 43: Share of completeness of elementary flows for each impact category. Impact category Share of covered elementary flows (%)
Climate change 100 Ozone depletion 100 Human toxicity (cancer) 100 Human toxicity (non cancer) 100 Particulate matter 100 Ionizing radiation (Human Health) 100 Ionizing radiation (Ecosystems) 100 Photochemical ozone formation 100 Acidification 100 Eutrophication (terrestrial) 100 Eutrophication (freshwater) 100 Eutrophication (marine) 100 Ecotoxicity (freshwater) 100 Resource depletion (minerals, fossil & renewable) 100 Resource depletion (water) 100 Land use 100
Number of considered impacts categories first rate 16 1 Share of elementary flows (%) second rate 100 1
Rate 1 (very good)
Justification The whole impact categories can be assessed and the 100% of elementary flows are considered
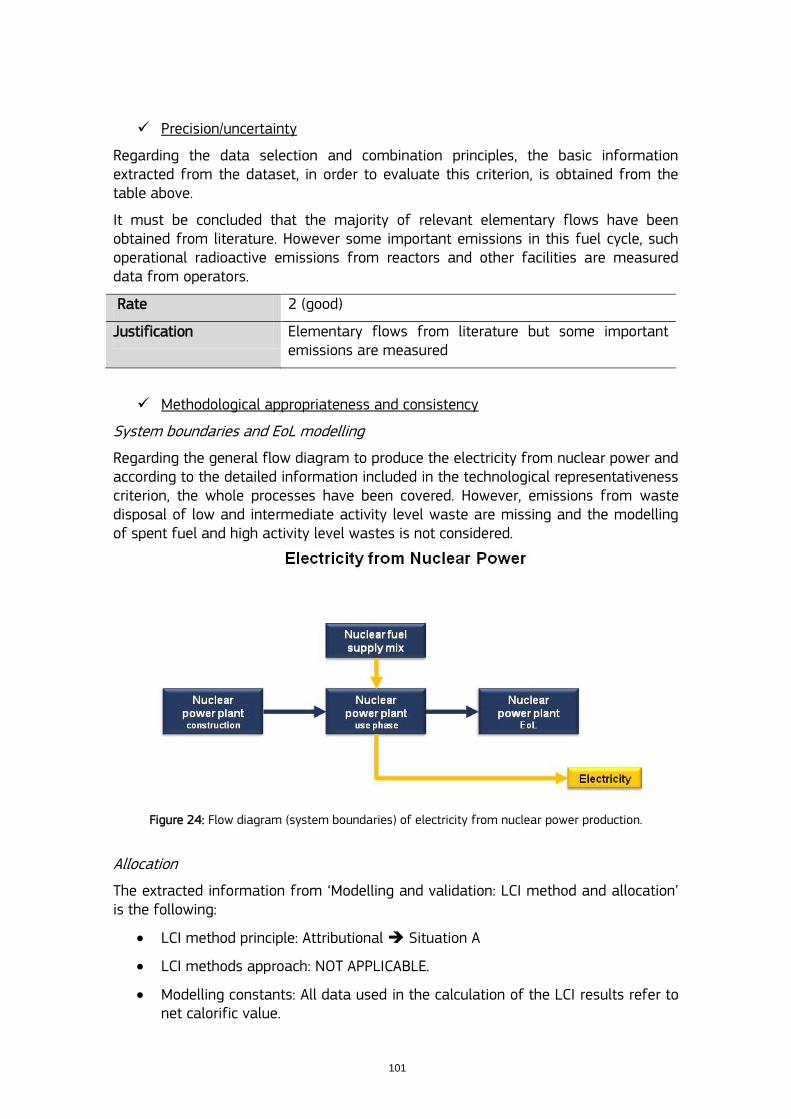
101
Precision/uncertainty
Regarding the data selection and combination principles, the basic information extracted from the dataset, in order to evaluate this criterion, is obtained from the table above.
It must be concluded that the majority of relevant elementary flows have been obtained from literature. However some important emissions in this fuel cycle, such operational radioactive emissions from reactors and other facilities are measured data from operators.
Rate 2 (good)
Justification Elementary flows from literature but some important emissions are measured
Methodological appropriateness and consistency
System boundaries and EoL modelling
Regarding the general flow diagram to produce the electricity from nuclear power and according to the detailed information included in the technological representativeness criterion, the whole processes have been covered. However, emissions from waste disposal of low and intermediate activity level waste are missing and the modelling of spent fuel and high activity level wastes is not considered.
Figure 24: Flow diagram (system boundaries) of electricity from nuclear power production.
Allocation
The extracted information from „Modelling and validation: LCI method and allocation‟ is the following:
LCI method principle: Attributional Situation A
LCI methods approach: NOT APPLICABLE.
Modelling constants: All data used in the calculation of the LCI results refer to net calorific value.

102
Rate 2 (good)
Justification Situation A
Dataset includes a „cradle-to-grave‟ system process; it comprises EoL to some extent and infrastructure.
Allocation is not needed in the foreground, but used in the background processes.
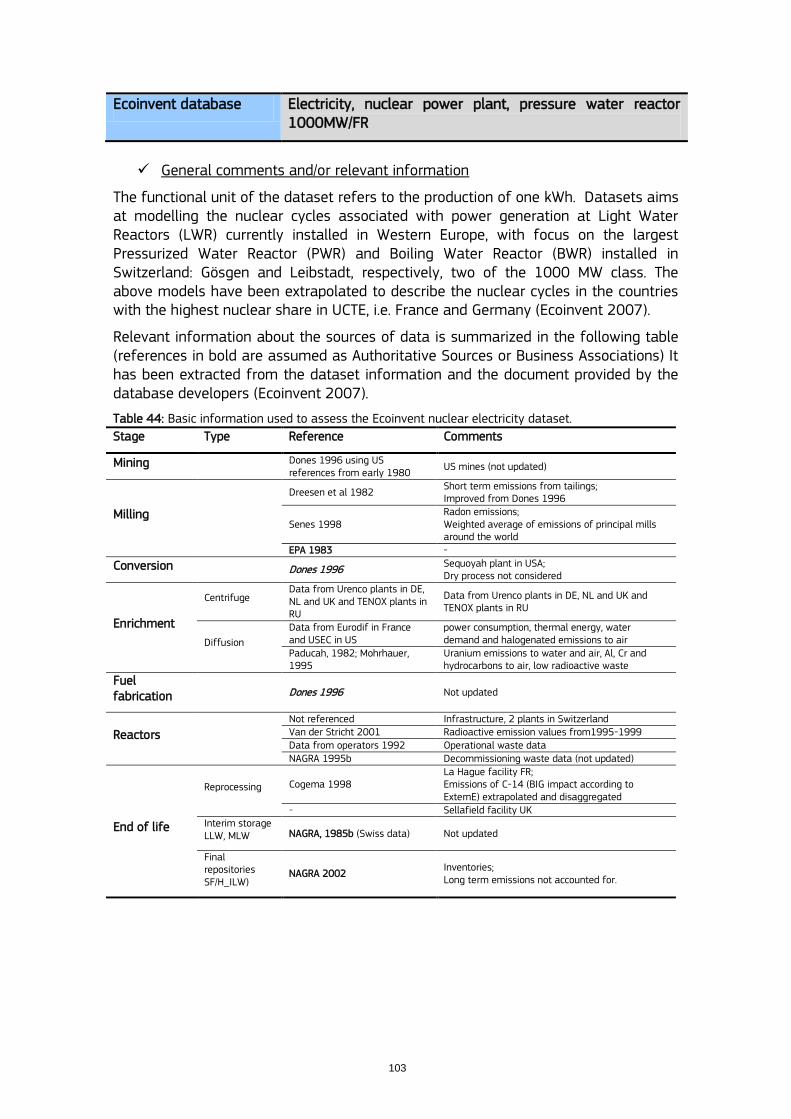
103
Ecoinvent database Electricity, nuclear power plant, pressure water reactor 1000MW/FR
General comments and/or relevant information
The functional unit of the dataset refers to the production of one kWh. Datasets aims at modelling the nuclear cycles associated with power generation at Light Water Reactors (LWR) currently installed in Western Europe, with focus on the largest Pressurized Water Reactor (PWR) and Boiling Water Reactor (BWR) installed in Switzerland: Gösgen and Leibstadt, respectively, two of the 1000 MW class. The above models have been extrapolated to describe the nuclear cycles in the countries with the highest nuclear share in UCTE, i.e. France and Germany (Ecoinvent 2007).
Relevant information about the sources of data is summarized in the following table (references in bold are assumed as Authoritative Sources or Business Associations) It has been extracted from the dataset information and the document provided by the database developers (Ecoinvent 2007).
Table 44: Basic information used to assess the Ecoinvent nuclear electricity dataset.
Stage Type Reference Comments
Mining Dones 1996 using US references from early 1980
US mines (not updated)
Milling
Dreesen et al 1982 Short term emissions from tailings; Improved from Dones 1996
Senes 1998 Radon emissions; Weighted average of emissions of principal mills around the world
EPA 1983 -
Conversion Dones 1996 Sequoyah plant in USA; Dry process not considered
Enrichment
Centrifuge Data from Urenco plants in DE, NL and UK and TENOX plants in RU
Data from Urenco plants in DE, NL and UK and TENOX plants in RU
Diffusion
Data from Eurodif in France and USEC in US
power consumption, thermal energy, water demand and halogenated emissions to air
Paducah, 1982; Mohrhauer, 1995
Uranium emissions to water and air, Al, Cr and hydrocarbons to air, low radioactive waste
Fuel fabrication
Dones 1996 Not updated
Reactors
Not referenced Infrastructure, 2 plants in Switzerland Van der Stricht 2001 Radioactive emission values from1995-1999 Data from operators 1992 Operational waste data NAGRA 1995b Decommissioning waste data (not updated)
End of life
Reprocessing Cogema 1998 La Hague facility FR; Emissions of C-14 (BIG impact according to ExternE) extrapolated and disaggregated
- Sellafield facility UK Interim storage LLW, MLW NAGRA, 1985b (Swiss data) Not updated
Final repositories SF/H_ILW)
NAGRA 2002 Inventories; Long term emissions not accounted for.
104
Technological representativeness
Regarding the technology description about electricity from nuclear power described in the LCI report (Ecoinvent, 2007) and the dataset info, the basic information, in order to evaluate this criterion, is remarked in the previous table.
The dataset for France considers only PWRs.
Rate 2 (good)
Justification Consideration of only PWRs for producing electricity from nuclear power in France which is true for France but extrapolating technology data from Swiss PWRs power plants.
Geographical representativeness
Regarding exclusively the origin of raw materials (uranium, principally), this dataset include data for mining and milling activities in USA. According to the correspondence with the pre-analysis, USA is not among the biggest suppliers of uranium to France.
Conversion activities data come from the Sequoya plant in USA. Enrichment activities are modelled using data from Eurodif plant in France. Fuel fabrication data comes from Dones 1996 which uses Swiss data. Reactor data regarding emissions come from actual data from French reactors. Infrastructure data are extrapolated from two Swiss power plants. End of life activities are modelled taking into account data from actual French facilities (La Hague) but some data is extrapolated from Swiss facilities.
Rate 2 (good)
Justification Uranium comes from USA is not the biggest French supplier. Reactors infrastructure is extrapolated from Swiss data as well as some other parts of the fuel cycle.
Time-related representativeness
Regarding the information of the datasets, the time periods are the following:
„Electricity, nuclear, at power plant pressure water reactor, FR‟: 1995-1999.
„Uranium natural, in yellowcake, at mill plant, RNA‟: 1980-1992.
References from Ecoinvent (2007) report are from 1980 to 2002. Some important sources of data are documents from the early 1980s.
Rate 2 (good)
Justification The reference year for plants is 1995-1999.
In general terms, references year period are 1980-2002.
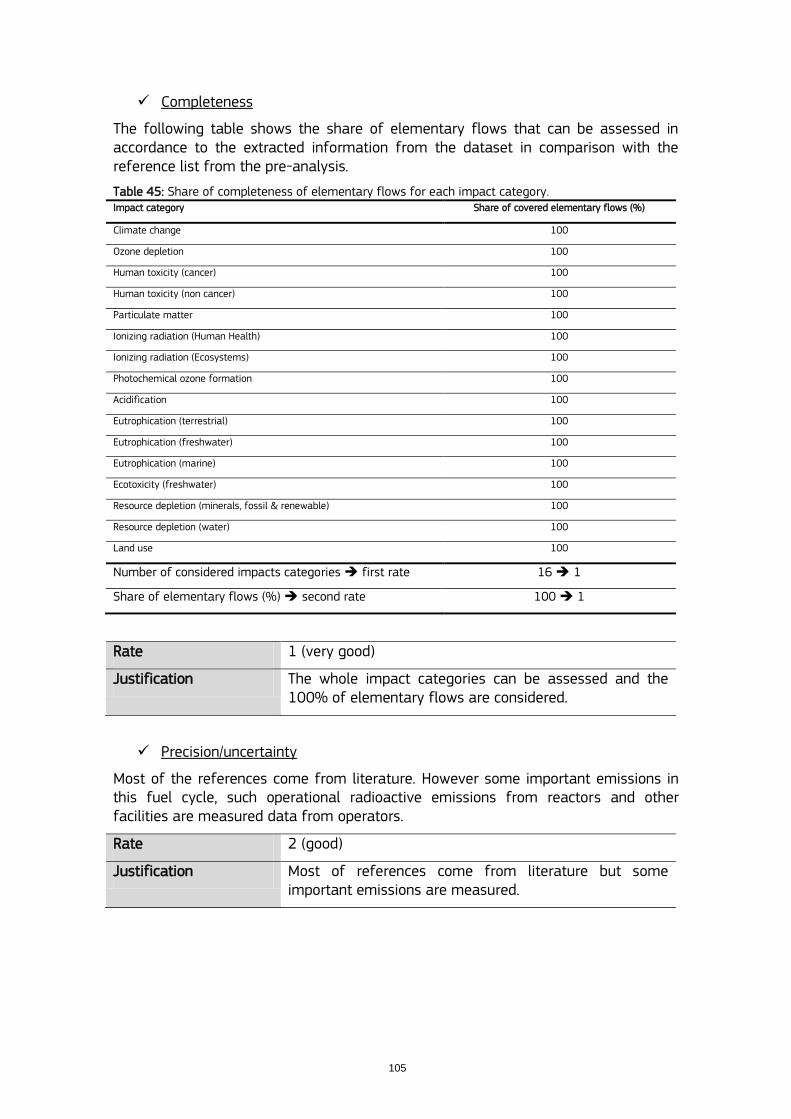
105
Completeness
The following table shows the share of elementary flows that can be assessed in accordance to the extracted information from the dataset in comparison with the reference list from the pre-analysis.
Table 45: Share of completeness of elementary flows for each impact category. Impact category Share of covered elementary flows (%)
Climate change 100
Ozone depletion 100
Human toxicity (cancer) 100
Human toxicity (non cancer) 100
Particulate matter 100
Ionizing radiation (Human Health) 100
Ionizing radiation (Ecosystems) 100
Photochemical ozone formation 100
Acidification 100
Eutrophication (terrestrial) 100
Eutrophication (freshwater) 100
Eutrophication (marine) 100
Ecotoxicity (freshwater) 100
Resource depletion (minerals, fossil & renewable) 100
Resource depletion (water) 100
Land use 100
Number of considered impacts categories first rate 16 1
Share of elementary flows (%) second rate 100 1
Rate 1 (very good)
Justification The whole impact categories can be assessed and the 100% of elementary flows are considered.
Precision/uncertainty
Most of the references come from literature. However some important emissions in this fuel cycle, such operational radioactive emissions from reactors and other facilities are measured data from operators.
Rate 2 (good)
Justification Most of references come from literature but some important emissions are measured.
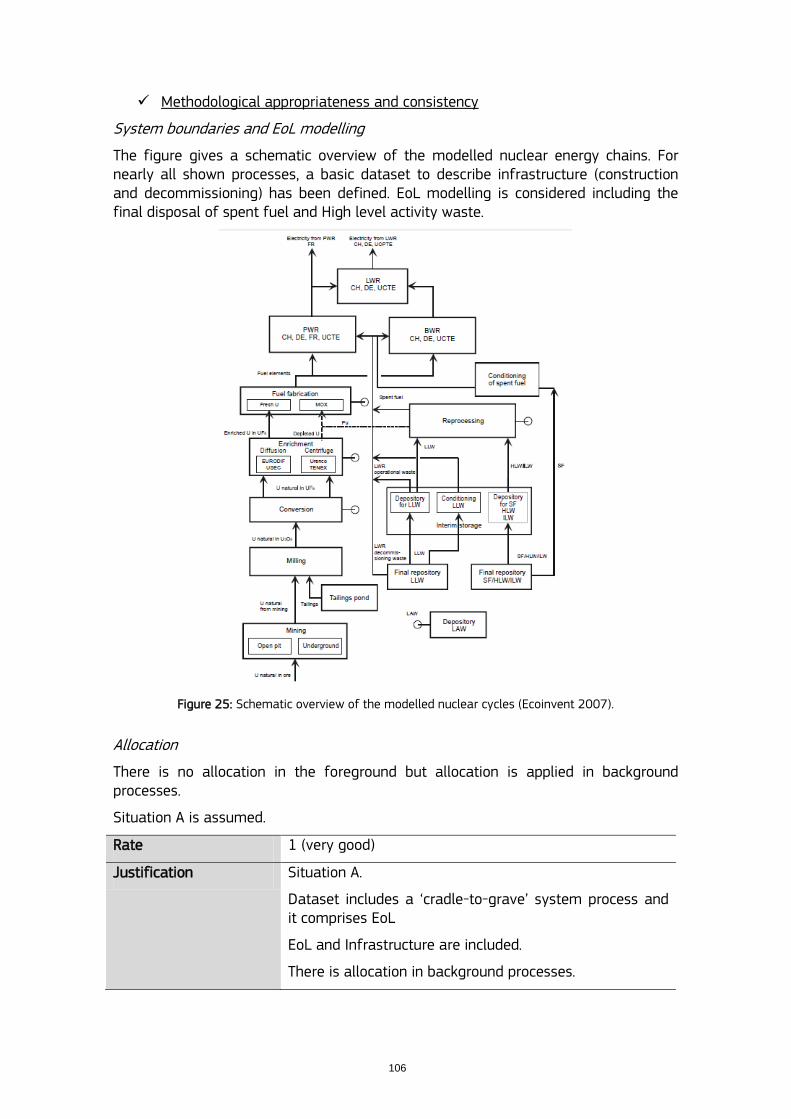
106
Methodological appropriateness and consistency
System boundaries and EoL modelling
The figure gives a schematic overview of the modelled nuclear energy chains. For nearly all shown processes, a basic dataset to describe infrastructure (construction and decommissioning) has been defined. EoL modelling is considered including the final disposal of spent fuel and High level activity waste.
Figure 25: Schematic overview of the modelled nuclear cycles (Ecoinvent 2007).
Allocation
There is no allocation in the foreground but allocation is applied in background processes.
Situation A is assumed.
Rate 1 (very good)
Justification Situation A.
Dataset includes a „cradle-to-grave‟ system process and it comprises EoL
EoL and Infrastructure are included.
There is allocation in background processes.
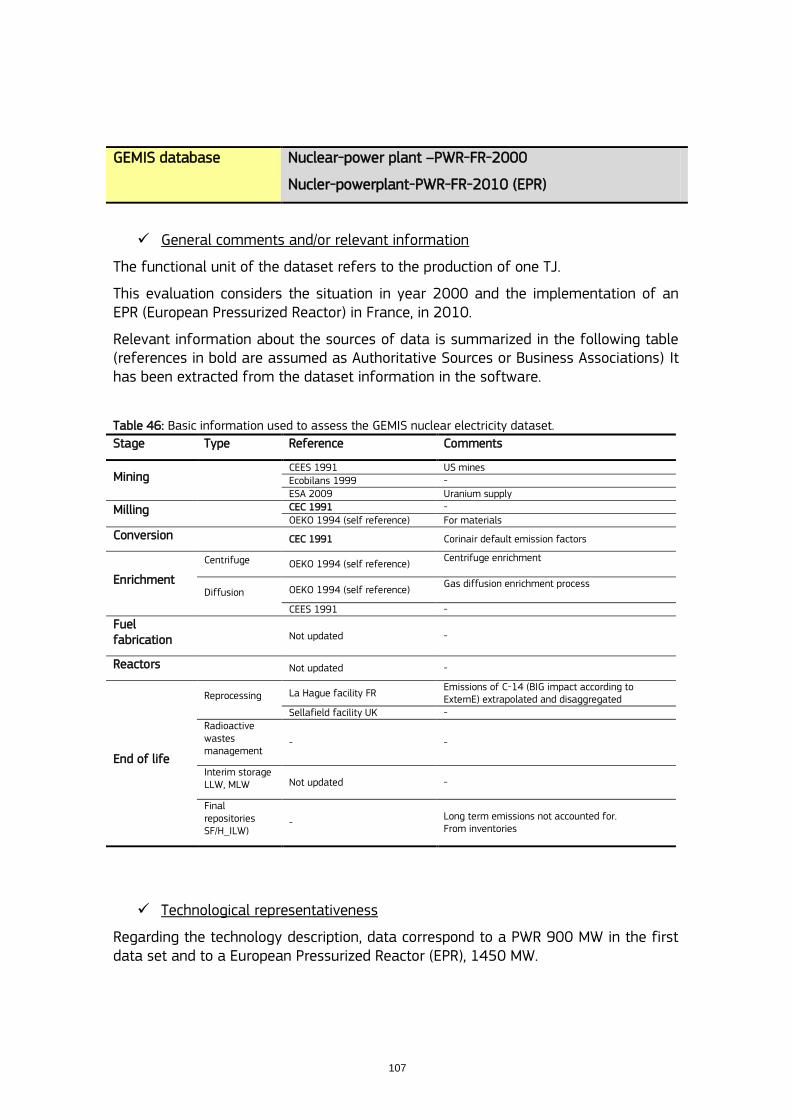
107
GEMIS database Nuclear-power plant –PWR-FR-2000
Nucler-powerplant-PWR-FR-2010 (EPR)
General comments and/or relevant information
The functional unit of the dataset refers to the production of one TJ.
This evaluation considers the situation in year 2000 and the implementation of an EPR (European Pressurized Reactor) in France, in 2010.
Relevant information about the sources of data is summarized in the following table (references in bold are assumed as Authoritative Sources or Business Associations) It has been extracted from the dataset information in the software.
Table 46: Basic information used to assess the GEMIS nuclear electricity dataset.
Stage Type Reference Comments
Mining CEES 1991 US mines Ecobilans 1999 - ESA 2009 Uranium supply
Milling CEC 1991 - OEKO 1994 (self reference) For materials
Conversion CEC 1991 Corinair default emission factors
Enrichment
Centrifuge OEKO 1994 (self reference) Centrifuge enrichment
Diffusion OEKO 1994 (self reference) Gas diffusion enrichment process
CEES 1991 -
Fuel fabrication
Not updated -
Reactors Not updated -
End of life
Reprocessing La Hague facility FR Emissions of C-14 (BIG impact according to ExternE) extrapolated and disaggregated
Sellafield facility UK - Radioactive wastes management
- -
Interim storage LLW, MLW Not updated -
Final repositories SF/H_ILW)
- Long term emissions not accounted for. From inventories
Technological representativeness
Regarding the technology description, data correspond to a PWR 900 MW in the first data set and to a European Pressurized Reactor (EPR), 1450 MW.
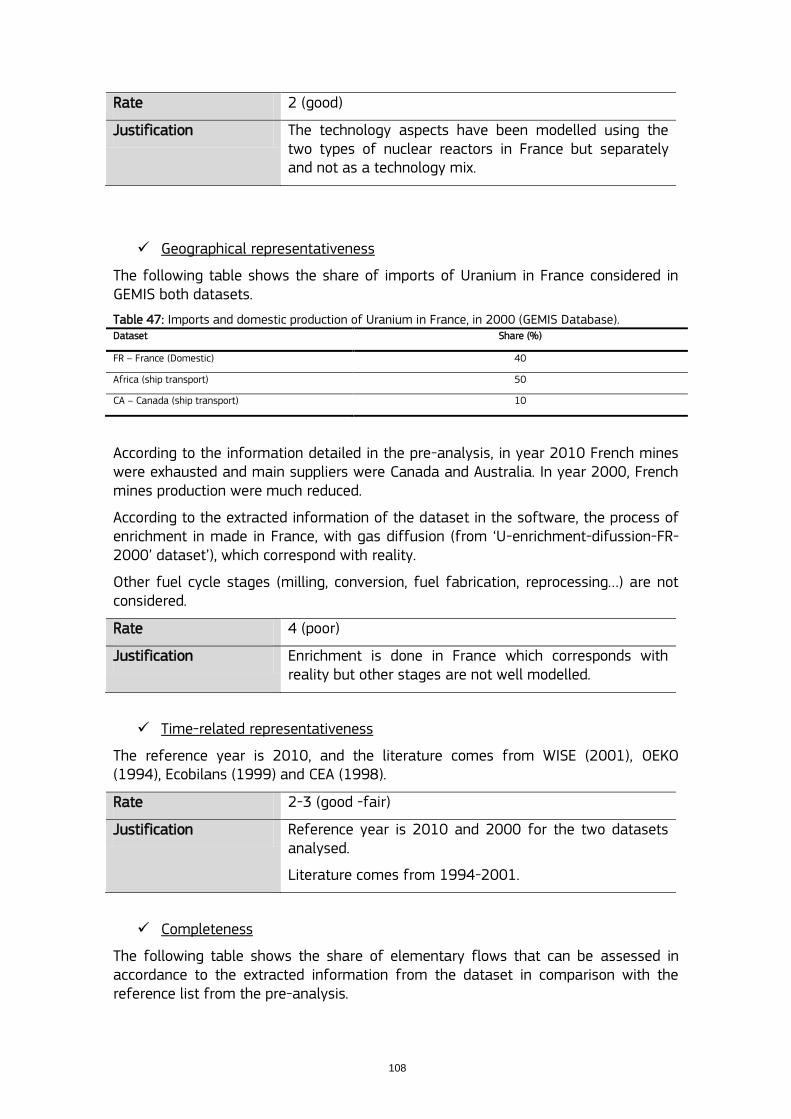
108
Rate 2 (good)
Justification The technology aspects have been modelled using the two types of nuclear reactors in France but separately and not as a technology mix.
Geographical representativeness
The following table shows the share of imports of Uranium in France considered in GEMIS both datasets.
Table 47: Imports and domestic production of Uranium in France, in 2000 (GEMIS Database). Dataset Share (%)
FR – France (Domestic) 40
Africa (ship transport) 50
CA – Canada (ship transport) 10
According to the information detailed in the pre-analysis, in year 2010 French mines were exhausted and main suppliers were Canada and Australia. In year 2000, French mines production were much reduced.
According to the extracted information of the dataset in the software, the process of enrichment in made in France, with gas diffusion (from „U-enrichment-difussion-FR-2000‟ dataset‟), which correspond with reality.
Other fuel cycle stages (milling, conversion, fuel fabrication, reprocessing…) are not considered.
Rate 4 (poor)
Justification Enrichment is done in France which corresponds with reality but other stages are not well modelled.
Time-related representativeness
The reference year is 2010, and the literature comes from WISE (2001), OEKO (1994), Ecobilans (1999) and CEA (1998).
Rate 2-3 (good -fair)
Justification Reference year is 2010 and 2000 for the two datasets analysed.
Literature comes from 1994-2001.
Completeness
The following table shows the share of elementary flows that can be assessed in accordance to the extracted information from the dataset in comparison with the reference list from the pre-analysis.
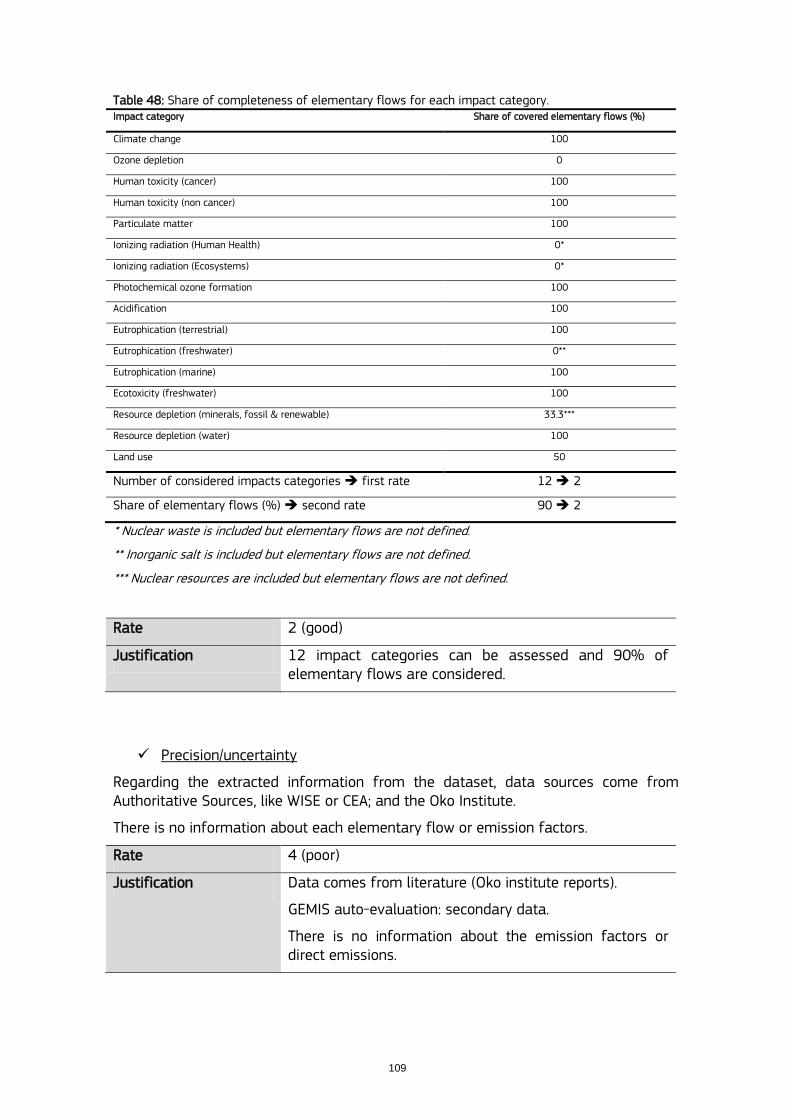
109
Table 48: Share of completeness of elementary flows for each impact category. Impact category Share of covered elementary flows (%)
Climate change 100
Ozone depletion 0
Human toxicity (cancer) 100
Human toxicity (non cancer) 100
Particulate matter 100
Ionizing radiation (Human Health) 0*
Ionizing radiation (Ecosystems) 0*
Photochemical ozone formation 100
Acidification 100
Eutrophication (terrestrial) 100
Eutrophication (freshwater) 0**
Eutrophication (marine) 100
Ecotoxicity (freshwater) 100
Resource depletion (minerals, fossil & renewable) 33.3***
Resource depletion (water) 100
Land use 50
Number of considered impacts categories first rate 12 2
Share of elementary flows (%) second rate 90 2
* Nuclear waste is included but elementary flows are not defined.
** Inorganic salt is included but elementary flows are not defined.
*** Nuclear resources are included but elementary flows are not defined.
Rate 2 (good)
Justification 12 impact categories can be assessed and 90% of elementary flows are considered.
Precision/uncertainty
Regarding the extracted information from the dataset, data sources come from Authoritative Sources, like WISE or CEA; and the Oko Institute.
There is no information about each elementary flow or emission factors.
Rate 4 (poor)
Justification Data comes from literature (Oko institute reports).
GEMIS auto-evaluation: secondary data.
There is no information about the emission factors or direct emissions.
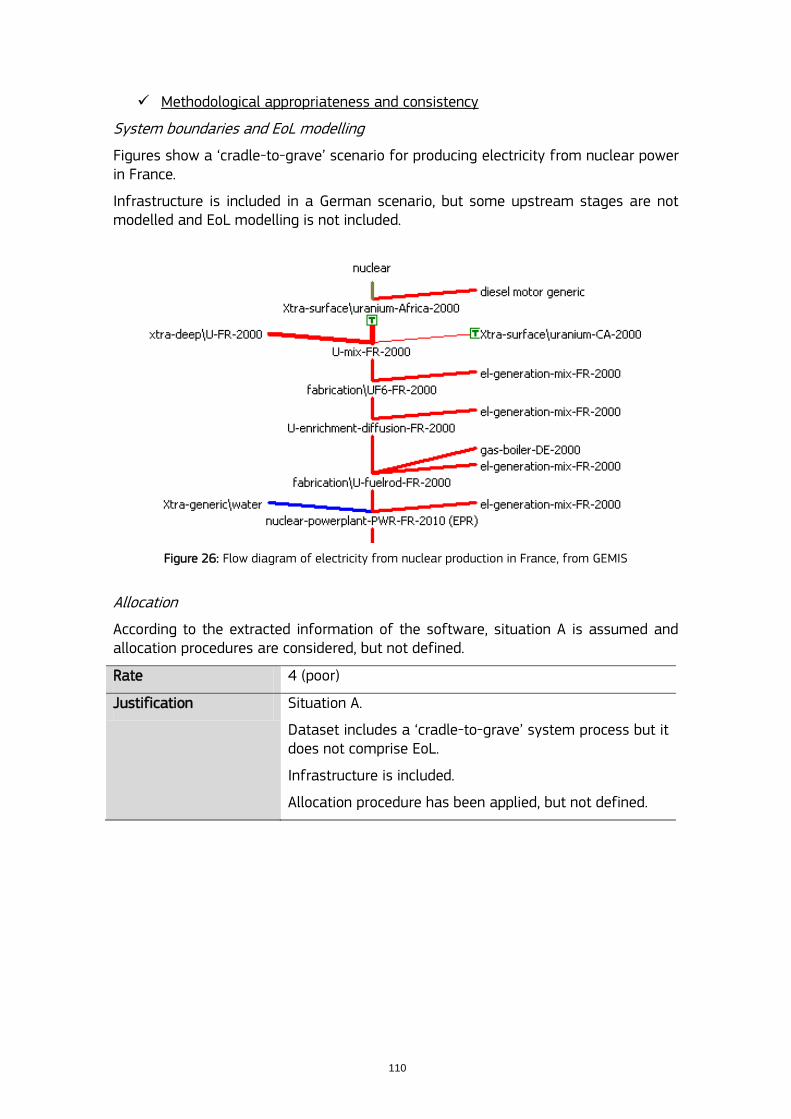
110
Methodological appropriateness and consistency
System boundaries and EoL modelling
Figures show a „cradle-to-grave‟ scenario for producing electricity from nuclear power in France.
Infrastructure is included in a German scenario, but some upstream stages are not modelled and EoL modelling is not included.
Figure 26: Flow diagram of electricity from nuclear production in France, from GEMIS
Allocation
According to the extracted information of the software, situation A is assumed and allocation procedures are considered, but not defined.
Rate 4 (poor)
Justification Situation A.
Dataset includes a „cradle-to-grave‟ system process but it does not comprise EoL.
Infrastructure is included.
Allocation procedure has been applied, but not defined.
111
E3 database Power Station / Nuclear (DWR-F)
General comments and/or relevant information
The functional unit of the dataset refers to the production of one kWh.
Technological representativeness
Regarding the technology description, data come from GEMIS dataset „Nuclear-power plant-PWR-FR‟, but considering a process scale (not a real plant) of a PWR in France.
Rate 4 (poor)
Justification The technology aspects have been modelled by a process scale, sited in France.
Geographical representativeness
Regarding the extracted information of the dataset in the software, data and considerations come from GEMIS dataset „Nuclear-power plant-PWR-DE‟, so the rate for this criterion is assumed the same as the previous. This dataset includes: Nuclear / Deep mining / France (GEMIS); Nuclear / Surface mining / Canada (GEMIS); Nuclear / Surface/deep mining mix South Africa / GEMIS; Nuclear / UF-6 production / GEMIS; and Nuclear / Enrichment / Diffusion / France / GEMIS.
Rate 4 (poor)
Justification As GEMIS dataset.
Time-related representativeness
The reference year is 2000, and the literature comes from Globales Emissions-Modell Integrierter Systeme (GEMIS) (2002). Original references in GEMIS are however older 1994-1999.
Rate 3 (fair)
Justification The reference year is 2000.
Original references come from 1994-1999.
Completeness
The following table shows the share of elementary flows that can be assessed in accordance to the extracted information from the dataset in comparison with the reference list from the pre-analysis.
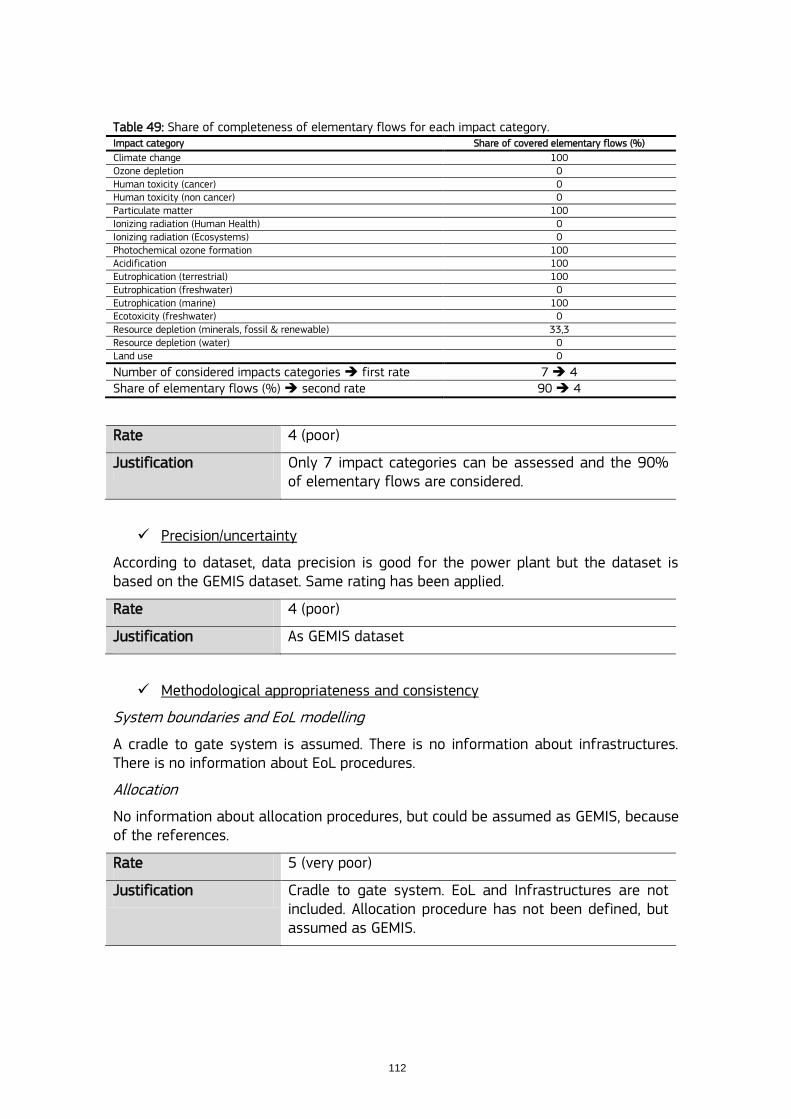
112
Table 49: Share of completeness of elementary flows for each impact category. Impact category Share of covered elementary flows (%)
Climate change 100 Ozone depletion 0 Human toxicity (cancer) 0 Human toxicity (non cancer) 0 Particulate matter 100 Ionizing radiation (Human Health) 0 Ionizing radiation (Ecosystems) 0 Photochemical ozone formation 100 Acidification 100 Eutrophication (terrestrial) 100 Eutrophication (freshwater) 0 Eutrophication (marine) 100 Ecotoxicity (freshwater) 0 Resource depletion (minerals, fossil & renewable) 33,3 Resource depletion (water) 0 Land use 0
Number of considered impacts categories first rate 7 4 Share of elementary flows (%) second rate 90 4
Rate 4 (poor)
Justification Only 7 impact categories can be assessed and the 90% of elementary flows are considered.
Precision/uncertainty
According to dataset, data precision is good for the power plant but the dataset is based on the GEMIS dataset. Same rating has been applied.
Rate 4 (poor)
Justification As GEMIS dataset
Methodological appropriateness and consistency
System boundaries and EoL modelling
A cradle to gate system is assumed. There is no information about infrastructures. There is no information about EoL procedures.
Allocation
No information about allocation procedures, but could be assumed as GEMIS, because of the references.
Rate 5 (very poor)
Justification Cradle to gate system. EoL and Infrastructures are not included. Allocation procedure has not been defined, but assumed as GEMIS.
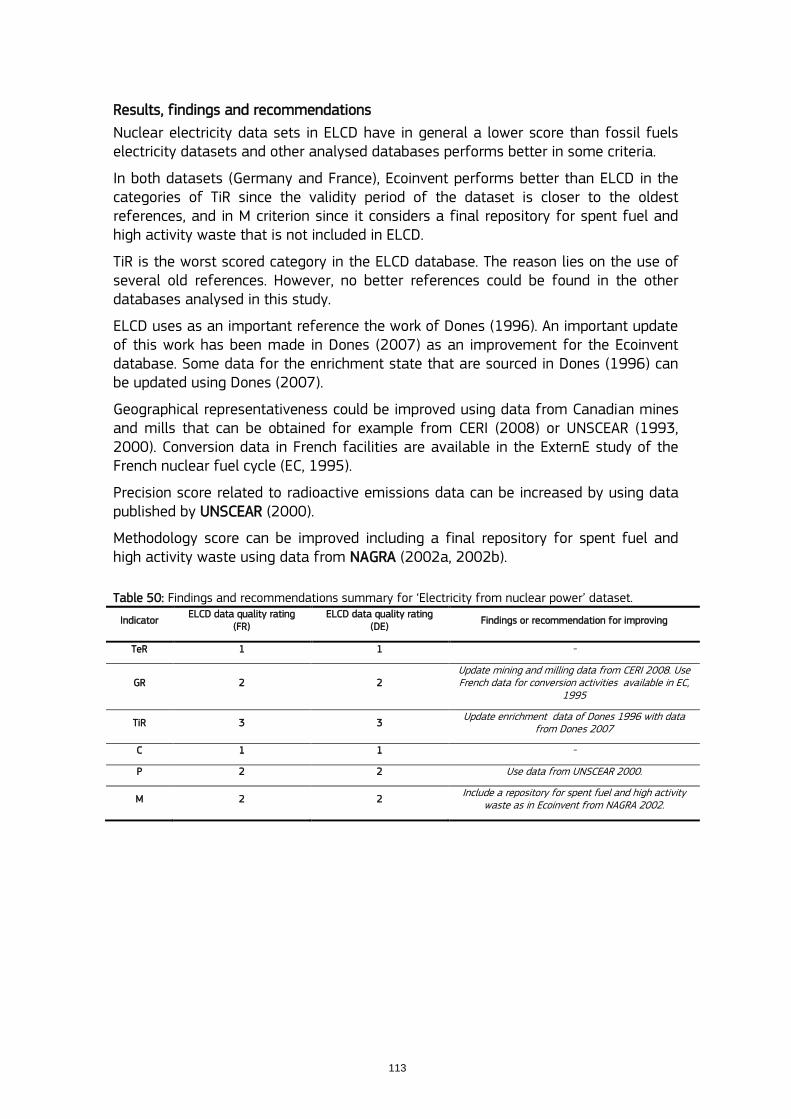
113
Results, findings and recommendations
Nuclear electricity data sets in ELCD have in general a lower score than fossil fuels electricity datasets and other analysed databases performs better in some criteria.
In both datasets (Germany and France), Ecoinvent performs better than ELCD in the categories of TiR since the validity period of the dataset is closer to the oldest references, and in M criterion since it considers a final repository for spent fuel and high activity waste that is not included in ELCD.
TiR is the worst scored category in the ELCD database. The reason lies on the use of several old references. However, no better references could be found in the other databases analysed in this study.
ELCD uses as an important reference the work of Dones (1996). An important update of this work has been made in Dones (2007) as an improvement for the Ecoinvent database. Some data for the enrichment state that are sourced in Dones (1996) can be updated using Dones (2007).
Geographical representativeness could be improved using data from Canadian mines and mills that can be obtained for example from CERI (2008) or UNSCEAR (1993, 2000). Conversion data in French facilities are available in the ExternE study of the French nuclear fuel cycle (EC, 1995).
Precision score related to radioactive emissions data can be increased by using data published by UNSCEAR (2000).
Methodology score can be improved including a final repository for spent fuel and high activity waste using data from NAGRA (2002a, 2002b).
Table 50: Findings and recommendations summary for „Electricity from nuclear power‟ dataset.
Indicator ELCD data quality rating
(FR) ELCD data quality rating
(DE) Findings or recommendation for improving
TeR 1 1 -
GR 2 2 Update mining and milling data from CERI 2008. Use French data for conversion activities available in EC,
1995
TiR 3 3 Update enrichment data of Dones 1996 with data
from Dones 2007
C 1 1 -
P 2 2 Use data from UNSCEAR 2000.
M 2 2 Include a repository for spent fuel and high activity
waste as in Ecoinvent from NAGRA 2002.
114
3.4. Electricity from hydroelectric power
Evaluation: EU-27
ELCD database EU-27: Electricity from hydro power (AC, technology mix of run-off-river, storage and pump storage | production mix, at power plant | 1kV - 60kV)
General comments and/or relevant information
The functional unit of the dataset refers to the production of one kWh. The dataset covers all relevant process steps and technologies along the supply chain. The country / region specific share of run-of-river, storage and pump storage hydro power plants is taken into account. The inventory is partly based on primary industry data, partly on secondary literature data. Direct emission values from biomass degradation within the reservoir are considered under climatic boundary conditions. These values are taken from literature.
Dataset developers have not provided any information extra in order to list the references and the sources by stage of the process, like other technologies.
Technological representativeness
Regarding the technology description, the basic information extracted from the dataset, in order to evaluate this criterion, is detailed below.
Three types of hydro power plants are modelled individually (run-of-river, storage and pump storage) and mixed to a regional specific technology mix.
The following life cycle phases are considered in all models: Construction, installation, operation, decommissioning and removal of electrical parts of the system. End-of-life of infrastructure like concrete foundations or earth dams is not taken into consideration. Shares of the three hydro power types are modelled region specific. The construction of the hydro power plant includes the main components: Cables and power house, Earth-/ mineral dam, and Concrete dam.
Operational life time of the hydro power models are 60 years. Maintenance is included as well as the change of service material like oil for the generators. Region specific GHGs from biomass degradation in reservoirs are included.
Rate 1 (very good)
Justification The technology aspects have been modelled as the European (EU-27) technology mix.
The most used technologies have been modelled individually (run-of-river, storage and pump storage) and mixed to specific technology mix.
Geographical representativeness
Regarding the information included in the dataset, the basic information, in order to evaluate this criterion, is written down.
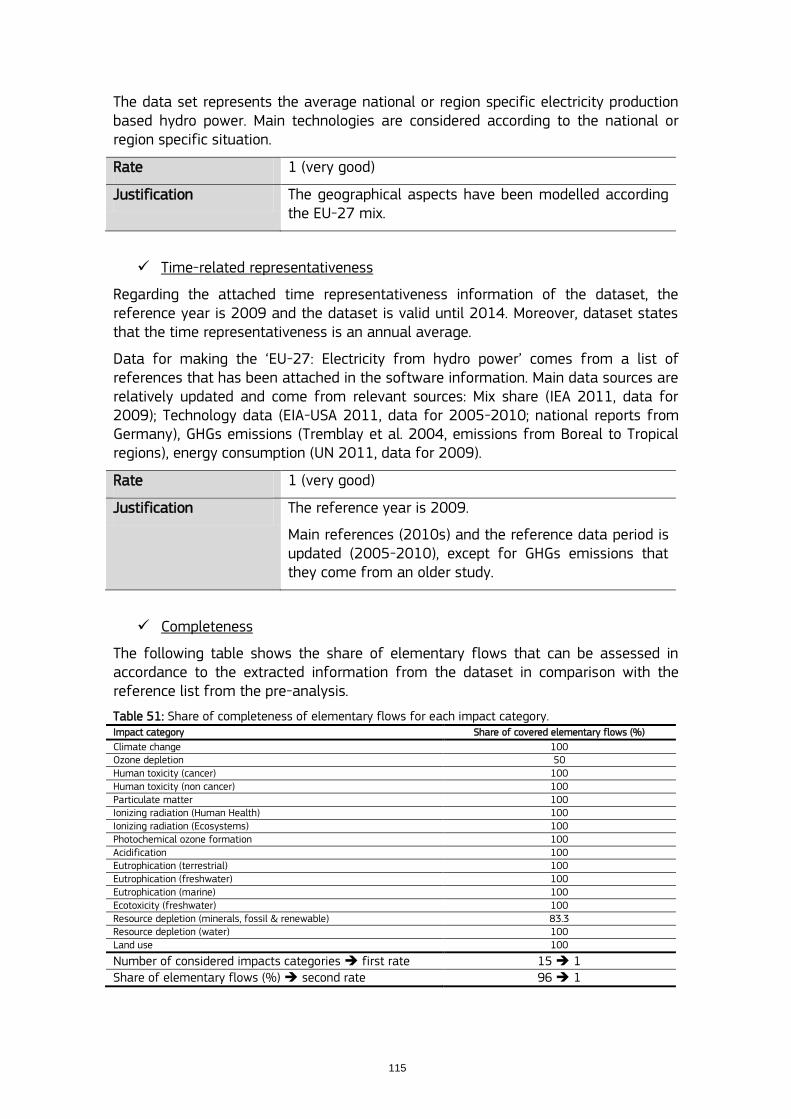
115
The data set represents the average national or region specific electricity production based hydro power. Main technologies are considered according to the national or region specific situation.
Rate 1 (very good)
Justification The geographical aspects have been modelled according the EU-27 mix.
Time-related representativeness
Regarding the attached time representativeness information of the dataset, the reference year is 2009 and the dataset is valid until 2014. Moreover, dataset states that the time representativeness is an annual average.
Data for making the „EU-27: Electricity from hydro power‟ comes from a list of references that has been attached in the software information. Main data sources are relatively updated and come from relevant sources: Mix share (IEA 2011, data for 2009); Technology data (EIA-USA 2011, data for 2005-2010; national reports from Germany), GHGs emissions (Tremblay et al. 2004, emissions from Boreal to Tropical regions), energy consumption (UN 2011, data for 2009).
Rate 1 (very good)
Justification The reference year is 2009.
Main references (2010s) and the reference data period is updated (2005-2010), except for GHGs emissions that they come from an older study.
Completeness
The following table shows the share of elementary flows that can be assessed in accordance to the extracted information from the dataset in comparison with the reference list from the pre-analysis.
Table 51: Share of completeness of elementary flows for each impact category. Impact category Share of covered elementary flows (%)
Climate change 100 Ozone depletion 50 Human toxicity (cancer) 100 Human toxicity (non cancer) 100 Particulate matter 100 Ionizing radiation (Human Health) 100 Ionizing radiation (Ecosystems) 100 Photochemical ozone formation 100 Acidification 100 Eutrophication (terrestrial) 100 Eutrophication (freshwater) 100 Eutrophication (marine) 100 Ecotoxicity (freshwater) 100 Resource depletion (minerals, fossil & renewable) 83.3 Resource depletion (water) 100 Land use 100
Number of considered impacts categories first rate 15 1 Share of elementary flows (%) second rate 96 1
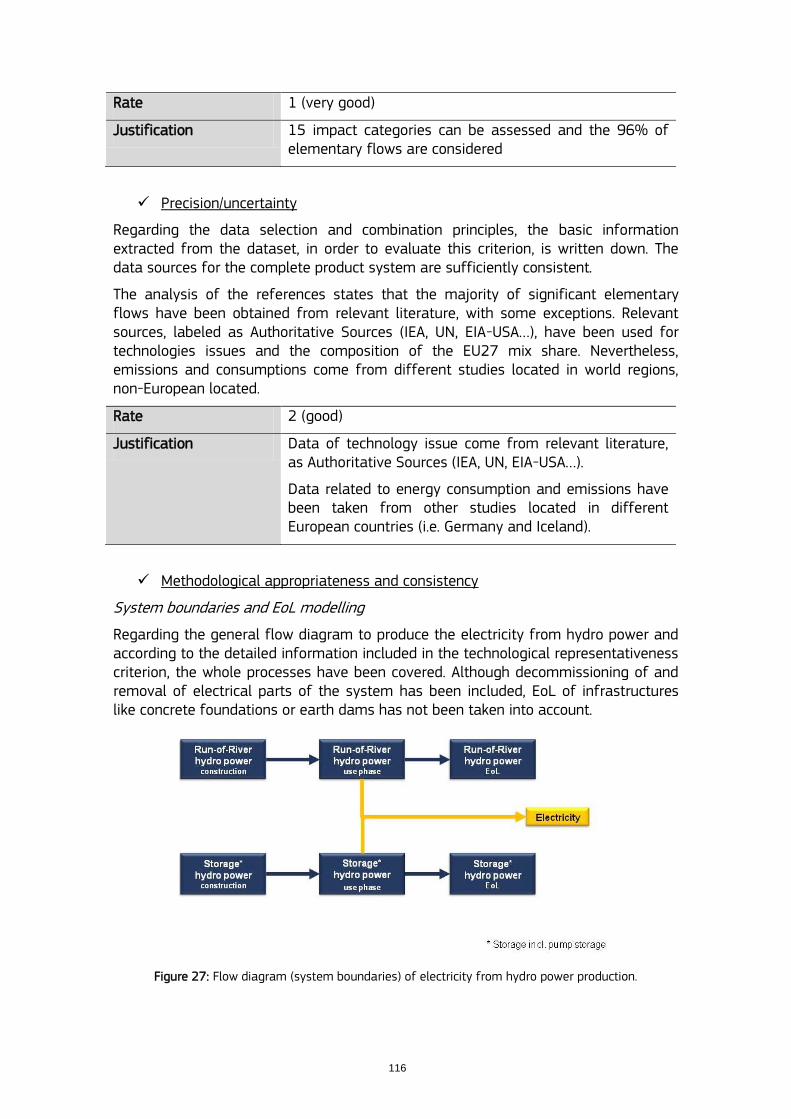
116
Rate 1 (very good)
Justification 15 impact categories can be assessed and the 96% of elementary flows are considered
Precision/uncertainty
Regarding the data selection and combination principles, the basic information extracted from the dataset, in order to evaluate this criterion, is written down. The data sources for the complete product system are sufficiently consistent.
The analysis of the references states that the majority of significant elementary flows have been obtained from relevant literature, with some exceptions. Relevant sources, labeled as Authoritative Sources (IEA, UN, EIA-USA…), have been used for technologies issues and the composition of the EU27 mix share. Nevertheless, emissions and consumptions come from different studies located in world regions, non-European located.
Rate 2 (good)
Justification Data of technology issue come from relevant literature, as Authoritative Sources (IEA, UN, EIA-USA…).
Data related to energy consumption and emissions have been taken from other studies located in different European countries (i.e. Germany and Iceland).
Methodological appropriateness and consistency
System boundaries and EoL modelling
Regarding the general flow diagram to produce the electricity from hydro power and according to the detailed information included in the technological representativeness criterion, the whole processes have been covered. Although decommissioning of and removal of electrical parts of the system has been included, EoL of infrastructures like concrete foundations or earth dams has not been taken into account.
Figure 27: Flow diagram (system boundaries) of electricity from hydro power production.
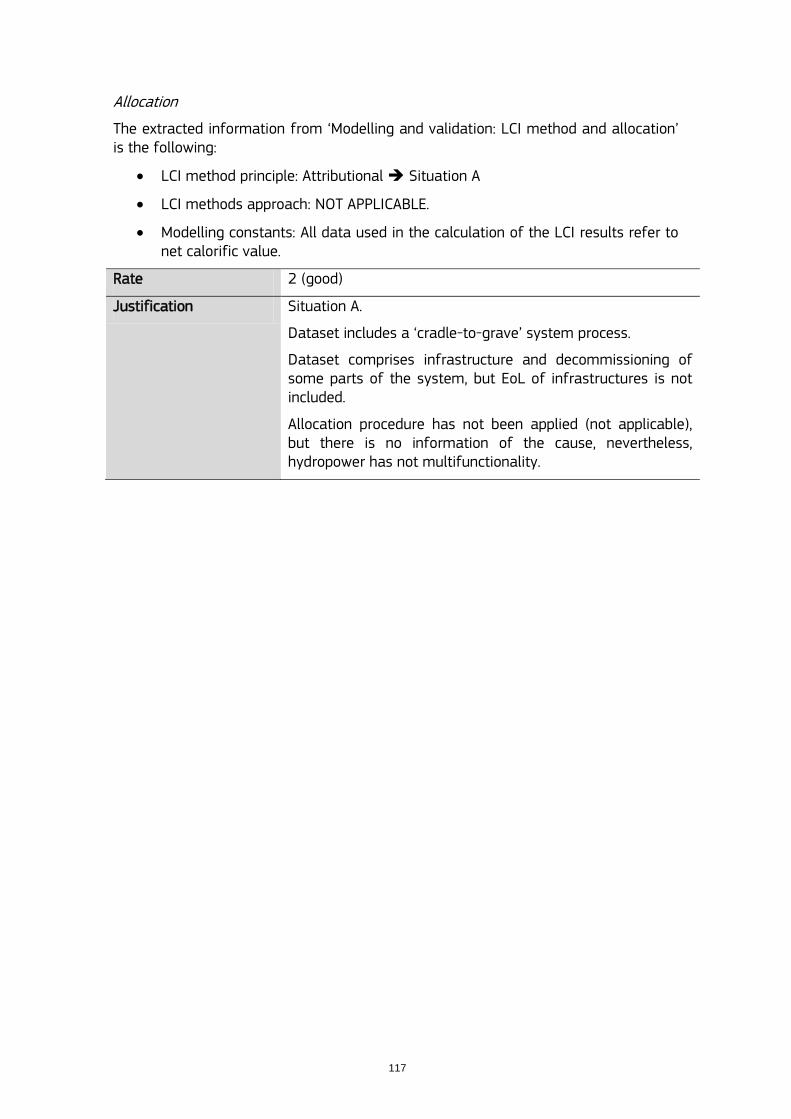
117
Allocation
The extracted information from „Modelling and validation: LCI method and allocation‟ is the following:
LCI method principle: Attributional Situation A
LCI methods approach: NOT APPLICABLE.
Modelling constants: All data used in the calculation of the LCI results refer to net calorific value.
Rate 2 (good)
Justification Situation A.
Dataset includes a „cradle-to-grave‟ system process.
Dataset comprises infrastructure and decommissioning of some parts of the system, but EoL of infrastructures is not included.
Allocation procedure has not been applied (not applicable), but there is no information of the cause, nevertheless, hydropower has not multifunctionality.
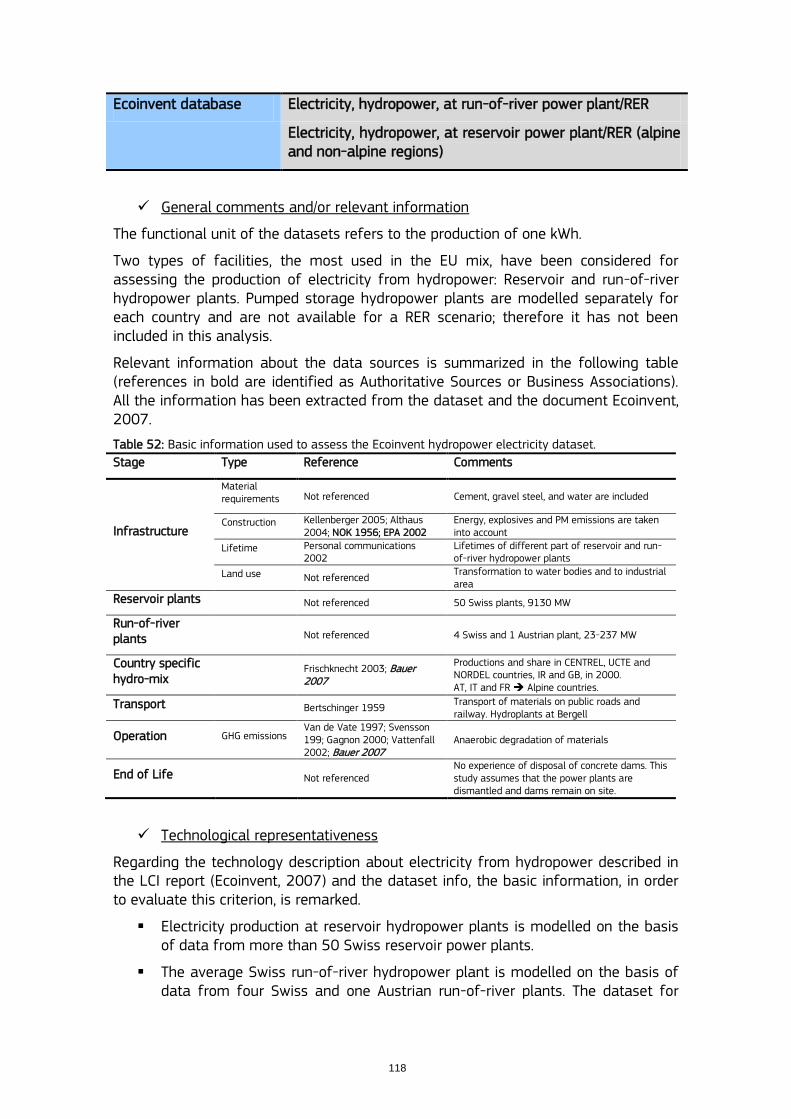
118
Ecoinvent database Electricity, hydropower, at run-of-river power plant/RER
Electricity, hydropower, at reservoir power plant/RER (alpine and non-alpine regions)
General comments and/or relevant information
The functional unit of the datasets refers to the production of one kWh.
Two types of facilities, the most used in the EU mix, have been considered for assessing the production of electricity from hydropower: Reservoir and run-of-river hydropower plants. Pumped storage hydropower plants are modelled separately for each country and are not available for a RER scenario; therefore it has not been included in this analysis.
Relevant information about the data sources is summarized in the following table (references in bold are identified as Authoritative Sources or Business Associations). All the information has been extracted from the dataset and the document Ecoinvent, 2007.
Table 52: Basic information used to assess the Ecoinvent hydropower electricity dataset.
Stage Type Reference Comments
Infrastructure
Material requirements Not referenced Cement, gravel steel, and water are included
Construction Kellenberger 2005; Althaus 2004; NOK 1956; EPA 2002
Energy, explosives and PM emissions are taken into account
Lifetime Personal communications 2002
Lifetimes of different part of reservoir and run-of-river hydropower plants
Land use Not referenced Transformation to water bodies and to industrial area
Reservoir plants Not referenced 50 Swiss plants, 9130 MW
Run-of-river plants
Not referenced 4 Swiss and 1 Austrian plant, 23-237 MW
Country specific hydro-mix
Frischknecht 2003; Bauer 2007
Productions and share in CENTREL, UCTE and NORDEL countries, IR and GB, in 2000. AT, IT and FR Alpine countries.
Transport Bertschinger 1959 Transport of materials on public roads and railway. Hydroplants at Bergell
Operation GHG emissions Van de Vate 1997; Svensson 199; Gagnon 2000; Vattenfall 2002; Bauer 2007
Anaerobic degradation of materials
End of Life Not referenced No experience of disposal of concrete dams. This study assumes that the power plants are dismantled and dams remain on site.
Technological representativeness
Regarding the technology description about electricity from hydropower described in the LCI report (Ecoinvent, 2007) and the dataset info, the basic information, in order to evaluate this criterion, is remarked.
Electricity production at reservoir hydropower plants is modelled on the basis of data from more than 50 Swiss reservoir power plants.
The average Swiss run-of-river hydropower plant is modelled on the basis of data from four Swiss and one Austrian run-of-river plants. The dataset for
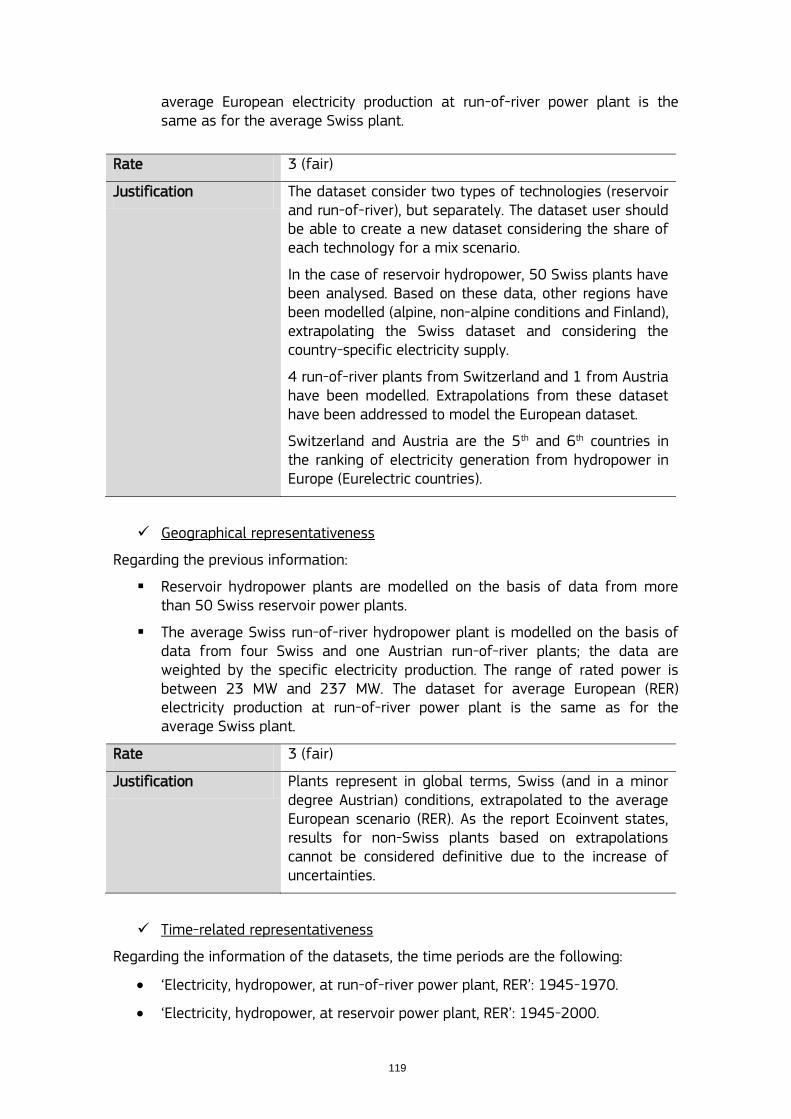
119
average European electricity production at run-of-river power plant is the same as for the average Swiss plant.
Rate 3 (fair)
Justification The dataset consider two types of technologies (reservoir and run-of-river), but separately. The dataset user should be able to create a new dataset considering the share of each technology for a mix scenario.
In the case of reservoir hydropower, 50 Swiss plants have been analysed. Based on these data, other regions have been modelled (alpine, non-alpine conditions and Finland), extrapolating the Swiss dataset and considering the country-specific electricity supply.
4 run-of-river plants from Switzerland and 1 from Austria have been modelled. Extrapolations from these dataset have been addressed to model the European dataset.
Switzerland and Austria are the 5th and 6th countries in the ranking of electricity generation from hydropower in Europe (Eurelectric countries).
Geographical representativeness
Regarding the previous information:
Reservoir hydropower plants are modelled on the basis of data from more than 50 Swiss reservoir power plants.
The average Swiss run-of-river hydropower plant is modelled on the basis of data from four Swiss and one Austrian run-of-river plants; the data are weighted by the specific electricity production. The range of rated power is between 23 MW and 237 MW. The dataset for average European (RER) electricity production at run-of-river power plant is the same as for the average Swiss plant.
Rate 3 (fair)
Justification Plants represent in global terms, Swiss (and in a minor degree Austrian) conditions, extrapolated to the average European scenario (RER). As the report Ecoinvent states, results for non-Swiss plants based on extrapolations cannot be considered definitive due to the increase of uncertainties.
Time-related representativeness
Regarding the information of the datasets, the time periods are the following:
„Electricity, hydropower, at run-of-river power plant, RER‟: 1945-1970.
„Electricity, hydropower, at reservoir power plant, RER‟: 1945-2000.
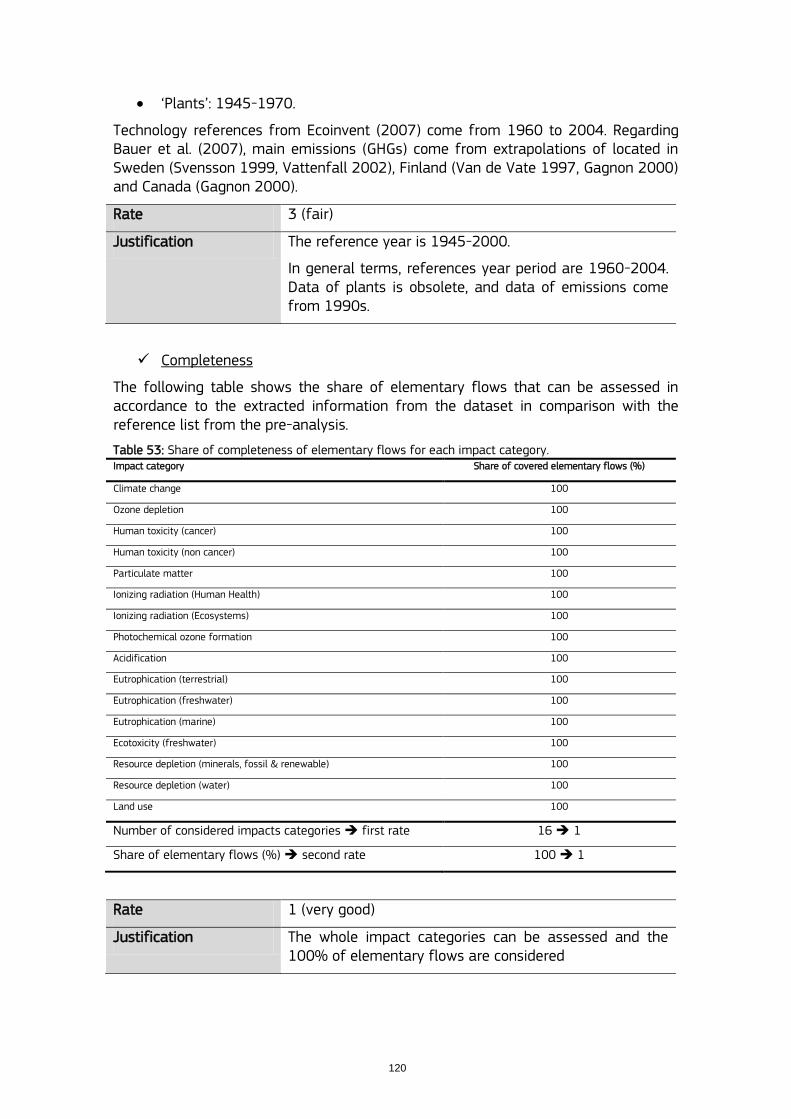
120
„Plants‟: 1945-1970.
Technology references from Ecoinvent (2007) come from 1960 to 2004. Regarding Bauer et al. (2007), main emissions (GHGs) come from extrapolations of located in Sweden (Svensson 1999, Vattenfall 2002), Finland (Van de Vate 1997, Gagnon 2000) and Canada (Gagnon 2000).
Rate 3 (fair)
Justification The reference year is 1945-2000.
In general terms, references year period are 1960-2004. Data of plants is obsolete, and data of emissions come from 1990s.
Completeness
The following table shows the share of elementary flows that can be assessed in accordance to the extracted information from the dataset in comparison with the reference list from the pre-analysis.
Table 53: Share of completeness of elementary flows for each impact category. Impact category Share of covered elementary flows (%)
Climate change 100
Ozone depletion 100
Human toxicity (cancer) 100
Human toxicity (non cancer) 100
Particulate matter 100
Ionizing radiation (Human Health) 100
Ionizing radiation (Ecosystems) 100
Photochemical ozone formation 100
Acidification 100
Eutrophication (terrestrial) 100
Eutrophication (freshwater) 100
Eutrophication (marine) 100
Ecotoxicity (freshwater) 100
Resource depletion (minerals, fossil & renewable) 100
Resource depletion (water) 100
Land use 100
Number of considered impacts categories first rate 16 1
Share of elementary flows (%) second rate 100 1
Rate 1 (very good)
Justification The whole impact categories can be assessed and the 100% of elementary flows are considered
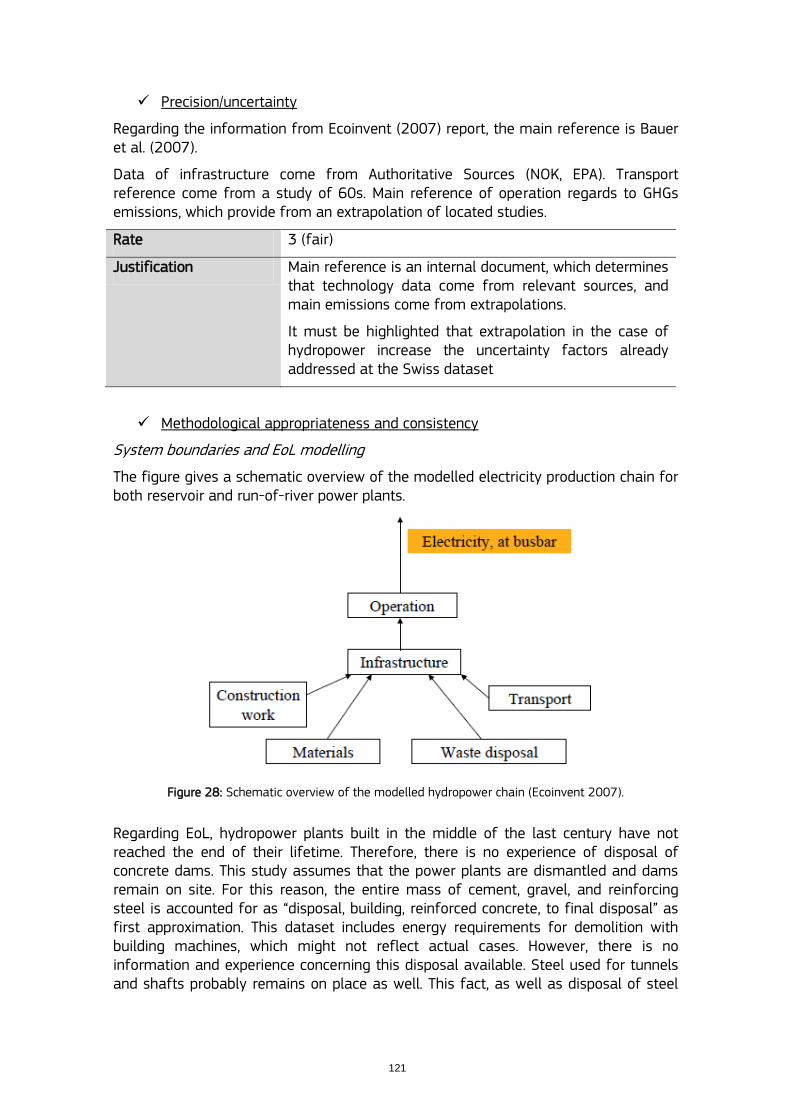
121
Precision/uncertainty
Regarding the information from Ecoinvent (2007) report, the main reference is Bauer et al. (2007).
Data of infrastructure come from Authoritative Sources (NOK, EPA). Transport reference come from a study of 60s. Main reference of operation regards to GHGs emissions, which provide from an extrapolation of located studies.
Rate 3 (fair)
Justification Main reference is an internal document, which determines that technology data come from relevant sources, and main emissions come from extrapolations.
It must be highlighted that extrapolation in the case of hydropower increase the uncertainty factors already addressed at the Swiss dataset
Methodological appropriateness and consistency
System boundaries and EoL modelling
The figure gives a schematic overview of the modelled electricity production chain for both reservoir and run-of-river power plants.
Figure 28: Schematic overview of the modelled hydropower chain (Ecoinvent 2007).
Regarding EoL, hydropower plants built in the middle of the last century have not reached the end of their lifetime. Therefore, there is no experience of disposal of concrete dams. This study assumes that the power plants are dismantled and dams remain on site. For this reason, the entire mass of cement, gravel, and reinforcing steel is accounted for as “disposal, building, reinforced concrete, to final disposal” as first approximation. This dataset includes energy requirements for demolition with building machines, which might not reflect actual cases. However, there is no information and experience concerning this disposal available. Steel used for tunnels and shafts probably remains on place as well. This fact, as well as disposal of steel
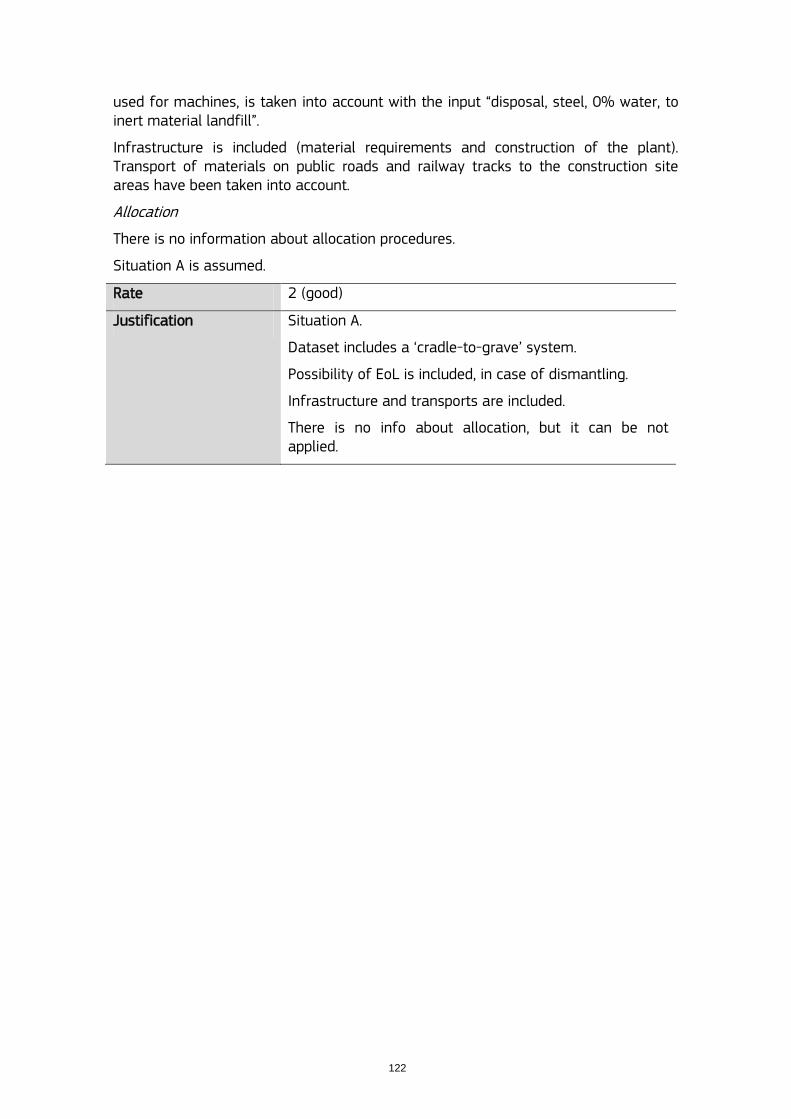
122
used for machines, is taken into account with the input “disposal, steel, 0% water, to inert material landfill”.
Infrastructure is included (material requirements and construction of the plant). Transport of materials on public roads and railway tracks to the construction site areas have been taken into account.
Allocation
There is no information about allocation procedures.
Situation A is assumed.
Rate 2 (good)
Justification Situation A.
Dataset includes a „cradle-to-grave‟ system.
Possibility of EoL is included, in case of dismantling.
Infrastructure and transports are included.
There is no info about allocation, but it can be not applied.
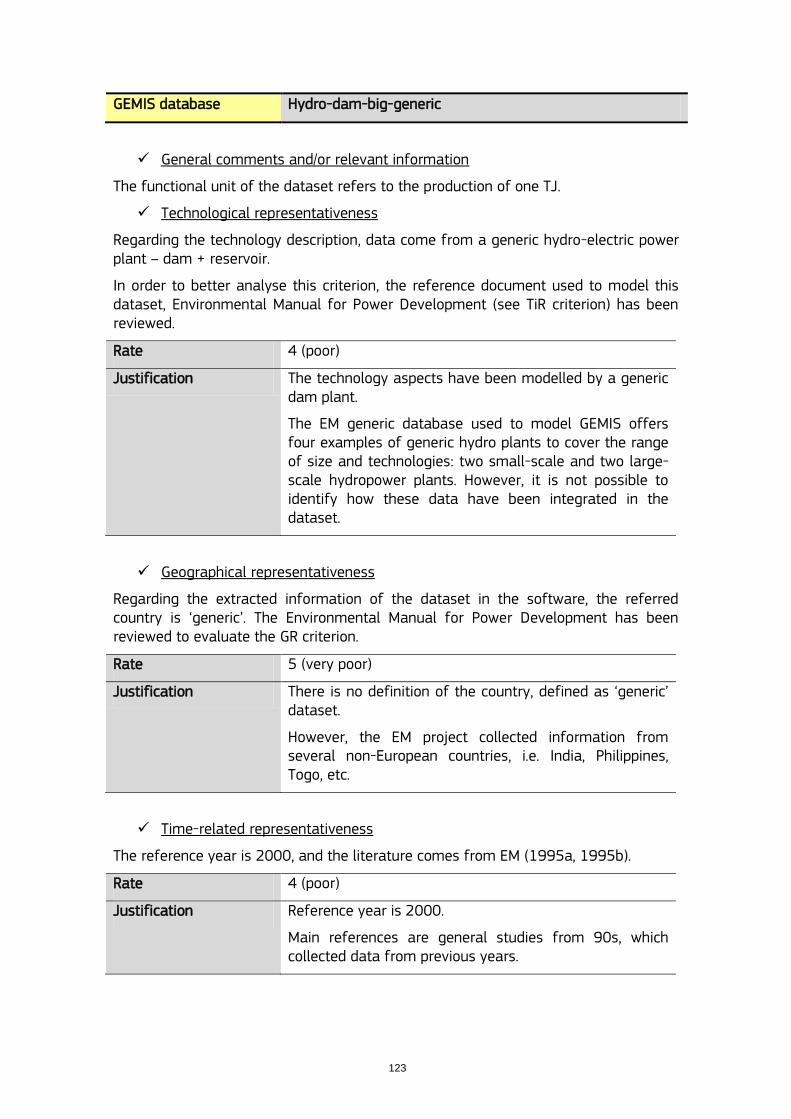
123
GEMIS database Hydro-dam-big-generic
General comments and/or relevant information
The functional unit of the dataset refers to the production of one TJ.
Technological representativeness
Regarding the technology description, data come from a generic hydro-electric power plant – dam + reservoir.
In order to better analyse this criterion, the reference document used to model this dataset, Environmental Manual for Power Development (see TiR criterion) has been reviewed.
Rate 4 (poor)
Justification The technology aspects have been modelled by a generic dam plant.
The EM generic database used to model GEMIS offers four examples of generic hydro plants to cover the range of size and technologies: two small-scale and two large-scale hydropower plants. However, it is not possible to identify how these data have been integrated in the dataset.
Geographical representativeness
Regarding the extracted information of the dataset in the software, the referred country is „generic‟. The Environmental Manual for Power Development has been reviewed to evaluate the GR criterion.
Rate 5 (very poor)
Justification There is no definition of the country, defined as „generic‟ dataset.
However, the EM project collected information from several non-European countries, i.e. India, Philippines, Togo, etc.
Time-related representativeness
The reference year is 2000, and the literature comes from EM (1995a, 1995b).
Rate 4 (poor)
Justification Reference year is 2000.
Main references are general studies from 90s, which collected data from previous years.
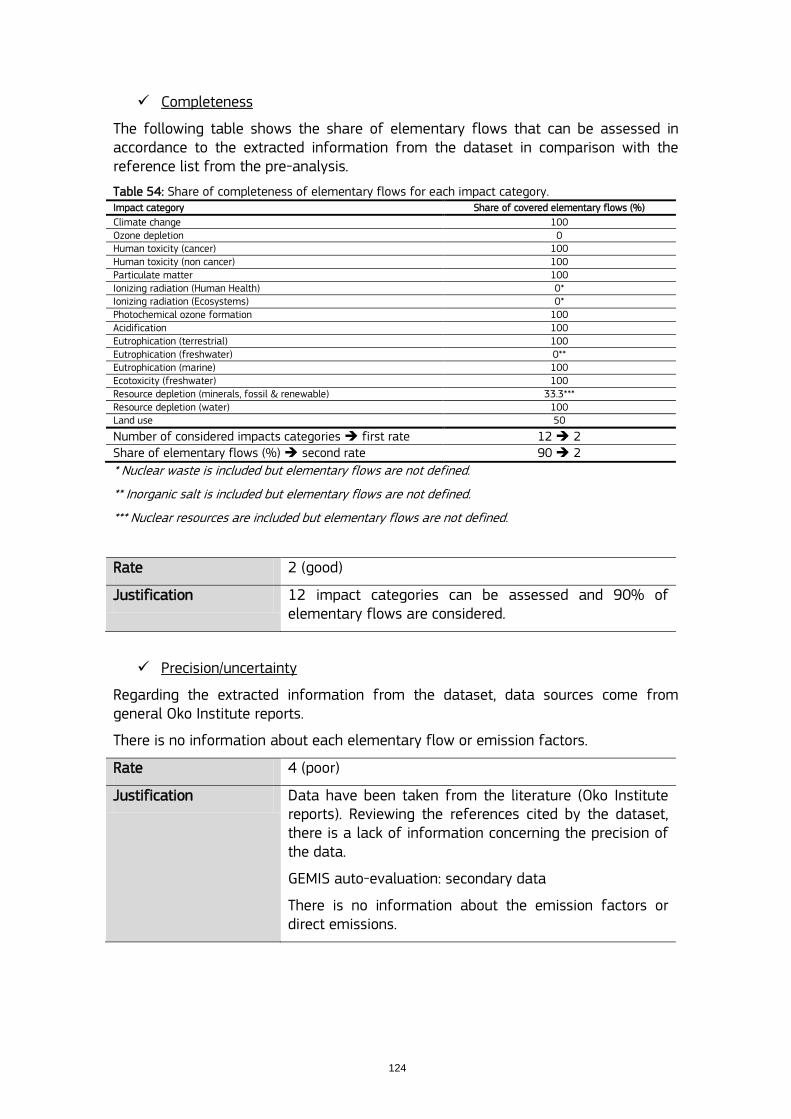
124
Completeness
The following table shows the share of elementary flows that can be assessed in accordance to the extracted information from the dataset in comparison with the reference list from the pre-analysis.
Table 54: Share of completeness of elementary flows for each impact category. Impact category Share of covered elementary flows (%)
Climate change 100 Ozone depletion 0 Human toxicity (cancer) 100 Human toxicity (non cancer) 100 Particulate matter 100 Ionizing radiation (Human Health) 0* Ionizing radiation (Ecosystems) 0* Photochemical ozone formation 100 Acidification 100 Eutrophication (terrestrial) 100 Eutrophication (freshwater) 0** Eutrophication (marine) 100 Ecotoxicity (freshwater) 100 Resource depletion (minerals, fossil & renewable) 33.3*** Resource depletion (water) 100 Land use 50
Number of considered impacts categories first rate 12 2 Share of elementary flows (%) second rate 90 2
* Nuclear waste is included but elementary flows are not defined.
** Inorganic salt is included but elementary flows are not defined.
*** Nuclear resources are included but elementary flows are not defined.
Rate 2 (good)
Justification 12 impact categories can be assessed and 90% of elementary flows are considered.
Precision/uncertainty
Regarding the extracted information from the dataset, data sources come from general Oko Institute reports.
There is no information about each elementary flow or emission factors.
Rate 4 (poor)
Justification Data have been taken from the literature (Oko Institute reports). Reviewing the references cited by the dataset, there is a lack of information concerning the precision of the data.
GEMIS auto-evaluation: secondary data
There is no information about the emission factors or direct emissions.

125
Methodological appropriateness and consistency
System boundaries and EoL modelling
Figures show a „cradle-to-grave‟ scenario for producing electricity from hydropower in a generic country.
Infrastructure is included in a German scenario, but EoL modelling is not included.
Figure 29: Flow diagram of electricity hydropower production, from GEMIS
Allocation
According to the extracted information of the software, situation A is assumed.
Regarding allocation procedures, dataset states that it should be considered that often multiple uses are associated with the hydropower development (e.g. irrigation, storage, recreation, etc.) so that an allocation of impacts to the specific uses might be appropriate.
Rate 3 (fair)
Justification Situation A.
Dataset includes a „cradle-to-grave‟ system process but it does not comprise EoL.
Infrastructure is included.
Allocation procedure might be appropriate in cases of multifunctionality consideration.
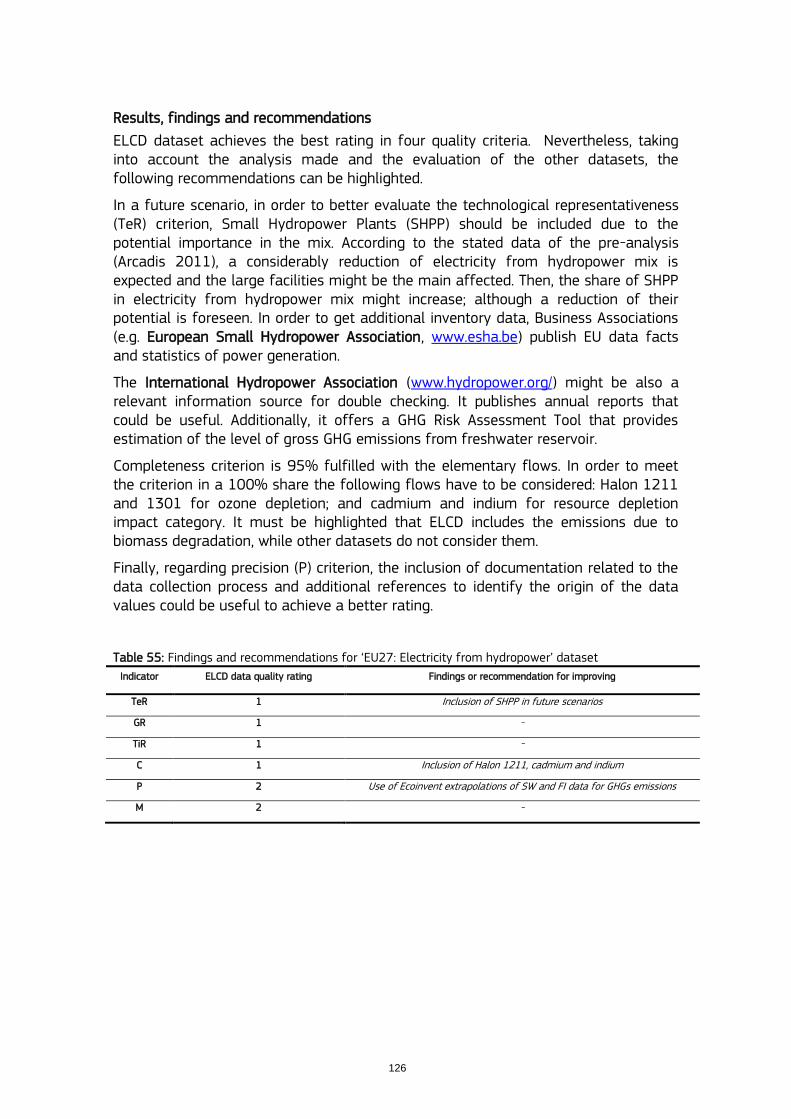
126
Results, findings and recommendations
ELCD dataset achieves the best rating in four quality criteria. Nevertheless, taking into account the analysis made and the evaluation of the other datasets, the following recommendations can be highlighted.
In a future scenario, in order to better evaluate the technological representativeness (TeR) criterion, Small Hydropower Plants (SHPP) should be included due to the potential importance in the mix. According to the stated data of the pre-analysis (Arcadis 2011), a considerably reduction of electricity from hydropower mix is expected and the large facilities might be the main affected. Then, the share of SHPP in electricity from hydropower mix might increase; although a reduction of their potential is foreseen. In order to get additional inventory data, Business Associations (e.g. European Small Hydropower Association, www.esha.be) publish EU data facts and statistics of power generation.
The International Hydropower Association (www.hydropower.org/) might be also a relevant information source for double checking. It publishes annual reports that could be useful. Additionally, it offers a GHG Risk Assessment Tool that provides estimation of the level of gross GHG emissions from freshwater reservoir.
Completeness criterion is 95% fulfilled with the elementary flows. In order to meet the criterion in a 100% share the following flows have to be considered: Halon 1211 and 1301 for ozone depletion; and cadmium and indium for resource depletion impact category. It must be highlighted that ELCD includes the emissions due to biomass degradation, while other datasets do not consider them.
Finally, regarding precision (P) criterion, the inclusion of documentation related to the data collection process and additional references to identify the origin of the data values could be useful to achieve a better rating.
Table 55: Findings and recommendations for „EU27: Electricity from hydropower‟ dataset
Indicator ELCD data quality rating Findings or recommendation for improving
TeR 1 Inclusion of SHPP in future scenarios
GR 1 -
TiR 1 -
C 1 Inclusion of Halon 1211, cadmium and indium
P 2 Use of Ecoinvent extrapolations of SW and FI data for GHGs emissions
M 2 -
127
3.5. Electricity from wind power
Evaluation: EU-27
ELCD database RER: Electricity from wind power (AC, technology mix of onshore and offshore | production mix, at producer | 1kV - 60kV)
General comments and/or relevant information
The functional unit of the dataset refers to the production of one kWh. The dataset covers all relevant process steps and technologies along the supply chain. The country / region specific share of onshore and offshore electricity generation as well annual full load hours are taken into account. The inventory is partly based on primary industry data, partly on secondary literature data.
Electricity generation by onshore and offshore is modelled individually and mixed to a national / regional specific technology mix.
For each type, an average representative state-of-the-art wind converter LCA model is set up. The operation phase of the wind power is completed by individual national / regional operation data.
The data set can be used for all LCA/CF studies where medium voltage electricity from wind power is needed. Combination with individual unit processes using this commodity enables the generation of user-specific (product) LCAs.
Technological representativeness
Regarding the technology description, the basic information extracted from the dataset, in order to evaluate this criterion, is the following:
The dataset includes an average onshore and offshore wind model.
The following life cycle phases are considered in both models: Production, transportation, installation, operation, decommissioning and removal of the wind turbines incl. electrical gear.
Onshore model: The onshore model is based on a 300 MW wind park, operating 182 wind turbines with 1.65 MW each.
Offshore model: The onshore model is based on a 300 MW wind park, operating 100 wind turbines with 3.00 MW each.
128
Rate 1 (very good)
Justification The dataset has been modelled taken into account both the onshore and offshore wind technologies currently available at the commercial level.
The technology description is well defined based on the current statistics provided by Authoritative Bodies such as the IEA and the EWEA. The dataset considers the shares of onshore to offshore wind power at the region and the full load hours during the operation phase, based on public statistics.
Detailed data related to manufacturing of the turbines have been collected from the largest companies involved in this sector.
EoL treatment has been included in the modelling, taken into account the expertise of companies and institutions working with dismantling, scrapping and recycling.
Geographical representativeness
Regarding the information included in the dataset, the basic information, in order to evaluate this criterion, is the following: The data set represents the average national or region specific electricity production based on wind power. Main technologies are considered according to the national or region specific situation.
Rate 1 (very good)
Justification The dataset has been modelled for the region of Europe (RER), and has considered the full load hours for the actual region using statistical information. The onshore and offshore shares in the region have been included, based on international and European statistic information.
Most relevant data related to manufacturing have been obtained from a European manufacturing company, which had the largest annual market share in 2011, operating in Denmark, Germany, India, Italy, Romania, Britain, Spain, Sweden and Norway.
Time-related representativeness
Regarding the attached time representativeness information of the dataset, the reference year is 2009 and the dataset is valid until 2014. Moreover, dataset states that the time representativeness is an annual average.
Data for making the „RER: Electricity from wind power‟ comes from a list of references that has been attached in the software information.

129
Rate 1 (very good)
Justification The dataset claims that the used data refer to years from 2008 to 2011. References reviewed to evaluate the criterion show that the time horizon is well covered.
Completeness
The following table shows the share of elementary flows that can be assessed in accordance to the extracted information from the dataset in comparison with the reference list from the pre-analysis.
Table 56: Share of completeness of elementary flows for each impact category. Impact category Share of covered elementary flows (%)
Climate change 100 Ozone depletion 33.3 Human toxicity (cancer) 100 Human toxicity (non cancer) 100 Particulate matter 100 Ionizing radiation (Human Health) 100 Ionizing radiation (Ecosystems) 100 Photochemical ozone formation 100 Acidification 100 Eutrophication (terrestrial) 100 Eutrophication (freshwater) 100 Eutrophication (marine) 100 Ecotoxicity (freshwater) 100 Resource depletion (minerals, fossil & renewable) 83.3 Resource depletion (water) 100 Land use 100
Number of considered impacts categories first rate 15 1 Share of elementary flows (%) second rate 96 1
Rate 1 (very good)
Justification 15 impact categories can be assessed and the 96% of elementary flows are considered
Precision/uncertainty
Regarding the data selection and combination principles, the basic information extracted from the dataset, in order to evaluate this criterion, is the following: The data sources for the complete product system are sufficiently consistent. It must be concluded that the majority of relevant elementary flows have been obtained from literature.
Rate 2 (good)
Justification The data used to model this technology have been obtained from manufacturing companies, as stated in the documentation. Some data are based on measured controls and on literature. Statistics from relevant Authoritative Sources and Business Association have been also used to model the dataset.
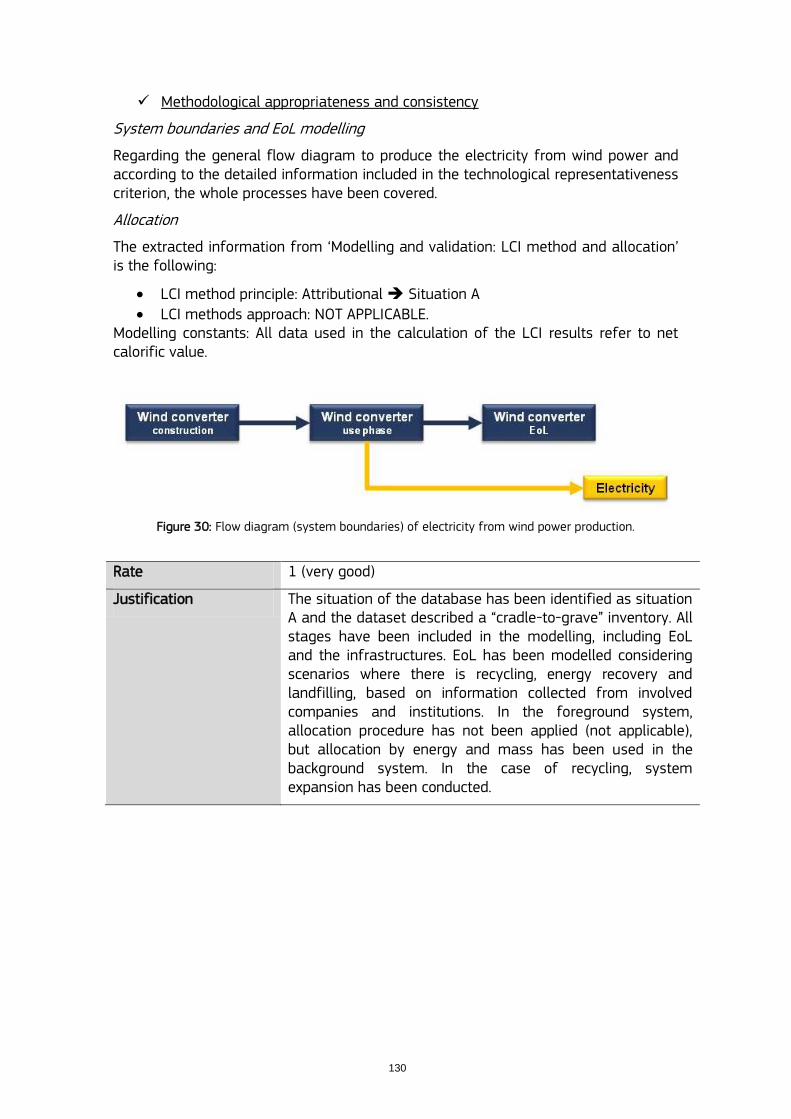
130
Methodological appropriateness and consistency
System boundaries and EoL modelling
Regarding the general flow diagram to produce the electricity from wind power and according to the detailed information included in the technological representativeness criterion, the whole processes have been covered.
Allocation
The extracted information from „Modelling and validation: LCI method and allocation‟ is the following:
LCI method principle: Attributional Situation A
LCI methods approach: NOT APPLICABLE. Modelling constants: All data used in the calculation of the LCI results refer to net calorific value.
Figure 30: Flow diagram (system boundaries) of electricity from wind power production.
Rate 1 (very good)
Justification The situation of the database has been identified as situation A and the dataset described a “cradle-to-grave” inventory. All stages have been included in the modelling, including EoL and the infrastructures. EoL has been modelled considering scenarios where there is recycling, energy recovery and landfilling, based on information collected from involved companies and institutions. In the foreground system, allocation procedure has not been applied (not applicable), but allocation by energy and mass has been used in the background system. In the case of recycling, system expansion has been conducted.
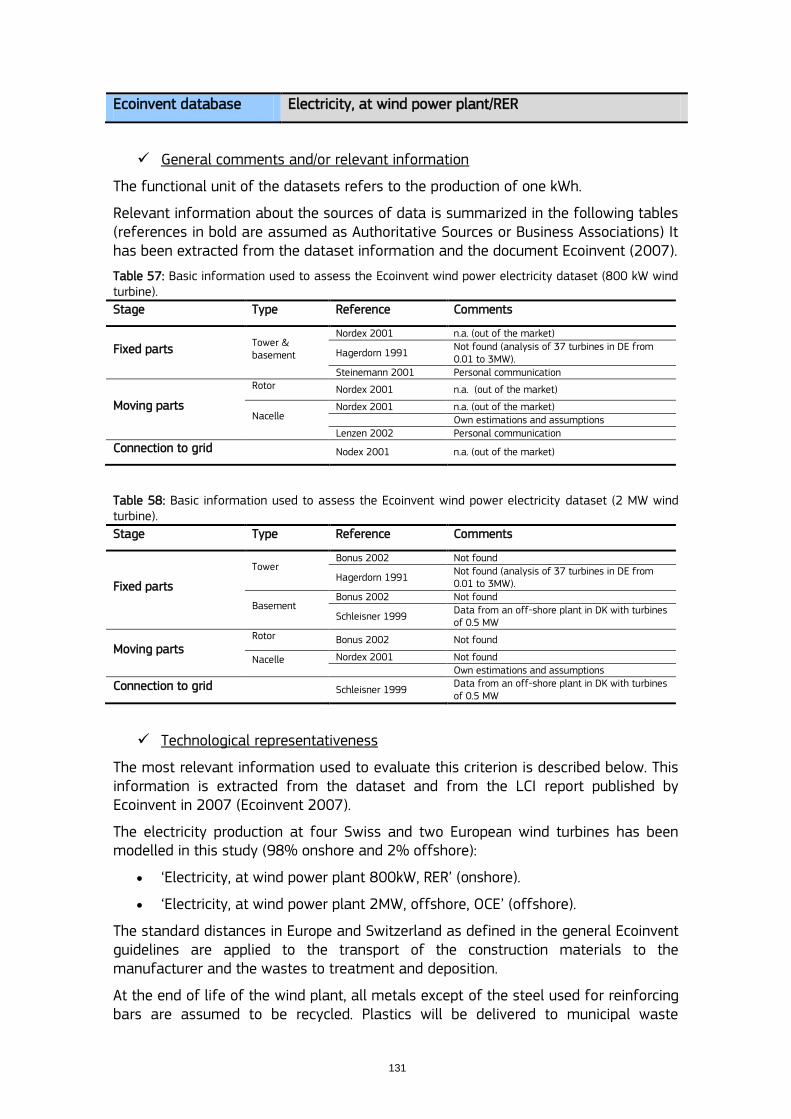
131
Ecoinvent database Electricity, at wind power plant/RER
General comments and/or relevant information
The functional unit of the datasets refers to the production of one kWh.
Relevant information about the sources of data is summarized in the following tables (references in bold are assumed as Authoritative Sources or Business Associations) It has been extracted from the dataset information and the document Ecoinvent (2007).
Table 57: Basic information used to assess the Ecoinvent wind power electricity dataset (800 kW wind turbine).
Stage Type Reference Comments
Fixed parts Tower & basement
Nordex 2001 n.a. (out of the market)
Hagerdorn 1991 Not found (analysis of 37 turbines in DE from 0.01 to 3MW).
Steinemann 2001 Personal communication
Moving parts
Rotor Nordex 2001 n.a. (out of the market)
Nacelle Nordex 2001 n.a. (out of the market) Own estimations and assumptions Lenzen 2002 Personal communication
Connection to grid Nodex 2001 n.a. (out of the market)
Table 58: Basic information used to assess the Ecoinvent wind power electricity dataset (2 MW wind turbine).
Stage Type Reference Comments
Fixed parts
Tower Bonus 2002 Not found
Hagerdorn 1991 Not found (analysis of 37 turbines in DE from 0.01 to 3MW).
Basement Bonus 2002 Not found
Schleisner 1999 Data from an off-shore plant in DK with turbines of 0.5 MW
Moving parts Rotor Bonus 2002 Not found
Nacelle Nordex 2001 Not found Own estimations and assumptions
Connection to grid Schleisner 1999 Data from an off-shore plant in DK with turbines of 0.5 MW
Technological representativeness
The most relevant information used to evaluate this criterion is described below. This information is extracted from the dataset and from the LCI report published by Ecoinvent in 2007 (Ecoinvent 2007).
The electricity production at four Swiss and two European wind turbines has been modelled in this study (98% onshore and 2% offshore):
„Electricity, at wind power plant 800kW, RER‟ (onshore).
„Electricity, at wind power plant 2MW, offshore, OCE‟ (offshore).
The standard distances in Europe and Switzerland as defined in the general Ecoinvent guidelines are applied to the transport of the construction materials to the manufacturer and the wastes to treatment and deposition.
At the end of life of the wind plant, all metals except of the steel used for reinforcing bars are assumed to be recycled. Plastics will be delivered to municipal waste
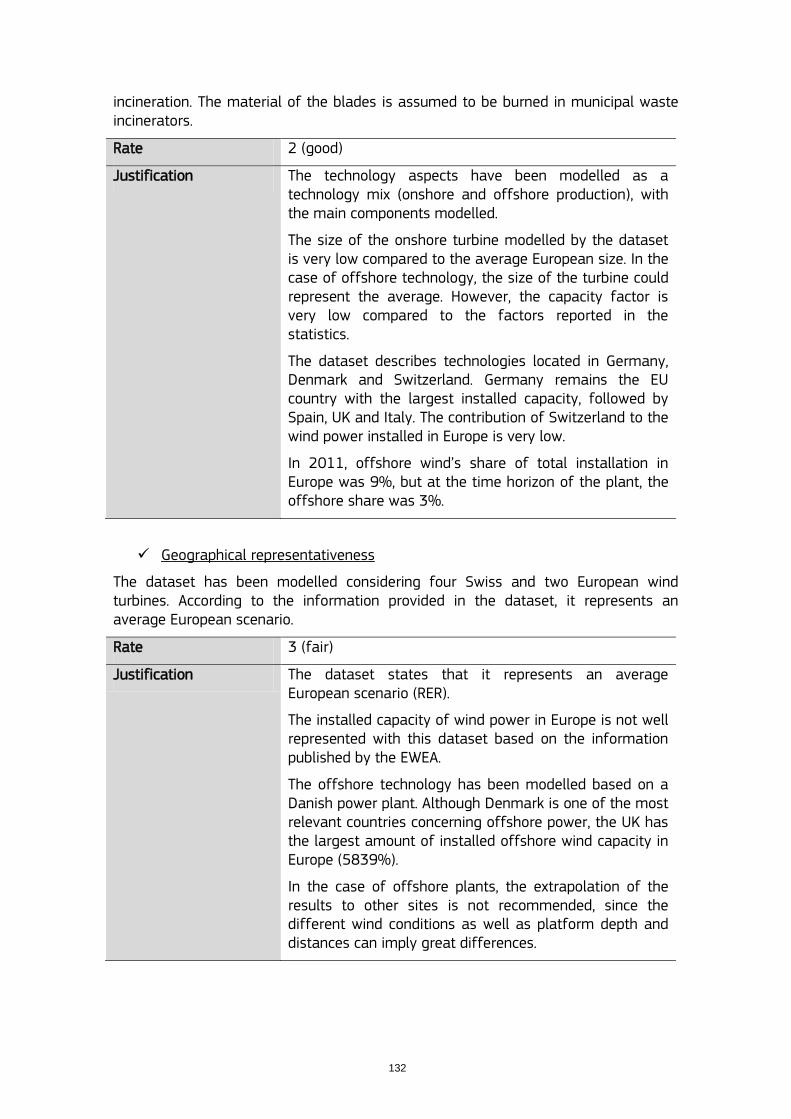
132
incineration. The material of the blades is assumed to be burned in municipal waste incinerators.
Rate 2 (good)
Justification The technology aspects have been modelled as a technology mix (onshore and offshore production), with the main components modelled.
The size of the onshore turbine modelled by the dataset is very low compared to the average European size. In the case of offshore technology, the size of the turbine could represent the average. However, the capacity factor is very low compared to the factors reported in the statistics.
The dataset describes technologies located in Germany, Denmark and Switzerland. Germany remains the EU country with the largest installed capacity, followed by Spain, UK and Italy. The contribution of Switzerland to the wind power installed in Europe is very low.
In 2011, offshore wind‟s share of total installation in Europe was 9%, but at the time horizon of the plant, the offshore share was 3%.
Geographical representativeness
The dataset has been modelled considering four Swiss and two European wind turbines. According to the information provided in the dataset, it represents an average European scenario.
Rate 3 (fair)
Justification The dataset states that it represents an average European scenario (RER).
The installed capacity of wind power in Europe is not well represented with this dataset based on the information published by the EWEA.
The offshore technology has been modelled based on a Danish power plant. Although Denmark is one of the most relevant countries concerning offshore power, the UK has the largest amount of installed offshore wind capacity in Europe (5839%).
In the case of offshore plants, the extrapolation of the results to other sites is not recommended, since the different wind conditions as well as platform depth and distances can imply great differences.
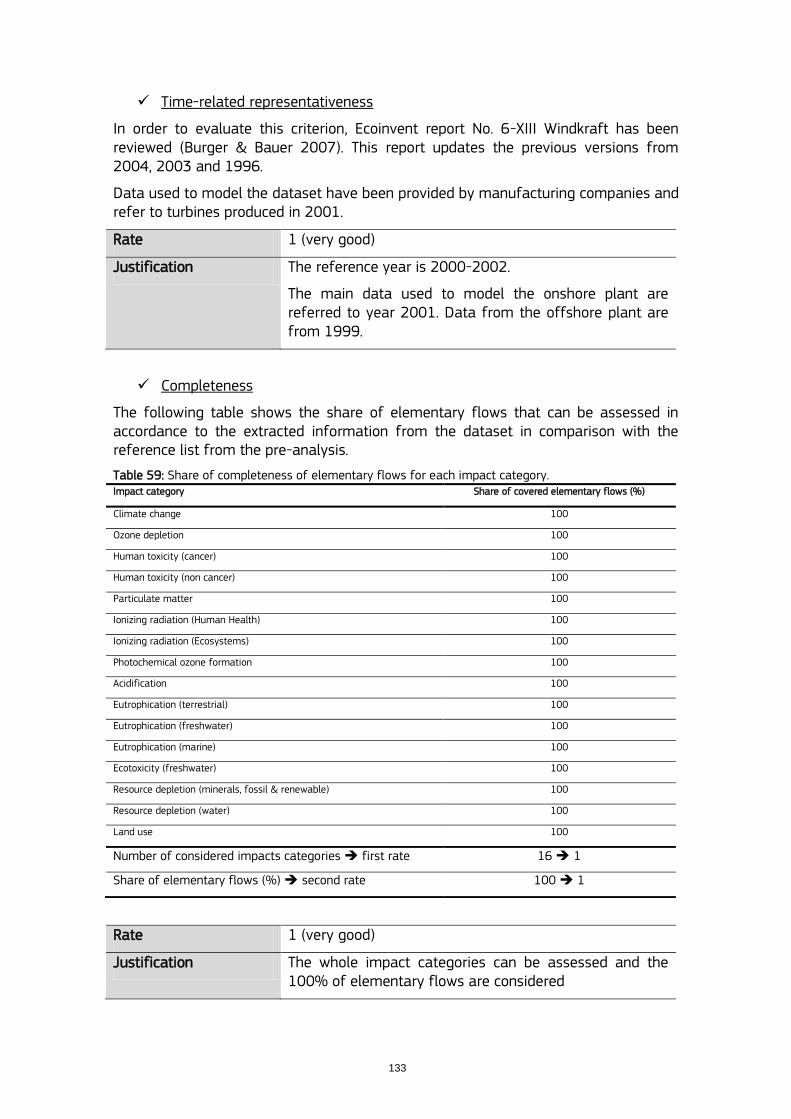
133
Time-related representativeness
In order to evaluate this criterion, Ecoinvent report No. 6-XIII Windkraft has been reviewed (Burger & Bauer 2007). This report updates the previous versions from 2004, 2003 and 1996.
Data used to model the dataset have been provided by manufacturing companies and refer to turbines produced in 2001.
Rate 1 (very good)
Justification The reference year is 2000-2002.
The main data used to model the onshore plant are referred to year 2001. Data from the offshore plant are from 1999.
Completeness
The following table shows the share of elementary flows that can be assessed in accordance to the extracted information from the dataset in comparison with the reference list from the pre-analysis.
Table 59: Share of completeness of elementary flows for each impact category. Impact category Share of covered elementary flows (%)
Climate change 100
Ozone depletion 100
Human toxicity (cancer) 100
Human toxicity (non cancer) 100
Particulate matter 100
Ionizing radiation (Human Health) 100
Ionizing radiation (Ecosystems) 100
Photochemical ozone formation 100
Acidification 100
Eutrophication (terrestrial) 100
Eutrophication (freshwater) 100
Eutrophication (marine) 100
Ecotoxicity (freshwater) 100
Resource depletion (minerals, fossil & renewable) 100
Resource depletion (water) 100
Land use 100
Number of considered impacts categories first rate 16 1
Share of elementary flows (%) second rate 100 1
Rate 1 (very good)
Justification The whole impact categories can be assessed and the 100% of elementary flows are considered
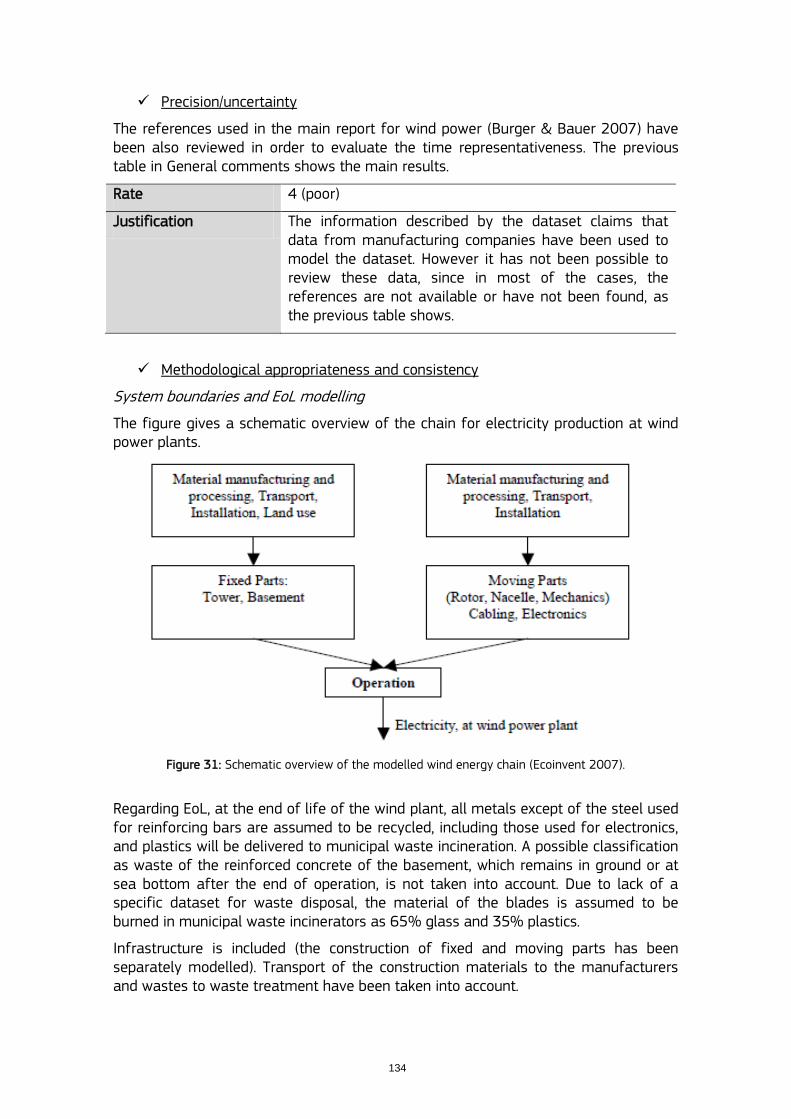
134
Precision/uncertainty
The references used in the main report for wind power (Burger & Bauer 2007) have been also reviewed in order to evaluate the time representativeness. The previous table in General comments shows the main results.
Rate 4 (poor)
Justification The information described by the dataset claims that data from manufacturing companies have been used to model the dataset. However it has not been possible to review these data, since in most of the cases, the references are not available or have not been found, as the previous table shows.
Methodological appropriateness and consistency
System boundaries and EoL modelling
The figure gives a schematic overview of the chain for electricity production at wind power plants.
Figure 31: Schematic overview of the modelled wind energy chain (Ecoinvent 2007).
Regarding EoL, at the end of life of the wind plant, all metals except of the steel used for reinforcing bars are assumed to be recycled, including those used for electronics, and plastics will be delivered to municipal waste incineration. A possible classification as waste of the reinforced concrete of the basement, which remains in ground or at sea bottom after the end of operation, is not taken into account. Due to lack of a specific dataset for waste disposal, the material of the blades is assumed to be burned in municipal waste incinerators as 65% glass and 35% plastics.
Infrastructure is included (the construction of fixed and moving parts has been separately modelled). Transport of the construction materials to the manufacturers and wastes to waste treatment have been taken into account.

135
Allocation
In the foreground system allocation is not applicable. In the background systems, energy, mass and economic allocation has been followed, when necessary, as defined in the “Overview and Methodology” report from Ecoinvent (Burger & Bauer 2007).
Situation A is assumed.
Rate 1 (very good)
Justification The dataset has been modelled following the requirements for situation A.
Dataset includes a „cradle-to-grave‟ system.
EoL has been included in the dataset, with recycling and incineration scenarios.
Infrastructure and transports are also taken into account.
136
GEMIS database Windfarm-big-generic
General comments and/or relevant information
The functional unit of the dataset refers to the production of one TJ.
Technological representativeness
Regarding the technology description, data come from a wind farm consisting of 10 turbines (1MW each), good wind regime, including cables and transformers.
Since the dataset does not provide any additional information about the technology, the project mentioned before has been reviewed in order to better evaluate the technological representativeness.
The EM project was concerned with the establishment of a database which covered a variety of energy projects, with processes for fossil fuels, renewable energy, transport, etc. It offers generic data for energy technologies which can be used if no project-specific information is available. The database contained data provided by manufacturers in 1993 and also reviewed from the literature. The capacity factors reviewed within the project amounted to 25-35% and 23-24% for coastal sites. The EM database included transport processes, based on a study for OECD countries, which is not cited, and therefore not reviewed. Emission factors used in EM are based on a German emission model called “Handbook Emission Factors of Motorized Road Traffic” (UBA 1995, 1997).
Rate 4 (poor)
Justification The dataset models a generic wind farm, with 10 turbines of 1MW each of them. Based on the references, the capacity factors assumed are 25-35%.
The installed capacity of wind power in Europe is not well represented with this dataset based on the information provided by the documentation and according to the EWEA.
It is not possible to identify the different technologies included in the dataset and the share between onshore and offshore plants.
Geographical representativeness
Regarding the extracted information of the dataset in the software, the referred country is „generic‟.
Rate 5 (very poor)
Justification The wind technology is very site-dependent and therefore a generic dataset cannot be geographical representativeness for the European context.
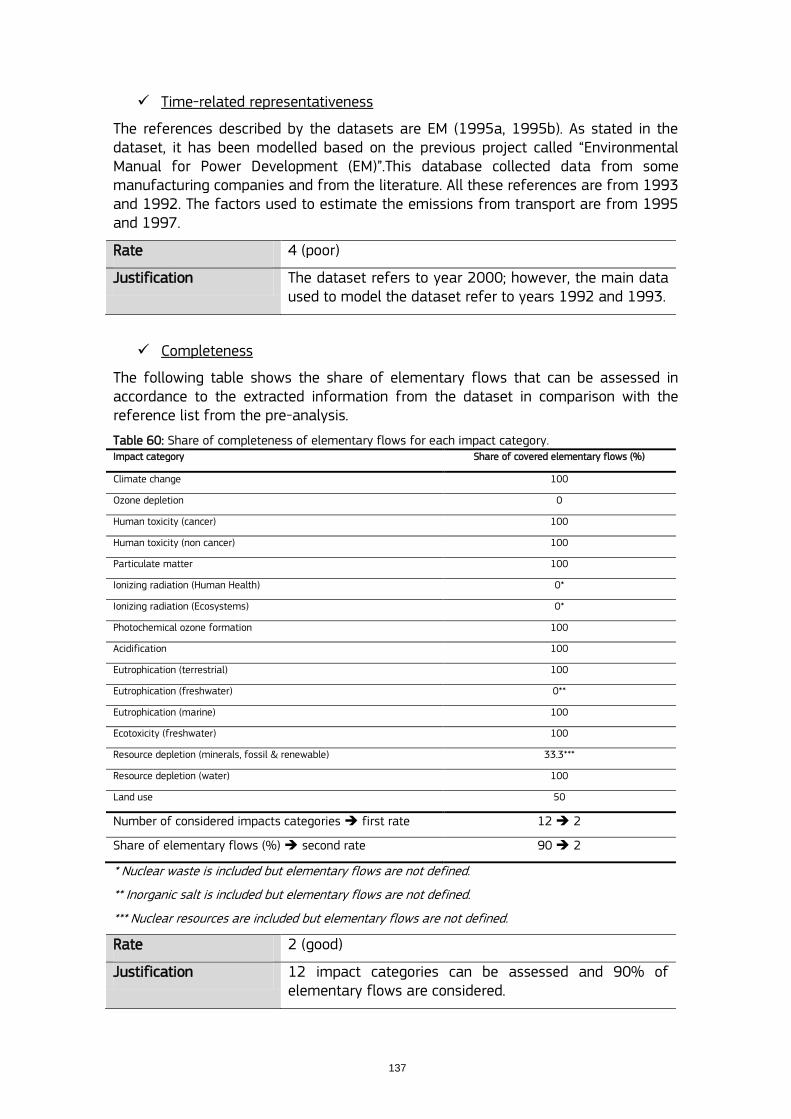
137
Time-related representativeness
The references described by the datasets are EM (1995a, 1995b). As stated in the dataset, it has been modelled based on the previous project called “Environmental Manual for Power Development (EM)”.This database collected data from some manufacturing companies and from the literature. All these references are from 1993 and 1992. The factors used to estimate the emissions from transport are from 1995 and 1997.
Rate 4 (poor)
Justification The dataset refers to year 2000; however, the main data used to model the dataset refer to years 1992 and 1993.
Completeness
The following table shows the share of elementary flows that can be assessed in accordance to the extracted information from the dataset in comparison with the reference list from the pre-analysis.
Table 60: Share of completeness of elementary flows for each impact category. Impact category Share of covered elementary flows (%)
Climate change 100
Ozone depletion 0
Human toxicity (cancer) 100
Human toxicity (non cancer) 100
Particulate matter 100
Ionizing radiation (Human Health) 0*
Ionizing radiation (Ecosystems) 0*
Photochemical ozone formation 100
Acidification 100
Eutrophication (terrestrial) 100
Eutrophication (freshwater) 0**
Eutrophication (marine) 100
Ecotoxicity (freshwater) 100
Resource depletion (minerals, fossil & renewable) 33.3***
Resource depletion (water) 100
Land use 50
Number of considered impacts categories first rate 12 2
Share of elementary flows (%) second rate 90 2
* Nuclear waste is included but elementary flows are not defined.
** Inorganic salt is included but elementary flows are not defined.
*** Nuclear resources are included but elementary flows are not defined.
Rate 2 (good)
Justification 12 impact categories can be assessed and 90% of elementary flows are considered.
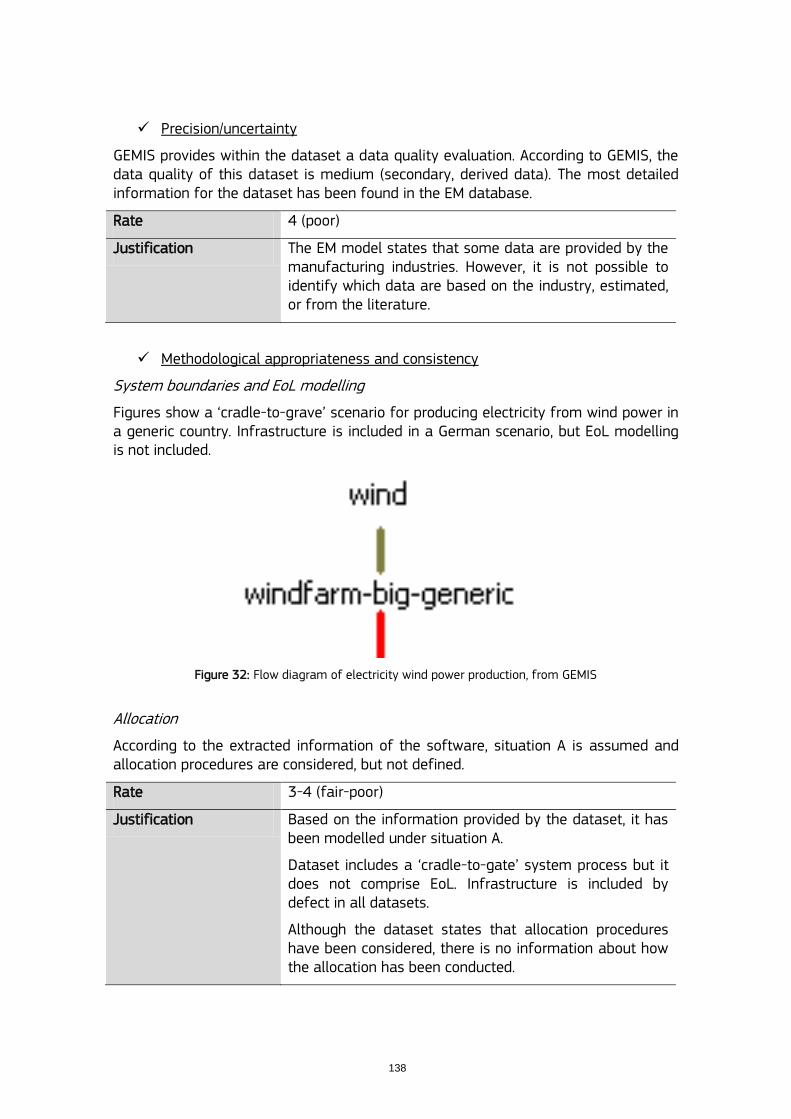
138
Precision/uncertainty
GEMIS provides within the dataset a data quality evaluation. According to GEMIS, the data quality of this dataset is medium (secondary, derived data). The most detailed information for the dataset has been found in the EM database.
Rate 4 (poor)
Justification The EM model states that some data are provided by the manufacturing industries. However, it is not possible to identify which data are based on the industry, estimated, or from the literature.
Methodological appropriateness and consistency
System boundaries and EoL modelling
Figures show a „cradle-to-grave‟ scenario for producing electricity from wind power in a generic country. Infrastructure is included in a German scenario, but EoL modelling is not included.
Figure 32: Flow diagram of electricity wind power production, from GEMIS
Allocation
According to the extracted information of the software, situation A is assumed and allocation procedures are considered, but not defined.
Rate 3-4 (fair-poor)
Justification Based on the information provided by the dataset, it has been modelled under situation A.
Dataset includes a „cradle-to-gate‟ system process but it does not comprise EoL. Infrastructure is included by defect in all datasets.
Although the dataset states that allocation procedures have been considered, there is no information about how the allocation has been conducted.
139
E3 database Power Station / Wind / on-shore / Enercon E-66 / 20.70 (Germany)
Power Station / Wind / off-shore / Horns Rev
General comments and/or relevant information
The functional unit of the dataset refers to the production of one kWh.
This evaluation includes two separate datasets according to the most usual technologies to produce electricity from wind power, sited in two different places of reference in Europe: Germany (onshore) and Denmark (offshore).
Technological representativeness
The description of the technologies used to model the datasets can be found in the literature.
The offshore plant is located in Horns Rev, Denmark. The plant operates since 2003 with 80 wind turbine, each of them with 2MW. The farm capacity is 160MW. The distance from the shore varies from the first turbine to the last one between 14 and 20 km (Öko-Institut, 1999).
In the case of the onshore technology, a tower of 84 m has been considered for the dataset, with a 1.8 MW turbine. Data seems to be provided by EnerCom, the largest wind manufacturing company in Germany.
Rate 3 (fair)
Justification The datasets model two wind technologies: an onshore tower and an offshore plant, located in Germany and Denmark, respectively.
The parameters described by both dataset are not enough to evaluate in detail whether they could be extrapolated to the European technology average.
Geographical representativeness
Regarding the extracted information of the dataset in the software, plants are sited in Germany (onshore) and Denmark (offshore).
Rate 3 (fair)
Justification The datasets model two technologies located in Germany and in Denmark.
The installed capacity of wind power in Europe is not well represented with this dataset based on the information published by the EWEA, although it contains two of the main relevant electricity producers with wind technologies.
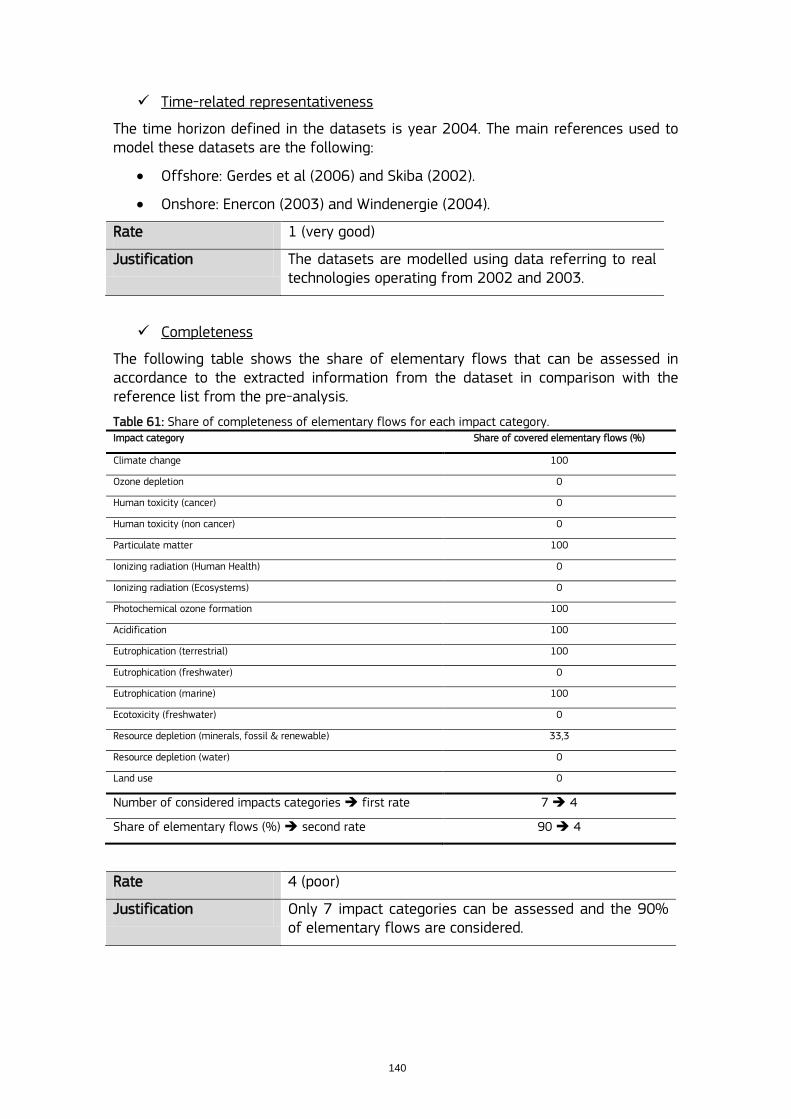
140
Time-related representativeness
The time horizon defined in the datasets is year 2004. The main references used to model these datasets are the following:
Offshore: Gerdes et al (2006) and Skiba (2002).
Onshore: Enercon (2003) and Windenergie (2004).
Rate 1 (very good)
Justification The datasets are modelled using data referring to real technologies operating from 2002 and 2003.
Completeness
The following table shows the share of elementary flows that can be assessed in accordance to the extracted information from the dataset in comparison with the reference list from the pre-analysis.
Table 61: Share of completeness of elementary flows for each impact category. Impact category Share of covered elementary flows (%)
Climate change 100
Ozone depletion 0
Human toxicity (cancer) 0
Human toxicity (non cancer) 0
Particulate matter 100
Ionizing radiation (Human Health) 0
Ionizing radiation (Ecosystems) 0
Photochemical ozone formation 100
Acidification 100
Eutrophication (terrestrial) 100
Eutrophication (freshwater) 0
Eutrophication (marine) 100
Ecotoxicity (freshwater) 0
Resource depletion (minerals, fossil & renewable) 33,3
Resource depletion (water) 0
Land use 0
Number of considered impacts categories first rate 7 4
Share of elementary flows (%) second rate 90 4
Rate 4 (poor)
Justification Only 7 impact categories can be assessed and the 90% of elementary flows are considered.
141
Precision/uncertainty
According to the datasets, the precision is good/medium for the power plants. In order to further evaluate it, a review of the references has been conducted.
Rate 3 (fair)
Justification The literature used to model the datasets provided information from real plants operating in Germany and Denmark during the time horizon.
In the references, a brief technical description of the technologies is provided. However, other data, such as emission factors, are not detailed.
Methodological appropriateness and consistency
System boundaries and EoL modelling
The datasets model a cradle to gate system. Information related to the infrastructures and the EoL procedures is not available, neither in the datasets nor in the references.
Allocation
Concerning the allocation procedures, since E3 cites GEMIS as reference, it could be assumed that this database uses the same rules, recommended under Situation A.
Rate 5 (very poor)
Justification The dataset does not seem to be linked with upstream processes. However, it is possible for the user to build a Cradle to gate system.
There is a lack of information related to EoL and infrastructures that does not allow assessing these issues.
In the same way, there is no information concerning the allocation procedures followed when modelling the dataset.
142
Results, findings and recommendations
ELCD got the best rates in four categories: technology, geographical, time-related representativeness and precision. Capacity factors and average sizes described by the dataset are in line with the statistics provided by Authoritative Sources, such as the European Wind Energy Association (EWEA) and the International Energy Agency (IEA). It would be recommended to include additional documentation, providing more detail concerning the different shares of onshore and offshore power as well as the contribution of each country to the total mix. Sources to consider in future versions are the country-specific associations. The British Wind Energy Association offers a UK Wind Energy Database with technical details of the British wind installations. Additionally, it is recommended to review for future versions other wind options, such as the “small and medium scale wind”, which might increase in the future, and the re-powering, which substitutes old turbines, increasing the capacity.
ELCD dataset models a non-defined region in Europe. It must be highlighted that this resource is a very site-specific energy source and therefore, this technology applied in each European country and their contribution to the total electricity generation by wind in Europe might vary. However, ELCD takes into account this particularity by considering the full load hours for the actual region using statistical information.
Completeness criterion, although rated with the highest score, 15 of 16 impact categories are fulfilled and the 98% of relevant elementary flows are considered. In order to fulfill the criterion in a 100%, the following flows should be considered: Halon 121114 and CFC-12 for ozone depletion and indium for resource depletion impact category.
ELCD has modelled the dataset using main data provided by the industry. The database providers should ensure that the documentation available to the user allows him/her reviewing the most relevant technical description, as well as energy and emission factors. The Wind Power Net (http://www.thewindpower.net/windfarms_europe_en.php) gives access to a large database with the current commercial wind turbines and the installed wind farms in the word. It provides information about the location of the farm, technology use, type of turbine, capacities, etc. This database can be used for double check some data.
The methodology followed by the dataset from ELCD complies with the requirements defined by the ILCD Handbook for this criterion. It must be highlighted the added value of the ELCD EoL modelling with respect to the other analysed database. ELCD has modelled the EoL phase taken into account information discussed and analysed by companies and institutions involved in the recycling and waste treatment sector. However, if re-powering systems are to be included in future versions, other EoL scenarios should be reviewed and considered, if applicable.
In general the ELCD dataset includes the most updated data.
14
See footnote 12

143
Table 62: Findings and recommendations summary for „EU27: Electricity from wind power‟ dataset
Indicator ELCD data quality rating Findings or recommendation for improving
TeR 1 Include information of the contribution of each country to the share for both
the onshore and offshore technologies (EWEA, 2013a, 2013b)
GR 1 Include information about the countries included in the region RER.
TiR 1 Include more detail related to references used to model the dataset. Dataset
is the most updated currently.
C 1 Include elementary flows to complete ozone depletion and resource depletion
impacts categories.
P 2 Include documentation related to data collection process. Include additional
references to identify the origin of the data.
M 1 -
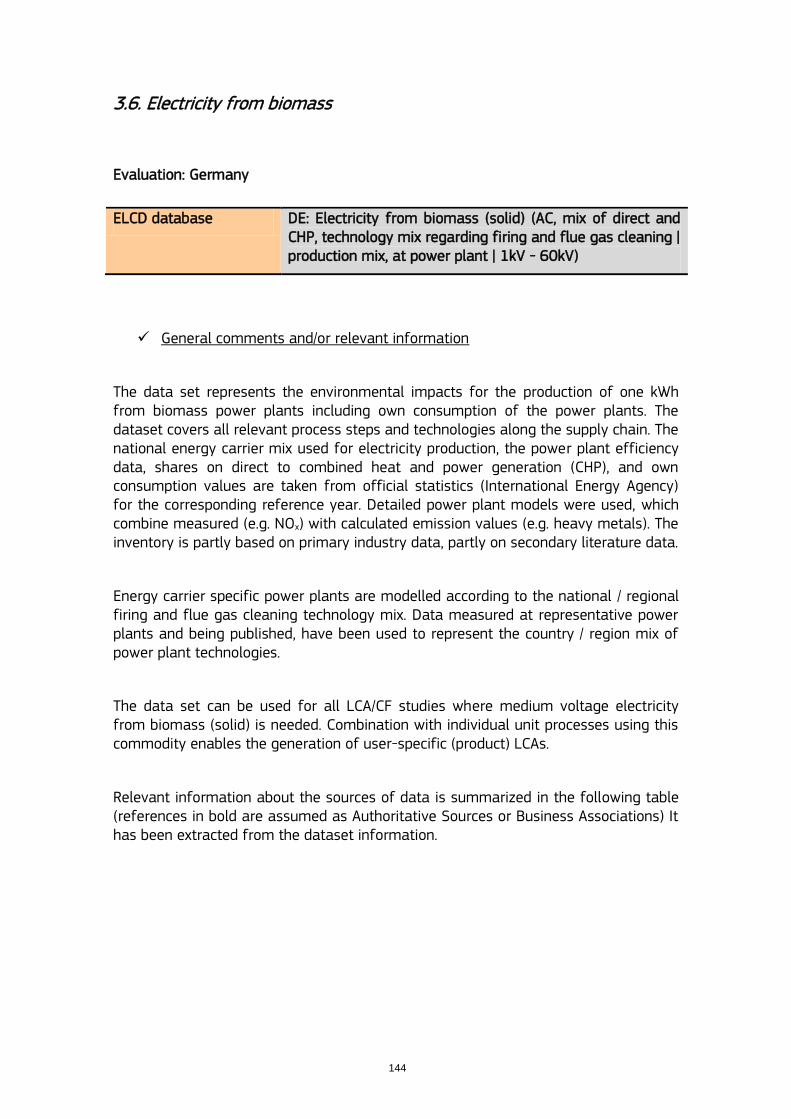
144
3.6. Electricity from biomass
Evaluation: Germany
ELCD database DE: Electricity from biomass (solid) (AC, mix of direct and CHP, technology mix regarding firing and flue gas cleaning | production mix, at power plant | 1kV - 60kV)
General comments and/or relevant information
The data set represents the environmental impacts for the production of one kWh from biomass power plants including own consumption of the power plants. The dataset covers all relevant process steps and technologies along the supply chain. The national energy carrier mix used for electricity production, the power plant efficiency data, shares on direct to combined heat and power generation (CHP), and own consumption values are taken from official statistics (International Energy Agency) for the corresponding reference year. Detailed power plant models were used, which combine measured (e.g. NOx) with calculated emission values (e.g. heavy metals). The inventory is partly based on primary industry data, partly on secondary literature data.
Energy carrier specific power plants are modelled according to the national / regional firing and flue gas cleaning technology mix. Data measured at representative power plants and being published, have been used to represent the country / region mix of power plant technologies.
The data set can be used for all LCA/CF studies where medium voltage electricity from biomass (solid) is needed. Combination with individual unit processes using this commodity enables the generation of user-specific (product) LCAs.
Relevant information about the sources of data is summarized in the following table (references in bold are assumed as Authoritative Sources or Business Associations) It has been extracted from the dataset information.
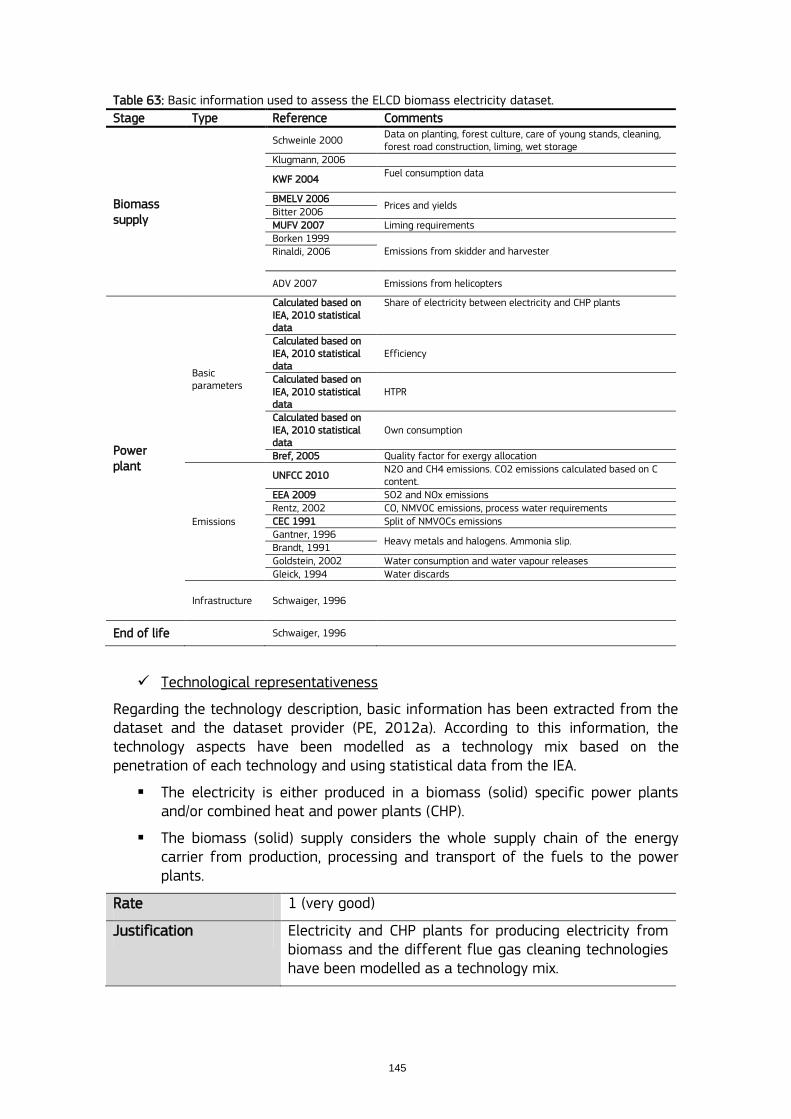
145
Table 63: Basic information used to assess the ELCD biomass electricity dataset.
Stage Type Reference Comments
Biomass supply
Schweinle 2000 Data on planting, forest culture, care of young stands, cleaning, forest road construction, liming, wet storage
Klugmann, 2006
KWF 2004 Fuel consumption data
BMELV 2006 Prices and yields
Bitter 2006 MUFV 2007 Liming requirements Borken 1999
Emissions from skidder and harvester Rinaldi, 2006
ADV 2007 Emissions from helicopters
Power plant
Basic parameters
Calculated based on IEA, 2010 statistical data
Share of electricity between electricity and CHP plants
Calculated based on IEA, 2010 statistical data
Efficiency
Calculated based on IEA, 2010 statistical data
HTPR
Calculated based on IEA, 2010 statistical data
Own consumption
Bref, 2005 Quality factor for exergy allocation
Emissions
UNFCC 2010 N2O and CH4 emissions. CO2 emissions calculated based on C content.
EEA 2009 SO2 and NOx emissions Rentz, 2002 CO, NMVOC emissions, process water requirements CEC 1991 Split of NMVOCs emissions Gantner, 1996
Heavy metals and halogens. Ammonia slip. Brandt, 1991 Goldstein, 2002 Water consumption and water vapour releases Gleick, 1994 Water discards
Infrastructure Schwaiger, 1996
End of life Schwaiger, 1996
Technological representativeness
Regarding the technology description, basic information has been extracted from the dataset and the dataset provider (PE, 2012a). According to this information, the technology aspects have been modelled as a technology mix based on the penetration of each technology and using statistical data from the IEA.
The electricity is either produced in a biomass (solid) specific power plants and/or combined heat and power plants (CHP).
The biomass (solid) supply considers the whole supply chain of the energy carrier from production, processing and transport of the fuels to the power plants.
Rate 1 (very good)
Justification Electricity and CHP plants for producing electricity from biomass and the different flue gas cleaning technologies have been modelled as a technology mix.
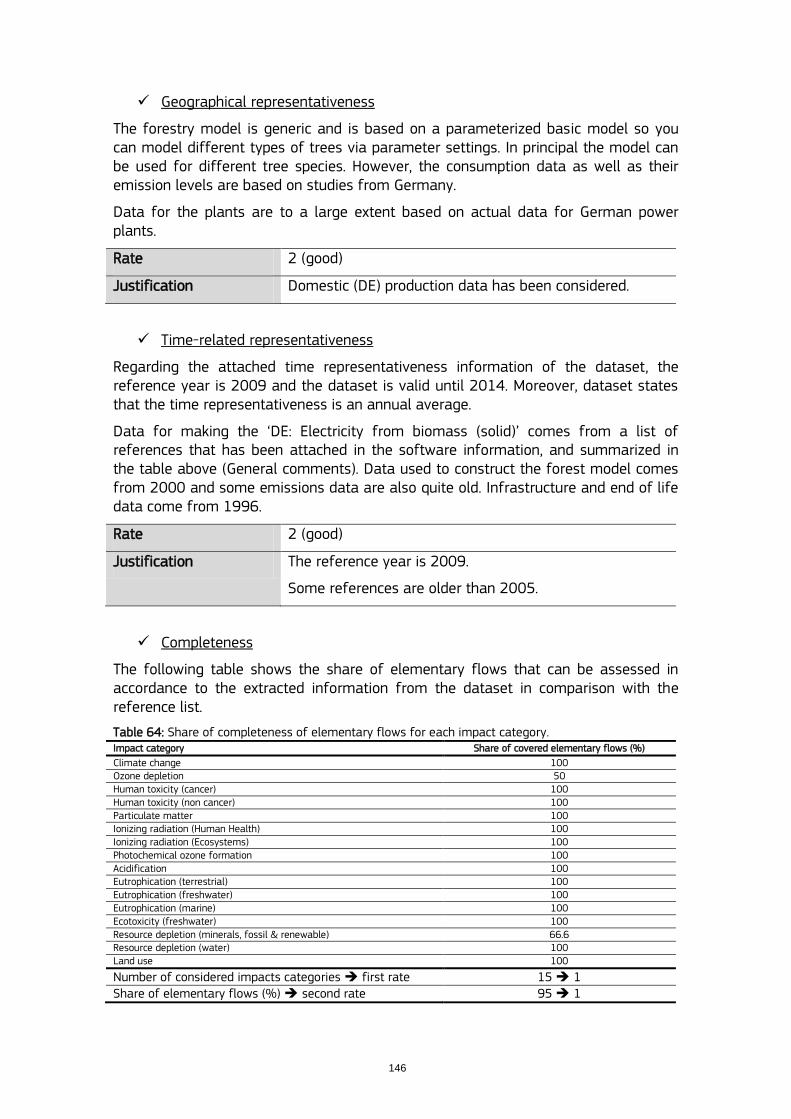
146
Geographical representativeness
The forestry model is generic and is based on a parameterized basic model so you can model different types of trees via parameter settings. In principal the model can be used for different tree species. However, the consumption data as well as their emission levels are based on studies from Germany.
Data for the plants are to a large extent based on actual data for German power plants.
Rate 2 (good)
Justification Domestic (DE) production data has been considered.
Time-related representativeness
Regarding the attached time representativeness information of the dataset, the reference year is 2009 and the dataset is valid until 2014. Moreover, dataset states that the time representativeness is an annual average.
Data for making the „DE: Electricity from biomass (solid)‟ comes from a list of references that has been attached in the software information, and summarized in the table above (General comments). Data used to construct the forest model comes from 2000 and some emissions data are also quite old. Infrastructure and end of life data come from 1996.
Rate 2 (good)
Justification The reference year is 2009.
Some references are older than 2005.
Completeness
The following table shows the share of elementary flows that can be assessed in accordance to the extracted information from the dataset in comparison with the reference list.
Table 64: Share of completeness of elementary flows for each impact category. Impact category Share of covered elementary flows (%)
Climate change 100 Ozone depletion 50 Human toxicity (cancer) 100 Human toxicity (non cancer) 100 Particulate matter 100 Ionizing radiation (Human Health) 100 Ionizing radiation (Ecosystems) 100 Photochemical ozone formation 100 Acidification 100 Eutrophication (terrestrial) 100 Eutrophication (freshwater) 100 Eutrophication (marine) 100 Ecotoxicity (freshwater) 100 Resource depletion (minerals, fossil & renewable) 66.6 Resource depletion (water) 100 Land use 100
Number of considered impacts categories first rate 15 1 Share of elementary flows (%) second rate 95 1
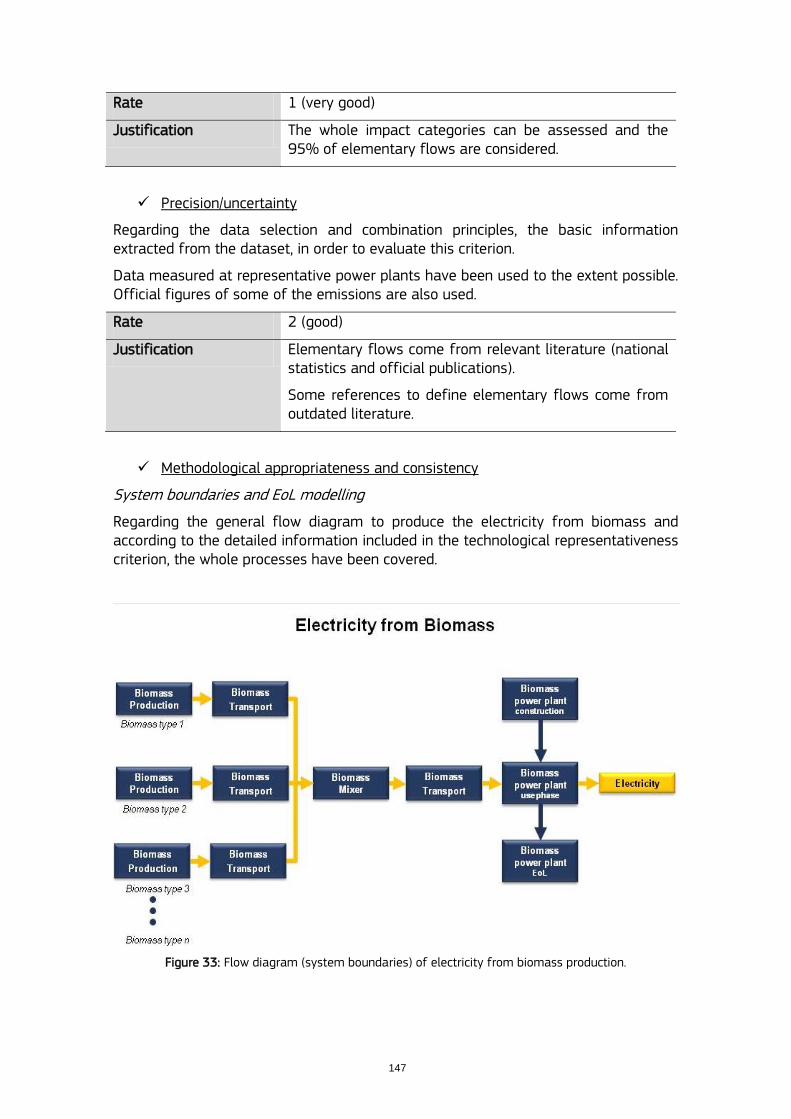
147
Rate 1 (very good)
Justification The whole impact categories can be assessed and the 95% of elementary flows are considered.
Precision/uncertainty
Regarding the data selection and combination principles, the basic information extracted from the dataset, in order to evaluate this criterion.
Data measured at representative power plants have been used to the extent possible. Official figures of some of the emissions are also used.
Rate 2 (good)
Justification Elementary flows come from relevant literature (national statistics and official publications).
Some references to define elementary flows come from outdated literature.
Methodological appropriateness and consistency
System boundaries and EoL modelling
Regarding the general flow diagram to produce the electricity from biomass and according to the detailed information included in the technological representativeness criterion, the whole processes have been covered.
Figure 33: Flow diagram (system boundaries) of electricity from biomass production.
148
Allocation
The extracted information from „Modelling and validation: LCI method and allocation‟ is the following:
LCI method principle: Attributional Situation A
LCI methods approach: Allocation (market values, exergetic content).
Deviations from LCI method approaches: For the combined heat and power (CHP) production allocation by exergetic content is applied. Electricity and power plant by-products, i.e. gypsum, boiler ash and fly ash are allocated by market value due to no common physical properties.
Modelling constants: All data used in the calculation of the LCI results refer to net calorific value.
Rate 1 (very good)
Justification Situation A.
Dataset includes a „cradle-to-grave‟ system process.
Dataset comprises EoL and infrastructure.
Allocation procedure has been applied by the exergetic content (heat and power) and market value (by-products).
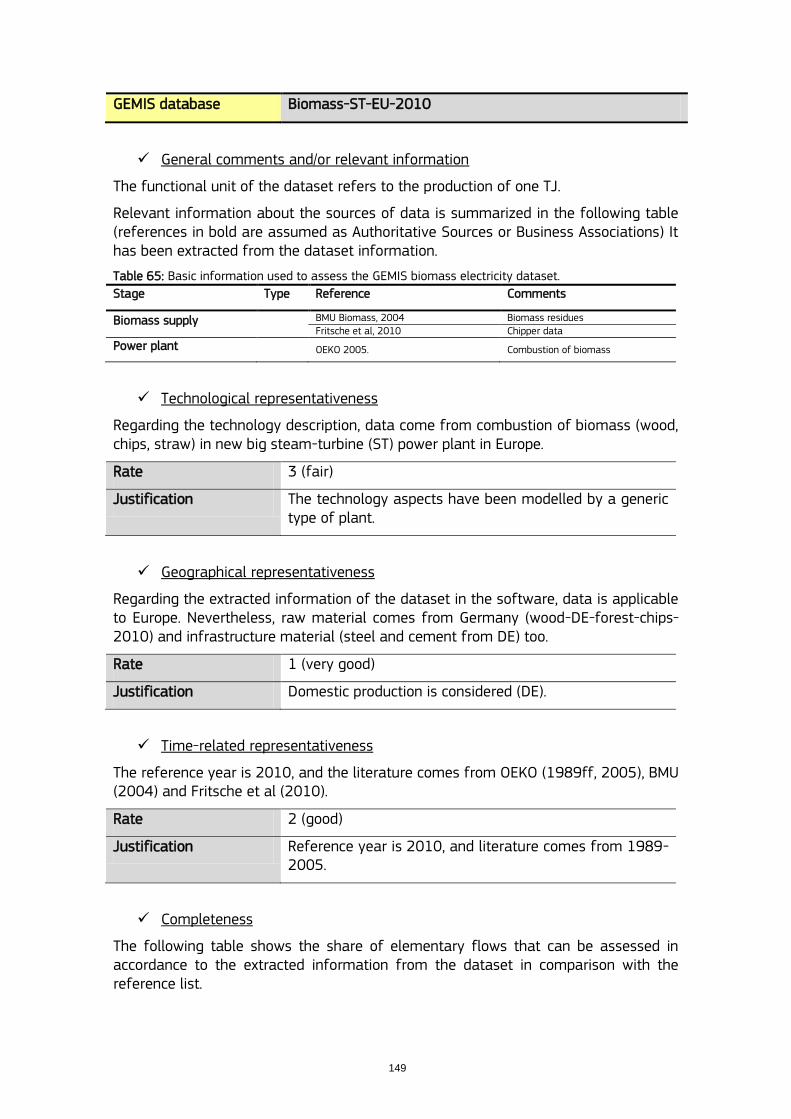
149
GEMIS database Biomass-ST-EU-2010
General comments and/or relevant information
The functional unit of the dataset refers to the production of one TJ.
Relevant information about the sources of data is summarized in the following table (references in bold are assumed as Authoritative Sources or Business Associations) It has been extracted from the dataset information.
Table 65: Basic information used to assess the GEMIS biomass electricity dataset.
Stage Type Reference Comments
Biomass supply BMU Biomass, 2004 Biomass residues Fritsche et al, 2010 Chipper data
Power plant OEKO 2005. Combustion of biomass
Technological representativeness
Regarding the technology description, data come from combustion of biomass (wood, chips, straw) in new big steam-turbine (ST) power plant in Europe.
Rate 3 (fair)
Justification The technology aspects have been modelled by a generic type of plant.
Geographical representativeness
Regarding the extracted information of the dataset in the software, data is applicable to Europe. Nevertheless, raw material comes from Germany (wood-DE-forest-chips-2010) and infrastructure material (steel and cement from DE) too.
Rate 1 (very good)
Justification Domestic production is considered (DE).
Time-related representativeness
The reference year is 2010, and the literature comes from OEKO (1989ff, 2005), BMU (2004) and Fritsche et al (2010).
Rate 2 (good)
Justification Reference year is 2010, and literature comes from 1989-2005.
Completeness
The following table shows the share of elementary flows that can be assessed in accordance to the extracted information from the dataset in comparison with the reference list.
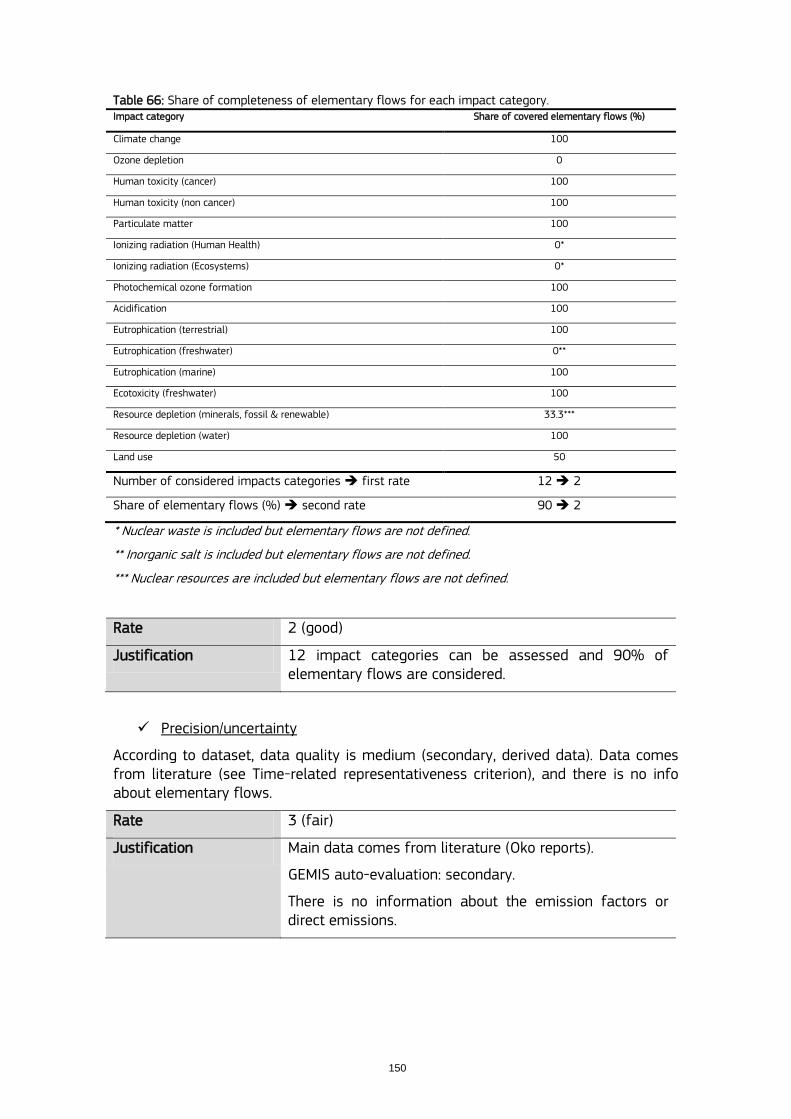
150
Table 66: Share of completeness of elementary flows for each impact category. Impact category Share of covered elementary flows (%)
Climate change 100
Ozone depletion 0
Human toxicity (cancer) 100
Human toxicity (non cancer) 100
Particulate matter 100
Ionizing radiation (Human Health) 0*
Ionizing radiation (Ecosystems) 0*
Photochemical ozone formation 100
Acidification 100
Eutrophication (terrestrial) 100
Eutrophication (freshwater) 0**
Eutrophication (marine) 100
Ecotoxicity (freshwater) 100
Resource depletion (minerals, fossil & renewable) 33.3***
Resource depletion (water) 100
Land use 50
Number of considered impacts categories first rate 12 2
Share of elementary flows (%) second rate 90 2
* Nuclear waste is included but elementary flows are not defined.
** Inorganic salt is included but elementary flows are not defined.
*** Nuclear resources are included but elementary flows are not defined.
Rate 2 (good)
Justification 12 impact categories can be assessed and 90% of elementary flows are considered.
Precision/uncertainty
According to dataset, data quality is medium (secondary, derived data). Data comes from literature (see Time-related representativeness criterion), and there is no info about elementary flows.
Rate 3 (fair)
Justification Main data comes from literature (Oko reports).
GEMIS auto-evaluation: secondary.
There is no information about the emission factors or direct emissions.
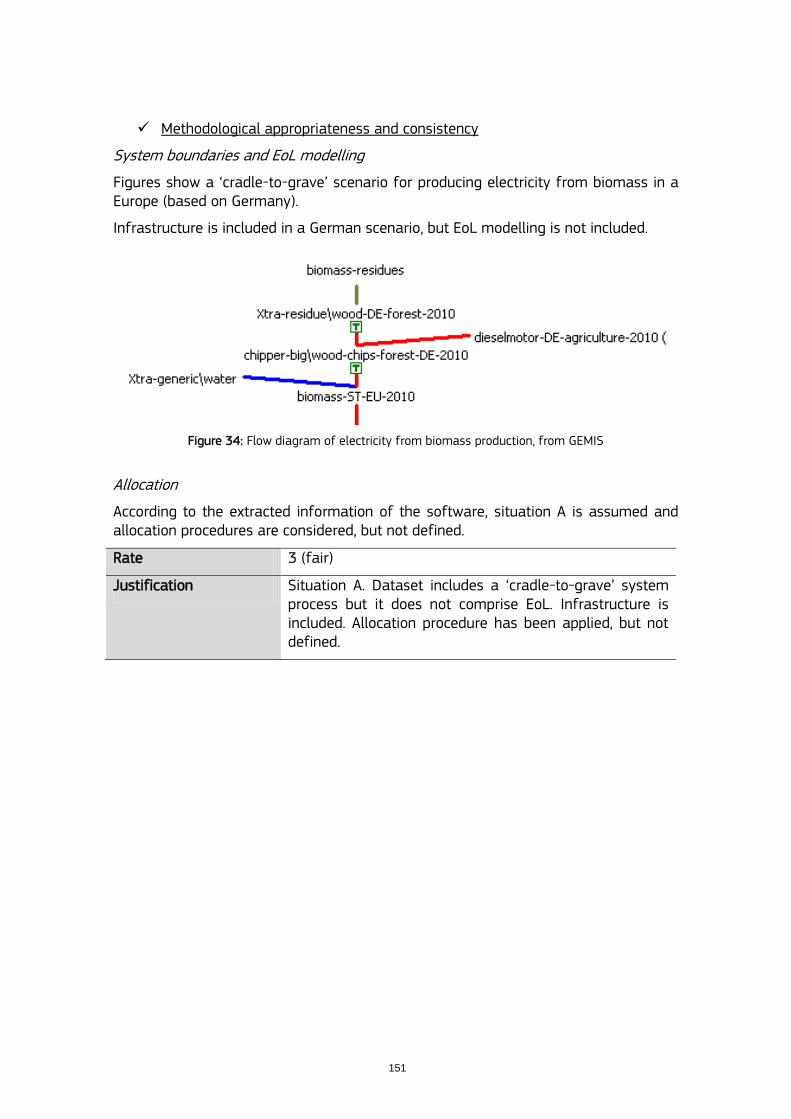
151
Methodological appropriateness and consistency
System boundaries and EoL modelling
Figures show a „cradle-to-grave‟ scenario for producing electricity from biomass in a Europe (based on Germany).
Infrastructure is included in a German scenario, but EoL modelling is not included.
Figure 34: Flow diagram of electricity from biomass production, from GEMIS
Allocation
According to the extracted information of the software, situation A is assumed and allocation procedures are considered, but not defined.
Rate 3 (fair)
Justification Situation A. Dataset includes a „cradle-to-grave‟ system process but it does not comprise EoL. Infrastructure is included. Allocation procedure has been applied, but not defined.
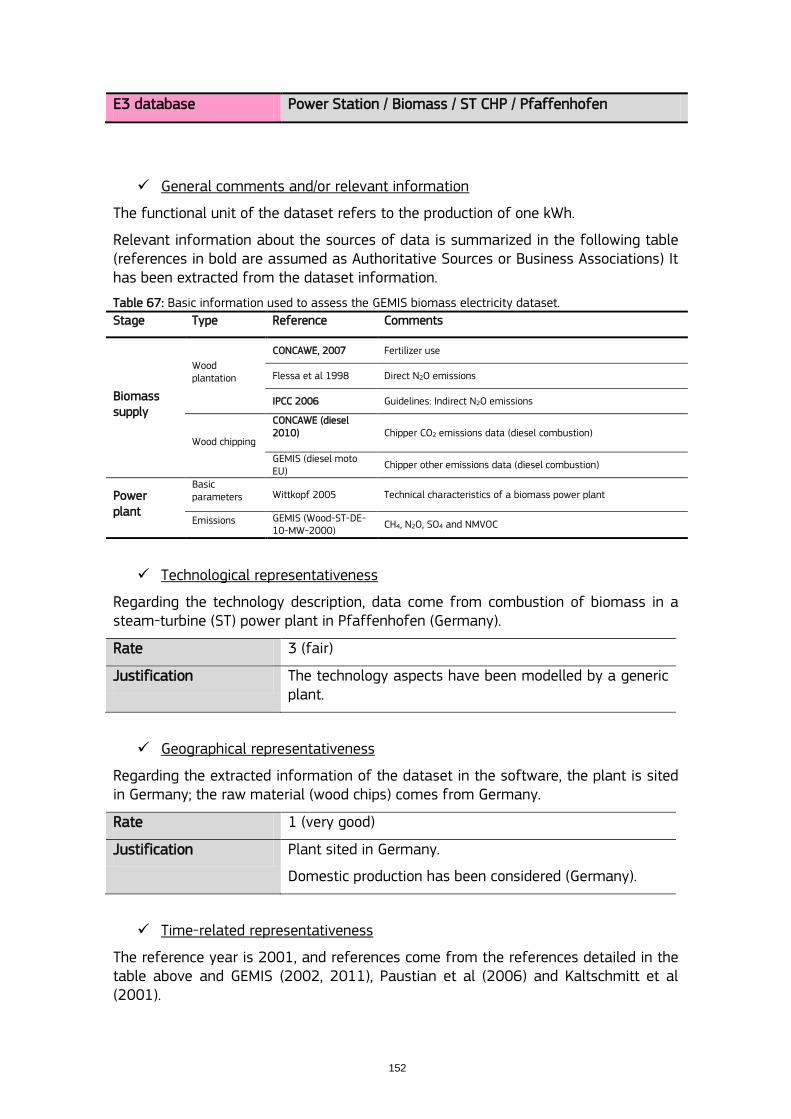
152
E3 database Power Station / Biomass / ST CHP / Pfaffenhofen
General comments and/or relevant information
The functional unit of the dataset refers to the production of one kWh.
Relevant information about the sources of data is summarized in the following table (references in bold are assumed as Authoritative Sources or Business Associations) It has been extracted from the dataset information.
Table 67: Basic information used to assess the GEMIS biomass electricity dataset.
Stage Type Reference Comments
Biomass supply
Wood plantation
CONCAWE, 2007 Fertilizer use
Flessa et al 1998 Direct N2O emissions
IPCC 2006 Guidelines: Indirect N2O emissions
Wood chipping
CONCAWE (diesel 2010)
Chipper CO2 emissions data (diesel combustion)
GEMIS (diesel moto EU)
Chipper other emissions data (diesel combustion)
Power plant
Basic parameters Wittkopf 2005 Technical characteristics of a biomass power plant
Emissions GEMIS (Wood-ST-DE-10-MW-2000)
CH4, N2O, SO4 and NMVOC
Technological representativeness
Regarding the technology description, data come from combustion of biomass in a steam-turbine (ST) power plant in Pfaffenhofen (Germany).
Rate 3 (fair)
Justification The technology aspects have been modelled by a generic plant.
Geographical representativeness
Regarding the extracted information of the dataset in the software, the plant is sited in Germany; the raw material (wood chips) comes from Germany.
Rate 1 (very good)
Justification Plant sited in Germany.
Domestic production has been considered (Germany).
Time-related representativeness
The reference year is 2001, and references come from the references detailed in the table above and GEMIS (2002, 2011), Paustian et al (2006) and Kaltschmitt et al (2001).
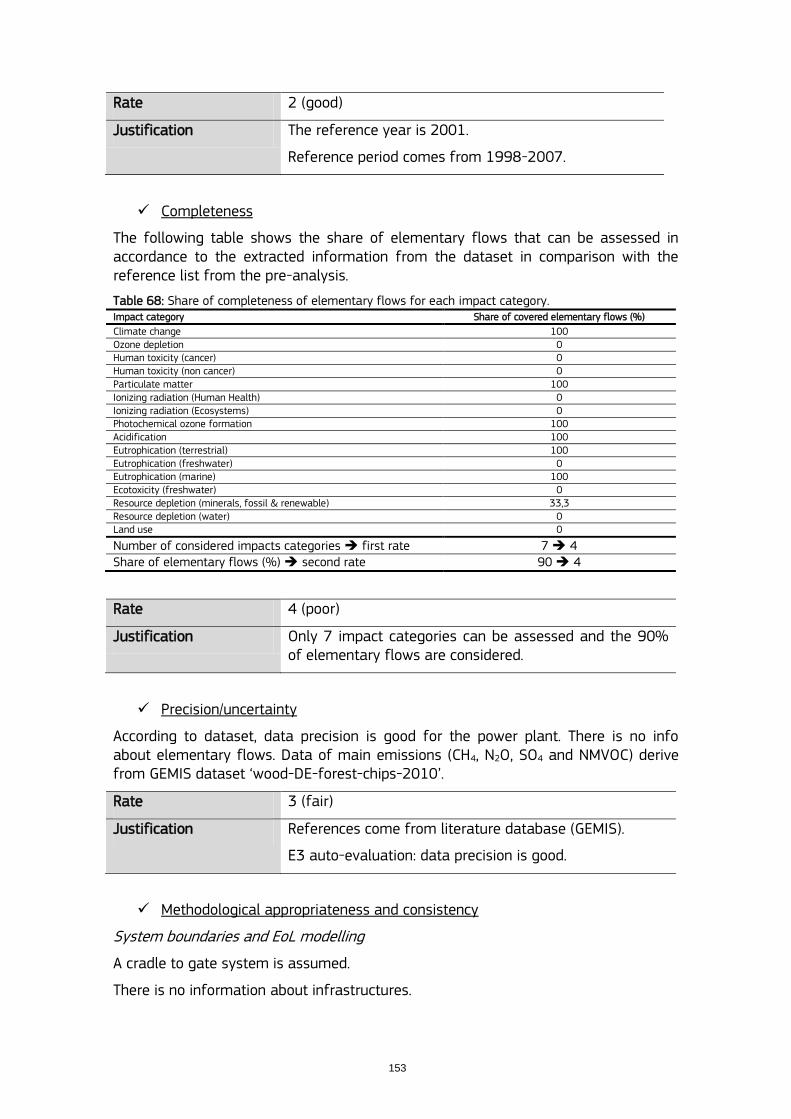
153
Rate 2 (good)
Justification The reference year is 2001.
Reference period comes from 1998-2007.
Completeness
The following table shows the share of elementary flows that can be assessed in accordance to the extracted information from the dataset in comparison with the reference list from the pre-analysis.
Table 68: Share of completeness of elementary flows for each impact category. Impact category Share of covered elementary flows (%)
Climate change 100 Ozone depletion 0 Human toxicity (cancer) 0 Human toxicity (non cancer) 0 Particulate matter 100 Ionizing radiation (Human Health) 0 Ionizing radiation (Ecosystems) 0 Photochemical ozone formation 100 Acidification 100 Eutrophication (terrestrial) 100 Eutrophication (freshwater) 0 Eutrophication (marine) 100 Ecotoxicity (freshwater) 0 Resource depletion (minerals, fossil & renewable) 33,3 Resource depletion (water) 0 Land use 0
Number of considered impacts categories first rate 7 4 Share of elementary flows (%) second rate 90 4
Rate 4 (poor)
Justification Only 7 impact categories can be assessed and the 90% of elementary flows are considered.
Precision/uncertainty
According to dataset, data precision is good for the power plant. There is no info about elementary flows. Data of main emissions (CH4, N2O, SO4 and NMVOC) derive from GEMIS dataset „wood-DE-forest-chips-2010‟.
Rate 3 (fair)
Justification References come from literature database (GEMIS).
E3 auto-evaluation: data precision is good.
Methodological appropriateness and consistency
System boundaries and EoL modelling
A cradle to gate system is assumed.
There is no information about infrastructures.

154
There is no information about EoL procedures.
Allocation
No information about allocation procedures, but could be assumed as GEMIS, because of the references.
Rate 5 (very poor)
Justification Cradle to gate system.
EoL and Infrastructures are not included.
Allocation procedure has not been defined, but assumed as GEMIS.
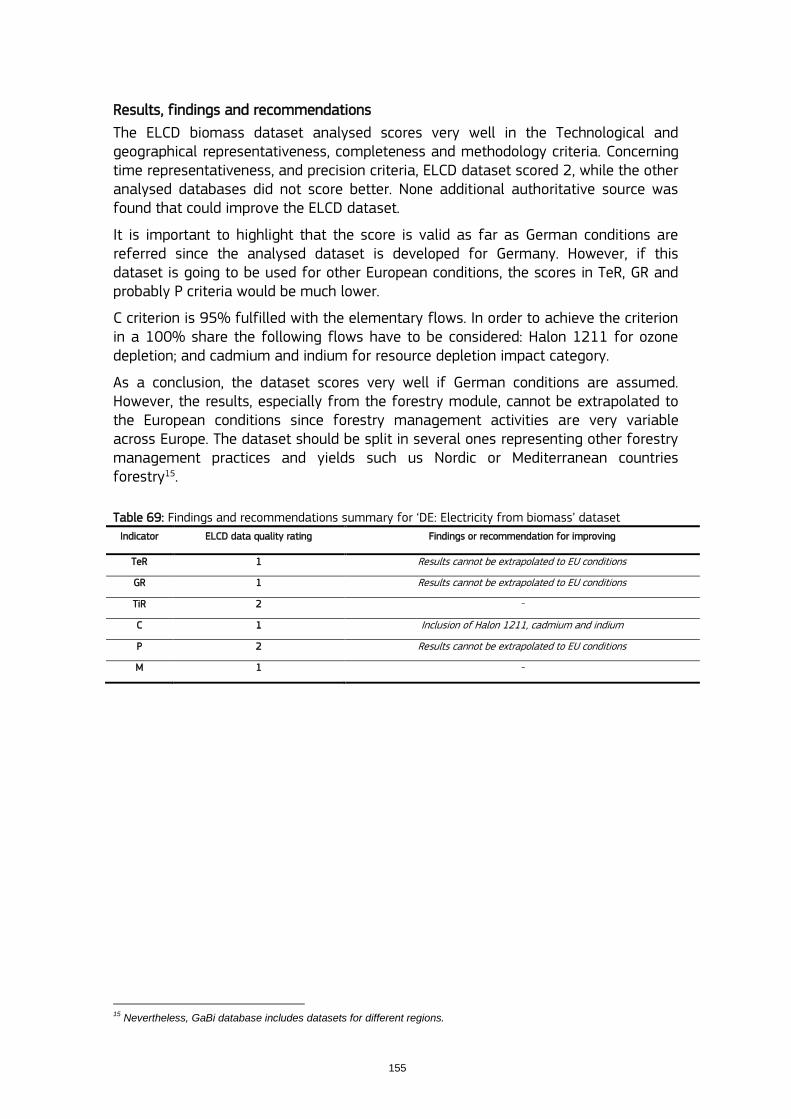
155
Results, findings and recommendations
The ELCD biomass dataset analysed scores very well in the Technological and geographical representativeness, completeness and methodology criteria. Concerning time representativeness, and precision criteria, ELCD dataset scored 2, while the other analysed databases did not score better. None additional authoritative source was found that could improve the ELCD dataset.
It is important to highlight that the score is valid as far as German conditions are referred since the analysed dataset is developed for Germany. However, if this dataset is going to be used for other European conditions, the scores in TeR, GR and probably P criteria would be much lower.
C criterion is 95% fulfilled with the elementary flows. In order to achieve the criterion in a 100% share the following flows have to be considered: Halon 1211 for ozone depletion; and cadmium and indium for resource depletion impact category.
As a conclusion, the dataset scores very well if German conditions are assumed. However, the results, especially from the forestry module, cannot be extrapolated to the European conditions since forestry management activities are very variable across Europe. The dataset should be split in several ones representing other forestry management practices and yields such us Nordic or Mediterranean countries forestry15.
Table 69: Findings and recommendations summary for „DE: Electricity from biomass‟ dataset
Indicator ELCD data quality rating Findings or recommendation for improving
TeR 1 Results cannot be extrapolated to EU conditions
GR 1 Results cannot be extrapolated to EU conditions
TiR 2 -
C 1 Inclusion of Halon 1211, cadmium and indium
P 2 Results cannot be extrapolated to EU conditions
M 1 -
15
Nevertheless, GaBi database includes datasets for different regions.
156
3.7. Electricity from solar power (photovoltaic)
Evaluation: Germany
ELCD database DE: Electricity from photovoltaic (AC, technology mix of CIS, CdTE, mono crystalline and multi crystalline | production mix, at power plant | 1kV - 60kV)
General comments and/or relevant information
The dataset represents the environmental impacts for the production of one kWh from photovoltaic power plants including own consumption of the power plants.
The dataset covers all relevant process steps and technologies along the supply chain. A global average share of different PV technologies is considered: Mono-Silicon 47.7 %, Multi-Silicon 38.3%, Cadmium-Telluride (CdTe) 6.4 %, Amorphous-Silicon 5.1 %, Ribbon-Silicon 1.5 %, and Copper-Indium-Gallium-Diselenide 1.0 %. It is assumed that the assembly of the photovoltaic panels takes place in Germany. Country / region specific annual irradiation values are taken into account. The inventory is partly based on primary industry data, partly on secondary literature data.
Different types of photovoltaic systems are modelled individually and mixed to a national / regional specific technology mix. For each of the types, the infrastructure data (manufacturing) are modelled on basis of averaging several selected panels and calculating on averaging material demand per kWh produced electricity. The operation phase of PV models is completed by individual national / regional operation data.
The dataset can be used for all LCA/CF studies where medium voltage electricity from photovoltaic (PV) is needed. Combination with individual unit processes using this commodity enables the generation of user-specific (product) LCAs.
Relevant information about the sources of data is summarized in the following table (references in bold are assumed as Authoritative Sources or Business Associations) It has been extracted from the dataset information.
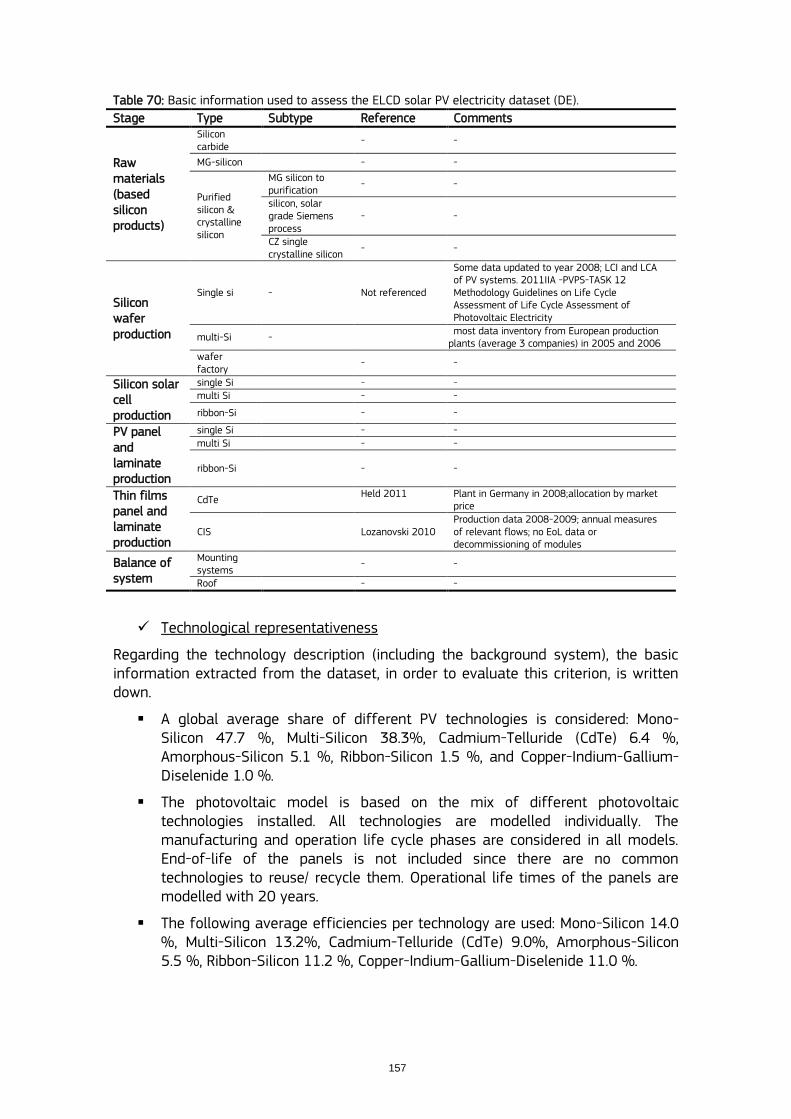
157
Table 70: Basic information used to assess the ELCD solar PV electricity dataset (DE).
Stage Type Subtype Reference Comments
Raw materials (based silicon products)
Silicon carbide
- -
MG-silicon - -
Purified silicon & crystalline silicon
MG silicon to purification
- -
silicon, solar grade Siemens process
- -
CZ single crystalline silicon
- -
Silicon wafer production
Single si - Not referenced
Some data updated to year 2008; LCI and LCA of PV systems. 2011IIA -PVPS-TASK 12 Methodology Guidelines on Life Cycle Assessment of Life Cycle Assessment of Photovoltaic Electricity
multi-Si - most data inventory from European production
plants (average 3 companies) in 2005 and 2006 wafer factory
- -
Silicon solar cell production
single Si - - multi Si - -
ribbon-Si - -
PV panel and laminate production
single Si - - multi Si - -
ribbon-Si - -
Thin films panel and laminate production
CdTe Held 2011
Plant in Germany in 2008;allocation by market price
CIS Lozanovski 2010 Production data 2008-2009; annual measures of relevant flows; no EoL data or decommissioning of modules
Balance of system
Mounting systems
- -
Roof - -
Technological representativeness
Regarding the technology description (including the background system), the basic information extracted from the dataset, in order to evaluate this criterion, is written down.
A global average share of different PV technologies is considered: Mono-Silicon 47.7 %, Multi-Silicon 38.3%, Cadmium-Telluride (CdTe) 6.4 %, Amorphous-Silicon 5.1 %, Ribbon-Silicon 1.5 %, and Copper-Indium-Gallium-Diselenide 1.0 %.
The photovoltaic model is based on the mix of different photovoltaic technologies installed. All technologies are modelled individually. The manufacturing and operation life cycle phases are considered in all models. End-of-life of the panels is not included since there are no common technologies to reuse/ recycle them. Operational life times of the panels are modelled with 20 years.
The following average efficiencies per technology are used: Mono-Silicon 14.0 %, Multi-Silicon 13.2%, Cadmium-Telluride (CdTe) 9.0%, Amorphous-Silicon 5.5 %, Ribbon-Silicon 11.2 %, Copper-Indium-Gallium-Diselenide 11.0 %.
158
Rate 1 (very good)
Justification The dataset has been modelled taken into account the technology mix of the different PV technologies currently available at the commercial level and their efficiencies.
Data reported by the European Photovoltaic Technology Platform, a relevant Authoritative Body, related to the cell technology shares in 2008 has been used.
Geographical representativeness
Regarding the information included in the dataset, the basic information, in order to evaluate this criterion, is remarked below.
The dataset represents the average national or region specific electricity production based on solar energy by use of photovoltaic. Main technologies on electricity generation are considered according to the national or region specific situation.
Rate 1 (very good)
Justification The geographical aspects have been modelled according a regional specific production (DE). Data to model the dataset have been taken from previous studies from German production plants.
Time-related representativeness
Regarding the attached time representativeness information of the dataset, the reference year is 2009 and the dataset is valid until 2014. Moreover, the dataset states that the time representativeness is an annual average.
Data for making the „DE: Electricity from photovoltaic‟ comes from a list of references that has been attached in the software information.
Rate 1 (very good)
Justification Data used to model the production of single- and multi-Si are from 2005 and 2006. Some updating factors have been used for the efficiencies and energy inputs (year 2009). In the case of CdTe PV modules, data from a production facility in Frankfurt have been used and refer to year 2008, while the data used for the CIS modules were collected between 2008 and 2009.
Completeness
The following table shows the share of elementary flows that can be assessed in accordance to the extracted information from the dataset in comparison with the reference list from the pre-analysis.
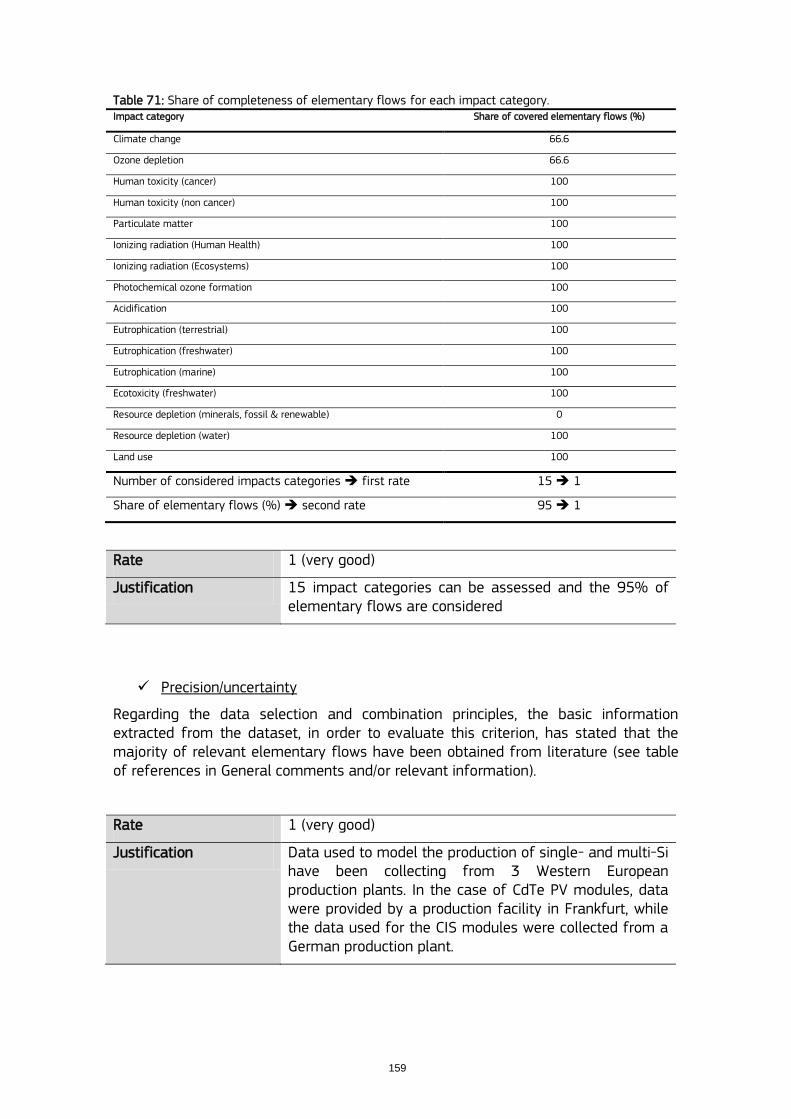
159
Table 71: Share of completeness of elementary flows for each impact category. Impact category Share of covered elementary flows (%)
Climate change 66.6
Ozone depletion 66.6
Human toxicity (cancer) 100
Human toxicity (non cancer) 100
Particulate matter 100
Ionizing radiation (Human Health) 100
Ionizing radiation (Ecosystems) 100
Photochemical ozone formation 100
Acidification 100
Eutrophication (terrestrial) 100
Eutrophication (freshwater) 100
Eutrophication (marine) 100
Ecotoxicity (freshwater) 100
Resource depletion (minerals, fossil & renewable) 0
Resource depletion (water) 100
Land use 100
Number of considered impacts categories first rate 15 1
Share of elementary flows (%) second rate 95 1
Rate 1 (very good)
Justification 15 impact categories can be assessed and the 95% of elementary flows are considered
Precision/uncertainty
Regarding the data selection and combination principles, the basic information extracted from the dataset, in order to evaluate this criterion, has stated that the majority of relevant elementary flows have been obtained from literature (see table of references in General comments and/or relevant information).
Rate 1 (very good)
Justification Data used to model the production of single- and multi-Si have been collecting from 3 Western European production plants. In the case of CdTe PV modules, data were provided by a production facility in Frankfurt, while the data used for the CIS modules were collected from a German production plant.
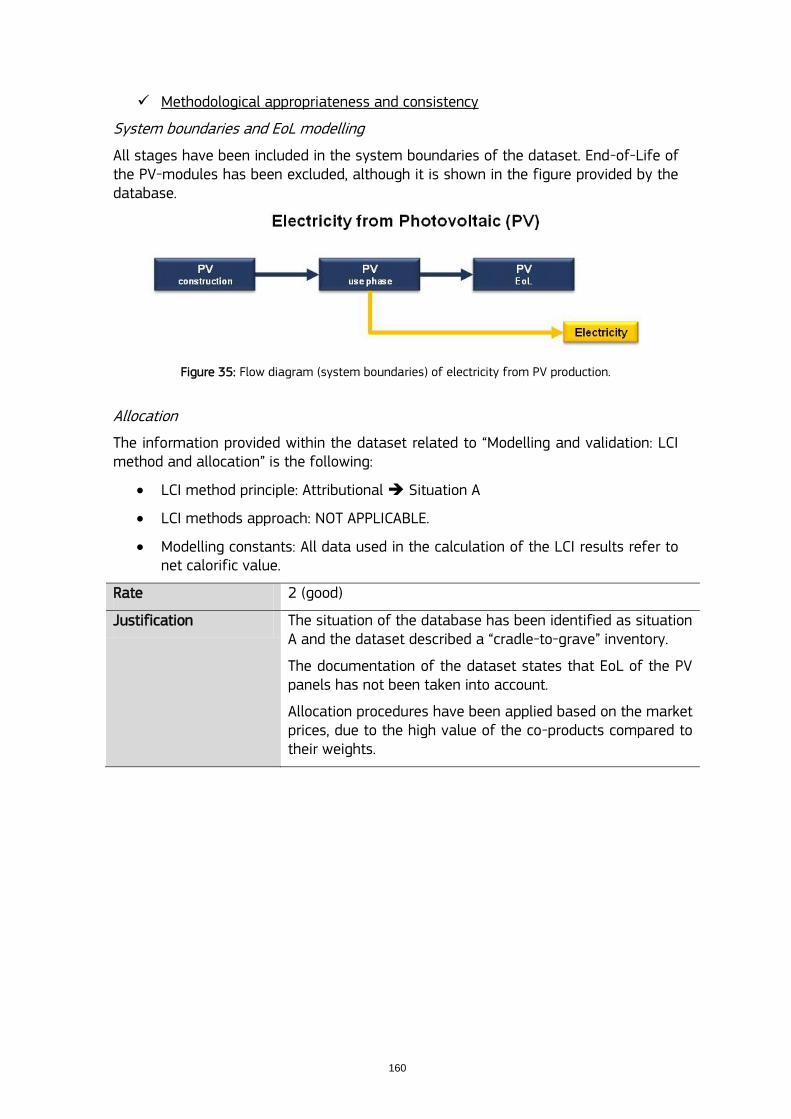
160
Methodological appropriateness and consistency
System boundaries and EoL modelling
All stages have been included in the system boundaries of the dataset. End-of-Life of the PV-modules has been excluded, although it is shown in the figure provided by the database.
Figure 35: Flow diagram (system boundaries) of electricity from PV production.
Allocation
The information provided within the dataset related to “Modelling and validation: LCI method and allocation” is the following:
LCI method principle: Attributional Situation A
LCI methods approach: NOT APPLICABLE.
Modelling constants: All data used in the calculation of the LCI results refer to net calorific value.
Rate 2 (good)
Justification The situation of the database has been identified as situation A and the dataset described a “cradle-to-grave” inventory.
The documentation of the dataset states that EoL of the PV panels has not been taken into account.
Allocation procedures have been applied based on the market prices, due to the high value of the co-products compared to their weights.
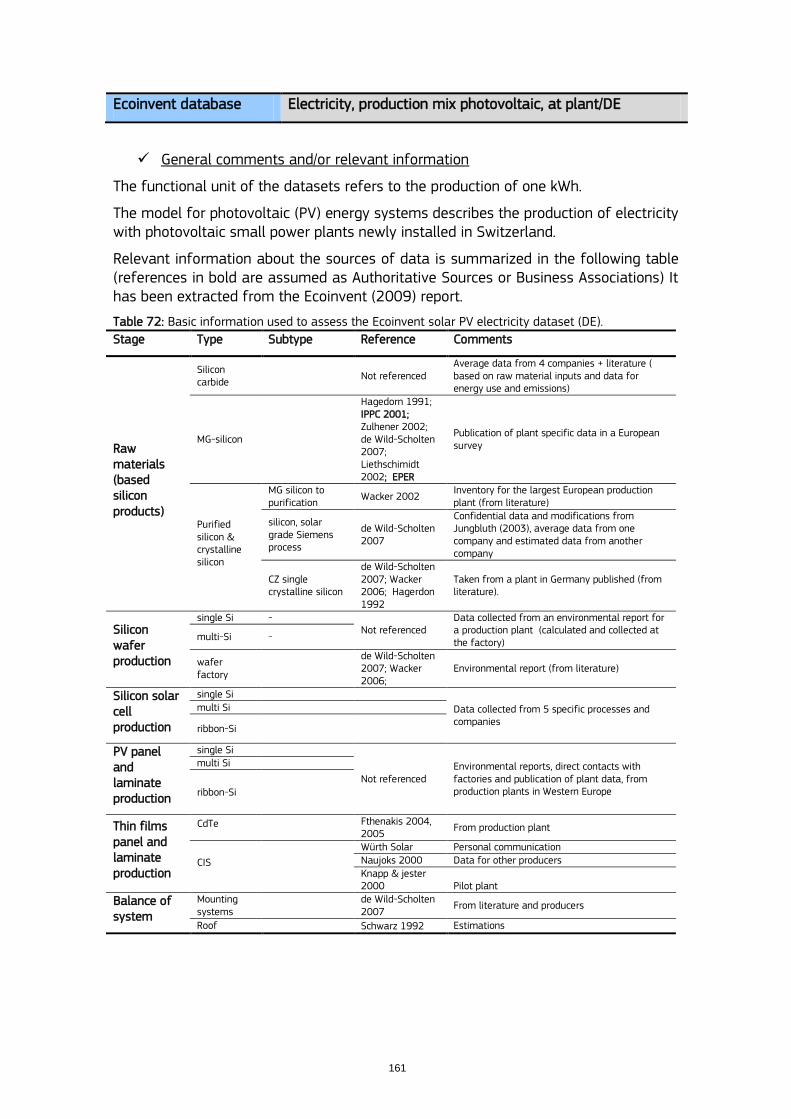
161
Ecoinvent database Electricity, production mix photovoltaic, at plant/DE
General comments and/or relevant information
The functional unit of the datasets refers to the production of one kWh.
The model for photovoltaic (PV) energy systems describes the production of electricity with photovoltaic small power plants newly installed in Switzerland.
Relevant information about the sources of data is summarized in the following table (references in bold are assumed as Authoritative Sources or Business Associations) It has been extracted from the Ecoinvent (2009) report.
Table 72: Basic information used to assess the Ecoinvent solar PV electricity dataset (DE).
Stage Type Subtype Reference Comments
Raw materials (based silicon products)
Silicon carbide
Not referenced Average data from 4 companies + literature ( based on raw material inputs and data for energy use and emissions)
MG-silicon
Hagedorn 1991; IPPC 2001; Zulhener 2002; de Wild-Scholten 2007; Liethschimidt 2002; EPER
Publication of plant specific data in a European survey
Purified silicon & crystalline silicon
MG silicon to purification
Wacker 2002 Inventory for the largest European production plant (from literature)
silicon, solar grade Siemens process
de Wild-Scholten 2007
Confidential data and modifications from Jungbluth (2003), average data from one company and estimated data from another company
CZ single crystalline silicon
de Wild-Scholten 2007; Wacker 2006; Hagerdon 1992
Taken from a plant in Germany published (from literature).
Silicon wafer production
single Si - Not referenced
Data collected from an environmental report for a production plant (calculated and collected at the factory)
multi-Si -
wafer factory
de Wild-Scholten 2007; Wacker 2006;
Environmental report (from literature)
Silicon solar cell production
single Si
Data collected from 5 specific processes and companies
multi Si
ribbon-Si
PV panel and laminate production
single Si
Not referenced Environmental reports, direct contacts with factories and publication of plant data, from production plants in Western Europe
multi Si
ribbon-Si
Thin films panel and laminate production
CdTe Fthenakis 2004, 2005
From production plant
CIS
Würth Solar Personal communication Naujoks 2000 Data for other producers Knapp & jester 2000 Pilot plant
Balance of system
Mounting systems
de Wild-Scholten 2007
From literature and producers
Roof Schwarz 1992 Estimations
162
Technological representativeness
The technology considered to model the dataset is described in the LCI report (Ecoinvent, 2009) and it is shown next:
Annual output of grid-connected PV power plants differentiated for Roof-Top and Facade plants. Literature data for optimum installation and not real performance in the country have been corrected with a factor of 92% according to experiences in Switzerland for average production. Mix of PV-plants based on worldwide average and own assumptions. A lifetime of 30 years is taken into account for the PV installation.
The following processes are included: Production mix of photovoltaic electricity in the country. Annual output, Roof-Top: 744, Annual output, Facade: 516 kWh / kWp. Amount of solar energy transformed to electricity. Waste heat emission due to losses of electricity in the system.
The dataset states that the technology data have been investigated for Switzerland. Several PV cell technologies have been considered, producing electricity under different efficiencies:
mc-Si: 52.6%; efficiencies between 11-16%.
sc-Si: 38.6%; efficiencies between 13-18%.
a-Si: 4.48%; efficiencies between 7-9%.
ribbon-Si: 2.76%; efficiencies between 10-12%.
CdTe: 1.33%
CIS: 0.191%
Rate 2 (good)
Justification The technology aspects have been modelled as a PV technology mix based on worldwide average production. The PV technologies currently available at the commercial level have been included, taken into account the efficiencies for each technology. However, the shares of these technologies to the PV mix are not in line with the European context.
Geographical representativeness
The dataset is modelled based on the manufacturing processes for European and North-American production. A correction factor has been applied according to experiences in Switzerland for the cells efficiencies.
163
Rate 2 (good)
Justification The dataset has been modelled considering technology production processes of Europe and North America. The report related to this process states that Germany is the highest PV cells producer and therefore, data from German companies have been taken. In the case of PV panels and laminated, Western Europe plants were analysed.
Some correction factors have been applied to adapt the dataset to the Swiss context. Although, no additional factors have been used or are documented to extrapolate the dataset to the German production, the Swiss and German contexts can be assumed to be similar.
Country-site specific information related to the grid would increase the geographical representativeness.
Time-related representativeness
All information used to model this dataset is included in the report “Part XII Photovoltaic” (Ecoinvent 2009). This document contains a review and an update of the previous reports related to photovoltaic datasets. The time reference is the following: „Electricity, productions mix PV, at plant, DE‟: 2007.
Rate 1 (very good)
Justification The reference year of the dataset is 2007.
This dataset has been updated several times based on the first dataset provided by Ecoinvent.
A big share of the foreground data to model the dataset was collected directly from photovoltaic companies along different projects from 2002 to 2006.
The most relevant references used in the current dataset are related to the period 2002-2007. Old references have been also used in few cases, i.e. the mounting system but it does not decrease the time representativeness of the dataset.
Completeness
The following table shows the share of elementary flows that can be assessed in accordance to the extracted information from the dataset in comparison with the reference list from the pre-analysis.

164
Table 73: Share of completeness of elementary flows for each impact category. Impact category Share of covered elementary flows (%)
Climate change 100
Ozone depletion 100
Human toxicity (cancer) 100
Human toxicity (non cancer) 100
Particulate matter 100
Ionizing radiation (Human Health) 100
Ionizing radiation (Ecosystems) 100
Photochemical ozone formation 100
Acidification 100
Eutrophication (terrestrial) 100
Eutrophication (freshwater) 100
Eutrophication (marine) 100
Ecotoxicity (freshwater) 100
Resource depletion (minerals, fossil & renewable) 100
Resource depletion (water) 100
Land use 100
Number of considered impacts categories first rate 16 1
Share of elementary flows (%) second rate 100 1
Rate 1 (very good)
Justification The whole impact categories can be assessed and the 100% of elementary flows are considered
Precision/uncertainty
The basic information related to the precision provided by the dataset templates does not allow to accurately evaluating this criterion. The dataset cites several literature sources that have been used.
In order to deeply evaluate this criterion, it has been necessary to review the additional documentation published by the database owner (Ecoinvent 2009).
Rate 1 (very good)
Justification Life cycle inventory used to model the production of the different cells, panels and laminates have been taken from production plants or literature, which included manufacturing data from real companies. Some data were collected directly from the companies based on questionnaires.
In the case of thin film technology, also personal communication with the production plants was used to collect data.
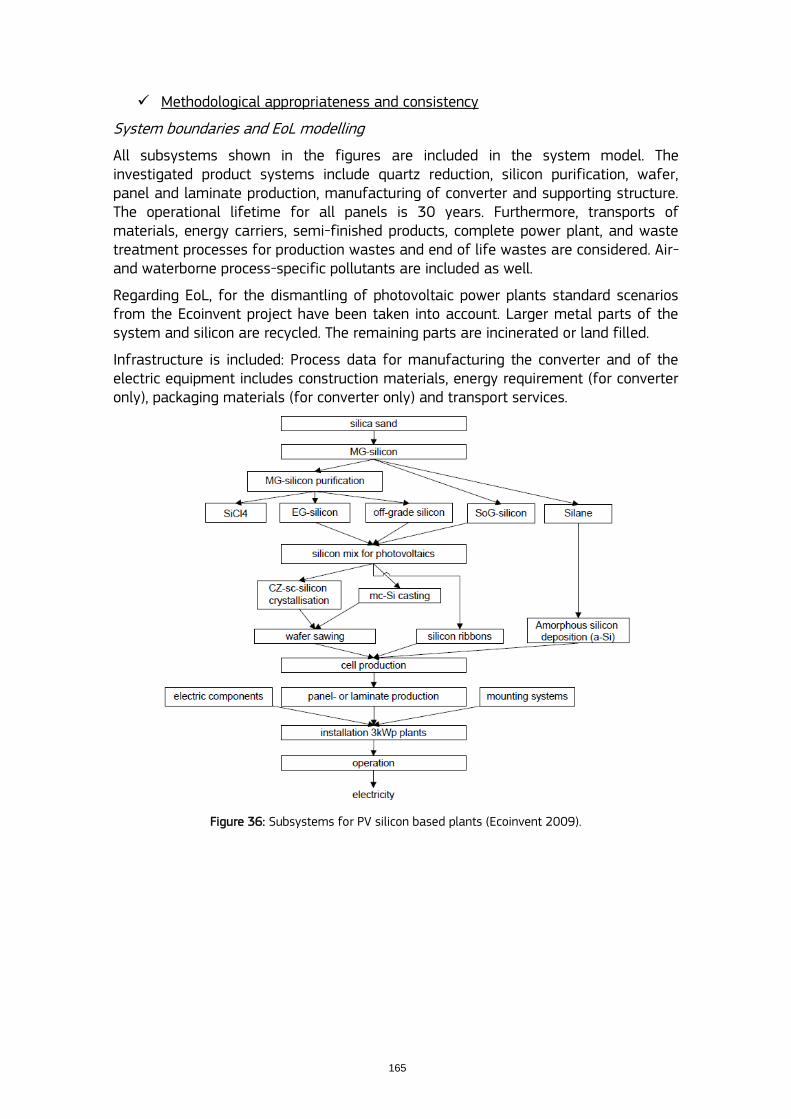
165
Methodological appropriateness and consistency
System boundaries and EoL modelling
All subsystems shown in the figures are included in the system model. The investigated product systems include quartz reduction, silicon purification, wafer, panel and laminate production, manufacturing of converter and supporting structure. The operational lifetime for all panels is 30 years. Furthermore, transports of materials, energy carriers, semi-finished products, complete power plant, and waste treatment processes for production wastes and end of life wastes are considered. Air- and waterborne process-specific pollutants are included as well.
Regarding EoL, for the dismantling of photovoltaic power plants standard scenarios from the Ecoinvent project have been taken into account. Larger metal parts of the system and silicon are recycled. The remaining parts are incinerated or land filled.
Infrastructure is included: Process data for manufacturing the converter and of the electric equipment includes construction materials, energy requirement (for converter only), packaging materials (for converter only) and transport services.
Figure 36: Subsystems for PV silicon based plants (Ecoinvent 2009).
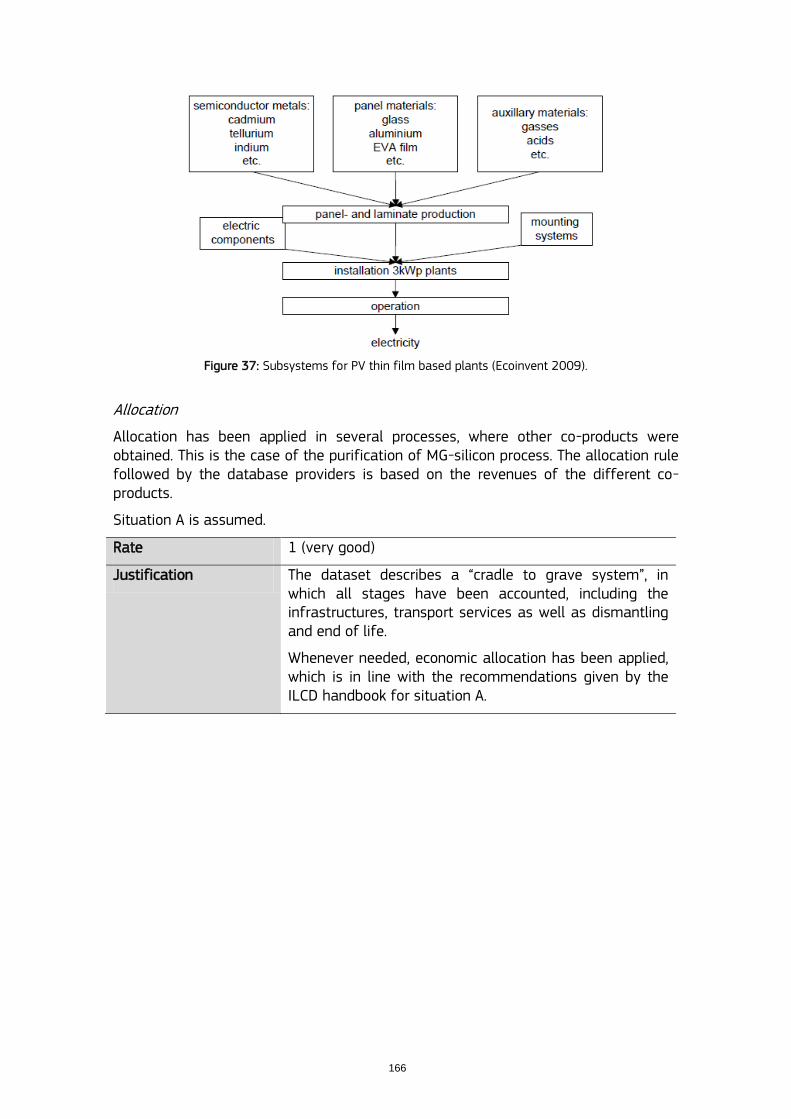
166
Figure 37: Subsystems for PV thin film based plants (Ecoinvent 2009).
Allocation
Allocation has been applied in several processes, where other co-products were obtained. This is the case of the purification of MG-silicon process. The allocation rule followed by the database providers is based on the revenues of the different co-products.
Situation A is assumed.
Rate 1 (very good)
Justification The dataset describes a “cradle to grave system”, in which all stages have been accounted, including the infrastructures, transport services as well as dismantling and end of life.
Whenever needed, economic allocation has been applied, which is in line with the recommendations given by the ILCD handbook for situation A.
167
GEMIS database Solar-PV-mono-framed-with-rack-DE-2010
Solar-PV-multi-framed-with-rack-DE-2010
General comments and/or relevant information
The functional unit of the dataset refers to the production of one TJ. This evaluation includes two separate datasets according to the most usual technologies to produce electricity from solar power, photovoltaic, in Germany.
Technological representativeness
Regarding the technology description of each dataset:
Data from „mono‟ come from a PV plant with 3.36 kWp, consisting of 20 monocrystal modules units, each of which has an installed capacity of 0.175 kWp. The installation takes place on a roof. Data for materials are own estimated. The plant is mounted with an angle of 30º. The inverter has an efficiency of 96%. Per module an area of 1.25 sq m is needed. The weight per module is 17.4 kg. The efficiency of the modules is 11.56% based on the solar isolation. Here, the efficiency set to 100% to comply with the rules for the cumulated energy requirements.
Data from „multi‟ come from a PV plant made of 20 multicrystalline modules (165 Wp each), total capacity 3.168 kWp. The installation takes place on a roof. Data for materials are own estimated. The plant is mounted with an angle of 30º. The inverter has an efficiency of 96%. Per module an area of 1.25 sq m is needed. The weight per module is 17.4 kg. The efficiency of the modules is 11% based on the solar isolation. Here, the efficiency set to 100% to comply with the rules for the cumulated energy requirements.
Rate 3 (fair)
Justification The dataset has been modelling considering only two types of PV technologies, mono-crystalline and multi-crystalline, which does not reflect any technology mix for Germany. The information provided with the dataset refers to the report “Environmental LCI of crystalline silicon PV modules production”, published by ECN in 2005. This report includes information related to the production of PV modules in different German plants. Data were collected in 2004. The meta-data of the dataset does not allow identifying which technologies from this report has been used. Additionally, the efficiency of the inverter reported by the dataset, 96% is high compared to other sources from the similar years (Häberlin et al. 2006; Kämpfer, 2006) that provided measured efficiencies around 93-94%.
Geographical representativeness
The dataset claims to represent the German situation. To model the dataset, two main references have been used, which provided data from the production of PV modules.
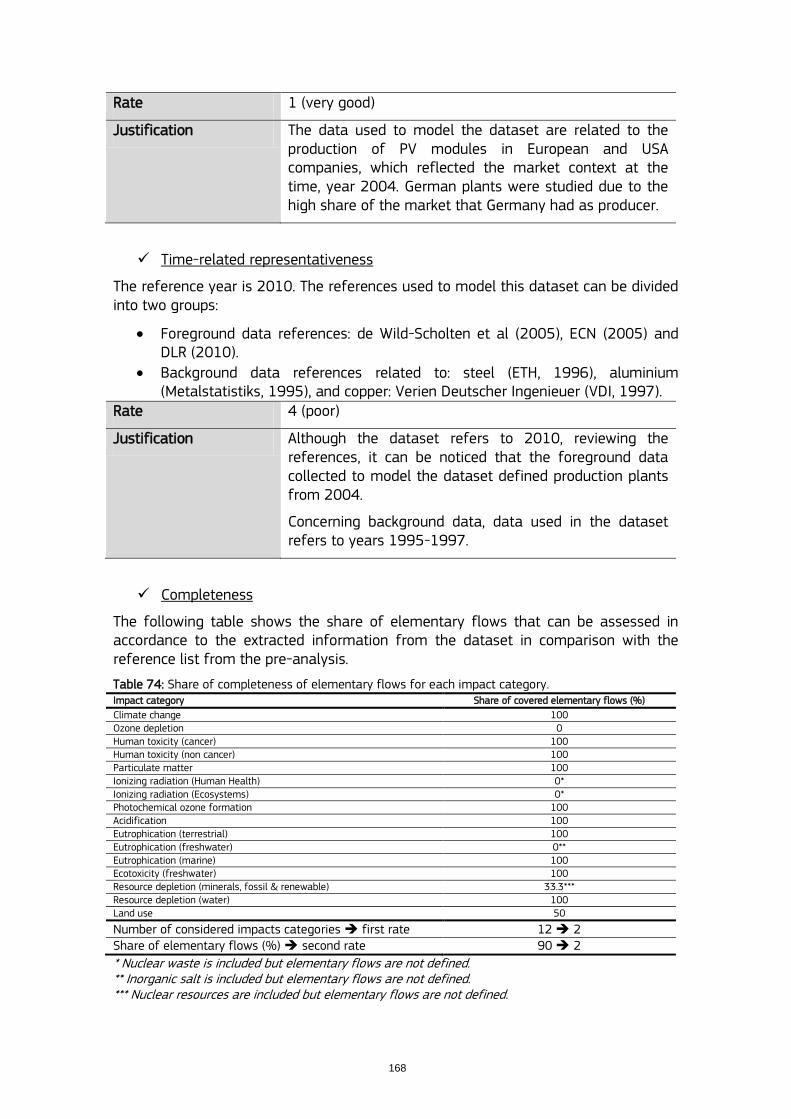
168
Rate 1 (very good)
Justification The data used to model the dataset are related to the production of PV modules in European and USA companies, which reflected the market context at the time, year 2004. German plants were studied due to the high share of the market that Germany had as producer.
Time-related representativeness
The reference year is 2010. The references used to model this dataset can be divided into two groups:
Foreground data references: de Wild-Scholten et al (2005), ECN (2005) and DLR (2010).
Background data references related to: steel (ETH, 1996), aluminium (Metalstatistiks, 1995), and copper: Verien Deutscher Ingenieuer (VDI, 1997).
Rate 4 (poor)
Justification Although the dataset refers to 2010, reviewing the references, it can be noticed that the foreground data collected to model the dataset defined production plants from 2004.
Concerning background data, data used in the dataset refers to years 1995-1997.
Completeness
The following table shows the share of elementary flows that can be assessed in accordance to the extracted information from the dataset in comparison with the reference list from the pre-analysis.
Table 74: Share of completeness of elementary flows for each impact category. Impact category Share of covered elementary flows (%)
Climate change 100 Ozone depletion 0 Human toxicity (cancer) 100 Human toxicity (non cancer) 100 Particulate matter 100 Ionizing radiation (Human Health) 0* Ionizing radiation (Ecosystems) 0* Photochemical ozone formation 100 Acidification 100 Eutrophication (terrestrial) 100 Eutrophication (freshwater) 0** Eutrophication (marine) 100 Ecotoxicity (freshwater) 100 Resource depletion (minerals, fossil & renewable) 33.3*** Resource depletion (water) 100 Land use 50
Number of considered impacts categories first rate 12 2 Share of elementary flows (%) second rate 90 2
* Nuclear waste is included but elementary flows are not defined. ** Inorganic salt is included but elementary flows are not defined. *** Nuclear resources are included but elementary flows are not defined.
169
Rate 2 (good)
Justification 12 impact categories can be assessed and 90% of elementary flows are considered.
Precision/uncertainty
There is no so much information to evaluate the precision of this dataset, therefore the rating of this criterion has been done based on the references used to model the dataset.
Rate 3 (fair)
Justification The main data used for modelling this dataset have been taken from the literature (de Wild-Scholten & Alsema 2005). This study analysed several production plants in Europe and the USA that have been measured and collected for the study.
However, due to the lack of information, it is not possible to identify which data have been used in the dataset.
Methodological appropriateness and consistency
System boundaries and EoL modelling
Figures show a „cradle-to-grave‟ scenario for producing electricity from solar PV in Germany. Infrastructure is included in a German scenario, but EoL modelling is not included.
Figure 38: Flow diagram of electricity from PV production (monocrystal), from GEMIS
Figure 39: Flow diagram of electricity from PV production (multicrystalline), from GEMIS
Allocation
According to the extracted information of the software, situation A is assumed and allocation procedures are considered, but not defined.

170
Rate 3 (fair)
Justification Based on the documentation provided by the database, the dataset has been modelled from cradle to gate, although it is not possible to identify the different stages in the dataset. Infrastructures have been included in the system boundaries, while the EoL stages have been excluded.
The dataset also states that allocation has been applied when necessary, however, there is no information concerning the type of allocation and the co-products.
171
E3 database Power Station / Photovoltaic / multi crystalline (990 kWh)
General comments and/or relevant information
The functional unit of the dataset refers to the production of one kWh.
Technological representativeness
Regarding the technology description, data come from a PV plant made of multicrystalline modules, with alumina frame, without rack, 990 kWh/kWp/a, and efficiency: 9.66%.
Rate 4 (poor)
Justification The dataset has been modelling considering only one type of PV technologies, multi-crystalline, which does not reflect the technology mix for Germany. Even in the case that the analysed technology could be considered as representative for Europe, it is not possible to analyse it in details due to the lack of information in relation to the origin of the data.
Based on the documentation of the dataset, literature data have been taken from one reference, production of PV, 1995, which has not be found as a report, only cited by other authors.
It is not possible to identify which data from the report have been used to model the dataset.
Geographical representativeness
Regarding the extracted information of the dataset in the software, the plant is generic, and there is no clear information about its situation.
Rate 5 (very poor)
Justification The dataset refers to a generic power plant. Based on the information from the dataset, more details about the plant should have been described in the literature used. However, it has been impossible to find the report, “Solarfabrik''96; Studie im Auftrag von Greenpeace“, being therefore impossible to analyse the geographical representativeness.
Time-related representativeness
The dataset states as reference year 1992. To model the dataset, as already mentioned, two references are provided in the documentation: GEMIS (2002) and Altmann et al (1995).
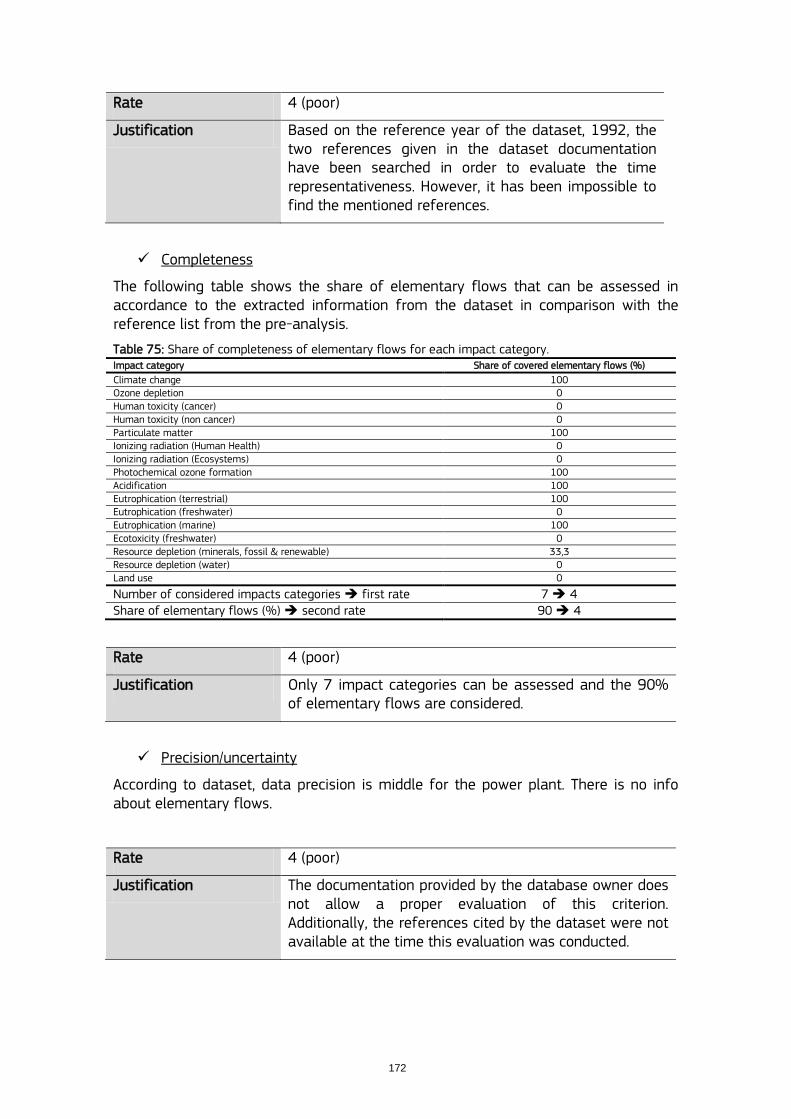
172
Rate 4 (poor)
Justification Based on the reference year of the dataset, 1992, the two references given in the dataset documentation have been searched in order to evaluate the time representativeness. However, it has been impossible to find the mentioned references.
Completeness
The following table shows the share of elementary flows that can be assessed in accordance to the extracted information from the dataset in comparison with the reference list from the pre-analysis.
Table 75: Share of completeness of elementary flows for each impact category. Impact category Share of covered elementary flows (%)
Climate change 100 Ozone depletion 0 Human toxicity (cancer) 0 Human toxicity (non cancer) 0 Particulate matter 100 Ionizing radiation (Human Health) 0 Ionizing radiation (Ecosystems) 0 Photochemical ozone formation 100 Acidification 100 Eutrophication (terrestrial) 100 Eutrophication (freshwater) 0 Eutrophication (marine) 100 Ecotoxicity (freshwater) 0 Resource depletion (minerals, fossil & renewable) 33,3 Resource depletion (water) 0 Land use 0
Number of considered impacts categories first rate 7 4 Share of elementary flows (%) second rate 90 4
Rate 4 (poor)
Justification Only 7 impact categories can be assessed and the 90% of elementary flows are considered.
Precision/uncertainty
According to dataset, data precision is middle for the power plant. There is no info about elementary flows.
Rate 4 (poor)
Justification The documentation provided by the database owner does not allow a proper evaluation of this criterion. Additionally, the references cited by the dataset were not available at the time this evaluation was conducted.
173
Methodological appropriateness and consistency
System boundaries and EoL modelling
Based on the dataset appearance, a cradle to grave analysis has been conducted to model the system, including the infrastructures. The dataset also provides some space to include data concerning the EoL.
Allocation
No information related to allocation procedures is provided with the documentation.
Rate 5 (very poor)
Justification Although the dataset allows the user to include some information to consider a cradle to grave system, it is not clear due to the lack of information whether all stages have been included or not in the dataset. .
The same applies for allocation rules, where there is no information, neither at the references level.
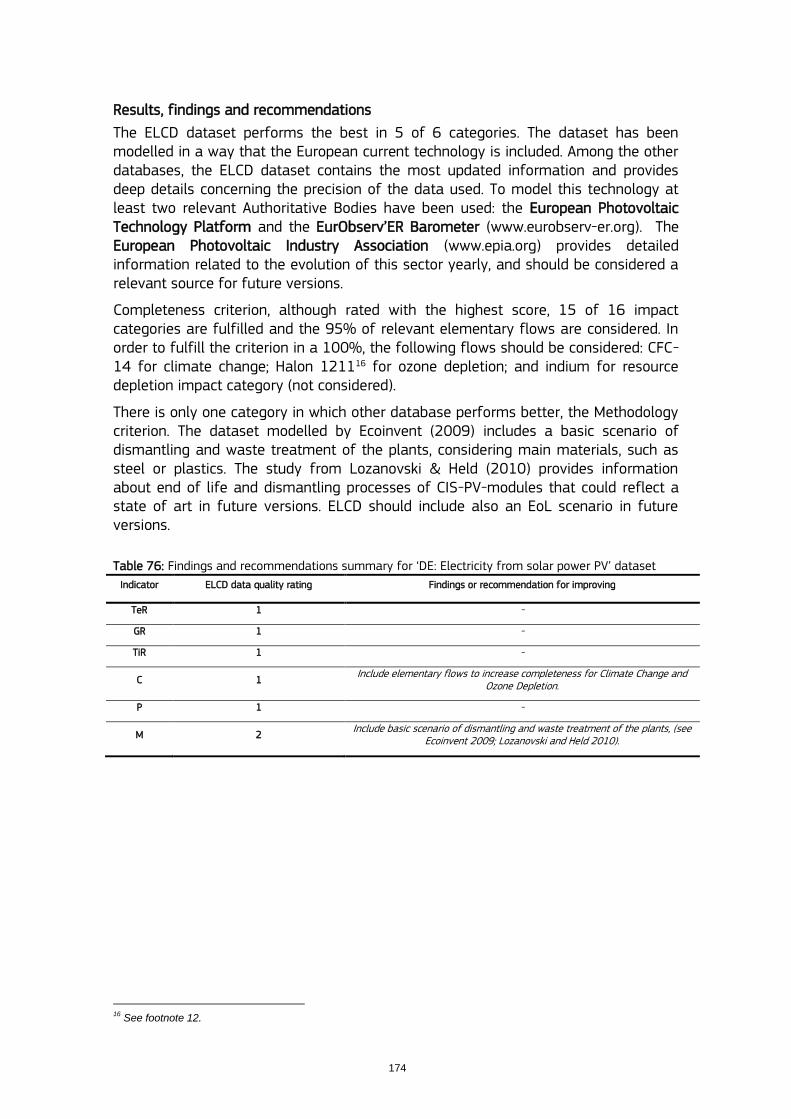
174
Results, findings and recommendations
The ELCD dataset performs the best in 5 of 6 categories. The dataset has been modelled in a way that the European current technology is included. Among the other databases, the ELCD dataset contains the most updated information and provides deep details concerning the precision of the data used. To model this technology at least two relevant Authoritative Bodies have been used: the European Photovoltaic Technology Platform and the EurObserv‟ER Barometer (www.eurobserv-er.org). The European Photovoltaic Industry Association (www.epia.org) provides detailed information related to the evolution of this sector yearly, and should be considered a relevant source for future versions.
Completeness criterion, although rated with the highest score, 15 of 16 impact categories are fulfilled and the 95% of relevant elementary flows are considered. In order to fulfill the criterion in a 100%, the following flows should be considered: CFC-14 for climate change; Halon 121116 for ozone depletion; and indium for resource depletion impact category (not considered).
There is only one category in which other database performs better, the Methodology criterion. The dataset modelled by Ecoinvent (2009) includes a basic scenario of dismantling and waste treatment of the plants, considering main materials, such as steel or plastics. The study from Lozanovski & Held (2010) provides information about end of life and dismantling processes of CIS-PV-modules that could reflect a state of art in future versions. ELCD should include also an EoL scenario in future versions.
Table 76: Findings and recommendations summary for „DE: Electricity from solar power PV‟ dataset
Indicator ELCD data quality rating Findings or recommendation for improving
TeR 1 -
GR 1 -
TiR 1 -
C 1 Include elementary flows to increase completeness for Climate Change and
Ozone Depletion.
P 1 -
M 2 Include basic scenario of dismantling and waste treatment of the plants, (see
Ecoinvent 2009; Lozanovski and Held 2010).
16
See footnote 12.
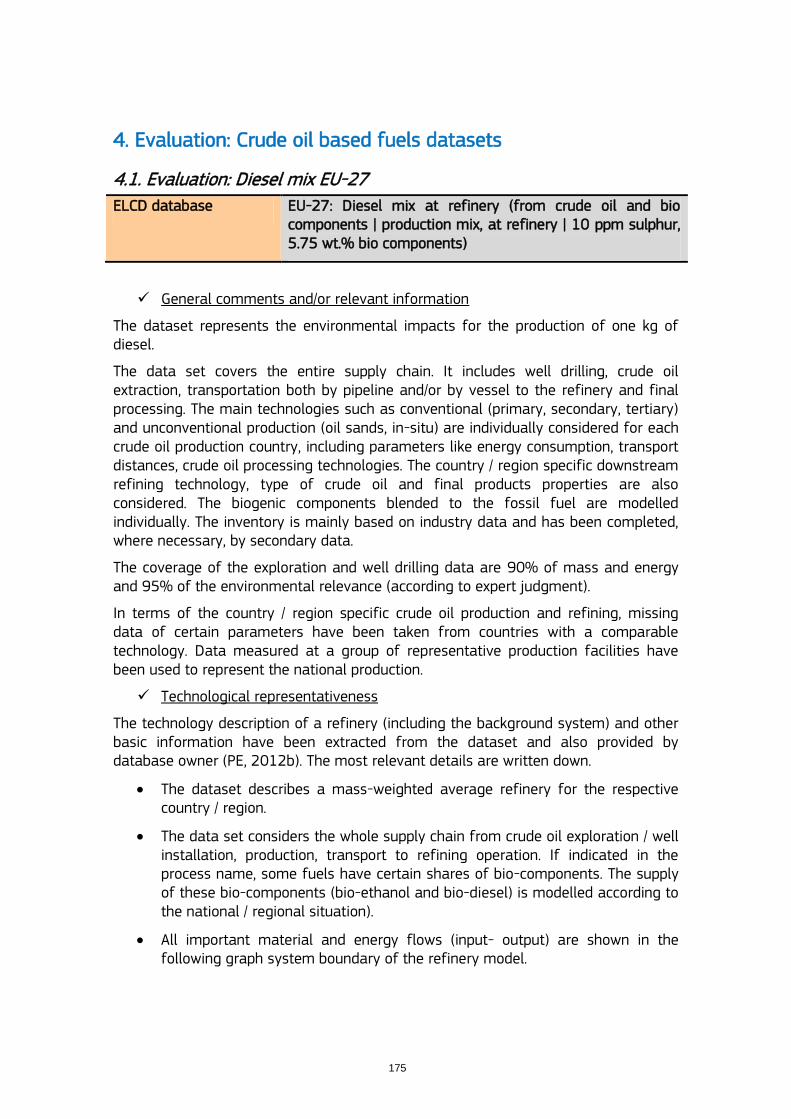
175
4. Evaluation: Crude oil based fuels datasets
4.1. Evaluation: Diesel mix EU-27
ELCD database EU-27: Diesel mix at refinery (from crude oil and bio components | production mix, at refinery | 10 ppm sulphur, 5.75 wt.% bio components)
General comments and/or relevant information
The dataset represents the environmental impacts for the production of one kg of diesel.
The data set covers the entire supply chain. It includes well drilling, crude oil extraction, transportation both by pipeline and/or by vessel to the refinery and final processing. The main technologies such as conventional (primary, secondary, tertiary) and unconventional production (oil sands, in-situ) are individually considered for each crude oil production country, including parameters like energy consumption, transport distances, crude oil processing technologies. The country / region specific downstream refining technology, type of crude oil and final products properties are also considered. The biogenic components blended to the fossil fuel are modelled individually. The inventory is mainly based on industry data and has been completed, where necessary, by secondary data.
The coverage of the exploration and well drilling data are 90% of mass and energy and 95% of the environmental relevance (according to expert judgment).
In terms of the country / region specific crude oil production and refining, missing data of certain parameters have been taken from countries with a comparable technology. Data measured at a group of representative production facilities have been used to represent the national production.
Technological representativeness
The technology description of a refinery (including the background system) and other basic information have been extracted from the dataset and also provided by database owner (PE, 2012b). The most relevant details are written down.
The dataset describes a mass-weighted average refinery for the respective country / region.
The data set considers the whole supply chain from crude oil exploration / well installation, production, transport to refining operation. If indicated in the process name, some fuels have certain shares of bio-components. The supply of these bio-components (bio-ethanol and bio-diesel) is modelled according to the national / regional situation).
All important material and energy flows (input- output) are shown in the following graph system boundary of the refinery model.
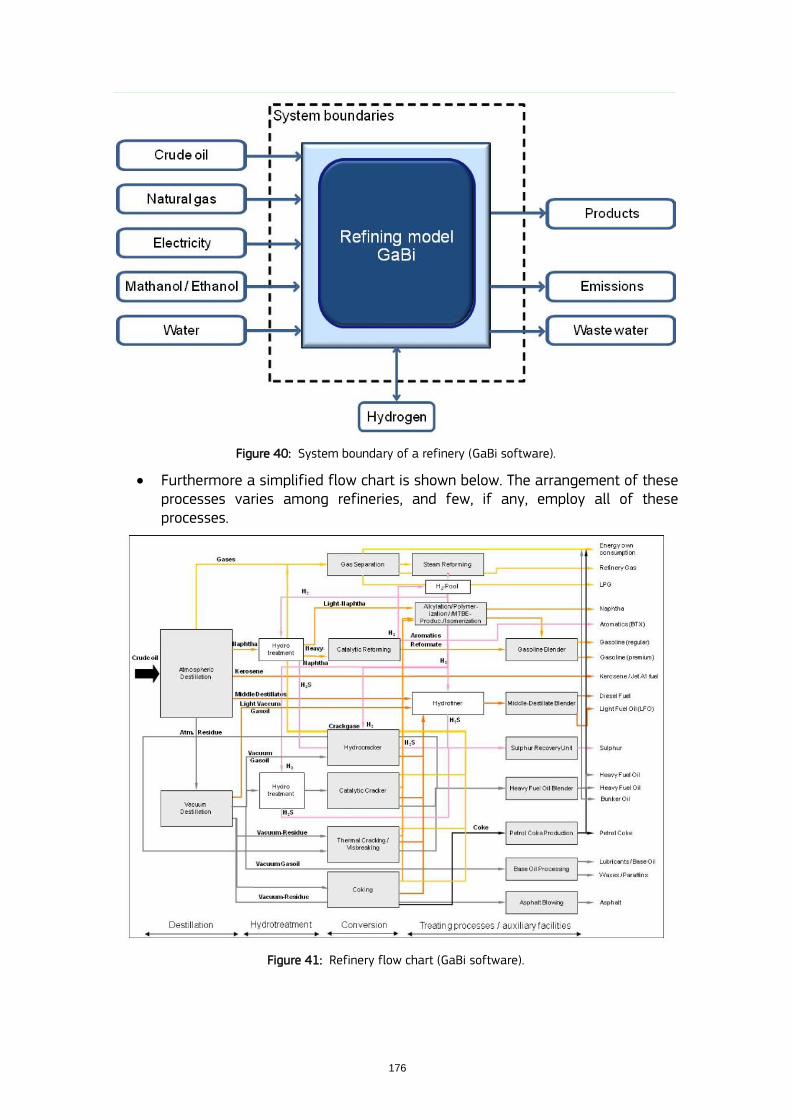
176
Figure 40: System boundary of a refinery (GaBi software).
Furthermore a simplified flow chart is shown below. The arrangement of these processes varies among refineries, and few, if any, employ all of these processes.
Figure 41: Refinery flow chart (GaBi software).
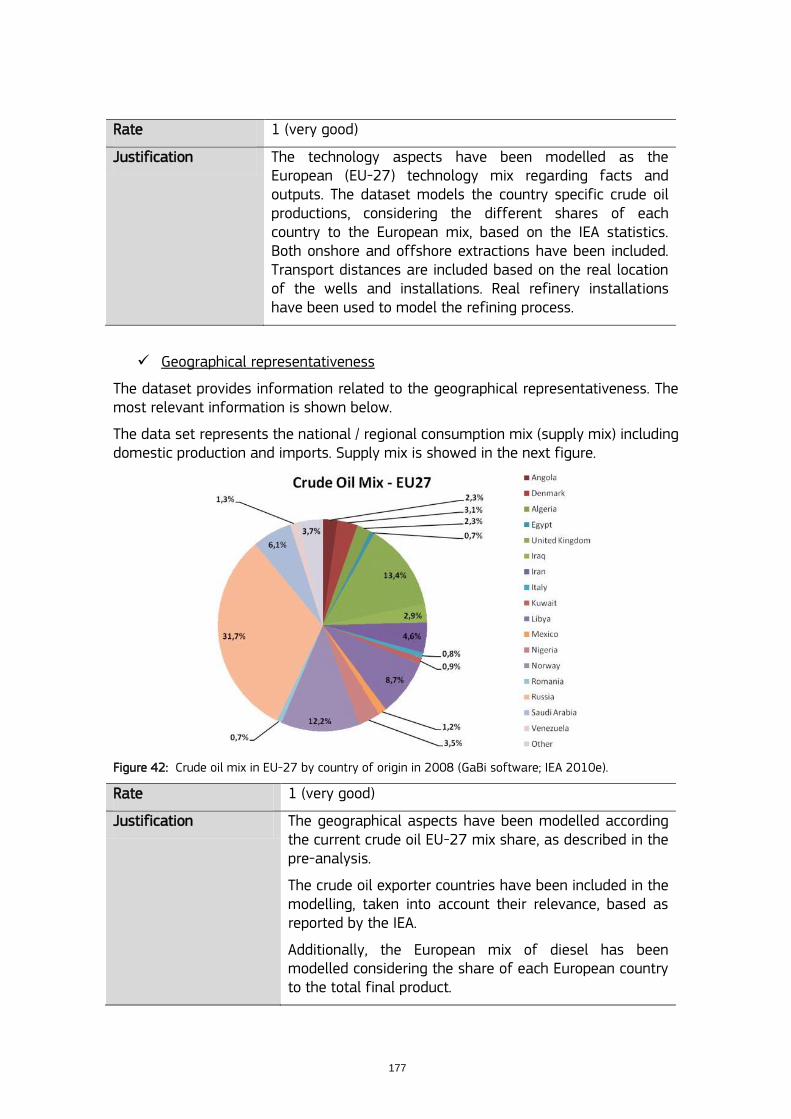
177
Rate 1 (very good)
Justification The technology aspects have been modelled as the European (EU-27) technology mix regarding facts and outputs. The dataset models the country specific crude oil productions, considering the different shares of each country to the European mix, based on the IEA statistics. Both onshore and offshore extractions have been included. Transport distances are included based on the real location of the wells and installations. Real refinery installations have been used to model the refining process.
Geographical representativeness
The dataset provides information related to the geographical representativeness. The most relevant information is shown below.
The data set represents the national / regional consumption mix (supply mix) including domestic production and imports. Supply mix is showed in the next figure.
Figure 42: Crude oil mix in EU-27 by country of origin in 2008 (GaBi software; IEA 2010e).
Rate 1 (very good)
Justification The geographical aspects have been modelled according the current crude oil EU-27 mix share, as described in the pre-analysis.
The crude oil exporter countries have been included in the modelling, taken into account their relevance, based as reported by the IEA.
Additionally, the European mix of diesel has been modelled considering the share of each European country to the total final product.
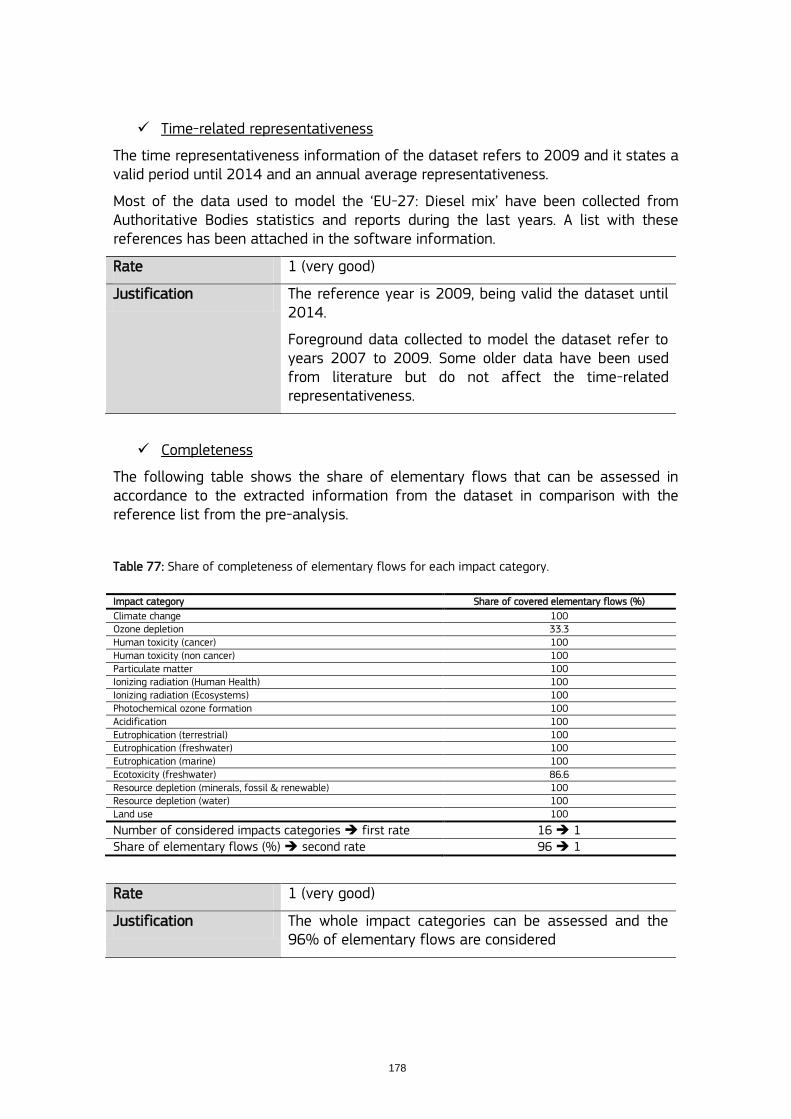
178
Time-related representativeness
The time representativeness information of the dataset refers to 2009 and it states a valid period until 2014 and an annual average representativeness.
Most of the data used to model the „EU-27: Diesel mix‟ have been collected from Authoritative Bodies statistics and reports during the last years. A list with these references has been attached in the software information.
Rate 1 (very good)
Justification The reference year is 2009, being valid the dataset until 2014.
Foreground data collected to model the dataset refer to years 2007 to 2009. Some older data have been used from literature but do not affect the time-related representativeness.
Completeness
The following table shows the share of elementary flows that can be assessed in accordance to the extracted information from the dataset in comparison with the reference list from the pre-analysis.
Table 77: Share of completeness of elementary flows for each impact category.
Impact category Share of covered elementary flows (%)
Climate change 100 Ozone depletion 33.3 Human toxicity (cancer) 100 Human toxicity (non cancer) 100 Particulate matter 100 Ionizing radiation (Human Health) 100 Ionizing radiation (Ecosystems) 100 Photochemical ozone formation 100 Acidification 100 Eutrophication (terrestrial) 100 Eutrophication (freshwater) 100 Eutrophication (marine) 100 Ecotoxicity (freshwater) 86.6 Resource depletion (minerals, fossil & renewable) 100 Resource depletion (water) 100 Land use 100
Number of considered impacts categories first rate 16 1 Share of elementary flows (%) second rate 96 1
Rate 1 (very good)
Justification The whole impact categories can be assessed and the 96% of elementary flows are considered
179
Precision/uncertainty
The most relevant information to evaluate this criterion is described below.
As mentioned before, the dataset has been modelled using industry data and literature data from Authoritative Sources, such as the IEA (IEA, 2009), EC-JRCs of the European Commission. The data sources for the complete product system are sufficiently consistent. Other relevant information has been collected from Business Associations like CONCAWE, EUCAR and the European Petroleum Industry (Europia, 2008).
Rate 1-2 (very good-good)
Justification The data used to model the dataset have been mainly collected from the industry involved in the sector and from reports and statistics published by Authoritative Sources and Business Associations. Additionally, some data have been calculated based on the technical descriptions, such as the quantity of water or steam injected in the well to extract the crude oil, Other data have been obtained from literature, such as data related to solid waste or waste water treatment.
It must be highlighted that emissions from the relevant elementary flows have been double checked based on the statistics and on emissions factors (taken into account the fuel qualities).
Methodological appropriateness and consistency
System boundaries and EoL modelling
Based on the general flow diagram for diesel mix, it can be seen that the whole processes have been covered in the system boundaries (see Figure 40).
The dataset includes the whole supply chain from crude oil exploration / well installation, production, transport and refining. If indicated in the process name, some fuels have certain shares of bio-components. The supply of these bio-components (bio-ethanol and bio-diesel) is modelled according to the national / regional situation).
Allocation
The extracted information from „Modelling and validation: LCI method and allocation‟ is the following:
LCI method principle: Attributional Situation A.
LCI methods approach: Allocation (net calorific value, mass).
Modelling constants: All data used in the calculation of the LCI results refer to net calorific value.
The data supplier has added detailed information about the allocation in the GaBi refinery model (PE, 2012b): The „backpack allocation‟, a procedure that is described below.
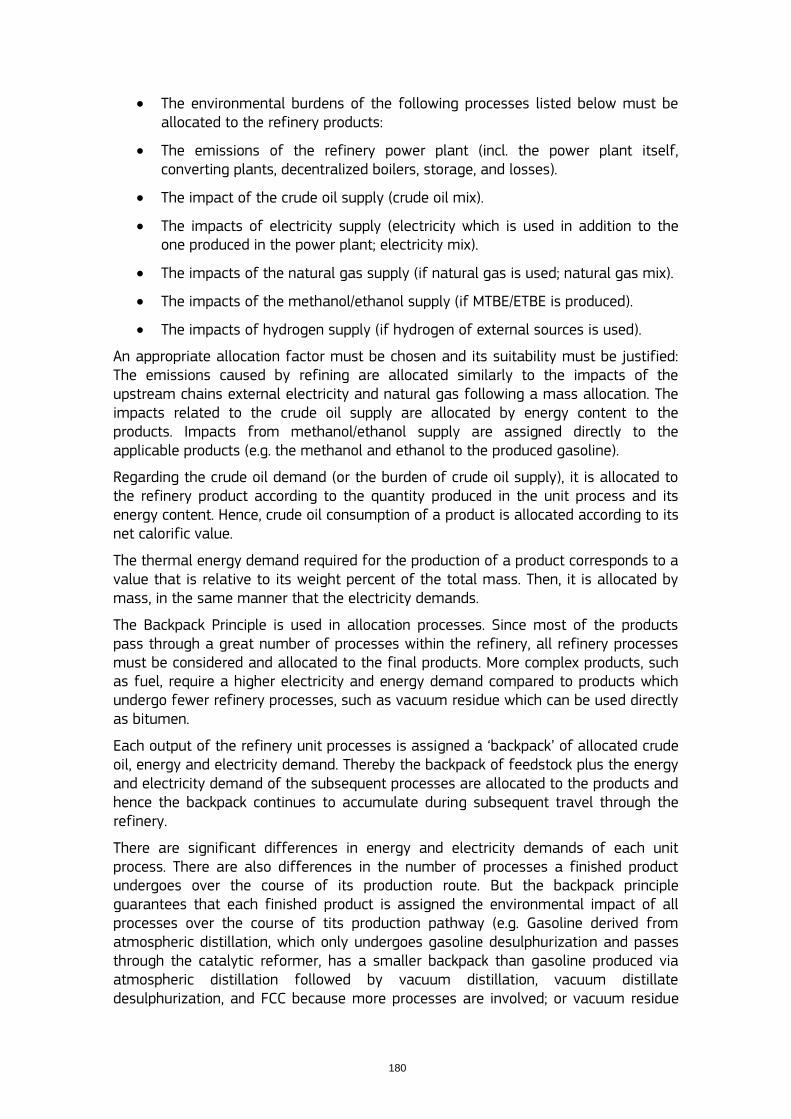
180
The environmental burdens of the following processes listed below must be allocated to the refinery products:
The emissions of the refinery power plant (incl. the power plant itself, converting plants, decentralized boilers, storage, and losses).
The impact of the crude oil supply (crude oil mix).
The impacts of electricity supply (electricity which is used in addition to the one produced in the power plant; electricity mix).
The impacts of the natural gas supply (if natural gas is used; natural gas mix).
The impacts of the methanol/ethanol supply (if MTBE/ETBE is produced).
The impacts of hydrogen supply (if hydrogen of external sources is used).
An appropriate allocation factor must be chosen and its suitability must be justified: The emissions caused by refining are allocated similarly to the impacts of the upstream chains external electricity and natural gas following a mass allocation. The impacts related to the crude oil supply are allocated by energy content to the products. Impacts from methanol/ethanol supply are assigned directly to the applicable products (e.g. the methanol and ethanol to the produced gasoline).
Regarding the crude oil demand (or the burden of crude oil supply), it is allocated to the refinery product according to the quantity produced in the unit process and its energy content. Hence, crude oil consumption of a product is allocated according to its net calorific value.
The thermal energy demand required for the production of a product corresponds to a value that is relative to its weight percent of the total mass. Then, it is allocated by mass, in the same manner that the electricity demands.
The Backpack Principle is used in allocation processes. Since most of the products pass through a great number of processes within the refinery, all refinery processes must be considered and allocated to the final products. More complex products, such as fuel, require a higher electricity and energy demand compared to products which undergo fewer refinery processes, such as vacuum residue which can be used directly as bitumen.
Each output of the refinery unit processes is assigned a „backpack‟ of allocated crude oil, energy and electricity demand. Thereby the backpack of feedstock plus the energy and electricity demand of the subsequent processes are allocated to the products and hence the backpack continues to accumulate during subsequent travel through the refinery.
There are significant differences in energy and electricity demands of each unit process. There are also differences in the number of processes a finished product undergoes over the course of its production route. But the backpack principle guarantees that each finished product is assigned the environmental impact of all processes over the course of tits production pathway (e.g. Gasoline derived from atmospheric distillation, which only undergoes gasoline desulphurization and passes through the catalytic reformer, has a smaller backpack than gasoline produced via atmospheric distillation followed by vacuum distillation, vacuum distillate desulphurization, and FCC because more processes are involved; or vacuum residue

181
which can be sold directly as bitumen has a smaller backpack than the finished diesel fuel product).
Rate 1 (very good)
Justification Situation A.
Dataset includes a „cradle-to-grave‟ system process.
Dataset comprises EoL and infrastructure.
Allocation procedure has been applied by the net calorific value and market value.
Use of the „Backpack‟ allocation.
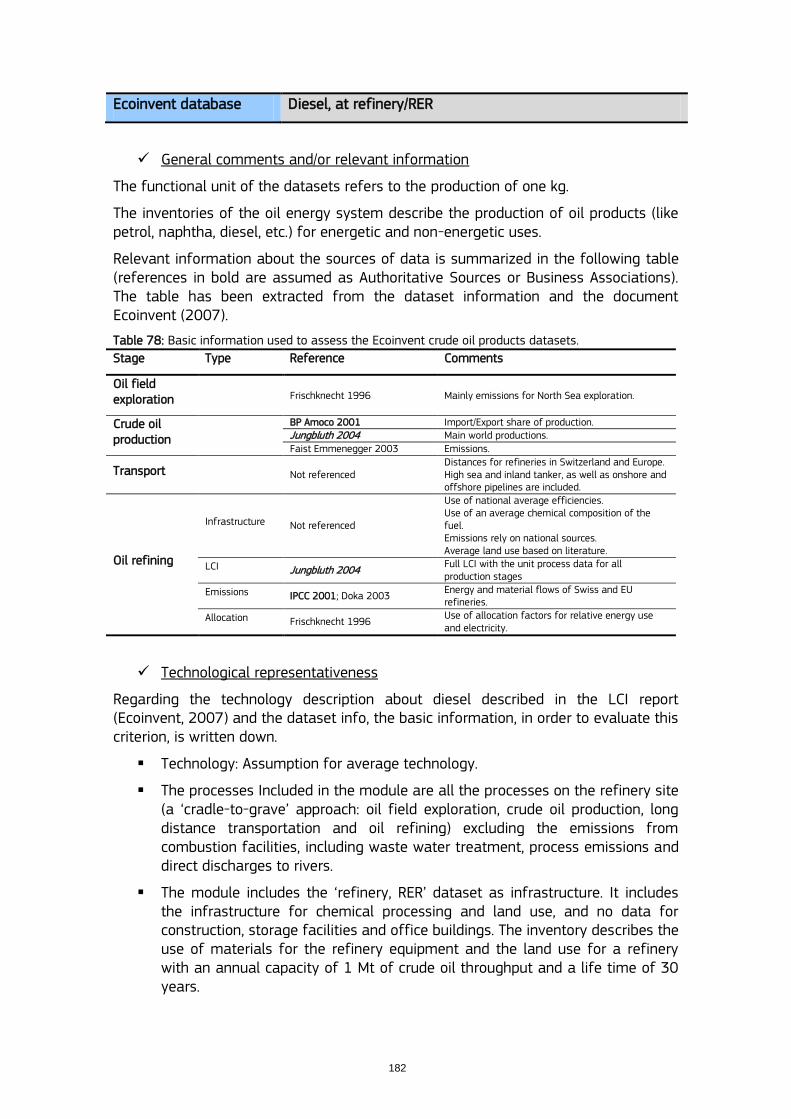
182
Ecoinvent database Diesel, at refinery/RER
General comments and/or relevant information
The functional unit of the datasets refers to the production of one kg.
The inventories of the oil energy system describe the production of oil products (like petrol, naphtha, diesel, etc.) for energetic and non-energetic uses.
Relevant information about the sources of data is summarized in the following table (references in bold are assumed as Authoritative Sources or Business Associations). The table has been extracted from the dataset information and the document Ecoinvent (2007).
Table 78: Basic information used to assess the Ecoinvent crude oil products datasets.
Stage Type Reference Comments
Oil field exploration
Frischknecht 1996 Mainly emissions for North Sea exploration.
Crude oil production
BP Amoco 2001 Import/Export share of production. Jungbluth 2004 Main world productions.
Faist Emmenegger 2003 Emissions.
Transport Not referenced Distances for refineries in Switzerland and Europe. High sea and inland tanker, as well as onshore and offshore pipelines are included.
Oil refining
Infrastructure Not referenced
Use of national average efficiencies. Use of an average chemical composition of the fuel. Emissions rely on national sources. Average land use based on literature.
LCI Jungbluth 2004 Full LCI with the unit process data for all production stages
Emissions IPCC 2001; Doka 2003 Energy and material flows of Swiss and EU refineries.
Allocation Frischknecht 1996 Use of allocation factors for relative energy use and electricity.
Technological representativeness
Regarding the technology description about diesel described in the LCI report (Ecoinvent, 2007) and the dataset info, the basic information, in order to evaluate this criterion, is written down.
Technology: Assumption for average technology.
The processes Included in the module are all the processes on the refinery site (a „cradle-to-grave‟ approach: oil field exploration, crude oil production, long distance transportation and oil refining) excluding the emissions from combustion facilities, including waste water treatment, process emissions and direct discharges to rivers.
The module includes the „refinery, RER‟ dataset as infrastructure. It includes the infrastructure for chemical processing and land use, and no data for construction, storage facilities and office buildings. The inventory describes the use of materials for the refinery equipment and the land use for a refinery with an annual capacity of 1 Mt of crude oil throughput and a life time of 30 years.
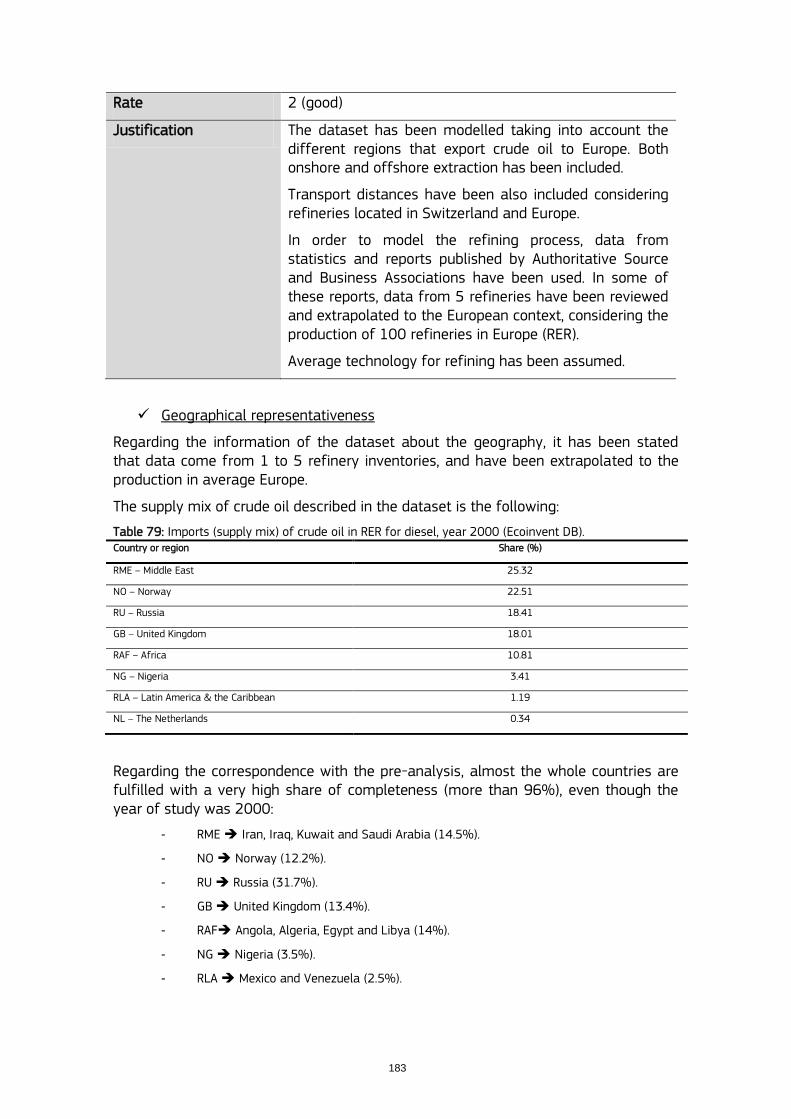
183
Rate 2 (good)
Justification The dataset has been modelled taking into account the different regions that export crude oil to Europe. Both onshore and offshore extraction has been included.
Transport distances have been also included considering refineries located in Switzerland and Europe.
In order to model the refining process, data from statistics and reports published by Authoritative Source and Business Associations have been used. In some of these reports, data from 5 refineries have been reviewed and extrapolated to the European context, considering the production of 100 refineries in Europe (RER).
Average technology for refining has been assumed.
Geographical representativeness
Regarding the information of the dataset about the geography, it has been stated that data come from 1 to 5 refinery inventories, and have been extrapolated to the production in average Europe.
The supply mix of crude oil described in the dataset is the following:
Table 79: Imports (supply mix) of crude oil in RER for diesel, year 2000 (Ecoinvent DB). Country or region Share (%)
RME – Middle East 25.32
NO – Norway 22.51
RU – Russia 18.41
GB – United Kingdom 18.01
RAF – Africa 10.81
NG – Nigeria 3.41
RLA – Latin America & the Caribbean 1.19
NL – The Netherlands 0.34
Regarding the correspondence with the pre-analysis, almost the whole countries are fulfilled with a very high share of completeness (more than 96%), even though the year of study was 2000:
- RME Iran, Iraq, Kuwait and Saudi Arabia (14.5%).
- NO Norway (12.2%).
- RU Russia (31.7%).
- GB United Kingdom (13.4%).
- RAF Angola, Algeria, Egypt and Libya (14%).
- NG Nigeria (3.5%).
- RLA Mexico and Venezuela (2.5%).
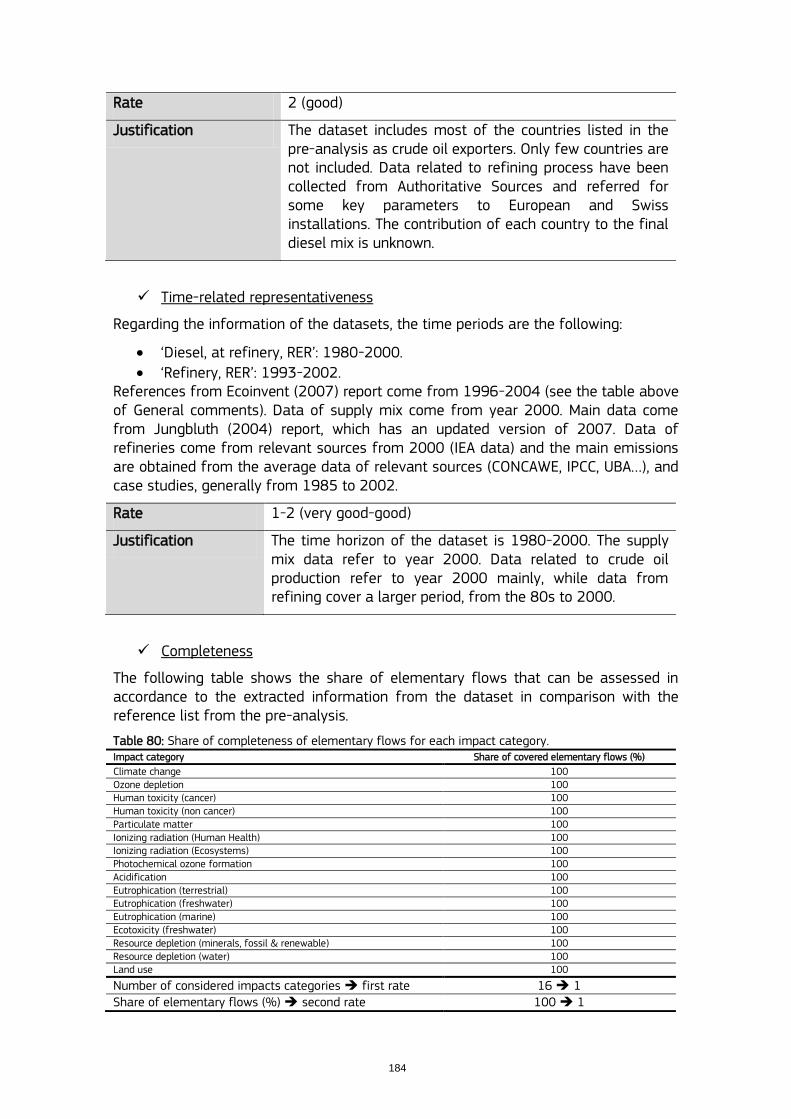
184
Rate 2 (good)
Justification The dataset includes most of the countries listed in the pre-analysis as crude oil exporters. Only few countries are not included. Data related to refining process have been collected from Authoritative Sources and referred for some key parameters to European and Swiss installations. The contribution of each country to the final diesel mix is unknown.
Time-related representativeness
Regarding the information of the datasets, the time periods are the following:
„Diesel, at refinery, RER‟: 1980-2000.
„Refinery, RER‟: 1993-2002. References from Ecoinvent (2007) report come from 1996-2004 (see the table above of General comments). Data of supply mix come from year 2000. Main data come from Jungbluth (2004) report, which has an updated version of 2007. Data of refineries come from relevant sources from 2000 (IEA data) and the main emissions are obtained from the average data of relevant sources (CONCAWE, IPCC, UBA…), and case studies, generally from 1985 to 2002.
Rate 1-2 (very good-good)
Justification The time horizon of the dataset is 1980-2000. The supply mix data refer to year 2000. Data related to crude oil production refer to year 2000 mainly, while data from refining cover a larger period, from the 80s to 2000.
Completeness
The following table shows the share of elementary flows that can be assessed in accordance to the extracted information from the dataset in comparison with the reference list from the pre-analysis.
Table 80: Share of completeness of elementary flows for each impact category. Impact category Share of covered elementary flows (%)
Climate change 100 Ozone depletion 100 Human toxicity (cancer) 100 Human toxicity (non cancer) 100 Particulate matter 100 Ionizing radiation (Human Health) 100 Ionizing radiation (Ecosystems) 100 Photochemical ozone formation 100 Acidification 100 Eutrophication (terrestrial) 100 Eutrophication (freshwater) 100 Eutrophication (marine) 100 Ecotoxicity (freshwater) 100 Resource depletion (minerals, fossil & renewable) 100 Resource depletion (water) 100 Land use 100
Number of considered impacts categories first rate 16 1 Share of elementary flows (%) second rate 100 1
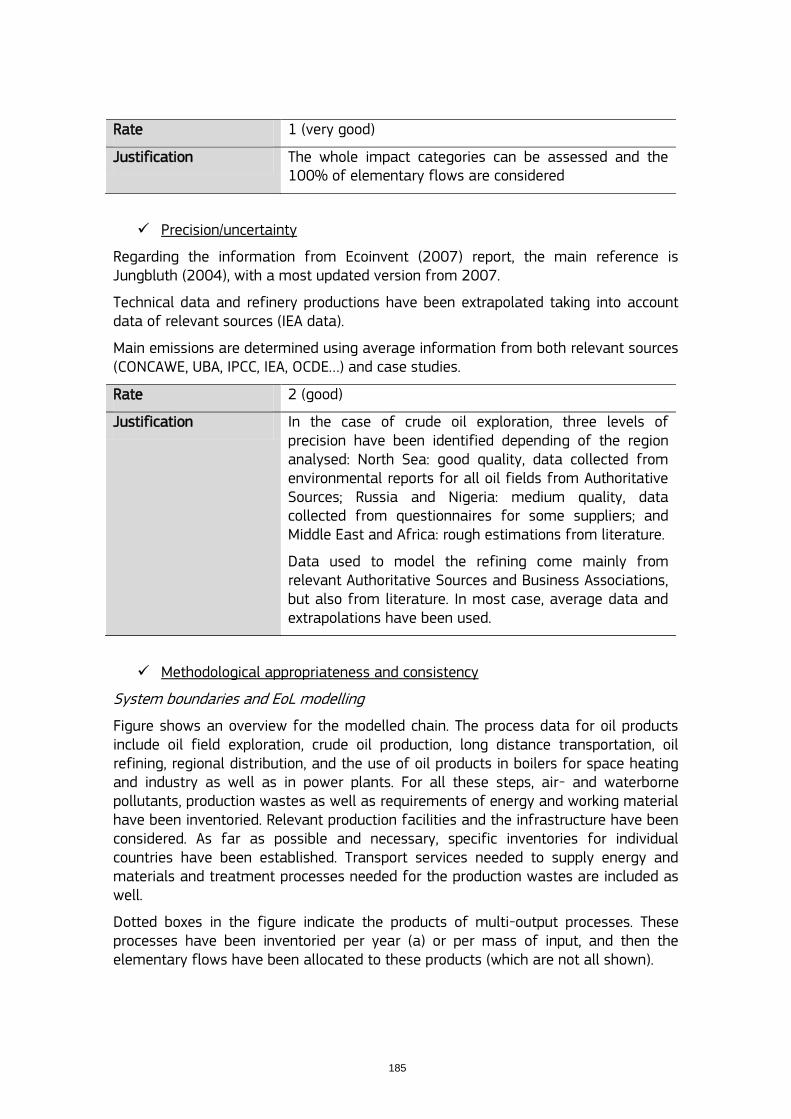
185
Rate 1 (very good)
Justification The whole impact categories can be assessed and the 100% of elementary flows are considered
Precision/uncertainty
Regarding the information from Ecoinvent (2007) report, the main reference is Jungbluth (2004), with a most updated version from 2007.
Technical data and refinery productions have been extrapolated taking into account data of relevant sources (IEA data).
Main emissions are determined using average information from both relevant sources (CONCAWE, UBA, IPCC, IEA, OCDE…) and case studies.
Rate 2 (good)
Justification In the case of crude oil exploration, three levels of precision have been identified depending of the region analysed: North Sea: good quality, data collected from environmental reports for all oil fields from Authoritative Sources; Russia and Nigeria: medium quality, data collected from questionnaires for some suppliers; and Middle East and Africa: rough estimations from literature.
Data used to model the refining come mainly from relevant Authoritative Sources and Business Associations, but also from literature. In most case, average data and extrapolations have been used.
Methodological appropriateness and consistency
System boundaries and EoL modelling
Figure shows an overview for the modelled chain. The process data for oil products include oil field exploration, crude oil production, long distance transportation, oil refining, regional distribution, and the use of oil products in boilers for space heating and industry as well as in power plants. For all these steps, air- and waterborne pollutants, production wastes as well as requirements of energy and working material have been inventoried. Relevant production facilities and the infrastructure have been considered. As far as possible and necessary, specific inventories for individual countries have been established. Transport services needed to supply energy and materials and treatment processes needed for the production wastes are included as well.
Dotted boxes in the figure indicate the products of multi-output processes. These processes have been inventoried per year (a) or per mass of input, and then the elementary flows have been allocated to these products (which are not all shown).
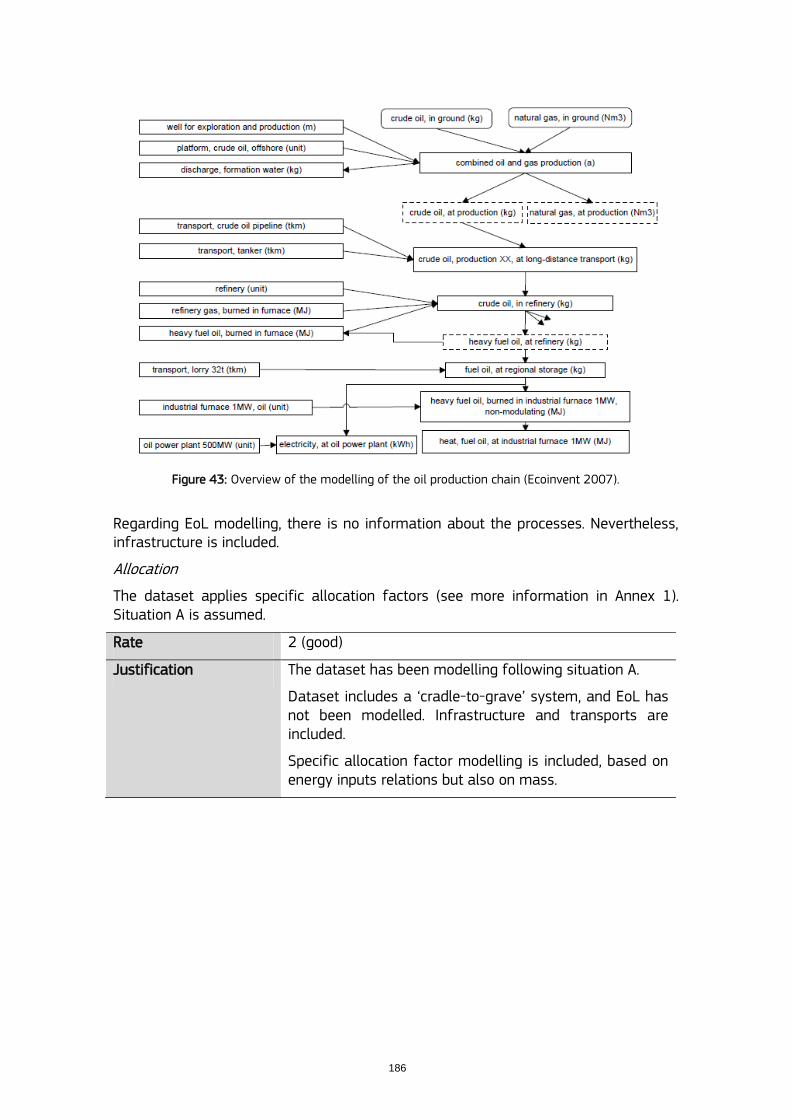
186
Figure 43: Overview of the modelling of the oil production chain (Ecoinvent 2007).
Regarding EoL modelling, there is no information about the processes. Nevertheless, infrastructure is included.
Allocation
The dataset applies specific allocation factors (see more information in Annex 1). Situation A is assumed.
Rate 2 (good)
Justification The dataset has been modelling following situation A.
Dataset includes a „cradle-to-grave‟ system, and EoL has not been modelled. Infrastructure and transports are included.
Specific allocation factor modelling is included, based on energy inputs relations but also on mass.
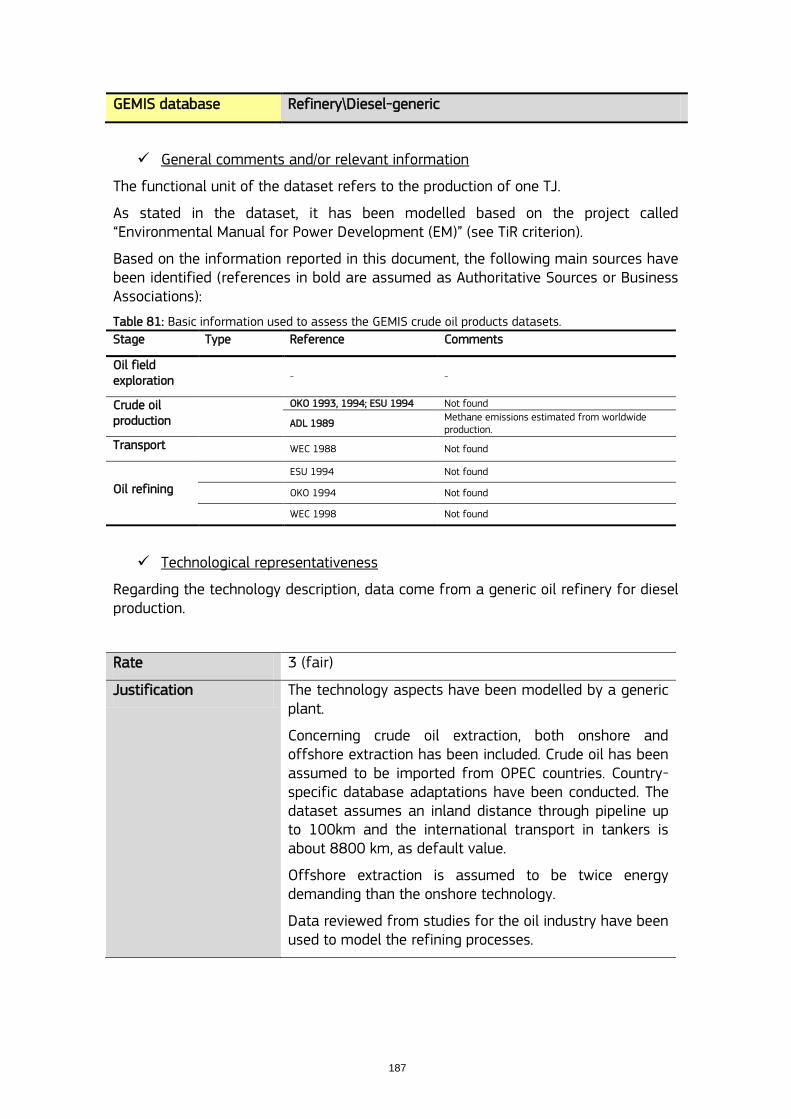
187
GEMIS database Refinery\Diesel-generic
General comments and/or relevant information
The functional unit of the dataset refers to the production of one TJ.
As stated in the dataset, it has been modelled based on the project called “Environmental Manual for Power Development (EM)” (see TiR criterion).
Based on the information reported in this document, the following main sources have been identified (references in bold are assumed as Authoritative Sources or Business Associations):
Table 81: Basic information used to assess the GEMIS crude oil products datasets.
Stage Type Reference Comments
Oil field exploration
- -
Crude oil production
OKO 1993, 1994; ESU 1994 Not found
ADL 1989 Methane emissions estimated from worldwide production.
Transport WEC 1988 Not found
Oil refining
ESU 1994 Not found
OKO 1994 Not found
WEC 1998 Not found
Technological representativeness
Regarding the technology description, data come from a generic oil refinery for diesel production.
Rate 3 (fair)
Justification The technology aspects have been modelled by a generic plant.
Concerning crude oil extraction, both onshore and offshore extraction has been included. Crude oil has been assumed to be imported from OPEC countries. Country- specific database adaptations have been conducted. The dataset assumes an inland distance through pipeline up to 100km and the international transport in tankers is about 8800 km, as default value.
Offshore extraction is assumed to be twice energy demanding than the onshore technology.
Data reviewed from studies for the oil industry have been used to model the refining processes.
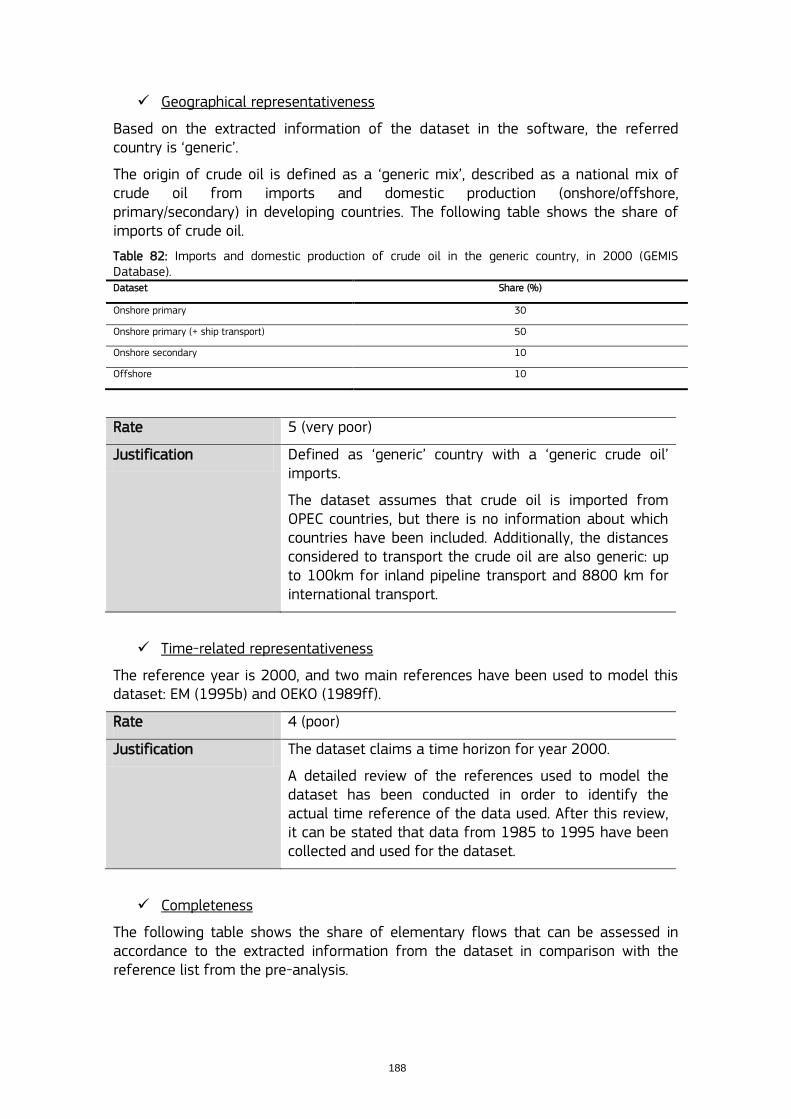
188
Geographical representativeness
Based on the extracted information of the dataset in the software, the referred country is „generic‟.
The origin of crude oil is defined as a „generic mix‟, described as a national mix of crude oil from imports and domestic production (onshore/offshore, primary/secondary) in developing countries. The following table shows the share of imports of crude oil.
Table 82: Imports and domestic production of crude oil in the generic country, in 2000 (GEMIS Database). Dataset Share (%)
Onshore primary 30
Onshore primary (+ ship transport) 50
Onshore secondary 10
Offshore 10
Rate 5 (very poor)
Justification Defined as „generic‟ country with a „generic crude oil‟ imports.
The dataset assumes that crude oil is imported from OPEC countries, but there is no information about which countries have been included. Additionally, the distances considered to transport the crude oil are also generic: up to 100km for inland pipeline transport and 8800 km for international transport.
Time-related representativeness
The reference year is 2000, and two main references have been used to model this dataset: EM (1995b) and OEKO (1989ff).
Rate 4 (poor)
Justification The dataset claims a time horizon for year 2000.
A detailed review of the references used to model the dataset has been conducted in order to identify the actual time reference of the data used. After this review, it can be stated that data from 1985 to 1995 have been collected and used for the dataset.
Completeness
The following table shows the share of elementary flows that can be assessed in accordance to the extracted information from the dataset in comparison with the reference list from the pre-analysis.
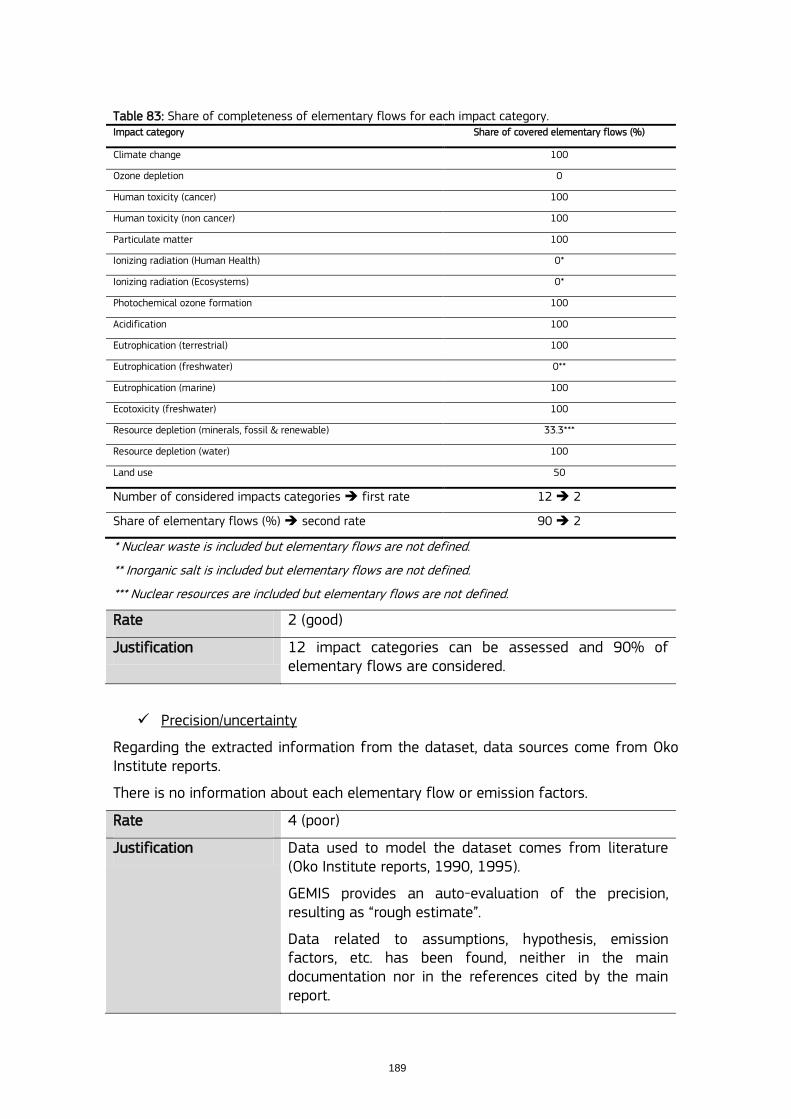
189
Table 83: Share of completeness of elementary flows for each impact category. Impact category Share of covered elementary flows (%)
Climate change 100
Ozone depletion 0
Human toxicity (cancer) 100
Human toxicity (non cancer) 100
Particulate matter 100
Ionizing radiation (Human Health) 0*
Ionizing radiation (Ecosystems) 0*
Photochemical ozone formation 100
Acidification 100
Eutrophication (terrestrial) 100
Eutrophication (freshwater) 0**
Eutrophication (marine) 100
Ecotoxicity (freshwater) 100
Resource depletion (minerals, fossil & renewable) 33.3***
Resource depletion (water) 100
Land use 50
Number of considered impacts categories first rate 12 2
Share of elementary flows (%) second rate 90 2
* Nuclear waste is included but elementary flows are not defined.
** Inorganic salt is included but elementary flows are not defined.
*** Nuclear resources are included but elementary flows are not defined.
Rate 2 (good)
Justification 12 impact categories can be assessed and 90% of elementary flows are considered.
Precision/uncertainty
Regarding the extracted information from the dataset, data sources come from Oko Institute reports.
There is no information about each elementary flow or emission factors.
Rate 4 (poor)
Justification Data used to model the dataset comes from literature (Oko Institute reports, 1990, 1995).
GEMIS provides an auto-evaluation of the precision, resulting as “rough estimate”.
Data related to assumptions, hypothesis, emission factors, etc. has been found, neither in the main documentation nor in the references cited by the main report.
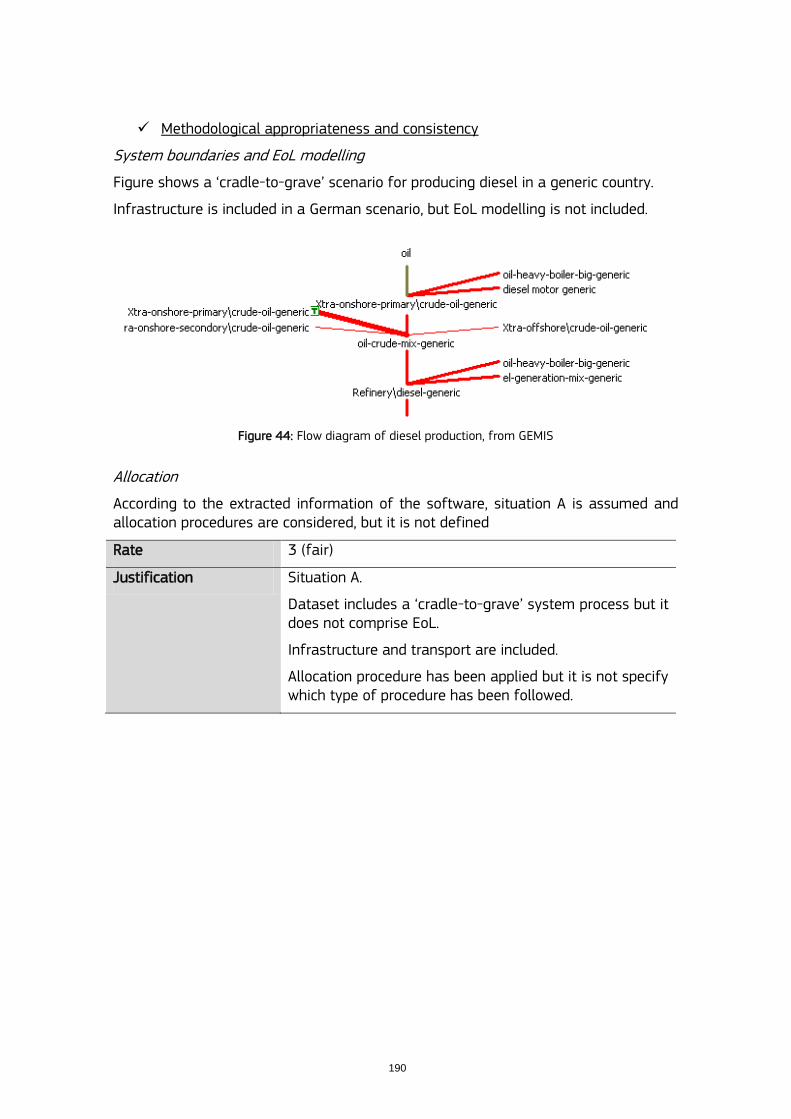
190
Methodological appropriateness and consistency
System boundaries and EoL modelling
Figure shows a „cradle-to-grave‟ scenario for producing diesel in a generic country.
Infrastructure is included in a German scenario, but EoL modelling is not included.
Figure 44: Flow diagram of diesel production, from GEMIS
Allocation
According to the extracted information of the software, situation A is assumed and allocation procedures are considered, but it is not defined
Rate 3 (fair)
Justification Situation A.
Dataset includes a „cradle-to-grave‟ system process but it does not comprise EoL.
Infrastructure and transport are included.
Allocation procedure has been applied but it is not specify which type of procedure has been followed.
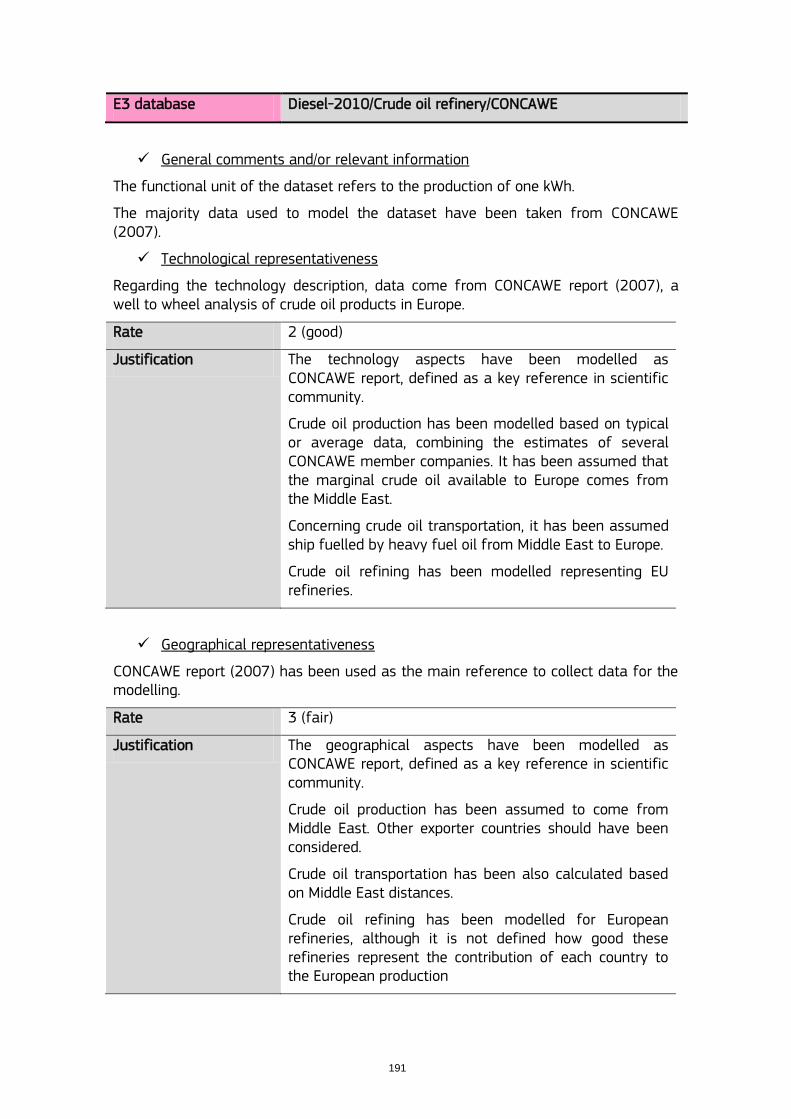
191
E3 database Diesel-2010/Crude oil refinery/CONCAWE
General comments and/or relevant information
The functional unit of the dataset refers to the production of one kWh.
The majority data used to model the dataset have been taken from CONCAWE (2007).
Technological representativeness
Regarding the technology description, data come from CONCAWE report (2007), a well to wheel analysis of crude oil products in Europe.
Rate 2 (good)
Justification The technology aspects have been modelled as CONCAWE report, defined as a key reference in scientific community.
Crude oil production has been modelled based on typical or average data, combining the estimates of several CONCAWE member companies. It has been assumed that the marginal crude oil available to Europe comes from the Middle East.
Concerning crude oil transportation, it has been assumed ship fuelled by heavy fuel oil from Middle East to Europe.
Crude oil refining has been modelled representing EU refineries.
Geographical representativeness
CONCAWE report (2007) has been used as the main reference to collect data for the modelling.
Rate 3 (fair)
Justification The geographical aspects have been modelled as CONCAWE report, defined as a key reference in scientific community.
Crude oil production has been assumed to come from Middle East. Other exporter countries should have been considered.
Crude oil transportation has been also calculated based on Middle East distances.
Crude oil refining has been modelled for European refineries, although it is not defined how good these refineries represent the contribution of each country to the European production
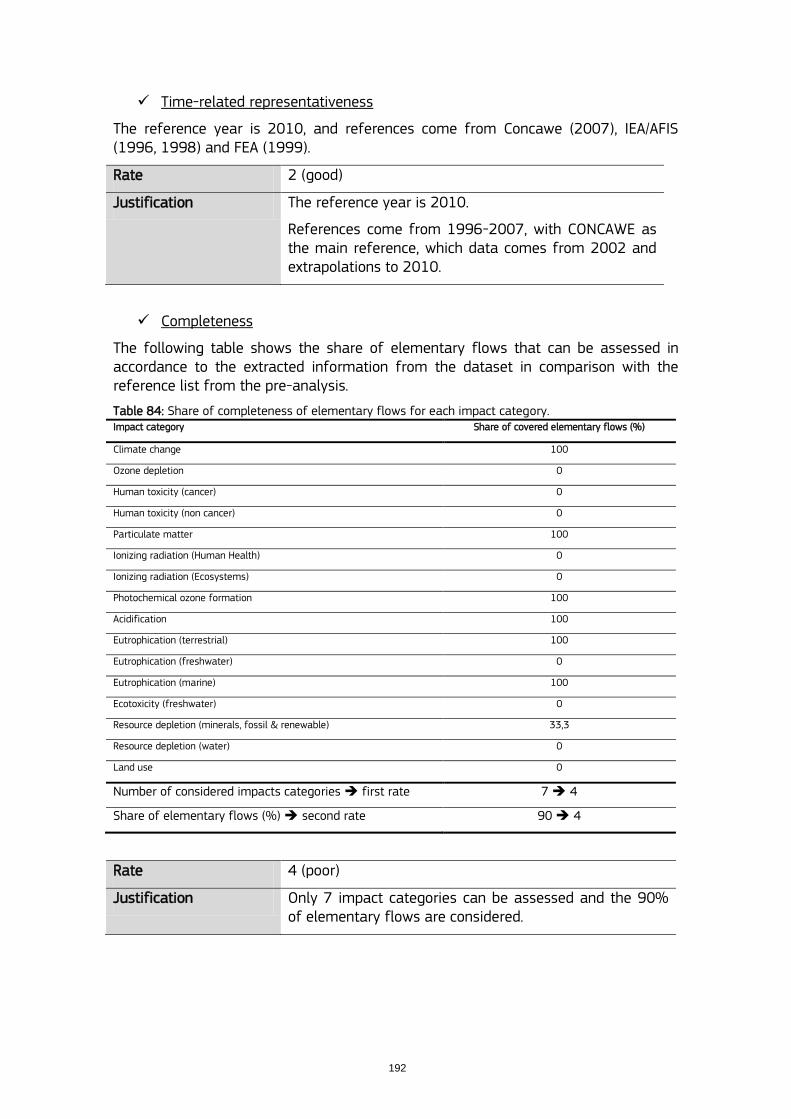
192
Time-related representativeness
The reference year is 2010, and references come from Concawe (2007), IEA/AFIS (1996, 1998) and FEA (1999).
Rate 2 (good)
Justification The reference year is 2010.
References come from 1996-2007, with CONCAWE as the main reference, which data comes from 2002 and extrapolations to 2010.
Completeness
The following table shows the share of elementary flows that can be assessed in accordance to the extracted information from the dataset in comparison with the reference list from the pre-analysis.
Table 84: Share of completeness of elementary flows for each impact category. Impact category Share of covered elementary flows (%)
Climate change 100
Ozone depletion 0
Human toxicity (cancer) 0
Human toxicity (non cancer) 0
Particulate matter 100
Ionizing radiation (Human Health) 0
Ionizing radiation (Ecosystems) 0
Photochemical ozone formation 100
Acidification 100
Eutrophication (terrestrial) 100
Eutrophication (freshwater) 0
Eutrophication (marine) 100
Ecotoxicity (freshwater) 0
Resource depletion (minerals, fossil & renewable) 33,3
Resource depletion (water) 0
Land use 0
Number of considered impacts categories first rate 7 4
Share of elementary flows (%) second rate 90 4
Rate 4 (poor)
Justification Only 7 impact categories can be assessed and the 90% of elementary flows are considered.
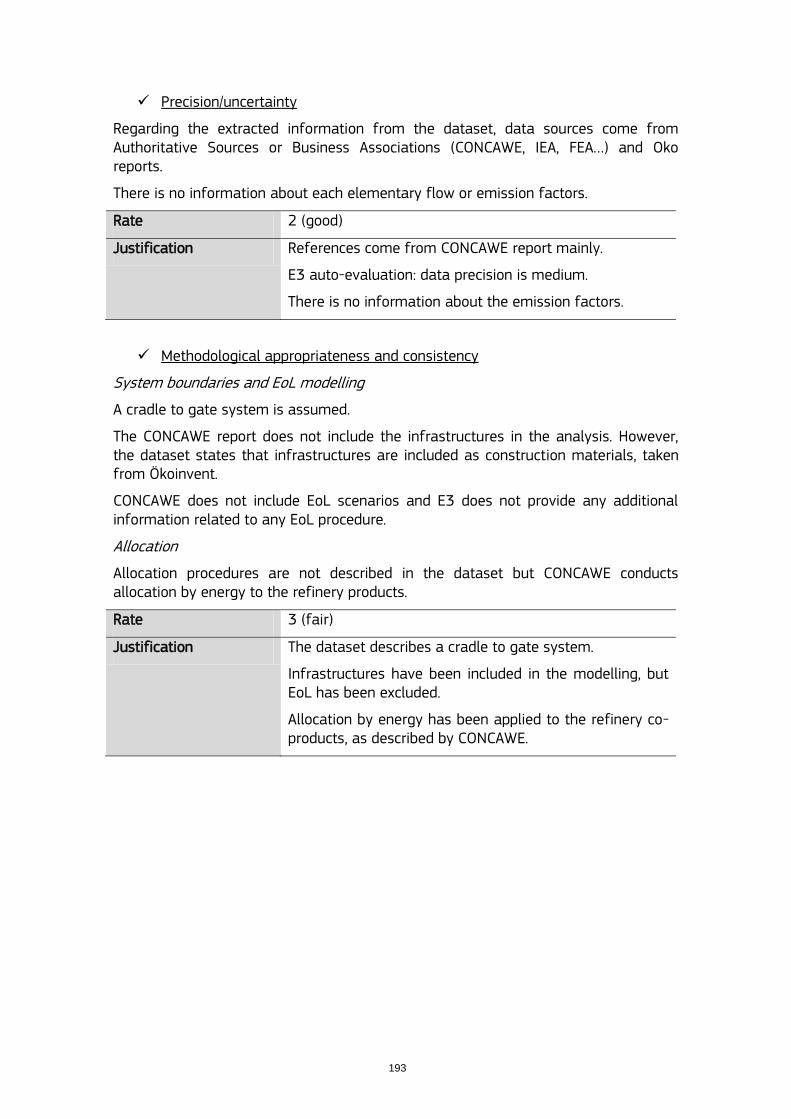
193
Precision/uncertainty
Regarding the extracted information from the dataset, data sources come from Authoritative Sources or Business Associations (CONCAWE, IEA, FEA…) and Oko reports.
There is no information about each elementary flow or emission factors.
Rate 2 (good)
Justification References come from CONCAWE report mainly.
E3 auto-evaluation: data precision is medium.
There is no information about the emission factors.
Methodological appropriateness and consistency
System boundaries and EoL modelling
A cradle to gate system is assumed.
The CONCAWE report does not include the infrastructures in the analysis. However, the dataset states that infrastructures are included as construction materials, taken from Ökoinvent.
CONCAWE does not include EoL scenarios and E3 does not provide any additional information related to any EoL procedure.
Allocation
Allocation procedures are not described in the dataset but CONCAWE conducts allocation by energy to the refinery products.
Rate 3 (fair)
Justification The dataset describes a cradle to gate system.
Infrastructures have been included in the modelling, but EoL has been excluded.
Allocation by energy has been applied to the refinery co-products, as described by CONCAWE.
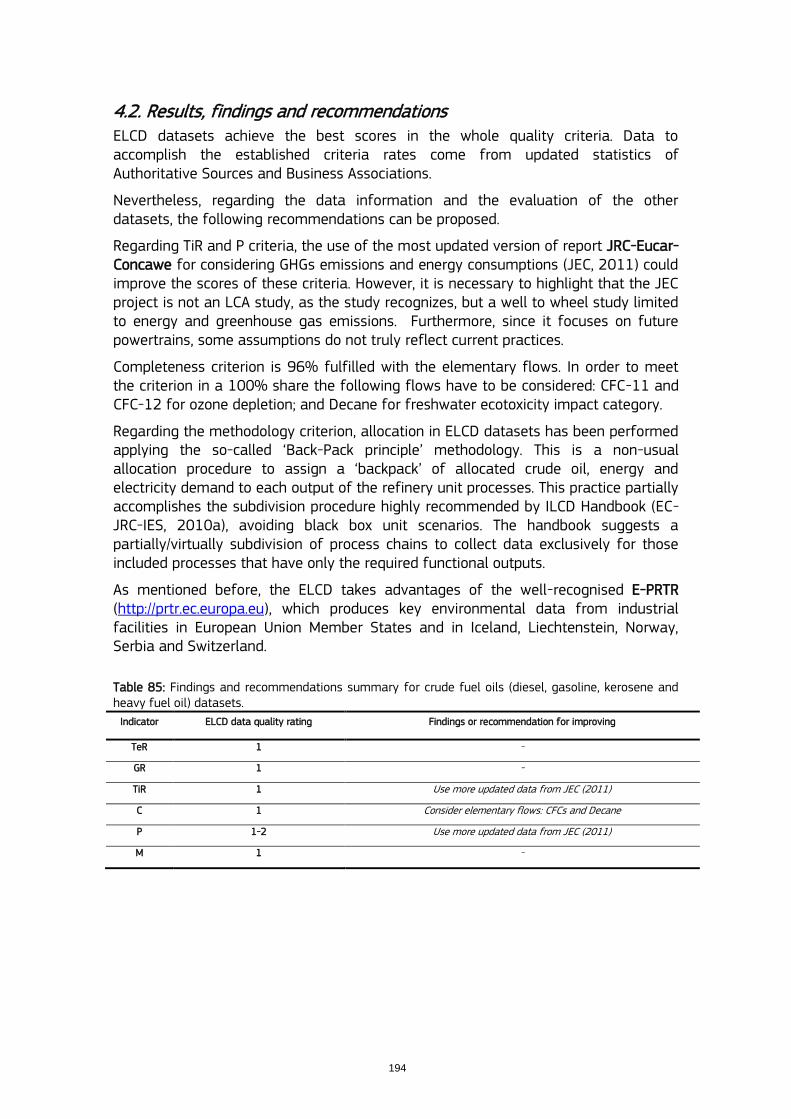
194
4.2. Results, findings and recommendations ELCD datasets achieve the best scores in the whole quality criteria. Data to accomplish the established criteria rates come from updated statistics of Authoritative Sources and Business Associations.
Nevertheless, regarding the data information and the evaluation of the other datasets, the following recommendations can be proposed.
Regarding TiR and P criteria, the use of the most updated version of report JRC-Eucar-Concawe for considering GHGs emissions and energy consumptions (JEC, 2011) could improve the scores of these criteria. However, it is necessary to highlight that the JEC project is not an LCA study, as the study recognizes, but a well to wheel study limited to energy and greenhouse gas emissions. Furthermore, since it focuses on future powertrains, some assumptions do not truly reflect current practices.
Completeness criterion is 96% fulfilled with the elementary flows. In order to meet the criterion in a 100% share the following flows have to be considered: CFC-11 and CFC-12 for ozone depletion; and Decane for freshwater ecotoxicity impact category.
Regarding the methodology criterion, allocation in ELCD datasets has been performed applying the so-called „Back-Pack principle‟ methodology. This is a non-usual allocation procedure to assign a „backpack‟ of allocated crude oil, energy and electricity demand to each output of the refinery unit processes. This practice partially accomplishes the subdivision procedure highly recommended by ILCD Handbook (EC-JRC-IES, 2010a), avoiding black box unit scenarios. The handbook suggests a partially/virtually subdivision of process chains to collect data exclusively for those included processes that have only the required functional outputs.
As mentioned before, the ELCD takes advantages of the well-recognised E-PRTR (http://prtr.ec.europa.eu), which produces key environmental data from industrial facilities in European Union Member States and in Iceland, Liechtenstein, Norway, Serbia and Switzerland.
Table 85: Findings and recommendations summary for crude fuel oils (diesel, gasoline, kerosene and heavy fuel oil) datasets.
Indicator ELCD data quality rating Findings or recommendation for improving
TeR 1 -
GR 1 -
TiR 1 Use more updated data from JEC (2011)
C 1 Consider elementary flows: CFCs and Decane
P 1-2 Use more updated data from JEC (2011)
M 1 -
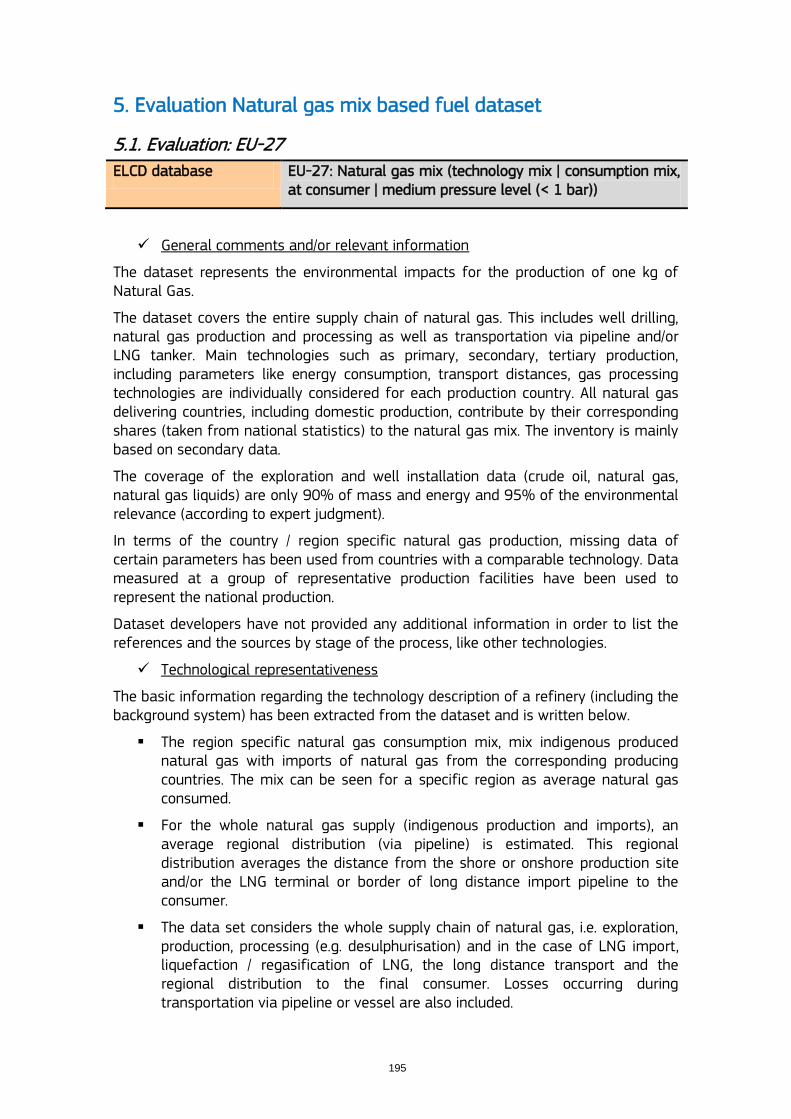
195
5. Evaluation Natural gas mix based fuel dataset
5.1. Evaluation: EU-27
ELCD database EU-27: Natural gas mix (technology mix | consumption mix, at consumer | medium pressure level (< 1 bar))
General comments and/or relevant information
The dataset represents the environmental impacts for the production of one kg of Natural Gas.
The dataset covers the entire supply chain of natural gas. This includes well drilling, natural gas production and processing as well as transportation via pipeline and/or LNG tanker. Main technologies such as primary, secondary, tertiary production, including parameters like energy consumption, transport distances, gas processing technologies are individually considered for each production country. All natural gas delivering countries, including domestic production, contribute by their corresponding shares (taken from national statistics) to the natural gas mix. The inventory is mainly based on secondary data.
The coverage of the exploration and well installation data (crude oil, natural gas, natural gas liquids) are only 90% of mass and energy and 95% of the environmental relevance (according to expert judgment).
In terms of the country / region specific natural gas production, missing data of certain parameters has been used from countries with a comparable technology. Data measured at a group of representative production facilities have been used to represent the national production.
Dataset developers have not provided any additional information in order to list the references and the sources by stage of the process, like other technologies.
Technological representativeness
The basic information regarding the technology description of a refinery (including the background system) has been extracted from the dataset and is written below.
The region specific natural gas consumption mix, mix indigenous produced natural gas with imports of natural gas from the corresponding producing countries. The mix can be seen for a specific region as average natural gas consumed.
For the whole natural gas supply (indigenous production and imports), an average regional distribution (via pipeline) is estimated. This regional distribution averages the distance from the shore or onshore production site and/or the LNG terminal or border of long distance import pipeline to the consumer.
The data set considers the whole supply chain of natural gas, i.e. exploration, production, processing (e.g. desulphurisation) and in the case of LNG import, liquefaction / regasification of LNG, the long distance transport and the regional distribution to the final consumer. Losses occurring during transportation via pipeline or vessel are also included.
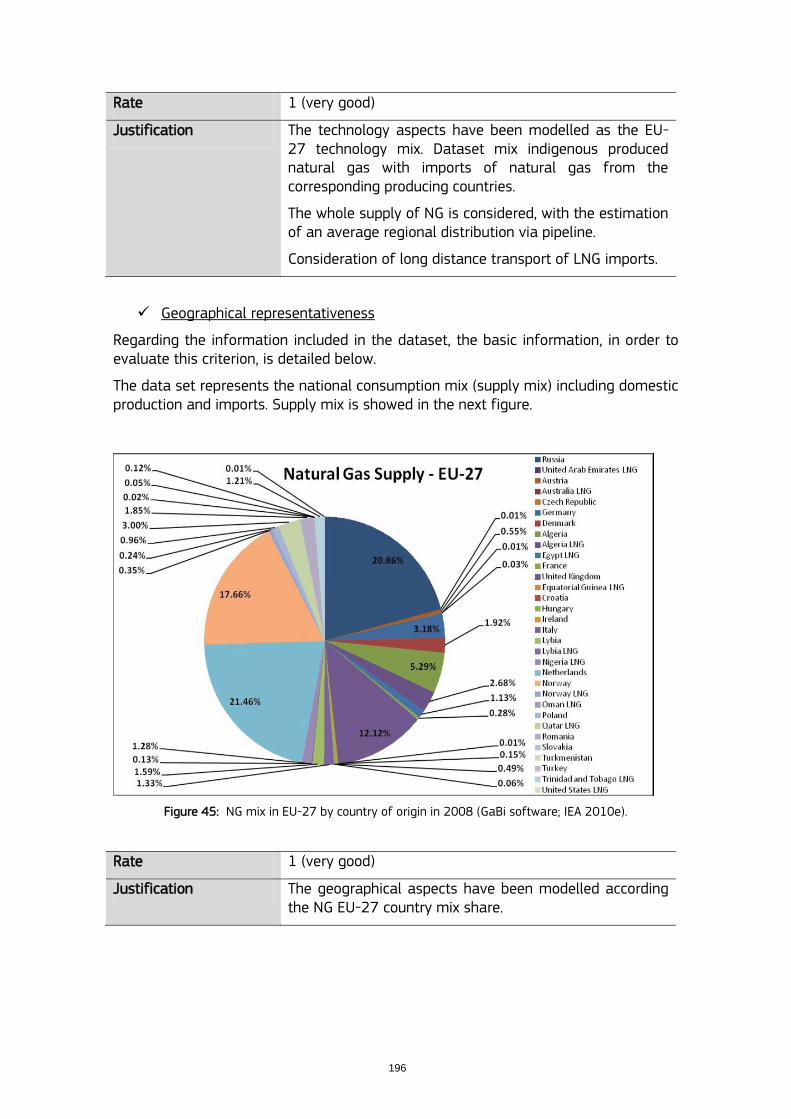
196
Rate 1 (very good)
Justification The technology aspects have been modelled as the EU-27 technology mix. Dataset mix indigenous produced natural gas with imports of natural gas from the corresponding producing countries.
The whole supply of NG is considered, with the estimation of an average regional distribution via pipeline.
Consideration of long distance transport of LNG imports.
Geographical representativeness
Regarding the information included in the dataset, the basic information, in order to evaluate this criterion, is detailed below.
The data set represents the national consumption mix (supply mix) including domestic production and imports. Supply mix is showed in the next figure.
Figure 45: NG mix in EU-27 by country of origin in 2008 (GaBi software; IEA 2010e).
Rate 1 (very good)
Justification The geographical aspects have been modelled according the NG EU-27 country mix share.
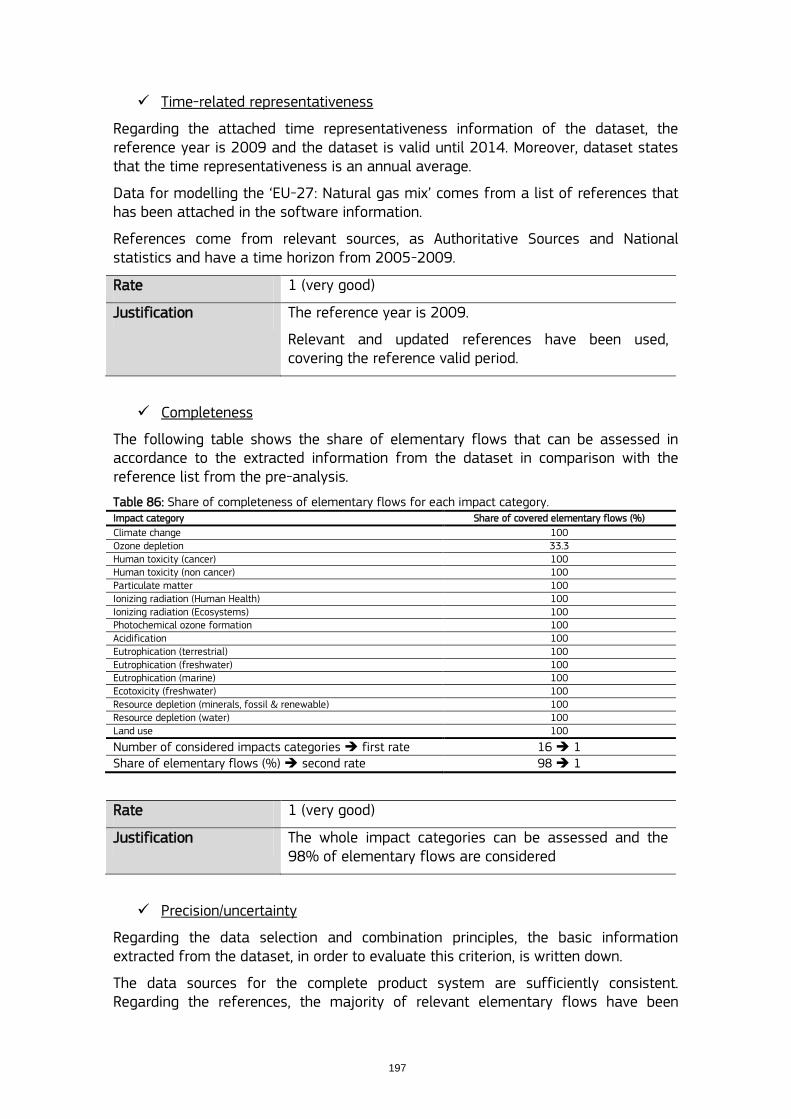
197
Time-related representativeness
Regarding the attached time representativeness information of the dataset, the reference year is 2009 and the dataset is valid until 2014. Moreover, dataset states that the time representativeness is an annual average.
Data for modelling the „EU-27: Natural gas mix‟ comes from a list of references that has been attached in the software information.
References come from relevant sources, as Authoritative Sources and National statistics and have a time horizon from 2005-2009.
Rate 1 (very good)
Justification The reference year is 2009.
Relevant and updated references have been used, covering the reference valid period.
Completeness
The following table shows the share of elementary flows that can be assessed in accordance to the extracted information from the dataset in comparison with the reference list from the pre-analysis.
Table 86: Share of completeness of elementary flows for each impact category. Impact category Share of covered elementary flows (%)
Climate change 100 Ozone depletion 33.3 Human toxicity (cancer) 100 Human toxicity (non cancer) 100 Particulate matter 100 Ionizing radiation (Human Health) 100 Ionizing radiation (Ecosystems) 100 Photochemical ozone formation 100 Acidification 100 Eutrophication (terrestrial) 100 Eutrophication (freshwater) 100 Eutrophication (marine) 100 Ecotoxicity (freshwater) 100 Resource depletion (minerals, fossil & renewable) 100 Resource depletion (water) 100 Land use 100
Number of considered impacts categories first rate 16 1 Share of elementary flows (%) second rate 98 1
Rate 1 (very good)
Justification The whole impact categories can be assessed and the 98% of elementary flows are considered
Precision/uncertainty
Regarding the data selection and combination principles, the basic information extracted from the dataset, in order to evaluate this criterion, is written down.
The data sources for the complete product system are sufficiently consistent. Regarding the references, the majority of relevant elementary flows have been
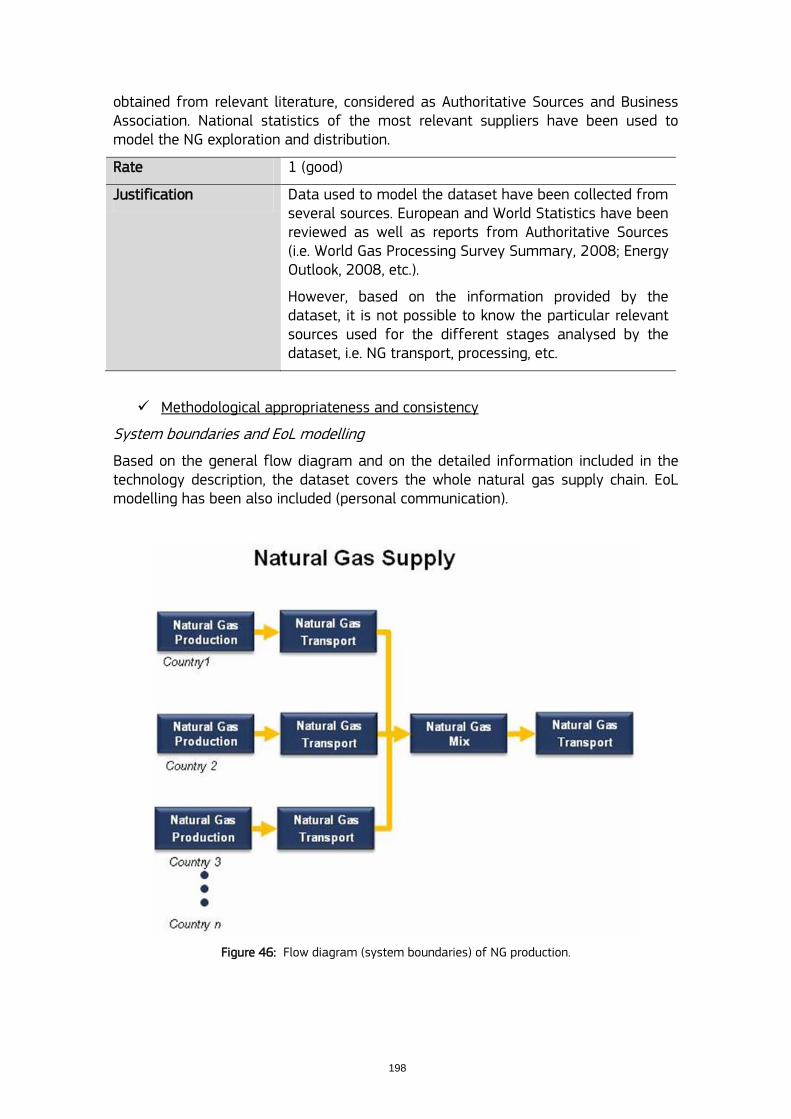
198
obtained from relevant literature, considered as Authoritative Sources and Business Association. National statistics of the most relevant suppliers have been used to model the NG exploration and distribution.
Rate 1 (good)
Justification Data used to model the dataset have been collected from several sources. European and World Statistics have been reviewed as well as reports from Authoritative Sources (i.e. World Gas Processing Survey Summary, 2008; Energy Outlook, 2008, etc.).
However, based on the information provided by the dataset, it is not possible to know the particular relevant sources used for the different stages analysed by the dataset, i.e. NG transport, processing, etc.
Methodological appropriateness and consistency
System boundaries and EoL modelling
Based on the general flow diagram and on the detailed information included in the technology description, the dataset covers the whole natural gas supply chain. EoL modelling has been also included (personal communication).
Figure 46: Flow diagram (system boundaries) of NG production.
199
Allocation
The extracted information from „Modelling and validation: LCI method and allocation‟ is the following:
LCI method principle: Attributional Situation A
LCI methods approach: Allocation (net calorific value).
Deviations from LCI approaches: For the combined crude oil, natural gas and natural gas liquids (NGL) production allocation by net calorific value is applied.
Modelling constants: All data used in the calculation of the LCI results refer to net calorific value.
Rate 1 (very good)
Justification The dataset has been modelled under situation A.
It models a „cradle-to-grave‟ system process.
Infrastructures and EoL modelling have been taken into account.
Allocation procedure has been applied through the net calorific value.
200
Ecoinvent database Natural gas, at long distance pipeline, RER
General comments and/or relevant information
The functional unit of the datasets refers to the production of one Nm3. This dataset describes the structure of the European gas requirements with regard to the countries of origin.
The system model “Natural Gas” describes the production and distribution of natural gas for industrial and domestic applications in Switzerland and Western Europe. The inventory includes gas field exploration, natural gas production, natural gas purification, long distance transport, regional distribution and local supply.
Relevant references used to model the dataset are listed in the following table (references in bold are identified as Authoritative Sources or Business Associations). This information has been extracted from the dataset and the document Ecoinvent (2007).
Table 87: Basic information used to assess the Ecoinvent NG fuel dataset.
Stage Type Reference Comments
NG supply
Jungbluth 2003; MEZ 2000; OLF 2001; WEG 2001
NG exploration: drilling and demand
Nisbet 2001; OLF 2001; Faist Emmenegger 2004
Production in North Sea, onshore Germany, Algeria, Russia and Nigeria
Aróstegui 2007; DGMK 1992; SWISSGAS 1999; ExternE 1999
Fuel properties
Transport Long distance
Snam 1999, 2000; personal communications with industrial experts
Pipeline and LNG tanker and freight ship
Regional Liechti 2002; Reichert 2000; Seifert 1998
Regional distribution and supply
Technological representativeness
The information regarding the technology description for natural gas is described in the LCI report (Ecoinvent, 2007) and in the dataset info. Below there is a short description of the most relevant information, used to assess this criterion: The processes included in the dataset Natural gas European mix are the following:
„Natural gas, production DE, at long-distance pipeline, RER‟.
„Natural gas, production, at production onshore, DE‟.
„Natural gas, production DZ, at long-distance pipeline, RER‟.
„Natural gas, production, at production onshore, DZ‟.
„Natural gas, production GB, at long-distance pipeline, RER‟.
„Natural gas, production, at production offshore, GB‟.
„Natural gas, production NL, at long-distance pipeline, RER‟:
o „Natural gas, production, at production onshore, NL‟.
o „Natural gas, production, at production offshore, NL‟.
„Natural gas, production NO, at long-distance pipeline, RER‟.
„Natural gas, production, at production offshore, NO‟.
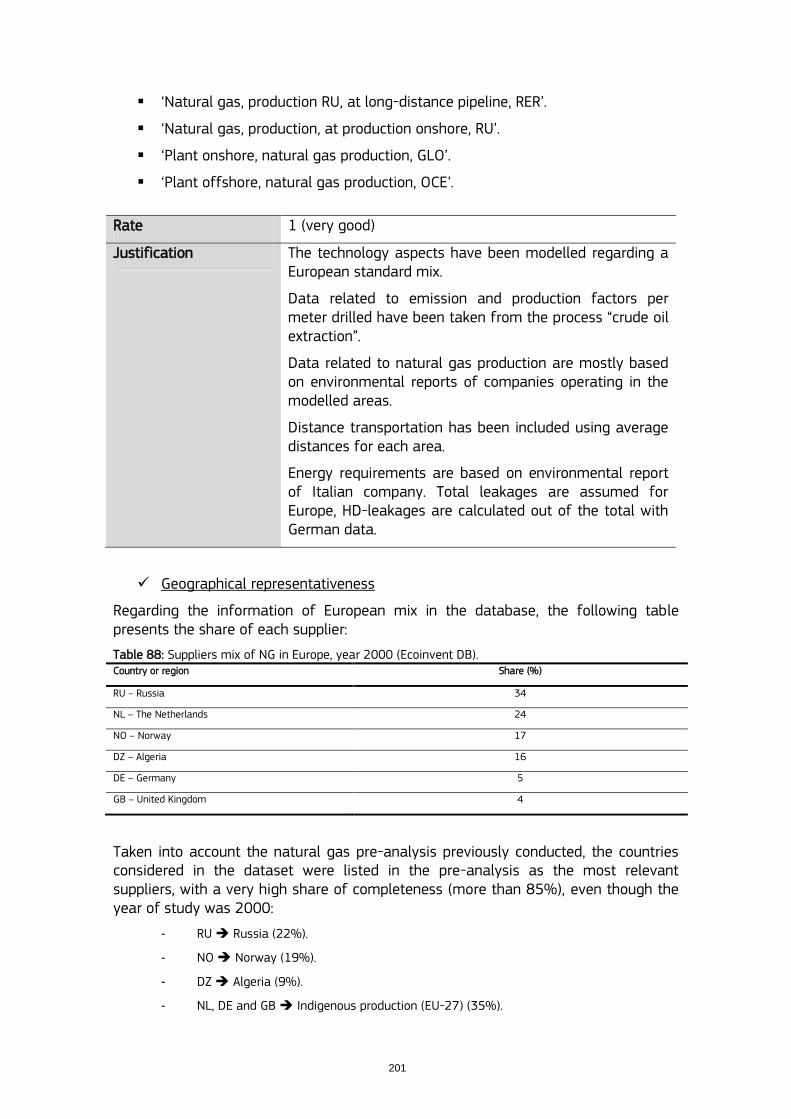
201
„Natural gas, production RU, at long-distance pipeline, RER‟.
„Natural gas, production, at production onshore, RU‟.
„Plant onshore, natural gas production, GLO‟.
„Plant offshore, natural gas production, OCE‟.
Rate 1 (very good)
Justification The technology aspects have been modelled regarding a European standard mix.
Data related to emission and production factors per meter drilled have been taken from the process “crude oil extraction”.
Data related to natural gas production are mostly based on environmental reports of companies operating in the modelled areas.
Distance transportation has been included using average distances for each area.
Energy requirements are based on environmental report of Italian company. Total leakages are assumed for Europe, HD-leakages are calculated out of the total with German data.
Geographical representativeness
Regarding the information of European mix in the database, the following table presents the share of each supplier:
Table 88: Suppliers mix of NG in Europe, year 2000 (Ecoinvent DB). Country or region Share (%)
RU – Russia 34
NL – The Netherlands 24
NO – Norway 17
DZ – Algeria 16
DE – Germany 5
GB – United Kingdom 4
Taken into account the natural gas pre-analysis previously conducted, the countries considered in the dataset were listed in the pre-analysis as the most relevant suppliers, with a very high share of completeness (more than 85%), even though the year of study was 2000:
- RU Russia (22%).
- NO Norway (19%).
- DZ Algeria (9%).
- NL, DE and GB Indigenous production (EU-27) (35%).
202
Rate 2 (good)
Justification The dataset includes more than 85% of the countries detailed in the pre-analysis. Minor countries are not included.
Time-related representativeness
Regarding the information of the datasets, the time periods are the following:
„Natural gas, production‟: 1989-2000.
„Natural gas, at long distance pipeline‟: 2000-2001.
References from dataset are detailed in the table of General comments. The following list details the main data sources of each country dataset included in the NG mix production in Europe:
NG of Norway: Data come from an environmental report for the total Norwegian production in year 2000 (OFL, 2001)
NG of The Netherlands: 75% of the data production comes from a national environmental report in 2000 (NAM 2001).
NG of Germany: 50% of the data production comes from a national environmental report in 2000 (BEB 2001). Data for disposal stages are extrapolations from Norway.
NG of United Kingdom: Data come from Jungbluth (2003) report, which is not available.
NG of Russia: Data come from estimations of several reports from 1990-2001. Data for disposal stages are extrapolations from Norway.
NG of Algeria: Main data come from extrapolations of Europe conditions. Data for disposal stages are extrapolations from Norway. No year references.
Rate 2 (good)
Justification The reference year stated at the dataset is 2000.
Based on the information shown before, the main contributors to the dataset cover the time horizon. There are few data collected for previous years, such as natural gas production in Russia.
Completeness
The following table shows the share of elementary flows that can be assessed in accordance to the extracted information from the dataset in comparison with the reference list from the pre-analysis.
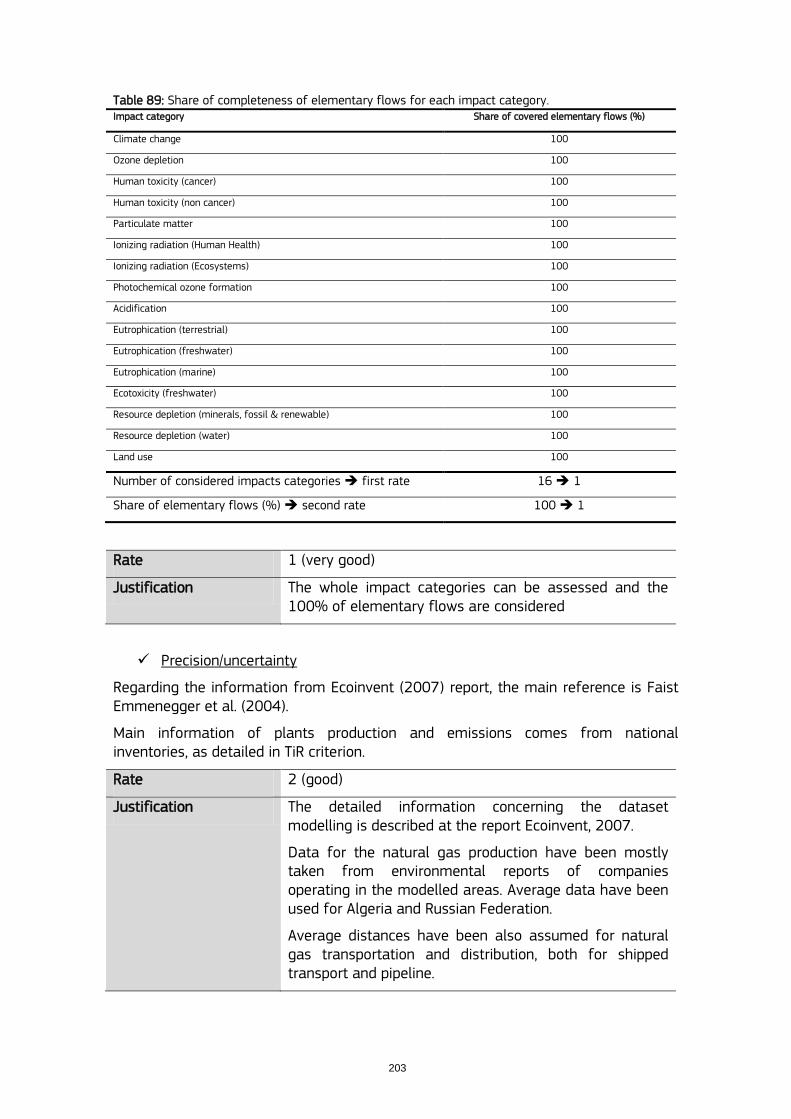
203
Table 89: Share of completeness of elementary flows for each impact category. Impact category Share of covered elementary flows (%)
Climate change 100
Ozone depletion 100
Human toxicity (cancer) 100
Human toxicity (non cancer) 100
Particulate matter 100
Ionizing radiation (Human Health) 100
Ionizing radiation (Ecosystems) 100
Photochemical ozone formation 100
Acidification 100
Eutrophication (terrestrial) 100
Eutrophication (freshwater) 100
Eutrophication (marine) 100
Ecotoxicity (freshwater) 100
Resource depletion (minerals, fossil & renewable) 100
Resource depletion (water) 100
Land use 100
Number of considered impacts categories first rate 16 1
Share of elementary flows (%) second rate 100 1
Rate 1 (very good)
Justification The whole impact categories can be assessed and the 100% of elementary flows are considered
Precision/uncertainty
Regarding the information from Ecoinvent (2007) report, the main reference is Faist Emmenegger et al. (2004).
Main information of plants production and emissions comes from national inventories, as detailed in TiR criterion.
Rate 2 (good)
Justification The detailed information concerning the dataset modelling is described at the report Ecoinvent, 2007.
Data for the natural gas production have been mostly taken from environmental reports of companies operating in the modelled areas. Average data have been used for Algeria and Russian Federation.
Average distances have been also assumed for natural gas transportation and distribution, both for shipped transport and pipeline.
204
Methodological appropriateness and consistency
System boundaries and EoL modelling
The model includes the natural gas production, transport (via pipeline) and the distribution.
Production and construction of the infrastructures, such as pipelines, are included.
Regarding EoL modelling, production of waste along the system has been taken into account, but there is no information about any waste treatment and dismantling of the infrastructures.
Allocation
The allocation procedure followed for the co-products is based on the heating value.
Situation A is assumed.
Rate 2 (good)
Justification The dataset has been modelling under situation A.
Dataset includes a „cradle-to-grave‟ system.
EoL modelling is not described.
Infrastructure and transports are included.
Allocation is included, based on heating value.
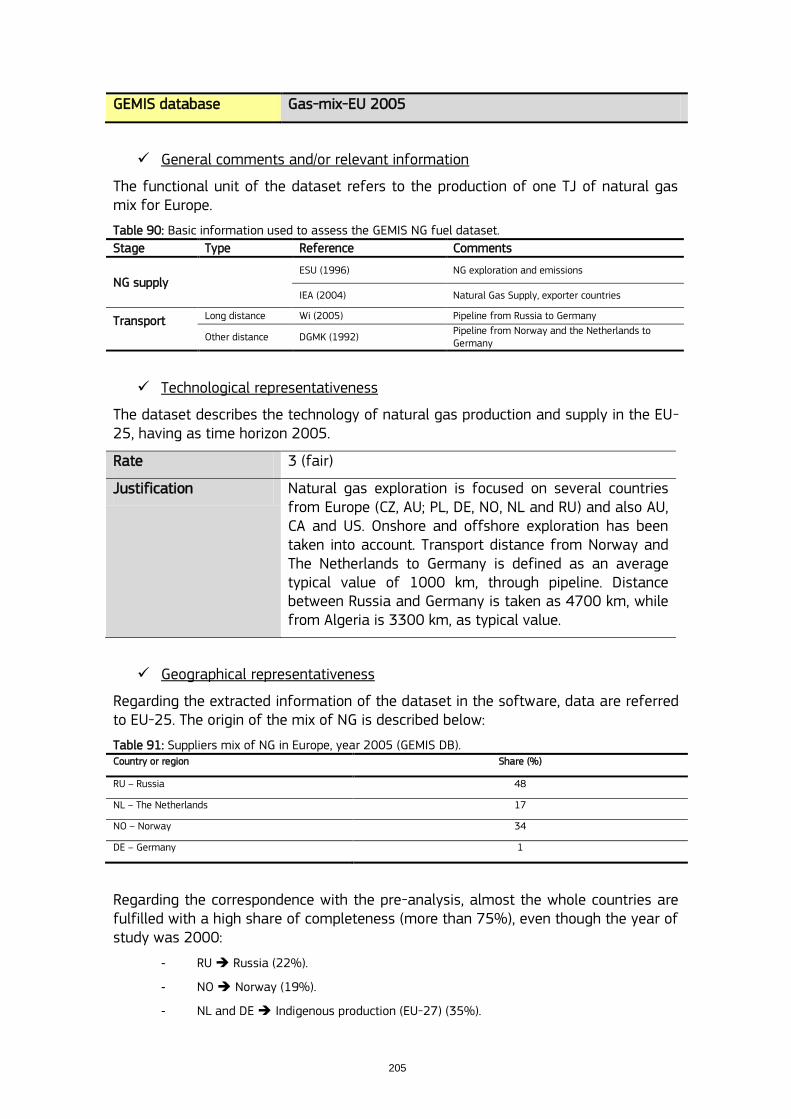
205
GEMIS database Gas-mix-EU 2005
General comments and/or relevant information
The functional unit of the dataset refers to the production of one TJ of natural gas mix for Europe.
Table 90: Basic information used to assess the GEMIS NG fuel dataset.
Stage Type Reference Comments
NG supply ESU (1996) NG exploration and emissions
IEA (2004) Natural Gas Supply, exporter countries
Transport
Long distance Wi (2005) Pipeline from Russia to Germany
Other distance DGMK (1992) Pipeline from Norway and the Netherlands to Germany
Technological representativeness
The dataset describes the technology of natural gas production and supply in the EU-25, having as time horizon 2005.
Rate 3 (fair)
Justification Natural gas exploration is focused on several countries from Europe (CZ, AU; PL, DE, NO, NL and RU) and also AU, CA and US. Onshore and offshore exploration has been taken into account. Transport distance from Norway and The Netherlands to Germany is defined as an average typical value of 1000 km, through pipeline. Distance between Russia and Germany is taken as 4700 km, while from Algeria is 3300 km, as typical value.
Geographical representativeness
Regarding the extracted information of the dataset in the software, data are referred to EU-25. The origin of the mix of NG is described below:
Table 91: Suppliers mix of NG in Europe, year 2005 (GEMIS DB). Country or region Share (%)
RU – Russia 48
NL – The Netherlands 17
NO – Norway 34
DE – Germany 1
Regarding the correspondence with the pre-analysis, almost the whole countries are fulfilled with a high share of completeness (more than 75%), even though the year of study was 2000:
- RU Russia (22%).
- NO Norway (19%).
- NL and DE Indigenous production (EU-27) (35%).
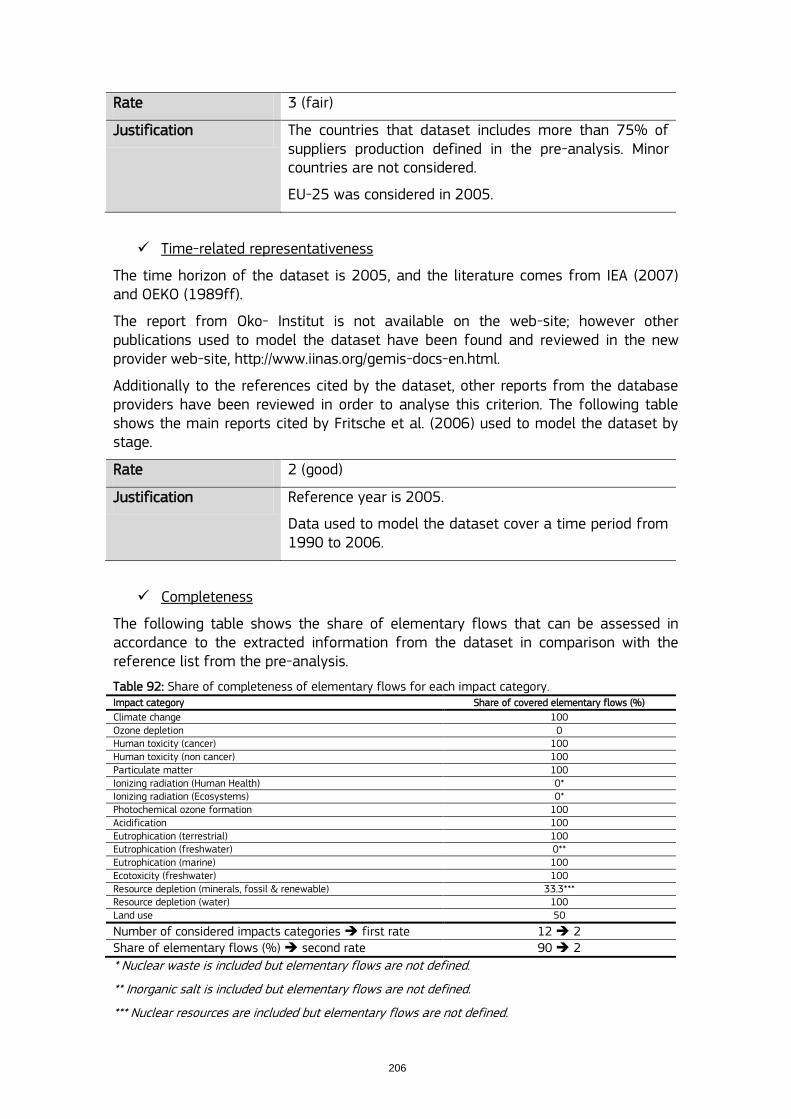
206
Rate 3 (fair)
Justification The countries that dataset includes more than 75% of suppliers production defined in the pre-analysis. Minor countries are not considered.
EU-25 was considered in 2005.
Time-related representativeness
The time horizon of the dataset is 2005, and the literature comes from IEA (2007) and OEKO (1989ff).
The report from Oko- Institut is not available on the web-site; however other publications used to model the dataset have been found and reviewed in the new provider web-site, http://www.iinas.org/gemis-docs-en.html.
Additionally to the references cited by the dataset, other reports from the database providers have been reviewed in order to analyse this criterion. The following table shows the main reports cited by Fritsche et al. (2006) used to model the dataset by stage.
Rate 2 (good)
Justification Reference year is 2005.
Data used to model the dataset cover a time period from 1990 to 2006.
Completeness
The following table shows the share of elementary flows that can be assessed in accordance to the extracted information from the dataset in comparison with the reference list from the pre-analysis.
Table 92: Share of completeness of elementary flows for each impact category. Impact category Share of covered elementary flows (%)
Climate change 100 Ozone depletion 0 Human toxicity (cancer) 100 Human toxicity (non cancer) 100 Particulate matter 100 Ionizing radiation (Human Health) 0* Ionizing radiation (Ecosystems) 0* Photochemical ozone formation 100 Acidification 100 Eutrophication (terrestrial) 100 Eutrophication (freshwater) 0** Eutrophication (marine) 100 Ecotoxicity (freshwater) 100 Resource depletion (minerals, fossil & renewable) 33.3*** Resource depletion (water) 100 Land use 50
Number of considered impacts categories first rate 12 2 Share of elementary flows (%) second rate 90 2
* Nuclear waste is included but elementary flows are not defined.
** Inorganic salt is included but elementary flows are not defined.
*** Nuclear resources are included but elementary flows are not defined.

207
Rate 2 (good)
Justification 12 impact categories can be assessed and 90% of elementary flows are considered.
Precision/uncertainty
According to the dataset, the quality of primary data is good .In order to assess this criterion; a deep review of all documentation provided at the web-site of the database has been conducted.
Rate 4 (poor)
Justification Although one of the main reference used to model the dataset is a relevant Authoritative Body, the IEA, there is a lack of information about how the data have been collected and the origin of these.
Emission factors have been taken from the report ESU, 1996. Since this study has been updated in several versions, it is not possible to identify the precision of these data.
Average distances have been taken for pipeline transportation. However, there is no much information about how the average has been calculated.
There is no extra Information about plants.
Methodological appropriateness and consistency
System boundaries and EoL modelling
Figure shows a „cradle-to-grave‟ scenario for producing and supplying NG in the EU-25.
Infrastructures are included in Germans scenarios, but EoL modelling has not been considered.
Figure 47: Flow diagram of NG production and supply, from GEMIS
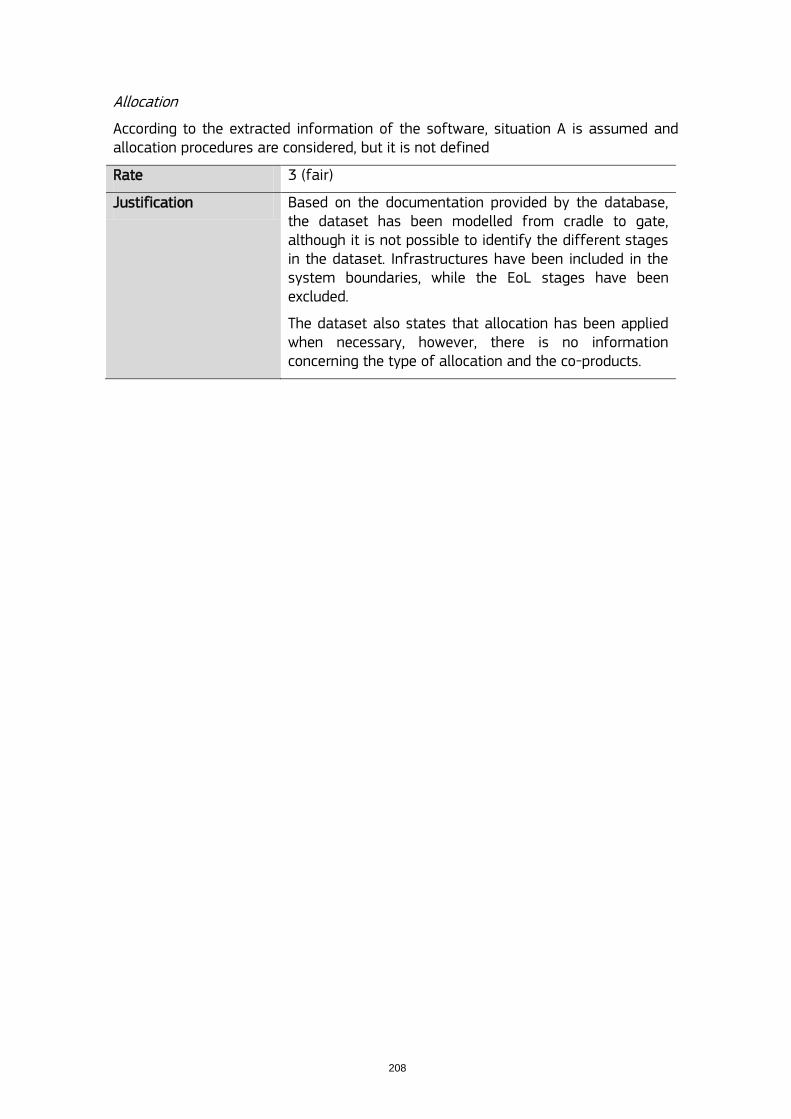
208
Allocation
According to the extracted information of the software, situation A is assumed and allocation procedures are considered, but it is not defined
Rate 3 (fair)
Justification Based on the documentation provided by the database, the dataset has been modelled from cradle to gate, although it is not possible to identify the different stages in the dataset. Infrastructures have been included in the system boundaries, while the EoL stages have been excluded.
The dataset also states that allocation has been applied when necessary, however, there is no information concerning the type of allocation and the co-products.
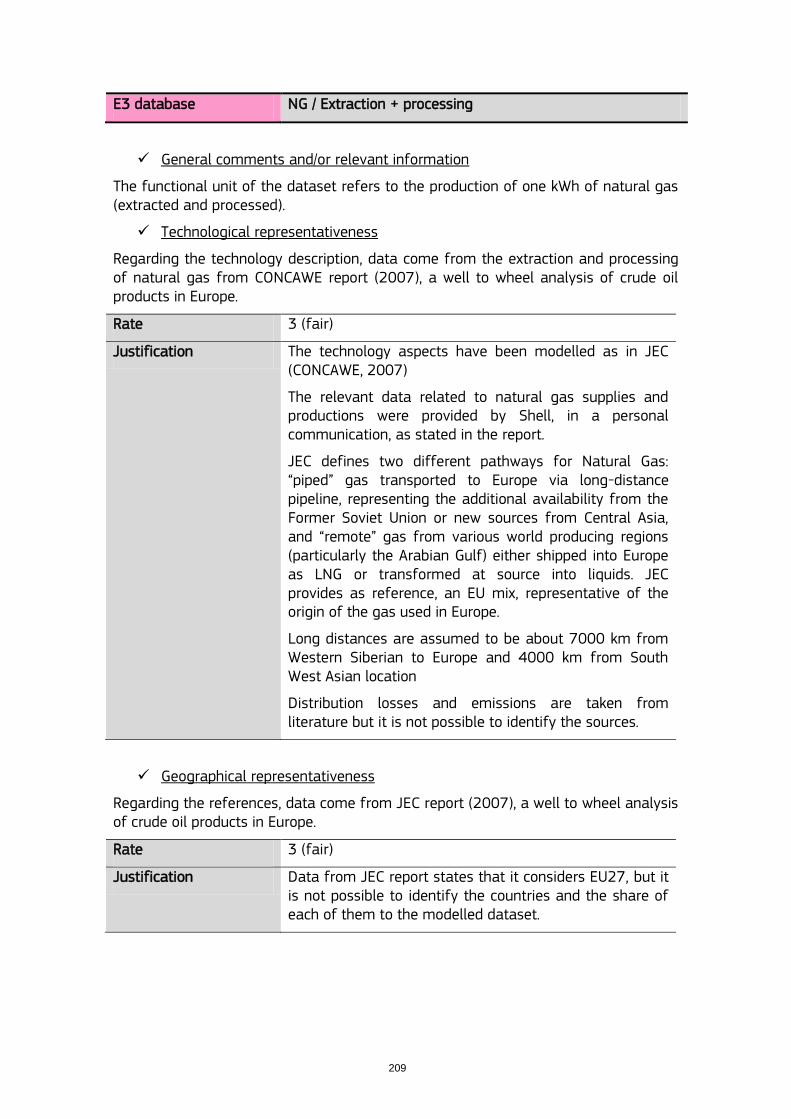
209
E3 database NG / Extraction + processing
General comments and/or relevant information
The functional unit of the dataset refers to the production of one kWh of natural gas (extracted and processed).
Technological representativeness
Regarding the technology description, data come from the extraction and processing of natural gas from CONCAWE report (2007), a well to wheel analysis of crude oil products in Europe.
Rate 3 (fair)
Justification The technology aspects have been modelled as in JEC (CONCAWE, 2007)
The relevant data related to natural gas supplies and productions were provided by Shell, in a personal communication, as stated in the report.
JEC defines two different pathways for Natural Gas: “piped” gas transported to Europe via long-distance pipeline, representing the additional availability from the Former Soviet Union or new sources from Central Asia, and “remote” gas from various world producing regions (particularly the Arabian Gulf) either shipped into Europe as LNG or transformed at source into liquids. JEC provides as reference, an EU mix, representative of the origin of the gas used in Europe.
Long distances are assumed to be about 7000 km from Western Siberian to Europe and 4000 km from South West Asian location
Distribution losses and emissions are taken from literature but it is not possible to identify the sources.
Geographical representativeness
Regarding the references, data come from JEC report (2007), a well to wheel analysis of crude oil products in Europe.
Rate 3 (fair)
Justification Data from JEC report states that it considers EU27, but it is not possible to identify the countries and the share of each of them to the modelled dataset.
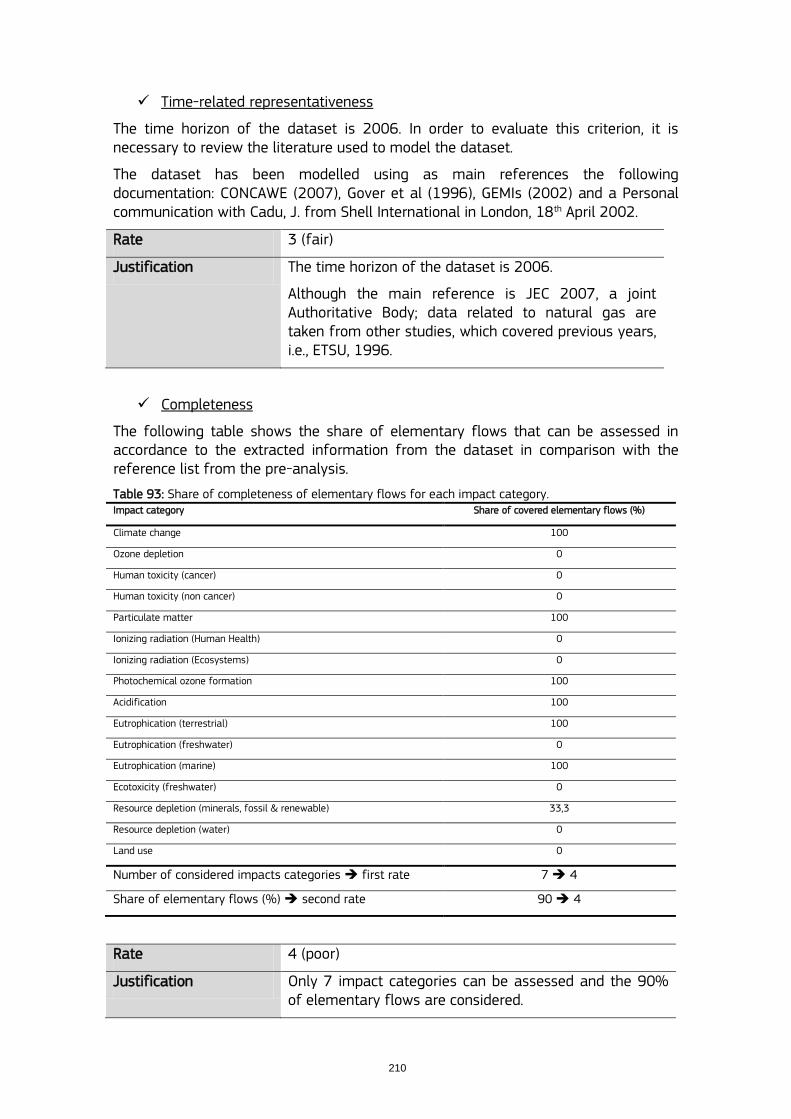
210
Time-related representativeness
The time horizon of the dataset is 2006. In order to evaluate this criterion, it is necessary to review the literature used to model the dataset.
The dataset has been modelled using as main references the following documentation: CONCAWE (2007), Gover et al (1996), GEMIs (2002) and a Personal communication with Cadu, J. from Shell International in London, 18th April 2002.
Rate 3 (fair)
Justification The time horizon of the dataset is 2006.
Although the main reference is JEC 2007, a joint Authoritative Body; data related to natural gas are taken from other studies, which covered previous years, i.e., ETSU, 1996.
Completeness
The following table shows the share of elementary flows that can be assessed in accordance to the extracted information from the dataset in comparison with the reference list from the pre-analysis.
Table 93: Share of completeness of elementary flows for each impact category. Impact category Share of covered elementary flows (%)
Climate change 100
Ozone depletion 0
Human toxicity (cancer) 0
Human toxicity (non cancer) 0
Particulate matter 100
Ionizing radiation (Human Health) 0
Ionizing radiation (Ecosystems) 0
Photochemical ozone formation 100
Acidification 100
Eutrophication (terrestrial) 100
Eutrophication (freshwater) 0
Eutrophication (marine) 100
Ecotoxicity (freshwater) 0
Resource depletion (minerals, fossil & renewable) 33,3
Resource depletion (water) 0
Land use 0
Number of considered impacts categories first rate 7 4
Share of elementary flows (%) second rate 90 4
Rate 4 (poor)
Justification Only 7 impact categories can be assessed and the 90% of elementary flows are considered.
211
Precision/uncertainty
The dataset states a precision level of medium. A review of the references has been conducted, with important focused on Concawe (2007) and ETSU (1996), in order to evaluate this criterion.
Rate 4 (poor)
Justification The documentation provided by dataset does not allow a complete evaluation of the precision, since it is not possible to associate the different sources with the data used to model the system.
E3 provides an auto-evaluation of the precision, resulting as “medium”.
There is no information about hypothesis and assumptions followed by the dataset developer.
Methodological appropriateness and consistency
System boundaries and EoL modelling
A cradle to gate system is assumed.
There is no information about infrastructures.
There is no information about EoL procedures.
Allocation
No information about allocation procedures.
Rate 4-5 (poor-very poor)
Justification Cradle to gate system.
EoL and Infrastructures are not included.
Allocation procedure has not been defined.
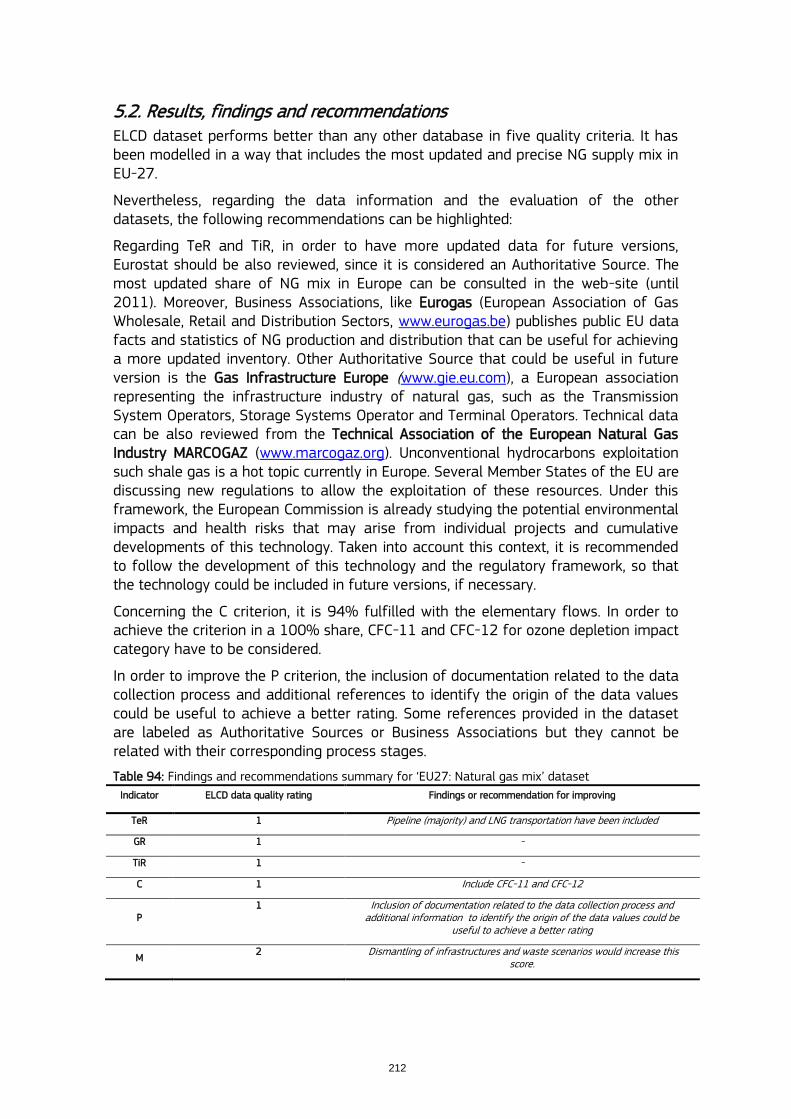
212
5.2. Results, findings and recommendations ELCD dataset performs better than any other database in five quality criteria. It has been modelled in a way that includes the most updated and precise NG supply mix in EU-27.
Nevertheless, regarding the data information and the evaluation of the other datasets, the following recommendations can be highlighted:
Regarding TeR and TiR, in order to have more updated data for future versions, Eurostat should be also reviewed, since it is considered an Authoritative Source. The most updated share of NG mix in Europe can be consulted in the web-site (until 2011). Moreover, Business Associations, like Eurogas (European Association of Gas Wholesale, Retail and Distribution Sectors, www.eurogas.be) publishes public EU data facts and statistics of NG production and distribution that can be useful for achieving a more updated inventory. Other Authoritative Source that could be useful in future version is the Gas Infrastructure Europe (www.gie.eu.com), a European association representing the infrastructure industry of natural gas, such as the Transmission System Operators, Storage Systems Operator and Terminal Operators. Technical data can be also reviewed from the Technical Association of the European Natural Gas Industry MARCOGAZ (www.marcogaz.org). Unconventional hydrocarbons exploitation such shale gas is a hot topic currently in Europe. Several Member States of the EU are discussing new regulations to allow the exploitation of these resources. Under this framework, the European Commission is already studying the potential environmental impacts and health risks that may arise from individual projects and cumulative developments of this technology. Taken into account this context, it is recommended to follow the development of this technology and the regulatory framework, so that the technology could be included in future versions, if necessary.
Concerning the C criterion, it is 94% fulfilled with the elementary flows. In order to achieve the criterion in a 100% share, CFC-11 and CFC-12 for ozone depletion impact category have to be considered.
In order to improve the P criterion, the inclusion of documentation related to the data collection process and additional references to identify the origin of the data values could be useful to achieve a better rating. Some references provided in the dataset are labeled as Authoritative Sources or Business Associations but they cannot be related with their corresponding process stages.
Table 94: Findings and recommendations summary for „EU27: Natural gas mix‟ dataset
Indicator ELCD data quality rating Findings or recommendation for improving
TeR 1 Pipeline (majority) and LNG transportation have been included
GR 1 -
TiR 1 -
C 1 Include CFC-11 and CFC-12
P 1 Inclusion of documentation related to the data collection process and
additional information to identify the origin of the data values could be useful to achieve a better rating
M 2 Dismantling of infrastructures and waste scenarios would increase this
score.
213
6. Evaluation: Biofuel dataset
6.1. Evaluation: RME Germany
ELCD database DE: Rapeseed Methyl Ester (RME) (technology mix | production mix, at producer)
General comments and/or relevant information
The dataset represents the environmental impacts for the production of one kg of biodiesel Rapeseed Methyl Ester (RME) in Germany.
The dataset covers all relevant process steps / technologies over the supply chain of the represented cradle to gate inventory. The inventory is mainly based on literature data.
All processing steps of transesterification are regarded, inclusive raw glycerin processing. Additionally, the production of the ancillaries hydrochloric acid, caustic soda, methanol and calcium hydrate are taken into account. Buildings and facilities are neglected.
Upstream processes –oil extraction and purification and rapeseed cropping- are linked to the transesterification process but detail information is not available.
Important remark:
The analysed dataset is modelled following a methodological approach that shows important discrepancies with the approach proposed in the Directive 28/2009 on the promotion of the use of energy from renewable sources Annex V point C in order to assess the greenhouse gas impacts of biofuels. Most important differences are related to allocation procedures of co-products and electricity produced in CHP. It would be advisable to harmonize the methodology used in the ELCD database with the proposed by the EC in the framework of biofuel sustainability certification.
Technological representativeness
Regarding the technology description of a biofuel plant production (including the background system), the basic information extracted from the dataset, in order to evaluate this criterion, is written below.
The process is modelled taking into account the stages of rapeseed cropping in Germany, rapeseed oil extraction and refining in Germany and Biodiesel production in Germany. According to the pre-analysis an important amount of the rapeseed used in Germany is imported from Australia, Ukraine and Russia. Germany also imports important amounts of rapeseed oil that have not been considered in the dataset.
Rate 2 (good)
Justification The dataset considers the whole process, but imports of both rapeseed and rapeseed oil are not considered.
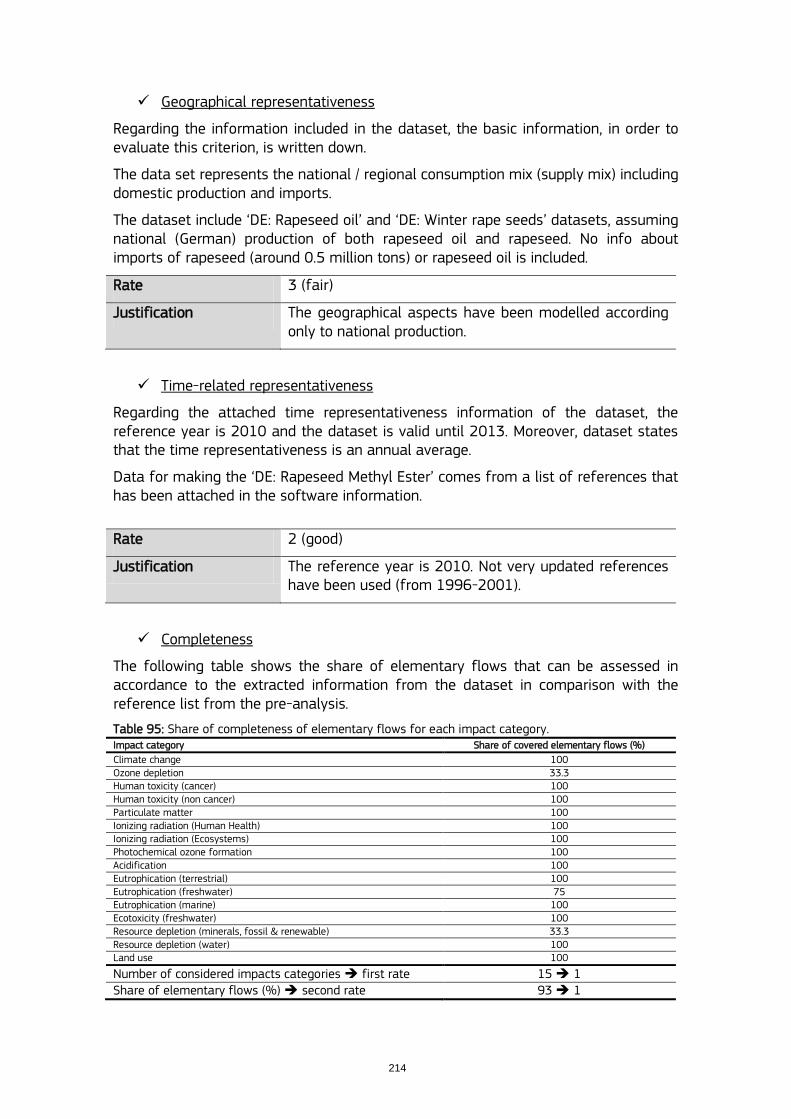
214
Geographical representativeness
Regarding the information included in the dataset, the basic information, in order to evaluate this criterion, is written down.
The data set represents the national / regional consumption mix (supply mix) including domestic production and imports.
The dataset include „DE: Rapeseed oil‟ and „DE: Winter rape seeds‟ datasets, assuming national (German) production of both rapeseed oil and rapeseed. No info about imports of rapeseed (around 0.5 million tons) or rapeseed oil is included.
Rate 3 (fair)
Justification The geographical aspects have been modelled according only to national production.
Time-related representativeness
Regarding the attached time representativeness information of the dataset, the reference year is 2010 and the dataset is valid until 2013. Moreover, dataset states that the time representativeness is an annual average.
Data for making the „DE: Rapeseed Methyl Ester‟ comes from a list of references that has been attached in the software information.
Rate 2 (good)
Justification The reference year is 2010. Not very updated references have been used (from 1996-2001).
Completeness
The following table shows the share of elementary flows that can be assessed in accordance to the extracted information from the dataset in comparison with the reference list from the pre-analysis.
Table 95: Share of completeness of elementary flows for each impact category. Impact category Share of covered elementary flows (%)
Climate change 100 Ozone depletion 33.3 Human toxicity (cancer) 100 Human toxicity (non cancer) 100 Particulate matter 100 Ionizing radiation (Human Health) 100 Ionizing radiation (Ecosystems) 100 Photochemical ozone formation 100 Acidification 100 Eutrophication (terrestrial) 100 Eutrophication (freshwater) 75 Eutrophication (marine) 100 Ecotoxicity (freshwater) 100 Resource depletion (minerals, fossil & renewable) 33.3 Resource depletion (water) 100 Land use 100
Number of considered impacts categories first rate 15 1 Share of elementary flows (%) second rate 93 1
215
Rate 1 (very good)
Justification 15 impact categories can be assessed and the 93% of elementary flows are considered
Precision/uncertainty
Regarding the data selection and combination principles, the basic information extracted from the dataset, in order to evaluate this criterion, is that the inventory (and the majority of relevant elementary flows) is mainly based on literature data.
Rate NOT EVALUATED
Justification Elementary flows basically come from literature, but there is no enough available information for many processes on the fuel chain.
Methodological appropriateness and consistency
System boundaries and EoL modelling
Regarding the general flow diagram to produce the RME according to the detailed information included in the technological representativeness criterion, the processes that have been covered are represented in the following figure.
Infrastructure has been neglected and EoL modelling has not been considered.
All processing steps of transesterification are regarded, inclusive raw glycerin processing. Additionally, the production of the ancillaries hydrochloric acid, caustic soda, methanol and calcium hydrate are taken into account. Buildings and facilities are neglected.
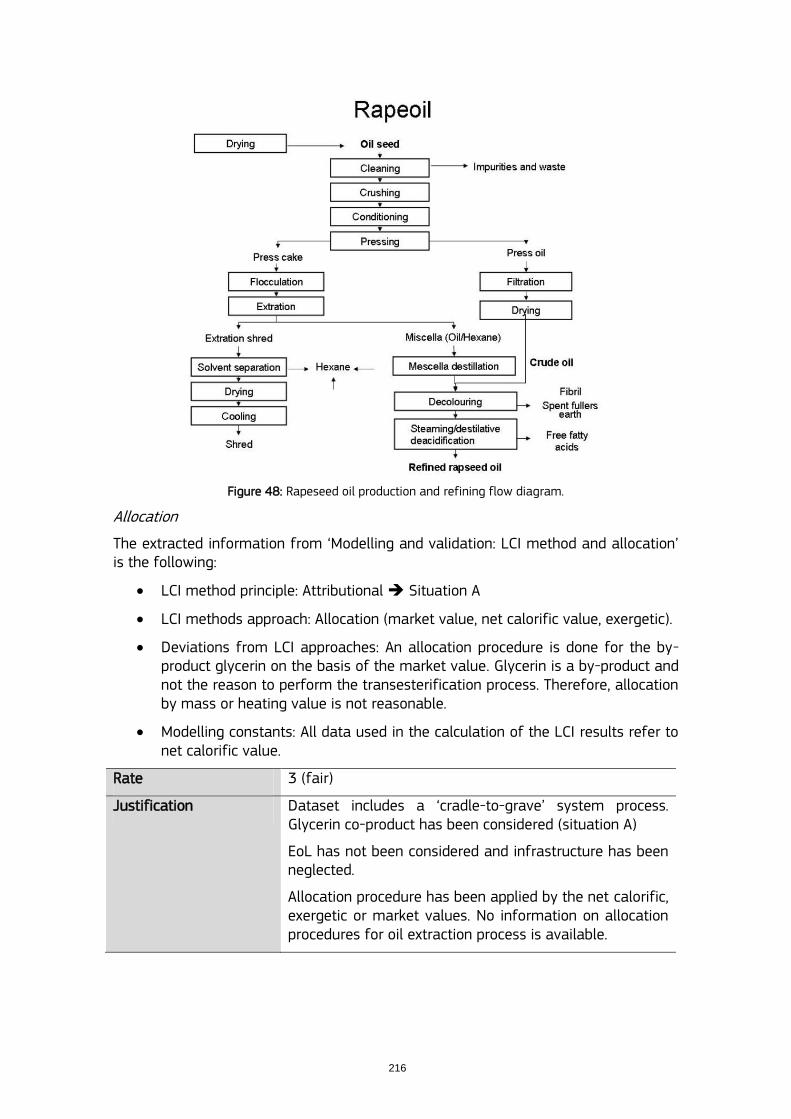
216
Figure 48: Rapeseed oil production and refining flow diagram.
Allocation
The extracted information from „Modelling and validation: LCI method and allocation‟ is the following:
LCI method principle: Attributional Situation A
LCI methods approach: Allocation (market value, net calorific value, exergetic).
Deviations from LCI approaches: An allocation procedure is done for the by-product glycerin on the basis of the market value. Glycerin is a by-product and not the reason to perform the transesterification process. Therefore, allocation by mass or heating value is not reasonable.
Modelling constants: All data used in the calculation of the LCI results refer to net calorific value.
Rate 3 (fair)
Justification Dataset includes a „cradle-to-grave‟ system process. Glycerin co-product has been considered (situation A)
EoL has not been considered and infrastructure has been neglected.
Allocation procedure has been applied by the net calorific, exergetic or market values. No information on allocation procedures for oil extraction process is available.
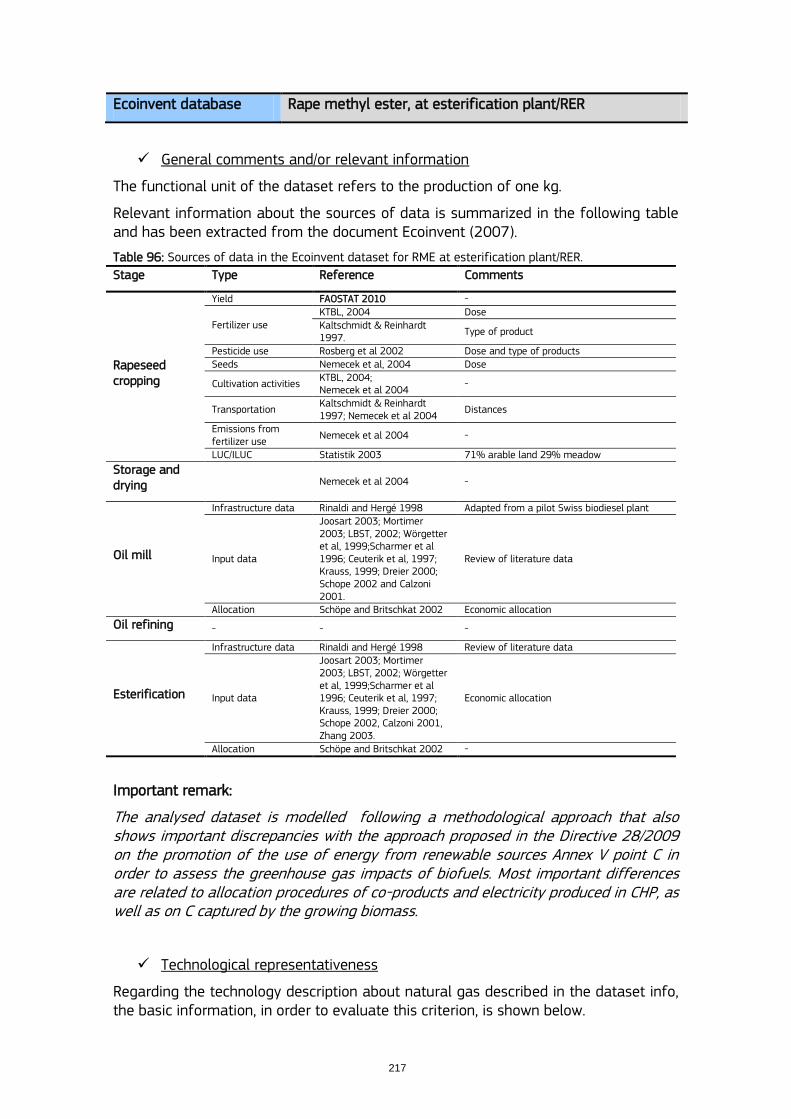
217
Ecoinvent database Rape methyl ester, at esterification plant/RER
General comments and/or relevant information
The functional unit of the dataset refers to the production of one kg.
Relevant information about the sources of data is summarized in the following table and has been extracted from the document Ecoinvent (2007).
Table 96: Sources of data in the Ecoinvent dataset for RME at esterification plant/RER.
Stage Type Reference Comments
Rapeseed cropping
Yield FAOSTAT 2010 -
Fertilizer use KTBL, 2004 Dose Kaltschmidt & Reinhardt 1997.
Type of product
Pesticide use Rosberg et al 2002 Dose and type of products Seeds Nemecek et al, 2004 Dose
Cultivation activities KTBL, 2004; Nemecek et al 2004
-
Transportation Kaltschmidt & Reinhardt 1997; Nemecek et al 2004
Distances
Emissions from fertilizer use
Nemecek et al 2004 -
LUC/ILUC Statistik 2003 71% arable land 29% meadow
Storage and drying
Nemecek et al 2004 -
Oil mill
Infrastructure data Rinaldi and Hergé 1998 Adapted from a pilot Swiss biodiesel plant
Input data
Joosart 2003; Mortimer 2003; LBST, 2002; Wörgetter et al, 1999;Scharmer et al 1996; Ceuterik et al, 1997; Krauss, 1999; Dreier 2000; Schope 2002 and Calzoni 2001.
Review of literature data
Allocation Schöpe and Britschkat 2002 Economic allocation
Oil refining - - -
Esterification
Infrastructure data Rinaldi and Hergé 1998 Review of literature data
Input data
Joosart 2003; Mortimer 2003; LBST, 2002; Wörgetter et al, 1999;Scharmer et al 1996; Ceuterik et al, 1997; Krauss, 1999; Dreier 2000; Schope 2002, Calzoni 2001, Zhang 2003.
Economic allocation
Allocation Schöpe and Britschkat 2002 -
Important remark:
The analysed dataset is modelled following a methodological approach that also shows important discrepancies with the approach proposed in the Directive 28/2009 on the promotion of the use of energy from renewable sources Annex V point C in order to assess the greenhouse gas impacts of biofuels. Most important differences are related to allocation procedures of co-products and electricity produced in CHP, as well as on C captured by the growing biomass.
Technological representativeness
Regarding the technology description about natural gas described in the dataset info, the basic information, in order to evaluate this criterion, is shown below.
218
Rate 2 (good)
Justification A typical vegetable oil esterification (in Swiss conditions) plant designed for the production of RME in a RER context has been modelled, based on data from several European studies
Buildings and facilities have been included.
Only production of rapeseed, rapeseed oil and RME in Europe is considered. Not imported rapeseed or rapeseed oil is considered.
Geographical representativeness
Regarding the information included in the module, it includes „Rapeseed conventional at farm, DE‟ dataset, so national (German) production is assumed. No info about imports.
Rate 3 (fair)
Justification The geographical aspects have been modelled according German conditions of farming.
Not imported rapeseed or rapeseed oil is considered.
Time-related representativeness
Regarding the information of the datasets, the time periods are the following:
„Rape methyl ester, at esterification plant, RER‟: 1996-2006 (Data from 1996 to 2003, current technology in the EU has been considered).
„Rape oil, at oil mill, RER‟: 1996-2006 (Data from 1996 to 2003, current technology in the EU has been considered).
„Rapeseed, conventional, at farm, DE‟: 1996-2006 (Time of publications. Data for the fertilizers products and the transport distance to the farm are from 1996. Data for the pesticide use are from 2001. Data for the yield and land use are from 2006)
„Vegetable oil, esterification plant, CH‟: 2004-2008
No references from dataset are included.
Rate 1 (very good)
Justification The reference year is 1996-2000.
Sources of data are references from 1996 to 2010
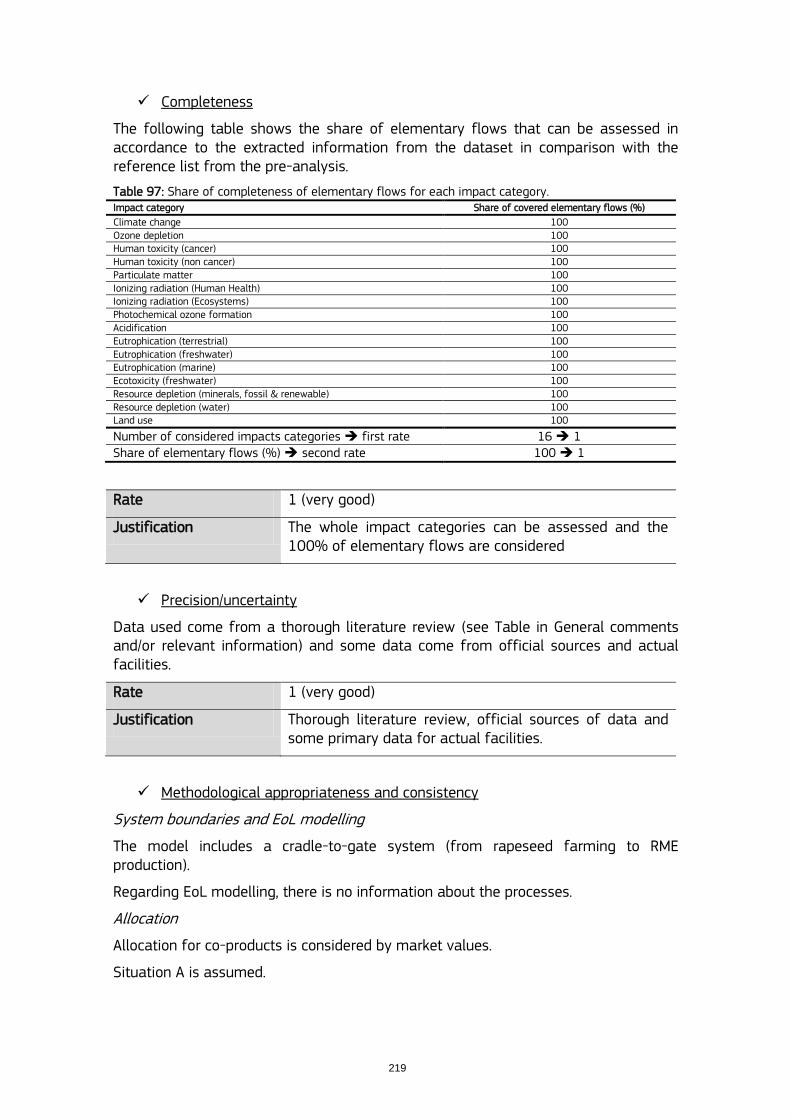
219
Completeness
The following table shows the share of elementary flows that can be assessed in accordance to the extracted information from the dataset in comparison with the reference list from the pre-analysis.
Table 97: Share of completeness of elementary flows for each impact category. Impact category Share of covered elementary flows (%)
Climate change 100 Ozone depletion 100 Human toxicity (cancer) 100 Human toxicity (non cancer) 100 Particulate matter 100 Ionizing radiation (Human Health) 100 Ionizing radiation (Ecosystems) 100 Photochemical ozone formation 100 Acidification 100 Eutrophication (terrestrial) 100 Eutrophication (freshwater) 100 Eutrophication (marine) 100 Ecotoxicity (freshwater) 100 Resource depletion (minerals, fossil & renewable) 100 Resource depletion (water) 100 Land use 100
Number of considered impacts categories first rate 16 1 Share of elementary flows (%) second rate 100 1
Rate 1 (very good)
Justification The whole impact categories can be assessed and the 100% of elementary flows are considered
Precision/uncertainty
Data used come from a thorough literature review (see Table in General comments and/or relevant information) and some data come from official sources and actual facilities.
Rate 1 (very good)
Justification Thorough literature review, official sources of data and some primary data for actual facilities.
Methodological appropriateness and consistency
System boundaries and EoL modelling
The model includes a cradle-to-gate system (from rapeseed farming to RME production).
Regarding EoL modelling, there is no information about the processes.
Allocation
Allocation for co-products is considered by market values.
Situation A is assumed.

220
Rate 2 (good)
Justification Situation A.
Dataset includes a „cradle-to-grave‟ system.
EoL modelling is not described.
Infrastructure and transports are included.
Allocation is included, based on market values
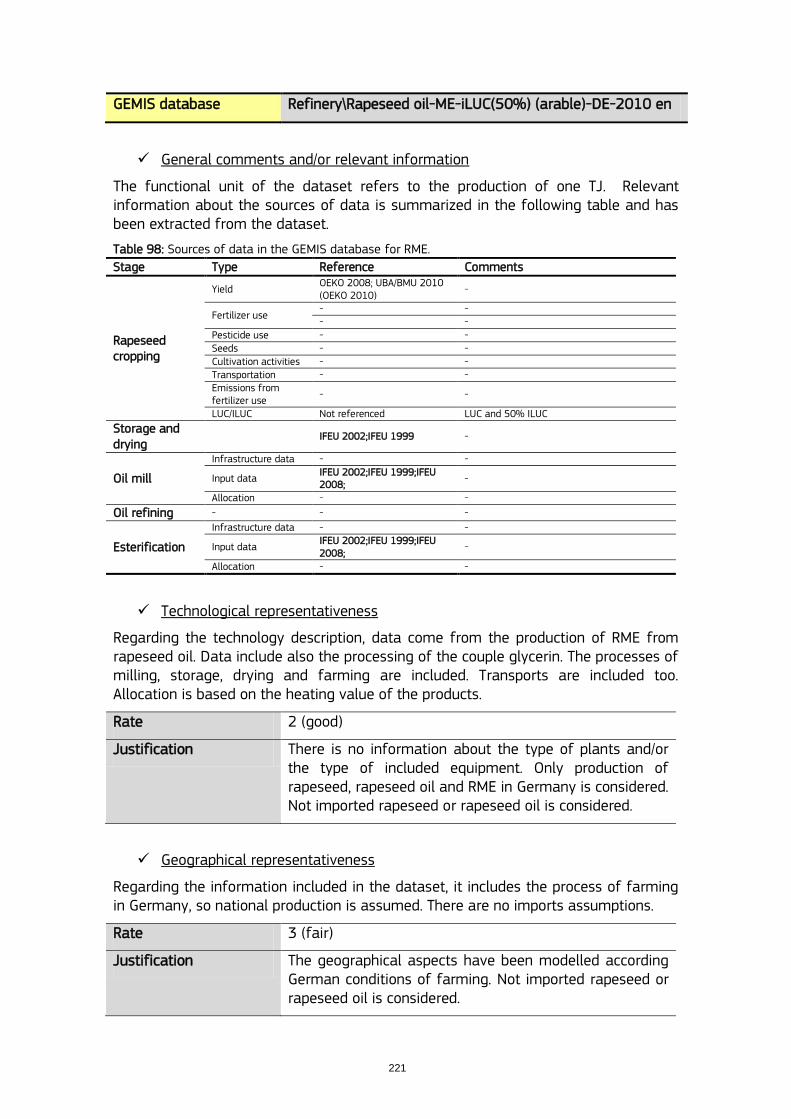
221
GEMIS database Refinery\Rapeseed oil-ME-iLUC(50%) (arable)-DE-2010 en
General comments and/or relevant information
The functional unit of the dataset refers to the production of one TJ. Relevant information about the sources of data is summarized in the following table and has been extracted from the dataset.
Table 98: Sources of data in the GEMIS database for RME.
Stage Type Reference Comments
Rapeseed cropping
Yield OEKO 2008; UBA/BMU 2010 (OEKO 2010)
-
Fertilizer use - - - -
Pesticide use - - Seeds - - Cultivation activities - - Transportation - - Emissions from fertilizer use
- -
LUC/ILUC Not referenced LUC and 50% ILUC
Storage and drying
IFEU 2002;IFEU 1999 -
Oil mill
Infrastructure data - -
Input data IFEU 2002;IFEU 1999;IFEU 2008;
-
Allocation - -
Oil refining - - -
Esterification
Infrastructure data - -
Input data IFEU 2002;IFEU 1999;IFEU 2008;
-
Allocation - -
Technological representativeness
Regarding the technology description, data come from the production of RME from rapeseed oil. Data include also the processing of the couple glycerin. The processes of milling, storage, drying and farming are included. Transports are included too. Allocation is based on the heating value of the products.
Rate 2 (good)
Justification There is no information about the type of plants and/or the type of included equipment. Only production of rapeseed, rapeseed oil and RME in Germany is considered. Not imported rapeseed or rapeseed oil is considered.
Geographical representativeness
Regarding the information included in the dataset, it includes the process of farming in Germany, so national production is assumed. There are no imports assumptions.
Rate 3 (fair)
Justification The geographical aspects have been modelled according German conditions of farming. Not imported rapeseed or rapeseed oil is considered.
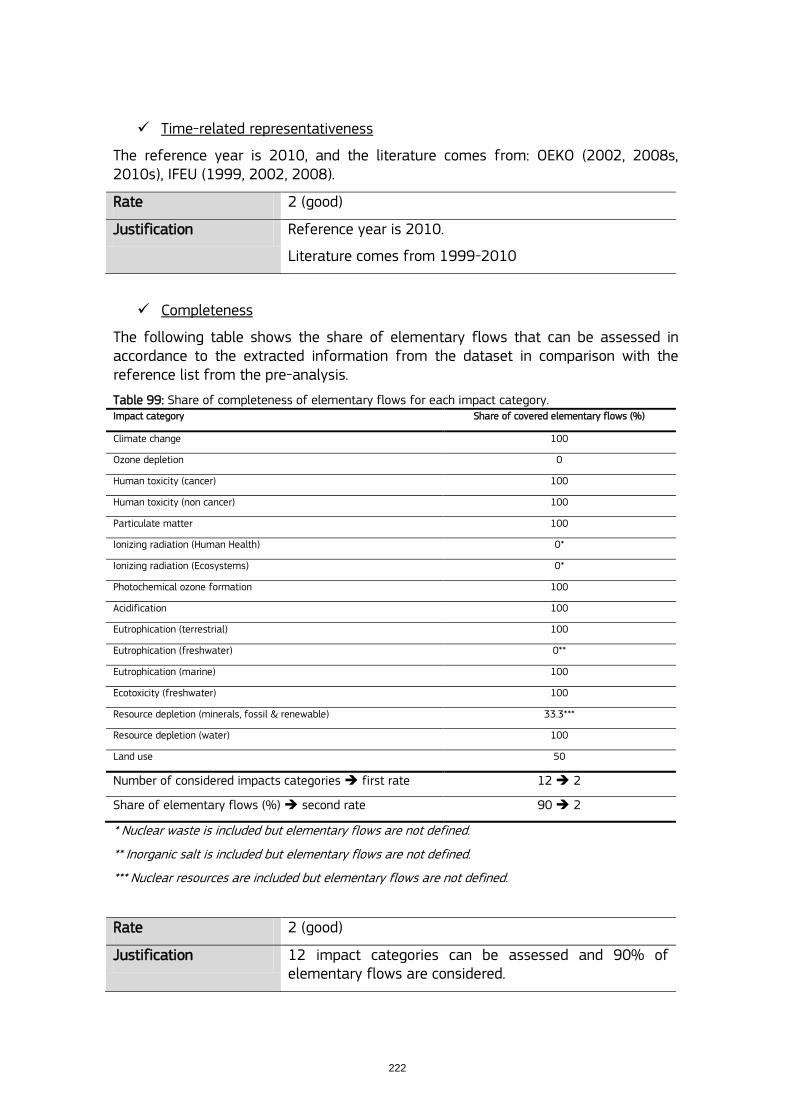
222
Time-related representativeness
The reference year is 2010, and the literature comes from: OEKO (2002, 2008s, 2010s), IFEU (1999, 2002, 2008).
Rate 2 (good)
Justification Reference year is 2010.
Literature comes from 1999-2010
Completeness
The following table shows the share of elementary flows that can be assessed in accordance to the extracted information from the dataset in comparison with the reference list from the pre-analysis.
Table 99: Share of completeness of elementary flows for each impact category. Impact category Share of covered elementary flows (%)
Climate change 100
Ozone depletion 0
Human toxicity (cancer) 100
Human toxicity (non cancer) 100
Particulate matter 100
Ionizing radiation (Human Health) 0*
Ionizing radiation (Ecosystems) 0*
Photochemical ozone formation 100
Acidification 100
Eutrophication (terrestrial) 100
Eutrophication (freshwater) 0**
Eutrophication (marine) 100
Ecotoxicity (freshwater) 100
Resource depletion (minerals, fossil & renewable) 33.3***
Resource depletion (water) 100
Land use 50
Number of considered impacts categories first rate 12 2
Share of elementary flows (%) second rate 90 2
* Nuclear waste is included but elementary flows are not defined.
** Inorganic salt is included but elementary flows are not defined.
*** Nuclear resources are included but elementary flows are not defined.
Rate 2 (good)
Justification 12 impact categories can be assessed and 90% of elementary flows are considered.
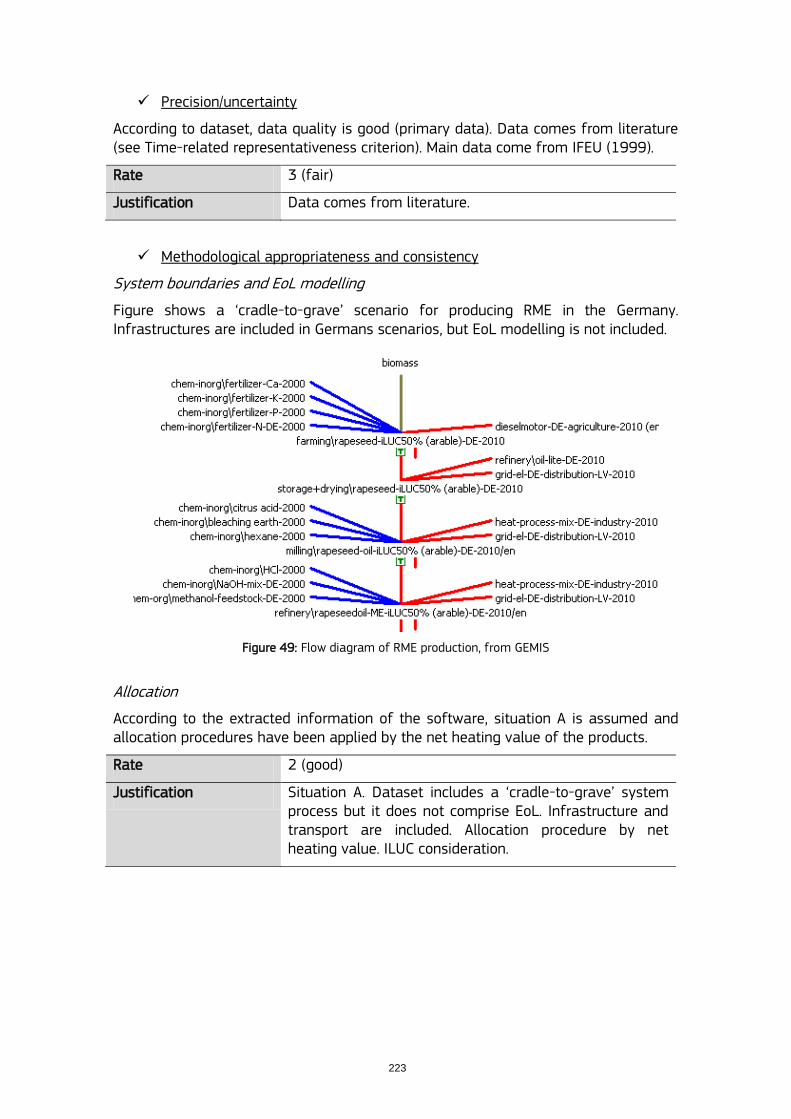
223
Precision/uncertainty
According to dataset, data quality is good (primary data). Data comes from literature (see Time-related representativeness criterion). Main data come from IFEU (1999).
Rate 3 (fair)
Justification Data comes from literature.
Methodological appropriateness and consistency
System boundaries and EoL modelling
Figure shows a „cradle-to-grave‟ scenario for producing RME in the Germany. Infrastructures are included in Germans scenarios, but EoL modelling is not included.
Figure 49: Flow diagram of RME production, from GEMIS
Allocation
According to the extracted information of the software, situation A is assumed and allocation procedures have been applied by the net heating value of the products.
Rate 2 (good)
Justification Situation A. Dataset includes a „cradle-to-grave‟ system process but it does not comprise EoL. Infrastructure and transport are included. Allocation procedure by net heating value. ILUC consideration.
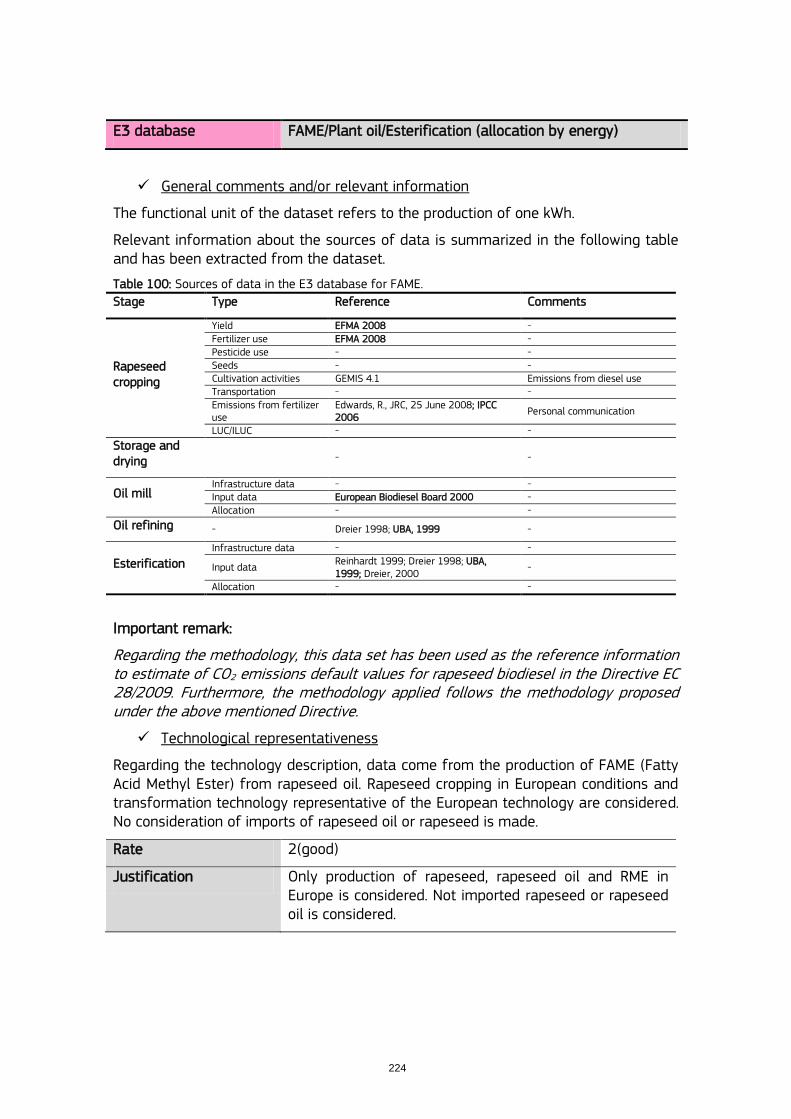
224
E3 database FAME/Plant oil/Esterification (allocation by energy)
General comments and/or relevant information
The functional unit of the dataset refers to the production of one kWh.
Relevant information about the sources of data is summarized in the following table and has been extracted from the dataset.
Table 100: Sources of data in the E3 database for FAME.
Stage Type Reference Comments
Rapeseed cropping
Yield EFMA 2008 - Fertilizer use EFMA 2008 - Pesticide use - - Seeds - - Cultivation activities GEMIS 4.1 Emissions from diesel use Transportation - - Emissions from fertilizer use
Edwards, R., JRC, 25 June 2008; IPCC 2006
Personal communication
LUC/ILUC - -
Storage and drying - -
Oil mill Infrastructure data - - Input data European Biodiesel Board 2000 - Allocation - -
Oil refining - Dreier 1998; UBA, 1999 -
Esterification Infrastructure data - -
Input data Reinhardt 1999; Dreier 1998; UBA, 1999; Dreier, 2000
-
Allocation - -
Important remark:
Regarding the methodology, this data set has been used as the reference information to estimate of CO2 emissions default values for rapeseed biodiesel in the Directive EC 28/2009. Furthermore, the methodology applied follows the methodology proposed under the above mentioned Directive.
Technological representativeness
Regarding the technology description, data come from the production of FAME (Fatty Acid Methyl Ester) from rapeseed oil. Rapeseed cropping in European conditions and transformation technology representative of the European technology are considered. No consideration of imports of rapeseed oil or rapeseed is made.
Rate 2(good)
Justification Only production of rapeseed, rapeseed oil and RME in Europe is considered. Not imported rapeseed or rapeseed oil is considered.
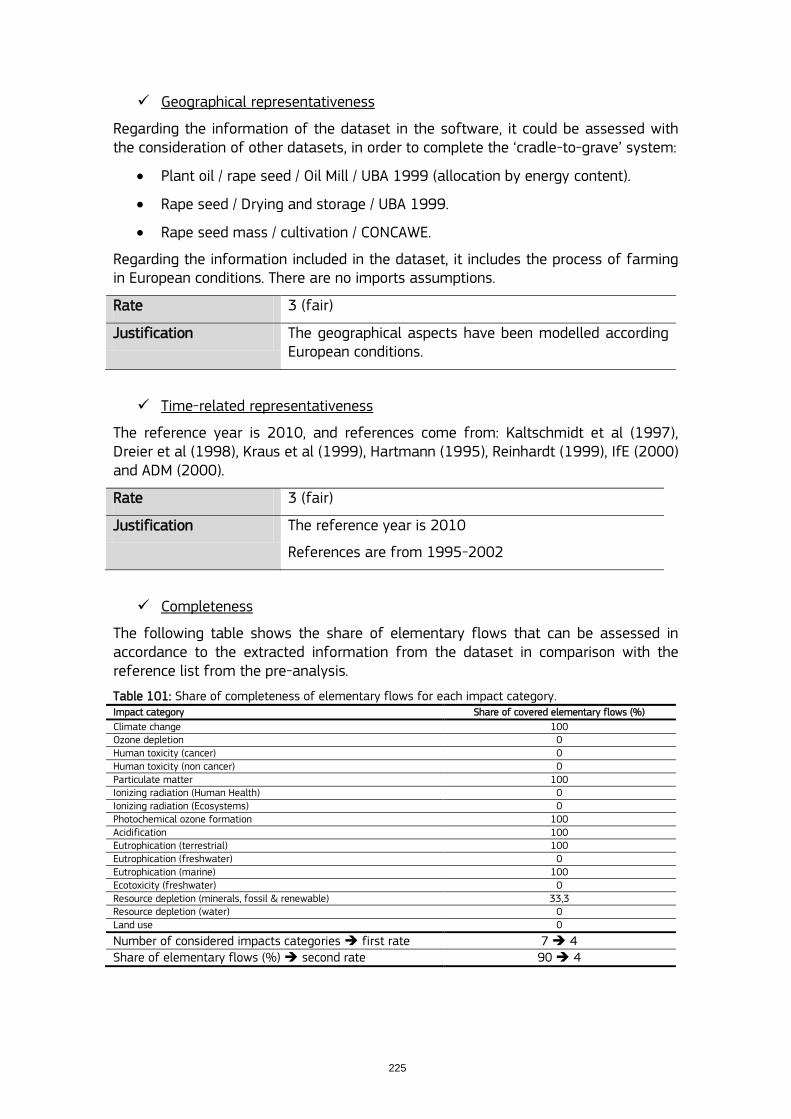
225
Geographical representativeness
Regarding the information of the dataset in the software, it could be assessed with the consideration of other datasets, in order to complete the „cradle-to-grave‟ system:
Plant oil / rape seed / Oil Mill / UBA 1999 (allocation by energy content).
Rape seed / Drying and storage / UBA 1999.
Rape seed mass / cultivation / CONCAWE.
Regarding the information included in the dataset, it includes the process of farming in European conditions. There are no imports assumptions.
Rate 3 (fair)
Justification The geographical aspects have been modelled according European conditions.
Time-related representativeness
The reference year is 2010, and references come from: Kaltschmidt et al (1997), Dreier et al (1998), Kraus et al (1999), Hartmann (1995), Reinhardt (1999), IfE (2000) and ADM (2000).
Rate 3 (fair)
Justification The reference year is 2010
References are from 1995-2002
Completeness
The following table shows the share of elementary flows that can be assessed in accordance to the extracted information from the dataset in comparison with the reference list from the pre-analysis.
Table 101: Share of completeness of elementary flows for each impact category. Impact category Share of covered elementary flows (%)
Climate change 100 Ozone depletion 0 Human toxicity (cancer) 0 Human toxicity (non cancer) 0 Particulate matter 100 Ionizing radiation (Human Health) 0 Ionizing radiation (Ecosystems) 0 Photochemical ozone formation 100 Acidification 100 Eutrophication (terrestrial) 100 Eutrophication (freshwater) 0 Eutrophication (marine) 100 Ecotoxicity (freshwater) 0 Resource depletion (minerals, fossil & renewable) 33,3 Resource depletion (water) 0 Land use 0
Number of considered impacts categories first rate 7 4 Share of elementary flows (%) second rate 90 4

226
Rate 4 (poor)
Justification Only 7 impact categories can be assessed and the 90% of elementary flows are considered.
Precision/uncertainty
According to dataset, data precision is good for the refinery, and medium for milling and cultivation. Many data come from literature references. However, main data inputs of the transformation process have been provided by EBB (European Biodiesel Board) and are primary data from the operators. Furthermore the data in this E3 dataset have been considered the base for the estimation of CO2 emissions default values for rapeseed biodiesel in the Directive EC 28/2009.
Rate 3 (fair)
Justification References come from literature
E3 auto-evaluation: data precision is rough estimate.
Methodological appropriateness and consistency
System boundaries and EoL modelling
A cradle to gate system is assumed.
Infrastructures not considered.
EoL not considered.
Allocation
Allocation procedures have been done by energy content.
Scenario with „allocation by masses‟ is available.
Rate 3 (fair)
Justification Cradle to gate system.
EoL and Infrastructures are not included.
Allocation procedure by energy.
227
6.2. Results, findings and recommendations The ELCD dataset has been analysed using the information provided by PE (developers of this dataset for the ELCD database, PE 2012a).
This dataset performs best in the completeness criterion. Nevertheless, although rated with the highest score, 15 of 16 impact categories are fulfilled and the 93% of relevant elementary flows are considered. In order to fulfill the criterion in a 100%, the following flows should be considered: Halon 121117 and CFC-10 for ozone depletion; and iridium, cadmium and cypermethrin for resource depletion impact category.
Regarding the technological representativeness criterion, the dataset lacks the consideration of raw material imports –rapeseed and rapeseed oil- . Important differences can appear especially in the cropping systems of rapeseed in exporter countries such as Australia, Ukraine and Russia. Consideration of these systems would improve the technological representativeness of the rapeseed biodiesel produced in Europe. The geographical representativeness criterion also score lower due to this lack of consideration of imported raw materials.
Time related representativeness scores 2, since many of the references do not cover the reference period. The Ecoinvent dataset performs better in this criterion since its validity year is closer to the years of the references but not due to the use of more recent references.
Precision criterion could not be assessed since there is a lack of information on many of the processes of the fuel chain.
Ecoinvent dataset scores better in methodological appropriateness and consistency since it takes into account the infrastructures.
Regarding the methodology, a general comment would be that the analysed dataset is modelled following a methodological approach that shows important discrepancies with the approach proposed in the Directive 28/2009 (RED 2009) on the promotion of the use of energy from renewable sources Annex V point C in order to assess the greenhouse gas impacts of biofuels. Most important differences are related to allocation procedures of co-products and electricity produced in CHP.
So, it would be advisable to harmonize the methodology used in the ELCD database with the proposed by the EC in the framework of biofuels sustainability certification. In order to do that the E3 dataset can be used. Nevertheless, it must be highlighted that the ILCD Handbook (EC-JRC-IES 2010a) and RED (2009) differ in methodological aspects such as allocation procedures in case of multifunctional processes.
Finally, the European Commission Energy Transparency Platform (http://ec.europa.eu/energy/renewables/biofuels/sustainability_criteria_en.htm) is also a source of relevant information.
17
See footnote 12.
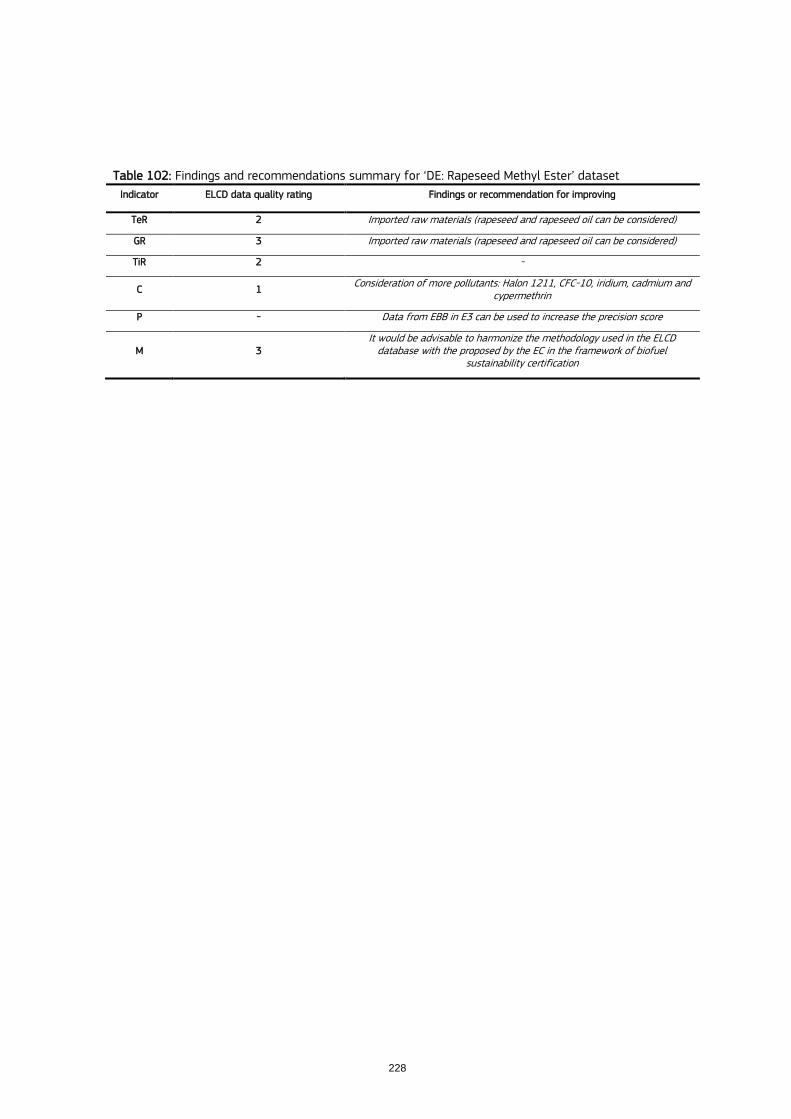
228
Table 102: Findings and recommendations summary for „DE: Rapeseed Methyl Ester‟ dataset
Indicator ELCD data quality rating Findings or recommendation for improving
TeR 2 Imported raw materials (rapeseed and rapeseed oil can be considered)
GR 3 Imported raw materials (rapeseed and rapeseed oil can be considered)
TiR 2 -
C 1 Consideration of more pollutants: Halon 1211, CFC-10, iridium, cadmium and
cypermethrin
P - Data from EBB in E3 can be used to increase the precision score
M 3 It would be advisable to harmonize the methodology used in the ELCD
database with the proposed by the EC in the framework of biofuel sustainability certification
229
7. Conclusions
The work done in this extended analysis of the ELCD database aimed at providing better founded information related to its data quality, following the indicators developed and described within the ILCD handbook (EC-JRC-IES 2010a, 2010b, 2011). This analysis has meant an opportunity to apply these quality indicators to different datasets for the first time, having two main consequences. Firstly, the implementation of the quality indicators to the energy-related datasets from the ELCD has been used to understand the room for improvement in future ELCD versions. Additionally, it has also served to identify whether these data quality indicators are applicable and useful for the database developers in general, as well as for the LCA practitioners.
In general terms, the quality of a dataset or database should be evaluated in a way that guarantee that the final conclusions derived from the use of the dataset are robust enough and are in line with the goal and scope described in the metadata. The robustness, then, should be ensured by the use of datasets, in which the technology and the time horizon defined as well as the considered geographical area are appropriate to model the system. Furthermore, it should be assured that the data used to build the dataset describe properly the relevant inputs and outputs (considering uncertainties due to measurements, process specific variations, temporal variations), that the elementary flows included cover the most relevant impacts and that methodology used to build the dataset is appropriate to model the analysed system.
The quality criteria indicators defined by the ILCD handbook have considered all these six variables. In the first stage of this work, these indicators were redefined in order to facilitate their implementation, and to ensure the quality of the assessment whenever expert judgment was required.
The quality criteria indicators can be applied to any type of LCA dataset. However, in order to ensure the appropriateness and robustness of the methodology applied, deep knowledge on the analysed topic is required. In this case, a pre-analysis of the current state of each analysed technology has been conducted to properly define the parameters and rating used to later evaluate the datasets. The need of a deep understanding of the technologies is basic, since expert judgement values have been applied in many cases.
In many occasions, data quality is associated to uncertainty of data, mainly related to the quantities that are described as inputs and outputs to the studied processes. This uncertainty is very difficult to assess, since it is common to have only one source of information and statistical values are not often provided. This analysis has tried to highlight, that uncertainty is not the only criterion to take into account, even in the cases where statistical information is enclosed within the dataset.
A comprehensive data quality analysis should be performed by any LCA practitioner, considering the six criteria defined by the ILCD handbook, the interaction between them and how the weakness and strengthens of the datasets might have influence on the final results. In the assessment conducted here, these indicators have been treated as independent from each other, in order to better identify the areas of improvement in future versions, and considering that they are not being used in a case study under this analysis. However, as mentioned before, the six criteria should

230
be taken into account by the LCA practitioner to evaluate the quality, depending on the goal and scope of the analysis.
Along the current study, several assumptions have been made in order to facilitate the analysis. The results of the study have to be understood under this context. Below, the most relevant assumptions are shown.
The region under study is Europe. Therefore, the European context in terms of technology and geographical boundaries has been considered. In some cases, the system boundaries of the dataset include other regions that have been taken into account in the analysis.
Time representativeness identifies how well the data represent the declared time, and depends on the intended application of the dataset. In this study, the time validity has been used to analyse this criterion, considering a deviation of ± 5 years. An analysis of the learning curves of each technology, out of the scope of this analysis, would have provided a better basis for a technology specific validity period.
Completeness has been evaluated based on the recommended methods published by the ILCD in 2011. The use of different impact assessment methods may result in different conclusions.
Precision or uncertainty is usually assessed according to the relative standard deviation value of data by means of statistical models. However, the calculation of the precision based on the standard deviation or other mathematical approaches is not seen as meaningful per se, since the interpretation might vary depending on different parameters. The assessment of this criterion has been based on expert judgement according to sources used to model the datasets.
Methodological appropriateness evaluates the correct and consistent application of the recommended LCI modelling framework and LCI method according to the ILCD handbook. The ILCD recommendations depend on the situation context in which the dataset will be used: Situation A (Micro-level decision support), Situation B (Meso/macro-level decision support) and Situation C (Accounting). Although the datasets should cover all situation concerning decision context, this analysis has been conducted considering that the database is modelled under Situation A18. The assessment has to be interpreted under this context. The analysis of this criterion might be different for other contexts.
Taking these considerations into account, the data quality assessment conducted in here should not be extrapolated to datasets under different contexts.
Furthermore, the analysis has been performed only in a selection of the most representative energy datasets from the ELCD as well as from the other selected databases. The conclusions obtained in this analysis cannot be extrapolated to other type of datasets, nor can be used to compare databases among them.
The current study has consisted of the analysis and comparison of different energy datasets and the review of authoritative sources that could be used in the context of the ELCD. From the deep analysis conducted, it must be highlighted that the ELCD datasets have been modelled based on an extensive review of the most relevant
18
The situation context has been defined according to the claims or decisions provided by the database providers.
231
literature and statistics. The documentation used to model the ELCD energy related datasets can be found in the Life Cycle Thinking Platform web-site19.
In terms of the quality criteria, the analysed ELCD datasets showed a very good performance in many of the criteria and especially in those criteria related to technology representativeness, methodology and completeness.
Concerning technology, it must be stated that the inclusion of still minority advanced electricity generation technologies that could have an important share in the future is seen as an important improvement of the database. Technologies such as solar thermal power plants already relevant in the mix of countries like Spain, ocean technologies, carbon capture technologies and shale gas have good prospects to be important in future energy mixes. Also in this line, the use of energy models such as PRIMES or TIMES to derive future European electricity mixes is also seen as an important improvement of the database that could be very useful for prospective and consequential LCA studies.
The analysis of the completeness criterion has revealed that there are some relevant elementary flows that are missing and preclude a full compliance with the criterion. These elementary flows are the following: Halon 121120, CFC-10, CFC-11, CFC-12, cadmium, indium, iridium, cypermethrin and decane.
In terms of methodology, and although it fully complies with the methodology quality criterion, it would be advisable to harmonize the methodology recommended by the ILCD handbook and used in the biofuels ELCD datasets with the proposed by the EC in the framework of biofuels sustainability certification. E3 database fully follows this methodology and can be used as a source of data. The EC Energy Transparency Platform (http://ec.europa.eu/energy/renewables/biofuels/sustainability_criteria_en.htm) is also a source of relevant information.
Concerning the different technologies analysed, ELCD datasets have the best quality rating in the majority of the technologies, with the exception of electricity from nuclear datasets in which TiR and M criteria score worse than other databases and PV dataset where M criterion also performs worse than in other databases. Several recommendations have been made to overcome these limitations.
Results from the analysis of the electricity mix dataset are quite good although some limitations of the use of this dataset are anticipated. Electricity datasets by energy source and country are not currently available in the ELCD database. Their inclusion in future versions will improve the flexibility and usefulness of the database.
Since electricity is a major input in many processes, having prospective future electricity mixes using the output information from energy models such as PRIMES or TIMES could be very useful for prospective and consequential LCA studies.
ELCD electricity production from fossil fuels datasets has also obtained very good results in this analysis. Main recommendations to improve some criteria are related to the inclusion of some missing technologies such as carbon capture and storage (CCS) technologies and the refinement of the inventory of some pollutants.
19
http://elcd.jrc.ec.europa.eu/ELCD3/ 20
See footnote 12.
232
Nuclear electricity data sets in ELCD have in general a lower score than fossil fuels electricity datasets and other analysed databases performs better in some criteria. The reason lies on the use of several old references and the lack of consideration of a final repository. Main recommendations to improve this dataset would be to update some of the old references, to use some proposed authoritative sources to feed the inventories and to include a final repository for spent fuel and high activity waste step.
Electricity production from hydropower performs quite well using the proposed criteria. Main recommendations for improvement related to the inclusion of small Hydropower Plants (SHPP) due to the potential importance in the mix.
Electricity production from wind dataset also got the best rates in most of the categories. However it is recommended to review for future versions other wind options, such as the “small and medium scale wind”, which might increase in the future, and the re-powering, which substitutes old turbines, increasing the capacity.
The ELCD biomass dataset analysed scored very well in most of the criteria. However it is important to highlight that the score is valid as far as German conditions are referred since the analysed dataset is developed for Germany. However, the results, especially from the forestry module, cannot be extrapolated to the European conditions since forestry management activities are very variable across Europe. The dataset should be split in several ones representing other forestry management practices and yields such us Nordic or Mediterranean countries forestry21.
The ELCD solar PV dataset performs the best in 5 of 6 categories. In order to improve the score in the Methodology criterion the dataset should include an EoL scenario. Regional specificities in terms of capacity factors are also a concern in this dataset and should be handled with care since this dataset could be used for different geographical contexts.
Crude oil fuel based ELCD datasets achieve the best scores in the whole quality criteria. It is acknowledged the extensive use of Authoritative Sources and Business Associations as a source of data and the effort to apply an innovative allocation methodology avoiding black box unit scenarios.
Natural fuel ELCD dataset performs better than any other database in five quality criteria. It has been modelled in a way that includes the most updated and precise NG supply mix in EU-27.
Unconventional hydrocarbons exploitation such shale gas is a hot topic currently in Europe. Several Member States of the EU are discussing new regulations to allow the exploitation of these resources. Under this framework, the European Commission is already studying the potential environmental impacts and health risks that may arise from individual projects and cumulative developments of this technology. Taken into account this context, it is recommended to follow the development of this technology and the regulatory framework, so that the technology could be included in future versions, if necessary.
The rapeseed biodiesel ELCD dataset has been analysed using the information provided by PE (developers of this dataset for the ELCD database, PE 2012a) and some information is missing and could not be evaluated. The dataset lacks the
21
Nevertheless, GaBi database includes datasets for different regions.
233
consideration of raw material imports –rapeseed and rapeseed oil- which is considered to be a big limitation that should be improved. Regarding the methodology it is highlighted the lack of harmonization between the methodology used in the ELCD database and the methodology proposed by the EC in the framework of biofuels sustainability verification.
Regarding the use of authoritative sources, the ELCD database makes extensive use of the statistical information provided by the IEA. This is of course an authoritative source. However, for the European context it seems appropriate the use of data reported by each country to Eurostat, which is freely available from the web-site22. In order to improve precision, it would be advisable to make a more extensive use of Business Associations and Authoritative sources data that have been proposed through the analysis.
The goal and scope of this study aims at providing guidance for the improvement of the energy-related ELCD datasets in future versions, so that recommended actions for the short-medium and long term can be distinguished.
Actions to be taken in the short-medium term
One of the most relevant weaknesses of the ELCD is the lack of datasets that model electricity produced by each technology in each European country. Currently, the ELCD includes electricity mix datasets for each country, modelled considering an established share of sources that might be different to the needs of the user.
Although the optimal solution to this limitation would be to model new datasets for electricity production by technology and for each country, this might not be feasible for the short term. An alternative solution would be to model datasets for each technology under a European context, and to introduce parameters in the electricity mix datasets to vary the shares of each technology.
In order to give response to any change or advance in technologies, and to be able to model new datasets and/or to modify the current ones if necessary, it is highly recommended to constantly review the evolution of advanced technologies and their share in the European market..
This study has identified some of the technologies that might play an important role in the future electricity mixes in Europe:
Carbon Capture and Storage
Small hydropower
Small and medium scale wind, and wind re-powering
Concentrated Solar Power
Shale gas.
Business associations and authoritative sources are relevant sources to update the status of these technologies. Along this study relevant sources have been identified. Next, the most relevant business associations and authoritative sources are listed in the table.
22 http://epp.eurostat.ec.europa.eu/portal/page/portal/energy/data/database.
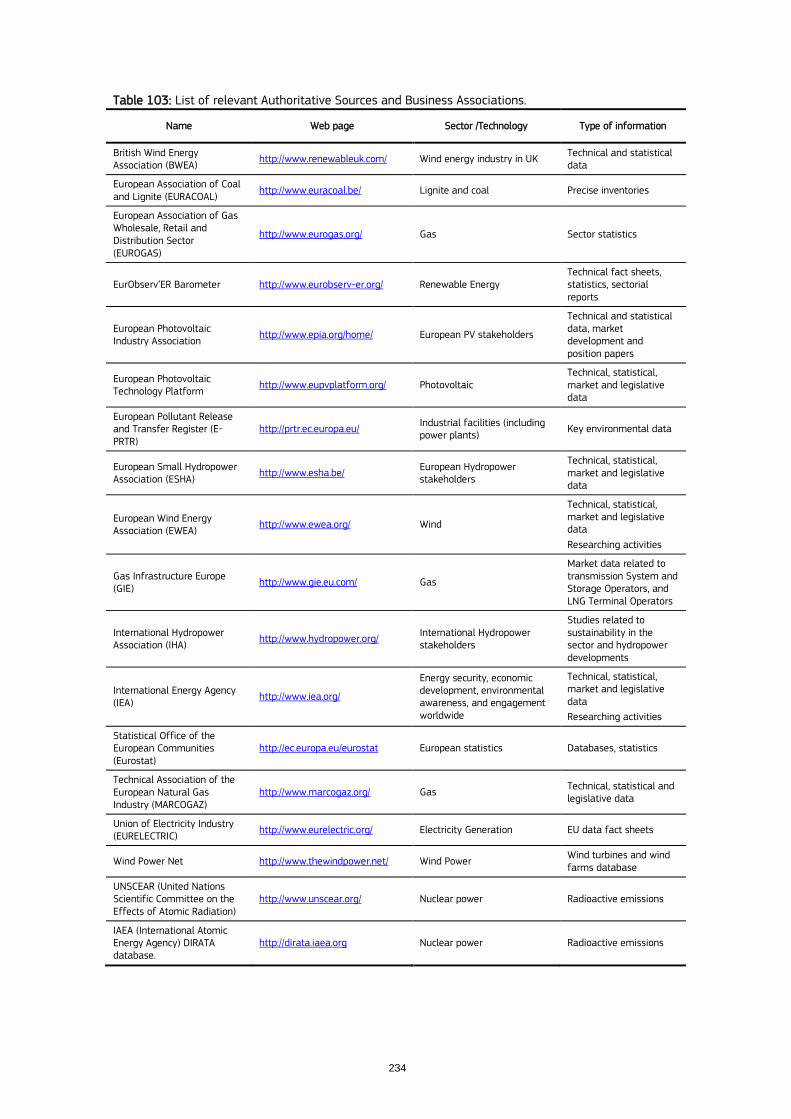
234
Table 103: List of relevant Authoritative Sources and Business Associations.
Name Web page Sector /Technology Type of information
British Wind Energy Association (BWEA)
http://www.renewableuk.com/ Wind energy industry in UK Technical and statistical data
European Association of Coal and Lignite (EURACOAL)
http://www.euracoal.be/ Lignite and coal Precise inventories
European Association of Gas Wholesale, Retail and Distribution Sector (EUROGAS)
http://www.eurogas.org/ Gas Sector statistics
EurObserv‟ER Barometer http://www.eurobserv-er.org/ Renewable Energy Technical fact sheets, statistics, sectorial reports
European Photovoltaic Industry Association
http://www.epia.org/home/ European PV stakeholders
Technical and statistical data, market development and position papers
European Photovoltaic Technology Platform
http://www.eupvplatform.org/ Photovoltaic Technical, statistical, market and legislative data
European Pollutant Release and Transfer Register (E-PRTR)
http://prtr.ec.europa.eu/ Industrial facilities (including power plants)
Key environmental data
European Small Hydropower Association (ESHA)
http://www.esha.be/ European Hydropower stakeholders
Technical, statistical, market and legislative data
European Wind Energy Association (EWEA)
http://www.ewea.org/ Wind
Technical, statistical, market and legislative data
Researching activities
Gas Infrastructure Europe (GIE)
http://www.gie.eu.com/ Gas
Market data related to transmission System and Storage Operators, and LNG Terminal Operators
International Hydropower Association (IHA)
http://www.hydropower.org/ International Hydropower stakeholders
Studies related to sustainability in the sector and hydropower developments
International Energy Agency (IEA)
http://www.iea.org/
Energy security, economic development, environmental awareness, and engagement worldwide
Technical, statistical, market and legislative data
Researching activities
Statistical Office of the European Communities (Eurostat)
http://ec.europa.eu/eurostat European statistics Databases, statistics
Technical Association of the European Natural Gas Industry (MARCOGAZ)
http://www.marcogaz.org/ Gas Technical, statistical and legislative data
Union of Electricity Industry (EURELECTRIC)
http://www.eurelectric.org/ Electricity Generation EU data fact sheets
Wind Power Net http://www.thewindpower.net/ Wind Power Wind turbines and wind farms database
UNSCEAR (United Nations Scientific Committee on the Effects of Atomic Radiation)
http://www.unscear.org/ Nuclear power Radioactive emissions
IAEA (International Atomic Energy Agency) DIRATA database.
http://dirata.iaea.org Nuclear power Radioactive emissions
235
Actions to be taken in the long term
As mentioned before, future versions of the ELCD should include new datasets for electricity production by technology and by country. Also, future electricity scenarios can be developed using to that end the output from energy models such as PRIMES or TIMES. This is an important improvement of the database that could be very useful for prospective and consequential LCA studies.
Modelling the end of life of the systems appears to be a difficult task due to the novelty of some technologies and the lack of data from other technologies (solar PV, final repository for spent nuclear fuel and natural gas plant dismantling). Efforts on this challenge should be kept in the future.
Since its first release, the ELCD database has been updated two times. The needs of reviewing and updating the ELCD database depend on the different sectors and the technologies. It would be useful to define periods to revise the energy-related datasets.
For this purpose, a deep analysis of the learning curves would identify the level of maturity for each technology. Then, special periods for reviewing could be identified by technology.
This study shows the results of the first analysis of energy- related datasets based on the data quality indicators described by the ILCD Handbook (EC-JRC-IES 2010a, 2010b, 2011). The study provides detailed information about the datasets quality in terms of representativeness (technological, geographical and time-related) and appropriateness (completeness, precision and methodological). These results ensure the quality of the energy-related datasets to any LCA practitioner, and provide insights related to the limitations and assumptions underling in the datasets modelling.
Giving this information, the LCA practitioner will be able to decide whether the use of the ELCD datasets is appropriate based on the goal and scope of the analysis to be conducted.
236
8. References and bibliography ADL (1989) Arthur D. Little: Methane emissions from the oil and gas production industries, prepared for
Ruhrgas, Wiesbaden
ADM (2000) Archer Daniels Midland Company (ADM), November 2000; www.biodiesel.de
AEBIOM (2010): Annual report 2010, European Biomass Association (www.aebiom.org).
Aebischer B., Catenazzi G., Jakob M., Jochem E., Kumbaroglu G., Madlener R., Dones R., Gantner U., Hirschberg S., Kypreos S., Lienin S., Röder A., Frischknecht R., Jungbluth N., Faist M. and Schwarz J. (2002) CO2- Reduktionspotential Erdgas. Projekt-phase 1: Referenzsze-nario., Zürich.
Althaus H.-J., Blaser S., Classen M. and Jungbluth N. (2004) Life Cycle Inventories of Metals. Final report Ecoinvent 2000 No. 10. EMPA Dübendorf, Swiss Centre for Life Cycle Inventories, Dübendorf, CH, retrieved from: www.ecoinvent.ch.
Altmann, M.; Blandow, V.; Brunner, E.; Fechner, U.; Schindler, J.; Reismayr, D.; Zehner, M.: Solarfabrik''96; Studie im Auftrag von Greenpeace; Ludwig-Bölkow-Systemtechnik GmbH, Ottobrunn, September 1995.
AP-42 2002 U.S. Environmental Protection Agency (EPA) (2002) AP-42, Fifth Edition, Volume I Chapter 1: External Combustion Sources. Bituminous and Subbituminous Coal Combustion. Downloaded from http://www.epa.gov/ttn/chief/ap42/ch01/final/c01s01.pdf (8.4.2003).
Arcadis (2011) Hydropower Generation in the context of the EU WFD, Contract N° 070307/2010/574390, EC DG Environment, Project number 11418 | version 2 | 09-03-2011, http://epl.org.ua/fileadmin/user_upload/Docs/Small_Hydropowers_Stattions/11418_WFD_HP_draft_final_110309.pdf (January 2013).
AREVA (2009a) Tricastin Site - Données chiffrées et informations sur la sûreténucléaire et radioprotection du site AREVA Tricastin, 2009,http://www.areva.com/EN/operations-852/tricastin-nuclear-site-theonly-industrial-site-of-its-kind-in-europe.html, last access September2010
AREVA (2009b) Tricastin site - Rapport de sûreté nucléaire et de radioprotection 2009 du site AREVA Tricastin. 2009. http://www.areva.com/EN/operations-852/tricastin-nuclear-site-theonly-industrial-site-of-its-kind-in-europe.html, last access September 2010
AREVA (2009c) Rapport environnemental, social et sociétal 2008 – Établissement de La Hague.“ Areva. Areva. July 2009. http://www.arevanp.com/common/liblocal/docs/Environnement/FBFC%20RAPPORT%20SSESNR.pdf , last access September 2010.
AREVA (2009d) FBFC Romans Fuel Production - Rapport environmental, social, sociétal, de sûreté nucléaire et de radioprotection 2008. 2010. http://www.areva.com/EN/operations-1010/fbfc-romans-fuelassemblies-for-nuclear-reactors.html, last access September 2010
Aróstegui M. (1997) ExternE National Implementation Spain, Final Re-port. CIEMAT.
Ballestra, Adami I. (2003): Three steps towards biodiesel. In: Oils & Fats International, November 2003.
Bauer C., Bollinger R., Tuschmid M, Faist-Emmenegger M. (2007) Wasserkraft. In :Dones R (Ed.) et al., Sachbilanzen von Energiesystem: Grundlagen für den ökologischen Vergleich von Energiesystemen und den Einbezug von Energiesystemen in Ökobilanzen für die Schweiz. Final report Ecoinvent No. 6-VIII, PSI Villigen, Swiss Centre for life cycle inventories, Dübendorf, CH.
Bauer, C.; T. Heck, R. Dones, O. Mayer-Spohn, M. Blesl (2008). Final report on technical data, costs, and life cycle inventories of advanced fossil power generation systems. Deliverable n° 7.2 - RS 1a. NEEDS (New Energy Externalities Developments for Sustainability) Integrated project.
Beer T., et al. (2001). Comparison of transport fuels. Life-cycle emissions analysis of alternative fuels for heavy vehicles. Prepared for the Australian Greenhouse Office, by CSIRO, in collaboration with the University of Melbourne and RMIT Center for Design.
Bendz K. (2005). EU25 Oilseeds and products: Biofuels situation in the European Union. Global Agriculture Information Network, GAIN voluntary report No. E35058, March 23, 2005.
237
Bertschinger H. (1959) Versorgungs- und Transportprobleme beim Bau der Bergeller Kraftwerke der Stadt Zürich. In: Wasser- und Energiewirtschaft, 51(7), pp. 191-198.
BGR, (1999). Stoffmengenflusse und Energiebedarf bei der Gweinnung ausgewalther mineralisher Rohstoffe-Tilstudie Steinkohle, Hannover.
Biomasse-Heizkraftwerk Pfaffenhofen (2001) ; C.A.R.M.E.N, November 2001
Bitter, W.-G.: ZMP Marktbilanz Forst und Holz (2006), ZMP Markt- und Preisberichtstelle GmbH, Bonn, 2006
BMLEV (2006) Bundesministerium für Ernährung, Landwirtschaft und Verbraucherschutz (BMELV) (2006): Holzmarktbericht 2/2005, Abschlussergebnisse für die Forst- und Holzwirtschaft des Wirtschaftsjahres 2005, 2006
BMU (2002) (Bundesministerium für Umwelt, Naturschutz und Reaktorsicherheit) 2002: TA Luft Novelle 2002, Berlin (not found).
BMU (2004). Material Flow Analysis of Sustainable Biomass Use for Energy
BNFL (1992) British Nuclear Fuels (BNFL) (1992): Application for an Authorisation for the gaseous wastes from the Sellafield site. Warrington, 1992
Bockey D. (2004). Policy initiative schemes and benefit of biofuel promotion in Germany: Current status of legislation and production. Conference on biofuels : Challenges for Asian future, Queen Sirikit National Convention Center, Bangkok, Thailand.
Bolliger R. and Bauer C. (2004) Wasserkraft. In: Sachbilanzen von Energiesystemen: Grundlagen für den ökologischen Vergleich von Energiesystemen und den Einbezug von Energiesystemen in Ökobilanzen für die Schweiz (Ed. Dones R.). Paul Scherrer Institut Villigen, Swiss Centre for Life Cycle Inventories, Dübendorf, CH retrieved from: www.ecoinvent.ch.
Bonus (2001): Stiesdal H. (2001) Middelgrunden Offshore, A newsletter for customers and business associates, Bonus energy A/S. General technical description, Technical specification, Drawings and design, Bonus 2 MW offshore. Isager Bogtryt/Offset, Svendborg, Denmark. Retrieved from: www.bonus.dk.
Borken, J., Patyk, A. and Reinhardt, G. A. (1999): Basisdaten für ökologische Bilanzierungen, Braunschweig, 1999
BP Amoco (2001) BP Amoco statistical review of world energy June 2001. BP Amoco, London, retrieved from: www.bp.com/centres/energy/.
Brander M., Wylie C. (2011) „The use of substitution in attributional Life Cycle Assessment‟, Global Gas Measurement and Management, Vol 1, Issue 3-4, pp. 161-166.
Brandt, F. (1991), Brennstoffe und Verbrennungsrechnung, 2. Auflage, Essen, Germany, 1991
BREF (2003) Integrated Pollution Prevention and Control (IPPC): Reference Document on Best Available Techniques for Mineral Oil and Gas Refineries, February 2003.
BREF (2005) Garcilaso, I.: Integrated Pollution Prevention and Control – Reference Document on Best Available Techniques for Large Combustion plants, European Commission, http://eippcb.jrc.es, Seville, Spain, 2005
Brekke A., Askam C., Modahl I.S., Vold B.I., Johnsen F.M. (2012). Environmental assessment of amine-based carbon capture. Scenario modelling with life cycle assessment (LCA), Report OR.17.12, EDecIDe Project, Ostfold Research,Norway.
Brunk F. (1991) Information from ABB for the first edition of Ökoinventare.
Buczek B. and Czepirski L. (2004). Applicability of used rapeseed oil for production of biodiesel. In: Inform, Industrial oil products, Vol. 15 (3), pp. 186-188, March 2004.
Bundesamt für Gesundheit (BAG) (1996-2003) Umweltradioaktivität und Strahlendosen in der Schweiz. BAG, Abteilung Strahlenschutz, Sektion Überwachung der Radioaktivität. Freiburg, Schweiz.
Burger B. and Bauer C. (2004) Windkraft. In: Sachbilanzen von Energiesystemen: Grundlagen für den ökologischen Vergleich von Energiesystemen und den Einbezug von Energiesystemen in
238
Ökobilanzen für die Schweiz (Ed. Dones R.). Paul Scherrer Institut Villigen, Swiss Centre for Life Cycle Inventories, Dübendorf, CH retrieved from: www.ecoinvent.ch.
Burger B. and Bauer C. (2007) Windkraft. In: Sachbilanzen von Energiesystemen: Grundlagen für den ökologischen Vergleich von Energiesystemen und den Einbezug von Energiesystemen in Ökobilanzen für die Schweiz (Ed. Dones R.). Paul Scherrer Institut Villigen, Swiss Centre for Life Cycle Inventories, Dübendorf, CH retrieved from: www.ecoinvent.ch.
CEA (1998): Commissariat a l'Energie Atomique, CEA/Fontenay-aux-Roses, Informations Utiles, Edition 1998.
CEC (1991) Commission of the European Community (CEC): CORINAIR Inventory. Part 6. VOC´s Default Emission Factors (Total NMVOC and CH4), Working Group: R. Bouscaren, J. Fugala, G. McInnes, K.E. Joerss, O. Rentz, G. Thira and C. Veldt
CEES (1991): Emissions of GHG gases from transportation fuels and electricity. Final report. M. Delucchi. This study is too old and could not be found.
CENTREL (2001) CENTREL Annual Report 2001, retrieved from www.centrel.org.
Cerbe G., Carlowitz O., Kätelhön J. E., Köhler H., Lehmann J., Lendt B., Lethen H., Mauruschat H. and Pietsch H. (1999) Grundlagen der Gas-technik: Gasbeschaffung, Gasverteilung, Gasverwendung. 5., vollständig neubearbeitete Auflage Edition. Carl Hanser Verlag, ISBN 3-446-21109-8, München Wien.
CERI (2008) (Canadian Energy Research Institute), 2008. Comparative life cycle assessment (LCA) of base load electricity generation in Ontario.
Ceuterick, D. & Spirinckx, C. (1997). Comparative LCA of biodiesel and fossil diesel fuel. Final report No. 1997/PPE/R/026, VITO, Flemish Institute for Technological Research, Mol, Belgium.
Cieslinska, J.; Debski, B. et al (2010): Poland's National Inventory Report 2010 Greenhouse gas Inventory for 1998-2008 – Submission under the UN Framework Convention on Climate Change and its Kyoto Protocol, Institute of Environmental Protection, Warsaw
Ciroth, A. (2009) „Cost data quality considerations for eco-efficiency measures‟, Ecological Economics 68 (2009) 1583-1590.
Ciseri L., I. Knoepfel (1996): Ökoinventare von Energiesystemen Grundlagen für den ökologischen Vergleich von Energiesystemen und den Einbezug von Energiesystemen in Ökobilanzen für die Schweiz – Teil V Erdgas, i m Auftrag des Bundesamtes für Energiewirtschaft und des Nationalen Energie-Forschungs-Fonds, 3. Aufl., Bern 1996
Concawe (2012): EU refinery energy systems and efficiency, report n. 3/12, Brussels, Belgium.
Concawe (Ed.) (2007): Oil Refining in the EU in 2015. Report no. 1/07. With support from M. Dastillung and J.F. Larive. Brussels, Belgium. Online available: http://www.concawe.org
Concawe (Ed.) (2009): Impact of marine fuels quality legislation on EU refineries at the 2020 horizon. Report no. 3/09. With support from M. Dastillung, J-F. Larivé and M. Fredriksson. Brussels, Belgium. Online available: http://www.concawe.org
Concawe (Ed.) (2010-01-19): Impact of product quality and demand evolution on EU refineries at the 2020 horizon – CO2 emissions trend and mitigation options. Report no. 8/08. With support from M. Dasstillung and J.F. Larivé. Brussels, Belgium. Online available: http://www.concawe.org
Dauriat A., Fromentin A., Sarlos G. (2001). Possibilités d'utilisation de biocarburants à l'Aéroport International de Genève. Rapport 140.104, préparé par le Laboratoire de Systèmes Energétiques (LASEN) de l'EPFL pour l'Aéroport International de Genève, avec la collaboration du GECOS, EPFL et Fromentin Bioenergy Consulting.
de Wild-Scholten M. J. and Alsema E. A. (2007) Environmental Life Cycle Inventory of Crystalline Silicon Photovoltaic System Production. Energy research Center of the Netherlands, Petten, The Netherlands and Copernicus Institute for Sustainable Development and Innovation, Utrecht University, The Netherlands, retrieved from: http://www.ecn.nl/publicaties/default.aspx?au=44649.
de Wild-Scholten M. J., Alsema E. A., Fthenakis V., Agostinelli G., Dekkers H. and Kinzig V. (2007) Fluorinated Greenhouse Gases In Photovoltaic Module Manufacturing: Potential Emissions And
239
Abatement Strategies. In proceedings from: European Photovoltaic Solar Energy Conference, 3-7 September 2007, Fiera Milano, Italy.
de Wild-Scholten M. J., Alsema E. A., ter Horst E. W., Bächler M. and Fthenakis V. (2006) A cost and environmental impact comparision of gridconnected rooftop and ground based PV systems. In proceedings from: 21th European Photovoltaic Solar Energy Conference, Dresden, DE, 4-8.9.2006.
de Wild-Scholten, M.J. & Alsema, E.A. (2005). Environmental Life Cycle Inventory of Crystalline Silicon Photovoltaic Module Production
DECC (2010) Tomas, J.; MacCarthy, J. et al: Department of Energy & Climate Change (DECC), UK Greenhouse gas inventory, 1990 to 2008 – Annual Report for Submission under the Framework Convention on Climate Change, Offordshire, UK, 2010
Delucchi M.A. and Lipman T. (2003). A lifecycle emissions model (LEM): Lifecycle emissions from transportation fuels, motor vehicles, transportation modes, electricity use, heating and cooking fuels, and materials. Report UCD-ITS-RR- 03-17A, Institute of Transportation Studies, University of California, Davis, CA, US. Retrieved from: www.its.ucdavis.edu/publications.html (ref. 2005).
DERA, 2011. Annual Report. Reserves, Resources and Availability of Energy Resources 2011. Retrieved from: http://www.bgr.bund.de/EN/Themen/Energie/Downloads/annual_report_2011_en.pdf?__blob=publicationFile&v=2
DGMK (1992) Deutsche wissenschaftliche Gesellschaft für Erdöl, Erdgas und Kohle e.V.: Ansatzpunkte und Potentiale zur Minderung des Treibhauseffekts aus Sicht der fossilen Energieträger – Forschungsbericht 448-2, Hamburg, 1992
DLR (2009) (Deutsches Zentrum für Luft- und Raumfahrt)/IfnE (Ingenieurbüro für neue Energien) 2009: Langfristszenarien und Strategien für den Ausbau erneuerbarer Energien in Deutschland - Leitszenario 2009; Untersuchung im Auftrag des Bundesministeriums für Umwelt, Naturschutz und Reaktorsicherheit; Stuttgart/Teltow http://www.erneuerbare-energien.de/files/pdfs/allgemein/application/pdf/leitszenario2009_bf.pdf
DLR (2010) (Deutsches Zentrum für Luft- und Raumfahrt)/IWES (Fraunhofer Institut für Windenergie und Energiesystemtechnik)/IfnE (Ingenieurbüro für neue Energien) 2010: Langfristszenarien und Strategien für den Ausbau der erneuerbaren Energien in Deutschland bei Berücksichtigung der Entwicklung in Europa und global - „Leitstudie 2010“; Nitsch, Joachim et al.; i.A. des BMU, FKZ 03MAP146; Stuttgart usw.
DOE (1979) US Department of Energy (DOE): Environemental Aspects of Commerical Radioactive Waste Management, Batelle Pacific Northwest Labs, 1979
Doka G. (2003) Life Cycle Inventories of Waste Treatment Services. Final report ecoinvent 2000 No. 13. EMPA St. Gallen, Swiss Centre for Life Cycle Inventories, Dübendorf, CH. Bezug unter: www.ecoinvent.ch.
Dones, R. and Zollinger, E. (1996) Ökoinventare von Energiessystemen – Kernergie PSI (Paul Scherrer Institut), Villigen (Switzerland), 1996
Dones, R., Bauer, C., Röder, A. (2007) Kohle. In: Dones, R. (Ed.) et al., Sachbilanzen von Energiesystemen: Grundlagen für den ökologischen Vergleich von Energiesystemen und den Einbezug von Energiesystemen in Ökobilanzen für die Schweiz. Final report ecoinvent No. 6-VI, Paul Scherrer Institut Villigen, Swiss Centre for Life Cycle Inventories, Dübendorf, CH.
Dreesen D.R. et al., (1982) Preliminary Evaluation of Uranium Mill Tailings Conditioning as an Alternative Remedial Action Technology. In: Proc. NEA Workshop Uranium Mill Tailings Management. Colorado State University, OECD, Paris.
Dreicer M., Tort V., und Manen P. (1995) Nuclear Fuel Cycle - Estimation of Physical Impacts and Monetary Valuation for Priority Pathways. Report Nº 234 prepared for DG XII of CEC in the framework of the ExternE Project. CEPN, Fontenay aux Roses, France.
Dreier T. (1999). Biogener Kraftstoffe: Energetische, ökologische und ökonomische Analyse. IFE Schriftenreihe Heft No. 38, Lehrstuhl für Energiewirtschaft und Anwendungstechnik, TU München.
240
Dreier T. (2000). Ganzheitliche Systemanalyse und Potenziale biogener Kraftstoffe. IFE Schriftenreihe Heft No. 42, Lehrstuhl für Energiewirtschaft und Anwendungstechnik, TU München.
Dreier T., Geiger B. & Saller A. (1998). Ganzheitliche Prozesskettenanalyse für die Erzeugung und Anwendung von biogenen Kraftstoffen. Lehrstuhl für Energiewirtschaft und Anwendungstechnik, TU München, Studie im Auftrag der Daimler Benz AG und des Zentrums für Angewandte Energieforschung in Bayern (ZAE).
Dreier, T.; Geiger, B. (1998); Lehrstuhl für Energiewirtschaft und Kraftwerkstechnik, TU München (IfE); Saller, A., Forschungsstelle für Energiewirtschaft (FfE): Ganzheitliche Prozeßkettenanalyse für die Erzeugung und Anwendung von biogenen Kraftstoffen; Studie im Auftrag der Daimler Benz AG, Stuttgart und des Bayerischen Zentrums für Angewandte Energieforschung e.V. (ZAE); Mai 1998
DVFG (2003) Flüssiggas Internet Information. Deutscher Verband für Flüssiggas (DVFG), Berlin, Germany, retrieved from: http://www.dvfg.de/frames/flue/h.htm.
DWK (1988) Deutsche Gesellschaft für Wiederaufbereitung von Kernbrennstoffen (DWK): Kurzbeschreibung für die Wiederaufarbeitungsanlage Wckersdorf, 1988
EAA (2000) Environmental profile report for the European aluminium industry April 2000. European Aluminium Association, Brussels.
EBB (2006) European Biodiesel Board (2006). Statistics of the EU biodiesel industry. Consulted on 11.05.2006 on the internet site of the European Biodiesel Board (EBB) (www.ebb-eu.org).
EC (1995a). ExternE. Externalities of energy. Vol 3. Coal and Lignite. EUR 16522 EN.
EC (1995b). ExternE. Externalities of Energy. Vol. 5. NUCLEAR.
EC (2008): Study on oil refining and oil markets, Prepared for European Commission by Purvin & Gerzt Inc., 2008.
EC (2010): EU energy trends to 2030 – updated 2009, EC, Directorate-General for Energy in collaboration with Climate Action DG and Mobility and Transport DG, Luxembourg, 2010, Authors (E3M-Lab): Prof. P. Capros, Dr. L. Mantzos, N. Tasios, A. De Vita, N. Kouvaritakis http://ec.europa.eu/clima/policies/package/docs/trends_to_2030_update_2009_en.pdf
EC (2011) Energy Roadmap 2050. Impact Assessment and Scenario Analysis. SEC (2011) 1565 final. Brussels 15.12.2011
EC-JRC-IES (2010a): European Commission - Joint Research Centre - Institute for Environment and Sustainability. „International Reference Life Cycle Data System (ILCD) Handbook – General guide for Life Cycle Assessment – Detailed guidance‟, First edition March 2010. EUR 24708 EN. Luxembourg. Publications Office of the European Union, 2010.
EC-JRC-IES (2010b): European Commission - Joint Research Centre - Institute for Environment and Sustainability. „International Reference Life Cycle Data System (ILCD) Handbook - Specific guide for Life Cycle Inventory data sets‟, First edition March 2010. EUR 24709 EN. Luxembourg. Publications Office of the European Union, 2010.
EC-JRC-IES (2011): European Commission-Joint Research Centre - Institute for Environment and Sustainability: „International Reference Life Cycle Data System (ILCD) Handbook- Recommendations for Life Cycle Impact Assessment in the European context‟, First edition November 2011. EUR 24571 EN. Luxemburg. Publications Office of the European Union, 2011.
EC-MOE (2011): European Commission – Directorate general for Energy – market Observatory for Energy: „Europe‟s energy position – 2010 Annual report‟, Luxembourg. Publication Office of the European Union, 2011.
ECN (2005): Energy Centre of the Netherlands, Environmental life cycle inventory of crystalline silicon photovoltaic module production, M.J. de Wild-Schoten; E.A. Alsema (Utrecht University); Table I.
Ecobilans (1999). French LCA study for electric heating. This study has not been found and the primary references could not be checked.
Ecoinvent (2007): Dones R., Bauer C., Bolliger R., Burger B., Faist Emmenegger M., Frischknecht R., Heck T., Jungbluth N., Röder A., Tuchschmid M. (2007) Life Cycle Inventories of Energy Systems: Results
241
for Current Systems in Switzerland and other UCTE Countries. ecoinvent report No. 5. Paul Scherrer Institut Villigen, Swiss Centre for Life Cycle Inventories, Dübendorf, CH, 2007.
Ecoinvent (2009): Jungbluth N., Stucki M, and Frischknecht R. (2009) Photovoltaics. In Dones, R. (Ed.) et al., Sachbilanzen von Energiesystemen: Grundlagen für den ökologischen Vergleich von Energiesystemen und den Einbezug von Energiesystemen in Ökobilanzen für die Schweiz. ecoinvent report No. 6-XII, Swiss Centre for Life Cycle Inventories, Dübendorf, CH, 2009.
EC-PV (2005): European Commission Community Research: A vision for Photovoltaic technology, Luxembourg: Office for Official Publications of the European Communities, 2005, ISBN 92-894-8004-1.
EDUCOGEN (2001) Second Edition, December 2001. COGEN Europe, Brussels, Belgium, retrieved from: http://www.cogen.org/projects/educogen.htm.
EEA (2006) European Environment Agency: EMEP/Corinair Emission Inventory Guidebook 2006 – Combustion in energy & transformation industries- Activities: Large combustion installations, Copenhagen, Denmark, 2006
EEA (2009) European Environment Agency (EEA): Plant-by-Plant emissions of SO2, NOx and dust and energy input to large combustion plants covered by Directive 2001/80/EC – temporal coverage 2004-2006, Copenhagen, Denmark, March 2009
EIA (2005) Energy Information Administration (2005). Energy consumption by sector. Manufacturing inputs for heat, power, and electricity generation by end use, 2002. In: Annual Energy Review 2004. Report No. DOE-EIA-0384(2004), 15 August 2005.
EIA (2005) Energy Information Administration (US Energy department): C.5 Gross Heat Content of Dry Natural Gas Production, 1980-2004, 2005 EURATOM 2009 Euratom Supply Agency: Annual Report 2008, European Commission – DG Energy, Brussels, 2009
EIA-USA (2011): Energy Information Administration Hydroelectric Pumped Storage Electricity Net Generation, Washington D.C., USA, 2011
EM (1995a) Project "ENVIRONMENTAL MANUAL FOR POWER DEVELOPMENT (EM)"; sponsored byy GTZ, DfID, DGIS, KfW and Swiss Agency for Development and Cooperation; 1990-1995, see: http://www.oeko.de/service/gemis/en/em/overview.htm.
EM (1995b): Environmental Manual for Power Development Data Sources and Data Compilation for the EM Database, prepared by Öko-Institut for GTZ, Darmstadt - available as PDF file from the EM website: http:/www.oeko.de/service/em/
Enercon GmbH (2003), Aurich: Turmgewichte und Abmessungen; 2003
Environmental Manual for Power Development (1996) - Data Sources and Data Compilation for the Indian dataset, prepared by Niels Jungbluth for GTZ (Deutsche Gesellschaft für Technische Zusammenarbeit, Eschborn), Berlin 1996.
EPA (1983): Office of Radiation Programs of US Environmental Protection Agency (1983) Final Environmental Impact Statement for Standards for the Control of Byproduct Materials from Uranium Ore Processing (40 CFR 192), Volume I. EPA 520/1-83-008-1, USEPA, Washington D.C., USA.
EPA (2002) Informationen unter http://www.epa.gov/ttn/chief/ap42/ im Mai 2002 bezogen: AP-42.
ESA (2009). Euratom Supply Agengy Annual report 2008.
ESU (1994): (Energie-Stoffe-Umwelt) Eco-inventories of energy systems, P.Hofstetter et al., ETH Zürich
ESU (1996) (Gruppe Energie-Stoffe-Umwelt an der ETH Zürich)/PSI (Paul-Scherrer-Institut)/ Bundesamt für Energiewirtschaft (BEW) 1996: Ökoinventare von Energiesystemen, Zürich (3. Auflage mit CDROM)
ETH (1996): Eidgenössische Technische Hochschule (ETH) 1996: Vergleichende Umweltrelevanz des Einsatzes alternativer Kältemittel in Kompressions-Wärmepumpen und -Kälteanlagen, T. Weibel, Institut für Energietechnik, Laboratorium für Energiesysteme, ETH Zürich.
ETSAP (2010a): Coal Fired Power, IEA ETSAP - Technology Brief E01 – April 2010 - www.etsap.org.
242
ETSAP (2010b): Gas Fired Power, IEA ETSAP - Technology Brief E02 – April 2010 - www.etsap.org.
ETSAP (2010c): Nuclear Power, IEA ETSAP - Technology Brief E03 – April 2010 - www.etsap.org.
ETSAP (2010d): Biomass for Heat and Power, IEA ETSAP - Technology Brief E05 – May 2010 - www.etsap.org.
ETSAP (2010e): Hydropower, IEA ETSAP - Technology Brief E06 – May2010 - www.etsap.org.
ETSAP (2013): Photovoltaic solar power, IEA ETSAP - Technology Brief E11 – January 2013 - www.etsap.org.
EU DG-TREN (2003): European Commission Directorate-General for Transport and Energy, European Energy and Transport Trends to 2030 (PRIMES), Brussels.
EUCAR; Concawe; European Commission – JRC, Institute for Environment and Sustainability (IES) (Ed.) (2008): Well-to-Wheels analysis of future automotive fuels and powetrtrains in the European context. Ispra, Italy. (Version 3). Online verfügbar unter http://ies.jrc.ec.europa.eu/our-activities/support-for-eu-policies/well-to-wheels-analysis/WTW.html
EURACOAL (2011): Coal industry around Europe 2011, European Association for coal and lignite (www.euracoal.org).
Euracoal 2009. An Energy Strategy for Europe: Importance and Best Use of Indigenous Coal. Retrieved from: www.euracoal.be
EURATOM-EC (2012): EURATOM Supply Agency, Annual Report 2011, European Commission, Luxembourg: Publications Office of the European Union, 2012.
EURELECTRIC (2001) Statistics and prospects for the European electricity sector (1980-1999, 2000-2020) (Eurprog 2001). Union of the Electricity Industry - EURELECTRIC, Brussels, retrieved from www.eurelectric.org.
EurObserv‟ER (2005). Biofuels Barometer, June 2005. In: Systèmes Solaires No. 167, June 2005.
EUROGAS (2011): Statistical report 2011, European Union of gas natural industry (www.eurogas.org).
European Biodiesel Board supplied by Robert Edwards, Joint Research Centre (JRC), Ispra, Italy, 21 July 2009; Kaltschmitt, et al 1997; Dreier, et al, 1998; UBA 1999; Hartmann, 1995; Archer Daniels Midland Company (ADM), November 2000; www.biodiesel.de
European Commission – JRC, Institute for Prospective Technological Studies (IPTS) (Ed.) (2003): Integrated Pollution Prevention and Control (IPPC) – Reference Document on Best Available Techniques for Mineral Oil and Gas Refineries. Sevilla, Spain. Online available: http://eippcb.jrc.es/reference
European Commission (Ed.) (2000): The Auto-Oil II Programme. A report from the services of the European Commission, reported by the Directorates General for: Economic and Financial Affairs, Enterprise, Transport and Energy, Environment, Research and Taxation and Customs Union. Brussels, Belgium.
European Environment Agency (EEA) (Ed.) (2009): EMEP/EEA air pollutant emission inventory guidebook – 2009. Formerly referred to as the EMEP CORINAIR guidebook. Technical report no. 6/2009. Copenhagen, Denmark. Online available: http://www.eea.europa.eu
European Environment Agency (EEA) (Ed.) (2010): The European Pollutant Release and Transfer Register. Herausgegeben von European Environment Agency (EEA). Copenhagen, Denmark. Online available: http://prtr.ec.europa.eu
European Parliament (Ed.) (2003): Directive 2003/30/EC of the European Parliament and of the Council of 8 May 2003 on the promotion of the use of biofuels or other renewable uels for transport.
EUROPIA (2010): How a Refinery works, European Petroleum Industry Association (www.europia.com).
EUROPIA (2011): Annual Report 2011, European Petroleum Industry Association (www.europia.com).
Europia (Ed.) (2009): Annual report 2008. Brussels, Belgium. Online available: http://www.europia.com
EWEA (2013a) European offshore wind industry –key trends and statistics 2012. http://www.ewea.org/statistics/european/
243
EWEA (2013b) Wind in power. 2011 European statistics. http://www.ewea.org/statistics/european/
ExternE (1999) UK national implementation study, Table 1: Definition of the gas fuel cycle. Retrieved 10.9.2002 retrieved from:http://externe.jrc.es/7a99file1.htm.
Faist Emmenegger M., Heck T. and Jungbluth N. (2003) Erdgas. In: Sachbilanzen von Energiesystemen: Grundlagen für den ökologischen Vergleich von Energiesystemen und den Einbezug von Energiesystemen in Ökobilanzen für die Schweiz (Ed. Dones R.). Paul Scherrer Institut Villigen, Swiss Centre for Life Cycle Inventories, Dübendorf, CH retrieved from: www.ecoinvent.ch.
Faist Emmenegger M., Heck T. and Jungbluth N. (2004) Erdgas. in: Sachbilanzen von Energiesystemen: Grundlagen für den ökologischen Vergleich von Energiesystemen und den Einbezug von Energiesystemen in Ökobilanzen für die Schweiz (Ed. Dones R.). Final report ecoinvent 2000 No. 6, Paul Scherrer Institut Villigen, Swiss Centre for Life Cycle Inventories, Dübendorf, CH retrieved from: www.ecoinvent.ch.
Faist Emmenegger M., Heck T. and Jungbluth N. Tuchsmid M. (2007) Erdgas. In: Sachbilanzen von Energiesystemen: Grundlagen für den ökologischen Vergleich von Energiesystemen und den Einbezug von Energiesystemen in Ökobilanzen für die Schweiz (Ed. Dones R.). Paul Scherrer Institut Villigen, Swiss Centre for Life Cycle Inventories, Dübendorf, CH retrieved from: www.ecoinvent.ch.
FAOSTAT (2006) Faostat Database Query: Rape Production, from http://faostat.fao.org/faostat/
Fava, J., Jensen, A.A., Lindfors, L., Pomper, S., de Smet, B., Warren, J. and Vigon, B., (1994): „Life-cycle assessment data quality: a conceptual framework‟. SETAC Foundation for Environmental Education, Pensacola, US.
FEA (1999) Federal Environment Agency - Austria: State of the art in the refining industry with regard to the IPCC-directive - Summary; IB 610 (1999).
FEI (2002) Fossil Energy International (FEI): An Energy Overview of Columbia; October 2002 http://www.fe.doe/international/colbover.html (not found).
FEI (2010) Finnish Environment Institute: Air pollutant emissions in Finland 1990- 2008 Informative Inventory report, Helsinki, Finnland, 2010
FINLAND (2010) Statistics Finland - Greenhouse Gas Inventory Unit: Greenhouse Gas Emissions in Finland 1990-2008 National Inventory Report under the UNFCCC and the Koto Protocol, Helsinki, Finnland, 2010
Flessa, H.:, Beese, F.; Brumme, R.; Priesack, E.; Przemeck, E.; Lay, J., P. (1998): Freisetzung und Verbrauch der klimarelevanten Spurengase N2O und CH4 beim Anbau nachwachsender Rohstoffe; Deutsche Bundesstiftung Umwelt; Zeller Verlag 1998
Fontelle, J.-P (2010) General Directorate for Energy and Climate – Department for Climate and Air Quality, Organisation et methodes des inventaires nationaux des emission atmospheriques en France, Paris, France, 2010
FQD (2009): DIRECTIVE 2009/30/EC OF THE EUROPEAN PARLIAMENT AND OF THE COUNCIL of 23 April 2009 amending Direct. 98/70/EC as regards the specification of petrol, diesel and gas-oil and introducing a mechanism to monitor and reduce greenhouse gas emissions and amending Council Directive 1999/32/EC as regards the specification of fuel used by inland waterway vessels and repealing Direct. 93/12/EEC, Official Journal of the European Union, 5.6.2009. http://eur-lex.europa.eu/LexUriServ/LexUriServ.do?uri=OJ:L:2009:140:0088:0113:EN:PDF
Frischknecht R. & Jungbluth N. (2002). Qualitätsrichtlinien ecoinvent 2000. Arbeitspapier v5.4, Schweizer Zentrum für Ökoinventare, Dübendorf, CH.
Frischknecht R. and Faist Emmenegger M. (2003) Strommix und Stromnetz. In: Sachbilanzen von Energiesystemen: Grundlagen für den ökologischen Vergleich von Energiesystemen und den Einbezug von Energiesystemen in Ökobilanzen für die Schweiz (Ed. Dones R.). Paul Scherrer Institut Villigen, Swiss Centre for Life Cycle Inventories, Dübendorf, CH retrieved from: www.ecoinvent.ch.
Frischknecht R., Althaus H.-J., Doka G., Dones R., Hischier R., Hellweg S., Jungbluth N., Kellenberger D., Nemecek T., Rebitzer G. and Spiel-mann M. (2004) Overview and Methodology. Final report ecoinvent 2000 No. 1. Swiss Centre for Life Cycle Inventories, Dübendorf, CH, re-trieved from: www.ecoinvent.ch.
244
Frischknecht R., Bollens U., Bosshart S., Ciot M., Ciseri L., Doka G., Dones R., Gantner U., Hischier R. and Martin A. (1996) Ökoinventare von Energiesystemen: Grundlagen für den ökologischen Vergleich von Energiesystemen und den Einbezug von Energiesystemen in Ökobilanzen für die Schweiz. 3. Gruppe Energie - Stoffe - Umwelt (ESU), Eidgenössische Technische Hochschule Zürich und Sektion Ganzheitliche Systemanalysen, Paul Scherrer Institut, Villigen, Bundesamt für Energie (Hrsg.), Bern, CH, retrieved from: www.energieforschung.ch.
Frischknecht R., Hofstetter P., Knoepfel I., Dones R. and Zollinger E. (1994) Ökoinventare für Energiesysteme. Grundlagen für den ökologischen Vergleich von Energiesystemen und den Einbezug von Energiesystemen in Ökobilanzen für die Schweiz. 1. Gruppe Energie - Stoffe - Umwelt (ESU), Eidgenössische Technische Hochschule Zürich und Sektion Ganzheitliche Systemanalysen, Paul Scherrer Institut Villigen, Bundesamt für Energie (Hrsg.), Bern.
Frischknecht R., Jungbluth N. (Eds), Althaus H.-J., Doka G., Dones R., Hellweg S., Hischier R., Nemecek T., Rebitzer G., Spielmann M. (2003) Overview and Methodology – Data v1.01 - ecoinvent Report No.1. Swiss Centre for Life Cycle Inventories, Duebendorf, Switzerland.
Frischknecht R., Jungbluth N., Althaus H.-J., Doka G., Dones R., Hischier R., Hellweg S., Humbert S., Margni M., Nemecek T. and Spielmann M. (2003) Implementation of Life Cycle Impact Assessment Methods. Final report ecoinvent 2000 No. 3. Swiss Centre for Life Cycle Inventories, Dübendorf, CH, retrieved from: www.ecoinvent.ch
Frischknecht R., Jungbluth N., Althaus H.-J., Doka G., Dones R., Hellweg S., Hischier R., Humbert S., Margni M., Nemecek T. & Spielmann M. (2004). Implementation of Life Cycle Impact Assessment Methods. Final report ecoinvent 2000 No. 3. Swiss Centre for Life Cycle Inventories, Dübendorf, CH, retrieved from: www.ecoinvent.ch.
Fritsche U., Rausch L., und Schmidt K., (2006), Stand und Entwicklung von Treibhausgasemissionen in den Vorketten für Erdöl und Erdgas für das Institut für wirtschaftliche Oelheizung e.V. (IWO) – Öko-Institute, Darmstadt
Fritsche UR, Lothar Rausch (1999): Gemis Software Version 3.1, Öko- Institut e.V., Darmstadt, 1999 FUSION 1999 Fusion Technology Institute: Enrichment and Conversion of Fission Reactor Fuel Elements, Fusion Technology Institute - University of Wiscosin-Madison, fti.neep.wisc.edu/neep423/FALL99/lecture7.pdf, 1999
Fritsche, Uwe R.; Hennenberg, Klaus J.; Hermann, Andreas; Hünecke, Katja; Herrera, Rocio (Öko-Institut), Fehrenbach, Horst; Roth, Elvira; Hennecke, Anna; Giegrich Jürgen (IFEU). (2010). Sustainable Bioenergy: Summarizing Final Report for the Project „Development of strategies and sustainability standards for the certification of internationally traded biomass (Bio-global)”. Summarizing Final Report.
Fthenakis, V., Chul Kim, H., Frischknecht, R., Raugei, M., Sinha P. and Studcki, M. (2011), Life cycle Inventories and Life cycle Assessments of Photovoltaics Systems. IEA. Photovoltaic Power Systems Programme. Task 12. Methodology Guidelines.
GaBi (2011): Martin Baitz, Cecilia Makishi-Colodel, Thilo Kupfer, Julia Pflieger, Oliver Schuller, Fabian Hassel, Morton Kokborg, Lauren Fong (2011): GaBi database and modelling principles, Version 5.0, November 2011, PE International, Echterdingen, Germany.
GaBi 6 software (2012) Information of datasets (included in GaBi 6 sofware).
Gagnon L. and Varfalfvy L. (2000) Greenhouse Gas Emissions from Boreal Reservoirs, Quebec, Canada.
Gantner U., P. Hofstetter (1996): Ökoinventare von Energiesystemen Grundlagen für den ökologischen Vergleich von Energiesystemen und den Einbezug von Energiesystemen in Ökobilanzen für die Schweiz – Teil VI Kohle, i m Auftrag des Bundesamtes für Energiewirtschaft und des Nationalen Energie-Forschungs-Fonds, 3. Aufl., Bern 1996
Garraín, D., de la Rúa, C., Lechón, Y. (2012) „Background analysis of energy data to be considered for the European Reference Life Cycle Database (ELCD) – 1. Methodological report‟, Report from tender IES/H/2011/01/13/NC, October 2012.
Gary, J.H.; Handwerk, G.E. (2001): Petroleum Refining – Technology and Economics. New York, USA: Marcel Dekker Verlag.
245
Gerdes, G.; Tiedermann, A.; Zeelenberg, S.: Case study: European offshore wind farms a survey for the analysis of experiecies and lessons learnt by developers of offshore wind farms; Final report; Deutsche WindGard GmbH; Deutsch Energie-Agentur (dena); University of Groningen; 2006.
Gleick (1994): Water and energy. Annu. Rev. Energy. Environ. 19:267-299, 1994
Globales Emissions-Modell Integrierter Systeme (GEMIS), version 3.03, 1998, Database and Calculation Model of the Oeko-Institut, Darmstadt.
Globales Emissions-Modell Integrierter Systeme (GEMIS), version 4.1.3.2; 2002; http://www.oeko-institut.org/service/gemis/index.htm
Globales Emissions-Modell Integrierter Systeme (GEMIS), version 4.5.0.0; 2009; http://www.oeko-institut.org/service/gemis/index.htm.
Globales Emissions-Modell Integrierter Systeme (GEMIS), version 4.7, 2011; http://www.oeko-institut.org/service/gemis/index.htm
Goldstein R., Smith W.(2002) Water and sustainability (Volume 3): U.S. water consumption for power production – the next half century, EPRI (Electric Power Research Institute), Palo Alto, USA
Gover, M. P.; Collings, S. A.; Hitchcock, G. S.; Moon, D. P.; Wilkins, G. T. (1996): Alternative Road Transport Fuels - A Preliminary Life-cycle Study for the UK, Volume 2; A study co-funded by the Department of Trade and Industry and the Department of Transport; ETSU, Harwell March 1996.
Grote, K.H.; Feldhusen, J. (1997): Dubbel – Taschenbuch für den Maschinenbau, Springer Verlag, 1997
GTZ (1997) Deutsche Gesellschaft für Technische Zusammenarbeit (1997). Environmental management guideline for the palm oil industry. Thailand, September 1997. IPInstitut für Projektplanung GmbH on behalf of GTZ.
Günther, Eckart C. (2004): Coal industry across Europe, EURACOAL, 2004
Häberlin H. Kämpfer, M. and Zwahlen U (2006). Neuw Tests and Photovoltaikwechselrichtern: Gesamtübersicht über Testergebnisse un gemessene totale Wirkungsgrade.
Hagedorn G., Ilmberger F. (1991) Cumulated Energy Demand for the production of wind turbines. Forschungsstelle für Energiewirtschaft, Munich.
Hartmann, H. (1995): Energie aus Biomasse; Teil IX der Reihe Regenerative Energien; VDI GET 1995
Heck T. (2004) Wärme-Kraft-Kopplung. In: Sachbilanzen von Energiesystemen: Grundlagen für den ökologischen Vergleich von Energiesys-temen und den Einbezug von Energiesystemen in Ökobilanzen für die Schweiz (Ed. Dones R.). Final report ecoinvent 2000 No. 6, Paul Scherrer Institut Villigen, Swiss Centre for Life Cycle Inventories, Dübendorf, CH retrieved from: www.ecoinvent.ch.
Held, M. and Ilg, R. (2011), Update of environmental indicators and energy payback time of CdTe PV systems in Europe. Progress in Photovoltaics: Research and Applications.
Henson I.E. (1997). Analysis of palm oil productivity: 1. The estimation of seasonal trends in bunch dry matter production. In: Journal of Oil Palm Research, Vol. 2, pp. 69-77, December 1997. © Malaysian Palm Oil Board.
Hinrichs et al. 1999 Hinrichs W., Atmaca T., Neumann W., Thormann A. (1999) Stoffmengenflüsse und Energiebedarf bei der Gewinnung ausgewählter mineralischer Rohstoffe. Teistudie Steinkohle. Bundesanstalt für Geowissenschaften und Rohstoffe, Staatliche geologische Dienste in der Bundesrepublik Deutschland. Hannover, Germany.
Hirsinger F., Schick K.P. & Stalmans M. (1995b). A Life-Cycle Inventory for the Production of Oleochemical Raw Materials. In: Tenside Surf. Det., 32(5), pp. 420 - 432.
Hirsinger F., Schick K.P., Schul W. & Stalmans M. (1995a). A Life-Cycle Inventory for the Production of Detergent-grade Alcohols. In: Tenside Surf. Det., 32(5), pp. 398 - 410.
HMSO (1999). Her Majesty‟s Stationary Office. 2000. The UK Energy Report 1999. London
Hoh R. (2006). Malaysia oilseeds and products, Update (March). GAIN Report No. MY6011, Foreign Agricultural Service, US Department of Agriculture, 6/3 2006.
246
IAEA (2005). Country nuclear fuel cycle profiles, International Atomic Energy Agency, 2nd edition, Technical report series No. 425, 2005, Vienna (Austria) http://www-pub.iaea.org/MTCD/publications/PDF/TRS425_web.pdf.
IDEAM (2001) Executive Summary of Columbia´s First National Communication to the United Nations Framework Convention on Climate Change; IDEAM, 2001.
IEA (2001) Electricity Information. International Energy Agency, OECD, Paris.
IEA (2004a) International Energy Agency (IEA): Electricity Information 2004, Paris, France, 2004
IEA (2004b): International Energy Agency (IEA): Natural gas Information 2004, Paris, France, 2004
IEA (2004c). Biofuels for transport. An nternationa perspective. Prepared by the International Energy Agency (IEA), Paris, April 2004.
IEA (2010a) International Energy Agency (IEA), Electricity Information 2010, Paris, France, 2010
IEA (2010b) International Energy Agency (IEA), Energy Statistics of OECD Countries 2010, Paris, France, 2010
IEA (2010c) International Energy Agency (IEA), Energy Balances of Non-OECD Countries 2010, Paris, France, 2010
IEA (2010d) International Energy Agency (IEA), Natural Gas Information 2010, Paris, France, 2010
IEA (2010e) International Energy Agency (IEA), Coal Information 2010, Paris, France, 2010
IEA (2011f). Power generation from coal. Ongoing Developments and Outlook. Information paper. Keith Burnard and Sankar Bhattacharya. Retrieved from: http://www.iea.org/papers/2011/power_generation_from_coal.pdf of 23 October 2001 on the limitation of emissions of certain pollutants into the air from large combustion plants. OJEC 27.11.2001 L 309/1.
IEA/AFIS (1996): Automotive Fuels Survey: Raw Materials and Conversion
IEA/AFIS (1998): Automotive Fuels Survey: Comparison and selection
IEA/OECD (2002) Energy Statistics of OECD Countries 1999-2000. International Energy Agency, Organisation for Economic Co-Operation and Development, Paris.
IEA-ETSAP (2010a), International Energy Agency Energy-Technology Systems Analysis Program (2010). Coal-fired power. Technology Brief E01 – April 2010. Retrieved from: www.etsap.org. Last accessed August 2012.
IEER (2010) Institute for Energy and Environmental Research (IEER): Uranium – Its Uses and Hazards, http://www.ieer.org/fctsheet/uranium.html, last access September 2010
IfE (2000) wirtschaft und Anwendungstechnik, Technische Universität München, Ordinarius: Prof. Dr-Ing. Ulrich Wagner; 2000; ISBN 3 - 933283 - 18 – 3
IFEU (1999) (Institut für Energie- und Umweltforschung) 1999: Basisdaten für ökologische Bilanzierungen. Einsatz von Nutzfahrzeugen in Transport, Landwirtschaft und Bergbau; J. Borken, A. Patyk, G. A. Reinhardt; Friedr. Vieweg & Sohn Verlagsgesellschaft, Braunschweig/Wiesbaden
IFEU (2002) (Institut für Energie- und Umweltforschung) 2002: eigene Berechnungen und Abschätzungen, Heidelberg
IFEU (2008) (Institute for Energy and Environment Research) 2008: Default Data for the GHG calculation in the German BSO; Heidelberg
IPCC (2001) Intergovernmental Panel on Climate Change: Climate Change 2001: The Scientific Basis. Contribution of Working Group I to the Third Assessment Report of the Intergovernmental Panel on Climate Change, (Houghton, J.T., Ding, Y., Griggs, D.J., Noguer, M., van der Linden, P.J., Dai, X., Maskell, K., and Johnson, C.A., eds.). Cambridge University Press, Cambridge, United Kingdom and New York, NY, USA.
IPCC (2002) Integrated Pollution Prevention and Control (IPPC): Reference Document on Best Available Techniques for Mineral Oil and Gas Refineries. European Commission Directorate-general JRC, Joint Research Centre, Seville, Spain, retrieved from: http://eippcb.jrc.es.
247
IPIS (2003) Roheisen Internet Information. International Pig Iron Secre-tariat (IPIS), Ratingen, Deutschland, retrieved from: http://www.roheisen.de.
IPPNW (2010) International Physicians for the Prevention of Nuclear War – German Section (IPPNW): Die Versorgung Deutschlands mit Uran – Stand 21.07.2010, 2010, http://www.ippnw.de/commonFiles/pdfs/Atomenergie/uran_deutschland_2009.pdf
ISPRA (2010) Institute for Environmental Protection and Research (ISPRA), Italian Greenhouse Gas Inventory 1990-2008, Rome, Italy, 2010
JEC (2011) JRC-EUCAR-CONCAWE collaboration, Well-to-wheels Analysis of Future Automotive Fuels and Powertrains in the European Context, WELL-to-WHEELS Report, Version 3c, July 2011.
Jörß W., V. Handke (2003): Emissionsschätzung für SO2, NOx, NMVOC und NH3 in Deutschland 2000-2020, Institut für Zukunftsstudien und Technologiebewertung, Berlin, Germany, 2003
Jossart J.-M. (2003). Les biocarburants en Wallonie. Rapport réalisé dans le cadre du projet "Filière Agriculture et Ressources Renouvelables en Wallonie", avec le soutien du Ministère de la région wallonne - Direction Générale de l‟Agriculture, Valbiom, UCL.
Jungbluth N. (2003) Erdöl. In: Sachbilanzen von Energiesystemen: Grundlagen für den ökologischen Vergleich von Energiesystemen und den Einbezug von Energiesystemen in Ökobilanzen für die Schweiz (Ed. Dones R.). Final report ecoinvent 2000 No. 6, Paul Scherrer Institut Vil-ligen, Swiss Centre for Life Cycle Inventories, Dübendorf, CH retrieved from: www.ecoinvent.ch.
Jungbluth N. (2003) Photovoltaik. In: Sachbilanzen von Energiesystemen: Grundlagen für den ökologischen Vergleich von Energiesystemen und den Einbezug von Energiesystemen in Ökobilanzen für die Schweiz (Ed. Dones R.). Paul Scherrer Institut Villigen, Swiss Centre for Life Cycle Inventories, Dübendorf, CH retrieved from: www.ecoinvent.ch.
Jungbluth N. (2004) Erdöl. In: Sachbilanzen von Energiesystemen: Grundlagen für den ökologischen Vergleich von Energiesystemen und den Einbezug von Energiesystemen in Ökobilanzen für die Schweiz (Ed. Dones R.). Paul Scherrer Institut Villigen, Swiss Centre for Life Cycle Inventories, Dübendorf, CH retrieved from: www.ecoinvent.ch.
Jungbluth N. (2007) Erdöl. In: Sachbilanzen von Energiesystemen: Grundlagen für den ökologischen Vergleich von Energiesystemen und den Einbezug von Energiesystemen in Ökobilanzen für die Schweiz (Ed. Dones R.). Paul Scherrer Institut Villigen, Swiss Centre for Life Cycle Inventories, Dübendorf, CH retrieved from: www.ecoinvent.ch
Jungbluth, N. (1995): Limited Life Cycle Assessment for the Use of Liquefied Petroleum Gas and Kerosene as Cooking Fuels in India, Diplomarbeit (Thesis), FG Environmental Chemistry, Department of Environmental Technology, Technical University Berlin
Jungbluth, N., Chudacoff, M., Dauriat, A., Dinkel, F., Doka, G., Faist Emmenegger, M., Gnansounou, E., Kljun, N., Schleiss, K., Spielmann, M., Stettler, C., Sutter, J. (2007): Life Cycle Inventories of Bioenergy. ecoinvent report No. 17, Swiss Centre for Life Cycle Inventories, Dübendorf, CH.
Kaltschmitt M. & Reinhard G. A. (1997). Nachwachsende Energieträger: Grundlagen, Verfahren, Ökologische Bilanzierung. Vieweg, ISBN/ISSN 3-528-06778- 0, Braunschweig, Wiesbaden.
Kaltschmitt, M; Hartmann, H. (2001): Energie aus Biomasse - Grundlagen, Techniken und Verfahren; Springer-Verlag Berlin Heidelberg New York; 2001; ISBN 3-540-64853-4
Kämpfer, M., Zwahlen U. and Häberling H. (2006) Testbericht Sunnyboy 3800
Kellenberger D., Althaus H.-J., Jungbluth N. and Künniger T. (2005): Life Cycle Inventories of Building Products. Final report ecoinvent 2000 No. 7. EMPA Dübendorf, Swiss Centre for Life Cycle Inventories, Dübendorf, CH.
Kittikun A.H., Prasertsan P., Srisuwan G & Krause A. (2000). Environmental management for palm oil mill. Department of Industrial Biotechnology, Faculty of Agro-Industry, Prince of Songkla University, Hat Yai, Thailand Kraus 1999 Kraus K., Niklas G. & Trappe M. (1999). Aktuelle Bewertung des Einsatzes von Rapsöl/RME im Vergleich zu Dieselkraftstoff. UBA-Texte No. 79/99, Umweltbundesamt, www.umweltbundesamt.de (ref. 2005), Berlin.
248
Klugmann, K. (2006): Laufzeiten und Kosten der Motorsäge in der Holzernte, Ergebnisse einer deutschlandweiten Praxisuntersuchung, Kuratorium für Waldarbeit und Forsttechnik, 2006
KMW (2002) Bericht über das Geschäftsjahr 2001. Kraftwerke Mainz Wiesbaden Aktiengesellschaft, Mainz, Germany, retrieved from: http://www.kmw-ag.de/download/kmw_gb2001.pdf.
KOHLESTATISTIK (2003) Statistik der Kohlenwirtschaft e.V.: Kohle- und Energiedaten ausgewählter europäischer Länder, Essen, 2003
Koornneef J., van Keulen T., Faaij A., Turkenburg W. (2008). Life cycle assessment of a pulverized coal power plant with post-combustion capture, transport and storage of CO2, International Journal of Greenhouse Gas Control 2 (2008) 448-467.
Kraus, K.; Niklas, G.; Tappe, M.; Umweltbundesamt (UBA), Deutschland: Aktuelle Bewertung des Einsatzes von Rapsöl/RME im Vergleich zu DK; Texte 79/99; ISSN 0722-186X
KTBL (2004) Kuratorium für Technik und Bauwesen in der Landwirtschaft e. V.: Betriebsplanung Landwirtschaft 2004/2005 – Daten für die Betriebsplanung in der Landwirtschaft. 20. Auflage. Darmstadt
KWF (2004) Kuratorium für Waldarbeit und Forsttechnik (KWF): Holzernteverfahren – Vergleichende Erhebung und Beurteilung, Groß-Umstadt, 2004
Lambert, I. (2010): Australia´s In Situ Recovery Uranium Mining Best Practice Guide - Groundwaters, Residues and Radiation Protection, Canberra, Australia, 2010
LBST (2002) L-B-Systemtechnik GmbH (2002). GM well-to-wheel analysis of energy use and greenhouse gas emissions of advanced fuel/vehicle systems: A European study. Prepared by L-B-Systemtechnik and sponsored by GM, LBST, BP, ExxonMobil, Shell.
Liechti A. (2002) Swiss Greenhouse Gas Inventory 2000. Bundesamt für Umwelt, Wald und Landschaft, Bern, CH.
Liethschmidt K. (2002) Silicon Carbide. In: Ullmann's encyclopedia of industrial chemistry: Electronic release (Ed. Arpe et al.). 6 Edition. Wiley-VCH, Weinheim, D retrieved from: http://www.mrw.interscience.wiley.com/ueic/index.html.
Lozanovski, A. and Held, M. (2010), Update of the Environmental Indicators and Energy Payback Time (EPBT) of CIS Modules in Europe and Scenario Analysis of Solar Cell Printing. 25th European Photovoltaic Solar Energy Conference and Exhibition, 5th World Conference on Photovoltaic Energy Conversion, 6-10 September 2010, Valencia, Spain.
Mattson B., Cederberg C. & Blix L. (2000). Agricultural land use in LCA: case studies of three vegetable oil crops. In: Journal of Cleaner Production 8 (2000) pp. 283-292.
Meadley T. (1995) Uranium Institute, Persönliche Mitteilung, London, UK.
Metalstatistiks (1995): Metallstatistik 1995: Metallstatistik, 82. Jhg. (1984-1994), World Bureau of Metal Statistics, Ware, England.
Meteotest (2002) Information from Swiss wind power plants http://stratus.meteotest.ch/mme/a_turbinenbeschrieb.asp?lang=d, retrieved in July 2003.
MEZ (2000) Oil and gas in the Netherlands: exploration and production 1999. A review of oil and gas exploration and production activities in the Netherlandsand the Netherlands sector of the Continental Shelf. Minis-terie van Economische Zaken (Ministry of Economic Affairs)'s-Gravenhage.
Mineralolwirtschaftsverband (MWV) e.V. (Ed.) (2001): Aus der Sprache des Öls. 12. überarbeitete Auflage. Hamburg, Germany. Online available: http://www.mwv.de
Mineralolwirtschaftsverband (MWV) e.V. (Ed.) (2003): Mineralöl und Raffinerien. Hamburg, Germany. Online available: http://www.mwv.de
Mohrhauer H. (1995) Entwicklung bei der Uran-Anreicherung. atw 40 8/9.
Mudd, G. and Diesendorf, M. (2008): Sustainability of Uranium Mining and Milling: Toward Quantifying Resources and Eco-Efficiency.“ Environmental Science & Technology, 2624-2630, April 2008
249
MUFV (2007) Ministerium für Umwelt, Forsten und Verbraucherschutz Rheinland Pfalz (MUFV): Oral information about liming of forests from Dr. Harald Egidi, 2007
Nagra (1985a) Limmat Nationale Genossenschaft für die Lagerung Radioaktiver Abfälle (Nagra): Endlager fur schwach- und mittelaktive Abfälle Bautechnik und Betriebsphase, Bände 85-86 von Projektbericht NGB, Baden, Switzerland, 1985
Nagra (1985b) Limmat Nationale Genossenschaft für die Lagerung Radioaktiver Abfälle (Nagra): Radioaktive Abfälle: Eigenschaften und Zuteilung auf die Endlager-Typen. Band 85, Ausgabe 2 von Projektbericht NGB, Baden, Switzerland, 1985
Nagra (2002a) Projekt Opalinuston - Konzept für die Anlage und den Betrieb eines geologischen Tiefenlagers. Entsorgungsnachweis für abgebrannte Brennelemente, verglaste hochaktive sowie langlebige mittelaktive Abfälle. Technischer Bericht 02-02. Nationale Genossenschaft für die Lagerung radioaktiverAbfälle (Nagra), Wettingen, Schweiz.
Nagra (2002b) Project Opalinus Clay - Safety Report. Demonstration of disposal feasibility for spent fuel vitrified high level waste and long-lived intermediate level waste (Entsorgungsnachweis). Technical Report 02-05. Nationale Genossenschaft für die Lagerung radioaktiverAbfälle (Nagra), Wettingen, Switzerland.
NEA-OECD (1984) Nuclear Energy Agency - Organisation for Economic Co-operation and Development: Long-term radiological aspects of management of wastes from uranium mining and milling. OECD, Paris, Frankreich.
Nemecek et al. (2004) Nemecek T., Heil A., Huguenin O., Meier S., Erzinger S., Blaser S., Dux. D. and Zimmermann A. (2004) Life Cycle Inventories of Agricultural Production Systems. Final report ecoinvent 2000 No. 15. Agroscope FAL Reckenholz and FAT Taenikon, Swiss Centre for Life Cycle Inventories, Dübendorf, CH, retrieved from: www.ecoinvent.ch.
Nemecek T., Heil A., Huguenin O., Meier S., Erzinger S., Blaser S., Dux. D. And Zimmermann A. (2004). Life Cycle Inventories of Agricultural Production Systems. Final report ecoinvent 2000 No. 15. Agroscope FAL Reckenholz and FAT Taenikon, Swiss Centre for Life Cycle Inventories, Dübendorf, CH, retrieved from: www.ecoinvent.ch.
NERI (2010) Nielsen, O.-K; Plejdrup, M.; Hjelgaard, K., National Environmental Research Institute (NERI), Denmark's National Inventory report 2010, Copenhagen, Denmark, 2010
Nisbet E. G. (2001) Russian Emissions of Atmospheric Methane: Study of Sources. INTAS 97-2055, 1998-2001. INTAS.
NOK (1956) Nordostschweizerische Kraftwerke AG: Das Kraftwerk Wildegg-Brugg. In: Schweizerische Bauzeitung, 74 (4), 47-52; 74 (5), 63-67; 74 (6), 83-88; 74 (7), 93-99; 74 (8), 111-116; 74 (10), 145-147; 74 (12), 167-172.
NORDEL (2001) Nordel annual report 2000. NORDEL, Oslo, retrieved from www.nordel.org.
Nordex (2001) Technical characterisation: Nordex N50-800 (2001). www.nordex-online.com
O‟Connor (2004). Biodiesel in North-America: Implementation Issues. Prepared by (S&T)2 Consultants Inc. for IEA Bioenergy Task 39, Februara 28, 2004.
OCHRONY (2010) Instytut Ochrony Srodowiska, Poland's Informative Inventory 2010, Warsaw, Poland, 2010
OEKO (2008): Greenhouse gas balances and cumulated primary energy use of bioenergy conversions pathways taking into account possible land-use changes; Uwe R. Fritsche/Kirsten Wiegmann; prepared for the Scientific Advisory Board on Global Change (WBGU); Darmstadt (in German)
OEKO (2011): EUPOPP: European Policies Promote Sustainable Consumption Patterns; research project of Oeko-Institut (coordination), NCR, UCL, ICLEI, ISOE, ecoinstitut (see www.eupopp.net).
OEKO et al. (2004): Material Flow Analysis of sustainable biomass use for energy; project consortium lead by Öko-Institut, scientific partners FhI-UMSICHT, IE Leipzig, IFEU Heidelberg, IZES Saarbrücken, TU Braunschweig, and TU München; sponsored by Federal Ministry for Environment (Bundesministerium für Umwelt, Naturschutz und Reaktorsicherheit); project results (brochure, final report, database, information leaflets etc.) available (in German) at www.oeko.de/service/bio
250
Oeko-Institut (2008): Cumulated Primary Energy Requirement (CER) of biogenic oils; brief study for the Instituts für wirtschaftliche Oelheizung (IWO); Uwe R. Fritsche/Kirsten Wiegmann; Darmstadt (see www.gemis.de)
Oeko-Institut/IFEU (2010): Sustainable Bioenergy: Summarizing Final Report for the research project "Development of strategies and sustainability standards for the certification of biomass for the international trade“; sponsored by BMU and UBA; FKZ 37 07 93 100; Darmstadt/Heidelberg (www.oeko.de/service/bio)
Ohtsuka, Y. Desulfuration of coal. Coal, oil shale, natural bitumen, heavy oil and peat. Volume I. http://www.eolss.net/Sample-Chapters/C08/E3-04-02-04.pdf
Oil & Gas Journal (OGJ) (Ed.) (2010): Worldwide Refining Survey 2009. Tulsa, USA.
ÖKO (1993): Emissions from energy imports to the Federal Republic of Germany, U. R. Fritsche/F.C.Matthes, prepared for IKARUS (sub-project 3), Freiburg/Darmstadt/Berlin (in German)
ÖKO (1994): Environmental Analysis of Energy, Transport, and Material Systems: Total-Emission-Model for Integrated Systems (TEMIS) Version 2.0 - 2nd revised edition, U. R. Fritsche et al., prepared for the Ministry of Environment and Energy of Hesse, Wiesbaden (in German).
Öko-Institut (1999): The Environmental Manual for Power Development – The EM Generic Database – Sources and Data Documentation- Berlin.
Öko-Institut (2001): Nachhaltiger Umgang mit Verpackung - eine Vision für das DSD im Jahre 2020, Wollny, V.; Dehoust, G.; Dopfer, J.; Gebers, B.; Hochfeld, C.; Stahl, H.; Cames M.; Matthes F.; Darmstadt/Berlin.
Öko-Institut (2007) (Institut for Applied Ecology)/IZES (Institut for FutureEnergySystems) 2007: Environmental Effects of electricity and heat production as well as transport fuel use: time series from 1990 to 2004; final report prepared for ZSW/AGEEStat, Darmstadt (see www.gemis.de) - in German.
Öko-Institut /FhI-UMSICHT (2003): Future Technologies; Working paper and Excel datasheets prepared in the project "Material Flow Analysis of Sustainable Biomass for Energy", Darmstadt/Oberhausen
OLF (2001) Emissions and discharges from the Norwegian Petroleum Industry 2000; prepared for OLF by Novatech a.s. Norwegian Oil Indus-try Association, Stavanger, retrieved from: www.olf.no, www.novatech.no.
OPET, 2002. Cleaner Fossil Fuel OPET-Contract nº NNES/2002/97. Work package 3. Promotion pof CCT Implementation options in existing coal fired power plants. Annex1. Report. Soild fuel power sector in India, China, East Europena, South Caucasus and Balkan countries. Current Situation. CCT Implementation possibilities. Retrieved from : http://www.lignite.gr/OPET/CFF/WP3/WP3_Annex_1.pdf
Paducah Gaseous Diffusion Plant (1982) Final Environmental Impact Assessment of the Paducah Gaseous Diffusion Plant Site. DOE/EA-0155 (DE83001211). Paducah, Kentucky, USA.
Parkash, S. (2006): Refining Processing Handbook. Norwich, USA: Knovel Library.
Patyk A., Reinhardt A. & Jungk N.C. (2000). Bioenergy for Europe: Which ones fit best? A comparative analysis for the Community. Research funded by The European Commission in the framework of the FAIR V Programme, contract CT 98 3832, November 2000.
Paustian, K., et al (2006) IPCC Guidelines for National Greenhouse Gas Inventories; IPCC National Greenhouse Inventories Programme; published by the Institute for Global Environmental Strategies (IGES), Hayama, Japan on behalf of the Intergovernmental Panel on Climate Change (IPCC), 2006; http://www.ipcc-nggip.iges.or.jp/public/2006gl/pdf/4_Volume4, Soil N2O: V4_11_Ch11_N2O&CO2.pdf
PE (2012a). „Documentation of energy datasets in GaBi 5.0‟. Confidential report provided by PE International, 2012.
PE (2012b). GaBi modelling in refineries. Confidential report provided by PE International, 2012.
Pimentel D. & Patzek T. (2005). Ethanol production using corn, switchgrass, and wood; Biodiesel production using soybean and sunflower. In: Natural Resources Research, Vol. 14, No. 1, pp. 65-76.
251
Provance P. (2003). EU: Biodiesel industra expanding use of of oilseeds. Production Estimates and Crop Assessment Division, Foreign Agricultural Service, US Department of Agriculture, September 20, 2003.
RED (2009): DIRECTIVE 2009/28/EC OF THE EUROPEAN PARLIAMENT AND OF THE COUNCIL of 23 April 2009 on the promotion of the use of energy from renewable sources and amending and subsequently repealing Directives 2001/77/EC and 2003/30/EC, Official Journal of the European Union, 5.6.2009. http://eur-lex.europa.eu/LexUriServ/LexUriServ.do?uri=Oj:L:2009:140:0016:0062:en:PDF
Reichert J. and Schön M. (2000) Methanemissionen durch den Einsatz von Gas in Deutschland von 1990 bis 1997 mit einem Ausblick auf 2010. Untersuchung für den Deutschen Verein des Gas- und Wasserfaches e.V., unter Mitarbeit von Lars Behnke. Fraunhofer-Institut für System-technik und Innovationsforschung (ISI), Karlsruhe.
Reinhardt, G., A.; Patyk, A.; Borken, J. (1999): Basisdaten für ökologische Bilanzierungen; Vieweg 1999; ISBN 3-528-03118-2
Rentz O., U. Karl, H. Peter (2002): Ermittlung und Evaluierung von Emissionsfaktoren für Feuerungsanlagen in Deutschland für die Jahre 1995, 2000 und 2010, Deutsch-Französisches Institut für Umweltforschung, Karlsruhe / Germany, 2002
Rheinbraun AG (1993) Zahlen-Daten 91/92. Köln.
Rinaldi M. & Hergé E. (1998). Esters d'huiles végétales suisses utilisées comme carburant pour moteur diesel: Les premiers résultats d'exploitation sont positifs. Rapport FAT No. 514, Station Fédérale de recherche en économie et technologie agricoles (FAT), 1998 (http://www.fat.admin.ch/f/publi/fb/fatb514f.html).
Rinaldi, M., Erzinger, S. and Stark, R. (2006): Treibstoffverbrauch und Emissionen von Traktoren bei landwirtschaftlichen Arbeiten, FATSchriftenreihe Nr.65, agroscope, FAT Tänikon. 2006
Röder A., Bauer C. and Dones R. (2004) Kohle. In: Sachbilanzen von Energiesystemen: Grundlagen für den ökologischen Vergleich von Energiesystemen und den Einbezug von Energiesystemen in Ökobilanzen für die Schweiz (Ed. Dones R.). Final report ecoinvent 2000 No. 6-VI. Paul Scherrer Institut Villigen, Swiss Centre for Life Cycle Inventories, Dübendorf, CH, retrieved from: www.ecoinvent.ch.
ROMANIAN (2010) National Environmental Protection Agency, Romanian Informative Inventory 2008, Bucharest, Romania, 2010
Roßberg et al. (2002) Roßberg, D./Gutsche, V./Enzian, S./Wick, M. (2002): Neptun 2000 – Erhebung von Daten zum tatsächlichen Einsatz chemischer Pflanzenschutzmittel im Ackerbau Deutschlands. Berichte aus der Biologischen Bundesanstalt für Land- und Forstwirtschaft Heft 98.
Scharmer K., Gosse G., Gabrielle B., Golbs G., Lambert L., Poschmann T., Rodenbrock A. & Zimalla K. (1996) Energy balance, ecological impact and economics of vegetable oil methylester production in Europe as substitute for fossil diesel. ALTENER Programme, Contract No. 4.1030/E/94-002-1, GET – Gesellschaft für Entwicklungstechnologie, Jülich.
Scheuermann, A.; Thrän, D.; Scholwin, F.; Dilger, M.; Falkenberg, D.; Nill, M.; Witt, J. (2003); Institut für Energetik & Umwelt gGmbH (IE), Leipzig: Monitoring zur Wirkung der Biomasseverordnung auf Basis des Erneuerbare-Energien-Gesetzes (EEG);Im Auftrag des Bundesministerium für Umwelt, Naturschutz und Reaktorsicherheit (BMU) und des Umweltbundesamtes (UBA); Endbericht, 17. Dezember 2003
Schleisner L. (1999) Life cycle assessment of a wind farm and related externalities. Riso national Laboratory, Roskilde, Denmark.
Schmidt J. (2004). The importance of system boundaries for LCA on large material flows of vegetable oils Text version of poster presented to the Fourth World SETAC Congress, 14-18. November, 2004, Portland, Oregon, USA.
Schöpe M. and Britschkat G. (2002). Macroeconomic evaluation of rape cultivation for biodiesel production in Germany. Preliminary report from Ifo Schnelldienst No.6, Institüt für Wirtschaftsorschung, München, Germany.
252
Schuller, O. (2004): Erstellung eines Raffineriemodells in der Software zur Ganzheitlichen Bilanzierung GaBi. Diplomarbeit. Betreut von P. Eyerer. Leinfelden-Echterdingen, Germany. Universität Stuttgart, Institut für Kunststoffprüfung und Kunststoffkunde (IKP).
Schwaiger, K. (1996): Ganzheitliche Bilanzierung der Energiebereitstellung (GaBiE) - Teil 1 Allgemeiner Teil, Forschungsstelle für Energiewirtschaft der Gesellschaft für praktische Energiekunde e.V. München (FfE), München 1996
Schweinle, J. (2000): Analyse und Bewertung der forstlichen Produktion als Grundlage für weiterführende forst- und holzwirtschaftliche Produktlinien- Analysen, Mitteilungen der Bundesforstanstalt für Forst- und Holzwirtschaft, Hamburg, Nr. 184., 2000
Seifert M. (1998) Methanfreisetzung. In: Sonderdruck Nr. 1414, gwa 9/98, Schweizerischer Verein des Gas- und Wasserfaches (SVGW), Zü-rich, pp.
Senes Consultants Limited (1998) Long-Term Population Dose due to Radon (Rn-222) Released From Uranium Mill Tailings. Prepared for The Uranium Institute. Senes Consultants Limited, Richmond Hill, Ontario, Canada.
SEPA (2010) Swedish Environmental Protection Agency: National Inventory Report Sweden 2010 Thermal values and emission factors energy – Submitted under the Nations Framework Convention on Climate Change and the Kyoto Protocol, 2010
Sheehan J. et al. (1998a). Life-cycle inventory of biodiesel and petroleum diesel for use in an urban bus. A joint study sponsored by the US Department of Agriculture and the US Department of Energy. NREL, Final report, May 1998.
Sheehan J., Camobreco V., Duffield J., Graboski M. & Shapouri H. (1998b). An overview of biodiesel and petroleum diesel life-cycles. A joint study sponsored by the US Department of Agriculture and the US Department of Energy. NREL, May 1998.
Skiba, M. (2002), Reppower Systems AG: Offshore-Windenergienutzung; BWK Bd. 54 (2002) Nr. 10; 25-28
Snam (1999) Health, Safety and Environment; 1998 Report. Snam Eni Group, Mailand.
Snam (2000) Health, Safety and Environment; 1999 Report. (ed. Snam Eni Group), Mailand.
SOCODEI (2010): Documentation - Rapport Public Annuel 2009, http://www.socodei.fr/fileadmin/contenus/menus/menu_haut/espace_documentation/Rapport_Public_Annuel.pdf, last access June 2010
Spath P.L., Mann M.K., Kerr D.R. (1999): Life Cycle Assessment for coal-fired power production, NREL/TP-570-25119 report, National Renewable Energy Laboratory, USA, June 1999.
Stanley J.R., Dávila-Serrano M. (2012). A life cycle assessment of a coal fired power plant with carbon capture and storage in Mexico, International Journal of Physical Sciences Vol. 7 (41) pp.5624-5641, 30 October 2012.
Svensson B. (1999) Greenhouse gas emissions from hydroelectric reservoirs - the need of a new appraisal. SwedPower AB, University of Kalmar, Sweden.
SVGW (2002) Zertifizierungsverzeichnis (Zulassungsliste) Gas 2002. Schweizerischer Verein des Gas- und Wasserfaches (SVGW), Zürich.
SWISSGAS (1999) Eigenschaften der in der Schweiz verteilten Erdgase im Jahre 1998. Schweizerische Aktiengesellschaft für Erdgas, Zürich.
Tapasvi D., Wiesenborn D. & Gustafson S. (2003). Process modelling approach for evaluating the economic feasibility of biodiesel production. Written for presentation at the 2004 North Central ASAE/CSAE Conference Sponsored by the Manitoba Section of CSAE Winnipeg, Canada, September 24-25, 2004.
Teuchert, E, and Axmann, J. (2007): Nuclear Technology (vol. 23), Wiley-VCH Verlag GmbH & Co. KGaA. 15. January 2007. http://onlinelibrary.wiley.com/doi/10.1002/14356007.a17_589.pub2/full
253
Tremblay, A.; Varfalvy, L.; Roehm, C.; Garneau, M., Tremblay, A.; Varfalvy, L.; Roehm, C.; Garneau, M. (2004): The Issue of Greenhouse Gas Emissions from Hydroelectric Reservoirs: From Boreal To Tropical Regions, Quebec, Canada, 2004
Trowbridge L.D. (1991) Enrichment Technical Operations – Greenhouse Warming Potential of Candidate Gaseous Diffusion Plant Coolants. Prepared by the Uranium Enrichment Organization, managed by Martin-Marietta Energy Systems, Inc. for the U.S. Department of Energy, contract DE-AC05-84OR2140.
U.S. EPA (Ed.) (2008) U.S. Environmental Protection Agency: Toxic Release Inventory (TRI). Release reports generated by the TRI-Explorer. Published by U.S. Environmental Protection Agency (U.S. EPA). Online available: http://www.epa.gov/triexplorer
U.S. EPA (Ed.) (2009) U.S. Environmental Protection Agency: Inventory of the US Greenhouse Gas Emissions and Sinks 1990-2007. Washington D.C., USA. Online available: http://www.epa.gov
UBA (1995) Umweltbundesamt: Handbook Emission Factors of Road Traffic. PC-Tool, Version 1.1. Berlin.
UBA (1997) Umweltbundesamt: German Programme for an Updated Traffic Emission Inventory Methodology. In: German Federal Environmental Agency (UBA): A Selection of Recent Publications - Volume 5. Berlin: 1997, pp. 260-28.
UBA (2007) Umweltbundesamt: Central System for Emissions - Database retrieval as of April 2007; internal database of UBA, Dessau.
UBA (2010a) Umweltbundesamt (UBA): Submission under the UN Framework Convention on Climate Change and under the Kyoto Protocol 2010, Dessau- Roßlau, Germany, 2010
UBA (2010b) Umweltbundesamt (UBA): Emissions of German electricity and CHP plants, personal written communication Mrs. Kristina Juhrich 10 May 2010, Dessau-Roßlau, Germany, 2010
UCPTE (1992) Union for the Coordination of Transmission of Electricity (UCPTE): Annual Report 1992, Madrid, 1992
UCTE (2001) Statistical Yearbook 2000. Union for the Co-ordination of the Trans-mission of Electricity, Berlin, retrieved from www.ucte.org.
UFOP (2004). Biodiesel flower power: Facts, arguments, tips. Published by the Union zur Förderung von Oel- und Proteinpflanzen e. V. (UFOP), Berlin. Eds: Bockey D., WPR Communication GmbH & Co. KG, Königswinter & Berlin.
UFOP (2006). Current situation and prospects for biodiesel and vegetable oils as fuels: From niche products to market players. By Dieter Bockey, Union for the Promotion of Oil and Protein Plants (UFOP), Version 02/2006.
UMTSP: Uranium Mill Tailings Study Panel - Board on Radioactive Waste Management - Commission on Physical Sciences, Mathematics, and Resources – National Research Council (1986) Scientific Basis for Risk Assessment and Management of Uranium Mill Tailings. National Academy Press, Washington D.C., USA.
UN (2011) Untied Nations Statistics Division, Electricity - consumption by pump-storage plants, New York, USA, 2011
UNFCC (2005) National Inventory Report.
UNFCCC (2010) United Nations Framework Conditions on Climate Change (UNFCC), GHG Inventories 2008 - Common Reporting Format (CRF), Bonn, Germany, 2010
United Nations Environment Programme (UNEP) – Partnership for Clean Fuels and Vehicles (Ed.) (2009): Asia-Pacific Diesel Sulphur Matrix. Nairobi, Kenya. Online available: http://www.unep.org
United Nations Environment Programme (UNEP) – Partnership for Clean Fuels and Vehicles (Ed.) (2009): Current and Proposed Sulphur levels in Diesel in Asia, EU and USA. Online available: http://www.unep.org
254
United Nations Environment Programme (UNEP) – Partnership for Clean Fuels and Vehicles (Ed.) (2010): Latin America and the Caribbean Sulphur Levels in Diesel Fuel. Nairobi, Kenya. Online available: http://www.unep.org
UNSCEAR (1993) Report SOURCES AND EFFECTS OF IONIZING RADIATION. Annex B.
UNSCEAR (2000) Report Vol. I SOURCES AND EFFECTS OF IONIZING radiation. Annex C.
Urenco (2000) Urananreicherungsanlage Gronau – Umwelterklärung 1999. Urenco Deutschland GmbH, Gronau, Deutschland.
URENCO (2008) Urenco: Gronau Environmental Brochure, http://www.urenco.com/Content/45/Urenco-Deutschland-Gronau.aspx, 2008
URENCO (2009) Urenco: Urenco Sustainability Report 2009, http://www.urenco.com/content/335/Sustainability-Report-2009.aspx, 2009
URENCO (2010) Urenco - Enriching the future, http://www.urenco.com/, last access 2010
US Bureau of Census (2002). Oil mill Statistics. In: The Trade News Service, Vol. 88 (52), p. 17, December 27, 2002
USEC (2009) United States Enrichment Corporation (USEC): A Global Energy Company, http://www.usec.com/whatisaswu.htm, last access September 2010
Van de Vate J.F., and Gagnon L. (1997) Greenhouse gas emissions from hydropower – The state of research in 1996. In: Energy Policy, Vol. 25, No. 1, pp. 7-13.
Van der Stricht S., Janssens A. (2001) Radioactive effluents from nuclear power stations and nuclear fuel reprocessing plants in the European Union, 1995-1999. Radiation Protection, 127. European Commission, Directorate-General Environment. Office for Official Publications of the European Communities, Luxembourg
Van der Stricht, S. and Janssens, A. (2005): Radioactive effluents from nuclear power stations and nuclear fuel reprocessing sites in the European Union, 1999 – 2003; European Commission – DG Energy, Luxembourg, 2005
Vattenfall (2002) Sammanfattning av Vattenfall Abs Certifierade Miljövarudeklaration av El fran Lule/Ume älv. Information available at: http://www.environdec.com/swe/epdforteckning.asp
Veltman K., Singh B., Hertwich E.G. (2010). Human and environmental impact assessment of postcombustion CO2 capture focusing on emissions from amine-based scrubbing solvents to air, Enviromental Science & Technology, Vol. 44, n.4, 2010, pp. 1496-1502.
Verien Deutscher Ingenieuer (VDI) (1997): Verein Deutscher Ingenieure (VDI) 1997: Richtlinie "Kumulierter Energieaufwand", VDI 4600 Blatt 1, Entwurf: Definition und Beispiele, Beuth Verlag 10772 Berlin.
VSG (2001) VSG-Jahresstatistik 2000. Verband der Schweizerischen Gasindustrie, Zürich.
Wacker (2000) Daten und Fakten zu Umwelt und Sicherheit: Werk Freiberg. Wacker Siltronic AG, Freiberg, DE, retrieved from: www.wacker.de.
Wacker (2002) Umwelterklärung 2002 für die Standorte Burghausen und Wasserburg. Wacker-Chemie GmbH, Wacker Siltronic AG, Burghausen, DE, retrieved from: www.wacker.de.
Wacker (2006) Daten und Fakten zu Umwelt und Sicherheit: Standort Freiberg. Wacker Siltronic AG, Freiberg, DE, retrieved from: www.wacker.de.
WCI, World Coal Institute (2005) Clean Coal Technologies. Coal Power for Progress.Retrieved from www.wci-coal.com/uploads/ccts.pdf
WEC (1988) World Energy Conference: Environmental Effects Arising from Electricity Supply and Utilisation and the Resulting Costs to the Utility, WEC Report 1988, London
WEC (2007): The role of nuclear energy in Europe, 2007 World Energy Council, ISBN 0 946121 23 0, London, UK.
WEG (2001) Jahresbericht 2000: Zahlen & Fakten. Wirtschaftsverband Erdölund Erdgasgewinnung (WEG), Hannover.
255
Weidema, B.P. (1998) „Multi-user test of the data quality matrix for product life cycle inventory data‟, International Journal of Life Cycle Assessment 3 (5) 259-265 (1998).
Weidema, B.P., Wenaes M.S. (1996) „Data quality management for life cycle inventories – an example of using data quality indicators‟, Journal of Cleaner Production, 1996, Volume 4, Number 2-4, pp. 167-174.
WI (2005) Wuppertal-Institut für Klima, Umwelt, Energie GmbH: Treibhausgasemissionen des russischen Erdgas-Exportpipeline-Systems, S. Lechtenböhmer u.a. in Zusammenarbeit mit dem MPI für Chemie (Mainz), i.A. der E.ON Ruhrgas AG, Wuppertal
Windenergie (2004); Bundesverband Windenergie (BWE), www.wind-energie.de
WISE (2001) Wold International Servive on Energy: European Pressurized Water Reactor Cost Projections of Framatome/Siemens, Paris.
Wittkopf St (2005): Das Biomasse-Heizkraftwerk Pfaffenhofen; 2005
WNA (2010) World Nuclear Association (WNA): World Nuclear Association, http://www.world-nuclear.org/, last access September 2010.
Wörgetter M., Lechner M., Rathbauer J. (1999) Ecobalance biodiesel. Federal Institute of Agricultural Engineering, on order of the Federal Ministry for Agriculture and Forestry, Wieselburg.
World Energy Outlook (2008): IEA: World Energy Outlook 2008, Paris, France, 2008.
World Gas Processing Survey Summary (2008) Oil & Gas Journal (OGJ), World Gas Processing Survey Summary 2008, Tulsa, USA, 2008-9.
Zhang Y., Dubé M.A., McLean D.D., Kates M. (2003a). Biodiesel productionfrom waste cooking oil: 1. Process design and technological assessment. In Bioresources Technology No. 89, pp. 1-16, Elsevier.
Zhang Y., Dubé M.A., McLean D.D., Kates M. (2003b). Biodiesel production from waste cooking oil: 2. Economic assessment and sensitivity analysis. In Bioresources Technology No. 90, pp. 229-240, Elsevier.
Zilio J. (2005). Biodiesel economics in Brazil. Bunge Alimentos. In: Biofuels seminar, São Paulo, Brazil, May 20, 2005. Brazil-Germany chamber.
Zulehner W., Neuer B. and Rau G. (2002) Silicon. In: Ullmann's encyclopedia of industrial chemistry: Electronic release (Ed. Arpe et al.). 6 Edition. Wiley- VCH, Weinheim, D retrieved from: http://www.mrw.interscience.wiley.com/ueic/index.html.

Annex 1 Pre-analyses According to the definitions of the quality criteria in the Methodological Report (Garraín et al, 2012), the following pre-analyses and considerations have been performed for further assessment the TeR and GR quality criteria.
Electricity mix
TeR and GR criteria shall be related to the European market context. For that purpose, a pre-analysis of the situation of the electricity EU-27 grid mix has been performed. This grid mix dataset can be derived by two different but complementary ways: i) by adding the national grid mixes of the EU-27 Member States according to the individual share of gross production in the overall EU gross production of electricity, or ii) by adding the fuel sources mixes for generating electricity in EU-27 Member States. Figure 50 and Figure 51 show the electricity EU-27 grid mix by the different ways described below.
In case of considering the EU-27 country-mix, each national electricity grid mix has to be considered in the same way. Table shows the share of electricity from individual energy sources in each EU-27 Member State.
Figure 50: Share of countries in the electricity EU-27 grid mix in 2009 (IEA 2010a, PE 2012a)
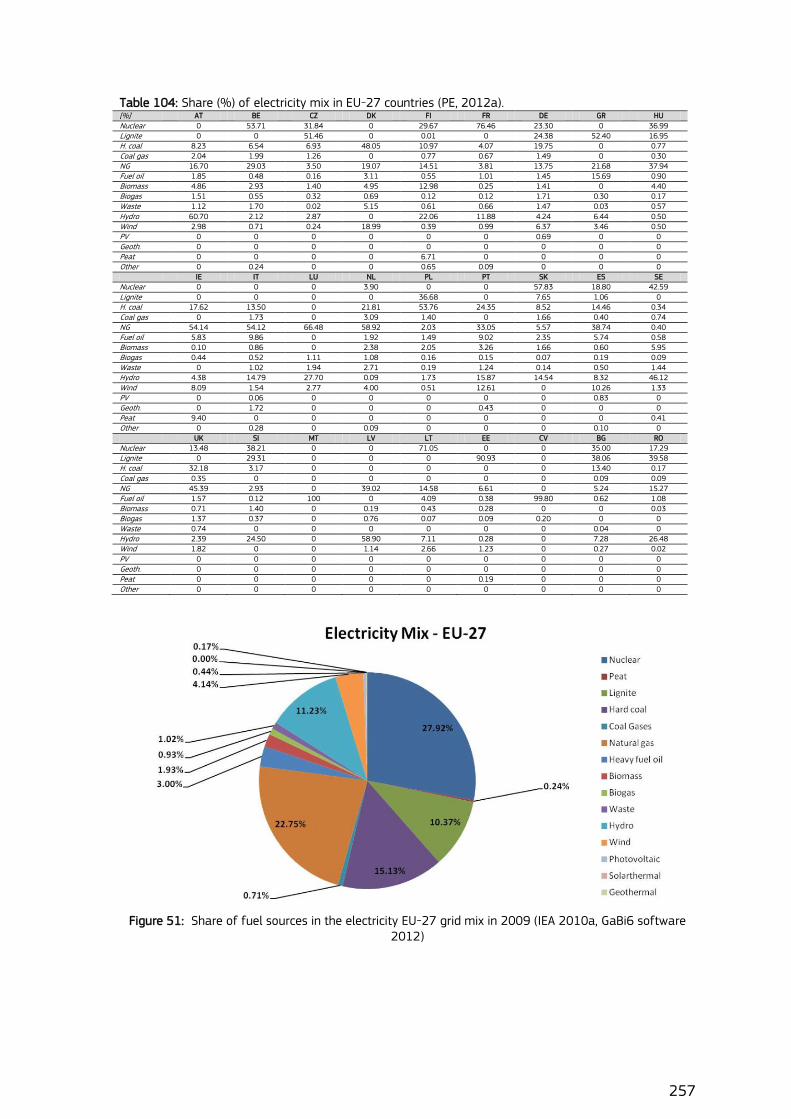
257
Table 104: Share (%) of electricity mix in EU-27 countries (PE, 2012a). [%] AT BE CZ DK FI FR DE GR HU
Nuclear 0 53.71 31.84 0 29.67 76.46 23.30 0 36.99
Lignite 0 0 51.46 0 0.01 0 24.38 52.40 16.95
H. coal 8.23 6.54 6.93 48.05 10.97 4.07 19.75 0 0.77
Coal gas 2.04 1.99 1.26 0 0.77 0.67 1.49 0 0.30
NG 16.70 29.03 3.50 19.07 14.51 3.81 13.75 21.68 37.94
Fuel oil 1.85 0.48 0.16 3.11 0.55 1.01 1.45 15.69 0.90
Biomass 4.86 2.93 1.40 4.95 12.98 0.25 1.41 0 4.40
Biogas 1.51 0.55 0.32 0.69 0.12 0.12 1.71 0.30 0.17
Waste 1.12 1.70 0.02 5.15 0.61 0.66 1.47 0.03 0.57
Hydro 60.70 2.12 2.87 0 22.06 11.88 4.24 6.44 0.50
Wind 2.98 0.71 0.24 18.99 0.39 0.99 6.37 3.46 0.50
PV 0 0 0 0 0 0 0.69 0 0
Geoth. 0 0 0 0 0 0 0 0 0
Peat 0 0 0 0 6.71 0 0 0 0
Other 0 0.24 0 0 0.65 0.09 0 0 0
IE IT LU NL PL PT SK ES SE
Nuclear 0 0 0 3.90 0 0 57.83 18.80 42.59
Lignite 0 0 0 0 36.68 0 7.65 1.06 0
H. coal 17.62 13.50 0 21.81 53.76 24.35 8.52 14.46 0.34
Coal gas 0 1.73 0 3.09 1.40 0 1.66 0.40 0.74
NG 54.14 54.12 66.48 58.92 2.03 33.05 5.57 38.74 0.40
Fuel oil 5.83 9.86 0 1.92 1.49 9.02 2.35 5.74 0.58
Biomass 0.10 0.86 0 2.38 2.05 3.26 1.66 0.60 5.95
Biogas 0.44 0.52 1.11 1.08 0.16 0.15 0.07 0.19 0.09
Waste 0 1.02 1.94 2.71 0.19 1.24 0.14 0.50 1.44
Hydro 4.38 14.79 27.70 0.09 1.73 15.87 14.54 8.32 46.12
Wind 8.09 1.54 2.77 4.00 0.51 12.61 0 10.26 1.33
PV 0 0.06 0 0 0 0 0 0.83 0
Geoth. 0 1.72 0 0 0 0.43 0 0 0
Peat 9.40 0 0 0 0 0 0 0 0.41
Other 0 0.28 0 0.09 0 0 0 0.10 0
UK SI MT LV LT EE CV BG RO
Nuclear 13.48 38.21 0 0 71.05 0 0 35.00 17.29
Lignite 0 29.31 0 0 0 90.93 0 38.06 39.58
H. coal 32.18 3.17 0 0 0 0 0 13.40 0.17
Coal gas 0.35 0 0 0 0 0 0 0.09 0.09
NG 45.39 2.93 0 39.02 14.58 6.61 0 5.24 15.27
Fuel oil 1.57 0.12 100 0 4.09 0.38 99.80 0.62 1.08
Biomass 0.71 1.40 0 0.19 0.43 0.28 0 0 0.03
Biogas 1.37 0.37 0 0.76 0.07 0.09 0.20 0 0
Waste 0.74 0 0 0 0 0 0 0.04 0
Hydro 2.39 24.50 0 58.90 7.11 0.28 0 7.28 26.48
Wind 1.82 0 0 1.14 2.66 1.23 0 0.27 0.02
PV 0 0 0 0 0 0 0 0 0
Geoth. 0 0 0 0 0 0 0 0 0
Peat 0 0 0 0 0 0.19 0 0 0
Other 0 0 0 0 0 0 0 0 0
Figure 51: Share of fuel sources in the electricity EU-27 grid mix in 2009 (IEA 2010a, GaBi6 software
2012)
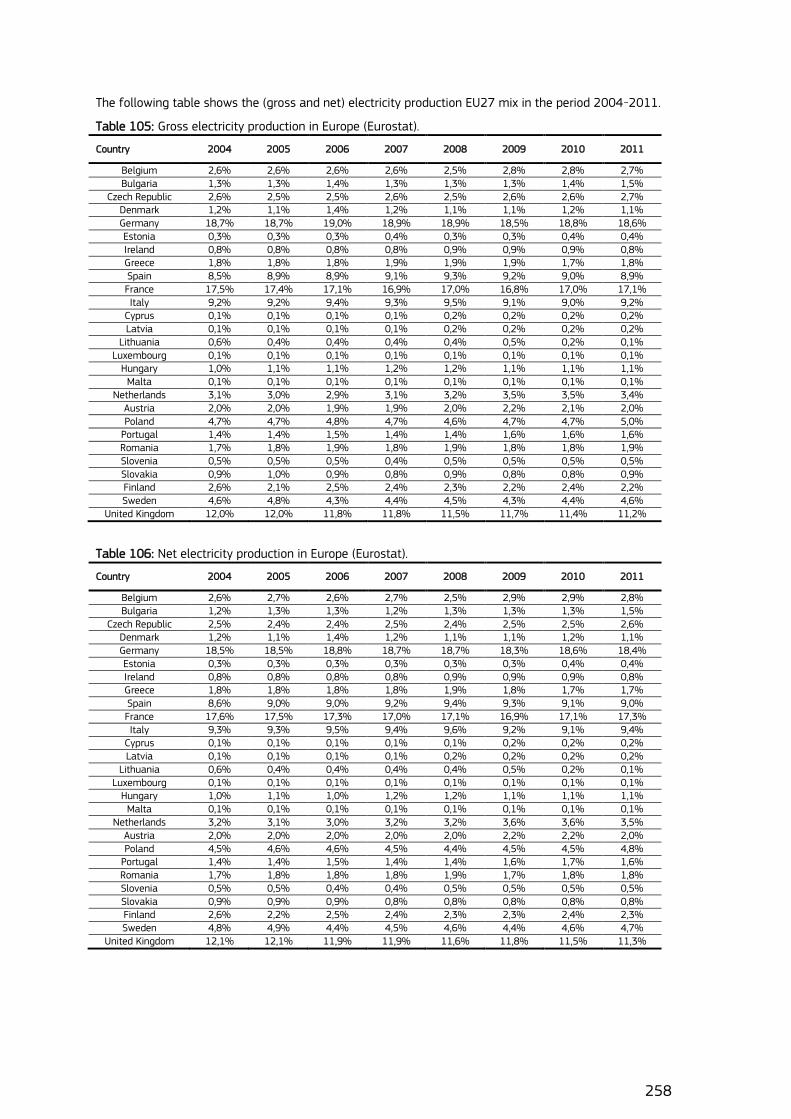
258
The following table shows the (gross and net) electricity production EU27 mix in the period 2004-2011.
Table 105: Gross electricity production in Europe (Eurostat).
Country 2004 2005 2006 2007 2008 2009 2010 2011
Belgium 2,6% 2,6% 2,6% 2,6% 2,5% 2,8% 2,8% 2,7% Bulgaria 1,3% 1,3% 1,4% 1,3% 1,3% 1,3% 1,4% 1,5%
Czech Republic 2,6% 2,5% 2,5% 2,6% 2,5% 2,6% 2,6% 2,7% Denmark 1,2% 1,1% 1,4% 1,2% 1,1% 1,1% 1,2% 1,1% Germany 18,7% 18,7% 19,0% 18,9% 18,9% 18,5% 18,8% 18,6% Estonia 0,3% 0,3% 0,3% 0,4% 0,3% 0,3% 0,4% 0,4% Ireland 0,8% 0,8% 0,8% 0,8% 0,9% 0,9% 0,9% 0,8% Greece 1,8% 1,8% 1,8% 1,9% 1,9% 1,9% 1,7% 1,8% Spain 8,5% 8,9% 8,9% 9,1% 9,3% 9,2% 9,0% 8,9% France 17,5% 17,4% 17,1% 16,9% 17,0% 16,8% 17,0% 17,1% Italy 9,2% 9,2% 9,4% 9,3% 9,5% 9,1% 9,0% 9,2%
Cyprus 0,1% 0,1% 0,1% 0,1% 0,2% 0,2% 0,2% 0,2% Latvia 0,1% 0,1% 0,1% 0,1% 0,2% 0,2% 0,2% 0,2%
Lithuania 0,6% 0,4% 0,4% 0,4% 0,4% 0,5% 0,2% 0,1% Luxembourg 0,1% 0,1% 0,1% 0,1% 0,1% 0,1% 0,1% 0,1%
Hungary 1,0% 1,1% 1,1% 1,2% 1,2% 1,1% 1,1% 1,1% Malta 0,1% 0,1% 0,1% 0,1% 0,1% 0,1% 0,1% 0,1%
Netherlands 3,1% 3,0% 2,9% 3,1% 3,2% 3,5% 3,5% 3,4% Austria 2,0% 2,0% 1,9% 1,9% 2,0% 2,2% 2,1% 2,0% Poland 4,7% 4,7% 4,8% 4,7% 4,6% 4,7% 4,7% 5,0%
Portugal 1,4% 1,4% 1,5% 1,4% 1,4% 1,6% 1,6% 1,6% Romania 1,7% 1,8% 1,9% 1,8% 1,9% 1,8% 1,8% 1,9% Slovenia 0,5% 0,5% 0,5% 0,4% 0,5% 0,5% 0,5% 0,5% Slovakia 0,9% 1,0% 0,9% 0,8% 0,9% 0,8% 0,8% 0,9% Finland 2,6% 2,1% 2,5% 2,4% 2,3% 2,2% 2,4% 2,2% Sweden 4,6% 4,8% 4,3% 4,4% 4,5% 4,3% 4,4% 4,6%
United Kingdom 12,0% 12,0% 11,8% 11,8% 11,5% 11,7% 11,4% 11,2%
Table 106: Net electricity production in Europe (Eurostat).
Country 2004 2005 2006 2007 2008 2009 2010 2011
Belgium 2,6% 2,7% 2,6% 2,7% 2,5% 2,9% 2,9% 2,8% Bulgaria 1,2% 1,3% 1,3% 1,2% 1,3% 1,3% 1,3% 1,5%
Czech Republic 2,5% 2,4% 2,4% 2,5% 2,4% 2,5% 2,5% 2,6% Denmark 1,2% 1,1% 1,4% 1,2% 1,1% 1,1% 1,2% 1,1% Germany 18,5% 18,5% 18,8% 18,7% 18,7% 18,3% 18,6% 18,4% Estonia 0,3% 0,3% 0,3% 0,3% 0,3% 0,3% 0,4% 0,4% Ireland 0,8% 0,8% 0,8% 0,8% 0,9% 0,9% 0,9% 0,8% Greece 1,8% 1,8% 1,8% 1,8% 1,9% 1,8% 1,7% 1,7% Spain 8,6% 9,0% 9,0% 9,2% 9,4% 9,3% 9,1% 9,0% France 17,6% 17,5% 17,3% 17,0% 17,1% 16,9% 17,1% 17,3% Italy 9,3% 9,3% 9,5% 9,4% 9,6% 9,2% 9,1% 9,4%
Cyprus 0,1% 0,1% 0,1% 0,1% 0,1% 0,2% 0,2% 0,2% Latvia 0,1% 0,1% 0,1% 0,1% 0,2% 0,2% 0,2% 0,2%
Lithuania 0,6% 0,4% 0,4% 0,4% 0,4% 0,5% 0,2% 0,1% Luxembourg 0,1% 0,1% 0,1% 0,1% 0,1% 0,1% 0,1% 0,1%
Hungary 1,0% 1,1% 1,0% 1,2% 1,2% 1,1% 1,1% 1,1% Malta 0,1% 0,1% 0,1% 0,1% 0,1% 0,1% 0,1% 0,1%
Netherlands 3,2% 3,1% 3,0% 3,2% 3,2% 3,6% 3,6% 3,5% Austria 2,0% 2,0% 2,0% 2,0% 2,0% 2,2% 2,2% 2,0% Poland 4,5% 4,6% 4,6% 4,5% 4,4% 4,5% 4,5% 4,8%
Portugal 1,4% 1,4% 1,5% 1,4% 1,4% 1,6% 1,7% 1,6% Romania 1,7% 1,8% 1,8% 1,8% 1,9% 1,7% 1,8% 1,8% Slovenia 0,5% 0,5% 0,4% 0,4% 0,5% 0,5% 0,5% 0,5% Slovakia 0,9% 0,9% 0,9% 0,8% 0,8% 0,8% 0,8% 0,8% Finland 2,6% 2,2% 2,5% 2,4% 2,3% 2,3% 2,4% 2,3% Sweden 4,8% 4,9% 4,4% 4,5% 4,6% 4,4% 4,6% 4,7%
United Kingdom 12,1% 12,1% 11,9% 11,9% 11,6% 11,8% 11,5% 11,3%
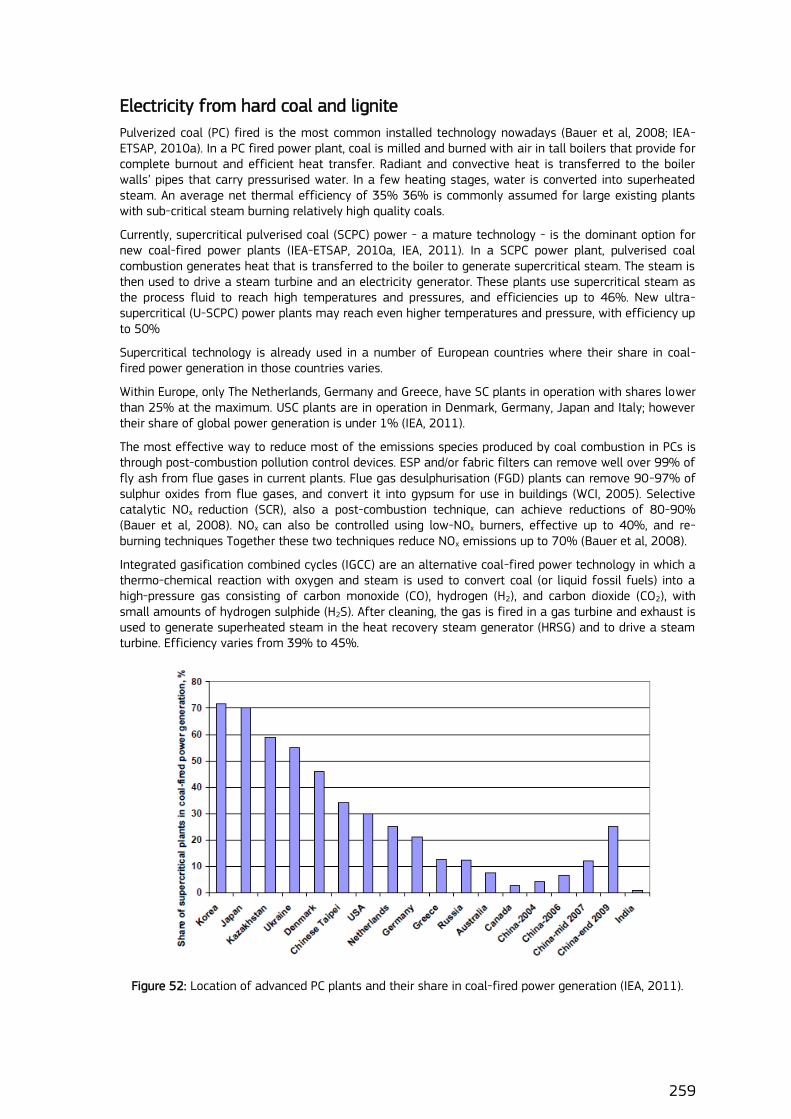
259
Electricity from hard coal and lignite
Pulverized coal (PC) fired is the most common installed technology nowadays (Bauer et al, 2008; IEA-ETSAP, 2010a). In a PC fired power plant, coal is milled and burned with air in tall boilers that provide for complete burnout and efficient heat transfer. Radiant and convective heat is transferred to the boiler walls‟ pipes that carry pressurised water. In a few heating stages, water is converted into superheated steam. An average net thermal efficiency of 35% 36% is commonly assumed for large existing plants with sub-critical steam burning relatively high quality coals.
Currently, supercritical pulverised coal (SCPC) power - a mature technology - is the dominant option for new coal-fired power plants (IEA-ETSAP, 2010a, IEA, 2011). In a SCPC power plant, pulverised coal combustion generates heat that is transferred to the boiler to generate supercritical steam. The steam is then used to drive a steam turbine and an electricity generator. These plants use supercritical steam as the process fluid to reach high temperatures and pressures, and efficiencies up to 46%. New ultra-supercritical (U-SCPC) power plants may reach even higher temperatures and pressure, with efficiency up to 50%
Supercritical technology is already used in a number of European countries where their share in coal-fired power generation in those countries varies.
Within Europe, only The Netherlands, Germany and Greece, have SC plants in operation with shares lower than 25% at the maximum. USC plants are in operation in Denmark, Germany, Japan and Italy; however their share of global power generation is under 1% (IEA, 2011).
The most effective way to reduce most of the emissions species produced by coal combustion in PCs is through post-combustion pollution control devices. ESP and/or fabric filters can remove well over 99% of fly ash from flue gases in current plants. Flue gas desulphurisation (FGD) plants can remove 90-97% of sulphur oxides from flue gases, and convert it into gypsum for use in buildings (WCI, 2005). Selective catalytic NOx reduction (SCR), also a post-combustion technique, can achieve reductions of 80-90% (Bauer et al, 2008). NOx can also be controlled using low-NOx burners, effective up to 40%, and re-burning techniques Together these two techniques reduce NOx emissions up to 70% (Bauer et al, 2008).
Integrated gasification combined cycles (IGCC) are an alternative coal-fired power technology in which a thermo-chemical reaction with oxygen and steam is used to convert coal (or liquid fossil fuels) into a high-pressure gas consisting of carbon monoxide (CO), hydrogen (H2), and carbon dioxide (CO2), with small amounts of hydrogen sulphide (H2S). After cleaning, the gas is fired in a gas turbine and exhaust is used to generate superheated steam in the heat recovery steam generator (HRSG) and to drive a steam turbine. Efficiency varies from 39% to 45%.
Figure 52: Location of advanced PC plants and their share in coal-fired power generation (IEA, 2011).
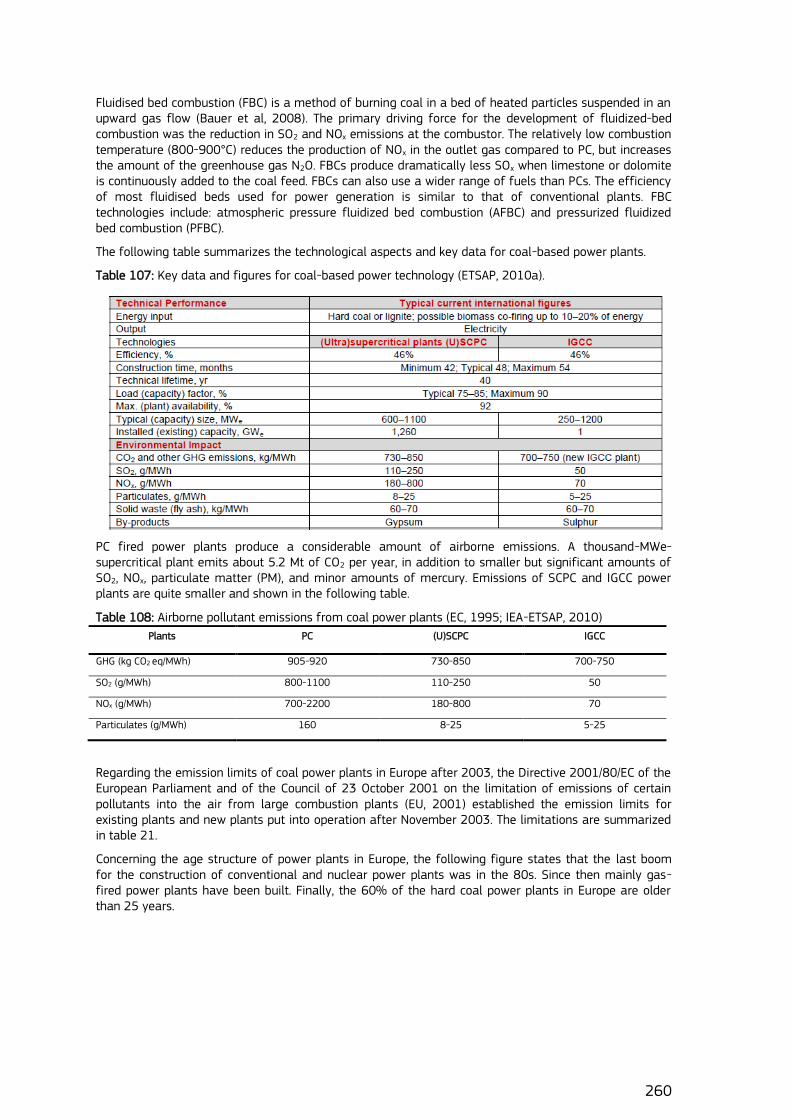
260
Fluidised bed combustion (FBC) is a method of burning coal in a bed of heated particles suspended in an upward gas flow (Bauer et al, 2008). The primary driving force for the development of fluidized-bed combustion was the reduction in SO2 and NOx emissions at the combustor. The relatively low combustion temperature (800-900°C) reduces the production of NOx in the outlet gas compared to PC, but increases the amount of the greenhouse gas N2O. FBCs produce dramatically less SOx when limestone or dolomite is continuously added to the coal feed. FBCs can also use a wider range of fuels than PCs. The efficiency of most fluidised beds used for power generation is similar to that of conventional plants. FBC technologies include: atmospheric pressure fluidized bed combustion (AFBC) and pressurized fluidized bed combustion (PFBC).
The following table summarizes the technological aspects and key data for coal-based power plants.
Table 107: Key data and figures for coal-based power technology (ETSAP, 2010a).
PC fired power plants produce a considerable amount of airborne emissions. A thousand-MWe-supercritical plant emits about 5.2 Mt of CO2 per year, in addition to smaller but significant amounts of SO2, NOx, particulate matter (PM), and minor amounts of mercury. Emissions of SCPC and IGCC power plants are quite smaller and shown in the following table.
Table 108: Airborne pollutant emissions from coal power plants (EC, 1995; IEA-ETSAP, 2010)
Plants PC (U)SCPC IGCC
GHG (kg CO2 eq/MWh) 905-920 730-850 700-750
SO2 (g/MWh) 800-1100 110-250 50
NOx (g/MWh) 700-2200 180-800 70
Particulates (g/MWh) 160 8-25 5-25
Regarding the emission limits of coal power plants in Europe after 2003, the Directive 2001/80/EC of the European Parliament and of the Council of 23 October 2001 on the limitation of emissions of certain pollutants into the air from large combustion plants (EU, 2001) established the emission limits for existing plants and new plants put into operation after November 2003. The limitations are summarized in table 21.
Concerning the age structure of power plants in Europe, the following figure states that the last boom for the construction of conventional and nuclear power plants was in the 80s. Since then mainly gas-fired power plants have been built. Finally, the 60% of the hard coal power plants in Europe are older than 25 years.

261
Figure 53: Age structure of power plants in Europe in 2007 (http://www.rwe.com/web/cms/de/8/rwe).
Summarizing all the information presented, a representative technology for coal power plants in Europe can be defined as follows:
Table 109: Representative technology for coal power plants in Europe.
Existing plants New plants
Technology PC SCPC Efficiency 35 46 Life time 40 40 Load factor 75-85 75-85 Size 600-1100 600-1100 Emission limits (EU, 2011) PC SCPC SO2 (mg/NM3) 400 (or 94% desulphurization rate) 200 NOx (mg/NM3) 500 (200 after 2016) 200 PM (mg/Nm3) 50 30
It must be stated that lignite power plants with super-critical steam conditions are installed exclusively in Germany. In other countries only lignite-fired power plants with sub-critical parameters are operated (Bauer et al, 2008).
According to the GR criterion, the pre-analysis has to state which countries are considered based on their contribution to the imported raw materials. Then, the origin and the share of imported (and domestic) hard coal in Germany, UK and Poland, within their technical characteristics, have been listed in the following tables.
Table 110: Domestic hard coal production and imports in Germany in 2009 (IEA, 2010e).
Country Tons %
Domestic (DE) 13760 26 Imports 38475 74 Russia 9529 18 Colombia 6487 12 South Africa 5320 10 USA 4424 8 Poland 4056 8 Others 3864 7 Australia 3607 7 Canada 1109 2 Great Britain 65 0

262
Table 111: Domestic hard coal production and imports in UK in 2009 (IEA, 2010e).
Country Tons %
Domestic (UK) 18060 29
Imports 43875 71
Russia 21909 35
Colombia 5294 9
South Africa 4281 7
USA 4280 7
Australia 3902 6
Indonesia 2162 3
Canada 1378 2
Others 365 1
Poland 224 0
China 51 0
Germany 19 0
Venezuela 9 0
Czech Republic 1 0
Table 112: Domestic hard coal production and imports in Poland in 2009 (IEA, 2010e).
Country Tons %
Domestic (PL) 78060 88
Imports 10793 12
CIS 7730 9
Czech republic 1749 2
USA 963 1
Colombia 255 0
Australia 65 0
Others 17 0
Germany 5 0
China 5 0
South Africa 3 0
Great Britain 1 0
Table 113: Technical characteristics of hard coal by country (WCI, 2005).
Country %S (wt) LHV (MJ/kg)
Russia 0.3-0.8
16 (15-20)
Colombia 0.4-0.9
USA 0.2-7.7
Poland 0.4-1.2 21-28
Germany 0.45-1.8 21-32
Australia 0.2-1.3 22.5-27
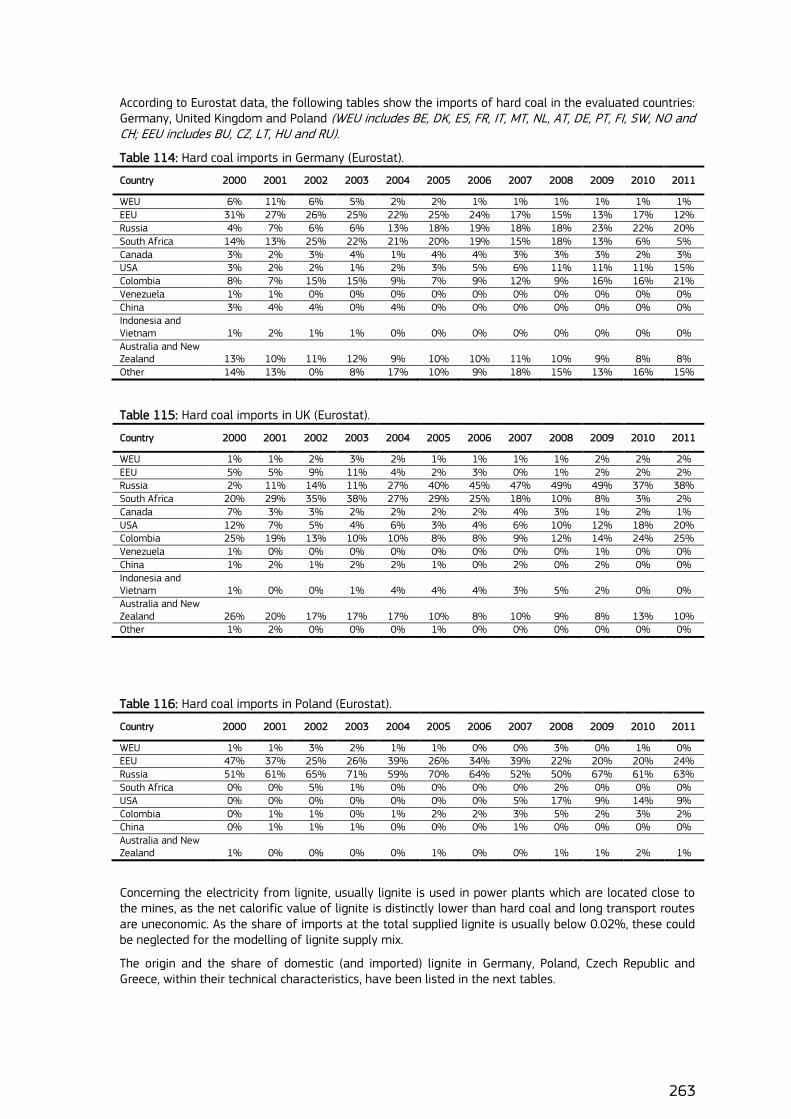
263
According to Eurostat data, the following tables show the imports of hard coal in the evaluated countries: Germany, United Kingdom and Poland (WEU includes BE, DK, ES, FR, IT, MT, NL, AT, DE, PT, FI, SW, NO and CH; EEU includes BU, CZ, LT, HU and RU).
Table 114: Hard coal imports in Germany (Eurostat).
Country 2000 2001 2002 2003 2004 2005 2006 2007 2008 2009 2010 2011
WEU 6% 11% 6% 5% 2% 2% 1% 1% 1% 1% 1% 1% EEU 31% 27% 26% 25% 22% 25% 24% 17% 15% 13% 17% 12% Russia 4% 7% 6% 6% 13% 18% 19% 18% 18% 23% 22% 20% South Africa 14% 13% 25% 22% 21% 20% 19% 15% 18% 13% 6% 5% Canada 3% 2% 3% 4% 1% 4% 4% 3% 3% 3% 2% 3% USA 3% 2% 2% 1% 2% 3% 5% 6% 11% 11% 11% 15% Colombia 8% 7% 15% 15% 9% 7% 9% 12% 9% 16% 16% 21% Venezuela 1% 1% 0% 0% 0% 0% 0% 0% 0% 0% 0% 0% China 3% 4% 4% 0% 4% 0% 0% 0% 0% 0% 0% 0% Indonesia and Vietnam 1% 2% 1% 1% 0% 0% 0% 0% 0% 0% 0% 0% Australia and New Zealand 13% 10% 11% 12% 9% 10% 10% 11% 10% 9% 8% 8% Other 14% 13% 0% 8% 17% 10% 9% 18% 15% 13% 16% 15%
Table 115: Hard coal imports in UK (Eurostat).
Country 2000 2001 2002 2003 2004 2005 2006 2007 2008 2009 2010 2011
WEU 1% 1% 2% 3% 2% 1% 1% 1% 1% 2% 2% 2% EEU 5% 5% 9% 11% 4% 2% 3% 0% 1% 2% 2% 2% Russia 2% 11% 14% 11% 27% 40% 45% 47% 49% 49% 37% 38% South Africa 20% 29% 35% 38% 27% 29% 25% 18% 10% 8% 3% 2% Canada 7% 3% 3% 2% 2% 2% 2% 4% 3% 1% 2% 1% USA 12% 7% 5% 4% 6% 3% 4% 6% 10% 12% 18% 20% Colombia 25% 19% 13% 10% 10% 8% 8% 9% 12% 14% 24% 25% Venezuela 1% 0% 0% 0% 0% 0% 0% 0% 0% 1% 0% 0% China 1% 2% 1% 2% 2% 1% 0% 2% 0% 2% 0% 0% Indonesia and Vietnam 1% 0% 0% 1% 4% 4% 4% 3% 5% 2% 0% 0% Australia and New Zealand 26% 20% 17% 17% 17% 10% 8% 10% 9% 8% 13% 10% Other 1% 2% 0% 0% 0% 1% 0% 0% 0% 0% 0% 0%
Table 116: Hard coal imports in Poland (Eurostat).
Country 2000 2001 2002 2003 2004 2005 2006 2007 2008 2009 2010 2011
WEU 1% 1% 3% 2% 1% 1% 0% 0% 3% 0% 1% 0% EEU 47% 37% 25% 26% 39% 26% 34% 39% 22% 20% 20% 24% Russia 51% 61% 65% 71% 59% 70% 64% 52% 50% 67% 61% 63% South Africa 0% 0% 5% 1% 0% 0% 0% 0% 2% 0% 0% 0% USA 0% 0% 0% 0% 0% 0% 0% 5% 17% 9% 14% 9% Colombia 0% 1% 1% 0% 1% 2% 2% 3% 5% 2% 3% 2% China 0% 1% 1% 1% 0% 0% 0% 1% 0% 0% 0% 0% Australia and New Zealand 1% 0% 0% 0% 0% 1% 0% 0% 1% 1% 2% 1%
Concerning the electricity from lignite, usually lignite is used in power plants which are located close to the mines, as the net calorific value of lignite is distinctly lower than hard coal and long transport routes are uneconomic. As the share of imports at the total supplied lignite is usually below 0.02%, these could be neglected for the modelling of lignite supply mix.
The origin and the share of domestic (and imported) lignite in Germany, Poland, Czech Republic and Greece, within their technical characteristics, have been listed in the next tables.
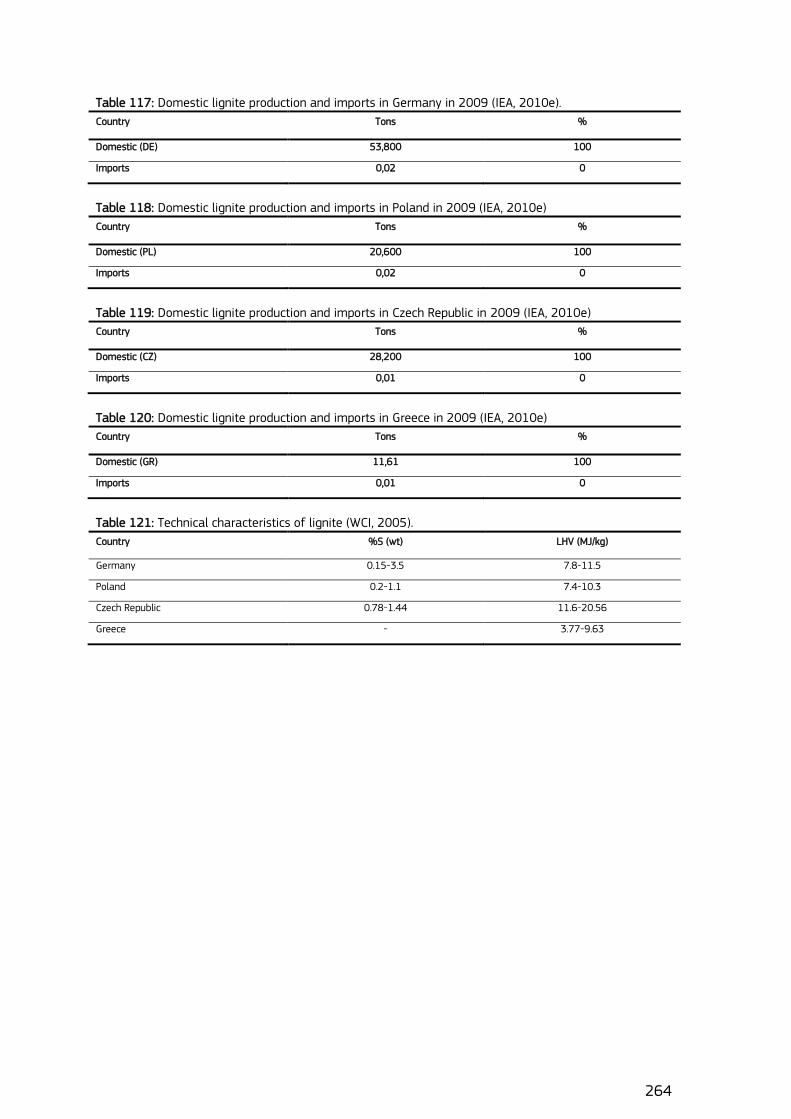
264
Table 117: Domestic lignite production and imports in Germany in 2009 (IEA, 2010e).
Country Tons %
Domestic (DE) 53,800 100
Imports 0,02 0
Table 118: Domestic lignite production and imports in Poland in 2009 (IEA, 2010e)
Country Tons %
Domestic (PL) 20,600 100
Imports 0,02 0
Table 119: Domestic lignite production and imports in Czech Republic in 2009 (IEA, 2010e)
Country Tons %
Domestic (CZ) 28,200 100
Imports 0,01 0
Table 120: Domestic lignite production and imports in Greece in 2009 (IEA, 2010e)
Country Tons %
Domestic (GR) 11,61 100
Imports 0,01 0
Table 121: Technical characteristics of lignite (WCI, 2005).
Country %S (wt) LHV (MJ/kg)
Germany 0.15-3.5 7.8-11.5
Poland 0.2-1.1 7.4-10.3
Czech Republic 0.78-1.44 11.6-20.56
Greece - 3.77-9.63
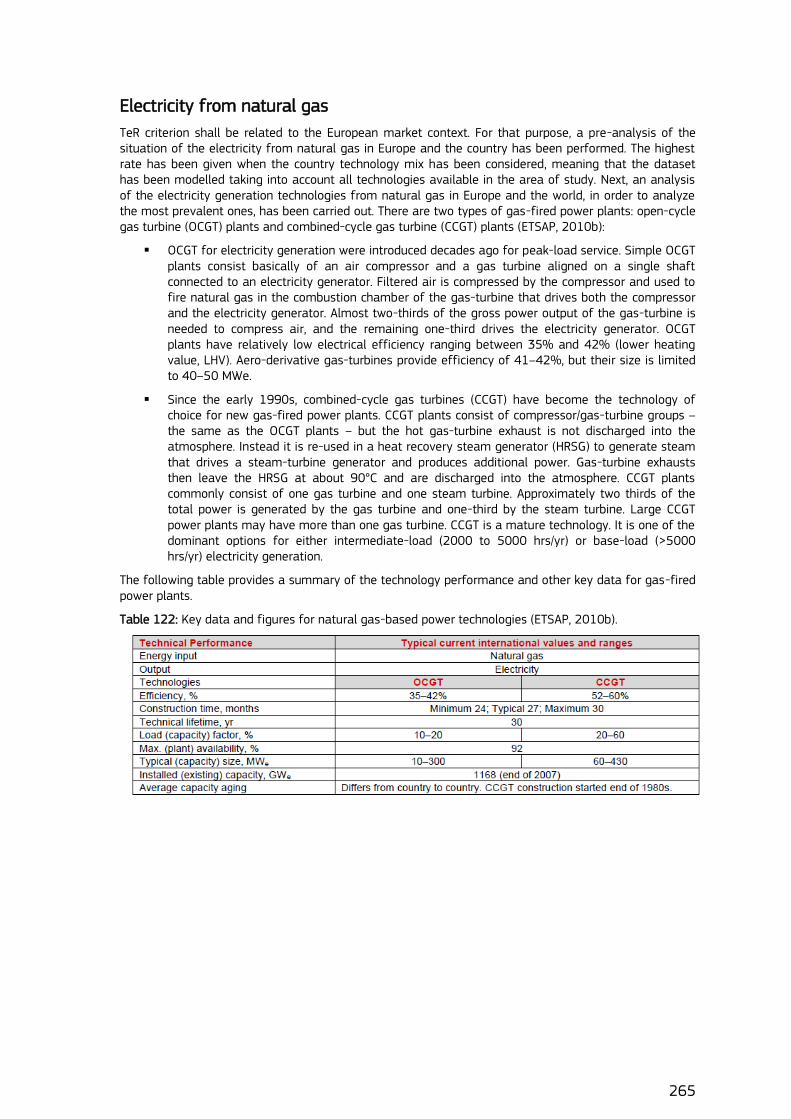
265
Electricity from natural gas
TeR criterion shall be related to the European market context. For that purpose, a pre-analysis of the situation of the electricity from natural gas in Europe and the country has been performed. The highest rate has been given when the country technology mix has been considered, meaning that the dataset has been modelled taking into account all technologies available in the area of study. Next, an analysis of the electricity generation technologies from natural gas in Europe and the world, in order to analyze the most prevalent ones, has been carried out. There are two types of gas-fired power plants: open-cycle gas turbine (OCGT) plants and combined-cycle gas turbine (CCGT) plants (ETSAP, 2010b):
OCGT for electricity generation were introduced decades ago for peak-load service. Simple OCGT plants consist basically of an air compressor and a gas turbine aligned on a single shaft connected to an electricity generator. Filtered air is compressed by the compressor and used to fire natural gas in the combustion chamber of the gas-turbine that drives both the compressor and the electricity generator. Almost two-thirds of the gross power output of the gas-turbine is needed to compress air, and the remaining one-third drives the electricity generator. OCGT plants have relatively low electrical efficiency ranging between 35% and 42% (lower heating value, LHV). Aero-derivative gas-turbines provide efficiency of 41–42%, but their size is limited to 40–50 MWe.
Since the early 1990s, combined-cycle gas turbines (CCGT) have become the technology of choice for new gas-fired power plants. CCGT plants consist of compressor/gas-turbine groups – the same as the OCGT plants – but the hot gas-turbine exhaust is not discharged into the atmosphere. Instead it is re-used in a heat recovery steam generator (HRSG) to generate steam that drives a steam-turbine generator and produces additional power. Gas-turbine exhausts then leave the HRSG at about 90°C and are discharged into the atmosphere. CCGT plants commonly consist of one gas turbine and one steam turbine. Approximately two thirds of the total power is generated by the gas turbine and one-third by the steam turbine. Large CCGT power plants may have more than one gas turbine. CCGT is a mature technology. It is one of the dominant options for either intermediate-load (2000 to 5000 hrs/yr) or base-load (>5000 hrs/yr) electricity generation.
The following table provides a summary of the technology performance and other key data for gas-fired power plants.
Table 122: Key data and figures for natural gas-based power technologies (ETSAP, 2010b).
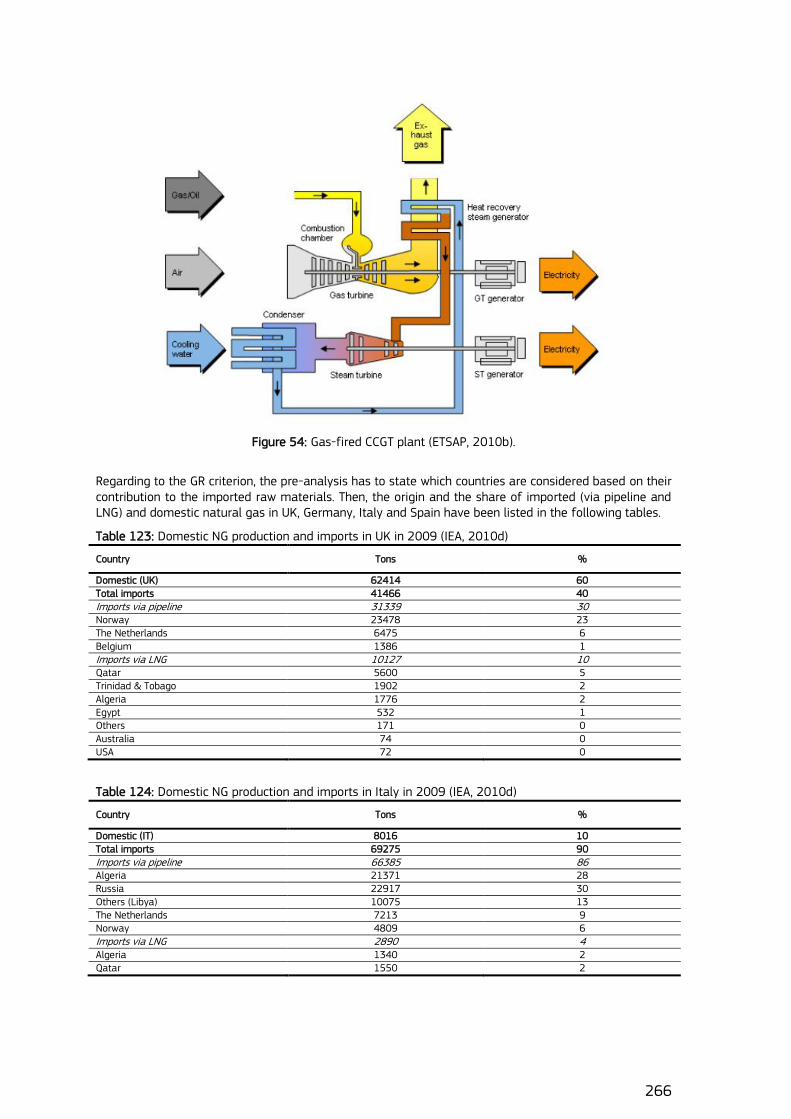
266
Figure 54: Gas-fired CCGT plant (ETSAP, 2010b).
Regarding to the GR criterion, the pre-analysis has to state which countries are considered based on their contribution to the imported raw materials. Then, the origin and the share of imported (via pipeline and LNG) and domestic natural gas in UK, Germany, Italy and Spain have been listed in the following tables.
Table 123: Domestic NG production and imports in UK in 2009 (IEA, 2010d)
Country Tons %
Domestic (UK) 62414 60 Total imports 41466 40 Imports via pipeline 31339 30 Norway 23478 23 The Netherlands 6475 6 Belgium 1386 1 Imports via LNG 10127 10 Qatar 5600 5 Trinidad & Tobago 1902 2 Algeria 1776 2 Egypt 532 1 Others 171 0 Australia 74 0 USA 72 0
Table 124: Domestic NG production and imports in Italy in 2009 (IEA, 2010d)
Country Tons %
Domestic (IT) 8016 10 Total imports 69275 90 Imports via pipeline 66385 86 Algeria 21371 28 Russia 22917 30 Others (Libya) 10075 13 The Netherlands 7213 9 Norway 4809 6 Imports via LNG 2890 4 Algeria 1340 2 Qatar 1550 2
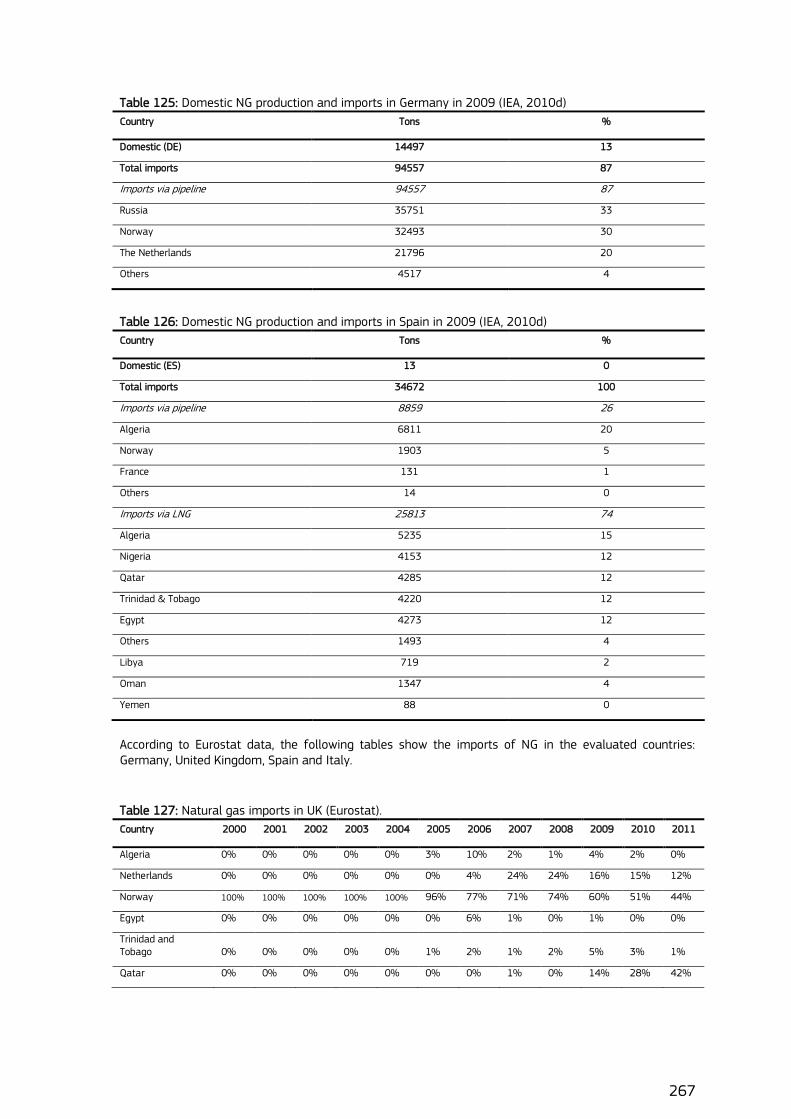
267
Table 125: Domestic NG production and imports in Germany in 2009 (IEA, 2010d)
Country Tons %
Domestic (DE) 14497 13
Total imports 94557 87
Imports via pipeline 94557 87
Russia 35751 33
Norway 32493 30
The Netherlands 21796 20
Others 4517 4
Table 126: Domestic NG production and imports in Spain in 2009 (IEA, 2010d)
Country Tons %
Domestic (ES) 13 0
Total imports 34672 100
Imports via pipeline 8859 26
Algeria 6811 20
Norway 1903 5
France 131 1
Others 14 0
Imports via LNG 25813 74
Algeria 5235 15
Nigeria 4153 12
Qatar 4285 12
Trinidad & Tobago 4220 12
Egypt 4273 12
Others 1493 4
Libya 719 2
Oman 1347 4
Yemen 88 0
According to Eurostat data, the following tables show the imports of NG in the evaluated countries: Germany, United Kingdom, Spain and Italy.
Table 127: Natural gas imports in UK (Eurostat).
Country 2000 2001 2002 2003 2004 2005 2006 2007 2008 2009 2010 2011
Algeria 0% 0% 0% 0% 0% 3% 10% 2% 1% 4% 2% 0%
Netherlands 0% 0% 0% 0% 0% 0% 4% 24% 24% 16% 15% 12%
Norway 100% 100% 100% 100% 100% 96% 77% 71% 74% 60% 51% 44%
Egypt 0% 0% 0% 0% 0% 0% 6% 1% 0% 1% 0% 0%
Trinidad and Tobago 0% 0% 0% 0% 0% 1% 2% 1% 2% 5% 3% 1%
Qatar 0% 0% 0% 0% 0% 0% 0% 1% 0% 14% 28% 42%
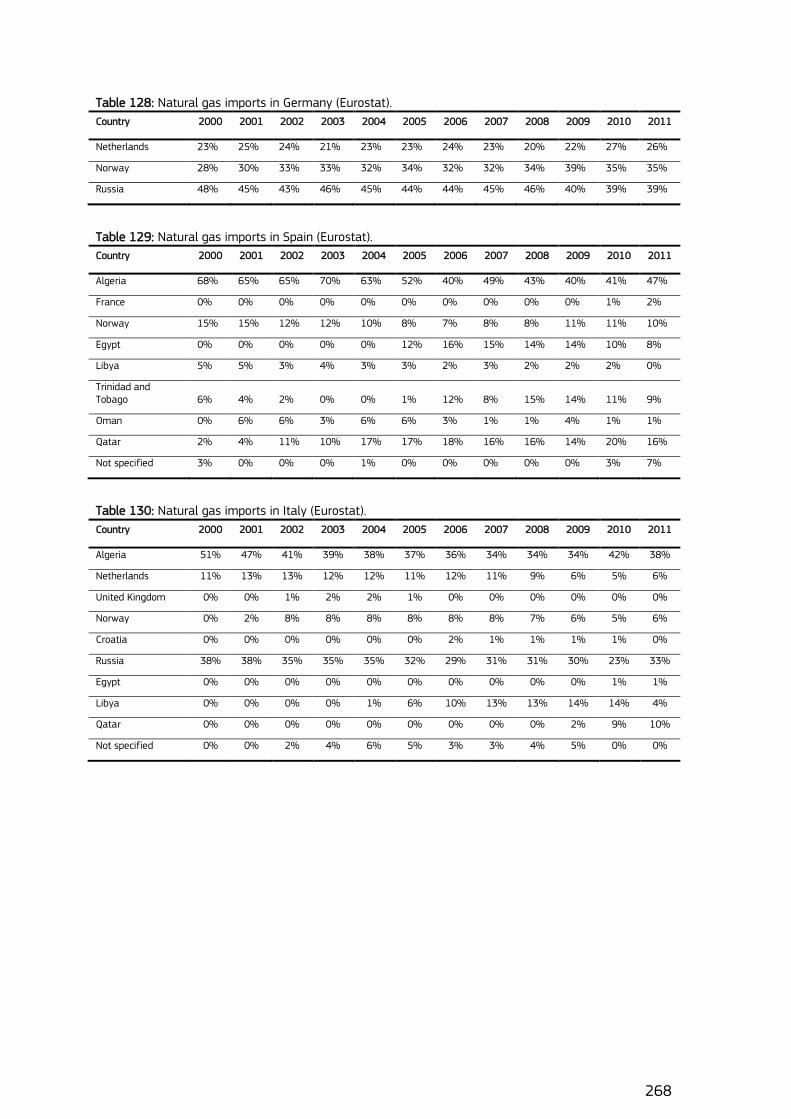
268
Table 128: Natural gas imports in Germany (Eurostat).
Country 2000 2001 2002 2003 2004 2005 2006 2007 2008 2009 2010 2011
Netherlands 23% 25% 24% 21% 23% 23% 24% 23% 20% 22% 27% 26%
Norway 28% 30% 33% 33% 32% 34% 32% 32% 34% 39% 35% 35%
Russia 48% 45% 43% 46% 45% 44% 44% 45% 46% 40% 39% 39%
Table 129: Natural gas imports in Spain (Eurostat).
Country 2000 2001 2002 2003 2004 2005 2006 2007 2008 2009 2010 2011
Algeria 68% 65% 65% 70% 63% 52% 40% 49% 43% 40% 41% 47%
France 0% 0% 0% 0% 0% 0% 0% 0% 0% 0% 1% 2%
Norway 15% 15% 12% 12% 10% 8% 7% 8% 8% 11% 11% 10%
Egypt 0% 0% 0% 0% 0% 12% 16% 15% 14% 14% 10% 8%
Libya 5% 5% 3% 4% 3% 3% 2% 3% 2% 2% 2% 0%
Trinidad and Tobago 6% 4% 2% 0% 0% 1% 12% 8% 15% 14% 11% 9%
Oman 0% 6% 6% 3% 6% 6% 3% 1% 1% 4% 1% 1%
Qatar 2% 4% 11% 10% 17% 17% 18% 16% 16% 14% 20% 16%
Not specified 3% 0% 0% 0% 1% 0% 0% 0% 0% 0% 3% 7%
Table 130: Natural gas imports in Italy (Eurostat).
Country 2000 2001 2002 2003 2004 2005 2006 2007 2008 2009 2010 2011
Algeria 51% 47% 41% 39% 38% 37% 36% 34% 34% 34% 42% 38%
Netherlands 11% 13% 13% 12% 12% 11% 12% 11% 9% 6% 5% 6%
United Kingdom 0% 0% 1% 2% 2% 1% 0% 0% 0% 0% 0% 0%
Norway 0% 2% 8% 8% 8% 8% 8% 8% 7% 6% 5% 6%
Croatia 0% 0% 0% 0% 0% 0% 2% 1% 1% 1% 1% 0%
Russia 38% 38% 35% 35% 35% 32% 29% 31% 31% 30% 23% 33%
Egypt 0% 0% 0% 0% 0% 0% 0% 0% 0% 0% 1% 1%
Libya 0% 0% 0% 0% 1% 6% 10% 13% 13% 14% 14% 4%
Qatar 0% 0% 0% 0% 0% 0% 0% 0% 0% 2% 9% 10%
Not specified 0% 0% 2% 4% 6% 5% 3% 3% 4% 5% 0% 0%
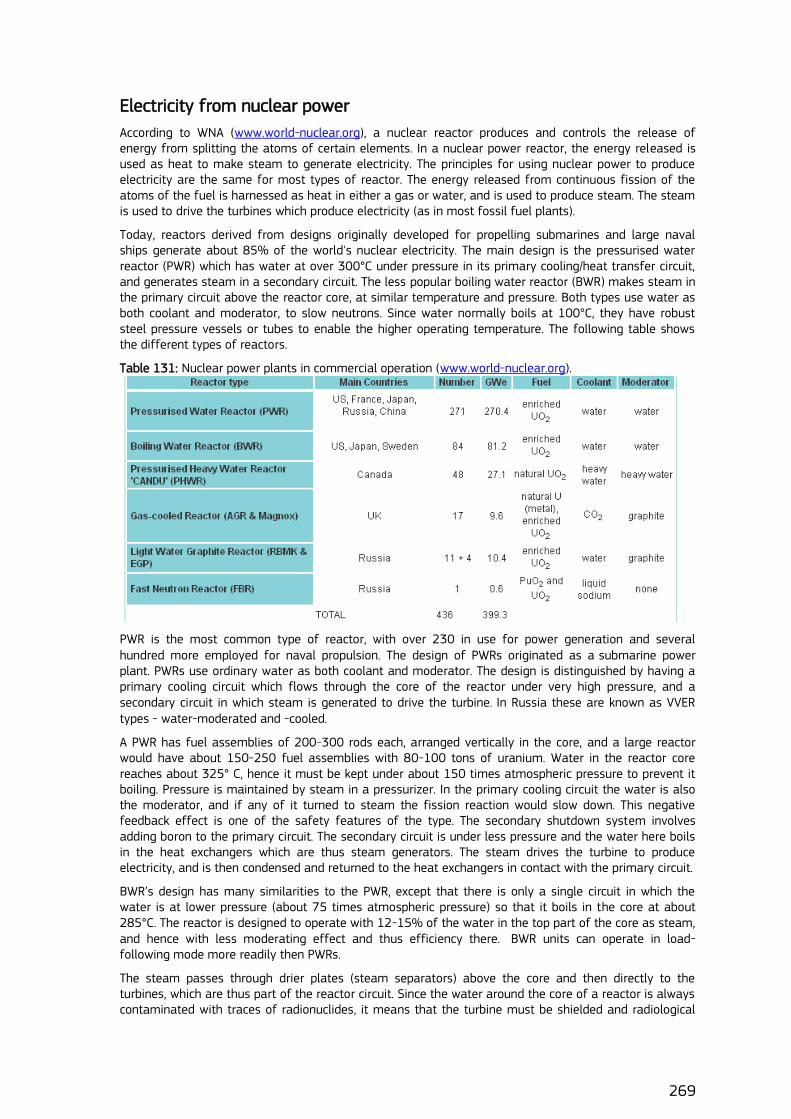
269
Electricity from nuclear power
According to WNA (www.world-nuclear.org), a nuclear reactor produces and controls the release of energy from splitting the atoms of certain elements. In a nuclear power reactor, the energy released is used as heat to make steam to generate electricity. The principles for using nuclear power to produce electricity are the same for most types of reactor. The energy released from continuous fission of the atoms of the fuel is harnessed as heat in either a gas or water, and is used to produce steam. The steam is used to drive the turbines which produce electricity (as in most fossil fuel plants).
Today, reactors derived from designs originally developed for propelling submarines and large naval ships generate about 85% of the world's nuclear electricity. The main design is the pressurised water reactor (PWR) which has water at over 300°C under pressure in its primary cooling/heat transfer circuit, and generates steam in a secondary circuit. The less popular boiling water reactor (BWR) makes steam in the primary circuit above the reactor core, at similar temperature and pressure. Both types use water as both coolant and moderator, to slow neutrons. Since water normally boils at 100°C, they have robust steel pressure vessels or tubes to enable the higher operating temperature. The following table shows the different types of reactors.
Table 131: Nuclear power plants in commercial operation (www.world-nuclear.org).
PWR is the most common type of reactor, with over 230 in use for power generation and several hundred more employed for naval propulsion. The design of PWRs originated as a submarine power plant. PWRs use ordinary water as both coolant and moderator. The design is distinguished by having a primary cooling circuit which flows through the core of the reactor under very high pressure, and a secondary circuit in which steam is generated to drive the turbine. In Russia these are known as VVER types - water-moderated and -cooled.
A PWR has fuel assemblies of 200-300 rods each, arranged vertically in the core, and a large reactor would have about 150-250 fuel assemblies with 80-100 tons of uranium. Water in the reactor core reaches about 325° C, hence it must be kept under about 150 times atmospheric pressure to prevent it boiling. Pressure is maintained by steam in a pressurizer. In the primary cooling circuit the water is also the moderator, and if any of it turned to steam the fission reaction would slow down. This negative feedback effect is one of the safety features of the type. The secondary shutdown system involves adding boron to the primary circuit. The secondary circuit is under less pressure and the water here boils in the heat exchangers which are thus steam generators. The steam drives the turbine to produce electricity, and is then condensed and returned to the heat exchangers in contact with the primary circuit.
BWR‟s design has many similarities to the PWR, except that there is only a single circuit in which the water is at lower pressure (about 75 times atmospheric pressure) so that it boils in the core at about 285°C. The reactor is designed to operate with 12-15% of the water in the top part of the core as steam, and hence with less moderating effect and thus efficiency there. BWR units can operate in load-following mode more readily then PWRs.
The steam passes through drier plates (steam separators) above the core and then directly to the turbines, which are thus part of the reactor circuit. Since the water around the core of a reactor is always contaminated with traces of radionuclides, it means that the turbine must be shielded and radiological
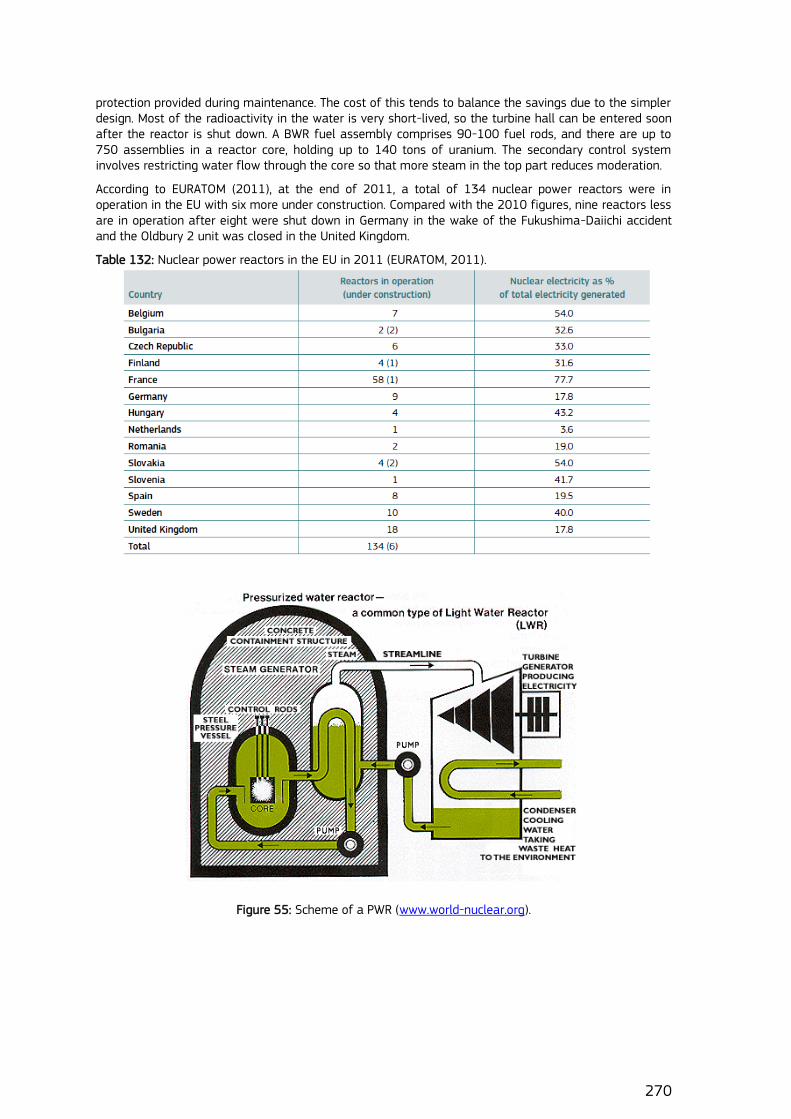
270
protection provided during maintenance. The cost of this tends to balance the savings due to the simpler design. Most of the radioactivity in the water is very short-lived, so the turbine hall can be entered soon after the reactor is shut down. A BWR fuel assembly comprises 90-100 fuel rods, and there are up to 750 assemblies in a reactor core, holding up to 140 tons of uranium. The secondary control system involves restricting water flow through the core so that more steam in the top part reduces moderation.
According to EURATOM (2011), at the end of 2011, a total of 134 nuclear power reactors were in operation in the EU with six more under construction. Compared with the 2010 figures, nine reactors less are in operation after eight were shut down in Germany in the wake of the Fukushima-Daiichi accident and the Oldbury 2 unit was closed in the United Kingdom.
Table 132: Nuclear power reactors in the EU in 2011 (EURATOM, 2011).
Figure 55: Scheme of a PWR (www.world-nuclear.org).
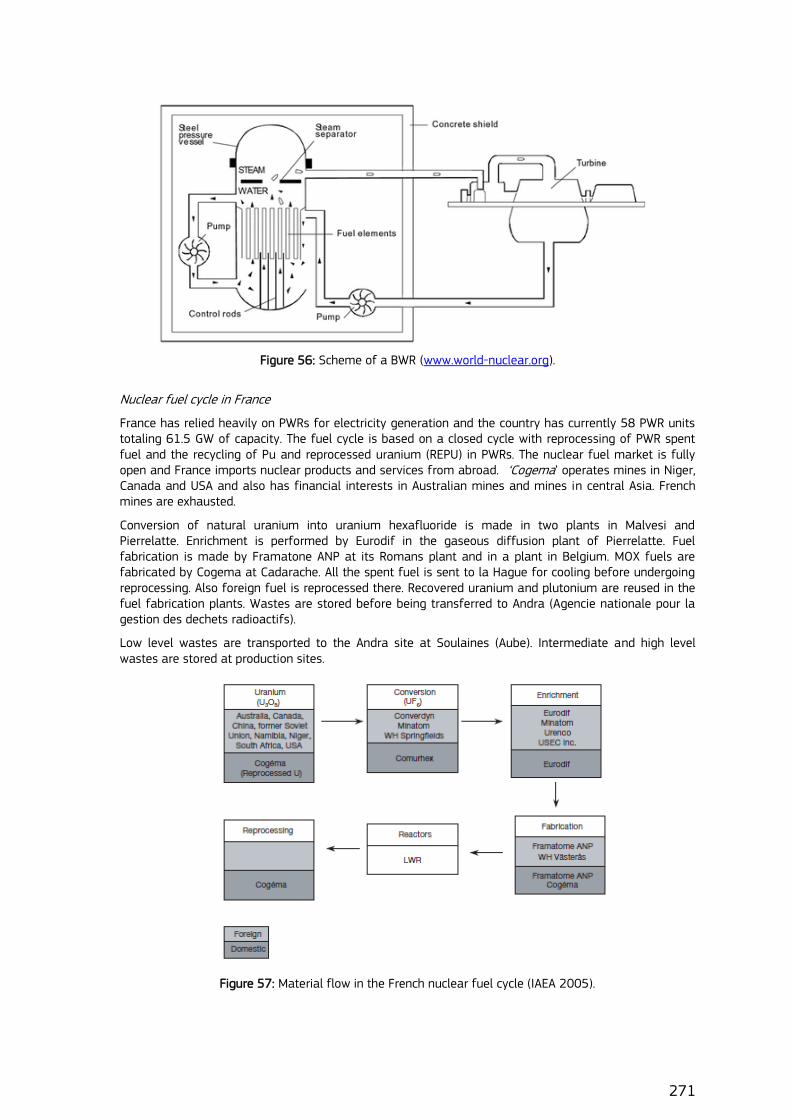
271
Figure 56: Scheme of a BWR (www.world-nuclear.org).
Nuclear fuel cycle in France
France has relied heavily on PWRs for electricity generation and the country has currently 58 PWR units totaling 61.5 GW of capacity. The fuel cycle is based on a closed cycle with reprocessing of PWR spent fuel and the recycling of Pu and reprocessed uranium (REPU) in PWRs. The nuclear fuel market is fully open and France imports nuclear products and services from abroad. „Cogema‟ operates mines in Niger, Canada and USA and also has financial interests in Australian mines and mines in central Asia. French mines are exhausted.
Conversion of natural uranium into uranium hexafluoride is made in two plants in Malvesi and Pierrelatte. Enrichment is performed by Eurodif in the gaseous diffusion plant of Pierrelatte. Fuel fabrication is made by Framatone ANP at its Romans plant and in a plant in Belgium. MOX fuels are fabricated by Cogema at Cadarache. All the spent fuel is sent to la Hague for cooling before undergoing reprocessing. Also foreign fuel is reprocessed there. Recovered uranium and plutonium are reused in the fuel fabrication plants. Wastes are stored before being transferred to Andra (Agencie nationale pour la gestion des dechets radioactifs).
Low level wastes are transported to the Andra site at Soulaines (Aube). Intermediate and high level wastes are stored at production sites.
Figure 57: Material flow in the French nuclear fuel cycle (IAEA 2005).
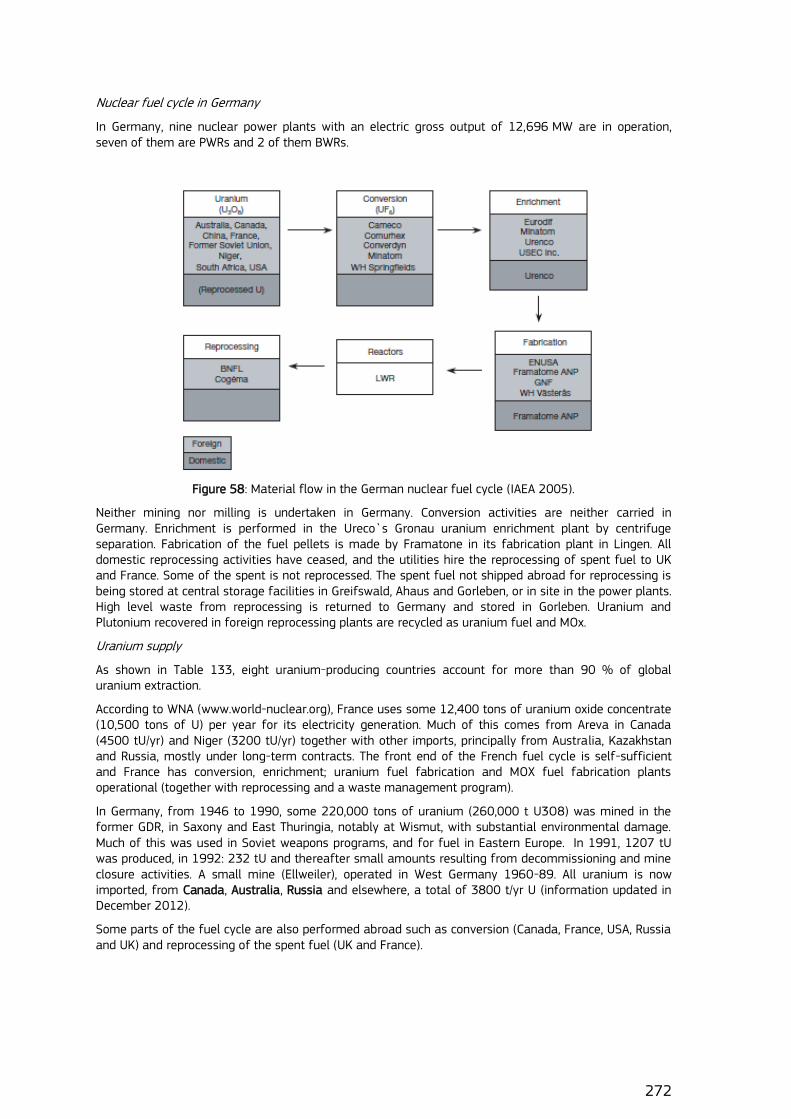
272
Nuclear fuel cycle in Germany
In Germany, nine nuclear power plants with an electric gross output of 12,696 MW are in operation, seven of them are PWRs and 2 of them BWRs.
Figure 58: Material flow in the German nuclear fuel cycle (IAEA 2005).
Neither mining nor milling is undertaken in Germany. Conversion activities are neither carried in Germany. Enrichment is performed in the Ureco`s Gronau uranium enrichment plant by centrifuge separation. Fabrication of the fuel pellets is made by Framatone in its fabrication plant in Lingen. All domestic reprocessing activities have ceased, and the utilities hire the reprocessing of spent fuel to UK and France. Some of the spent is not reprocessed. The spent fuel not shipped abroad for reprocessing is being stored at central storage facilities in Greifswald, Ahaus and Gorleben, or in site in the power plants. High level waste from reprocessing is returned to Germany and stored in Gorleben. Uranium and Plutonium recovered in foreign reprocessing plants are recycled as uranium fuel and MOx.
Uranium supply
As shown in Table 133, eight uranium-producing countries account for more than 90 % of global uranium extraction.
According to WNA (www.world-nuclear.org), France uses some 12,400 tons of uranium oxide concentrate (10,500 tons of U) per year for its electricity generation. Much of this comes from Areva in Canada (4500 tU/yr) and Niger (3200 tU/yr) together with other imports, principally from Australia, Kazakhstan and Russia, mostly under long-term contracts. The front end of the French fuel cycle is self-sufficient and France has conversion, enrichment; uranium fuel fabrication and MOX fuel fabrication plants operational (together with reprocessing and a waste management program).
In Germany, from 1946 to 1990, some 220,000 tons of uranium (260,000 t U3O8) was mined in the former GDR, in Saxony and East Thuringia, notably at Wismut, with substantial environmental damage. Much of this was used in Soviet weapons programs, and for fuel in Eastern Europe. In 1991, 1207 tU was produced, in 1992: 232 tU and thereafter small amounts resulting from decommissioning and mine closure activities. A small mine (Ellweiler), operated in West Germany 1960-89. All uranium is now imported, from Canada, Australia, Russia and elsewhere, a total of 3800 t/yr U (information updated in December 2012).
Some parts of the fuel cycle are also performed abroad such as conversion (Canada, France, USA, Russia and UK) and reprocessing of the spent fuel (UK and France).
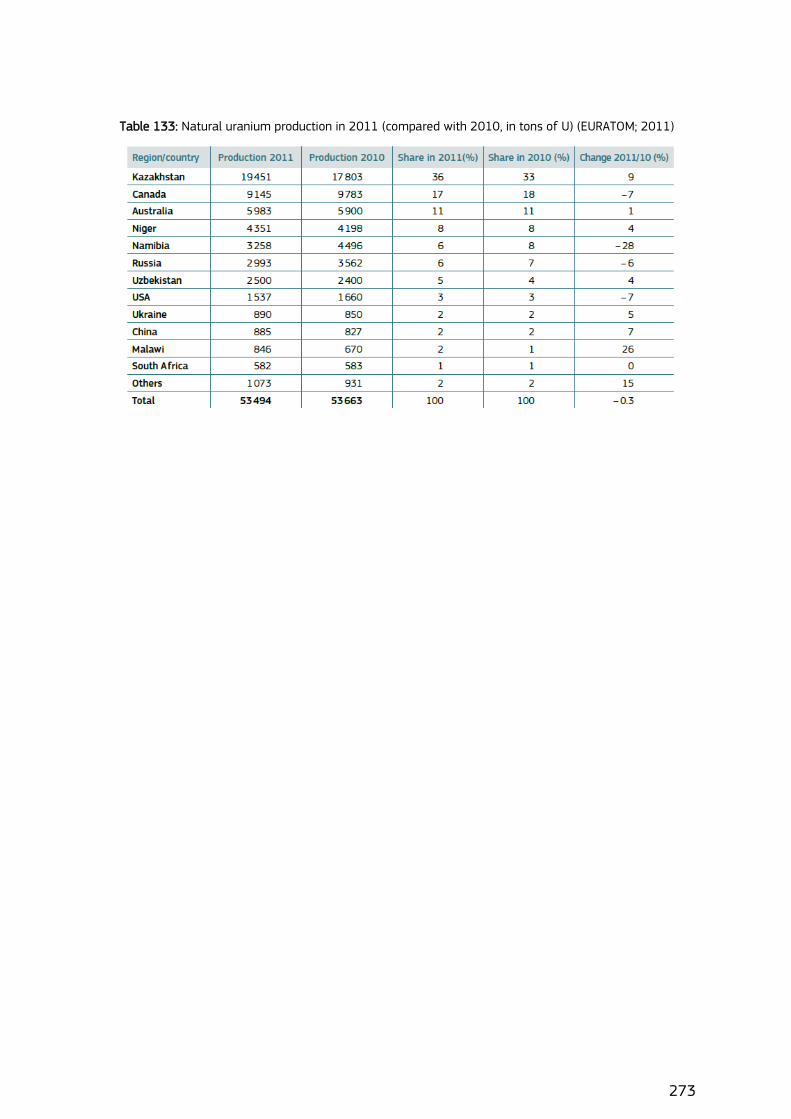
273
Table 133: Natural uranium production in 2011 (compared with 2010, in tons of U) (EURATOM; 2011)
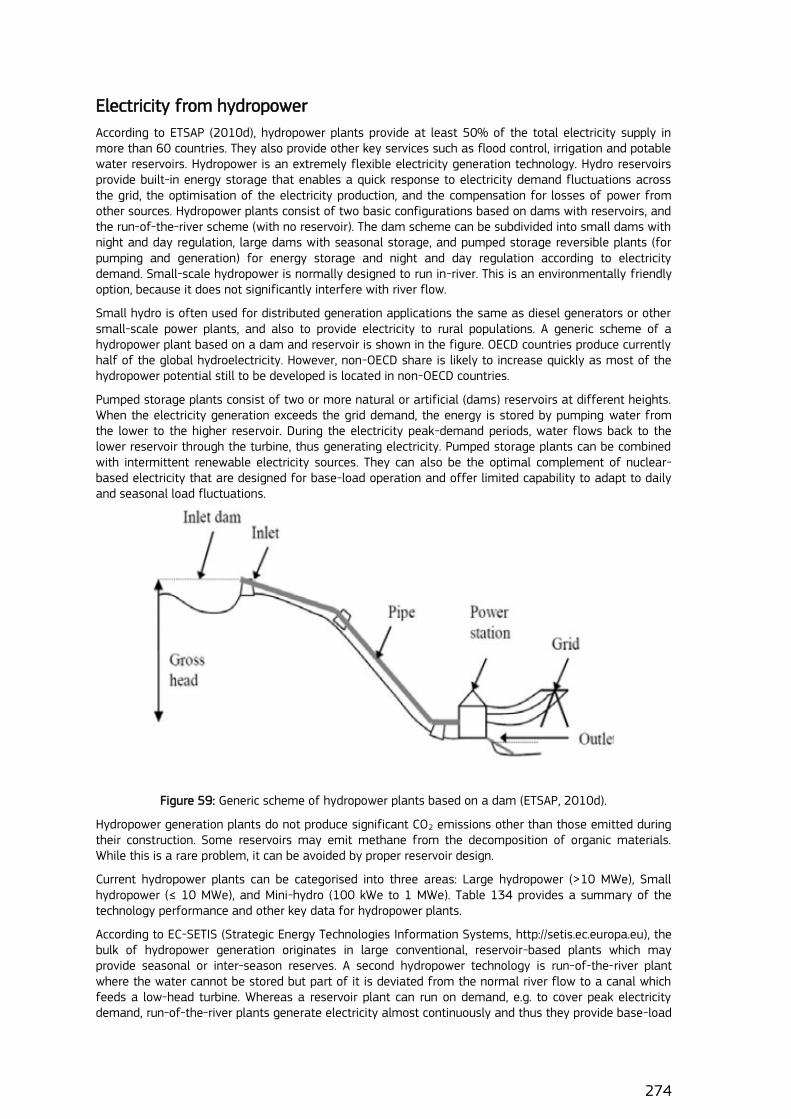
274
Electricity from hydropower
According to ETSAP (2010d), hydropower plants provide at least 50% of the total electricity supply in more than 60 countries. They also provide other key services such as flood control, irrigation and potable water reservoirs. Hydropower is an extremely flexible electricity generation technology. Hydro reservoirs provide built-in energy storage that enables a quick response to electricity demand fluctuations across the grid, the optimisation of the electricity production, and the compensation for losses of power from other sources. Hydropower plants consist of two basic configurations based on dams with reservoirs, and the run-of-the-river scheme (with no reservoir). The dam scheme can be subdivided into small dams with night and day regulation, large dams with seasonal storage, and pumped storage reversible plants (for pumping and generation) for energy storage and night and day regulation according to electricity demand. Small-scale hydropower is normally designed to run in-river. This is an environmentally friendly option, because it does not significantly interfere with river flow.
Small hydro is often used for distributed generation applications the same as diesel generators or other small-scale power plants, and also to provide electricity to rural populations. A generic scheme of a hydropower plant based on a dam and reservoir is shown in the figure. OECD countries produce currently half of the global hydroelectricity. However, non-OECD share is likely to increase quickly as most of the hydropower potential still to be developed is located in non-OECD countries.
Pumped storage plants consist of two or more natural or artificial (dams) reservoirs at different heights. When the electricity generation exceeds the grid demand, the energy is stored by pumping water from the lower to the higher reservoir. During the electricity peak-demand periods, water flows back to the lower reservoir through the turbine, thus generating electricity. Pumped storage plants can be combined with intermittent renewable electricity sources. They can also be the optimal complement of nuclear-based electricity that are designed for base-load operation and offer limited capability to adapt to daily and seasonal load fluctuations.
Figure 59: Generic scheme of hydropower plants based on a dam (ETSAP, 2010d).
Hydropower generation plants do not produce significant CO2 emissions other than those emitted during their construction. Some reservoirs may emit methane from the decomposition of organic materials. While this is a rare problem, it can be avoided by proper reservoir design.
Current hydropower plants can be categorised into three areas: Large hydropower (>10 MWe), Small hydropower (≤ 10 MWe), and Mini-hydro (100 kWe to 1 MWe). Table 134 provides a summary of the technology performance and other key data for hydropower plants.
According to EC-SETIS (Strategic Energy Technologies Information Systems, http://setis.ec.europa.eu), the bulk of hydropower generation originates in large conventional, reservoir-based plants which may provide seasonal or inter-season reserves. A second hydropower technology is run-of-the-river plant where the water cannot be stored but part of it is deviated from the normal river flow to a canal which feeds a low-head turbine. Whereas a reservoir plant can run on demand, e.g. to cover peak electricity demand, run-of-the-river plants generate electricity almost continuously and thus they provide base-load
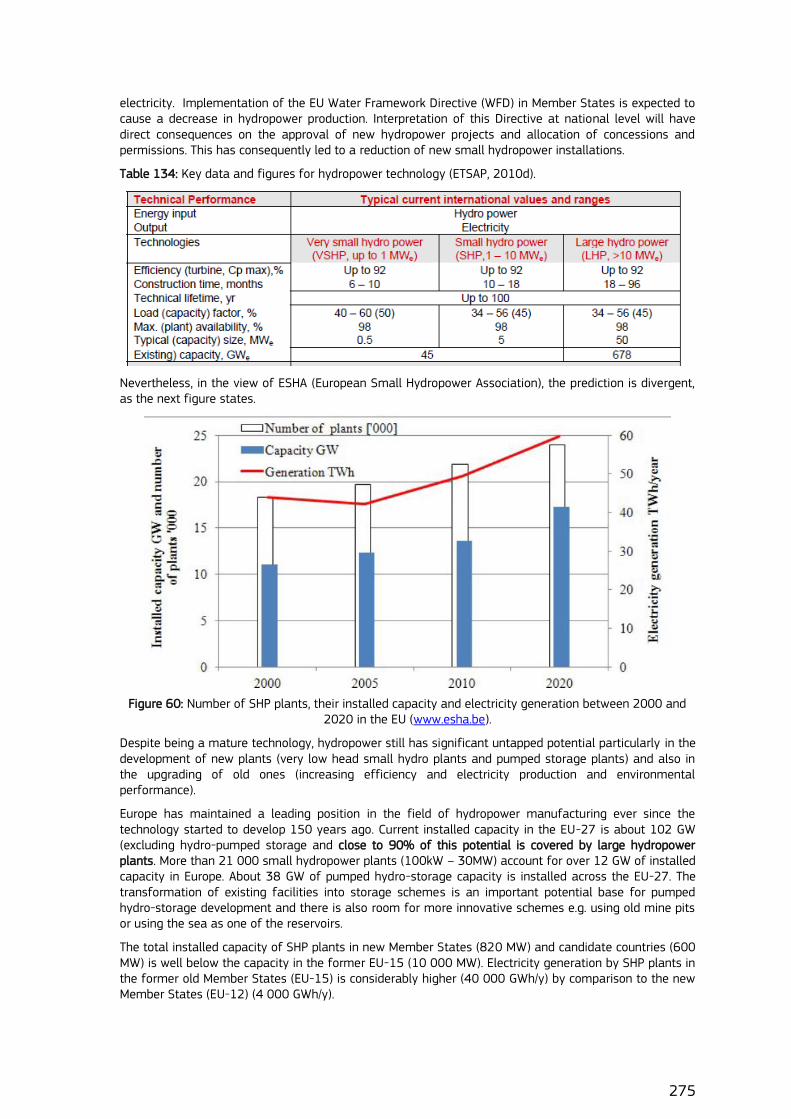
275
electricity. Implementation of the EU Water Framework Directive (WFD) in Member States is expected to cause a decrease in hydropower production. Interpretation of this Directive at national level will have direct consequences on the approval of new hydropower projects and allocation of concessions and permissions. This has consequently led to a reduction of new small hydropower installations.
Table 134: Key data and figures for hydropower technology (ETSAP, 2010d).
Nevertheless, in the view of ESHA (European Small Hydropower Association), the prediction is divergent, as the next figure states.
Figure 60: Number of SHP plants, their installed capacity and electricity generation between 2000 and 2020 in the EU (www.esha.be).
Despite being a mature technology, hydropower still has significant untapped potential particularly in the development of new plants (very low head small hydro plants and pumped storage plants) and also in the upgrading of old ones (increasing efficiency and electricity production and environmental performance).
Europe has maintained a leading position in the field of hydropower manufacturing ever since the technology started to develop 150 years ago. Current installed capacity in the EU-27 is about 102 GW (excluding hydro-pumped storage and close to 90% of this potential is covered by large hydropower plants. More than 21 000 small hydropower plants (100kW – 30MW) account for over 12 GW of installed capacity in Europe. About 38 GW of pumped hydro-storage capacity is installed across the EU-27. The transformation of existing facilities into storage schemes is an important potential base for pumped hydro-storage development and there is also room for more innovative schemes e.g. using old mine pits or using the sea as one of the reservoirs.
The total installed capacity of SHP plants in new Member States (820 MW) and candidate countries (600 MW) is well below the capacity in the former EU-15 (10 000 MW). Electricity generation by SHP plants in the former old Member States (EU-15) is considerably higher (40 000 GWh/y) by comparison to the new Member States (EU-12) (4 000 GWh/y).
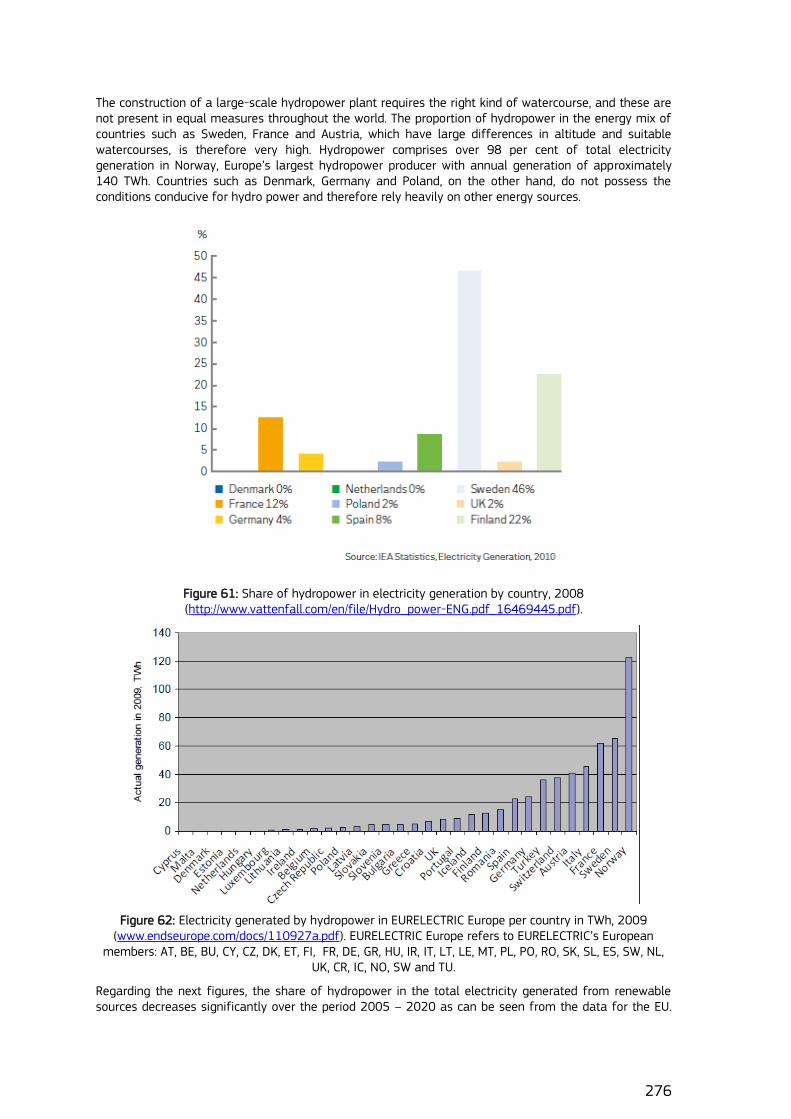
276
The construction of a large-scale hydropower plant requires the right kind of watercourse, and these are not present in equal measures throughout the world. The proportion of hydropower in the energy mix of countries such as Sweden, France and Austria, which have large differences in altitude and suitable watercourses, is therefore very high. Hydropower comprises over 98 per cent of total electricity generation in Norway, Europe‟s largest hydropower producer with annual generation of approximately 140 TWh. Countries such as Denmark, Germany and Poland, on the other hand, do not possess the conditions conducive for hydro power and therefore rely heavily on other energy sources.
Figure 61: Share of hydropower in electricity generation by country, 2008 (http://www.vattenfall.com/en/file/Hydro_power-ENG.pdf_16469445.pdf).
Figure 62: Electricity generated by hydropower in EURELECTRIC Europe per country in TWh, 2009 (www.endseurope.com/docs/110927a.pdf). EURELECTRIC Europe refers to EURELECTRIC‟s European
members: AT, BE, BU, CY, CZ, DK, ET, FI, FR, DE, GR, HU, IR, IT, LT, LE, MT, PL, PO, RO, SK, SL, ES, SW, NL, UK, CR, IC, NO, SW and TU.
Regarding the next figures, the share of hydropower in the total electricity generated from renewable sources decreases significantly over the period 2005 – 2020 as can be seen from the data for the EU.
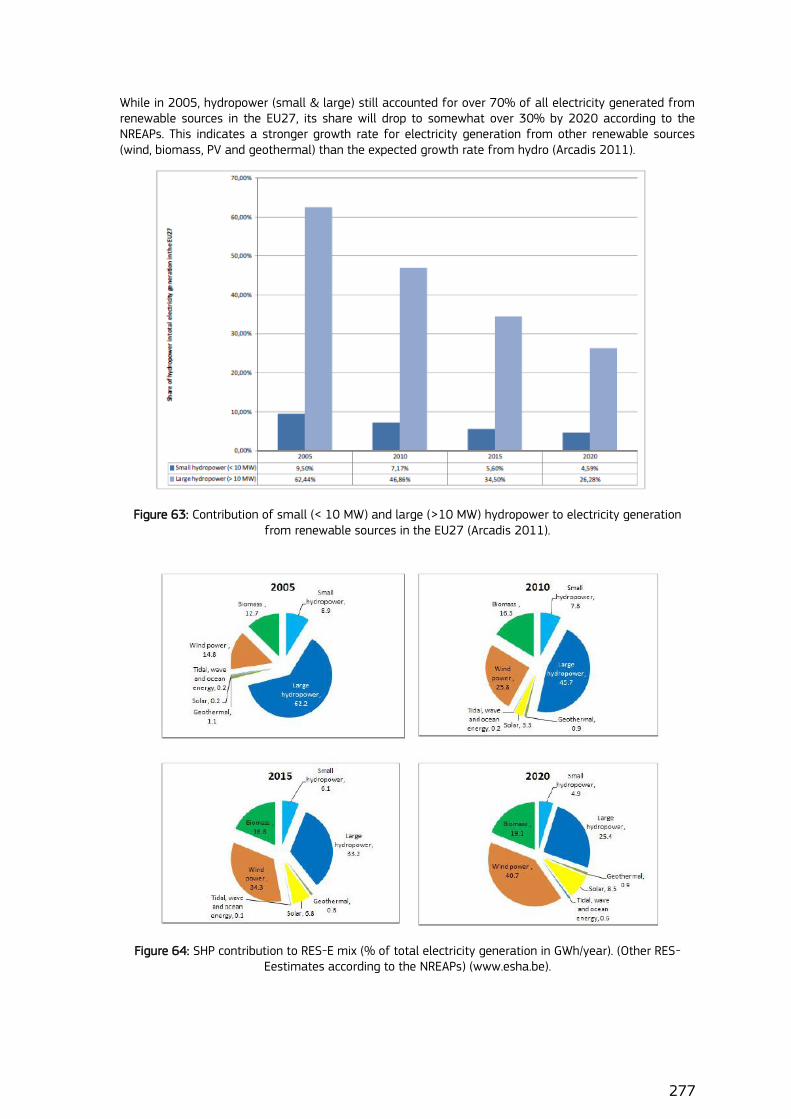
277
While in 2005, hydropower (small & large) still accounted for over 70% of all electricity generated from renewable sources in the EU27, its share will drop to somewhat over 30% by 2020 according to the NREAPs. This indicates a stronger growth rate for electricity generation from other renewable sources (wind, biomass, PV and geothermal) than the expected growth rate from hydro (Arcadis 2011).
Figure 63: Contribution of small (< 10 MW) and large (>10 MW) hydropower to electricity generation from renewable sources in the EU27 (Arcadis 2011).
Figure 64: SHP contribution to RES-E mix (% of total electricity generation in GWh/year). (Other RES-Eestimates according to the NREAPs) (www.esha.be).
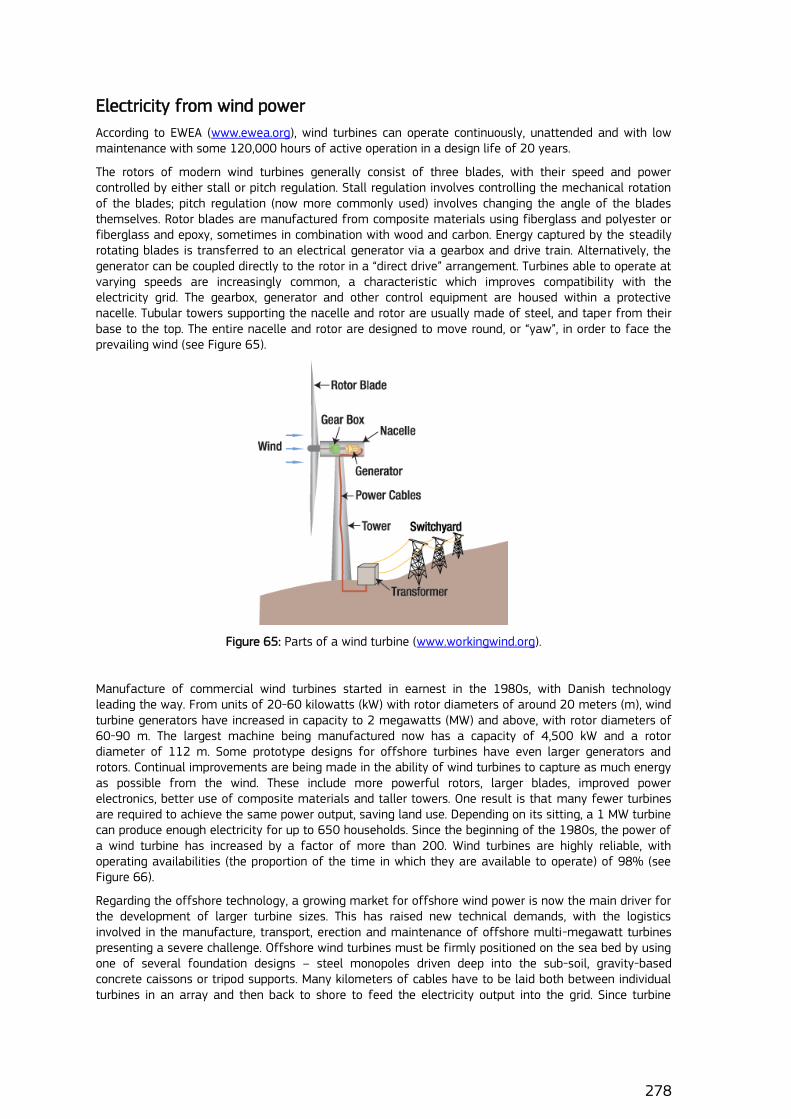
278
Electricity from wind power
According to EWEA (www.ewea.org), wind turbines can operate continuously, unattended and with low maintenance with some 120,000 hours of active operation in a design life of 20 years.
The rotors of modern wind turbines generally consist of three blades, with their speed and power controlled by either stall or pitch regulation. Stall regulation involves controlling the mechanical rotation of the blades; pitch regulation (now more commonly used) involves changing the angle of the blades themselves. Rotor blades are manufactured from composite materials using fiberglass and polyester or fiberglass and epoxy, sometimes in combination with wood and carbon. Energy captured by the steadily rotating blades is transferred to an electrical generator via a gearbox and drive train. Alternatively, the generator can be coupled directly to the rotor in a “direct drive” arrangement. Turbines able to operate at varying speeds are increasingly common, a characteristic which improves compatibility with the electricity grid. The gearbox, generator and other control equipment are housed within a protective nacelle. Tubular towers supporting the nacelle and rotor are usually made of steel, and taper from their base to the top. The entire nacelle and rotor are designed to move round, or “yaw”, in order to face the prevailing wind (see Figure 65).
Figure 65: Parts of a wind turbine (www.workingwind.org).
Manufacture of commercial wind turbines started in earnest in the 1980s, with Danish technology leading the way. From units of 20-60 kilowatts (kW) with rotor diameters of around 20 meters (m), wind turbine generators have increased in capacity to 2 megawatts (MW) and above, with rotor diameters of 60-90 m. The largest machine being manufactured now has a capacity of 4,500 kW and a rotor diameter of 112 m. Some prototype designs for offshore turbines have even larger generators and rotors. Continual improvements are being made in the ability of wind turbines to capture as much energy as possible from the wind. These include more powerful rotors, larger blades, improved power electronics, better use of composite materials and taller towers. One result is that many fewer turbines are required to achieve the same power output, saving land use. Depending on its sitting, a 1 MW turbine can produce enough electricity for up to 650 households. Since the beginning of the 1980s, the power of a wind turbine has increased by a factor of more than 200. Wind turbines are highly reliable, with operating availabilities (the proportion of the time in which they are available to operate) of 98% (see Figure 66).
Regarding the offshore technology, a growing market for offshore wind power is now the main driver for the development of larger turbine sizes. This has raised new technical demands, with the logistics involved in the manufacture, transport, erection and maintenance of offshore multi-megawatt turbines presenting a severe challenge. Offshore wind turbines must be firmly positioned on the sea bed by using one of several foundation designs – steel monopoles driven deep into the sub-soil, gravity-based concrete caissons or tripod supports. Many kilometers of cables have to be laid both between individual turbines in an array and then back to shore to feed the electricity output into the grid. Since turbine
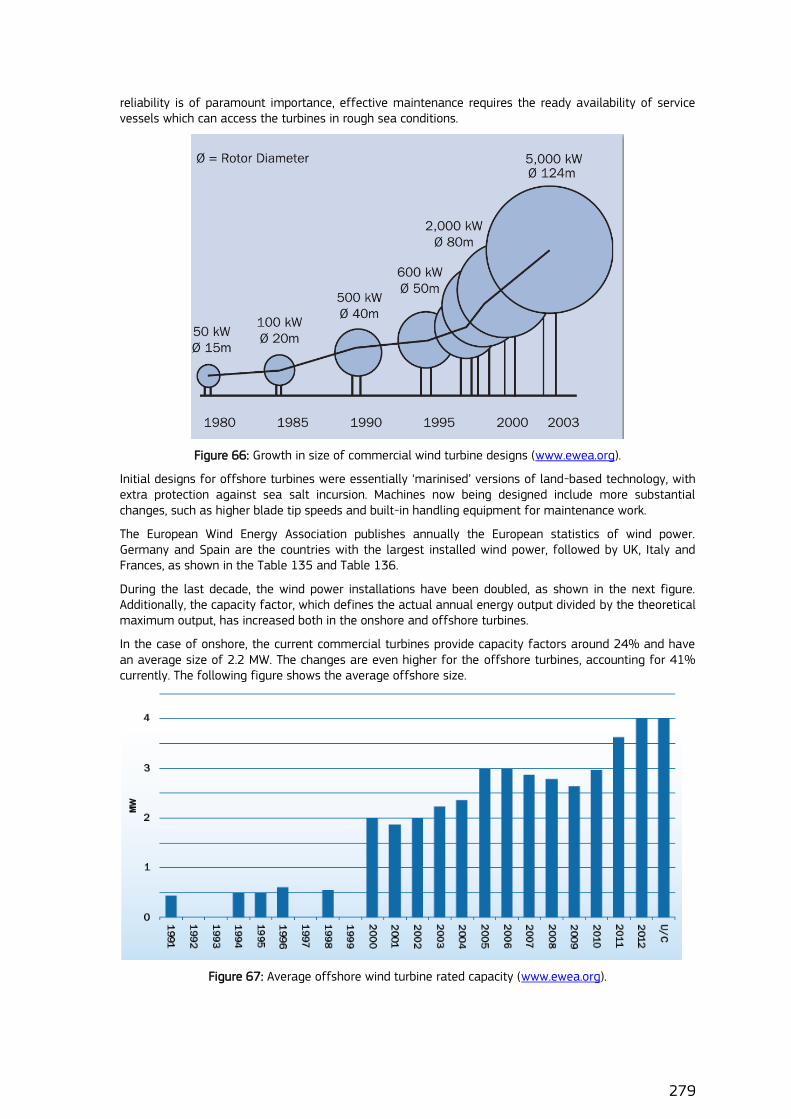
279
reliability is of paramount importance, effective maintenance requires the ready availability of service vessels which can access the turbines in rough sea conditions.
Figure 66: Growth in size of commercial wind turbine designs (www.ewea.org).
Initial designs for offshore turbines were essentially „marinised‟ versions of land-based technology, with extra protection against sea salt incursion. Machines now being designed include more substantial changes, such as higher blade tip speeds and built-in handling equipment for maintenance work.
The European Wind Energy Association publishes annually the European statistics of wind power. Germany and Spain are the countries with the largest installed wind power, followed by UK, Italy and Frances, as shown in the Table 135 and Table 136.
During the last decade, the wind power installations have been doubled, as shown in the next figure. Additionally, the capacity factor, which defines the actual annual energy output divided by the theoretical maximum output, has increased both in the onshore and offshore turbines.
In the case of onshore, the current commercial turbines provide capacity factors around 24% and have an average size of 2.2 MW. The changes are even higher for the offshore turbines, accounting for 41% currently. The following figure shows the average offshore size.
Figure 67: Average offshore wind turbine rated capacity (www.ewea.org).
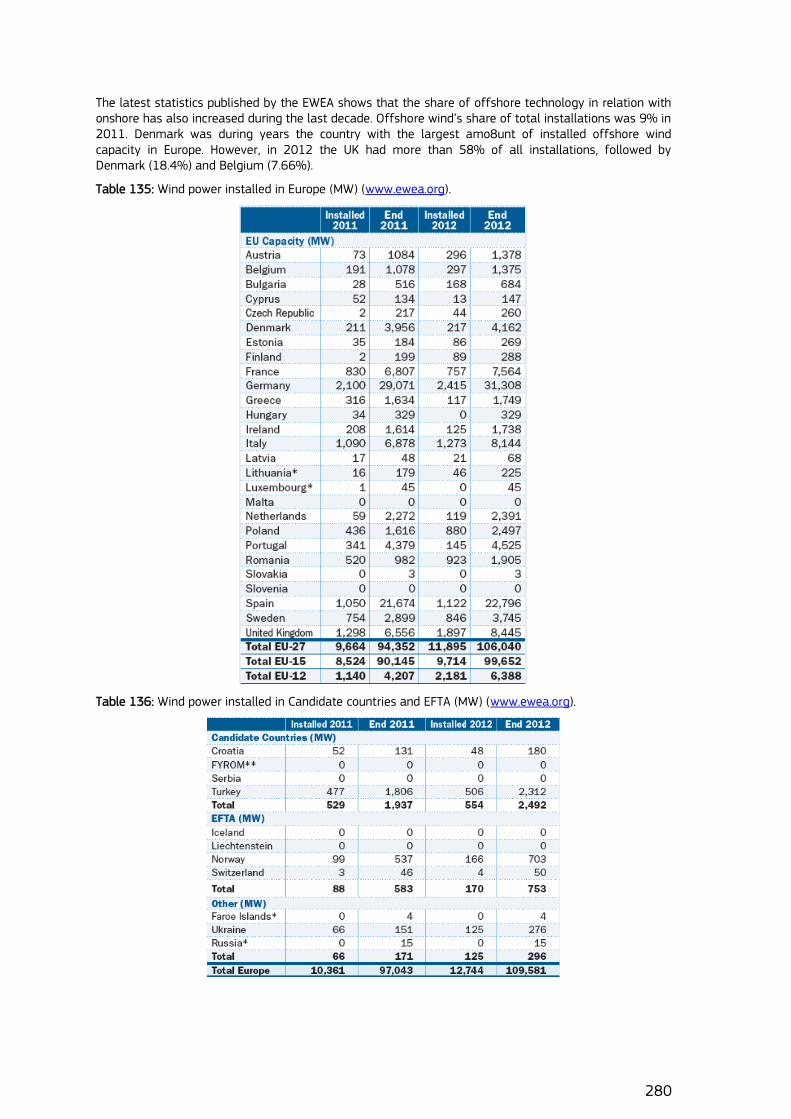
280
The latest statistics published by the EWEA shows that the share of offshore technology in relation with onshore has also increased during the last decade. Offshore wind‟s share of total installations was 9% in 2011. Denmark was during years the country with the largest amo8unt of installed offshore wind capacity in Europe. However, in 2012 the UK had more than 58% of all installations, followed by Denmark (18.4%) and Belgium (7.66%).
Table 135: Wind power installed in Europe (MW) (www.ewea.org).
Table 136: Wind power installed in Candidate countries and EFTA (MW) (www.ewea.org).
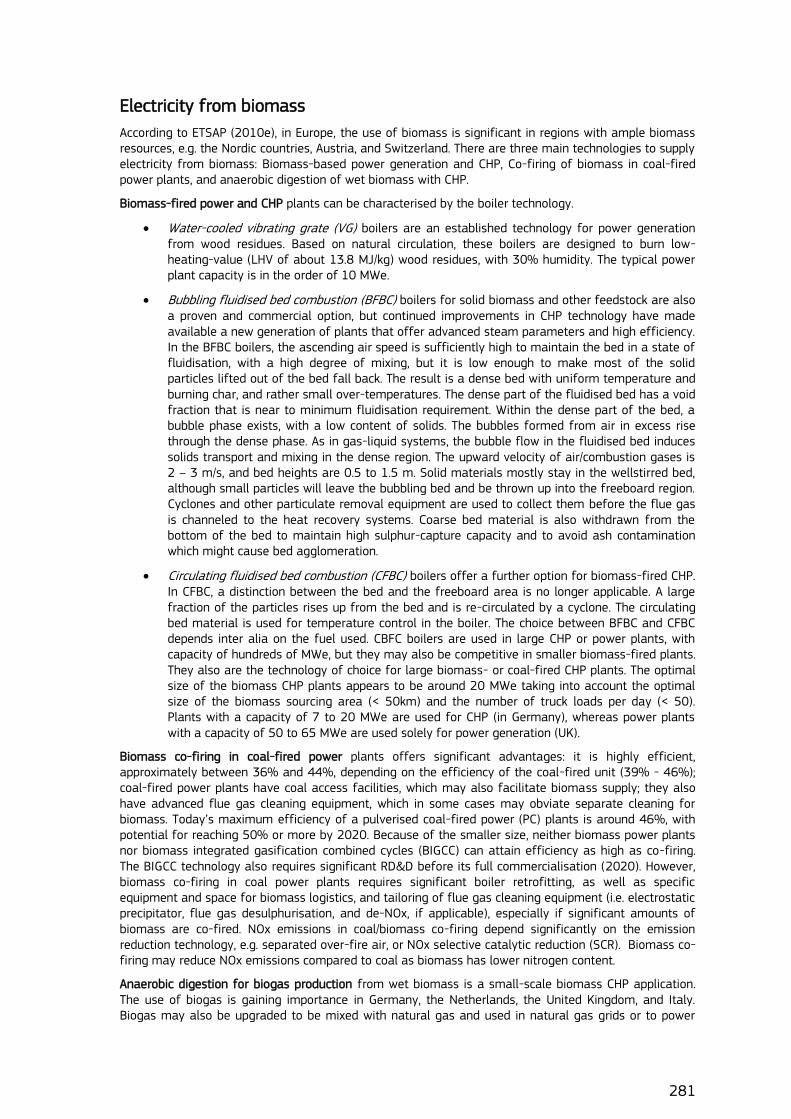
281
Electricity from biomass
According to ETSAP (2010e), in Europe, the use of biomass is significant in regions with ample biomass resources, e.g. the Nordic countries, Austria, and Switzerland. There are three main technologies to supply electricity from biomass: Biomass-based power generation and CHP, Co-firing of biomass in coal-fired power plants, and anaerobic digestion of wet biomass with CHP.
Biomass-fired power and CHP plants can be characterised by the boiler technology.
Water-cooled vibrating grate (VG) boilers are an established technology for power generation from wood residues. Based on natural circulation, these boilers are designed to burn low-heating-value (LHV of about 13.8 MJ/kg) wood residues, with 30% humidity. The typical power plant capacity is in the order of 10 MWe.
Bubbling fluidised bed combustion (BFBC) boilers for solid biomass and other feedstock are also a proven and commercial option, but continued improvements in CHP technology have made available a new generation of plants that offer advanced steam parameters and high efficiency. In the BFBC boilers, the ascending air speed is sufficiently high to maintain the bed in a state of fluidisation, with a high degree of mixing, but it is low enough to make most of the solid particles lifted out of the bed fall back. The result is a dense bed with uniform temperature and burning char, and rather small over-temperatures. The dense part of the fluidised bed has a void fraction that is near to minimum fluidisation requirement. Within the dense part of the bed, a bubble phase exists, with a low content of solids. The bubbles formed from air in excess rise through the dense phase. As in gas-liquid systems, the bubble flow in the fluidised bed induces solids transport and mixing in the dense region. The upward velocity of air/combustion gases is 2 – 3 m/s, and bed heights are 0.5 to 1.5 m. Solid materials mostly stay in the wellstirred bed, although small particles will leave the bubbling bed and be thrown up into the freeboard region. Cyclones and other particulate removal equipment are used to collect them before the flue gas is channeled to the heat recovery systems. Coarse bed material is also withdrawn from the bottom of the bed to maintain high sulphur-capture capacity and to avoid ash contamination which might cause bed agglomeration.
Circulating fluidised bed combustion (CFBC) boilers offer a further option for biomass-fired CHP. In CFBC, a distinction between the bed and the freeboard area is no longer applicable. A large fraction of the particles rises up from the bed and is re-circulated by a cyclone. The circulating bed material is used for temperature control in the boiler. The choice between BFBC and CFBC depends inter alia on the fuel used. CBFC boilers are used in large CHP or power plants, with capacity of hundreds of MWe, but they may also be competitive in smaller biomass-fired plants. They also are the technology of choice for large biomass- or coal-fired CHP plants. The optimal size of the biomass CHP plants appears to be around 20 MWe taking into account the optimal size of the biomass sourcing area (< 50km) and the number of truck loads per day (< 50). Plants with a capacity of 7 to 20 MWe are used for CHP (in Germany), whereas power plants with a capacity of 50 to 65 MWe are used solely for power generation (UK).
Biomass co-firing in coal-fired power plants offers significant advantages: it is highly efficient, approximately between 36% and 44%, depending on the efficiency of the coal-fired unit (39% - 46%); coal-fired power plants have coal access facilities, which may also facilitate biomass supply; they also have advanced flue gas cleaning equipment, which in some cases may obviate separate cleaning for biomass. Today‟s maximum efficiency of a pulverised coal-fired power (PC) plants is around 46%, with potential for reaching 50% or more by 2020. Because of the smaller size, neither biomass power plants nor biomass integrated gasification combined cycles (BIGCC) can attain efficiency as high as co-firing. The BIGCC technology also requires significant RD&D before its full commercialisation (2020). However, biomass co-firing in coal power plants requires significant boiler retrofitting, as well as specific equipment and space for biomass logistics, and tailoring of flue gas cleaning equipment (i.e. electrostatic precipitator, flue gas desulphurisation, and de-NOx, if applicable), especially if significant amounts of biomass are co-fired. NOx emissions in coal/biomass co-firing depend significantly on the emission reduction technology, e.g. separated over-fire air, or NOx selective catalytic reduction (SCR). Biomass co-firing may reduce NOx emissions compared to coal as biomass has lower nitrogen content.
Anaerobic digestion for biogas production from wet biomass is a small-scale biomass CHP application. The use of biogas is gaining importance in Germany, the Netherlands, the United Kingdom, and Italy. Biogas may also be upgraded to be mixed with natural gas and used in natural gas grids or to power
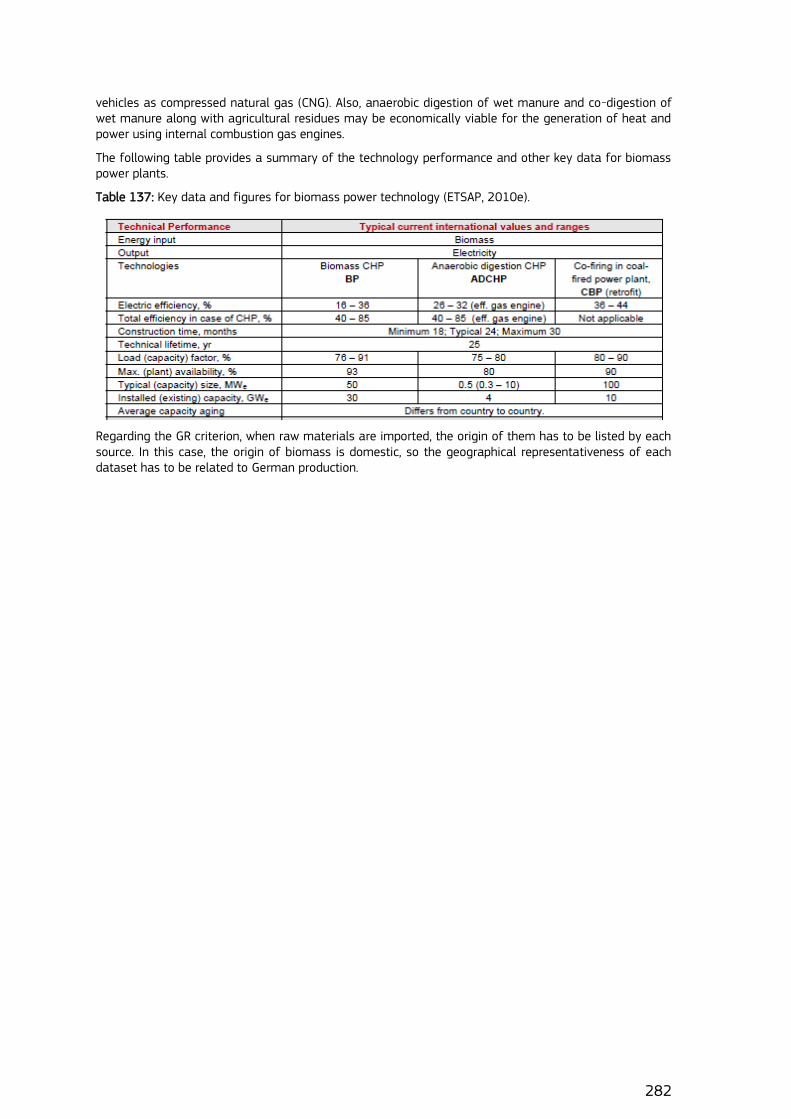
282
vehicles as compressed natural gas (CNG). Also, anaerobic digestion of wet manure and co-digestion of wet manure along with agricultural residues may be economically viable for the generation of heat and power using internal combustion gas engines.
The following table provides a summary of the technology performance and other key data for biomass power plants.
Table 137: Key data and figures for biomass power technology (ETSAP, 2010e).
Regarding the GR criterion, when raw materials are imported, the origin of them has to be listed by each source. In this case, the origin of biomass is domestic, so the geographical representativeness of each dataset has to be related to German production.
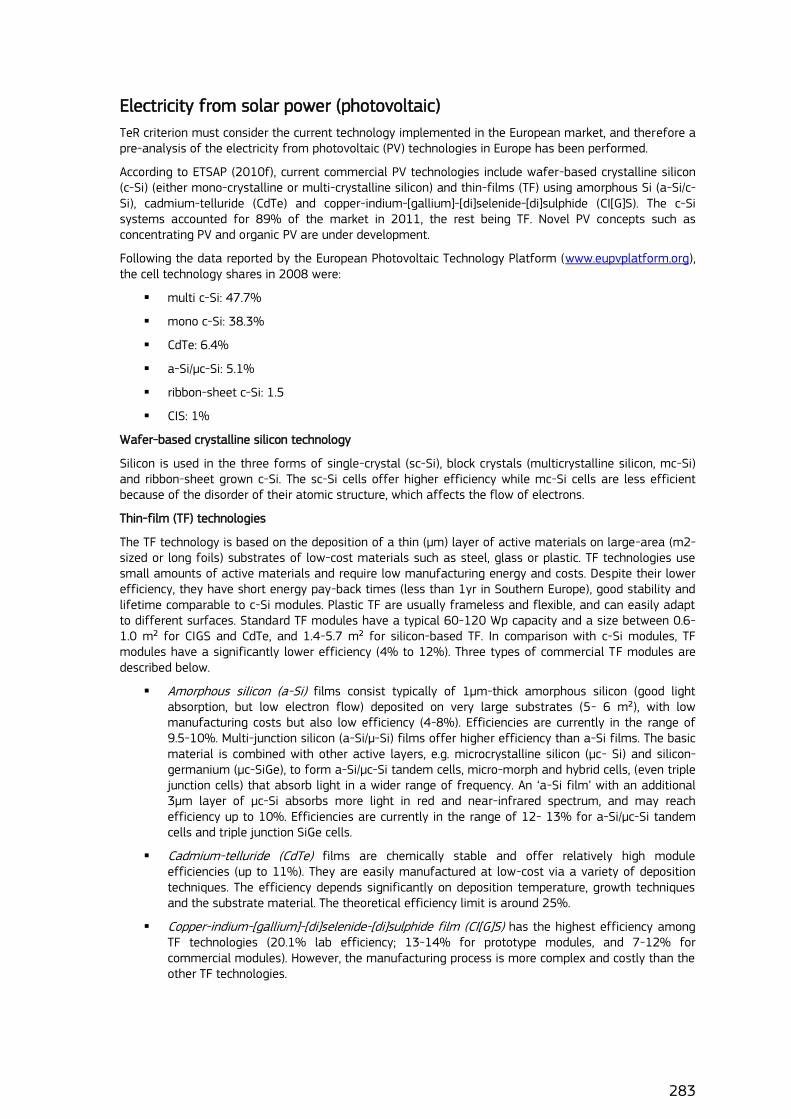
283
Electricity from solar power (photovoltaic)
TeR criterion must consider the current technology implemented in the European market, and therefore a pre-analysis of the electricity from photovoltaic (PV) technologies in Europe has been performed.
According to ETSAP (2010f), current commercial PV technologies include wafer-based crystalline silicon (c-Si) (either mono-crystalline or multi-crystalline silicon) and thin-films (TF) using amorphous Si (a-Si/c-Si), cadmium-telluride (CdTe) and copper-indium-[gallium]-[di]selenide-[di]sulphide (CI[G]S). The c-Si systems accounted for 89% of the market in 2011, the rest being TF. Novel PV concepts such as concentrating PV and organic PV are under development.
Following the data reported by the European Photovoltaic Technology Platform (www.eupvplatform.org), the cell technology shares in 2008 were:
multi c-Si: 47.7%
mono c-Si: 38.3%
CdTe: 6.4%
a-Si/μc-Si: 5.1%
ribbon-sheet c-Si: 1.5
CIS: 1%
Wafer-based crystalline silicon technology
Silicon is used in the three forms of single-crystal (sc-Si), block crystals (multicrystalline silicon, mc-Si) and ribbon-sheet grown c-Si. The sc-Si cells offer higher efficiency while mc-Si cells are less efficient because of the disorder of their atomic structure, which affects the flow of electrons.
Thin-film (TF) technologies
The TF technology is based on the deposition of a thin (μm) layer of active materials on large-area (m2-sized or long foils) substrates of low-cost materials such as steel, glass or plastic. TF technologies use small amounts of active materials and require low manufacturing energy and costs. Despite their lower efficiency, they have short energy pay-back times (less than 1yr in Southern Europe), good stability and lifetime comparable to c-Si modules. Plastic TF are usually frameless and flexible, and can easily adapt to different surfaces. Standard TF modules have a typical 60-120 Wp capacity and a size between 0.6-1.0 m² for CIGS and CdTe, and 1.4-5.7 m² for silicon-based TF. In comparison with c-Si modules, TF modules have a significantly lower efficiency (4% to 12%). Three types of commercial TF modules are described below.
Amorphous silicon (a-Si) films consist typically of 1μm-thick amorphous silicon (good light absorption, but low electron flow) deposited on very large substrates (5- 6 m²), with low manufacturing costs but also low efficiency (4-8%). Efficiencies are currently in the range of 9.5-10%. Multi-junction silicon (a-Si/μ-Si) films offer higher efficiency than a-Si films. The basic material is combined with other active layers, e.g. microcrystalline silicon (μc- Si) and silicon-germanium (μc-SiGe), to form a-Si/μc-Si tandem cells, micro-morph and hybrid cells, (even triple junction cells) that absorb light in a wider range of frequency. An „a-Si film‟ with an additional 3μm layer of μc-Si absorbs more light in red and near-infrared spectrum, and may reach efficiency up to 10%. Efficiencies are currently in the range of 12- 13% for a-Si/μc-Si tandem cells and triple junction SiGe cells.
Cadmium-telluride (CdTe) films are chemically stable and offer relatively high module efficiencies (up to 11%). They are easily manufactured at low-cost via a variety of deposition techniques. The efficiency depends significantly on deposition temperature, growth techniques and the substrate material. The theoretical efficiency limit is around 25%.
Copper-indium-[gallium]-[di]selenide-[di]sulphide film (CI[G]S) has the highest efficiency among TF technologies (20.1% lab efficiency; 13-14% for prototype modules, and 7-12% for commercial modules). However, the manufacturing process is more complex and costly than the other TF technologies.
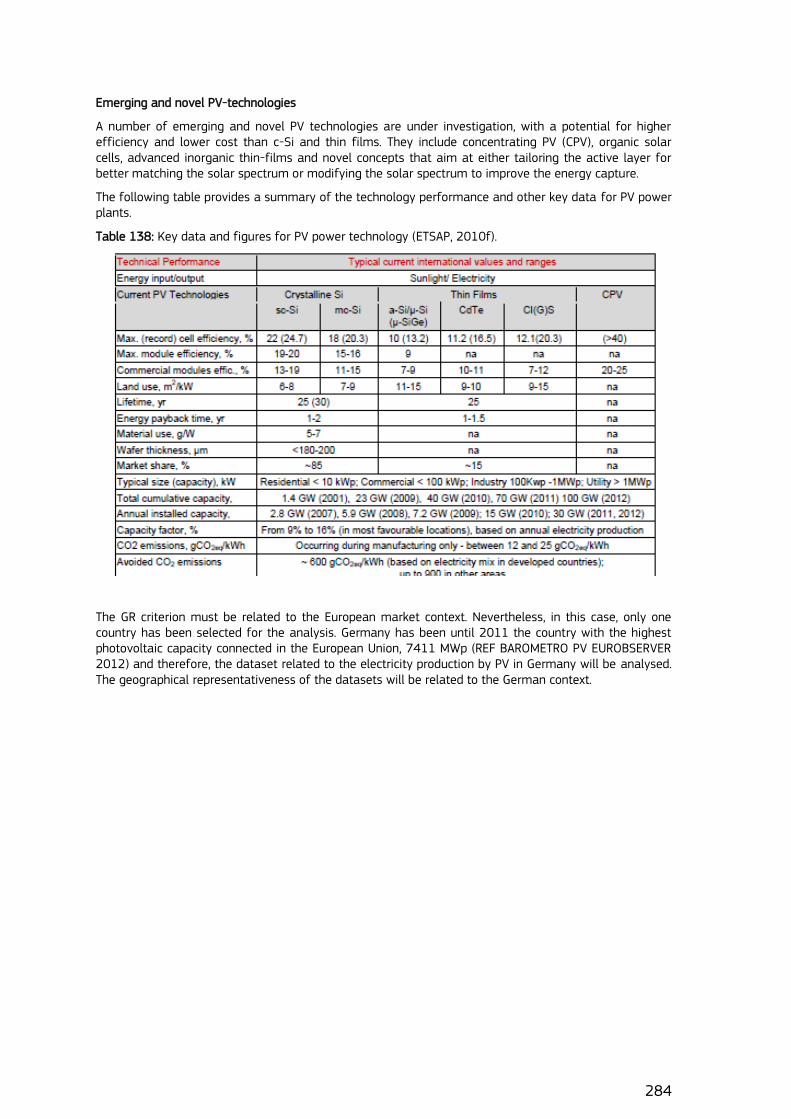
284
Emerging and novel PV-technologies
A number of emerging and novel PV technologies are under investigation, with a potential for higher efficiency and lower cost than c-Si and thin films. They include concentrating PV (CPV), organic solar cells, advanced inorganic thin-films and novel concepts that aim at either tailoring the active layer for better matching the solar spectrum or modifying the solar spectrum to improve the energy capture.
The following table provides a summary of the technology performance and other key data for PV power plants.
Table 138: Key data and figures for PV power technology (ETSAP, 2010f).
The GR criterion must be related to the European market context. Nevertheless, in this case, only one country has been selected for the analysis. Germany has been until 2011 the country with the highest photovoltaic capacity connected in the European Union, 7411 MWp (REF BAROMETRO PV EUROBSERVER 2012) and therefore, the dataset related to the electricity production by PV in Germany will be analysed. The geographical representativeness of the datasets will be related to the German context.
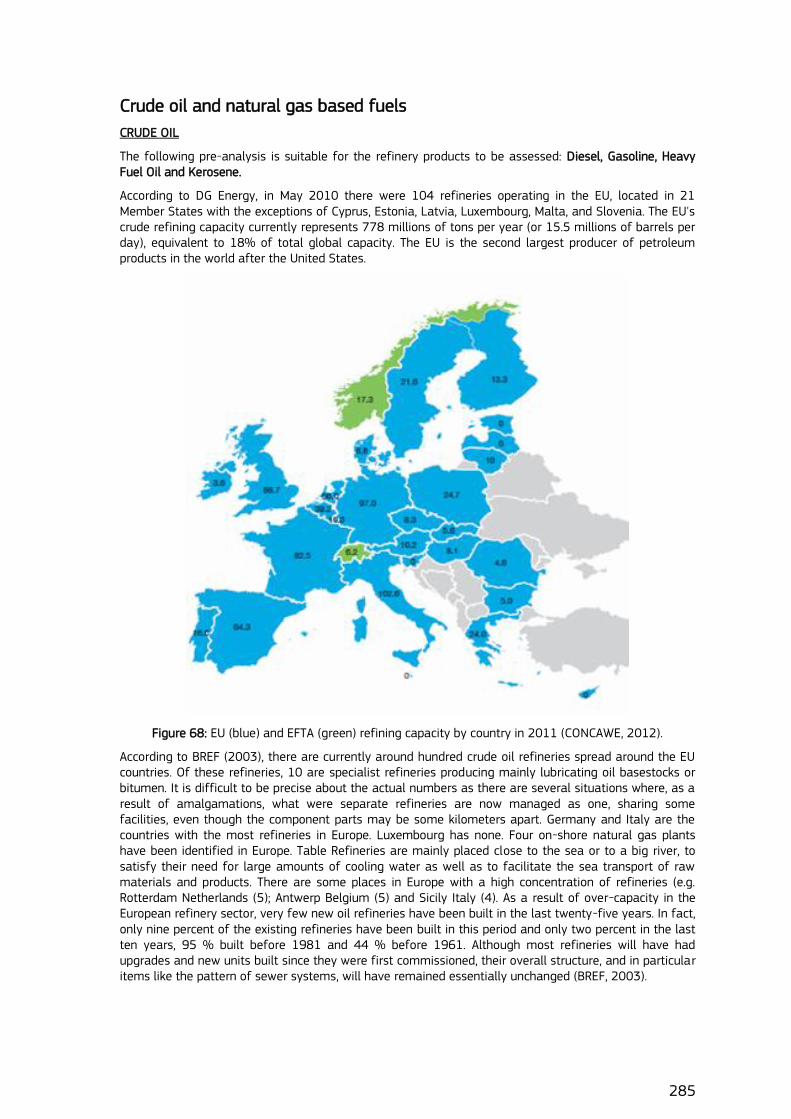
285
Crude oil and natural gas based fuels
CRUDE OIL
The following pre-analysis is suitable for the refinery products to be assessed: Diesel, Gasoline, Heavy Fuel Oil and Kerosene.
According to DG Energy, in May 2010 there were 104 refineries operating in the EU, located in 21 Member States with the exceptions of Cyprus, Estonia, Latvia, Luxembourg, Malta, and Slovenia. The EU's crude refining capacity currently represents 778 millions of tons per year (or 15.5 millions of barrels per day), equivalent to 18% of total global capacity. The EU is the second largest producer of petroleum products in the world after the United States.
Figure 68: EU (blue) and EFTA (green) refining capacity by country in 2011 (CONCAWE, 2012).
According to BREF (2003), there are currently around hundred crude oil refineries spread around the EU countries. Of these refineries, 10 are specialist refineries producing mainly lubricating oil basestocks or bitumen. It is difficult to be precise about the actual numbers as there are several situations where, as a result of amalgamations, what were separate refineries are now managed as one, sharing some facilities, even though the component parts may be some kilometers apart. Germany and Italy are the countries with the most refineries in Europe. Luxembourg has none. Four on-shore natural gas plants have been identified in Europe. Table Refineries are mainly placed close to the sea or to a big river, to satisfy their need for large amounts of cooling water as well as to facilitate the sea transport of raw materials and products. There are some places in Europe with a high concentration of refineries (e.g. Rotterdam Netherlands (5); Antwerp Belgium (5) and Sicily Italy (4). As a result of over-capacity in the European refinery sector, very few new oil refineries have been built in the last twenty-five years. In fact, only nine percent of the existing refineries have been built in this period and only two percent in the last ten years, 95 % built before 1981 and 44 % before 1961. Although most refineries will have had upgrades and new units built since they were first commissioned, their overall structure, and in particular items like the pattern of sewer systems, will have remained essentially unchanged (BREF, 2003).
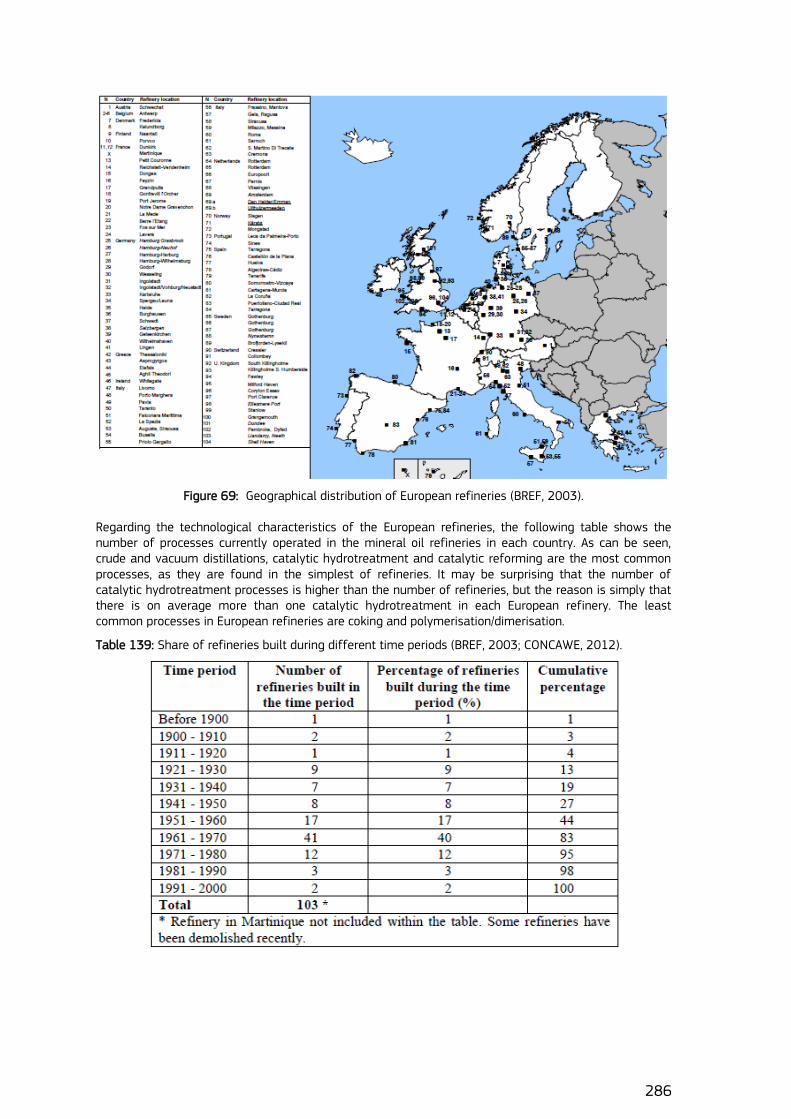
286
Figure 69: Geographical distribution of European refineries (BREF, 2003). Regarding the technological characteristics of the European refineries, the following table shows the number of processes currently operated in the mineral oil refineries in each country. As can be seen, crude and vacuum distillations, catalytic hydrotreatment and catalytic reforming are the most common processes, as they are found in the simplest of refineries. It may be surprising that the number of catalytic hydrotreatment processes is higher than the number of refineries, but the reason is simply that there is on average more than one catalytic hydrotreatment in each European refinery. The least common processes in European refineries are coking and polymerisation/dimerisation.
Table 139: Share of refineries built during different time periods (BREF, 2003; CONCAWE, 2012).
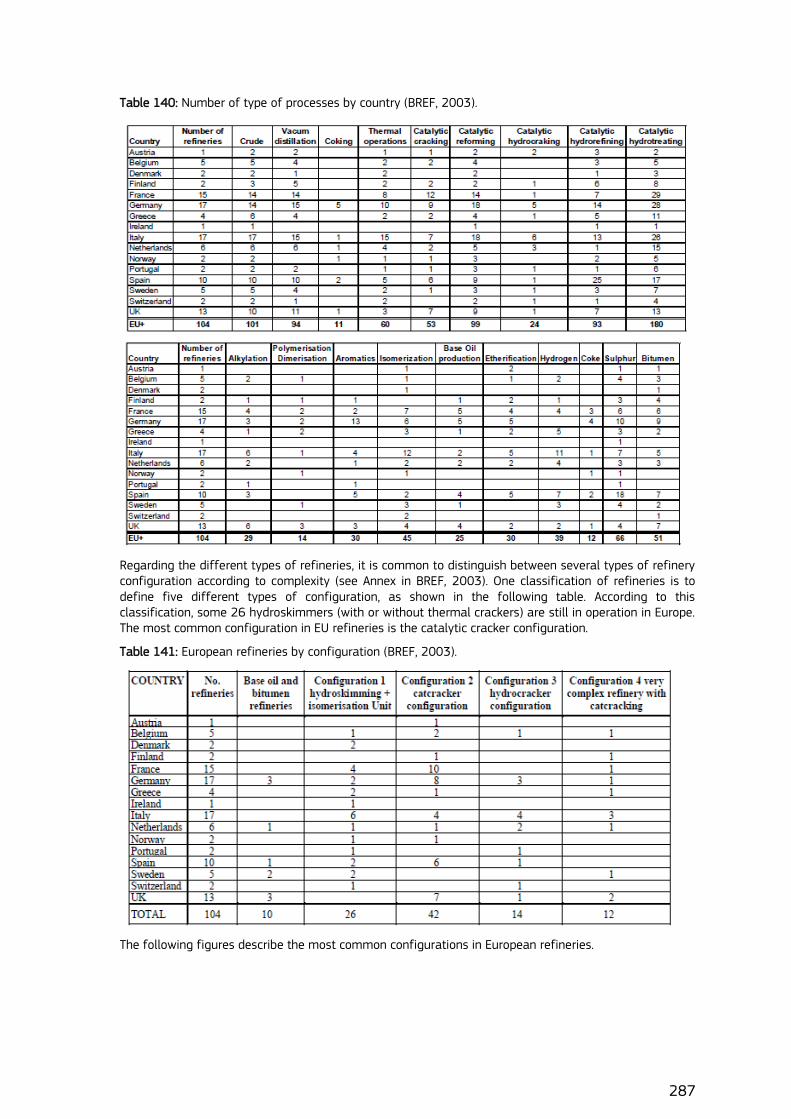
287
Table 140: Number of type of processes by country (BREF, 2003).
Regarding the different types of refineries, it is common to distinguish between several types of refinery configuration according to complexity (see Annex in BREF, 2003). One classification of refineries is to define five different types of configuration, as shown in the following table. According to this classification, some 26 hydroskimmers (with or without thermal crackers) are still in operation in Europe. The most common configuration in EU refineries is the catalytic cracker configuration.
Table 141: European refineries by configuration (BREF, 2003).
The following figures describe the most common configurations in European refineries.
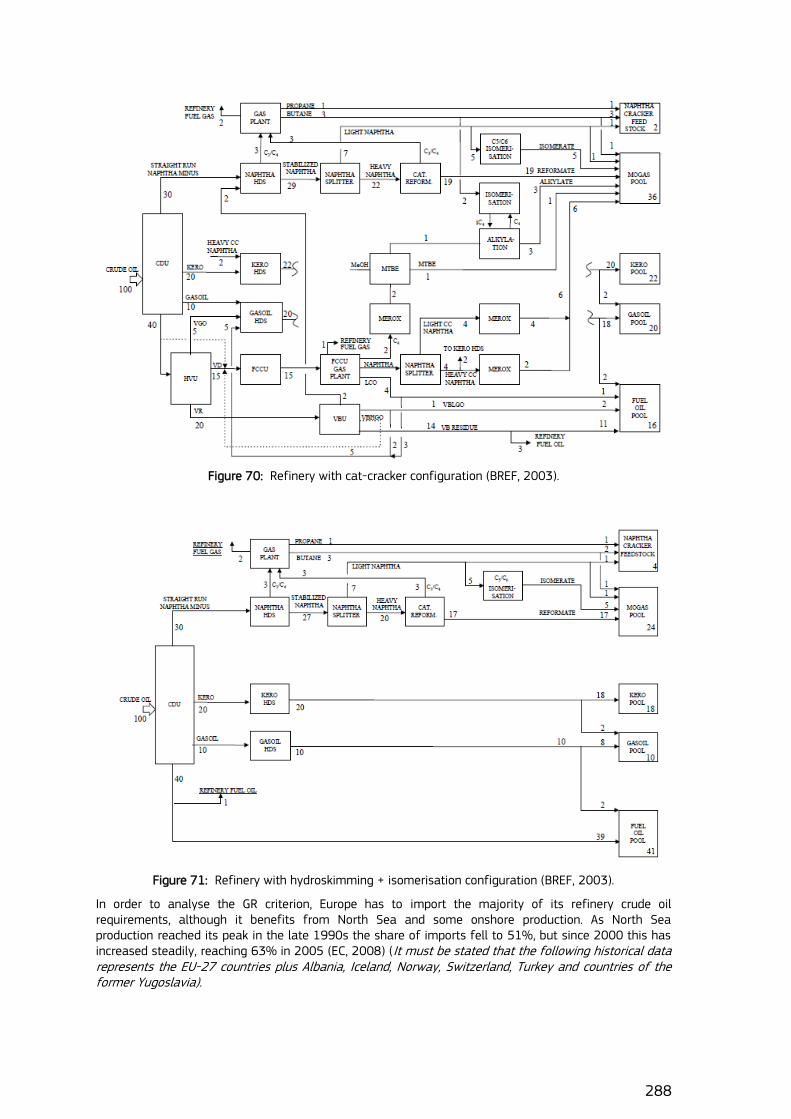
288
Figure 70: Refinery with cat-cracker configuration (BREF, 2003).
Figure 71: Refinery with hydroskimming + isomerisation configuration (BREF, 2003).
In order to analyse the GR criterion, Europe has to import the majority of its refinery crude oil requirements, although it benefits from North Sea and some onshore production. As North Sea production reached its peak in the late 1990s the share of imports fell to 51%, but since 2000 this has increased steadily, reaching 63% in 2005 (EC, 2008) (It must be stated that the following historical data represents the EU-27 countries plus Albania, Iceland, Norway, Switzerland, Turkey and countries of the former Yugoslavia).
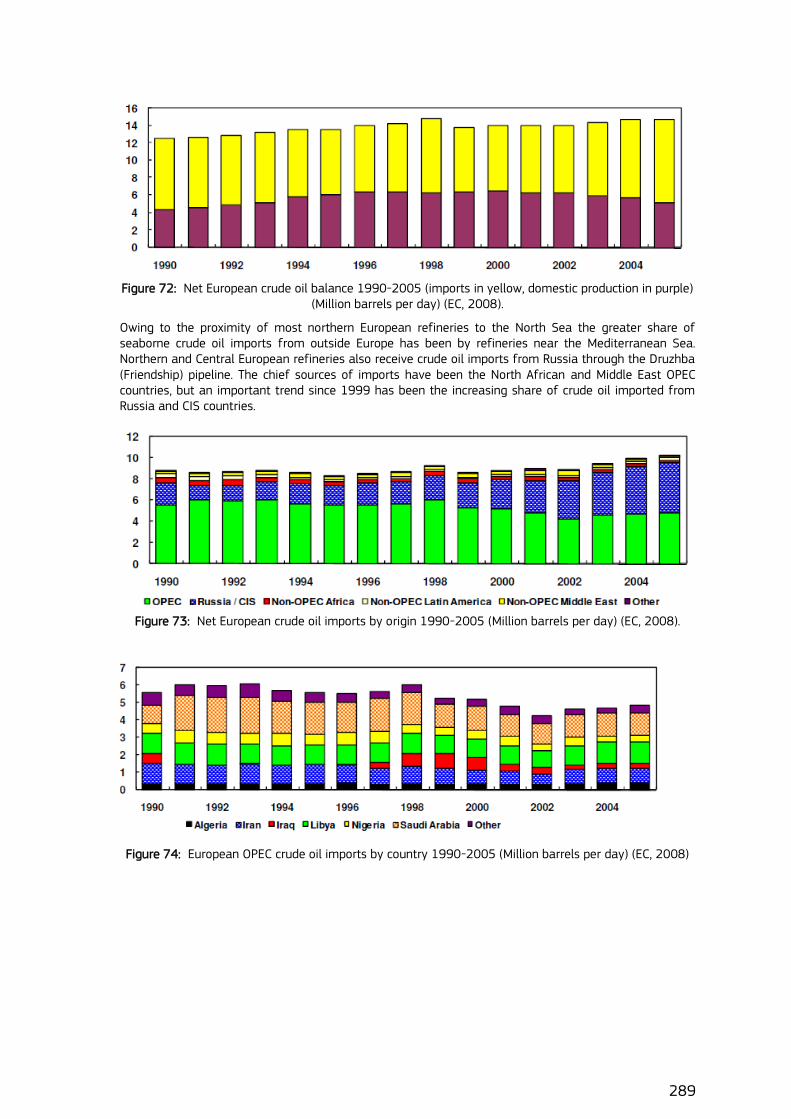
289
Figure 72: Net European crude oil balance 1990-2005 (imports in yellow, domestic production in purple) (Million barrels per day) (EC, 2008).
Owing to the proximity of most northern European refineries to the North Sea the greater share of seaborne crude oil imports from outside Europe has been by refineries near the Mediterranean Sea. Northern and Central European refineries also receive crude oil imports from Russia through the Druzhba (Friendship) pipeline. The chief sources of imports have been the North African and Middle East OPEC countries, but an important trend since 1999 has been the increasing share of crude oil imported from Russia and CIS countries.
Figure 73: Net European crude oil imports by origin 1990-2005 (Million barrels per day) (EC, 2008).
Figure 74: European OPEC crude oil imports by country 1990-2005 (Million barrels per day) (EC, 2008)
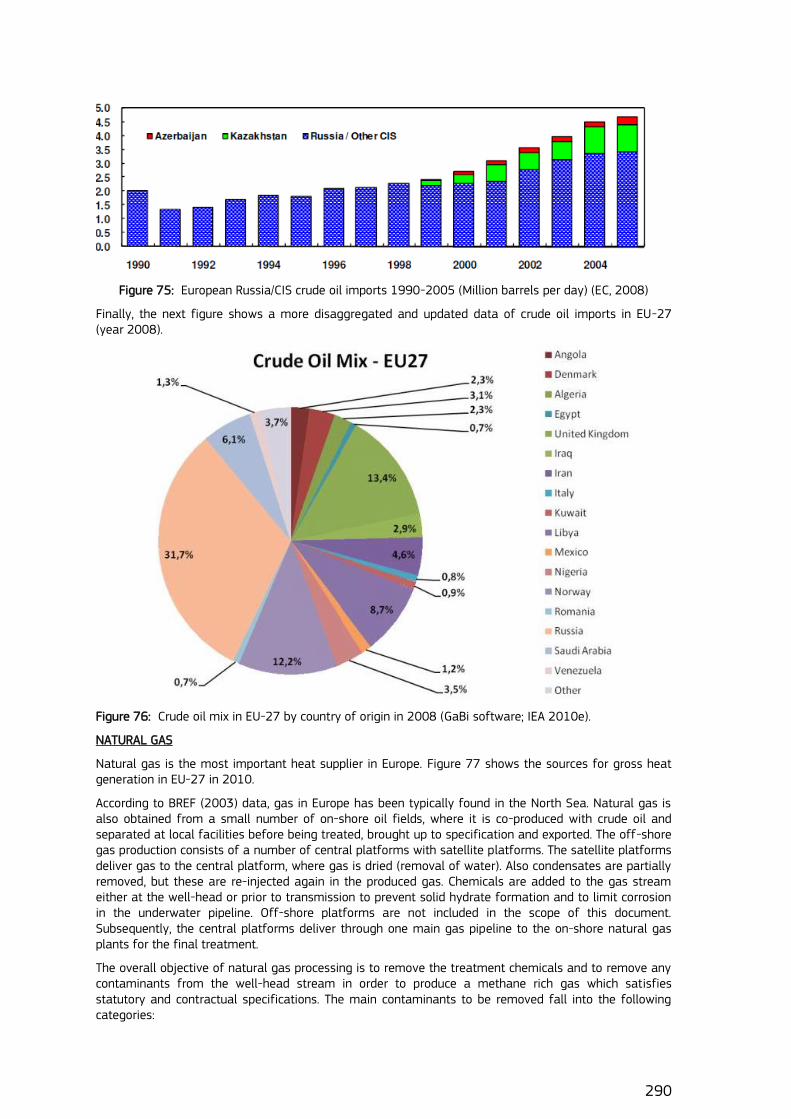
290
Figure 75: European Russia/CIS crude oil imports 1990-2005 (Million barrels per day) (EC, 2008)
Finally, the next figure shows a more disaggregated and updated data of crude oil imports in EU-27 (year 2008).
Figure 76: Crude oil mix in EU-27 by country of origin in 2008 (GaBi software; IEA 2010e).
NATURAL GAS
Natural gas is the most important heat supplier in Europe. Figure 77 shows the sources for gross heat generation in EU-27 in 2010.
According to BREF (2003) data, gas in Europe has been typically found in the North Sea. Natural gas is also obtained from a small number of on-shore oil fields, where it is co-produced with crude oil and separated at local facilities before being treated, brought up to specification and exported. The off-shore gas production consists of a number of central platforms with satellite platforms. The satellite platforms deliver gas to the central platform, where gas is dried (removal of water). Also condensates are partially removed, but these are re-injected again in the produced gas. Chemicals are added to the gas stream either at the well-head or prior to transmission to prevent solid hydrate formation and to limit corrosion in the underwater pipeline. Off-shore platforms are not included in the scope of this document. Subsequently, the central platforms deliver through one main gas pipeline to the on-shore natural gas plants for the final treatment.
The overall objective of natural gas processing is to remove the treatment chemicals and to remove any contaminants from the well-head stream in order to produce a methane rich gas which satisfies statutory and contractual specifications. The main contaminants to be removed fall into the following categories:
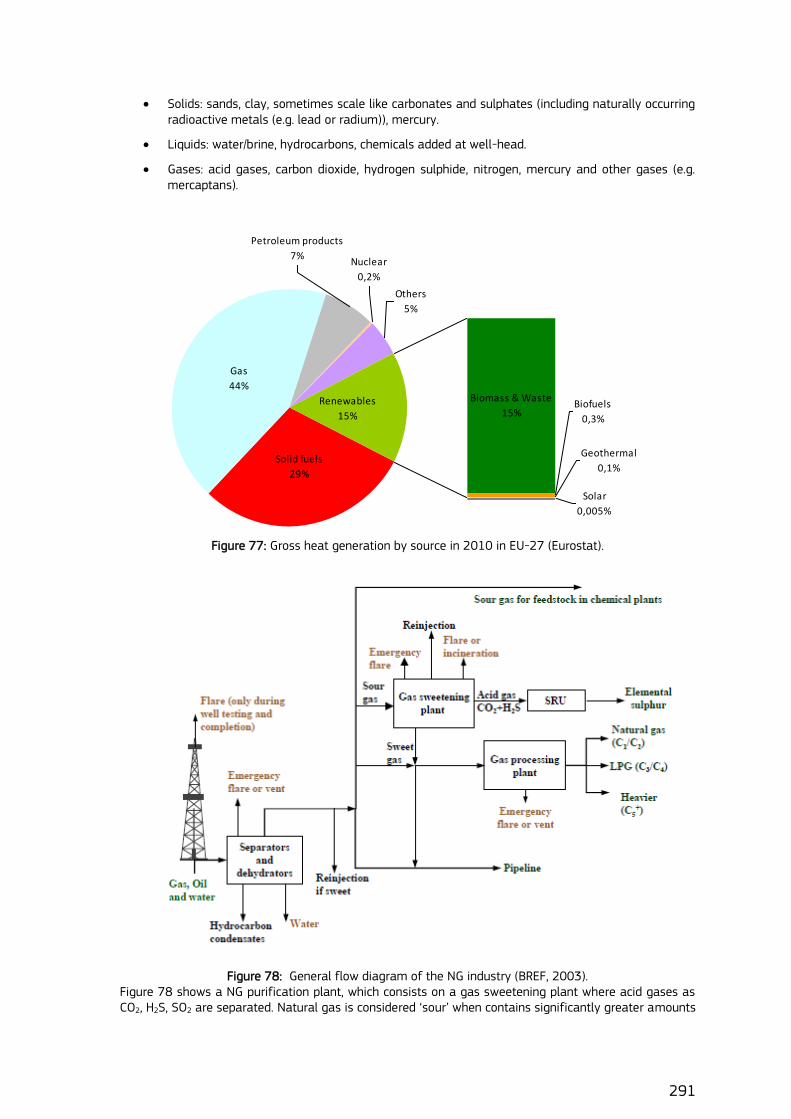
291
Solids: sands, clay, sometimes scale like carbonates and sulphates (including naturally occurring radioactive metals (e.g. lead or radium)), mercury.
Liquids: water/brine, hydrocarbons, chemicals added at well-head.
Gases: acid gases, carbon dioxide, hydrogen sulphide, nitrogen, mercury and other gases (e.g. mercaptans).
Figure 77: Gross heat generation by source in 2010 in EU-27 (Eurostat).
Figure 78: General flow diagram of the NG industry (BREF, 2003). Figure 78 shows a NG purification plant, which consists on a gas sweetening plant where acid gases as CO2, H2S, SO2 are separated. Natural gas is considered „sour‟ when contains significantly greater amounts
Gross heat generation
Solid fuels
29%
Gas
44%Biomass & Waste
15%Biofuels
0,3%
Geothermal
0,1%
Solar
0,005%
Others
5%
Nuclear
0,2%
Petroleum products
7%
Renewables
15%
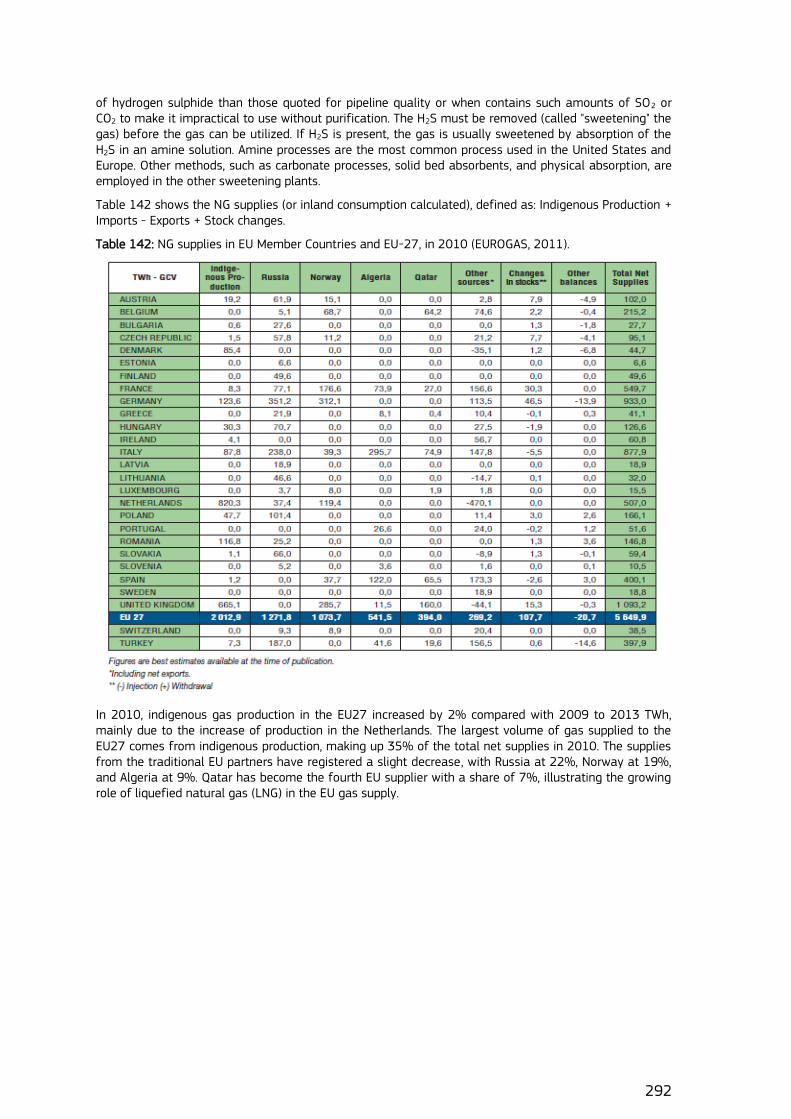
292
of hydrogen sulphide than those quoted for pipeline quality or when contains such amounts of SO2 or CO2 to make it impractical to use without purification. The H2S must be removed (called "sweetening" the gas) before the gas can be utilized. If H2S is present, the gas is usually sweetened by absorption of the H2S in an amine solution. Amine processes are the most common process used in the United States and Europe. Other methods, such as carbonate processes, solid bed absorbents, and physical absorption, are employed in the other sweetening plants.
Table 142 shows the NG supplies (or inland consumption calculated), defined as: Indigenous Production + Imports - Exports + Stock changes.
Table 142: NG supplies in EU Member Countries and EU-27, in 2010 (EUROGAS, 2011).
In 2010, indigenous gas production in the EU27 increased by 2% compared with 2009 to 2013 TWh, mainly due to the increase of production in the Netherlands. The largest volume of gas supplied to the EU27 comes from indigenous production, making up 35% of the total net supplies in 2010. The supplies from the traditional EU partners have registered a slight decrease, with Russia at 22%, Norway at 19%, and Algeria at 9%. Qatar has become the fourth EU supplier with a share of 7%, illustrating the growing role of liquefied natural gas (LNG) in the EU gas supply.
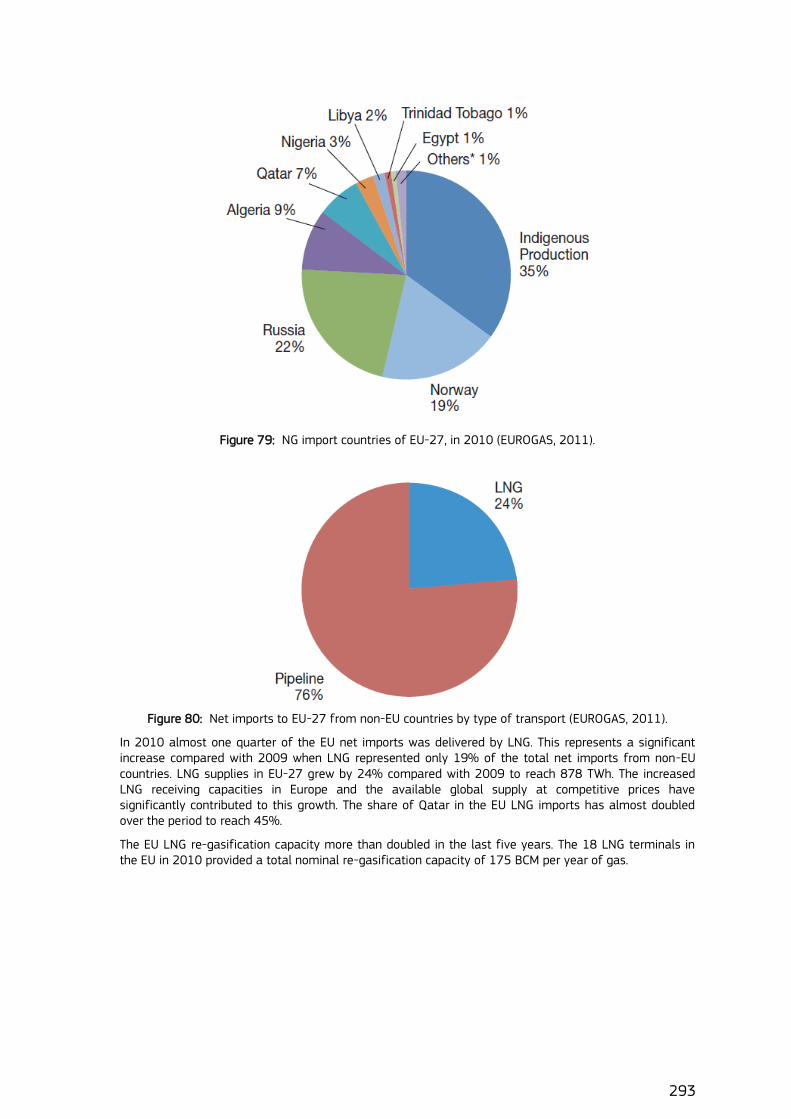
293
Figure 79: NG import countries of EU-27, in 2010 (EUROGAS, 2011).
Figure 80: Net imports to EU-27 from non-EU countries by type of transport (EUROGAS, 2011).
In 2010 almost one quarter of the EU net imports was delivered by LNG. This represents a significant increase compared with 2009 when LNG represented only 19% of the total net imports from non-EU countries. LNG supplies in EU-27 grew by 24% compared with 2009 to reach 878 TWh. The increased LNG receiving capacities in Europe and the available global supply at competitive prices have significantly contributed to this growth. The share of Qatar in the EU LNG imports has almost doubled over the period to reach 45%.
The EU LNG re-gasification capacity more than doubled in the last five years. The 18 LNG terminals in the EU in 2010 provided a total nominal re-gasification capacity of 175 BCM per year of gas.
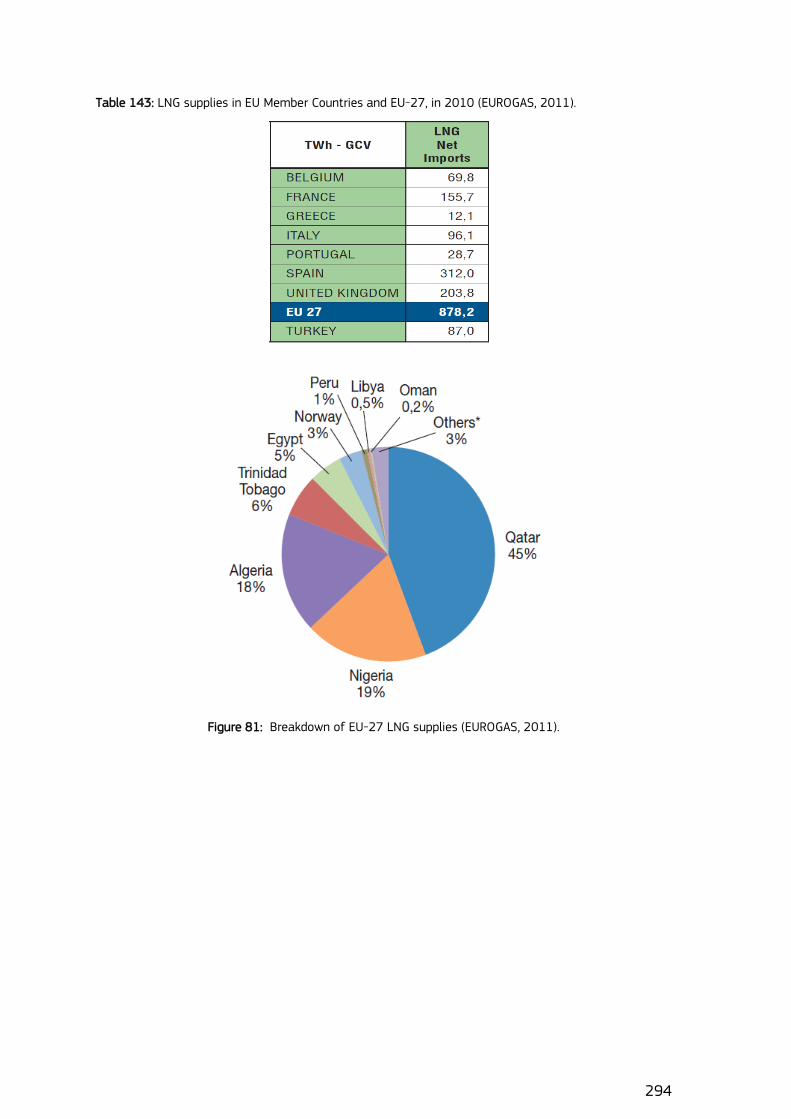
294
Table 143: LNG supplies in EU Member Countries and EU-27, in 2010 (EUROGAS, 2011).
Figure 81: Breakdown of EU-27 LNG supplies (EUROGAS, 2011).
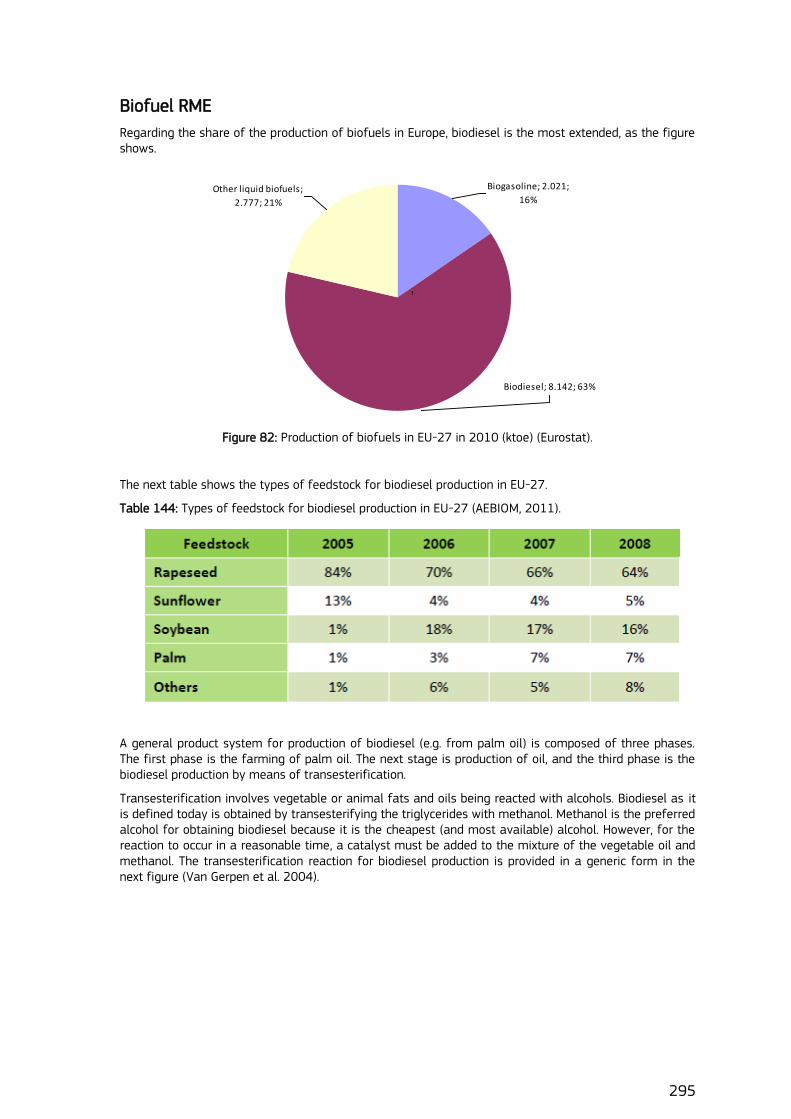
295
Biofuel RME
Regarding the share of the production of biofuels in Europe, biodiesel is the most extended, as the figure shows.
Figure 82: Production of biofuels in EU-27 in 2010 (ktoe) (Eurostat).
The next table shows the types of feedstock for biodiesel production in EU-27.
Table 144: Types of feedstock for biodiesel production in EU-27 (AEBIOM, 2011).
A general product system for production of biodiesel (e.g. from palm oil) is composed of three phases. The first phase is the farming of palm oil. The next stage is production of oil, and the third phase is the biodiesel production by means of transesterification.
Transesterification involves vegetable or animal fats and oils being reacted with alcohols. Biodiesel as it is defined today is obtained by transesterifying the triglycerides with methanol. Methanol is the preferred alcohol for obtaining biodiesel because it is the cheapest (and most available) alcohol. However, for the reaction to occur in a reasonable time, a catalyst must be added to the mixture of the vegetable oil and methanol. The transesterification reaction for biodiesel production is provided in a generic form in the next figure (Van Gerpen et al. 2004).
Primary production (ktoe)
Biodiesel; 8.142; 63%
Biogasoline; 2.021;
16%Other liquid biofuels;
2.777; 21%
,
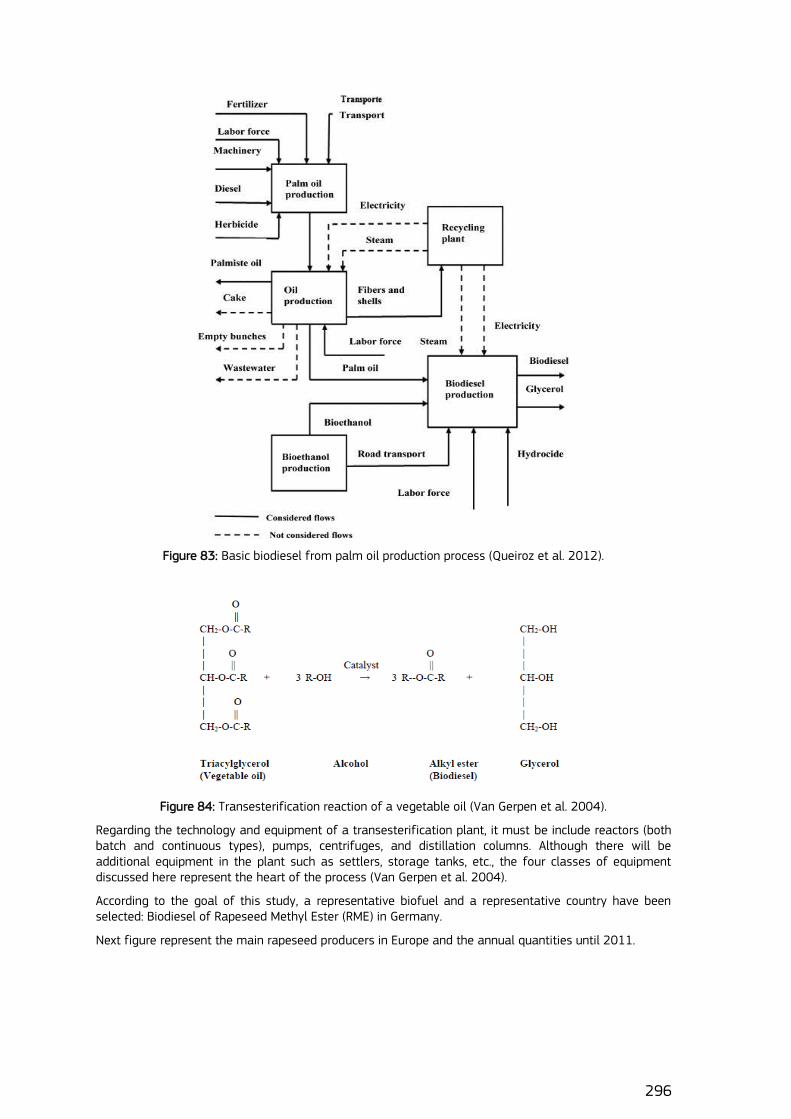
296
Figure 83: Basic biodiesel from palm oil production process (Queiroz et al. 2012).
Figure 84: Transesterification reaction of a vegetable oil (Van Gerpen et al. 2004).
Regarding the technology and equipment of a transesterification plant, it must be include reactors (both batch and continuous types), pumps, centrifuges, and distillation columns. Although there will be additional equipment in the plant such as settlers, storage tanks, etc., the four classes of equipment discussed here represent the heart of the process (Van Gerpen et al. 2004).
According to the goal of this study, a representative biofuel and a representative country have been selected: Biodiesel of Rapeseed Methyl Ester (RME) in Germany.
Next figure represent the main rapeseed producers in Europe and the annual quantities until 2011.
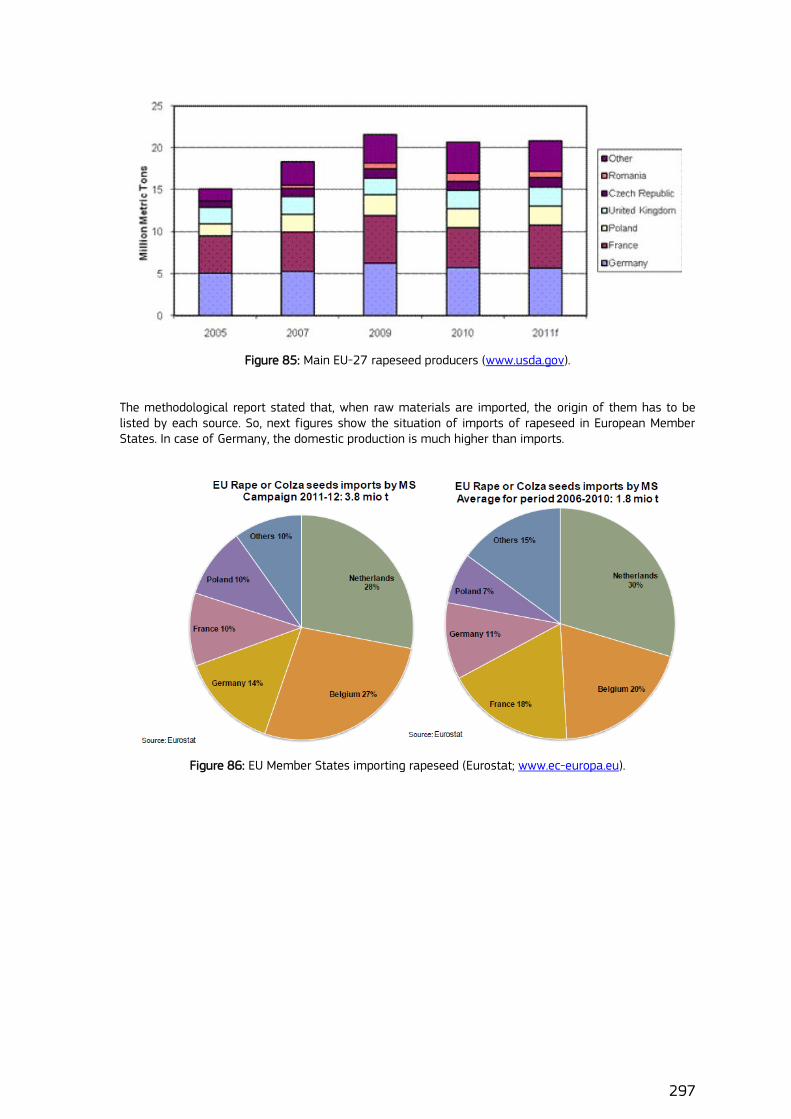
297
Figure 85: Main EU-27 rapeseed producers (www.usda.gov).
The methodological report stated that, when raw materials are imported, the origin of them has to be listed by each source. So, next figures show the situation of imports of rapeseed in European Member States. In case of Germany, the domestic production is much higher than imports.
Figure 86: EU Member States importing rapeseed (Eurostat; www.ec-europa.eu).
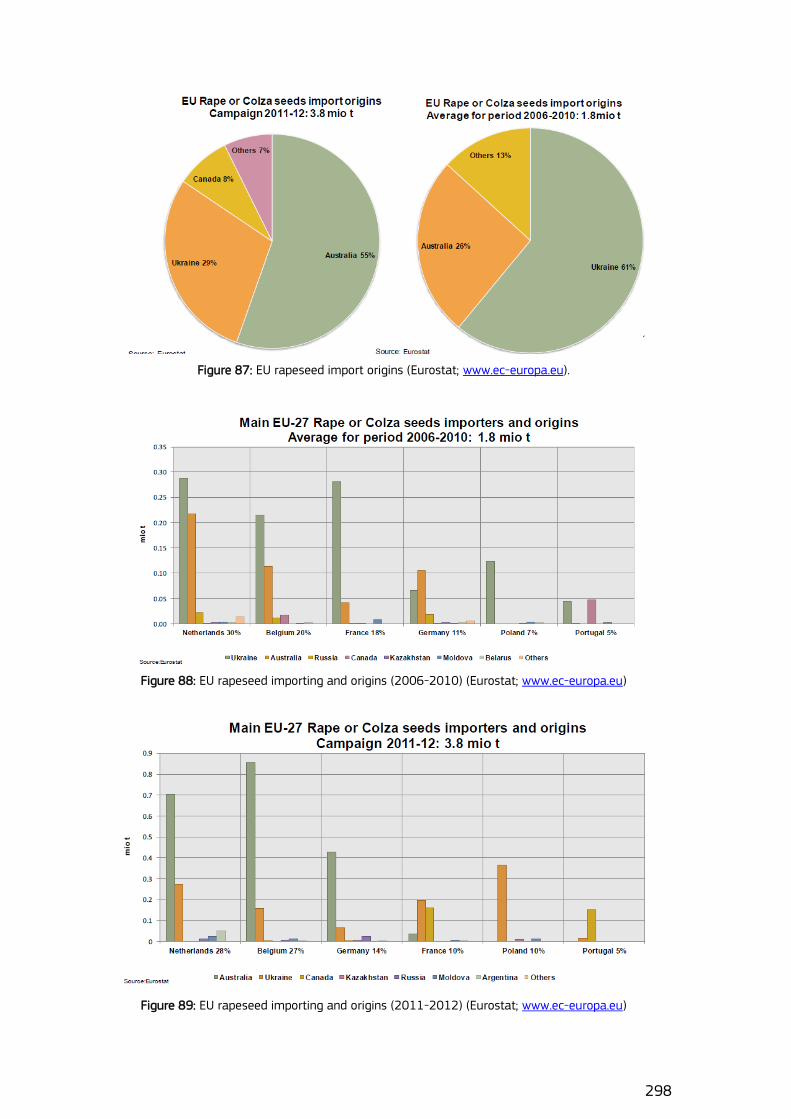
298
Figure 87: EU rapeseed import origins (Eurostat; www.ec-europa.eu).
Figure 88: EU rapeseed importing and origins (2006-2010) (Eurostat; www.ec-europa.eu)
Figure 89: EU rapeseed importing and origins (2011-2012) (Eurostat; www.ec-europa.eu)
299
Annex 2. Stakeholder‟s panel review A stakeholder‟s panel review was arranged in order to check and review the quality of the methodological report and the final findings and recommendations of study itself. This stakeholder panel was planned to be made up of members of analysed databases and members of the utilities/petrol/electricity industry associations.
The invitation to participate in the panel was sent to the following experts:
Uwe Albrecht, Managing Director Ludwig-Bölkow-Systemtechnik GmbH (LBST).
Gregor Wernet, Ecoinvent Executive Manager.
Chrsitian Bauer, Ecoinvent Center
Bo Weidema, Ecoinvent Chief Scientist.
Uwe Fritsche, GEMIS project manager.
Rolf Frischknecht, Managing Partner of ESU-services.
Gian Carlo Tosato, International Energy Agency (IEA) and Energy Technology Systems Analysis programme (ETSAP).
Margarita de Gregorio, Asociación de Productores de Energías Renovables (APPA).
María Romera Martínez, Asociación Española de la Industria Eléctrica (UNESA).
Martin Baitz, PE International.
The methodological report was reviewed by:
Uwe Albrecht, LBST.
Martin Baitz, PE International.
Michael Faltenbacher, PE International.
Thilo Kupfer, PE International.
Alexander Stoffregen, PE International.
Finally, the summary with findings and recommendations was reviewed by:
Oliver Schuller, PE International.
Michael Faltenbacher, PE International.
Thilo Kupfer, PE International.
Alexander Stoffregen, PE International.


European Commission EUR 26431 – Joint Research Centre – Institute for Environment and Sustainability Background analysis of energy data to be considered for the European Reference Life Cycle Database (ELCD) Authors: Simone Fazio, Fabrice Mathieux, Marco Recchioni, Daniel Garrain, Cristina de la Rùa, Yolanda Lechòn. Luxembourg: Publications Office of the European Union 2013 – 299 pp. – 21.0 x 29.7 cm EUR – Scientific and Technical Research series
ISBN 978-92-79-35071-9 ISSN 1831-9424 doi: 10.2788/5377
As the Commission’s in-house science service, the Joint Research Centre’s mission is to
provide EU policies with independent, evidence-based scientific and technical support
throughout the whole policy cycle.
Working in close cooperation with policy Directorates-General, the JRC addresses key societal
challenges while stimulating innovation through developing new standards, methods and tools,
and sharing and transferring its know-how to the Member States and international community.
Key policy areas include: environment and climate change; energy and transport; agriculture
and food security; health and consumer protection; information society and digital agenda;
safety and security including nuclear; all supported through a cross-cutting and multi-
disciplinary approach.
LB
-NA
-26431-E
N-N
ISBN 978-92-79-35071-9