Axons with highly branched terminal regions successfully regenerate across spinal midline...
19
Axons With Highly Branched Terminal Regions Successfully Regenerate Across Spinal Midline Transections in the Adult Cat Keith K. Fenrich * and P. Ken Rose CIHR Group in Sensory-Motor Systems, Department of Physiology, Center for Neuroscience, Queen’s University, Kingston, ON, Canada ABSTRACT We recently reported that some, but not all, axotomized propriospinal commissural interneurons (PCI) of the adult mammal can regenerate through spinal midsagit- tal transection injury sites (Fenrich and Rose [2009] J Neurosci 29:12145–12158). In this model, regenerating axons grow through a lesion site surrounded by a dense deposition of chondroitin sulfate proteoglycans (CSPG), which are typically inhibitory to regenerating axons. However, the mechanisms that lead some regen- erating axons to grow through spinal cord injury (SCI) sites while others remain trapped in the CSPG zones or retract to their soma remain unknown. As a first step toward elucidating these mechanisms, here we show that the ability of PCI axons to regenerate across a SCI site depends on the branching patterns of their distal terminals. Using 3D reconstruction techniques through multiple serial sections and immunohistochemical analy- ses, we found that at 7 days postinjury a majority of PCI axons terminated in CSPG zones ipsilateral of the spinal midline. Conversely, at 9 days postinjury some PCI axons had regenerated across the midline, but others terminated outside the CSPG zones near their soma. Furthermore, we show that the most successful regenerators were those with the most extensive branching patterns, whereas those that terminated out- side the CSPG zones had terminal regions indistinguish- able from dystrophic terminals. Our results demonstrate that the morphological characteristics of regenerating axons play an important role in their ability to regener- ate across SCI sites, and that the branching patterns of some regenerating axons are more extensive and have a far greater complexity than previously reported. J. Comp. Neurol. 519:3240–3258, 2011. V C 2011 Wiley-Liss, Inc. INDEXING TERMS: axon regeneration; spinal interneuron; spinal cord injury; chondroitin sulfate proteoglycans; growth cone; axon guidance Regenerating axons in the adult mammalian central nervous system (CNS) typically extend rapidly in intact nervous tissue (Davies et al., 1999), but often cannot cross traumatic injury sites (Ramon Y Cajal, 1959; Yiu and He, 2006). This switch from growing to growth-inhib- ited is coupled with a change in morphology of their distal tips. For instance, the axons of transplanted adult dorsal root ganglia (DRG) neurons typically follow a straight tra- jectory and have a small and streamlined terminal swel- ling while located within uninjured white matter (Davies et al., 1999). However, within spinal cord injury (SCI) sites, these terminal regions follow irregular paths and have swollen endballs (Davies et al., 1999). Similar mor- phologies have also been described for cut corticospinal axons within glial scars (Li and Raisman, 1994, 1995). Consistent with the terminal regions of regenerating axons, during development the morphologies of axonal growth cones vary depending on their local environment. For example, the terminals of developing axons projecting from the spinal cord to the periphery have filopodia and lamellipodia at nerve plexus regions or follow a circuitous path and have multiple branches and enlargements at muscle regions, but are small with few varicosities in spi- nal nerves (Tosney and Landmesser, 1985). Similarly, axon terminals growing across the CNS midline at the corpus callosum (Ozaki and Wahlsten, 1992; Halloran Grant sponsor: Canadian Institutes for Health Research; Grant number: MOP-79299; Grant sponsor: Trevor C. Holland Fellowship; Dr. Robert John Wilson Fellowship; Ontario Graduate Scholarship (all to K.K.F.). *CORRESPONDENCE TO: Keith K. Fenrich, PhD, Department of Physiology, Queen’s University, Kingston, ON, Canada, K7L 3N6. E-mail: [email protected] V C 2011 Wiley-Liss, Inc. Received August 23, 2010; Revised December 15, 2010; Accepted May 28, 2011 DOI 10.1002/cne.22686 Published online June 14, 2011 in Wiley Online Library (wileyonlinelibrary. com) 3240 The Journal of Comparative Neurology | Research in Systems Neuroscience 519:3240–3258 (2011) RESEARCH ARTICLE
Transcript of Axons with highly branched terminal regions successfully regenerate across spinal midline...
Axons With Highly Branched Terminal RegionsSuccessfully Regenerate Across Spinal MidlineTransections in the Adult Cat
Keith K. Fenrich* and P. Ken Rose
CIHR Group in Sensory-Motor Systems, Department of Physiology, Center for Neuroscience, Queen’s University, Kingston, ON, Canada
ABSTRACTWe recently reported that some, but not all, axotomized
propriospinal commissural interneurons (PCI) of the
adult mammal can regenerate through spinal midsagit-
tal transection injury sites (Fenrich and Rose [2009] J
Neurosci 29:12145–12158). In this model, regenerating
axons grow through a lesion site surrounded by a
dense deposition of chondroitin sulfate proteoglycans
(CSPG), which are typically inhibitory to regenerating
axons. However, the mechanisms that lead some regen-
erating axons to grow through spinal cord injury (SCI)
sites while others remain trapped in the CSPG zones or
retract to their soma remain unknown. As a first step
toward elucidating these mechanisms, here we show
that the ability of PCI axons to regenerate across a SCI
site depends on the branching patterns of their distal
terminals. Using 3D reconstruction techniques through
multiple serial sections and immunohistochemical analy-
ses, we found that at 7 days postinjury a majority of
PCI axons terminated in CSPG zones ipsilateral of the
spinal midline. Conversely, at 9 days postinjury some
PCI axons had regenerated across the midline, but
others terminated outside the CSPG zones near their
soma. Furthermore, we show that the most successful
regenerators were those with the most extensive
branching patterns, whereas those that terminated out-
side the CSPG zones had terminal regions indistinguish-
able from dystrophic terminals. Our results demonstrate
that the morphological characteristics of regenerating
axons play an important role in their ability to regener-
ate across SCI sites, and that the branching patterns of
some regenerating axons are more extensive and have
a far greater complexity than previously reported.
J. Comp. Neurol. 519:3240–3258, 2011.
VC 2011 Wiley-Liss, Inc.
INDEXING TERMS: axon regeneration; spinal interneuron; spinal cord injury; chondroitin sulfate proteoglycans; growth
cone; axon guidance
Regenerating axons in the adult mammalian central
nervous system (CNS) typically extend rapidly in intact
nervous tissue (Davies et al., 1999), but often cannot
cross traumatic injury sites (Ramon Y Cajal, 1959; Yiu
and He, 2006). This switch from growing to growth-inhib-
ited is coupled with a change in morphology of their distal
tips. For instance, the axons of transplanted adult dorsal
root ganglia (DRG) neurons typically follow a straight tra-
jectory and have a small and streamlined terminal swel-
ling while located within uninjured white matter (Davies
et al., 1999). However, within spinal cord injury (SCI)
sites, these terminal regions follow irregular paths and
have swollen endballs (Davies et al., 1999). Similar mor-
phologies have also been described for cut corticospinal
axons within glial scars (Li and Raisman, 1994, 1995).
Consistent with the terminal regions of regenerating
axons, during development the morphologies of axonal
growth cones vary depending on their local environment.
For example, the terminals of developing axons projecting
from the spinal cord to the periphery have filopodia and
lamellipodia at nerve plexus regions or follow a circuitous
path and have multiple branches and enlargements at
muscle regions, but are small with few varicosities in spi-
nal nerves (Tosney and Landmesser, 1985). Similarly,
axon terminals growing across the CNS midline at the
corpus callosum (Ozaki and Wahlsten, 1992; Halloran
Grant sponsor: Canadian Institutes for Health Research; Grant number:MOP-79299; Grant sponsor: Trevor C. Holland Fellowship; Dr. Robert JohnWilson Fellowship; Ontario Graduate Scholarship (all to K.K.F.).
*CORRESPONDENCE TO: Keith K. Fenrich, PhD, Department ofPhysiology, Queen’s University, Kingston, ON, Canada, K7L 3N6. E-mail:[email protected]
VC 2011 Wiley-Liss, Inc.
Received August 23, 2010; Revised December 15, 2010; Accepted May28, 2011
DOI 10.1002/cne.22686
Published online June 14, 2011 in Wiley Online Library (wileyonlinelibrary.com)
3240 The Journal of Comparative Neurology | Research in Systems Neuroscience 519:3240–3258 (2011)
RESEARCH ARTICLE
and Kalil, 1994) or optic chiasm (Mason and Wang, 1997)
have more branches and enlargements as they approach
and cross the midline compared to those that have al-
ready crossed, which are simple and flat.
Recent studies have shown that certain neurons in the
adult mammal can regenerate their cut axons through
SCI sites in the absence of therapeutic interventions. For
instance, Dray et al. (2009) found that mouse spinal DRG
axons can regenerate through pinprick SCIs. In addition,
we recently showed that axons of some axotomized pro-
priospinal commissural interneurons (PCI) can regenerate
through SCI sites in the adult cat (Fenrich and Rose,
2009). However, whether there are certain morphological
characteristics that distinguish between axons that cross
a lesion site and those that fail to cross a lesion site
remains unknown.
In the present study we used serial reconstruction
techniques to trace the path(s) taken by axons of individ-
ual PCIs after axotomy, from their origin at the soma to all
of their terminations. These reconstructions were used to
compare the morphological characteristics of axotomized
PCI axons and gauge their regenerative capacity. This
approach revealed that many axons form elaborate termi-
nal and preterminal arborizations whose full complexity
only became evident using serial reconstruction techni-
ques. The axons that had grown the furthest toward the
contralateral spinal cord had the most complex terminal
and preterminal arborizations. In contrast, the terminal
regions furthest from crossing the midline typically had
compact swollen terminals with multiple short protru-
sions and few arborizations. Our results suggest that the
branch-structure morphology of the terminal regions of
regenerating PCI axons is a key indicator of successful
penetration and navigation through SCI sites.
MATERIALS AND METHODS
SurgeriesAll surgical and animal care protocols for these experi-
ments were consistent with the guidelines established by
the Canadian Council of Animal Care and were approved
by the Queen’s University Animal Care Committee. These
experiments were performed on six adult cats (>10
months of age) weighing 2.8–3.5 kg. Animals were pre-
medicated with a cocktail of medetomidine (0.03 mg/
kg), ketamine (5.0 mg/kg), glycopyrrolate (0.005 mg/
kg), and hydromorphone (0.075 mg/kg) injected subcuta-
neously; deep anesthesia was maintained with either iso-
flurane (recovery experiments; 1–2%) or sodium pento-
barbital (terminal experiments; 10 mg/kg intravenously
[i.v.]; supplemental dosages, 5 mg/kg i.v.). The surgical
procedures, peripheral nerve stimulation protocols, and
postoperative care procedures have previously been
described (Fenrich et al., 2007; Fenrich and Rose, 2009).
Briefly, the animal’s head was placed in a stereotaxic
head-holder, the C2 and C3 vertebra were exposed and
the dorsal bone covering the C3 segment was removed.
The spinous process of the T2 or T3 vertebra was
exposed and the animal’s torso was further suspended
with spinal clamps attached to the exposed spinous pro-
cess. The nerves innervating the C3 biventer cervicis and
complexus (BCCM) muscles were isolated and mounted
on bipolar hook electrodes. The exposed dura was
resected and folded onto the lateral vertebral opening to
expose the dorsal surface of the C3 spinal cord.
Spinal midline transectionsThe spinal midline was located in two ways. First, we
identified the midline as a point equidistant from the
BCCM motoneuron nuclei located in the left and right
ventral horns. We recorded the field potentials of anti-
dromically activated BCCM motoneurons and found the
center of the motoneuron pool on both sides of the spinal
cord. The midpoint between these bilateral motoneuron
pools was considered the ‘‘ventral’’ midline. Second, we
removed the arachnoid and pia matter from the exposed
dorsal spinal cord. This served two purposes: first, to
reduce the amount of tissue drag and dimpling encoun-
tered during the lesion (see below); and second, to ex-
pose the dorsal median sulcus. The sulcus was used to
mark the ‘‘dorsal’’ midline of the spinal cord. In most
experiments the ventral and dorsal midpoints matched.
However, in two experiments the medial-lateral location
of the ventral and dorsal midlines did not match (�150–
200 lm difference), thus indicating that the spinal cord
was slightly twisted. In these cases the midpoint between
the dorsal and ventral midlines was considered the
midline.
Lesions were performed using specially modified dou-
ble-edged scalpel blades. These blades were mounted on
a microdrive attached to the stereotaxic frame. The lesion
protocol has previously been described in detail (Fenrich
et al., 2007; Fenrich and Rose, 2009). Briefly, the blade
was aligned with the spinal midline on the dorsal surface
of the spinal cord at the caudal edge of the planned lesion
site. The blade was lowered 2.5 mm into the spinal mid-
line and then retracted to the surface. The blade was
advanced rostrally 0.5 mm and the spinal midline was
pierced using the same procedure as at the previous loca-
tion. In previous studies (Fenrich et al., 2007; Fenrich and
Rose, 2009) we used advances of 0.75 mm. The shorter
intervals used in the present study reduced spinal com-
pression and resulted in more effective lesions. These
rostral advances and piercing movements were continued
to the rostral edge of the lesion, where the blade was low-
ered 2.5 mm. While the blade was still lowered 2.5 mm,
Morphology of regenerating interneuron axons
The Journal of Comparative Neurology | Research in Systems Neuroscience 3241

the blade was moved caudally then rostrally then caudally
the entire length of the lesion. From a depth of 2.5 mm
and starting at the caudal edge of the lesion, the piercing
and advancing procedure was repeated except the blade
was lowered until a 5-mm depth indicator on the blade
was no longer visible at the dorsal surface of the spinal
cord. Once the rostral edge of the lesion was reached,
the blade was lowered so that the 5-mm depth indicator
marked on the blade was no longer visible. The blade was
then moved caudally then rostrally then caudally the
entire length of the lesion and removed from the spinal
cord. We have previously shown that this lesion protocol
effectively cuts all axons that cross the midline through-
out the entire length of the lesion (Fenrich and Rose,
2009). All lesions for this study were between 4 mm and
6 mm in length. Postoperative pain was controlled with
burenorphine (0.005–0.01 mg/kg s.q., every 6 hours or
as required) and Metacam (1 drop oral, per day as
required).
Neurobiotin stainingAll terminal experiments were performed at 7 days or 9
days postlesion. In these experiments the dorsal verte-
brae were removed to expose the C1 to C5 spinal cord.
The animal was suspended from a stereotaxic frame and
the nerves innervating the left C3 and C4 BCCM, C2 and
C3 splenius, and trapezius muscles were mounted on
hook stimulating electrodes. At 7 days postlesion dense
scar tissue had developed on the dorsal surface of the
spinal cord at the SCI site. Attempts to advance glass
micropipettes through this tissue caused the micropip-
ettes to break. The scar tissue was therefore removed
using curved spring scissors (Fine Science Tools, North
Vancouver, BC, Canada). All animals were paralyzed with
gallamine triethiodide (Sigma, St. Louis, MO; 2.5–5 mg/
kg/hr i.v.) and ventilated using a respirator.
The Neurobiotin injection protocols are identical to
those used for previous studies (Fenrich et al., 2007; Fen-
rich and Rose, 2009). Briefly, glass micropipette tips
were broken to achieve a tip diameter of �4 lm. Pipettes
were filled with 12% Neurobiotin (Vector, Burlington, ON,
Canada) in 0.5 M KCl and 0.1 M Tris-HCl buffer, pH 8.2.
All injections were made into the extracellular space of
the left ventral horn. For each track in which Neurobiotin
was injected, an injection was made at 200 lm dorsal of
the BCCM field potential and another at 800 lm dorsal of
the BCCM field potential. Injections were made with 5 lApositive pulses for 90 seconds with a 10-second on-off
duty cycle (Midgard Electronics, Canton, MA; model
CS3). These injection parameters yielded about 10–20
well-stained neurons per injection site. Not all of the
stained neurons were PCIs; however, only axotomized
PCIs were included in this study (see below).
The first injection track of each experiment was 1–2
mm caudal of the caudal edge of the midline lesion site.
Each subsequent injection track was 750 lm rostral of
the previous. Injections were made throughout the entire
rostral-caudal length of the midline lesion and 1–2 mm
rostral of the midline lesion. Following the final Neurobio-
tin injection, the tracer was allowed to spread for 8–10
hours prior to fixation.
Tissue preparation andimmunohistochemistry
All animals were administered Heparin (25,000 IU i.v.)
followed by a euthanizing dose of sodium pentobarbital.
The animals were perfused with 1 L of normal saline fol-
lowed by 4% paraformaldehyde in 0.1 M phosphate-
buffered saline (PBS) (pH 7.4) for 20 minutes. The spinal
cords were removed, postfixed overnight, and then trans-
ferred to 20% sucrose in PBS for several days prior to
sectioning.
Horizontal serial sections (50 lm thick) were cut using
a freezing microtome. Sections were placed in PBS with
30% sucrose and 30% ethylene glycol and stored at
�20�C for several weeks. Sections were removed from
the freezer and rinsed several times in PBS. Sections
were incubated in PBS with 0.1% NaBH4 for 25 minutes,
and then rinsed several times in PBS. To visualize the dis-
tribution of chondroitin sulfate proteoglycans (CSPG),
sections were incubated with CS-56 monoclonal antibod-
ies, which are reported to be specific for the glycosamino-
glycan (GAG) moieties of CSPGs (1:250; mAb CS-56;
Sigma; cat. no. C80735) for 2 nights at 4�C. These anti-
bodies were raised in mouse against ventral membranes
of chicken gizzard fibroblasts. These antibodies were
visualized with AMCA-conjugated secondary antibodies
(1:250; goat antimouse; IgM l-chain specific; Jackson
ImmunoResearch, Mississauga, ON, Canada). To visualize
Neurobiotin the sections were incubated in streptavidin
conjugated to Cy5 (1:100; Jackson ImmunoResearch).
Sections were mounted on subbed slides with Vecta-
shield mounting medium (Vector) and stored at 2–4�C.
Antibody characterizationTo characterize the specificity of the CS-65 monoclonal
antibodies in cats we first compared the pattern of stain-
ing along and immediately adjacent to spinal midline
transection sites in the cat with labeling at spinal cord
injury sites of other species as reported in previous stud-
ies (Davies et al., 1999; Kim et al., 2006). In the cat, at 7
and 9 days postmidline transection CS-56 antibodies
yielded densely stained regions along and immediately
adjacent to the transection sties, with less staining in the
adjacent gray matter, and very little staining in the lateral
K.K. Fenrich and P.K. Rose
3242 The Journal of Comparative Neurology |Research in Systems Neuroscience
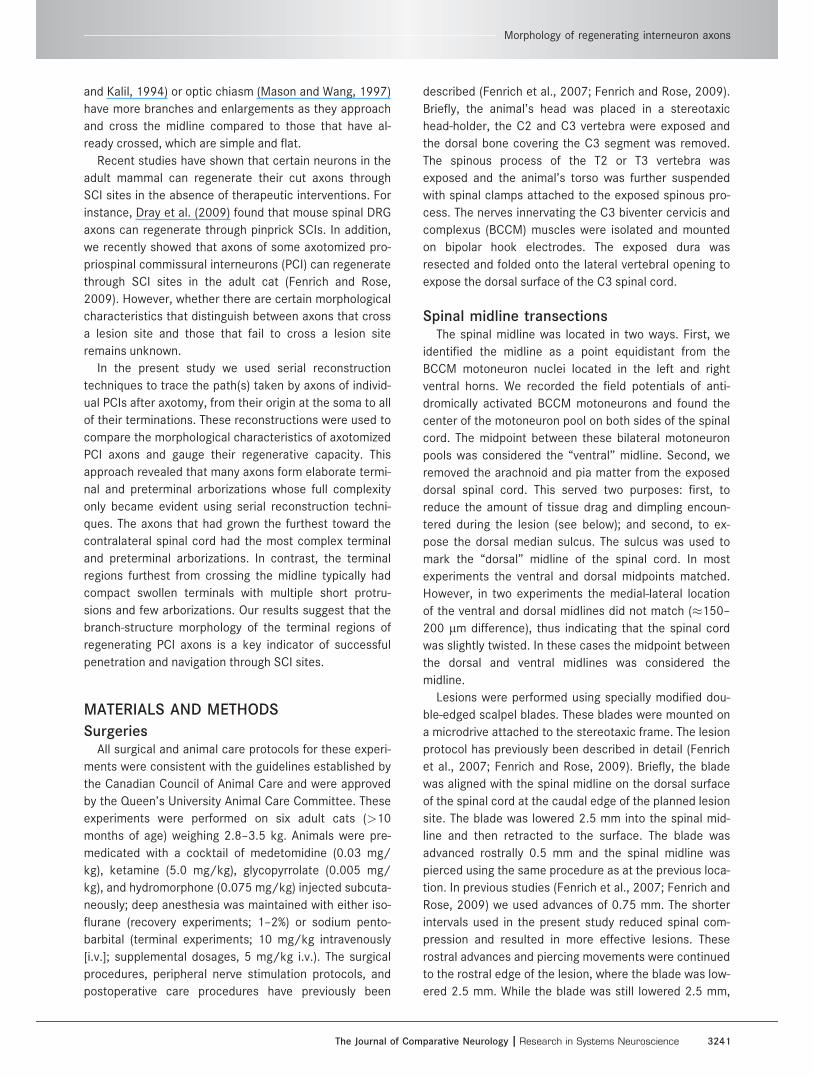
white matter. The CS-56 staining patterns at and near the
spinal transection sites in the cat were nonuniform due to
densely labeled interconnected ‘‘tube-like’’ structures
(Fig. 1A,C). In zones between the tube-like structures the
CS-56 staining was less intense and more diffuse. These
staining patterns are very similar to the CS-56 staining
patterns at and near spinal cord injury sites in adult mice
and rats at 7 and 8 days post-SCI (Davies et al., 1999;
Kim et al., 2006). To further characterize the specificity of
the CS-56 antibody in injured cat spinal tissue, we
digested the GAG portion of the CSPG molecules in some
tissue sections using chondroitinase ABC (6 or 24 hours
incubation; 0.05 units/ml; Sigma; cat. no. C2905) before
continuing with the CS-56 incubation protocol (Munyer
and Schulte, 1991). For these control experiments we
used a pair of serial tissue sections from each animal:
one tissue section was incubated with chondroitinase
ABC prior to the CS-56 incubation protocol, whereas the
other tissue section was simultaneously incubated in
buffer alone prior to the CS-56 incubation protocol. We
used tissue sections that were immediately dorsal to
those used for the rest of this study. Digestion of the
GAGs eliminated the dense CS-56 staining at and near
SCI sites for both 7 and 9 day post-SCI experiments (Fig.
1). Our results strongly suggest that CS-56 antibodies
specifically recognize the GAG chains of CSPGs in the cat
spinal cord. Considering the close similarity between the
CS-56 staining patterns in our study to the CS-56 staining
Figure 1. CS-56 antibodies specifically recognize CSPG GAG chains in the cat spinal cord. A,B: Fluorescent images showing CS-56 anti-
body labeling from equivalent regions along a spinal midline transection site from adjacent serial sections from a 7-day post-SCI experi-
ment. The tissue section shown in A was preincubated in buffer for 24 hours prior to staining with CS-56 antibodies, whereas the tissue
section shown in B was preincubated in chondroitinase ABC for 24 hours prior to staining with CS-56 antibodies. C,D: Fluorescent images
showing CS-56 antibody labeling from equivalent regions along a spinal midline transection site from adjacent serial sections from a 9-day
post-SCI experiment. The tissue section shown in C was preincubated in buffer for 6 hours prior to staining with CS-56 antibodies,
whereas the tissue section shown in D was preincubated in chondroitinase ABC for 6 hours prior to staining with CS-56 antibodies. All
images were acquired in one imaging session using the same microscope settings and subjected to the same brightness and contrast
adjustments. Scale bars ¼ 100 lm.
Morphology of regenerating interneuron axons
The Journal of Comparative Neurology | Research in Systems Neuroscience 3243

patterns in other spinal cord injury studies using the
same antibodies, and that incubation of dorsal tissue sec-
tions in chondroitinase ABC abolished CS-56 staining, we
consider the CS-56 staining observed in the present
study to be indicative of the distribution of CSPGs.
ReconstructionsAxons were reconstructed using a fluorescent micro-
scope (Olympus BX60) equipped with 40� (0.75 NA) and
60� (0.90) dry immersion lenses, a Neurolucida System
(MBF Biosciences, Williston, VT, v. 8.22), and a Retiga EXi
camera (QImaging, Surrey, BC, Canada). A reconstruction
is a 3D tracing of a neuron, or part of a neuron, through
serial histological sections in which each process is repre-
sented as a series of connected points. Each point has an
x- (mediolateral), y- (rostrocaudal), and z- (dorsoventral)
coordinate and a diameter. To begin a reconstruction,
image stacks of an axon terminal were acquired from one
tissue section. The axon terminal was reconstructed
using these image stacks. As the axon and reconstruction
progressed to processes found on adjacent tissue sec-
tions, image stacks of the axon were acquired from these
sections. The image stacks of each section was aligned
and stitched to the image stacks of the previous sections
so that by the end of the reconstruction process the
entire axon was stored as a series of stitched digital
image stacks. All reconstructions began at an axon termi-
nal and followed the trajectory of the terminal region
branches, as well as the parent axon back to the cell of
origin in the ventral horn. Unless noted, all axonal proc-
esses were followed to their termination, defined by an
abrupt loss of Neurobiotin.
Only axons that were well stained with Neurobiotin and
were sufficiently well isolated from other Neurobiotin-
stained processes were reconstructed. To restrict our
analysis only to axotomized PCI axons (Steward et al.,
2003), only axons that terminated either 1) within the
dense CSPG labeling of the lesion site, or 2) within the
gray matter adjacent to the dense CSPG staining were
chosen for reconstruction. All reconstructions were cor-
rected for tissue shrinkage in the z-axis.
The reconstruction techniques described above are
ideally suited for tracing tubular structures such as axons
and dendrites. In some cases the axon terminal region
consisted of one or more large swellings. The surface of
these swellings was often covered with smaller bulbous
appendages or formed convoluted shapes such as a ca-
lyx. These structures cannot be rendered using Neurolu-
cida. In these cases only the parent axon and the main
shaft of the axon was reconstructed as described above.
To visualize the structure of these axon terminal regions,
confocal image stacks were acquired (Leica TCS SP2 mul-
tiphoton microscope). Three-dimensional images of these
image stacks were rendered using ImagePro Plus (v. 6.3;
Media Cybernetics, Silver Springs, MD), and the contrast
and brightness were optimized. With the exception of the
CS-56 control illustrations (Fig. 1), these image acquisi-
tion techniques were used for all photomicrograph
illustrations.
Morphological quantification and statisticalanalysis
Quantitative analysis was performed on entire terminal
regions and their parent axon, or on the terminal regions
only. To analyze segments of axons and/or their terminal
regions, the segments of interest were extracted from the
reconstruction and analyzed individually. Quantitative
measures, such as the number of branch points, were col-
lected using NeuroExplorer (MBF Biosciences, v. 4.7).
Statistical significance was evaluated using nonpara-
metric tests, including the Two-Sample KS test, Kruskal–
Wallis test, Mann–Whitney U-test, and Fisher’s exact test;
and, where applicable, parametric tests including simple
linear regression models and Student’s t-test (Systat:
SPSS, Chicago, IL). The specific tests used for each evalu-
ation are described in the text.
RESULTS
Axonal growth from 7 to 9 dayspostaxotomy
At 7 days following a spinal C3 midsagittal transection,
the terminals of many axotomized PCI axons are located
in the ipsilateral spinal cord, and very few cross the
injured midline (Fenrich and Rose, 2009). In contrast, by
56–72 days postinjury many axotomized PCI axons had
crossed the midsagittal transection site and terminated
in the contralateral ventromedial funiculus. In the present
study we examined axotomized PCI axons at 7 and 9 days
following a spinal C3 midsagittal transection. Our goal
was to obtain two ‘‘snapshots’’ of the regenerative pro-
cess in close temporal succession. Comparisons of the
distribution of the leading edge of the advancing axon
terminals provide an estimate of the migration, stasis, or
retraction of PCI axons, as a population, as they
regenerate.
The axons and somata of 52 axotomized PCIs were
reconstructed (Fig. 2A) (n ¼ 22 at 7 days postinjury; n ¼30 at 9 days postinjury). In all experiments there was a
dense deposition of CSPGs along the midline, and
extended the same rostrocaudal distance as the lesion
(Fenrich and Rose, 2009). CSPGs are extracellular matrix
molecules that are typically inhibitory to the growth of
regenerating axons (Rudge and Silver, 1990; McKeon
et al., 1991; Bradbury et al., 2002), and are released by
reactive astrocytes that invade injury sites and contribute
K.K. Fenrich and P.K. Rose
3244 The Journal of Comparative Neurology |Research in Systems Neuroscience

to the formation of a glial scar following SCI (McKeon
et al., 1991; Silver and Miller, 2004). Considering their
role in axonal regeneration, we traced the border of the
dense CSPG zones every 3–5 tissue sections relative to
the location of the gray matter, midline, and the recon-
structed neurons. The CSPG dense zones extended later-
ally several hundred microns to the gray matter border or
within 100 lm of the gray matter border. All reconstruc-
tions began at the distal regions of the cut PCI axons ei-
ther within or adjacent to the dense CSPG zone and con-
tinued to their cell body. All cell bodies were located
within the ventral horn adjacent to the dense CSPG label-
ing and in close proximity to a Neurobiotin injection site.
The distal regions of many cut axons were located within
the CSPG zones (Fig. 2B) and their proximal regions
located in the adjacent gray matter (Fig. 2C). Closer to
the soma the axons had a uniform diameter and some-
times had very short, fine, right-angled branches (Fig.
2D). Similar to uninjured axons, the cut axons emerged
from a soma or proximal dendrite and had characteristics,
such as a thin diameter, typical of an initial segment (Fig.
2E). Similar to previous studies (Fenrich et al., 2007; Fen-
rich and Rose, 2009), all somata were located in the ven-
tral horn and within a few hundred microns of an injection
site. In the mediolateral axis, the majority of somata were
located near the center third of the ventral horn, with only
a few located near the medial or lateral edge of the ven-
tral horn.
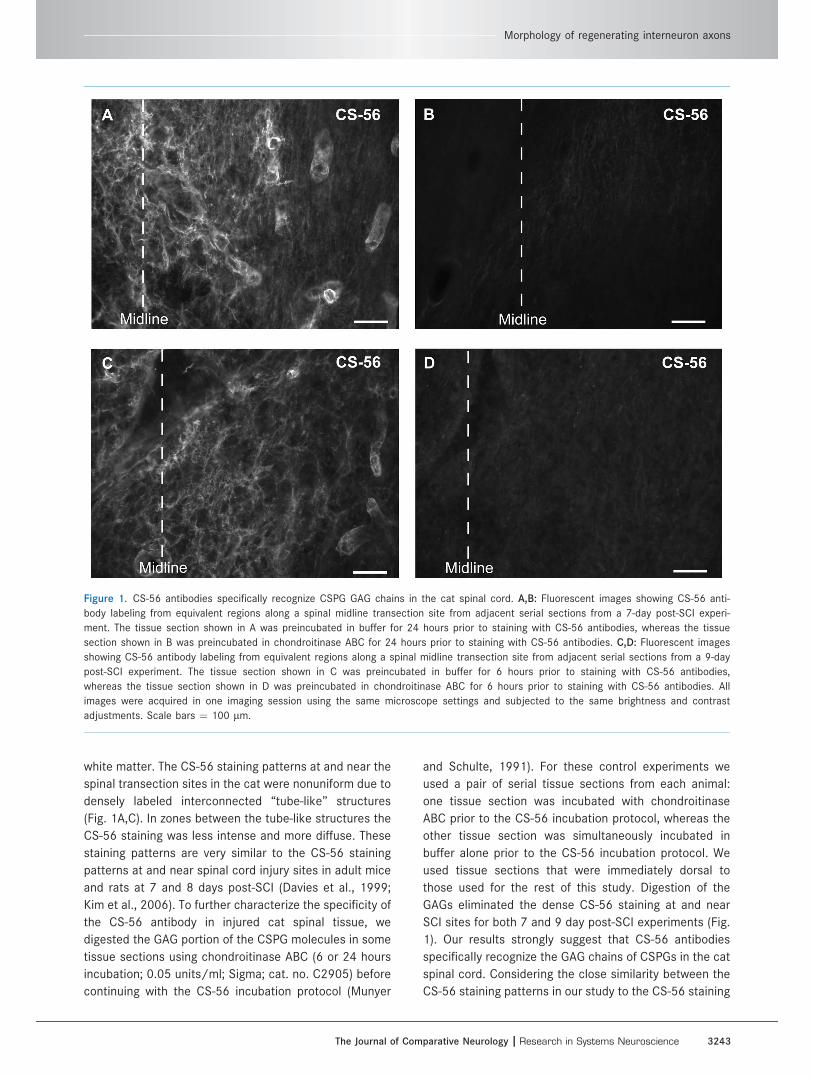
To compare the migration of axon terminals toward the
contralateral spinal cord at 7 days and 9 days postaxot-
omy, the mediolateral distance from the leading process
(i.e., the process furthest toward the contralateral spinal
cord) of each axon to the midline was measured (Fig. 3A).
At 9 days postinjury, cut PCI axons had grown an average
of 180 lm further toward the contralateral spinal cord,
relative to the midline, compared to cut PCI axons from 7
day postinjury experiments (P < 0.01, Two-Sample KS
test). In addition, more axons had regenerated across the
midline at 9 days compared to 7 days postinjury.
To examine the growth of PCI axons relative to the
dense CSPG labeling, we determined the proportion of
PCI axons that had penetrated the dense CSPG zones at
7 and 9 days postinjury. Each axon was categorized
according to the mediolateral location of its leading
Figure 2. Some regenerating axons progress further toward the contralateral spinal cord than others at 7 and 9 days postinjury. A: Recon-
struction of a PCI that terminated within the CSPG-rich lesion site ipsilateral of the midline (cell 71-10 in Table 2). Black, axons; dark gray,
somata. B–E: Confocal image stacks showing parts of the representative Neurobiotin stained PCI axon and CSPG labeling shown in A. The
dashed boxes in A indicate the location of the images in B–E. B: The distal terminals of the axon within the zone with dense CSPG label-
ing. C: The axon at the border of the CSPG zone. D: An intermediate segment of the axon. E: The soma and initial segment (between
arrowheads). Scale bars ¼ 100 lm in A; 25 lm in B–E.
Morphology of regenerating interneuron axons
The Journal of Comparative Neurology | Research in Systems Neuroscience 3245
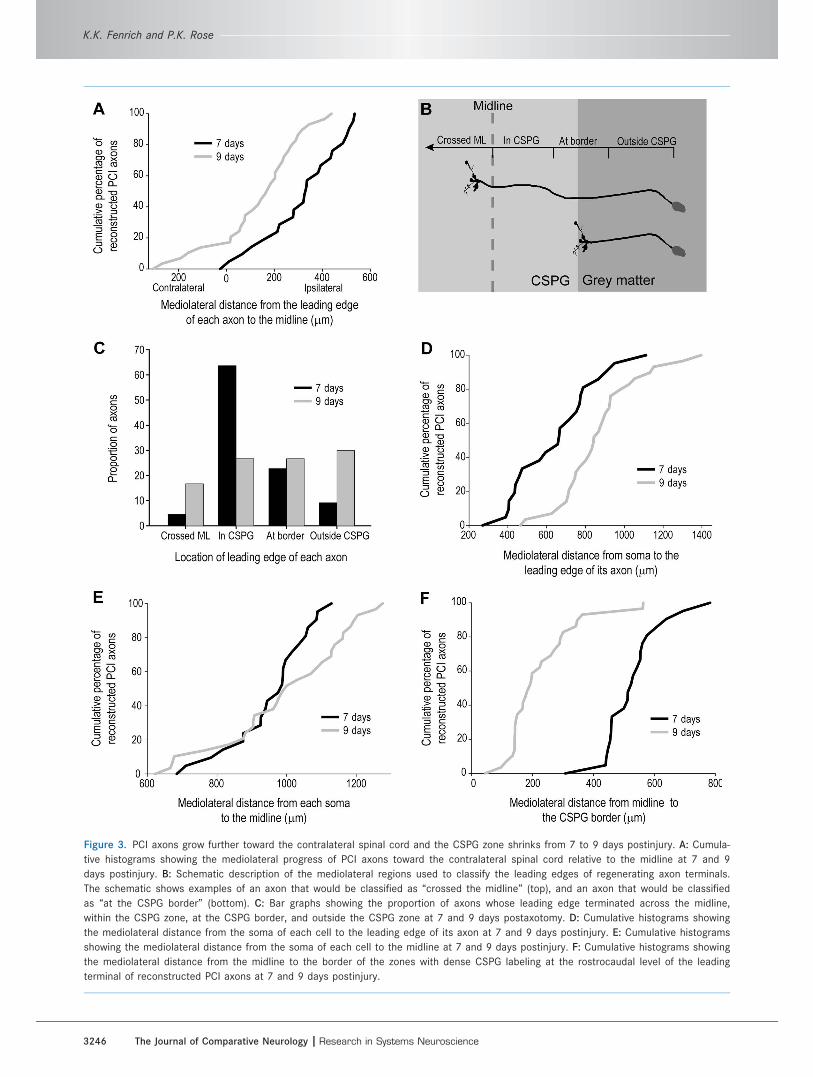
Figure 3. PCI axons grow further toward the contralateral spinal cord and the CSPG zone shrinks from 7 to 9 days postinjury. A: Cumula-
tive histograms showing the mediolateral progress of PCI axons toward the contralateral spinal cord relative to the midline at 7 and 9
days postinjury. B: Schematic description of the mediolateral regions used to classify the leading edges of regenerating axon terminals.
The schematic shows examples of an axon that would be classified as ‘‘crossed the midline’’ (top), and an axon that would be classified
as ‘‘at the CSPG border’’ (bottom). C: Bar graphs showing the proportion of axons whose leading edge terminated across the midline,
within the CSPG zone, at the CSPG border, and outside the CSPG zone at 7 and 9 days postaxotomy. D: Cumulative histograms showing
the mediolateral distance from the soma of each cell to the leading edge of its axon at 7 and 9 days postinjury. E: Cumulative histograms
showing the mediolateral distance from the soma of each cell to the midline at 7 and 9 days postinjury. F: Cumulative histograms showing
the mediolateral distance from the midline to the border of the zones with dense CSPG labeling at the rostrocaudal level of the leading
terminal of reconstructed PCI axons at 7 and 9 days postinjury.
K.K. Fenrich and P.K. Rose
3246 The Journal of Comparative Neurology |Research in Systems Neuroscience

process relative to the midline and CSPG labeling. The
categories were: a) crossed the midline; b) within the
CSPG zone, but not across the midline; c) within 50 lm of
the border of the CSPG zone; and d) outside the CSPG
zone in the ipsilateral spinal cord (Fig. 3B). Unexpectedly,
the proportion of axons that terminated at the CSPG bor-
der or outside the CSPG zone was greater at 9 days post-
injury (n ¼ 57%) compared to 7 days postinjury (n ¼ 32%)
(Fig. 3C). This change in distribution was most noticeable
outside of the CSPG zone (n ¼ 9% at 7 days to 30% at 9
days). Together, these findings, in combination with the
findings that PCI axons had migrated further toward the
contralateral spinal cord by 9 days raised the questions:
1) does the rate of axon growth change between 7 and 9
days; and/or 2) does the size of the CSPG zone change
between 7 to 9 days postinjury?
To test whether some axons stall or retract from 7 to 9
days postinjury, the mediolateral distance from the soma
to the leading process was measured for each cell. At 9
days postinjury, cut PCI axons had grown an average of
222 lm further from their soma toward the contralateral
spinal cord compared to cut PCI axons at 7 days postin-
jury (Fig. 3D) (P < 0.01, Two-Sample KS test). This pro-
gression away from their soma is consistent with the pro-
gression toward and across the midline from 7 to 9 days
postinjury (cf. Fig. 3A). If, however, some axons were
stalled or had retracted from 7 to 9 days postinjury, we
would expect these axons to be at the same mediolateral
distance or closer to their soma at 9 days compared to 7
days postinjury. Such an outcome would result in a
change in the slope of the distribution of the mediolateral
distances between their somata and leading edges. To
test if this is the case, we compared the slopes of the
simple linear regressions of these distributions at 7 days
(slope ¼ 0.141; R2 ¼ 0.96) and 9 days (slope ¼ 0.138;
R2 ¼ 0.89) postinjury and found no differences (P ¼0.446; Student’s t-test). However, the increased medio-
lateral distance from somata to the leading edge of their
axons at 9 days postinjury may be because the popula-
tion of PCIs examined at 7 days postinjury were located
more medially than the PCIs sampled from 9 day experi-
ments. To test whether this is the case, the mediolateral
distance from the soma to the midline was measured for
each cell. For the 7-day postinjury experiments the
somata were located an average of 42 lm further from
the midline compared to 9 days postinjury, but these dif-
ferences were not significant (Fig. 3E) (P > 0.05, Two-
Sample KS test), indicating that the PCIs from the 7 and
9 day experiments occupy the same mediolateral
regions. Moreover, although the differences in the aver-
age mediolateral distances from soma to midline are not
significant between 7- and 9-day experiments, the 42-lmshift away from the midline for 7-day experiments
accounts for the discrepancy between the average
mediolateral axon progression as measured relative to
the midline (180 lm; Fig. 3A) and somata (222 lm; Fig.
3D). Collectively, these data indicate that PCI axons con-
tinued to grow toward the contralateral spinal cord from
7 to 9 days postinjury.
To determine whether the size of the CSPG zone
changes from 7 to 9 days postinjury, the mediolateral dis-
tance from the midline to the ipsilateral CSPG border was
measured for all PCI axons at the rostrocaudal level of
their leading edge. At 7 days postinjury the width of the
dense CSPG labeling from the midline to the ipsilateral
border was an average of 301 lm wider than at 9 days
postinjury (Fig. 3F) (P < 0.01, Two-Sample KS test).
These data show that between 7 and 9 days postinjury
the CSPG zone retracts a greater distance toward the
midline than the average mediolateral growth of PCI
axons toward the contralateral spinal cord.
Collectively, these data show that PCI axons continue
to grow toward the contralateral spinal cord from 7 to 9
days postinjury, and the mediolateral extent of the CSPG
zone diminishes more than the average distance of axo-
nal growth toward the contralateral spinal cord in the
same time period (see Fig. 9). These results suggest that
some of the terminal regions located outside of the CSPG
zone at 9 days postinjury may have been located within
the CSPG zones at 7 days postinjury. Furthermore, our
data suggest that this relocation from within the CSPG
zone at 7 days to outside of the CSPG zone at 9 days may
be due to retraction of the CSPG zone toward the midline
rather than a retraction of the axons toward their somata.
Taken together, these data suggest that growing PCI
axons can be divided into two groups: those that grow to-
ward the contralateral spinal cord as fast as or faster
than the retraction of the CSPG zone, and those that are
unable to grow toward the contralateral spinal cord as
fast as the retraction of the CSPG zone. We therefore
asked the question: do the morphological characteristics
of terminal regions located in the CSPG zones and across
the injured midline differ from terminal regions located at
the CSPG border or outside of the CSPG zones? However,
to answer this question we must first define what consti-
tutes the terminal regions of cut PCI axons and describe
their morphologies.
Terminal regions of regenerating PCI axonshave a wide range of morphologiesDefinition of terminal regions
In the preceding section we used the location of the
leading process of PCI axons to describe the morphology
of the axons en route to the contralateral ventromedial
funiculus. However, this parameter does not describe the
Morphology of regenerating interneuron axons
The Journal of Comparative Neurology | Research in Systems Neuroscience 3247

complex structural features of the terminal region of PCI
axons at 7 and 9 days following axotomy. For this purpose
we defined an axon’s terminal region as the distal seg-
ments of the axon with many branches and/or swellings
that emerged from a parent axon. In many cases the
boundary between the terminal region and parent axon
was obvious. However, in some cases the transition was
gradual and the start of the terminal zone was difficult to
identify. As a consequence, the proximal segment of the
terminal region was defined as a 50-lm long segment
with no swellings or branches. There was one exception
to this definition. If the axon entered the CSPG zone, all
axon segments located within the CSPG zone were con-
sidered part of its terminal region. Together, this means
that some terminal regions were outside of CSPG zones,
some were largely restricted to CSPG zones, while others
began outside of CSPG zones but also had segments
located within CSPG zones.
General observationsTables 1 and 2 summarize the branching structure,
length, and surface area of the reconstructed PCI axon
terminal regions at 7 days and 9 days postinjury, respec-
tively. Terminal regions were classified into two catego-
ries, ‘‘arboreal’’ and/or ‘‘compact,’’ based on their
morphological characteristics. Arboreal terminal regions
had thin processes that extended from thicker shafts,
easily discernible branch points, and swellings that were
smooth and elliptical. Compact terminal regions had dis-
tinctive large swellings with irregular 3D shapes (i.e., not
smooth and/or elliptical). For instance, some of these
formed thin veils in the shape of a calyx, while others had
a pitted or multilobed globular surface. Compact terminal
regions with these features were called ‘‘irregular.’’ Other
compact terminal regions had many short fine filopodia-
like branches that emerged from a large terminal or en
passant swelling. These compact terminal regions were
called ‘‘filopodial.’’ A small number of axons had terminal
regions that consisted of two or more zones, with features
in one zone consistent with one classification, whereas
the other zones had features consistent with a different
classification. These terminal regions are described as
hybrids with the most distal zone listed first (e.g., Arboreal
þ Compact; Tables 1 and 2). Since the parts of the axon
that had advanced the farthest en route to the contralat-
eral spinal cord were, from the perspective of replacing
lost connections, the closest to meeting this objective,
the classification of the distal zone was used to assign
axons with hybrid terminal regions to a specific class.
Arboreal terminal regionsAs summarized in Tables 1 and 2, 38 terminal regions
had arboreal features. All arboreal terminal regions had
the same basic structural components. The parent axon
gave rise to short branches and/or longer branches that
divided several times to form more elaborate branching
structures. Although the parent axons with arboreal ter-
minal regions typically followed a relatively straight path
toward the contralateral spinal cord, several took a more
tortuous route. In contrast, the terminal and preterminal
branches often followed a meandering path. These termi-
nal branches were sometimes in close proximity to the
densely CSPG stained tube-like structures located at and
near the lesion site, but most terminals were located in
zones with less dense CSPG labeling between the tube-
like structures. Branch points often occurred at swellings,
and some swellings gave rise to more than one branch.
All arboreal terminal regions had en passant varicosities,
and most branches ended with a terminal swelling. Both
en passant varicosities and terminal swellings tended to
be smooth and elliptical.
Although all arboreal terminal regions had similar char-
acteristics, the number of branches and swellings per ter-
minal region varied greatly. For instance, some terminal
TABLE 1.
Comparison of Branch Structure and Size of
Reconstructed Terminal Regions at 7 Days Postinjury
Cell
Morphological
classification1
Total
no. of
branches
Total
length
(lm)2
Surface
area
(lm2)2
66-4 Arboreal 11 1091.3 5418.666-5 Compact
(Irregular)12 1709.6 1202.8
73-6 Arboreal 12 447.7 2621.666-3 Arboreal 15 493.6 1833.966-2 Arboreal 16 703 2770.466-1 Arboreal 23 1090.2 7878.266-8 Arboreal 24 1062.5 4009.873-1 Arboreal þ
Compact(Irregular)
36 1117.9 4283
73-5 Arboreal 36 1007.7 2885.966-7 Arboreal 44 2005.7 6529.166-12 Arboreal 44 1161 4866.966-6 Arboreal 48 1652.5 5441.173-3 Arboreal 56 2314.8 7032.873-2 Arboreal 79 3868.3 10144.467-1 Arboreal 81 2676.9 6113.767-5 Arboreal 88 3338.8 11200.367-7 Arboreal 93 2861.8 6125.167-3 Arboreal 286 6612.3 19373.766-13 Arboreal þ
Compact(Irregular)
382 16322.5 45191.7
66-10 Compact(Irregular þFilopodial)
NA NA NA
66-11 Filopodial NA NA NA73-4 Filopodial NA NA NA
1See Results for description of morphological classifications.2Includes the root axon and all branches.
K.K. Fenrich and P.K. Rose
3248 The Journal of Comparative Neurology |Research in Systems Neuroscience

regions had only 2 or 3 branches, whereas others had
over 100 branches. To more accurately describe the ar-
boreal terminal regions, they were further categorized
based on the number of branch points as ‘‘simple,’’ ‘‘inter-
mediate,’’ and ‘‘complex.’’ The criteria for each of these
categories was arbitrarily set at 20 or fewer branch
points, between 21 and 100 branch points, and greater
than 100 branch points, respectively.
Fifteen of the arboreal terminal regions were classified
as ‘‘simple.’’ The parent axons followed a fairly straight
path, and had only a few branch points (from 2 to 20) and
swellings (Fig. 4). The branches of these terminal regions
were short and had few second- and third-order
branches. The branches belonging to seven of the simple
terminal regions were largely restricted to the most distal
regions of the axon, whereas the branches that formed
the arbor in the remaining eight simple terminal regions
also originated from more proximal regions of the axon
(cf. Fig. 4A,B, respectively).
Eighteen of the arboreal terminal regions were classi-
fied as ‘‘intermediate,’’ and had between 22 and 93
branch points. Most of the parent shafts of these terminal
regions were quite tortuous, forming ‘‘S’’ trajectories or
loops and only a few followed a relatively direct route to-
ward the contralateral spinal cord (cf. Fig. 5A,B, respec-
tively). Turns and loops occurred primarily at either the
border of the gray and white matter or as the axon
entered the CSPG zone (Fig. 5A). Many of the branches of
intermediate arboreal terminal regions were short with a
few swellings, similar to the simple arboreal terminal
regions. However, some intermediate arboreal terminal
regions also had much longer branches that gave rise to
several levels of higher-order branches that often had
multiple swellings, and occasionally followed a tortuous
trajectory. The branches were largely restricted to the
most distal parts of 15 of the terminal regions (Fig. 5A). In
the remaining three intermediate arboreal terminal
regions, most branches were restricted to a distal cluster,
but there was a second smaller cluster of branches more
proximally (Fig. 5B).
Four arboreal terminal regions had highly intricate
structures, each with several hundred branch points and
many swellings. These arboreal terminal regions were
classified as ‘‘complex.’’ Two of these terminal regions
were reconstructed in their entirety (Fig. 6), whereas only
the parent axon and some of the simpler branches were
reconstructed for the remaining two. These terminal
regions were not reconstructed in their entirety because
their branches were tightly intertwined and could not be
traced without fear of linking segments of branches incor-
rectly. However, by stacking images of aligned serial sec-
tions we were able to visualize the 3D structure of these
complex arboreal terminal regions and identify all of the
branch points (Table 2). Despite the high branching den-
sity, the size of these terminal regions and the character-
istics of their swellings were similar to terminal regions
that were reconstructed completely. All four of the com-
plex arboreal terminal regions had many fine branches
that projected over several tens to hundreds of microns
TABLE 2.
Comparison of Branch Structure and Size of
Reconstructed Terminal Regions at 9 Days Postinjury
Cell
Morphological
classification1
Total
no. of
branches
Total
length
(lm)2
Surface
area
(lm2)2
71-19 Arboreal 2 158 168474-2 Arboreal 3 469 154371-4 Arboreal 4 304 143571-5 Arboreal 4 334 189371-17 Compact
(Irregular)4 182 3191
71-18 Arboreal 4 203 102571-21 Arboreal 5 525 184771-20 Compact
(Irregular)7 323 5025
71-16 Compact(Irregular) þArboreal
8 404 2280
71-11 Arboreal 10 242 199975-2 Compact
(Irregular)13 1025 11050
71-22 Compact(Irregular)
14 379 3832
71-3 Arboreal 15 413 196071-15 Arboreal 17 809 519271-10 Arboreal 19 553 178775-3 Arboreal 20 821 432871-14 Arboreal þ
Compact(Irregular)
22 660 3041
71-9 Arboreal 26 1547 1035275-5 Arboreal 32 1497 431871-2 Arboreal 36 1711 672771-8 Arboreal 43 1662 468371-13 Compact
(Irregular)49 1385 8735
74-5 Arboreal 61 2187 607974-3 Arboreal 3273 NA NA75-1 Arboreal 3613 NA NA71-6 Compact
(Filopodial)NA NA NA
71-7 Compact(Filopodial)
NA NA NA
74-1 Compact(Filopodial þIrregular)
NA NA NA
74-4 Compact(Filopodial)
NA NA NA
75-4 Compact(Filopodial þIrregular)
NA NA NA
1See Results for description of morphological classifications.2Includes the root axon and all branches.3Terminal region not reconstructed in entirety; branch points were
counted through serial sections; see Results section for description of
counting method.
Morphology of regenerating interneuron axons
The Journal of Comparative Neurology | Research in Systems Neuroscience 3249
in the x, y, and z axes. Higher-order branches were tortu-
ous and often intertwined with one another. Most of the
branch points of these terminal regions were located in
one main cluster, and the majority of the remaining
branches were located in one or two smaller clusters. The
main cluster of branches was located at the most distal
zone of two of these terminal regions (Fig. 6A). Con-
versely, the main cluster of branches was located more
proximally, with relatively simple clusters located more
distally, in the other two complex arboreal terminal
regions (Fig. 6B).
Compact terminal regionsAs summarized in Tables 1 and 2, 18 terminal regions
had compact features. Compact terminal regions had
large irregular swellings with complex contours and/or a
very dense array of fine branches.
Thirteen compact terminal regions were classified as
‘‘irregular.’’ All had very large swellings, a pitted surface
(Fig. 7A,B), and/or had bulbous appendages or flaps that
projected from their surface (Fig. 7C). In addition, the
main shaft of some of these terminal regions formed one
or more thin veiled structures connected on either end by
small diameter cylindrical shafts (Fig. 7A,B). These veiled
structures were distended in one plane and thin in the
perpendicular plane, and thus had the appearance of a
calyx.
Despite their complex surface characteristics, most of
the features of irregular terminal regions could be cap-
tured by our reconstruction techniques with two small
modifications. First, most of the wave-like folds and flaps
were reconstructed as swellings unless they protruded
longer than the diameter of the parent shaft, in which
case they were reconstructed as a branch. Second, the
calyx-like structures were represented as large swellings
with a diameter equal to the width of the calyx.
Compact terminal regions with many delicate, short
branches were classified as ‘‘filopodial’’ (Fig. 7D). These
branches ranged in length from a few microns to many
tens of microns. These branches were usually straight,
with few or no higher order branches, and often termi-
nated in a small swelling. Because the filopodia-like
Figure 4. Some PCI axons have simple arboreal terminal regions with few branches and swellings. A,B: Reconstructions of axotomized PCI
axons with simple arboreal terminal regions (black, axon) at 9 days postinjury (A) (cell 74-2; see Table 2), and 7 days postinjury (B) (cell 66-
2; see Table 1). Regions distal (left) of the asterisks indicate the location of the terminal regions of the axon. Scale bars ¼ 50 lm.
K.K. Fenrich and P.K. Rose
3250 The Journal of Comparative Neurology |Research in Systems Neuroscience
branches were very delicate and numerous, filopodial ter-
minal regions could not be reconstructed in their entirety.
Instead, we reconstructed the axon that gave rise to the
filopodial terminal region, all of the larger branches, and
all of the swellings, but not the filopodial branches.
Eight of the compact terminal regions had morphologi-
cal characteristics that were classified as ‘‘filopodial.’’
Large swellings with filopodia-like branches were located
on both the proximal segments of the axon that gave rise
to the filopodial terminal region as well as at the most dis-
tal terminals.
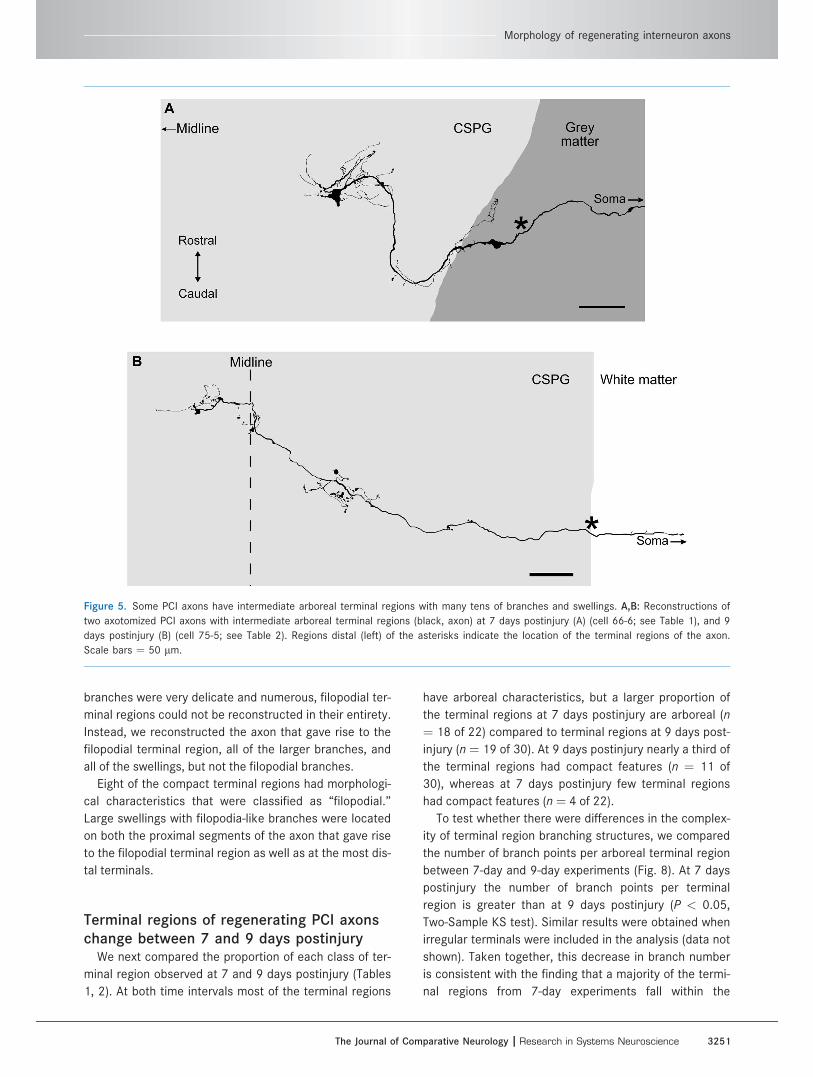
Terminal regions of regenerating PCI axonschange between 7 and 9 days postinjury
We next compared the proportion of each class of ter-
minal region observed at 7 and 9 days postinjury (Tables
1, 2). At both time intervals most of the terminal regions
have arboreal characteristics, but a larger proportion of
the terminal regions at 7 days postinjury are arboreal (n
¼ 18 of 22) compared to terminal regions at 9 days post-
injury (n¼ 19 of 30). At 9 days postinjury nearly a third of
the terminal regions had compact features (n ¼ 11 of
30), whereas at 7 days postinjury few terminal regions
had compact features (n¼ 4 of 22).
To test whether there were differences in the complex-
ity of terminal region branching structures, we compared
the number of branch points per arboreal terminal region
between 7-day and 9-day experiments (Fig. 8). At 7 days
postinjury the number of branch points per terminal
region is greater than at 9 days postinjury (P < 0.05,
Two-Sample KS test). Similar results were obtained when
irregular terminals were included in the analysis (data not
shown). Taken together, this decrease in branch number
is consistent with the finding that a majority of the termi-
nal regions from 7-day experiments fall within the
Figure 5. Some PCI axons have intermediate arboreal terminal regions with many tens of branches and swellings. A,B: Reconstructions of
two axotomized PCI axons with intermediate arboreal terminal regions (black, axon) at 7 days postinjury (A) (cell 66-6; see Table 1), and 9
days postinjury (B) (cell 75-5; see Table 2). Regions distal (left) of the asterisks indicate the location of the terminal regions of the axon.
Scale bars ¼ 50 lm.
Morphology of regenerating interneuron axons
The Journal of Comparative Neurology | Research in Systems Neuroscience 3251

Figure 6. Some PCI axons have complex arboreal terminal regions with over 100 branches and swellings. A,B: Reconstructions of two
axotomized PCI axons with complex arboreal terminal regions (black, axon) at 7 days postinjury. A: The terminal region of the axon belong-
ing to cell 66-13 (see Table 1). B: The terminal region of the axon belonging to cell 67-3 (see Table 1). Regions distal (left) of the asterisks
indicate the location of the terminal regions of the axon. Scale bars ¼ 50 lm.
K.K. Fenrich and P.K. Rose
3252 The Journal of Comparative Neurology |Research in Systems Neuroscience

intermediate arboreal category, whereas a majority of the
terminal regions from 9-day experiments fall within the
simple arboreal category.
Axons with highly branched arborealterminal regions progress further toward thecontralateral spinal cord than axons withcompact terminal regions
It is conceivable that the axons with arboreal terminals
belong to PCIs whose somata are located in different
regions of the ventral horn than the somata of PCIs whose
axons have compact terminal regions. To test whether
this is the case we measured the mediolateral distance
from the soma to midline for each PCI, and found no dif-
ferences between PCIs whose axons had arboreal termi-
nal regions and PCIs whose axons had compact terminal
regions (data not shown). In addition, all Neurobiotin-
stained PCI somata were restricted to a small zone in the
dorsoventral axis since all were in close proximity to Neu-
robiotin injection sites located in the ventral horn
between 200 and 800 lm dorsal of the motoneuron
pools. Furthermore, we found several examples of closely
adjacent PCI somata whose axons had either arboreal ter-
minal regions or compact terminal regions. Taken to-
gether, these data suggest that the morphology of PCI
Figure 7. Some PCI axons have compact terminal regions that are swollen, have complex membrane features, and are restricted to small
regions. Confocal image stacks showing irregular terminal regions (A-C) and a filopodial terminal region (D) at 9 days postinjury. A,B: The
same axon in adjacent serial sections. The part of the axon shown in A is distal to B, and the star in A shows the continuation point of
the axon from the star in B. Arrows in B,C indicate the continuation points of the axon in adjacent tissue sections. In all images the mid-
line is to the left and the somata are located to the right. Scale bars ¼ 20 lm.
Figure 8. PCI axons with arboreal terminal regions have more
branch points at 7 days postaxotomy compared to 9 days postax-
otomy. Cumulative histograms showing the number of branch
points per axonal terminal region at 7 and 9 days postaxotomy.
Morphology of regenerating interneuron axons
The Journal of Comparative Neurology | Research in Systems Neuroscience 3253
axon terminals is not dependent on the location of their
somata in the ventral horn.
Given that PCI axons can be divided into two classes
based on their progression toward the contralateral cord,
and that terminal regions can be classified as either arbo-
real or compact, we returned to our question: Do the mor-
phological characteristics of terminal regions located in
the CSPG zones and across the midline differ from termi-
nal regions located at the border or outside of the dense
CSPG zones?
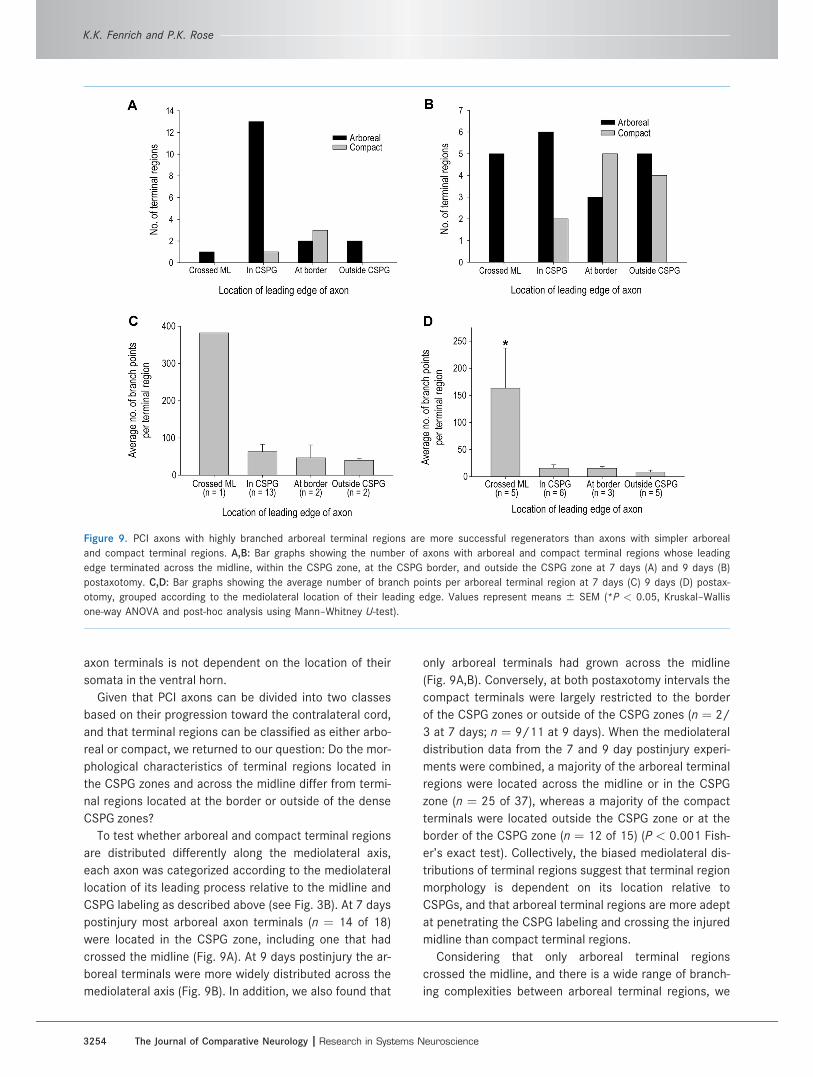
To test whether arboreal and compact terminal regions
are distributed differently along the mediolateral axis,
each axon was categorized according to the mediolateral
location of its leading process relative to the midline and
CSPG labeling as described above (see Fig. 3B). At 7 days
postinjury most arboreal axon terminals (n ¼ 14 of 18)
were located in the CSPG zone, including one that had
crossed the midline (Fig. 9A). At 9 days postinjury the ar-
boreal terminals were more widely distributed across the
mediolateral axis (Fig. 9B). In addition, we also found that
only arboreal terminals had grown across the midline
(Fig. 9A,B). Conversely, at both postaxotomy intervals the
compact terminals were largely restricted to the border
of the CSPG zones or outside of the CSPG zones (n ¼ 2/
3 at 7 days; n ¼ 9/11 at 9 days). When the mediolateral
distribution data from the 7 and 9 day postinjury experi-
ments were combined, a majority of the arboreal terminal
regions were located across the midline or in the CSPG
zone (n ¼ 25 of 37), whereas a majority of the compact
terminals were located outside the CSPG zone or at the
border of the CSPG zone (n ¼ 12 of 15) (P < 0.001 Fish-
er’s exact test). Collectively, the biased mediolateral dis-
tributions of terminal regions suggest that terminal region
morphology is dependent on its location relative to
CSPGs, and that arboreal terminal regions are more adept
at penetrating the CSPG labeling and crossing the injured
midline than compact terminal regions.
Considering that only arboreal terminal regions
crossed the midline, and there is a wide range of branch-
ing complexities between arboreal terminal regions, we
Figure 9. PCI axons with highly branched arboreal terminal regions are more successful regenerators than axons with simpler arboreal
and compact terminal regions. A,B: Bar graphs showing the number of axons with arboreal and compact terminal regions whose leading
edge terminated across the midline, within the CSPG zone, at the CSPG border, and outside the CSPG zone at 7 days (A) and 9 days (B)
postaxotomy. C,D: Bar graphs showing the average number of branch points per arboreal terminal region at 7 days (C) 9 days (D) postax-
otomy, grouped according to the mediolateral location of their leading edge. Values represent means 6 SEM (*P < 0.05, Kruskal–Wallis
one-way ANOVA and post-hoc analysis using Mann–Whitney U-test).
K.K. Fenrich and P.K. Rose
3254 The Journal of Comparative Neurology |Research in Systems Neuroscience
next asked whether the terminal regions that crossed the
midline had any distinguishing features. To test whether
arboreal terminal region complexity is dependent on their
mediolateral location, arboreal terminal regions were
grouped according to their mediolateral location, as
described above, and the number of branches per termi-
nal region was compared between groups. At 7 days post-
axotomy there was only one axon that had regenerated
across the midline, and only two arboreal terminal regions
that terminated outside the CSPG zone, thus statistical
analysis was not performed (Fig. 9C). A similar distribu-
tion was observed at 9 days postinjury (Fig. 9D). How-
ever, at 9 days postinjury terminal regions that crossed
the midline had significantly more branch points than ter-
minal regions in all other zones (P < 0.05, Kruskal–Wallis
one-way analysis of variance [ANOVA] and post-hoc
analysis using Mann–Whitney U-test) (Fig. 9D).
Taken together, these results show that axons with
highly branched arboreal terminal regions are more suc-
cessful at regenerating through CSPG zones and across
the lesioned midline compared to axons with simpler ar-
boreal terminals regions or compact terminal regions at 7
and 9 days postaxotomy.
DISCUSSION
After SCI, most cut axons fail to regenerate across the
injury site (Ramon Y Cajal, 1959; Yiu and He, 2006). Cut
PCI axons, however, can regenerate across SCI sites fol-
lowing a midsagittal transection of the spinal cord (Fen-
rich and Rose, 2009). Our present study was designed to
compare the morphology of cut PCI axons after a SCI,
and to evaluate whether certain morphological character-
istics are indicative of successful regeneration across the
injured midline. Here we show that at 7 and 9 days post-
injury the terminal regions of cut PCI axons have a wide
range of morphological characteristics, and the axons
with highly branched arboreal terminal regions grow fur-
ther toward the contralateral cord and crossed the
injured midline compared to axons with compact terminal
regions.
Growth within and outside of zones withdense CSPG labeling (arboreal vs. compact)
At later postinjury times (4 to 10 weeks) some cut PCI
axons have regenerated across the CSPG-rich SCI site,
whereas others remain within the dense CSPG zones ipsi-
lateral of the lesioned midline or have retracted to their
soma (Fenrich et al., 2007; Fenrich and Rose, 2009). At 7
days postmidline transection we found that most axon
terminal regions (n ¼ 26 of 27) were located within or
before the CSPG zones (Fenrich and Rose, 2009). In this
previous study we also observed one axon terminal that
had regenerated across the midline, through the CSPG-
rich zone, and terminated in the contralateral white mat-
ter. With the goal of capturing a population of axon termi-
nals that were before the CSPG zones, within the CSPG
zones, and had just crossed the CSPG zones, we
repeated the 7-day experiments for the present study.
Contrary to our hypothesis, we found that at 7 days post-
injury a majority of the axon terminals examined were
located in CSPG zones adjacent to the lesion site and had
not crossed the midline. To develop a more comprehen-
sive picture of regenerating axons across spinal midline
transection sites and capture more axons that had
crossed the midline, we examined axon terminal morphol-
ogy at 9 days postinjury. By 9 days postinjury more axons
had crossed the midline, but more also terminated out-
side the CSPG zones in the ipsilateral gray matter, and
none had successfully regenerated through the CSPG
zone to the contralateral gray matter. Together, these
data suggest that our previous observation of a single
axon that had crossed the midline and escaped the con-
tralateral CSPG zone at 7 days is a very rare event and
that growth across the lesion site is slower (about 90
lm/day) than we first suspected.
In the adult CNS the rate of axonal growth of trans-
planted adult DRG neurons in both uninjured and degen-
erating spinal white matter has been measured at �1
mm/day (Davies et al., 1999). However, the rate of
growth of these axons slows substantially near SCI sites,
and these axons eventually stop progressing and remain
trapped within the glial scar of SCI sites (Davies et al.,
1999). Similarly, in the regenerating peripheral nervous
system (PNS), cut axons grow at a much slower rate
across a nerve scar (about 0.25 mm/day) than in distal
nerve segments (about 0.4–3 mm/day) (Guttemann
et al., 1942; Al Majed et al., 2000). Our findings show
that regenerating PCI axons grow at a much slower rate
toward the contralateral spinal cord than DRG axons in
uninjured or degenerating white matter or regenerating
PNS axons. However, since transplanted DRGs do not
regenerate through CSPG-rich zones, whereas some PCI
axons do successfully regenerate through CSPG-rich
zones, the present findings indicate that the overall
regeneration rate of PCI axons through CSPG-rich zones
is faster than DRG axons through CSPG-rich zones. This
finding does not exclude the likely possibility that regen-
erating PCI axons grow faster once they reach the white
matter tracts of the contralateral spinal cord, but whether
this is the case remains to be tested.
Although it is not possible to follow the same axon ter-
minals from day 7 to day 9, our results suggest that some
axons terminating in the CSPG zones near the midline at
7 days continue to regenerate across the midline by 9
days, whereas others fail to maintain their presence
Morphology of regenerating interneuron axons
The Journal of Comparative Neurology | Research in Systems Neuroscience 3255

within the retracting CSPG zone by 9 days (Fig. 10). This
change in mediolateral distribution of terminal regions is
associated with a change in their morphology and a
change in the mediolateral distribution of CSPGs. This
change in morphology is most apparent by the increased
number of compact terminal regions at the border of the
CSPG zone and outside the CSPG zone at 9 days com-
pared to 7 days postinjury (Fig. 10). This prevalence for
compact terminals to be located outside or at the border
of the CSPG zones suggests that compact terminal mor-
phology may be dependent on the density and/or distri-
bution of CSPGs surrounding the terminal.
In addition to the changes in distribution and morphol-
ogy, we also found that axons with highly branched termi-
nal regions had crossed the lesioned midline with a higher
prevalence than axons with simple arboreal or compact
terminal regions. Whether these axons with highly
branched arboreal terminals are the ones that will form
functional synaptic connections in the contralateral cord
given more time is unknown. We also cannot rule out the
possibility that the compact terminals can grow toward
and cross the midline at later timepoints. However, this
later scenario seems unlikely given their close morpho-
logical similarities with descriptions of stalled and retract-
ing terminal regions of other axons that had failed to grow
across SCI sites (Ramon Y Cajal, 1959; Risling et al.,
1983; Davies et al., 1999; Tom et al., 2004).
Collectively, our findings show that the morphology of
regenerating axon terminals can change dramatically with
time and/or their location within the injured spinal cord.
Moreover, these findings strongly suggest that a more
comprehensive examination of axon terminal morphology
at earlier and later timepoints may provide important in-
formation about the relationships between axon terminal
morphology, their locations relative to injury sites, and
postinjury time.
Arboreal branching patternsTo our knowledge, this is the first study to show regen-
erating axon terminal regions with such complex arboreal
branching patterns. Arboreal branching patterns have
previously been described for axon terminals approaching
or within SCI sites (Ramon Y Cajal, 1959; Linda et al.,
1992; Li and Raisman, 1994, 1995; Davies et al., 1999;
Dray et al., 2009). However, the terminal regions
described in these studies resemble the simple arboreal
terminal regions of regenerating PCI axons. The paucity
of complex arboreal terminal regions in these other stud-
ies may be due to two possibilities.
First, these other studies examined only the most distal
parts of the axon due to the extensive overlap of terminal
zones and axons in the immediate region (Dray et al.,
2009), described only axon terminals within single tissue
sections (Ramon Y Cajal, 1959; Li and Raisman, 1994,
1995; Davies et al., 1999), or focused primarily on the
proximal portion of the axon terminals (Linda et al.,
1992). These approaches therefore may have excluded
parts of the terminal regions. For this study, we recon-
structed regenerating axons from their soma to all of their
terminations by following each axon through serial tissue
sections. Using this approach we found that no individual
tissue section revealed the true complexity of the highly
branched arboreal terminal regions and the detailed
branching patterns of these terminal regions was only
apparent following reconstruction.
Second, with the exception of the work by Dray et al.
(2009) on DRG axons and the work by Linda et al. (1992)
on motoneuron axons, none of the axons examined in
previous studies can successfully regenerate through SCI
sites. Our study examined axons that spontaneously
regenerate across SCI sites in response to axotomy.
Although we cannot preclude the possibility that highly
branched arboreal terminal regions are unique to PCI
axons, our results suggest that this morphological pheno-
type may be part of an important strategy used by cut PCI
axons to regenerate across SCI sites.
Taken together, these observations raise the question:
What features of the highly branched arboreal terminal
Figure 10. Schematic representation of the CSPG environment
and axon growth/morphology changes from 7 days to 9 days
postaxotomy (black, axons; dark gray, somata). At 7 days most
axons terminate within the CSPG zone (upper axons). Between 7
and 9 days PCI axons continue to grow toward the contralateral
spinal cord and the mediolateral extent of the CSPG zone shrinks.
At 9 days some axons terminate outside of the CSPG zone; many
of these axons have compact terminal regions (middle axon). In
addition, at 9 days some axons have remained within the CSPG
zone and have regenerated across the midline; these axons have
highly branched arboreal terminals (lower axon).
K.K. Fenrich and P.K. Rose
3256 The Journal of Comparative Neurology |Research in Systems Neuroscience
regions allow them to navigate through CSPG-rich injury
sites?
Growth permissive vs. growth inhibitoryzones
In a previous study we postulated that PCI axons may
regenerate through CSPG-rich SCI sites using one, or a
combination of the following three mechanisms: PCI axons
1) are not inhibited by CSPGs; 2) have an unusually high
capacity for growth; or 3) are able to find the least inhibi-
tory path through zones with dense CSPG labeling (Fenrich
and Rose, 2009). In order for the third possibility to be true
the elongating terminal regions of PCI axons would have to
acquire information about its environment to identify the
path of least inhibition. Consistent with this idea, in our
present study we found that the axon terminals that had
regenerated the furthest toward and into the contralateral
spinal cord were those that were highly branched and were
thus well designed to sample large regions of the injured
spinal cord. Moreover, we observed that some of the termi-
nal and preterminal branches of these highly branched
axons were in close proximity to tube-like structures that
were densely stained for CSPGs, whereas other branches
were located in zones with less dense CSPG staining. These
observations suggest that at least some of the branches of
these axons are less likely to be inhibited by CSPGs than
other branches of the same axon. Whether this ability of
PCI axons to simultaneously sample large regions of the
injured spinal cord is also associated with a reduced
responsiveness to inhibitory molecules and/or with an
increased regenerative capacity remains to be determined.
One other possible reason why PCI axons can regener-
ate across midline lesions may be because the lesion site
and surrounding regions are permissive rather than inhibi-
tory to axonal regeneration. This idea stems from the find-
ings that in addition to releasing CSPGs, some astrocytes
can also support the growth of regenerating axons by pro-
ducing growth factors such as nerve growth factor (Goss
et al., 1998) and growth supportive substrates such as
laminin (Liesi, 1985; Liesi and Kauppila, 2002). The inhibi-
tory components of CSPGs are sulfated glycosaminogly-
can (GAG) chains attached to a protein core (Bradbury
et al., 2002; Rhodes and Fawcett, 2004). For this study
we stained CSPGs using CS-56 monoclonal antibodies
that specifically recognize the inhibitory GAG chains of
CSPGs (Avnur and Geiger, 1984). Thus, PCI axons must
traverse zones that contain molecules that are typically
inhibitory to regenerating axons. Nevertheless, we cannot
discount the possibility that there is a preferential upreg-
ulation of permissive factors that overcome the inhibitory
effects of CSPGs. This scenario is unlikely, since previous
studies have found that only astrocytes distal from SCI
sites are permissive to growth, and astrocytes within the
lesion core are inhibitory (Mansour et al., 1990; Davies
et al., 1999). Previous data have shown that the spinal
regions with dense CSPGs correspond to the regions with
reactive astrocytes and the lesion core (Davies et al.,
1999; Silver and Miller, 2004). For our study we found
high levels of CSPGs along, and surrounding, the midsa-
gittal lesion sites, indicating that these regions likely con-
tain predominantly inhibitory astrocytes.
Collectively, although we cannot discount the possibil-
ity that spinal midsagittal lesion sites contain some
growth-supporting substrates or growth-promoting cues,
CSPGs present an environment that prevents the growth
of some, but not all axons.
Significance for understandingregenerative mechanisms
This study provides compelling evidence that extensive
arboreal branching patterns are a common feature of PCI
axons that can successfully regenerate through SCI sites
and cross the injured midline at 7 and 9 days postinjury.
These structural correlates are the first step toward
understanding the mechanisms that allow cut PCI axons
to regenerate across spinal injury sites. Considering the
structural complexity of these terminal regions, with
some branches having progressed further toward the
contralateral spinal cord than others, or some closer to a
dense pocket of CSPG than others, one might hypothe-
size that the regenerative capacity of any one branch is
partially independent of the other branches. Such a sce-
nario implies that the molecular mechanisms governing
the regenerative capacity of an axon, as a whole, may be
conditional on the regenerative capacity of any given
branch at the terminal region of the axon. Together, these
interpretations suggest that understanding the molecular
mechanisms leading to successful regeneration must be
examined and interpreted in the context of their location
within the complex arbores of the axon terminal regions
rather than on a whole-cell basis.
ACKNOWLEDGMENTS
We thank Rob Maratta and Monica Neuber-Hess for
help with the CS-56 antibody control experiments. We
also thank Rebecca Cranham and Shauna Ketcheson for
help with animal care, surgeries, and data acquisition,
and Monica Neuber-Hess for help in conducting the
experiments.
LITERATURE CITEDAl Majed AA, Neumann CM, Brushart TM, Gordon T. 2000.
Brief electrical stimulation promotes the speed and accu-racy of motor axonal regeneration. J Neurosci 20:2602–2608.
Morphology of regenerating interneuron axons
The Journal of Comparative Neurology | Research in Systems Neuroscience 3257

Avnur Z, Geiger B. 1984. Immunocytochemical localization ofnative chondroitin-sulfate in tissues and cultured cellsusing specific monoclonal antibody. Cell 38:811–822.
Bradbury EJ, Moon LD, Popat RJ, King VR, Bennett GS, PatelPN, Fawcett JW, McMahon SB. 2002. Chondroitinase ABCpromotes functional recovery after spinal cord injury. Na-ture 416:636–640.
Davies SJA, Goucher DR, Doller C, Silver J. 1999. Robustregeneration of adult sensory axons in degenerating whitematter of the adult rat spinal cord. J Neurosci 19:5810–5822.
Dray C, Rougon G, Debarbieux F. 2009. Quantitative analysisby in vivo imaging of the dynamics of vascular and axonalnetworks in injured mouse spinal cord. Proc Natl Acad SciU S A 106:9459–9464.
Fenrich KK, Rose PK. 2009. Spinal interneuron axons sponta-neously regenerate after spinal cord injury in the adult fe-line. J Neurosci 29:12145–12158.
Fenrich KK, Skelton N, MacDermid VE, Meehan CF, ArmstrongS, Neuber-Hess MS, Rose PK. 2007. Axonal regenerationand development of de novo axons from distal dendritesof adult feline commissural interneurons after a proximalaxotomy. J Comp Neurol 502:1079–1097.
Goss JR, O’Malley ME, Zou L, Styren SD, Kochanek PM,DeKosky ST. 1998. Astrocytes are the major source ofnerve growth factor upregulation following traumatic braininjury in the rat. Exp Neurol 149:301–309.
Guttemann E, Guttmann L, Medawar PB, Young JZ. 1942. Therate of regeneration of nerve. J Exp Biol 19:14–44.
Halloran MC, Kalil K. 1994. Dynamic behaviors of growthcones extending in the corpus callosum of living corticalbrain slices observed with video microscopy. J Neurosci14:2161–2177.
Kim BG, Dai HN, Lynskey JV, McAtee M, Bregman BS. 2006.Degradation of chondroitin sulfate proteoglycans potenti-ates transplant-mediated axonal remodeling and functionalrecovery after spinal cord injury in adult rats. J Comp Neu-rol 497:182–198.
Li Y, Raisman G. 1994. Schwann-cells induce sprouting inmotor and sensory axons in the adult-rat spinal-cord.J Neurosci 14:4050–4063.
Li Y, Raisman G. 1995. Sprouts from cut corticospinal axonspersist in the presence of astrocytic scarring in long-termlesions of the adult-rat spinal-cord. Exp Neurol 134:102–111.
Liesi P. 1985. Laminin-immunoreactive glia distinguish regen-erative adult CNS systems from non-regenerative ones.EMBO J 4:2505–2511.
Liesi P, Kauppila T. 2002. Induction of type IV collagen andother basement-membrane-associated proteins after spinal
cord injury of the adult rat may participate in formation ofthe glial scar. Exp Neurol 173:31–45.
Linda H, Cullheim S, Risling M. 1992. A light and electron mi-croscopic study of intracellularly HRP-labeled lumbar moto-neurons after intramedullary axotomy in the adult cat. JComp Neurol 318:188–208.
Mansour H, Asher R, Dahl D, Labkovsky B, Perides G, Bignami A.1990. Permissive and non-permissive reactive astrocytes:immunofluorescence study with antibodies to the glial hyalu-ronate-binding protein. J Neurosci Res 25:300–311.
Mason CA, Wang LC. 1997. Growth cone form is behavior-specific and, consequently, position-specific along the reti-nal axon pathway. J Neurosci 17:1086–1100.
McKeon RJ, Schreiber RC, Rudge JS, Silver J. 1991. Reductionof neurite outgrowth in a model of glial scarring followingCNS injury is correlated with the expression of inhibitorymolecules on reactive astrocytes. J Neurosci 11:3398–3411.
Munyer PD, Schulte BA. 1991. Immunohistochemical identifi-cation of proteoglycans in gelatinous membranes of catand gerbil inner ear. Hear Res 52:369–378.
Ozaki HS, Wahlsten D. 1992. Prenatal formation of the normalmouse corpus callosum: a quantitative study with carbocy-anine dyes. J Comp Neurol 323:81–90.
Ramon Y Cajal S. 1959. Degeneration and regenerations ofthe nervous system. New York: Hafner.
Rhodes KE, Fawcett JW. 2004. Chondroitin sulphate proteogly-cans: preventing plasticity or protecting the CNS? J Anat204:33–48.
Risling M, Cullheim S, Hildebrand C. 1983. Reinnervation ofthe ventral root L7 from ventral horn neurons followingintramedullary axotomy in adult cats. Brain Res 280:15–23.
Rudge JS, Silver J. 1990. Inhibition of neurite outgrowth onastroglial scars in vitro. J Neurosci 10:3594–3603.
Silver J, Miller JH. 2004. Regeneration beyond the glial scar.Nat Rev Neurosci 5:146–156.
Steward O, Zheng B, Tessier-Lavigne M. 2003. False resurrec-tions: distinguishing regenerated from spared axons in theinjured central nervous system. J Comp Neurol 459:1–8.
Tom VJ, Steinmetz MP, Miller JH, Doller CM, Silver J. 2004.Studies on the development and behavior of the dystro-phic growth cone, the hallmark of regeneration failure, inan in vitro model of the glial scar and after spinal cordinjury. J Neurosci 24:6531–6539.
Tosney KW, Landmesser LT. 1985. Growth cone morphologyand trajectory in the lumbosacral region of the chick-embryo. J Neurosci 5:2345–2358.
Yiu G, He Z. 2006. Glial inhibition of CNS axon regeneration.Nat Rev Neurosci 7:617–627.
K.K. Fenrich and P.K. Rose
3258 The Journal of Comparative Neurology |Research in Systems Neuroscience