Awareness, acceptance of and willingness to buy genetically modified foods in Urban China
8
Research Report Awareness, acceptance of and willingness to buy genetically modified foods in Urban China Jikun Huang a, * , Huanguang Qiu a , Junfei Bai a , Carl Pray b a Institute of Geographical Sciences and Natural Resource Research (IGSNRR), Chinese Academy of Sciences (CAS), Center for Chinese Agricultural Policy, Jia 11, Datun Road, Beijing 100101, China b Department of Agricultural, Food, and Resource Economics, Rutgers University, 55 Dudley Road, New Brunswick, NJ 08901-8520, USA Received 20 April 2005; received in revised form 18 October 2005; accepted 15 November 2005 Abstract There is concern about the extent to which consumers will accept genetically modified (GM) foods if they are commercialized in China. The evidence from the existing literature is mixed and sometimes confusing. The objective of this study is to conduct a large in-depth face-to-face in- house survey that examines the consumers’ awareness, acceptance of and willingness to buy GM foods in China. To achieve this objective, a well- designed consumer survey was conducted in 11 cities of five provinces in Eastern China in 2002 and 2003. The results indicate that despite much less information on GM foods available publicly in China, more than two thirds of consumers in urban areas have heard of GM foods. But their knowledge on biotechnology was limited. Chinese consumers’ acceptance of and willingness to buy GM foods was much higher than in other countries. Chinese consumers also demonstrated great variance in their acceptance of different GM foods. Information and prices of GM foods were two important factors affecting consumers’ attitudes toward GM foods. Based on the findings of this study and given that our sample is in the more developed eastern Urban China, we conclude that the commercialization of GM foods is not likely to receive great resistance from the consumers in China. q 2005 Elsevier Ltd. All rights reserved. Keywords: Genetically modified foods; Awareness; Acceptance; China Introduction Worldwide studies showed that consumers’ concerns about genetically modified (GM) foods are rising and acceptance of GM foods varies among countries (Bredahl, 1999; Curtis, McCluskey, & Wahl, 2004; Gaskell, Bauer, Durant, & Allum, 1999). Many consumers in European countries and Japan have difficulty accepting GM foods (Hoban, 1997; Macer & Ng, 2000; Magnusson & Hursti, 2002; McCliskey & Wahl, 2003; Verdurme, Gellynck, & Viaene, 2001). However, the results of other studies show that the consumers are much less worried about GM foods in the US and many developing countries (Aerni, 2001; Gaskell et al., 1999; Hallman, Hebden, Auino, Cuite, & Lang, 2003). Consumers’ acceptance of GM food in US ranged from 59 (IFIC, 2004) to 50% (Hallman et al., 2003) but has declined slightly over time (Hallman, Hebden, Cuite, Auino, & Lang, 2004). The findings from several recent consumer surveys in China are mixed. On one extreme, a study in Guangzhou, Shanghai, and Beijing by Greenpeace (2004) claimed that GM foods were generally not accepted by Chinese consumers. On the other extreme, Li, Curtis, McCluskey, and Wahl (2003) and Zhang (2002) showed that Chinese consumers were willing to pay a premium for GM foods. Zhang (2002) showed that the majority of consumers in Tianjin city were willing to pay up to 20% extra. A survey in Beijing concluded that consumers, on average, were willing to pay a 38% premium for GM rice over non-GM rice (Li et al., 2003). There are also a number of recent surveys in different locations of China showing a large variation of consumer’s acceptance of GM foods ranging from about half in Tianjin (Wang, 2003) and Nanjing (Zhong, Marchant, Ding, & Lu, 2003) to about 80% in Beijing (Zhou & Tian, 2003). The uncertainty about Chinese consumers’ attitudes toward GM foods contributes to uncertainty for policy makers on how China should proceed with its future biotechnology policies in general and GM foods in particular. For example, although China has invested substantially in GM rice research and GM rice has been ready for commercialization since 2000 (Huang, Appetite 46 (2006) 144–151 www.elsevier.com/locate/appet 0195-6663/$ - see front matter q 2005 Elsevier Ltd. All rights reserved. doi:10.1016/j.appet.2005.11.005 * Corresponding author. E-mail address: [email protected] (J. Huang).
-
Upload
independent -
Category
Documents
-
view
1 -
download
0
Transcript of Awareness, acceptance of and willingness to buy genetically modified foods in Urban China
Research Report
Awareness, acceptance of and willingness to buy genetically modified foods
in Urban China
Jikun Huang a,*, Huanguang Qiu a, Junfei Bai a, Carl Pray b
a Institute of Geographical Sciences and Natural Resource Research (IGSNRR), Chinese Academy of Sciences (CAS), Center for Chinese Agricultural Policy, Jia 11,
Datun Road, Beijing 100101, Chinab Department of Agricultural, Food, and Resource Economics, Rutgers University, 55 Dudley Road, New Brunswick, NJ 08901-8520, USA
Received 20 April 2005; received in revised form 18 October 2005; accepted 15 November 2005
Abstract
There is concern about the extent to which consumers will accept genetically modified (GM) foods if they are commercialized in China. The
evidence from the existing literature is mixed and sometimes confusing. The objective of this study is to conduct a large in-depth face-to-face in-
house survey that examines the consumers’ awareness, acceptance of and willingness to buy GM foods in China. To achieve this objective, a well-
designed consumer survey was conducted in 11 cities of five provinces in Eastern China in 2002 and 2003. The results indicate that despite much
less information on GM foods available publicly in China, more than two thirds of consumers in urban areas have heard of GM foods. But their
knowledge on biotechnology was limited. Chinese consumers’ acceptance of and willingness to buy GM foods was much higher than in other
countries. Chinese consumers also demonstrated great variance in their acceptance of different GM foods. Information and prices of GM foods
were two important factors affecting consumers’ attitudes toward GM foods. Based on the findings of this study and given that our sample is in the
more developed eastern Urban China, we conclude that the commercialization of GM foods is not likely to receive great resistance from the
consumers in China.
q 2005 Elsevier Ltd. All rights reserved.
Keywords: Genetically modified foods; Awareness; Acceptance; China
Introduction
Worldwide studies showed that consumers’ concerns about
genetically modified (GM) foods are rising and acceptance of
GM foods varies among countries (Bredahl, 1999; Curtis,
McCluskey, & Wahl, 2004; Gaskell, Bauer, Durant, & Allum,
1999). Many consumers in European countries and Japan have
difficulty accepting GM foods (Hoban, 1997; Macer & Ng,
2000; Magnusson & Hursti, 2002; McCliskey & Wahl, 2003;
Verdurme, Gellynck, & Viaene, 2001). However, the results of
other studies show that the consumers are much less worried
about GM foods in the US and many developing countries
(Aerni, 2001; Gaskell et al., 1999; Hallman, Hebden, Auino,
Cuite, & Lang, 2003). Consumers’ acceptance of GM food in
US ranged from 59 (IFIC, 2004) to 50% (Hallman et al., 2003)
but has declined slightly over time (Hallman, Hebden, Cuite,
Auino, & Lang, 2004).
0195-6663/$ - see front matter q 2005 Elsevier Ltd. All rights reserved.
doi:10.1016/j.appet.2005.11.005
* Corresponding author.
E-mail address: [email protected] (J. Huang).
The findings from several recent consumer surveys in China
are mixed. On one extreme, a study in Guangzhou, Shanghai,
and Beijing by Greenpeace (2004) claimed that GM foods were
generally not accepted by Chinese consumers. On the other
extreme, Li, Curtis, McCluskey, and Wahl (2003) and Zhang
(2002) showed that Chinese consumers were willing to pay a
premium for GM foods. Zhang (2002) showed that the majority
of consumers in Tianjin city were willing to pay up to 20%
extra. A survey in Beijing concluded that consumers, on
average, were willing to pay a 38% premium for GM rice over
non-GM rice (Li et al., 2003). There are also a number of recent
surveys in different locations of China showing a large
variation of consumer’s acceptance of GM foods ranging
from about half in Tianjin (Wang, 2003) and Nanjing (Zhong,
Marchant, Ding, & Lu, 2003) to about 80% in Beijing (Zhou &
Tian, 2003).
The uncertainty about Chinese consumers’ attitudes toward
GM foods contributes to uncertainty for policy makers on how
China should proceed with its future biotechnology policies in
general and GM foods in particular. For example, although
China has invested substantially in GM rice research and GM
rice has been ready for commercialization since 2000 (Huang,
Appetite 46 (2006) 144–151
www.elsevier.com/locate/appet
Table 1
Characteristics of respondents in 2002 and 2003
2002 (nZ1005) 2003 (nZ666)
Mean Standard
deviation
Mean Standard
deviation
Household characteristics
Household size
(persons)
3.0 0.8 3.0 0.7
Monthly per capita
income (yuan)
844 416 952 469
Residing city (%):
Small city 30 46 30 46
Medium city 30 46 32 46
Large city 40 49 38 48
Respondents’ individual characteristics
Share of male (%) 41 49 41 49
Age (years) 47 12 47 12
Education (years) 11 3 11 3
Occupation (%):
Government 22 42 23 42
Enterprises 44 49 46 50
Unemployment 8 3 9 28
Retired and others 26 28 22 41
Roles in family food purchasing (%):
Primary role 58 49 60 49
Average role 12 32 12 33
Little or no role 30 46 28 45
Note: The sampled cities include two large cities (Beijing and Shanghai), three
medium cities (Ningbo of Zhejiang, Nanjing of Jiangsu, and Jinan of
Shandong), and six small cities (Dezhou and Weihai of Shandong, Yancheng
and Nantong of Jiangsu, and Shaoxing and Jinhua of Zhejiang).
J. Huang et al. / Appetite 46 (2006) 144–151 145
Hu, Rozelle, & Pray, 2004a), Chinese leaders have not decided
whether to allow production of GM rice in China or not. At the
same time, they have allowed imports of GM foods such as GM
soybeans and maize.
Understanding the consumers’ attitudes toward GM foods is
important not only to the decision makers, but also to the
biotechnology industry, food manufacturers, and food retailers.
Studies have shown that consumer resistance to GM foods has
changed food industry behavior and created substantial costs in
order to segment the GM foods from non-GM foods (Baker &
Burnham, 2001; Lin, Somwaru, Tuan, Huang & Bai, 2004;
Qaim, Krattiger, & Braun, 2000). Consequently, some of these
costs will be passed to the consumers regardless of whether
they reject or accept GM foods (Lin & Johnson, 2004).
China is an interesting case for several reasons. China is the
world’s most populous nation and has been one of the world
leaders in promoting agricultural biotechnology research
through public investment (Huang, Rozelle, Pray, & Wang,
2002). China’s final decision on whether it should commercia-
lize GM rice will greatly influence what the rest of Asia does
about GM food crops. The goal of this study is to conduct a
comprehensive survey of consumers’ attitudes toward GM
foods in Urban China.
The paper is organized as the follows. In Section 2, the
survey design and data collection process are described.
Chinese consumers’ awareness and understanding of GM
foods based on our survey are discussed in Section 3. Section 4
presents consumers’ acceptance of and willingness to buy GM
foods. Section 5 provides some concluding remarks.
Survey method and sample description
Previous studies are often limited by the size of their
samples and the way they selected the interviewees. Most
studies were conducted in one location or a small sample of
consumers. For example, Wang (2003) reported the results of
awareness and acceptance of GM food for 289 individuals in
one supermarket in Tianjin city. Zhang’s study (2002) covered
different locations ranging from supermarkets to open markets
and residential areas, but all 300 individuals were interviewed
on the streets in one city (Tianjin) with a very limited time for
the interviewees to response the questionnaires. Li et al. (2003)
had a relatively large sample size (599), but their survey was
also conducted on the streets. Greenpace’s study on Chinese
consumers’ attitude to GM food was based on a survey in three
big cites of China which conducted via telephone. Moreover,
all previous studies were conducted in the largest cities, which
may not be a good representation of China’s urban consumers.
Sampling and survey questionnaire
The sample used in this study is a sub-set of the Urban
Household Income and Expenditure’ survey (UHIE) conducted
by the National Bureau of Statistics of China (NBSC). NBSC’s
UHIE is a national survey consisted of about 250 thousand
randomly selected households across China. These data are the
official source of information on urban consumers’ income and
expenditure and have been widely used by scholars for
consumer food consumption studies. Normally, NBSC replaces
about one third of the sample each year.
Within UHIE’s sample, we applied a stratified random
sampling approach to choose our survey areas and households.
The stratified method was used to select the study areas to
ensure wide coverage of geographical locations, the level of
economic development and the size of cities. Based on this
sampling approach, we selected 11 cities in Northern and
Eastern China. They include two large cities (Beijing and
Shanghai), three medium cities (Ningbo, Nanjing, and Jinan),
and six small cities (Dezhou, Weihai, Yancheng, Nantong,
Shaoxing, and Jinhua). The total UHIE sample in these 11
cities is 2300, of which 1005 households were randomly
selected and all of them were permitted by the local statistical
bureaus for in-person, in-house, and face-to-face interviews in
2002. Each interview lasted for an average of about 1 h. In
2003, we went back to the same households for a second round
of interviews to see whether their attitudes toward GM foods
had been changed in the past year. Because NBSC replaced one
third of their samples in the study areas, among 1005
households we interviewed in 2002, we were only able to
find 666 households for interviews in 2003. The statistical tests
show that there is no significant difference in the households’
characteristics between the samples in 2002 and 2003 except
for income increased 13% in 2003 (Table 1).
We based our questionnaire on one developed by the Food
Policy Institute of Rutgers University. The survey
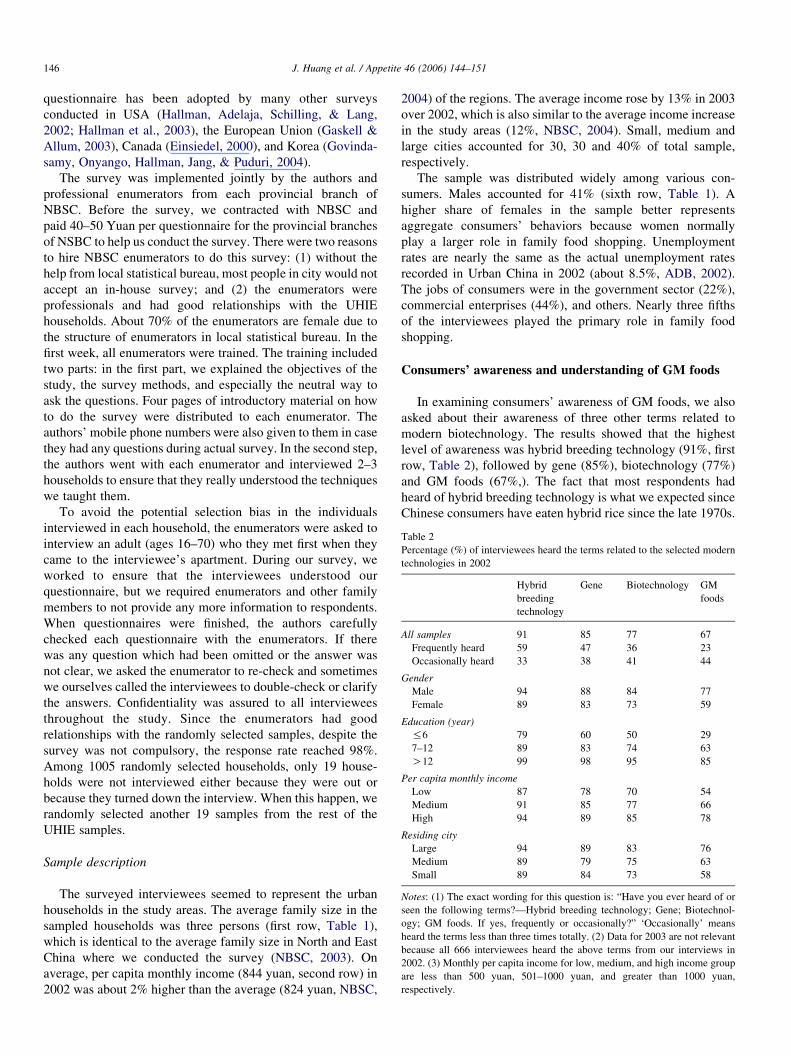
Table 2
Percentage (%) of interviewees heard the terms related to the selected modern
technologies in 2002
Hybrid
breeding
technology
Gene Biotechnology GM
foods
All samples 91 85 77 67
Frequently heard 59 47 36 23
Occasionally heard 33 38 41 44
Gender
Male 94 88 84 77
Female 89 83 73 59
Education (year)
%6 79 60 50 29
7–12 89 83 74 63
O12 99 98 95 85
Per capita monthly income
Low 87 78 70 54
Medium 91 85 77 66
High 94 89 85 78
Residing city
Large 94 89 83 76
Medium 89 79 75 63
Small 89 84 73 58
Notes: (1) The exact wording for this question is: “Have you ever heard of or
seen the following terms?—Hybrid breeding technology; Gene; Biotechnol-
ogy; GM foods. If yes, frequently or occasionally?” ‘Occasionally’ means
heard the terms less than three times totally. (2) Data for 2003 are not relevant
because all 666 interviewees heard the above terms from our interviews in
2002. (3) Monthly per capita income for low, medium, and high income group
are less than 500 yuan, 501–1000 yuan, and greater than 1000 yuan,
respectively.
J. Huang et al. / Appetite 46 (2006) 144–151146
questionnaire has been adopted by many other surveys
conducted in USA (Hallman, Adelaja, Schilling, & Lang,
2002; Hallman et al., 2003), the European Union (Gaskell &
Allum, 2003), Canada (Einsiedel, 2000), and Korea (Govinda-
samy, Onyango, Hallman, Jang, & Puduri, 2004).
The survey was implemented jointly by the authors and
professional enumerators from each provincial branch of
NBSC. Before the survey, we contracted with NBSC and
paid 40–50 Yuan per questionnaire for the provincial branches
of NSBC to help us conduct the survey. There were two reasons
to hire NBSC enumerators to do this survey: (1) without the
help from local statistical bureau, most people in city would not
accept an in-house survey; and (2) the enumerators were
professionals and had good relationships with the UHIE
households. About 70% of the enumerators are female due to
the structure of enumerators in local statistical bureau. In the
first week, all enumerators were trained. The training included
two parts: in the first part, we explained the objectives of the
study, the survey methods, and especially the neutral way to
ask the questions. Four pages of introductory material on how
to do the survey were distributed to each enumerator. The
authors’ mobile phone numbers were also given to them in case
they had any questions during actual survey. In the second step,
the authors went with each enumerator and interviewed 2–3
households to ensure that they really understood the techniques
we taught them.
To avoid the potential selection bias in the individuals
interviewed in each household, the enumerators were asked to
interview an adult (ages 16–70) who they met first when they
came to the interviewee’s apartment. During our survey, we
worked to ensure that the interviewees understood our
questionnaire, but we required enumerators and other family
members to not provide any more information to respondents.
When questionnaires were finished, the authors carefully
checked each questionnaire with the enumerators. If there
was any question which had been omitted or the answer was
not clear, we asked the enumerator to re-check and sometimes
we ourselves called the interviewees to double-check or clarify
the answers. Confidentiality was assured to all interviewees
throughout the study. Since the enumerators had good
relationships with the randomly selected samples, despite the
survey was not compulsory, the response rate reached 98%.
Among 1005 randomly selected households, only 19 house-
holds were not interviewed either because they were out or
because they turned down the interview. When this happen, we
randomly selected another 19 samples from the rest of the
UHIE samples.
Sample description
The surveyed interviewees seemed to represent the urban
households in the study areas. The average family size in the
sampled households was three persons (first row, Table 1),
which is identical to the average family size in North and East
China where we conducted the survey (NBSC, 2003). On
average, per capita monthly income (844 yuan, second row) in
2002 was about 2% higher than the average (824 yuan, NBSC,
2004) of the regions. The average income rose by 13% in 2003
over 2002, which is also similar to the average income increase
in the study areas (12%, NBSC, 2004). Small, medium and
large cities accounted for 30, 30 and 40% of total sample,
respectively.
The sample was distributed widely among various con-
sumers. Males accounted for 41% (sixth row, Table 1). A
higher share of females in the sample better represents
aggregate consumers’ behaviors because women normally
play a larger role in family food shopping. Unemployment
rates are nearly the same as the actual unemployment rates
recorded in Urban China in 2002 (about 8.5%, ADB, 2002).
The jobs of consumers were in the government sector (22%),
commercial enterprises (44%), and others. Nearly three fifths
of the interviewees played the primary role in family food
shopping.
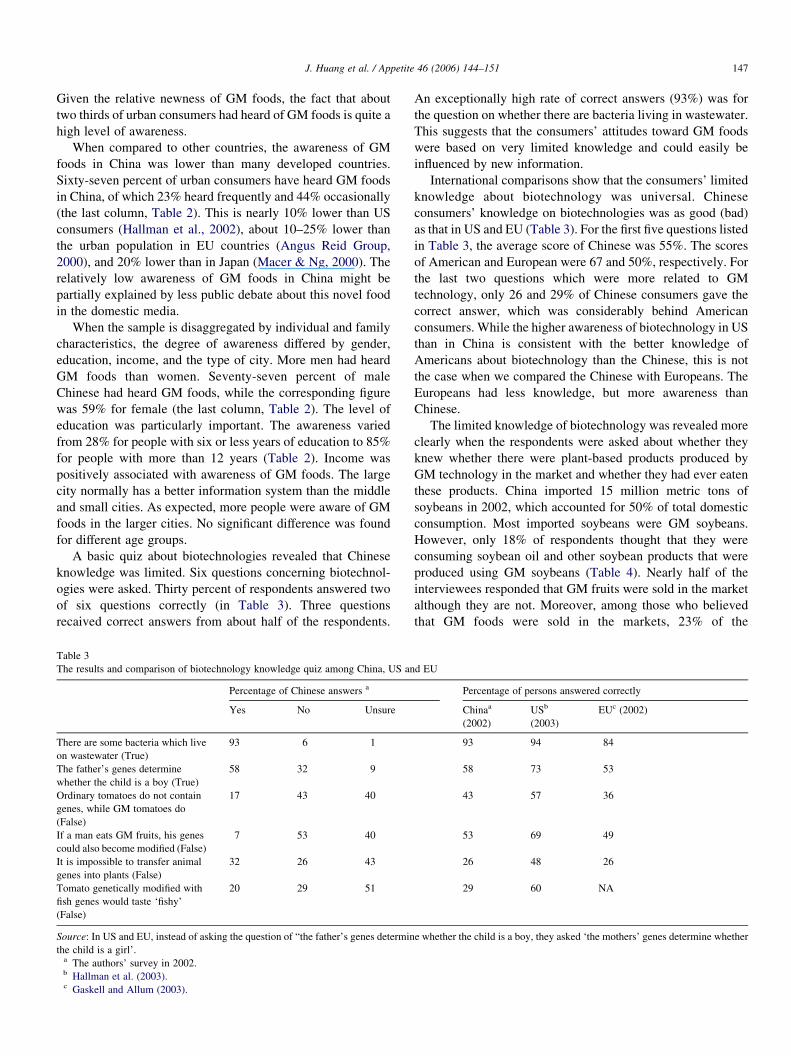
Consumers’ awareness and understanding of GM foods
In examining consumers’ awareness of GM foods, we also
asked about their awareness of three other terms related to
modern biotechnology. The results showed that the highest
level of awareness was hybrid breeding technology (91%, first
row, Table 2), followed by gene (85%), biotechnology (77%)
and GM foods (67%,). The fact that most respondents had
heard of hybrid breeding technology is what we expected since
Chinese consumers have eaten hybrid rice since the late 1970s.
J. Huang et al. / Appetite 46 (2006) 144–151 147
Given the relative newness of GM foods, the fact that about
two thirds of urban consumers had heard of GM foods is quite a
high level of awareness.
When compared to other countries, the awareness of GM
foods in China was lower than many developed countries.
Sixty-seven percent of urban consumers have heard GM foods
in China, of which 23% heard frequently and 44% occasionally
(the last column, Table 2). This is nearly 10% lower than US
consumers (Hallman et al., 2002), about 10–25% lower than
the urban population in EU countries (Angus Reid Group,
2000), and 20% lower than in Japan (Macer & Ng, 2000). The
relatively low awareness of GM foods in China might be
partially explained by less public debate about this novel food
in the domestic media.
When the sample is disaggregated by individual and family
characteristics, the degree of awareness differed by gender,
education, income, and the type of city. More men had heard
GM foods than women. Seventy-seven percent of male
Chinese had heard GM foods, while the corresponding figure
was 59% for female (the last column, Table 2). The level of
education was particularly important. The awareness varied
from 28% for people with six or less years of education to 85%
for people with more than 12 years (Table 2). Income was
positively associated with awareness of GM foods. The large
city normally has a better information system than the middle
and small cities. As expected, more people were aware of GM
foods in the larger cities. No significant difference was found
for different age groups.
A basic quiz about biotechnologies revealed that Chinese
knowledge was limited. Six questions concerning biotechnol-
ogies were asked. Thirty percent of respondents answered two
of six questions correctly (in Table 3). Three questions
recaived correct answers from about half of the respondents.
Table 3
The results and comparison of biotechnology knowledge quiz among China, US an
Percentage of Chinese answers a
Yes No Unsure
There are some bacteria which live
on wastewater (True)
93 6 1
The father’s genes determine
whether the child is a boy (True)
58 32 9
Ordinary tomatoes do not contain
genes, while GM tomatoes do
(False)
17 43 40
If a man eats GM fruits, his genes
could also become modified (False)
7 53 40
It is impossible to transfer animal
genes into plants (False)
32 26 43
Tomato genetically modified with
fish genes would taste ‘fishy’
(False)
20 29 51
Source: In US and EU, instead of asking the question of “the father’s genes determin
the child is a girl’.a The authors’ survey in 2002.b Hallman et al. (2003).c Gaskell and Allum (2003).
An exceptionally high rate of correct answers (93%) was for
the question on whether there are bacteria living in wastewater.
This suggests that the consumers’ attitudes toward GM foods
were based on very limited knowledge and could easily be
influenced by new information.
International comparisons show that the consumers’ limited
knowledge about biotechnology was universal. Chinese
consumers’ knowledge on biotechnologies was as good (bad)
as that in US and EU (Table 3). For the first five questions listed
in Table 3, the average score of Chinese was 55%. The scores
of American and European were 67 and 50%, respectively. For
the last two questions which were more related to GM
technology, only 26 and 29% of Chinese consumers gave the
correct answer, which was considerably behind American
consumers. While the higher awareness of biotechnology in US
than in China is consistent with the better knowledge of
Americans about biotechnology than the Chinese, this is not
the case when we compared the Chinese with Europeans. The
Europeans had less knowledge, but more awareness than
Chinese.
The limited knowledge of biotechnology was revealed more
clearly when the respondents were asked about whether they
knew whether there were plant-based products produced by
GM technology in the market and whether they had ever eaten
these products. China imported 15 million metric tons of
soybeans in 2002, which accounted for 50% of total domestic
consumption. Most imported soybeans were GM soybeans.
However, only 18% of respondents thought that they were
consuming soybean oil and other soybean products that were
produced using GM soybeans (Table 4). Nearly half of the
interviewees responded that GM fruits were sold in the market
although they are not. Moreover, among those who believed
that GM foods were sold in the markets, 23% of the
d EU
Percentage of persons answered correctly
Chinaa
(2002)
USb
(2003)
EUc (2002)
93 94 84
58 73 53
43 57 36
53 69 49
26 48 26
29 60 NA
e whether the child is a boy, they asked ‘the mothers’ genes determine whether
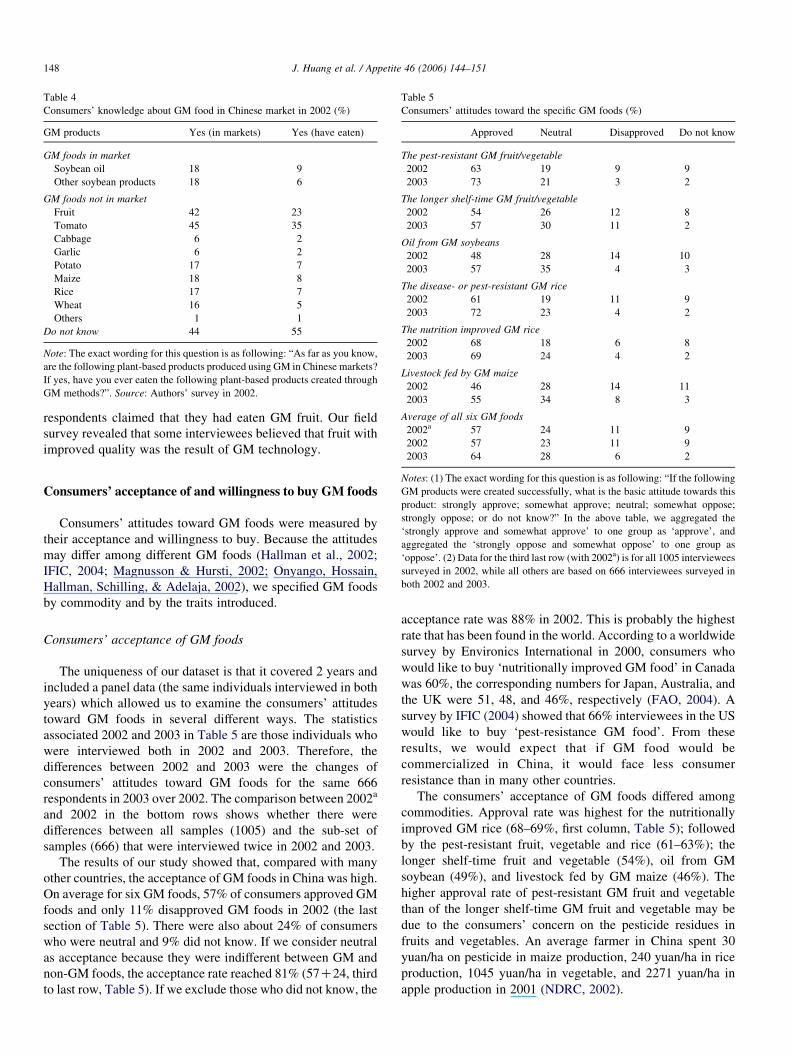
Table 5
Consumers’ attitudes toward the specific GM foods (%)
Approved Neutral Disapproved Do not know
The pest-resistant GM fruit/vegetable
2002 63 19 9 9
2003 73 21 3 2
The longer shelf-time GM fruit/vegetable
2002 54 26 12 8
2003 57 30 11 2
Oil from GM soybeans
2002 48 28 14 10
2003 57 35 4 3
The disease- or pest-resistant GM rice
2002 61 19 11 9
2003 72 23 4 2
The nutrition improved GM rice
2002 68 18 6 8
2003 69 24 4 2
Livestock fed by GM maize
2002 46 28 14 11
2003 55 34 8 3
Average of all six GM foods
2002a 57 24 11 9
2002 57 23 11 9
2003 64 28 6 2
Table 4
Consumers’ knowledge about GM food in Chinese market in 2002 (%)
GM products Yes (in markets) Yes (have eaten)
GM foods in market
Soybean oil 18 9
Other soybean products 18 6
GM foods not in market
Fruit 42 23
Tomato 45 35
Cabbage 6 2
Garlic 6 2
Potato 17 7
Maize 18 8
Rice 17 7
Wheat 16 5
Others 1 1
Do not know 44 55
Note: The exact wording for this question is as following: “As far as you know,
are the following plant-based products produced using GM in Chinese markets?
If yes, have you ever eaten the following plant-based products created through
GM methods?”. Source: Authors’ survey in 2002.
J. Huang et al. / Appetite 46 (2006) 144–151148
respondents claimed that they had eaten GM fruit. Our field
survey revealed that some interviewees believed that fruit with
improved quality was the result of GM technology.
Notes: (1) The exact wording for this question is as following: “If the following
GM products were created successfully, what is the basic attitude towards this
product: strongly approve; somewhat approve; neutral; somewhat oppose;
strongly oppose; or do not know?” In the above table, we aggregated the
‘strongly approve and somewhat approve’ to one group as ‘approve’, and
aggregated the ‘strongly oppose and somewhat oppose’ to one group as
‘oppose’. (2) Data for the third last row (with 2002a) is for all 1005 interviewees
surveyed in 2002, while all others are based on 666 interviewees surveyed in
both 2002 and 2003.
Consumers’ acceptance of and willingness to buy GM foods
Consumers’ attitudes toward GM foods were measured by
their acceptance and willingness to buy. Because the attitudes
may differ among different GM foods (Hallman et al., 2002;
IFIC, 2004; Magnusson & Hursti, 2002; Onyango, Hossain,
Hallman, Schilling, & Adelaja, 2002), we specified GM foods
by commodity and by the traits introduced.
Consumers’ acceptance of GM foods
The uniqueness of our dataset is that it covered 2 years and
included a panel data (the same individuals interviewed in both
years) which allowed us to examine the consumers’ attitudes
toward GM foods in several different ways. The statistics
associated 2002 and 2003 in Table 5 are those individuals who
were interviewed both in 2002 and 2003. Therefore, the
differences between 2002 and 2003 were the changes of
consumers’ attitudes toward GM foods for the same 666
respondents in 2003 over 2002. The comparison between 2002a
and 2002 in the bottom rows shows whether there were
differences between all samples (1005) and the sub-set of
samples (666) that were interviewed twice in 2002 and 2003.
The results of our study showed that, compared with many
other countries, the acceptance of GM foods in China was high.
On average for six GM foods, 57% of consumers approved GM
foods and only 11% disapproved GM foods in 2002 (the last
section of Table 5). There were also about 24% of consumers
who were neutral and 9% did not know. If we consider neutral
as acceptance because they were indifferent between GM and
non-GM foods, the acceptance rate reached 81% (57C24, third
to last row, Table 5). If we exclude those who did not know, the
acceptance rate was 88% in 2002. This is probably the highest
rate that has been found in the world. According to a worldwide
survey by Environics International in 2000, consumers who
would like to buy ‘nutritionally improved GM food’ in Canada
was 60%, the corresponding numbers for Japan, Australia, and
the UK were 51, 48, and 46%, respectively (FAO, 2004). A
survey by IFIC (2004) showed that 66% interviewees in the US
would like to buy ‘pest-resistance GM food’. From these
results, we would expect that if GM food would be
commercialized in China, it would face less consumer
resistance than in many other countries.
The consumers’ acceptance of GM foods differed among
commodities. Approval rate was highest for the nutritionally
improved GM rice (68–69%, first column, Table 5); followed
by the pest-resistant fruit, vegetable and rice (61–63%); the
longer shelf-time fruit and vegetable (54%), oil from GM
soybean (49%), and livestock fed by GM maize (46%). The
higher approval rate of pest-resistant GM fruit and vegetable
than of the longer shelf-time GM fruit and vegetable may be
due to the consumers’ concern on the pesticide residues in
fruits and vegetables. An average farmer in China spent 30
yuan/ha on pesticide in maize production, 240 yuan/ha in rice
production, 1045 yuan/ha in vegetable, and 2271 yuan/ha in
apple production in 2001 (NDRC, 2002).
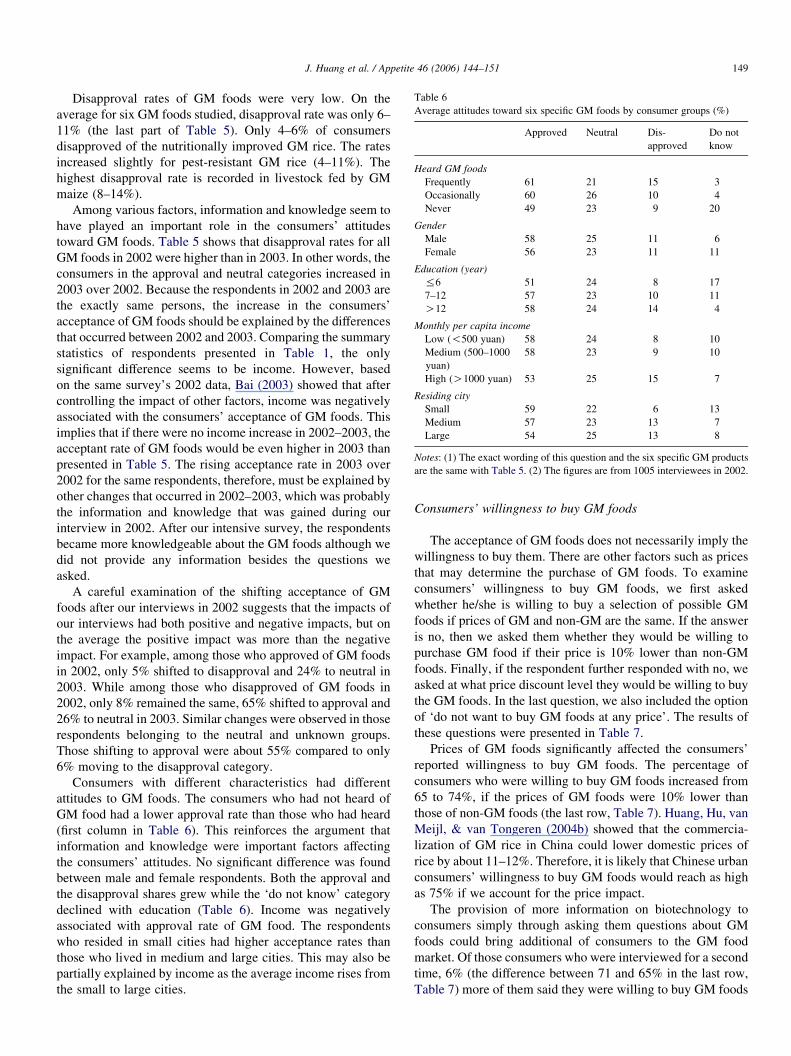
Table 6
Average attitudes toward six specific GM foods by consumer groups (%)
Approved Neutral Dis-
approved
Do not
know
Heard GM foods
Frequently 61 21 15 3
Occasionally 60 26 10 4
Never 49 23 9 20
Gender
Male 58 25 11 6
Female 56 23 11 11
Education (year)
%6 51 24 8 17
7–12 57 23 10 11
O12 58 24 14 4
Monthly per capita income
Low (!500 yuan) 58 24 8 10
Medium (500–1000
yuan)
58 23 9 10
High (O1000 yuan) 53 25 15 7
Residing city
Small 59 22 6 13
Medium 57 23 13 7
Large 54 25 13 8
Notes: (1) The exact wording of this question and the six specific GM products
are the same with Table 5. (2) The figures are from 1005 interviewees in 2002.
J. Huang et al. / Appetite 46 (2006) 144–151 149
Disapproval rates of GM foods were very low. On the
average for six GM foods studied, disapproval rate was only 6–
11% (the last part of Table 5). Only 4–6% of consumers
disapproved of the nutritionally improved GM rice. The rates
increased slightly for pest-resistant GM rice (4–11%). The
highest disapproval rate is recorded in livestock fed by GM
maize (8–14%).
Among various factors, information and knowledge seem to
have played an important role in the consumers’ attitudes
toward GM foods. Table 5 shows that disapproval rates for all
GM foods in 2002 were higher than in 2003. In other words, the
consumers in the approval and neutral categories increased in
2003 over 2002. Because the respondents in 2002 and 2003 are
the exactly same persons, the increase in the consumers’
acceptance of GM foods should be explained by the differences
that occurred between 2002 and 2003. Comparing the summary
statistics of respondents presented in Table 1, the only
significant difference seems to be income. However, based
on the same survey’s 2002 data, Bai (2003) showed that after
controlling the impact of other factors, income was negatively
associated with the consumers’ acceptance of GM foods. This
implies that if there were no income increase in 2002–2003, the
acceptant rate of GM foods would be even higher in 2003 than
presented in Table 5. The rising acceptance rate in 2003 over
2002 for the same respondents, therefore, must be explained by
other changes that occurred in 2002–2003, which was probably
the information and knowledge that was gained during our
interview in 2002. After our intensive survey, the respondents
became more knowledgeable about the GM foods although we
did not provide any information besides the questions we
asked.
A careful examination of the shifting acceptance of GM
foods after our interviews in 2002 suggests that the impacts of
our interviews had both positive and negative impacts, but on
the average the positive impact was more than the negative
impact. For example, among those who approved of GM foods
in 2002, only 5% shifted to disapproval and 24% to neutral in
2003. While among those who disapproved of GM foods in
2002, only 8% remained the same, 65% shifted to approval and
26% to neutral in 2003. Similar changes were observed in those
respondents belonging to the neutral and unknown groups.
Those shifting to approval were about 55% compared to only
6% moving to the disapproval category.
Consumers with different characteristics had different
attitudes to GM foods. The consumers who had not heard of
GM food had a lower approval rate than those who had heard
(first column in Table 6). This reinforces the argument that
information and knowledge were important factors affecting
the consumers’ attitudes. No significant difference was found
between male and female respondents. Both the approval and
the disapproval shares grew while the ‘do not know’ category
declined with education (Table 6). Income was negatively
associated with approval rate of GM food. The respondents
who resided in small cities had higher acceptance rates than
those who lived in medium and large cities. This may also be
partially explained by income as the average income rises from
the small to large cities.
Consumers’ willingness to buy GM foods
The acceptance of GM foods does not necessarily imply the
willingness to buy them. There are other factors such as prices
that may determine the purchase of GM foods. To examine
consumers’ willingness to buy GM foods, we first asked
whether he/she is willing to buy a selection of possible GM
foods if prices of GM and non-GM are the same. If the answer
is no, then we asked them whether they would be willing to
purchase GM food if their price is 10% lower than non-GM
foods. Finally, if the respondent further responded with no, we
asked at what price discount level they would be willing to buy
the GM foods. In the last question, we also included the option
of ‘do not want to buy GM foods at any price’. The results of
these questions were presented in Table 7.
Prices of GM foods significantly affected the consumers’
reported willingness to buy GM foods. The percentage of
consumers who were willing to buy GM foods increased from
65 to 74%, if the prices of GM foods were 10% lower than
those of non-GM foods (the last row, Table 7). Huang, Hu, van
Meijl, & van Tongeren (2004b) showed that the commercia-
lization of GM rice in China could lower domestic prices of
rice by about 11–12%. Therefore, it is likely that Chinese urban
consumers’ willingness to buy GM foods would reach as high
as 75% if we account for the price impact.
The provision of more information on biotechnology to
consumers simply through asking them questions about GM
foods could bring additional of consumers to the GM food
market. Of those consumers who were interviewed for a second
time, 6% (the difference between 71 and 65% in the last row,
Table 7) more of them said they were willing to buy GM foods
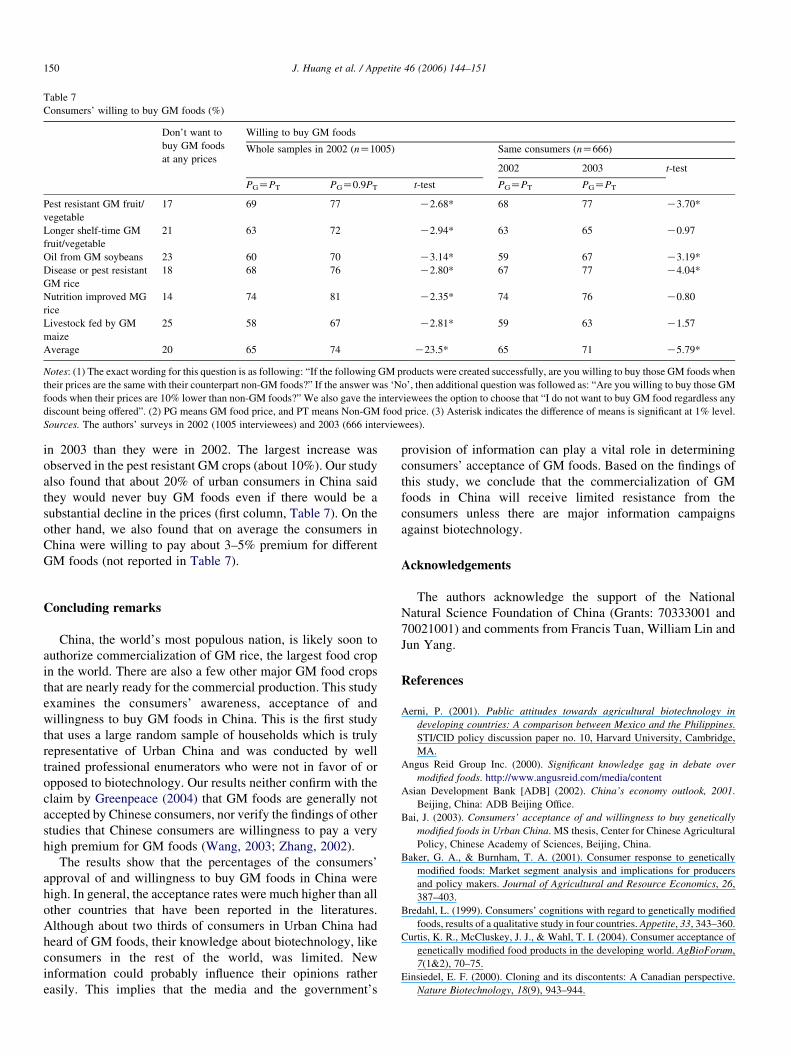
Table 7
Consumers’ willing to buy GM foods (%)
Don’t want to
buy GM foods
at any prices
Willing to buy GM foods
Whole samples in 2002 (nZ1005) Same consumers (nZ666)
2002 2003 t-test
PGZPT PGZ0.9PT t-test PGZPT PGZPT
Pest resistant GM fruit/
vegetable
17 69 77 K2.68* 68 77 K3.70*
Longer shelf-time GM
fruit/vegetable
21 63 72 K2.94* 63 65 K0.97
Oil from GM soybeans 23 60 70 K3.14* 59 67 K3.19*
Disease or pest resistant
GM rice
18 68 76 K2.80* 67 77 K4.04*
Nutrition improved MG
rice
14 74 81 K2.35* 74 76 K0.80
Livestock fed by GM
maize
25 58 67 K2.81* 59 63 K1.57
Average 20 65 74 K23.5* 65 71 K5.79*
Notes: (1) The exact wording for this question is as following: “If the following GM products were created successfully, are you willing to buy those GM foods when
their prices are the same with their counterpart non-GM foods?” If the answer was ‘No’, then additional question was followed as: “Are you willing to buy those GM
foods when their prices are 10% lower than non-GM foods?” We also gave the interviewees the option to choose that “I do not want to buy GM food regardless any
discount being offered”. (2) PG means GM food price, and PT means Non-GM food price. (3) Asterisk indicates the difference of means is significant at 1% level.
Sources. The authors’ surveys in 2002 (1005 interviewees) and 2003 (666 interviewees).
J. Huang et al. / Appetite 46 (2006) 144–151150
in 2003 than they were in 2002. The largest increase was
observed in the pest resistant GM crops (about 10%). Our study
also found that about 20% of urban consumers in China said
they would never buy GM foods even if there would be a
substantial decline in the prices (first column, Table 7). On the
other hand, we also found that on average the consumers in
China were willing to pay about 3–5% premium for different
GM foods (not reported in Table 7).
Concluding remarks
China, the world’s most populous nation, is likely soon to
authorize commercialization of GM rice, the largest food crop
in the world. There are also a few other major GM food crops
that are nearly ready for the commercial production. This study
examines the consumers’ awareness, acceptance of and
willingness to buy GM foods in China. This is the first study
that uses a large random sample of households which is truly
representative of Urban China and was conducted by well
trained professional enumerators who were not in favor of or
opposed to biotechnology. Our results neither confirm with the
claim by Greenpeace (2004) that GM foods are generally not
accepted by Chinese consumers, nor verify the findings of other
studies that Chinese consumers are willingness to pay a very
high premium for GM foods (Wang, 2003; Zhang, 2002).
The results show that the percentages of the consumers’
approval of and willingness to buy GM foods in China were
high. In general, the acceptance rates were much higher than all
other countries that have been reported in the literatures.
Although about two thirds of consumers in Urban China had
heard of GM foods, their knowledge about biotechnology, like
consumers in the rest of the world, was limited. New
information could probably influence their opinions rather
easily. This implies that the media and the government’s
provision of information can play a vital role in determining
consumers’ acceptance of GM foods. Based on the findings of
this study, we conclude that the commercialization of GM
foods in China will receive limited resistance from the
consumers unless there are major information campaigns
against biotechnology.
Acknowledgements
The authors acknowledge the support of the National
Natural Science Foundation of China (Grants: 70333001 and
70021001) and comments from Francis Tuan, William Lin and
Jun Yang.
References
Aerni, P. (2001). Public attitudes towards agricultural biotechnology in
developing countries: A comparison between Mexico and the Philippines.
STI/CID policy discussion paper no. 10, Harvard University, Cambridge,
MA.
Angus Reid Group Inc. (2000). Significant knowledge gag in debate over
modified foods. http://www.angusreid.com/media/content
Asian Development Bank [ADB] (2002). China’s economy outlook, 2001.
Beijing, China: ADB Beijing Office.
Bai, J. (2003). Consumers’ acceptance of and willingness to buy genetically
modified foods in Urban China. MS thesis, Center for Chinese Agricultural
Policy, Chinese Academy of Sciences, Beijing, China.
Baker, G. A., & Burnham, T. A. (2001). Consumer response to genetically
modified foods: Market segment analysis and implications for producers
and policy makers. Journal of Agricultural and Resource Economics, 26,
387–403.
Bredahl, L. (1999). Consumers’ cognitions with regard to genetically modified
foods, results of a qualitative study in four countries. Appetite, 33, 343–360.
Curtis, K. R., McCluskey, J. J., & Wahl, T. I. (2004). Consumer acceptance of
genetically modified food products in the developing world. AgBioForum,
7(1&2), 70–75.
Einsiedel, E. F. (2000). Cloning and its discontents: A Canadian perspective.
Nature Biotechnology, 18(9), 943–944.
J. Huang et al. / Appetite 46 (2006) 144–151 151
FAO (Food and Agricultural Organization of the United Nations). (2004). State
of food and agriculture 2003–2004. Available at: http://www.fao.org/
documents
Gaskell, G., & Allum, N. (2003). Europeans and biotechnology in 2002.
Eurobarometer 58.0. DG research, European Commission.
Gaskell, G., Bauer, M. W., Durant, J., & Allum, N. C. (1999). Worlds apart?
The reception of genetically modified foods in Europe and the US. Science,
16, 384–387.
Govindasamy, R., Onyango, B., Hallman, W., Jang, Ho-Min, & Puduri, V.
(2004). Public approval of plant and animal biotechnology in Korea:
An ordered probit analysis. Food Policy Institute working WP1104-
016.
Greenpeace. (2004). Public’s perception of genetically engineered food:
Summary of report. Available at: http://www.greenpeace.org.hk
Hallman, W. K., Adelaja, A. O., Schilling, B. J., & Lang, J. T. (2002). Public
perceptions of genetically modified foods: Americans know not what they
eat. Food Policy Institute, Cook College, Rutgers, the State University of
New Jersey, New Brunswick, NJ. Available at: http://www.foodpolicyin-
stitute.org
Hallman, W. K., Hebden, W. C., Auino, H. L., Cuite, C. L., & Lang, J. T.
(2003). Public perceptions of genetically modified foods: National study of
Americans knowledge and opinion. Food Policy Institute, Cook College,
Rutgers, the State University of New Jersey, New Brunswick, NJ. Available
at: www.foodpolicyinstitute.org
Hallman, W. K., Hebden, W. C., Cuite, C. L., Auino, H. L., & Lang, J. T.
(2004). Americans and GM food: Knowledge, opinion & interest in 2004.
Food Policy Institute, Cook College, Rutgers, the State University of
New Jersey, New Brunswick, NJ. Available at: http://www.foodpolicyin-
stitute.org
Hoban, T. J. (1997). Consumer acceptance of biotechnology: An international
perspective. Nature Biotechnology, 15, 232–234.
Huang, J., Hu, R., Rozelle, S., & Pray, C. (2004a). GM rice in farmer
fields: Assessing productivity and health effects in China. Working
paper, Center for Chinese Agricultural Policy, Chinese Academy of
Sciences.
Huang, J., Hu, R., van Meijl, H., & van Tongeren, F. (2004b). Biotechnology
boosts to crop productivity in China: Trade and welfare implications.
Journal of Development Economics, 75, 27–54.
Huang, J., Rozelle, S., Pray, C., & Wang, Q. (2002). Plant biotechnology in
China. Science, 295, 674–677.
IFIC [International Food Information Council] (2004). Support for food
biotechnology stable despite news on unrelated food safety issues.
Available at: http://ific.org/research/biotechres03.cfm
Li, Q., Curtis, K. R., McCluskey, J. J., &Wahl, T. I. (2003). Consumer attitudes
toward genetically modified foods in Beijing, China. AgBioForum, 5(4),
145–152.
Lin, W., & Johnson, D. (2004). Segregation of non-biotech corn and soybeans:
Who bears the cost?. In R. E. Evenson, & V. Santeniello (Eds.), The
regulation of agricultural biotechnology (pp. 221–230). Wallingford:
CABI Publishing.
Lin, W., Somwaru, A., Tuan, F., Huang, J., & Bai, J. (2004). Consumer
attitudes toward biotech foods in China. Working paper, US Department of
Agriculture, Economics Research Service.
Macer, D., & Ng, M. A. C. (2000). Changing attitudes to biotechnology in
Japan. Nature Biotechnology, 18, 945–947.
Magnusson, M. K., & Hursti, U. K. (2002). Consumer attitudes towards
genetically modified foods. Appetite, 39, 9–24.
McCliskey, J., & Wahl, T. (2003). Reacting to GM foods: Consumer response
in Asia and Europe. IMPACT highlights. International Marketing Program
for Agricultural Commodities and Trade, College of Agriculture And Home
Economics, Washington State University.
NBSC [National Bureau of Statistics of China] (2001–2003). China population
statistics yearbook. Beijing: China Statistics Press.
NBSC [National Bureau of Statistics of China] (2004). National economic and
scoical development statistical brief 2002. Beijing: China Statistics Press.
NDRC [National Development and Reform Commission] (2002). National
agricultural production cost and benefit material. Beijing: China Statistics
Press.
Onyango, B., Hossain, F., Hallman, W., Schilling, B., & Adelaja, A. (2002).
Public perception of food biotechnology: Uncovering factors driving
consumer acceptance of genetically modified food. Paper presented at the
43rd annual conference of The Food Distribution Research Society, Miami,
FL.
Qaim, M., Krattiger, A. M., & Braun, J. V. (2000). Agricultural biotechnology
in developing countries: Towards optimizing the benefits for the poor.
Boston, MA: Kluwer Academic Publishers.
Verdurme, Annelies, Gellynck, Xavier, & Viaene, Jacques (2001). Consumer’s
acceptance of GM food. Paper presented at the 71st EAAE Seminar on ‘The
Food Consumer in the Early 21st Century’, Zaragoza, Spain, April 19–20.
Wang, Zhigang (2003). Knowledge of food safety and consumption decision:
An empirical study on consumer in Tianjing, China. China Rural Economy,
4, 41–48.
Zhang, Xiaoyong (2002). Chinese consumers’ concerns over food safety.
Working paper, Agricultural Economics Institute, Hague, The Netherlands.
Available at: http://mailman.greenpeace.org/mailman/listinfo/press-
releases
Zhong, F., Marchant, M., Ding, Y., & Lu, K. (2003). GM foods: A Nanjing case
study of Chinese consumers’ awareness and potential attitudes. AgBio-
Forum, 5(4), 136–144.
Zhou, F., & Tian, W. (2003). Consumer perceptions and attitudes toward
genetically modified foods and their determinants: A Beijing case study.
China Agricultural Economic Review, 1(3), 266–293.