
Autonomous Control for a Reliable Internet of Services
416
Autonomous Control for a Reliable Internet of Services State-of-the-Art Survey LNCS 10768 Methods, Models, Approaches, Techniques, Algorithms, and Tools Ivan Ganchev R. D. van der Mei Hans van den Berg (Eds.)
-
Upload
khangminh22 -
Category
Documents
-
view
0 -
download
0
Transcript of Autonomous Control for a Reliable Internet of Services
Autonomous Control for a Reliable Internet of Services
Stat
e-of
-the-
Art
Surv
eyLN
CS 1
0768
Methods, Models, Approaches, Techniques,Algorithms, and Tools
Ivan GanchevR. D. van der MeiHans van den Berg (Eds.)
Lecture Notes in Computer Science 10768
Commenced Publication in 1973Founding and Former Series Editors:Gerhard Goos, Juris Hartmanis, and Jan van Leeuwen
Editorial Board
David HutchisonLancaster University, Lancaster, UK
Takeo KanadeCarnegie Mellon University, Pittsburgh, PA, USA
Josef KittlerUniversity of Surrey, Guildford, UK
Jon M. KleinbergCornell University, Ithaca, NY, USA
Friedemann MatternETH Zurich, Zurich, Switzerland
John C. MitchellStanford University, Stanford, CA, USA
Moni NaorWeizmann Institute of Science, Rehovot, Israel
C. Pandu RanganIndian Institute of Technology Madras, Chennai, India
Bernhard SteffenTU Dortmund University, Dortmund, Germany
Demetri TerzopoulosUniversity of California, Los Angeles, CA, USA
Doug TygarUniversity of California, Berkeley, CA, USA
Gerhard WeikumMax Planck Institute for Informatics, Saarbrücken, Germany

More information about this series at http://www.springer.com/series/7411
Ivan Ganchev • R. D. van der MeiHans van den Berg (Eds.)
Autonomous Controlfor a Reliable Internetof ServicesMethods, Models, Approaches, Techniques,Algorithms, and Tools

EditorsIvan GanchevUniversity of LimerickLimerickIreland
R. D. van der MeiCentrum Wiskunde and InformaticaAmsterdamThe Netherlands
Hans van den BergTNOThe HagueThe Netherlands
ISSN 0302-9743 ISSN 1611-3349 (electronic)Lecture Notes in Computer ScienceISBN 978-3-319-90414-6 ISBN 978-3-319-90415-3 (eBook)https://doi.org/10.1007/978-3-319-90415-3
Library of Congress Control Number: 2018941550
LNCS Sublibrary: SL5 – Computer Communication Networks and Telecommunications
Acknowledgement and DisclaimerThe work published in this book is supported by the European Union under the EU Horizon 2020 FrameworkProgram and especially the COST Action IC1304 “Autonomous Control for a Reliable Internet of Services(ACROSS).” The book reflects only the authors’ views. Neither the COST Association nor any person actingon its behalf is responsible for the use, which might be made of the information contained in this publication.The COST Association is not responsible for external Web sites referred to in this publication.
© The Editor(s) (if applicable) and The Author(s) 2018. This book is an open access publication.Open Access This book is licensed under the terms of the Creative Commons Attribution 4.0 InternationalLicense (http://creativecommons.org/licenses/by/4.0/), which permits use, sharing, adaptation, distributionand reproduction in any medium or format, as long as you give appropriate credit to the original author(s) andthe source, provide a link to the Creative Commons license and indicate if changes were made.The images or other third party material in this book are included in the book’s Creative Commons license,unless indicated otherwise in a credit line to the material. If material is not included in the book’s CreativeCommons license and your intended use is not permitted by statutory regulation or exceeds the permitted use,you will need to obtain permission directly from the copyright holder.The use of general descriptive names, registered names, trademarks, service marks, etc. in this publicationdoes not imply, even in the absence of a specific statement, that such names are exempt from the relevantprotective laws and regulations and therefore free for general use.The publisher, the authors and the editors are safe to assume that the advice and information in this book arebelieved to be true and accurate at the date of publication. Neither the publisher nor the authors or the editorsgive a warranty, express or implied, with respect to the material contained herein or for any errors oromissions that may have been made. The publisher remains neutral with regard to jurisdictional claims inpublished maps and institutional affiliations.
Printed on acid-free paper
This Springer imprint is published by the registered company Springer International Publishing AGpart of Springer NatureThe registered company address is: Gewerbestrasse 11, 6330 Cham, Switzerland
COST
This publication is based upon work from COST Action IC1304 “Autonomous Controlfor a Reliable Internet of Services (ACROSS)” supported by COST (EuropeanCooperation in Science and Technology).
COST (European Cooperation in Science and Technology) is a funding agency forresearch and innovation networks. Our Actions help connect research initiatives acrossEurope and enable scientists to grow their ideas by sharing them with their peers. Thisboosts their research, career and innovation.
www.cost.eu

Foreword
This book was prepared to play the role of a publication and dissemination platformof the technical aspects of the Final Report of the COST Action IC1304 “AutonomousControl for a Reliable Internet of Services (ACROSS)” that has run for four years, fromFall 2013 until Fall 2017. COST (European Cooperation in Science and Technology) isan EU funding agency for research and innovation networks that enables researchers toset up their interdisciplinary networks in Europe and beyond. In particular, the maingoal of the COST Action ACROSS was to create a European network of experts,aiming at the development of monitoring and autonomous control methods for areliable and quality-aware future Internet of Services (IoS). As usual for COSTActions, the collaboration within ACROSS proceeded on the basis of a Memorandumof Understanding (MoU) setting out its main objectives and technical scope.
The relevance of the IoS paradigm has been emphasized by the rapid developmentsregarding network softwarization (SDN, NFV, dew-, fog-, edge-, and cloud computing,etc.) in the course of the Action. This has raised many new research challenges and theneed for the development of new methods to ensure the reliability of services offeredvia the IoS.
ACROSS has attracted many researchers. It has consistently grown over the yearsand has evolved into a powerful eco-system that consists of over 100 internationalexperts from 31 European countries, where both academia and industry are wellrepresented.
To support the realization of the Action’s main goals, we have organizedsemi-annual Management Committee (MC) meetings and co-located technical meet-ings, open international workshops on dedicated research topics within the Action’sscope, and international Summer Schools for training of PhD students and otherearly-stage researchers (ESR) in the field. In addition, ACROSS has also funded manyso-called short-term scientific missions (STSM) to enable short international researchvisits.
This book contains chapters written by various groups of co-authors that cover abroad range of research challenges and topics addressed by them during the course

of the Action. We emphasize that the range of topics is based on the preferences andresearch interests of the members of these different groups.
The Action has been successful in establishing many new Pan-European researchcollaborations, and has boosted the career of a large number of participants. This bookis the product of a fruitful informal collaboration, and we hope that it will be receivedin the same spirit that motivated its co-authors.
March 2018 Ivan GanchevR. D. van der MeiHans van den Berg
VIII Foreword
Preface
The explosive growth of the Internet has fundamentally changed global society. Theemergence of concepts like service-oriented architecture (SOA), software as a service(SaaS), platform as a service (PaaS), infrastructure as a service (IaaS), network as aservice (NaaS), and cloud computing in general has catalyzed the migration from theinformation-oriented Internet to an Internet of Services (IoS). This has opened upvirtually unbounded possibilities for the creation of new and innovative services thatfacilitate business processes and improve the quality of life. However, this also calls fornew approaches to ensure quality and reliability of these services. To overcome currentshortcomings, a huge number of research challenges have to be addressed in this area,ranging from the initial conceptualization and modelling, to the elaboration of suitableapproaches, techniques, and algorithms, and to the development of suitable tools andthe elaboration of realistic use-case scenarios by also taking into account correspondingsocietal and economical aspects.
The objective of this book is, by applying a systematic approach, to assess the stateof the art and consolidate the main research results achieved in this area. It wasprepared as a final publication of the COST Action IC1304 “Autonomous Control for aReliable Internet of Services (ACROSS).” The book contains 14 chapters and is ashowcase of the main outcomes of the Action in line with its scientific goals. The bookcan serve as a valuable reference for undergraduate students, postgraduate students,educators, faculty members, researchers, engineers, and research strategists working inthis field.
The book chapters were collected through an open, but selective, three-stagesubmission/review process. An open call for contributions was distributed among theCOST ACROSS community in October 2016. In order to ensure a good book quality,reduce the overlap, and increase the level of synergy between different research groupsworking on similar problems, the leaders of the Task Forces, established withinACROSS, were asked to coordinate and consolidate the initial chapter proposals. As aresult, a total of 17 extended abstracts were received in response to the call. These werereviewed by the book editors and their authors were invited to the next stage offull-chapter submission. At the end of this stage, 15 full-chapter proposals werereceived by the set deadline. All submitted chapters were peer-reviewed by indepen-dent reviewers (including reviewers outside the COST Action ACROSS), appointed bythe book editors, and after the first round of reviews 14 chapters remained. These wereduly revised according to the reviewers’ comments, suggestions, notes, etc. and finallywere accepted for publication in this book.
The first chapter entitled “State of the Art and Research Challenges in the Area ofAutonomous Control for a Reliable Internet of Services” serves as an introduction tothis book. For this, it first analyzes the state of the art in the area of autonomous controlfor a reliable IoS and then identifies the main research challenges within it. A generalbackground and high-level description of the current state of knowledge are presented.

Then, for each of the three subareas – autonomous management and real-time control,methods and tools for monitoring and service prediction, and smart pricing andcompetition in multi-domain systems – a brief general introduction and background arepresented, and a list of key research challenges is formulated.
The second chapter, “Context Monitoring for Improved System Performance andQoE,” is focused on the potential of enhancing the quality of experience (QoE) man-agement mechanisms by exploiting valuable context information. First, a generalframework for context monitoring is discussed along with the context information,including technical, usage, social, economic, temporal, and physical factors. Thenopportunities, challenges, and benefits of including context in the QoE monitoring andmanagement are considered. The benefits are demonstrated through use cases involvingvideo flash crowds, and online and cloud gaming. Finally, potential technical real-izations of context-aware QoE monitoring and management, based on the softwaredefined networking (SDN) paradigm, are discussed.
The concept of QoE management is also treated in the next chapter “QoE Man-agement for Future Networks,” which provides an introduction to this concept bydiscussing its origins and key terms, and gives an overview of the most relevantexisting theoretical frameworks. Promising technical approaches to QoE-driven man-agement, provided across different layers of the networking stack, are also discussedalong with an outlook on the future of the QoE management with a focus on the keyenablers that are essential for ultimate transfiguration of the QoE-aware network andapplication management into reality.
Staying on the same note, the chapter “Scalable Traffic Quality and System EfficiencyIndicators Towards Overall Telecommunication System’s QoE Management” delves intothe conceptual and analytical models of overall telecommunication systems, and thedefinition of scalable indicators on each system level for QoS monitoring and prediction,and toward QoE management. Two network cost/quality integral criteria are proposed –
mean and instantaneous – along with illustrative numerical predictions of the latter, whichcould be used for dynamic execution of pricing policies, depending on the network load.
The next chapter “Lag Compensation for First-Person Shooter Games in CloudGaming” continues by exploring the impact of latency, known as lag, on QoE forso-called first-person shooter cloud games. The authors, firstly, describe their approachfor lag compensation, based on real-time equalization (within reason) of the uplink anddownlink delays for all game players. Secondly, they describe the testbed (theopen-source Gaming Anywhere platform), the use of the network time protocol(NTP) to synchronize time, the network emulator, and the role of the centralized logserver. At the end the authors present results, validating their approach, along withsmall-scale and preliminary subjective tests for assessing its performance, and concludethe chapter by outlining ongoing and future work.
This is followed by the chapter entitled “The Value of Context-Awareness inBandwidth-Challenging HTTP Adaptive Streaming Scenarios,” which analyzes anadaptive streaming technology, based on the hypertext transfer protocol (HTTP), whichadapts the video reproduction to the current prevailing network conditions. Particularly,the authors study how context awareness can be combined with the adaptive streaminglogic to design a proactive context-aware client-based video streaming strategy,showing promising results for successful mitigation of video stalling due to network
X Preface

connectivity problems. The authors analyze the performance of this strategy by com-paring it with the optimal case, as well as by considering situations where contextawareness lacks reliability.
The next chapter, entitled “Conceptual and Analytical Models for Predicting theQuality of Service of Overall Telecommunication Systems,” presents scalable con-ceptual and analytical performance models of overall telecommunication systems,allowing the prediction of multiple quality of service (QoS) indicators as functionsof the user and network behavior. The authors consider two conceptual model pre-sentation structures along with an analytical method for conversion between them, andpropose corresponding additive and multiplicative metrics for practical use. An ana-lytical model, allowing the prediction of flow, time, and traffic characteristics of theoverall network performance, is elaborated. Differentiated QoS indicators, as well asanalytical expressions for their prediction, are proposed. The results demonstrate theability of the proposed model to facilitate a more precise dynamic QoS management aswell as to predict some QoE indicators.
The chapter “QoS-Based Elasticity for Service Chains in Distributed Edge CloudEnvironments” is focused on elasticity as a dominant system engineering attribute forproviding QoS-aware services to users by the emerging Internet of Things (IoT) andcloud-based networked systems relying heavily on virtualization technologies. Eventhough the concept of elasticity can introduce significant QoS and cost benefits, indistributed systems with several layers of abstraction, controlling the elasticity in acentralized manner could strongly penalize scalability. To address this problem, theauthors propose an approach of splitting the system in autonomous subsystems, whichimplement elasticity mechanisms and run control policies in a decentralized manner,and coordinate elasticity decisions that collectively improve the overall system per-formance. The authors’ focus is on design choices that may affect the elasticityproperties. For this, an overview of some decentralized design patterns, related to thecoordination of elasticity decisions, is provided as well.
The next chapter “Integrating SDN and NFV with QoS-aware Service Composition”provides an overview of QoS-aware strategies that can be used at the networkabstraction levels aiming to fully exploit the new network opportunities of full inte-gration of heterogeneous hardware and software functions, configured at runtime, with aminimal time-to-market cycle, provided to end-users on a “as a service” basis. Morespecifically, the authors present three use cases of integrating SDN and network functionvirtualization (NFV) technologies with QoS-aware service composition, ranging fromthe energy-efficient placement of virtual network functions inside modern data centers,to the deployment of data stream processing applications using SDN to control thenetwork paths, and to exploiting SDN for context-aware service compositions.
By stating that energy awareness and capability to deliver multimedia content withdifferent possible combinations of quality and cost require complex optimizationframeworks, the chapter “Energy vs. QoX Network- and Cloud Services Management”emphasizes that it is necessary to define more flexible paradigms by taking into accountother design parameters, such as energy, and by considering these as tuneable variablesplaying a vital role in the adaptation mechanisms. The authors briefly introduce mostcommonly used frameworks for multi-criteria optimization and evaluate these underdifferent “energy vs. quality of anything (QoX)” sample scenarios. Finally, the current
Preface XI

status of related network management tools is described in order to identify possibleapplication areas.
The next chapter “Traffic Management for Cloud Federation” provides a survey onarchitectures for cloud federation and describes corresponding standardization activi-ties, before proposing a comprehensive five-level model for traffic management forcloud federations, providing specific methods and algorithms at each level. Theeffectiveness of the proposed solutions is verified by using simulation and analyticalmethods. A specialized simulator for testing cloud-federation solutions within an IoTenvironment is described at the end of the chapter.
By arguing that most of the distributed systems simulators are either too detailed ornot extensible enough to support the modelled IoT devices, and hence problematic toapply in the newly emerging IoT domain, the chapter “Efficient Simulation of IoTCloud Use Cases” shows how generic IoT sensors could be modelled in a state-of-the-art simulator using a derived generalized IoT use case. A validation of theapplicability of the introduced IoT extension with fitness and meteorological use casescompletes the chapter.
Considering the IoT as one of the main building blocks of the future IoS, the nextchapter “Security of Internet of Things for a Reliable Internet of Services” shifts thefocus on the security of IoT, which could successfully contribute to achieving a highlyreliable IoS by preventing, detecting, or mitigating autonomously attacks against it. Theauthors review the characteristics of IoT environments, cryptography-based securitymechanisms and (distributed) denial of service (D/DoS) attacks targeting IoT networks.Moreover, they extensively analyze the intrusion detection and mitigation mechanismsproposed for IoT and evaluate these from various points of view. Open research issuesfor more reliable and available IoT and IoS are discussed at the end of the chapter.
The final chapter “TCP Performance over Current Cellular Access: A Compre-hensive Analysis” moves from the area of services into the area of underlying com-munication protocols. More specifically, it treats unresolved questions and problemsregarding the interaction between the transmission control protocol (TCP) and mobilebroadband technologies such as the long-term evolution (LTE). To this end, the chaptercollects the behavior of distinct TCP implementations (both loss-based and delay-based) under various network conditions in different LTE deployments and comparesthem in terms of the achieved throughput and utilization of radio resources.
The book editors wish to thank all reviewers for their excellent and rigorousreviewing work, as well as their responsiveness during the critical stages to consolidatethe contributions provided by the authors. We are most grateful to all authors who haveentrusted their excellent work, the fruits of many years’ research in each case, to us andfor their patience and continued demanding revision work in response to reviewers’feedback. We also thank them for adjusting their chapters to the specific book templateand style requirements, completing all the bureaucratic but necessary paperwork, andmeeting all the publishing deadlines.
March 2018 Ivan GanchevR. D. van der MeiHans van den Berg
XII Preface

Organization
Reviewers
Luigi Atzori University of Cagliari, ItalySabina Barakovic University of Sarajevo, American University in Bosnia
and HerzegovinaJoost Bosman Centrum Wiskunde & Informatica (CWI), The NetherlandsRasa Bruzgiene Kaunas University of Technology, LithuaniaWojciech Burakowski Warsaw University of Technology, PolandPantelis Frangoudis EURECOM, FranceTihana Galinac Grbac University of Rijeka, CroatiaIvan Ganchev University of Limerick, Ireland; University of Plovdiv
“Paisii Hilendarski”, Bulgaria; Institute of Mathematicsand Informatics, Bulgarian Academy of Sciences,Bulgaria
Rossitza Goleva New Bulgarian University, BulgariaTobias Hossfeld University of Duisburg-Essen, GermanyJyrki Huusko VTT Technical Research Centre of Finland Ltd., FinlandAttila Kertesz University of Szeged, HungaryPhilipp Leitner University of Zurich, SwitzerlandEirini Liotou National and Kapodistrian University of Athens, GreeceSeferin Mirtchev Technical University of Sofia, BulgariaEdmundo Monteiro University of Coimbra, PortugalPeter Pocta University of Zilina, SlovakiaStoyan Poryazov Institute of Mathematics and Informatics,
Bulgarian Academy of Sciences, BulgariaJavier Sainz Innovati, SpainMichael Seufert University of Würzburg, GermanyVasilios Siris Athens University of Economics and Business, GreeceHalina Tarasiuk Warsaw University of Technology, PolandPhuoc Tran-Gia University of Würzburg, GermanyDenis Trcek University of Ljubljana, SloveniaBoris Tsankov Technical University of Sofia, BulgariaAleksandar Tsenov Technical University of Sofia, BulgariaKurt Tutschku BTH, SwedenMassimo Villari University of Messina, ItalyKatarzyna Wac University of Geneva, SwitzerlandFlorian Wamser University of Würzburg, GermanyAndrej Zgank University of Maribor, Slovenia

Contents
State of the Art and Research Challenges in the Area of AutonomousControl for a Reliable Internet of Services . . . . . . . . . . . . . . . . . . . . . . . . . 1
Rob van der Mei, Hans van den Berg, Ivan Ganchev, Kurt Tutschku,Philipp Leitner, Pasi Lassila, Wojciech Burakowski, Fidel Liberal,Åke Arvidsson, Tobias Ho�feld, Katarzyna Wac, Hugh Melvin,Tihana Galinac Grbac, Yoram Haddad, and Peter Key
Context Monitoring for Improved System Performance and QoE. . . . . . . . . . 23Florian Metzger, Tobias Hoßfeld, Lea Skorin-Kapov, Yoram Haddad,Eirini Liotou, Peter Pocta, Hugh Melvin, Vasilios A. Siris, Andrej Zgank,and Michael Jarschel
QoE Management for Future Networks . . . . . . . . . . . . . . . . . . . . . . . . . . . 49Raimund Schatz, Susanna Schwarzmann, Thomas Zinner,Ognjen Dobrijevic, Eirini Liotou, Peter Pocta, Sabina Barakovic,Jasmina Barakovic Husic, and Lea Skorin-Kapov
Scalable Traffic Quality and System Efficiency Indicators TowardsOverall Telecommunication System’s QoE Management . . . . . . . . . . . . . . . 81
Stoyan Poryazov, Emiliya Saranova, and Ivan Ganchev
Lag Compensation for First-Person Shooter Games in Cloud Gaming . . . . . . 104Zhi Li, Hugh Melvin, Rasa Bruzgiene, Peter Pocta, Lea Skorin-Kapov,and Andrej Zgank
The Value of Context-Awareness in Bandwidth-Challenging HTTPAdaptive Streaming Scenarios. . . . . . . . . . . . . . . . . . . . . . . . . . . . . . . . . . 128
Eirini Liotou, Tobias Hoßfeld, Christian Moldovan, Florian Metzger,Dimitris Tsolkas, and Nikos Passas
Conceptual and Analytical Models for Predicting the Quality of Serviceof Overall Telecommunication Systems . . . . . . . . . . . . . . . . . . . . . . . . . . . 151
Stoyan Poryazov, Emiliya Saranova, and Ivan Ganchev
QoS-Based Elasticity for Service Chains in Distributed EdgeCloud Environments . . . . . . . . . . . . . . . . . . . . . . . . . . . . . . . . . . . . . . . . 182
Valeria Cardellini, Tihana Galinac Grbac, Matteo Nardelli,Nikola Tanković, and Hong-Linh Truong
Integrating SDN and NFV with QoS-Aware Service Composition . . . . . . . . . 212Valeria Cardellini, Tihana Galinac Grbac, Andreas Kassler,Pradeeban Kathiravelu, Francesco Lo Presti, Antonio Marotta,Matteo Nardelli, and Luís Veiga

Energy vs. QoX Network- and Cloud Services Management. . . . . . . . . . . . . 241Bego Blanco, Fidel Liberal, Pasi Lassila, Samuli Aalto, Javier Sainz,Marco Gribaudo, and Barbara Pernici
Traffic Management for Cloud Federation . . . . . . . . . . . . . . . . . . . . . . . . . 269Wojciech Burakowski, Andrzej Beben, Hans van den Berg,Joost W. Bosman, Gerhard Hasslinger, Attila Kertesz, Steven Latre,Rob van der Mei, Tamas Pflanzner, Patrick Gwydion Poullie,Maciej Sosnowski, Bart Spinnewyn, and Burkhard Stiller
Efficient Simulation of IoT Cloud Use Cases . . . . . . . . . . . . . . . . . . . . . . . 313Andras Markus, Andre Marques, Gabor Kecskemeti, and Attila Kertesz
Security of Internet of Things for a Reliable Internet of Services. . . . . . . . . . 337Ahmet Arış, Sema F. Oktuğ, and Thiemo Voigt
TCP Performance over Current Cellular Access:A Comprehensive Analysis . . . . . . . . . . . . . . . . . . . . . . . . . . . . . . . . . . . 371
Eneko Atxutegi, Åke Arvidsson, Fidel Liberal, Karl-Johan Grinnemo,and Anna Brunstrom
Author Index . . . . . . . . . . . . . . . . . . . . . . . . . . . . . . . . . . . . . . . . . . . . 401
XVI Contents
State of the Art and Research Challengesin the Area of Autonomous Controlfor a Reliable Internet of Services
Rob van der Mei1, Hans van den Berg2(&), Ivan Ganchev3,4,5 ,Kurt Tutschku6, Philipp Leitner7, Pasi Lassila8,
Wojciech Burakowski9, Fidel Liberal10, Åke Arvidsson11,Tobias Hobfeld12, Katarzyna Wac13, Hugh Melvin14,
Tihana Galinac Grbac15, Yoram Haddad16, and Peter Key17
1 Centrum Wiskunde & Informatica (CWI),Science Park 123, 1098 XG Amsterdam, Netherlands
[email protected] TNO, Anna van Buerenplein 1, 2595 DA Den Haag, Netherlands
[email protected] University of Limerick, Limerick, Ireland
[email protected] University of Plovdiv “Paisii Hilendarski”, Plovdiv, Bulgaria
5 Institute of Mathematics and Informatics, Bulgarian Academy of Sciences,Sofia, Bulgaria
6 Blekinge Institute of Technology (BTH),Campus Grasvik, 37179 Karlskrona, Sweden
[email protected] University of Zurich, Binzmühlestrasse 14, 8050 Zurich, Switzerland
[email protected] Aalto University, 00076 Espoo, Finland
[email protected] Institute of Telecommunications, Warsaw University of Technology,
15/19 Nowowiejska Str., 00-665 Warsaw, [email protected]
10 University of the Basque Country (UPV/EHU), ETSI de Bilbao,Alameda Urquijo s/n, 48013 Bilbao, Spain
[email protected] Kristianstad University, Elmetorpsvagen 15, 29188 Kristianstad, Sweden
[email protected] Institute of Computer Science and Business Information Systems (ICB),
Schutzenbahn 70, 45127 Essen, [email protected]
13 University of Geneva, SES 7, route de Drize, Carouge,1227 Geneva, Switzerland
[email protected] National University of Ireland - Galway, Galway, Ireland
[email protected] University of Rijeka, Vukovarska 58, 51 000 Rijeka, Croatia
© The Author(s) 2018I. Ganchev et al. (Eds.): Autonomous Control for a Reliable Internet of Services, LNCS 10768, pp. 1–22, 2018.https://doi.org/10.1007/978-3-319-90415-3_1
16 JCT-Lev Academic Center, Guivat Mordehai Neighborhood, PO BOX 16031,91160 Jerusalem, [email protected]
17 Microsoft Research Ltd., Roger Needham Building, 7 J J Thomson Avenue,Cambridge, UK
Abstract. The explosive growth of the Internet has fundamentally changed theglobal society. The emergence of concepts like service-oriented architecture(SOA), Software as a Service (SaaS), Platform as a Service (PaaS), Infrastruc-ture as a Service (IaaS), Network as a Service (NaaS) and Cloud Computing ingeneral has catalyzed the migration from the information-oriented Internet intoan Internet of Services (IoS). This has opened up virtually unbounded possi-bilities for the creation of new and innovative services that facilitate businessprocesses and improve the quality of life. However, this also calls for newapproaches to ensuring quality and reliability of these services. The goal of thisbook chapter is to first analyze the state-of-the-art in the area of autonomouscontrol for a reliable IoS and then to identify the main research challenges withinit. A general background and high-level description of the current state ofknowledge is presented. Then, for each of the three subareas, namely theautonomous management and real-time control, methods and tools for moni-toring and service prediction, and smart pricing and competition inmulti-domain systems, a brief general introduction and background are pre-sented, and a list of key research challenges is formulated.
Keywords: Internet of Services (IoS) � Autonomous controlAutonomous management � Service monitoring � Service predictionSmart pricing
1 Introduction
Today, we are witnessing a paradigm shift from the traditional information-orientedInternet into an Internet of Services (IoS). This transition opens up virtually unboundedpossibilities for creating and deploying new services. Eventually, the Information andCommunication Technologies (ICT) landscape will migrate into a global system wherenew services are essentially large-scale service chains, combining and integrating thefunctionality of (possibly huge) numbers of other services offered by third parties,including cloud services. At the same time, as our modern society is becoming moreand more dependent on ICT, these developments raise the need for effective means toensure quality and reliability of the services running in such a complex environment.
Motivated by this, the EU COST Action IC1304 “Autonomous Control for aReliable Internet of Services (ACROSS)” has been established to create a Europeannetwork of experts, from both academia and industry, aiming at the development ofautonomous control methods and algorithms for a reliable and quality-aware IoS.
The goal of this chapter is to identify the main scientific challenges faced during thecourse of the COST Action ACROSS. To this end, a general background and a
2 R. van der Mei et al.

high-level description of the current state of knowledge are first provided. Then, foreach of the Action’s three working groups (WGs), a brief introduction and backgroundinformation are provided, followed by a list of key research topics pursued during theAction’s lifetime, along with their short description.
2 General Background and Current State of Knowledge
The explosive growth of the Internet has fundamentally changed the global society.The emergence of concepts like service-oriented architecture (SOA), Software as aService (SaaS), Platform as a Service (PaaS), Infrastructure as a Service (IaaS) andCloud Computing has catalyzed the migration from the information-oriented Internetinto an IoS. Together with the Network as a Service (NaaS) concept, enabled throughemerging network softwarization techniques (like SDN and NFV), this has opened upvirtually unbounded possibilities for the creation of new and innovative services thatfacilitate business processes and improve the quality of life. As a consequence, modernsocieties and economies are and will become even more heavily dependent on ICT.Failures and outages of ICT-based services (e.g., financial transactions, Web-shopping,governmental services, generation and distribution of sustainable energy) may causeeconomic damage and affect people’s trust in ICT. Therefore, providing reliable androbust ICT services (resistant against system failures, cyber-attacks, high-load andoverload situations, flash crowds, etc.) is crucial for our economy at large. Moreover, inthe competitive markets of ICT service offerings, it is of great importance for serviceproviders to be able to realize short time-to-market and to deliver services at sharpprice-quality ratios. These observations make the societal and economic importance ofreliable Internet services evident.
A fundamental characteristic of the IoS is that services combine and integratefunctionalities of other services. This has led to complex service chains with possiblyeven hundreds of services offered by different third parties, each with their own businessincentives. In current practice, service quality of composite services is usually controlledon an ad-hoc basis, while the consequences of failures in service chains are not wellunderstood. The problem is that, although such an approach might work for smallservice chains, this will become useless for future complex global-scale service chains.
Over the past few years, significant research has been devoted to controllingQuality of Service (QoS) and Quality of Experience (QoE) for IoS. To this end, muchprogress has been made at the functional layer of QoS-architectures and frameworks,and system development for the IoS. However, relatively little attention has been paidto the development, evaluation and optimization of algorithms for autonomous controlthat can deal with the growing scale and complexity of the involved service chains. Inthis context, the main goal of the COST Action ACROSS was to bring thestate-of-the-art on autonomous control to the next level by developing quantitativemethods and algorithms for autonomous control for a reliable IoS.
In the area of quantitative control methods the main focus has been on ‘traditional’controls for QoS provisioning at the network layer and lower layers. In this context, itis important to note that control methods for the IoS also operate at the higher protocollayers and typically involve a multitude of administrative domains. As such, these
State of the Art and Research Challenges in the Area of ACROSS 3
control methods – and their effectiveness – are fundamentally different from the tra-ditional control methods, posing fundamentally new challenges. For example, forcomposite service chains the main challenges are methods for dynamic re-composition,to prevent or mitigate the propagation of failures through the service chains, andmethods for overload control at the service level.
Another challenging factor in quality provisioning in the IoS is its highly dynamicnature, imposing a high degree of uncertainty in many respects (e.g., in terms ofnumber and diversity of the service offerings, the system load of services suddenlyjumping to temporary overload, demand for cloud resources, etc.). This raises theurgent need for online control methods with self-learning capabilities that quickly adaptto – or even anticipate – changing circumstances [9].
The COST Action ACROSS has brought the state-of-the-art in the area of auton-omous quality-based control in the IoS to the next level by developing efficientmethods and algorithms that enable network and service providers to fully exploit theenormous possibilities of the IoS. This required conducting a research in the followingimportant sub-areas:
1. Autonomous management and real-time control;2. Methods and tools for monitoring and service prediction;3. Smart pricing and competition in multi-domain systems.
These sub-areas were respectively covered by the three ACROSS working groups –WG1, WG2 and WG3. In the following sections, scientific challenges faced in thecontext of each of these three working groups are elaborated.
3 Autonomous Management and Real-Time Control
On a fundamental level, the working group WG1, associated with this researchsub-area, was primarily concerned with the management and control of networks,services, applications, and compositions of services or applications. Of particularinterest were management and control techniques that span multiple levels, e.g., thenetwork and service level.
3.1 Introduction and Background
To deliver reliable services in the IoS, service providers need to implement controlmechanisms, ranging from simplistic to highly advanced. Typical questions are thefollowing:
• How can one realize the efficient use of control methods by properly settingparameter values and decision thresholds?
• How can one effectively use these mechanisms depending on the specific context ofa user (e.g., in terms of user’s location, the user’s role, operational settings orexperienced quality)?
• How do control methods implemented by multiple providers interact?
4 R. van der Mei et al.
• How does the interaction between multiple control methods affect theireffectiveness?
• What about stability?• How to resolve conflicts?
Ideally, control mechanisms would be fully distributed and based on (experienced)quality. However, some level of centralized coordination among different autonomouscontrol mechanisms may be needed. In this context, a major challenge is to achieve aproper trade-off between fully distributed control (having higher flexibility androbustness/resilience) and more centralized control (leading to better performanceunder ‘normal’ conditions). This will lead to hybrid approaches, aiming to combine‘the best of two worlds’.
3.2 Control Issues in Emerging Softwarized Networks
As part of the current cloud computing trend, the concept of cloud networking [63] hasemerged. Cloud networking complements the cloud computing concept by enablingand executing network features and functions in a cloud computing environment. Thesupplement of computing capabilities to networks outlines elegantly the notion of“softwarization of networks”. The added computing capabilities are typically generalprocessing resources, e.g. off-the-shelf servers, which can be used for satisfyingcomputing requirements, i.e. at the application layer (e.g. for the re-coding of videos) orat the network layer (e.g. for the computation of routes). Hence, features and functionsin the network-oriented layers are moved away from hardware implementations intosoftware where appropriate, what is lately being termed as network function virtual-ization (NFV) [24].
The Software-Defined Networking (SDN) paradigm [31] emerged as a solution tothe limitations of the monolithic architecture of conventional network devices. Bydecoupling the system that makes decisions about where traffic is sent (the controlplane) from the underlying systems that forward traffic to the selected destination (thedata plane), SDN allows network administrators to manage network services throughthe abstraction of a lower level and more fine-grained functionality. Hence, SDN andthe softwarization of networks (NFV) stand for a “new and fine-grained split of net-work functions and their location of execution”. Issues related to the distribution andcoordination of software-based network functionality controlling the new simplifiedhardware (or virtualized) network devices formed a major research issue withinACROSS.
3.3 Scalable QoS-Aware Service Composition Using HybridOptimization Methods
Automated or semi-automated QoS-aware service composition is one of the mostprevalent research areas in the services research community [25, 56, 85]. In QoS-awarecomposition, a service composition (or business process, or scientific workflow) isconsidered as an abstract graph of activities that need to be executed. Concrete servicescan be used to implement specific activities in the graph. Typically, it is assumed that
State of the Art and Research Challenges in the Area of ACROSS 5

there are multiple functionally identical services with differing QoS available toimplement each activity in the abstract composition. The instantiation problem is thento find the combination of services to use for each activity so that the overall QoS(based on one or more QoS metrics) is optimal, for instance, to minimize the QoSmetric “response time” given a specific budget. The instantiation problem can bereduced to a minimization problem, and it is known to be NP-complete.
Traditionally, QoS-aware service composition has been done using deterministicmethods (e.g., simplex) for small service compositions, or a wide array of heuristics forlarge-scale problem instances (e.g., genetic algorithms, simulated annealing, and var-ious custom implementations). However, the advent of cloud services and SDNs,service brokers, as well as the generally increasing size of service compositions requirenew hybrid methods, which combine locally optimal solutions on various levels (e.g.,the network, application, or service broker level). It is yet unclear how such opti-mizations on various levels, conducted by various separate entities, can be optimallyperformed and coordinated, and how stability of such systems can be ensured. How-ever, one promising approach is the utilization of nature-inspired composition tech-niques, for instance, the chemical programming metaphor [25, 58].
3.4 Efficient Use of Cloud Federation and Cloud Bursting Concepts
One of the challenges of current cloud computing systems is the efficient use ofmultiple cloud services or cloud providers. On the network level, this includes the ideaof virtual network infrastructures (VNIs), c.f. [44]. The VNI concept assumesexploitation of network resources offered by different network providers and theircomposition into a common, coherent communication infrastructure supporting dis-tributed cloud federation [17]. Controlling, managing, and monitoring networkresources would allow cloud federations to implement various new features that could:(1) optimize traffic between sites, services, and users; (2) provide isolation for thewhole clouds or even for particular users, e.g. who require deployment of their ownprotocols over the network layer; (3) simplify the process of extending and integratingcloud providers and network providers into a federation with reduced efforts and costs.
On the service and application level, the idea of cloud bursting has been proposed asa way to efficiently use multiple cloud services [32, 57]. In cloud bursting, applicationsor services are typically running in a private cloud setup, until an external event (e.g., asignificant load spike that cannot be covered by internal resources) forces the applicationto “burst” and move either the entire application or parts of it to a public cloud service.While this model has clear commercial advantages, its concrete realization is still dif-ficult, as the cloud bursting requires intelligent control and management mechanisms forpredicting the load, for deciding which applications or services to burst, and for tech-nically implementing a seamless migration. Additionally, the increased network latencyis often a current practical problem in cloud bursting scenarios.
3.5 Energy-Aware Network and Service Control
Traditionally, the optimization of ICT service provision made use of network perfor-mance related characteristics or key performance indicators (KPI) as basic inputs for
6 R. van der Mei et al.
control and actuation loops. Those initially simple and technical-only parametersevolved later to more complex QoE related aspects, leading to multi-variate opti-mization problems. New control and actuation loops then involved several parametersto be handled in a joint manner due to the different trade-offs and interdependenciesamong input and output indicators. This is usually done by composing the effectsthrough a simplified utility function. Therefore, resulting approaches have put the focusparticularly in the reward (in terms of users’ satisfaction) to be achieved by efficientlyusing the available network resources (c.f. [75]).
Meanwhile, the cost of doing so was most of the times faced as a constraint of themathematical problem and considered again technical resources only. However, in thewake of “green ICT” and, more generally speaking, the requirement of economicallysustainable and profitable service provision entail new research challenges where thecost of service provisioning must also consider energy consumption and price (c.f.[74]). The resulting energy- and price-aware control loops demand intensive research,as the underlying multi-objective optimization problem as well as the complexity ofutility functions (c.f. [60]) and the mechanisms for articulation of preferences exceedcurrent common practices.
Such constraints affect not only the network but also the whole ICT service pro-vision chain. For example, server farms are vital components in cloud computing andadvanced multi-server queueing models that include features essential for character-izing scheduling performance as well as energy efficiency need to be developed. Recentresults in this area include [29, 40, 41] and analyze fundamental structural properties ofpolicies that optimize the performance-energy trade-off. On the other hand, severalworks exist [20, 67] that employ energy-driven Markov Decision Process (MDP) so-lutions. In addition, the use of energy-aware multi-path TCP in heterogeneous networks([15, 21]) has become challenging.
3.6 Developments in Transport Control Protocols
Transport protocols, particularly TCP and related protocols, are subject to continuousevolution for at least two reasons besides the omnipresent, general desire to improve.The first reason is a need to keep up with the development of internet infrastructurewith, e.g., reduced memory costs, widespread fibre deployment and high speed cellulartechnologies which enable larger buffers, higher bit rates and/or more variable chan-nels. The second reason is the increasing competition between providers of internetbased services which drives various efforts to keep ahead of the competition in terms ofuser experience. The results are new versions of the TCP congestion control algorithmas well as new protocols to replace TCP.
The work on new TCP congestion control algorithms includes work on adapting tothe changing characteristics of the internet such as the higher and more variablebandwidths offered by cellular accesses [1, 11, 34, 50, 52, 80, 84], possibly using crosslayer approaches [6, 10, 59, 61], but also simple tuning of existing TCP such asincreasing the size of the initial window [13, 16, 66, 82].
State of the Art and Research Challenges in the Area of ACROSS 7
The efforts to replace TCP include QUIC (Quick UDP Internet Connection, aprotocol from Google) and SPUD (Session Protocol for User Datagrams, an IETFinitiative) and its successor PLUS (Path Layer UDP Substrate, also an IETF initiative),c.f. [76]. The QUIC protocol aims at reducing latencies by combining connectionestablishment (three way handshake in TCP) with encryption key exchange (presently asecond transaction); it also includes the possibility of completely eliminating keyexchange if cached keys are available and can be reused. Another key feature is thebuilt-in support for HTML/2 such that multiple objects can be multiplexed over thesame stream [18, 72]. The purpose of SPUD/PLUS is to offer and end-to-end transportprotocol based on UDP with support for direct communication with middleboxes (e.g.,firewalls). The rationale for this is the difficulties with developing TCP that follow fromthe fact that present middleboxes rely on implicit interpretations of TCP, and/or lack ofencryption to perform different forms of functionality some of which even may beunwanted. Examples of such implicit interpretations include TCP packets with SYNand ACK flags being interpreted by gateways as confirmations of NAT (networkaddress translation) settings and by firewalls as confirmations of user acceptance [23,49]. Examples of possibly unwanted functionality include traffic management devicesaborting flows by manipulating the RST flag in TCP packets [22].
New versions of TCP or new DIY (do-it-yourself) protocols open a world of threatsand opportunities. The threats range from unfair competition [18, 72] to the risk ofcongestion collapse as content providers develop more and more aggressive protocolsand deploy faster and faster accesses in an attempt to improve their service [13, 66, 82].But it also includes the inability to cache popular objects near users or prioritizebetween flows on congested access links as a result of the tendency to paint all traffic“grey”, i.e. to encrypt even trivial things like public information (cf. Section 4.6). Asfor opportunities, TCP clearly has some performance problems and is a part of theossification of the Internet. A (set of) new protocol(s) could circumvent the issuesrelated to TCP and be adapted to present networks and content, and therefore providepotentially better performance.
The goal of the work on transport protocols in this context is, primary, to evaluateexisting transport protocols and, secondary, to present new congestion control algo-rithms and/or new transport protocols that work better than present TCP, and at thesame time compete with well behaved, legacy TCP in a fair way.
4 Methods and Tools for Monitoring and Service Prediction
Methods and tools for monitoring and service prediction was the main topic of WG2,mostly considered in the context of a larger system that needs to be (autonomously)controlled.
4.1 Introduction and Background
A crucial element for autonomous control in the IoS is monitoring and service pre-diction. For autonomous real-time (user-perceived) QoS and QoE in large, dynamic,complex multi-domain environments like the IoS, there is a great need for scalable,
8 R. van der Mei et al.

non-intrusive monitoring and measurement of service demands, service performance,and resource usage. Additional constraints regarding, for instance, privacy and integrityfurther complicate the challenges for monitoring and measurement. In addition,proactive service adaptation capabilities are rapidly becoming increasingly importantfor service-oriented systems like IoS. In this context, there is a need for online qualityprediction methods in combination with self-adaptation capabilities (e.g., servicere-composition). Service performance monitoring capabilities are also important for theassessment of Service Level Agreement (SLA) conformance, and moreover, to provideaccurate billing information. In general, the metrics to monitor rely on the point of viewadopted. For instance, cloud providers need metrics to monitor SLA conformance andmanage the cloud whereas composite service provider have to monitor multiple SLAswhich is also different than what is required to be monitored for customers and serviceconsumers.
4.2 How to Define ‘QoS’ and ‘QoE’, and What to Measure?
A common definition of QoE is provided in [55]: “QoE is the degree of delight orannoyance of the user of an application or service. It results from the fulfillment of hisor her expectations with respect to the utility and/or enjoyment of the application orservice in the light of the user’s personality and current state.” In contrast, the ITU-TRec. P.10 defines QoE as “the overall acceptability of an application or service, asperceived subjectively by the end user”. The definition in [55] advances the ITU-Tdefinition by going beyond merely binary acceptability and by emphasizing theimportance of both, pragmatic (utility) and hedonic (enjoyment) aspects of qualityjudgment formation. The difference to the definition of QoS by the ITU-T Rec. E.800 issignificant: “[the] totality of characteristics of a telecommunications service that bearon its ability to satisfy stated and implied needs of the user of the service”. Factorsimportant for QoE like context of usage and user characteristics are not comprehensiblyaddressed by QoS.
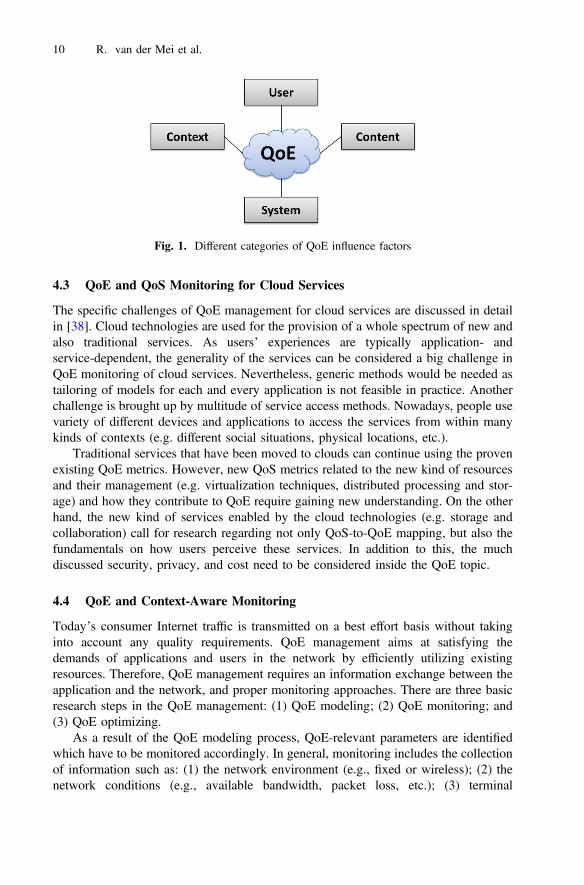
As a common denominator, four different categories of QoE influence factors[37, 55] are distinguished, which are the influence factors on the context, user, system,and content level (Fig. 1). The context level considers aspects like the environmentwhere the user is consuming the service, the social and cultural background, or thepurpose of using the service like time killing or information retrieval. The user levelincludes psychological factors like expectations of the user, memory and recencyeffects, or the usage history of the application. The technical influence factors areabstracted on the system level. They cover influences of the transmission network, thedevices and screens, but also of the implementation of the application itself like videobuffering strategies. The content level addresses, for instance on the example of videodelivery, the video codec, format, resolution, but also the duration, contents, and typeof the video and its motion patterns.
State of the Art and Research Challenges in the Area of ACROSS 9
4.3 QoE and QoS Monitoring for Cloud Services
The specific challenges of QoE management for cloud services are discussed in detailin [38]. Cloud technologies are used for the provision of a whole spectrum of new andalso traditional services. As users’ experiences are typically application- andservice-dependent, the generality of the services can be considered a big challenge inQoE monitoring of cloud services. Nevertheless, generic methods would be needed astailoring of models for each and every application is not feasible in practice. Anotherchallenge is brought up by multitude of service access methods. Nowadays, people usevariety of different devices and applications to access the services from within manykinds of contexts (e.g. different social situations, physical locations, etc.).
Traditional services that have been moved to clouds can continue using the provenexisting QoE metrics. However, new QoS metrics related to the new kind of resourcesand their management (e.g. virtualization techniques, distributed processing and stor-age) and how they contribute to QoE require gaining new understanding. On the otherhand, the new kind of services enabled by the cloud technologies (e.g. storage andcollaboration) call for research regarding not only QoS-to-QoE mapping, but also thefundamentals on how users perceive these services. In addition to this, the muchdiscussed security, privacy, and cost need to be considered inside the QoE topic.
4.4 QoE and Context-Aware Monitoring
Today’s consumer Internet traffic is transmitted on a best effort basis without takinginto account any quality requirements. QoE management aims at satisfying thedemands of applications and users in the network by efficiently utilizing existingresources. Therefore, QoE management requires an information exchange between theapplication and the network, and proper monitoring approaches. There are three basicresearch steps in the QoE management: (1) QoE modeling; (2) QoE monitoring; and(3) QoE optimizing.
As a result of the QoE modeling process, QoE-relevant parameters are identifiedwhich have to be monitored accordingly. In general, monitoring includes the collectionof information such as: (1) the network environment (e.g., fixed or wireless); (2) thenetwork conditions (e.g., available bandwidth, packet loss, etc.); (3) terminal
Fig. 1. Different categories of QoE influence factors
10 R. van der Mei et al.
capabilities (e.g., CPU, memory, display resolution); (4) service- andapplication-specific information (e.g., video bit rate, encoding, content genre) [26, 69].But also monitoring at the application layer may be important. For instance, QoEmonitoring for YouTube requires monitoring or estimating the video buffer status inorder to recognize or predict when stalling occurs.
The QoE monitoring can either be performed: (1) at the end user or terminal level;(2) within the network; or (3) by a combination thereof. While the monitoring withinthe network can be done by the provider itself for a fast reaction to QoE degradation, itrequires mapping functions between network QoS and QoE. When taking into accountapplication-specific parameters additional infrastructure like deep packet inspection(DPI) may be required to derive and estimate these parameters within the network.A better view on user perceived quality is achieved by monitoring at the end user level.However, additional challenges arise, e.g., how to feed QoE information back to theprovider for adapting and controlling QoE. In addition, trust and integrity issues arecritical as users may cheat to get better performance [68].
Going beyond QoE management, additional information may be exploited to opti-mize the services on a system level, e.g. allocation and utilization of system resources,resilience of services, but also the user perceived quality. While QoE managementmainly targets the optimization of current service delivery and currently running appli-cations, the exploitation of context information by network operators may lead to a moresophisticated traffic management, a reduction of the traffic load on inter-domain links,and a reduction of the operating costs for the Internet service providers (ISPs).
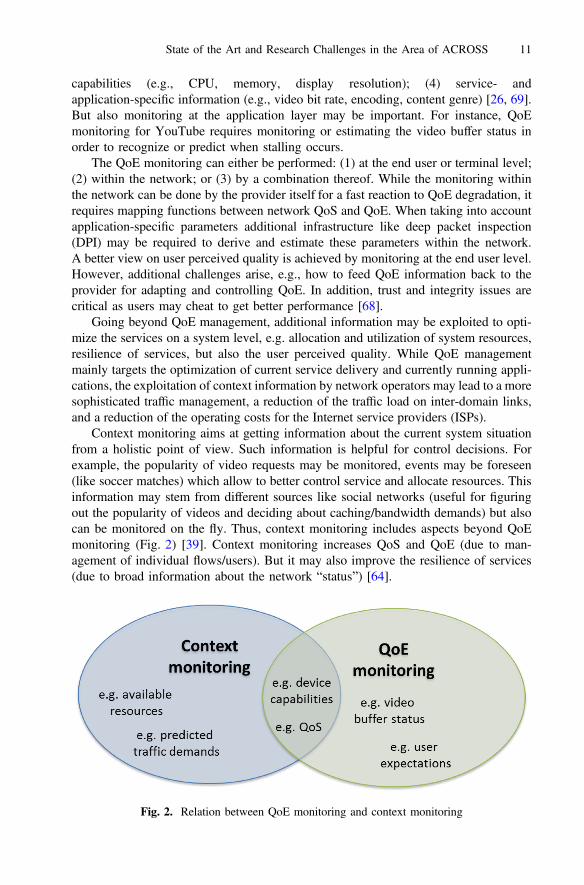
Context monitoring aims at getting information about the current system situationfrom a holistic point of view. Such information is helpful for control decisions. Forexample, the popularity of video requests may be monitored, events may be foreseen(like soccer matches) which allow to better control service and allocate resources. Thisinformation may stem from different sources like social networks (useful for figuringout the popularity of videos and deciding about caching/bandwidth demands) but alsocan be monitored on the fly. Thus, context monitoring includes aspects beyond QoEmonitoring (Fig. 2) [39]. Context monitoring increases QoS and QoE (due to man-agement of individual flows/users). But it may also improve the resilience of services(due to broad information about the network “status”) [64].
Fig. 2. Relation between QoE monitoring and context monitoring
State of the Art and Research Challenges in the Area of ACROSS 11

Context monitoring requires models, metrics, and approaches which capture theconditions/state of the system (network infrastructure, up to and including the servicelayer), but also application/service demands and the capabilities of the end-user device.The challenges here are the following: (1) identification of relevant context informationrequired for QoE but also reliable services; (2) quantification of QoE, based on relevantQoS and context information; and (3) monitoring architecture and concept.
4.5 Inclusion of Human Factors
Inevitably, Internet applications and services on a growing scale assist us in our daily lifesituations, fulfilling our needs for leisure, entertainment, communication or information.However, on one hand, user acceptance of an existing Internet service/applicationdepends on the variety of human factors influencing its perception, and, on the otherhand, there are many human factors and needs, which could be supported by the Internetservices and computing at large, yet unknown to date. However, despite the importanceof understanding of the human factors in computing, a sound methodology for evalu-ation of these factors and delineation of new ones, as well as reliable methods to designnew Internet services with these factors in mind, do not exist.
This challenge goes beyond the QoE/QoS challenge presented in the previoussubsection relating to the user experience with respect to an existing and used system.The challenge presented here relates to identification of the unmet (implicit) needs ofthe user enabling future provision of novel and useful services. These human factorsmay relate to some specific phenomena ranging from, for example, the most preferredinteraction style with a service (e.g., auditory, kinesthetic, visual) in a given context,via the user’s specific health and care needs (e.g., wellness or anti-ageing), to the user’sspecific factors like cognitive load, physical flexibility, or momentary perception ofsafety, or intimacy in a specific context [33, 42, 54]
In this challenge, one aims to provide a set of rigorous interdisciplinary, i.e.,mixed-methods based methodological steps to be taken aiming to quantify humanfactors in computing within the user’s natural environments and different contexts ofservice usage [78]. The methodology incorporates qualitative and quantitative methodsand involves real users in their real life environments through:
• Gathering the cumulative users’ opinion via open-ended interviews and surveys.Thus, specifically focusing on understanding the users’ expectations towards aresearched phenomenon and current experience of this phenomenon, mostly toestablish the users’ baseline experience on the experiment variables and context, butalso to gather general demographics about the experiment participants.
• Gathering the momentary users’ opinion upon some specific factors like healthbehaviors, moods, feelings, social interactions, or environmental and contextualconditions via the Experience Sampling Method (ESM). Special momentary sur-veys executed multiple times per day ‘in situ’, i.e., in the natural users’ environ-ments [79].
• Gathering the episodic users’ opinion upon some specific factors (as above) alongsemi-structured interviews based on the diary, for example by the Day Recon-struction Method.
12 R. van der Mei et al.

• Gathering the data upon the users’ daily life contexts and smartphone usage viacontinuous, automatic, unobtrusive data collection on the users’ device through themeasurements-based ‘Logger’ service.
Secondly, in this challenge, one wish to provide guidelines on analyzing therelation of these factors with the design features of the computing system itself.Thirdly, one would like to provide guidelines for Internet services/applications lever-aging the human factors in their design process, assuring user’s experience (QoE) andthus maximizing the user acceptance for these services.
4.6 Aggregated and Encrypted Data (‘Grey Traffic’)
Monitoring generally assumes that it is possible to extract from the data a set ofparameters (e.g. fields within a packet) that enables to know what data (or services) istravelling (resp. provided). However, there is recent tendency to paint all traffic “grey”,i.e. to encrypt even trivial things like public information. Even though this may appearto protect user privacy, in fact such obfuscation complicates or prevents monitoring,caching, and prioritization which could have been used to reduce costs and optimizeuser experience. Actually, it is not only the content that is being encrypted but also theprotocol itself (i.e. only the UDP header or similar is left open). This means that,contrary to present TCP, one cannot even monitor a flow in terms of data andacknowledgments to, e.g. detect malfunctioning flows (e.g., subject to extreme losses)or perform local retransmission (e.g. from a proxy). Regarding content identification,the solution needs not necessarily be unprotected content (there are reasons related tocontent ownership, etc.) but one can imagine tags of different kinds. Then there is achallenge to find incentives that encourage correct labelling [12], such that traffic canbe monitored and identified to the extent necessary to optimize networks (long term)and QoE (short term).
4.7 Timing Accuracy for Network and Service Control
A key objective of ACROSS was to ensure that the ICT infrastructure that supportsfuture Internet is designed such that the quality and reliability of the services running insuch a complex environment can be guaranteed. This is a huge challenge with manyfacets, particularly as the Internet evolves in scale and complexity. One key buildingblock that is required at the heart of this evolving infrastructure is precise and verifiabletiming. Requirements such as ‘real-time control’, ‘quality monitoring’, ‘QoS and QoEmonitoring’, ‘SDN’ cannot easily or effectively be met without a common sense ofprecise time distributed across the full infrastructure. ‘You cannot control what you donot understand’ is a phrase that applies here – and you cannot understand a dynamicand real-time system without having precise and verifiable timing data on its perfor-mance. As a first step, such timing services will firstly ensure that application- andnetwork performance can be precisely monitored, but secondly, and more importantly,will facilitate the design of better systems and infrastructures to meet the future needs.Unfortunately, current ICT systems do not readily support this paradigm [83]. Appli-cations, computers and communications systems have been developed with modules
State of the Art and Research Challenges in the Area of ACROSS 13
and layers that optimize data processing but degrade accurate timing. State-of-the-artsystems now use timing but only as a performance metric. To enable the predictedmassive growth, accurate timing needs cross-disciplinary research to be integrated intoexisting and future systems. In addition, timing accuracy and security of timing ser-vices issues represent another critical need. In many cases, having assurance that thetime is correct is a more difficult problem than accuracy. A number of recent initiativesare focusing on these challenges, c.f. [19, 43, 71, 73, 81].
4.8 Prediction of Performance, Quality and Reliability for CompositeServices
Service orientation as a paradigm which switches software production to software useis gaining more popularity; the number of services is growing with higher potential ofservice reuse and integration into composite services. There may be number of pos-sibilities to create specific composite services and they may differ in structure andselection of services that form this composition. The composite services are alsocharacterized by functional and non-functional attributes. Here the focus is on pre-diction models for behavior of composite services in respect to performance, qualityand reliability. There are many approaches to build Quality of Service (QoS) awareservice compositions [47] and most of them are based on heuristic and meta-heuristicapproaches. However, there is a lack of mathematical models that provide betterunderstanding of underlying causes that generate particular QoS behavior.
Regarding QoS and reliability prediction of composite services, it is well knownthat size-, fault-and failure distribution over software components in large scale com-plex software systems follow power law distributions [30, 36]. The knowledge ofunderlying generative models for these distributions enables developers to identifycritical parts of such systems at early stages of development and act accordingly toproduce higher quality and more reliable software at lower cost. Similar behavior isexpected from large-scale service compositions. The challenge is to extend the theoryof distribution of size, faults and failures to other attributes of services (e.g. abovementioned non- functional attributes) in large-scale service compositions. Identificationof such distributions, that may contain generative properties, would enable to predictthe behavior of composite services.
4.9 Monitoring with SDN
SDN is a new and promising networking paradigm [53, 62]. It consists in decouplingcontrol plane from forwarding plane and offers a whole set of opportunities to monitorthe network performance. In SDN, each node (router, switch, …) updates a controllerabout almost any information regarding the traffic traveling at any time in the network.A set of patterns can be defined by the controller for the node to apply and count thenumber of packets matching this specific pattern. Basic monitoring applies on thewell-known header fields at any communication layer. However, some NFV can beintroduced at some nodes to perform fine monitoring on data (e.g. DPI to get specificinfo from data) and therefore to enable the controller to have full knowledge on whathappens in the network.
14 R. van der Mei et al.
Of course these great opportunities provided by SDN are accompanied by a list of(measurement andmonitoring) challenges currently researched over the world [14, 35, 46].For instance, how many controllers should be deployed? Too many controllers wouldbring us back to the older architecture but on the other hand too few controllers thatcentralize a large area would induce delay in getting the information and would requirevery expensive computation power to deal with huge amount of data. In this latter case, thiswould also generate bottleneck near the area of the controller(s).
5 Smart Pricing and Competition in Multi-domain Systems
WG3 dealt with pricing and competition in the IoS, in particular in relation to servicequality and reliability.
5.1 Introduction and Background
Service providers in the IoS could implement their own pricing mechanism, which mayinvolve simple static pricing to advanced dynamic policies where prices may e.g. vary(even at small time scale) according to the actual demand [4]. The involvement ofthird-party and cloud services in making up a composite service in these dynamic andcompetitive environments (with all involved parties striving for maximization of theirown profit) raises challenging questions that are new, even though one can learn fromthe past. For example, in the traditional Internet, volume-based charging schemes tendto be replaced by flat-fee charging schemes. In this context, typical questions are:(1) what are the implications of implementing different pricing mechanisms in amulti-domain setting? (2) how do quality levels and pricing mechanisms relate?(3) how can one develop smart pricing mechanisms that provide proper incentives forthe involved parties (regarding brokering, SLA negotiation strategies, federation, etc.)that lead to a stable ecosystem? (4) what governing rules are needed to achieve this?
5.2 Modeling QoS/QoE-Aware Pricing Issues
A key challenge is to understand what are the correct digital “goods” (e.g. in the cloud,in a distributed setting, beyond just physical resources), and at what level of granularityto consider pricing and competition issues [2, 7]. An overview of some of the pricingissues for the cloud is given in [51]. Initial cloud services were primarily resourcebased, with different types of resources (such as compute power, storage, bandwidth),different types of service (service and batch) and different service types (IaaS, SaaSetc.). Simple fixed pricing schemes are typically used by the providers, with the largecloud providers forming an oligopoly and competing on price. But even in this setting,each of the individual component resources and services have their own QoS measuresand SLAs, which makes specifying the QoS and QoE of an actual service used by acustomer difficult. The landscape is also changing: different types of cloud serviceproviders are emerging, as are different types of services (such as data services, data
State of the Art and Research Challenges in the Area of ACROSS 15

analytics, automated Machine Learning), which brings additional complexity. Henceresearch is needed on the following subtopics:
• The digital goods and services for an IoS. The challenge is to identify the funda-mental building blocks: for example, are they just physical or virtual resources, aswith current IaaS/PaaS, or do they include abstract computing elements andcapabilities? Can they include software abstractions that would enable flexible SaaSdescriptions rather than the current, limited, application specific SaaS offering? Howcan data be included as a good? Can higher layer services, such as automatedanalytics or machine learning be specified as capabilities? A fundamental questionfor pricing is whether goods and services are multidimensional or can be thought ofa primarily unidimensional (see [51]).
• A QoS and QoE framework for describing services. The current state of the art inIaaS is for providers to specify individual resources or bundles, each with someQoS measure or SLA, that often is just based on availability or mean throughput.The customer has to decide what to purchase and assemble the different resourcesand, somehow, translate into the solution into a QoS or QoE for their usage sce-nario. At the other extreme, specific solutions are offered by SaaS for limitedapplications (e.g. SAP). As the service and solutions that customers need or want tooffer to their own customers become ever richer, a framework is needed that allowsrealistic services to be described in terms of their own QoS and QoE.
• Component specification that allows services to be built up from components. Thechallenges here are closely tied to those for QoS and QoE. The current bottom-uppurchase and construction of services from individual components makes life easyfor providers but difficult for customers and solution providers, who would typicallywant a top-down specification. For example, an end-customer may see their data asthe primary resource, building services and analytics based on it, and hence wantperformance and QoS measures related to these. There is a need to be able to buildservices from different components and different providers; the challenge is how toachieve this.
• Brokering, transfer charging and “exchanges” to allow for third parties, and formulti-provider services. Pricing models in use now are basic: they typically involvepay-as-you-go pricing, with discounts for bundling, and with a rudimentary reser-vation offering. Amazon offers a Spot market for IAAS, although the pricingdoesn’t appear to reflect a true auction mechanism [5]. There is a need for moreflexible pricing models to enable users with flexible workloads to balance priceagainst performance, and to reflect elastic demand. Research is needed to see howtransfer charging may encourage multi-provider services, and whether compute anddata resources can be treated as digital commodities and traded in exchanges.
5.3 Context-Dependent Pricing, Charging and Billing of CompositeServices
Pricing, charging and billing of composite services, provided to the end user by dif-ferent service providers, require the construction and elaboration of new mechanismsand techniques in order to provide the best service to the user [3, 48, 77], depending on
16 R. van der Mei et al.

their current context1, and to enable viable business models for the service providers [8,28, 65]. Solving this problem requires advances in mechanism design: current eco-nomic theory lacks the sophistication to handle the potentially rich variety of servicedescriptions and specifications that could be delivered in the IoT and Next GenerationInternet (NGI).
Charging and billing (C&B) requires mechanisms to allow secure transactions,trusted third party (TTP) C&B [45], cross-provider payments, micropayments and toallow for new payment paradigms, such as peer-to-peer currencies. The TTP feature ofthe C&B entity, perhaps, will also facilitate the initial establishment of trust andsubsequent interaction, e.g. to ensure interoperability, between different service pro-viders as regards the services (service components) provided by each of them.
The pricing and C&B need to be aligned with service definition and implemen-tation. Hence the autonomous control aspects (ACROSS WG1) need to be inextricablylinked to pricing, and what can be measured (ACROSS WG2). This challenge relatesalso to the services’ intelligent demand shaping (IDS) and services’ measurement,analytics, and profiling (MAP).
As a specific example, service delivery and SLAs are linked to the dynamicmonitoring of the quality of each component of the composite service, with an ability todynamically replace/substitute the component(s) that is/are currently underperformingwith another one(s), which is/are identified as working better in the current context. Thereplacement of service components must be performed transparently to the user –
perhaps with the user only noticing improvements in the overall service quality.
5.4 QoS and Price-Aware Selection of Cloud Service Providers
The upraise of IaaS clouds has led to an interesting dilemma for software engineers.Fundamentally, the basic service offered by different providers (e.g., Amazon EC2, or,more recently, Google Compute Engine) is entirely interchangeable. However,non-functional aspects (e.g., pricing models, expected performance of acquiredresources, stability and predictability of performance) vary considerably, not onlybetween providers, but even among different data centers of the same provider. This ismade worse by the fact that, currently, IaaS providers are notoriously vague whenspecifying details of their service (e.g., “has two virtual CPUs and medium networkingperformance”). As a consequence, cloud users are currently not able to make aninformed decision about which cloud to adopt, and which concrete configuration (e.g.,instance type) to use for which application. Hence, cloud users often base their mostfundamental operations decisions on hearsay, marketing slogans, and anecdotal evi-dence rather than sound data. Multiple research teams worldwide have proposed toolsto allow developers to benchmark cloud services in a more rigid way prior to
1 The context, from which the price is computed, has three main components – user context (i.e. theuser’s location, preferences and profile(s), the user mobile device(s), etc.), network context (i.e. thecongestion level, the current data usage pattern, the current QoS/QoE index, the cost of using anetwork, etc.), and service context (i.e. the category, type, scope, and attributes of the service beingrequested, the request time, the application initiating the request, the current QoS/QoE index of theservice component, etc.).
State of the Art and Research Challenges in the Area of ACROSS 17

deployment (e.g., CloudCrawler, CloudBench, or Cloud Workbench, [27, 70]).However, so far, fundamental insights are missing as regards which kind of IaaSprovider and configuration is suitable for which kind of application and workload.
6 Conclusion
As can be seen from this chapter, there is a high variety of research challenges in thearea of autonomous control for a reliable Internet of Services (IoS), which of coursecannot be covered by a single book. The following chapters deal with a subset of these,mainly related to service monitoring, control, management, and prediction, leaving therest of challenges for another book.
Acknowledgments. This work was coordinated under the EU COST Action IC1304 “Auton-omous Control for a Reliable Internet of Services (ACROSS)”.
References
1. Abdelsalam, A., Luglio, M., Roseti, C., Zampognaro, F.: TCP wave: a new reliable transportapproach for future internet. Comput. Netw. 112, 122–143 (2017)
2. Abhiskeh, V., Kash, I.A., Key, P.: Fixed and market pricing for cloud services. In:Proceedings of 7th Workshop on Economics of Networks, Systems and Computation(NetEcon 2012), Orlando, USA (2012)
3. Abundo, M., Valerio, V.D., Cardellini, V., Lo Presti, F.: Bidding strategies in QoS-awarecloud systems based on N-armed bandit problems. In: Proceedings of the 3rd IEEESymposium on Network Cloud Computing and Applications (NCCA 2014), pp. 38–45(2014)
4. Alzhouri, F., Agarwal, A., Liu, Y., Bataineh, A.S.: Dynamic pricing for maximizing cloudrevenue: a column generation approach. In: Proceedings of the 18th International Conferenceon Distributed Computing and Networking (ICDCN 2017) (2017). Article No. 22
5. Ben-Yehuda, O.A., et al.: Deconstructing amazon EC2 spot instance pricing. ACM Trans.Econom. Comput. 1(3), 16:1–16:20 (2013)
6. Beshay, J.D., Taghavi Nasrabadi, A., Prakash, R., Francini, A.: Link-coupled TCP for 5Gnetworks. In: IEEE/ACM 25th International Symposium on Quality of Service (IWQoS),pp. 1–6 (2017)
7. Bhattacharjee, S., Gopal, R.D., Marsden, J.R., Sankaranarayanan, R.: Digital goods andmarkets: emerging issues and challenges. ACM Trans. Manag. Inf. Syst. 2(2), 1–23 (2011)
8. Blocq., G., Bachrach, Y., Key, P.: The shared assignment game and applications to pricingin cloud computing. In: AAMAS 2014, Paris, France (2014)
9. Bosman, J., Van den Berg, H., Van der Mei, R.: Real-time QoS control for serviceorchestration. In: Proceedings of the 27th International Teletraffic Congress (ITC27),pp. 152–158 (2015)
10. Cabrera Molero, I., Möller, N., Petersson, J., Skog, R., Arvidsson, Å., Flärdh, O., Johansson,K.H.: Cross-layer adaptation for TCP-based applications in WCDMA systems. In: ISTMobile and Wireless Communications Summit, Dresden, Germany (2005)
11. Cardwell, N., Cheng, Y., Gunn, C.S., Yeganeh, S.H., Jacobson, V.: BBR: congestion-basedcongestion control. ACM Queue 14(5), 20–53 (2016)
18 R. van der Mei et al.
12. Casaretto, J.: The Internet strikes back: global encrypted SSL traffic booms (2014). http://siliconangle.com/blog/2014/05/20/the-internet-strikes-back-global-encrypted-ssl-traffic-booms/
13. CDNPlanet Initcwnd settings of major CDN providers (2017). https://www.cdnplanet.com/blog/initcwnd-settings-major-cdn-providers. Accessed 12 Oct 2017
14. Chaudet, C., Haddad, Y.: Wireless software defined networks: challenges and opportunities.In: IEEE International Conference on Microwaves, Communications, Antennas andElectronics Systems (COMCAS 2013), pp. 1–5 (2013)
15. Chen, S., Yuan, Z., Muntean, G.M.: A traffic burstiness-based offload scheme for energyefficiency deliveries in heterogeneous wireless networks. In: IEEE Globecom Workshops,Atlanta, USA (2013)
16. Chu, J., Dukkipati, N., Cheng, Y., Mathis, M.: Increasing TCP’s Initial Window. IETF RFC6928, April 2013
17. CONTRAIL project (Seamless cloud federation through open virtualization infrastructure).In: EU 7th Framework Programme. http://contrail-project.eu/
18. Cook, S., Mathieu, B., Truong, P., Hamchaoui, I.: QUIC: better for what and for whom? In:IEEE International Conference on Communications (ICC), pp. 1–6 (2017)
19. Cyber-Physical Systems Public Working Group (CPS PWG). http://www.cpspwg.org/20. Dechen, D., Shami, A.: Energy efficient QoS constrained scheduler for SC-FDMA uplink.
Pers. Commun. 8, 81–90 (2013)21. Ding, T., et al.: Smartphone energy consumption models for multimedia services using
multipath TCP. In: Proceedings of the 11th IEEE Consumer Communications andNetworking Conference (CCNC), Las Vegas, USA (2014)
22. Eckersley, P., Von Lohmann, F., Schoen, S.: Packet forgery by ISPs: a report on the comcastaffair. In: Electronic Frontier Foundation (2007). https://www.eff.org/sv/wp/packet-forgery-isps-report-comcast-affair. Accessed 12 Oct 2017
23. Edeline, K., Kühlewind, M., Trammell, B., Aben, E., Donnet, B.: Using UDP for internettransport evolution. ETH TIK Technical Report 366 (2016)
24. ETSI ISG on NFV (2014) Network functions virtualisation – white paper #3. http://portal.etsi.org/NFV/NFV_White_Paper3.pdf
25. Fernández, H., Tedeschi, C.: A chemistry-inspired workflow management system fordecentralizing workflow execution. IEEE Trans. Serv. Comput. 9(2), 213–226 (2016)
26. Fiedler, M., Hoßfeld, T., Tran-Gia, P.: A generic quantitative relationship between quality ofexperience and quality of service. IEEE Netw. 24(2), 36–41 (2010)
27. Frey, S., Fittkau, F., Hasselbring, W.: Search-based genetic optimization for deployment andreconfiguration of software in the cloud. In: 2013 International Conference on SoftwareEngineering (ICSE 2013), pp. 512–521. IEEE Press, Piscataway (2013)
28. Gao, X.A., Bachrach, Y., Key, P., Graepel, T.: Quality expectation-variance tradeoffs incrowdsourcing contests. In: AAAI 2012, Toronto, Canada (2012)
29. Gebrehiwot, M.E., Aalto, S., Lassila, P.: Optimal sleep-state control of energy-aware M/G/1queues. In: Proceedings of the 8th International Conference on Performance EvaluationMethodologies and Tools (Value tools), Bratislava, Slovakia (2014)
30. Grbac, T.G., Huljenić, D.: On the probability distribution of faults in complex softwaresystems. Inf. Softw. Technol. 58, 250–258 (2016)
31. Ghodsi, A., Godfrey, P.B., McKeown, N., Parulkar, G., Raghavan, B.: Architecting forinnovation. ACM Comput. Commun. Rev. 41(3), 24–36 (2011)
32. Guo, T., Sharma, U., Wood, T., Sahu, S., Shenoy, P.: Seagull: intelligent cloud bursting forenterprise applications. In: 2012 USENIX Annual Technical Conference (USENIX ATC2012), USENIX Association, Berkeley, CA, USA (2012)
State of the Art and Research Challenges in the Area of ACROSS 19
33. Gustarini, M., Scipioni, M., Fanourakis, M., Wac, K.: Differences in smartphone usage:validating, evaluating, and predicting mobile user intimacy. Pervasive Mob. Comput. 30,50–72 (2016)
34. Gwak, Y., Kim, R.Y.: A novel wireless TCP for 5G mobile networks. World J. Wirel.Devices Eng. 1(1), 1–6 (2017)
35. Hakiri, A., et al.: Software-defined networking: challenges and research opportunities forfuture internet. Comput. Netw. 75, 453–471 (2014)
36. Hatton, L.L.: Power-law distributions of component size in general software systems. IEEETrans. Softw. Eng. 35(4), 566–572 (2009)
37. Hoßfeld, T., Schatz, R., Biersack, E., Plissonneau, L.: Internet video delivery in youtube:from traffic measurements to quality of experience. In: Biersack, E., Callegari, C.,Matijasevic, M. (eds.) Data Traffic Monitoring and Analysis. LNCS, vol. 7754, pp. 264–301.Springer, Heidelberg (2013). https://doi.org/10.1007/978-3-642-36784-7_11
38. Hoßfeld, T., Schatz, R., Varela, M., Timmerer, C.: Challenges of QoE management for cloudapplications. IEEE Commun. Mag. 50(4), 28–36 (2012)
39. Hoßfeld, T., Skorin-Kapov, L., Haddad, Y., Pocta, P., Siris, V., Zgank, A., Melvin, H.: Cancontext monitoring improve QoE? a case study of video flash crowds in the internet ofservices. In: IFIP/IEEE International Symposium on Integrated Network Management (IM),pp. 1274–1277 (2015)
40. Hyytiä, E., Righter, R., Aalto, S.: Task assignment in a server farm with switching delaysand general energy-aware cost structure. Perform. Eval. 75–76, 17–35 (2014)
41. Hyytiä, E, Righter, R., Aalto, S.: Energy-aware job assignment in server farms with setupdelays under LCFS and PS. In: Proceedings of the 26th International Teletraffic Congress(ITC’26), Karlskrona, Sweden (2014)
42. Ickin, S., et al.: Factors influencing quality of experience of commonly used mobileapplications. IEEE Commun. Mag. 50(4), 48–56 (2012)
43. IEEE 802.1 Time-Sensitive Networking Task Group. http://www.ieee802.org/1/pages/tsn.html
44. Jain, S., Kumar, A., Mandal, S., et al.: B4: experience with a globally-deployed softwaredefined WAN. In: SIGCOMM 2013. ACM, New York (2013)
45. Jakab, J., Ganchev, I., O’Droma, M.: Third-party charging and billing for the ubiquitousconsumer wireless world. Int. J. Commun. Ant. Prop. 1(2), 136–144 (2011)
46. Jarschel, M., et al.: On the accuracy of leveraging SDN for passive network measurements.In: ATNAC 2013, Christchurch, New Zealand (2013)
47. Jatoth, C., Gangadharan, G.R., Buyya, R.: Computational intelligence based QoS-aware webservice composition: a systematic literature review. IEEE Trans. Serv. Comput. 10(3), 475–492 (2017)
48. Ji, Z., Ganchev, I., O’Droma, M.: An IWBC consumer application for always best connectedand best served: design and implementation. IEEE Trans. Consum. Electron. 57(2), 462–470(2011)
49. Jones, T., Fairhurst, G., Perkins, C.: Raising the datagram API to support transport protocolevolution. In: Proceedings of the 16th International IFIP TC6 Networking Conference(Networking 2017), Stockholm (2017)
50. Kairi, A., Chakraborty, S.: A study of packet control techniques for wireless network. Am.J. Adv. Comput. 3(1), 38–45 (2016)
51. Kash, I., Key, P.: Pricing the cloud. IEEE Internet Comput. 20, 36–43 (2016)52. Khurshid, A., Kabir, M.H., Prodhan, M.A.T.: An improved TCP congestion control
algorithm for wireless networks. In: Proceedings of the 13th IEEE Pacific Rim Conferenceon Communications, Computers and Signal Processing, August 2011, pp. 382–387 (2011)
20 R. van der Mei et al.

53. Kreutz, D., et al.: Software-defined networking: a comprehensive survey (2014). http://arxiv.org/abs/1406.0440
54. Laghari, K.U.R., Crespi, N., Connelly, K.: Toward total quality of experience: a QoE modelin a communication ecosystem. Commun. Mag. IEEE 50(4), 58–65 (2012)
55. Le Callet, P., Möller, S., Perkis, A., eds.: Qualinet white paper on definitions of quality ofexperience. European Network on Quality of Experience in Multimedia Systems andServices (COST Action IC 1003), Lausanne, Switzerland, v1.2 (2012)
56. Leitner, P., Hummer, W., Dustdar, S.: Cost-based optimization of service compositions.IEEE Trans. Serv. Comput. 6(2), 239–251 (2013)
57. Leitner, P., Zabolotnyi, R., Gambi, A., Dustdar, S.: A framework and middleware forapplication-level cloud bursting on top of infrastructure-as-a-service clouds. In: 2013IEEE/ACM 6th International Conference on Utility and Cloud Computing (UCC 2013),pp. 163–170. IEEE Computer Society, Washington (2013)
58. Lemos, A.L., Daniel, F., Benatallah, B.: Web service composition: a survey of techniquesand tools. ACM Comput. Surv. 48(3), Art. 33, 1–41 (2015)
59. Li, M.: Cross-layer resource control to improve TCP performance over wireless network. In:Proceedings of the 6th IEEE/ACIS International Conference on Computer and InformationScience (ICIS 2007), pp. 706–711 (2007)
60. Liberal, F., Taboada, I., Fajardo, J.O.: Dealing with energy-QoE trade-offs in mobile video.J Comput. Netw. Commun. 2013 (2013). Article ID 412491, 12 pages
61. Lu, F., Du, H., Jain, A., Voelker, G.M., Snoeren, A.C., Terzis, A.: CQIC: revisitingcross-layer congestion control for cellular networks. In: Proceedings of the 16th InternationalWorkshop on Mobile Computing Systems and Applications (HotMobile 2015), pp. 45–50(2015)
62. McKeown, N., Anderson, T., Balakrishnan, H., Parulkar, G., Peterson, L., Rexford, J.,Shenker, S., Turner, J.: OpenFlow: enabling innovation in campus networks. SIGCOMMComput. Commun. Rev. 38(2), 69–74 (2008)
63. Mell, P., Grance, T.: The NIST definition of cloud computing. National Institute ofStandards and Technology, NIST Special Publication 800-145 (2011)
64. Metzger, F., Liotou, E., Moldovan, C., Hoßfeld, T.: TCP video streaming and mobilenetworks: not a love story, but better with context. Comput. Netw. 109(2016), 246–256(2016)
65. O’Droma, M., Ganchev, I.: The creation of a ubiquitous consumer wireless world throughstrategic ITU-T standardization. IEEE Commun. Mag. 48(10), 158–165 (2010)
66. Pathak, N.: A look at TCP Initial congestion window in content delivery networks (2017).https://blog.imaginea.com/look-at-tcp-initcwnd-cdns. Accessed 12 Oct 2017
67. Raiss-el-Fenni, M., et al.: POMDP game framework for service providers inciting mobileusers. In: IEEE International Conference on Communication (ICC2014), Sydney, Australia(2014)
68. Reichl, P., Egger, S., Möller, S., Kilkki, K., Fiedler, M., Hossfeld, T., Tsiaras, C., Asrese, A.:Towards a comprehensive framework for QoE and user behavior modelling. In: Proceedingsof the 7th International Workshop on Quality of Multimedia Experience (QoMEX) (2015)
69. Reiter, U., Brunnström, K., De Moor, K., Larabi, M.C., Pereira, M., Pinheiro, A., You, J.,Zgank, A.: Factors influencing quality of experience. In: Quality of Experience, pp. 55–72(2014)
70. Scheuner, J., Leitner, P., Cito, J., Gall, H.: Cloud WorkBench – infrastructure-as-code basedcloud benchmarking. In: Proceedings of the 6th IEEE International Conference on CloudComputing Technology and Science (CloudCom 2014) (2014)
State of the Art and Research Challenges in the Area of ACROSS 21

71. Shannon, J.O., Flaithearta, P., Cinar, Y., Melvin, H.: Enhancing multimedia QoE via moreeffective time synchronisation over 802.11 Networks. In: Proceedings of the 7thInternational Conference on Multimedia Systems ACM MMSys 2016, Article No. 25 (2016)
72. Srivastava, A.: Performance analysis of QUIC protocol under network congestion. MasterThesis, Worcester Polytechnic Institute (2017)
73. TAACCS: Cross-Disciplinary Research on Time-Aware Applications, Computers, andCommunication Systems. http://www.taaccs.org/index.html
74. Taboada, I., Fajardo, J.O., Liberal, F.: QoE and energy-awareness for multi-layer videobroadcasting. In: IEEE International Conference on Multimedia and Expo (ICME2011),Barcelona, Spain (2011)
75. Taboada, I., Liberal, F.: A novel scheduling index rule for QoE maximization in wirelessnetworks. In: Abstract and Applied Analysis 2014 (2014)
76. Trammell, B., Hildebrand, J.: The trouble with transports – moving UDP to layer 3.5 (2014).http://www.ietf.org/proceedings/90/slides/slides-90-appsawg-7.pdf
77. Valerio, V.D., Cardellini, V., Lo Presti, F.: Optimal pricing and service provisioningstrategies in cloud systems: a Stackelberg game approach. In: IEEE 6th InternationalConference on Cloud Computing (CLOUD 2013), Santa Clara, CA, pp. 115–122 (2013)
78. Wac, K., Fiordelli, M., Gustarini, M., Rivas, H.: Quality of life technologies: experiencesfrom the field and key research challenges. IEEE Internet Comput. 19(4), 28–35 (2015)
79. Wac, K., et al.: mQoL: experimental methodology for longitudinal, continuous quality of lifeassessment via unobtrusive, context-rich mobile computing in situ. In: The InternationalSociety for Quality-of-Life Studies Conference (ISQOLS 2016) (2016)
80. Wang, Z., Zeng, X., Liu, X., Xu, M., Wen, Y., Chen, L.: TCP congestion control algorithmfor heterogeneous internet. J. Netw. Comput. Appl. 68(C), 56–64 (2016)
81. Weiss, M., Melvin, H., Chandoke, S.: Time: an integral part of cyber-physical systems. In:Time-Sensitive Networks and Applications (TSNA) (2016)
82. White, G.: Analysis of Google SPDY and TCP Initcwnd. Cable Labs (2012). https://www.cablelabs.com/wp–content/uploads/2014/05/Analysis_of_Google_SPDY_TCP.pdf. Acces-sed 12 Oct 2017
83. Wilhelm, R., Grund, D.: Computation takes time, but how much? Commun. ACM 57(2),94–103 (2014)
84. Yin, Q., Kaur, J., Smith, D.: TCP rapid: from theory to practice. Technical report 17-001,Department of Computer Science, UNC Chapel Hill (2017)
85. Zeng, L., Benatallah, B., Ngu, A.H.H., Dumas, M., Kalagnanam, J., Chang, H.: QoS-awaremiddleware for web services composition. IEEE Trans. Soft. Eng. 30(5), 311–327 (2004)
Open Access This chapter is licensed under the terms of the Creative Commons Attribution4.0 International License (http://creativecommons.org/licenses/by/4.0/), which permits use,sharing, adaptation, distribution and reproduction in any medium or format, as long as yougive appropriate credit to the original author(s) and the source, provide a link to the CreativeCommons license and indicate if changes were made.The images or other third party material in this chapter are included in the chapter’s Creative
Commons license, unless indicated otherwise in a credit line to the material. If material is notincluded in the chapter’s Creative Commons license and your intended use is not permitted bystatutory regulation or exceeds the permitted use, you will need to obtain permission directlyfrom the copyright holder.
22 R. van der Mei et al.
Context Monitoring for Improved SystemPerformance and QoE
Florian Metzger1(B), Tobias Hoßfeld1, Lea Skorin-Kapov2, Yoram Haddad3,Eirini Liotou4, Peter Pocta5, Hugh Melvin6, Vasilios A. Siris7, Andrej Zgank8,
and Michael Jarschel9
1 Chair of Modeling of Adaptive Systems, University of Duisburg-Essen,Essen, Germany
{florian.metzger,tobias.hossfeld}@uni-due.de2 Faculty of Electrical Engineering and Computing, University of Zagreb,
Zagreb, [email protected]
3 Jerusalem College of Technology, Jerusalem, [email protected]
4 Communication Networks Laboratory, University of Athens, Athens, [email protected]
5 Department of Multimedia and Information-Communication Technology,Faculty of Electrical Engineering, University of Zilina, Zilina, Slovakia
[email protected] Discipline of Information Technology, National University of Ireland,
Galway, [email protected]
7 Department of Informatics, Athens University of Economics and Business,Athens, [email protected]
8 Faculty of Electrical Engineering and Computer Science,University of Maribor, Maribor, Slovenia
[email protected] Nokia Bell Labs, Munich, Germany
Abstract. Whereas some application domains show a certain consensuson the role of system factors, human factors, and context factors, QoEmanagement of multimedia systems and services is still faced with thechallenge of identifying the key QoE influence factors. In this chapter,we focus on the potential of enhancing QoE management mechanismsby exploiting valuable context information.
To get a good grip on the basics we first discuss a general frame-work for context monitoring and define context information, includingtechnical, usage, social, economic, temporal, and physical factors. Wethen iterate the opportunities and challenges in involving context in QoEmonitoring solutions, as context may be, e.g., hard to ascertain or verysituational.
c© The Author(s) 2018I. Ganchev et al. (Eds.): Autonomous Control for a Reliable Internet of Services, LNCS 10768, pp. 23–48, 2018.https://doi.org/10.1007/978-3-319-90415-3_2

24 F. Metzger et al.
The benefits of including context in QoE monitoring and managementare demonstrated through use cases involving video flash crowds as wellas online and cloud gaming.
Finally, we discuss potential technical realizations of context-awareQoE monitoring and management derived based on the SDN paradigm.
1 Introduction
With the ever increasing availability of media-rich, personalized, and context-aware services delivered over today’s networks, service and network providers areconstantly battling to maintain a satisfied customer base. In addition, a paradigmshift is being witnessed in Internet service delivery, whereby we see a transitiontowards what has been referred to as an Internet of Services (IoS), envisioningeverything on the Internet as a service [44]. Such a transition will potentiallylead to new services being realized as large-scale service chains, combining andintegrating the functionality of (possibly many) other services offered by thirdparties (e.g., infrastructure providers, software providers, platform providers).Key aspects and challenges to address will include the reliability and Quality ofService (QoS) delivery, which inherently relies on monitoring, quality estimation,and prediction mechanisms.
In light of the very competitive market, end-user Quality of Experience (QoE)will be one key differentiator between providers. In order to successfully manageQoE, it is necessary to identify and understand the many factors that can—andthe specific factors that actually do in a given scenario—affect user QoE. Result-ing QoE models dictate the parameters to be monitored and measured, with theultimate goal being effective QoE optimization strategies [23]. The majority ofQoE-based management approaches to date are primarily based on either net-work management (facilitated through monitoring and exerting control on accessand core network level) or application management (e.g., adaptation of qualityand performance on end-user and application host/cloud level) [52]. For example,many Web services (e.g., YouTube or Netflix), which are transparently run overvarious Internet Service Provider (ISP) networks, commonly implement QoEcontrol schemes on the application layer by adapting the application to the con-ditions found in the network. The network and service management approachesof today’s networks are often designed to operate solely in the domain of a singlestakeholder. Consequently, due to a lack of information exchange and coopera-tion among involved parties the effectiveness of such approaches is limited [6].
Going beyond QoE management, additional information may be exploitedto optimize the services on a system level, e.g., by considering resource allo-cation and utilization of system resources, resilience of services, but also theuser perceived quality. While QoE management chiefly targets the optimizationof service delivery and currently running applications, the exploitation of con-text information by network operators could lead to more sophisticated trafficmanagement, a reduction of the traffic load on the inter-domain links, and areduction of the operating costs for the ISPs. Context monitoring in its broadest

Context Monitoring for Improved System Performance and QoE 25
sense aims to obtain as much information about the current system state aspossible. For example, the popularity of video requests could be monitored, orthe consequences of events (such as soccer matches) could be foreseen based ondata collected from different sources, such as social networks (e.g., the popularityof videos could dictate caching/bandwidth demands). Such a holistic viewpointoffers the necessary input for providing enhanced service control and resourceallocation functions, with clear potential for improving QoE. To date, there is stilla limited understanding of the potential business models, technical realizations,and exploitation benefits of extending “traditional” QoE monitoring solutions(e.g., monitoring of network conditions, device capabilities, application specificparameters, and user-related factors) with context monitoring.
The goal of this chapter is to provide further insight into the potential ofexploiting context monitoring for QoE management, both in terms of increas-ing QoS and QoE (by managing individual flows and users), and also in termsof improving the resilience of services (by making available information aboutnetwork state to these services). We also acknowledge the fact that today’s Inter-net traffic mix is extremely diverse, with traffic from numerous services fusedtogether. Context monitoring is discussed from the perspective of a single service(or class of services), as those fundamentals are important to us. The interac-tions of concurrent QoE management efforts in a single network are extremelyinteresting as well but not in the scope of this paper.
This chapter is organized as follows. Section 2 lays out a generic framework forcontext monitoring by proposing a classification scheme for context informationand discussing the potential involvement of this information in QoE monitoringand management solutions. For demonstration purposes, example scenarios aredepicted in Sect. 3 illustrating the benefits of exploiting context information inactual use cases that can ultimately lead to overall QoE improvements. Section 4then discusses a technological solution path for enhancing QoE with SoftwareDefined Networking (SDN) that utilizes context monitoring data. Finally, con-cluding remarks and future work are given in Sect. 5.
2 Generic Framework for Context Monitoring
A generic framework for context monitoring provides the means to utilize contextinformation in order to improve a networked system. To this end, the termcontext information is defined in Sect. 2.1. A classification scheme of contextinformation is proposed which provides the means for systematically identifyinguseful context information for various use cases. Section 2.2 describes how tomodel QoS and QoE as input for any improvement strategy. Different approachesfor involving context in QoE monitoring are introduced in Sect. 2.3.
2.1 Definition and Classification of Context Information
The term context is very broad and several definitions exist in literature. Thosedefinitions vary depending on the actual system under consideration. Goals that
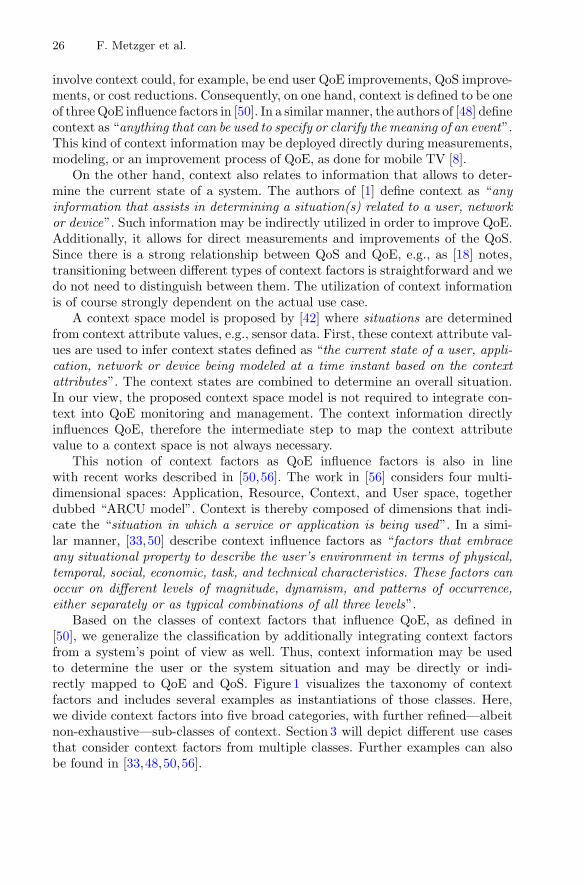
26 F. Metzger et al.
involve context could, for example, be end user QoE improvements, QoS improve-ments, or cost reductions. Consequently, on one hand, context is defined to be oneof three QoE influence factors in [50]. In a similar manner, the authors of [48] definecontext as “anything that can be used to specify or clarify the meaning of an event”.This kind of context information may be deployed directly during measurements,modeling, or an improvement process of QoE, as done for mobile TV [8].
On the other hand, context also relates to information that allows to deter-mine the current state of a system. The authors of [1] define context as “anyinformation that assists in determining a situation(s) related to a user, networkor device”. Such information may be indirectly utilized in order to improve QoE.Additionally, it allows for direct measurements and improvements of the QoS.Since there is a strong relationship between QoS and QoE, e.g., as [18] notes,transitioning between different types of context factors is straightforward and wedo not need to distinguish between them. The utilization of context informationis of course strongly dependent on the actual use case.
A context space model is proposed by [42] where situations are determinedfrom context attribute values, e.g., sensor data. First, these context attribute val-ues are used to infer context states defined as “the current state of a user, appli-cation, network or device being modeled at a time instant based on the contextattributes”. The context states are combined to determine an overall situation.In our view, the proposed context space model is not required to integrate con-text into QoE monitoring and management. The context information directlyinfluences QoE, therefore the intermediate step to map the context attributevalue to a context space is not always necessary.
This notion of context factors as QoE influence factors is also in linewith recent works described in [50,56]. The work in [56] considers four multi-dimensional spaces: Application, Resource, Context, and User space, togetherdubbed “ARCU model”. Context is thereby composed of dimensions that indi-cate the “situation in which a service or application is being used”. In a simi-lar manner, [33,50] describe context influence factors as “factors that embraceany situational property to describe the user’s environment in terms of physical,temporal, social, economic, task, and technical characteristics. These factors canoccur on different levels of magnitude, dynamism, and patterns of occurrence,either separately or as typical combinations of all three levels”.
Based on the classes of context factors that influence QoE, as defined in[50], we generalize the classification by additionally integrating context factorsfrom a system’s point of view as well. Thus, context information may be usedto determine the user or the system situation and may be directly or indi-rectly mapped to QoE and QoS. Figure 1 visualizes the taxonomy of contextfactors and includes several examples as instantiations of those classes. Here,we divide context factors into five broad categories, with further refined—albeitnon-exhaustive—sub-classes of context. Section 3 will depict different use casesthat consider context factors from multiple classes. Further examples can alsobe found in [33,48,50,56].
Context Monitoring for Improved System Performance and QoE 27
Fig. 1. Classification of context factors involved in QoS and QoE monitoring. Examplesare denoted in light grey.
2.2 Towards Context-Aware QoE Modeling and EstimationStrategies
Following the overview of different categories of context factors influencing QoE,we discuss QoE modeling concepts and the potential of enhancing the qualityestimation process with context awareness.
The main aim of QoE estimation models is to mimic the quality assessmentprocess performed by the end user of a corresponding service as accurately aspossible. The main output of the model is thus an estimation of the qualityas perceived by the end user in the specific scenarios of interest. The aim is toachieve a high correlation between estimated quality scores and subjective scoresin these scenarios. Quantifiable influence factors are mapped to quality scorescommonly expressed by Mean Opinion Score (MOS) values. To this end, thedata obtained from subjective quality tests is required in order to find mappingfunctions that best resemble the human perception of quality. Different types ofquality models are currently in use for service quality estimation, quality mon-itoring, or even service design. We refer the prospective reader to [53], whichprovides a comprehensive review of different types of quality models. Reducedreference and no-reference models are generally deployed for real-time servicemonitoring, as they do not require access to a complete reference signal in theassessment process. In principle, both reduced reference models as well as no-reference models can be applied at different points in the network in order tobetter quantify the impact of packet loss and other important network parame-ters on QoE.
As QoE is a multidimensional concept influenced by a number of system,user, and context factors, it is important to keep in mind that QoE is highlydependent on QoS. According to [23], QoS parameters represent one of the mostbusiness-relevant parameters for network and service providers. The mathemat-ical dependency of QoE on QoS parameters at both the network and applicationlevel can usually be characterized by logarithmic or exponential functions as they
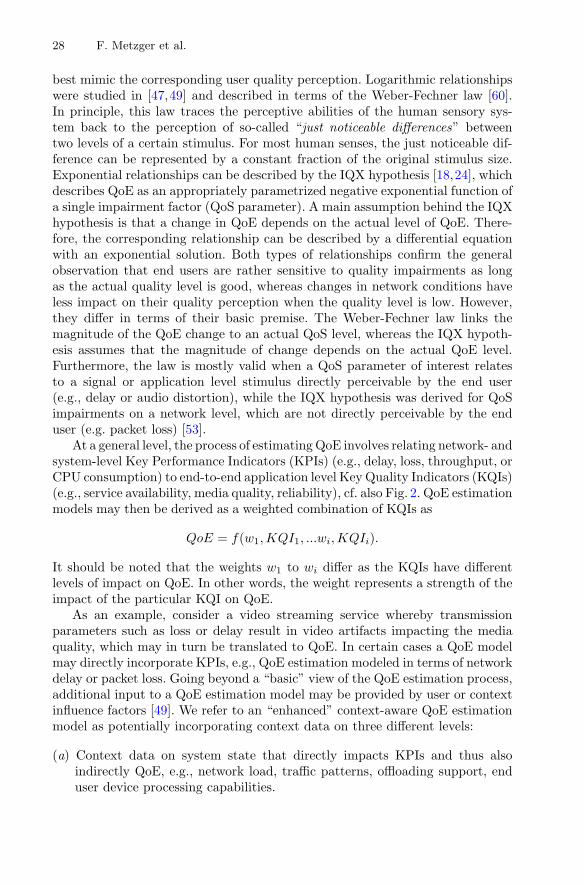
28 F. Metzger et al.
best mimic the corresponding user quality perception. Logarithmic relationshipswere studied in [47,49] and described in terms of the Weber-Fechner law [60].In principle, this law traces the perceptive abilities of the human sensory sys-tem back to the perception of so-called “just noticeable differences” betweentwo levels of a certain stimulus. For most human senses, the just noticeable dif-ference can be represented by a constant fraction of the original stimulus size.Exponential relationships can be described by the IQX hypothesis [18,24], whichdescribes QoE as an appropriately parametrized negative exponential function ofa single impairment factor (QoS parameter). A main assumption behind the IQXhypothesis is that a change in QoE depends on the actual level of QoE. There-fore, the corresponding relationship can be described by a differential equationwith an exponential solution. Both types of relationships confirm the generalobservation that end users are rather sensitive to quality impairments as longas the actual quality level is good, whereas changes in network conditions haveless impact on their quality perception when the quality level is low. However,they differ in terms of their basic premise. The Weber-Fechner law links themagnitude of the QoE change to an actual QoS level, whereas the IQX hypoth-esis assumes that the magnitude of change depends on the actual QoE level.Furthermore, the law is mostly valid when a QoS parameter of interest relatesto a signal or application level stimulus directly perceivable by the end user(e.g., delay or audio distortion), while the IQX hypothesis was derived for QoSimpairments on a network level, which are not directly perceivable by the enduser (e.g. packet loss) [53].
At a general level, the process of estimating QoE involves relating network- andsystem-level Key Performance Indicators (KPIs) (e.g., delay, loss, throughput, orCPU consumption) to end-to-end application level Key Quality Indicators (KQIs)(e.g., service availability, media quality, reliability), cf. also Fig. 2. QoE estimationmodels may then be derived as a weighted combination of KQIs as
QoE = f(w1,KQI1, ...wi,KQIi).
It should be noted that the weights w1 to wi differ as the KQIs have differentlevels of impact on QoE. In other words, the weight represents a strength of theimpact of the particular KQI on QoE.
As an example, consider a video streaming service whereby transmissionparameters such as loss or delay result in video artifacts impacting the mediaquality, which may in turn be translated to QoE. In certain cases a QoE modelmay directly incorporate KPIs, e.g., QoE estimation modeled in terms of networkdelay or packet loss. Going beyond a “basic” view of the QoE estimation process,additional input to a QoE estimation model may be provided by user or contextinfluence factors [49]. We refer to an “enhanced” context-aware QoE estimationmodel as potentially incorporating context data on three different levels:
(a) Context data on system state that directly impacts KPIs and thus alsoindirectly QoE, e.g., network load, traffic patterns, offloading support, enduser device processing capabilities.
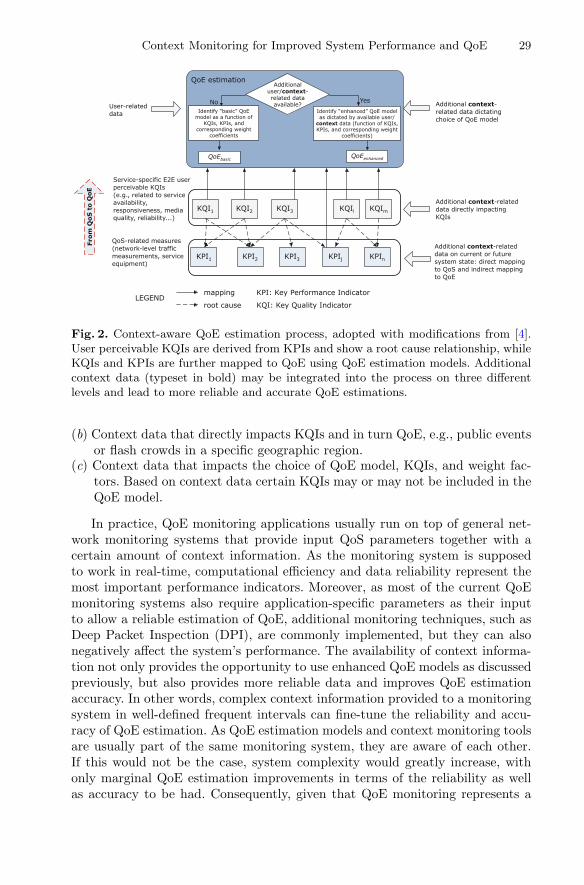
Context Monitoring for Improved System Performance and QoE 29
KPI1 KPI2 KPI3 KPIj KPIn
KQI1 KQI3 KQIiKQI2 KQIm
QoS-related measures (network-level traffic measurements, service equipment)
Service-specific E2E user perceivable KQIs(e.g., related to service availability, responsiveness, media quality, reliability...)
User-related data
Additional context-related data dictating choice of QoE model
From
QoS
to
QoE
Additional context-related data on current or future system state: direct mapping to QoS and indirect mapping to QoE
Additionaluser/context- related data available?
QoE estimation
as dictated by available user/context data (function of KQIs, KPIs, and corresponding weight
coefficients)
No Yes
model as a function of KQIs, KPIs, and
corresponding weight coefficients
QoEenhanced
Additional context-related data directly impacting KQIs
QoEbasic
mapping
root causeLEGEND
KPI: Key Performance Indicator
KQI: Key Quality Indicator
Fig. 2. Context-aware QoE estimation process, adopted with modifications from [4].User perceivable KQIs are derived from KPIs and show a root cause relationship, whileKQIs and KPIs are further mapped to QoE using QoE estimation models. Additionalcontext data (typeset in bold) may be integrated into the process on three differentlevels and lead to more reliable and accurate QoE estimations.
(b) Context data that directly impacts KQIs and in turn QoE, e.g., public eventsor flash crowds in a specific geographic region.
(c) Context data that impacts the choice of QoE model, KQIs, and weight fac-tors. Based on context data certain KQIs may or may not be included in theQoE model.
In practice, QoE monitoring applications usually run on top of general net-work monitoring systems that provide input QoS parameters together with acertain amount of context information. As the monitoring system is supposedto work in real-time, computational efficiency and data reliability represent themost important performance indicators. Moreover, as most of the current QoEmonitoring systems also require application-specific parameters as their inputto allow a reliable estimation of QoE, additional monitoring techniques, such asDeep Packet Inspection (DPI), are commonly implemented, but they can alsonegatively affect the system’s performance. The availability of context informa-tion not only provides the opportunity to use enhanced QoE models as discussedpreviously, but also provides more reliable data and improves QoE estimationaccuracy. In other words, complex context information provided to a monitoringsystem in well-defined frequent intervals can fine-tune the reliability and accu-racy of QoE estimation. As QoE estimation models and context monitoring toolsare usually part of the same monitoring system, they are aware of each other.If this would not be the case, system complexity would greatly increase, withonly marginal QoE estimation improvements in terms of the reliability as wellas accuracy to be had. Consequently, given that QoE monitoring represents a
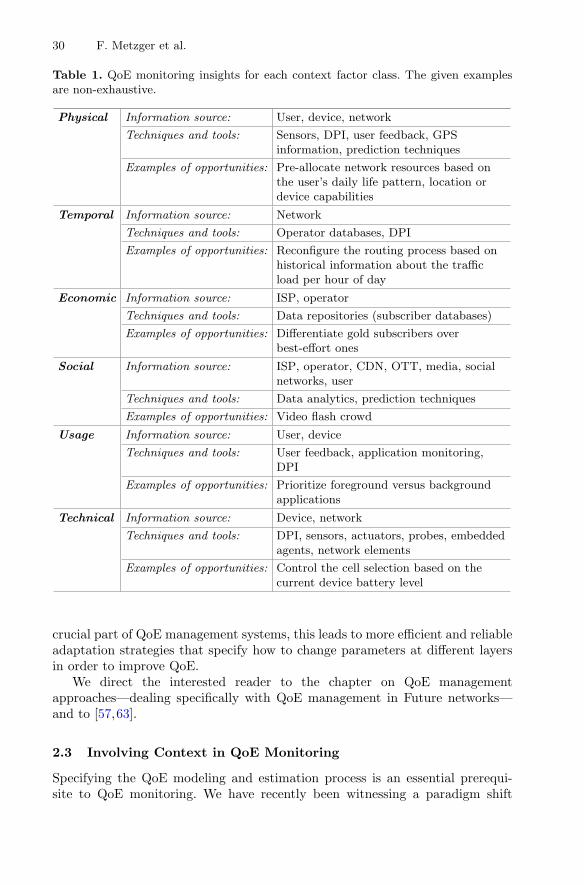
30 F. Metzger et al.
Table 1. QoE monitoring insights for each context factor class. The given examplesare non-exhaustive.
Physical Information source: User, device, network
Techniques and tools: Sensors, DPI, user feedback, GPSinformation, prediction techniques
Examples of opportunities: Pre-allocate network resources based onthe user’s daily life pattern, location ordevice capabilities
Temporal Information source: Network
Techniques and tools: Operator databases, DPI
Examples of opportunities: Reconfigure the routing process based onhistorical information about the trafficload per hour of day
Economic Information source: ISP, operator
Techniques and tools: Data repositories (subscriber databases)
Examples of opportunities: Differentiate gold subscribers overbest-effort ones
Social Information source: ISP, operator, CDN, OTT, media, socialnetworks, user
Techniques and tools: Data analytics, prediction techniques
Examples of opportunities: Video flash crowd
Usage Information source: User, device
Techniques and tools: User feedback, application monitoring,DPI
Examples of opportunities: Prioritize foreground versus backgroundapplications
Technical Information source: Device, network
Techniques and tools: DPI, sensors, actuators, probes, embeddedagents, network elements
Examples of opportunities: Control the cell selection based on thecurrent device battery level
crucial part of QoE management systems, this leads to more efficient and reliableadaptation strategies that specify how to change parameters at different layersin order to improve QoE.
We direct the interested reader to the chapter on QoE managementapproaches—dealing specifically with QoE management in Future networks—and to [57,63].
2.3 Involving Context in QoE Monitoring
Specifying the QoE modeling and estimation process is an essential prerequi-site to QoE monitoring. We have recently been witnessing a paradigm shift

Context Monitoring for Improved System Performance and QoE 31
from “traditional” QoS monitoring to QoE monitoring procedures [35]. Variousapproaches can be used for QoE monitoring, namely on end-user or device level,network level, or a combination of the two, see, e.g., [53]. QoE monitoring mayrun on the network layer to capture QoS parameters, requiring the existence ofmapping functions between QoS and QoE, but also on application layer in orderto obtain relevant information directly from the application in question.
Including additional context data, potentially gathered from a broad rangeof sources, can significantly enrich QoE monitoring by providing better infor-mation about a system’s current and future properties and state. For example,monitoring social networks’ text streams with natural language processing algo-rithms and machine learning approaches [28] can provide a valuable source ofinformation regarding short-term trends in popular content or potential “high-profile” future events which allows for better caching strategies to avoid stallingin video streaming [55].
While QoE-based management is already a novel procedure when comparedto traditional QoS-based management, its performance can still be enhancedfurther with context awareness. Therefore, in order to reap all the benefits thatstem from the possibility of context-awareness in a network, viable and fea-sible context monitoring mechanisms need to be devised. It is expected thatthese mechanisms will differ per use case, to better reflect the requirements andidiosyncrasies of each scenario (as it will be also explained in Sect. 3). However,often a trade-off has to be made between the amount of information collectedand the processing time required to use them properly.
In Table 1, we provide some insights about QoE monitoring in a high-levelway. Specifically, following the context factor classification proposed in Sect. 2.1,we present the potential sources of information per class, the techniques or toolsto extract information from the appropriate sources, and finally some new oppor-tunities, that will arise if context monitoring, and subsequently, context- andQoE-aware management are realized. Possible sources of context information are:
(a) The end-users themselves,(b) The users’ device characteristics, ranging from the device’s hardware/
software up to the application layer,(c) The network, i.e., any intermediate network nodes in the core or the access
network that are capable of providing context-related information,(d) The operator’s or ISP’s proprietary infrastructure,(e) Third party information, namely feedback from any players who do not con-
trol the information flow, but only its content and format (e.g., content and“Over-The-Top” (OTT) service providers, social channels such as Facebook,Twitter, etc., provisioning their services over the operator’s or ISP’s infras-tructure).
Regarding the acquisition of technical context factors, some insights may befound in [15].
The main concerns and challenges in implementing QoE monitoring proce-dures on top of the already available network mechanisms mainly have to do

32 F. Metzger et al.
with the complexity and signaling overhead that would be inevitably imposed inthe network. Context awareness does not come without a cost. Thus, it is impor-tant to employ it only when and where it is meaningful. A crucial point is toavoid turning the context monitoring procedure into another negative QoE influ-ence factor, e.g., by introducing a higher congestion to the network, or drainingthe user device’s battery faster, or even persistently requesting user feedback.Therefore, the extent of the influence of each context factor on QoE needs tobe established. A further challenge in capturing the context and consequentlyin validating QoE monitoring techniques is the fact that these studies have tobe conducted in the field. The controlled laboratory environments, which areconventionally used for QoE monitoring and modeling purposes, do not allowfor capturing the diversity of the various context factors and the plethora of usecases. Some best practices for acquiring context information are provided in [51],although the focus there is mainly on user experience studies and not QoE.
It should be emphasized that context monitoring requires models, metrics,and approaches that capture the condition of the system on a network andservice layer, application and service demands, and the capabilities of the end-user device. Assuming, however, that context monitoring can be realized, thenthe exploitation of context information may lead to more sophisticated systemand traffic management, traffic load reduction on the inter-domain links, andreduction of operating costs for ISPs. However, before this can occur, effectivemethods need to be determined in order to incorporate the monitored contextparameters into an enhanced cross-layer QoE management. A promising optionmight be based on SDN [31] as discussed further in Sect. 4.
3 Context Factor Examples, Use Cases and Literature
To demonstrate the potential benefits of context information in QoE monitoringand management, this section presents some practical examples, with varyinginvolved parties and services. Table 2 also highlights the relevant factors for somescenarios. As outlined in Sect. 2.1, context is a very broad umbrella term thatencompasses a wide range of elements, many of which are interrelated. To get agrasp of their influences, a general overview and related research that illustratesthe idea of context factors is presented here for individual factors first, beforemoving on to more specific use cases.
3.1 Usage Examples for the Context Factor Categories
Usage Context Factors. The interactivity required for a certain task to beconducted in a satisfactory fashion is another usage context factor that can beessential in certain scenarios. Besides gaming this especially concerns conver-sational applications. In [7], the extent to which interactivity requirements ofReal-time Communications (RTCs) and specifically voice applications impactQoE is examined. Of particular note is the ITU-T E-Model [29], a telecom-munications planning tool that generates a QoE score. Thus they developed a
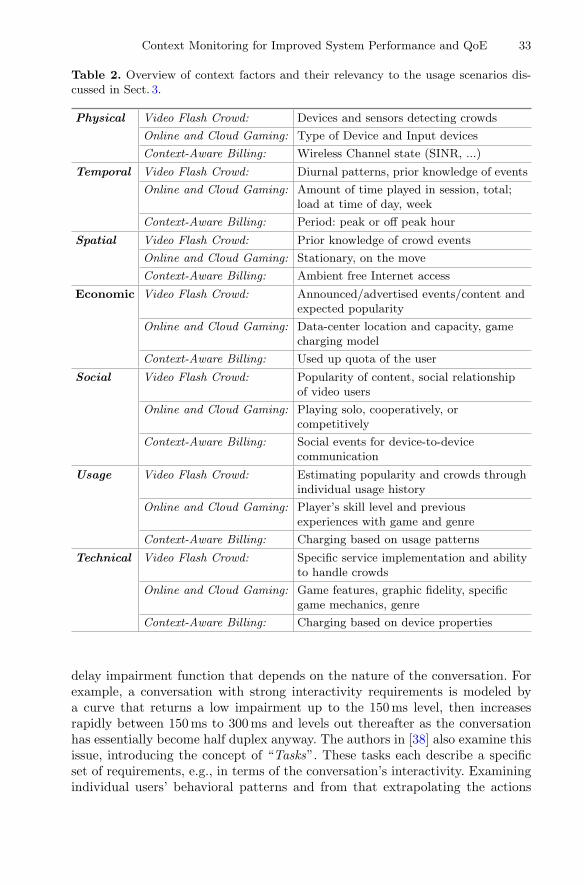
Context Monitoring for Improved System Performance and QoE 33
Table 2. Overview of context factors and their relevancy to the usage scenarios dis-cussed in Sect. 3.
Physical Video Flash Crowd: Devices and sensors detecting crowds
Online and Cloud Gaming: Type of Device and Input devices
Context-Aware Billing: Wireless Channel state (SINR, ...)
Temporal Video Flash Crowd: Diurnal patterns, prior knowledge of events
Online and Cloud Gaming: Amount of time played in session, total;load at time of day, week
Context-Aware Billing: Period: peak or off peak hour
Spatial Video Flash Crowd: Prior knowledge of crowd events
Online and Cloud Gaming: Stationary, on the move
Context-Aware Billing: Ambient free Internet access
Economic Video Flash Crowd: Announced/advertised events/content andexpected popularity
Online and Cloud Gaming: Data-center location and capacity, gamecharging model
Context-Aware Billing: Used up quota of the user
Social Video Flash Crowd: Popularity of content, social relationshipof video users
Online and Cloud Gaming: Playing solo, cooperatively, orcompetitively
Context-Aware Billing: Social events for device-to-devicecommunication
Usage Video Flash Crowd: Estimating popularity and crowds throughindividual usage history
Online and Cloud Gaming: Player’s skill level and previousexperiences with game and genre
Context-Aware Billing: Charging based on usage patterns
Technical Video Flash Crowd: Specific service implementation and abilityto handle crowds
Online and Cloud Gaming: Game features, graphic fidelity, specificgame mechanics, genre
Context-Aware Billing: Charging based on device properties
delay impairment function that depends on the nature of the conversation. Forexample, a conversation with strong interactivity requirements is modeled bya curve that returns a low impairment up to the 150 ms level, then increasesrapidly between 150 ms to 300 ms and levels out thereafter as the conversationhas essentially become half duplex anyway. The authors in [38] also examine thisissue, introducing the concept of “Tasks”. These tasks each describe a specificset of requirements, e.g., in terms of the conversation’s interactivity. Examiningindividual users’ behavioral patterns and from that extrapolating the actions
34 F. Metzger et al.
of a larger crowd in order to enhance, e.g., network-wide video streaming QoEmanagement is also an enticing aspect of this type of context factors.
Noise and Vibration Context Factors. Research by Wilk et al. [62] presentsa prototype that measures smartphone background noise and screen vibrationin real-time for users on the move. These factors are then used to decreasedownloaded video and audio quality in order to reduce bandwidth. This strategyis based on the premise that delivering high quality audio and video under suchconditions represents a waste of bandwidth and perhaps money, illustrating thepotential inter-relatedness of context factors and economics.
Charging and Billing Context Factors. With usage-based pricing in mobilenetworks being a reality in many countries, users are incentivised to sparingly usetheir alloted data volume. Pursuing this line of thought, context monitoring couldopen up several opportunities for interactions between the operator, the network,and the user in this regard. Data-cap-aware video adaptation is examined in[10]. The work proposes to choose the best video resolution that still enables theclient to stay below its data cap. Another approach presented in [21] evaluatesthe case of shifting elastic traffic to off-peak periods. Alternatively, one canpostpone delay-tolerant traffic until it can be offloaded to free-of-charge Wi-Finetworks. With the upcoming 5G mobile networks it could also be feasible tooffload certain traffic using direct device-to-device communication with someonewilling to transfer the data for free assuming sufficient resource availability [9].In this case, context information can be utilized to predict when such a suitableconnection will be available. Finally, a channel-aware pricing model could also bean opportunity, such as is discussed in [19]. Herein, the operator sets the pricesto a value that fits the currently available radio and network resources.
Mobility Context Factors. With the evolving mobile architectures, usersincreasingly expect service and application availability whilst on the move.Returning to the aforementioned ITU-T E-model [29] the advantage of appli-cation accessibility on the move is modeled by an advantage factor defined as“the compensation of impairment factors when the user benefits from other typesof access”. However, this is specifically designed for voice communication anddoes not necessarily apply to the same extent to other applications such asonline video games or non-RTC applications, thus further research is required.A more recent example is provided in [40]. Here, the scenario of adaptive videostreaming on the move is highlighted, especially the challenges surrounding theprediction of outage events through context and appropriately modifying thebuffering behavior to avoid playback stalls.
Location Context Factors. Usually location relates specifically to user loca-tion. However, for applications that are hosted remotely in the cloud could beextended to include where the application is hosted, keeping in mind the relative
Context Monitoring for Improved System Performance and QoE 35
distance between host and client and the impact on latency. With the growingimportance of cloud services this raises an interesting interdependence of spatial,physical, and economic context factors and can have a significant impact on theQoE of RTC-applications such as communication and gaming.
A 2011 study [34] suggests a Data Center (DC) energy consumption ratioof 1.5% of the global production. This share may continue to rise as public andprivate cloud adoption is growing steadily. About 70% of the power usage isdirectly proportional to the server load, making efficient usage of the existingservers a must. The principal underlying technology, which facilitates manage-ment of workload in a DC, is virtualization. Rather than each server hostinga single application instance, a number of Virtual Machines (VMs) are runningconcurrently on a single physical server. These VMs may be migrated to a differ-ent local host or across the Wide Area Network (WAN) depending on a varietyof strategies with significant impact on QoE.
A good example is the follow-the-sun-strategy that helps minimizing thenetwork latency during office hours by placing VMs close to where they arerequested most often. Such a strategy can improve QoE, with the trade-off ofincreased energy costs as they are typically higher during daylight time. Wherelatency is not a primary concern or where other factors are given precedence,there are a number of different strategies which can be applied in addition. Thesegenerally involve VMs getting shifted to locations with cheaper resource costs,for example to places where less expensive cooling is required, exploiting lowerpower costs during night times (“follow-the-moon”), or following fluctuatingelectricity prices on the open market [46].
A final reason for monitoring spatial context factors in DC environmentsis that of data safety. Operations related to fault tolerance, mirroring, mainte-nance, or disaster recovery can be the cause of VM migrations. Regardless of themotivation, migrating VMs can greatly impact application response times andthus QoE. If detailed Service Level Agreements (SLAs) are negotiated and inplace, QoS parameters can be contractually covered. However, users without anSLA may then suddenly find greatly increased delays during or after a migration.
3.2 Use Case: Video Flash Crowd and QoE
The potential of context monitoring for video streaming was assessed, e.g., insimulation studies in [22,25] on which this section is based. In the papers’ sce-nario, a flash crowd of users watching the same video is examined. This suddenincrease of popularity is a typical phenomenon of video platforms with user-generated content like YouTube. Video cascades can often emerge due to new orpopular content being spread through social media challenges. Those phenom-ena, dubbed flash crowds, may be temporarily limited because of event-relatedcontent, spatially limited because of regional interests, or socially limited dueto grouping effects in social interests [12]. The simulation provides a modelfor the effects of flash crowds on adaptive streaming and compares differentapproaches to Content Distribution Network (CDN) load balancing and video
36 F. Metzger et al.
adaptation strategies to each other to study the benefits of context informationin the approaches that support it.
The context-unaware strategy has no knowledge of flash crowds and reactstoo slow to such events. Hence, some users experience stalling even thoughenough capacity would be available to serve all users and stalling should beentirely avoidable. HTTP adaptive streaming (HAS) is necessary in order toadapt to the current network situation and to reduce the number of stallingevents. If many of the users unaware of the flash crowd event request the videoat its highest quality, most of the users will suffer from stalling, leading to aworse overall QoE. This topic is also covered under the term QoE fairness [26].
The utilization of context information by the CDN as well as by HASimproves QoE. It is difficult to properly configure the context-unaware load bal-ancing strategies as the exact values strongly depend on the actual flash crowd.Therefore, a proper information exchange mechanism is required to make theinformation available across layers. The earlier the flash crowd scenario is rec-ognized by the load balancer the better the overall system performance will be.
The results are very sensitive to the dynamics and interactions of the HAScontrol loop and the CDN load balancing. Thus, in practice, realistic tests andinput models are required to quantify the results and to derive reasonable config-urations. This serves to demonstrate the potential of exploiting relevant contextdata. In the given use case, the contextual information regarding the formationof a flash crowd is collected by a third party. Other studies have also addressedrelated improvements, such as the approach proposed in [37], which suggests avideo control plane that can dynamically adapt both the CDN allocation andvideo bitrate midstream based on global context knowledge of network state,distribution of active clients, and CDN performance variability.
Other video scenarios addressed in related work draw similar conclusions.For example, significant work has addressed the challenges arising from multi-ple concurrent clients accessing HAS video in a given access network, therebycompeting for bandwidth across a shared bottleneck link. Problems arise due toindividual clients making adaptation decisions based on local observations, henceclients’ adaptation behaviors interact with each other, which results in qualityoscillations. Solutions proposed in literature involve centralized network-basedsolutions deployed using SDN [20], enhanced client-side adaptation to improvefairness among flows [32], and server-based traffic shaping [2]. However, in allthese cases context information (in this case network state data including over-all resource availability and global resource and traffic demands) could likely beutilized to control quality adaptation decisions (on a domain-wide level), conse-quently reducing oscillations and improving QoE.
The flash crowd scenario can illustrate the benefits of employing SDN as acentralized technological solution. With traditional IP networks, decisions aremade based on local knowledge, so even if a server that conducts data miningon social networks could foresee a high download rate, it will be challenging toperform load balancing. This task would require changing the routing policy atthe Border Gateway Protocol (BGP) level but may also have an impact on the
Context Monitoring for Improved System Performance and QoE 37
Interior Gateway Protocol (IGP) which is confined to its autonomous system.Even if the propagation of the routing updates would be implemented by a gossipalgorithm, the time it takes will make the network topology change irrelevant.However, with SDN, this very complex and time consuming task is simplified.The forwarding decision is taken higher up by the central controller, so an updateto the routing decision at the controller implements the load balancing. Froma technical perspective, further insight is needed in regards to the informationexchange between SDN controllers that are responsible for different domains, andbetween SDN controllers and other entities that can provide context information.
3.3 Use Case: Online and Cloud Gaming
Context monitoring can play a huge role for video games, specifically for onlineand cloud games. Compared to videos and watching video streams, video gamesadd a high degree of user interactivity to the mix, which limits and alters thetype of eligible evaluation and management approaches.
In the case of cloud gaming, the game server executes the game logic, ren-ders the scene, and sends an encoded video stream to the client in real-time[27,41]. The client is responsible for decoding the video and capturing the player’scommands. Two network-level factors are critical: the bandwidth required by thevideo stream (influencing image quality and frame rate) [58], and the Round-Trip Time (RTT) (influencing the game’s responsiveness to input commands)[13,14]. For online games, the throughput is much less important when comparedto the RTT. Nonetheless, the network path is influenced by numerous kinds ofcontext factors, most prominently technical (type of access), spatial (user on themove), and economic (data center location and amount of available processingand GPU resources).
Speaking of the economic factor, service providers are inclined to either usea centralized (to achieve a maximum multiplexing gain especially of the costlyGPU resources) or a follow-the-moon strategy on their active server locationsto save energy and processing costs. However choosing a too-distant data-centerlocation would introduce additional latency to the system, negatively impactingthe player’s experience. The amount of concurrent players can be deduced by adiurnal temporal context factor. Proper trade-offs between these three contextfactors (namely economic, spatial, and temporal) have to be determined.
Besides network aspects, the type of device used for the gaming client and itsinput methods play a significant role in evaluating cloud gaming. The device’snative resolution determines the game’s optimal rendering quality setting andthe capture resolution as well as the required bandwidth to transmit the videostream. Likewise, but maybe not as obvious, the available input methods deter-mine the effect size latency has on the game. This especially concerns touchcontrols, which typically lack in accuracy as well as immediacy that can beespecially felt in fast-paced games such as first-person-shooters.
This argument can additionally be extended to consider the type and genreof a game as a further context factor. The range of interactivity in games is verylarge and diverse, sometimes even in a single game. While some games require
38 F. Metzger et al.
decision-making and inputs on a millisecond-scale (e.g., first person shooterslike Counter-Strike: Global Offensive or DOOM), some games might requirehundreds of input decisions every minute (StarCraft II), while others requireonly a single input every few seconds or even minutes with very wide timingwindows (take turn-based strategy games or adventure games with logic puzzlessuch as the classic Monkey Island series). This technical context factor repre-sents itself well in the way QoE management can be conducted in online andCloud games. If the specific characteristics of a game are known in advance, thetiming constraints can be determined without further measurements and put touse for management of the transmission. Also, if a game with an online com-ponent is played through a cloud gaming service, the game’s lag concealmentmechanisms (that are in place for almost any kind of online multiplayer game)could additionally encompass the cloud gaming service and provide telemetryon the streaming latency to the online game’s server in an effort to capture theactual end-to-end latency and improve the gaming experience.
A further player-level temporal and social context factor might also be inter-esting for management purposes: the duration players have been playing thesame game in one session as well as the total time. Both metrics might eitherheighten the player’s sensitivity to deviations from the expected playing expe-rience or might make her more tired and thus ignorant of quality degradations.Depending on the direction of the interaction, QoE management can either belenient or become more stringent during the course of a game session. Previ-ous studies have shown the link between network performance and game playduration [11]. Further studies have shown that player experience and skill areimportant QoE influence factors which may clearly impact a player’s tolerance toperformance degradations [43,59]. Hence, experienced players could be treateddifferently to novice or unexperienced players by the responsible mechanism.
4 Discussion on Technical Realization Approachesof Context Monitoring
Thus far we have discussed a generic framework for context monitoring andprovided use cases which outline the opportunities for exploiting concrete contextdata in QoE monitoring, estimation, and management solutions. In this sectionwe discuss novel technical realization approaches and challenges.
In recent years, concepts like SDN and Network Functions Virtualization(NFV) have become key drivers of network innovation. With their emergence,the importance of software in networking has grown rapidly. This trend is leadby open-source initiatives like the OpenDaylight1 project, the Open NetworkOperating System (ONOS)2 project, or the Open Platform for NFV (OPNFV)3
project. The introduction of these technologies paves the way for new possibilitiesto control and centrally orchestrate the network in a more flexible fashion in1 https://www.opendaylight.org.2 http://onosproject.org.3 https://www.opnfv.org.

Context Monitoring for Improved System Performance and QoE 39
order to achieve and maintain a high QoE standard for the users. SDN involvesdecoupling the data plane from the control plane [39] where the decision on howto forward a packet is taken.
One of the goals of SDN is the creation of a network OS which abstracts thenetwork complexity and allows operators to specify a network policy based ondata analytics and other sources without having to take care of the implemen-tation details. Similarly, SDN can enable applications and services to expressthe required QoS expected from the network and let applications on top of thecontroller translate this algorithmically into optimized forwarding decision inorder to satisfy QoE demands. SDN increases flexibility and efficiency by allow-ing the information to be aggregated at a single logically-centralized location(global SDN controller) to be subsequently accessed by multiple applications.SDN can enable a global or domain-wide view of a network and its usage, whichincludes network-level QoS and topology, user and application QoE, and context.Information from multiple sources can enhance the correlation and predictionof traffic demand. SDN allows the creation of dedicated monitoring solutions.The programmability of these kinds of flow-based monitoring functions sup-ports a fine-grained adaptivity (e.g., per user, per application) of monitoringand enforcement procedures. These features can enable real-time application-aware network resource management. Combined with new distributed cloudapproaches, like fog or mobile edge computing, this can bring services muchcloser to the user, thereby reducing latency and improving quality. Informationgained from context-based QoE monitoring can thus not only be used to steertraffic, but also to dynamically instantiate edge cloud capabilities.
It should be noted, that SDN is, by far, not the only solution to contextmonitoring. But it might be the most prolific one in the future when speak-ing about operator-wide orchestrated monitoring. Other solutions might includemore network-independent, end-to-end, application-layer, as well as cross-layer-focused approaches, e.g. in the fashion of [3]. While these are out of scope forthis work, they merit their own separate investigations in the future. Moreover,this section should be understood of a high-level discussion of the benefits andobstacles of the SDN-based approach and not as an instruction manual on theactual implementation of context monitoring.
4.1 Monitoring with SDN
One of the benefits of SDN is that it facilitates data collection through standard-ized vendor-independent interfaces and makes the monitoring task more scalableby not having to place isolated monitors in multiple locations. Rather, QoS, QoE,and context information can be collected at a logically centralized location (forexample the SDN controller). The interface between the controller and the net-work forwarding devices is generally referred to as Southbound Interface (SBI),enabling the controller to know what is going on in the network. Several SBI pro-tocols have already been proposed (e.g., “ForCES” by IETF) although the mostfamous is OpenFlow (OF). While in principle the OpenFlow protocol enablesmonitoring, its main purpose is the control of traffic flows. Therefore, usually
40 F. Metzger et al.
dedicated monitoring protocols such as “sFlow” are used to gather informationfor the SDN controller.
At this stage a couple of issues already arise. These are mostly present inclassic monitoring solutions as well, as long as they act as an intermediaryand not on an end-to-end basis. First, application QoE measurements and con-text information require communication and information exchange between SDNcontrollers and end-user devices or content providers. Monitoring protocols arehowever typically designed to communicate with network elements, but for theenvisaged scenario, metrics are also needed from user devices, such as terminalcapabilities (e.g., CPU) or buffer state. Generally, the concept where a globalSDN controller has relevant information from the full end-to-end infrastructure(core/access/end device) is tied to emerging research on time-aware applicationsand systems [61]. This initiative is investigating the opportunities and challengesthat are presented by having precise time synchronization demands on all inter-connected devices. One key benefit of this approach is in the area of QoS/QoEwhereby the SDN controller will have access to precisely timestamped networkinformation. This is especially important for delay-sensitive applications, suchas multiplayer online games or teleconferencing.
Context information includes, amongst others, the available Wi-Fi networks,user and subscription information, and provider policies. For this reason, inter-working and communication of SDN with entities such as 3GPP’s Access Net-work Discovery and Selection Function (ANDSF) and Policy and Charging RulesFunction (PCRF) can be important. The PCRF and the accompanying Policyand Charging Enforcement Function (PCEF), which are traffic management andDPI nodes located in the core network, have access to all the policy and charg-ing information related to subscribers. Having this knowledge, they control theprovisioning of the QoS for each flow through the concept of bearers (a networktunneling concept). These two entities are therefore also a good candidate forcontrolling and enforcing QoE-based policies. A future, enhanced PCRF shouldthen be able to enrich the bearer selection and management process based onthe specific QoE requirements of each service data flow.
Accurate SDN-based QoE monitoring requires measurements from multipledomains, which in turn necessitates communication between SDN controllers(between their “westbound” and “eastbound” interfaces). In [54] different hierar-chies and topologies for the deployment of controllers are proposed. The ONOSproject [5] is a good example of efforts to tackle the challenge of providing acentralized coordination while avoiding performance degradation at the controlplane. ONOS maintains a global view of the network while the SBI is physicallydistributed among multiple servers.
4.2 QoE Management with SDN
Overview of Existing Approaches. Initial commercial applications thatcombine QoE management with SDN already exist (e.g. for mobile nets4). This is4 https://www.nokia.com/en int/news/releases/2014/09/02/nokia-networks-big-
data-innovation-promises-dynamic-experience-management-networksperform.

Context Monitoring for Improved System Performance and QoE 41
reflected in literature as well. In [36] the SDN architecture is leveraged in orderto introduce a “QoE-service” specifically for OTT providers. This QoE-servicetakes advantage of network QoS metrics, application QoE metrics or user feed-back, and by combining them with the global resource view of the network itenables elastic traffic steering with the objective to enhance the performance ofOTT applications or for premium users.
The work in [45] considers a framework where the QoE of streaming videois measured at the video player running at the destination node, informing thenetwork of the achieved QoE. If the video QoE is low, the SDN-based networkidentifies bottlenecks on the delivery path and assigns a new video server todeliver the requested video to the end-node. A similar approach is taken in[30] on the example of YouTube video streaming. An agent at the end devicesmeasures the amount of buffered video data of the video and notifies an appli-cation controller if it drops below a certain threshold. The application controllerinstructs an SDN controller to temporarily relocate the YouTube flows of thisuser to a less congested link. When the video recovers, the relocation is reversedto conserve resources.
The work in [17] proposes an in-network QoE measurement framework.Unlike the previous approach, the QoE is measured inside the network and basedon the video fidelity and representation switching. This is achieved by SDN repli-cating the video stream to a QoE measurement agent. The QoE measurementsare collected by a measurement controller, which can modify the forwardingpaths using SDN in order to improve the delivered QoE. Moreover, the measure-ment controller exposes an API to allow other applications to obtain informationon the delivered QoE. The work in [16] proposes a QoE management frameworkfor SDN-enabled mobile networks and consists of three modules: QoE monitor-ing, QoE policy and rules, and QoE enforcement through network management.
Example Context Monitoring Solution with SDN. Previously discussedmetrics (network and system-level KPIs, application-level KQIs, context infor-mation) may be accumulated at the controller and provide input to the man-agement plane. This information can be used by an application on top of theNetwork operating system (NOS) to perform optimization and control. Thisinformation is forwarded by the controller via the Northbound interface (NBI).There are several ways this information can be leveraged to perform efficientmanagement of resources. For example, in the context of the video flash crowduse case presented in Sect. 3, it could be used at the CDN level to make theCDN aware of expected congestion and perform proactive rather than reactiveload balancing. In the latter case this means that another dedicated applicationat the CDN will change the resource allocation through a dedicated controller.
Assuming some decision is taken, this decision has to be forwarded to thecontroller via an NBI, and finally from the controller to the device via the sameSBI that has been used before. As such, both the NBI and SBI are used formonitoring in the uplink as well as management in the downlink. In Fig. 3 weillustrate a use case, namely a video service provider communicating with the

42 F. Metzger et al.
Context monitoring byBig Data service provider
Video service provider
SDN networkcontrol plane
Legacy networkcontrol plane
Networkcontrolmodule
Networkcontrolmodule
Applicationcontrol
interface
Application control plane
Applicationcontrolmodule
Applicationcontrolmodule
Applicationcontrolmodule
Context monitoring byBig Data service provider
Switch Switch
Switch
Cloud SDN WAN Legacy WAN
User
User
User
HypervisorvSwitchHypervisor
vSwitchHypervisorvSwitch
SDN network control plane
Westbound API Eastbound API
Northbound API
Southbound API
Fig. 3. An example of performing context monitoring in an SDN environment, adaptedfrom [31] and extended to illustrate a context monitoring scenario. Other scenariosmay also utilize APIs bound to different directions, e.g., context monitoring can alsobe conducted through the NBI.
NOS (controllers) via NBI which in turn gather the monitored data or providethe rules (i.e., how to handle the traffic) to the involved virtual and physicalnetwork elements.
5 Conclusions
This paper has provided detailed insights into how context monitoring can bebeneficial for QoE management with the goal to improve both QoS and QoE. Acontext information classification scheme has been proposed to serve as a genericframework, which has further been applied to different context monitoring usecases with various types of services involved. The use case scenarios were selectedto demonstrate the significance of context factors and the ways in which theycan interrelate. The video streaming use case illustrates the benefits of havingaccess to context data prior and during the formation of a flash crowd, andhow such an event could be combated with CDN load balancing strategies. Thebenefits and potential exploitation of context data are further discussed in thecase of on-line and cloud gaming, representing a highly demanding real-time

Context Monitoring for Improved System Performance and QoE 43
interactive scenario. Further use cases have highlighted some opportunities ofhow context monitoring can be deployed to improve QoE in future wireless andmobile networks.
Key issues to address with respect to deploying context-aware QoE moni-toring and management solutions are the technical realization challenges. Wefocus our discussions on the SDN paradigm as it can offer a promising technicalsolution. We are also aware of the potential implications to and conflicts withuser privacy. This topic was specifically omitted here, as it very much merits aseparate discussion.
In the growing Internet of Services, QoE management will play an importantrole. It can be proliferated, e.g., through SDN, especially when the variety ofservice providers, monitored metrics and SDN controllers is considered. Finally,underlying business models will play a key role in putting an effective QoEmanagement scheme based on enhanced monitoring into practice.
Acknowledgment. This work has been supported/partially supported by the ICTCOST Action IC1304—Autonomous Control for a Reliable Internet of Services(ACROSS), November 14, 2013 – November 13, 2017, funded by European Union.
References
1. Abowd, G.D., Dey, A.K., Brown, P.J., Davies, N., Smith, M., Steggles, P.: Towardsa better understanding of context and context-awareness. In: Gellersen, H.-W. (ed.)HUC 1999. LNCS, vol. 1707, pp. 304–307. Springer, Heidelberg (1999). https://doi.org/10.1007/3-540-48157-5 29
2. Akhshabi, S., Anantakrishnan, L., Dovrolis, C., Begen, A.C.: Server-based trafficshaping for stabilizing oscillating adaptive streaming players. In: 23rd ACM Work-shop on Network and Operating Systems Support for Digital Audio and Video,pp. 19–24. ACM (2013)
3. Alimi, R., Penno, R., Yang, Y., Kiesel, S., Previdi, S., Roome, W., Shalunov, S.,Woundy, R.: Application-Layer Traffic Optimization (ALTO) Protocol. RFC 7285(Proposed Standard), September 2014. http://www.ietf.org/rfc/rfc7285.txt
4. Batteram, H., Damm, G., Mukhopadhyay, A., Philippart, L., Odysseos, R.,Urrutia-Valdes, C.: Delivering quality of experience in multimedia networks. BellLabs Tech. J. 15(1), 175–193 (2010)
5. Berde, P., Gerola, M., Hart, J., Higuchi, Y., Kobayashi, M., Koide, T., Lantz, B.,O’Connor, B., Radoslavov, P., Snow, W., Parulkar, G.: ONOS: towards an open,distributed SDN OS. In: Proceedings of the Third Workshop on Hot Topics inSoftware Defined Networking, HotSDN 2014, pp. 1–6. ACM, New York (2014).http://doi.acm.org/10.1145/2620728.2620744
6. Bouten, N., Latre, S., De Turck, F.: QoE-centric management of multimedia net-works through cooperative control loops. In: Doyen, G., Waldburger, M., Celeda,P., Sperotto, A., Stiller, B. (eds.) AIMS 2013. LNCS, vol. 7943, pp. 96–99. Springer,Heidelberg (2013). https://doi.org/10.1007/978-3-642-38998-6 13
7. Boutremans, C., Le Boudec, J.Y.: Adaptive joint playout buffer and FEC adjust-ment for Internet telephony. In: INFOCOM 2003, Twenty-Second Annual JointConference of the IEEE Computer and Communications, vol. 1, pp. 652–662, IEEESocieties, March 2003

44 F. Metzger et al.
8. Buchinger, S., Kriglstein, S., Hlavacs, H.: A comprehensive view on user studies:survey and open issues for mobile TV. In: Proceedings of the Seventh EuropeanConference on European Interactive Television Conference, EuroITV 2009, pp.179–188. ACM, New York (2009). http://doi.acm.org/10.1145/1542084.1542121
9. Chavez-Santiago, R., Szydeko, M., Kliks, A., Foukalas, F., Haddad, Y., Nolan,K.E., Kelly, M.Y., Masonta, M.T., Balasingham, I.: 5G: the convergence of wirelesscommunications. Wirel. Pers. Commun. pp. 1–26 (2015). https://doi.org/10.1007/s11277-015-2467-2
10. Chen, J., Ghosh, A., Magutt, J., Chiang, M.: QAVA: quota aware video adapta-tion. In: Proceedings of the 8th International Conference on Emerging Network-ing Experiments and Technologies, CoNEXT 2012, pp. 121–132. ACM, New York(2012). http://doi.acm.org/10.1145/2413176.2413191
11. Chen, K.T., Huang, P., Lei, C.L.: How sensitive are online gamers to networkquality? Commun. ACM 49(11), 34–38 (2006)
12. Cheng, X., Li, H., Liu, J.: Video sharing propagation in social networks: measure-ment, modeling, and analysis. In: IEEE INFOCOM 2013, pp. 45–49. IEEE (2013)
13. Claypool, M., Finkel, D.: The effects of latency on player performance in cloud-based games. In: Proceedings of 13th Annual IEEE/ACM NetGames, pp. 1–6(2014)
14. Clincy, V., Wilgor, B.: Subjective Evaluation of Latency and Packet Loss in aCloud-Based Game. In: 2013 Tenth International Conference on Information Tech-nology: New Generations (ITNG), pp. 473–476. IEEE (2013)
15. Cuadra-Sanchez, A., Cutanda-Rodriguez, M., Perez-Mateos, I., Aurelius, A.,Brunnstrom, K., Laulajainen, J., Varela, M., de Vergara, J.: A global customerexperience management architecture. In: 2012 Future Network Mobile Summit(FutureNetw), pp. 1–8, July 2012
16. Eckert, M., Knoll, T.M.: QoE management framework for internet services inSDN enabled mobile networks. In: Bauschert, T. (ed.) EUNICE 2013. LNCS,vol. 8115, pp. 112–123. Springer, Heidelberg (2013). https://doi.org/10.1007/978-3-642-40552-5 11
17. Farshad, A., Georgopoulos, P., Broadbent, M., Mu, M., Race, N.: Leveraging SDNto provide an in-network QoE measurement framework. In: IEEE INFOCOM 20152nd Workshop on Communication and Networking Techniques for ContemporaryVideo, April 2015
18. Fiedler, M., Hoßfeld, T., Tran-Gia, P.: A generic quantitative relationship betweenquality of experience and quality of service. IEEE Netw. 24 (2010)
19. Fund, F., Hosseini, S., Panwar, S.: More bars, more bang for the buck: channel-dependent pricing for video delivery to mobile users. In: 2014 IEEE Conferenceon Computer Communications Workshops (INFOCOM WKSHPS), pp. 565–570,April 2014
20. Georgopoulos, P., Elkhatib, Y., Broadbent, M., Mu, M., Race, N.: Towardsnetwork-wide QoE fairness using openflow-assisted adaptive video streaming. In:ACM SIGCOMM 2013 Workshop on Future Human-Centric Multimedia Network-ing, pp. 15–20. ACM (2013)
21. Ha, S., Sen, S., Joe-Wong, C., Im, Y., Chiang, M.: TUBE: time-dependent pric-ing for mobile data. In: Proceedings of the ACM SIGCOMM 2012 Conference onApplications, Technologies, Architectures, and Protocols for Computer Communi-cation, SIGCOMM 2012, pp. 247–258. ACM, New York (2012). http://doi.acm.org/10.1145/2342356.2342402
Context Monitoring for Improved System Performance and QoE 45
22. Hoßfeld, T., Moldovan, C., Schwartz, C.: To each according to his needs: dimension-ing video buffer for specific user profiles and behavior. In: IFIP/IEEE Workshopon QoE Centric Management 2015 (QCMan), May 2015
23. Hoßfeld, T., Schatz, R., Varela, M., Timmerer, C.: Challenges of QoE managementfor cloud applications. IEEE Commun. Mag. 50(4) (2012)
24. Hoßfeld, T., Tran-Gia, P., Fiedler, M.: Quantification of quality of experience foredge-based applications. In: Mason, L., Drwiega, T., Yan, J. (eds.) ITC 2007.LNCS, vol. 4516, pp. 361–373. Springer, Heidelberg (2007). https://doi.org/10.1007/978-3-540-72990-7 34
25. Hoßfeld, T., Skorin-Kapov, L., Haddad, Y., Pocta, P., Siris, V., Zgank, A., Melvin,H.: Can context monitoring improve QoE? A case study of video flash crowds in theinternet of services. In: 2015 IFIP/IEEE International Symposium on IntegratedNetwork Management (IM), pp. 1274–1277, May 2015
26. Hoßfeld, T., Skorin-Kapov, L., Heegaard, P.E., Varela, M.: Definition of QoE fair-ness in shared systems. IEEE Commun. Lett. 21(1), 184–187 (2017)
27. Huang, C.Y., Chen, K.T., Chen, D.Y., Hsu, H.J., Hsu, C.H.: GamingAnywhere:the first open source cloud gaming system. ACM Trans. Multimedia Comput. Com-mun. Appl. 2(3), 1–26 (2010)
28. Hurriyetoglu, A., Kunneman, F., van den Bosch, A.: Estimating the time betweentwitter messages and future events. In: Eickhoff, C., de Vries, A.P. (eds.) DIR,CEUR Workshop Proceedings, vol. 986, pp. 20–23 (2013). CEUR-WS.org
29. ITU: The E-model: a computational model for use in transmission planning (ITU-TRecommendation G.107 (02/14)). International Telecommunications Union, Febru-ary 2014
30. Jarschel, M., Wamser, F., Hohn, T., Zinner, T., Tran-Gia, P.: SDN-basedapplication-aware networking on the example of YouTube video streaming. In:2nd European Workshop on Software Defined Networks (EWSDN 2013), Berlin,Germany, October 2013
31. Jarschel, M., Zinner, T., Hoßfeld, T., Tran-Gia, P., Kellerer, W.: Interfaces,attributes, and use cases: a compass for SDN. IEEE Commun. Mag. 52(6), 210–217(2014)
32. Jiang, J., et al.: Improving fairness, efficiency, and stability in HTTP-based adap-tive video streaming with FESTIVE. IEEE/ACM Trans. Netw. 22(1), 326–340(2014)
33. Jumisko-Pyykko, S., Vainio, T.: Framing the context of use for mobile HCI. Int. J.Mob. Hum. Comput. Interact. 2(4), 1–28 (2010). https://doi.org/10.4018/jmhci.2010100101
34. Koomey, J.: Growth in data center electricity use 2005 to 2010. A report by Ana-lytical Press, completed at the request of The New York Times, p. 9 (2011)
35. Liotou, E., Tsolkas, D., Passas, N., Merakos, L.: Quality of experience managementin mobile cellular networks: key issues and design challenges. IEEE Commun. Mag.Netw. Serv. Manag. Ser. 53, 145–153 (2015)
36. Liotou, E., Tseliou, G., Samdanis, K., Tsolkas, D., Adelantado, F., Verikoukis, C.:An SDN QoE-service for dynamically enhancing the performance of OTT applica-tions. In: 7th International Workshop on Quality of Multimedia Experience (IEEEQoMEX) (2015)
37. Liu, X., Dobrian, F., Milner, H., Jiang, J., Sekar, V., Stoica, I., Zhang, H.: A casefor a coordinated internet video control plane. In: Proceedings of the ACM SIG-COMM 2012 Conference on Applications, Technologies, Architectures, and Pro-tocols for Computer Communication, SIGCOMM 2012, pp. 359–370. ACM, NewYork (2012). http://doi.acm.org/10.1145/2342356.2342431
46 F. Metzger et al.
38. Markopoulou, A., Tobagi, F., Karam, M.: Assessment of VoIP quality over Internetbackbones. In: INFOCOM 2002, Proceedings of the Twenty-First Annual JointConference of the IEEE Computer and Communications Societies, vol. 1, pp. 150–159. IEEE (2002)
39. McKeown, N., Anderson, T., Balakrishnan, H., Parulkar, G., Peterson, L., Rexford,J., Shenker, S., Turner, J.: OpenFlow: enabling innovation in campus networks.SIGCOMM Comput. Commun. Rev. 38(2), 69–74 (2008)
40. Metzger, F., Liotou, E., Moldovan, C., Hoßfeld, T.: TCP video streaming andmobile networks: not a love story, but better with context. Comput. Netw.109(Part 2), 246–256 (2016). http://www.sciencedirect.com/science/article/pii/S1389128616302134, traffic and Performance in the Big Data Era
41. Metzger, F., Rafetseder, A., Schwartz, C.: A comprehensive end-to-end lag modelfor online and cloud video gaming. In: PQS 2016 5th ISCA/DEGA Workshop onPerceptual Quality of Systems, pp. 20–24 (2016). https://doi.org/10.21437/PQS.2016-5
42. Mitra, K., Zaslavsky, A., Ahlund, C.: Context-aware QoE modelling, measurement,and prediction in mobile computing systems. IEEE Trans. Mobile Comput. 14(5),920–936 (2015)
43. Moller, S., et al.: Towards a new ITU-T recommendation for subjective methodsevaluating gaming QoE. In: Proceedings of the 7th International Workshop onQuality of Multimedia Experience (QoMEX 2015), pp. 1–6 (5 2015)
44. Moreno-Vozmediano, R., Montero, R., Llorente, I.: Key challenges in cloud com-puting: enabling the future internet of services. IEEE Internet Comput. 17(4),18–25 (2013)
45. Nam, H., Kim, K.H., Kim, J.Y., Schulzrinne, H.: Towards QoE-aware video stream-ing using SDN. In: 2014 IEEE Global Communications Conference, pp. 1317–1322,December 2014
46. Qureshi, A., Weber, R., Balakrishnan, H., Guttag, J., Maggs, B.: Cutting theelectric bill for internet-scale systems. SIGCOMM Comput. Commun. Rev. 39(4),123–134 (2009). http://doi.acm.org/10.1145/1594977.1592584
47. Reichl, P., Egger, S., Schatz, R., D’Alconzo, A.: The logarithmic nature of QoE andthe role of the Weber-Fechner law in QoE assessment. In: 2010 IEEE InternationalConference on Communications (ICC), pp. 1–5, May 2010
48. Reichl, P., Egger, S., Moller, S., Kilkki, K., Fiedler, M., Hossfeld, T., Tsiaras,C., Asrese, A.: Towards a comprehensive framework for QoE and user behaviormodelling. In: 7th International Workshop on Quality of Multimedia Experience(QoMEX), Costa Navarino, Greece, September 2015
49. Reichl, P., Tuffin, B., Schatz, R.: Logarithmic laws in service quality perception:where microeconomics meets psychophysics and quality of experience. Telecom-mun. Syst. 52(2), 587–600 (2013). https://doi.org/10.1007/s11235-011-9503-7
50. Reiter, U., Brunnstrom, K., De Moor, K., Larabi, M.-C., Pereira, M., Pinheiro,A., You, J., Zgank, A.: Factors influencing quality of experience. In: Moller, S.,Raake, A. (eds.) Quality of Experience: Advanced Concepts, Applications andMethods. TSTS, pp. 55–72. Springer, Cham (2014). https://doi.org/10.1007/978-3-319-02681-7 4
51. Roto, V., Vaataja, H., Jumisko-Pyykko, S., Vaananen-Vainio-Mattila, K.: Bestpractices for capturing context in user experience studies in the wild. In: Proceed-ings of the 15th International Academic MindTrek Conference: Envisioning FutureMedia Environments, MindTrek 2011, pp. 91–98. ACM, New York (2011). http://doi.acm.org/10.1145/2181037.2181054
Context Monitoring for Improved System Performance and QoE 47
52. Schatz, R., Fiedler, M., Skorin-Kapov, L.: QoE-based network and applicationmanagement. In: Moller, S., Raake, A. (eds.) Quality of Experience: AdvancedConcepts, Applications and Methods. TSTS, pp. 411–426. Springer, Cham (2014).https://doi.org/10.1007/978-3-319-02681-7 28
53. Schatz, R., Hoßfeld, T., Janowski, L., Egger, S.: From packets to people: qualityof experience as a new measurement challenge. In: Biersack, E., Callegari, C.,Matijasevic, M. (eds.) Data Traffic Monitoring and Analysis: From Measure-ment, Classification, and Anomaly Detection to Quality of Experience. LNCS,vol. 7754, pp. 219–263. Springer, Heidelberg (2013). https://doi.org/10.1007/978-3-642-36784-7 10
54. Schmid, S., Suomela, J.: Exploiting locality in distributed SDN control. In: Sec-ond ACM SIGCOMM Workshop on Hot Topics in Software Defined Networking,HotSDN 2013, pp. 121–126. ACM, New York (2013). http://doi.acm.org/10.1145/2491185.2491198
55. Seufert, M., Burger, V., Wamser, F., Tran-Gia, P., Moldovan, C., Hoßfeld, T.:Utilizing home router caches to augment CDNs toward information-centric net-working. In: European Conference on Networks and Communications (EuCNC),Paris, France, June 2015
56. Skorin-Kapov, L., Varela, M.: A multi-dimensional view of QoE: the ARCU model.In: 2012 Proceedings of the 35th International Convention MIPRO, pp. 662–666.IEEE (2012)
57. Stankiewicz, R., Jajszczyk, A.: A survey of QoE assurance in converged net-works. Comput. Netw. 55(7), 1459–1473 (2011). http://www.sciencedirect.com/science/article/pii/S138912861100051X, recent Advances in Network Convergence
58. Suznjevic, M., Beyer, J., Skorin-Kapov, L., Moller, S., Sorsa, N.: Towards under-standing the relationship between game type and network traffic for cloud gam-ing. In: 2014 IEEE International Conference on Multimedia and Expo Workshops(ICMEW), pp. 1–6, July 2014
59. Suznjevic, M., Skorin-Kapov, L., Matijasevic, M.: Impact of user, system, and con-text factors on gaming QoE: a case study involving MMORPGs. In: Proceedings ofthe 12th ACM SIGCOMM Workshop on Network and System Support for Games(2013)
60. Weber, E.H.: De Pulsu, resorptione, auditu et tactu. Annotationes anatomicae etphysiologicae, auctore, Koehler (1834)
61. Weiss, M., Eidson, J., Barry, C., Goldin, L., Iannucci, R.A., Lee, E., Stanton, K.:The Case for Cross Disciplinary Research on Time Aware Applications, Computersand Communication Systems (TAACCS) (2013). Whitepaper
62. Wilk, S., Schonherr, S., Stohr, D., Effelsberg, W.: EnvDASH: an environment-aware dynamic adaptive streaming over HTTP system. In: Proceedings of the ACMInternational Conference on Interactive Experiences for TV and Online Video,TVX 2015, pp. 113–118. ACM, New York (2015). http://doi.acm.org/10.1145/2745197.2745205
63. Zhang, J., Ansari, N.: On assuring end-to-end QoE in next generation networks:challenges and a possible solution. IEEE Commun. Mag. 49(7), 185–191 (2011)

48 F. Metzger et al.
Open Access This chapter is licensed under the terms of the Creative CommonsAttribution 4.0 International License (http://creativecommons.org/licenses/by/4.0/),which permits use, sharing, adaptation, distribution and reproduction in any mediumor format, as long as you give appropriate credit to the original author(s) and thesource, provide a link to the Creative Commons license and indicate if changes weremade.
The images or other third party material in this chapter are included in the chapter’sCreative Commons license, unless indicated otherwise in a credit line to the material. Ifmaterial is not included in the chapter’s Creative Commons license and your intendeduse is not permitted by statutory regulation or exceeds the permitted use, you willneed to obtain permission directly from the copyright holder.

QoE Management for Future Networks
Raimund Schatz1(B), Susanna Schwarzmann2, Thomas Zinner2,Ognjen Dobrijevic3, Eirini Liotou4, Peter Pocta5, Sabina Barakovic6,
Jasmina Barakovic Husic6, and Lea Skorin-Kapov3
1 AIT Austrian Institute of Technology, Vienna, [email protected]
2 University of Wurzburg, Wurzburg, Germany{susanna.schwarzmann,zinner}@informatik.uni-wuerzburg.de
3 University of Zagreb, Faculty of Electrical Engineering and Computing,Zagreb, Croatia
{lea.skorin-kapov,ognjen.dobrijevic}@fer.hr4 University of Athens, Athens, Greece
[email protected] University of Zilina, Zilina, Slovakia
[email protected] University of Sarajevo, Sarajevo, Bosnia and [email protected], [email protected]
Abstract. This chapter discusses prospects of QoE management forfuture networks and applications. After motivating QoE management, itfirst provides an introduction to the concept by discussing its origins, keyterms and giving an overview of the most relevant existing theoreticalframeworks. Then, recent research on promising technical approaches toQoE-driven management that operate across different layers of the net-working stack is discussed. Finally, the chapter provides conclusions andan outlook on the future of QoE management with a focus on thosekey enablers (including cooperation, business models and key technolo-gies) that are essential for ultimately turning QoE-aware network andapplication management into reality.
Keywords: Quality of Experience · QoE ManagementQoE-driven Network and Application Management · SDNNFV · MEC
1 Introduction to QoE Management
Understanding, monitoring and managing the provisioning of networked applica-tions and services is a domain that receives growing interest by academia and indus-try. This development is mainly a consequence of increasing competition amongststakeholders in the ICT, media, and entertainment markets, the proliferation ofresource intensive services (such as online video and virtual reality movie stream-ing) and the ever-present risk of customer churn caused by inadequate service qual-ity. Furthermore, the foreseen paradigm shift towards an Internet of Services (IoS)
c© The Author(s) 2018I. Ganchev et al. (Eds.): Autonomous Control for a Reliable Internet of Services, LNCS 10768, pp. 49–80, 2018.https://doi.org/10.1007/978-3-319-90415-3_3
50 R. Schatz et al.
will lead to systems where new applications and services are based on flexibly con-figurable large-scale service chains, which depend on high levels of flexibility, qual-ity, and reliability [20].
These trends create conflicting demands, particularly on the network operatorsand service providers involved. On the one hand, they need to offer sophisticatedhigh-performance infrastructures and services that enable affordable high qualityexperiences that lead to customer satisfaction and loyalty [48]. On the other hand,they have to operate on a profitable basis in order to remain economically viablein the long run.
In this context, Network and Application Management (NAM) has the poten-tial to resolve this central dilemma by enabling a better match between resourcesupply and demand on the basis of more informed trade-offs between quality,performance, and economy [66,73,84] based on validated ground truths. NAMis supposed to observe and react quickly to quality problems, at best beforecustomers perceive them and decide to churn. It should ensure that sufficientquality and performance are provided while constraining the application (andits underlying service building blocks) to behave as resource-efficiently as possi-ble in order to minimize operational costs.
Figure 1 provides a high-level overview of managing resources and qualityin the context of networked multimedia and communication services, where themanagement of networks and applications constitute complementary approaches.Network management (NM) focuses on monitoring and controlling the networkentities of the delivery infrastructure on access, core network, and Internet level.The goals of network management typically are efficient resource allocation,avoidance of Quality of Service (QoS) problems (like packet loss from congestion)and generally keep the network “up and running” without faults. In contrast,application management (AM) aims to adapt quality and performance on end-user as well as application host/cloud level.
In most cases nowadays, AM adapts the application to the conditions encoun-tered in the network as it is situated much closer to the user than network-levelcontrols. For example, in the context of HTTP Adaptive Streaming (HAS), wherethe quality of the media stream (and consequently, its bitrate) is dynamicallyadapted not only to the network bandwidth available on the path between clientand server, but also application layer parameters (like video buffer level) and con-text (like battery status). AM thus often acts as a “mediator” between networkand the end user, while taking other aspects (application, user preferences, con-text) into account. While AM is being widely used in todays consumer Internetwhere traffic is transmitted on a “best effort” basis without taking into accountthe diverse quality requirements of different applications and users, it is onlywhen network and application management are being used in conjunction, thatthe full potential of NAM can be reached [66,84].
In addition, there is a growing awareness within the scientific communityand industry that technology-centric concepts like Quality of Service (QoS) donot cover every relevant performance aspect of a given application or service(cf. [30,65]) and to understand the related value that people attribute to it as

QoE Management for Future Networks 51
Fig. 1. Overview: Network- and Application Management operate at different controlpoints along the delivery chain of services and applications (based on [66]).
a consequence [21,48]. For these reasons, the concept of Quality of Experience(QoE) has gained strong interest, both from academic research and industrystakeholders. Being linked very closely to the subjective perception of the enduser, QoE is supposed to enable a broader, more holistic understanding of impactand performance of network communication and content delivery systems andthus to complement traditional perspectives on quality and performance.
While conceptualizations and definitions of QoE have dynamically evolvedover time (cf. [67]), the most comprehensive and widely used definition of QoEtoday has emerged from the EU Qualinet community (COST Action IC1003:European Network on Quality of Experience in Multimedia Systems and Services):“Quality of Experience (QoE) is the degree of delight or annoyance of the user of anapplication or service. It results from the fulfillment of his or her expectations withrespect to the utility and/or enjoyment of the application or service in the light of theusers personality and current state. In the context of communication services, QoEis influenced by service, content, device, application, and context of use.” (QualinetWhite Paper on Definitions of Quality of Experience (2012)) [61].
Thus in contrast to QoS, QoE not only depends on the technical perfor-mance of the transmission and delivery chain but also on a wide range of otherfactors, including content, application, user expectations and goals, and contextof use. Understanding QoE thus demands for a multi-disciplinary research app-roach that goes beyond the network level. In particular, different applicationshave different QoE requirements (also including different QoS-dependencies),necessitating different QoE models, monitoring and eventually, different QoEmanagement approaches. For example, while for securing the QoE of onlinevideo services, media playback quality (high resolution, no stalling, etc.) is ofprime importance, the situation is different for online cloud gaming, where thereactiveness of the system is at least equally relevant.
52 R. Schatz et al.
For these reasons, the potential of extending QoS-focused traditional NAMtowards QoE-based NAM1 seems large. According to existing literature (cf.[6,66,70,73,84]) QoE-based NAM is supposed to yield the following main advan-tages:
– More efficient and effective utilization of resources (network bandwidth, radioresources, CPU, etc.) by performing informed trade-offs (e.g. low latencyvs. less playback interruptions when increasing buffer sizes) and maximizingimpact of resource allocation
– Increased satisfaction of users, plus the resulting economic benefits (increasedloyalty, reduced churn, ability to upsell, etc.)
– Maximization/balancing of user satisfaction over the whole customer popula-tion (QoE Fairness)
– Ability to quickly detect/anticipate problems that really matter and solvethem in real-time or even before the customer perceives them
– Ability to charge for value (i.e. high quality or reliability of the service) thathas actually being delivered to the customer, enabling new business models
Given these potential improvements and benefits, the overarching key ques-tion of this chapter is: “How can QoE frameworks, tools, and methods be used tosubstantially improve the management of future applications and networks?” Tothis end, this chapter discusses the potential of QoE-driven NAM for future net-works in the light of current research. In this context we aim to take into accountchallenges arising from current and future applications (like Virtual Reality, orVR, and Augmented Reality, or AR), as well as the ongoing transformation ofcommunication networks by emerging technologies such as Network FunctionsVirtualization (NFV), Software-defined Networking (SDN), and Mobile EdgeComputing (MEC). It first provides an overview of the most relevant theoret-ical frameworks related to QoE management in Sect. 2. Then selected concreteresearch on promising technical approaches to QoE-driven NAM that operateacross different layers of the network stack presented. Finally, the chapter pro-vides an outlook on the future of QoE management with a focus on those keyenabling technology that will be essential for realizing the vision of truly effectiveQoE-aware network and application management.
2 Towards a Generic Framework for QoE-DrivenNetwork and Application Management
In this section, we first derive the key components and challenges of QoE man-agement by surveying recent literature discussing QoE management and relatedframeworks. Then we present a generic framework for QoE-driven Network andApplication Management (NAM).
1 QoE-based NAM refers to QoE management applied to the domains of telecommu-nications and multimedia.

QoE Management for Future Networks 53
2.1 Key Components and Key Challenges
Technical Frameworks and Challenges. Schatz et al. [66] provide a com-prehensive overview of previous work in this area before 2014, distinguishingbetween network and application management. When it comes to network man-agement, fault and performance management represent areas of specific impor-tance. QoE-driven network resource management is the second main topic in thiscontext. Several works on resource management targeting two different parts ofthe network (access and core network) are discussed as well as QoE-based net-work management in multi-operator settings. The part on QoE-based applicationmanagement focuses on management schemes explicitly designed for UDP/RTP-based and HTTP Adaptive Multimedia Streaming. Finally, the authors demon-strate a usefulness of a joint network and application management on two verydistinct application scenarios, i.e. QoE management for managed services andOver-The-Top (OTT) Video. Finally, the authors state that a key challenge tobe addressed by the research community relates to clarification and ensuring acommon understanding of the meaning of different concepts and notions (likequality and performance) as well as highlighting their importance for differentstakeholders.
Furthermore, a survey published in [11] authored by Barakovic et al. presentsan overview, key aspects and challenges of QoE management focusing in par-ticular on the domain of wireless networks. The paper addresses three aspects:QoE modeling of the QoE management, i.e. monitoring and measurement, QoEadaptation and optimization. When it comes to the first aspect, i.e. monitor-ing and measurement, the authors have concluded that different actors involvedin the service provisioning chain will monitor and measure QoE in differentways, focusing on those parameters over which a given actor has control (e.g., anetwork provider will monitor how QoS-related performance parameters willimpact QoE, a device manufacturer will monitor device-related performanceissues, while application developers will be interested in how the service designor usability will affect QoE). Moreover, the authors identify the following fourmonitoring challenges, which should be properly addressed by the research com-munity: (1) Which data to collect?; (2) Where to collect?; (3) When to col-lect?; and (4) How to collect? On the other hand, a part dedicated to the lasttwo aspects was concluded with a statement that in most situations the userperceived QoE will depend on the underlying network performance. However,network-oriented QoE optimization processes would clearly benefit from per-ceived quality feedback data collected at the users side, since QoE is inherentlyuser-centric. Similarly as in the previous case, the authors identify the followingfour control challenges that arise in this context: (1) What to control?; (2) Whereto control?; (3) When to control?; and (4) How to control?
On the other hand, when it comes to frameworks, Liotou et al. present in[53] a conceptual framework toward QoE support, described in terms of func-tionalities, interactions, and design challenges. The framework consists of threemain building blocks, i.e., a QoE-controller, QoE-monitor, and QoE-manager,all part of a “central QoE management entity”. The QoE-controller plays a role
54 R. Schatz et al.
of an interface between a central QoE management entity and underlying net-work, synchronizing communication exchange in both directions. It is in chargeof configuring a data acquisition process, by requesting and collecting feedbackfrom appropriate data sources. It also provides the collected data to both theQoE-monitor and QoE-manager. Finally, the QoE-controller applies the corre-sponding QoE-aware control decisions back to the network, during a final step ofthe QoE management loop. On the other hand, the QoE-monitor is responsiblefor estimating the QoE per flow, that is, per users session, and for reporting thisto the QoE-manager. The QoE-manager is in charge of conducting any type ofcustomer experience management or QoE-aware network management. Regard-ing the first building block, i.e. the QoE-monitor, and challenges in this context,it is of crucial importance to select and implement the most convenient QoE esti-mation model for an application scenario of interest as its accuracy and reliabilitycan rapidly influence a precision and reliability of actions done by other buildingblocks of the framework and therefore also of all the QoE management process.When it comes to the QoE-controller and challenges in this case, it becomeseven more complicated. Firstly, a selection of appropriate nodes to be used foran acquisition of QoE-related input is of a strategic importance. Secondly, anappropriate type of collected QoE-related input represents the other challenge.The authors also discuss some realization issues and challenges in the paper, e.g.a physical location and type of a QoE management framework’s implementationas well as power requirements for collecting QoE data. Besides the technicalchallenges listed above, an operator interested in implementing this frameworkhas to take some business and legal aspects, which are clearly highlighted anddiscussed in the paper, into account. Finally, the authors showcase usefulnessand efficiency of the proposed framework via an LTE case study.
Another framework termed an autonomous QoE-driven network managementframework designed by Seppanen et al. is described in [70]. The authors considerthe proposed framework generic and applicable to a broad range of systems. Theframework represents a part of a complete customer experience management sys-tem. It consists of three layers, i.e. a data acquisition,monitoring, and control layer.The data acquisition layer is in charge of collecting all raw data by probes or othermeans of data collection. On the monitoring layer, the raw data produced by thedata acquisition layer is processed into knowledge about a state of the network,which is in turn passed to the control layer. The control layer performs actionsupon the network based on this knowledge. The authors verify the performanceand effectiveness of the proposed framework by several tests, where RTP videostreams were subject to a quality-driven network control. In all the cases, the testsresult in an improved quality for the relevant clients. More specifically, the testsshow that it is possible to improve the quality perceived by premium users with-out sacrificing the quality of the streams belonging to normal users. Finally, theauthors claim that the framework is not only able to make a good decision for agiven time instant, but also to predict the outcome of different decisions and pickthe most optimal one. In other words, the framework is not only able to improvethe perceived quality of the selected streams, but also to be conservative with theavailable resources and identify when they are really needed.
QoE Management for Future Networks 55
Non-technical Frameworks and Challenges. Both [53,70] highlight thebenefits of performing QoE-driven and application-aware network management.In general, information exchange and cooperation among players involved in ser-vice delivery has the potential to improve the effectiveness of QoE mangementschemes [35]. However in practice, involved players need incentives to engagein cooperative efforts (e.g., information exchange, content caching, etc.) due toconflicting goals and interests. For example, a cloud provider might aim to max-imize end-customer QoE, while a network provider might aim for maximizingthe efficient use of network resources. Thus, the overall goal of QoE-driven NAMdepends on the actual stakeholder group(s) involved in its realization. Examplesfor such goals are: maximizing the QoE of a given customer (end user perspec-tive), maximizing overall average QoE of multiple customers in a cell/segmentwhile maintaining QoE fairness (ISP perspective), or maximizing the number ofsatisfied users while minimizing resource consumption (network/cloud providerperspective).
In this sense, the overall goals of QoE management strongly depend on thestakeholders or groups of stakeholders taken into account. As regards the lat-ter, the challenge to address in this context is: to which extent can cooperativemanagement schemes and underlying business models involving multiple playersachieve efficient management of network/system resources, while enhancing cus-tomer QoE? ISPs employ various traffic engineering mechanisms to keep theirinfrastructures running efficiently. Insight into the network requirements andadaptation capabilities of OTT services could aid them in making more efficienttraffic management decisions. For example, information such as service utilityfunctions and service adaptation capabilities could be used to perform cross-layerQoE-driven resource allocation among multiple simultaneous and competing ser-vice flows [40]. Furthermore, insight into application-level KPIs could aid ISPsin identifying user perceived QoE degradations and determining root causes ofdegradations. Given that a large portion of customer complaints aimed at ISPsstem from service provider problems rather than network operation problems,insights into the root causes of QoE degradations could help ISPs determinewhether or not resolving a given problem falls within their domain.
Offering application providers access to network-related performance infor-mation through APIs could provide the potential for enhanced network-awareadaptation decisions (e.g., adapt video streaming quality, or assign end usersto servers such that end-to-end delays are minimized). Furthermore, insightinto contextual information such as traffic load patterns can be used byservice providers for optimizing service delivery. Similarly, offering networkproviders access to application-level requirements could provide the potentialfor application-aware and QoE-driven cross-layer resource management.
In general, as stated in [27], cooperation opportunities can act as enablers forISPs as well as content delivery infrastructure and service providers to jointlylaunch new applications in a cost effective way. For example, traffic-intensiveapplications such as the delivery of high definition video on-demand, or real-time applications such as online games, could benefit from cooperative QoEmanagement solutions.
56 R. Schatz et al.
From a business oriented point of view, when considering QoE management,a key question is how to exploit QoE-related knowledge in terms of increasingrevenue, preventing customer churn, and ensuring efficient network operations.Given a multi-stakeholder environment, business models driven by the previ-ously discussed incentives are needed to model the relationships between dif-ferent actors involved in the service-delivery chain. Ahmad et al. [6] addressboth the technical aspects and the motivation in terms of revenue generation forOTT-ISP collaboration. Their simulation results show that based on a proposedcollaboration approach, there is a potential for increased revenue for the OTTsand the ISPs, stemming from increased customer satisfaction due to improvedQoE. This work was further extended in [7] covering different perspectives ofISP and OTT collaboration in terms of QoE management, i.e., quality deliv-ery, technical realizations, and economic incentives. The authors propose andevaluate a QoE-aware collaboration approach between OTTs and ISPs based onprofit maximization by considering the user churn of Most Profitable Customersclassified in terms of Customer Lifetime Value.
Consequently, an important consideration are the economical and moneti-zation aspects of QoE [77,85]. Examples of different business models may beforeseen exploiting the cooperation between ISPs and OTT providers as sum-marized by Liotou et al. [52]:
– token-based models: charge a user according to a certain level of QoS/QoE;this may be accompanied with the purchase of a particular application,
– contract-based models following a tiered approach with different bandwidthsand quotas, and
– Pay-as-you-go service models, where users are charged for a QoS/QoE levelin relation to a particular service.
Summary of Key Challenges. To summarize, the key challenges to be dealtwith by the research community and practitioners in the near future, comingfrom the works surveyed above, can be divided into three main parts, i.e., chal-lenges related to QoE management as a whole (covering high-level conceptual,overarching technical and non-technical aspects of the QoE management), chal-lenges directly related to QoE monitoring and challenges directly related toQoE adaptation and optimization (i.e. control). The challenges are summarizedin Table 1.
When it comes to the challenges related to QoE management as a whole, itis critical to ensure a common understanding of different concepts and notionsdeployed in this context and to highlight their importance for different com-munities involved in the QoE management. Moreover, the physical location ofa QoE management framework and the type of its implementation representpragmatic challenges in this case. As also previously noted, legal and businessaspects related to the implementation of a QoE management framework needto be addressed. This includes the different optimization goals and interests ofdifferent stakeholders. In this context, the willingness and (financial) incentivesof different players involved in service delivery to disclose information to each
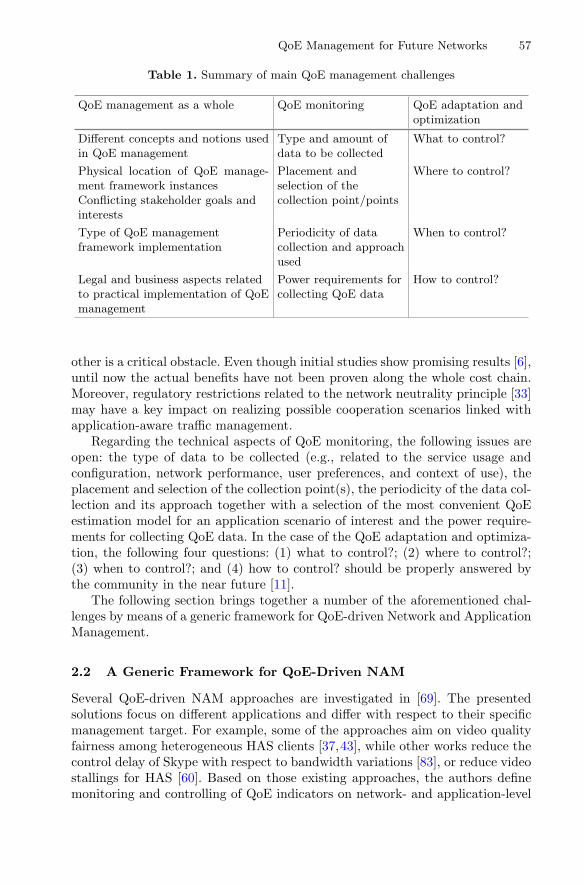
QoE Management for Future Networks 57
Table 1. Summary of main QoE management challenges
QoE management as a whole QoE monitoring QoE adaptation andoptimization
Different concepts and notions usedin QoE management
Type and amount ofdata to be collected
What to control?
Physical location of QoE manage-ment framework instancesConflicting stakeholder goals andinterests
Placement andselection of thecollection point/points
Where to control?
Type of QoE managementframework implementation
Periodicity of datacollection and approachused
When to control?
Legal and business aspects relatedto practical implementation of QoEmanagement
Power requirements forcollecting QoE data
How to control?
other is a critical obstacle. Even though initial studies show promising results [6],until now the actual benefits have not been proven along the whole cost chain.Moreover, regulatory restrictions related to the network neutrality principle [33]may have a key impact on realizing possible cooperation scenarios linked withapplication-aware traffic management.
Regarding the technical aspects of QoE monitoring, the following issues areopen: the type of data to be collected (e.g., related to the service usage andconfiguration, network performance, user preferences, and context of use), theplacement and selection of the collection point(s), the periodicity of the data col-lection and its approach together with a selection of the most convenient QoEestimation model for an application scenario of interest and the power require-ments for collecting QoE data. In the case of the QoE adaptation and optimiza-tion, the following four questions: (1) what to control?; (2) where to control?;(3) when to control?; and (4) how to control? should be properly answered bythe community in the near future [11].
The following section brings together a number of the aforementioned chal-lenges by means of a generic framework for QoE-driven Network and ApplicationManagement.
2.2 A Generic Framework for QoE-Driven NAM
Several QoE-driven NAM approaches are investigated in [69]. The presentedsolutions focus on different applications and differ with respect to their specificmanagement target. For example, some of the approaches aim on video qualityfairness among heterogeneous HAS clients [37,43], while other works reduce thecontrol delay of Skype with respect to bandwidth variations [83], or reduce videostallings for HAS [60]. Based on those existing approaches, the authors definemonitoring and controlling of QoE indicators on network- and application-level

58 R. Schatz et al.
as key building blocks for a generic NAM framework. By focusing on the keyfunctionalities, the framework can cope with a multitude of NAM approaches,despite the diverse objectives and applications that are covered. The presentedframework is a first step towards addressing the QoE management challengesintroduced in Subsect. 2.1, as it helps to achieve a common understanding ofdifferent concepts and can be used to compare different solutions, e.g. withrespect to design choices like frequency or location of monitoring and controlfunctionalities.
We note that the focus in this section is on the technical realizationaspects of NAM and not on the business aspects and financial incentivesof multi-stakeholder cooperation. The presented framework assumes that thereare underlying business models as well as contractual mechanisms (like SLAs,ELAs2) supporting the necessary cooperation between multiple involved stake-holders, such as OTT/service providers and network providers.
Building Blocks. In order to supervise the state of running applications, Appli-cation Monitoring (AppMon) is performed, while Network Monitoring (NetMon)keeps track of network-related QoE influence factors (QoE-IFs). The collectedinformation is communicated to a centralized instance, e.g. a Policy Manager(PM), which has an up-to-date global view of the network and the applica-tions running on top of it. Based on its knowledge, the PM is capable to com-pute appropriate control actions, which, on the one hand, can be performed onnetwork-side. This is denoted as Network Control (NetCon). On the other hand,control actions can be performed on application-level, forming the ApplicationControl (AppCon). Further, a joint optimization of application and networkmight be feasible for several use-cases. Repeatedly monitoring and controlling ofapplication and network then form the control loop of those approaches. Thisis in line with two of the general steps for QoE management, as defined in [11],namely (1) QoE monitoring and measurements, and (2) QoE optimization andcontrol.
Besides the implementation of NAM building blocks, the abstract frameworkconsiders three optimization types:
– Application-level Optimization (ALO)– Network-level Optimization (NLO)– Policy Manager Optimization (PMO)
The location, where monitoring information is used to decide control actions,determines the optimization type. We shortly describe the optimization typesand illustrate their employment in NAM approaches by providing examples inthe following paragraphs.
Application-level Optimization (ALO). The application collects significantinformation about network or application. Based on this knowledge, the appli-cation initiates adaptation or invokes network-level mechanisms.
2 The acronyms refer to service level agreements (SLAs) and experience level agree-ments (ELAs) respectively, cf. [77].

QoE Management for Future Networks 59
Zhu et al. [83] propose an ALO-based cross-layer framework for OTT ser-vices like Skype conferencing. Their applied methods are similar to existingnetwork layer techniques, such as Explicit Congestion Notification (ECN) andDifferentiated Services (DiffServ). They use the existing ECN and DiffServ IPpacket header fields to exchange cross-layer information like for example conges-tion and packet priority. Their results show a speed up of Skypes’s response tobandwidth variation by indicating congestion immediately. Further, the audiopackets’ delays can be reduced by intra-flow prioritization.
Adzic et al. [5] use a content aware method to determine whether the videoquality gain (expressed in SSIM) when switching to a higher level justifies theadditional bandwidth consumption. The researchers assume DASH streaming ina mobile environment, where high-speed bandwidth volume is mostly limited.DASH servers provide videos encoded in constant bitrate (CBR), that does notconsider the video content. Thus, an increase in bitrate does not necessarily meana remarkable increase in SSIM for each video sequence. This ALO-mechanismprevents the client from selecting a higher bitrate when video quality cannot beincreased significantly.
Network-level Optimization (NLO). The network collects significant infor-mation about network or application. Using this information, the network param-eter are adapted or instructions for adaptation are given to the application.
NLO-centricmechanisms are discussed in theworks ofWamser et al. [41,79,80].All of them implement an estimator of the YouTube client’s buffer state by deeppacket inspection performed in the network. Based on this information, differentactions are performed in thenetwork.The software-definednetworking (SDN)app-roach [41] proposes a dynamical re-routing of traffic. Whereas, in [80] resources areflexibly aggregated from one or more access networks. A home network scenariowas investigated in [79], as a network adaptation, YouTube flows are dynamicallyprioritized. The employment of these mechanisms supports clients that are at riskof an empty buffer. The methods applied in the network lead to a fast buffer re-fillof those clients and the video stream’s smoothness can be enhanced.
Policy Manager Optimization (PMO). A centralized instance (PM) hasknowledge about both, network and application state. Based on its global systemview, it can orchestrate control actions for applications or network.
A PMO approach called NOVA, short for Network Optimization for VideoAdaptation, is developed by Joseph et al. [43]. The network regularly sends stateupdates to a so called base station. The client sent signal to the base stationin case the video is in risk of a re-buffering event. An algorithm implementedin the base station computes the necessary bandwidth slices for each DASHclient so that several QoE-IFs are optimized. The network controller performsthe bandwidth slice allocation, the rate adaption is performed by the clientsindependently.
The model for NAM approaches, including the different building blocks, opti-mization types, and monitoring/control information flow, is illustrated in Fig. 2.

60 R. Schatz et al.
Fig. 2. Abstract NAM model with its building blocks and optimization types. Bluearrows indicate monitoring information, yellow arrows represent control information.(Color figure online)
It is very generic and omits details on the specific realization of the buildingblocks, e.g. distributed vs. centralized realization, or the monitoring layer, e.g.packet inspection vs. flow-based monitoring in the network. Frequency, location,and accuracy of monitoring dictate the level how fine-grained control actions canbe performed and influence the potential of optimizing QoE. For instance, largetime intervals between bandwidth probes restrict to a rough estimation thatcannot consider short-time fluctuations. In turn, this leads to periods in whichresources are under- or overestimated, resulting in non-optimal QoE due to themissing possibility to appropriately adapt to current network conditions. Never-theless, the authors intend this generality in order to allow a simple classificationNAM solutions with respect to monitoring and control capabilities. Based on theproposed framework, we classify several QoE-driven NAM approaches (Table 2).Besides building blocks and optimization type, we also provide the monitoredQoE-IFs and the considered applications of the presented NAM approaches.As video streaming represents the majority of today’s Internet traffic [23], it islargely discussed in current research. Accordingly, video streaming, is the dom-inant application among the approaches presented in the table. In particular,HAS is considered prevalently. To be able to adapt video quality, it alreadyimplements a control loop that monitors the network throughput or the client’sbuffer filling level. However, there is variety of applications running on top offuture networks, e.g. VR applications or 3D and 360◦ video streaming. The QoErequirements of those applications need to be evaluated in order to facilitateQoE optimization. [32] proposes a QoE management approach for Cloud gam-ing, which can be seen as one representative in that direction. Furthermore, itshows that the generic functions of the NAM model also suit for applications
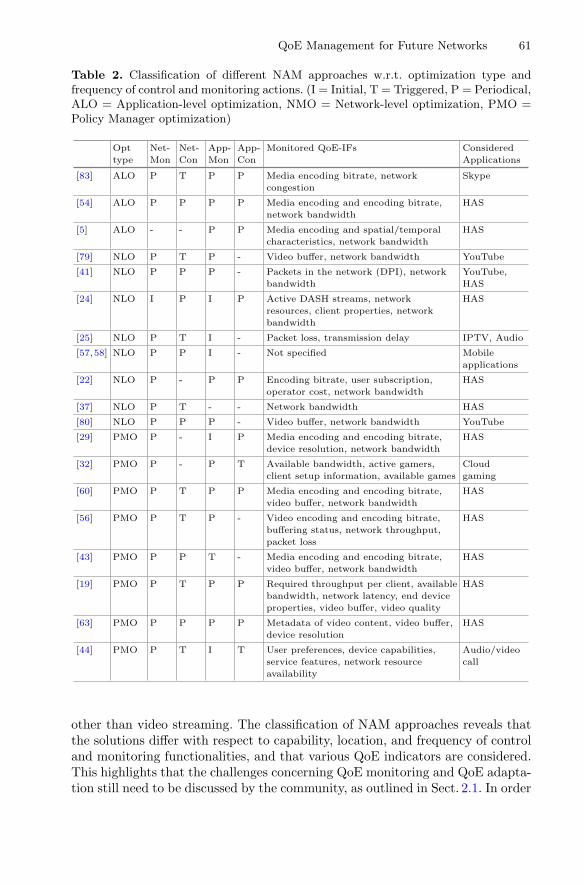
QoE Management for Future Networks 61
Table 2. Classification of different NAM approaches w.r.t. optimization type andfrequency of control and monitoring actions. (I = Initial, T = Triggered, P = Periodical,ALO = Application-level optimization, NMO = Network-level optimization, PMO =Policy Manager optimization)
Opt
type
Net-
Mon
Net-
Con
App-
Mon
App-
Con
Monitored QoE-IFs Considered
Applications
[83] ALO P T P P Media encoding bitrate, network
congestion
Skype
[54] ALO P P P P Media encoding and encoding bitrate,
network bandwidth
HAS
[5] ALO - - P P Media encoding and spatial/temporal
characteristics, network bandwidth
HAS
[79] NLO P T P - Video buffer, network bandwidth YouTube
[41] NLO P P P - Packets in the network (DPI), network
bandwidth
YouTube,
HAS
[24] NLO I P I P Active DASH streams, network
resources, client properties, network
bandwidth
HAS
[25] NLO P T I - Packet loss, transmission delay IPTV, Audio
[57,58] NLO P P I - Not specified Mobile
applications
[22] NLO P - P P Encoding bitrate, user subscription,
operator cost, network bandwidth
HAS
[37] NLO P T - - Network bandwidth HAS
[80] NLO P P P - Video buffer, network bandwidth YouTube
[29] PMO P - I P Media encoding and encoding bitrate,
device resolution, network bandwidth
HAS
[32] PMO P - P T Available bandwidth, active gamers,
client setup information, available games
Cloud
gaming
[60] PMO P T P P Media encoding and encoding bitrate,
video buffer, network bandwidth
HAS
[56] PMO P T P - Video encoding and encoding bitrate,
buffering status, network throughput,
packet loss
HAS
[43] PMO P P T - Media encoding and encoding bitrate,
video buffer, network bandwidth
HAS
[19] PMO P T P P Required throughput per client, available
bandwidth, network latency, end device
properties, video buffer, video quality
HAS
[63] PMO P P P P Metadata of video content, video buffer,
device resolution
HAS
[44] PMO P T I T User preferences, device capabilities,
service features, network resource
availability
Audio/video
call
other than video streaming. The classification of NAM approaches reveals thatthe solutions differ with respect to capability, location, and frequency of controland monitoring functionalities, and that various QoE indicators are considered.This highlights that the challenges concerning QoE monitoring and QoE adapta-tion still need to be discussed by the community, as outlined in Sect. 2.1. In order
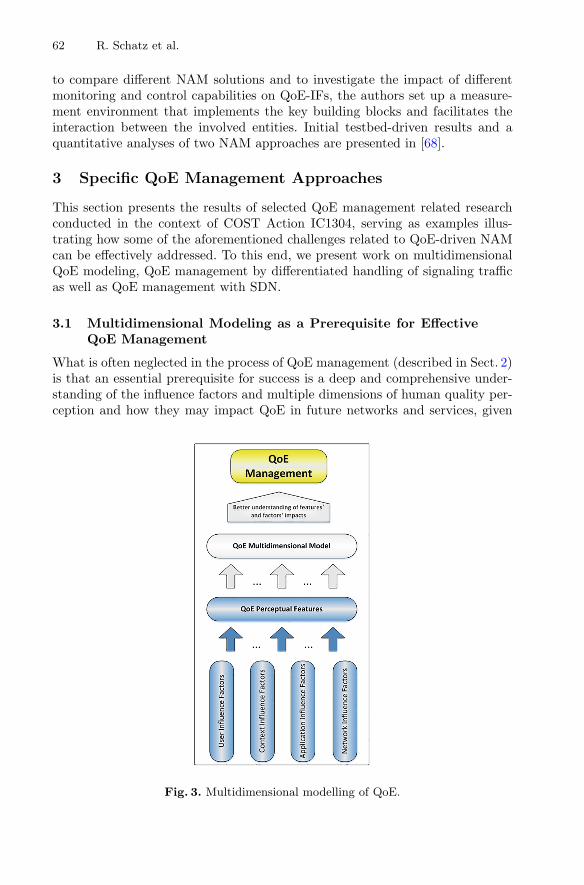
62 R. Schatz et al.
to compare different NAM solutions and to investigate the impact of differentmonitoring and control capabilities on QoE-IFs, the authors set up a measure-ment environment that implements the key building blocks and facilitates theinteraction between the involved entities. Initial testbed-driven results and aquantitative analyses of two NAM approaches are presented in [68].
3 Specific QoE Management Approaches
This section presents the results of selected QoE management related researchconducted in the context of COST Action IC1304, serving as examples illus-trating how some of the aforementioned challenges related to QoE-driven NAMcan be effectively addressed. To this end, we present work on multidimensionalQoE modeling, QoE management by differentiated handling of signaling trafficas well as QoE management with SDN.
3.1 Multidimensional Modeling as a Prerequisite for EffectiveQoE Management
What is often neglected in the process of QoE management (described in Sect. 2)is that an essential prerequisite for success is a deep and comprehensive under-standing of the influence factors and multiple dimensions of human quality per-ception and how they may impact QoE in future networks and services, given
Fig. 3. Multidimensional modelling of QoE.
QoE Management for Future Networks 63
that humans are quality meters [49]. With the advent of 5G, the range of offeredservices, application domains, and the context in which they shall be used inwill increase significantly. Consequently, factors such as explosive growth of datatraffic volume, number of connected devices, continuous emergence of new ser-vices and applications, etc., will all contribute to the complexity of managingQoE [82]. The challenge is even greater, given that all above mentioned targetsshould be addressed in a multidimensional fashion (multiple factors and fea-tures) and from the point of various actors in the service provisioning chain. Inthis respect, multidimensional QoE modeling aims to quantify the relationshipbetween different measurable QoE influence factors, quantifiable QoE features(or dimensions), and QoE for a given service provided by future environment (asgiven in Fig. 3).
Approaches and Results. In search for multidimensional modelingapproaches to QoE in terms of multimedia services, one may note that moststudies, addressing different factors and features that impact and describe theuser experience or quality thereof (referring also to studies of user satisfaction orpreferences), focus on a limited set of factors and features. Hence they offer anincomplete view of the user experience and QoE. For example, as summarizedin [75], we have, models for file transfer [74], Voice over IP [38], video stream-ing [34,36,45,71], online video [39], etc. which are based on weighted impactsof system influence factors (that is Quality of Service technical parameters).What is generally missing, is a multidimensional approach to QoE modeling,i.e., the quantification and deeper understanding of multiple influence factorsaffecting QoE and features describing it, together with their mutual interplay[12,13].
Following the idea, authors in [72] give a generic framework for QoE in amultidimensional fashion by offering an ARCU (Application-Resource-Context-User) model which categorizes influence factors into four multidimensional spacesand further maps points from these spaces to a multidimensional QoE space,representing both qualitative and quantitative QoE metrics. What this studylacks is the concrete implementation on given multidimensional services andconsequently the results.
However, studies that have started to address QoE modeling as an impor-tant part of QoE management in a multidimensional fashion, operated in a Webenvironment. In a stationary/desktop Web context, authors in [76] used a multi-dimensional approach to investigate Web QoE by focusing on evaluation of threekey dimensions that contribute to overall Web QoE: perceived performance, aes-thetics, and ease-of-use. Key results have shown that page loading time andvisual appeal have a significant effect on overall user QoE and that both, higherperceived aesthetics and ease-of-use, result in an increased user tolerance todelay. Also, the research proved that there exists strong correlation betweenoverall QoE and perceived aesthetics, ease-of-use, and network performance.
In the mobile Web browsing context (browsing information, thematic, and e-mail portals via both a smartphone and tablet), authors in [12,13] have proposed
64 R. Schatz et al.
multidimensional models that represent and quantify mutual relations of QoE andkey features, i.e., perceived Web site loading time, perceived aesthetics of Web site,perceived usability of Web sites, and perceived quality of Web site information, aswell as key IFs and QoE features. These studies follow the principle given in Fig. 3and their contribution is three-fold. Firstly, QoE in a mobile Web browsing contextis addressed as a multidimensional concept. Then, the authors have shown that theimpact of page loading time, aesthetics, usability, and quality of information pro-vided by Web sites on mobile Web QoE exists. Finally, mutual relations betweenQoE and its features, as well as QoE IFs and features are quantified, and basedon the obtained models, one is able to identify the importance (impact degree) ofdistinct dimensions in terms of considered perceptions and overall QoE. There-fore, the perception of Web site usability, aesthetics, loading time, and quality ofinformation respectively in that order differ in the degree to which they impactthe overall QoE (going from most to least influential) regardless of performed taskor used device in a mobile Web browsing context [12]. In other words, the multi-dimensional models for mobile Web browsing QoE show that the most importantperceptual dimensions were found to be perceived Web site usability and aesthet-ics, respectively, and that they impact QoE in a mobile environment more than theperception of Web site loading time, which was previously found to be the mostinfluential in a desktop environment. The extension study given in [13] shows thatin case of perception of Web site loading time, Web site loading time and numberof taps respectively in that order differ in the degree to which they impact this QoEfeature (going from most to least influential) in all considered cases (information,thematic, and e-mail portal). The number of taps, aesthetics of Web site, Web siteloading time, and quality of Web site information respectively in that order differ inthe degree to which they impact perceived usability (going from most to least influ-ential) in all considered cases except when browsing the thematic portal (regard-less of used device). Namely, when browsing the thematic portal via mobile device,Web site loading time and quality of Web site information switch places, i.e., theresulting order of impacts is: number of taps, aesthetics of Web site, quality of Website information, and Web site loading time. The aesthetics of a Web site, numberof taps, and quality of Web site information respectively in that order differ in thedegree to which they impact the perception of aesthetics (going from most to leastinfluential) in all considered cases except in the case of browsing the thematic por-tal via a smartphone, where the number of taps and quality of information switchplaces. The quality of Web site information, aesthetics of Web site, and number oftaps to reach desired Web content respectively in that order differ in the degree towhich they impact the perception of quality of Web site information (going frommost to least influential) in all considered cases.
Conclusion. It is clear that not all factors can be addressed together in asingle study. Therefore, the focus should be on exploring the impact of a chosenkey set of influence factors and their perceptions (QoE features) on the userrating of overall perceived QoE for a given multimedia service in future networkenvironment in a multidimensional fashion [14]. Based on that, one would be
QoE Management for Future Networks 65
able to identify the importance of distinct dimensions in terms of overall userperceived QoE and consequently contribute to better QoE management, whichrepresents an ultimate goal.
3.2 QoE Management by Differentiated Handling of Session-ControlSignaling
As previously discussed in Sect. 2.2, the applications are responsible for collectingimportant information about the network or the applications runing on top ofit, which are used for application-level adaptation or invocation of network-levelmechanisms. These tasks concern the application-level signaling as being themain source of network intelligence, analysis, and user experience monitoring.The cooperation between the application- and network-level mechanisms may berealized by using different application-level signaling protocols, such as SessionInitiation Protocol (SIP) or Hypertext Transfer Protocol (HTTP) [15]. While thenew versions HTTP (i.e., HTTP/2) and HTTP alternatives (e.g., Stream ControlTransport Protocol (SCTP) or Quick UDP Internet Connections (QUIC)) arethe dominant signaling protocols in the Internet domain, the SIP is more usedin the telecoms domain in the context of real-time communication services. Theincreasing usage of these services requires the real-time processing of growingamount of SIP signaling. In order to cope with the explosion of SIP signaling,the mechanism for differentiated handling of SIP messages is needed to increasethe service quality, while decreasing the load of session-control resources [15].
In order to ensure high availability and reliability of SIP servers, different over-load protection mechanisms have been previously discussed in the signaling per-formance context [31]. Many research activities have been performed to providethe SIP overload control by considering various parameters such as call rejection[10,51,81], session aware [42], and response time [55]. Moreover, the increasingusage of SIP signaling has resulted in the need for creating a methodology for SIPserver performance measuring [78]. Different SIP performance metrics have beenevaluated for that purpose in various environments, such as Internet Protocol (IP)multimedia subsystem (IMS) [16], Asterisk IP private branch exchange (PBX)[47], long term evolution mission critical systems (LTE-MCS) [8,9], content-aware network (CAN) and content-centric network (CCN) [62]. Considering therelated work, it can be noticed that most of the research activities have beenfocused on analyzing the impact of session-control signaling on Quality of Service(QoS). However, acceptable QoS does not guarantee that end user will experienceacceptable QoE.
Approaches and Results. In this regard, an algorithm for SIP message clas-sification and priorization [18] (which is implemented in an NS-2 simulationenvironment [17] and on an Kamailio SIP server) has been investigated in termsof QoE impact. Serving as a mechanism for QoE management at the applicationlayer shown in Fig. 4, this algorithm allows the optimization of SIP signalingprocedures especially under high-load or overload conditions through improving
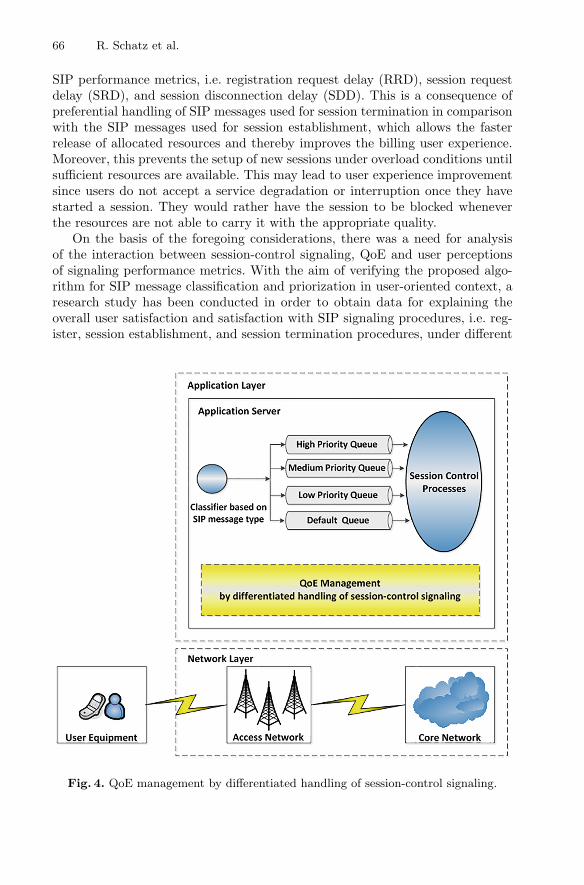
66 R. Schatz et al.
SIP performance metrics, i.e. registration request delay (RRD), session requestdelay (SRD), and session disconnection delay (SDD). This is a consequence ofpreferential handling of SIP messages used for session termination in comparisonwith the SIP messages used for session establishment, which allows the fasterrelease of allocated resources and thereby improves the billing user experience.Moreover, this prevents the setup of new sessions under overload conditions untilsufficient resources are available. This may lead to user experience improvementsince users do not accept a service degradation or interruption once they havestarted a session. They would rather have the session to be blocked wheneverthe resources are not able to carry it with the appropriate quality.
On the basis of the foregoing considerations, there was a need for analysisof the interaction between session-control signaling, QoE and user perceptionsof signaling performance metrics. With the aim of verifying the proposed algo-rithm for SIP message classification and priorization in user-oriented context, aresearch study has been conducted in order to obtain data for explaining theoverall user satisfaction and satisfaction with SIP signaling procedures, i.e. reg-ister, session establishment, and session termination procedures, under different
Fig. 4. QoE management by differentiated handling of session-control signaling.
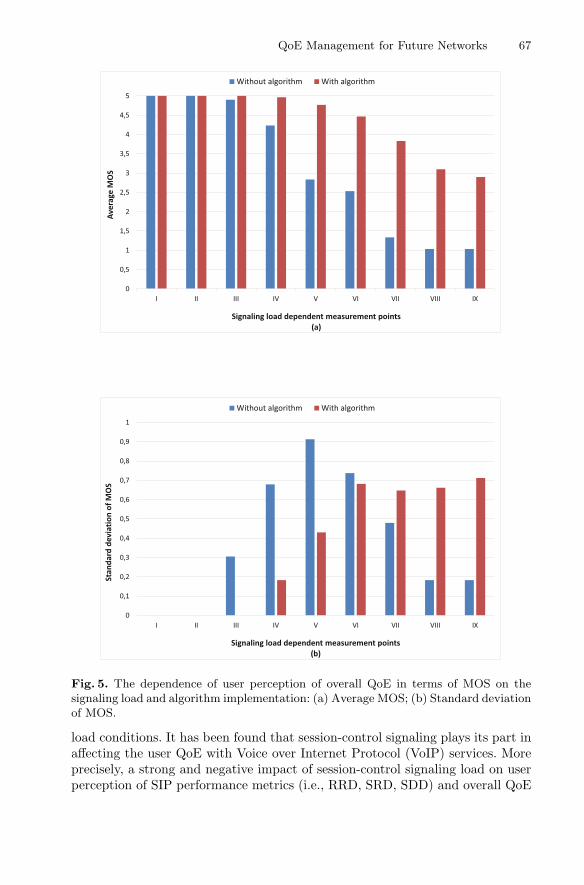
QoE Management for Future Networks 67
Fig. 5. The dependence of user perception of overall QoE in terms of MOS on thesignaling load and algorithm implementation: (a) Average MOS; (b) Standard deviationof MOS.
load conditions. It has been found that session-control signaling plays its part inaffecting the user QoE with Voice over Internet Protocol (VoIP) services. Moreprecisely, a strong and negative impact of session-control signaling load on userperception of SIP performance metrics (i.e., RRD, SRD, SDD) and overall QoE
68 R. Schatz et al.
has been determined. Fig. 5 shows the user perception of overall QoE expressedin terms of mean opinion score (MOS) in dependence on the session-controlsignaling load and algorithm implementation. Furthermore, the linear model isproposed to describe the relation between user perception of SIP performancemetrics and overall QoE with VoIP.
In addition, it has been shown that the proposed algorithm for SIP messageclassification and priorization affects user perception of SIP performance metricsand overall QoE with VoIP by decreasing the strong impact of session-controlsignaling load on considered SIP performance metrics. Therefore, the additionalmodel has been provided to evaluate the mutual relations of user perception ofdistinct SIP performance metrics and QoE. This has allowed us to determine theimportance of various SIP signaling metrics according to the listed order, goingfrom most to least influential: user perception of SRD, user perception of SDD,and user perception of RRD.
Moreover, since the algorithm for SIP message classification and priorizationmay be used for service differentiation, it has been investigated whether dif-ferentiated handling of SIP messages affects the quality of unified communica-tion (UC) service components (i.e., QoS for voice/video calls, instant messaging(IM)/presence status) or not. It has been preliminary found that there is nostatistically significant impact of SIP message differentiation on the QoS for thevoice/video calls, IM/presence status. Nevertheless, the future work will addressthe impact of the differentiation of UC service components on QoE in differentcontexts.
Conclusion. Although the importance of session-control signaling has beenalready emphasized in the field of QoS, it has been considered to a limited extentin terms of the QoE. The performed research study has focused on the interactionbetween session-control signaling,QoEanduser perception of SIP signaling perfor-mance metrics. The research findings indicate that session-control signaling loadnegatively affects the user perception of SIP signaling performance metrics andoverall QoE with the VoIP service. On the other hand, it is shown that differen-tiated handling of session-control signaling does not affect the QoS of UC service,whereas its impact onQoE in this context is planned for the futurework.Therefore,one may conclude that further investigation of this application-levelmechanism forQoE management is needed not to draw the misleading conclusion.
3.3 QoE Management with SDN
Motivation. Subsection 2.2 provides an overview of several QoE-driven NAMapproaches, while this one expands on that overview so as to present theapproaches that exploit the relatively new Software-Defined Networking (SDN)paradigm [46] in particular. Communication networks are already undergoingan immense transformation in light of this paradigm. SDN commonly refersto the separation of the network control and data planes, allowing a networkinfrastructure to be configured from a central point, an SDN controller (SDNC),
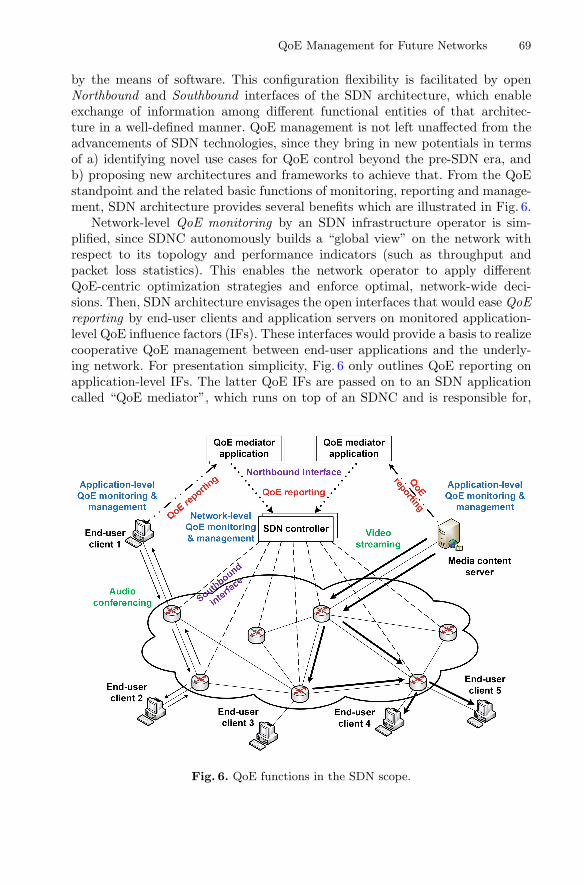
QoE Management for Future Networks 69
by the means of software. This configuration flexibility is facilitated by openNorthbound and Southbound interfaces of the SDN architecture, which enableexchange of information among different functional entities of that architec-ture in a well-defined manner. QoE management is not left unaffected from theadvancements of SDN technologies, since they bring in new potentials in termsof a) identifying novel use cases for QoE control beyond the pre-SDN era, andb) proposing new architectures and frameworks to achieve that. From the QoEstandpoint and the related basic functions of monitoring, reporting and manage-ment, SDN architecture provides several benefits which are illustrated in Fig. 6.
Network-level QoE monitoring by an SDN infrastructure operator is sim-plified, since SDNC autonomously builds a “global view” on the network withrespect to its topology and performance indicators (such as throughput andpacket loss statistics). This enables the network operator to apply differentQoE-centric optimization strategies and enforce optimal, network-wide deci-sions. Then, SDN architecture envisages the open interfaces that would ease QoEreporting by end-user clients and application servers on monitored application-level QoE influence factors (IFs). These interfaces would provide a basis to realizecooperative QoE management between end-user applications and the underly-ing network. For presentation simplicity, Fig. 6 only outlines QoE reporting onapplication-level IFs. The latter QoE IFs are passed on to an SDN applicationcalled “QoE mediator”, which runs on top of an SDNC and is responsible for,
Fig. 6. QoE functions in the SDN scope.
70 R. Schatz et al.
e.g., generating aggregated QoE reports from multiple end users/applications.Aggregated QoE reports are delivered to the SDNC over a Northbound interfacethat it exposes. For a realization of the cooperative management, QoE media-tors may also serve as, e.g., PMOs and instruct end-user clients or applicationservers which management actions to enforce. The latter role would require QoEmediators to employ an interface that supports conveying application-level man-agement instructions as well. With regards to network-level QoE management,SDN facilitates per-flow network forwarding decisions and differentiated traf-fic treatment (e.g., video streaming vs. audio conferencing) on various levels ofgranularity, thus adding to overall QoE management flexibility.
Approaches and Results. Recent research papers show that this potential hasalready been acknowledged and taken advantage of. So far, most attention hasbeen paid on how SDN’s Southbound interface and, one of its main realizations,the OpenFlow (OF) specification [2] can be used to program network switches incompliance with operator policies, which enforce automated flow manipulation.This way, different traffic management schemes can be applied, such as to re-calculate and adjust traffic routes, prioritize traffic handling in the switches, oremploy network admission control. A high-level view of an SDN-based systemthat would maximize user QoE by optimizing path selection process is describedby Kassler et al. [44]. The authors present general requirements of such a systemthat would consider demands and parameters of various multimedia flows, interms of media codecs, flow bitrates, end-to-end (E2E) delay, etc. To achieveit, an SDNC would be used to collect information on multimedia applications,build a global network view, and install optimal routing decisions. QoE FairnessFramework (QoE-FF) for adaptive video streaming is presented by Georgopouloset al. in [29]. The goal of QoE-FF is to find an optimal point of video qualityrequests among heterogeneous end-user clients competing for the same networkresources. To realize such a goal, QoE-FF relies on a PMO entity that collectsclient device characteristics influencing QoE (e.g., screen resolution) and videoservice features (such as supported content bitrates) via a Northbound interface,as well as network bandwidth status, and then impose the respective bitratedemand on each client. Jarschel et al. [41] describe an SDN-based approach thatinvestigates route selection strategies in order to improve QoE for YouTube users.For the application-aware strategy, an SDNC exploits the estimated playoutbuffer status and traffic demand on network bandwidth to choose a less congestednetwork path.
Nam et al. jointly optimize the selection of video delivery nodes in a ContentDistribution Network (CDN) and network routes in the base SDN infrastruc-ture [56]. Their approach is built on monitoring application-level QoE IFs, suchas initial reproduction delay and buffering rate, and calculating a new path inresponse to QoE degradations. An approach to dynamic network bandwidthreservation that optimizes QoE among multiple competing video clients is out-lined by Ramakrishnan et al. in [63]. This approach employs the scheme of allo-cating bandwidth to each client that considers QoE IFs in terms of, for example,
QoE Management for Future Networks 71
specific content type (e.g., dynamic vs. static video scenes), media codec used, aswell as client’s playout buffer level. Implementation-wise, an SDN-centric archi-tecture is proposed that revolves around the QoE optimization application on topof PMO-like SDNC. This SDN application obtains information on client’s devicetype and its buffer status, requested video sequence(s) and base network topol-ogy, and then tailors the bandwidth reservation in cases of congested network.M. Eckert and T. M. Knoll present the Internet Service quality Assessment andAutomatic Reaction (ISAAR) framework [26], which encompasses QoE manage-ment functions for an SDN-enabled mobile network, namely network-level QoEmonitoring and control. ISAAR exploits the SDN capabilities for (a) flow-basedQoE estimation, which is realized by OF flow detection and selective packet cap-turing, and (b) QoE control enforcement via OF traffic prioritization and othertraffic engineering (TE) techniques. Ramakrishnan et al. in [64] describe an SDN-based architecture that allows the generation of QoE metrics (e.g., PSNR) andQoE analytics. To achieve that, a “Video Quality Application” (VQA) queriesinformation from an SDNC regarding video content, user devices, and networkperformance.
This emerging interest of tackling QoE management with SDN is also visiblefrom recent European research projects. The CASPER project (http://casper-h2020.eu/) exploits SDN and NFV advancements towards improving end-userQoE in wireless networks, focusing on voice, data and traditional video applica-tions. A novel framework is proposed, targeting its integration by mobile oper-ators. Moreover, the INPUT project (http://input-project.eu/) aims to extendSDN and NFV paradigms, in order to pave the way for personal cloud servicesand functionalities with the goal to optimize QoE. Also, 5G NORMA (https://5gnorma.5g-ppp.eu/) envisions a flexible architecture that enables the multi-service- and context-aware adaptation of network functions to support a varietyof services and corresponding QoE/QoS requirements. Finally, project CROSS-FIRE (http://mitn-crossfire.eu/) has investigated the sharing of the same phys-ical infrastructure by multiple network operators with the objective to optimizenetwork operation and enforce QoE management by the means of SDN/NFV.
Conclusion. To summarize, most of the SDN-based solutions and frameworksfor QoE management focus on a single end-user application, such as videostreaming, and on network-level management mechanisms, but without provid-ing specific details on technical SDN realization and important architecturalaspects. In the latter, some of the key parts missing relate to: (1) a coordi-nated approach in distributed QoE monitoring, and (2) common interfaces forreporting on QoE IFs, which regard applications and the underlying network,but also end-users and general context information. Furthermore, the outlinedapproaches are often use-case-specific and do not discuss general guidelines onhow to extend them so as to achieve more comprehensive QoE managementsolutions.

72 R. Schatz et al.
4 Outlook: Future Evolution of Software-Based QoEManagement
As discussed in the previous sections, QoE provisioning within the current net-worked communication paradigm is a very challenging task, since the servicedelivery chain involves multiple stakeholders typically with competing inter-ests (OTT service providers, traditional Mobile Network Operators (MNO), andInternet Service Providers (ISPs)). As a result, true E2E QoE management ofa service is currently impossible, since data traffic produced by an OTT is sub-ject to the network quality provided by an MNO, before it reaches the end-user. However, new technological advancements bring hope towards overcomingthis isolation and truly enabling a holistic, E2E, cross-layer (i.e. network-leveland application-level) QoE management. These identified technologies are SDN,NFV and MEC. Although MEC and NFV are driven by the same motives andfollow similar design principles, according to [4], they are “complementary con-cepts that can exist independently”; therefore, they are examined separatelybelow.
4.1 Software-Defined Networking (SDN)
First of all, SDN is a promising technology towards the direction of software-based QoE management (see Sect. 3.3). SDN, as of today, is mainly a tool usedby operators of the network infrastructure to enforce traffic management policieswithin their domain, leaving the potential of a joint orchestration at the networkand application levels unexploited. Nevertheless, SDN enables an abstraction ofthe network infrastructure, which, combined with the necessary SDN interfaces,can facilitate a closer collaboration between MNOs/ISPs and OTTs, respectingin parallel privacy concerns of each stakeholder. This visionary approach hasbeen acknowledged by strategic white papers [3], as well as research papers,such as [6] and [52].
To achieve the full potential of QoE management with SDN, well-definedinterfaces capable of realizing QoE reporting for different multimedia services areneeded. Such interfaces would allow the SDN architectural elements, namely end-user clients, application servers, SDN applications, SDNCs and infrastructuredevices, to convey information on all relevant QoE IFs. These interfaces can bescenario-specific and open, introducing great flexibility to 3rd parties who canprogram proprietary applications that use these interfaces. In this way, not only acomprehensive view on QoE could be formed, but also a more rapid design andimplementation of QoE management frameworks would be enforced. Anotherimportant technological aspect that should be addressed is the identification ofhow generic QoE management blocks (see Sect. 2.2) are “mapped” to concreteSDN architectures and combined to create an efficient management cycle. Thelatter calls for the specification of different management strategies with regardsto SDN monitoring and network-level traffic treatment as well.
QoE Management for Future Networks 73
4.2 Network Functions Virtualization (NFV)
The NFV paradigm enables the implementation of network functions in softwarethat can then run on common hardware, but that can also be moved or instan-tiated at various network locations on demand. In order to achieve that, theavailable network, processing, and storage resources are to be configured basedon policies from a central NFV orchestration system. One NFV topic closelyrelated to QoE management that requires research attention deals with design-ing network-level QoE monitoring as a virtual function, which could be started“on-the-fly” on a commodity server. Other NFV aspects that need inspectionrelate to the orchestration process, which combines the operation of virtualizednetwork functions. Here, one of the challenges is to efficiently merge differentvirtualized network-level functions so as to achieve a specific QoE managementobjective.
4.3 Multi-access Edge Computing (MEC)
MEC is another promising technology that fosters the closer collaboration of net-work operators and OTT parties, such as cloud, content and application providers,with the goal of efficiently maximizing QoE. MEC differs from NFV in terms ofapplications’ location (i.e. at the network edge), type (i.e. interfacing with theaccess network), and scope (i.e. mobility applications). Specifically, MEC repre-sents a technological paradigm, where network operators open up the Radio AccessNetwork (RAN) edge of their networks to 3rd parties so that the latter can flexiblyimplement and offer novel services to their mobile customers, such as video analyt-ics and optimized local content distribution [1]. The ETSI body sees MEC as “theconvergence of IT and telecommunications networking”. Similarly to SDN, MECschemes will foster the joint, cross-layer QoE management for mobile subscribers,through authorizing the OTT players to exploit assets that exclusively belong toMNOs. An early example of this potential is found in [50], where a MEC serverruns a novel adaptation algorithm enriched by the knowledge on wireless networkcongestion, which is provided by the MNO. This algorithm changes on the fly theHAS manifest files in response to the current network congestion, which drives end-user clients to select appropriate video segment representations that will diminishstallings and, thus, improve QoE. Similarly, Ge et al. in [28] guide the segmentselection for video streaming users by locally caching the most popular content atthe qualities that current network throughput can support. A reference architec-ture for the QoE-oriented management of services in the MEC ecosystem, exploit-ing Channel State Information (CSI), is discussed in [59].
5 Conclusion
In this chapter we have discussed the current state of the art in QoE managementas well as the main challenges faced in this field. We presented a comprehensiveframework for QoE-driven Network and Application Management (NAM) as well
74 R. Schatz et al.
as specific approaches and discussed future prospects of selected technologies inthis field.
In general, our survey shows that there are many promising sophisticatedapproaches towards QoE-driven NAM. However, we also observe that research inthis field tends to be rather patchy (i.e. addressing just parts of the overall sys-tem or optimizing just for a specific service) or tends to remain on a high level ofabstraction (i.e. being far away from practical implementability). Thus the mainoverarching challenges in realizing the vision ofQoE-drivenNAMare less related tosingular components, but rather to putting all components (and the related stake-holders) together in a coordinated and sustainable fashion. In fact, a number ofworks have shown that the most promising solutions require cooperation betweenstakeholders typically facing conflicting business interests (see Sect. 2.1). Thus, wehope to see more future work addressing these non-technical, yet critical challengesby pointing out collaboration opportunities and value creation in the context ofQoE-driven NAM. Furthermore, monitoring and managing QoE comes at the costof increased overhead and complexity (data gathering, coordination and control,etc.), which is further catalyzed by the emerging SDN and NFV technologies. Suchcosts tend to be neglected in existing research, yet they represent a major barrierto adoption in practice. Therefore we encourage the community to stronger inte-grate these aspects (and complexity in particular) in the design and evaluationof QoE management approaches. This especially refers to a holistic exploitationof SDN, NFV and MEC that would unleash the potenital of a coordinated QoEmanagement between the application and network levels.
Finally, bringing QoE, AM and NM closely together also raises the need foraligned views and mindsets. Besides clarifying and synchronizing the meaning ofdifferent concepts and notions (like “quality”, “acceptability” or “performance”),their importance for the different academic and industrial communities needs tobe assessed and aligned in order to make the vision of truly QoE-driven Networkand Application Management a reality.
References
1. Multi-access Edge Computing. http://www.etsi.org/technologies-clusters/technologies/multi-access-edge-computing. Accessed 06 Apr 2017
2. OpenFlow Switch Specification: Version 1.3.5 (Protocol version 0x04).https://www.opennetworking.org/images/stories/downloads/sdn-resources/onf-specifications/openflow/openflow-switch-v1.3.5.pdf. Accessed 04 Apr 2017
3. Enabling the OTT revolution - How telecom operators can stake their claim (2013).Strategy & (formerly Booz & Company)
4. ETSI GS MEC 003 V1.1.1, Mobile Edge Computing (MEC); Framework and Ref-erence Architecture (2016)
5. Adzic, V., Kalva, H., Furht, B.: Optimized adaptive http streaming for mobiledevices. In: SPIE Optical Engineering+ Applications, p. 81350T. InternationalSociety for Optics and Photonics (2011)
6. Ahmad, A., Floris, A., Atzori, L.: QoE-centric service delivery: a collaborativeapproach among OTTs and ISPs. Comput. Netw. 110(C), 168–179 (2016). https://doi.org/10.1016/j.comnet.2016.09.022
QoE Management for Future Networks 75
7. Ahmad, A., Floris, A., Atzori, L.: OTT-ISP joint service management: a customerlifetime value based approach. In: 2017 IFIP/IEEE Symposium on Integrated Net-work and Service Management (IM), pp. 1017–1022. IEEE (2017)
8. Ali, A., Alshamrani, M., Kuwadekar, A., Al-Begain, K.: Evaluating SIP signalingperformance for VoIP over LTE based mission-critical communication systems. In:9th International Conference on Next Generation Mobile Applications, Servicesand Technologies. IEEE (2015)
9. Ali, A., Kuwadekar, A., Al-Begain, K.: IP multimedia subsystem SIP registrationsignaling evaluation for mission critical communication systems. In: InternationalConference on Data Science and Data Intensive Systems (DSDIS). IEEE (2015)
10. Azhari, S.V., Homayouni, M., Nemati, H., Enayatizadeh, J., Akbari, A.: Overloadcontrol in SIP networks using no explicit feedback: a window based approach.Comput. Commun. 35, 1472–1483 (2012)
11. Barakovic, S., Skorin-Kapov, L.: Survey and challenges of QoE management issuesin wireless networks. J. Comput. Netw. Commun. 2013, 1–28 (2013)
12. Barakovic, S., Skorin-Kapov, L.: Multidimensional modelling of quality of experi-ence for mobile web browsing. Comput. Hum. Behav. 50, 314–332 (2015)
13. Barakovic, S., Skorin-Kapov, L.: Modelling the relationship betweendesign/performance factors and perceptual features contributing to qualityof experience for mobile web browsing. Comput. Hum. Behav. 74, 311–329 (2017)
14. Barakovic, S., Skorin-Kapov, L.: A survey of research on user experience and qual-ity of experience modelling for web and mobile web browsing (2017). Accepted for[publication] in Quality and User Experience
15. Barakovic Husic, J., Bajric, H., Barakovic, S.: Evolution of signaling informationtransmission. ISRN Commun. Netw. 2012, 1–9 (2012)
16. Barakovic Husic, J., Bajric, H., Nekovic, E., Barakovic, S.: Basic telephony SIPend-to-end performance metrics. In: IX International Symposium on Telecommu-nications (BIHTEL 2012). IEEE (2012)
17. Barakovic Husic, J., Hidic, A., Hadzialic, M., Barakovic, S.: Simulation-based opti-mization of signaling procedures in IP multimedia subsystem. In: 15th Conferenceof Open Innovations Association FRUCT, pp. 9–14. IEEE (2014)
18. Barakovic Husic, J., Perenda, E., Hadzialic, M., Barakovic, S.: Performance mod-elling and optimization of IP multimedia subsystem. In: European Modelling Sym-posium (EMS 2013), pp. 617–623. IEEE (2013)
19. Bentaleb, A., Begen, A.C., Zimmermann, R.: SDNDASH: Improving QoE of HTTPadaptive streaming using software defined networking. In: Proceedings of the 2016ACM on Multimedia Conference, pp. 1296–1305. ACM (2016)
20. van den Berg, H.: Autonomous control for a reliable internet of services: an overviewof the activities of cost action across. In: Proceedings of the 8th ACM/SPECon International Conference on Performance Engineering Companion, ICPE 2017Companion, p. 3. ACM, New York (2017). http://doi.acm.org/10.1145/3053600.3053606
21. Bjorksten, M., Pohjola, O.P., Kilkki, K.: Applying user segmentation and estimat-ing user value in techno-economic modeling. In: 2007 6th Conference on Telecom-munication Techno-Economics, CTTE 2007, p. 16 (2007)
22. Bouten, N., Famaey, J., Latre, S., Huysegems, R., De Vleeschauwer, B., Van Leek-wijck, W., De Turck, F.: QoE optimization through in-network quality adaptationfor HTTP adaptive streaming. In: 2012 8th International Conference on Networkand Service Management (CNSM) and 2012 Workshop on Systems VirtualiztionManagement (SVM), pp. 336–342. IEEE (2012)
76 R. Schatz et al.
23. Cisco: Cisco Visual Networking Index: Forecast and Methodology, 2014–2019White Paper. Technical report, Cisco Systems Inc., San Jose, USA (2015)
24. Cofano, G., Cicco, L.D., Zinner, T., Nguyen-Ngoc, A., Tran-Gia, P., Mascolo, S.:Design and experimental evaluation of network-assisted strategies for HTTP adap-tive video streaming. In: Proceedings of the 7th ACM Multimedia Systems Con-ference (MMSys 2016), pp. 3:1–3:12. Klagenfurt, Austria, May 2016
25. Dobrijevic, O., Santl, M., Matijasevic, M.: Ant colony optimization for QoE-centricflow routing in software-defined networks. In: Proceedings of the 11th InternationalConference on Network and Service Management (CNSM 2015), Barcelona, Spain,pp. 274–278 (2015)
26. Eckert, M., Knoll, T.M.: QoE management framework for internet services in SDN-enabled mobile networks. In: Software Defined Mobile Networks (SDMN), pp. 247–264. Wiley (2015)
27. Frank, B., Poese, I., Smaragdakis, G., Feldmann, A., Maggs, B.M., Uhlig, S.,Aggarwal, V., Schneider, F.: Collaboration opportunities for content delivery andnetwork infrastructures. Recent Adv. Netw. 1, 305–377 (2013)
28. Ge, C., Wang, N., Skillman, S., Foster, G., Cao, Y.: QoE-driven DASH videocaching and adaptation at 5G mobile edge. In: Proceedings of the 3rd ACM Con-ference on Information-Centric Networking, ACM-ICN 2016, pp. 237–242. ACM,New York (2016). http://doi.acm.org/10.1145/2984356.2988522
29. Georgopoulos, P., Elkhatib, Y., Broadbent, M., Mu, M., Race, N.: Towardsnetwork-wide QoE fairness using openflow-assisted adaptive video streaming. In:Proceedings of the 2013 ACM SIGCOMM Workshop on Future Human-centricMultimedia Networking (FhMN), Hong Kong, China, pp. 15–20 (2013)
30. Gomez, G., Sanchez, R.: End-to-End Quality of Service Over Cellular Networks:Data Services Performance and Optimization in 2G/3G. Wiley, Hoboken (2005)
31. Happenhofer, M., Fabini, J., Egger, C., Hirschbichler, M.: An Architectural andevaluative review of implicit and explicit SIP overload handling. In: AdvancedInstrument Engineering: Measurement, Calibration, and Design, pp. 257–273. IGIGlobal (2013)
32. Hong, H.J., Hsu, C.F., Tsai, T.H., Huang, C.Y., Chen, K.T., Hsu, C.H.: Enablingadaptive cloud gaming in an open-source cloud gaming platform. IEEE Trans.Circuits Syst. Video Technol. 25(12), 2078–2091 (2015)
33. Hosein, P., Choi, W., Seok, W., et al.: Disruptive network applications and theirimpact on network neutrality. In: 2015 17th International Conference on AdvancedCommunication Technology (ICACT), pp. 663–668. IEEE (2015)
34. Hoßfeld, T., Schatz, R., Biersack, E., Plissonneau, L.: Internet video delivery inYouTube: from traffic measurements to quality of experience. In: Biersack, E.,Callegari, C., Matijasevic, M. (eds.) Data Traffic Monitoring and Analysis. LNCS,vol. 7754, pp. 264–301. Springer, Heidelberg (2013). https://doi.org/10.1007/978-3-642-36784-7 11
35. Hoßfeld, T., Schatz, R., Varela, M., Timmerer, C.: Challenges of QoE Managementfor Cloud Applications. IEEE Commun. Mag. 50(4), 28–36 (2012)
36. Hoßfeld, T., Seufert, M., Sieber, C., Zinner, T.: Assessing effect sizes of influencefactors towards a QoE model for HTTP adaptive streaming. In: 6th InternationalWorkshop on Quality of Multimedia Experience (QoMEX 2014), pp. 111–116.IEEE (2014)
37. Houdaille, R., Gouache, S.: Shaping HTTP adaptive streams for a better userexperience. In: Proceedings of the 3rd Multimedia Systems Conference, pp. 1–9.ACM (2012)
QoE Management for Future Networks 77
38. The E-model: a computational model for use in transmission planning. Standard,ITU-T (2014)
39. Opinion model for video-telephony applications. Standard, ITU-T (2012)40. Ivesic, K., Skorin-Kapov, L., Matijasevic, M.: Cross-layer QoE-driven admission
control and resource allocation for adaptive multimedia services in LTE. J. Netw.Comput. Appl. 46, 336–351 (2014)
41. Jarschel, M., Wamser, F., Hohn, T., Zinner, T., Tran-Gia, P.: SDN-basedapplication-aware networking on the example of YouTube video streaming. In: Pro-ceedings of the 2nd European Workshop on Software Defined Networks (EWSDN2013), Berlin, Germany, pp. 87–92 (2013)
42. Jiang, H., Iyengar, A., Nahum, E., Segmuller, W., Tantawi, A.N., Wright, C.:Design, implementation, and performance of a load balancer for SIP server clusters.IEEE/ACM Trans. Netw. 20, 1190–1202 (2012)
43. Joseph, V., de Veciana, G.: Nova: QoE-driven optimization of dash-based videodelivery in networks. In: IEEE INFOCOM 2014-IEEE Conference on ComputerCommunications, pp. 82–90. IEEE (2014)
44. Kassler, A., Skorin-Kapov, L., Dobrijevic, O., Matijasevic, M., Dely, P.: TowardsQoE-driven multimedia service negotiation and path optimization with softwaredefined networking. In: SoftCOM 2012, 20th International Conference on Software,Telecommunications and Computer Networks, pp. 1–5. IEEE (2012)
45. Khan, A., Sun, L., Jammeh, E., Ifeachor, E.: Quality of experience driven adapta-tion scheme for video applications over wireless networks. IET Commun. 4, 1337–1347 (2010)
46. Kreutz, D., Ramos, F.M.V., Verssimo, P.E., Rothenberg, C.E., Azodolmolky,S., Uhlig, S.: Software-defined networking: a comprehensive survey. Proc. IEEE103(1), 14–76 (2015)
47. Kulin, M., Kazaz, T., Mrdovic, S.: SIP server security with TLS: relative perfor-mance evaluation. In: IX International Symposium on Telecommunications (BIH-TEL 2012), 1–6. IEEE (2012)
48. Kumar, V.: Managing Customers for Profit: Strategies to Increase Profits and BuildLoyalty. Pearson Prentice Hall, Upper Saddle River (2008)
49. Laghari, K.U.R., Connelly, K.: Toward total quality of experience: a QoE modellingin a communication ecosystem. IEEE Commun. Mag. 50(4), 58–65 (2012)
50. Li, Y., Frangoudis, P.A., Hadjadj-Aoul, Y., Bertin, P.: A Mobile Edge Computing-based architecture for improved adaptive HTTP video delivery. In: 2016 IEEEConference on Standards for Communications and Networking (CSCN), pp. 1–6,October 2016
51. Liao, J., Wang, J., Li, T., Wang, J., Wang, J., Zhu, X.: A distributed end-to-end overload control mechanism for networks of SIP servers. Comput. Netw. 56,2847–2868 (2012)
52. Liotou, E., Tseliou, G., Samdanis, K., Tsolkas, D., Adelantado, F., Verikoukis,C.: An SDN QoE-Service for dynamically enhancing the performance of OTTapplications. In: 2015 Seventh International Workshop on Quality of MultimediaExperience (QoMEX), pp. 1–2. IEEE (2015)
53. Liotou, E., Tsolkas, D., Passas, N., Merakos, L.: Quality of experience managementin mobile cellular networks: key issues and design challenges. IEEE Commun. Mag.53(7), 145–153 (2015)
54. Mok, R.K., Luo, X., Chan, E.W., Chang, R.K.: QDASH: A QoE-aware DASHSystem. In: Proceedings of the 3rd Multimedia Systems Conference (MMSys 2012).pp. 11–22. Chapel Hill, NC, USA (2012)
78 R. Schatz et al.
55. Montazerolghaem, A., Shekofteh, S., Yaghmaee, M.H., Naghibzadeh, M.: A loadscheduler for SIP proxy servers: design, implementation and evaluation of a historyweighted window approach. International Journal of Communication Systems 30(2015)
56. Nam, H., Kim, K.H., Kim, J.Y., Schulzrinne, H.: Towards QoE-aware VideoStreaming using SDN. In: Proceedings of the 2014 IEEE Global CommunicationsConference (GLOBECOM). pp. 1317–1322. Austin, TX, USA (2014)
57. Paul, S., Jain, R.: OpenADN: Mobile Apps on Global Clouds Using OpenFlow andSoftware Defined Networking. In: Proceedings of the 2012 IEEE Global Communi-cations Conference (GLOBECOM) Workshops. pp. 719–723. Anaheim, CA, USA(2012)
58. Paul, S., Jain, R., Pan, J., Iyer, J., Oran, D.: OpenADN: A Case for Open Appli-cation Delivery Networking. In: Proceedings of the 22nd Int’l Conference on Com-puter Communication and Networks (ICCCN 2013). pp. 1–7. Nassau, Bahamas(2013)
59. Peng, S., Fajardo, J.O., Khodashenas, P.S., Blanco, B., Liberal, F., Ruiz,C., Turyagyenda, C., Wilson, M., Vadgama, S.: QoE-Oriented Mobile EdgeService Management Leveraging SDN and NFV. Mobile Information Systems2017(3961689) (2017). 14 pages
60. Petrangeli, S., Wauters, T., Huysegems, R., Bostoen, T., De Turck, F.: Network-based Dynamic Prioritization of HTTP Adaptive Streams to Avoid Video Freezes.In: Proceedings of the 2015 IFIP/IEEE Int’l Symposium on Integrated NetworkManagement (IM). pp. 1242–1248. Ottawa, Canada (2015)
61. Qualinet White Paper on Definitions of Quality of Experience, 2012, March 201362. Ramakrishna, M., Karunakar, A.: SIP and SDP based content adaptation during
real-time video streaming in future internets. Multimedia Tools Appl. 2016, 1–21(2016)
63. Ramakrishnan, S., Zhu, X., Chan, F., Kambhatla, K.: SDN based QoE optimizationfor HTTP-based adaptive video streaming. In: 2015 IEEE International Sympo-sium on Multimedia (ISM), pp. 120–123. IEEE (2015)
64. Ramakrishnan, S., Zhu, X.: An SDN based approach to measuring and optimizingABR video quality of experience. Technical report, Cisco Systems (2014)
65. Reichl, P.: From charging for quality of service to charging for quality of experience.annals of telecommunications-annales des telecommunications 65(3–4), 189–199(2010)
66. Schatz, R., Fiedler, M., Skorin-Kapov, L.: QoE-based network and applicationmanagement. In: Moller, S., Raake, A. (eds.) Quality of Experience. TSTS, pp.411–426. Springer, Cham (2014). https://doi.org/10.1007/978-3-319-02681-7 28
67. Schatz, R., Hoßfeld, T., Janowski, L., Egger, S.: From packets to people: qualityof experience as a new measurement challenge. In: Biersack, E., Callegari, C.,Matijasevic, M. (eds.) Data Traffic Monitoring and Analysis. LNCS, vol. 7754, pp.219–263. Springer, Heidelberg (2013). https://doi.org/10.1007/978-3-642-36784-7 10
68. Schwarzmann, S., Zinner, T., Dobrijevic, O.: Towards a framework for comparingapplication-network interaction mechanisms. In: 2016 28th International TeletrafficCongress (ITC 28), vol. 3, pp. 13–18. IEEE (2016)
69. Schwarzmann, S., Zinner, T., Dobrijevic, O.: Quantitative comparison ofapplication-network interaction: a case study of adaptive video streaming. Qual.User Experience 2(1) (2017). 18 pages
70. Seppanen, J., Varela, M., Sgora, A.: An autonomous QoE-driven network manage-ment framework. J. Vis. Commun. Image Represent. 25(3), 565–577 (2014)
QoE Management for Future Networks 79
71. Seufert, M., Egger, S., Slanina, M., Zinner, T., Hoßfeld, T., Tran-Gia, P.: A surveyon quality of experience of HTTP adaptive streaming. IEEE Commun. Surv. Tutor.17, 469–492 (2015)
72. Skorin-Kapov, L., Varela, M.: A multi-dimensional view of QoE: the ARCU model.In: 35th International Convention on Information and Communication Technology,Electronics and Microelectronics (MIPRO 2012), pp. 662–666. IEEE (2012)
73. Stankiewicz, R., Jajszczyk, A.: A survey of QoE assurance in converged networks.Comput. Netw. 55(7), 1459–1473 (2011)
74. Thakolsri, S., Khan, S., Steinbach, E., Kellerer, W.: QoE-driven cross-layer opti-mization for high speed downlink packet access. J. Commun. 4, 669–680 (2009)
75. Tsolkas, D., Liotou, E., Passas, N., Merakos, L.: A survey on parametric QoEestimation for popular services. J. Netw. Comput. Appl. 77, 1–17 (2017)
76. Varela, M., Skorin-Kapov, L., Maki, T., Hoßfeld, T.: QoE in the web: a dance ofdesign and performance. In: 7th International Workshop on Quality of MultimediaExperience (QoMEX 2015), pp. 1–7. IEEE (2015)
77. Varela, M., Zwickl, P., Reichl, P., Xie, M., Schulzrinne, H.: From service level agree-ments (SLA) to experience level agreements (ELA): the challenges of selling QoEto the user. In: 2015 IEEE International Conference on Communication Workshop(ICCW), pp. 1741–1746. IEEE (2015)
78. Voznak, M., Rozhon, J.: Approach to stress tests in SIP environment based onmarginal analysis. Telecommun. Syst. 52(3), 1583–1593 (2013)
79. Wamser, F., Ifflander, L., Zinner, T., Tran-Gia, P.: Implementing application-awareresource allocation on a home gateway for the example of YouTube. In: Aguero,R., Zinner, T., Goleva, R., Timm-Giel, A., Tran-Gia, P. (eds.) MONAMI 2014.LNICSSITE, vol. 141, pp. 301–312. Springer, Cham (2015). https://doi.org/10.1007/978-3-319-16292-8 22
80. Wamser, F., Zinner, T., Tran-Gia, P., Zhu, J.: Dynamic bandwidth allocation formultiple network connections: improving user QoE and network usage of YouTubein mobile broadband. In: Proceedings of the 2014 ACM SIGCOMM Capacity Shar-ing Workshop (CSWS), Chicago, IL, USA, pp. 57–62 (2014)
81. Wang, J., Liao, J., Li, T., Wang, J., Wang, J., Qi, Q.: Probe-based end-to-endoverload control for networks of SIP servers. J. Netw. Comput. Appl. 41, 114–125(2014)
82. Wang, Y., Li, P., Jiao, L., Su, Z., Cheng, N., Shen, X.S., Zhang, P.: A data-drivenarchitecture for personalized QoE management in 5G wireless networks. IEEEWirel. Commun. 24(1), 102–110 (2017)
83. Zhu, J., Vannithamby, R., Rodbro, C., Chen, M., Vang Andersen, S.: ImprovingQoE for Skype video call in mobile broadband network. In: Proceedings of the2012 IEEE Global Communications Conference (GLOBECOM), Anaheim, CA,USA, pp. 1938–1943 (2012)
84. Zinner, T., Hoßfeld, T., Fiedler, M., Liers, F., Volkert, T., Khon-doker, R., Schatz, R.: Requirement driven prospects for realizing user-centric network orchestration. Multimedia Tools Appl. 74(2), 413–437 (2015).http://dx.doi.org/10.1007/s11042-014-2072-5
85. Zwickl, P., Reichl, P., Skorin-Kapov, L., Dobrijevic, O., Sackl, A.: On the approx-imation of ISP and user utilities from quality of experience. In: 2015 SeventhInternational Workshop on Quality of Multimedia Experience (QoMEX), pp. 1–6.IEEE (2015)

80 R. Schatz et al.
Open Access This chapter is licensed under the terms of the Creative CommonsAttribution 4.0 International License (http://creativecommons.org/licenses/by/4.0/),which permits use, sharing, adaptation, distribution and reproduction in any mediumor format, as long as you give appropriate credit to the original author(s) and thesource, provide a link to the Creative Commons license and indicate if changes weremade.
The images or other third party material in this chapter are included in the chapter’sCreative Commons license, unless indicated otherwise in a credit line to the material. Ifmaterial is not included in the chapter’s Creative Commons license and your intendeduse is not permitted by statutory regulation or exceeds the permitted use, you willneed to obtain permission directly from the copyright holder.
Scalable Traffic Quality and System EfficiencyIndicators Towards Overall Telecommunication
System’s QoE Management
Stoyan Poryazov1(✉) , Emiliya Saranova1,2 , and Ivan Ganchev1,3,4
1 Institute of Mathematics and Informatics, Bulgarian Academy of Sciences,Sofia, Bulgaria
[email protected], [email protected] University of Telecommunications and Post, Sofia, Bulgaria
3 University of Limerick, Limerick, [email protected]
4 University of Plovdiv “Paisii Hilendarski”, Plovdiv, Bulgaria
Abstract. Conceptual and analytical models of an overall telecommunicationsystem are utilized in this chapter for the definition of scalable indicators towardsQuality of Service (QoS) monitoring, prediction, and management. The telecom‐munication system is considered on different levels – service phase, service stage,network, and overall system. The network itself is presented in seven service stages– A-user, A-terminal, Dialing, Switching, B-terminal Seizure, B-terminal, and B-user, each having its own characteristics and specifics. Traffic quality indicators areproposed on each level. Two network cost/quality ratios are proposed – mean andinstantaneous – along with illustrative numerical predictions of the latter, whichcould be useful for dynamic pricing policy execution, depending on the networkload. All defined indicators could be considered as sources for Quality of Experi‐ence (QoE) prediction.
Keywords: Overall telecommunication system · Performance modelDynamic quality of service (QoS) · Telecommunication subservicesDifferentiated QoS subservice indicator · QoS prediction · Human factors of QoSInstantaneous Cost/Quality Ratio · Quality of Experience (QoE)
1 Introduction
Starting from 2010, e.g. [1], a new attitude towards the Quality of Service (QoS) hasbecome dominant, namely to consider QoS and Quality of Experience (QoE) as goods,and the usage of Experience Level Agreement (ELA) [2] has started to be discussed.The importance of the teletraffic models, particularly of the overall QoS indicators, forQoE assessment is emphasized by Fiedler [3]. Until now, however, the usage ofperformance models of overall telecommunication systems was not very popular. Thischapter utilizes the models, elaborated in the Chapter “Conceptual and AnalyticalModels for Predicting the Quality of Service of Overall Telecommunication Systems”of this book, for the definition of scalable QoS indicators towards overall
© The Author(s) 2018I. Ganchev et al. (Eds.): Autonomous Control for a Reliable Internet of Services, LNCS 10768, pp. 81–103, 2018.https://doi.org/10.1007/978-3-319-90415-3_4
telecommunication system’s QoS monitoring, prediction, and management. Some indi‐cators reflect predominantly the users’ experience. All defined indicators depend onhuman (users’) characteristics and technical characteristics, and may be considered assources for QoE prediction.
For this, in Sect. 2, traffic characterization of a service in a real device (service phase)is first elaborated. Definitions of served-, carried-, parasitic-, ousted-, and offered carriedtraffic are proposed, based on the ITU-T definitions, and eight service phase trafficquality indicators are proposed.
In Sect. 3, the service stage concept is developed and corresponding traffic qualityindicators are defined.
In Sect. 4, telecommunication system and network efficiency indicators are proposedas follows: eight indicators – on the service stage level, five indicators – on the networklevel, and three indicators – on the overall system level. The relationship between indi‐cators on the service stage-, network-, and system level are described. A comparisonwith classical network efficiency indicators is made. The applicability of the approachand results obtained for defining other indicators, as well as for numerical prediction ofindicators’ values, is shown.
In Sect. 5, two network cost/quality ratios are proposed – mean and instantaneous –and illustrative numerical predictions of the latter are presented, which may be usefulfor dynamic pricing policy execution, depending on the network load.
In the Conclusion, possible directions for future research are briefly discussed.
2 Service Phase Concept and Traffic Quality Indicators
The conceptual model utilized in this chapter is described in detail in the Chapter“Conceptual and Analytical Models for Predicting the Quality of Service of OverallTelecommunication Systems” of this book. It consists of five levels: (1) overall tele‐communication system and its environment; (2) overall telecommunication network;(3) service stages; (4) service phases; and (5) basic virtual devices. In the followingsubsections, the concepts of ‘service phase’ and ‘service stage’ are elaborated.
2.1 Service Phase
Based on the ITU-T definition of a service, provided in [4] (Term 2.14), i.e. “A set offunctions offered to a user by an organization constitutes a service”, we propose thefollowing definition of a service phase.
Definition 1: The Service Phase is a service presentation containing:
• One of the functions, realizing the service, which is considered indivisible;• All modeled reasons for ending/finishing this function, i.e. the causal structure of the
function;• Hypothetic characteristics, related to the causal structure of the function (a well-
known example of a hypothetic characteristic is the offered traffic concept).
82 S. Poryazov et al.
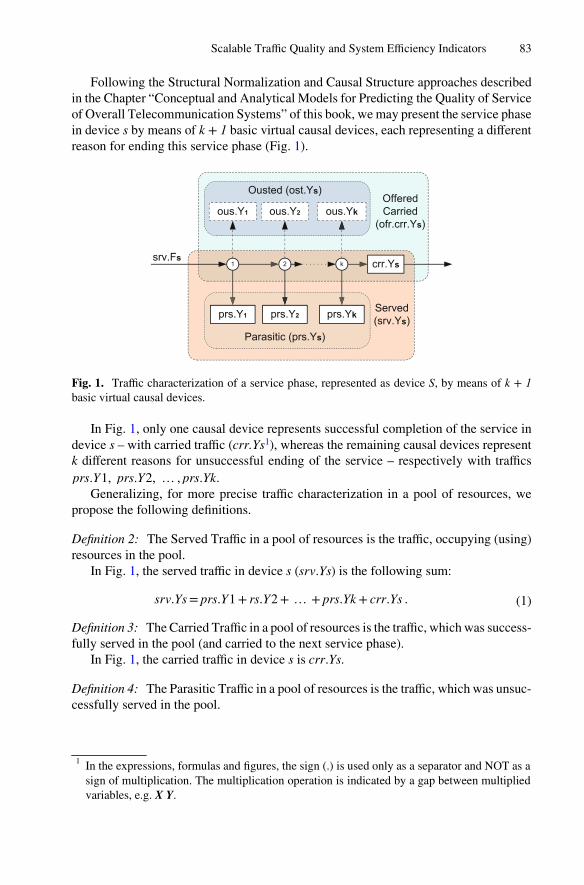
Following the Structural Normalization and Causal Structure approaches describedin the Chapter “Conceptual and Analytical Models for Predicting the Quality of Serviceof Overall Telecommunication Systems” of this book, we may present the service phasein device s by means of k + 1 basic virtual causal devices, each representing a differentreason for ending this service phase (Fig. 1).
OfferedCarried
(ofr.crr.Ys)
srv.Fs
ous.Yk
Served(srv.Ys)
2
ous.Y2ous.Y1
crr.Ys1 k
prs.Yk
Parasitic (prs.Ys)
Ousted (ost.Ys)
prs.Y2prs.Y1
Fig. 1. Traffic characterization of a service phase, represented as device S, by means of k + 1basic virtual causal devices.
In Fig. 1, only one causal device represents successful completion of the service indevice s – with carried traffic (crr.Ys1), whereas the remaining causal devices representk different reasons for unsuccessful ending of the service – respectively with trafficsprs.Y1, prs.Y2, … , prs.Yk.
Generalizing, for more precise traffic characterization in a pool of resources, wepropose the following definitions.
Definition 2: The Served Traffic in a pool of resources is the traffic, occupying (using)resources in the pool.
In Fig. 1, the served traffic in device s (srv.Ys) is the following sum:
srv.Ys= prs.Y1+ rs.Y2+ … + prs.Yk+ crr.Ys . (1)
Definition 3: The Carried Traffic in a pool of resources is the traffic, which was success‐fully served in the pool (and carried to the next service phase).
In Fig. 1, the carried traffic in device s is crr.Ys.
Definition 4: The Parasitic Traffic in a pool of resources is the traffic, which was unsuc‐cessfully served in the pool.
1 In the expressions, formulas and figures, the sign (.) is used only as a separator and NOT as asign of multiplication. The multiplication operation is indicated by a gap between multipliedvariables, e.g. X Y.
Scalable Traffic Quality and System Efficiency Indicators 83

In Fig. 1, each of traffics prs.Y1, prs.Y2, … , prs.Yk is a parasitic one. Parasitictraffic occupies real resources but not for an effective service execution.
In Definitions 2 and 3, the served- and carried traffic are different terms, despite theITU-T definition of the carried traffic as “The traffic served by a pool of resources” ([5],Term 5.5). We believe that this distinction leads to a better and more detailed traffic-and QoS characterization.
Definition 5: The Ousted Traffic is the traffic that would be carried, if there is no unsuc‐cessful service ending in the pool of resources.
In Fig. 1, each parasitic traffic prs.Y1, prs.Y2, … , prs.Yk ousts a correspondingtraffic that would be carried, if there is no unsuccessful service ending of the corre‐sponding type: ous.Y1, ous.Y2, … , ous.Yk. The flow intensity to a parasitic device andthe corresponding ousted device is the same by definition, i.e.:
ous.Fi = prs.Fi, for i= [1, k], (2)
but the service times are different.The hypothetic service time for every ousted device (ous.Ti) equals the carried
service time (crr.Ts):
ous.Ti = crr.Ts, for i= [1, k] . (3)
The ousted traffic is a hypothetic one with the following intensity:
ous.Yi = prs.Fi crr.Ts, for i= [1, k] . (4)
2.2 Causal Generalization
In the Chapter “Conceptual and Analytical Models for Predicting the Quality of Serviceof Overall Telecommunication Systems” of this book, the causal presentation and causalaggregation are discussed. The causal aggregation is understood as an aggregation ofall cases in the model, corresponding to different reasons for service ending (referred toas unsuccessful cases further in this chapter).
Here a causal generalization is proposed, as an aggregation of all unsuccessful cases(prs.Ys). Besides this, an aggregation of all cases of ousted traffic (ous.Ys) could be used:
prs.Ys=
k∑
i=1
prs.Yi; (5)
ous.Ys=
k∑
i=1
ous.Yi. (6)
By Definition 2, the served traffic is a sum of the parasitic and carried traffic (c.f.Fig. 1):
84 S. Poryazov et al.
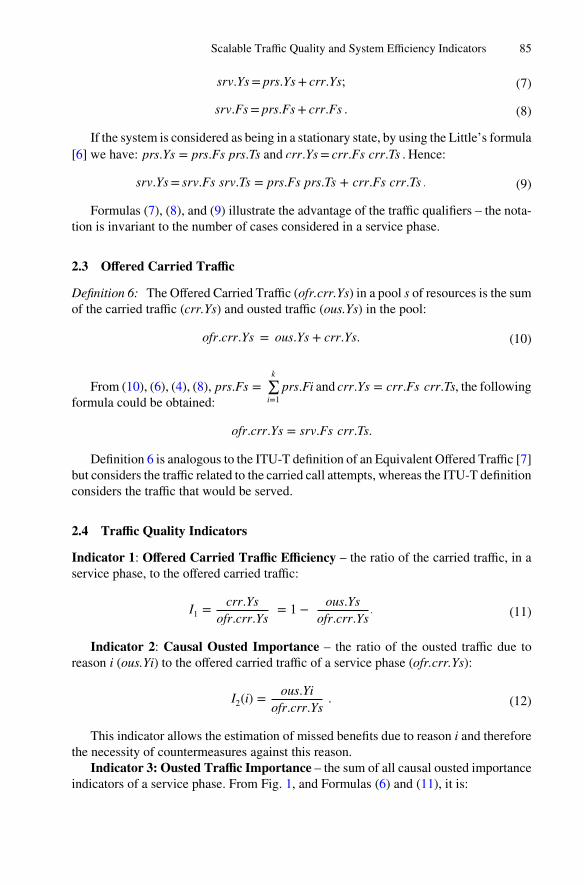
srv.Ys= prs.Ys+ crr.Ys; (7)
srv.Fs= prs.Fs+ crr.Fs . (8)
If the system is considered as being in a stationary state, by using the Little’s formula[6] we have: prs.Ys = prs.Fs prs.Ts and crr.Ys= crr.Fs crr.Ts . Hence:
srv.Ys= srv.Fs srv.Ts = prs.Fs prs.Ts + crr.Fs crr.Ts . (9)
Formulas (7), (8), and (9) illustrate the advantage of the traffic qualifiers – the nota‐tion is invariant to the number of cases considered in a service phase.
2.3 Offered Carried Traffic
Definition 6: The Offered Carried Traffic (ofr.crr.Ys) in a pool s of resources is the sumof the carried traffic (crr.Ys) and ousted traffic (ous.Ys) in the pool:
ofr.crr.Ys = ous.Ys + crr.Ys. (10)
From (10), (6), (4), (8), prs.Fs =k∑
i=1prs.Fi and crr.Ys = crr.Fs crr.Ts, the following
formula could be obtained:
ofr.crr.Ys = srv.Fs crr.Ts.
Definition 6 is analogous to the ITU-T definition of an Equivalent Offered Traffic [7]but considers the traffic related to the carried call attempts, whereas the ITU-T definitionconsiders the traffic that would be served.
2.4 Traffic Quality Indicators
Indicator 1: Offered Carried Traffic Efficiency – the ratio of the carried traffic, in aservice phase, to the offered carried traffic:
I1 =crr.Ys
ofr.crr.Ys= 1 −
ous.Ys
ofr.crr.Ys. (11)
Indicator 2: Causal Ousted Importance – the ratio of the ousted traffic due toreason i (ous.Yi) to the offered carried traffic of a service phase (ofr.crr.Ys):
I2(i) =ous.Yi
ofr.crr.Ys. (12)
This indicator allows the estimation of missed benefits due to reason i and thereforethe necessity of countermeasures against this reason.
Indicator 3: Ousted Traffic Importance – the sum of all causal ousted importanceindicators of a service phase. From Fig. 1, and Formulas (6) and (11), it is:
Scalable Traffic Quality and System Efficiency Indicators 85
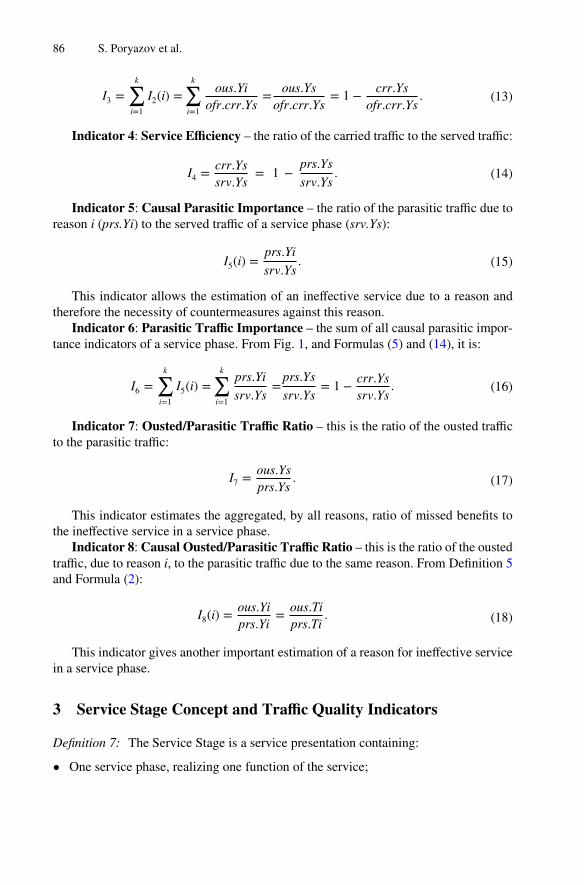
I3 =
k∑
i=1
I2(i) =
k∑
i=1
ous.Yi
ofr.crr.Ys=
ous.Ys
ofr.crr.Ys= 1 −
crr.Ys
ofr.crr.Ys. (13)
Indicator 4: Service Efficiency – the ratio of the carried traffic to the served traffic:
I4 =crr.Ys
srv.Ys= 1 −
prs.Ys
srv.Ys. (14)
Indicator 5: Causal Parasitic Importance – the ratio of the parasitic traffic due toreason i (prs.Yi) to the served traffic of a service phase (srv.Ys):
I5(i) =prs.Yi
srv.Ys. (15)
This indicator allows the estimation of an ineffective service due to a reason andtherefore the necessity of countermeasures against this reason.
Indicator 6: Parasitic Traffic Importance – the sum of all causal parasitic impor‐tance indicators of a service phase. From Fig. 1, and Formulas (5) and (14), it is:
I6 =
k∑
i=1
I5(i) =
k∑
i=1
prs.Yi
srv.Ys=
prs.Ys
srv.Ys= 1 −
crr.Ys
srv.Ys. (16)
Indicator 7: Ousted/Parasitic Traffic Ratio – this is the ratio of the ousted trafficto the parasitic traffic:
I7 =ous.Ys
prs.Ys. (17)
This indicator estimates the aggregated, by all reasons, ratio of missed benefits tothe ineffective service in a service phase.
Indicator 8: Causal Ousted/Parasitic Traffic Ratio – this is the ratio of the oustedtraffic, due to reason i, to the parasitic traffic due to the same reason. From Definition 5and Formula (2):
I8(i) =ous.Yi
prs.Yi=
ous.Ti
prs.Ti. (18)
This indicator gives another important estimation of a reason for ineffective servicein a service phase.
3 Service Stage Concept and Traffic Quality Indicators
Definition 7: The Service Stage is a service presentation containing:
• One service phase, realizing one function of the service;
86 S. Poryazov et al.
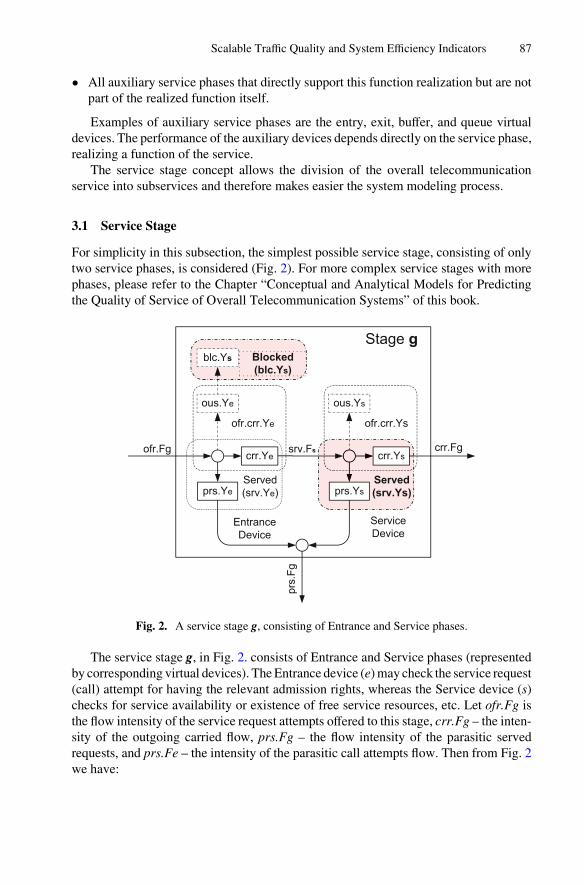
• All auxiliary service phases that directly support this function realization but are notpart of the realized function itself.
Examples of auxiliary service phases are the entry, exit, buffer, and queue virtualdevices. The performance of the auxiliary devices depends directly on the service phase,realizing a function of the service.
The service stage concept allows the division of the overall telecommunicationservice into subservices and therefore makes easier the system modeling process.
3.1 Service Stage
For simplicity in this subsection, the simplest possible service stage, consisting of onlytwo service phases, is considered (Fig. 2). For more complex service stages with morephases, please refer to the Chapter “Conceptual and Analytical Models for Predictingthe Quality of Service of Overall Telecommunication Systems” of this book.
srv.Fs
blc.Ys
ofr.Fg
Blocked(blc.Ys)
Served(srv.Ye)
ous.Ys
Served(srv.Ys)prs.Ys
crr.Ys
ofr.crr.Ys
ous.Ye
crr.Ye
prs.Ye
ofr.crr.Ye
EntranceDevice
ServiceDevice
crr.Fg
prs.Fg
Stage g
Fig. 2. A service stage g, consisting of Entrance and Service phases.
The service stage g, in Fig. 2. consists of Entrance and Service phases (representedby corresponding virtual devices). The Entrance device (e) may check the service request(call) attempt for having the relevant admission rights, whereas the Service device (s)checks for service availability or existence of free service resources, etc. Let ofr.Fg isthe flow intensity of the service request attempts offered to this stage, crr.Fg – the inten‐sity of the outgoing carried flow, prs.Fg – the flow intensity of the parasitic servedrequests, and prs.Fe – the intensity of the parasitic call attempts flow. Then from Fig. 2we have:
Scalable Traffic Quality and System Efficiency Indicators 87

prs.Fe = ofr.Fg prs.Pe, (19)
where prs.Pe is the probability of directing the service request attempts to the general‐ized parasitic service in device e. By analogy:
prs.Fs = ofr.Fg (1 − prs.Pe) prs.Ps. (20)
The total parasitic flow in service stage g is:
prs.Fg = prs.Fe + prs.Fs. (21)
The carried traffic (crr.Yg) in service stage g is a sum of the carried traffic in devicese and s:
crr.Yg = crr.Ye + crr.Ys = crr.Fe crr.Te + crr.Fs crr.Ts, (22)
where:
crr.Fe = ofr.Fg (1 − prs.Pe); (23)
crr.Fs = ofr.Fg (1 − prs.Pe) (1 − prs.Ps). (24)
The total carried traffic in service stage g is:
crr.Yg = ofr.Fg (1 − prs.Pe) ( crr.Te + (1 − prs.Ps) crrTs). (25)
The estimation of the carried traffic in a service stage could be problematic due tothe fact that some of the carried service requests attempts in the first device (e) are notcarried to the next device (s), i.e. they become parasitic service requests with probabilityprs.Ps (c.f. Fig. 2).
Based on the ITU-T definition of ‘effective traffic’ [5], i.e. as “The traffic corre‐sponding only to the conversational portion of effective call attempts”, we propose herethe Effective Carried Traffic concept.
Definition 8: The Effective Carried Traffic in a service stage is the traffic correspondingto the service request attempts leaving the stage with a fully successful (carried) service.
In Fig. 2, the effective carried traffic (eff.crr.Yg) of service stage g is:
eff .crr.Yg = eff .crr.Fg eff .crr.Tg, (26)
where:
eff .crr.Fg = crr.Fs = ofr.Fg (1 − prs.Pe)(1 − prs.Ps); (27)
eff .crr.Tg = crr.Te + crr.Ts. (28)
From (26), (27), and (28), we obtain:
eff .crr.Yg = ofr.Fg (1 − prs.Pe)(1 − prs.Ps)(crr.Te + crr.Ts). (29)
88 S. Poryazov et al.

Note the difference between (25) and (29), i.e. in general, in a service stage, theeffective carried traffic is less than the carried traffic.
The Offered Traffic is a fundamental teletraffic engineering concept. We use theITU-T definition of the Equivalent Offered Traffic [7], i.e. “Offered traffic, to a pool ofresources, is the sum of carried and blocked traffic of this pool”.
The blocked traffic corresponds to the blocked attempts, as per Definition 2.8 in [5]:“Blocked call attempt: A call attempt that is rejected owing to a lack of resources in thenetwork”. This definition, however, is too narrow to be applied directly to blockedservice request attempts as it does not include most of the reasons for rejection, includingaccess control, service unavailability, called terminal unavailability or busyness, andmany others. Thus we propose the following extension of it.
Definition 9: The Blocked Service Request Attempt is a service request attempt withrejected service, in the intended pool of resources, due to any reason.
Blocked traffic is a service stage concept because it considers blocking of servicerequests before entering the service phase, or in other words, blocking that occurs inanother virtual device before the corresponding service device.
In Fig. 2, blocking occurs in the Entrance device. The blocked traffic (blc.Ys) corre‐sponds to the service request attempts offered to service stage g (ofr.Fg), but notbelonging to the served attempts (srv.Fs). From Fig. 2 and the Little’s theorem, weobtain:
blc.Ys = blc.Fs blc.Ts. (30)
The service request attempts that are not carried in phase e, and hence are rejectedto the next service phase, are considered parasitic in phase e. For the intensity of theblocked attempts, the following equality holds:
blc.Fs = prs.Fe = ous.Fe = ofr.Fg prs.Pe. (31)
The offered traffic is a hypothetic one “that would be served” if it is not blocked, andtherefore:
blc.Ts = srv.Ts (32)
From (30), (31), and (32), we obtain the following formula:
blc.Ys = ofr.Fg prs.Pe srv.Ts, (33)
which is valid for the generalized reason for service request attempts rejection in servicephase e (i.e. in the Entrance device).
From the definition of the equivalent offered traffic, Fig. 2, and Formulas (23), (33),and srv.Fs = crr.Fe, the traffic offered to the service device s is:
ofr.Ys = blc.Ys + srv.Ys = ofr.Fg srv.Ts. (34)
Scalable Traffic Quality and System Efficiency Indicators 89

3.2 Traffic Quality Indicators
Many of the service-stage traffic quality indicators may be reformulated as service-stageperformance indicators as done below.
Indicator 9: Carried Effectiveness of a Service Stage – the ratio of the effectivecarried traffic to the carried traffic:
I9 =eff .crr.Y
crr.Y. (35)
For instance, from (25) and (29), the Carried Effectiveness of service stage g inFig. 2 is:
eff .crr.Yg
crr.Yg=
(1 − prs.Ps)(crr.Te + crr.Ts)
crr.Te + (1 − prs.Ps) crr.Ts. (36)
4 Telecommunication System and Network Efficiency Indicators
4.1 Telecommunication System QoS Concept
Users are shown in “Fig. 1 – Schematic contributions to end-to-end QoS” in [4] but theyare not connected to the network. In Fig. 3, schematic contributions to QoS in an overalltelecommunication system, including users, is presented in more detail.
Fig. 3. Schematic contributions to QoS in an overall telecommunication system, including users.
In Fig. 3, the calling (A) and called (B) users and terminals, as well as the mainservice stages of the service request (call) attempts in a telecommunication network, arepresented. The telecommunication network is usually presented as having five servicestages: A-terminal, Dialing, Switching, B-terminal Seizure, and B-terminal, where each
90 S. Poryazov et al.

service stage has its own characteristics. However, there are two other stages – A-userand B-user –, with their own specifics.
In Fig. 3, the possible paths of service request (call2) attempts are the following:
1. int.Fa: The calling users (A-users) generate intent call attempts, with intensityint.Fa, represented as a Generate device in the A-User block. Call intent is “Thedesire to establish a connection to a user”. “This would normally be manifested bya call demand. However, demands may be suppressed or delayed by the callinguser’s expectation of poor Quality of Service performance at a particulartime” [5].
2. sup.Fa: The intensity of suppressed intent call attempts. Suppressed traffic is “Thetraffic that is withheld by users who anticipate a poor quality of service (QoS)performance” [5]. “At present, suitable algorithms for estimating suppressed traffichave not been defined” [7].
3. dem.Fa: The intensity of demand call attempts. Call demand is: “A call intent thatresults in a first call attempt” [5].
4. rep.Fa: The intensity of repeated call attempts. Repeated call attempt is: “Any ofthe call attempts subsequent to a first call attempt related to a given call demand.NOTE – Repeated call attempts may be manual, i.e. generated by humans, or auto‐matic, i.e. generated by machines” [7].
5. ofr.Fa: The intensity of all call attempts (demand and repeated) trying to occupyA-terminals. A-terminals are considered as the first service stage (c.f. Sect. 3) inthe telecommunication network. From Fig. 3:
ofr.Fa = dem.Fa + rep.Fa. (37)
6. prs.Fa: The intensity of all parasitic (unsuccessfully served, c.f. Sect. 2) callattempts in A-terminals.We are modeling the system in a stationary state and for each considered servicestage the intensity of the offered call attempts equals the sum of the outgoing para‐sitic and carried flows, e.g. ofr.Fa = prs.Fa + crr.Fa.For each service stage, part of the parasitic attempts are terminated by the A-user(c.f. devices of type ‘terminator’ in Fig. 3) and the rest join the repeated attempt’sflow (rep.Fa).
7. ofr.Fd = crr.Fa: The intensity of carried (in A-terminals) call attempts (crr.Fa) isequal to the intensity of the offered call attempts (ofr.Fd) to the Dialing stage in thenetwork.
8. prs.Fd: The intensity of all parasitic (unsuccessfully served, c.f. Sect. 2) callattempts in the Dialing stage.
9. ofr.Fs = prs.Fs + crr.Fs: The intensity of the offered-, parasitic-, and carriedflows of call attempts of the Switching stage.
2 Throughout the rest of this chapter, the term ‘call’ should be interpreted in a broader meaningof a ‘service request’.
Scalable Traffic Quality and System Efficiency Indicators 91

10. ofr.Fz = prs.Fz + crr.Fz: The intensity of the offered-, parasitic-, and carriedflows of call attempts of the ‘B-terminal seizure’ stage. The intended B-terminalmay be busy or unavailable and this will cause blocking of call attempts.
11. ofr.Fb = prs.Fb + crr.Fb: The intensity of the offered-, parasitic-, and carriedflows of call attempts of the B-terminal stage.
12. ofr.Fbu = prs.Fbu + crr.Fbu: The intensity of the offered-, parasitic-, andcarried flows of call attempts of the B-user stage. The B-user may be absent, busy,tired, etc.
4.2 Efficiency Indicators
The efficiency indicators, proposed in this chapter, are considered on five levels: (1)service phase; (2) service stage; (3) part of network; (4) overall network; and (5) overalltelecommunication system.
4.2.1 Proposed Efficiency Indicators on Service Stage LevelIn each service stage, a basic performance indicator is the ratio between intensities ofthe carried flow and offered flow of call attempts. An exception is the A-User stagebecause there are two sub-stages in it – Ai (considering the intent call attempts) and Ad(considering the demand call attempts).
Indicator 10: Efficiency indicator Qai on the Ai sub-stage:
I10 = Qai =dem.Fa
int.Fa(38)
Indicator 11: Efficiency indicator Qad on the Ad sub-stage.Let Pr is the aggregated probability of repetition of the offered (to the A-terminals)
call attempts:
Pr =rep.Fa
ofr.Fa. (39)
From (37) and (39), the following formula could be obtained for the efficiency indi‐cator Qad:
I11 = (1 − Pr) =dem.Fa
ofr.Fa=
dem.Fa
dem.Fa + rep.Fa=
1𝛽= Qad, (40)
where β is defined in [7] as:
𝛽 =All call attempts
First call attempts. (41)
In (40), Qad is de-facto the probability corresponding to the ratio of the primary(demand) call attempts’ intensity to the offered attempts’ intensity. It may be consideredas an aggregated overall network performance indicator (as per the initial attempt in [8]).
92 S. Poryazov et al.
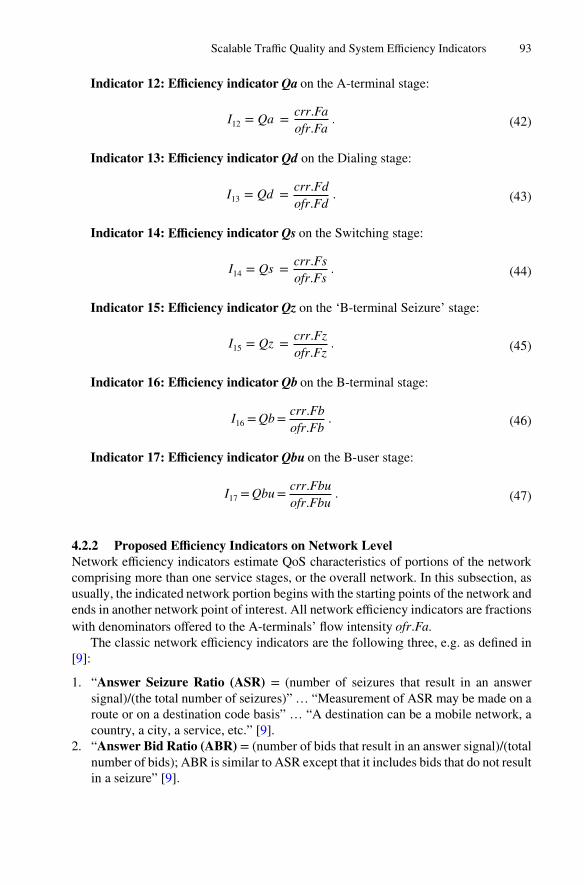
Indicator 12: Efficiency indicator Qa on the A-terminal stage:
I12 = Qa =crr.Fa
ofr.Fa. (42)
Indicator 13: Efficiency indicator Qd on the Dialing stage:
I13 = Qd =crr.Fd
ofr.Fd. (43)
Indicator 14: Efficiency indicator Qs on the Switching stage:
I14 = Qs =crr.Fs
ofr.Fs. (44)
Indicator 15: Efficiency indicator Qz on the ‘B-terminal Seizure’ stage:
I15 = Qz =crr.Fz
ofr.Fz. (45)
Indicator 16: Efficiency indicator Qb on the B-terminal stage:
I16 =Qb=crr.Fb
ofr.Fb. (46)
Indicator 17: Efficiency indicator Qbu on the B-user stage:
I17 =Qbu=crr.Fbu
ofr.Fbu. (47)
4.2.2 Proposed Efficiency Indicators on Network LevelNetwork efficiency indicators estimate QoS characteristics of portions of the networkcomprising more than one service stages, or the overall network. In this subsection, asusually, the indicated network portion begins with the starting points of the network andends in another network point of interest. All network efficiency indicators are fractionswith denominators offered to the A-terminals’ flow intensity ofr.Fa.
The classic network efficiency indicators are the following three, e.g. as defined in[9]:
1. “Answer Seizure Ratio (ASR) = (number of seizures that result in an answersignal)/(the total number of seizures)” … “Measurement of ASR may be made on aroute or on a destination code basis” … “A destination can be a mobile network, acountry, a city, a service, etc.” [9].
2. “Answer Bid Ratio (ABR) = (number of bids that result in an answer signal)/(totalnumber of bids); ABR is similar to ASR except that it includes bids that do not resultin a seizure” [9].
Scalable Traffic Quality and System Efficiency Indicators 93

3. “Network Effectiveness Ratio (NER): NER is designed to express the ability ofnetworks to deliver calls to the far-end terminal. NER expresses the relationshipbetween the number of seizures and the sum of the number of seizures resulting ineither an answer message, or a user busy, or a ring no answer, or in the case of ISDNa terminal rejection/unavailability. Unlike ASR, NER excludes the effects ofcustomer behavior and terminal behavior” [9].
These classic efficiency indicators reflect network providers’ attitude but don’tconsider the possibilities for initiated but unsuccessful communication as well as theinfluence of repeated attempts.
Below we propose new network efficiency indicators, all having as an index the firstletter of the last service stage considered.
Indicator 18: Network efficiency indicator Ea on the A-terminal stage, c.f. also(42):
I18 = Ea =crr.Fa
ofr.Fa= Qa = I12. (48)
Indicator 19: Network efficiency indicator Ed on the Dialing stage, c.f. also (43):
I19 = Ed =crr.Fd
ofr.Fa= Qa Qd = I12 I13. (49)
Indicator 20: By taking into account that crr.Fd = ofr.Fs, c.f. Fig. 3 and (44), thenetwork efficiency indicator Es on the Switching stage is:
I20 = Es =crr.Fs
ofr.Fa= Qa Qd Qs = I14 I19 . (50)
Indicator 21: By taking into account that crr.Fs = ofr.Fz, c.f. Fig. 3 and (45), thenetwork efficiency indicator Ez on the ‘B-terminal seizure’ stage is:
I21 = Ez =crr.Fz
ofr.Fa= Qa Qd Qs Qz = I15 I20 . (51)
Indicator 22: By taking into account that crr.Fz = ofr.Fb, c.f. Fig. 3 and (46), thenetwork efficiency indicator Eb on the B-terminal stage is:
I22 = Eb =crr.Fb
ofr.Fa= Qa Qd Qs Qz Qb = I16 I21 . (52)
This indicator corresponds to the cases of B-user answers, but does not consider thesuccessfulness of the communication.
4.2.3 Proposed Efficiency Indicators on Overall System LevelIndicator 23: By taking into account that crr.Fb = ofr.Fbu, c.f. Fig. 3 and (47), thesystem efficiency indicator Ebu on the B-user stage is:
94 S. Poryazov et al.
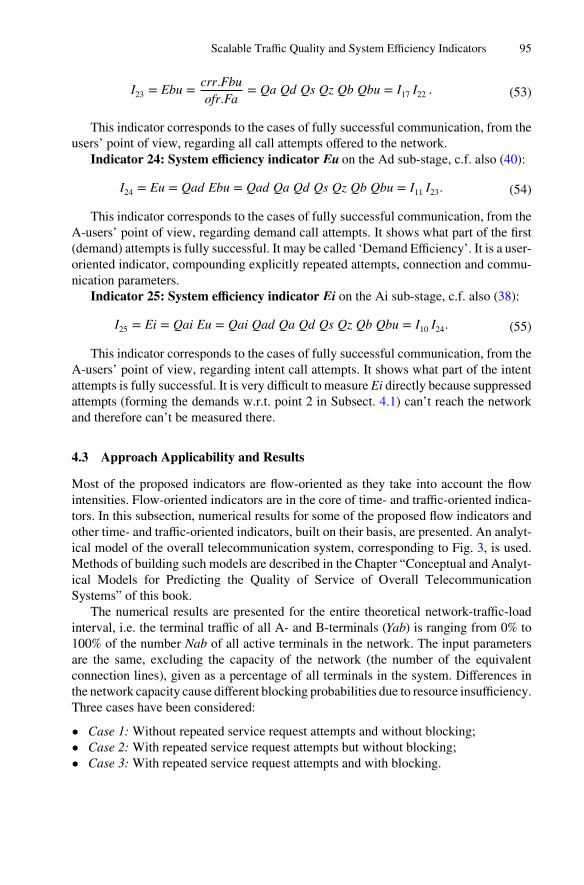
I23 = Ebu =crr.Fbu
ofr.Fa= Qa Qd Qs Qz Qb Qbu = I17 I22 . (53)
This indicator corresponds to the cases of fully successful communication, from theusers’ point of view, regarding all call attempts offered to the network.
Indicator 24: System efficiency indicator Eu on the Ad sub-stage, c.f. also (40):
I24 = Eu = Qad Ebu = Qad Qa Qd Qs Qz Qb Qbu = I11 I23. (54)
This indicator corresponds to the cases of fully successful communication, from theA-users’ point of view, regarding demand call attempts. It shows what part of the first(demand) attempts is fully successful. It may be called ‘Demand Efficiency’. It is a user-oriented indicator, compounding explicitly repeated attempts, connection and commu‐nication parameters.
Indicator 25: System efficiency indicator Ei on the Ai sub-stage, c.f. also (38):
I25 = Ei = Qai Eu = Qai Qad Qa Qd Qs Qz Qb Qbu = I10 I24. (55)
This indicator corresponds to the cases of fully successful communication, from theA-users’ point of view, regarding intent call attempts. It shows what part of the intentattempts is fully successful. It is very difficult to measure Ei directly because suppressedattempts (forming the demands w.r.t. point 2 in Subsect. 4.1) can’t reach the networkand therefore can’t be measured there.
4.3 Approach Applicability and Results
Most of the proposed indicators are flow-oriented as they take into account the flowintensities. Flow-oriented indicators are in the core of time- and traffic-oriented indica‐tors. In this subsection, numerical results for some of the proposed flow indicators andother time- and traffic-oriented indicators, built on their basis, are presented. An analyt‐ical model of the overall telecommunication system, corresponding to Fig. 3, is used.Methods of building such models are described in the Chapter “Conceptual and Analyt‐ical Models for Predicting the Quality of Service of Overall TelecommunicationSystems” of this book.
The numerical results are presented for the entire theoretical network-traffic-loadinterval, i.e. the terminal traffic of all A- and B-terminals (Yab) is ranging from 0% to100% of the number Nab of all active terminals in the network. The input parametersare the same, excluding the capacity of the network (the number of the equivalentconnection lines), given as a percentage of all terminals in the system. Differences inthe network capacity cause different blocking probabilities due to resource insufficiency.Three cases have been considered:
• Case 1: Without repeated service request attempts and without blocking;• Case 2: With repeated service request attempts but without blocking;• Case 3: With repeated service request attempts and with blocking.
Scalable Traffic Quality and System Efficiency Indicators 95

Figures 4, 5, 6 present numerical results obtained for some of the proposed efficiencyindicators, whereas Figs. 7, 8, 9 present numerical results obtained for some time- andtraffic-oriented indicators.
Fig. 4. Efficiency indicators Qad, Ebu and Eu for Case 1 (Qad = 1 and Ebu = Eu because thereare no repeated service request attempts in the system).
Fig. 5. Efficiency indicators Qad, Ebu and Eu for Case 2 (the network performance is degradedconsiderably due to repeated service request attempts).
96 S. Poryazov et al.
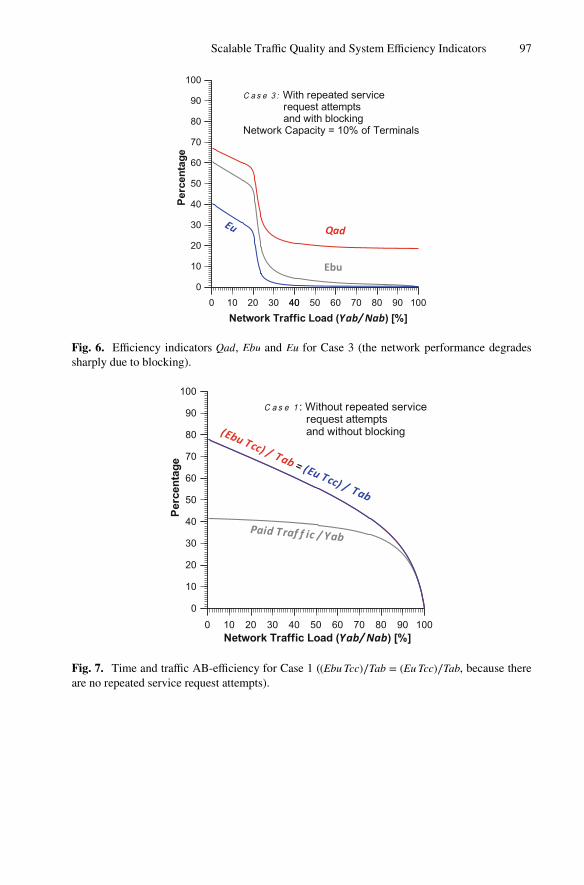
Fig. 6. Efficiency indicators Qad, Ebu and Eu for Case 3 (the network performance degradessharply due to blocking).
Fig. 7. Time and traffic AB-efficiency for Case 1 ((Ebu Tcc)∕Tab = (Eu Tcc)∕Tab, because thereare no repeated service request attempts).
Scalable Traffic Quality and System Efficiency Indicators 97

Fig. 8. Time and traffic AB-efficiency for Case 2 ((Eu Tcc) ∕Tab is sensitive to repeated servicerequest attempts in contrast to (Ebu Tcc) ∕Tab, which is not).
Fig. 9. Time and traffic AB-efficiency for Case 3 (the indicator paid Traffic ∕Yab is not sensibleenough in the network-load interval without blocking).
5 Network Cost/Quality Ratios
We consider the overall telecommunication system model, presented in Fig. 3, with thefollowing assumptions:
98 S. Poryazov et al.

Assumption 1: The observation time interval Δt is limited;Assumption 2: The full system costs (SC) in the time interval Δt are known;Assumption 3: The cost/quality ratio depends on the paid volume of traffic (paid.V) inthis time interval and the QoS indicator (Q);Assumption 4: The full system costs (SC) don’t depend considerably on the servedtraffic volume in the time interval Δt;Assumption 5: The QoS indicator (Q) is dimensionless with values from the interval(0,1] and is proportional to the quality (Q = 1 means ‘the best quality’).
5.1 Mean Cost/Quality Ratio
Based on these assumptions and the definition of the traffic volume, i.e. “The trafficvolume in a given time interval is the time integral of the traffic intensity over this timeinterval” [5], the ‘Cost per Unit’ quantity is:
Cost per Unit =Full System′s Costs [Euro]
Paid Traffic Volume [Erlang × Δt]. (56)
By dividing this to the QoS indicator (Q), we obtain the following:
Cost per Unit
Quality=
Full System′s Costs [Euro]
Q paid.V [Erlang × Δt]=
SC
Q paid.V. (57)
The definition of the paid traffic may depend on the telecommunication serviceprovider. The estimation of the paid traffic volume is a routine operation (c.f. ITU-TRecommendations Series D: General Tariff Principles).
The definition of the QoS indicator (Q) may differ from users’ perspective (i.e. as ageneralized QoE parameter) to the telecommunication service provider’s perspective.In general, the best is to include the Q definition in the Service Level Agreement (SLA).In any case, the value of the QoS indicator (Q) in (57) is the mean value in the timeinterval considered.
The mean cost/quality ratio (57) is suitable for relatively long intervals – days,months, years.
5.2 Instantaneous Cost/Quality Ratio
We consider the traffic intensity (Y) as per the ITU-T definition, i.e. “The instantaneoustraffic in a pool of resources is the number of busy resources at a given instant of time”[5]. From assumptions made and (57), the following formula could be obtained:
Cost per Unit
Quality=
Full System′s Costs [Euro]
Δt [Time] paid.Y [Erlang] Q=
SC
Δt Q paid.Y. (58)
The paid traffic intensity (paid.Y) is an instantaneous quantity but the ratio ‘Cost perUnit/Quality’ (58) depends on the time interval duration. We define the ‘System’s Costs
Scalable Traffic Quality and System Efficiency Indicators 99
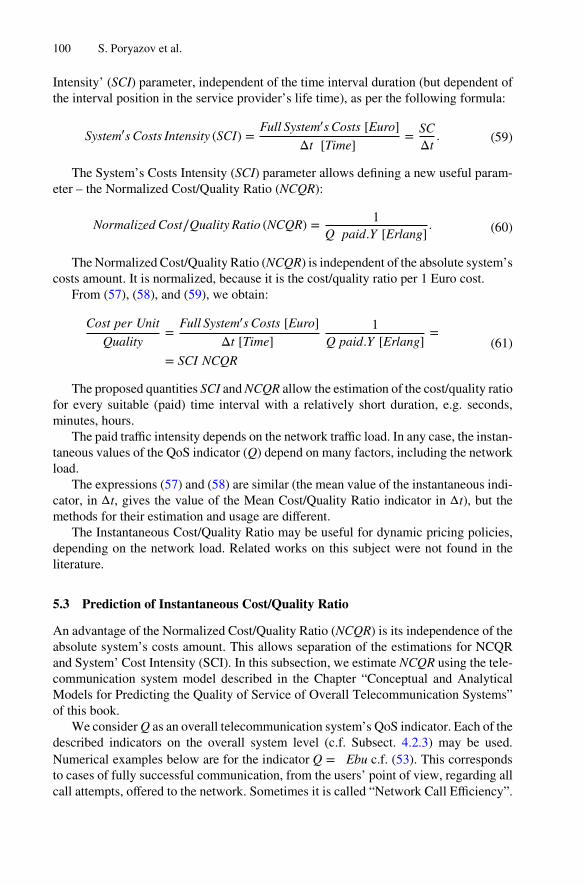
Intensity’ (SCI) parameter, independent of the time interval duration (but dependent ofthe interval position in the service provider’s life time), as per the following formula:
System′s Costs Intensity (SCI) =Full System′s Costs [Euro]
Δt [Time]=
SC
Δt. (59)
The System’s Costs Intensity (SCI) parameter allows defining a new useful param‐eter – the Normalized Cost/Quality Ratio (NCQR):
Normalized Cost∕Quality Ratio (NCQR) =1
Q paid.Y [Erlang]. (60)
The Normalized Cost/Quality Ratio (NCQR) is independent of the absolute system’scosts amount. It is normalized, because it is the cost/quality ratio per 1 Euro cost.
From (57), (58), and (59), we obtain:
Cost per Unit
Quality=
Full System′s Costs [Euro]
Δt [Time]
1Q paid.Y [Erlang]
=
= SCI NCQR
(61)
The proposed quantities SCI and NCQR allow the estimation of the cost/quality ratiofor every suitable (paid) time interval with a relatively short duration, e.g. seconds,minutes, hours.
The paid traffic intensity depends on the network traffic load. In any case, the instan‐taneous values of the QoS indicator (Q) depend on many factors, including the networkload.
The expressions (57) and (58) are similar (the mean value of the instantaneous indi‐cator, in Δt, gives the value of the Mean Cost/Quality Ratio indicator in Δt), but themethods for their estimation and usage are different.
The Instantaneous Cost/Quality Ratio may be useful for dynamic pricing policies,depending on the network load. Related works on this subject were not found in theliterature.
5.3 Prediction of Instantaneous Cost/Quality Ratio
An advantage of the Normalized Cost/Quality Ratio (NCQR) is its independence of theabsolute system’s costs amount. This allows separation of the estimations for NCQRand System’ Cost Intensity (SCI). In this subsection, we estimate NCQR using the tele‐communication system model described in the Chapter “Conceptual and AnalyticalModels for Predicting the Quality of Service of Overall Telecommunication Systems”of this book.
We consider Q as an overall telecommunication system’s QoS indicator. Each of thedescribed indicators on the overall system level (c.f. Subsect. 4.2.3) may be used.Numerical examples below are for the indicator Q = Ebu c.f. (53). This correspondsto cases of fully successful communication, from the users’ point of view, regarding allcall attempts, offered to the network. Sometimes it is called “Network Call Efficiency”.
100 S. Poryazov et al.

As a paid traffic, the successful communication (carried) traffic is used:
NCQR =1
Ebu paid.Y. (62)
The values of input parameters of human behavior and technical system, to themodel, in the presented output numerical results are typical for voice-oriented networks.
Figures 10 and 11 present numerical results for the entire theoretical network trafficload interval, i.e. the terminal traffic of all A- and B-terminals (Yab) is within the rangeof 0% to 100% of the number Nab of all active terminals in the system. The inputparameters are the same, excluding the capacity of the network (the number of equivalentconnection lines), given as a percentage of all terminals in the system. Differences inthe network capacity cause different blocking probabilities due to resource insufficiency.Two cases have been considered:
• Case 1: The network capacity equals 10% of all terminals presented in the system;• Case 2: The network capacity equals 25% of all terminals presented in the system.
Paid Network Traf f ic
0 10 20 30 40 50 60 70 80 90 100
0
10
20
30
40
50
60
70
80
Normalized C
ost /Qu
alityRatio
Network Traffic Load [%]
Call Eff iciency
NetworkCallE
fficiency(Ebu)[%]
Normalized
Cost/
QualityRatio
(NCQR)
[%]
Network capacity =10% of Terminals
Network
Fig. 10. Numerical prediction of the Normalized Cost/Quality Ratio (NCQR), Network CallEfficiency (Ebu), and Paid Traffic Intensity in an overall telecommunication system with QoSguarantees (Case 1: Network capacity = 10% of terminals).
Scalable Traffic Quality and System Efficiency Indicators 101
PaidNetw
orkTraf
f ic
0 10 20 30 40 50 60 70 80 90 100
0
10
20
30
40
50
60
70
80
Normalized
Cost /
QualityRatio
Network Traffic Load [%]
Network Call Efficiency
NetworkCallE
fficiency(Ebu
)[%]
Normalized
Cost/
QualityRati o
(NCQR)
[%] Network capacity =
25% of Terminals
Fig. 11. Numerical prediction of the Normalized Cost/Quality Ratio (NCQR), Network CallEfficiency (Ebu), and Paid Traffic Intensity in an overall telecommunication system with QoSguarantees (Case 2: Network capacity = 25% of terminals).
The results show considerable sensitivity of the Normalized Cost/Quality Ratio(NCQR) from the network capacity and traffic load.
6 Conclusion
In this chapter, a more detailed and precise approach to the traffic characterization hasbeen taken, which allows the definition of new efficiency indicators on different levels,starting with the service phases and stages, continuing with (part of) the network, andfinishing with the overall telecommunication system. The proposed Instantaneous Cost/Quality Ratio may be used for the establishment and utilization of dynamic pricingpolicies, depending on the network load. The use of the instantaneous cost/quality ratiosas a source for QoE prediction is a very perspective direction of research. Using similarapproaches and specific QoS indicators for other types of networks, e.g. multimedia-and multiservice networks, seems also very topical.
Acknowledgments. This work was coordinated under the EU COST Action IC1304“Autonomous Control for a Reliable Internet of Services (ACROSS)”. The work was partiallyfunded by the Bulgarian NSF Projects DCOST 01/9 (the work of S. Poryazov) and DCOST 01/20(the work of E. Saranova).
102 S. Poryazov et al.

References
1. Reichl, P.: From charging for quality of service to charging for quality of experience. Ann.Telecommun. 65(3–4), 189–199 (2010)
2. Varela, M., Zwickl, P., Reichl, P., Xie, M., Schulzrinne, H.: From service level agreements(SLA) to experience level agreements (ELA): the challenges of selling QoE to the user. In:Proceedings of IEEE ICC QoE-FI, London, June 2015. ISSN: 2164-7038, https://doi.org/10.1109/iccw.2015.7247432
3. Fiedler, M.: Teletraffic models for quality of experience assessment. Tutorial at 23rdInternational Teletraffic Congress (ITC 23), San Francisco, CA, September 2011. http://iteletrafic.org/_Resources/Persistent/9269df1c3dca0bf58ee715c3b9afabbc71d4fb26/fiedler11.pdf. Accessed 20 July 2017
4. ITU-T Recommendation E.800 (09/08): Definitions of terms related to quality of service5. ITU-T Recommendation E.600 (03/93): Terms and definitions of traffic engineering6. Little, J.D.C.: A Proof of the Queueing Formula L = λW. Oper. Res. 9, 383–387 (1961)7. ITU-T Recommendation E.501(05/97): Estimation of Traffic Offered in The Network8. Poryazov, S., Saranova, E.: User-oriented, overall traffic and time efficiency indicators in
telecommunications. In: TELFOR 2016 International IEEE Conference #39555, Belgrade,Serbia, 22–23 November 2016, IEEE Catalog Number: CFP1698P-CDR. IEEE (2016). ISBN:978-1-5090-4086-5/16, INSPEC Accession Number: 16603129, https://doi.org/10.1109/telfor.2016.7818729
9. ITU-T Rec. E.425 (03/2002): Network management – Internal automatic observations
Open Access This chapter is licensed under the terms of the Creative Commons Attribution 4.0International License (http://creativecommons.org/licenses/by/4.0/), which permits use, sharing,adaptation, distribution and reproduction in any medium or format, as long as you give appropriatecredit to the original author(s) and the source, provide a link to the Creative Commons licenseand indicate if changes were made.
The images or other third party material in this chapter are included in the chapter’s CreativeCommons license, unless indicated otherwise in a credit line to the material. If material is notincluded in the chapter’s Creative Commons license and your intended use is not permitted bystatutory regulation or exceeds the permitted use, you will need to obtain permission directly fromthe copyright holder.
Scalable Traffic Quality and System Efficiency Indicators 103

Lag Compensation for First-Person ShooterGames in Cloud Gaming
Zhi Li1 , Hugh Melvin1(&) , Rasa Bruzgiene2 , Peter Pocta3 ,Lea Skorin-Kapov4 , and Andrej Zgank5
1 National University of Ireland, Galway, [email protected]
2 Kaunas University of Technology, Kaunas, Lithuania3 University of Zilina, Zilina, Slovakia4 University of Zagreb, Zagreb, Croatia
5 University of Maribor, Maribor, Slovenia
Abstract. Cloud gaming is an emerging technology that combines cloudcomputing with computer games. Compared to traditional gaming, its coreadvantages include ease of development/deployment for developers, and lowertechnology costs for users given the potential to play on thin client devices. Inthis chapter, we firstly describe the approach, and then focus on the impact oflatency, known as lag, on Quality of Experience, for so-called First PersonShooter games. We outline our approach to lag compensation whereby weequalize within reason the up and downlink delays in real-time for all players.We describe the testbed in detail, the open source Gaming Anywhere platform,the use of NTP to synchronise time, the network emulator and the role of thecentralized log server. We then present results that firstly validate the mecha-nism and also use small scale and preliminary subjective tests to assess andprove its performance. We conclude the chapter by outlining ongoing and futurework.
Keywords: Cloud gaming � Quality of experience � Network delayLag compensation
1 Introduction
The gaming industry plays an important role in the entertainment and softwareindustries. According to “Video Game Revenue Forecast: 2017-22”, it is expected thatthe global market of video games will grow up to $174 billion by 2022 [1].
Traditionally, computer games are downloaded from the Internet and installed on aPC or other end user device allowing players to run the corresponding game. Withgame sizes running into multiple gigabytes, the installation process may take the orderof hours, with perhaps additional time required to install patches of new game versions.Furthermore, when players wish to play newly released games, they may require ahigher specified hardware configuration to enable all the visual effects, and so theyhave to upgrade their computers to meet the particular specification. Both of thesefactors can result in frustration and may result in gamers give up the game [2].
© The Author(s) 2018I. Ganchev et al. (Eds.): Autonomous Control for a Reliable Internet of Services, LNCS 10768, pp. 104–127, 2018.https://doi.org/10.1007/978-3-319-90415-3_5

Unlike conventional computer games, cloud gaming has a different paradigm. The‘heavy lifting’ of game processing is done by servers in the cloud [3]. Game actions arecaptured by game clients and sent to cloud server(s). The resulting game scenes arerendered by the cloud servers and the audio and video frames are streamed back toclients over the broadband network. Gamers thus interact and control games throughthin clients, the thin client being a lightweight process (often a browser) which interactswith the remote server [2]. Figure 1 shows the relationship between the server andclient in a cloud gaming service, with gamer actions captured and sent to thecloud-based gaming provider which then streams a video back to the client. For thisreason, cloud gaming allows gamers to play games with simple devices (also referredto as thin client devices) without having to install the games or to continuously upgradecomputer hardware.
For these reasons, game developers and users/gamers are paying more attention tocloud gaming systems [3]. From the developer perspective, the benefits include thepotential of reaching out to more gamers, easier testing of ideas to improve cloudgaming systems, avoiding piracy due to the fact that games are not being downloadedto client devices [4].
From the gamer perspective, the benefits include access to games anytime (ondemand), without the need to download games, reduced costs due to the fact that thecomputer hardware does not need to be upgraded frequently, and ability to play gameson different platforms, such as PC, smartphone, tablet and so on.
Fig. 1. Cloud gaming service
Lag Compensation for First-Person Shooter Games in Cloud Gaming 105
Although cloud games open up a new direction for the video games industry, it isnot without its challenges [2]. According to previous research, not only the bandwidthbut also the CPU has a significant influence on cloud gamers’ Quality of Experience(QoE) [5]. Ideally, gamers would like to play games with both high quality videos, andwhere games are delay sensitive, low latency. Latency, also known as lag in gaming, isespecially important in the First Person Shooter (FPS) game genre. However - highquality videos, for example, 720p/1080p at 50 fps, can make cloud gaming systemsvulnerable to a high network latency [3] as much more network capacity is needed thanin the case of conventional video games (e.g., 5000 kb/s vs. 50 kb/s) [3]. To meet theneeds of cloud gamers, network service providers thus have to take network latency,efficiency, high video quality, and error resiliency into consideration [6]. These factorsrepresent significant challenges to the roll out of large scale cloud gaming services.Without adequate infrastructure that meets the specific needs of cloud gaming, thepotential and benefits will not be realised.
In this chapter, we focus on the impact of lag on QoE for so-called FPS games. Inmulti-player scenarios, different lag values experienced among players can lead tounfair game play and frustration among players [7]. In [8], the authors report findingsthat state that different QoS leads to unfairness or imbalanced games when there are nomechanisms for mitigating the QoS differences. Previous research has analysed thepotential of achieving fairness in multi-player networked games through automatedlatency balancing [9]. We further tackle these challenges in the context of cloudgaming. We describe in detail our approach to lag compensation whereby we equalisewithin reason the up and downlink delays in real-time for all players, aiming to achievefairness among players and consequently improve QoE.
At present, several cloud service providers have developed cloud gaming platforms,most of which are closed source (e.g., Sony PlayStation Now, NVIDIA GeForce Now).Therefore, game developers cannot test and fine-tune their games on them [3] and theyhave to do the tests and fine-tuning of the games on emulators. This fact increases thedifficulty of improving cloud gaming systems to better reflect gamers’ needs andexpectations.
In response to this, Gaming Anywhere (GA) was designed and developed. It is thefirst open-source cloud gaming platform that allows researchers to quickly explore theirideas. More importantly, GA has greatly promoted the evolution of cloud gamingwithin the video game industry [3].
The remainder of this chapter is structured as follows. Section 2 provides a liter-ature survey on gaming QoE. It firstly deals with the impact of latency and packet losson game QoE, before focusing specifically on latency. It then examines the impact ofdelay for different game genres. Section 3 introduces the concept of lag compensationand outlines our two research objectives. Section 4 outlines in detail how lag equali-zation was implemented on the Gaming Anywhere platform in order to address bothresearch objectives. Section 5 presents results that firstly validate the lag compensationmechanism and then outlines the results of preliminary subjective tests. Section 6concludes the paper by outlining ongoing and future work.
106 Z. Li et al.
2 Literature Review
A key research challenge has been to determine the impact of a wide range of influencefactors on gaming QoE, including a wide range of human, system, and context factors[10–12]. Focusing on system influence factors, and as outlined in the previous section,cloud gaming demands a high level of network Quality of Service (QoS) to deliveracceptable user perceived quality (QoE) to players. Key QoS-related factors includepacket loss and delay, with their impact on QoE differing for different types (genres) ofgames.
In this section, we review relevant literature that outlines the impact that bothroundtrip delay (latency), also known as Response Delay (RD) or lag, and packet losshave on the end user experience in general, and also for different game genres. As themain focus of this chapter is on lag compensation, we focus more on lag in theliterature review.
Given the inherently interactive nature of gaming in general, a key challenge ismeeting delay requirements. This involves the delivery of both user control inputs(mouse, keyboard strokes) to the game server and uninterrupted presentation of con-tinuous game content to players, transmitted in the form of a video stream. For thisreason, conventional methods for diminishing the effects of poor network conditionsand consequent jitter on streaming media, such as buffering data for display, are notreadily applicable in the context of cloud gaming. Moreover, lag compensation tech-niques applicable in “traditional” gaming, such as client-side prediction [13], are notapplicable in the context of cloud gaming, where the client is simply decoding andportraying the stream received from the server. Consequently, numerous studies haveaddressed the impact of latency due to heterogeneous and variable network conditionson the end user QoE of cloud gaming.
As reported in [5, 14–16], packet loss and delay have a significant impact on cloudgaming QoE. Basically, network congestion results in network delay jitter and whenqueue size is exceeded, packet loss occurs. Delay and jitter impact both on uplink timebetween the player sending input events to the server, and downlink transmission ofgame scenes that are eventually displayed on the screen. Moreover, as it has beenshown in [17], a high network delay disrupts an interaction between server and playersand negatively influence players’ QoE.
It is important to note that not all cloud games are equally sensitive to latency, as isof course also the case for “traditional” networked games [18]. For Real-time Strategy(RTS) games, the process of constructing buildings or moving troops towards a bat-tlefield is unaffected by latency as high as 1000 ms [15]. However, First PersonShooter (FPS) games, where users are shooting at a moving target tend to be moresensitive to latency with delays of over 100 ms seen as unacceptable [19]. Moreover,the effects of latency are based on two action properties: precision and deadline.Precision refers to the accuracy of actions, whereas deadline refers to the timeliness ofevents. Games with higher precision and tight deadline are more sensitive to latency.For this reason, FPS players always emphasis precision and deadline [20].
As it has been reported above, latency plays a very important role when it comes tocloud gaming. Despite this fact, there is no work, to the best of our knowledge, dealing
Lag Compensation for First-Person Shooter Games in Cloud Gaming 107
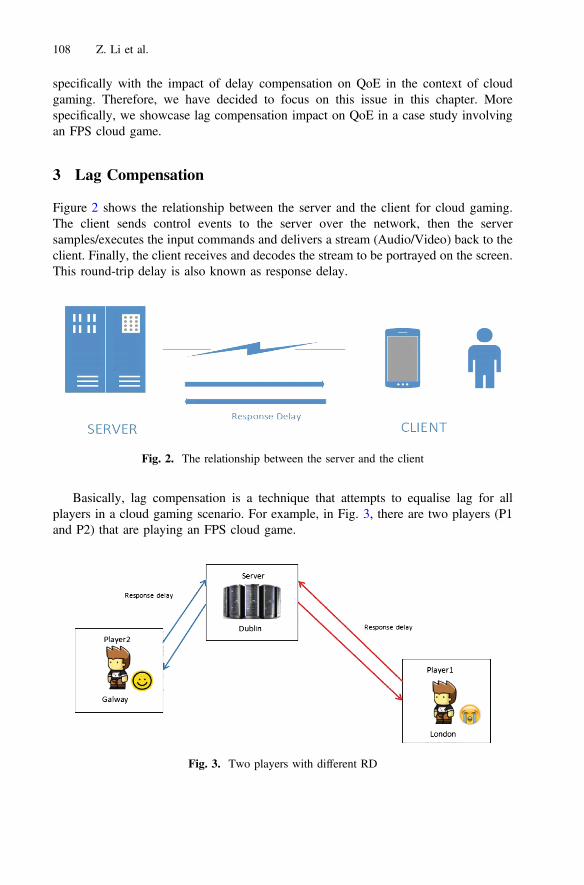
specifically with the impact of delay compensation on QoE in the context of cloudgaming. Therefore, we have decided to focus on this issue in this chapter. Morespecifically, we showcase lag compensation impact on QoE in a case study involvingan FPS cloud game.
3 Lag Compensation
Figure 2 shows the relationship between the server and the client for cloud gaming.The client sends control events to the server over the network, then the serversamples/executes the input commands and delivers a stream (Audio/Video) back to theclient. Finally, the client receives and decodes the stream to be portrayed on the screen.This round-trip delay is also known as response delay.
Basically, lag compensation is a technique that attempts to equalise lag for allplayers in a cloud gaming scenario. For example, in Fig. 3, there are two players (P1and P2) that are playing an FPS cloud game.
Fig. 2. The relationship between the server and the client
Fig. 3. Two players with different RD
108 Z. Li et al.

The game server is located in Dublin, Ireland, P1 plays in London with an averagelag of say 100 ms (equal delay in both directions) while P2 is in Galway, Ireland withan average lag of say 10 ms, again with equal delay in both directions. Since P1 has alonger RD than P2, P1 will have a relatively bad game experience as P2 has an inherentadvantage.
To analyse and visualise this lag difference further considers Fig. 4, where theplayer in Galway (P2) has moved from Position A to Position B.
The red hitbox shows the A position where P2 was prior to moving. However, dueto longer RD for P1, his view of the game still shows P2 at position A. When P1executes a shoot action, the gameplay information is sent to the server. When thiscommand arrives at the server, the target P2 has already moved to position B. As aresult, P1 misses P2 even though P1 correctly aimed at the opponent in his view of thegame. To eliminate this issue, lag compensation is needed on server side, such that anartificial delay is added to P2 so that both P1 and P2 experience the same lag on both upand downlink traffic and the game thus becomes fairer. Figure 5 shows the game afterlag compensation.
Fig. 4. Example of Lag in an FPS game (taken from https://developer.valvesoftware.com/wiki/Source_Multiplayer_Networking) (Color figure online)
Fig. 5. Game after lag compensation
Lag Compensation for First-Person Shooter Games in Cloud Gaming 109
As shown, equal delays are added to both the uplink (client to server or c2s) anddownlink (server to client or s2c) traffic. The assumption of equal delays in bothdirections is in reality rarely true, largely due to asymmetry in traffic flows.
3.1 Research Objectives
Having given a brief overview of literature relating to the QoE of gaming, and intro-duced the proposed lag equalization concept, we define two key research objectivesthat are the focus for the remainder of the chapter:
1. How feasible is it to implement a real-time lag compensation strategy for cloudgaming?
2. Will the lag compensation approach result in improved QoE for FPS gamers?
4 Implementation
In this section, we describe the implementation details related to the testbed used toaddress both research objectives. We firstly describe the cloud gaming platformGaming Anywhere that was used, followed by the game that was chosen for theplatform. Other testbed requirements and tools such as time synchronization and net-work emulator are also briefly described.
4.1 Infrastructure
As previously mentioned, GA is designed to better bridge the computer game industryand the research community. The most attractive feature is its openness, with GA beingthe first open-source cloud gaming platform. Unlike other existing systems, GA allowsdevelopers and researchers to explore their ideas on a real testbed and extend currentsystem. As defined previously, the response delay RD is the time between GA clientsending input events to GA server and the responding game scenes being displayed onthe player’s screen. Basically, the RD is composed of three components [21]:
• Processing delay (PD): it represents the time between when the server receives thecontrol events and sends the encoded frames to the client.
• Playout delay (OD): it is the time to decode and render the decoded frames on thescreen on the client side.
• Network delay (ND): it is the time required for a round trip data exchange betweenthe client and the server.
With the platform chosen, the next step was to choose a suitable game with whichto test/validate our approach. As outlined in the Literature Review, an FPS game wasmost suited as these have the tightest lag constraints, i.e., are more sensitive to lag thanother game genres. For this reason, the game Assault Cube was chosen.
110 Z. Li et al.
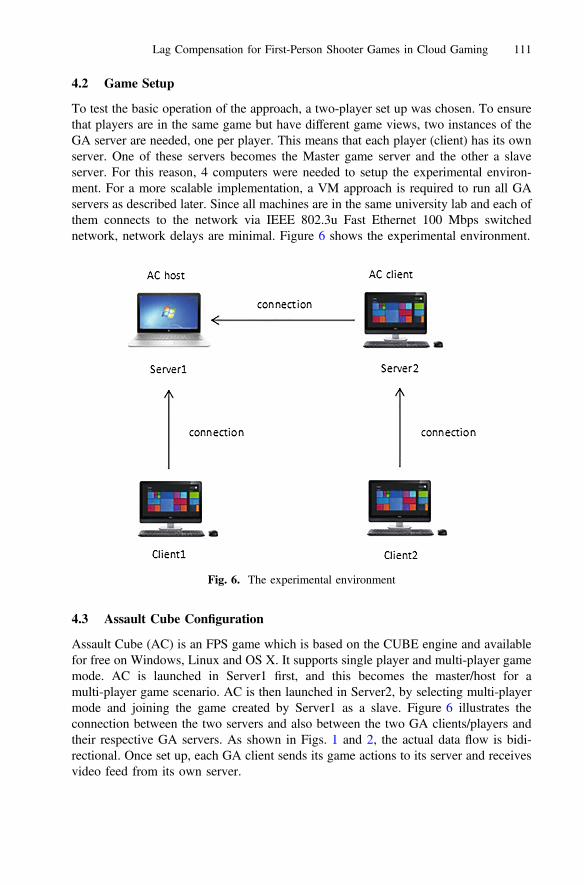
4.2 Game Setup
To test the basic operation of the approach, a two-player set up was chosen. To ensurethat players are in the same game but have different game views, two instances of theGA server are needed, one per player. This means that each player (client) has its ownserver. One of these servers becomes the Master game server and the other a slaveserver. For this reason, 4 computers were needed to setup the experimental environ-ment. For a more scalable implementation, a VM approach is required to run all GAservers as described later. Since all machines are in the same university lab and each ofthem connects to the network via IEEE 802.3u Fast Ethernet 100 Mbps switchednetwork, network delays are minimal. Figure 6 shows the experimental environment.
4.3 Assault Cube Configuration
Assault Cube (AC) is an FPS game which is based on the CUBE engine and availablefor free on Windows, Linux and OS X. It supports single player and multi-player gamemode. AC is launched in Server1 first, and this becomes the master/host for amulti-player game scenario. AC is then launched in Server2, by selecting multi-playermode and joining the game created by Server1 as a slave. Figure 6 illustrates theconnection between the two servers and also between the two GA clients/players andtheir respective GA servers. As shown in Figs. 1 and 2, the actual data flow is bidi-rectional. Once set up, each GA client sends its game actions to its server and receivesvideo feed from its own server.
Fig. 6. The experimental environment
Lag Compensation for First-Person Shooter Games in Cloud Gaming 111

4.4 Time Synchronization
Network Time Protocol (NTP) is designed to synchronise system time of computersacross IP networks to Universal Coordinated Time (UTC), achieving millisecond(ms) level synch or better across well provisioned wired LANs and single ms levelsynch across well configured WANs. In this experiment, NTP plays a key role insynchronising time across the GA servers and GA clients. This then facilitates accuratedelay measurements as outlined in the next section. In our university LAN, the serverto client (s2c) delay and client to server (c2s) are minimal with RTT measured via theping utility of the order of a few ms or less. Due to NTP tolerances when running onWindows platform and resulting clock offsets, the s2c and c2s delays occasionally aredetermined as less than 0 or greater than the RTT.
For our testbed, Server1 was set as the reference clock (NTP server mode) with theother GA server and both GA clients setup as NTP clients. With this configuration,shown in Fig. 7, time offsets of around 1 ms were typical with occasional fluctuations.Although the synchronisation performance of NTP on Windows platform is not asgood as on Unix type platforms, the levels of synchronization achieved (1–2 ms) aresufficient for the case where we are looking at network delays of 100 ms and more.
Fig. 7. NTP setup
112 Z. Li et al.
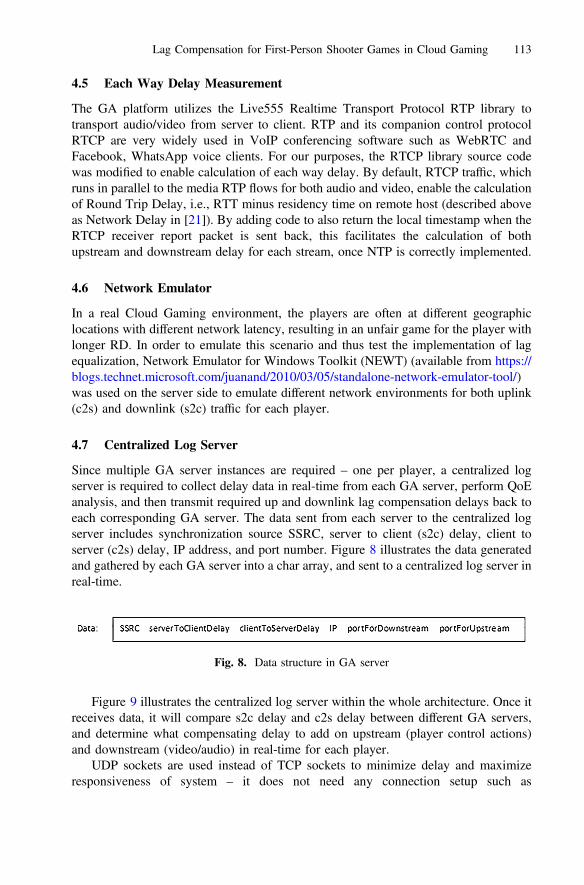
4.5 Each Way Delay Measurement
The GA platform utilizes the Live555 Realtime Transport Protocol RTP library totransport audio/video from server to client. RTP and its companion control protocolRTCP are very widely used in VoIP conferencing software such as WebRTC andFacebook, WhatsApp voice clients. For our purposes, the RTCP library source codewas modified to enable calculation of each way delay. By default, RTCP traffic, whichruns in parallel to the media RTP flows for both audio and video, enable the calculationof Round Trip Delay, i.e., RTT minus residency time on remote host (described aboveas Network Delay in [21]). By adding code to also return the local timestamp when theRTCP receiver report packet is sent back, this facilitates the calculation of bothupstream and downstream delay for each stream, once NTP is correctly implemented.
4.6 Network Emulator
In a real Cloud Gaming environment, the players are often at different geographiclocations with different network latency, resulting in an unfair game for the player withlonger RD. In order to emulate this scenario and thus test the implementation of lagequalization, Network Emulator for Windows Toolkit (NEWT) (available from https://blogs.technet.microsoft.com/juanand/2010/03/05/standalone-network-emulator-tool/)was used on the server side to emulate different network environments for both uplink(c2s) and downlink (s2c) traffic for each player.
4.7 Centralized Log Server
Since multiple GA server instances are required – one per player, a centralized logserver is required to collect delay data in real-time from each GA server, perform QoEanalysis, and then transmit required up and downlink lag compensation delays back toeach corresponding GA server. The data sent from each server to the centralized logserver includes synchronization source SSRC, server to client (s2c) delay, client toserver (c2s) delay, IP address, and port number. Figure 8 illustrates the data generatedand gathered by each GA server into a char array, and sent to a centralized log server inreal-time.
Figure 9 illustrates the centralized log server within the whole architecture. Once itreceives data, it will compare s2c delay and c2s delay between different GA servers,and determine what compensating delay to add on upstream (player control actions)and downstream (video/audio) in real-time for each player.
UDP sockets are used instead of TCP sockets to minimize delay and maximizeresponsiveness of system – it does not need any connection setup such as
Fig. 8. Data structure in GA server
Lag Compensation for First-Person Shooter Games in Cloud Gaming 113
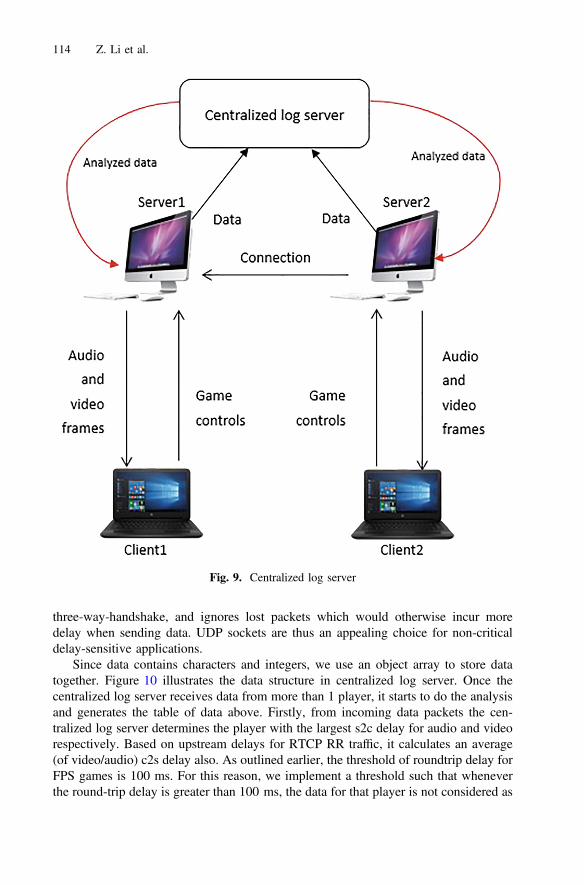
three-way-handshake, and ignores lost packets which would otherwise incur moredelay when sending data. UDP sockets are thus an appealing choice for non-criticaldelay-sensitive applications.
Since data contains characters and integers, we use an object array to store datatogether. Figure 10 illustrates the data structure in centralized log server. Once thecentralized log server receives data from more than 1 player, it starts to do the analysisand generates the table of data above. Firstly, from incoming data packets the cen-tralized log server determines the player with the largest s2c delay for audio and videorespectively. Based on upstream delays for RTCP RR traffic, it calculates an average(of video/audio) c2s delay also. As outlined earlier, the threshold of roundtrip delay forFPS games is 100 ms. For this reason, we implement a threshold such that wheneverthe round-trip delay is greater than 100 ms, the data for that player is not considered as
Fig. 9. Centralized log server
114 Z. Li et al.
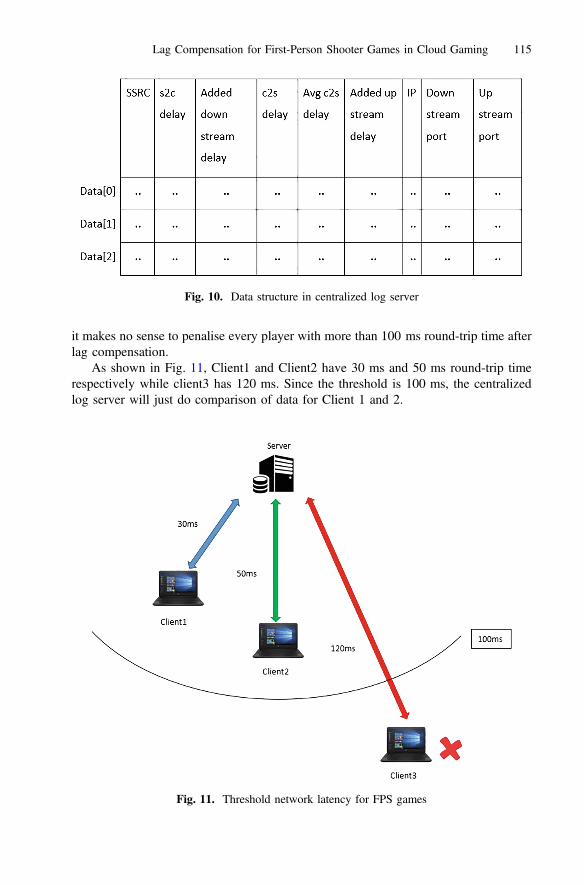
it makes no sense to penalise every player with more than 100 ms round-trip time afterlag compensation.
As shown in Fig. 11, Client1 and Client2 have 30 ms and 50 ms round-trip timerespectively while client3 has 120 ms. Since the threshold is 100 ms, the centralizedlog server will just do comparison of data for Client 1 and 2.
Fig. 10. Data structure in centralized log server
Fig. 11. Threshold network latency for FPS games
Lag Compensation for First-Person Shooter Games in Cloud Gaming 115

Once determined, the centralized log server sends recommended compensationdelay data back to each GA server based on IP address. The respective GA servers thenintroduce these additional delays on upstream control traffic (player actions) anddownstream data (audio/video).
Figure 12 shows the full structure of testbed in this experiment and also outlines thedata flows as well as role of network emulator and lag compensation.
As shown above, we introduce emulated delays of 20 (10/10) and 40 (20/20) ms toClient1 and Client2 respectively. This results in lag compensation of 10 ms on both upand down link traffic for Client2 – shown in grey above so that c2s and s2c are equalfor both clients. Note that the delays shown here are symmetric, which is rarely the casein reality. Further details on setting up the testbed and background work can be foundin [22].
Fig. 12. Full system architecture and data flows
116 Z. Li et al.

5 Results
In this section, we outline results that address both research objectives from Sect. 3.1.We firstly present a range of results for the 2-player scenario in order to validate theperformance of the lag compensation mechanism. We present baseline delays with noemulated delays to get a sense for delays as measured across the university LANnetwork and the possible need for lag compensation to cope with inherent delayasymmetries. We then outline a range of tests whereby we introduce both up anddownlink delays for different players using the network emulator and see how the lagcompensation mechanism performs. Moving to objective 2, we then present results ofpreliminary subjective tests that exposed players to a range of delays with and withoutlag compensation and captured the resulting QoE scores. The section concludes with adiscussion of ongoing and future work.
5.1 Baseline Results
Figure 13 shows the analysed data processed by the log server from the twoservers/players deployed across the LAN network environment with no artificial delaysadded by the network emulator. Player 1 data is shown in the first 2 data rows, Data 1for video and Data 2 for audio. Player 2 data is shown in the next 2 rows, Data 3 forvideo and Data 4 for audio. As outlined above, the columns (left to right) show SSRC(v for video and a for audio), s2c delay, delay added to downstream (s2c) traffic, c2sdelay, average c2s delay (of video and audio stream), delay added to upstream traffic(c2s), IP address and 2 ports. The average c2s is calculated (from audio and videoRTCP traffic) and used to delay the uplink control traffic.
Fig. 13. Analysed data with no emulated delays
Lag Compensation for First-Person Shooter Games in Cloud Gaming 117
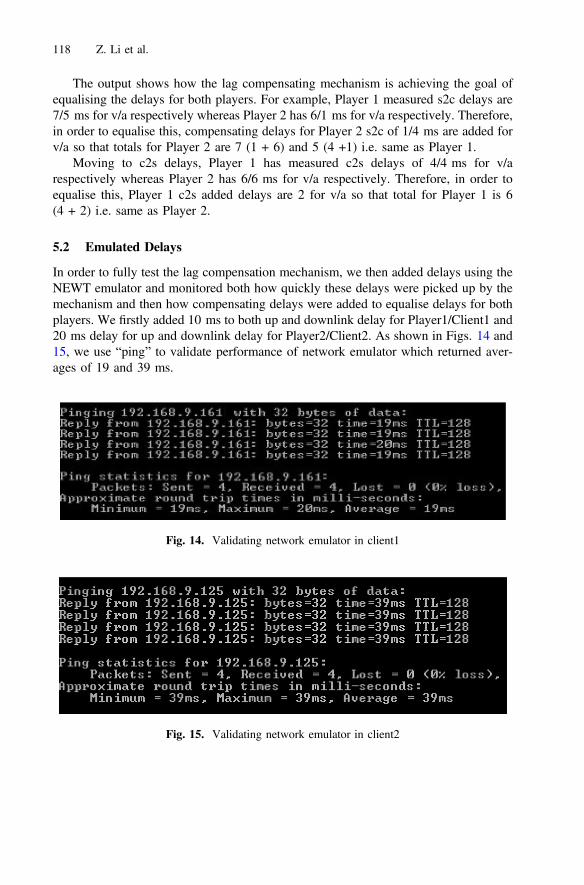
The output shows how the lag compensating mechanism is achieving the goal ofequalising the delays for both players. For example, Player 1 measured s2c delays are7/5 ms for v/a respectively whereas Player 2 has 6/1 ms for v/a respectively. Therefore,in order to equalise this, compensating delays for Player 2 s2c of 1/4 ms are added forv/a so that totals for Player 2 are 7 (1 + 6) and 5 (4 +1) i.e. same as Player 1.
Moving to c2s delays, Player 1 has measured c2s delays of 4/4 ms for v/arespectively whereas Player 2 has 6/6 ms for v/a respectively. Therefore, in order toequalise this, Player 1 c2s added delays are 2 for v/a so that total for Player 1 is 6(4 + 2) i.e. same as Player 2.
5.2 Emulated Delays
In order to fully test the lag compensation mechanism, we then added delays using theNEWT emulator and monitored both how quickly these delays were picked up by themechanism and then how compensating delays were added to equalise delays for bothplayers. We firstly added 10 ms to both up and downlink delay for Player1/Client1 and20 ms delay for up and downlink delay for Player2/Client2. As shown in Figs. 14 and15, we use “ping” to validate performance of network emulator which returned aver-ages of 19 and 39 ms.
Fig. 14. Validating network emulator in client1
Fig. 15. Validating network emulator in client2
118 Z. Li et al.

Figure 16 shows the analysed data for two players under these emulated networkenvironments. It can be seen that the actual delays as measured by modified RTCP codeare not 10/10 and 20/20 as implemented by the emulator. The delays are closer to thoseseen above under zero emulated delays plus the emulated delays plus additional noisecaused by non-determinism in various application software and OS stack etc. Thisresults for example in s2c delays for Player 1 of 15/19 ms v/a, c2s delays of Player 115/12 v/a, and for Player 2, s2c v/a delays of 26/30 ms and c2s delays of 24/26 ms v/a.
Based on these results, GA server1 requires:
• additional delay of 11 ms on downstream s2c v/a stream so that Player 1 has a totalof 26 ms (15 + 11) for video and 30 (19 + 11) for audio – same as Player 2,
• additional delay of 12 ms on upstream so that totals are 25 ms – same as Player 2.
We then changed network latency to 30 ms (15 ms up/downstream) and 60 ms(30 ms up/down stream) for Player 1 and 2 respectively. The results are shown in Fig. 17.
Fig. 16. Analysed data with different network environments
Fig. 17. Analyzed data after changed network latency
Lag Compensation for First-Person Shooter Games in Cloud Gaming 119
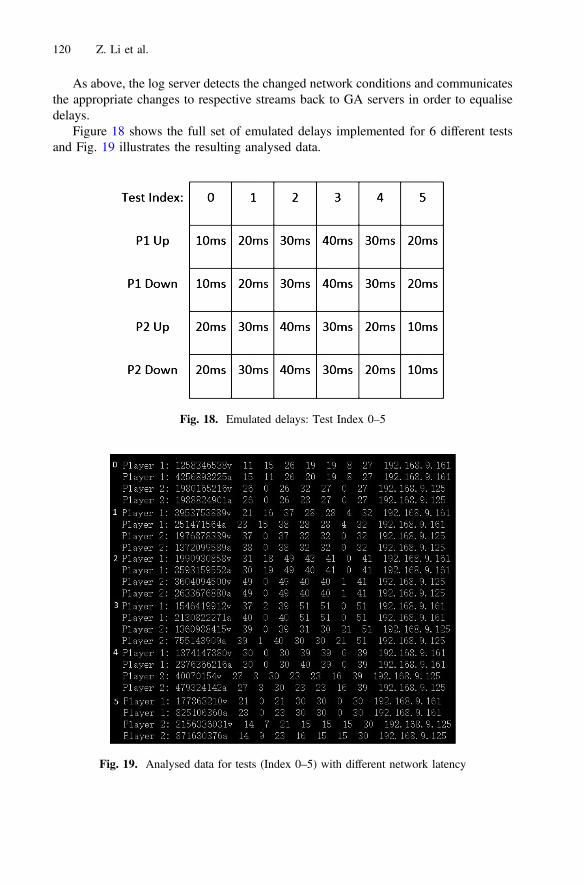
As above, the log server detects the changed network conditions and communicatesthe appropriate changes to respective streams back to GA servers in order to equalisedelays.
Figure 18 shows the full set of emulated delays implemented for 6 different testsand Fig. 19 illustrates the resulting analysed data.
Fig. 18. Emulated delays: Test Index 0–5
Fig. 19. Analysed data for tests (Index 0–5) with different network latency
120 Z. Li et al.

The data (left to right) has two additional columns outlining total s2c and c2s delays(measured + compensation delays). The columns are:
• SSRC,• s2c delay,• delay added to downstream s2c,• total s2c delay after lag equalization,• c2s delay,• avg c2s delay,• delay added to downstream c2s,• total c2s delay after lag equalization and• IP address.
In each case, the mechanism is seen to work correctly by firstly detecting the impactof the emulated delays (including noise) typically within one second and then imple-menting lag compensation so that total c2s and s2c delays for player 1 and 2 are equal.
5.3 Preliminary Subjective Testing
Although the initial plan was to setup all GA servers in virtual machines for subjectivetesting, some technical problems and limitations arose, and thus the tests were carriedout using separate servers. Since Assault Cube can supports a maximum of 5 players ina LAN, we thus used 10 computers (5 as GA servers and 5 as GA clients) to run thegame. As shown in Fig. 20, a multiplayer game was created in Server1 and othersjoined the game created by Server1. The GA connection between GA servers and GAclients was then established. NTP was also configured in both GA servers and clients tosynchronise system time. Finally, the network emulator was used to introduce artificialdelay to implement different network environment.
Fig. 20. Testbed
Lag Compensation for First-Person Shooter Games in Cloud Gaming 121
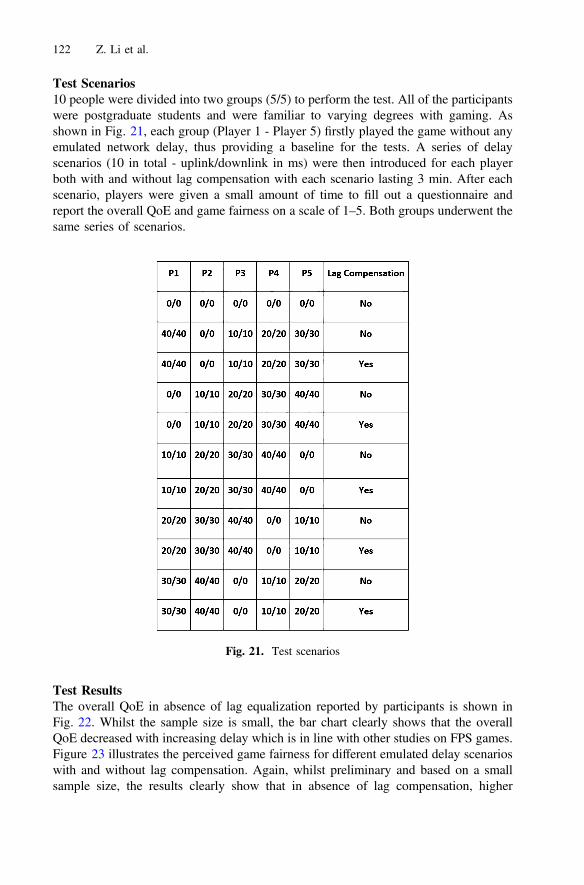
Test Scenarios10 people were divided into two groups (5/5) to perform the test. All of the participantswere postgraduate students and were familiar to varying degrees with gaming. Asshown in Fig. 21, each group (Player 1 - Player 5) firstly played the game without anyemulated network delay, thus providing a baseline for the tests. A series of delayscenarios (10 in total - uplink/downlink in ms) were then introduced for each playerboth with and without lag compensation with each scenario lasting 3 min. After eachscenario, players were given a small amount of time to fill out a questionnaire andreport the overall QoE and game fairness on a scale of 1–5. Both groups underwent thesame series of scenarios.
Test ResultsThe overall QoE in absence of lag equalization reported by participants is shown inFig. 22. Whilst the sample size is small, the bar chart clearly shows that the overallQoE decreased with increasing delay which is in line with other studies on FPS games.Figure 23 illustrates the perceived game fairness for different emulated delay scenarioswith and without lag compensation. Again, whilst preliminary and based on a smallsample size, the results clearly show that in absence of lag compensation, higher
Fig. 21. Test scenarios
122 Z. Li et al.

relative network latency results in lower game fairness. However, the game fairnessremains high once lag compensation is introduced. It is very interesting to note thatthere was no decrease in QoE as emulated delays increased, presumably as all par-ticipants were experiencing the same delays and values were less than the 100 msthreshold that is reported as being the threshold for acceptability in FPS games.
More comprehensive and rigorous tests are planned to fully evaluate the effec-tiveness of our approach. More detailed results from the above preliminary tests areavailable in [22].
Fig. 22. Average overall QoE reported for different test scenarios. Delays portrayed on the xaxis indicate RTTs.
Fig. 23. Perceived game fairness
Lag Compensation for First-Person Shooter Games in Cloud Gaming 123

5.4 Next Step – Virtualization
The above tests were carried out using dedicated servers for each player GA instance.In order to scale up the testbed, we plan to run all GA server instances using VirtualMachines (VM). This will also help to eliminate some of the non-determinism seenabove in the results. This architecture is shown in Fig. 24, whereby each GA serverruns in a dedicated VM and sets up connections with each client.
6 Conclusions
In this chapter, we examine cloud gaming from the delay (lag) perspective, and inparticular the impact of lag on QoE of gamers. Cloud gaming is an emerging service,which combines cloud computing and online gaming. It opens a promising directionfor the computer games industry but several challenges still remain to provide goodQoE for every player. We review the literature and then analyze certain QoS-relatedkey factors and characteristics, which influence the QoE for cloud gaming, especiallyfor so-called FPS games. The conclusion is that for FPS games, network latencypresents one of the most important QoE factors. In this context, we propose a lagequalization strategy to level the playing field in the context of QoE and outline tworesearch objectives. The first objective is to examine the feasibility of implementing areal-time lag compensation mechanism for cloud gaming. To meet this objective,
Fig. 24. Run GA server instances in a VM
124 Z. Li et al.
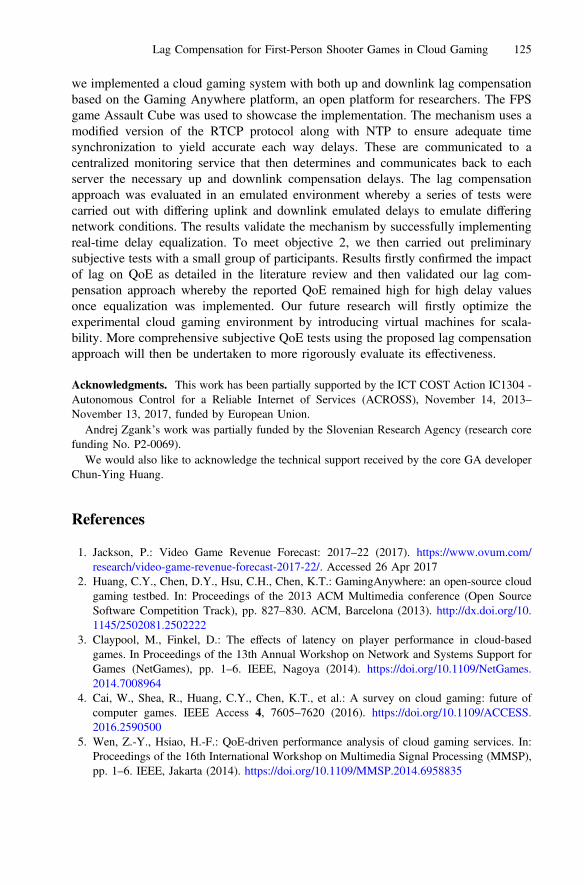
we implemented a cloud gaming system with both up and downlink lag compensationbased on the Gaming Anywhere platform, an open platform for researchers. The FPSgame Assault Cube was used to showcase the implementation. The mechanism uses amodified version of the RTCP protocol along with NTP to ensure adequate timesynchronization to yield accurate each way delays. These are communicated to acentralized monitoring service that then determines and communicates back to eachserver the necessary up and downlink compensation delays. The lag compensationapproach was evaluated in an emulated environment whereby a series of tests werecarried out with differing uplink and downlink emulated delays to emulate differingnetwork conditions. The results validate the mechanism by successfully implementingreal-time delay equalization. To meet objective 2, we then carried out preliminarysubjective tests with a small group of participants. Results firstly confirmed the impactof lag on QoE as detailed in the literature review and then validated our lag com-pensation approach whereby the reported QoE remained high for high delay valuesonce equalization was implemented. Our future research will firstly optimize theexperimental cloud gaming environment by introducing virtual machines for scala-bility. More comprehensive subjective QoE tests using the proposed lag compensationapproach will then be undertaken to more rigorously evaluate its effectiveness.
Acknowledgments. This work has been partially supported by the ICT COST Action IC1304 -Autonomous Control for a Reliable Internet of Services (ACROSS), November 14, 2013–November 13, 2017, funded by European Union.
Andrej Zgank’s work was partially funded by the Slovenian Research Agency (research corefunding No. P2-0069).
We would also like to acknowledge the technical support received by the core GA developerChun-Ying Huang.
References
1. Jackson, P.: Video Game Revenue Forecast: 2017–22 (2017). https://www.ovum.com/research/video-game-revenue-forecast-2017-22/. Accessed 26 Apr 2017
2. Huang, C.Y., Chen, D.Y., Hsu, C.H., Chen, K.T.: GamingAnywhere: an open-source cloudgaming testbed. In: Proceedings of the 2013 ACM Multimedia conference (Open SourceSoftware Competition Track), pp. 827–830. ACM, Barcelona (2013). http://dx.doi.org/10.1145/2502081.2502222
3. Claypool, M., Finkel, D.: The effects of latency on player performance in cloud-basedgames. In Proceedings of the 13th Annual Workshop on Network and Systems Support forGames (NetGames), pp. 1–6. IEEE, Nagoya (2014). https://doi.org/10.1109/NetGames.2014.7008964
4. Cai, W., Shea, R., Huang, C.Y., Chen, K.T., et al.: A survey on cloud gaming: future ofcomputer games. IEEE Access 4, 7605–7620 (2016). https://doi.org/10.1109/ACCESS.2016.2590500
5. Wen, Z.-Y., Hsiao, H.-F.: QoE-driven performance analysis of cloud gaming services. In:Proceedings of the 16th International Workshop on Multimedia Signal Processing (MMSP),pp. 1–6. IEEE, Jakarta (2014). https://doi.org/10.1109/MMSP.2014.6958835
Lag Compensation for First-Person Shooter Games in Cloud Gaming 125
6. Amiri, M., Al Osman, H., Shirmohammadi, S.: Datacenter traffic shaping for delay reductionin cloud gaming. In: Proceedings of the International Symposium on Multimedia (ISM),pp. 569–574. IEEE, San Jose (2016). https://doi.org/10.1109/ISM.2016.0124
7. Brun, J., Safaei, F., Boustead, P.: Fairness and playability in online multiplayer games. In:Proceedings of the 3rd IEEE Consumer Communications and Networking Conference(CCNC 2006), pp. 1199–1203. IEEE, Las Vegas (2006). https://doi.org/10.1109/CCNC.2006.1593228
8. Zander, S., Armitage, G.: Empiricallymeasuring theQoS sensitivity of interactive online gameplayers. In: Proceedings of the Australian Telecommunications Networks and ApplicationsConference (ATNAC 2004), pp. 511–518. ATNAC, Sydney (2004)
9. Zander, S., Leeder, I., Armitage, G.: Achieving fairness in multiplayer network gamesthrough automated latency balancing. In; Proceedings of the 2005 ACM SIGCHIInternational Conference on Advances in Computer Entertainment Technology, pp. 117–124. ACM, Valencia (2005). https://doi.org/10.1145/1178477.1178493
10. Jarschel, M., Schlosser, D., Scheuring, S., Hoßfeld, T.: Gaming in the clouds: QoE and theusers’ perspective. Math. Comput. Model. 57(11–12), 2883–2894 (2013). https://doi.org/10.1016/j.mcm.2011.12.014
11. Möller, S., Pommer, D., Beyer, J., Rake-Revelant, J.: Factors influencing gaming QoE:lessons learned from the evaluation of cloud gaming services. In: Proceedings of the 4thInternational Workshop on Perceptual Quality of Systems (PQS), TU-Berlin, Vienna,Austria, pp. 1–5 (2013)
12. Slivar, I., Skorin-Kapov, L., Suznjevic, M.: Cloud gaming QoE models for deriving videoencoding adaptation strategies. In: Proceedings of the 7th International Conference onMultimedia Systems (MMSys 2016), pp. 18:1–18:12. ACM, Klagenfurt (2016). https://doi.org/10.1145/2910017.2910602
13. Bernier, Y.W.: Latency compensating methods in client/server in-game protocol design andoptimization. In: Proceedings of the Game Developers Conference, vol. 98033, no.425 (2001)
14. Slivar, I., Suznjevic, M., Skorin-Kapov, L., Matijasevic, M.: Empirical QoE study ofin-home streaming of online games. In: Proceedings of the 14th Annual Workshop onNetwork and Systems Support for Games (NetGames), pp. 1–6. IEEE, Nagoya (2014)
15. Clincy, V., Wilgor, B.: Subjective evaluation of latency and packet loss in a cloud-basedgame. In: Proceedings of the 10th International Conference on Information Technology:New Generations (ITNG), pp. 473–476. IEEE, Las Vegas (2013). https://doi.org/10.1109/ITNG.2013.79
16. Jarschel, M., Schlosser, D., Scheuring, S., Hoßfeld, T.: An evaluation of QoE in cloudgaming based on subjective tests. In: Proceedings of the 2011 Fifth International Conferenceon Innovative Mobile and Internet Services in Ubiquitous Computing (IMIS 2011), pp. 330–335. IEEE Computer Society, Washington, DC (2011). http://dx.doi.org/10.1109/IMIS.2011.92
17. Amiri, M., Malik, K.P.S., Al Osman, H., Shirmohammadi, S.: Game-aware resourcemanager for home gateways. In: Proceedings of the International Symposium on Multimedia(ISM), pp. 403–404. IEEE, San Jose (2016). https://doi.org/10.1109/ISM.2016.0091
18. Claypool, M., Claypool, K.: Latency and player actions in online games. Mag. Commun.ACM 49(11), 40–45 (2006). https://doi.org/10.1145/1167838.1167860
19. Beyer, J., Varbelow, R., Antons, J.N., Zander, S.: A method for feedback delay measurementusing a low-cost arduino microcontroller: lesson learned: delay influenced by video bitrateand game-level. In: Proceedings of the 7th International Workshop on Quality of MultimediaExperience (QoMEX), pp. 1–2. IEEE, Pylos-Nestoras (2013). https://doi.org/10.1109/QoMEX.2015.7148095
126 Z. Li et al.

20. Amiri, M., Osman, H.A., Shirmohammadi, S., Abdallah, M.: Toward delay-efficientgame-aware data centers for cloud gaming. ACM Trans. Multimedia Comput. Commun.Appl. (TOMM) 12(5), 71/1–71/19 (2016). https://doi.org/10.1145/2983639
21. Huang, C.-Y., et al.: GamingAnywhere: the first open source cloud gaming system. ACMTrans. Multimedia Comput. Commun. Appl. (TOMM) 10(1), 10/1–10/25 (2014). https://doi.org/10.1145/2537855
22. Li, Z.: Time Aware Gaming – Levelling the playing field for everyone. In: MSc thesis,National University of Ireland, Galway, Ireland, August 2017. Available on Request
Open Access This chapter is licensed under the terms of the Creative Commons Attribution4.0 International License (http://creativecommons.org/licenses/by/4.0/), which permits use,sharing, adaptation, distribution and reproduction in any medium or format, as long as yougive appropriate credit to the original author(s) and the source, provide a link to the CreativeCommons license and indicate if changes were made.The images or other third party material in this chapter are included in the chapter’s Creative
Commons license, unless indicated otherwise in a credit line to the material. If material is notincluded in the chapter’s Creative Commons license and your intended use is not permitted bystatutory regulation or exceeds the permitted use, you will need to obtain permission directlyfrom the copyright holder.
Lag Compensation for First-Person Shooter Games in Cloud Gaming 127

The Value of Context-Awarenessin Bandwidth-Challenging HTTPAdaptive Streaming Scenarios
Eirini Liotou1(B), Tobias Hoßfeld2, Christian Moldovan2, Florian Metzger2,Dimitris Tsolkas1, and Nikos Passas1
1 National and Kapodistrian University of Athens, Athens, Greece{eliotou,dtsolkas,passas}@di.uoa.gr
2 University of Duisburg-Essen, Essen, Germany{tobias.hossfeld,christian.moldovan,florian.metzger}@uni-due.de
Abstract. Video streaming has become an indispensable technology inpeople’s lives, while its usage keeps constantly increasing. The variabil-ity, instability and unpredictability of network conditions pose one of thebiggest challenges to video streaming. In this chapter, we analyze HTTPAdaptive Streaming, a technology that relieves these issues by adaptingthe video reproduction to the current network conditions. Particularly,we study how context awareness can be combined with the adaptivestreaming logic to design a proactive client-based video streaming strat-egy. Our results show that such a context-aware strategy manages tosuccessfully mitigate stallings in light of network connectivity problems,such as an outage. Moreover, we analyze the performance of this strategyby comparing it to the optimal case, as well as by considering situationswhere the awareness of the context lacks reliability.
Keywords: HTTP Adaptive Streaming · Video streamingContext awareness · Quality of Experience · Stalling probability
1 Introduction
1.1 Motivation
The rising number of smart phone subscriptions, which are expected to reach9.2 billion by 2020, combined with the explosive demand for mobile video, whichis expected to grow around 13 times by 2019, accounting for 50% of all globalmobile data traffic, will result in a ten-fold increase of mobile data traffic by2020 [1]. This explosive demand for mobile video is fueled by the ever-increasingnumber of video-capable devices and the integration of multimedia content inpopular mobile applications, e.g. Facebook and Instagram. Furthermore, the useof video-capable devices, which range from devices with high resolution screensto interactive head mounted displays, requires a further increase of the band-width, so that on-demand video playback can be supported and differentiatedexpectations raised by the end video consumers can be satisfied.
c© The Author(s) 2018I. Ganchev et al. (Eds.): Autonomous Control for a Reliable Internet of Services, LNCS 10768, pp. 128–150, 2018.https://doi.org/10.1007/978-3-319-90415-3_6
The Value of Context-Awareness in Bandwidth-Challenging HAS Scenarios 129
Following this trend for video streaming, mobile network operators, and ser-vice providers focus on the Quality of Experience (QoE) of their customers, con-trolling network or application-level parameters, respectively. In parallel, fromthe user’s side, a better QoE enhancement can be achieved if both network-and application-level information are utilized (cross-layer approaches). On topof that, greatest gains can be possible if also “context information” is used by anyof these parties, complementary to the usually available Key Performance andKey Quality Indicators (KPIs and KQIs), to which the service/network providersalready have access. As a general conclusion, (ideally) cross-party, cross-layer,and multi-context information is required towards devising mechanisms that willhave the greatest impact on the overall user QoE.
In parallel, since most of the consumed video of a mobile data network isdelivered through server-controlled traditional HTTP video streaming, the abil-ity of such monolithic HTTP video streaming to support a fully personalizedvideo playback experience at the end-user is questioned. To this end, this tradi-tional technique is gradually being replaced by client-controlled video streamingexploiting HTTP Adaptive Streaming (HAS). HAS can split a video file intoshort segments of a few seconds each, with different quality levels and multipleencoding rates, allowing a better handling of the video streaming process, e.g.by adapting the quality level of future video segments. HAS is a key enablertowards a fully personalized video playback experience to the user, as it enablesthe terminal to adapt the video quality based on the end device capabilities, theexpected video quality level, the current network status, the content server load,and the device remaining battery, among others.
In this chapter, our objective is to investigate how context awareness inmobile networks can help not only understand but also enhance the user expe-rienced quality during HAS sessions. We study a scenario where users travellingwith a vehicle experience bad or no service at all (i.e. a service outage). In thisor similar type of scenarios, the opportunity emerges to propose novel, preemp-tive strategies to overcome such imminent problems, for instance by proposingproactive adaptive streaming or buffering techniques for video streaming ser-vices. This scenario has been modelled, optimized and investigated by meansof simulation. Before presenting the problem under study, we first identify theneed and the changes needed to move from a QoE-oriented to a context-awarenetwork/application management.
1.2 From QoE-Awareness to Context-Awareness
QoE is defined as “the degree of delight or annoyance of the user of an appli-cation or service” [2], and as such, it is an inherently subjective indication ofquality. Consequently, a significant amount of research efforts has been devotedto the measurement of this subjective QoE. The goal of these efforts is to findobjective models that can reliably estimate the quality perceived/experienced bythe end-user. To this end, subjective experiments that involve human assessorsare carefully designed, with the purpose of mapping the various quality influence
130 E. Liotou et al.
factors to QoE values. In [2], these influence factors are defined as “any charac-teristic of a user, system, service, application, or context whose actual state orsetting may have influence on the Quality of Experience for the user”, and theyare basically classified into three distinct groups, namely, Human, System, andContext factors. Human influence factors include any psychophysical, cognitive,psychological or demographic factors of the person receiving a service, whilesystem influence factors concern technical parameters related to the network,application and device characteristics and parameters. Finally, context relatesto any spatio-temporal, social, economic and task-related factors.
The awareness of QoE in a network is a valuable knowledge not only perse (namely for network monitoring and benchmarking purposes) but also as auseful input for managing a network in an effective and efficient way. The “QoE-centric management” of a network can be performed as a closed loop procedure,which consists of three distinguishable steps:
QoE Modelling: For the purposes of QoE modelling, key influence factors thathave an impact on the network’s quality need to be mapped to QoE values. Tothis direction, QoE models have to be used that try to accurately reflect/predicta subjective QoE estimation.
QoE Monitoring: This step provides answers on how, where and when QoE-related input can be collected. It includes the description of realistic architecturesin terms of building blocks, mechanisms, protocols and end-to-end signalling inthe network. Also, this procedure relates to the way in which feedback concerningQoE measurements can be provided from end-user devices and any networknodes to the responsible QoE-decision making entities in the network.
QoE Management and Control: This step includes all the possible QoE-driven mechanisms that can help the network operate in a more efficient andqualitative way. These mechanisms may include for instance power control,mobility management, resource management and scheduling, routing, networkconfiguration, etc. All these procedures can be managed based on QoE insteadof traditional Quality of Service (QoS) criteria and their impact can be assessedbased on the QoE they achieve. Multiple variants of the three previous steps orbuilding blocks can be found in the literature, such as [3,4].
“Context” may refer to “any information that can be used to characterize thesituation of an entity” [5]. In this way, context awareness can facilitate a tran-sition from packet-level decisions to “scenario-level” decisions: Indeed, decidingon a per-scenario rather than on a per-packet level may ensure not only a higheruser QoE but also the avoidance of over-provisioning in the network. This hugepotential has been recently identified in academia and as a result, research workson context awareness and context-aware network control mechanisms are con-stantly emerging in the literature. In [6], a context aware handover managementscheme for proper load distribution in an IEEE 802.11 network is proposed. In[7], the impact of social context on compressed video QoE is investigated, whilein [8] a novel decision-theoretic approach for QoE modelling, measurement, andprediction is presented, to name a few characteristic examples.

The Value of Context-Awareness in Bandwidth-Challenging HAS Scenarios 131
If we now revisit the three-step QoE control loop described earlier by alsoconsidering context awareness, then this is enriched as follows:
Context Modelling: Based on the earlier discussion about the QoE modellingprocedure, we may observe that the System as well as the Human influencefactors are directly or indirectly taken into account in the subjective experiments’methodologies, e.g. [9]. Consequently, the impact of technical- and human-levelcharacteristics is tightly integrated into the derived QoE models. Nevertheless,the Context influence factors are mostly missing in these methodologies, or arenot clearly captured. This happens due to the fact that the QoE evaluations areusually performed in controlled environments, not allowing for diversity in thecontext of use. Besides, context factors are challenging to control, especially in alab setting, and new subjective experiment types would have to be designed. Asa consequence, the mapping of context influence factors to QoE is absent frommost QoE models that appear both in the literature and in standardizationbodies. Therefore, novel context-aware QoE models need to be devised that areable to accurately measure and predict QoE under a specific context of use, asthese context factors are (often) neglected. These context factors could eitherbe integrated inside a QoE model directly, or, be used as a tuning factor of anotherwise stand-alone QoE model.
Context Monitoring: On top of QoE monitoring, context monitoring proce-dures could (and should) be implemented in the network. These procedures willrequire different input information from the ones used by traditional QoS/QoEmonitoring techniques. The acquired context information may be used forenhancing the QoE of the users or for the prediction of imminent problems, suchas bottlenecks, and may range from spatio-temporal to social, economic andtask-related factors. Some of the possible context information that may be mon-itored in a network is the following (to give a few examples): the current infras-tructure, which is more or less static (access points, base stations, neighbouringcells, etc.), the specific user’s surrounding environment (location awareness, out-doors/indoors environment, terrain characteristics, presence of blind spots suchas areas of low coverage or limited capacity, proximity to other devices, etc.),the time of day, the current and predicted/expected future network load, thecurrent mobility level or even the predicted mobility pattern of users in a cell(e.g. a repeated pattern), the device capabilities or state (e.g. processing power,battery level, storage level, etc.), the user task (e.g. urgent or leisure activity),as well as application awareness (e.g. foreground or background processes), andsocial awareness of the end-users, among others. Moreover, charging and pricingcan also be included in the general context profile of a communication scenario.It needs to be noted here that context awareness does not necessarily rely onpredicting the future (e.g. future traffic demand) but also on solid knowledgethat is or can be available (e.g. time of day, outage location, etc.).
Context-Aware Management and Control: Three possibilities emerge in acontext-aware network. First, the network can take more sophisticated controldecisions that are also influenced by context-awareness, such as for instance,
132 E. Liotou et al.
a decision to relax the handover requirements for a user in a fast-moving vehi-cle or a decision to connect a device with low battery to a WiFi access point.Second, the network can actualize control decisions exploiting the current con-text. For instance, it can exploit information about flash crowd formation todrive an effective Content Distribution Network (CDN) load balancing strategy[10] or, more generally, to take control decisions proactively based on contextinformation about the near future. Finally, context-awareness can help to takedecisions with the objective to increase the network efficiency as measured inspectrum, energy, processing resources, etc., and consequently to reduce opera-tional expenses. For instance, context information could allow for a more mean-ingful distribution of the network resources among competing flows that refer todifferent communication scenarios.
This book chapter handles a characteristic use case of context-aware man-agement, to showcase its potential. More specifically, we study a scenario where“context awareness” refers to awareness of the location and duration of a forth-coming outage, namely of a restricted area of very low or zero bandwidth (e.g.limited coverage due to physical obstacles or limited capacity due to high net-work congestion). Based on this knowledge, we devise a proactive HAS strategythat will enhance the viewing experience of a user travelling inside a vehicletowards this area.
Related work involves HAS strategies that use geo-location information([11,12]), and evoke users to send measurements regarding their data rate, sothat an overall map of bandwidth availability can be created for a certain area.Other HAS techniques rely on prediction, rather than context-awareness. Forinstance, [13] describes a HAS method where higher quality segment requestsare a posteriori replaced with lower ones, as soon as a zero-bandwidth spatio-temporal event is identified. Moreover, similarly to our approach, [14] proposesan anticipatory HAS strategy, which requires prediction of the channel statein terms of Received Signal Strength (RSS) and proactively adjusts the user’sbuffer. An optimization problem is formulated that minimizes the required num-ber of spectrum resources, while it ensures the user buffer is better prepared foran imminent coverage loss. The authors even conducted a demo of this approachin [15] that serves as a proof of concept. Our difference with this approach, isthat we rely on longer-term context-awareness rather than imminent channelprediction, and that instead of manipulating the user buffer size, we proactivelyadapt the video quality selection. Finally, [16] combines RSS information withlocalization sensors from the smart phones that reveal the user’s coverage stateand help achieve a smoother and stabler HAS policy, called Indoors-Outdoorsaware Buffer Based Adaptation (IOBBA).
2 System Analysis
2.1 System Model
The environment under study is a mobile cellular network. We consider a cell,where one base station is offering connectivity to multiple users, residing inside
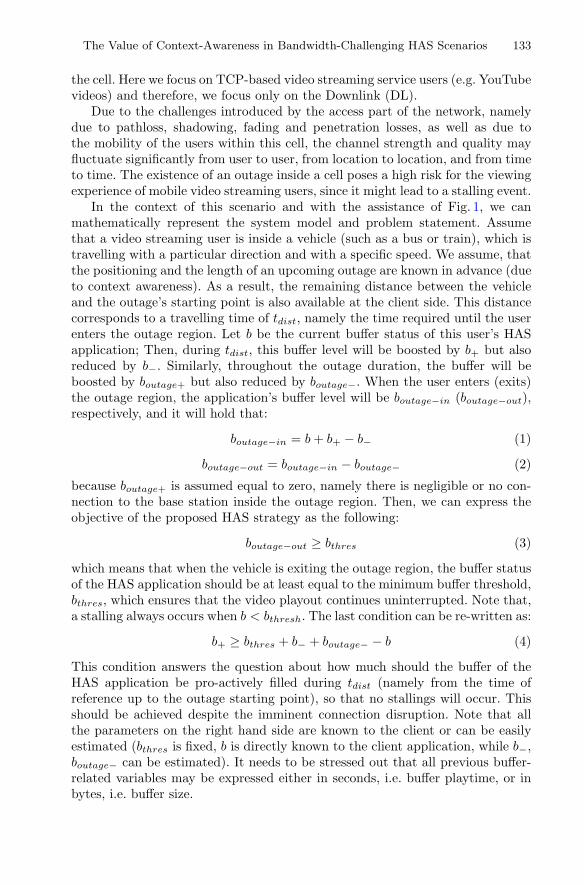
The Value of Context-Awareness in Bandwidth-Challenging HAS Scenarios 133
the cell. Here we focus on TCP-based video streaming service users (e.g. YouTubevideos) and therefore, we focus only on the Downlink (DL).
Due to the challenges introduced by the access part of the network, namelydue to pathloss, shadowing, fading and penetration losses, as well as due tothe mobility of the users within this cell, the channel strength and quality mayfluctuate significantly from user to user, from location to location, and from timeto time. The existence of an outage inside a cell poses a high risk for the viewingexperience of mobile video streaming users, since it might lead to a stalling event.
In the context of this scenario and with the assistance of Fig. 1, we canmathematically represent the system model and problem statement. Assumethat a video streaming user is inside a vehicle (such as a bus or train), which istravelling with a particular direction and with a specific speed. We assume, thatthe positioning and the length of an upcoming outage are known in advance (dueto context awareness). As a result, the remaining distance between the vehicleand the outage’s starting point is also available at the client side. This distancecorresponds to a travelling time of tdist, namely the time required until the userenters the outage region. Let b be the current buffer status of this user’s HASapplication; Then, during tdist, this buffer level will be boosted by b+ but alsoreduced by b−. Similarly, throughout the outage duration, the buffer will beboosted by boutage+ but also reduced by boutage−. When the user enters (exits)the outage region, the application’s buffer level will be boutage−in (boutage−out),respectively, and it will hold that:
boutage−in = b + b+ − b− (1)
boutage−out = boutage−in − boutage− (2)
because boutage+ is assumed equal to zero, namely there is negligible or no con-nection to the base station inside the outage region. Then, we can express theobjective of the proposed HAS strategy as the following:
boutage−out ≥ bthres (3)
which means that when the vehicle is exiting the outage region, the buffer statusof the HAS application should be at least equal to the minimum buffer threshold,bthres, which ensures that the video playout continues uninterrupted. Note that,a stalling always occurs when b < bthresh. The last condition can be re-written as:
b+ ≥ bthres + b− + boutage− − b (4)
This condition answers the question about how much should the buffer of theHAS application be pro-actively filled during tdist (namely from the time ofreference up to the outage starting point), so that no stallings will occur. Thisshould be achieved despite the imminent connection disruption. Note that allthe parameters on the right hand side are known to the client or can be easilyestimated (bthres is fixed, b is directly known to the client application, while b−,boutage− can be estimated). It needs to be stressed out that all previous buffer-related variables may be expressed either in seconds, i.e. buffer playtime, or inbytes, i.e. buffer size.
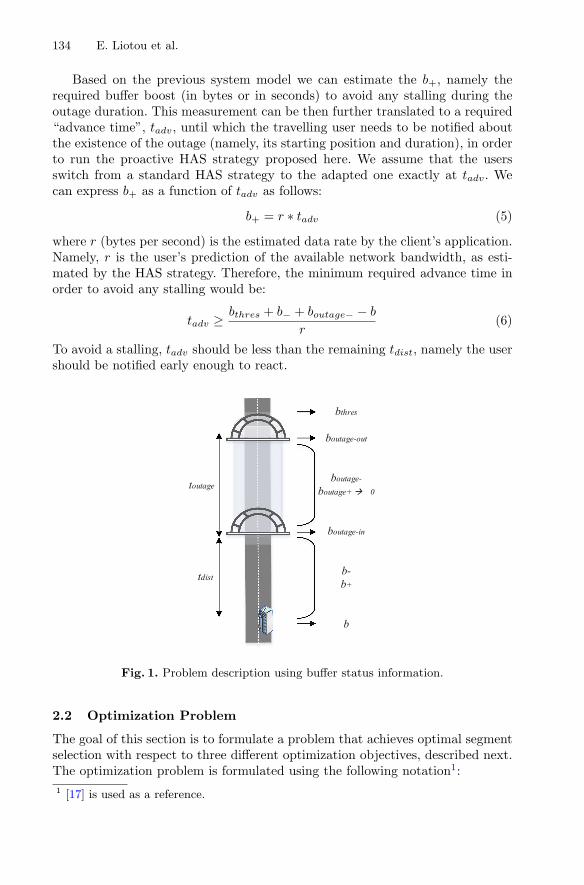
134 E. Liotou et al.
Based on the previous system model we can estimate the b+, namely therequired buffer boost (in bytes or in seconds) to avoid any stalling during theoutage duration. This measurement can be then further translated to a required“advance time”, tadv, until which the travelling user needs to be notified aboutthe existence of the outage (namely, its starting position and duration), in orderto run the proactive HAS strategy proposed here. We assume that the usersswitch from a standard HAS strategy to the adapted one exactly at tadv. Wecan express b+ as a function of tadv as follows:
b+ = r ∗ tadv (5)
where r (bytes per second) is the estimated data rate by the client’s application.Namely, r is the user’s prediction of the available network bandwidth, as esti-mated by the HAS strategy. Therefore, the minimum required advance time inorder to avoid any stalling would be:
tadv ≥ bthres + b− + boutage− − b
r(6)
To avoid a stalling, tadv should be less than the remaining tdist, namely the usershould be notified early enough to react.
Fig. 1. Problem description using buffer status information.
2.2 Optimization Problem
The goal of this section is to formulate a problem that achieves optimal segmentselection with respect to three different optimization objectives, described next.The optimization problem is formulated using the following notation1:1 [17] is used as a reference.

The Value of Context-Awareness in Bandwidth-Challenging HAS Scenarios 135
– τ is the length of each segment in seconds.– T0 is the initial delay of the video.– Di is the deadline of each segment i, meaning that this segment needs to be
completely downloaded up to this point.
Then:Di = T0 + iτ, ∀i = 1, ..., n. (7)
Also:
– n is the total number of segments that comprise the video.– rmax is the maximum number of available layers/representations.– xij represents segment i of layer j.– wij is the weighting factor for the QoE of segment i of layer j. Here, we use
the quality layer value as weighting factor = {1,2,3}.– Sij is the size of segment i of layer j (e.g. in bytes).– b(t) is the total data downloaded until the point in time t. We assume perfect
knowledge of b(t).– α is the weight for the impact of the quality layer and β for the impact of the
switches (α + β = 1, α > 0, β > 0).
QoE studies on HAS (e.g. [18,19]) have revealed that major quality influencefactors are in order of significance: a) the layers selected and especially the timespent on highest layer and b) the altitude, i.e. the difference between subsequentquality levels (the smaller the better). Other factors with less significance are: thenumber of quality switches, the recency time and the last quality level. Takingthese findings into account, we focus on three different types of optimizationobjectives, which aim to maximize the positive impact of higher level selection,deducing the negative impact of quality switches and altitude. Three differentversions of optimization objectives are thus formulated, as follows:
– Optimal strategy “W” accounts only for the impact of the quality layers,trying to maximize their value, so that the highest layer will be favored overthe intermediate layer, which will be preferred over the lowest layer.
– Optimal strategy “W+S” additionally accounts for the number of switches,trying to minimize their occurrence.
– Optimal strategy “W+S+A” additionally accounts for the altitude effect,trying to minimize the distance between subsequent layers, thus preferringdirect switches e.g. from layer 1 to layer 2 rather than from layer 1 to layer 3.
This leads us to the three different formulations of the optimization problem forone user:
– W: Maximize the quality layer values:
maximizen∑
i=1
rmax∑
j=1
αwijxij (8)
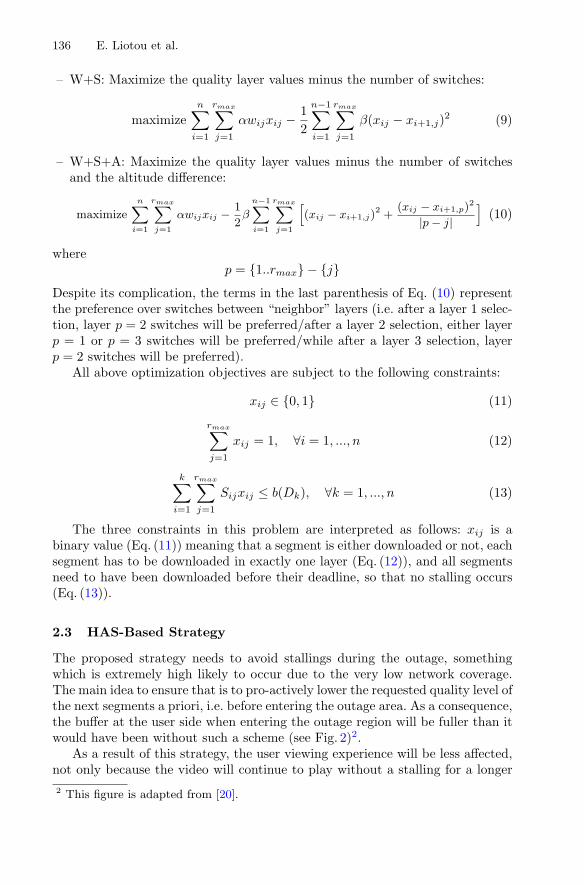
136 E. Liotou et al.
– W+S: Maximize the quality layer values minus the number of switches:
maximizen∑
i=1
rmax∑
j=1
αwijxij − 12
n−1∑
i=1
rmax∑
j=1
β(xij − xi+1,j)2 (9)
– W+S+A: Maximize the quality layer values minus the number of switchesand the altitude difference:
maximizen∑
i=1
rmax∑
j=1
αwijxij − 1
2β
n−1∑
i=1
rmax∑
j=1
[(xij − xi+1,j)
2 +(xij − xi+1,p)
2
|p − j|]
(10)
wherep = {1..rmax} − {j}
Despite its complication, the terms in the last parenthesis of Eq. (10) representthe preference over switches between “neighbor” layers (i.e. after a layer 1 selec-tion, layer p = 2 switches will be preferred/after a layer 2 selection, either layerp = 1 or p = 3 switches will be preferred/while after a layer 3 selection, layerp = 2 switches will be preferred).
All above optimization objectives are subject to the following constraints:
xij ∈ {0, 1} (11)
rmax∑
j=1
xij = 1, ∀i = 1, ..., n (12)
k∑
i=1
rmax∑
j=1
Sijxij ≤ b(Dk), ∀k = 1, ..., n (13)
The three constraints in this problem are interpreted as follows: xij is abinary value (Eq. (11)) meaning that a segment is either downloaded or not, eachsegment has to be downloaded in exactly one layer (Eq. (12)), and all segmentsneed to have been downloaded before their deadline, so that no stalling occurs(Eq. (13)).
2.3 HAS-Based Strategy
The proposed strategy needs to avoid stallings during the outage, somethingwhich is extremely high likely to occur due to the very low network coverage.The main idea to ensure that is to pro-actively lower the requested quality level ofthe next segments a priori, i.e. before entering the outage area. As a consequence,the buffer at the user side when entering the outage region will be fuller than itwould have been without such a scheme (see Fig. 2)2.
As a result of this strategy, the user viewing experience will be less affected,not only because the video will continue to play without a stalling for a longer2 This figure is adapted from [20].
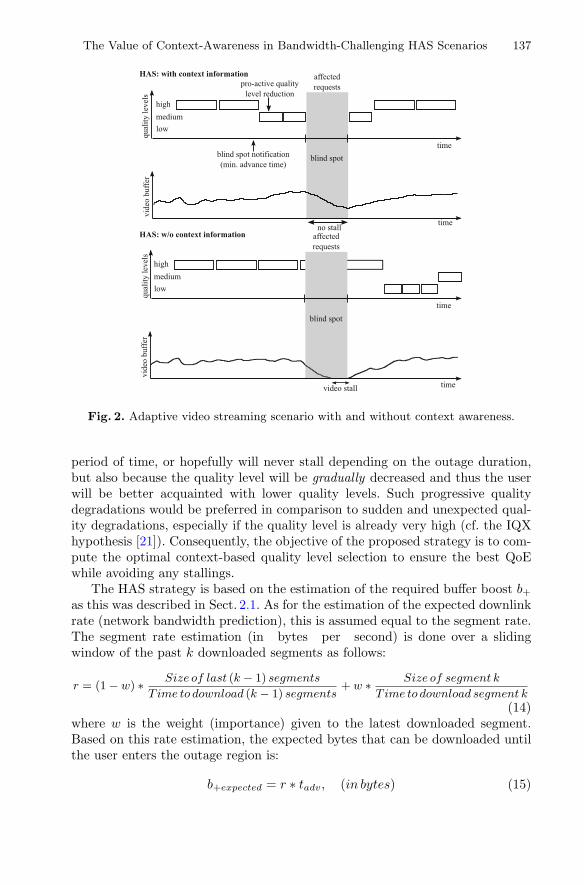
The Value of Context-Awareness in Bandwidth-Challenging HAS Scenarios 137
Fig. 2. Adaptive video streaming scenario with and without context awareness.
period of time, or hopefully will never stall depending on the outage duration,but also because the quality level will be gradually decreased and thus the userwill be better acquainted with lower quality levels. Such progressive qualitydegradations would be preferred in comparison to sudden and unexpected qual-ity degradations, especially if the quality level is already very high (cf. the IQXhypothesis [21]). Consequently, the objective of the proposed strategy is to com-pute the optimal context-based quality level selection to ensure the best QoEwhile avoiding any stallings.
The HAS strategy is based on the estimation of the required buffer boost b+as this was described in Sect. 2.1. As for the estimation of the expected downlinkrate (network bandwidth prediction), this is assumed equal to the segment rate.The segment rate estimation (in bytes per second) is done over a slidingwindow of the past k downloaded segments as follows:
r = (1 − w) ∗ Size of last (k − 1) segments
T ime to download (k − 1) segments+ w ∗ Size of segment k
T ime to download segment k(14)
where w is the weight (importance) given to the latest downloaded segment.Based on this rate estimation, the expected bytes that can be downloaded untilthe user enters the outage region is:
b+expected = r ∗ tadv, (in bytes) (15)

138 E. Liotou et al.
while the minimum required buffer playtime to exit the outage region and avoida stalling is:
b+ = bthres + b− + boutage− − b, (in seconds) (16)
Therefore, the required bytes per segment are:
required video rate =b+expected
b+, (in bytes per second) (17)
Note that the higher the outage duration, the larger the b+ and thus the lowerthe required video rate (lower layer selection). Based on the required video rateestimation, the HAS strategy will request the highest possible representation jthat fulfills this condition:
Sij
τ≤ required video rate (18)
Namely, the layer j that will be requested will be the highest one that yields avideo bit rate less or equal to this estimation. The “required video rate” esti-mation may be updated each time in order to account for the most recentlyachieved data rate r. Alternatively, an average value may be calculated in thebeginning (on tadv) and assumed valid until entering the outage region. In thecase that the actual available data rate for this user is less than his subjectiverate estimation, r, there is, however, a higher risk of stalling. We assume thatthe player requests the lowest layer when initialized.
2.4 QoE Models
The QoE models that are used in this work are the following:
– A QoE model for HAS, where no stallings are assumed. This model can befound in [17] and it can be described by the following formula:
QoE = 0.003 ∗ e0.064∗t + 2.498 (19)
where t is the percentage of the time that the video was being played out atthe highest layer (here layer 3).
– A QoE model for TCP-based video streaming, if stallings occur. This modelcan be found in [22] and it is described as follows:
QoE = 3.5 ∗ exp(−(0.15 ∗ L + 0.19) ∗ N) + 1.5 (20)
where N is number of stalling events and L is the stalling length.
For the purposes of this scenario we combine the two aforementioned models, sothat in case that no stalling has occurred, the former QoE model is used, whileduring and after a stalling event, we use the latter.
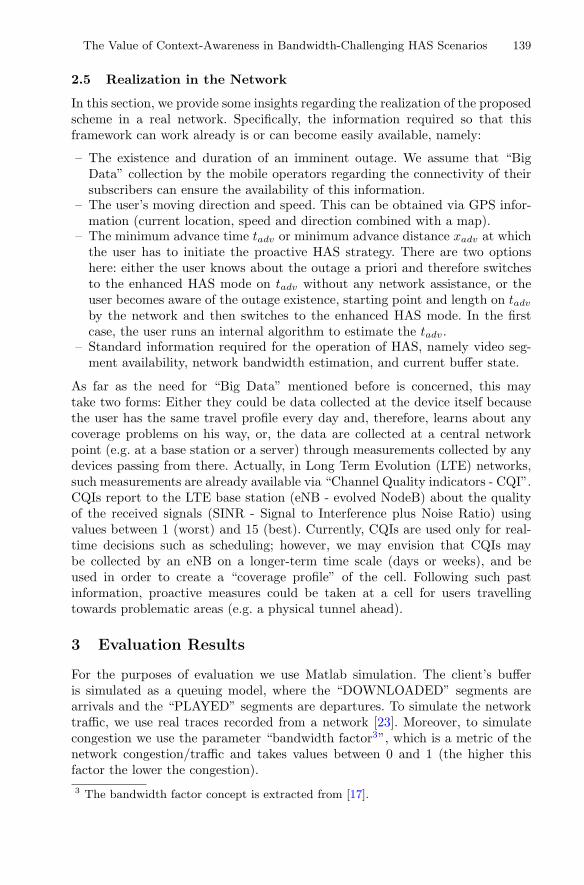
The Value of Context-Awareness in Bandwidth-Challenging HAS Scenarios 139
2.5 Realization in the Network
In this section, we provide some insights regarding the realization of the proposedscheme in a real network. Specifically, the information required so that thisframework can work already is or can become easily available, namely:
– The existence and duration of an imminent outage. We assume that “BigData” collection by the mobile operators regarding the connectivity of theirsubscribers can ensure the availability of this information.
– The user’s moving direction and speed. This can be obtained via GPS infor-mation (current location, speed and direction combined with a map).
– The minimum advance time tadv or minimum advance distance xadv at whichthe user has to initiate the proactive HAS strategy. There are two optionshere: either the user knows about the outage a priori and therefore switchesto the enhanced HAS mode on tadv without any network assistance, or theuser becomes aware of the outage existence, starting point and length on tadvby the network and then switches to the enhanced HAS mode. In the firstcase, the user runs an internal algorithm to estimate the tadv.
– Standard information required for the operation of HAS, namely video seg-ment availability, network bandwidth estimation, and current buffer state.
As far as the need for “Big Data” mentioned before is concerned, this maytake two forms: Either they could be data collected at the device itself becausethe user has the same travel profile every day and, therefore, learns about anycoverage problems on his way, or, the data are collected at a central networkpoint (e.g. at a base station or a server) through measurements collected by anydevices passing from there. Actually, in Long Term Evolution (LTE) networks,such measurements are already available via “Channel Quality indicators - CQI”.CQIs report to the LTE base station (eNB - evolved NodeB) about the qualityof the received signals (SINR - Signal to Interference plus Noise Ratio) usingvalues between 1 (worst) and 15 (best). Currently, CQIs are used only for real-time decisions such as scheduling; however, we may envision that CQIs maybe collected by an eNB on a longer-term time scale (days or weeks), and beused in order to create a “coverage profile” of the cell. Following such pastinformation, proactive measures could be taken at a cell for users travellingtowards problematic areas (e.g. a physical tunnel ahead).
3 Evaluation Results
For the purposes of evaluation we use Matlab simulation. The client’s bufferis simulated as a queuing model, where the “DOWNLOADED” segments arearrivals and the “PLAYED” segments are departures. To simulate the networktraffic, we use real traces recorded from a network [23]. Moreover, to simulatecongestion we use the parameter “bandwidth factor3”, which is a metric of thenetwork congestion/traffic and takes values between 0 and 1 (the higher thisfactor the lower the congestion).3 The bandwidth factor concept is extracted from [17].
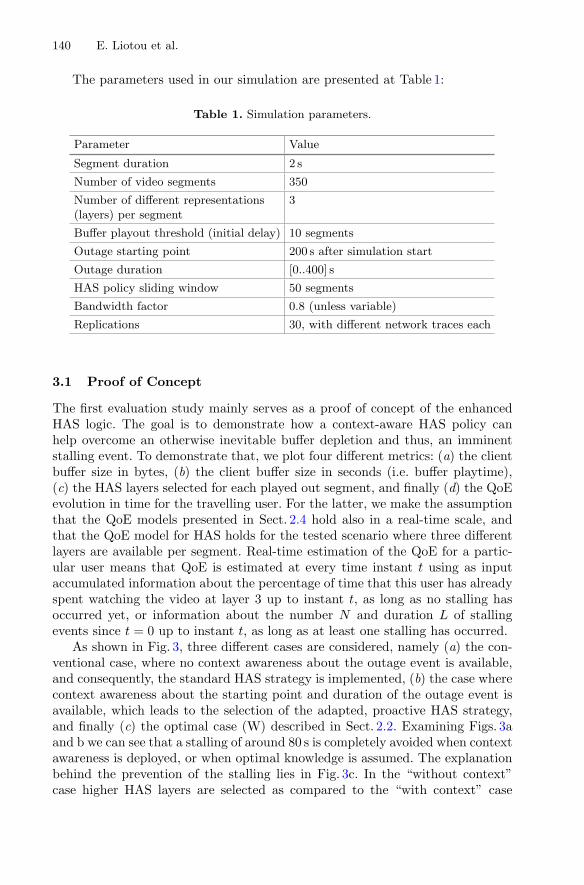
140 E. Liotou et al.
The parameters used in our simulation are presented at Table 1:
Table 1. Simulation parameters.
Parameter Value
Segment duration 2 s
Number of video segments 350
Number of different representations(layers) per segment
3
Buffer playout threshold (initial delay) 10 segments
Outage starting point 200 s after simulation start
Outage duration [0..400] s
HAS policy sliding window 50 segments
Bandwidth factor 0.8 (unless variable)
Replications 30, with different network traces each
3.1 Proof of Concept
The first evaluation study mainly serves as a proof of concept of the enhancedHAS logic. The goal is to demonstrate how a context-aware HAS policy canhelp overcome an otherwise inevitable buffer depletion and thus, an imminentstalling event. To demonstrate that, we plot four different metrics: (a) the clientbuffer size in bytes, (b) the client buffer size in seconds (i.e. buffer playtime),(c) the HAS layers selected for each played out segment, and finally (d) the QoEevolution in time for the travelling user. For the latter, we make the assumptionthat the QoE models presented in Sect. 2.4 hold also in a real-time scale, andthat the QoE model for HAS holds for the tested scenario where three differentlayers are available per segment. Real-time estimation of the QoE for a partic-ular user means that QoE is estimated at every time instant t using as inputaccumulated information about the percentage of time that this user has alreadyspent watching the video at layer 3 up to instant t, as long as no stalling hasoccurred yet, or information about the number N and duration L of stallingevents since t = 0 up to instant t, as long as at least one stalling has occurred.
As shown in Fig. 3, three different cases are considered, namely (a) the con-ventional case, where no context awareness about the outage event is available,and consequently, the standard HAS strategy is implemented, (b) the case wherecontext awareness about the starting point and duration of the outage event isavailable, which leads to the selection of the adapted, proactive HAS strategy,and finally (c) the optimal case (W) described in Sect. 2.2. Examining Figs. 3aand b we can see that a stalling of around 80 s is completely avoided when contextawareness is deployed, or when optimal knowledge is assumed. The explanationbehind the prevention of the stalling lies in Fig. 3c. In the “without context”case higher HAS layers are selected as compared to the “with context” case
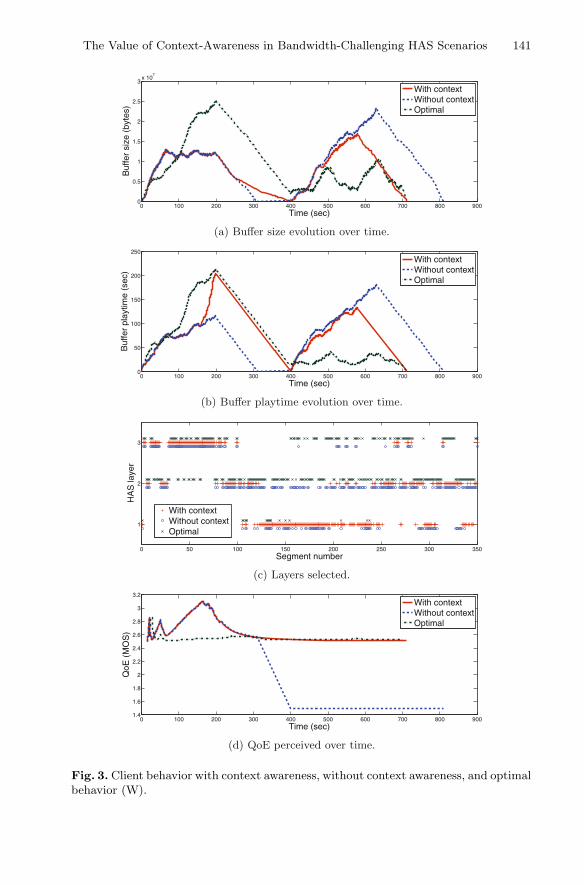
The Value of Context-Awareness in Bandwidth-Challenging HAS Scenarios 141
0 100 200 300 400 500 600 700 800 9000
0.5
1
1.5
2
2.5
3x 10
7
Time (sec)
Buf
fer
size
(by
tes)
With contextWithout contextOptimal
(a) Buffer size evolution over time.
0 100 200 300 400 500 600 700 800 9000
50
100
150
200
250
Time (sec)
Buf
fer
play
time
(sec
)
With contextWithout contextOptimal
(b) Buffer playtime evolution over time.
0 50 100 150 200 250 300 350
1
2
3
Segment number
HA
S la
yer
With contextWithout contextOptimal
(c) Layers selected.
0 100 200 300 400 500 600 700 800 9001.4
1.6
1.8
2
2.2
2.4
2.6
2.8
3
3.2
Time (sec)
QoE
(M
OS
)
With contextWithout contextOptimal
(d) QoE perceived over time.
Fig. 3. Client behavior with context awareness, without context awareness, and optimalbehavior (W).
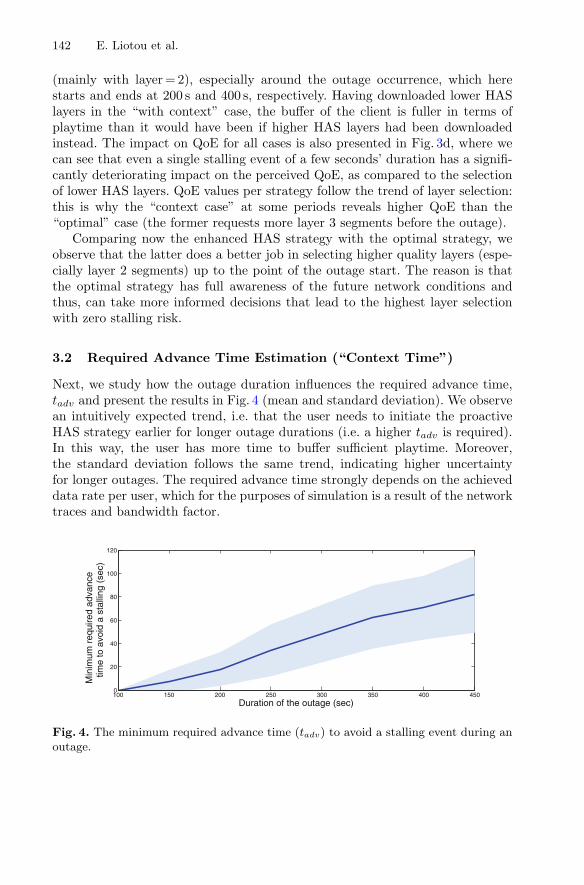
142 E. Liotou et al.
(mainly with layer = 2), especially around the outage occurrence, which herestarts and ends at 200 s and 400 s, respectively. Having downloaded lower HASlayers in the “with context” case, the buffer of the client is fuller in terms ofplaytime than it would have been if higher HAS layers had been downloadedinstead. The impact on QoE for all cases is also presented in Fig. 3d, where wecan see that even a single stalling event of a few seconds’ duration has a signifi-cantly deteriorating impact on the perceived QoE, as compared to the selectionof lower HAS layers. QoE values per strategy follow the trend of layer selection:this is why the “context case” at some periods reveals higher QoE than the“optimal” case (the former requests more layer 3 segments before the outage).
Comparing now the enhanced HAS strategy with the optimal strategy, weobserve that the latter does a better job in selecting higher quality layers (espe-cially layer 2 segments) up to the point of the outage start. The reason is thatthe optimal strategy has full awareness of the future network conditions andthus, can take more informed decisions that lead to the highest layer selectionwith zero stalling risk.
3.2 Required Advance Time Estimation (“Context Time”)
Next, we study how the outage duration influences the required advance time,tadv and present the results in Fig. 4 (mean and standard deviation). We observean intuitively expected trend, i.e. that the user needs to initiate the proactiveHAS strategy earlier for longer outage durations (i.e. a higher tadv is required).In this way, the user has more time to buffer sufficient playtime. Moreover,the standard deviation follows the same trend, indicating higher uncertaintyfor longer outages. The required advance time strongly depends on the achieveddata rate per user, which for the purposes of simulation is a result of the networktraces and bandwidth factor.
100 150 200 250 300 350 400 4500
20
40
60
80
100
120
Duration of the outage (sec)
Min
imum
req
uire
d ad
vanc
e
tim
e to
avo
id a
sta
lling
(se
c)
Fig. 4. The minimum required advance time (tadv) to avoid a stalling event during anoutage.
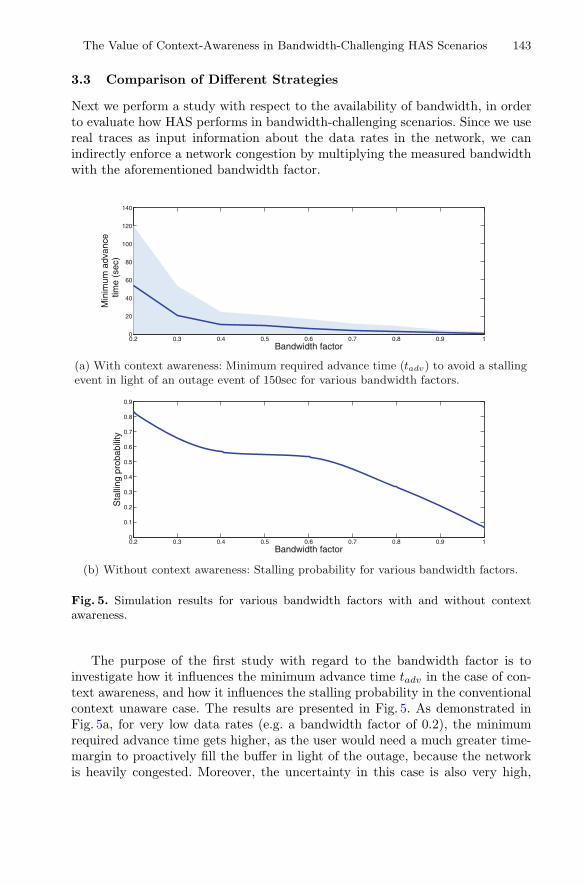
The Value of Context-Awareness in Bandwidth-Challenging HAS Scenarios 143
3.3 Comparison of Different Strategies
Next we perform a study with respect to the availability of bandwidth, in orderto evaluate how HAS performs in bandwidth-challenging scenarios. Since we usereal traces as input information about the data rates in the network, we canindirectly enforce a network congestion by multiplying the measured bandwidthwith the aforementioned bandwidth factor.
0.2 0.3 0.4 0.5 0.6 0.7 0.8 0.9 10
20
40
60
80
100
120
140
Bandwidth factor
Min
imum
adv
ance
time
(sec
)
(a) With context awareness: Minimum required advance time (tadv) to avoid a stallingevent in light of an outage event of 150sec for various bandwidth factors.
0.2 0.3 0.4 0.5 0.6 0.7 0.8 0.9 10
0.1
0.2
0.3
0.4
0.5
0.6
0.7
0.8
0.9
Bandwidth factor
Sta
lling
pro
babi
lity
(b) Without context awareness: Stalling probability for various bandwidth factors.
Fig. 5. Simulation results for various bandwidth factors with and without contextawareness.
The purpose of the first study with regard to the bandwidth factor is toinvestigate how it influences the minimum advance time tadv in the case of con-text awareness, and how it influences the stalling probability in the conventionalcontext unaware case. The results are presented in Fig. 5. As demonstrated inFig. 5a, for very low data rates (e.g. a bandwidth factor of 0.2), the minimumrequired advance time gets higher, as the user would need a much greater time-margin to proactively fill the buffer in light of the outage, because the networkis heavily congested. Moreover, the uncertainty in this case is also very high,

144 E. Liotou et al.
a conclusion that we have seen at the previous section as well. On the con-trary, the more relaxed the network conditions, the higher the margin for anearly notification about the outage, while this practically gets zero seconds (i.e.,no notification is needed) when the network conditions are very relaxed (band-width factor = 1). Similar conclusions are drawn for the context-unaware casewith regard to the stalling probabilities for different bandwidth factors, namelythe less this factor, the higher the stalling probability, as expected (Fig. 5b).
Next, we compare the behaviour of the three different types of the optimalstrategy (i.e. cases W/W+S/W+S+A, as described in Sect. 2.2) both amongthem, but also with the context-aware strategy. In Figs. 6a–d, the percentageof time spent on each of the three layers as well as the resulting number ofswitches are presented per strategy. All four strategies follow a similar trend asbandwidth availability increases, that is higher and higher layer 3 segments areselected, while lower and lower layer 1 segments are selected. With respect tolayer 2 segments, the behaviour is different when the bandwidth factor changesfrom 0.25 to 0.5 (increasing layer 2 selection) from when it changes from 0.5 to1 (decreasing layer 2 selection). Note that a bandwidth factor of 0.25 representsvery high congestion and a bandwidth factor of 1 represents very low congestion.
Another interesting observation is that strategy W+S+A “avoids” layer 2segments almost completely. The reason behind that is that layer 2 in W+S+Ais mostly used as a “transition step” to switch to layer 1 or layer 3, respectingthe objective to keep the altitude of two sequential layers as low as possible.Equation (10) gives the same priority to staying at the same layer and to switch-ing to a +1 or −1 layer. Perhaps, this is not necessarily the best action in termsof QoE, but there is no complete HAS QoE model to be able to build the perfectoptimization function. However, the optimization goal of low altitude betweensuccessive layers holds. On the contrary, strategy W+S has a tendency to selectmany layer 2 segments, which is explained by its goal to minimize the switchesand thus operate at a stable but safe level. We have also tested a “W+A” opti-mal strategy (not mentioned in Sect. 2.2), but this has been found to cause toomany quality switches; therefore it was not considered for further investigation.
It is important to note that no optimal strategy is considered “better” thanthe other; They all represent how different optimization objectives behave undervarying bandwidth conditions. However, once a validated multi-parameter QoEmodel for HAS becomes available in the future, the optimization problem couldbe revisited.
In terms of quality switches caused, which is another important QoE impair-ment factor, the context aware strategy and the optimal W strategy cause thehighest number of switches, since they do not take measures to prevent them(see Fig. 6d). On the contrary, the optimal W+S and optimal W+S+A strate-gies cause the least number of switches. Between the last two, W+S+A causesmore switches, as it puts equal priority to mitigating switches and keeping thealtitude of any switches at a low level.

The Value of Context-Awareness in Bandwidth-Challenging HAS Scenarios 145
(a) Percentage of time spent on layer 1.
(b) Percentage of time spent on layer 2.
(c) Percentage of time spent on layer 3.
0.3 0.4 0.5 0.6 0.7 0.8 0.9 10
10
20
30
40
50
60
70
80
90
Bandwidth factor
Num
ber
of s
witc
hes
ContextOptimal WOptimal W+SOptimal W+S+A
(d) Number of switches.
Fig. 6. Simulation results for various bandwidth factors for the three optimal casesW/W+S/W+S+A as well as the context-aware strategy.
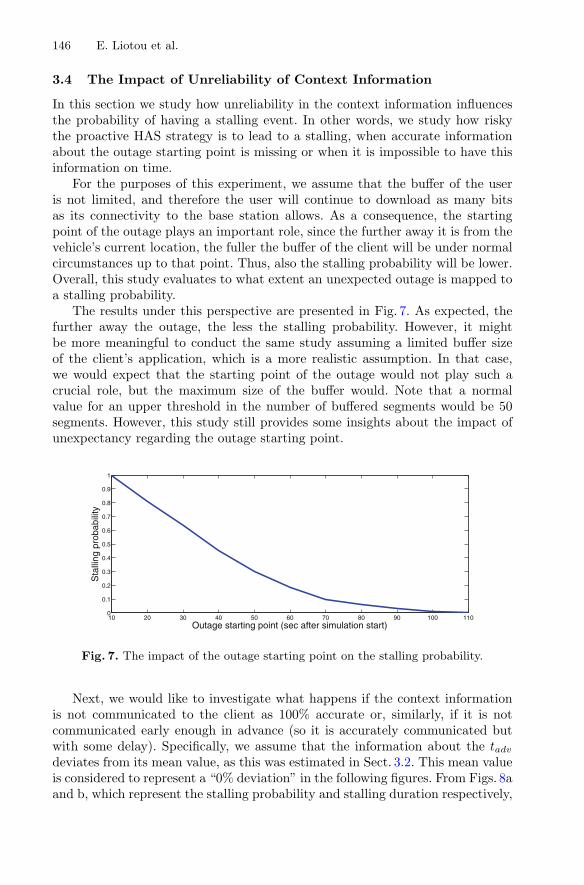
146 E. Liotou et al.
3.4 The Impact of Unreliability of Context Information
In this section we study how unreliability in the context information influencesthe probability of having a stalling event. In other words, we study how riskythe proactive HAS strategy is to lead to a stalling, when accurate informationabout the outage starting point is missing or when it is impossible to have thisinformation on time.
For the purposes of this experiment, we assume that the buffer of the useris not limited, and therefore the user will continue to download as many bitsas its connectivity to the base station allows. As a consequence, the startingpoint of the outage plays an important role, since the further away it is from thevehicle’s current location, the fuller the buffer of the client will be under normalcircumstances up to that point. Thus, also the stalling probability will be lower.Overall, this study evaluates to what extent an unexpected outage is mapped toa stalling probability.
The results under this perspective are presented in Fig. 7. As expected, thefurther away the outage, the less the stalling probability. However, it mightbe more meaningful to conduct the same study assuming a limited buffer sizeof the client’s application, which is a more realistic assumption. In that case,we would expect that the starting point of the outage would not play such acrucial role, but the maximum size of the buffer would. Note that a normalvalue for an upper threshold in the number of buffered segments would be 50segments. However, this study still provides some insights about the impact ofunexpectancy regarding the outage starting point.
10 20 30 40 50 60 70 80 90 100 1100
0.1
0.2
0.3
0.4
0.5
0.6
0.7
0.8
0.9
1
Outage starting point (sec after simulation start)
Sta
lling
pro
babi
lity
Fig. 7. The impact of the outage starting point on the stalling probability.
Next, we would like to investigate what happens if the context informationis not communicated to the client as 100% accurate or, similarly, if it is notcommunicated early enough in advance (so it is accurately communicated butwith some delay). Specifically, we assume that the information about the tadvdeviates from its mean value, as this was estimated in Sect. 3.2. This mean valueis considered to represent a “0% deviation” in the following figures. From Figs. 8aand b, which represent the stalling probability and stalling duration respectively,

The Value of Context-Awareness in Bandwidth-Challenging HAS Scenarios 147
we draw two main conclusions. Firstly, we confirm that the mean values of tadvare not enough to prevent a stalling, due to the fact that standard deviationshave not been taken into account. In fact, as presented in Sect. 3.2, the standarddeviations are higher for larger outage lengths and thus we observe higher stallingprobabilities for the 0% values (compare the three plots per figure).
A second important conclusion, which is the emphasis of this simulationstudy, is that a potential uncertainty in this context information can lead toinevitable stallings. This is interpreted both in terms of stalling probabilitiesand stalling lengths. This emphasizes the need for accurate and timely contextinformation, which also takes into account statistical metrics such as the stan-dard deviation.
−60% −40% −20% 0% +20% +40% +60% +80% +100%0.1
0.2
0.3
0.4
0.5
0.6
0.7
0.8
0.9
1
Deviation in the time of notification about the outage
Sta
lling
pro
babi
lity
outage duration = 200secoutage duration = 300secoutage duration = 400sec
(a) Resulting stalling probability.
−60% −40% −20% 0% +20% +40% +60% +80% +100%0
20
40
60
80
100
120
Deviation in the time of notification about the outage
Sta
lling
dur
atio
n (s
ec)
outage duration = 200secoutage duration = 300secoutage duration = 400sec
The 0% represents the mostaccurate estimation of the t
adv
(b) Resulting stalling duration.
Fig. 8. Stalling effects when tadv deviates from its mean value.
4 Conclusions
In this chapter, a novel proactive HAS strategy has been proposed and evalu-ated, demonstrating significant benefits as compared to the current approachesin terms of QoE and meaningful KPIs such as stalling probability. The proposed
148 E. Liotou et al.
strategy can successfully help prevent stallings at the client’s HAS applicationduring network coverage problems. The “cost to pay” is the collection and sig-nalling of context information, which could however be realistically implemented;therefore its adoption in a real network should not be difficult.
Even though this work focused on outage conditions of zero bandwidth, wecould easily extend this solution to a more general problem where bandwidthmay be insufficient (but not zero). Similarly, the same problem could be adjustedfor cases of an imminent service disruption such as a handover, where the afore-mentioned HAS strategy can help prevent stallings during the disruption period(i.e. the handover period). This may become possible by exploiting handover-hinting information, a priori. In this way, the user will be better prepared for apotential interruption in his viewing experience.
It would be also interesting as future work to study a scenario of more thanone mobile video streaming users using HAS, and investigate how the decisionsof one user potentially affect the others. Stability and fairness issues, togetherwith QoE analysis would be of great interest in this case.
Finally, as a general comment, we would like to point out that this workcould be revisited once a standard QoE model for HAS becomes available. Inthat case, we could have the opportunity not only to produce a more accurateoptimization problem, but also to enhance the proposed HAS strategy, focusingon the key factors that mostly influence the end-users’ QoE.
References
1. Ericsson Mobility Report: Mobile World Congress Edition, February 20152. Qualinet White Paper on Definitions of Quality of Experience, March 20133. Cuadra-Sanchez, A., et al.: IPNQSIS project, Deliverable 2.2: “Definition of
requirements of the management systems to keep up with QoE expectations basedon QoS and traffic monitoring” (2011)
4. Liotou, E., Tsolkas, D., Passas, N., Merakos, L.: Quality of experience managementin mobile cellular networks: key issues and design challenges. Commun. Mag. IEEE53(7), 145–153 (2015)
5. Abowd, G.D., Dey, A.K., Brown, P.J., Davies, N., Smith, M., Steggles, P.: Towardsa better understanding of context and context-awareness. In: Gellersen, H.-W. (ed.)HUC 1999. LNCS, vol. 1707, pp. 304–307. Springer, Heidelberg (1999). https://doi.org/10.1007/3-540-48157-5 29
6. Sarma, A., Chakraborty, S., Nandi, S.: Context aware handover management: sus-taining QoS and QoE in a public IEEE 802.11e hotspot. IEEE Trans. Netw. Serv.Manage. 11(4), 530–543 (2014)
7. Zhu, Y., Heynderickx, I., Redi, J.A.: Understanding the role of social context anduser factors in video quality of experience. Comput. Hum. Behav. 49, 412–426(2015)
8. Mitra, K., Zaslavsky, A., Ahlund, C.: Context-aware QoE modelling, measure-ment and prediction in mobile computing systems. IEEE Trans. Mob. Comput.99(PrePrints), 1 (2014)
9. Recommendation ITU-T P.800: Methods for Subjective Determination of Trans-mission Quality (1998)
The Value of Context-Awareness in Bandwidth-Challenging HAS Scenarios 149
10. Hoßfeld, T., Skorin-Kapov, L., Haddad, Y., Pocta, P., Siris, V., Zgank, A., Melvin,H.: Can context monitoring improve QoE? A case study of video flash crowds in theinternet of services. In: 2015 IFIP/IEEE International Symposium on IntegratedNetwork Management (IM), pp. 1274–1277, May 2015
11. Riiser, H., et al.: Video streaming using a location-based bandwidth-lookup servicefor bitrate planning. ACM Trans. Multimed. Comput. Commun. Appl. 8(3), 24:1–24:19 (2012)
12. Hao, J., et al.: GTube: geo-predictive video streaming over HTTP in mobileenvironments. In: Proceedings of the 5th ACM Multimedia Systems Conference,MMSys 2014, pp. 259–270. ACM, New York (2014)
13. Ramamurthi, V., Oyman, O., Foerster, J.: Using link awareness for HTTP adaptivestreaming over changing wireless conditions. In: 2015 International Conference onComputing, Networking and Communications (ICNC), pp. 727–731, February 2015
14. Sadr, S., Valentin, S.: Anticipatory buffer control and resource allocation for wire-less video streaming. CoRR abs/1304.3056 (2013)
15. Mekki, S., Valentin, S.: Anticipatory quality adaptation for mobile streaming: flu-ent video by channel prediction. In: 2015 IEEE 16th International Symposium onA World of Wireless, Mobile and Multimedia Networks (WoWMoM), pp. 1–3, June2015
16. Mekki, S., Karagkioules, T., Valentin, S.: HTTP adaptive streaming with indoors-outdoors detection in mobile networks. CoRR abs/1705.08809 (2017)
17. Hoßfeld, T., Seufert, M., Sieber, C., Zinner, T., Tran-Gia, P.: Identifying QoE opti-mal adaptation of HTTP adaptive streaming based on subjective studies. Comput.Netw. 81, 320–332 (2015)
18. Seufert, M., Egger, S., Slanina, M., Zinner, T., Hoßfeld, T., Tran-Gia, P.: A surveyon quality of experience of HTTP adaptive streaming. IEEE Commun. Surv. Tutor.17, 469–492 (2015)
19. Hoßfeld, T., Seufert, M., Sieber, C., Zinner, T.: Assessing effect sizes of influencefactors towards a QoE model for HTTP adaptive streaming. In: 2014 Sixth Inter-national Workshop on Quality of Multimedia Experience (QoMEX), pp. 111–116,September 2014
20. Metzger, F., Steindl, C., Hoßfeld, T.: A simulation framework for evaluating theQoS and QoE of TCP-based streaming in an LTE network. In: 27th InternationalTeletraffic Congress (ITC 27), September 2015
21. Fiedler, M., Hoßfeld, T., Tran-Gia, P.: A generic quantitative relationship betweenquality of experience and quality of service. Netw. IEEE 24(2), 36–41 (2010)
22. Hoßfeld, T., Schatz, R., Biersack, E., Plissonneau, L.: Internet video delivery inyoutube: from traffic measurements to quality of experience. In: Biersack, E., Cal-legari, C., Matijasevic, M. (eds.) Data Traffic Monitoring and Analysis. LNCS,vol. 7754, pp. 264–301. Springer, Heidelberg (2013). https://doi.org/10.1007/978-3-642-36784-7 11
23. Muller, C., Lederer, S., Timmerer, C.: An evaluation of dynamic adaptive stream-ing over HTTP in vehicular environments. In: Proceedings of the 4th Workshopon Mobile Video, MoVid 2012, pp. 37–42. ACM, New York (2012)

150 E. Liotou et al.
Open Access This chapter is licensed under the terms of the Creative CommonsAttribution 4.0 International License (http://creativecommons.org/licenses/by/4.0/),which permits use, sharing, adaptation, distribution and reproduction in any mediumor format, as long as you give appropriate credit to the original author(s) and thesource, provide a link to the Creative Commons license and indicate if changes weremade.
The images or other third party material in this chapter are included in the chapter’sCreative Commons license, unless indicated otherwise in a credit line to the material. Ifmaterial is not included in the chapter’s Creative Commons license and your intendeduse is not permitted by statutory regulation or exceeds the permitted use, you willneed to obtain permission directly from the copyright holder.
Conceptual and Analytical Modelsfor Predicting the Quality of Service
of Overall Telecommunication Systems
Stoyan Poryazov1(✉) , Emiliya Saranova1,2 , and Ivan Ganchev1,3,4
1 Institute of Mathematics and Informatics, Bulgarian Academy of Sciences,Sofia, Bulgaria
[email protected], [email protected] University of Telecommunications and Post, Sofia, Bulgaria
3 University of Limerick, Limerick, [email protected]
4 University of Plovdiv “Paisii Hilendarski”, Plovdiv, Bulgaria
Abstract. This chapter presents scalable conceptual and analytical performancemodels of overall telecommunication systems, allowing the prediction of multipleQuality of Service (QoS) indicators as functions of the user- and networkbehavior. Two structures of the conceptual presentation are considered and ananalytical method for converting the presentations, along with correspondingadditive and multiplicative metrics, is proposed. A corresponding analyticalmodel is elaborated, which allows the prediction of flow-, time-, and traffic char‐acteristics of terminals and users, as well as the overall network performance. Inaccordance with recommendations of the International TelecommunicationsUnion’s Telecommunication Standardization Sector (ITU-T), analytical expres‐sions are proposed for predicting four QoS indicators. Differentiated QoS indi‐cators for each subservice, as well as analytical expressions for their prediction,are proposed. Overall pie characteristics and their causal aggregations areproposed as causal-oriented QoS indicators. The results demonstrate the abilityof the model to facilitate a more precise dynamic QoS management as well as toserve as a source for predicting some Quality of Experience (QoE) indicators.
Keywords: Overall telecommunication system · Performance modelOverall causal QoS indicator · Dynamic QoS managementTelecommunication subservices · Differentiated QoS subservice indicatorQoS prediction · Human factors of QoS
1 Introduction
The telecommunication service is the basis for the Information Service Networks. Fromthe very beginning the Internet began its existence as a packet-based communicationsystem without guarantees for the quality of the services, which are provided on a best-effort basis. At the same time, with the evolution of hardware technologies, and servicesand applications becoming more and more complex, the quality of service (QoS) has
© The Author(s) 2018I. Ganchev et al. (Eds.): Autonomous Control for a Reliable Internet of Services, LNCS 10768, pp. 151–181, 2018.https://doi.org/10.1007/978-3-319-90415-3_7
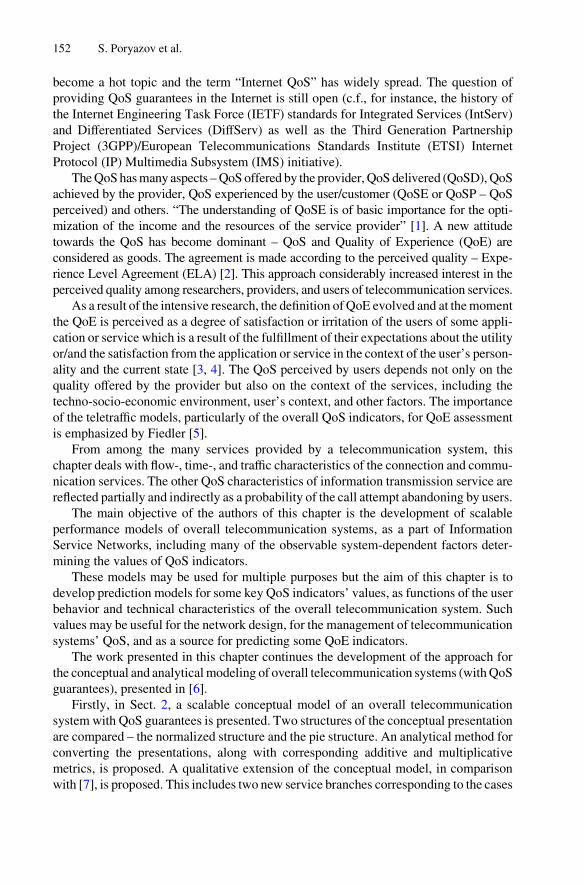
become a hot topic and the term “Internet QoS” has widely spread. The question ofproviding QoS guarantees in the Internet is still open (c.f., for instance, the history ofthe Internet Engineering Task Force (IETF) standards for Integrated Services (IntServ)and Differentiated Services (DiffServ) as well as the Third Generation PartnershipProject (3GPP)/European Telecommunications Standards Institute (ETSI) InternetProtocol (IP) Multimedia Subsystem (IMS) initiative).
The QoS has many aspects – QoS offered by the provider, QoS delivered (QoSD), QoSachieved by the provider, QoS experienced by the user/customer (QoSE or QoSP – QoSperceived) and others. “The understanding of QoSE is of basic importance for the opti‐mization of the income and the resources of the service provider” [1]. A new attitudetowards the QoS has become dominant – QoS and Quality of Experience (QoE) areconsidered as goods. The agreement is made according to the perceived quality – Expe‐rience Level Agreement (ELA) [2]. This approach considerably increased interest in theperceived quality among researchers, providers, and users of telecommunication services.
As a result of the intensive research, the definition of QoE evolved and at the momentthe QoE is perceived as a degree of satisfaction or irritation of the users of some appli‐cation or service which is a result of the fulfillment of their expectations about the utilityor/and the satisfaction from the application or service in the context of the user’s person‐ality and the current state [3, 4]. The QoS perceived by users depends not only on thequality offered by the provider but also on the context of the services, including thetechno-socio-economic environment, user’s context, and other factors. The importanceof the teletraffic models, particularly of the overall QoS indicators, for QoE assessmentis emphasized by Fiedler [5].
From among the many services provided by a telecommunication system, thischapter deals with flow-, time-, and traffic characteristics of the connection and commu‐nication services. The other QoS characteristics of information transmission service arereflected partially and indirectly as a probability of the call attempt abandoning by users.
The main objective of the authors of this chapter is the development of scalableperformance models of overall telecommunication systems, as a part of InformationService Networks, including many of the observable system-dependent factors deter‐mining the values of QoS indicators.
These models may be used for multiple purposes but the aim of this chapter is todevelop prediction models for some key QoS indicators’ values, as functions of the userbehavior and technical characteristics of the overall telecommunication system. Suchvalues may be useful for the network design, for the management of telecommunicationsystems’ QoS, and as a source for predicting some QoE indicators.
The work presented in this chapter continues the development of the approach forthe conceptual and analytical modeling of overall telecommunication systems (with QoSguarantees), presented in [6].
Firstly, in Sect. 2, a scalable conceptual model of an overall telecommunicationsystem with QoS guarantees is presented. Two structures of the conceptual presentationare compared – the normalized structure and the pie structure. An analytical method forconverting the presentations, along with corresponding additive and multiplicativemetrics, is proposed. A qualitative extension of the conceptual model, in comparisonwith [7], is proposed. This includes two new service branches corresponding to the cases
152 S. Poryazov et al.

of ‘called party being busy with another call’ and ‘mailing a message’. This allowsanalyzing telecommunication systems’ QoS indicators as a composition of QoS indi‐cators of consecutive and parallel subservices.
The developed model is based on: a Bernoulli–Poisson–Pascal (BPP) input flow;repeated calls; limited number of homogeneous terminals; 11 cases of losses of callattempts (due to abandoning, interrupting, blocking, and unavailable service); and threesuccessful cases (normal interactive communication, communication after call holding,and mailing). The calling (A) and called (B) terminals (and users) are considered sepa‐rately, but in interaction to each other. This allows formulation of QoS indicators sepa‐rately for A-, B-, and AB-terminals.
In Sect. 3, on the basis of the developed conceptual model, a corresponding analyticalmodel is elaborated. User behavior parameters and technical characteristics of the tele‐communication network serve as an input for the model. The model itself is intendedfor systems remaining in a stationary state. It is insensitive to the distributions of randomvariables and provides results in the form of mean values of the output parameters. Themodel is verified for the entire theoretical interval of network load. It allows the predic‐tion of flow-, time-, and traffic characteristics of A-, B-, and AB-terminals (and users),as well as of the overall network performance.
In accordance with recommendations of the International TelecommunicationsUnion’s Telecommunication Standardization Sector (ITU-T), analytical expressions forthe prediction of three QoS indicators are proposed:
• Carried Switching Efficiency, for finding B-terminal (Subservice 1);• B-Terminal Connection Efficiency, for connection to the B-terminal, which aggre‐
gates the Carried Switching Efficiency;• Overall Call Attempt Efficiency, for call attempts finishing with fully successful
communication, which aggregates the Carried Switching Efficiency, B-TerminalConnection Efficiency, Finding B-User Subservice, and Communication Subservice.
Four differentiated QoS indicators for each subservice are proposed along with analyticalexpressions for their prediction:
• Carried Switching Efficiency (Ecs), for finding B-terminal (Subservice 1) as per theITU-T recommendations;
• QoS specific indicator (Qb) of Connection to the B-terminal (Subservice 2);• QoS specific indicator (Qu) of Finding B-user (Subservice 3);• QoS specific indicator (Qc) of Communication (Subservice 4).
The four QoS specific indicators are independent. They are components (in multipli‐cative metrics) of the ITU-T concordant Overall Call Attempt Efficiency indicator (Ec):
Ec = Ecs Qb Qu Qc.
The usage of the proposed QoS indicators of telecommunication subservices allowsconducting a more specific QoS analysis and more adequate QoS management.
In Sect. 4, in accordance with the ITU-T recommendations, analytical expressionsfor the prediction of the Overall Traffic Efficiency Indicator and other overall pie
Conceptual and Analytical Models for Predicting the Quality of Service 153

parameters and their causal aggregations are proposed and illustrated numerically. Theoverall pie characteristics and their causal aggregations could be considered as causal-oriented QoS indicators. The results allow a more precise estimation of the dynamicimportance of each reason of call attempts finishing and thus a more precise dynamiceffort targeting of the QoS management.
In the Conclusion, possible directions for future research are discussed.
2 Conceptual Model
2.1 Background
At the telecommunication system level, Ericson has proposed a reference modelconsisting of five parts – terminals, access-, transport-, network management-, andnetwork intelligence part [8]. We have extended this reference model by making differ‐ence between the telecommunication system and the telecommunication network, andby applying the present ITU-T terminology (Fig. 1). It contains seven parts (subsystems):(1) Network Environment (natural-, technological-, and socio-economic environment);(2) Users; (3) Subscribers/Customers1; (4) Terminals; (5) Telecommunication Network;(6) Network’s Information Servers (network intelligence); and (7) TelecommunicationAdministration (network service provider). The interaction between subsystems (if any)is presented by a common border between their representing rectangles in Fig. 1. Eachsubsystem is part of the environment (context) of the other subsystems.
1 According to [1], the user is “A person or entity external to the network, which utilizes connec‐tions through the network for communication”, whereas the customer is “A user who isresponsible for payment for the services”.
Fig. 1. A reference model of an overall telecommunication system and its environment (anextension of [9]).
154 S. Poryazov et al.
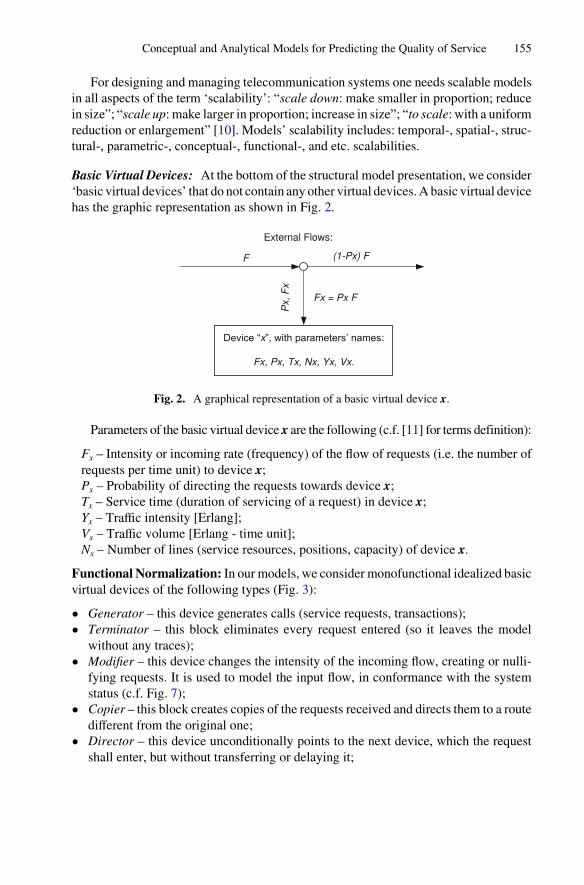
For designing and managing telecommunication systems one needs scalable modelsin all aspects of the term ‘scalability’: “scale down: make smaller in proportion; reducein size”; “scale up: make larger in proportion; increase in size”; “to scale: with a uniformreduction or enlargement” [10]. Models’ scalability includes: temporal-, spatial-, struc‐tural-, parametric-, conceptual-, functional-, and etc. scalabilities.
Basic Virtual Devices: At the bottom of the structural model presentation, we consider‘basic virtual devices’ that do not contain any other virtual devices. A basic virtual devicehas the graphic representation as shown in Fig. 2.
Fig. 2. A graphical representation of a basic virtual device x.
Parameters of the basic virtual device x are the following (c.f. [11] for terms definition):
Fx – Intensity or incoming rate (frequency) of the flow of requests (i.e. the number ofrequests per time unit) to device x;Px – Probability of directing the requests towards device x;Tx – Service time (duration of servicing of a request) in device x;Yx – Traffic intensity [Erlang];Vx – Traffic volume [Erlang - time unit];Nx – Number of lines (service resources, positions, capacity) of device x.
Functional Normalization: In our models, we consider monofunctional idealized basicvirtual devices of the following types (Fig. 3):
• Generator – this device generates calls (service requests, transactions);• Terminator – this block eliminates every request entered (so it leaves the model
without any traces);• Modifier – this device changes the intensity of the incoming flow, creating or nulli‐
fying requests. It is used to model the input flow, in conformance with the systemstatus (c.f. Fig. 7);
• Copier – this block creates copies of the requests received and directs them to a routedifferent from the original one;
• Director – this device unconditionally points to the next device, which the requestshall enter, but without transferring or delaying it;
Conceptual and Analytical Models for Predicting the Quality of Service 155
• Enter Switch – this block checks if there is a free resource/place in the next block fora request to be accommodated in: if yes, the request is passed to it without delay; ifnot – the request is re-directed to another device;
• Server – this device models the delay (service time, holding time) of requests in thecorresponding device without their generation or elimination. It models also trafficand time characteristics of the requests processing (c.f. Fig. 2);
• Transition – this device selects one of its possible exits for each request entered, thusdetermining the next device where this request shall go to;
• Graphic Connector – this is used to simplify the graphical representation of theconceptual model structure. It has no modeling functions.
Fig. 3. A graphical block representation of the main basic virtual mono-functional devices used.
Structural Normalization: Following the theorem of Böhm and Jacopini [12], we usebasic virtual devices mainly with one entrance and one exit. Exceptions are: the transi‐tion device, which in our structural normalization has one entrance and two exits (forsplitting the requests’ flows) or two entrances and one exit (for merging the requests’flows); and the copier with its one entrance and two exits.
Causal Structure Presentation: Any service may end due to many reasons. In a tele‐communication network, all reasons are classified into four types: network failures, userfailures (ineffective calls associated with the callers and callees), network serviceprovider failures, and successful ending (completed seizures) [13, 14]. The ‘cause value’field in [14] contents 99 items. In [13], there are 127 ‘cause value’ numbers. Cisco lists131 ‘call termination cause codes’ and 44 ‘Cisco-specific call termination causecodes’ [15].
Complex Virtual Devices: Each reason for service ending has its own probability tooccur and mean service time (duration). In our conceptual model, the service executiongoes through different stages (e.g. dialing, switching, ringing, etc.), each consisting ofdifferent phases. Each stage of a modeled service corresponds to one (or more) complexvirtual device and contains ‘service branches’ (service phases). Typically, a servicephase includes a service device and all necessary auxiliary devices such as queues, entryand exit devices, as well as virtual devices reflecting the user behavior, associated withthis phase, e.g. the waiting time before initiating a repeated call attempt. Each servicebranch corresponds to a different reason of service ending. The service branches formthe ‘causal structure’ of the modeled service. The causal structure of a complex virtual
156 S. Poryazov et al.
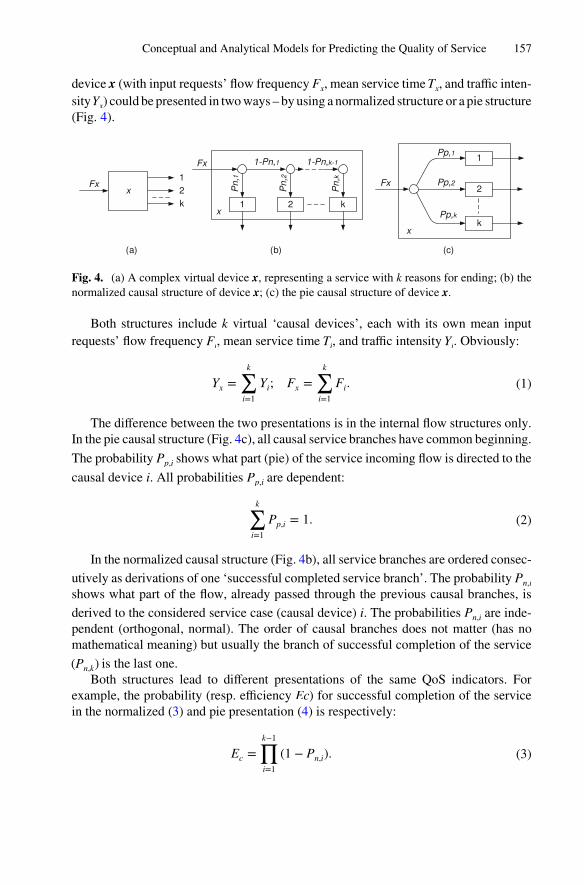
device x (with input requests’ flow frequency Fx, mean service time Tx, and traffic inten‐sity Yx) could be presented in two ways – by using a normalized structure or a pie structure(Fig. 4).
Fig. 4. (a) A complex virtual device x, representing a service with k reasons for ending; (b) thenormalized causal structure of device x; (c) the pie causal structure of device x.
Both structures include k virtual ‘causal devices’, each with its own mean inputrequests’ flow frequency Fi, mean service time Ti, and traffic intensity Yi. Obviously:
Yx =
k∑i=1
Yi; Fx =
k∑i=1
Fi. (1)
The difference between the two presentations is in the internal flow structures only.In the pie causal structure (Fig. 4c), all causal service branches have common beginning.The probability Pp,i shows what part (pie) of the service incoming flow is directed to thecausal device i. All probabilities Pp,i are dependent:
k∑i=1
Pp,i = 1. (2)
In the normalized causal structure (Fig. 4b), all service branches are ordered consec‐utively as derivations of one ‘successful completed service branch’. The probability Pn,ishows what part of the flow, already passed through the previous causal branches, isderived to the considered service case (causal device) i. The probabilities Pn,i are inde‐pendent (orthogonal, normal). The order of causal branches does not matter (has nomathematical meaning) but usually the branch of successful completion of the service(Pn,k) is the last one.
Both structures lead to different presentations of the same QoS indicators. Forexample, the probability (resp. efficiency Ec) for successful completion of the servicein the normalized (3) and pie presentation (4) is respectively:
Ec =
k−1∏i=1
(1 − Pn,i). (3)
Conceptual and Analytical Models for Predicting the Quality of Service 157
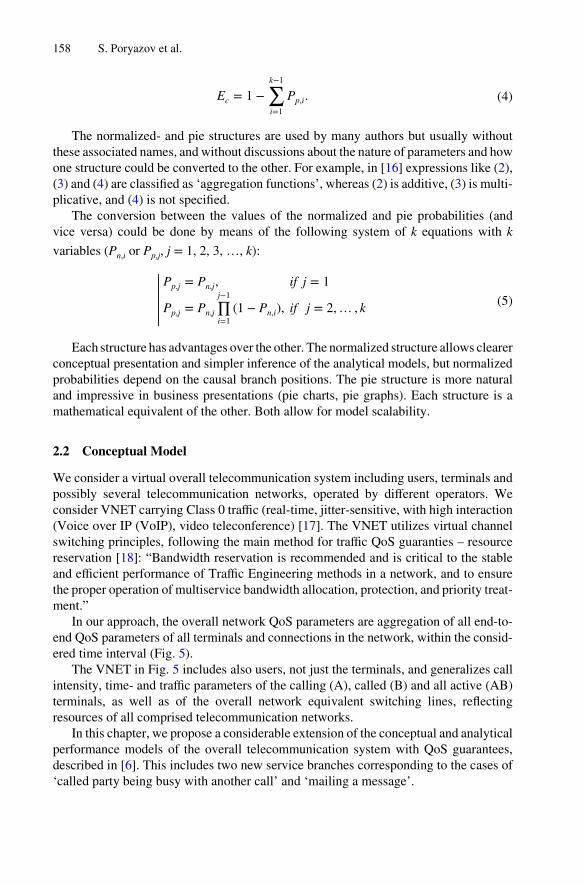
Ec = 1 −
k−1∑i=1
Pp,i. (4)
The normalized- and pie structures are used by many authors but usually withoutthese associated names, and without discussions about the nature of parameters and howone structure could be converted to the other. For example, in [16] expressions like (2),(3) and (4) are classified as ‘aggregation functions’, whereas (2) is additive, (3) is multi‐plicative, and (4) is not specified.
The conversion between the values of the normalized and pie probabilities (andvice versa) could be done by means of the following system of k equations with kvariables (Pn,i or Pp,j, j = 1, 2, 3, …, k):
|||||||
Pp,j = Pn,j, if j = 1
Pp,j = Pn,j
j−1∏i=1
(1 − Pn,i), if j = 2,… , k(5)
Each structure has advantages over the other. The normalized structure allows clearerconceptual presentation and simpler inference of the analytical models, but normalizedprobabilities depend on the causal branch positions. The pie structure is more naturaland impressive in business presentations (pie charts, pie graphs). Each structure is amathematical equivalent of the other. Both allow for model scalability.
2.2 Conceptual Model
We consider a virtual overall telecommunication system including users, terminals andpossibly several telecommunication networks, operated by different operators. Weconsider VNET carrying Class 0 traffic (real-time, jitter-sensitive, with high interaction(Voice over IP (VoIP), video teleconference) [17]. The VNET utilizes virtual channelswitching principles, following the main method for traffic QoS guaranties – resourcereservation [18]: “Bandwidth reservation is recommended and is critical to the stableand efficient performance of Traffic Engineering methods in a network, and to ensurethe proper operation of multiservice bandwidth allocation, protection, and priority treat‐ment.”
In our approach, the overall network QoS parameters are aggregation of all end-to-end QoS parameters of all terminals and connections in the network, within the consid‐ered time interval (Fig. 5).
The VNET in Fig. 5 includes also users, not just the terminals, and generalizes callintensity, time- and traffic parameters of the calling (A), called (B) and all active (AB)terminals, as well as of the overall network equivalent switching lines, reflectingresources of all comprised telecommunication networks.
In this chapter, we propose a considerable extension of the conceptual and analyticalperformance models of the overall telecommunication system with QoS guarantees,described in [6]. This includes two new service branches corresponding to the cases of‘called party being busy with another call’ and ‘mailing a message’.
158 S. Poryazov et al.

Basic Virtual Devices’ Name Notation. In the normalized conceptual model, eachvirtual device has a unique name, depending on its position and the role it plays in themodel (Figs. 6, 7, 8, 9 and 10).
Fig. 6. The basic virtual devices’ name notation.
The model is partitioned into service stages (dialing, switching, ringing, holding,communication, and mailing).
Each service stage has different branches (entered, abandoned, blocked, interrupted,not available, carried), corresponding to the modeled possible cases of ending theservice.
Each branch has two exits (repeated, terminated) that show what happens with theservice request after it enters the telecommunication system. Users may make a new bid(repeated service request) or may stop attempting (terminated service request).
In the virtual devices’ name notation, the corresponding first letters of the name ofthe branch exit, the branch, and the service stage are used (in this order) to form thename of the virtual device:
𝐕𝐢𝐫𝐭𝐮𝐚𝐥 𝐃𝐞𝐯𝐢𝐜𝐞𝐍𝐚𝐦𝐞 = < 𝐁𝐑𝐀𝐍𝐂𝐇𝐄𝐗𝐈𝐓 >< 𝐁𝐑𝐀𝐍𝐂𝐇 >< 𝐒𝐓𝐀𝐆𝐄 >
Complex Virtual Devices’ Names. We use the following complex virtual devices (i.e.devices, consisting of several basic virtual devices):
Fig. 5. A generalized VNET, including users and terminals, with overall QoS guaranties (amodification of [19]).
Conceptual and Analytical Models for Predicting the Quality of Service 159
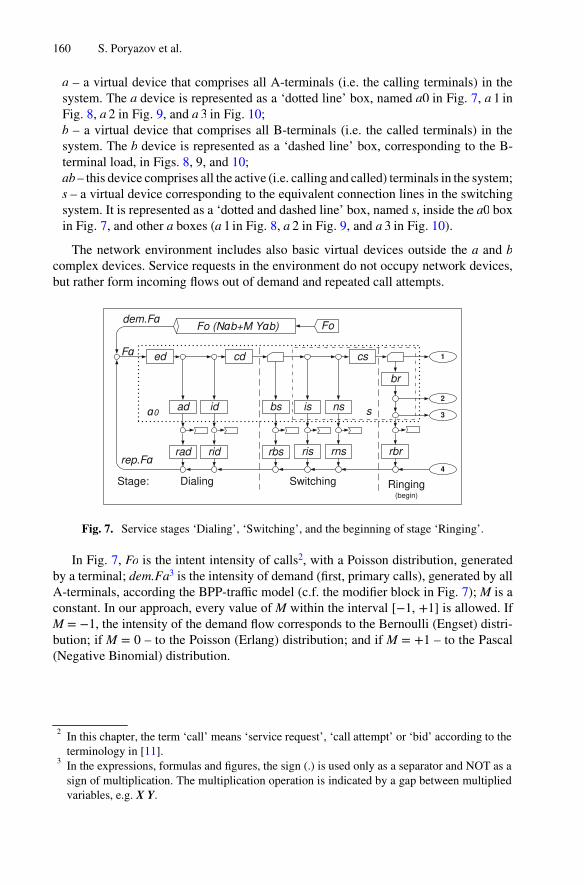
a – a virtual device that comprises all A-terminals (i.e. the calling terminals) in thesystem. The a device is represented as a ‘dotted line’ box, named a0 in Fig. 7, a 1 inFig. 8, a 2 in Fig. 9, and a 3 in Fig. 10;b – a virtual device that comprises all B-terminals (i.e. the called terminals) in thesystem. The b device is represented as a ‘dashed line’ box, corresponding to the B-terminal load, in Figs. 8, 9, and 10;ab – this device comprises all the active (i.e. calling and called) terminals in the system;s – a virtual device corresponding to the equivalent connection lines in the switchingsystem. It is represented as a ‘dotted and dashed line’ box, named s, inside the a0 boxin Fig. 7, and other a boxes (a 1 in Fig. 8, a 2 in Fig. 9, and a 3 in Fig. 10).
The network environment includes also basic virtual devices outside the a and bcomplex devices. Service requests in the environment do not occupy network devices,but rather form incoming flows out of demand and repeated call attempts.
Fig. 7. Service stages ‘Dialing’, ‘Switching’, and the beginning of stage ‘Ringing’.
In Fig. 7, Fo is the intent intensity of calls2, with a Poisson distribution, generatedby a terminal; dem.Fa3 is the intensity of demand (first, primary calls), generated by allA-terminals, according the BPP-traffic model (c.f. the modifier block in Fig. 7); M is aconstant. In our approach, every value of M within the interval [−1, +1] is allowed. IfM = −1, the intensity of the demand flow corresponds to the Bernoulli (Engset) distri‐bution; if M = 0 – to the Poisson (Erlang) distribution; and if M = +1 – to the Pascal(Negative Binomial) distribution.
2 In this chapter, the term ‘call’ means ‘service request’, ‘call attempt’ or ‘bid’ according to theterminology in [11].
3 In the expressions, formulas and figures, the sign (.) is used only as a separator and NOT as asign of multiplication. The multiplication operation is indicated by a gap between multipliedvariables, e.g. X Y.
160 S. Poryazov et al.

rep.Fa stands for repeated attempts, generated by A-users and A-terminals, in thecase of unsuccessful call attempts; Fa is the flow generated by and occupying the A-terminals (it is a sum of the intensities of primary (demand) call attempts (dem.Fa) andrepeated attempts rep.Fa).
Devices ‘entered dialing’ (ed), ‘carried dialing’ (cd), and ‘carried switching’ (cs),belong to the successful service branch.
Devices ‘abandoned dialing’ (ad), ‘interrupted dialing’ (id), ‘blocked switching’(bs), ‘interrupted switching’ (is), ‘not available switching (service, number)’ (ns), and‘blocked ringing’ (br) belong to the unsuccessful (due to different reasons) servicebranches. They reflect durations of the correspondent signaling, e.g. the ‘busy tone’duration.
Devices ‘repeated abandoned dialing’ (rad), ‘repeated interrupted dialing’ (rid),‘repeated blocked switching’ (rbs), ‘repeated interrupted switching’ (ris), ‘repeated notavailable switching (service, number)’ (rns), and ‘repeated blocked ringing’ (rbr) corre‐spond to the duration of users’ requests waiting, outside the network equipment, beforethe next repeated call attempt.
The device of type ‘Enter Switch’ (just before the ‘blocked switching’ (bs device)in Fig. 7) deflects calls if there is no free line in the switching system, with probabilityof blocked switching (Pbs). The second ‘Enter Switch’ device (after the block ‘carriedswitching’ (cs) in Fig. 7) deflects calls, with probability of blocked ringing (Pbr), if thecalled B-terminal is busy.
Note that there is no B-terminal traffic in the part of the conceptual model, presentedin Fig. 7.
Fig. 8. Service stages ‘Ringing’ (end), ‘Communication’, and ‘B-terminal Load’ (Case 1).
Figure 8 presents the call flows, in Case 1, when the B-terminal is found free (c.f.Connector 1 in Figs. 7 and 8). In this case, the flow intensity, occupying the B-terminal,is generated by the Copy device (c.f. Connector B1), because at the beginning of theringing stage, the B-terminal becomes busy. In Case 1, the traffic load on the A-terminalequals the traffic load on the B-terminal.
Conceptual and Analytical Models for Predicting the Quality of Service 161
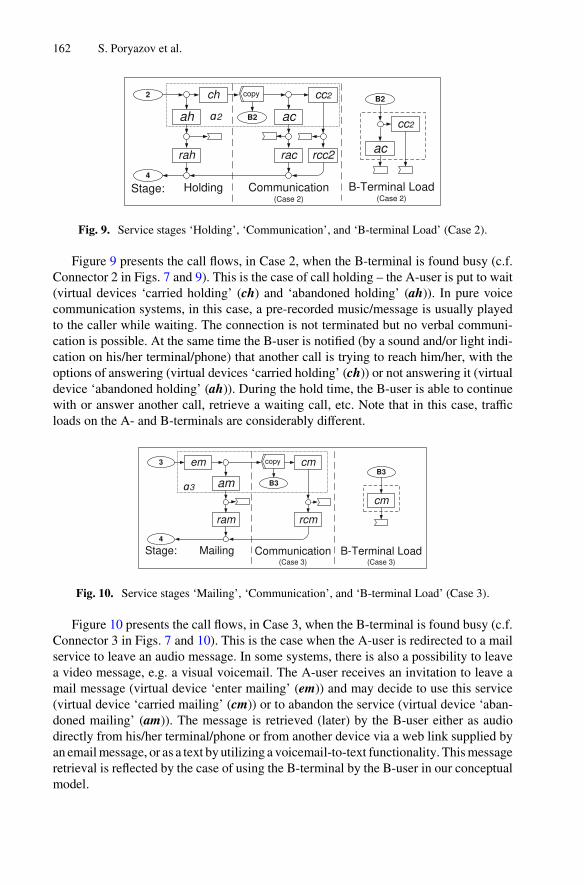
Fig. 9. Service stages ‘Holding’, ‘Communication’, and ‘B-terminal Load’ (Case 2).
Figure 9 presents the call flows, in Case 2, when the B-terminal is found busy (c.f.Connector 2 in Figs. 7 and 9). This is the case of call holding – the A-user is put to wait(virtual devices ‘carried holding’ (ch) and ‘abandoned holding’ (ah)). In pure voicecommunication systems, in this case, a pre-recorded music/message is usually playedto the caller while waiting. The connection is not terminated but no verbal communi‐cation is possible. At the same time the B-user is notified (by a sound and/or light indi‐cation on his/her terminal/phone) that another call is trying to reach him/her, with theoptions of answering (virtual devices ‘carried holding’ (ch)) or not answering it (virtualdevice ‘abandoned holding’ (ah)). During the hold time, the B-user is able to continuewith or answer another call, retrieve a waiting call, etc. Note that in this case, trafficloads on the A- and B-terminals are considerably different.
Fig. 10. Service stages ‘Mailing’, ‘Communication’, and ‘B-terminal Load’ (Case 3).
Figure 10 presents the call flows, in Case 3, when the B-terminal is found busy (c.f.Connector 3 in Figs. 7 and 10). This is the case when the A-user is redirected to a mailservice to leave an audio message. In some systems, there is also a possibility to leavea video message, e.g. a visual voicemail. The A-user receives an invitation to leave amail message (virtual device ‘enter mailing’ (em)) and may decide to use this service(virtual device ‘carried mailing’ (cm)) or to abandon the service (virtual device ‘aban‐doned mailing’ (am)). The message is retrieved (later) by the B-user either as audiodirectly from his/her terminal/phone or from another device via a web link supplied byan email message, or as a text by utilizing a voicemail-to-text functionality. This messageretrieval is reflected by the case of using the B-terminal by the B-user in our conceptualmodel.
162 S. Poryazov et al.

Parameters’ Qualification. In Fig. 7, one may see notations ‘Fa’, ‘dem.Fa’, and‘rep.Fa’, using qualifiers dem and rep. Traffic qualification is necessary and it is used in[11], but without any attempt for including the qualifiers in the parameters’ names. Theproblem is more complex: (1) one would like to have the same, or very similar, param‐eters’ names in the conceptual-, analytic-, and computer models; (2) one would like tomeet the Name Design Criteria: “Names with which human beings deal directly shouldbe user-friendly. A user-friendly name is one that takes the human user’s point of view,not the computer’s. It is one that is easy for people to deduce, remember and understand,rather than one that is easy for computers to interpret.” [20], Annex J: “Name DesignCriteria”.
Since 2006 [6] we use up to two qualifiers as a part of the parameter’s name. Thefirst is for the parameter value’s origin, e.g. emp for ‘empirical’, dsn for ‘designed’, trgfor ‘target’, etc. The second qualifier characterizes the traffic. Most of the traffic qualifiersare described in [11]. In this paper we use dem for ‘demand’, rep for ‘repeated’, ofr for‘offered’, and crr for ‘carried’. We expand the meaning of the traffic qualifiers to theother parameters determining the traffic, e.g. in our notations, ofr.Ys = ofr.Fssrv.Ts
means: ‘the offered traffic intensity to the switching system is a product of the offeredrequests’ frequency (rate) and the service time in the switching system.
The definition of the offered traffic needs more explanations. There are two offeredtraffic definitions in the ITU-T recommendations: (1) Equivalent Traffic Offered [21];and (2) Traffic Offered [11]. In the other standardization documents, there is only oneoffered traffic definition, close to the Equivalent Traffic Offered [21]. In the overallnetwork performance models, both definitions give considerably different values [22].In this chapter, we use only the definition of the Equivalent Traffic Offered [21].
2.3 QoS Prediction Task Formulation
We consider the conceptual model presented in Figs. 6, 7, 8, 9, 10 and described inSect. 2.2. In this chapter, we consider that the overall telecommunication systemprovides four services: (1) finding B-terminal; (2) connection to B-terminal; (3) findingB-user (with sound, vibration, message, etc.); and (4) transmission and/or record ofmessages. The quality of this services depends on many subsystems (c.f. Fig. 1),including the user- and network behavior.
Types of Parameters. There are two types of parameters – static and dynamic. The10 basic dynamic parameters (with values dependent of the system state) are: Fo, Yab,Fa, dem.Fa, rep.Fa, Pbs, Pbr, ofr.Fs, Ts, and ofr.Ys. All others dynamic parameters canbe obtained from these.
Note that the traffic Yab from all terminals is accepted as a system macro-stateparameter.
Input Parameters. These are mostly static, i.e. related to the network technical char‐acteristics or the user behavior. We choose one dynamic parameter - Fo (the intentintensity of calls of one idle terminal) as an independent input variable. The proposedanalytical model allows to find all dynamic values, if Fo and all static parameters areknown.
Conceptual and Analytical Models for Predicting the Quality of Service 163
The probability of finding the B-user is considered static (i.e. independent of thesystem state).
The basic QoS output parameters are:
• Quality of finding the B-terminal service, represented by the probability of callblocking due to unavailable network equipment (equivalent network switching lines)– blocked switching (Pbs);
• Quality of connection to the B-terminal, represented by the probability of callblocking due to busy B-terminal – blocked ringing (Pbr).
These two parameters allow determination of many other QoS indicators, related totraffic-, time-, and flow characteristics of users and terminals.
The goal of this section is to find analytically all unknown basic dynamic parameters,including the basic QoS output parameters.
2.4 Main Assumptions
For a clear analytical modeling of a telecommunication system with QoS guarantees,the following assumptions were made:
Assumption 1. A closed service system, presented in Figs. 6, 7, 8, 9 and 10, isconsidered;
Assumption 2 (Capacity of Devices). The switching system (s) has capacity of Ns
connections (every virtual internal switching line may carry only one call attempt).Complex devices have limited capacity: the capacity of the ab device is Nab ∈ [2,∞)
terminals; the capacity of every terminal is engaging in one call (incoming or outgoing);all basic virtual devices have unlimited capacity;
Assumption 3 (Occupation of A-terminals). Every incoming call attempt (Fa), fromthe environment, falls only on a free A-terminal. This terminal becomes a busy one;
Assumption 4 (Steady State). Every device is in a stationary state. Hence the Little’stheorem [23] is applicable to each device: Y = F T;
Assumption 5 (Capacity of Call Attempts). Every call attempt may occupy no morethan one place, if any, in each basic virtual device;
Assumption 6 (Network Environment). The calls and devices in the environment(outside blocks a and b in Figs. 7, 8, 9 and 10) form the intent- and repeated calls flows).They don’t create telecommunication network’s load;
Assumption 7 (Device Independence). Excluding the dependences described in themathematical model, all parameters of a virtual device are independent from the param‐eters’ values of any other virtual device in the model;
164 S. Poryazov et al.

Assumption 8 (Randomness of the Processes). All variables in the analytical modelare considered random with a fixed distribution; the Little’s theorem is used for workingwith their mean values.
Assumption 9 (A and B Simultaneity). If a call attempt is served in correspondingvirtual devices belonging to A- and B-terminal’s load (e.g. ar, cr, ac, c1, cc2, cm inFigs. 7, 8, 9 and 10), it seizes and releases them simultaneously, with the same serviceload and duration.
Assumption 10 (Virtual Channel Switching). Every call attempt occupies simulta‐neously places in all the basic virtual devices of the complex device a or b it is passingthrough, including the basic device where it is at the moment of observation. Everycall attempt releases all occupied places at the very moment it leaves the complexdevice a or b.
Assumption 11 (Homogeneity4). All terminals and users are homogeneous.
Assumption 12 (Self-Excluding). Every A-terminal directs, with uniform distribution,all its call attempts to other terminals, not to itself;
Assumption 13 (B-flow). The flow of call attempts, occupying B-terminals (Fb), isordinary. (The case when two or more call attempts reach simultaneously a free B-terminal is not considered, due to its statistical unimportance);
Assumption 14 (B-terminal Busy Probability). The stationary probability of a call tofind the intended B-terminal busy (‘blocked ringing’ (Pbr)) during the first (primary,demand) attempt and all subsequent (repeated) attempts is one and the same.
3 Analytical Model
3.1 Overall Input Flow Intensity
The input (incoming) flow to the telecommunication network, with intensity Fa, is theflow generated by (and occupying) A-terminals. From the ITU E.600 definitions andFig. 7 it is obvious that the intensity of incoming flow is a sum of the intensities ofprimary (demand) call attempts (dem.Fa) and repeated attempts (rep.Fa):
Fa = dem.Fa + rep.Fa. (6)
From the definition of the BBP-flow and Fig. 7 we have:
dem.Fa = Fo(Nab + M Yab) (7)
4 Homogeneity means that all relevant characteristics and their considered mean values are thesame.
Conceptual and Analytical Models for Predicting the Quality of Service 165

3.2 QoS Indicator 1: Carried Switching Efficiency
According to Definition 2.11 in [11]: “fully routed call attempt; successful call attempt”is “A successful call attempt that receives an answer signal”. We define the CarriedSwitching Efficiency of the ‘Finding B-Terminal’ service as a ratio of the flow intensityof the calls reaching the intended B-terminal (Fcs) and receiving an answer signal ‘busytone’ or ‘ringing tone’, to the incoming call attempts intensity (Fa).
The Carried Switching Efficiency corresponds to the concept of “answer bid ratio(ABR)” in [11]: “On a route or a destination code basis and during a specified timeinterval, the ratio of the number of bids that result in an answer signal, to the total numberof bids.”
In the conceptual model considered (c.f. Fig. 7), the calls served in the device ‘carriedswitching’ (Fcs) are those, reaching the B-terminals. The intensity Fcs may be calculatedby taking into account Fa and losses on the way to the cs device (c.f. Fig. 7). This,expressed in two ways – by using the lost call flows and probabilities of successfulmoving of requests along the successful branch, results in the following: a
Fcs = Fa (1 − Pad) (1 − Pid) (1 − Pbs) (1 − Pis) (1 − Pns). (8)
So, the Carried Switching Efficiency (Ecs) of the ‘Finding B-Terminal’ service is:
Ecs =Fcs
Fa= (1 − Pad)(1 − Pid)(1 − Pbs)(1 − Pis)(1 − Pns). (9)
3.3 Repeated Calls Flow
Based on the repeated calls definition [21] and the proposed conceptual model (Figs. 7,8, 9 and 10), the intensity of the repeated attempts (rep.Fa) is:
rep.Fa = Frad + Frid + Frbs + Fris + Frns + Frbr + Fr1 + Fr2 + Fr3, (10)
where Fr1 = Frar + Frac + Frcc1 is the intensity of repeated attempts in Case 1,directed to Connector 4 (c.f. Fig. 8); Fr2 = Frah + Frac + Frcc2 is the intensity ofrepeated attempts in Case 2, directed to Connector 4 (c.f. Fig. 9.); Fr3 = Fram + Frcm
is the intensity of repeated attempts in Case 3, directed to Connector 4 (c.f. Fig. 10).
Proposition 1. The intensity of the repeated attempts rep.Fa may be obtained as:
rep.Fa = Fa(Pad Prad + (1 − Pad)(Pid Prid + (1 − Pid)(Pbs Prbs
+ (1 − Pbs)(Pis Pris + (1 − Pis)(Pns Prns + (1 − Pns)Pbr (Ph Pr2+ (1 − Ph)(Pm Pr3 + (1 − Pm)Prbr)) + (1 − Pbr)Pr1))))),
(11)
where Ph (‘holding’) is the probability of calls going to Case 2 (c.f. Connector 2 inFig. 7), Pm (‘mailing’) is the probability of calls going to Case 3 (c.f. Connector 3 inFig. 7), and:
166 S. Poryazov et al.

Pr1 = Ecs (Pah Prah + (1 − Pah) (Pac Prac + (1 − Pac)Prcc1)); (12)
Pr2 = Ecs Pbr Ph (1 − Par) (Pah Prah + (1 − Pah)(Pac Prac + (1 − Pac)Prcc2)); (13)
Pr3 = Ecs Pbr (1 − Ph) Pm (Pam Pram + (1 − Pam)Prcm). (14)
Proof: As can be seen from Figs. 7, 8, 9 and 10, Assumption 1, and (10), rep.Fa is asum of intensities of repeated attempt flows, in all branches. The intensities of repeatedattempt flows, in all branches, may be easily expressed as functions of Fa, following theconceptual model structure depicted in Figs. 7, 8, 9 and 10:
Frad = Fa Pad Prad; (15)
Frid = Fa (1 − Pad) Pid Prid; (16)
Frbs = Fa (1 − Pad)(1 − Pid) Pbs Prbs; (17)
Fris = Fa (1 − Pad)(1 − Pid)(1 − Pbs)Pis Pris; (18)
Frns = Fa (1 − Pad)(1 − Pid)(1 − Pbs)(1 − Pis)Pns Prns; (19)
Frbr = Fa (1 − Pad)(1 − Pid)(1 − Pbs)(1 − Pis)(1 − Pns)Pbr Prbr; (20)
Fr1 = Fa (1 − Pad)(1 − Pid)(1 − Pbs)(1 − Pis)(1 − Pns)(1 − Pbr) (Pah Prah
+ (1 − Pah)(Pac Prac + (1 − Pac)Prcc1)) = Fa Pr1; (21)
Fr2 = Fa (1 − Pad)(1 − Pid)(1 − Pbs)(1 − Pis)(1 − Pns)Pbr Ph (1 − Par)
(Pah Prah + (1 − Pah)(Pac Prac + (1 − Pac)Prcc2)) = Fa Pr2; (22)
Fr3 = Fa (1 − Pad)(1 − Pid)(1 − Pbs)(1 − Pis)(1 − Pns)Pbr (1 − Ph)Pm
(Pam Pram + (1 − Pam)Prcm) = Fa Pr3. (23)
By adding Eqs. (15) to (23) and taking into account (10), we obtain (11).
Proposition 2. By distinguishing static and dynamic parameters in (11), and after somealgebraic operations, we obtain rep.Fa as a simple function of Fa, Pbr, and Pbs:
rep.Fa = Fa (R1 + R2 Pbr (1 − Pbs) + R3 Pbs), (24)
where:
R1 = Pad Prad + (1 − Pad)(Pid Prid + (1 − Pid) Pis Pris
+ (1 − Pis)(Pns Prns + (1 − Pns) Pr1); (25)
R2 = (1 − Pad)(1 − Pid)(1 − Pis)(1 − Pns)(Ph Pr2 + (1 − Ph)(Pm Pr3+ (1 − Pm)Prbr) − Pr1); (26)
R3 = (1 − Pad)(1 − Pid)(Prbs − (Pis Pris + (1 − Pis)(Pns Prns + (1 − Pns)Pr1))). (27)
Conceptual and Analytical Models for Predicting the Quality of Service 167

3.4 QoS Indicator 2: B-Terminal Connection Efficiency
Definition 2.10. in [11] describes “completed call attempt; effective call attempt” as “A callattempt that receives intelligible information about the state of the called user”.
Based on this, we define the B-Terminal Connection Efficiency as a ratio of the flowintensity of the calls occupying the intended B-terminal (Fb) to the incoming callattempts’ intensity (Fa).
In the considered conceptual model, the calls occupying the B-terminal receive infor‐mation about the state of the called B-user such as signals ‘ringing tone’ (Case 1 in Fig. 8),‘holding signal’ (Case 2 in Fig. 9), or ‘invitation to mailing’ signal (Case 3 in Fig. 10). TheA-user may accept (devices cr, ch, cm) or reject (devices ar, ah, am) the offers.
3.5 B-Terminals’ Characteristics
The intensity of the input flow occupying all B-terminals (Fb) is a sum of the followingintensities of input flows (to B-terminals): Fb1, in Case 1 - Ringing stage (generated inthe copy device in Fig. 8); Fb2, in Case 2 - Communication stage (generated in the copydevice in Fig. 9); and Fb3, in Case 3 - Communication stage (generated in the copydevice in Fig. 10), or:
Fb = Fb1 + Fb2 + Fb3. (28)
The flow intensities Fb1, Fb2 and Fb3 can be calculated by considering the intensityof the carried switching flow Fcs. From Figs. 7, 8, 9 and 10, we obtain directly:
Fb1 = Fcs (1 − Pbr) (29)
Fb2 = Fcs Pbr Ph (1 − Pah) (30)
Fb3 = Fcs Pbr (1 − Ph)Pm (1 − Pam) (31)
After summation, we obtain Fb as:
Fb = Ecs Fa ((1 − Pbr) + Pbr (Ph (1 − Pah)
+ (1 − Ph)Pm (1 − Pam))) = Eb Fa(32)
where Fb is the B-Terminal Connection Efficiency, or shortly ‘B-Efficiency’. B-Efficiency (Eb) is expressed as a ratio of flow intensity, occupying B-terminals (Fb),to the intensity of the incoming flow (Fa). It is considerably different from theCarried Switching Efficiency (Ecs):
Eb =Fb
Fa= Ecs((1 − Pbr) + Pbr (Ph (1 − Pah) + (1 − Ph)Pm (1 − Pam))). (33)
Flow of Call Attempts, Occupying all B-TerminalsTraffic intensity to B-terminals (Yb) is a sum of traffic intensities (to them) in cases 1, 2, and3. From Figs. 8, 9 and 10 and the Little’s theorem, we can obtain directly the following:
168 S. Poryazov et al.
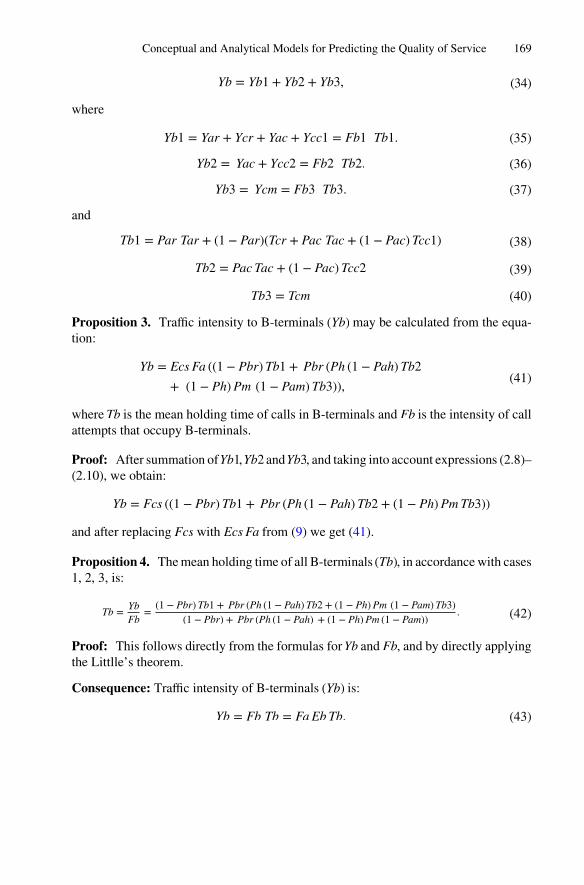
Yb = Yb1 + Yb2 + Yb3, (34)
where
Yb1 = Yar + Ycr + Yac + Ycc1 = Fb1 Tb1. (35)
Yb2 = Yac + Ycc2 = Fb2 Tb2. (36)
Yb3 = Ycm = Fb3 Tb3. (37)
and
Tb1 = Par Tar + (1 − Par)(Tcr + Pac Tac + (1 − Pac)Tcc1) (38)
Tb2 = Pac Tac + (1 − Pac)Tcc2 (39)
Tb3 = Tcm (40)
Proposition 3. Traffic intensity to B-terminals (Yb) may be calculated from the equa‐tion:
Yb = Ecs Fa ((1 − Pbr)Tb1 + Pbr (Ph (1 − Pah)Tb2+ (1 − Ph)Pm (1 − Pam)Tb3)), (41)
where Tb is the mean holding time of calls in B-terminals and Fb is the intensity of callattempts that occupy B-terminals.
Proof: After summation of Yb1, Yb2 and Yb3, and taking into account expressions (2.8)–(2.10), we obtain:
Yb = Fcs ((1 − Pbr)Tb1 + Pbr (Ph (1 − Pah)Tb2 + (1 − Ph)Pm Tb3))
and after replacing Fcs with Ecs Fa from (9) we get (41).
Proposition 4. The mean holding time of all B-terminals (Tb), in accordance with cases1, 2, 3, is:
Tb =Yb
Fb=
(1 − Pbr)Tb1 + Pbr (Ph (1 − Pah)Tb2 + (1 − Ph)Pm (1 − Pam)Tb3)(1 − Pbr) + Pbr (Ph (1 − Pah) + (1 − Ph)Pm (1 − Pam))
. (42)
Proof: This follows directly from the formulas for Yb and Fb, and by directly applyingthe Littlle’s theorem.
Consequence: Traffic intensity of B-terminals (Yb) is:
Yb = Fb Tb = Fa Eb Tb. (43)
Conceptual and Analytical Models for Predicting the Quality of Service 169

3.6 A-Terminals’ Characteristics
In this subsection, analytical expressions characterizing all A-terminals (traffic intensity(Ya), intensity of occupation flow (Fa), holding time (Ta)) are obtained, as functions ofknown variables.
Proposition 5. A-terminals’ traffic intensity (Ya) is:
Ya = Ya0 + Ya1 + Ya2 + Ya3 = Fa Ta, (44)
where
Ya0 = Yed + Yad + Yid + Ycd + Ybs + Yis + Yns + Ycs (45)
Ya1 = Yb1, (46)
Ya2 = Yah + Ych + Yb2, (47)
Ya3 = Yem + Yam + Yb3. (48)
Proof: Based on the proposed conceptual model and Figs. 7, 8, 9 and 10, and byapplying the Little’s theorem, we can obtain the traffic intensity for each virtual device,in a0 (Ya0), a 1 (Ya1), a 2 (Ya2), and a3 (Ya3) blocks, of stages Dialing(Yed, Yad, Yid, Ycd), Switching (Ybs, Yis, Yns, Ycs), Holding (Yah, Ych), and Mailing(Yem, Yam), and by using the found traffic intensities of B-terminals (Yb1, Yb2, Yb3).
After summation, we obtain the following:
Ya = Fa Ta = Fa (Ted + Pad Tad + (1 − Pad)(Pid Tid + (1 − Pid)(Tcd + Pbs Tbs
+ (1 − Pbs)(Pis Tis + (1 − Pis)(Pns Tns + (1 − Pns)(Tcs + (1 − Pbr)Tb1 + Pbr (Tbr
+ Ph (Pah Tah + (1 − Pah)(Tch + Tb2)+ (1 − Ph)Pm (Tem + Pam Tam + (1 − Pam)Tb3))))))))).
(49)
Proposition 6. By distinguishing static and dynamic parameters, the mean holding timeTa of A-terminals is:
Ta = S1 − S2(1 − Pbs)Pbr − S3 Pbs − Ecs (Tb1 + Pbr (−Tb1+ Ph (1 − Pah)Tb2 + (1 − Ph)Pm (1 − Pam)Tb3)), (50)
where S1, S2, and S3 are generalized static parameters:
S1 = Ted + Pad Tad + (1 − Pad)(Pid Tid + (1 − Pid)(Tcd + Pis Tis
+ (1 − Pis)(Pns Tns + (1 − Pns)(Tcs + 2Tb1)))). (51)
S2 = (1 − Pad)(1 − Pid)(1 − Pis)(1 − Pns)(2Tb1 − Tbr − Ph (Pah Tah
+ (1 − Pah)(Tch + 2Tb2)) − (1 − Ph)Pm (Tem + Pam Tam + (1 − Pam)2Tb3)) (52)
S3 = (1 − Pad)(1 − Pid)(Pis Tis − Tbs + (1 − Pis)(Pns Tns + (1 − Pns)(Tcs + 2Tb1))) (53)
Proof: Based on (49) in Proposition 5, obviously:
170 S. Poryazov et al.
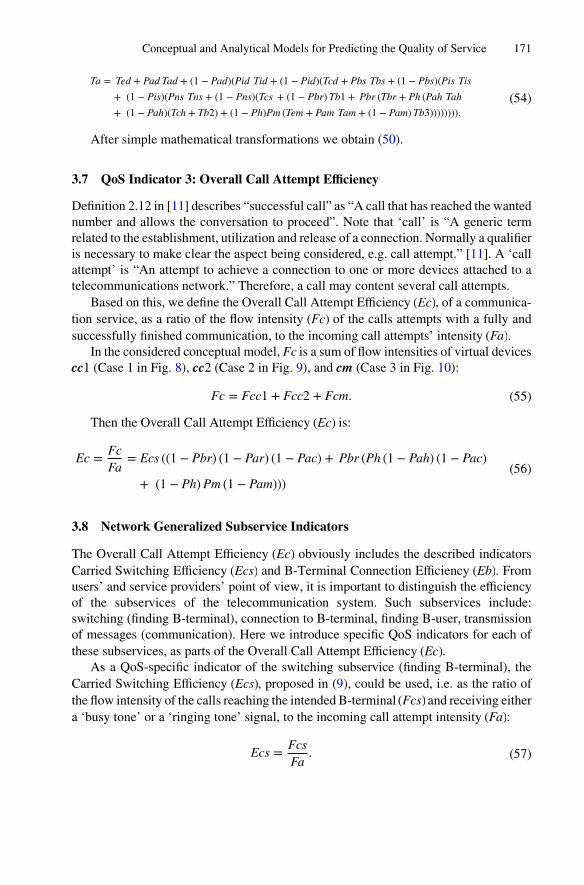
Ta = Ted + Pad Tad + (1 − Pad)(Pid Tid + (1 − Pid)(Tcd + Pbs Tbs + (1 − Pbs)(Pis Tis
+ (1 − Pis)(Pns Tns + (1 − Pns)(Tcs + (1 − Pbr)Tb1 + Pbr (Tbr + Ph (Pah Tah
+ (1 − Pah)(Tch + Tb2) + (1 − Ph)Pm (Tem + Pam Tam + (1 − Pam)Tb3)))))))).(54)
After simple mathematical transformations we obtain (50).
3.7 QoS Indicator 3: Overall Call Attempt Efficiency
Definition 2.12 in [11] describes “successful call” as “A call that has reached the wantednumber and allows the conversation to proceed”. Note that ‘call’ is “A generic termrelated to the establishment, utilization and release of a connection. Normally a qualifieris necessary to make clear the aspect being considered, e.g. call attempt.” [11]. A ‘callattempt’ is “An attempt to achieve a connection to one or more devices attached to atelecommunications network.” Therefore, a call may content several call attempts.
Based on this, we define the Overall Call Attempt Efficiency (Ec), of a communica‐tion service, as a ratio of the flow intensity (Fc) of the calls attempts with a fully andsuccessfully finished communication, to the incoming call attempts’ intensity (Fa).
In the considered conceptual model, Fc is a sum of flow intensities of virtual devicescc1 (Case 1 in Fig. 8), cc2 (Case 2 in Fig. 9), and cm (Case 3 in Fig. 10):
Fc = Fcc1 + Fcc2 + Fcm. (55)
Then the Overall Call Attempt Efficiency (Ec) is:
Ec =Fc
Fa= Ecs ((1 − Pbr) (1 − Par) (1 − Pac) + Pbr (Ph (1 − Pah) (1 − Pac)
+ (1 − Ph)Pm (1 − Pam)))
(56)
3.8 Network Generalized Subservice Indicators
The Overall Call Attempt Efficiency (Ec) obviously includes the described indicatorsCarried Switching Efficiency (Ecs) and B-Terminal Connection Efficiency (Eb). Fromusers’ and service providers’ point of view, it is important to distinguish the efficiencyof the subservices of the telecommunication system. Such subservices include:switching (finding B-terminal), connection to B-terminal, finding B-user, transmissionof messages (communication). Here we introduce specific QoS indicators for each ofthese subservices, as parts of the Overall Call Attempt Efficiency (Ec).
As a QoS-specific indicator of the switching subservice (finding B-terminal), theCarried Switching Efficiency (Ecs), proposed in (9), could be used, i.e. as the ratio ofthe flow intensity of the calls reaching the intended B-terminal (Fcs) and receiving eithera ‘busy tone’ or a ‘ringing tone’ signal, to the incoming call attempt intensity (Fa):
Ecs =Fcs
Fa. (57)
Conceptual and Analytical Models for Predicting the Quality of Service 171

Definition 1. A QoS-specific indicator (Qb) of the subservice ‘Connection to B-terminal’ is the ratio of the intensity of the flow seizing B-terminals (Fb) to the flowintensity of all calls reaching the intended B-terminal (Fcs):
Qb =Fb
Fcs. (58)
Definition 2. A QoS-specific indicator (Qu) of the subservice ‘Finding B-user’ is theratio of the intensity of the flow seizing B-users (Fu) to the intensity of the flow seizingB-terminals (Fb):
Qu =Fu
Fb. (59)
The intensity of the flow seizing B-users (Fu) is a sum of intensities of the flows:after ringing Fb1 − (Far + Fcr) in Case 1 (c.f. Fig. 8); after holding Fb2 in Case 2 (c.f.Fig. 9.); and of the carried mailing Fb3:
Fu = Fb1 − Far − Fcr + Fb2 + Fb3. (60)
Definition 3. A QoS-specific indicator (Qc) of the communication subservice is theratio of the flow intensity of call attempts with fully successfully finished communication(Fc) to the intensity of the flow seizing B-users (Fu):
Qc =Fc
Fu. (61)
The proposed specific QoS indicators of telecommunication subservices are aggre‐gated because: they aggregate many call attempts from many users and terminals (theyare stochastic); some of them comprise several parallel services, e.g. Qc includes threesuccessful cases – normal interactive communication, communication after call holding,and mailing.
Considering the Overall Call Attempt Efficiency (Ec) as a composition of the fourconsidered subservices, one may find that the quality metric is multiplicative:
Ec =Fc
Fa=
Fcs
Fa
Fb
Fcs
Fu
Fb
Fc
Fu= Ecs Qb Qu Qc. (62)
This result allows more specific QoS analysis and more adequate QoS management.
3.9 AB-Terminals’ Characteristics
In this subsection, analytical expressions of characteristics of AB-terminals (all occupiedcalling terminals (A) and called terminals (B)) – i.e. traffic intensity (Yab), intensity ofoccupation flow (Fab), and holding time (Tab) – are obtained as functions of knownvariables.
172 S. Poryazov et al.
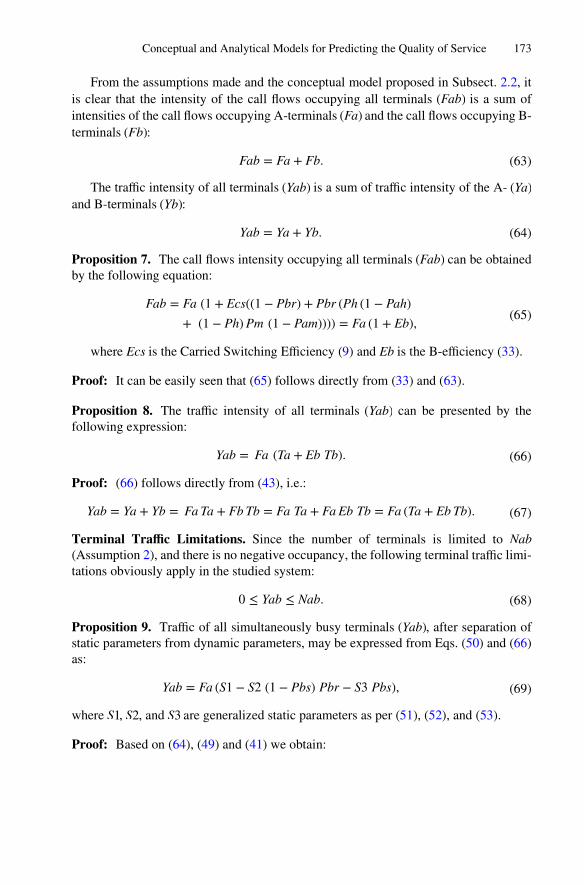
From the assumptions made and the conceptual model proposed in Subsect. 2.2, itis clear that the intensity of the call flows occupying all terminals (Fab) is a sum ofintensities of the call flows occupying A-terminals (Fa) and the call flows occupying B-terminals (Fb):
Fab = Fa + Fb. (63)
The traffic intensity of all terminals (Yab) is a sum of traffic intensity of the A- (Ya)
and B-terminals (Yb):
Yab = Ya + Yb. (64)
Proposition 7. The call flows intensity occupying all terminals (Fab) can be obtainedby the following equation:
Fab = Fa (1 + Ecs((1 − Pbr) + Pbr (Ph (1 − Pah)
+ (1 − Ph)Pm (1 − Pam)))) = Fa (1 + Eb), (65)
where Ecs is the Carried Switching Efficiency (9) and Eb is the B-efficiency (33).
Proof: It can be easily seen that (65) follows directly from (33) and (63).
Proposition 8. The traffic intensity of all terminals (Yab) can be presented by thefollowing expression:
Yab = Fa (Ta + Eb Tb). (66)
Proof: (66) follows directly from (43), i.e.:
Yab = Ya + Yb = Fa Ta + Fb Tb = Fa Ta + Fa Eb Tb = Fa (Ta + Eb Tb). (67)
Terminal Traffic Limitations. Since the number of terminals is limited to Nab
(Assumption 2), and there is no negative occupancy, the following terminal traffic limi‐tations obviously apply in the studied system:
0 ≤ Yab ≤ Nab. (68)
Proposition 9. Traffic of all simultaneously busy terminals (Yab), after separation ofstatic parameters from dynamic parameters, may be expressed from Eqs. (50) and (66)as:
Yab = Fa (S1 − S2 (1 − Pbs) Pbr − S3 Pbs), (69)
where S1, S2, and S3 are generalized static parameters as per (51), (52), and (53).
Proof: Based on (64), (49) and (41) we obtain:
Conceptual and Analytical Models for Predicting the Quality of Service 173
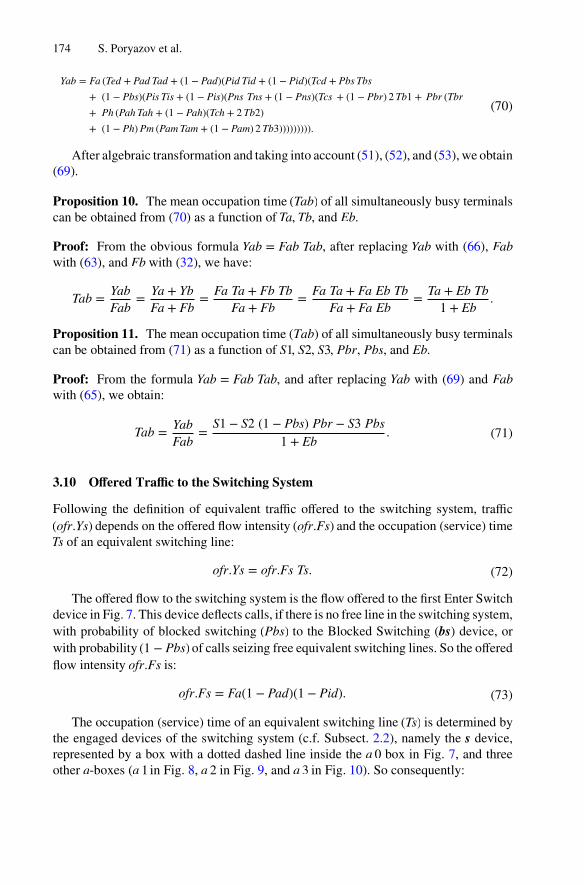
Yab = Fa (Ted + Pad Tad + (1 − Pad)(Pid Tid + (1 − Pid)(Tcd + Pbs Tbs
+ (1 − Pbs)(Pis Tis + (1 − Pis)(Pns Tns + (1 − Pns)(Tcs + (1 − Pbr) 2 Tb1 + Pbr (Tbr
+ Ph (Pah Tah + (1 − Pah)(Tch + 2 Tb2)+ (1 − Ph)Pm (Pam Tam + (1 − Pam) 2 Tb3))))))))).
(70)
After algebraic transformation and taking into account (51), (52), and (53), we obtain(69).
Proposition 10. The mean occupation time (Tab) of all simultaneously busy terminalscan be obtained from (70) as a function of Ta, Tb, and Eb.
Proof: From the obvious formula Yab = Fab Tab, after replacing Yab with (66), Fab
with (63), and Fb with (32), we have:
Tab =Yab
Fab=
Ya + Yb
Fa + Fb=
Fa Ta + Fb Tb
Fa + Fb=
Fa Ta + Fa Eb Tb
Fa + Fa Eb=
Ta + Eb Tb
1 + Eb.
Proposition 11. The mean occupation time (Tab) of all simultaneously busy terminalscan be obtained from (71) as a function of S1, S2, S3, Pbr, Pbs, and Eb.
Proof: From the formula Yab = Fab Tab, and after replacing Yab with (69) and Fab
with (65), we obtain:
Tab =Yab
Fab=
S1 − S2 (1 − Pbs) Pbr − S3 Pbs
1 + Eb. (71)
3.10 Offered Traffic to the Switching System
Following the definition of equivalent traffic offered to the switching system, traffic(ofr.Ys) depends on the offered flow intensity (ofr.Fs) and the occupation (service) timeTs of an equivalent switching line:
ofr.Ys = ofr.Fs Ts. (72)
The offered flow to the switching system is the flow offered to the first Enter Switchdevice in Fig. 7. This device deflects calls, if there is no free line in the switching system,with probability of blocked switching (Pbs) to the Blocked Switching (bs) device, orwith probability (1 − Pbs) of calls seizing free equivalent switching lines. So the offeredflow intensity ofr.Fs is:
ofr.Fs = Fa(1 − Pad)(1 − Pid). (73)
The occupation (service) time of an equivalent switching line (Ts) is determined bythe engaged devices of the switching system (c.f. Subsect. 2.2), namely the s device,represented by a box with a dotted dashed line inside the a 0 box in Fig. 7, and threeother a-boxes (a 1 in Fig. 8, a 2 in Fig. 9, and a 3 in Fig. 10). So consequently:
174 S. Poryazov et al.
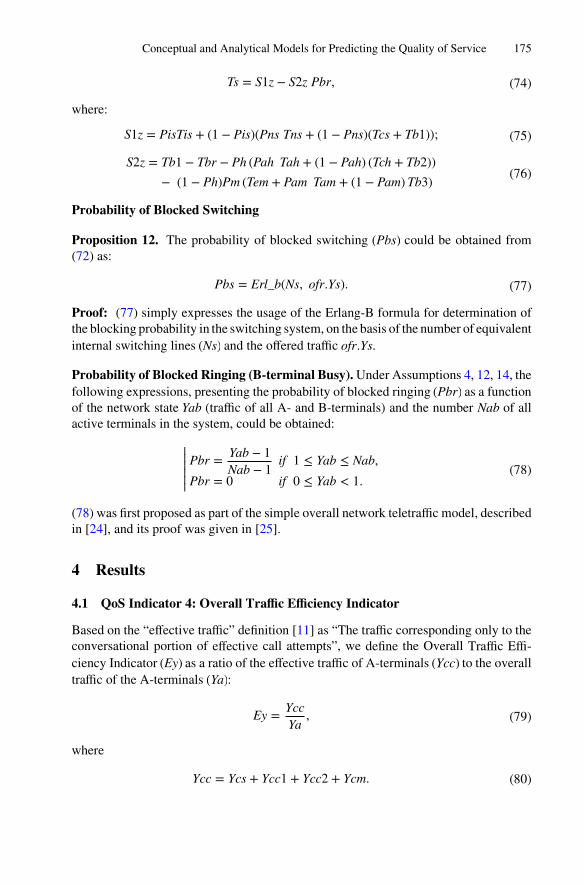
Ts = S1z − S2z Pbr, (74)
where:
S1z = PisTis + (1 − Pis)(Pns Tns + (1 − Pns)(Tcs + Tb1)); (75)
S2z = Tb1 − Tbr − Ph (Pah Tah + (1 − Pah) (Tch + Tb2))− (1 − Ph)Pm (Tem + Pam Tam + (1 − Pam)Tb3) (76)
Probability of Blocked Switching
Proposition 12. The probability of blocked switching (Pbs) could be obtained from(72) as:
Pbs = Erl_b(Ns, ofr.Ys). (77)
Proof: (77) simply expresses the usage of the Erlang-B formula for determination ofthe blocking probability in the switching system, on the basis of the number of equivalentinternal switching lines (Ns) and the offered traffic ofr.Ys.
Probability of Blocked Ringing (B-terminal Busy). Under Assumptions 4, 12, 14, thefollowing expressions, presenting the probability of blocked ringing (Pbr) as a functionof the network state Yab (traffic of all A- and B-terminals) and the number Nab of allactive terminals in the system, could be obtained:
||||||Pbr =
Yab − 1Nab − 1
if 1 ≤ Yab ≤ Nab,Pbr = 0 if 0 ≤ Yab < 1.
(78)
(78) was first proposed as part of the simple overall network teletraffic model, describedin [24], and its proof was given in [25].
4 Results
4.1 QoS Indicator 4: Overall Traffic Efficiency Indicator
Based on the “effective traffic” definition [11] as “The traffic corresponding only to theconversational portion of effective call attempts”, we define the Overall Traffic Effi‐ciency Indicator (Ey) as a ratio of the effective traffic of A-terminals (Ycc) to the overalltraffic of the A-terminals (Ya):
Ey =Ycc
Ya, (79)
where
Ycc = Ycs + Ycc1 + Ycc2 + Ycm. (80)
Conceptual and Analytical Models for Predicting the Quality of Service 175

The Overall Traffic Efficiency Indicator is used for simpler models in [7]. Someauthors use the name “Overall Traffic Efficiency” in other meaning, and without anydefinition, e.g. [26].
4.2 Numerical Results
The input data considered is typical for voice communications in the Global System forMobile communication (GSM). For simplicity we set M (defined in the explanations ofFig. 7) to 0.
Figure 11 presents results (as functions of the state of the network load – the trafficof all AB-terminals Yab, in the theoretical interval [0, 100]) for a network with blockingprobability due to insufficient resources. The number of all terminals (Nab) in the systemis 1000 and the number of equivalent switching lines is Ns = 200 (i.e. 20% of Nab).
Fig. 11. The values of the main output parameters of the model of an overall network with limitedcapacity.
The probability of finding B-terminal busy (Pbr), not shown in Fig. 11, increaseslinearly with the network traffic load, c.f. (78), to almost 1. The numerical resultsdemonstrate the existence of a local maximum for the probability of blocked switchingPbs. This is because the overall blocking probability in the network, including Pbr andPbs, has an absolute maximum of 1, c.f. Fig. 12.
176 S. Poryazov et al.

Fig. 12. The causal aggregated overall pie probabilities
4.3 Overall Pie Parameters
In the model considered (c.f. Figs. 7, 8, 9 and 10), there are five reasons for call attemptending: abandoning (6 branches), interruption (1 branch), blocking (2 branches),unavailable service (1 branch), and successful communication (3 branches). Bydescribing the effect caused by each reason, one can construct a ‘causal branch’ for it.The causal branch comprises all basic virtual devices involved in the call attempt endingdue the considered reason, which form the corresponding causal complex virtual devicewith its flow-, time-, and traffic characteristics. Overall, in the model, there are 13 causalbranches considered.
The three branches of successful communication have the following service timesTp.cc1, Tp.cc2, and Tp.cm:
Tp.cc1 = Ted + Tcd + Tcs + Tcr + Tcc1; (81)
Tp.cc2 = Ted + Tcd + Tcs + Tch + Tcc2; (82)
Tp.cm = Ted + Tcd + Tcs + Tem + Tcm. (83)
The pie flow intensities, of the three subcases of successful communication, coincidewith the flow intensity of the last virtual device in the causal branch, respectively:Fp.cc1 = Fcc1; Fp.cc2 = Fcc2 and Fp.cm = Fcm.
The pie flow probabilities of the three branches of successful communication respec‐tively are:
Conceptual and Analytical Models for Predicting the Quality of Service 177

Pp.cc1 =Fp.cc1
Fa; Pp.cc2 =
Fp.cc2Fa
; Pp.cm =Fp.cm
Fa. (84)
The pie traffic intensities of the three branches of successful communication are:
Yp.cc1 =Fp.cc1 Tp.cc1
Ya; Yp.cc2 =
Fp.cc2 Tp.cc2Ya
; Yp.cm =Fp.cm Tp.cm
Ya. (85)
By analogy, one may easily obtain all other overall pie probabilities, pie flows, andpie traffic intensities in the model, by using the normalized parameters found in Sect. 3.
4.4 Causal Aggregated Overall Pie Parameters
The overall causal branches may be aggregated as might be needed for telecommuni‐cation system monitoring, design, or management. A usable aggregation is the causalaggregation of all the branches corresponding to one type of call attempts ending.
For instance, for the case of successful communication, one can express the aggre‐gated parameters of the branches of the Aggregated Overall Successful Carried Commu‐nication Branch, considered as a complex virtual device p.c. The metrics are additivebecause this is a pie presentation of the model.
The causal aggregated overall pie probability of a call attempt ending with successfulcommunication (Pp.c) is:
Pp.c = Pp.cc1 + Pp.cc2 + Pp.cm. (86)
By taking into account (56), the overall causal pie flow intensity of successfulcommunication (Fp.c) respectively is:
Fp.c = Fp.cc1 + Fp.cc2 + Fp.cm =Fcc1 + Fcc2 + Fcm
Fa=
Fc
Fa= Ec. (87)
The overall causal pie traffic intensity of successful communication (Yp.c) is:
Yp.c = Yp.cc1 + Yp.cc2 + Yp.cm. (88)
Similarly, one may find all other causal aggregated overall pie parameters of themodel.
4.5 Numerical Results for Pie Characteristics
Figures 12 and 13 present numerical results for the causal overall pie probabilities andtraffic intensities for each of the five reasons for call attempt ending (i.e. abandoning p.a, interrupting p.i, blocking p.b, service not available p.n, and successful communicationp.c) as functions of the network traffic load.
178 S. Poryazov et al.

Fig. 13. The causal aggregated overall pie traffic intensities
The overall pie characteristics and their causal aggregations may be considered andused as causal-oriented QoS indicators. They allow more precise estimation of thedynamic importance of each reason for call attempt ending and thus a more precisedynamic effort targeting of the QoS management.
5 Conclusion
The presented modeling approach and corresponding numerical results demonstrate thebig potential and importance of the overall teletraffic models of telecommunicationsystems with QoS guarantees.
Such models allow prediction of many overall QoS indicators as regards the flow-,time-, and traffic characteristics of the A-, B-, and AB-terminals and users, as well as ofthe overall network performance.
The approach makes easy the separation of an overall telecommunication serviceinto different subservices with specific QoS indicators for each of them.
In this chapter, the newly proposed indicators are network-oriented or terminal-oriented. The model, however, is suitable for the development of user-oriented indicatorsas well. This will be a task for future research.
Applying pie characteristics and their causal aggregations to the subservices resultsin causal-oriented QoS indicators. This allows a more precise estimation of the dynamicimportance of each reason, in every subservice, of call attempt ending, and thus a moreprecise dynamic effort targeting of the QoS management. Applying a similar approach(with specific QoS indicators) for multimedia and multiservice networks seems veryattractive and promising.
Conceptual and Analytical Models for Predicting the Quality of Service 179
Another important goal could be the development of methods for using specific QoSindicators as sources for predicting QoE indicators.
Acknowledgments. This work was coordinated under the EU COST Action IC1304“Autonomous Control for a Reliable Internet of Services (ACROSS)”. The work was partiallyfunded by the Bulgarian NSF Projects DCOST 01/9 (the work of S. Poryazov) and DCOST 01/20(the work of E. Saranova).
References
1. ITU-T Recommendation E.800: Definitions of terms related to quality of service, September2008
2. Martin, V., Zwickl, P., Reichl, P., Xie, M., Schulzrinne, H.: From Service Level Agreements(SLA) to Experience Level Agreements (ELA): the challenges of selling QoE to the user. In:Proceedings of IEEE ICC QoE-FI, London, June 2015. https://doi.org/10.1109/iccw.2015.7247432. ISSN 2164-7038
3. Möller, S., Raake, A.: Quality of Experience: Advanced Concepts, Applications and Methods.Springer, Cham (2014). https://doi.org/10.1007/978-3-319-02681-7
4. Reichl, P.: Quality of experience in convergent communication ecosystems. In: Lugmayr, A.,Dal Zotto, C. (eds.) The Media Convergence Handbook, vol. 2, pp. 225–244. Springer,Heidelberg (2016). https://doi.org/10.1007/978-3-642-54487-3_12
5. Fiedler, M.: Teletraffic models for Quality of Experience assessment. In: Tutorial at 23rdInternational Teletraffic Congress (ITC 23), San Francisco, CA, September 2011. http://i-teletrafic.org/_Resources/Persistent/9269df1c3dca0bf58ee715c3b9afabbc71d4fb26/fiedler11.pdf. Accessed 20 July 2017
6. Poryazov, S.A., Saranova, E.T.: Some general terminal and network teletraffic equations invirtual circuit switching systems. In: Nejat Ince, A., Topuz, E. (eds.) Modeling and SimulationTools for Emerging Telecommunications Networks, Chap. 24, pp. 471–505. Springer, Boston(2006). https://doi.org/10.1007/0-387-34167-6_24. ISBN-10 0-387-32921-8 (HB)
7. Poryazov, S., Saranova, E.: Models of Telecommunication Networks with Virtual ChannelSwitching and Applications, p. 238. Prof. Marin Drinov, Academic Publishing House, Sofia(2012). ISBN 978-954-322-540-8
8. Ericsson, T.: Understanding Telecommunications, Book 2, 673 pages. Chartwell-Bratt,Bromley (1998). ISBN 91-44-00214-9
9. Poryazov, S., Saranova, E.: Overall QoS referencing in telecommunication systems – somecurrent concepts and open issues. Int. J. Inf. Technol. Knowl. 5(4), 424–452 (2011). ITHEA.ISSN 1313-0455
10. Soanes, C., Stevenson, A. (eds.): Concise Oxford English Dictionary, 11th edn. OxfordUniversity Press, Oxford (1911)
11. ITU-T Recommendation E.600: Terms and definitions of traffic engineering, March 199312. Böhm, C., Jacopini, G.: Flow diagrams, turing machines and languages with only two
formation rules. Comm. ACM 9, 366–371 (1966)13. ITU-T Recommendation Q.850: Usage of cause and location in the Digital Subscriber
Signalling System No. 1 and the Signalling System No. 7 ISDN user part, May 199814. ITU-T Recommendation E.425: Network management – Internal automatic observations,
March 200215. Cisco Unified Communications Manager Call Detail Records Administration Guide, Release
8.5(1). Text Part Number: OL-22521-01, p. 172. Cisco Systems (2010)
180 S. Poryazov et al.
http://i-teletrafic.org/_Resources/Persistent/9269df1c3dca0bf58ee715c3b9afabbc71d4fb26/fiedler11.pdf
http://i-teletrafic.org/_Resources/Persistent/9269df1c3dca0bf58ee715c3b9afabbc71d4fb26/fiedler11.pdf
16. Henggeler, A.C., Craveirinha, J., Clímaco, J., Barrico, C.: A multiple objective routingalgorithm for integrated communication networks. In: Key, P., Smith, D. (eds.) Proceedingsof the ITC-16, vol. 3B, p. 14. Elsevier Science B. V. (1999). http://di.ubi.pt/~cbarrico/Investigacao/Downloads/16th_International_Teletraffic_Congress_99.pdf. Accessed 17 July2017
17. ITU-T Recommendation Y.1541: Network performance objectives for IP-based services,February 2006
18. ITU-T Recommendation E.360.1: Framework for QoS routing and related traffic engineeringmethods for IP-, ATM-, and TDM-based multiservice networks, May 2002
19. Poryazov, S., Saranova, E.: On the minimal state tuple of VNET with overall QoS guaranties.In: IEEE 19th Telecommunications Forum TELFOR 2011, Belgrade, Serbia, 22–24November 2011. IEEE Catalog Number CFP1198P-CDR. ISBN 978-1-4577-1498-6
20. ITU-T Recommendation X.501: International standard ISO/IEC 9594-2, ITU-TRecommendation X.501. Information technology – Open Systems Interconnection – TheDirectory: Models, August 2005
21. ITU-T Recommendation E.501: Estimation of Traffic Offered in The Network, May 199722. Poryazov, S.A.: What is offered traffic in a real telecommunication network? In: Liang,
X.J., Xin, Z.H., Iversen, V.B., Kuo, G.S. (eds.) 19th International Teletraffic Congress,Beijing, China, August 29–September 2 2005, vol. 6a, pp. 707–718. Beijing University ofPosts and Telecommunications Press. https://itc-conference.org/_Resources/Persistent/321454b378f49b23d9a04e23dd5a5fe58da7ad60/poryazov05.pdf. Accessed Mar 2017
23. Little, J.D.C.: A proof of the queueing formula L = λW. Oper. Res. 9(1961), 383–387 (1961)24. Poryazov, S.: Determination of the probability of finding B-subscriber busy in telephone
systems with decentralized control. Comptes Rendus de l’Academie Bulgare des Sciences –Sofia 44(3), 37–39 (1991)
25. Poryazov, S.: The B-terminal busy probability prediction. IJ Inf. Theor. Appl. 11(4), 409–415 (2004)
26. de Souza, A.M., Brennand, C.A.R.L., Yokoyama, R.S., Donato, E.A., Madeira, E.R.M., Villas,L.A.: Traffic management systems: a classification, review, challenges, and future perspectives.Int. J. Distrib. Sens. Netw. 13(4), 14 (2017). https://doi.org/10.1177/1550147716683612
Open Access This chapter is licensed under the terms of the Creative Commons Attribution 4.0International License (http://creativecommons.org/licenses/by/4.0/), which permits use, sharing,adaptation, distribution and reproduction in any medium or format, as long as you give appropriatecredit to the original author(s) and the source, provide a link to the Creative Commons licenseand indicate if changes were made.
The images or other third party material in this chapter are included in the chapter’s CreativeCommons license, unless indicated otherwise in a credit line to the material. If material is notincluded in the chapter’s Creative Commons license and your intended use is not permitted bystatutory regulation or exceeds the permitted use, you will need to obtain permission directly fromthe copyright holder.
Conceptual and Analytical Models for Predicting the Quality of Service 181
QoS-Based Elasticity for Service Chainsin Distributed Edge Cloud Environments
Valeria Cardellini1 , Tihana Galinac Grbac2(B) , Matteo Nardelli1 ,Nikola Tankovic3 , and Hong-Linh Truong4
1 University of Rome Tor Vergata, Rome, Italy{cardellini,nardelli}@ing.uniroma2.it
2 University of Rijeka, Rijeka, [email protected]
3 Juraj Dobrila University of Pula, Pula, [email protected] TU Wien, Vienna, Austria
Abstract. With the emerging IoT and Cloud-based networked systemsthat rely heavily on virtualization technologies, elasticity becomes a dom-inant system engineering attribute for providing QoS-aware services totheir users. Although the concept of elasticity can introduce significantQoS and cost benefits, its implementation in real systems is full of chal-lenges. Indeed, nowadays systems are mainly distributed, built upon sev-eral layers of abstraction, and with centralized control mechanisms. Insuch a complex environment, controlling elasticity in a centralized man-ner might strongly penalize scalability. To overcome this issue, we canconveniently split the system in autonomous subsystems that implementelasticity mechanisms and run control policies in a decentralized manner.To efficiently and effectively cooperate with each other, the subsystemsneed to communicate among themselves to determine elasticity deci-sions that collectively improve the overall system performance. This newarchitecture calls for the development of new mechanisms and efficientpolicies. In this chapter, we focus on elasticity in IoT and Cloud-basedsystems, which can be geo-distributed also at the edge of the networks,and discuss its engineering perspectives along with various coordinationmechanisms. We focus on the design choices that may affect the elas-ticity properties and provide an overview of some decentralized designpatterns related to the coordination of elasticity decisions.
1 Introduction
Elasticity is a quality attribute that is widely used in virtual environmentstogether with the “as a service” paradigm to deal with on-demand changes.Although elasticity is multi-dimensional [27,72], in most cases, elasticity tech-niques just focus on offering elastic resources on demand and dynamically provi-sion them to fluctuating workload needs based on the “pay-per-use” concept [23].
c© The Author(s) 2018I. Ganchev et al. (Eds.): Autonomous Control for a Reliable Internet of Services, LNCS 10768, pp. 182–211, 2018.https://doi.org/10.1007/978-3-319-90415-3_8

QoS-Based Elasticity for Service Chains in Edge Cloud Environments 183
In this sense, elasticity mechanisms automatize the process of reconfiguring vir-tualized resources, mostly at infrastructural levels, at runtime with the goal ofsustaining offered Quality of Service (QoS) levels and optimizing resource cost.
Due to its usefulness, there are many works that have addressed issuesrelated to elasticity [23]. However, most of them discuss elasticity in specificenvironments, such as Cloud systems in centralized, large-scale data centers(e.g., [46]), edge/fog-based systems (e.g., [54]), network function virtualization(NFV) (e.g. [67]), except a few works that consider Internet of Things (IoT)Cloud systems, e.g., [70]. In this chapter, we investigate how distributed systemscan be efficiently executed in the emerging context resulting from the conver-gence of IoT, NFV, edge systems, and Clouds. More precisely, our goal is tosurvey elasticity needs, mechanisms, and policies for geo-distributed systems run-ning over multiple edge/fog1 and Cloud infrastructures. Furthermore, we presentseveral design patterns that help to efficiently decentralize and coordinate theelasticity control of such systems. The main contributions of this chapter are thefollowing:
– We present how the emerging computing paradigms and technologies help torealize elastic systems, which can execute with guaranteed QoS even in faceof changing running conditions.
– We survey the key elasticity properties and techniques that have been pre-sented so far in the related literature. Specifically, we survey the approachesthat enable elasticity at different stages of the system life time, distinguishingbetween design-time and runtime.
– Motivated by the scalability limitation of distributed complex systems, wepropose different coordination patterns for decentralized elasticity control.The latter represent architectural design guidelines that help to oversee largescale systems with the aim to improve performance and reliability withoutcompromising scalability.
– We describe the main challenges of nowadays systems so to identify researchdirections that are worth of investigation, in order to develop seamlessly elas-tic systems that can operate over geo-distributed and Cloud-supported edgeenvironments.
The rest of the chapter is organized as follows. In Sect. 2 we provide anoverview about elasticity. In Sect. 3 we briefly present the large-scale distributedsystems we focus on in this chapter, that is systems of IoT, NFV and Cloudsand discuss their elasticity coordination needs. In Sect. 4 we provide an overviewof optimization approaches used to take elasticity choices. In Sect. 5 we presentsome design patterns that can be used in distributed edge Cloud environmentsto coordinate elasticity decisions in a decentralized fashion. In Sect. 6 we discusssome research challenges for elasticity control. We conclude the chapter in Sect. 7with some final remarks.
1 From our point of view, in this chapter we consider edge computing as interchange-able with fog computing, although we are aware that some differences exist [53].
184 V. Cardellini et al.
2 Overview of Elasticity
Elasticity has become one of the key attributes of self-adaptive software systems.Although it has been and is widely investigated, there is no unique consensusrelated to elasticity definition. The most frequently used definition of elasticityhas been formulated by Herbst et al. [36] as follows: “Elasticity is the degree towhich a system is able to adapt to workload changes by provisioning and depro-visioning resources in an autonomic manner, such that at each point in time theavailable resources match the current demand as closely as possible”. The elastic-ity quality attribute is tightly related to the scalability and efficiency attributes.Scalability addresses a typically static system attribute related to the abilityof a system to adjust its resources to changing load. However, volatile softwareenvironments demand a continuous adaptation process [78], which yields con-siderable additional costs if applied manually. Another, closely related qualityattribute is efficiency, that is related to the amount of the resources consumedto process traffic needs. Traditionally, these terms were related to a static sys-tem configuration and not considered in terms of dynamical system architecturemodels.
With the emergence of virtualization technologies, especially lightweight onessuch as containers [12] and unikernels [13], there are new automation possibili-ties no longer related to the physical scaling of system resources, but rather tothe dynamic adaptation of the system to deal with changing environment condi-tions. System/application components can scale out according to traffic needs toaccommodate changes in the traffic volumes and avoid SLA violations, and canscale in to save energy and costs caused by over–dimensioning. Virtualizationtechnologies have opened new possibilities to system automation and implemen-tation of elastic attribute into dynamic systems. However, when implementedin real systems, the beneficial effects of elasticity can be limited mainly by thespeed of the system adaptation process and by the precision in aligning the allo-cated virtual resources to the temporal resource demands. Therefore, dynamicadaptation models have also to consider limitations of real systems to adapttimely and precisely.
The main aim of dynamic adaptation models is to exploit optimization algo-rithms that guide elastic decisions at runtime, as traffic changes for the best QoSand cost gains, while considering a large combinatorial set of architectural designoptions that are no longer manageable by human designers [77]. Optimizationsolutions can be categorized according to several key aspects [4]:
– Which software attributes are to be optimized? Every software attribute forwhich a representing quantifiable model can be provided is a candidate tobe used in the quality evaluation function. Quality attributes also includeeconomical attributes, such as associated costs [10], among which operationalinfrastructure costs prevail in the Cloud era [27]. According to the selectedquality attributes, optimization approaches can be single- or multi-objective.
– What design choices are considered under optimization? In order to pro-vide an automatized optimization process, a machine-readable format of the
QoS-Based Elasticity for Service Chains in Edge Cloud Environments 185
software architecture is required. These can vary from formal models, UMLmodels, or models in different architectural languages such as ADL. On topof that model, there must also exist an unambiguous definition of what com-binatorial, categorical or ordinal variables are to be considered in forming anoptimization search space. These definitions may also yield additional designconstraints, which exclude some of the combinations due to some architecturalconstraints (e.g., applying certain architectural style). In literature, these vari-ables are referred as architectural degrees of freedom (DoF) [42].
– In which phase does optimization take place? According to this dimension,solutions vary from design-time optimization to runtime optimization meth-ods. In design-time approaches, the system is first modeled in the desiredlanguage where optimization is performed on derived models according tospecific quality attributes. These can include block diagrams, Markov chains,queuing networks, Petri nets with quality attributes predicted by using acomputer simulation or analytical models when they are available in closedform. Runtime approaches are generally simpler due to stringent executionspeed and overhead constraints, so they often consider optimizing only asingle attribute or they naively combine several attributes using the simpleadditive weighting (SAW) method [39].
A thorough literature review of existing optimization methods used in soft-ware architectures was performed in [4]; therefore, we analyze only researchworks that have been conducted afterwards. We focus on emerging systems ofIoT, virtual network functions, and distributed Clouds. We also give specialattention to optimization in the domain of distributed system environments andclassify existing works according to the phase of execution. Furthermore, we con-sider decentralized coordination design patterns that can be employed to realizea distributed elasticity control where elasticity decisions have to be taken atmultiple layers.
3 Systems of IoT, NFV and Clouds and Their ElasticityCoordination Needs
Research works related to elastic architectures and applications spawn multi-ple areas, ranging from embedded systems and information systems design, tosoftware performance engineering and quality attributes [4]. A general observa-tion from all involved research communities is that system complexity generallyincreases and, as such, it is hard to manage and scale, is expensive to maintainand change. A general trend is to define new system architectural models thatdecompose complex system architectures into smaller and easily self-manageableobjects, e.g., microservices [26]. These new system architectures are based on vir-tualization and automatic software provisioning and configuration technologiesto enable dynamic system models that can autonomously adapt to face varyingoperating conditions.
Emerging systems and services are and will be characterized by the inte-gration and convergence of different paradigms and technologies that span from
186 V. Cardellini et al.
IoT, virtual network functions, distributed edge/fog computing, and Cloud com-puting [73]. We briefly review the main features of some of these paradigms andtechnologies prior to analyze their coordination needs.
NFV is a new network architecture framework where network functions,which traditionally used dedicated hardware (e.g., network appliances), areimplemented in software that runs on top of general purpose hardware, exploit-ing virtualization technologies. Virtual network functions can be interconnectedinto simple service compositions (called chains) to create more complex com-munication services. Component network functions in the service chain can bescaled either vertically or horizontally (i.e., either acquiring more powerful com-puting resources or spawning more replicas of the same virtual network functionand load balancing among them).
Edge and fog computing paradigms provide a distributed computing and stor-age infrastructure located at the edges of the network, resulting in low latencyaccess and faster response times to application requests. These paradigms turnout to be particularly effective in moving computation and storage capabilitiescloser to data production sources (e.g., IoT devices) and data consumption des-tinations, which are heavily dispersed and typically located at the edges of thenetwork. Therefore, they can better meet the requirements of IoT applicationswith respect to the use of a conventional Cloud [64].
Dealing with elasticity for such emerging systems is important and chal-lenging. However, elasticity techniques that have been separately studied forvirtualized systems mainly in large-scale and centralized Cloud data centers orless frequently in distributed edge/fog environments, may not be sufficient toefficiently manage more complex environments that arise from the convergenceof IoT, NFV and Clouds. Figure 1 outlines the concept view of such virtual-ized systems, built atop various views on IoT Cloud [44,70]. With such systems,it is crucial to have an end-to-end elasticity [71], requiring a strong elasticitycoordination between the IoT, NFV and Clouds. For example, let us considerhow elasticity coordination would help to prepare at best the Cloud to serve datafrom the edge. Currently, most of the times, the Cloud does not really care aboutthe edge - if more data come, the Cloud reacts and provisions more resources.However, if the elasticity demands from the edge were known and propagatedto the Cloud in advance, the Cloud could be able to provision resources in amore effective way. This can be done when we consider that we control on bothsides - edge and Cloud. On the one hand, the end-to-end elasticity requires us towork horizontally across IoT, NFV, and Cloud. On the other hand, each systemmight have different layers, as shown in Fig. 1 and discussed in [65]. Therefore,it is crucial to coordinate elasticity both horizontally and vertically across lay-ers and across subsystems. This leads to our focus on models and techniques tocontrol and manage elasticity.
The following key elasticity properties and techniques are crucial to us tounderstand:
– Which types of elasticity properties are suitable for which layers (resources,data, service, network)?
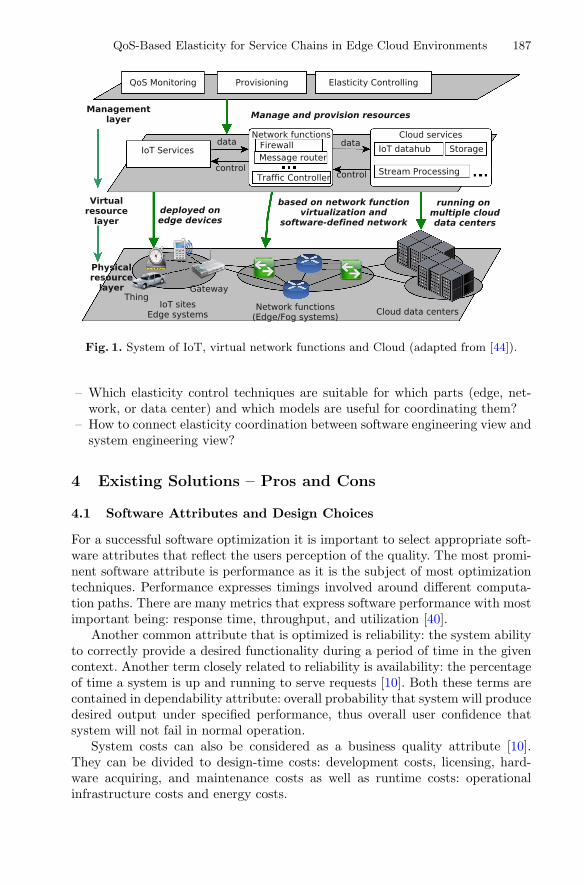
QoS-Based Elasticity for Service Chains in Edge Cloud Environments 187
Fig. 1. System of IoT, virtual network functions and Cloud (adapted from [44]).
– Which elasticity control techniques are suitable for which parts (edge, net-work, or data center) and which models are useful for coordinating them?
– How to connect elasticity coordination between software engineering view andsystem engineering view?
4 Existing Solutions – Pros and Cons
4.1 Software Attributes and Design Choices
For a successful software optimization it is important to select appropriate soft-ware attributes that reflect the users perception of the quality. The most promi-nent software attribute is performance as it is the subject of most optimizationtechniques. Performance expresses timings involved around different computa-tion paths. There are many metrics that express software performance with mostimportant being: response time, throughput, and utilization [40].
Another common attribute that is optimized is reliability: the system abilityto correctly provide a desired functionality during a period of time in the givencontext. Another term closely related to reliability is availability: the percentageof time a system is up and running to serve requests [10]. Both these terms arecontained in dependability attribute: overall probability that system will producedesired output under specified performance, thus overall user confidence thatsystem will not fail in normal operation.
System costs can also be considered as a business quality attribute [10].They can be divided to design-time costs: development costs, licensing, hard-ware acquiring, and maintenance costs as well as runtime costs: operationalinfrastructure costs and energy costs.
188 V. Cardellini et al.
Design choices that are considered in optimization process should not alterany functionality of the end-system, but affect only its quality attributes. Choicescan be software related or deployment related [42] and are categorized in Table 1.
4.2 Design-Time Approaches
Historically, design-time optimization solutions were oriented to embedded sys-tems because of their stringent extra-functional properties (EFPs) requirements.For that purpose, ArcheOpteryx tool [3] is an Eclipse plug-in that implementsAADL specifications [30] and employs multi-objective evolutionary heuristics forapproximating optimal solution of embedded component-based systems. Specif-ically, ArcheOpteryx optimizes communication cost between components in twoways: it optimizes data transmission reliability formed around total frequencyof component interactions against network connection reliability; and commu-nication overhead due to limited network bandwidth and delays. Another rep-resentative solution from the automotive domain is EAST-ADL language [74],inspired by MARTE modeling language [59]. EAST-ADL also employs geneticalgorithms (GAs) with multi-objective selection procedure NSGA-II [25], quitecommon in all multi-objective approaches. Quality is evaluated using fault-treemodels for safety analysis and the MAST analysis tool was used to derive meansystem response times. Component life-cycle cost was also one of the objectives.
Recently, the focus of design-time optimization shifted towards informationsystems, as systems became more complex and at the same time more reli-able with stricter EFP requirements regulated through service-level agreements(SLAs). The majority of research works employs search heuristics through vari-ous multi-objective evolutionary algorithms. Li et al. [45] applied a model-basedmethodology to size and plan enterprise application under SLAs, consideringresponse time and cost as optimization quality attributes. They modeled a multi-tier enterprise application with a closed queuing network model and applied anevolutionary algorithm to evaluate different configurations. They parametrizedqueue network models by measuring the real system and applied exponentialarrival and service times. Mean Value Analysis was used to obtain the responsetime in a stationary state. A similar approach was also employed in [60], wheremulti-objective evolutionary algorithms have been used to optimize performanceand reliability of system expressed through AADL models. Menasce et al. [48]proposed to optimize performance and availability of service-based informationsystems by applying a hill-climbing optimization method. Overall system is rep-resented as a service-activity model which models execution sequence of dif-ferent services. The PerOpteryx tool [43] applied a Palladio Component Model(PCM) [11] for predicting the performance of various architecture configurationsof component-based information applications. Optimized attributes also includedsystem performance and cost. Industrial case study of PerOpteryx tool was con-ducted in [32]. The underlying PCM model is automatically transformed toLayered Queue Models (LQM) [66] with predicted values obtained using a simu-lation. PerOpteryx also applies multi-objective genetic algorithm with NSGA-II

QoS-Based Elasticity for Service Chains in Edge Cloud Environments 189
Table 1. Possible software and deployment design choices
Software design choices
Selection of components Wherever functionality is encapsulatedwithin interchangeable components like incomponent-based or service-basedarchitectures a set of compatiblecomponents can be expresses with differentquality properties. In component-basedsystem such selection is often available onlyat design-time, while service-based systemsenable services to be selected in run-time
Component configuration parameters Often components provide furtherconfiguration parameters that affect theirdelivered quality. This is especially the casein component-based architectures. Forexample, in a component that processes andcompresses input data, a compression ratiocan be altered which can balance theoutput quality over processing performance.Parameters can also be non-numerical, likeselection of compression algorithms orsupported encryption algorithms in SSLcommunication. Such parameters alsoinclude the multiplicity of logical resourceslike limits for allowed number of threads ordatabase connections or state the prioritiesfor certain actions in concurrent processingscenarios. These all affect overall deliveredcomponent quality and thus can be subjectto optimization
Deployment design choices
Allocation Allocation is defined by a mapping fromsoftware components to available hardwareresources. Each component can be allowedon only a single resource or deployed acrossseveral resources. Components can possesscertain allocation constraints that need tobe satisfied such as minimal amount ofRAM required. Distributed systems arevery sensitive to allocation as it affectsquality attributes like response time,throughput, reliability and availability ofsystem. Performance is affected with thecommunication overheads betweencomponents allocated on different servers,where reliability suffers if components aredeployed on same servers which requires acareful balance
(continued)

190 V. Cardellini et al.
Table 1. (continued)
Deployment design choices
Replication Replication design choice states the number of deployedcomponent instances required. Replication affects reliabilityand overall performance. When component replication ispresent, additional components are required likeload-balancers for balancing workload between severalcomponents or switches that route traffic from primarycomponents to fail-over components in passive replicationscenarios. Replication design freedom is the key run-timeparameter in elastic systems as it altered to continually adaptmaximal component processing capacity to current workloadrequirements
Resource selection When performing software component allocation to hardwareresources a number of different configuration options ispresent: selecting appropriate disk storage, type of CPU/GPU,etc. In embedded systems these are predetermined atdesign-time but for elastic information systems they can bevaried in runtime as well in reconfiguration process. Resourceselection primarily affect costs and performance attributes butcan also affect dependability attributes. Resource selection canbe achieved at different granularity levels. Sometimes selectionrefers to individual hardware components, but more often itrefers to selecting pre-configured available resource types, likeselecting virtual machine type from Cloud provider. In thecase of selecting whole servers, resource selection can alsoprovided software packages like OS, pre-installed tools andplatforms etc.
Resource parameters Selected resources, both hardware and software, can havemany tunable parameters that can be altered atselection/installation time, or sometimes even at runtime. Atselection, resources can be chosen based on differentparameters (e.g., CPU clock-rate, number of cores, amount ofRAM) and during installation different platform parameterscan be altered (e.g., virtual memory available, TCP stackparameters, JVM configuration). If supported, someparameters can also be altered during runtime
Resource provider When selecting resources, different competing providers can bechosen. Differences lay in hardware offers, pricing amount,pricing model options, and offered SLAs. Greatest benefit fromchoosing diverse resource providers is increase in systemreliability and prevention of vendor lock-in
Resource location In the era of IoT, edge computing and latency criticalapplications, resource location is also an important factor tooptimize. Data center location, whether Cloud data center ormicro edge/fog data center, impacts largely on networklatencies, especially in distributed mobile systems
QoS-Based Elasticity for Service Chains in Edge Cloud Environments 191
selection method. By employing simulation, a more sophisticated set of mea-sures, such as percentiles which are often agreed in SLAs, can be obtained. Afaster evaluation method that can also predict performance measures beyondmean values is fluid analysis [69]. Perez and Casale [57] suggested a method forderiving fluid models LQN networks obtained through PCM models. Fluid mod-els are described by a set of ordinary differential equations that approximate theevolution of Markovian models, in their case closed class queue networks. Maleket al. [47] proposed a method for optimizing availability, communication secu-rity, latency, and energy consumption that are influenced from various deploy-ments of a distributed information system. They applied both Mixed-IntegerNonlinear Programming (MINLP) algorithms and genetic algorithms to solvethe derived optimization problems. They also provided guidelines on strengthsand weaknesses of both approaches. There is also a semi-automatized approachwhich employs formalized expert knowledge used to suggest different solutionsto recurrent problems, like performance bottlenecks as presented in [7]. In [8]anti-patterns are mitigated using a fuzzy approach so that each anti-pattern islabeled with a probability of occurrence. Similar efforts tailored for Cloud envi-ronments have been also proposed [62]. Perez-Palancin et al. [58] suggested aframework for analyzing trade-offs between system cost and adaptability. Theymodeled service adaptability through several metrics based on the number ofused components for providing a given service and the total number of compo-nents offering such service.
There are also recent solutions that are specialized for dealing with dynami-cally used logical resources such as elastic Cloud infrastructure. These solutionsmust take into account the dynamics of used resources over time, which was notsupported in before-mentioned approaches. The SPACE4CLOUD project [31]resulted in a design-time tool for predicting costs and performance of certainCloud information system topology expressed in PCM. In order to enable fullyautomated search over design space, the SPACE4CLOUD tool was combinedwith PerOpteryx evolutionary heuristics in a separate study [20]. Evangelinouet al. [19,29] further developed such a tool to provide a methodology for migrat-ing existing enterprise applications to Cloud by selecting an optimal deploy-ment topology that takes topology cost and performance into account. To enablefaster search, initial solutions for evolutionary algorithm are provided throughMixed-Integer Linear Programming (MILP) algorithm. Evolutionary algorithmsare supplemented with local search heuristics. Like before, application topol-ogy in SPACE4CLOUD is optimized for a specific workload intensity, typicallyat peak. Andrikopoulos et al. [6] employed a graph-based model to representa Cloud application topology with a complementary method for selecting thebest topologies based only on operational infrastructure cost provided by simpleanalytical models.
4.3 Runtime Approaches
In contrast to design-time approaches, runtime approaches continually variatethe chosen architecture DoFs in order to adapt to volatile environments while

192 V. Cardellini et al.
keeping the desired application attributes optimal. Runtime optimization is pri-marily focused on, but not limited to, availability, performance, and cost qualityattributes and is considered the key characteristic of self-adaptive systems [24].Since algorithms are running online at all times, they are forced to apply simplerbut very fast analytical models like simple aggregation functions (summation,maximal and average values) or analytical models of M/M/1 queues. Researchefforts have been mostly oriented towards service-based [52] and Cloud systems.Calinescu et al. [14] systematized a majority of runtime optimization researchinvolved in service-based systems, and based their approach around DiscreteTime Markov-Chain models. They provided a means to formally specify QoSrequirements, model-based QoS evaluation, and a MAPE-K cycle [38] for adap-tation. Passacantando et al. [56] formulated runtime management of IaaS infras-tructure from a SaaS Cloud provider viewpoint as a Generalized Nash Equi-librium Problem (GNEP). SaaS providers strive to minimize the costs of usedresources, and in parallel IaaS providers tend to maximize profits. From per-formance aspect, services are modeled as simple M/G/1 queues. A distributedalgorithm based on best-reply dynamics is used to compute the equilibrium peri-odically. Gomez Saez et al. [61] provided a conceptual framework for achievingoptimal distribution of application that involves both runtime and design-timeprocesses. Nanda et al. [51] formulated the optimization problem for minimizingthe SLA penalty and dynamic resource provisioning cost. Their model definedonly single DoF expressed as number of virtual machines designated to eachapplication tier. Grieco et al. [33] proposed an algorithm for the continuousredeployment of multi-tier Cloud applications due to system evolution. Theyproposed an adaptation graph aimed to find the best composition of adaptationprocesses satisfying a goal generated at runtime. Goals are defined as transi-tions from original to destination state. Recently, the SPACE4CLOUD tool wasextended to provide optimal runtime scaling decisions limited to replication DoF[34], while Moldovan et al. [49] provided a cost model for resource replicationthat is more aligned with public Cloud offerings.
4.4 Other Relevant Research
The third group of works we consider is not directly targeting optimization itself,but exploit techniques and mechanisms that are relevant for further optimiza-tion. A mapping study that identifies relevant research around modeling QoSin Cloud is in [9]. Copil et al. [22] provided general guidelines to build elasticsystems in Cloud, IoT, or hybrid human-computer context. A research agendafor implementing optimization tools for data-intensive applications has been pre-sented in [18,21]; the main concepts to consider are volume, velocity, and loca-tion of data. Kistowski et al. [41] proposed to model incoming workload intensityusing time-series decomposition to identify seasonal, trend and noise componentswhich could yield in more robust optimization techniques. Andrikopoulos et al.[5] proposed a GENTL language for modeling multi-Cloud applications as thefoundation for any optimization of its deployment. They argued that GENTLcontains the right amount of abstraction that captures essential concepts of

QoS-Based Elasticity for Service Chains in Edge Cloud Environments 193
multi-Cloud applications. Similar claim and model are also the result of researchby Wettinger et al. [75], where a concept of deployment aggregate is introducedto automate deployment of Cloud applications. Etxeberria et al. [28] arguedthere is a large amount of uncertainty present in performance results and pro-posed a technique to tame such uncertainty, while Nambiar et al. [50] highlightedall challenges involved in model-driven performance engineering and proposeda more modular approach to modeling performance. Pahl and Lee [55] demon-strated the application of more lightweight virtualization solutions in the contextof edge computing. Such virtualization capabilities should also be integrated inarchitecture optimization techniques.
A systematic mapping study on software architectural decisions like docu-menting decisions or functional requirements is provided in [68]. It identifies arecent increase in interest involved around architectural decisions. Consideringall research involved on architecture optimization with these conclusions, thereis a need for further incentives in closing the gap between human and automatedprocesses around architecture formation and optimization.
5 Coordination Patterns for Decentralized ElasticityControl
An elastic system has the ability to dynamically adjust the amount of allocatedresources to meet variations in workload demands [2,23]. To realize an elasticsystem, we need to perform several operations aimed to observe the system evo-lution, determine the scaling operations to be performed, and finally reconfigurethe system (if needed). A prominent and well-known reference model to orga-nize the autonomous control of a software system is MAPE [24,63]. It includesfour main components, namely Monitor, Analyze, Plan, and Execute, which areresponsible for the key functions of self-adaptation, and specifically of elasticity.
The Monitor component collects data about the controlled system and theexecution environment. Furthermore, the Monitor component specifies the inter-action mode (e.g., push, pull) and the interaction frequency (e.g., time-based,event-based) that starts the control loop. Afterwards, the Analyze componentprocesses the harvested data, so to identify whether adapting the system (e.g.,scaling out the number of system resources) can be beneficial for its performance.During this phase, the costs related to the reconfiguration (e.g., due to the migra-tion and/or replication of the resource and its state) should be also taken intoaccount, because as a side effect the reconfiguration could impact negatively onthe system performance. For example, too much frequent reconfigurations thatrequire data movement and/or freezing the application can determine a QoSdegradation (e.g., in terms of availability).
If some adaptation action is needed, the Plan component is triggered and isresponsible for: determining which system component needs to be reconfigured;identifying whether the number of resources (e.g., computing, network, storage)needs to be increased or decreased; and computing the number of resources tobe added/removed/migrated and, if required, their new location. As soon as the
194 V. Cardellini et al.
reconfiguration strategy is computed, the Execute component puts it in action.According to the controlled system, enacting a reconfiguration can be translated,e.g., in updating routing rules, in replicating processing elements, in migratingstate information and component code.
When the controlled system is geographically distributed (e.g., Fog comput-ing, distributed Cloud computing) or when it includes a large number of compo-nents (e.g., IoT devices, network switches), a single MAPE loop, where decisionsare centralized on a single component, may not effectively manage the elastic-ity. As described by Weyns et al. in [76], different patterns to design multipleMAPE loops have been used in practice by decentralizing the functions of self-adaptation. In this section, we customize the patterns proposed in [76] aiming toprovide some guidelines for the development of systems that control the elastic-ity of geographically distributed resources. The distributed system componentsrunning the MAPE loop can be arranged in a hierarchical architecture (Sect. 5.1)or in a flat architecture (Sect. 5.2). In the first case, MAPE loops are organizedin a hierarchy, where some control loops supervise the execution of subordinateMAPE loops. In the latter case, MAPE loops are peers one another; as such,they can work autonomously or coordinate their execution by exchanging controlmessages.
5.1 Hierarchical Patterns
In this section, we present three patterns that organize the MAPE loops in ahierarchy, where a higher-level control loop manages subordinated control loops.
Master-Worker Pattern. When a system includes a large number of compo-nents, having a (single) centralized component that performs elasticity decisionsmight easily become the architecture bottleneck. To overcome this issue, the sys-tem can be organized so to decentralize some of the MAPE operations, exploitingthe ability of distributed components to run control operations. Nevertheless, thesystem may need to perform the monitoring and planning operations locally ateach distributed component, e.g., because of special equipment, size of exchangeddata, specificity of operations. On the other hand, to preserve a consistent view ofthe system and meet global guarantees while keeping the system simple, the lat-ter can include a centralized entity which coordinates the elasticity decisions. Assuch, it can easily prevent unneeded reconfigurations or conflicting scaling oper-ations. Differently from a completely centralized approach, this design patternrelieves the burden of the central component, which now oversees only a subsetof the MAPE phases, by including and integrating multiple, decentralized con-trol cycles, in charge of performing locally some control activities. Specifically,this pattern is well suited when the distributed entities to be controlled havemonitoring and actuating capacity and can change their behavior according toexternal decisions (e.g., machines in smart manufacturing, SDN devices, VirtualNetwork Functions).
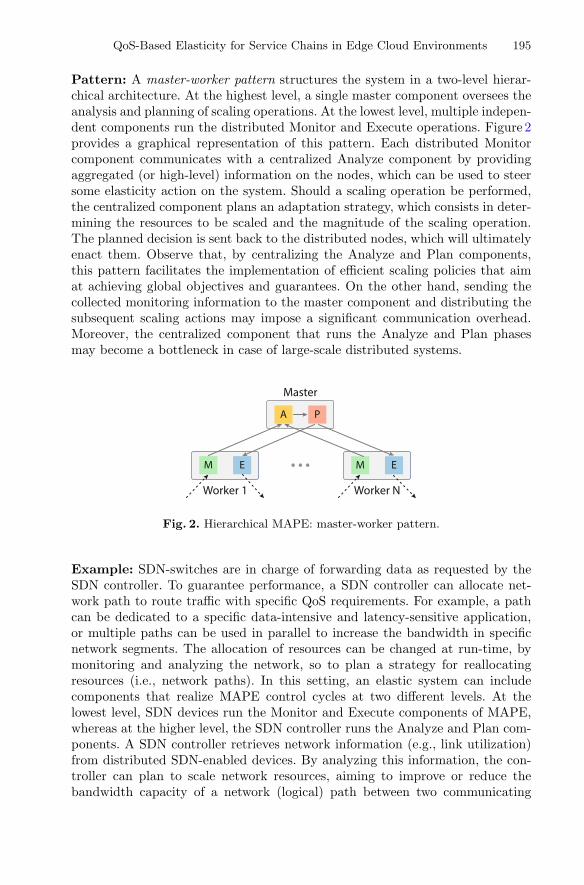
QoS-Based Elasticity for Service Chains in Edge Cloud Environments 195
Pattern: A master-worker pattern structures the system in a two-level hierar-chical architecture. At the highest level, a single master component oversees theanalysis and planning of scaling operations. At the lowest level, multiple indepen-dent components run the distributed Monitor and Execute operations. Figure 2provides a graphical representation of this pattern. Each distributed Monitorcomponent communicates with a centralized Analyze component by providingaggregated (or high-level) information on the nodes, which can be used to steersome elasticity action on the system. Should a scaling operation be performed,the centralized component plans an adaptation strategy, which consists in deter-mining the resources to be scaled and the magnitude of the scaling operation.The planned decision is sent back to the distributed nodes, which will ultimatelyenact them. Observe that, by centralizing the Analyze and Plan components,this pattern facilitates the implementation of efficient scaling policies that aimat achieving global objectives and guarantees. On the other hand, sending thecollected monitoring information to the master component and distributing thesubsequent scaling actions may impose a significant communication overhead.Moreover, the centralized component that runs the Analyze and Plan phasesmay become a bottleneck in case of large-scale distributed systems.
Fig. 2. Hierarchical MAPE: master-worker pattern.
Example: SDN-switches are in charge of forwarding data as requested by theSDN controller. To guarantee performance, a SDN controller can allocate net-work path to route traffic with specific QoS requirements. For example, a pathcan be dedicated to a specific data-intensive and latency-sensitive application,or multiple paths can be used in parallel to increase the bandwidth in specificnetwork segments. The allocation of resources can be changed at run-time, bymonitoring and analyzing the network, so to plan a strategy for reallocatingresources (i.e., network paths). In this setting, an elastic system can includecomponents that realize MAPE control cycles at two different levels. At thelowest level, SDN devices run the Monitor and Execute components of MAPE,whereas at the higher level, the SDN controller runs the Analyze and Plan com-ponents. A SDN controller retrieves network information (e.g., link utilization)from distributed SDN-enabled devices. By analyzing this information, the con-troller can plan to scale network resources, aiming to improve or reduce thebandwidth capacity of a network (logical) path between two communicating
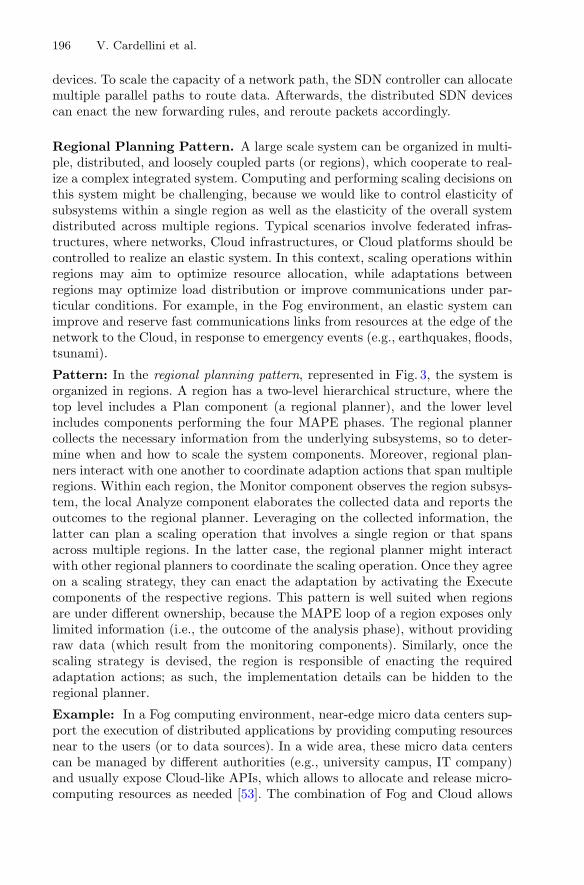
196 V. Cardellini et al.
devices. To scale the capacity of a network path, the SDN controller can allocatemultiple parallel paths to route data. Afterwards, the distributed SDN devicescan enact the new forwarding rules, and reroute packets accordingly.
Regional Planning Pattern. A large scale system can be organized in multi-ple, distributed, and loosely coupled parts (or regions), which cooperate to real-ize a complex integrated system. Computing and performing scaling decisions onthis system might be challenging, because we would like to control elasticity ofsubsystems within a single region as well as the elasticity of the overall systemdistributed across multiple regions. Typical scenarios involve federated infras-tructures, where networks, Cloud infrastructures, or Cloud platforms should becontrolled to realize an elastic system. In this context, scaling operations withinregions may aim to optimize resource allocation, while adaptations betweenregions may optimize load distribution or improve communications under par-ticular conditions. For example, in the Fog environment, an elastic system canimprove and reserve fast communications links from resources at the edge of thenetwork to the Cloud, in response to emergency events (e.g., earthquakes, floods,tsunami).
Pattern: In the regional planning pattern, represented in Fig. 3, the system isorganized in regions. A region has a two-level hierarchical structure, where thetop level includes a Plan component (a regional planner), and the lower levelincludes components performing the four MAPE phases. The regional plannercollects the necessary information from the underlying subsystems, so to deter-mine when and how to scale the system components. Moreover, regional plan-ners interact with one another to coordinate adaption actions that span multipleregions. Within each region, the Monitor component observes the region subsys-tem, the local Analyze component elaborates the collected data and reports theoutcomes to the regional planner. Leveraging on the collected information, thelatter can plan a scaling operation that involves a single region or that spansacross multiple regions. In the latter case, the regional planner might interactwith other regional planners to coordinate the scaling operation. Once they agreeon a scaling strategy, they can enact the adaptation by activating the Executecomponents of the respective regions. This pattern is well suited when regionsare under different ownership, because the MAPE loop of a region exposes onlylimited information (i.e., the outcome of the analysis phase), without providingraw data (which result from the monitoring components). Similarly, once thescaling strategy is devised, the region is responsible of enacting the requiredadaptation actions; as such, the implementation details can be hidden to theregional planner.
Example: In a Fog computing environment, near-edge micro data centers sup-port the execution of distributed applications by providing computing resourcesnear to the users (or to data sources). In a wide area, these micro data centerscan be managed by different authorities (e.g., university campus, IT company)and usually expose Cloud-like APIs, which allows to allocate and release micro-computing resources as needed [53]. The combination of Fog and Cloud allows
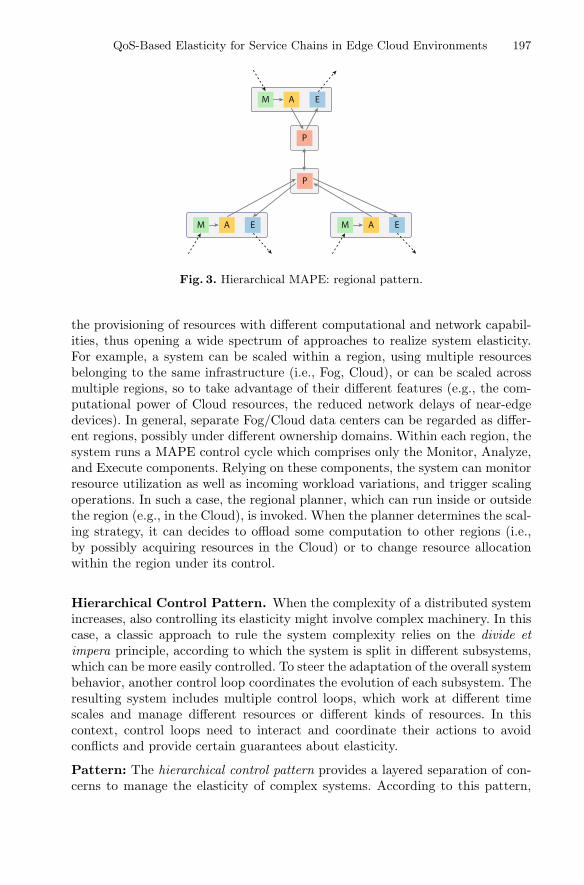
QoS-Based Elasticity for Service Chains in Edge Cloud Environments 197
Fig. 3. Hierarchical MAPE: regional pattern.
the provisioning of resources with different computational and network capabil-ities, thus opening a wide spectrum of approaches to realize system elasticity.For example, a system can be scaled within a region, using multiple resourcesbelonging to the same infrastructure (i.e., Fog, Cloud), or can be scaled acrossmultiple regions, so to take advantage of their different features (e.g., the com-putational power of Cloud resources, the reduced network delays of near-edgedevices). In general, separate Fog/Cloud data centers can be regarded as differ-ent regions, possibly under different ownership domains. Within each region, thesystem runs a MAPE control cycle which comprises only the Monitor, Analyze,and Execute components. Relying on these components, the system can monitorresource utilization as well as incoming workload variations, and trigger scalingoperations. In such a case, the regional planner, which can run inside or outsidethe region (e.g., in the Cloud), is invoked. When the planner determines the scal-ing strategy, it can decides to offload some computation to other regions (i.e.,by possibly acquiring resources in the Cloud) or to change resource allocationwithin the region under its control.
Hierarchical Control Pattern. When the complexity of a distributed systemincreases, also controlling its elasticity might involve complex machinery. In thiscase, a classic approach to rule the system complexity relies on the divide etimpera principle, according to which the system is split in different subsystems,which can be more easily controlled. To steer the adaptation of the overall systembehavior, another control loop coordinates the evolution of each subsystem. Theresulting system includes multiple control loops, which work at different timescales and manage different resources or different kinds of resources. In thiscontext, control loops need to interact and coordinate their actions to avoidconflicts and provide certain guarantees about elasticity.
Pattern: The hierarchical control pattern provides a layered separation of con-cerns to manage the elasticity of complex systems. According to this pattern,
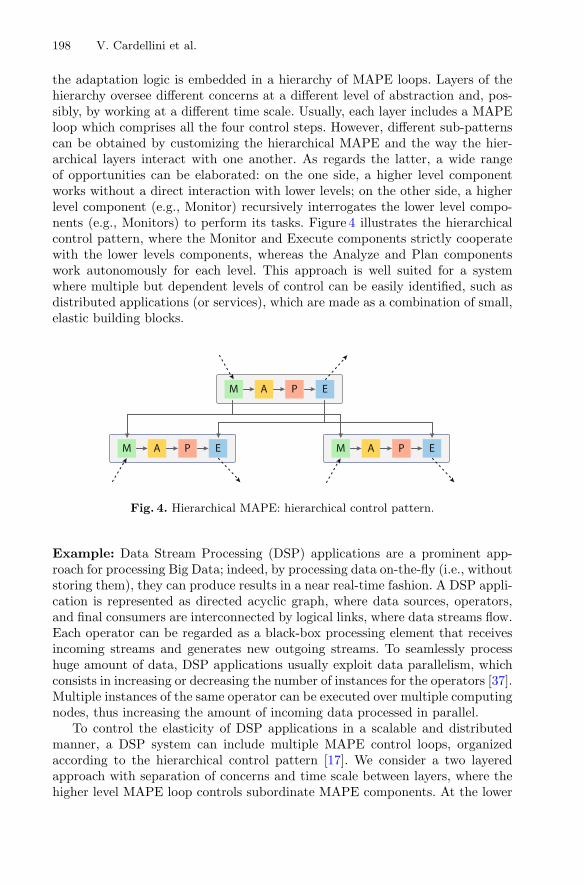
198 V. Cardellini et al.
the adaptation logic is embedded in a hierarchy of MAPE loops. Layers of thehierarchy oversee different concerns at a different level of abstraction and, pos-sibly, by working at a different time scale. Usually, each layer includes a MAPEloop which comprises all the four control steps. However, different sub-patternscan be obtained by customizing the hierarchical MAPE and the way the hier-archical layers interact with one another. As regards the latter, a wide rangeof opportunities can be elaborated: on the one side, a higher level componentworks without a direct interaction with lower levels; on the other side, a higherlevel component (e.g., Monitor) recursively interrogates the lower level compo-nents (e.g., Monitors) to perform its tasks. Figure 4 illustrates the hierarchicalcontrol pattern, where the Monitor and Execute components strictly cooperatewith the lower levels components, whereas the Analyze and Plan componentswork autonomously for each level. This approach is well suited for a systemwhere multiple but dependent levels of control can be easily identified, such asdistributed applications (or services), which are made as a combination of small,elastic building blocks.
Fig. 4. Hierarchical MAPE: hierarchical control pattern.
Example: Data Stream Processing (DSP) applications are a prominent app-roach for processing Big Data; indeed, by processing data on-the-fly (i.e., withoutstoring them), they can produce results in a near real-time fashion. A DSP appli-cation is represented as directed acyclic graph, where data sources, operators,and final consumers are interconnected by logical links, where data streams flow.Each operator can be regarded as a black-box processing element that receivesincoming streams and generates new outgoing streams. To seamlessly processhuge amount of data, DSP applications usually exploit data parallelism, whichconsists in increasing or decreasing the number of instances for the operators [37].Multiple instances of the same operator can be executed over multiple computingnodes, thus increasing the amount of incoming data processed in parallel.
To control the elasticity of DSP applications in a scalable and distributedmanner, a DSP system can include multiple MAPE control loops, organizedaccording to the hierarchical control pattern [17]. We consider a two layeredapproach with separation of concerns and time scale between layers, where thehigher level MAPE loop controls subordinate MAPE components. At the lower
QoS-Based Elasticity for Service Chains in Edge Cloud Environments 199
level and at a faster time scale, an operator manager is the distributed entityin charge of controlling the replication degree of a single DSP application oper-ator through a local MAPE loop. It monitors the system logical and physicalcomponents used by the operator and then, by analyzing the monitored data,determines whether a local operator scaling action is needed. In positive case,the lower-level analyze component issues an operator adaptation request to thehigher layer. At the higher level and at a slower time scale, an application man-ager is the centralized entity that coordinates the elasticity of the overall DSPapplication through a global MAPE loop. First, it monitors the global appli-cation behavior. Then, it analyzes the monitored data and the reconfigurationrequests received by the multiple operator managers, so to decide which reconfig-urations should be granted. Afterwards, the granted decisions are communicatedto each operator manager, which can, finally, execute the operator adaptationactions. The higher level control loop has a more strategic view of the applica-tion evolution, therefore it coordinates the scaling operations. Since performinga scaling operation introduces a temporary application downtime, the globalMAPE loop limits the number of reconfigurations when they are not needed(e.g., when the application performance requirements are satisfied). Conversely,when the application performance is approaching a critical value (e.g., maximumresponse time), the global MAPE loop is more willing to grants reconfigurations,so to quickly settle the performance issues.
Such hierarchical design of the elasticity control allows to overcome the sys-tem bottleneck represented by the centralized components of the MAPE loop inthe master-slave pattern (e.g., see [16] for its application to elastic data streamprocessing), especially when the system is composed by a multitude of processingentities scattered in a large-scale geo-distributed environment.
5.2 Flat Patterns
We now discuss two patterns that organize the MAPE loops in a flat structure,where multiple control loops cooperate as peers to manage the elasticity of adistributed system. Due to the lack of central coordination, designing a stablescaling strategy is challenging, although the resulting control architecture makesthe system highly scalable.
Coordinated Control Pattern. Sometimes controlling the elasticity of a sys-tem in a centralized component is unfeasible. Such a lack of feasibility may arisefor several reasons, among which the scale of the system and the presence ofmultiple ownership domains. As regards the former issue, a large scale systemmakes difficult (or impractical) to quickly move all the monitored data to a sin-gle node, which is prone to become the system bottleneck. Nevertheless, in sucha context, we still need to develop a system which can control the system elas-ticity so to meet certain QoS attributes. In this case, multiple MAPE loops canbe employed so to control the distributed system. Each control loop supervisesone part of the system; the resulting control loops must also coordinate withone another as peers so to reach, if needed, some joint adaptation decision aboutelasticity.

200 V. Cardellini et al.
Pattern: The coordinated control pattern employs multiple MAPE loops, whichare disseminated within the system. Each loop is in charge of controlling one partof the system. To compute scaling decisions, the phases of each loop can coordi-nate their operation with corresponding phases of other peer loops. The patterndoes not provide regulations on the number of peer loops that should coordinatewith one another: in some implementations peers are completely autonomous; inothers, the cooperation is restricted to neighbor peers; and in some others all thepeers communicate one another. Figure 5 provides a graphical representation ofthis pattern. For example, the distributed Analyze components exchange infor-mation so to determine whether some part of the system needs to perform a scal-ing decision. Then, after planning the reconfiguration, the distributed Executecomponents exchange messages to synchronize the adaptation actions, whichshould be performed without compromising the application integrity.
Fig. 5. Flat MAPEs: coordinated control pattern.
Example: This pattern can be useful to control elasticity when the system spansmultiple ownership domains with no trustworthy authority to control adaptation.We consider the example of a monitoring application that manages smart powerplugs (i.e., a special kind of IoT device) disseminated on multiple cities. We fur-ther assume that these IoT devices reside under different authority domains, e.g.,one for each city (or neighborhood). To support the proper execution of the mon-itoring application, the nowadays network and computing infrastructure shouldadapt itself to support the varying load imposed by the application. Specifically,the IoT devices continuously emit a varying load of data that should be pushedtowards the core of the Internet, so to reach Cloud data centers, where theapplications extract meaningful information (e.g., predict energy consumption,identify anomalies). The communication between IoT devices and the Cloudis often mediated by IoT gateways, which allow to overcome the heterogene-ity of the two parts, in terms of connectivity, energy power, and availability.To properly control this distributed infrastructure, a MAPE control loop canbe installed within each authority domain, so to elastically scale the number ofresources needed to realize the communication between the involved parties (i.e.,smart power plugs, Cloud). In this case, the Monitor component of the MAPEloop collects data on the working conditions of IoT devices. These data are ana-lyzed so to determine whether new IoT gateways should be allocated to meet the

QoS-Based Elasticity for Service Chains in Edge Cloud Environments 201
application requirements. Since allocating a gateway imposes a monetary cost,the multiple MAPE loops can coordinate their action so to limit the executioncosts and do not exceed the allocated budget. Ultimately, when a scaling actionis granted, the Execute component starts a new IoT gateway on the authoritydomain specified by the Plan component.
Information Sharing Pattern. Some large scale systems comprise distributedpeers which cooperatively work to accomplish tasks. In particular, each peer isable of performing some tasks (e.g., it offers services), but could require an inter-action with other peers to carry out these tasks (e.g., to solve service dependen-cies). Examples of this scenario come from the pervasive computing domain likeambient intelligence or smart transportation systems, where peers work togetherto reach some common goals. Each distributed peer can locally take scalingdecisions. Nevertheless, since a local adaptation may influence the other systemcomponents, taking scaling decisions require some form of coordination that canbe reached by sharing information among system components.
Pattern: The information sharing pattern is a special case of coordinated con-trol pattern, where the interaction between the decentralized MAPE controlloops involves only the Monitor phase (see Fig. 6). The pattern does not strictlyregulate the way peers interact with one another: for example, when the sys-tem comprises a large number of peers, only a subset of them (i.e., neigh-bors) exchange monitoring information. The following MAPE phases operateon (approximately) the same view of the system, thus allowing the Analyze,Plan, and Execute phases to be performed locally. On the one hand, this pat-tern helps to realize scalable and elastic systems. On the other hand, since thereis no explicit coordination among peers (i.e., they operate autonomously), con-flicting or sub-optimal scaling actions can be enacted; in the worst case, thesystem enters in an unstable state, where adaptation actions are continuouslyapplied.
Fig. 6. Flat MAPEs: information sharing pattern.
202 V. Cardellini et al.
Example: Relying on this pattern, the system can elastically acquire and releaseresources in a fully decentralized manner, leveraging only on monitoring informa-tion which is shared among the distributed controllers. We consider the problemof executing long-running workflow of services in a fully decentralized system.The system comprises peers that run and expose some services. A peer canreceive requests of service workflow execution; a service workflow is a graph ofabstract services (i.e., definition of required services) that needs to be resolvedin a set of concrete services (i.e., implementation of abstract services). To real-ize the service choreography, each peer needs to discover the services offeredby other peers, together with their utilization level, so to determine the bestmapping that satisfy the workflow requirements (e.g., minimum response time,maximum throughput). Similarly to the approach presented in [15], the systemcan employ the information sharing pattern to share, among peers, knowledgeabout the services offered by peers and their utilization state. Relying on thisinformation, at run-time, the service choreography can be adapted so to auto-matically scale the number of concrete services to be used to run the workflow.Aside the shared monitoring information, the scaling decisions are performedlocally to each peer.
6 Challenges and Future Perspectives
Although many research efforts have investigated how to efficiently achieve elas-ticity, most of them relies on a centralized Cloud environment. With the diffu-sion of the edge/fog computing, we have witnessed a paradigm shift with theexecution of complex systems over distributed Cloud and edge/fog computingresources, which brings system components closer to the data, rather than theother way around. This new environment, which offers geo-distributed resources,promises to open new possibilities for realizing elasticity, thanks to the coopera-tion of computing resources at different levels of the overall infrastructure (i.e.,at the network edge and in the network core). Nevertheless, the full potential-ities, together with the challenges, of this distributed edge cloud environmentsare still, to the best of our knowledge, largely unexplored.
We identify several main challenges and research directions that could benefitfrom further investigation, so to bring improvements to the current state ofthe art.
Strategies for Decentralization. Thanks to their widespread adoption, IoTdevices act as geo-distributed data sources that continuously emit data. The mostdiffused approaches for processing these data rely on a centralized Cloud solu-tion, where all the data are collected in a single data center, processed, and ulti-mately sent back to (possibly distributed) information consumers. Although theCloud offers flexibility and elasticity, such a centralized solution is not well suitedto efficiently handle the increased demand of real-time, low-latency services withdistributed IoT sources and consumers. As envisioned by the convergence ofedge/fog and Cloud computing resources, this diffused environment can supportthe execution of distributed applications by increasing scalability and reducing
QoS-Based Elasticity for Service Chains in Edge Cloud Environments 203
communication latencies. Nevertheless, in this context, computing resources areoften heterogeneous and, most importantly, can be interconnected by networklinks with not negligible communication latencies. In this geo-distributed infras-tructure, a relevant problem consists in determining, within a set of availabledistributed computing resources, the ones that should execute each componentof the distributed application, aiming to optimize the application QoS attributes.Nevertheless, most of the existing deployment solutions have been designed towork in centralized environment, where network latencies are (almost) zero. Assuch, these policies cannot be easily adapted to run in the emerging environ-ment. To the best of our knowledge, efficient approaches to deploy applicationsin distributed hybrid edge Cloud environments are still largely unexplored.
Infrastructure-awareness. The convergence of distributed edge/fog environ-ments with Cloud environments results in a great variety of resources, whosepeculiar features can be exploited to perform specific tasks. For example,resources located at the network edges, which are usually characterized by amedium-low computing capacity and possibly limited battery, can be used bya monitoring system to filter and aggregate raw data as soon as they are gen-erated. Conversely, clusters of specialized machines (e.g., [1]) can be exploitedto efficiently perform machine learning tasks. Most of the existing distributedsystems, which manage data coming from decentralized sources, are infrastruc-ture oblivious, i.e., their deployment neglects the peculiar characteristics of theavailable computing and networking infrastructure. In the IoT context, wherehuge amount of data have to be moved between geo-distributed resources, inef-ficient exploitation of resources can strongly penalize the resulting performanceof distributed applications. To deliver efficient and flexible solutions, next gen-eration systems should consider, as key factor, the physical connection and therelationship among infrastructural elements.
Elasticity in the Emerging Environment. The combination of edge/fog andCloud computing results in a hierarchical architecture, where multiple layers arespread as a continuum from the edge to the core of the network. The presenceof multiple layers, each with different computational capabilities, opens a widespectrum of approaches for realizing elasticity. For example, we could scale hori-zontally the application components, so to use multiple resources that belong tothe same infrastructural layer (i.e., edge, Cloud); alternatively, we could employresources belonging to multiple layers, so to take advantage of their differentfeatures (e.g., the computational power of Cloud servers, the closeness of edgedevices). Moreover, the presence of multiple degrees of freedom raises concernsregarding the coordination among the different scaling operations. When is itmore convenient to use resources from the same layer? When should we employresources from multiple layers? Can communication delays obfuscate the benefitof operating with resources belonging to multiple layers?
The Cost of Elasticity. Reconfiguring an application at runtime involves theexecution of management operations that enact the deployment changes whilepreserving the application integrity. The latter is a critical task especially whenthe application includes components that cannot be simply restarted on a new
204 V. Cardellini et al.
location, but require, e.g., to export and import on the new location some inter-nal state. Therefore, together with long term benefits, adapting the applicationdeployment also introduces some adaptation costs, usually expressed in termsof downtime, that penalize the application performance in the short period.Because of these costs, reconfigurations cannot be applied too frequently. A keychallenge is to wisely select the most profitable adaptation actions to enact, soto identify a suitable trade-off, in terms of performance, between applicationelasticity and adaptation costs.
Multi-dimensional Elasticity. Besides resource elasticity, we can identify dif-ferent elasticity dimensions, as envisioned by Truong et al. [72]. Examples ofother dimensions are cost, data, and fault tolerance. Indeed, during the execu-tion of a complex distributed system, the cost of using computing resources orthe benefits coming from the output of the system may change at runtime. Simi-larly, the quality of data can be elastically managed, in a such a way that when itis too expansive to produce results with high quality, we can tune the system totemporary degrade result quality, in a controlled manner, so to save resources.For example, this could be helpful during congestion periods, when we mightaccept to discard a wisely selected subset of the incoming data. As regards faulttolerance, for some kinds of applications, we might be willing to sacrifice faulttolerance during congestion periods so to perform computation with reducedcosts. As expected, finding an optimal trade-off between the different elasticitydimensions strongly depends on the application at hand and, in general, is notan easy task.
Resource Management. The resulting infrastructure is complex: multipleheterogeneous resources are available at different geo-distributed locations; dis-tributed applications expose different QoS attributes and requirements; and dif-ferent elasticity dimensions can be controlled. Moreover, the elastic adaptation ofapplications might require infrastructure-awareness, that enables to convenientlyoperate at different levels of the computing infrastructure.
To rule this complexity, a new architectural layer should be designed so tosupport the execution of (multiple) applications over a continuum set of edge/fogand Cloud resources. This intermediate layer can be implemented as a distributedresource manager, which should be able to efficiently control the allocation ofcomputing and network resources, by conveniently exposing different views ofthe infrastructure. On the one hand, the resource manager allows to fairly exe-cute multiple applications by better exploiting the presence of resources. On theother hand, by taking care of managing the computing infrastructure, it enablesdistributed applications to more easily control their elasticity.
A side effect of the introduction of a resource manager is the need of designingstandardized interfaces between the applications and the decentralize resources.To the best of our knowledge, today there are no standard mechanisms that allowresources to announce their availability to host software components as well asfor distributed applications to smoothly control edge/fog and Cloud resources.
Accountability, Monitoring, and Security. Together with the specific chal-lenges previously identified, we have several other more general challenges.

QoS-Based Elasticity for Service Chains in Edge Cloud Environments 205
They regard the accountability of resource consumption, the monitoring of elas-tic applications/systems, and security aspects that arise from multi-tenancy anddata distribution across several locations.
We need to investigate methodologies for the accountability, because in theenvisioned edge/fog computing environment, users can flexibly share their spareresources to host applications. The hybrid resource continuum from edge/fogto Cloud calls for studying dynamic pricing mechanisms, similar to the spotinstance pricing from Amazon EC2 service2.
The ability of monitoring the elasticity of a system/application deployed ina large-scale, dispersed and multi-provider hybrid environment requires inves-tigation. How to quantify and measure the elasticity of a complex distributedsystem? As regards elasticity, we can quantify its performance by consideringthe number of missing or superfluous adaptations over time, the durations insub-optimal states, and the amount of over-/under-provisioned resources [35].However, how to measure such quantities in a dispersed, large-scale environ-ment with multiple providers turns out to be challenging.
Similarly to Cloud computing, we need to identify (or develop) efficient busi-ness models that support and encourage the diffusion of trusted computingresources and the elasticity requirements for such business models. One of themost important challenge arises from the lack of central controlling authorities inthe edge/fog computing environment, which makes it difficult to assert whethera device is hosting an application component. Security aspects are of key impor-tance, because nowadays the value of data is very high and an infrastructurethat does not guarantee stringent security properties will be hardly adopted.Similarly for the accountability issue, the decentralization of the emerging envi-ronment requires to deal with the lack of a central security authority. Sophisti-cated yet lightweight security mechanisms and policies should be introduced, soto create a disseminated trustworthy environment.
7 Conclusions
In this chapter, we presented an analysis of QoS-based elasticity for servicechains in distributed edge Cloud environments. Firstly, we introduced the elas-ticity concept that arises in emerging systems of systems, which are complex,distributed, and based on various virtualization technologies. Then, we focusedon IoT and Cloud systems, in whose context we elaborated the need and meaningof elasticity.
A key ingredient of elasticity is the optimization technique aiming to optimizesome QoS attributes. Firstly, we identified the key attributes that are frequentlyoptimized with elasticity. Then, we introduced a software engineering viewpointto model elasticity as one of the system attributes. In that respect, elasticitymechanisms can be implemented in the system design phase to model softwaresystems that exploit at best elasticity during runtime. Furthermore, elasticity
2 https://aws.amazon.com/ec2/.
206 V. Cardellini et al.
involves a runtime choice for the best optimal solution and such a selectionhas also to be properly designed. Therefore, we reviewed the research workson modeling elasticity in the context of design and runtime choices aiming toprovide the best elasticity model and optimal solution.
In distributed environments, elasticity mechanisms may arise not only atdifferent layers of system abstraction, but also within each segment of the dis-tributed system that, as a whole, has to deliver service to the end users. There-fore, key elements for running QoS-aware service compositions are the coordi-nation mechanisms; the latter have to be efficiently implemented in order todeliver high-level user-experience. In this chapter, we also provided a review ofseveral design patterns for decentralized coordination, aiming to realize elasticityin complex systems.
Finally, we discussed the challenges related to designing elasticity mecha-nisms in geo-distributed environments. Software engineering decisions and coor-dination mechanisms among segments of distributed systems need further inves-tigation based on empirical evidence from the real technical environments.
References
1. Abadi, M., Barham, P., Chen, J., Chen, Z., et al.: TensorFlow: a system for large-scale machine learning. In: Proceedings of USENIX OSDI 2016, pp. 265–283 (2016)
2. Al-Dhuraibi, Y., Paraiso, F., Djarallah, N., Merle, P.: Elasticity in cloud computing:state of the art and research challenges. IEEE Trans. Serv. Comput. PP, 1 (2017).https://doi.org/10.1109/TSC.2017.2711009
3. Aleti, A., Bjornander, S., Grunske, L., Meedeniya, I.: ArcheOpterix: an extendabletool for architecture optimization of AADL models. In: Proceedings of 2009 ICSEWorkshop on Model-Based Methodologies for Pervasive and Embedded Software,pp. 61–71 (2009)
4. Aleti, A., Buhnova, B., Grunske, L., Koziolek, A., Meedeniya, I.: Software archi-tecture optimization methods: a systematic literature review. IEEE Trans. Softw.Eng. 39(5), 658–683 (2013)
5. Andrikopoulos, V., Reuter, A., Gomez Saez, S., Leymann, F.: A GENTL approachfor cloud application topologies. In: Villari, M., Zimmermann, W., Lau, K.-K.(eds.) ESOCC 2014. LNCS, vol. 8745, pp. 148–159. Springer, Heidelberg (2014).https://doi.org/10.1007/978-3-662-44879-3 11
6. Andrikopoulos, V., Gomez Saez, S., Leymann, F., Wettinger, J.: Optimal dis-tribution of applications in the cloud. In: Jarke, M., Mylopoulos, J., Quix, C.,Rolland, C., Manolopoulos, Y., Mouratidis, H., Horkoff, J. (eds.) CAiSE 2014.LNCS, vol. 8484, pp. 75–90. Springer, Cham (2014). https://doi.org/10.1007/978-3-319-07881-6 6
7. Arcelli, D., Cortellessa, V., Trubiani, C.: Antipattern-based model refactoring forsoftware performance improvement. In: Proceedings of ACM SIGSOFT QoSA2012, pp. 33–42 (2012)
8. Arcelli, D., Cortellessa, V., Trubiani, C.: Performance-based software model refac-toring in fuzzy contexts. In: Egyed, A., Schaefer, I. (eds.) FASE 2015. LNCS,vol. 9033, pp. 149–164. Springer, Heidelberg (2015). https://doi.org/10.1007/978-3-662-46675-9 10
9. Ardagna, D., Casale, G., Ciavotta, M., Perez, J.F., Wang, W.: Quality-of-servicein cloud computing: modeling techniques and their applications. J. Int. Serv. Appl.5(1), 11 (2014). https://doi.org/10.1186/s13174-014-0011-3

QoS-Based Elasticity for Service Chains in Edge Cloud Environments 207
10. Bass, L., Clements, P., Kazman, R.: Software Architecture in Practice, 3rd edn.Addison-Wesley Professional, Reading (2012)
11. Becker, S., Koziolek, H., Reussner, R.: The palladio component model for model-driven performance prediction. J. Syst. Softw. 82(1), 3–22 (2009)
12. Bernstein, D.: Containers and cloud: from LXC to Docker to Kubernetes. IEEECloud Comput. 1(3), 81–84 (2014)
13. Bratterud, A., Walla, A.A., Haugerud, H., Engelstad, P.E., Begnum, K.:IncludeOS: a minimal, resource efficient unikernel for cloud services. In: Proceed-ings of IEEE CloudCom 2015, pp. 250–257 (2015)
14. Calinescu, R., Grunske, L., Kwiatkowska, M., Mirandola, R., Tamburrelli, G.:Dynamic QoS management and optimization in service-based systems. IEEETrans. Soft. Eng. 37(3), 387–409 (2011)
15. Caporuscio, M., D’Angelo, M., Grassi, V., Mirandola, R.: Reinforcement learningtechniques for decentralized self-adaptive service assembly. In: Aiello, M., Johnsen,E.B., Dustdar, S., Georgievski, I. (eds.) ESOCC 2016. LNCS, vol. 9846, pp. 53–68.Springer, Cham (2016). https://doi.org/10.1007/978-3-319-44482-6 4
16. Cardellini, V., Lo Presti, F., Nardelli, M., Russo Russo, G.: Optimal operatordeployment and replication for elastic distributed data stream processing. Concurr.Comput. (2017). https://doi.org/10.1002/cpe.4334
17. Cardellini, V., Lo Presti, F., Nardelli, M., Russo Russo, G.: Towards hierarchicalautonomous control for elastic data stream processing in the fog. In: Heras, D.B.,Bouge, L. (eds.) Euro-Par 2017. LNCS, vol. 10659, pp. 106–117. Springer, Cham(2018). https://doi.org/10.1007/978-3-319-75178-8 9
18. Casale, G., Ardagna, D., Artac, M., Barbier, F., et al.: DICE: quality-driven devel-opment of data-intensive cloud applications. In: Proceedings of 7th InternationalWorkshop on Modeling in Software Engineering, pp. 78–83. IEEE Press (2015)
19. Ciavotta, M., Ardagna, D., Gibilisco, G.P.: A mixed integer linear programmingoptimization approach for multi-cloud capacity allocation. J. Syst. Softw. 123,64–78 (2017)
20. Ciavotta, M., Ardagna, D., Koziolek, A.: Palladio optimization suite: QoS opti-mization for component-based cloud applications. In: Proceedings of 9th EAI Inter-national Conference on Performance Evaluation Methodologies and Tools, pp. 170–171 (2016)
21. Ciavotta, M., Gianniti, E., Ardagna, D.: D-SPACE4Cloud: a design tool for bigdata applications. In: Carretero, J., Garcia-Blas, J., Ko, R.K.L., Mueller, P.,Nakano, K. (eds.) ICA3PP 2016. LNCS, vol. 10048, pp. 614–629. Springer, Cham(2016). https://doi.org/10.1007/978-3-319-49583-5 48
22. Copil, G., Moldovan, D., Truong, H.L., Dustdar, S.: Continuous elasticity: designand operation of elastic systems. it-Inf. Technol. 58(6), 329–348 (2016)
23. Coutinho, E.F., de Carvalho Sousa, F.R., Rego, P.A.L., Gomes, D.G., de Souza,J.N.: Elasticity in cloud computing: a survey. Ann. Telecomm. 70(7), 289–309(2015)
24. de Lemos, R., et al.: Software engineering for self-adaptive systems: a secondresearch roadmap. In: de Lemos, R., Giese, H., Muller, H.A., Shaw, M. (eds.)Software Engineering for Self-Adaptive Systems II. LNCS, vol. 7475, pp. 1–32.Springer, Heidelberg (2013). https://doi.org/10.1007/978-3-642-35813-5 1
25. Deb, K., Pratap, A., Agarwal, S., Meyarivan, T.: A fast and elitist multiobjectivegenetic algorithm: NSGA-II. IEEE Trans. Evol. Comput. 6(2), 182–197 (2002)
26. Dragoni, N., Lanese, I., Larsen, S.T., Mazzara, M., Mustafin, R., Safina, L.:Microservices: how to make your application scale. CoRR abs/1702.07149 (2017)
208 V. Cardellini et al.
27. Dustdar, S., Guo, Y., Satzger, B., Truong, H.L.: Principles of elastic processes.IEEE Int. Comput. 15(5), 66–71 (2011)
28. Etxeberria, L., Trubiani, C., Cortellessa, V., Sagardui, G.: Performance-basedselection of software and hardware features under parameter uncertainty. In: Pro-ceedings of ACM QoSA 2014, pp. 23–32. ACM (2014)
29. Evangelinou,A.,Ciavotta,M.,Ardagna,D.,Kopaneli,A.,Kousiouris,G.,Varvarigou,T.: Enterprise applications cloud rightsizing through a joint benchmarking and opti-mization approach. Future Gener. Comput. Syst. 78, 102–114 (2018)
30. Feiler, P., Gluch, D., Hudak, J.: The architecture analysis and design language(AADL): an introduction. Technical report. CMU/SEI-2006-TN-011, SoftwareEngineering Institute, Carnegie Mellon University, Pittsburgh, PA (2006)
31. Franceschelli, D., Ardagna, D., Ciavotta, M., Di Nitto, E.: Space4cloud: a tool forsystem performance and costevaluation of cloud systems. In: Proceedings of 2013International Workshop on Multi-cloud Applications and Federated Clouds, pp.27–34. ACM (2013)
32. de Gooijer, T., Jansen, A., Koziolek, H., Koziolek, A.: An industrial case studyof performance and cost design space exploration. In: Proceedings of ACM/SPECICPE 2012, pp. 205–216 (2012)
33. Grieco, L.A., Colucci, S., Mongiello, M., Scandurra, P.: Towards a goal-orientedapproach to adaptable re-deployment of cloud-based applications. In: Proceedingsof CLOSER 2016, pp. 253–260. SciTePress (2016)
34. Guerriero, M., Ciavotta, M., Gibilisco, G.P., Ardagna, D.: A model-driven DevOpsframework for QoS-aware cloud applications. In: Proceedings of SYNASC 2015, pp.345–351. IEEE (2015)
35. Herbst, N., Becker, S., Kounev, S., Koziolek, H., Maggio, M., Milenkoski, A.,Smirni, E.: Metrics and benchmarks for self-aware computing systems. Self-AwareComputing Systems, pp. 437–464. Springer, Cham (2017). https://doi.org/10.1007/978-3-319-47474-8 14
36. Herbst, N.R., Kounev, S., Reussner, R.H.: Elasticity in cloud computing: what it is,and what it is not. In: Proceedings of 10th International Conference on AutonomicComputing, ICAC 2013, pp. 23–27 (2013)
37. Hirzel, M., Soule, R., Schneider, S., Gedik, B., Grimm, R.: A catalog of streamprocessing optimizations. ACM Comput. Surv. 46(4), 46:1–46:34 (2014)
38. Huebscher, M.C., McCann, J.A.: A survey of autonomic computing - degrees, mod-els, and applications. ACM Comput. Surv. 40(3), 7:1–7:28 (2008)
39. Hwang, C., Yoon, K.: Multiple criteria decision making. Lecture Notes in Eco-nomics and Mathematical Systems. Springer, New York (1981)
40. Jain, R.: The Art of Computer Systems Performance Analysis, vol. 491. Wiley,New York (1991)
41. Kistowski, J.V., Herbst, N.R., Kounev, S.: Modeling variations in load intensityover time. In: Proceedings of 3rd International Workshop on Large Scale Testing,LT 2014. ACM (2014)
42. Koziolek, A.: Automated Improvement of Software Architecture Models for Per-formance and Other Quality Attributes. Ph.D. thesis, Karlsruhe Institute of Tech-nology (2011)
43. Koziolek, A., Koziolek, H., Reussner, R.: PerOpteryx: automated application oftactics in multi-objective software architecture optimization. In: Proceedings ofACM SIGSOFT QoSA-ISARCS 2011, pp. 33–42 (2011)
44. Le, D., Narendra, N.C., Truong, H.L.: HINC - harmonizing diverse resource infor-mation across IoT, network functions, and clouds. In: Proceedings of 4th Inter-national Conference on Future Internet of Things and Cloud, FiCloud 2016, pp.317–324 (2016)

QoS-Based Elasticity for Service Chains in Edge Cloud Environments 209
45. Li, H., Casale, G., Ellahi, T.N.: SLA-driven planning and optimization of enterpriseapplications. In: Proceedings of 1st Joint WOSP/SIPEW International Conferenceon Performance Engineering, pp. 117–128. ACM (2010)
46. Lorido-Botran, T., Miguel-Alonso, J., Lozano, J.: A review of auto-scaling tech-niques for elastic applications in cloud environments. J. Grid Comput. 12(4), 559–592 (2014)
47. Malek, S., Medvidovic, N., Mikic-Rakic, M.: An extensible framework for improvinga distributed software system’s deployment architecture. IEEE Trans. SoftwareEng. 38(1), 73–100 (2012)
48. Menasce, D.A., Ewing, J.M., Gomaa, H., Malex, S., Sousa, J.A.P.: A frameworkfor utility-based service oriented design in SASSY. In: Proceedings of 1st JointWOSP/SIPEW International Conference on Performance Engineering, pp. 27–36.ACM (2010)
49. Moldovan, D., Truong, H.L., Dustdar, S.: Cost-aware scalability of applications inpublic clouds. In: Proceedings of IEEE IC2E 2016, pp. 79–88 (2016)
50. Nambiar, M., Kattepur, A., Bhaskaran, G., Singhal, R., Duttagupta, S.: Modeldriven software performance engineering: current challenges and way ahead. ACMSIGMETRICS Perform. Eval. Rev. 43(4), 53–62 (2016)
51. Nanda, S., Hacker, T.J., Lu, Y.H.: Predictive model for dynamically provisioningresources in multi-tier web applications. In: Proceedings of IEEE CloudCom 2016,pp. 326–335 (2016)
52. Neto, P.A.S., Vargas-Solar, G., da Costa, U.S., Musicante, M.A.: Designing service-based applications in the presence of non-functional properties: a mapping study.Inf. Softw. Technol. 69, 84–105 (2016)
53. OpenFog Consortium: OpenFog reference architecture (2017). https://www.openfogconsortium.org/ra/
54. Orsini, G., Bade, D., Lamersdorf, W.: Computing at the mobile edge: designingelastic android applications for computation offloading. In: Proceedings of 8th IFIPWireless and Mobile Networking Conference, WMNC 2015, pp. 112–119, October2015
55. Pahl, C., Lee, B.: Containers and clusters for edge cloud architectures-a technologyreview. In: Proceedings of FiCloud 2015, pp. 379–386. IEEE (2015)
56. Passacantando, M., Ardagna, D., Savi, A.: Service provisioning problem in cloudand multi-cloud systems. INFORMS J. Comput. 28(2), 265–277 (2016)
57. Perez, J.F., Casale, G.: Assessing SLA compliance from Palladio component mod-els. In: Proceedings of SYNASC 2013, pp. 409–416 (2013)
58. Perez-Palacin, D., Mirandola, R., Merseguer, J.: On the relationships between qosand software adaptability at the architectural level. J. Syst. Softw. 87, 1–17 (2014)
59. Quadri, I.R., Gamatie, A., Boulet, P., Meftali, S., Dekeyser, J.L.: Expressingembedded systems configurations at high abstraction levels with UML MARTEprofile: advantages, limitations and alternatives. J. Syst. Architect. 58(5), 178–194(2012)
60. Rahmoun, S., Borde, E., Pautet, L.: Automatic selection and composition of modeltransformations alternatives using evolutionary algorithms. In: Proceedings of 2015European Conference on Software Architecture Workshops, ECSAW 2015, pp.25:1–25:7. ACM (2015)
61. Saez, S.G., Andrikopoulos, V., Leymann, F., Strauch, S.: Towards dynamic appli-cation distribution support for performance optimization in the cloud. In: Proceed-ings of IEEE CLOUD 2014, pp. 248–255 (2014)
210 V. Cardellini et al.
62. Saez, S.G., Andrikopoulos, V., Wessling, F., Marquezan, C.C.: Cloud adaptationand application (re-)distribution: bridging the two perspectives. In: Proceedingsof IEEE 18th International Enterprise Distributed Object Computing ConferenceWorkshops and Demonstrations, pp. 163–172 (2014)
63. Salehie, M., Tahvildari, L.: Self-adaptive software: landscape and research chal-lenges. ACM Trans. Auton. Adapt. Syst. 4(2), 1–42 (2009)
64. Sarkar, S., Chatterjee, S., Misra, S.: Assessment of the suitability of fog computingin the context of internet of things. IEEE Trans. Cloud Comput. PP, 1 (2015)
65. Schatzberg, D., Appavoo, J., Krieger, O., Van Hensbergen, E.: Scalable elasticsystems architecture. In: Proceedings of ASPLOS RESoLVE Workshop, March2011
66. Shoaib, Y., Das, O.: Web application performance modeling using layered queueingnetworks. Electr. Notes Theor. Comput. Sci. 275, 123–142 (2011)
67. Szabo, R., Kind, M., Westphal, F.J., Woesner, H., Jocha, D., Csaszar, A.: Elasticnetwork functions: opportunities and challenges. IEEE Netw. 29(3), 15–21 (2015)
68. Tofan, D., Galster, M., Avgeriou, P., Schuitema, W.: Past and future of softwarearchitectural decisions-a systematic mapping study. Inf. Softw. Technol. 56(8),850–872 (2014)
69. Tribastone, M.: Efficient optimization of software performance models viaparameter-space pruning. In: Proceedings of ACM/SPEC ICPE 2014, pp. 63–73(2014)
70. Truong, H.L., Dustdar, S.: Principles for engineering IoT cloud systems. IEEECloud Comput. 2(2), 68–76 (2015)
71. Truong, H.L., Dustdar, S.: Programming elasticity in the cloud. IEEE Comput.48(3), 87–90 (2015)
72. Truong, H.L., Dustdar, S., Leymann, F.: Towards the realization of multi-dimensional elasticity for distributed cloud systems. In: Proceedings of 2nd Inter-national Conference on Cloud Forward, pp. 14–23 (2016). https://doi.org/10.1016/j.procs.2016.08.276
73. Truong, H.L., Narendra, N.C.: SINC - an information-centric approach for end-to-end IoT cloud resource provisioning. In: Proceedings of International Conferenceon Cloud Computing Research and Innovations, ICCCRI 2016, pp. 17–24 (2016)
74. Walker, M., Reiser, M.O., Tucci-Piergiovanni, S., Papadopoulos, Y., et al.: Auto-matic optimisation of system architectures using EAST-ADL. J. Syst. Softw.86(10), 2467–2487 (2013)
75. Wettinger, J., Gorlach, K., Leymann, F.: Deployment aggregates-a generic deploy-ment automation approach for applications operated in the cloud. In: Proceedingsof IEEE 18th International Conference on Enterprise Distributed Object Comput-ing Workshops and Demonstrations, EDOCW 2014, pp. 173–180 (2014)
76. Weyns, D., et al.: On patterns for decentralized control in self-adaptive systems.In: de Lemos, R., Giese, H., Muller, H.A., Shaw, M. (eds.) Software Engineeringfor Self-Adaptive Systems II. LNCS, vol. 7475, pp. 76–107. Springer, Heidelberg(2013). https://doi.org/10.1007/978-3-642-35813-5 4
77. Wu, W., Kelly, T.: Towards evidence-based architectural design for safety-criticalsoftware applications. In: de Lemos, R., Gacek, C., Romanovsky, A. (eds.) WADS2006. LNCS, vol. 4615, pp. 383–408. Springer, Heidelberg (2007). https://doi.org/10.1007/978-3-540-74035-3 17
78. Yoder, J.W., Johnson, R.: The adaptive object-model architectural style. In: Bosch,J., Gentleman, M., Hofmeister, C., Kuusela, J. (eds.) Software Architecture. ITI-FIP, vol. 97, pp. 3–27. Springer, Boston, MA (2002). https://doi.org/10.1007/978-0-387-35607-5 1
QoS-Based Elasticity for Service Chains in Edge Cloud Environments 211
Open Access This chapter is licensed under the terms of the Creative CommonsAttribution 4.0 International License (http://creativecommons.org/licenses/by/4.0/),which permits use, sharing, adaptation, distribution and reproduction in any mediumor format, as long as you give appropriate credit to the original author(s) and thesource, provide a link to the Creative Commons license and indicate if changes weremade.
The images or other third party material in this chapter are included in the chapter’sCreative Commons license, unless indicated otherwise in a credit line to the material. Ifmaterial is not included in the chapter’s Creative Commons license and your intendeduse is not permitted by statutory regulation or exceeds the permitted use, you willneed to obtain permission directly from the copyright holder.

Integrating SDN and NFVwith QoS-Aware Service Composition
Valeria Cardellini1 , Tihana Galinac Grbac2(B) , Andreas Kassler3 ,Pradeeban Kathiravelu4 , Francesco Lo Presti1 , Antonio Marotta3 ,
Matteo Nardelli1 , and Luıs Veiga4
1 University of Rome Tor Vergata, Rome, Italy{cardellini,nardelli}@ing.uniroma2.it, [email protected]
2 Faculty of Engineering, University of Rijeka, Rijeka, [email protected]
3 Karlstad University, Karlstad, [email protected], [email protected]
4 INESC-ID Lisboa/Instituto Superior Tecnico,Universidade de Lisboa, Lisbon, Portugal
[email protected], [email protected]
Abstract. Traditional networks are transformed to enable full integra-tion of heterogeneous hardware and software functions, that are config-ured at runtime, with minimal time to market, and are provided to theirend users on “as a service” principle. Therefore, a countless number ofpossibilities for further innovation and exploitation opens up. NetworkFunction Virtualization (NFV) and Software-Defined Networking (SDN)are two key enablers for such a new flexible, scalable, and service-orientednetwork architecture. This chapter provides an overview of QoS-awarestrategies that can be used over the levels of the network abstractionaiming to fully exploit the new network opportunities. Specifically, wepresent three use cases of integrating SDN and NFV with QoS-awareservice composition, ranging from the energy efficient placement of vir-tual network functions inside modern data centers, to the deployment ofdata stream processing applications using SDN to control the networkpaths, to exploiting SDN for context-aware service compositions.
1 Introduction
Software-Defined Networking (SDN) is a new paradigm that provides pro-grammability in configuring network resources. It introduces an abstraction layeron the network control layer that allows runtime and ad-hoc network reconfig-uration. Therefore, it enables to adapt at runtime not only physical networkresources but also software services that compose complex services delivered toend users. Such a new network feature thus provides a valuable mechanism to beexploited in the modeling of QoS-aware service compositions integrating servicesfrom various networks. This paradigm has been successfully incorporated intothe virtualization of the telecommunication network and an architecture concept
c© The Author(s) 2018I. Ganchev et al. (Eds.): Autonomous Control for a Reliable Internet of Services, LNCS 10768, pp. 212–240, 2018.https://doi.org/10.1007/978-3-319-90415-3_9
Integrating SDN and NFV with QoS-Aware Service Composition 213
called Network Function Virtualization (NFV), where virtual network functionsare interconnected into service compositions to create communication services.
Traditional networks that have been designed for yesterday peak require-ments are inefficient to cope with nowadays massive communication trafficinjected by a large number of users (e.g., billions of devices in the Internet ofThings). The main obstacle of traditional networks to provide full exploitation oftheir resources and accelerate innovation is caused by the lack of integration ofthe variety of hardware and software appliances. Moreover, the lack of standard-ized interfaces make network management costly and slow adapting to moderntrends, and user demands [14,20,27].
Within the 5G network, SDN and NFV are the two key technologies intro-duced as enablers [33]. In future networks, the optimal cost is achieved throughdynamic and self-adaptive deployment on a network infrastructure which is con-tinuously controlling its performances and autonomously managing its resources.The primary goal of such a dynamic and autonomous deployment is to accom-plish and maintain the quality of service (QoS) requirements of complex services.By adopting SDN and NFV for the composition of complex services, Software-Defined Service Composition (SDSC) [21] separates the execution of service com-positions from the data plane of the overall system.
SDSC facilitates the integration and interoperability of more diverse imple-mentations and adaptations of the services. A reliable execution of service com-position can be guaranteed through the network management capabilities offeredby SDN, in finding the best alternative among various service implementationsand deployments among the multiple potential services deployments for theservice composition execution. SDSC thus offers an increased control over theunderlying network, while supporting the execution from various traditional webservice engines and distributed frameworks.
There are various modeling approaches for QoS-aware service compositionwhich have been proposed so far. With the introduction of a programmableapproach to implement and use network resources, we should investigate per-formance modeling approaches that jointly consider all network layers and theircomposite behavior and outputs. Therefore, the contribution of this chapter isto analyze the integration of SDN and NFV in modeling the performance ofservice compositions and investigate possible side effects that can arise fromtheir composite interactions. To this end, we present three different use cases ofintegrating SDN and NFV with QoS-aware service composition, ranging fromthe energy efficient placement of virtual network functions inside modern datacenters, to the deployment of data stream processing (DSP) applications usingSDN to control the network paths, to exploiting SDN for context-aware servicecompositions.
In the upcoming sections of this chapter, we continue to discuss the benefitsand use cases of integrating SDN and NFV with QoS-aware service composition.Section 2 provides an overview of the basic concepts: SDN, NFV, and servicecompositions. Section 3 discusses the energy-efficient green strategies enabled bythe integration of SDN and NFV with service compositions. Section 4 focuses
214 V. Cardellini et al.
on a specific example of composite service - represented by DSP applications -and elaborates on the integration of a DSP framework with an SDN controller,showing a full vertical integration of the application and network layers. Section 5discusses how SDN can offer context-aware service compositions. Finally, wediscuss the benefits and open research issues in QoS-aware service compositionsin Sect. 6 and conclude the chapter by identifying future research directions inSect. 7.
2 Overview of Basic Concepts
A traditional network architecture divides Telco/Network operators from Inter-net Service Providers (ISPs) and Content Providers. Services are provided overhighly specialized technologies which limit their full exploitation by end users.A new network architecture that is proposed for future networks introduces newabstraction layers with standardized interfaces that would enable Telco/NetworkProviders, ISPs, and Content Providers to provide their services over the web,independently from the underlying network. The vision of future networks is toprovide their users with complex services that result from the autonomous com-position of simple, possibly legacy, elementary services. Such a service orientationhas also been recently reaffirmed for the next decade in the Service Computingmanifesto [6], that call for the widespread adoption of service computing.
2.1 Introduction to NFV
The basic concept of NFV is to apply Cloud computing technologies to realizetelecommunication applications. NFV revolves around the concept of virtualiza-tion, which enables to run multiple systems in isolation on a single hardware sys-tem. The exploitation of virtualization allows to decouple network functions fromthe related (dedicated) hardware [17]. In other words, a software implementationof different network functions (e.g., modulation, coding, multiple access, firewall,deep packet inspection, evolved packet core components) can be deployed on topof a so-called hypervisor, which runs on commercial off-the-shelf servers insteadof dedicated hardware equipment. The hypervisor provides for virtualizationand resource management (e.g., scheduling access to CPU, memory, and diskfor the network functions). In addition, an orchestration framework needs to bein place, so to combine different virtual functions to obtain higher layer servicechains implementing the end-to-end service. Moreover, the orchestration frame-work manages the deployment (e.g., which virtual function to place on whatphysical server) and the life cycle of the virtual network functions, including themanagement of their scalability. The latter comprises several tasks, among whichmonitoring performance, scaling either vertically or horizontally resources (i.e.,either acquiring more powerful computing resources or spawning more replicasof the same virtual network function and load balancing among them).
Consequently, Virtual Network Functions (VNFs) are different from classicalserver virtualization technologies because VNF may form service chains com-posed of multiple virtual network functions, that exchange traffic which may be

Integrating SDN and NFV with QoS-Aware Service Composition 215
deployed on one or multiple virtual machines running different network func-tions and replacing thus a variety of hardware appliances [33]. Such softwareimplementation of network functions is easily portable among different vendorsand may coexist with hardware-based platforms. Thus, the main benefits pro-vided are a reduction of capital and operational expenditures, offering a reducedtime-to-market as well as scalability to different resource demands.
However, with the introduction of VNFs, additional problems may arise, suchas increased complexity. Additional interfaces need to be defined and maintained(e.g., between the hypervisor and the orchestration system), which leads to morecomplex system design. In addition, as applications can have strict requirementsin terms of latency, performance guarantees are more difficult to be satisfied.This is because a given implementation of a VNF may perform differently whendeployed on different hardware. For example, the deployment of I/O intensiveVNF (e.g., a home subscriber service) on a server equipped with a standard HDDmay lead to lower performance than the one resulting from a deployment on aserver equipped with an SSD or NV-RAM. Consequently, new benchmarkingtools are required that allow correlating the performance of a given VNF whendeployed on a given hardware with a certain configuration.
2.2 Introduction to Service Composition Using SDN
The second enabling technology is SDN, which separates the network controlplane from the infrastructure (data) plane [31]. It involves logical centralizationof network intelligence and introduces abstraction of physical networks fromthe applications and services via standardized interfaces. SDN is consideredan enabling technology for high volumes of traffic flows and responds “at run-time” on dynamic demand for network resources by avoiding time-consuming andcostly manual reconfiguration of the network. Thus, it increases network resourceexploitation and decreases time to market. Furthermore, service-orientation isintroduced to enable the runtime discovery and deployment of services. Whencombined with NFV and SDN technologies, this feature can significantly improvethe efficiency of network operations.
Figure 1 presents a high-level architecture, emphasizing three distinct man-agement layers that are coordinated by a vertical deployment manager to providepossibly coordinated QoS-aware decisions about service deployment.
At the infrastructure layer, routers and switches are distributed over thenetwork topology. These devices have their logical representation that is usedfor control and management purposes. Decisions of centralized network controlare transferred over the standardized physical interfaces to operate over devicesin this layer.
Network resources are virtualized in the virtualization layer. Each virtualresource has its logical representation that enables efficient management. Thevirtual resources may be interconnected into a graph-like topology. Again,autonomous decisions about their interconnection and placement are subjectof the management entity at this layer.

216 V. Cardellini et al.
Fig. 1. High-level network overview.
Finally, at the application layer a number of basic component services areavailable in distributed data centers and exposed in service libraries. The com-plex services may be composed of many basic services that are accessible throughservice registries and can be composed on the basis of different goals. In the threeuse cases, we present later in this chapter, we consider network service chains,Web service and eScience workflows, and data stream processing (DSP) applica-tions. A network service chain allows assembling services out of multiple servicefunctions typically using basic patterns for service composition, e.g., a sequenceof VNFs, with one or multiple instances needed for each VNF. Web services andeScience workflows usually organize their component services using more com-plex workflow patterns, e.g., conditional choice, loops, and fork-and-join. Finally,a DSP application is represented as a directed acyclic graph, that can be seenas a workflow diagram.
A service composition deployment on top of SDN allows cross-layer optimiza-tions, as the services interact with the SDN controller through its northboundApplication Programming Interface (API) protocols and using REpresentationalState Transfer (REST) [39], Advanced Message Queuing Protocol (AMQP) [42],and Message Queue Telemetry Transport (MQTT) [32] transport protocols. Onthe other hand, the SDN controller orchestrates the data center network that theservices are deployed on, through its southbound API protocols such as Open-Flow [28] and NetConf [16]. Such a cross-layer optimization supported by SDNallows QoS guarantees at the service and network levels.
Integrating SDN and NFV with QoS-Aware Service Composition 217
NFV and SDN do not rely on each other. NFV is providing flexible infras-tructure, while SDN software can run and can provide flow-based configura-tion of network functions. Both technologies, when used in cooperation, canoffer enhanced QoS guarantees. In such new network architecture, the networklogic is abstracted on several layers of abstraction. The management decisions ofeach layer may have reflections on the QoS provided by the network. Thus, theselection of collected management decisions within deployment manager shouldbalance between flexibility provided at each level of network abstraction andoptimal QoS.
An ongoing standardization endeavor is Next Generation Service OverlayNetwork (NGSON), aiming to establish a collaborative framework among thestakeholders from various networks and technology paradigms in order to unifytheir vision on common service delivery platform. Thus, the end-user need forcomplex service delivery across the network borders would be satisfied. Thestandard aims to identify self-organizing management capabilities of NGSONincluding self-configuration, self-recovery, and self-optimization of NGSON nodesand functional entities.
2.3 Overview of Use Cases
In this chapter, we will look into three illustrative use cases of integrating SDNand NFV with QoS-aware service composition.
Section 3 presents an overview on green strategies for VNF embedding, sup-ported by SDN and NFV. Here, the key idea is to manage the NFV infras-tructure, namely the composition of compute and networking resources includ-ing servers and networking equipment in an energy efficient way. By poweringdown unused servers and switches, the total energy of the infrastructure can beminimized. Important questions to ask are then what is the minimum numberof servers, switches, and links that are necessary in order to provide the SLAdesired for the service chains that need to be embedded into the physical net-work and compute infrastructure, where to place the functions and how to routethe service chain traffic in order to find a balance between energy efficiency,performance and SLA.
Section 4 presents how the integration of an SDN controller with a DSPframework allows to adjust the network paths as per-application needs in theQos-aware deployment of DSP applications on the computing and networkresources. In the proposed integrated framework, SDN is used to expose to theDSP framework the network topology and network-related QoS metrics. Suchinformation is exploited in a general formulation of the optimal placement prob-lem for DSP applications, which jointly addresses the selection of computingnodes and of network paths between each pair of selected computing nodes.
We define services that access, process, and manage Big Data as big services.They pose computation and communication challenges due to their complex-ity, volume, variety, and velocity of Big Data they deal with. Moreover, theyare often deadline-bound and mission-critical. Each big service is composed

218 V. Cardellini et al.
of multiple services to be able to execute it in the Internet-scale at the dis-tributed clouds. Such a componentization of big service improves its resilienceand latency-awareness. For example, consider a big service for weather fore-cast. It consists of various services including sensor data retrieval, data analysisservices, and prediction. These component services are inherently distributed,including the ones that manage the actuators and the sensors in land, sea, andsatellites. By leveraging the SDN and NFV paradigms, SDSC ensures an effi-cient service composition from the replicated and globally distributed services.Section 5 discusses how SDSC leverages SDN to build and efficiently executecomplex scientific workflows and business processes as service compositions.
3 Green Strategies for VNF Embedding
Next generation 5G networks will rely on distributed virtualized datacenters tohost virtualized network functions on commodity servers. Such NFV will lead tosignificant savings in terms of infrastructure cost and reduced management com-plexity. Virtualization inside modern datacenters is a key enabler for resourcesconsolidation, leading towards green strategies to manage both compute andnetwork infrastructures where VNFs are hosted. However, green strategies fornetworking and computing inside data centers, such as server consolidation orenergy aware flow routing, should not negatively impact on the quality andservice level agreements expected from network operators, given that enoughresources exist. For example, given two different resource allocation strategies,one focusing on performance while the other focusing on energy efficiency, whileboth strategies may lead to a resource allocation that satisfies user demands andSLAs, a green strategy does so by minimizing the energy consumption. Oncefewer resources are available than requested, green strategies should guide theresource allocation processes towards operational points that are more energyfriendly.
Important tools available for Cloud Operators are server consolidation strate-gies that migrate Virtual Machines (VMs) towards the fewest number of serversand power down unused ones to save energy. As VNFs are composed of a set ofVNF Components (VNFC) that need to exchange data over the network undercapacity and latency constraints, the networking also plays an important part.By using SDN, one can dynamically adjust the network topology and availablecapacity by powering down unused switch ports or routers that are not needed tocarry a certain traffic volume [19], thus consuming the least amount of energy at apotential expense of higher latency. Green strategies try to place the VNFC ontothe fewest amount of servers and to adjust the network topology and capacity tomatch the demands of the VNFCs while consuming the least amount of energyfor operating the VNF Infrastructure. Such design of the VNF placement andvirtual network embedding can be formulated as a mathematical optimizationproblem, and efficient heuristics can be designed to quickly solve the problem.
We can consider the Virtualized Compute and Network Infrastructure asthe set of hardware resources (which is comprised of the compute and network
Integrating SDN and NFV with QoS-Aware Service Composition 219
infrastructure) that is hosting a certain number of VNFs inside a virtualizeddata center. The virtualized data center can be geo-distributed to serve differentusers at different locations using the lowest cost in terms of energy, network, etc.We assume that each VNF is made of a set of service chains, which is a groupof VNFC which have a set of traffic demands and a maximum tolerable latencyallocated towards them. More precisely, the traffic demands specify how muchtraffic, between two adjacent services in a chain, the first sends to the secondone. A service needs resources, e.g., in terms of CPU, memory, disk, and so on, toprocess packets and then forward the processing results to the next componentof the chain.
The latency of a service chain is the sum of the experienced delays on theused paths, on which all the demands of the service chain are forwarded. Italso includes the host internal processing related latency, which may be differentfor different architectural setups. For example, using standard Linux networkingapproach leads to much higher latency and less available capacity compared tousing the recently developed approaches for user-mode packet forwarding andprocessing based on proprietary techniques, such as Intel’s Data Plane Devel-opment Kit (DPDK).1 Similarly, Single Root Input/Output Virtualization (SR-IOV2) is an extension to the PCI-express standard that allows different virtualmachines (VMs) hosting the VNFs in a virtual environment to share a singlenetwork card over fast PCI-express lanes. Consequently, the additional latencyfor VNF packet processing depends on the virtualization technology used in theservers, which may be different for different server types. In addition, when twoVNFC are placed on the same server, there is also a not negligible overheadwhen forwarding the packets from one component to another (after proper pro-cessing) and this overhead (and thus the additional latency and capacity limits)also depends on the virtualization technology used.
In the following, we assume that we have available a set J of servers anda network graph G(N,E), where N represents the set of network nodes and Edenotes the links among them. Given the family of service chains, which aredefined as a specific number of traffic demands between couples of a subsetV ⊂ V out of all VNFC, the objective of the problem is to allocate all theVNFCs on the servers and to find the network routes that satisfy the trafficdemands while minimizing the overall power consumption PV NI of the VirtualNetwork Infrastructure, which is the sum of the power consumption of the com-pute (Pservers) and network infrastructure (Pswitches), given the latency, resourceand bandwidth capacity budgets:
min f = PV NI = Pservers + Pswitches (1)
The key idea for developing green strategies is to place the network functions onthe minimum number of servers and use the minimum number of highly energy
1 https://software.intel.com/en-us/networking/dpdk.2 https://www.intel.com/content/dam/doc/white-paper/pci-sig-single-root-io-virtua
lization-support-in-virtualization-technology-for-connectivity-paper.pdf.

220 V. Cardellini et al.
efficient network nodes that can serve the required capacity. Consequently, allunused servers and switches can be powered down to reduce energy consumption.
3.1 Power Model Examples for Compute and NetworkInfrastructure
Several power models have been proposed for the compute infrastructure. Typ-ically, they assume that the CPU of a server is the most power hungry compo-nent [35], and consequently most models just consider the power consumptiondue to CPU load. In general, the relationship between server power consumptionand CPU utilization is linear [24,36] with some small deviations that are due toprocessor architecture, CPU cache related aspects and compiler optimizationsleading to a different CPU execution. For performance modeling of green serverand network consolidation strategies, we can simplify that for each server j thereis a unique idle power consumption Pidle,j , which denotes the energy requiredby the server when it is just powered on and does not run any compute (exceptthe basic Operating System and management services). The maximum powerconsumption Pmax,j denotes the power consumed by the given server when allthe CPU cores are under full load. In between the two extreme cases, the powerconsumption follows a linear model dependent on the CPU utilization.
The network related power consumption can also be simplified to make ittractable in numerical models. For example, the work in [5] assumes that fornetwork switches there are two main components that impact the total powerconsumption. A static and constant power is required to power the chassis andthe line cards, which is independent of the traffic that the switch serves andthe number of ports used. In addition, depending on the number of ports perline rate are powered on, there is a dynamic power consumption, which alsodepends on the link speed the port is using (e.g., 1 Gbps or 10 Gbps) and thedynamic utilization of the ports. The power consumption also depends on theswitch manufacturers: the work by Heller et al. [19] provides an overview onthe power consumption of three different 48-port switch models. For example,one switch has a power consumption of 151 W when the switch is idle and allthe ports are powered down, while it increases to 184 W when all the ports areenabled and to 195 W when all the ports serve traffic at 1 Gbps. As one can see,just powering on a switch requires the highest amount of power, while poweringon additional ports does not add much to the total power consumption while thetraffic dependent power consumption is almost negligible. Consequently, manygreen strategies try to conserve energy by powering down unused switches andpower down unused ports.
3.2 Illustrative Example
In this section, we provide a simple example to illustrate the problem in Fig. 2.We assume there are seven servers (labeled from s1 to s7), each one with itsown dedicated power profile specified by a given idle power Pmin
s and maxi-mum power consumption Pmax
s . Each server has limited resources in terms of,
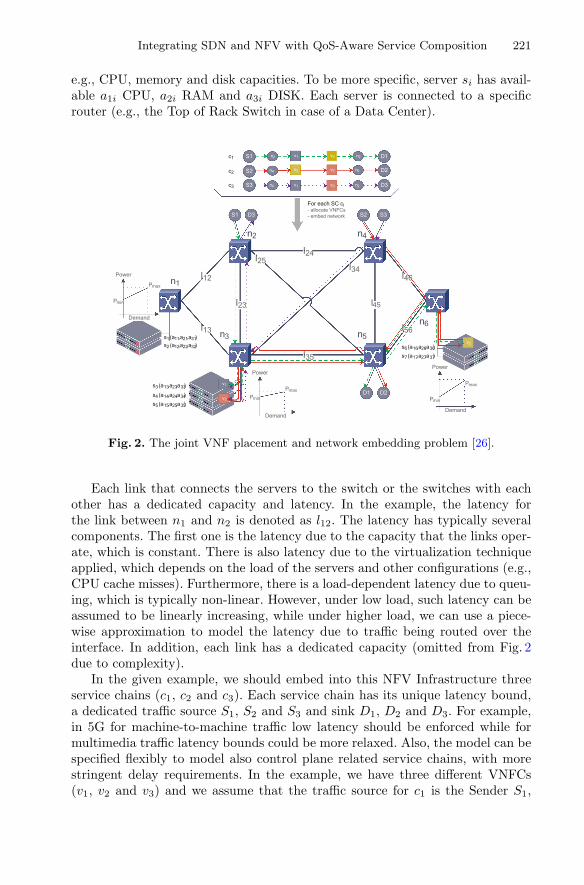
Integrating SDN and NFV with QoS-Aware Service Composition 221
e.g., CPU, memory and disk capacities. To be more specific, server si has avail-able a1i CPU, a2i RAM and a3i DISK. Each server is connected to a specificrouter (e.g., the Top of Rack Switch in case of a Data Center).
Fig. 2. The joint VNF placement and network embedding problem [26].
Each link that connects the servers to the switch or the switches with eachother has a dedicated capacity and latency. In the example, the latency forthe link between n1 and n2 is denoted as l12. The latency has typically severalcomponents. The first one is the latency due to the capacity that the links oper-ate, which is constant. There is also latency due to the virtualization techniqueapplied, which depends on the load of the servers and other configurations (e.g.,CPU cache misses). Furthermore, there is a load-dependent latency due to queu-ing, which is typically non-linear. However, under low load, such latency can beassumed to be linearly increasing, while under higher load, we can use a piece-wise approximation to model the latency due to traffic being routed over theinterface. In addition, each link has a dedicated capacity (omitted from Fig. 2due to complexity).
In the given example, we should embed into this NFV Infrastructure threeservice chains (c1, c2 and c3). Each service chain has its unique latency bound,a dedicated traffic source S1, S2 and S3 and sink D1, D2 and D3. For example,in 5G for machine-to-machine traffic low latency should be enforced while formultimedia traffic latency bounds could be more relaxed. Also, the model can bespecified flexibly to model also control plane related service chains, with morestringent delay requirements. In the example, we have three different VNFCs(v1, v2 and v3) and we assume that the traffic source for c1 is the Sender S1,

222 V. Cardellini et al.
which is connected to router n2 and injects a certain volume of traffic into theservice chain towards v1. Then, v1 processes the packets (for which it needsresources such as CPU, memory, and disk) and forwards the processed traffic(which may have a different volume than the one injected) towards VNFC v2,which again processes it and forwards a certain volume to the destination D1
that is connected to router n2.Note that Fig. 2 assumes additional source/sink nodes where traffic for a
service chain is created/terminated. The figure shows an example of joint VNFplacement and network embedding into the physical substrate network. VNFCv1 would be placed onto server s3, v3 onto server s4, and so on. Servers hostingno VNFC would be powered down (s1, s2, s5, s7) together with all the nodesnot carrying any traffic (n1).
4 Integrating SDN into the Optimal Deployment of DSPApplications
In the section, we present a use case of integrating SDN with QoS-aware servicecomposition that focuses on Data Stream Processing (DSP) applications. Theadvent of the Big Data era and the diffusion of the Cloud computing paradigmhave renewed the interest in DSP applications, which can continuously collectand process data generated by an increasing number of sensing devices, to timelyextract valuable information. This emerging scenario pushes DSP systems to awhole new performance level. Strict QoS requirements, large volumes of data, andhigh production rate exacerbate the need for an efficient usage of the underlyinginfrastructure. The distinguishing feature of DSP applications is their ability toprocessing data on-the-fly (i.e., without storing them), moving them from an oper-ator to the next one, before reaching the final consumers of the information. A DSPapplication can be regarded as a composition of services [1] with real-time pro-cessing issues to address. It is usually modeled as a directed acyclic graph (DAG),where the vertexes represent the processing components (called application opera-tors, e.g., correlation, aggregation, or filtering) and the edges represent the logicallinks between operators, through which the data streams flow.
To date, DSP applications are typically deployed on large-scale and central-ized (Cloud) data centers that are often distant from data sources [18]. However,as data increase in size, pushing them towards the Internet core could causeexcessive stress on the network infrastructure and also introduce high delays. Asolution to improve scalability and reduce network latency lies in taking advan-tage of the ever-increasing presence of near-edge/Fog computing resources [4]and decentralizing the DSP application, by moving the computation to the edgesof the network close to data sources. Nevertheless, the use of a diffused infras-tructure poses new challenges that include network and system heterogeneity,geographic distribution as well as non-negligible network latencies among dis-tinct nodes processing different parts of a DSP application. In particular, thislatter aspect could have a strong impact on DSP applications running in latency-sensitive domains.

Integrating SDN and NFV with QoS-Aware Service Composition 223
Fig. 3. DSP framework with SDN controller integration.
To address these challenges, we have proposed the solution depicted in Fig. 3and named SDN-integrated DSP Framework (for short, SIDF), which combinesand integrates a DSP application framework with an SDN controller. To thisend, we have:
– extended the architecture of Apache Storm, a well known open-source DSPframework, by designing, developing, and integrating few key modules thatenable a distributed QoS-aware scheduler architected according to the MAPE(Monitor, Analyze, Plan, and Execute) reference model for autonomic sys-tems [7,8];
– designed, developed and implemented the controller logic for standard SDNcontroller and the associated API to provide network monitoring and dedi-cated stream routing configuration in an SDN network.
The proposed solution represents a full vertical integration of the applicationand network layers. The resulting architecture is highly modular and capable oftaking full advantage of the SDN paradigm in modeling and optimizing the per-formance of Fog-based distributed DSP applications. In particular, SIFD enablesthe cross-layer optimization of the Fog/Cloud and SDN layers, whereby the SDNlayer exposes to the upper layer the network topology and QoS metrics. Thisallows the optimal deployment of DSP applications by exploiting full knowl-edge of the computational and network resources availability and status. In thissetting, an optimal deployment algorithm determines not only the applicationcomponents placement on the underlying infrastructure but also the networkpaths between them.
224 V. Cardellini et al.
For the sake of comparison with a non-SDN based solution, the proposedsolution is backward compatible with legacy IP network, whereby network pathsare solely determined by the underlying routing protocol and cannot be adjustedas per-application needs, thus providing no control by the DSP framework. Inthis setting, the DSP manager can at most monitor the network performancebetween candidate endpoints (see, e.g., [13] for a scalable network monitoringservice) and determine operator placement on the underlying infrastructure bytaking account the observed network delays.
4.1 The SIDF Architecture
SIDF uses a layered architecture to combine a DSP framework with an SDNcontroller (Fig. 3). The layered infrastructure enforces separation of concerns andallows to obtain a loosely coupled system. Each layer realizes new functionalitieson top of lower-level services and exposes them as a service to the higher layer.SIDF comprises three main layers: infrastructure layer, network control layer,and application layer.
At the lowest level, the infrastructure layer and the network control layer rep-resent the classical SDN network. Specifically, the infrastructure layer comprisesnetwork equipment, such as SDN devices and legacy IP devices. The formerenables to monitor and dedicate communication paths, whereas the latter onlyexposes paths as black-boxes, resulting from their routing protocol.
The network control layer manages the heterogeneity of network devicesand controls their working conditions. SIDF includes a network controller thatrealizes two functionalities: monitor and QoS routing. The monitoring compo-nents periodically observe the network so to extract metrics of interest; to limitthe footprint of monitoring operations, we only retrieve network delays amongnetwork devices and computing nodes. Observe that these monitoring opera-tions can be realized in an SDN controller assisted manner as proposed in [41],where the SDN controller periodically sends probes on links to measure theirtransferring delays, or in a distributed manner, where neighbor SDN devicesautonomously compute latencies. As a result, the network control layer canexpose a view of the infrastructure as a connected graph (or network graph),where network devices and computing nodes are interconnected by networklinks; the latter are labeled with monitoring information (e.g., network latency).Observe that, with legacy IP devices, the link between two network nodes rep-resents the logical connectivity resulting from the routing protocols. As regardsthe QoS routing functionalities, the SDN controller allows installing dedicatedstream routing configurations in the underlying infrastructure. Leveraging onthe exposed network graph, the application layer of SIDF can instruct the net-work to route streams on specific paths, according to application needs. Forexample, the application might require to route data using either a best-effortpath, the path that minimizes the number of hops, or the one that minimizesthe end-to-end delay between two computing nodes.

Integrating SDN and NFV with QoS-Aware Service Composition 225
The application layer includes the DSP framework, which abstracts the com-puting and network infrastructure and exposes to users simple APIs to executeDSP applications. Many DSP frameworks have been developed so far. Never-theless, most of them have been designed to run in a clustered environment,where network delays are (almost) zero [9]. Since in an infrastructure with dis-tributed computing resources (like in the Fog computing environment) networkdelays cannot be neglected, SIDF includes a custom distributed DSP frameworkthat conveniently optimizes the execution of DSP applications. This framework,named Distributed Storm [8], has been implemented as an extension of ApacheStorm [40], one of the mostly adopted open-source DSP frameworks. DistributedStorm oversees the deployment of DSP applications, which can be reconfiguredat runtime so to satisfy QoS requirements (e.g., maximum application responsetime). To this end, the framework includes few key modules that realize theMAPE (Monitor, Analyze, Plan, and Execute) control cycle, which representsthe reference model for autonomic systems [7,8]. During the execution of MAPEphases, Distributed Storm cooperates with the other layers of SIDF so to jointlyoptimize the application deployment and the QoS-aware stream routing. Specif-ically, during the Monitor phase, the framework retrieves the resource and net-work conditions (e.g., utilization, delay) together with relevant application met-rics (e.g., response time). Network conditions are exposed by the network controllayer. During the Analyze phase, all the collected data are analyzed to determinewhether a reconfiguration of the application deployment should be planned. If itis worth to reconfigure the application as to improve performance (or more gener-ally, to satisfy QoS requirements), in the Plan and Execute phases the frameworkfirst plans and then executes the corresponding adaptation actions (e.g., relocatethe application operators, change the replication degree of operators). The Planphase determines the optimal deployment problem, whose general formulation ispresented in the next section. If a reconfiguration involves changing the streamrouting strategy, the Execute phase also interacts with the network control layer,so to enforce new forwarding rules.
4.2 DSP Deployment Problem
We now illustrate the optimal deployment problem for DSP applications withQoS requirements. We provide a general formulation of the optimal placementproblem for DSP applications which jointly addresses the operator placementand the data stream routing by modeling both the computational and networkingresources. A detailed description of the system model can be found in [9].
For a DSP application, solving the deployment problem consists in determin-ing for each operator i:
1. the operator placement, that is the computational node where to deploy theoperator i;
2. the network paths that the data streams have to traverse from an operator ito each of the downstream operator j.
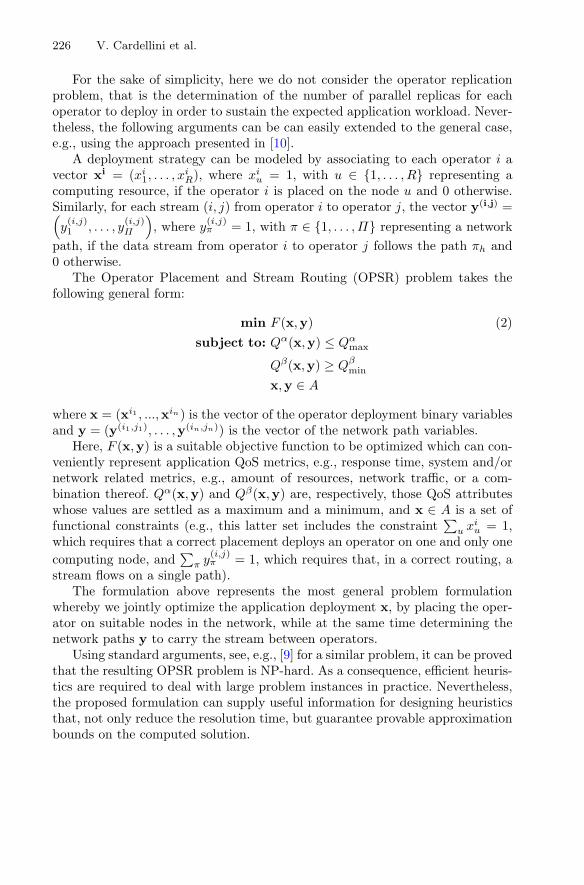
226 V. Cardellini et al.
For the sake of simplicity, here we do not consider the operator replicationproblem, that is the determination of the number of parallel replicas for eachoperator to deploy in order to sustain the expected application workload. Never-theless, the following arguments can be can easily extended to the general case,e.g., using the approach presented in [10].
A deployment strategy can be modeled by associating to each operator i avector xi = (xi
1, . . . , xiR), where xi
u = 1, with u ∈ {1, . . . , R} representing acomputing resource, if the operator i is placed on the node u and 0 otherwise.Similarly, for each stream (i, j) from operator i to operator j, the vector y(i,j) =(y(i,j)1 , . . . , y
(i,j)Π
), where y
(i,j)π = 1, with π ∈ {1, . . . , Π} representing a network
path, if the data stream from operator i to operator j follows the path πh and0 otherwise.
The Operator Placement and Stream Routing (OPSR) problem takes thefollowing general form:
min F (x,y) (2)subject to: Qα(x,y) ≤ Qα
max
Qβ(x,y) ≥ Qβmin
x,y ∈ A
where x = (xi1 , ...,xin) is the vector of the operator deployment binary variablesand y = (y(i1,j1), . . . ,y(in,jn)) is the vector of the network path variables.
Here, F (x,y) is a suitable objective function to be optimized which can con-veniently represent application QoS metrics, e.g., response time, system and/ornetwork related metrics, e.g., amount of resources, network traffic, or a com-bination thereof. Qα(x,y) and Qβ(x,y) are, respectively, those QoS attributeswhose values are settled as a maximum and a minimum, and x ∈ A is a set offunctional constraints (e.g., this latter set includes the constraint
∑u xi
u = 1,which requires that a correct placement deploys an operator on one and only onecomputing node, and
∑π y
(i,j)π = 1, which requires that, in a correct routing, a
stream flows on a single path).The formulation above represents the most general problem formulation
whereby we jointly optimize the application deployment x, by placing the oper-ator on suitable nodes in the network, while at the same time determining thenetwork paths y to carry the stream between operators.
Using standard arguments, see, e.g., [9] for a similar problem, it can be provedthat the resulting OPSR problem is NP-hard. As a consequence, efficient heuris-tics are required to deal with large problem instances in practice. Nevertheless,the proposed formulation can supply useful information for designing heuristicsthat, not only reduce the resolution time, but guarantee provable approximationbounds on the computed solution.
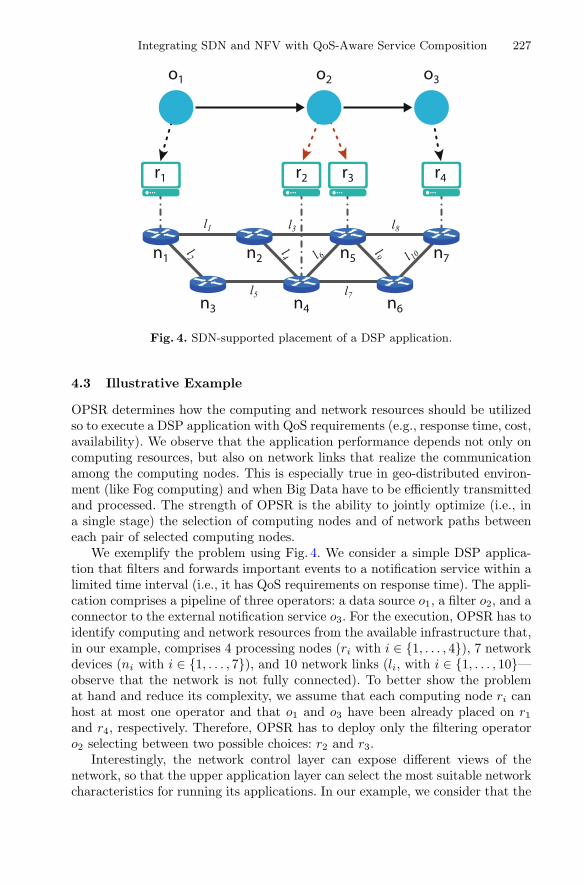
Integrating SDN and NFV with QoS-Aware Service Composition 227
Fig. 4. SDN-supported placement of a DSP application.
4.3 Illustrative Example
OPSR determines how the computing and network resources should be utilizedso to execute a DSP application with QoS requirements (e.g., response time, cost,availability). We observe that the application performance depends not only oncomputing resources, but also on network links that realize the communicationamong the computing nodes. This is especially true in geo-distributed environ-ment (like Fog computing) and when Big Data have to be efficiently transmittedand processed. The strength of OPSR is the ability to jointly optimize (i.e., ina single stage) the selection of computing nodes and of network paths betweeneach pair of selected computing nodes.
We exemplify the problem using Fig. 4. We consider a simple DSP applica-tion that filters and forwards important events to a notification service within alimited time interval (i.e., it has QoS requirements on response time). The appli-cation comprises a pipeline of three operators: a data source o1, a filter o2, and aconnector to the external notification service o3. For the execution, OPSR has toidentify computing and network resources from the available infrastructure that,in our example, comprises 4 processing nodes (ri with i ∈ {1, . . . , 4}), 7 networkdevices (ni with i ∈ {1, . . . , 7}), and 10 network links (li, with i ∈ {1, . . . , 10}—observe that the network is not fully connected). To better show the problemat hand and reduce its complexity, we assume that each computing node ri canhost at most one operator and that o1 and o3 have been already placed on r1and r4, respectively. Therefore, OPSR has to deploy only the filtering operatoro2 selecting between two possible choices: r2 and r3.
Interestingly, the network control layer can expose different views of thenetwork, so that the upper application layer can select the most suitable networkcharacteristics for running its applications. In our example, we consider that the

228 V. Cardellini et al.
network control layer exposes paths with different QoS attributes in terms ofcommunication latency and available bandwidth.
– In case o2 is deployed on r2, OPSR has to further select the network paths forstreams (o1, o2) and (o2, o3), which should flow between (r1, r2) and (r2, r4),respectively. For the first stream (o1, o2), the network controller exposes π1 ={l1, l4}, with 10 ms latency and 100 Mb/s bandwidth, and π2 = {l2, l5},with 25 ms latency and 1 Gb/s bandwidth. Similarly, for the second stream(o2, o3), the network controller exposes π3 = {l6, l8}, with 10 ms latency and300 Mb/s bandwidth, and π4 = {l7, l10}, with 15 ms latency and 850 Mb/sbandwidth.
– In case o2 is deployed on r3, OPSR can determine the network paths forstreams (o1, o2) and (o2, o3), which should flow between (r1, r3) and (r3, r4),respectively. For the first stream (o1, o2), the network controller exposes π5 ={l1, l3}, with 10 ms latency and 100 Mb/s bandwidth, and π6 = {l2, l5, l6},with 30 ms latency and 600 Mb/s bandwidth. For the second stream (o2, o3),the network controller exposes π7 = {l8}, with 5 ms latency and 100 Mb/sbandwidth, and π8 = {l9, l10}, with 15 ms latency and 600 Mb/s bandwidth.
The utilization of any of these paths is upon request, because the SDN con-troller has to allocate resources so to guarantee that QoS performance does notdegrade over time (e.g., due to link over-utilization). Since selecting one pathor another deeply changes the application performance, OPSR picks the mostsuitable one driven by the DSP application QoS requirements, which are cap-tured by the objective function F (x,y). Our DSP application needs to forwardevent notifications with bounds on delay, therefore it prefers to transfer datausing the paths with minimum communication latency. Hence, OPSR maps o2on r3 and selects the paths π5 and π7, which introduce a limited communicationlatency of 15 ms. Observe that, in case the DSP application aimed to optimizethe amount available bandwidth (as in case of media streaming applications),OPSR would have mapped o2 on r2 and selected the paths π2 and π4, whichprovide a bandwidth of 1 Gb/s and 850 Mb/s, respectively.
Although this is a toy example, it gives a flavor of the potentialities comingfrom the cooperation between SDN and distributed DSP applications. At thesame time, the example shows the combinatorial nature of the OPSR problem,which calls for the development of new efficient heuristics.
4.4 Related Work on Big Data and SDN
With the renewed interest in DSP applications, in the last years many researchworks have focused on the placement and runtime reconfiguration of DSP appli-cations (e.g., [2,9,10,25,45] and therein cited works). However, some of theseworks [2,45] do only consider the deployment of the DSP application in a clus-tered and locally distributed environment. Moreover, to the best of our knowl-edge, none of them exploits the support for the flexible and fine-grained pro-grammable network control offered by SDN.

Integrating SDN and NFV with QoS-Aware Service Composition 229
Enlarging the focus to Big Data applications, of which DSP applicationsrepresent the real-time or near-real-time constituent, SDN is considered as apromising paradigm that can help to address issues that are prevailing withsuch a kind of applications [11,37]. These issues comprise data processing andresource allocation in locally and geographically distributed data centers, includ-ing micro data centers in Fog and edge computing, data delivery to end users,a joint optimization that addresses the tight coupling between data movementand computation, and application scheduling and deployment.
So far, in the Big Data scenario, most works have leveraged SDN to opti-mize the communication-intensive phase of Hadoop MapReduce [15] by placingMapReduce tasks close to their data, thus reducing the amount of data that mustbe transferred and therefore the MapReduce job completion time [29,38,43,44].A first work that explores the tight integration of application and network con-trol utilizing SDN has been presented by Wang et al. [43], which explores the ideaof application-aware networking through the design of an SDN controller usinga cross-layer approach that configures the network based on MapReduce jobdynamics at runtime. The Pythia system proposed by Neves et al. [29] employscommunication intent prediction for Hadoop and uses this predictive knowledgeto optimize at runtime the network resource allocation. The Pythia networkscheduling component computes an optimized allocation of flows to networkpaths and, similarly to the QoS routing in our SIDF architecture, maps the log-ical flow allocation to the physical topology and installs the proper sequence offorwarding rules on the network switches. Xiong et al. propose Cormorant [44],which is a Hadoop-based query processing system built on top of SDN, whereMapReduce optimizes task schedules based on the network state provided bySDN and SDN guarantees the exact schedule to be executed. Specifically, SDN isexploited to provide the current snapshot of the network status and to install thenetwork path having the best available bandwidth. Their experimental resultsshow a 14–38% improvement in query execution time over a traditional app-roach that optimizes task and flow scheduling without SDN collaboration. Qinet al. in [38] propose a heuristic bandwidth-aware task scheduler that combinesHadoop with the bandwidth control capability offered by SDN with the goal tominimize the completion time of MapReduce jobs.
The integration of SDN into the control loop of self-adaptive applications hasbeen studied by Beigi-Mohammadi et al. [3] with the goal of exploiting networkprogrammability to meet application requirements. This is a new trend in thedesign of self-adaptive systems. We also explore it with the SIDF architecture:the integration of SDN allows us to adapt at runtime the stream routing sothat the QoS requirements of the DSP application can still be guaranteed whennetwork operating conditions change. Besides the SDN appealing features, thestrict cooperation between adaptive systems and the SDN controller might easilybecome a scalability bottleneck. Indeed, SDN controller are often implemented asa single centralized entity, whereas adaptive systems can span over geographicallydistributed infrastructures. Further research investigations are needed to enablethe exploitation of SDN features in a scalable manner.

230 V. Cardellini et al.
5 Context-Aware Composition of Big Services
Big services are typically composed of smaller web services or microservices,each with multiple alternative deployments to ensure performance, scalability,and fault-tolerance. Such service compositions enable the design and implemen-tation of complex business processes, eScience workflows, and Big data applica-tions, by aggregating the services. Services are often implemented using severalapproaches, languages, and frameworks still offering the same API, standardizedas RESTful or Service Oriented Architecture (SOA) [30] web services.
As the demand for QoS and data quality is on the rise, along with the ever-increasing scale of Big data, service compositions execute in computational nodesthat are geographically distributed in the Internet-scale. SDN can be extendedand leveraged to manage the underlying network that interconnects the build-ing blocks of such complex workflows, to enhance the scalability and potentialuse cases in services computing. An integration of SDN and NFV into servicecomposition facilitates efficient context-aware distribution of service executioncloser to the data, minimizing latency and communication overhead.
5.1 Software-Defined Service Composition (SDSC)
SDSC is an approach to a distributed and decentralized service composition,which leverages SDN for an efficient service placement on the service nodes.Following the SDSC approach, a typical eScience workflow is mapped onto ageographically distributed service composition. SDSC exploits both the data-as-a-service layer and network layer for the resource allocation. System admin-istrators can monitor the health of the service compositions, through the webservice engines that host the services, by observing the runtime parameters suchas the executed requests and the requests on the fly can be monitored. The listof multiple web service deployments can be retrieved from the web service reg-istry. In addition to these, SDSC leverages the global network knowledge of theSDN controller to find the network parameters such as bandwidth utilization tofine tune the services placement, offering features such as congestion control andload balancing, which can better be achieved in the network layer.
By separating the execution from the data plane of the overall system, SDSCfacilitates integration and interoperability of more diverse implementations andadaptations of the services. A resilient execution of service composition can beguaranteed through the network management capabilities offered by SDN, infinding the best alternative among various service implementations and deploy-ments among the multiple potential services deployments for the service compo-sition execution. SDSC thus facilitates an increased control over the underlyingnetwork, while supporting the execution from various traditional web servicesengines and the distributed execution frameworks.
The core of SDSC is constituted by the communication between inter-domain SDN controllers, facilitated by various Message-Oriented Middleware(MOM) [12] protocols such as AMQP and MQTT. The service requests aremapped to the network through SDN, and the resource provisioning is managed

Integrating SDN and NFV with QoS-Aware Service Composition 231
with the assistance of the SDN controller. Hence, each domain is aware of theservices that are served by the services hosted in them. By offering communica-tion between inter-domain controllers, resources are allocated efficiently for eachservice request.
There is an increased demand for configurability to service composition.Context-aware service composition is enabled by exploiting SDN in deployingservice compositions. The Next Generation Service Overlay Network (NGSON)specification offers context-aware service compositions by leveraging virtualiza-tion [20]. SDN and NFV support context-awareness and traffic engineering capa-bilities [34], to manage and compose services. Research efforts focus on efficientresource utilization as well as enabling pervasive services [23] motivated by thestandardization effort of NGSON.
5.2 Componentizing Data-Centric Big Services on the Internet
Workflows of mission-critical applications consist of redundancy in links andalternative implementations and deployments in place, either due to parallelindependent developments or developed such to handle failures, congestion, andoverload in the nodes. Distributed cloud computing and volunteer computingare two examples that permit multi-tenant computation-intensive complex work-flows to be executed in parallel, leveraging distributed resources.
Figure 5 represents a multi-tenant cloud environment with various tenants.The tenants execute several big services. Many aspects such as locality of theexecuting cloud data center and policies must be considered for an efficientexecution of the service workflow. An SDN controller deployment can ensure QoSto the cloud, by facilitating an efficient management of the network-as-a-serviceconsisting of SDN switches, middleboxes, and hosts or servers. The controllercommunicates with the cloud applications through its northbound API, whilecontrolling the SDN switches through its southbound API. Thus, SDN facilitatesan efficient execution of big services.
In practice, no complex big service is built and deployed as a singleton or atightly coupled single cohesive unit. Mayan [21], which is a distributed executionmodel and framework for SDSC, defines the services that compose a big servicesworkflow as the “building blocks” of the workflow. SDSC aims to extend theSDN-enabled service execution further to the Internet-scale.
Representation of the Model. We need to consider and analyze the poten-tial execution alternatives of the services, to support a context-aware executionof service compositions. In this section, we formally model the big services asservice compositions and consider the potential execution alternatives for theircontext-aware execution. Services are implemented by various developers follow-ing different programming languages and paradigms.
∀n ∈ Z+;∀α ∈ {A,B, . . . , N}: sn
α represents the αth implementation ofservice sn.
Each implementation of a service can have multiple deployments, dis-tributed throughout the globe, either as replicated deployments or independent
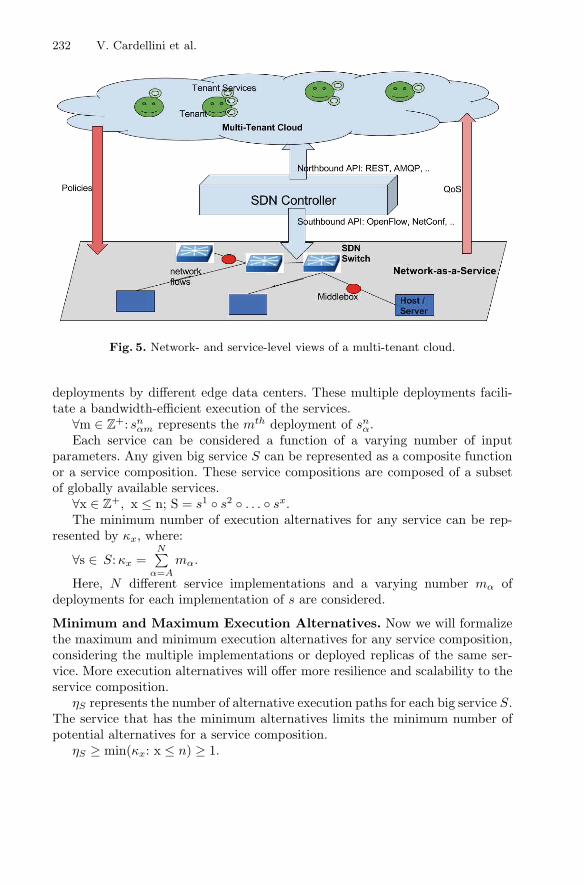
232 V. Cardellini et al.
Fig. 5. Network- and service-level views of a multi-tenant cloud.
deployments by different edge data centers. These multiple deployments facili-tate a bandwidth-efficient execution of the services.
∀m ∈ Z+: sn
αm represents the mth deployment of snα.
Each service can be considered a function of a varying number of inputparameters. Any given big service S can be represented as a composite functionor a service composition. These service compositions are composed of a subsetof globally available services.
∀x ∈ Z+, x ≤ n; S = s1 ◦ s2 ◦ . . . ◦ sx.
The minimum number of execution alternatives for any service can be rep-resented by κx, where:
∀s ∈ S: κx =N∑
α=A
mα.
Here, N different service implementations and a varying number mα ofdeployments for each implementation of s are considered.
Minimum and Maximum Execution Alternatives. Now we will formalizethe maximum and minimum execution alternatives for any service composition,considering the multiple implementations or deployed replicas of the same ser-vice. More execution alternatives will offer more resilience and scalability to theservice composition.
ηS represents the number of alternative execution paths for each big service S.The service that has the minimum alternatives limits the minimum number ofpotential alternatives for a service composition.
ηS ≥ min(κx: x ≤ n) ≥ 1.
Integrating SDN and NFV with QoS-Aware Service Composition 233
Taking into account the alternatives due to various service combinations inthe big service, the maximum alternatives is limited by a product of alternativesfor each service.
ηS ≤ ∏nx=1 κx.
Hence,min(κx: x ≤ n) ≤ ηS ≤ ∏n
x=1 κx.Various protocols and web services standards unify the message passing
between the services, and enable seamless migration among the alternatives,in a best-effort and best-fit strategy. SOA and RESTful web services supportcommon message formats through standardizations. These efforts unify and rev-olutionize the way services are built on the Internet.
5.3 Illustrative Example
Figure 6 illustrates a sample workflow that represents a service composition. Thisworkflow can be an eScience workflow or a complex business process. The work-flow represents multiple possible execution paths when the service compositionis decomposed or componentized into services (Services 1, 2, .., n). A, B, C, .., Zrepresents the alternative implementations for each of the services. Thus, serviceimplementations such as 1A, 1B, and 1Z can function as an alternative to eachother (here, each of these is an implementation of service 1).
As illustrated by Fig. 6, if service 3A is either congested or crashed, theservice execution can be migrated to the next best-fit (chosen based on localityor some other policy) deployment 3B. (2,3)Z represents a service that is equal tothe service composition of 3A(2A), the output of 2A as an input to 3A. Hence, itis not an alternative to 2A or 3A. It is also possible that not all the services havealternative deployments in considered environments (as indicated by the lack ofService 2 as in 2C). Service deployment details need to be specified in the serviceregistry to be able to compose and execute the service workflows seamlessly.
5.4 eScience Workflows as Service Compositions
The Internet consists of various data-centric big services. Complex eScienceworkflows leverage multiple big services for their execution and can be decom-posed into various geo-distributed web services and microservices. eScience work-flows can, therefore, be represented by service compositions. Thus, these bigservices, centered around big data, can be expressed into simpler web services,which can be executed in a distributed manner.
Mayan seeks to find the best fit among the alternatives of available serviceexecution options, considering various constraints of network and service levelresource availability and requirements, while respecting the locality of the servicerequests. Mayan proposes a scalable and resilient execution approach to offera multi-tenant distributed cloud computing platform to execute these servicesbeyond data center scale.
Mayan enables an adaptive execution of scientific workflows through feder-ated SDN controllers deployed in a wide area network. Hence, Mayan leverages
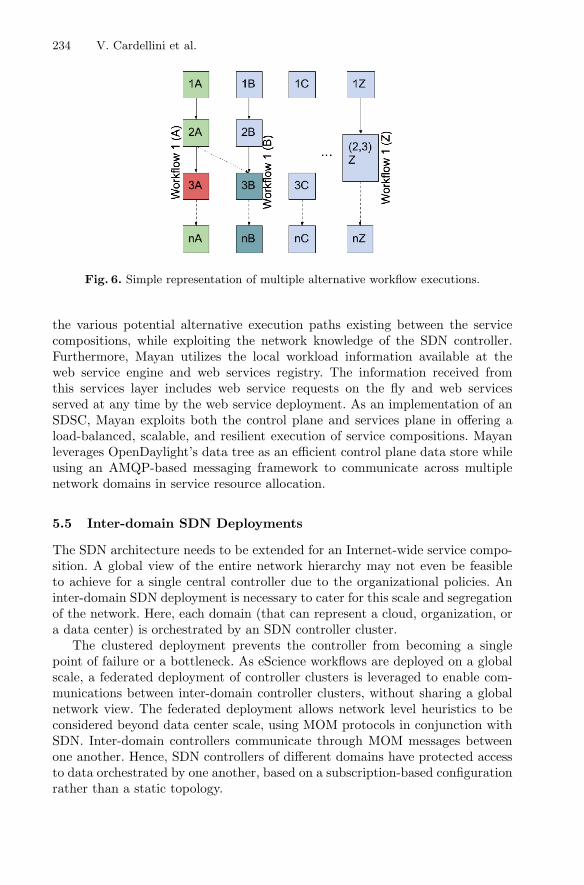
234 V. Cardellini et al.
Fig. 6. Simple representation of multiple alternative workflow executions.
the various potential alternative execution paths existing between the servicecompositions, while exploiting the network knowledge of the SDN controller.Furthermore, Mayan utilizes the local workload information available at theweb service engine and web services registry. The information received fromthis services layer includes web service requests on the fly and web servicesserved at any time by the web service deployment. As an implementation of anSDSC, Mayan exploits both the control plane and services plane in offering aload-balanced, scalable, and resilient execution of service compositions. Mayanleverages OpenDaylight’s data tree as an efficient control plane data store whileusing an AMQP-based messaging framework to communicate across multiplenetwork domains in service resource allocation.
5.5 Inter-domain SDN Deployments
The SDN architecture needs to be extended for an Internet-wide service compo-sition. A global view of the entire network hierarchy may not even be feasibleto achieve for a single central controller due to the organizational policies. Aninter-domain SDN deployment is necessary to cater for this scale and segregationof the network. Here, each domain (that can represent a cloud, organization, ora data center) is orchestrated by an SDN controller cluster.
The clustered deployment prevents the controller from becoming a singlepoint of failure or a bottleneck. As eScience workflows are deployed on a globalscale, a federated deployment of controller clusters is leveraged to enable com-munications between inter-domain controller clusters, without sharing a globalnetwork view. The federated deployment allows network level heuristics to beconsidered beyond data center scale, using MOM protocols in conjunction withSDN. Inter-domain controllers communicate through MOM messages betweenone another. Hence, SDN controllers of different domains have protected accessto data orchestrated by one another, based on a subscription-based configurationrather than a static topology.

Integrating SDN and NFV with QoS-Aware Service Composition 235
Some research work has previously leveraged federated SDN controllerdeployments for various use cases. CHIEF [22] presents a scalable inter-domainfederated SDN controller deployment for wide area networks, as a “controllerfarm”. It builds a large-scale community cloud orchestrated by various indepen-dent controller clusters sharing data through a protected MOM API. Such con-troller farm may support collaboration between multiple organization networks,otherwise limited from network-level coordination. SDSC can be extended to cre-ate a Service Function Chaining (SFC), that is an ordered sequence of middleboxactions or VNFs such as load balancing and firewall.
6 Benefits and Open Issues
Network virtualization and programmability of network resources enabledynamic creation of service chains that satisfy QoS demands of complex ser-vices at runtime. Runtime control of traffic and usage of network resources isprovided from infrastructure to control layer thus enabling runtime managementdecisions. Abstracting the network infrastructure plane is a movement similaras introducing higher levels of abstraction into programming languages. Thekey benefit of such abstraction is enabling less experienced developers to eas-ier program new applications, using abstract objects of network resources, withthe help of formal programming frameworks and environments. The risks of pro-grammer faults are minimized through formalisms implemented in programminglanguages. The main benefit is in offloading new application developers of verycomplex network skills, thus opening application development even to not skilledpeople and innovation opportunities to the wider community. Abstraction of net-work resources will benefit with opening innovation opportunities based on theuse of unlimited network resources.
A direct consequence of opening network resources to wider developers com-munity is in accelerating the process of offering new features to end users andminimizing development costs. Another result of abstraction is the introductionof standard interfaces that enable evolution and change of each layer indepen-dently. Contrary to traditional networks where there is a dominant vendor lock-in solutions, in new network architecture, with introduced standard applicationplatform interfaces between network layers, the independence to provider equip-ment has opened numerous opportunities for innovation by using an unlimitedpoll of network resources and services offered by various networks.
Furthermore, the programmable network enables numerous possibilities fornetwork automation. New service management models may be developed at eachnetwork layer independently with runtime control of network resources. Thesemay be used to autonomous control efficiency of network resource use whileaddressing specific QoS requirements of the particular application.
Nowadays, service compositions and Big Data applications must deal withchanging environments and variable loads. Therefore, to guarantee acceptableperformance, these applications require frequent reconfigurations, such as adjust-ments of application component placement or selection of new services. In this

236 V. Cardellini et al.
respect, SDN capability of programming, the network at runtime allows a cross-layer management of computational and networking resources, thus enabling ajoint optimization of application placement (or service composition) and datastream routing. The cross-layer management can be beneficial especially in geo-distributed environments, where network resources are heterogeneous, subjectto changing working conditions (e.g., congestion), and characterized by non-negligible communication delays. In an SDN environment, the application controllayer (e.g., service composition broker, DSP framework) can regard the networkas a logical resource, which can be managed as a computing resource in a virtu-alized computing environment. Specifically, the programmability allows to auto-mate and control the network so to adjust its behavior as to fulfill the applica-tion needs. For example, multiple paths or paths with specific QoS attributes canbe reserved for transmitting data, data streams can be redirected during applica-tion components downtime, or network devices can be programmed to carry outnew functions. Moreover, the use of standardized interfaces between the applica-tion layer and network controller (i.e., Northbound APIs) allows simplifying theimplementation and utilization of new network services (e.g., QoS-based routing).
With respect to the integration of SDN and Big Data and specifically tothe SIFD architecture presented in Sect. 4, we observe that when the networkcontroller in SDN is used for Big Data applications, its performance could bedegraded due to the rapid and frequent flow table update requests which mightnot be sustained by today SDN controllers. The problem is exacerbated if thecontroller serves multiple applications/frameworks as it can easily become theperformance bottleneck of the entire architecture. To this end, we need to definesolutions which cater for the presence of multiple applications, with possiblediverse and conflicting QoS requirements by defining policies which ensure fairusage of network resources in the face of competing resources requests. The prob-lem becomes relevant in large-scale distributed environments, where a centralizedapproach might not scale, and distributed solution becomes preferable.
New service development formalisms may be required to standardize processesat the network management level. In the future use of such a programmable net-work environment, a network is seen as an unlimited pool of resources. So, it isexpected a significantly increase in the network use with a number of new andinnovative services. Such increase in diversity of network services and a numberof new application interfaces would need to redefine service development and man-agement models. New design principles would be needed, and this need would berecognized with increased diversity at network application layer. For such pur-poses, there is a need for new developments in formal methods for introducing thecontrolled behavior in programming network. Development of network compilersis ongoing research activity for these purposes. Furthermore, new mathematicalmodels are needed that would be able to describe network behavior. There is aneed for some generative models that can predict the parameters from the internalproperties of the processes we are controlling. Such models would not only bringefficiency in processing network control algorithms, but would also be stimulatingphenomena in network behavior.

Integrating SDN and NFV with QoS-Aware Service Composition 237
7 Conclusions
In this chapter, we looked into how SDN and NFV enable QoS-aware servicecompositions, and how SDN can be leveraged to facilitate cross-layer optimiza-tions between the various network and service layers. So far, SDN has beenlargely and separately exploited mainly in telecommunication environments. Forexample, NFV placement and SDN routing for network embedding have beenused to achieve energy efficiency as explained in Sect. 3. However, there is anincreasing interest in exploring the network control opportunities offered bySDN in the Big Data context, as discussed for the deployment of DSP appli-cations on the underlying computing and networking resources. In the use casepresented in Sect. 4, SDN is used to expose to the service management layer thenetwork topology and network-related QoS metrics. The service managementlayer determines both the application components placement on the underlyingcomputing resources and the network paths between them. In this way, SDNallows autonomous adjustment of the network paths as per-application needs.Furthermore, in Sect. 5 we provided an example of using SDN for the design andimplementation of complex scientific and business processes.
Through these three examples, we presented different deployment manage-ment decisions for service compositions over the layers of a network architecturethat integrates SDN and NFV. As future research direction, we identify the needfor the development of an autonomous management framework that can coordi-nate cross-layer decisions taken by different management layers while deployingservice compositions that satisfy QoS guarantees in an Internet-scale distributednetwork. Future work is also needed to investigate the side effects that may arisefrom the coordination among management decisions at different layers.
References
1. Abadi, D.J., Carney, D., Cetintemel, U., Cherniack, M., et al.: Aurora: a new modeland architecture for data stream management. VLDB J. 12(2), 120–139 (2003)
2. Aniello, L., Baldoni, R., Querzoni, L.: Adaptive online scheduling in Storm. In:Proceedings of 7th ACM International Conference on Distributed Event-BasedSystems, DEBS 2013, pp. 207–218 (2013)
3. Beigi-Mohammadi, N., Khazaei, H., Shtern, M., Barna, C., Litoiu, M.: On effi-ciency and scalability of software-defined infrastructure for adaptive applications.In: Proceedings of 2016 IEEE International Conference on Autonomic Computing,ICAC 2016, pp. 25–34 (2016)
4. Bonomi, F., Milito, R., Zhu, J., Addepalli, S.: Fog computing and its role in theinternet of things. In: Proceedings of 1st Workshop on Mobile Cloud Computing,MCC 2012, pp. 13–16 (2012)
5. Boru, D., Kliazovich, D., Granelli, F., Bouvry, P., Zomaya, A.: Energy-efficientdata replication in cloud computing datacenters. Cluster Comput. 18(1), 385–402(2015)
6. Bouguettaya, A., Singh, M., Huhns, M., Sheng, Q.Z., et al.: A service computingmanifesto: the next 10 years. Commun. ACM 60(4), 64–72 (2017)
7. Cardellini, V., Grassi, V., Lo Presti, F., Nardelli, M.: On QoS-aware schedulingof data stream applications over fog computing infrastructures. In: Proceedings ofIEEE ISCC 2015, pp. 271–276, July 2015
238 V. Cardellini et al.
8. Cardellini, V., Grassi, V., Lo Presti, F., Nardelli, M.: Distributed QoS-awarescheduling in Storm. In: Proceedings of 9th ACM International Conference onDistributed Event-Based Systems, DEBS 2015, pp. 344–347 (2015)
9. Cardellini, V., Grassi, V., Lo Presti, F., Nardelli, M.: Optimal operator placementfor distributed stream processing applications. In: Proceedings of 10th ACM Inter-national Conference on Distributed and Event-Based Systems, DEBS 2016, pp.69–80 (2016)
10. Cardellini, V., Grassi, V., Lo Presti, F., Nardelli, M.: Optimal operator replicationand placement for distributed stream processing systems. ACM SIGMETRICSPerform. Eval. Rev. 44(4), 11–22 (2017)
11. Cui, L., Yu, F.R., Yan, Q.: When big data meets software-defined networking: SDNfor big data and big data for SDN. IEEE Netw. 30(1), 58–65 (2016)
12. Curry, E.: Message-oriented middleware. In: Middleware for Communications, pp.1–28. Wiley, Hoboken (2005)
13. Dabek, F., Cox, R., Kaashoek, F., Morris, R.: Vivaldi: a decentralized networkcoordinate system. SIGCOMM Comput. Commun. Rev. 34(4), 15–26 (2004)
14. Davy, S., Famaey, J., Serrat, J., Gorricho, J.L., Miron, A., Dramitinos, M., Neves,P.M., Latre, S., Goshen, E.: Challenges to support edge-as-a-service. IEEE Com-mun. 52(1), 132–139 (2014)
15. Dean, J., Ghemawat, S.: MapReduce: simplified data processing on large clusters.Commun. ACM 51(1), 107–113 (2008)
16. Enns, R., Bjorklund, M., Bierman, A., Schonwalder, J.: Network ConfigurationProtocol (NETCONF). RFC 6241, June 2011
17. Han, B., Gopalakrishnan, V., Ji, L., Lee, S.: Network function virtualization: chal-lenges and opportunities for innovations. IEEE Commun. 53(2), 90–97 (2015)
18. Heinze, T., Aniello, L., Querzoni, L., Jerzak, Z.: Cloud-based data stream process-ing. In: Proceedings of 8th ACM International Conference on Distributed Event-Based Systems, DEBS 2014, pp. 238–245 (2014)
19. Heller, B., Seetharaman, S., Mahadevan, P., Yiakoumis, Y., Sharma, P., Banerjee,S., McKeown, N.: ElasticTree: saving energy in data center networks. In: Proceed-ings of 7th USENIX Conference on Networked Systems Design and Implementa-tion, NSDI 2010 (2010)
20. John, W., Pentikousis, K., Agapiou, G., Jacob, E., Kind, M., Manzalini, A., Risso,F., Staessens, D., Steinert, R., Meirosu, C.: Research directions in network servicechaining. In: 2013 IEEE SDN for Future Networks and Services. SDN4FNS (2013)
21. Kathiravelu, P., Galinac Grbac, T., Veiga, L.: Building blocks of Mayan: Compo-nentizing the escience workflows through software-defined service composition. In:Proceedings of 2016 IEEE International Conference on Web Services, ICWS 2016,pp. 372–379 (2016)
22. Kathiravelu, P., Veiga, L.: CHIEF: controller farm for clouds of software-definedcommunity networks. In: Proceedings of 2016 IEEE International Conference onCloud Engineering Workshop, IC2EW 2016 (2016)
23. Liao, J., Wang, J., Wu, B., Wu, W.: Toward a multiplane framework of NGSON:a required guideline to achieve pervasive services and efficient resource utilization.IEEE Commun. 50(1) (2012)
24. Lim, S.H., Sharma, B., Nam, G., Kim, E.K., Das, C.R.: MDCSim: a multi-tier datacenter simulation platform. In: Proceedings of 2009 IEEE International Conferenceon Cluster Computing and Workshops, August 2009
25. Lohrmann, B., Janacik, P., Kao, O.: Elastic stream processing with latency guar-antees. In: Proceedings of IEEE ICDCS 2015, pp. 399–410 (2015)
Integrating SDN and NFV with QoS-Aware Service Composition 239
26. Marotta, A., D’Andreagiovanni, F., Kassler, A., Zola, E.: On the energy cost ofrobustness for green virtual network function placement in 5G virtualized infras-tructures. Comput. Netw. 125, 64–75 (2017)
27. Matsubara, D., Egawa, T., Nishinaga, N., Kafle, V.P., Shin, M.K., Galis, A.: Towardfuture networks: a viewpoint from ITU-T. IEEE Commun. 51(3), 112–118 (2013)
28. McKeown, N., Anderson, T., Balakrishnan, H., Parulkar, G., Peterson, L., Rexford,J., Shenker, S., Turner, J.: OpenFlow: enabling innovation in campus networks.ACM SIGCOMM Comput. Commun. Rev. 38(2), 69–74 (2008)
29. Neves, M.V., De Rose, C.A.F., Katrinis, K., Franke, H.: Pythia: faster big datain motion through predictive software-defined network optimization at runtime.In: Proceedings of IEEE 28th International Parallel and Distributed ProcessingSymposium, IPDPS 2014, pp. 82–90 (2014)
30. Newcomer, E., Lomow, G.: Understanding SOA with Web Services. Addison-Wesley, Upper Saddle River (2005)
31. Nunes, B.A.A., Mendonca, M., Nguyen, X.N., Obraczka, K., Turletti, T.: A surveyof software-defined networking: past, present, and future of programmable net-works. IEEE Commun. Surv. Tutorials 16(3), 1617–1634 (2014)
32. OASIS: MQTT version 3.1.1 (2014)33. Osseiran, A., Monserrat, J.F., Marsch, P.: 5G Mobile and Wireless Communica-
tions Technology, 1st edn. Cambridge University Press, New York (2016)34. Paganelli, F., Ulema, M., Martini, B.: Context-aware service composition and deliv-
ery in NGSONs over SDN. IEEE Commun. 52(8), 97–105 (2014)35. Panda, P.R., Silpa, B.V.N., Shrivastava, A., Gummidipudi, K.: Power-Efficient
System Design, 1st edn. Springer, Boston (2010). https://doi.org/10.1007/978-1-4419-6388-8
36. Pedram, M., Hwang, I.: Power and performance modeling in a virtualized serversystem. In: Proceedings of 39th International Conference on Parallel ProcessingWorkshops, ICPPW 2010, pp. 520–526 (2010)
37. Qadir, J., Ahad, N., Mushtaq, E., Bilal, M.: SDNs, clouds, and big data: newopportunities. In: Proceedings of 12th International Conference on Frontiers ofInformation Technology, pp. 28–33 (2014)
38. Qin, P., Dai, B., Huang, B., Xu, G.: Bandwidth-aware scheduling with SDN inHadoop: a new trend for big data. IEEE Syst. J. 11(4), 2337–2344 (2015)
39. Richardson, L., Ruby, S.: RESTful Web Services. O’Reilly Media, Inc., Sebastopol(2008)
40. Toshniwal, A., Taneja, S., Shukla, A., Ramasamy, K., et al.: Storm@Twitter. In:Proceedings of ACM SIGMOD 2014, pp. 147–156 (2014)
41. Van Adrichem, N.L., Doerr, C., Kuipers, F.A.: OpenNetMon: network monitoringin OpenFlow software-defined networks. In: Proceedings of 2014 IEEE NetworkOperations and Management Symposium, NOMS 2014 (2014)
42. Vinoski, S.: Advanced message queuing protocol. IEEE Internet Comput. 10(6)(2006)
43. Wang, G., Ng, T.E., Shaikh, A.: Programming your network at run-time for bigdata applications. In: Proceedings of 1st Workshop on Hot Topics in SoftwareDefined Networks, HotSDN 2012, pp. 103–108. ACM (2012)
44. Xiong, P., He, X., Hacigumus, H., Shenoy, P.: Cormorant: running analytic querieson MapReduce with collaborative software-defined networking. In: Proceedings of3rd IEEE Workshop on Hot Topics in Web Systems and Technologies, HotWeb2015, pp. 54–59 (2015)
45. Xu, J., Chen, Z., Tang, J., Su, S.: T-Storm: traffic-aware online scheduling in Storm.In: Proceedings of IEEE 34th International Conference on Distributed ComputingSystems, ICDCS 2014, pp. 535–544 (2014)

240 V. Cardellini et al.
Open Access This chapter is licensed under the terms of the Creative CommonsAttribution 4.0 International License (http://creativecommons.org/licenses/by/4.0/),which permits use, sharing, adaptation, distribution and reproduction in any mediumor format, as long as you give appropriate credit to the original author(s) and thesource, provide a link to the Creative Commons license and indicate if changes weremade.
The images or other third party material in this chapter are included in the chapter’sCreative Commons license, unless indicated otherwise in a credit line to the material. Ifmaterial is not included in the chapter’s Creative Commons license and your intendeduse is not permitted by statutory regulation or exceeds the permitted use, you willneed to obtain permission directly from the copyright holder.
Energy vs. QoX Network- and CloudServices Management
Bego Blanco1(B) , Fidel Liberal1 , Pasi Lassila2, Samuli Aalto2,Javier Sainz3 , Marco Gribaudo4 , and Barbara Pernici4
1 University of the Basque Country, Leioa, Spain{begona.blanco,fidel.liberal}@ehu.eus
2 Aalto University, Espoo, Finland{Pasi.Lassila,samuli.aalto}@aalto.fi
3 Innovati Group, Madrid, [email protected]
4 Politecnico di Milano - DEIB, Milan, Italy{marco.gribaudo,barbara.pernici}@polimi.it
Abstract. Network Performance (NP)- and more recently Quality ofService/Experience/anything (QoS/QoE/QoX)-based network manage-ment techniques focus on the maximization of associated Key Perfor-mance Indicators (KPIs). Such mechanisms are usually constrained bycertain thresholds of other system design parameters. e.g., typically,cost. When applied to the current competitive heterogeneous Cloud Ser-vices scenario, this approach may have become obsolete due to its staticnature. In fact, energy awareness and the capability of modern technolo-gies to deliver multimedia content at different possible combinations ofquality (and prize) demand a complex optimization framework.
It is therefore necessary to define more flexible paradigms that makeit possible to consider cost, energy and even other currently unforeseendesign parameters not as simple constraints, but as tunable variablesthat play a role in the adaptation mechanisms.
In this chapter we will briefly introduce most commonly used frame-works for multi-criteria optimization and evaluate them in differentEnergy vs. QoX sample scenarios. Finally, the current status of relatednetwork management tools will be described, so as to identify possibleapplication areas.
1 Introduction
Network Performance- and more recently Quality of Service/Experience/X-based network management techniques (where “X” can represent “S” service,“P” perception, “E” experience or “F” flow, just to give a few examples), focus onthe maximization of associated KPIs. Such mechanisms are usually constrainedby certain thresholds of other system design parameters, e.g., typically, cost.When applied to the current competitive heterogeneous Internet of Services sce-nario, this approach may have become obsolete due to its static nature. In fact,
c© The Author(s) 2018I. Ganchev et al. (Eds.): Autonomous Control for a Reliable Internet of Services, LNCS 10768, pp. 241–268, 2018.https://doi.org/10.1007/978-3-319-90415-3_10

242 B. Blanco et al.
energy awareness and the capability of modern technologies to deliver multime-dia content at different possible combinations of quality (and prize) demand acomplex optimization framework.
It is therefore necessary to define a more flexible paradigm that makes itpossible to consider cost, energy and even other currently unforeseen designparameters not as simple constraints, but as tunable variables that play a role inthe adaptation mechanisms. As a result, for example, the service supply will thensearch for the maximum QoE at the minimum cost and/or energy consumption.In consequence, a certain service will not be offered at a single and specificguaranteed price, but will vary with the objective of obtaining the best (QoE,cost, energy, etc.) combination at a given time.
Unfortunately, most considered design parameters are conflicting, and there-fore the improvement of one of them entails some deterioration of the others.In these circumstances, it is necessary to find a trade-off solution that optimizesthe antagonistic criteria in the most efficient way. Therefore, the resource allo-cation problem becomes a multi-criteria optimization problem and the relevanceof each criteria gains uttermost importance.
This chapter analyzes the existing optimization frameworks and tools andstudies the complexity of introducing utility functions into network/managementmechanisms, including fairness considerations. Then, we present cost/energy/*-aware network and cloud services management scenarios. Finally, we address thechallenge of introducing energy-awareness in network controlling mechanism andprovide a general view of current technologies and solutions.
2 Dealing with Multi-criteria Optimization: Frameworksand Optimization Tools
Regardless the mathematical or heuristic tools applied in order to find (near)optimal solutions in the scope of Internet of Services management mechanisms,all of them share common issues due to the extension of the original definitionof the problem to a multi-criteria one. This section provides a summarized com-pilation of those issues, especially those related to how the decision maker (DM)will take into consideration different antagonistic criteria.
2.1 Generic Definition of the Problem
The classical constrained single criteria problem deals with finding the combina-tion of design parameters (normally represented by a vector x∗) in the feasiblespace (S) that minimize a single function (1).
∃x∗ ∈ S / min f(x∗) = z (1)
Then the multi-criteria or multi-objective optimization problem, defined asan extension of the mono-criteria one, aims at simultaneously minimizing a col-lection of requirements keeping the equality and inequality constraints of thefeasible space (2).
Energy vs. QoX Network- and Cloud Services Management 243
∃x∗ ∈ S / min fi(x∗) = zi∀i = 1, 2, . . . , k (2)
The optimal solution that minimizes simultaneously all the criteria is most ofthe times hardly achievable, and is known as utopian solution [5]. Therefore, theactual best solution of the problem should be as close as possible to this utopiansolution. The optimization problem must then be redefined to extract from thewhole feasible space of solutions, those closer to the utopian solution. That setof solutions characterizes the Pareto-optimal front. The goal of a good multi-criteria optimization problem is the search of a set of solutions that properlyrepresents that Pareto front, i.e., uniformly distributed along that Pareto front.
However, due to the trade-offs among different parameters, in most of thecases there will not exist such a solution which minimizes all the criteria simul-taneously. So, the nature of the problem is usually re-defined by introducing theconcept of Utility Function, responsible for quantifying the relevance and com-posite articulation of different criteria. Then, the real formulation of the problemcan be expressed mathematically as follows (3).
∃x∗ ∈ S / min U(z1, z2, . . . , zk) (3)
2.2 Incorporating Multiple Criteria in General OptimizationMethods
Multiple Objective Optimization (MOO) has been a field of intensive researchin different engineering areas. This activity has led to the development of a lotof MOO methods ranging from exact methods to meta-heuristics and includingseveral different nature algorithms.
In this section, we propose a comprehensive taxonomy of the optimizationproblem synthesized from the works in [13,14,21,30,31,36]. The presented tax-onomy categorizes the optimization problems according to different perspectiveswhere the main goal is to determine how the multiple criteria are consideredby the DM. Table 1 summarizes the characterization of the optimization criteriathat are defined as follows:
– Qualitative vs. quantitative criteria: refers to how the analyzed criteriaare measured. If the DM is able to represent the preference degree of oneoption against the others by a numerical value, then the criteria are quan-titative. Otherwise, the criteria are qualitative, meaning that preference cannot be numerically measured or compared and, in consequence, a descriptivevalue is assigned.
– Preference articulation: refers to the point in time the DM establishes itspreferences:
• A priori preference articulation: the preferences are defined at prob-lem modeling stage, adding supplementary constraints to the problem(i.e., weighted sum and lexicographic methods).
• A posteriori preference articulation: once the optimization problemprovides the set of results from the optimization process, DM’s preferencesare used to refine the final solution (i.e., in evolutive and genetic methods).

244 B. Blanco et al.
• Progressive preference articulation: DM’s preferences are graduallyincorporated in an interactive way during the optimization process.
• Without preference articulation: when there is no preference defini-tion for the problem (i.e., max-min formulation, global criterion method).
– Continuous vs. discrete: refers to the variable type used to describe theoptimization criteria. When the optimization problem handle discrete vari-ables, such as integers, binary values or other abstract objects, the objectiveof the problem is to select the optimum solution from a finite, but usuallyhuge, set. On the contrary, continuous optimization problems handle infinitevariable values. In consequence, continuous problems are usually easier tosolve due to their predictability, because the solution can be achieved withan approximate iterative process. Since cost/energy aware network and ser-vices management must deal with both discrete (i.e., number of servers, routelengths, radio bearers, etc.) and continuous design parameters (i.e., coding bitrate, transmission power, etc.) both techniques should be considered.
– Constrained vs. not constrained: refers to the possibility of attachinga set of requirements expressed through (in)equality equations to the opti-mization problem. In this case, besides finding a solution that optimizes acollection of criteria, it must also meet a set of constraints. Non constrainedmethods can be used to solve constrained methods, replacing restrictions forpenalizations on objective functions to prevent possible constraint violations.As aforementioned, classical network management approached involved con-sidering a single criteria only and establishing Cost and Energy constrains.The proposal in ACROSS to move to a multi-criteria optimization analysisdoes not necessarily imply getting rid of all the possible constraints.
Those classifications do not result into disjoint categories. In fact, multi-criteria optimization problems in the considered heterogeneous network and ser-vices management scenario may fall into one or several of the categories listedabove.
Summarizing, before beginning with the process of multi-criteria optimiza-tion problem there is a crucial previous step: the definition of the criteria to beoptimized, i.e., the preferences of the DM about the suitability of the obtainedsolution.
Regardless the decision maker being the Cloud/Network/SOA designer orservice operator the adaptation algorithm must incorporate the impact of dif-ferent criteria on their perception of the goodness of any solution. A key factorin the analysis for decision making is indeed the fact that the functions thatmodel decision maker’s preferences (criteria or objective functions) are not usu-ally known a priori.
2.3 Complexity of Defining Multi-criteria Utility Functionsto be Incorporated in Network/Management Mechanisms
Considering the relevance of the choice of a multi-criteria utility function, dif-ferent tools aiding at this task will be reviewed in this section.

Energy vs. QoX Network- and Cloud Services Management 245
Table 1. Characterization of the optimization criteria for DM.
Description type Qualitative
Quantitative
Preference articulation A priori
A posteriori
Progressive
None
Type of variables Continuous
Discrete
Constraint definition Constrained
Not constrained
– Goal attainment– MAUT (Multi-Attribute Utility Theory)– Preference relations– Fuzzy logic– Valuation scale
Goal Attainment. This basic format restricts the feasible space with the mostrelevant set of alternatives according to the DM’s preferences (Fig. 1). Such pref-erences if represented mathematically usually result in a n-dimensional shape orcontour in the decision space limiting those solutions acceptable by the DM(similar to that imposed by the constraints in the design space). It is a simpleand direct format, that just splits alternatives into relevant/non-relevant groups.However, it only offers little information about preferences, not providing anyhint about the predilections of the DM.
Fig. 1. Selection set within feasible space.
The work in [8,9] describe the use of goal attainment preference modeling inmulti-criteria algorithms.
246 B. Blanco et al.
Multi-Attribute Utility Function. In this case, the utility function is buildby describing the repercussion of an action regarding a specific criterion. Eachaction is assigned a numerical value, so that the higher the value, the morepreferable the action. Then, the assessment of an action becomes the weightedsum of the numerical values related to each considered criterion. This represen-tation format is capable of modeling DM’s preference more precisely than theSelection Set. Nontheless, it also means that the DM must evaluate its incli-nations globally, comparing each criterion against all the others, which is notalways possible. Therefore, this type of utility function is suitable just for thecases in which a perfect global rationality can be assumed [46]. For example, thisclassic model is commonly employed in economics and welfare field.
Besides, utility has an ordinal nature, in the sense that the preference relationbetween the possible choices is more significant than the specific numerical values[4]. So, this leaves the door open to discarding the numerical value of the utility,as it is shown next.
Preference Relations. This representation format models the inclination overa set of possible choices using a binary relation that describes the qualitativepreference among alternatives. Then, a numerical value is linked to that rela-tion, defining the preference degree of alternative xi against alternative xk in aquantitative way [37].
This format of preference modeling provides an alternative to the assign-ment of a numerical value to different utility levels, allowing the comparison ofalternatives pairwise, providing the DM higher expressiveness to enunciate hispreferences (i.e., similar to Analytic Hierarchy Process – AHP [39]). Outrankingmethods employ this format of preference representation.
Fuzzy Logic. This format allows the introduction of uncertainty over the pref-erences under analysis. In order to avoid ambiguity in the definition process ofthe preferences, each “xi is not worse than xk” is attached a credibility index.In this sense, fuzzy logic becomes a useful tool [46], as a general framework forpreference modeling where certain sentences are a particular case.
The obstacle of using fuzzy logic with credibility indexes is the weakeningof the concept of truth. The infinite possible values of truth between absolutetruth and falseness have an intuitive meaning that does not correspond to theirformal semantics. In addition, there are other problems, such as the formulationof the credibility index itself.
Valuation Scale. This preference formulation defines a formal representationof the comparison between possible choices that expresses both the structure ofthe described situation and the variety of manipulations that can be made on it[37]. This type of sentences are appropriately expressed in logical language. Butclassical logic can be too inflexible to acceptably define expressive models. Inconsequence, other formalisms must be taken into account to provide the modelwith the required flexibility.
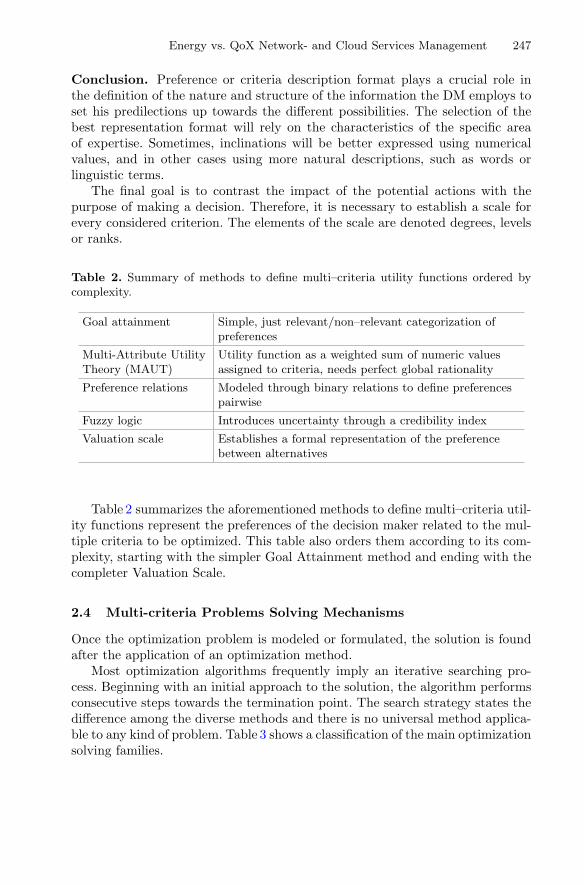
Energy vs. QoX Network- and Cloud Services Management 247
Conclusion. Preference or criteria description format plays a crucial role inthe definition of the nature and structure of the information the DM employs toset his predilections up towards the different possibilities. The selection of thebest representation format will rely on the characteristics of the specific areaof expertise. Sometimes, inclinations will be better expressed using numericalvalues, and in other cases using more natural descriptions, such as words orlinguistic terms.
The final goal is to contrast the impact of the potential actions with thepurpose of making a decision. Therefore, it is necessary to establish a scale forevery considered criterion. The elements of the scale are denoted degrees, levelsor ranks.
Table 2. Summary of methods to define multi–criteria utility functions ordered bycomplexity.
Goal attainment Simple, just relevant/non–relevant categorization ofpreferences
Multi-Attribute UtilityTheory (MAUT)
Utility function as a weighted sum of numeric valuesassigned to criteria, needs perfect global rationality
Preference relations Modeled through binary relations to define preferencespairwise
Fuzzy logic Introduces uncertainty through a credibility index
Valuation scale Establishes a formal representation of the preferencebetween alternatives
Table 2 summarizes the aforementioned methods to define multi–criteria util-ity functions represent the preferences of the decision maker related to the mul-tiple criteria to be optimized. This table also orders them according to its com-plexity, starting with the simpler Goal Attainment method and ending with thecompleter Valuation Scale.
2.4 Multi-criteria Problems Solving Mechanisms
Once the optimization problem is modeled or formulated, the solution is foundafter the application of an optimization method.
Most optimization algorithms frequently imply an iterative searching pro-cess. Beginning with an initial approach to the solution, the algorithm performsconsecutive steps towards the termination point. The search strategy states thedifference among the diverse methods and there is no universal method applica-ble to any kind of problem. Table 3 shows a classification of the main optimizationsolving families.
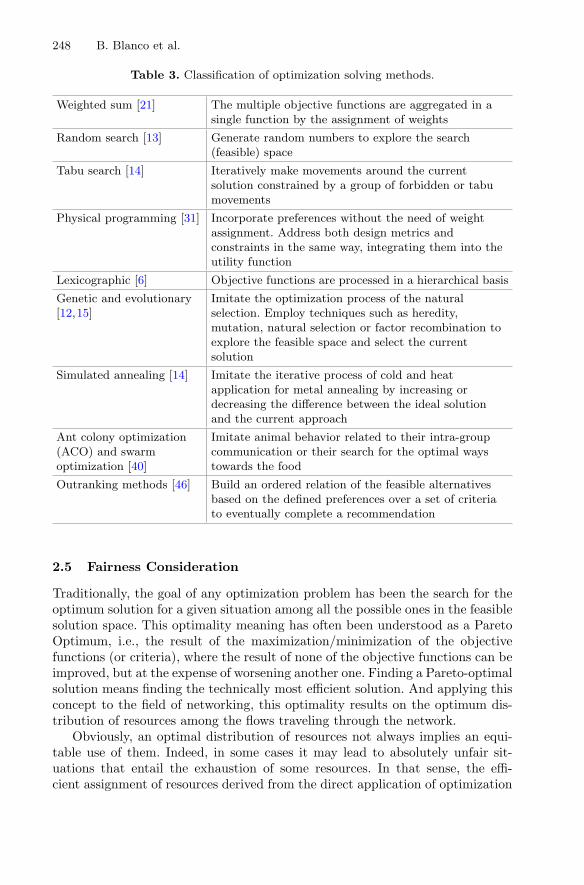
248 B. Blanco et al.
Table 3. Classification of optimization solving methods.
Weighted sum [21] The multiple objective functions are aggregated in asingle function by the assignment of weights
Random search [13] Generate random numbers to explore the search(feasible) space
Tabu search [14] Iteratively make movements around the currentsolution constrained by a group of forbidden or tabumovements
Physical programming [31] Incorporate preferences without the need of weightassignment. Address both design metrics andconstraints in the same way, integrating them into theutility function
Lexicographic [6] Objective functions are processed in a hierarchical basis
Genetic and evolutionary[12,15]
Imitate the optimization process of the naturalselection. Employ techniques such as heredity,mutation, natural selection or factor recombination toexplore the feasible space and select the currentsolution
Simulated annealing [14] Imitate the iterative process of cold and heatapplication for metal annealing by increasing ordecreasing the difference between the ideal solutionand the current approach
Ant colony optimization(ACO) and swarmoptimization [40]
Imitate animal behavior related to their intra-groupcommunication or their search for the optimal waystowards the food
Outranking methods [46] Build an ordered relation of the feasible alternativesbased on the defined preferences over a set of criteriato eventually complete a recommendation
2.5 Fairness Consideration
Traditionally, the goal of any optimization problem has been the search for theoptimum solution for a given situation among all the possible ones in the feasiblesolution space. This optimality meaning has often been understood as a ParetoOptimum, i.e., the result of the maximization/minimization of the objectivefunctions (or criteria), where the result of none of the objective functions can beimproved, but at the expense of worsening another one. Finding a Pareto-optimalsolution means finding the technically most efficient solution. And applying thisconcept to the field of networking, this optimality results on the optimum dis-tribution of resources among the flows traveling through the network.
Obviously, an optimal distribution of resources not always implies an equi-table use of them. Indeed, in some cases it may lead to absolutely unfair sit-uations that entail the exhaustion of some resources. In that sense, the effi-cient assignment of resources derived from the direct application of optimization
Energy vs. QoX Network- and Cloud Services Management 249
algorithms may leave without service some customers or final users, due to theprovision of all the benefit to others (see examples in [9,38]). Obviously, theglobal utility of the system is the maximum, but the result is clearly unfair, andthe situation worsens as the heterogeneity of the final users increases.
The conflict between the maximization of the benefit, the optimal resourceallocation and the fairness of the distribution is a field that has been widelyanalyzed in Economy, as part of microeconomics or public finances. The conclu-sion is that the incompatibility between fairness and efficiency is not a designproblem of the optimization algorithms, but of the formulation of the problem tobe optimized, where the fairness concept must be included. The difficulty risesup since efficiency is an objective or technical goal that, in consequence, can bemeasured and assessed quantitatively. This has nothing to do with the conceptof fairness, a subjective concept whose assessment is not trivial.
Although fairness may initially seem to be easy to define, it has a variety ofaspects that complicate its proper delimitation. Taking the sense of equanimity,an equitable distribution of resources could be defined as an evenly split availableresource assignment among the flows competing for them. The disadvantage ofthis distribution is that it does not take into account the specific necessities ofeach flow. If all the flows obtain the same portion of resources, those with lowerrequirements benefit from a proportionally higher resource quantity.
Changing the definition of fair distribution to that assigning the resourcesproportionally on the basis of flow requirements is neither the ideal solution. Inthis case, the most consuming items are benefited, i.e., those which contributemore to the network congestion, to the detriment of lighter transmissions andconsequently, of the global performance of the network.
In addition, other aspects such as cooperation must also be considered. Theremay be some nodes in the network not willing to give up their resources toother transmissions, and so, this kind of behavior should be punished. But, whathappens when a node doesn’t give up resources to the network due to the lackof them? It would be the case of a node with low battery or low capacity links.Would these be reason enough to reduce the transmission resources that havebeen assigned? In this case, would the distribution be fair? This conflict remainsunsolved, although some approaches have been formulated and are discussednext.
The work in [8] presents several interpretations of the concept of fairness. Inone hand, there is the widely accepted max-min fairness definition [38], usuallyemployed in social science. It is based in the search for consecutive approachesto the optimum solution in a way that no individual or criterion can improve itsstate or utility if it means a loss for a weaker individual or criterion.
Translating this concept to communications, the distribution of networkresources is considered max-min fair when all the minimum transmission ratesof the data flows are maximized and all the maximum transmission rates areminimized. It is proven that this fairness interpretation is Pareto-efficient.
Another interpretation of fairness that also searches for the trade-off betweenefficiency and equity is the proportional fairness [26]. A resource distribution
250 B. Blanco et al.
among the network flows is considered proportional when the planned priorityof a flow is inversely proportional to the estimated resource consumption of thisflow. It can also be proven that the proportional fairness is Pareto-efficient.
Both aforementioned interpretations the bandwidth is shared to maximizesome utility function for instantaneous flows. This means that the optimality ofthe resource assignment is measured for a static combination of flows. Taking intoaccount the real random nature of the network traffic, it is necessary to definethe utility in terms of the performance of individual flows with finite duration.And in this case, it is not so clear that the max-min or proportional fairnessconcepts reach an optimum result. With random traffic, the performance and,in consequence, the utility depend on precise statistics of the offered traffic andare hard, if not impossible, to be analytically assessed.
Sharing flows under a balanced fairness criterion [9], the performancebecomes indifferent to the specific traffic characteristics, simplifying its for-mulation. The term balanced fairness comes from the necessary and sufficientrelations that must be fulfilled to guarantee the insensitiveness in stochastic net-works. This insensitiveness entails that the distribution of the active flow numberand, in consequence, the estimated throughput, depends just on the main trafficoffered in each route.
Balanced fairness makes it possible to approach the behavior of the elastictraffic over the network and, in addition to the insensitiveness property, it alsomakes it possible to find the exact probability of the distribution of concurrentflows in different routes and then evaluate the performance metrics.
The balanced fairness is not always Pareto-efficient, but in the case thatexisting one, it will be one of a kind.
3 Cost/Energy/*-Aware Network and Cloud ServicesManagement Scenarios
Once most well knows multi-criteria optimization techniques are introduced, thenext step is to analyze the application scenarios. This section overviews sev-eral research scenarios where energy-aware control of different systems has beenconsidered as part of the ACROSS project. The scenarios include the following:modeling and analysis of performance-energy trade-off in data centers, charac-terization and energy-efficiency of applications in cloud computing, energy-awareload balancing in 5G HetNets and finally incorporating energy and cost to oppor-tunistic QoE-aware scheduling.
3.1 Modeling and Analysis of Performance-Energy Trade-Offin Data Centers
An increasing demand for green ICT has inspired the queueing community toconsider energy-aware queueing systems. In many cases, it is no longer enoughto optimize just the performance costs, but one should also take into account theenergy costs. An idle server (waiting for an arriving job to be processed) in the

Energy vs. QoX Network- and Cloud Services Management 251
server farm of a typical data center may consume as much as 60% of the peakpower. From the energy point of view, such an idle server should be switchedoff until a new job arrives. However, from the performance point of view, thisis suboptimal since it typically takes a rather long time to wake the server up.Thus, there is a clear trade-off between the performance and energy aspects.
The two main metrics used in the literature to analyze the performance-energy trade-off in energy-aware queueing systems are ERWS and ERP. Both ofthem are based on the expected response time, E[T ], and the expected powerconsumption per time unit, E[P ]. The former one, ERWS, is defined as theirweighted sum, w1E[T ] + w2E[P ] and the latter one, ERP, as their product,E[T ] · E[P ]. Also, generalized versions of these can be easily derived.
Here we model data centers as queuing systems and develop policies for theoptimal control of the performance-energy trade-off. For a single machine thesystem is modeled as an M/G/1 queue. When considering a whole data-center,then a natural abstraction of the problem is provided by the dispatching problemin a system of parallel queues.
Optimal Sleep State Control in M/G/1 Queue: Modern processors support manysleep states to enable energy saving and the deeper the sleep state the longer isthe setup delay to wake up from the sleep state. An additional feature in thecontrol is to consider if it helps to wait for a random time (idling time) afterbusy period before going to sleep. Possible approaches for the sleep state selectionpolicy include: randomized policy, where processor selects the sleep state froma given (optimized) distribution, or sequential policy, where sleep states aretraversed sequentially starting from the lightest sleep state to the deepest one.Analysis of such a queuing system resembles that of classical vacation models.
Gandhi et al. see [17], considered the M/M/1 FIFO queue with deterministicsetup delay and randomized sleep state selection policy but without the possi-bility of the idle timer, i.e., the timer is either zero or infinite, and they showedfor the ERP metric that the optimal sleep state selection policy is deterministic,i.e., after busy period the system goes to some sleep state with probability 1(which depends on the parameters). Maccio and Down [29] added the possibilityof an exponential idle timer in the server before going to sleep, and showed forthe ERWS cost metrics and for exponential setup delays that the optimal idletimer control still sets the idle timer equal to zero or infinite, i.e., the idle timercontrol remains the same. Gebrehiwot et al. considered the more general M/G/1model with generally distributed service times, idle timer distributions and setupdelays, both ERP and ERWS cost metrics (and even slightly more generalizedones) and randomized/sequential sleep state selection policies. Assuming theFIFO service discipline, it was shown in [20] that even after all the generaliza-tions the optimal control finally remains the same: the optimal policy (a) eithernever uses any sleep states or (b) it will directly go to some deterministic sleepstate and wake up from there. This result was shown to hold for the Proces-sor Sharing (PS) discipline in [19] and for the Shortest Remaining ProcessingTime (SRPT) discipline in [18]. Thus, it is plausible that the result holds for anywork-conserving discipline.
252 B. Blanco et al.
Energy-Aware Dispatching with Parallel Queues: The data center can be mod-eled as a system of parallel single-server queues with setup delays. The systemreceives randomly arriving jobs with random service requirements. The problemis then to identify for each arrival where to dispatch arriving new jobs basedon state information available about the system, e.g., the number of jobs in theother queues. Another modeling approach is to consider a centralized queue withmultiple servers, i.e., the models are then variants of the multiserver M/M/nmodel.
In the parallel queue setting and without any energy-aware considerations,the optimality of the JSQ policy for minimizing the mean delay with homoge-neous servers is one classical result, see [48]. However, in an energy-aware settingthe task is to find a balance for using enough servers to provide reasonably lowjob delay while taking into account the additional setup delay costs, and to letother servers sleep to save energy. Achieving this is not at all clear. For the cen-tralized queue approach, Gandhi et al. proposed the delayed-off scheme, whereservers upon a job completion use an idle timer, wait in the idle state for this timebefore going to sleep, and new jobs are sent to idle servers if one is available orotherwise some sleeping server is activated. An exact analysis under Markovianassumptions was done in [16], and it was shown that by appropriately selectingthe mean idle timer value, the system keeps a sufficient number of servers inbusy/idle state and allows the rest to sleep. An important result has been onlyrecently obtained by Mukherjee et al. in [33], which considers the delayed-offscheme in a distributed parallel queue setting: it was shown that asymptoticallydelayed-off can achieve the same delay scaling as JSQ, i.e., is asymptoticallydelay optimal, and at the same time leaves a certain fraction of servers in a sleepstate, independent of the value of the idle timer and the setup delay. This resultholds asymptotically when the server farm is large with thousands of servers.
However, in a small/moderate sized data center there is still scope for opti-mization. In this setting the use of MDP (Markov Decision Process) and PolicyIteration has been recently considered by Gebrehiwot et al. in [28], where thedata center is assumed to consist of two kinds of servers: normal always-onservers and instant-off servers, which go to sleep immediately after queue emp-ties, i.e., there are no idle timers, and an explicit near optimal policy is obtainedfor minimizing the ERWS metric that uses as state the number of jobs in thequeues and the busy/sleep status. Also, size-aware approaches with MDP havebeen recently applied by Hyytia et al. in [24,25].
3.2 Characterization and Energy-Efficiency of Applicationsin Cloud Computing
Modeling Applications. With the goal of improving energy efficiency in cloudcomputing, several authors have studied the different factors that are causingenergy loss and energy waste in data centers. In [32], the different aspects arediscussed in detail, and idle runs are discussed as one of the causes for energywaste, as already mentioned earlier in this chapter. Low power modes have beenproposed in the literature both for servers and storage components, however
Energy vs. QoX Network- and Cloud Services Management 253
their benefits are often limited due to their transition costs and inefficiencies.To improve energy efficiency and reduce the environmental impact of federatedclouds, in the EU project ECO2Clouds [47] an adaptive approach to resourceallocation is proposed, based on monitoring the use and energy consumption ofresources, and associating it to running applications. The demand for resourcescan therefore associated to applications requesting resources, rather than onlyto the scheduling of resources and tasks in the underlying cloud environment.
Along this line, we have studied within ACROSS how different types of appli-cations make use of resources, with the goal of improving energy efficiency.
As mentioned in Sect. 3.1, to compare different solutions in terms of responsetime and power consumption, the two main approaches are ERWS and ERP. Analternative, which allows evaluating energy efficiency at application level, is theenergy per job indicator. This indicator allows comparing different solutions interms of work performed, rather than on performance parameters, and to discussways of improving energy efficiency of applications in terms of application-levelparameters.
Another aspect which has been considered is that increasing resources is notalways beneficial in terms of performances, as the systems may present bottle-necks in their execution which may cause inefficiencies in the system: in somecases, the additional resources will worsen energy efficiency, as the new resourcesare not solving the problem and are themselves underutilized. As a consequence,in considering energy efficiency in applications in clouds, some aspects can bettercharacterize the use of resources:
– Shared access to resources: during their execution application can requestaccess to shared resources with an impact on energy consumption due tosynchronization and waiting times.
– The characterization of the application execution patterns: batch applica-tions and transactional applications present different execution patterns: inbatch applications the execution times are usually longer with larger useof resources, but response time constraints are not critical; in transactionalapplications, response times are often subject to constraints and the allocatedresources must guarantee they are satisfied.
These application-level aspects have an impact on the resource allocationcriteria in different cases. In the following, we discuss how to model batch andtransactional applications considering these aspects with the goal of choosingthe number of resources to be associated to an application in terms of VMs withthe goal of minimizing the energy-per-job parameter.
Batch Applications. Batch applications have been studied in detail in [22] toconsider the following aspects: number of VMs allocated for executing a batchof similar applications, shared resources (in particular shared storage access andaccess synchronization), heterogeneous deployments environments for VMs, withservers with different capacity.
While for the details we refer to [22], we summarize here the main charac-teristics of the approach. The general goal is to minimize idle time to improve

254 B. Blanco et al.
energy efficiency, while avoiding to increase execution time for each applicationin the batch, which would result in an increase of the total energy. We assumethat in computing the energy per job, idle time is distributed to all applicationsbeing run on the system in an equal basis. Queuing models have been developedto represent applications, in terms of computing nodes to execute the applica-tion and storage nodes for data access, which is assumed to be shared, withthe possibility of choosing between asynchronous access and synchronous access(with synchronization points). In both cases the critical point is represented bythe ratio between the service time for computing nodes and the service time forstorage access: going beyond this point the energy per job is increasing withoutsignificant benefit in execution times.
An example is shown in Fig. 2, where it is clear that increasing the numberof VMs for an application after the critical point is mainly resulting in a loss ofenergy efficiency, both with synchronous and asynchronous storage access.
Transactional Workloads. For transactional workloads, the main application-level parameter affecting energy consumption is the arrival rate. In fact, assumingan exponential distribution of arrivals, if the arrival rate λ is much lower than theservice time, the idle times will be significant. On the other hand, getting closer toservice time, the response time will increase, as shown in Fig. 3. The details of thecomputations can be found in [23]. The paper also describes how different loaddistribution policies for VMs can influence energy-per-job. Assuming again thatidle power is uniformly distributed to all VMs running on the same host, threepolicies have been evaluated: (1) distributing the load equally; (2) allocatinglarger loads to VMs with lower idle power; (3) allocating larger loads to VMswith higher idles power. Initial simulation results result in Policy 2 being theworst, while Policy 1 and 3 are almost equivalent, with Policy 1 resulting inbetter energy-per-job and Policy 3 in better response times [23].
Fig. 2. Energy per job in batch applications

Energy vs. QoX Network- and Cloud Services Management 255
Fig. 3. Energy-per-job in transactional applications [23]
3.3 Energy-Aware Load Balancing in 5G HetNets
The exponential growth of mobile data still continues and heterogeneous net-works have been introduced as a vital part of the network architecture of future5G networks. Heterogeneous networks (HetNet) especially alleviate the prob-lem that the user data intensity may have spatially large variations. These arenetwork architectures with small cells (e.g., pico and femtocells) overlaying themacrocell network. The macrocells are high power base stations providing thebasic coverage to the whole cell area, while the small cells are low power basestations used for data traffic hotspot areas within a macrocell to improve spectralefficiency per unit area or for areas that the macrocell cannot cover efficiently.
In HetNets, when a user arrives in the coverage area of a small cell it cantypically connect to either the local small cell or to the macrocell, as illustratedin Fig. 4. Typically, the small cells offer in its coverage area a possibility forachieving high transmission rates. However, depending on the congestion levelat the small cell it may be better from the system point of view to utilize theresources of the macrocell instead. This raises the need to design dynamic loadbalancing algorithms. In 5G networks the energy consumption of the systemwill also be an important factor. Thus, the load balancing algorithms must bedesigned so that they take into account both the performance of the system, aswell as the energy used by the whole system.
Consider a single macrocell with several small cells inside its coverage area.The small cells are assumed to have a wired backhaul connection to the Internet.
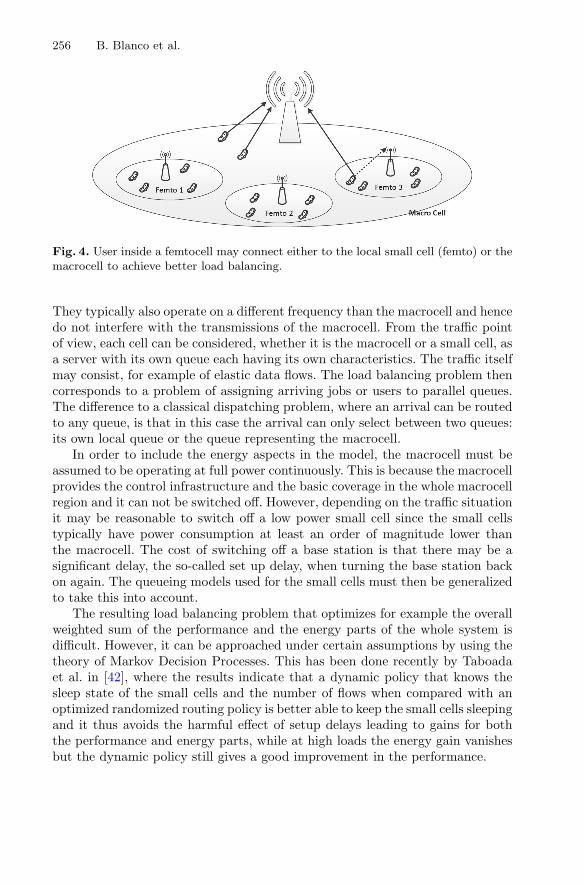
256 B. Blanco et al.
Fig. 4. User inside a femtocell may connect either to the local small cell (femto) or themacrocell to achieve better load balancing.
They typically also operate on a different frequency than the macrocell and hencedo not interfere with the transmissions of the macrocell. From the traffic pointof view, each cell can be considered, whether it is the macrocell or a small cell, asa server with its own queue each having its own characteristics. The traffic itselfmay consist, for example of elastic data flows. The load balancing problem thencorresponds to a problem of assigning arriving jobs or users to parallel queues.The difference to a classical dispatching problem, where an arrival can be routedto any queue, is that in this case the arrival can only select between two queues:its own local queue or the queue representing the macrocell.
In order to include the energy aspects in the model, the macrocell must beassumed to be operating at full power continuously. This is because the macrocellprovides the control infrastructure and the basic coverage in the whole macrocellregion and it can not be switched off. However, depending on the traffic situationit may be reasonable to switch off a low power small cell since the small cellstypically have power consumption at least an order of magnitude lower thanthe macrocell. The cost of switching off a base station is that there may be asignificant delay, the so-called set up delay, when turning the base station backon again. The queueing models used for the small cells must then be generalizedto take this into account.
The resulting load balancing problem that optimizes for example the overallweighted sum of the performance and the energy parts of the whole system isdifficult. However, it can be approached under certain assumptions by using thetheory of Markov Decision Processes. This has been done recently by Taboadaet al. in [42], where the results indicate that a dynamic policy that knows thesleep state of the small cells and the number of flows when compared with anoptimized randomized routing policy is better able to keep the small cells sleepingand it thus avoids the harmful effect of setup delays leading to gains for boththe performance and energy parts, while at high loads the energy gain vanishesbut the dynamic policy still gives a good improvement in the performance.
Energy vs. QoX Network- and Cloud Services Management 257
3.4 Incorporating Energy and Cost to Opportunistic QoE-AwareScheduling
One of the fundamental challenges that network providers nowadays face is themanagement for sharing network resources among users’ traffic flows so that mostof traditional scheduling strategies for resource allocation have been orientedto the maximization of objective quality parameters. Nevertheless, consideringthe importance and the necessity of network resource allocation for maximizingsubjective quality, scheduling algorithms aimed at maximizing users’ perceptionof quality become essential.
Thus, to overcome the lacks found in the field of traffic flow scheduling opti-mization, during the last years we have analyzed the following three stochasticand dynamic resource allocation problems:
1. Subjective quality maximization when channel capacity is constant [44],2. Subjective quality maximization in channels with time-varying capacity [43],3. Mean delay minimization for general size distributions in channels with time-
varying capacity [41,45].
Since these problems are analytically and computationally unfeasible for find-ing an optimal solution, we focus on designing simple, tractable and imple-mentable well-performing heuristic priority scheduling rules.
For this aim, our research is focused on the Markovian Decision Processes(MDP) framework and on Gittins and Whittle methods [41,43–45] to obtainscheduling index rule solutions. In this way, first of all, the above schedulingproblems are modeled in the framework of MDPs. Later, using methodologiesbased on Gittins or/and Whittle approaches for their resolution, we have pro-posed scheduling index rules with closed-form expression.
The idea of Gittins consists in allocating resources to jobs with the currenthighest productivity of using the resource. The Gittins index is the value ofthe charge that provides that the expected serving-cost to the scheduler is inbalance with the expected reward obtained when serving a job in r consecutivetime slots, which results in the ratio between the expected total reward earnedand the expected time spent in the system when serving a job in r consecutivetime slots.
On the other hand, the Whittle approach consists in obtaining a function thatmeasures the dynamic service priority. For that purpose, the optimization prob-lem formulated as a Markov Decision Process (MDP) can be relaxed by requiringto serve a job per slot on average, which may allow introducing the constraintinside the objective function. Then, it is further approached by Lagrangian meth-ods and can be decomposed into a single-job price-based parametrized optimiza-tion problem. Since the Whittle index is the break-even value of the Lagrangianparameter, it can be interpreted as the per cost of serving. In such a way, theWhittle index represents the rate between marginal reward and marginal work,where marginal reward (work) is the difference between the expected total rewardearned (work done) by serving and not serving at an initial state and thenemploying a certain optimal policy.

258 B. Blanco et al.
As a first step towards ACROSS targeted multi-criteria optimization, it isworth mentioning the utility-based MDP employed in [43,44] for QoE maximiza-tion. This function depended on delay only but we plan to extend it to a genericproblem aimed at maximizing a multivariate objective function. Considering themeaning of work and reward in Whittle related modeling, such extension coulddemand the modification of the structure of the problem itself (i.e., alternativeMDP) or just considering different criteria in the work/reward assignments.
Although we carried out some very preliminary tests with LP and AHPbased articulation of preferences for QoE vs. energy optimization in [27] we planto further analyze index rules techniques in the multi-criteria problem.
4 Current Technologies and Solutions
Research on energy-aware control has been actively pursued in the academiaalready for a long time, and Sect. 3 introduced several scenarios that have ana-lyzed and given valuable insights to the fundamental tradeoff between energyefficiency and QoS/QoE. Due to the rising costs of energy, the industry is alsoactively developing solutions that would enable more energy efficient networks.Next we review industry efforts towards such architectures and finally we intro-duce a framework for energy-aware network management systems.
4.1 Industry Efforts for Integrating Energy Consumptionin Network Controlling Mechanisms
New network technologies have been recently started to consider cost/energyissues in the early stages of the design and deployment process. Besides theinfrastructure upgrade, the incorporation of such technologies requires the thenetwork managers must handle a number of real-time parameters parameters tooptimize Network energy /cost profile. These parameters include, among others,the sleep status of networks elements or the activation of mobile resources toprovide extra coverage or change in performance status of some of the processorsin the network.
The fact is that energy consumption in networks is rising. Therefore, networkequipment requires more power and greater amounts of cooling. According to[27]. By 2017 more than 5 zettabytes of data will pass through the network everyyear. The period 2010–2020 will see an important increase in ICT equipment toprovide and serve this traffic. Smartphones and tablets will drive the mobiletraffic to grow up to 89 times by 2020, causing energy use to grow exponentially.For example, mobile video traffic is expected to grow 870%, M2M (IoT) 990%and Applications 129%. As a consequence, ICT will consume 6% of Total ofGlobal Energy consumption: in 2013 it was 109,1 GW according to the energyuse models at different network levels shown in Table 4.
Energy vs. QoX Network- and Cloud Services Management 259
Table 4. Energy use models.
Devices Networks
PC’s 36,9 GW Home & Enterprise 9,5 GW
Printer 0,9 GW Access 21,2 GW
Smartphones 0,6 GW Metro 0,6 GW Aggregation and transport
Mobile 0,6 GW Edge 0,7 GW
Tablets 0,2 GW Core 0,3 GW
Service Provider & Data Center 37,1 GW
One of the challenges the industry faces is how to support that growth ina sustainable and economically viable way. However, there is an opportunityfor important reductions in the energy consumption because the networks aredimensioned in excess of current demand and even when the network is lowin traffic the power used is very important and most of it is wasted [34]. Theintroduction of new technologies will provide a solution to improve the energyefficiency at the different scenarios (see Table 5).
Table 5. Scenarios for energy efficiency increase.
Home: Sleep mode
Office: Cloud
Access: VDL2, Vectoring, VoIP Wireless Access: LTE Femto, Small, HetNet
IP: MPLS Backhaul
Fixed Wireless: Microwave Backhaul for Wireless2G 3G, Fiber
Copper: VDL2, Vectoring, VoIP, PON
Metro: IP/MPLS Transport, Packet Optical
Edge: IP Edge
IP Core: Next Gen IP Router and Transport (10Gb)
Service Provider & Data Center
Current forecasts estimate that the trend will be to manage energy consump-tion and efficiency policies based on different types of traffic. Two organizationspursuing this goal are introduced next.
GeSI Global e-Sustainability Initiative (GeSI) [2]. Building a sustainableworld In collaboration with members from major Information and Communica-tion Technology (ICT) companies and organisations around the globe, the Globale-Sustainability Initiative (GeSI) is a leading source of impartial information,resources and best practices for achieving integrated social and environmentalsustainability through ICT.
260 B. Blanco et al.
In a rapidly growing information society, technology presents both challengesand opportunities. GeSI facilitates real world solutions to real world issues bothwithin the ICT industry and the greater sustainability community. We con-tribute to a sustainable future, communicate the industry’s corporate responsi-bility efforts, and increasingly drive the sustainability agenda.
Members and Partners: ATT, Telecom Italia, Ericsson, KPN, Microsoft,Nokia, Nokia Siemens.
Green Touch [3]. GreenTouch is a consortium of leading Information andCommunications Technology (ICT) industry, academic and non-governmentalresearch experts dedicated to fundamentally transforming communications anddata networks, including the Internet, and significantly reducing the carbon foot-print of ICT devices, platforms and networks.
4.2 C-RAN: Access Network Architecture of Future 5G Networks
Cloud computing represents a paradigm shift in the evolution of ICT and hasquickly become a key technology for offering new and improved services to con-sumers and businesses. Massive data centers, consisting of thousands of con-nected servers, are fundamental functional building blocks in the implementa-tion of cloud services. With the rapidly increasing adoption of cloud computing,the technology has faced many new challenges related to scalability, high capac-ity/reliability demands and energy efficiency. At the same time, the huge increasein the processing capacity enables the use of more accurate information that thecontrol decision may be based on. This justifies the development of much moreadvanced control methods and algorithms, which is the objective of the work asdescribed earlier in Sect. 3.
To address the growing challenges, the research community has proposedseveral architectures for data centers, including FatTree, DCell, FiConn, Scafidaand JellyFish [7]. On the other hand, vendors, such as, Google, Amazon, Apple,Google etc., have been developing their own proprietary solutions for the datacenters which has created interoperability problems between service providers.To push forward the development of architectures addressing the challengesand to enable better interoperability between cloud service providers, IEEE haslaunched the IEEE Cloud Computing Initiative which is developing presentlytwo standards in the area: IEEE P2301 Draft Guide for Cloud Portability andInteroperability Profiles and IEEE P2302 Draft Standard for Intercloud Inter-operability and Federation.
Cloud-based approaches are also considered as part of the development ofthe future 5G networks. Namely, in the C-RAN (Cloud-Radio Access Network)architecture [35] the radio access network functionality is moved to the cloud.This means that all the radio resource management and cell coordination relatedfunctionality requiring complex computations are implemented in the cloud. Thismakes the functionality of the base stations simpler and hence also cheaper tomanufacture. However, this places tough requirements on the computing capac-ity and efficiency of the centralized processing unit, essentially a data center, and
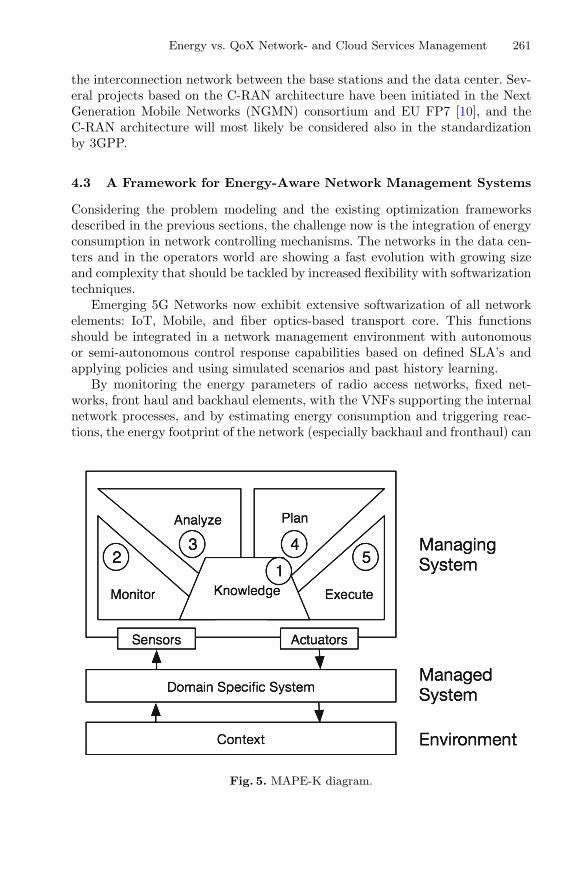
Energy vs. QoX Network- and Cloud Services Management 261
the interconnection network between the base stations and the data center. Sev-eral projects based on the C-RAN architecture have been initiated in the NextGeneration Mobile Networks (NGMN) consortium and EU FP7 [10], and theC-RAN architecture will most likely be considered also in the standardizationby 3GPP.
4.3 A Framework for Energy-Aware Network Management Systems
Considering the problem modeling and the existing optimization frameworksdescribed in the previous sections, the challenge now is the integration of energyconsumption in network controlling mechanisms. The networks in the data cen-ters and in the operators world are showing a fast evolution with growing sizeand complexity that should be tackled by increased flexibility with softwarizationtechniques.
Emerging 5G Networks now exhibit extensive softwarization of all networkelements: IoT, Mobile, and fiber optics-based transport core. This functionsshould be integrated in a network management environment with autonomousor semi-autonomous control response capabilities based on defined SLA’s andapplying policies and using simulated scenarios and past history learning.
By monitoring the energy parameters of radio access networks, fixed net-works, front haul and backhaul elements, with the VNFs supporting the internalnetwork processes, and by estimating energy consumption and triggering reac-tions, the energy footprint of the network (especially backhaul and fronthaul) can
Fig. 5. MAPE-K diagram.
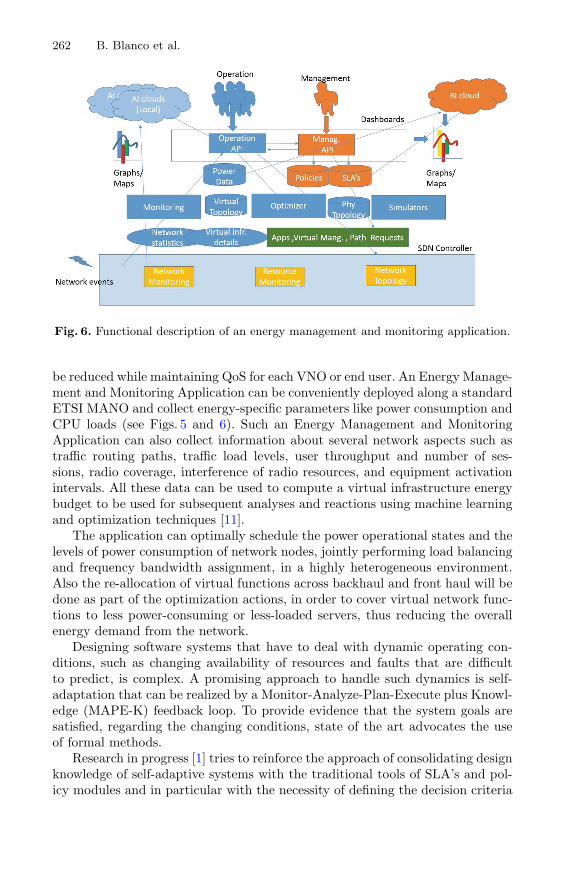
262 B. Blanco et al.
Fig. 6. Functional description of an energy management and monitoring application.
be reduced while maintaining QoS for each VNO or end user. An Energy Manage-ment and Monitoring Application can be conveniently deployed along a standardETSI MANO and collect energy-specific parameters like power consumption andCPU loads (see Figs. 5 and 6). Such an Energy Management and MonitoringApplication can also collect information about several network aspects such astraffic routing paths, traffic load levels, user throughput and number of ses-sions, radio coverage, interference of radio resources, and equipment activationintervals. All these data can be used to compute a virtual infrastructure energybudget to be used for subsequent analyses and reactions using machine learningand optimization techniques [11].
The application can optimally schedule the power operational states and thelevels of power consumption of network nodes, jointly performing load balancingand frequency bandwidth assignment, in a highly heterogeneous environment.Also the re-allocation of virtual functions across backhaul and front haul will bedone as part of the optimization actions, in order to cover virtual network func-tions to less power-consuming or less-loaded servers, thus reducing the overallenergy demand from the network.
Designing software systems that have to deal with dynamic operating con-ditions, such as changing availability of resources and faults that are difficultto predict, is complex. A promising approach to handle such dynamics is self-adaptation that can be realized by a Monitor-Analyze-Plan-Execute plus Knowl-edge (MAPE-K) feedback loop. To provide evidence that the system goals aresatisfied, regarding the changing conditions, state of the art advocates the useof formal methods.
Research in progress [1] tries to reinforce the approach of consolidating designknowledge of self-adaptive systems with the traditional tools of SLA’s and pol-icy modules and in particular with the necessity of defining the decision criteria

Energy vs. QoX Network- and Cloud Services Management 263
using formalized templates and making it understandable for a human opera-tor or manager via the human interfaces and dashboards as shown in Fig. 6.This figure shows the proposed architecture of an advanced Network Monitoringand Management System that includes energy management. At the top are thetwo agents responsible for the management of the network: On one side thoseresponsible for the negotiating the SLA’s with the customers and of establishingthe policies of the operation. On the other side those responsible for the detailedtechnical operation. These roles are supported by a set of applications and residein the corresponding specialized cloud environments. The Business Intelligentcloud helps the Management API to generate dashboards for the optimizationof the operation business results, issuing recommendations to the managers orautonomously implementing decisions. Those decisions will be based dynami-cally on contractual commitments, market conditions and customer’s needs. Theoperational cloud supports the technical operations with specialized technical AIdashboards using available information from many sources: Network monitoringinformation including real and historical performance data from the network,power data and network statistics. Simulated data can be used to support theoperation by providing hypothetical failure scenarios, possible solutions and theimpact of applying those solutions. This helps together with the historical datawith the analysis of the consequences of possible decisions when trying to solvespecific incidents. As in the Business application the operational cloud will anal-yse the scenarios and select the optimal configuration autonomously or mediatedby the operator interaction via the corresponding dashboards reducing the totalenergy footprint of the network. At the bottom of Fig. 6 is the SND networkController with access to Network and Resource Monitoring and Topology thatreacts to real Network events implementing the required network solution asdirected by the layers above.
5 Conclusions and Foreseen Future Research Lines
5.1 Conclusions
This chapter has addressed the challenges of combining energy and QoS/QoEissues in the management mechanisms of network and cloud services. Unfor-tunately, these design parameters are usually conflicting and it is necessary tointroduce multi-criteria optimization techniques in order to achieve the requiredtrade-off solution.
So, as a first step, the common issues related to multi-objective optimiza-tion problems and mechanism have been depicted. These issues include typicalpreference articulation mechanisms, typical optimization methods and fairnessconsiderations. Then, most well-known optimization methods have been brieflysummarized in order to provide Internet of Services research community with abroad set of tools for properly addressing the inherent multi-criteria problems.
Finally, in the multiuser/multiservice environments considered in ACROSS,how resources are distributed and the impact into different kind of users mustbe carefully tackled. As analyzed, fairness is most of the times considered once

264 B. Blanco et al.
the algorithm has selected the most efficient (i.e., optimal) solution. However,the incompatibility between fairness and efficiency is not a design problem of theoptimization algorithms, but of the formulation of the problem to be optimized,where the fairness concept must be included.
The next step is to model and analyze the problem of including the per-formance/energy trade-off into different scenarios in the scope of the ACROSSproject. We start this analysis studying the use case of data centers modeledas queuing systems to develop policies for the optimal control of the QoS/QoE-energy balance. The trend in this area is to focus in small/moderate size datacenters.
Then, the second scenario focuses on the way different applications use theresources available in cloud environments and its impact in terms of energeticcost. Considering that increasing resources does not always benefit the perfor-mance of the system, we analyze two application-level approaches in order toimprove energy efficiency: the characterization of the application execution pat-terns and the shared access to resources.
Next, we show an example of energy-aware load balancing in 5G HetNetswhere cells of different sizes are used to adapt the coverage to the variations ofuser data traffic. We discuss the challenge of designing a load-balancing algorithmthat considers both the performance of the system and the energy consumptionof the whole system. The discussion suggests a MDP approach for the multi-criteria optimization problem.
The last analyzed scenario presents a network services provider that sharesresources among different traffic flows. The goal here is to introduce energy andcost into opportunistic QoE-aware scheduling. The research focuses on the use ofMDP framework to model the scheduling problem and the application of Gittinsand Whittle methods to obtain scheduling index rule solutions.
Finally, the chapter compiles the current state of emerging technologies andforeseen solutions to the energy/performance trade-off issue in network and cloudmanagement systems addressed in the ACROSS project. Based on the expectedhuge increase of network traffic and, in consequence, of energy consumption, thedesign of upcoming network management systems must face the challenge ofaddressing power efficiency while still meeting the KPIs of the offered services.Industry is already fostering innovative initiatives to integrate energy issues intonetwork controlling mechanisms.
In this direction, we present C-RAN architecture as the cloud-based solutionfor the future 5G access network. This approach moves all the radio resourcemanagement and cell coordination functionality to the cloud. The increasingcomplexity of the service management and orchestration in the cloud requiresadvanced network control methods and algorithms. Therefore, as final conclu-sion, we suggest a framework to include energy awareness in network manage-ment systems that implements a MAPE-K feedback loop.
Energy vs. QoX Network- and Cloud Services Management 265
5.2 Future Work
The joint research accomplished in the scope of the COST ACROSS action hasallowed the identification of common interests to develop in future collaborations.Remaining under the umbrella of Energy/Cost–aware network management, thisfuture work will strongly relay on the application of multi–criteria optimizationtechniques in order to cope with conflicting performance objectives.
As previously concluded, the consideration of fairness in a optimization pro-cess does not fall to the multi–criteria optimization algorithm. On the contrary, itmust be considered in the formulation of the design problem itself. Therefore oneof the issues that will be addressed in future work grounded in the result of theCOST ACROSS action is the inclusion of fairness among users/services/resourceallocation in the definition network and services management optimization.
Besides, analyzing the problem of the introduction of energy-awareness inload balancing processes in 5G HetNets, another of the proposed future researchlines is to use MDP and Policy Iteration in order to optimize the dispatchingproblem focusing in small/moderate size data centers. Similarly, we also foundcommon interests in the development of further analysis of index rules techniquesin the multi-criteria problem of opportunistic QoE–aware scheduling.
Finally, research in progress envisages innovative initiatives to integrateenergy issues into network controlling mechanisms and interactive managementapproaches including self-adaption features.
Acknowledgment. The research leading to these results has been supported by theEuropean Commission under the COST ACROSS action, supported by COST (Euro-pean Cooperation in Science and Technology), and by Spanish MINECO under theproject 5RANVIR (no. TEC2016-80090-C2-2-R).
References
1. Decide Project ICT H2020 ID: 731533: ICT-10. Software Technologies. Technicalreport
2. GeSI home: thought leadership on social and environmental ICT sustainability.http://gesi.org/. Accessed 09 Oct 2017
3. GreenTouch. https://s3-us-west-2.amazonaws.com/belllabs-microsite-greentouch/index.html. Accessed 09 Oct 2017
4. Aleskerov, F.T.: Threshold utility, choice, and binary relations. Autom. RemoteControl 64(3), 350–367 (2003)
5. Andersson, J.: A survey of multiobjective optimization in engineering design. Uni-versity, Linkoping, Sweden, Technical Report No: LiTH-IKP-R-1097 (2000)
6. Belton, V., Stewart, T.J.: Multiple Criteria Decision Analysis: An Integrated App-roach. Kluwer Academic Publishers, New York (2002)
7. Bilal, K., Malik, S.U.R., Khan, S.U., Zomaya, A.Y.: Trends and challenges in clouddatacenters. IEEE Cloud Comput. 1(1), 10–20 (2014)
8. Bonald, T., Massoulie, L., Proutiere, A., Virtamo, J.: A queueing analysis of max-min fairness, proportional fairness and balanced fairness. Queueing Syst. 53(1–2),65–84 (2006)
266 B. Blanco et al.
9. Bonald, T., Proutiere, A.: On performance bounds for balanced fairness. Perform.Eval. 55(1–2), 25–50 (2004)
10. Chih-Lin, I., Huang, J., Duan, R., Cui, C., Jiang, J.X., Li, L.: Recent progress onC-RAN centralization and cloudification. IEEE Access 2, 1030–1039 (2014)
11. Casetti, C., Costa, L.C., Felix, K., Perez, G.M., Robert, M., Pedro, M., Perez-Romero, J., Weigold, H., Al-Dulaimi, A., Christos, B.J., Gerry, F., Giovanni, G.,Leguay, J., Mascolo, S., Papazois, A., Rodriguez, J.: Cognitive network man-agement for 5G by 5GPPP working group on network management and QoSthe path towards the development and deployment of cognitive networking listof contributors. Technical report, 5GPPP Network Management & Quality ofService Working Group (2017). https://bscw.5g-ppp.eu/pub/bscw.cgi/d154625/NetworkManagement WhitePaper 1.pdf
12. Coello, C.: Handling preferences in evolutionary multiobjective optimization: asurvey. In: Proceedings of the 2000 Congress on Evolutionary Computation, CEC00(Cat. No.00TH8512), vol. 1, pp. 30–37. IEEE (2000)
13. Ehrgott, M., Gandibleux, X.: Multiple Criteria Optimization: State of the ArtAnnotated Bibliographic Surveys. Kluwer Academic Publishers, New York (2002)
14. Farina, M., Deb, K., Amato, P.: Dynamic multiobjective optimization problems:test cases, approximations, and applications. IEEE Trans. Evol. Comput. 8(5),425–442 (2004)
15. Fonseca, C., Fleming, P.: Genetic algorithms for multiobjective optimization: for-mulationdiscussion and generalization. In: International Conference on GeneticAlgorithms, vol. 93, pp. 416–423, San Mateo, California (1993)
16. Gandhi, A., Doroudi, S., Harchol-Balter, M., Scheller-Wolf, A.: Exact analysis ofthe M/M/k/setup class of Markov chains via recursive renewal reward. QueueingSyst. 77(2), 177–209 (2014)
17. Gandhi, A., Gupta, V., Harchol-Balter, M., Kozuch, M.A.: Optimality analysis ofenergy-performance trade-off for server farm management. Perform. Eval. 67(11),1155–1171 (2010)
18. Gebrehiwot, M.E., Aalto, S., Lassila, P.: Energy-aware server with SRPT schedul-ing: analysis and optimization. In: Agha, G., Van Houdt, B. (eds.) QEST 2016.LNCS, vol. 9826, pp. 107–122. Springer, Cham (2016). https://doi.org/10.1007/978-3-319-43425-4 7
19. Gebrehiwot, M.E., Aalto, S., Lassila, P.: Energy-performance trade-off for proces-sor sharing queues with setup delay. Oper. Res. Lett. 44(1), 101–106 (2016)
20. Gebrehiwot, M.E., Aalto, S., Lassila, P.: Optimal energy-aware control policies forFIFO servers. Perform. Eval. 103, 41–59 (2016)
21. Hamacher, H.W., Pedersen, C.R., Ruzika, S.: Multiple objective minimum costflow problems: a review. Eur. J. Oper. Res. 176(3), 1404–1422 (2007)
22. Ho, T.T.N., Gribaudo, M., Pernici, B.: Characterizing energy per job in cloudapplications. Electronics 5(4), 90 (2016)
23. Ho, T.T.N., Gribaudo, M., Pernici, B.: Improving energy efficiency for transactionalworkloads in cloud environments. In: Proceedings of Energy-Efficiency for DataCenters (E2DC), Hong Kong, May 2017
24. Hyytia, E., Righter, R., Aalto, S.: Energy-aware job assignment in server farmswith setup delays under LCFS and PS. In: 2014 26th International TeletrafficCongress (ITC), pp. 1–9. IEEE, September 2014
25. Hyytia, E., Righter, R., Aalto, S.: Task assignment in a heterogeneous server farmwith switching delays and general energy-aware cost structure. Perform. Eval. 75–76, 17–35 (2014)
Energy vs. QoX Network- and Cloud Services Management 267
26. Kelly, F.P., Maulloo, A.K., Tan, D.K.H.: Rate control for communication networks:shadow prices, proportional fairness and stability. J. Oper. Res. Soc. 49(3), 237–252 (1998)
27. Liberal, F., Taboada, I., Fajardo, J.O.: Dealing with energy-QoE trade-offs inmobile video. J. Comput. Netw. Commun. 2013, 1–12 (2013)
28. Gebrehiwot, M.E., Aalto, S., Lassila, P.: Near-optimal policies for energy-awaretask assignment in server farms. In: 2nd International Workshop on TheoreticalApproaches to Performance Evaluation, Modeling and Simulation (2017)
29. Maccio, V., Down, D.: On optimal policies for energy-aware servers. Perform. Eval.90, 36–52 (2015)
30. Marler, R., Arora, J.: Survey of multi-objective optimization methods for engineer-ing. Struct. Multi. Optim. 26(6), 369–395 (2004)
31. Marler, T.: A study of multi-objective optimization methods: for engineering appli-cations. VDM Publishing, Saarbrucken (2009)
32. Mastelic, T., Oleksiak, A., Claussen, H., Brandic, I., Pierson, J., Vasilakos, A.V.:Cloud computing: survey on energy efficiency. ACM Comput. Surv. 47(2), 33:1–33:36 (2014). https://doi.org/10.1145/2656204
33. Mukherjee, D., Dhara, S., Borst, S., van Leeuwaarden, J.S.H.: Optimal serviceelasticity in large-scale distributed systems. In: Proceedings of ACM SIGMETRICS(2017)
34. Nedevschi, S., Popa, L., Iannaccone, G., Ratnasamy, S.: Reducing network energyconsumption via sleeping and rate-adaptation. NsDI 8, 323–336 (2008)
35. NGMN Alliance: suggestions on potential solutions to C-RAN. Technicalreport (2013). http://www.ngmn.org/uploads/media/NGMN CRAN Suggestionson Potential Solutions to CRAN.pdf
36. Nocedal, J., Wright, S.J.: Numerical Optimization. Springer, New York (2006).https://doi.org/10.1007/978-0-387-40065-5
37. Ozturke, M., Tsoukias, A., Vincke, P.: Preference modelling. In: Figueira, J., Greco,S., Ehrogott, M. (eds.) Multiple Criteria Decision Analysis: State of the Art Sur-veys. International Series in Operations Research & Management Science, vol. 78,pp. 27–59. Springer, New York (2005). https://doi.org/10.1007/0-387-23081-5 2
38. Pioro, M., Dzida, M., Kubilinskas, E., Ogryczak, W.: Applications of the max-min fairness principle in telecommunication network design. In: Next GenerationInternet Networks, pp. 219–225. IEEE (2005)
39. Saaty, T.L.: Decision making with the analytic hierarchy process. Int. J. Serv. Sci.1(1), 83–98 (2008)
40. Shaw, K.: Including real-life problem preferences in genetic algorithms to improveoptimisation of production schedules. In: Second International Conference onGenetic Algorithms in Engineering Systems, vol. 1997, pp. 239–244. IEE (1997)
41. Taboada, I., Jacko, P., Ayestaa, U., Liberal, F.: Opportunistic scheduling of flowswith general size distribution in wireless time-varying channels. In: 2014 26th Inter-national Teletraffic Congress (ITC), pp. 1–9. IEEE, September 2014
42. Taboada, I., Aalto, S., Lassila, P., Liberal, F.: Delay- and energy-aware load bal-ancing in ultra-dense heterogeneous 5G networks. Trans. Emerg. Telecommun.Technol. 28, e3170 (2017)
43. Taboada, I., Liberal, F.: A novel scheduling index rule proposal for QoE maximiza-tion in wireless networks. Abs. Appl. Anal. 2014, 1–14 (2014)
44. Taboada, I., Liberal, F., Fajardo, J.O., Ayesta, U.: QoE-aware optimization ofmultimedia flow scheduling. Comput. Commun. 36(15–16), 1629–1638 (2013)

268 B. Blanco et al.
45. Taboada, I., Liberal, F., Jacko, P.: An opportunistic and non-anticipating size-aware scheduling proposal for mean holding cost minimization in time-varyingchannels. Perform. Eval. 79, 90–103 (2014)
46. Tsoukias, A., Vincke, P.: A survey on non conventional preference modelling. Ric.Operativa 61(5–48), 20 (1992)
47. Wajid,U., Cappiello, C., Plebani, P., Pernici, B.,Mehandjiev,N.,Vitali,M.,Gienger,M., Kavoussanakis, K., Margery, D., Garcıa-Perez, D., Sampaio, P.: On achievingenergy efficiency and reducing co2 footprint in cloud computing. IEEE Trans. CloudComput. 4(2), 138–151 (2016). https://doi.org/10.1109/TCC.2015.2453988
48. Winston, W.: Optimality of the shortest line discipline. J. Appl. Probab. 14(1),181–189 (1977)
Open Access This chapter is licensed under the terms of the Creative CommonsAttribution 4.0 International License (http://creativecommons.org/licenses/by/4.0/),which permits use, sharing, adaptation, distribution and reproduction in any mediumor format, as long as you give appropriate credit to the original author(s) and thesource, provide a link to the Creative Commons license and indicate if changes weremade.
The images or other third party material in this chapter are included in the chapter’sCreative Commons license, unless indicated otherwise in a credit line to the material. Ifmaterial is not included in the chapter’s Creative Commons license and your intendeduse is not permitted by statutory regulation or exceeds the permitted use, you willneed to obtain permission directly from the copyright holder.

Traffic Management for Cloud Federation
Wojciech Burakowski1(B), Andrzej Beben1, Hans van den Berg2,Joost W. Bosman3, Gerhard Hasslinger4, Attila Kertesz5, Steven Latre6,
Rob van der Mei3, Tamas Pflanzner5, Patrick Gwydion Poullie7,Maciej Sosnowski1, Bart Spinnewyn6, and Burkhard Stiller7
1 Warsaw University of Technology, Warsaw, Poland{wojtek,abeben,m.sosnowski}@tele.pw.edu.pl
2 Netherlands Organisation for Applied Scientific Research,The Hague, [email protected]
3 Centrum Wiskunde & Informatica, Amsterdam, Netherlands{j.w.bosman,r.d.van.der.mei}@cwi.nl4 Deutsche Telekom AG, Bonn, Germany
[email protected] University of Szeged, Szeged, Hungary
{keratt,tamas.pflanzner}@inf.u-szeged.hu6 University of Antwerp - iMINDS, Antwerp, Belgium{steven.latre,bart.spinnewyn}@uantwerpen.be
7 University of Zurich - CSG@IfI, Zurich, Switzerland{poullie,stiller}@ifi.uzh.ch
Abstract. The chapter summarizes activities of COST IC1304ACROSS European Project corresponding to traffic management forCloud Federation (CF). In particular, we provide a survey of CF archi-tectures and standardization activities. We present comprehensive multi-level model for traffic management in CF that consists of five levels: Level5 - Strategies for building CF, Level 4 - Network for CF, Level 3 - Servicespecification and provision, Level 2 - Service composition and orchestra-tion, and Level 1 - Task service in cloud resources. For each level wepropose specific methods and algorithms. The effectiveness of these solu-tions were verified by simulation and analytical methods. Finally, we alsodescribe specialized simulator for testing CF solution in IoT environment.
Keywords: Cloud federation · Traffic managementMulti-layer model · Service provision · Service composition
1 Introduction
Cloud Federation (CF) extends the concept of cloud computing systems by merg-ing a number of clouds into one system. Thanks to this, CF has a potentialityto offer better service to the clients than it can be done by a separated cloud.This can happen since CF has more resources and may offer wider scope of ser-vices. On the other hand, the management of CF is more complex comparing to
c© The Author(s) 2018I. Ganchev et al. (Eds.): Autonomous Control for a Reliable Internet of Services, LNCS 10768, pp. 269–312, 2018.https://doi.org/10.1007/978-3-319-90415-3_11
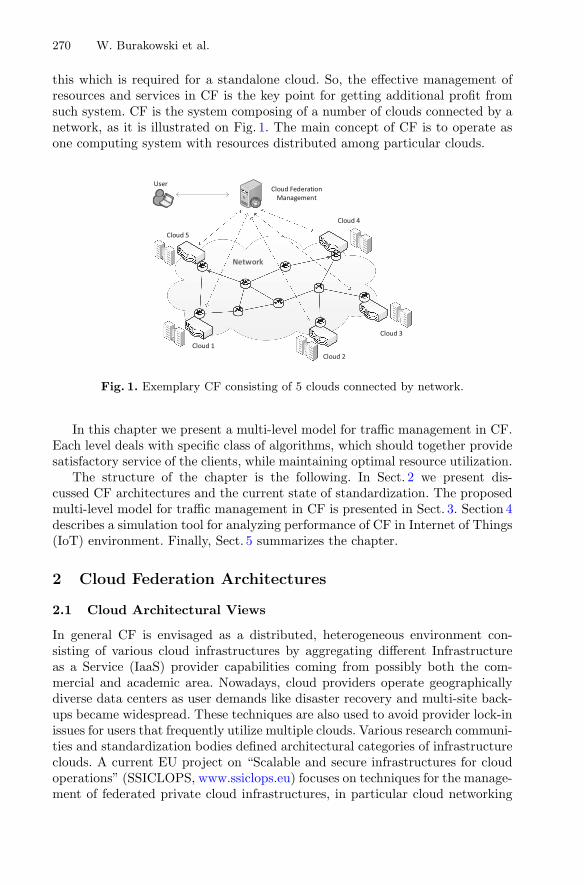
270 W. Burakowski et al.
this which is required for a standalone cloud. So, the effective management ofresources and services in CF is the key point for getting additional profit fromsuch system. CF is the system composing of a number of clouds connected by anetwork, as it is illustrated on Fig. 1. The main concept of CF is to operate asone computing system with resources distributed among particular clouds.
Fig. 1. Exemplary CF consisting of 5 clouds connected by network.
In this chapter we present a multi-level model for traffic management in CF.Each level deals with specific class of algorithms, which should together providesatisfactory service of the clients, while maintaining optimal resource utilization.
The structure of the chapter is the following. In Sect. 2 we present dis-cussed CF architectures and the current state of standardization. The proposedmulti-level model for traffic management in CF is presented in Sect. 3. Section 4describes a simulation tool for analyzing performance of CF in Internet of Things(IoT) environment. Finally, Sect. 5 summarizes the chapter.
2 Cloud Federation Architectures
2.1 Cloud Architectural Views
In general CF is envisaged as a distributed, heterogeneous environment con-sisting of various cloud infrastructures by aggregating different Infrastructureas a Service (IaaS) provider capabilities coming from possibly both the com-mercial and academic area. Nowadays, cloud providers operate geographicallydiverse data centers as user demands like disaster recovery and multi-site back-ups became widespread. These techniques are also used to avoid provider lock-inissues for users that frequently utilize multiple clouds. Various research communi-ties and standardization bodies defined architectural categories of infrastructureclouds. A current EU project on “Scalable and secure infrastructures for cloudoperations” (SSICLOPS, www.ssiclops.eu) focuses on techniques for the manage-ment of federated private cloud infrastructures, in particular cloud networking
Traffic Management for Cloud Federation 271
techniques within software-defined data centers and across wide-area networks.The scope of the SSICLOPS project includes high cloud computing workloadse.g. within the CERN computing cloud (home.cern/about/computing) as wellas cloud applications for securing web access under challenging demands for lowdelay. An expert group set up by the European Commission published their viewon Cloud Computing in [1]. These reports categorize cloud architectures into fivegroups.
– Private Clouds consist of resources managed by an infrastructure providerthat are typically owned or leased by an enterprise from a service provider.Usually, services with cloud-enhanced features are offered, therefore this groupincludes Software as a Service (SaaS) solutions like eBay.
– Public Clouds offer their services to users outside of the company and mayuse cloud functionality from other providers. In this solution, enterprises canoutsource their services to such cloud providers mainly for cost reduction.Examples of these providers are Amazon or Google Apps.
– Hybrid Clouds consist of both private and public cloud infrastructures toachieve a higher level of cost reduction through outsourcing by maintainingthe desired degree of control (e.g., sensitive data may be handled in privateclouds). The report states that hybrid clouds are rarely used at the moment.
– In Community Clouds, different entities contribute with their (usually small)infrastructure to build up an aggregated private or public cloud. Smaller enter-prises may benefit from such infrastructures, and a solution is provided byZimory.
– Finally, Special Purpose Clouds provide more specialized functionalities withadditional, domain specific methods, such as the distributed document man-agement by Google’s App Engine. This group is an extension or a specializa-tion of the previous cloud categories.
The third category called hybrid clouds are also referred as cloud federationsin the literature. Many research groups tried to grasp the essence of federa-tion formation. In general, cloud federation refers to a mesh of cloud providersthat are interconnected based on open standards to provide a universal decen-tralized computing environment where everything is driven by constraints andagreements in a ubiquitous, multi-provider infrastructure. Until now, the cloudecosystem has been characterized by the steady rising of hundreds of indepen-dent and heterogeneous cloud providers, managed by private subjects, whichoffer various services to their clients.
Buyya et al. [2] envisioned Cloud Computing as the fifth utility by satisfy-ing the computing needs of everyday life. They emphasized and introduced amarket-oriented cloud architecture, then discussed how global cloud exchangescould take place in the future. They further extended this vision suggesting afederation oriented, just in time, opportunistic and scalable application servicesprovisioning environment called InterCloud. They envision utility oriented fed-erated IaaS systems that are able to predict application service behavior forintelligent down and up-scaling infrastructures. They list the research issues of

272 W. Burakowski et al.
flexible service to resource mapping, user and resource centric Quality of Service(QoS) optimization, integration with in-house systems of enterprises, scalablemonitoring of system components. They present a market-oriented approach tooffer InterClouds including cloud exchanges and brokers that bring together pro-ducers and consumers. Producers are offering domain specific enterprise Cloudsthat are connected and managed within the federation with their Cloud Coor-dinator component.
Celesti et al. [3] proposed an approach for the federation establishment con-sidering generic cloud architectures according to a three-phase model, represent-ing an architectural solution for federation by means of a Cross-Cloud FederationManager, a software component in charge of executing the three main function-alities required for a federation. In particular, the component explicitly manages:
1. the discovery phase in which information about other clouds are receivedand sent,
2. the match-making phase performing the best choice of the provider accordingto some utility measure and
3. the authentication phase creating a secure channel between the federatedclouds. These concepts can be extended taking into account green policiesapplied in federated scenarios.
Bernstein et al. [4] define two use case scenarios that exemplify the problemsof multi-cloud systems like
1. Virtual Machines (VM) mobility where they identify the networking, the spe-cific cloud VM management interfaces and the lack of mobility interfaces asthe three major obstacles and
2. storage interoperability and federation scenario in which storage providerreplication policies are subject to change when a cloud provider initiates sub-contracting. They offer interoperability solutions only for low-level functional-ity of the clouds that are not focused on recent user demands but on solutionsfor IaaS system operators.
In the Federated Cloud Management solution [5], interoperability is achievedby high-level brokering instead of bilateral resource renting. Albeit this doesnot mean that different IaaS providers may not share or rent resources, but ifthey do so, it is transparent to their higher level management. Such a federationcan be enabled without applying additional software stack for providing low-level management interfaces. The logic of federated management is moved tohigher levels, and there is no need for adapting interoperability standards by theparticipating infrastructure providers, which is usually a restriction that someindustrial providers are reluctant to undertake.
2.2 Standardization for Cloud Federation
Standardization related to clouds, cloud interoperability and federation hasbeen conducted by the ITU (International Telecommunication Union) [6],
Traffic Management for Cloud Federation 273
IETF (Internet Engineering Task Force) [7], NIST (National Institute of Stan-dards and Technology) [8] and IEEE (Institute of Electrical and ElectronicsEngineers) [9]. In 2014, the ITU released standard documents on the vocabu-lary, a reference architecture and a framework of inter-cloud computing. Thelatter provides an overview, functional requirements and refers to a number ofuse cases. The overview distinguishes between:
– Inter-cloud Peering: between a primary and secondary CSP (i.e. Cloud ServiceProvider), where cloud services are provided by the primary CSP who estab-lishes APIs (application programming interfaces) in order to utilize servicesand resources of the secondary CSP,
– Inter-cloud Intermediary: as an extension of inter-cloud peering including a setof secondary CSPs, each with a bilateral interface for support of the primaryCSP which offers all services provided by the interconnected clouds, and
– Inter-cloud Federation: which is based on a set of peer CSPs interconnectedby APIs as a distributed system without a primary CSP with services beingprovided by several CSPs. For each service, the inter-cloud federation may actas an inter-cloud intermediary with a primary CSP responsible for the service.The user population may also be subdivided and attributed to several CSPs.
The main functional requirements to set up and operate a cloud federationsystem are:
– Networking and communication between the CSPs,– Service level agreement (SLA) and policy negotiations,– Resource provisioning and discovery mechanisms,– Resource selection, monitoring and performance estimation mechanisms,– Cloud service switch over between CSPs.
Finally, the ITU [6] takes a number of use cases into account to be addressedby could interconnection and federation approaches:
– Performance guarantee against an abrupt increase in load (offloading),– Performance guarantee regarding delay (optimization for user location),– Guaranteed availability in the event of a disaster or large-scale failure,– Service continuity (in the case of service termination of the original CSP),
service operation enhancement and broadening service variety,– Expansion and distribution of cloud storage, media and virtual data center,– Market transactions in inter-cloud intermediary pattern and cloud service
rebranding.
The standardization on cloud federation has many aspects in common withthe interconnection of content delivery networks (CDN). A CDN is an infras-tructure of servers operating on application layers, arranged for the efficientdistribution and delivery of digital content mostly for downloads, softwareupdates and video streaming. The CDN interconnection (CDNI) working group
274 W. Burakowski et al.
of the IETF provided informational RFC standard documents on the prob-lem statement, framework, requirements and use cases for CDN interconnec-tion in a first phase until 2014. Meanwhile specifications on interfaces betweenupstream/downstream CDNs including redirection of users between CDNs havebeen issued in the proposed standards track [7]. CDNs can be considered as aspecial case of clouds with the main propose of distributing or streaming largedata volumes within a broader service portfolio of cloud computing applications.The underlying distributed CDN architecture is also useful for large clouds andcloud federations for improving the system scalability and performance. This isreflected in a collection of CDNI use cases which are outlined in RFC 6770 [7]in the areas of:
– footprint extension,– offloading,– resilience enhancement,– capability enhancements with regard to technology, QoS/QoE support, the
service portfolio and interoperability.
The CDNI concept is foreseen as a basis for CDN federations, where a fed-eration of peer CDN systems is directly supported by CDNI. A CDN exchangeor broker approach is not included but can be build on top of core CDNI mech-anisms.
In 2013, NIST [8] published a cloud computing standards roadmap includ-ing basic definitions, use cases and an overview on standards with focus oncloud/grid computing. Gaps are identified with conclusions on priorities for ongo-ing standardization work. However, a recently started standards activity by theIEEE [9] towards intercloud interoperability and federation is still motivated bytoday’s landscape of independent and incompatible cloud offerings in proprietaryas well as open access architectures.
3 Multi-level Model for Traffic Management in CloudFederation
Developing of efficient traffic engineering methods for Cloud Federation is essen-tial in order to offer services to the clients on appropriate quality level whilemaintaining high utilization of resources. These methods deal with such issuesas distribution of resources in CF, designing of network connecting particularclouds, service provision, handling service requests coming from clients and man-aging virtual resource environment. The proposed traffic management model forCF consists of 5 levels, as it is depicted on Fig. 2. Below we shortly discussobjectives of each level of the model.
Level 5: This is the highest level of the model which deals with the rulesfor merging particular clouds into the form of CF. The addressed issue is e.g.amount of resources which would be delegated by particular clouds to CF. Weassume that the main reason for constituting federation is getting more profit

Traffic Management for Cloud Federation 275
Fig. 2. Traffic management model for Cloud Federation
comparing to the situation when particular clouds work alone. So, this level dealswith the conditions when CF can be attractive solution for cloud owners evenif particular clouds differ in their capabilities, e.g. in amount of resources, clientpopulation and service request rate submitted by them.
Level 4: This level deals with design of the CF network for connecting par-ticular clouds. Such network should be of adequate quality and, if it is possible,its transfer capabilities should be controlled by the CF network manager. Theaddressed issues are: required link capacities between particular clouds and effec-tive utilization of network resources (transmission links). We assume that net-work capabilities should provide adequate quality of the offered by CF serviceseven when resources allocated for a given service (e.g. virtual machines) comefrom different clouds. Effective designing of the network in question is especiallyimportant when CF uses network provided by a network operator based on SLA(Service Level Agreement) and as a consequence it has limited possibilities tocontrol network. Currently such solution is a common practice.
Level 3: This level is responsible for handling requests corresponding to ser-vice installation in CF. The installation of new service requires: (1) specificationof the service and (2) provision of the service. Specification of the service is pro-vided in the form of definition of appropriate task sequence that is executed inCF when a client asks for execution of this service. Furthermore, provision of
276 W. Burakowski et al.
the service corresponds to allocation of resources when particular tasks can beexecuted.
Level 2: This level deals with service composition and orchestration pro-cesses. So, the earlier specified sequence of tasks should be executed in responseto handle service requests. Service composition time should meet user qualityexpectations corresponding to the requested service.
Level 1: The last and the lowest level deals with task execution in cloudresources in the case when more than one task is delegated at the same time tobe served by a given resource. So, appropriate scheduling mechanisms should beapplied in order to provide e.g. fairness for tasks execution. In addition, impor-tant issue is to understand dependencies between different types of resources invirtualized cloud environment.
3.1 Level 5: Strategy for Cloud Resource Distribution in Federation
3.1.1 Motivation and State of the ArtCloud Federation is the system that is built on the top of a number of clouds.Such system should provide some additional profits for each cloud owner incomparison to stand-alone cloud. In this section we focus on strategies, in whichway clouds can make federation to get maximum profit assuming that it is equallyshared among cloud owners.
Unfortunately, there are not too many positions dealing with discussed prob-lem. For instance in [10] the authors consider effectiveness of different federationschemes using the M/M/1 queueing system to model cloud. They assume thatprofit get from a task execution depends on the waiting time (showing receivedQoS) of this task. Furthermore, they consider scenarios when the profit is max-imized from the perspective of the whole CF, and scenarios when each cloudmaximizes its profit. Another approach is presented in [11], where the authorapplied game theory to analyze the selfish behavior of cloud owner selling unusedresources depending on uncertain load conditions.
3.1.2 Proposed ModelIn the presented approach we assume that capacities of each cloud are charac-terized in terms of number of resources and service request rate. Furthermore,for the sake of simplicity, it is assumed that both types of resources and exe-cuted services are the same in each cloud. In addition, execution of each serviceis performed by single resource only. Finally, we will model each cloud by well-known loss queueing system M/M/c/c (e.g. [12]), where c denotes number ofidentical cloud resources, arrival service request rate follows Poisson distribu-tion with parameter λ, service time distribution is done by negative exponentialdistribution with the rate 1/h (h is the mean service time). The performancesof cloud system are measured by: (1) Ploss, which denotes the loss rate dueto lack of available resources at the moment of service request arrival, and (2)Acarried = λh(1 − Ploss), which denotes traffic carried by the cloud, that corre-sponds directly to the resource utilization ratio.

Traffic Management for Cloud Federation 277
Now, let us search for the appropriate scheme for building CF system. Forthis purpose, let us consider a number, say N , of clouds that intend to buildCF where the i-th cloud (i = 1, ..., N) is characterized by two parameters (λi
and ci). In addition, the mean service times of service execution are the samein each cloud h1 = h2 = ... = hN = h. Subsequently we assume that h = 1,and as a consequence offered load A = λh will be denoted as A = λ. Next,the assumed objective function for comparing the discussed schemes for CF isto maximize profit coming from resource utilization delegated from each cloudto CF. Furthermore, the profit is equally shared among clouds participating inCF. Such approach looks to be reasonable (at least as the first approach) sinceotherwise in CF we should take into account requests coming from a given cloudand which resource (from each cloud) was chosen to serve the request.
We consider three schemes:
– Scheme no. 1 (see Fig. 3): this is the reference scheme when the clouds workalone, denoted by SC.
– Scheme no. 2 (see Fig. 4): this scheme is named as full federation and assumesthat all clouds dedicate all theirs resources and clients to the CF system. Thisscheme we denote as FC.
– Scheme no. 3 (see Fig. 5): for this scheme we assume that each cloud candelegate to CF only a part of its resources as well as a part of service requestscoming from its clients. This scheme we name as PCF (Partial CF).
First, let us compare the performances of schemes SC and FC in terms ofresource utilization ratio and service request loss rate. The first observationis that FC scheme will have lower loss probabilities as well as better resourceutilization ratio due to larger number of resources. But the open question is inwhich way to share profit gained from FC scheme when the clouds are of differentcapabilities? Table 1 shows exemplary results for the case, when the profit, whichis consequence of better resources utilization, is shared equally among clouds.
The results from Table 1 show that, as it was expected, FC scheme assures lessservice request loss rate and better resource utilization ratio for most of clouds(except cloud no. 1 that is under loaded). Note, that if we share the profit equally,the clouds with smaller service requests rate can receive more profit from FC
Fig. 3. Scenario with clouds working in separate way

278 W. Burakowski et al.
Fig. 4. Scenario with clouds creating Cloud Federation based on full federation scheme
scheme comparing to the SC scheme while the clouds with higher service requestrate get less profit comparing to the SC scheme. So, one can conclude that FCscheme is optimal solution when the capabilities of the clouds are similar but ifthey differ essentially then this scheme simply fails.
Scheme no. 3 mitigates the drawbacks of the schemes no. 1 and no. 2. As itwas above stated, in this scheme we assume that each cloud can delegate to CFonly a part of its resources as well as a part of service request rate submitted byits clients. The main assumptions for PFC scheme are the following:
Table 1. Exemplary results comparing SC and FC schemes in terms of loss rate andresource utilization parameters. Number of clouds N = 5, values of λ: λ1 = 0.2, λ2 =0.4, λ3 = 0.6, λ4 = 0.8, the same mean service times h1 = h2 = h3 = h4 = h5 = 1,Number of resources in each cloud: c1 = c2 = c3 = c4 = c5 = 10.
Cloud characteristics SC scheme FC scheme
No. Servicerequests rate
Number ofresources
Resourceutilization
Lossrate [%]
Resourceutilization
Lossrate[%]
1 2 10 0.2 <0.01 0.6 0.02
2 4 10 0.398 0.54 0.6 0.02
3 6 10 0.575 4.3 0.6 0.02
4 8 10 0.703 12 0.6 0.02
5 10 10 0.786 21 0.6 0.02
1. we split the resources belonging to the i-th cloud (i = 1, ..., N), say ci, into 2main subsets:– set of private resources that are delegated to handle only service requests
coming from the i-th cloud clients– set of resources dedicated to Cloud Federation for handling service requests
coming from all clouds creating Cloud Federation, denoted as ci3
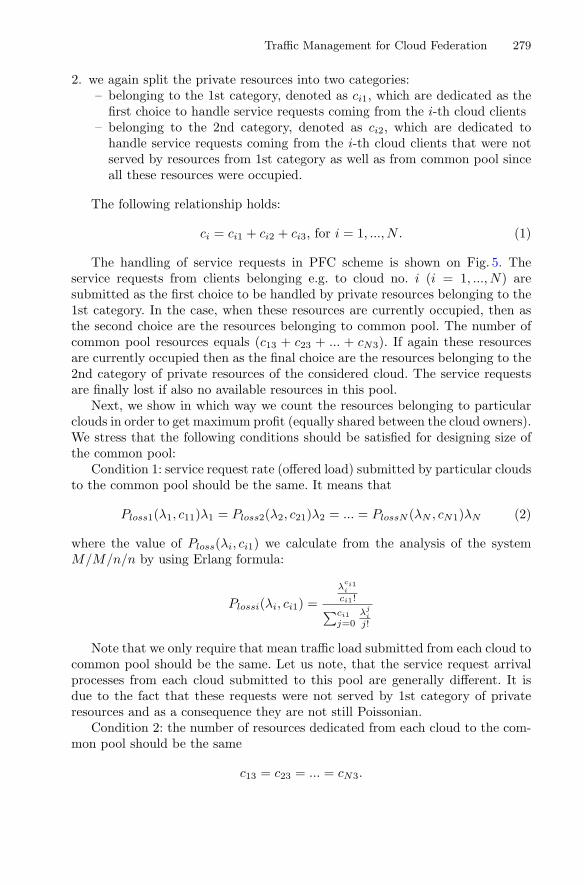
Traffic Management for Cloud Federation 279
2. we again split the private resources into two categories:– belonging to the 1st category, denoted as ci1, which are dedicated as the
first choice to handle service requests coming from the i-th cloud clients– belonging to the 2nd category, denoted as ci2, which are dedicated to
handle service requests coming from the i-th cloud clients that were notserved by resources from 1st category as well as from common pool sinceall these resources were occupied.
The following relationship holds:
ci = ci1 + ci2 + ci3, for i = 1, ..., N. (1)
The handling of service requests in PFC scheme is shown on Fig. 5. Theservice requests from clients belonging e.g. to cloud no. i (i = 1, ..., N) aresubmitted as the first choice to be handled by private resources belonging to the1st category. In the case, when these resources are currently occupied, then asthe second choice are the resources belonging to common pool. The number ofcommon pool resources equals (c13 + c23 + ... + cN3). If again these resourcesare currently occupied then as the final choice are the resources belonging to the2nd category of private resources of the considered cloud. The service requestsare finally lost if also no available resources in this pool.
Next, we show in which way we count the resources belonging to particularclouds in order to get maximum profit (equally shared between the cloud owners).We stress that the following conditions should be satisfied for designing size ofthe common pool:
Condition 1: service request rate (offered load) submitted by particular cloudsto the common pool should be the same. It means that
Ploss1(λ1, c11)λ1 = Ploss2(λ2, c21)λ2 = ... = PlossN (λN , cN1)λN (2)
where the value of Ploss(λi, ci1) we calculate from the analysis of the systemM/M/n/n by using Erlang formula:
Plossi(λi, ci1) =λci1i
ci1!∑ci1
j=0λji
j!
Note that we only require that mean traffic load submitted from each cloud tocommon pool should be the same. Let us note, that the service request arrivalprocesses from each cloud submitted to this pool are generally different. It isdue to the fact that these requests were not served by 1st category of privateresources and as a consequence they are not still Poissonian.
Condition 2: the number of resources dedicated from each cloud to the com-mon pool should be the same
c13 = c23 = ... = cN3.
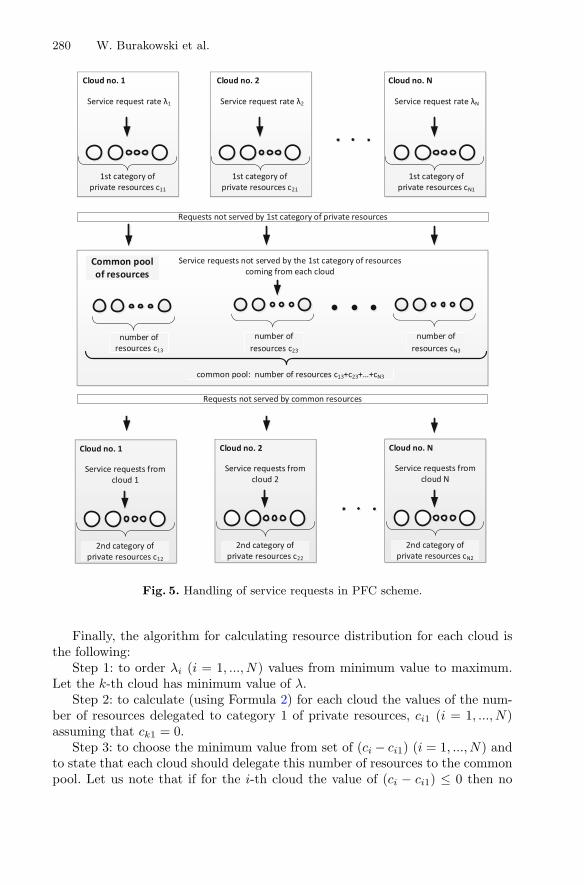
280 W. Burakowski et al.
Fig. 5. Handling of service requests in PFC scheme.
Finally, the algorithm for calculating resource distribution for each cloud isthe following:
Step 1: to order λi (i = 1, ..., N) values from minimum value to maximum.Let the k-th cloud has minimum value of λ.
Step 2: to calculate (using Formula 2) for each cloud the values of the num-ber of resources delegated to category 1 of private resources, ci1 (i = 1, ..., N)assuming that ck1 = 0.
Step 3: to choose the minimum value from set of (ci − ci1) (i = 1, ..., N) andto state that each cloud should delegate this number of resources to the commonpool. Let us note that if for the i-th cloud the value of (ci − ci1) ≤ 0 then no
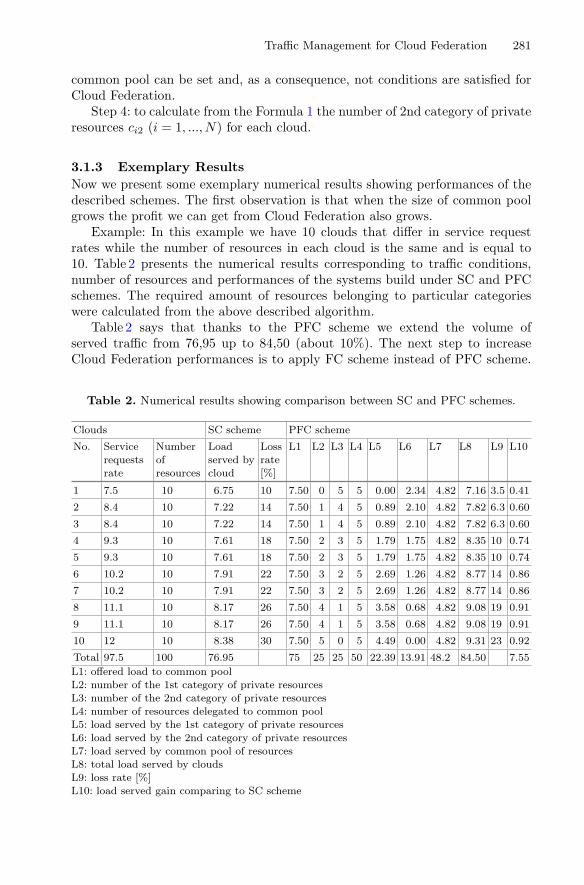
Traffic Management for Cloud Federation 281
common pool can be set and, as a consequence, not conditions are satisfied forCloud Federation.
Step 4: to calculate from the Formula 1 the number of 2nd category of privateresources ci2 (i = 1, ..., N) for each cloud.
3.1.3 Exemplary ResultsNow we present some exemplary numerical results showing performances of thedescribed schemes. The first observation is that when the size of common poolgrows the profit we can get from Cloud Federation also grows.
Example: In this example we have 10 clouds that differ in service requestrates while the number of resources in each cloud is the same and is equal to10. Table 2 presents the numerical results corresponding to traffic conditions,number of resources and performances of the systems build under SC and PFCschemes. The required amount of resources belonging to particular categorieswere calculated from the above described algorithm.
Table 2 says that thanks to the PFC scheme we extend the volume ofserved traffic from 76,95 up to 84,50 (about 10%). The next step to increaseCloud Federation performances is to apply FC scheme instead of PFC scheme.
Table 2. Numerical results showing comparison between SC and PFC schemes.
Clouds SC scheme PFC scheme
No. Servicerequestsrate
Numberofresources
Loadserved bycloud
Lossrate[%]
L1 L2 L3 L4 L5 L6 L7 L8 L9 L10
1 7.5 10 6.75 10 7.50 0 5 5 0.00 2.34 4.82 7.16 3.5 0.41
2 8.4 10 7.22 14 7.50 1 4 5 0.89 2.10 4.82 7.82 6.3 0.60
3 8.4 10 7.22 14 7.50 1 4 5 0.89 2.10 4.82 7.82 6.3 0.60
4 9.3 10 7.61 18 7.50 2 3 5 1.79 1.75 4.82 8.35 10 0.74
5 9.3 10 7.61 18 7.50 2 3 5 1.79 1.75 4.82 8.35 10 0.74
6 10.2 10 7.91 22 7.50 3 2 5 2.69 1.26 4.82 8.77 14 0.86
7 10.2 10 7.91 22 7.50 3 2 5 2.69 1.26 4.82 8.77 14 0.86
8 11.1 10 8.17 26 7.50 4 1 5 3.58 0.68 4.82 9.08 19 0.91
9 11.1 10 8.17 26 7.50 4 1 5 3.58 0.68 4.82 9.08 19 0.91
10 12 10 8.38 30 7.50 5 0 5 4.49 0.00 4.82 9.31 23 0.92
Total 97.5 100 76.95 75 25 25 50 22.39 13.91 48.2 84.50 7.55
L1: offered load to common poolL2: number of the 1st category of private resourcesL3: number of the 2nd category of private resourcesL4: number of resources delegated to common poolL5: load served by the 1st category of private resourcesL6: load served by the 2nd category of private resourcesL7: load served by common pool of resourcesL8: total load served by cloudsL9: loss rate [%]L10: load served gain comparing to SC scheme
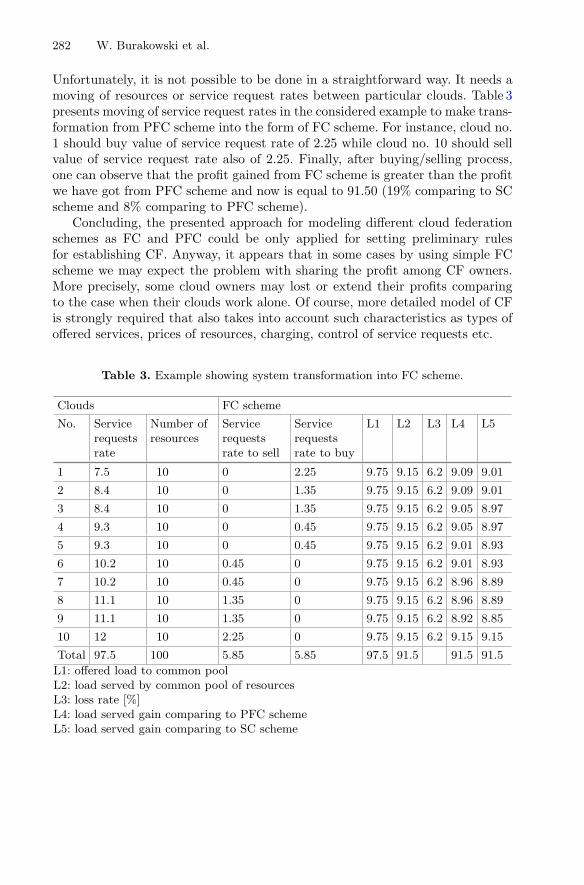
282 W. Burakowski et al.
Unfortunately, it is not possible to be done in a straightforward way. It needs amoving of resources or service request rates between particular clouds. Table 3presents moving of service request rates in the considered example to make trans-formation from PFC scheme into the form of FC scheme. For instance, cloud no.1 should buy value of service request rate of 2.25 while cloud no. 10 should sellvalue of service request rate also of 2.25. Finally, after buying/selling process,one can observe that the profit gained from FC scheme is greater than the profitwe have got from PFC scheme and now is equal to 91.50 (19% comparing to SCscheme and 8% comparing to PFC scheme).
Concluding, the presented approach for modeling different cloud federationschemes as FC and PFC could be only applied for setting preliminary rulesfor establishing CF. Anyway, it appears that in some cases by using simple FCscheme we may expect the problem with sharing the profit among CF owners.More precisely, some cloud owners may lost or extend their profits comparingto the case when their clouds work alone. Of course, more detailed model of CFis strongly required that also takes into account such characteristics as types ofoffered services, prices of resources, charging, control of service requests etc.
Table 3. Example showing system transformation into FC scheme.
Clouds FC scheme
No. Servicerequestsrate
Number ofresources
Servicerequestsrate to sell
Servicerequestsrate to buy
L1 L2 L3 L4 L5
1 7.5 10 0 2.25 9.75 9.15 6.2 9.09 9.01
2 8.4 10 0 1.35 9.75 9.15 6.2 9.09 9.01
3 8.4 10 0 1.35 9.75 9.15 6.2 9.05 8.97
4 9.3 10 0 0.45 9.75 9.15 6.2 9.05 8.97
5 9.3 10 0 0.45 9.75 9.15 6.2 9.01 8.93
6 10.2 10 0.45 0 9.75 9.15 6.2 9.01 8.93
7 10.2 10 0.45 0 9.75 9.15 6.2 8.96 8.89
8 11.1 10 1.35 0 9.75 9.15 6.2 8.96 8.89
9 11.1 10 1.35 0 9.75 9.15 6.2 8.92 8.85
10 12 10 2.25 0 9.75 9.15 6.2 9.15 9.15
Total 97.5 100 5.85 5.85 97.5 91.5 91.5 91.5
L1: offered load to common poolL2: load served by common pool of resourcesL3: loss rate [%]L4: load served gain comparing to PFC schemeL5: load served gain comparing to SC scheme

Traffic Management for Cloud Federation 283
3.2 Level 4: Network for Cloud Federation
3.2.1 Motivation and State of the ArtThe services offered by CF use resources provided by multiple clouds with dif-ferent location of data centers. Therefore, CF requires an efficient, reliable andsecure inter-cloud communication infrastructure. This infrastructure is espe-cially important for mission critical and interactive services that have strictQoS requirements. Currently, CF commonly exploits the Internet for inter-cloudcommunication, e.g. CONTRAIL [13]. Although this approach may be suffi-cient for non-real time services, i.e., distributed file storage or data backups,it inhibits deploying more demanding services like augmented or virtual real-ity, video conferencing, on-line gaming, real-time data processing in distributeddatabases or live video streaming. The commonly used approach for ensuringrequired QoS level is to exploit SLAs between clouds participating in CF. TheseSLAs are established on demand during the service provisioning process (seeLevel 3 of the model in Fig. 2) and use network resources coming from networkproviders. However, independently established SLAs lead to inefficient utilizationof network resources, suffer scalability concerns and increase operating expen-ditures (OPEX) costs paid by CF. These negative effects become critical forlarge CFs with many participants as well as for large cloud providers offer-ing plethora of services. For example, the recent experiences of Google cloudpoint out that using independent SLAs between data centers is ineffective [14].Therefore, Google creates their own communication infrastructure that can beoptimized and dynamically reconfigured following demands of currently offeredservices, planned maintenance operations as well as restoration actions taken toovercome failures.
3.2.2 Proposed SolutionThe proposed approach for CF is to create, manage and maintain a Virtual Net-work Infrastructure (VNI), which provides communication services tailored forinter-cloud communication. The VNI is shared among all clouds participating inCF and is managed by CF orchestration and management system. Actually, VNIconstitutes a new “service component” that is orchestrated during service provi-sioning process and is used in service composition process. The key advantagesof VNI are the following:
1. The common orchestration of cloud and VNI resources enables optimizationof service provisioning by considering network capabilities. In particular, CFcan benefit from advanced traffic engineering algorithms taking into accountknowledge about service demands and VNI capabilities, including QoS guar-antees and available network resources. The objective function of designedalgorithms may cover efficient load balancing or maximization and fair shareof the CF revenue.
2. New communication facilities tailored for cloud services:– The cloud services significantly differ in QoS requirements, e.g. interac-
tive services are delay sensitive, while video on demand or big data storage
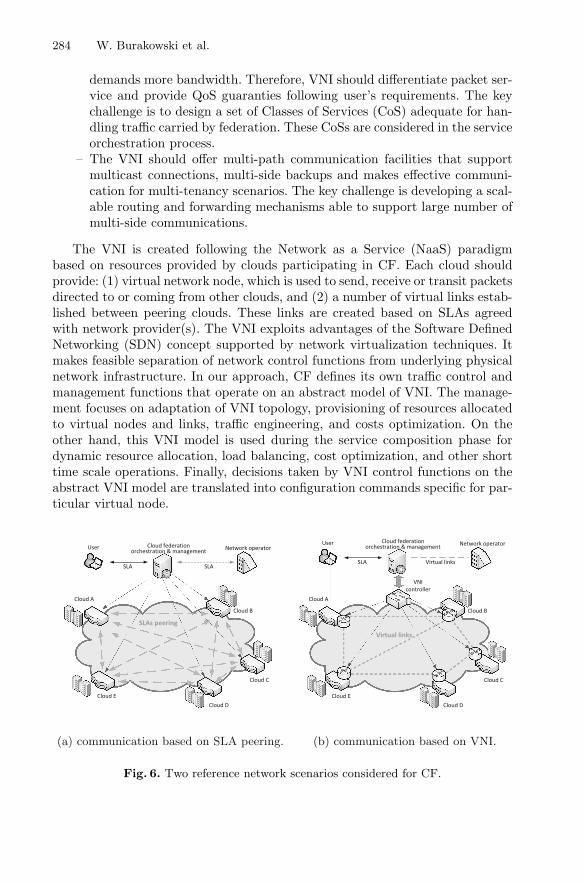
284 W. Burakowski et al.
demands more bandwidth. Therefore, VNI should differentiate packet ser-vice and provide QoS guaranties following user’s requirements. The keychallenge is to design a set of Classes of Services (CoS) adequate for han-dling traffic carried by federation. These CoSs are considered in the serviceorchestration process.
– The VNI should offer multi-path communication facilities that supportmulticast connections, multi-side backups and makes effective communi-cation for multi-tenancy scenarios. The key challenge is developing a scal-able routing and forwarding mechanisms able to support large number ofmulti-side communications.
The VNI is created following the Network as a Service (NaaS) paradigmbased on resources provided by clouds participating in CF. Each cloud shouldprovide: (1) virtual network node, which is used to send, receive or transit packetsdirected to or coming from other clouds, and (2) a number of virtual links estab-lished between peering clouds. These links are created based on SLAs agreedwith network provider(s). The VNI exploits advantages of the Software DefinedNetworking (SDN) concept supported by network virtualization techniques. Itmakes feasible separation of network control functions from underlying physicalnetwork infrastructure. In our approach, CF defines its own traffic control andmanagement functions that operate on an abstract model of VNI. The manage-ment focuses on adaptation of VNI topology, provisioning of resources allocatedto virtual nodes and links, traffic engineering, and costs optimization. On theother hand, this VNI model is used during the service composition phase fordynamic resource allocation, load balancing, cost optimization, and other shorttime scale operations. Finally, decisions taken by VNI control functions on theabstract VNI model are translated into configuration commands specific for par-ticular virtual node.
Fig. 6. Two reference network scenarios considered for CF.
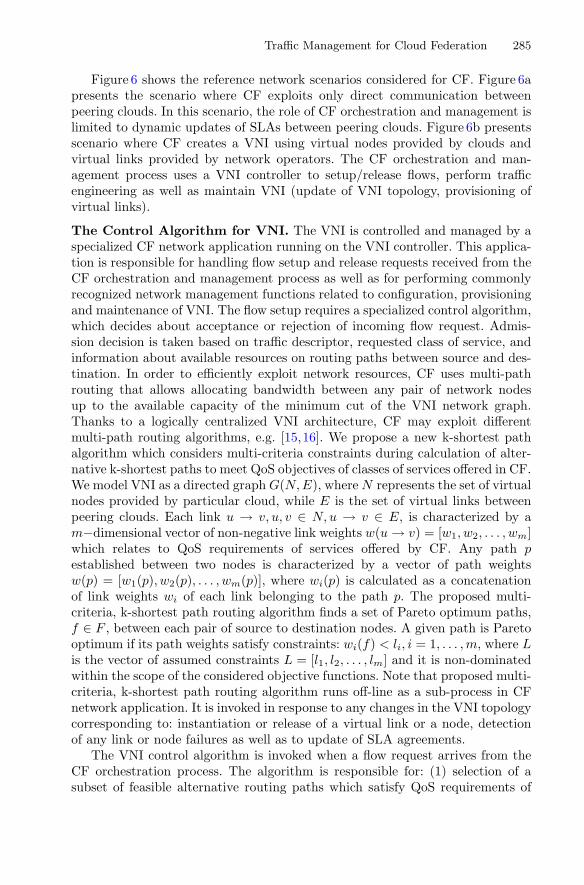
Traffic Management for Cloud Federation 285
Figure 6 shows the reference network scenarios considered for CF. Figure 6apresents the scenario where CF exploits only direct communication betweenpeering clouds. In this scenario, the role of CF orchestration and management islimited to dynamic updates of SLAs between peering clouds. Figure 6b presentsscenario where CF creates a VNI using virtual nodes provided by clouds andvirtual links provided by network operators. The CF orchestration and man-agement process uses a VNI controller to setup/release flows, perform trafficengineering as well as maintain VNI (update of VNI topology, provisioning ofvirtual links).
The Control Algorithm for VNI. The VNI is controlled and managed by aspecialized CF network application running on the VNI controller. This applica-tion is responsible for handling flow setup and release requests received from theCF orchestration and management process as well as for performing commonlyrecognized network management functions related to configuration, provisioningand maintenance of VNI. The flow setup requires a specialized control algorithm,which decides about acceptance or rejection of incoming flow request. Admis-sion decision is taken based on traffic descriptor, requested class of service, andinformation about available resources on routing paths between source and des-tination. In order to efficiently exploit network resources, CF uses multi-pathrouting that allows allocating bandwidth between any pair of network nodesup to the available capacity of the minimum cut of the VNI network graph.Thanks to a logically centralized VNI architecture, CF may exploit differentmulti-path routing algorithms, e.g. [15,16]. We propose a new k-shortest pathalgorithm which considers multi-criteria constraints during calculation of alter-native k-shortest paths to meet QoS objectives of classes of services offered in CF.We model VNI as a directed graph G(N,E), where N represents the set of virtualnodes provided by particular cloud, while E is the set of virtual links betweenpeering clouds. Each link u → v, u, v ∈ N,u → v ∈ E, is characterized by am−dimensional vector of non-negative link weights w(u → v) = [w1, w2, . . . , wm]which relates to QoS requirements of services offered by CF. Any path pestablished between two nodes is characterized by a vector of path weightsw(p) = [w1(p), w2(p), . . . , wm(p)], where wi(p) is calculated as a concatenationof link weights wi of each link belonging to the path p. The proposed multi-criteria, k-shortest path routing algorithm finds a set of Pareto optimum paths,f ∈ F , between each pair of source to destination nodes. A given path is Paretooptimum if its path weights satisfy constraints: wi(f) < li, i = 1, . . . , m, where Lis the vector of assumed constraints L = [l1, l2, . . . , lm] and it is non-dominatedwithin the scope of the considered objective functions. Note that proposed multi-criteria, k-shortest path routing algorithm runs off-line as a sub-process in CFnetwork application. It is invoked in response to any changes in the VNI topologycorresponding to: instantiation or release of a virtual link or a node, detectionof any link or node failures as well as to update of SLA agreements.
The VNI control algorithm is invoked when a flow request arrives from theCF orchestration process. The algorithm is responsible for: (1) selection of asubset of feasible alternative routing paths which satisfy QoS requirements of
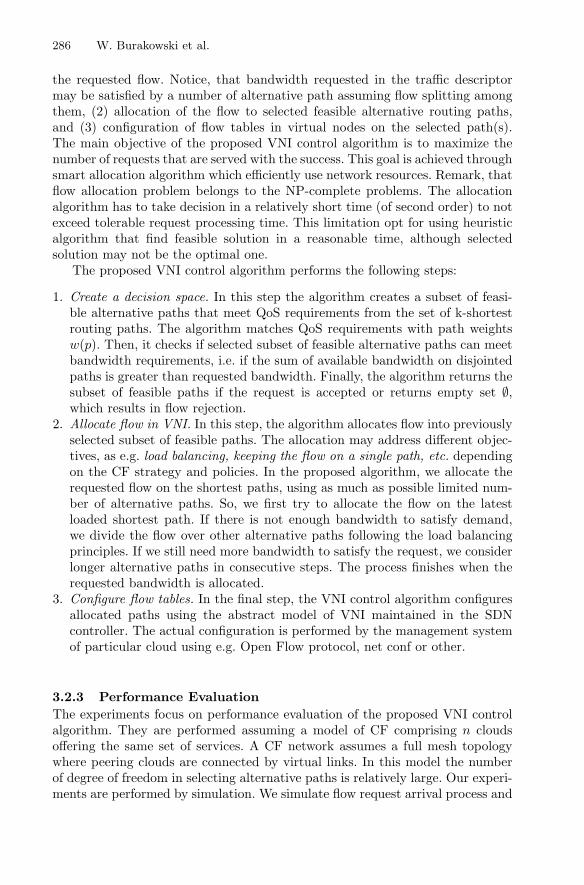
286 W. Burakowski et al.
the requested flow. Notice, that bandwidth requested in the traffic descriptormay be satisfied by a number of alternative path assuming flow splitting amongthem, (2) allocation of the flow to selected feasible alternative routing paths,and (3) configuration of flow tables in virtual nodes on the selected path(s).The main objective of the proposed VNI control algorithm is to maximize thenumber of requests that are served with the success. This goal is achieved throughsmart allocation algorithm which efficiently use network resources. Remark, thatflow allocation problem belongs to the NP-complete problems. The allocationalgorithm has to take decision in a relatively short time (of second order) to notexceed tolerable request processing time. This limitation opt for using heuristicalgorithm that find feasible solution in a reasonable time, although selectedsolution may not be the optimal one.
The proposed VNI control algorithm performs the following steps:
1. Create a decision space. In this step the algorithm creates a subset of feasi-ble alternative paths that meet QoS requirements from the set of k-shortestrouting paths. The algorithm matches QoS requirements with path weightsw(p). Then, it checks if selected subset of feasible alternative paths can meetbandwidth requirements, i.e. if the sum of available bandwidth on disjointedpaths is greater than requested bandwidth. Finally, the algorithm returns thesubset of feasible paths if the request is accepted or returns empty set ∅,which results in flow rejection.
2. Allocate flow in VNI. In this step, the algorithm allocates flow into previouslyselected subset of feasible paths. The allocation may address different objec-tives, as e.g. load balancing, keeping the flow on a single path, etc. dependingon the CF strategy and policies. In the proposed algorithm, we allocate therequested flow on the shortest paths, using as much as possible limited num-ber of alternative paths. So, we first try to allocate the flow on the latestloaded shortest path. If there is not enough bandwidth to satisfy demand,we divide the flow over other alternative paths following the load balancingprinciples. If we still need more bandwidth to satisfy the request, we considerlonger alternative paths in consecutive steps. The process finishes when therequested bandwidth is allocated.
3. Configure flow tables. In the final step, the VNI control algorithm configuresallocated paths using the abstract model of VNI maintained in the SDNcontroller. The actual configuration is performed by the management systemof particular cloud using e.g. Open Flow protocol, net conf or other.
3.2.3 Performance EvaluationThe experiments focus on performance evaluation of the proposed VNI controlalgorithm. They are performed assuming a model of CF comprising n cloudsoffering the same set of services. A CF network assumes a full mesh topologywhere peering clouds are connected by virtual links. In this model the numberof degree of freedom in selecting alternative paths is relatively large. Our experi-ments are performed by simulation. We simulate flow request arrival process and
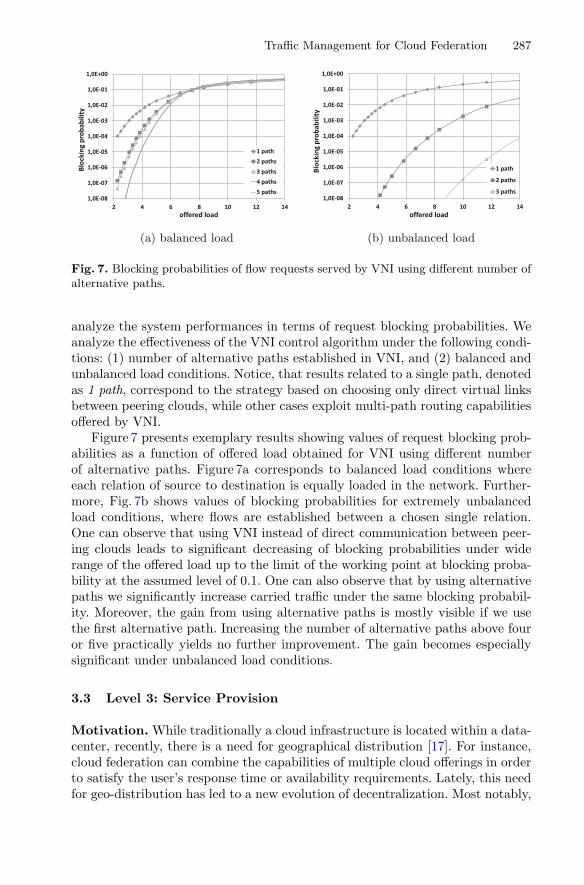
Traffic Management for Cloud Federation 287
(a) balanced load (b) unbalanced load
Fig. 7. Blocking probabilities of flow requests served by VNI using different number ofalternative paths.
analyze the system performances in terms of request blocking probabilities. Weanalyze the effectiveness of the VNI control algorithm under the following condi-tions: (1) number of alternative paths established in VNI, and (2) balanced andunbalanced load conditions. Notice, that results related to a single path, denotedas 1 path, correspond to the strategy based on choosing only direct virtual linksbetween peering clouds, while other cases exploit multi-path routing capabilitiesoffered by VNI.
Figure 7 presents exemplary results showing values of request blocking prob-abilities as a function of offered load obtained for VNI using different numberof alternative paths. Figure 7a corresponds to balanced load conditions whereeach relation of source to destination is equally loaded in the network. Further-more, Fig. 7b shows values of blocking probabilities for extremely unbalancedload conditions, where flows are established between a chosen single relation.One can observe that using VNI instead of direct communication between peer-ing clouds leads to significant decreasing of blocking probabilities under widerange of the offered load up to the limit of the working point at blocking proba-bility at the assumed level of 0.1. One can also observe that by using alternativepaths we significantly increase carried traffic under the same blocking probabil-ity. Moreover, the gain from using alternative paths is mostly visible if we usethe first alternative path. Increasing the number of alternative paths above fouror five practically yields no further improvement. The gain becomes especiallysignificant under unbalanced load conditions.
3.3 Level 3: Service Provision
Motivation. While traditionally a cloud infrastructure is located within a data-center, recently, there is a need for geographical distribution [17]. For instance,cloud federation can combine the capabilities of multiple cloud offerings in orderto satisfy the user’s response time or availability requirements. Lately, this needfor geo-distribution has led to a new evolution of decentralization. Most notably,
288 W. Burakowski et al.
the extension of cloud computing towards the edge of the enterprise network, isgenerally referred to as fog or edge computing [18]. In fog computing, computa-tion is performed at the edge of the network at the gateway devices, reducingbandwidth requirements, latency, and the need for communicating data to theservers. Second, mist computing pushes processing even further to the networkedge, involving the sensor and actuator devices [19].
Compared to a traditional cloud computing environment, a geo-distributedcloud environment is less well-controlled and behaves in an ad-hoc manner.Devices may leave and join the network, or may become unavailable due tounpredictable failures or obstructions in the environment.
Additionally, while in a data-center heterogeneity is limited to multiple gen-erations of servers being used, there is a large spread on capabilities within ageo-distributed cloud environment. Memory and processing means range fromhigh (e.g. servers), over medium (e.g. cloudlets, gateways) to very low (e.g.mobile devices, sensor nodes). While some communication links guarantee acertain bandwidth (e.g. dedicated wired links), others provide a bandwidth witha certain probability (e.g. a shared wired link), and others do not provide anyguarantees at all (wireless links).
Reliability is an important non-functional requirement, as it outlines howa software systems realizes its functionality [20]. The unreliability of substrateresources in a heterogeneous cloud environment, severely affects the reliabilityof the applications relying on those resources. Therefore, it is very challengingto host reliable applications on top of unreliable infrastructure [21].
Moreover, traditional cloud management algorithms cannot be applied here,as they generally consider powerful, always on servers, interconnected over wiredlinks. Many algorithms do not even take into account bandwidth limitations.While such an omission can be justified by an appropriately over provisioned net-work bandwidth within a data-center, it is not warranted in the above describedgeo-distributed cloud networks.
State of the Art. In this section, the state of the art with regard to theApplication Placement Problem (APP) in cloud environments is discussed. Earlywork on application placement merely considers nodal resources, such as CentralProcessing Unit (CPU) and memory capabilities. Deciding whether requests areaccepted and where those virtual resources are placed then reduces to a MultipleKnapsack Problem (MKP) [22]. An MKP is known to be NP-hard and thereforeoptimal algorithms are hampered by scalability issues. A large body of work hasbeen devoted to finding heuristic solutions [23–25].
When the application placement not only decides where computational enti-ties are hosted, but also decides on how the communication between thoseentities is routed in the Substrate Network (SN), then we speak of network-aware APP. Network-aware application placement is closely tied to VirtualNetwork Embedding (VNE) [26]. An example of a network-aware approach isthe work from Moens et al. [27]. It employs a Service Oriented Architecture(SOA), in which applications are constructed as a collection of communicatingservices. This optimal approach performs node and link mapping simultaneously.
Traffic Management for Cloud Federation 289
In contrast, other works try to reduce computational complexity by performingthose tasks in distinct phases [28,29].
While the traditional VNE problem assumes that the SN network remainsoperational at all times, the Survivable Virtual Network Embedding (SVNE)problem does consider failures in the SN. For instance, Ajtai et al. try andguarantee that a virtual network can still be embedded in a physical network,after k network components fail. They provide a theoretical framework for fault-tolerant graphs [30]. However, in this model, hardware failure can still resultin service outage as migrations may be required before normal operation cancontinue.
Mihailescu et al. try to reduce network interference by placing VirtualMachines (VMs) that communicate frequently, and do not have anti-collocationconstraints, on Physical Machines (PMs) located on the same racks [31]. Addi-tionally, they uphold application availability when dealing with hardware fail-ures by placing redundant VMs on separate server racks. A major shortcomingis that the number of replicas to be placed, and the anti-collocation constraintsare user-defined.
Csorba et al. propose a distributed algorithm to deploy replicas of VM imagesonto PMs that reside in different parts of the network [32]. The objective is toconstruct balanced and dependable deployment configurations that are resilient.Again, the number of replicas to be placed is assumed predefined.
SiMPLE allocates additional bandwidth resources along multiple disjointpaths in the SN [33]. This proactive approach assumes splittable flow, i.e. thebandwidth required for a Virtual Link (VL) can be realized by combining mul-tiple parallel connections between the two end points. The goal of SiMPLE isto minimize the total bandwidth that must be reserved, while still guarantee-ing survivability against single link failures. However, an important drawbackis that while the required bandwidth decreases as the number of parallel pathsincreases, the probability of more than one path failing goes up exponentially,effectively reducing the VL’s availability.
Chowdhury et al. propose Dedicated Protection for Virtual Network Embed-ding (DRONE) [34]. DRONE guarantees Virtual Network (VN) survivabilityagainst single link or node failure, by creating two VNEs for each request. Thesetwo VNEs cannot share any nodes and links.
Aforementioned SVNE approaches [30–34] lack an availability model. Whenthe infrastructure is homogeneous, it might suffice to say that each VN or VNEneed a predefined number of replicas. However, in geo-distributed cloud environ-ments the resulting availability will largely be determined by the exact placementconfiguration, as moving one service from an unreliable node to a more reliableone can make all the difference. Therefore, geo-distributed cloud environmentsrequire SVNE approaches which have a computational model for availability asa function of SN failure distributions and placement configuration.
The following cloud management algorithms have a model to calculate avail-ability. Jayasinghe et al. model cloud infrastructure as a tree structure with arbi-trary depth [35]. Physical hosts on which Virtual Machines (VMs) are hosted
290 W. Burakowski et al.
are the leaves of this tree, while the ancestors comprise regions and availabilityzones. The nodes at bottom level are physical hosts where VMs are hosted. Wanget al. were the first to provide a mathematical model to estimate the resultingavailability from such a tree structure [36]. They calculate the availability of asingle VM as the probability that neither the leaf itself, nor any of its ancestorsfail. Their work focuses on handling workload variations by a combination ofvertical and horizontal scaling of VMs. Horizontal scaling launches or suspendsadditional VMs, while vertical scaling alters VM dimensions. The total availabil-ity is then the probability that at least one of the VMs is available. While theirmodel suffices for traditional clouds, it is ill-suited for a geo-distributed cloudenvironment as link failure and bandwidth limitations are disregarded.
In contrast, Yeow et al. define reliability as the probability that critical nodesof a virtual infrastructure remain in operation over all possible failures [37]. Theypropose an approach in which backup resources are pooled and shared acrossmultiple virtual infrastructures. Their algorithm first determines the requiredredundancy level and subsequently performs the actual placement. However,decoupling those two operations is only possible when link failure can be omittedand nodes are homogeneous.
Availability Model. In this section we introduce an availability model for geo-distributed cloud networks, which considers any combination of node and linkfailures, and supports both node and link replication. Then, building on thismodel, we will study the problem of guaranteeing a minimum level of availabil-ity for applications. In the next section, we introduce an Integer Linear Program(ILP) formulation of the problem. The ILP solver can find optimal placementconfigurations for small scale networks, its computation time quickly becomesunmanageable when the substrate network dimensions increase. Subsequentlytwo heuristics are presented: (1) a distributed evolutionary algorithm employinga pool-model, where execution of computational tasks and storage of the pop-ulation database (DB) are separated (2) a fast centralized algorithm, based onsubgraph isomorphism detection. Finally, we evaluate the performance of theproposed algorithms.
3.3.0.1 Application Requests. We consider a SOA, which is a way of structur-ing IT solutions that leverage resources distributed across the network [38]. Ina SOA, each application is described as its composition of services. Through-out this work, the collected composition of all requested applications will berepresented by the instance matrix (I).
Services have certain CPU (ω) and memory requirements (γ). Additionally,bandwidth (β) is required by the VLs between any two services. A sub-modularapproach allows sharing of memory resources amongst services belonging to mul-tiple applications.
3.3.0.2 Cloud Infrastructure. Consider a substrate network consisting of nodesand links. Nodes have certain CPU (Ω) and memory capabilities (Γ ). Physicallinks between nodes are characterized by a given bandwidth (B). Both links and
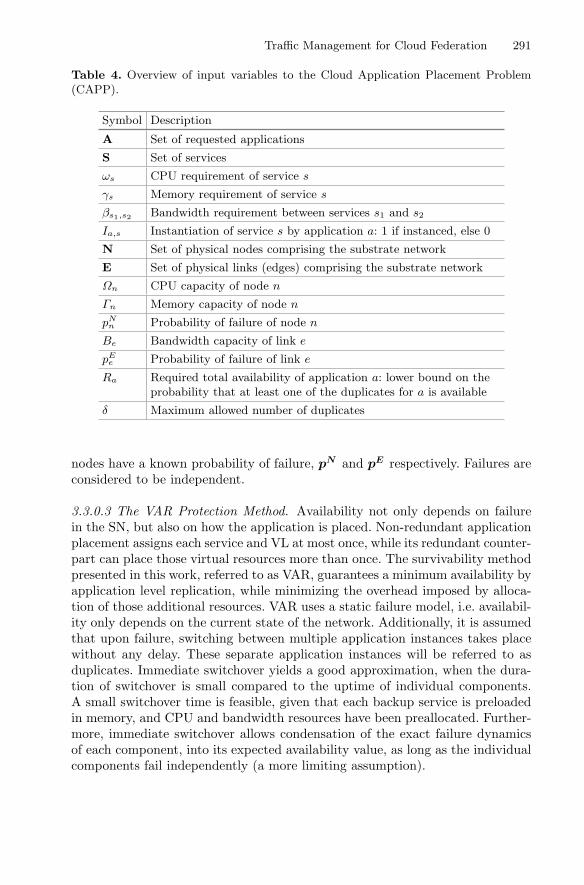
Traffic Management for Cloud Federation 291
Table 4. Overview of input variables to the Cloud Application Placement Problem(CAPP).
Symbol Description
A Set of requested applications
S Set of services
ωs CPU requirement of service s
γs Memory requirement of service s
βs1,s2 Bandwidth requirement between services s1 and s2
Ia,s Instantiation of service s by application a: 1 if instanced, else 0
N Set of physical nodes comprising the substrate network
E Set of physical links (edges) comprising the substrate network
Ωn CPU capacity of node n
Γn Memory capacity of node n
pNn Probability of failure of node n
Be Bandwidth capacity of link e
pEe Probability of failure of link e
Ra Required total availability of application a: lower bound on theprobability that at least one of the duplicates for a is available
δ Maximum allowed number of duplicates
nodes have a known probability of failure, pN and pE respectively. Failures areconsidered to be independent.
3.3.0.3 The VAR Protection Method. Availability not only depends on failurein the SN, but also on how the application is placed. Non-redundant applicationplacement assigns each service and VL at most once, while its redundant counter-part can place those virtual resources more than once. The survivability methodpresented in this work, referred to as VAR, guarantees a minimum availability byapplication level replication, while minimizing the overhead imposed by alloca-tion of those additional resources. VAR uses a static failure model, i.e. availabil-ity only depends on the current state of the network. Additionally, it is assumedthat upon failure, switching between multiple application instances takes placewithout any delay. These separate application instances will be referred to asduplicates. Immediate switchover yields a good approximation, when the dura-tion of switchover is small compared to the uptime of individual components.A small switchover time is feasible, given that each backup service is preloadedin memory, and CPU and bandwidth resources have been preallocated. Further-more, immediate switchover allows condensation of the exact failure dynamicsof each component, into its expected availability value, as long as the individualcomponents fail independently (a more limiting assumption).

292 W. Burakowski et al.
Fig. 8. Overview of this work: services {ω, γ, β}, composing applications {I}, areplaced on a substrate network where node {pN } and link failure {pE } is modeled.By increasing the redundancy δ, a minimum availability R can be guaranteed.
Table 5. An overview of resource sharing amongst identical services and VLs.
Sharing of resources
CPU Memory Bandwidth
Within application Yes Yes Yes
Amongst applications No Yes No
In the VAR model, an application is available if at least one of its duplicatesis on-line. A duplicate is on-line if none of the PMs and Physical Links (PLs),that contribute its placement, fail. Duplicates of the same application can sharephysical components. An advantage of this reuse is that a fine-grained tradeoffcan be made between increased availability, and decreased resource consumption.An overview of resources’ reuse is shown in Table 5. In Fig. 9 three possibleplacement configurations using two duplicates are shown for one application.In Fig. 9a both duplicates are identical, and no redundancy is introduced. Thenodal resource consumption is minimal, as CPU and memory for s1, s2, ands3 are provisioned only once. Additionally, the total bandwidth required for(s1, s2), and (s2, s3) is only provisioned once. The bandwidth consumption ofthis configuration might not be minimal, if consolidation of two or three servicesonto one PM is possible. This placement configuration does not provide anyfault-tolerance, as failure of either n1, n2 or n3, or (n1, n2), (n2, n3) results indowntime.
When more than one duplicate is placed and the resulting arrangements ofVLs and services differ, then the placement is said to introduce redundancy.However, this increased redundancy results in a higher resource consumption.In Fig. 9b the application survives a singular failure of either (n4, n2), (n2, n3),(n4, n5), or (n5, n3). The placement configuration depicted in Fig. 9c survives allsingular failures in the SN, except for a failure of n1.
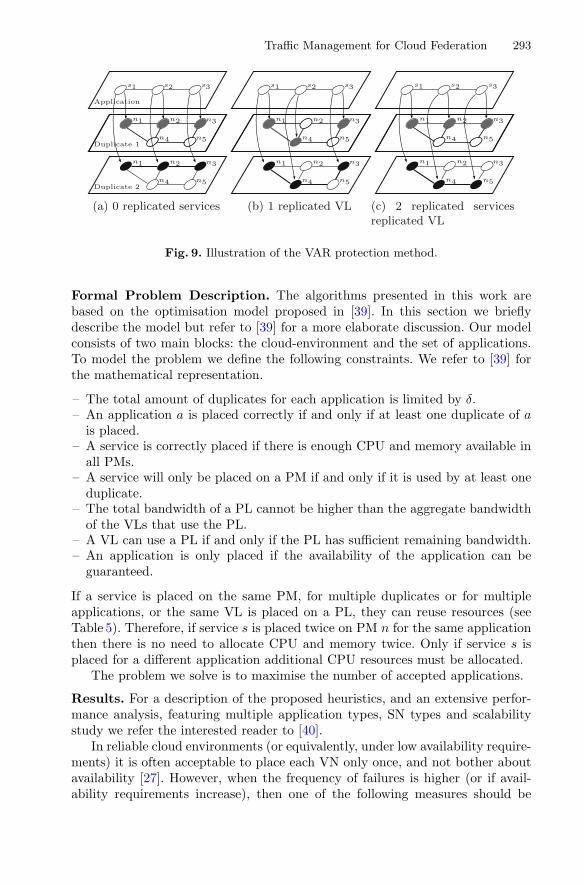
Traffic Management for Cloud Federation 293
Application
Duplicate 1
Duplicate 2
s1 s2 s3
n1 n2 n3
n4 n5
n1 n2 n3
n4 n5
(a) 0 replicated services
s1 s2 s3
n1 n2 n3
n4 n5
n1 n2 n3
n4 n5
(b) 1 replicated VL
s1 s2 s3
n1 n2 n3
n4 n5
n1 n2 n3
n4 n5
(c) 2 replicated servicesreplicated VL
Fig. 9. Illustration of the VAR protection method.
Formal Problem Description. The algorithms presented in this work arebased on the optimisation model proposed in [39]. In this section we brieflydescribe the model but refer to [39] for a more elaborate discussion. Our modelconsists of two main blocks: the cloud-environment and the set of applications.To model the problem we define the following constraints. We refer to [39] forthe mathematical representation.
– The total amount of duplicates for each application is limited by δ.– An application a is placed correctly if and only if at least one duplicate of a
is placed.– A service is correctly placed if there is enough CPU and memory available in
all PMs.– A service will only be placed on a PM if and only if it is used by at least one
duplicate.– The total bandwidth of a PL cannot be higher than the aggregate bandwidth
of the VLs that use the PL.– A VL can use a PL if and only if the PL has sufficient remaining bandwidth.– An application is only placed if the availability of the application can be
guaranteed.
If a service is placed on the same PM, for multiple duplicates or for multipleapplications, or the same VL is placed on a PL, they can reuse resources (seeTable 5). Therefore, if service s is placed twice on PM n for the same applicationthen there is no need to allocate CPU and memory twice. Only if service s isplaced for a different application additional CPU resources must be allocated.
The problem we solve is to maximise the number of accepted applications.
Results. For a description of the proposed heuristics, and an extensive perfor-mance analysis, featuring multiple application types, SN types and scalabilitystudy we refer the interested reader to [40].
In reliable cloud environments (or equivalently, under low availability require-ments) it is often acceptable to place each VN only once, and not bother aboutavailability [27]. However, when the frequency of failures is higher (or if avail-ability requirements increase), then one of the following measures should be
294 W. Burakowski et al.
taken. First, one can improve the availability by placing additional backups,which fail independently of one another. However, this approach works best inhomogeneous cloud environments, where one can use the same number of backupVN embeddings, regardless of the exact placement configuration. In heteroge-neous environments a fixed redundancy level for each application either resultsin wasted SN resources, or a reduced placement ratio. In the context of cloudfederation, the reliability of the links interconnecting the different cloud enti-ties can be highly heterogeneous (leased lines, or best-effort public internet).Therefore, to further improve revenue, cloud federation should take these failurecharacteristics into consideration, and estimate the required replication level.
3.4 Level 2: Service Composition and Orchestration
Service composition and orchestration have become the predominant paradigmsthat enable businesses to combine and integrate services offered by third par-ties. For the commercial viability of composite services, it is crucial that they areoffered at sharp price-quality ratios. A complicating factor is that many attrac-tive third-party services often show highly variable service quality. This raisesthe need for mechanisms that promptly adapt the composition to changes in thequality delivered by third party services. In this section, we discuss a real-timeQoS control mechanism that dynamically optimizes service composition in realtime by learning and adapting to changes in third party service response timebehaviors. Our approach combines the power of learning and adaptation withthe power of dynamic programming. The results show that real-time service re-compositions lead to dramatic savings of cost, while meeting the service qualityrequirements of the end-users.
3.4.1 Background and MotivationIn the competitive market of information and communication services, it is cru-cial for service providers to be able to offer services at competitive price/qualityratios. Succeeding to do so will attract customers and generate business, whilefailing to do so will inevitably lead to customer dissatisfaction, churn and loss ofbusiness. A complicating factor in controlling quality-of-service (QoS) in serviceoriented architectures is that the ownership of the services in the composition(sub-services) is decentralized: a composite service makes use of sub-servicesoffered by third parties, each with their own business incentives. As a conse-quence, the QoS experienced by the (paying) end user of a composite servicedepends heavily on the QoS levels realized by the individual sub-services run-ning on different underlying platforms with different performance characteristics:a badly performing sub-service may strongly degrade the end-to-end QoS of acomposite service. In practice, service providers tend to outsource responsibil-ities by negotiating Service Level Agreements (SLAs) with third parties. How-ever, negotiating multiple SLAs in itself is not sufficient to guarantee end-to-endQoS levels as SLAs in practice often give probabilistic QoS guarantees and SLAviolations can still occur. Moreover probabilistic QoS guarantees do not nec-essarily capture time-dependent behavior e.g. short term service degradations.
Traffic Management for Cloud Federation 295
Therefore, the negotiation of SLAs needs to be supplemented with run-timeQoS-control capabilities that give providers of composite services the capabilityto properly respond to short-term QoS degradations (real-time composite ser-vice adaptation). Motivated by this, in this section we propose an approach thatadapts to (temporary) third party QoS degradations by tracking the responsetime behavior of these third party services.
3.4.2 Literature and Related WorkThe problem of QoS–aware optimal composition and orchestration of compositeservices has been well–studied (see e.g. [41,42]). The main problem addressed inthese papers is how to select one concrete service per abstract service for a givenworkflow, in such a way that the QoS of the composite service (as expressed bythe respective SLA) is guaranteed, while optimizing some cost function. Onceestablished, this composition would remain unchanged the entire life–cycle ofthe composite web service. In reality, SLA violations occur relatively often, lead-ing to providers’ losses and customer dissatisfaction. To overcome this issue,it is suggested in [43–45] that, based on observations of the actually realisedperformance, re–composition of the service may be triggered. During the re–composition phase, new concrete service(s) may be chosen for the given work-flow. Once re–composition phase is over, the (new) composition is used as long asthere are no further SLA violations. In particular, the authors of [43–45] describewhen to trigger such (re–composition) event, and which adaptation actions maybe used to improve overall performance.
A number of solutions have been proposed for the problem of dynamic, run–time QoS–aware service selection and composition within SOA [46–49]. These(proactive) solutions aim to adapt the service composition dynamically at run–time. However, these papers do not consider the stochastic nature of responsetime, but its expected value. Or they do not consider the cost structure, revenueand penalty model as given in this paper.
In the next section, we extend the approach presented in [48] such that wecan learn an exploit response-time distributions on the fly. The use of classicalreinforcement-learning techniques would be a straight forward approach. How-ever, our model has a special structure that complicates the use of the classicalTemporal Difference learning (TD) learning approaches. The solution of our DPformulation searches the stochastic shortest path in a stochastic activity net-work [50]. This DP can be characterized as a hierarchical DP [51,52]. Thereforeclassical Reinforcement Learning (RL) is not suitable and hierarchical RL has tobe applied [52]. Also changes in response-time behavior are likely to occur whichcomplicates the problem even more. Both the problem structure and volatilityare challenging areas of research in RL. Typically RL techniques solve complexlearning and optimization problems by using a simulator. This involves a Q valuethat assigns utility to state–action combinations. Most algorithms run off-lineas a simulator is used for optimization. RL has also been widely used in on–lineapplications. In such applications, information becomes available gradually with
296 W. Burakowski et al.
time. Most RL approaches are based on environments that do not vary overtime. We refer to [51] for a good survey on reinforcement learning techniques.
In our approach we tackle both the hierarchical structure, and time vary-ing behavior challenges. To this end we are using empirical distributions andupdating the lookup table if significant changes occur. As we are considering asequence of tasks, the number of possible response time realizations combina-tions explodes. By discretizing the empirical distribution over fixed intervals weovercome this issue.
3.4.3 Composition and Orchestration ModelWe consider a composite service that comprises a sequential workflow consistingof N tasks identified by T1, . . . , TN . The tasks are executed one–by–one in thesense that each consecutive task has to wait for the previous task to finish. Oursolution is applicable to any workflow that could be aggregated and mappedinto a sequential one. Basic rules for aggregation of non–sequential workflowsinto sequential workflows have been illustrated in, e.g. [48,50,53]. However, theaggregation leads to coarser control, since decisions could not be taken for asingle service within the aggregated workflow, but rather for the aggregatedworkflow patterns themselves.
The workflow is based on an unambiguous functionality description of a ser-vice (“abstract service”), and several functionally identical alternatives (“con-crete services”) may exist that match such a description [54]. Each task has anabstract service description or interface which can be implemented by externalservice providers.
The workflow in Fig. 10 consists of four abstract tasks, and each task mapsto three concrete services (alternatives), which are deployed by (independent)third–party service providers. For each task Ti there are Mi concrete serviceproviders CS(i,1), . . . ,CS(i,Mi) available that implement the functionality corre-sponding to task Ti. For each request processed by CS(i,j) cost c(i,j) has to bepaid. Furthermore there is an end–to–end response-time deadline δp. If a requestis processed within δp a reward of R is received. However, for all requests thatare not processed within δp a penalty V had to be paid. After the execution ofa single task within the workflow, the orchestrator decides on the next concreteservice to be executed, and composite service provider pays to the third partyprovider per single invocation. The decision points for given tasks are illustratedat Fig. 10 by A, B, C and D. The decision taken is based on (1) execution costs,and (2) the remaining time to meet the end–to–end deadline. The response timeof each concrete service provider CS(i,j) is represented by the random variableD(i,j). After each decision the observed response time is used for updating theresponse time distribution information of the selected service. Upon each lookuptable update the corresponding distribution information is stored as referencedistribution. After each response the reference distribution is compared againstthe current up-to date response time distribution information.
In our approach response-time realizations are used for learning an updatingthe response-time distributions. The currently known response-time distribution
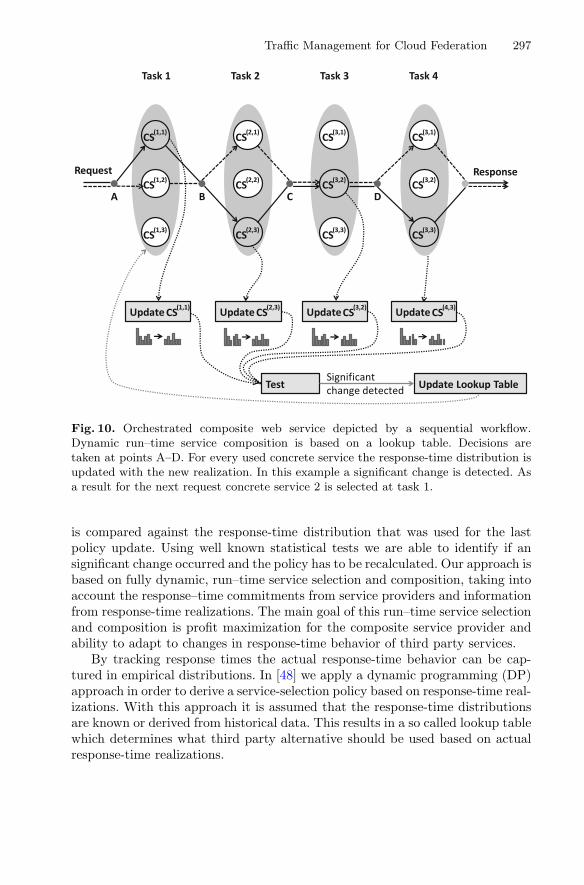
Traffic Management for Cloud Federation 297
Fig. 10. Orchestrated composite web service depicted by a sequential workflow.Dynamic run–time service composition is based on a lookup table. Decisions aretaken at points A–D. For every used concrete service the response-time distribution isupdated with the new realization. In this example a significant change is detected. Asa result for the next request concrete service 2 is selected at task 1.
is compared against the response-time distribution that was used for the lastpolicy update. Using well known statistical tests we are able to identify if ansignificant change occurred and the policy has to be recalculated. Our approach isbased on fully dynamic, run–time service selection and composition, taking intoaccount the response–time commitments from service providers and informationfrom response-time realizations. The main goal of this run–time service selectionand composition is profit maximization for the composite service provider andability to adapt to changes in response-time behavior of third party services.
By tracking response times the actual response-time behavior can be cap-tured in empirical distributions. In [48] we apply a dynamic programming (DP)approach in order to derive a service-selection policy based on response-time real-izations. With this approach it is assumed that the response-time distributionsare known or derived from historical data. This results in a so called lookup tablewhich determines what third party alternative should be used based on actualresponse-time realizations.
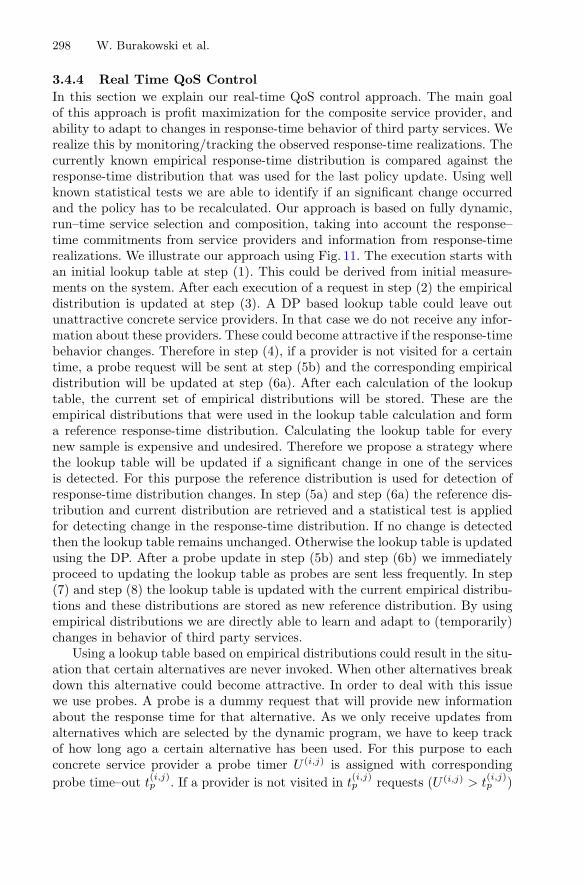
298 W. Burakowski et al.
3.4.4 Real Time QoS ControlIn this section we explain our real-time QoS control approach. The main goalof this approach is profit maximization for the composite service provider, andability to adapt to changes in response-time behavior of third party services. Werealize this by monitoring/tracking the observed response-time realizations. Thecurrently known empirical response-time distribution is compared against theresponse-time distribution that was used for the last policy update. Using wellknown statistical tests we are able to identify if an significant change occurredand the policy has to be recalculated. Our approach is based on fully dynamic,run–time service selection and composition, taking into account the response–time commitments from service providers and information from response-timerealizations. We illustrate our approach using Fig. 11. The execution starts withan initial lookup table at step (1). This could be derived from initial measure-ments on the system. After each execution of a request in step (2) the empiricaldistribution is updated at step (3). A DP based lookup table could leave outunattractive concrete service providers. In that case we do not receive any infor-mation about these providers. These could become attractive if the response-timebehavior changes. Therefore in step (4), if a provider is not visited for a certaintime, a probe request will be sent at step (5b) and the corresponding empiricaldistribution will be updated at step (6a). After each calculation of the lookuptable, the current set of empirical distributions will be stored. These are theempirical distributions that were used in the lookup table calculation and forma reference response-time distribution. Calculating the lookup table for everynew sample is expensive and undesired. Therefore we propose a strategy wherethe lookup table will be updated if a significant change in one of the servicesis detected. For this purpose the reference distribution is used for detection ofresponse-time distribution changes. In step (5a) and step (6a) the reference dis-tribution and current distribution are retrieved and a statistical test is appliedfor detecting change in the response-time distribution. If no change is detectedthen the lookup table remains unchanged. Otherwise the lookup table is updatedusing the DP. After a probe update in step (5b) and step (6b) we immediatelyproceed to updating the lookup table as probes are sent less frequently. In step(7) and step (8) the lookup table is updated with the current empirical distribu-tions and these distributions are stored as new reference distribution. By usingempirical distributions we are directly able to learn and adapt to (temporarily)changes in behavior of third party services.
Using a lookup table based on empirical distributions could result in the situ-ation that certain alternatives are never invoked. When other alternatives breakdown this alternative could become attractive. In order to deal with this issuewe use probes. A probe is a dummy request that will provide new informationabout the response time for that alternative. As we only receive updates fromalternatives which are selected by the dynamic program, we have to keep trackof how long ago a certain alternative has been used. For this purpose to eachconcrete service provider a probe timer U (i,j) is assigned with correspondingprobe time–out t
(i,j)p . If a provider is not visited in t
(i,j)p requests (U (i,j) > t
(i,j)p )

Traffic Management for Cloud Federation 299
Fig. 11. Real-time QoS control approach.
then the probe timer has expired and a probe will be collected incurring probecost c
(k,j)p . If for example, in Fig. 10, the second alternative of the third task has
not been used in the last ten requests, the probe timer for alternative two hasvalue U (3,2) = 10. After a probe we immediately update the corresponding dis-tribution. No test is applied here as probes are collected less frequent comparedto processed requests.
In order to evaluate the proposed QoS control methods we have performedextensive evaluation testing in an experimental setting. The results show thatreal-time service re-compositions indeed lead to dramatics savings in cost, whilestill meeting QoS requirements of the end users. The reader is referred to [55]for the details.
3.5 Level 1: Resource Management in Virtualized Infrastructure
Level 1 deals with the dependencies of different physical resources, such as Cen-tral Processing Unit (CPU) time, Random Access Memory (RAM), disk I/O,and network access, and their effect on the performance that users perceive.These dependencies can be described by functions that map resource combi-nations, i.e. resource vectors, to scalars that describe the performance that isachieved with these resources. Therefore, such utility functions describe how thecombination of different resources influences the performance users perceive [56].Accordingly, utility functions (a) indicate in which ratios resources have to beallocated, in order to maximize user satisfaction and efficiency, (b) are deter-mined by technical factors, and (c) are investigated in this section.
3.5.1 MethodologyIn order to get an idea about the nature of utility functions that VMs have duringruntime, dependencies between physical resources, when utilized by VMs, andeffects on VM performance are investigated as follows. Different workloads are
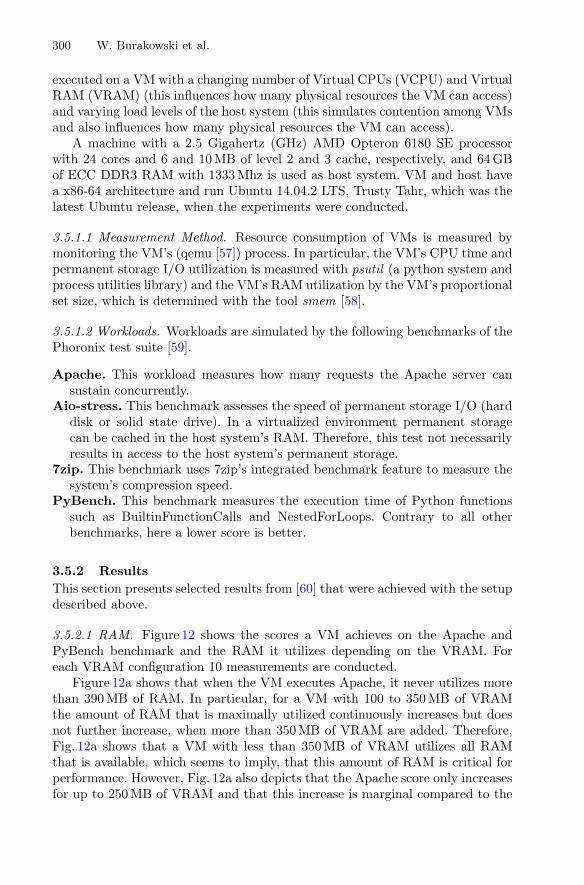
300 W. Burakowski et al.
executed on a VM with a changing number of Virtual CPUs (VCPU) and VirtualRAM (VRAM) (this influences how many physical resources the VM can access)and varying load levels of the host system (this simulates contention among VMsand also influences how many physical resources the VM can access).
A machine with a 2.5 Gigahertz (GHz) AMD Opteron 6180 SE processorwith 24 cores and 6 and 10 MB of level 2 and 3 cache, respectively, and 64 GBof ECC DDR3 RAM with 1333 Mhz is used as host system. VM and host havea x86-64 architecture and run Ubuntu 14.04.2 LTS, Trusty Tahr, which was thelatest Ubuntu release, when the experiments were conducted.
3.5.1.1 Measurement Method. Resource consumption of VMs is measured bymonitoring the VM’s (qemu [57]) process. In particular, the VM’s CPU time andpermanent storage I/O utilization is measured with psutil (a python system andprocess utilities library) and the VM’s RAM utilization by the VM’s proportionalset size, which is determined with the tool smem [58].
3.5.1.2 Workloads. Workloads are simulated by the following benchmarks of thePhoronix test suite [59].
Apache. This workload measures how many requests the Apache server cansustain concurrently.
Aio-stress. This benchmark assesses the speed of permanent storage I/O (harddisk or solid state drive). In a virtualized environment permanent storagecan be cached in the host system’s RAM. Therefore, this test not necessarilyresults in access to the host system’s permanent storage.
7zip. This benchmark uses 7zip’s integrated benchmark feature to measure thesystem’s compression speed.
PyBench. This benchmark measures the execution time of Python functionssuch as BuiltinFunctionCalls and NestedForLoops. Contrary to all otherbenchmarks, here a lower score is better.
3.5.2 ResultsThis section presents selected results from [60] that were achieved with the setupdescribed above.
3.5.2.1 RAM. Figure 12 shows the scores a VM achieves on the Apache andPyBench benchmark and the RAM it utilizes depending on the VRAM. Foreach VRAM configuration 10 measurements are conducted.
Figure 12a shows that when the VM executes Apache, it never utilizes morethan 390 MB of RAM. In particular, for a VM with 100 to 350 MB of VRAMthe amount of RAM that is maximally utilized continuously increases but doesnot further increase, when more than 350 MB of VRAM are added. Therefore,Fig. 12a shows that a VM with less than 350 MB of VRAM utilizes all RAMthat is available, which seems to imply, that this amount of RAM is critical forperformance. However, Fig. 12a also depicts that the Apache score only increasesfor up to 250 MB of VRAM and that this increase is marginal compared to the
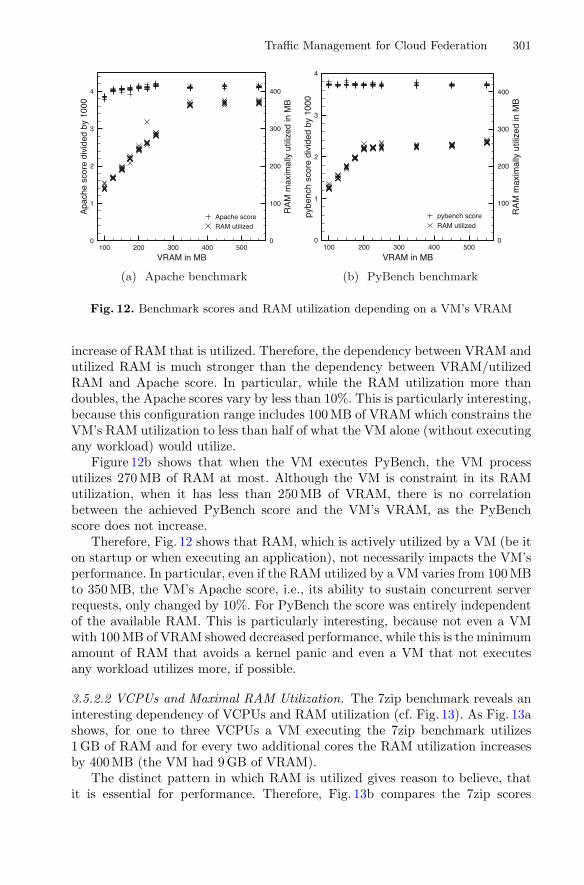
Traffic Management for Cloud Federation 301
Fig. 12. Benchmark scores and RAM utilization depending on a VM’s VRAM
increase of RAM that is utilized. Therefore, the dependency between VRAM andutilized RAM is much stronger than the dependency between VRAM/utilizedRAM and Apache score. In particular, while the RAM utilization more thandoubles, the Apache scores vary by less than 10%. This is particularly interesting,because this configuration range includes 100 MB of VRAM which constrains theVM’s RAM utilization to less than half of what the VM alone (without executingany workload) would utilize.
Figure 12b shows that when the VM executes PyBench, the VM processutilizes 270 MB of RAM at most. Although the VM is constraint in its RAMutilization, when it has less than 250 MB of VRAM, there is no correlationbetween the achieved PyBench score and the VM’s VRAM, as the PyBenchscore does not increase.
Therefore, Fig. 12 shows that RAM, which is actively utilized by a VM (be iton startup or when executing an application), not necessarily impacts the VM’sperformance. In particular, even if the RAM utilized by a VM varies from 100 MBto 350 MB, the VM’s Apache score, i.e., its ability to sustain concurrent serverrequests, only changed by 10%. For PyBench the score was entirely independentof the available RAM. This is particularly interesting, because not even a VMwith 100 MB of VRAM showed decreased performance, while this is the minimumamount of RAM that avoids a kernel panic and even a VM that not executesany workload utilizes more, if possible.
3.5.2.2 VCPUs and Maximal RAM Utilization. The 7zip benchmark reveals aninteresting dependency of VCPUs and RAM utilization (cf. Fig. 13). As Fig. 13ashows, for one to three VCPUs a VM executing the 7zip benchmark utilizes1 GB of RAM and for every two additional cores the RAM utilization increasesby 400 MB (the VM had 9 GB of VRAM).
The distinct pattern in which RAM is utilized gives reason to believe, thatit is essential for performance. Therefore, Fig. 13b compares the 7zip scores
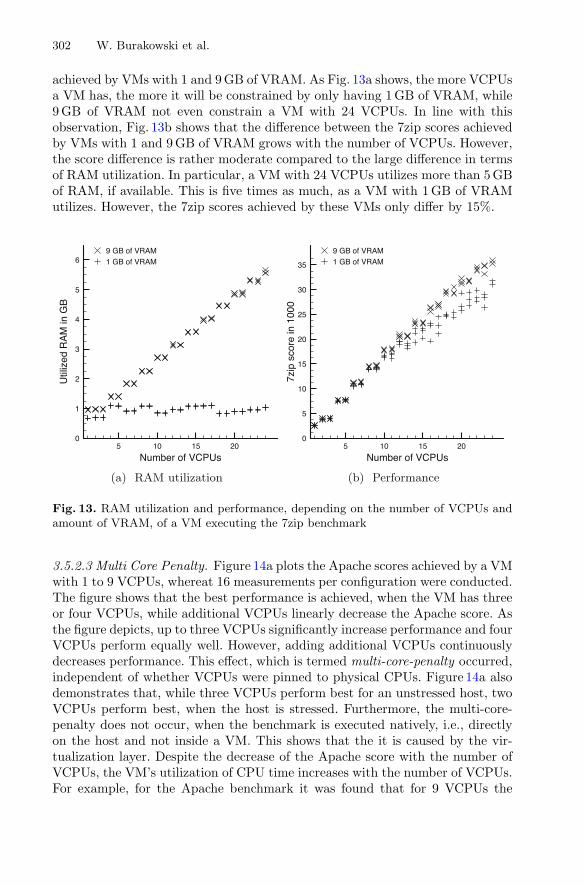
302 W. Burakowski et al.
achieved by VMs with 1 and 9 GB of VRAM. As Fig. 13a shows, the more VCPUsa VM has, the more it will be constrained by only having 1 GB of VRAM, while9 GB of VRAM not even constrain a VM with 24 VCPUs. In line with thisobservation, Fig. 13b shows that the difference between the 7zip scores achievedby VMs with 1 and 9 GB of VRAM grows with the number of VCPUs. However,the score difference is rather moderate compared to the large difference in termsof RAM utilization. In particular, a VM with 24 VCPUs utilizes more than 5 GBof RAM, if available. This is five times as much, as a VM with 1 GB of VRAMutilizes. However, the 7zip scores achieved by these VMs only differ by 15%.
Fig. 13. RAM utilization and performance, depending on the number of VCPUs andamount of VRAM, of a VM executing the 7zip benchmark
3.5.2.3 Multi Core Penalty. Figure 14a plots the Apache scores achieved by a VMwith 1 to 9 VCPUs, whereat 16 measurements per configuration were conducted.The figure shows that the best performance is achieved, when the VM has threeor four VCPUs, while additional VCPUs linearly decrease the Apache score. Asthe figure depicts, up to three VCPUs significantly increase performance and fourVCPUs perform equally well. However, adding additional VCPUs continuouslydecreases performance. This effect, which is termed multi-core-penalty occurred,independent of whether VCPUs were pinned to physical CPUs. Figure 14a alsodemonstrates that, while three VCPUs perform best for an unstressed host, twoVCPUs perform best, when the host is stressed. Furthermore, the multi-core-penalty does not occur, when the benchmark is executed natively, i.e., directlyon the host and not inside a VM. This shows that the it is caused by the vir-tualization layer. Despite the decrease of the Apache score with the number ofVCPUs, the VM’s utilization of CPU time increases with the number of VCPUs.For example, for the Apache benchmark it was found that for 9 VCPUs the
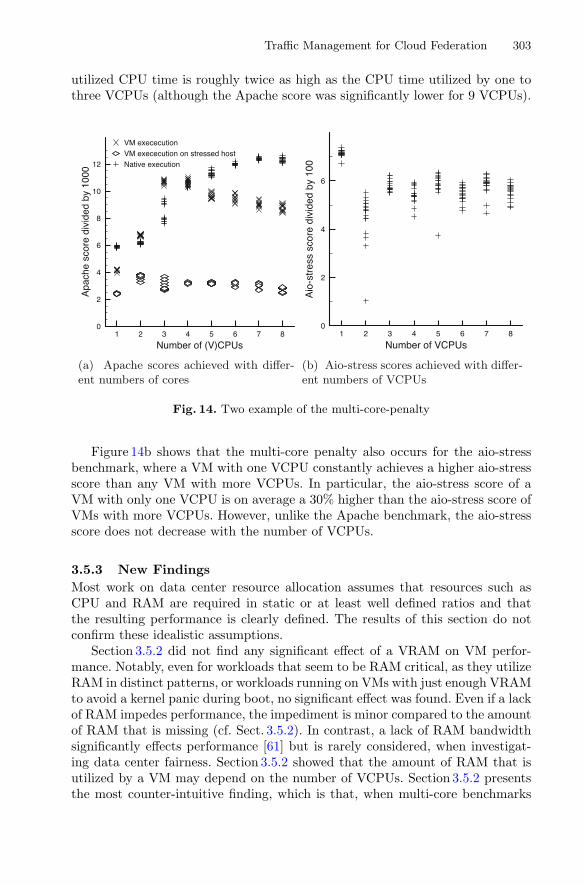
Traffic Management for Cloud Federation 303
utilized CPU time is roughly twice as high as the CPU time utilized by one tothree VCPUs (although the Apache score was significantly lower for 9 VCPUs).
Fig. 14. Two example of the multi-core-penalty
Figure 14b shows that the multi-core penalty also occurs for the aio-stressbenchmark, where a VM with one VCPU constantly achieves a higher aio-stressscore than any VM with more VCPUs. In particular, the aio-stress score of aVM with only one VCPU is on average a 30% higher than the aio-stress score ofVMs with more VCPUs. However, unlike the Apache benchmark, the aio-stressscore does not decrease with the number of VCPUs.
3.5.3 New FindingsMost work on data center resource allocation assumes that resources such asCPU and RAM are required in static or at least well defined ratios and thatthe resulting performance is clearly defined. The results of this section do notconfirm these idealistic assumptions.
Section 3.5.2 did not find any significant effect of a VRAM on VM perfor-mance. Notably, even for workloads that seem to be RAM critical, as they utilizeRAM in distinct patterns, or workloads running on VMs with just enough VRAMto avoid a kernel panic during boot, no significant effect was found. Even if a lackof RAM impedes performance, the impediment is minor compared to the amountof RAM that is missing (cf. Sect. 3.5.2). In contrast, a lack of RAM bandwidthsignificantly effects performance [61] but is rarely considered, when investigat-ing data center fairness. Section 3.5.2 showed that the amount of RAM that isutilized by a VM may depend on the number of VCPUs. Section 3.5.2 presentsthe most counter-intuitive finding, which is that, when multi-core benchmarks
304 W. Burakowski et al.
are executed inside a VM, the performance often decreases, when more VCPUsare added to the VM.
This section showed that it is a complex task to determine a class of utilityfunctions that properly models the allocation of a node’s PRs to VMs. However,a realistic class of utility functions would greatly aid cloud resource allocation,as it would allow to theoretically determine allocations that are practically moreefficient. Therefore, positive results on this topic would also greatly aid the per-formance of cloud federations, as it would also allow to execute tasks in thecloud of a federation, that performs best for this task. Nonetheless, no workexists on this topic. This lack of work is caused by the topic’s complexity. Forexample, resource dependencies vary over time, and depend on the workloadthat is executed inside a VM and the host’s architecture. Also, the performanceof a VM is determined by a combination of resources as diverse as CPU time,RAM, disk I/O, network access, CPU cache capacity, and memory bandwidth,where substitutabilities may or may not apply.
4 Cloud Federation for IoT
4.1 State-of-the-Art in IoT Cloud Research
The integration of IoT and clouds has been envisioned by Botta et al. [62] bysummarizing their main properties, features, underlying technologies, and openissues. A solution for merging IoT and clouds is proposed by Nastic et al. [63].They argued that system designers and operations managers faced numerouschallenges to realize IoT cloud systems in practice, due to the complexity anddiversity of their requirements in terms of IoT resources consumption, customiza-tion and runtime governance. They also proposed a novel approach for IoT cloudintegration that encapsulated fine-grained IoT resources and capabilities in well-defined APIs in order to provide a unified view on accessing, configuring andoperating IoT cloud systems, and demonstrated their framework for managingelectric fleet vehicles.
Atzori et al. [64,65] examined IoT systems in a survey. They identified manyapplication scenarios, and classified them into five application domains: trans-portation and logistics, healthcare, smart environments (home, office, plant),personal, social and futuristic domains. They described these domains in detail,and defined open issues and challenges for all of them. Concerning privacy, theystated that much sensitive information about a person can be collected withouttheir awareness, and its control is impossible with current techniques.
Escribano [66] discussed the first opinion [67] of the Article 29 Data Pro-tection Working Party (WP29) on IoT. According to these reports four cate-gories can be differentiated: the first one is wearable computing, which meansthe application of everyday objects and clothes, such as watches and glasses, inwhich sensors were included to extend their functionalities. The second categoryis called the ‘quantified self things’, where things can also be carried by individ-uals to record information about themselves. With such things we can examinephysical activities, track movements, and measure weight, pulse or other healthindicators. The third one is home automation, which covers applications using

Traffic Management for Cloud Federation 305
devices placed in offices or homes such as connected light bulbs, thermostats,or smoke alarms that can be controlled remotely over the Internet. They alsomention smart cities as the fourth category, but they do not define them explic-itly. They argue that sharing and combining data through clouds will increaselocations and jurisdictions, where personal data resides. Therefore it is crucial toidentify and realize which stakeholder is responsible for data protection. WP29named many challenges concerning privacy and data protection, like lack of usercontrol, intrusive user profiling and communication and infrastructure relatedsecurity risks.
IoT application areas and scenarios have already been categorized, such asby Want et al. [68], who set up three categories: Composable systems, whichare ad-hoc systems that can be built from a variety of nearby things by makingconnections among these possibly different kinds of devices. Since these devicescan discover each other over local wireless connections, they can be combinedto provide higher-level capabilities. Smart cities providing modern utilities couldbe managed more efficiently with IoT technologies. As an example traffic-lightsystems can be made capable of sensing the location and density of cars in thearea, and optimizing red and green lights to offer the best possible service fordrivers and pedestrians. Finally, resource conservation scenarios, where majorimprovements can be made in the monitoring and optimization of resourcessuch as electricity and water.
4.2 MobIoTSim for Simulating IoT Devices
Cloud Federation can help IoT systems by providing more flexibility and scala-bility. Higher level decisions can be made on where to place a gateway service toreceive IoT device messages, e.g. in order to optimize resource usage costs andenergy utilization. Such complex IoT cloud systems can hardly be investigatedin real world, therefore we need to turn to simulations.
The main purpose of MobIoTSim [69], our proposed mobile IoT device simu-lator, is to help cloud application developers to learn IoT device handling withoutbuying real sensors, and to test and demonstrate IoT applications utilizing mul-tiple devices. The structure of the application lets users create IoT environmentsimulations in a fast and efficient way that allows for customization.
MobIoTSim can simulate one or more IoT devices, and it is implementedas a mobile application for the Android platform. Sensor data generation ofthe simulated devices are random generated values in the range given by theuser, or replayed data from trace files. The data sending frequency can also bespecified for every device. The application uses the MQTT protocol to send datawith the use of the Eclipse Paho opensource library. The data is represented ina structured JSON object compatible with the IBM IoT Foundation messageformat [70].
The basic usage of the simulator is to (i) connect to a cloud gateway, wherethe data is to be sent, (ii) create and configure the devices to be simulatedand (iii) start the (data generation of the) required devices. These main stepsare represented by three main parts of the application: the Cloud settings, theDevices and the Device settings screens. In the Cloud settings screen, the user

306 W. Burakowski et al.
can set the required information about the targeted cloud, where the data will bereceived and processed. Currently there are two types of clouds supported: IBMBluemix and MS Azure. For the IBM cloud we have two options: the Bluemixquickstart and the standard Bluemix IoT service. The Bluemix quickstart is apublic demo application, it can visualise the data from a selected device. Fora fast and easy setup (i.e. to try out the simulator) this type is recommended.The standard Bluemix IoT service type can be used if the user has a registeredaccount for the Bluemix platform, and already created an IoT service. This IoTservice can be used to handle devices, which have been registered before. Themain part of the IoT service is an MQTT broker, this is the destination of thedevice messages, and it forwards them to the cloud applications. Such cloudapplications can process the data, react to it or just perform some visualisation.The required configuration parameters for the standard Bluemix IoT service inMobIoTSim are: the Organization ID, which is the identifier of the IoT serviceof the user in Bluemix, and an authentication key, so that the user does nothave to register the devices on the Bluemix web interface, and the commandand event IDs, which are customizable parts of the used MQTT topics to sendmessages from the devices to the cloud and vice versa. MobIoTSim can registerthe created devices with these parameters automatically, by using the RESTinterface of Bluemix.
The Devices screen lists the created devices, where every row is a device ora device group. These devices can be started and stopped by the user at will,both together or separately for the selected ones. Some devices have the abilityto display warnings and notifications sent back by a gateway. In this screen wecan also create new devices or device groups. There are some pre-defined devicetemplates, which can be selected for creation. These device templates help tocreate often used devices, such as a temperature sensor, humidity sensor or athermostat. If the user selects a template for the base of the device, the messagecontent and frequency will be set to some predefined values. The Thermostattemplate has a temperature parameter, it turns on by reaching a pre-definedlow-level value and turns off at the high-level value. The On/Off state of thedevice is displayed all the time. It is possible to select the Custom template toconfigure a device in detail.
The new device creation and the editing of an existing one are made in theDevice settings screen. The user can add more parameters to a device and cancustomize it with its own range. The range will be used to generate randomvalues for the parameters. A device group is a group of devices with the samebase template and they can be started and stopped together. If a device wantsto send data to the Bluemix IoT service, it has to be registered beforehand. Theregistered devices have device IDs and tokens for authentication. The MobIoT-Sim application handles the device registration in the cloud with REST calls,so the user does not have to register the devices manually on the graphical webinterface. There is an option to save the devices to a file and load them back tothe application later. The device type attribute can be used to group devices.The simulation itself can also be saved, so the randomly generated data can be
Traffic Management for Cloud Federation 307
replayed later many times. Even trace files from real world applications can beplayed from other sources, i.e. saved samples from the OpenWeatherMap publicweather data provider [71]. The OpenWeatherMap monitors many cities andstores many parameters for them, including temperature, humidity, air pressureand wind speed. Using this trace loader feature, the simulation becomes closerto a real life scenario. In some cases, the user may want to send data to not justone but more cloud gateways at the same time. This is also possible by changingthe organization ID attribute of a device to one of the already saved ones in thecloud settings.
We modified the Bluemix visualisation application to create a new privategateway to handle more than one device at the same time. In this way we can seethe data from all devices in a real time chart. The node.js application subscribesto all device topics with the MQTT protocol, and waits for the data. In thisrevised gateway we use paging to overcome device management limitations (25devices at a time). In order to enhance and better visualize many device data atthe same time, we introduced device grouping for the chart generation.
To summarize, MobIoTSim together with the proposed gateways providea novel solution to enable the simulation and experimentation of IoT cloudsystems. Our future work will address extensions for additional thing and sensortemplates, and will provide cases for scalability investigations involving multiplecloud gateways.
5 Summary
In this chapter we have reported activities of the COST IC1304 ACROSS Euro-pean Project corresponding to traffic management for Cloud Federation. Inparticular, we have provided survey of discussed CF architectures and corre-sponding standardization activities, we have proposed comprehensive multi-levelmodel for traffic management for CF together with proposed solutions for eachlevel. The effectiveness of these solutions were verified by simulation and ana-lytical methods. The proposed levels are: Level 5 - Strategies for building CF,Level 4 - Network for CF, Level 3 - Service specification and provision, Level 2 -Service composition and orchestration, Level 1 - Task service in cloud resources.Finally, we have presented specialized simulator for testing CF solution in IoTenvironment.
References
1. Schubert, L., Jeffery, K.: Advances in Clouds - Research in Future Cloud Comput-ing, Report from the Cloud Computing Expert Working Group Meeting. Cordis(Online), BE: European Commission (2012). http://cordis.europa.eu/fp7/ict/ssai/docs/future-cc-2may-finalreport-experts.pdf
2. Grozev, N., Buyya, R.: Inter-cloud architectures and application brokering: taxon-omy and survey. Softw. Pract. Exper. (2012). https://doi.org/10.1002/spe.2168
308 W. Burakowski et al.
3. Celesti, A., Tusa, F., Villari, M., Puliafito, A.: How to enhance cloud architecturesto enable cross-federation. In: Proceedings of the 3rd International Conference onCloud Computing (CLOUD 2010), Miami, Florida, USA, pp. 337–345. IEEE (2010)
4. Bernstein, D., Ludvigson, E., Sankar, K., Diamond, S., Morrow, M.: Blueprint forthe intercloud - protocols and formats for cloud computing interoperability. In:Proceedings of the Fourth International Conference on Internet and Web Applica-tions and Services, pp. 328–336 (2009)
5. Marosi, A.C., Kecskemeti, G., Kertesz, A., Kacsuk, P.: FCM: an architecture forintegrating IaaS cloud systems. In: Proceedings of the Second International Con-ference on Cloud Computing, GRIDs, and Virtualization (Cloud Computing 2011),IARIA, pp. 7–12, Rome, Italy (2011)
6. International Telecommunication Union (ITU-T): Framework of Inter-Could Com-puting (2014)
7. Internet Engineering Task Force (IETF): Working group on Content Delivery Net-work Interconnection (CDNI) (2011)
8. National Institute of Standards and Technology [NIST]: U.S. Dept. of Commerce,NIST Cloud Computing Standards Roadmap, Spec. Publ. 500–291 (2013)
9. Institute of electrical and electronics engineering (IEEE): Inter-cloud workinggroup, Standard for Intercloud Interoperability and Federation (SIIF) (2017)
10. Darzanos, G., Koutsopoulos, I., Stamoulis, G.D.: Economics models and policiesfor cloud federations. In: 2016 IFIP Networking Conference (IFIP Networking) andWorkshops, Vienna, pp. 485–493 (2016). https://doi.org/10.1109/IFIPNetworking.2016.7497246
11. Samaan, N.: A novel economic sharing model in a federation of selfish cloudproviders. IEEE Trans. Parallel Distrib. Syst. 25(1), 12–21 (2014). https://doi.org/10.1109/TPDS.2013.23
12. Kleinrock, L.: Queueing Systems Volume 1: Theory, p. 103. Wiley, Hoboken (1975).ISBN 0471491101
13. Carlini, E., Coppola, M., Dazzi, P., Ricci, L., Righetti, G.: Cloud federations incontrail. In: Alexander, M., et al. (eds.) Euro-Par 2011. LNCS, vol. 7155, pp. 159–168. Springer, Heidelberg (2012). https://doi.org/10.1007/978-3-642-29737-3 19
14. Jain, S., Kumar, A., Mandal, S., Ong, J., Poutievski, L., Singh, A., Venkata, S.,Wanderer, J., Zhou, J., Zhu, M., Zolla, J., Holzle, U., Stuart, S., Vahdat, A.: B4:experience with a globally-deployed software defined WAN. In: ACM SIGCOMM2013 Conference, New York, USA (2013)
15. Yen, J.Y.: Finding the K shortest loopless paths in a network. Manag. Sci. JSTOR17(11), 712–716 (1971). www.jstor.org/stable/2629312
16. Aljazzar, H., Leue, S.: K∗: a heuristic search algorithm for finding the k shortestpaths. Artif. Intell. 175(18), 2129–2154 (2011). https://doi.org/10.1016/j.artint.2011.07.003. ISSN 0004–3702
17. Puleri, M., Sabella, R.: Cloud robotics: 5G paves the way for mass-market autma-tion. In: Charting the Future of Innovation, 5th edn., vol. 93, Ericsson, Stockholm(2016)
18. Bonomi, F., Milito, R., Zhu, J., Addepalli, S.: Fog computing and its role in theInternet of Things. In: Proceedings of the First Edition of the MCC Workshopon Mobile Cloud Computing, pp. 13–16. ACM (2012). https://doi.org/10.1145/2342509.2342513
Traffic Management for Cloud Federation 309
19. Al-Muhtadi, J., Campbell, R., Kapadia, A., Mickunas, M.D., Yi, S.: Routingthrough the mist: privacy preserving communication in ubiquitous computing envi-ronments. In: Proceedings 22nd International Conference on Distributed Com-puting Systems, pp. 74–83 (2002). https://doi.org/10.1109/ICDCS.2002.1022244.http://ieeexplore.ieee.org/lpdocs/epic03/wrapper.htm?arnumber=1022244
20. ISO/IEC-25010: Systems and software engineering - Systems and software Qual-ity Requirements and Evaluation (SQuaRE) - System and software quality mod-els, Standard, International Organization for Standardization, Geneva, CH, March2010
21. Spinnewyn, B., Latre, S.: Towards a fluid cloud: an extension of the cloud into thelocal network. In: Latre, S., Charalambides, M., Francois, J., Schmitt, C., Stiller,B. (eds.) AIMS 2015. LNCS, vol. 9122, pp. 61–65. Springer, Cham (2015). https://doi.org/10.1007/978-3-319-20034-7 7
22. Camati, R., Calsavara, A., Lima Jr., L.: Solving the virtual machine placement prob-lem as a multiple multidimensional Knapsack problem. In: ICN 2014, no. c, pp. 253–260 (2014). https://www.thinkmind.org/download.php?articleid=icn 2014 11 1030065
23. Xu, J., Fortes, J.A.B.: Multi-objective virtual machine placement in virtualizeddata center environments. In: 2010 IEEE/ACM International Conference on \&International Conference on Cyber, Physical and Social Computing (CPSCom),GREENCOM-CPSCOM 2010, IEEE Computer Society, Washington, DC, USA,pp. 179–188 (2010). https://doi.org/10.1109/GreenCom-CPSCom.2010.137
24. Ren, Y., Suzuki, J., Vasilakos, A., Omura, S., Oba, K.: Cielo: an evolutionary gametheoretic framework for virtual machine placement in clouds. In: Proceedings - 2014International Conference on Future Internet of Things and Cloud, FiCloud 2014,pp. 1–8 (2014). https://doi.org/10.1109/FiCloud.2014.11
25. Moens, H., Truyen, E., Walraven, S., Joosen, W., Dhoedt, B., De Turck, F.: Cost-effective feature placement of customizable multi-tenant applications in the cloud.J. Netw. Syst. Manag. 22(4), 517–558 (2014). https://doi.org/10.1007/s10922-013-9265-5
26. Fischer, A., Botero, J.F., Beck, M.T., De Meer, H., Hesselbach, X.:Virtual network embedding: a survey. IEEE Commun. Surv. Tutor.15(4), 1888–1906 (2013). https://doi.org/10.1109/SURV.2013.013013.00155.http://ieeexplore.ieee.org/lpdocs/epic03/wrapper.htm?arnumber=6463372
27. Moens, H., Hanssens, B., Dhoedt, B., De Turck, F.: Hierarchical network-awareplacement of service oriented applications in clouds. In: IEEE/IFIP NOMS 2014 -IEEE/IFIP Network Operations and Management Symposium: Management ina Software Defined World, pp. 1–8 (2014). https://doi.org/10.1109/NOMS.2014.6838230
28. Cheng, X., Su, S., Zhang, Z., Wang, H., Yang, F., Luo, Y., Wang, J.: Virtual net-work embedding through topology-aware node ranking. ACM SIGCOMM Comput.Commun. Rev. 41(2), 38 (2011). https://doi.org/10.1145/1971162.1971168
29. Zhu, Y., Ammar, M.: Algorithms for assigning substrate network resources to vir-tual network components. In: Proceedings - IEEE INFOCOM, pp. 1–12 (2006).https://doi.org/10.1109/INFOCOM.2006.322
30. Ajtai, M., Alon, N., Bruck, J., Cypher, R., Ho, C., Naor, M., Szemeredi,E.: Fault tolerant graphs, perfect hash functions and disjoint paths. In: Pro-ceedings, 33rd Annual Symposium on Foundations of Computer Science, pp.693–702 (1992). https://doi.org/10.1109/SFCS.1992.267781. http://ieeexplore.ieee.org/lpdocs/epic03/wrapper.htm?arnumber=267781

310 W. Burakowski et al.
31. Mihailescu, M., Sharify, S., Amza, C.: Optimized application placement for net-work congestion and failure resiliency in clouds. In: 2015 IEEE 4th InternationalConference on Cloud Networking, CloudNet 2015, pp. 7–13 (2015). https://doi.org/10.1109/CloudNet.2015.7335272
32. Csorba, M.J., Meling, H., Heegaard, P.E.: Ant system for service deployment inprivate and public clouds. In: Proceeding of the 2nd Workshop on Bio-inspiredAlgorithms for Distributed Systems - BADS 2010, p. 19. ACM (2010). https://doi.org/10.1145/1809018.1809024. http://portal.acm.org/citation.cfm?doid=1809018.1809024
33. Khan, M.M.A., Shahriar, N., Ahmed, R., Boutaba, R.: SiMPLE: survivability inmulti-path link embedding. In: Proceedings of the 11th International Conferenceon Network and Service Management, CNSM 2015, pp. 210–218 (2015). https://doi.org/10.1109/CNSM.2015.7367361
34. Chowdhury, S., Ahmed, R., Alamkhan, M.M., Shahriar, N., Boutaba, R., Mitra,J., Zeng, F.: Dedicated protection for survivable virtual network embedding. In:IEEE Transactions on Network and Service Management, p. 1 (2016). https://doi.org/10.1109/TNSM.2016.2574239. http://ieeexplore.ieee.org/document/7480798/
35. Jayasinghe, D., Pu, C., Eilam, T., Steinder, M., Whalley, I., Snible, E.: Improv-ing performance and availability of services hosted on IaaS clouds with structuralconstraint-aware virtual machine placement. In: Proceedings - 2011 IEEE Inter-national Conference on Services Computing, SCC 2011, pp. 72–79. IEEE (2011).https://doi.org/10.1109/SCC.2011.28
36. Wang, W., Chen, H., Chen, X.: An availability-aware virtual machine placementapproach for dynamic scaling of cloud applications. In: Proceedings - IEEE 9thInternational Conference on Ubiquitous Intelligence and Computing and IEEE9th International Conference on Autonomic and Trusted Computing, UIC-ATC2012, pp. 509–516 (2012). https://doi.org/10.1109/UIC-ATC.2012.31
37. Yeow, W.-L., Westphal, C., Kozat, U.: Designing and embedding reliable virtualinfrastructures. In: Proceedings of the Second ACM SIGCOMM Workshop on Vir-tualized Infrastructure Systems and Architectures - VISA 2010, vol. 41(2), p. 33(2010) . arXiv:1005.5367. https://doi.org/10.1145/1851399.1851406. http://portal.acm.org/citation.cfm?doid=1851399.1851406
38. Laskey, K.B., Laskey, K.: Service oriented architecture. Wiley Interdisc. Rev. Com-put. Stat. 1(1), 101–105 (2009). https://doi.org/10.1002/wics.8
39. Spinnewyn, B., Braem, B., Latre, S.: Fault-tolerant application placement in het-erogeneous cloud environments. In: Proceedings of the 11th International Confer-ence on Network and Service Management, CNSM 2015, pp. 192–200. IEEE (2015).https://doi.org/10.1109/CNSM.2015.7367359
40. Spinnewyn, B., Mennes, R., Botero, J.F., Latre, S.: Resilient application placementfor geo-distributed cloud networks. J. Netw. Comput. Appl. 85(1), 14–31 (2017).https://doi.org/10.1016/j.jnca.2016.12.015
41. Canfora, G., Di Penta, M., Esposito, R., Villani, M.L.: An approach for QoS-aware service composition based on genetic algorithms. In: Proceedings of the2005 Conference on Genetic and Evolutionary Computation, pp. 1069–1075. ACM(2005)
42. Yu, T., Zhang, Y., Lin, K.J.: Efficient algorithms for web services selection withend-to-end QoS constraints. ACM Trans. Web (TWEB) 1, 6 (2007). ACM
43. Canfora, G., Di Penta, M., Esposito, R., Villani, M.L.: A framework for QoS-awarebinding and re-binding of composite web services. J. Syst. Softw. 81, 1754–1769(2008). Elsevier

Traffic Management for Cloud Federation 311
44. Zeng, L., Lingenfelder, C., Lei, H., Chang, H.: Event-driven quality of serviceprediction. In: Bouguettaya, A., Krueger, I., Margaria, T. (eds.) ICSOC 2008.LNCS, vol. 5364, pp. 147–161. Springer, Heidelberg (2008). https://doi.org/10.1007/978-3-540-89652-4 14
45. Leitner, P.: Ensuring cost-optimal SLA conformance for composite serviceproviders. ICSOC/ServiceWave 2009. Ph.D. symposium, p. 49 (2009)
46. Cardellini, V., Casalicchio, E., Grassi, V., Lo Presti, F.: Adaptive managementof composite services under percentile-based service level agreements. In: Maglio,P.P., Weske, M., Yang, J., Fantinato, M. (eds.) ICSOC 2010. LNCS, vol. 6470, pp.381–395. Springer, Heidelberg (2010). https://doi.org/10.1007/978-3-642-17358-5 26
47. Gao, A., Yang, D., Tang, S., Zhang, M.: Web service composition using Markovdecision processes. In: Fan, W., Wu, Z., Yang, J. (eds.) WAIM 2005. LNCS,vol. 3739, pp. 308–319. Springer, Heidelberg (2005). https://doi.org/10.1007/11563952 28
48. Zivkovic, M., Bosman, J.W., van den Berg, J.L., van der Mei, R.D., Meeuwissen,H.B., Nunez-Queija, R.: Run-time revenue maximization for composite web ser-vices with response time commitments. In: 2012 IEEE 26th International Confer-ence on Advanced Information Networking and Applications (AINA), pp. 589–596.IEEE (2012)
49. Doshi, P., Goodwin, R., Akkiraju, R., Verma, K.: Dynamic workflow compositionusing Markov decision processes. Int. J. Web Serv. Res. 2, 1–17 (2005)
50. Choudhury, G.L., Houck, D.J.: Combined queuing and activity network based mod-eling of sojourn time distributions in distributed telecommunication systems. In:Labetoulle, J., Roberts, J.W. (eds.) The Fundamental Role of Teletraffic in theEvolution of Telecommunications Networks, Proceedings ITC, vol. 14, pp. 525–534 (1994)
51. Gosavi, A.: Reinforcement learning: a tutorial survey and recent advances.INFORMS J. Comput. 21, 178–192 (2009)
52. Barto, A.G., Mahadeva, S.: Recent advances in hierarchical reinforcement learn-ing. Discrete Event Dyn. Syst. 13, 341–379 (2004). https://doi.org/10.1023/A:1022140919877
53. Zheng, H., Zhao, W., Yang, J., Bouguettaya, A.: QoS analysis for web servicecomposition. In: 2009 IEEE International Conference on Services Computing, pp.235–242. IEEE (2009)
54. Preist, C.: A conceptual architecture for semantic web services. In: McIlraith, S.A.,Plexousakis, D., van Harmelen, F. (eds.) ISWC 2004. LNCS, vol. 3298, pp. 395–409.Springer, Heidelberg (2004). https://doi.org/10.1007/978-3-540-30475-3 28
55. Bosman, J.W., van den Berg, J.L., van der Mei, R.D.: Real-time QoS control forservice orchestration. In: 27-th International Teletraffic Congress, Ghent, Belgium(2015)
56. Poullie, P., Bocek, T., Stiller, B.: A survey of the state-of-the-art in fair multi-resource allocations for data centers. IEEE Trans. Netw. Serv. Manag. 15(1), 169–183 (2017). TNSM 2017
57. Bellard, F.: QEMU, a fast and portable dynamic translator. In: Annual Conferenceon USENIX Annual Technical Conference, ATEC 2005, p. 41, Anaheim, CA, USA(2005)
58. Selenic Consulting: smem memory reporting tool. https://www.selenic.com/smem/. Accessed 7 Feb 2017
59. Phoronix Media: Phoronix test suite (2017). http://www.phoronix-test-suite.com.Accessed 18 Jan 2017

312 W. Burakowski et al.
60. Poullie, P.: Decentralized multi-resource allocation in clouds. Dissertation, Univer-sity of Zurich, Zurich, Switzerland, September 2017
61. Gruhler, A.L.: Investigation of resource reallocation capabilities of KVM and Open-Stack. Bachelor Thesis, Universitat Zurich, Zurich, Switzerland, August 2015.https://files.ifi.uzh.ch/CSG/staff/poullie/extern/theses/BAgruhler.pdf
62. Botta, A., de Donato, W., Persico, V., Pescape, A.: On the integration of cloudcomputing and Internet of Things. In: The 2nd International Conference on FutureInternet of Things and Cloud (FiCloud-2014), August 2014
63. Nastic, S., Sehic, S., Le, D., Truong, H., Dustdar, S.: Provisioning software-definedIoT cloud systems. In: The 2nd International Conference on Future Internet ofThings and Cloud (FiCloud-2014), August 2014
64. Atzori, L., Iera, A., Morabito, G.: The Internet of Things: a survey. Comput. Netw.54(15), 2787–2805 (2010)
65. Farris, I., Militano, L., Nitti, M., Atzori, L., Iera, A.: MIFaaS: a Mobile-IoT-Federation-as-a-Service model for dynamic cooperation of IoT cloud providers.Future Gene. Comp. Syst. 70, 126–137 (2017)
66. Escribano, B.: Privacy and security in the Internet of Things: challenge oropportunity. In: OLSWANG, November 2014. http://www.olswang.com/me-dia/48315339/privacy and security in the iot.pdf
67. Opinion 8/2014 on the on Recent Developments on the Internet of Things, Octo-ber 2014. http://ec.europa.eu/justice/data-protection/article-29/documentation/opinion-recommendation/files/2014/wp223 en.pdf
68. Want, R., Dustdar, S.: Activating the Internet of Things. Computer 48(9), 16–20(2015)
69. Pflanzner, T., Kertesz, A., Spinnewyn, B., Latre, S.: MobIoTSim: towards a mobileIoT device simulator. In: 2016 IEEE 4th International Conference on Future Inter-net of Things and Cloud Workshops (FiCloudW), pp. 21–27 (2016)
70. IBM IoT Foundation message format. https://docs.internetofthings.ibmcloud.com/gateways/mqtt.html#/managed-gateways#managed-gateways. Accessed Mar2017
71. OpenWeatherMap. http://www.openweathermap.org. Accessed Mar 2017
Open Access This chapter is licensed under the terms of the Creative CommonsAttribution 4.0 International License (http://creativecommons.org/licenses/by/4.0/),which permits use, sharing, adaptation, distribution and reproduction in any mediumor format, as long as you give appropriate credit to the original author(s) and thesource, provide a link to the Creative Commons license and indicate if changes weremade.
The images or other third party material in this chapter are included in the chapter’sCreative Commons license, unless indicated otherwise in a credit line to the material. Ifmaterial is not included in the chapter’s Creative Commons license and your intendeduse is not permitted by statutory regulation or exceeds the permitted use, you willneed to obtain permission directly from the copyright holder.

Efficient Simulation of IoTCloud Use Cases
Andras Markus2, Andre Marques1, Gabor Kecskemeti1, and Attila Kertesz2(B)
1 Liverpool John Moores University, Liverpool, [email protected]
2 University of Szeged, Szeged, [email protected]
Abstract. In the paradigm of Internet of Things (IoT), sensors, actu-ators and smart devices are connected to the Internet. Applicationproviders utilize the connectivity of these devices with novel approachesinvolving cloud computing. Some applications require in depth analysisof the interaction between IoT devices and clouds. Research in this areais facing questions like how we should govern such large cohort of devices,which may easily go up often to tens of thousands. In this chapter weinvestigate IoT Cloud use cases, and derive a general IoT use case. Dis-tributed systems simulators could help in such analysis, but they areproblematic to apply in this newly emerging domain, since most of themare either too detailed, or not extensible enough to support the to bemodelled devices. Therefore we also show how generic IoT sensors couldbe modelled in a state of the art simulator using our generalized caseto exemplify how the fundamental properties of IoT entities can be rep-resented in the simulator. Finally, we validate the applicability of theintroduced IoT extension with a fitness and a meteorological use case.
Keywords: Internet of Things · Cloud computing · Simulation
1 Introduction
The Internet of Things (IoT) groups connected sensors (e.g. heart rate, heat,motion, etc.) and actuators (e.g. motors, lighting devices) allowing for automatedand customisable systems to be utilised [8]. IoT systems are currently expandingrapidly as the amount of smart devices (sensors with networking capabilities) isgrowing substantially, while the costs of sensors decreases.
IoT solutions are often used a lot within businesses to increase the perfor-mance in certain areas and allow for smarter decisions to be made based onmore accurate and valuable data. Businesses have grown to require IoT systemsto be accurate as decisions based on their data is relied on heavily. An exampleof IoT in industry is the tracking of parcels for delivery services. The systemcan provide users with real time information of where their parcel currently isand notify them of potential arrival times. This requires a large infrastructureto facilitate as there is a lot of data being produced.
c© The Author(s) 2018I. Ganchev et al. (Eds.): Autonomous Control for a Reliable Internet of Services, LNCS 10768, pp. 313–336, 2018.https://doi.org/10.1007/978-3-319-90415-3_12

314 A. Markus et al.
Many sensors have different behaviour. For example, a heart rate sensor hasdifferent behaviour to a light sensor in that a heart rate sensor relies on humanbehaviour which is inheritably unpredictable, whereas a light sensor could bepredicted quite accurately based on the time of day/location. Predicting howa sensor may impact a system is important as companies generally want toleverage the most out of an IoT system however an incorrect estimation of theperformance impact can damage the performance of other systems (e.g. usingtoo many sensors could flood the network, potentially causing inaccurate data,slow responses, or system crashes). As there are many ways a sensor can behaveit is difficult to predict the impact they may have on a scalable system, thereforethey must be tested to determine what the system can handle. Performing thistesting could be costly, time consuming, and high risk if the infrastructure hasto be created and a wide range of sensors are purchased before any informationis obtained about the system. It is even more difficult to determine the impact ofa prototype system on the network as there may limited or no physical sensorsto perform tests with. An example of this is the introduction of soil moisturesensors that analyse soil in real time and adjust water sprinklers to ensure cropshave the correct conditions to grow. In order to test this IoT system effectively,a lot of these sensors are required, however they can become quite costly anddifficult to implement.
There are cloud simulators that provide the tools required to perform a cus-tomised simulation of an IoT system which can somewhat accurately simulatethe performance impact that a particular setup may have on an infrastructure.The issue with simulators is that due to the wide range of sensor behaviours,to be useful to a wide range of people the simulators cannot be too specific andinstead rely on extensions to be implemented in order to function. This requiresa lot of specialised code (Such as the sensor’s behaviour and the network infras-tructure) to be implemented on top of the chosen simulator which can take alot of time and may have to be altered frequently when situations change. Thislimits the simulators application as it demands programming skills, a lot of time,and a firm understanding of the API.
In this research work we develop extensions for the DISSECT-CF [5] simula-tor, which already has the ability to model cloud systems, and has the potentialto provide accurate representation of IoT systems. Therefore the goal of thisresearch is to: (i) investigate IoT Cloud use cases, and (ii) derive a general IoTuse case. We also show (iii) how generic IoT sensors could be modelled in a stateof the art simulator using our generalized case to exemplify how the fundamen-tal properties of IoT entities can be represented in the simulator. Finally, we(iv) validate the applicability of the introduced IoT extension with a fitness anda meteorological use case.
The remainder of this paper is as follows: Sect. 2 presents related work, and inSect. 3, we detail our proposal for a general use case. In Sects. 5 and 4 we discusstwo concrete applications, and the contributions are summarised in Sect. 6.

Efficient Simulation of IoT Cloud Use Cases 315
2 Related Work
There are many simulators available to examine distributed and specifically cloudsystems. These existing simulators are mostly general network simulators, e.g.Qualnet [1] and OMNeT++ [14]. With these tools IoT-related processes canbe examined such as device placement planning and network interference. TheOMNeT++ discrete event simulation environment [14] is one of these examples,and it can be used in numerous domains from queuing network simulations towireless and ad-hoc network simulations, from business process simulation topeer-to-peer network, optical switch and storage area network simulations.
There are more specific IoT simulators, which are closer to our approach. Asan example, Han et al. [4] have designed DPWSim, which is a simulation toolkitto support the development of service-oriented and event-driven IoT applicationswith secure web service capabilities. Its aim is to support the OASIS standardDevices Profile for Web Services (DPWS) that enables the use of web services onsmart and resource-constrained devices. SimIoT [13] is derived from the SimICsimulation framework [12], which provides a deeper insight into the behaviorof IoT systems, and introduces several techniques that simulates the communi-cation between an IoT sensor and the cloud, but it is limited by its computeoriented activity modeling.
Moschakis and Karatza [9] have introduced several simulation concepts tobe used in IoT systems. They showed how the interfacing of the various cloudproviders and IoT systems could be modeled in a simulation. They also provideda novel approach to apply IoT related workloads, where data is gathered andprocessed from sensors taking part in the IoT system. Unfortunately, their workdo not consider actuators, and they rather focus on the behavior of cloud systemsthat support the processing of data originated from the IoT world. The dynamicnature of IoT systems is addressed by Silva et al. [11]. They investigate faultbehaviors and introduce a fault model to these systems. Although faults areimportant for IoT modeling, the scalability of the introduced fault behaviorsand concepts are not sufficient for investigating large scale systems that wouldbenefit from decentralized control mechanisms.
Khan et al. [6] introduce a novel infrastructure coordination technique thatsupports the use of larger scale IoT systems. They build on CloudSim [3], whichcan be used to model a community cloud based on residential infrastructures.On top of CloudSim they provide customizations that are tailored for theirspecific home automation scenarios and therefore limit the applicability of theirextensions for evaluating new IoT coordination approaches. These papers arealso limited on sensors/smart objects thus not allowing to evaluate a wide rangeof IoT applications that are expected to rise to widespread use in the near future.Zeng et al. [15] proposed IOTSim that supports and enables simulation of bigdata processing in IoT systems using the MapReduce model. They also presenteda real case study that validates the effectiveness of their simulator.
In the field of resource abstraction for IoT, good efforts have been madetowards the description and implementation of languages and frameworks for effi-cient representation, annotation and processing of sensed data. The integration
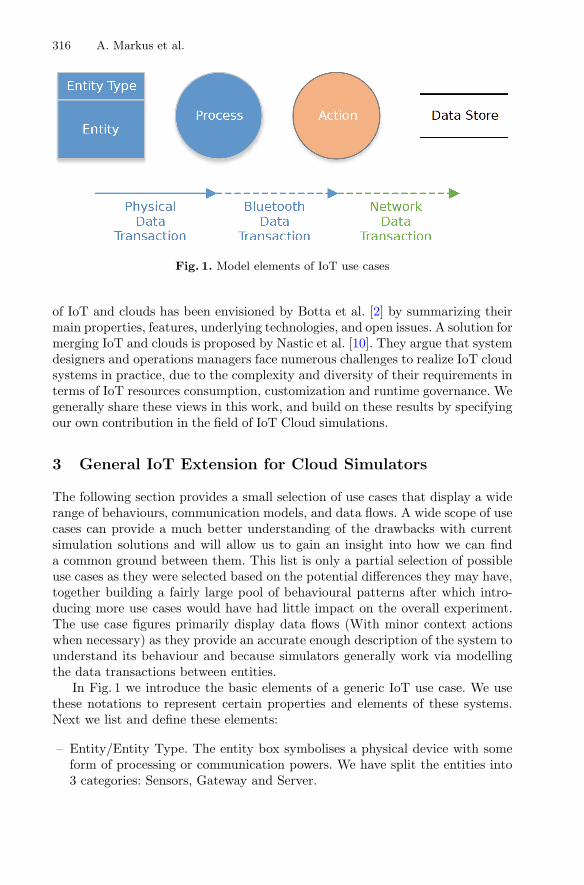
316 A. Markus et al.
Fig. 1. Model elements of IoT use cases
of IoT and clouds has been envisioned by Botta et al. [2] by summarizing theirmain properties, features, underlying technologies, and open issues. A solution formerging IoT and clouds is proposed by Nastic et al. [10]. They argue that systemdesigners and operations managers face numerous challenges to realize IoT cloudsystems in practice, due to the complexity and diversity of their requirements interms of IoT resources consumption, customization and runtime governance. Wegenerally share these views in this work, and build on these results by specifyingour own contribution in the field of IoT Cloud simulations.
3 General IoT Extension for Cloud Simulators
The following section provides a small selection of use cases that display a widerange of behaviours, communication models, and data flows. A wide scope of usecases can provide a much better understanding of the drawbacks with currentsimulation solutions and will allow us to gain an insight into how we can finda common ground between them. This list is only a partial selection of possibleuse cases as they were selected based on the potential differences they may have,together building a fairly large pool of behavioural patterns after which intro-ducing more use cases would have had little impact on the overall experiment.The use case figures primarily display data flows (With minor context actionswhen necessary) as they provide an accurate enough description of the system tounderstand its behaviour and because simulators generally work via modellingthe data transactions between entities.
In Fig. 1 we introduce the basic elements of a generic IoT use case. We usethese notations to represent certain properties and elements of these systems.Next we list and define these elements:
– Entity/Entity Type. The entity box symbolises a physical device with someform of processing or communication powers. We have split the entities into3 categories: Sensors, Gateway and Server.

Efficient Simulation of IoT Cloud Use Cases 317
Table 1. Use case feature requirements
Use cases Trace model Trace replay Custom device Responsive device
1. Meteorologicalanalysis
� � �
2. Automated wastemanagement systems
�
3. Real time industrialwater contaminationsystem
� � �
4. Automated carparking space detector
�
5. Vehicle black boxinsurance system
�
6. Fitness watchactivity tracker
�
7. Smartphone stepcounter
�
– Process. The Process circle represents some form of data processing withinthe linked Entity. It is used to symbolise the transformation, testing, and/orchecking of data flows to produce either more data flows, or a contextual eventto trigger. An example of this function can be the interpretation of analoginput data from a sensor into something usable.
– Action. The Action circle simply represents a contextual event which generallycomes in the form of a physical event. Actions usually require some form ofdata processing in order to trigger and thus are mostly used at the end of adata flow process. An example of this is a smartphone notification displayinga message from a cloud service.
– Data Store. The Data Store is used primarily by gateways and servers andsymbolises the physical disk storage that a device might read/write to.Although this isn’t necessary to model, it may help understand some of thediagrams as to where the data may be coming from (As sometimes the datastores are used as a buffer to hold the data).
– Data Transactions. Data Transactions display the movement of data betweenentities and processes via a range of methods. A Physical Data Transactionrefers to a direct link that entities and processes may have, such as a wiredconnection. Alternatively Bluetooth and Network transactions are differen-tiated to assist get understanding of how links are formed (To give a smallreflection in the distances that can be assumed. Bluetooth having a shorterrange than a network transaction).
In Table 1 we gathered the basic feature requirements of representative IoTuse cases. We have identified 4 requirements to be supported by simulationsfocusing on IoT device behaviour:

318 A. Markus et al.
Fig. 2. The architecture of DISSECT-CF, showing the foundations for our extensions
Trace model. Allow device behaviour to be characterised by its statisticalproperties (e.g., distribution functions and their properties like mean, mediandata packet size, communication frequency etc.).
Trace replay. Let devices behave according to real-life recordings from thepast. Here we expect devices to be defined with pointers to trace files thatcontain network, storage and computing activities in a time series.
Custom device. In general, we expect that most of the simulations could bedescribed by fulfilling the above two requirements. On the other hand, if thebuilt in behaviour models are not sufficient, and there are no traces available,the simulation could incorporate specialised device implementations whichimplement the missing models.
Responsive device. We expect that some custom devices would react to thesurrounding simulated environment. Thus the device model is not exclusivelydependent on the internals of the device, but on the device context (e.g.,having a gateway that can dynamically change its behaviour depending onthe size of its monitored sensor set).
Based on these requirements, we examined seven cases ranging from smart regiondown to smart home applications. We chose to examine these cases by means ofsimulations, and we will focus on two distinguished cases further on: cases no.1. and 6.
DISSECT-CF [5] is a compact, highly customizable open source1 cloud sim-ulator with special focus on the internal organization and behavior of IaaS sys-tems. Figure 2 presents its architecture. It groups the major components withdashed lines into subsystems. There are five major subsystems implemented inde-pendently, each responsible for a particular aspect of internal IaaS functionality:(i) event system – for a primary time reference; (ii) unified resource sharing –to resolve low-level resource bottleneck situations; (iii) energy modeling – forthe analysis of energy-usage patterns of individual resources (e.g., network links,CPUs) or their aggregations; (iv) infrastructure simulation – to model physical
1 Available from: https://github.com/kecskemeti/dissect-cf.

Efficient Simulation of IoT Cloud Use Cases 319
Fig. 3. 1. Use case: meteorological application
and virtual machines as well as networked entities; and finally (v) infrastructuremanagement – to provide a real life cloud like API and encapsulate cloud levelscheduling.
As we aim at supporting the simulation of several thousand (or even more)devices participating in previously unforeseen IoT scenarios, or possibly existingsystems that have not been examined before in more detail (e.g. in terms ofscalability, responsiveness, energy efficiency or management costs). Since thehigh performance of a simulator’s resource sharing mechanism is essential, wehave chosen to use the DISSECT-CF simulator, because of its unified resourcesharing foundation. Building on this foundation, it is possible to implement thebasic constructs of IoT systems (e.g., smart objects, sensors or actuators) andkeep the performance of the past simulator.
The proposed extension provides a runnable Application interface that cantake an XML file defining the Machine Data (Such as Physical Machines, Reposi-tories, and their Connection data) and an XML file defining the Simulation Data(Such as the Devices and their behaviours). The Simulation Data can contain ascalable number of Devices and each device has its own independent behaviourmodel defined. The behaviour of the Device can be modelled in a combinationof 3 ways; a direct link to a Trace File (Which should contain the target device,timestamp, and data size), a Trace Producer Model which contains the Distribu-tion set to produce an approximation of the device trace, or finally the simulatorcan accept device extensions which allow custom devices to be included in thesource to programmatically model more specific behaviours.
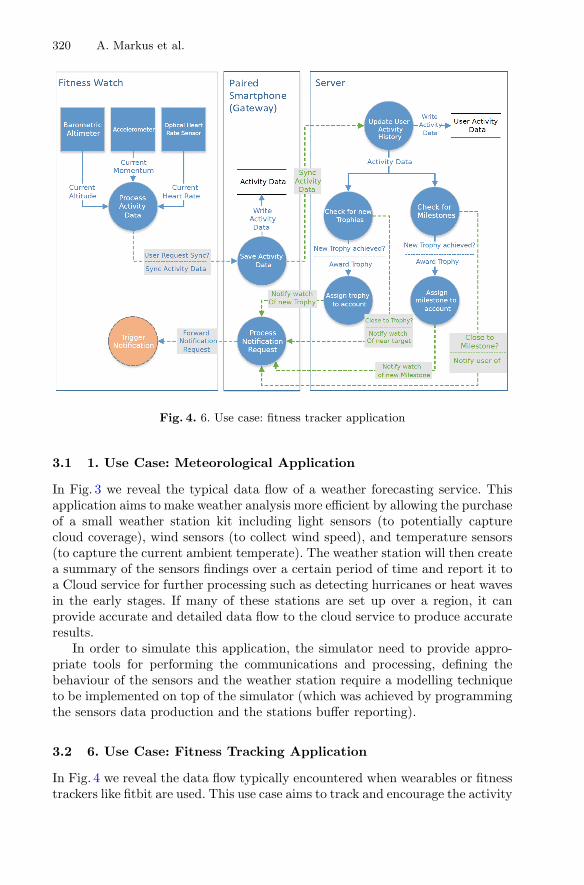
320 A. Markus et al.
Fig. 4. 6. Use case: fitness tracker application
3.1 1. Use Case: Meteorological Application
In Fig. 3 we reveal the typical data flow of a weather forecasting service. Thisapplication aims to make weather analysis more efficient by allowing the purchaseof a small weather station kit including light sensors (to potentially capturecloud coverage), wind sensors (to collect wind speed), and temperature sensors(to capture the current ambient temperate). The weather station will then createa summary of the sensors findings over a certain period of time and report it toa Cloud service for further processing such as detecting hurricanes or heat wavesin the early stages. If many of these stations are set up over a region, it canprovide accurate and detailed data flow to the cloud service to produce accurateresults.
In order to simulate this application, the simulator need to provide appro-priate tools for performing the communications and processing, defining thebehaviour of the sensors and the weather station require a modelling techniqueto be implemented on top of the simulator (which was achieved by programmingthe sensors data production and the stations buffer reporting).
3.2 6. Use Case: Fitness Tracking Application
In Fig. 4 we reveal the data flow typically encountered when wearables or fitnesstrackers like fitbit are used. This use case aims to track and encourage the activity
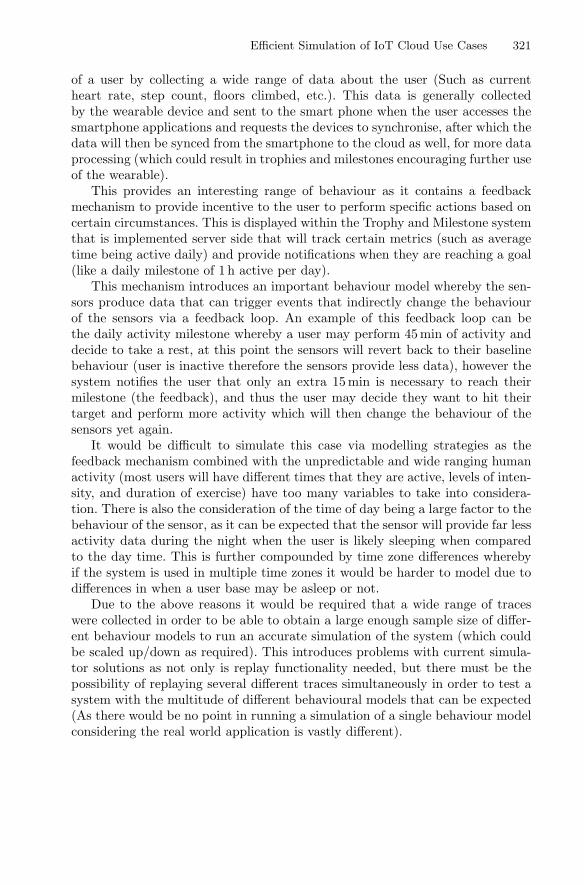
Efficient Simulation of IoT Cloud Use Cases 321
of a user by collecting a wide range of data about the user (Such as currentheart rate, step count, floors climbed, etc.). This data is generally collectedby the wearable device and sent to the smart phone when the user accesses thesmartphone applications and requests the devices to synchronise, after which thedata will then be synced from the smartphone to the cloud as well, for more dataprocessing (which could result in trophies and milestones encouraging further useof the wearable).
This provides an interesting range of behaviour as it contains a feedbackmechanism to provide incentive to the user to perform specific actions based oncertain circumstances. This is displayed within the Trophy and Milestone systemthat is implemented server side that will track certain metrics (such as averagetime being active daily) and provide notifications when they are reaching a goal(like a daily milestone of 1 h active per day).
This mechanism introduces an important behaviour model whereby the sen-sors produce data that can trigger events that indirectly change the behaviourof the sensors via a feedback loop. An example of this feedback loop can bethe daily activity milestone whereby a user may perform 45 min of activity anddecide to take a rest, at this point the sensors will revert back to their baselinebehaviour (user is inactive therefore the sensors provide less data), however thesystem notifies the user that only an extra 15 min is necessary to reach theirmilestone (the feedback), and thus the user may decide they want to hit theirtarget and perform more activity which will then change the behaviour of thesensors yet again.
It would be difficult to simulate this case via modelling strategies as thefeedback mechanism combined with the unpredictable and wide ranging humanactivity (most users will have different times that they are active, levels of inten-sity, and duration of exercise) have too many variables to take into considera-tion. There is also the consideration of the time of day being a large factor to thebehaviour of the sensor, as it can be expected that the sensor will provide far lessactivity data during the night when the user is likely sleeping when comparedto the day time. This is further compounded by time zone differences wherebyif the system is used in multiple time zones it would be harder to model due todifferences in when a user base may be asleep or not.
Due to the above reasons it would be required that a wide range of traceswere collected in order to be able to obtain a large enough sample size of differ-ent behaviour models to run an accurate simulation of the system (which couldbe scaled up/down as required). This introduces problems with current simula-tor solutions as not only is replay functionality needed, but there must be thepossibility of replaying several different traces simultaneously in order to test asystem with the multitude of different behavioural models that can be expected(As there would be no point in running a simulation of a single behaviour modelconsidering the real world application is vastly different).

322 A. Markus et al.
4 Implementing the Extension for a MeteorologicalApplication
Based on the generic plans discussed before, we performed the extension of theDISSECT-CF simulator towards a meteorological application covering a widerregion. To derive the sensor models for the extension, we started by modellinga real-world IoT system: as one of the earliest examples of sensor networks arefrom the field of meteorology and weather prediction, we choose to model thecrowdsourced meteorological service of Hungary called Idokep.hu. It has beenestablished in 2004, and it is one of the most popular websites on meteorologyin Hungary. Since 2008 weather information can be viewed on Croatia and evenon Germany. Detailed information of its system architecture and operation canalso be found on the website: more than 400 stations send sensor data to theirsystem (including temperature, humidity, barometric pressure, rainfall and windproperties), and the actual weather conditions are refreshed every 10 min. Theyalso provide forecasts up to a week. They also produce and sell sensor stationscapable to extend their sensor network and improve their weather predictions.These can be bought and installed at buyer specific locations.
We followed a bottom-up approach to add IoT functionalities to the simulator,and implemented a weather prediction application using public data available onsensors and their behaviour at http://www.idokep.hu.
Each entity that aims to perform repeated events in DISSECT-CT has touse the Timed class (see Fig. 2), by implementing the tick() method. We addedtwo of such classes, the Application and the Station. The Station is an entityacting as a gateway. I.e., it provides the network connection for sensors, andoptimises the network usage of the sensors by caching and bundling outgoingmetering data of its supervised sensors. Figure 5 depicts how data stored abouteach station in an IoT system. This description is useful to set up predefinedstations from files. The tasksize attribute of Application defines the amountof data (in bytes) to be gathered in a cloud storage (sent by the stations) beforetheir processing in a VM.
Stations have unique identifiers (i.e., a name). We can specify their lifetimewith the tag time by defining their starttime and stoptime. The cardinality ofthe supervised sensor set is set via sbnumber. Alongside the set cardinality, onecan also specify the average data size produced by one of the sensors in the set.To set up more stations with the same properties, one can use the count optionin the name tag. Data generation frequency (freq) could be set for the sensorset (in milliseconds). The station’s caching mechanism is influenced with the tagratio. This defines the amount of data to be kept at the local storage relativeto the average dataset produced by the sensors at each data generation event.If the unsent data in the local storage (which is defined in storage) overreachesthe caching limit, the station is modelled to send the cached items to the cloud’sstorage (identified with its network node id specified in the torepo tag). The localstorage is also keeping a log of previously sent data until its capacity (defined inthe storage tag) is exceeded. The station’s network connectivity to the outsideworld is specified by the tags maxinbw and maxoutbw.
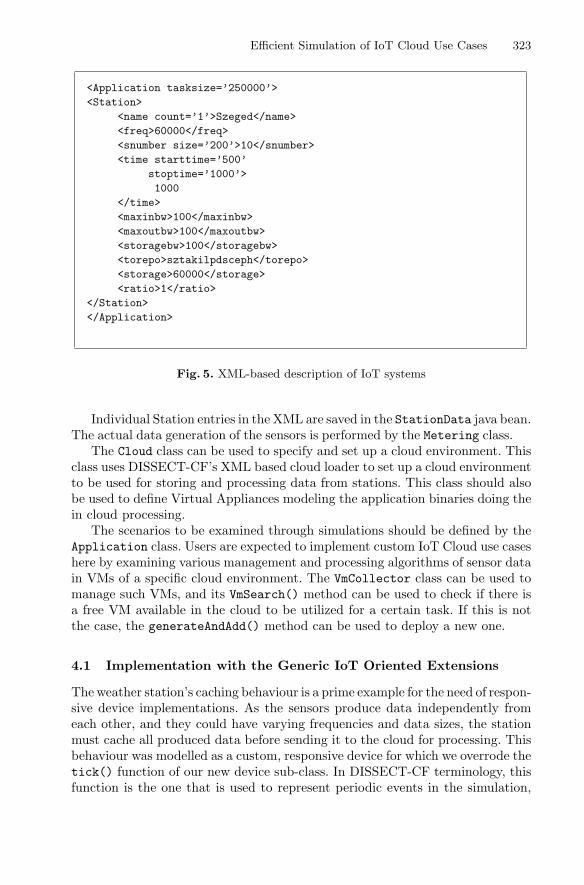
Efficient Simulation of IoT Cloud Use Cases 323
<Application tasksize=’250000’>
<Station>
<name count=’1’>Szeged</name>
<freq>60000</freq>
<snumber size=’200’>10</snumber>
<time starttime=’500’
stoptime=’1000’>
1000
</time>
<maxinbw>100</maxinbw>
<maxoutbw>100</maxoutbw>
<storagebw>100</storagebw>
<torepo>sztakilpdsceph</torepo>
<storage>60000</storage>
<ratio>1</ratio>
</Station>
</Application>
Fig. 5. XML-based description of IoT systems
Individual Station entries in the XML are saved in the StationData java bean.The actual data generation of the sensors is performed by the Metering class.
The Cloud class can be used to specify and set up a cloud environment. Thisclass uses DISSECT-CF’s XML based cloud loader to set up a cloud environmentto be used for storing and processing data from stations. This class should alsobe used to define Virtual Appliances modeling the application binaries doing thein cloud processing.
The scenarios to be examined through simulations should be defined by theApplication class. Users are expected to implement custom IoT Cloud use caseshere by examining various management and processing algorithms of sensor datain VMs of a specific cloud environment. The VmCollector class can be used tomanage such VMs, and its VmSearch() method can be used to check if there isa free VM available in the cloud to be utilized for a certain task. If this is notthe case, the generateAndAdd() method can be used to deploy a new one.
4.1 Implementation with the Generic IoT Oriented Extensions
The weather station’s caching behaviour is a prime example for the need of respon-sive device implementations. As the sensors produce data independently fromeach other, and they could have varying frequencies and data sizes, the stationmust cache all produced data before sending it to the cloud for processing. Thisbehaviour was modelled as a custom, responsive device for which we overrode thetick() function of our new device sub-class. In DISSECT-CF terminology, thisfunction is the one that is used to represent periodic events in the simulation,

324 A. Markus et al.
Fig. 6. Analysis of the buffering behaviour in the alternative simulations of a weatherstation
in this particular case it was used to simulate the data reporting requests fromthe cloud. Each station has connections to its 8 sensors, which produced randomlysized data with the frequency of [ 1
60−1] Hz. Upon every tick call, our custom devicedetermines if there is a need to send its buffered contents to the cloud or not. Thisis based on the buffered data size that was set to be at least 1 kB before emptyingthe buffer.
The implementation was tested by running the original and the new imple-mentations side-by-side so that we could analyse the network traffic differences.Due to the random nature of the data production the two solutions don’t com-pletely line up, however Fig. 6 displays how the simulation extension producesa very similar result to the original implementation in that although there isa lot of randomness to the investigated scenario, the mean and median valuesare having a close match. The distribution is also following the same pattern:whereby the bulk of the buffer loads are within 1600 bytes and are less frequentthe further away from this value it goes.
At it can be observed, the basic extensions described here are mainly focusingon device behaviour. The application level operations are completely up to theuser to define. E.g., application logic for how many virtual machines do we needfor processing the sensor data is not to be described by the XML descriptors. Inthe next sub-section we will discuss such situations and explore how to combineapplication level behaviour with the new sensor and device models.

Efficient Simulation of IoT Cloud Use Cases 325
4.2 Evaluation with Alternative Application Level Scenarios
During our implementation and evaluation, where applicable, we used publiclyavailable information to populate our experiments. Unfortunately, some detailsare unpublished (e.g. sensor data sizes, data-processing times), for those, we haveprovided estimates and listed them below.
In the website of Idokep.hu2, we learnt that the service operates with 487 sta-tions. Each of them has sensors at most monitoring the following environmentalproperties:
1. timestamp;2. air and dew point temperature – ◦C;3. humidity – %;4. barometic pressure – in hPa;5. rainfall – mm/hour and mm/day;6. wind speed – km/h;7. wind direction;8. and UV-B level.
Concerning the size of such sensor data, we expect them to be save in astructured text file (eg., CSV). Stored this way, we can estimate that approxi-mately 50 bytes (e.g., based on the website of the Murdoch University WeatherStation3) are produced if each sensor produces data in every measurement.
Next, we detail the steps of the behaviour of our Application implementa-tion which was used for all evaluation scenarios later (see Fig. 7):
1. Set up the cloud using an XML. As we expect meteorological scenarios willoften use private clouds, we used the model of our local private infrastructure(the LPDS Cloud of MTA SZTAKI);
2. Set up the 487 stations (using a scenario specific XML description) with thepreviously listed 8 sensors per station;
3. Start the Application to deploy an initial VM (generateAndAddVM()) forprocessing and to start the metering process in all stations (startStation());
4. Thestationsthenmonitor (Metering()), saveandsend(startCommunicate())sensor data (to the cloud storage) according to their XML definition;
5. A daemon service checks regularly if the cloud repository received a scenariospecific amount of data (see the tasksize attribute in Fig. 5). If there so,then the Application generates tasks which will finish processing within apredefined amount of time.
6. Next, for each generated task, a free VM is searched (by VmSearch()). If aVM is found, the task and the relevant data is sent to it for processing.
7. In case there are no free VMs found, the daemon initiates a new VM deploy-ment and holds back the not yet mapped tasks.
2 http://idokep.hu/automata.3 http://wwwmet.murdoch.edu.au/downloads.
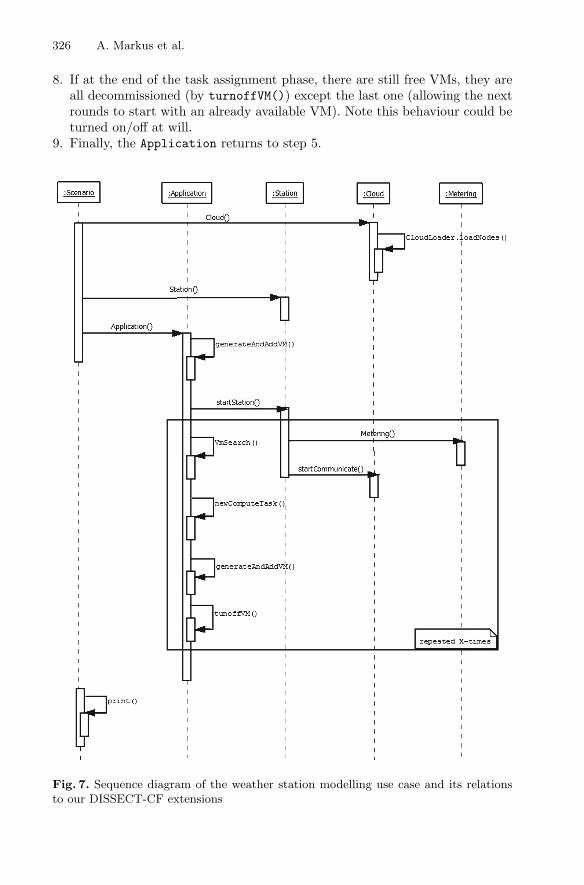
326 A. Markus et al.
8. If at the end of the task assignment phase, there are still free VMs, they areall decommissioned (by turnoffVM()) except the last one (allowing the nextrounds to start with an already available VM). Note this behaviour could beturned on/off at will.
9. Finally, the Application returns to step 5.
Fig. 7. Sequence diagram of the weather station modelling use case and its relationsto our DISSECT-CF extensions
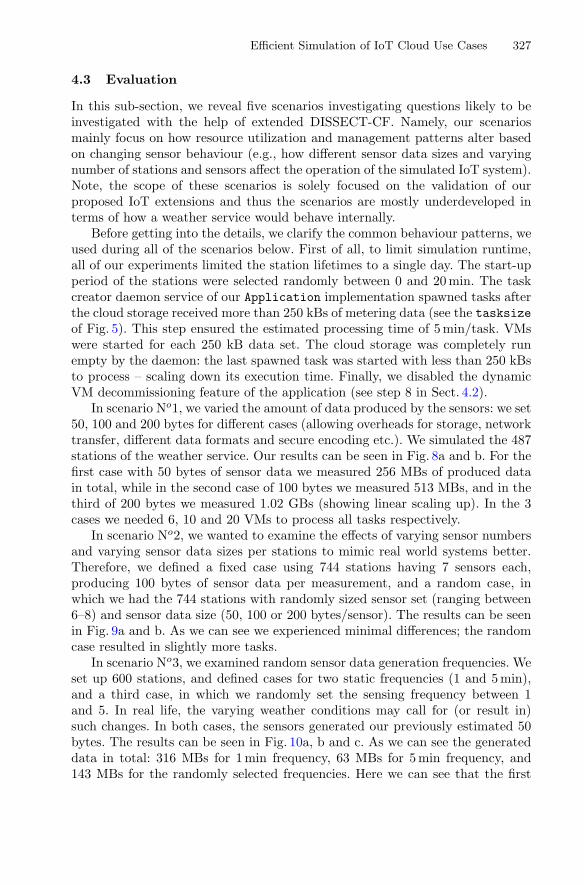
Efficient Simulation of IoT Cloud Use Cases 327
4.3 Evaluation
In this sub-section, we reveal five scenarios investigating questions likely to beinvestigated with the help of extended DISSECT-CF. Namely, our scenariosmainly focus on how resource utilization and management patterns alter basedon changing sensor behaviour (e.g., how different sensor data sizes and varyingnumber of stations and sensors affect the operation of the simulated IoT system).Note, the scope of these scenarios is solely focused on the validation of ourproposed IoT extensions and thus the scenarios are mostly underdeveloped interms of how a weather service would behave internally.
Before getting into the details, we clarify the common behaviour patterns, weused during all of the scenarios below. First of all, to limit simulation runtime,all of our experiments limited the station lifetimes to a single day. The start-upperiod of the stations were selected randomly between 0 and 20 min. The taskcreator daemon service of our Application implementation spawned tasks afterthe cloud storage received more than 250 kBs of metering data (see the tasksizeof Fig. 5). This step ensured the estimated processing time of 5 min/task. VMswere started for each 250 kB data set. The cloud storage was completely runempty by the daemon: the last spawned task was started with less than 250 kBsto process – scaling down its execution time. Finally, we disabled the dynamicVM decommissioning feature of the application (see step 8 in Sect. 4.2).
In scenario No1, we varied the amount of data produced by the sensors: we set50, 100 and 200 bytes for different cases (allowing overheads for storage, networktransfer, different data formats and secure encoding etc.). We simulated the 487stations of the weather service. Our results can be seen in Fig. 8a and b. For thefirst case with 50 bytes of sensor data we measured 256 MBs of produced datain total, while in the second case of 100 bytes we measured 513 MBs, and in thethird of 200 bytes we measured 1.02 GBs (showing linear scaling up). In the 3cases we needed 6, 10 and 20 VMs to process all tasks respectively.
In scenario No2, we wanted to examine the effects of varying sensor numbersand varying sensor data sizes per stations to mimic real world systems better.Therefore, we defined a fixed case using 744 stations having 7 sensors each,producing 100 bytes of sensor data per measurement, and a random case, inwhich we had the 744 stations with randomly sized sensor set (ranging between6–8) and sensor data size (50, 100 or 200 bytes/sensor). The results can be seenin Fig. 9a and b. As we can see we experienced minimal differences; the randomcase resulted in slightly more tasks.
In scenario No3, we examined random sensor data generation frequencies. Weset up 600 stations, and defined cases for two static frequencies (1 and 5 min),and a third case, in which we randomly set the sensing frequency between 1and 5. In real life, the varying weather conditions may call for (or result in)such changes. In both cases, the sensors generated our previously estimated 50bytes. The results can be seen in Fig. 10a, b and c. As we can see the generateddata in total: 316 MBs for 1 min frequency, 63 MBs for 5 min frequency, and143 MBs for the randomly selected frequencies. Here we can see that the first
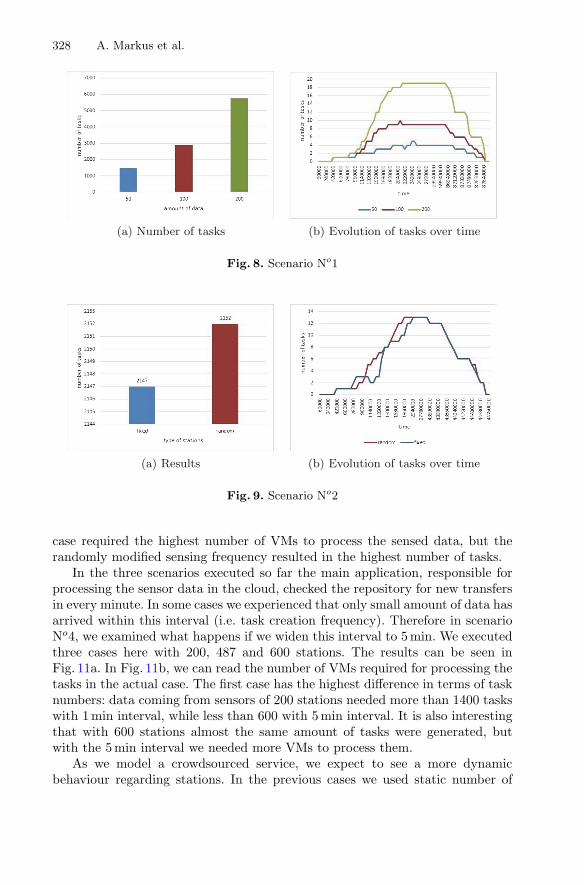
328 A. Markus et al.
(a) Number of tasks (b) Evolution of tasks over time
Fig. 8. Scenario No1
(a) Results (b) Evolution of tasks over time
Fig. 9. Scenario No2
case required the highest number of VMs to process the sensed data, but therandomly modified sensing frequency resulted in the highest number of tasks.
In the three scenarios executed so far the main application, responsible forprocessing the sensor data in the cloud, checked the repository for new transfersin every minute. In some cases we experienced that only small amount of data hasarrived within this interval (i.e. task creation frequency). Therefore in scenarioNo4, we examined what happens if we widen this interval to 5 min. We executedthree cases here with 200, 487 and 600 stations. The results can be seen inFig. 11a. In Fig. 11b, we can read the number of VMs required for processing thetasks in the actual case. The first case has the highest difference in terms of tasknumbers: data coming from sensors of 200 stations needed more than 1400 taskswith 1 min interval, while less than 600 with 5 min interval. It is also interestingthat with 600 stations almost the same amount of tasks were generated, butwith the 5 min interval we needed more VMs to process them.
As we model a crowdsourced service, we expect to see a more dynamicbehaviour regarding stations. In the previous cases we used static number of
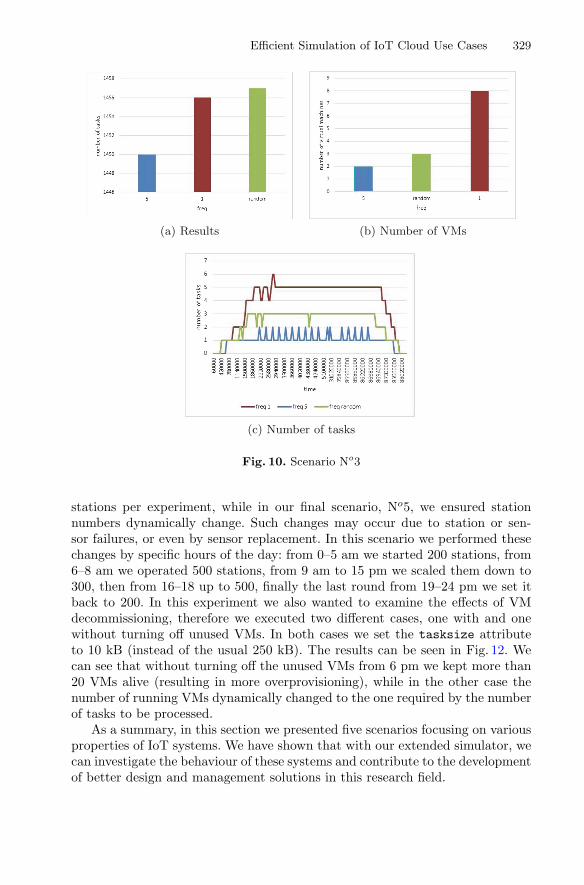
Efficient Simulation of IoT Cloud Use Cases 329
(a) Results (b) Number of VMs
(c) Number of tasks
Fig. 10. Scenario No3
stations per experiment, while in our final scenario, No5, we ensured stationnumbers dynamically change. Such changes may occur due to station or sen-sor failures, or even by sensor replacement. In this scenario we performed thesechanges by specific hours of the day: from 0–5 am we started 200 stations, from6–8 am we operated 500 stations, from 9 am to 15 pm we scaled them down to300, then from 16–18 up to 500, finally the last round from 19–24 pm we set itback to 200. In this experiment we also wanted to examine the effects of VMdecommissioning, therefore we executed two different cases, one with and onewithout turning off unused VMs. In both cases we set the tasksize attributeto 10 kB (instead of the usual 250 kB). The results can be seen in Fig. 12. Wecan see that without turning off the unused VMs from 6 pm we kept more than20 VMs alive (resulting in more overprovisioning), while in the other case thenumber of running VMs dynamically changed to the one required by the numberof tasks to be processed.
As a summary, in this section we presented five scenarios focusing on variousproperties of IoT systems. We have shown that with our extended simulator, wecan investigate the behaviour of these systems and contribute to the developmentof better design and management solutions in this research field.
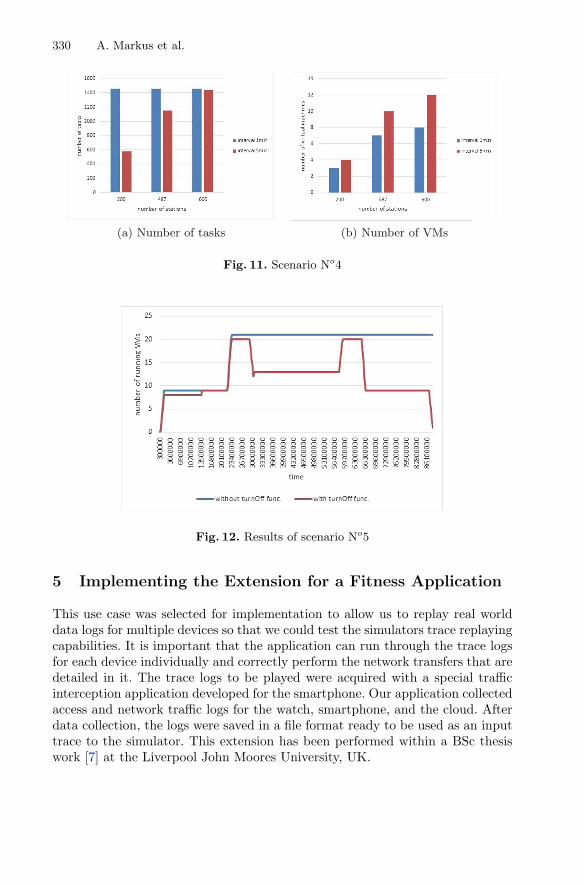
330 A. Markus et al.
(a) Number of tasks (b) Number of VMs
Fig. 11. Scenario No4
Fig. 12. Results of scenario No5
5 Implementing the Extension for a Fitness Application
This use case was selected for implementation to allow us to replay real worlddata logs for multiple devices so that we could test the simulators trace replayingcapabilities. It is important that the application can run through the trace logsfor each device individually and correctly perform the network transfers that aredetailed in it. The trace logs to be played were acquired with a special trafficinterception application developed for the smartphone. Our application collectedaccess and network traffic logs for the watch, smartphone, and the cloud. Afterdata collection, the logs were saved in a file format ready to be used as an inputtrace to the simulator. This extension has been performed within a BSc thesiswork [7] at the Liverpool John Moores University, UK.
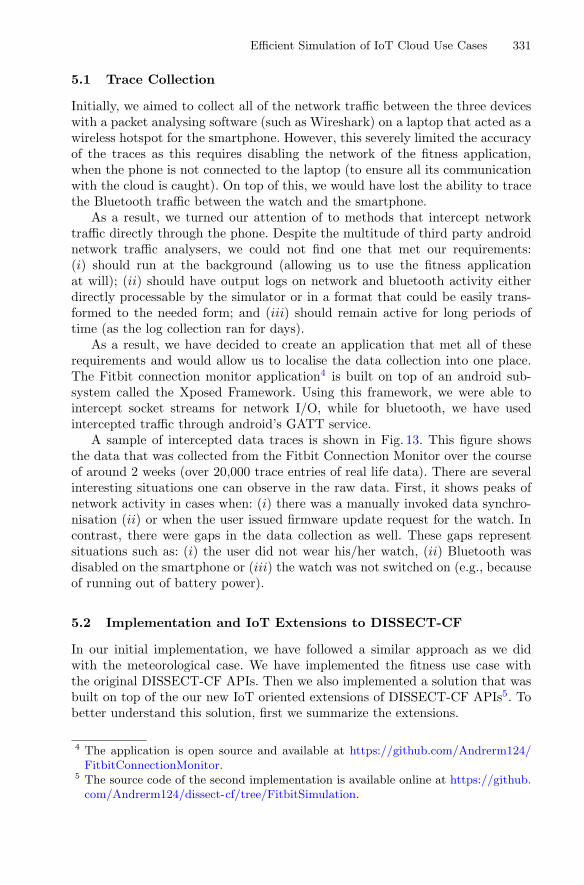
Efficient Simulation of IoT Cloud Use Cases 331
5.1 Trace Collection
Initially, we aimed to collect all of the network traffic between the three deviceswith a packet analysing software (such as Wireshark) on a laptop that acted as awireless hotspot for the smartphone. However, this severely limited the accuracyof the traces as this requires disabling the network of the fitness application,when the phone is not connected to the laptop (to ensure all its communicationwith the cloud is caught). On top of this, we would have lost the ability to tracethe Bluetooth traffic between the watch and the smartphone.
As a result, we turned our attention of to methods that intercept networktraffic directly through the phone. Despite the multitude of third party androidnetwork traffic analysers, we could not find one that met our requirements:(i) should run at the background (allowing us to use the fitness applicationat will); (ii) should have output logs on network and bluetooth activity eitherdirectly processable by the simulator or in a format that could be easily trans-formed to the needed form; and (iii) should remain active for long periods oftime (as the log collection ran for days).
As a result, we have decided to create an application that met all of theserequirements and would allow us to localise the data collection into one place.The Fitbit connection monitor application4 is built on top of an android sub-system called the Xposed Framework. Using this framework, we were able tointercept socket streams for network I/O, while for bluetooth, we have usedintercepted traffic through android’s GATT service.
A sample of intercepted data traces is shown in Fig. 13. This figure showsthe data that was collected from the Fitbit Connection Monitor over the courseof around 2 weeks (over 20,000 trace entries of real life data). There are severalinteresting situations one can observe in the raw data. First, it shows peaks ofnetwork activity in cases when: (i) there was a manually invoked data synchro-nisation (ii) or when the user issued firmware update request for the watch. Incontrast, there were gaps in the data collection as well. These gaps representsituations such as: (i) the user did not wear his/her watch, (ii) Bluetooth wasdisabled on the smartphone or (iii) the watch was not switched on (e.g., becauseof running out of battery power).
5.2 Implementation and IoT Extensions to DISSECT-CF
In our initial implementation, we have followed a similar approach as we didwith the meteorological case. We have implemented the fitness use case withthe original DISSECT-CF APIs. Then we also implemented a solution that wasbuilt on top of the our new IoT oriented extensions of DISSECT-CF APIs5. Tobetter understand this solution, first we summarize the extensions.
4 The application is open source and available at https://github.com/Andrerm124/FitbitConnectionMonitor.
5 The source code of the second implementation is available online at https://github.com/Andrerm124/dissect-cf/tree/FitbitSimulation.
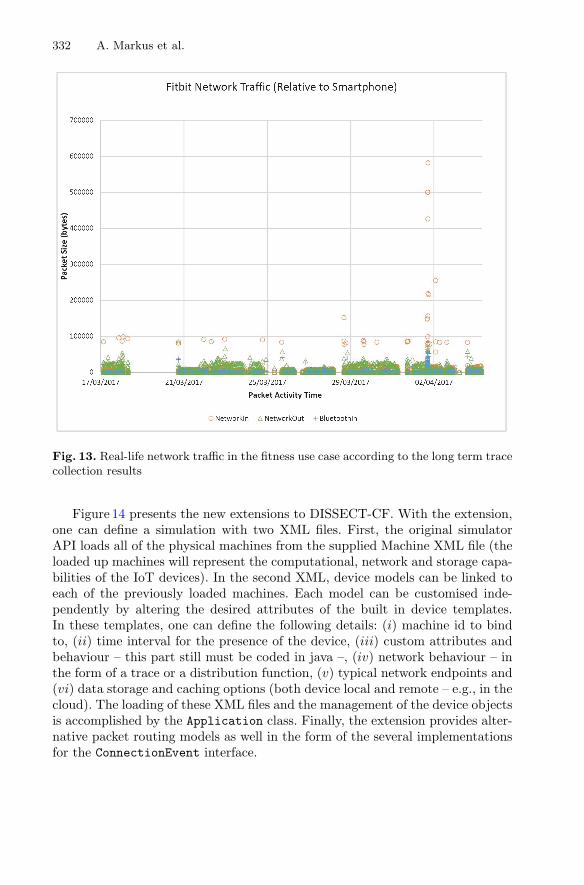
332 A. Markus et al.
Fig. 13. Real-life network traffic in the fitness use case according to the long term tracecollection results
Figure 14 presents the new extensions to DISSECT-CF. With the extension,one can define a simulation with two XML files. First, the original simulatorAPI loads all of the physical machines from the supplied Machine XML file (theloaded up machines will represent the computational, network and storage capa-bilities of the IoT devices). In the second XML, device models can be linked toeach of the previously loaded machines. Each model can be customised inde-pendently by altering the desired attributes of the built in device templates.In these templates, one can define the following details: (i) machine id to bindto, (ii) time interval for the presence of the device, (iii) custom attributes andbehaviour – this part still must be coded in java –, (iv) network behaviour – inthe form of a trace or a distribution function, (v) typical network endpoints and(vi) data storage and caching options (both device local and remote – e.g., in thecloud). The loading of these XML files and the management of the device objectsis accomplished by the Application class. Finally, the extension provides alter-native packet routing models as well in the form of the several implementationsfor the ConnectionEvent interface.

Efficient Simulation of IoT Cloud Use Cases 333
Fig. 14. The IoT oriented DISSECT-CF extensions
To analyse the effectiveness of our extensions, we have compared the devel-opment time and the simulation results for the fitness application. The initialimplementation has been created as custom classes for all devices participatingin the use case. This required approximately 3 days of development time. In con-trast, with the new extensions, barely more than 20 lines of XML code (shownin Fig. 15) plus the previously collected trace files were required to define thewhole simulation. To validate the new implementation, we also compared thedata produced from this new and the initial completely java based implemen-tation. We have concluded that the two implementations produced equivalentresults (albeit the XML based one allowed much more rapid changes to deviceconfigurations and to their behaviour).

334 A. Markus et al.
<?xml version="1.0" encoding="UTF-8" standalone="yes"?>
<Simulation>
<Devices>
<Device>
<ID>Watch</ID>
<TraceFileReader>
<SimulationFilePath>bluetooth_in.csv</SimulationFilePath>
</TraceFileReader>
</Device>
<Device>
<ID>Smartphone</ID>
<TraceFileReader>
<SimulationFilePath>network_out.csv</SimulationFilePath>
</TraceFileReader>
</Device>
<Device>
<ID>Cloud</ID>
<TraceFileReader>
<SimulationFilePath>network_in.csv</SimulationFilePath>
</TraceFileReader>
</Device>
</Devices>
</Simulation>
Fig. 15. XML model of the fitness use case
5.3 Evaluation
To evaluate our extensions, we have set up the exact same situation in the simu-lation as we have had during the trace collection. We also ensured the simulationwrites its output in terms of simulated network and computing activities in thesame format as the originally collected traces. This allowed easy comparisonbetween the simulated and the real-life traces. Figure 16 show the comparisonof the bluetooth trace. According to the figure, the simulation can accuratelyreproduce the real-life traces, i.e., the simulated data transfers occur at the pre-scribed times and have the same levels of data movement as the ones recorded inreal-life. The network communication between the cloud and the smartphone hasshown similar trends (thus the simulation was capable to reproduce the completeFig. 13).
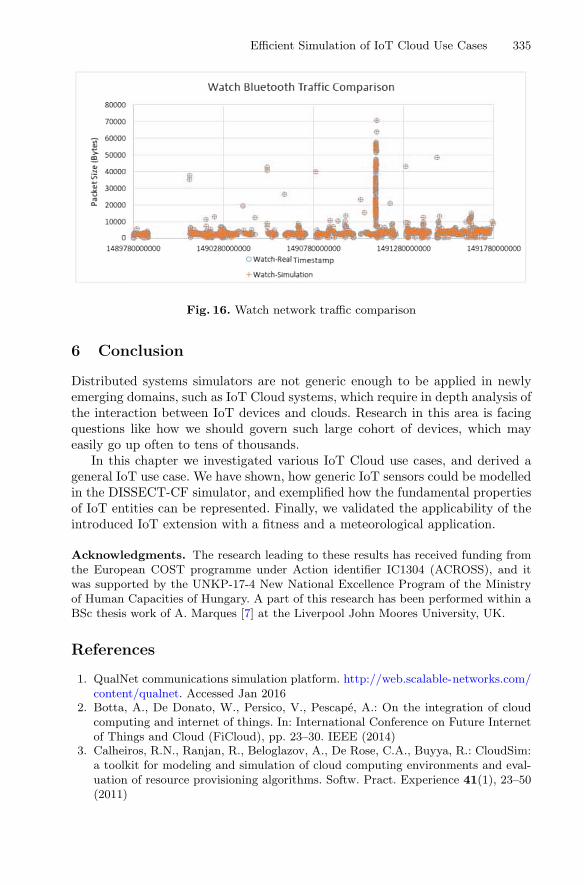
Efficient Simulation of IoT Cloud Use Cases 335
Fig. 16. Watch network traffic comparison
6 Conclusion
Distributed systems simulators are not generic enough to be applied in newlyemerging domains, such as IoT Cloud systems, which require in depth analysis ofthe interaction between IoT devices and clouds. Research in this area is facingquestions like how we should govern such large cohort of devices, which mayeasily go up often to tens of thousands.
In this chapter we investigated various IoT Cloud use cases, and derived ageneral IoT use case. We have shown, how generic IoT sensors could be modelledin the DISSECT-CF simulator, and exemplified how the fundamental propertiesof IoT entities can be represented. Finally, we validated the applicability of theintroduced IoT extension with a fitness and a meteorological application.
Acknowledgments. The research leading to these results has received funding fromthe European COST programme under Action identifier IC1304 (ACROSS), and itwas supported by the UNKP-17-4 New National Excellence Program of the Ministryof Human Capacities of Hungary. A part of this research has been performed within aBSc thesis work of A. Marques [7] at the Liverpool John Moores University, UK.
References
1. QualNet communications simulation platform. http://web.scalable-networks.com/content/qualnet. Accessed Jan 2016
2. Botta, A., De Donato, W., Persico, V., Pescape, A.: On the integration of cloudcomputing and internet of things. In: International Conference on Future Internetof Things and Cloud (FiCloud), pp. 23–30. IEEE (2014)
3. Calheiros, R.N., Ranjan, R., Beloglazov, A., De Rose, C.A., Buyya, R.: CloudSim:a toolkit for modeling and simulation of cloud computing environments and eval-uation of resource provisioning algorithms. Softw. Pract. Experience 41(1), 23–50(2011)
336 A. Markus et al.
4. Han, S.N., Lee, G.M., Crespi, N., Heo, K., Van Luong, N., Brut, M., Gatellier, P.:DPWSim: a simulation toolkit for IoT applications using devices profile for webservices. In: IEEE World Forum on Internet of Things (WF-IoT), pp. 544–547.IEEE (2014)
5. Kecskemeti, G.: DISSECT-CF: a simulator to foster energy-aware scheduling ininfrastructure clouds. Simul. Model. Pract. Theor. 58(P2), 188–218 (2015)
6. Khan, A.M., Navarro, L., Sharifi, L., Veiga, L.: Clouds of small things: provision-ing infrastructure-as-a-service from within community networks. In: 2013 IEEE9th International Conference on Wireless and Mobile Computing, Networking andCommunications (WiMob), pp. 16–21. IEEE (2013)
7. Marques, A.: Abstraction and Simplification of IoT System Modelling Using aDiscrete Cloud Event Simulator. B.Sc. thesis, Department of Computer Science,Liverpool John Moores University, Liverpool, UK, April 2017
8. Miorandi, D., Sicari, S., De Pellegrini, F., Chlamtac, I.: Internet of things: vision,applications and research challenges. Ad Hoc Netw. 10(7), 1497–1516 (2012)
9. Moschakis, I.A., Karatza, H.D.: Towards scheduling for internet-of-things appli-cations on clouds: a simulated annealing approach. Concurrency Comput. Pract.Experience 27(8), 1886–1899 (2015). https://doi.org/10.1002/cpe.3105
10. Nastic, S., Sehic, S., Le, D.H., Truong, H.L., Dustdar, S.: Provisioning software-defined IoT cloud systems. In: 2014 International Conference on Future Internetof Things and Cloud (FiCloud), pp. 288–295. IEEE (2014)
11. Silva, I., Leandro, R., Macedo, D., Guedes, L.A.: A dependability evaluation toolfor the internet of things. Comput. Electr. Eng. 39(7), 2005–2018 (2013)
12. Sotiriadis, S., Bessis, N., Antonopoulos, N., Anjum, A.: SimIC: designing a newinter-cloud simulation platform for integrating large-scale resource management.In: 2013 IEEE 27th International Conference on Advanced Information Networkingand Applications (AINA), pp. 90–97. IEEE (2013)
13. Sotiriadis, S., Bessis, N., Asimakopoulou, E., Mustafee, N.: Towards simulating theinternet of things. In: 2014 28th International Conference on Advanced InformationNetworking and Applications Workshops (WAINA), pp. 444–448. IEEE (2014)
14. Varga, A., et al.: The OMNeT++ discrete event simulation system. In: Proceedingsof the European Simulation Multiconference (ESM 2001), vol. 9, p. 185. sn (2001)
15. Zeng, X., Garg, S.K., Strazdins, P., Jayaraman, P.P., Georgakopoulos, D., Ranjan,R.: IOTSim: a simulator for analysing IoT applications. J. Syst. Architect. 72,93–107 (2016)
Open Access This chapter is licensed under the terms of the Creative CommonsAttribution 4.0 International License (http://creativecommons.org/licenses/by/4.0/),which permits use, sharing, adaptation, distribution and reproduction in any mediumor format, as long as you give appropriate credit to the original author(s) and thesource, provide a link to the Creative Commons license and indicate if changes weremade.
The images or other third party material in this chapter are included in the chapter’sCreative Commons license, unless indicated otherwise in a credit line to the material. Ifmaterial is not included in the chapter’s Creative Commons license and your intendeduse is not permitted by statutory regulation or exceeds the permitted use, you willneed to obtain permission directly from the copyright holder.

Security of Internet of Things for aReliable Internet of Services
Ahmet Arıs1(B) , Sema F. Oktug1, and Thiemo Voigt2
1 Faculty of Computer and Informatics Engineering,Istanbul Technical University, Istanbul, Turkey
{arisahmet,oktug}@itu.edu.tr2 Swedish Institute of Computer Science (SICS), Kista, Sweden
Abstract. The Internet of Things (IoT) consists of resource-constraineddevices (e.g., sensors and actuators) which form low power and lossy net-works to connect to the Internet. With billions of devices deployed in vari-ous environments, IoT is one of the main building blocks of future Internetof Services (IoS). Limited power, processing, storage and radio dictateextremely efficient usage of these resources to achieve high reliability andavailability in IoS. Denial of Service (DoS) and Distributed DoS (DDoS)attacks aim to misuse the resources and cause interruptions, delays, lossesand degrade the offered services in IoT. DoS attacks are clearly threatsfor availability and reliability of IoT, and thus of IoS. For highly reliableand available IoS, such attacks have to be prevented, detected or mitigatedautonomously. In this study, we propose a comprehensive investigation ofInternet of Things security for reliable Internet of Services. We review thecharacteristics of IoT environments, cryptography-based security mech-anisms and D/DoS attacks targeting IoT networks. In addition to these,we extensively analyze the intrusion detection and mitigation mechanismsproposed for IoT and evaluate them from various points of view. Lastly, weconsider and discuss the open issues yet to be researched for more reliableand available IoT and IoS.
Keywords: IoT · IoT security · IoS · DoS · DDoSInternet of Things · Internet of Services · Reliable IoS
1 Introduction
Internet of Things is a network of sensors, actuators, embedded and wearabledevices that can connect to the Internet. Billions of devices are expected to bepart of this network and make houses, buildings, cities and many other deploymentareas smarter [17]. In order to reach populations as much as billions, elements ofIoT network are expected to be cheap and small form-factor devices with limitedresources.
IoT is a candidate technology in order to realize the future Internet of Servicesand Industry 4.0 revolution. Accommodation of billions of devices with sensing
c© The Author(s) 2018I. Ganchev et al. (Eds.): Autonomous Control for a Reliable Internet of Services, LNCS 10768, pp. 337–370, 2018.https://doi.org/10.1007/978-3-319-90415-3_13
338 A. Arıs et al.
and/or actuation capabilities will introduce crucial problems with management,interoperability, scalability, reliability, availability and security. Autonomouscontrol and reliability of future IoS are directly related to reliability and avail-ability of IoT. However, there are serious threats for IoT, which aim to degradethe performance of the network, deplete the batteries of the devices and causepacket losses and delays. These attacks are called as Denial of Service attacks,which are already notorious for their effects in existing communication systems.Limited power, processing, storage and radio dictate extremely efficient usageof these resources to achieve high reliability and availability in IoS. However,DoS and DDoS attacks aim to misuse the resources and cause interruptions,delays, losses and degrade the offered services in IoT. DoS attacks are clearlythreats for availability and reliability of IoT, and thus of IoS. For highly reli-able and available IoS, such attacks have to be prevented, detected or mitigatedautonomously.
DoS and DDoS attacks can target any communication system and cause dev-astation. Such attacks make use of the vulnerabilities in the protocols, operatingsystems, applications and actual physical security of the target system. Readerscan easily find several incident news related to D/DoS attacks on the Internet.These attacks are so common that every day it is possible to see them (e.g.,please check the digital attack map of Arbor Networks and Google Ideas [3]). Itis not hard to predict that IoT will face with D/DoS attacks, either as a targetor source of the attacks. In fact, quite recently one of the major Domain NameSystem (DNS) infrastructure provider of popular web sites and applications wasthe target of DDoS attacks where a botnet called as Mirai compromised thou-sands of cameras and digital video recorder players [2]. This incident was thefirst example of IoT being used as an attack source for DDoS. It clearly showedthat, protection of IoT networks from attacks is not sufficient and protection ofthe Internet from IoT networks is needed as well.
A very interesting report [53] on how security of IoT will be playing an impor-tant role in defining the cybersecurity of future was published by UC BerkeleyCenter for Long-Term Cybersecurity in 2016. A group of people from variousdisciplines developed five scenarios regarding with what will security be like inthe future considering various dimensions including people, governments, orga-nizations, companies, society, culture, technological improvements and of courseattackers. Although all of the scenarios are related to the security of IoT, thelast two scenarios have direct relations. The fourth scenario puts the emphasison the ubiquity of IoT in a way that IoT will be everywhere and will be play-ing a vital role on the management of several applications and systems. Thiswill give attackers more chance to target. In such a world, attackers will able toaffect organizations, governments and the daily life of people easier than now.Thus, cybersecurity term will be transformed to just security since it will ableto affect everything. The last scenario considers the wearable devices and theirnovel purpose of use. According to the hypothesis, the wearables of future willnot only perform basic measurement tasks, but will be used to track emotionalstates of humans. Advancements in the technologies will allow such a change.

Security of Internet of Things for a Reliable Internet of Services 339
Emotional, mental and physical state information which is very important forindividuals will be the target of attackers and will be used as a weapon againstthem. Of course in such a scenario, it will be very crucial for people to managetheir emotional, mental and physical state and this will affect the society in var-ious ways which we can not imagine. This report clearly shows that if we failto secure the IoT networks, then the ubiquity and proliferation of IoT will nottransform the future to smarter but will cause catastrophic effects on humanlife, environment, culture and society.
Securing IoT networks is not an easy problem since we have to think ofdevice, network and application characteristics, affordable cryptography-basedsolutions, physical security of the network and devices, compromise scenarios,intrusion detection systems. Designers and administrators will face many trade-offs, where security will be on one side and cost, network lifetime, Quality-of-Service (QoS), reliability and many more will be on the other side. When weare considering all of these dimensions, we should not avoid the user side. Wehave to bear in mind that users may not be security-aware. We also have topay attention to propose user-friendly solutions which consider the usabilityand the user experience. If our solutions in the services that we provide at notsatisfactory, then our efforts will be in vain, making the attackers’ job easier.
The goal of this study is to present researchers a comprehensive investigationof IoT security for reliable future IoS. In order to be comprehensive, we analyzedthe majority of the digital libraries (i.e., IEEE, ACM, Web of Science, Springer-link, Google Scholar) for quality conference, journal and magazine proposals.Studies published between 2008 and 2017 were included in this work where sev-enteen studies were analyzed to examine the D/DoS attacks for IoT networksand twenty-six studies were evaluated which either analyze the effects of theattacks, or propose a mitigation or a detection system against such attacks.
The remaining sections of this work are organized as follows: In Sect. 2, webriefly explain the related works. Section 3 explores the characteristics of IoTenvironments with devices, networks and applications. Section 4 considers Inter-net of Things security extensively. In Sect. 5, we examine D/DoS attacks forIoT. Section 6 consists of studies which analyze the effects of the D/DoS attacksfor IoT networks. In Sect. 7, we examine the mitigation systems against D/DoSattacks, as well as security solutions for specific protocols. Section 8 is on theintrusion detection systems proposed for IoT, where we analyze several propos-als from various points of views. In Sect. 9, we discuss the open problems andissues in IoT security and aim to provide new research directions. Finally Sect. 10concludes this study.
2 Related Works
The Internet of Things is one of the most active topic of research nowadays. Thereare several surveys which address the security of IoT, attacks, countermeasuresand Intrusion Detection Systems for IoT.
Zarpelao et al. [60] proposed a taxonomy of IDSes based on the placementapproaches, detectionmethods andvalidation strategies. In theirwork, the authors
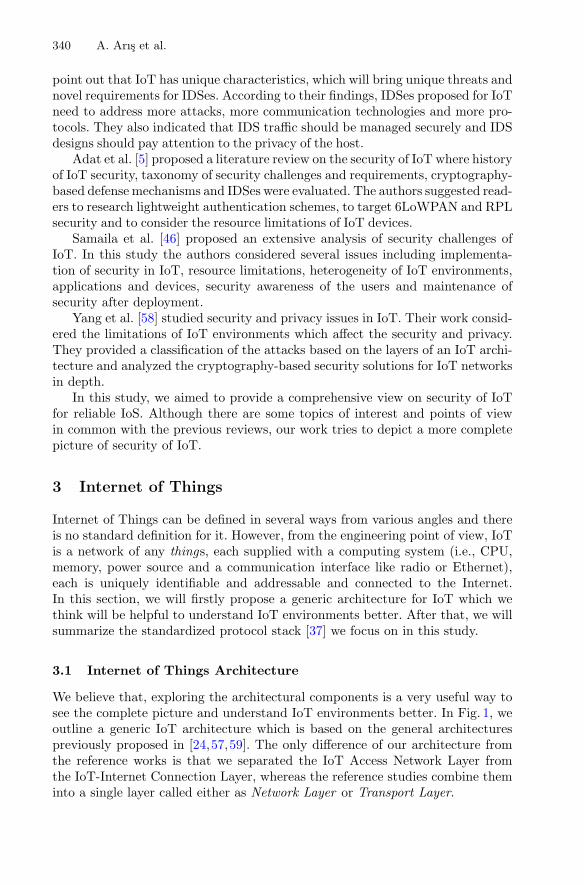
340 A. Arıs et al.
point out that IoT has unique characteristics, which will bring unique threats andnovel requirements for IDSes. According to their findings, IDSes proposed for IoTneed to address more attacks, more communication technologies and more pro-tocols. They also indicated that IDS traffic should be managed securely and IDSdesigns should pay attention to the privacy of the host.
Adat et al. [5] proposed a literature review on the security of IoT where historyof IoT security, taxonomy of security challenges and requirements, cryptography-based defense mechanisms and IDSes were evaluated. The authors suggested read-ers to research lightweight authentication schemes, to target 6LoWPAN and RPLsecurity and to consider the resource limitations of IoT devices.
Samaila et al. [46] proposed an extensive analysis of security challenges ofIoT. In this study the authors considered several issues including implementa-tion of security in IoT, resource limitations, heterogeneity of IoT environments,applications and devices, security awareness of the users and maintenance ofsecurity after deployment.
Yang et al. [58] studied security and privacy issues in IoT. Their work consid-ered the limitations of IoT environments which affect the security and privacy.They provided a classification of the attacks based on the layers of an IoT archi-tecture and analyzed the cryptography-based security solutions for IoT networksin depth.
In this study, we aimed to provide a comprehensive view on security of IoTfor reliable IoS. Although there are some topics of interest and points of viewin common with the previous reviews, our work tries to depict a more completepicture of security of IoT.
3 Internet of Things
Internet of Things can be defined in several ways from various angles and thereis no standard definition for it. However, from the engineering point of view, IoTis a network of any things, each supplied with a computing system (i.e., CPU,memory, power source and a communication interface like radio or Ethernet),each is uniquely identifiable and addressable and connected to the Internet.In this section, we will firstly propose a generic architecture for IoT which wethink will be helpful to understand IoT environments better. After that, we willsummarize the standardized protocol stack [37] we focus on in this study.
3.1 Internet of Things Architecture
We believe that, exploring the architectural components is a very useful way tosee the complete picture and understand IoT environments better. In Fig. 1, weoutline a generic IoT architecture which is based on the general architecturespreviously proposed in [24,57,59]. The only difference of our architecture fromthe reference works is that we separated the IoT Access Network Layer fromthe IoT-Internet Connection Layer, whereas the reference studies combine theminto a single layer called either as Network Layer or Transport Layer.
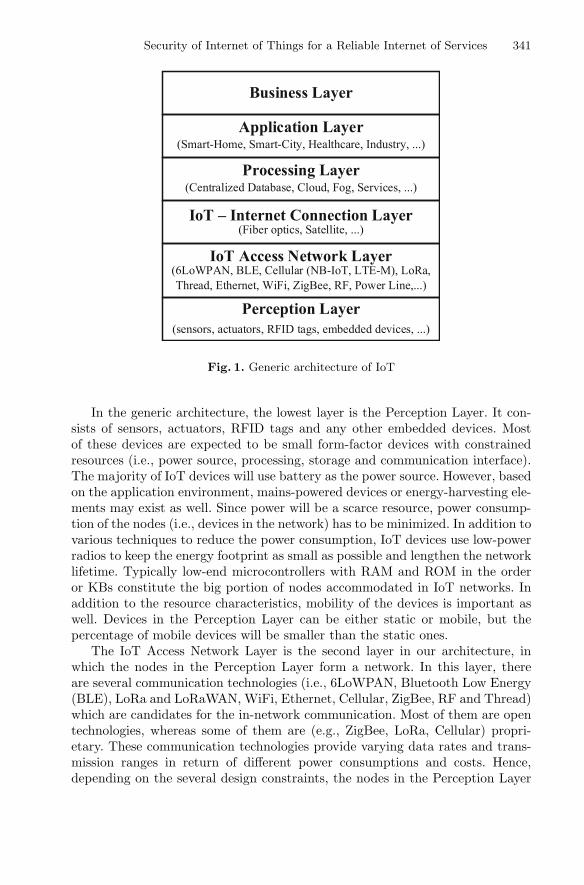
Security of Internet of Things for a Reliable Internet of Services 341
Application Layer(Smart-Home, Smart-City, Healthcare, Industry, ...)
Processing Layer(Centralized Database, Cloud, Fog, Services, ...)
IoT – Internet Connection Layer(Fiber optics, Satellite, ...)
IoT Access Network Layer(6LoWPAN, BLE, Cellular (NB-IoT, LTE-M), LoRa,Thread, Ethernet, WiFi, ZigBee, RF, Power Line,...)
Perception Layer(sensors, actuators, RFID tags, embedded devices, ...)
Business Layer
Fig. 1. Generic architecture of IoT
In the generic architecture, the lowest layer is the Perception Layer. It con-sists of sensors, actuators, RFID tags and any other embedded devices. Mostof these devices are expected to be small form-factor devices with constrainedresources (i.e., power source, processing, storage and communication interface).The majority of IoT devices will use battery as the power source. However, basedon the application environment, mains-powered devices or energy-harvesting ele-ments may exist as well. Since power will be a scarce resource, power consump-tion of the nodes (i.e., devices in the network) has to be minimized. In addition tovarious techniques to reduce the power consumption, IoT devices use low-powerradios to keep the energy footprint as small as possible and lengthen the networklifetime. Typically low-end microcontrollers with RAM and ROM in the orderor KBs constitute the big portion of nodes accommodated in IoT networks. Inaddition to the resource characteristics, mobility of the devices is important aswell. Devices in the Perception Layer can be either static or mobile, but thepercentage of mobile devices will be smaller than the static ones.
The IoT Access Network Layer is the second layer in our architecture, inwhich the nodes in the Perception Layer form a network. In this layer, thereare several communication technologies (i.e., 6LoWPAN, Bluetooth Low Energy(BLE), LoRa and LoRaWAN, WiFi, Ethernet, Cellular, ZigBee, RF and Thread)which are candidates for the in-network communication. Most of them are opentechnologies, whereas some of them are (e.g., ZigBee, LoRa, Cellular) propri-etary. These communication technologies provide varying data rates and trans-mission ranges in return of different power consumptions and costs. Hence,depending on the several design constraints, the nodes in the Perception Layer
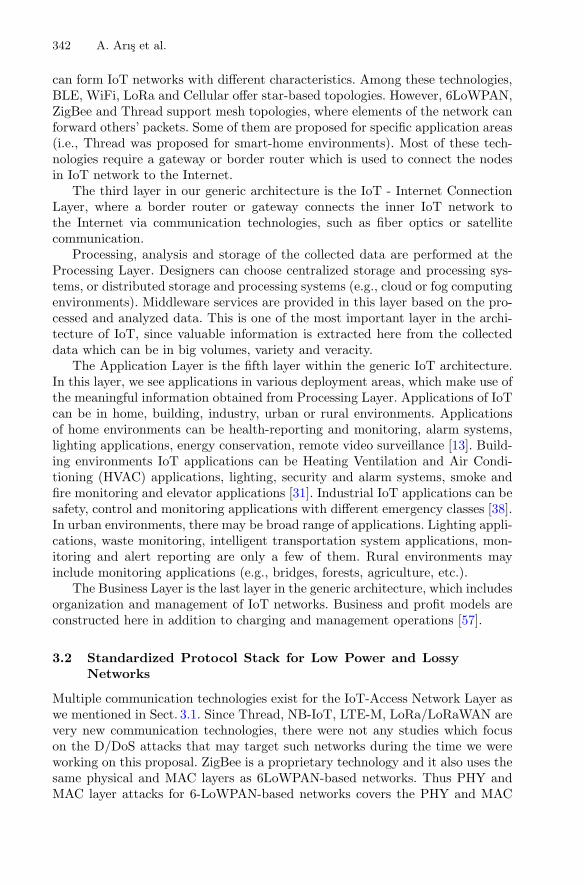
342 A. Arıs et al.
can form IoT networks with different characteristics. Among these technologies,BLE, WiFi, LoRa and Cellular offer star-based topologies. However, 6LoWPAN,ZigBee and Thread support mesh topologies, where elements of the network canforward others’ packets. Some of them are proposed for specific application areas(i.e., Thread was proposed for smart-home environments). Most of these tech-nologies require a gateway or border router which is used to connect the nodesin IoT network to the Internet.
The third layer in our generic architecture is the IoT - Internet ConnectionLayer, where a border router or gateway connects the inner IoT network tothe Internet via communication technologies, such as fiber optics or satellitecommunication.
Processing, analysis and storage of the collected data are performed at theProcessing Layer. Designers can choose centralized storage and processing sys-tems, or distributed storage and processing systems (e.g., cloud or fog computingenvironments). Middleware services are provided in this layer based on the pro-cessed and analyzed data. This is one of the most important layer in the archi-tecture of IoT, since valuable information is extracted here from the collecteddata which can be in big volumes, variety and veracity.
The Application Layer is the fifth layer within the generic IoT architecture.In this layer, we see applications in various deployment areas, which make use ofthe meaningful information obtained from Processing Layer. Applications of IoTcan be in home, building, industry, urban or rural environments. Applicationsof home environments can be health-reporting and monitoring, alarm systems,lighting applications, energy conservation, remote video surveillance [13]. Build-ing environments IoT applications can be Heating Ventilation and Air Condi-tioning (HVAC) applications, lighting, security and alarm systems, smoke andfire monitoring and elevator applications [31]. Industrial IoT applications can besafety, control and monitoring applications with different emergency classes [38].In urban environments, there may be broad range of applications. Lighting appli-cations, waste monitoring, intelligent transportation system applications, mon-itoring and alert reporting are only a few of them. Rural environments mayinclude monitoring applications (e.g., bridges, forests, agriculture, etc.).
The Business Layer is the last layer in the generic architecture, which includesorganization and management of IoT networks. Business and profit models areconstructed here in addition to charging and management operations [57].
3.2 Standardized Protocol Stack for Low Power and LossyNetworks
Multiple communication technologies exist for the IoT-Access Network Layer aswe mentioned in Sect. 3.1. Since Thread, NB-IoT, LTE-M, LoRa/LoRaWAN arevery new communication technologies, there were not any studies which focuson the D/DoS attacks that may target such networks during the time we wereworking on this proposal. ZigBee is a proprietary technology and it also uses thesame physical and MAC layers as 6LoWPAN-based networks. Thus PHY andMAC layer attacks for 6-LoWPAN-based networks covers the PHY and MAC
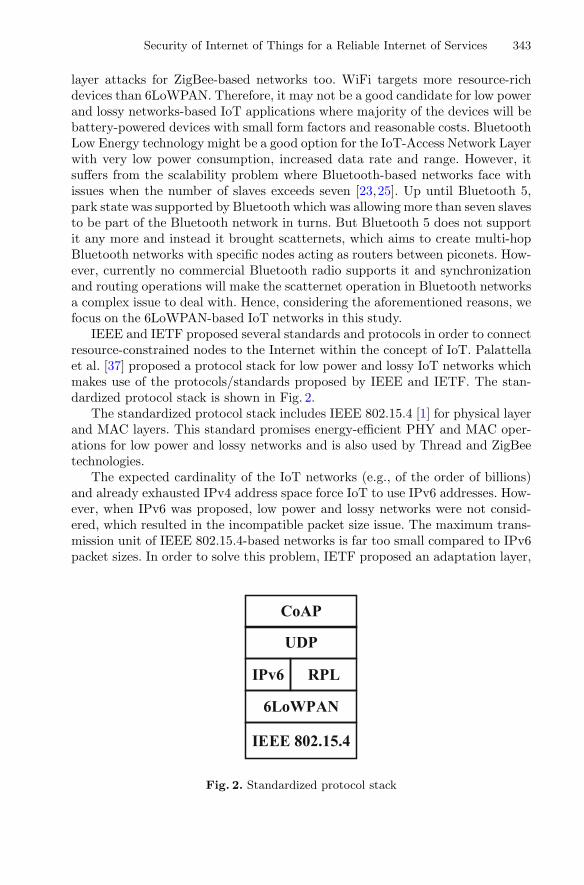
Security of Internet of Things for a Reliable Internet of Services 343
layer attacks for ZigBee-based networks too. WiFi targets more resource-richdevices than 6LoWPAN. Therefore, it may not be a good candidate for low powerand lossy networks-based IoT applications where majority of the devices will bebattery-powered devices with small form factors and reasonable costs. BluetoothLow Energy technology might be a good option for the IoT-Access Network Layerwith very low power consumption, increased data rate and range. However, itsuffers from the scalability problem where Bluetooth-based networks face withissues when the number of slaves exceeds seven [23,25]. Up until Bluetooth 5,park state was supported by Bluetooth which was allowing more than seven slavesto be part of the Bluetooth network in turns. But Bluetooth 5 does not supportit any more and instead it brought scatternets, which aims to create multi-hopBluetooth networks with specific nodes acting as routers between piconets. How-ever, currently no commercial Bluetooth radio supports it and synchronizationand routing operations will make the scatternet operation in Bluetooth networksa complex issue to deal with. Hence, considering the aforementioned reasons, wefocus on the 6LoWPAN-based IoT networks in this study.
IEEE and IETF proposed several standards and protocols in order to connectresource-constrained nodes to the Internet within the concept of IoT. Palattellaet al. [37] proposed a protocol stack for low power and lossy IoT networks whichmakes use of the protocols/standards proposed by IEEE and IETF. The stan-dardized protocol stack is shown in Fig. 2.
The standardized protocol stack includes IEEE 802.15.4 [1] for physical layerand MAC layers. This standard promises energy-efficient PHY and MAC oper-ations for low power and lossy networks and is also used by Thread and ZigBeetechnologies.
The expected cardinality of the IoT networks (e.g., of the order of billions)and already exhausted IPv4 address space force IoT to use IPv6 addresses. How-ever, when IPv6 was proposed, low power and lossy networks were not consid-ered, which resulted in the incompatible packet size issue. The maximum trans-mission unit of IEEE 802.15.4-based networks is far too small compared to IPv6packet sizes. In order to solve this problem, IETF proposed an adaptation layer,
CoAP
UDP
IPv6 RPL
6LoWPAN
IEEE 802.15.4
Fig. 2. Standardized protocol stack
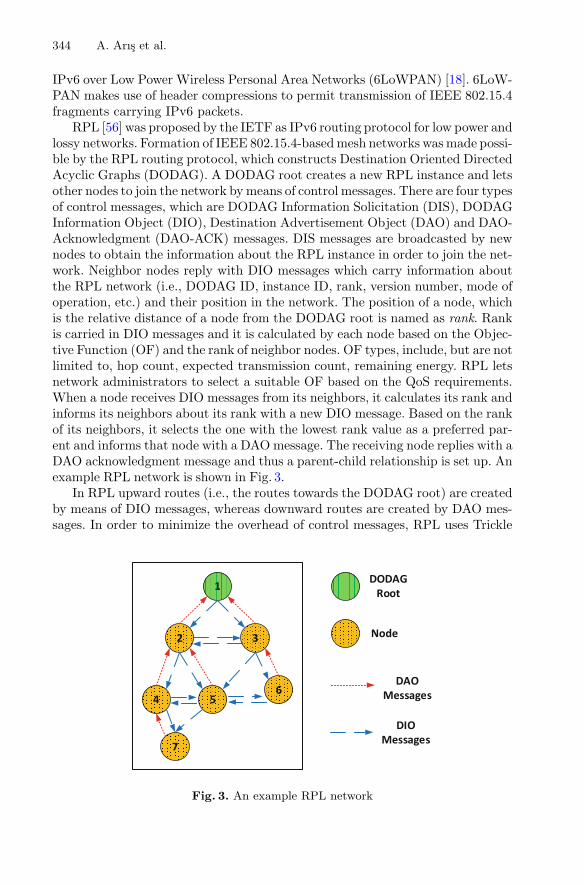
344 A. Arıs et al.
IPv6 over Low Power Wireless Personal Area Networks (6LoWPAN) [18]. 6LoW-PAN makes use of header compressions to permit transmission of IEEE 802.15.4fragments carrying IPv6 packets.
RPL [56] was proposed by the IETF as IPv6 routing protocol for low power andlossy networks. Formation of IEEE 802.15.4-based mesh networks was made possi-ble by the RPL routing protocol, which constructs Destination Oriented DirectedAcyclic Graphs (DODAG). A DODAG root creates a new RPL instance and letsother nodes to join the network by means of control messages. There are four typesof control messages, which are DODAG Information Solicitation (DIS), DODAGInformation Object (DIO), Destination Advertisement Object (DAO) and DAO-Acknowledgment (DAO-ACK) messages. DIS messages are broadcasted by newnodes to obtain the information about the RPL instance in order to join the net-work. Neighbor nodes reply with DIO messages which carry information aboutthe RPL network (i.e., DODAG ID, instance ID, rank, version number, mode ofoperation, etc.) and their position in the network. The position of a node, whichis the relative distance of a node from the DODAG root is named as rank. Rankis carried in DIO messages and it is calculated by each node based on the Objec-tive Function (OF) and the rank of neighbor nodes. OF types, include, but are notlimited to, hop count, expected transmission count, remaining energy. RPL letsnetwork administrators to select a suitable OF based on the QoS requirements.When a node receives DIO messages from its neighbors, it calculates its rank andinforms its neighbors about its rank with a new DIO message. Based on the rankof its neighbors, it selects the one with the lowest rank value as a preferred par-ent and informs that node with a DAO message. The receiving node replies with aDAO acknowledgment message and thus a parent-child relationship is set up. Anexample RPL network is shown in Fig. 3.
In RPL upward routes (i.e., the routes towards the DODAG root) are createdby means of DIO messages, whereas downward routes are created by DAO mes-sages. In order to minimize the overhead of control messages, RPL uses Trickle
DODAG Root
Node
DAO Messages
DIO Messages
1
2 3
4 56
7
Fig. 3. An example RPL network
Security of Internet of Things for a Reliable Internet of Services 345
Timer [30] to reduce the number of control messages created as network getsmore stable. Nodes are expected to follow the rules of the RPL specification inorder to create loop-free and efficient RPL DODAGs. In low power and lossynetworks, faults and problems tend to occur. To recover from such issues, RPLaccommodates repair mechanisms (i.e., global repair and local repair).
The standardized protocol stack for low power and lossy networks employsthe Constrained Application Protocol (CoAP) [50] for the application layer.CoAP is built on top of UDP and supports Representational State Transfer(REST) architecture. By means of CoAP, even resource-constrained nodes canbe part of the World Wide Web (WWW). In order to optimize the data carriedby CoAP messages, the IETF proposed another standard for the binary repre-sentation of the structured data called Concise Binary Object Representation(CBOR) [12] on top of CoAP.
4 Internet of Things Security
In Sect. 3.2, we briefly summarized the standardized protocol stack which con-sists of standards and protocols proposed by IEEE and IETF for low power andlossy networks. In this section, we focus on the security of IoT networks whichaccommodate the standardized protocol stack.
Securing a communication network is not an easy task and requires a compre-hensive approach. In such a study, we have to determine assets, think of threatsand consider compromise scenarios and possible vulnerabilities. Following these,we have to find the suitable solutions which will help us to ensure a secure sys-tem. When we think of the solutions, the first thing that probably comes intoour minds is the cryptography. Cryptography promises to provide confidential-ity and integrity of the messages, authentication of the users and systems andnon-repudiation of the transactions. Confidentiality means that the content ofthe message is kept secret from eavesdroppers. Integrity ensures that the con-tent of the message is not changed and is still the same as the first time it wasproduced. Authentication allows the end points of the communicating partiesto identify each other and determine the correct target of the communication.Non-repudiation prevents one end of the communication to deny its actions thatit performs and protects the other end.
In this section, we firstly outline the cryptography-based security solutions forthe low power and lossy networks which employ the standardized protocol stack.After that, we analyze the protocols and point out the advantages and disadvan-tages. Then we will inquire whether cryptography is enough for us or not.
4.1 Cryptography-Based Security Solutions for Low Powerand Lossy Networks
A number of cryptography-based solutions exist so as to secure the low powerand lossy networks that employ the standardized protocol stack. These solutionsare shown in Fig. 4.
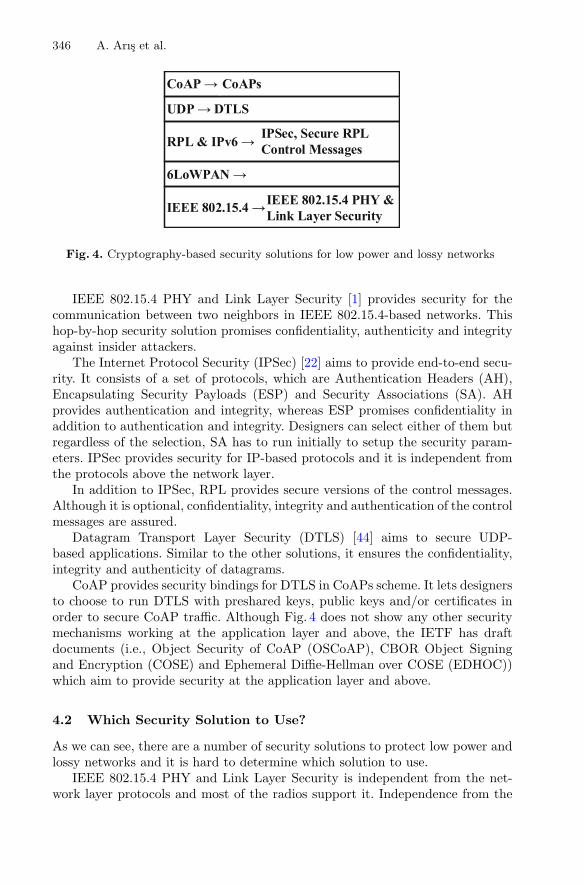
346 A. Arıs et al.
DTLS
IPSec, Secure RPL Control Messages
IEEE 802.15.4 PHY &Link Layer Security
UDP →
RPL & IPv6 →
6LoWPAN →
IEEE 802.15.4 →
CoAPsCoAP →
Fig. 4. Cryptography-based security solutions for low power and lossy networks
IEEE 802.15.4 PHY and Link Layer Security [1] provides security for thecommunication between two neighbors in IEEE 802.15.4-based networks. Thishop-by-hop security solution promises confidentiality, authenticity and integrityagainst insider attackers.
The Internet Protocol Security (IPSec) [22] aims to provide end-to-end secu-rity. It consists of a set of protocols, which are Authentication Headers (AH),Encapsulating Security Payloads (ESP) and Security Associations (SA). AHprovides authentication and integrity, whereas ESP promises confidentiality inaddition to authentication and integrity. Designers can select either of them butregardless of the selection, SA has to run initially to setup the security param-eters. IPSec provides security for IP-based protocols and it is independent fromthe protocols above the network layer.
In addition to IPSec, RPL provides secure versions of the control messages.Although it is optional, confidentiality, integrity and authentication of the controlmessages are assured.
Datagram Transport Layer Security (DTLS) [44] aims to secure UDP-based applications. Similar to the other solutions, it ensures the confidentiality,integrity and authenticity of datagrams.
CoAP provides security bindings for DTLS in CoAPs scheme. It lets designersto choose to run DTLS with preshared keys, public keys and/or certificates inorder to secure CoAP traffic. Although Fig. 4 does not show any other securitymechanisms working at the application layer and above, the IETF has draftdocuments (i.e., Object Security of CoAP (OSCoAP), CBOR Object Signingand Encryption (COSE) and Ephemeral Diffie-Hellman over COSE (EDHOC))which aim to provide security at the application layer and above.
4.2 Which Security Solution to Use?
As we can see, there are a number of security solutions to protect low power andlossy networks and it is hard to determine which solution to use.
IEEE 802.15.4 PHY and Link Layer Security is independent from the net-work layer protocols and most of the radios support it. Independence from the
Security of Internet of Things for a Reliable Internet of Services 347
upper layer protocols means that we do not have to change anything with them.However, since IEEE 802.15.4 PHY and Link Layer Security provides the secu-rity between two neighbors, trustworthiness of every node on the routing pathbecomes a very crucial issue. If the routing path has a malicious node, thenthe security of the messages routed through this path cannot be guaranteed. Inaddition to this, IEEE 802.15.4 PHY and Link Layer Security works only in theIoT - Access Network Layer in our generic architecture and when messages leavethis layer and enter the Internet, they are no more protected [40].
IPSec provides end-to-end security and is independent from the upper layerprotocols. End-to-end security guarantees security between two hosts which canbe in different networks. Designers do not have to worry about the trustwor-thiness of the other nodes, devices or networks on the path. However, it bringsburden to 6LoWPAN layer, where packets with IPSec require header compres-sion [40]. In addition to this, Security Associations is connection-oriented andsimplex, which means if two hosts want to send packets secured with IPSec toeach other, then each of them individually need to establish SAs [26]. Further-more, firewalls may limit the packets with IPSec and Internet Service Providers(ISPs) tend to welcome packets with IPSec as business-class packets and preferto charge them more. So, if IoT data will be secured with IPSec, there are anumber of issues we have to consider before using it.
DTLS serves as the security solution between two UDP-based applicationsrunning on different end-points. Although it aims to protect the application layerdata, it does not promise security for anything else. This means, if we employDTLS as the only security solution, then we cannot protect IP headers whenpackets are passing through the IoT - Access Network Layer and through theInternet. So, security of the routing becomes susceptible to the attacks, such asDoS and DDoS attacks. This is why the primary security concern of DTLS is onD/DoS attacks.
4.3 We Have Cryptography-Based Solutions, Are We All Set?
In Sect. 4.1 we outlined the cryptography-based security solutions very briefly.As we explained in Sect. 4.2, each solution comes with its advantages and dis-advantages. It is not an easy task to select the appropriate solution. However,there are a number of other issues which we have to consider when protectingIoT networks.
First of all, cryptography is generally thought to be heavy weight, and is fullof resource consuming operations implemented in software and/or hardware.When we consider the resource limitations of the devices in low power and lossynetworks, affordability of such solutions becomes questionable. Designers haveto face the trade off between security and very crucial parameters such as cost,network life time and performance.
Secondly, although cryptography-based solutions are proved to be secure,proper implementation of the protocols and algorithms is extremely important.However, most of the implementations of these solutions have vulnerabilities as
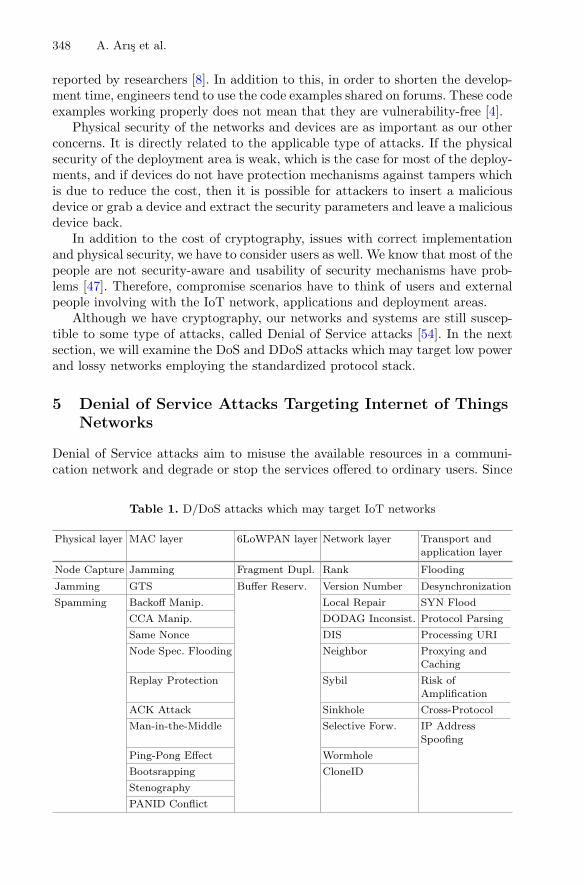
348 A. Arıs et al.
reported by researchers [8]. In addition to this, in order to shorten the develop-ment time, engineers tend to use the code examples shared on forums. These codeexamples working properly does not mean that they are vulnerability-free [4].
Physical security of the networks and devices are as important as our otherconcerns. It is directly related to the applicable type of attacks. If the physicalsecurity of the deployment area is weak, which is the case for most of the deploy-ments, and if devices do not have protection mechanisms against tampers whichis due to reduce the cost, then it is possible for attackers to insert a maliciousdevice or grab a device and extract the security parameters and leave a maliciousdevice back.
In addition to the cost of cryptography, issues with correct implementationand physical security, we have to consider users as well. We know that most of thepeople are not security-aware and usability of security mechanisms have prob-lems [47]. Therefore, compromise scenarios have to think of users and externalpeople involving with the IoT network, applications and deployment areas.
Although we have cryptography, our networks and systems are still suscep-tible to some type of attacks, called Denial of Service attacks [54]. In the nextsection, we will examine the DoS and DDoS attacks which may target low powerand lossy networks employing the standardized protocol stack.
5 Denial of Service Attacks Targeting Internet of ThingsNetworks
Denial of Service attacks aim to misuse the available resources in a communi-cation network and degrade or stop the services offered to ordinary users. Since
Table 1. D/DoS attacks which may target IoT networks
Physical layer MAC layer 6LoWPAN layer Network layer Transport andapplication layer
Node Capture Jamming Fragment Dupl. Rank Flooding
Jamming GTS Buffer Reserv. Version Number Desynchronization
Spamming Backoff Manip. Local Repair SYN Flood
CCA Manip. DODAG Inconsist. Protocol Parsing
Same Nonce DIS Processing URI
Node Spec. Flooding Neighbor Proxying andCaching
Replay Protection Sybil Risk ofAmplification
ACK Attack Sinkhole Cross-Protocol
Man-in-the-Middle Selective Forw. IP AddressSpoofing
Ping-Pong Effect Wormhole
Bootsrapping CloneID
Stenography
PANID Conflict
Security of Internet of Things for a Reliable Internet of Services 349
IoT will be one of the main building block of Internet of Services, detection,mitigation and prevention of such attacks are very crucial.
In this section, we present and explain the D/DoS attacks which may targetIoT networks. Table 1 categorizes such attacks with respect to the layers of thestandardized protocol stack. This categorization is an extended version of ourprevious study [10].
5.1 D/DoS Attacks to the Physical Layer
Physical Layer D/DoS attacks are node capture, jamming and spamming.As its name implies, in node capture attacks, attackers capture the physical
nodes within the network. The aim of the attackers may be creating routingholes or tampering the device and extracting security parameters. After that,they may place the node back with the compromised software or place the nodewith a replica of it. By this way, they can apply various attacks (e.g., otherattacks categorized as higher layer attacks).
Physical Layer jamming attacks comprise of malicious devices creating inter-ference to the signals transmitted in the physical layer [7]. Attackers can con-stantly, randomly or selectively (i.e., jamming signals carrying specific packets,such as routing or data packets) apply jamming.
In spamming attack, attackers place malicious QR codes to the deploymentareas which cause users to be forwarded to malicious targets on the Internet [42].
5.2 D/DoS Attacks to the MAC Layer
MAC Layer D/DoS attacks are link layer jamming, GTS, backoff manipulation,CCA manipulation, same nonce attack, node specific flooding, replay protectionattack, ACK attack, man-in-the-middle, ping-pong effect, bootstrapping attack,PANID conflict and stenography.
Link layer jamming is a type of jamming where frames are jammed insteadof signals as in the physical layer [7].
IEEE 802.15.4 standard has an optional feature called as Guaranteed TimeSlot (GTS) which works in beacon-enabled operational mode. GTS is intendedfor timely critical applications that require strict timing with channel accessand transmissions. Nodes have to request and allocate time slots in order to usethis feature. However, if attackers cause interference during this process (e.g.,by jamming), then ordinary nodes cannot register themselves for the guaranteedtime slots and thus QoS of the application gets affected. This attack is calledGTS attack [51].
ACK attack consists of attackers creating interference to Acknowledgment(ACK) frames and thus causing a node to believe that its fragment was notsuccessfully received by the receiving node [7]. By this way targeted nodes areforced to retransmit the same fragment and consume more power. QoS of therunning application would be affected by it too. Moreover, it may cause thesender node believe that its next hop neighbor is filtering the messages.

350 A. Arıs et al.
Clear Channel Assessment (CCA) mechanism is used by nodes to sense thechannel and find out if any other node is currently using the channel or not.This approach is commonly used to prevent collisions. However, attackers canskip CCA and access the channel, which causes collisions. By this way, delays,retransmissions and unnecessary energy usage occurs. This attack is called CCAmanipulation [7].
Backoff manipulation attack compromises the backoff periods of CarrierSense Multiple Access (CSMA)-based medium access with attackers choosingshorter backoff times instead of longer [7]. By this way, they get the chance touse the channel as much as possible and limit the other users’ channel accesses.
Sequence numbers are used in the IEEE 802.15.4 standard in order to preventmalicious devices sending the previously sent fragments over and over. However,in replay protection attacks [7], attackers can still misuse it by sending frameswith bigger sequence number than the targeted ordinary node. This would causethe receiving node drop the fragments coming from the ordinary node since itnow looks like it is sending old fragments.
As we mentioned in Sect. 4, IEEE 802.15.4 PHY and Link Layer Securityis a candidate security mechanism for IoT security, which promises to protectthe communication between two neighbor nodes. If nodes share the same keyand nonce values in the implementation of IEEE 802.15.4 PHY and Link LayerSecurity, then attackers may extract the keys by eavesdropping the messageswhich happens in the same nonce attack [7].
The PANID Conflict attack misuses the conflict resolution procedure of IEEE802.15.4 which functions when two coordinators are placed close to each other in adeployment area and holding the same Personal Area Network ID (PANID). Mali-cious nodes may transmit a conflict notification message when there is actually noconflict to force the coordinator to initiate the conflict resolution process [7].
Another MAC Layer D/DoS attack is the ping-pong effect, where maliciousnodes intentionally switch between different PANs [7]. If attackers choose to doit frequently, then they may cause packet losses, delays and extra overhead tothe already limited resources.
In the bootstrapping attack, attackers aim to obtain useful information abouta new node joining the network. In order to do so, firstly a targeted node is forcedto leave the network by the attackers. Then when it tries to join the networkagain, attackers obtain the bootstrapping information which they may use toassociate a malicious node to the network [7].
Node specific flooding attacks are a type of flooding attack which is appliedat the MAC layer [7]. In this attack, malicious nodes send unnecessary fragmentsto the target node which aims to consume its resources and thus is no longerable to serve for its ordinary purpose.
The Stenography attack abuses the unused fields in the frame format of IEEE802.15.4. Unused bits can be used by the attackers to carry hidden information [7].

Security of Internet of Things for a Reliable Internet of Services 351
5.3 D/DoS Attacks to the 6LoWPAN Layer
Hummen et al. [19] proposed two attacks, namely fragment duplication and bufferreservation, which may target the 6LoWPAN Adaptation Layer.
In fragment duplication attack, attackers duplicate a single fragment of apacket and thus force the receiving node to drop the fragments of the corre-sponding packet. In this attack, attackers abuse the approach of 6LoWPANstandard which deals with the duplicate fragments. The standard advises todrop the fragments of a packet in case of duplicates so as to get rid of the over-head of dealing with duplicates and save resources. However, malicious nodescan turn this naive mechanism into a DoS attack very easily.
In Buffer reservation attacks, attackers reserve the buffer space of the tar-geted node with incomplete packets and keep it occupied as long as possible.Since resources are limited, nodes cannot afford to spare extra buffer space forthe incomplete packets of other nodes. Thus, during the time the attacker holdsthe buffer space, ordinary nodes’ fragments cannot be accepted. Readers shouldnote that, this behavior of 6LoWPAN is possible when 6LoWPAN is configuredto forward the fragments according to the route-over approach, where all frag-ments of a packet are reassembled by the receiving node before being forwarded.
5.4 D/DoS Attacks to the Network Layer
D/DoS attacks which may target the IoT Network Layer can be divided intotwo categories: RPL-specific and non-RPL-specific attacks. RPL-specific attacksare rank, version number, local repair, DODAG inconsistency and DIS attacks.Non-RPL-specific attacks are the ones which are already known from the wirelesssensor networks, and other communication networks research. Although theylook old-fashioned, they are still applicable in RPL-based networks. Non-RPL-specific attacks are sybil, sinkhole, selective forwarding, wormhole, cloneID andneighbor attacks.
RPL-Specific Attacks. D/DoS attacks which may target RPL networks abusethe vulnerabilities of the RPL protocol design. RPL, designed by the IETF forthe routing of IPv6 packets on low power and lossy networks, has vulnerabilitieswith the control plane security and attackers can easily misuse it. In order tosecure RPL networks, the IETF advises to use cryptography-based security solu-tions, secure control messages and some attack-specific countermeasures (e.g.,using location information, multi-path routing) [52]. However, as explained inSect. 4.3, there are several issues to consider with security and it is highly prob-able that RPL-based networks will be susceptible to D/DoS attacks.
Rank is a very crucial parameter of the RPL protocol which represents anode’s position within the DODAG. This position is a relative distance of a nodefrom the DODAG root. The distance is determined with respect to the ObjectiveFunction and can be based on the hop count, link quality, remaining poweretc. Rank is used to create an efficient DODAG according to the applicationneeds and to set up the child-parent relationship. For optimized and loop-free
352 A. Arıs et al.
DODAGs, nodes have to follow the rules. However malicious nodes may use rankin various ways to apply D/DoS attacks. In [27] and [28], an attacker node selectsthe neighbor with worst rank as a preferred parent instead of choosing the onewith the best rank. Thus an inefficient DODAG is created which causes delaysand an increased number of control messages. In [29], the attacker intentionallyskips applying the rank check which breaks the rank rule constructing the loop-free parent-child relationship.
RPL has two repair mechanisms in order to keep the DODAG healthy. Oneof them is the global repair operation where the entire DODAG is re-created.According to the RPL specification, only the DODAG root can initiate theglobal repair mechanism by incrementing the Version Number parameter. EveryDODAG has a corresponding version number that is carried in DIO messages.When the root increments the version number, nodes in the RPL network findout the global repair operation by checking the version number in the incomingDIO messages. They exchange control messages and setup the new DODAG.However, there is no mechanism in RPL which guarantees that only the DODAGroot can change the version number field. Malicious nodes can change the versionnumber and force the entire network to set up the DODAG from scratch [11,35].This attack is called Version Number attack and it affects the network withunnecessary control messages, delays, packet losses and reduced network lifetime.
Similar to the global repair, the local repair mechanism of RPL can be thetarget of a D/DoS attack called local repair [27,29]. Local repair is an alternativerepair solution of RPL which aims to solve the local inconsistencies and issuesand cost less than the global repair mechanism since it involves a smaller portionof the network. If nodes find out inconsistencies (e.g., loops, packets with wrongdirection indicators), then they start the local repair mechanism which consistsof exchanging control messages and re-creating the parent-child relationshipsand getting appropriate ranks again. However malicious nodes can start localrepair when there is no need so as to misuse the resources. This type of attackis called local repair attack.
RPL has a data path validation mechanism, in which headers of the IPv6 datapackets carry RPL flags that indicate the direction of the packet and possibleinconsistencies with the rank of the previous sender/forwarder. When a nodereceives a packet with those flags indicating an inconsistency, it drops the packetand starts the local repair mechanism. In DODAG inconsistency attacks [49],attackers can set the corresponding flags of a data packet before they forward itand force the receiver node to drop the packet and start local repair.
The last D/DoS attack specific to RPL is the DIS attack. DIS messages areused in RPL when a new node wants to join the network and therefore askingfor information about the RPL network. Attackers can send unnecessary DISmessages in DIS attacks [27], which causes the neighboring nodes to reset theirDIO timers and send DIO messages frequently. Thus, the attacker forces nodesto generate redundant control messages and consume more power.

Security of Internet of Things for a Reliable Internet of Services 353
Attacks not Specific to RPL. Attacks which are not specific but still appli-cable to RPL are neighbor, sybil, sinkhole, selective forwarding, wormhole andcloneID.
A malicious node can apply the neighbor attack by retransmitting the routingcontrol messages it hears [27]. This behavior causes neighbor nodes to think thatthe source of the control message is close to them and take actions accordingly.Actions could be sending control messages back, trying to select it as a preferredparent, etc. If the attacker uses a high power radio, then it may affect a largeportion of the network by this way.
In sybil attacks, a malicious node seems to act as multiple nodes, introducingitself with multiple logical identities [54]. If there is a voting mechanism runningin the IoT network (e.g., voting based security mechanisms, cluster head selec-tion), attackers can apply sybil to change the results and thus take control ofthe complete network or a portion of the network.
The CloneID attack is similar to the sybil attack but works in a differentdimension. The attacker in this case places the clones of a malicious node ornormal node to the multiple positions at the network [41,54]. This attack hassimilar aims as sybil and it may also be called node replication attack.
Sinkhole attacks are another type of attacks where malicious nodes adver-tise good routing parameters to show themselves as candidate parents. In RPL,attackers can advertise good ranks, which causes the neighbor nodes to selectit as the preferred parent [41,54,55]. When a malicious node is selected as thepreferred parent by neighbor nodes, then it can apply other attacks, such asselective forwarding.
In selective forwarding attacks, a malicious node inspects the incoming pack-ets, drops the ones it is interested in and forwards the rest [41,54]. For example,it may forward only the routing messages, whereas it may drop the data pack-ets. Or, malicious node may filter specific packets sourced from or destined tospecific addresses.
The last attack we explore in this category is the wormhole attack [39,54]. Inwormhole attacks, at least a couple of malicious nodes create a hidden communi-cation channel by means of multiple radios and transfer the overheard messagestransmitted at one end point to another. This may work bidirectional as well.By this way, two sets of nodes around each attacker believe that they are in thecommunication range of each other, which causes several issues.
5.5 D/DoS Attacks to the Transport and Application Layer
D/DoS attacks which may target Transport and Application Layers are flooding,desynchronization, SYN flood, protocol parsing, processing URI, proxying andcaching, risk of amplification, cross-procotol and IP address spoofing attacks [21,50]. The majority of the attacks mentioned here were not studied in the literatureand the IETF considers them as possible threats for CoAP.

354 A. Arıs et al.
6 Studies that Analyze D/DoS Attacks for Internetof Things
The previous section was about the possible D/DoS attacks which can targetthe IoT networks. Starting from this section, we will analyze the studies forthe aforementioned attacks. In this section, we will explore the works whichinvestigate the effects of the attacks.
Sokullu et al. [51] proposed GTS attacks to IEEE 802.15.4 in 2008. In theirwork, they also analyzed the effects of the attack in the bandwidth utilizationof Contention Free Period (CFP). They considered single and multiple attackerswhere attackers can either attack randomly or intelligently. They found outsignificant decrease in the bandwidth utilization of CFP periods due to GTSattacks.
Le et al. analyzed the rank attack in [28] in RPL networks in 2013. In thiswork, they applied the rank attacks with different cases where the attacker con-stantly applies the attack or switches between legitimate and malicious behaviorsfrequently. Analysis with respect to combinations of attacking cases show that ifthe rank attack is applied in a dense part of the network, then its effect is moredetrimental. They also realized that, the number of affected nodes, number ofgenerated DIO messages, average end-to-end delay and delivery ratio can be theindicator of such attacks.
Mayzaud et al. studied RPL version number attacks in [35] in 2014. Theyinvestigation with a single attacker in a grid topology at varying positions showedthat the location of the attacker is correlated to the effects of the attack. If theattacker is located far from the DODAG root within the grid, then its effect islarger than when attacker is closer to the root.
The Version number attack is analyzed by another work [11] proposed by Ariset al. in 2016. In this study, the authors considered a factory environment con-sisting of varying topologies (i.e., grid and random) with different node mobilities(e.g., static and mobile nodes). A probabilistic attacker model is incorporatedhere. Based on the simulations, in addition to the location-effect correlationfound in Mayzaud’s work [35], the authors found out that the mobile attackers’
Table 2. Categorization of the studies that analyze the D/DoS attacks for IoT
Proposal Target attack Finding
Sokullu [51] GTS (MAC Layer) Significant bandwidth utilization decrease inCFP
Le [28] Rank (Routing) Dense networks are more vulnerable
Mayzaud [35] Version Number(Routing)
Attacking position-effect of the attackcorrelation
Aris [11] Version Number(Routing)
Mobile attackers are more detrimental andattack triples the power consumption of thenetwork

Security of Internet of Things for a Reliable Internet of Services 355
effect can be as detrimental as the farthest attacking position in the network.They also showed that, version number attacks can increase the power consump-tion of the nodes by more than a factor of two.
Table 2 categorizes the studies which analyze the effects of the D/DoS attacksfor IoT. When we review the studies in this section, we realize that researchersfocused on the IoT-specific attacks rather than the attacks which we are alreadyfamiliar with from the Wireless Sensor Networks research (i.e., selective forward-ing, wormhole, sinkhole, etc.). In addition to this, three of the studies found outcorrelations with the success of the attack and the attack settings. Such findingscan be extremely useful in defending IoT networks against the attackers anddesigning better detection and mitigation systems which consider these findings.In Table 1, we had provided a categorization of the D/DoS attacks for IoT and itis clear that many attacks have not been implemented and analyzed in a similarmanner.
7 Mitigation Systems and Protocol Security Solutionsfor Internet of Things
Mitigation systems are proposed by researchers in order to minimize the effectsof the attacks. Such systems are far from being a complete security solution butstill can increase the strength of the system against attackers. In this context,existing protocols are enriched with additional features by the designers whichcan mitigate the detrimental effects of the D/DoS attacks. On the other hand,protocol security solutions referred here consist of mechanisms which aim tosecure a communication protocol or a specific part of it. In this section, readerscan find the studies which either propose a security solution or mitigate theeffect of the attacks.
Dvir et al. proposed VeRA [16], a security solution for the crucial versionnumber and rank parameters carried in DIO messages in 2011. Their solutionmakes use of hash chains and message authentication codes in order to securelyexchange these RPL parameters in DIO messages.
Weekly et al. [55] evaluated the defense techniques for sinkhole attacks inRPL in 2012. They compared a reduced implementation of VeRA to their noveltechnique called as Parent Failover. Parent Failover uses Unheard Node Setwhich includes the IDs of the nodes that the BR did not hear from. Each nodeblacklists its parent if it sees itself in the list in this technique.
Wallgren et al. [54] proposed implementations of routing attacks (i.e., selec-tive forwarding, sinkhole, hello flood, wormhole, sybil) which are not specific toRPL. They did not analyze the effects of the attacks. However, they made com-ments on possible mitigation/detection mechanisms against such attacks. Theirmitigation ideas include usage of geographical location information, incorpora-tion of cryptography schemes, using multiple routes and/or RPL instances andkeeping track of the number of nodes within the network. Although the authorssuggest to use such mechanisms against the corresponding attacks, they did notimplement the mitigation mechanisms and analyze the performance of them.

356 A. Arıs et al.
Hummen et al. [19] proposed two novel attacks to 6LoWPAN adaptationlayer, which are fragment duplication attack and buffer reservation attack. Theyalso proposed two novel mitigation mechanisms against these attacks. For frag-ment duplication attacks, the authors proposed hash chain structures whichcreate a binding for fragments of a packet to the first fragment of the corre-sponding packet. In order to mitigate the effects of buffer reservation attacks,they suggested to split the reassembly buffer into fragment-sized slots and letmultiple fragments belonging to different packets use it. They merged split bufferapproach with a fragment discard mechanism in case of overloaded buffer con-ditions.
In 2014, Sehgal et al. [49] proposed a mitigation study which targets DODAGinconsistency attacks. According to the authors, RPL uses a threshold to miti-gate the effects of such an attack. In RPL, a node receiving a data packet withflags indicating an inconsistency drops the packet and resets its trickle timer.A node can do this until reaching a threshold. After this threshold it does notreset the trickle timer any more. This proposal changes the constant thresholdof RPL to an adaptive threshold to mitigate the effects of the attack better.
Another mitigation technique for DODAG inconsistency attacks was pro-posed by Mayzaud et al. [33] in 2015. It is an improved version of the mitigationtechnique proposed in Sehgal’s work [49]. In the former study, packets with ‘R’flags set were counted, whereas in this study, the number of trickle timer resetsare counted. Based on this, a node either drops the packets and resets trickletimer, or forwards the packets with modifying the R and O flags to the normalstate.
Table 3. Categorization of the mitigation systems and protocol security solutions
Proposal Target attack Mitigation/Security mechanism
VeRA [16] Rank and VersionNumber (Routing)
Hash chains and Message AuthenticationCodes
Weekly [55] Sinkhole (Routing) Reduced VeRA and Unheard Node Set
Wallgren [54] Routing attacks notspecific to RPL
Geographical Location Info.,Cryptography, Multiple Paths andInstances, Cardinality of the Network
Hummen [19] Fragment Duplicationand Buffer Reservation(MAC)
Content Chaining Using Hash Chains,Split Buffer with Fragment Discard
Sehgal [49] DODAG Inconsistency(Routing)
Adaptive Threshold for InconsistencySituations
Mayzaud [33] DODAG Inconsistency(Routing)
Adaptive Threshold for InconsistencySituations
Ramani [43] CloneID (Routing),General DoS
Distributed Firewall

Security of Internet of Things for a Reliable Internet of Services 357
In 2016, Ramani proposed a two-way firewall [43] for low power and lossynetworks. The two-way firewall analyzes the traffic destined to the 6LoWPANnetwork and traffic leaving from the network. The proposed firewall was testedagainst the CloneID and simple DoS attacks. The main module of the firewallworks on the BR and becomes active when packets destined to the CoAP andDTLS ports are captured. Packets are parsed into incoming and outgoing pack-ets and their IP addresses and ports are verified. After this check, informationrelated to the packet is saved and checked against the protocol rules. Erroneouspackets are dropped here. Also the nodes in the 6LoWPAN network are equippedwith mini-firewall modules which inform the main firewall about their behavior.
Table 3 categorizes the Mitigation Systems and Protocol Security Solutionsfor IoT. Mitigation mechanisms against routing attacks constitute the majorityof the studies in this section. Researchers targeted both RPL-specific attacksand other routing attacks which can be applied to RPL as well. Considering theresource limitations in IoT networks, we can see that three proposals use hashfunctions as lightweight solutions.
8 Intrusion Detection Systems for Internet of Things
In this section, we will survey the literature for intrusion detection systemsproposed against D/DoS attacks for IoT networks. This section is organized asfollows: Firstly, we will briefly give some background information about IntrusionDetection Systems (IDS). After that, we will analyze the IDSes proposed for IoT.
8.1 Intrusion Detection Systems
Intrusion Detection Systems serve as a strong line of defense for computer net-works against the attackers. Without IDS, the puzzle of a secure network isincomplete. As explained in Sect. 4.3, despite having cryptography-based solu-tions, attacks are still possible and IDS comes into the picture here, where itmonitors and analyzes the traffic, data, behavior or resources and tries to pro-tect the network from attackers.
Intrusion Detection Systems can be explored from various points of view.Figure 5 shows a 3D Cartesian Plane of IDSes, where axes depict importantcategories which may be helpful to classify the IDSes. Although not shown,there may be other dimensions in this figure, such as operation frequency andtargeted attacks.
Intrusion Detection Systems: Detection Techniques. IDSes can bedivided into four classes based on the detection technique. These are anomaly-based, signature-based, specification/rule-based and hybrid systems where theformer two are the most popular ones.
Anomaly-based systems learn the behavior of the system when there is noattack and create a profile. Deviations from the profile show possible anomalies.Anomaly-based IDSes can detect the new attacks since attacks are expected
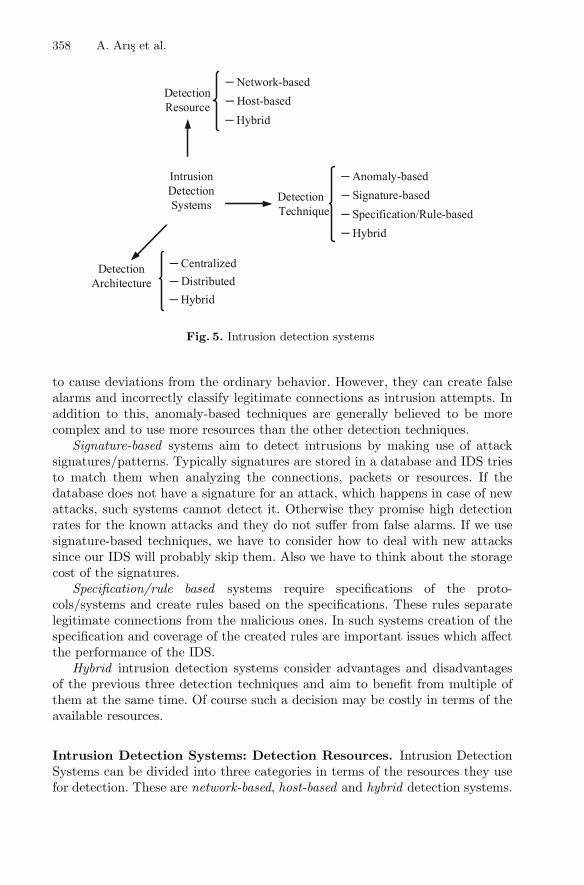
358 A. Arıs et al.
Detection Technique
Detection Resource
Detection Architecture
Intrusion Detection Systems
‒ Network-based‒ Host-based‒ Hybrid
‒ Anomaly-based‒ Signature-based
‒ Hybrid‒ Specification/Rule-based
‒ Centralized‒ Distributed‒ Hybrid
Fig. 5. Intrusion detection systems
to cause deviations from the ordinary behavior. However, they can create falsealarms and incorrectly classify legitimate connections as intrusion attempts. Inaddition to this, anomaly-based techniques are generally believed to be morecomplex and to use more resources than the other detection techniques.
Signature-based systems aim to detect intrusions by making use of attacksignatures/patterns. Typically signatures are stored in a database and IDS triesto match them when analyzing the connections, packets or resources. If thedatabase does not have a signature for an attack, which happens in case of newattacks, such systems cannot detect it. Otherwise they promise high detectionrates for the known attacks and they do not suffer from false alarms. If we usesignature-based techniques, we have to consider how to deal with new attackssince our IDS will probably skip them. Also we have to think about the storagecost of the signatures.
Specification/rule based systems require specifications of the proto-cols/systems and create rules based on the specifications. These rules separatelegitimate connections from the malicious ones. In such systems creation of thespecification and coverage of the created rules are important issues which affectthe performance of the IDS.
Hybrid intrusion detection systems consider advantages and disadvantagesof the previous three detection techniques and aim to benefit from multiple ofthem at the same time. Of course such a decision may be costly in terms of theavailable resources.
Intrusion Detection Systems: Detection Resources. Intrusion DetectionSystems can be divided into three categories in terms of the resources they usefor detection. These are network-based, host-based and hybrid detection systems.
Security of Internet of Things for a Reliable Internet of Services 359
Network-based IDSes use the incoming and outgoing monitoring trafficto/from the network in addition to the internal traffic to detect the intrusions.Network-based IDSes can have a global view of the network and use it to boostthe detection performance. However, such systems lack the information aboutthe individual resource consumptions and logs of the nodes within the networkwhich may be crucial for the detection of specific attacks.
Host-based intrusion detection systems consider the traffic only coming toand leaving from the host. Such systems monitor the resources and logs of thehosts as well which may provide hints about attacks. Since they work locally, theycannot have a global knowledge about the state of other nodes or the networkwhich can be very useful to increase the performance of the IDS.
Hybrid IDSes combine the strengths of network-based and host-based systemsthat benefit from both network and node resources.
Intrusion Detection Systems: Detection Architecture. Architecture ofIntrusion Detection Systems can be centralized, distributed or hybrid.
Centralized IDSes place the intrusion detection to a central location and allof the monitoring information has to be collected here. One of the main reasonsto select a central point for intrusion detection can be the available resources. Asmentioned previously, anomaly detection techniques can be resource-hungry andit may not be feasible to place them on every node due to resource-constraints.Therefore, a resource-rich node, such as border router, can accommodate theintrusion detection system. However, centralized systems come along with com-munication overhead since monitoring data has to be carried all the way to thecentral location. If malicious nodes prevent monitoring data from reaching tothe centralized IDS, then they may achieve to mislead the IDS.
In Distributed IDSes, intrusion detection runs locally at every node in thenetwork. In order to afford an IDS at every node, designers have to tailor thedetection technique or algorithm according to the available resources. This app-roach clearly does not have any communication overhead, however the IDS hasonly local information to analyze in order to detect the intrusions.
Hybrid IDSes again harmonize both of the detection architectures and try tobenefit from each of them as much as possible. In such systems, IDS is dividedinto modules and these modules are distributed along the network. Modules atevery node can apply intrusion detection to a certain extend, may share lessinformation (in comparison with centralized IDSes) with the centralized moduleand thus both reduce the communication overhead and enjoy the rich resourcesof the centralized module.
8.2 Intrusion Detection Systems Proposed for Internet of Things
Cho et al. [15] proposed a botnet detection mechanism for 6LoWPAN-basednetworks in 2009. They assumed that the nodes in the IoT network use TCPtransport layer protocol. Nearly seven years before the Mirai botnet, this studyconsidered how IoT networks can be used as a botnet for DDoS attacks.
360 A. Arıs et al.
The authors thought that, if there exists a malicious node on the forwardingpath, then it can forge the packets and direct them to the target victim addressbased on the command of the bot master. A detection mechanism is placed atthe 6LoWPAN gateway node which analyzes the TCP control fields, averagepacket lengths and number of connections to detect the botnets. The idea isbased on hypothesis that the ordinary IoT traffic should be very homogeneousand botnet would cause significant deviations on the traffic.
Le et al. proposed a specification-based IDS [29] for IoT in 2011. It targetsrank and local repair attacks. Their work assumes that a monitoring network isset up at the start of the network with minimum number of trustful monitoringnodes which has full coverage of the RPL network and has capability to doadditional monitoring jobs. In this context, it has a distributed architectureand it is a network-based IDS. Each Monitoring Node stores the IDs, ranksand preferred parents of neighboring nodes. MNs accommodate a Finite StateMachine (FSM) of RPL with normal and anomaly states to detect the attacks.If a MN cannot decide whether a node is an attacker or not, then it can ask theother MNs. This IDS was not implemented and the authors did not specify theformat of the communication between the monitoring nodes.
Misra et al. [36] proposed a learning automata based IDS for DDoS attacksin IoT. When there is an attack taking place, packets belonging to the mali-cious entities need to be sampled and dropped. This study aims to optimize thissampling rate by means of Learning Automata (LA). Firstly DDoS attacks aredetected at each IoT node in the network based on the serving capacity thresh-olds. When the source of the attack is identified, all of the nodes are informedabout it. In the next step, each node samples the attack packets and drops them.This is when the LA solution comes to the scene. Sampling rate of the attackpackets are optimized by means of the LA.
SVELTE IDS [41] was proposed by Raza et al. in 2013. It targets sinkholeand selective forwarding attacks. It has a hybrid architecture where it placeslightweight IDS modules (i.e., 6LoWPAN mapper client and mini firewall mod-ule) at the resource-constrained devices and the main IDS (i.e., 6LoWPAN map-per, intrusion detection module and distributed mini firewall) at the resource-richBorder Router (BR). 6LoWPAN Mapper at the BR periodically sends requests tothe mapper clients at nodes. Mapper clients reply with their ID, rank, their parentID, IDs of neighbors and their ranks. Based on the collected information about theRPL DODAG, SVELTE compares ranks to find out inconsistencies. It also com-pares the elements of the white-list and elements of current RPL DODAG and usesnodes’ message transmission times to find out the filtered nodes. The mini fire-wall module is used to filter outsider attackers. In addition to these, nodes changetheir parents with respect to packet losses encountered. In terms of the detectionresources used, we can classify SVELTE into network-based IDSes. We can alsoput it into the category of specification/rule-based IDSes.
In the same year with SVELTE, Kasinathan et al. proposed a centralizedand network-based IDS [21] and its demo [20] for 6LoWPAN-based IoT net-works. The motivation of this study is the drawback of centralized IDSes which

Security of Internet of Things for a Reliable Internet of Services 361
suffer from internal attackers. As mentioned in Sect. 8.1, internal attackers mayprevent monitoring data from reaching the centralized IDS. This is due to thefact that monitoring data is sent through the shared wireless medium, which canbe interfered by attackers. In this IDS architecture, the authors place monitor-ing probes to the IoT network which have wired connections to the centralizedmodule. Evaluation of their architecture was done via a very simple scenariowhere they used an open source signature-based IDS. A monitoring probe sendsmonitoring data under the UDP flood attack.
Amaral et al. [6] proposed a network-based IDS for IPv6 enabled WSNs. Inthe proposed scheme, watchdogs which employ network-based IDS are deployedin specific positions within the network. These nodes listen their neighbors andperform monitoring of exchanged packets. IDS modules at each watchdogs userules to detect the intrusion attempts. These rules are transmitted to watchdogsthrough a dedicated channel. In order to dynamically configure the watchdogs,the authors used policy programming approach.
In 2015, Pongle et al. proposed an IDS [39] for wormhole attacks. Their IDShas a hybrid architecture similar to SVELTE. Main IDS is located at the BR andlightweight modules are located at the nodes. This study assumes that the nodesare static and the location of each node is known by the BR at the beginning.The main IDS collects neighbor information from nodes and uses it to find outthe suspected nodes whose distance is found to be more than the transmissionrange of a node. The probable attacker is detected by the IDS based on thecollected Received Signal Strength Indicator (RSSI) measurements related tothe suspected nodes. In terms of the detection resource, we can consider thisstudy as a network-based IDS. And from the detection technique point of view,it can be counted as a specification/rule-based IDS.
Another IDS proposed in 2015 was INTI [14] which targets sinkhole attacks.INTI consists of four modules. The first module is responsible for the cluster for-mation, which converts the RPL network to a cluster-based network. The secondmodule monitors the routing operations. The third module is the attacker detec-tion module, where reputation and trust parameters are determined by meansof Beta distribution. Each node sends its status information to its leader node,which in turn determines the trust and reputation values. Threshold values onthese parameters define whether a node is an attacker or not. The fourth moduleisolates the attacker by broadcasting its information. INTI can be classified as ananomaly-based IDS with distributed IDS architecture. In terms of the detectionresources, we can put it into the category of hybrid IDSes.
Sedjelmaci et al. proposed an anomaly-detection technique [48] for low powerand lossy networks in 2016. Unlike the other IDSes targeting specific attacksand aiming to detect them, this study focuses on the optimization of runningtimes of detection systems. The motivation of the study is derived from thefact that anomaly-based systems require more resources compared to signature-based systems. If our system can afford to be a hybrid system, having both of thedetection systems, then we have to optimize the running time of the anomaly-detection module in order to lengthen the lifetime of the network. The authors

362 A. Arıs et al.
choose game-theory in this study for the optimization of the running time of theanomaly detection system. They claim that, thanks to the game-theory, anomalydetection runs only when a new attack is expected to occur. Anomaly detectionruns only during such time intervals and create attack signatures. The signature-based system in turn puts this signature to its database and runs more oftenthan the anomaly-detection system.
Mayzaud et al. proposed a detection system [32] for version number attacksin 2016. Their system uses the monitoring architecture which was proposed inthe authors’ earlier work [34]. Their monitoring system makes use of the multipleinstance support of RPL protocol. It consists of special monitoring nodes withlong range communication radios. These nodes are assumed to be covering thewhole network and can send the monitoring information to the DODAG rootusing the second RPL instance that was setup as the monitoring network. In theproposed IDS, monitoring nodes eavesdrop the communication around them andsend the addresses of their neighbors and addresses of the nodes who sends DIOmessages with incremented version numbers to the root. The root detects themalicious nodes by means of the collected monitoring information. However, theproposed technique suffers from high false positives. This IDS can be countedas a network-based IDS with centralized detection architecture. We can alsocategorize it as a specification/rule-based IDS.
Another IDS proposed in 2016 was Saeed et al.’s work [45]. This study focuseson the attacks targeting a smart building/home environment where readings ofsensors are sent to the server via a base station. In this study, the focus is onthe attacks that target the base station. These attacks include software-basedattacks and other attacks (i.e., performance degradation attacks, attacks to theintegrity of the data). The anomaly-based with a centralized architecture islocated at the base station. It consists of two layers. The first layer is respon-sible for analyzing the behavior of the system and detecting anomalies. It usesRandom Neural Networks to create the profile and detect the anomalies. Thesecond part is responsible from the software-based attacks. It comes up with atagging mechanism to pointer variables. Accesses with the pointer are aimed tobe limited with respect to the tag boundaries.
Le et al. proposed a specification-based IDS [27] which is based on theirprevious work [29]. Their IDS targets rank, sinkhole, local repair, neighbor andDIS attacks. Firstly the proposal obtains an RPL specification via analysis of thetrace files of extensive simulations of RPL networks without any attacker. Afterthe analysis of the traces for each node, states, transitions and statistics of eachstate are obtained. These are merged to obtain a final FSM of RPL which helpsthem to find out instability states and required statistics. This study organizesthe network in a clustered fashion. The IDS is placed at each Cluster Head(CH). CH sends requests to cluster members periodically. Members reply withneighbor lists, rank and parent information. For each member, CH stores RPLrelated information. CH runs five mechanisms within the concept of IDS. Thesemechanisms are understanding the illegitimate DIS messages and checks for fakeDIO messages, rank inconsistencies and rules, and instability of the network.CH makes use of three thresholds to find out the attackers. These are number
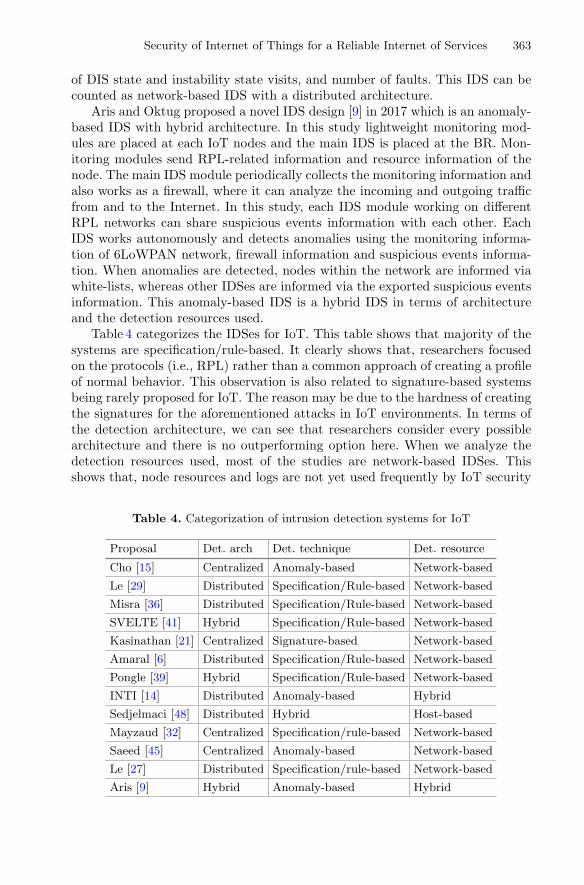
Security of Internet of Things for a Reliable Internet of Services 363
of DIS state and instability state visits, and number of faults. This IDS can becounted as network-based IDS with a distributed architecture.
Aris and Oktug proposed a novel IDS design [9] in 2017 which is an anomaly-based IDS with hybrid architecture. In this study lightweight monitoring mod-ules are placed at each IoT nodes and the main IDS is placed at the BR. Mon-itoring modules send RPL-related information and resource information of thenode. The main IDS module periodically collects the monitoring information andalso works as a firewall, where it can analyze the incoming and outgoing trafficfrom and to the Internet. In this study, each IDS module working on differentRPL networks can share suspicious events information with each other. EachIDS works autonomously and detects anomalies using the monitoring informa-tion of 6LoWPAN network, firewall information and suspicious events informa-tion. When anomalies are detected, nodes within the network are informed viawhite-lists, whereas other IDSes are informed via the exported suspicious eventsinformation. This anomaly-based IDS is a hybrid IDS in terms of architectureand the detection resources used.
Table 4 categorizes the IDSes for IoT. This table shows that majority of thesystems are specification/rule-based. It clearly shows that, researchers focusedon the protocols (i.e., RPL) rather than a common approach of creating a profileof normal behavior. This observation is also related to signature-based systemsbeing rarely proposed for IoT. The reason may be due to the hardness of creatingthe signatures for the aforementioned attacks in IoT environments. In terms ofthe detection architecture, we can see that researchers consider every possiblearchitecture and there is no outperforming option here. When we analyze thedetection resources used, most of the studies are network-based IDSes. Thisshows that, node resources and logs are not yet used frequently by IoT security
Table 4. Categorization of intrusion detection systems for IoT
Proposal Det. arch Det. technique Det. resource
Cho [15] Centralized Anomaly-based Network-based
Le [29] Distributed Specification/Rule-based Network-based
Misra [36] Distributed Specification/Rule-based Network-based
SVELTE [41] Hybrid Specification/Rule-based Network-based
Kasinathan [21] Centralized Signature-based Network-based
Amaral [6] Distributed Specification/Rule-based Network-based
Pongle [39] Hybrid Specification/Rule-based Network-based
INTI [14] Distributed Anomaly-based Hybrid
Sedjelmaci [48] Distributed Hybrid Host-based
Mayzaud [32] Centralized Specification/rule-based Network-based
Saeed [45] Centralized Anomaly-based Network-based
Le [27] Distributed Specification/rule-based Network-based
Aris [9] Hybrid Anomaly-based Hybrid

364 A. Arıs et al.
Table 5. Target attacks & Implementation environments of intrusion detection systemsfor IoT
Proposal Target attacks Implem. env.
Cho [15] Botnets Custom Simulation
Le [29] Rank, Local Repair Not-implemented
Misra [36] General DoS Custom Simulation
SVELTE [41] Sinkhole, Selective-forwarding Contiki Cooja
Kasinathan [21] UDP flooding Project Testbed
Amaral [6] General DoS Project Testbed
Pongle [39] Wormhole Contiki Cooja
INTI [14] Sinkhole Contiki Cooja
Sedjelmaci [48] General DoS TinyOS TOSSIM
Mayzaud [32] Version Number Contiki Cooja
Saeed [45] Software-based attacks, Integrity attacks,Flooding and other
Prototype impl.
Le [27] Rank, Sinkhole, Local Repair, Neighbor,DIS
Contiki Cooja
researchers. This may be due to the already limited resources of the nodes whichmay already be used 100% (e.g., RAM) or no space to store logs. But it isinteresting to see that no proposal considers to use the deviation of the powerconsumption as an intrusion attempt.
Table 5 compares the studies in terms of target attacks and implementationenvironments. The majority of the attacks targeted by IDSes for IoT are routingattacks as shown in the table. A big portion of the studies focus only on a singleattack, whereas only a few studies consider multiple attacks. When we considerthese attacks, nearly all of them are insider attacks. This means, IoT securityresearchers in this concept are not thinking of the threats sourced from theInternet yet. In addition to this, only one study targets software-based attacks.However, we know that embedded system developers choose programming in Clanguage, which may open software-based vulnerabilities to the attackers tar-geting IoT. In terms of the implementation environment, Contiki Cooja is theenvironment selected by most of the researchers.
9 Discussion and Open Issues
In this study, we provided an extensive overview of Internet of Things securityin order to ensure reliable Internet of Services for the future. Of course theremay be other studies which were left unmentioned unintentionally. Consideringthe limitations, attacks, cryptography-based security solutions and studies in theliterature, there are still several issues to research in order to reach a secure IoTenvironment.

Security of Internet of Things for a Reliable Internet of Services 365
One of the major points to consider is the usability and user experience whenproviding security to IoT environments. We have to consider users and provideuser-friendly schemes which will not disturb the satisfaction of users while promis-ing security. This is directly related to the success and acceptance of our solutions.Otherwise, our efforts will be in vain, making the attackers’ job easier.
As we have mentioned in Sect. 5.2, some of the MAC layer attacks make useof jamming attack to reach their aim. If we find a solution against jammingattacks, then this may makes it easier to mitigate the effects of such attacks.
IDSes proposed for IoT use thresholds to decide whether a node/connectionis malicious nor not. However, considering the proposals, thresholds seem to beset intuitively, not based on a scientific technique. This approach clearly limitsthe applicability and reproducibility of the proposed mechanism. The way weset thresholds may be an important issue to think about when designing IDSes.
Assumptions of the studies are another point to re-consider. Some studiesassume that there is a monitoring network covering the whole network with aminimum number of nodes and was setup at the beginning and is ready to use.Such assumptions have to be supported with deployment scenarios, otherwise itmay not be realistic to have such assumptions.
Anomaly-based and also specification-based IDSes typically require an attack-free period where the underlying system will able to understand the normal oper-ating conditions and create a profile accordingly. However, this may not be possiblefor real-life deployments. In addition to this, if our deployment includes thousandsof nodes, then ensuring such a period may not even be feasible.
Most of the studies target only a small number of attacks as mentioned inanother study [60]. Researchers have to target a broader range of attacks or pro-pose systems which have the capability to be extended to detect other attacks too.
In terms of the types of attacks, most of the studies focus only on insiderattacks, whereas outsider attacks from the Internet have to be researched andanalyzed. When we consider Table 1, we can see that attacks above the networklayer were not studied extensively. This clearly shows that transport and appli-cation layers of IoT may be vulnerable to attacks and IoT will be mentioned alot within news of DDoS attacks.
Another issue with IoT security research is related to reproducibility andcomparability of the studies. When we have a look at the studies, most of theauthors keep the source codes of their implementations closed. In addition tothis, IoT security research does not have datasets which can be used by theresearchers as a common performance evaluation benchmark although testbedsthat are publicly available exist. It would enrich the IoT security research if moreresearchers share their implementations with public and organizations providedatasets which can be used for evaluation purposes.
10 Conclusion
In this study while we aim to provide a comprehensive overview of security of IoTfor reliable IoS, we incorporated the points of view that include unique character-istics of IoT environments and how they affect security, architectural components

366 A. Arıs et al.
of IoT and their relation to the standardized protocol stack, cryptography-basedsolutions and their detailed comparisons in addition to considerations on issues(i.e., implementation flaws, users and usability, physical security of the devicesand trade offs), taxonomy of D/DoS attacks for IoT, analysis of the studies whichanalyze the effects of the attacks based on the attacks and findings, examinationof mitigation systems and protocol security solutions with respect to mitigationmechanisms and targeted attacks, categorization of D/DoS attacks according todetection architecture, detection technique, detection resources as well as tar-geted attacks and implementation environments.
Although we can think that cryptography will be enough for us, variousissues open our networks to D/DoS attacks. D/DoS attacks are clearly threatsnot only for availability but also for reliability of future Internet of Services.There are various attacks and literature has several studies to secure the IoTnetworks against these attacks. When we consider the efforts, we cannot say thatIoT security is over now. Clearly, there is still a lot to research and consider.
Although majority of studies examined in this work target 6LoWPAN net-works, security of emerging communication technologies such as LoRaWAN, NB-IoT, Thread and many others needs attention of researchers.
Based on our analysis, we can say that a plethora of research exists for routinglayer D/DoS attacks, whereas we can not see studies targeting the applicationlayer of IoT. Therefore, security of the application layer considering the attacksand use-cases needs research. In addition to this, most of the studies do not focuson a broad range of attacks, but only a few. There is a need for proposals whichare capable of targeting more attacks for IoT security research.
Only a few papers consider IoT to be used as an attacking tool for D/DoSattacks by malicious entities. However, the predicted number of devices in IoTnetworks is in the order of billions and IoT applications will be weaved into thefabric of our daily lives. It will be very easy for attackers to target. Therefore,there is a serious need for studies which address this issue.
Nevertheless, while researchers will focus into the mentioned issues as futureresearch, they will face with several challenges including resource limitations,heterogeneity of devices and applications, usability and security awareness, man-agement and cost.
Acknowlegments. This study was supported by COST Action IC1304 withSTSM reference ECOST-STSM-IC1304-010217-081547. It was also supported by2211C - Domestic Doctoral Scholarship Program Intended for Priority Areas, No.1649B031503218 of the Scientific and Technological Research Council of Turkey(TUBITAK).
References
1. IEEE Standard for Local and Metropolitan Area Networks - Part 15.4: Low RateWireless Personal Area Networks. IEEE Std. 802.15.4-2011 (2011)
2. DDoS on Dyn Impacts Twitter, Spotify, Reddit (2016). https://krebsonsecurity.com/2016/10/ddos-on-dyn-impacts-twitter-spotify-reddit/. Accessed 7 Dec 2016
Security of Internet of Things for a Reliable Internet of Services 367
3. Digital Attack Map Top daily DDoS attacks worldwide (2018). http://www.digitalattackmap.com/. Accessed 19 Jan 2018
4. Acar, Y., Backes, M., Fahl, S., Kim, D., Mazurek, M.L., Stransky, C.: How Internetresources might be helping you develop faster but less securely. IEEE Secur. Priv.15(2), 50–60 (2017). https://doi.org/10.1109/MSP.2017.24
5. Adat, V., Gupta, B.B.: Security in Internet of Things: issues, challenges, taxonomy,and architecture. Telecommun. Syst. (2017). https://doi.org/10.1007/s11235-017-0345-9
6. Amaral, J.P., Oliveira, L.M., Rodrigues, J.J.P.C., Han, G., Shu, L.: Policy andnetwork-based intrusion detection system for IPv6-enabled wireless sensor net-works. In: 2014 IEEE International Conference on Communications (ICC), pp.1796–1801 (2014)
7. Amin, Y.M., Abdel-Hamid, A.T.: A comprehensive taxonomy and analysis of IEEE802.15.4 attacks. J. Electr. Comput. Eng., 1–12 (2016). https://doi.org/10.1155/2016/7165952
8. Arce, I., Clark-Fisher, K., Daswani, N., DelGrosso, J., Dhillon, D., Kern, C.,Kohno, T., Landwehr, C., McGraw, G., Schoenfield, B., et al.: Avoiding the top 10software security design flaws. Technical report, IEEE Computer Societys Centerfor Secure Design (CSD) (2014)
9. Aris, A., Oktug, S.F.: Poster: state of the art ids design for IoT. In: InternationalConference on Embedded Wireless Systems and Networks (EWSN 2017) (2017)
10. Aris, A., Oktug, S.F., Yalcin, S.B.O.: Internet-of-Things security: denial of ser-vice attacks. In: 2015 23th Signal Processing and Communications ApplicationsConference (SIU), pp. 903–906 (2015). https://doi.org/10.1109/SIU.2015.7129976
11. Aris, A., Oktug, S.F., Yalcin, S.B.O.: RPL version number attacks: in-depth study.In: NOMS 2016 - 2016 IEEE/IFIP Network Operations and Management Sympo-sium, pp. 776–779 (2016). https://doi.org/10.1109/NOMS.2016.7502897
12. Bormann, C., Hoffman, P.: Concise Binary Object Representation (CBOR). RFC7049 (Proposed Standard) (2013). https://doi.org/10.17487/RFC7049. https://www.rfc-editor.org/rfc/rfc7049.txt
13. Brandt, A., Buron, J., Porcu, G.: Home Automation Routing Requirements inLow-Power and Lossy Networks. RFC 5826 (Informational) (2010). http://www.ietf.org/rfc/rfc5826.txt
14. Cervantes, C., Poplade, D., Nogueira, M., Santos, A.: Detection of sinkhole attacksfor supporting secure routing on 6LoWPAN for Internet of Things. In: 2015IFIP/IEEE International Symposium on Integrated Network Management (IM),pp. 606–611 (2015)
15. Cho, E.J., Kim, J.H., Hong, C.S.: Attack model and detection scheme for botneton 6LoWPAN. In: Hong, C.S., Tonouchi, T., Ma, Y., Chao, C.-S. (eds.) APNOMS2009. LNCS, vol. 5787, pp. 515–518. Springer, Heidelberg (2009). https://doi.org/10.1007/978-3-642-04492-2 66
16. Dvir, A., Holczer, T., Buttyan, L.: VeRA - version number and rank authenticationin RPL. In: 2011 IEEE 8th International Conference on Mobile Adhoc and SensorSystems (MASS), pp. 709–714 (2011)
17. Evans, D.: The Internet of Things how the next evolution of the internet is chang-ing everything (2011). http://www.cisco.com/web/about/ac79/docs/innov/IoTIBSG 0411FINAL.pdf
18. Hui, J., Thubert, P.: Compression Format for IPv6 Datagrams over IEEE 802.15.4-Based Networks. RFC 6282 (Proposed Standard) (2011)

368 A. Arıs et al.
19. Hummen, R., Hiller, J., Wirtz, H., Henze, M., Shafagh, H., Wehrle, K.: 6LoWPANfragmentation attacks and mitigation mechanisms. In: Proceedings of the SixthACM Conference on Security and Privacy in Wireless and Mobile Networks, WiSec2013, pp. 55–66 (2013)
20. Kasinathan, P., Costamagna, G., Khaleel, H., Pastrone, C., Spirito, M.A.: DEMO:an IDS framework for internet of things empowered by 6LoWPAN. In: Proceedingsof the 2013 ACM SIGSAC Conference on Computer and Communications Security,CCS 2013, pp. 1337–1340 (2013)
21. Kasinathan, P., Pastrone, C., Spirito, M., Vinkovits, M.: Denial-of-service detectionin 6LoWPAN based Internet of Things. In: 2013 IEEE 9th International Conferenceon Wireless and Mobile Computing, Networking and Communications (WiMob),pp. 600–607 (2013)
22. Kent, S., Seo, K.: Security architecture for the internet protocol. RFC 4301(Proposed Standard) (2005). https://doi.org/10.17487/RFC4301. https://www.rfc-editor.org/rfc/rfc4301.txt. Updated by RFCs 6040, 7619
23. Kettimuthu, R., Muthukrishnan, S.: Is bluetooth suitable for large-scale sensornet-works? In: ICWN, pp. 448–454. Citeseer (2005)
24. Khan, R., Khan, S.U., Zaheer, R., Khan, S.: Future internet: the Internet of Thingsarchitecture, possible applications and key challenges. In: 2012 10th InternationalConference on Frontiers of Information Technology, pp. 257–260 (2012). https://doi.org/10.1109/FIT.2012.53
25. Krco, S.: Bluetooth based wireless sensor networks–implementation issues and solu-tions (2002). http://www.telfor.org.yu/radovi/4019.pdf
26. Kurose, J.F., Ross, K.W.: Computer Networking: A Top-Down Approach, 6th edn.Pearson (2012)
27. Le, A., Loo, J., Chai, K.K., Aiash, M.: A specification-based IDS for detectingattacks on RPL-based network topology. Information 7(2) (2016). https://doi.org/10.3390/info7020025. http://www.mdpi.com/2078-2489/7/2/25
28. Le, A., Loo, J., Lasebae, A., Vinel, A., Chen, Y., Chai, M.: The impact of rankattack on network topology of routing protocol for low-power and lossy net-works. IEEE Sens. J. 13(10), 3685–3692 (2013). https://doi.org/10.1109/JSEN.2013.2266399
29. Le, A., Loo, J., Luo, Y., Lasebae, A.: Specification-based IDS for securing RPLfrom topology attacks. In: 2011 IFIP Wireless Days (WD), pp. 1–3 (2011). https://doi.org/10.1109/WD.2011.6098218
30. Levis, P., Clausen, T., Hui, J., Gnawali, O., Ko, J.: The Trickle algorithm. RFC6206 (Proposed Standard) (2011). https://doi.org/10.17487/RFC6206. https://www.rfc-editor.org/rfc/rfc6206.txt
31. Martocci, J., Mil, P.D., Riou, N., Vermeylen, W.: Building automation routingrequirements in low-power and lossy networks. RFC 5867 (Informational) (2010).http://www.ietf.org/rfc/rfc5867.txt
32. Mayzaud, A., Badonnel, R., Chrisment, I.: Detecting version number attacks usinga distributed monitoring architecture. In: Proceedings of IEEE/IFIP/In Associ-ation with ACM SIGCOMM International Conference on Network and ServiceManagement (CNSM 2016), pp. 127–135 (2016)
33. Mayzaud, A., Sehgal, A., Badonnel, R., Chrisment, I., Schnwlder, J.: Mitigationof topological inconsistency attacks in RPL-based low-power lossy networks. Int.J. Netw. Manag. 25(5), 320–339 (2015). https://doi.org/10.1002/nem.1898
34. Mayzaud, A., Sehgal, A., Badonnel, R., Chrisment, I., Schnwlder, J.: Using theRPL protocol for supporting passive monitoring in the Internet of Things. In:

Security of Internet of Things for a Reliable Internet of Services 369
NOMS 2016 - 2016 IEEE/IFIP Network Operations and Management Symposium,pp. 366–374 (2016). https://doi.org/10.1109/NOMS.2016.7502833
35. Mayzaud, A., Sehgal, A., Badonnel, R., Chrisment, I., Schonwalder, J.: A study ofRPL DODAG version attacks. In: Sperotto, A., Doyen, G., Latre, S., Charalambides,M., Stiller, B. (eds.) AIMS 2014. LNCS, vol. 8508, pp. 92–104. Springer, Heidelberg(2014). https://doi.org/10.1007/978-3-662-43862-6 12
36. Misra, S., Krishna, P.V., Agarwal, H., Saxena, A., Obaidat, M.S.: A learningautomata based solution for preventing distributed denial of service in Internetof Things. In: Proceedings of the 2011 International Conference on Internet ofThings and 4th International Conference on Cyber, Physical and Social Comput-ing, ITHINGSCPSCOM 2011, pp. 114–122 (2011)
37. Palattella, M., Accettura, N., Vilajosana, X., Watteyne, T., Grieco,L., Boggia, G.,Dohler, M.: Standardized protocol stack for the internet of (Important) things.IEEE Commun. Surv. Tutor. 15(3), 1389–1406 (2013)
38. Pister, K., Thubert, P., Dwars, S., Phinney, T.: Industrial routing requirements inlow-power and lossy networks. RFC 5673 (Informational) (2009). http://www.ietf.org/rfc/rfc5673.txt
39. Pongle, P., Chavan, G.: Article: real time intrusion and wormhole attack detectionin Internet of Things. Int. J. Comput. Appl. 121(9), 1–9 (2015)
40. Raza, S., Duquennoy, S., Chung, T., Yazar, D., Voigt, T., Roedig, U.: Securingcommunication in 6LoWPAN with compressed IPsec. In: 2011 International Con-ference on Distributed Computing in Sensor Systems and Workshops (DCOSS),pp. 1–8 (2011). https://doi.org/10.1109/DCOSS.2011.5982177
41. Raza, S., Wallgren, L., Voigt, T.: SVELTE: real-time intrusion detection in theInternet of Things. Ad Hoc Netw. 11(8), 2661–2674 (2013)
42. Razzak, F.: Spamming the Internet of Things: a possibility and its probable solu-tion. Proc. Comput. Sci. 10, 658–665 (2012). https://doi.org/10.1016/j.procs.2012.06.084. http://www.sciencedirect.com/science/article/pii/S1877050912004413
43. Renuka Venkata Ramani, C.: Two way Firewall for Internet of Things. Master’sthesis. KTH, School of Electrical Engineering (EES) (2016)
44. Rescorla, E., Modadugu, N.: Datagram transport layer security. RFC 4347 (Pro-posed Standard) (2006). https://doi.org/10.17487/RFC4347. https://www.rfc-editor.org/rfc/rfc4347.txt. Obsoleted by RFC 6347, updated by RFCs 5746, 7507
45. Saeed, A., Ahmadinia, A., Javed, A., Larijani, H.: Intelligent intrusion detection inlow-power IoTs. ACM Trans. Internet Technol. 16(4), 27:1–27:25 (2016). https://doi.org/10.1145/2990499. http://doi.acm.org/10.1145/2990499
46. Samaila, M.G., Neto, M., Fernandes, D.A.B., Freire, M.M., Inacio, P.R.M.: Secu-rity challenges of the Internet of Things. In: Batalla, J.M., Mastorakis, G.,Mavromoustakis, C.X., Pallis, E. (eds.) Beyond the Internet of Things. IT, pp.53–82. Springer, Cham (2017). https://doi.org/10.1007/978-3-319-50758-3 3
47. Schneier, B.: Stop trying to fix the user. IEEE Secur. Priv. 14(5), 96 (2016).https://doi.org/10.1109/MSP.2016.101
48. Sedjelmaci, H., Senouci, S.M., Al-Bahri, M.: A lightweight anomaly detection tech-nique for low-resource IoT devices: a game-theoretic methodology. In: 2016 IEEEInternational Conference on Communications, ICC 2016 (2016). https://doi.org/10.1109/ICC.2016.7510811
49. Sehgal, A., Mayzaud, A., Badonnel, R., Chrisment, I., Schonwalder, J.: AddressingDODAG inconsistency attacks in RPL networks. In: Global Information Infrastruc-ture and Networking Symposium (GIIS 2014), pp. 1–8 (2014)
50. Shelby, Z., Hartke, K., Bormann, C.: The Constrained Application Protocol(CoAP). RFC 7252 (Proposed Standard) (2014)

370 A. Arıs et al.
51. Sokullu, R., Dagdeviren, O., Korkmaz, I.: On the IEEE 802.15.4 MAC LayerAttacks: GTS Attack. In: Second International Conference on Sensor Technolo-gies and Applications, SENSORCOMM 2008, pp. 673–678 (2008)
52. Tsao, T., Alexander, R., Dohler, M., Daza, V., Lozano, A., Richardson, M.: Asecurity threat analysis for the routing protocol for low-power and Lossy Networks(RPLs). RFC 7416 (Informational) (2015). http://www.ietf.org/rfc/rfc7416.txt
53. UC Berkeley Center for Long-Term Cybersecurity: Cybersecurity Futures 2020.Technical report (2016)
54. Wallgren, L., Raza, S., Voigt, T.: Routing attacks and countermeasures in theRPL-based internet of things. Int. J. Distrib. Sens. Netw. 2013, 11 (2013)
55. Weekly, K., Pister, K.: Evaluating sinkhole defense techniques in RPL networks.In: 2012 20th IEEE International Conference on Network Protocols (ICNP), pp.1–6 (2012)
56. Winter, T., Thubert, P., Brandt, A., Hui, J., Kelsey, R., Levis, P., Pister, K.,Struik, R., Vasseur, J., Alexander, R.: RPL: IPv6 Routing Protocol for Low-Powerand Lossy Networks. RFC 6550 (Proposed Standard) (2012)
57. Wu, M., Lu, T.J., Ling, F.Y., Sun, J., Du, H.Y.: Research on the architecture ofInternet of Things. In: 2010 3rd International Conference on Advanced ComputerTheory and Engineering (ICACTE), vol. 5, pp. V5–484–V5–487 (2010). https://doi.org/10.1109/ICACTE.2010.5579493
58. Yang, Y., Wu, L., Yin, G., Li, L., Zhao, H.: A survey on security and privacy issuesin Internet-of-Things. IEEE Internet of Things J. 4(5), 1250–1258 (2017). https://doi.org/10.1109/JIOT.2017.2694844
59. Yang, Z., Yue, Y., Yang, Y., Peng, Y., Wang, X., Liu, W.: Study and application onthe architecture and key technologies for IoT. In: 2011 International Conference onMultimedia Technology, pp. 747–751 (2011). https://doi.org/10.1109/ICMT.2011.6002149
60. Zarpelo, B.B., Miani, R.S., Kawakani, C.T., de Alvarenga, S.C.: A survey ofintrusion detection in Internet of Things. J. Netw. Comput. Appl. 84, 25 –37(2017). https://doi.org/10.1016/j.jnca.2017.02.009. http://www.sciencedirect.com/science/article/pii/S1084804517300802
Open Access This chapter is licensed under the terms of the Creative CommonsAttribution 4.0 International License (http://creativecommons.org/licenses/by/4.0/),which permits use, sharing, adaptation, distribution and reproduction in any mediumor format, as long as you give appropriate credit to the original author(s) and thesource, provide a link to the Creative Commons license and indicate if changes weremade.
The images or other third party material in this chapter are included in the chapter’sCreative Commons license, unless indicated otherwise in a credit line to the material. Ifmaterial is not included in the chapter’s Creative Commons license and your intendeduse is not permitted by statutory regulation or exceeds the permitted use, you willneed to obtain permission directly from the copyright holder.

TCP Performance over Current CellularAccess: A Comprehensive Analysis
Eneko Atxutegi1(B) , Ake Arvidsson2 , Fidel Liberal1 ,Karl-Johan Grinnemo3 , and Anna Brunstrom3
1 University of the Basque Country (UPV/EHU), Bilbao, Spain{eneko.atxutegi,fidel.liberal}@ehu.eus
2 Kristianstad University, Kristianstad, [email protected]
3 Karlstad University, Karlstad, Sweden{karl-johan.grinnemo,anna.brunstrom}@kau.se
Abstract. Mobile Internet usage has increased significantly over the lastdecade and it is expected to grow to almost 4 billion users by 2020.Even after the great effort dedicated to improving the performance, therestill exist unresolved questions and problems regarding the interactionbetween TCP and mobile broadband technologies such as LTE. Thischapter presents a thorough investigation of the behavior of distinct TCPimplementation under various network conditions in different LTE deploy-ments including to which extent TCP is capable of adapting to the rapidvariability of mobile networks under different network loads, with dis-tinct flow types, during start-up phase and in mobile scenarios at differentspeeds. Loss-based algorithms tend to completely fill the queue, creatinghuge standing queues and inducing packet losses both under stillness andmobility circumstances. On the other side delay-based variants are capa-ble of limiting the standing queue size and decreasing the amount of pack-ets that are dropped in the eNodeB, but under some circumstances theyare not able to reach the maximum capacity. Similarly, under mobility inwhich the radio conditions are more challenging for TCP, the loss-basedTCP implementations offer better throughput and are able to better uti-lize available resources than the delay-based variants do. Finally, CUBICunder highly variable circumstances usually enters congestion avoidancephase prematurely, provoking a slower and longer start-up phase due tothe use of Hybrid Slow-Start mechanism. Therefore, CUBIC is unable toefficiently utilize radio resources during shorter transmission sessions.
Keywords: TCP adaptability · LTE · Flow size · Slow-StartMobility
1 Introduction
Mobile Internet usage has increased significantly over the last decade, growingalmost 18-fold over the past 5 years and more than half a million new mobiledevices and connections in 2016 [1]. The following years are expected to be
c© The Author(s) 2018I. Ganchev et al. (Eds.): Autonomous Control for a Reliable Internet of Services, LNCS 10768, pp. 371–400, 2018.https://doi.org/10.1007/978-3-319-90415-3_14

372 E. Atxutegi et al.
equally promising with 4G traffic reaching quotas of more than three-quarters ofthe total mobile traffic by 2021. The growth expectation is not only related to thetraffic volume itself but also to the average speed. To continue this growth andto meet user expectations, all the involved stakeholders have a common interestin fast downloads, quick responses, high utilization and few packet losses.
Since a large part of mobile Internet comprises TCP flows, the performanceof TCP over cellular networks has become an important research topic. Eventhough in the last three decades many different TCP implementations have beendeveloped [2] each of them targeting a different Congestion Control Algorithm(CCA), there still exists room for improvement in terms of achieved throughputand resulting delay over highly variable mobile networks.
Previous studies and proposals have reported their results regarding the inter-action effects between mobile networks and TCP [3–5] and tried to define suitableCCAs for mobile networks [6]. However, none of them have extensively study theimplication of a wide range of TCP implementations in a variety of static andmoving scenarios. This chapter complements and extends previous works onmobile networks by studying and evaluating the behavior of a selection of TCPvariants with different packet sizes, network loads, during start-up and mobilitywith different speeds, i.e. scenarios that are considered challenging for TCP. Inorder to appropriately study the different sources capable of impacting the finalperformance, the chapter suggests a bottom-up scenario with respect to com-plexity starting with static conditions so as to understand the responsiveness ofTCP under distinct network status and load combinations and finishing with avariety of mobility scenarios.
The chapter is organized as follows. Section 2 covers related work. In Sect. 3, abrief overview of the studied TCP variants is provided and the LTE testbeds aredescribed. Next, in Sect. 4, we explain the methodology regarding the performedmeasurements and the studied scenarios. The findings and results from our workare presented in Sect. 5. Finally, Sect. 6 concludes the chapter with a summaryand a discussion of future work.
2 Related Work
TCP and LTE cellular access have been deeply studied throughout the lastyears. Most of the studies have either research the TCP side or mobile networkside. However, a significant amount of researchers have been attracted by theinteraction between TCP and LTE.
One of the first basis of such interaction is the impact that radio retransmis-sions have into the delay increment and how they therefore degrade the achievedgoodput [7,8]. It has been proven that the number of simultaneously active UserEquipments (UEs) towards a common eNodeB has a huge impact on the effec-tive available bandwidth due to radio resources being shared. Thus, the work [9]found that sudden increases in background traffic load have an important effectin the Round-Trip Time (RTT) increment. This cross-traffic effect severely influ-ences the network playground for TCP, provoking sudden changes in the network

TCP Performance over Current Cellular Access: A Comprehensive Analysis 373
conditions and making TCP struggle while following the fluctuations in the avail-able capacity. This chapter compiles a more detailed treatment of the effects ofbuffering in the radio access part of LTE by also considering the performance ofhigh-speed/long-delay variants of TCP in these kinds of networks.
The so-called bufferbloat effect has also a huge impact into the performance ofTCP over LTE [10]. The bufferbloat effect is possible due to the configuration oflong queues both in the end-nodes and intermediate nodes, which can accumulatea great number of packets without any drop. However, that excessive packetbuffering in a single queue in the end-to-end network path, causes a great latencyincrease and therefore, throughput degradation. Our work does not merely focuson bufferbloat, but considers the implications of different TCP variants in queuebuild-up under certain network conditions.
Considering that many flows in Internet are short, it is important to verifythe efficiency of TCP to carry out such transmissions over cellular networks,it has been demonstrated [11] that under some network conditions TCP failsto correctly utilize the available capacity and therefore, the flows last longerthan necessary. The current work complements such works and analyzes theimpact that different flow sizes have in the performance outcome of differentTCP flavors. To this end, our work not only focuses on the stationary phases ofTCP but also on its behavior during start-up due to its significant impact in shortflows performance. In particular, we study the Hybrid Slow-Start scheme [12],and evaluate how it operates in LTE networks in comparison with the StandardSlow-Start scheme.
Other studies have measured TCP over live LTE networks. Apart from theclassic metrics of TCP throughput and RTT in [4] they also measured the delaycaused by mobile devices going from idle to connected state. In [13], measurementtrials were carried out over the cellular access of four Swedish operators and thediurnal variation of TCP throughput and delay were analyzed. [14,15] studiesdid similar TCP measurements, however, they did not consider daily variations.None of these live measurements took into account the impact of speed in theperformance of TCP, or the behavior on different types of CCAs. So, to thebest of our knowledge, our work both complements and extends these worksthrough the study and evaluation of the behavior of common TCP variants inLTE networks under mobility with different speeds.
There are only a few works that have considered the impact of different speedson the performance of TCP over LTE networks. Even though some works [5] havestudied different speeds, the primary metrics were more related to the radio partwith spectral efficiency and share of resource blocks among the UEs. Even thoughthe utilization of such radio resources was studied, one or two simple variants ofTCP were utilized in a multi-user resource share, leading to TCP micro-effectsmasking. Also, in [3] the impact of speed on TCP in LTE was studied. The workfocused on uplink and downlink throughput, RTTs and also considered time-of-day variations. Still, they did not consider how the CCA factor into the TCPperformance at different velocities. Our work serves to cover all the options andextends the previous studies with multiple mobility patterns, different speedsand a wide range of CCAs.
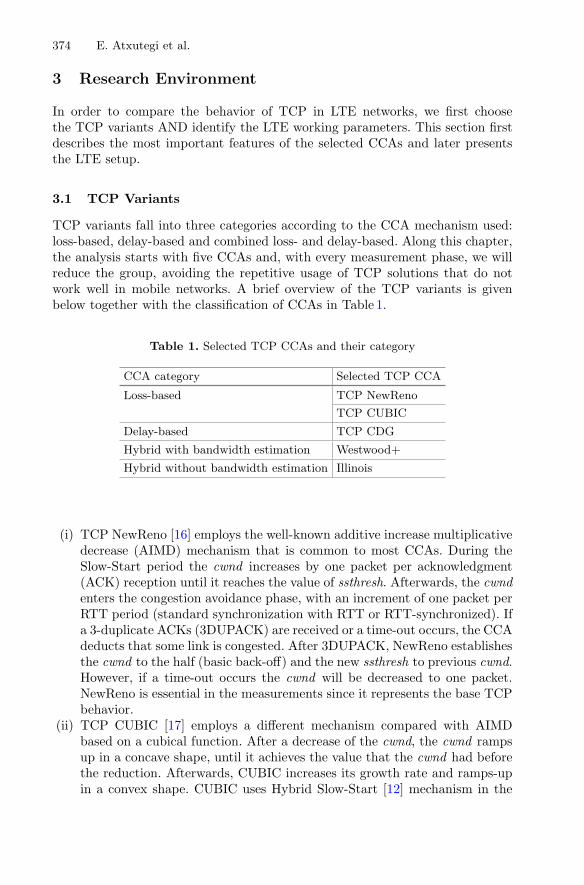
374 E. Atxutegi et al.
3 Research Environment
In order to compare the behavior of TCP in LTE networks, we first choosethe TCP variants AND identify the LTE working parameters. This section firstdescribes the most important features of the selected CCAs and later presentsthe LTE setup.
3.1 TCP Variants
TCP variants fall into three categories according to the CCA mechanism used:loss-based, delay-based and combined loss- and delay-based. Along this chapter,the analysis starts with five CCAs and, with every measurement phase, we willreduce the group, avoiding the repetitive usage of TCP solutions that do notwork well in mobile networks. A brief overview of the TCP variants is givenbelow together with the classification of CCAs in Table 1.
Table 1. Selected TCP CCAs and their category
CCA category Selected TCP CCA
Loss-based TCP NewReno
TCP CUBIC
Delay-based TCP CDG
Hybrid with bandwidth estimation Westwood+
Hybrid without bandwidth estimation Illinois
(i) TCP NewReno [16] employs the well-known additive increase multiplicativedecrease (AIMD) mechanism that is common to most CCAs. During theSlow-Start period the cwnd increases by one packet per acknowledgment(ACK) reception until it reaches the value of ssthresh. Afterwards, the cwndenters the congestion avoidance phase, with an increment of one packet perRTT period (standard synchronization with RTT or RTT-synchronized). Ifa 3-duplicate ACKs (3DUPACK) are received or a time-out occurs, the CCAdeducts that some link is congested. After 3DUPACK, NewReno establishesthe cwnd to the half (basic back-off) and the new ssthresh to previous cwnd.However, if a time-out occurs the cwnd will be decreased to one packet.NewReno is essential in the measurements since it represents the base TCPbehavior.
(ii) TCP CUBIC [17] employs a different mechanism compared with AIMDbased on a cubical function. After a decrease of the cwnd, the cwnd rampsup in a concave shape, until it achieves the value that the cwnd had beforethe reduction. Afterwards, CUBIC increases its growth rate and ramps-upin a convex shape. CUBIC uses Hybrid Slow-Start [12] mechanism in the

TCP Performance over Current Cellular Access: A Comprehensive Analysis 375
sender instead of the Standard Slow-Start phase. Hybrid Slow-Start aimsat finding the proper exit point for standard Slow-Start in order to avoidmassive packet losses. The detection of such an exit point is based on themeasurements of ACK trains and RTT delay samples. The TCP CUBICimplementation has been selected for the analysis due to its widespreaduse due to the fact that it currently is the default CCA in Linux servers,whose market share comprises the 67% of world-wide servers (as stated byW3Techs [18]).
(iii) TCP CAIA delay gradient (CDG) [19] modifies the TCP sender to useRTT gradients as a congestion indicator. CDG also calculates the state ofthe bottleneck queue so that packet losses are treated as congestion signalsonly when the queue is full. Finally, CDG also uses Hybrid Slow-Start butwith a more strict configuration than CUBIC. The selection of TCP CDGhas been based on its novel use of delay gradients in the AIMD mechanismand to evaluate the actual usefulness of such a different feature in mobilenetworks.
(iv) TCP Westwood+ [20] is capable of estimating the available bandwidth andminimum RTT (RTTmin) by measuring ACK inter-arrival times. The esti-mations are used to decide the new cwnd after a congestion episode of3DUPACK. With timeouts the ssthresh is calculated in accordance to theestimations and the cwnd is set to 1 segment. TCP Westwood+ has beenselected in this study for its hybrid behavior using loss-based mechanismstogether with delay-awareness.
(v) TCP Illinois [21] controls the AIMD mechanism by the estimated queu-ing delay and buffer size. In a normal situation when no queuing delay isdetected, the cwnd is increased by 10 packets per RTT. If estimated delaystarts increasing, the increment of cwnd will be gradually lowering untilthe minimum value of 0.3 packets per RTT is reached. When the RTT isconsidered as high as compared to the baseline RTT, the loss is consideredas buffer overflow, whereas in low RTT the loss counts as packet corruption.Developed to perform efficiently within high speed networks, its loss-basedand delay-awareness make a perfect candidate for our study.
3.2 LTE Setup
In order to evaluate the performance of LTE three different environments havebeen used: simulation, emulation and controlled deployment. Most of the workdescribed in this chapter has been carried out over the simulated environmentand for comparison purposes the findings and results have been correlated withthe behavior in the other two deployments. Since the configuration and expla-nation of the simulated environment is comprised of many parameters and inorder to help the reader understand the setup, Table 2 gathers the most impor-tant information about the simulation environment regarding the configurationparameters and experiment-related conditions.
As the simulated environment, ns-3 simulator with the LTE capabilities ofLENA module is used. This module also allows to create standard-based fading

376 E. Atxutegi et al.
traces that can be applied to the channel between the UE and the eNodeB.Since ns-3 does not exactly use the available TCP implementations in the Linuxkernel, we used Direct Code Execution (DCE) Cradle [22] to be able to run realTCP implementations in ns-3. In order to simulate the distance to the server, thepropagation delay between the fixed remote host and the Packet Data NetworkGateway (PGW) was set to 40 ms. In the Radio Link Control (RLC) layer weselected the Acknowledged Mode (AM) in order to resemble the most commonlydeployed configuration in real-world. We modified the mechanism to be able tosupport a limitation is terms of packets, establishing in our setup a commonpacket buffer size in the eNodeB of 750 packets. Regarding the radio resources,the eNodeB was configured to have a standard value of 100 available physicalresource blocks (PRB). We simulated the frequency band 7 (2600 MHz), one ofthe most commonly used commercial LTE frequency bands (in Europe).
Background flows are used to load the network with multiple short TCPconnections, similar to the behavior of real networks. The same TCP variantis used for both background and foreground traffic in order not to be affectedby issues of TCP friendliness. The amount of data transferred in a backgroundconnection as well as the inter-arrival time between two connections were drawnfrom uniform random distributions.
The controlled testbed aims at providing a measurement platform with theability to measure TCP in more realistic radio conditions in order to confirm orreject the findings and assumptions made in simulated environment in relation tothe behavior of TCP over LTE. We have used the iMinds’/iMEC’s LTE facility(LTE w-iLab.t [23]) in Zwijnaarde, Ghent. Apart from the provisioning of all theagents involved in LTE, the deployment allows ad-hoc mobility patterns while
Table 2. Simulation parameters
Simulation environment
Simulator ns-3 LENA LTE model
Linux Kernel 4.3 (DCE)
CCA NewReno/CUBIC/Illinois/CDG/Westwood+
Parameter Value
One-way delay PGW-Server 40 ms
MAC scheduler Proportional fair
AMC model MiError
Number of PRBs 100
LTE band 7 (2600 MHz)
RLC mode AM
RLC transmission queue 750 PDUs
Pathloss model FriisPropagationLossModel
Fading models EVA60/EVA200

TCP Performance over Current Cellular Access: A Comprehensive Analysis 377
experimenting. It is important to underline that in this environment, the LTEtransmissions are done over the air, thus allowing a proper study of TCP andLTE events. Even though the movement is real, the space limitation could limitthe employed speed.
The emulated testbed targets the validation of simulated results of TCPunder mobility circumstances. To this end, a LTE emulator or LTE-in-a-box(Aeroflex 7100) has been used. This emulator is capable of creating the LTEradio signal and all the necessary LTE protocol events to support the attach-ment and registration of any LTE device through a radiofrequency cable orover the air. The tests have been completed with an smartphone, a couple ofservers and a controller to synchronize the experiments and all the equipmentinvolved during the assessments. Since the UE in the emulated testbed is not ableto physically move, the controller would continuously manipulate the baselineSignal-to-interference-plus-noise ratio (SINR) levels and Aeroflex would applythe corresponding fading pattern so as to model actual movement.
4 Methodology Description
The intrinsic operation mode of LTE (i.e. resource sharing, scheduling, HARQmechanisms) results in a constant change in the available capacity. Even consid-ering single-UE scenarios, different positions and fadings would lead to have adifferent SINR and it would therefore report a distinct Channel Quality Indica-tor (CQI) to the eNodeB. Thus, the eNodeB would assign a different availablecapacity for the channel of the UE through the Modulation and Coding Scheme(MCS) and transport block size (tbSize). Due such fluctuations in the radio side,the cwnd will be continuously evolving in order to obtain a resulting goodputas close as possible to the available capacity. The relative progressions of bothparameters (available capacity and achieved capacity) play a fundamental rolein the final performance.
In this section, the applied methodology will be presented. Figure 1 showsthe different scenarios that have been used in the analysis of the effects betweenTCP’s different CCAs and LTE. The methodology and reasoning of each scenariois explained below.
(I) Implication of cross-traffic and responsiveness of TCP: The static sce-nario aims at providing insights of the evolution and responsiveness of TCPunder different background traffics (I point in Fig. 1). There are three main goalswith this scenario: the comparative study of TCP behavior with and without aloaded cell, the analysis of TCP focusing on short flows and the responsivenesscomparison of TCP variants with a sudden capacity increase and decrease. Sev-eral metrics are gathered at different nodes along the path. At the source, TCPstate information such as cwnd and ssthresh is saved. At the eNodeB, the trans-mission buffer length, the drop count and the Packet Data Convergence Protocol(PDCP) delay (i.e., the time it takes for a PDCP Protocol Data Unit -PDU-to go from the eNodeB to the UE), are logged. Finally, in the UE, the goodputis recorded. Since it is measured at the application level, packet losses and/orreordering may result in goodput spikes.
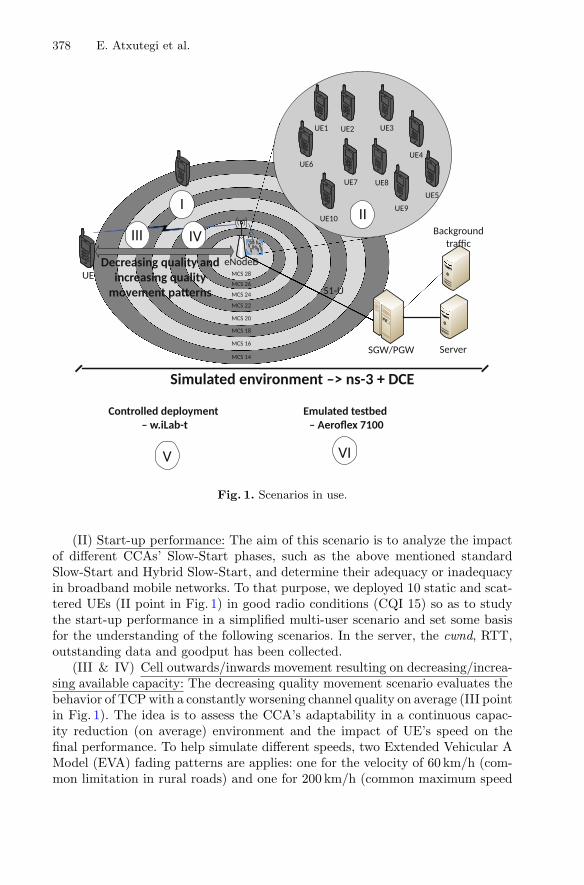
378 E. Atxutegi et al.
Fig. 1. Scenarios in use.
(II) Start-up performance: The aim of this scenario is to analyze the impactof different CCAs’ Slow-Start phases, such as the above mentioned standardSlow-Start and Hybrid Slow-Start, and determine their adequacy or inadequacyin broadband mobile networks. To that purpose, we deployed 10 static and scat-tered UEs (II point in Fig. 1) in good radio conditions (CQI 15) so as to studythe start-up performance in a simplified multi-user scenario and set some basisfor the understanding of the following scenarios. In the server, the cwnd, RTT,outstanding data and goodput has been collected.
(III & IV) Cell outwards/inwards movement resulting on decreasing/increa-sing available capacity: The decreasing quality movement scenario evaluates thebehavior of TCP with a constantly worsening channel quality on average (III pointin Fig. 1). The idea is to assess the CCA’s adaptability in a continuous capac-ity reduction (on average) environment and the impact of UE’s speed on thefinal performance. To help simulate different speeds, two Extended Vehicular AModel (EVA) fading patterns are applies: one for the velocity of 60 km/h (com-mon limitation in rural roads) and one for 200 km/h (common maximum speed
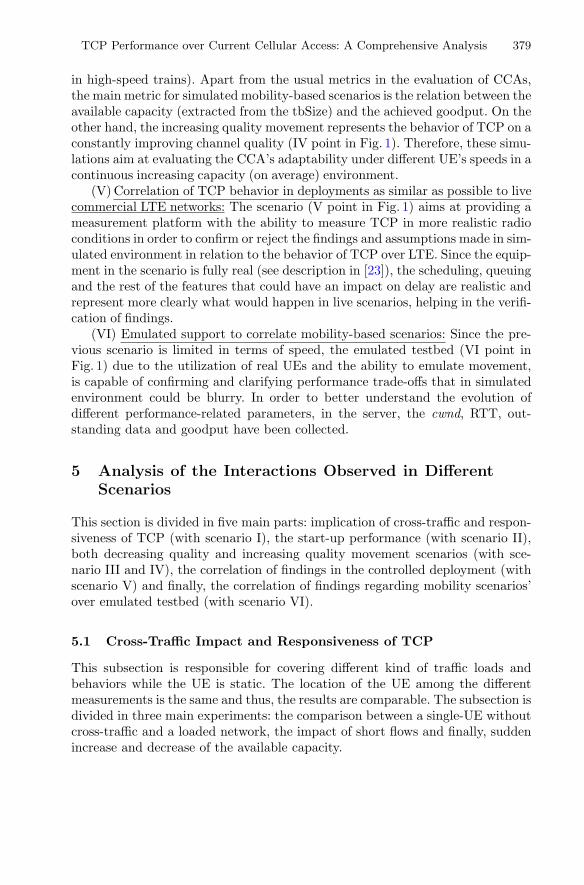
TCP Performance over Current Cellular Access: A Comprehensive Analysis 379
in high-speed trains). Apart from the usual metrics in the evaluation of CCAs,the main metric for simulated mobility-based scenarios is the relation between theavailable capacity (extracted from the tbSize) and the achieved goodput. On theother hand, the increasing quality movement represents the behavior of TCP on aconstantly improving channel quality (IV point in Fig. 1). Therefore, these simu-lations aim at evaluating the CCA’s adaptability under different UE’s speeds in acontinuous increasing capacity (on average) environment.
(V) Correlation of TCP behavior in deployments as similar as possible to livecommercial LTE networks: The scenario (V point in Fig. 1) aims at providing ameasurement platform with the ability to measure TCP in more realistic radioconditions in order to confirm or reject the findings and assumptions made in sim-ulated environment in relation to the behavior of TCP over LTE. Since the equip-ment in the scenario is fully real (see description in [23]), the scheduling, queuingand the rest of the features that could have an impact on delay are realistic andrepresent more clearly what would happen in live scenarios, helping in the verifi-cation of findings.
(VI) Emulated support to correlate mobility-based scenarios: Since the pre-vious scenario is limited in terms of speed, the emulated testbed (VI point inFig. 1) due to the utilization of real UEs and the ability to emulate movement,is capable of confirming and clarifying performance trade-offs that in simulatedenvironment could be blurry. In order to better understand the evolution ofdifferent performance-related parameters, in the server, the cwnd, RTT, out-standing data and goodput have been collected.
5 Analysis of the Interactions Observed in DifferentScenarios
This section is divided in five main parts: implication of cross-traffic and respon-siveness of TCP (with scenario I), the start-up performance (with scenario II),both decreasing quality and increasing quality movement scenarios (with sce-nario III and IV), the correlation of findings in the controlled deployment (withscenario V) and finally, the correlation of findings regarding mobility scenarios’over emulated testbed (with scenario VI).
5.1 Cross-Traffic Impact and Responsiveness of TCP
This subsection is responsible for covering different kind of traffic loads andbehaviors while the UE is static. The location of the UE among the differentmeasurements is the same and thus, the results are comparable. The subsection isdivided in three main experiments: the comparison between a single-UE withoutcross-traffic and a loaded network, the impact of short flows and finally, suddenincrease and decrease of the available capacity.
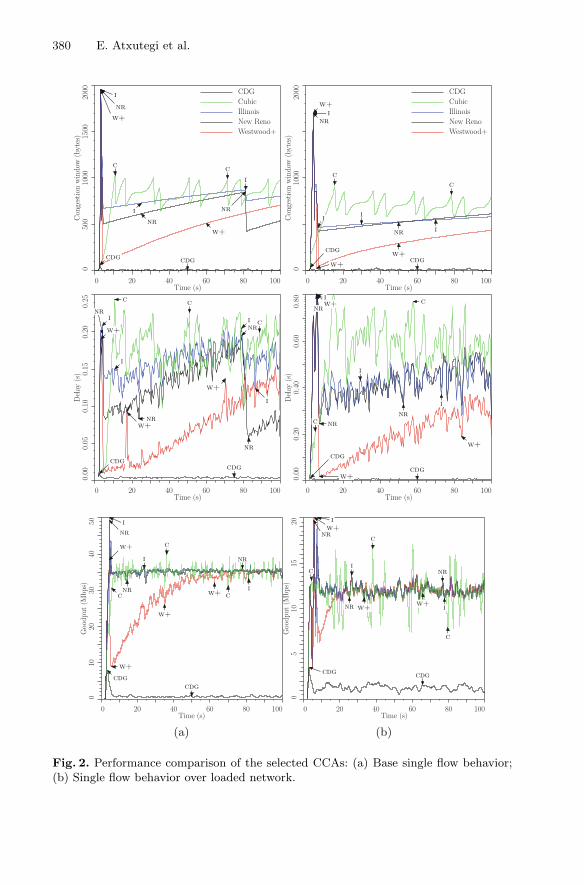
380 E. Atxutegi et al.
Time (s)0 20 40 60 80 100
Congestionwindow(bytes)
0500
1000
1500
2000
w+
w+
nr
nr
nr
i
i
i
c c
cdg cdg
CDGCubicIllinoisNew RenoWestwood+
Time (s)0 20 40 60 80 100
Congestionwindow(bytes)
01000
2000
w+
w+w+
nr
nr
i
i i
i
cc
cdgcdg
CDGCubicIllinoisNew RenoWestwood+
Time (s)0 20 40 60 80 100
Delay
(s)
0.00
0.05
0.10
0.15
0.20
0.25
w+
w+
w+
nr
nr
nr
nr
i
i
i
i
c c
c
cdgcdg
Time (s)0 20 40 60 80 100
Delay
(s)
0.00
0.20
0.40
0 .60
0.80 w+
w+
w+
nr
nrnr
i
i
i
c
c
cdg
cdg
Time (s)0 20 40 60 80 100
Goodp
ut(M
bps)
010
2030
4050
w+
w+
w+
w+
nr
nr
nr
i
i
ic
c
c
cdgcdg
(a)Time (s)
0 20 40 60 80 100
Goodp
ut(M
bps)
05
1015
20
nr
nr
nr
w+
w+ w+
i
i
i
c
c
c
cdg cdg
(b)
Fig. 2. Performance comparison of the selected CCAs: (a) Base single flow behavior;(b) Single flow behavior over loaded network.
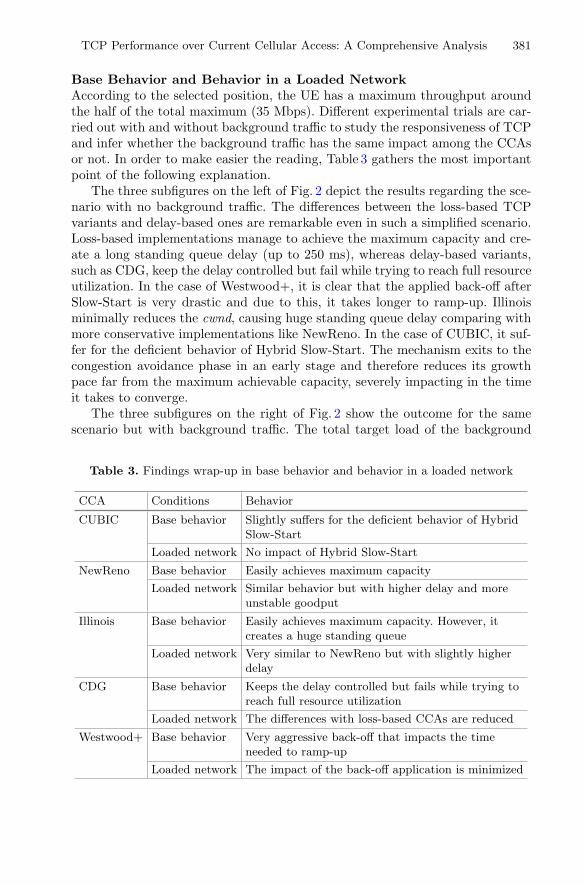
TCP Performance over Current Cellular Access: A Comprehensive Analysis 381
Base Behavior and Behavior in a Loaded NetworkAccording to the selected position, the UE has a maximum throughput aroundthe half of the total maximum (35 Mbps). Different experimental trials are car-ried out with and without background traffic to study the responsiveness of TCPand infer whether the background traffic has the same impact among the CCAsor not. In order to make easier the reading, Table 3 gathers the most importantpoint of the following explanation.
The three subfigures on the left of Fig. 2 depict the results regarding the sce-nario with no background traffic. The differences between the loss-based TCPvariants and delay-based ones are remarkable even in such a simplified scenario.Loss-based implementations manage to achieve the maximum capacity and cre-ate a long standing queue delay (up to 250 ms), whereas delay-based variants,such as CDG, keep the delay controlled but fail while trying to reach full resourceutilization. In the case of Westwood+, it is clear that the applied back-off afterSlow-Start is very drastic and due to this, it takes longer to ramp-up. Illinoisminimally reduces the cwnd, causing huge standing queue delay comparing withmore conservative implementations like NewReno. In the case of CUBIC, it suf-fer for the deficient behavior of Hybrid Slow-Start. The mechanism exits to thecongestion avoidance phase in an early stage and therefore reduces its growthpace far from the maximum achievable capacity, severely impacting in the timeit takes to converge.
The three subfigures on the right of Fig. 2 show the outcome for the samescenario but with background traffic. The total target load of the background
Table 3. Findings wrap-up in base behavior and behavior in a loaded network
CCA Conditions Behavior
CUBIC Base behavior Slightly suffers for the deficient behavior of HybridSlow-Start
Loaded network No impact of Hybrid Slow-Start
NewReno Base behavior Easily achieves maximum capacity
Loaded network Similar behavior but with higher delay and moreunstable goodput
Illinois Base behavior Easily achieves maximum capacity. However, itcreates a huge standing queue
Loaded network Very similar to NewReno but with slightly higherdelay
CDG Base behavior Keeps the delay controlled but fails while trying toreach full resource utilization
Loaded network The differences with loss-based CCAs are reduced
Westwood+ Base behavior Very aggressive back-off that impacts the timeneeded to ramp-up
Loaded network The impact of the back-off application is minimized

382 E. Atxutegi et al.
traffic is set to the 50% of the link capacity. The capacity reduction minimizesthe performance gap between loss-based and delay-based variants and still, themore capacity a CCA gets, the harder impact it inflicts in terms of queuingdelay (Illinois as an example). Big differences appear comparing with the baseexample without background traffic, mostly related to a significant increment inthe queuing delay and the reduction of the gap in terms of capacity to reflectthe differences amongst the CCAs. RTT-clocked CCAs suffer due to a lengthenof the time between implementation decisions. In contrast, CUBIC behaves bet-ter because it does not suffer for RTT increase. The scenario itself due to itsreduction in the available capacity cushions the underperformance of HybridSlow-Start.
Short Flows StudyLive measurements have shown that many flows over Internet are small (90% ofdownstreams carry no more than 35.9 KB of data [4]). Therefore it is importantto assess the impact that such load distribution has in final performance. In orderto do so, the previous foreground TCP flow must be replaced by a succession ofshort flows following an exponential distribution regarding their amount of data.
Throughput (Mbps)0 2 4 6 8 10 12
ECDF
0.0
0.2
0.4
0.6
0.8
1.0
w+
w+
nr
nr
i
i
c
c
cdg
CDG
Cubic
Illinois
New Reno
Westwood+
(a)Queue length (packets)
0 200 400 600 800
ECDF
0.0
0.2
0.4
0.6
0 .8
1 .0
w+
w+
nr
nr
nr
i
i
i
c
ccdg
CDGCubicIllinoisNew RenoWestwood+
(b)
Fig. 3. Throughput and queue size ECDF at 700 m
The Fig. 3 represent as an Empirical Cumulative Distribution Function(ECDF) the results obtained regarding the achieved throughput and standingqueue size. In Fig. 4 the size of the flows and the number of induced drops arecorrelated.
In Fig. 3a, it is clear that the achieved throughput is very similar amongmost the CCAs and their differences really appear regarding the amount ofenqueued packets in Fig. 3b. The delay-based variant, CDG, successfully limits

TCP Performance over Current Cellular Access: A Comprehensive Analysis 383
File size (MB)10−3 10−2 10−1 10+0 10+1 10+2
Drops
(packets)
0200
400
600
800
1000
1200
∗∗
∗
∗∗∗
∗
∗∗∗
∗
∗
∗∗
∗
∗∗∗
∗
∗∗∗
∗
∗
•••
•
◦ CDG• Cubic∗ Illinois
New RenoWestwood+
Fig. 4. eNodeB drops at 700 m
the enqueued packets while loss-based implementations overshoot causing a greatstanding queue. Due to the detected behavior of Westwood+ in the beginningof the transmissions and the short duration of the flows, it prompts little abilityto inject packets in the eNodeB. In contrast, NewReno, Illinois and CUBIChappen to be the average solutions. If we compare two deficient solutions such asCUBIC and Westwood+, we clearly see that even with short flows and thereforequick transmission duration, the premature exit from Slow-Start for the formerperforms better than the excessive back-off of the latter.
Considering the reported findings, Fig. 4 shows the number of packets thathave exceeded the queue size with each flow size, being therefore dropped. Itis clear that the more aggressive the CCA is, the more packet are dropped bythe eNodeB. Illinois for instance has a more aggressive behavior in congestionavoidance phase. It enqueues more packets and gets more packets dropped. As aresult Illinois suffers on average 100 more dropped packets than any other TCPcandidate. Once again, the behavior of Hybrid Slow-Start is clearly shown. Ifwe avoid the fact that the transmissions with Hybrid Slow-Start take slightlymore time to be completed, it only suffers drops with longer transmissions andwhen it has congestion events, the number of losses are very few. With loss-basedAIMD mechanisms, the drop packets metric appears to be directly related tothe aggressiveness and back-off strategy. NewReno and Westwood+ have quitesimilar results (Table 4).

384 E. Atxutegi et al.
Table 4. Findings wrap-up in short flows study
CCA Behavior
CUBIC Thanks to the underperformance of Hybrid Slow-Start, it only suffersdrops with longer transmissions and when it has congestion events,the number of losses are very few
NewReno The average solution
Illinois Very aggressive behavior that results in 100 more dropped packets onaverage
CDG Successfully limits the enqueued packets
Westwood+ In the beginning of the transmissions and the short duration of theflows, it prompts little ability to inject packets due to the aggressiveback-off
Sudden Increase and Decrease of the Available CapacityOnce the main features of the CCAs have been detected in loaded scenarios incomparison with the base behavior as well as the impact of different short flowson the drop rate, it is important to study the responsiveness of CCAs in bigand sudden capacity changes. To this end, two type of simulations are carriedout: with the background traffic being stopped at 20 s of the test and with thebackground traffic being started at 20 s of the test. In order to make easier thereading, Table 5 gathers the most important point of the following explanation.
On the one hand, the left part of Fig. 5 shows the results regarding thescenario with a sudden capacity increase. In general, as soon as the capacityincreases, the queue size is lowered due to a release of previously enqueued pack-ets. It is clear that loss-based CCAs quickly respond to an additional bandwidthassignment. However, Westwood+ still suffers from the excessive reduction ofthe cwnd after the Slow-Start phase. During the congestion avoidance phase,its AIMD mechanism is very conservative and the enqueued packets tend to bealmost 0, therefore with a new and greater achievable capacity, the adaptationability of the CCA is very weak. In the case of delay-based variants, since theymainly focus on reducing the delay over path, they usually fail to increase theirpace and thus, the new available capacity is wasted.
On the other hand, the right part of Fig. 5 depicts the case in which thebackground traffic is activated at 20 s. Due to the sudden reduction of avail-able capacity, the queue size suffer an instant increment because of the relationbetween the same number of incoming packets to the eNodeB and the drasticreduction of outgoing ones. The Fig. 5 clearly shows that all CCAs but CDG areable to successfully react to the capacity reduction. However, in some cases suchas CUBIC, the CCA takes more time to stabilize to the new pace.
These simulations reflect that most CCAs, even delay-based implementa-tions, are capable of reducing their throughput when sudden available capacitydecreases happen but delay-based variants struggle to adapt their pace to band-width increases.

TCP Performance over Current Cellular Access: A Comprehensive Analysis 385
Time (s)0 10 20 30 40
Congestionwindow(bytes)
01000
2000
w+
w+
w+ w+
nr
nr
nr
i
i
i
c
c
cdg cdg
CDGCubicIllinoisNew RenoWestwood+
Time (s)0 10 20 30 40
Congestionwindow(bytes)
01000
2000 w+
w+
w+
nr
nr
nr
i
i
i i
c
c
c
cdg
cdg
CDGCubicIllinoisNew RenoWestwood+
Time (s)0 10 20 30 40
Queue
(packets)
0200
400
600
800
i
i
i
w+
w+
w+
nr
nrnr
c
c
c
cdgcdg
Time (s)0 10 20 30 40
Queue
(packets)
0200
400
600
800
c
c
c c
cdg cdg
cdg
w+
w+
w+
i
i
i
nr
nr
nr
Time (s)0 10 20 30 40
Goodp
ut(M
bps)
010
2030
40
w+
w+
w+nr
nr
i
i
c
c
cdg cdg
(a)Time (s)
0 10 20 30 40
Goodp
ut(M
bps)
010
2030
4050 nr
nr
nr
w+
w+
w+
i
i
i
c
c
c
c
cdg
cdg
(b)
Fig. 5. Performance comparison of the selected CCAs: (a) Sudden capacity increase;(b) Sudden capacity decrease.

386 E. Atxutegi et al.
Table 5. Findings wrap-up in sudden increase and decrease of the available capacity
CCA Conditions Behavior
CUBIC Inc. available cap. Good performance without the impact of HybridSlow-Start due to the low available capacity atthe beginning of the transmission
Dec. available cap. Impact of Hybrid Slow-Start in the beginning.Aggressive behavior in congestion avoidancephase that leads to an instant huge increment ofqueue size while reducing the available capacity
NewReno Inc. available cap. Good responsiveness and average delay impact
Dec. available cap. Average loss-based solution that suffers andinstant standing queue increase while reducingthe available capacity
Illinois Inc. available cap. Good responsiveness and greater induced delaythan NewReno
Dec. available cap. Its aggressiveness is harmful in this scenario andtakes some time to stabilize the goodput
CDG Inc. available cap. Fails to increase its pace and thus, the newavailable capacity is wasted
Dec. available cap. Bad performance in terms of goodput but fullcontrol of the delay that is always close to thebaseline delay
Westwood+ Inc. available cap. Its AIMD mechanism is very conservative andthe enqueued packets tend to be very few, beingnot capable of responding to a sudden greatercapacity assignment
Dec. available cap. The combination of its dynamics (with a slowramp-up ability) and the available capacityreduction happen to get the best performancedue to the achievement of the maximumgoodput and the lowest impact in terms of delay
5.2 Start-Up Performance
In very simplified scenarios, we have seen that the behavior of Standard Slow-Start and Hybrid Slow-Start differs leading in some occasions to a successfulavoidance of massive losses with Hybrid Slow-Start. However, the LTE cells areusually more crowded and therefore the UEs could inflict more delay as cross-traffic that could impact Hybrid Slow-Start. The target is to assess whether theinternal mechanisms of Hybrid Slow-Start could provoke an early exit from thestandard ramp-up, following to a slow increment of the cwnd and therefore asignificant underutilization of radio resources or not.
We first measured the convergence behavior of the Standard Slow-Start,recording the packets that are in-flight at every moment. Later, we assessed

TCP Performance over Current Cellular Access: A Comprehensive Analysis 387
Fig. 6. Hybrid Slow-Start impact in mobile networks: injected packets during a stan-dard Slow-Start period.
the same for Hybrid Slow-Start. Figure 6 shows the probability density func-tion (PDF) of the number of injected packets for both mechanisms in the timeStandard Slow-Start takes to converge. This is, we would compare in the fastestconvergence period of time, the ability of both methods to put packets in-flight.
Figure 6 shows the behavior of Standard Slow-Start has a equal distributionof packets in flight, whereas Hybrid has an imbalanced distribution presumablyformed by the period of time in which Hybrid Slow-Start has ramped-up asStandard Slow-Start and the period after detecting a delay variation and behav-ing under the incremental pace of congestion avoidance phase. The distributionrepresents the huge difference between both methods regarding the ability toinject packets which leads to a extrapolation of the time needed to converge orachieve the maximum capacity from the beginning of the transmission.
It is clear that not only in simplified scenarios, but also in multi-UE mea-surements, Hybrid Slow-Start suffers due to the detection of delay incrementand the early trigger of exit condition from fast ramp-up. So, under some delayvariability circumstances Hybrid Slow-Start slows-down the ramp-up of TCP.In some situations, this effect could underutilize the available radio resourcesand lengthens the time needed to converge, directly impacting on the qualityexperienced by users (QoE).
5.3 Mobility Performance
This subsection covers the analysis of decreasing quality and increasing qualitymovement for the selection ofCCAs.Even though it has been proven in Subsect. 5.1that some CCAs fail in mobile networks (Westwood+ and CDG), they have beenkept for comparison and confirmation purposes. In order to measure the ability

388 E. Atxutegi et al.
or inability of distinct TCP implementation to take advantage of radio resources,the results will be presented as the portion of tbSize that has been actually uti-lized every Transmission Time Interval (TTI). In other words, since the TTI iscommonly configured in 1 ms, the portion of tbSize will show how many bits areused for the UE every millisecond. Considering that different MCS values lead tohave distinct available capacity and therefore a different achievable throughput,the analysis is divided in MCS ranges.
Decreasing Quality MovementThe decreasing quality movement scenario stands for the continuous movementevolution of a certain UE from the eNodeB to a further location. In other words,on average the obtained SINR due to the distance from the UE to the eNodeBand the fading will have a tendency to be worse. So will be the reported CQI andthe assigned MCS (instead of worse, it is a tendency to become a more robustmodulation). In such a transition, the CCA will need to adapt to the differentavailable capacities. Figure 7 shows the difference between the available capacityand the achieved capacity for different CCAs under distinct speeds, all classifiedby average MCS.
Fig. 7. Achieved/Available capacity at different speeds for different TCP variants(decreasing quality movement).
Figure 7 clearly depicts three main areas:
Slow-Start phase: Located in the coverage zone associated to MCS 28, duringthe transmission establishment and first ramp-up, the cwnd is not great enoughto take full advantage of available radio resources. Considering that StandardSlow-Start converges very fast, the MCS 28 area also takes the first back-offapplication. For that reason Westwood+ or NewReno among others do not reportthe same result. Since the distance associated with a MCS is covered a lot faster

TCP Performance over Current Cellular Access: A Comprehensive Analysis 389
at 200 km/h, the cwnd has no time to grow quickly enough and therefore theimpact of ramp-up is more significant for the scenario at 200 km/h, promptinga lower value of achieved/available for this speed.
“Bufferbloat” area: While in the area between MCS 26 to 18-20, the CCAs areable to take advantage of already enqueued packets in the eNodeB (bufferbloateffect). However the effect itself has a drawback in relation to the inflicted delay.This feature is more present in the examples at 60 km/h. The time spent in eachMCS area makes it possible to the TCP variant to inject packets throughouta longer time, getting loss packets and requiring to recover from them underhigh-delay conditions and therefore, not allowing the CCA to achieve maximumcapacity.
Queue draining zone: Regardless the speed, it is an area in which the radioconditions are not good enough to maintain a full utilization of resources. Eventhough the average MCS values are between 18 to 14, fading conditions forcethe eNodeB to operate with very low MCS values (achieving sometimes MCS4 and 6) in some drastic fades. With each sudden fade, it is easier to receivemore robust modulations, leading the packets to need stronger segmentation.As a side effect, both the queue size of the eNodeB and the delay increase. Therecovery of losses in such network conditions is also a harmful process for TCPthat leads to queue starvation events. When it comes to faster UE scenario,the eNodeB is able to lengthen the utilization of previously enqueued packet tofurther positions, therefore, the draining effect is slower or at least happens infurther positions.
Figure 7 shows that in decreasing quality movement the differences in loss-based CCAs are minimum, getting more credit of aggressiveness at 60 km/h andRTT-synchronization at 200 km/h (NewReno and Illinois over CUBIC). Onceagain and even in a scenario that moves towards worse radio position, the delay-based variants have demonstrated to be unable to cope with the delay variabilityof LTE. CDG maintains a RTT close to the baseline RTT but underutilizes mostof the assigned bandwidth. In the case of Westwood+, even though it is a scenariothat helps get the maximum capacity to the weak AIMD mechanisms due to itscontinuous achievable capacity reduce, it takes very long time to achieve such atask at 60 km/h and it is not capable of doing so at 200 km/h.
Increasing Quality MovementOnce analyzed the decreasing quality movement and the behavior of differentCCAs under distinct speeds, it is necessary to study the increasing quality move-ment in a constant evolution of the channel quality to better positions. Consid-ering the findings in decreasing quality movement, it is important to determinewhether the different methods of Slow-Start equally struggle under challengingradio condition or not and analyze whether the aggressiveness of TCP overshotssufficient packets to serve a continuous greater capacity or not.
Trying to better explain the effects of this scenario in the beginning of thetransmission and the relation between cwnd evolution and achieved goodput,Fig. 8 represents the relation between them. The graphs have been split for the

390 E. Atxutegi et al.
better understanding in two blocks: the result in relation to the cwnd evolu-tion is on the left and goodput’s cumulative sum on the right. Figure 8 depictsthe behavior difference between CUBIC with Hybrid Slow-Start and NewRenowith Standard Slow-Start. It is clear that the network conditions are challengingbecause even in Standard Slow-Start the shape of the cwnd is very stepped.In such conditions in which the delay variability is also a hard drawback totackle, the Hybrid Slow-Start mechanism detects an increment in the delay thatis considered enough to trigger an early exit to congestion avoidance phase. Theresultant cumulative goodput of both CCAs is represented on the right wherethe graphs shows a big outcome gap between both methods. Once again theunderperformance of Hybrid Slow-Start is shown. Besides, in this case the earlyexit of fast ramp-up is provoked in a single-UE scenario in which the movementand fading are the only sources that vary the delay.
Fig. 8. NewReno vs. CUBIC in increasing quality scenarios at 200 km/h.
Considering the explained effect regarding how Hybrid Slow-Start couldaffect the performance, we will now proceed to study the performance differ-ences under different speeds between NewReno, CUBIC, Westwood+, Illinoisand CDG, classified by average MCS levels (see Fig. 9). At a first glance, thefigure looks very similar to Fig. 7, but some differences are present. The behav-ior of such scenario is divided in two areas.
Ramp-up phase: The hardest radio conditions for the channel are present fromMCS 14 to 18. In such a challenging conditions the CCAs initialize the trans-mission and employ the selected Slow-Start method in a try to ramp-up andconvergence as fast as possible without inducing a bursty loss event. As seenbeforehand, at 200 km/h the performances of Standard Sow-Start and Hybrid
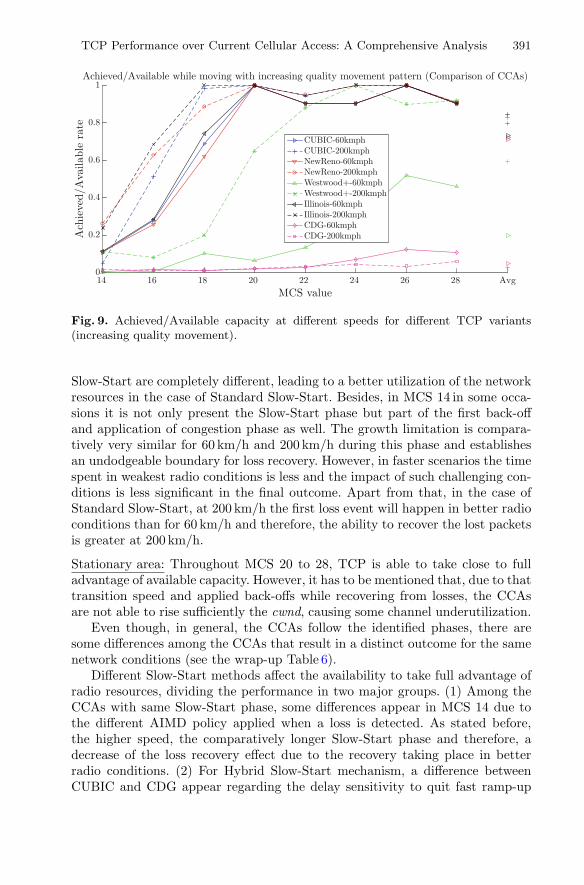
TCP Performance over Current Cellular Access: A Comprehensive Analysis 391
Fig. 9. Achieved/Available capacity at different speeds for different TCP variants(increasing quality movement).
Slow-Start are completely different, leading to a better utilization of the networkresources in the case of Standard Slow-Start. Besides, in MCS 14 in some occa-sions it is not only present the Slow-Start phase but part of the first back-offand application of congestion phase as well. The growth limitation is compara-tively very similar for 60 km/h and 200 km/h during this phase and establishesan undodgeable boundary for loss recovery. However, in faster scenarios the timespent in weakest radio conditions is less and the impact of such challenging con-ditions is less significant in the final outcome. Apart from that, in the case ofStandard Slow-Start, at 200 km/h the first loss event will happen in better radioconditions than for 60 km/h and therefore, the ability to recover the lost packetsis greater at 200 km/h.
Stationary area: Throughout MCS 20 to 28, TCP is able to take close to fulladvantage of available capacity. However, it has to be mentioned that, due to thattransition speed and applied back-offs while recovering from losses, the CCAsare not able to rise sufficiently the cwnd, causing some channel underutilization.
Even though, in general, the CCAs follow the identified phases, there aresome differences among the CCAs that result in a distinct outcome for the samenetwork conditions (see the wrap-up Table 6).
Different Slow-Start methods affect the availability to take full advantage ofradio resources, dividing the performance in two major groups. (1) Among theCCAs with same Slow-Start phase, some differences appear in MCS 14 due tothe different AIMD policy applied when a loss is detected. As stated before,the higher speed, the comparatively longer Slow-Start phase and therefore, adecrease of the loss recovery effect due to the recovery taking place in betterradio conditions. (2) For Hybrid Slow-Start mechanism, a difference betweenCUBIC and CDG appear regarding the delay sensitivity to quit fast ramp-up
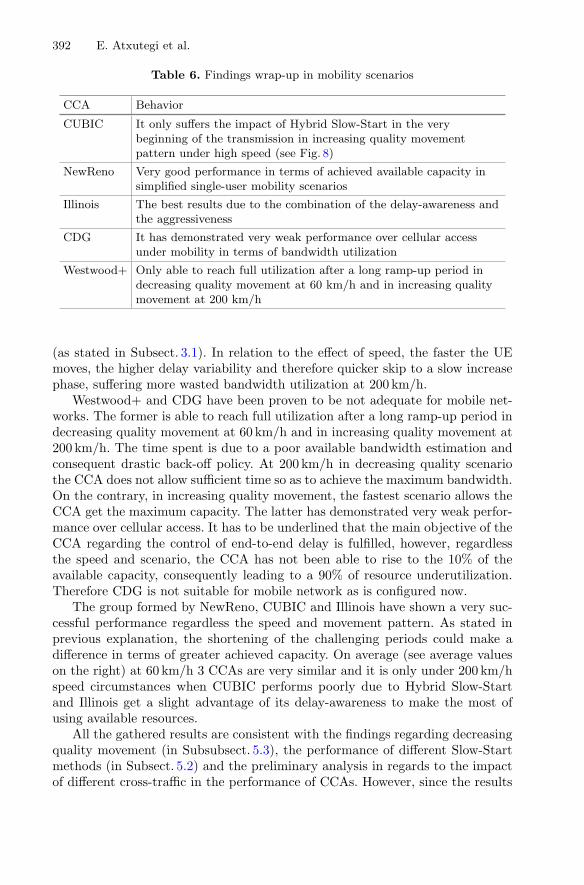
392 E. Atxutegi et al.
Table 6. Findings wrap-up in mobility scenarios
CCA Behavior
CUBIC It only suffers the impact of Hybrid Slow-Start in the verybeginning of the transmission in increasing quality movementpattern under high speed (see Fig. 8)
NewReno Very good performance in terms of achieved available capacity insimplified single-user mobility scenarios
Illinois The best results due to the combination of the delay-awareness andthe aggressiveness
CDG It has demonstrated very weak performance over cellular accessunder mobility in terms of bandwidth utilization
Westwood+ Only able to reach full utilization after a long ramp-up period indecreasing quality movement at 60 km/h and in increasing qualitymovement at 200 km/h
(as stated in Subsect. 3.1). In relation to the effect of speed, the faster the UEmoves, the higher delay variability and therefore quicker skip to a slow increasephase, suffering more wasted bandwidth utilization at 200 km/h.
Westwood+ and CDG have been proven to be not adequate for mobile net-works. The former is able to reach full utilization after a long ramp-up period indecreasing quality movement at 60 km/h and in increasing quality movement at200 km/h. The time spent is due to a poor available bandwidth estimation andconsequent drastic back-off policy. At 200 km/h in decreasing quality scenariothe CCA does not allow sufficient time so as to achieve the maximum bandwidth.On the contrary, in increasing quality movement, the fastest scenario allows theCCA get the maximum capacity. The latter has demonstrated very weak perfor-mance over cellular access. It has to be underlined that the main objective of theCCA regarding the control of end-to-end delay is fulfilled, however, regardlessthe speed and scenario, the CCA has not been able to rise to the 10% of theavailable capacity, consequently leading to a 90% of resource underutilization.Therefore CDG is not suitable for mobile network as is configured now.
The group formed by NewReno, CUBIC and Illinois have shown a very suc-cessful performance regardless the speed and movement pattern. As stated inprevious explanation, the shortening of the challenging periods could make adifference in terms of greater achieved capacity. On average (see average valueson the right) at 60 km/h 3 CCAs are very similar and it is only under 200 km/hspeed circumstances when CUBIC performs poorly due to Hybrid Slow-Startand Illinois get a slight advantage of its delay-awareness to make the most ofusing available resources.
All the gathered results are consistent with the findings regarding decreasingquality movement (in Subsubsect. 5.3), the performance of different Slow-Startmethods (in Subsect. 5.2) and the preliminary analysis in regards to the impactof different cross-traffic in the performance of CCAs. However, since the results

TCP Performance over Current Cellular Access: A Comprehensive Analysis 393
have been obtained in a single LTE deployment, it is important to determine towhich extent our findings could be extrapolated as a general-purpose behaviorof CCAs and whether the results are biased towards the simulated/emulatedtestbed or not.
5.4 Correlation of TCP Behavior over w-iLab.t LTE Testbed
The current subsection aims at representing and explaining the behavior of aselection of CCAs over the controlled LTE testbed called w-iLab.t. Since thedeployment is formed with completely real equipment (i.e. UEs, eNodeBs, fem-tocells, servers), the internal mechanisms of LTE and the interaction with TCPare closer to real-world behavior and therefore the variability is presumablyhigher comparing with simulated environment. Thus, such testbed allows carry-ing out experiments that represent the performance of the reality in a smallerscale. CDG was removed from the comparison set for its incompatibility withmobile networks. Westwood+ is kept in the selection of CCAs to confirm or denythe underperformance under more variable circumstances.
We configured three different paths to be followed by the robots with decreas-ing quality and increasing quality movements. The location of those movementpatterns were located in different places of the femtocell, having a pattern closeto the eNodeB, another one close to the spacial limits of the testbed and a thirdone in the middle of the previous two. After ten experiments over the differentconfigurations/patterns, we gathered the following average throughput valuesfor CUBIC, NewReno, Westwood+ and Illinois.
Fig. 10. CCA comparison over w-iLab-t under mobility circumstances.
394 E. Atxutegi et al.
Figure 10 shows that the previous findings in ns-3 were accurate enough toexplain the possible effect of CCAs in other LTE deployments. In fact, somedeficiencies such as the ones regarding Hybrid Slow-Start and Westwood+ aremore harmful than in simulation environment, causing a greater gap betweenthe available capacity and the achieved one.
In general three are the most important features to be underlined. First,the drastic back-off application of Westwood+ leads the CCA to be incapableof achieving the maximum capacity even within 20 s of transmission. Lookingat the growth tendency, the CCA may well take around 1 min to convergencewhich is an unacceptable value in order to provide a good service to the UEs.Second, the underperformance of Hybrid Slow-Start is more remarkable in thistestbed and the results prompt a convergence time around 4.5 s. The performancedifference with Standard Slow-Start (present in NewReno and Illinois) could becushioned if the transmission is long enough (average value of CUBIC is closeto NewReno or Illinois in 20 s transmission). However, the impact in short-livedflows would be more notable. Third, the performance of NewReno and Illinois arevery similar and the only distinction appear due to the greater aggressivenessof Illinois for its delay-awareness. Nevertheless, the utilized femtocells give avery good channel quality regardless the mobility pattern, movement patternsor speed. Thus, the “signal quality rings” that are present in real-world couldnot be represented. Therefore, in order to better understand the performancetradeoff of CUBIC, NewReno and Illinois in congestion avoidance phase duringmobility circumstances, an additional analysis was demanded.
5.5 Performance Tradeoff of Selected TCP Variants Under Mobilityin Emulated Testbed
Once the previous findings regarding the behavior of CCAs have been demon-strated in a controlled testbed, this subsection covers the comparison analysisof most adequate TCP flavors (CUBIC, NewReno and Illinois) over emulatedtestbed with mobile scenarios of decreasing quality and increasing quality move-ment. The previous scenarios have shown that CUBIC, NewReno and Illinoishave a very close outcome. Therefore, this subsection will serve not only as aconfirmation step of the findings in another testbed but to also carry out experi-ments in mobility circumstances with a realistic representation of “signal qualityrings”.
The testbed itself is not able to emulate movement due to the fixed positionof the UE attached to a radio cable. Nonetheless, a computer that plays the roleof a experiment controlled, is capable of establishing the baseline SINR at anymoment. Besides, the lte-in-a-box called Aeroflex 7100 applies a fading patternto such a variable baseline SINR, modelling this way the effect of movement witha static UE.
To help decide the best timing for different baseline SINR values, averagedSINR traces obtained from ns-3 with a UE moving in decreasing quality andincreasing quality movement patterns at 60 km/h are used. In order to give morerealism to the experiments, the EVA60 fading model in Aeroflex 7100 are applied.

TCP Performance over Current Cellular Access: A Comprehensive Analysis 395
We have decided to only use the scenarios at 60 km/h due to the result equality inns-3. At 200 km/h the differences among CCAs were noticeable. Therefore, theseexperiments add additional information to the previous inconclusive outcomesand gives more insight regarding the differences among the selected CC. Figure 11depicts the average goodput, end-to-end delay and duplicated ACK (DUPACK)events per second as a sign of congestion for decreasing quality movement at thetop and for increasing quality movement at the bottom.
Fig. 11. Performance tradeoff of CCAs in the emulated testbed at 60 km/h: (a)Decreasing quality movement; (b) Increasing quality movement.
396 E. Atxutegi et al.
In this case, the differences among the CCAs are noticeable for both move-ment patterns. The goodput results do not prompt any new feature and clas-sify the performance of the selected TCP implementations from better to worseas Illinois, CUBIC and NewReno. This outcome equally applies for decreas-ing quality and increasing quality movement, getting slightly more difference inincreasing quality movement due to the continuous capacity increase and theavailability to cushion overshots. The simplest way to proceed would be to saythat Illinois is the best amongst the CCAs. However, depending on the perfor-mance objective, the decision could be another one. The reasons are manyfold.First, even though the goodput performance is better for Illinois, the inducesdelay and the consequent packet losses are a way larger than in the examples ofCUBIC and NewReno. Second, if we compare the overall performance of CUBICand NewReno, we see that in spite of the delay and DUPACK events being verysimilar, CUBIC makes the most in terms of goodput. Therefore, trying to avoidmassive packet losses and delay infliction, the selection of CUBIC would be moredesirable in this simple comparison. Third, for comparison purposes, since theobjective of this scenario was the understanding of congestion avoidance phasesand the adaptability to mobile LTE scenarios, the Hybrid Slow-Start mechanismwas disabled. Taking into account this detail and depending on the requirementsof the application, the selection of NewReno could not be discarded. To concludethis tradeoff study, it is clear that Illinois, CUBIC and NewReno have very sim-ilar results, but it cannot be easily decided whether one is better than the otherbecause each of them has its “bright side” and drawback.
6 Conclusion
This chapter has tried to shed some light in the explanation of CCAs adaptabilityto different mobile network situation including the implication of different typeof cross-traffics, the start-up phase and mobile UEs with increasing quality anddecreasing quality movement patterns. The chapter has also included differentLTE deployments so as to confirm and clarify the obtained result in the simulatedenvironment. Table 7 wrap-ups the detected findings and confirmations of CCAsbehavior under distinct circumstances.
Simple static experimentation with different background traffic profiles andbehaviors has demonstrated that loss-based TCP mechanisms reach the max-imum capacity quicker than delay-based variants. The former achieves greaterthroughputs but fails limiting the standing queue size and therefore inflict severedelays. The latter is able to keep the end-to-end delay close to the baseline delayvalue but struggle to ramp-up or speed up its injection pace, wasting this way agreat amount of the available radio resources.
Different scenarios have shown the huge impact that Hybrid Slow-Start mech-anism has under some delay variability circumstances. Having in mind that thedelay’s instability is one of the main features in mobile networks, Hybrid Slow-Start is capable of slowing down the start-up phase leading to a bad resourceutilization. Taking into account the widespread usage of CUBIC due to the
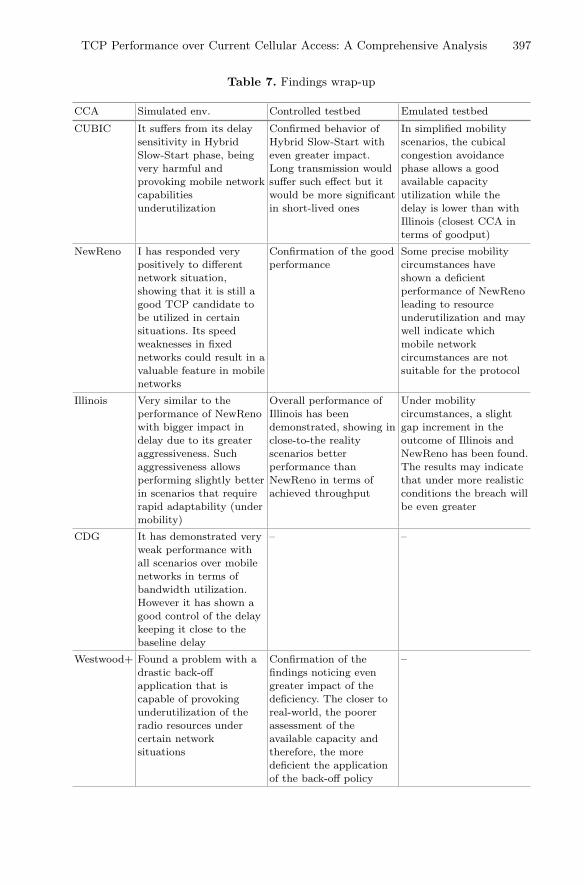
TCP Performance over Current Cellular Access: A Comprehensive Analysis 397
Table 7. Findings wrap-up
CCA Simulated env. Controlled testbed Emulated testbed
CUBIC It suffers from its delaysensitivity in HybridSlow-Start phase, beingvery harmful andprovoking mobile networkcapabilitiesunderutilization
Confirmed behavior ofHybrid Slow-Start witheven greater impact.Long transmission wouldsuffer such effect but itwould be more significantin short-lived ones
In simplified mobilityscenarios, the cubicalcongestion avoidancephase allows a goodavailable capacityutilization while thedelay is lower than withIllinois (closest CCA interms of goodput)
NewReno I has responded verypositively to differentnetwork situation,showing that it is still agood TCP candidate tobe utilized in certainsituations. Its speedweaknesses in fixednetworks could result in avaluable feature in mobilenetworks
Confirmation of the goodperformance
Some precise mobilitycircumstances haveshown a deficientperformance of NewRenoleading to resourceunderutilization and maywell indicate whichmobile networkcircumstances are notsuitable for the protocol
Illinois Very similar to theperformance of NewRenowith bigger impact indelay due to its greateraggressiveness. Suchaggressiveness allowsperforming slightly betterin scenarios that requirerapid adaptability (undermobility)
Overall performance ofIllinois has beendemonstrated, showing inclose-to-the realityscenarios betterperformance thanNewReno in terms ofachieved throughput
Under mobilitycircumstances, a slightgap increment in theoutcome of Illinois andNewReno has been found.The results may indicatethat under more realisticconditions the breach willbe even greater
CDG It has demonstrated veryweak performance withall scenarios over mobilenetworks in terms ofbandwidth utilization.However it has shown agood control of the delaykeeping it close to thebaseline delay
– –
Westwood+ Found a problem with adrastic back-offapplication that iscapable of provokingunderutilization of theradio resources undercertain networksituations
Confirmation of thefindings noticing evengreater impact of thedeficiency. The closer toreal-world, the poorerassessment of theavailable capacity andtherefore, the moredeficient the applicationof the back-off policy
–
398 E. Atxutegi et al.
presence of it by default in most Web servers, the problem is even worse. Eventhough, long transmissions suffer the impact of the underperformance of HybridSlow-Start, the effect is greater in the case of short-lived flows.
Regarding the mobility scenarios, two have been studied. In decreasing qual-ity movement most CCAs are able to achieve the maximum capacity duringgood radio conditions and they lengthen the utilization of previously enqueuedpackets while running towards worse channel qualities. At higher speeds, thealready enqueued packets are driven to further positions comparing with lowerspeeds, improving the average capacity utilization. In increasing quality move-ment, regardless the speed, the transmission initialization and first ramp-uphappens in very challenging radio conditions, requiring CCAs availability toscale, recover from losses and AIMD mechanisms’ suitability to make the mostof available capacity.
In relation to the specific features of each CCAs’ adaptability, several findingshave to be mentioned: (1) CUBIC suffers from its delay sensitivity in HybridSlow-Start phase, being very harmful and provoking mobile network capabili-ties underutilization. (2) CDG keeps the delay close to the baseline delay valuebut is incapable of growing its pace in order to utilize greater capacities. Inits current state is not suitable for mobile networks and it could more suitablefor wired networks where the delay variation in not that abrupt. However, thedelay boundaries of the protocol may well be adapted to cellular networks’ con-straints. (3) Westwood+ has shown to be incapable to properly estimate theavailable bandwidth, leading to big cwnd reductions and the necessity to grow-up from very low values and very weak AIMD incremental pace.The adaptationof the estimation is required in order to make it suitable for mobile networks.(4) NewReno and Illinois have demonstrated to beat the other CCAs (apart fromCUBIC in some situations) under different loads, traffic patterns, mobility andspeed contexts. Even though in simulated environment the only detected differ-ence has appeared in increasing quality scenario in which the delay-awarenessand greater aggressiveness has given to Illinois the best performance regardingthe use of available capacity, in emulated testbed the differences have been alsopresent in decreasing quality movement. Since the emulated testbed has showna slight gap increment in the outcome of Illinois and NewReno, the results mayindicate that under more realistic conditions the breach will be even greater.
The feature-based findings have been confirmed over the LTE deploymentof w-iLab.t and the performance tradeoff of the best CCAs has been explainedunder mobility circumstances in order to give insights regarding the appropriateselection depending on the application requirements. This chapter has given anoverview of the behavior of the different TCP mechanisms in a LTE networkunder different circumstances. This work might be of value as a validation of theperformance of different CCAs and as an indication of fruitful directions for theimprovement of TCP congestion control over cellular networks.
Some knowledge from the network would help TCP decide the best strategyin accordance to the network conditions. The envisioned scenario is aligned withthe main features of mobile edge computing (MEC) management that would
TCP Performance over Current Cellular Access: A Comprehensive Analysis 399
allow removing as much end-to-end TCP variant dependency as possible. In thesame way, other initiatives such as QUIC [24] that propose transport servicesin the user-space of the operating system with TCP-alike CCAs on top of UDP(UDP as a substrate) could take advantage of this comprehensive analysis inorder to select the most appropriate TCP candidate (i.e. depending on multi-criteria that considers both network state and application requirements) in eachnetwork conditions and enable such TCP-alike implementation.
Acknowledgments. This chapter has been possible thanks to the Cost Action IC1304through the STSMs entitled “Evaluation of QoE-optimized transport protocols on cel-lular access” and “Evaluation of modern transport protocols over iMinds LTE facil-ities”. The work has been partially funded by the European Union’s Horizon 2020research and innovation programme under grant agreement No. 644399 (MONROE)through the open call project MARiL and by the Spanish Ministerio de Economiay Competitividad (MINECO) under grant TEC2016-80090-C2-2-R (5RANVIR). Theviews expressed are solely those of the author(s). The authors would like to thank RemiRobert for the useful discussions on the experiments and his work and dedication inthe simulated environment.
References
1. Cisco: Cisco Visual Networking Index: Global Mobile Data Traffic Forecast Update,2016–2021. Technical report, Cisco (2017)
2. Callegari, C., et al.: Behavior analysis of TCP linux variants. Comput. Netw. 56(1),462–476 (2012)
3. Huang, J., et al.: A close examination of performance and power characteristics of4G LTE networks. In: MobiSys 2012, pp. 225–238. ACM, New York (2012)
4. Huang, J., et al.: An in-depth study of LTE: effect of network protocol and applica-tion behavior on performance. SIGCOMM Comput. Commun. Rev. 43(4), 363–374(2013)
5. Merz, R., et al.: Performance of LTE in a high-velocity environment: a measurementstudy. In: AllThingsCellular 2014, pp. 47–52. ACM, New York (2014)
6. Johansson, I.: Congestion control for 4G and 5G access. Internet-Draft draft-johansson-cc-for-4g-5g-02. IETF Secretariat, July 2016. http://www.ietf.org/internet-drafts/draft-johansson-cc-for-4g-5g-02.txt
7. Alfredsson, S., et al.: Cross-layer analysis of TCP performance in a 4G system. In:SoftCOM, pp. 1–6, September 2007
8. Park, H.S., et al.: TCP performance issues in LTE networks. In: ICTC 2011, pp.493–496 (2011)
9. Nguyen, B., et al.: Towards understanding TCP performance on LTE/EPC mobilenetworks. In: Proceedings of AllThingsCellular 2014, pp. 41–46. ACM, New York(2014)
10. Alfredsson, S., et al.: Impact of TCP congestion control on bufferbloat in cellularnetworks. In: WoWMoM 2013, June 2013 (2013)
11. Garcia, J., et al.: A measurement based study of TCP protocol efficiency in cellularnetworks. In: Proceedings of WiOpt 2014, pp. 131–136 (2014)
12. Ha, S., Rhee, I.: Taming the elephants: new TCP slow start. Comput. Netw. 55(9),2092–2110 (2011)
400 E. Atxutegi et al.
13. Garcia, J., et al.: Examining TCP short flow performance in cellular networksthrough active and passive measurements. In: AllThingsCellular 2015, pp. 7–12.ACM, New York (2015)
14. Chen, Y.C., et al.: Measuring cellular networks: characterizing 3G, 4G, and pathdiversity. In: Annual Conference of International Technology Alliance, pp. 1–6,December 2010
15. Wylie-Green, M.P., et al.: Throughput, capacity, handover and latency perfor-mance in a 3GPP LTE FDD field trial. In: GLOBECOM 2010, pp. 1–6 (2010)
16. Henderson, T., et al.: The NewReno Modification to TCP’s Fast Recovery Algo-rithm. RFC 6582 (Proposed Standard), April 2012
17. Ha, S., et al.: CUBIC: a new TCP-friendly high-speed TCP variant. SIGOPS Oper.Syst. Rev. 42(5), 64–74 (2008)
18. WeTechs: Usage Statistics and Market Share of Operating Systems for Websites(2017)
19. Hayes, D.A., Armitage, G.: Revisiting TCP congestion control using delay gradi-ents. In: Domingo-Pascual, J., Manzoni, P., Palazzo, S., Pont, A., Scoglio, C. (eds.)NETWORKING 2011. LNCS, vol. 6641, pp. 328–341. Springer, Heidelberg (2011).https://doi.org/10.1007/978-3-642-20798-3 25
20. Mascolo, S., et al.: TCP westwood: bandwidth estimation for enhanced transportover wireless links. In: MobiCom 2001, pp. 287–297. ACM, New York (2001)
21. Liu, S., et al.: TCP-Illinois: a loss and delay-based congestion control algorithmfor high-speed networks. In: valuetools 2006. ACM, New York (2006)
22. Tazaki, H., et al.: Direct code execution: revisiting library OS architecture forreproducible network experiments. In: CoNEXT 2013, pp. 217–228. ACM, NewYork (2013)
23. Bouckaert, S., Vandenberghe, W., Jooris, B., Moerman, I., Demeester, P.: Thew-iLab.t testbed. In: Magedanz, T., Gavras, A., Thanh, N.H., Chase, J.S. (eds.)TridentCom 2010. LNICST, vol. 46, pp. 145–154. Springer, Heidelberg (2011).https://doi.org/10.1007/978-3-642-17851-1 11
24. Langley, A., Riddoch, A., Wilk, A., Vicente, A., Krasic, C., Zhang, D., Yang, F.,Kouranov, F., Swett, I., Iyengar, J., et al.: The QUIC transport protocol: designand internet-scale deployment. In: Proceedings of the Conference of the ACM Spe-cial Interest Group on Data Communication, pp. 183–196. ACM (2017)
Open Access This chapter is licensed under the terms of the Creative CommonsAttribution 4.0 International License (http://creativecommons.org/licenses/by/4.0/),which permits use, sharing, adaptation, distribution and reproduction in any mediumor format, as long as you give appropriate credit to the original author(s) and thesource, provide a link to the Creative Commons license and indicate if changes weremade.
The images or other third party material in this chapter are included in the chapter’sCreative Commons license, unless indicated otherwise in a credit line to the material. Ifmaterial is not included in the chapter’s Creative Commons license and your intendeduse is not permitted by statutory regulation or exceeds the permitted use, you willneed to obtain permission directly from the copyright holder.

Author Index
Aalto, Samuli 241Arış, Ahmet 337Arvidsson, Åke 1, 371Atxutegi, Eneko 371
Barakovic Husic, Jasmina 49Barakovic, Sabina 49Beben, Andrzej 269Blanco, Bego 241Bosman, Joost W. 269Brunstrom, Anna 371Bruzgiene, Rasa 104Burakowski, Wojciech 1, 269
Cardellini, Valeria 182, 212
Dobrijevic, Ognjen 49
Galinac Grbac, Tihana 1, 182, 212Ganchev, Ivan 1, 81, 151Gribaudo, Marco 241Grinnemo, Karl-Johan 371
Haddad, Yoram 1, 23Hasslinger, Gerhard 269Hoßfeld, Tobias 1, 23, 128
Jarschel, Michael 23
Kassler, Andreas 212Kathiravelu, Pradeeban 212Kecskemeti, Gabor 313Kertesz, Attila 269, 313Key, Peter 1
Lassila, Pasi 1, 241Latre, Steven 269Leitner, Philipp 1Li, Zhi 104Liberal, Fidel 1, 241, 371Liotou, Eirini 23, 49, 128Lo Presti, Francesco 212
Markus, Andras 313Marotta, Antonio 212Marques, Andre 313Melvin, Hugh 1, 23, 104Metzger, Florian 23, 128Moldovan, Christian 128
Nardelli, Matteo 182, 212
Oktuğ, Sema F. 337
Passas, Nikos 128Pernici, Barbara 241Pflanzner, Tamas 269Pocta, Peter 23, 49, 104Poryazov, Stoyan 81, 151Poullie, Patrick Gwydion 269
Sainz, Javier 241Saranova, Emiliya 81, 151Schatz, Raimund 49Schwarzmann, Susanna 49Siris, Vasilios A. 23Skorin-Kapov, Lea 23, 49, 104Sosnowski, Maciej 269Spinnewyn, Bart 269Stiller, Burkhard 269
Tanković, Nikola 182Truong, Hong-Linh 182Tsolkas, Dimitris 128Tutschku, Kurt 1
van den Berg, Hans 1, 269van der Mei, Rob 1, 269Veiga, Luís 212Voigt, Thiemo 337
Wac, Katarzyna 1
Zgank, Andrej 23, 104Zinner, Thomas 49