Automating the Assessment of ICT Risk
19
Baiardi et al. TO APPEAR ON JOURNAL OF INFORMATION SECURITY AND APPLICATIONS Automating the Assessment of ICT Risk Fabrizio Baiardi 1* , Fabio Cor` o 1† , Federico Tonelli 1† and Daniele Sgandurra 2† * Correspondence: [email protected] 1 Dipartimento di Informatica, Universit` a di Pisa, Largo Bruno Pontecorvo 3, Pisa, Italy Full list of author information is available at the end of the article † [email protected], [email protected], and [email protected] Abstract We present a pair of tools to assess the risk of an ICT system through a scenario-based method. In each scenario, rational threat agents compose attacks against the system to reach some predefined goal. The first tool builds a description of the target system by automatically discovering and classifying the vulnerabilities in its components and the attacks they enable. Starting from this description and from the one of the agents, the other tool applies a Monte Carlo method to simulate step by step each agent and its attacks. By collecting samples on the agent attacks, the number of times they reach a goal and the corresponding impact this tool returns a database to compute statistics to support the assessment. After describing both tools, we exemplify their adoption in the assessment of a industrial control system that supervises a power production plant. Keywords: Vulnerability Assessment; Risk evaluation; Monte Carlo; Scenario Analysis; Complex Attack 1 Introduction We consider a quantitative approach to the probabilistic risk assessment of an ICT system under attack by intelligent threat agents. These agents are interested in achieving some goals that is in collecting a set of privileges, e.g. access rights. To this purpose, they compose into complex attacks, or plans, the elementary attacks enabled by the local vulnerabilities of system components. A plan is a sequence of elementary attacks that results a privilege escalation where the agent exploits the privileges acquired through an attack to implement the following till it collects all the privileges in a goal. The escalation may involve distinct nodes of an ICT network. To assess the risk posed by the target system, our approach considers some sce- narios with one or several agents and it estimates in each scenario the overall impact due to the agents. While this may result in an accurate assessment, the complex- ity of discovering the probability that an agent selects and implements a plan is rather high. To produce the samples to compute the statistics of interest, we adopt a Monte Carlo method. For each scenario, the method runs several step by step simulations of how agents select and implement their attacks. By collecting samples of interest in each simulation, the tool populates a database to compute statistics on the attacks of each agent, the probability it reaches a goal and the corresponding impact. This can assess the risk posed by the system starting from the description of the system and the one of the agents and of their goals. To build the system description, we consider all the vulnerabilities in the system components and the attacks they enable. Currently, several tools can discover these vulnerabilities and
Transcript of Automating the Assessment of ICT Risk
Baiardi et al.
TO APPEAR ON JOURNAL OF INFORMATION SECURITY AND APPLICATIONS
Automating the Assessment of ICT RiskFabrizio Baiardi1*, Fabio Coro1†, Federico Tonelli1† and Daniele Sgandurra2†
*Correspondence:
[email protected] Dipartimento di Informatica,
Universita di Pisa, Largo Bruno
Pontecorvo 3, Pisa, Italy
Full list of author information is
available at the end of the article†[email protected],
[email protected], and
Abstract
We present a pair of tools to assess the risk of an ICT system through ascenario-based method. In each scenario, rational threat agents compose attacksagainst the system to reach some predefined goal. The first tool builds adescription of the target system by automatically discovering and classifying thevulnerabilities in its components and the attacks they enable. Starting from thisdescription and from the one of the agents, the other tool applies a Monte Carlomethod to simulate step by step each agent and its attacks. By collectingsamples on the agent attacks, the number of times they reach a goal and thecorresponding impact this tool returns a database to compute statistics tosupport the assessment. After describing both tools, we exemplify their adoptionin the assessment of a industrial control system that supervises a powerproduction plant.
Keywords: Vulnerability Assessment; Risk evaluation; Monte Carlo; ScenarioAnalysis; Complex Attack
1 IntroductionWe consider a quantitative approach to the probabilistic risk assessment of an ICT
system under attack by intelligent threat agents. These agents are interested in
achieving some goals that is in collecting a set of privileges, e.g. access rights. To
this purpose, they compose into complex attacks, or plans, the elementary attacks
enabled by the local vulnerabilities of system components. A plan is a sequence
of elementary attacks that results a privilege escalation where the agent exploits
the privileges acquired through an attack to implement the following till it collects
all the privileges in a goal. The escalation may involve distinct nodes of an ICT
network.
To assess the risk posed by the target system, our approach considers some sce-
narios with one or several agents and it estimates in each scenario the overall impact
due to the agents. While this may result in an accurate assessment, the complex-
ity of discovering the probability that an agent selects and implements a plan is
rather high. To produce the samples to compute the statistics of interest, we adopt
a Monte Carlo method. For each scenario, the method runs several step by step
simulations of how agents select and implement their attacks. By collecting samples
of interest in each simulation, the tool populates a database to compute statistics
on the attacks of each agent, the probability it reaches a goal and the corresponding
impact. This can assess the risk posed by the system starting from the description
of the system and the one of the agents and of their goals. To build the system
description, we consider all the vulnerabilities in the system components and the
attacks they enable. Currently, several tools can discover these vulnerabilities and

Baiardi et al. Page 2 of 19
the corresponding elementary attacks, but they do not determine whether an agent
can compose the attacks to reach a goal. Also several approaches to characterize the
risk paired with a vulnerability, such as the Common Vulnerability Scoring System
[1], do not consider privilege escalations implemented by composing elementary at-
tacks into complex ones. As a consequence, they cannot evaluate the risk paired
with a complex attack.
This paper presents Haruspex, a pair of tools to automate both the building of
a scenario description and the simulation of the agent plans. The first tool is the
description builder, an evolution of a vulnerability scanner. This tool returns
a description of the topology of the target ICT system, of its components, their
vulnerabilities, and the elementary attacks they enable. This description is merged
with the one of the threat agents to define the scenario of interest that is the input
of the second tool, the simulation engine. This tool applies a Monte Carlo method
to produce a database with the statistical samples it collects. Statistics to support
the assessment are computed by applying proper packages to the database.
This paper is structured as follows. Sect. 2 briefly reviews related works on vul-
nerabilities, attack graphs, agent and attack simulation. Sect. 3 discusses the formal
description of a scenario with both the ICT target system and the threat agents.
Sect. 4 outlines the simulation engine and how it returns a database with the statis-
tical samples by applying a Monte Carlo method to the scenario description. Sect.
5 explains how the scenario builder produces the description of the target system
outlined in Sect. 3. The current implementation of this tool is built around a classifi-
cation of the vulnerabilities discovered by scanning all the nodes the target system.
We also discuss how the accuracy of this classification influences the description
that is returned. We present the builder after the engine to show how the former
deduces the inputs of the simulation. Sect. 6 shows the adoption of the two tools to
assess an industrial control system that supervises a power generation plan. Lastly,
we draw some conclusions and outline future work.
With respect to our previous works [2, 3, 4], this paper is focused on the automatic
description of the scenario to be supplied to the Monte Carlo method. We present
and evaluate the tool that builds this description and that plays a fundamental
role to automate the assessment. Furthermore, we discuss the limitation of the
adopted approach and present in some detail the adoption of the two tools to assess
the control system of a power generation plant. This is a real system with some
SCADA components.
2 Related WorksWe briefly review the main related works on attack plans, their description, and the
simulation of agent attacks to evaluate the corresponding risk.
We model the agent plans through attack graphs [5, 6]. With respect to safety
and reliability models where threat agents without a predefined goal randomly
select their attacks, attack graphs assume threat agents are intelligent [7] and they
support an assessment of the security status of an ICT system in terms of attacks,
vulnerabilities and privileges even when the system is under attack [8, 9]. They have
been used to define robustness metrics and to select and evaluate countermeasures
[10, 11, 12]. The automatic generation of attack graphs is discussed in [13, 14].

Baiardi et al. Page 3 of 19
Haruspex uses full graphs [15]to discover all the agent plans and the attacks they
share. [16] computes the success probability of a plan by mapping a graph into
a Markov chain where the transition probabilities are a function of the success
probabilities of attacks. This mapping assumes that any vulnerability is known
and returns a chain with rather large number of states. [17] takes into account
trust among network nodes to build an attack graph and to compute the success
probability of a plan when both an agent has selected it and all the vulnerabilities
are known. Defense graphs extend attack graphs with countermeasures [18] and they
are transformed into Bayesian networks to compute the probability that a plan is
successful. As previously mentioned, with respect to these approaches Haruspex
supports a more detailed simulation of the behavior of threat agents.
[19, 20, 21, 22, 11] analyze the simulation of attacks against ICT or critical in-
frastructures. Intelligent, goal oriented agents have been analyzed with reference to
terrorism [23, 24]. [25] presents a formal model of plans similar to the one we have
adopted. [26] discusses the prerequisites and the effects of attacks and pairs each
attack with the proper countermeasures.
The simulation of agent attacks has been investigated in the framework of game
theory [27, 28]. With respect to this approach, Haruspex assume that an assessment
does not know, and it is interested in computing, the probability that an agent
reaches its goals. This implies, among others, that the output of Haruspex can be
used to reduce this probability rather than to divert it to a distinct target [29].
[30, 31] survey agent-based simulation. [32] discusses the measurement of the risk
posed by ICT systems, while [33] reviews the problems posed by a Delphi approach.
Besides [4], other works have already introduced and discussed complex attacks
without defining or developing tools to automate their discovery. As an example,
[34] introduces a taxonomy less general than the one we proposed as it is focused on
a series of use case events. [35] introduces a classification of vulnerabilities that maps
each vulnerability into just one class. [36] shows a theoretical approach to analyze
complex attacks involving distinct nodes of an infrastructure and it is focused on
the compromised level of a node. The resulting approach is rather efficient, but it
does not enumerate all complex attacks. [37] defines a language to model attack
scenarios through several steps.
3 Describing a ScenarioHere and in the following, for the sake of brevity, we use the term Haruspex to
denote both tools and the common framework underlying their definition. Further-
more, assessment is a synonymous for probabilistic risk assessment and right is a
shorthand for access right. We adopt the following definition of risk [38]:
”Risk is the result of a threat with adverse effects to a vulnerable system. It can
be quantified in terms of the loss for the system owner and of the probability that
the loss occurs.”
A scenario describes both S, the target of the assessment, and the threat agents
that attack it. In the following we detail the modular description that Haruspex
adopts. Table 1 defines the abbreviations used in the paper.
Baiardi et al. Page 4 of 19
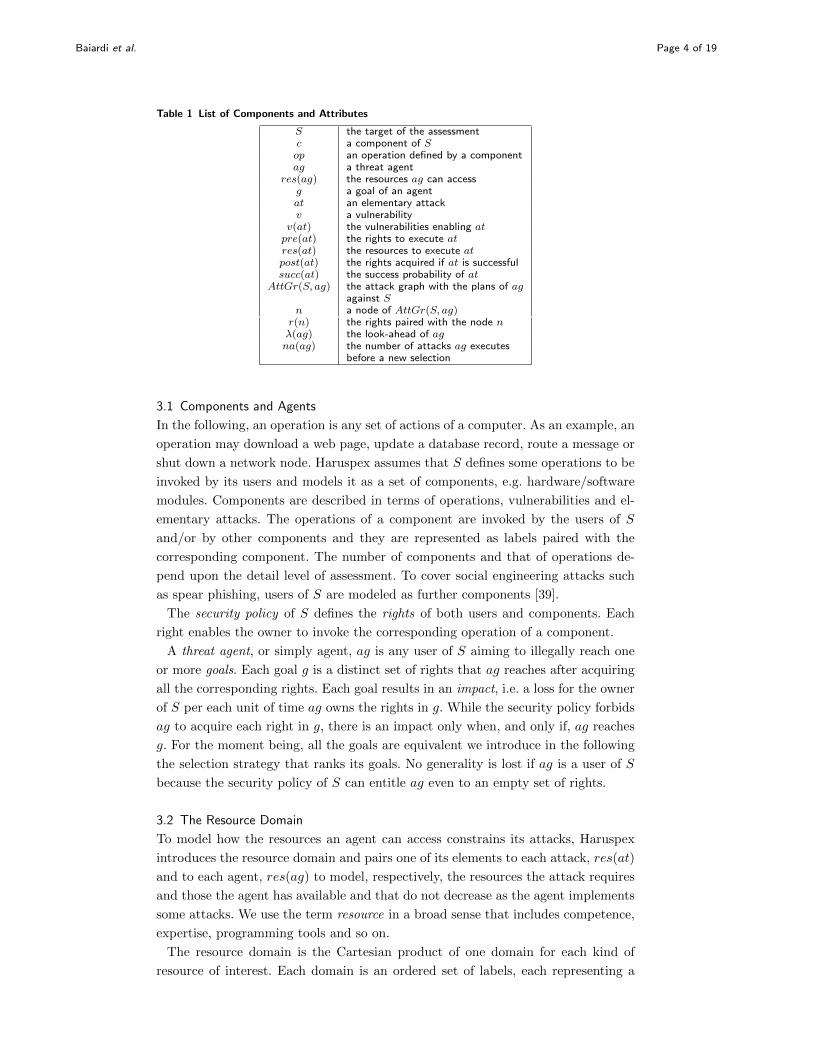
Table 1 List of Components and Attributes
S the target of the assessmentc a component of Sop an operation defined by a componentag a threat agent
res(ag) the resources ag can accessg a goal of an agentat an elementary attackv a vulnerability
v(at) the vulnerabilities enabling atpre(at) the rights to execute atres(at) the resources to execute atpost(at) the rights acquired if at is successfulsucc(at) the success probability of at
AttGr(S, ag) the attack graph with the plans of agagainst S
n a node of AttGr(S, ag)r(n) the rights paired with the node nλ(ag) the look-ahead of agna(ag) the number of attacks ag executes
before a new selection
3.1 Components and Agents
In the following, an operation is any set of actions of a computer. As an example, an
operation may download a web page, update a database record, route a message or
shut down a network node. Haruspex assumes that S defines some operations to be
invoked by its users and models it as a set of components, e.g. hardware/software
modules. Components are described in terms of operations, vulnerabilities and el-
ementary attacks. The operations of a component are invoked by the users of S
and/or by other components and they are represented as labels paired with the
corresponding component. The number of components and that of operations de-
pend upon the detail level of assessment. To cover social engineering attacks such
as spear phishing, users of S are modeled as further components [39].
The security policy of S defines the rights of both users and components. Each
right enables the owner to invoke the corresponding operation of a component.
A threat agent, or simply agent, ag is any user of S aiming to illegally reach one
or more goals. Each goal g is a distinct set of rights that ag reaches after acquiring
all the corresponding rights. Each goal results in an impact, i.e. a loss for the owner
of S per each unit of time ag owns the rights in g. While the security policy forbids
ag to acquire each right in g, there is an impact only when, and only if, ag reaches
g. For the moment being, all the goals are equivalent we introduce in the following
the selection strategy that ranks its goals. No generality is lost if ag is a user of S
because the security policy of S can entitle ag even to an empty set of rights.
3.2 The Resource Domain
To model how the resources an agent can access constrains its attacks, Haruspex
introduces the resource domain and pairs one of its elements to each attack, res(at)
and to each agent, res(ag) to model, respectively, the resources the attack requires
and those the agent has available and that do not decrease as the agent implements
some attacks. We use the term resource in a broad sense that includes competence,
expertise, programming tools and so on.
The resource domain is the Cartesian product of one domain for each kind of
resource of interest. Each domain is an ordered set of labels, each representing a
Baiardi et al. Page 5 of 19
distinct amount of the corresponding resource. The detail level of the assessment
determines the number of domains and their sizes.
As an example, we can model the computing resources and the know-how through
a resource domain that is the Cartesian product of CompPower and KnowHow
where CompPower is {PC,multicore, supercomputer} and PC ≺ multicore ≺supercomputer.KnowHow models the competences an attack requires, its elements
are {user, expert, admin} and we have that user ≺ expert ≺ admin.
3.3 Vulnerabilities and Attacks
The attacks against S are enabled by the vulnerabilities in its components. In an
ICT context, a vulnerability is a defect in a component or an erroneous or malicious
behavior of some users [40, 41]. Haruspex does not search for unknown vulnerabili-
ties in the components and only consider effective and potential vulnerabilities. The
former has been independently discovered before applying Haruspex. Instead, the
latter is suspected only and Haruspex pairs it with the probability distribution of
being discovered at a given time.
An elementary attack, or simply attack, at, consists of some actions. Haruspex
pairs each attack at with the following attributes [25, 26]:
• vulnerabilities, v(at), the defects in some components that enable at,
• success probability, succ(at), atmay fail due to reasons out of the agent control,
• precondition, pre(at), the rights to execute the actions of at,
• resources, res(at), the resources to execute the actions of at,
• post condition, post(at), the rights an agent acquires if at is successful,
• execution time, time(at) the time to execute the actions of at.
Haruspex does not define the actions of at and only models their complexity
through succ(at) and time(at). It is worth stressing that the time to successfully
implement an attack depends upon both time(at) and succ(at) since the former
determines the time of one instance of at and the latter the average number of
instances to be executed before at succeeds.
An agent ag can implement at if and only if each element in res(ag) is larger than
or equal to the corresponding one in res(at) and if ag owns the rights in pre(at) that
it may have acquired through previous attacks. post(at) describes the escalation in
the rights of ag if at is successful. If any vulnerability in v(at) is effective, at is
enabled and succeeds with a probability succ(at). As an example of factors outside
the control of ag that influence the success of at, suppose that ag has to execute the
actions of at in the time window between the commands of two distinct processes.
If ag cannot control these processes, it can only execute the actions of at at distinct
times to guess the correct one. Here, succ(at) increases with the window size. We
refer to [2] for the modeling of denial of service attacks.
If the detail level of the assessment changes, then at may be decomposed into
several attacks or several attacks may be merged.
As an example, we consider the attributes of a format string attack [42] where
ag transmits a forged parameter p to an operation op of c that interpreters it as a
format string rather than as a string to be printed. This enables ag to update at
most any memory position. The enabling vulnerability is the lack of a parameter
in op that specifies that p is the string to be printed rather than the format one.

Baiardi et al. Page 6 of 19
The precondition is the right of invoking op, while the post condition depends
upon the role of c in S. Since the attack may be successful only if ag can access
information on the memory allocation, only agents that know how to forge p can
implement the attack. The success probability of this attack increases with the
available information on the memory allocation.
4 Simulating a ScenarioAfter introducing attack plans, this section outlines their representation to simulate
the agent attacks. The next section shows how the builder computes the input
information for the engine.
4.1 Attack Plans
We briefly recall some properties of attack plans and define two user inputs, λ(ag)
and na(ag) to simulate the behavior of ag.
An attack plan, or simply plan, is one of the shortest sequences of attacks that
enable ag to reach a goal. Being intelligent, ag strive to minimize the number of
attacks of each plan so that no attack can be removed from a plan. In the following,
a subplan is any final (sub)sequence of a plan.
As an example, ag can control a node n′ of S through a plan pl1 with four
attacks. The first one gains access to an account on a node n. Then, ag becomes the
administrator of n through a privilege escalation. The third step of pl1 is a remote
attack that ag from n against n′ to control a second account on this node. Lastly,
agreaches its goal through another privilege escalation attack. Obviously, distinct
plans for the same or other goals may share some sequences of attacks with pl1.
Hence, a plan pl2 to control a distinct node n′′
may include the same attacks against
n of pl1 and then further attacks against n′′.
4.1.1 Selecting a Plan
At a given time, ag can implement some attacks according to its current rights and
to the effective vulnerabilities in the components of S. If attacks in some (sub)plans
for some goals still to be reached are enabled, ag selects one (sub)plan and imple-
ments its attacks. Otherwise, ag is idle. The selection strategy of ag balances costs
and benefits of alternative (sub)plans [43]. As exemplified in the following, most of
the strategies ag may adopt share a parameter λ(ag), the look-ahead of ag. λ(ag) is
the number of attacks in a subplan the selection strategy of ag considers to rank the
subplans. If λ(ag) = 0, ag neglects any information on S and randomly selects an
attack according to its current rights only. Hence, ag may select a subplan starting
with an attack that is not enabled. If λ(ag) > 0, then ag ranks subplans starting
with an enabled attack according to their first λ(ag) attacks. Hence, if λ(ag) = 1,
then ag considers the attribute(s) of the first attack only, while if λ(ag) = 2, it
considers those of the first two attacks. As an example, if the strategy considers the
success probability of attacks and λ(ag) = 2, then ag ranks the plans according the
joint success probability of the first two attacks of each plan.
Notice that λ(ag) determines how ag evaluates the usefulness of an attack at and
that a low value of λ(ag) may prevent agfrom determining whether at is useful to
reach a goal. Hence, ag may even implement some useless attacks before discovering

Baiardi et al. Page 7 of 19
the one to reach some goals. As a consequence, the sentence ”ag selects a subplan”
is a shorthand for
”if possible, according to its current rights and those of the goals, the selection strat-
egy of ag returns a subplan. Otherwise it returns a sequence of attacks according
to the information it can access ”.
In Haruspex, the time to select a subplan depends upon the information that
ag has available. Indeed, before ranking a plan, ag gathers information on the
components affected by the vulnerabilities that enable the attacks in the plan. As
an example, to rank a plan with an attack against c, ag runs a vulnerability scanning
that requires a time depending on c. This time is paid only the first time ag ranks
a plan where an attack exploits a vulnerability of c. This implies that the time
of a selection increases with the number of components it considers for the first
time. In turn, this number increases with λ(ag). By pairing each agent with the
components it knows before starting its attacks, Haruspex models that insiders can
access information on some components.
4.1.2 Updating the Selection
Meanwhile ag implements the attacks of a subplan previously selected, further at-
tacks may become enabled due to the discovery of some potential vulnerabilities.
This enables ag to select a better subplan. Let us suppose that ag has preferred
pl2 over pl1 because some attacks of pl1 are not enabled. However, after attacking
n, some vulnerabilities discovered in the meanwhile may enable ag to select pl1.
Hence, the behavior of ag also depends upon na(ag), the numbers of attacks it ex-
ecutes before applying again the selection strategy. Lower values of na(ag) enable
ag to quickly exploit newly discovered vulnerabilities, but they increase the num-
ber of vulnerability scanning. Regardless of na(ag), ag applies its selection strategy
anytime the next attack to be executed is not enabled yet.
The probability that ag selects and successfully implements a plan pl is correlated
to several factors such as the probability that ag reaches some rights or that an
attack becomes enabled. The complexity of an analytical model to compute this
probability has suggested the adoption of a Monte Carlo method.
4.2 Attack Graphs
An attack graph AttGr(S, ag) is a direct, acyclic, labeled graph that represents the
attacks and the plan ag can select according to its current rights. Each node n
of AttGr(S, ag) represents a set r(n) of rights that ag may own. Node transitions
are due to elementary attacks and there is an arc from n1 to n2 labeled by at if
r(n1) includes pre(at), but not post(at), and r(n2) is equal to r(n1) ∪ post(at).If some vulnerabilities enabling at are potential, then AttGr(S, ag) includes the
corresponding arcs only after their discovery, i.e. when they are effective. n is initial
if the security policy of S grants to ag all and only the rights in r(n). n is final if
it is the first node on a path from the initial node where r(n) includes the rights of
a goal g. ag reaches a node n after acquiring any right in r(n) through the attacks
labeling the arcs on the path from the initial node to n. A path from the initial node
to a final one defines a plan for the corresponding goal. As an example, AttGr(S, ag)
represents a plan that composes three elementary attacks as a path with four nodes
and three arcs.
Baiardi et al. Page 8 of 19
To apply the selection strategy of ag, the engine dynamically builds a fragment
of AttGr(S, ag) anytime ag invokes its strategy. The initial node of this fragment
depends upon the current rights of ag. Since the strategy considers at most λ(ag)
arcs on each path, each path of the fragment includes, at most, λ(ag) arcs.
4.3 Monte Carlo Simulation
Starting from a scenario description, an Haruspex experiment returns a database
with samples collected in several independent runs that simulate, for the same time
interval, the agents behavior and the discovery of potential vulnerabilities. At each
time step of a run, after determining which potential vulnerabilities are discovered,
the engine considers each agents ag and according to the status of ag, it selects a
subplan and implements some attacks. At the end of a run, the engine inserts into
the database a sample with information on the plans and the attacks the agents have
implemented, the goals they have reached, the corresponding times and impacts.
Then, to guarantee that runs are independent, the engine reinitializes the state
of S and of the agents and starts a new run. In this way, each run contributes
with exactly one sample. Hence, the confidence level of any statistics computed
through the output database depends upon the number of samples, e.g. of runs
in an experiment. The user can specify either this number or the confidence level
for some predefined statistics. In the latter case, the engine starts a new run until
reaching this level.
4.4 Agent Simulation
In each simulated time step, the engine considers each agent ag that still has to
reach at least one goal and that is not busy due to a previous attack. If ag has
already selected a (sub)plan p, has completed the execution of one of its attacks
and has executed less than na(ag) attacks, then the engine considers the next attack
at in p. If at is enabled, the engine simulates it and ag will be busy for the next
time(at) steps. The engine applies the selection strategy of ag if at is not enabled
or if ag is idle or has already executed na(ag) attacks of p. The strategy builds the
fragment of AttGr(S, ag) and, if there is at least one attack that ag can select, it
returns a (sub)plan sp. Then, the engine simulates at, the first attack of sp, and ag
is busy for time(at) plus the time of the selection, otherwise it is busy for the time
of the selection only. If at succeeds, the engine checks if ag has reached a goal and
updates the impact due to ag. A failed attack is repeated for a user defined number
of times before selecting a distinct attack.
Currently, the user can pair each agent with one of four strategies:
1 random: ag selects each path with the same probability,
2 max probability: ag selects the attack with the highest success probability,
3 max increment: ag selects the attack with the largest post condition,
4 min difference: ag minimizes the number of steps, regardless to the attack
success probability.
If λ(ag) = 0 then ag can adopt the random strategy only. This strategy that may
even return a path where the first attack is not enabled. If λ(ag) > 0, then ag can
be adopted with any of the other strategies that returns a subplan from the initial
node of the fragment of AttGr(S, ag) to a final node provided that its first attack

Baiardi et al. Page 9 of 19
is enabled. If, due to λ(ag), a strategy cannot determine whether a path leads to a
final node, i.e. if a sequence of attacks is a subplan, it considers the rights granted
by the last attack in the sequence.
5 Building a Scenario DescriptionWe have previously shown how the simulation engine produces the output database
starting from a scenario description. In the following, we show how the description
builder computes the description of S, of its components, of their vulnerabilities,
and the corresponding attacks.
5.1 A Classification of Vulnerabilities
Attack pre and post conditions are the critical elements in a scenario description
to discover how attacks can be composed into plans. Hence, the builder maps each
vulnerability into the attacks it enables and their pre and post conditions. The
builder defines the mapping through a proper classification of vulnerabilities. We
have defined the corresponding classes and the rules to map each vulnerability into a
class in order to minimize the complexity of the overall description while preserving
all the properties of interest. In particular, we have tried to define the lowest number
of classes able to distinguish the various vulnerabilities so that we can determine
the attribute of each attack a vulnerability enables.
The main input of the builder is the output of a vulnerability scanning of each
node of S. Distinct scanners can be applied to distinct system nodes. To be in-
dependent from the adopted scanner, the builder consider a standard description
of a vulnerability to classify it. We have adopted the CVE [44] description as our
reference model. The builder classifies each vulnerability discovered by the scanner
by searching some patterns in the corresponding CVE description. Each pattern
consists of predefined terms and phrases and the category depends upon the pat-
terns that a description matches. Even if CVE descriptions are not fully formal,
they define the effect of an attack by combining a small number of predefined key-
words. Hence, in general, the same keywords describe vulnerabilities that enable
attacks that require and grant the same privileges. We have used these keywords
to define the patterns to drive the classification. To ensure that any vulnerability is
assigned to just one subclass so that distinct subclasses and classes are disjoint, the
classification considers at most two set of patterns for each subclass. To simplify
these patterns and reduce their number, all the patterns are concurrently matched
against a vulnerability description. However, even the adoption of two patterns can-
not assure that a vulnerability is mapped into just one subclass, because several
CVE descriptions use similar phrases. To avoid any ambiguity, we pair some classes
with further keywords that cannot appear in the CVE description of their vulner-
abilities. Furthermore, to minimize misclassified vulnerability, the classification is
context sensitive because the class of a vulnerability also depends upon the ordering
of the patterns in the description. To classify a vulnerability even if its description
that does not include any of the specified patterns, the builder uses the information
provided by CVE Details [44, 45], a de facto standard in vulnerability information.
When defining how attacks can be composed in a plan, it is important to determine
whether an agent can attack components in another node. In the following, we
Baiardi et al. Page 10 of 19
assume that only an agent that fully controls the node can launch attack from it.
To this purpose, we distinguish three classes of rights:
1 enabling the full control of a node;
2 enabling the full control of a node only if paired with rights acquired through
distinct attacks;
3 that cannot enable the full control of a node.
In turn, each class is partitioned into subclasses according to the rights that each
vulnerability grants. Each subclass is paired with a name, at most four keyword
sets and, eventually, some associated subclasses. A subclass is associated with other
ones if an agent has to exploit one vulnerability in each subclass to control a node.
By introducing associated subclasses we simplify the discovery of attacks that result
in the control of a node.
Currently, class 1) only contains one subclass:
1 Remote code execution with admin privileges or Man In The Middle
It results in remote code execution with admin privileges or in host access
through man-in-the-middle attacks, rogue certificates, cryptographic attacks
and brute-force attacks.
The second class contains the following subclasses:
2 Local Privileges Escalation
They allow a user to elevate his/her privileges. They can be exploited using
a user account on a host. This subclass is associated with “Remote to local”
and “User login guessable” or Remote code execution with user privileges.
3 Remote code execution with user privileges
They result in remote code execution with user account privileges. It is asso-
ciated with “Admin login guessable” or Local Privileges Escalation.
4 Admin login guessable
They enable an attacker to gain sysadmin credentials through sniffing, brute-
force or default password attacks. It is associated with “Remote to local”.
5 User login guessable
Similar to category 4, but they only permit to gain user credentials. It is
associated with “Remote to local” and “Local Privileges Escalation”.
6 Remote to local
They result in the creation of a denied connection to a host. For example,
they allow an attacker to add arbitrary routes in a router or in a firewall. This
category is associated with “Admin login guessable” or “User login guessable”
and “Local Privileges Escalation”.
Finally, the third class contains the following subclasses:
7 Minor Vulnerabilities
They make it possible to discover information, violate integrity or confiden-
tiality constraints, identify users and system administrator, enable an attacker
to stop a service temporary or permanently.
8 Further output
They report information useless to discover pre and post conditions but that
support the discovery of, among other, the topology of the interconnection
network and of node interactions.

Baiardi et al. Page 11 of 19
The patterns of distinct subclasses are searched in a fixed order in a CVE descrip-
tion to guarantee that a vulnerability is mapped into the subclass corresponding to
the most dangerous privileges that an agent may acquire.
Table 2 shows, for each subclass, the number of patterns, the number of associated
subclass, and the privilege class that an agent may obtain.
Table 2 Subclass properties
C 1L 2L 3L Exc AS Priv
1 20 16 - 1 - T12 11 3 14 - 3 T23 15 2 17 1 2 T24 8 9 - 1 1 T25 4 5 - - 2 T26 10 0 - - 3 T27 62 6 - - - T38 38 0 - - - T4
C = Subclass number1L = Regular expression number in the first set of pattern2L = Regular expression number in the second set of pattern3L = Regular expression number in the third set of patternExc = Number of keywords who mustn’t appear in vulnerability descriptionAS = Associated subclasses numberPriv = Obtained privileges typeT1 = Full node controlT2 = Full node control only with the associated subclassesT3 = No node controlT4 = Useless vulnerability
Figure 1 Reducing Misclassification through CVE Details
By classifying all the vulnerabilities that have been discovered till now, we have
verified that the proposed approach does not map any vulnerability in a wrong
class. However, it does not classify some vulnerabilities. Fig.1 shows the percentage
of these vulnerabilities for each year. Fig.1 also shows how this percentage may be
reduced by a classification that integrates CVE description and CVE Details. To
solve any missed classification when building a system description, the user is invited
to manually classify these vulnerabilities. However, the resulting complexity does
not hinder scalability because the probability that a vulnerability is not correctly
classified decreases with the time a vulnerability is discovered and described. In

Baiardi et al. Page 12 of 19
fact, newly discovered vulnerabilities have an higher probability of being correctly
classified because their descriptions are more formal than those of older vulnerabil-
ities.
5.2 Deducing Attack Attributes
After classifying the various vulnerabilities affecting the nodes of S, the builder
considers all the attacks they enable and pairs each attack at with its attributes.
vuln(at) is trivially determined since we consider at first the vulnerabilities and then
the attacks they enable. In the current version of the builder, vuln(at) always include
just one vulnerability that we denote by v(at). pre(at) and post(at) are determined
according to which of the three classes previously introduced v(at) belongs to. To
determine succ(at), the builder considers the CVSS score of v(at) [1]. time(at) may
span from seconds to days. To determine the proper value, the builder distinguishes
those attacks that can be fully automated from those that requires some preliminary
actions such as sniffing some information or some social engineering actions such as
sending a phishing message. As the number of actions increases so does time(at).
As previously discussed, the time to successfully implement an attack depends on
both succ(at) and time(at).
Lastly, we discuss the resource domains that currently includes just two elements
to model the know-how that at requires. To pair at with the corresponding elements,
we consider whether an exploit to implement it is public available. In this case,
res(at) is the minimum of the resource domain, otherwise it is the top of the domain.
In this way, a scenario can distinguish a script kiddie from a motivated attacker.
To exemplify the definition of attack attributes starting from the classification,
we consider the attack at that is enabled by a vulnerability v identified as CVE
2012-4595 with the following description:
“McAfee Email and Web Security (EWS) 5.5 through Patch 6 and 5.6 through
Patch 3, and McAfee Email Gateway (MEG) 7.0.0 and 7.0.1, allows remote at-
tackers to bypass authentication and obtain an admin session ID via unspecified
vectors.”
The builder maps this vulnerability into the subclass “Remote code execution
with admin privileges or Man In The Middle” because this is the first subclass
paired with patterns that match the phrases “bypass authentication” and “remote
attackers” while they do not match “sensitive information”. The first two patterns
are defined by the regular expressions:
1 “bypass.*(authentication|CRLvalidation)\ˆ sensitive.*information”,
2 “remote attackers?”.
at can be implemented from an agent that controls a node that can interact with
n, the node affected by v. The attack post condition is the control of n. The order
of time(at) is hours since at requires a human intervention. succ(at) is high due to
the low complexity of at. Lastly, the know-how that at requires is high since there
is not a public exploit.
5.3 Physical and Logical topology
The builder computes the attack surface of each node ni to discover how the node
components can be attacked from other ones. This surface includes the first attack
Baiardi et al. Page 13 of 19
against ni of a subplan to control ni starting from the control of a distinct node
nj that can interact with ni. In other words, the surface of ni includes the attacks
that an agent controlling a distinct node can launch against ni. To compute this
surface, information on the vulnerabilities of a node components is merged with
user-supplied information on interconnections among nodes of S. To describe the
corresponding logical topology, the user enumerates the subnets in the physical one.
For each node in these subnets, the user defines:
1 name,
2 network device IP addresses,
3 number of network interfaces,
4 any routing among these interfaces,
5 node privileges on its connection.
For each node, the user lists known open ports, the active protocols it can support
and, eventually, network filtering mechanisms. To this purpose, we introduce a set D
of quadruples <source, destination, port, protocol> where source and destination
are the network interfaces used to describe the logical topology and to compute
the attack surfaces. Each quadruple specifies that its source interface can reach its
destination one through the corresponding port and protocol.
The information on the topology supports the discovery of connections among
node interfaces and of privileges paired with each interface that are automatically
inserted into D. As previously said, also some scanner outputs support the user in
defining this information. As an example, the information in the subclass Further
Output may be used to determine the logical topology of the connections. Lastly, we
can configure the routing between node interfaces to represent nodes connected to
several subnets, such as a router or a firewall. The user can model network filtering
mechanisms by removing some tuples from D.
5.4 Agent description
For each agent ag, the user defines its goals, the resources it can access and the set
of rights that the security policy of S grants to ag. Each goal of ag corresponds to a
set of rights. By defining both λ(ag) and the components ag knows before starting
its attacks, the user defines whether ag is an insider with detailed information on
S or an agent that acquires this information by scanning the nodes of S.
5.5 Limitations of this approach
As previously mentioned, to model S at several abstraction levels, the adopted
framework does not detail the component operations or the actions of an attack.
However, the builder does not fully support this flexibility as it only considers the
abstraction level of a standard vulnerability scanner. At this level, a component is
an off-the-shelf module running on the scanned node. Under this constraint, we can
deduce both the component vulnerabilities and their description from a vulnerability
database such as the Common Vulnerability Enumeration [41].
Furthermore, the description builder only considers those vulnerabilities that can
be discovered by scanning the nodes of S. In this way, it determines the abstrac-
tion level of the description because the operations and the corresponding rights to
define the agent goals and the attack pre and post conditions are those related to

Baiardi et al. Page 14 of 19
Figure 2 Network architecture of the experimental IT infrastructure
the operations in the components that the scanning can discover. As an example,
we cannot consider the vulnerabilities of a word processor if they cannot be dis-
covered by a vulnerability scanner. A further limitation is that the description of
S constrains the privilege escalations of an agent by assuming that only an agent
that fully controls, e.g. is an administrator of, a node of S can attack another one.
As far as concerns social engineering attacks against the users of S, the engine
can model users of S as further components provided that the corresponding vul-
nerabilities and the attacks they enable are manually inserted into the description
of S returned by the builder.
6 Assessing a Real SystemWe adopted both the description builder and the simulation engine to assess an
experimental IT infrastructure, a supervision and control system for a network of
hydroelectric power plants. This section briefly introduces this system and outlines
the results of the assessment that has used the Haruspex tools.
6.1 The Target System
The target system, see Fig 2, is partitioned into six subnets: the central network, a
local intranet, an hydroelectric process network, another thermoelectric process net-
work, one DMZ network and lastly an hydroelectric control one. The infrastructure
includes 50 nodes that runs the following OSes:
a) Microsoft Windows XP
b) Microsoft Windows 2000
c) Microsoft Windows Server 2003
d) Microsoft Windows Server 2008
e) Linux
f) Cisco
The main Substation Automation System that remotely controls a set of hydroelec-
tric plants belongs to the central network and it consists of 24 nodes. The central
network is connected to local intranets of the electric company through VPNs man-
aged by firewalls. In our case, we have analyzed a local intranet in one location
only. The business processes of the organization are managed by the nodes in the
local intranets. Some nodes in these subnets have full access privileges to the process
Baiardi et al. Page 15 of 19
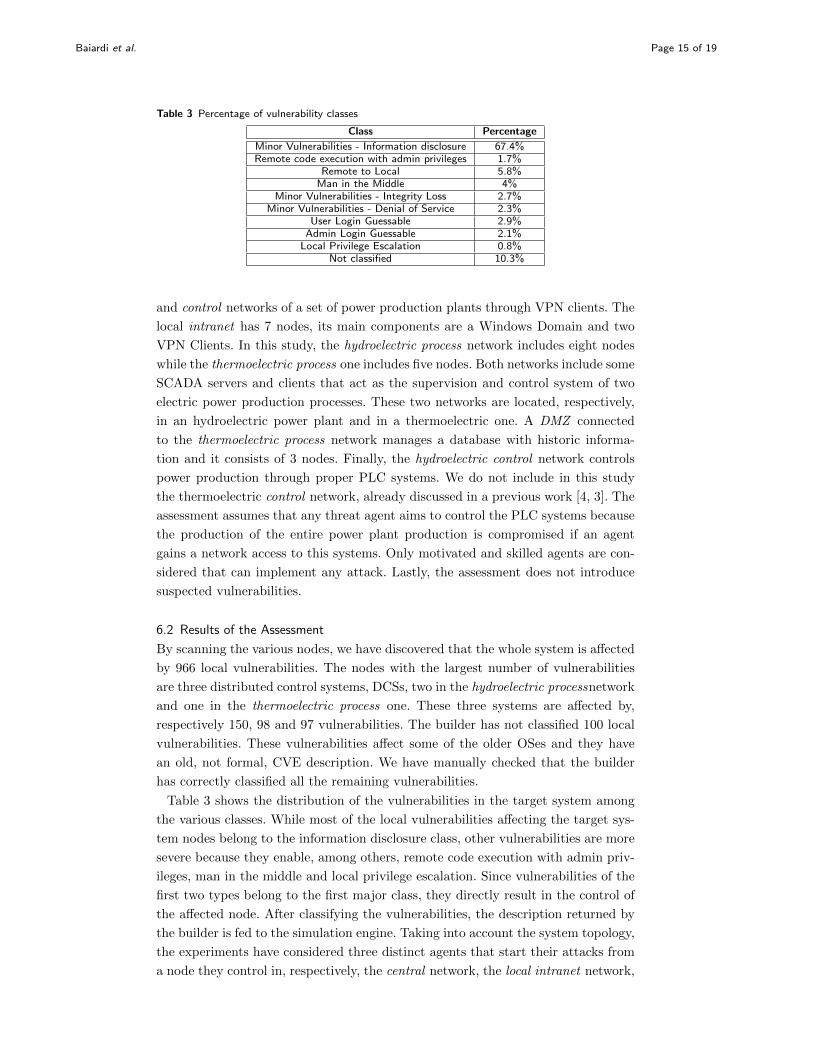
Table 3 Percentage of vulnerability classes
Class Percentage
Minor Vulnerabilities - Information disclosure 67.4%Remote code execution with admin privileges 1.7%
Remote to Local 5.8%Man in the Middle 4%
Minor Vulnerabilities - Integrity Loss 2.7%Minor Vulnerabilities - Denial of Service 2.3%
User Login Guessable 2.9%Admin Login Guessable 2.1%
Local Privilege Escalation 0.8%Not classified 10.3%
and control networks of a set of power production plants through VPN clients. The
local intranet has 7 nodes, its main components are a Windows Domain and two
VPN Clients. In this study, the hydroelectric process network includes eight nodes
while the thermoelectric process one includes five nodes. Both networks include some
SCADA servers and clients that act as the supervision and control system of two
electric power production processes. These two networks are located, respectively,
in an hydroelectric power plant and in a thermoelectric one. A DMZ connected
to the thermoelectric process network manages a database with historic informa-
tion and it consists of 3 nodes. Finally, the hydroelectric control network controls
power production through proper PLC systems. We do not include in this study
the thermoelectric control network, already discussed in a previous work [4, 3]. The
assessment assumes that any threat agent aims to control the PLC systems because
the production of the entire power plant production is compromised if an agent
gains a network access to this systems. Only motivated and skilled agents are con-
sidered that can implement any attack. Lastly, the assessment does not introduce
suspected vulnerabilities.
6.2 Results of the Assessment
By scanning the various nodes, we have discovered that the whole system is affected
by 966 local vulnerabilities. The nodes with the largest number of vulnerabilities
are three distributed control systems, DCSs, two in the hydroelectric processnetwork
and one in the thermoelectric process one. These three systems are affected by,
respectively 150, 98 and 97 vulnerabilities. The builder has not classified 100 local
vulnerabilities. These vulnerabilities affect some of the older OSes and they have
an old, not formal, CVE description. We have manually checked that the builder
has correctly classified all the remaining vulnerabilities.
Table 3 shows the distribution of the vulnerabilities in the target system among
the various classes. While most of the local vulnerabilities affecting the target sys-
tem nodes belong to the information disclosure class, other vulnerabilities are more
severe because they enable, among others, remote code execution with admin priv-
ileges, man in the middle and local privilege escalation. Since vulnerabilities of the
first two types belong to the first major class, they directly result in the control of
the affected node. After classifying the vulnerabilities, the description returned by
the builder is fed to the simulation engine. Taking into account the system topology,
the experiments have considered three distinct agents that start their attacks from
a node they control in, respectively, the central network, the local intranet network,
Baiardi et al. Page 16 of 19
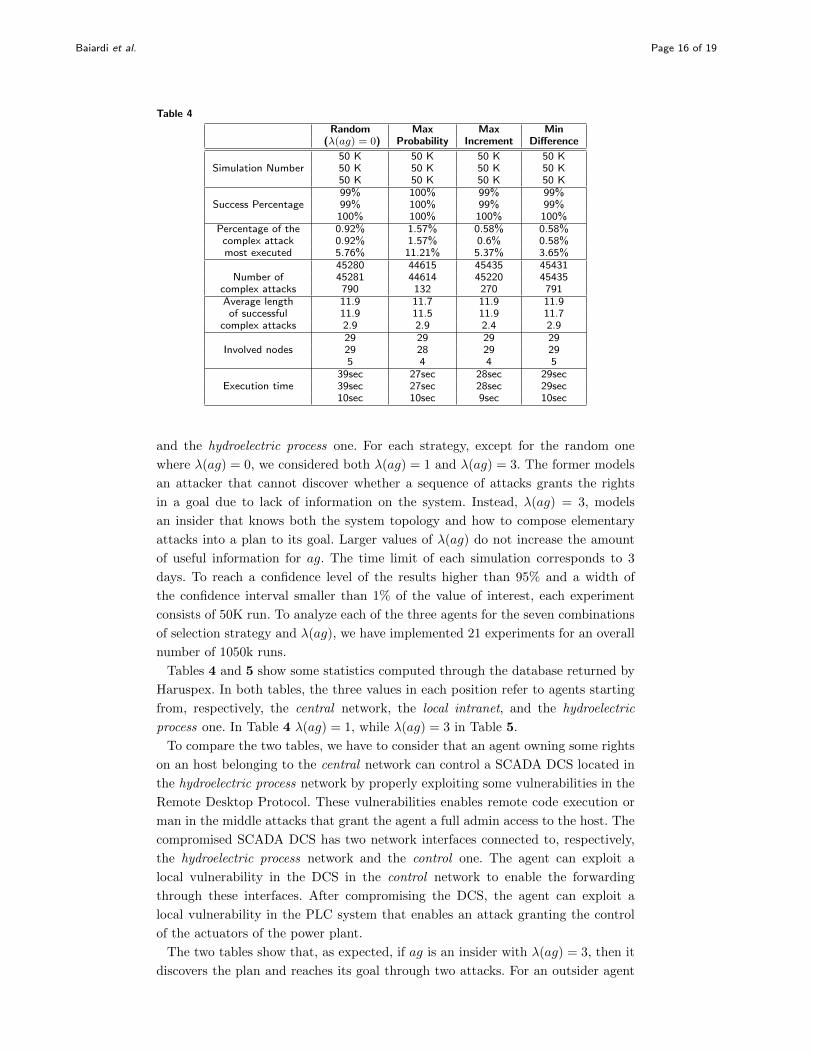
Table 4
Random Max Max Min(λ(ag) = 0) Probability Increment Difference
50 K 50 K 50 K 50 KSimulation Number 50 K 50 K 50 K 50 K
50 K 50 K 50 K 50 K99% 100% 99% 99%
Success Percentage 99% 100% 99% 99%100% 100% 100% 100%
Percentage of the 0.92% 1.57% 0.58% 0.58%complex attack 0.92% 1.57% 0.6% 0.58%most executed 5.76% 11.21% 5.37% 3.65%
45280 44615 45435 45431Number of 45281 44614 45220 45435
complex attacks 790 132 270 791Average length 11.9 11.7 11.9 11.9
of successful 11.9 11.5 11.9 11.7complex attacks 2.9 2.9 2.4 2.9
29 29 29 29Involved nodes 29 28 29 29
5 4 4 539sec 27sec 28sec 29sec
Execution time 39sec 27sec 28sec 29sec10sec 10sec 9sec 10sec
and the hydroelectric process one. For each strategy, except for the random one
where λ(ag) = 0, we considered both λ(ag) = 1 and λ(ag) = 3. The former models
an attacker that cannot discover whether a sequence of attacks grants the rights
in a goal due to lack of information on the system. Instead, λ(ag) = 3, models
an insider that knows both the system topology and how to compose elementary
attacks into a plan to its goal. Larger values of λ(ag) do not increase the amount
of useful information for ag. The time limit of each simulation corresponds to 3
days. To reach a confidence level of the results higher than 95% and a width of
the confidence interval smaller than 1% of the value of interest, each experiment
consists of 50K run. To analyze each of the three agents for the seven combinations
of selection strategy and λ(ag), we have implemented 21 experiments for an overall
number of 1050k runs.
Tables 4 and 5 show some statistics computed through the database returned by
Haruspex. In both tables, the three values in each position refer to agents starting
from, respectively, the central network, the local intranet, and the hydroelectric
process one. In Table 4 λ(ag) = 1, while λ(ag) = 3 in Table 5.
To compare the two tables, we have to consider that an agent owning some rights
on an host belonging to the central network can control a SCADA DCS located in
the hydroelectric process network by properly exploiting some vulnerabilities in the
Remote Desktop Protocol. These vulnerabilities enables remote code execution or
man in the middle attacks that grant the agent a full admin access to the host. The
compromised SCADA DCS has two network interfaces connected to, respectively,
the hydroelectric process network and the control one. The agent can exploit a
local vulnerability in the DCS in the control network to enable the forwarding
through these interfaces. After compromising the DCS, the agent can exploit a
local vulnerability in the PLC system that enables an attack granting the control
of the actuators of the power plant.
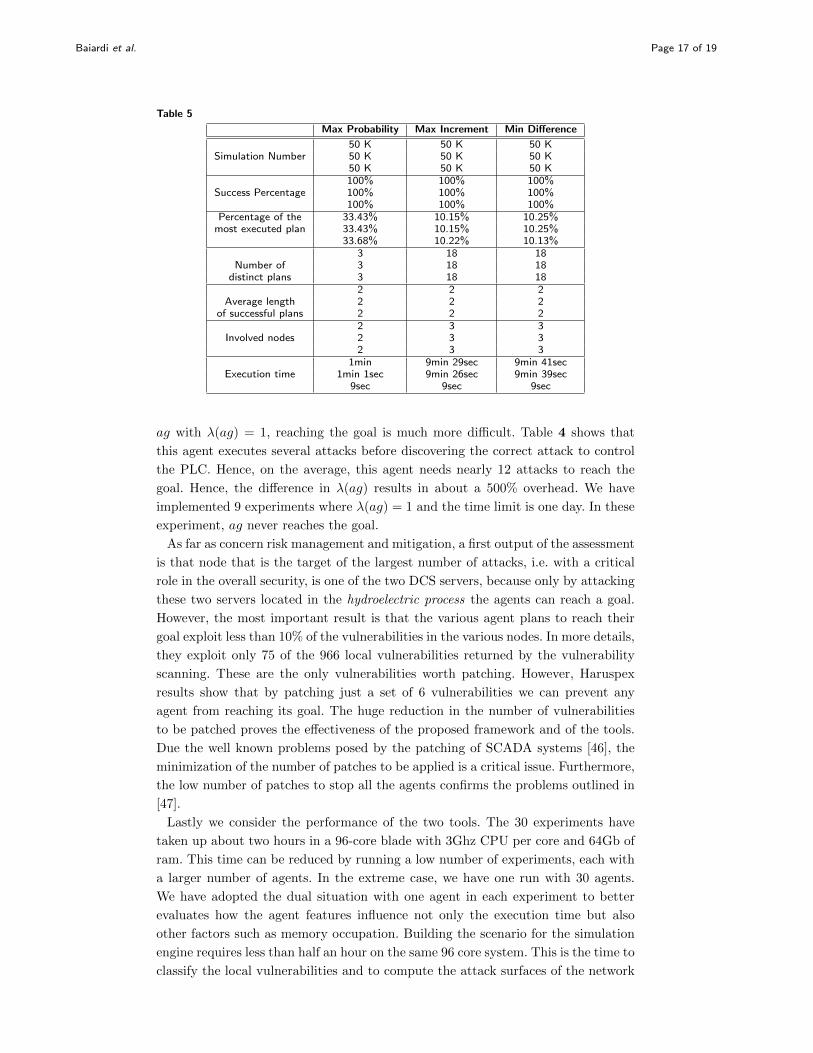
The two tables show that, as expected, if ag is an insider with λ(ag) = 3, then it
discovers the plan and reaches its goal through two attacks. For an outsider agent
Baiardi et al. Page 17 of 19
Table 5
Max Probability Max Increment Min Difference
50 K 50 K 50 KSimulation Number 50 K 50 K 50 K
50 K 50 K 50 K100% 100% 100%
Success Percentage 100% 100% 100%100% 100% 100%
Percentage of the 33.43% 10.15% 10.25%most executed plan 33.43% 10.15% 10.25%
33.68% 10.22% 10.13%3 18 18
Number of 3 18 18distinct plans 3 18 18
2 2 2Average length 2 2 2
of successful plans 2 2 22 3 3
Involved nodes 2 3 32 3 3
1min 9min 29sec 9min 41secExecution time 1min 1sec 9min 26sec 9min 39sec
9sec 9sec 9sec
ag with λ(ag) = 1, reaching the goal is much more difficult. Table 4 shows that
this agent executes several attacks before discovering the correct attack to control
the PLC. Hence, on the average, this agent needs nearly 12 attacks to reach the
goal. Hence, the difference in λ(ag) results in about a 500% overhead. We have
implemented 9 experiments where λ(ag) = 1 and the time limit is one day. In these
experiment, ag never reaches the goal.
As far as concern risk management and mitigation, a first output of the assessment
is that node that is the target of the largest number of attacks, i.e. with a critical
role in the overall security, is one of the two DCS servers, because only by attacking
these two servers located in the hydroelectric process the agents can reach a goal.
However, the most important result is that the various agent plans to reach their
goal exploit less than 10% of the vulnerabilities in the various nodes. In more details,
they exploit only 75 of the 966 local vulnerabilities returned by the vulnerability
scanning. These are the only vulnerabilities worth patching. However, Haruspex
results show that by patching just a set of 6 vulnerabilities we can prevent any
agent from reaching its goal. The huge reduction in the number of vulnerabilities
to be patched proves the effectiveness of the proposed framework and of the tools.
Due the well known problems posed by the patching of SCADA systems [46], the
minimization of the number of patches to be applied is a critical issue. Furthermore,
the low number of patches to stop all the agents confirms the problems outlined in
[47].
Lastly we consider the performance of the two tools. The 30 experiments have
taken up about two hours in a 96-core blade with 3Ghz CPU per core and 64Gb of
ram. This time can be reduced by running a low number of experiments, each with
a larger number of agents. In the extreme case, we have one run with 30 agents.
We have adopted the dual situation with one agent in each experiment to better
evaluates how the agent features influence not only the execution time but also
other factors such as memory occupation. Building the scenario for the simulation
engine requires less than half an hour on the same 96 core system. This is the time to
classify the local vulnerabilities and to compute the attack surfaces of the network

Baiardi et al. Page 18 of 19
nodes. A last important factor is the time to scan each node. Obviously, this time
depends upon the local vulnerability scanner. Nessus, the scanner we have adopted,
takes 3 hours to scan all the nodes in the target system.
7 Conclusion and future worksA Monte Carlo method can support a powerful scenario analysis to assess the risk
posed by an ICT system. However, building the scenario description may be rather
complex when the system components are affected by a large number of vulnerabil-
ities. Since the consistency of the assessment completely depend upon the accuracy
of the description, Haruspex defines both a scenario builder and a simulation engine.
The scenario builder adopts a formal classification of the vulnerabilities returned by
the vulnerability scanning of each node. Then, the builder classifies the vulnerabil-
ities and computes the node attack surfaces taking into account the logical system
topology. Starting from the description, the simulation engine returns a database
with samples to compute statistics to support decisions to assess and manage the
risk. Furthermore, the tools may support a what− if analysis to investigate attacks
enabled by suspected vulnerabilities.
We have applied the tools to an industrial control system and the overall assess-
ment has required less than one day. An important output of this assessment is
a quantitative evaluation of how the access to information on the target system
increases the success probability of the agents. A further output is the minimal
number of vulnerabilities to patch to stop all the agents. Further work will be de-
voted to generalize the description returned by the builder and to the automatic
discovery of the logical interconnection topology by analyzing the system routing
tables.
Author details1 Dipartimento di Informatica, Universita di Pisa, Largo Bruno Pontecorvo 3, Pisa, Italy. 2 Imperial College,
London, UK.
References1. Scarfone, K., Mell, P.: An analysis of cvss version 2 vulnerability scoring. In: Empirical Software Eng. and
Measurement, 2009, pp. 516–525 (2009)
2. Baiardi, F., Sgandurra, D.: Assessing ict risk through a monte carlo method. Environment Systems and
Decisions, 1–14 (2013)
3. Baiardi, F., Coro, F., Tonelli, F., Guidi, L.: Qsec: Supporting security decisions on an it infrastructure. In: Eighth
CRITIS Conference on Critical Information Infrastructures Security, Amsterdam, The Netherlands (2013)
4. Baiardi, F., Coro, F., Tonelli, F., Guidi, L.: Gvscan: Scanning networks for global vulnerabilities. In: First
International Workshop on Emerging Cyberthreats and Countermeasures, Regensburg, Germany (2013)
5. Sheyner, O., Haines, J., Jha, S., Lippmann, R., Wing, J.M.: Automated Generation and Analysis of Attack
Graphs. In: Proc. of the 2002 IEEE Symposium on Security and Privacy, Washington, DC, USA, p. 273 (2002)
6. Lippmann, R., Ingols, K., Scott, C., Piwowarski, K., Kratkiewicz, K., Artz, M., Cunningham, R.: Validating and
restoring defense in depth using attack graphs. In: Proc. of the 2006 IEEE Conf. on Military Communications,
Piscataway, NJ, USA, pp. 981–990 (2006)
7. Lee, W.S., Grosh, D., Tillman, F.: Fault tree analysis, methods, and applications- a review. IEEE transactions
on reliability (1985)
8. Cuppens, F., Autrel, F., Miege, A., Benferhat, S.: Correlation in an intrusion detection process. In: Internet
Security Communication Workshop (SECI 02), pp. 153–172 (2002)
9. Noel, S., Jajodia, S., Wang, L., Singhal, A.: Measuring security risk of networks using attack graphs.
International Journal of Next-Generation Computing 1(1), 135–147 (2010)
10. Zhang, S., Song, S.: A Novel Attack Graph Posterior Inference Model Based on Bayesian Network. Journal of
Information Security 2, 8–27 (2011)
11. LeMay, E., Unkenholz, W., Parks, D., Muehrcke, C., Keefe, K., Sanders, W.: Adversary-driven state-based
system security evaluation. In: Proc. of the 6th Int. Workshop on Security Measurements and Metrics. MetriSec
’10, pp. 5–159. ACM, New York, NY, USA (2010)
12. S.Noel, A.S. L. Wang, Jajodia, S.: Measuring security risk of networks using attack graphs. ‘Int.Jour.of Next
Generation Computing 1(1) (2010)
13. Ghosh, N., Ghosh, S.: A planner-based approach to generate and analyze minimal attack graph. Applied
Intelligence, 1–22 (2010)
Baiardi et al. Page 19 of 19
14. Ou, X., Boyer, W.F., McQueen, M.A.: A scalable approach to attack graph generation. In: 13th ACM Conf. on
Computer and Communications Security. CCS ’06, pp. 336–345. ACM, New York, USA (2006)
15. Lippmann, R., Ingols, K., Scott, C., Piwowarski, K., Kratkiewicz, K., Artz, M., Cunningham, R.: Evaluating and
Strenghening Enterprise Network Security using Attack Graphs. Lincoln Laboratory, MIT IA-2 (2005)
16. Jha, S., Sheyner, O., Wing, J.: Two Formal Analyses of Attack Graphs. In: Proc. of the 15th Computer
Security Foundation Workshop, pp. 49–63 (2002)
17. Wang, Y., Yun, X., Zhang, Y., Jin, S., Qiao, Y.: Research of network vulnerability analysis based on attack
capability transfer. In: Computer and IT, 2012 IEEE 12th Int. Conf. On, pp. 38–44 (2012)
18. Sommestad, T., Ekstedt, M., Johnson, P.: Cyber security risks assessment with bayesian defense graphs and
architectural models. In: System Sciences, 2009. HICSS ’09. 42nd Hawaii International Conference On, pp.
1–10 (2009)
19. Gorodetski, V., Kotenko, I.: Attacks against Computer Network: Formal Grammar-Based Framework and
Simulation Tool. In: Recent Advances in Intrusion Detection. LNCS, vol. 2516, pp. 219–238. Springer, ???
(2002)
20. Helbing, D., Balietti, S.: How to do Agent Based Simulations in the Future (2011)
21. Conrad, S.H., LeClaire, R.J., O’Reilly, G.P., Uzunalioglu, H.: Critical national infrastructure reliability modeling
and analysis. Bell Labs Technical Journal 11(3), 57–71 (2006)
22. Brown, T., Beyeler, W., Barton, D.: Assessing infrastructure interdependencies: the challenge of risk analysis
for complex adaptive systems. Int. Journal of Critical Infrastructures 1(1), 108–117 (2004)
23. Rios Insua, D., Rios, J., Banks, D.: Adversarial risk analysis. Journal of the American Statistical Association
104(486), 841–854 (2009)
24. Buede, D.M., Mahoney, S., Ezell, B., Lathrop, J.: Using plural modeling for predicting decisions made by
adaptive adversaries. Reliability Engineering and System Safety 108(0), 77–89 (2012)
25. Cheung, S., Lindqvist, U., Fong, M.W.: Modeling multistep cyber attacks for scenario recognition. In: DARPA
Information Survivability, vol. 1, pp. 284–2921 (2003)
26. Barnum, S.: Common attack pattern enumeration and classification (capec) schema description. Cigital Inc. 3(2008)
27. Bier, V.M., Oliveros, S., Samuelson, L.: Choosing what to protect: Strategic defensive allocation against an
unknown attacker. Journal of Public Economic Theory 9, 563–587 (2007)
28. Hausken, K., Bier, V.M.: Defending against multiple different attackers. European Journal of Operational
Research 211, 370–384 (2011)
29. Florencio, D., Herley, C.: Where Do All the Attacks Go? In: The Tenth Workshop on Economics of Information
Security (2011)
30. Macal, C.M., North, M.J.: Tutorial on agent-based modelling and simulation. Journal of Simulation 4(3),
151–162 (2010)
31. Rob, A.: A Survey of Agent Based Modelling and Simulation Tools. Technical Report DL-TR-2010-07, Science
and Technology Facilities Council (2010)
32. Arora, A., Hall, D., Piato, C.A., Ramsey, D., Telang, R.: Measuring the risk-based value of it security solutions.
IT Professional 6(6), 35–42 (2004)
33. Herrmann, A.: The quantitative estimation of it-related risk probabilities. Risk Analysis, (2012)
34. Howard, J.D.: An analysis of security incidents on the internet 1989 - 1995. Ph.D Thesis (1998)
35. Engle, S., Whalen, S., Howard, D., Bishop, M.: Tree approach to vulnerability classification (2005)
36. Ammann, P., Pamula, J., Ritchey, R., Street, J.: A host-based approach to network attack chaining analysis.
Technical Report SERC-TR-165-P (2005)
37. Cheung, S., Lindqvist, U., Fong, M.W.: Modeling multistep cyber attacks for scenario recognition. In: DARPA
Inf. Survivability Conf. and Exposition, 2003, vol. 1, pp. 284–2921 (2003)
38. Haimes, Y.Y.: On the definition of vulnerabilities in measuring risks to infrastructures. Risk Analysis 26(2),
293–296 (2006)
39. Jagatic, T.N., Johnson, N.A., Jakobsson, M., Menczer, F.: Social phishing. Commun. ACM 50(10), 94–100
(2007)
40. NIST: National vulnerability database. Technical report. http://nvd.nist.gov/
41. MITRE: CWE - common weakness enumeration. Technical report. http://cww.mitre.org/
42. Newsham, T.: Format string attacks. Technical report, Guardent Inc (Sept. 2000)
43. Boddy, M., Gohde, J., Haigh, T., Harp, S.: Course of action generation for cyber security using classical
planning. In: Proc. ICAPS 2005, pp. 12–21. AAAI Press, ??? (2005)
44. MITRE: Cve, a dictionary of publicly known information security vulnerabilities and exposures. Technical report.
http://cve.mitre.org/
45. Ozkan, S.: Cve details, the ultimate security vulnerability datasource. Technical report.
http://www.cvedetails.com
46. Pauna, A., Moulinos, K.: Windows of exposure ... a real problem for scada systems? Technical report, ENISA
(Dec. 2013)
47. Geer, D., Roytman, M.R.: Measuring vs. modeling. ;login 38(6), 64–67 (2013)