Automatic Object Classification through Semantic Analysis
8
Automatic Object Classification through Semantic Analysis Xiaokun Li 1 and Zhigang Zhu 2 1 Signal/Image Processing Systems, DCM Research Resources, LLC, MD 20874, USA 2 Department of Computer Science, the City University of New York, NY 10031, USA Abstract Currently available methods for object recognition and classification primarily rely on static information in single-frame images. However, for the combat aerial video (usually low resolution video), all these static indexes used for object classification and recognition are almost impossible to obtain. To address this challenge, we propose an innovative 3D and dynamic semantic scene analysis based approach that exploits surveillance video data mainly captured from UAV platforms to classify static object (e.g. buildings) and moving object (e.g. vehicles) automatically. In our proposed automatic object detection and classification framework, in addition to 3D static object’s visual features (e.g. building’s or vehicle’s shape, line orientation, color, and texture) and the 3D static structures of the urban environment, we also explore dynamic video features which include vehicle motion patterns over time. All these static and dynamic features will be considered to construct spatial-temporal feature vectors, and the new generated vectors will then be sent to a probabilistic Dynamic Influence Diagram (DID) reasoning model for real-time and automatic building and vehicle classification. In addition, we also propose novel 3D algorithms on automatic building detection, 3D terrain modeling, and visualization to support accurate object categorization/classification. 1. Introduction In the latest research of pattern recognition and object classification, analysts are highly interested in object functionality or purpose as it can provide a further level of classification. Video, particularly the persistent surveillance video, enables the determination of object type or function that would be difficult or impossible for the traditional methods that only rely on finding classable features in static images. Many challenges exist in automatic functional classification, such as handling errors in moving object detection and tracking, large intra-class variability in the activity involving static structures, and large amounts of clutter traffic in urban areas. To address these challenges, researchers are particularly interested in developing new techniques to determine the type, functionality, purpose or intent of static and moving objects through analysis of their dynamic information in persistent surveillance video. The objects of interest include buildings, functional area, vehicles, and human beings. Based on top of the state-of-the-art technologies and our recent work [1, 3-6, 13-15], an innovative 3D and dynamic semantic analysis-based object classification approach/framework is proposed. The system has six tightly-integrated major components in the system. First, a state-of-the-art content-based 3D mosaic representation is applied to rapidly construct a large 3D dynamic field of view from UAV surveillance video. Second, a highly effective and efficient 3D building detection algorithm is proposed to detect buildings automatically. Third, a 3D analysis-based algorithm is proposed to extract human/vehicle motion/behavioral patterns and analyze traffic situation over time to build an activity and trafficability map. Fourth, all static characters (e.g. shape, color, texture, line orientation) and dynamic information (e.g. environment context and human/vehicle behavioral patterns) are extracted and selected for object classification. Fifth, a probabilistic Dynamic Influence Diagram (DID) reasoning model is designed for semantic analysis-based object-class reasoning. Our proposed approach goes beyond conventional video-based object detection and classification systems/algorithms by performing 3D and dynamic semantic analysis for object classification. In our approach, the 3D mosaics to be used is a unified and core technique to both 3D reconstruction and moving target extraction from a video sequence captured by an aerial moving platform. This provides a very efficient way to identify object by using not only the object’s geometric structures, but also the layouts of its surroundings (e.g. the motion patterns and activities of humans and vehicles). The only input for the approach/system is video data from an airborne video camera, typically with low resolution (>= 10 cm/pixel). The approach is particularly effective for unknown urban areas where no a prior knowledge is available. Instead of integrating multiple local 3D maps into a global map, which is neither efficient nor accurate, the 3D and dynamic semantic analysis based approach takes an innovative path to object classification with three 2008 20th IEEE International Conference on Tools with Artificial Intelligence 1082-3409/08 $25.00 © 2008 IEEE DOI 10.1109/ICTAI.2008.10 505 2008 20th IEEE International Conference on Tools with Artificial Intelligence 1082-3409/08 $25.00 © 2008 IEEE DOI 10.1109/ICTAI.2008.10 505 2008 20th IEEE International Conference on Tools with Artificial Intelligence 1082-3409/08 $25.00 © 2008 IEEE DOI 10.1109/ICTAI.2008.10 497
-
Upload
khangminh22 -
Category
Documents
-
view
1 -
download
0
Transcript of Automatic Object Classification through Semantic Analysis
Automatic Object Classification through Semantic Analysis
Xiaokun Li1 and Zhigang Zhu
2
1Signal/Image Processing Systems, DCM Research Resources, LLC, MD 20874, USA 2Department of Computer Science, the City University of New York, NY 10031, USA
Abstract
Currently available methods for object recognition
and classification primarily rely on static information in
single-frame images. However, for the combat aerial
video (usually low resolution video), all these static
indexes used for object classification and recognition are
almost impossible to obtain. To address this challenge,
we propose an innovative 3D and dynamic semantic
scene analysis based approach that exploits surveillance
video data mainly captured from UAV platforms to
classify static object (e.g. buildings) and moving object
(e.g. vehicles) automatically. In our proposed automatic
object detection and classification framework, in addition
to 3D static object’s visual features (e.g. building’s or
vehicle’s shape, line orientation, color, and texture) and
the 3D static structures of the urban environment, we also
explore dynamic video features which include vehicle
motion patterns over time. All these static and dynamic
features will be considered to construct spatial-temporal
feature vectors, and the new generated vectors will then
be sent to a probabilistic Dynamic Influence Diagram
(DID) reasoning model for real-time and automatic
building and vehicle classification. In addition, we also
propose novel 3D algorithms on automatic building
detection, 3D terrain modeling, and visualization to
support accurate object categorization/classification.
1. Introduction
In the latest research of pattern recognition and object classification, analysts are highly interested in object functionality or purpose as it can provide a further level of classification. Video, particularly the persistent surveillance video, enables the determination of object type or function that would be difficult or impossible for the traditional methods that only rely on finding classable features in static images. Many challenges exist in automatic functional classification, such as handling errors in moving object detection and tracking, large intra-class variability in the activity involving static structures, and large amounts of clutter traffic in urban areas. To address these challenges, researchers are particularly interested in developing new techniques to determine the type,
functionality, purpose or intent of static and moving objects through analysis of their dynamic information in persistent surveillance video. The objects of interest include buildings, functional area, vehicles, and human beings.
Based on top of the state-of-the-art technologies and our recent work [1, 3-6, 13-15], an innovative 3D and dynamic semantic analysis-based object classification approach/framework is proposed. The system has six tightly-integrated major components in the system. First, a state-of-the-art content-based 3D mosaic representation is applied to rapidly construct a large 3D dynamic field of view from UAV surveillance video. Second, a highly effective and efficient 3D building detection algorithm is proposed to detect buildings automatically. Third, a 3D analysis-based algorithm is proposed to extract human/vehicle motion/behavioral patterns and analyze traffic situation over time to build an activity and trafficability map. Fourth, all static characters (e.g. shape, color, texture, line orientation) and dynamic information (e.g. environment context and human/vehicle behavioral patterns) are extracted and selected for object classification. Fifth, a probabilistic Dynamic Influence Diagram (DID) reasoning model is designed for semantic analysis-based object-class reasoning.
Our proposed approach goes beyond conventional
video-based object detection and classification
systems/algorithms by performing 3D and dynamic
semantic analysis for object classification. In our
approach, the 3D mosaics to be used is a unified and core
technique to both 3D reconstruction and moving target
extraction from a video sequence captured by an aerial
moving platform. This provides a very efficient way to
identify object by using not only the object’s geometric
structures, but also the layouts of its surroundings (e.g. the
motion patterns and activities of humans and vehicles).
The only input for the approach/system is video data from
an airborne video camera, typically with low resolution
(>= 10 cm/pixel). The approach is particularly effective
for unknown urban areas where no a prior knowledge is
available.
Instead of integrating multiple local 3D maps into a
global map, which is neither efficient nor accurate, the
3D and dynamic semantic analysis based approach takes
an innovative path to object classification with three
2008 20th IEEE International Conference on Tools with Artificial Intelligence
1082-3409/08 $25.00 © 2008 IEEE
DOI 10.1109/ICTAI.2008.10
505
2008 20th IEEE International Conference on Tools with Artificial Intelligence
1082-3409/08 $25.00 © 2008 IEEE
DOI 10.1109/ICTAI.2008.10
505
2008 20th IEEE International Conference on Tools with Artificial Intelligence
1082-3409/08 $25.00 © 2008 IEEE
DOI 10.1109/ICTAI.2008.10
497
processing level: lower-level for 3D and motion
extraction, intermediate level for multi-scale modeling and
visualization, and higher-level for object classification and
activity perception.
• In the lower level (signal level processing), a content-based 3D mosaic (CB3M) model is constructed with the following three steps. (1) Large field-of-view panoramic mosaics are generated from a low-resolution video sequence. The mosaics preserve both 3D and dynamic information, and therefore are truly 3D registered. (2) A content-based 3D model is created by using a segmentation-based stereo matching for pairs of stereo mosaics. The results will be parametric representation of planar patches, with information of their neighboring patches. Meanwhile, moving targets in the coverage of the video sequence are extracted after the 3D reconstruction. (3) We perform the following procedures for spatial and motion pattern extraction from the CB3D mosaic representation: building structure extraction, and human/vehicle motion pattern analysis.
• In the intermediate level (feature level processing), all features/cues of an object will be saved in a multi-level data structure for multi-scale real-time modeling and visualization. Two types of features/cues (static characters, and human/vehicle behavioral patterns) are selected for object classification.
• In the higher level (semantic analysis level): A probabilistic Dynamic Influence Diagram (DID) reasoning model: Object classification is performed by feeding the multiple cues to a probabilistic DID reasoning tool. As a special kind probabilistic graphical models, DIDs provide a coherent and hierarchical probabilistic data fusion framework to systematically represent information from different modalities at different levels of abstraction and systematically account for their uncertainties as well as to principally propagate the uncertainties within the model to assess their impacts on other variables in the model, and especially on the hypothesis of the complex environment. DIDs can not only work well on static sensory measurements (e.g. building), but also systematically model the uncertainties associated with dynamic sensory measurements of the humans and vehicles, the effects of various environmental conditions on the behaviors of the humans/vehicles, as well as the complex interactions among them. With the dependencies coded in the graphical model, DIDs can handle situations where some data are missing or unobserved, which may often happen during data collection process, especially for UAV video streams.
2. 3D and dynamic semantic analysis-based
object classification system
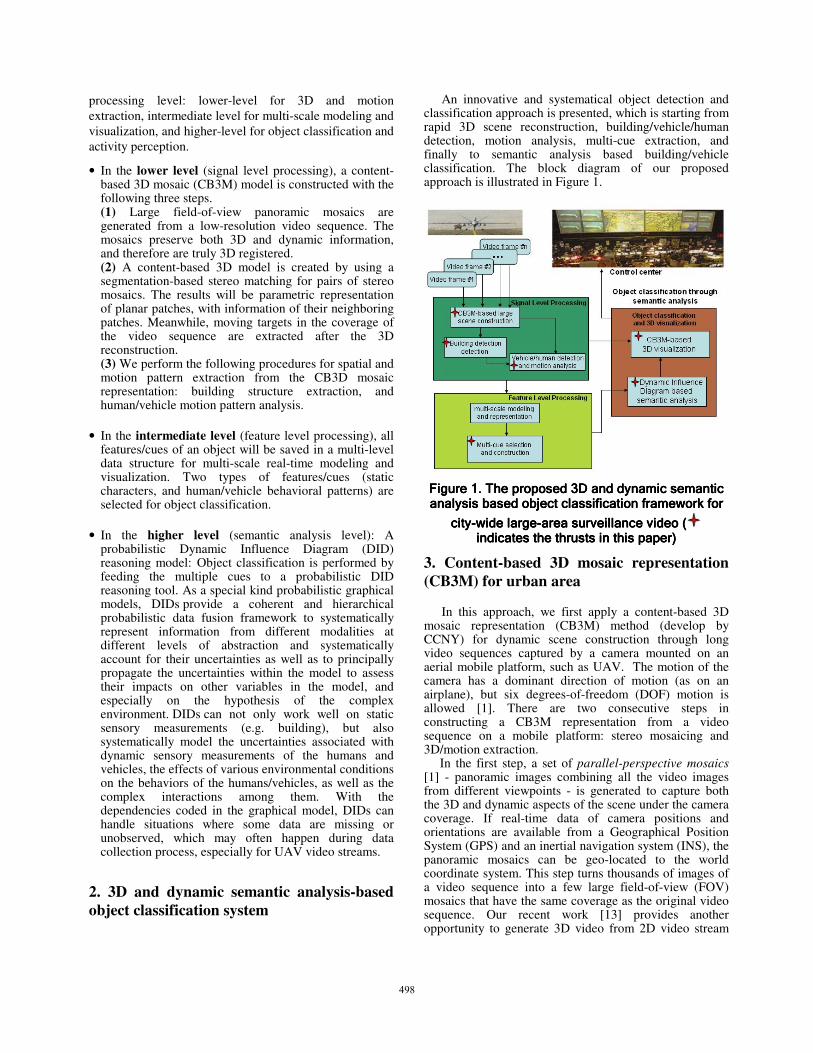
An innovative and systematical object detection and classification approach is presented, which is starting from rapid 3D scene reconstruction, building/vehicle/human detection, motion analysis, multi-cue extraction, and finally to semantic analysis based building/vehicle classification. The block diagram of our proposed approach is illustrated in Figure 1.
Figure Figure Figure Figure 1111.... The proThe proThe proThe proposed 3D and dynamic semantic posed 3D and dynamic semantic posed 3D and dynamic semantic posed 3D and dynamic semantic analysis baanalysis baanalysis baanalysis based object classification frameworksed object classification frameworksed object classification frameworksed object classification framework for for for for
citycitycitycity----wide largewide largewide largewide large----area surveillance videoarea surveillance videoarea surveillance videoarea surveillance video (((( indicates the thrusts in this paper)indicates the thrusts in this paper)indicates the thrusts in this paper)indicates the thrusts in this paper)
3. Content-based 3D mosaic representation
(CB3M) for urban area
In this approach, we first apply a content-based 3D mosaic representation (CB3M) method (develop by CCNY) for dynamic scene construction through long video sequences captured by a camera mounted on an aerial mobile platform, such as UAV. The motion of the camera has a dominant direction of motion (as on an airplane), but six degrees-of-freedom (DOF) motion is allowed [1]. There are two consecutive steps in constructing a CB3M representation from a video sequence on a mobile platform: stereo mosaicing and 3D/motion extraction.
In the first step, a set of parallel-perspective mosaics [1] - panoramic images combining all the video images from different viewpoints - is generated to capture both the 3D and dynamic aspects of the scene under the camera coverage. If real-time data of camera positions and orientations are available from a Geographical Position System (GPS) and an inertial navigation system (INS), the panoramic mosaics can be geo-located to the world coordinate system. This step turns thousands of images of a video sequence into a few large field-of-view (FOV) mosaics that have the same coverage as the original video sequence. Our recent work [13] provides another opportunity to generate 3D video from 2D video stream
506506498
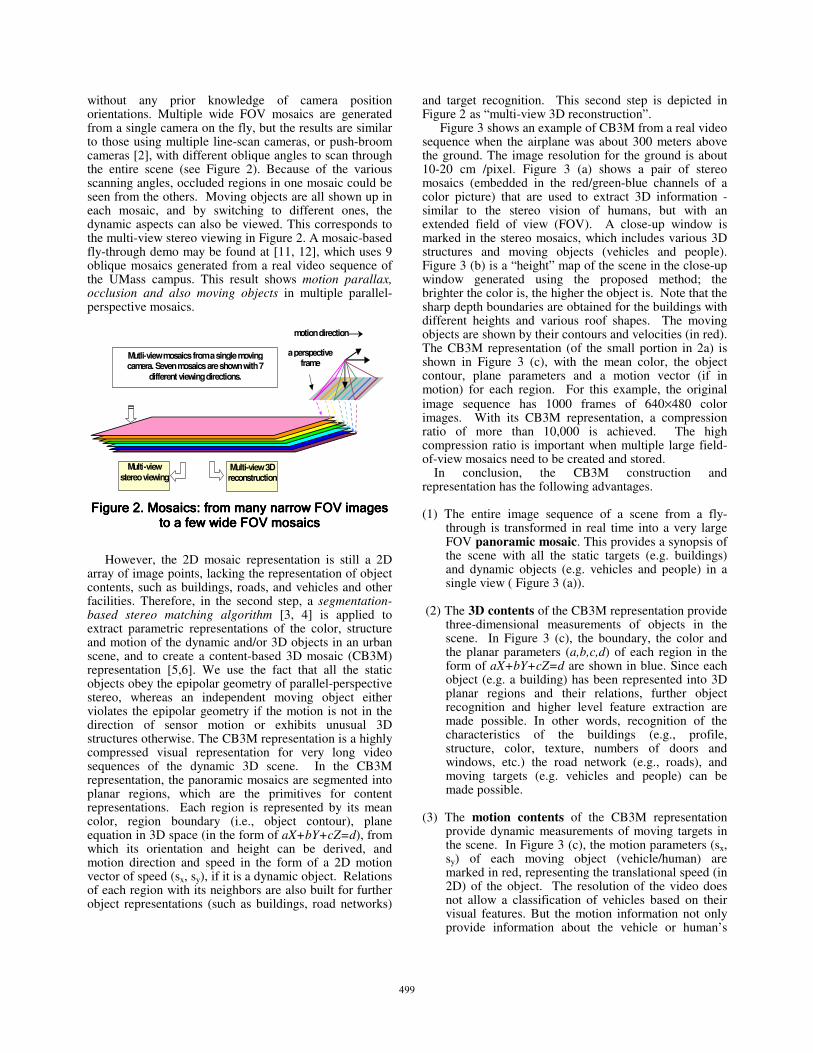
without any prior knowledge of camera position orientations. Multiple wide FOV mosaics are generated from a single camera on the fly, but the results are similar to those using multiple line-scan cameras, or push-broom cameras [2], with different oblique angles to scan through the entire scene (see Figure 2). Because of the various scanning angles, occluded regions in one mosaic could be seen from the others. Moving objects are all shown up in each mosaic, and by switching to different ones, the dynamic aspects can also be viewed. This corresponds to the multi-view stereo viewing in Figure 2. A mosaic-based fly-through demo may be found at [11, 12], which uses 9 oblique mosaics generated from a real video sequence of the UMass campus. This result shows motion parallax, occlusion and also moving objects in multiple parallel-perspective mosaics.
motion direction
Multi-view stereo viewing
Multi-view 3D reconstruction
Mutli-view mosaics from a single moving camera. Seven mosaics are shown with 7
different viewing directions.
a perspective frame
Figure Figure Figure Figure 2222.... Mosaics: from many narrow FOV images Mosaics: from many narrow FOV images Mosaics: from many narrow FOV images Mosaics: from many narrow FOV images to a few wide FOV mosaicsto a few wide FOV mosaicsto a few wide FOV mosaicsto a few wide FOV mosaics
However, the 2D mosaic representation is still a 2D
array of image points, lacking the representation of object contents, such as buildings, roads, and vehicles and other facilities. Therefore, in the second step, a segmentation-based stereo matching algorithm [3, 4] is applied to extract parametric representations of the color, structure and motion of the dynamic and/or 3D objects in an urban scene, and to create a content-based 3D mosaic (CB3M) representation [5,6]. We use the fact that all the static objects obey the epipolar geometry of parallel-perspective stereo, whereas an independent moving object either violates the epipolar geometry if the motion is not in the direction of sensor motion or exhibits unusual 3D structures otherwise. The CB3M representation is a highly compressed visual representation for very long video sequences of the dynamic 3D scene. In the CB3M representation, the panoramic mosaics are segmented into planar regions, which are the primitives for content representations. Each region is represented by its mean color, region boundary (i.e., object contour), plane equation in 3D space (in the form of aX+bY+cZ=d), from which its orientation and height can be derived, and motion direction and speed in the form of a 2D motion vector of speed (sx, sy), if it is a dynamic object. Relations of each region with its neighbors are also built for further object representations (such as buildings, road networks)
and target recognition. This second step is depicted in Figure 2 as “multi-view 3D reconstruction”.
Figure 3 shows an example of CB3M from a real video sequence when the airplane was about 300 meters above the ground. The image resolution for the ground is about 10-20 cm /pixel. Figure 3 (a) shows a pair of stereo mosaics (embedded in the red/green-blue channels of a color picture) that are used to extract 3D information - similar to the stereo vision of humans, but with an extended field of view (FOV). A close-up window is marked in the stereo mosaics, which includes various 3D structures and moving objects (vehicles and people). Figure 3 (b) is a “height” map of the scene in the close-up window generated using the proposed method; the brighter the color is, the higher the object is. Note that the sharp depth boundaries are obtained for the buildings with different heights and various roof shapes. The moving objects are shown by their contours and velocities (in red). The CB3M representation (of the small portion in 2a) is shown in Figure 3 (c), with the mean color, the object contour, plane parameters and a motion vector (if in motion) for each region. For this example, the original image sequence has 1000 frames of 640×480 color images. With its CB3M representation, a compression ratio of more than 10,000 is achieved. The high compression ratio is important when multiple large field-of-view mosaics need to be created and stored.
In conclusion, the CB3M construction and representation has the following advantages.
(1) The entire image sequence of a scene from a fly-
through is transformed in real time into a very large FOV panoramic mosaic. This provides a synopsis of the scene with all the static targets (e.g. buildings) and dynamic objects (e.g. vehicles and people) in a single view ( Figure 3 (a)).
(2) The 3D contents of the CB3M representation provide
three-dimensional measurements of objects in the scene. In Figure 3 (c), the boundary, the color and the planar parameters (a,b,c,d) of each region in the form of aX+bY+cZ=d are shown in blue. Since each object (e.g. a building) has been represented into 3D planar regions and their relations, further object recognition and higher level feature extraction are made possible. In other words, recognition of the characteristics of the buildings (e.g., profile, structure, color, texture, numbers of doors and windows, etc.) the road network (e.g., roads), and moving targets (e.g. vehicles and people) can be made possible.
(3) The motion contents of the CB3M representation
provide dynamic measurements of moving targets in the scene. In Figure 3 (c), the motion parameters (sx, sy) of each moving object (vehicle/human) are marked in red, representing the translational speed (in 2D) of the object. The resolution of the video does not allow a classification of vehicles based on their visual features. But the motion information not only provide information about the vehicle or human’s
507507499
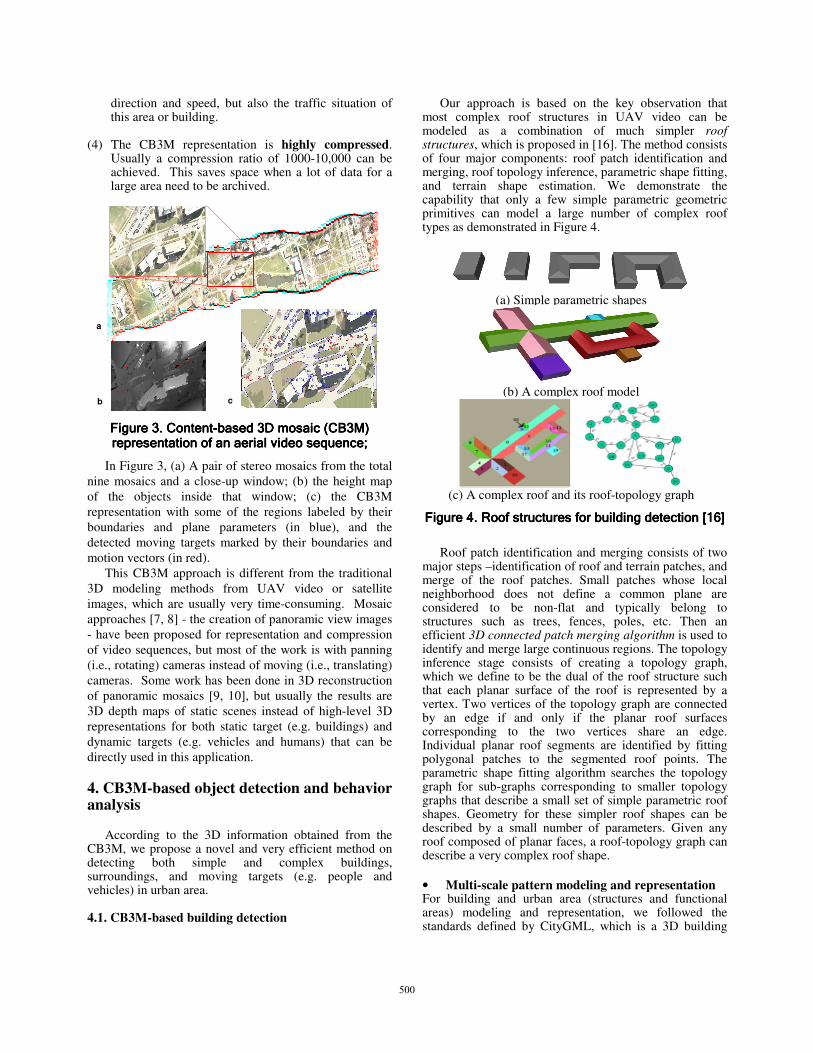
direction and speed, but also the traffic situation of this area or building.
(4) The CB3M representation is highly compressed.
Usually a compression ratio of 1000-10,000 can be achieved. This saves space when a lot of data for a large area need to be archived.
a
b c
Figure Figure Figure Figure 3333.... ContentContentContentContent----based 3D mosabased 3D mosabased 3D mosabased 3D mosaic (CB3M) ic (CB3M) ic (CB3M) ic (CB3M) representation of an aerial video sequence;representation of an aerial video sequence;representation of an aerial video sequence;representation of an aerial video sequence;
In Figure 3, (a) A pair of stereo mosaics from the total
nine mosaics and a close-up window; (b) the height map
of the objects inside that window; (c) the CB3M
representation with some of the regions labeled by their
boundaries and plane parameters (in blue), and the
detected moving targets marked by their boundaries and
motion vectors (in red).
This CB3M approach is different from the traditional
3D modeling methods from UAV video or satellite
images, which are usually very time-consuming. Mosaic
approaches [7, 8] - the creation of panoramic view images
- have been proposed for representation and compression
of video sequences, but most of the work is with panning
(i.e., rotating) cameras instead of moving (i.e., translating)
cameras. Some work has been done in 3D reconstruction
of panoramic mosaics [9, 10], but usually the results are
3D depth maps of static scenes instead of high-level 3D
representations for both static target (e.g. buildings) and
dynamic targets (e.g. vehicles and humans) that can be
directly used in this application.
4. CB3M-based object detection and behavior analysis
According to the 3D information obtained from the CB3M, we propose a novel and very efficient method on detecting both simple and complex buildings, surroundings, and moving targets (e.g. people and vehicles) in urban area. 4.1. CB3M-based building detection
Our approach is based on the key observation that most complex roof structures in UAV video can be modeled as a combination of much simpler roof structures, which is proposed in [16]. The method consists of four major components: roof patch identification and merging, roof topology inference, parametric shape fitting, and terrain shape estimation. We demonstrate the capability that only a few simple parametric geometric primitives can model a large number of complex roof types as demonstrated in Figure 4.
(a) Simple parametric shapes
(b) A complex roof model
(c) A complex roof and its roof-topology graph
Figure Figure Figure Figure 4444.... Roof structures for Roof structures for Roof structures for Roof structures for building detectionbuilding detectionbuilding detectionbuilding detection [ [ [ [16]16]16]16]
Roof patch identification and merging consists of two
major steps –identification of roof and terrain patches, and merge of the roof patches. Small patches whose local neighborhood does not define a common plane are considered to be non-flat and typically belong to structures such as trees, fences, poles, etc. Then an efficient 3D connected patch merging algorithm is used to identify and merge large continuous regions. The topology inference stage consists of creating a topology graph, which we define to be the dual of the roof structure such that each planar surface of the roof is represented by a vertex. Two vertices of the topology graph are connected by an edge if and only if the planar roof surfaces corresponding to the two vertices share an edge. Individual planar roof segments are identified by fitting polygonal patches to the segmented roof points. The parametric shape fitting algorithm searches the topology graph for sub-graphs corresponding to smaller topology graphs that describe a small set of simple parametric roof shapes. Geometry for these simpler roof shapes can be described by a small number of parameters. Given any roof composed of planar faces, a roof-topology graph can describe a very complex roof shape.
• Multi-scale pattern modeling and representation For building and urban area (structures and functional areas) modeling and representation, we followed the standards defined by CityGML, which is a 3D building
508508500
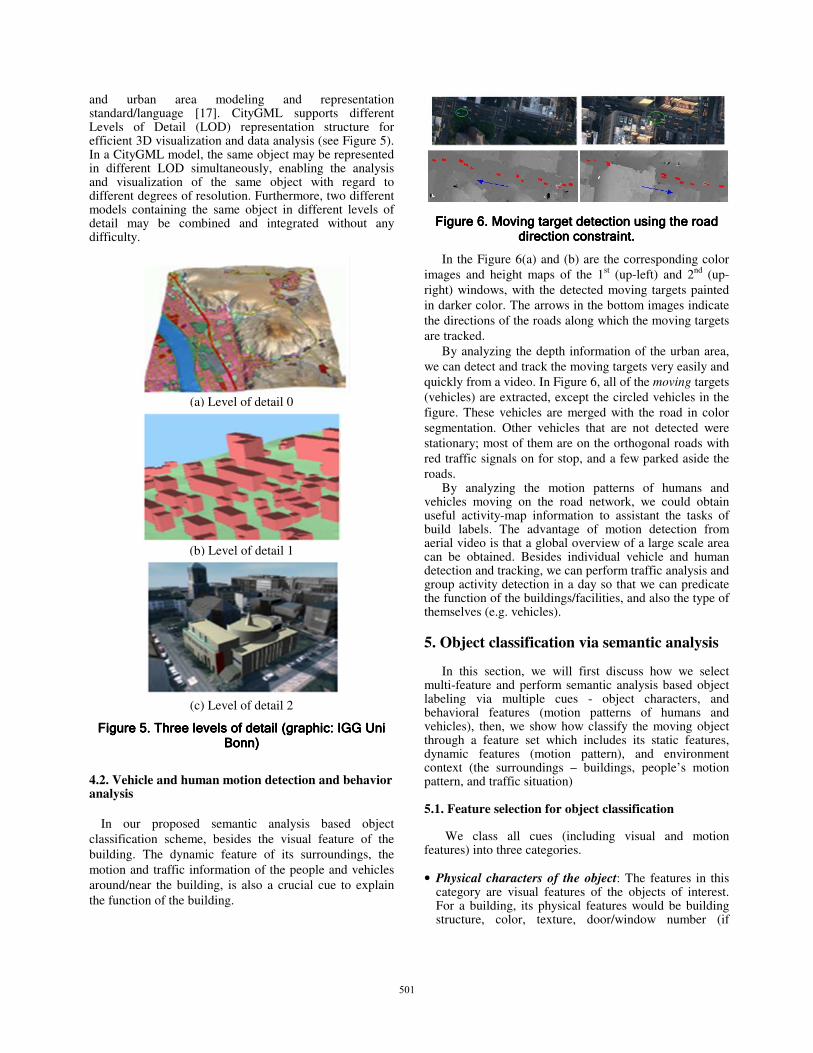
and urban area modeling and representation standard/language [17]. CityGML supports different Levels of Detail (LOD) representation structure for efficient 3D visualization and data analysis (see Figure 5). In a CityGML model, the same object may be represented in different LOD simultaneously, enabling the analysis and visualization of the same object with regard to different degrees of resolution. Furthermore, two different models containing the same object in different levels of detail may be combined and integrated without any difficulty.
(a) Level of detail 0
(b) Level of detail 1
(c) Level of detail 2
Figure Figure Figure Figure 5555. . . . Three levels of detail (graphic: IGG Uni Three levels of detail (graphic: IGG Uni Three levels of detail (graphic: IGG Uni Three levels of detail (graphic: IGG Uni Bonn)Bonn)Bonn)Bonn)
4.2. Vehicle and human motion detection and behavior analysis
In our proposed semantic analysis based object
classification scheme, besides the visual feature of the
building. The dynamic feature of its surroundings, the
motion and traffic information of the people and vehicles
around/near the building, is also a crucial cue to explain
the function of the building.
Figure Figure Figure Figure 6666.... Moving target detection using the road Moving target detection using the road Moving target detection using the road Moving target detection using the road direction constraint.direction constraint.direction constraint.direction constraint.
In the Figure 6(a) and (b) are the corresponding color
images and height maps of the 1st (up-left) and 2
nd (up-
right) windows, with the detected moving targets painted
in darker color. The arrows in the bottom images indicate
the directions of the roads along which the moving targets
are tracked.
By analyzing the depth information of the urban area,
we can detect and track the moving targets very easily and
quickly from a video. In Figure 6, all of the moving targets
(vehicles) are extracted, except the circled vehicles in the
figure. These vehicles are merged with the road in color
segmentation. Other vehicles that are not detected were
stationary; most of them are on the orthogonal roads with
red traffic signals on for stop, and a few parked aside the
roads. By analyzing the motion patterns of humans and
vehicles moving on the road network, we could obtain useful activity-map information to assistant the tasks of build labels. The advantage of motion detection from aerial video is that a global overview of a large scale area can be obtained. Besides individual vehicle and human detection and tracking, we can perform traffic analysis and group activity detection in a day so that we can predicate the function of the buildings/facilities, and also the type of themselves (e.g. vehicles).
5. Object classification via semantic analysis
In this section, we will first discuss how we select multi-feature and perform semantic analysis based object labeling via multiple cues - object characters, and behavioral features (motion patterns of humans and vehicles), then, we show how classify the moving object through a feature set which includes its static features, dynamic features (motion pattern), and environment context (the surroundings – buildings, people’s motion pattern, and traffic situation) 5.1. Feature selection for object classification
We class all cues (including visual and motion
features) into three categories. • Physical characters of the object: The features in this
category are visual features of the objects of interest. For a building, its physical features would be building structure, color, texture, door/window number (if
509509501

available), location, orientation, 3D size, etc. The physical characters of a vehicle can be its down-looking 3D profile derived from the depth map, color, texture, etc.
• Environment context: This category includes the visual
features (e.g. parking lot, building type near/around the object of interest, etc.) of the surrounding and some available high-level information (e.g. location in the city, community type, culture, population, race, current time, temperature, etc.).
• Human/vehicle behavioral patterns: The detection
results of human and vehicle motion (speed, acceleration, trajectory, and direction), records of traffic flows, and other dynamic information are classified into this category.
5.2 Building and vehicle classification via dynamic influence diagram (DID)
A DID is a directed acyclic graph consisting of nodes and the directed links among nodes. DID is a very powerful machine learning modeling and reasoning tool for semantic analysis with multi-cues. Nodes of DID are grouped into random nodes, decision nodes, and value nodes. Random nodes (ellipse-shaped) represent random events, decision nodes (rectangle-shaped) are used to represent decisional events, and a value node (diamond-shaped) is attached to each decision node, representing the utility of a decision. The links characterize probabilistic dependencies among the nodes in the DID. Specifically, a link to a random node indicates the probabilistic dependence of the node on its parents, and a link to a decision node represents availability of information at the time the decision is taken.
DID model is a Context-Functional Reasoning Model. The six components are represented with different types of nodes in Figure 7. (1) The functional state component is represented by the state node in the middle of the model. It represents a hypothesis about the building class. (2) The context component represents specific environmental factors that strongly related to the building of interest. These factors include the environmental properties (e.g. business center, transportation center, apartment community, etc.) environmental context (e.g. the distribution of different-type buildings in this area), the terrain information of this urban area, and the importance of the mission which building is pursuing for labeling. The profile variable models the building characters in performing the required classification. Typical profile information of a building may include its geometric properties, volume, number of windows and doors, wall/roof color, texture, etc. (3) The profile component plays an important role in adapting the model to individual differences among buildings. The contextual variables are represented by nodes above the building class node and they form (4) The predictive portion of the model. (5) The observation component includes sensory observations from different views and time instances
describing the building’s visual and its surrounding (environmental) information. They are represented by nodes below the functional state node, forming (6) The diagnostic portion of the model.
In the DID model, we consider three classes of measurable evidence: physical measures of the building, human/vehicle behavioral characteristics, and environmental measures. Measurements for a object’s behaviors may vary, depending different buildings. For a restaurant, its physical measures must include not only its geometric profile, color, texture, but also street(s), and parking lot near to the building. Its behavioral measures must include the varying human flow in and out the restaurant in a day and the change of the vehicle number in the parking lot. Its environmental measures include the properties of this area which may be culture, population, race, type of business, surrounding buildings, and the other cues which might be useful for building labeling.
Figure Figure Figure Figure 7777.... A probabilistic model based on the A probabilistic model based on the A probabilistic model based on the A probabilistic model based on the Dynamic Influence Diagram for building labelingDynamic Influence Diagram for building labelingDynamic Influence Diagram for building labelingDynamic Influence Diagram for building labeling
The intermediate nodes are needed to link the object class node to sensory measurements and to model the correlations among the measurements. Examples include the physical node, the behavioral node and the environmental node. The hybrid structure enables the DID to combine the predictive factors and observable evidences in object-type inference. In summary, the network outlines the causal relations between context, state, and evidence variables. The context influences object class while the state decides which class the object (e.g. building) is. All random nodes are quantized into discrete values. Finally, the sensory actions constitute the action component of the model (rectangular decision nodes).
The diagram (See Figure 7) captures the information necessary for one purpose: recognizing building type (functional state). The upper, predictive portion, of the diagram depicts contextual factors that can alter functional states. Such elements include environmental context, physical conditions, (human/vehicle) behaviors that the building is current having. The lower, diagnostic portion depicts the observable features that reflect the functional
510510502
states of the building. These features may include quantifiable measures on physical properties, behaviors, and environmental context. The left, temporal portion, models the temporal evolution of building’s functional state and the judgment made at different view-points.
Figure Figure Figure Figure 8888.... A probabilistic model based on the A probabilistic model based on the A probabilistic model based on the A probabilistic model based on the Dynamic Influence Diagram for vehicle Dynamic Influence Diagram for vehicle Dynamic Influence Diagram for vehicle Dynamic Influence Diagram for vehicle
classificationclassificationclassificationclassification
The diagram (See Figure 8) illustrates the information necessary for recognizing vehicle type (functional state). The upper, predictive portion, of the diagram depicts contextual factors that can alter functional states. Such elements include environmental context, physical characters, (human/vehicle) behaviors that the car is current having. The lower, diagnostic portion depicts the observable features that reflect the functional states of the vehicle. These features may include quantifiable measures on physical properties, behaviors, and environmental context. The left, temporal portion, models the temporal evolution of vehicle’s functional state and the judgment made at different view-points.
• Model Construction and Parameterization
Given the structure of a DID, a key problem is model parameterization, which involves quantifying each node with a conditional probability table (CPT) describing the conditional probability of the node given all possible outcomes for its parent(s). In addition, we also need to specify transitional relationships between two neighboring static slices with a transitional probability matrix for each temporal node. The CPTs can be either learned from training data or specified subjectively by domain experts. Fortunately, an experienced expert can often produce rather accurate estimate of local probabilities. The subjectively specified network can later be refined by the available training data using one of the existing learning methods such as the maximum likelihood method [18].
• Dynamic Object State Influence
Here, we focus on the techniques for recognizing object (building and vehicle) type. This is achieved through DID evaluation. DID evaluation starts with updating the
current estimate of object type, followed by evaluating the decision nodes (sensory and reasoning) to identify those that maximize the expected utility of the decisions. Specifically, updating the object-type estimate is based on three streams of information, one from the previous object-type estimate, which provides a temporal diagnostic support for current type estimate, one from the available contextual data, which provides a top-down predictive type estimate, and the last one assesses the impact of the type obtained in different view-points. Through belief propagation, the influence of the three streams of information on object-type estimate is estimated, based on which the object-type probability is updated.
Evaluation of decision nodes is carried out in two steps. First, the model decides what sensory measurements to collect. This is accomplished with view-point selection. Active sensing first identifies a subset of view-points that yield the most gain in object classification. The collected measurements are then propagated throughout the model to update the probability distribution of the object classification. Second, a view-point selection decision is then made as to which view-point is the best to use based on the updated object-type estimate. The benefit of such a scheme is that the best performance can be achieved by using only most useful information for building labeling, therefore avoiding any wrong labeling.
6. Experiments
We have tested our proposed framework on some
different video sets taken over cities, small towns,
suburban and rural areas. The video sets contain over
hundred buildings and vehicles. Our algorithms can
correctly classify/categorize most of buildings and
vehicles at the rate of 90% with the trained models. The
performance is much better (averagely 15% better) than
the classifiers that rely only on static object features and
do not consider the dynamic information of the object and
its environment context.
Figure 9 and Figure 10 show results of automatic
building and vehicle categorization using our proposed
semantic analysis based approach outlined in previous
sections. Our classification algorithm can robustly
categorize vehicles into truck, postal car, bus, and
ordinary car, and categorize buildings into single house,
townhouse, and storehouse, according to their static and
dynamical features together with the environmental
information. In addition, function area, such as parking
lot, can also be correctly recognized as shown in Figure
10.
7. Conclusions
We have presented a novel framework on
static/moving object classification through semantic
analysis from extensive UAV surveillance video. Our
511511503

proposed approach integrates many innovative
components including content-based 3D mosaic (CB3M)
representation, CB3M-based building detection, CB3M-
based human/vehicle detection and motion pattern
analysis, and probabilistic Dynamic Influence Diagram.
Empirical studies have proven the feasibility and
effectiveness of the proposed automatic object
classification framework.
Figure Figure Figure Figure 9999.... Results of recognizing buildings and Results of recognizing buildings and Results of recognizing buildings and Results of recognizing buildings and vehiclesvehiclesvehiclesvehicles
Figure Figure Figure Figure 10101010.... Results of recognizing buildings and Results of recognizing buildings and Results of recognizing buildings and Results of recognizing buildings and vehiclvehiclvehiclvehicles in complex environmentes in complex environmentes in complex environmentes in complex environment
References [1] Z. Zhu, E. Riseman, A. Hanson, Generalized Parallel-Perspective Stereo Mosaics from Airborne Videos, IEEE Trans. PAMI, 26(2), Feb 2004, 226-237. [2] R. Gupta and R. Hartley, Linear pushbroom cameras, IEEE Trans PAMI, 19(9), Sep. 1997: 963-975. [3] Z. Zhu, H. Tang, B. Shen, G. Wolberg, 3D and Moving Target Extraction from Dynamic Pushbroom Stereo Mosaics, IEEE Workshop on Advanced 3D Imaging for Safety and Security (with CVPR’05), June 25, 2005, San Diego, CA, USA. [4] H. Tang, Z. Zhu, G. Wolberg and J. R. Layne, Dynamic 3D Urban Scene Modeling Using Multiple Pushbroom Mosaics, the
Third International Symposium on 3D Data Processing, Visualization and Transmission (3DPVT 2006), University of North Carolina, Chapel Hill, USA, June 14-16, 2006. [5] Z. Zhu, H. Tang, G. Wolberg and J. R. Layne, Content-Based 3D Mosaic Representation for Video of Dynamic 3D Scenes. IEEE/AIPR Workshop 2005: Multi-Modal Imaging, Washington DC, October 19-21, 2005. [6] Z. Zhu, H. Tang, Content-Based Dynamic 3D Mosaics, IEEE Workshop on Three-Dimensional Cinematography (3DCINE'06), June 22, New York City (in conjunction with CVPR). [7] M. Irani, P. Anandan, J. Bergen, R. Kumar, and S. Hsu, Mosaic representations of video sequences and their applications. Signal Processing: Image Communication, vol. 8, no. 4, May 1996. [8] W. H. Leung and T. Chen, Compression with mosaic prediction for image-based rendering applications, IEEE Intl. Conf. Multimedia & Expo., New York, July 2000. [9] Y. Li, H.-Y. Shum, C.-K. Tang, R. Szeliski, Stereo reconstruction from multiperspective panoramas, IEEE Trans. on PAMI, 26(1), pp 45-62, 2004. [10] C. Sun and S. Peleg, Fast Panoramic Stereo Matching using Cylindrical Maximum Surfaces, IEEE Trans. SMC Part B, 34, 760-765, 2004. [11] Z. Zhu, A. R. Hanson, Mosaic-Based 3D Scene Representation and Rendering, Special Session on Interactive Representation of Still and Dynamic Scenes, the Eleventh International Conference on Image Processing, Genova, Italy, September 11-14, pp I-633 -636, 2005. [12] Peter Freeman, CISE Overview, Infrastructure 2006: NSF CISE CRI-PI's Workshop, Snowbird, Utah, June 23-25, 2006. [13] X. Li, R. Xu, X. Zhou, and B. Li, “Creating 3D video from a 2D monocular video stream”, ISVC, 2007. [14] X. Li, G. Chen, K. Pham, Erik Blasch, “Moving target detection and recognition from EO images,” SPIE Conf. on Defense & Security, Orlando, FL, 2008. [15] X. Li, G. Chen, E. Blasch, H. H. Szu, T. McKenna. “A novel scheme for non-cooperative long-range biometric recognition,” SPIE Conf. on Defense & Security, Orlando FL, 2008. [16] V. Verma R. Kumar, S. Hsu, “3D building detection and modeling from aerial LIDAR data,” CVPR, 2006. [17] http://www.citygmlwiki.org [18] F. V. Jensen, Bayesian Networks and Decision Graphs, Statistics for Engineering and Information Science, Springer, 2001.
512512504

![KLV-30MR1 - Error: [object Object]](https://static.fdokumen.com/doc/165x107/631786651e5d335f8d0a6a63/klv-30mr1-error-object-object.jpg)