
Automated Creation of a Forms-based Database Query Interface
15
Automated Creation of a Forms-based Database Query Interface * Magesh Jayapandian Department of EECS University of Michigan [email protected] H. V. Jagadish Department of EECS University of Michigan [email protected] ABSTRACT Forms-based query interfaces are widely used to access databases today. The design of a forms-based interface is often a key step in the deployment of a database. Each form in such an interface is capable of expressing only a very limited range of queries. Ide- ally, the set of forms as a whole must be able to express all pos- sible queries that any user may have. Creating an interface that approaches this ideal is surprisingly hard. In this paper, we seek to maximize the ability of a forms-based interface to support queries a user may ask, while bounding both the number of forms and the complexity of any one form. Given a database schema and con- tent we present an automated technique to generate a good set of forms that meet the above desiderata. While a careful analysis of real or expected query workloads are useful in designing the inter- face, these query sets are often unavailable or hard to obtain prior to the database even being deployed. Hence generating a good set of forms just using the database itself is a challenging yet impor- tant problem. Our experimental analysis shows that our techniques can create a reasonable set of forms, one that can express 60–90% of user queries, without any input from the database administrator. Human experts, without support from software such as ours, are often unable to support as high a fraction of user queries. 1. INTRODUCTION A form is a simple and intuitive query interface frequently used to provide easy database access. It requires no knowledge, on the part of the user, of how the data is organized in storage and no ex- pertise in query languages. For these reasons, forms are a popular choice for most of today’s databases. However, while easy to use, forms provide the user a constrained view of the underlying data. If a user requires some information that is present in the database but inaccessible via the available forms, he or she is helpless without a querying alternative. While in some cases certain query types are intentionally disallowed for security, performance or other reasons, it is often the case that a query isn’t supported simply because the demand for it wasn’t anticipated by the interface developer. On the other hand, it is not practical to support all possible queries, particu- larly if the schema of the database is complex: the interface would * Supported in part by NSF 0438909 and NIH 1-U54-DA021519. Permission to copy without fee all or part of this material is granted provided that the copies are not made or distributed for direct commercial advantage, the VLDB copyright notice and the title of the publication and its date appear, and notice is given that copying is by permission of the Very Large Data Base Endowment. To copy otherwise, or to republish, to post on servers or to redistribute to lists, requires a fee and/or special permission from the publisher, ACM. VLDB ‘08, August 24-30, 2008, Auckland, New Zealand Copyright 2008 VLDB Endowment, ACM 000-0-00000-000-0/00/00. need far too many forms and each form would be too complex, overwhelming users and negating the benefits of a forms-based in- terface. Hence a trade-off needs to be made between expressivity and complexity while designing forms. This trade-off is critical to interface usability and is non-trivial due to the potentially wide range of querying needs of intended users. Creating a forms-based interface for an existing database requires careful analysis of its data content and user requirements. To de- sign structured forms, an interface developer must have a clear un- derstanding of what data is available, its structure and semantics, in addition to predicting user needs. Our goal in this paper is to automate the task of form generation in an attempt to significantly reduce, if not eliminate, the developer’s role in the process. We do so by developing an automated procedure, based on a set of heuris- tics, to analyze the database – its schema as well as its content – to identify zones of potential interest. We then generate a set of forms that highlight those parts of the data and support as many and as di- verse queries as possible to those areas. While a real user query log can help produce an even better set of forms, such queries are not typically easy to acquire before the database is even publicly acces- sible. Hence, being able to generate a reasonably good starting set of forms without the benefit of user queries is important. Thresh- olds on form complexity and form set size are input parameters to this procedure. An interface that has too many forms or numerous parameters per form could overwhelm users. The complexity and size thresholds guard against this. Our problem statement thus be- comes: Design a form interface that maximizes expressivity while respecting specified upper-bounds on interface complexity. We de- fine expressivity of an interface as the range of queries that can be expressed using it. Interface complexity, as defined above, is lim- ited through thresholds on size and individual form complexity. 1.1 Motivation The effectiveness of a manually designed forms-based interface largely depends on the developer’s understanding and estimation of its users’ needs. This is evident from observable differences be- tween two or more interfaces designed to serve the same purpose but by different UI designers. For example, consider the task of buying a used car. There are several database-backed websites that help users buy used vehicles and several of them provide forms- based interfaces to help a user find exactly the type of car he or she is looking for. While the task is common to all these websites, the interfaces they provide are quite different. Specifically, the set of queries that they allow users to ask about the desired car are not the same. This can make some more desirable for a specific informa- tion need even if the data is the same in all of them. We analyzed the interfaces provided by five such websites: Car.com, Cars.com, AutoTrader.com, CarsDirect and eBay Motors. Only sections con- cerning used cars were considered. Table 1 provides a summary. 695 Permission to make digital or hard copies of portions of this work for personal or classroom use is granted without fee provided that copies are not made or distributed for profit or commercial advantage and that copies bear this notice and the full citation on the first page. Copyright for components of this work owned by others than VLDB Endowment must be honored. Abstracting with credit is permitted. To copy otherwise, to republish, to post on servers or to redistribute to lists requires prior specific permission and/or a fee. Request permission to republish from: Publications Dept., ACM, Inc. Fax +1 (212) 869-0481 or [email protected]. PVLDB '08, August 23-28, 2008, Auckland, New Zealand Copyright 2008 VLDB Endowment, ACM 978-1-60558-305-1/08/08
-
Upload
khangminh22 -
Category
Documents
-
view
0 -
download
0
Transcript of Automated Creation of a Forms-based Database Query Interface
Automated Creation of a Forms-based Database QueryInterface ∗
Magesh JayapandianDepartment of EECSUniversity of Michigan
H. V. JagadishDepartment of EECSUniversity of Michigan
ABSTRACTForms-based query interfaces are widely used to access databasestoday. The design of a forms-based interface is often a key stepin the deployment of a database. Each form in such an interfaceis capable of expressing only a very limited range of queries. Ide-ally, the set of forms as a whole must be able to express all pos-sible queries that any user may have. Creating an interface thatapproaches this ideal is surprisingly hard. In this paper, we seek tomaximize the ability of a forms-based interface to support queriesa user may ask, while bounding both the number of forms and thecomplexity of any one form. Given a database schema and con-tent we present an automated technique to generate a good set offorms that meet the above desiderata. While a careful analysis ofreal or expected query workloads are useful in designing the inter-face, these query sets are often unavailable or hard to obtain priorto the database even being deployed. Hence generating a good setof forms just using the database itself is a challenging yet impor-tant problem. Our experimental analysis shows that our techniquescan create a reasonable set of forms, one that can express 60–90%of user queries, without any input from the database administrator.Human experts, without support from software such as ours, areoften unable to support as high a fraction of user queries.
1. INTRODUCTIONA form is a simple and intuitive query interface frequently used
to provide easy database access. It requires no knowledge, on thepart of the user, of how the data is organized in storage and no ex-pertise in query languages. For these reasons, forms are a popularchoice for most of today’s databases. However, while easy to use,forms provide the user a constrained view of the underlying data. Ifa user requires some information that is present in the database butinaccessible via the available forms, he or she is helpless without aquerying alternative. While in some cases certain query types areintentionally disallowed for security, performance or other reasons,it is often the case that a query isn’t supported simply because thedemand for it wasn’t anticipated by the interface developer. On theother hand, it is not practical to support all possible queries, particu-larly if the schema of the database is complex: the interface would
∗Supportedin part by NSF 0438909 and NIH 1-U54-DA021519.
Permission to copy without fee all or part of this material is granted providedthat the copies are not made or distributed for direct commercial advantage,the VLDB copyright notice and the title of the publication and its date appear,and notice is given that copying is by permission of the Very Large DataBase Endowment. To copy otherwise, or to republish, to post on serversor to redistribute to lists, requires a fee and/or special permission from thepublisher, ACM.VLDB ‘08,August 24-30, 2008, Auckland, New ZealandCopyright 2008 VLDB Endowment, ACM 000-0-00000-000-0/00/00.
need far too many forms and each form would be too complex,overwhelming users and negating the benefits of a forms-based in-terface. Hence a trade-off needs to be made between expressivityand complexity while designing forms. This trade-off is criticalto interface usability and is non-trivial due to the potentially widerange of querying needs of intended users.
Creating a forms-based interface for an existing database requirescareful analysis of its data content and user requirements. To de-sign structured forms, an interface developer must have a clear un-derstanding of what data is available, its structure and semantics,in addition to predicting user needs. Our goal in this paper is toautomate the task of form generation in an attempt to significantlyreduce, if not eliminate, the developer’s role in the process. We doso by developing an automated procedure, based on a set of heuris-tics, to analyze the database – its schema as well as its content – toidentify zones of potential interest. We then generate a set of formsthat highlight those parts of the data and support as many and as di-verse queries as possible to those areas. While a real user query logcan help produce an even better set of forms, such queries are nottypically easy to acquire before the database is even publicly acces-sible. Hence, being able to generate a reasonably good starting setof forms without the benefit of user queries is important. Thresh-olds on form complexity and form set size are input parameters tothis procedure. An interface that has too many forms or numerousparameters per form could overwhelm users. The complexity andsize thresholds guard against this. Our problem statement thus be-comes:Design a form interface that maximizes expressivity whilerespecting specified upper-bounds on interface complexity. We de-fine expressivity of an interface as the range of queries that can beexpressed using it. Interface complexity, as defined above, is lim-ited through thresholds on size and individual form complexity.
1.1 MotivationThe effectiveness of a manually designed forms-based interface
largely depends on the developer’s understanding and estimationof its users’ needs. This is evident from observable differences be-tween two or more interfaces designed to serve the same purposebut by different UI designers. For example, consider the task ofbuying a used car. There are several database-backed websites thathelp users buy used vehicles and several of them provide forms-based interfaces to help a user find exactly the type of car he or sheis looking for. While the task is common to all these websites, theinterfaces they provide are quite different. Specifically, the set ofqueries that they allow users to ask about the desired car are not thesame. This can make some more desirable for a specific informa-tion need even if the data is the same in all of them. We analyzedthe interfaces provided by five such websites: Car.com, Cars.com,AutoTrader.com, CarsDirect and eBay Motors. Only sections con-cerning used cars were considered. Table 1 provides a summary.
695
Permission to make digital or hard copies of portions of this work for personal or classroom use is granted without fee provided that copies are not made or distributed for profit or commercial advantage and that copies bear this notice and the full citation on the first page. Copyright for components of this work owned by others than VLDB Endowment must be honored. Abstracting with credit is permitted. To copy otherwise, to republish, to post on servers or to redistribute to lists requires prior specific permission and/or a fee. Request permission to republish from: Publications Dept., ACM, Inc. Fax +1 (212) 869-0481 or [email protected]. PVLDB '08, August 23-28, 2008, Auckland, New Zealand Copyright 2008 VLDB Endowment, ACM 978-1-60558-305-1/08/08
Website # Forms # Fields in each form
W1 AutoTrader.com 1 30W2 Car.com 3 5, 7, 8W3 Cars.com 5 2, 5, 11, 11, 12W4 CarsDirect 4 3, 3, 5, 13W5 eBayMotors 2 3, 16
Table 1: Comparison of Websites selling Used Cars
While all of these websites serve the same purpose (helping auser find and buy a used car) and have the same underlying data(used car listings) with more or less the same set of attributes foreach listing, the ways in which their query forms are structured andpresented to users are quite different. These differences are notonly in the number of forms and how they are positioned relativeto each other, but also in the content and layout of each form. Thecontent of a form directly impacts the range of queries that a usercan issue using it. Consider the following queries:
Q1. Find a certified pre-owned Acura that comes with side airbags.Q2. Show all 2005 Chrysler Sebrings listed in the past two weeks.Q3. List all Mazda Proteges with fewer than 50,000 miles on themthat are selling for under $20,000.Q4. Show minivans available for a monthly payment below $200.Q5. Find a car that has a 600hp V12 engine.
We found that even though results matching all five queries wereavailable in all five websites, not all of these queries could be is-sued using the forms provided. QueryQ1 could only be asked intwo of the five websites (W1 andW5). Q2 was supported only bythe forms provided inW3 while Q4 was only issuable usingW2.All sites exceptW2 allowedQ3 to be asked. QueryQ5 could notbe expressed using any of the five query interfaces. It bears repeat-ing that, for the unsatisfactory websites, the data attributes usedin these queries wereavailable in the databases but notqueriableusing the interfaces. This heterogeneity shows that finding a uni-versally satisfying solution to any form design task is hard, and thateven if done manually by human experts, they can have limitationsthat lead to unsatisfied users1.
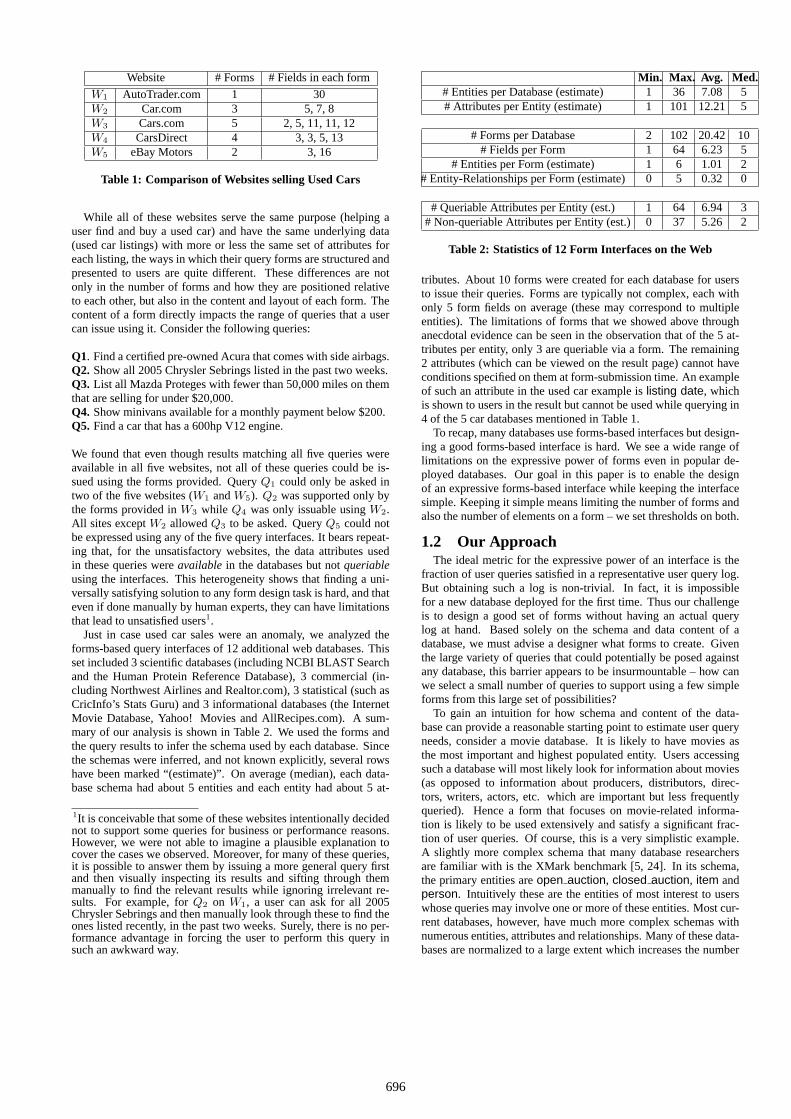
Just in case used car sales were an anomaly, we analyzed theforms-based query interfaces of 12 additional web databases. Thisset included 3 scientific databases (including NCBI BLAST Searchand the Human Protein Reference Database), 3 commercial (in-cluding Northwest Airlines and Realtor.com), 3 statistical (such asCricInfo’s Stats Guru) and 3 informational databases (the InternetMovie Database, Yahoo! Movies and AllRecipes.com). A sum-mary of our analysis is shown in Table 2. We used the forms andthe query results to infer the schema used by each database. Sincethe schemas were inferred, and not known explicitly, several rowshave been marked “(estimate)”. On average (median), each data-base schema had about 5 entities and each entity had about 5 at-
1It is conceivable that some of these websites intentionally decidednot to support some queries for business or performance reasons.However, we were not able to imagine a plausible explanation tocover the cases we observed. Moreover, for many of these queries,it is possible to answer them by issuing a more general query firstand then visually inspecting its results and sifting through themmanually to find the relevant results while ignoring irrelevant re-sults. For example, forQ2 on W1, a user can ask for all 2005Chrysler Sebrings and then manually look through these to find theones listed recently, in the past two weeks. Surely, there is no per-formance advantage in forcing the user to perform this query insuch an awkward way.
Min. Max. Avg. Med.# Entities per Database (estimate) 1 36 7.08 5# Attributes per Entity (estimate) 1 101 12.21 5
# Forms per Database 2 102 20.42 10# Fields per Form 1 64 6.23 5
# Entities per Form (estimate) 1 6 1.01 2# Entity-Relationships per Form (estimate) 0 5 0.32 0
# Queriable Attributes per Entity (est.) 1 64 6.94 3# Non-queriable Attributes per Entity (est.)0 37 5.26 2
Table 2: Statistics of 12 Form Interfaces on the Web
tributes. About 10 forms were created for each database for usersto issue their queries. Forms are typically not complex, each withonly 5 form fields on average (these may correspond to multipleentities). The limitations of forms that we showed above throughanecdotal evidence can be seen in the observation that of the 5 at-tributes per entity, only 3 are queriable via a form. The remaining2 attributes (which can be viewed on the result page) cannot haveconditions specified on them at form-submission time. An exampleof such an attribute in the used car example islisting date, whichis shown to users in the result but cannot be used while querying in4 of the 5 car databases mentioned in Table 1.
To recap, many databases use forms-based interfaces but design-ing a good forms-based interface is hard. We see a wide range oflimitations on the expressive power of forms even in popular de-ployed databases. Our goal in this paper is to enable the designof an expressive forms-based interface while keeping the interfacesimple. Keeping it simple means limiting the number of forms andalso the number of elements on a form – we set thresholds on both.
1.2 Our ApproachThe ideal metric for the expressive power of an interface is the
fraction of user queries satisfied in a representative user query log.But obtaining such a log is non-trivial. In fact, it is impossiblefor a new database deployed for the first time. Thus our challengeis to design a good set of forms without having an actual querylog at hand. Based solely on the schema and data content of adatabase, we must advise a designer what forms to create. Giventhe large variety of queries that could potentially be posed againstany database, this barrier appears to be insurmountable – how canwe select a small number of queries to support using a few simpleforms from this large set of possibilities?
To gain an intuition for how schema and content of the data-base can provide a reasonable starting point to estimate user queryneeds, consider a movie database. It is likely to have movies asthe most important and highest populated entity. Users accessingsuch a database will most likely look for information about movies(as opposed to information about producers, distributors, direc-tors, writers, actors, etc. which are important but less frequentlyqueried). Hence a form that focuses on movie-related informa-tion is likely to be used extensively and satisfy a significant frac-tion of user queries. Of course, this is a very simplistic example.A slightly more complex schema that many database researchersare familiar with is the XMark benchmark [5, 24]. In its schema,the primary entities areopen auction, closed auction, item andperson. Intuitively these are the entities of most interest to userswhose queries may involve one or more of these entities. Most cur-rent databases, however, have much more complex schemas withnumerous entities, attributes and relationships. Many of these data-bases are normalized to a large extent which increases the number
696
of entities needed to capture the data of interest. In most cases theschema complexity is simply due to the richness of the data. Thiscomplexity is reflected in the queries to the database, many withmore than one entity of interest. In this paper, we describe our ap-proach to determine exactly that. We can break the forms interfacedesign problem down into three challenges discussed below.
The first challenge to address is determining the schema frag-ment(s) most likely to be of interest to a querying user. Schemascan be extremely complex in real-world databases, but actual queriesissued to a database typically focus on a small subset of its schema(as we have observed and believe). In Sec. 2, we introduce a metric,calledqueriability, to measure the likelihood of various elements ofa schema being queried. We develop techniques to estimate queri-ability based solely on the database schema and content, and use itto discard schema elements that are less likely to be queried.
The second challenge in automated form design is to partition thefiltered collection of schema elements into groups (not necessarilydistinct) such that the entities, attributes and relationships presentin a single group can meaningfully interrelate on a form to expressuser queries. A random collection of highly queriable schema el-ements may not make sense together in a single form. We presentour approach in Sec. 3.
A very large number of queries can potentially be composedfrom a given set of related schema elements. Not all of thesequeries can be supported by a single form. The third challengein our form generation process is to convert each of these groupsof schema elements into a form that a user can employ to express adesired query. We address this challenge in Sec. 4.
Since we are predicting likely user queries based solely on schemaand data, our techniques cannot have associated analytic guaran-tees. As such, a careful performance evaluation is essential. Weevaluate the performance of our system with the help of real data-base queries and present our results and observations in Sec. 5. Ourmain result is that, using only the schema and the data, it is possibleto create a small set (e.g.< 4) of simple forms (e.g.< 12 fieldseach) that can express most queries users ask (e.g.> 80%).
2. DATABASE ANALYSISAny form that can express a query of interest must include one
or more entities, attributes of those entities and optionally one ormore relationships between the entities. To build a forms-basedinterface we must select which entities to employ and in what com-binations in order to cover all queries of interest to users. Thisproblem may have a deterministic solution if the queries are knowna priori. Since that is not typically the case, the best we can do isto use heuristics for entity selection. We define a set of postulatesthat we use to compute the queriabilities based on observations ofthe schema and the data. In this section we describe the databaseanalysis we perform to obtain this queriability score. In the nextsection we show how we can use this score to construct forms.
2.1 Schema AnalysisThe schema of a database defines its structure. It is a set of enti-
ties along with their attributes and the relationships they have withone another. These relationships may be structural links or referen-tial links between the respective entities. A schema is thus a graphwhose nodes denote entities and attributes and whose edges repre-sent links between them. An entity in our data model correspondsto an entity set in the ER Model. Our notion of an attribute in-cludes not only simple and multi-valued attributes (as defined inthe ER Model), but also complex-typed attributes (which are mod-eled as entities in the ER Model). Also unlike the ER Model, ourdata model does not support relationship attributes nor does it dis-
tinguish between strong and weak entities. Classes in a class hier-archy are all viewed as separate entities. A formal definition of aschema in our data model is as follows.
DEFINITION 1. (SCHEMA)Theschemaof a database is a di-rected graph〈E, A, L〉,where:– E is a finite set ofentities;– A is a finite set ofattributes, each belonging to a single entity;– L is a finite set oflinks between nodes(entities or attributes) inthe graph, i.e.,L is a subset of(E ∪A)× (E ∪A).
Entities differ from one another structurally in terms of the num-ber of attributes they possess and how well connected they are inthe schema. We exploit these differences to identify the ones morelikely to be queried by a user. A starting point is the definition ofschema element importance [28] used to choose entities to summa-rize a schema. But in addition, we also need to analyze attributesand relationships, which are not of much significance in schemasummarization. This brings us to the first of the postulates on whichour form generation approach is based.
POSTULATE 1. The query relevance of an entity depends onhow well-connected it is to other parts of the schema.
By connectednesswe mean the number of attributes and other en-tities to which this entity is connected via structural or referentiallinks. In the next subsection, we assign a strength to each connec-tion based on how often it occurs in the data. Connectedness of anentity depends on its neighborhood in the schema. In a sense, it isa measure of an entity’s centrality to the database.
2.2 Data AnalysisIf the given database is populated and its content is available at
interface design time, we can analyze how the data is distributedto infer the relative importance of each schema entity, attribute andrelationship. Specifically, we at for the number of times each nodein the schema graph (element or attribute) is instantiated in the data.We call this itsabsolute cardinality. The higher the number ofoccurrences of an entity node, the higher the probability that it isan entity that a user may be interested in. For instance, a moviedatabase is likely to have many movie entities in it, but very fewproduction companies. This brings us to the second postulate weuse to estimate entity importance.
POSTULATE 2. The query relevance of an entity depends onhow many instances (records) of it occur in the database.
Absolute cardinality, as a measure of entity importance, may notalways tell the whole story. For instance, a movie database typ-ically has more actors than movies. This does not mean that theyare more important either to the data provider or the database users.To avoid ranking actors ahead of movies while designing an inter-face for such a database, we need to look at a second property of anentity, itsrelative cardinalitywith respect to its neighboring nodes(via structural or referential links) [28]. This is a measure of itsconnectedness as observed in the data rather than in the schema. Itmeasures the relative importance of all nodes in the schema.
FORMULA 1. (RELATIVE CARDINALITY) The relative car-dinality of a node with respect to a neighboring node is computedas the cardinality of the link instances between them (in the data),normalized by the absolute cardinality of the node.
RC(ni → n) =C(ni → n)
C(n)
Here, C(ni → n) denotes the link cardinality between the nodesni andn in the database, whileC(n) is theabsolute cardinalityof noden.
697
2.3 QueriabilityGiven a database, our goal is to determine which entities, entity
collections and attributes are likely to be queried most often. Wedo this by computing theirqueriability, an estimate of their likeli-hood of being used in a query. We compute a probabilistic estimatefor every entity, entity collection or attribute and call this its queri-ability. If an entity has a queriability of 1, we expect it to occur inevery single query to the database (this is, in fact, possible if it isthe only entity in the schema). A queriability of 0 means that it isunlikely any query to the database will include this entity (which ispossible if, for example, the entity is deprecated and/or has no datainstances).
2.3.1 Queriability of EntitiesThe queriability of an entity depends on its schema connected-
ness and its data cardinality. While connectedness of an entity isindependent of the connectedness of other entities, an entity oughtto be more queriable if it is connected to other highly queriable enti-ties than if it were connected to the same number of lowly queriableentities2. Hence we use a recursive formula to compute queriabil-ity making use of postulates P1 and P2 (like how schema elementimportance was computed in [28]).
FORMULA 2. (ENTITY QUERIABILITY) The queriability ofan entitye ∈ E is computed in two steps. First we perform aniterative computation of theimportance I of each noden (entityor attribute) in the schema graph until convergence3 is reached.
Irn = p ∗ Ir−1
n + (1− p) ∗X
i
Wni→n ∗ Ir−1ni
where Wni→n =RC(ni → n)Pk RC(ni → nk)
, (ni → n) ∈ L
Here,p is a tuning parameter that takes values between 0 and 1,ris the iteration counter andRC denotes therelative cardinality ofa node with another node.W , which we call theneighbor weight,weighs the importance contribution of each neighbor node (i.e., anode that is linked to this node in the schema graph) by its relativecardinality with this node. The initial importance of any node (I0
n)is simply itsabsolute cardinality in the data. After the values con-verge, we normalize the final importance of each entity by the sumof theabsolute cardinalitiesof all nodes in the schema and assignthe resulting value to the queriability of the entity.
Q(e) =Ic
ePi Cni
Here, Ice denotes the importance of entitye at convergenceand
Cni is theabsolute cardinality of nodeni.
In the above formula, schema connectedness is factored in by thesummation over all neighbor nodes and the data cardinality is cap-tured by the neighbor weightsW of these nodes. Due to the in-terdependence of a node’s importance on the importance of othernodes, a recursive formula is necessary. The contribution of onenode to the importance of another is weighted by the strength ofthe link between them, measured by their relative cardinality.
2.3.2 Queriability of Related EntitiesEntities in a schema can have relationships with one another and
related entities are often the focus of queries to the database. Forms2This heuristic is inspired by the approach taken by several searchengines to rank web documents. A document is considered “im-portant” if it is connected (linked) to other “important” documents.3Proof of convergence can be seen in an analogous problem in [19].
querying a single entity can be limiting. On the other hand, creatingforms for all pairs, triples, etc. of queriable entities can lead to toomany forms that do not make sense. What we need is a measureof queriability of related entities indicating how likely a pair (andeventually, a collection) of entities will be queried together.
POSTULATE 3. The queriability of a collection of related enti-ties depends on the individual queriabilities of entities in it.
POSTULATE 4. The queriability of a collection of related enti-ties depends on the data cardinality of all pair-wise relationshipsbetween the entities in it.
We posit that the queriability of a collection of related entitiesis directly proportional to their individual queriabilities and is alsoproportional to the strength of the relationship (measured by its datacardinality). If multiple relationships exist between two entities,each relationship contributes to the queriability of the collection.
FORMULA 3. (RELATED ENTITIES QUERIABILITY)We cal-culate the queriability of two related entitiese1, e2 ∈ E as theproduct of their individual queriabilities weighted by the averageof their ratios of participation in the relationship between them.
Q(e1 ∧ e2) = Q(e1) ∗Q(e2) ∗�
R(e1 → e2) + R(e2 → e1)
2
�
where R(ei → ej) =N(ei → ej)
C(ei)
Here R(ei → ej) denotes theparticipation ratio of ei in the re-lationship betweenei and ej . N(ei → ej) is the number of in-stances of entityei connected to some instance of entityej whileC(ei) refers to theabsolute cardinality of entityei in the data4.The participation ratio of an entity in a relationship is 0 if no in-stance of that entity participates in the relationship, and it is 1 ifevery instance of the entity is related to at least one instance of theother entity via the relationship.
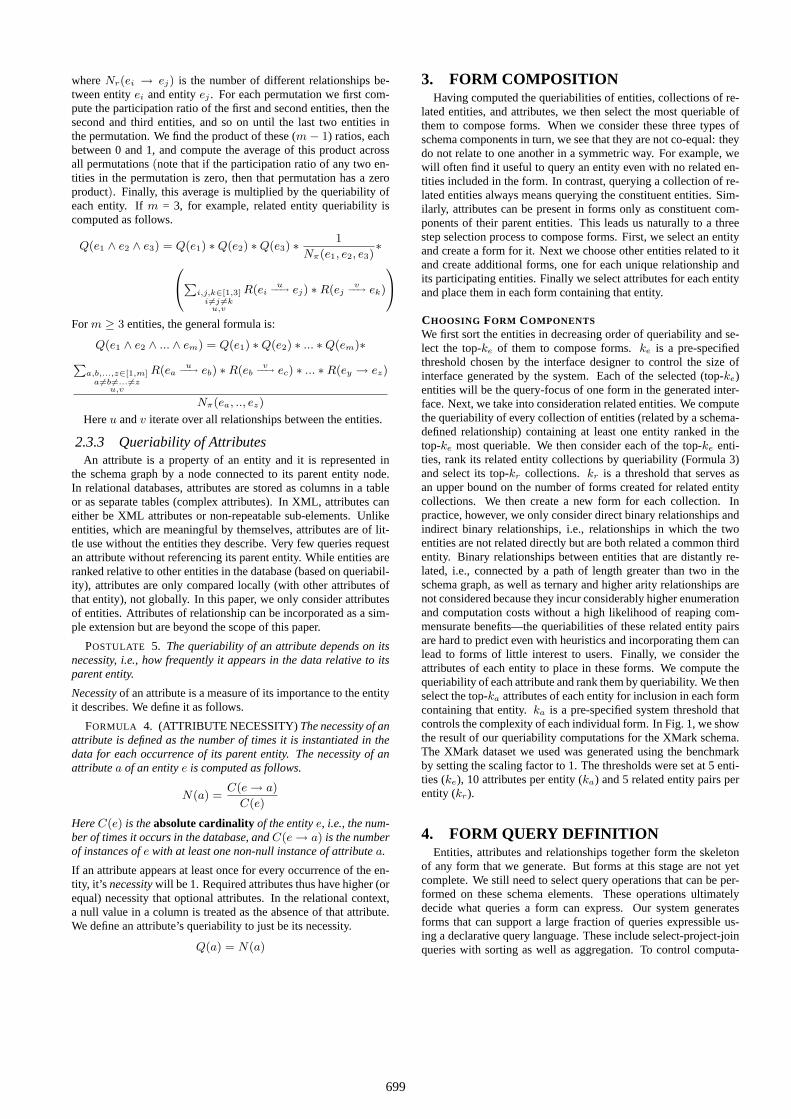
An example of related entity queriability can be seen in Fig. 1where theclosed auction entity is related to theperson entity (aclosed auction has a seller who is aperson). Since its participa-tion in the relationship is total, (every closed auction has a seller),the queriability of the related entity pair is simply the product ofqueriabilities of the two entities.
Q(closed auction ∧ person) = Q(closed auction)Q(person)
= 0.0128 ∗ 0.0372 = 0.0005
If there are three or more related entities, the formula changesslightly. We start by enumerating all possible permutations of theseentities. If there arem related entities, the number of permuta-tions will be Nπ(e1, .., em) = m! provided there is at most onerelationship between any two entities. But if there are multiple re-lationships between any two entities, each additional relationshipwill create additional permutations. The total number of permuta-tions then becomes
Nπ(e1, .., em) = m! ∗Y
ei,ej∈E
Nr(ei → ej)
4Notethe subtle difference betweenparticipation ratioandrelativecardinality. If a link exists between entitiesei andej in the schema,relative cardinality measures the average number ofei instancesper instance ofej . Participation ratio, on the other hand, is thefraction of ei instances connected to at least one instance ofej .While participation ratio lies between 0 and 1, relative cardinalityhas no upper bound.
698
whereNr(ei → ej) is the number of different relationships be-tween entityei and entityej . For each permutation we first com-pute the participation ratio of the first and second entities, then thesecond and third entities, and so on until the last two entities inthe permutation. We find the product of these (m− 1) ratios, eachbetween 0 and 1, and compute the average of this product acrossall permutations(note that if the participation ratio of any two en-tities in the permutation is zero, then that permutation has a zeroproduct). Finally, this average is multiplied by the queriability ofeach entity. Ifm = 3, for example, related entity queriability iscomputed as follows.
Q(e1 ∧ e2 ∧ e3) = Q(e1) ∗Q(e2) ∗Q(e3) ∗ 1
Nπ(e1, e2, e3)∗
0@P
i,j,k∈[1,3]i6=j 6=k
u,v
R(eiu−−→ ej) ∗R(ej
v−−→ ek)
1A
Form ≥ 3 entities, the general formula is:
Q(e1 ∧ e2 ∧ ... ∧ em) = Q(e1) ∗Q(e2) ∗ ... ∗Q(em)∗P
a,b,...,z∈[1,m]a6=b6=...6=z
u,v
R(eau−−→ eb) ∗R(eb
v−−→ ec) ∗ ... ∗R(ey → ez)
Nπ(ea, .., ez)
Hereu andv iterate over all relationships between the entities.
2.3.3 Queriability of AttributesAn attribute is a property of an entity and it is represented in
the schema graph by a node connected to its parent entity node.In relational databases, attributes are stored as columns in a tableor as separate tables (complex attributes). In XML, attributes caneither be XML attributes or non-repeatable sub-elements. Unlikeentities, which are meaningful by themselves, attributes are of lit-tle use without the entities they describe. Very few queries requestan attribute without referencing its parent entity. While entities areranked relative to other entities in the database (based on queriabil-ity), attributes are only compared locally (with other attributes ofthat entity), not globally. In this paper, we only consider attributesof entities. Attributes of relationship can be incorporated as a sim-ple extension but are beyond the scope of this paper.
POSTULATE 5. The queriability of an attribute depends on itsnecessity, i.e., how frequently it appears in the data relative to itsparent entity.
Necessityof an attribute is a measure of its importance to the entityit describes. We define it as follows.
FORMULA 4. (ATTRIBUTE NECESSITY)The necessity of anattribute is defined as the number of times it is instantiated in thedata for each occurrence of its parent entity. The necessity of anattributea of an entitye is computed as follows.
N(a) =C(e → a)
C(e)
HereC(e) is theabsolute cardinality of the entitye, i.e., the num-ber of times it occurs in the database, andC(e → a) is the numberof instances ofe with at least one non-null instance of attributea.
If an attribute appears at least once for every occurrence of the en-tity, it’s necessitywill be 1. Required attributes thus have higher (orequal) necessity that optional attributes. In the relational context,a null value in a column is treated as the absence of that attribute.We define an attribute’s queriability to just be its necessity.
Q(a) = N(a)
3. FORM COMPOSITIONHaving computed the queriabilities of entities, collections of re-
lated entities, and attributes, we then select the most queriable ofthem to compose forms. When we consider these three types ofschema components in turn, we see that they are not co-equal: theydo not relate to one another in a symmetric way. For example, wewill often find it useful to query an entity even with no related en-tities included in the form. In contrast, querying a collection of re-lated entities always means querying the constituent entities. Sim-ilarly, attributes can be present in forms only as constituent com-ponents of their parent entities. This leads us naturally to a threestep selection process to compose forms. First, we select an entityand create a form for it. Next we choose other entities related to itand create additional forms, one for each unique relationship andits participating entities. Finally we select attributes for each entityand place them in each form containing that entity.
CHOOSING FORM COMPONENTS
We first sort the entities in decreasing order of queriability and se-lect the top-ke of them to compose forms.ke is a pre-specifiedthreshold chosen by the interface designer to control the size ofinterface generated by the system. Each of the selected (top-ke)entities will be the query-focus of one form in the generated inter-face. Next, we take into consideration related entities. We computethe queriability of every collection of entities (related by a schema-defined relationship) containing at least one entity ranked in thetop-ke most queriable. We then consider each of the top-ke enti-ties, rank its related entity collections by queriability (Formula 3)and select its top-kr collections. kr is a threshold that serves asan upper bound on the number of forms created for related entitycollections. We then create a new form for each collection. Inpractice, however, we only consider direct binary relationships andindirect binary relationships, i.e., relationships in which the twoentities are not related directly but are both related a common thirdentity. Binary relationships between entities that are distantly re-lated, i.e., connected by a path of length greater than two in theschema graph, as well as ternary and higher arity relationships arenot considered because they incur considerably higher enumerationand computation costs without a high likelihood of reaping com-mensurate benefits—the queriabilities of these related entity pairsare hard to predict even with heuristics and incorporating them canlead to forms of little interest to users. Finally, we consider theattributes of each entity to place in these forms. We compute thequeriability of each attribute and rank them by queriability. We thenselect the top-ka attributes of each entity for inclusion in each formcontaining that entity.ka is a pre-specified system threshold thatcontrols the complexity of each individual form. In Fig. 1, we showthe result of our queriability computations for the XMark schema.The XMark dataset we used was generated using the benchmarkby setting the scaling factor to 1. The thresholds were set at 5 enti-ties (ke), 10 attributes per entity (ka) and 5 related entity pairs perentity (kr).
4. FORM QUERY DEFINITIONEntities, attributes and relationships together form the skeleton
of any form that we generate. But forms at this stage are not yetcomplete. We still need to select query operations that can be per-formed on these schema elements. These operations ultimatelydecide what queries a form can express. Our system generatesforms that can support a large fraction of queries expressible us-ing a declarative query language. These include select-project-joinqueries with sorting as well as aggregation. To control computa-
699
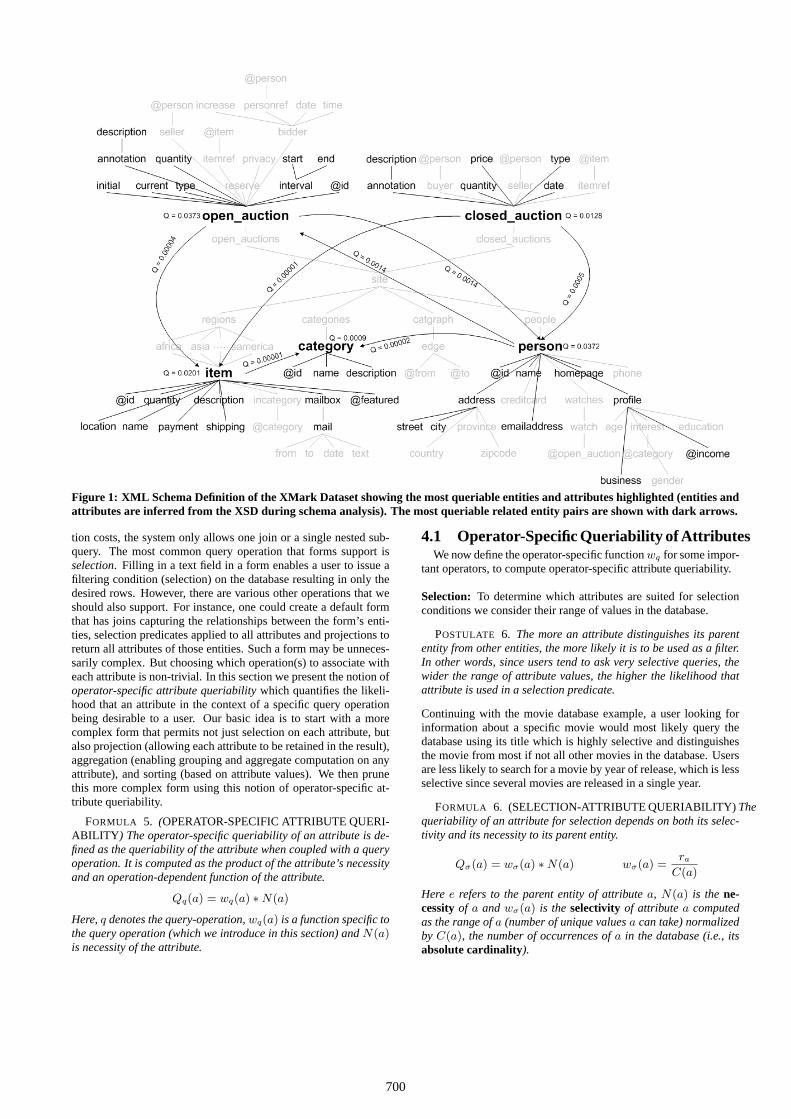
Figure 1: XML Schema Definition of the XMark Dataset showing the most queriable entities and attributes highlighted (entities andattributes are inferred from the XSD during schema analysis). The most queriable related entity pairs are shown with dark arrows.
tion costs, the system only allows one join or a single nested sub-query. The most common query operation that forms support isselection. Filling in a text field in a form enables a user to issue afiltering condition (selection) on the database resulting in only thedesired rows. However, there are various other operations that weshould also support. For instance, one could create a default formthat has joins capturing the relationships between the form’s enti-ties, selection predicates applied to all attributes and projections toreturn all attributes of those entities. Such a form may be unneces-sarily complex. But choosing which operation(s) to associate witheach attribute is non-trivial. In this section we present the notion ofoperator-specific attribute queriabilitywhich quantifies the likeli-hood that an attribute in the context of a specific query operationbeing desirable to a user. Our basic idea is to start with a morecomplex form that permits not just selection on each attribute, butalso projection (allowing each attribute to be retained in the result),aggregation (enabling grouping and aggregate computation on anyattribute), and sorting (based on attribute values). We then prunethis more complex form using this notion of operator-specific at-tribute queriability.
FORMULA 5. (OPERATOR-SPECIFIC ATTRIBUTE QUERI-ABILITY ) The operator-specific queriability of an attribute is de-fined as the queriability of the attribute when coupled with a queryoperation. It is computed as the product of the attribute’s necessityand an operation-dependent function of the attribute.
Qq(a) = wq(a) ∗N(a)
Here,q denotes the query-operation,wq(a) is a function specific tothe query operation (which we introduce in this section) andN(a)is necessity of the attribute.
4.1 Operator-Specific Queriability of AttributesWe now define the operator-specific functionwq for some impor-
tant operators, to compute operator-specific attribute queriability.
Selection: To determine which attributes are suited for selectionconditions we consider their range of values in the database.
POSTULATE 6. The more an attribute distinguishes its parententity from other entities, the more likely it is to be used as a filter.In other words, since users tend to ask very selective queries, thewider the range of attribute values, the higher the likelihood thatattribute is used in a selection predicate.
Continuing with the movie database example, a user looking forinformation about a specific movie would most likely query thedatabase using its title which is highly selective and distinguishesthe movie from most if not all other movies in the database. Usersare less likely to search for a movie by year of release, which is lessselective since several movies are released in a single year.
FORMULA 6. (SELECTION-ATTRIBUTE QUERIABILITY)Thequeriability of an attribute for selection depends on both its selec-tivity and its necessity to its parent entity.
Qσ(a) = wσ(a) ∗N(a)
�wσ(a) =
ra
C(a)
�
Here e refers to the parent entity of attributea, N(a) is thene-cessityof a and wσ(a) is theselectivity of attributea computedas the range ofa (number of unique valuesa can take) normalizedby C(a), the number of occurrences ofa in the database (i.e., itsabsolute cardinality).
700
Projection: Attributes that are projected compose the output of aquery. It is difficult to estimate which attributes of the entity (orentities) involved with the query would be of most interest to users.Usingnecessityas a metric to choose the most desirable attribute(s)may be the best we can do. But sometimes entities have complexattributes, i.e., attributes that are not simple single-valued fields.These include repeatable sub-elements in XML and dependent en-tities in relational databases. If present, these attributes should begiven higher priority than simpler fields because they convey moreinformation.
POSTULATE 7. Complex attributes are more queriable than sim-ple attributes.
We propose a measure calledattribute sizethat counts the numberof non-null text-fields in an attribute. This is averaged over all itsdata instances. Theattribute sizeof single-valued attributes is 1.
FORMULA 7. (PROJECTION-ATTRIBUTE QUERIABILITY)The queriability of an attribute for projection depends on its neces-sity and its size measured as the number of text-fields it contains.
Qπ(a) = wπ(a) ∗N(a)
"wπ(a) =
C(a → f)Pe→ai
C(ai → fi)
#
Here,wπ(a) refers to the size of attributea (number of text-fields,f ) normalized by the sum of sizes of all attributes of the entity,e.
Sort: “Order-by” attributes have an output role and determine thedisplay order of the query’s result. Query results can be sortedby different field types, such as numeric, alphanumeric or purelytextual. But these must be simple and preferably required (not null).
POSTULATE 8. Single-valued and mandatory attributes are moreoften used to order query results than optional or complex attributes.
We measure their queriability using the following formula.
FORMULA 8. (SORT-ATTRIBUTE QUERIABILITY)The que-riability of an attribute for sorting is its necessity multiplied by anindicator function denoting whether the attribute is both single-valued and a required attribute or not.
Qψ(a) = wψ(a)∗N(a)
24wψ(a) =
8<:
1 a is single-valuedand required;
0 otherwise.
35
Aggregation: While any attribute in a schema can be aggre-gated as the result of a grouping, aggregation on numeric-valuedattributes (for e.g., to find a sum, an average, a maximum value,etc.) is more common than others. Also, repeatable attributes aremore likely to be aggregated. For example, the number of authorsof a book, the number of available seats in an airline, etc. In re-lational schemas, repeatable attributes are represented as separatetables with a 1-to-many or a many-to-many relationship with theentity tables. These notions are captured in the following postulate.
POSTULATE 9. Repeatable and numeric attributes have a greaterlikelihood of being aggregated in a query than other types of at-tributes.
FORMULA 9. (AGGREGATION-ATTRIBUTE QUERIABILITY)The queriability of an attribute for aggregation is its necessity mul-tiplied by an indicator function denoting whether or not the at-tribute is both numeric and repeatable.
Qγ(a) = wγ(a)∗N(a)
24wγ(a) =
8<:
1 a is numeric andrepeatable;
0 otherwise.
35
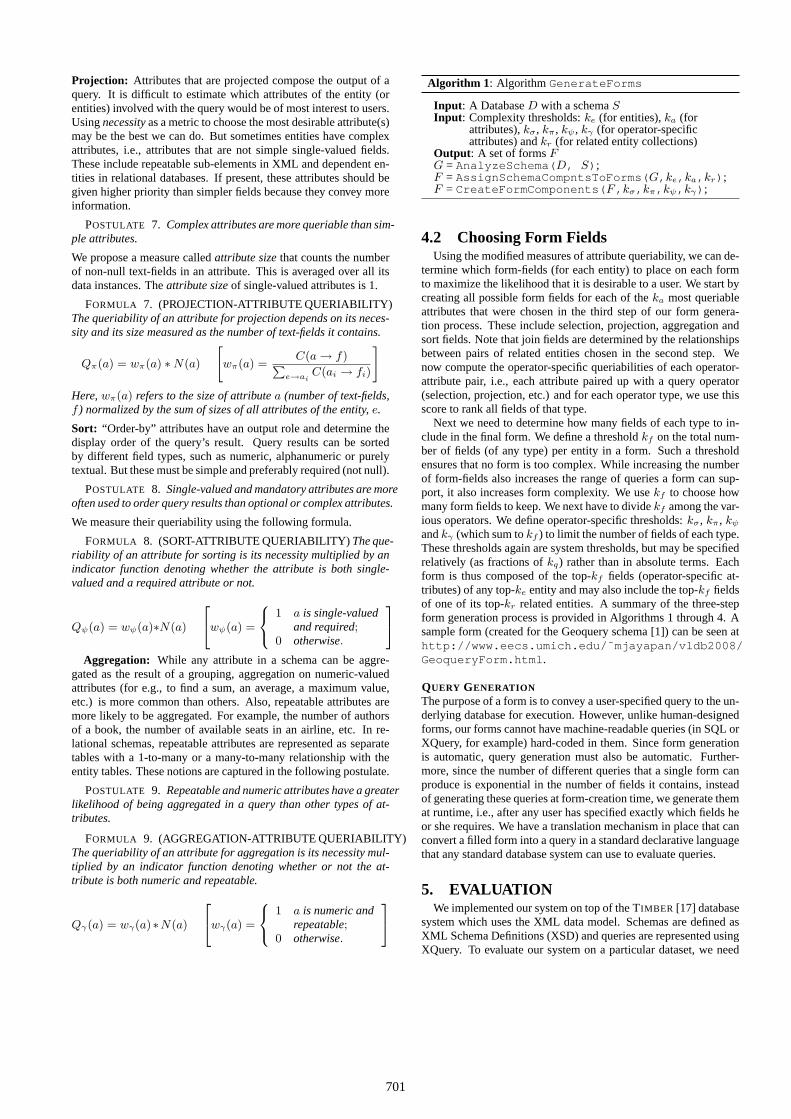
Algorithm 1: Algorithm GenerateForms
Input : A DatabaseD with a schemaSInput : Complexity thresholds:ke (for entities),ka (for
attributes),kσ, kπ, kψ, kγ (for operator-specificattributes) andkr (for related entity collections)
Output : A set of formsFG = AnalyzeSchema( D, S);F = AssignSchemaCompntsToForms( G, ke,k a,k r) ;F = CreateFormComponents( F ,k σ,k π,k ψ,k γ);
4.2 Choosing Form FieldsUsing the modified measures of attribute queriability, we can de-
termine which form-fields (for each entity) to place on each formto maximize the likelihood that it is desirable to a user. We start bycreating all possible form fields for each of theka most queriableattributes that were chosen in the third step of our form genera-tion process. These include selection, projection, aggregation andsort fields. Note that join fields are determined by the relationshipsbetween pairs of related entities chosen in the second step. Wenow compute the operator-specific queriabilities of each operator-attribute pair, i.e., each attribute paired up with a query operator(selection, projection, etc.) and for each operator type, we use thisscore to rank all fields of that type.
Next we need to determine how many fields of each type to in-clude in the final form. We define a thresholdkf on the total num-ber of fields (of any type) per entity in a form. Such a thresholdensures that no form is too complex. While increasing the numberof form-fields also increases the range of queries a form can sup-port, it also increases form complexity. We usekf to choose howmany form fields to keep. We next have to dividekf among the var-ious operators. We define operator-specific thresholds:kσ, kπ, kψ
andkγ (which sum tokf ) to limit the number of fields of each type.These thresholds again are system thresholds, but may be specifiedrelatively (as fractions ofkq) rather than in absolute terms. Eachform is thus composed of the top-kf fields (operator-specific at-tributes) of any top-ke entity and may also include the top-kf fieldsof one of its top-kr related entities. A summary of the three-stepform generation process is provided in Algorithms 1 through 4. Asample form (created for the Geoquery schema [1]) can be seen athttp://www.eecs.umich.edu/˜mjayapan/vldb2008/GeoqueryForm.html .
QUERY GENERATION
The purpose of a form is to convey a user-specified query to the un-derlying database for execution. However, unlike human-designedforms, our forms cannot have machine-readable queries (in SQL orXQuery, for example) hard-coded in them. Since form generationis automatic, query generation must also be automatic. Further-more, since the number of different queries that a single form canproduce is exponential in the number of fields it contains, insteadof generating these queries at form-creation time, we generate themat runtime, i.e., after any user has specified exactly which fields heor she requires. We have a translation mechanism in place that canconvert a filled form into a query in a standard declarative languagethat any standard database system can use to evaluate queries.
5. EVALUATIONWe implemented our system on top of the TIMBER [17] database
system which uses the XML data model. Schemas are defined asXML Schema Definitions (XSD) and queries are represented usingXQuery. To evaluate our system on a particular dataset, we need
701
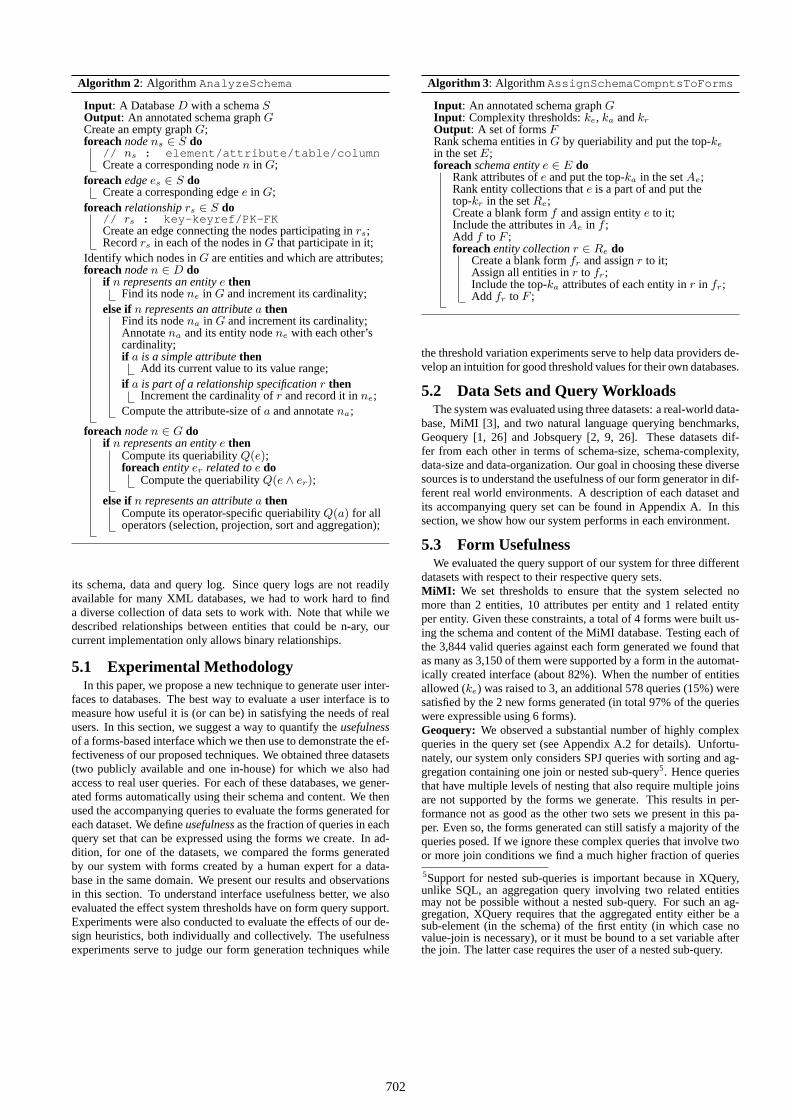
Algorithm 2: Algorithm AnalyzeSchema
Input : A DatabaseD with a schemaSOutput : An annotated schema graphGCreate an empty graphG;foreachnodens ∈ S do
// ns : element/attribute/table/columnCreate a corresponding noden in G;
foreachedgees ∈ S doCreatea corresponding edgee in G;
foreachrelationshiprs ∈ S do// rs : key-keyref/PK-FKCreate an edge connecting the nodes participating inrs;Recordrs in each of the nodes inG that participate in it;
Identify which nodes inG are entities and which are attributes;foreachnoden ∈ D do
if n represents an entitye thenFind its nodene in G and increment its cardinality;
elseif n represents an attributea thenFind its nodena in G and increment its cardinality;Annotatena and its entity nodene with each other’scardinality;if a is a simple attributethen
Add its current value to its value range;if a is part of a relationship specificationr then
Incrementthe cardinality ofr and record it inne;Computethe attribute-size ofa and annotatena;
foreachnoden ∈ G doif n represents an entitye then
Computeits queriabilityQ(e);foreachentityer related toe do
Computethe queriabilityQ(e ∧ er);
elseif n represents an attributea thenComputeits operator-specific queriabilityQ(a) for alloperators (selection, projection, sort and aggregation);
its schema, data and query log. Since query logs are not readilyavailable for many XML databases, we had to work hard to finda diverse collection of data sets to work with. Note that while wedescribed relationships between entities that could be n-ary, ourcurrent implementation only allows binary relationships.
5.1 Experimental MethodologyIn this paper, we propose a new technique to generate user inter-
faces to databases. The best way to evaluate a user interface is tomeasure how useful it is (or can be) in satisfying the needs of realusers. In this section, we suggest a way to quantify theusefulnessof a forms-based interface which we then use to demonstrate the ef-fectiveness of our proposed techniques. We obtained three datasets(two publicly available and one in-house) for which we also hadaccess to real user queries. For each of these databases, we gener-ated forms automatically using their schema and content. We thenused the accompanying queries to evaluate the forms generated foreach dataset. We defineusefulnessas the fraction of queries in eachquery set that can be expressed using the forms we create. In ad-dition, for one of the datasets, we compared the forms generatedby our system with forms created by a human expert for a data-base in the same domain. We present our results and observationsin this section. To understand interface usefulness better, we alsoevaluated the effect system thresholds have on form query support.Experiments were also conducted to evaluate the effects of our de-sign heuristics, both individually and collectively. The usefulnessexperiments serve to judge our form generation techniques while
Algorithm 3: AlgorithmAssignSchemaCompntsToForms
Input : An annotated schema graphGInput : Complexity thresholds:ke, ka andkr
Output : A set of formsFRank schema entities inG by queriability and put the top-ke
in the setE;foreachschema entitye ∈ E do
Rankattributes ofe and put the top-ka in the setAe;Rank entity collections thate is a part of and put thetop-kr in the setRe;Create a blank formf and assign entitye to it;Include the attributes inAe in f ;Add f to F ;foreachentity collectionr ∈ Re do
Createa blank formfr and assignr to it;Assign all entities inr to fr;Include the top-ka attributes of each entity inr in fr;Add fr to F ;
thethreshold variation experiments serve to help data providers de-velop an intuition for good threshold values for their own databases.
5.2 Data Sets and Query WorkloadsThe system was evaluated using three datasets: a real-world data-
base, MiMI [3], and two natural language querying benchmarks,Geoquery [1, 26] and Jobsquery [2, 9, 26]. These datasets dif-fer from each other in terms of schema-size, schema-complexity,data-size and data-organization. Our goal in choosing these diversesources is to understand the usefulness of our form generator in dif-ferent real world environments. A description of each dataset andits accompanying query set can be found in Appendix A. In thissection, we show how our system performs in each environment.
5.3 Form UsefulnessWe evaluated the query support of our system for three different
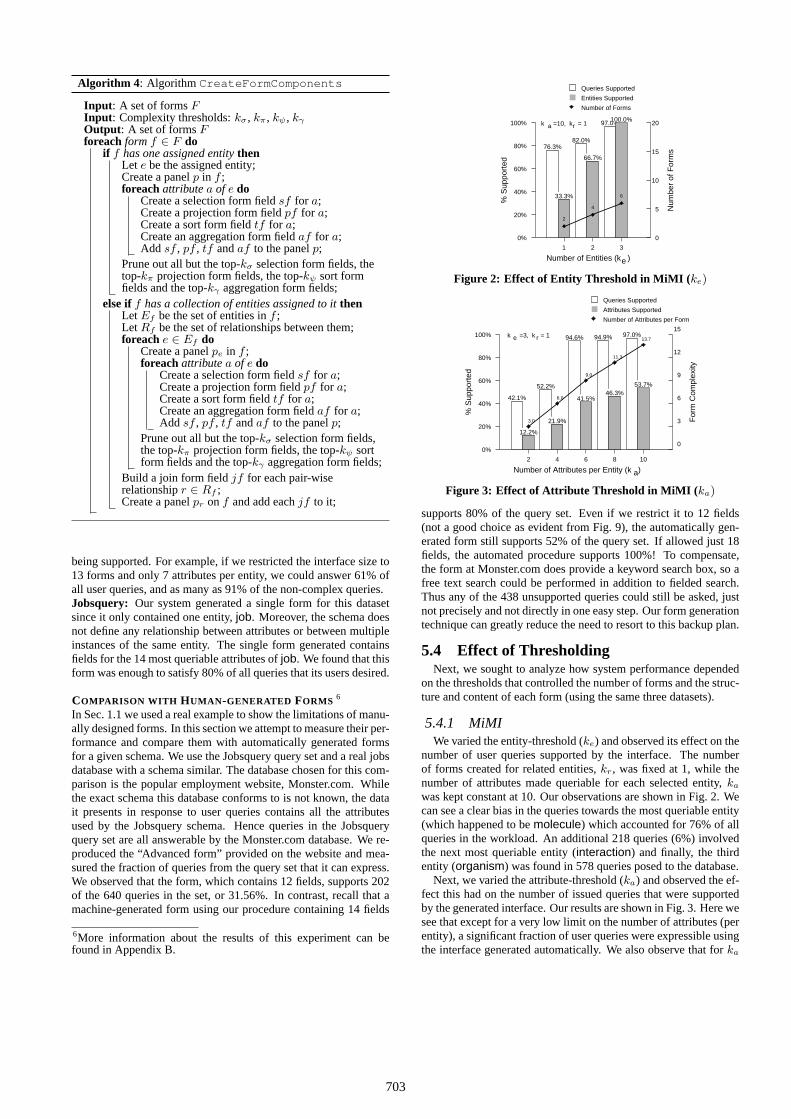
datasets with respect to their respective query sets.MiMI: We set thresholds to ensure that the system selected nomore than 2 entities, 10 attributes per entity and 1 related entityper entity. Given these constraints, a total of 4 forms were built us-ing the schema and content of the MiMI database. Testing each ofthe 3,844 valid queries against each form generated we found thatas many as 3,150 of them were supported by a form in the automat-ically created interface (about 82%). When the number of entitiesallowed (ke) was raised to 3, an additional 578 queries (15%) weresatisfied by the 2 new forms generated (in total 97% of the querieswere expressible using 6 forms).Geoquery: We observed a substantial number of highly complexqueries in the query set (see Appendix A.2 for details). Unfortu-nately, our system only considers SPJ queries with sorting and ag-gregation containing one join or nested sub-query5. Hence queriesthat have multiple levels of nesting that also require multiple joinsare not supported by the forms we generate. This results in per-formance not as good as the other two sets we present in this pa-per. Even so, the forms generated can still satisfy a majority of thequeries posed. If we ignore these complex queries that involve twoor more join conditions we find a much higher fraction of queries
5Supportfor nested sub-queries is important because in XQuery,unlike SQL, an aggregation query involving two related entitiesmay not be possible without a nested sub-query. For such an ag-gregation, XQuery requires that the aggregated entity either be asub-element (in the schema) of the first entity (in which case novalue-join is necessary), or it must be bound to a set variable afterthe join. The latter case requires the user of a nested sub-query.
702
Algorithm 4: Algorithm CreateFormComponents
Input : A set of formsFInput : Complexity thresholds:kσ, kπ, kψ, kγ
Output : A set of formsFforeach formf ∈ F do
if f hasone assigned entitythenLet e bethe assigned entity;Create a panelp in f ;foreachattributea of e do
Createa selection form fieldsf for a;Create a projection form fieldpf for a;Create a sort form fieldtf for a;Create an aggregation form fieldaf for a;Add sf , pf , tf andaf to the panelp;
Pruneout all but the top-kσ selection form fields, thetop-kπ projection form fields, the top-kψ sort formfields and the top-kγ aggregation form fields;
elseif f has a collection of entities assigned to itthenLet Ef bethe set of entities inf ;Let Rf be the set of relationships between them;foreache ∈ Ef do
Createa panelpe in f ;foreachattributea of e do
Createa selection form fieldsf for a;Create a projection form fieldpf for a;Create a sort form fieldtf for a;Create an aggregation form fieldaf for a;Add sf , pf , tf andaf to the panelp;
Pruneout all but the top-kσ selection form fields,the top-kπ projection form fields, the top-kψ sortform fields and the top-kγ aggregation form fields;
Build a join form fieldjf for each pair-wiserelationshipr ∈ Rf ;Create a panelpr onf and add eachjf to it;
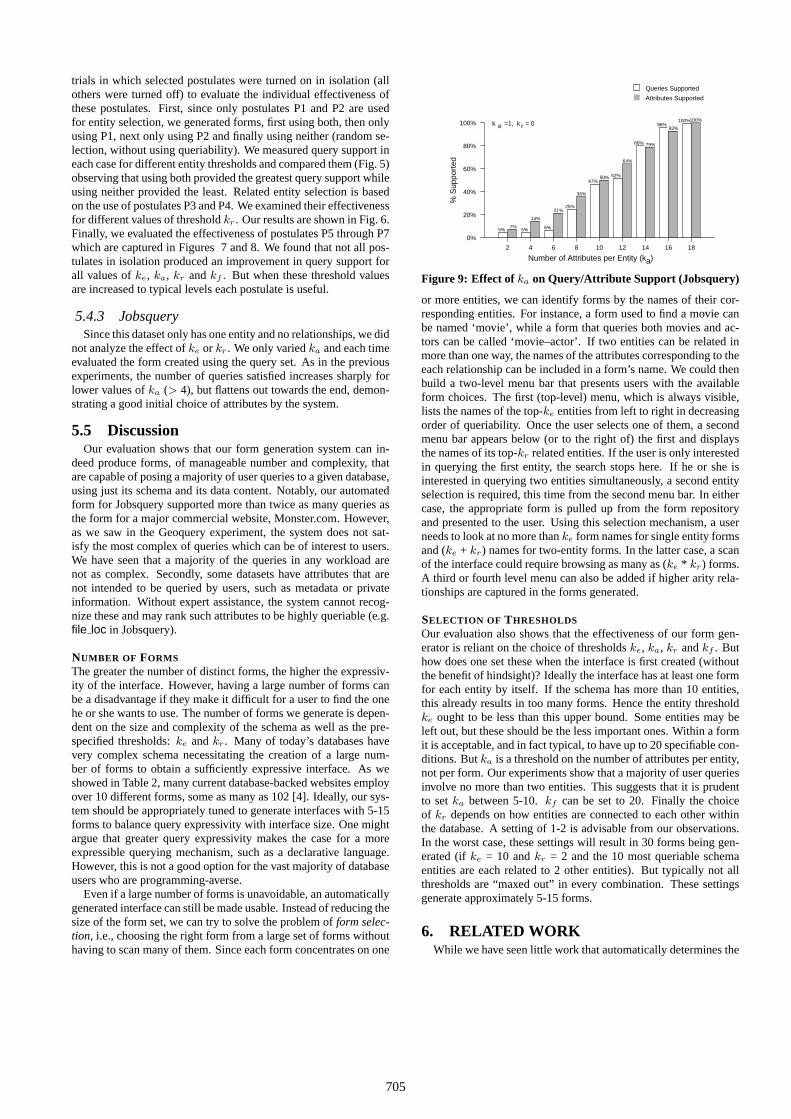
beingsupported. For example, if we restricted the interface size to13 forms and only 7 attributes per entity, we could answer 61% ofall user queries, and as many as 91% of the non-complex queries.Jobsquery: Our system generated a single form for this datasetsince it only contained one entity,job. Moreover, the schema doesnot define any relationship between attributes or between multipleinstances of the same entity. The single form generated containsfields for the 14 most queriable attributes ofjob. We found that thisform was enough to satisfy 80% of all queries that its users desired.
COMPARISON WITH HUMAN -GENERATED FORMS 6
In Sec. 1.1 we used a real example to show the limitations of manu-ally designed forms. In this section we attempt to measure their per-formance and compare them with automatically generated formsfor a given schema. We use the Jobsquery query set and a real jobsdatabase with a schema similar. The database chosen for this com-parison is the popular employment website, Monster.com. Whilethe exact schema this database conforms to is not known, the datait presents in response to user queries contains all the attributesused by the Jobsquery schema. Hence queries in the Jobsqueryquery set are all answerable by the Monster.com database. We re-produced the “Advanced form” provided on the website and mea-sured the fraction of queries from the query set that it can express.We observed that the form, which contains 12 fields, supports 202of the 640 queries in the set, or 31.56%. In contrast, recall that amachine-generated form using our procedure containing 14 fields
6More information about the results of this experiment can befound in Appendix B.
Number of Entities (k ) e
1 2 3
% S
uppo
rted
0%
20%
40%
60%
80%
100%
76.3%82.0%
97.0%
33.3%
66.7%
100.0%
Num
ber
of F
orm
s
0
5
10
15
20
2
4
6
Queries Supported
Entities Supported
Number of Forms
k =10, k = 1 a r
Figure 2: Effect of Entity Threshold in MiMI ( ke)
Number of Attributes per Entity (k ) a
2 4 6 8 10%
Sup
port
ed
0%
20%
40%
60%
80%
100%
42.1%
52.2%
94.6% 94.9% 97.0%
12.2%
21.9%
41.5%46.3%
53.7%
For
m C
ompl
exity
0
3
6
9
12
15
3.0
6.0
9.0
11.3
13.7
Queries Supported
Attributes Supported
Number of Attributes per Form
k =3, k = 1 e r
Figure 3: Effect of Attribute Threshold in MiMI ( ka)
supports 80% of the query set. Even if we restrict it to 12 fields(not a good choice as evident from Fig. 9), the automatically gen-erated form still supports 52% of the query set. If allowed just 18fields, the automated procedure supports 100%! To compensate,the form at Monster.com does provide a keyword search box, so afree text search could be performed in addition to fielded search.Thus any of the 438 unsupported queries could still be asked, justnot precisely and not directly in one easy step. Our form generationtechnique can greatly reduce the need to resort to this backup plan.
5.4 Effect of ThresholdingNext, we sought to analyze how system performance depended
on the thresholds that controlled the number of forms and the struc-ture and content of each form (using the same three datasets).
5.4.1 MiMIWe varied the entity-threshold (ke) and observed its effect on the
number of user queries supported by the interface. The numberof forms created for related entities,kr, was fixed at 1, while thenumber of attributes made queriable for each selected entity,ka
was kept constant at 10. Our observations are shown in Fig. 2. Wecan see a clear bias in the queries towards the most queriable entity(which happened to bemolecule) which accounted for 76% of allqueries in the workload. An additional 218 queries (6%) involvedthe next most queriable entity (interaction) and finally, the thirdentity (organism) was found in 578 queries posed to the database.
Next, we varied the attribute-threshold (ka) and observed the ef-fect this had on the number of issued queries that were supportedby the generated interface. Our results are shown in Fig. 3. Here wesee that except for a very low limit on the number of attributes (perentity), a significant fraction of user queries were expressible usingthe interface generated automatically. We also observe that forka
703
Number of Entities (k ) e
1 2 3 4 5
% Q
uerie
s S
uppo
rted
0%
20%
40%
60%
80%
100%
14.8%
33.0%
46.8%53.6%
61.5%
21.9%
48.7%
69.0%
79.1%
90.7%
Num
ber
of F
orm
s
0
4
8
12
16
20
3
78
910
% of all Queries Supported
% of Non−complex Queries Supported
Number of Forms
k =7, k = 3 a r
(a) Geoquery: Dependence onke
Number of Attributes per Entity (k ) a
1 2 3 4 5 6 7
% Q
uerie
s S
uppo
rted
0%
20%
40%
60%
80%
100%
2.8%
11.5%
34.9%
49.8%56.4% 57.0%
62.8%
4.1%
17.0%
51.5%
73.5%
83.2% 84.1%
92.7%
For
m C
ompl
exity
0
4
8
12
16
20
1.4
2.8
4.15.1
5.66.2
6.7
% of all Queries Supported
% of Non−complex Queries Supported
Number of Attributes per Form
k =8, k = 3 e r
(b) Geoquery: Dependence onka
Number of Related−Entities per Entity (k ) r
0 1 2 3 4
% Q
uerie
s S
uppo
rted
0%
20%
40%
60%
80%
100%
60.4% 60.8% 61.3% 61.5% 63.2%
89.2% 89.8% 90.5% 90.7% 93.2%
Num
ber
of F
orm
s
0
5
10
15
20
25
8
10
12 13
14
% of all Queries Supported
% of Non−complex Queries Supported
Number of Formsk =8, k = 7 e a
(c) Geoquery: Dependence onkr
Figure 4: Effect of Thresholds on Query Support in Geoquery
Number of Entities (k ) e
1 2 3 4 5
% Q
uerie
s S
uppo
rted
0%
20%
40%
60%
80%
100%Neither P1 only P2 only Both
k =7, k = 3 a r
Figure 5: Effect of Postulates P1 and P2
Number of Related−Entities per Entity (k ) r
0 1 2 3 4 5 6 7
% Q
uerie
s S
uppo
rted
56%
57%
58%
59%
60%
61%
62%
63%
64%
65%Neither P3 only P4 only Both
k =8, k = 7 e a
Figure 6: Effect of Postulates P3 and P4
> 6, the increase in query support is low even as more and moreattributes are made queriable to users. This is because the thresholdof 6 includes the most important attributes of each entity, and sub-sequent increases only add attributes that were less frequently used.We also show in the figure the actual fraction of unique attributesqueried by users that our forms actually include. Considering thecomplexity of the database, it is noteworthy that 54% of queried at-tributes are ranked in the top 10 by our algorithm. These accountedfor 97% of all queries posed to the database.
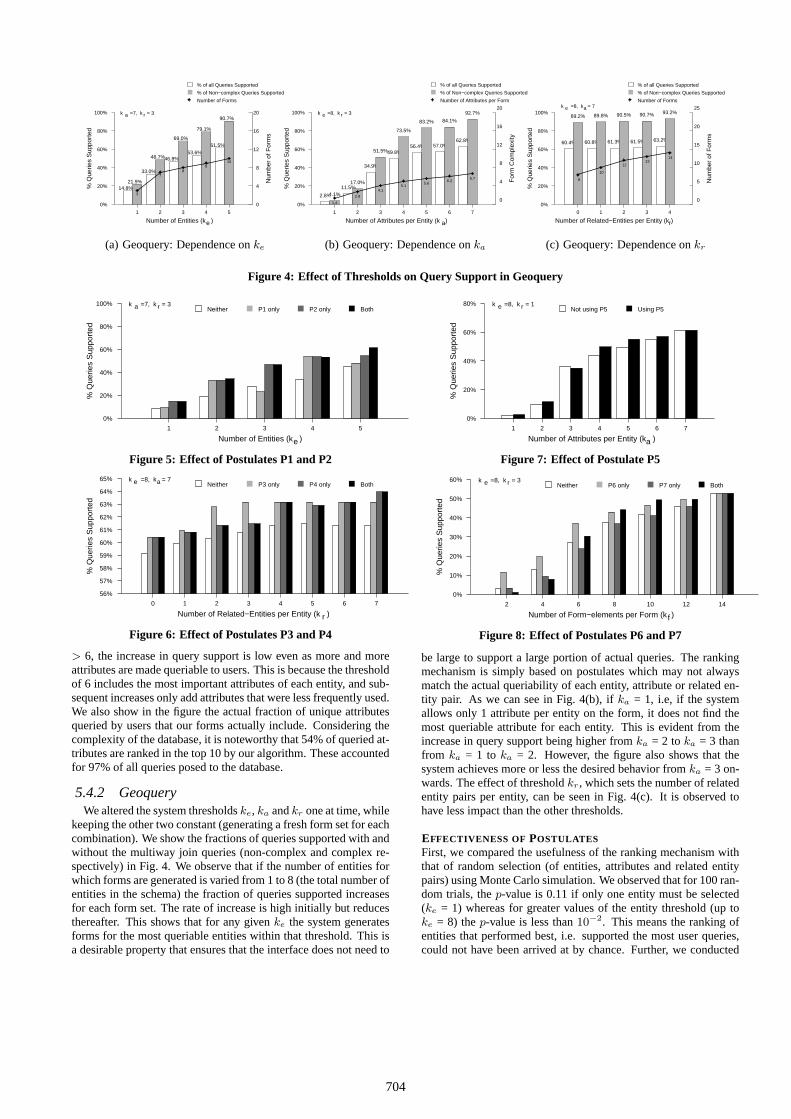
5.4.2 GeoqueryWe altered the system thresholdske, ka andkr one at time, while
keeping the other two constant (generating a fresh form set for eachcombination). We show the fractions of queries supported with andwithout the multiway join queries (non-complex and complex re-spectively) in Fig. 4. We observe that if the number of entities forwhich forms are generated is varied from 1 to 8 (the total number ofentities in the schema) the fraction of queries supported increasesfor each form set. The rate of increase is high initially but reducesthereafter. This shows that for any givenke the system generatesforms for the most queriable entities within that threshold. This isa desirable property that ensures that the interface does not need to
Number of Attributes per Entity (k ) a
1 2 3 4 5 6 7
% Q
uerie
s S
uppo
rted
0%
20%
40%
60%
80%Not using P5 Using P5
k =8, k = 1 e r
Figure 7: Effect of Postulate P5
Number of Form−elements per Form (k ) f
2 4 6 8 10 12 14
% Q
uerie
s S
uppo
rted
0%
10%
20%
30%
40%
50%
60%Neither P6 only P7 only Both
k =8, k = 3 e r
Figure 8: Effect of Postulates P6 and P7
be large to support a large portion of actual queries. The rankingmechanism is simply based on postulates which may not alwaysmatch the actual queriability of each entity, attribute or related en-tity pair. As we can see in Fig. 4(b), ifka = 1, i.e, if the systemallows only 1 attribute per entity on the form, it does not find themost queriable attribute for each entity. This is evident from theincrease in query support being higher fromka = 2 toka = 3 thanfrom ka = 1 to ka = 2. However, the figure also shows that thesystem achieves more or less the desired behavior fromka = 3 on-wards. The effect of thresholdkr, which sets the number of relatedentity pairs per entity, can be seen in Fig. 4(c). It is observed tohave less impact than the other thresholds.
EFFECTIVENESS OF POSTULATES
First, we compared the usefulness of the ranking mechanism withthat of random selection (of entities, attributes and related entitypairs) using Monte Carlo simulation. We observed that for 100 ran-dom trials, thep-value is 0.11 if only one entity must be selected(ke = 1) whereas for greater values of the entity threshold (up toke = 8) thep-value is less than10−2. This means the ranking ofentities that performed best, i.e. supported the most user queries,could not have been arrived at by chance. Further, we conducted
704
trials in which selected postulates were turned on in isolation (allothers were turned off) to evaluate the individual effectiveness ofthese postulates. First, since only postulates P1 and P2 are usedfor entity selection, we generated forms, first using both, then onlyusing P1, next only using P2 and finally using neither (random se-lection, without using queriability). We measured query support ineach case for different entity thresholds and compared them (Fig. 5)observing that using both provided the greatest query support whileusing neither provided the least. Related entity selection is basedon the use of postulates P3 and P4. We examined their effectivenessfor different values of thresholdkr. Our results are shown in Fig. 6.Finally, we evaluated the effectiveness of postulates P5 through P7which are captured in Figures 7 and 8. We found that not all pos-tulates in isolation produced an improvement in query support forall values ofke, ka, kr andkf . But when these threshold valuesare increased to typical levels each postulate is useful.
5.4.3 JobsquerySince this dataset only has one entity and no relationships, we did
not analyze the effect ofke or kr. We only variedka and each timeevaluated the form created using the query set. As in the previousexperiments, the number of queries satisfied increases sharply forlower values ofka (> 4), but flattens out towards the end, demon-strating a good initial choice of attributes by the system.
5.5 DiscussionOur evaluation shows that our form generation system can in-
deed produce forms, of manageable number and complexity, thatare capable of posing a majority of user queries to a given database,using just its schema and its data content. Notably, our automatedform for Jobsquery supported more than twice as many queries asthe form for a major commercial website, Monster.com. However,as we saw in the Geoquery experiment, the system does not sat-isfy the most complex of queries which can be of interest to users.We have seen that a majority of the queries in any workload arenot as complex. Secondly, some datasets have attributes that arenot intended to be queried by users, such as metadata or privateinformation. Without expert assistance, the system cannot recog-nize these and may rank such attributes to be highly queriable (e.g.file loc in Jobsquery).
NUMBER OF FORMS
The greater the number of distinct forms, the higher the expressiv-ity of the interface. However, having a large number of forms canbe a disadvantage if they make it difficult for a user to find the onehe or she wants to use. The number of forms we generate is depen-dent on the size and complexity of the schema as well as the pre-specified thresholds:ke andkr. Many of today’s databases havevery complex schema necessitating the creation of a large num-ber of forms to obtain a sufficiently expressive interface. As weshowed in Table 2, many current database-backed websites employover 10 different forms, some as many as 102 [4]. Ideally, our sys-tem should be appropriately tuned to generate interfaces with 5-15forms to balance query expressivity with interface size. One mightargue that greater query expressivity makes the case for a moreexpressible querying mechanism, such as a declarative language.However, this is not a good option for the vast majority of databaseusers who are programming-averse.
Even if a large number of forms is unavoidable, an automaticallygenerated interface can still be made usable. Instead of reducing thesize of the form set, we can try to solve the problem ofform selec-tion, i.e., choosing the right form from a large set of forms withouthaving to scan many of them. Since each form concentrates on one
Number of Attributes per Entity (k ) a
2 4 6 8 10 12 14 16 18
% S
uppo
rted
0%
20%
40%
60%
80%
100%
5% 5% 6%
25%
47% 52%
80%
96%100%
7%
14%
21%
36%
50%
64%
79%
93%
100%
Queries Supported
Attributes Supported
k =1, k = 0 e r
Figure 9: Effect ofka on Query/Attribute Support (Jobsquery)
or more entities, we can identify forms by the names of their cor-responding entities. For instance, a form used to find a movie canbe named ‘movie’, while a form that queries both movies and ac-tors can be called ‘movie–actor’. If two entities can be related inmore than one way, the names of the attributes corresponding to theeach relationship can be included in a form’s name. We could thenbuild a two-level menu bar that presents users with the availableform choices. The first (top-level) menu, which is always visible,lists the names of the top-ke entities from left to right in decreasingorder of queriability. Once the user selects one of them, a secondmenu bar appears below (or to the right of) the first and displaysthe names of its top-kr related entities. If the user is only interestedin querying the first entity, the search stops here. If he or she isinterested in querying two entities simultaneously, a second entityselection is required, this time from the second menu bar. In eithercase, the appropriate form is pulled up from the form repositoryand presented to the user. Using this selection mechanism, a userneeds to look at no more thanke form names for single entity formsand (ke + kr) names for two-entity forms. In the latter case, a scanof the interface could require browsing as many as (ke * kr) forms.A third or fourth level menu can also be added if higher arity rela-tionships are captured in the forms generated.
SELECTION OF THRESHOLDS
Our evaluation also shows that the effectiveness of our form gen-erator is reliant on the choice of thresholdske, ka, kr andkf . Buthow does one set these when the interface is first created (withoutthe benefit of hindsight)? Ideally the interface has at least one formfor each entity by itself. If the schema has more than 10 entities,this already results in too many forms. Hence the entity thresholdke ought to be less than this upper bound. Some entities may beleft out, but these should be the less important ones. Within a formit is acceptable, and in fact typical, to have up to 20 specifiable con-ditions. Butka is a threshold on the number of attributes per entity,not per form. Our experiments show that a majority of user queriesinvolve no more than two entities. This suggests that it is prudentto setka between 5-10.kf can be set to 20. Finally the choiceof kr depends on how entities are connected to each other withinthe database. A setting of 1-2 is advisable from our observations.In the worst case, these settings will result in 30 forms being gen-erated (ifke = 10 andkr = 2 and the 10 most queriable schemaentities are each related to 2 other entities). But typically not allthresholds are “maxed out” in every combination. These settingsgenerate approximately 5-15 forms.
6. RELATED WORKWhile we have seen little work that automatically determines the
705
correctset of forms for a database, there has been a great deal ofwork in simplifying the form specification task for interface de-velopers. Even with standard form building tools like Cold Fu-sion [12], Visual Basic [14], CGI [13], ASP, JSP, business tools likeInfoPath, XAML, Ariba, SAP, SAS, Access, Visual Web Devel-oper and user-friendly solutions like WUFOO, WyaWorks, ZOHOCreator and Coghead having come a long way, the task of formcreation is still largely manual. An exception is [16] in whichforms are generated dynamically based on metadata embedded inrelational tables. This system however, only creates survey formswhose purpose is data-entry rather than data-retrieval. They essen-tially support only a single insertion query and are orthogonal toour work, which supports a wide range of retrieval queries. Othersystems include powerful tools like the QURSED Form and ReportEditor [22, 23] which enables developers to create form-based in-terfaces in fewer simpler steps. This editor uses the schema of thedatabase as a starting point (like our system does) but it is up tothe developer to select the desired schema elements and attributesto use in forms. It allows developers to annotate the schema be-forehand so that every time an element is selected for use, the rightset of form-controls and the right query-fragment (for translation todeclarative queries) are automatically put in place. Earlier work inUI design includes DRIVE [20], a runtime user-interface develop-ment environment for object-oriented databases. This system usedthe NOODL data model enabling context-sensitive interface edit-ing. [27] proposed the use of XML to represent forms rather thanHTML, making forms more reusable, scalable, machine-readableand easier to standardize. Our system too has a textual human-readable form representation, but we still render forms in HTML.FoXQ [6] and EquiX [11] are examples of work done to hide fromusers the intricacies of a declarative language (XQuery). Both aresystems where users build queries incrementally by navigating throughlayers of forms. Visual querying began as early as in 1975 withQBE [29]. Since then, there have been several graphical querylanguages designed to make declarative querying more intuitive.Some examples of these are XQBE [8], VISIONARY [7], Kalei-doquery [21], QBT (Query By Templates) [25], Marmotta [10] andGRIP [15]. IBM distributes a query builder called Visual XQueryBuilder with its DB2 Developer Workbench. These help users cre-ate declarative language queries instead of using forms with pre-embedded declarative queries.
7. CONCLUSIONA forms-based interface is the gateway to many a database and
it ultimately determines the availability and usefulness of the data.Designing a good set of forms is hard. Insufficiently expressiveforms can frustrate a user. In this paper, we have developed a mech-anism to generate a forms-based interface with nothing more thanthe database itself. In the absence of real user queries to guide in-terface design prior to database deployment, this is a challengingproblem, but one of practical importance. We introduced metricsto estimate the usefulness of various schema components from aquerying angle based on an analysis of the schema and the contentof the database. We presented our approach to form building us-ing an XML implementation. However, in principle, our conceptsare equally applicable to relational databases. We evaluated oursystem’s performance on two public benchmark datasets and querysets. We also conducted experiments on an in-house compiled data-base available to the public. We observed that the interfaces wegenerate satisfy a large fraction (60-90%) of actual queries. In com-parison, our analysis of deployed databases shows that this level ofcoverage is difficult to achieve today, even with expert design.
8. REFERENCES[1] Geoquery Database:
http://www.cs.utexas.edu/users/ml/geo.html .[2] Jobsquery Database:
http://www.cs.utexas.edu/users/ml/nldata/jobquery.html .
[3] MiMI – Michigan Molecular Interaction Database:http://mimi.ctaalliance.org .
[4] NCBI BLAST:http://www.ncbi.nlm.nih.gov/blast/Blast.cgi .
[5] XMark: An XML Benchmark Project:http://www.xml-benchmark.org/ .
[6] Robin Abraham. FoxQ–XQuery by Forms. InHCC, 2003.[7] Francesca Benzi, Dario Maio, and Stefano Rizzi. VISIONARY: a
Viewpoint-based Visual Language for Querying RelationalDatabases.Journal of Visual Languages and Computing, 10(2), 1999.
[8] Daniele Braga, Alessandro Campi, and Stefano Ceri.XQBE(XQueryBy Example): A Visual Interface to the Standard XML QueryLanguage.ACM TODS, 30(2), 2005.
[9] Mary Elaine Califf and Raymond J. Mooney. Relational Learning ofPattern-Match Rules for Information Extraction. InAAAI, 1999.
[10] Fabrizio Capobianco, Mauro Mosconi, and Lorenzo Pagnin. Lookingfor convenient alternatives to forms for querying remote databases onthe Web: a new iconic interface for progressive queries. InAVI, 1996.
[11] Sara Cohen et al. EquiX–A Search and Query Language for XML.JASIST, 53(6), 2002.
[12] Ben Forta, Raymond Camden, Leon Chalnick, and Angela C.Buraglia.Macromedia ColdFusion MX 7 Web ApplicationConstruction Kit. Macromedia Press, 2005.
[13] Shishir Gundavaram.CGI Programming on the World Wide Web.O’Reilly, 1996.
[14] Michael Halvorson.Microsoft Visual Basic 2008 Step by Step.Microsoft Press, 2008.
[15] Harald Schoning. A Graphical Interface to a Complex-ObjectDatabase Management System. InIDS, 1992.
[16] D. J. Helm and B. W. Thompson. An Approach for Totally DynamicForms Processing in Web-Based Applications. InICEIS (2), 2001.
[17] H. V. Jagadish et al. TIMBER: A Native-XML Database.VLDBJournal, 11(4), 2002.
[18] Magesh Jayapandian, Adriane Chapman, et al. Michigan MolecularInteractions (MiMI): Putting the Jigsaw Puzzle Together.NucleicAcids Research (Database Issue), 35, 2007.
[19] Sergey Melnik.Generic Model Management: Concepts andAlgorithms.Chapter 7. PhD thesis, University of Leipzig, 2004.
[20] Kenneth J. Mitchell and Jessie B. Kennedy. DRIVE: An Environmentfor the Organized Construction of User-Interfaces to Databases. InInterfaces to Databases (IDS-3), 1996.
[21] Norman Murray, Norman Paton, and Carole Goble. Kaleidoquery: AVisual Query Language for Object Databases. InAVI, 1998.
[22] Yannis Papakonstantinou, Michalis Petropoulos, and VasilisVassalos. QURSED: Querying and Reporting Semistructured Data.In SIGMOD, 2002.
[23] Michalis Petropoulos, Yannis Papakonstantinou, and VasilisVassalos. Graphical Query Interfaces for Semistructured Data: TheQURSED System.ACM TOIT, 5(2), 2005.
[24] A. R. Schmidt, F. Waas, M. L. Kersten, D. Florescu, I. Manolescu,M. J. Carey, and R. Busse. The XML Benchmark Project. TechnicalReport INS-R0103, CWI.
[25] Arijit Sengupta and Andrew Dillon. Query by Templates: AGeneralized Approach for Visual Query Formulation for TextDominated Databases. InADL, 1997.
[26] Lappoon R. Tang and Raymond J. Mooney. Using Multiple ClauseConstructors in Inductive Logic Programming for Semantic Parsing.In ECML, 2001.
[27] Anders Tornqvist, Chris Nelson, and Mats Johnsson. XML andObjects-The Future for E-Forms on the Web. InWETICE. IEEEComputer Society, 1999.
[28] Cong Yu and H. V. Jagadish. Schema Summarization. InVLDB,2006.
[29] Moshe M. Zloof. Query-by-Example: the Invocation and Definitionof Tables and Forms. InVLDB, 1975.
706
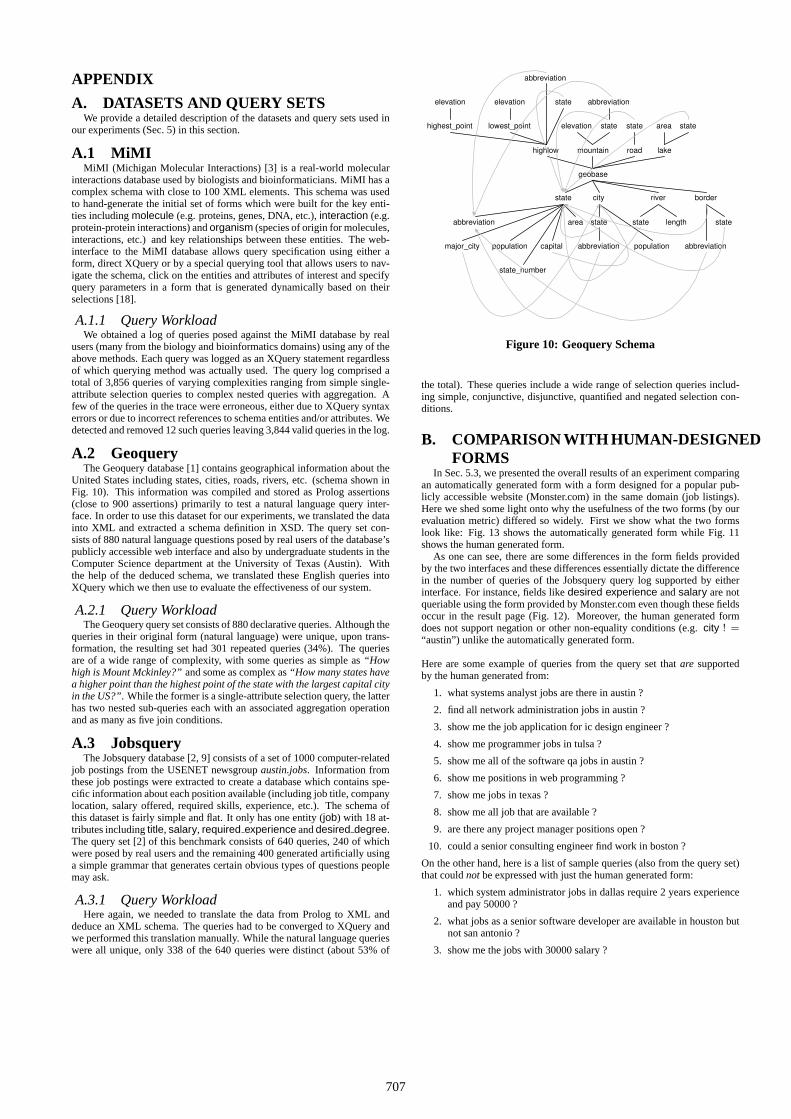
APPENDIX
A. DATASETS AND QUERY SETSWe provide a detailed description of the datasets and query sets used in
our experiments (Sec. 5) in this section.
A.1 MiMIMiMI (Michigan Molecular Interactions) [3] is a real-world molecular
interactions database used by biologists and bioinformaticians. MiMI has acomplex schema with close to 100 XML elements. This schema was usedto hand-generate the initial set of forms which were built for the key enti-ties includingmolecule (e.g. proteins, genes, DNA, etc.),interaction (e.g.protein-protein interactions) andorganism (species of origin for molecules,interactions, etc.) and key relationships between these entities. The web-interface to the MiMI database allows query specification using either aform, direct XQuery or by a special querying tool that allows users to nav-igate the schema, click on the entities and attributes of interest and specifyquery parameters in a form that is generated dynamically based on theirselections [18].
A.1.1 Query WorkloadWe obtained a log of queries posed against the MiMI database by real
users (many from the biology and bioinformatics domains) using any of theabove methods. Each query was logged as an XQuery statement regardlessof which querying method was actually used. The query log comprised atotal of 3,856 queries of varying complexities ranging from simple single-attribute selection queries to complex nested queries with aggregation. Afew of the queries in the trace were erroneous, either due to XQuery syntaxerrors or due to incorrect references to schema entities and/or attributes. Wedetected and removed 12 such queries leaving 3,844 valid queries in the log.
A.2 GeoqueryThe Geoquery database [1] contains geographical information about the
United States including states, cities, roads, rivers, etc. (schema shown inFig. 10). This information was compiled and stored as Prolog assertions(close to 900 assertions) primarily to test a natural language query inter-face. In order to use this dataset for our experiments, we translated the datainto XML and extracted a schema definition in XSD. The query set con-sists of 880 natural language questions posed by real users of the database’spublicly accessible web interface and also by undergraduate students in theComputer Science department at the University of Texas (Austin). Withthe help of the deduced schema, we translated these English queries intoXQuery which we then use to evaluate the effectiveness of our system.
A.2.1 Query WorkloadThe Geoquery query set consists of 880 declarative queries. Although the
queries in their original form (natural language) were unique, upon trans-formation, the resulting set had 301 repeated queries (34%). The queriesare of a wide range of complexity, with some queries as simple as“Howhigh is Mount Mckinley?”and some as complex as“How many states havea higher point than the highest point of the state with the largest capital cityin the US?”. While the former is a single-attribute selection query, the latterhas two nested sub-queries each with an associated aggregation operationand as many as five join conditions.
A.3 JobsqueryThe Jobsquery database [2, 9] consists of a set of 1000 computer-related
job postings from the USENET newsgroupaustin.jobs. Information fromthese job postings were extracted to create a database which contains spe-cific information about each position available (including job title, companylocation, salary offered, required skills, experience, etc.). The schema ofthis dataset is fairly simple and flat. It only has one entity (job) with 18 at-tributes includingtitle, salary, required experience anddesired degree.The query set [2] of this benchmark consists of 640 queries, 240 of whichwere posed by real users and the remaining 400 generated artificially usinga simple grammar that generates certain obvious types of questions peoplemay ask.
A.3.1 Query WorkloadHere again, we needed to translate the data from Prolog to XML and
deduce an XML schema. The queries had to be converged to XQuery andwe performed this translation manually. While the natural language querieswere all unique, only 338 of the 640 queries were distinct (about 53% of
geobase
state city river border
highlow mountain road lake
area state state state elevation
abbreviation state
abbreviation
highest_point
elevation
lowest_point
elevation
state
abbreviation
state length state
population abbreviation
area abbreviation
state_number
major_city capital population
Figure 10: Geoquery Schema
the total). These queries include a wide range of selection queries includ-ing simple, conjunctive, disjunctive, quantified and negated selection con-ditions.
B. COMPARISON WITH HUMAN-DESIGNEDFORMS
In Sec. 5.3, we presented the overall results of an experiment comparingan automatically generated form with a form designed for a popular pub-licly accessible website (Monster.com) in the same domain (job listings).Here we shed some light onto why the usefulness of the two forms (by ourevaluation metric) differed so widely. First we show what the two formslook like: Fig. 13 shows the automatically generated form while Fig. 11shows the human generated form.
As one can see, there are some differences in the form fields providedby the two interfaces and these differences essentially dictate the differencein the number of queries of the Jobsquery query log supported by eitherinterface. For instance, fields likedesired experience andsalary are notqueriable using the form provided by Monster.com even though these fieldsoccur in the result page (Fig. 12). Moreover, the human generated formdoes not support negation or other non-equality conditions (e.g.city ! =“austin”) unlike the automatically generated form.
Here are some example of queries from the query set thatare supportedby the human generated from:
1. what systems analyst jobs are there in austin ?
2. find all network administration jobs in austin ?
3. show me the job application for ic design engineer ?
4. show me programmer jobs in tulsa ?
5. show me all of the software qa jobs in austin ?
6. show me positions in web programming ?
7. show me jobs in texas ?
8. show me all job that are available ?
9. are there any project manager positions open ?
10. could a senior consulting engineer find work in boston ?
On the other hand, here is a list of sample queries (also from the query set)that couldnotbe expressed with just the human generated form:
1. which system administrator jobs in dallas require 2 years experienceand pay 50000 ?
2. what jobs as a senior software developer are available in houston butnot san antonio ?
3. show me the jobs with 30000 salary ?
707
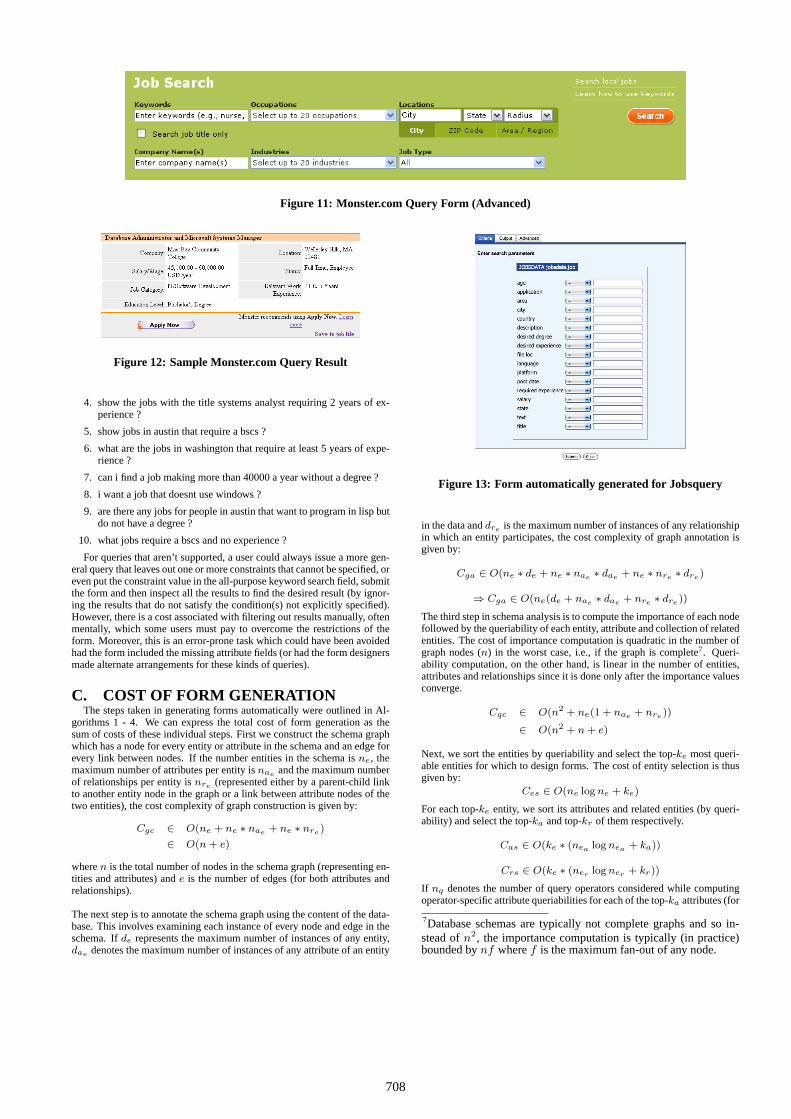
Figure 11: Monster.com Query Form (Advanced)
Figure 12: Sample Monster.com Query Result
4. show the jobs with the title systems analyst requiring 2 years of ex-perience ?
5. show jobs in austin that require a bscs ?
6. what are the jobs in washington that require at least 5 years of expe-rience ?
7. can i find a job making more than 40000 a year without a degree ?
8. i want a job that doesnt use windows ?
9. are there any jobs for people in austin that want to program in lisp butdo not have a degree ?
10. what jobs require a bscs and no experience ?
For queries that aren’t supported, a user could always issue a more gen-eral query that leaves out one or more constraints that cannot be specified, oreven put the constraint value in the all-purpose keyword search field, submitthe form and then inspect all the results to find the desired result (by ignor-ing the results that do not satisfy the condition(s) not explicitly specified).However, there is a cost associated with filtering out results manually, oftenmentally, which some users must pay to overcome the restrictions of theform. Moreover, this is an error-prone task which could have been avoidedhad the form included the missing attribute fields (or had the form designersmade alternate arrangements for these kinds of queries).
C. COST OF FORM GENERATIONThe steps taken in generating forms automatically were outlined in Al-
gorithms 1 - 4. We can express the total cost of form generation as thesum of costs of these individual steps. First we construct the schema graphwhich has a node for every entity or attribute in the schema and an edge forevery link between nodes. If the number entities in the schema isne, themaximum number of attributes per entity isnae and the maximum numberof relationships per entity isnre (represented either by a parent-child linkto another entity node in the graph or a link between attribute nodes of thetwo entities), the cost complexity of graph construction is given by:
Cgc ∈ O(ne + ne ∗ nae + ne ∗ nre )
∈ O(n + e)
wheren is the total number of nodes in the schema graph (representing en-tities and attributes) ande is the number of edges (for both attributes andrelationships).
The next step is to annotate the schema graph using the content of the data-base. This involves examining each instance of every node and edge in theschema. Ifde represents the maximum number of instances of any entity,dae denotes the maximum number of instances of any attribute of an entity
Figure 13: Form automatically generated for Jobsquery
in the data anddre is the maximum number of instances of any relationshipin which an entity participates, the cost complexity of graph annotation isgiven by:
Cga ∈ O(ne ∗ de + ne ∗ nae ∗ dae + ne ∗ nre ∗ dre )
⇒ Cga ∈ O(ne(de + nae ∗ dae + nre ∗ dre ))
The third step in schema analysis is to compute the importance of each nodefollowed by the queriability of each entity, attribute and collection of relatedentities. The cost of importance computation is quadratic in the number ofgraph nodes (n) in the worst case, i.e., if the graph is complete7. Queri-ability computation, on the other hand, is linear in the number of entities,attributes and relationships since it is done only after the importance valuesconverge.
Cqc ∈ O(n2 + ne(1 + nae + nre ))
∈ O(n2 + n + e)
Next, we sort the entities by queriability and select the top-ke most queri-able entities for which to design forms. The cost of entity selection is thusgiven by:
Ces ∈ O(ne log ne + ke)
For each top-ke entity, we sort its attributes and related entities (by queri-ability) and select the top-ka and top-kr of them respectively.
Cas ∈ O(ke ∗ (nea log nea + ka))
Crs ∈ O(ke ∗ (ner log ner + kr))
If nq denotes the number of query operators considered while computingoperator-specific attribute queriabilities for each of the top-ka attributes (for
7Databaseschemas are typically not complete graphs and so in-stead ofn2, the importance computation is typically (in practice)bounded bynf wheref is the maximum fan-out of any node.
708
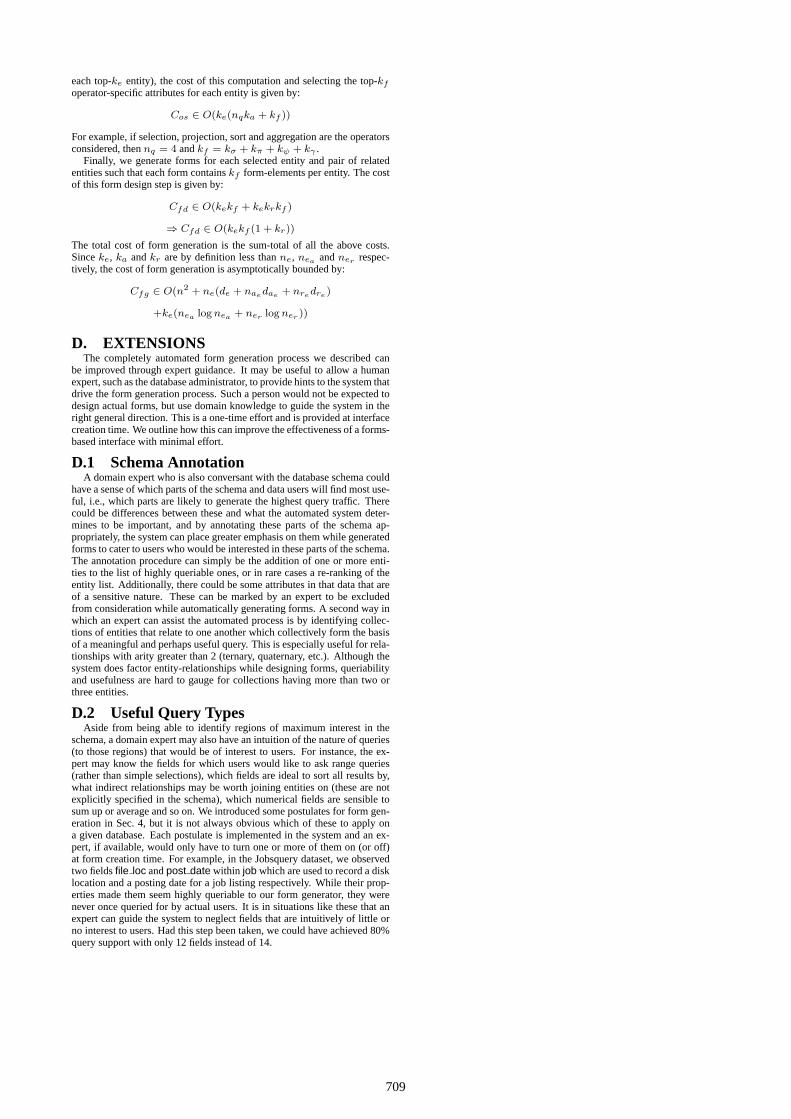
eachtop-ke entity), the cost of this computation and selecting the top-kf
operator-specific attributes for each entity is given by:
Cos ∈ O(ke(nqka + kf ))
For example, if selection, projection, sort and aggregation are the operatorsconsidered, thennq = 4 andkf = kσ + kπ + kψ + kγ .
Finally, we generate forms for each selected entity and pair of relatedentities such that each form containskf form-elements per entity. The costof this form design step is given by:
Cfd ∈ O(kekf + kekrkf )
⇒ Cfd ∈ O(kekf (1 + kr))
The total cost of form generation is the sum-total of all the above costs.Sinceke, ka andkr are by definition less thanne, nea andner respec-tively, the cost of form generation is asymptotically bounded by:
Cfg ∈ O(n2 + ne(de + naedae + nredre )
+ke(nea log nea + ner log ner ))
D. EXTENSIONSThe completely automated form generation process we described can
be improved through expert guidance. It may be useful to allow a humanexpert, such as the database administrator, to provide hints to the system thatdrive the form generation process. Such a person would not be expected todesign actual forms, but use domain knowledge to guide the system in theright general direction. This is a one-time effort and is provided at interfacecreation time. We outline how this can improve the effectiveness of a forms-based interface with minimal effort.
D.1 Schema AnnotationA domain expert who is also conversant with the database schema could
have a sense of which parts of the schema and data users will find most use-ful, i.e., which parts are likely to generate the highest query traffic. Therecould be differences between these and what the automated system deter-mines to be important, and by annotating these parts of the schema ap-propriately, the system can place greater emphasis on them while generatedforms to cater to users who would be interested in these parts of the schema.The annotation procedure can simply be the addition of one or more enti-ties to the list of highly queriable ones, or in rare cases a re-ranking of theentity list. Additionally, there could be some attributes in that data that areof a sensitive nature. These can be marked by an expert to be excludedfrom consideration while automatically generating forms. A second way inwhich an expert can assist the automated process is by identifying collec-tions of entities that relate to one another which collectively form the basisof a meaningful and perhaps useful query. This is especially useful for rela-tionships with arity greater than 2 (ternary, quaternary, etc.). Although thesystem does factor entity-relationships while designing forms, queriabilityand usefulness are hard to gauge for collections having more than two orthree entities.
D.2 Useful Query TypesAside from being able to identify regions of maximum interest in the
schema, a domain expert may also have an intuition of the nature of queries(to those regions) that would be of interest to users. For instance, the ex-pert may know the fields for which users would like to ask range queries(rather than simple selections), which fields are ideal to sort all results by,what indirect relationships may be worth joining entities on (these are notexplicitly specified in the schema), which numerical fields are sensible tosum up or average and so on. We introduced some postulates for form gen-eration in Sec. 4, but it is not always obvious which of these to apply ona given database. Each postulate is implemented in the system and an ex-pert, if available, would only have to turn one or more of them on (or off)at form creation time. For example, in the Jobsquery dataset, we observedtwo fieldsfile loc andpost date within job whichare used to record a disklocation and a posting date for a job listing respectively. While their prop-erties made them seem highly queriable to our form generator, they werenever once queried for by actual users. It is in situations like these that anexpert can guide the system to neglect fields that are intuitively of little orno interest to users. Had this step been taken, we could have achieved 80%query support with only 12 fields instead of 14.
709