Au/TiO2/Ru(0001) model catalysts and their interaction with CO
37
This is the author’s version of a work that was accepted for publication in Surface Science. Changes resulting from the publishing process, such as peer review, editing, corrections, structural formatting, and other quality control mechanisms, may not be reflected in this document. Changes may have been made to this work since it was submitted for publication. A definitive version was subsequently published in: Surface Science, volume 600, issue 22, pages 4992-5003, 11/2006, DOI: http://dx.doi.org/10.1016/j.susc.2006.08.022
-
Upload
independent -
Category
Documents
-
view
1 -
download
0
Transcript of Au/TiO2/Ru(0001) model catalysts and their interaction with CO

This is the author’s version of a work that was accepted for publication in Surface Science. Changes resulting from the publishing process, such as peer review, editing, corrections, structural formatting, and other quality control mechanisms, may not be reflected in this document. Changes may have been made to this work since it was submitted for publication. A definitive version was subsequently published in: Surface Science, volume 600, issue 22, pages 4992-5003, 11/2006, DOI: http://dx.doi.org/10.1016/j.susc.2006.08.022

2
Au/TiO2/Ru(0001) model catalysts and their interaction with CO
Z. Zhao1), T.Diemant1), D. Rosenthal2), K. Christmann2), J.Bansmann1), H. Rauscher1,a),
and R. J. Behm1,b)
1)Abt. Oberflächenchemie und Katalyse, Universität Ulm, D-89069 Ulm, Germany 2)Institut für Chemie, Bereich Physikalische und Theoretische Chemie, FU Berlin, D-14195
Berlin, Germany
Abstract
Au/TiO2/Ru(0001) model catalysts and their interaction with CO were investigated by scan-
ning tunneling microscopy and different surface spectroscopies. Thin titanium oxide films
were prepared by Ti deposition on Ru(0001) in an O2 atmosphere and subsequent anneal-
ing in O2. By optimizing the conditions for deposition and post-treatment, smooth films
were obtained either as fully oxidized TiO2 or as partly reduced TiOx, depending on the
preparation conditions. CO adsorbed molecularly on both oxidized and reduced TiO2, with
slightly stronger bonding on the reduced films. Model catalyst surfaces were prepared by de-
positing submonolayer quantities of Au on the films and characterized by X-ray photoelectron
spectroscopy and scanning tunneling microscopy. From X-ray photoelectron spectroscopy, a
weak interaction between Au and the TiO2 substrate was found. At 100 K CO adsorption
occurred on both the TiO2 film and on the Au nanoparticles. CO desorbed from the Au
particles with activation energies between 53 and 65 kJ/mole, depending on the Au coverage.
If the Au deposit was annealed to 770 K prior to CO exposure, the CO adsorption energy
decreased significantly. STM measurements revealed that the Au particles grow upon an-
nealing, but are not encapsulated by TiOx suboxides. The higher CO adsorption energy
observed for smaller Au coverages and before annealing is attributed to a significantly
stronger interaction of CO with mono- and bilayer Au islands, while for higher particles, the
adsorption energy becomes more bulk-like. The implications of these effects on the known
particle size effects in CO oxidation over supported Au/TiO2 catalysts are discussed.
Keywords: Model Catalyst, Structure, Stability, Au/TiO2, CO Adsorption, Adsorption Energy,
STM XPS, FTIR, TPD
Resubmitted to Surface Science: 21.07.2006
a) Pres. address: Institute for Health and Consumer Protection, European Commission, Joint Research Centre,
I-21020 Ispra (VA), Italy b) Author to whom correspondence should be addressed; electronic mail: [email protected]
3
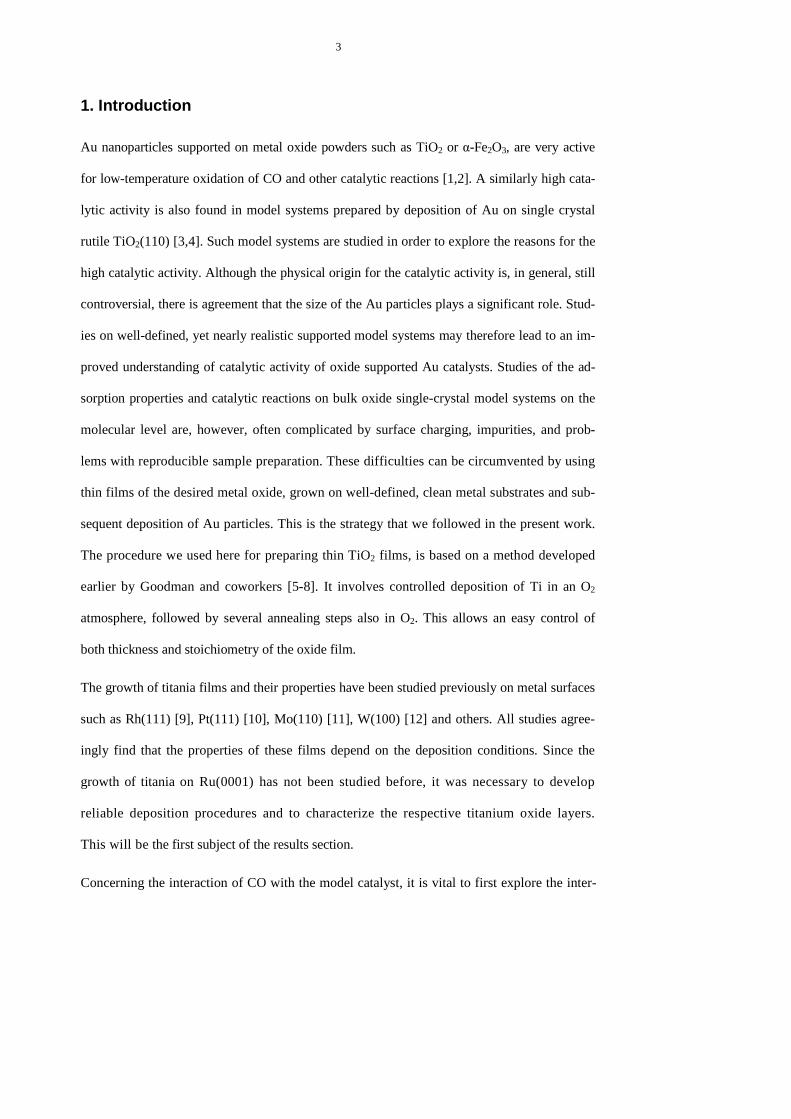
1. Introduction
Au nanoparticles supported on metal oxide powders such as TiO2 or α-Fe2O3, are very active
for low-temperature oxidation of CO and other catalytic reactions [1,2]. A similarly high cata-
lytic activity is also found in model systems prepared by deposition of Au on single crystal
rutile TiO2(110) [3,4]. Such model systems are studied in order to explore the reasons for the
high catalytic activity. Although the physical origin for the catalytic activity is, in general, still
controversial, there is agreement that the size of the Au particles plays a significant role. Stud-
ies on well-defined, yet nearly realistic supported model systems may therefore lead to an im-
proved understanding of catalytic activity of oxide supported Au catalysts. Studies of the ad-
sorption properties and catalytic reactions on bulk oxide single-crystal model systems on the
molecular level are, however, often complicated by surface charging, impurities, and prob-
lems with reproducible sample preparation. These difficulties can be circumvented by using
thin films of the desired metal oxide, grown on well-defined, clean metal substrates and sub-
sequent deposition of Au particles. This is the strategy that we followed in the present work.
The procedure we used here for preparing thin TiO2 films, is based on a method developed
earlier by Goodman and coworkers [5-8]. It involves controlled deposition of Ti in an O2
atmosphere, followed by several annealing steps also in O2. This allows an easy control of
both thickness and stoichiometry of the oxide film.
The growth of titania films and their properties have been studied previously on metal surfaces
such as Rh(111) [9], Pt(111) [10], Mo(110) [11], W(100) [12] and others. All studies agree-
ingly find that the properties of these films depend on the deposition conditions. Since the
growth of titania on Ru(0001) has not been studied before, it was necessary to develop
reliable deposition procedures and to characterize the respective titanium oxide layers.
This will be the first subject of the results section.
Concerning the interaction of CO with the model catalyst, it is vital to first explore the inter-

4
action of CO with pure titania, in the absence of gold. Previous studies concentrated on the
adsorption of CO on single crystalline TiO2 [13], on an oxidized Ti foil [14], or on titania pow-
der [15,16]. It was shown that CO adsorbs weakly on acidic sites (oxygen vacancies) of the
oxidized Ti foil [14], with a higher saturation coverage and a stronger CO−surface bond, if
the titania at the surface is in a more reduced state. Based on a study of the interaction of CO
with oxidized and partially reduced TiO2(110), it was proposed (and supported by ab-initio
MO calculations [17]), that CO adsorbs via the C moiety to Ti sites, with an enhanced bond
strength if it is adsorbed in the vicinity of a vacancy site [13]. CO2 production was not ob-
served under these conditions.
In the second and third part of the results section, we will examine the interaction of CO with
TiO2 films and Au-covered TiO2 films supported on Ru(0001) more closely. Results on nu-
cleation and growth of Au particles on TiO2 have been surveyed in Ref. [18]. In the initial
stages of particle formation, up to ~0.2-0.4 monolayers (ML) depending on deposition condi-
tions, Au grows in flat 2D islands, whereas a more hemispherical shape prevails if more Au is
deposited. There is no evidence for a strong interaction between Au and planar TiO2, as indi-
cated by the small changes in X-ray photoelectron spectroscopy (XPS) signals obtained
from these surfaces as a function of Au coverage [19]. Core level shifts were also absent in
XPS measurements of high-surface-area Au/TiO2 catalysts before and after annealing in O2
[20].
Adsorption measurements of CO on small Au particles on TiO2(110) revealed little or no
adsorption at 300 K under ultra-high vacuum (UHV) conditions [19], but CO adsorbs reversi-
bly at elevated pressures [21-23]. This was confirmed by Fourier-transform infrared (FTIR)
measurements performed with high-surface area Au/TiO2 exposed to higher CO pressures at
room temperature [24]. CO absorption bands attributed to CO on TiO2 as well as on Au were
detected in that study. Thermal desorption experiments of CO from Au particles on titania

5
have not been reported so far, but Meier and Goodman recently determined the heat of CO
adsorption as a function of Au coverage for the system Au/TiO2/Mo(110) by means of infra-
red reflection absorption spectroscopy (IRAS) [25].
Our main goals in this work were to fabricate a well-defined model catalyst consisting of
Au particles supported on thin TiO2 films on a Ru(0001) surface and to characterize its inter-
action with CO after the different preparation steps. This included optimization of the
procedure for oxide film deposition towards a smooth morphology and, at the same
time, a fully oxidized film composition. However, because of the rapid loss of oxygen
at the high temperatures required for preparing smooth and well ordered films, these
two objectives are in competition. We used a combined XPS, scanning tunneling
microscopy (STM), and temperature programmed desorption (TPD) approach (i) to show
that well-defined, fully oxidized thin films of TiO2 can be reproducibly prepared on Ru(0001),
(ii) to characterize the interaction of CO with these films, (iii) to subsequently deposit and
characterize Au particles on these films and (iv) to study the interaction of CO with the re-
sulting model catalyst.
2. Experimental
The experiments were performed in two different UHV systems. One was equipped with a
home-built STM and standard facilities for surface preparation and characterization such
as Ar ion sputtering and Auger electron spectroscopy (AES) [26]. The other system was
set up for XPS (with a hemispherical sector energy analyzer), TPD, and FTIR, in addition
to standard methods for surface preparation [27]. AES was used for the cross-calibration of
coverages between the two systems. The preparation of the Ru(0001) samples followed
procedures developed previously [27,28]. The residual impurities were below the detection
limit of AES (<0.01 ML). In addition, prior to the TPD experiments, the purity of the surface

6
was controlled by a TPD spectrum of a saturated CO adlayer, which is very sensitive towards
surface contaminations. Titania films were prepared by deposition of Ti vapor from an elec-
tron-beam evaporator onto the Ru(0001) surface in an O2 background (2×10⁻⁷ mbar), while the
sample was kept at 500-700 K. The layer obtained in this way is called film A. Subsequently,
the sample was first annealed in 2×10⁻⁷ mbar O2 to 800 K (film B) and then heated to 1000 K in
the same O2 atmosphere (film C). Finally, the sample was annealed for 10 min at 700 K in 2×10⁻⁶
mbar O2, before it was allowed to cool for 30 min in 2×10⁻⁶ mbar O2 to room temperature (film
D). In some cases, an additional annealing step to 900 K in vacuum followed (film E). The
titania layers were deposited at a rate of 0.5 MLE/min, as calibrated by STM and AES. We
define one monolayer equivalent (MLE) as the amount of titania necessary to completely
cover the Ru(0001) surface by one layer. We had shown recently, by STM, that the Ru(0001)
surface is indeed covered by a closed monolayer of titanium oxide at this coverage [29].
Au was deposited at 300 K from a home-made evaporator. The deposition rate and the Au
coverages were calibrated by depositing Au on clean Ru(0001) at 300 K, followed by an-
nealing to 500 K, which leads to the formation of monolayer islands up to saturation of the
first layer [30]. Thereafter, the surface was exposed to CO, and a TPD-spectrum was re-
corded. Room temperature CO adsorption is inhibited as soon as the Au film covers the active
Ru surface completely. This Au coverage is denoted as “one monolayer” (ML). It is also char-
acterized by a break in the intensity vs. deposition-time curve of the Au AES signal.
The XP spectra were recorded at room temperature, using non-monochromatized Al-Kα ra-
diation for excitation and a hemispherical sector analyzer operated in the fixed transmission
mode at a pass energy of 20.0 eV (detail scans) or 50.0 eV (survey scans). The electron bind-
ing energies were referenced to the Ru(3d5/2) peak at 280.0 eV [29]. After subtraction of a
Shirley background, the peaks were fitted using a nonlinear, least squares routine with
mixed Gaussian-Lorentzian peak characteristics. For fitting of the Ti(2p) signals, we as-
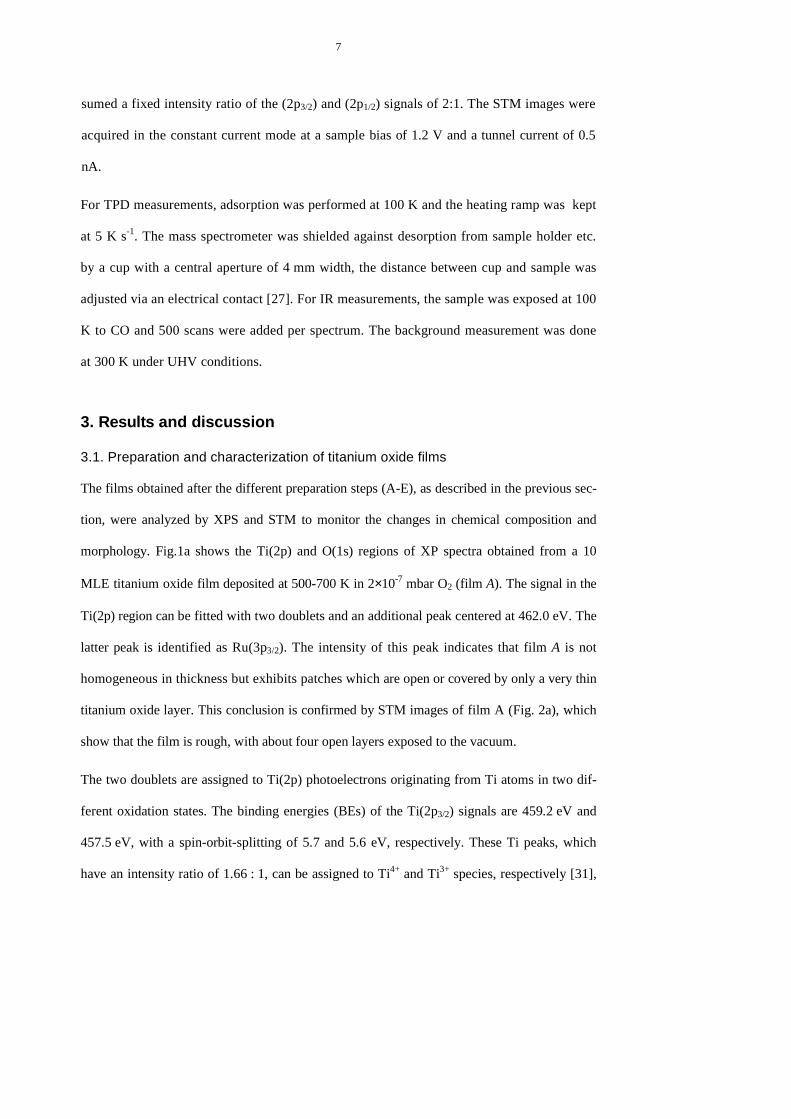
7
sumed a fixed intensity ratio of the (2p3/2) and (2p1/2) signals of 2:1. The STM images were
acquired in the constant current mode at a sample bias of 1.2 V and a tunnel current of 0.5
nA.
For TPD measurements, adsorption was performed at 100 K and the heating ramp was kept
at 5 K s-1. The mass spectrometer was shielded against desorption from sample holder etc.
by a cup with a central aperture of 4 mm width, the distance between cup and sample was
adjusted via an electrical contact [27]. For IR measurements, the sample was exposed at 100
K to CO and 500 scans were added per spectrum. The background measurement was done
at 300 K under UHV conditions.
3. Results and discussion
3.1. Preparation and characterization of titanium oxide films
The films obtained after the different preparation steps (A-E), as described in the previous sec-
tion, were analyzed by XPS and STM to monitor the changes in chemical composition and
morphology. Fig.1a shows the Ti(2p) and O(1s) regions of XP spectra obtained from a 10
MLE titanium oxide film deposited at 500-700 K in 2×10⁻⁷ mbar O2 (film A). The signal in the
Ti(2p) region can be fitted with two doublets and an additional peak centered at 462.0 eV. The
latter peak is identified as Ru(3p3/2). The intensity of this peak indicates that film A is not
homogeneous in thickness but exhibits patches which are open or covered by only a very thin
titanium oxide layer. This conclusion is confirmed by STM images of film A (Fig. 2a), which
show that the film is rough, with about four open layers exposed to the vacuum.
The two doublets are assigned to Ti(2p) photoelectrons originating from Ti atoms in two dif-
ferent oxidation states. The binding energies (BEs) of the Ti(2p3/2) signals are 459.2 eV and
457.5 eV, with a spin-orbit-splitting of 5.7 and 5.6 eV, respectively. These Ti peaks, which
have an intensity ratio of 1.66 : 1, can be assigned to Ti4+ and Ti3+ species, respectively [31],

8
indicating that two oxidation states coexist in film A and that the film is not completely oxi-
dized at this preparation stage. The O(1s) signal of film A has an asymmetric shape, which
equally suggests that it is composed of more than one peak. Following earlier work on the
formation of ultrathin TiOx films on Ru(0001) [29], we fitted the O(1s) signal with two peaks
at 530.6 eV and 531.8 eV, respectively, with a fixed full width at half maximum (FWHM) of
1.5 eV. We assign the larger peak to oxygen bound to Ti4+ ions (TiO2 stoichiometry), and the
other one to oxygen bound to Ti3+ (Ti2O3 stoichiometry) species. The ratio of the two oxygen
peaks corroborates this assumption. If the film were composed entirely of TiO2 and Ti2O3,
then, according to the experimental ratio of 1.66 : 1 obtained for Ti4+(2p) : Ti3+(2p), and as-
suming the same atomic sensitivity factors for Ti4+(2p) and Ti3+(2p), one should get a ratio of
2.21:1 for the respective oxygen peaks in the TiO2 and Ti2O3 stoichiometry. The experimental
value from our data is 2.17, which is in excellent agreement with this estimate. Hence, we
conclude that film A consists of a mixture of TiO2 and Ti2O3, and we rule out the existence of
significant amounts of other Ti suboxide(s).
In the next step, film A was converted into film B by annealing it to 800 K in 2×10⁻⁷ mbar O2.
In the XP spectra, the Ti(2p) region of this film could be fitted with two Ti(2p) doublets with-
out the need to include an additional Ru(3d) peak. This indicates that the film became more
homogeneous in thickness after the thermal treatment. In agreement with these results, STM
images reveal a smoother surface morphology and larger terraces compared to film A (see fig.
2b).
The intensity ratio of the Ti(2p) changed in favor of the doublet assigned to Ti3+; in film B,
the Ti4+:Ti3+ intensity ratio is 1:1. In parallel, the ratio of the two oxygen signals also changed;
the measured value of 1.43:1 is still in excellent agreement with the value expected when all
Ti4+ is in TiO2 and all Ti3+ is in Ti2O3. An increase of the Ti2O3 fraction means that film B is

9
more reduced than film A. Apparently, the O2 partial pressure was too low to compensate for
the loss of oxygen during the annealing process.
The film becomes even more reduced after flashing to 1000 K in 2×10⁻⁷ mbar O2 (yielding
film C), as indicated by the change of the Ti(2p) and O(1s) signals. The Ti4+ : Ti3+ ratio is
now 0.78:1, while the ratio of the oxygen peaks is 1.11:1, still indicating an essentially pure
mixture of TiO2 and Ti2O3. However, STM shows that film C has become again flatter with
even larger terraces compared to film B (fig. 2c).
Annealing film C at 700 K for 10 min in 2×10⁻⁶ mbar O2 and letting it cool in the same O2
atmosphere for 30 min changes again its properties, resulting in a film of type D. The XP
spectrum of film D is rather different from that of film C: the Ti(2p) region can be fitted with
a single doublet and peak binding energies of 459.2 and 464.9 eV. These peaks are assigned
to the (2p3/2) and (2p1/2) states of Ti4+, which is in excellent agreement with the Ti(2p) signal
from the surface of stoichiometric rutile TiO2(110) [32]. In addition, the O(1s) signal has
become narrower (FWHM = 1.5 eV); it can be fitted with a single peak centered at 530.5 eV,
which is characteristic for oxygen in TiO2(110) [32]. Film D is therefore well oxidized and
exclusively consists of stoichiometric TiO2. STM imaging of this film is hampered, however,
by the long exposure to O2, which deteriorates the quality of the tunnel tip and results in a less
clear topography than obtained from the other films A-C. Nevertheless, an STM image of this
film (fig. 2d) shows that the surface still exhibits extended flat terraces, at least the same size
or even larger than on film C. Otherwise, the topography of film D resembles the one of film
C (fig. 2c). Hence, reoxidation under these conditions removes the O vacancies responsible
for Ti3+ formation, without causing the film to roughen again.
Film D can be reduced again, e.g., by annealing to 900 K in vacuum, leading to film E. In the
Ti(2p) region of the XP spectra, the Ti3+ doublet is again present (fig. 1e), and at the same
time the O(1s) peak becomes broader again due to the presence of a second oxygen species,

10
similar to the spectra of films A-C. As suggested earlier by Linsebigler et al. [13], oxygen
vacancies may be produced by desorption of oxygen upon annealing to 900 K., producing
Ti3+ defect sites.
These results underline that the chemical composition of the titania thin film deposited at
700 K in 2×l0-7 mbar O2 is actually a mixture of TiO2 and Ti2O3. STM clearly reveals that the
“as-deposited” film is rough and not homogeneous. After annealing to 800 K and further to
1000 K at the same O2 pressure, the film becomes more reduced, but still consists of a mixture
of TiO2 and Ti2O3 with an increasing fraction of the latter species. The latter two preparation
steps further lead to film smoothening and production of larger terraces. Fully oxidized films
can be obtained by an additional annealing step at 700 K in 2×10⁻⁶ mbar O2 with subsequent
cooling to room temperature. Further annealing of the oxidized film in UHV yields again a
mixture of TiO2 and Ti2O3.
3.2. Adsorption of CO on TiO2 films
Smooth oxidized and reduced titania film surfaces with a thickness of 10 MLE (films D and
E, respectively) were exposed to CO at 100 K to evaluate the influence of the different formal
Ti oxidation states on the CO adsorption properties. After the respective CO exposures,
we recorded TD spectra, simultaneously monitoring the m/e = 28 (CO), 32 (O2) and 44 (CO2)
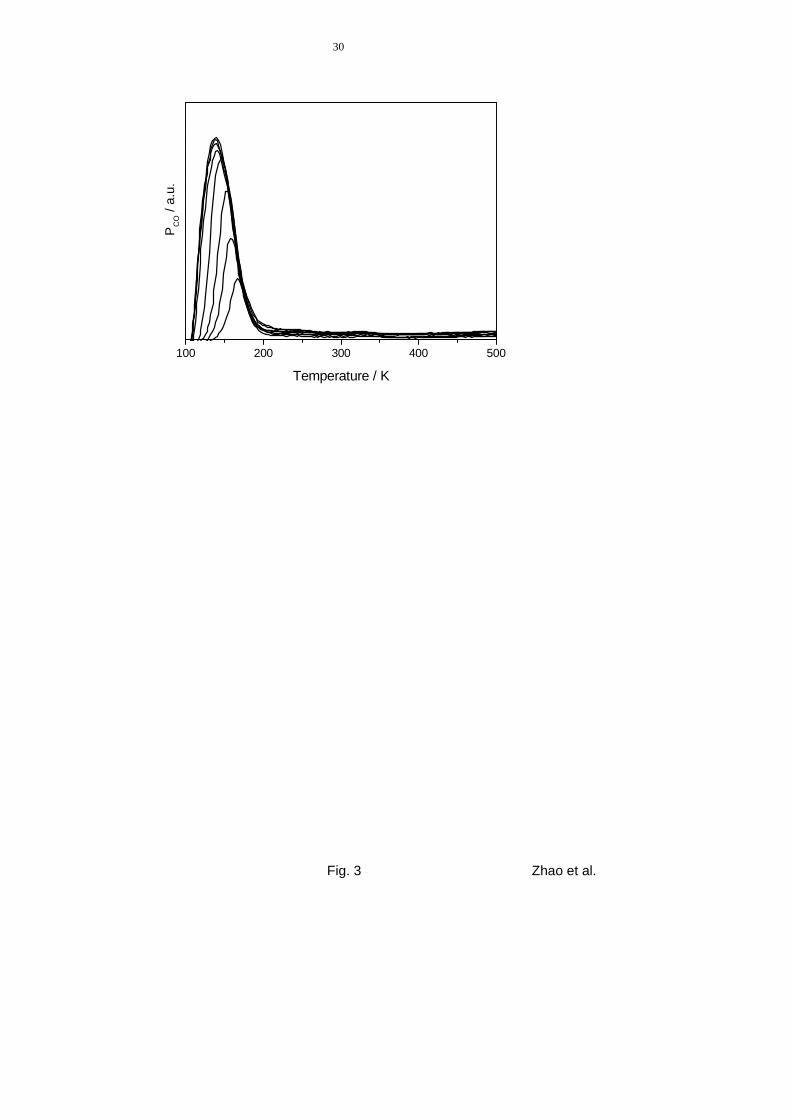
signals. Fig. 3 shows CO TPD spectra obtained from film D (fully oxidized) after CO ex-
posures between 0.04 L and 15 L at 100 K. The peaks exhibit a single maximum, which
shifts from 170 K at 0.04 L to merely 140 K after an exposure of 15 L; the asymmetric
shape, with a slower decrease of the signals at their high temperature side, indicates in-
creasing lateral CO-CO repulsions with higher coverage or an increasing population of more
weakly bonding adsorption sites. Saturation is attained after an exposure of ~1 L. We em-
phasize that CO is the only desorption product observed in these experiments. In particular,
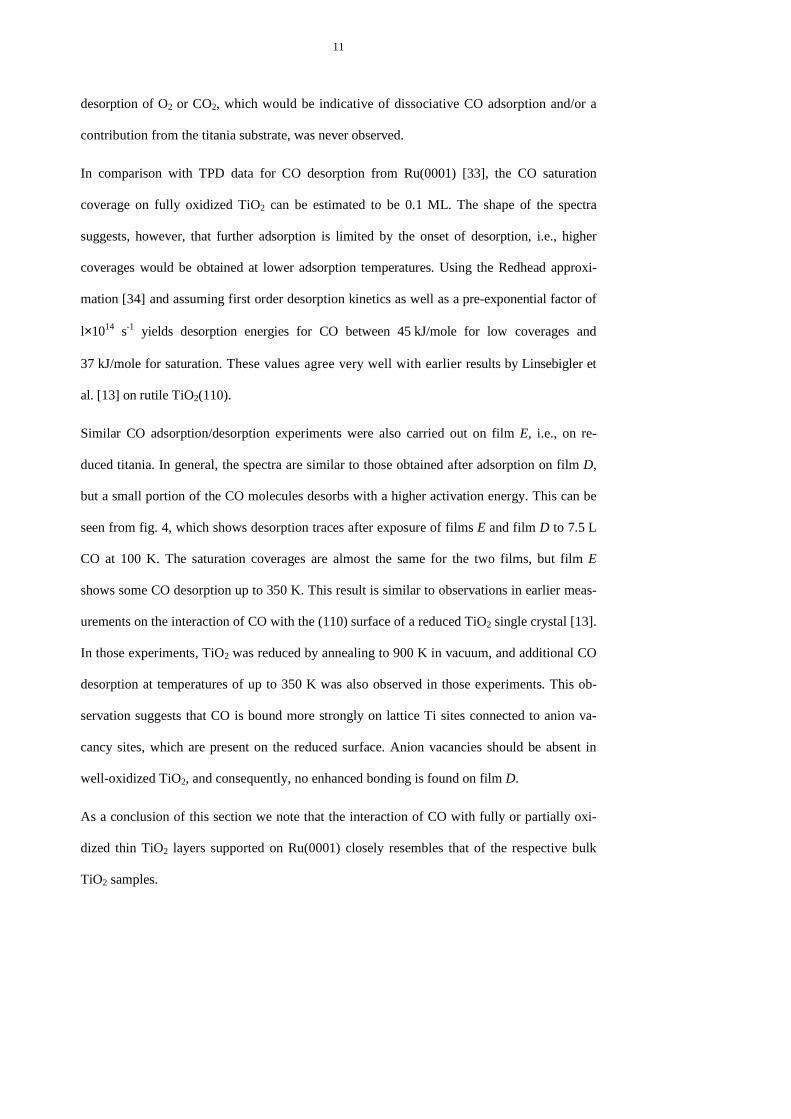
11
desorption of O2 or CO2, which would be indicative of dissociative CO adsorption and/or a
contribution from the titania substrate, was never observed.
In comparison with TPD data for CO desorption from Ru(0001) [33], the CO saturation
coverage on fully oxidized TiO2 can be estimated to be 0.1 ML. The shape of the spectra
suggests, however, that further adsorption is limited by the onset of desorption, i.e., higher
coverages would be obtained at lower adsorption temperatures. Using the Redhead approxi-
mation [34] and assuming first order desorption kinetics as well as a pre-exponential factor of
l×1014 s-1 yields desorption energies for CO between 45 kJ/mole for low coverages and
37 kJ/mole for saturation. These values agree very well with earlier results by Linsebigler et
al. [13] on rutile TiO2(110).
Similar CO adsorption/desorption experiments were also carried out on film E, i.e., on re-
duced titania. In general, the spectra are similar to those obtained after adsorption on film D,
but a small portion of the CO molecules desorbs with a higher activation energy. This can be
seen from fig. 4, which shows desorption traces after exposure of films E and film D to 7.5 L
CO at 100 K. The saturation coverages are almost the same for the two films, but film E
shows some CO desorption up to 350 K. This result is similar to observations in earlier meas-
urements on the interaction of CO with the (110) surface of a reduced TiO2 single crystal [13].
In those experiments, TiO2 was reduced by annealing to 900 K in vacuum, and additional CO
desorption at temperatures of up to 350 K was also observed in those experiments. This ob-
servation suggests that CO is bound more strongly on lattice Ti sites connected to anion va-
cancy sites, which are present on the reduced surface. Anion vacancies should be absent in
well-oxidized TiO2, and consequently, no enhanced bonding is found on film D.
As a conclusion of this section we note that the interaction of CO with fully or partially oxi-
dized thin TiO2 layers supported on Ru(0001) closely resembles that of the respective bulk
TiO2 samples.
12
3.3. Au on TiO2/Ru(0001)
3.3.1 Deposition of Au on TiO2
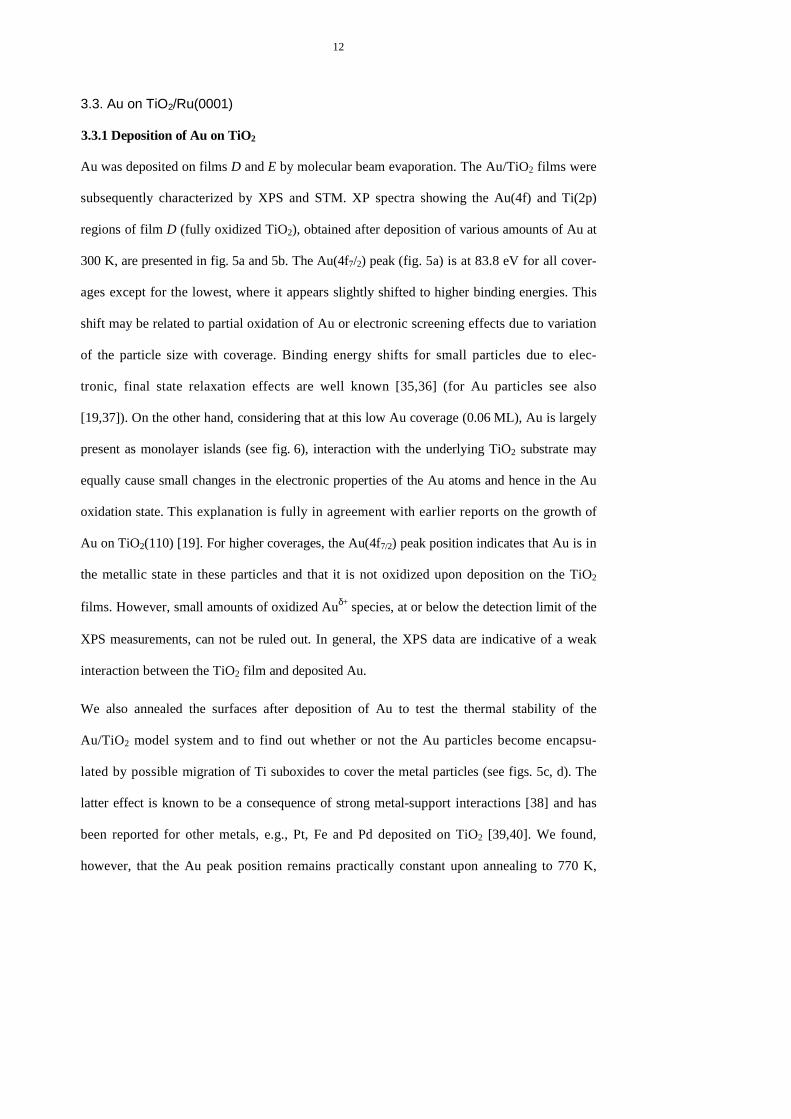
Au was deposited on films D and E by molecular beam evaporation. The Au/TiO2 films were
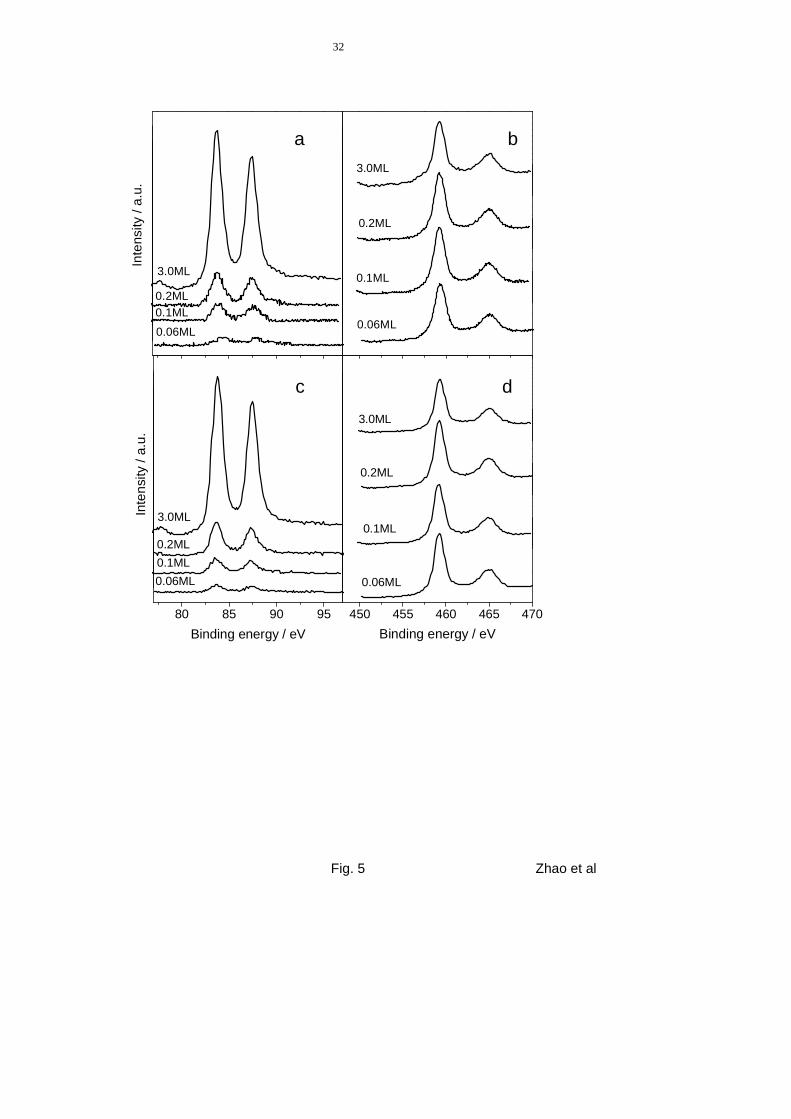
subsequently characterized by XPS and STM. XP spectra showing the Au(4f) and Ti(2p)
regions of film D (fully oxidized TiO2), obtained after deposition of various amounts of Au at
300 K, are presented in fig. 5a and 5b. The Au(4f7/2) peak (fig. 5a) is at 83.8 eV for all cover-
ages except for the lowest, where it appears slightly shifted to higher binding energies. This
shift may be related to partial oxidation of Au or electronic screening effects due to variation
of the particle size with coverage. Binding energy shifts for small particles due to elec-
tronic, final state relaxation effects are well known [35,36] (for Au particles see also
[19,37]). On the other hand, considering that at this low Au coverage (0.06 ML), Au is largely
present as monolayer islands (see fig. 6), interaction with the underlying TiO2 substrate may
equally cause small changes in the electronic properties of the Au atoms and hence in the Au
oxidation state. This explanation is fully in agreement with earlier reports on the growth of
Au on TiO2(110) [19]. For higher coverages, the Au(4f7/2) peak position indicates that Au is in
the metallic state in these particles and that it is not oxidized upon deposition on the TiO2
films. However, small amounts of oxidized Auδ+ species, at or below the detection limit of the
XPS measurements, can not be ruled out. In general, the XPS data are indicative of a weak
interaction between the TiO2 film and deposited Au.
We also annealed the surfaces after deposition of Au to test the thermal stability of the
Au/TiO2 model system and to find out whether or not the Au particles become encapsu-
lated by possible migration of Ti suboxides to cover the metal particles (see figs. 5c, d). The
latter effect is known to be a consequence of strong metal-support interactions [38] and has
been reported for other metals, e.g., Pt, Fe and Pd deposited on TiO2 [39,40]. We found,
however, that the Au peak position remains practically constant upon annealing to 770 K,

13
only a minor decrease in the Au/Ti relative intensity was observed (fig. 5a and 5c). After an-
nealing, the Au/Ti ratio had decreased to 82% of the original intensity for the layer with
0.06 ML Au. Since a signal associated with the presence of Ti3+ was not detected in the
Ti(2p) region, encapsulation of Au by TiOx suboxides can be ruled out. The change in inten-
sity must be due to thermally activated changes of the morphology of the Au nanoparticles,
i.e., of their size and shape, since previous studies [19] have found that diffusion of Au into the
TiO2 substrate can be ruled out during annealing at 775 K. This is corroborated by XP spectra
of Au on reduced TiO2 substrates (film E), which only exhibit intensity changes of the Au and
Ti signals, but are otherwise similar to the spectra obtained from films of type D. In particular, a
change of the relative Ti4+ : Ti3+ intensity ratio was not detected after annealing, which means
that encapsulation of Au by TiOx suboxides can be ruled out also for the case where Au is
deposited on film E with subsequent annealing.
To confirm this conclusion, we performed STM measurements on the Au/TiO2 surfaces after
Au deposition on reduced TiO2 (film C) and on oxidized TiO2 (film D). Fig. 6 shows STM
images obtained after deposition of 0.17 ML Au on film C (fig. 6a) and after subsequent
annealing to 770 K for 2 min (fig. 6b). The data in fig. 6c indicate that Au forms islands
with characteristic heights of 0.23 – 0.69 nm (1-3 atomic layers), which is in good agreement
with earlier work [19]. Most of the islands have the shape of irregular polygons, and usually
their mean diameter is about 2.0 nm (note that these island sizes are effective values, which
still include contributions from the STM tip). Upon annealing to 770 K (fig. 6b), the size
and height distribution of the particles has changed: the islands are generally larger, their
mean diameter lies at about 2.5 nm and the fraction of double-layer islands increases on the
expense of monolayer Au islands (fig. 6c). At the same time, the island density has decreased
from 3.4×1012 cm-2 to 2.0×1012 cm-2.

14
Fig. 7 shows STM images obtained after deposition of 0.1 ML Au on a fully oxidized TiO2
(film D, fig. 7a) and after subsequent annealing to 770 K for 2 min (fig. 7b). As deposited, the
Au particles are also polygon-shaped with a mean diameter of about 1.7 nm. However, as
shown in fig.7c, the particles are clearly higher than those grown on a reduced TiO2 film.
Most of them also have heights of 1 to 3 atomic layers, but the fraction of monolayer islands
has decreased significantly and that of 3 layers height has increased correspondingly. In addi-
tion, a small fraction of the particles consists of 4 and 5 atomic layers. After annealing, the Au
particles became even larger and more round-shaped. Particles with only 1 atomic layer are
almost nonexistent, while the number of particles with 3 and 4 atomic layers increased sig-
nificantly. After annealing, the density of Au particles is even more strongly diminished than
on reduced TiO2, from about 3.0×1012 cm-2 to 1.4×1012 cm-2. Apparently, Au islands on the
fully oxidized TiO2 are less stable than those on the partly reduced TiOx film, which results in
the more pronounced sintering upon annealing. Furthermore, considering the tendency for
higher islands, up to 4 and 5 Au layers, at an even lower Au coverage on the fully oxidized
substrate, also the interaction between substrate and Au islands must be less strong on the
fully oxidized film than on the partly reduced film. Both observations indicate that oxygen
vacancies on the titania surface stabilize the Au particles, which agrees well with recent theo-
retical and experimental results [41,42]. The much higher number of oxygen vacancies on
reduced TiO2 surfaces leads to the formation of particles with a smaller height, especially
when increasing the mobility by annealing. On the other hand, the Au island density is of
similar magnitude on both surfaces, despite of the lower Au coverage on the fully oxidized
film; i.e., it is hardly affected by the higher number of vacancies on the partly reduced film.
The latter result can be understood if homogeneous nucleation of Au islands results in compa-
rable island densities as heterogeneous nucleation on vacancies on these substrates.

15
3.3.2 The interaction of CO with Au/TiO2/Ru(0001)
CO and O2 do not adsorb on planar Au surfaces at room temperature under UHV conditions
[43], and small Au particles are known to be crucial for the high catalytic CO oxidation activ-
ity [44,45]. In order to search for evidence for the reactivity of small Au particles towards CO,
we also studied the adsorption and desorption of CO on/from Au supported on oxidized and
reduced TiO2 films for different Au coverages, using CO thermal desorption. In addition, we
have characterized the model catalysts by XPS before adsorption and after desorption to de-
tect changes of the Au particles and the substrate induced by interaction with CO.
CO-TPD spectra resulting from Au/TiO2 surfaces with different Au coverages on fully oxi-
dized TiO2 films (film type D) are displayed in fig. 8. The spectrum for Au-free TiO2 is identi-
cal to the spectra after CO saturation exposure (7.5 L) shown in figs. 3 and 4. For Au/TiO2
substrates we equally find an intense peak with a maximum at 140 K, but, in addition, CO de-
sorption reaches to higher temperatures, up to about 350 K, which is attributed to CO desorp-
tion from the Au nanoparticles. This assignment will be corroborated by in-situ IR results
discussed later. For small amounts of Au, up to about 0.2 ML, we found a distinct high-tem-
perature peak, whose peak position depends on the Au coverage. For 0.1 ML Au, this peak
appears at ~240 K; it shifts to 220 K when increasing the Au coverage to 0.2 ML. At 1.5 ML
Au, this peak appears only as a shoulder in the main CO desorption maximum. After subtrac-
tion of the TiO2 related background intensity, the shoulder corresponds to a peak with a
maximum at about 190 K. Considering the significant increase of the size and, in particular,
the height of the Au particles with coverage determined in STM measurements, the strong
shift in desorption temperature of the Au related feature with increasing Au coverage indi-
cates pronounced particle size effects. Similar results have been reported for Au supported on
other oxide surfaces, such as thin Al2O3 films on NiAl(110) or FeO(111) and Fe3O4(111)

16
films on Pt(111) single crystals [46]. The shifts in desorption temperature with Au coverage
reported in ref. [46] are comparable to our own data.
In total, the combined TPD and STM data clearly indicate that CO is adsorbed more strongly
on mono- or bilayer Au particles than on higher 3D particles.
The low-temperature peak, centered around 140 K, which is attributed to CO desorption from
the titania support, shows an approximately constant peak area independent of the amout of
deposited Au on the surface. In the case of the sample with the highest gold coverage
(1.5 ML), a considerable part of the support surface is already covered by the gold particles
(30-40 %) and a concomitant decrease of the CO adsorption on the titania support is expected.
The constancy of the low temperature peak therefore implies that, at least for the sample with
the highest gold coverage, additional desorption from the gold particles contributes to this
peak as well. For the samples with lower gold coverages (0.1 ML and 0.2 ML), it is difficult
to assert if additional CO desorption from the Au particles is involved in the low temperature
peak, because the surface percentage covered by the Au particles is relatively low. The obser-
vance of a low temperature contribution for the CO desorption from Au model catalysts is in
line with observations by Shaikhutdinov et al. [46] and by Winkler et al. [47] for CO desorp-
tion from Au modified alumina or iron oxide films, where noticeable CO desorption was al-
ways found in the temperature range between 100 and 150 K. Winkler et al. [47] attributed
this low temperature peak to desorption from the terraces of the Au particles. Considering,
however, that the CO saturation coverage on TiO2 at 100 K is ~0.1 ML and that the loss of
CO desorption from TiO2 must be compensated by a similar amount of CO desorption from
Au nanoparticles, this assignment is not straightforward. Either the CO saturation adsorption
on the facets of the Au particles is rather low, around 5 – 10% of a monolayer, or CO desorp-
tion from the 3D Au particles at 140 K results from desorption of undercoordinated sites on
these particles and/or perimeter sites. A low saturation coverage on the facets would point to a

17
bulklike CO adsorption behavior on these sites, since low saturation CO coverages have also
been observed previously on smooth Au single crystal surfaces [48-50]. On the other hand,
the total amount of CO desorption would also be compatible with desorption from undercoor-
dinates Au sites on these particles [51]. Hence, a definite identification of the CO adsorption
sites responsible for CO desorption at 140 K is not possible from the data available so far.
The assignment of the additional TD contribution (high-temperature peak) to CO desorption
from Au nanoparticles is supported by FTIR measurements: Fig. 9 displays FTIR spectra re-
corded on a type D titania film covered with 0.2 ML of Au, which is exposed to 1×10⁻⁴ mbar
CO at 100 K. The intense band at 2105 cm-1 is assigned to CO adsorbed on Au particles [25],
whereas the band at 2185 cm-1 is attributed to CO adsorbed on TiO2, i.e., on the Ti4+ sites of
the titania film surface [52].
Assuming again a pre-exponential factor of 1×10¹⁴ s-1 and first order desorption kinetics, the
activation energy for desorption of CO from the Au particles is 65 kJ/mole for a coverage of
0.1 ML Au on oxidized TiO2. It decreases to 51 kJ/mole for a Au coverage of 1.5 ML. These
values are in excellent agreement to results obtained in a recent study on the interaction of CO
with Au particles supported on TiO2/Mo(110) [25]. In that work, the heats of CO adsorption
were determined from isosteric plots of IRAS data, resulting in adsorption energies of 70-75
kJ mol-1 for similar Au particle sizes. Likewise, Gottfried et al. [49] and McElhiney et al. [48]
reported adsorption energies of 59 kJ mol-1 and 58 kJ mol-1 for low coverage CO adsorption
(θCO→ 0) on Au(110) and Au(100). respectively.
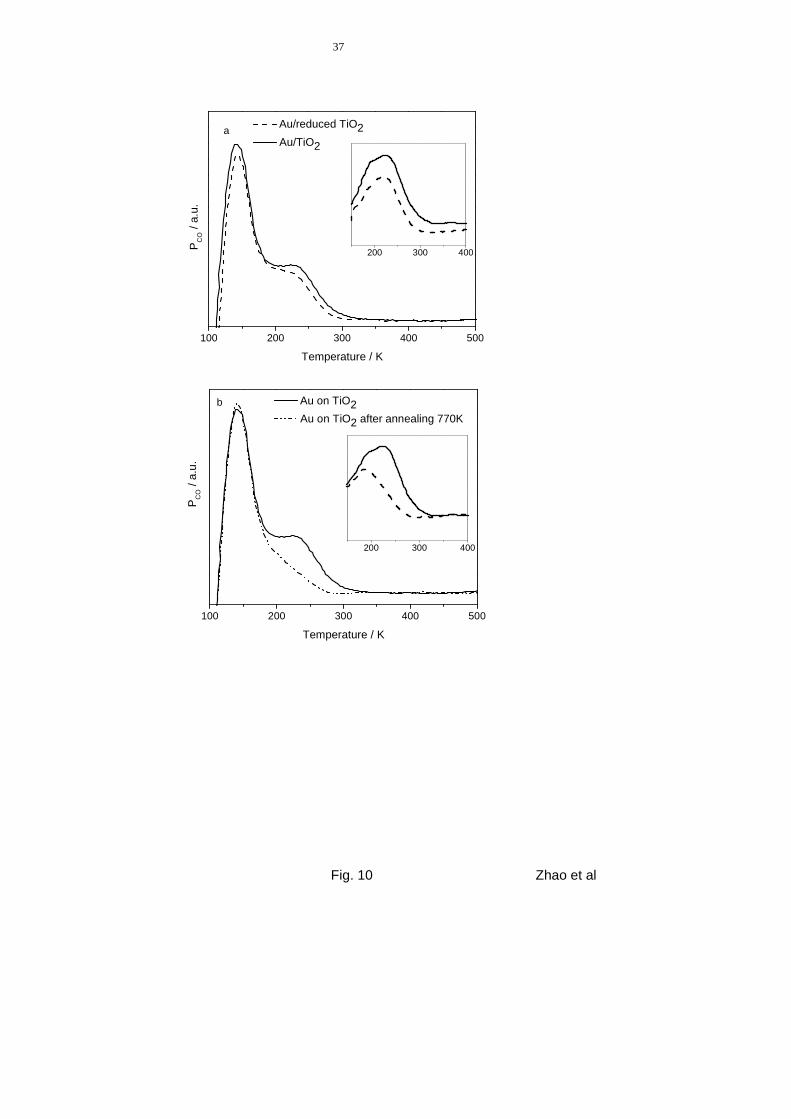
Finally, we investigated the influence of the chemical state of the TiO2 films on the CO-TPD
spectra, focusing on the contribution from the Au particles. The spectra in fig. 10a show CO
desorption spectra from 0.2±0.04 ML Au deposited on reduced and oxidized TiO2 films
(7.5 L CO exposure at 100 K). The data exhibit a small difference in the Au-related feature at
about 230 K. However, when taking into account the slightly different CO-TPD background

18
signal from both titania surfaces (cf. fig. 4), the peak positions are practically identical, and
the difference is merely due to an intensity difference, with a higher intensity on the reduced
Au/TiO2 model catalyst (see inset in fig. 10a). From our STM measurements (in fig. 6 and 7),
it is known that the Au particles on reduced surfaces have a lower height compared to parti-
cles on oxidized surfaces (at comparable Au coverage). The amount of CO adsorption on
more strongly adsorbing Au sites on mono- or bilayer Au islands is therefore expected to be
higher on the reduced film. On the other side, it has been shown that the binding strength of
adsorbates is also influenced by the interaction of the metal particles with the support [53]. In
our case, the stronger interaction of the Au particles with the vacancies in the reduced surface
should lead to a weakening of the CO adsorption bond, using simple bond-order conservation
arguments. In that case, the CO adsorption energy on mono- and bilayer Au islands should be
shifted to lower values, for larger 3D Au islands these effects are likely to be very small. Con-
sidering also the uncertainties in the respective Au coverages it is not possible to separate
these two counteracting effects in the TPD spectra, where the Au-related CO desorption sig-
nal appears roughly at the same temperature for the reduced surface and the oxidized surface.
TPR experiments performed by exposing the model catalyst to a CO and O2 mixture (10-
7 mbar CO, 10-7 mbar O2, 100 K, 10 s) show no CO2 formation in the subsequent temperature
ramp, confirming earlier results that catalytic oxidation of CO is not possible upon low tem-
perature adsorption of the molecular species under UHV conditions [13], but requires either
dissociated oxygen on the surface [54] or other types of activated oxygen [55]. On the other
hand, we observed a strong dependence of the CO oxidation rate on the pressure of the reac-
tion gas (CO + O2) in measurements of the CO oxidation kinetics in the millibar to sub-milli-
bar range over disperse supported Au/TiO2 catalysts [56]. Furthermore, CO2 formation was
observed in pulse experiments admitting alternately CO and O2 pulses to a supported Au/TiO2
catalyst during the CO pulses, indicating that active oxygen was formed and remained ad-

19
sorbed on the catalyst under these experimental conditions (1015 particles per 300 µs pulse,
background pressure 10-7 mbar, 300 - 350 K) [57,58]. Comparing these observations with our
present results, it is clear that after low temperature coadsorption of CO and O2 desorption of
CO at about 200 K is much more facile than CO oxidation. This result does not contradict the
other results mentioned above. The absence of detectable CO2 formation in the present ex-
periments can easily be understood by the sensitivity of the present experiment being too
low− CO oxidation rates compatible with the above results would be well below the detection
limit of the present experiment, and by the rapid desorption of CO and the resulting low COad
coverages at reaction temperatures. Basic differences between disperse supported Au/TiO2
catalysts and planar model catalysts do not need to be invoked.
XPS measurements performed before and after the TPD experiments, in which the surface
was annealed up to 550 K, do not show significant changes in the substrate properties after
the TPD experiments. In particular, the TiO2 substrate does not change, and also the intensity
of the Au signals remains constant, suggesting that the Au particles do not sinter under these
conditions.
As discussed above, sintering of the Au particles occurs, however, upon annealing to 770 K
(see fig. 7). When CO is adsorbed on a 770 K annealed model catalyst surface with a mor-
phology as shown in fig. 7b (fully oxidized substrate), the CO TD spectrum differs signifi-
cantly from one taken prior to annealing. The effect of annealing the Au particles is demon-
strated in fig. 10b. The spectrum obtained prior to 770 K annealing (full line, Au coverage
0.2 ML) shows a pronounced high-temperature peak at 230 K, assigned to CO desorption from
Au particles. After annealing, subsequent CO adsorption (7.5 L, 100 K) and desorption (dashed
line) leads to a much less intense high-temperature CO desorption signal from the Au
nanoparticles, while the intensity of the main desorption peak (140 K) remains about constant.
The Au-related desorption appears mainly as a high temperature shoulder to the TiO2 related
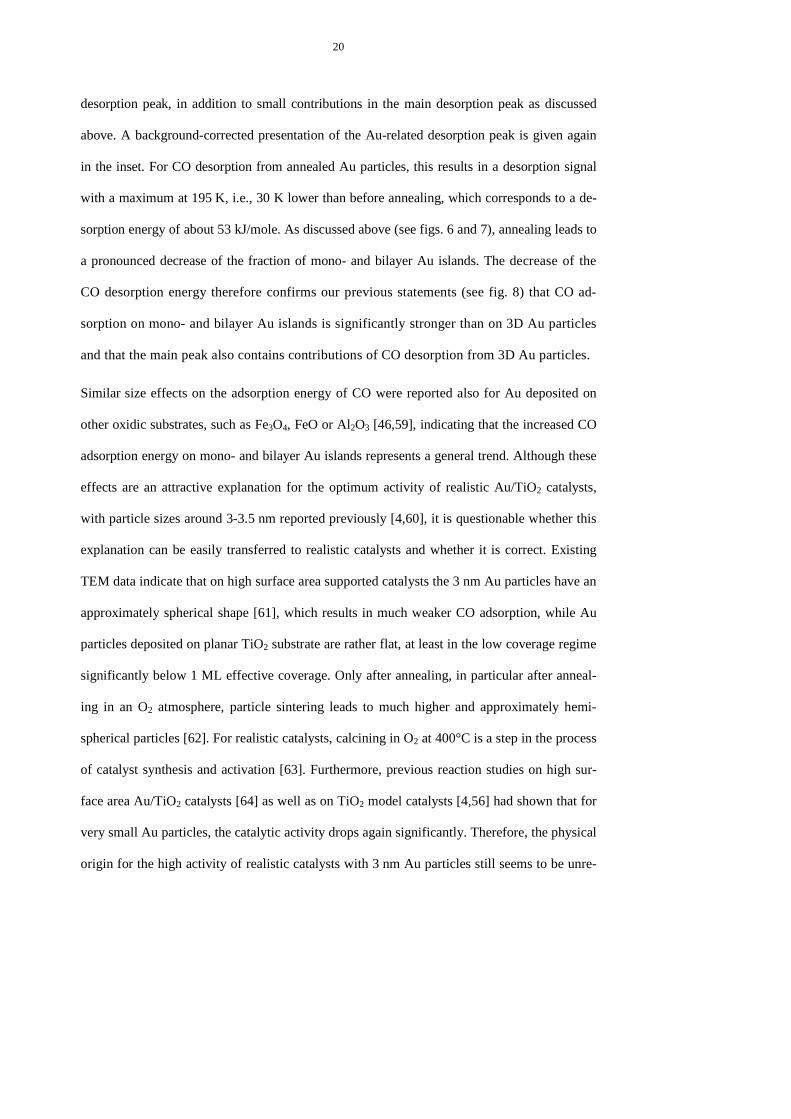
20
desorption peak, in addition to small contributions in the main desorption peak as discussed
above. A background-corrected presentation of the Au-related desorption peak is given again
in the inset. For CO desorption from annealed Au particles, this results in a desorption signal
with a maximum at 195 K, i.e., 30 K lower than before annealing, which corresponds to a de-
sorption energy of about 53 kJ/mole. As discussed above (see figs. 6 and 7), annealing leads to
a pronounced decrease of the fraction of mono- and bilayer Au islands. The decrease of the
CO desorption energy therefore confirms our previous statements (see fig. 8) that CO ad-
sorption on mono- and bilayer Au islands is significantly stronger than on 3D Au particles
and that the main peak also contains contributions of CO desorption from 3D Au particles.
Similar size effects on the adsorption energy of CO were reported also for Au deposited on
other oxidic substrates, such as Fe3O4, FeO or Al2O3 [46,59], indicating that the increased CO
adsorption energy on mono- and bilayer Au islands represents a general trend. Although these
effects are an attractive explanation for the optimum activity of realistic Au/TiO2 catalysts,
with particle sizes around 3-3.5 nm reported previously [4,60], it is questionable whether this
explanation can be easily transferred to realistic catalysts and whether it is correct. Existing
TEM data indicate that on high surface area supported catalysts the 3 nm Au particles have an
approximately spherical shape [61], which results in much weaker CO adsorption, while Au
particles deposited on planar TiO2 substrate are rather flat, at least in the low coverage regime
significantly below 1 ML effective coverage. Only after annealing, in particular after anneal-
ing in an O2 atmosphere, particle sintering leads to much higher and approximately hemi-
spherical particles [62]. For realistic catalysts, calcining in O2 at 400°C is a step in the process
of catalyst synthesis and activation [63]. Furthermore, previous reaction studies on high sur-
face area Au/TiO2 catalysts [64] as well as on TiO2 model catalysts [4,56] had shown that for
very small Au particles, the catalytic activity drops again significantly. Therefore, the physical
origin for the high activity of realistic catalysts with 3 nm Au particles still seems to be unre-

21
solved, although modifications in the CO adsorption energy may play an important role. Fu-
ture work should consider the characteristic differences in the pretreatment and morphology
of realistic and model systems.
4. Conclusions
In order to prepare planar Au/TiO2 model catalysts, epitaxial thin TiO2 films have been grown
on Ru(0001) by depositing Ti in an O2 atmosphere, followed by annealing and subsequent
cooling in O2. XPS, STM, and CO-TPD were used to characterize the growth, the chemical
composition, and the structure of the TiO2 films, the deposition of Au on these films, and the
interaction of the respective Au/TiO2 films with CO. Optimizing the conditions for growth and
post-treatment, smooth titanium oxide films were prepared either as fully oxidized TiO2 or as
partially reduced films, depending on the preparation conditions. Reduced films consisted of a
mixture of TiO2 and Ti2O3. As deposited, Au particles were distributed homogeneously on
fully oxidized and reduced TiO2 surfaces; however, Au particles on oxidized TiO2 were
slightly higher than those on reduced TiO2. Au and TiO2 interacted only weakly; in particu-
lar, we found no overgrowth of Au by TiOx suboxides upon annealing to 770 K, indicating
that strong metal-support interactions are absent. 770 K annealing did, however, lead to Au
particle growth, resulting in more hemispheric particles and an increased fraction of higher,
3D islands. Compared to Au supported on fully oxidized TiO2, Au islands supported on re-
duced TiOx are more stable, which is attributed to a stabilization of the Au particles by O va-
cancies in the underlying TiOx substrate, implying a stronger interaction between the particles
and the substrate in the latter case. After exposure of CO to Au/TiO2/Ru(0001) model catalysts
CO is adsorbed molecularly on both Au nanoparticles and on the TiO2 substrate. The desorp-
tion energy of CO adsorbed on these TiO2 layers is close to the CO adsorption energies on
TiO2(110) single crystals. CO adsorption on Au particles shows a clear size and/or shape

22
effect in that CO is more strongly bound on mono- and bimetallic Au islands on TiO2 than on
higher, 3D Au particles with a more bulk-like adsorption behavior.
Acknowledgments
This work was supported by the Deutsche Forschungsgemeinschaft within the Priority
Programme 1091 (Be 1201/9-5 and Ch 64/3-3). We would like to thank T. Hager for the valu-
able discussions.

23
References
[1] M. Haruta, S. Tsubota, T. Kobayashi, H. Kageyama, M.J. Genet, B. Delmon, J. Catal.
144 (1993) 175.
[2] M. Haruta, Catal. Today 36 (1997) 153.
[3] M. Valden, S. Pak, X. Lai, D.W. Goodman, Catal. Lett. 56 (1998) 7.
[4] M. Valden, D. Lai, D.W. Goodman, Science 281 (1998) 1647.
[5] M.-C. Wu, J.S. Corneille, C.A. Estrada, J.-W. He, D.W. Goodman, Chem. Phys. Lett. 182
(1991) 472.
[6] M.-C. Wu, C.M. Truong, D.W. Goodman, J. Phys. Chem. 97 (1993) 4182.
[7] J.-W. He, X. Xu, J.S. Corneille, D.W. Goodman, Surf. Sci. 279 (1992) 119.
[8] W.S. Oh, C. Xu, D.Y. Kim, D.W. Goodman, J. Vac. Sci. Technol. A 15 (1997) 1710.
[9] K.J. Williams, M. Salmeron, A.T. Bell, G.A. Somorjai, Surf. Sci. 204 (1988) L745-L753.
[10] A.B. Boffa, H.C. Galloway, P.W. Jacobs, J.J. Benítez, J.D. Batteas, M. Salmeron, A.T.
Bell, G.A. Somorjai, Surf. Sci. 326 (1995) 80.
[11] Q. Guo, W.S. Oh, D.W. Goodman, Surf. Sci. 437 (1999) 49.
[12] N.D. McCavish and R.A. Bennett, Surf. Sci. 546 (2003) 47.
[13] A. Linsebigler, G. Lu, J.T. Yates, J. Chem. Phys. 103 (1995) 9438.
[14] G.B. Raupp and J.A. Dumesic, J. Phys. Chem. 89 (1985) 5240.
[15] D.D. Beck, J.M. White, C.T. Ratcliffe, J. Phys. Chem. 90 (2005) 3132.
[16] G. Martra, Appl. Catal. A 200 (2000) 275.
[17] H. Kobayashi and M. Yamaguchi, Surf. Sci. 214 (1989) 466.
[18] F. Cosandey and T.E. Madey, Surf. Rev. Lett. 8 (2001) 73.
[19] L. Zhang, R. Persaud, T.E. Madey, Phys. Rev. B 56 (1997) 10549.
[20] J.-D. Grunwaldt, M. Maciejewski, O.S. Becker, P. Fabrizioli, A. Baiker, J. Catal. 186
(1999) 458.
[21] S. Lin and M.A. Vannice, Catal. Lett. 10 (1991) 47.
[22] S.D. Lin, M.A. Bollinger, M.A. Vannice, Catal. Lett. 17 (1993) 245.
[23] Y. Iizuka, H. Fujiki, N. Yamauchi, T. Chijiiwa, S. Arai, S. Tsubota, M. Haruta, Catal.

24
Today 36 (1997) 115.
[24] M.A.P. Dekkers, M.J. Lippits, B.E. Nieuwenhuys, Catal. Lett. 56 (1998) 195.
[25] D.C. Meier and D.W. Goodman, J. Am. Chem. Soc. 126 (2004) 1892.
[26] E. Kopatzki and R.J. Behm, Surf. Sci. 245 (1991) 255.
[27] T. Diemant, T. Hager, H.E. Hoster, H. Rauscher, R.J. Behm, Surf. Sci. 541 (2003) 137.
[28] F. Buatier de Mongeot, M. Scherer, B. Gleich, E. Kopatzki, R.J. Behm, Surf. Sci. 411
(1998) 249.
[29] A. Männig, Z. Zhao, D. Rosenthal, K. Christmann, H. Hoster, H. Rauscher, R.J. Behm,
Surf. Sci. 576 (2004) 29.
[30] R.Q. Hwang, C. Günther, J. Schröder, S. Günther, E. Kopatzki, R.J. Behm, J. Vac. Sci.
Technol. A 10 (1992) 1970.
[31] J.T. Mayer, U. Diebold, T.E. Madey, E. Garfunkel, J. Electron Spectrosc. Rel. Phenom.
73 (1995) 1.
[32] U. Diebold, Surf. Sci. Rep. 48 (2003) 53.
[33] H. Pfnür, P. Feulner, H.A. Engelhardt, D. Menzel, Chem. Phys. Lett. 59 (1978) 481.
[34] P.A. Redhead, Vacuum 12 (1962) 203.
[35] G.K. Wertheim, S.B. DiCenzo, S.E. Youngquist, Phys. Rev. Lett. 51 (1983) 2310.
[36] H. Hövel, B. Grimm, M. Pollmann, B. Reihl, Phys. Rev. Lett. 81 (1998) 4608.
[37] H.-G. Boyen, T. Herzog, G. Kästle, F. Weigl, P. Ziemann, J.P. Spatz, M. Möller, R.
Wahrenberg, M.G. Garnier, P. Oelhafen, Phys. Rev. B 65 (2002) 075412-1.
[38] G.L. Haller and D.E. Resaco, Adv. Catal. 36 (1989) 173.
[39] J.-M. Pan and T.E. Madey, Catal. Lett. 20 (1993) 269.
[40] F. Pesty, H.-P. Steinrück, T.E. Madey, Surf. Sci. 339 (1995) 83.
[41] E. Wahlström, N. Lopez, R. Schaub, P. Thostrup, A. Ronnau, C. Africh, E. Laegsgaard,
J.K. Nørskov, F. Besenbacher, Phys. Rev. Lett. 90 (2003) 261011.
[42] N. Lopez, J.K. Nørskov, T.V.W. Janssens, A. Carlsson, A. Puig-Molina, B.S. Clausen,
J.-D. Grunwaldt, J. Catal. 225 (2004) 86.
[43] A.G. Sault, R.J. Madix, C.T. Campbell, Surf. Sci. 169 (1986) 347.
[44] T. Kobayashi, M. Haruta, H. Sano, M. Nakane, Sens. and Actuat. 13 (1988) 339.
25
[45] M. Haruta, N. Yamada, T. Kobayashi, S. Iijima, J. Catal. 115 (1989) 301.
[46] C. Lemire, R. Meyer, S.K. Shaikhutdinov, H.-J. Freund, Surf. Sci. 552 (2004) 27.
[47] C. Winkler, A.J. Carew, S. Haq, R. Raval, Langmuir 19 (2003) 717.
[48] G. McElhiney and J. Pritchard, Surf. Sci. 60 (1976) 397.
[49] J.M. Gottfried, K.J. Schmidt, S.L.M. Schroeder, K. Christmann, Surf. Sci. 536 (2003)
206.
[50] C. Zhang, H. He, K.-I. Tanaka, Catalysis Communications 6 (2005) 211.
[51] A. Carlsson, A. Puig-Molina, T.V.W. Janssens, J. Phys. Chem. B 110 (2006) 5286.
[52] F. Boccuzzi, A. Chiorino, M. Manzoli, Surf. Sci. 502-503 (2002) 513.
[53] C.T. Campbell, A.W. Grant, D.E. Starr, S.C. Parker, V.A. Bondzie, Topics in Catalysis
14 (2001) 43.
[54] J.M. Gottfried and K. Christmann, Surf. Sci. 566-568 (2004) 1112.
[55] V.A. Bondzie, S.C. Parker, C.T. Campbell, Catal. Lett. 63 (1999) 143.
[56] T. Diemant, B. Schumacher, R. Leppelt, Z. Zhao, H. Rauscher, and R. J. Behm, to be
publ..
[57] M. Olea and Y. Iwasawa, Appl. Catal. A 275 (2004) 35.
[58] R. Leppelt, T. Häring, G. Bräth, and R. J. Behm, to be publ..
[59] S.K. Shaikhutdinov, R. Meyer, M. Naschitzki, M. Bäumer, H.-J. Freund, Catal. Lett. 86
(2003) 211.
[60] M. Valden, S. Pak, X. Lai, D.W. Goodman, Catal. Lett. 56 (1998) 7.
[61] S. Ichikawa, T. Akita, M. Okumura, M. Haruta, K. Tanaka, M. Kohyama, J. Electr.
Micros. 52 (2003) 21.
[62] S. Kielbassa, M. Kinne, R.J. Behm, J. Phys. Chem. B 108 (2004) 19184.
[63] B. Schumacher, V. Plzak, M. Kinne, R.J. Behm, Catal. Lett. 89 (2003) 109.
[64] G.R. Bamwenda, S. Tsubota, T. Nakamura, M. Haruta, Catal. Lett. 44 (1997) 83.

26
Figure captions
Figure 1 XP spectra obtained at different stages in the preparation of titanium oxide lay-
ers on Ru(0001). Left column: Ti(2p) region, right column: O(1s) region: a)
Film A: after deposition of 10 MLE Ti in 2×10⁻⁷ mbar O2 on clean Ru(0001)
held at 640 K. b) Film B: after annealing film A at 800 K in 2×10⁻⁷ mbar O2 for 2
min. c) Film C: after annealing film B at 1000 K in 2×10⁻⁷ mbar O2 for 2 min. d)
Film D: after annealing film C in 2×10⁻⁶ mbar O2 at 700 K for 10 min and
cooling it down to room temperature for 30 min in the same O2 atmosphere. e)
Film E: after annealing film D to 900 K in UHV for 2 min.
Figure 2 Representative STM images obtained on film A (a), film B (b), film C (c) and
film D (d). Image sizes (a-d): 100 nm × 100 nm.
Figure 3 TPD spectra (amu 28) obtained after exposure of film D (fully oxidized TiO2) to
increasing CO exposures at 100 K (exposures: 0 L, 0.038 L, 0.075 L, 0.15 L,
0.38 L, 3.8 L, 7.5 L, 15 L). Heating rate: 5 K s-1.
Figure 4 TPD spectra (amu 28) obtained after exposure of a fully oxidized TiO2 film
(film D, dashed line) and a partly reduced TiOx film (film E, solid line) to7.5 L
CO at 100 K. Heating rate: 5 K s-1.
Figure 5 XPS spectra of the Au(4f) (left) and Ti(2p) (right) regions obtained after
deposition of Au on film D at room temperature (a, b) and after annealing it to
770 K (c, d). The numbers refer to the respective Au coverage.
Figure 6 STM images (100 nm × 100 nm) obtained (a) after deposition of 0.17 ± 0.02 ML
Au on a partly reduced TiOx (film C) at 300 K and (b) after annealing it to
27
770 K. The histogram in (c) shows the height distribution of the Au particles
before (grey) and after (hatched) annealing.
Figure 7 STM images (50 nm × 50 nm) obtained (a) after deposition of 0.1 ± 0.02 ML Au
on a fully oxidized TiO2 film (film D) at 300 K and (b) after subsequent an-
nealing to 770 K. The histogram in (c) shows the height distribution of the Au
particles before (grey) and after (hatched) annealing.
Figure 8 CO TPD spectra (amu 28) obtained from Au/TiO2 films (TiO2: film D) with
various Au coverages after a 7.5 L CO exposure at 100 K (saturation coverage).
Heating rate: 5 K s-1.
Figure 9 Infrared spectrum obtained from a CO adlayer on a 0.2 ML Au/TiO2 film in a
CO atmosphere (fully oxidized TiO2, CO pressure: 1×10⁻⁴ mbar at 100 K).
Figure 10 CO-TPD spectra (amu 28) obtained from Au/TiO2 films (Au coverage 0.2 ML)
exposed to 7.5 L CO at 100 K. The insets in both panels show the correspond-
ing TD spectra enlarged after subtracting the background from the support. (a)
Solid line: Au on oxidized TiO2 (film D), dashed line: Au on partly reduced
TiOx film (film E). (b) Au deposited on fully oxidized TiO2 (film D): Solid line:
Au deposited at 300 K without annealing steps; dashed line: after annealing the
Au/TiO2 layer to 770 K.

28
a Ti(2p)
O(1s)
b
Inte
nsity
/ a.
u. c
d
450 455 460 465 470
Binding Energy / eV
e
525 530 535 540
Fig. 1 Zhao et al.

29
Fig. 2 Zhao et al
d c
a b Formatiert: Schriftart:(Standard) Arial, 16 pt,Schriftartfarbe: Weiß
Formatiert: Schriftart:(Standard) Arial, 16 pt,
Schriftartfarbe: Weiß
Formatiert: Schriftart:
(Standard) Arial, 16 pt,Schriftartfarbe: Weiß
Formatiert: Schriftart:
(Standard) Arial, 16 pt,Schriftartfarbe: Weiß
30
100 200 300 400 500
Temperature / K
PC
O /
a.u.
Fig. 3 Zhao et al.

31
100 200 300 400 500
from oxidized TiO2
from reduced TiO2
Temperature / K
PC
O/ a
.u.
Fig. 4 Zhao et al.
32
0.06ML
0.1ML
0.2ML
3.0ML
450 455 460 465 470
Binding energy / eV
0.06ML
0.1ML
0.2ML
3.0ML
0.06ML
Inte
nsity
/ a.
u.
0.1ML
0.2ML
3.0ML
a b
c d
80 85 90 95
Binding energy / eV
0.06ML
0.1ML
Inte
nsity
/ a.
u.
0.2ML
3.0ML
Fig. 5 Zhao et al

33
aa
bb
0 2 4 6 8 10 120
10
20
30
40
50
60
4 ML
3 ML
2 ML
after annealing
Fra
ctio
n of
Au
part
icle
s / %
Height / Å
before annealing
1 ML
c
0 2 4 6 8 10 120
10
20
30
40
50
60
4 ML
3 ML
2 ML
after annealing
Fra
ctio
n of
Au
part
icle
s / %
Height / Å
before annealing
1 ML
c
Fig. 6 Zhao et al.

34
aa
bb
0 2 4 6 8 10 120
10
20
30
40
50
60
5ML
4ML
3ML
2ML
1ML
after annealing
Fra
ctio
n of
Au
part
icle
s / %
Height / Å
before annealing
c
0 2 4 6 8 10 120
10
20
30
40
50
60
5ML
4ML
3ML
2ML
1ML
after annealing
Fra
ctio
n of
Au
part
icle
s / %
Height / Å
before annealing
c
Fig. 7 Zhao et al.

35
100 200 300 400 500
TiO2
0.1ML Au
0.2ML Au
140K
Temperature / K
PC
O /
a.u.
1.5ML Au
Fig. 8 Zhao et al.

36
2250 2200 2150 2100 2050 2000
Abs
orba
nce
/ a.u
.
Wave number / cm-1
CO on TiO2 (2185) cm-1
CO on Au (2105) cm-1
Fig. 9 Zhao et al.
37
100 200 300 400 500
Au/reduced TiO2 Au/TiO2
Temperature / K
PC
O /
a.u.
a
200 300 400
100 200 300 400 500
Au on TiO2 Au on TiO2 after annealing 770K
Temperature / K
PC
O /
a.u.
b
200 300 400
Fig. 10 Zhao et al