Attentional and anatomical considerations for the representation of simple stimuli in visual...
11
ORIGINAL ARTICLE Attentional and anatomical considerations for the representation of simple stimuli in visual short-term memory: evidence from human electrophysiology Rosalie Perron Æ Christine Lefebvre Æ Nicolas Robitaille Æ Benoit Brisson Æ Fre ´de ´ric Gosselin Æ Martin Arguin Æ Pierre Jolicœur Received: 20 December 2007 / Accepted: 28 May 2008 / Published online: 18 February 2009 Ó Springer-Verlag 2009 Abstract Observers encoded the spatial arrangement of two or three horizontal line segments relative to a square frame presented for 150 ms either in left or right visual field and either above or below the horizontal midline. The target pattern was selected on the basis of colour (red vs. green) from an equivalent distractor pattern in the opposite left–right visual hemifield. After a retention interval of 450 or 650 ms a test pattern was presented at fixation. The task was to decide whether the test was the same as the encoded pattern or different. Selection of the to-be-memorised pattern produced an N2pc response that was not influenced by the number of line segments nor by the length of the retention interval, but that was smaller in amplitude for patterns presented in the upper visual field compared with patterns presented in the lower visual field. A sustained posterior contralateral negativity (SPCN) followed the N2pc. The SPCN was larger for patterns with three line segments than for two, was larger for patterns encoded from lower visual field than from upper visual field, and returned to baseline sooner for the shorter retention interval than for the longer interval. These results, and others, provide an interesting and complex pattern of similarities and differences between the N2pc and SPCN, consistent with the view that N2pc reflects mechanisms of attentional selection whereas the SPCN reflects maintenance in visual short-term memory. Introduction The main goals of the present research were to investigate the neural basis of selective visual spatial attention and of visual short-term memory, and the relationship between these two important cognitive functions in the neurologi- cally intact adult human brain. We used the event-related potential (ERP) method to analyse the electroencephalo- gram recorded while observers performed a task that required both visual selection based on colour and the encoding and retention of simple visual patterns in the context of a task designed to isolate visual short-term memory (VSTM). The N2pc component was used to index the moment-to-moment deployment of visual spatial attention. The sustained posterior contralateral negativity (SPCN) was used to index encoding and retention in VSTM. The N2pc is an ERP component that has been argued to reflect the locus of visual spatial attention (Eimer, 1996; Luck & Hillyard, 1994a, 1994b; Luck, Girelli, McDermott, & Ford, 1997). This component is observed typically about 180–270 ms after target onset and is computed by taking the voltage difference between corresponding pairs of electrodes over left and right posterior scalp (e.g., PO7 and PO8), taking into account the hemifield in which attention is deployed. The voltage at the electrode on the contralat- eral side relative to the attended hemifield is more negative than the voltage at the ipsilateral electrode. Usually, researchers compute an average contralateral waveform by averaging the voltage at the right-sided electrode (e.g., PO8) when attention is deployed to the left with the voltage at the left-sided electrode (e.g., PO7) when attention is deployed to the right. An average ipsilateral waveform is computed by averaging the voltage at the left-sided elec- trode when attention is deployed to the left with the voltage at the right-sided electrode when attention is deployed to R. Perron C. Lefebvre N. Robitaille B. Brisson F. Gosselin M. Arguin P. Jolicœur (&) De ´partement de Psychologie, Universite ´ de Montre ´al, C.P. 6128, Succursale Centre-ville, Montreal, QC H3C 3J7, Canada e-mail: [email protected] 123 Psychological Research (2009) 73:222–232 DOI 10.1007/s00426-008-0214-y
-
Upload
independent -
Category
Documents
-
view
2 -
download
0
Transcript of Attentional and anatomical considerations for the representation of simple stimuli in visual...

ORIGINAL ARTICLE
Attentional and anatomical considerations for the representationof simple stimuli in visual short-term memory: evidencefrom human electrophysiology
Rosalie Perron Æ Christine Lefebvre Æ Nicolas Robitaille ÆBenoit Brisson Æ Frederic Gosselin Æ Martin Arguin ÆPierre Jolicœur
Received: 20 December 2007 / Accepted: 28 May 2008 / Published online: 18 February 2009! Springer-Verlag 2009
Abstract Observers encoded the spatial arrangement oftwo or three horizontal line segments relative to a square
frame presented for 150 ms either in left or right visual
field and either above or below the horizontal midline. Thetarget pattern was selected on the basis of colour (red vs.
green) from an equivalent distractor pattern in the opposite
left–right visual hemifield. After a retention interval of 450or 650 ms a test pattern was presented at fixation. The task
was to decide whether the test was the same as the encoded
pattern or different. Selection of the to-be-memorisedpattern produced an N2pc response that was not influenced
by the number of line segments nor by the length of the
retention interval, but that was smaller in amplitude forpatterns presented in the upper visual field compared with
patterns presented in the lower visual field. A sustained
posterior contralateral negativity (SPCN) followed theN2pc. The SPCN was larger for patterns with three line
segments than for two, was larger for patterns encoded
from lower visual field than from upper visual field, andreturned to baseline sooner for the shorter retention interval
than for the longer interval. These results, and others,provide an interesting and complex pattern of similarities
and differences between the N2pc and SPCN, consistent
with the view that N2pc reflects mechanisms of attentionalselection whereas the SPCN reflects maintenance in visual
short-term memory.
Introduction
The main goals of the present research were to investigate
the neural basis of selective visual spatial attention and ofvisual short-term memory, and the relationship between
these two important cognitive functions in the neurologi-
cally intact adult human brain. We used the event-relatedpotential (ERP) method to analyse the electroencephalo-
gram recorded while observers performed a task that
required both visual selection based on colour and theencoding and retention of simple visual patterns in the
context of a task designed to isolate visual short-term
memory (VSTM). The N2pc component was used to indexthe moment-to-moment deployment of visual spatial
attention. The sustained posterior contralateral negativity
(SPCN) was used to index encoding and retention in VSTM.The N2pc is an ERP component that has been argued to
reflect the locus of visual spatial attention (Eimer, 1996;
Luck & Hillyard, 1994a, 1994b; Luck, Girelli, McDermott,& Ford, 1997). This component is observed typically about
180–270 ms after target onset and is computed by takingthe voltage difference between corresponding pairs of
electrodes over left and right posterior scalp (e.g., PO7 and
PO8), taking into account the hemifield in which attentionis deployed. The voltage at the electrode on the contralat-
eral side relative to the attended hemifield is more negative
than the voltage at the ipsilateral electrode. Usually,researchers compute an average contralateral waveform by
averaging the voltage at the right-sided electrode (e.g.,
PO8) when attention is deployed to the left with the voltageat the left-sided electrode (e.g., PO7) when attention is
deployed to the right. An average ipsilateral waveform is
computed by averaging the voltage at the left-sided elec-trode when attention is deployed to the left with the voltage
at the right-sided electrode when attention is deployed to
R. Perron ! C. Lefebvre ! N. Robitaille ! B. Brisson !F. Gosselin ! M. Arguin ! P. Jolicœur (&)Departement de Psychologie, Universite de Montreal,C.P. 6128, Succursale Centre-ville,Montreal, QC H3C 3J7, Canadae-mail: [email protected]
123
Psychological Research (2009) 73:222–232
DOI 10.1007/s00426-008-0214-y

the right. In a final step, the ipsilateral waveform is sub-
tracted from the contralateral waveform, yielding the N2pcwaveform. The name of this component, N2pc, thus sig-
nifies a negative-going deflection in the ‘‘N2’’ time range
(180–270 ms) that is largest at posterior ‘‘p’’ scalp sites andcontralateral ‘‘c’’ to the location of the attended visual item.
The designation ‘‘N2’’ is not meant to associate this com-
ponent with other N2 components, but rather merelyindicates the approximate time range of the component
(Luck & Hillyard, 1994a).The N2pc has proven to be a sensitive measure of the
locus of visual spatial attention in visual search (e.g., Luck
& Hillyard, 1994a, b; Woodman & Luck, 2003), underdual-task conditions, such as the attentional blink (e.g.,
Dell’Acqua, Sessa, Jolicœur, & Robitaille, 2006; Jolicœur,
Sessa, Dell’Acqua, & Robitaille, 2006a, b; Robitaille,Jolicœur, Dell’Acqua, & Sessa, 2007) or the psychological
refractory period (e.g., Brisson & Jolicœur, 2007a, b), and
under conditions where attention could be captured bydistracting peripheral stimuli (e.g., Hickey, McDonald, &
Theeuwes, 2007; Kiss, Jolicoeur, Dell’Acqua, & Eimer,
2008; Leblanc, Prime, & Jolicœur, 2008).In many experiments designed to elicit the N2pc
researchers have also found a slower and later wave in the
contralateral-minus-ipsilateral waveforms. We will refer tothis ERP component as the SPCN (sustained posterior
contralateral negativity; e.g., Jolicœur et al., 2006a).
Jolicœur et al. (2006a, b) suggested that the SPCN reflectsinformation storage in VSTM, despite the fact that their
experiments were not specifically designed to study mem-
ory. Jolicœur and colleagues argued that passage throughVSTM was required in order for visual stimuli to make
contact with mechanisms that exercise cognitive control
over subsequent behaviour. As for the N2pc, the SPCN isobserved following the visual encoding of a stimulus pre-
sented off the vertical midline, either in the left or right
visual field. In order to deconfound memory encoding fromlow-level stimulus differences, the target stimuli in one
visual field are presented with an equivalent set of distractor
stimuli in the other visual field. Klaver, Talsma, Wijers,Heinze, and Mulder (1999) were the first to argue that the
SPCN reflects activity specifically related to encoding and
retention in VSTM, a view that received additional supportfrom the elegant work by Vogel and colleagues (Vogel &
Machizawa, 2004; McCollough, Machizawa, & Vogel,
2007). Importantly for present purposes, Vogel and col-leagues showed that the amplitude of the SPCN increased as
the number of target items is increased, reaching a maxi-
mum when the number of stimuli to be encoded equalled orexceeded the estimated capacity of VSTM (on a subject-by-
subject basis; Vogel & Machizawa, 2004). There is also a
strong association between the probability of a correctresponse and the amplitude of the SPCN in several studies
(e.g., Dell’Acqua et al., 2006; Jolicœur et al., 2006a, b;
Robitaille et al., 2007).Given that the N2pc and SPCN are observed following
the same contralateral-minus-ipsilateral waveform sub-
traction, just at different times, one may wonder whetherthe SPCN is simply additional activity of the same sort as
that which generated the N2pc. In other words, is the SPCN
a reflection of additional activity due to spatial attention, asopposed to activity associated with VSTM, as some have
argued? Jolicœur, Brisson, and Robitaille (2008) examinedthis issue by varying the number of items to be encoded in
a task requiring an immediate response. They found an
effect of the number of items on the amplitude of the SPCNand the absence of a similar effect for the N2pc. One goal
of the present study was to provide further evidence for the
claim that the SPCN is a component distinct from N2pcthat reflects primarily activity in VSTM whereas N2pc
reflects spatial attention. Thus, one goal was to dissociate
these two ERPs. To achieve that goal, we first addressed apossible methodological confound that could provide an
alternative, attentional account of the SPCN. Then, we used
two different manipulations to link the SPCN to VSTM.In the work of Vogel and colleagues, the test items were
always presented at the same, lateralized location as the
memory items (Vogel & Machizawa, 2004; McColloughet al., 2007). Thus, the resulting SPCN could reflect the
maintenance of stimuli in VSTM at that particular location,
or simply be the result of sustained attention to a lateralisedlocation, resulting in a prolongation of the N2pc. We
therefore designed our experiment specifically to discour-
age subjects from maintaining attention at the location ofencoding, by always presenting the test array at fixation
instead of at the lateralised memory location. Conse-
quently, the most important spatial location immediatelyfollowing encoding of the memory items was the region
around the fixation point. Sustained attention to the central
fixation point could not yield an SPCN, because of thelateralised nature of this component. We note that Klaver
et al. (1999) tested memory for polygons either at the same
location, or on the opposite side relative to side of encodingand nonetheless found an SPCN, suggesting that antic-
ipating a test shape at the same location on all trials is not
necessary in order to observe the SPCN, and one mightargue that their procedure would have encouraged subjects
to attend to the middle or to spread attention to the entire
display in anticipation of the test array. Nonetheless, in50% of their trials the memory probe was on the same side
as the encoded shape, and this may have been sufficient to
encourage subjects to maintain an attentional focus on thatside (with attention shifting to the other side when
required). As such, our procedure provides a stronger test
because the test array was never presented at the site of thememory array, providing no reason to maintain attention at
Psychological Research (2009) 73:222–232 223
123

that location, unless part and parcel of the creation and
maintenance of a visual memory require continued atten-tion at the spatial locations of encoded items.
We also used two strategies to link the SPCN with
VSTM. First, we manipulated the number of items to beencoded and retained in the memory task. The stimuli
consisted of two or three small horizontal bars in a square
frame, illustrated in Fig. 1. Based on previous research(e.g., Jolicoeur et al., 2008; Vogel & Machizawa, 2004),
we anticipated that the amplitude of the SPCN would begreater for three bars than for two bars, to the extent that
observers encoded them as distinct objects within the
frame. At the same time we could determine whether theN2pc was also affected by this manipulation. Here we
expected that the N2pc would likely not vary in amplitude
as a function of the number of items to be encoded. Thispattern of results—greater SPCN amplitude for three bars
than two, with no difference for N2pc—would constitute a
dissociation of SPCN from N2pc in terms of the effects ofthe quantity (or perhaps complexity) of the information to
be encoded and retained in VSTM.
The second way of providing a link between retention inVSTM and the SPCN was to vary the duration (450 vs.
650 ms) of the retention interval (the time between the
termination of the memory array and the onset of the test
array). On the assumption that observers would maintain a
representation of the memory array only as long as nec-essary, we expected that the SPCN would return to baseline
earlier (by about 200 ms) for the shorter retention interval
than for the longer one, some time after the presentation ofthe test array. The N2pc should not be affected by the
retention interval because this manipulation occurred after
the usual time range of the N2pc.There is a final way in which the SPCN and the N2pc
could be distinguished. Luck et al. (1997) found that N2pcamplitude was smaller when the items in the search array
were in the upper visual field compared to equivalent items
in the lower field. One account of this difference is basedon the way in which receptive fields of visually-sensitive
cells project to primary and secondary visual cortex
depending on the position of the stimuli in visual space.Stimuli in the upper visual field project from the retina to
more ventral portions of the primary visual cortex (not to
be mistaken with the ventral stream) whereas stimuli in thelower visual field project from the retina to more dorsal
portions of the primary visual cortex (Kandel, Schwartz, &
Jessell, 2000; Sereno et al., 1995). This anatomical dis-tinction is maintained, although less so, in other (later)
visual areas. One interpretation of the effect of visual fields
on the amplitude of the N2pc is that projections to neuralgenerators in more dorsal portions of visual cortex are
closer and/or perhaps oriented more optimally to produce
large potentials at typical posterior electrode sites such asPO7 and PO8. In contrast, stimulation of the upper visual
field would lead to the activation of more distant (and
perhaps less optimally oriented) generators in visual cortex,leading to smaller voltages at occipital electrodes. Another
account that has been proposed hinges on the notion that
attentional mechanisms receiving projections from theupper versus lower visual fields are different, with higher
spatial resolution for the lower visual field than or the
upper visual field (He, Cavanagh, & Intriligator, 1996).Based on several psychophysical results differentiating
performance for stimuli in the upper versus lower visual
field, but not for adaptation believed to occur in V1, Heet al. (1996) argued that an attentional filter acts beyond the
primary visual cortex, in one or more higher visual cortical
areas, with different filter characteristics for upper andlower visual field inputs. The evidence suggests a func-
tional asymmetry in the allocation of the attention in favour
of the lower visual field (better spatial resolution in lowervisual field compared to upper), and perhaps this is the
result of an anatomical difference between projections
from V1 to the dorsal versus ventral paths in early visualprocessing. This could be taking place very locally, rather
than at the scale of the larger ventral–dorsal distinction
associated with the what–where distinction, although, forexample, Maunsell and Newsome (1987) found more
++
+
++
+
150 ms
450 msor
650 ms
untilresponse
accuracyfeedback
++++
+++
++
+
++++++
+++
150 ms
450 msor
650 ms
untilresponse
accuracyfeedback
Fig. 1 Illustration of the stimuli and trial sequence. The uppersequence shows a trial in which stimuli to be memorised werepresented in the upper visual field and consisted of two red bars (halfof the subjects encoded red items and half green items). Stimuli to beencoded could be presented to the left or right. From left to right, thememory array was presented for 150 ms, followed by a retentioninterval of either 450 or 650 ms during which the fixation cross wasvisible. The probe array was presented centered at fixation andremained on the screen until the observer responded (same ordifferent). Immediately after the response we provided accuracyfeedback (? or -) at fixation. The lower sequence illustrates a trial inwhich memory items (three red bars) were presented in lower visualfield. See text for further details
224 Psychological Research (2009) 73:222–232
123

numerous projections between early visual areas to parietal
region for the lower visual field than the upper visual field.Although we cannot yet determine whether the differ-
ence in the amplitude of the N2pc for upper versus lower
visual field stimuli is due to simple anatomical differencesin terms of direct projections from the retina to early visual
cortex (ventral vs. dorsal projections for V1 and V2; Luck
et al., 1997) or to more complex wiring differences acrosscortical areas representing upper and lower visual fields in
terms of connections to other brain regions, implementingdifferent attentional filtering properties (He et al., 1996),
this is not critical. We know of no experimental work that
has examined the effects of upper versus lower visual fieldencoding on the SPCN, and presumably on the represen-
tation of objects in VSTM. This was one of the key
manipulations in the present work. Stimuli to be encoded inVSTM were presented either in the upper or lower visual
hemifield. We expected this manipulation to have a large
impact on the amplitude of the N2pc (replicating results ofLuck et al., 1997), and we sought to discover whether this
manipulation would have any effect on the SPCN. If the
SPCN is not affected by the upper/lower field manipulationbut the N2pc is, as expected, then we would conclude that
the N2pc and SPCN are generated by different neural
generators because this would constitute an obviousneurophysiological dissociation. If both the N2pc and
SPCN are affected, in similar ways, by the upper/lower
visual field manipulation, however, then the interpretationwould be more complex. Given the convincing prior
evidence for a functional difference between these com-
ponents (corroborated further by results of the presentwork), we might conclude that the same neural generators
produce the observed activity (N2pc and SPCN), but that
they perform different functions at different times. We willdiscuss these possibilities at greater length in ‘‘Discussion’’
of the article.
Methods
Participants
Twenty-three undergraduate student volunteers were testedand paid for their participation. They reported no history of
neurological problems, normal or corrected-to-normal
acuity, and normal colour vision. Signed informed consentwas provided by each participant prior to participation. Ten
subjects were excluded because their electroencephalo-
gram (EEG) included too many artefacts (as explained indetails in the electrophysiological recording section);
leaving 13 subjects (9 females, 4 males, ranging from 20–
26 years in age). All females and one male were right-handed.
Stimuli
The stimuli were displayed on a 17-in. colour cathode-raytube (CRT) controlled by a microcomputer running E-
prime 1.04 software. The stimuli were two outline white
squares (two frames), presented at the same time, eachcontaining horizontal bars. The center of each frame was
located 3.0" above or below and 3.2" on the left and right
of the fixation point (at a distance of 57 cm from thecomputer screen). Each frame subtended a visual angle of
5.0". A fixation point (0.2") was present at the center of
display. The layout is illustrated (not to scale) in Fig. 1.In a given trial, the two frames were presented in the
upper visual field or the lower visual field, randomly from
trial to trial. Each frame in a trial contained the samenumber of bars, two or three (varied randomly from trial to
trial). The total number of pixels in two- and three-bar
displays was the same and thus bars in two-bar and three-bar displays had different lengths, but the overall stimulus
energy was the same. The position of each bar in each
frame was randomly generated at run time, under followingconstraints: the bars did not have the same position, did not
go outside of the frame, or overlap other bar(s), the vertical
distance between two bars had a minimum of 0.02".The target was defined by bar colour: red for half of the
participants and green for other half, counterbalanced
across subjects. The green and red bars were always inopposite visual field. The relevant side changed randomly
from trial to trial. The colours of the bars were approxi-
mately equiluminant to equate their early sensoryresponses. The luminance of the stimuli was measured with
a Minolta CS-100 chroma meter. The luminance of the
green colour was 26 cd/m2 (CIE xy coordinates ofx = 0.297, y = 0.579; Wyszecki & Stiles, 1982), red was
26 cd/m2 (x = 0.391, y = 0.282), the fixation point and
frame were 26 cd/m2 (x = 0.276, y = 0.271) and lumi-nance of the background was 0.70 cd/m2 (x = 0.249,
y = 0.271).
Procedure
The participant was seated at a distance of 57 cm from thecomputer screen in a dark electrically shielded chamber.
The space bar on the keyboard was pressed to start each
trial. After trial initiation, a fixation point appeared in thecenter of the screen followed by the memory stimulus
array. As illustrated in Fig. 1, the memory array consisted
of a 150 ms symmetric bilateral display of two whiteframes—one containing green bars; the other containing
red bars. After the offset of the visual display, a delay of450 ms [short-retention condition; 600 ms, stimulus onset
asynchrony (SOA)] or 650 ms (long-retention condition;
800 ms SOA) was imposed, followed by the presentation
Psychological Research (2009) 73:222–232 225
123

of a probe display at fixation. The retention interval (450 or
650 ms) varied randomly from trial to trial. The fixationpoint remained visible during the retention interval.
The memory probe array was a white frame with bars in
the target colour. Participants were instructed to decidewhether probe bar positions were identical (in the positions
of all bars) or different from the memory array, as fast as
possible, while making as few errors as possible. Whendifferent, the probe display varied from the memory dis-
play in the position of one bar. When different, one bar wasmoved by a minimum of 20 pixels, (visual angle of 0.7")but remained inside the white frame. The trials in which a
bar position was changed represented 50% of trials (ran-domly throughout the experiment). Participants responded
with the right hand using a specific key on the numeric
keypad of a computer keyboard when target and probewere identical (the key was ‘‘1’’) and another key when
they were different (the key was ‘‘2’’). Accuracy feedback
was provided at the end of each trial. A plus sign appearedwhen participant made a correct response and a minus sign
when they made an error. Participants pressed the space bar
on the keyboard to start the next trial. Each subject per-formed one practice block of 64 trials followed by 15
experimental blocks of 64 trials for a total of 960 experi-
mental trials. Participants were required to maintainfixation on the centrally located point throughout each trial.
They were instructed to blink and move their eyes only
between trials.
EEG recording and data analysis
EEG recordings were made with a Biosemi Active-two
system, with 64 active Ag-AgCl scalp electrodes posi-tioned using the International 10-10 system: Fp1, Fp2, Fpz,
AF3, AF4, AF7, AF8, AFz, F1, F2, F3, F4, F5, F6, F7, F8,
Fz, FC1, FC2, FC3, FC4, FC5, FC6, FCz, FT7, FT8, C1,C2, C3, C4, C5, C6, Cz, T7, T8, TP7, TP8, CP1, CP2, CP3,
CP4, CP5, CP6, CPz, P1, P2, P3, P4, P5, P6, P7, P8, P9,
P10, Pz, PO3, PO4, PO7, PO8, POz, O1, O2, Oz, Iz. Inaddition, activity was also recorded at the two mastoids.
The EEG was algebraically re-referenced to the average of
the left and right mastoids during post-recording analyses.The electrooculogram (EOG) was recorded with active
Ag–AgCl electrodes placed at the left and right canthi
(HEOG) and above and below the left eye (VEOG). Thehorizontal electrooculogram (HEOG) was obtained by
subtracting the signal at the left electrode from the signal
recorded at the right electrode. The vertical electrooculo-gram (VEOG) was obtained by subtracting the signal at the
electrode above the left eye from the signal at the electrode
below the left eye. For three participants, the verticalelectrooculogram (VEOG) was obtained by subtracting the
signal at FP1, above the left eye, from the signal at the
electrode below the left eye. The signals were amplified,low-pass filtered with a cut-off frequency of 67 Hz, and
digitized at 256 Hz during the recordings.
During post-recording analysis, a 5 Hz, 48 db Hz low-pass filter was applied to the HEOG and VEOG waveforms,
while a filter with a 0.1 Hz, 12 db high-pass was applied to
all electrode waveforms. A derivation of more than 50 lVover 100 ms in the VEOG was considered as an eye blink.
A derivation of more than 35 lV within a period of 200 ms([2", Hillyard & Galambos, 1970; Lins, Picton, Berg &
Scherg, 1993; see also Luck, 2005; for a review), in the
HEOG was considered as an eye movement. Trials withincorrect responses, eyes blinks, or eyes movements, were
removed during post-recording analysis. The remaining
trials were submitted to a final inspection, where a deriva-tion of more than 100 lV over 200 ms during a trial was
considered an artefact, and trials with such artefacts were
removed from the average for this electrode.Participants were excluded from behavioural and elec-
trophysiological analyses if the trials with incorrect
responses, eyes blinks, eyes movements, and artefactsrepresented more than 40% of the trials. For each partici-
pant and each condition we also computed an average
HEOG waveform for trials on which the memory itemswere on the left and an average for trials on which the
memory items were on the right. Participants were also
excluded if the average HEOG waveform for left or righttrials exceeded residual 3.0 lV, corresponding to an eye
movement of about 0.2" in the direction of the to-be-
encoded items (Hillyard & Galambos, 1970; Lins et al.,1993; see Luck, 2005; for a review). Eight participants
were excluded because of eye movements toward the
memory items exceeding 0.2" and one participant wasexcluded because eyes blinks contaminated too many trials.
One participant was excluded from the analysis because a
technical problem resulted in the loss of more than 50% ofthis subject’s data.
In most analyses we segmented the continuous EEG
starting 200 ms prior to, and ending 1,100 ms after, theonset of the memory array. The EEG at each electrode was
baseline corrected by subtracting the mean voltage during
the 200 ms pre-stimulus period from the voltage during theentire segment. The EEG from artefact-free trials was
averaged, separately for each condition, as detailed below.
However, evaluation of the effects of the retention intervalmanipulation required longer segments (-200 to 1,800 ms,
relative to the onset of the memory array). Unfortunately,
many subjects had a tendency to blink, or move their eyes,towards the end of the trials, and lengthening the segments
caused the rejection of a very large proportion of trials
for several subjects. To deal with this issue, we analysedthe data differently for the analyses focusing on the
226 Psychological Research (2009) 73:222–232
123
manipulation of the duration of the retention interval. For
these analyses only, after removing trials contaminated byeye movements, we did not reject trials with blinks, but
instead corrected the EEG using the Gratton–Coles algo-
rithm (Gratton, Coles, & Donchin, 1983), which enabled usto retain a sufficient number of trials. Although we prefer
to reject trials contaminated with ocular artefacts, here we
adopted a simple correction procedure and compared thewaveforms obtained in analyses in which artefact trials
were rejected with the waveforms obtained after theapplication of the correction procedure. The general
appearance of the waveforms was not changed, suggesting
that the application of the ocular artefact correction pro-cedure did not distort the waveforms significantly. No
formal test was used to test the effect of the ocular cor-
rection. As will be described in full details below, the N2pcand the SPCN are lateralized components resulting from
the subtraction of activation measured on one side from the
activation measured on the other side of the scalp. Eyeblink artefacts, however, are bilateral. Therefore, even if
the correction did not completely remove eye blinks, and
residual artefacts were still present in the posterior sitesthat are of interest in this paper, it would not have an effect
on the N2pc or the SPCN. Indeed, the bilateral residual
activation would be cancelled in the subtraction of one sidefrom the other.
The N2pc and SPCN waveforms were obtained by
subtracting the average ipsilateral waveform from theaverage contralateral waveform, for each lateralized elec-
trode pair, using the following formula:
VN2pc;SPCN " 1
2VleftStim#right $ VrightStim#left
! "
# 1
2V leftStim#left $ VrightStim#right
# $;
where VleftStim-right is the voltage at a left-sided electrode(e.g., PO7) for trials on which the to-be-encoded bars were
in the right visual field.
The N2pc was quantified by computing the mean volt-age in a window of 180–270 ms relative to the onset of the
memory array. The SPCN was generally quantified by
computing the mean voltage in a window of 450–600 msfrom the onset of the memory array. However, there were a
number of other measures used to highlight various aspects
of the SPCN, and these are described in ‘‘Results’’.
Results
The analyses are reported in two sections: behavioural and
electrophysiological results. Only the trials with a correctresponse were analysed in reaction time and electrophysi-
ological results.
Behavioural results
Both success rate and reaction time were analysed. Foreach measure we performed an ANOVA in which position
(upper vs. lower field), memory load (two vs. three bars),
and retention interval (450 vs. 650 ms) were treated aswithin-subjects factors. Mean accuracy and mean reaction
time are shown in Table 1. The only statistically significant
effect was the main effect of number of items in theanalysis of response times; the mean RT was 628 ms when
verifying memory for 2 bars and 638 ms when verifying
memory for 3 bars, F(1, 12) = 11.92, MSE = 225.8,p\ 0.01. All other Fs were smaller than 2.20, while all Fsfor accuracy data were smaller than 2.13. These results
suggest a slightly longer process of comparison when morebars were to be retained in memory.
Electrophysiological results
Initial electrophysiological analyses examined mean
amplitudes measured for the six posterior lateralizedelectrode pairs: (O1, O2), (PO3, PO4), (P3, P4), (P5, P6),
(P7, P8), and (PO7, PO8). The N2pc and SPCN had a
maximum voltage at (PO7, PO8), and so we performed allfurther analyses for the waveforms measured at these sites.
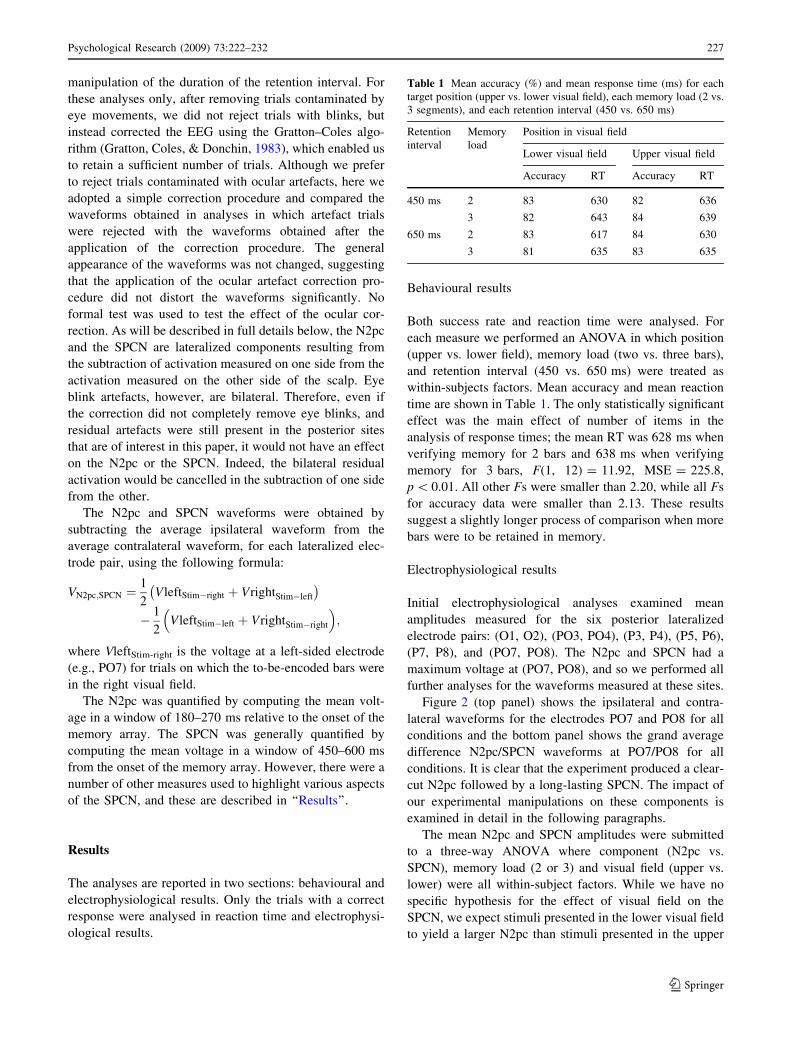
Figure 2 (top panel) shows the ipsilateral and contra-
lateral waveforms for the electrodes PO7 and PO8 for allconditions and the bottom panel shows the grand average
difference N2pc/SPCN waveforms at PO7/PO8 for all
conditions. It is clear that the experiment produced a clear-cut N2pc followed by a long-lasting SPCN. The impact of
our experimental manipulations on these components is
examined in detail in the following paragraphs.The mean N2pc and SPCN amplitudes were submitted
to a three-way ANOVA where component (N2pc vs.
SPCN), memory load (2 or 3) and visual field (upper vs.lower) were all within-subject factors. While we have no
specific hypothesis for the effect of visual field on the
SPCN, we expect stimuli presented in the lower visual fieldto yield a larger N2pc than stimuli presented in the upper
Table 1 Mean accuracy (%) and mean response time (ms) for eachtarget position (upper vs. lower visual field), each memory load (2 vs.3 segments), and each retention interval (450 vs. 650 ms)
Retentioninterval
Memoryload
Position in visual field
Lower visual field Upper visual field
Accuracy RT Accuracy RT
450 ms 2 83 630 82 636
3 82 643 84 639
650 ms 2 83 617 84 630
3 81 635 83 635
Psychological Research (2009) 73:222–232 227
123
visual field. We also expect that a higher memory load will
create a greater SPCN, but that factor will not have aneffect on the size of the measured N2pc, therefore pro-
ducing at least an interaction between component and
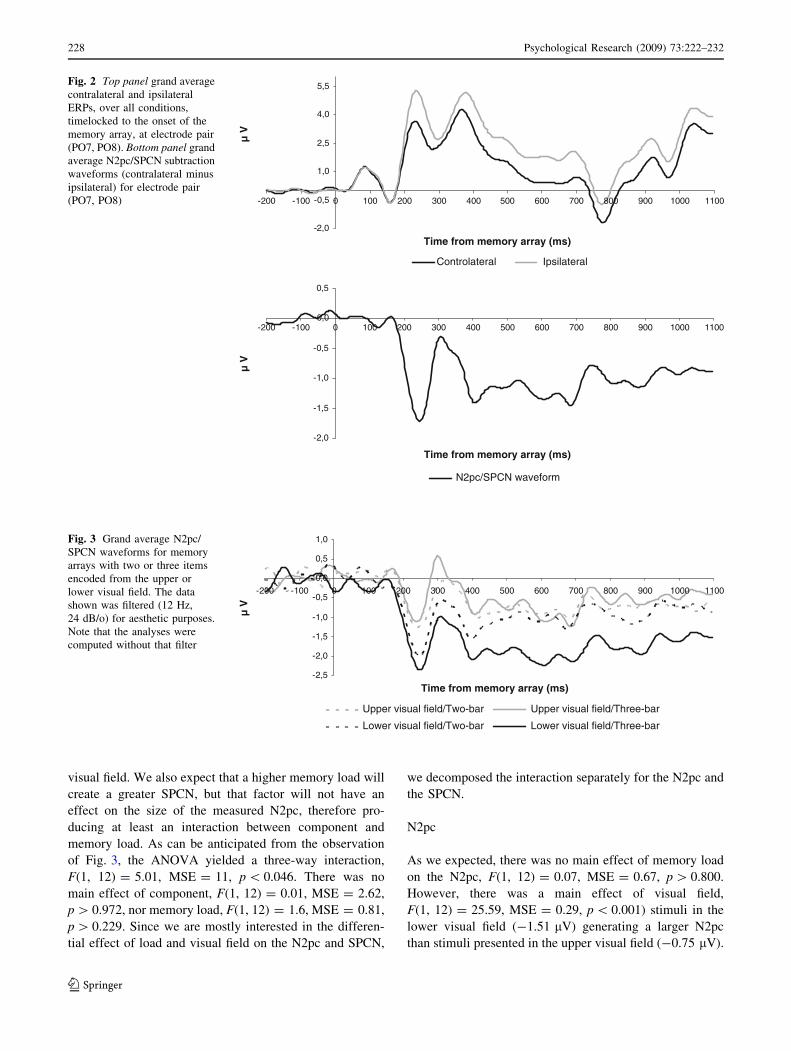
memory load. As can be anticipated from the observationof Fig. 3, the ANOVA yielded a three-way interaction,
F(1, 12) = 5.01, MSE = 11, p\ 0.046. There was no
main effect of component, F(1, 12) = 0.01, MSE = 2.62,p[ 0.972, nor memory load, F(1, 12) = 1.6, MSE = 0.81,
p[ 0.229. Since we are mostly interested in the differen-tial effect of load and visual field on the N2pc and SPCN,
we decomposed the interaction separately for the N2pc and
the SPCN.
N2pc
As we expected, there was no main effect of memory load
on the N2pc, F(1, 12) = 0.07, MSE = 0.67, p[ 0.800.
However, there was a main effect of visual field,F(1, 12) = 25.59, MSE = 0.29, p\ 0.001) stimuli in the
lower visual field (-1.51 lV) generating a larger N2pcthan stimuli presented in the upper visual field (-0.75 lV).
-2,0
-0,5
1,0
2,5
4,0
5,5
-200 -100 0 100 200 300 400 500 600 700 800 900 1000 1100
Time from memory array (ms)µ
V
Controlateral Ipsilateral
-2,0
-1,5
-1,0
-0,5
0,0
0,5
-200 -100 0 100 200 300 400 500 600 700 800 900 1000 1100
Time from memory array (ms)
µ V
N2pc/SPCN waveform
Fig. 2 Top panel grand averagecontralateral and ipsilateralERPs, over all conditions,timelocked to the onset of thememory array, at electrode pair(PO7, PO8). Bottom panel grandaverage N2pc/SPCN subtractionwaveforms (contralateral minusipsilateral) for electrode pair(PO7, PO8)
-2,5
-2,0
-1,5
-1,0
-0,5
0,0
0,5
1,0
-200 -100 0 100 200 300 400 500 600 700 800 900 1000 1100
Time from memory array (ms)
µ V
Upper visual field/Two-bar Upper visual field/Three-bar
Lower visual field/Two-bar Lower visual field/Three-bar
Fig. 3 Grand average N2pc/SPCN waveforms for memoryarrays with two or three itemsencoded from the upper orlower visual field. The datashown was filtered (12 Hz,24 dB/o) for aesthetic purposes.Note that the analyses werecomputed without that filter
228 Psychological Research (2009) 73:222–232
123

The interaction between memory load and visual field was
not significant, F(1, 12) = 2.68, MSE = 0.24, p[ 0.127.
SPCN
As expected from the overall interaction, the pattern of
results for the SPCN differed from that of the N2pc.
Contrary to the N2pc, there was an interaction betweenmemory load and visual field. Decomposition of this
interaction revealed that the memory load effect was sig-
nificant in the lower visual field, F(1, 12) = 8.72,MSE = 0.60, p\ 0.013, a memory load of three yielding
alarger SPCN (-1.93 lV) than a memory load of 2
(-1.03 lV), but not for the upper visual field, a memoryload of two yielding a slightly larger SPCN (-0.81 lV)than a memory load of 3 (-0.69 lV), F(1, 12) = 0.48,
MSE = 0.20, p[ 0.503. Note that this interaction couldnot be due to the absence of an SPCN in the load 2 con-
dition: a t test revealed that the mean amplitude during the
450–600 ms interval was significantly different than 0,t(12) = -2.95, p\ 0.013.
Retention interval (450 vs. 650 ms)
We examined the effects of the duration of the retention
interval by segmenting the EEG into longer segments(-200 to 1,800 ms relative to the onset of the memory
array) than for the previous analyses. As explained earlier,
rather than exclude trials with ocular artefacts we applied acorrection algorithm. The corrected EEG was then aver-
aged separately for each retention interval. These curveswere baseline corrected based on the mean amplitude in a
window of 400–600 ms (200 ms prior to the presentation
of the test array, at the shortest retention interval). Wechose this new baseline to equate the curves as much as
possible just prior to when they might start to deviate from
each other, given that, in principle, all conditions were
identical up to that point. The resulting curves, given thatthey start from a time during which the SPCN was in full
force, should deviate toward the positive when the SPCN
returns to baseline.The grand average ERPs resulting from these proce-
dures are shown in Fig. 4. The reader will note that the data
were filtered in a lowpass, 3 Hz, 48 dB/o, in accordancewith the Jackknife procedure. The waveform for the short-
retention interval condition deviates toward the positive
about 200 ms earlier than the waveforms for the long-retention interval. We used a jackknife approach to
determine whether the waveforms returned to baseline at
different latencies for the two retention intervals. In thejackknife approach each of the n subjects was removed
once from n grand average based on n - 1 subjects (see
Kiesel, Miller, Jolicœur, & Brisson, 2008; Miller, Patterson,& Ulrich, 1998; Ulrich & Miller, 2001). We performed
a jackknife analysis in which we estimated, for each
jackknifed waveform, the latency at which the waveformcrossed a voltage of 0.6 lV separately for the short and
long-retention interval waveforms, and subjected these
estimates to an ANOVA that considered retention intervalas a within-subjects factor. Given that the measurements
are taken on a curve that includes virtually the same sub-
jects, the variance of the resulting set of measurements issmaller than the variance of the measurements that would
have been obtained from each individual subject curves.
The results of the ANOVA were therefore corrected to takeinto account the smaller variability of the jackknifed
estimates (see Miller, Patterson, & Ulrich, 1998; Ulrich &Miller, 2001). The analysis confirmed that the SPCN
returned to baseline earlier in the shorter retention interval
condition (mean = 1,092 ms) than in the longer retentioninterval condition (mean = 1,296 ms), F(1, 12) = 11.73,
MSE = 159.78, p\ 0.006.
Fig. 4 Grand average SPCN waveforms for different retentionintervals, baseline corrected relative to the 200 ms period prior tothe onset of the memory test array (in the short-retention intervalcondition, that is, 400–600 ms from onset of the memory array; note
that the same baseline period was used for the two retention intervalconditions). Note that the data is shown with the filter applied duringthe Jackknife procedure
Psychological Research (2009) 73:222–232 229
123

In Fig. 5 we show maps of the distributions of mean
voltage during the N2pc (170–280 ms) and SPCN (450–600 ms). The voltage maps were quite similar across the
N2pc and SPCN, suggesting that the neural generators of
the two components are both in posterior visual areas.
Discussion
In this study we used a paradigm that combined a simplevisual spatial task with a VSTM task. Stimuli to be enco-
ded in VSTM first had to be selected from a more complex
display on the basis of a pop-out colour (e.g., green) fromone side of a left-right bilateral display in which an equal
amount of distractor information (e.g., in red) on the other
side was to be ignored. The purpose of this manipulationwas to induce a clear and distinct N2pc component on the
basis of the deployment of visual spatial attention to the
to-be-memorised items, which could, in principle, be iso-lated from the later expected SPCN component associated
with maintenance in VSTM (e.g., Jolicœur et al., 2006a, b;
Vogel & Machizawa, 2004). In previous work (e.g., Klaver
et al., 1999; Vogel & Machizawa, 2004) focusing onVSTM, the relevant information was cued well ahead of
the onset of the memory array, making the isolation of
N2pc from SPCN more difficult. As can be seen in Fig. 2,our procedure was successful in eliciting distinct N2pc and
SPCN waves, enabling us to target analyses on each
component designed to evaluate the impact of our experi-mental manipulations.
VSTM was tested by presenting a pattern at fixation(Fig. 1). This aspect of the experimental design was
intended to require a deployment of visual spatial attention
in the region surrounding the fixation point, at the time ofthe memory test. If the SPCN reflected ongoing deploy-
ment of visual spatial attention at the location of previously
encoded visual objects—in other words a prolongedN2pc—rather than a distinct component reflecting activity
in VSTM, then the SPCN should have disappeared 600 ms
after the onset of the memory array, because this was thetime at which the test array was presented in half of the
trials (short-retention interval condition). As can be seen in
Fig. 4, the SPCN waves began to attenuate significantly(indicated by a positive-going shift in Fig. 4) long after the
presentation of the test array, for both retention interval
conditions. If the SPCN was just a long N2pc, presentingthe test array at fixation would cause a disappearance of the
SPCN about 200 ms following the onset of the test array
(because the test array was at fixation, and neither in leftnor right visual field, attention to this stimulus cannot
generate an N2pc). Thus, the fact that the positive-going
shifts in Fig. 4 begin long after an expected cancellation ofthe N2pc, associated with a shift of attention towards fix-
ation, provides further evidence for the distinctive nature of
the SPCN. This finding suggests that the SPCN reflectsactivity specifically related to VSTM, rather than ongoing
visual spatial attention.
We gathered more evidence of the association betweenthe SPCN and VSTM through our manipulation of the
retention interval. We used two different retention intervals
to test whether the SPCN would return to baseline laterwith a longer retention interval, which it did. Moreover, the
difference in return to baseline was about the same
(204 ms) as the difference between intervals (200 ms). Ifwe assume that stimuli are maintained in VSTM only as
long as necessary, then this pattern of return to baseline is
consistent with a link between the SPCN and VSTM.The SPCN was also influenced by the number of items
in the memory array, the larger memory load yielding a
greater SPCN, whereas the N2pc was not influenced bymemory load, as shown in the decomposition of the three-
way interaction. This difference constitutes a clear func-
tional dissociation between the two components, as well asevidence in favour of a link between VSTM and the SPCN.
Fig. 5 Distribution of mean voltage during the N2pc (170–280 msfrom onset of the memory array), left column, and the SPCN (450–600 ms) right column, for upper visual field memory arrays, top row,and for lower visual field memory arrays, bottom row. Sinceipsilateral data from the left and the right, as well as contralateraldata from both sides are averaged in the subtraction procedure used tocreate these maps, we end with data for one side of the scalp. Weadded a mirror reflection of these data for aesthetic purposes
230 Psychological Research (2009) 73:222–232
123

However, the interaction of memory load with visual
field, for the SPCN, makes the portrait a bit more complex,and will be discussed below. As can be seen in Fig. 2, the
field of presentation of the memory array (upper vs. lower
visual field) had a major impact both on the amplitude ofthe N2pc and of the SPCN. The lower N2pc amplitude for
upper visual field stimuli was expected on the basis of
results of Luck et al. (1997). Here we show for the firsttime that the amplitude of the SPCN is also affected in a
very similar way by presentation in the upper versus lowervisual field. This finding is important because it shows that
the anatomical, and/or attentional, field effects that influ-
ence the N2pc also have a commensurate impact on theSPCN. Also, the effect of the field of presentation (upper
vs. lower) was similar across the components, suggesting
that the neural generators of the N2pc and of the SPCN arestructured in the same orientation relative to the recording
electrodes, with receptive fields in upper versus lower
visual fields projecting to more ventral and dorsal portionsof visual cortex, respectively. Perhaps the very same
generators are involved but they perform different func-
tions at different times. The N2pc might reflect an initialdeployment of attention to the general region of interest
(and hence not influenced by the number of items in that
region), whereas a later differentiation of items would takeplace as information is transferred to VSTM, leading to
effects on SPCN.
The situation becomes more complex when we take intoaccount the interaction between memory load and visual
field observed for the SPCN mentioned earlier. Recall that
the SPCN had a larger amplitude for three bars than for twobars, but only for memory arrays presented in the lower
visual field. There was no increase in SPCN amplitude as
the number of items was increased for memory arrayspresented in the upper visual field (Fig. 2). These are
perhaps the most intriguing results of the present work.
Note that there were no differences in overall accuracy orresponse time as a function of field (upper vs. lower) of
presentation. To remain consistent with previous research,
we suggest that representations of stimuli encoded from thelower visual field may have a greater tendency to be
encoded as distinct elements, perhaps because of a greater
attentional resolution (He et al., 1996). Items shown in theupper visual field may tend to be encoded more holisti-
cally, as a single pattern, perhaps as a result of a greater
difficulty to individuate elements due to lower attentionalresolution. The difference between two- and three-bar
patterns would be attenuated for memory arrays shown in
the upper visual field because the additional bar would beless likely to be encoded as a distinct item. Of course, this
interpretation is highly speculative, but it is broadly con-
sistent with earlier work showing differences in attentionalresolution across the upper and lower visual fields
(He et al., 1996). The other, anatomical account would be
that the orientation of the cells in the primary visual cortex,which could explain the smaller effect observed in the
upper visual field, would also make the distinction between
the two memory loads harder to observe, because of a flooreffect. Basically, if the orientation of the cells makes the
SPCN difficult to detect, than it would also make variations
in the SPCN difficult to detect too.In conclusion, the SPCN is strongly affected by whether
stimuli are encoded from the upper or lower visual field,much in the same way as the N2pc, suggesting a strong
neuroanatomical connection between these two compo-
nents. Additional evidence for this connection comes fromseveral experiments, including the present one (Fig. 5), in
which the distribution of voltages on the scalp was very
similar across the two components (e.g., Robitaille &Jolicœur, 2006; Brisson & Jolicœur, 2007b). Nonetheless,
other evidence (such as the differential effect of the number
of items on the two components) suggests strongly that N2pcand SPCN reflect distinct aspects of visual processing, with
N2pc reflecting the deployment of visual spatial attention
and the SPCN reflecting the maintenance of informationin VSTM. The present work contributes to our growing
understanding of the functional and neuroanatomical
underpinnings of these two important cognitive functions.
Acknowledgments This research was supported by research grantsfrom the Natural Sciences and Engineering Research Council ofCanada, The Canadian Institutes of Health Research, the CanadianResearch Chair program, and by an infrastructure grant from theFonds de Recherche en Sante du Quebec to the last author.
References
Brisson, B., & Jolicœur, P. (2007a). Electrophysiological evidence ofcentral interference in the control of visuospatial attention.Psychonomic Bulletin & Review, 14, 126–132.
Brisson, B., & Jolicœur, P. (2007b). A psychological refractory periodin access to visual short-term memory and the deployment ofvisual-spatial attention: Multitasking processing deficits revealedby event-related potentials. Psychophysiology, 44, 323–333.
Dell’Acqua, R., Sessa, P., Jolicœur, P., & Robitaille, N. (2006).Spatial attention freezes during the attention blink. Psychophys-iology, 43, 394–400.
Eimer, M. (1996). The N2pc component as an indicator of attentionalselectivity. Electroencephalography and Clinical Neurophysiol-ogy, 99, 225–234.
Gratton, G., Coles, M. G. H., & Donchin, E. (1983). A new methodfor off-line removal of ocular artifacts. Electroencephalographyand Clinical Neurophysiology, 55, 468–484.
He, S., Cavanagh, P., & Intriligator, J. (1996). Attentional resolutionand the locus of visual awareness. Nature, 383, 334–337.
Hillyard, S. A., & Galambos, R. (1970). Eye movement artifact in theCNV. Electroencephalography and Clinical Neurophysiology,28, 173–182.
Hickey, C., McDonald, J., & Theeuwes, J. (2006). Electrophysiolog-ical evidence of the capture of visual attention. Journal ofCognitive Neuroscience, 18, 604–613.
Psychological Research (2009) 73:222–232 231
123

Jolicœur, P., Brisson, B., & Robitaille, N. (2008). Dissociation of theN2pc and sustained posterior contralateral negativity in a choiceresponse task. Brain Research, 1215, 160–172.
Jolicœur, P., Sessa, P., Dell’acqua, R., & Robitaille, N. (2006a).Attentional control and capture in the attentional blink paradigm:Evidence from human electrophysiology. PsychologicalResearch, 19, 560–578.
Jolicœur, P., Sessa, P., Dell’Acqua, R., & Robitaille, N. (2006b). Onthe control of visual spatial attention: Evidence from humanelectrophysiology. Psychological Research, 70, 414–424.
Kandel, E. R., Schwartz, J. H., & Jessell, T. M. (2000). Principles ofneural science (4th ed.). New York: McGraw-Hill.
Kiesel, A., Miller, J., Jolicœur, P., & Brisson, B. (2008). Measure-ment of ERP latency differences: A comparison of single-participant and jackknife-based scoring methods. Psychophysi-ology, 45, 250–274.
Kiss, M., Jolicœur, P., Dell’Acqua, R., & Eimer, M. (2008).Attentional capture by visual singletons is mediated by top-down task set: New evidence from the N2pc component.Psychophysiology, 45, 1013–1024.
Klaver, P., Talsma, D., Wijers, A. A., Heinze, H.-J., & Mulder, G.(1999). An event-related brain potential correlate of visual short-term memory. NeuroReport, 10, 2001–2005.
Leblanc, E., Prime, D., & Jolicœur, P. (2008). Tracking the locationof visuospatial attention in a contingent capture paradigm.Journal of Cognitive Neuroscience, 20, 657–671.
Lins, O. G., Picton, T. W., Berg, P., & Scherg, M. (1993). Ocularartifacts in EEG and event-related potentials 1: Scalp topogra-phy. Brain Topography, 6, 51–63.
Luck, S. J. (2005). An introduction to the event-related potentialtechnique. Cambridge, MA: The MIT Press.
Luck, S. J., Girelli, M., McDermott, M. T., & Ford, M. A. (1997).Bridging the gap between monkey neurophysiology and humanperception: An ambiguity resolution theory of visual selectiveattention. Cognitive Psychology, 33, 64–87.
Luck, S. J., & Hillyard, S. A. (1994a). Electrophysiological correlatesof feature analysis during visual search. Psychophysiology, 31,291–308.
Luck, S. J., & Hillyard, S. A. (1994b). Spatial filtering during visualsearch: Evidence from human electrophysiology. Journal ofExperimental Psychology: Human Perception and Performance,20, 1000–1014.
Maunsell, J. H. R., & Newsome, W. T. (1987). Visual processing inmonkey extrastriate cortex. Annual Reviews of Neuroscience, 10,363–401.
McCollough, A. W., Machizawa, M. G., & Vogel, E. K. (2007).Electrophysiological measures of maintaining representations invisual working memory. Cortex, 43, 77–94.
Miller, J., Paterson, T., & Ulrich, R. (1998). Jackknife-based methodfor measuring LRP onset latency differences. Psychophysiology,35, 99–115.
Robitaille, N., & Jolicœur, P. (2006). Fundamental properties of theN2pc as an index of spatial attention: Effects of masking.Canadian Journal of Experimental Psychology, 60, 101–111.
Robitaille, N., Jolicœur, P., Dell’Acqua, R., & Sessa, P. (2007). Short-term consolidation of visual patterns interferes with visuo-spatialattention: Converging evidence from human electrophysiology.Brain Research, 1185, 158–169.
Sereno, M. I., Dale, A. M., Reppas, J. B., Kwong, K. K., Belliveau, J. W.,Brady, T. J., et al. (1995). Borders of multiple visual areas inhumans revealed by functional magnetic resonance imaging.Science, 268, 889–893.
Ulrich, R., & Miller, J. (2001). Using the jackknife-based scoringmethod for measuring LRP onset effects in factorial designs.Psychophysiology, 38, 816–827.
Vogel, E. K., & Machizawa, M. G. (2004). Neural activity predictsindividual differences in visual working memory capacity.Nature, 428, 748–751.
Woodman, G. F., & Luck, S. J. (2003). Serial deployment of attentionduring visual search. Journal of Experimental Psychology:Human Perception & Performance, 29, 121–138.
Wyszecki, G., & Stiles, W. S. (1982). Color Science: Concepts andmethods, quantitative data and formulae (2nd ed.). New York:Wiley.
232 Psychological Research (2009) 73:222–232
123