ATSDR - Public Health Statement: Lead Page 1 of 14
368
ATSDR - Public Health Statement: Lead Page 1 of 14 Index | Home | Glossary | Contact Us AGENCY FOR TOXIC SUBSTANCES AND DISEASE REGISTRY CONTENTS U What is lead? 1.2 What happens to lead when it enters the environment? 1.3 How might I be exposed to lead? 1.4 How can lead enter and leave my body? 1.5 How can lead affect my health? 1L6 How can lead affect children? 1.7 How can families reduce the risk of exposure to lead? 1.8 Is there a medical test to determine whether I have been exposed to lead? 19 What recommendations has the federal government made to protect human health? 1.10 Where can I get more information? References RELATED RESOURCES ToxFAQ™ ~ ToxFAQ™ en Espaflol Public Health Statement Toxicological Profile A-Z INDEX ABODE FGHUK L M M Q £ QRSIU VWXYZ ATSDR RESOURCES ToxFAQs™ ToxFAQs™ en Esparlol Public Health Statements Toxicological Profiles Minimum Risk Levels •\30k Public Health Statement for Lead August 1997 CAS# 12709-98-7 This Public Health Statement is the summary chapter from the jk Toxicological Profile for lead. It is one in a series of Public j r Health Statements about hazardous substances and their | health effects. A shorter version, the ToxFAQs™, is also available. This information is important because this substance may harm you. The effects of exposure to any hazardous substance depend on the dose, the duration, how you are exposed, personal traits and habits, and whether other^ chemicals are present. For more information, call the ATSDR' £_ Information Center at 1-888-422-8737. This public health statement tells you about lead and the effects of exposure. The Envirnonmetal Protection Agency (EPA) identifies the most serious hazardous waste sites in the nation. These sites make up the National Priorities List (NPL) and are the sites targeted for long-term federal cleanup activities. Lead has been found in at least 1,026 of the 1,467 current or former NPL sites. However, the total number of NPL sites evaluated for this substance is not known. As more sites are evaluated, the sites at which lead is found may increase. This information is important because exposure to this substance may harm you and because these sites may be sources of exposure. When a substance is released from a large area, such as an industrial plant, or from a container, such as a drum or bottle, it enters the environment. This release does not always result in exposure. You are exposed to a substance only when you come in contact with it. You may be exposed by breathing, eating, or drinking the substance or by skin contact. If you are exposed to lead, many factors determine whether you'll be harmed. These factors include the dose (how much), the duration (how long), and how you come in contact with it. You must also consider the other chemicals you're exposed to and your age, sex, diet, family traits, lifestyle, and state of health http://www.atsdr.cdc.gov/toxprofiles/phsl3.html 9/20/2005
-
Upload
khangminh22 -
Category
Documents
-
view
0 -
download
0
Transcript of ATSDR - Public Health Statement: Lead Page 1 of 14
ATSDR - Public Health Statement: Lead Page 1 of 14
Index | Home | Glossary | Contact UsAGENCY FOR TOXIC SUBSTANCES
AND DISEASE REGISTRY
CONTENTSU What is lead?1.2 What happens to leadwhen it enters theenvironment?1.3 How might I beexposed to lead?1.4 How can lead enterand leave my body?1.5 How can lead affectmy health?1L6 How can lead affectchildren?1.7 How can familiesreduce the risk ofexposure to lead?1.8 Is there a medical testto determine whether Ihave been exposed tolead?19 Whatrecommendations has thefederal government madeto protect human health?1.10 Where can I getmore information?ReferencesRELATED RESOURCES
ToxFAQ™ ~
ToxFAQ™ enEspaflolPublic HealthStatementToxicologicalProfile
A-Z INDEXA B O D EF G H U KL M M Q £Q R S I UV W X Y Z
ATSDR RESOURCESToxFAQs™ToxFAQs™ en EsparlolPublic Health Statements
Toxicological ProfilesMinimum Risk Levels
•\30k
Public Health Statementfor
Lead
August 1997
CAS# 12709-98-7
This Public Health Statement is the summary chapter from the jkToxicological Profile for lead. It is one in a series of Public j rHealth Statements about hazardous substances and their |health effects. A shorter version, the ToxFAQs™, is alsoavailable. This information is important because thissubstance may harm you. The effects of exposure to anyhazardous substance depend on the dose, the duration, howyou are exposed, personal traits and habits, and whether other^chemicals are present. For more information, call the ATSDR' £_Information Center at 1-888-422-8737.
This public health statement tells you about lead and the effects ofexposure.
The Envirnonmetal Protection Agency (EPA) identifies the mostserious hazardous waste sites in the nation. These sites make upthe National Priorities List (NPL) and are the sites targeted forlong-term federal cleanup activities. Lead has been found in atleast 1,026 of the 1,467 current or former NPL sites. However, thetotal number of NPL sites evaluated for this substance is notknown. As more sites are evaluated, the sites at which lead isfound may increase. This information is important becauseexposure to this substance may harm you and because these sitesmay be sources of exposure.
When a substance is released from a large area, such as anindustrial plant, or from a container, such as a drum or bottle, itenters the environment. This release does not always result inexposure. You are exposed to a substance only when you come incontact with it. You may be exposed by breathing, eating, ordrinking the substance or by skin contact.
If you are exposed to lead, many factors determine whether you'llbe harmed. These factors include the dose (how much), theduration (how long), and how you come in contact with it. Youmust also consider the other chemicals you're exposed to and yourage, sex, diet, family traits, lifestyle, and state of health
http://www.atsdr.cdc.gov/toxprofiles/phsl3.html 9/20/2005
ATSDR - Public Health Statement: Lead Page 2 of 14
MMGs
MHMIsInteraction Profiles
Priority List of HazardousSubstancesDivision of Toxicology
1.1 What is lead?Lead is a naturally occurring bluish-gray metal found in smallamounts in the earth's crust. It has no characteristic taste or smell.Metallic lead does not dissolve in water and does not burn. Leadcan combine with other chemicals to form what are usually knownas lead compounds or lead salts. Some lead salts dissolve in waterbetter than others. Some natural and manufactured substancescontain lead but do not look like lead in its metallic form. Some ofthese substances can burn—for example, organic lead compoundsin some gasolines.
Lead has many different uses. Its most important use is in theproduction of some types of batteries. It is also used in theproduction of ammunition, in some kinds of metal products (suchas sheet lead, solder, some brass and bronze products, and pipes),and in ceramic glazes. Some chemicals containing lead, such astetraethyl lead and tetramethyl lead, were once used as gasolineadditives to increase octane rating. However, their use was phasedout in the 1980s, and lead was banned for use in gasoline fortransportation beginning January 1, 1996. Other chemicalscontaining lead are used in paint. The amount of lead added topaints and ceramic products, caulking, gasoline, and solder hasalso been reduced in recent years to minimize lead's harmfuleffects on people and animals. Lead used in ammunition, which isthe largest non-battery end-use, has remained fairly constant inrecent years. Lead is used in a large variety of medical equipment(radiation shields for protection against X-rays, electronic ceramicparts of ultrasound machines, intravenous pumps, fetal monitors,and surgical equipment). Lead is also used in scientific equipment(circuit boards for computers and other electronic circuitry) andmilitary equipment (jet turbine engine blades, military trackingsystems).
Most lead used by industry comes from mined ores ("primary") orfrom recycled scrap metal or batteries ("secondary"). Humanactivities (such as the former use of "leaded" gasoline) have spreadlead and substances that contain lead to all parts of theenvironment. For example, lead is in air, drinking water, rivers,lakes, oceans, dust, and soil. Lead is also in plants and animalsthat people may eat.
back to top
1.2 What happens to lead when it enters theenvironment?Lead occurs naturally in the environment. However, most of thelead found throughout the environment comes from humanactivities. Before the use of leaded gasoline was banned, most ofthe lead released into the U.S. environment came from carexhaust. In 1979, cars released 94.6 million kilograms (kg; 1 kgequals 2.2 pounds) of lead into the air in the United States. In1989, when the use of lead was limited but not banned, cars
http://www.atsdr.cdc.gov/toxprofiles/phsl3.html 9/20/2005
ATSDR - Public Health Statement: Lead Page 3 of 14
released only 2.2 million kg to the air. Since EPA banned the useof leaded gasoline for highway transportation in 1996, the amountof lead released into the air has decreased further. Other sourcesof lead released to the air include burning fuel, such as coal or oil,industrial processes, and burning solid waste. Once lead goes intothe atmosphere, it may travel thousands of miles if the leadparticles are small or if the lead compounds easily evaporate.Lead is removed from the air by rain and by particles falling to theground or into surface water.
The release of lead to air is now less than the release of lead toland. Most of the lead in inner city soils comes from old housespainted with paint containing lead and previous automotiveexhaust emitted when gasoline contained lead. Landfills maycontain waste from lead ore mining, ammunition manufacturing,or other industrial activities such as battery production.
Sources of lead in dust and soil include lead that falls to theground from the air, and weathering and chipping of lead-basedpaint from buildings and other structures. Lead in dust may alsocome from windblown soil. Disposal of lead in municipal andhazardous waste dump sites may also add lead to soil. Miningwastes that have been used for sandlots, driveways, and roadbedscan be also sources of lead.
Higher levels of lead in soil can be measured near roadways. Thisaccumulation came from car exhaust in the past. Once lead fallsonto soil, it usually sticks to soil particles. Small amounts of leadmay enter rivers, lakes, and streams when soil particles are movedby rainwater. Lead may remain stuck to soil particles in water formany years. Movement of lead from soil particles intounderground water or drinking water is unlikely unless the water isacidic or "soft." Movement of lead from soil will also depend onthe type of lead salt or compound and on the physical andchemical characteristics of the soil.
Sources of lead in surface water or sediment include deposits oflead-containing dust from the atmosphere, waste water fromindustries that handle lead (primarily iron and steel industries andlead producers), urban runoff, and mining piles.
Some of the chemicals that contain lead are broken down bysunlight, air, and water to other forms of lead. Lead compounds inwater may combine with different chemicals depending on theacidity and temperature of the water. Lead itself cannot be brokendown.
The levels of lead may build up in plants and animals from areaswhere air, water, or soil are contaminated with lead. If animals eatcontaminated plants or animals, most of the lead that they eat willpass through their bodies.
http://www.atsdr.cdc.gov/toxprofiles/phsl3.html 9/20/2005
ATSDR - Public Health Statement: Lead Page 4 of 14
back to top
1.3 How might I be exposed to lead?People living near hazardous waste sites may be exposed to leadand chemicals that contain lead by breathing air, drinking water,eating foods, or swallowing or touching dust or dirt that containslead. For people who do not live near hazardous waste sites,exposure to lead may occur in several ways: (1) by eating foods ordrinking water that contain lead, (2) by spending time in areaswhere leaded paints have been used and are deteriorating, (3) byworking in jobs where lead is used, (4) by using health-careproducts or folk remedies that contain lead, and (5) by havinghobbies in which lead may be used such as sculpturing (leadsolder) and staining glass.
Foods such as fruits, vegetables, meats, grains, seafood, softdrinks, and wine may have lead in them. Cigarette smoke alsocontains small amounts of lead. Lead gets into food from waterduring cooking and into foods and beverages from dust thatcontains lead falling onto crops, from plants absorbing lead that isin the soil, and from dust that contains lead falling onto foodduring processing. Lead may also enter foods if they are put intoimproperly glazed pottery or ceramic dishes and from leaded-crystal glassware. Illegal whiskey made using stills that containlead-soldered parts (such as truck radiators) may also containlead. The amount of lead found in canned foods decreased 87%from 1980 to 1988, which indicates that the chance of exposure tolead in canned food from lead-soldered containers has been greatlyreduced. Lead may also be released from soldered joints in kettlesused to boil water for beverages.
In general, very little lead is found in lakes, rivers, or groundwaterused to supply the public with drinking water. More than 99% ofall publicly supplied drinking water contains less than 0.005 partsof lead per million parts of water (ppm). However, the amount oflead taken into your body through drinking water can be higher incommunities with acidic water supplies. Acidic water makes iteasier for the lead found in pipes, leaded solder, and brass faucetsto enter water. Public water treatment systems are now required touse control measures to make water less acidic. Sources of lead indrinking water include lead that can come out of lead pipes,faucets, and leaded solder used in plumbing. Plumbing thatcontains lead may be found in public drinking water systems, andin houses, apartment buildings, and public buildings that are morethan twenty years old.
Breathing in or swallowing airborne dust and dirt that have lead inthem is another way you can be exposed. In 1984, burning leadedgasoline was the single largest source of lead emissions. Very littlelead in the air comes from gasoline now because EPA has bannedits use in gasoline. Other sources of lead in the air include releases
http://www.atsdr.cdc.gov/toxprofiles/phsl 3.html 9/20/2005

ATSDR - Public Health Statement: Lead Page 5 of 14
to the air from industries involved in iron and steel production,lead-acid-battery manufacturing, and non-ferrous (brass andbronze) foundries. Lead released into air may also come fromburning of solid lead-containing waste, windblown dust,volcanoes, exhaust from workroom air, burning or weathering oflead-painted surfaces, fumes from leaded gasoline, and cigarettesmoke.
Skin contact with dust and dirt containing lead occurs every day.Some cosmetics and hair dyes contain lead compounds. However,not much lead can get into your body through your skin. Leadedgasoline contains a lead compound that may be quickly absorbed.
In the home, you or your children may be exposed to lead if youtake some types of home remedy medicines that contain leadcompounds. Lead compounds are in some non-Westerncosmetics, such as surma and kohl. Some types of hair colorantsand dyes contain lead acetate. Read the labels on hair coloringproducts, use them with caution, and keep them away fromchildren.
People who are exposed at work are usually exposed by breathingin air that contains lead particles. Exposure to lead occurs in manyjobs. People who work in lead smelting and refining industries,brass/bronze foundries, rubber products and plastics industries,soldering, steel welding and cutting operations, batterymanufacturing plants, and lead compound manufacturingindustries may be exposed to lead. Construction workers andpeople who work at municipal waste incinerators, pottery andceramics industries, radiator repair shops, and other industries thatuse lead solder may also be exposed. Between 0.5 and 1.5 millionworkers are exposed to lead in the workplace. In California alone,more than 200,000 workers are exposed to lead. Families ofworkers may be exposed to higher levels of lead when workersbring home lead dust on their work clothes.
You may also be exposed to lead in the home if you work withstained glass as a hobby, make lead fishing weights orammunition, or if you are involved in home renovation thatinvolves the removal of old lead-based paint.
back to top
1.4 How can lead enter and leave my body?Some of the lead that enters your body comes from breathing indust or chemicals that contain lead. Once this lead gets into yourlungs, it goes quickly to other parts of the body in your blood.
You may swallow lead by eating food and drinking liquids thatcontain it, and also by swallowing large particles (diameter greaterthan 5 micrometers; 1 micrometer is one millionth of a meter).Most of the lead that enters your body comes through swallowing,
http://www.atsdr.cdc.gov/toxprofiles/phsl3.html 9/20/2005
ATSDR - Public Health Statement: Lead Page 6 of 14
even though very little of the amount you swallow actually entersyour blood and other parts of your body. In addition to the leadthat may be present in food and drink, accidental ingestion of leadmay occur due to skin contamination while eating, drinking,smoking, or applying cosmetics (including lip balm). The amountthat gets into your body from your stomach partially depends onwhen you ate your last meal. It also depends on how old you areand how well the lead particles you ate dissolved in your stomachjuices. Experiments using adult volunteers showed that, for adultswho had just eaten, the amount of lead that got into the blood fromthe stomach was only about 6% of the total amount taken in. Inadults who had not eaten for a day, about 60-80% of the lead fromthe stomach got into their blood. In general, if adults and childrenswallow the same amount of lead, a bigger proportion of theamount swallowed will enter the blood in children than in adults.
Dust and soil that contain lead may get on your skin, but only asmall portion of the lead will pass through your skin and enteryour blood if it is not washed off. More lead can pass through skinthat has been damaged (for example by scrapes, scratches, andwounds). The only kinds of lead compounds that easily penetratethe skin are the additives in leaded gasoline, which is no longersold to the general public. Therefore, the general public is notlikely to encounter lead that can enter through the skin.
Shortly after lead gets into your body, it travels in the blood to the"soft tissues" (such as the liver, kidneys, lungs, brain, spleen,muscles, and heart). After several weeks, most of the lead movesinto your bones and teeth. In adults, about 94% of the totalamount of lead in the body is contained in the bones and teeth.About 73% of the lead in children's bodies is stored in theirbones. Some of the lead can stay in your bones for decades;however, some lead can leave your bones and reenter your bloodand organs under certain circumstances, for example, duringpregnancy and periods of breast feeding, after a bone is broken,and during advancing age.
Your body does not change lead into any other form. Once it istaken in and distributed to your organs, the lead that is not storedin your bones leaves your body in your urine or your feces. About99% of the amount of lead taken into the body of an adult willleave in the waste within a couple of weeks, but only about 32% ofthe lead taken into the body of a child will leave in the waste.Under conditions of continued exposure, not all the lead that entersthe body will be eliminated, and this may result in accumulation oflead in body tissues, notably bone.
back 10 top
1.5 How can lead affect my health?The effects of lead are the same whether it enters the body throughbreathing or swallowing. The main target for lead toxicity is the
http://www.atsdr.cdc.gov/toxprofiles/phsl3.html 9/20/2005

ATSDR - Public Health Statement: Lead Page 7 of 14
nervous system, both in adults and in children. Long-termexposure of adults to lead at work has resulted in decreasedperformance in some tests that measure functions of the nervoussystem. Lead exposure may also cause weakness in fingers, wrists,or ankles. Some studies in humans have suggested that leadexposure may increase blood pressure, but the evidence isinconclusive. Lead exposure may also cause anemia, a lownumber of blood cells. The connection between the occurrence ofsome of these effects (e.g., increased blood pressure, alteredfunction of the nervous system) and low levels of exposure to leadis not certain. At high levels of exposure, lead can severelydamage the brain and kidneys in adults or children. In pregnantwomen, high levels of exposure to lead may cause miscarriage.High-level exposure in men can damage the organs responsible forsperm production.
To protect the public from the harmful effects of toxic chemicalsand to find ways to treat people who have been harmed, scientistsuse many tests.
One way to see if a chemical will hurt people is to learn how thechemical is absorbed, used, and released by the body; for somechemicals, animal testing may be necessary. Animal testing mayalso be used to identify health effects such as cancer or birthdefects. Without laboratory animals, scientists would lose a basicmethod to get information needed to make wise decisions toprotect public health. Scientists have the responsibility to treatresearch animals with care and compassion. Laws today protectthe welfare of research animals, and scientists must comply withstrict animal care guidelines.
We have no proof that lead causes cancer in humans. Kidneytumors have developed in rats and mice given large doses of lead.The animal studies have been criticized because of the very highdoses used, among other things. The results of high-dose studiesshould not be used to predict whether lead may cause cancer inhumans. The Department of Health and Human Services (DHHS)has determined that lead acetate and lead phosphate mayreasonably be expected to be capable of causing cancer, based onsufficient evidence from animal studies, but there is inadequateevidence from human studies.
back to top
1.6 How can lead affect children?This section discusses potential health effects from exposuresduring the period from conception to maturity at 18 years of age inhumans. Potential effects on children resulting from exposures ofthe parents are also considered.
Studies carried out by the Center for Disease Control andPrevention (CDC) show that the levels of lead in the blood of U.S.
http://www.atsdr.cdc.gov/toxprofiles/phsl 3.html 9/20/2005
ATSDR - Public Health Statement: Lead Page 8 of 14
children have been getting lower and lower. This is because leadis banned from gasoline, residential paint, and solder that is usedfor food cans and water pipes. Still, about 900,000 U.S. childrenbetween the ages of 1 and 5 years are believed to have blood leadlevels equal or greater than 10 ug/dL, the CDC level of concern.
Children are more vulnerable to lead poisoning than adults.Children are exposed to lead all through their lives. They can beexposed to lead in the womb if their mothers have lead in theirbodies. Babies can swallow lead when they breast feed, or eatother foods and drink water that contains lead. Babies andchildren can swallow and breathe lead in dirt, dust, or sand whilethey play on the floor or ground. These activities make it easierfor children to be exposed to lead than adults. The dirt or dust ontheir hands, toys, and other items may have lead particles in it. Insome cases children swallow nonfood items such as paint chips;these may contain very large amounts of lead, particularly in andaround older houses that were painted with lead-based paint. Thepaint in these houses often chips off and mixes with dust and dirt.Some old paint is 5^0% lead. Also, compared to adults, a biggerproportion of the amount of lead swallowed will enter the blood inchildren.
Children are more sensitive to the effects of lead than adults. Leadaffects children in different ways depending how much lead achild swallows. A child who swallows large amounts of lead willdevelop blood anemia, kidney damage, colic (severe"stomachache"), muscle weakness, and brain damage which cankill the child. A large amount of lead might get into a child's bodyif the child ate small pieces of old paint that contained largeamounts of lead. If a child swallows smaller amounts of lead,much less severe effects on blood and brain function may occur.In this case, recovery is likely once the child is removed from thesource of lead exposure and the amount of lead in the child's bodyis lowered by giving the child certain drugs that help eliminatelead from the body. At still lower levels of exposure, lead canaffect a child's mental and physical growth. Fetuses exposed tolead in the womb, because their mothers had a lot of lead in theirbodies, may be born prematurely and have lower weights at birth.Exposure in the womb, in infancy, or in early childhood may alsoslow mental development and lower intelligence later inchildhood. There is evidence that some effects may persist beyondchildhood.
Health workers can find out whether a child may have beenexposed to harmful levels of lead by taking a blood sample. Theycan also find out how much lead is in a child's bones by taking aspecial type of X-ray of the finger, knee, or elbow.
back to top
1.7 How can families reduce the risk of exposure to lead?
http://www.atsdr.cdc.gov/toxprofiles/phsl 3.html 9/20/2005
ATSDR - Public Health Statement: Lead Page 9 of 14
If your doctor finds that you have been exposed to significantamounts of lead, ask your doctor if children may also be exposed.When necessary your doctor may need to ask your state publichealth department to investigate.
The most important way families can lower exposures to lead is toknow about the sources of lead in their homes and avoid exposureto these sources. Some homes or day-care facilities may havemore lead in them than others. Families who live in or visit theseplaces may be exposed to higher amounts of lead. These includehomes built before 1978 that may have been painted with paintthat contains lead (lead-based paint). If you are buying a homethat was built before 1978, you may want to known if it containslead based paint. Federal government regulations require a personselling a home to tell the real estate agent or person buying thehome of any known lead-based hazards on the property. Addinglead to paint is no longer allowed. If your house was built before1978, it may have been painted with lead-based paint. This leadmay still be on walls, floors, ceilings, and window sills, or on theoutside walls of the house. The paint may have been scraped offby a previous owner, and the paint chips and dust may still be inthe yard soil. In some states, homeowners can have the paint intheir homes tested for lead by their local health departments.Families can lower the possibility of children swallowing paintchips by not allowing their children to chew or mouth thesepainted surfaces and be sure they wash their hands often,especially before eating. Families can also have a professionallead paint removal expert remove and dispose of peeling or flakingpaint or painted surfaces, and repaint the surface. Using heat gunsor dry scrapping of old lead containing paint during homereconstruction and remodeling can be a substantial source of leadexposure to children. Surfaces should be tested before suchactivities, and professional home repair personnel should beconsulted to make sure that safe procedures are used and removedmaterials and dust are contained in order to keep exposures tochildren to a minimum. These repairs should not be made byhomeowners themselves, unless they consult with a professional toget the information they need to prevent the possibility of leadpoisoning during or after the repairs.
Older homes that have plumbing with lead or lead solder may havehigher amounts of lead in drinking water. You cannot see, taste,or smell lead in water, and boiling your water will not get rid oflead. Running your water for 15 to 30 seconds before drinking orcooking with it will get rid of lead that may leach out from thepipes, especially if you have not used your water for a while, forexample, overnight. You can contact your local health departmentor water supplier to find out about testing your water for lead.
You can bring lead home in the dust on your hands or clothes iflead is used in the place where you work. Lead dust is likely to be
http://www.atsdr.cdc.gov/toxprofiles/phsl 3.html 9/20/2005

ATSDR - Public Health Statement: Lead Page 10 of 14
found in places where lead is mined or smelted, where carbatteries are made or recycled, where electric cable sheathing ismade, where fine crystal glass is made, or where certain types ofceramic pottery are made. Pets can also bring lead into the homein dust or dirt on their fur or feet if they spend time in places thathave high levels of lead in the soil.
Lead may be taken up in edible plants from the soil by the roots;therefore, home gardening may also contribute to exposure if theproduce is grown in soils that have high lead concentrations.Certain hobbies and home or car repair activities like radiatorrepair can add lead to the home as well. These include solderingglass or metal, making bullets or slugs, or glazing pottery. Somenon-Western "folk remedies" contain lead. Examples of theseinclude greta and azarcon used to treat diarrhea.
Some types of paints and pigments that are used as facial make-upor hair coloring contain lead. Cosmetics that contain lead includesurma and kohl, which are popular in certain Asian countries.Read the labels on hair coloring products, and keep hair dyes thatcontain lead acetate away from children. Do not allow children totouch hair that has been colored with lead-containing dyes or anysurfaces that have come into contact with these dyes because leadcompounds can rub off onto their hands and be transferred to theirmouths.
Swallowing of lead in house dust or soil is a very importantexposure pathway for children. This problem can be reduced inmany ways. Regular hand and face washing to remove lead dustsand soil, especially before meals, can lower the possibility thatlead on the skin is accidentally swallowed while eating. Familiescan lower exposures to lead by regularly cleaning the home of dustand tracked in soil. Door mats can help lower the amount of soilthat is tracked into the home; removing your shoes before will alsohelp. Planting grass and shrubs over bare soil areas in the yard canlower contact that children and pets may have with soil and thetracking of soil into the home.
Families whose members are exposed to lead dusts at work cankeep these dusts out of reach of children by showering andchanging clothes before leaving work, and bagging their workclothes before they are brought into the home for cleaning. Properventilation and cleaning—during and after hobby activities, homeor auto repair activities, and hair coloring with products thatcontain lead—will decrease the possibility of exposure.
It is important that children have proper nutrition and eat abalanced diet of foods that supply adequate amounts of vitaminsand minerals, especially calcium and iron. Good nutrition lowersthe amount of swallowed lead that passes to the bloodstream andalso may lower some of the toxic effects of lead.
http://www.atsdr.cdc.gov/toxprofiles/phsl3.html 9/20/2005

ATSDR - Public Health Statement: Lead Page 11 of 14
You can find out whether your child may have been exposed tolead by having your doctor take a blood sample.
back to top
1.8 Is there a medical test to determine whether I havebeen exposed to lead?The amount of total lead in the blood can be measured todetermine if exposure to lead has occurred. This test can tell ifyou have been recently exposed to lead. Lead can be measuredlead in teeth or bones by X-ray techniques, but these methods arenot widely available. These tests tell about long-term exposures tolead. Exposure to lead can be evaluated by measuring erythrocyteprotoporphyrin (EP) in blood samples. EP is a part of red bloodcells known to increase when the amount of lead in the blood ishigh. However, the EP level is not sensitive enough to identifychildren with elevated blood lead levels below about 25micrograms per deciliter (ug/dL). For this reason, the primaryscreening method is measurement of blood lead.
back to lop
1.9 What recommendations has the federal governmentmade to protect human health?The federal government develops regulations andrecommendations to protect public health. Regulations can beenforced by law. Federal agencies that develop regulations fortoxic substances include the Environmental Protection Agency(EPA), the Occupational Safety and Health Administration(OSHA), and the Food and Drug Administration (FDA).Recommendations provide valuable guidelines to protect publichealth but cannot be enforced by law. Federal organizations thatdevelop recommendations for toxic substances include the Agencyfor Toxic Substances and Disease Registry (ATSDR) and theNational Institute for Occupational Safety and Health (NIOSH).
Regulations and recommendations can be expressed in not-to-exceed levels in air, water, soil, or food that are usually based onlevels that affect animals; then they are adjusted to help protectpeople. Sometimes these not-to-exceed levels differ amongfederal organizations because of different exposure times (an 8-hour workday or a 24-hour day), the use of different animalstudies, or other factors.
Recommendations and regulations are also periodically updated asmore information becomes available. For the most currentinformation, check with the federal agency or organization thatprovides it. Some regulations and recommendations for leadinclude the following:
CDC recommends that states develop a plan to find children whomay be exposed to lead and have their blood tested for lead. Theymake basic recommendations for states to follow. These include
http://www.atsdr.cdc.gov/toxprofiles/phsl3.html 9/20/2005

ATSDR - Public Health Statement: Lead Page 12 of 14
testing children at ages 1 and 2. Children who are 3 to 6 years oldshould be tested if they have never been tested for lead before andthey receive services from public assistance programs for the poorsuch as Medicaid or the Supplemental Food Program for Women,Infants and Children (WIC); if they live in a building or frequentlyvisit a house built before 1950; if they visit a home (house orapartment) built before 1978 that has been recently remodeled; orif they have a brother, sister, or playmate who has had leadpoisoning.
CDC considers children to have an elevated level of lead if theamount of lead in the blood is at least 10 ug/dL. Medicalevaluation and environmental investigation and remediationshould be done for all children with blood lead levels equal orgreater than 20 ug/dL. Medical treatment may be necessary inchildren if the lead concentration in blood is higher than 45 ug/dL.
EPA requires that the concentration of lead in air that the publicbreathes be no higher than 1.5 micrograms per cubic meter(ug/m3) averaged over 3 months. EPA regulations no longer allowlead in gasoline. The Clean Air Act Amendments (CAAA) of1990 banned the sale of leaded gasoline as of December 31, 1995.
EPA regulations also limit lead in drinking water to 0.015milligrams per liter (mg/L). The 1988 Lead ContaminationControl Act requires the Consumer Product Safety Commission(CPSC), EPA, and the states to recall or repair water coolerscontaining lead. This law also requires new coolers to be lead-free. In addition, drinking water in schools must be tested for lead,and the sources of lead in this water must be removed.
To help protect small children, CPSC requires that theconcentration of lead in most paints available through normalconsumer channels be not more than 0.06%. The FederalHazardous Substance Act (FHSA) bans children's productscontaining hazardous amounts of lead.
The Department of Housing and Urban Development (HUD)develops recommendations and regulations to prevent exposure tolead. HUD requires that federally funded housing andrenovations, public housing, and Indian housing be tested for lead-based paint hazards and that such hazards be fixed by covering thepaint or removing it. When determining whether lead-based paintapplied to interior or exterior painted surfaces of dwellings shouldbe removed, the standard used by EPA and HUD is that paint witha lead concentration equal to or greater than 1.0 milligram persquare centimeter (mg/cm2) of surface area should be removed orotherwise treated. HUD is carrying out demonstration projects todetermine the best ways of covering or removing lead-based paintin housing.
http://www.atsdr.cdc.gov/toxprofiles/phsl 3.html 9/20/2005
ATSDR - Public Health Statement: Lead Page 13 of 14
EPA has developed standards for lead paint hazards, lead in dust,and lead in soil. To educate parents, homeowners, and tenantsabout lead hazards, lead poisoning prevention in the home, and thelead abatement process, EPA has published several generalinformation pamphlets. Copies of these pamphlets can beobtained from the National Lead Information Center or fromvarious Internet sites, including http://www.epa.gov/opptintr/lead.
OSHA regulations limit the concentration of lead in workroom airto 50 ug/m3 for an 8-hour workday. If a worker has a blood leadlevel of 50 ug/dL, then OSHA requires that worker be removedfrom the workroom where lead exposure is occurring.
FDA includes lead on its list of poisonous and deleterioussubstances. FDA considers foods packaged in cans containinglead solders to be adulterated. Tin-coated lead foil has been usedas a covering applied over the cork and neck areas of wine bottlesfor decorative purposes and to prevent insect infestations.Because it can be reasonably expected that lead could become acomponent of the wine, the use of these capsules is also a violationof the Federal Food, Drug, and Cosmetic Act. FDA has reviewedseveral direct human food ingredients and has determined them tobe "generally recognized as safe" when used in accordance withcurrent good manufacturing practices. Some of these ingredientscontain allowable lead concentrations that range from 0.1 to 10parts per million (ppm).
back to top
1.10 Where can I get more information?If you have any more questions or concerns, please contactyour community or state health or environmental qualitydepartment or:
Agency for Toxic Substances and Disease RegistryDivision of Toxicology1600 Clifton Road NE, Mailstop F-32Atlanta, GA 30333
Information line and technical assistance:
Phone:888-422-8737FAX:(770)-488-4178
ATSDR can also tell you the location of occupational andenvironmental health clinics. These clinics specialize inrecognizing, evaluating, and treating illnesses resulting fromexposure to hazardous substances.
To order toxicological profiles, contact:
National Technical Information Service
http://www.atsdr.cdc.gov/toxprofiles/phsl 3.html 9/20/2005

ATSDR - Public Health Statement: Lead Page 14 of 14
5285 Port Royal RoadSpringfield, VA 22161Phone: 800-553-6847 or 703-605-6000
back to top
ReferencesAgency for Toxic Substances and Disease Registry (ATSDR).1997. Toxicological profile for lead. Atlanta, GA: U.S.Department of Health and Human Services, Public HealthService.
back 10 top
ATSDR Information Center / [email protected] / 1-888-422-8737
This page was updated on November 22, 2004
ATSDR Home | Search | Index | Glossary | Contact UsAbout ATSDR | News Archive | ToxFAQs | HazDat | Public Health Assessments
Privacy Policy | External Links Disclaimer | AccessibilityU.S. Department of Health and Human Services
http://www.atsdr.cdc.gov/toxprofiles/phsl3.html 9/20/2005
TOXICOLOGICAL PROFILE FORLEAD
U.S. DEPARTMENT OF HEALTH AND HUMAN SERVICESPublic Health Service
Agency for Toxic Substances and Disease Registry
July 1999

LEAD
DISCLAIMER
The use of company or product name(s) is for identification only and does not imply endorsement by theAgency for Toxic Substances and Disease Registry.

LEAD
UPDATE STATEMENT
A Toxicological Profile for Lead, Draft for Public Comment, was released in September 1997. Thisedition supersedes any previously released draft or final profile.
Toxicological profiles are revised and republished as necessary, but no less than once every three years.For information regarding the update status of previously released profiles, contact ATSDR at:
Agency for Toxic Substances and Disease RegistryDivision of Toxicology/Toxicology Information Branch
1600 Clifton Road NE.E-29Atlanta, Georgia 30333

FOREWORD
This lexicological profile is prepared in accordance with guidelines* developed by the Agency forToxic Substances and Disease Registry (ATSDR) and the Environmental Protection Agency (EPA). Theoriginal guidelines were published in the Federal Register on April 17, 1987. Each profile will be revisedand republished as necessary.
The ATSDR toxicological profile succinctly characterizes the toxicologic and adverse health effectsinformation for the hazardous substance described therein. Each peer-reviewed profile identifies andreviews the key literature that describes a hazardous substance's toxicologic properties. Other pertinentliterature is also presented, but is described in less detail than the key studies. The profile is not intended tobe an exhaustive document; however, more comprehensive sources of specialty information are referenced.
The focus of the profiles is on health and toxicologic information; therefore, each toxicologicalprofile begbs with a public health statement that describes, in nontechnical language, a substance's relevanttoxicological properties. Following the public health statement is information concerning levels ofsignificant human exposure and, where known, significant health effects. The adequacy of information todetermine a substance's health effects is described in a health effects summary. Data needs that are ofsignificance to protection of public health are identified by ATSDR and EPA.
Each profile includes the following:
(A) The examination, summary, and interpretation of available toxicologic information andepidemiologic evaluations on a hazardous substance to ascertain the levels of significant humanexposure for the substance and the associated acute, subacute, and chronic health effects;
(B) A determination of whether adequate information on the health effects of each substance isavailable or in the process of development to determine levels of exposure that present asignificant risk to human health of acute, subacute, and chronic health effects; and
(C) Where appropriate, identification of toxicologic testing needed to identify the types or levels ofexposure that may present significant risk of adverse health effects in humans.
The principal audiences for the toxicological profiles are health professionals at the Federal, State,and local levels; interested private sector organizations and groups; and members of the public.
This profile reflects ATSDR's assessment of all relevant toxicologic testing and information that hasbeen peer-reviewed. Staff of the Centers for Disease Control and Prevention and other Federal scientistshave also reviewed the profile. In addition, this profile has been peer-reviewed by a nongovernmental paneland was made available for public review. Final responsibility for the contents and views expressed in thistoxicological profile resides with ATSDR.
Jeffrey P. Kbplan, M.D., M.P.H.Administrator
Agency for Toxic Substances andDisease Registry
VI
*Lcgislative Background
The toxicological profiles are developed in response to the Superfund Amendments andReauthorization Act (SARA) of 1986 (Public Law 99-499) which amended the ComprehensiveEnvironmental Response, Compensation, and Liability Act of 1980 (CERCLA or Superfund). This publiclaw directed ATSDR to prepare toxicological profiles for hazardous substances most commonly found atfacilities on the CERCLA National Priorities List and that pose the most significant potential threat tohuman health, as determined by ATSDR and the EPA. The availability of the revised priority list of 275hazardous substances was announced in the Federal Register on November 17, 1997 (62 FR 61332). Forprior versions of the list of substances, see Federal Register notices dated April 29, 1996 (61 FR 18744);April 17, 1987 (52 FR 12866); October 20, 1988 (53 FR 41280); October 26, 1989 (54 FR 43619);October 17,1990 (55 FR 42067); October 17, 1991 (56 FR 52166); October 28, 1992 (57 FR 48801); andFebruary 28, 1994 (59 FR 9486). Section 104(i)(3) of CERCLA, as amended, directs the Administrator ofATSDR to prepare a toxicological profile for each substance on the list.

LEAD
QUICK REFERENCE FOR HEALTH CARE PROVIDERS
Toxicological Profiles are a unique compilation of toxicological information on a given hazardoussubstance. Each profile reflects a comprehensive and extensive evaluation, summary, and interpretation ofavailable toxicologic and epidemiologic information .on a substance. Health care providers treatingpatients potentially exposed to hazardous substances will find the following information helpful for fastanswers to often-asked questions.
Primary Chapters/Sections of Interest
Chapter 1: Public Health Statement: The Public Health Statement can be a useful tool for educatingpatients about possible exposure to a hazardous substance. It explains a substance's relevanttoxicologic properties in a nontechnical, question-and-answer format, and it includes a review ofthe general health effects observed following exposure.
Chapter 2: Health Effects: Specific health effects of a given hazardous compound are reported by routeof exposure, by type of health effect (death, systemic, immunologic, reproductive), and by lengthof exposure (acute, intermediate, and chronic). In addition, both human and animal studies arereported in this section.
NOTE: Not all health effects reported in this section are necessarily observed inthe clinical setting. Please refer to the Public Health Statement to identifygeneral health effects observed following exposure.
Pediatrics: Four new sections have been added to each Toxicological Profile to address child healthissues:Section 1.6 How Can (Chemical X) Affect Children?Section 1.7 How Can Families Reduce the Risk of Exposure to (Chemical X)?Section 2.6 Children's SusceptibilitySection 5.6 Exposures of Children
Other Sections of Interest:Section 2.7 Biomarkers of Exposure and EffectSection 2.10 Methods for Reducing Toxic Effects
ATSDR Information CenterPhone: 1-888-42-ATSDR (1-888-422-8737)
or 404-639-6357 Fax: 404-639-6359E-mail: [email protected] Internet: http://www.atsdr.cdc.gov
The following additional material can be ordered through the ATSDR Information Center:
Case Studies in Environmental Medicine: Taking an Exposure History—The importance of taking anexposure history and how to conduct one are described, and an example of a thorough exposurehistory is provided. Other case studies of interest include Reproductive and DevelopmentalHazards; Skin Lesions and Environmental Exposures; Cholinesterase-Inhibiting PesticideToxicity; and numerous chemical-specific case studies.
LEAD
Managing Hazardous Materials Incidents is a three-volume set of recommendations for on-scene(prehospital) and hospital medical management of patients exposed during a hazardous materials incident.Volumes I and II are planning guides to assist first responders and hospital emergency departmentpersonnel in planning for incidents that involve hazardous materials: Volume III—Medical ManagementGuidelines for Acute Chemical Exposures—is a guide for health care professionals treating patientsexposed to hazardous materials.
Fact Sheets (ToxFAQs) provide answers to frequently asked questions about toxic substances.
Other Agencies and Organizations
The National Center for Environmental Health (NCEH) focuses on preventing or controlling disease,injury, and disability related to the interactions between people and their environment outside theworkplace. Contact: NCEH, Mailstop F-29, 4770 Buford Highway, NE, Atlanta, GA 30341-3724• Phone: 770-488-7000 • FAX: 770-488-7015.
The National Institute for Occupational Safety and Health (NIOSH) conducts research on occupationaldiseases and injuries, responds to requests for assistance by investigating problems of health andsafety in the workplace, recommends standards to the Occupational Safety and HealthAdministration (OSHA) and the Mine Safety and Health Administration (MSHA), and trainsprofessionals in occupational safety and health. Contact: NIOSH, 200 Independence Avenue,SW, Washington, DC 20201 • Phone: 800-356-4674 or NIOSH Technical Information Branch,Robert A. Taft Laboratory, Mailstop C-19, 4676 Columbia Parkway, Cincinnati, OH 45226-1998 •Phone: 800-35-NIOSH.
The National Institute of Environmental Health Sciences (NIEHS) is the principal federal agency forbiomedical research on the effects of chemical, physical, and biologic environmental agents onhuman health and well-being. Contact: NIEHS, PO Box 12233, 104 T.W. Alexander Drive,Research Triangle Park, NC 27709 • Phone: 919-541-3212.
Referrals
The Association of Occupational and Environmental Clinics (AOEC) has developed a network of clinicsin the United States to provide expertise in occupational and environmental issues. Contact:AOEC, 1010 Vermont Avenue, NW, #513, Washington, DC 20005 • Phone: 202-347-4976 •FAX: 202-347-4950 • e-mail: aoec(g).dgs.desvs.com • AOEC Clinic Director: http://occ-env-med.mc.duke.edu/oem/aoec.htm.
The American College of Occupational and Environmental Medicine (ACOEM) is an association ofphysicians and other health care providers specializing in the field of occupational andenvironmental medicine. Contact: ACOEM, 55 West Seegers Road, Arlington Heights, IL 60005• Phone: 847-228-6850 • FAX: 847-228-1856.
LEAD
CONTRIBUTORS
CHEMICAL MANAGER(S)/AUTHORS(S):
Henry Abadin, MiS.P.H.ATSDR, Division of Toxicology, Atlanta, GA
Fernando Llados, Ph.D.Syracuse Research Corporation, Syracuse, NY
THE PROFILE HAS UNDERGONE THE FOLLOWING ATSDR INTERNAL REVIEWS:
1. Health Effects Review. The Health Effects Review Committee examines the health effects chapterof each profile for consistency and accuracy in interpreting health effects and classifying endpoints.
2. Minimal Risk Level Review. The Minimal Risk Level Workgroup considers issues relevant tosubstance-specific minimal risk levels (MRLs), reviews the health effects database of each profile,and makes recommendations for derivation of MRLs.
3. Data Needs Review. The Research Implementation Branch reviews data needs sections to assureconsistency across profiles and adherence to instructions in the Guidance.

LEAD
PEER REVIEW
A peer review panel was assembled for lead. The panel consisted of the following members:
1. Dr. Deborah Cory-Slechta, Professor of Environmental Medicine, Neurobiology and Anatomy,Department of Environmental Medicine, University of Rochester, Rochester, New York;
2. Dr. Joseph P. Gould, Research Scientist, School of Civil Engineering, Georgia Institute ofTechnology, Atlanta, Georgia;
3. Dr. Shane Que Hee, Professor, Department of Environmental Health Sciences, UCLA School ofPublic Health, Los Angeles, California; and
4. Dr. Marty Kanarek, Professor, Department of Preventive Medicine, University of Wisconsin,Madison, Wisconsin.
These experts collectively have knowledge of lead's physical and chemical properties, toxicokinetics, keyhealth end points, mechanisms of action, human and animal exposure, and quantification of risk tohumans. All reviewers were selected in conformity with the conditions for peer review specified inSection 104(i)(13) of the Comprehensive Environmental Response, Compensation, and Liability Act, asamended.
Scientists from the Agency for Toxic Substances and Disease Registry (ATSDR) have reviewed the peerreviewers' comments and determined which comments will be included in the profile. A listing of the peerreviewers' comments not incorporated in the profile, with a brief explanation of the rationale for theirexclusion, exists as part of the administrative record for this compound. A list of databases reviewed and alist of unpublished documents cited are also included in the administrative record.
The citation of the peer review panel should not be understood to imply its approval of the profile's finalcontent. The responsibility for the content of this profile lies with the ATSDR.

LEAD
CONTENTS
FOREWORD v
QUICK REFERENCE FOR HEALTH CARE PROVIDERS vii
CONTRIBUTORS ix
PEER REVIEW xi
LIST OF FIGURES xviii
LIST OF TABLES xx
1. PUBLIC HEALTH STATEMENT 11.1 WHAT IS LEAD? 11.2 WHAT HAPPENS TO LEAD WHEN IT ENTERS THE ENVIRONMENT? 21.3 HOW MIGHT I BE EXPOSED TO LEAD? 41.4 HOW CAN LEAD ENTER AND LEAVE MY BODY? 61.5 HOW CAN LEAD AFFECT MY HEALTH? 81.6 HOW CAN LEAD AFFECT CHILDREN? 91.7 HOW CAN FAMILIES REDUCE THE RISK OF EXPOSURE TO LEAD? 101.8 IS THERE A MEDICAL TEST TO DETERMINE WHETHER I HAVE BEEN
EXPOSED TO LEAD? 131.9 WHAT RECOMMENDATIONS HAS THE FEDERAL GOVERNMENT MADE TO
PROTECT HUMAN HEALTH? 131.10 WHERE CAN I GET MORE INFORMATION? 16
2. HEALTH EFFECTS 192.1 INTRODUCTION 192.2 DISCUSSION OF HEALTH EFFECTS BY ROUTE OF EXPOSURE 19
2.2.1 Effects in Humans Based on Blood Lead (PbB) Levels 222.2.1.1 Death 222.2.1.2 Systemic Effects 352.2.1.3 Jmmunological Effects 652.2.1.4 Neurological Effects 682.2.1.5 Reproductive Effects 932.2.1.6 Developmental Effects 982.2.1.7 Genotoxic Effects 1132.2.1.8 Cancer 114
2.2.2 Inhalation Exposure 1162.2.2.1 Death 1162.2.2.2 Systemic Effects 1162.2.2.3 Immunological Effects 1222.2.2.4 Neurological Effects 1232.2.2.5 Developmental Effects 1232.2.2.6 Reproductive Effects 124
2.2.2.7 Genotoxic Effects 1242.2.2.8 Cancer 124
2.2.3 Oral Exposure 124
LEAD
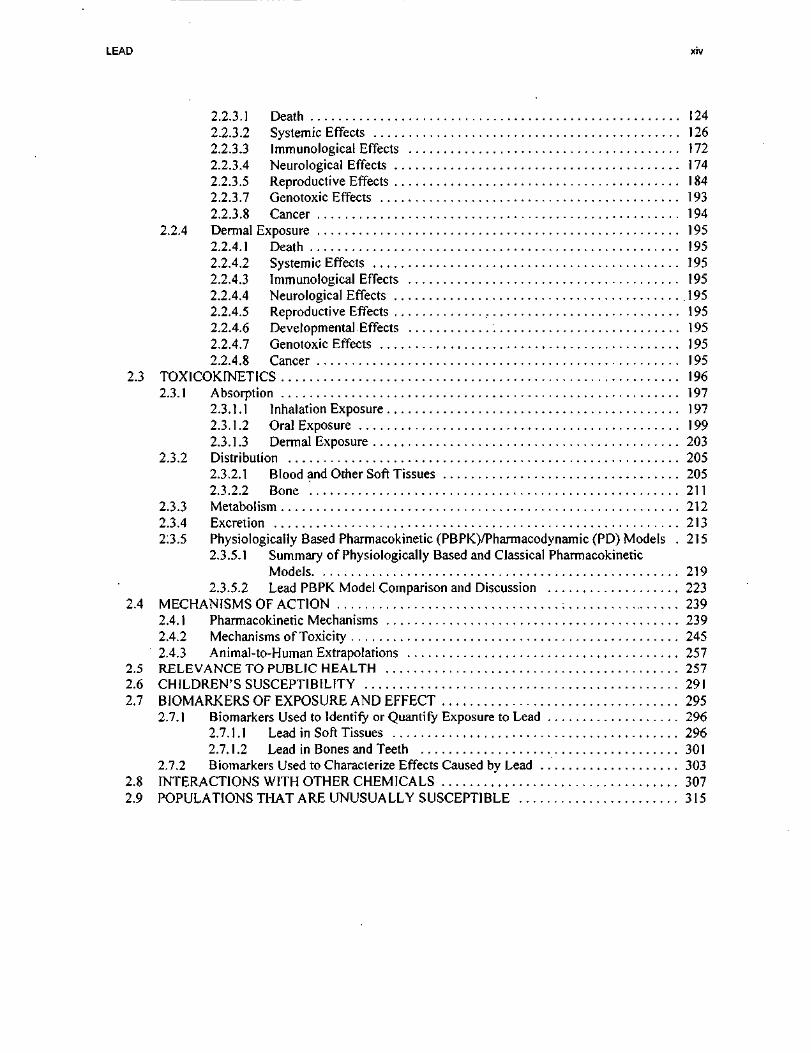
2.2.3.1 Death 1242.2.3.2 Systemic Effects 1262.2.3.3 Immune-logical Effects 1722.2.3.4 Neurological Effects 1742.2.3.5 Reproductive Effects 1842.2.3.7 Genotoxic Effects 1932.2.3.8 Cancer 194
2.2.4 Dermal Exposure 1952.2.4.1 Death 1952.2.4.2 Systemic Effects 1952.2.4.3 Immunological Effects 1952.2.4.4 Neurological Effects 1952.2.4.5 Reproductive Effects , 1952.2.4.6 Developmental Effects 1952.2.4.7 Genotoxic Effects 1952.2.4.8 Cancer 195
2.3 TOX1COKINETICS 1962.3.1 Absorption 197
2.3.1.1 Inhalation Exposure 1972.3.1.2 Oral Exposure 1992.3.1.3 Dermal Exposure 203
2.3.2 Distribution 2052.3.2.1 Blood and Other Soft Tissues 2052.3.2.2 Bone 211
2.3.3 Metabolism 2122.3.4 Excretion 2132:3.5 Physiologically Based Pharmacokinetic (PBPK)/Pharmacodynamic (PD) Models . 2 1 5
2.3.5.1 Summary of Physiologically Based and Classical PharmacokineticModels 219
2.3.5.2 Lead PBPK Model Comparison and Discussion 2232.4 MECHANISMS OF ACTION : 239
2.4.1 Pharmacokinetic Mechanisms 2392.4.2 Mechanisms of Toxicity 2452.4.3 Animal-to-Human Extrapolations 257
2.5 RELEVANCE TO PUBLIC HEALTH 2572.6 CHILDREN'S SUSCEPTIBILITY 2912.7 BIOMARKERS OF EXPOSURE AND EFFECT 295
2.7.1 Biomarkers Used to Identify or Quantify Exposure to Lead 2962.7.1.1 Lead in Soft Tissues 2962.7.1.2 Lead in Bones and Teeth 301
2.7.2 Biomarkers Used to Characterize Effects Caused by Lead 3032.8 INTERACTIONS WITH OTHER CHEMICALS 3072.9 POPULATIONS THAT ARE UNUSUALLY SUSCEPTIBLE 315

LEAD
2.10 METHODS FOR REDUCING TOXIC EFFECTS 3192.10.1 Reducing Peak Absorption Following Exposure 3202.10.2 Reducing Body Burden '. 3212.10.3 Interfering with the Mechanism of Action for Toxic Effects 322
2.11 ADEQUACY OF THE DATABASE 3232.11.1 Existing Information on Health Effects of Lead 3232.11.2 Identification of Data Needs 3232.11.3 Ongoing Studies 342
3. CHEMICAL AND PHYSICAL INFORMATION 3573.1 CHEMICAL IDENTITY 3573.2 PHYSICAL AND CHEMICAL PROPERTIES 357
4. PRODUCTION, IMPORT, USE, AND DISPOSAL 3674.1 PRODUCTION 3674.2 IMPORT/EXPORT 3684.3 USE 3714.4 DISPOSAL 374
5. POTENTIAL FOR HUMAN EXPOSURE 3775.1 OVERVIEW 3775.2 RELEASES TO THE ENVIRONMENT 378
5.2.1 Air 3825.2.2 Water 3855.2.3 Soil 3855.2.4 Paint 386
5.3 ENVIRONMENTAL FATE 3885.3.1 Transport and Partitioning 3885.3.2 Transformation and Degradation 393
5.3.2.1 Air 3935.3.2.2 Water 3945.3.2.3 Sediment and Soil 394
5.4 LEVELS MONITORED OR ESTIMATED IN THE ENVIRONMENT 3955.4.1 Air 3965.4.2 Water 3975.4.3 Sediment and Soil 3995.4.4 . Paint 4025.4.5 Other Sources 403
5.5 GENERAL POPULATION AND OCCUPATIONAL EXPOSURE 4075.6 EXPOSURES OF CHILDREN 4145.7 POPULATIONS WITH POTENTIALLY HIGH EXPOSURES 4235.8 ADEQUACY OF THE DATABASE 424
5.8.1 Identification of Data Needs 4245.8.2 Ongoing Studies 427
6. ANALYTICAL METHODS 4316.1 BIOLOGICAL SAMPLES 4316.2 ENVIRONMENTAL SAMPLES 439

LEAD xvi
6.3 ADEQUACY OF THE DATABASE 4466.3.1 Identification of Data Needs 4476.3.2 Ongoing Studies 448
7. REGULATIONS AND ADVISORIES 449
8. REFERENCES 473
9. GLOSSARY 581
APPENDICES
A. ATSDR MINIMAL RISK LEVELS AND WORKSHEETS A-l
B. USER'S GUIDE B-1
C. ACRONYMS, ABBREVIATIONS, AND SYMBOLS C-l
D. A FRAMEWORK TO GUIDE PUBLIC HEALTH ASSESSMENT DECISIONS ATLEAD SITES D-I
LEAD xvii
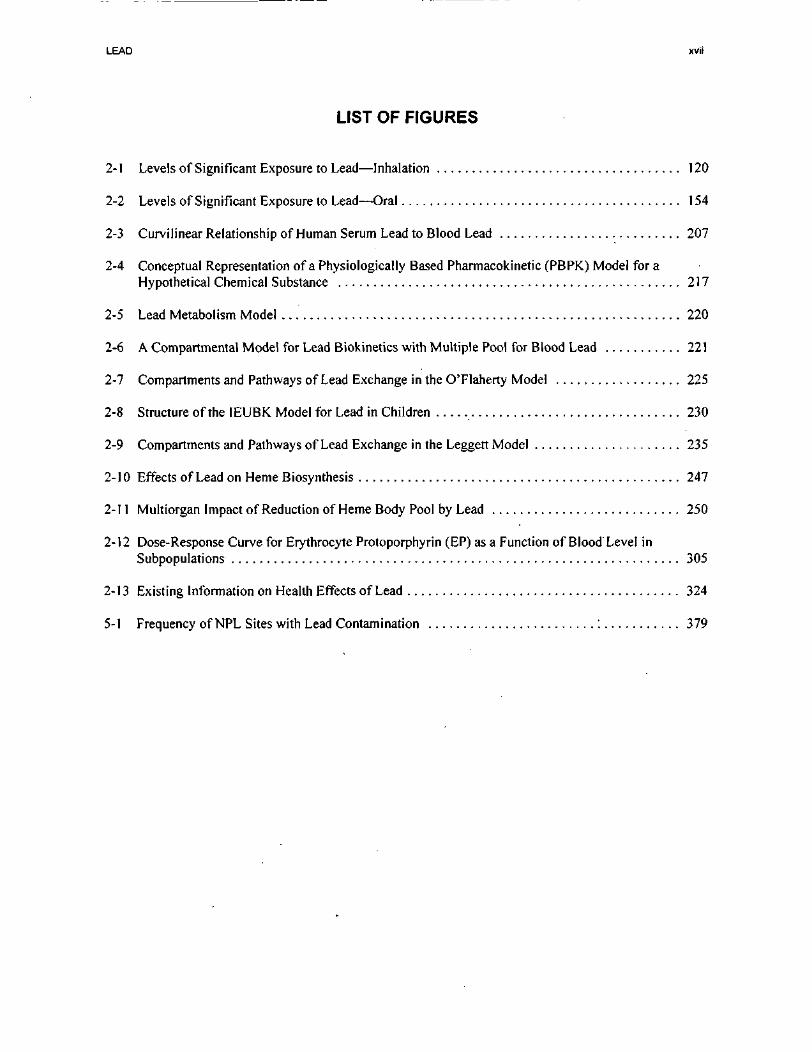
LIST OF FIGURES
2-1 Levels of Significant Exposure to Lead—Inhalation 120
2-2 Levels of Significant Exposure to Lead—Oral 154
2-3 Curvilinear Relationship of Human Serum Lead to Blood Lead 207
2-4 Conceptual Representation of a Physiologically Based Pharmacokinetic (PBPK) Model for aHypothetical Chemical Substance 217
2-5 Lead Metabolism Model 220
2-6 A Compartmental Model for Lead Biokinetics with Multiple Pool for Blood Lead 221
2-7 Compartments and Pathways of Lead Exchange in the O'Flaherty Model 225
2-8 Structure of the IEUBK Model for Lead in Children 230
2-9 Compartments and Pathways of Lead Exchange in the Leggett Model 235
2-10 Effects of Lead on Heme Biosynthesis 247
2-11 Multiorgan Impact of Reduction of Heme Body Pool by Lead 250
2-12 Dose-Response Curve for Erythrocyte Protoporphyrin (EP) as a Function of Blood Level inSubpopulations 305
2-13 Existing Information on Health Effects of Lead 324
5-1 Frequency of NPL Sites with Lead Contamination : 379
LEAD
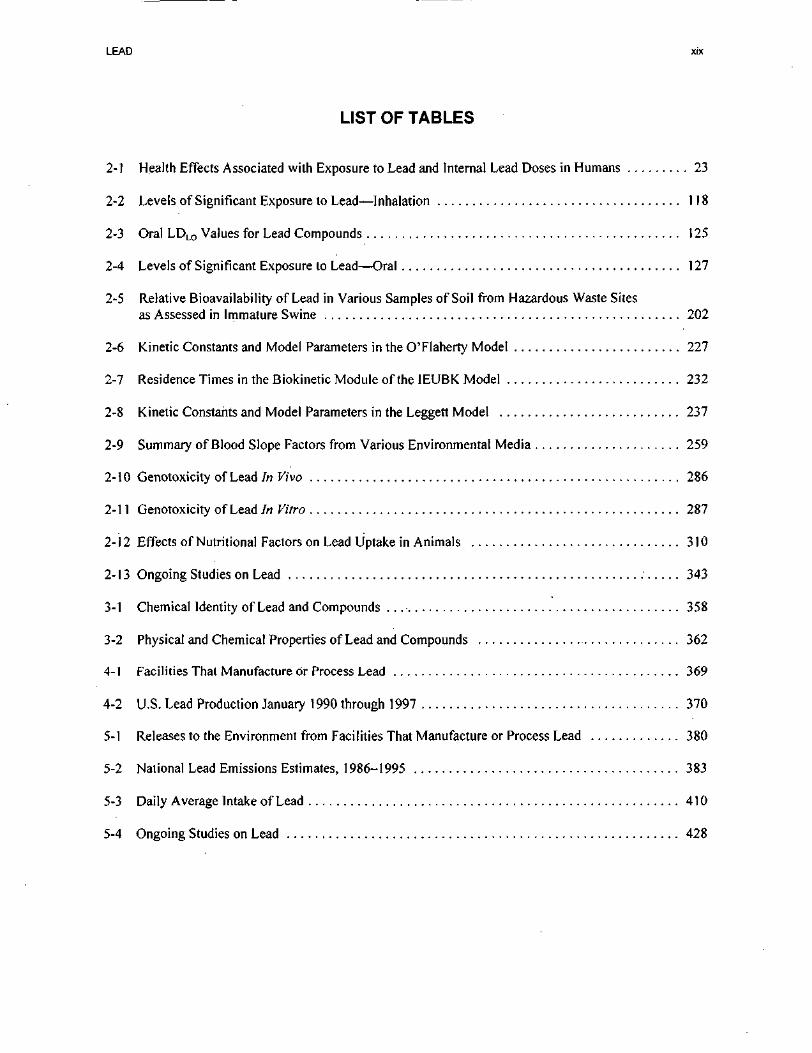
LIST OF TABLES
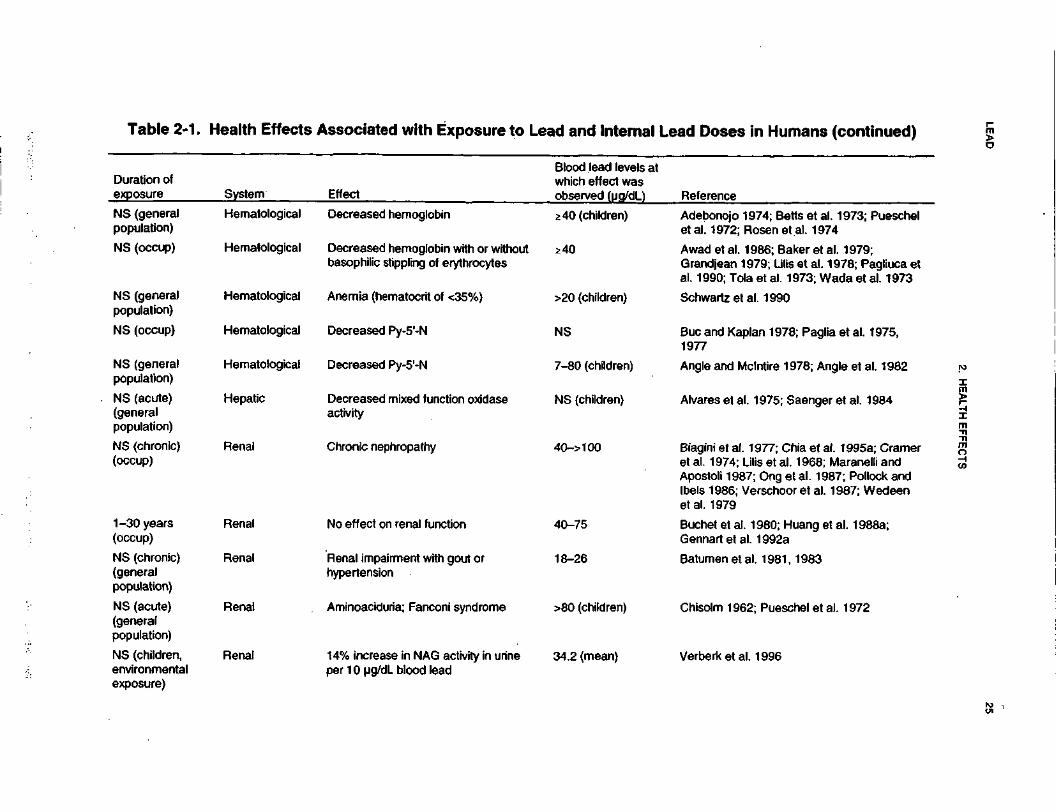
2-1 Health Effects Associated with Exposure to Lead and Internal Lead Doses in Humans 23
2-2 Levels of Significant Exposure to Lead—Inhalation 118
2-3 Oral LDLO Values for Lead Compounds 125
2-4 Levels of Significant Exposure to Lead—Oral 127
2-5 Relative Bioavailability of Lead in Various Samples of Soil from Hazardous Waste Sitesas Assessed in Immature Swine 202
2-6 Kinetic Constants and Model Parameters in the O'Flaherty Model 227
2-7 Residence Times in the Biokinetic Module of the IEUBK Model 232
2-8 Kinetic Constants and Model Parameters in the Leggert Model 237
2-9 Summary of Blood Slope Factors from Various Environmental Media 259
2-10 Genotoxicity of Lead In Vivo 286
2-11 Genotoxicity of Lead In Vitro 287
2-12 Effects of Nutritional Factors on Lead Uptake in Animals 310
2-13 Ongoing Studies on Lead 343
3-1 Chemical Identity of Lead and Compounds . 358
3-2 Physical and Chemical Properties of Lead and Compounds 362
4-1 Facilities That Manufacture or Process Lead 369
4-2 U.S. Lead Production January 1990 through 1997 370
5-1 Releases to the Environment from Facilities That Manufacture or Process Lead 380
5-2 National Lead Emissions Estimates, 1986-1995 383
5-3 Daily Average Intake of Lead 410
5-4 Ongoing Studies on Lead 428

LEAD
6-1 Analytical Methods for Determining Lead in Biological Samples 433
6-2 Analytical Methods for Determining Lead in Environmental Samples 440
7-1 Regulations and Guidelines Applicable to Lead 457

LEAD 19
2. HEALTH EFFECTS
2.1 INTRODUCTION
The primary purpose of this chapter is to provide public health officials, physicians, toxicologists, and
other interested individuals and groups with an overall perspective of the toxicology of lead and a
depiction of significant exposure levels associated with various adverse health effects. It contains
descriptions and evaluations of studies and presents levels of significant exposure for lead based on
toxicological an studies and epidemiological investigations.
2.2 DISCUSSION OF HEALTH EFFECTS BY ROUTE OF EXPOSURE
To help public health professionals address the needs of persons living or working near hazardous waste
sites, the information in this section is organized first by route of exposure-—inhalation, oral, and
dermal—and then by health effect—death, systemic, immunological, neurological, developmental,
reproductive, genotoxic, and carcinogenic effects. These data are discussed in terms of three exposure
periods—acute (14 days or less), intermediate (15-364 days), and chronic (365 days or more).
Levels of significant exposure for each route and duration are presented in tables and illustrated in figures.
The points in the figures showing no-observed-adverse-effect levels (NOAELs) or lowest-observed-
adverse-effect levels (LOAELs) reflect the actual doses (levels of exposure) used in the studies. LOAELs
have been classified into "less serious" or "serious" effects. These distinctions are intended to help the
users of the document identify the levels of exposure at which adverse health effects start to appear. They
should also help to determine whether or not the effects vary with dose and/or duration, and place into
perspective the possible significance of these effects to human health.
The significance of the exposure levels shown in the tables and figures may differ depending on the user's
perspective. For example, physicians concerned with the interpretation of clinical findings in exposed
persons may be interested in levels of exposure associated with "serious" effects. Public health officials
and project managers concerned with appropriate actions to take at hazardous waste sites may want
information on levels of exposure associated with more subtle effects in humans or animals (LOAEL) or
exposure levels below which no adverse effects (NOAEL) have been observed. Estimates of levels posing

LEAD 20
2. HEALTH EFFECTS
minimal risk to humans (Minimal Risk Levels, MRLs) may be of interest to health professionals and
citizens alike.
Levels of exposure associated with the carcinogenic effects of lead are indicated in Table 2-4 and
Figure 2-2.
Estimates of exposure levels posing minimal risk to humans (MRLs) have been made, where data were
believed reliable, for the most sensitive noncancer effect for each exposure duration. MRLs include
adjustments to reflect human variability and extrapolation of data from laboratory animals to humans.
Although methods have been established to derive these levels (Barnes and Dourson 1988; EPA 1989e),
uncertainties are associated with these techniques. Furthermore, ATSDR acknowledges additional
uncertainties inherent in the application of the procedures to derive less than lifetime MRLs. As an
example, acute inhalation MRLs may not be protective for health effects that are delayed in development
or are acquired following repeated acute insults, such as hypersensitivity reactions, asthma, or chronic
bronchitis. As these kinds of health effects data become available and methods to assess levels of
significant human exposure improve, these MRLs will be revised.
This chapter will focus primarily on inorganic lead compounds (lead, its salts, and oxides/sulfides), the
predominant forms of lead in the environment. The available data on organic (i.e., alkyl) lead compounds
indicate that some of the toxicologic effects of alkyl lead are mediated through metabolism to inorganic
lead and that during the combustion of gasolines containing alkyl lead, significant amounts of inorganic
lead are released to contaminate the environment. In addition, the lead alkyl halides in automobile
exhausts are quickly oxidized by sunlight and air, and do not appear to be present at hazardous waste sites
in significant amounts. By far, most lead at hazardous waste sites is inorganic lead. The limited data
available on alkyl lead compounds indicate that the toxicokinetic profiles and toxicological effects of these
compounds are qualitatively and quantitatively different from those of inorganic lead (EPA 1985b).
The database for lead is unusual in that it contains a great deal of data concerning dose-effect relationships
in humans. These data come primarily from studies of occupationally exposed groups and the general
population. However, the dose data for humans are generally expressed in terms of absorbed dose, usually

LEAD 21
2. HEALTH EFFECTS
measured as levels of lead in the blood (PbB). PbB reflects recent lead exposures and also historical lead
exposure baselines caused by hematopoiesis (blood cell synthesis) in bone marrow.
Dose-effect data in terms of external exposure levels, or milligrams per kilogram per day (mg/kg/day)
doses of lead by a single route of exposure, as in studies in animals, are not generally available for humans.
In these studies, exposure to other chemical agents also occurred, and it is assumed that lead is the major
toxicant. Exposure to lead in occupational studies is primarily through inhalation, although some
contribution to body burden is derived from the oral route. Conversely, the general population, including
children, is exposed to lead primarily through the oral route, but with some contribution to body burden
through inhalation. The toxic effects of lead are the same regardless of the route of entry into the body,
and they are correlated with internal exposure as PbB level. For these reasons, Section 2.2.1 of the profile
will not attempt to separate human dose data by routes of exposure (unless these data are available) but
will present it in terms of PbB levels. Most of the human data, therefore, cannot be displayed graphically
by the methods previously described; these data require a different approach, based on PbB levels.
Nonetheless, human data are the best basis for any assessment of potential health effects from lead
exposure to persons living or working near hazardous waste sites or to other populations at risk.
Experimental studies of lead toxicity in animals provide support for observations in human studies, with
some consistency in types of effects and PbB-effect relationships. However, animal data on lead toxicity
are generally considered less suitable as the basis for health effects assessments than are the human data.
There is no absolutely equivalent animal model for the effects of lead on humans.
Data concerning dose-effect relationships in animals are available not only in terms of PbB levels but also
in terms of external exposure levels or mg/kg/day doses. The animal data are presented in Sections 2.2.2,
2.2.3, and 2.2.4 and can be displayed graphically by methods previously described. However, the
graphical presentation will be done primarily for consistency with other toxicological profiles in this series
and is not recommended for use in assessing possible health hazards to persons living or working near
waste sites. MRLs were not derived for lead because a clear threshold for some of the more sensitive
effects in humans have not been identified. In addition, deriving an MRL would overlook the significant
body of PbB literature. These data suggest that certain enzyme level changes and subtle neurobehavioral
effects in children may occur at very low PbB levels. In lieu of MRLs, ATSDR has developed a
framework to guide decisions at lead sites. This approach utilizes site-specific exposure data to estimate
internal doses as measured by PbB levels (See chapter 2.5 and appendix D).
LEAD 22
2. HEALTH EFFECTS
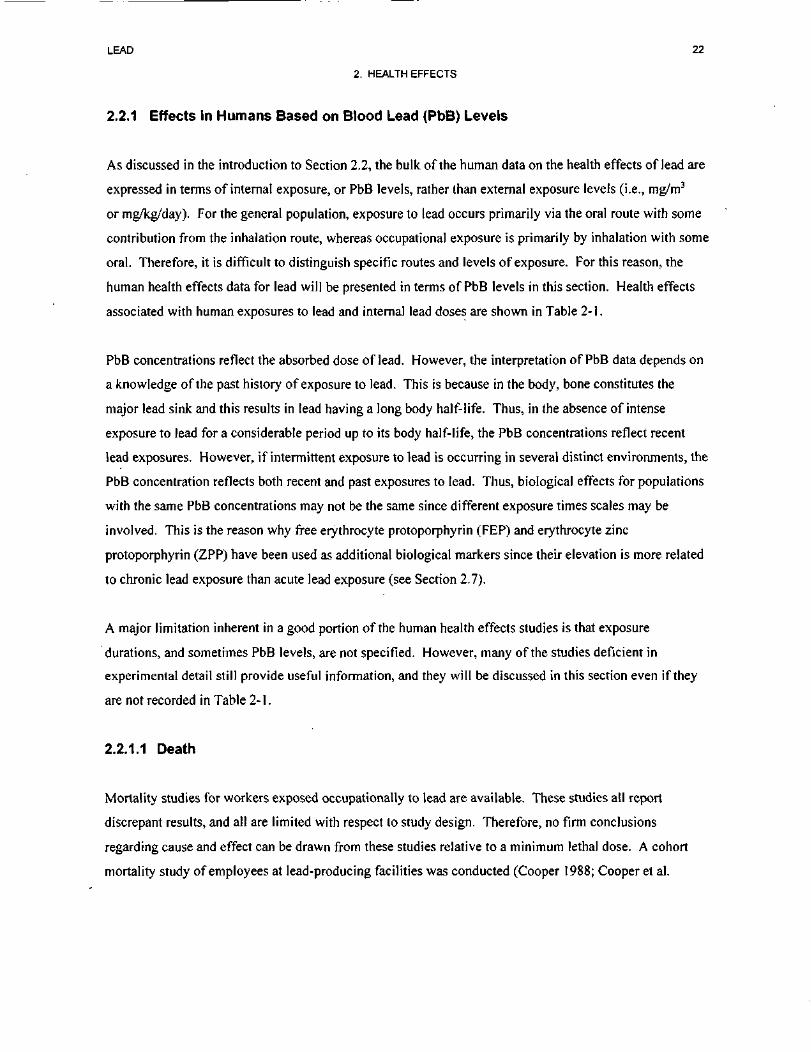
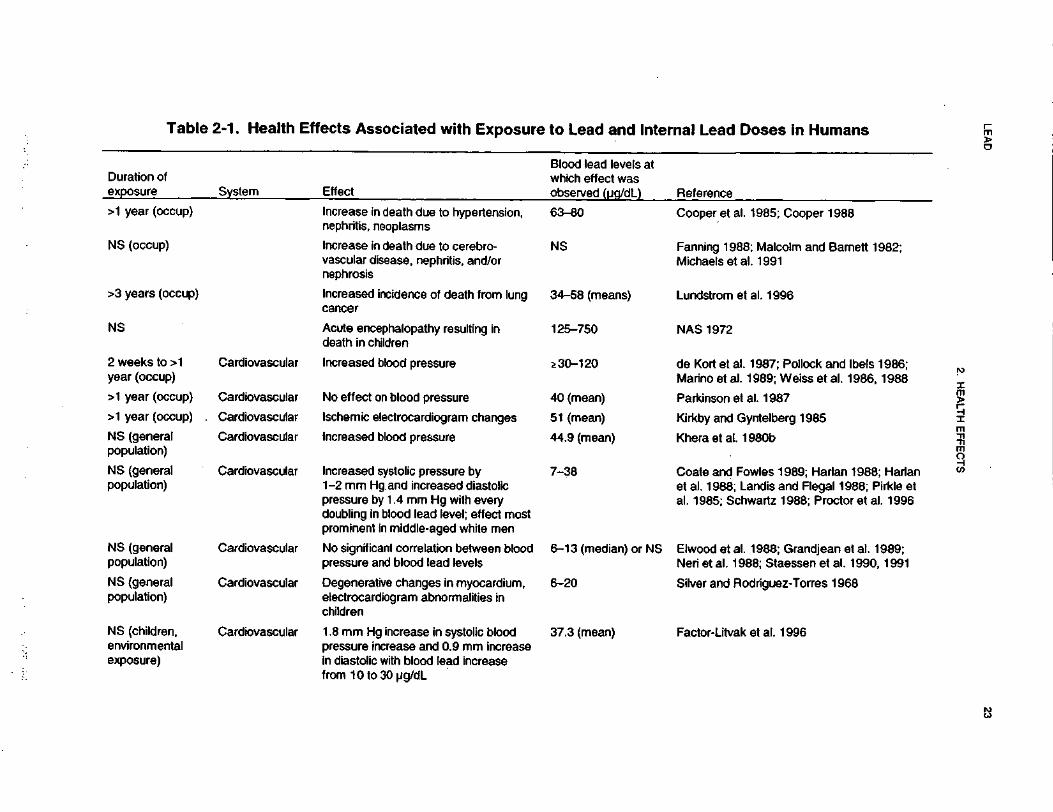
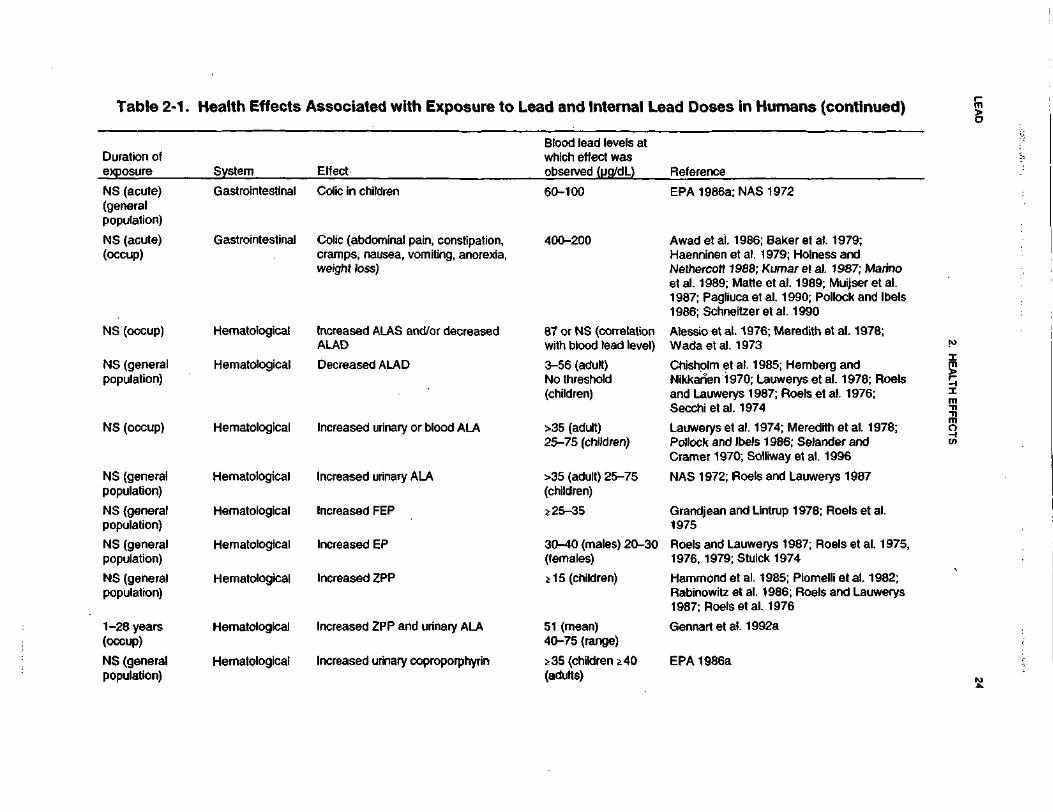
2.2.1 Effects in Humans Based on Blood Lead (PbB) Levels
As discussed in the introduction to Section 2.2, the bulk of the human data on the health effects of lead are
expressed in terms of internal exposure, or PbB levels, rather than external exposure levels (i.e., mg/m3
or mg/kg/day). For the general population, exposure to lead occurs primarily via the oral route with some
contribution from the inhalation route, whereas occupational exposure is primarily by inhalation with some
oral. Therefore, it is difficult to distinguish specific routes and levels of exposure. For this reason, the
human health effects data for lead will be presented in terms of PbB levels in this section. Health effects
associated with human exposures to lead and internal lead doses are shown in Table 2-1.
PbB concentrations reflect the absorbed dose of lead. However, the interpretation of PbB data depends on
a knowledge of the past history of exposure to lead. This is because in the body, bone constitutes the
major lead sink and this results in lead having a long body half-life. Thus, in the absence of intense
exposure to lead for a considerable period up to its body half-life, the PbB concentrations reflect recent
lead exposures. However, if intermittent exposure to lead is occurring in several distinct environments, the
PbB concentration reflects both recent and past exposures to lead. Thus, biological effects for populations
with the same PbB concentrations may not be the same since different exposure times scales may be
involved. This is the reason why free erythrocyte protoporphyrin (FEP) and erythrocyte zinc
protoporphyrin (ZPP) have been used as additional biological markers since their elevation is more related
to chronic lead exposure than acute lead exposure (see Section 2.7).
A major limitation inherent in a good portion of the human health effects studies is that exposure
durations, and sometimes PbB levels, are not specified. However, many of the studies deficient in
experimental detail still provide useful information, and they will be discussed in this section even if they
are not recorded in Table 2-1.
2.2.1.1 Death
Mortality studies for workers exposed occupationally to lead are available. These studies all report
discrepant results, and all are limited with respect to study design. Therefore, no firm conclusions
regarding cause and effect can be drawn from these studies relative to a minimum lethal dose. A cohort
mortality study of employees at lead-producing facilities was conducted (Cooper 1988; Cooper et al.
LE
AD
23
2. H
EA
LT
H E
FF
EC
TS
(0COE3V)0)(0o0•o(0(0cTJ<0
TJCO0)0)3(AOQ.
XUJ
TJ2(0'ootf>(A<(A*rfOCUJ«0)
egon
S llj
.2*1
"S
o"'
« 3=
"o^^ a;
"§€ 5
§£
£m
$ o
Duration oexposure
0)a.ooOih"§8.ooo
GO
0>co1i •§.y
1It•E
c
co gO00 *
"53 oo.o
o
S
o g
21 N
e-•
oo •u
^ 6J" °> —
sl - *
- =5=
o>EJT<5*oa>8a>S^
S .I iK
|J5§
f!.ll111III^
^-
p8
-1 1
5: £
<o
cd co
eo
0) W
V
)
^
k.
k.
^(
Q(
OC
O(
QO
OO
O
1
ooomA
CO
Q3
tD
-.
Oo>
m
fr
118UJ
COzT3E
*- ~o
UJ o
ǤIo
81_(0O
* 1w
1t>nul
II
CD
ID
fl Hi fi
t^fH
M-
oX
-O
-E
-e
oc
o-
gS
E£
g>
§?
2|
co c 5 ~
•=
o>3
£'
I «
55
O
<S -Q
CD
IS
fo
~
O 5
C3
•g>.£ o
o
(=
21
5
I(0O
(0_(0O
i- C
L Q
.
of
§ §
2
^2
-p
*-
o-
S-
-2
.a)
5 «
c§
!& I s &1 §>!»
!=
>
«>
,~
-'
='~
-'3
<N'
-T
-o
">
.A
AZ
a.
Za
.
llll
si s
iw
g-c
o§
-Z
Q.Z
Q.
LEA
D24
2. HE
ALTH
EFFE
CTS
C1oo,(0n3tft
<D(AOQ•o(0(0I•oCO•o(00)Iinoa.xUJ
£I'5o(0<A(Ats0>
uiCO0)
CNA(0
jo eg '"T
lisi5ll
®
o §>
o03
LU
Duratioexposur
o>COLU
coI
ina>i55
« -
1
Grandjean ;£O)
1•oCOIOCD0D
C
RO)
i
Hammond <Rabinowitz
Mi
SCCh."
1
Gennart et ;
-IS
8
children
OTo10)WO
CO
ICOCOCD
<u co)
lli 1'
S®-5
a;
g <D
JS .2
iS
§ ^
S
?£
s
°oo °| 5S
rt
AK A
•?
ci
CM« s-A
CM
s s
'c? '8 1
!CDCDI
e-|sT3$COy'81
1CD
<&12_coo'CD
Q.
LUT5CDCOCOCD(0U'5).oo"5CD
"SCOCO0>COu'ooCOCD
tCO,yO
)ooCD
gsi
CO ,—.
CO .—^
CO .—^
g
§
ffl §
<
K
§
si s
i si
w §
- w &
« §
-Z
D
. Z
D. Z
Q
.
TJCO
Q.
D.
NT3CDCOCOP8>oCOCD£2co
•oCDCOso'o>ooCOCDCO _.
™ «
Sa
Ǥ
-Z
Q
.
LEA
D25
2. HE
ALT
H E
FF
EC
TS
0>c1oo^V)
m3Zjc«CDMoQ•oCO0)
To£«JC•O(0T
J(05o>>_in0Q.
xAssociated with ECOts<uSUJ£To0)iCM_0)
m
Reference
wJ2
co ^J
CU W
"O
ID
^
ll"S"O
_C
f—
ffll «1UJ
E 'CO
Duration ofexposure f
rt f2 C
M
E
"P
£
IS
£
! <
* S
Sli
•-<S
5>-=
o>
*~. 05
..._O
CD
<§
s !"£
-* ^15
211* S
§*„ IjS
U
1 » ?
fife
"! '
5B
fe™
r5 €
5
«
«r.g
r «
2*
2
TB 7
8 ^
- §"
f. E
1 «
58
-w
»
S
«W
-5
C
D
gj t^
°-
S
«
CO ^
^
*
W
0>
<J2
1 «
' I s * o
S
-
w
61
5*8
^ «
- 8
«S*«i*
1 «
i
tisSf II?
i |
^r
rS
wt
ow
•?
o
.
'~:n
r;-"-5
^
—
"co
<
>J
T~
'~
'5
-^
g-
5
•=
_; —
' oo
•-* -
co
™
to
15
•l£ 5i K. ?
5
E
* SR
*SR S* "
" *
c o
> 0
.». o
C
^
a
w
.r^
^c
no
i^-C
cD
E
•;£
S
. -D ?
S i
W.
CB 2
-
E^
tt
^^
Sc
E
o
5®
w
«w
"J
o
^r
a
5
g)'c
5o
-^
'Sy
=3
»
-B
"o
^s
^-
o
3o
>c
.2
.w
"j
Q-
2J
.3
®w
^
: o
><
CD
<O
cO
CO
C
Q»
-<
<
CD
'5)
<£
'cD
CQ
OC
Q
O
>
^~.
F" "S
" *
-c
"=
^£
2 -o
S
2 •£•
"O
"O
s=
±=
73
TO
1
i o
1
§
IE
ij
. w
'
"'
o'
-
in
co
u£
O
**— *
A
r*1-
CM
^"^
*•0
0
0
rn
CO
fft
V
1
I
0
<N
•*
•*
c
\j
W7
CO
i
6o
b
oo
^±
AI
N
AZ
h-
Z
rj- T
J-
I-
A
rt
1
-g
•e
«
CD
m
-c
>
0>
C
O
*^
3>
-e
«
E
._
if ?
1
5 I
:lif §
§
.i |
1 I
c
c a>
?>
t3
S
* "S
^^
•B
^
i '
^
§f
§2
^8?
&?
a
?
?
S
«
7
3 |
«
zE
§c
=S
mi
nc
B
Q.
eg
"-
C
c5
g«
g:
«^
^|
e
2
I «
»
3
^^
••
si
0-
0-
5 Q
. «
=
1 s '§
s=ri
•O
T3
™2
-o
-c
i-
a
as
05
. 2
-n
« 5
SS
if
SS
S
c
t3
£"
l s
ic
ow
£.
2c
oc
ow
>.
.y
a>
.-
a>
w
u^
3-
CD o
)Q
.p
CD
o
c
u-
g^
c t-
=t:
2
•- oo
fe
gl
bb
b-
ie
«?
«.
§
js
-C
Dc
BJ
gc
CB
CD
CD
-C
i:
OC
D§
;E
i-Jj
xj
<Q
mO
2
.0
C£
<
?Q
.
SCO
(0
C
D
(0o
o
o
u
'c? 'S
1
f '?
'c
?S
O
o
o
_o
o*J3
*jj
*j *•
*™
••-".<
u(
0
(D
CO
(0
"J
±
— ;
TS
^S
"S
*S
EE
E
EE
2.
C?
cc
c
2<
DO
O
Q)
(D
(D
Q
) 0
)0
)
0)
O)
IX IIII
D
C
DC
CC
DC
D
C
lit 1
?| !§
?_
§!
§ L
ff.fl'lor
si&
sis
sSu
Sitf
f|iiliilt§l
sis
sis
^li^H^^
2&
sslsslsls
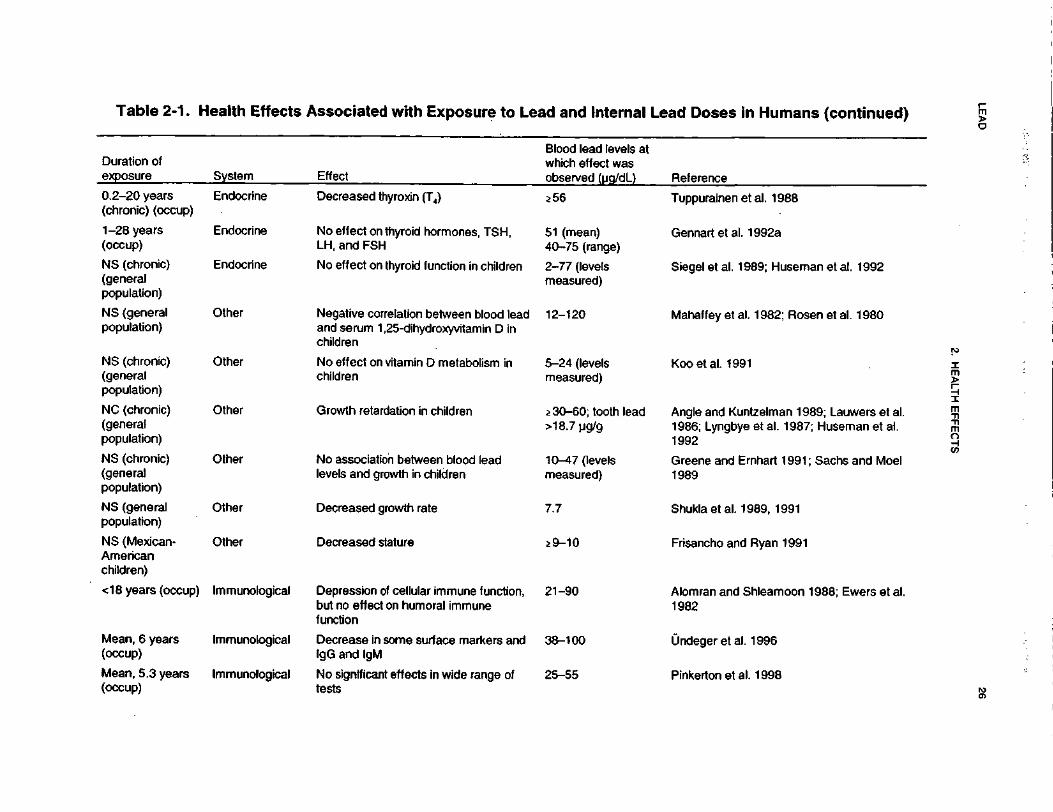
LEA
D26
2. HE
ALTH
EF
FE
CT
S
•o0)3C•3COJ,
(0luman
z.£</>w0Omi_0)**•o(0•ore0>o**1(00Q
.XUl
s.*i53**(0
'o0(/>(0(0"o0)St^"50)Z
*1
J2(0H
Reference
"5J2 co
j
CD C
O
-
CD ~ra
T3
J:
^o
o ®
J9
Z ^
CD $
O^cu
LUCDCO
CO
Duration ofexposure
CO _
: C
D
CO
^
CO
O
»-
CM
O
CD
*- ^»
C
DO
) C
O
. C
O
* _
CO
2
?
W §
C
0)
5 c
n
S
22
ll
-8
m
-0>
ffl 3
C
O
^c
c
of 3
: co
SCO
CD
CO
- - i—
s IS
Is i
§ I
§J
Df
OX
c
vf
E—
r ^
«=
E
to
00
"S
en
g
2
I » 1
Sf
1
2
S*
C)
^^
"ccj
5>
§>
,U
J
T^
TJ
^ _
j"
(5
1
S
2
1.
?
Ifl 2
S
§
?
11 | i
1 2
"tfc
M lo
» 1 1
IC
M f |
?
1 f
I 1
188 1
8 1
S
IS
=
1
1
nJ^^
—<j)
£
wO
) (0
W
O
"Q
|lif
g if
si if g
At
LO
^
(Si
C
^~
LO
t M
A
T
™ C
t**"
^
^^
C^
C^
73
_C
<
0
C
P^
^ ^
C
^
CO
^
M Is
i
i ls i i
wc
-c
'E
o
-
o=
S2
S
•-
CC
OJ
3
C
S
CP
c?
^C
ZC
d
J.
tS
CO
C
D
Sc
3^
EC
D
g.2
S
.
«
-D
sS
>
E -i
«
1^
^E
o
B^
E
2
c—
E
~
o
5i£
5 5
5 -o ' Q
£
cS
'5's
'^ S
"§ ~
C
"D
"D
^
r*
_C
—
^
C1
-
"^
^t
"'
c3
'5? 'o
'o
•—
E
S
"CD
'r-
*^ ®
==
?
CD
C
D
§,.}r.c
r I
s™
i
cf
ll
s|
l«
^
O C
O
O
O
c
^
"*^
*^
"O
^O
^
OD
—
r$
\ ??
Q)
4— L
L
^^ t
^_>
Q
) "Q
73
Q
} <j)
(O
y. Q
J ^^
.it
0) 3
r£J
3z
'Sw
Sit
S?
^ w
w S
S
®
o.
°2
§.
Q5
o
o^
o
o-
nP
®^
o
ro"o
o
o
Q-
cy
o,
nw
^0
) O
TO
C
Dc
*_
pO
"F ^-
O>
CU
Q
) C
U^
Cc
UV
Jo
^Q
Z_
iZ
Z
co
oZ
u
O
ZJ92
D
Q
Q^
^Q
^Z
S
to co
cdto
o
o0)
0) tu
Q>
O
) D
>
0
0
O
C
C
C
III!!!!!! ill
LU
LU
L
U
O
O
O
O
OO
1
11
. — .
"5Q
. 3
C
O
Oj
0
i 0
2
*"
It L fill! iifl«
!fi!il]§f i
lafs
7|o
gs
«|3
| si|s
«fsi|s
|S.-i||-
g=
g|
CM
^v
oc
oc
og
-c
ox
- c
oa
)§
-o
a>
g-
co
a>
g-
co
R-
c/)
E:F
2
a>
" «
«d
^.r!-0
.z
SQ
.Z
Q.
zS
o.z
SQ
.z
So
.Z
Q.Z
<o
v
2-2
-2
5-
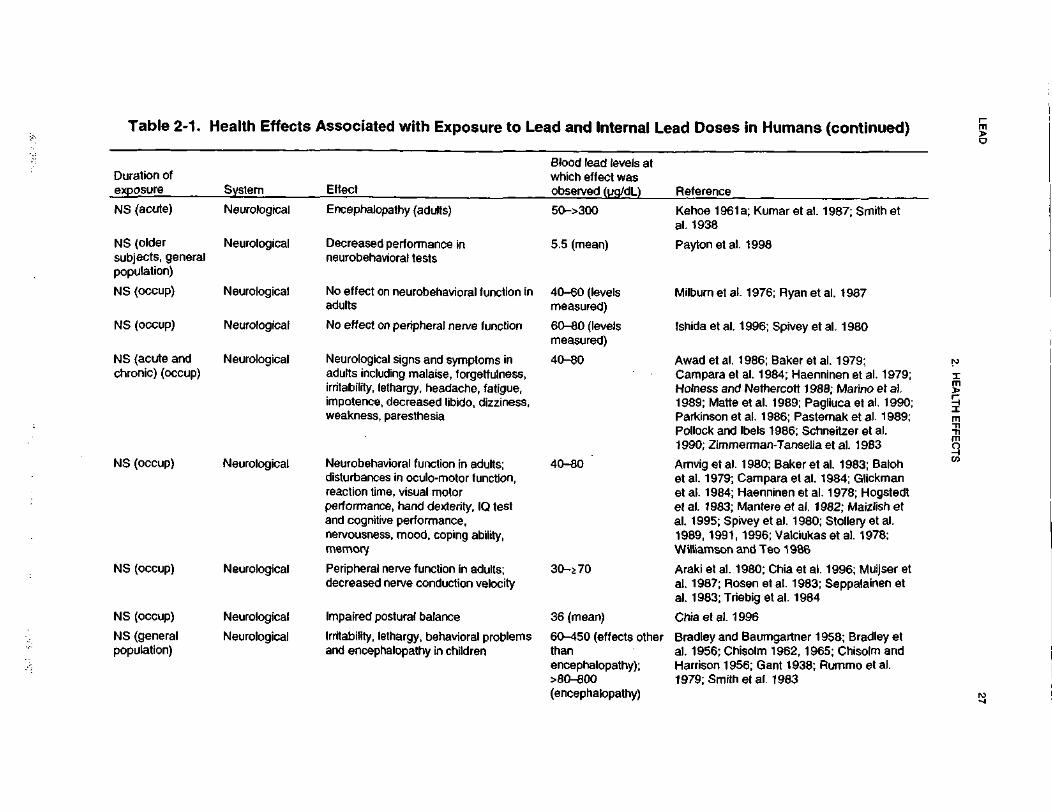
LEA
D27
2. HE
ALTH
E
FFEC
TS
•u0)3CiOtoc(03IC• M
»
(0fl>(0o0•oa"5c5j:TJ
•oa0)o£3(0OQ.
XUJ
**'isociatedin4
-ti0)
UJ£"«5d>.T™CslJ)(0^^
0)
805
505oc
mJ2 w
s j'05
« T
3m
^ *
C
Blood lead l<which effectobserved (u
BUJP0505
W
IBS3
ns O
3 3
O 0
*-CO.cECON05
Tto15to3^to"s^
00
SC
O05
0) *"
i«i "5
50->300
"inT3^5->,
.cncephalopat
UJTO
oD5
1CDZ"oT-to.COZ
sO)
^r-
75cf«Q.
f05
ininc8I*E o>O
—•c
to
ecreased pe3urobehavioi
Q c
~cau'<?o05
"«05C05
05 8)
— t3
-£-.*,CO
"Z
05
§
? :
?iis
||^(0
tO
-^
•;=
60" '-H
«5I
§!976;lburn et al
0) -K
1Q.
COCDO)
O5Q)
toT3
Hi
^
»-
<O
XT
-£
LO
_r
-
oo"oc
_3
,3
avioNo effect on neurobadults
03O§O
0)
"to0)
ICOCLCOoSC9
S
05" g
"i'f'S
llli^^i^m"8 -s 1
? S
Sl^
SI!
.-
S.S
£gH
il•
--
too'O5
£205Z
_-
^ _: 0
5 o
,- «
^
0) 0
>
05 »
1 2 2 2 "• 8 1 1 "• "• '•£ £^«<
«O
o;'f
5'
i->
<
««
O
B
Q T
B I
05 -B
li
•s05
oco
^ js '§
f
If
CO
.
Will
l§«lli
| 8
§ 8
5 tf
ufo05Uo2,
CO
SISI
mgs
«o'CD
Os-0oCOZ
.
£lOQ-c
« 2
o 2
I'-B•i.s•°.>•«O
5 5
1to to
1 I
2
205
05Z
Z
III
O
^ ^
CO
CO
§"
Z
Z Q
.
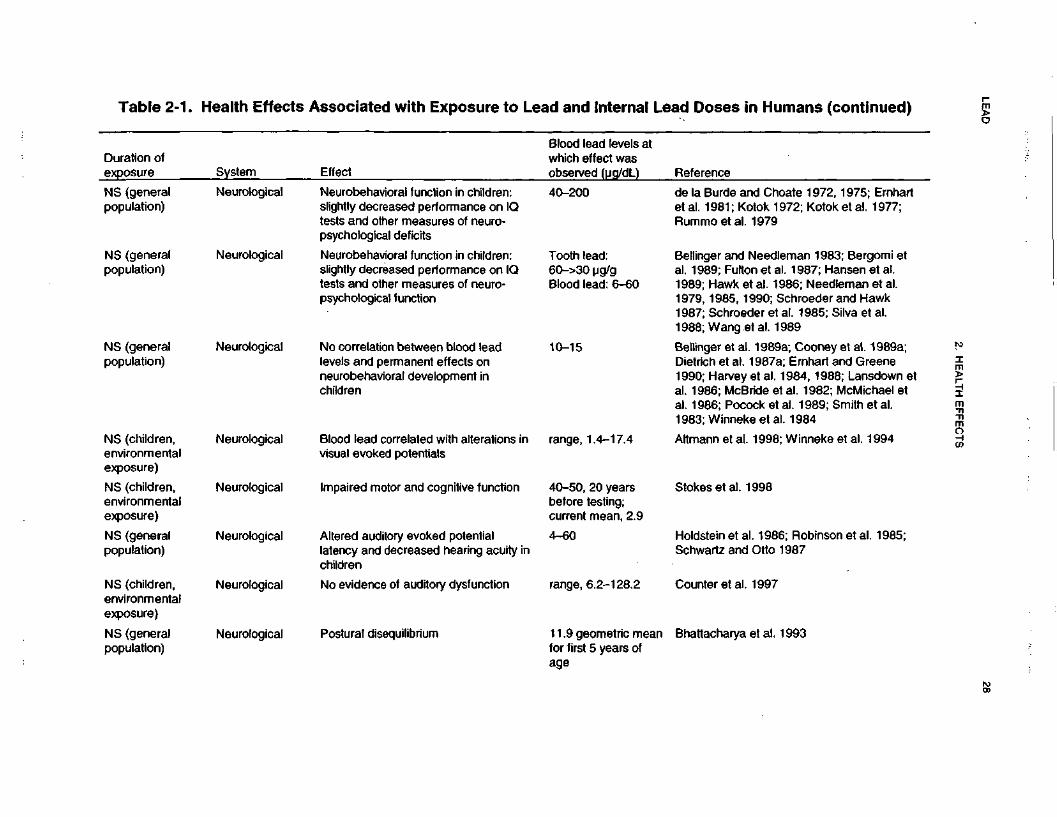
LEA
D28
2. H
EA
LTH
EF
FE
CT
S
°? ^
CD
-5
T?0)
_c4—o(0reE3X£(00)(0oo•ore0)i"re^^
0)4-1
•oCre•ore0)—
loMhAssociated with Exposure
W00)
111£+^
0)XvCM0).0re
Reference
ToTo co
^
1 S^
ill.2 7i3 §o
€ |
CO $
O73<D
UJcu.
CD^S
,
CO
Duration ofexposure
r-C r«-
E "*"
UJ
°2
£7
5
c\T 73
SS5 c
\fco I s-O
O
5-C
»-
05
II!
"2 5 ®
jo •= E
—
co ^T3
75 CC
rr..0F "^
iCD
C
o
Neurobehavioral function in childrslightly decreased performance otests and other measures of neurpsychological deficits
COU'05o^J
05
Z
NS (generalpopulation)
<5'E 75 TO
a»*IIIr-
Jr
s|3
°> s
- N
5C
00
1^8
<D
— ; O
)^
C
O ,—
|»7
5
|l *
C
3 •*
J":^
lij
75
"S
CD 75 ?O
rni
±3
O5
T)
CO 3-
CO
CD Q
C
D
n?^8 i oH
C
O C
O
c-
CD C
0
Neurobehavioral function in childrslightly decreased performance otests and other measures of neur
COO$oDCDZ
NS (generalpopulation)
J£1 *
CO <-
I
CD
•o 5Schroeder aal. 1985; Si989
°?
^?
«S
8 i?^«
$05" r--" co"N
oo
coO
) G
5 G
5
psychological function
75CO"
C
<DO
5 C
D 5
-g
j _.
O5
CD
•§
J5
,
75 CD
jo if
£
|li"|f.
__ o)
^- ^3
TT
;- C
D "C
g
CD
2 ^0
CO ..
.. ~
c -H
o" 05 05
^>"^
75 O
5 r™
^~
C
O* ~
O
5 _: _
: O
)CO
Q *-
co
co
i-
3_
No correlation between blood lealevels and permanent effects onneurobehavioral development inchildren
75.yO5
O2DCDZ!"£
•
8|
SI
^R
.O
>O
>T
~
To; Winneke e
00
05o>7575cCO
<TT
N^
4CD"D5
§.cinO
Blood lead correlated with alterativisual evoked potentials
CO
oO)
o2<DZ
. 75
NS (childrenenvironmentexposure)
Stokes etal. 1998
05
2 c\i
CO i-f.
-0)
O) c
>>~ w
O
W ^
OJ
.CD
C
o" CD
75
o 75 3
1-
JD
O
cQf?Impaired motor and cognitive funiCOoeno2DCDZ
. 75
NS (childrenenvironmentexposure)
mCO
O5
75«
6; Robinson1987
Holdstein et al. 198iSchwartz and Otto
5.c£,
e \
Altered auditory evoked potentiallatency and decreased hearing a<children
COO'eno03CDNS (generalpopulation)
Counter etal. 1997
C\J
COC\J
5COCD"C
U
2§
No evidence of auditory dysfunctiCOooo13CDZ
. 75
NS (childrenenvironmentexposure)
CO§
Bhattacharya et al.cCOCDE7
5
£ 55CD
<D
E •**
o in
CD
«-
o> tn^_j
^
Postural disequilibriumCOO'05
o03CDZ
NS (generalpopulation)
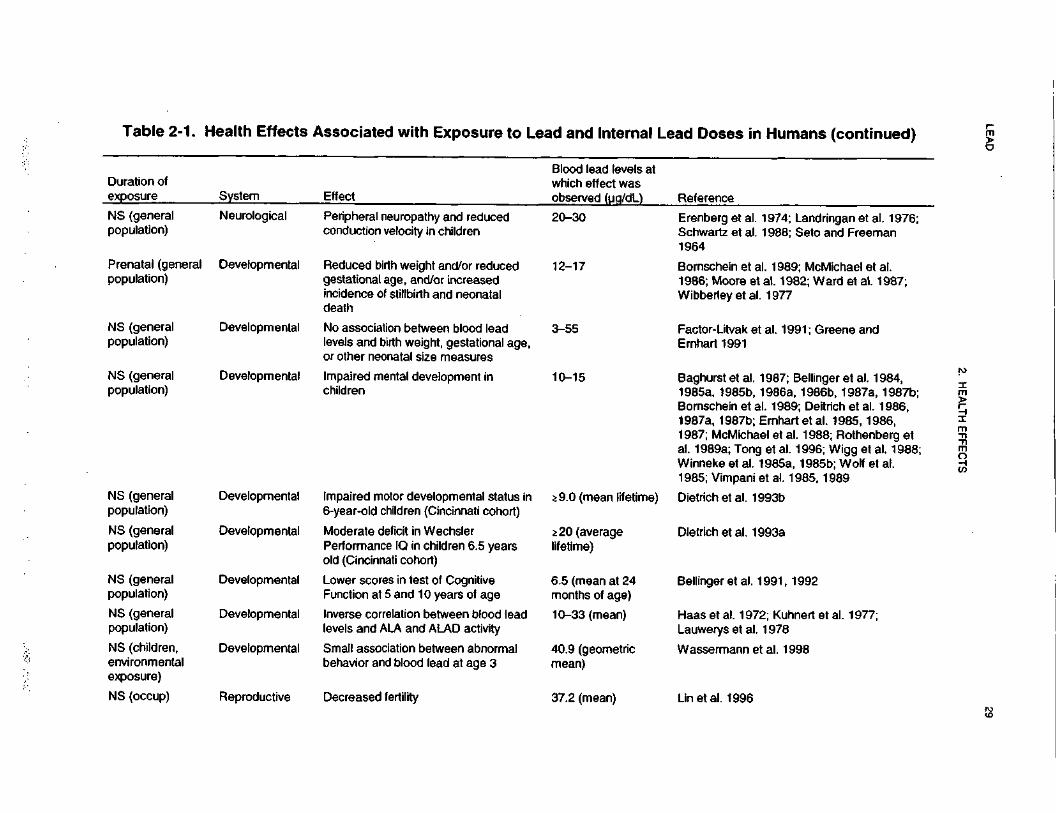
LEA
D29
2. HE
ALTH
EFFE
CTS
0)cco(An3X_CCO0>(0oQ•oto0>0)
T3
T3(Q§COoaXUJ
•o5<a'oo(A0)
*2a>no0)J3CO
Reference
"«Iff
111
CD S
O13.2m_o>toCO
Ifi
O
3
"13 8S 1
o 5
N15 E—
, CD
ndringan eIo and Fre
<« ,"£_l C
O
r co~h- C
OO5
O)
"S "(H
Erenberg et iSchwartz et i1964
I•aCDST3
_2 Sral neuropathy and
ion velocity in childPeripheconduct
—Cu
*O)
O23CDz"S
,-.
IIsizl
.-
*'*
03 —
'_
CO
SU
o-S
5>2
?cvf6) co00 ^
f^*
05 *~
O3
^ 15 '-
CO «-
— :
l C
D
CO
Bornschein e1986; MooreWibberley et
CMCU3 -o 150>
S
«>-
CO
5S
£ §
d birth weight and/inal age, and/or inc:e of stillbirth and n<
°>.Q
£
3I3
S0>
<8
0
CD
CC
O>.£
T3
15"cCDE"55IO2CDS
"B
15 |O
D
.
£ a
c; Greene a.C7>
?15^^CD
.£ o>
^i
o jS
ffi^
en•D
""
CO CO
O ffl
3
iciation between bl<id birth weight, gesneonatal size mea
i w
-cS
l°z
® o
2cCDE0.
oCD
Q—ifsin
^3
^^
» <
TO
(0 C
O
o>
2
"55 *--COfeSO
>
O5
^~
*
— i _Q
"
cf
el
*~1
d mental developm
tlE^
2c0)Ea.
oCD
Q1? --~
11
^l
8
5$
!~ "
c ™
a>
18|S
1»
•£ 0) C
E ^
> co
•c ^ 3J- >
.a J2
Q) *»~ O
5 00
6)" "C
— =
T" ^"-
^co
rt ^
~— ^
OJ
f~
^* (0
U
O —
^ £ —
o a> *-flj
^^ Jrt
O)
™*- ia
"
c —
: 'c
0
O>
C
35 _J >
0)
m ^- ,-
co 5- -r-
05
-S
-.TB?11
«»
1
"5T<O
0>CD
CJ
CD
•
-
CO co
coC
M-
®co
o E
o•c0)
n
-
</33
52coCO3
CD "D
.£ C
O*
O
!
C "5
_
15C
CD
CO COI
iT
3
SS
= '5
a «
®
CO
£
COtO
a> CD
I
IoQ
Q.
CDD
S
SCUa.
CDa.CDDcua
o30)IT
&! as>—
•- D
•»—
- 3frt
a. rn a
.i a
zg. s
^z-ai8-
t°§ 1
Zo
.Z
oa
>Z
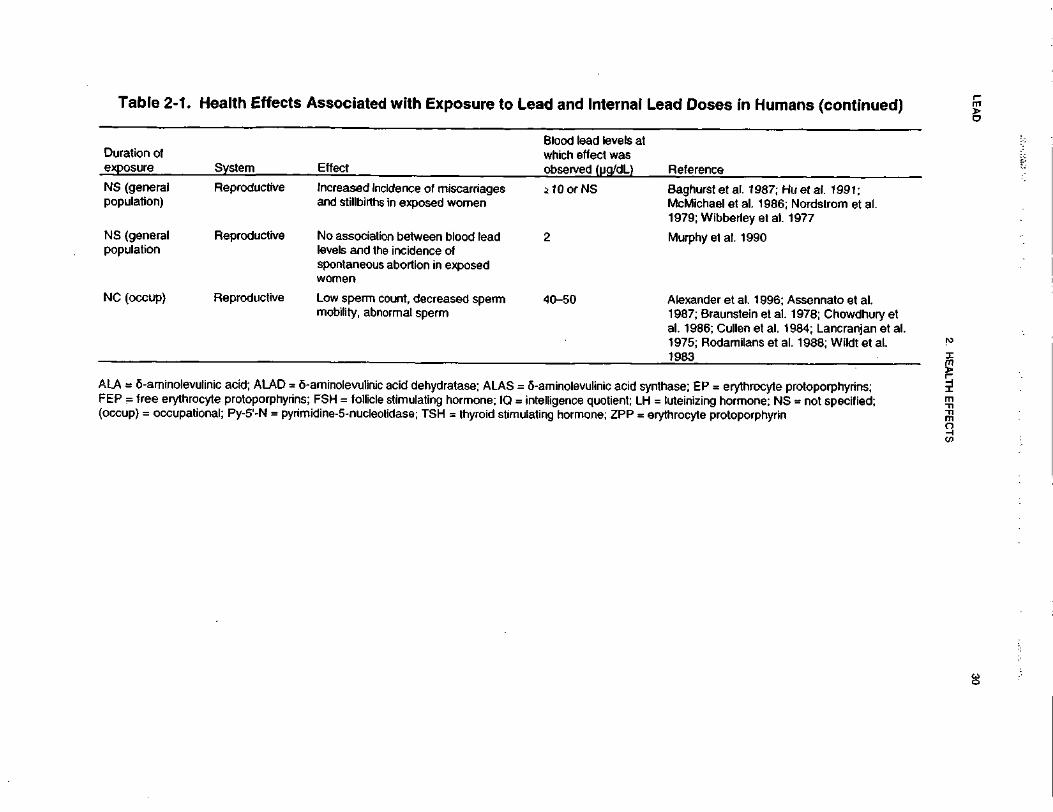
LEA
D30
2. HE
ALTH
EF
FE
CT
S
0)3.cco^~^t
tocreE3X.c(00)(AOQTJre0)
75o>cT3re•oCO0)Jo+
^
2>3toOQ.
XUJ
_e
iB
1TJ^ssociate
-^
to"5LU£150)zT
^C
VI
Q)
B(0•
Reference
"55w
w 2"
gj 5 "g
~~ 75 3« ;£
TJ
l|l
oo 5
oILU*B
IEO
3•.c
</)ffl O3
&O
o>
CO
52 I
— - "55
03 -r~t
•*- fc
- j
"5 O
l^
•?—
Baghurst et al. 1987; f-McMichael et al. 1986;1979;Wibberleyetal.
wZooT—/yw0)
O)
.2? c
V—
QJ
(0 £
u o
•j? 5
fc
"D
O
wQ
) 2
5 5-Ic
o «
Increased irand stillbirth
CD
1Q.
0>OCa-p
s ~5W
o
Z Q
.
Murphy et at. 1990
C\J
T3
•n ">
o
o§^ s-JD
O
O
)C
0)
CCD
O
—
CD
C
C5
C
D
om
~ 't-
111
No associallevels and tlspontaneouwomen
CDReproductiv
il3~5C/5 ^
2 Q
.
*2 •2
l-l5CD
5
(O P
o ^
o
>
C
I rf\C
yV
i" m
S I s-
•*" O
>y)
O)
GO
T-
<
••" O
> _:
Alexander et al. 1996; ,1987; Braunstein et al.al. 1986;Cullenetal. 11975; Rodamilans et a1983
0toit1w-Q0)CO C
CD £
O
0)
®
S"
—
§1
8|
CD.21Q
.CD
QCI-2.O
11
>.'o
SI CD
Q. Q
.^ C
A0 „
Q-'S
2 °
2 n
n «
n
lase; EP = erythrocyte |luteinizing hormone; N£throcyte protoporphyrin
•E ii
g1
||
a!
o .2 N
'c R
CD"
=3 §•§
1 S i
0
C o
C
CD
.c
E^a
,tp
»•£10
C
(fl
ii ii 2
(/) Q
.£
^*»
w
< ill
m
O
t^en
P
t~JS
0
**
CO ^
II
"D
O)I
CD "(0
*~73
3 C
D"
"o E
co "So So
CD
'o
aminolevuliniFSH = follici
idine-5-nucle
10 in" E
„ c -c
ii •=
>,Q
l-0-
3 e
-i;? o 2<
Q
.- 1
trS *?
•a 2
^05 °- ..
=5
00
"5 %
3
i » 8
t a,
O7
£
II
>o ^= ^^
n II. §•
^
Q. c
j-j LU
y<
u. 3.
LEAD 31
2. HEALTH EFFECTS
1985). Two cohorts of male lead workers, 4,519 battery plant workers and 2,300 lead production workers,
all of whom had been employed for at least 1 year during the period 1946-1970, were studied for mortality
from 1947 through 1980. Overall mortality and standardized mortality ratios (SMRs) were determined.
From 1947 through 1972, mean PbB levels were 63 ug/dL for 1,326 battery plant workers and 80 ug/dL
for 537 lead production workers (PbB data were not available for many of the workers and most of the
monitoring was done after 1960). For both groups, the number of observed deaths from all causes
combined was significantly greater (p<0.01) than expected, based on national mortality rates for white
males. The increased mortality rates resulted in large part from malignant neoplasms; chronic renal
disease, including hypertension and nephritis; and "ill-defined" causes.
Two studies of mortality in four lead acid battery plants in England were conducted (Fanning 1988;
Malcolm and Barnett 1982). In the report by Malcolm and Barnett (1982), causes of death between 1925
and 1976 of workers with no, low, or high lead exposure were compared to national mortality rates. In the
high lead exposure group, a slight, but not statistically significant, increase in deaths due to cerebro-
vascular disease was observed. However, among the workers aged 65-69 years, death due to cerebro-
vascular disease was significantly increased. In addition, a marginally significant increase in the incidence
of deaths due to nephritis and nephrosis was observed in the combined low- and high-exposure groups
during 1935-1958, but not at later periods. A significant increase in cancer of the digestive tract among
the high-exposure group was observed among those workers who died during employment, but not among
retirees. The relevance to lead effects was questioned by the authors. However, it may be that these
retirees are the less susceptible members of the population.
The second study compared the causes of death among 867 workers exposed to lead from 1926 to 1985
with 1,206 workers having low or no lead exposure (Fanning 1988). Environmental lead levels and bio-
logical monitoring for body lead burdens were not available for the entire period. A significant increase in
deaths due to cerebrovascular disease was found in lead workers that died between 1946 and 1965 as
compared to controls. No other cause produced an excess of deaths in lead workers. The author suggested
that the increased risk of death due to cerebrovascular disease was not present from 1965 to 1985 because
of stricter occupational standards resulting in lower levels of exposure. Because environmental lead levels
and/or lead body burdens were not quantified for the entire period of study, the possibility of
misclassification of workers exists. Furthermore, various potentially confounding factors, such as age,
smoking, etc., were not accounted for in this study.
LEAD 32
2. HEALTH EFFECTS
Increased risk of death due to cerebrovascular disease was also observed in a cohort of 1,261 white male
newspaper printers (typesetters) (Michaels et al. 1991). The cohort was followed from January 1961
through December 1984. While neither environmental levels of lead nor PbB levels were measured, the
authors assumed that exposure was generally below the OSHA Permissible Exposure Limit (PEL) of
50 ug/m3 based on historical industrial hygiene studies in the printing industry. Furthermore, these
workers had little or no occupational exposure to any other potentially toxic agents. Information on death
and length of employment (used as a surrogate for duration of exposure) was obtained from union records.
It was assumed that lead exposure ceased in 1976 when the transition to computerized typesetting
occurred. SMRs were calculated for 92 cause-of-death categories using the mortality rates of New York
City as the comparison population. The authors found that there were no significantly elevated
nonmalignant or malignant causes of death in this cohort. In fact, the SMRs were generally less than
unity, indicating that there were less deaths than expected, which the authors attributed to the "healthy
worker effect." However, the SMR for cerebrovascular disease was significantly elevated in those
members of the cohort employed for more than 30 years. This was not accompanied by an excess of
arteriosclerotic heart disease, which suggests that lead exposure may selectively increase the effect of
cerebrovascular disease.
Another cohort mortality study compared the mortality rates due to various causes in 437 Swedish smelter
workers with verified high lead exposure for at least 3 years from 1950 to 1974 (Gerhardsson et al. 1986b).
The mortality data for these workers were compared with national and county mortality rates specified for
cause, sex, and calendar periods. Environmental lead levels and PbB levels were available for all workers
since 1950. Mean blood lead was 58 ug/dL in 1950 and 34 ug/dL in 1974. The group of 437 lead-
exposed workers was further subdivided into high and low mean PbB levels and high and low peak blood
levels based on the cumulative PbB dose 1950-1974 and peak PbB values. Of all the specific causes of
death examined, only the SMR for lung cancer was increased, but the increase did not achieve statistical
significance. In addition, no consistent dose-response patterns were seen in the subgroups. Limitations of
this study include the fact that it did not account for various confounding factors, such as smoking, and the
fact that all of the workers were exposed to other toxic chemicals, such as antimony, arsenic, cadmium, -
chromium, cobalt, lanthanum, selenium, zinc, benzo(a)pyrene, and short-lived free radicals. Results from
a follow-up study of 1,992 workers at this smelter, 326 with high exposure, were reported by Lundstrom et
al. (1997). Expected mortality in 1955-1987 and cancer incidence in 1958-1987 were calculated relative
to the county rates, specified for cause, gender, 5-year age groups, and calendar years. Among the highest
exposed group, the SMR for all malignancies was slightly increased to 1.5 (95% CI 0.8-2.4), but the SMR
LEAD 33
2. HEALTH EFFECTS
for lung cancer was considerably higher (SMR 4.1, 95% CI 1.5-9.0). Since the workers may have been
exposed to other carcinogens, including arsenic, the specific role of lead cannot be ascertained. An
additional study of 664 Swedish male lead battery workers employed for at least 3 months during
1942-1987 found an increased overall mortality, and an increased mortality from ischaemic heart diseases
and all malignant neoplasms among the cohort (Gerhardsson et al. 1995a). However, no dose-response
pattern was found and the risk estimates did not increase when a latency period of 15 years was applied.
The study also found an increased incidence of gastrointestinal malignancies among the workers exposed
to lead; this tendency was related to employment before 1970 and not to lead dose or to latency time.
Gerhardsson et al. (1995a) suggested that the results be interpreted with caution because of limited
numbers and the lack of dietary and smoking data.
The possible effects of lead exposure on mortality were examined in a series of 454 pediatric patients at
Boston's Children Hospital who were diagnosed with lead poisoning between 1923 and 1966 and who
were traced through 1991 (McDonald and Potter 1996). Observed deaths were compared with expected
deaths (O/E) using an updated version of the United States Death Rates computer program. Of the 454
patients eligible for the study, 88% had a history of paint pica or known lead exposure; 90% had radiologic
evidence of skeletal changes consistent with lead poisoning; and 97% had characteristic gastrointestinal,
hematologic, and/or neurologic symptoms. The average PbB level in 23 children tested was 113 ug/dL;
PbB tests were performed routinely at the hospital only after 1963. Among the 454 eligible patients, 86
deaths were observed compared to 49.3 expected (O/E 1.7); 56 deaths were observed among males and 30
among females. Although the distribution of causes of mortality generally agreed with expectations, there
was a statistically significant excess of death from cardiovascular disease (O/E 2.1, 95% Cl 1.3-3.2).
Three of four deaths from cerebrovascular accidents occurred in females, and 9 of 12 deaths from
arteriosclerotic heart disease occurred in males. Two men died from pancreatic cancer (O/E 10.2) and
2 from non-Hodgkin's lymphoma (O/E 13.0). Chronic nephritis was not a significant cause of death.
Cocco et al. (1997) evaluated cause-specific mortality among workers of a lead-smelting plant in Italy. The
cohort consisted of 1,388 men whose vital status was followed from January 1950, or 12 months after the
date of hiring, whichever was later, through December 1992. For this period, reference mortality rates of
the Italian male population were available from the mortality data base of the World Health Organization
(WHO). The deaths from all causes, all malignant neoplasms, diseases of the nervous system,
cardiovascular diseases, and digestive tract diseases were fewer than expected when compared with
LEAD 34
2. HEALTH EFFECTS
the national mortality rates. A 4.5-fold excess mortality from pneumoconiosis and other diseases of the
respiratory system was observed. Previous exposure to silica in other workplaces was suggested as a likely
cause for this increase. Mortality from lung cancer was not increased. SMRs for genitourinary diseases and
kidney cancer were not significantly elevated, but both risks increased significantly with duration of
employment. Cocco et al. (1997) noted that as kidney cancer accounts for about 0.4% of the total deaths
both at the national and regional level, the small size of the cohort may not have allowed detection of small
increases over the very low background rate.
In summary, while no strong conclusions can be drawn based on these mortality studies, it is important to
note that four of these studies (Fanning 1988; Malcolm and Barnett 1982; McDonald and Potter 1996;
Michaels et al. 1991) reported some elevation in deaths due to cerebrovascular disease. No other studies
reported increased mortality due to cerebrovascular disease caused by lead exposure.
High levels of lead have been suggested as a causative agent in Sudden Infant Death Syndrome (SIDS)
(Drasch et al. 1988). PbB levels in 41 victims of SIDS (3.9±1.8 ug/dL) were compared to those of 77 living
control babies (3.5±1.2 u.g/dL) and 5 babies of the same ages who died from traumatic causes
(3.5±2.1 ug/dL). The authors controlled for several factors that may influence PbB levels, including post-
mortem shifts in blood water, age, sex, social class, nutrition, fever prior to death or sampling, birth weight,
complications at birth, premature birth, and pregnancy history of the mothers. None of these factors
differed significantly between the SIDS babies and the control babies. The post-mortem shift in blood
water was accounted for by calculation of the lead concentration in blood dry weight. There was no
significant difference between either the arithmetic or geometric means of the dry PbB concentration for the
SIDS and control babies. However, a significantly greater number of the highest lead concentrations in dry
blood were found in the SIDS group than in the control babies (p<0.01) as determined by Chi-square
analysis. Based on these results, there may be an association between higher body burdens of lead and
SIDS. Possibilities include an effect of lead on prenatal and/or postnatal neurological development. It
should be noted, however, that the authors did not control for smoking, a known risk factor for SIDS
(Haglund and Cnattingius 1990).
In children, entry of lead into the body occurs primarily by ingestion, although inhalation also contributes to
body burden. Once lead intoxication proceeds to encephalopathy, the risk of death exists. Dose-response
information on a pediatric population relating PbB levels with the occurrence of acute
LEAD 35
2. HEALTH EFFECTS
encephalopathy and death was compiled by the National Academy of Sciences (NAS 1972) using
unpublished data from groups of patients originally reported by Chisolm (1962) and ChJsolm and Harrison
(1956). The range of PbB levels associated with encephalopathy was approximately 90-800 ug/dL
(mean, 330 (ig/dL), and the range associated with death was approximately 125-750 ug/dL
(mean, 327 ug/dL). All but 1 of the 98 cases of fatal encephalopathy had PbB levels • ISO ug/dL.
2.2.1.2 Systemic Effects
No studies were located regarding musculoskeletal, dermal, or ocular effects in humans after exposure to
lead.
Respiratory Effects. The only information located regarding respiratory effects in humans associated
with lead exposure was a case report of a 41-year-old man who was exposed to lead for 6 years while
removing old lead-based paint from a bridge. At the time of the initial assessment, his PbB level was
87 ug/dL, and he complained of mild dyspnea for the last 2-3 years. No abnormalities in respiratory
function were seen at clinical examination, so it is not possible to conclude that his respiratory symptoms
were related to exposure to lead (Pollock and Ibels 1986).
Cardiovascular Effects. There is currently considerable scientific debate as to whether there is a
causal relationship between lead exposure and hypertension. Another area of controversy is whether
African Americans are more susceptible to the cardiovascular effects of lead than are whites or Hispanics.
The evidence from both occupational studies and large-scale general population studies (i.e., National
Health and Nutrition Examination Survey [NHANES II], British Regional Heart Study [BRHS]) is not
sufficient to conclude that such a causal relationship exists between PbB levels and increases in blood
pressure. The database on lead-induced effects on cardiovascular function in humans will be discussed by
presenting a summary of several representative occupational studies followed by a discussion of the
findings from the large-scale general population studies.
Cardiovascular effects have been noted in occupationally exposed workers after exposure to high levels of
lead following exposure durations of as short as 4 weeks. Construction workers (race not specified) using
oxyacetylene torches to cut a metal bridge that had been painted with lead-based paint were reported to
exhibit increases in heart rate and blood pressure after 4 weeks of exposure (Marino et al. 1989). Steep
LEAD 36
2. HEALTH EFFECTS
increases in PbB levels were observed only 2 weeks after work began. Peak PbB levels ranged from 48 to
120 ug/dL. Personal breathing zone exposure to airborne lead ranged from 600 to 4,000 ug/m3.
Hypertension was also observed in another group of men (race not specified) who removed lead-based paint
from a metal bridge for varying lengths of time (Pollock and Jbels 1986). PbB levels measured in these
workers ranged from 50 to 85 u.g/dL; 2 of the 5 cases also exhibited nephropathy and one complained of
angina.
Another occupational study compared 53 lead-exposed male workers (2 nonwhite, 51 white) (mean PbB,
47.4 ug/dL; range, 44-51 ug/dL) from a plant processing lead and cadmium compounds with a control
group of 52 workers (8 nonwhite, 44 white) (mean PbB, 8.1 ug/dL, with none exceeding 20 u,g/dL) from a
nonlead industry (de Kort et al. 1987). Blood pressure levels were positively correlated with PbB and urine
cadmium levels, but not with blood cadmium levels. The correlation for systolic blood pressure and PbB
level remained significant after controlling for confounding variables.
The relationship of PbB level to systolic and diastolic blood pressure was determined in a study of
89 Boston policemen (race not specified) (Weiss et al. 1986, 1988). These policemen were under
observation for health outcomes related to environmental work exposures (i.e., they had traffic exposure
histories). After statistically adjusting for previous systolic blood pressure, body mass index, age, and
cigarette smoking, high PbB level (• SO u.g/dL) was a significant (p=0.01) predictor of subsequent elevation
in systolic blood pressure of 1.5-11 mm Hg in the working policemen with normal blood pressure. Low
PbB level (20-29 ug/dL) was not a predictor of subsequent systolic blood pressure elevations. Diastolic
pressure was unrelated to PbB levels.
Each of the four studies discussed above (de Kort et al. 1987; Marino et al. 1989; Pollock and Ibels 1986;
Weiss et al. 1986, 1988) involved cohorts of fewer than 100 subjects and failed to control for one or more
possibly significant confounding factors, such as smoking and alcohol intake.
Another occupational study failed to reveal any significant correlation between occupational lead exposure
and diastolic and systolic blood pressure (Parkinson et al. 1987). After controlling for known risk factors
(e.g., age, education, income, cigarette usage, alcohol consumption, and exercise), the association between
exposure and blood pressure was found to be small and nonsignificant when a group of randomly selected
LEAD 37
2. HEALTH EFFECTS
white battery plant workers (n=270) was compared to 158 nonexposed workers. The average PbB of
exposed workers was 40±13 ug/dL; in nonexposed workers it was 7±5 ug/dL.
One cohort mortality study (Fanning 1988) has reported an increased mortality rate due to circulatory
disease, but three others found no such correlation (Cooper 1988; Gerhardsson et al. 1986b, 1995a) as
discussed in Section 2.2.1.1 (Table 2-1). An increased risk of death due to cerebrovascular disease was
observed in a cohort of 1,261 white male newspaper printers (typesetters) (Michaels et al. 1991) (see
Section 2.2.1.1).
Cardiovascular effects other than blood pressure changes have also been observed in individuals
occupationally exposed to lead. For example, 66% of a group of adults • 46 years old, with chronic lead
poisoning of occupational origin, had electrocardiographic (ECG) abnormalities, a rate four times the
adjusted normal rate for that age group (Kosmider and Petelenz 1962). A study of 95 lead smelter workers
(mean PbB, 51 ug/dL) and matched unexposed controls (mean PbB, 11 ug/dL) revealed a significantly
higher incidence of ischemic ECG changes (20%) in the lead workers than in controls (6%) (Kirkby and
Gyntelberg 1985). In addition, a slight (4-5 mm Hg) but significant increase in diastolic blood pressure
was seen in the lead workers compared to controls. Systolic blood pressure was not affected. In contrast
with the results from Kosmider and Petelenz (1962) and Kirkby and Gyntelberg (1985), Gennart et al.
(1992a) found no effect of lead exposure on the R-R interval variations on the electrocardiogram in a group
of 98 workers from a lead acid battery factory. The mean exposure duration was 10.6 years and the mean
PbB level at the time of the examination was 51 ug/dL (range, 40-75 ug/dL). A group of 85 people not
occupationally exposed to lead served as controls; the mean PbB in this group was 20.9 ug/dL (range,
4.4-39 ug/dL). No other cardiovascular end point was evaluated.
Hypertension has also been associated with lead exposure in the general population. In a case-control study
of clinically defined groups, 38 male cardiovascular patients were compared with 48 matched normotensive
patients (Khera et al. 1980b). The cardiovascular patients were found to have higher PbB levels (mean,
44.9 ug/dL) than the normotensive patients (mean, 29.0 ug/dL). However, this study is limited by small
sample size and incomplete control of confounding factors.
Two large-scale general population studies, the BHRS (Pocock et al. 1984, 1985, 1988) and NHANES II
(Coate and Fowles 1989; Gartside 1988; Harlan 1988; Harlan et al. 1985; Landis and Flegal 1988; Pirkle
LEAD 38
2. HEALTH EFFECTS
et al. 1985; Schwartz 1988), examined the relationship between PbB levels and blood pressure in men.
Relationships between PbB levels and hypertension were evaluated in a clinical survey of 7,735 men, aged
40-49 years, from 24 British towns in the BHRS (Pocock et al. 1984, 1985, 1988). A small but significant
correlation between systolic blood pressure and PbB level was found. Of the 74 men with PbB levels
higher than 37 ug/dL, a higher proportion had systolic or diastolic hypertension than did all other men
combined. Reanalysis of the same data resulted in highly significant associations between both systolic and
diastolic blood pressure and PbB levels when adjustments were made for variation due to site (town) in
multiple regression analyses (Pocock et al. 1985). However, when these data were reanalyzed again, it was
concluded that the relationship, although statistically significant, was extremely weak (Pocock et al. 1988).
In the 1988 reanalysis (using multiple regression analysis), confounding factors, such as town of residence,
alcohol consumption, body mass index, age, cigarette smoking, and social class were adjusted for, and it
was found that a number of these factors (e.g., alcohol consumption) had a greater influence on pressure
than did PbB level. This reanalysis found that mean systolic blood pressure increased by 1.45 mm Hg and
diastolic blood pressure increased by 1.25 mm Hg for every doubling in PbB level, with the correlation
coefficients attaining statistical significance only because of the very large number of subjects in the survey.
Indeed, when separate univariate regression analyses were conducted on each town (i.e., smaller sample
size), there was no consistency among the regression coefficients obtained, indicating the high random
variability and the weakness of the association. In addition, when the PbB levels of 316 men who
experienced cardiovascular events associated with major ischemic heart disease were compared to those of
the rest of the cohort and adjustment was made for age, number of years smoking cigarettes, and town of
residence, the excess in PbB level among the ischemic heart diseases cases was 0.014 umole/L
(0.03 (ig/dL), not a statistically significant difference. Based on their reanalyses, these authors concluded
that". . . we see no convincing epidemiological evidence at present to support the claim that moderate
elevations in body lead burden are of relevance to the risk of cardiovascular disease" (Pocock et al. 1988).
Simple correlational analysis of the NHANES II data by Harlan (1988) and Harlan et al. (1985) revealed
statistically significant associations between PbB levels and systolic and diastolic blood pressure for both
men and women, aged 12-74 years. Statistical analyses controlling for a number of other potentially
confounding factors (e.g., age, race, and body mass index), however, indicated significant associations
between PbB level and blood pressure only for the men. Based on these analyses, the effect of PbB
concentration on blood pressure was estimated to be an increase in blood pressure of 7 mm Hg at PbB
levels between 14 and 30 ug/dL.
LEAD 39
2. HEALTH EFFECTS
Additional analyses of the same data set by Pirkle et al. (1985) focused on white males (40-59 years of age)
revealed significant correlations between PbB level and blood pressure. No threshold was found below
which PbB level was not significantly related to systolic or diastolic blood pressure across a range of
7-38 ug/dL. Moreover, the analysis by Pirkle et al. (1985) showed that large initial increments in blood
pressure occurred at relatively low PbB levels, with a diminution of blood pressure increments at higher
PbB levels. Lead was a significant predictor of diastolic blood pressure of- 90 mm Hg, the criterion now
employed in the United States to define diastolic hypertension.
Other analyses of the NHANES II data for men have addressed the issue of possible time-trend effects
confounded by variations in sampling sites (Landis and Flegal 1988; Schwartz 1988). These analyses
confirm that correlations between systolic or diastolic blood pressure and PbB levels in men remain
significant when site is included as a variable in multiple regression analyses. In a separate analysis of the
NHANES 11 data, Gartside (1988) examined the relationship between PbB and systolic and diastolic blood
pressure for 26 different age groups, and concluded that there was no convincing evidence of an association
between PbB and blood pressure as reported by Schwartz (1988). Forward stepwise regression analyses
revealed statistically significantly correlation coefficients in only 24 of the 156 analyses (15%). Systolic
blood pressure increased about 1.1-4.4 mm Hg for every doubling of PbB in white males, and the largest
values were obtained in the older age groups. However, none of these achieved statistical significance.
Changes in systolic blood pressure ranged from a loss of 0.9 mm Hg to a gain of 0.7 mm Hg for every
doubling of PbB in white females; none of these changes were statistically significant. Systolic blood
pressure changes ranged from a loss of 4.7 mm Hg in the older blacks to a gain of 5.7 mm Hg in the
younger blacks. Only the changes in the younger age groups achieved statistical significance. All age
groups, sexes, and races grouped together resulted in an overall average increase of 1.1 mm Hg in systolic
blood pressure and 1.4 mm Hg in diastolic blood pressure for every doubling of PbB level. Based on this
reanalysis, it can be concluded that the NHANES II data provide only a negligible or weak association
between PbB level and blood pressure.
Problems with the NHANES II data cast some doubt on its usefulness for analyzing the relationship .
between PbB levels and blood pressure. When the NHANES II data were reanalyzed, correcting for the
questionable blood pressure data, the significance and magnitude of the PbB-blood pressure relationship
reported by previous studies (Harlan 1988; Harlan et al. 1985; Landis and Flegal 1988; Pirkle et al. 1985;
Schwartz 1988) were far less than reported (Coate and Fowles 1989).

LEAD 40
2. HEALTH EFFECTS
A study of 1,627 pregnant women in south central Los Angeles (73% immigrants) found a positive
relationship between blood lead levels and blood pressure only in the immigrant group (Rothenberg et al.
1999a). From the 5th to 95th blood lead percentiles (0.9-6.2 ug/dL) in immigrants, systolic blood pressure
increased 2.8 mm Hg and diastolic blood pressure increased 2.4 mm Hg. The geometric mean PbB was
2.3 ug/dL in the immigrant group compared with 1.9 ug/dL in the non-immigrant group. Since most
potential confounders were accounted for, these results suggest that past lead exposure in the immigrant
group may have contributed to their slightly higher PbB and to the observed association between PbB and
blood pressure.
Several other general population studies failed to detect a convincing association between PbB levels and
blood pressure. Two studies were conducted in Wales (the Caerphilly Collaborative Heart Disease Studies
and the Welsh Heart Programme) in which PbB levels and blood pressure were measured in a cohort of
1,164 men and another cohort of 868 men and 856 women (Elwood et al. 1988). The geometric mean PbB
level was 12.7 ug/dL in the first cohort and 11.6 (males) and 9.0 ug/dL (females) in the second cohort.
Linear regression analysis, adjusting for age only, revealed no statistically significant relationship between
PbB level and blood pressure. The authors suggest that even if the correlation coefficients were significant,
the effect of PbB on blood pressure would be small. At most a mean rise in both systolic and diastolic
pressures of approximately 0.7 mm Hg for every 10-ug/dL difference in PbB was predicted for this
population.
A similar study was undertaken in Denmark in a cohort consisting of 451 men and 410 women (Grandjean
et al. 1989). A weak but statistically significant association was seen, particularly in the men, between PbB
and systolic and diastolic blood pressures. However, when multiple regression analysis was conducted,
adjusting for exercise, smoking, alcohol intake, occupation, height-adjusted weight index, blood
hemoglobin, serum cholesterol, and serum triglycerides, no statistically significant association between PbB
level and blood pressure was seen in this cohort. Hemoglobin concentration and alcohol intake correlated
best with both PbB levels and blood pressure; when one or both of these confounders were included in the
regression analysis, any statistically significant relationship between blood pressure and PbB levels was lost
for this population.
A negative correlation was found between PbB and systolic pressure in Belgian men in the Cadmibel study
(a cross-sectional population study of the health effects of environmental exposure to cadmium) (Staessen
LEAD 41
2. HEALTH EFFECTS
et al. 1991). In this study, blood pressure and urinary cation (positive ions found in the urine, such as
sodium, potassium, and calcium) concentration data were obtained from 963 men and 1,019 women;
multiple stepwise regression analyses were conducted adjusting for age, body mass index, pulse rate,
y-glutamyltranspeptidase, smoking habits, and use of a contraceptive pill. The only statistically significant
association found between PbB and blood pressure was negative, leading the authors to conclude that there
is no biologically significant correlation between PbB levels and blood pressure for this population. Similar
findings were subsequently published by the same groups of investigators based on observations collected
in a random population studied in Belgium for 1985 through 1989 (baseline) and reexamined for 1991
through 1995 (follow-up) (Staessen et al. 1996). The study group totaled 728 subjects (49% men) age 20 to
82 years old. Multivariate analysis controlled for most known potential confounders. At baseline, the mean
systolic/diastolic blood pressure was 130/77 mm Hg, the mean PbB was 8.7 ug/dL, and the mean ZPP was
1.0 ug/g hemoglobin. At follow-up, mean blood lead dropped to 2.9 ug/dL, systolic blood pressure
decreased 1.5 mm Hg, diastolic increased 1.7 mm Hg, and ZPP increased 0.5 ug/g hemoglobin.
Multivariate analysis showed that blood pressure was not correlated with PbB or ZPP concentrations in all
men; the same was true for all women, except that diastolic blood pressure tended to be positively
correlated with PbB. However, the association lost statistical significance after further adjustment for
hematocrit or hemoglobin. Analysis of the results also showed that of 501 initially normotensive subjects,
51 became borderline hypertensive and 47 became definitively hypertensive, but the risk of becoming
hypertensive was not associated with blood lead or ZPP concentrations at baseline.
A study of 398 male and 133 female civil servants in London, England, measured blood pressure, PbB, and
serum creatinine concentration; the study found no correlation between blood pressure and PbB after
adjustment for significant covariates, including sex, age, cigarette smoking, alcohol intake, and body mass
index in a stepwise multiple regression analysis (Staessen et al. 1990).
Both cross-sectional and longitudinal data collected in Canada indicated that there might be a slight
association between PbB and blood pressure (Men et al. 1988). Analysis of the data from the cross-
sectional sampling of the general population (2,193 people, aged 25-64 years) resulted in a zero-order
correlation between diastolic blood pressure and a PbB level of 0.115 that was statistically significant at the
pO.OOl level. These results can be translated into a PbB level in excess of the median value of 10 ug/dL
being associated with a 37% higher risk of having a diastolic pressure above 90 mm Hg. The authors
showed that the variability in the blood pressure data that was estimated to be at most 3.0 mm Hg
LEAD 42
2. HEALTH EFFECTS
(0.064 mm Hg per unit of PbB) exceeded any difference in blood pressure that could be attributed to PbB.
Using these same data, multiple regression analyses were conducted including age, body weight/height
index, serum zinc, and hemoglobin as possible confounders, and there was no longer a statistically
significant relationship between PbB and blood pressure. These same authors also conducted a longitudinal
study of an occupationally exposed group of foundry workers in an attempt to eliminate the high variability
in blood pressure seen in the general Canadian population data and to compare blood pressure and PbB
level rises and falls within individuals. Multiple regression analyses, accounting for age and body weight,
detected a weak association between PbB and blood pressure; diastolic and systolic blood pressure
increased by 0.298 mm Hg and 0.210 mm Hg, respectively, for every ug/dL increase in PbB. However,
since the foundry workers were also exposed to cadmium, analysis of the association of cadmium and blood
pressure was conducted, and it was found that urinary cadmium levels also correlated with PbB levels.
Therefore, the association observed may be due to lead or cadmium, or both in combination.
The role of dietary calcium in the relationship between PbB and blood pressure was examined in a group of
798 male subjects who were participants in the Normative Aging Study (MAS), a longitudinal study of
aging established by the Veterans Administration in 1961 (Proctor et al. 1996). The age range of the
subjects was 43-93 years (mean, 66.1 years) and the PbB concentration ranged from 0.5 ug/dL to 35 ug/dL
(median, 5.6 (ig/dL). Approximately 85% of the cohort had PbB level <10 ug/dL and only 1% had PbB
levels >20 ug/dL. The mean systolic/diastolic blood pressure was 133.7/80.1 mm Hg. The mean PbB
concentration in 334 men who had a daily intake of calcium of* 800 mg (the RDA is 800 mg/day) was
6.7 |ig/dL compared to 6.2 ug/dL in men who ingested >800 mg calcium/day. For the cohort overall,
neither PbB nor dietary calcium were significantly correlated with blood pressure. In multivariate
regression analyses that adjusted for age, body mass index, dietary calcium intake, (adjusted for total calorie
intake), alcohol consumption, sitting heart rate, kilocalories/week expended in exercise, hematocrit, and
smoking status, a unit increase in PbB predicted an increase of 1.2 mm Hg in diastolic blood pressure (95%
CI, 0.11, 2.2, p=0.03). Adjusted calcium intake of 800 mg/day predicted a decrease of 3.2 mm Hg in
systolic blood pressure (95% CI, -0.56, -0.24, p=0.03). There was no evidence of an interaction between
dietary calcium and PbB on blood pressure. When the analyses were limited to men • 74 years old, a unit
increase in PbB predicted an increase of 1.6 mm Hg in diastolic blood pressure. However, when men on
antihypertensive medication were excluded, PbB was not significantly associated with increased diastolic
blood pressure and neither was adjusted calcium intake associated with systolic blood pressure.
LEAD 43
2. HEALTH EFFECTS
Taken together, the results of both the occupational and general population studies do not provide
conclusive evidence that lead exposure, as assessed by PbB levels, is positively associated with hyper-
tension. The evidence is suggestive for adult men aged 40-59 years old and for systolic rather than
diastolic pressure. This association is most apparent for PbB levels as low as 7 ug/dL for middle-aged men,
and a mean increase in systolic blood pressure of 1.0-2.0 mm Hg appears to occur for every doubling in
PbB levels in middle-aged men with the increase being somewhat less in adult women. However, when the
existing data are adjusted for important confounding factors (e.g., age, body weight index, alcohol
consumption, cigarette smoking), the results do not allow for the establishment of a relationship between
PbB levels and hypertension. Future studies should control for anti-hypertensive medication status and type
of medication.
A study in children reported a small association between PbB concentration and blood pressure (Factor-
Litvak et al. 1996). The authors examined a group of 281 children age 5.5 years from the Kosovo,
Yugoslavia prospective study (see Section 2.2.1.6 for more details on this cohort). Approximately half the
children (n=137) lived in a town with heavy lead contamination and the other half (n=144) were relatively
unexposed. The mean PbB in the exposed town was 37.3 ug/dL compared with 8.7 ug/dL among the
referents. Mean systolic blood pressures in the exposed and unexposed towns were 100.5 mm Hg and
98.4 mm Hg, respectively; the corresponding mean diastolic blood pressures were 59.1 mm Hg and
58.4 mm Hg. In unadjusted data it was found that an increase in PbB from 10 to 30 ug/dL was associated
with a 1.8 mm Hg increase in systolic blood pressure and a 0.9 mm Hg increase in diastolic blood pressure.
Adjusting for relevant covariates reduced the magnitude of the unadjusted regression coefficient for systolic
blood pressure by 40%, but did not modify the association with diastolic blood pressure. The magnitude of
the association between PbB concentration and blood pressure also decreased after adjusting for maternal
blood pressure and hemoglobin concentration at age 5.5 years.
The hypothesis that long-term lead accumulation, as reflected by levels of lead in bone, is associated with
an increased odds of developing hypertension was tested in a study by Hu et al. (1996a). A total of 590
male subjects participants in the NAS were evaluated. At the time of the evaluation, ages of the subjects
ranged from 48 to 92 years (mean 66.6 years). Blood lead levels, measured beginning in 1988, ranged from
<1 to 28 p.g/dL. Levels of lead in the tibia (representing cortical bone) and the patella (representing
trabecular bone) were measured starting in 1991 with a K X-ray fluorescence instrument. The outcome
chosen, hypertension rather than blood pressure perse, was defined as taking daily medication for the
LEAD 44
2. HEALTH EFFECTS
treatment of hypertension or systolic blood pressure higher than 160 mm Hg or diastolic blood pressure of
90 mm Hg or higher during the time of the examination. Analysis of the results showed that an increase in
tibia bone lead from the middle of the lowest quintile (8 ug/g bone mineral) to the middle of the highest
quintile (37 ug/g) of 29 ug/g was associated with an increased odds ratio of hypertension of 1.5 (95%
confidence interval, 1.1-1.8) after adjusting fro body mass index, family history of hypertension, and tibia
lead. Among the study limitations recognized by the authors were crude estimations of long-term ethanol
ingestion and smoking habits and uncertain estimates of past dietary habits.
Qualitative evidence linking lead exposure to cardiac effects includes the finding of degenerative changes in
cardiac muscle, reported as the proximate cause of death in five fatal cases of lead poisoning in young
children with histories of pica (Kline 1960). Additional evidence indicates that ECG abnormalities are
fairly common in cases of childhood lead encephalopathy but disappear following chelation therapy (EPA
1986a). For example, abnormal electrocardiograms occurred in 21 of 30 overtly lead-intoxicated children
prior to chelation therapy, but in only 4 of these children after therapy (Silver and Rodriguez-Torres 1968).
In adults, a study of 75 autopsies of persons who had resided in a soft-water, leached soil region of North
Carolina found a positive correlation between lead level in the aorta and death from heart-related disease
(Voorsetal. 1982). The association persisted after adjustment for the effect of age. A similar correlation
was found between cadmium levels in the liver and death from heart-related disease. (Aortic lead and liver
cadmium levels were considered to be suitable indices of exposure.) The effects of the two metals appeared
to be additive. Potential confounding variables other than age were not included in the analysis. The
investigators stated that fatty liver (indicative of alcohol consumption) and cigarette smoking did not
account for the correlations between lead, cadmium and heart-disease death.
Gastrointestinal Effects. Colic is a consistent early symptom of lead poisoning in occupationally
exposed cases or in individuals acutely exposed to high levels of lead, such as occurs during the removal of
lead-based paint. Colic is characterized by a combination of the following symptoms: abdominal pain,
constipation, cramps, nausea, vomiting, anorexia, and weight loss. Although gastrointestinal symptoms
typically occur at PbB levels of 100-200 |ig/dL, they have sometimes been noted in workers whose PbB
levels were as low as 40-60 ug/dL (Awad et al. 1986; Baker et al. 1979; Haenninen et al. 1979; Holness
and Nethercott 1988; Kumar et al. 1987; Marino et al. 1989; Matte et al. 1989; Muijser et al. 1987; Pagliuca
et al. 1990; Pollock and Ibels 1986; Schneitzer et al. 1990).
LEAD 45
2. HEALTH EFFECTS
Colic is also a symptom of lead poisoning in children. EPA (1986a) has identified a LOAEL of
approximately 60-100 ug/dL for children. This value apparently is based on a National Academy of
Sciences (NAS 1972) compilation of unpublished data from the patient groups originally discussed in
Chisolm (1962, 1965) and Chisolm and Harrison (1956) in which other signs of acute lead poisoning, such
as severe constipation, anorexia, and intermittent vomiting, occurred at • 60 ug/dL.
Hematological Effects. Lead has long been known to have profound effects on heme biosynthesis.
In summary, lead inhibits the activity of certain enzymes involved in heme biosynthesis, namely,
5-aminolevulinic acid dehydratase (ALAD), and ferrochelatase. As a consequence of these changes, heme
biosynthesis is decreased and the activity of the rate limiting enzyme of the pathway, 5-aminolevulinic acid
synthetase (ALAS), which is feedback inhibited by heme, is subsequently increased. The end results of
these changes in enzyme activities are increased urinary porphyrins, coproporphyrin, and 5-aminolevulinic
acid (ALA); increased blood and plasma ALA; and increased erythrocyte protoporphyrin (EP); FEP; and
ZPP (EPA 1986a). However, the adverse effects of decreased ALAD and pyrimidine-5'-nucleotidase
activities seen at low PbB levels in the absence of detectable effects on hemoglobin levels and erythrocyte
function or survival are of questionable biological significance.
Increases in ALAS activity have been observed in lead workers (Meredith et al. 1978). Leukocyte ALAS
was stimulated at a PbB level of 87 ug/dL (Meredith et al. 1978), a level at which ALAD activity is already
significantly inhibited. ALAD activity correlated inversely with PbB levels in occupationally exposed
individuals (Alessio et al. 1976; Wada et al. 1973), as has been seen in subjects with no occupational
exposure (Secchi et al. 1974). Erythrocyte ALAD and hepatic ALAD activities were correlated directly
with each other and correlated inversely with PbB levels in the range of 12-56 ug/dL (Secchi et al. 1974).
General population studies indicate that the activity of ALAD is inhibited at very low PbB levels, with no
threshold yet apparent. ALAD activity was inversely correlated with PbB levels over the entire range of
3-34 ug/dL in urban subjects never exposed occupationally (Hernberg and Nikkanen 1970). Other reports
have confirmed the correlation and apparent lack of threshold in different age groups and exposure
categories (children—Chisolm et al. 1985; children—Roels and Lauwerys 1987; adults—Roels et al. 1976).
Inverse correlations between PbB levels and ALAD activity were found in mothers (at delivery) and their
newborns (cord blood). PbB levels ranged from approximately 3 to 30 ug/dL (Lauwerys et al. 1978).
LEAD 46
2. HEALTH EFFECTS
Inhibition of ALAD and stimulation of ALAS result in increased levels of ALA in blood or plasma and in
urine. For example, in a case report of a 53-year-old man with an 11-year exposure to lead from removing
old lead-based paint from a bridge, a PbB level of 55 ug/dL was associated with elevated urinary ALA
(Pollock and Ibels 1986). The results of the Meredith et al. (1978) study on lead workers and controls
indicated an exponential relationship between PbB and blood ALA. Numerous studies reported direct
correlations between PbB level and log urinary ALA in workers. Some of these studies indicated that
correlations can be seen at PbB levels of <40 ug/dL (Lauwerys et al. 1974; Selander and Cramer 1970;
Solliway et al. 1996), although the slope may be different (less steep) than at PbB levels of >40 ug/dL. In a
study of 98 occupationally exposed subjects (51 ug/dL, mean PbB) and 85 matched controls (20.9 ug/dL,
mean PbB) it was found that log ZPP and log ALA in urine correlated well with PbB levels (Gennart et al.
1992a). In the exposed group, the mean ZPP was 4 times higher than in the controls, whereas urinary ALA
was increased 2-fold.
Correlations between PbB levels and urinary ALA similar to those observed in occupationally exposed
adults have also been reported in non-occupationally exposed adults (Roels and Lauwerys 1987) and
children (unpublished data of J.J. Chisolm, Jr., reported by NAS 1972). Linear regression analyses
conducted on data obtained from 39 men and 36 women revealed that increases in urinary ALA may occur
at PbB levels of >35 ug/dL in women and >45 ug/dL in men (Roels and Lauwerys 1987). A significant
linear correlation between PbB level and log ALA was obtained for data in children 1-5 years old with PbB
levels of 25-75 ug/dL. The correlation was seen primarily at PbB levels >40 ug/dL, but some correlation
may persist at <40 ug/dL (NAS 1972).
A dose-related elevation of EP or ZPP in lead workers has been documented extensively (Herber 1980;
Matte et al. 1989). Correlations between PbB levels and log EP or ZPP indicate an apparent threshold for
EP elevation in male workers at 25-35 ug/dL (Grandjean and Lintrup 1978; Roels et al. 1975) for FEP and
a threshold of 30-40 ng/dL for EP (Roels and Lauwerys 1987; Roels et al. 1979). The threshold for EP
elevation appears to be somewhat lower (20-30 ug/dL) in women than in men (Roels and Lauwerys 1987;
Roels et al. 1975, 1976, 1979; Stuik 1974), regardless of whether exposure is primarily by inhalation
(occupational) or oral (nonoccupational). These studies were controlled for possible confounding factors
such as iron deficiency or age, both of which increase erythrocyte ZPP.
LEAD 47
2. HEALTH EFFECTS
Many studies have reported the elevation of EP or ZPP as being exponentially correlated with PbB levels in
children. However, peak ZPP levels lag behind peak levels of PbB. The threshold for this effect in children
is approximately 15 ug/dL (Hammond et al. 1985; Piomelli et al. 1982; Rabinowitzet al. 1986; Roels and
Lauwerys 1987; Roels et al. 1976), and may be lower in the presence of iron deficiency (Mahaffey and
Annest 1986; Marcus and Schwartz 1987). A study by Koren et al. (1990) suggested that the current
Centers for Disease Control and Prevention (CDC) standard for acceptable blood FEP levels among
children up to 10 years of age is not applicable to newboms. The measurement of the maternal and
umbilical cord lead levels and FEP among 95 mother-infant pairs from Toronto showed a significant
inverse correlation. Most (99%) infants had cord PbB levels below 7 ug/dL; in 11 cases the levels were
below the detection limit. The cord blood FEP levels were higher than the maternal levels. This may
reflect immature heme synthesis and increased erythrocyte volume rather than lead poisoning, or perhaps an
early effect of lead poisoning.
An increase in urinary coproporphyrin has long been recognized in workers and children with lead
poisoning and used as an indicator of excessive exposure to lead (EPA 1986a). EPA (1986a) identified a
LOAEL for elevated coproporphyrin at a PbB level of 40 ug/dL for adults and 35 ng/dL for children, but
did not present the basis for this conclusion.
The threshold PbB level for a decrease in hemoglobin in occupationally exposed adults is estimated by EPA
(1986a) to be 50 ug/dL, based on evaluations of the data of Baker et al. (1979), Grandjean (1979), Lilis et
al. (1978), Tola et al. (1973), and Wada et al. (1973). For example, 5% of smelter workers with PbB levels
of 40-59 ng/dL, 14% with levels of 60-79 ug/dL, and 36% with levels of >80 u£/dL had anemia. In a
study of 98 workers from a lead acid battery factory with a mean PbB level of 51 ug/dL, the mean
hemoglobin concentration was not significantly different than in a control unexposed group of 85 subjects.
However, 4 exposed workers, but no controls, had hemoglobin levels below the level considered as the limit
value for defining anemia (13 g/dL) (Gennart et al. 1992a). The mean erythrocyte counts did not differ
significantly between the two populations. Solliway et al. (1996) also reported no significant differences in
hemoglobin concentration between a group of 34 workers from a battery factory (mean PbB 40.7 ug/dL,
range 23-66 ug/dL) and a group of 56 nonexposed persons (mean PbB 6.7 ug/dL, range 1-13 ng/dL).
However, red blood cell count was significantly lower in exposed workers than in the controls. Lead-
induced anemia is often accompanied by basophilic stippling of erythrocytes (Awad et al. 1986; Pagliuca et
al. 1990). The PbB threshold for decreased hemoglobin levels in children is judged to be approximately
LEAD 48
2. HEALTH EFFECTS
40 ug/dL (EPA 1986a; WHO 1977), based on the data of Adebonojo (1974), Betts et al. (1973), Pueschel et
al. (1972), and Rosen et al. (1974). However, a cross-sectional epidemiologic study was conducted to
assess the association between blood lead level and hematocrit in 579 children 1-5-years old who lived in
close proximity to a primary lead smelter; the study revealed that adverse effects on hematocrit may occur
at even lower PbB levels in children (Schwartz et al. 1990). Anemia was defined as a hematocrit of <35%
and was not observed at PbB below 20 ug/dL. Analyses revealed that there is a strong negative nonlinear
dose-response relationship between PbB levels and hematocrit (i.e., there was a strong association between
elevation of PbB level and the probability of anemia). Between 20 ug/dL and 100 u.g/dL, the decrease in
hematocrit was greater than proportional to the increase in PbB concentration. The effect was strongest in
the youngest children. The analysis also revealed that at PbB levels of 25 ug/dL there is a dose-related
depression of hematocrit in young children. Similarly, a study of 200 Saudi Arabian boys found a negative
correlation between PbB levels and all hematological values when the study group was subdivided into
"high" PbB (>15 ug/dL; mean 19±3 ug/dL) versus "normal" PbB (<15 ug/dL; mean 6.5 ug/dL) (Kutbi et al.
1989). Hematocrit and mean corpuscular volume values were marginally below the normal range; red
blood cells and hemoglobin were at the low normal range; and mean corpuscular hemoglobin concentration
and white blood cells were within normal range. The authors state that this pattern is predictive of the early
stages of microcytic anemia, and suggest that low PbB levels once considered to be safe (e.g., 25 ug/dL)
may induce the early stages of microcytic anemia. However, it should be noted that both the higher and
lower exposure groups had low hematological readings for all of the parameters examined in the study, and
the lowest values recorded were in the lowest lead exposure group. This suggests that other factors, such as
poor iron or mineral status, could be contributing to the effects reported.
Erythrocyte pyrimidine-5'-nucleotidase activity was inhibited in lead workers, with the greatest inhibition
and marked accumulations of pyrimidine nucleotides apparent in workers with overt intoxication, including
anemia (Paglia et al. 1975, 1977). PbB levels in these workers ranged between 45 and 110 ug/dL, and 7 of
9 were anemic. Pyrimidine-5'-nucleotidase activity was correlated inversely with PbB when corrected for
an enhanced population of young cells due to hemolytic anemia in some of the workers (Buc and Kaplan
1978). Erythrocyte pyrimidine-5'-nucleotidase is inhibited in children at very low PbB levels. A significant
negative linear correlation between pyrimidine-5'-nucleotidase and PbB level was seen in 21 children with
PbB levels ranging from 7 to 80 |ag/dL (Angle and Mclntire 1978). Similar results were seen in another
study with 42 children whose PbB levels ranged from <10 to 72 ug/dL (Angle et al. 1982). Additional
LEAD 49
2. HEALTH EFFECTS
findings included a direct correlation between cytidine phosphate levels and PbB levels (log-log). There
was no indication of a threshold for these effects of lead in these two studies.
Hepatic Effects. In children, exposure to lead has been shown to inhibit formation of the heme-
containing protein cytochrome P-450, as reflected in decreased activity of hepatic mixed-function
oxygenases (Alvares et al. 1975; Saenger et al. 1984). Two children with clinical manifestations of acute
lead poisoning did not metabolize the test drug antipyrine as rapidly as did controls (Alvares et al. 1975).
Significantly reduced 6 p-hydroxylation of cortisol was observed in children who had positive (urinary
excretion of lead • 500 ug/24 hours) calcium sodium ethylenediamine tetraacetate (EDTA) tests as
compared with an age-matched control group, controlling for free cortisol (Saenger et al. 1984). These
reactions are mediated by hepatic mixed-function oxygenases.
Abnormal liver function tests (alkaline phosphatase, aspartate transaminase, and gamma glutamyl
transferase) and mild hepatitis revealed at necropsy were observed in a 52-year-old man who was
occupationally exposed to lead following the oxyacetylene cutting of red lead painted ironwork (Pagliuca et
al. 1990). The man's PbB level upon hospital admission was 203 ug/dL. It is not clear whether this
relatively high level of lead exposure was responsible for the liver toxicity observed in this man, since
nothing was reported about his medical history, drinking habits, or other factors that may have contributed
to hepatotoxicity.
Renal Effects. The characteristics of early or acute lead-induced nephropathy in humans include
nuclear inclusion bodies, mitochondrial changes, and cytomegaly of the proximal tubular epithelial cells;
dysfunction of the proximal tubules (Fanconi's syndrome) manifested as aminoaciduria, glucosuria, and
phosphaturia with hypophosphatemia; and increased sodium and decreased uric acid excretion. These
effects appear to be reversible. Characteristics of chronic lead nephropathy include progressive interstitial
fibrosis, dilation of tubules and atrophy or hyperplasia of the tubular epithelial cells, and few or no nuclear
inclusion bodies, reduction in glomerular filtration rate, and azotemia. These effects are irreversible. The
acute form is reported in lead-intoxicated children, whose primary exposure is via the oral route, and
sometimes in lead workers. The chronic form is reported mainly in lead workers, whose primary exposure
is via inhalation. Animal studies provide evidence of nephropathy similar to that which occurs in humans,
particularly the acute form (see Section 2.2.3.2).
LEAD 50
2. HEALTH EFFECTS
In a study of 102 cases of occupational lead poisoning, 17 cases of clinically verified chronic nephropathy
were found (Lilis et al. 1968). Endogenous creatinine clearance was <80 ug/dL. The mean PbB level for
the entire study population was 80 ug/dL (range, 42-141 ug/dL). Nephropathy was more common among
those exposed to lead for more than 10 years than among those exposed for less than 10 years.
Histopathological evidence of renal damage has been observed in lead-exposed workers. Renal
ultrastrucrure and function were examined in five men with heavy occupational exposure to lead (Cramer et
al. 1974). In addition, renal function was evaluated in two men from whom renal biopsies were not
obtained. PbB levels ranged from 71 to 138 ug/dL. Renal function tests were normal in all except for a
reduced glomerular filtration rate in one worker. Two subjects with relatively short exposure to lead
(6 weeks and 8 months) and PbB levels of 89-129 u,g/dL had intranuclear inclusions in the proximal
tubules. Renal biopsies from workers with longer periods of lead exposure (4-20 years, PbB levels of
71-138 ng/dL) had diffuse interstitial or peritubular fibrosis. Glomeruli were normal in all subjects. Two
men exposed to lead for 15-25 years while removing old lead-based paint from a bridge also exhibited
clinical and histopathological signs of nephropathy (Pollock and Ibels 1986). In one man (PbB level =
80 ug/dL) who had 2 episodes of pyelonephritis over the past 11 years and hematuria, renal biopsy revealed
sclerotic and obliterated glomeruli. In the other, who complained of gouty arthritis and nocturia for the past
10 years, renal biopsy revealed sclerotic glomeruli and nephronal hypertrophy with interstitial scars.
Renal function was evaluated by means of clinical, functional, and morphological studies in 11 patients
diagnosed as having "plumbism" based on job background and laboratory findings (criteria not specified)
(Biagini et al. 1977). PbB levels in these patients ranged from 50 to 200 ug/dL. Negative associations
between urinary lead excretion following chelation with EDTA and clearance of/>aminohippuric acid
(PAH), glomerular filtration rate and duration of lead exposure were the only statistically significant effects
observed. Renal biopsies of these patients revealed signs of degeneration (swollen mitochondria, dilated
endoplasmic reticulum, scanty microvilli), signs of probable regeneration (poorly differentiated cells with
few microvilli, shallow infoldings of basal cell membrane), and signs of metabolic hyperactivity
(intranuclear granular inclusions) in the proximal tubules.
In a study of lead workers, Wedeen et al. (1979) identified 15 who had no other risk factors for renal
disease and who had previously unsuspected lead nephropathy (detected as reduced glomerular filtration
LEAD 51
2. HEALTH EFFECTS
rates). Only 3 of the 15 men had ever experienced symptoms of lead poisoning. Blood lead levels were as
follows: >80 (ig/dL in 1 subject, 40-80 ug/dL in 11 subjects, and <40 ug/dL in 3 subjects. Examination of
renal biopsies from 12 of these men revealed focal interstitial nephritis in 6, in addition to nonspecific
changes, including deformed mitochondria, in the proximal tubules.
Other studies where no renal biopsies were conducted have yielded varying results with regard to
occupational lead exposure and nephropathy. The inconsistencies can be partially explained by differences
in the renal functional parameters measured. Various indicators of renal function were assessed in 155 male
lead workers and 126 male control workers (Verschoor et al. 1987). Workers were matched for factors such
as age, smoking habits, socioeconomic status, and duration of employment. Parameters measured included
PbB levels, ZPP, urinary lead levels, serum creatinine, serum urea, serum uric acid, serum p\p-globulin,
serum retinal binding protein (RJ3P-S), creatinine in urine, uric acid in urine, total urinary protein, urinary
albumin, urinary p\M-globulin, urinary retinal binding protein (RBP-U), immunoglobulin G, and
jV-aceryl-p-D-glucosaminidase (NAG). The length of exposure to lead was not explicitly stated. Exposure
levels were not available, but indicators of lead body burden or effect were: PbB level = 33.8-63.2 ng/dL
in the exposed workers and 5.6-12 ug/dL in the controls; ZPP = 34-292 ^mol/mol hemoglobin in the
exposed workers and 10-35 umol/mol hemoglobin in the controls. The highest PbB level measured was
97.6 ug/dL. No significant difference between exposed and control workers was found with respect to the
tubular or glomerular parameters studied, all urinary and serum parameters were within normal ranges,
there was no difference in protein excretion patterns, and there were no signs of clinical renal impairment.
Furthermore, no relationship was found between any of the renal parameters and duration of exposure. The
NAG levels in the lead-exposed workers were significantly increased over control values, and significantly
increased with increasing PbB level and ZPP. NAG is a lysosomal enzyme that is present in renal tubular
cells. It has been shown to be a sensitive indicator of early, subclinical renal disease. These results indicate
that lead exposure resulting in PbB levels • 62 (ig/dL can affect renal tubular function more so than
glomerular function.
Blood lead levels, urinary lead levels, serum creatinine, blood urea nitrogen (BUN): creatinine clearance
(CCT), and NAG were measured in 158 male and 51 female workers in a lead battery factory or a lead
smelting plant in Japan (Ong et al. 1987). Controls consisted of 30 professional and laboratory staff
members with no history of renal disease or lead exposure. The length of exposure to lead averaged
10.8±8.0 years with a range of 1-36 years. Exposure levels were not available, but indicators of lead body
LEAD 52
2. HEALTH EFFECTS
burden in the exposed workers were: PbB level = 3.0-80.0 ug/dL and urinary lead level = 0.5-49.7 u.g/dL.
The highest PbB level measured was 80 ug/dL, and only five workers (3%) had PbB level levels over
60 ug/dL. Control values for these indicators of lead body burden were not provided. A weak but
statistically significant positive association was found between PbB level and BUN, PbB level and serum
creatinine; CCT was reduced with increased PbB level. The same associations were found with urinary
lead level. The NAG levels in the lead-exposed workers were significantly increased over control values,
and significantly increased with increasing PbB level and urinary lead level (when the data were adjusted
for age). These results indicate that lead exposure resulting in relatively low PbB levels can affect renal
function.
Various indicators of renal function were assessed in 60 workers diagnosed as having "lead poisoning"
(Maranelli and Apostoli 1987). No criteria for "lead poisoning" were specified. Controls consisted of
patients hospitalized for respiratory ailments with no history of lead exposure. Parameters measured
included PbB levels, urinary lead excretion following chelation with EDTA (PbU-EDTA), ZPP, urinary
5-aminolevulinic acid (ALA-U), and serum creatinine and serum uric acid clearance. The length of
exposure to lead averaged 10.8±8.0 years with a range of 1-34 years, and the occupations of the workers
varied considerably. Exposure levels were not available, but indicators of lead body burden or effect in the
"poisoned workers" were: PbB level = 71.9±16.6 ug/dL; PbU-EDTA = 3,375±2,737 ug/24 hours; ZPP =
12.8±6.9 ug/g hemoglobin; and ALA-U = 1.4±1.2 mg/24 hours. Control values for these indicators of lead
body burden were not provided. The only parameters of renal function that differed significantly from the
control group were increases in BUN and serum uric acid. There was no definitive correlation between
indicators of lead body burden or effect and parameters of renal function.
A study of 137 lead-exposed workers found that of various indices of exposure, time integrated index of
PbB was the best predictor of variation in serum p\M-globulin, serum a,M-globulin, and urinary albumin
(Chia et al. 1995a). Another index of exposure examined was the number of times the PbB level was above
critical values (e.g., 40, 50, 60 ug/dL). Serum p\M-globulin was the only marker showing a significantly
higher prevalence rate ratio of abnormalities (increase) among lead-exposed workers. Based on
associations between abnormal serum (32M-globulin and urinary albumin values and the number of times the
PbB was above critical values, Chia et al. (1995a) suggested that the threshold of 70 ug/dL for PbB may not
prevent the occurrence of nephropathy.
LEAD 53
2. HEALTH EFFECTS
Renal function in workers exposed to lead has also been examined in relation to bone lead, since this
measurement of exposure provides a better assessment of cumulative dose of lead to the kidneys than PbB.
The study was conducted in a group of 76 male lead workers and 68 controls matched for age, sex,
socioeconomic status, general environment, and workshift characteristics (Roels et al. 1994). The average
exposure duration was 18 years. Ten blood and urinary markers of nephrotoxicity were monitored. An
additional parameter measured was the increase in glomerular filtration rate (GFR) that occurs after acute
consumption of protein. GFR was evaluated in terms of creatinine clearance. The mean geometric lead
concentration in the tibia from workers and controls was 66 and 21 \ig lead/g bone mineral, respectively.
Workers had higher mean PbB levels (43 ug/dL) than controls (14 u.g/dL) and also higher mean urinary
lead than controls (40 versus 7.5 ug lead/g creatinine). Stepwise multiple regression analysis revealed that
none of the 10 renal markers measured was related to lead exposure. Furthermore, neither PbB, urinary
lead, or blood ZPP predicted baseline or peak GFR after the protein challenge. However, bone lead showed
a modest but positive and statistically significant association with both baseline and peak creatinine
clearance. No associations with lead in blood or urine, and blood ZPP were found in controls or lead-
exposed workers. The authors concluded that PbB levels <70 ng/dL do not cause adverse renal effects in
most adult male workers.
Other occupational studies have yielded negative results with regard to lead exposure and renal function.
Various serum and urinary indicators of renal function were assessed in 25 male lead smelter workers and
88 male control workers (Buchet et al. 1980). Factors such as age, smoking habits, socioeconomic status,
and duration of employment were examined for both groups. Parameters measured included PbB levels,
urinary lead levels, FEP, and various enzymes and proteins. The length of exposure to lead was
3.1-29.8 years. Exposure levels were not available, but indicators of lead body burden or effect were: PbB
level = 33.8-61.3 ug/dL in the exposed workers and 5.5-34.2 ug/dL in the controls; and urinary lead levels
= 15.2-297.9 ug/g creatinine in the workers, 2.53-42.9 ug/g creatinine in the controls. No significant
difference between exposed and control workers was found with respect to any of the parameters of renal
function, and there were no signs of clinical renal impairment. FEP and ALA in urine were increased in the
lead group, and the concentration of urinary ALA was found to correlate positively with blood lead levels.
The results of this study of 25 lead smelter workers indicate that lead exposure leading to PbB levels of
• 62 ug/dL does not result in nephrotoxicity. Another study examined kidney function in a group of 98
workers from a lead acid battery factory (Gennart et al. 1992a). Kidney function was assessed by
measurements of urinary retinol-binding protein, |32M-globulin, albumin, NAG, and serum measurements of
creatinine and |32M-globulin. The mean duration of employment was 10.6 years, and the
LEAD 54
2. HEALTH EFFECTS
mean PbB level at the time of the evaluation was 51 ug/dL (range, 40-75 ug/dL). A group of 85 subjects
non-occupationally exposed to lead served as controls; the mean PbB level in this group was 20.9 ug/dL.
The results showed no effect of lead on the renal parameters whether the comparison was made on the basis
of mean values or on the basis of prevalence of abnormal values. It should be noted that since in these two
studies some control subjects had PbB levels of 20 ug/dL and above, the extent to which they serve as true
controls for normal function may be questionable, thus lead effects may been missed or underestimated.
Renal function was evaluated in a group of 36 male and 4 female lead smelter workers (Huang et al. 1988a).
The workers were exposed to lead for 1-10.4 years (mean, 5.4 years). Renal function was assessed by
means of a medical history, physical exam, routine urinalysis, total urinary protein, urinary IgG, urinary and
serum (52M-globulin, and urinary creatinine. The presence of proteinuria is usually indicative of
nephrotoxicity; increased urinary (32(1-globulin without an increase in serum (32M-globulin can indicate tubular
dysfunction; and increased excretion of IgG combined with excess total protein can indicate glomerular
damage. Serum p2^-globulin levels, however, are closely related to glomerular filtration rate. All
parameters were compared to average values in the healthy Chinese from Beijing obtained in previous
studies. The mean PbB level in the exposed workers was 41.8 ug/dL and the mean urinary lead level was
71 ug/L. The only statistically significant finding was an increase in urinary p\M-globulin in the lead group
which may indicate subclinical tubular dysfunction.
A cohort mortality study was conducted to compare the mortality rates due to chronic renal disease in 4,519
battery plant workers and 2,300 lead production or smelter workers from 1947 to 1980 (Cooper 1988;
Cooper et al. 1985). The mortality data for these workers were compared with national mortality rates for
white males. Environmental lead levels and PbB levels were available for only about 30% of all workers
for varying time periods from 1947 to 1972. Statistically significant increases in mortality from "other
hypertensive disease" and "chronic nephritis" were seen in both lead cohorts. Limitations of this study
include the fact that various confounding factors, such as smoking, were not accounted for, and the workers
were probably exposed to other toxic chemicals.
Taken together, these studies provide some evidence for the association of chronic nephropathy in
occupational ly exposed workers with PbB levels ranging from 60 to > 100 ug/dL. It should be noted,
however, that PbB levels measured at the time of renal function testing may not fully reflect the exposure
history that contributed to the development of chronic nephropathy in lead workers.
LEAD 55
2. HEALTH EFFECTS
Excessive lead exposure has been implicated as a causative agent in kidney disease associated with gout
(Batuman et al. 1981). A correlation was found between the amount of mobilizable lead and the degree of
renal impairment in 44 veterans with gout. The 44 gout patients were similar with respect to age, duration
of gout, hypertension, history of lead exposure, serum uric acid concentration, PbB concentration, and ZPP.
A 3-day EDTA lead mobilization test was administered to all 44 gout patients, and kidney function was
assessed by measuring serum creatinine concentration, creatinine clearance, and 24-hour urinary protein
excretion. The results of the 3-day EDTA lead mobilization test were significantly different for the gout
patients with renal impairment than for the gout patients without renal impairment. The gout patients with
renal impairment excreted 806±90 ug lead over the 3 days, compared to 470±52 \ig lead over 3 days in
patients with gout but no renal impairment. The upper limit of normal in this test is 600 ug lead excreted
over 3 days. To rule out the possibility that the renal impairment itself was the cause of excessive
mobilizable lead in patients with gout, 10 patients with renal disease but no gout were used as controls for
the EDTA lead mobilization test. These controls excreted approximately the same amount of lead over the
3 days as the gout patients without renal impairment (424±72 ug lead). In addition, the severity of renal
impairment (as determined by the serum creatinine concentration) was directly correlated with the amount
of mobilizable lead measured in the EDTA test. It is important to note that the gout patients with high
mobilizable lead and renal impairment had blood lead levels and ZPP concentrations that were no different
from the rest of the group, indicating that there was no indication of lead overexposure in these individuals
until the EDTA lead mobilization test was administered. Based on these results, it may be concluded that
more extracellular lead accumulates in the renal impairment associated with some forms of gout.
Excessive lead exposure has also been implicated as a causative agent in kidney disease associated with
essential hypertension (Batuman et al. 1983). The 3-day EDTA lead mobilization test was administered to
70 veterans; 48 had essential hypertension (27 of which also were diagnosed with renal impairment) and the
22 that served as controls had renal failure but no hypertension. The 48 patients with essential hypertension
were similar with respect to age, blood lead concentration, and history of exposure to lead. Kidney function
was assessed by measuring serum creatinine concentration, creatinine clearance, and 24-hour urinary
protein excretion. A significant difference was found between the hypertensive patients with renal
impairment and those without with respect to the amount of mobilizable lead excreted over 3 days in the
EDTA test; the patients with both hypertension and renal impairment excreted 860±101 ug lead as
compared to 340±39 ug lead in the hypertensive patients without renal impairment. To rule out the
possibility that the renal impairment itself was the cause of excessive mobilizable lead in patients with gout,
LEAD 56
2. HEALTH EFFECTS
22 patients with renal disease but no hypertension were used as controls for the EDTA lead mobilization
test. The amount of lead excreted over the 3 days by this group was not significantly different from that
excreted by the hypertensive patients without renal impairment (440±50 u.g lead). In addition, the severity
of renal impairment (as determined by the serum creatinine concentration or creatinine clearance rate) was
directly correlated with the amount of mobilizable lead measured in the EDTA test. Based on these results,
it may be concluded that more extracellular lead accumulates in both the development of renal impairment
and essential hypertension.
The results from a longitudinal study provide information regarding low-level lead exposure and renal
function (Kim et al. 1996a). The cohort consisted of 459 men randomly selected from the participants of
the Normative Aging Study (MAS). The MAS is a longitudinal study of aging established by the Veterans
Administration in 1961. The main outcome measured, serum creatinine concentration, was determined at
each examination between 1979 and 1994. PbB was assayed in thawed samples of packed red blood cells
collected between 1979 and 1991 and in fresh whole blood for the period 1992 to 1994. The following
potential covariates known to be associated with blood lead and/or serum creatinine were considered: age,
body mass index, current smoking status, daily alcohol intake, hypertensive status, and educational level at
the inception of the cohort. Subjects were classified as hypertensive if they had a diastolic blood pressure
of 95 mm Hg, or a systolic blood pressure of 160 mm Hg, or if they were on antihypertensive medications.
The mean age of the study subjects was 56.9 years (range, 37.7-87.5) at the first visit (baseline). At this
time the mean serum creatinine concentration was 1.22 mg/dL and the mean PbB concentration was
9.9 ug/dL. After adjustment for the selected covariates, PbB was positively and significantly associated
with concurrent concentration of serum creatinine. The association between lead levels and change in
serum creatinine concentration was positive but statistically not significant, with additional controls for
baseline serum creatinine (reflecting baseline level over time) and time elapsed since the initial examination
(reflecting age related change). A 10-fold increase in PbB level predicted an increase of 0.08 mg/dL in
serum creatinine concentration. The association was also significant among subjects whose PbB levels had
never been • 10 ug/dL throughout the study period. The results also showed that the age-related increase in
serum creatinine was earlier and faster and more linear among subjects in the highest quartile than among
those in the lowest quartile. Based on the results, Kim et al. (1996a) concluded that low-level exposure to
lead may impair renal function in middle-aged and older men; however, the biological significance of a
0.08 mg/dL increase in serum creatinine is unknown.
LEAD 57
2. HEALTH EFFECTS
The relationship between lead exposure and renal function was also investigated in the Cadmibel Study
(Staessen et al. 1992). The cohort consisted of a random population sample of 965 men and 1,016 women
between 20 and 88 years old. Lead exposure was estimated by PbB levels and ZPP; creatinine clearance
rate was also calculated in all subjects. The geometric mean PbB in men and women was 11.4 ug/dL
(range, 2.3-72.5) and 7.5 ug/dL (range, 1.7-60.3), respectively. The mean ZPP was 1.0 and 1.1 ug/g
hemoglobin in men and women, respectively. Analyses of the data showed that creatinine clearance rate
was inversely correlated with blood lead and ZPP in men and women, both before and after adjustment for
age, body mass index, and diuretic treatment (blood and urinary cadmium were among covariates con-
sidered in the analysis). A 10-fold increase in PbB was associated with a reduction of 10-13 mL/minute in
creatinine clearance. There was a positive correlation between serum p\M-globulin and PbB in men, between
serum p,M-globulin and ZPP in both sexes, and between serum creatinine and ZPP in men. These results
suggest that environmental lead exposure may impair renal function in the general population. However,
the alternative hypothesis that renal impairment may lead to an increase in PbB was not excluded.
Full Fanconi syndrome has been reported to be present in some children with lead encephalopathy (Chisolm
1968; Chisolm et al. 1955). According to the National Academy of Sciences (NAS 1972), the Fanconi
syndrome is estimated to occur in approximately one out of three children with encephalopathy and PbB
levels of approximately 150 ug/dL. Aminoaciduria occurs at PbB levels >80 ug/dL in children with acute
symptomatic lead poisoning (Chisolm 1962). The aminoaciduria and symptoms of lead toxicity
disappeared after treatment with chelating agents (Chisolm 1962).
In a study of children with slight neurological signs indicative of lead toxicity, aminoaciduria was found in
4 of 43 children with average PbB levels of 35 ug/dL (Pueschel et al. 1972). The highest PbB level for the
43 children was 68 ug/dL. Although PbB levels were not reported specifically for the children with
aminoaciduria, it may be assumed that they were probably at the high end of the range.
A study of 55 adolescents who had been treated for lead intoxication in early childhood (11-17 years
earlier) revealed no evidence of chronic nephropathy, as evidenced by endogenous creatinine clearance,
BUN, serum uric acid, and routine urinalysis (Chisolm et al. 1976). PbB levels during the acute poisoning
episode ranged from 100 to 650 ug/dL; all patients received immediate chelation therapy. At the time of
the study, their PbB levels had decreased to less than 40 ug/dL.
LEAD 58
2. HEALTH EFFECTS
A study of 151 children ages 3-6 years old living near a lead smelter in town in Romania found a significant
relationship between PbB concentration and NAG activity in the urine (Verberk et al. 1996). The mean
PbB concentration among the children was 34.2 ug/dL. NAG activity was found to increase 14% per
10 ug/dL PbB. No significant relationship was found between PbB and other urinary markers of renal
function such as albumin, a,M-globulin, retinol binding protein, or alanine aminopeptidase. It was unlikely
that the increase in NAG activity was due to exposure to cadmium since cadmium in blood was less than
2 ug/L.
On the basis of the more recent study by Verberk et al. (1996), it seems that tubular damage may occur in
children at PbB levels of <40 ug/dL.
Endocrine Effects. The effects of lead exposure on thyroid function have been examined in
occupationally exposed workers and in children. Blood lead levels, EP, total thyroxin (T4), free thyroxin
(FTJ total triiodothyronine (T3), and thyroid stimulating hormone (TSH) were measured in 172 black male
workers in 2 Kenyan car battery factories and one secondary lead smelter (Tuppurainen et al. 1988). The
mean duration of exposure to lead was 7.6±5.1 years (range, 0.1-20 years). The mean PbB level was
56±24 ug/dL (range, 15-134 ug/dL) and the mean EP was 16.3±5.1 umol/L (range, 2-104 umol/L). No
correlation was found between PbB level and T4, T3, or TSH, as determined by regression analyses.
However, there was a weak, but statistically significant, negative correlation between duration of exposure
and levels of T4 and FT4. This association was even more apparent when only workers considered to have
"high" lead exposure (i.e., PbB level of* 56 ug/dL) were analyzed. Although these results suggest that lead
may adversely affect the thyroid over time, the authors did not control for confounding factors (such as
preexisting conditions that may affect thyroid function or exposure to other chemicals) and lead exposures
may have varied considerably in the workers. An additional study examined some endocrine parameters
(T3, FT4, T4, TSH, follicle-stimulating hormone, and luteinizing hormone) in a group of 98 workers from a
lead acid battery factory (Gennart et al. 1992a). The mean duration of exposure was 10.6 years and the
mean PbB concentration at the time of the evaluation was 51 ug/dL (range, 40-75 ug/dL). A group of
85 non-occupationally exposed subjects served as controls (mean PbB, 20.9 ug/dL; range, 4.4-39.0 ug/dL).
The results showed no lead-related alterations in the parameters examined. It should be noted that the mean
PbB level of 20.9 ug/dL in the control group may not be low enough to be considered a true control and
could have lessened the possibility of finding a lead effect in the more highly exposed group.
LEAD 59
2. HEALTH EFFECTS
No effects of lead on thyroid function have been found in children. Thirty-six male and 32 female children
ranging in age from 11 months to 7 years (median age of 25 months) took part in a study of the effects of
lead exposure on thyroid function in inner city children (Siegel et al. 1989). Blood lead levels, T4, and T4
uptake were determined, and sex, race, socioeconomic status, and hemoglobin were also assessed for each
child. The PbB levels ranged from 2.0 to 77 u.g/dL, with a mean of 25 ug/dL. Forty-four percent of the
children had elevated lead levels (>24 ug/dL). Linear regression analysis revealed that there was no
association between PbB levels and either T4 or FT4. This is contrary to what has been observed in adults
(i.e., others have shown that there is a relationship between PbB levels and T4 levels in lead-exposed
workers) (Tuppurainen et al. 1988). The authors offered four possible explanations for the apparent lack of
effect of lead on thyroid function in children. Children may be less susceptible to the toxic effects of lead
on the thyroid gland. However, this is not consistent with the greater susceptibility of children to the other
toxic effects of lead (e.g., neurotoxicity). The lead-exposed workers had higher PbB levels than the
children in this study (51.9 ug/dL versus 25 ug/dL). However, no effect on thyroxine was seen even in the
children with PbB of* 60 ug/dL. The workers had a longer duration of exposure (average exposure of
7.6 years versus 2.8 years in the children). T4 levels may not be a sensitive enough indicator of thyroid
function. On the other hand, the positive findings in the adults described above are of limited value because
the authors did not control for confounding factors (such as preexisting conditions that may affect thyroid
function or exposure to other chemicals).
The results of a study by Siegel et al. (1989) are consistent with the findings of Huseman et al. (1992) who
examined a group of 12 children (2-5 years old) from the Omaha Lead and Poison Prevention Program with
PbB levels in the range of 41 to 72 ug/dL. The authors found that basal TSH, prolactin, T4 and T3 were not
affected by PbB. Also, TSH and prolacting responses to thyrotropin-releasing hormone, and cortisol
responses to insulin were not altered by PbB. However, Huseman et al. (1992) did find that the peak human
growth hormone (hGH) response to an L-dopa and insulin test, although within normal limits, was
significantly lower in children with toxic levels of lead compared with the peak response in children with
lower PbB levels (<30 ug/dL). Furthermore, the mean 24-hour hGH in children with high PbB was not
only significantly lower than those of normal children, but was comparable with that of children with hGH
neurosecretory dysfunction. High PbB levels were also associated with a lower mean insulin-like growth
factor I.
LEAD 60
2. HEALTH EFFECTS
Other Systemic Effects.
Effects on Vitamin DMetabolism. Lead interferes with the conversion of vitamin D to its hormonal form,
1,25-dihydroxyvitamin D. This conversion takes place via hydroxylation to 25-hydroxyvitamin D in the
liver followed by 1-hydroxylation in the mitochondria of the renal tubule by a complex cytochrome P-450
system (Mahaffey et al. 1982; Rosen and Chesney 1983). Evidence for this effect comes primarily from
studies of children with high lead exposure.
Lead-exposed children with PbB levels of 33-120 ug/dL had marked reductions in serum levels of
1,25-dihydroxyvitamin D (Rosen et al. 1980). Even in the range of 33-55 ug/dL, highly significant
depressions in circulating 1,25-dihydroxyvitamin D were found, but the most striking decreases occurred in
children whose PbB lead levels were >62 ug/dL. In addition, children with PbB levels of >62 ug/dL also
had significant decreases in serum total calcium and ionized calcium and significant increases in serum
parathyroid hormone. These conditions would tend to enhance production of 1,25-dihydroxyvitamin D;
thus, the inhibition caused by lead may have been greater than was indicated by 1,25-dihydroxyvitamin D
levels. Serum levels of 1,25-dihydroxyvitamin D returned to normal within 2 days after chelation therapy.
These results are consistent with an effect of lead on renal biosynthesis of 1,25-dihydroxyvitamin D. A
strong inverse correlation between 1,25-dihydroxyvitamin D levels and PbB was also found among children
with PbB levels ranging from 12 to 120 ug/dL, with no change in the slope of the line at levels less than
30 ug/dL (Mahaffey et al. 1982).
However, results obtained by Koo et al. (1991) indicate that low to moderate lead exposure (average
lifetime PbB level range of 4.9-23.6 ug/dL, geometric mean of 9.8 ug/dL, n=105) in young children with
adequate nutritional status, particularly with respect to calcium, phosphorus, and vitamin D, has no effect on
vitamin D metabolism, calcium and phosphorus homeostasis, or bone mineral content. The authors
attribute the difference in results from those other studies to the fact that the children in their study had
lower PbB levels (only 5 children had PbB levels >60 ug/dL and all 105 children had average lifetime PbB
levels <45 ug/dL at the time of assessment) and had adequate dietary intakes of calcium, phosphorus, and
vitamin D. They concluded that the effects of lead on vitamin D metabolism observed in previous studies
may, therefore, only be apparent in children with chronic nutritional deficiency and chronically elevated
PbB levels. Similar conclusions were reached by IPCS (1995) after review of the epidemiological data.
LEAD 61
2. HEALTH EFFECTS
Effects on Growth. Since the report by Nye (1929) of runting in overtly lead-poisoned children, a number
of epidemiological studies have reported an association between PbB levels and decreased growth in
children, who take in lead primarily through the oral route (Johnson and Tenuta 1979). Although these
findings in the early epidemiological studies were suggestive of an effect, many of the studies failed to
control for possible confounding factors such as age, race, sex, or nutritional status. However, results from
some more recent and better conducted epidemiological studies have suggested an association between PbB
levels and decreased growth.
In a study that ruled out possible confounding effects of socioeconomic status on lead absorption, a set of
biometric measurements (including stature and weight) for children with PbB levels of less than 30 ug/dL
and for children with PbB levels of 40-60 u.g/dL was compared (Lauwerys et al. 1986). When only the
children • 8 years old were considered, the results indicated that slight decreases in biometric values
occurred in the high-lead group as compared with the lower-lead group. Huseman et al. (1992) found that
in a small group of 6 children (2-5 years old) with PbB levels between 41 and 72 ug/dL the growth rate
averaged 4.2 cm/year before chelation therapy, and 9.0 cm/year following chelation therapy.
Stronger evidence for an association between lead exposure and growth retardation is available in the
analyses by Schwartz et al. (1986) of data for 2,695 children • ? years old from the NHANES II study.
Stepwise multiple regression analyses indicated that PbB levels (range, 4-35 ug/dL) were a statistically
significant predictor of children's height, weight, and chest circumference, after controlling for age, race,
sex, and nutritional covariates. The strongest relationship was observed between PbB and height, with
segmented regression models indicating no evident threshold for the relationship down to the lowest
observed PbB level of 4 ug/dL. Parental stature was not considered as a variable, but analysis showed that
age, sex, nutrition, and PbB level accounted for 91% of the variance in height. The authors concluded that
the mean PbB level of the children at the average age of 59 months appeared to be associated with a
reduction of approximately 1.5% in the height that would be expected if the PbB level had been zero. The
impact on weight and chest circumference was of the same magnitude. This study is limited in that
environmental factors (in particular parental smoking) were not controlled for.
PbB concentrations in the range of 2.8 to 40 ug/dL were related with decreased stature in a cohort of
1,454 Mexican-American children aged 5 to 12 who were participants in the Hispanic Health and Nutrition
Examination Survey (HHANES) conducted in 1982-1984 (Frisancho and Ryan 1991). Height was
LEAD 62
2. HEALTH EFFECTS
considered the dependent variable in the multiple regression analyses, and age, poverty index, hematocrit,
hemoglobin, transferrin saturation, and blood lead were the independent variables. The mean PbB
concentration in males and females was 10.6 and 9.3 ug/dL, respectively. Eighty-two percent of the
variance in height in males was accounted for by hematocrit and PbB; in females the same 82% was
accounted for by age, poverty index, and PbB. After adjusting for these covariates, children whose PbB
levels were above the median for their age and sex (9-10 ug/dL range) were 1.2 cm shorter than children
with PbB levels below the median.
In a preliminary report of a cohort study of Danish children of homogeneous social/ethnic background
joining the first grade in 1982-1983, tooth lead was significantly associated with decreased height after
controlling for other variables (e.g., child's medical history, dietary history, behavior, tobacco smoking of
parent, and sociodemographic factors) (Lyngbye et al. 1987). Exposed children had tooth lead levels of
greater than 18.7 ug/g, while controls had tooth lead levels less than 5 ug/g. The average PbB level in the
exposed cohort was <60 ug/dL.
A retrospective study of the growth of 54 children from birth to 48 months of age was undertaken (Angle
and Kuntzelman 1989). Children were initially chosen for the study based on finding high EP (>35 ug/dL)
between 12 and 23 months of age. Blood lead levels were used to subdivide the children into 2 groups: the
low-lead <30 ug/dL (n=24), and the high-lead • 30 ug/dL (n=30). The two groups were comparable with
respect to gender and skin color. None of the children were considered to have clinical signs of lead
toxicity. The mean annual PbB level increased from 17.0±1.7 ug/dL at 12-23 months to 18.5±3.5 ug/dL at
35-48 months in the low-lead group. The mean annual PbB level decreased from 46.7±3.5 ug/dL at
12-23 months to 40.5±2.4 ug/dL at 35-48 months in the high-lead group. The mean EP level decreased
with age in the low-lead children but remained consistently elevated in the high-lead children. The rate of
weight gain was significantly increased at 15 months, and mean weight was significantly increased at
24 months in the high-lead group. Even though the high-lead children showed initial increased growth,
analysis of the rates of height and weight gain from birth to 36 months showed a significant decrease in
growth of high-lead children when compared to the low-lead group. The authors state that the increased
growth rate at 15 months in the high-lead children is associated with increased food intake (particularly of
finger foods), therefore increasing the probability of lead ingestion from dust on the fingers. The
contribution of prenatal lead burden and iron deficiency to the growth patterns observed could not be
determined. This study suggested that after an initial acceleration in growth, high PbB may be associated
LEAD 63
2. HEALTH EFFECTS
with growth retardation, and that food and hand dust are among the primary sources of lead in the first year
of life.
A study was conducted on 21 children, aged 18 to 36 months, to examine the potential relationship between
the amounts of lead ingested in food and anthropometric measurements (height, weight, head circum-
ference, and mid-upper arm circumference) (Stanek et al. 1998). The children resided in homes located in
an urban area with potentially high lead levels. The main outcomes measured were lead contamination in
food and on hands, and blood lead levels. The mean PbB concentration was 6.4 u.g/dL, and the total intake
of lead from food was 4.95 ug/day. Home-handled foods, canned foods, and hand-wipe lead were
significant predictors of lead content in food. When the anthropometric measurements were compared with
mean PbB levels, a negative relationship with head circumference was found. Regression analyses showed
that, in addition to blood lead, total energy intake was significantly related to head.circumference,
suggesting possible nutritional influence. The influence ofother factors such as prenatal care, nutrition, and
genetics was also mentioned as being possibly responsible for the findings.
Two studies failed to establish an association between PbB levels and growth. In a study designed to look
at the effect of lead exposure on stature (height and weight) among 104 high-lead subjects and 27 sibling
controls, PbB did not affect growth or the genetic predisposition for eventual adult height (Sachs and Moel
1989). The high-lead subjects had PbB that ranged from 10 to 47 ug/dL, and their nonexposed sibling
controls had PbB levels that ranged from 1 to 4 u.g/dL. PbB levels, height, and weight were measured in
1974 (the year of their first post-treatment recall for evaluation, when the mean age was 8 years) and 1985
(the year of their sixth recall, when their mean age was 18 years). Between 70% and 77% of the high-lead
subjects ranked in or above the 50th percentile for height in 1974; in 1985, 84% of the high-lead subjects
ranked in or above the 50th percentile for height. These percentages were not different from those seen in
the sibling controls.
A follow-up of the 260 infants from the Cincinnati cohort (see Section 2.2.1.6 for a description of this
cohort) revealed that postnatal growth rates, measured as covariate-adjusted increases in stature from 3 to
15 months of age, were inversely correlated with postnatal increases in blood lead levels from 3 to
15 months of age (Shukla et al. 1987, 1989). This relationship was significant only for infants with
relatively higher prenatal lead exposures (i.e., those whose mothers had prenatal PbB levels of* 9.7 u.g/dL).
During the second and third years of life, 235 infants from this cohort were reevaluated
LEAD 64
2. HEALTH EFFECTS
(Shukla et al. 1991). Mean PbB during the period of 18 to 33 months was chosen as an integrated index for
lead exposure for this period. Mean PbB concentration for the cohort during this period was 17 (ig/dL
(range, 5.7-53.9 ug/dL); mean PbB levels during the period of 3 to 15 months was 11.8 ug/dL. Length
measurements were conducted at 18, 21, 24, 27, 30, and 33 months. The results of the statistical analyses
showed that mean PbB levels during the second and third years were negatively associated (p=0.002) with
attained height at 33 months of age. However, this association was significant only among those children
who had mean PbB levels greater than the cohort median (• 10.8 ug/dL) during the 3-15 months interval. It
also appeared that the effect of lead exposure (both prenatal and during the 3-15 month interval) was
transient as long as subsequent exposure was not excessive.
Two sets of analyses were conducted on the data from the Cleveland Prospective Study to assess the
association between PbB levels and size from a cohort of 359 mother-infant pairs (Greene and Ernhart
1991). The first analyses investigated the association between prenatal lead exposure and neonatal size
measures as well as growth through the preschool years. The second analyses were concerned with the
relationships between preschool PbB indices (at 6 months, 2 years, 3 years, and 4 years 10 months) and
concurrent and subsequent measurements of weight, length, and head circumference. The possible
interaction between prenatal and preschool lead exposure and its effect on reduced size were also studied.
Weight, length, and head circumference were measured at birth and during five subsequent in-home visits;
cord and maternal PbB levels were used as a measure of prenatal lead exposure, and preschool PbB samples
were taken at 6 months, 3 years, and 4 years 10 months. The analyses controlled for a variety of possible
confounding factors. Multivariate longitudinal analyses revealed no statistically significant effect of PbB
levels on growth from birth through age 4 years 10 months.
The results from a study that examined the effect of chronic lead exposure on body mass index (BMI,
weight in kg divided by the square of the height in meters), as well as on weight and height, have recently
become available (Kim et al. 1995). The cohort consisted of children who attended first and second grades
in the period between 1975 and 1978 in Chelsea and Somerville, Massachusetts, who were evaluated at a
13-year interval (see also Needleman et al. 1979 in Sections 2.2.1.4 and 2.2.1.6). A total of 236 subjects
provided complete information for the study of cross-sectional relationship between dentin lead levels and
physical growth in 1975-1978 (Study 1). Independent variables other than log]0 dentin levels were age,
sex, birth weight, and mother's socioeconomic status as of 1975-1978. Fifty-eight subjects provided data
on the relationship between the dependent variable (change in physical growth between 1978-1978 and
LEAD 65
2. HEALTH EFFECTS
1989-1990) and log,0 dentin lead levels in 1975-1978 (Study 2). Also, 54 children provided information
on the relationship between changes in growth between 1975-1978 and 1989-1990, and lead in bone (tibia,
patella, or mean bone lead) in 1975-1978 (Study 3). Other independent variables adjusted in Studies 2 and
3 were age as of 1975-1978, age increase between 1975-87 and 1989-1990, sex, mother's socioeconomic
status as of 1975-1978, and physical parameters (weight, height, or BMI). Analysis of the results showed
that loglo dentin lead was significantly associated with BMI, but not with weight or with height, after
controlling for age as of 1975-1978, sex, birth weight, and mother's socioeconomic status. Also, after
adjusting for BMI as of 1975-1978, age increase, age as of 1975-1978, sex, and mother's socioeconomic
status, log,0 dentin lead was significantly associated with BMI change between 1975-1978 and 1989-1990.
No significant associations were found between log]0 dentin lead and weight, or between log]0 dentin lead
and height. Furthermore, no significant associations were observed between bone lead as of 1989-1990
and any of the changes in physical growth between 1975-1978 and 1989-1990. Further analysis of the
results showed that a 10-fold increase in dentin lead level was associated with an increase of 1.02 kg/m2 in
BMI at the age of 7 years, and a 10-fold increase in dentin level was also associated with an increase in
BMI change of 2.65 kg/m2 from age 7 to age 20. Kim et al. (1995) indicate that because dentin lead level
reflects chronic exposure to lead during the several years prior to shedding of teeth, the results suggest that
children exposed to lead during childhood had greater BMI gain between age 7 and 20 than those less
exposed.
2.2.1.3 Immunological Effects
The data on immunological effects in occupationally exposed humans following exposure to lead are
inconsistent and limited, with some indication that lead may have an effect on the cellular component of the
immune system, while the humoral component is relatively unaffected. Lead workers with PbB levels of
21-90 ug/dL (median, 55 ug/dL) had more colds and influenza infections per year and had a significant
suppression of secretory IgA levels (Ewers et al. 1982). Secretory IgA is a major factor in the defense
against respiratory and gastrointestinal infections (Koller 1985). Serum immunoglobulin levels were not
significantly altered. Immune function in lead workers exposed occupationally for 4-30 years, whose PbB
levels at the time of testing ranged from 25 to 53 ug/dL (mean, 38.4 (j.g/dL), was no different from controls
whose PbB levels at the time of testing ranged from 8 to 17 ug/dL (mean, 11.8 ug/dL) (Kimber et al.
1986b). There were no differences between the workers and controls with regard to serum concentrations
of IgG, IgA, or IgM and no correlation between PbB levels and serum immunoglobulin levels. In addition,
LEAD 66
2. HEALTH EFFECTS
responses to the mitogen phytohemagglutinin (PHA) (a stimulator of T lymphocytes) and natural killer
(NK) cell activity were not altered in workers compared with controls. Lymphocyte transformation
(in vitro) and serum IgG and IgA levels were studied in 39 male lead storage battery workers who had
exposure to lead oxides, in 10 age-matched nonexposed health volunteers, and in 9 nonexposed
management personnel (Alomran and Shleamoon 1988). The length of exposure was not precisely
specified, but the range was 0 to about 18 years. The mean PbB level in these workers had been previously
shown to be 64 ug/dL, and the air concentration of lead oxide within the plant was reported to be
266 ug/m3. No specifics were given regarding how this measurement was obtained. The lymphocytes from
the exposed workers were significantly less responsive to stimulation by PHA and concanavalin A (con A)
than those from the controls, and the severity of the depression was related to the duration of exposure.
There was no effect on IgG and IgA levels.
Fischbein et al. (1993) examined the phenotypic parameters and functional integrity of peripheral blood
lymphocytes in a group of 51 firearm instructors employed in the New York Metropolitan area. A group of
36 industrial workers with no known exposure to lead served as control subjects. Fifteen of the 51 firearm
instructors had PbB levels • £5 u.g/dL (mean 31.4 ug/dL), whereas the rest had a mean PbB concentration of
14.6 (ig/dL. The control group tested negative for lead. The results showed a significant decrease in
percentage and number of CD3+ and CD4+ cells in the high-exposure group relative to the low-exposure
group. In addition, cell-mediated immunity, assessed by the response of lymphocytes to T-cell mitogens
and by the mixed-lymphocyte culture, was impaired in lead-exposed subjects. Other cell types including
CD8+, the B-Iymphocyte, or the NK cells were not significantly altered relative to controls. The authors
proposed that a likely mechanism for the observed lead effects may be its high affinity for the sulfhydryl
groups on the surface receptors of the affected cell types.
A significant decrease in the number of CD4+ cells as well as C3 and C4 complement levels among lead-
exposed workers (n=25) relative to unexposed controls (n=25) was also reported by Undeger et al. (1996).
The mean PbB level in the exposed workers was 74.8 u.g/dL (range, 38-100 ug/dL) compared to
16.7 u.g/dL (range, 11-30 |ig/dL) among the controls. The mean duration of exposure was 6 years (range,
0.5-15 years) These authors also found a significantly reduced number of T-helper lymphocytes and
reduced serum IgG and IgM levels among the exposed workers. However, they found no significant
alterations in the number or percentage of other subsets of peripheral lymphocytes such as T-suppressor, B
LEAD 67
2. HEALTH EFFECTS
cells, and NK cells. No information was provided regarding the current or past health status of the exposed
cohort.
Sata et al. (1998) did not find significant differences in the number or percentages of CD4+ or CD3+ cells
between a group of 71 male workers engaged in the manufacturing of lead stearate who had a mean PbB
level of 19 ug/dL (range, 7-50 ug/dL) and a control group of 28 workers with no known occupational
exposure to lead (PbB levels in the controls were not measured). However, the exposed workers had a
significant reduction in the number of CD3+CD45RO+ (memory T) cells and a significant increase in the
percentage of CDS* cells compared with controls. Also, there was a significant correlation between the
percentage of CD3*CD45RA+ cells and PbB levels in the exposed workers. At the time of the study, no
subject had any signs or symptoms indicative of infection.
Pinkerton et al. (1998) evaluated a comprehensive panel of immunologic parameters among 145 lead-
exposed male workers from a large secondary lead smelter in the United States with a median PbB level of
39 ug/dL (range, 25-55 (ig/dL). A group of 84 unexposed workers with a mean PbB level of <2 ug/dL
(range, 2-12 ug/dL) served as controls. The primary exposure at the smelter was lead. According to
company monitoring data, air concentration of other metals was negligible. The mean age of the exposed
workers was 32.9 years, and the mean duration of employment was 5.3 years. The following were
considered candidate covariates: age, race, smoking habits, alcohol consumption, marijuana use, whether
the subject worked first or second shifts, exposure to five or more hours of direct sunlight during the last
week, cold or flu symptoms in the last week, and hours of sleep the evening prior to the test. The covariates
for all final models were age, race, whether the subject worked first or second shifts, and current smoking
status. The study found no significant differences in the percentages of CD3+ cells, CD4+ T cells, CD8+ T
cells, B cells, or NK cells between exposed and unexposed workers. In addition, there were no differences
between exposed and unexposed workers in serum immunoglobulin levels, salivary IgA, C3 complement
levels, or lymphoproliferative responses with tetanus toxoid. The study did find that on average, exposed
workers had a significantly lower percentage of monocytes than unexposed workers, although the
magnitude was small. Among exposed workers the percentage and number of B cells were positively
associated with current blood lead level, serum IgG was negatively associated with cumulative lead
exposure, and the percentage and number of CD4+/CD45RA+ cells was positively associated with
cumulative lead exposure. Pinkerton et al. (1998) concluded that their results provided no evidence for a
marked immunotoxic effect of lead at the exposure levels studied. They also suggested that differences
LEAD 68
2. HEALTH EFFECTS
between their results and those of others, such as Fischbein et al. (1993) and Ondeger et al. (1996), may
reflect methodological differences.
The data available on the iinmunologic effects of lead exposure on children are very limited. In a
comparison of 12 preschool children having PbB levels • 40 ug/dL and elevated FEP with 7 preschool
children with lower PbB levels (14-30 ug/dL), it was found that there were no differences between groups
with respect to complement levels, immunoglobulin levels, or antitoxoid liters following booster
immunization with tetanus toxoid (Reigart and Graher 1976). The small number of children, the lack of
unexposed controls, and the fact that PbB levels of up to 30 ug/dL were seen in the comparison group limit
the conclusions that can be drawn from this report.
2.2.1.4 Neurological Effects
Neurological Signs and Symptoms in Adults. The most severe neurological effect of lead in
adults is lead encephalopathy, which is a general term to describe various diseases that affect brain function.
Early symptoms that may develop within weeks of initial exposure include dullness, irritability, poor
attention span, headache, muscular tremor, loss of memory, and hallucinations. The condition may then
worsen, sometimes abruptly, to delirium, convulsions, paralysis, coma, and death (Kumar et al. 1987).
Histopathological findings in fatal cases of lead encephalopathy in adults are similar to those in children
(see discussion below).
Severe lead encephalopathy is generally not observed in adults except at extremely high PbB levels (e.g.,
460 ug/dL [Kehoe I96la]). Other data (Smith et al. 1938) suggest that acute lead poisoning, including
severe gastrointestinal symptoms and/or signs of encephalopathy, can occur in some adults at PbB levels
that range from approximately 50 to >300 ng/dL, but the data are somewhat ambiguous.
Occupational exposure to lead has often been associated with signs of neurotoxicity. The literature contains
numerous case reports and small cohort studies that describe a higher incidence of these symptoms,
including malaise, forgetfulness, irritability, lethargy, headache, fatigue, impotence, decreased libido,
dizziness, weakness, and paresthesia at PbB levels that range from approximately 40 to 120 ug/dL
following acute-, intermediate-, and chronic-duration occupational exposure (Awad et al. 1986; Holness and
Nethercott 1988; Marino et al. 1989; Matte et al. 1989; Pagliuca et al. 1990; Pasternak et al. 1989;
LEAD 69
2. HEALTH EFFECTS
Pollock and Ibels 1986; Schneitzer et al. 1990). For example, significantly increased central and peripheral
nervous system and gastrointestinal symptoms were reported among 25 lead workers with maximum PbB
levels of 50-69 ug/dL and significantly increased central nervous system symptoms among 20 lead workers
with maximum PbB levels <50 ug/dL (Haenninen et al. 1979). Controls (n=23) had average PbB levels of
11.9 ug/dL. In another study, no smelter workers with PbB levels of <40 ug/dL had signs or symptoms of
lead intoxication, while 13% of the workers with PbB levels of 40-79 ug/dL had extensor muscle weakness
or gastrointestinal symptoms (Baker et al. 1979).
A study comparing 288 lead-exposed workers (current or historical PbB level of >35 ug/dL) at 3 battery
plants with 181 workers with current PbB level of • 35 ug/dL at a truck frame plant reported a few
differences in neurobehavioral or psychosocial indices (Parkinson et al. 1986). Because the lead-exposed
workers were younger, less educated, employed for fewer years, and earned less income than the unexposed
workers, the analysis adjusted for age, education, and income. Exposed workers had mean current, time-
weighted average and peak PbB levels of 40.0, 48.8, and 78.8 ug/dL, respectively. PbB data for unexposed
workers were not characterized in this manner. Exposed workers had an increase in the number of work-
related accidents and poorer performance in a motor speed/manual dexterity test with the nondominant
hand, and greater levels of conflict in interpersonal relationships as compared with unexposed workers.
When multiple regression analyses were performed on the data for exposed workers, only the levels-of-
conflict measure showed a significant dose-response relationship with current or cumulative PbB levels.
Twenty low-exposure men (mean blood lead level, 20.4 ug/dL; range, 11.1-27.1 ug/dL), 20 intermediate-
exposure men (mean PbB level, 31.7 ug/dL; range, 26-35 ug/dL), and 20 men high-exposure men (mean
PbB level, 52.5 ug/dL; range, 45-60 ug/dL) at an storage battery plant were studied (Campara et al. 1984;
Zimmerman-Tanselia et al. 1983). Consistent and significant dose-response trends were observed in
symptoms such as loss of appetite, paresthesia in lower limbs, weakness of upper limbs, and dropping of
objects, with the most marked increases in neurological symptoms in the high-lead group (Zimmerman-
Tanselia et al. 1983). In addition, the high-lead workers performed significantly less well on neuro-
behavioral tests, with general performance on cognitive and visual-motor coordination tasks and verbal
reasoning ability most markedly impaired (Campara et al. 1984).
LEAD 70
2. HEALTH EFFECTS
The results of these studies showing neurological effects at lower exposure levels of lead indicate that the
lowest levels for overt signs and symptoms of neurotoxicity in adults is in the range of 40-60 ug/dL. These
neurological signs and symptoms occur at roughly the same PbB levels as do other overt signs and
symptoms of lead intoxication, such as gastrointestinal complaints.
Behavioral Function in Adults. Neurobehavioral testing has revealed effects in adults at PbB levels
(i.e., 40-80 ug/dL) below those causing encephalopathy (>400 ug/dL). Evaluations of occupationally
exposed adults include several affected parameters at PbB levels between 40 and 80 ug/dL. Disturbances in
oculomotor function (saccadic eye movements) in lead workers with mean PbB levels of 57-61 ug/dL were
reported in a study by Baloh et al. (1979) with follow-up by Spivey et al. (1980) and in a study by
Glickman et al. (1984). Deficits in hand-eye coordination and reaction time were reported in 190 lead-
exposed workers (mean PbB level, 60.5 ug/dL) (NIOSH 1974). Most of the workers had been exposed for
between 5 and 20 years. A similar study, however, reported no differences in arousal, reaction time, or grip
strength between controls (mean PbB, 28±10 ug/dL) and workers who had been exposed to lead for
12±9.5 years (mean PbB level, 61±12 ug/dL) (Milburn et al. 1976). Disturbances in reaction time, visual
motor performance, hand dexterity, IQ test and cognitive performance, nervousness, mood, or coping
ability were observed in lead workers with PbB levels of 50-80 ug/dL (Arnvig et al. 1980; Haenninen et al.
1978; Hogstedt et al. 1983; Mantere et al. 1982; Valciukas et al. 1978).
As previously noted, Campara et al. (1984) found that workers with PbB levels of 45-60 ug/dL performed
less well on neurobehavioral tests. Impaired memory and learning ability were observed in workers with
time-weighted average PbB of 27-52 ug/dL (Hogstedt et al. 1983). In another study, impaired verbal
concept formation, memory, and visual/motor performance and increased rates of depression, confusion,
anger, fatigue, and tension were found among workers with PbB levels of >40 ug/dL (Baker et al. 1983).
Similar findings were reported in a cohort of 43 Venezuelan workers from a lead smelter who had a mean
employment duration of 4 years and a mean PbB concentration of 42 ug/dL (Maizlish et al. 1995). The
workers were evaluated with the WHO neurobehavioral core test battery and the results showed a
significant association between altered mood states and current, peak, and time-weighted average (TWA)
blood lead levels. Other parameters such as memory, perceptual speed, reaction time, and manual dexterity
tended to be poorer with increasing exposure, but the magnitude of the effect was small. A limitation of
this study may be that fact that neither the subjects nor the interviewers were blinded to the exposure
results.
LEAD 71
2. HEALTH EFFECTS
No neurobehavioral effects were seen in 288 randomly selected males who were occupationally exposed to
lead as compared to 181 demographically similar controls (Ryan et al. 1987). The mean PbB level in the
exposed workers was 40.1 ug/dL and that of the controls was 7.2 ug/dL. Nineteen tests of
neuropsychological performance were conducted. The lead-exposed workers performed no differently from
controls on all measures except psychomotor speed and manual dexterity. The authors discounted this
difference due to the observation that conflicting results were obtained in two different tests of motor speed
and manual dexterity and possible confounding effects of age. There was no evidence that history of
previous very high exposure had any effect on performance.
Ninety-one workers divided into three groups based on PbB levels (<20 ug/dL, 21^40 ug/dL, 41-80 ug/dL)
underwent a battery of neuropsychological testing including syntactic reasoning, serial reaction time,
category search, visual spatial memory, and category search recall (Stollery et al. 1989). They also
completed a mood checklist. There was no significant difference in mood in the three exposure groups.
Workers with high PbB concentrations showed evidence of impairment on tests of serial reaction time and
category search, with only weak impairment on tasks measuring syntactic reasoning and delayed verbal free
recall. In general, the magnitude of the impairment correlated with PbB levels. The impairment of serial
reaction time was the best predictor of PbB levels. A follow-up evaluation of 70 these workers confirmed
the results of the previous study (Stollery et al. 1991). The main deficit was a slowing of sensory motor
reaction time, which was seen most clearly when the cognitive demands of the task were low. The response
tended to be restricted to workers in the high PbB level group. A subsequent study examined the
performance of the 70 workers on a five-choice unprepared reaction time test to elucidate the basis for the
slowing (Stollery 1996). Performance was assessed by analyzing the distributional properties of correct
reaction times. The results showed that lead impaired both the speed of making simple movements, as well
as decisions, and suggested that decision slowing is due to central rather than peripheral factors.
Limitations of these studies include the fact that there were no lead-free controls, subjects had variable
durations of exposure, and only cross-sectional exposure data were available (i.e., no history of PbB levels
in the past were available).
One study has reported effects on neurobehavioral function in lead-exposed workers at mean PbB levels of
50 ug/dL (Williamson and Teo 1986). Neurobehavioral function was measured using tests that are based
on information processing theory in 59 lead workers and 59 controls matched for age, type of job, time on
the job, education level, smoking history, and alcohol consumption. Statistically significant decreases in
LEAD 72
2. HEALTH EFFECTS
the lead-exposed workers were seen for critical flicker fusion reaction, simple reaction time, tracking
speeds, hand steadiness tests, and sensory store memory. Sensory store memory speed showed a low but
statistically significant correlation with PbB concentrations. Measurements of neurobehavioral function
seemed well chosen, and repeated measures with associated appropriate statistics were used. The
performance of the lead-exposed workers was significantly impaired. The critical flicker fusion threshold
may reflect retinal or intermediate visual pathway function as well as cortical arousal.
A recent study examined the correlation between short- and long-term measures of exposure to lead and
performance on neuropsychological tests among a group of 467 Canadian male lead smelter workers
(Lindgren et al. 1996). The current PbB concentration was 27.5 ug/dL, and mean duration of employment
was 17.7 years. Three measures of exposure were evaluated: current PbB concentration, time-weighted
average (TWA), and time integrated blood lead (1BL), a cumulative dose estimate. Based on these three
measures estimates, the workers were divided into exposure terciles. Multivariate analyses of the
covariance showed that none of the three measures of exposure were significant. When years of
employment, a suppressor variable (a variable which improves the overall predictive validity of another
variable by removing irrelevant variance) was included as a covariate, 1BL exposure groups differed
significantly in 5 of the 14 neuropsychological variables. The affected neuropsychological variables tested
primarily visuomotor skills. Lindgren et al. (1996) indicated that the lack of an association between current
blood lead or TWA PbB and neuropsychological performance was not necessarily inconsistent with other
studies that found such an association since in their study the current mean PbB levels were lower than in
other studies. Current PbB as well as TWA blood lead may have lacked the sensitivity to detect the
decrement in performance.
In summary, in studies where adults were exposed occupationally to lead, a number of neurobehavioral
parameters were affected. Current PbB levels in these workers were between 40 and 80 ug/dL. However,
some measures of cumulative exposure may be better predictors of impaired performance in workers with
current PbB levels <40 ug/dL.
The effects of lead exposure on cognitive dysfunction in nonoccupational cohorts of older persons has been
evaluated in two recent studies. Muldoon et al. (1996) conducted a wide range of cognitive tests designed
to assess memory, language, visuospatial ability, and general intellectual status, as well as sensorimotor
function in a group of 530 female participants in the Study of Osteoporotic Fractures. The cohort
LEAD 73
2. HEALTH EFFECTS
consisted of 325 rural dwellers and 205 urban dwellers with geometric mean PbB concentrations of
4.5 ug/dL and 5.4 ug/dL, respectively; the overall range was 1-21 ug/dL. The corresponding mean ages
were 71.1 and 69.4 years. For the group, the scores on the various tests were average, consistent with
normal values reported for older women. Analyses of the relationship between PbB concentrations and
neuropsychological function showed significant inverse associations with performance only among the rural
dwellers. After adjusting for age, education, and tobacco and alcohol consumption, women with blood
levels • 8 ug/dL performed significantly worst in tests of psychomotor speed, manual dexterity, sustained
attention, and mental flexibility than women with PbB concentrations • 3 ug/dL. Similar results were found
for reaction time tests after further adjusting for history of diabetes and/or arthritis. Muldoon et al. (1996)
stated that the reason for the inconsistency between the urban and rural cohorts is unclear; however, the
results suggest that factors other than lead have a bigger influence in the outcomes measured. A similar
study was conducted in a cohort of 141 men participants in the MAS (Payton et al. 1998). In this study, in
addition to PbB levels, lead in bone (tibia and patella) was also measured. The mean PbB concentration
among the participants was 5.5 |ig/dL (range not provided), and the mean age was 66.8 years. Tibial and
patellar bone lead showed a stronger correlation with each other than either of them with blood lead. After
adjusting for age and education, the results showed that men with higher levels of blood lead recalled and
defined fewer words, identified fewer line-drawn objects, and required more time to attain the same level of
accuracy on a perceptual comparison test as men with the lowest level of PbB. In addition, men with higher
blood and tibial lead copied spatial figures less accurately, and men with higher tibial lead had slower
response for pattern memory. Payton et al. (1998) stated that the results are consistent with the hypothesis
that even within the relatively low range of exposure, higher levels of blood lead are associated with poorer
performance on some cognitive tests. The results showed that PbB was the strongest predictor of
performance on most tests. Also of interest was the finding that lead in the tibia, which changes at a slower
rate, showed more significant relationships with cognitive test scores than patellar bone lead, which changes
more rapidly. Limitations of the study recognized by the authors included the possibility of unknown
confounders, the greater error associated with bone lead measurements compared with PbB measurements,
and the need for a greater number of participants with higher PbB to minimize Type II errors.
Peripheral Nerve Function in Adults. There are numerous studies available on peripheral nerve
function that measured the conduction velocity of electrically stimulated nerves in the arm or leg of lead
workers. The most important studies are summarized below. In prospective occupational studies,
LEAD 74
2. HEALTH EFFECTS
decreased nerve conduction velocities (NCVs) were found in workers with PbB levels of 30-48 ug/dL
(Seppalainen et al. 1983), but another study found no significant differences in NCVs in workers with PbB
levels of 60-80 ug/dL, relative to controls (Spivey et al. 1980). Decreased NCVs were seen in the median
(motor and sensory) and ulnar (motor and sensory) nerves of newly employed high-exposure workers after
1 year of exposure and in the motor nerve conduction velocity of the median nerve of this group after 2 or
4 years of exposure (Seppalainen et al. 1983). Although the severity of the effects on NCV appeared to
lessen with continued exposure, several of the high-exposure workers in this study quit 1 or 2 years after
starting. Thus, the apparent improvement in NCVs may have been due to a healthy worker effect. A
similar healthy worker effect may have accounted for the negative results of Spivey et al. (1980) who tested
ulnar (motor and slow fiber) and peroneal (motor) nerves in 55 workers exposed for 1 year or more. The
studies differed in design; one prospectively obtained exposure history, while the other did it retro-
spectively. The end points that were measured also differed; Spivey et al. (1980) did not test the median
nerve, which was the most sensitive end point in the study by Seppalainen et al. (1983).
In cross-sectional occupational studies, significant decreases in NCVs were observed in fibular (motor) and
sural (sensory) nerves as a function of PbB levels with duration of exposure showing no effect (Rosen and
Chesney 1983). In another study, decreases in NCVs of ulnar (sensory, distal) and median (motor) nerves
were seen primarily at PbB levels of >70 ug/dL (Triebig et al. 1984). Duration of exposure and number of
lead-exposed workers in these 2 studies were 0.5-28 years and 15 workers (Rosen and Chesney 1983), and
1-28 years and 133 workers (Triebig et al. 1984). Results of an earlier study by Araki et al. (1980) suggest
that the decrease in NCV is probably due to lead since median (motor) NCVs in workers with a mean PbB
level of 48.3 ug/dL were improved significantly when PbB levels were lowered through CaNa2EDTA
chelation therapy.
There is suggestive evidence indicating that the changes in NCV associated with lead exposure may be
transient. Muijser et al. (1987) investigated the effects of a 5-month exposure to lead during the demolition
of a steel structure coated with lead-based paints. The motor and sensory nerve conduction velocities were
measured in the median and ulnar nerves of eight exposed workers and compared with unexposed referents
as well as themselves at 3 and 15 months after the termination of exposure. The mean PbB levels in the
exposed workers were 82.5±18.9 ug/dL at the termination of exposure, 50.3±9.9 ug/dL 3 months after the
termination of exposure, and 29±11.8 ng/dL 15 months after the termination of exposure. Following
termination of the exposure, the motor nerve conduction velocity and distal motor latency were slowed as
LEAD 75
2. HEALTH EFFECTS
compared to the referents. However, the distal sensory conduction velocity was not affected by lead
exposure. Three months after exposure, these affected parameters showed improvement, and 15 months
after exposure were not different from the referents. These results suggest that a limited (5-month)
exposure to lead results in NCV deficits that are specific to motor nerves and are reversible in nature.
The results of these studies indicate that NCV effects occur in adults at PbB levels <70 ug/dL, and possibly
as low as 30 ug/dL. Ehle (1986), in reviewing many of the studies of NCV effects, concluded that a mild
slowing of certain motor and sensory NCVs may occur at PbB levels below 60 ug/dL, but that the majority
of studies did not find correlations between PbB and NCV below 70 ug/dL and that slowing of NCV is
neither a clinical nor a subclinical manifestation of lead neuropathy in humans. Ehle (1986), however, did
not cite or analyze the studies by Rosen and Chesney (1983) or Seppalainen et al. (1983). Other reviewers
have pointed out that decreases in NCV are slight in peripheral neuropathies (such as that induced by lead)
that involve axonal degeneration (Le Quesne 1987), and that although changes in conduction velocity
usually indicate neurotoxicity, considerable nerve damage can occur without an effect on conduction
velocity (Anderson 1987). EPA (1986a) noted that although many of the observed changes in NCV may
fall within the range of normal variation, the effects represent departures from normal neurological
functioning. NCV effects are seen consistently across studies and although the effects may not be clinically
significant for an individual, they are significant when viewed on a population basis. This is further
supported by the meta analysis of effects of lead exposure on NCV conducted by Davis and Svendsgaard
(1990).
More recent studies have also produced mixed results. Chia et al. (1996a) measured NCV in a group of 72
male workers from a lead battery manufacturing factory and 82 unexposed referents. Measurements of
NCV in the median and ulnar nerves, as well as of blood lead were performed every 6 months over a 3-year
period. Of the 72 original workers and 82 referents, only 28 and 4, respectively, completed the 3-year
period. The geometric mean PbB concentration for the exposed workers at the beginning of the study was
36.9 ug/dL compared to 10.5 ug/dL for the referents; the mean for the 28 workers who completed the study
was 39.7 ug/dL. Baseline measurements revealed significant slower NCV in workers, mostly in the median
nerve. Serial measurements in the exposed workers over the 3-year period showed a peak in PbB in the
third test which was followed by a decrease in median sensory conduction velocity and ulnar sensory nerve
conduction velocity in the fourth test. Evaluation at the end of the study of the 28 workers who completed
the 3-year period showed significant associations between PbB and 5 out 8 parameters
LEAD 76
2. HEALTH EFFECTS
measured. The same was observed when only workers with blood lead concentrations of* 40 ug/dL were
included in the analysis, but no significant association was found among workers with PbB concentrations
of <40 ug/dL. Ishida et al. (1996) found no significant association between PbB concentrations in the range
of 2.1 ug/dL to 69.5 ug/dL and median nerve conduction velocity among a group of 58 male and 70 female
ceramic painters. They also found no significant association between blood lead and a test designed to
measure parasympathetic function. However, they did find a significant association between lead and an in-
direct measure of sympathetic function, but could not conclude that the alteration in test result with
increasing blood lead truly reflected sympathetic nerve dysfunction. Yeh et al. (1995) evaluated nerve
conduction velocity and electromyographic (EMG) activity in a group of 31 workers from a battery
recycling factory and 31 sex and age matched controls. The mean duration of exposure to lead was
30.4 months and the mean PbB concentration was 63 ug/dL (range, 17-186 ug/dL). Eighty percent of the
workers (n=25) had extensor weakness of the distal upper limbs and six of these workers had weakness in
dorsiflexion of the foot; data for the control group were not provided. These 25 workers were classified as
the lead neuropathy subgroup and the remaining 6 as the lead exposure subgroup. Studies of motor nerve
conduction experiments showed a significantly increased distal latency in the median nerve from exposed
workers relative to controls, but no such effect was seen in the ulnar, peroneal, and tibial nerves. Studies of
sensory nerve conduction did not reveal any significant differences between exposed and control workers.
Ninety-four percent of the exposed workers had abnormal EMG, but no mention was made regarding the
control group. After controlling for age and sex, the authors found a significant positive association
between an index of cumulative exposure to lead (1CL) and the distal motor latencies of tibial nerves and
significant negative association between ICL and the NCVs of sural nerves. No correlation was found
between current PbB or duration of exposure and neurophysiological data.
Effects on Other Neurological End Points in Adults. Recent studies have provided evidence that
exposure to lead affects postural balance. For example, Chia et al. (1996b) evaluated the possible
association between postural sway parameters and current PbB concentration, cumulative PbB at different
years of exposure, and an index of total cumulative exposure to lead in a group of 60 workers; 60
unexposed subjects served as a control group. The current PbB concentrations were 36 ug/dL (range,
6.4-64.5 ug/dL) among the workers and 6.3 ug/dL (range, 3.1-10.9 ug/dL) among the referents. Exposed
and referents differed significantly in postural sway parameters when the tests were conducted with the eyes
closed, but not with the eyes open. Analyses of Pearson's correlation coefficients showed that postural
sway parameters were not significantly correlated with current PbB concentration or with total cumulative
LEAD 77
2. HEALTH EFFECTS
lead exposure, but a significant correlation existed with cumulative exposure the 2 years prior to testing.
Also, some parameters had a significant correlation with cumulative lead exposure during the 9 years before
the tests were conducted. Further analysis showed that the association observed with the previous 2-year
exposure was not affected by the group of workers with longer exposure. The authors speculated that the
lack of correlation between postural sway and cumulative lead exposure could be due to underestimation of
cumulative exposure and/or to the effects of lead being reversible. A similar study of 49 male lead workers
employed at a chemical factory producing lead stearate found that an increase in postural sway with the
eyes open in the anterior-posterior direction observed in exposed workers was related to current PbB levels
(18 ug/dL) (Yokoyama et al. 1997). Also, an increase in sway with the eyes closed in the right-left
direction was significantly related to the mean blood concentration in the past. According to Yokoyama et
al. (1997), the change in the vestibule-cerebellum seemed to reflect current lead absorption, whereas the
change in the anterior cerebellar lobe reflected past lead absorption.
No significant association was found between exposure to lead and the latencies of visual and brainstem
auditory evoked potentials in a group of 36 female glass workers (Murata et al. 1995). The mean PbB
concentration among the workers was 55.6 ug/dL (range, 25.8-79.3 ug/dL) and the mean exposure duration
was 7.8 years. On the other hand, parameters of peripheral autonomic function, assessed as
electrocardiographic R-R interval variability, were significantly depressed compared to a group of 17
referents with no known occupational exposure to lead. However, another study found no significant
alterations on the R-R interval variability among lead workers with a mean PbB concentration of
20.9 ug/dL (range, 4.4-39.0 ug/dL) (Gennart et al. 1992a).
Neurological Signs and Symptoms in Children. High-level exposure to lead produces encephalo-
pathy in children. The most extensive compilation of dose-response information on a pediatric population
is the summarization by NAS (1972) of unpublished data from the patient populations reported in Chisolm
(1962, 1965) and Chisolm and Harrison (1956). This compilation relates the occurrence of acute enceph-
alopathy and death in children in Baltimore, Maryland, to PbB levels determined by the Baltimore City
Health Department between 1930 and 1970. Other signs of acute lead poisoning and blood lead levels
formerly regarded as asymptomatic were also summarized. An absence of signs or symptoms was observed
in some children at PbB levels of 60-300 ug/dL (mean, 105 ug/dL). Acute lead poisoning symptoms other
than signs of encephalopathy were observed at PbB levels of approximately 60—450 ug/dL (mean,
178 ug/dL). Signs of encephalopathy such as hyperirritability, ataxia, convulsions, stupor, and
LEAD 78
2. HEALTH EFFECTS
coma were associated with blood lead levels of approximately 90-800 ug/dL (mean, 330 (ig/dL). The
distribution of PbB levels associated with death (mean, 327 (ig/dL) was virtually the same as for levels
associated with encephalopathy.
Additional evidence from medical reports (Bradley and Baumgartner 1958; Bradley etal. 1956; Gant 1938;
Rummo et al. 1979; Smith et al. 1983) suggests that acute encephalopathy in the most susceptible children
may be associated with PbB levels in the range of 80-100 ug/dL. However, a recent study reported
19 cases of acute encephalopathy in infants of mean age 3.8 months and with mean PbB levels of
74.5 ug/dL (range, 49.7-331 ng/dL) following use of traditional medicines containing lead (surma, Bint al
Thahab) (Al Khayat et al. 1997a). Seven cases had PbB levels • ?0 ug/dL. In this report, lead level at
2 months post chelation was a significant predictor of abnormal neurological outcome.
Histopathological findings in fatal cases of lead encephalopathy in children include cerebral edema, altered
capillaries, and perivascular glial proliferation. Neuronal damage is variable and may be caused by anoxia
(EPA 1986a).
Numerous studies clearly show that childhood lead poisoning with encephalopathy results in a greatly
increased incidence of permanent neurological and cognitive impairments. Additional studies indicate that
children with symptomatic lead poisoning without encephalopathy (PbB level, >80-100 ug/dL) also have
an increased incidence of lasting neurological and behavioral damage.
Behavioral Function in Children. A number of studies of asymptomatic children with relatively high
lead body burdens have been published. These children were identified through lead screening programs or
other large-scale programs focusing on mother-infant health relationships and early childhood development.
Studies that were conducted rigorously enough to warrant consideration of their findings were those of de la
Burde and Choate (1972, 1975), Ernhart et al. (1981), Kotok (1972), Kotok et al. (1977), and Rummo et al.
(1979). These studies found that, in general, groups with high lead exposure performed less well on IQ or
other psychometric tests than did referent control groups with lower lead exposures. Some of these studies
did not control for important confounding variables, such as parental IQ or educational background; when
reanalyzed taking these variables into account, the authors found that differences between lead-exposed and
control children were reduced or lost statistical significance. In addition, many of the referent control
groups tended to have what are now recognized to be elevated PbB
LEAD 79
2. HEALTH EFFECTS
levels (averaging 20-40 ug/dL, or 55 |ag/dL in the case of Kotok [1972]). Nevertheless, the consistent
pattern of lower 1Q values and other neuropsychologic deficits among the children exposed to higher lead
levels in these studies indicates that cognitive deficits occur in apparently asymptomatic children with
markedly elevated PbB levels (starting at 40-60 ug/dL and ranging up to • 70-200 ug/dL).
The average decrement of approximately 5 IQ points observed in studies by de la Burde and Choate (1972),
and Rummo et al. (1979), described in more detail below, represents a reasonable estimate of the magnitude
of full-scale IQ decrements associated with markedly elevated PbB levels (mean: approximately
50-70 ug/dL) in asymptomatic children.
A mean Stanford-Binet IQ decrement of 5 points, fine motor dysfunction, and altered behavioral profiles
were found in 70 preschool children exhibiting pica for paint and plaster and elevated PbB levels
(>40 ug/dL, mean of 58 ug/dL), when compared with results for matched control subjects not engaged in
pica for paint and plaster (de la Burde and Choate 1972). A follow-up study on these children (ages
1-3 years) at 7-8 years of age (de la Burde and Choate 1975) reported a mean Wechsler Intelligence Scale
for Children (WISC) full-scale IQ decrement of 3 points and impairment in learning and behavior, despite
decreases in PbB levels since the original study. These studies, however, did not report the PbB levels in
controls.
Additional evidence of lead-induced decrement in children's IQ was provided by Rummo et al. (1979) who
observed hyperactivity and a decrement of approximately 16 IQ points on the McCarthy General Cognitive
Index (GCI) among children who had previously had encephalopathy and whose average maximum PbB
levels at the t ime of encephalopathy were 88 ug/dL (average PbB level, 59-64 ng/dL). Asymptomatic
children with long-term lead exposures and average maximum PbB levels of 68 ug/dL (average PbB level,
51-56 ug/dL versus 21 ug/dL in a control group) had an average decrement of 5 IQ points on the McCarthy
GCI. Their scores on several McCarthy Subscales were generally lower than those for controls, but the
difference was not statistically significant (at p<0.05). Children with short-term exposure and average
maximum PbB levels of 61 ug/dL (average PbB level, 46-50 ug/dL) did not differ from controls. PbB
levels in the referent group averaged 21 ug/dL, which is high for so-called "controls." In these studies, the
environmental exposure levels and the durations of lead exposure were not reported.
LEAD 80
2. HEALTH EFFECTS
A number of general population studies available evaluated asymptomatic children with lower lead body
burdens than those evaluated in the above studies. Some of these studies provide evidence of an association
between neurobehavioral effects and the relatively low body burdens of lead representative of general
pediatric populations. The effects of PbB on IQ may have major implications for public health when
considered on a population basis as discussed by Davis and Svendsgaard (1987) and Grant and Davis
(1989). A study of 158 first- and second-grade children by Needleman et al. (1979) provides evidence for
the association of full-scale IQ deficits of approximately 4 points and other neurobehavioral defects with
tooth dentin lead values that exceed 20-30 ppm. Corresponding average PbB values would probably range
from 30 to 50 ug/dL (EPA 1986a). In comparison with children having low dentin lead levels (<10 ppm),
children having high dentin lead levels (>20 ppm) had significantly lower full-scale WISC-Revised scores;
IQ deficits of approximately 4 points; and significantly poorer scores on tests of auditory and verbal
processing, on a test of attentional performance as measured by reaction time under conditions of varying
delay, and on a teachers' behavioral rating. The frequency of non-adaptive classroom behavior as rated by
teachers increased in a dose-related fashion to dentin lead levels (Needleman et al. 1979). The distribution
of verbal IQ scores was shifted downward in the high-lead group, such that none of the children in the high-
lead group had verbal IQ scores of > 125, whereas 5% of the children in the low-lead group had verbal IQ
scores of >125. Furthermore, children in the high-lead group were three times more likely to have verbal
IQ scores of <80 than were children in the low-lead group. Using regression analysis, Bellinger and
Needleman (1983) found that IQ scores of children in the high-lead group (with >20 ppm dentin lead) fell
below those expected based on their mothers' IQ scores and that the amount by which a child's IQ fell below
the expected IQ increased with increasing dentin lead levels in a nonlinear manner. These data indicate that
dentin lead level was not significantly correlated with IQ residuals in the low-lead children (with >10 ppm
dentin lead) or in the high-lead children (with 20-29.9 ppm dentin lead) but was significantly correlated
with IQ residuals in high-lead children with 30-39.9 ppm dentin lead.
The study by Needleman et al. (1979) has been reanalyzed in additional reports (Bellinger and Needleman
1983; Needleman et al. 1985) and critically evaluated by EPA, as well as by other investigators.
In a later study, a subset (n=132) of a cohort of children studied as primary school students was reexamined
as young adults (mean age, 18.4 years) (Needleman et al. 1990). Neurobehavioral functioning had been
LEAD 81
2. HEALTH EFFECTS
found to be inversely related to dentin lead levels at the earlier examination (see discussion above). When
the 132 were reexamined 11 years later, impairment of neurobehavioral function was still found to be
related to the lead content of teeth shed at the ages of 6 and 7 years. In this study, higher lead levels in
childhood were significantly associated with lower class standing in high school, increased absenteeism,
lower grammatical-reasoning scores, lower vocabulary, poorer hand-eye coordination, longer reaction
times, and slower finger tapping. However, no significant associations were found with the results of 10
other tests of neurobehavioral functioning. These later effects could stem from a poor academic start as
opposed to effects of lead exposure; however, it could also be that the early lead exposure resulted in long-
term consequences.
Other investigators have also found that parameters of neurobehavioral function are associated with tooth
lead levels. A cross-sectional cohort of school children in first grade was ascertained in the city of Aarhus,
Denmark (Hansen et al. 1989), where the population is very homogeneous with regard to ethnicity and
language. A total of 2,412 children were contacted and asked to contribute a shed deciduous tooth. A total
of 1,291 children responded (response rate = 54%). Lead was determined in the circumpulpal dentin and
averaged 10.7 ug/g. A nested case-control study was set up within this cohort. Children with lead levels
above 18.7 ug/g (n=l 10) were matched by sex and socioeconomic status with children with levels
<5.0 ug/g in order to identify risk factors for exposure to lead. The cases and controls were reviewed and
excluded if risk factors (other than lead) for neurobehavioral effects were present. Psychometric tests were
administered to 162 children. The high-lead children scored lower on the WISC than the low-lead controls.
No significant difference was seen between the high- and low-exposure groups on the Performance 1Q and
on several experimental tests. Impaired function associated with lead exposure was also found on the
Bender Visual Motor Gestalt Test (pO.OOl) and on a behavioral rating scale (pO.Ol). These results
suggested that some children may be affected in neuropsychological functioning at low lead levels seen in
minimally polluted areas. A group of 141 children from this cohort were reassessed at age 15 (Damm et al.
1993). At this time, mean dentin lead levels in the low- and high-lead groups were unchanged from the
values obtained when the children were 8 years old. At age 9, the geometric mean of the PbB concentration
was 5.7 ug/dL in 78 children from the high-lead group and 3.7 ug/dL in 83 children from the low-lead
group. Analysis of the results showed that most differences observed between the low-lead group an high-
lead group observed at age 8 years had decreased to nonsignificant levels. However, in children with a
history of neonatal jaundice, increased lead exposure was associated with mild neurobehavioral deficits, as
indicated by lower verbal IQ and decreased visuomotor coordination. The authors indicate that although
neonatal jaundice in this study did not exceed levels indicating clinical intervention, hyperbilirubinemia or
some other factor associated with it may have reduced the threshold to lead neurotoxicity.
LEAD 82
2. HEALTH EFFECTS
The possible relationship between children's behavior and levels of lead in hair has also been investigated.
The study cohort consisted of 277 first grade students (51% male, 96% white) enrolled in the public schools
in a western Massachusetts city (Tuthill 1996). The study location had no known problem with heavy
metals. The children's behavior in the classroom was evaluated by the teachers as they completed the
abbreviated Boston's Teachers Rating Scale (ABTR) and by the parents, who completed a short
questionnaire. According to Tuthill (1996), the ABTR scale identifies children's inability to focus attention
in a relatively structured classroom learning situation. Each child provided approximately 0.5 g of hair
from the nape of the neck. Cut pieces of hair were thoroughly washed to rule out external contamination.
The concentration of lead in hair ranged form <1 (ig/gto 12 ug/g. The high lead group was defined as
those whose hair had • 3 ug lead/g; this group contained approximately the upper quartile of hair lead levels
and teacher deficit ratings. The results of unadjusted data showed a strong association between high lead
concentration in hair and high deficit teacher ratings. Gender and ethnicity were also found to be related to
both lead level and teacher's scores. Controlling for gender, ethnicity, child's age, education and
occupation of main wage earner, and socioeconomic status did not reduce the original association below the
level of statistical significance. In a final logistic regression model into which gender, ethnicity, age, and
socioeconomic status were forced before lead level, gender and hair lead levels were the only two
significant variables that accounted for the variance in teacher's attention-deficit ratings. While only 13.5%
of children with hair lead below 1 ug/g had high deficit scores, 62.5% in the highest group with • 6 (ig/g
had high deficit scores. The results showed also a strong association between hair lead levels and the
diagnosis of attention deficit hyperactivity disorder (prevalence odds ratio of 4.41). Although the results of
this study point to an association between hair lead and altered behavior, it should be noted that hair is not
considered a valid marker of lead exposure due to the extensive contamination possibilities and the extent to
which it relates to other usual markers of lead is not clear (Tracqui et al. 1994).
The association between lead burden, assessed by K X-ray fluorescence spectroscopy of the tibia, and social
adjustment was evaluated by Needleman et al. (1996). From a population of 850 boys in the first grade at
public schools, 503 were selected on the basis of a risk scale for antisocial behavior, and 212 of these
children (31 % white) were analyzed in the study. Reports of antisocial behavior came from the parents,
teachers, and the subjects themselves at 7 and 11 years of age. Also evaluated in relation to bone lead were
attentional function, neurobehavioral, and academic performance. To minimize confounding, the authors
controlled for nine relevant social and economic variables covering the areas of maternal intelligence,
socioeconomic status, and quality of children rearing. Bone lead measures and psychological measures
LEAD 83
2. HEALTH EFFECTS
were determined at the mean age of 10.2 years and again at the mean age of 12 years. After adjustment for
covariates, the results showed borderline associations between teachers' aggression, delinquency, and
externalization scores and bone lead at 7 years of age. At age 11, the parents reported a significant
association between lead and somatic complaints and delinquent, aggressive, internalizing, and
externalizing behavior. Also at age 11, teachers reported significant increases in scores associated with
bone lead on somatic complaints, anxious/depressed, social problems, attention problems, delinquent
behavior, aggressive behavior, internalizing, and externalizing. In addition, high-lead subjects reported
higher scores in self-reports on delinquency and were more likely to obtain worse scores on all items of the
Child Behavior Checklist during the 4-year period of observation. Lead concentration in bone was found to
be positively related to verbal and full-scale IQ, but social rearing factors were much more influential than
lead. This study has been criticized on the basis of uncertainties related to the X-ray fluorescence
technique, lack of control for factors such as parental supervision and discipline and parent criminality.
The relationships between current and long-term indicators of lead exposure were studied to establish which
indicator correlated best with psychometric test scores, and to determine the most suitable neurological test
to evaluate the early effects of low-level lead exposure (Bergomi et al. 1989). Children (131 males and 106
females), whose average age was 7 years 8 months, living in an area of northern Italy with a high density of
ceramics factories were chosen. The daily air levels of lead decreased from 2.4-3.8 ug/m3 in 1975 to
0.20-1.81 ug/m3 in 1985, the year of the study. The biological indicators of lead exposure measured in this
study were PbB, tooth lead, hair lead, and ALAD activity. The following psychometric tests were
conducted: WISC-Revised IQ, including two verbal and two performance tests; Bender Gestalt test to
assess visual-motor performance; Trail Making test to evaluate visual-motor and sequential ability;
Toulouse Pieron cancellation test to evaluate ability in figure identification, discrimination, and attention;
and a test for delayed reaction time. The influence of potentially confounding variables (e.g., age, sex, and
parental socioeconomic status) was evaluated and accounted for in the regression analyses that were
performed. Higher levels of hair and tooth lead and the IQ test were found to be affected by socioeconomic
status. The geometric means of PbB, hair lead, and tooth lead were 11.0 |ag/dL, 6.8 ug/g, and 6.1 ug/g,
respectively. Mean ALAD activity was 51 milliunits(mU)/mL red blood cells. Statistical analyses
revealed that total and verbal WISC-R IQ and Toulouse Pieron test results were negatively correlated with
levels of lead in teeth. ALAD values were also related to WISC-R IQ scores. The most predictive measure
of lead exposure was tooth lead (which is indicative of chronic lead exposure). Blood lead (which is
indicative of recent exposure) and hair lead (which is indicative of short-term exposure) were of little or no

LEAD 84
2. HEALTH EFFECTS
predictive value. These results indicate that neuropsychological impairment is associated with long-term
lead exposure. Limitations of this study include the fact that there was no control for parental IQ and
HOME scores.
Schroeder et al. (1985) and Schroeder and Hawk (1987) evaluated 104 black children of lower socio-
economic status at ages 10 months to 6.5 years, using the Bay ley Mental Development Index (MDI) or
Stanford-Binet IQ Scale. Hierarchical backward stepwise regression analyses indicated that PbB levels
(range: 6-59 ug/dL) were a significant source of the variance in IQ and MDI scores after controlling for
socioeconomic status and other factors. Fifty of the children were examined again 5 years later, at which
time PbB levels were • 30 ug/dL. The 5-year follow-up IQ scores were inversely correlated with
contemporary and initial blood lead levels, but the effect of lead was not significant after covariates,
especially socioeconomic status, were included in the analysis.
The above study was replicated later with 75 asymptomatic black children, 3-7 years old, of uniformly low
socioeconomic status (Hawk et al. 1986; Schroeder and Hawk 1987). Backward stepwise multivariate
regression analysis revealed a highly significant negative linear relationship between Stanford-Binet IQ
scores and contemporary PbB levels over the entire range of 6—47 ug/dL (mean, 20.8 ug/dL). The
association was nearly as striking when past maximum or mean blood lead levels were used. Because
socioeconomic status was uniformly low, it was not a significant covariate. These results indicate that it
may be much easier to detect the effects of lead from a susceptible high risk group of homogeneous low
socioeconomic background.
Fulton et al. (1987) examined a total of 501 children, 6-9 years old, and of higher and less uniform
socioeconomic status, from Edinburgh, Scotland, exposed to lead primarily via drinking water. The
children were selected from a larger sample of 855 (mean PbB level, 10.4 ug/dL) by taking all subjects in
the top quartile of the PbB distribution from each of the 18 participating schools plus a random
approximately 1 in 3 subsample of the remaining children. The mean PbB level of the study population was
11.5 ug/dL, with a range of 3.3-34 ug/dL. A PbB level >25 ug/dL was found in 10 children. Multiple
regression analyses revealed a significant inverse correlation between log PbB and the British Ability
Scales Combined (BASC) score and attainment test scores for number skills and word reading after
adjustment for confounding variables. Further analysis divided the children into 10 groups of approx-
imately 50 each based on PbB level and plotted the group mean lead values against the group mean

LEAD 85
2. HEALTH EFFECTS
difference from the school mean score, adjusted for covariates. The authors reported that this analysis
revealed a dose-effect relationship extending from the mean PbB level of the highest lead groups
(22.1 ug/dL) down through the mean PbB level of the lowest-lead group (5.6 ug/dL), without an obvious
threshold. Although this study provides evidence that PbB levels of less than 25 ug/dL may result in IQ
deficits, the size of the effects of lead were small relative to that of other factors.
Two studies reported findings at even lower blood lead levels. Wang et al. (1989) reported on school
children residing near a battery plant in Shanghai, China. A significant dose-effect relationship was found
between blood lead levels and neuropsychological performance in children without any obvious signs of
lead poisoning. The PbB levels in these children (6-14 years old) ranged from 10 to >30 ug/dL; IQ
decreased as PbB level increased. This dose-response existed after confounding variables were controlled.
The study estimated that an increase of 10 (ig/dL of PbB would result in a lowering of verbal IQ of 8 points,
performance IQ of 7 points, and full-scale IQ of 9 points.
In the second study Silva et al. (1988) evaluated intelligence, reading and behavior problems in 579
11-year-old children (both of European and Maori/Pacific Island descent) in New Zealand. Mean PbB lead
levels were 11.1 ug/dL (range, 4-50 ug/dL). The authors found a significant increase in behavioral
problems (inattention and hyperactivity) with increased PbB levels.
On the other hand, several studies have been published that suggest that there is no association between
PbB levels and neurobehavioral development (Cooney et al. 1989a; Ernhart and Greene 1990; Harvey et al.
1984, 1988; Lansdown et al. 1986; McMichael et al. 1986; Pocock et al. 1989; Smith et al. 1983), or that
some effects are not permanent (Bellinger et al. 1989a; Dietrich et al. 1987a). A cohort of Australian
children was investigated in a study that was designed to test the hypothesis that low-level ambient lead
exposure in the prenatal or early postnatal periods affects mental or motor development at age 4 (Cooney et
al. 1989a). Stringent selection criteria were used to ensure a homogeneous sample (n=207) so that potential
confounders could be minimized and the statistical power of the study enhanced. PbB levels were obtained
at birth (cord blood), at 6-month intervals to 4 years, and again at 5 years. This sample was drawn from a
well-educated, middle-class population. Mean PbB levels increased from birth to 18 months, then steadily
declined to 48 months. At 42 months, the percentage of the sample reaching the Australian level of concern
(25 ug/dL) was 1.5%; at 48 months, this percentage was 0.5%. The geometric mean PbB level at
48 months was 10.1 ug/dL. This study found no association between current or any previous PbB
LEAD 86
2. HEALTH EFFECTS
level with any developmental outcomes at age 4. Several prospective studies that focused on
neurobehavioral effects of prenatal exposure to lead are summarized in Section 2.2.1.6.
Eighteen separate measures were made on a total of 201 boys and girls aged 5.5 years to assess a variety of
cognitive, performance, neuropsychological, and behavioral end points (Harvey et al. 1988). The children
were randomly selected from birth records from the inner city area of Birmingham, United Kingdom. The
selection criteria were quite stringent to control for confounding factors in neuropsychological
development. There were no significant correlations between PbB and any of the three IQ measures. Birth
order and mother's IQ were good predictors of IQ. The Factual Performance Test time decreased with
increasing PbB levels (an improvement in performance), but results of the star copying test were poorer as
lead levels increased. The authors concluded that the effects of lead found in thJs inner urban area
(mean PbB, 13.05 ug/dL) in the United Kingdom are small and generally not significant.
Results by Smith et al. (1983), indicated an association between lead burden (mean PbB, 12.8 ug/dL; range,
7-27 ug/dL) and intelligence in 6-year-old children in London. However, no association between blood
lead levels and intelligence and other psychological tests remained once social factors were controlled.
Lansdown et al. (1986) conducted an investigation in children of the same age, living near a main road in
London. In these children, the mean PbB level was 13 ug/dL (range, 7-24 ng/dL). The authors found no
evidence of the previously observed original association, which may have been due to different social
compositions of the two groups. The second study group consisted of more middle-class families than the
first group.
Pocock et al. (1989) further investigated the influence of confounding factors (sex, social group, family
size, length of gestation, birth weight, hospital stay after birth, mother's IQ and mental health, parent's
marital relationship and interest in child, and family characteristics score) in addition to lead that may
impact upon children's IQ. The investigators used the cohort from the study by Smith et al. (1983). Body
burden of lead was determined by lead concentration in teeth (low = 2.5 ug/g; medium = 5.5 ug/g; and high
= >8 ug/g). Rather than dividing the children into groups of low, medium, and high lead concentration, the
actual tooth concentration was used as a continuous variable. When all factors were considered, parental IQ
was the best predictor for child IQ along with family size, social class, and quality of marital relationship.
Tooth lead concentration was not associated with child IQ.

LEAD 87
2. HEALTH EFFECTS
The studies by Emhart et al. (1988) and Ernhart and Greene (1990) found no associations between prenatal
lead exposure and intelligence or language development, whereas those by Dietrich et al. (1987a) and
Bellinger et al. (1989a) demonstrated that some effects that may have been present early in life were no
longer present after 2 years. These and many additional pediatric prospective epidemiological studies
which evaluated sensory and motor development rather than solely 1Q are described in detail in
Section 2.2.1.6, Developmental Effects.
In conclusion, PbB levels of 40-60 ug/dL are considered to be markedly elevated in children, and neuro-
behavioral effects are distinct. There are no clear definitions of what constitutes low versus moderate PbB
levels, and effects observed at the lower levels (particularly <15 ug/dL), have proven more difficult to
separate from socioeconomic and other variables. Many of the cross-sectional studies that showed
neurobehavioral and other deficits, did so at mean PbB levels of >15 ug/dL. The studies that used dentin
lead as an indicator of exposure, mostly fall into this category of exposure level. Two well-designed studies
(Fulton et al. 1987; Silva et al. 1988) demonstrated effects on behavior, number skills, and word reading at
mean PbB levels in children as low as 11 ug/dL. Earlier studies by McBride et al. (1982) and Winneke et
al. (1984) showed no effects on intelligence at PbB levels of 14 and 8 ug/dL, respectively. A meta-analysis
of 13 studies (providing data on an inverse relationship between blood lead and children's IQ) concluded
that the joint probability of obtaining the reported results was less than 3 in a billion (Needleman 1987b;
Needleman and Bellinger 1987). This analysis indicates that the effects observed at the lower levels of PbB
are real and do not constitute findings by chance.
The results of a neurological evaluation of young adults who were exposed to lead during childhood
(20 years earlier) while living near a lead smelter in the Silver Valley, Idaho, were recently published
(Stokes et al. 1998). The cohort consisted of 917 young adults 19-29 years of age who were from 9 months
to 9 years of age during the period January 1974 to December 1975. This period was chosen because the
smelter was known to have operated without appropriate emissions reduction devices during this period.
Data from past PbB surveillance of this population showed that mean PbB concentrations among
9-month-old to 9-year-old children were 50 ug/dL in 1974 and 39.6 ug/dL in 1975. The referent group
consisted of 754 subjects. From the exposed and referent groups, a randomly selected subsample of 281
exposed and 287 referents were included in the study. Further exclusions due, for example, to conditions
such as traumatic injury to the hand, arm, or shoulder, or consumption of medications that would affect the
PNS or CNS reduced the groups to 257 exposed and 276 referents. The tests were

LEAD 88
2. HEALTH EFFECTS
designed to evaluate peripheral and central motor and sensory function, as well as cognitive function and
mood. K X-ray fluorescence (K-XRF) of tibia lead content (ug Pb/g bone mineral) was used to assess lead
burden. Differences in mean test scores between exposed and unexposed groups were compared with
simple f tests. Subsequently, backward elimination stepwise multiple linear regression models were fitted
separately to each of the 20 neurobehavioral test score variables to control for potentially confounding
effects of important covariates of the neurological and neurobehavioral outcomes of the population
evaluated. Current PbB levels for the exposed and control groups were 2.9 ug/dL and 1.6 ug/dL,
respectively. Mean tibia lead concentrations were 4.6 and 0.6 ug Pb/g bone mineral in exposed and
referents, respectively. When the subjects were stratified into 4 groups according to bone lead, 44% of
exposed had tibia lead >5 ug Pb/g bone mineral compared to 25% of referents. The results showed
significant differences in crude mean values for 11 out of 12 motor and cognitive function tests (results of
other tests are summarized under Peripheral Function). After controlling for relevant covariates, the
exposure group was significantly associated with poorer performance on the hand-eye coordination, simple
reaction time, trails B, symbol digit, serial digit learning, Raven progressive matrices, and vocabulary tests.
Also, the score from the Swedish Q16 questionnaire for neuropsychiatric evaluation was significantly
associated with exposure groups after controlling for relevant covariates. When tibial bone lead
concentration was forced into the model rather than exposure, of all the tests (neurological and
neurobehavioral), only vocabulary score approached significance. Similar results were obtained when
stratified tibial bone lead was used in the models rather than tibial bone lead as a continuous measure.
Based on the results, Stokes et al. (1998) concluded that tibial bone lead measurements may not have the
precision necessary to measure community-based exposure to lead in young adults.
The issue of whether neurobehavioral deficits associated with lead burden can be reversed by reducing lead
body burden has been investigated. For example, Ruff et al. (1996) conducted such a study in 42 children
ages 18 to 30 month with PbB levels between 25 and 55 ug/dL. Cognitive function was assessed upon
enrollment into an intervention program and 6 months later. The intervention program consisted of
chelation therapy, if appropriate, iron supplementation, if needed, and steps aimed at eliminating the source
of lead in the home environment. Prescription for chelation and/or iron supplementation was based on the
results of the lead mobilization test (assessment of changes in urinary lead excretion in response to
CaNa2EDTA administration) and/or serum ferritin levels, respectively. Depending on the diagnostic
outcomes, the children received both forms of treatment, neither form, or either one of them alone. The
dependent measure of cognitive function was the MDI of the Bayley Scales of Infant Development.
LEAD 89
2. HEALTH EFFECTS
Analyses showed that the improvement in MDI scores over 6 months (particularly in perceptual motor
performance) was related to an interaction between change in PbB and initial iron status, such that in iron-
sufficient children, there was an increase of 1.2 points for every 1 ug/dL decrease in PbB. No such
relationship was observed in iron-deficient children. In the latter, however, a change in MDI results was
related to change in hemoglobin levels. It was also noticed that iron-deficient-children experience a lower
decline in PbB lead than iron-sufficient children. Ruff et al. (1996) suggested that low iron may have
interfered with the relationship between MDI scores and declines in blood lead by influencing absorption
and/or excretion of lead (see Section 2.3). Another possibility suggested was that iron levels are associated
with cognitive performance either directly or indirectly. This was supported by the finding that the
performance of the iron-deficient children seemed to change along with changes in hemoglobin and MCV,
and the observation that in this group there was an association between MDI and initial hemoglobin
concentration.
Electrophysiological Evidence of Neurotoxicity in Children. Electrophysiological studies have
provided evidence suggestive of effects on central nervous system function at PbB levels lower than
30 ug/dL, but findings were inconsistent. Linear dose-effect relationships were observed in slow-wave
voltage during conditioning in a series of studies (Otto et al. 1981, 1982, 1985) on the same subjects studied
by Schroeder et al. (1985). The association was linear throughout the range of PbB values (6-59 |ig/dL).
No such relationships were observed in a replicate test, performed on the same subjects studied by
Schroeder and Hawk (1987). A study of 384 6-year-old German children with a geometric mean PbB
concentration of 4.3 ug/dL (range, 1.4-17.4 ug/dL) from three environmentally contaminated areas in East
and West Germany found significant lead-related deficits for two out of three visual evoked potentials
(VHP) interpeak latencies after adjusting for confounding effects (Altmann et al. 1998). No association was
found between PbB concentrations and VHP amplitudes. These results confirmed previous findings from
the same group of investigators (Winneke et al. 1994). Altmann et al. (1998) also measured visual contrast
sensitivity and found no significant association between this parameter and lead.
Brainstem auditory evoked potential (BAEP) latency (Holdstein et al. 1986; Otto et al. 1985; Robinson et
al. 1987), pattern-reversal visual evoked potential (PREP) latency and their amplitude were also correlated
with blood lead levels (Holdstein et al. 1986; Otto et al. 1985). The specific components affected and the
direction of effect varied across studies. Some of these studies did not specify the route and the duration of
lead exposure and only accurately measured recent lead exposure; they revealed little about the exposure
LEAD 90
2. HEALTH EFFECTS
history of the individual. A study of 30 infants, the Mexico City Prospective Lead Study (see
Section 2.2.1.6) found alterations in BAEP (decreased wave 111 latency and increased III-V interpeak
interval) measured in the first weeks of life (Rothenberg et al. 1994). These effects were associated (p<0.1)
with mid-pregnancy maternal PbB levels in the range 2.5-35 ug/dL. Retesting at age 3 months showed that
maternal PbB levels at 20 and 36 weeks of pregnancy and cord PbB were associated with increased III-V
interpeak intervals. The authors indicate, however, that since they did not attempt to correct test-wise error
(possibility of false positives due to multiple regressions) in the multiple independent statistical tests, some
of the reported correlations could have been due to chance alone. In a subsequent publication, the authors
reported an association between altered acoustic cry parameters in some of these infants and maternal log
PbB concentrations at various times during pregnancy (Rothenberg et al. 1995). Since they found a
negative correlation between the latencies of peak III and peak V of the BAEP with percent nasal cry, they
speculated that some changes in 15- and 30-day cry characteristics, which were associated with lead
exposure, might be secondary to lead-induced alteration in auditory function.
Suggestive evidence of a lead-related decrease in hearing acuity in children has been reported by Robinson
et al. (1985) and Schwartz and Otto (1987, 1991). Hearing thresholds at 2,000 Hertz increased linearly with
maximum blood lead levels, indicating that lead adversely affects auditory function. The PbB levels in 75
asymptomatic black children, 3-7 years old, ranged from 6 to 59 ug/dL (mean, 26.7 ug/dL). The children
were healthy and did not have middle ear infections at the time of testing. These results were confirmed in
an examination of a group of 3,545 subjects aged 6-19 years who participated in the Hispanic Health and
Nutrition Survey (Schwartz and Otto 1991). For the left ear, lead was associated with an increased risk of
elevated hearing thresholds at the four frequencies tested, 500, 1,000, 2,000, and 4,000 Hz, whereas for the
right ear the relationship was insignificant at 4,000 Hz. An increase in PbB from 6 ug/dL to 18 |ig/dL was
associated with a 2-dB loss in hearing at all frequencies, and an additional 15% of the children had hearing
thresholds that were below the standard at 2,000 Hz.
NHANES II data, including audiometric results, developmental milestones (age at which a child first sat up,
walked, and spoke, according to parent's recollection) and presence of hyperactivity and speech difficulties
in 4,519 children (4-19 years old) were analyzed by Schwartz and Otto (1987). The analyses included
possible covariates or confounding variables that were then available from NHANES II data (e.g., race, sex,
head of household, education level, income, dietary factors, indices of iron deficiency and anemia [for
developmental milestones], history of signs of ear infection [for audiometric results]). Because
LEAD 91
2. HEALTH EFFECTS
children's PbB levels decrease with age but tend to remain in the same percentile within age group, data
were analyzed in two different ways: with current PbB as an independent variable and with PbB percentile
rank within age group as an independent variable. Logistic regression analysis revealed that the probability
of elevated hearing thresholds for both ears at 500, 1,000, 2,000, and 4,000 Hertz increased significantly
with increasing blood lead levels; this relationship was apparent across the entire range of PbB levels from
<4 to >50 ug/dL. When the regression analysis used PbB percentile rank within age group as the
independent variable, the association with hearing was not significant. According to the investigators, the
lack of association with lead rank indicated that the effect of lead was due to current rather than past lead
exposure. The probability that a child was hyperactive increased significantly with increasing PbB levels
(as PbB percentile rank within age group). The probability of speech impairment, however, was not related
to blood lead levels. Linear regression analysis demonstrated that PbB levels (as PbB percentile rank within
age group) were significantly associated with delays in all three developmental milestones.
These three studies indicate that exposure to low levels of lead may impact negatively upon children's
hearing. However, the authors of the Robinson study did not state whether age and other possible
confounding variables were controlled for. Similarly, in the NHANES study, age may have been a
confounding variable.
In contrast with the suggestive evidence of impaired hearing in lead exposed children from the studies
summarized above, Counter et al. (1997) found normal wave latencies and neural transmission times, and
no correlation between PbB and interpeak latencies among a group of 54 children (7-8 years old) with a
median PbB concentration of 40 ug/dL (range, 6.2-128.2 ug/dL). Furthermore, audiological tests showed
normal cochlear function and no statistical relation between auditory thresholds and PbB concentration.
The cohort evaluated in this study were children living in Andean villages of Ecuador exposed to lead as a
result of extensive production of lead glazed tiles and artisan crafts.
Bhattacharya et al. (1993) have presented evidence relating lead exposure and postural disequilibrium in
children. The authors evaluated 109 children from the Cincinnati Lead Program Project (see
Section 2.2.1.6, Developmental Effects, for a more detailed description of this cohort). The mean age of the
children was 5.8 years and the geometric mean PbB for the first 5 years of life was 11.9 ug/dL (range,
5.1-28.2 ug/dL). Balance was assessed in a system that provided a quantitative description of postural
sway by measuring the movement pattern of the body's center of gravity during testing. Sway area was
LEAD 92
2. HEALTH EFFECTS
significantly correlated with PbB level in tests performed with the eyes closed, but not in a test performed
with the eyes open. This led the authors to suggest that lead-induced sway impairment might be related to
modifications of the functions of vestibular and proprioception systems, on which close-eye tests rely more.
Sway length was significantly correlated with blood lead under all test conditions. Three out of 4 postural
sway responses showed significant improvement in an 8-year-old child after an initial chelation trial with
CaEDTA followed by 7 chelation regimens with succimer over a 19-month period (Bhattacharya et al.
1998). The child's PbB concentration fluctuated considerably during therapy from a pre-therapy
concentration of 81 ug/dL to a minimum of 27 ug/dL after the third dose of succimer; at the end of therapy,
the PbB concentration was 54 ug/dL. According to the authors, the three responses that showed
improvement rely relatively less on higher centers for balance compared to the response that did not
improve, which rely primarily on the vestibular system for balance maintenance.
Peripheral Nerve Function in Children. Effects of lead on peripheral nerve function have been
documented in children. Frank peripheral neuropathy has been observed in children at PbB levels of
60-136 ug/dL (Erenberg et al. 1974). Of a total of 14 cases of childhood lead neuropathy reviewed by
Erenberg et al. (1974), 5 also had sickle cell disease (4 were black), a finding which the authors suggested
might indicate an increased susceptibility to lead neuropathy among children with sickle cell disease.
However, effects of race cannot be eliminated. A case study (Seto and Freeman 1964) reported signs of
peripheral neuropathy in a child with a PbB level of 30 ug/dL, but lead lines in the long bones suggested
past exposures leading to peak PbB levels of* 40-60 ug/dL and probably in excess of 60 ug/dL (EPA
1986a). NCV studies have indicated an inverse correlation between peroneal NCV and PbB levels over a
range of 13-97 ug/dL in children living near a smelter in Kellogg, ID (Landrigan et al. 1976). These data
were reanalyzed to determine whether a threshold exists for this effect. Three different methods of analysis
(segmental, logistic, and quadratic regressions) revealed evidence of a threshold for NCV at PbB levels of
20-30 ug/dL (Schwartz et al. 1988).
A recent study used tibial bone lead to assess lead burden among a group of 281 young adults who were
exposed to lead during childhood (20 years earlier) while living near a lead smelter in the Silver Valley,
Idaho (Stokes et al. 1998). A group of 287 referents served as controls (a summary of the study design can
be found under Behavioral Function in Children). The study found that crude mean sural sensory
amplitude and peroneal motor amplitudes were slightly smaller among the exposed group than among the
referent group. The corresponding nerve conduction velocities were similar between the two groups. The
LEAD 93
2. HEALTH EFFECTS
results of behavioral tests of peripheral nerve function showed significant differences between exposed and
referents regarding crude means for vibrotactile thresholds of the finger and standing steadiness both with
eyes open and eye closed. However, crude means for visual contrast sensitivity, and vibrotactile thresholds
of the toes did not differ significantly between the two groups. After controlling for relevant covariates, the
differences between means remained significant and the difference in vibrotactile thresholds of toes
achieved significance. When tibial bone lead concentration was forced into the model rather than exposure,
of all the tests, only finger and toes vibrotactile thresholds approached significance. Similar results were
obtained when stratified tibial bone lead was used in the models rather than tibial bone lead as a continuous
measure. As previously mentioned, Stokes et al. (1998) concluded that tibial bone lead measurements may
not have the precision necessary to measure community based exposure to lead in young adults.
2.2.1.5 Reproductive Effects
A large body of literature clearly indicates that high levels of lead cause adverse effects on both male and
female human reproductive functions. Women in particular, who are exposed during pregnancy, have
experienced miscarriages and stillbirths. Although the mechanisms underlying these effects are unknown at
this time, many factors could contribute to such results. These factors range from indirect effects of lead on
maternal nutrition or hormonal status before and during pregnancy to more direct gametogenic effects that
could affect parental fertility in both sexes. Human data have largely been derived from studies involving
relatively small numbers of subjects and therefore do not allow for discriminating statistical analysis.
Reproductive effects of exposure to chronic low levels of lead are less known. The results of 2 studies in
females with blood lead levels of 10 ug/dL indicate no effect on the rate of spontaneous abortions. Studies
in males indicated that effects on sperm may start to appear at PbB levels around 40 ug/dL.
Selected studies are discussed below and include reports on occupational exposure to lead for females and
males followed by environmental (low level) exposure to lead in females and males.
An increased frequency of spontaneous abortion was reported in women living close to a lead smelter
(Nordstrom et al. 1979). Moreover, the female workers at the smelter had an increased frequency of
spontaneous miscarriage when employed at the smelter during pregnancy, or when employed at the smelter
prior to pregnancy and still living near the smelter. Women who worked in more highly contaminated areas
LEAD 94
2. HEALTH EFFECTS
of the smelter were more likely to have aborted than were other women. These studies were confounded by
the presence of other toxic agents and by the lack of controlling for socioeconomic status.
Pregnancies were evaluated in the center of Port Pirie, a lead smelter town in South Australia (high
environmental lead exposure; mean maternal mid-pregnancy PbB level was 10.6 u.g/dL; n=645) and in the
surrounding areas (low environmental lead exposure; mean maternal mid-pregnancy PbB level was
7.6 u.g/dL; n=185). While no association was found between PbB levels and spontaneous abortions, 22 of
23 miscarriages and 10 of 11 stillbirths occurred in the Port Pirie residents, with only 1 miscarriage and
1 stillbirth occurring in residents outside Port Pirie (Baghurst et al. 1987; McMichael et al. 1986). Maternal
PbB levels were lower in the cases of stillbirth than in the cases of live birth, but fetal and placental levels
in this and another study (Wibberley et al. 1977) were higher than in cases of normal birth. Davis and
Svendsgaard (1987) suggested that these findings may be due to a transfer of lead from mother to fetus,
which is toxic to the fetus. This study is discussed more fully in the section on developmental toxicity (see
Section 2.2.1.6) because the study focuses primarily on the effects of prenatal exposure to low levels of lead
on fetal and early childhood development.
The rates of spontaneous abortions were compared in a prospective study (Murphy et al. 1990) in females
living close to a lead smelter (n=304; mid-pregnancy mean PbB concentration of 15.9 ug/dL) and females
living 25 miles away (n=335; mid-pregnancy mean PbB concentration of 5.2 u.g/dL). Women were
recruited at mid-pregnancy and their past reproductive history (first pregnancy; spontaneous abortion=feta!
loss prior to 7th month; stillbirth=fetal loss from 7th month) was examined. The results indicated no
difference between the towns regarding the rate of spontaneous abortions. The rates were 16.4% and 14.0%
for the lead smelter town and the unexposed town, respectively. Similar results had been reported by
Alexander and Delves (1981) in a study of two groups of pregnant women, one from an urban area and the
other from a rural area based on a mining town. Mean PbB levels in the pregnant women were not
significantly different than in same-location nonpregnant controls (12-13 ug/dL in rural area as opposed to
16-17 ng/dL in urban area).
The time to pregnancy was studied in a group of 121 women biologically monitored for exposure to lead at
the Finnish Institute of Occupational Health from 1973 to 1983 (Sallmen et al. 1995). The exposure
assessment was based on the self-report of lead exposure, detailed work description, and biological
measurements. Very low exposure was defined as having a PbB level <10 ug/dL, low exposure
LEAD 95
2. HEALTH EFFECTS
corresponded to PbB levels between 10 and 19 ug/dL, and the moderate-to-high category corresponded to
PbB • 20 ug/dL. All other women were classified as nonexposed. Multivariate analysis revealed no
systematic differences in the distribution of time to pregnancy between exposed and nonexposed women.
Following adjustment for exposure to carcinogens, age, parity, use of alcohol, use of coffee, vaginitis, and
frequency of intercourse, the data showed that exposure to lead was not significantly associated with
decreased fecundability. However, among the eight most heavily exposed women (PbB between 29 and
50 ug/dL measured during time to pregnancy or during pregnancy), there was a suggestive association
between blood lead and decreased fecundability.
Hu (1991) examined the long-term consequences among survivors of childhood plumbism. Survivors
consisted of children admitted to the Boston Children's Hospital from 1930 to 1944 for childhood
plumbism. Matched controls (age, sex, and neighborhood) were enlisted through the use of town books.
All participants were asked to respond to a self-administered questionnaire. Information on all pregnancies
engendered (men) or carried (women); outcome; and intellectual development of resulting children were
given. Among the matched females, the rate of spontaneous abortion or stillbirths among pregnancies was
higher than for the controls (relative risk = 1.60; 95% confidence interval = 0.6—4.0). In addition, the
offspring from a matched female plumbism subject was more likely to experience learning disabilities
(relative risk = 3.0; 95% confidence interval = 0.9-10.2). Although this study included only a small
number of plumbism survivors, the results indicate that women significantly exposed during childhood may
be at risk even later in life for adverse reproductive outcomes.
Lead-induced effects on male reproductive functions have been reported in humans (Assennato et al. 1987;
Chowdhury et al. 1986; Lancranjan et al. 1975; Lerda 1992; Wildt et al. 1983). A group of 150 workmen
with long-term lead exposure were categorized by clinical and toxicological data into four groups: lead-
poisoned (mean PbB level, 74.5 ug/dL), and moderately (mean, 52.8 ug/dL), slightly (mean, 4] ng/dL), or
physiologically (mean, 23 ng/dL) exposed to lead (Lancranjan et al. 1975). The lead-poisoned group and
the moderately exposed group had decreases in fertility, as measured by asthenospermia, hypospermia, and
teratospermia. The effect of lead was thought to be directly on the testes because tests for changes in
gonadotropin secretion were negative. Secretion of androgens by the testes was not affected.
Another study compared two groups of men in a Swedish battery factory (Wildt et al. 1983). The men
exposed to high levels of lead had PbB levels of* 50 ug/dL at least once prior to the study and had mean
LEAD 96
2. HEALTH EFFECTS
PbB levels of 46.1 and 44.6 ug/dL (range, 25-75 ug/dL) during fall and springiest periods. The controls
(exposed only to low environmental levels of lead) had PbB levels that seldom exceeded 30 ug/dL, and had
mean PbB levels of 21.1 and 21.5 ug/dL (range, 8-39 ug/dL) during fall and spring test periods. The high-
lead group tended to exhibit decreased prostate/seminal vesicle function as measured by seminal plasma
constituents, low semen volumes, and lower functional maturity of sperm (as measured by swelling of the
sperm heads in detergent [sodium dodecyl sulfonate] solution).
Chowdhury et al. (1986) reported that occupational exposure of 10 men to lead caused a significant
decrease in sperm count and motility and an increased percentage of abnormal spermatozoa. The average
PbB concentration in the lead-exposed group was higher (42.5 ug/dL) compared to controls (14.8 ug/dL).
Assennato et al. (1987) reported decreased sperm production in 39 battery factory workers with high PbB
levels ranging from 50 to 61 ug/dL, compared to 39 nonexposed workers. Lerda (1992) reported
significant decreases in sperm count and motility, as well as increases in the percent of dead sperm and in
sperm with anomalies in a group of 30 workers in a battery factory compared to 30 controls. PbB levels in
the exposed workers ranged from 40 to 98 ug/dL, whereas the range in controls was 18-26 ug/dL.
Although some parameters were within the normal range for the general population, they were significantly
different than those from the referent group. These studies, however, were limited by the small sample size.
Alexander et al. (1996) published the results of the evaluation of a much bigger cohort (n=2,469) of males
employed at a lead smelter; 152 workers provided blood samples and 119 also provided semen samples.
The workers were divided into four groups according to their current PbB concentration: <15, 15-24,
25-39, and >40 ug/dL; the geometric mean sperm concentrations were, respectively, 79.1, 56.5, 62.7, and
44.4 mill ion cells/mL and the geometric mean total sperm counts were 186, 153, 137, and 89 mil l ion cells.
The p value for the trend was 0.04. Workers with current PbB concentration of* 40 ug/dL had an increased
risk of below normal sperm and total sperm count relative to those with PbB concentrations of <15 ug/dL.
Independent of current lead exposure, sperm concentration, total sperm count, and total motile sperm count
were inversely related to measures of long-term lead exposure. The authors also found no association
between lead exposure and measures of lead motility, sperm morphology, or serum concentrations of
reproductive hormones.
The effect of lead exposure on male fertility was examined in a group of 74 workers in a lead factory
(Gennart et al. 1992b). Fertility was assessed by examining the birth experiences of their wives through a
logistic regression model. Workers had a mean age of 39 years, had been exposed for a mean of
LEAD 97
2. HEALTH EFFECTS
10.7 years, and had a current mean PbB level of 46.3 ug/dL. They were compared with a group of 138
unexposed individuals whose mean PbB concentration was 10.4 ug/dL. In the exposed workers there was a
tendency before exposure to an increased birthrate. However, a significant decrease in fertility was
observed during the period of exposure relative to the unexposed group; duration of exposure was also
associated with decreased fertility. As indicated by the authors, the main limitation of the study was the
fact that the worker's wives could not be interviewed, and therefore, the medical and occupational factors
that might also have affected their reproductive system could not be assessed. The results of an assessment
of male fertility in a much bigger cohort evaluated 4,256 lead-exposed workers and 5,148 matched
comparison subjects (Lin et al. 1996). Exposed workers were defined as having a PbB level • 40 ug/dL
before 1986 or • 25 ug/dL for the study period (1981-1992). The results showed that the lead-exposed
workers had fewer births than expected relative to the comparison group, and this was observed among all
age categories with the exception of the 51- to 55-year-old group. Those with the highest cumulative
exposure (mean PbB level x duration) had the most obvious reduction in fertility. However, Lin et al.
(1996) stated that the study conclusion may be limited by the inability to control for some confounders such
as marital status or contraceptive use.
In contrast with the results summarized above, two studies found no significant effects of lead exposure on
fertility. Coste et al. (1991) conducted a person-year analysis and reported no effects on fertility (defined as
the number of live births to a couple) among men exposed to lead in a French battery factory. Exposed
workers (229) were categorized into groups with PbB levels of <40 ug/dL, 40-60 ug/dL, and >60 ug/dL.
Nonexposed workers (125) did not have their PbB levels recorded. In agreement with these results are the
findings of a study that examined fertility among 1,349 male battery plant employees and 9,596 reference
workers at 3 Danish plants (Bonde and Kolstad 1997). The mean PbB concentration in a subset of 400
workers who provided 4,639 blood samples was 39.2 ug/dL. This study found no association between
employment at the plants and changes in fertility in terms of birth rate, either during years of employment
or during subsequent years. The authors point out, however, that their findings do rule out that the time
taken to achieve a pregnancy is increased among battery workers because most pregnancies in Denmark are
planned.
The relation between concentration of circulating pituitary and testicular hormones was evaluated in a
group of 122 workers in three lead battery factories (Ng et al. 1991). A group of 49 nonexposed subjects
was used for comparison. The mean PbB level in workers was 35.2 ug/dL (mean in controls was
LEAD 98
2. HEALTH EFFECTS
8.3 u.g/dL) and the mean duration of exposure was 6 years. The results showed that increasing age was
significantly associated with increases in luteinizing hormone (LH) and follicle stimulating hormone (FSH)
concentrations, but not with testosterone or prolactin concentrations. Smoking was significantly associated
with decreased prolactin concentrations. Compared with control subjects, workers exposed for less than
10 years had normal testosterone but significantly higher levels of FSH and LH; those exposed for 10 or
more years had lower testosterone, but normal FSH and LH. As a group, the exposed workers had
testosterone levels comparable to controls; however, older (• 40 years) workers had significantly lower
testosterone levels than older control subjects. LH and FSH concentrations showed a moderate increase
with PbB in the 10-40 ug/dL range; no clear association was observed for prolactin and testosterone. These
results are in general agreement with those of earlier studies of lead workers with higher PbB levels
(• 66 u.g/dL), which indicates that lead acts directly on the testes to cause severe depression of sperm count
and peritubular testicular fibrosis, and also produces reduced testosterone synthesis or disrupts regulation of
LH secretion at the hypothalamic-pituitary level (Braunstein et al. 1978; Cullen et al. 1984; Rodamilans et
al. 1988). Although some of these studies had limitations such as concomitant exposure of workers to other
chemicals, lack of matched control group, small sample size, and in some cases a possibility of observed
effects being precipitated by the EDTA chelation (as in Braunstein et al. 1978), taken together they provide
evidence for lead-induced endocrine disturbances and reproductive dysfunction in male workers.
2.2.1.6 Developmental Effects
The best data regarding potential developmental consequences of low-level prenatal exposure to lead are
provided by several recent human studies. Because of improved analytical techniques for measuring low
lead levels in blood, the availability of large numbers of subjects, and careful consideration of potential
confounding factors, these human studies provide useful information on the developmental effects of lead.
Less emphasis has been placed on studies conducted in animals because of the availability of good human
data, although a large body of animal data is available and the results are in agreement with those of the
human studies. (See review by Davis et al. [1990]) for a comparison of human and animal data in
developmental neurotoxicity.)
In most of these studies, prenatal exposure was generally estimated through maternal and/or cord blood lead
concentrations. Exposure of the mothers can be assumed to have been primarily through the oral
LEAD 99
2. HEALTH EFFECTS
route, but with contribution from the inhalation route as well. The most relevant studies are discussed
below, along with results from a few investigations of different markers for lead exposure.
No reports were found indicating low levels of lead as a cause of major congenital anomalies. Needleman
et al. (1984), however, demonstrated an association between blood lead levels and minor congenital
anomalies. Using logistic regression modeling techniques and controlling for a number of possible
confounders, the authors reported a significant association between cord blood lead levels and the collective
occurrence of minor anomalies in 4,354 infants born in Boston. Data were obtained from hospital records.
The most common of these anomalies were hemangiomas, lymphangiomas, minor skin anomalies (tags and
papillae), and undescended testicles. No individual anomaly was significantly associated with blood lead
levels. Major malformations, birth weight, and gestational age were not associated with PbB lead levels.
A cross-sectional study of 236 mothers and their infants in Glasgow, Scotland, demonstrated reductions in
gestational age with increasing cord or maternal PbB lead levels (Moore et al. 1982). In the 11 cases of
premature birth (gestational age <38 weeks), maternal PbB levels averaged approximately 21 ug/dL, and
cord PbB lead levels averaged approximately 17 ug/dL at delivery. The overall geometric mean PbB levels
at delivery were 14 (ig/dL (maternal) and 12 ug/dL (cord). Statistical analyses showed significant negative
coefficients for length of gestation against log-transformed maternal or cord PbB levels. Birth weight was
not associated with PbB lead levels.
The association between low birth weight and parental occupational lead exposure variables was studied by
Min et al. (1996). The study comprised 220 cases (birth weight <2,500 g) and 522 controls (birth weight
• £,500 g) selected among 3,572 participants in the Baltimore-Washington Infant Study. Parental
occupational exposure was inferred from jobs held during the period 6 months before pregnancy to the end
of pregnancy. Only a few mothers were potentially exposed to lead either directly or indirectly during the
exposure period of interest; therefore, the analysis included fathers only. Twenty-one percent of the fathers
were potentially exposed to lead either directly or indirectly. Univariate analyses of low birth weight in
relation to various measures of lead exposure showed that the risk of low birth weight was significantly
increased only among infants of fathers with direct and high levels of lead exposure. This association
persisted after adjusting for relevant confounders. Although reports of sperm abnormalities and reduced
fertility among lead-exposed men (Section 2.2.1.5) would support a direct male-mediated effect, Min et al.
(1996) suggested that a direct paternal preconceptional effect on birth weight, which is gained after 24
LEAD 100
2. HEALTH EFFECTS
weeks of gestation, is unlikely. A more likely explanation discussed is that prenatal exposure occurs by
indirect maternal contact with contaminated work clothing or tools brought home. Limitations of the study
include lack of actual measures of exposure in the workplace, possible additional non-occupational
exposure to lead, and simultaneous occupational exposure to other chemicals.
An ongoing prospective study of the effects on child development following prenatal and postnatal lead
exposure in the lead smelter town of Port Pirie, South Australia, and its surrounding areas, has provided
information on congenital anomalies, length of gestation, birth weight, and stillbirth or miscarriage
(McMichael et al. 1986), and on neurobehavioral development (Baghurst et al. 1987, 1992; Vimpani et al.
1985, 1989). Of 831 pregnant women, 774 pregnancies were followed to completion (McMichael etal.
1986). Although still relatively low, PbB levels during pregnancy and at delivery in women who lived in
Port Pirie were significantly higher than in those who lived in adjacent towns and rural areas (e.g., at
delivery: 11.2 ug/dL in Port Pirie and 7.5 ug/dL in the surrounding areas). No association was found
between the PbB lead levels and the occurrence of congenital anomalies when pertinent risk factors, such as
smoking and alcohol consumption, were controlled for. As was the case with Needleman's study
(Needleman et al. 1984), hospital records were used to detect congenital anomalies. This may have caused
a lack of precision and uniformity. Also, the relatively small number of subjects may not have been
sufficient for detection of differences in low frequencies of anomalies. Multivariate analysis revealed a
significant association between preterm delivery (before the 37th week of pregnancy) and maternal blood
lead levels at delivery. The relative risk of preterm delivery increased more than 4-fold at PbB levels of
>14 u.g/dL compared with a relative risk of 1 at PbB levels of- 8 ug/L. The incidence of low birth weight
(<2,500 g at gestational age • 37 weeks) was greater in Port Pirie than in the surrounding areas, but maternal
and cord PbB levels at delivery were somewhat lower in the low-birth-weight pregnancies. Similarly, 22 of
the 23 miscarriages and 10 of the 11 stillbirths in this study occurred in the Port Pirie mothers, but the
average maternal PbB level at delivery was significantly lower for stillbirths than for live births.
The results of McMichael et al. (1986) are puzzling because the proportion of Port Pirie pregnancies
(delivery maternal PbB, 10.4 ug/dL) resulting in low-birth-weight infants was more than twice that for
outside pregnancies (delivery maternal PbB lead, 5.5 ug/dL). Yet the maternal and cord PbB levels were
somewhat lower in low-birth-weight pregnancies than in pregnancies with birth weights >2,500 g. A
similar phenomenon was seen with regard to stillbirths, which occurred primarily in the Port Pirie
LEAD 101
2. HEALTH EFFECTS
pregnancies, but which were associated with lower maternal PbB levels than were live births. Davis and
Svendsgaard (1987) suggested that the findings for blood lead versus birth weight or stillbirth in the Port
Pirie study suggest an increased transfer of lead from mother to fetus, which is toxic to the fetus. This
suggestion is supported by the inverse correlation between placenta! lead levels and birth weight, head
circumference, and placenta! weight reported by Ward et al. (1987) and the increased levels of lead in the
placenta reported by Wibberley et al. (1977) in cases of stillbirth and neonatal death. Alternatively, it has
been suggested that such findings may indicate that lead accumulates in the placenta in times of fetal stress
(Wibberley et al. 1977).
In a prospective study by Factor-Litvak et al. (1991), prenatal lead exposure versus reproductive outcome
(intrauterine growth and preterm delivery) were assessed in pregnant women from two towns in Kosovo,
Yugoslavia. Titova Mitrovica is a lead smelter town, while Pristina is an unexposed town 25 miles further
south. At mid-pregnancy, 401 and 506 women were recruited from T. Mitrovica and Pristina, respectively,
with mean PbB concentrations of 0.92 and 0.27 umol/L (19 and 5.6 ug/dL) in the respective group; at time
of delivery, these concentrations were 1.13 and 0.33 umol/L (23.4 and 6.8 ug/dL), respectively. No
differences were found between the two areas for either birth weight or length of gestation. In addition, no
associations were observed between PbB concentrations (maternal and cord, at mid-term and time of
delivery) and birth weight, length of gestation, or preterm delivery (<37 weeks). Children from this cohort
were reevaluated at age 4 (Wasserman et al. 1994). The study was conducted in a group of 332 children.
The geometric mean PbB level in children from the smelter town rose from 22.4 ug/dL at birth to
39.9 ug/dL at age 4; in children from Pristina, it rose from 5.4 ug/dL to 9.6 ug/dL. Of all the potential
confounders examined, the Home Observation for Measurement of the Environment (HOME) scores,
maternal age, intelligence, education, language, birthweight, and gender accounted for 42.7% of the
variance of the McCarthy Scales General Cognitive Index (GCI). After adjusting for these confounders and
concurrent hemoglobin concentration, it was found that PbB, measured every 6 months from birth to age 4,
was significantly associated with a decrease in GCI at each age point. It was also found that 4-year GCI
scores declined by an estimated 4 points as PbB, measured between 24 and 48 months, increased from 10 to
25 ug/dL, and similar patterns were seen for five other subscales of the McCarthy. Interestingly, blood lead
measured at 24 months or later accounted for a greater portion of the variance in the subscales than did
prenatal PbB or that measured during infancy. Also, of the five subscales examined, the Perceptual-
Performance subscale appeared to be the most sensitive to lead exposure. These findings are consistent
with those of other prospective studies (see below). A group of 309 children from this cohort
LEAD 102
2. HEALTH EFFECTS
was evaluated again at age 7 years (6.5-7.5 years) (Wasserman et al. 1997). At this time the investigators
examined the association between lifetime lead exposure, estimated by the area under the blood lead versus
time curve, and intelligence, assessed by the WISC-III. Geometric mean PbB concentration at age 7 was
34 ug/dL in children from Mitrovica versus 8 (ig/dL in children from Pristina. There were no differences in
serum ferritin levels or hemoglobin concentration between the two towns. Consistent with results from
other studies, covariates such as HOME, birth weight, gender, number of siblings, maternal age, ethnicity,
and education explained 41-47% of the variance in Full Scale, Performance, and Verbal 1Q. Furthermore,
before covariate adjustment, lifetime lead exposure was not related to IQ. However, after adjustment,
lifetime lead exposure explained a significant 2.8^4.2% of the variance in IQ, and a change in lifetime PbB
lead from 10 to 30 (ig/dL was associated with an estimated decrease in 4.3 Full Scale IQ points. The
decreases in Verbal and Performance IQ were 3.4 and 4.5 points respectively. It was also found that
lifetime lead exposure was significantly inversely related to three WISC-III factor scores: Freedom from
Distractibility, Perceptual Organization, and Verbal Comprehension; of these, Perceptual Organization
showed the strongest association, suggesting that perceptual motor skills are significantly more sensitive
than are the language related aspects of intelligence.
Information regarding behavior problems in children from the Yugoslavian cohort were recently published
(Wasserman et al. 1998). The evaluation was conducted when the children were 3 years old. A total of 379
children comprised the sample. At that time, the geometric mean PbB concentration was 40.9 u.g/dL in the
exposed children (Mitrovica) versus 9.8 |ig/dL in the referents (Pristina). The mothers in the study had
completed Infant Characteristics Questionnaire at child-age 2, from which the authors included scores on
the Difficult Temperament scale. When the children were 3 years old, the mothers completed the Child
Behavior Checklist/2-3 (CBCL), which generates 6 subscales: Destructive, Aggressive, Somatic Problems,
Withdrawn, Anxious-Depressed, and Sleep Problems. Seven to 18% of the variance on the CBCL
subscales was explained by a set of sociodemographic confounders. After controlling for confounders, and
prior to examination of Difficult Temperament scores, log PbB at age 3 accounted for an incremental 4% of
the variance in Destructive and Withdrawn scores, 2% of the variance in Somatic Problems and Sleep
Problems, and 1% of the variance on the Anxious-Depressed subscale. However, only tests on the
Destructive and Withdrawn subscale achieved a p<0.01 level of significance. Log PbB at age 3 was most
strongly associated with behavior across all subscales; log PbB other ages showed no clear pattern of
association with behavior. Difficult temperament was also significantly associated with 5 of the 6
subscales, accounting for 2-5% of their variances, but had little impact on the association between log
LEAD 103
2. HEALTH EFFECTS
blood lead and behavior. Log PbB at age 3 remained significantly associated with scores on the Destructive
and Withdrawn subscales, even after control for prior difficult temperament. Wasserman et al. (1998)
concluded that lead/behavior associations are significant but small compared with the effects of social
factors.
Numerous others studies have found that exposure to low levels of lead interferes with the mental
development of children. Preliminary results of blood lead and neurobehavioral testing of 592 children
from the Port Pirie study were reported by Baghurst et al. (1987), Vimpani et al. (1985, 1989), and Wigg et
al. (1988). In these children, geometric mean PbB levels increased from approximately 14 ug/dL at
6 months of age to approximately 21 u,g/dL at 15 and 24 months. At 24 months, approximately 20% of the
children had PbB levels >30 u.g/dL. Neurobehavioral tests-—the Bayley MDI and Bayley Psychomotor
Development Index (PDI)—were conducted at 24 months. Multiple regression analyses indicated that
reduced MDI scores were significantly (p=0.07) associated with higher integrated postnatal blood lead
levels and with 6-month PbB levels, but not with prenatal delivery or cord PbB levels. Controlling for both
maternal IQ and HOME scores, the association between 6-month PbB and 24-month MDI scores remained
significant, with a 2-point deficit in MDI for every 10-u.g/dL increase in PbB. A follow-up of this cohort
involved PbB testing at 3 and 4 years of age and neurobehavioral assessment using the McCarthy Scales of
Children's Abilities (McMichael et al. 1988). Multiple regression analyses showed that children's scores on
these tests were significantly and inversely correlated with log PbB levels at 6, 24, and 36 months and with
the integrated average for birth to 4 years. The estimated decrease in the GCI score was approximately
7.2 points, for an increase in integrated average PbB from 10 to 30 u,g/dL. The neurobehavioral
development of this cohort, as assessed by the WISC was again studied at 7 years of age (n=494) (Baghurst
et al. 1992). Multiple regression analysis adjusting for sex, parents' level of education, maternal age at
delivery, parents' smoking status, socioeconomic status, quality of the home environment, maternal IQ,
birth weight, birth order, feeding method, duration of breast-feeding, and whether the child's natural parents
were living together revealed a statistically significant inverse relationship between IQ and blood lead
levels from birth through 7 years of age. This relationship was more evident for PbB levels at 15 months to
4 years. The IQ was reduced by 4.4-5.3 points for an increase in PbB levels of 10-30 u.g/dL. In a later
publication, the authors examined the relationship between lead concentration in deciduous central upper
incisor teeth from 262 Port Pirie children and intellectual functioning (McMichael et al. 1994). Intellectual
functioning was assessed with the revised WISC (WISC-R) when the children were in their eighth year; the
average age at which the teeth were shed was 6.8 years. The results showed
LEAD 104
2. HEALTH EFFECTS
that there was an inverse relation between tooth lead concentration and intellectual development. Twelve of
13 scales/subscales assessed were inversely associated with tooth lead concentration (p* 6.10). A
particularly strong inverse association was found for the Block Design subscale, which tests a subject's
perceptual organization and synthesis, spatial visualization, nonverbal concept formation, and visual-motor
coordination. After adjusting for all the measured covariates, it was found that the full-scale 1Q declined
2.6 points for each natural-log unit increase in tooth lead concentration, expressed in ppm. The results also
showed no statistically significant interaction between a child's sex and tooth lead concentration for any of
the WISC-R scales. A subsequent study of this cohort, also at age 7 years (mean PbB, 11.6 ug/dL), showed
a dose-related inverse association between both prenatal and postnatal PbB concentrations and children's
visual motor performance, assessed with the Beery Developmental Test of Visual-Motor Integration (VMI)
(Baghurst et al.. 1995). The children's mean VMI score was 13.4 points. The analyses showed that for an
increase in lifetime average PbB concentration from 10 to 30 ug/dL, the expected deficit was estimated to
be 1.6 points. The association between PbB and VMI scores were stronger in girls and in children from
lower socioeconomic background. Baghurst et al. (1995) pointed out that visual-motor integration may be a
more sensitive index than global measures of development, such as 1Q. They also stated that although a
decrease of 1.6 points in VMI in an individual may not be considered clinically or biologically important, a
change of this magnitude across an entire community may be worrisome.
The Port Pirie cohort was evaluated again at the age of 11-13 years (Tong et al. 1996). The cohort
consisted of 375 children whose current geometric mean blood level was 7.9 ug/dL (range,
0.6-30.9 ng/dL). The revised version of the W1SC was used to assess the cognitive abilities of each child.
Unadjusted analyses of the results revealed a consistent inverse relation between PbB and scores for all 12
subscales of the WISC-R. This association held for PbB concentrations at all ages, except at birth. The
magnitude of the deficit in IQ with increased PbB was similar for the verbal and performance scales. The
larger IQ deficits were associated with PbB concentrations measured at earlier ages and with lifetime
average PbB concentration. Simple regression analyses showed that all measures of PbB except those of
the cord sample, were significantly inversely associated with IQ. In multiple regression analyses after the
effects of potential confounders were adjusted for, the inverse associations between PbB concentration and
IQ were attenuated. In particular, the associations of children's IQ with maternal and cord PbB
concentrations lost significance. However, the inverse association between various measures of PbB
concentrations over the range 15 months to 7 years and IQ remained significant or marginally significant
after adjusting for potential confounders. The mean score for ful l scale IQ declined 3 points for a doubling
LEAD 105
2. HEALTH EFFECTS
of lifetime PbB from 10 to 20 ug/dL. Individual subscales scores showed varying degrees of inverse
association with lifetime PbB lead levels. However, those showing the strongest associations were the
information, arithmetic, block design, and maze subscales. Analyses of the association between PbB
concentrations stratified by thirds, between the ages of 2 and 11-13 years, and developmental status showed
that the adjusted differences in developmental scores between the top and bottom thirds of exposure were
4 points on the Bayley mental developmental index at age 2; 4.8 points on the McCarthy general cognitive
index at age 4; and 4.9 and 4.5 1Q points at 7 years and 11-13 years, respectively, after accounting for
confounders.
In other prospective studies (Bellinger et al. 1984, 1985a, 1985b, 1986a, 1986b, 1987a, 1987b), cord PbB
levels were determined at delivery, for 249 middle-class and upper-middle class Boston children. PbB
levels and MDI and PDI scores were measured every 6 months thereafter. Infants born at <34 weeks of
gestation were excluded from the study. Cord PbB lead values were <16 ug/dL for 90% of the subjects,
with the highest value being 25 ug/dL. On the basis of cord PbB lead levels, the children were divided into
low-dose (<3 ug/dL; mean = 1.8 ug/dL), medium-dose (6-7 ug/dL; mean = 6.5 ug/dL), and high-dose
(•10 ug/dL; mean = 14.6 ng/dL) exposure groups. A slight but not significant direct correlation between
cord PbB lead category and length of gestation was seen. However, analysis within gestational age
categories indicated no correlation between cord PbB lead category and length of gestation (Bellinger et al.
1984, 1985a). The percentage of infants that were small for their gestational age increased with increasing
cord PbB, although the trend was not statistically significant (Bellinger et al. 1984). Multivariate regression
analysis revealed an inverse correlation between cord PbB levels and MDI scores at 6, 12, 18, and
24 months of age (Bellingeret al. 1985a, 1985b, 1986a, 1986b, 1987a). The high-lead group had an
average deficit of 4.8 points on the covariate-adjusted MDI score as compared with the low-lead group.
MDI did not correlate with postnatal PbB lead levels. No correlations between PDI and cord or postnatal
blood lead levels were seen. The findings of earlier studies (Bellingeret al. 1985a, 1985b, 1986a, 1986a,
1987b) were confirmed in subsequent studies (Bellinger et al. 1989a, 1989b) and suggest that the younger
the infants are, the more vulnerable they are to lead-induced developmental toxicity. Moreover, the decline
in MDI scores varied with the child's age at exposure, the level of exposure, and socioeconomic status
(Bellinger et al. 1989b). Infants in lower socioeconomic groups showed deficits at lower levels of prenatal
exposure (mean PbB levels, 6-7 ug/dL) than children in higher socioeconomic groups. The early postnatal
PbB levels (range, 10-25 ug/dL) were also associated with lower MDI scores, but only among children in
lower socioeconomic groups. Follow-up evaluation of these children at approximately 5 years of age
LEAD 106
2. HEALTH EFFECTS
showed that deficits in GCl scores correlated significantly with PbB levels at 24 months of age (mean
7 ug/dL), but not with prenatal PbB levels (Bellinger et al. 1991). These results suggest that prenatal PbB
levels are a better predictor of cognitive development in infants than in 4-5-year-old children and that early
developmental deficits associated with elevated PbB may not persist to 4-5 years of age, especially in
socioeconomically advantaged families.
Bellinger and coworkers have presented preliminary findings regarding the association between pre- and
postnatal lead exposure and problem behavior in the Boston children at the age of 8 years (Bellinger et al.
1994). Problem behavior was rated on the Teacher Report Form of the Child Behavior Profile. Prenatal
and postnatal lead exposure was assessed by umbilical cord PbB (mean 6.8 ug/dL) and dentin lead of a shed
deciduous tooth (mean 3.4 ug/g). The results showed that cord PbB level was not associated with overall
prevalence or nature of problem behaviors. However, tooth lead was significantly associated with total
problem behavior scores in both crude and adjusted analyses, and with both internalizing and externalizing
scores. The association was not limited to children manifesting the most problems or the highest levels of
tooth lead but was nevertheless considered modest; tooth lead accounted for less than 1% of the variance in
total problem behavior scores. Furthermore, the authors recognized that the study provided little basis for
distinguishing alternative hypothesis about temporal features of the association between tooth lead and
problem behavior. According to Bellinger et al. (1994) two factors not measured in the study that could
have influenced the outcome were the family history of psychiatric illness and the family
microenvironment.
A neuropsychological evaluation of 148 of the Boston cohort children at age 10 years confirmed the
continued presence of the association noted at 5 years of age (Bellinger et al. 1992). The primary end
points evaluated were the W1SC-R and the Kaufman Test of Educational Achievement (K-TEA). Analysis
of the unadjusted data showed that all postnatal blood lead levels were inversely associated with Full Scale
1Q measured at age 10; however, only the associations involving PbB level at ages 10 years, 57 months, and
24 months were statistically significant. This was also seen for both Verbal and Performance 1Q scores.
After adjusting for confounding, only the coefficient associated with 24-month blood lead level remained
significant. It was also shown that the association between 24-month PbB and Full Scale 1Q at age 10 years
was not due simply to the high correlation between GCI scores at age 5 years and 1Q. The decline in Full
Scale 1Q corresponded to 5.8 points per 10 ug/dL increase in 24-month PbB. PbB at 24 months was also
significantly associated with Verbal 1Q and five WISC-R subtest scores. Only PbB
LEAD 107
2. HEALTH EFFECTS
levels at 24 months were significantly associated with adjusted K.-TEA scores. For each 10 ug/dL increase
in 24-month PbB the battery composite score declined 8.9 points. The results suggested that timing of
exposure may be more important than magnitude alone and supported the hypothesis of an age-specific
vulnerability.
Interim results of an investigation of 185 subjects and later results from the complete follow-up sample of
305 subjects in a prospective study of inner-city children (>80% black) born in Cincinnati, Ohio, were
reported by Dietrich et al. (1986, 1987a, 1987b). Maternal PbB levels were measured at the first prenatal
visit; cord PbB was measured at delivery; infant PbB levels were measured at 10 days and at 3 months of
age; and neurobehavioral tests were performed at 3 and 6 months of age. Mean PbB levels were as follows:
prenatal (maternal)—8.0 ug/dL (range, 1-27 u.g/dL); umbilical cord—6.3 ug/dL (range, 1-28 u.g/dL);
10-day-old and 3-month-old infants—4.6 and 5.9 ug/dL (range, 1-22 ug/dL for each). Multiple regression
analyses, with perinatal health factors such as birth weight and gestational age treated as confounders,
showed inverse correlations between prenatal or cord PbB levels and performance on the MDI at 3 months,
and between prenatal or 10-day neonatal PbB levels and performance on the MDI at 6 months. No
significant correlation of PbB level with PDI was seen. Male infants and low socioeconomic status infants
appeared to be more sensitive to the effect on the MDI. Multiple regression analyses for male or low
socioeconomic status infants showed covariate-adjusted decrements of 0.84 or 0.73 MDI points per ug/dL
of prenatal or 10-day neonatal PbB, respectively (i.e., an approximate 8-point deficit for a 10-ug/dL
increase in PbB) (Dietrich et al. 1987a).
Further analyses by structural equation modeling in the study by Dietrich et al. (1987a) showed that the
effect of prenatal lead exposure on MDI was in part mediated through its effects on birth weight and
gestational age. Higher prenatal PbB levels were associated with reduced birth weight and reduced
gestational age, which were each significantly associated with reduced MDI scores (Dietrich et al. 1987a).
Separate preliminary analyses of the data from the Cincinnati study by Bornschein et al. (1989) indicated
that for each natural log unit increase in PbB, the decrease in birth weight averaged 114 g, but ranged from
58 to 601 g depending on the age of the mother. The authors reported that the threshold for this effect could
be approximately 12-13 ug/dL PbB. In addition, a decrease in birth length of 2.5 centimeters per natural
log unit of maternal PbB was seen, but only in white infants. In a later report, the PbB levels during
prenatal (maternal PbB, 8.2 ug/dL; range, 1-27 ug/dL) and neonatal (4.8 ug/dL, range, 1-23 ug/dL)
periods were found to be inversely related to a complex of sensorimotor developmental indices at 6 and
LEAD 108
2. HEALTH EFFECTS
12 months of age. The prenatal maternal blood level was also related to lower birth weight, which in turn
was related to poorer sensorimotor performance in infants during the first year of age (Dietrich et al. 1989).
The cognitive development of 258 children from the Cincinnati Lead Study was examined when the
children were 4 years old (Dietrich et al. 1991). Cognitive development was assessed by the Kaufman
Assessment Battery for Children (K-ABC), which measures general intelligence, information processing,
and achievement for children between the ages of 2.5 and 12.5 years. The results showed that higher
neonatal PbB levels were associated with poorer performance in all K-ABC subscales; however, there was a
significant interaction between neonatal PbB and socioeconomic status. Results from separate regression
analysis conducted to determine the nature of the interaction revealed that the association was limited to
children from the poorest families. This, according to the authors, suggested that children from less
advantaged environments express cognitive deficits at lower PbB levels than do children from families of
relatively higher socioeconomic status. Prenatal (maternal) PbB levels were not related to 4-year cognitive
status. Significant negative associations between postnatal PbB levels and K-ABC subscales were found in
unadjusted regression analyses. These associations were most consistently significant for PbB levels at
ages 3-4 years and mean lifetime PbB levels; PbB levels at ages 1-2 years were usually unrelated to
K-ABC performance. No statistically significant effects of postnatal PbB on any of the K-ABC subscales
was found after covariate adjustment. A subsequent evaluation of the same cohort at age 5 found that fetal
(maternal), neonatal, and postnatal PbB levels were significantly and inversely associated with performance
on the Filtered Word Subtest (FWS) of the SCAN (a screening test for auditory processing disorders)
(Dietrich et al. 1992). In addition, higher postnatal PbB levels were associated with poorer performance on
all cognitive developmental subscales of the K-ABC; however, after controlling for HOME scores and
maternal intelligence most of the observed relationships lost statistical significance.
Two hundred and fifty-three children from the Cincinnati lead study cohort were administered the WISC-R
again at approximately 6.5 years of age (Dietrich et al. 1993a). In this cohort, mean prenatal and neonatal
PbB concentrations were 8.3 ug/dL and 5 ug/dL, respectively. Examination of the PbB concentration for
the group from 3 to 60 months of age showed that PbB peaked at approximately 2 years of age and declined
thereafter. Analysis of unadjusted data showed that prenatal and neonatal PbB were unrelated to
intellectual capacity at 6.5 years, but almost every index of postnatal exposure was associated with
Wechsler Performance 1Q, including PbB at 66 and 72 months of age. Verbal IQ was associated only with

LEAD 109
2. HEALTH EFFECTS
PbB close to the time of testing. When PbB regression coefficients were adjusted for HOME score,
maternal IQ, birth weight, birth length, child sex, and cigarette consumption during pregnancy, postnatal
PbB continued to be associated with lower Performance IQ. Also, the mean PbB concentrations during the
5th and 6th year of life were inversely associated with Wechsler Full Scale IQ. It was also found that, of
the various cofactors, maternal IQ was usually the strongest predictor of a child's Full Scale IQ. Further
analysis of the results suggested that averaged lifetime PbB concentrations in excess of 20 ug/dL were
associated with deficits in Performance IQ on the order of about 7 points when compared with children with
mean PbB concentrations HO ug/dL. The authors noted that many of the children with lifetime average
PbB 20 ug/dL had fairly high PbB levels at earlier ages. Dietrich et al. (1993a) stressed that the statistical
significance was retained after adjustment for covariates such as maternal IQ and HOME scores and
suggested that this may be a function of the increased reliability and precision of measurement which is
gained when testing older children.
Two hundred and forty-five children from the same cohort examined by Dietrich et al. (1993a) were also
evaluated at approximately 72 months of age with a comprehensive and standardized assessment of gross-
and fine-motor functioning using the Bruininks-Oseretsky Test of Motor Proficiency (BOTMP) (Dietrich et
al. 1993b). The authors hypothesized that measures of motor development may be less confounded with
sociohereditary cofactors in lower socioeconomic status populations than cognitive or other language-based
indices. In the BOTMP, gross motor skills are assessed with the subtests of Running Speed and Agility,
Balance, Bilateral Coordination, and Strength, while fine-motor skills are indexed by the subtests of
Response Speed, Visual-Motor Control, and Upper Limb Speed and Dexterity. As a group, the children
showed average performance on the Bilateral Coordination, Strength, Upper-Limb Coordination, and
Upper-Limb Speed and Dexterity subsets, but did poorly on the Balance, Response Speed, and Visual-
Motor Control subtests relative to national norms. Prior to covariate adjustment, the results showed that
prenatal, neonatal, and postnatal PbB levels were unrelated to Balance, Strength, Upper-Limb Coordination,
or Response Speed. However, neonatal and/or postnatal PbB were significantly associated with lower
scores on the Bilateral Coordination, Visual-Motor Control, and Upper-Limb Speed and Dexterity subtests
as well as the Fine Motor Composite. After adjusting for HOME scores, maternal IQ, social class, and child
sex and race, Bilateral Coordination, Visual-Motor Control, Upper-Limb Speed and Dexterity, and the Fine
Motor Composite retained some significant relationships to neonatal and/or postnatal PbB. Again, prenatal
(maternal) PbB was not related to BOTMP performance. However, neonatal PbB levels were significantly
associated with lower scores on the Upper-Limb Speed and Dexterity subtests and the Fine Motor
LEAD 110
2. HEALTH EFFECTS
Composite and marginally related to lower scores on the Bilateral Coordinations subtests. Further analysis
of the results revealed that children having a mean lifetime PbB of • 9 ug/dL appeared to experience a
deficit on both the Bilateral Coordination subtests and Fine Motor Composite relative to children in the
lowest PbB quartile.
Some neurobehavioral effects (decreased ability to self-quiet and to be consoled) seemed to be associated
with a rise in maternal blood lead levels from 36 weeks gestation to birth (Rothenberg et al. 1989a).
Absolute PbB levels did not appear to be associated with effects. These results were obtained on 42
mother-infant pairs selected in the Mexico City pilot study. Blood samples were obtained at 36 weeks
gestation from the mother. At birth, cord blood samples and maternal samples were obtained. The
Brazelton Neonatal Behavioral Assessment Scale (NBAS) was administered by psychologists certified in
the use of this instrument. The principal shortcoming of this study is the small sample size (42-50 mother-
baby pairs, depending on the end point measured). Large numbers of statistical analyses were performed,
increasing the likelihood that some significant associations would occur by chance.
Emory et al. (1999) evaluated 103 African-American newborns with the NBAS. Maternal PbB levels were
obtained at 6-7 months of pregnancy. No significant differences were found between quartiles across
Brazelton Cluster scores. The researchers then compared the low quartile group (maternal PbB • 1
ug/dL; mean=0.855 ug/dL; n=26) with the high quartile group (maternal PbB • 2.5 ug/dL;
mean=4.01 ug/dL; n=14) and found modest detrimental effects as determined by four Brazelton
item scores related to motor control and attention. A slight trend was observed when PbB levels
were plotted against motor maturity and hand-to-mouth activity.
In a prospective study of mothers and infants in Cleveland, Ohio (Ernhart et al. 1985, 1986, 1987; Wolf et
al. 1985), mean PbB levels at the time of delivery were 6.5 ug/dL (range, 2.7-11.8 ug/dL) for 185 maternal
samples and 5.8 ug/dL (range, 2.6-14.7 ug/dL) for 162 cord samples. There were 132 mother-infant pairs
of data. The infants were evaluated for anomalies using a systematic, detailed protocol and for
neurobehavioral effects using the NBAS and part of the Graham-Rosenblith Behavioral Examination for
Newborns (G-R), including a Neurological Soft Signs scale. Hierarchical regression analysis was
performed. No evidence of an association between PbB levels and morphological anomalies was found.
This relatively small number of subjects, however, may not have been sufficient for the detection of
differences in low frequencies of anomalies. Using the complete set of data, abnormal reflexes and
LEAD 111
2. HEALTH EFFECTS
neurological soft signs scales were significantly related to cord PbB lead levels and the muscle tonicity
scale was significantly related to maternal PbB level. Using data from the mother-infant pairs, the only
significant association found was between the Neurological Soft Signs score and cord PbB levels, which
averaged 5.8 ug/dL and ranged up to only 14.7 ug/dL; no association with maternal PbB levels was seen
(Ernhart et al. 1985, 1986). A brief, preliminary report on later outcomes from this study reported a
significant association between the Neurological Soft Signs measure and the MDI scores at 12 months
(Wolf et al. 1985). Hence, it is possible to infer an indirect effect of cord PbB on MDI (Davis and
Svendsgaard 1987; EPA 1986a), although Ernhart et al. (1985, 1986) did not reach such a conclusion. The
effects noted by these investigators were significantly related to cord PbB levels that averaged 5.8 ug/dL
and ranged upward to only 14.7 ug/dL.
A later analysis (Ernhart et al. 1987) related PbB levels obtained at delivery (maternal and cord blood) and
at 6 months, 2 years, and 3 years of age to developmental tests (MDI, PDI, Kent Infant Development Scale
[KID], and Stanford-Binet IQ) administered at 6 months, 1 year, 2 years, and 3 years of age, as appropriate.
After controlling for covariates and confounding risk factors, the only significant associations of blood lead
with concurrent or later development were an inverse association between maternal (but not cord) blood
lead and MDI, PDI, and KID at 6 months, and a positive association between 6-month PbB and 6-month
KID. The investigators concluded that, taken as a whole, the results of the 21 analyses of correlation
between blood lead and developmental test scores were "reasonably consistent with what might be expected
on the basis of sampling variability," that any association of blood lead level with measures of development
was likely to be due to the dependence of both PbB and development on the caretaking environment, and
that if low-level lead exposure has an effect on development the effect is quite small. Ernhart et al. (1987)
also analyzed for reverse causality (i.e., whether developmental deficit or psychomotor superiority in
infants at 6 months of age contributes to increases in subsequent blood lead levels). No significant
correlations were observed when covariates were controlled. Greene and Ernhart (1991) conducted further
analyses of the 132 mother-infant pairs in the Cleveland Prospective Study searching for a potential
relationship between prenatal lead exposure and neonatal size measures (weight, height and head
circumference) and gestational age. No such relationship was observed.
The predictive value of different markers of lead exposure for neurobehavioral performance (WISC verbal,
performance, and full-scale IQs; Wiener [Vienna] reaction performance tests; Cued Reaction Time) was
investigated by Winneke et al. (1985a, 1985b). This investigation involved the follow-up, at 6-7 years of
LEAD 112
2. HEALTH EFFECTS
age, of 114 children from an original study population of 383 children bom in Nordenham, Germany. At
delivery, the mean maternal PbB level was 9.3 ug/dL (range, 4-31 ug/dL), and the mean cord PbB level
was 8.2 ug/dL (range, 4-30 ug/dL); most of the PbB levels were • 15 ug/dL. Cord and maternal PbB levels
were highly correlated. Stepwise multiple regression analyses indicated that maternal PbB levels at
delivery accounted for nearly as much of the variance in neurobehavioral test scores at 6-7 years as did
contemporary PbB levels in the children. With either exposure marker, significance was seen only in
increased errors on the Wiener Reaction Performance tests.
Bonithon-Kopp et al. (1986b) investigated another potential marker for lead exposure. Maternal and infant
hair lead levels, determined from hair samples taken at birth, were found to be correlated inversely with
results on neurobehavioral tests (McCarthy Scales of Children's Abilities) when the children were tested at
6 years of age. Other studies have also reported associations between hair lead levels and behavioral or
cognitive test scores, but measures of lead in hair may not accurately reflect internal body burden of lead,
and such data should not be used to evaluate internal dose-response relationships (EPA 1986a).
A few studies have reported associations between prenatal lead exposure and changes in heme metabolism.
In a study of 294 mother-infant pairs, Haas et al. (1972) reported mean PbB levels of 16.98 ug/dL for
mothers and 14.98 ug/dL for newborns. Infant PbB levels and ALA-U were positively correlated. The
authors, however, did not report the levels of ALA-secretion in infants and mothers with no lead exposure.
In pregnant urban women (Kuhnert et al. 1977), cord erythrocyte lead levels ranged from 16 to 67 ug/dL of
cells (mean: 32.9 ug/dL) and were inversely correlated with A LAD activity, as were maternal erythrocyte
lead levels. In a study of 500 mothers at delivery, Lauwerys et al. (1978) reported negative correlations
between PbB levels and ALAD activity in both mothers and their infants (cord blood). No correlation
between PbB level and erythrocyte protoporphyrin was seen. PbB levels averaged 10.2 ug/dL with a range
of 3.1-31 ug/dL in the mothers and 8.4 ug/dL with a range of 2.7-27.3 ng/dL in the infants. Taken
together, the results of these studies indicate that ALAD activity may be a more sensitive indicator of lead
effects on fetal heme synthesis than erythrocyte protoporphyrin or ALA-U levels (EPA 1986a). In contrast
to the findings of Lauwerys et al. (1978), the measurement of maternal and umbilical cord PbB levels and
FEP levels for 95 mother-infant pairs from Toronto showed a significant inverse correlation. Most infants
had cord PbB levels below 7 ug/dL; the cord blood FEP levels were higher than the maternal levels (Koren
et al. 1990). The higher FEP levels may reflect immature hematopoiesis.
LEAD 113
2. HEALTH EFFECTS
Developmental effects that have been observed in humans following exposure to low levels of lead include
reduced birth weight, reduced gestational age and neurobehavioral deficits or delays. No evidence of an
association with major congenital malformations has been found, although one study reported an
association between cord PbB levels and the collective occurrence of minor anomalies. The evidence for an
association between PbB levels and reduced birth weight and gestational age is inconsistent. The weight of
evidence indicates that there may not be a direct association. There is a predominance of negative results,
with the most recent (and presumably best designed) studies showing no such association. The evidence in
support of neurobehavioral deficits or delays is more consistent, with most of the studies indicating that
there is an association between lead exposure at low levels and developmental neurobehavioral effects.
2.2.1.7 Genotoxic Effects
Results of assays made following in vivo exposure from occupational sources are contradictory, but do
suggest that lead may have an effect on chromosomes. Increased frequency of sister chromatid exchange
was not observed in one study of occupationally exposed adults with blood lead levels of 48.7 ug/dL
(Maki-Paakkanen et al. 1981) or in environmentally exposed children with PbB levels of 30-63 ug/dL
(Dalpra et al. 1983). A slight positive correlation between sister chromatid exchanges and increasing
duration of exposure has been reported in lead-exposed workers (Grandjean et al. 1983). This observation
was independent of PbB level. Similar slight increases of sister chromatid exchanges in lead-exposed
workers that may have been confounded by age effects were reported in a study that used too few controls
to show conclusive results (Leat-Garza et al. 1986). Increased frequencies of chromosomal aberrations
(primarily chromatid-type) were seen in 21 battery factory workers; these elevations were positively
correlated with PbB levels, and showed a marked increase when PbB levels reached 50 ug/dL. Sister
chromatid exchanges were also significantly elevated in these workers when PbB levels reached 80 u.g/dL
(Huang et al. 1988b). This study examined a fairly small number of workers, but appropriate selection
criteria were used in order to minimize the effects of other potential genotoxic factors, such as smoking,
drinking, viral diseases, exposure to medical X-rays, dictation agents, or use of medications with known
clastogenic effects. A common problem in these occupational studies is possible concurrent exposures to
many other agents in the occupational environment.
Occupational exposure to lead is associated with increased mitotic activity in peripheral lymphocytes,
increased rate of abnormal mitosis (Forni et al. 1976; Sarto et al. 1978; Schwanitz et al. 1970), and
LEAD 114
2. HEALTH EFFECTS
increased incidence of chromosomal aberrations (Al-Hakkak et al. 1986; Forni et al. 1976, 1980; Nordensb'n
et al. 1978; Schwanitz et al. 1970) at PbB levels ranging from 22 to 89 ug/dL. While a positive correlation
between PbB levels and the frequency of chromosomal aberrations has been reported (Nordensb'n et al.
1978), most of the available data on occupationally exposed workers show no increase in the frequency of
chromosomal aberrations when PbB levels ranged from 38 to 120 ug/dL (Bauchinger et al. 1977; Maki-
Paakkanen et al. 1981; O'Riordan and Evans 1974; Schmid et al. 1972; Schwanitz et al. 1975) or in
environmentally exposed children with PbB levels of 12-33 ug/dL (Bauchinger et al. 1977). Other
genotoxicity studies are discussed in Section 2.5.
2.2.1.8 Cancer
The information available regarding the association of occupational exposure to lead with increased cancer
risk is generally limited in its usefulness because the actual compound(s) of lead, the route(s) of exposure,
and level(s) of lead to which the workers were exposed were often not reported. Furthermore, potential for
exposure to other chemicals including arsenic, cadmium, and antimony occurred, particularly in lead
smelters, and smoking was a possible confounder (Cooper 1976; 1ARC 1987). These studies, therefore, are
not sufficient to determine the carcinogenicity of lead in humans, and the following discussion is restricted
to the most comprehensive of these studies.
The most extensive was a series of reports of a large number of workers at 6 domestic lead production
plants (smelters and recycling plants) and 10 battery plants (Cooper 1976; Cooper and Gaffey 1975). A
total of 7,032 individuals were studied. PbB lead levels were available for 1,850 individuals, and the
distribution was as follows: 1,433 had a PbB concentration • 40 ug/dL, 488 had • 70 ug/dL, 188 had
• 80 ug/dL, and 77 had • 100 ug/dL. Increased incidences of total malignant neoplasms were observed for
both categories of lead workers, but the increase was statistically significant only for lead production
workers. The increase in total malignancies appeared to be due to small, statistically nonsignificant
increases in digestive and respiratory tract tumors (evident in both the lead production and battery workers)
and urinary tract tumors (in production workers). In a statistical reanalysis of the Cooper and Gaffey (1975)
data, Rang et al. (1980) determined that the incidence of total malignant neoplasms, cancers of the digestive
tract, and cancers of the respiratory tract were statistically elevated in both lead production workers and
battery workers.
LEAD 115
2. HEALTH EFFECTS
In a follow-up to the original study, Cooper (1981) reported that lead had no cancer-inducing properties,
although standard mortality ratios (SMRs) of 125-149% for total malignant neoplasms, 172% for
respiratory cancer, and 229% for cancers of other sites were reported in battery workers. In a subsequent
evaluation of a more select subset from the original study, Cooper et al. (1985) reported increased SMRs for
total malignancies in both groups of workers (statistically significant only in the battery workers) attributed
to digestive and respiratory cancers. These small excesses of cancer deaths could not be correlated with
onset, duration, or level of exposure. In addition, no adjustments could be made for other concomitant
industrial exposures or for smoking. The attributable risk of smoking could easily explain the small
increase in respiratory cancer in an industrial cohort that contained an excess of heavy smokers. Also, a
marginally significant increase in digestive tract cancer in acid-lead battery workers was observed during
the early years of lead exposure (when lead levels were presumably higher than in later years) (Fanning
1988; Malcolm and Barnett 1982).
In a historical cohort mortality study of 1,990 primary lead smelter workers, an SMR of 2.04 for mortality
from renal cancer was calculated (Selevan et al. 1985). The cohort consisted of workers who had worked at
least 1 year, with at least 1 day of employment at the smelter between 1940 and 1965. The cohort had been
heavily exposed to lead and in 1976 the PbB levels averaged 56.3 ug/dL. Exposures to cadmium and
arsenic were generally minor. A follow-up study of this cohort was conducted from 1977 through 1988
(Steenland et al. 1992). Analysis of the follow-up study revealed an excess of kidney cancer, particularly in
the high-lead group (SMR 2.39). Although, as the authors indicate, the study is limited by lack of detailed
data on lead exposures, potential confounding exposures to cadmium and arsenic, lack of smoking data, and
small cohort size, the results are of interest because animal studies associate lead exposure with kidney
cancer (see Section 2.2.2.8). In addition, two cases of renal cancer have been reported in occupationally
exposed men who had symptoms of lead poisoning and high blood lead levels (Baker et al. 1980; Lilis
1981). In one case, the tumor was reported to contain a high level of lead and to have histopathological
characteristics similar to those of kidney tumors induced by lead in animals (Baker et al. 1980).
In a study of cancer incidence in workers exposed to tetraethyl lead, a statistically significant association
was found between exposure to this compound and rectal cancer (odds ratio = 3.7; 90% confidence limits of
1.3-10.2) (Fayerweather et al. 1997). The odds ratio increased four times at the high-to-very high
cumulative exposure level, demonstrating a dose-response relationship. When a 10-year latency was
LEAD 116
2. HEALTH EFFECTS
assumed, the association became even more pronounced. No increases in the incidence of cancer at other
sites (i.e., brain, kidney, lung, spleen, and bone) were observed in the exposed workers. A study that
comprised 20,700 Finnish workers exposed to lead during 1973-1983 found a 1.4-fold increase in the
overall cancer incidence and a 1.8-fold increase in the incidence of lung cancer among workers who had
ever had a blood lead level • 21 ug/dL (Anttila et al. 1995). The overall mortality for the whole cohort,
however, was less than expected, and there was no clear excess mortality for specific causes of death. In
order to examine the association of lung cancer with indices of lifetime exposure to lead and to obtain
information on potential confounders, the authors conducted a case-referent study on lung cancer within the
study base. Analysis of the results showed an increased odds ratio for lung cancer for concomitant
exposure to lead and engine exhaust. In a subsequent study of this same cohort, an excess risk of nervous
system cancer, specifically gliomas, was found in workers with a PbB concentration • 29 ug/dL compared
with those whose PbB concentration had not exceeded 14.4 ug/dL (Anttila et al. 1996). However, the
authors stated that no firm conclusions could be drawn because of the small number of cases, the rather
short follow-up time, and the low response rate.
2.2.2 Inhalation Exposure
2.2.2.1 Death
Deaths associated with occupational exposure to inorganic lead (which is predominantly by the inhalation
route of exposure) are discussed in Section 2.2.1.1. No studies were located regarding death in animals
after inhalation exposure to inorganic lead.
2.2.2.2 Systemic Effects
No studies were located regarding cardiovascular, gastrointestinal, musculoskeletal, dermal, or ocular
effects in humans or animals after inhalation exposure to inorganic lead.
Respiratory Effects. No studies were located regarding respiratory effects in humans after inhalation
exposure to inorganic lead. See Section 2.2.1.2 for a discussion of the respiratory effects of lead in humans
after multi-route exposure.
LEAD 117
2. HEALTH EFFECTS
Lung weights in mice continuously exposed to lead nitrate at a concentration of 1.6 mg lead/m3 for 28 days
were slightly but significantly elevated. The lungs from these mice appeared hemorrhagic at necropsy.
These effects were most likely due to pulmonary edema resulting from an irritative response to the
inhalation of lead aerosol for 28 days (Hillam and Ozkan 1986). Increased lung weight and hemorrhage
were not observed in the lungs of mice similarly exposed for 14 days, indicating that the effects observed in
mice exposed for 28 days were exposure duration dependent (Hillam and Ozkan 1986). This LOAEL is
presented in Table 2-2 and plotted in Figure 2-1.
Hematological Effects. As discussed in Section 2.2.1.2, lead has long been known to affect heme
biosynthesis by affecting the activities of several enzymes of the heme biosynthetic pathway. Lead inhibits
the activity of certain enzymes involved in heme biosynthesis, namely, ALAD, and ferrochelatase. The
mechanisms for these effects are discussed in detail in Section 2.4. As a consequence of these changes, the
activity of the rate limiting enzyme of the pathway, ALAS, is subsequently increased. The end results of
these changes in enzyme activities are increased urinary porphyrins, coproporphyrin, and ALA; increased
blood levels of ALA; and increased EP, FEP, and ZPP (EPA 1986a).
In one study, adult male volunteers were exposed to particulate lead in air at 0.003 or 0.01 mg lead/m3 for
23 hours a day for 3-4 months. Mean PbB levels increased from 20 ug/dL (preexposure) to 27 ug/dL at the
0.003 mg/m3 exposure level and from 20 ug/dL (preexposure) to 37 ug/dL at the 0.01 mg/m3 exposure
level. ALAD decreased to approximately 80% of preexposure values in the 0.003 mg/m3 group after
5 weeks of exposure and to approximately 53% of preexposure values in the 0.01 mg/m3 group after
4 weeks of exposure (Griffin et al. 1975b). These results are presented in Table 2-2 and plotted in
Figure 2-1.
Hepatic Effects. A significant increase in liver weight was observed in mice continuously exposed to
1.6 mg/m3 lead nitrate for 14 or 28 days as compared to air-exposed control animals (Hillam and Ozkan
1986). Although the authors suggest that these results indicate that inhalation exposure to lead may be toxic
to the liver, no functional (i.e., serum enzyme) or histopathological studies were conducted. Therefore, the
toxicological significance of this increase in liver weight is not known. These results are presented in
Table 2-2 and plotted in Figure 2-1.
Renal Effects. No studies were located regarding renal effects in humans after inhalation exposure to
inorganic lead. See Section 2.2.1.2 for a discussion of the other systemic effects of lead in humans after
multi-route exposure.
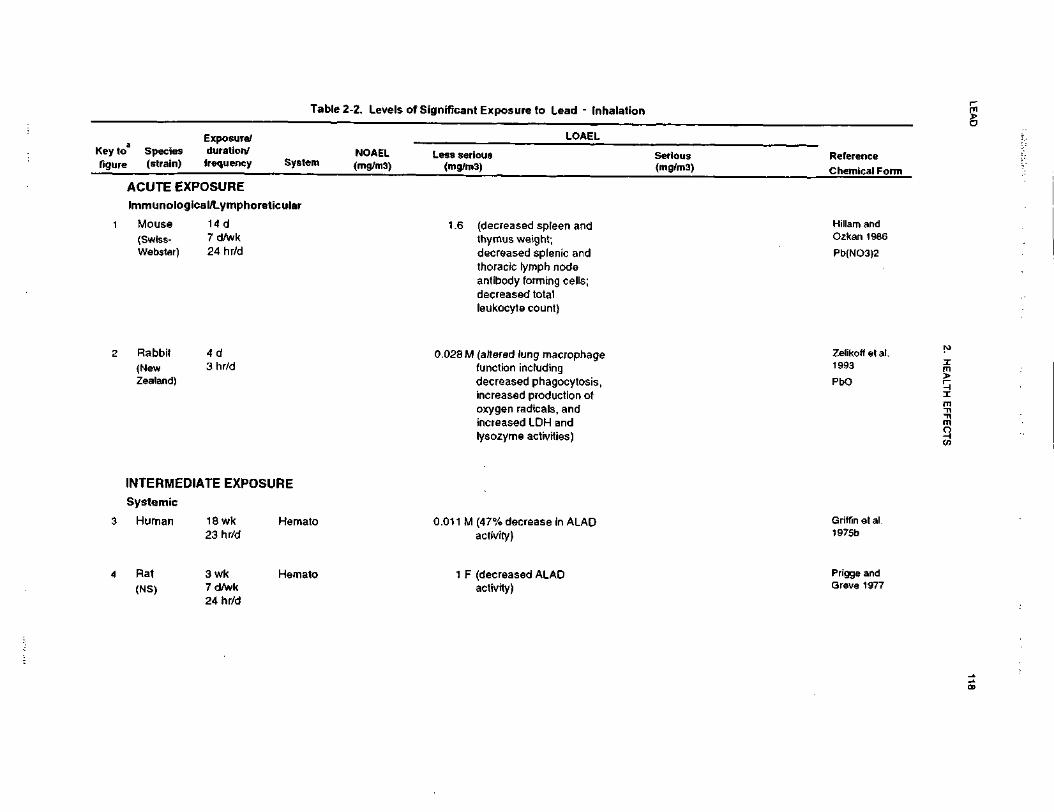
LEA
D118
2. H
EA
LTH
EF
FE
CT
S
ctoIV.cct Exposure to Lead -c1cBl
C/5inVuINoilUJ3H
11
01
_
" re
_l
UJ3
Referen
Chemic
IIen.2 ""
w n>
o> C
£•=.
-I nill ^
^ c
z 5-EatM
-i -
>>§
"_
8 2 i
x 3 *
LU
«fc
S "c"
85
s-sn0
£
^ 3
eg .S
1
LUocn(0oQ.
XLUACUTE
w"3o£oaE"5o0)
oImmuno
"OcjgI(decreased spleen and
CD
"-
Mouse
'-
CDs^CD
thymus weight;
>"^(/)tn1
SiCO*oS
"Q
.decreased splenic andthoracic lymph nodeantibody forming cells;decreased totalleukocyte count)
-£,
t^CN. — .
5S1
•S"cu^s
:= O
)
r?i2
oD)(altered lung macropha
function including
50}
80
T3
"O
*~T
t C
O
5M
.2EC
S-
CM
2a.indecreased phagocytosiincreased production ofoxygen radicals, andincreased LDH and
Zealand
lysozyme activities)
<<cCDCOraCOo•Dqci
O<CDmCO
<-
2.$
-o .>
0} ^
LUCCMOQ.
XLUOrt
oroOCO<D
oo m
T- 00
COE
oc E
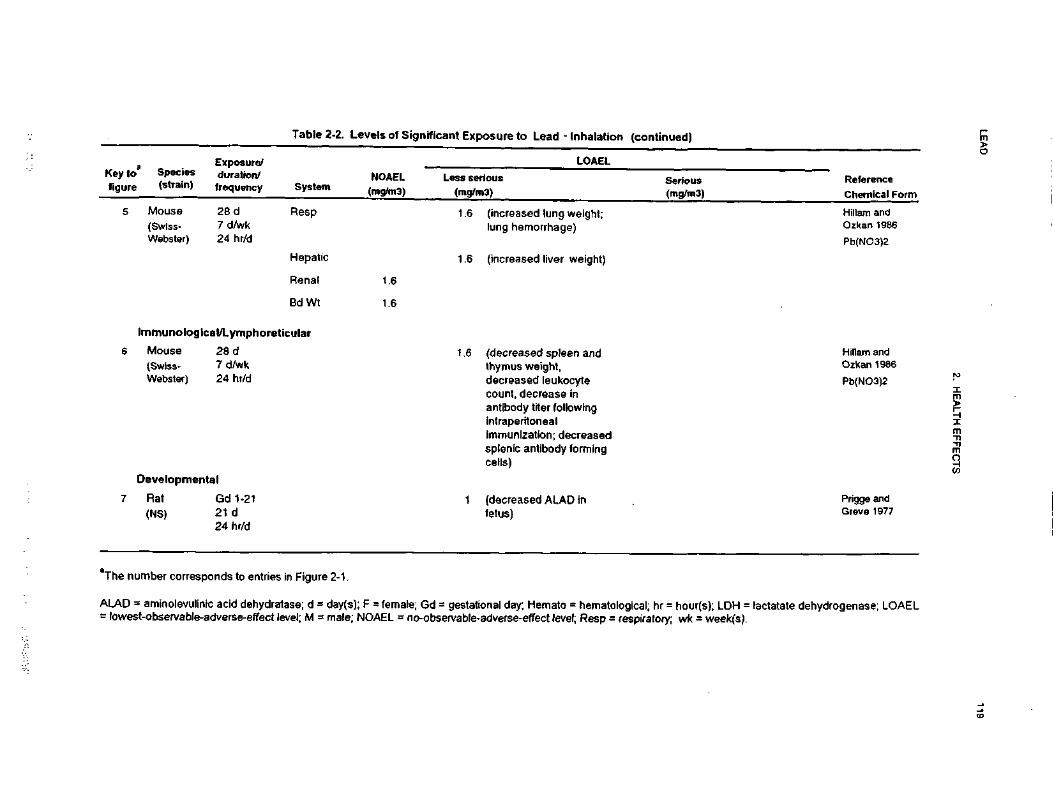
LEAD
119
2. HEALTH EFFECTS
TJfl>3C•soo.c0Inhalat
TJraHI
_jposure toXUJ
*-<cratj•ECU>
(75ioVI
01
5CNJCNCUS£
oa
"•
gl
i §V
£
jUJ
S
o: u
2 t
0 I
Q)
CV
I *—
"
Gft
ItI* S_l
_l £
T»
UJ
?<
£
1 1
Es.(A
ll "i ?
38-= y111 *
i:
tc"5
B
ll
"asSr §>*
c
CD
c S
5X
ra "-
nE
S i
CO .
,
==
N
jaX
O
Q
.
DJ
.2*
'CD |>
5 "i?
>
0)
0)
._c
ra C
DJ2 •£
=
TJ
O
TJ
(DC
0
)
«| ss
0) -
C
D
0
g>
0
~ 1
=.
CD CO
CO^~
oQ
. en
raCO
Q.
CCD
CD CD
cc x
tr
J£
TJ
TJ -§ i
oo "° M-
CN
N- CM_
| S «
0
5-g
S
"g
10
CO*~
5TJ
CO
= 'N 2"
I O Q.
« -
5 « | S §
_»•§.« s 5 s §5
.-tTJ o ra
.£ .5
«) o
£oj CD
2 CM
a_o'5i_oO CD
§ §
c o
< a>
S «
? -8
^_ I s*
T3 h-
c <
j>(0
f-Q)
a0) >
D)
<D
£c5
.cQ<<TJ0)CACO0»
-,0 «
<D =
S^
-C\J TJ
r •£
Developmental
7 Rat Gd 1(NS) 21 d
24 h
CM£3O)
LLcinCD•c1rO
)o"he number corresponds t
r^a
_l
111<O_lCD"
COraca>01o•D>*
£CDT
J
SS'rot3JSII _^
142.
31
1^ItIL 2?
-c S^_. raro
-t
•5,»
c?2!S
iira Q
.
II11 -s
0 >
ro Si
E t3
CD CD
X.1
ft g
? 1
C T
Jo co
isCD ra
O)
&n
«T
J^
0 V
• - O
.£ c
ra uE i£
uj
"gv-.i•2- b">>
—ro
™T
J E
n n
~° 2C
D~ ^—
~C
O
CD
ra >
13
-2
t|
j: !fcCD
<u•° i
LAD = aminolevulinic acidlowest-observable-adversi
< ii
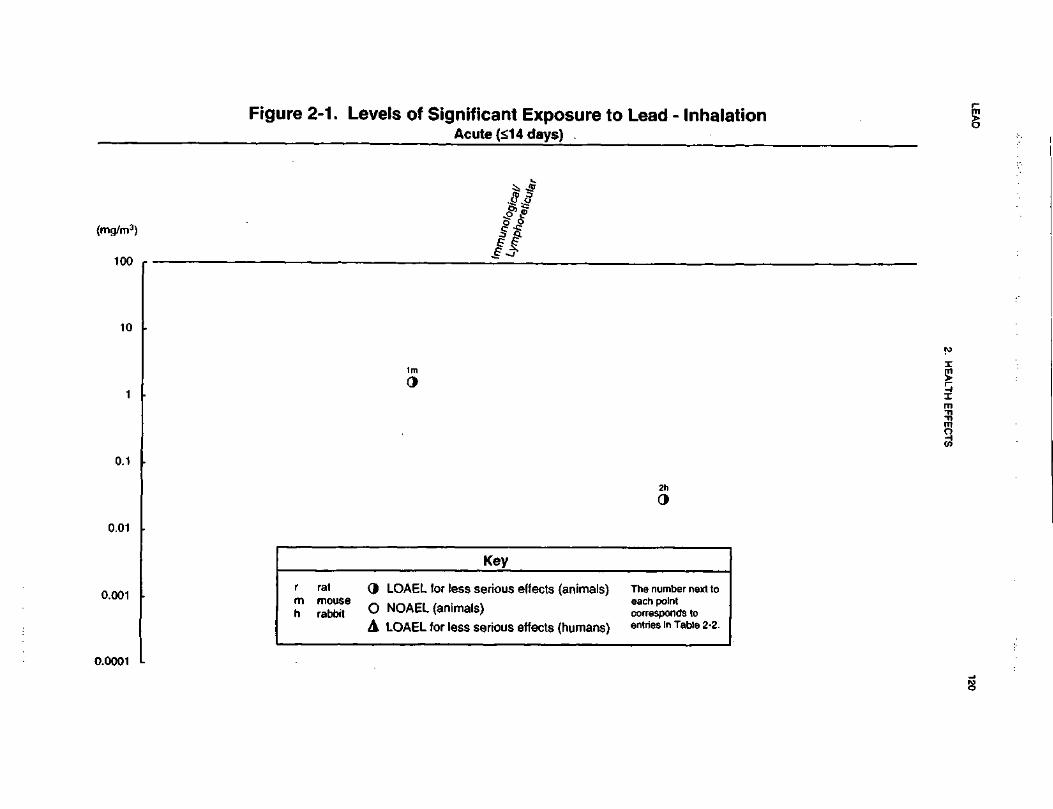
LEA
D120
2. H
EA
LTH
EF
FE
CT
S
c.o*•*mtoJCc"OCO£3(0asX
«U
J ^
*- ^c vi5 J
«J—
3
c^
O)
(7)CM23O)
'll
_
Q>
0)
0 t S
£
at o
ch
- 0) 0
ffl
05 «J
1 I
5 3
ious effects
ous effects
0> ^^
0>to
_w
w
W
(0 0)
05 C
05
^) .£ _ro
o
«.
o•*-
«*-
^ ^
o g g
Is—
O
-O
re E
«
- E£
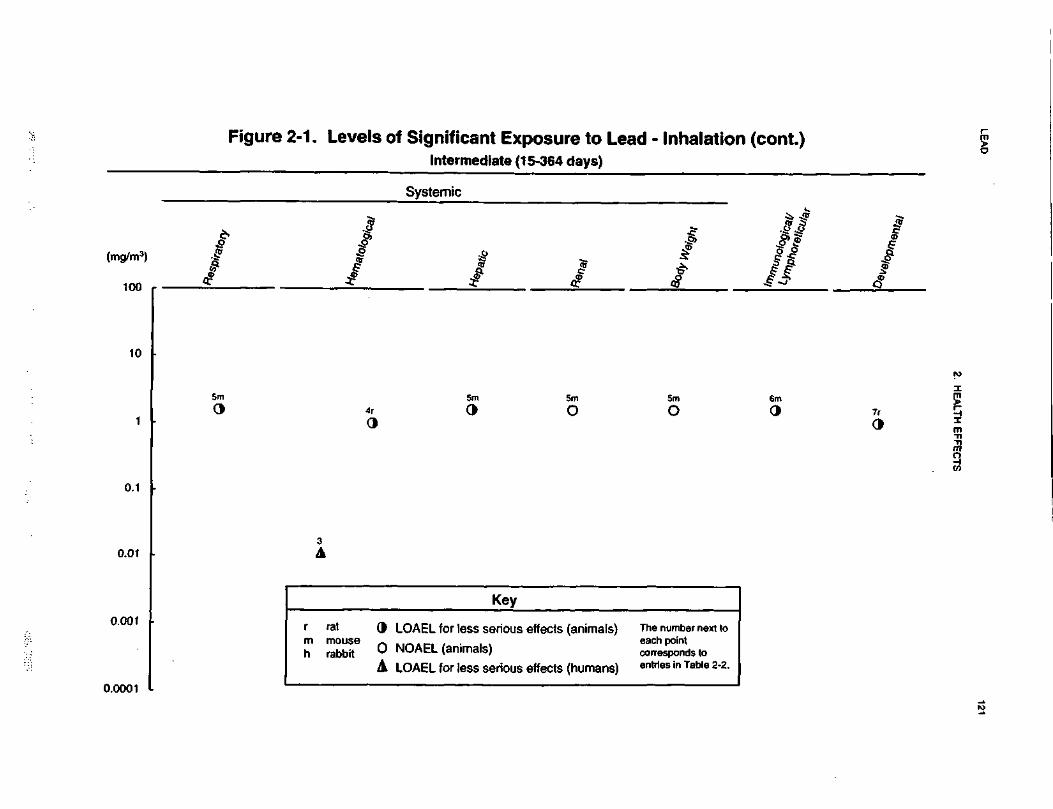
LEAD
121
2. HEALTH EFFECTS
oura•ore0)
S2
2> 5
II^ J^
m o>
«^
(Dc '-58
4)£•
0)•5J2§Io>
S(A
10
10
10
S-
2 o
t 1H
S 8
(O
CO
1 IW
J
1*§to
si(00
o
•c -c
0) ^
0)
to jg
05O
) CO
O
)01
C
C
Ojs
•- saS 1
o—
' lil
—'
LU
UJ
LU
O
Q o
—
o .o2
E
2
"p
0
•R -
LEAD 122
2. HEALTH EFFECTS
No increase in kidney weight was noted in mice continuously exposed to 1.6 mg lead/m3 as lead nitrate for
28 days (Hillam and Ozkan 1986). No other studies were located regarding renal effects in animals after
inhalation exposure to inorganic lead. These results are presented in Table 2-2 and plotted in Figure 2-1.
Body Weight Effects. No studies were located regarding body weight effects in humans after
inhalation exposure to inorganic lead. See Section 2.2.1.2 fora discussion of effects of lead on growth in
humans after multi-route exposure.
No effects on body weight were noted in mice continuously exposed to 1.6 mg lead/m3 as lead nitrate for
28 days (HiLlam and Ozkan 1986). No other studies were located regarding body weight effects in animals
after inhalation exposure to inorganic lead. These results are presented in Table 2-2 and plotted in
Figure 2-1.
2.2.2.3 Immunological Effects
One study was identified that examined the effects of acute-duration exposure to lead via inhalation on
macrophage function in rabbits (Zelikoff et al. 1993). Lung macrophage function (phagocytosis, production
of reactive oxygen intermediates, and biological activity of tumor necrosis factor-a [TNF]) were examined
in vitro up to 72 hours after nose-only exposure to paniculate PbO at a concentration of 0.028 mg Pb/m3 for
3 hours per day for 4 days. Exposure to lead decreased phagocytic activity, increased spontaneous
production of hydrogen peroxide by macrophages, and increased stimulated production of superoxide anion
radicals. While spontaneous release of TNF was not altered by exposure to lead oxide, lipopolysaccharide-
stimulated TNF activity was significantly decreased immediately and 24 hours after the last exposure; this
was followed by a significant increase in activity relative to controls at 72 hours. Exposure to PbO also
resulted in a significant increase in lactate dehydrogenase activity (marker of lung cell damage) and
lysozyme levels (marker of lysosomal membrane permeability) in the fluid 24 and 72 hours after the final
exposure. The concentration of lead in blood from the lead-exposed rabbits remained near control levels
(l-2ug/dL).
The effects of acute- and intermediate-duration inhalation lead exposure on local and systemic immune
function following intratracheal, intraperitoneal, or intravenous immunization were studied in mice
continuously exposed to lead nitrate for 14 or 28 days (Hillam and Ozkan 1986). Several parameters of
local and systemic immune function were measured in the immunized, lead-exposed mice. Lead content

LEAD 123
2. HEALTH EFFECTS
was significantly higher in the liver, spleen, thymus, lung, and kidney as compared to the control group in
both the 14-day and 28-day exposure groups, but the effect was more pronounced in the 28-day exposure
group. Both splenic and thymic weights were significantly decreased in all of the lead-exposed animals as
compared to the controls. Decreases in leukocyte counts, circulating antibodies, and antibody forming cells
were noted in different lead exposed groups. These results suggest that lead induces immunosuppression.
Furthermore, since only the thoracic lymph node response was suppressed after intravenous immunization,
it seems that inhaled lead does not cause systemic immunosuppression. These results also demonstrate that
inhaled lead accumulates in the body, since higher tissue levels were observed following 28 days of
exposure as compared to 14 days of exposure, and the immunosuppressive effects were more pronounced in
the mice exposed for 28 days as compared to those exposed for 14 days.
The LOAEL from these studies are presented in Table 2-2 and plotted in Figure 2-1.
2.2.2.4 Neurological Effects
No studies were located regarding neurological effects in humans or animals after inhalation exposure to
inorganic lead. See Section 2.2.1.4 for a discussion of the neurological effects of lead in humans after
multi-route exposure.
2.2.2.5 Developmental Effects
No studies were located regarding developmental effects in humans after inhalation exposure to inorganic
lead. See Section 2.2.1.6 for a discussion of the developmental effects of lead in humans after multi-route
exposure.
The data from the only available animal study (Prigge and Greve 1977) indicate that inhaled lead is not
teratogenic. However, it impaired heme synthesis in both rat dams and fetuses. In this study, dams were
exposed to 1, 3, or 10 mg lead/m3 (chemical species not provided) throughout gestation (days 1-21).
Maternal and fetal ALAD were inhibited at all exposure levels in a dose-related manner, and fetal (but not
maternal) hematocrit and body weight were decreased at the 10-mg/m3 lead level. These results suggest
that the fetuses were more sensitive to lead-induced toxicity than were the dams.
The LOAEL from this study is presented in Table 2-2 and plotted in Figure 2-1.

LEAD 124
2. HEALTH EFFECTS
2.2.2.6 Reproductive Effects
No studies were located regarding reproductive effects in humans or animals after inhalation exposure to
inorganic lead. See Section 2.2.1.5 for a discussion of these effects in humans after multi-route exposure to
inorganic lead.
2.2.2.7 Genotoxic Effects
No studies were located regarding genoloxic effects in humans or animals after inhalation exposure to
inorganic lead. See Section 2.2.1.7 fora discussion of these effects in humans after multi-route exposure to
inorganic lead.
Genotoxicity studies are discussed in Section 2.5.
2.2.2.8 Cancer
No studies were located regarding cancer in humans or animals after inhalation exposure to inorganic lead.
See Section 2.2.1.8 for a discussion of cancer in humans following multi-route exposure to inorganic lead.
2.2.3 Oral Exposure
2.2.3.1 Death
Oral LD50 values for lead or its inorganic or organic salts were not found in the available literature. LDLO
values for a number of lead compounds have been estimated (Sax 1984, see Table 2-3). An LDLO is defined
as the lowest dose of a substance given over any given period of time in one or more divided portions
reported to have caused death (Sax 1984). Furthermore, unlike LD50 values, these values are not derived
statistically, and comparisons between compounds and species are difficult.
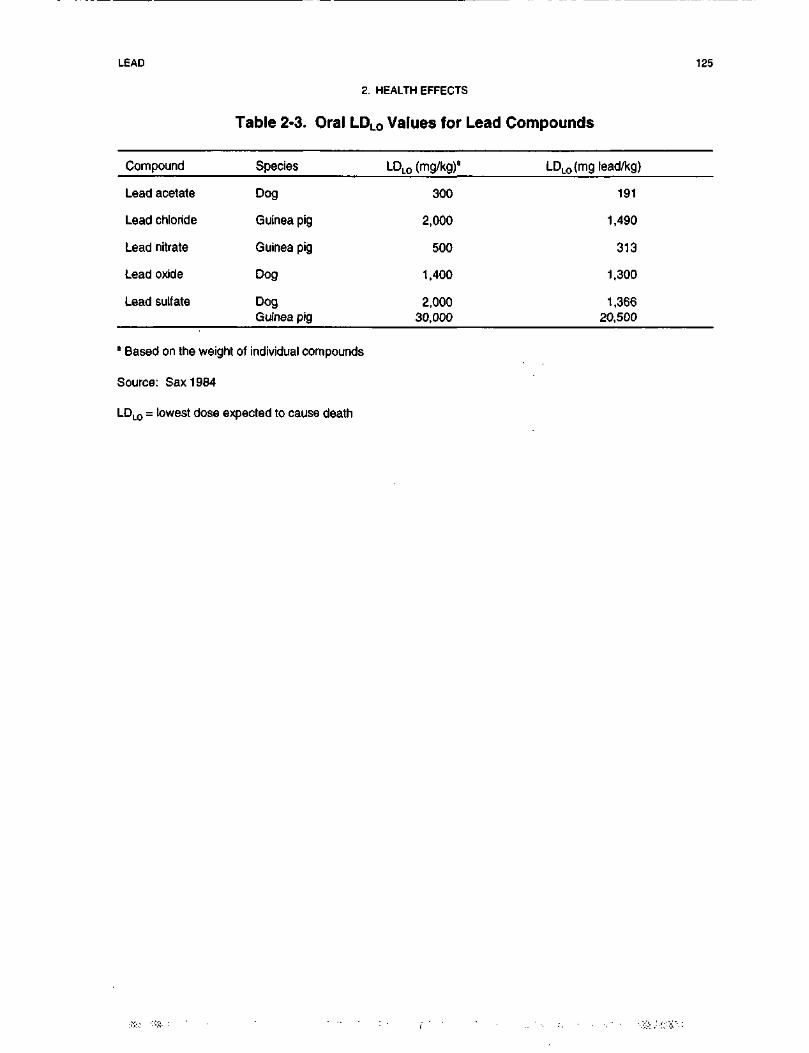
LEAD 125
2. HEALTH EFFECTS
Table 2-3. Oral LDLO Values for Lead Compounds
Compound
Lead acetate
Lead chloride
Lead nitrate
Lead oxide
Lead sulfate
Species
Dog
Guinea pig
Guinea pig
Dog
DogGuinea pig
LDLO (mg/kg)'
300
2,000
500
1,400
2,00030,000
LDLO(mg lead/kg)
191
1,490
313
1,300
1,36620,500
8 Based on the weight of individual compounds
Source: Sax 1984
LDLO = lowest dose expected to cause death
LEAD 126
2. HEALTH EFFECTS
Increased mortality was observed in a 2-year feeding study in rats (Azar et al. 1973). However, the
increased mortality did not occur in a dose-related manner. The apparent lack of a dose-response
relationship in either sex precludes meaningful conclusions regarding effect levels for mortality in this
study. Increased mortality was reported in mice exposed to 0.5% lead acetate in the drinking water in a
3-generation study (Rasile et al. 1995). This level of lead in the water provided approximately 605 mg
lead/kg/day.
The LOAEL values for mortality are presented in Table 2-4 and Figure 2-2.
2.2.3.2 Systemic Effects
No studies were located regarding respiratory effects in humans or animals following oral exposure to
inorganic lead. See Section 2.2.1.2 for a discussion of the respiratory effects of lead in humans after multi-
route exposure.
Cardiovascular Effects. No studies were located regarding cardiovascular effects in humans
following oral exposure to inorganic lead. See Section 2.2.1.2 for a discussion of the cardiovascular effects
of lead in humans after multi-route exposure.
Most of the animal database concerns effects of lead acetate, a "bioaccessible" form of lead that does not
mimic the bioaccessibility of lead oxide, lead sulfide, or other forms of geologic lead. Lead acetate has
been used as a paint pigment and hair dye. There is a large database that describes cardiovascular
(primarily hypertensive) effects in laboratory animals resulting from exposure to lead. In the earlier studies,
relatively high doses of lead were administered (i.e., 70 mg/day), and it is difficult to determine whether the
hypertension observed in the treated animals was due to a direct effect of lead or was secondary to lead-
induced renal damage (Victory 1988). Furthermore, increases in blood pressure were not always observed
in these studies; sometimes decreases in blood pressure were observed, and PbB levels were not always
quantified, making comparisons across studies difficult because of considerable experimental design
differences (Victery 1988). The more recent chronic-duration exposure studies at doses that are otherwise
nontoxic clearly indicate that lead ingestion is associated with an elevation in blood pressure that is
sustained over a considerable portion of the animal's l ife span. For example, male rats given lead acetate at
50 ppm lead in the drinking water for 160 days had markedly increased blood pressure
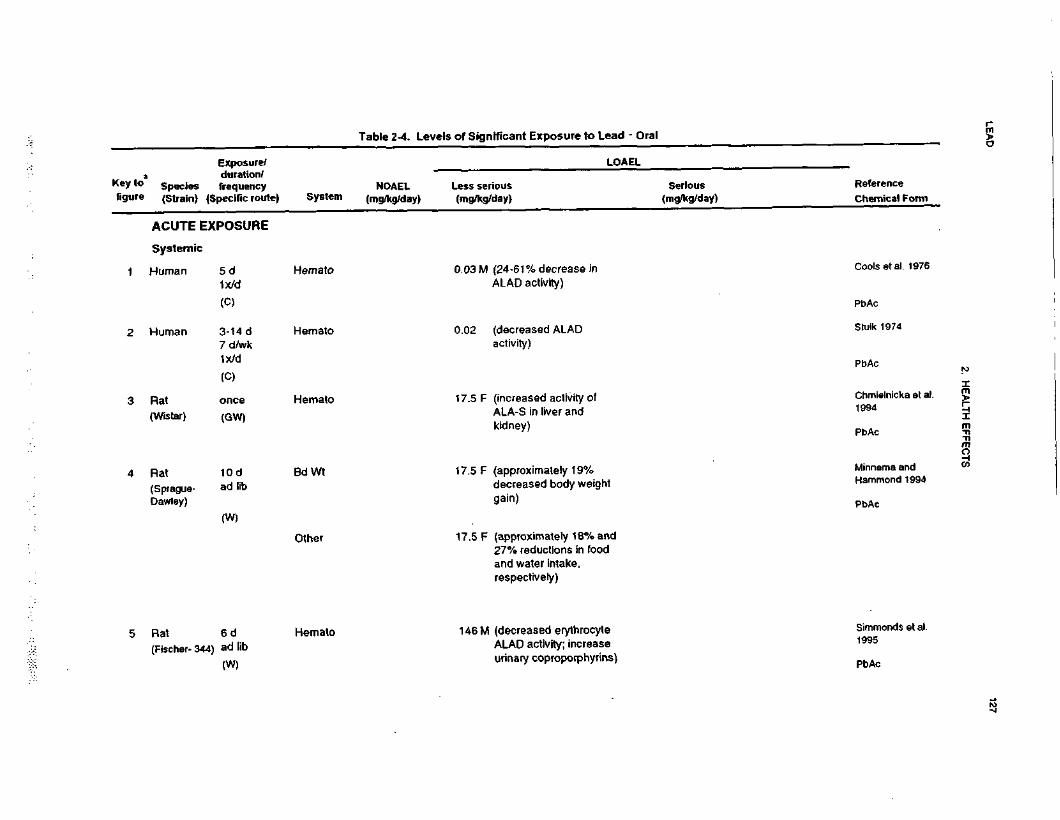
LEA
D127
2. HE
ALTH
EFFE
CTS
2O1•o2ificant Exposure to LifzSV)•5in0>iu"TCM01
JD
II
0)
_u T
oc
o£
'E£
501
£K
o
s|
O
O)
siI.
_!
UJ
S
S J"
J3~
Bit
^ O
>O
^£Z£11,CO1
!! *e o o35
£ So jo
^.c
ijj'fc S
.S2.
ll£2
-
"o
£.„
301
21
UJDC3(AO0.
XUJACUTE
CO0)CO0)
JG o
o
<0
S0
Q.
_cCOra0) .
o ^
-slv.0
O
o^ C
O
co Q
28OoiCDI
-Q
S B 5
o1 S
S. E
>»
3CO |
.
O)
! 2
CO
0.
(decreased ALADactivity)
CNJOC
D0raE0)I•c
-*
^
-< ~o
A !P
*
OCO
h* ^—
—
'
ctoXCM
T3'SegJCujcQ)
Is <
S2
£
(increased activity ofALA-S in liver andkidney)
LLS0raOI0) ^
o
?§ a
- 1(T
1.
M
^ O
)c »-
(0
C
C
^
1
121
a.
(approximately 19%decreased body weighgain)
LLL0i•oCD~O
:=O
T)
T- IBi
^_^
O)
5"
1 a
!j-
Simmond1995
Pb
TJC T
3CO
O
oo c
ls
S?11
§.sl1stina> {?
o
us I
8 8 £5g «1312(O
60)
CO
(8 —
LO
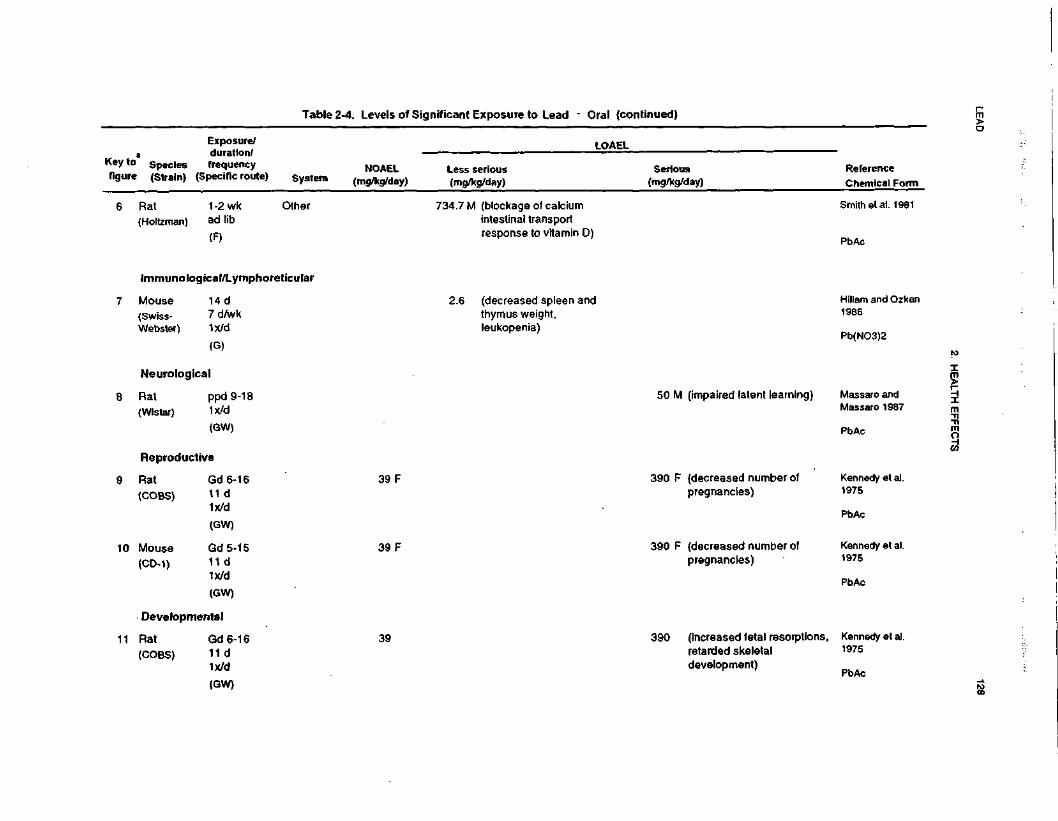
LEA
D128
2. H
EA
LTH
EF
FE
CT
S
^^
•ocu3_C
V*CB"56i•ore01
_jo
ant Exposure
uEcDl
55
•5I/I
$Z41_l
"fCM01
.0H
§
Reference
Chemical Fo
_i
Ul
^O_J
?09
T]
§!>i* « Eess serious
mg/kg/day)
_i —
J iU
J P
<
>o £
Z **•"
fn>.(/)
^
=
0_
n N
£s
f&•*•
^ u.
m.£•?8
2*a
™_ *.o
*>
» 1!*: =
m
Smith etal. 191
PbAc
Q
E
c3 C
'^"o
O
E
~ rt
(Hs §•§'o
2
oCD
^
m
7M (blockagintestinalresponst
^~C*)
1,_CD.CO"1
-D
2!^ £
"c"CO£)
m
oDC
5-
CO
IN
h-
o
|g•D
CM
ra >-
ra
5T
oo
c
O
ra
nS
to
z w
w
t>
S§
£
11
1
^ ^D)
C'craJ!1:CD
5•Q0)
'nj
Q.
_Es0uo
T3Ccoc0)0)
s- £"w
O)
« 1 '1
10 >
^
CO
w fU
£3
6-
o
E^
0> >.
32-£
"•
CDC
\J
w(Q3.0£oj:E
S^C
i
^
TJ
^-D
S-D
g
f
^^
7? 0
Xl |
U
T~
r** T~
•*
1 ^
Q. ^—
^—~
C
DD
l *j
-2 '5,
i -
fi
1 s
i § I"
1 1
11
IIIr-
oo
"3 ID
«> 1!
f
fE
K
5
iK
<g
o,
f
5fe g
"o "5
CD 5
-0
XI
E
E3
3e
— ~
e • —
•to
«•a
a -o cu
« y
g "
«
5
to g
£ c
S c
o
en
o o
>0)
0) C
D C
D
5- a. H
. Q.
u. u.
0
0C
D
CD
cn co
U-
U.
0) 0>
C*) O5
co in
^•d
-d
?
« -o
-o ?
. S
:=B 1
S^B 1
>0•oIS
§
v
& IS
|8
oC
D
T-
1cf:g-1£
Kennedy et al.1975
PbAc
COQ!•8CD_
C
8™
"S
.ffl
^~
*^S
<D
C
•o "^
«
o " E
S « 8-s -5 •§i_
^ Q
)
IIIoO
)nC
DC
OCO® T
I-O•a ^
a
0 -
S
18
T_
"
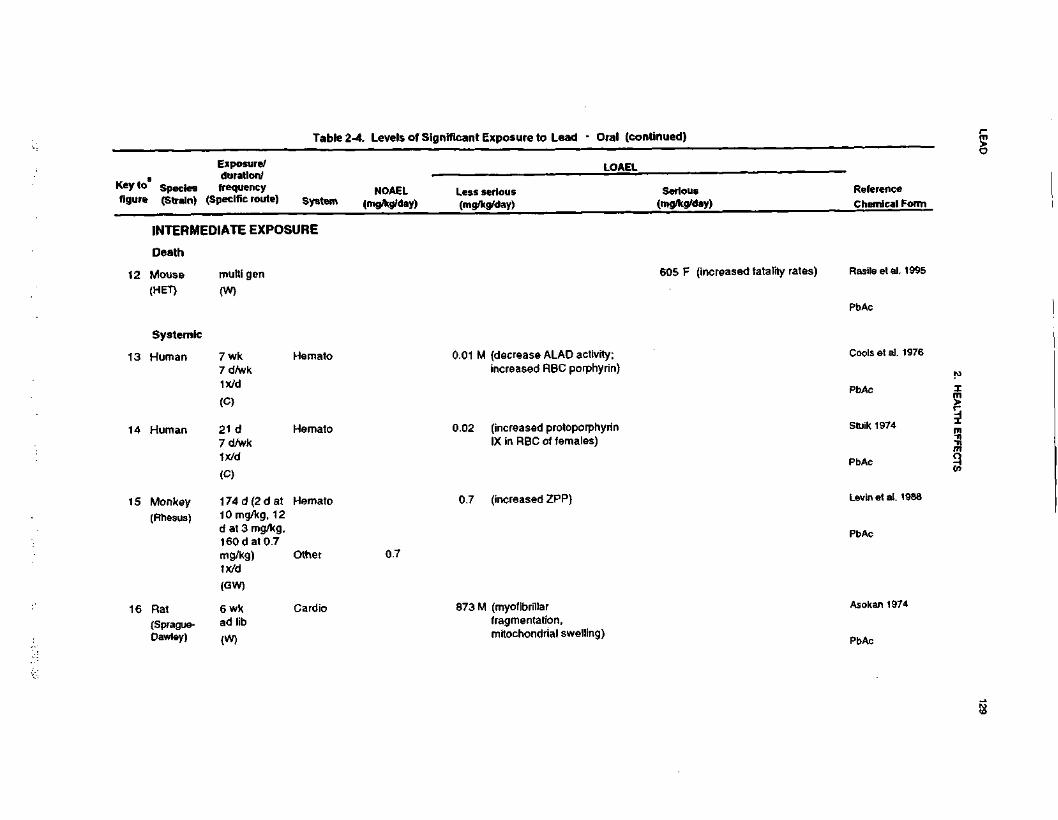
LEA
D129
2. H
EA
LTH
EFFE
CTS
?01
*•I201^!£3Mg.KUJ
*ri
8£J>w•0MSJiCM«>A^
01
"•
i »i i
S3
£
£ai
£K
Ot "~
11
ni/i —-§ if•e
sg|>
M
Ht
M
?
J^
Ul T
g|
z|£.
is.m^^
Us!
(A S
£
U
82
2.E
3
S W
i3* 1
1.
(0^^
B £
w&
"o »
&|
* u
U]
875o8cc"w"012:&rereT3OU
lre0)
u_c=-LLl/s
UJ
ccCO0Q.
X
cW
g,
IS 1
<
1aU
J£ f
gz 1 °
£o
5CM>—
a.
sen730ooo:
<No£(/]
•3«1a.
re o
O
°-<
o-I C
D<
CC
O
-o2 «>ra
«o>
ao 2
o> o
qo
°l
&£
I*
"g O
v> CD
ra QC
a_aN•o0)(0toIDr-d
"ai.1
= 2 "c|
»
5
m
oreE(D
Orere01
raO
4sE re
'co T
J
(0
cre
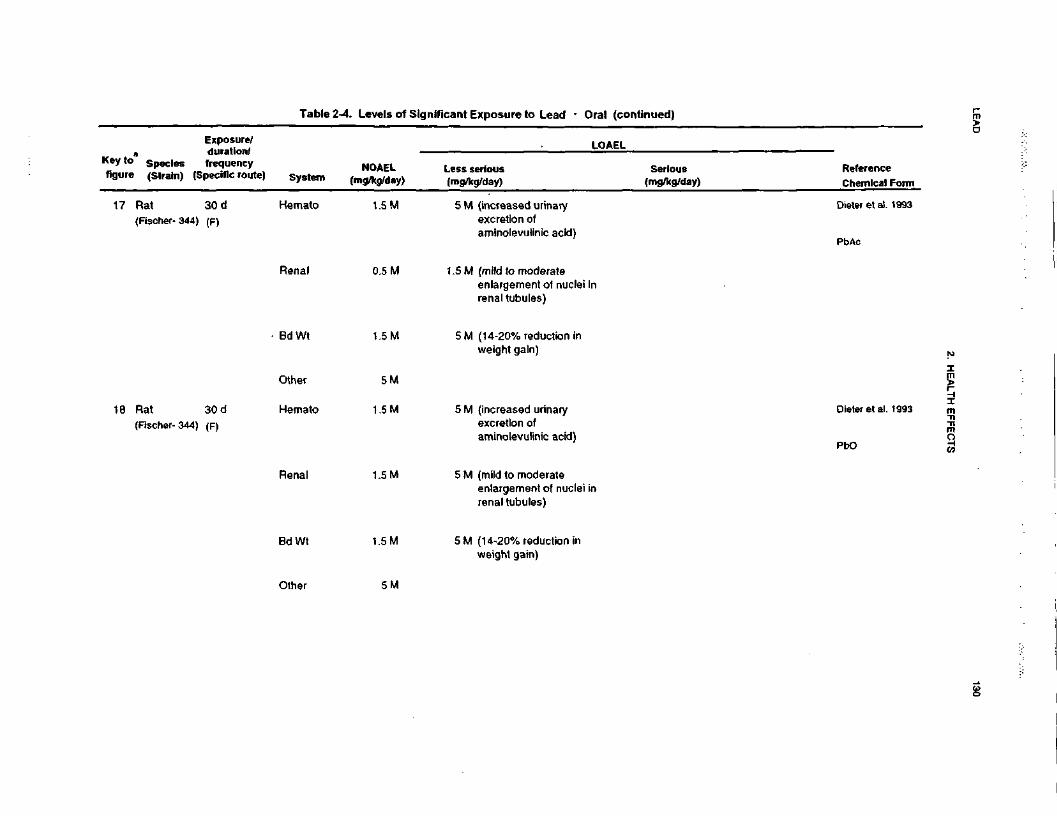
LEA
D130
2. H
EA
LTH
E
FFEC
TS
V
fCC
0
Ic5O•Dra2
xpos
ao°cStn•sJ2!TCM
2.
a
Se
-ll
££
•o
fi
"iS
o2D
.
jz'5
5•c >f
o
o|
i.8 1
I
c.2t33ȣ
"~ ra
jS en
S|,
? "
S
c^re(increased urinexcretion of Soreaminolevulinic
Sm(mild to moder;01o3enlargement ol
renal tubules)c.2t53T3£5OC\l
4-
"c"'i5O
)
£o>'a>
5inin0
2in
0)0)
CC
0).c
CD
oro<D0)
CC
15
II
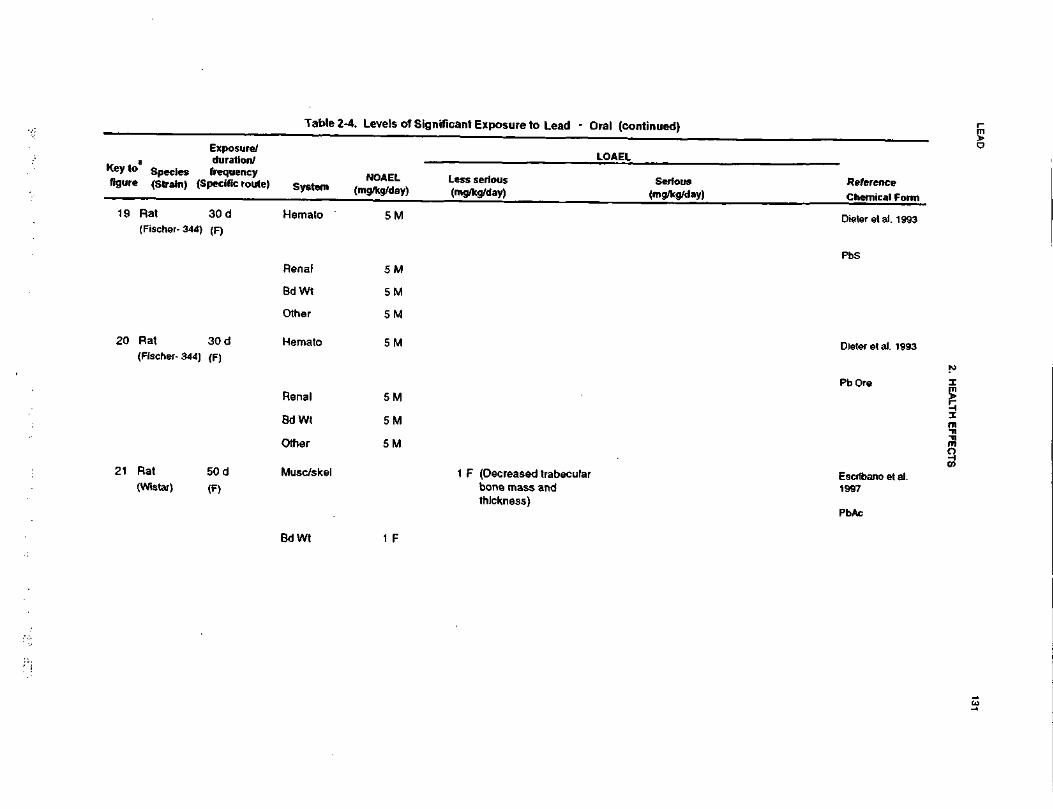
LEA
D131
2. HE
ALT
H E
FF
EC
TS
fXUJ
'erooEcO)
wfMJU.Q
ui 5
11w
11
»i
"S 2|>
l
13aS.9>Q
8o>Oieter et
o6XI
joiJD2o g
0) C £ o>
S
5m
in
Oaa>XT5g £C
O
—
O
s«
g
CD
750)
-oo 57
0) -D
CC
CDs
oin.5 t
oC\J
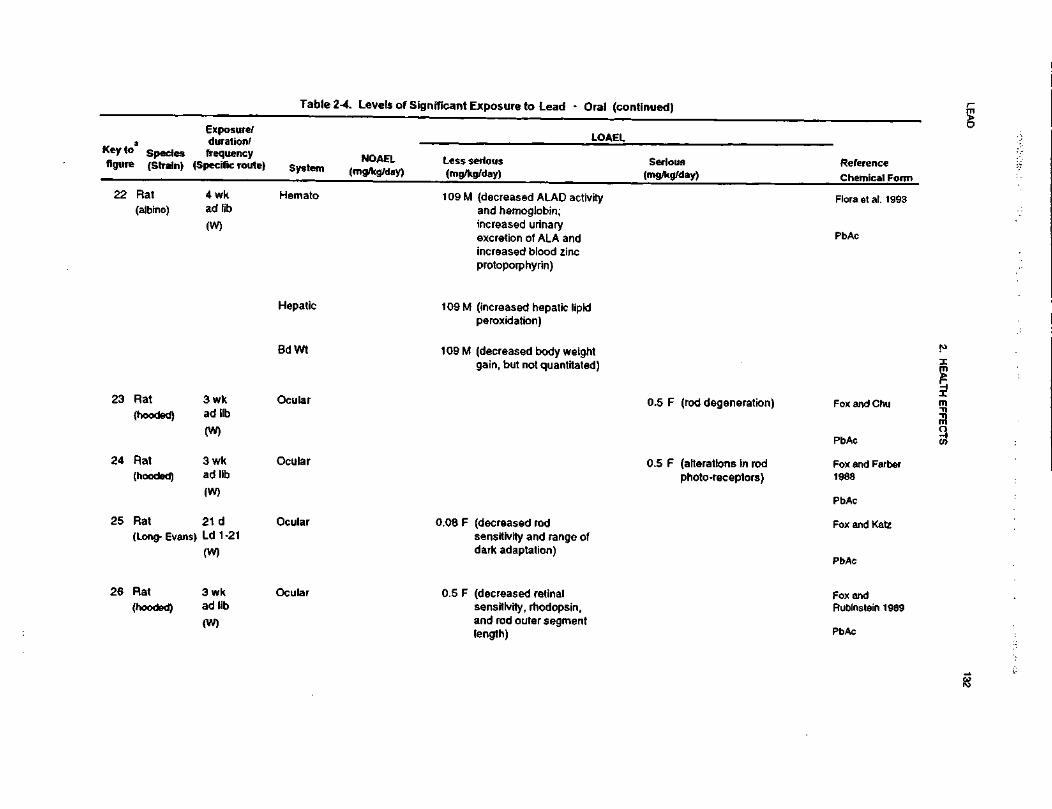
LEA
D132
2. H
EA
LTH
EFFE
CTS
"83_eI15cant Exposure to Lead - Or
£co>W"5J2s3u>T(M012n(-
§|« ±
8 3
2! ]
£ i
U
£a u
»l
g|iiu g
sO
L
Less serious(mg/kg/day)
_. ?
lit "O
11E.
!s.c/>
ITS
c 5
-1
a I c
£
Si8*
£•= S
fyfiffc
I.M.
0) C
"5 "5fi-wv)
*— •
£ £
£ D
>
5 c
rto>o>"5n
oo
2LL
a.
?~1 09 M (decreased ALAD activhand hemoglobin;increased urinaryexcretion of ALA andincreased blood zincprotoporphyrin)
0(Q0)I^ 5
i?
I
^__
O
*- .E
n £
CC 5.
CMCM
109 M (increased hepatic lipidperoxidation)
1 09 M (decreased body weightgain, but not quantitated
o75 5»
o.
»0)
73
I
CD
6IT
3§
£Q_
2 §
Q.
LL
2a.O
=
£ C
C
.22oc01o><D•oILL">O
2 "?
« 01
.2 g2 6
Ji a.
u.U)
o
oa0)
c
•o
2^
e?
5-o
« ™a>
•>, a.w .&
m« i -o
£ .tr «g
c«
•n *
<°
2.
<o fj
c at
- g
E
ra g- en
c
O «
•i: w
U!
re >
~o
.
s « e •=§
s^tiS
S»
LLUl
O
T3
CO
TO
m^ £
j:S
co rt
UO
CM
?
' I"
- C
\J -I
=-
"c/r§u
«cc .
U)
CM
raCC(O
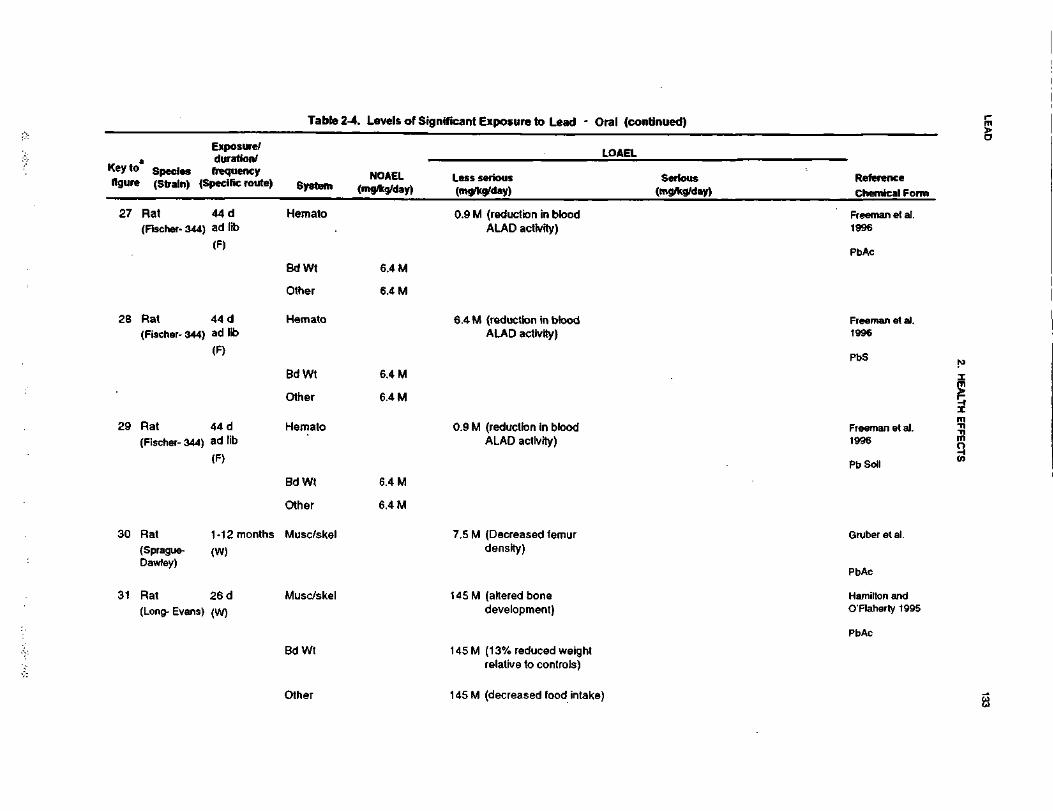
LEA
D133
2. H
EA
LTH
EF
FE
CT
S
1_c120i"83£|MaA•Mc1'e.S>CO0Jg1iCM»A™
ioIL
i1
Gi
2
at o
|l
to E
M .-*
M
A
2 Ej£•>;.J
10
Ul 5
§1z a<^
ffi
wCO
!*&f
If ifuj "" £
J,
8 "c
JT5§
(o £!•
"S
£3« S
1
^ c
is -a
» •&
|$
<
1$
£S
£
£2
1
Sc .•&
e ^
c £
c S
•B
S
-S
^
= 9
=
°S
3
35
-b-<
4^<
2
20>
Ti-
O
CD
^-
^C
O*
CO
O
O(TJ
i
i_ rt
e 5
« E
0) T
3
=
0)
I
m O I
T3 •§
-o
i^
T
J f
^ T
J^
nJ
— -
^
flj
I
I
S
Q)
£
C.
s. ^ a.
t—
00C
M
C\J
•3'ogS o> -Q
it 2
o.
aaS5
"f
ifSo
^3
^-<O
)
c>
T30>ma —
21 ^~
o u>0)
C
9.5
§ 55
£
"S I
TJ
CCD
OO
O
•O
££ <
D
co J5»-
a>
racT3§•o03v>ro2in
m
on0)
TJm
o>J£jnoECM
T3
m
0)
5
TJ
(OCM
§>
« £tr <2oC
O
o10tr
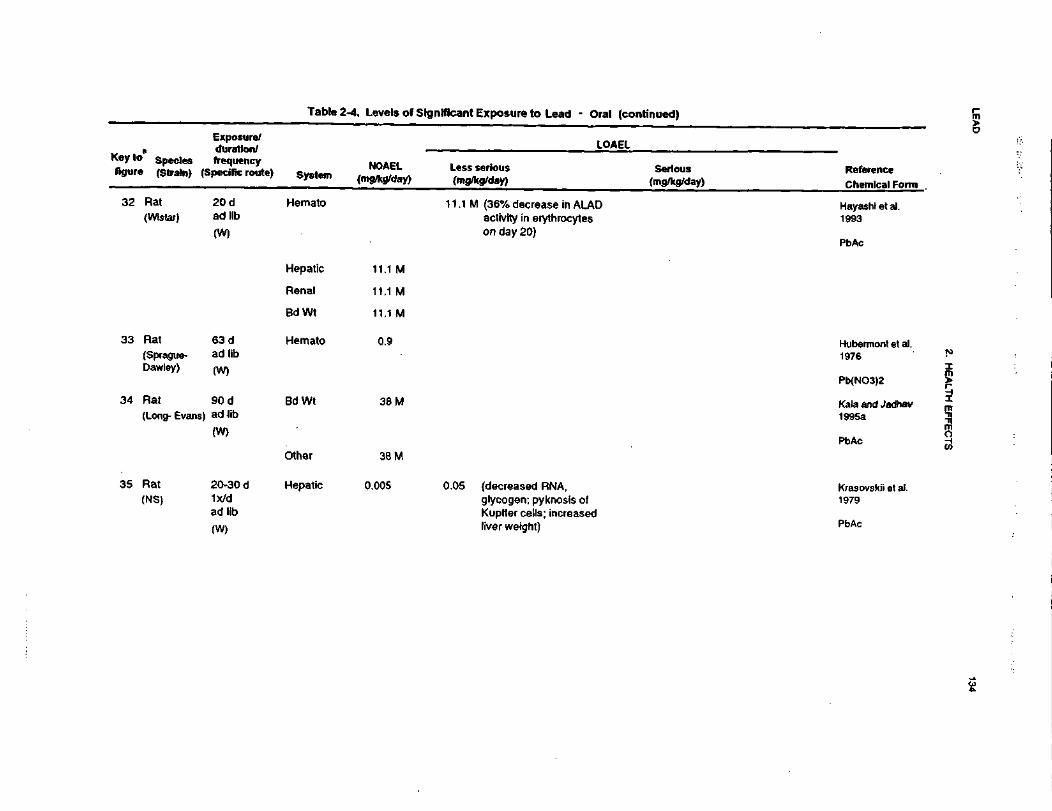
LEA
D134
2. HE
ALT
H E
FFE
CTS
o
g* e uDC o
IcO3.Qa
•3'S!i ifS I
£ £
£II
I
CD _c
(0 ^
s ^* • K
-O
f O
S
-^ C
M
; .£ T
J£
0 C
G. cd
o
o u>.2
S
Ili-S
S:S.
III!
55
5»
-.*•:*
-. °^
V—
V
—
T—
O
coCO
ino
oo in
co opO
O15a>O T
3CM
CO
ra s
EC
ora 15
a. c
at a
I CC
T3CD
oaai^i
2T
3CO
•om.6
raI
*i ?
§^ £
«
QCE
=iaccLOCO
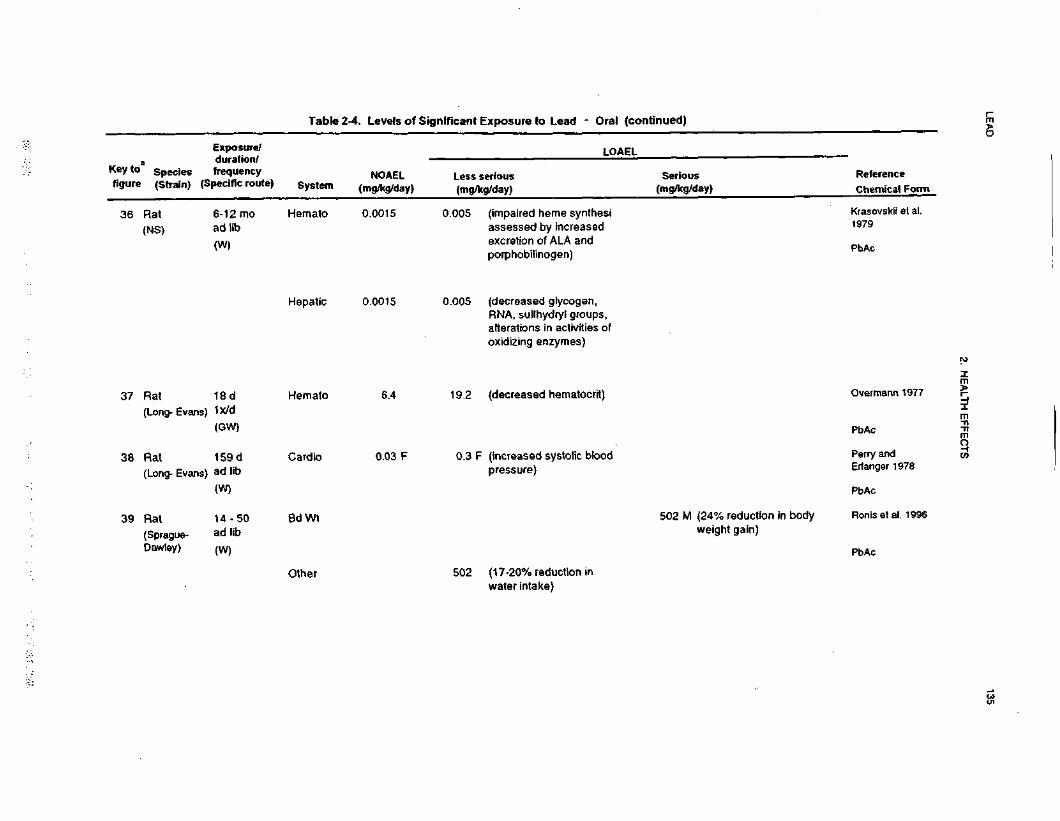
LEA
D135
2. HE
ALTH
EFFE
CTS
^•oV.11"5Exposure to Lead - Or
IAJ
'craosci/5'oinJ>«2
ou.
C
001
•=w
E
*£
v
CO .C
a u
M
*"
o i>IS&
Ul
q-j
1?
Si,
5* in ^« ,§.
_J W
UJ
"O
§ «
z a-ICO
IT•a
- >.=
5 § £ S
Ul S
0) O
UJ "° ^
S
.52,
11
{/) *•••'no
«>> =
n"CD•=CO2m
O
CO U
*
^
^
T-
Q_
._(impaired heme synthesassessed by increasedexcretion of ALA andporphobilinogen)
moooino0d0n)CDI0t ^
T T
D ?
CO
CD
=— •
re h>
cc S
.COCO
(decreased glycogen,RNA, sulfhydryl groups,alterations in activities ooxidizing enzymes)
inoqdmoodQ.
CDIE
r^„_grtgai <
>
.QO
Q
.
(decreased hematocrit)
CMO)
CCOroE0)I-D p
5
CD S
O
17UJdn*-
cCO
0or
zi.
CO
CDftO)
? g>
0
fc
CO ^
CD T:
£>Q
. U
J
0.
-n(increased systolic blooipressure)
u.nLL.C
*)Od.S(0O"O
ft
O ~
£-•
in T
3 5
T-
CO
S
.
•i?UJdn
*-* c
CO 0
o: d.00CO
§O»*~•50V>
oc
^o
^nr
n
•ooJ3Cc.2 _
0 C
•§ s,£ ^
••s ^
5.3
2CMOin5•^CDOin j2if
to ,°- a
or 52.DO
)co
(17-20% reduction inwater Intake)
CMo>•f~-O
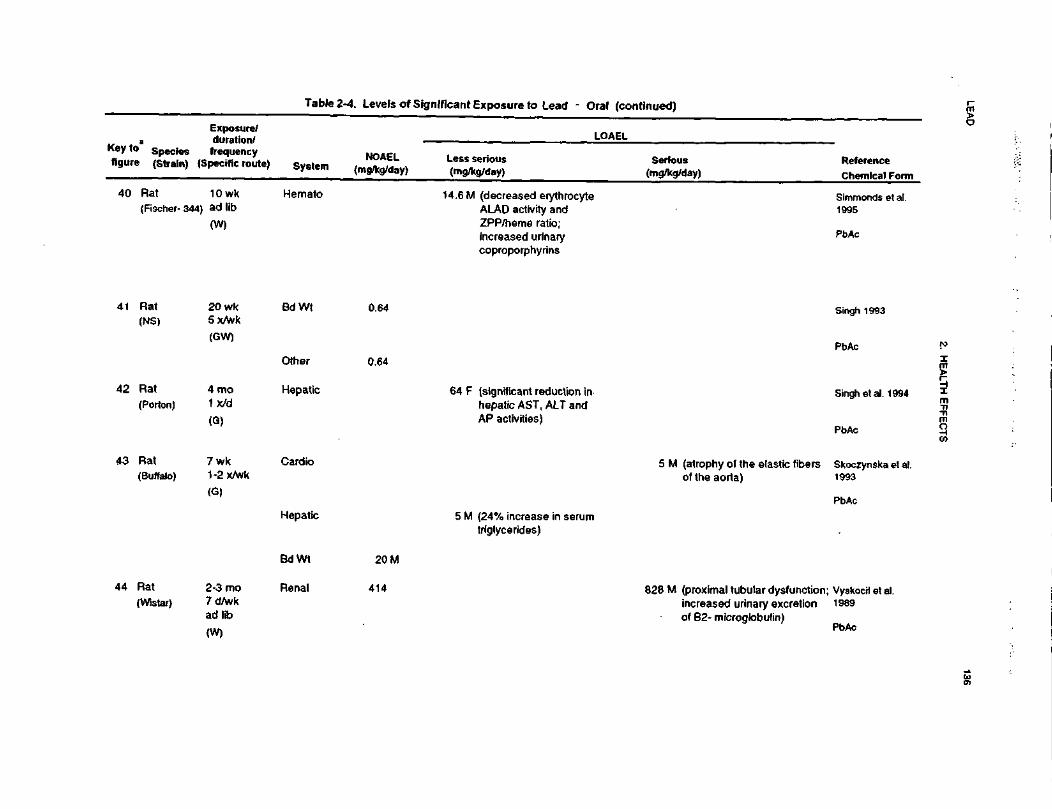
LEA
D136
2. HE
ALTH
E
FF
EC
TS
Exposure to Lead
7CM
JOre
H*!a u
•ft - >
.3
§§
SS
SIM
g-S
S
Ty
uS
't g.(0
T5'SSimm1995
•3is•§,-OQ
-w
;-
S2a>xi
v=.o_ egO
-C>
.0£
ra
CX
a)
S £
Q.
O"3^2
.2 C
Itl.a
~ 2
s
CD°: =
00CMCO
£otls|sII
0)njg
-oC
Q
l =
51
8.
Is
2S: o g-N
£ o
C
Co
ra'§ I-
•£ W
.2
i < -5
c ct>O
l CL
E301at —
^ra
in0)
0>
S
fi01
ll
•omSi a
W
^o: S.
5
too01(0D
.
o•SnO
.u<5Q.
0)
^ I
CM
« 5tr S.n
a>a:
T)
CO f
(8
2^^
coID
S
tr S.
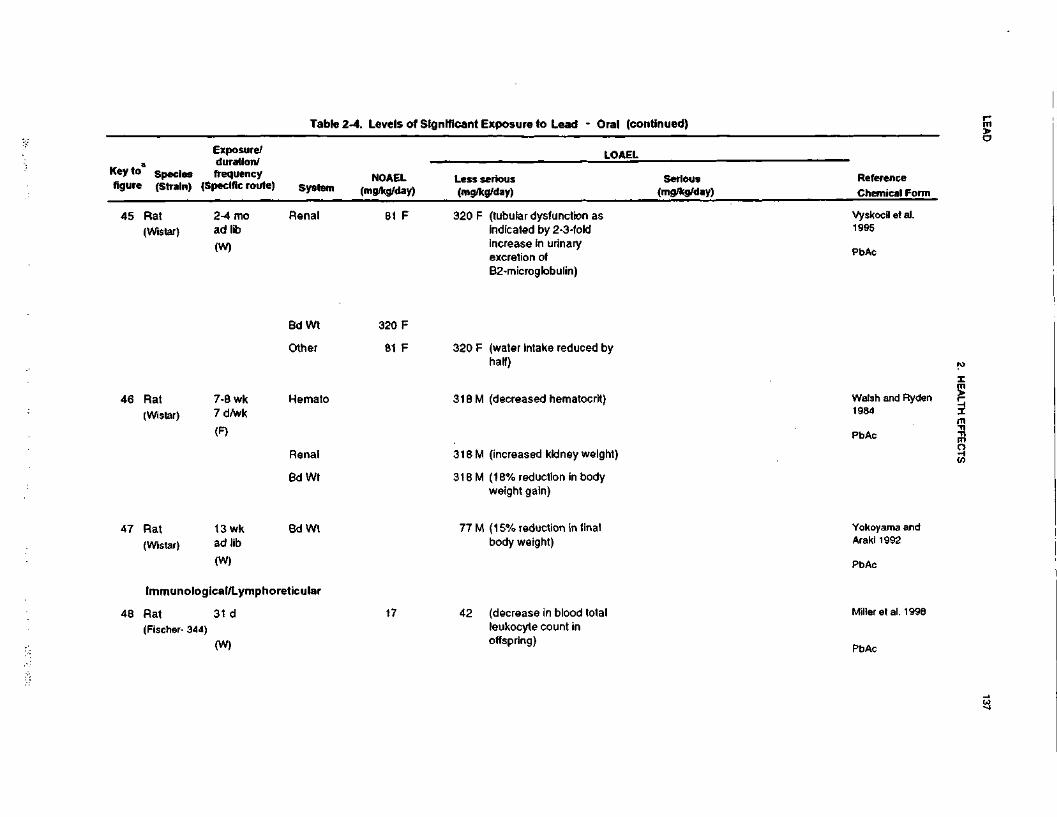
LEA
D137
2. HE
ALTH
EFFE
CTS
SO3IAaXLU£c»M•5(M
o m
= £
fill2.
8 =•
11
W «•
"5 £
Ia.
Q
co ^
2
Q.
</>raic^U
S•O
T
3« C
D
•i «IIoCM
fc- ~
14rease IexcretionB2-micro
S"oon0)
_wra£oCD
0)
1>*
0)c-T30)WraCDO
>.
o£c.ot3?00
•^zD)
'01
_c_cc.003T3CD
in
£O)
CD^»
~n
oCMCO
U.
LL
CM
00CO
00CO
00toooCO
ra"oII•E
8
ra >> c
2 n
~O
S
C
L03
3
«2-
® O
CMrf
nCDoc^^ f
CM
18
-
3
•om
CD
5
"ra01I
2 5
CO
-Otr
m
«^(8
>C
C
>
CO
T3T-
caa•^
wrt 5
CC €-
Q.
Ira_ooc
T>
Tt
CO
E
o-i
|fiCO
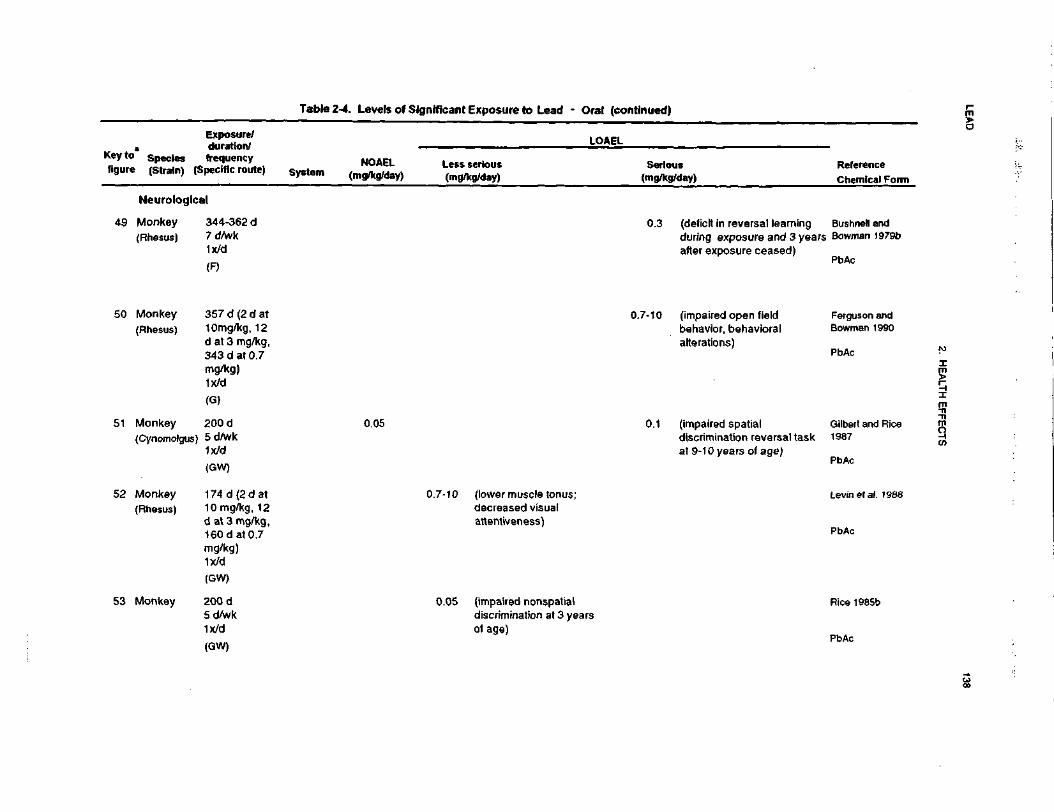
LEA
D138
2. H
EA
LTH
EF
FE
CT
S
1i2O1•o£i(AoaXiu**c(0
1CO•5J2-fCM»JOni-
go• It
u
nS -
l!a. o
UI
3
•>;
Serious(mg/kg/da
w
~S
it
u EJ
•5;d|
2^C5S.M"ST
" ^ o
oS
O
C
"-•ff
01 u
l§ll52.
S F
i!CO =i-
„**
^
1".?
?
Bushnell ai
CO
cE<n01^~
"re2CDVCo"SCOo•DcyID«?•*
_ s
a_oO
Q)
*- -X
0
0Z
20)
•«*
O)
en; Bowman 1reCD
P)T>cre2COOQ.
SO)
.c"gT3
|^I<D£
5.aCL
^~a>VI
reCDu0)CO8.X0)0)re
^B t
nSir?CO
oir
(B g
c're
0) ^
a
CD
ff .2 .2
S re
2
5"5S ^T0)
D)
~
"- oS
.§ 2
CO V
C
O
." £ o
co -c r
re_
cu
C —
O re.>
«
T)
0)
g
£ c
5
o a)
O
CD
1==-
TJ <
0
ino
oin
—
CM
ui -
ii.
fcoin
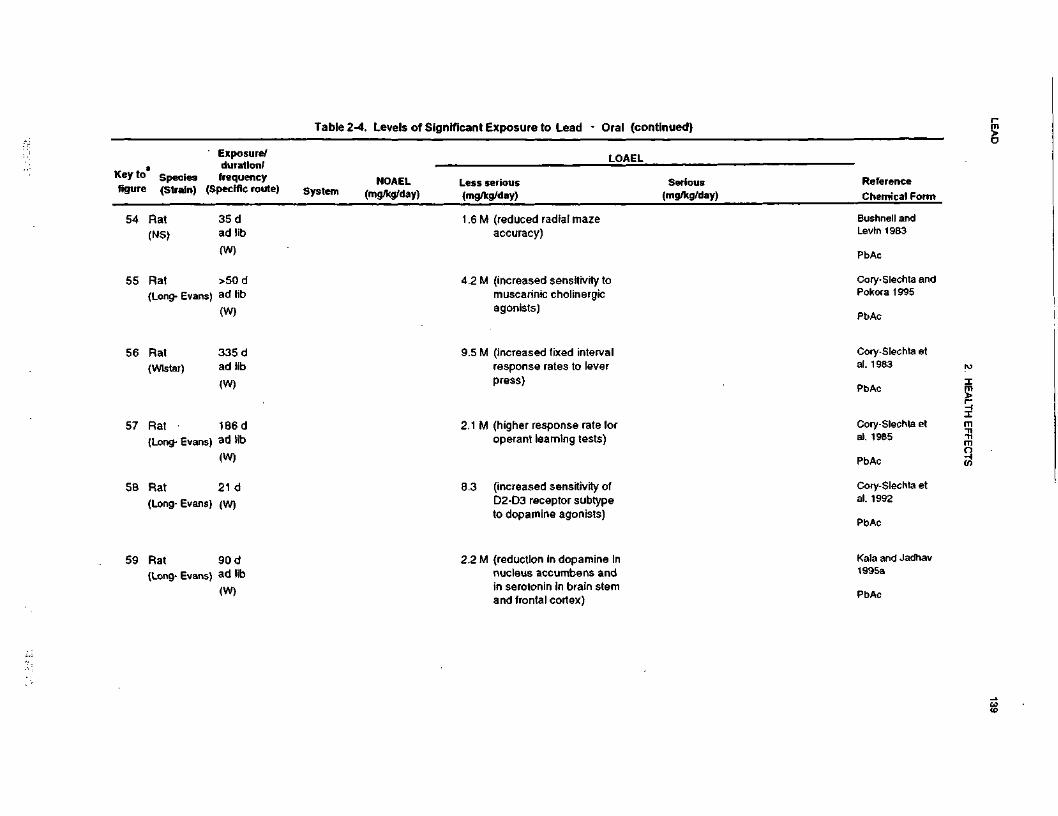
LEA
D139
2. H
EA
LTH
EF
FE
CT
S
f3'e0•Sixposure to Lead - Oral
LJJ«rfC5£c.S
1
15IA0)
5-JCM4)janf—
iou.2 1?
_JUl
O
£ ~
£ S
V
£or
u
If!|VI
X*
to 0>
j •£'
.5-
UJ
"O<
'Si
O ^
ZI1CO>.
w"3T
ml
(A ^
0>
U
W-
8—
* c
11CO ~
"S
£
1"!
•o§SBushnell
Levin 191(reduced radial mazeaccuracy)
_^i
IDwin -o
n n
a <gtr S
.^>in
T3c10273^
O
J<
&
•£
O
a- 0
(increased sensitivity to
•cCM^
•••
O§
inDCinin
ino>I 5
0
.0Q
. 0.
muscarinic cholinergicagonists)
.0"0
?(0
—
_CO1UJ6)c^
IB2.co*?O
(increased fixed interval
^inC3)
T>
inCOCOraCC(Oin
cr>o
75 CL
response rates to leverpress)
Si
I§
0)
HU£s^ o
>
oo""
"*•O
75
Q-
(higher response rate foroperant learning tests)
i£T—
c\j
CD
—
---03 T
J
5i-
rt
—
^^
V)
sai
(0
0CC
d-
in
Q)
5•g0 7
5
f
(increased sensitivity ofD2-D3 receptor subtypeto dopamine agonists)
nebll_^CO
UJ
ro o
00in
>*D(o-5Kala and1995a
(reduction In dopamine innucleus accumbens and
CMc\j
-o£
0 "O
en retffff_tflgU
J
ID
Occ
d-O
)in
$oQ.
in serotonin in brain stemand frontal cortex)
i
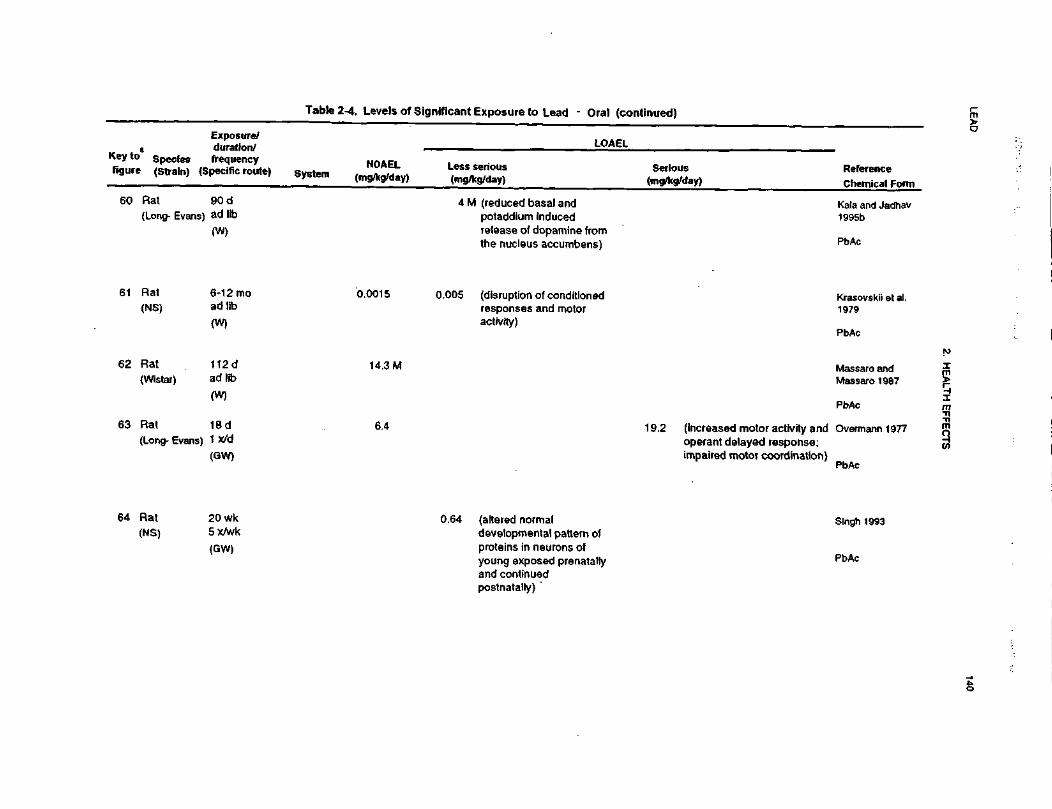
LEA
D140
2. H
EA
LTH E
FFE
CTS
^^
•§3I"S6.:ant Exposure to Lead
w1g>C
O
•5in"33•r(S0>Seg1-
LJ
S 15
a ••
u '
£ i
w
£C
U
sf
O
^
£ %w 1
u>3
.ess serious(mg/kg/day)
^_l n"
III V
UJ
Jr< >iS
E.
£SLw
Exposure/duration/frequency
(Specific route)
S?
82
,0-W
m —
"o j>
•r 5
is
z•§raT>CClJ r>
« 8 <
CO O
) ^
b^ r-
Q.
||
•n -r,
? -9
4 M (reduced basal ampotaddium inducecrelease of dopamilthe nucleus accurr
Tfi ~
O T
3 g
e» re
—
>UJ|L*
^ i"fU
0
CC =i
0CD
18"5!2wg« ?
2 £;«: i-
(
?cis05 (disruption of condresponses and meactivity)
0oin§oo«**V
T
3 g
(o ra
C-
ra M
CC S
.,_CD
.0Q.
CNI0)
raoi«
its
w co
_ S
.||-!5
co 2 o> T>
i 12 s
i ~il-s
&if
T3
Q. U
) CD
C
2
0> £
.£
0>
° <S
|5
| §
^l
15
§
-§
,S
ci
<oo
f T
3i- ra
reccCM(O
Io
>
* aoj in
=•
a: 5.
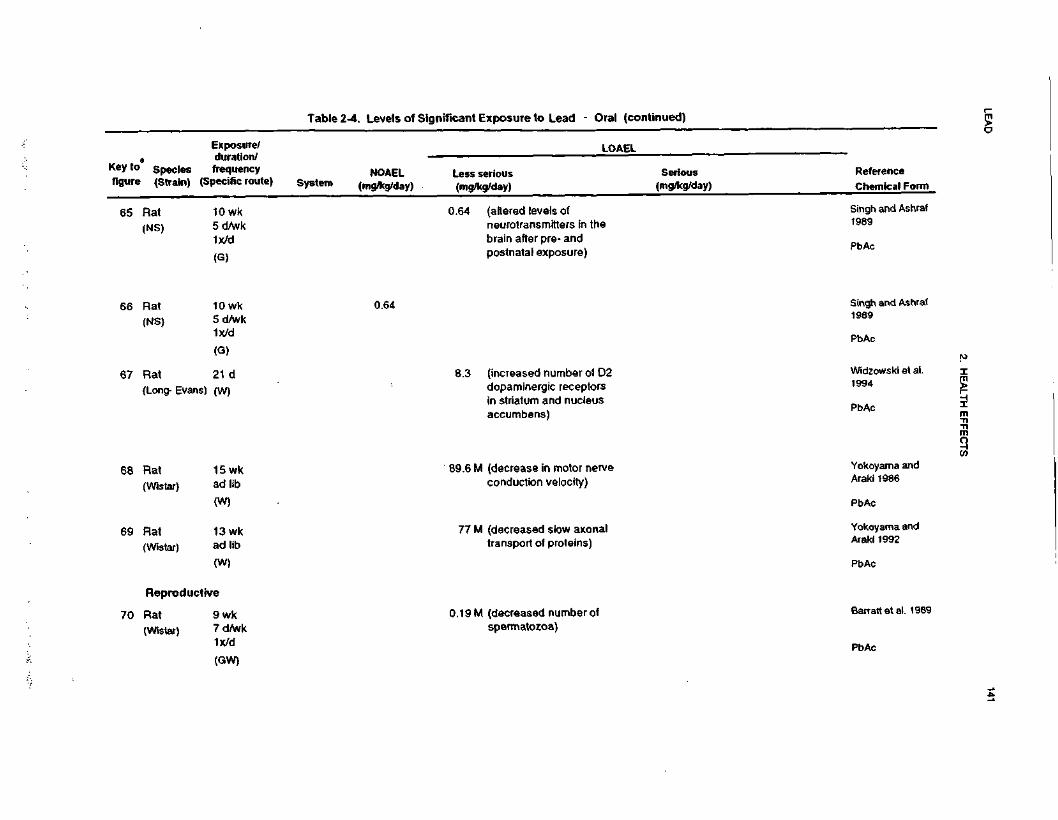
LEA
D141
2. H
EA
LTH
EF
FE
CT
S
•o0)ciV)
QQ.
Xmc.s>V)1CM_0>J3ra
!~-.3
>-
.2 -gic9
O
C E
5 = jj o
5 g
fs <
m?
S.
rasco
£ct-5
II
a CMc en1 2
JDQ.
JDQ.
-—
T3
0)_
w £
3
O
CO
7
W
•Si
a 8.>
I?S
S
CMQ
!2 w•—
O
3
O
Q.^
s S- y
"8"io"
ff o .. c
ll!•<tcoo
5 y cc
D) re
01 £
« -i
3 -S
S
£ -2
E
£ ra
£ 3
o
Q. 05
oc
o
_ o
=-T
3 .b
ra
fOCO
CDe<D8
s
O)
CO
ra .E
5 -2
o 2
<n Q.
"8 °m
-c
re o
at Q
.o «
m
E•D
15
CDJD3 *-.
c ro
"g Sra '5
2o>
CO<D
«a:inco
-^ *S <
po
T ^
^ in
,-
tr .
COco
c\j —
75 o
a: i
N-
co
l/) T
Ji- C
O
^^
CO
ra 5
o: s.00CO
«^
nre
>o: S.O
)co
U
Oi N
»-
•o2 i
I s
jc
cc e
.or»
.
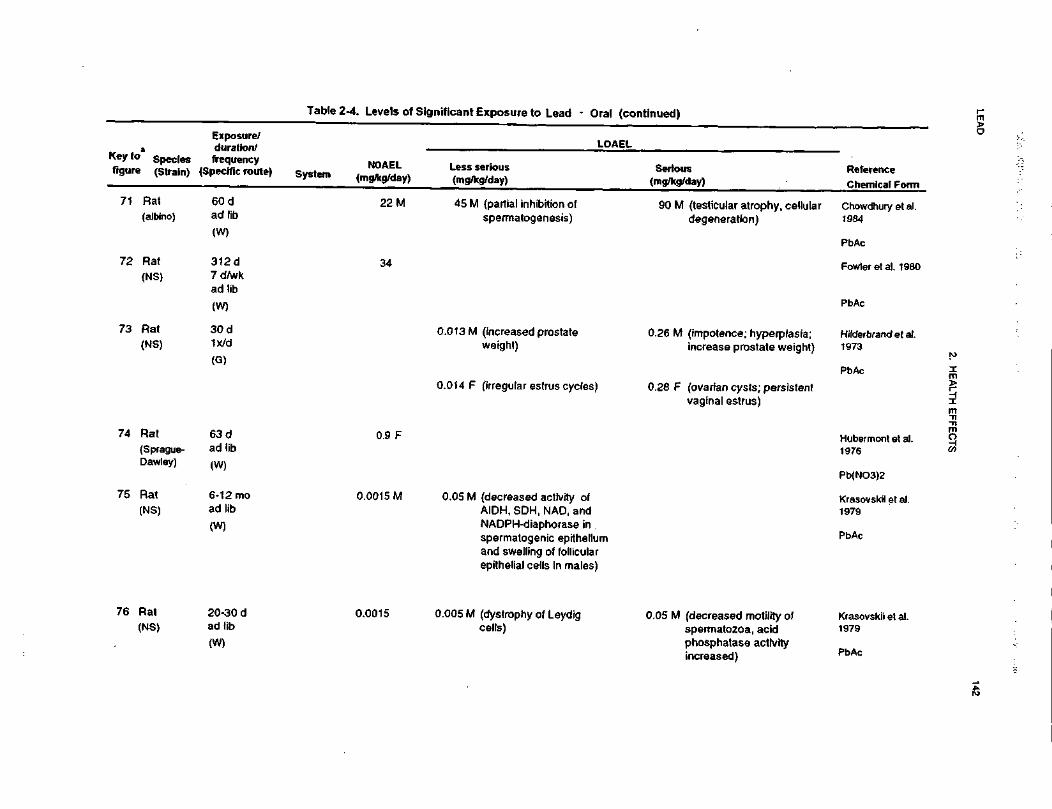
LEA
D142
2. HE
ALT
H E
FF
EC
TS
^^,
IJC'c0u^20* 5301nificant Exposun
O)
c/)i0IS)
s5_1•7N0)A(0H
1• 1u
nC
0
i111s
w
•=
£ i« £
DC U
i!0 1>
ljLess serious(mg/kg/day)
•>:_i
aU
J ^
< !>
o *
Z |>E.
|>.(A
1"
Oi -j.
>.S
S: c o ow e
o» o§.S
§.£
fcljlw
.
8^
M ••—
gflj£
o-tn(0 ^
100
£
X =
1*
2 8
II) *~
£• T
BJ2
0€
w
1 5
°
°:fr
Oi
-O
O
^3
O
-r- Q
_
LL
Q
.
CO
15u^^_
£•
Q.
2 •£•
-1C8 2
•5
J!0
C
—
CD
vi o>
0) C
O^-T
>
2oen,»_£«
•
ii^ 5i: C
D.c
0
—
(0
£|
(0
<U
38
-2in•<*
SSI S
j<;TJ .-9
^
5 S
o^ 5
^^^
^(
DM
—
P3
|-»
18
—
^75 |
« w
cc 3.
a: S
.
r- JM
r*H ps.
13'S?(Q
IP
<£
2
£
Co" jcw
.21
(Q
Q)
!•*Q
) (1)
y* rt.c
w
(impotence;increase pro
2<ot\j00)
swsa•DCD0.013 M (increasweight)
°° 5 —
0
>? C
3co '
*-
m
wcc
S.COh»
'SCD
CO
.:frsCDain" In"
(ovarian cyslvaginal estru
u.03
C\J
d'w'
Q)
u>>
tj
U)
D1oCDm3D>
CD
LLTf
oci
B
^5
»•8
Si
1g
m
«
Is I Is |
z5
£
52
£E
T-l
^ =
S
"«'
•3 "g
.E
CD
3
ffl...
<B
CD
£
0 C
O
f§§' &^"S z
-^ -S
° «
ro
Q.
C
._-, ^—
skills
« «
± 1
§ ™
£ ...-
CL E
S »
llli-if
-H.<
Z
M
<o <B
SU)
od
L.
Sen
in
°
00d0
T3
i _
W
«W
TJ
5
V T
3 g
to
«
—
to
ca —
i „ll
ra Q.|
TS w
a: S
2.Q
a: S
.^t
mh-
h.
s <
45
f
« o
o «
nE
(0*
CD
TJ
O
M
* o
™
S
"w S
n »
iy ra -C
w2 E
°- a
Jj E
w
o>®ino.0)
•£CD_l
B>s
.cQ.
8.
W
J
oqooq0O T
3 §
OJ
(0 —
EC
S.
(O
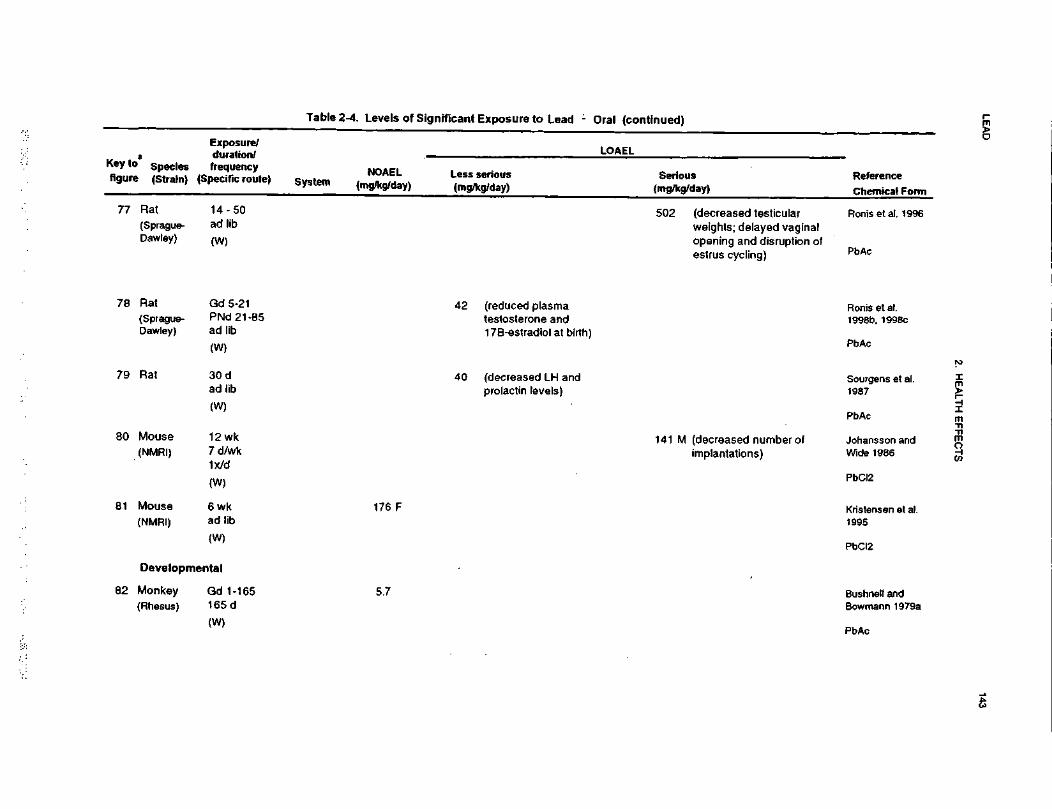
LEA
D143
2. HE
ALT
H E
FF
EC
TS
ID3CO•an0)
&<B3IH&XUJrou£cO)
co•5_j5so>CM_0)AK)
s05(A ,—
3 >•
O
«
ft(0
JO
O
e i-
**Nfoilwg 2
0-05W
52.
•raoi
£75
SraS
<o,9
»
<JOQ.
2 «o5
2o£
S m
,<2 o>5
2
CM0aa.J3Q
.
•- .
-0) -o
n) o
«> • -
_ ><
ro w
°>
o£
2
-E w
o
o) £
2
-g'l S
.t!S
5
o
0)
CMo
oojJ2«|
<n ra
ra _
I J5
<8 0)
5
-S § 9
ll"Q)
oo «
<D O
7>. ^
Ort
inCOin(O
«* -Dt-
(0
.If«>
,5- SQC
S2.Q
S^ *
raCC
3 =
llo00
CO -
§ iIt
Iua•2 5-f
1 I
sS i £
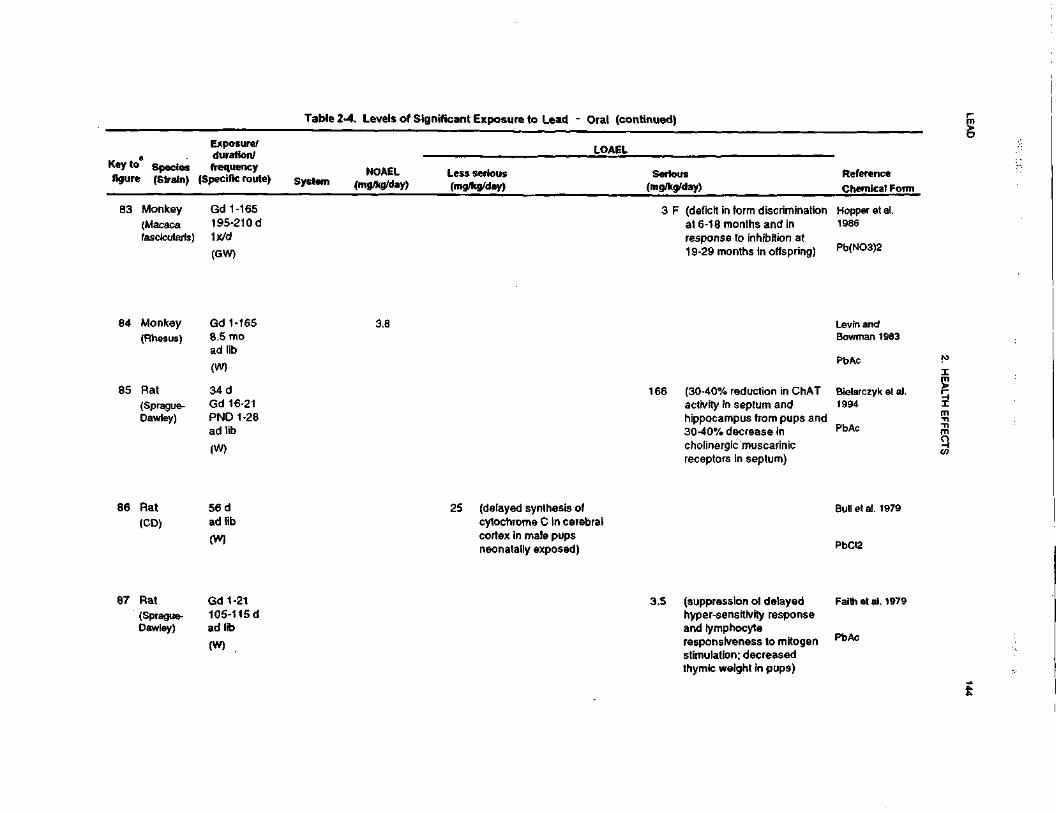
LEA
D144
2. HE
ALTH
EF
FE
CT
S
3C•ssc1"2o•os£1UJT:n|O)
w'5M0)5-1
2iraf-
|
« _
IItt 0iiV
O)
£,
tu0
Sf
If1
2 E
-i "~•>;_J
(0
<C 'di
o §
X E|to"
5 o £ «-
1! IIa*l|!!. wr5
^
1 =
a'Is 1
cg
,15
?c
*~*
||||lill.£ E
S
i
•e co c
fc
.9 V
° "*
LLCO
|I
^ ^
^ 5
S 2
* £
|sl
I tl
noo
CO ^
s »
"D
* "*
w I
Sc |
y
a •
* o
5!
! IS
1
-Q
5
£
-C
(0
"T, §•
.yc S
2--E
| ?
§
g
E
CD
™
3
•^ 5 i
<8 « g
-= gL M £
| »
u
q) J
o
•
r-CD
to O
. <D
O
•—
*~ C
E
*O
'o>
0)
o^
S^ « £
•»«• -F o
° .c
Q.
' -S
Q.
7;
CO
g o
.9- o
° «
£2- co .c co o
2
CDCDV-
00
CO
in T- oo
T °
S-
x?
|^
II ill
t in
00 C
D
•a3m
Na.
•a»ra
-o i §>
oo
O
-D-
E
u Q.
o £
a
CO CD
•o *-
C.S
O 3 -|
w ?
5
S s= Ic
•^*
n £
w
in
2
if -
0) £
Q
. O
W
£
E ^.
"S S.E «S^g 5 2•5
fi
tr o
incj
r- mCVJ
«-
O 1
3*- «
18
(OCO
,cr
S2.Q
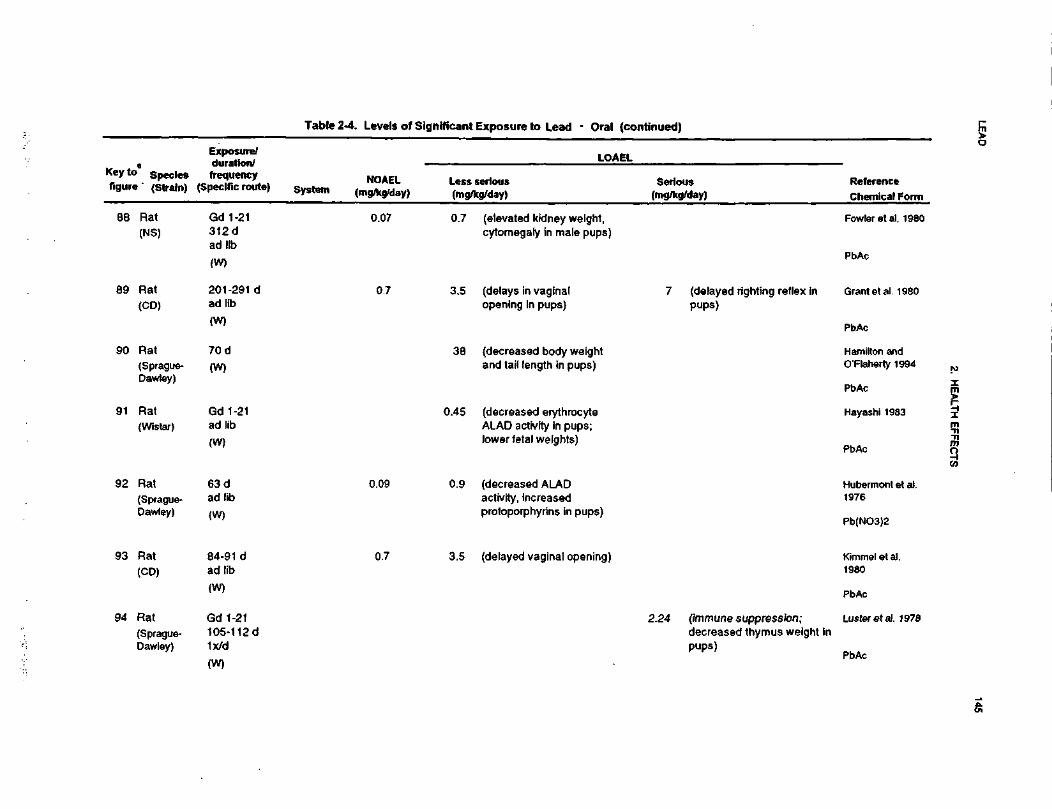
LEAD
145
2. HEALTH EFFECTS
f3•«C1ToExposure to Lead - Oi
«rf
3£cO)
w"Sin1_£~«NJ!ja«K
o« ±
=
3
dg•J
IIo: o— »
s{
o *
*$,in
£
at -~i|il,M
Jc
W
ft
Jil
_,?
•J nU
J "O
< %
i&
E,
Iw¥E. 5
o
o
5! 5 LI
Hi!<2.
1?
S £5-cnw
2.00 »
~
3??
01
5 C
o§•3Q)»£.(elevated kidney weight
r~O^N
.
O6T—CM
•D0«CC00
CD
COcytomegaly in male pup
"O
J3CM
—
»-
"DCO
CO
5Tz_
1-3a!
1
« I
JD
i-
AQ
. O
a.
_cX_ai"CDencf~O
)•cT
)CD>»
-CB
CO•3
Q.
si.
r-.PEl
s.™« c
IIinCOCJ
•o^«en^=
3
1 §
if
II
enCD
ffi n
? 2
S
Ifi- ?
0
«
JC
i: -C
to
•= ID
o <a
o
!§ ! 1
!
(decreased body weightand tail length in pups)
(decreased erythrocyteALAD activity In pups;lower fetal weights)
CD m
CO
T
t
c!^CM
-0
+&
S*
51
3 5
3 ->
—
O
a1
c3
s "i »
ra ,0- S
« !>
tr "a
cc S
.0
T-
o> en
T5'S"co
Huberm(decreased ALAD
o>CDCnoci
X)
CO<D"SccCN
Jen
£t
5TO
s s.
£
£
activity, increasedprotoporphyrins in pups)
JOi i* _
§> Srn .§
II
«'oi^°
SE
CO ^
.- ffi
-oX
i-
Q.
rn(delayed vaginal openini
incot^CJ
x>?^i
?S
^ I
ilCOen
1~Q>
IC.Q<nm2§-§-<nCDc^.E•tCMCM_C\J
•oCD«CCM-
O)
<JC
c£.S1
0)Sen=)e>,T>0)
(/}co2 "a
>o a.
CD D
•o ex
T3CNJ
iS P
0 «
T—
^—
4FT» ^^
II
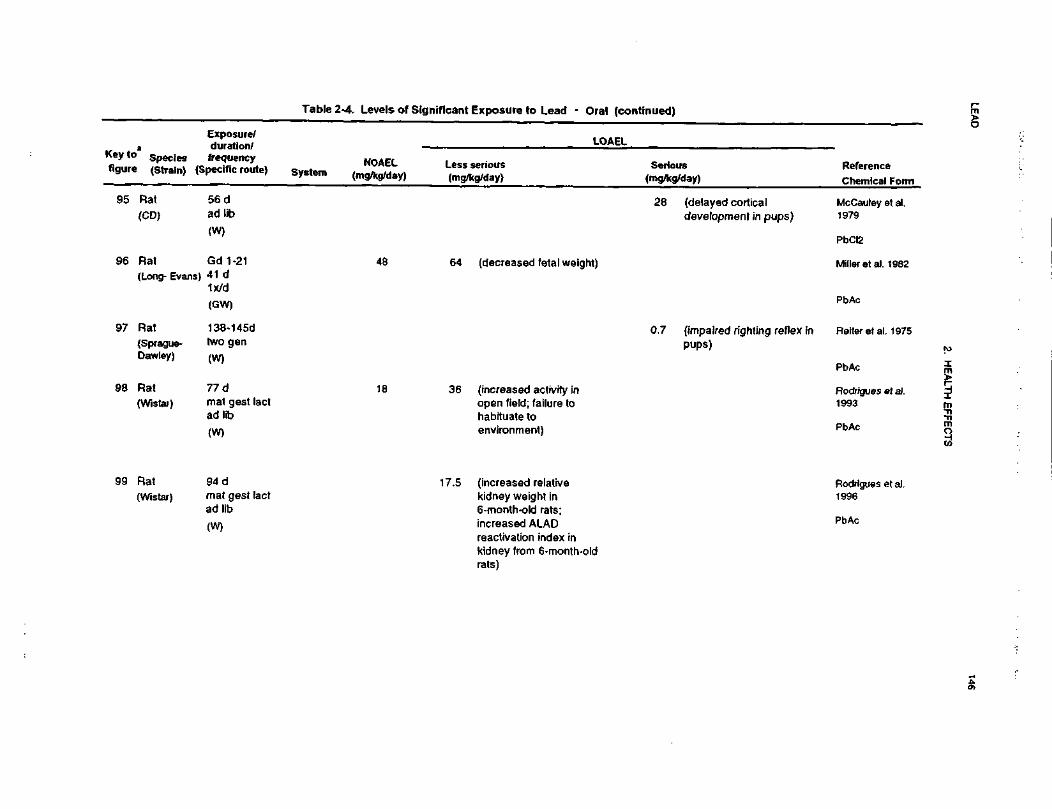
LEA
D146
2. H
EA
LTH E
FF
EC
TS
I»|"561(00).3posure to
XUJ**1'EOl
V)»;OMCO>Jj_
fc1CMSi^ra1-
|
«> !t
0 n
If
«I
K
U
if•5
*W
E— '
_iU)
j4»
o••1
V)
--*
Itw
o>v>
S1
8 fj£
j?
UJ ^
4 D
)O
d£Z
o
)
E.
_&s.(0"3T"S c
o
l
Hli
UJ
'-E
g.
M^^
8-c'o
a
* i:
,5- wtl)
—tg
0
V
>•§>•2
e
"<3'»1R o> 2*
" K
U
52
£
,*toa3—
Q
.ra
Z^o
.E
Ifll >i -ism
CD
ilCOCM
Tji
S^ 1
« Rcc
<iinCD
1 1
•s «
" 1
s ^
|
^;=
£>
C
O
XI
S
D.
a: a.
cX0)c£D
>C
.
JZ
•?T30)
II
==- Q
.
r»6
2CD
'3S5£T301U)
IDCDi•o•*(D00^
!5T-
in
r-o
j •* co
Slli if 6
^^14CLU
3
"•*•
•*- c
*- ^- 4
55
5&
Jg
fe
•<Ba!«0)
tl 1
•E o
>. *rx:
CO
\= a
»5 o i"
T3 ^_-
—
CO
<B 2
01 F
™= 1 I
£ c i 2
O
CO
X
I >
c
a. ra
c^=*
O £
C
O
(DCO
CD
t3ra
1D)
n
Si?
^h
. E
C
B &
I«^
V>ra 5
a: e.000>
a>=
c jo
QJS Z
ra <
CO
TJO
x
oW
Q
C
D p
B^
ll
?§
llff
(D .E
ff
3E 2
oJBE^
§-
to s
a: £
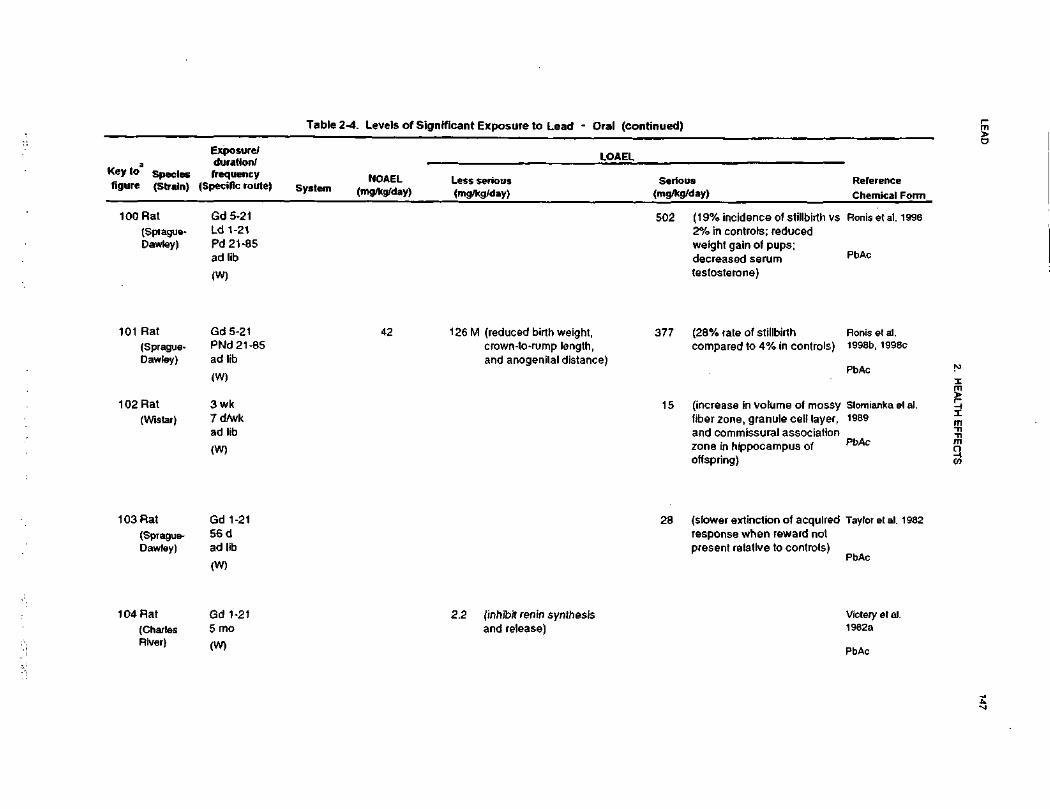
LEA
D147
2. H
EA
LTH
EF
FE
CT
S
0) _
o To
£01 _
EC O
12o•ora
s£liXIDD
)55•6015C
M4)
8.
SQ.
-GWoI IE5
=o
llfll
vp c
-c o> co
5; ~
.21 X
2
04oin
•aacoCC.c1528% rate of st
^^
t^t**C
O
o00O)
o>*~
-Qco y
C7> *t
1
£
"w"
o0oc.
$
ompared to 4O
OS
•5(SJCC15
(75>,
«rto'oCDE_3ncrease in vo'
in^
o>too
_
0)nule cell layberzone, gra
••-
coral associatnd commissure
o^s"otoDQ.
reo&.9-j:.c01coN
"55_cQ
.COcO
•5"S
s£a.ti
5<.aQ
.730)
-•= "5 *i§- c sO
T
3 •=
*
S O
^ I °
c
£ S
.2 c (B
o <» >
111
™
10 ~CO
<= C
JO
0)
a. to(0
CD£.
£ Q
.
coC\J
<D
1*1I « -D
•c 9
-JSE |
-E
J3
E
0>
i1?o ra
U)
.£ '5T
c
toCD
reC
a,
egrvi
inT
- •t-
00
'7= -o -o -oO
_l
QL
ra
inCDC
\l
inCM
~
cr>
ceco1-^
111
If
III
COo
(N•r- O
•° E i"C3 in
C.
£S
|S
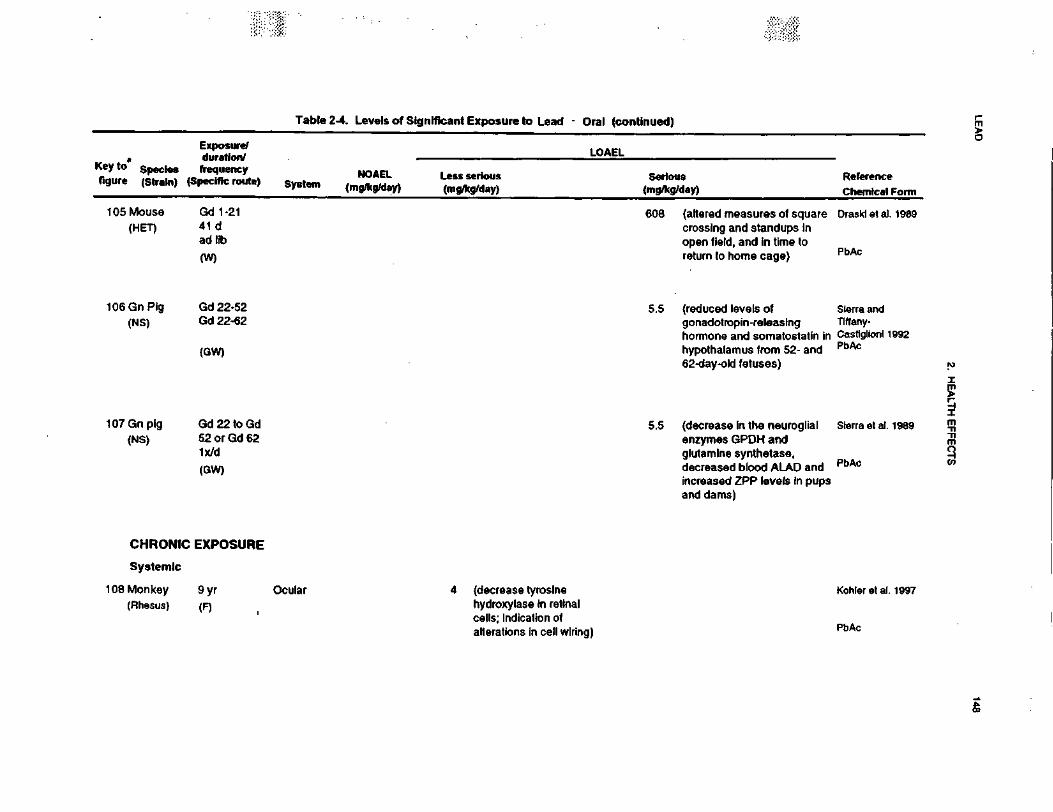
LEA
D148
2. H
EA
LTH
EF
FE
CT
S
fae"c81o22£2XUJ
"cc.5"
?J2wCsl
£ra
S
T«
01 •=
& i£
5a
•c *
^ E
,
Ul
O
M <•«.
1 -
•c 5S 1s
t~
elf
< ^
)"I£M
Exposure/duration/frequencypecnlc route)
52.
|I
«a
0^ 3
u O
)£
C
i««
o
0
1
0)ra(altered measures of squcrossing and standups Inopen field, and in time toreturn to home cage)
00§CM
i"°S ?
Oin j—
g tDS
£
m0^—
, |
m
O
5 t
S J
303
1-
O 0
.
C£ "c
(reduced levels ofgonadotropin-releasinghormone and somatostathypothalamus from 52- a62-day-old fetuses)
min"
CM CMin
of
CM
CMCM
C
M
y
ss 1
O)
0.
^c
w(3
S
.<oo^—
2'S5J3a.
inin
0)
« i
<B i s
£
a>
o
=<«
*- c
o2
-E.I
"« -
T3
Oo>'a ^
c wC3
S.
UJc(AOU
l O
) ~
O| I II
^r™
**
CO
)
O c^ |t
00o
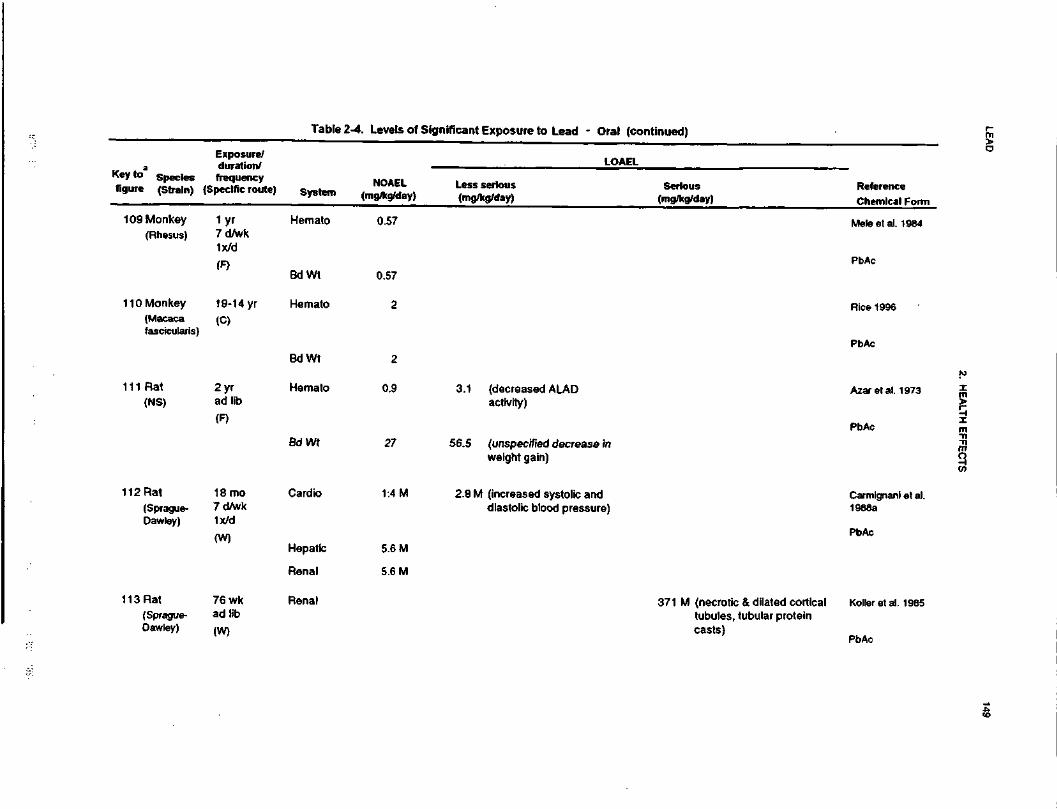
LEA
D149
2. HE
ALT
H E
FFE
CTS
2.|V)
oaxUJ
W•5•H010)2
_l n
ui 5§|
ZtI
I*
«1
o<a0.
s.oQ.
RO)
-$CD
I
o o>0 o-s—
* O
S
Q310(0 -
10?1•o -r-<D
^
it n
IIU)
(D10
o D
.
co .O
flj -TT
o> o
00C\j
Hemato
r-in0
0
5 i
SO)I
O>
OoraCD
toin
.S•gnO
aa.
O
ac.CD(T
« ¥£ §o
-c
5 E
a>o
ntrII
ncCDDC05 T
3 $
N-
CD
—
111
to
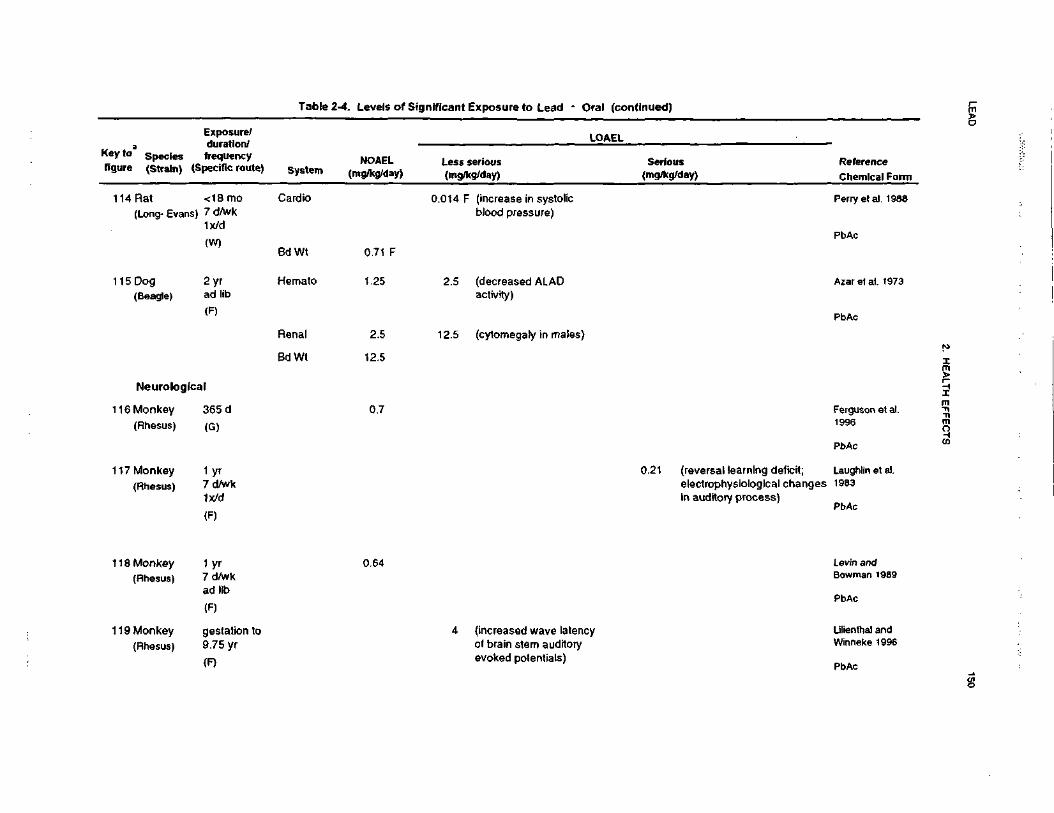
LEA
D150
2. H
EA
LTH
EF
FE
CT
S
__
^
3'cO•£1561•oraHI
-JExposure tocra1c_D)
sVI
1~!CM«ara
o«>
"•o
T5
l!Ol £
cc of(I)
•D
<D ra
iU
J
o
seriouskg/day)
§ t•5U
J 5
11,§cutfi
IHl
° 1
= E
UJ "
° t
jj.</i
jjj -g-
n.Jj(/}
^^n
£ C
ITB^
^01
-DC
L Q
.
0"5I?U)
3c «
—
m0)
oiw n
ftj ^^
0) TJ
II
1 1Oo
1 10
.2
5"P
>
ro TP
O
03
0 ^
m -1
T3
'v r^
2
S.
^,
wcCO
i3—
c
(0
0CC
.*
ma>"5"
0CO
*tN
-D
<
Q.
^___iiro
o
2<
fc
_l
C
i t
If i
2-
CO
£,
in
LOc\i
rJ
ir> m
un
^
C\j
oj
O1
25
0) 0)
-T3
I
cr
C
Q
.g
C\J
CO
t-
'ST
Q S
-IT
)
><». .
o.cD) P)
3 00
a av>0)O
).. c
.1= ra
o s
i••f-
u
_
o w
III
c\ici
2Q.
\\
~c c
S=ii
5•u 5
Q.
3 O
J(0
—
E S
T3
«o)
Oa.
ll
o .a
oc ^
>
-O
O Q
>
rajj01OO3
in ^-,
to C
3co
—
>• 7?
0)
3
c a>
Co
-o»- r^
ra
ft
c
o
.9 ._
« ^
s-?-^
n
C
ffiO
£
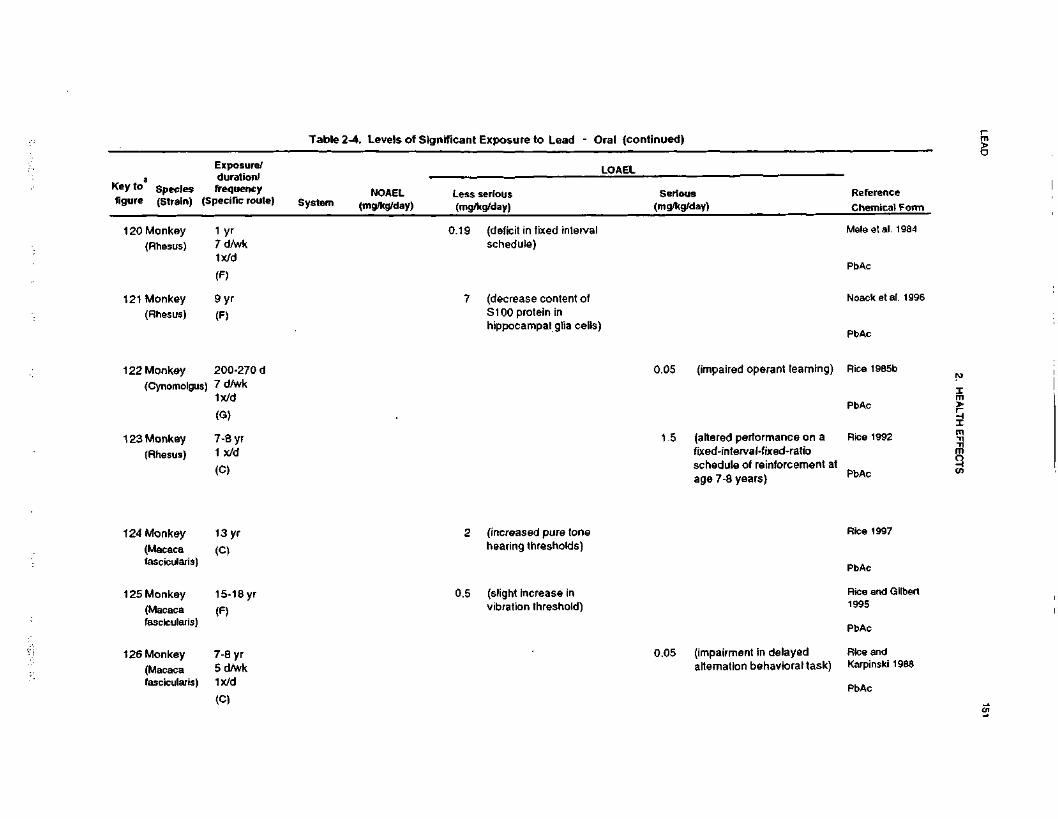
LEA
D151
2. H
EA
LTH
EF
FE
CT
S
s£
•o013Oore6•oreOS!3IAoaX111no£cg>
if•c <¥O
O
>W
E
"fCM01SID
8 2£
£
"o
Z
o'S
a'SJCSf
«scEcrea>a.oTJa>a.
C3
o
sac<a.
a:I
8» |
a a: T
- o.
o
'r o
S-g
o
§li-
0 ^S
2 521
1
o S
. Q
) (B~
COenre
.c
w
si^ «tnro•o —£
E_<o
oa>
°>T
3 re
£ "5
I!.t roqd
<2a.
ID<D
•D<D
C0)
_w"5o
0 "5
S.
S 2 I
S
^S
01
If°
"§£
o re
c a>•
a 2
ff
III
ino
T3O
-o
00in 2T
g>
5- f§oCM
C
01
0 ^
CO
>. o
1!
Si
COCM
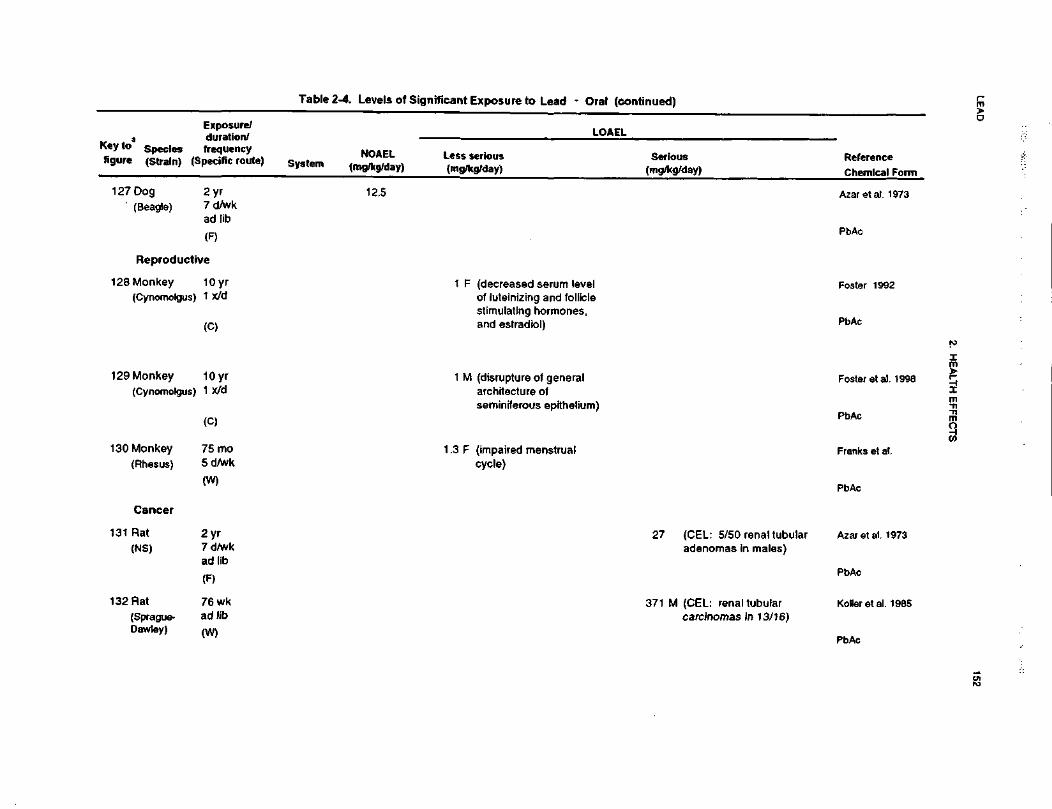
LEA
D152
2. H
EA
LTH
E
FF
EC
TS
o
f!£ 501 f
K
O
126TJ
5£23Wi££cO)
55sjntu>o><N0)
51,o I"
*f
3
O C
>-
"i s »>
u
o ™ a ic
Mil2
.
82-~B1
Ol
1C
•3'5
TB'S
f.aQ.
PbAc
fe"51N<I?„ gE£
Sjg
in E
U i
LU
0)O
~
°.
to
r-.w
XI
Q.
Koller et al,_ «o
s c
;3
?5
c ™S
E
-;g
« ^
i> .y IBQ
) ^
m
- o
!*t
s™^^
llfl
Mis
ga
E
P~n
•*—
^S
o w
n
j
« i
« 5
I t
O)
^_
fl)
•=
° co
O
3OI
BS
fH|
p «
.E•2
o |
s.s S
(impaired menstruacycle)
inr\i
3 .9
>>'°vtM
h-
ra
O)
D)
«O
«
O S
.t^-
.C
M
S.B0C
c
O
>N
o>CJ
o.
in
c.Is<D
"O
1
(0
* ?
^ u
c <z
O
-C5
£oCO
01u," a w
o a: S.r-
co
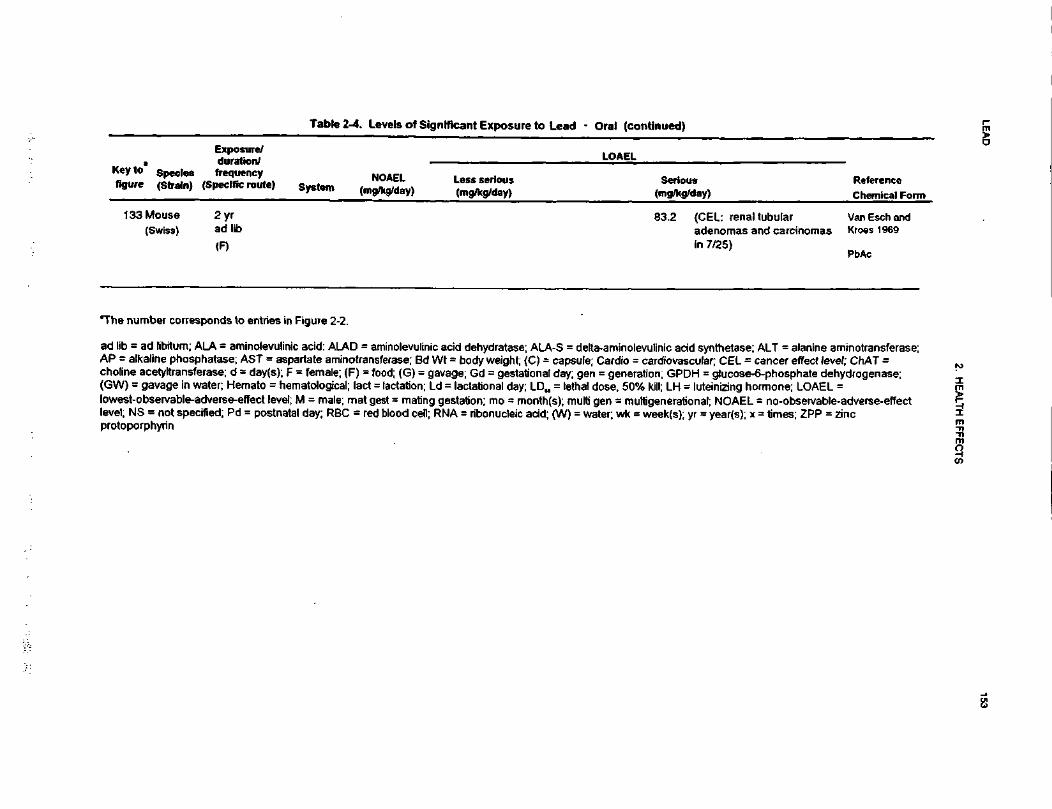
LEA
D153
2. HE
ALT
H E
FF
EC
TS
w
—" «
C
ijt)
•**
I !U
111O
NOAELg^g/da
(A
sure/duration/frequencypecific route
Expos
S
H<n S2-
I§1
> iC(Ano
5 I
3 O
15
02D.
0 ">
° sy
CO00
(An•§„
S
ui II
ra
2
0) -X "o U
J
- Q
. . - X3
uf"
is S c 9 25
S €
. § S i
<2
«?
l(U
.—
o
J?
< <
e"
ra» ii
2i .s
S K
E
•= -O
o) -
II 5
I <
5 ra S
c jf
A O
"
o S
i. -2
*L <D
< ro m
rati
aj E
po
£ra -D
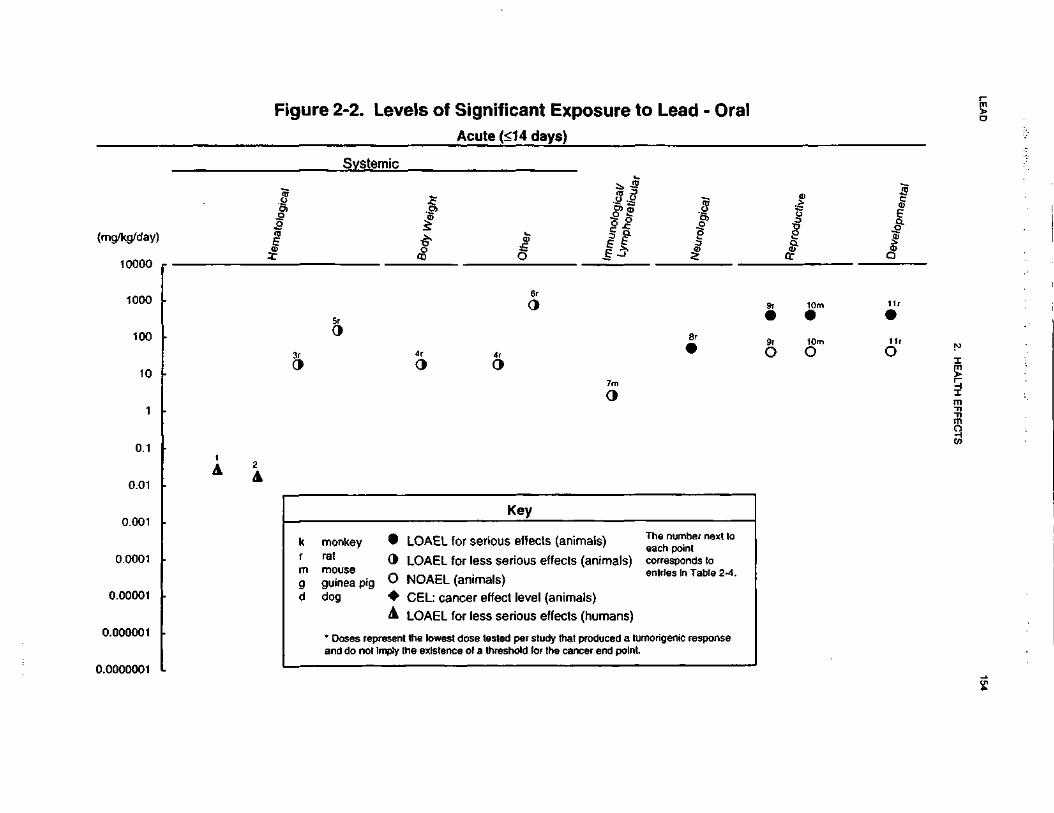
LEA
D154
2. H
EA
LTH
EF
FE
CT
S
CO
6•aCO0)ICOOax ^
UJ
»*-
aC
-o
CO t
c
*-.2>
S
(00)
CNCNa>3O)
il
-o
E
E
a
— "o
i—p
(—
C
E "5
§.-
<D O
t
5.c ro
o c
•3
c
c
-2-
•I a
I S
T5 o
cn
.-^ 3
jw
x:
g aI|
CD m
>
3.0)
o
~rr "*
vv
^i
w!i\
(A
c *u
tn
%
w
c ,_
£C
Q
) ~
p p S ^ p
3 3
• e o
(0o
OU
J
>•
da
O)
'5._
ra<n
a>
s
t -
Ogqo
88qo
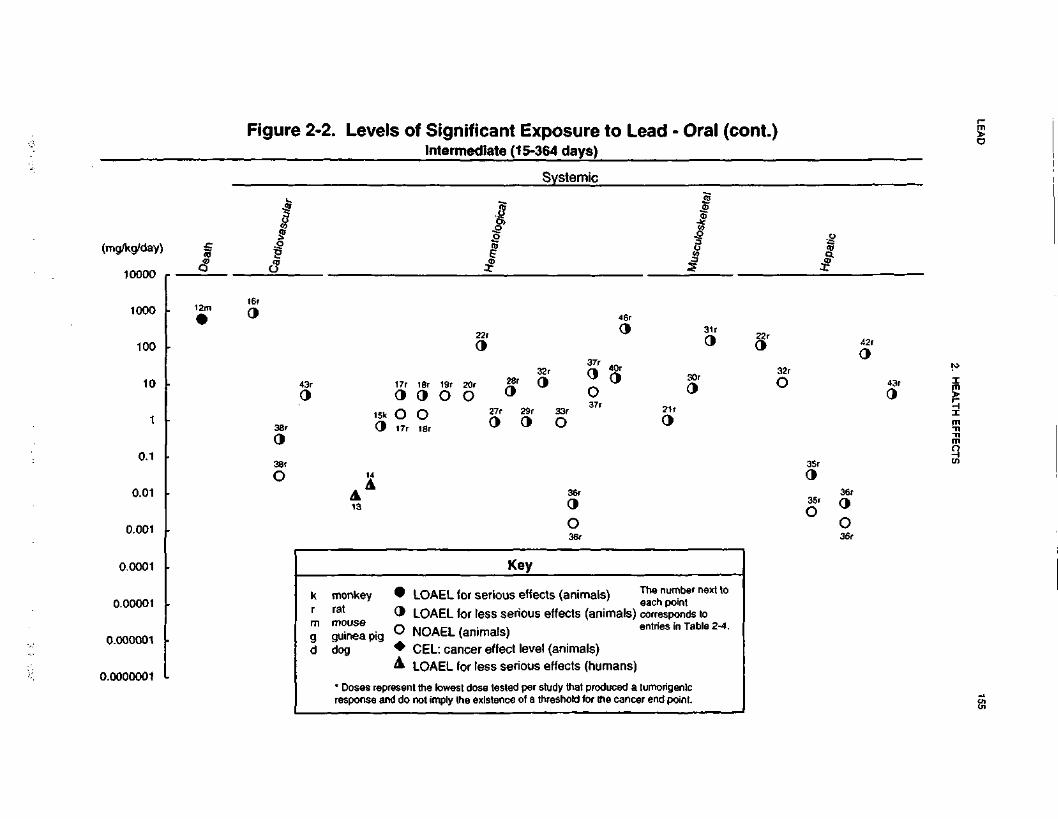
LEA
D155
2. H
EA
LTH
EF
FE
CT
S
CoQSOi•o
oE<DW£
O)
8©
O
S
© so
s©8©
SO
a©g©S
O
2©
O
S
!$© O
-u
?©
OS
0)
I 2
E g
-8
je _
E
S©
S
O
Ioo
o8oo
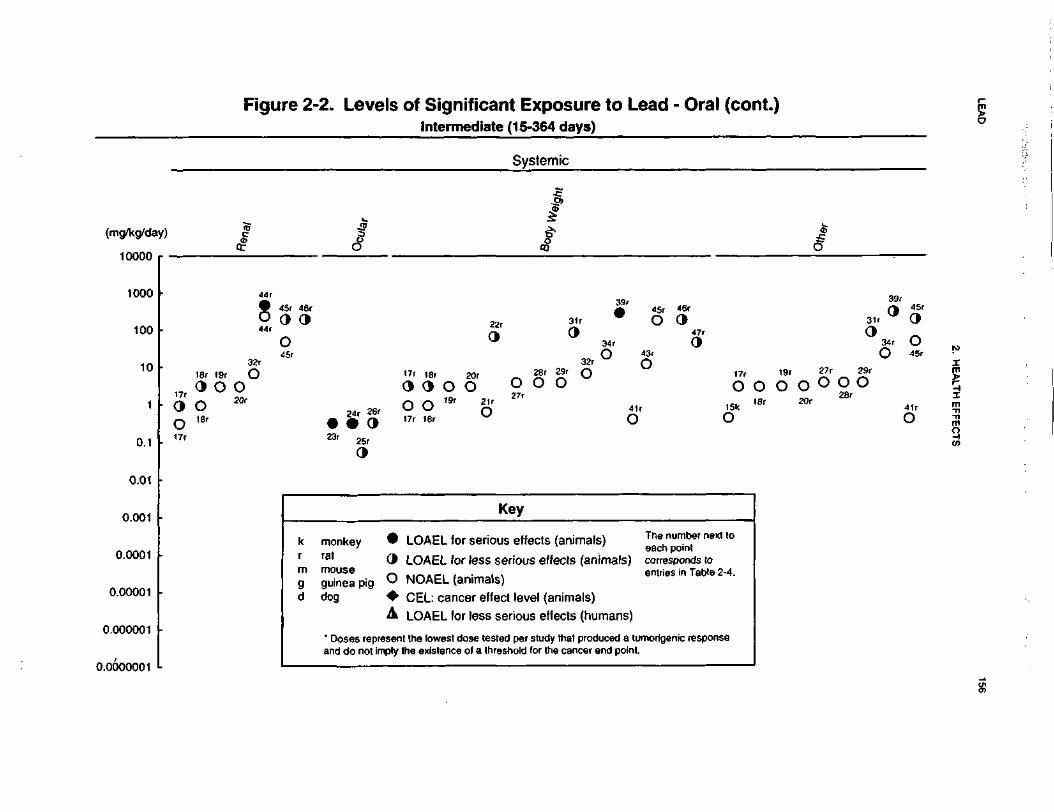
LEA
D156
2. HE
ALT
H E
FF
EC
TS
^cO^J
^0•a(00)^^^
o4->t Exposure
15-364 days)
£CQ
*••O
.2
!Z
"O» 0)
C |
(75 |
_<»0)>fl\^1
^^J
cvi040>30
)il
oQ)
"55W*
®t/j/~
\
ty&lQ
A' ^A
^JDO
o
/^?0/"\w
l&U
Qii
^s
£^*t
f^ «
^>
"* W
V
_J
-<
T
r-Q
OS
O 8
2Qn
«
*~ ^"^ u^^\
j___
v©•8 ^5
SO
5O
^oi ^-
^^n V
SO
SOOK
^c\l ^
^
>-
.
SO
O2
:®°=^_cS
©
^*-
iQ
j*T
^h
OJ^^
w
• S3
0©
•"©
O5
0)
o w
~
?
a>5
oj
«i 2| |
t w ,2
^.£
O
= rss s
<B o t
i; -c
,^ to
o c
o(
—m
od
) g3 ^
'JJT'
(/) C
O *g
lo
S
"S °"
C
-2-
^
S.
Q. S
'E
ffi P
~ ra
1co
o .|
o
£ o
w ==
-2- =| $i.
-
Q)
^
Q) 2
5
<n
<U
en
<n £
'So
^> o
g
.§a
» — o
fe -g^
Q
w
jfl Q
) w
(J5
2.
g 8 i
? 8
{«
^ o
.2
. ^ o
"o g
_,_
,_
!«
_,
g c
UJ LU
LU
" U
J
* -5<
<<
_!<
^ 'x
O
O
O U
J O
ffi
*-J
J
Z O
_J
£|
• e
o *-4
li
OJ g
»
S-'i
>-, °-
« c
(D
CD
C
D
0) O
jt in
U>
u> T3C
3
c
rn
0 -o
§5 ill ?
S
^
^ E
01T
3
v
'•O 5
SoO
S2
0»
©
02
t© O
t
t|
l§
°^
S|
oo
oo
c
t - ~
°
d
§ 1
i i
^
0
C
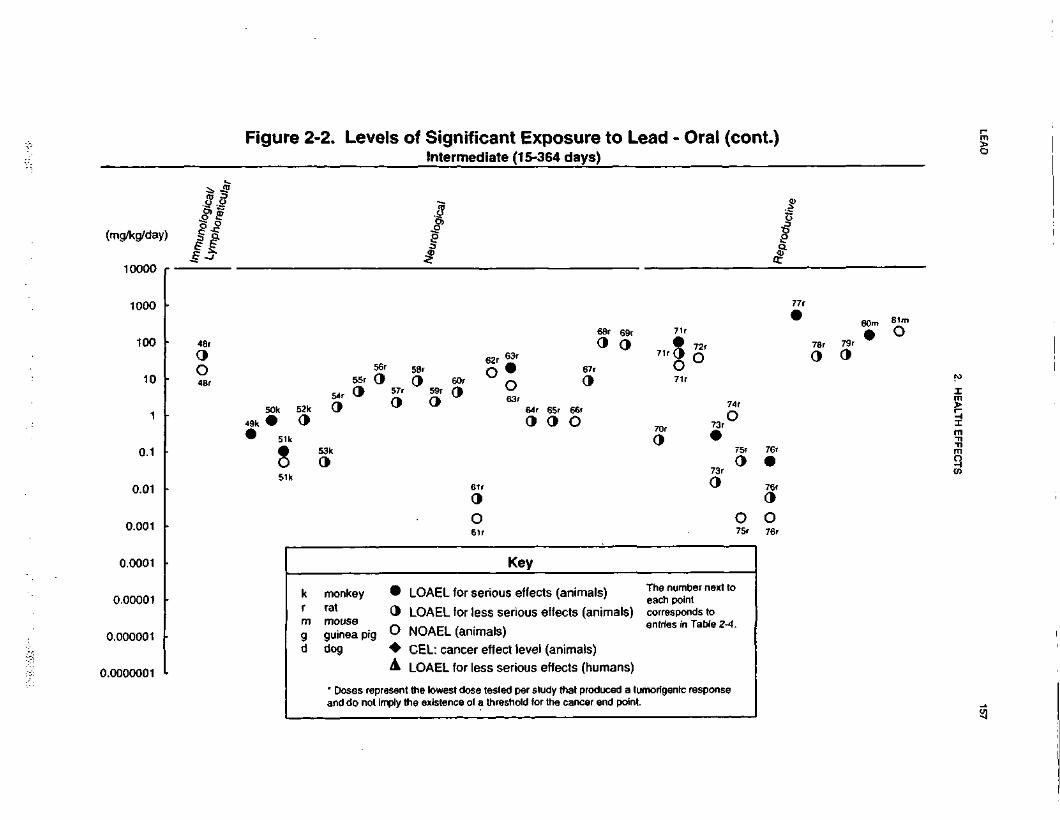
LEA
D157
2. HE
ALTH
EFFE
CTS
oQIoTJreo4-1
g>
"C
O1=
SK
3 T
OV)
-OO
«•
a jg
nj A
*" r-** *—
•£ *re
<D.£> =5
O) a>
J2oI<M2>3O)
00*94,
tone^
Wu//f7
Ur>VJU
jl
>,
lo!•S
Oso£
0^"
^^
£•
SO
O S
SO
g
e °"
?•
SO
RO
^ —
^^^- —r-^
O(J
h-
^
SO
SO
soS
O<c/^vsvJ
in **
toO
^ ^
SO
§• O
3
SO
sO
O
sS
Ocn
Am
v?
SO
feOcc 4
fesoB
OsOso
~oin N— '
•** ms\
*
>•a>X.
3
ix
NCD
o
»C
- ja
c5
_-S
^£) ?
C
E-5
S
-E=
Q
. S- U
)c
IT 2 cS
co€
?|
^
CO
O
C1—
a> o CD
!?C
s!
^CO
cO W
)
1 I 1
«. 8
1
" ^
~2-
t3 ®
—
« co
a>'s .§
li
" o5
— t>
g
UJ W
®
•c w
re
«:
m
CO
C
<B
8 - 1
«
o
o 5
. gi
i i
tom
Lu
DJ °
< <
<
UO
O
O
UJ
_j _
j 2
O
• 0
O 4
O)
>.
'°-a>
Q>m•£
i5 °
1 is
1 "I ?
E
£
E o
iT3
JC i-
E
C31T3
x
in W
W in
Ln^P!•
?O
O5
42
oo
oo
i-
»-
.i
->
-i
-'
-T
-P
o
o
o
T
- .
-j
oo
oo
o6>
Q
0
T-
°
._:
0
0
0
0
| §
-
d §
| §
,5. o
~U)
CCOE3.£_
(OIstVcoOa>coMU]
_cu
,0LU<2•4.0000001
o
SCJcCD
is10 2T3
Q.
ff -0
dy that producthe cancer eni
2 te
w £
CD S
Q. 0
? "
£ »
S£st dose t
nee of ait the lowethe existe
«*
itlig
0
8 T
3
? n
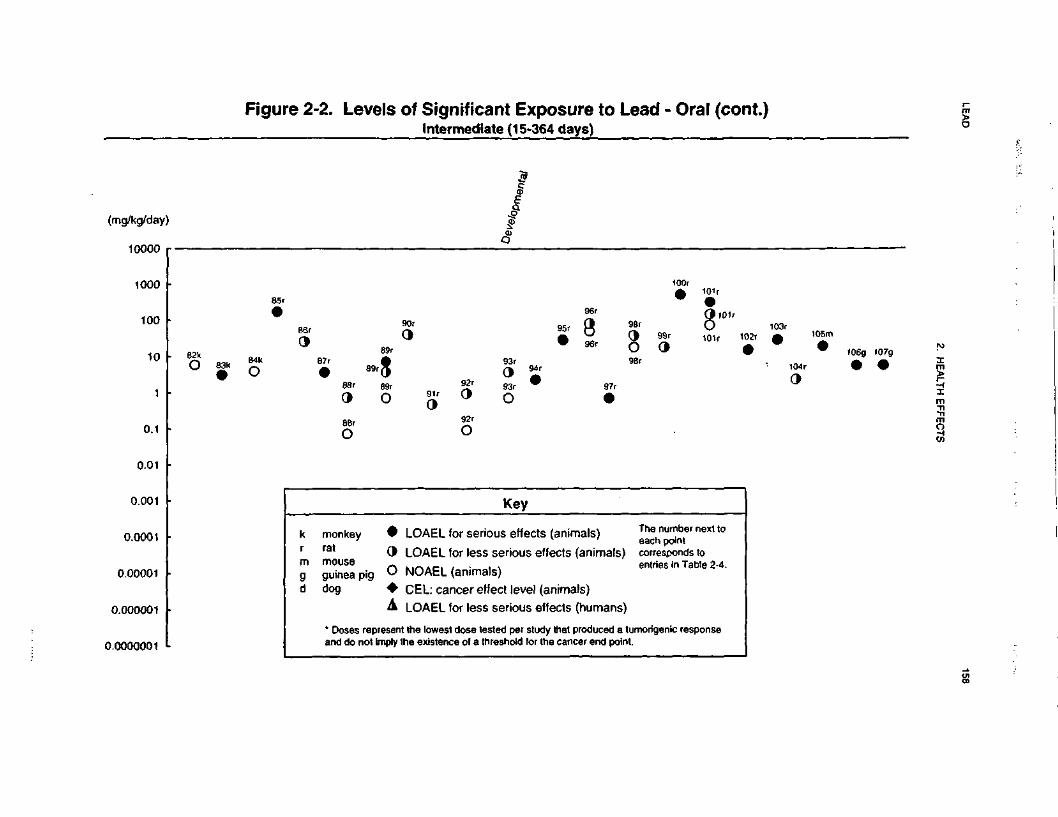
LEAD
158
2. HEALTH EFFECTS
co2O•o(Co(0OQ-xUJ•(-•c
£
OT
5oCsifi3O)
seos
a©
Q)
*
S
XT
^<<D
0 ffl
£
^ ™
-D H
C
C •—
O
c
1 R
|«
C
_
g <
Dffl €
t H
.C (0
o
CV—
Q
J O
fl>
"(5
<0 C
O
<f>
la
1-2
. S
c
W
-j- -2
-
OJ (/3
Q):r-
3
>^
.0
^)
^
<B
-— t>
•2 o> "S
~
g 8 -i
•~
T
" C
<D
0
0 3.
g.
,
i C
O
UJ U
J U
J
°< <
<
.li
S 2 i S
• 9
O •
C)
0) <D
<D
J£
U 0>
Is III
.* i_ E
en -a
(ACE3CD<D<nOCDU)(0in.*O•UJ
O-4
Scoa.I.90)O)
•c15 *-'
*- C
" S
T3 a.
s?3 £IsQ. Ua a)^ o
tf
« £
il•g-i
2 <
B
I*<0
T3
tt)
8 g
fl) <j)
S
o)
IsS -2
c trQ
J ^>
S |Q
.—
s IS
0
CO "O
Q
C*
(0
10
oo
I
qCD
oooo
oo§8C3
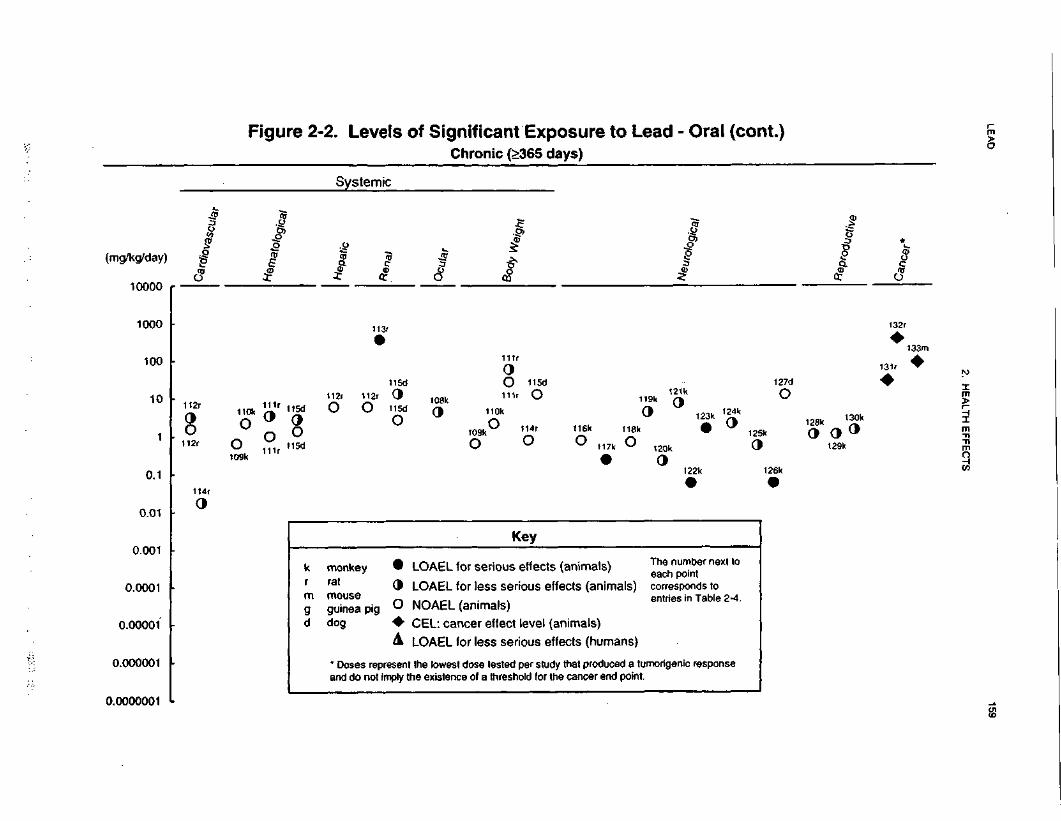
LEA
D159
2. H
EA
LTH
EF
FE
CT
S
oo,
Is6•on23 ^
0)
«S «Q
. TJU
J I
sS
« .2
U
c£
2
(/>«*-o(00)
oi
CNI
D)
E
g©£-*
1©fo»/^°o
Ho§0
>0>
*
ogcECn §
c£ n
1-
<D
^"5£.£•to^J0)
^30)tnJ5LU<s•
0'c*
+*
(/>•oQ
.
Sou****
—EcST3tQ)
U>D1_OJ
_oUJ<O9a-
7C\J
0J3CD1-w•£"0)-,E'c•S,
OOo>•Q
.o n
v> o
"3TCOEc>2-0)Q>
1L.
(PgCO0LUO*
lo"
cE3— •
H
ScoQ.
</)
S'E0)
O)
'CX3CO•Q8|Q
.
1
^'o2,
•gsu§<n
| ^5
DO)
_oLU
§•*
g.E
en
2 =
o
t
D1T3
E
0)•o
an1a0•oM0)
Isg-k-sc/>
s*
k_•S^Ito0)^
he existe
•h->
"^c€?n
o°
«3O)
LEAD 160
2. HEALTH EFFECTS
of 182/138 (systolic/diastolic) as compared with 128/98 in controls (lannaccone et al. 1981) when
anesthetized with pentobarbital. The mean PbB level of the treated group was 38.4 ug/dL. Male rats
administered lead acetate at 5 or 25 ppm lead in the drinking water for 5 months beginning in utero (PbB
levels of 5.6 and 18.2 (ig/dL, respectively) did not develop hypertension, although plasma renin activity was
increased at 25 ppm (Victery et al. 1982b). However, exposure of male rats to 100 ppm lead as lead acetate
in drinking water for 6 months beginning in utero resulted in a 17-mm Hg increase in blood pressure after
3.5 months of exposure as compared to the control animals when unanesthetized. No change in blood
pressure was observed in rats administered 500 ppm lead. It should be noted that kidney effects (e.g.,
increased kidney weight and intranuclear inclusion bodies) were observed at 100 ppm and/or 500 ppm
(Victery et al. 1982a). In a more recent study, administration of 100 ppm in the drinking water for 12
weeks to rats resulted in an increase in mean blood pressure from approximately 107 mm Hg to about 140
mm Hg (Ding et al. 1998). Interestingly, in this study PbB levels in the lead-exposed rats (3.2 u.g/dL),
while significantly higher than in controls (<1.0 ug/dL), were much lower than those reported in other
studies that exposed rats to similar or lower lead concentrations in the drinking water. Also in this study,
administration of a scavenger of reactive oxygen species or pharmacological manipulations that increase the
blood concentration of the vasodilator nitric oxide, caused a fall blood pressure towards control values.
Based on their results, Ding et al. (1998) suggested that hypertension in lead-exposed rats is related to both
diminished nitric oxide and increased reactive oxygen species.
An increase in systolic blood pressure was observed in rats at a very low exposure level (1 ppm lead, as
acetate, in the drinking water for 159 days), but the dietary and drinking water content of essential and
nonessential metals was abnormally low, and the low-contamination quarters in which the rats were housed
also limited their exposure to essential and nonessential metals (Perry and Erlanger 1978). These
conditions, which result in greater absorption of lead and effects at lower lead intakes than when the diet is
less restricted and the living quarters less isolated, may not be relevant to human exposure. Increases in
blood pressure at low exposure levels have been demonstrated in other studies. For example, rats
administered 0.1 and 1.0 ppm lead acetate in drinking water beginning at weaning through 18 months of
age exhibited an approximate 14 mm Hg elevation in blood pressure from 3 months (1 ppm) or 12 months
(0.1 ppm) through the entire 18 months of exposure (Perry et al. 1988). No obvious signs of toxicity were
observed in these animals.
Low-level, chronic-duration exposure of rats to lead (30 ppm lead acetate in the drinking water) for
18 months resulted in a 10-15 mm Hg increase in both systolic and diastolic blood pressure without any
LEAD 161
2. HEALTH EFFECTS
change in heart rate or histopathological evidence of damage to the kidney, heart, brain, aorta, or liver
(Carmignani et al. 1988a). However, lead exposure increased animal responsiveness to stimulation of a and
P receptors, altered the renin-angiotensin system, perhaps through inhibition of the renin-angiotensin
converting enzyme, and altered the cyclic adenosine monophosphate (cAMP)-dependent contractile
processes in both myocardium and vascular myocells. Please refer to Section 2.4 for a more complete
discussion of the proposed mechanisms for lead-induced hypertension.
Cardiovascular effects other than effects on blood pressure have also been observed in laboratory animals
following ingestion of lead. Male rats given 1% (10,000 ppm) lead acetate in their drinking water from 6 to
12 weeks of age had changes in the myocardium (including myofibrillar fragmentation and separation with
edema fluid), dilation of the sarcoplasmic reticulum, and mitochondrial swelling (Asokan 1974). PbB
levels in these rats averaged 112 (ig/dL versus 5 u,g/dL in controls. Administration by gavage of 35 mg
lead/kg as lead acetate twice per week for 7 weeks (5 mg/kg/day) to rats resulted in atrophy of the elastic
fibers of the aorta (Skoczynska et al. 1993). Mean PbB levels in controls were 4.6 u.g/dL compared with
16.8 u.g/dL in the lead-treated rats.
The highest NOAEL values and all reliable LOAEL values for each study for cardiovascular effects are
recorded in Table 2-4 and plotted in Figure 2-2.
Gastrointestinal Effects. No studies were located regarding gastrointestinal effects in humans or
animals after oral exposure to inorganic lead. See Section 2.2.1.2 for a discussion of the gastrointestinal
effects of lead in humans after multi-route exposure.
Hematological Effects. As discussed in Section 2.2.1.2, lead has long been known to affect heme
biosynthesis by affecting the activities of several enzymes in the heme biosynthetic pathway. The
mechanisms for these effects are discussed in detail in Section 2.4. Two experimental studies of the effects
of oral exposure to lead on heme synthesis in humans were available. Two groups of five women and one
group of five men who ingested lead acetate at 0.02 mg lead/kg/day every day for 21 days experienced
decreases in erythrocyte ALAD by day 3 of lead ingestion (Stuik 1974). The decreases became maximal
by day 14 and then remained constant through day 21. An increase in EP occurred in the women, but not
in the men, starting after 2 weeks of ingestion. PbB levels were approximately 15 ug/dL before exposure
and increased to approximately 40 ug/dL during exposure. Increased EP was observed in five men at a
higher dosage, 0.03 mg lead/kg/day (which produced a mean PbB level of 46 ug/dL). starting after 2
LEAD 162
2. HEALTH EFFECTS
weeks of lead ingestion (Stuik 1974). Similar results were reported by Cools et al. (1976) for 11 men
ingesting lead acetate at an initial dosage of 0.03 mg lead/kg/day, which was decreased to 0.02 mg
lead/kg/day or less as necessary to maintain a PbB level of 40 ug/dL; the mean pre-exposure PbB level
was 17.2 ug/dL.
Limited information was located regarding hematological effects in animals after acute oral administration
of lead. A significant decrease in erythrocyte ALAD activity was observed in rats administered lead
acetate in the drinking water at a dose of approximately 146 mg lead/kg/day for 6 days (Simmonds et al.
1995). PbB levels reached a concentration of 44 ug/dL in 24 hours and remained within 10 ug/dL of that
value throughout the exposure period. The results of this study also suggested that erythrocyte ALAD is
highly sensitive to lead, but it is not a good indicator of low-level exposure corresponding to PbB levels
below 25 ug/dL.
Intermediate-duration studies in animals indicate that adverse hematological effects (i.e., decreased
hematocrit, impaired heme synthesis) occur following oral exposure (Dieter et al. 1993; Flora et al. 1993;
Freeman et al. 1996; Hayashi et al. 1993; Krasovskii et al. 1979; Overmann 1977; Simmonds et al. 1995;
Walsh and Ryden 1984). The lowest dose at which these effects are seen depends on the route of
exposure, the nature of the end point studied, and the chemical form of lead. For example, decreases in
hematocrit were observed in rats that received 19.2 mg lead/kg/day (as acetate) by gavage (Overmann
1977), but this effect was not seen until a dose of 318 mg lead/kg/day (as acetate) was administered to rats
in their daily diet (Walsh and Ryden 1984). Rats that received up to 34 mg lead/kg/day as lead acetate in
their drinking water exhibited no adverse effects on hematocrit (Fowler et al. 1980; Victery et al. 1982b).
However, evidence of impaired heme synthesis (increased urinary ALA and coprophobilinogen) was
observed in rats that received 0.01 mg lead/kg/day as lead acetate in their drinking water for 6-12 months
(Krasovskii et al. 1979). A similar correlation between exposure to lead in the drinking water as lead
acetate and increased urinary ALA was observed by Fowler et al. (1980) and Flora et al. (1993). Increased
urinary ALA and erythrocyte ZPP were also correlated with increasing doses of lead in rats receiving 0,
1.67, or 6.35 mg lead/kg/day in their drinking water (Cory-Slechta 1990b). The increase was observed
earlier in the course of the study in older rats. Dieter et al. (1993) found that urinary excretion of ALA was
significantly increased in rats by lead administered in the diet for 30 days as acetate or oxide at a dose of
about 5 mg lead/kg/day, but not by an equivalent lead dose from lead sulfide or a lead ore concentrate.
Similar results were obtained by Freeman et al. (1996) regarding a decrease in blood ALAD activity; the
greatest inhibition was seen with lead acetate, followed by lead sulfide and lead-contaminated soil.
LEAD 163
2. HEALTH EFFECTS
Adverse hematological effects have been noted in chronic-duration studies, as well. The severity of the
effects seems to be dose-related. For example, dose (blood lead)-effect information for heme synthesis and
hematological effects is available; rats and dogs were fed lead acetate in the diet for 2 years (Azar et al.
1973). In rats, lead produced no effects at 10 ppm (PbB level, 11.0 ug/dL; not elevated above controls),
significant inhibition of ALAD at • 50 ppm (PbB level • 18.5 ug/dL), significant increase in urinary ALA
at • 500 ppm (PbB level • ?7.8 ug/dL), and slight but significant decreases in hemoglobin concentration
and hematocrit at • 1,000 ppm (PbB level • 98.6 ug/dL). In dogs, lead produced no effects at • 50 ppm
(PbB level • 31.5 ug/dL), significant inhibition of ALAD at • 100 ppm (PbB level • 42.5 ug/dL), and no
effect on urinary ALA, hemoglobin, or hematocrit at any exposure level (highest exposure level =
500 ppm, PbB level = 75.8 ug/dL). Control PbB levels were 12.7 and 16.4 ug/dL in the 2 rat groups and
15.8 ug/dL in the dogs.
Studies in animals indicate that the effects of lead on heme synthesis occur in many tissues and that the
time courses of these effects depends on the tissue, exposure duration, and the chemical and animal species
administered. Oral exposure of rats to lead acetate increased liver ALAS activity in a single dose study
(Chmielnicka et al. 1994), decreased liver ALAS activity in a chronic study (Silbergeld et al. 1982),
increased spleen ALAS activity (Silbergeld et al. 1982), increased kidney ALAS activity in a single dose
study (Chmielnicka et al. 1994), decreased kidney ALAS activity in a chronic study (Fowler et al. 1980),
decreased brain (Gerber et al. 1978), liver, and spleen (Silbergeld et al. 1982) ALAD activity, and
decreased kidney ferrochelatase activity along with mitochondrial injury and disturbance of mitochondrial
function (Fowler et al. 1980). A lifetime exposure study in monkeys conducted a comprehensive
evaluation of hematological and blood chemistry parameters at various times (Rice 1996). The monkeys
were exposed continuously to lead acetate at dose levels of 50, 100, 500, or 2,000 ug lead/kg/day for up to
14 years. Additional groups were exposed to 1,500 jig lead/kg/day according to 4 dosing regimens to
assess the effects of lead during development. PbB levels were dose-related and ranged between 10 and
90 ug/dL. Some differences (although within the normal range) observed between treated and controls
included a decreased lymphocyte count in the 50 and 100 ug/kg/day groups at both 7 and 11 years of age
and in the 2,000 ug/kg/day group at 11 years of age; decreased hematocrit and hemoglobin in the
2,000 ug/kg/day group at 7 (PbB 25 ng/dL) and 11 years (PbB 90 (ig/dL) of age, and decreased hemo-
globin at 6 years of age in a 1,500 ug/kg/day group that began exposure at 300 days old.
The highest NOAEL values and all reliable LOAEL values for each study for hematological effects are
recorded in Table 2-4 and plotted in Figure 2-2.
LEAD 164
2. HEALTH EFFECTS
Musculoskeletal Effects. Several case reports of individuals who experienced high exposures to
lead either occupationally or through the consumption of illicit lead contaminated whiskey described the
occurrence of a bluish-tinged line in the gums (Eskew et al. 1961; Pagliuca et al. 1990). The etiology of
this "lead line" has not been elucidated. This effect has also been observed in workers exposed to high
lead levels who had exposures via dust or fume. Individuals having high exposures to lead have also been
reported to complain of muscle weakness, cramps, and joint pain (Holness and "Nethercott 1988; Marino et
al. 1989; Matte et al. 1989; Pagliuca et al. 1990).
Only a few studies have explored the effects of oral lead exposure on bone growth and metabolism in
animals (Escribano et al. 1997; Gonzalez-Riola et al. 1997; Hamilton and O'Flaherty 1994,1995; Gruberet
al. 1997). These limited data, all from intermediate duration studies of rats, indicate that oral lead exposure
may impair normal bone growth and remodeling as indicated by decreased bone density and bone calcium
content, decreased trabecular bone volume, increased bone resorption activity and altered growth plate
morphology. Weanling female rats were exposed to 250 or 1,000 mg lead/L of lead acetate
(approximately 38 or 152 mg lead/kg/day) in drinking water for 49 days; the rats were mated and exposure
continued through parturition and lactation (approximately an additional 39 days) (Hamilton and
O'Flaherty 1994). PbB concentrations after 49 days of exposure to lead were 40 ng/dL in rats exposed to
250 mg lead/L and 74 ug/dL in rats exposed to 1,000 mg lead/L. Tibial calcium and phosphorus levels in
dams were decreased 20% relative to controls not supplemented with lead. In pups, body weight and tail
length were depressed at both lead exposure levels and tibial growth plate width was increased by
approximately 10% in high lead exposure group. The latter effect may represent retardation of bone
mineralization in the pups. Enhanced calcification and decreased alkaline phosphatase activity of
implanted demineralized bone matrix was observed in male rats exposed to 1,000 mg lead/L lead acetate in
drinking water for 26 days (approximately 145 mg lead/kg/day) (Hamilton and O'Flaherty 1995). In
female rats exposed to food supplemented with 17 mg lead acetate/kg food (approximately 1 mg
lead/kg/day) for 50 days, femur trabecular bone mass and thickness of the growth cartilage were decreased
(Escribano et al. 1997; Gonzalez-Riola et al. 1997). In male rats exposed to 100 mg/L lead acetate in
drinking water (approximately 7.7 lead/kg/day) for one year, bone density decreased as did bone calcium
content and trabecular bone volume; increased bone resorption activity was evident from increased osteoid
coverage of trabecular surfaces and increased osteoclast presence in trabecular lacunae. These changes
were evident after 3-12 months of exposure and at PbB concentrations of 20-30 ng/dL (Gruber et al.
1997).
LEAD 165
2. HEALTH EFFECTS
The highest NOAEL values and all reliable LOAEL values for each study for musculoskeletal effects are
recorded in Table 2-4 and plotted in Figure 2-2.
Hepatic Effects. No studies were located regarding hepatic effects in humans after oral exposure to
inorganic lead. See Section 2.2.1.2 for a discussion of hepatic effects in humans following multi-route
exposure to inorganic lead.
Liver toxicity, as evidenced by alterations in the incorporation of lysine into liver proteins, was observed
in rats administered 192 mg lead/kg/day by gavage as lead acetate for 9 weeks (Barratt et al. 1989). No
effects were observed at 21 mg lead/kg/day. However, the toxicological significance of this finding is not
known because neither serum enzymes nor histopathological evaluations were performed.
Intermediate-duration exposure to 0.01 mg lead/kg/day as lead acetate in the drinking water of rats resulted
in increased liver weight, decreases in RNA and glycogen, pycnosis of Kupffer cells, and decreased
enzyme activity (e.g., lactate dehydrogenase) (Krasovskii et al. 1979). In other studies in rats, significant
reductions in the activities of hepatic aspartate aminotransferase (AST), alanine aminotransferase (ALT)
and alkaline phosphatase (AP) were seen following treatment for 4 months with daily gavage doses of
64 mg lead/kg/day as lead acetate (Singh et al. 1994), but no effect was observed on the serum activities of
these enzymes after administration of 11 mg lead/kg/day (acetate) in the water for 20 days (Hayashi et al.
1993). Singh et al. (1994) attributed the decrease in hepatic enzyme activity to lead-related liver injury.
The effects of lead exposure on blood lipids was investigated in rats treated by gavage for 7 weeks with 5
or 20 mg lead/kg/day (as acetate) (Skoczynska et al. 1993). PbB levels were 16.8 and 32.4 ng/dL in the
low- and high-dose groups, respectively. Treatment with lead significantly decreased total cholesterol and
increased serum triglycerides in a dose-related fashion, decreased HDL-cholesterol in the high dose group,
and did not significantly alter serum lipid peroxide level or blood superoxide dismutase activity. However,
rats treated with lead in drinking water that provided a dose of approximately 109 mg lead/kg/day for
4 weeks had a significant increase in hepatic lipid peroxidation (Flora et al. 1993); PbB levels were not
provided in this study.
The highest NOAEL values and all reliable LOAEL values for each study for hepatic effects are recorded
in Table 2-4 and plotted in Figure 2-2.
LEAD 166
2. HEALTH EFFECTS
Renal Effects. Ingestion of drinking water containing lead was found to be associated with evidence
of renal insufficiency in humans (Campbell et al. 1977). Lead concentrations in drinking water were
compared to PbB concentrations in 283 residents who ingested this water for a mean of 21.5 years. A
highly significant correlation was found for these two parameters. In addition, elevated PbB
concentrations were associated with renal insufficiency, reflected as raised serum urea concentrations and
hyperuricemia. No renal biopsies were performed.
Information is available on the renal toxicity of ingested lead in several species, including rats, dogs,
monkeys, and rabbits. The results indicate that histopathological changes in the kidneys of lead-treated
animals are similar to those in humans (see Section 2.2.1.2). Reduced glomerular filtration rates and
aminoaciduria were reported in some of the animal studies. Key animal studies on lead-induced renal
toxicity will be discussed below.
Dose (blood lead)-effect data are available in the study by Fowler et al. (1980). Rats exposed to lead
acetate in the drinking water through the dams during gestation and lactation and then directly until
9 months of age had the following external exposures (ppm lead), internal exposures (ug lead/dL in
blood), and renal effects: 0 ppm (controls), 5 ug/dL, no lesions; 0.5 ppm, 4.5 ug/dL, no lesions; 5 ppm,
11 ug/dL, cytomegaly; 50 ppm, 26 ug/dL, cytomegaly, intranuclear inclusion bodies, and swollen
mitochondria; 250 ppm, 67 ug/dL, cytomegaly, intranuclear inclusion bodies, swollen mitochondria, and
hemosiderin. These effects occurred in the proximal tubule cells; no lesions were seen in the glomeruli.
No evidence of interstitial reaction or of tumor formation was seen. Using a similar exposure protocol,
Rodrigues et al. (1996) reported that the ALAD reactivation index by dithiothreitol (a sensitive index of
lead toxicity) was increased in the kidneys of 6-month-old rats that had a PbB concentration of 42 ug/dL.
Similar results were obtained by Vyskocil et al. (1989) who studied the effects of administration of lead
acetate in the drinking water for 2-3 months on renal function in male Wistar rats. Administration of
approximately 414 mg lead/kg/day (PbB, 105 ug/dL) was without effect. An increase in the urinary
excretion of P2)J-globulin was seen in the animals that received 828 mg lead/kg/day (PbB, 196 ug/dL).
Animals treated with 1,660 mg lead/kg/day (PbB, 320 ug/dL) exhibited increased urinary excretion of
p,M-globulin, glucose, total proteins, lysozyme, and lactate dehydrogenase (LDH) levels. Examination of
the kidneys revealed no treatment-related changes in the 414 mg/kg/day group, and morphological changes
primarily in the epithelial cells of the proximal tubules in the 828 and 1,660 mg/kg/day groups that were
characterized by intranuclear inclusion bodies and enlarged nuclei. Hyperplasia and flattening of the
LEAD 167
2. HEALTH EFFECTS
proximal tubular epithelium were also observed. Based on these results, exposure to lead acetate at levels
of* 828 mg lead/kg/day in the drinking water results in proximal tubular dysfunction in rats. In a more
recent publication, the same group of investigators repeated the study in female Wistar rats and the results
were essentially the same (Vyskocil et al. 1995). As seen in male rats, urinary excretion of P2(j-globulin
was the most sensitive marker of kidney toxicity. Another intermediate-duration study in male Fischer 344
rats reported kidney effects at much lower estimated doses than those used by Vyskocil et al. (1989, 1995).
In this study, lead acetate was administered in the food at doses of approximately 0.5, 1.5, or 5 mg
lead/kg/day for 30 days (Dieter et al. 1993). High-dose rats exhibited mild-to-moderate enlargement of
nuclei in the renal tubules, particularly in the outer stripe of the adrenal medulla. Mean PbB level in these
rats was about 80 ug/dL after 30 days of exposure. Similar results were observed with the same dietary
levels of lead oxide. However, no such effects were seen when the rats were treated with lead sulfide or a
lead ore concentrate from Skagway, Alaska; maximum PbB levels were below 15 ug/dL in these groups.
The results suggested that systemic toxicity is determined by the bioavailability of the lead species.
Histopathological changes were noted in the kidneys of rats administered lead acetate in the drinking water
for 76 weeks at lower doses (Koller et al. 1985). These changes, which were observed at a dose of
37 mg/kg/day, a dose much lower than that used by Vyskocil et al. (1989), included necrotic and dilated
cortical tubules, tubular protein casts, areas with large nuclei and fibrous connective tissue, and large
intranuclear inclusion bodies in the enlarged epithelial cells of the cortex near the cortical-medullary
junction.
The highest NOAEL values and all reliable LOAEL values for each study for renal effects are recorded in
Table 2-4 and plotted in Figure 2-2.
Endocrine Effects. No studies were located regarding endocrine effects in humans or animals after
oral exposure to inorganic lead. See Section 2.2.1.2 for a discussion of endocrine effects of lead in humans
after multi-route exposure to lead.
Dermal Effects. No studies were located regarding dermal effects in humans or animals after oral
exposure to inorganic lead.
Ocular Effects. No studies were located regarding ocular effects in humans after oral exposure to
inorganic lead.
LEAD 168
2. HEALTH EFFECTS
Long-term scotopic visual system deficits have been observed in laboratory animals following low-level
lead exposure during early postnatal development (Fox et al. 1982). To determine whether this was due to
an effect of lead on the central nervous system or a direct effect of lead on the eye, a series of experiments
were performed by Fox and coworkers to determine the effects of low-level lead exposure on ocular
function during early postnatal development in rats (Fox and Chu 1988; Fox and Farber 1988; Fox and
Rubinstein 1989). In the first study, timed-pregnant hooded rats were administered 0.2% lead acetate in
the drinking water from day of birth (day 0) through lactation (day 21). The authors state that results from
previous studies show that rat pups receive 0.5 mg/kg/day of lead through the milk under such an exposure
regimen. At weaning the animals were transferred to standard laboratory chow and maintained until
90 days of age. At this point, acute (single flash) electroretinograms (ERG) and cyclic nucleotide
metabolism studies were conducted. The PbB levels in the lead-exposed pups were 59 ug/dL at 21 days of
age and 7 ug/dL at 90 days of age. The results of the single-flash ERGs indicated that lead exposure
caused a significant decrease in amplitude, a significant increase in latency, and a significant decrease in
sensitivity in various waveforms suggesting that low-level lead exposure during postnatal development has
a selective detrimental effect on the rods of the retina. The authors speculated on the mechanism of such a
change. One possibility is that lead alters cyclic nucleotide metabolism such that the activity of the sodium
channels in the rods is changed. To investigate this possibility, cyclic nucleotide content and the activity
of the enzymes associated with their metabolism were measured. A significant increase in cyclic
guanosine monophosphate (cGMP), but not cyclic adenosine monophosphate (cAMP) was found in both
light- and dark-adapted lead-exposed animals as compared to the controls. This increase in cGMP content
was in turn found to be associated with decreased cGMP-phosphodiesterase (PDE) activity (Fox and
Farber 1988). In a subsequent study, it was found that the rod sensitivity and range of dark adaptation
were decreased after developmental exposure to 0.08 and 0.5 mg lead/kg/day and that the rate of dark
adaptation was decreased only at the 0.5 mg lead/kg/day level (Fox and Katz 1992). The authors
suggested that the reduced rod sensitivity was due to an increased rod depolarization, which in turn was
caused by increased intracellular sodium.
A similar exposure regimen was employed in the second study (Fox and Chu 1988) to study the effects of
low-level lead exposure on the ultrastructure and quantitative histology of the retina during early postnatal
development in rats. At weaning the animals were transferred to standard laboratory chow and maintained
until 90 days of age. At this point, the animals were sacrificed, and the retinas were removed for light and
electron microscopic analysis. The authors found that there was a selective degeneration of rod (but not
cone) photoreceptor cells in the lead-exposed rats, leading to an overall loss of 20% of rod cells.

LEAD 169
2. HEALTH EFFECTS
Degeneration occurred more in the inferior than the superior retina, and more in the posterior than the
peripheral retina. The outer and inner nuclear layers were also reduced in thickness in the lead exposed-
rats. General retinal damage was evidenced by the accumulation of glycogen particles in the lead-exposed
rats. These results support the hypothesis posed by Fox and Farber (1988) that lead exposure during
postnatal development has a selective detrimental effect on the rods of the retina.
In the third study, rats were exposed in the same manner as the two previous studies to evaluate the effects
of low-level lead exposure on retinal sensitivity, rhodopsin content, and rod outer segment length
throughout the first year of life in rats exposed during early postnatal development (Fox and Rubinstein
1989). The authors found that retinal sensitivity and rhodopsin content in the lead-exposed rats were
decreased at all ages tested. There was no change in the ^^ of the rhodopsin in the lead-exposed animals
as compared to the control animals. Histological evaluation revealed that there was a decrease in rod outer
segment length coupled with a selective loss of 20% of the rod cells which would account for the decrease
in rhodopsin content in the lead-exposed rats. The results also indicate that most of these effects occur
within the first 30 days of life, although the changes remain throughout the first year. In a subsequent
study from this series, Fox et al. (1997) compared the effects observed in rats exposed via dam's milk with
those seen in exposed adults. The result showed that developing and adult retinas exhibited qualitatively
similar structural and functional alterations, but developing retinas were much more sensitive, and in both
cases alterations in retinal cGMP metabolism was the underlying mechanism leading to lead-induced ERG
deficits and rod and bipolar cell death. Taken together, the results of these studies strongly suggest that
lead exposure during postnatal development has a selective detrimental effect on the rods of the retina in
rodents.
Retinal effects have also been reported in other species exposed to lead. For example, monkeys were fed a
diet containing 350 ppm or 600 ppm lead acetate in the diet for over 9 years (Kohler et al. 1997). This diet
provided approximately 4 or 7 mg lead/kg/day and resulted in PbB levels of about 38 ug/dL and 55 ug/dL
when the monkeys were 9 years old. The treatment period was followed by a 35-month period of lead-free
diet, during which time, PbB lead levels declined to nearly those of untreated monkeys. Treatment with
lead resulted in a dose-related decrease in tyrosine hydroxyiase (TH, rate-limiting enzyme in
catecholamine synthesis) content in neurons of the retina. Treated animals also showed a reduced number
of ascending fibers in the inner nuclear layer and of dense staining fibers in sublayer 1 of the inner
plexiform layer. The results showed that lead treatment during development can produce long-lasting
effects that persist long after PbB levels had return near background levels.
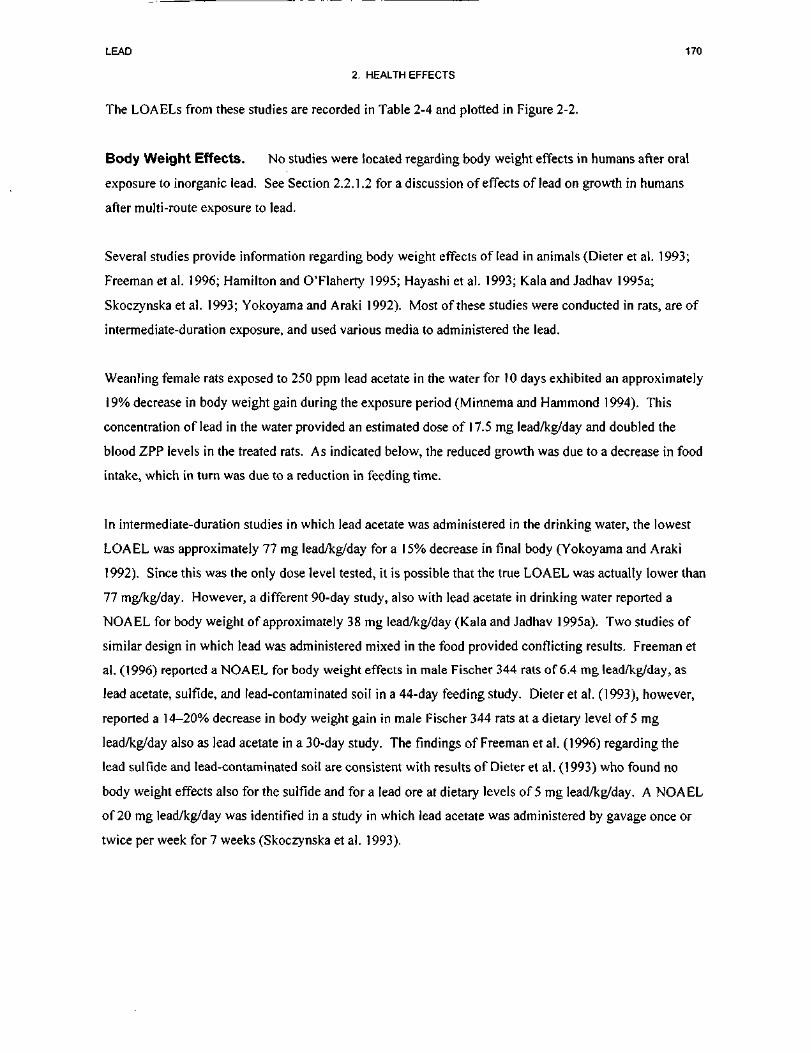
LEAD 170
2. HEALTH EFFECTS
The LOAELs from these studies are recorded in Table 2-4 and plotted in Figure 2-2.
Body Weight Effects. No studies were located regarding body weight effects in humans after oral
exposure to inorganic lead. See Section 2.2.1.2 for a discussion of effects of lead on growth in humans
after multi-route exposure to lead.
Several studies provide information regarding body weight effects of lead in animals (Dieter et al. 1993;
Freeman et al. 1996; Hamilton and O'Flaherty 1995; Hayashi et al. 1993; Kala and Jadhav 1995a;
Skoczynska et al. 1993; Yokoyama and Araki 1992). Most of these studies were conducted in rats, are of
intermediate-duration exposure, and used various media to administered the lead.
Weanling female rats exposed to 250 ppm lead acetate in the water for 10 days exhibited an approximately
19% decrease in body weight gain during the exposure period (Minnema and Hammond 1994). This
concentration of lead in the water provided an estimated dose of 17.5 mg lead/kg/day and doubled the
blood ZPP levels in the treated rats. As indicated below, the reduced growth was due to a decrease in food
intake, which in turn was due to a reduction in feeding time.
In intermediate-duration studies in which lead acetate was administered in the drinking water, the lowest
LOAEL was approximately 77 mg lead/kg/day for a 15% decrease in final body (Yokoyama and Araki
1992). Since this was the only dose level tested, it is possible that the true LOAEL was actually lower than
77 mg/kg/day. However, a different 90-day study, also with lead acetate in drinking water reported a
NOAEL for body weight of approximately 38 mg lead/kg/day (Kala and Jadhav 1995a). Two studies of
similar design in which lead was administered mixed in the food provided conflicting results. Freeman et
al. (1996) reported a NOAEL for body weight effects in male Fischer 344 rats of 6.4 mg lead/kg/day, as
lead acetate, sulfide, and lead-contaminated soil in a 44-day feeding study. Dieter et al. (1993), however,
reported a 14-20% decrease in body weight gain in male Fischer 344 rats at a dietary level of 5 mg
lead/kg/day also as lead acetate in a 30-day study. The findings of Freeman et al. (1996) regarding the
lead sulfide and lead-contaminated soil are consistent with results of Dieter et al. (1993) who found no
body weight effects also for the sulfide and for a lead ore at dietary levels of 5 mg lead/kg/day. A NOAEL
of 20 mg lead/kg/day was identified in a study in which lead acetate was administered by gavage once or
twice per week for 7 weeks (Skoczynska et al. 1993).
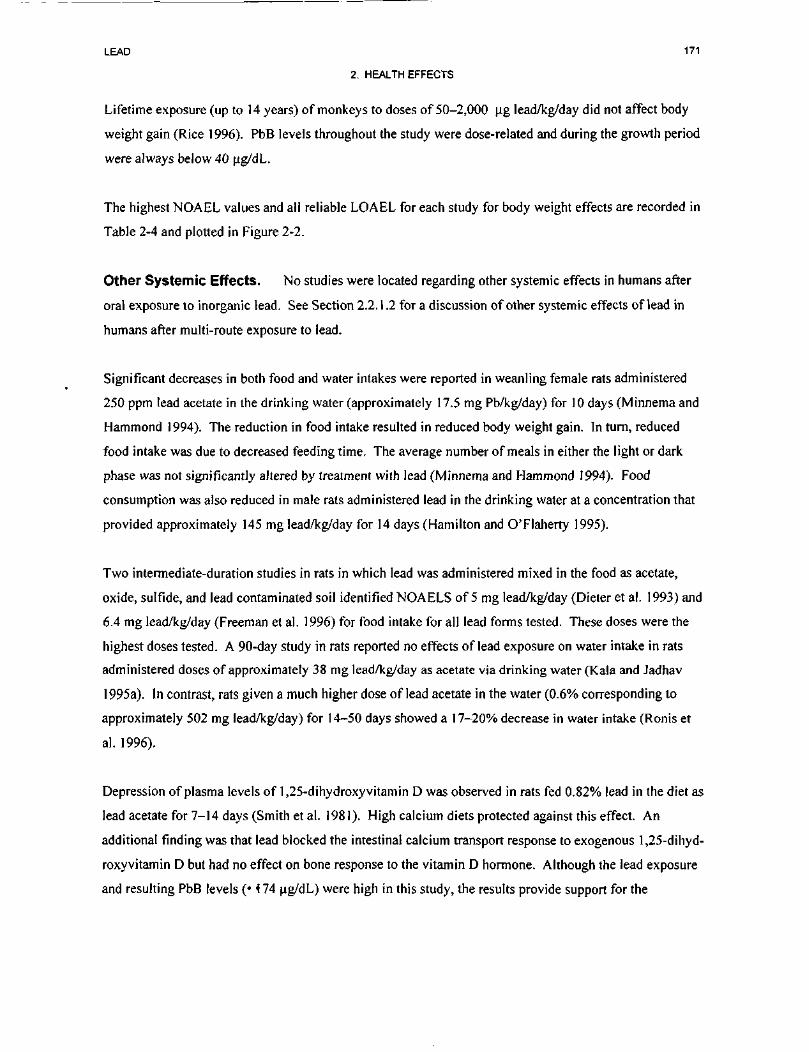
LEAD 171
2. HEALTH EFFECTS
Lifetime exposure (up to 14 years) of monkeys to doses of 50-2,000 ug lead/kg/day did not affect body
weight gain (Rice 1996). PbB levels throughout the study were dose-related and during the growth period
were always below 40 ug/dL.
The highest NOAEL values and all reliable LOAEL for each study for body weight effects are recorded in
Table 2-4 and plotted in Figure 2-2.
Other Systemic Effects. No studies were located regarding other systemic effects in humans after
oral exposure to inorganic lead. See Section 2.2.1.2 for a discussion of other systemic effects of lead in
humans after multi-route exposure to lead.
Significant decreases in both food and water intakes were reported in weanling female rats administered
250 ppm lead acetate in the drinking water (approximately 17.5 mg Pb/kg/day) for 10 days (Minnema and
Hammond 1994). The reduction in food intake resulted in reduced body weight gain. In turn, reduced
food intake was due to decreased feeding time. The average number of meals in either the light or dark
phase was not significantly altered by treatment with lead (Minnema and Hammond 1994). Food
consumption was also reduced in male rats administered lead in the drinking water at a concentration that
provided approximately 145 mg lead/kg/day for 14 days (Hamilton and O'Flaherty 1995).
Two intermediate-duration studies in rats in which lead was administered mixed in the food as acetate,
oxide, sulfide, and lead contaminated soil identified NOAELS of 5 mg lead/kg/day (Dieter et al. 1993) and
6.4 mg lead/kg/day (Freeman et al. 1996) for food intake for all lead forms tested. These doses were the
highest doses tested. A 90-day study in rats reported no effects of lead exposure on water intake in rats
administered doses of approximately 38 mg lead/kg/day as acetate via drinking water (Kala and Jadhav
1995a). In contrast, rats given a much higher dose of lead acetate in the water (0.6% corresponding to
approximately 502 mg lead/kg/day) for 14-50 days showed a 17-20% decrease in water intake (Ronis et
al. 1996).
Depression of plasma levels of 1,25-dihydroxy vitamin D was observed in rats fed 0.82% lead in the diet as
lead acetate for 7-14 days (Smith et al. 1981). High calcium diets protected against this effect. An
additional finding was that lead blocked the intestinal calcium transport response to exogenous 1,25-dihyd-
roxyvitamin D but had no effect on bone response to the vitamin D hormone. Although the lead exposure
and resulting PbB levels (• 174 ug/dL) were high in this study, the results provide support for the
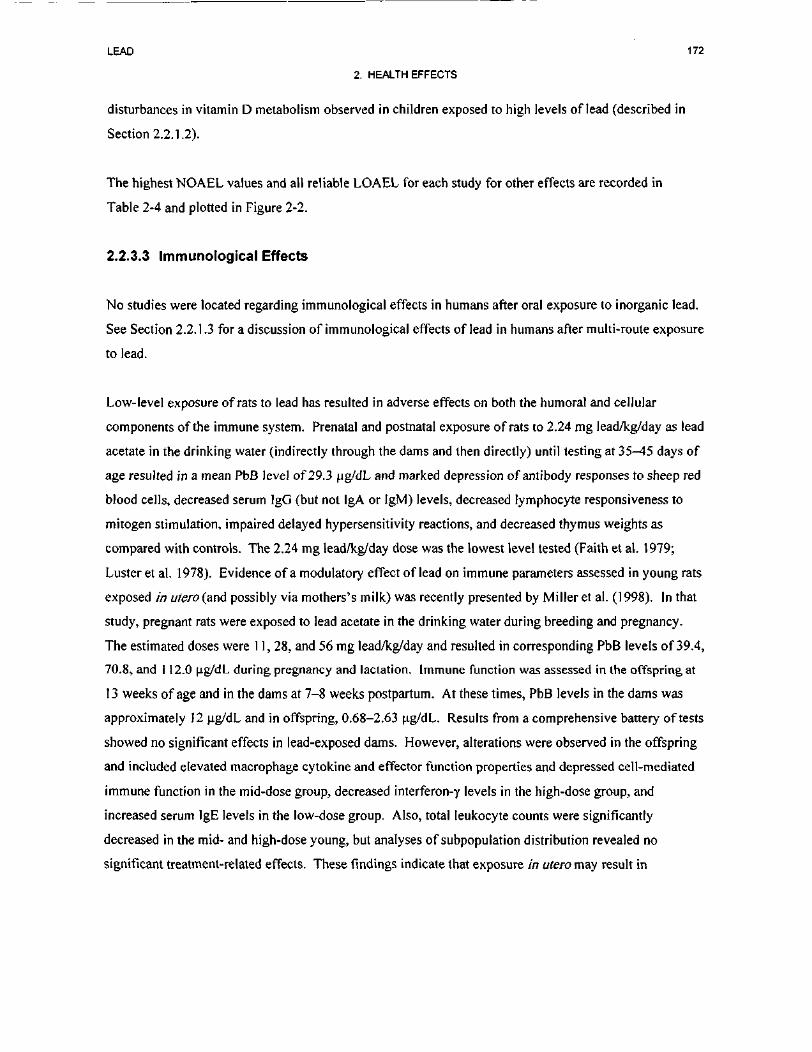
LEAD 172
2. HEALTH EFFECTS
disturbances in vitamin D metabolism observed in children exposed to high levels of lead (described in
Section 2.2.1.2).
The highest NOAEL values and all reliable LOAEL for each study for other effects are recorded in
Table 2-4 and plotted in Figure 2-2.
2.2.3.3 Immunologies! Effects
No studies were located regarding immunological effects in humans after oral exposure to inorganic lead.
See Section 2.2.1.3 for a discussion of immunological effects of lead in humans after multi-route exposure
to lead.
Low-level exposure of rats to lead has resulted in adverse effects on both the humoral and cellular
components of the immune system. Prenatal and postnatal exposure of rats to 2.24 mg lead/kg/day as lead
acetate in the drinking water (indirectly through the dams and then directly) until testing at 35^5 days of
age resulted in a mean PbB level of 29.3 ug/dL and marked depression of antibody responses to sheep red
blood cells, decreased serum IgG (but not IgA or IgM) levels, decreased lymphocyte responsiveness to
mitogen stimulation, impaired delayed hypersensitivity reactions, and decreased thymus weights as
compared with controls. The 2.24 mg lead/kg/day dose was the lowest level tested (Faith et al. 1979;
Luster et al. 1978). Evidence of a modulatory effect of lead on immune parameters assessed in young rats
exposed in ufero(and possibly via mothers's milk) was recently presented by Miller et al. (1998). In that
study, pregnant rats were exposed to lead acetate in the drinking water during breeding and pregnancy.
The estimated doses were 11, 28, and 56 mg lead/kg/day and resulted in corresponding PbB levels of 39.4,
70.8, and 112.0 (ig/dL during pregnancy and lactation. Immune function was assessed in the offspring at
13 weeks of age and in the dams at 7-8 weeks postpartum. At these times, PbB levels in the dams was
approximately 12 jag/dL and in offspring, 0.68-2.63 ug/dL. Results from a comprehensive battery of tests
showed no significant effects in lead-exposed dams. However, alterations were observed in the offspring
and included elevated macrophage cytokine and effector function properties and depressed cell-mediated
immune function in the mid-dose group, decreased interferon-y levels in the high-dose group, and
increased serum IgE levels in the low-dose group. Also, total leukocyte counts were significantly
decreased in the mid- and high-dose young, but analyses of subpopulation distribution revealed no
significant treatment-related effects. These findings indicate that exposure in utero may result in
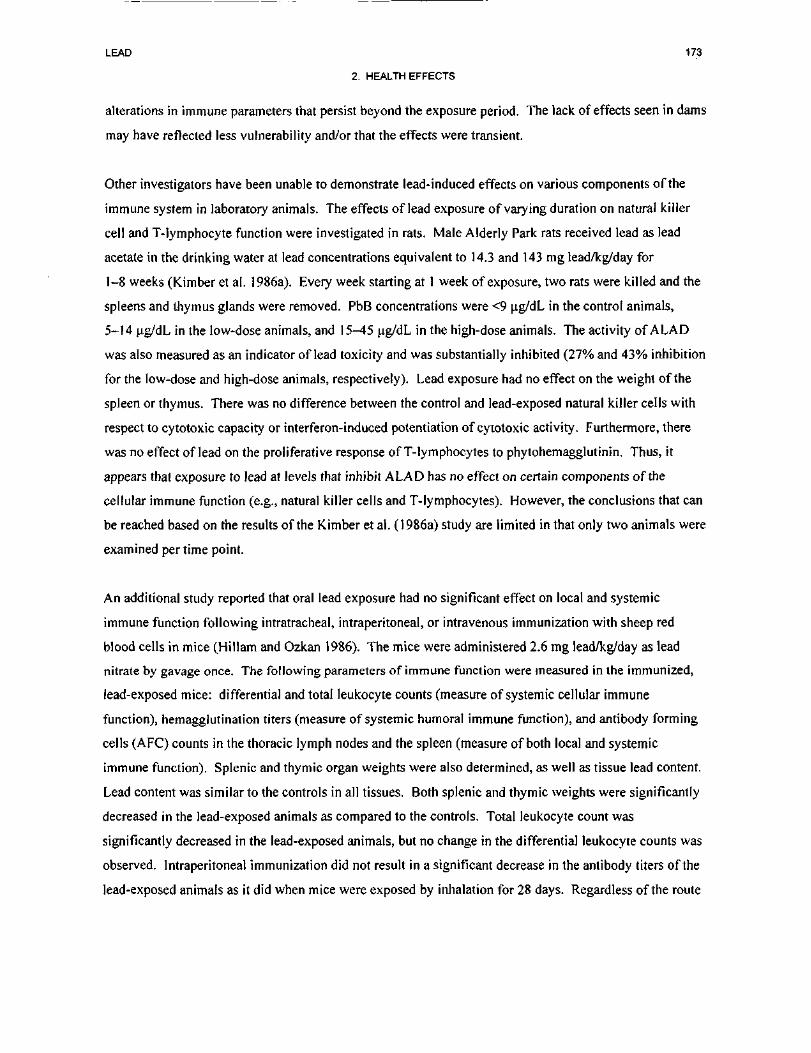
LEAD 173
2. HEALTH EFFECTS
alterations in immune parameters that persist beyond the exposure period. The lack of effects seen in dams
may have reflected less vulnerability and/or that the effects were transient.
Other investigators have been unable to demonstrate lead-induced effects on various components of the
immune system in laboratory animals. The effects of lead exposure of varying duration on natural killer
cell and T-lymphocyte function were investigated in rats. Male Alderly Park rats received lead as lead
acetate in the drinking water at lead concentrations equivalent to 14.3 and 143 mg lead/kg/day for
1-8 weeks (Kimber et al. 1986a). Every week starting at 1 week of exposure, two rats were killed and the
spleens and thymus glands were removed. PbB concentrations were <9 ug/dL in the control animals,
5-14 ug/dL in the low-dose animals, and 15^5 ug/dL in the high-dose animals. The activity of ALAD
was also measured as an indicator of lead toxicity and was substantially inhibited (27% and 43% inhibition
for the low-dose and high-dose animals, respectively). Lead exposure had no effect on the weight of the
spleen or thymus. There was no difference between the control and lead-exposed natural killer cells with
respect to cytotoxic capacity or interferon-induced potentiation of cytotoxic activity. Furthermore, there
was no effect of lead on the proliferative response of T-lymphocytes to phytohemagglutinin. Thus, it
appears that exposure to lead at levels that inhibit ALAD has no effect on certain components of the
cellular immune function (e.g., natural killer cells and T-lymphocytes). However, the conclusions that can
be reached based on the results of the Kimber et al. (1986a) study are limited in that only two animals were
examined per time point.
An additional study reported that oral lead exposure had no significant effect on local and systemic
immune function following intratracheal, intraperitoneal, or intravenous immunization with sheep red
blood cells in mice (Hillam and Ozkan 1986). The mice were administered 2.6 mg lead/kg/day as lead
nitrate by gavage once. The following parameters of immune function were measured in the immunized,
lead-exposed mice: differential and total leukocyte counts (measure of systemic cellular immune
function), hemagglutination liters (measure of systemic humoral immune function), and antibody forming
cells (AFC) counts in the thoracic lymph nodes and the spleen (measure of both local and systemic
immune function). Splenic and thymic organ weights were also determined, as well as tissue lead content.
Lead content was similar to the controls in all tissues. Both splenic and thymic weights were significantly
decreased in the lead-exposed animals as compared to the controls. Total leukocyte count was
significantly decreased in the lead-exposed animals, but no change in the differential leukocyte counts was
observed. Intraperitoneal immunization did not result in a significant decrease in the antibody liters of the
lead-exposed animals as it did when mice were exposed by inhalation for 28 days. Regardless of the route

LEAD 174
2. HEALTH EFFECTS
of immunization, oral administration of lead did not affect the number of AFCs in either the spleen or the
thoracic lymph node. Based on the fact that the concentration of lead in tissues and in blood did not differ
between treated an control mice, the absence of significant immunological effects in the treated mice is
not totally unexpected.
A LOAEL for immunological effects is recorded in Table 2-4 and plotted in Figure 2-2.
2.2.3.4 Neurological Effects
No studies were located regarding neurological effects in humans after oral exposure to inorganic lead.
See Section 2.2.1.4 for a discussion of neurological effects of lead in humans after multi-route exposure to
lead.
The literature on the neurobehavioral effects of oral exposure to lead in animals is extensive. Only those
studies considered key to clarifying human health issues will be presented here. High levels of exposure to
lead produce encephalopathy in several species, but blood lead data for this effect are generally not
available.
A number of histopathological studies of lead's effects on the nervous system of rats treated during early
postnatal life with lead acetate or carbonate in the drinking water or diet through their dams or directly, for
• 3 weeks, have shown a variety of adverse effects at PbB levels ranging from 258 to 400 ug/dL. These
effects include reductions or delays in the development of the hippocampus or other hippocampal changes
(Alfano and Petit 1982; Alfano et al. 1982; Slomianka et al. 1989), reductions or delays in the
development of the cerebral cortex (Petit and LeBoutillier 1979), reductions in the number and size of
axons in the optic nerve of mice (Tennekoon et al. 1979), and demyelination of peripheral nerves
(Windebank et al. 1980). Cytoarchitectural changes have also been noted in limited studies of the eyes of
monkeys chronically exposed to lead beginning at or shortly after birth (Reuhl et al. 1989).
A number of neurochemical changes have been observed in the brains of rats exposed both pre- and post-
natally to lead (Singh and Ashraf 1989). Pregnant rats were administered lead acetate by gavage in saline
5 times per week after day 14 of gestation at a dose of 0.64 mg lead/kg/day. After birth, pups were given
0.64 mg lead/kg/day by gavage 5 days per week for 10 weeks. Brain norepinephrine and •y-aminobutyric
acid (GABA) levels and glutamic acid decarboxylase (GAD) activity were decreased, and brain glutamate,
glutamine + asparagine, tyrosine levels, and monoaminooxygenase (MAO) activity were increased in the
LEAD 175
2. HEALTH EFFECTS
lead-exposed rats. Brain ammonia, alanine, aspartic acid, and dopamine were not affected. Brain uptake
values for glutamine were significantly increased. Similar results were observed in pups exposed to
0.64 mg lead/kg/day, 5 days per week for 10 weeks when exposure was initiated 5 days postnatally, but
not when initiated at 5 weeks postnatally. Brain lead levels were similar in the three exposure scenarios.
In a more recent study, it was reported that prenatal exposure to lead, that continued for 20 weeks after
birth resulted in altered normal developmental pattern of protein in neurons from the central nervous
system (Singh 1993). The effects were not observed in rats exposed only as adults; however, brain lead
levels were similar in the two groups. These results suggest that the rapidly developing rat brain may be
more susceptible to the neurotoxic effects of lead than the brains of older rats. Kala and Jadhav (1995a)
reported changes (increases and decreases) in the levels of several neurotransmitters and their metabolites
in various areas of the rat brain following 90-day exposure to lead acetate in the drinking water. The most
significant was a decrease in dopamine in the nucleus accumbens with the lowest lead dose tested,
approximately 2.2 mg/kg. These changes were observed at PbB concentrations in the 10-19 ug/dL range.
In a subsequent study, the same group of investigators reported that both the basal and potassium-induced
release of dopamine in the nucleus accumbens were significantly reduced as a result of lead treatment
(Kala and Jadhav 1995b) and suggested that lead may decrease the availability of dopamine in the neurons,
interfere with calcium-mediated transmitter release at the site, and/or interfere with autoreceptor processes.
The effect of lead on the distribution of calcium binding proteins in the hippocampus from monkeys was
recently examined by Noack et al. (1996). Monkeys were treated for 9 years (exposure beginning in uterd)
with lead in the diet at a concentration that provided approximately 4 or 7 mg lead/kg/day and resulted in
PbB levels of about 38 and 55 u.g/dL, respectively, at 9 years of age. After a 32-month period of lead-free
diet, PbB levels, while still higher than in unexposed monkeys, had decreased considerably. Immuno-
histochemical examination of the hippocampus revealed no significant differences in the pattern of
distribution of three high-affinity calcium binding neuronal proteins, but there was a marked decrease in
the immunoreactivity of the glial protein SI 00 in the high-dose group. The results were interpreted as
confirming the hypothesis that glial cells are the main target of lead toxicity in the central nervous system.
Recent studies have focused on neurobehavioral effects of exposure of the developing organisms to lead.
Studies concerned primarily with the effects of prenatal exposure are presented in the section on
developmental effects (Section 2.2.3.6), while studies concerned primarily with postnatal exposure are
discussed here.
LEAD 176
2. HEALTH EFFECTS
Investigations of the development of motor function and reflexes in rats have shown effects at PbB levels
of • 59 ug/dL. Male rats were treated with lead acetate at 45, 90, or 180 mg lead/kg/day by gavage on
postnatal days 3-21 (Kishi et al. 1983). The air righting reflex was significantly delayed at all doses. Eye
opening was accelerated at the lowest dose tested, which produced a mean PbB level of 59 u,g/dL.
Rotorod performance at postnatal days 53-58 was significantly impaired at the highest dose, which
produced a mean PbB level of 186 ug/dL. An adverse effect of lead on rotorod performance at
postnatal days 30-70 was noted in rats treated by gavage on days 3-21 of age with 19.2 mg lead/kg/day as
lead acetate, which resulted in a mean PbB level of 174 ug/dL, but no effect was noted in rats treated with
6.4 mg lead/kg/day as lead acetate, which resulted in a mean PbB level of 33 ug/dL (Overmann 1977).
Thus, neonatal lead exposure produced behavioral effects without causing adverse effects on growth or
overt signs of poisoning.
Several studies have reported effects on performance in learning tasks in rats with PbB levels of
<30 ug/dL. The lowest external exposure level that was significantly associated with a behavioral effect in
rats was reported by Bushnell and Levin (1983). The authors found that exposure of rats starting at
postnatal day 21 (postweaning) to drinking water at 1.6 mg lead/kg/day for 35 days produced a decrease in
spontaneous alternation in a radial arm maze. Although the PbB level was not measured, the mean brain
lead level on the day following termination of exposure was 0.05 ug/g. The effects of neonatal exposure
to lead on complex maze learning were studied in male Wistar rats. The rats were administered 50 mg
lead/kg/day as lead acetate in water by gavage on postgestation days 9, 12, 15, and 18, or 14.3 mg
lead/kg/day in the drinking water for 112 days beginning on postgestation day 21 (Massaro and Massaro
1987). Two control groups were included: a vehicle (sodium acetate) control group and an untreated
control group. The animals began extensive maze training on day 31 or 143 postpartum and were tested
on days 41-45 or 153-157. The parameter studied was latent learning: the animals were trained to run the
maze or explore an open field in a satiated condition and in the absence of any positive or negative
reinforcement (known as the free exploration phase). Experienced animals as well as unexperienced
animals are then placed in the maze following food deprivation. The measure of latent learning is the
performance of the experienced animals compared to that of the inexperienced animals. There was no
difference between the controls and the lead-exposed animals with respect to activity during the free
exploration phase. However, during the food deprivation trial in the maze, the animals exposed to lead
during the early postgestation period made significantly more errors, whereas the young adults exposed for
112 days did not. These results indicate that in animals lead exposure alters the ability to transfer
LEAD 177
2. HEALTH EFFECTS
information from a previous learning experience in this experimental paradigm but that this effect is not
seen in the young adult.
Other types of tests have also revealed behavioral changes in rats exposed to low levels of lead. For
example, weaning rats exposed to lead in the drinking water for 90 days at a concentration that provided
0.47-0.72 mg lead/kg/day and that resulted in PbB levels of 15 ug/dL exhibited in a significant delay in
learning a task (Jadhav and Areola 1997). However, no such impairment was seen in rats that had a PbB
concentration of 6 ug/dL. Significant effects were noted in rats exposed after weaning and throughout the
course of the experiment to lead acetate at 2.1 mg lead/kg/day in their drinking water, which resulted in
PbB levels of 15-20 p.g/dL (Cory-Slechta et al. 1985). The lead-exposed rats had a significantly higher
response rate and a significantly shorter interval between bar-press responses on a fixed-interval operant
schedule of food reinforcement. Similar results were obtained at higher exposure levels in a series of
earlier studies (Cory-Slechta and Thompson 1979; Cory-Slechta et al. 1981, 1983), even when the operant
schedule or contingency for reinforcement was rather different. According to EPA (1986a), a tendency in
lead-treated rats to respond more rapidly (higher response rate, shorter inter-response times, shorter
response latency) or to respond even when inappropriate (such as when no reward is provided for
responses or when reward is specifically withheld for responding) has been reported in many other studies
as well, frequently at PbB levels of <30 )ig/dL at the time of testing. A two-lever operant food-reinforced
drug discrimination paradigm was also used to examine the effects of lead exposure on the ontogeny of
dopaminergic systems in rats (Cory-Slechta et al. 1992). In this study the dams were exposed to lead
acetate in the drinking water (approximately 8.3 or 29.2 mg lead/kg/day) from postnatal day 1 until day 21;
this resulted in the pups being exposed to lead only through maternal milk. PbB in the low- and high-dose
pups at 21 days of age was 16 ug/dL and 34 ug/dL, respectively; however, at the time behavioral training
began it had declined below the detection limit of 5 ug/dL. The effect of exposure to lead was manifested
as a left-shift of the sensitivity dose-effect curve for discrimination of various doses of the D2 agonist
quinpirole and was consistent with an increased sensitivity of subtype D2 dopaminergic receptors to
dopamine agonists. The lead-induced supersensitivity represented a D2 autoreceptor rather than a
postsynaptic receptor supersensitivity. The results further suggested that functional supersensitivity is a
permanent effect of postnatal exposure since both blood and lead levels were negligible at the time training
began. Results from further studies by the same authors suggested that the increased D2 sensitivity may be
due to a facilitated D2 receptor number, particularly in the nucleus accumbens (Widzowski et al. 1994).
Evidence of increased sensitivity of muscarinic cholinergic receptors in the central nervous system as a
result of exposure to lead has also been presented (Cory-Slechta and Pokora 1995). A recent study from

LEAD 178
2. HEALTH EFFECTS
the same group of investigators showed that exposure of rats to lead in the drinking water for 12 months
from weaning selectively decreased dopamine binding sites in the nucleus accumbens (mesolimbic
dopamine system and not in the dorsal striatum (nigrostriatal dopamine system) (Pokora et al. 1996).
These changes were seen primarily in D2 receptors and in the dopamine transporter and after as little as
2 weeks of 150 ppm lead exposure (this resulted in a PbB level of 29 ug/dL at 8 months). Effects of a
50 ppm exposure with corresponding PbB levels of approximately 16 ug/dL were observed after
12 months of exposure.
Many studies have suggested that the N-methyl-D-aspartate (NMDA) receptor play a role in the lead-
induced neurobehavioral alterations in rodents (Cory-Slechta 1995a; Cory-Slechta et al. 1997b, 1997c).
To test this hypothesis, extensive use has been made of neuropharmacological tools. For example, in rats,
lead has been shown to decreases MK-801 binding throughout the brain (MK-801 is a noncompetitive
NMDA receptor antagonist); decreases in MK-801 binding suggest a hypoglutamatergic function. Some
studies have suggested that lead inhibits NMDA receptor binding through the zinc allosteric site, which
modulates receptor binding (Cory-Slechta 1995a; Guilarte et al. 1995). Studies have also shown that
treatment of adult rats with lead results in alterations in the NMDA receptor complex function similar to
those seen after treatment postnatally or postweaning, but only after administration of doses that result in
PbB levels 2-3 times higher (>40 ug/dL) than with exposures earlier in life (Cory-Slechta 1995b, 1997a;
Cory-Slechta et al. 1997d).
Impairment has also been reported at low blood lead levels in other types of behavior/learning studies in .
rats. In a test of spatial discrimination, rats were exposed to lead acetate at 745 mg lead/kg/day in the diet
indirectly via administration to their dams through gestation and lactation and then directly until testing (at
100 and 200 days of age) (Winneke et al. 1977). The lead-exposed rats were slower to learn the
discrimination than were controls. Their PbB levels at postnatal day 16 averaged 26.6 ug/dL and the
levels at 190 days averaged 28.5 |ig/dL.
The results from a study in rodents demonstrated that lead (at PbB levels <30 ug/dL) has a selective effect
on learning that is distinct from non-specific performance changes. Male Long-Evans rats were exposed to
lead as lead acetate in drinking water from weaning through the completion of the experiment (Cohn et al.
1992). At 55 days of age they were trained to respond on a multiple repeated acquisition (RA) and
performance (P) schedule. Each animal went through 80 daily sessions after training was complete. The
RA component required the learning of a new three-member sequence of lever pushes each session, and
LEAD 179
2. HEALTH EFFECTS
the P component remained constant across sessions. Correct completion of each sequence was rewarded
with a food pellet, and mistakes resulted in "time-outs" during which the chamber lights were off and
pushing the lever was without consequence. The authors reported that the learning component (i.e., the
RA) was selectively affected in the lead-exposed animals. The P component was unaffected, indicating
that the differences observed in the RA component were not due to a nonspecific effect on the ability to
press the lever. The errors committed by the lead-exposed animals in the RA component appeared to be
due either to perseverative responding on sequences similar to the P component sequence or perseverative
responding on a single lever; both types of behavior prohibited the ability to learn new sequences that were
unlike the P component sequence. The possibility that the reduced accuracy in the RA component of the
lead-exposed rats was due simply to some sort of impairment in their ability to attend to stimuli indicating
the transition from the P to the RA component of a session was eliminated by adding additional stimuli
which were without effect. PbB levels measured after 60 sessions were 2.8±1.0, 25.1 ±4.1, and
73.5±5.7 ug/dL for the 0-, 50-, and 250-ppm groups, respectively. No clinical signs of toxicity (if any) or
body weight were reported, but previous studies by these authors had shown that these PbB levels were not
associated with body weight changes (Cory-Slechta et al. 1985).
Several studies are available on the effects of postnatal lead exposure on a number of behavioral tests in
monkeys. For example, four rhesus monkeys (2 male and 2 female) were exposed to lead as lead acetate
trihydrate according to the following regimen: 2 doses of 10.0 mg lead/kg were administered to the
monkeys on day 8 or 9 and again on day 29 or 30 after birth by nasogastric intubation in distilled water
(Levin et al. 1988). From day 9 to day 29 they received 0.7 mg lead/kg/day in their milk formula, and for
12 days after the second dose of 10 mg lead/kg, they received daily doses of 3.0 mg lead/kg/day. For the
rest of the first 6 months after birth they were administered 0.7 mg lead/kg/day in the milk formula. Four
(two males and two females) rhesus monkeys receiving equiionic doses of sodium acetate served as
controls. This treatment regimen was supposed to mimic the temporal pattern of blood levels ("pulse
chronic") seen in children. Blood lead levels, ZPP, hematocrit, and body weight were measured. The
control monkeys had mean PbB levels of 4.1-7.9 ug/dL during the first 6 months. The lead-exposed
monkeys had mean PbB levels of 25.5 ug/dL during the first 4 weeks, which increased to between 33.1
and 42.9 ug/dL during the first 6 months. PbB levels peaked at 55.8 ug/dL 5 weeks after birth. The
following behavioral tests were conducted in an attempt to identify early predictors of later cognitive
impairment resulting from postnatal lead exposure: (1) the early infant behavioral scale (conducted during
the first 6 weeks after birth) to screen the development of a broad range of behavioral responses including
orientation, muscle tonus, motor maturity, temperament, and quieting abilities; (2) the Piagetian object
LEAD 180
2. HEALTH EFFECTS
permanence test (conducted at 14 days of age) to serve as an early measure of cognitive function during
the sensorimotor stage of development; and (3) the visual exploration test to assess delayed spatial
alternation performance which suggest deficits in visual attention. The lead-exposed infants were more
agitated and had lower muscle tonus in the early infant behavior test. All other parameters in this test were
not significantly affected by lead exposure. There was also no difference between the lead-exposed
monkeys and the controls in the Piagetian object permanence test. Some aspects of the visual exploration
test were affected by lead exposure; these changes were suggestive of decreased visual attentiveness in the
lead-exposed monkeys. Based on these results, these tests may serve as both indices of behavioral
dysfunction during postnatal lead exposure, and to predict later lead-induced cognitive dysfunction (Levin
etal. 1988).
Studies of the effects of lead on learning in monkeys are also available. Perinatal exposure to lead nitrate
(3 mg lead/kg/day) resulted in significant behavioral deficits in the offspring of Macaca fascicularis at
maternal gestational PbB concentration of 30-70 ug/dL with no signs of maternal toxicity (Hopper et al.
1986). The infant monkeys showed deficits in form discrimination performance (6-18 months age), and in
response inhibition performance (19-29 months of age). Persistent deficits in form discrimination up to
18 months following the termination of exposure suggests that lead-induced behavioral deficits may be
permanent. Other investigators have used discrimination reversal tasks to detect impaired learning in
monkeys treated orally with lead acetate (Bushnell and Bowman 1979b, 1979c; Laughlin et al. 1983; Levin
and Bowman 1983; Mele et al. 1984). Discrimination reversal tasks require the subject to correctly respond
to one of two stimuli to get a reward and then, once the task has been mastered, to make the reverse
discrimination (i.e., respond only to the cue formerly unpaired with reward). In these studies, monkeys
administered lead acetate orally from birth at low or high levels (0.2 or 0.88 mg lead/kg/day) that produced
PbB levels of • 32 ug/dL for 5 months to 1 year were consistently slower in reversal and other learning
tasks (Bushnell and Bowman 1979a; Laughlin et al. 1983; Levin and Bowman 1983) even when exposure
was terminated at 1 year and the monkeys were tested again at 33 months (Mele et al. 1984) and
49-55 months of age (Bushnell and Bowman 1979b). No effects were seen on body weight, growth rate,
hematocrit, or general health. The monkeys tested at 49-55 months of age had PbB levels of 4 u.g/dL for
controls, 5 ug/dL for the low-lead group, and 6 ug/dL for the high-lead group, as compared with average
and peak PbB levels during the year of treatment of 4 and 12 ug/dL for controls, 32 and 70 ug/dL for the
low-lead group, and 65 and 134 ug/dL for the high-lead group (Bushnell and Bowman 1979b, 1979c).
Additional evidence was provided by Ferguson and Bowman (1990) in a study on rhesus monkeys where
postnatal exposure to varying doses of lead (0.7-10 mg/kg/day) resulted in behavioral alterations such as
longer latency to enter the open field and increased activity and retarded habituation while in the open field.
LEAD 181
2. HEALTH EFFECTS
These effects were observed 3 years after cessation of exposure although blood levels were similar to
controls (• 5 ug/dL); the PbB levels averaged 36 ug/dL for the first year of age. Evaluation of these
monkeys at 7 years of age revealed that the open field behavioral alterations previously reported were
greatly diminished or no longer present (Ferguson et al. 1996). Latency to enter an open field was
marginally increased in the lead-treated monkeys, but levels of environmental exploration were comparable
to controls. Although these studies were well conducted, it is difficult to determine a dose-response
relationship given the unorthodox exposure regimen.
The above findings were supported and extended by other investigators (Gilbert and Rice 1987; Rice 1984,
1985b; Rice and Gilbert 1985; Rice and Karpinski 1988; Rice and Willes 1979; Rice et al. 1979). These
studies demonstrated impaired learning ability on operant conditioning tasks and discrimination reversal
tasks and extended the dose-response observations to lower blood lead levels. Monkeys were given lead (as
lead acetate) orally, 5 days a week, from birth throughout the duration of the studies; doses ranged from
0.05 to 2.0 mg lead/kg/day. Deficiencies in discrimination reversal and/or operant learning were noted in
the first 9 months and at 3-4 years with the highest dosage, and at 421 days through 3.5 years at
0.5 mg lead/kg/day (Rice 1984; Rice and Willes 1979; Rice et al. 1979). Peak and steady-state PbB levels
were 115 and 33 ug/dL for the 2.0-mg/kg group and 55.3 and 32.8 ug/dL for the 0.5-mg/kg group. Even at
the lowest dosages, 0.05 and 0.1 mg lead/kg/day, the monkeys performed significantly less well in learning
discrimination reversals at 3-4 years of age, in learning a delayed alternation task at 6-7 years of age, and
in learning discrimination reversals in the presence of irrelevant cues at 9-10 years of age (Gilbert and Rice
1987; Rice 1985b). In this series of studies on the same monkeys, peak and steady-state PbB levels were 15
and 11 ug/dL, respectively, for the 0.05-mg/kg group and 25 and 13 ug/dL, respectively, for the 0.1-mg/kg
group (Gilbert and Rice 1987; Rice 1985b).
In addition to the confirmation of the observation that lead-treated monkeys were impaired in their ability to
learn discrimination reversal tasks, notable findings were the tendency of lead-treated monkeys to respond
excessively or inappropriately (e.g., with more responses than controls during time-outs) in operant
schedules when responses were not rewarded (Rice et al. 1979). In addition, lead-treated monkeys were
also slower to learn reinforcement schedules which required a low rate of responding (Rice and Gilbert
1985), tended to have higher response rates and shorter inter-response times on fixed-interval operant
schedules, and made more perseverative errors on operant matching-to-sample tasks which required them to
direct their responses according to stimulus colors (Rice 1984). These characteristic findings are similar to
those seen in rats as discussed previously. No overt signs of toxicity were observed in the monkeys. In
LEAD 182
2. HEALTH EFFECTS
experiments conducted in separate groups of monkeys, in which the animals were exposed to lead
(1.5 mg/kg/day) either continuously for 7-8 years, only during infancy, or only as adults, it was found that
all three groups exhibited altered performance on a fixed-interval-fixed-ratio schedule of reinforcement
when tested at age 7-8 years (Rice 1992). These results suggested that exposure to lead during infancy is
not necessary for the altered adult performance, and also that exposure only during infancy is sufficient to
produce the effect.
Simple visual reaction time has proven not to be as sensitive an indicator of lead-induced neurotoxicity as
some of the other behavior paradigms discussed above. Adult monkeys were tested in a simple visual
reactive time task (Rice 1988). Seven cynomolgus monkeys (three female controls and two lead-treated
monkeys of each sex) were used in this study. The lead-treated monkeys received 0.5 mg/kg/day of lead
from birth into adulthood. The exact mode of administration was not specified. This study was conducted
when the monkeys were approximately 7 years of age. PbB levels increased from birth to 53 u.g/dL by
100 days of age, were stable at this level unti l 200 days of age, and then restabilized at a concentration of
33 ug/dL. The monkeys were trained to perform a simple visual reaction time task using delays between
1 and 13 seconds. There were no differences in performance between the control and treated monkeys.
Based on these results the authors concluded that this simple paradigm used to measure reaction time was
not a sensitive indicator of lead toxicity. These authors had previously demonstrated performance deficits
in the same group of monkeys using different behavioral tasks.
Long-term administration of lead has also resulted in neurological effects other than neurobehavioral. For
example, monkeys (Macaca fascicularis) treated for a lifetime with 0.5 mg lead/kg/day exhibited a slight
decrease in vibration sensitivity (increased threshold to stimuli) when tested at the age of 18 years (Rice and
Gilbert 1995). The results in a group treated with a 2 mg lead/kg/day dose, however, were equivocal in that
only 2 of 6 monkeys showed clear impairment. In a more recent publication, Rice (1997) showed that
lifetime treatment with 2 mg lead/kg/day increased thresholds for pure tones in 3 of 6 monkeys, higher
frequencies tended to be more affected. At the time of testing at the age of 12-13 years, the PbB levels
ranged between 70 and 150 ug/dL; up to age 10-11 years, PbB concentrations were stable at about
30 ng/dL. The results of increased hearing thresholds is consistent with results reported in humans
(Schwartz and Otto 1991). Lilienthal and Winneke (1996) reported increased latencies of waves of the
brain stem auditory evoked potentials in monkeys chronically exposed to 4 or 7 mg lead/kg/day, as lead
acetate, in the diet. Exposure was began in uteroand continued until the animals were about 9.7 years old.
LEAD 183
2. HEALTH EFFECTS
This altered response was still present when the monkeys were retested 18 months after treatment with lead
had ceased, at which time the PbB concentration had declined to nearly normal values.
Electrophysiological studies have reported effects at higher blood lead levels than have the neurobehavioral
studies presented above. Suckling rats whose dams were given 152.9 mg lead/kg/day as lead acetate in
their drinking water had significant alterations in the visual evoked responses (VERs) and decreased
scotopic visual acuity at postnatal day 21, at which time their PbB levels averaged 65 (ig/dL (Fox et al.
1977). Effects on the nervous system were persistent; decreases in visual acuity and spatial resolution were
observed at 90 days of age in rats exposed only from birth to weaning as noted above (Fox et al. 1982).
Further investigations by this laboratory on the effects on the eye of pre- and postnatal exposure of rats to
lead are discussed in Section 2.2.3.2.
Similarly, changes in nerve conduction velocity (NCV) have also been used as indicators of lead-induced
neurotoxicity (see Section 2.2.1.4), and these effects also occur at higher blood lead levels than those at
which neurobehavioral effects are observed. The effects of lead exposure on motor NCV were evaluated in
rats administered lead acetate in the drinking water for 15 weeks at the following doses: 0, 89.6, 448, 896,
and 1,792 mg lead/kg/day (Yokoyama and Araki 1986). Body weight, blood lead levels, and nerve lead
levels were measured at the termination of the exposure period. Maximal motor NCV of the left sciatic
nerve was measured in ether anesthetized rats after 15 weeks of exposure to lead. NCV was significantly
decreased in the 89.6 mg lead/kg/day group as compared to the controls (46.8 meters/second versus
51.2 meters/second). This decrease was roughly dose-dependent, although a wide range of NCVs were
observed at each dose. NCV was significantly correlated with PbB levels in all treated groups, but did not
correlate with nerve lead levels or body weight. The authors concluded that PbB level is a better indicator
of the effect of lead on NCV because it reflects the "active" lead in the peripheral nerves, whereas the nerve
lead level may represent an "inactive" form of lead. Yokoyama and Araki (1992) also reported that
exposure to lead (approximately 77 mg lead/kg/day in the drinking water for 13 weeks) induced a decrease
in slow axonal transport of proteins in the sciatic nerve of rats. The mean PbB concentration in the treated
and controls animals was 153 ug/dL and 9 ug/dL, respectively.
The highest NOAEL values and all reliable LOAEL values for each study for neurological effects are
recorded in Table 2-4 and plotted in Figure 2-2.
LEAD 184
2. HEALTH EFFECTS
2.2.3.5 Reproductive Effects
According to EPA (1986a), lead was used in preparations sold as abortifacients in Britain around the turn of
the century. These preparations were apparently effective at levels that produced marked signs of lead
poisoning in the women. The available studies were methodologically inadequate and did not provide dose-
effect information. Evidence for adverse reproductive outcomes in women with obvious lead poisoning is
of little help in defining the effects of lead at much lower exposure levels.
An adverse effect of lead on pregnancy rate has been noted in some animal studies (Kennedy et al. 1975).
Acute-duration gavage administration of 390 mg lead/kg/day as lead acetate to rats resulted in a sharp
decrease in pregnancy rates. This effect was not noted at 39 mg lead/kg/day. The study limitations include
a lack of measurement of blood lead levels and lack of statistical analysis of pregnancy incidence. A
decrease in the number of implantations was noted in untreated female mice that were mated to males that
had been treated with 141 mg/kg/day lead chloride in the drinking water for 3 months (Johansson and Wide
1986). A more recent study in mice found no effects of administration of lead chloride in the drinking
water on fertility in mice (Kristensen et al. 1995). Females (FO) received approximately 176 mg
lead/kg/day for 6 weeks before mating. This resulted in a median PbB concentration of 68 ug/dL
(0.8 ug/dL in controls) during the second week of pregnancy. F, females were continuously bred to
untreated males for 6 months. The results showed that treatment with lead had no significant effects on
number of litters, number of offspring, median number of offspring, median number of litters, median litter
size, and median number of days between litters. Moreover, ovarian weight was not altered and neither
were the number of small, medium, or large follicles/F,, or number of corpora lutea/F,.
No treatment-related effects on reproductive indices were noted in rats exposed to up to 0.9 mg lead/kg/day
as lead nitrate in the drinking water 3 weeks before mating, during gestation, and during lactation
(Hubermont et al. 1976). However, other animal studies have reported lead-induced damage to the ovaries
and testes. Such effects of lead were examined by Hilderbrand et al. (1973), who reported that oral dosing
with low dose levels of lead acetate, 0.014 and 0.26 mg lead/kg/day for 30 days produced PbB levels of 30
and 53 ug/dL, respectively; these were higher than levels found in the study by Grant et al. (1980).
Irregular estrous cycles occurred at both treatment levels, and ovarian follicular cysts with reductions in
numbers of corpora lutea occurred at the higher level. Male rats treated orally with lead acetate (0.013 and
0.26 mg lead/kg/day) in the same manner had PbB levels of 19 and 30 ug/dL, respectively, and had
LEAD 185
2. HEALTH EFFECTS
testicular damage at the higher exposure level, with increased prostate weight at the lower level. No details
regarding the strain of rats used were provided.
In a later study of lead effects on male reproductive tract, Chowdhury et al. (1984) found testicular atrophy
and cellular degeneration in male rats given lead acetate in drinking water at 90 mg lead/kg/day for 60 days.
PbB levels averaged 142.6 ug/dL. At a lower exposure level of 45 mg lead/kg/day and mean blood lead
level of 71.7 ug/dL, the seminiferous tubular diameter and spermatic count were reduced. No significant
changes were seen at 22 mg lead/kg/day and a PbB level of 54.0 u.g/dL. The study is limited by the lack of
determination of whether the partial inhibition of spermatogenesis seen at 45 mg lead/kg/day was a
transitional effect. Treatment of male rats with a dose of approximately 6.4 mg lead/kg/day as lead acetate
for 3 months resulted in altered spermatogenesis as reflected as a decrease in the number of all types of
germinal cells, and decreases in seminiferous tubular diameters and in the germinal height of the tubules
(Kaushal et al. 1996). These effects were less marked with higher doses, but were consistent with a higher
accumulation of lead in the testis with the lowest dose tested, 6.4 mg/kg/day. PbB levels, however, were
increased in a dose-related manner, 11.8 ug/dL with the lowest dose level versus 72.9 u.g/dL with the
highest dose level tested, 127.4 mg/kg/day. Relative testis weight was also maximally decreased in the low-
dose animals.
Decreases in sperm motility and increased acid phosphatase activity were reported to result from oral
administration of 0.05 mg/kg lead in drinking water to male rats for 20-30 days in a study from the former
U.S.S.R. (Krasovskii et al. 1979). Dystrophic changes of the Leydig cells were reported in gonadal tissues
of rats exposed to doses as low as 0.005 mg lead/kg/day. The weaknesses of the study include absence of
data on the strain and number of rats used, and the fact that PbB levels were not reported.
Male rats exposed to lead acetate in drinking water through the dams during gestation and lactation and then
directly until 9 months of age exhibited no significant effects on sperm count or sperm morphology (Fowler
et al. 1980). The PbB levels in these animals ranged from 4.5 to 67 ug/dL. Rats administered 0.19 mg
lead/kg/day as lead acetate by gavage for 9 weeks exhibited a significant reduction in the number of
spermatozoa within the cauda epididymis. At 192 mg lead/kg/day, the number of abnormal spermatozoa
increased significantly, but a decrease in the number of spermatozoa was not significant. No adverse effects
were noted in the testes. The results of this study indicate that lead affected spermatozoa after release from
the germinal epithelium which was possibly protected from the effects of lead by the blood-testes barrier
(Barratt et al. 1989).
LEAD 186
2. HEALTH EFFECTS
Lifetime exposure of male cynomolgus monkeys to lead at dose levels that resulted in mean PbB of
10 u.g/dL (range, 6-20 ug/dL) or 56 ug/dL (range, 22-148 ug/dL) did not alter circulating levels of
testosterone nor affected parameters of semen quality such as sperm count, viability, motility, and
morphology (Foster et al. 1996). However, there were treatment-related changes in sperm chromatin
structure, as revealed by flow cytometric analysis. These analyses were conducted over a period of one
year when the monkeys were 15-20 years old. According to Foster et al. (1996), the results suggest that
flow cytometric analysis of monkey sperm provides a more sensitive measure of toxicant-induced effects on
semen quality than measures such as sperm concentration, viability, and motility. Also, the observed
changes occurred at blood lead concentrations relevant to the human population. More recently, the same
group of investigators also reported on the effects of lead on reproductive parameters of monkeys exposed
from postnatal day 300 to 10 years of age (postinfancy) and from postnatal day 0 to 400 (infancy) (Foster et
al. 1998). A lifetime exposure group was also included. Endpoints evaluated included testis ultrastructure,
semen analysis, and hormone assays. PbB levels in lifetime and postinfancy exposed monkeys were
approximately 35 ug/dL compared to <1.0 ug/dL in controls and infancy exposed animals. Relative to
controls, absolute and relative testis weight was higher in lead-treated monkeys, but the difference was not
statistically significant. Circulating concentrations of follicle-stimulating hormone (FSH), luteinizing
hormone (LH), and testosterone were not altered by treatment with lead. Semen characteristics were not
affected by treatment with lead. Electron microscopy of the testis revealed disrupture of the general
architecture of the seminiferous epithelium that involved Sertoli cells, basal lamina, and spermatids in the
groups exposed for lifetime and during infancy, with equal severity. No such alterations were seen controls
or in the postinfancy exposure group. The results showed that lead exposure in monkeys during infancy
can induce testicular alterations that persist in later life when blood lead concentrations had decreased
considerably.
Exposure of female rhesus monkeys to 1.3 or 5 mg lead/kg/day as lead acetate in their drinking water for
75 months resulted in reduced circulating concentration of progesterone, suggesting impaired luteal
function; however, treatment with lead did not prevent ovulation (Franks et al. 1989). The monkeys also
exhibited longer and more variable menstrual cycles and shorter menstrual flow. PbB levels attained in the
monkeys in this study were 70 ug/dL. Female cynomolgus treated daily for up to 10 years with gelatin
capsules containing lead acetate, which provided approximately 1 mg lead/kg/day, had significantly
suppressed circulating levels of luteinizing hormone (LH), follicle stimulating hormone (FSH), and
estradiol (Foster 1992). However, circulating progesterone concentrations were not significantly affected
by lead treatment. In these monkeys, PbBs were approximately 35 ug/dL, half those observed in the
LEAD 187
2. HEALTH EFFECTS
monkeys studied by Franks et al. (1989). The results of these studies suggested that impaired luteal
function induced by relatively high PbB levels is secondary to lead-induced suppression of circulating FSH
concentrations.
Pre- and postnatal exposure of female animals to lead can affect pubertal progression and hypothalamic-
pituitary-ovarian-uterine functions in offspring. The administration of lead acetate in drinking water to rats,
both indirectly through the dams during gestation and lactation and then directly, produced no effects on
female offspring exposed to 0.7 mg lead/kg/day but delayed the vaginal opening in females exposed to
• 3.5 mg lead/kg/day (Grant et al. 1980); these females were not retarded in their growth. Similar effects
were also reported in dams receiving lead acetate prior to breeding (Kimmel et al. 1980). This effect was
dose-dependent. Exposure of male and female rats prepubertally (age 24 days to 74) to lead acetate in the
drinking water (approximately 502 mg lead/kg/day) resulted in significant reduction in testis weight and in
the weight of secondary sex organs in males and in delayed vaginal opening and disruption of estrus cycle
in females (Ronis et al. 1996). However, these effects were not observed in rats exposed postpubertally
(day 60-74 in males, 60-85 in females). Mean PbB concentrations in rats exposed prepubertally and
postpubertally were 57 and 31 ug/dL, respectively. In the same study, Ronis et al. (1996) also exposed a
group of rats beginning during gestation, and continuing through lactation and postpubertally. In this
group, the effects were much more severe than in the rats exposed only pre- or postpubertally, and were
consistent with the much higher blood lead concentrations achieved in the offspring, approximately
316 ug/dL (see also under Developmental Effects). In follow-up studies, Ronis et al. (1998a, 1998b,
1998c) found that prenatal lead exposure (0.15% or 0.45% lead acetate in drinking water; approximately
126 or 377 mg lead/kg/day) that continued until adulthood (85 days old) delayed sexual maturation in male
and female pups in a dose-related manner. PbB levels in the pups between the ages of 21 and 85 days
ranged from 103-192 ng/dL and 238-388 ug/dL in the two dosage groups. Measures of adult reproductive
physiology were less sensitive to lead exposure. According to Ronis et al. (1998b, 1998c), these findings
are consistent with a suppression of the normal sex steroid surges that occur at birth and during puberty and
suggested a site of lead action at the hypothalamic-pituitary unit. Also, the normalization of reproductive
parameters post-puberty suggested a transient rather than permanent defect.
An effect of lead on central regulation of endocrine functions through the hypothalamus-pituitary axis has
also been observed in adult animals. Following exposure to 40 mg lead/kg/day administered as lead acetate
in drinking water, histopathological examination of the gonads and thyroid gland and measurements of
serum testosterone, 17(J-estradiol, FSH, LH, prolactin, TSH, T3, and T4 were conducted. No changes were
LEAD 188
2. HEALTH EFFECTS
seen at the 40- and 81-mg/kg/day dose levels. No lead uptake was noted in the gonads. However, the
lowest dose was sufficient to reduce serum prolactin and LH levels significantly (Sourgens et al. 1987).
The highest NOAEL for reproductive effects in rats and mice and all reliable LOAELs for reproductive
effects in rats, mice, and monkeys are recorded in Table 2-4 and plotted in Figure 2-2.
2.2.3.6 Developmental Effects
No studies were located regarding developmental effects in humans after oral exposure to inorganic lead.
See Section 2.2.1.6 fora discussion of developmental effects in humans after multi-route exposure to lead.
Twenty-three teratogenicity studies in which lead compounds (acetate or nitrate) were administered in the
drinking water or feed or by gavage to rats and mice have shown no evidence that lead causes
malformations, but some evidence that lead causes fetotoxic effects. The following discussion is based on
the teratogenicity studies most relevant to current concerns for human prenatal exposure along with studies
concerned primarily or exclusively with the neurobehavioral effects of prenatal exposure to lead.
In rodents, a greater proportion of nervous system development takes place postnatally than in humans.
Accordingly, rodent studies of developmental neurobehavioral toxicity that extend exposure into the early
postnatal period are probably more analogous to human prenatal exposure than are rodent studies that use
only prenatal exposure.
Following oral administration of lead acetate at doses up to 64 mg lead/kg/day to rats before breeding and
throughout pregnancy, the only effect seen was fetal stunting at the high dose (Miller et al. 1982).
However, the lack of effect on fetal brain and litter size indicated that lead exposure failed to influence
development in rats. Maternal PbB values ranged from 80 to 92 ug/dL prior to mating and from 53 to
92 ug/dL during pregnancy. Pretreatment and control PbB levels averaged 6-10 ug/dL. Similar results
were obtained in rats administered up to 390 mg/kg/day by gavage on gestation days 6-16. Fetotoxicity
(retarded skeletal development) was evident at the high dose, a dose that was maternally toxic as well
(Kennedy et al. 1975). Treatment of rats with 0.6% lead acetate (estimated dose of 502 mg lead/kg/day) in
the drinking water on gestation days 5-21 resulted in 19% incidence of stillbirth compared to 2% observed
in a control group (Ronis et al. 1996). In subsequent studies using a similar experimental protocol, the same
group of investigators reported that treatment of rats with 0.45% lead acetate (approximately 377 mg
LEAD 189
2. HEALTH EFFECTS
lead/kg/day) in the drinking water on gestation days 5-21 resulted in 28% incidence of stillbirth (Ronis et
al. 1998b). The mean PbB level in the pups at birth in this exposure group was 197 ug/dL. Exposure to
0.15% lead acetate resulted in significant decreases in birth weight in males, crown-to-rump length in
males, and anogenital distance in both males and females. Pups up to age 85 days that drank water
containing 0.45% lead acetate showed a significant reduction in growth rate during the prepubertal and
pubertal period; growth rates during ages 55 and 85 days were similar to control rates. Lower exposure
concentrations (0.15% and 0.05% lead acetate) did not alter growth rates significantly (Ronis et al. 1998c).
The authors suggested that the reduced growth may have been caused by lead-induced effect on growth
hormone secretion, and this was confirmed after measuring a number of endocrine and biochemical
parameters known to be growth hormone-dependent.
Neurodevelopmental endpoints were assessed in the offspring of rats exposed to lead acetate at 448 mg
lead/kg/day in the drinking water prior to mating and throughout gestation (Rabe et al. 1985). The pups
were transferred to unexposed foster dams on the second day after birth. Mean PbB levels were 98 ug/dL at
day 1 and 20 ug/dL at day 16 of age in pups from treated dams and approximately 10 ug/dL at both ages in
pups from control dams. Body weights were reduced in treated pups relative to controls at birth but not at
30 days of age. Neurobehavioral function (surface righting and negative geotaxis reflexes, spatial
discrimination, and reversal in T-maze), tested in the pups at 17 days of age, was not affected by prenatal
lead treatment. In a study conducted on Binghamton Heterogeneous Stock mice by Draski et al. (1989),
dams received lead acetate (608 mg lead/kg/day) in their drinking water during gestation; at birth, litters
were cross-fostered so as to receive postnatal exposure to lead acetate. The PbB level in treated dams was
100 ug/dL (versus <10 ug/dL in controls); in pups the levels ranged from 76 to 130 ug/dL (versus
3-6 ug/dL in controls) during postnatal days 5-15. The open field test and time to return to home cage
showed changes in behavioral patterns of pups depending on the developmental stage during which the
dams were exposed, as well as age and conditions when tested. Open field behavior was also evaluated in
6-month-old rats that had been exposed to lead acetate in utero, during lactation, and through their drinking
water (Rodrigues et al. 1993). The daily doses of lead were approximately 18, 36, and 146 mg/kg/day,
which resulted in corresponding PbB concentrations of 51, 67, and 169 (ig/dL. Treatment with lead
resulted in an altered activity pattern in the mid- and high-dose groups consisting in increased activity in the
open field and failure to habituate to the environment.
The different aspects of a study of prenatal, postnatal, and long-term exposure of rats to lead were presented
by Kimmel et al. (1980) and Grant et al. (1980). The well-conducted study by Kimmel et al. (1980)
LEAD 190
2. HEALTH EFFECTS
provided a variety of relevant dose-effect data. In this study, female rats were exposed to lead acetate in the
drinking water at 0.07, 0.7, 3.5, 7, and 35 mg lead/kg/day from weaning through mating, gestation, and
lactation. The pups were weaned onto the same drinking water solutions as their dams received. In
addition, some of the dams were killed at day 21 or 22 of gestation for evaluation of the fetuses and uteri.
Toxicity to the dams (dose-related slight depression of body weight and delay in time of vaginal opening)
was seen at • 3.5 mg/kg/day. Exposure to lead did not affect the ability of females to conceive, to carry a
normal litter to term, or to deliver offspring. No significant differences in indices of embryo- or fetotoxicity
or teratogenicity were seen in treated groups relative to controls. Length of gestation and birth weights
were unaffected, but mean crown-rump length of 1-day-old female pups in the 35-mg/kg/day group was
significantly shorter than in controls. Median PbB levels just prior to mating and at day 21 of gestation
were 1 and 4 ug/dL for controls, 9 and 12 ug/dL for the 0.7-mg/kg/day group, 20 and 23 ug/dL for the
3.5-mg/kg/day group, 24 and 35 ug/dL for the 7-mg/kg/day group, and not reported for the 35-mg/kg/day
group (Kimmel et al. 1980).
Significant delays in vaginal opening in female pups of groups receiving • 3.5 mg lead/kg/day and
significant delays in the development of surface and air righting reflexes in pups receiving 7 or 35 mg
lead/kg/day were reported by Grant et al. (1980). PbB levels of the pups at I and 11 days were 4 and
3 |ig/dL for controls, 37 and 22 ug/dL for 3.5-mg/kg/day pups, 57 and 35 ug/dL for 7-mg/kg/day pups, and
not reported for 35-mg/kg/day pups. In comparing the results of this study with results of the study by Rabe
et al. (1985), in which no effects on the development of reflexes were seen at a much higher level of lead in
the drinking water, it should be noted that exposure to lead in the Rabe et al. (1985) study ceased shortly
after birth, but in the Grant et al. (1980) study exposure to lead continued through the time of testing.
Delays in the development of the righting reflex were observed by Reiter et al. (1975) in rat pups whose
dams were exposed to lead acetate at concentrations of 0.7 and 7 mg lead/kg/day in their drinking water
throughout gestation and lactation. Eye opening was delayed at the higher exposure level. Blood lead
levels were not determined.
In assessing the behavioral responses of rat pups, Taylor et al. (1982) found that exposure of female rats,
prior to mating and through gestation and lactation, to lead acetate (28 and 56 mg lead/kg/day) in the
drinking water did not result in significant differences in the pups' acquisition of a response when tested at
11 days of age, but did result in significantly slower extinguishing of the response when the reward was no
LEAD 191
2. HEALTH EFFECTS
longer provided. PbB levels at 21 days of age were 3.7 |ig/dL in controls, 38.2 ug/dL in the low-exposure
group, and 49.9 ug/dL in the high-exposure group. Jett et al. (1997) showed that treatment of rats with
250 ppm lead acetate in the diet beginning 10 days prior to breeding and continued during gestation and
lactation resulted in impaired learning of a swim task in the pups when tested at 21 days of age, but not at
56 or 91 days of age. PbB levels were not provided, but lead concentrations in the hippocampus of treated
pups was 4\-47% lower at age 56 and 91 days than at age 21 days. The authors stated that the age-
dependent differences in performance may be due both to developmental differences of lead effect on
neuronal targets, and the concentration of lead achieved at the site of action.
Neurobehavioral effects in infant monkeys were examined by Bushnell and Bowman (1979a) and Levin
and Bowman (1983) who treated adult female monkeys orally with lead acetate at 1.9 and 3.8 mg
lead/kg/day prior to mating and throughout gestation. PbB levels at birth were 5, 30, and 55 ug/dL in
control (n=5), low-lead (n=3), and high-lead (n=4) groups, respectively. Treatment of the mothers
produced no changes in early social behavior of their infants and no differences in learning ability, relative
to controls, when the offspring were tested on a search task at 4-5 years of age. However, the dosing was
administered over variable dose ranges throughout the study, which indicates metabolic differences in
maintaining the blood lead levels. A recent study reported prolonged deficits in learning and motor
functions in monkeys tested between the ages of 3 and 7 years and that were exposed to lead in utero
(Newland et al. 1996). During exposure, maternal PbB concentrations ranged from 21 to 70
Histological changes have been reported in the brains of rat pups at much higher blood lead levels than
those reported above. Administration of lead chloride (28 mg lead/kg/day) in drinking water to pregnant
rats during gestation and lactation was reported to produce a less mature synaptic profile in the cerebral
cortex of the pups at postnatal day 15 (McCauley et al. 1979) and a 30% reduction in synaptic density in the
cerebral cortex at postnatal day 15 but not day 21 (McCauley et al. 1982). PbB levels were 80 ug/dL at
birth. Although the authors reported a dose-dependent increase in blood lead levels in pups from the
4.2 and 28 mg/kg/day groups, the synaptic counts were measured only for pups from the high-dose group.
In rats exposed to lead during gestation and through postnatal day 28 via breast milk there was a 30—40%
reduction in the cholinergic marker choline acetyltransferase activity (ChAT) in the septum and hippo-
campus relative to controls (Bielarczyk et al. 1994). At this time, the PbB concentration in the pups was
approximately 20-22 ug/dL compared with 2-3 ug/dL in controls. This was paralleled by a reduction in
muscarinic cholinergic receptor binding in the septum, but not in the hippocampus. This suggested
LEAD 192
2. HEALTH EFFECTS
preferential vulnerability of septal cholinergic neurons to low-level lead exposure. Results from a follow-
up study with extended observation period showed that early lead exposure causes long-lasting cholinergic
deficits which induce secondary responses in the hippocampus resembling compensatory changes observed
following surgical cholinergic denervation of the hippocampus in adult animals (Bielarczyk et al. 1996;
Bourjeily and Suskiw 1997).
Decreased numbers of dendritic spines and malformed spines in brain parietal cortex were observed at
postnatal day 30 in rat pups whose mothers were administered 256^480 mg lead/kg/day as lead acetate in
drinking water during gestation and lactation (Murray et al. 1978). PbB levels were not reported.
Gestational exposure of guinea pigs to 5.5 or 11 mg lead/kg/day produced dose-dependent alterations of
neuroglial enzymes (glutamine synthetase and glycerol-3-phosphate dehydrogenase) and changes in trace
metal levels (Sierra et al. 1989). PbB levels in dams and fetuses associated with these changes were within
the range of 10-30 ug/dL lead. However, the authors did not examine for histopathological alterations in
neural tissue. The same group of investigators examined the effects of gestational exposure on the levels of
gonadotropin-releasing hormone (GRH) and somatostatin (ST) in the hypothalamus of guinea pig fetuses
(Sierra and Tiffany-Castiglioni 1992). Dams were exposed on gestation days 22-52 or 22-62. The doses
of lead were 0 (controls), 5.5, or 11 mg lead/kg/day and on gestation day 62 resulted in PbB levels in the
dams of 1.5, 22.2, and 39 ng/dL, respectively. PbB levels in the fetuses were similar to those of the dams.
Exposure to lead significantly reduced in a dose-related manner the hypothalamic levels of GRH and ST in
both fetuses and dams.
Some studies have investigated the effects of prenatal exposure to lead on heme metabolism. Hubermont et
al. (1976) administered lead nitrate at concentrations of 0.009, 0.09, and 0.9 mg lead/kg/day in drinking
water to female rats before mating, throughout gestation, and during lactation. PbB levels in the dams and
pups that received 0.9 mg lead/kg/day group were 68 and 42 ug/dL, respectively. An increase in free tissue
porphyrins and a decrease in blood ALAD activity were seen in the pups that received 0.9 mg lead/kg/day,
as compared with controls. The study did not examine the long-term hematological effects of lead. An
increase in free erythrocyte protoporphyrins was also observed in 1 -week-old rats exposed to lead acetate
in utero (gestation days 1-21) and via maternal milk for 7 days; no such effect was seen in 1-day-old pups
after similar gestational exposure (Bogden et al. 1995). Interestingly, the PbB concentration in the
1-day-old pups was higher (72.5 ng/dL) than in the 7-day-old pups (51.8 ug/dL).

LEAD 193
2. HEALTH EFFECTS
Effects at even lower external and internal exposure levels were reported by Hayashi (1983). Lead acetate
at 0.7 mg lead/kg/day in the drinking water of rats for the first 18 or 21 days of pregnancy resulted in
decreased ALAD activity in the fetal and maternal erythrocytes and increased ALAD activity in fetal but
not maternal liver. Fetal, but not maternal, hematocrits and hemoglobin levels were decreased in the group
treated for 21 days. Fetal PbB levels were 27 ug/dL and 19 ug/dL in the 18-day and the 21-day treated
groups, respectively. Maternal PbB levels were approximately 4 ug/dL in treated and control groups. The
study is limited by the use of one dose level, which precluded assessment of dose response.
Adverse kidney effects have been reported in rats exposed to lead during development (Fowler et al. 1980).
Also, alterations in immune function have been observed in young rats exposed to lead perinatally (Faith et
al. 1979; Luster et al. 1978). These studies are discussed in more detail in Sections 2.2.3.2 and 2.2.3.3.
The highest NOAEL values and all reliable LOAEL values for each study for developmental effects are
recorded in Table 2-4 and plotted in Figure 2-2.
2.2.3.7 Genotoxic Effects
Eleven male volunteers aged 20-30 years ingested lead acetate for 49 days. PbB levels were kept at
approximately 40 ug/dL. The frequency of chromosome aberrations was assayed after lymphocyte culture
for 72 hours and found to be no different from that of 10 controls. The lymphocytes from lead-exposed
subjects did show a higher mitotic activity (Bulsma and DeFrance 1976).
Intermediate-duration exposures of mice to lead in the diet resulted in slight increases in chromatid gaps,
but no significant increases in any class of serious chromosome aberrations (Jacquet et al. 1977).
Cytogenetic analysis was performed on bone marrow cells of Wistar rats exposed to 500 ppm lead acetate
in drinking water for 6 weeks. Although there was a marked increase in chromosome pulverization and
erosion, there was no increase in the frequency of chromosomal aberrations. Sister chromatid exchanges
were slightly, but significantly, increased over controls (Kowalska-Wochna et al. 1988).
Monkeys given daily doses of 1 or 5 mg of lead by intubation for 12 months showed only minor
chromosome aberrations such as chromatid and chromosome gaps and fragments at the beginning of the
experiment. After 7 months of exposure, more severe aberrations (translocations and dicentrics) appeared
in the lymphocytes. However, no statistically significant difference in severe aberrations between the
LEAD 194
2. HEALTH EFFECTS
exposed monkeys and the controls was ever seen. Lead treatment did produce a significant increase in the
number of gaps, but this was not related to dose or to measured blood lead level (Jacquet and Tachon 1981).
An earlier chronic study on monkeys given lead acetate in the diet 6 days a week for 16 months showed that
severe chromosome abnormalities occurred only in animals given a calcium-deficient diet (Deknudt et al.
1977).
Other genotoxicity studies are discussed in Section 2.5.
2.2.3.8 Cancer
No studies were located regarding cancer in humans after oral exposure to inorganic lead. See
Section 2.2.1.8 for a discussion of cancer in humans following multi-route exposure to lead.
The available data on the carcinogenicity of lead following ingestion by laboratory animals indicate that
lead acetate and lead phosphate are carcinogenic, and that the most common tumor is renal. However, the
extremely high cumulative doses of lead used in these studies are difficult to extrapolate to low-level
exposure in humans, and thus do not provide a sufficient basis for quantitative risk assessment (see
Section 2.5). In addition, it is possible that the high doses required to induce renal tumors may themselves
have produced a carcinogenic effect that was independent of any direct effect of lead as a result of
nonspecific tissue damage. Furthermore, the relevance of male rat kidney tumors induced by some
chemicals to humans has been questioned (EPA 1991c). It is not known whether the mechanism by which
lead induces tumors in the rat kidney involves the same or similar species-specific proteins (a2M-globulin)
identified in the recent studies of other substances, such as unleaded gasoline (see Section 2.9.3 for a
discussion of ongoing research designed to answer this question).
The most comprehensive set of studies was performed by Azar et al. (1973), who administered lead acetate
to rats for 2 years. Renal tumors occurred in 5 of 50 male rats that received 27 mg lead/kg/day, in 10 of 20
males that received 56.5 mg lead/kg/day, and in 16 of 20 males and 7 of 20 females that received
105 mg lead/kg/day. No renal tumors were observed in the control groups or in rats administered 0.9-7 mg
lead/kg/day. Limitations of this study were likelihood of environmental contamination from lead in the air
or drinking water was not mentioned, and the strains of rats used were not specified. Body weight gain in
the two highest dose treatment groups was reported to be depressed, but no details were given regarding this
finding.

LEAD 195
2. HEALTH EFFECTS
Male Sprague-Dawley rats were administered lead acetate equivalent to 37 mg lead/kg/day in their drinking
water for 76 weeks as part of a study to determine interactions between sodium nitrite, ethyl urea, and lead.
There were no kidney tumors in the 10 control rats. Renal tubular carcinomas were found in 13 (81%) of
the 16 treated rats. Three of these tumors were detected at 72 weeks and the remaining were found at
terminal necropsy (Koller et al. 1985).
An increased incidence of renal tumors (7 out of 25 combined adenomas and carcinomas) was observed in
male Swiss mice fed 0.1% basic lead acetate in the diet for 2 years (Van Esch and Kroes 1969). No renal
tumors were found in the control animals. One female in the 1.0% treatment group had a renal tumor. The
authors attributed the low tumor incidence in the 1.0% group to early mortality. The cancer effects levels
described above are recorded in Table 2-4 and plotted in Figure 2-2.
2.2.4 Dermal Exposure
No studies were located regarding the following effects in humans or animals after dermal exposure to
inorganic lead. See Section 2.2.1 for a discussion of these effects in humans following multi-route exposure
to lead:
2.2.4.1 Death
2.2.4.2 Systemic Effects
2.2.4.3 Immunological Effects
2.2.4.4 Neurological Effects
2.2.4.5 Reproductive Effects
2.2.4.6 Developmental Effects
2.2.4.7 Genotoxic Effects
Genotoxicity studies are discussed in Section 2.5.
2.2.4.8 Cancer
No adequate studies were located regarding cancer in humans or animals after dermal exposure to inorganic
lead. See Section 2.2.1.8 for a discussion of cancer in humans following multi-route exposure to lead.
LEAD 196
2. HEALTH EFFECTS
2.3 TOXICOKINETICS
The absorption, distribution, metabolism, and elimination of lead has been extensively studied in both
animals and humans. While some of the precise pharmacokinetic mechanisms that control these
physiological processes are unknown, available data can be used to quantify the uptake and disposition of
lead in the human body for various populations of children and adults. Lead absorption is influenced by the
route of exposure, chemical speciation, the physicochemical characteristics of the lead and exposure
medium, and the age and physiological states of the exposed individual (e.g., fasting, nutritional calcium
and iron status). The primary sites for inorganic lead absorption are the gastrointestinal and respiratory
tracts. The bioavailability of ingested soluble lead in adults may vary from less than 10% when ingested
with a meal to 60-80% when ingested after a fast. Nonlinear relationships observed between uptake and
blood lead concentrations may be explained by both capacity-limited absorption in the gastrointestinal tract,
and capacity-limited binding of lead with red blood cells. Immediately following absorption, lead is widely
distributed to blood plasma and soft tissues, then it redistributes and accumulates in bone. Bone lead
accounts for approximately 73% of the total body burden in children, increasing to 94% in adults due to
changes in bone turnover rates with age. Therefore, kinetic behavior of lead in humans is determined
largely by the mechanisms by which lead is exchanged between blood plasma and bone surfaces, processes
of bone growth and resorption, and heteroionic exchange processes in the kidney and intestines. Age-
dependence of lead kinetics is reflected by greater absorption efficiency, bone turnover rates, and excretion
efficiency in children compared with adults. Transplacental transfer of lead has been demonstrated based
on measurements of lead in umbilical cord blood in humans, as well as tissue concentrations in offspring of
mice. In addition, studies in suckling mice and rats suggest that as much as one-third of the maternal dose
of lead can be transferred to mother's milk during periods of lactation.
Inorganic lead ions are not known to be metabolized in the body but they are complexed by
macromolecules. Lead that is not retained in the body is excreted principally by the kidney as salts or
through biliary clearance into the gastrointestinal tract in the form of organometallic conjugates. Excretion
rates measured in infants, children, and adults are highly variable, although available data suggest that the
fraction of absorbed lead that is retained in humans decreases with age. In addition, acute and chronic lead
exposure studies in mice, rats, and non-human primates show that, in general, there is greater excretion of
lead in feces than in urine due to the high molecular weights of lead conjugates. Exhalation is a major route
of excretion following inhalation exposure of organic lead in humans.
LEAD 197
2. HEALTH EFFECTS
A number of mathematical pharmacokinetic models for lead have been proposed to explain and predict
physiological processes, including intercompartmental lead exchange rates, retention of lead in various
pools, and relative rates of distribution among the tissue groups. A physiologically based pharmacokinetic
(PBPK.) model developed by O'Flaherty (1993, 1995a) simulates lead absorption and disposition as a
function of age-specific anatomical and physiological variables. Compartmental pharmacokinetic models,
including the IEUBK Model for lead in children (EPA 1994a, 1994b) and the Leggett Model (Leggett
1993), simulate the same general processes, although transfer rate constants and kjnetic coefficients may not
have precise physiological correlates. All three models have been calibrated, to varying degrees, against
empirical physiological data on animals and humans, and on blood lead concentrations observed in exposed
populations of children and adults. Only the IEUBK model is used to estimate the probability distribution
of blood lead concentrations in children potentially exposed to lead via multiple exposure pathways at
hazardous waste sites. Efforts are currently in progress to fully assess the degree to which the IEUBK
Model accurately simulates blood lead distributions in populations of children who are exposed to lead at
hazardous waste sites. The O'Flaherty and Leggett models have accurately reproduced adult blood lead
concentrations, and may be modified to reflect changes in toxicokinetics of lead associated with pregnancy,
aging, or disease states.
2.3.1 Absorption
2.3.1.1 Inhalation Exposure
Inorganic Lead. Prior to the actual absorption of lead by the lungs, some fraction of inhaled airborne
lead must be deposited in the respiratory tract. The rate of deposition of paniculate airborne lead in adult
humans is approximately 30-50% and is modified by factors such as particle size and ventilation rate (EPA
I986a). Once deposited in the lower respiratory tract, particulate lead is almost completely absorbed, and
all chemical forms of lead also seem to be absorbed (EPA 1986a; Morrow et al. 1980). After subjects
breathed lead chloride, with a mass median aerodynamic diameter (MMAD) of 0.26 urn, and lead
hydroxide, with an MMAD of 0.24 urn, through a standard respiratory mouthpiece for 5 minutes, 23% and
26%, respectively, of the aerosol was deposited in the lungs and respiratory tract (Morrow et al. 1980). A
multiple linear regression model used to predict PbB concentrations in 44 adult males exposed to particulate
airborne lead showed a 25% stronger relationship (r2 increased from 0.36 to 0.45) between air lead and PbB
when particles smaller than 1 um were assumed to undergo greater rates of deposition and absorption in the
lungs than larger particle (Hodgkins et al. 1991).
LEAD 198
2. HEALTH EFFECTS
Absorption is suggested by elevated PbB concentrations in subjects who were continuously (23 hours per
day) exposed to 0.0032-0.011 mg lead/m3 for 18 weeks (the species of lead to which the subjects were
exposed was not specified) (Griffin et al. 1975b). Elevated blood and urinary lead concentrations were also
found in volunteers exposed to 0.15 mg lead/m3 for 7.5 hours per day, 5 days per week for 16-112 weeks
(Kehoe 1987). PbB concentrations as high as 45 ug/dL were observed in one subject exposed at that rate
for 2 years. Daily lead absorption of 14 ug was reported for five male volunteers who inhaled ambient air
(0.002 mg lead/m3) (Rabinowitz et al. 1977). No lead was found at autopsy in the lung tissues of
occupationally exposed lead workers (Barry 1975) and nonoccupationally exposed subjects (Gross et al.
1975), but the analytical techniques at the time may have not be sensitive enough to detect lead. In contrast,
Gerhardsson et al. (1995b) showed the presence of lead in the lungs from 32 deceased smelter workers.
Organic Lead. Following a single exposure to vapors of tetraalkyl lead compounds (approximately
1 mg/m3 breathed through a mouthpiece, 10-40 breaths of approximately 1 L volume) in four male subjects,
37% and 51% of inhaled tetraethyl and tetramethyl lead, respectively, were initially found in the respiratory
tract, but a considerable percentage of these volatile compounds was lost through exhalation (Heard et al.
1979). Approximately 60-80% of the deposited tetraalkyl lead was absorbed by the lungs. In a case report
of a 22-year-old male exposed to tetramethyl lead, absorption was evident because of elevated urinary lead
levels for 4 days after exposure (Gething 1975).
Limited experimental data suggest that inhaled lead, whether organic or inorganic, is absorbed rapidly by
animals (EPA 1986a). Female Wistar rats breathed total lead concentrations of 0.01 mg lead/m3 as
tetraethyl lead in the form of aerosolized leaded gasoline labeled with lead-210 (210Pb) tracer for 30^5
minutes; 1 hour later, lead clearance in the lungs was 30% and the majority of the particles were 0.1-0.5 urn
in diameter (Boudene et al. 1977). Immediately after nose-only breathing of engine exhaust aerosols
containing 6 mg lead/m3 as lead-203 (203Pb)-labeled tetraethyl lead for 40 or 60 minutes, 25% of the dose
was accounted for in tissues other than the lung and gastrointestinal tract in rats (Morgan and Holmes
1978). Initially, the lead content in lungs decreased quite rapidly; only 7.5% of the dose was retained in the
lungs after 48 hours, followed by a slower decline in which less than 2% of the dose remained in the lungs
after a week. The lung had the lowest tissue lead content in rats and rhesus monkeys who inhaled
0.0215 mg lead/m3 continuously (22 hours per day) for a year (Griffin et al. 1975b).
LEAD 199
2. HEALTH EFFECTS
2.3.1.2 Oral Exposure
The extent and rate of gastrointestinal absorption are influenced by physiological states of the exposed
individual (e.g., age, fasting, nutritional calcium and iron status) and physicochemical characteristics of the
medium ingested (e.g., panicle size, mineralogy, solubility, lead species). Although there were limited data,
gastrointestinal absorption of lead appears to be higher in children than in adults. Estimates derived from
dietary balance studies conducted in infants and children (ages 2 weeks to 8 years) indicate absorption of
approximately 40-50% of ingested lead (Alexander et al. 1974; Ziegler et al. 1978). In adults, estimates of
absorption of ingested water-soluble lead compounds (e.g., lead chloride, lead nitrate, lead acetate) range
from 20 to 70% in fasted subjects and 3-15% in fed subjects; fasted/fed ratios range from 0.04 to 0.2 (Blake
et al. 1983; Heard and Chamberlain 1983; James et al. 1985; Rabinowitz et al. 1980). Mineral content is
one contributing factor to the lower absorption of lead when lead is ingested with a meal; in particular, the
presence of calcium and phosphate in a meal will depress the absorption of ingested lead (Blake et al. 1983;
Blake and Mann 1983; Heard and Chamberlain 1982). Data available on lead absorption between
childhood and adulthood ages are very limited. While no absorption studies have been conducted on
subjects in this age group, the kinetics of the change in stable isotope signatures of blood lead in mothers
and their children as both come into equilibrium with a novel environmental lead isotope profile, suggest
that children ages 6-11 years and their mothers may absorb a similar percentage of ingested lead (Gulson et
al. 1997).
Studies in experimental animals provide additional evidence for an age-dependency of gastrointestinal
absorption of lead. The rat pup absorbs 40-50 times more lead via the diet than does the adult rat (Forbes
and Reina 1972; Kostial et al. 1978). In rats receiving an oral dose of 1 mL lead-212 (2l2Pb)-labeled tracer,
absorption was approximately 74-89% for animals 16-22 days of age, 15-42% in animals 24-32 days old,
and only 16% at 89 days old (Forbes and Reina 1972). A single dose of lead resulted in 52% absorption in
1-2-week-old suckling rats compared to 0.4% in adults (Kostial et al. 1978). Age differences in absorption
rate were evident in rat pups who had slightly higher tissue levels than adult rats following a single gavage
dose of 1 or 10 mg lead/kg as lead acetate (Aungst et al. 1981). Absorption was 37.9% for young monkeys
versus 26.4% in adults following a single radiolabeled gavage dose of 6.37 mg lead/kg as lead acetate
(Pounds et al. 1978). This age difference in absorption rate may be due, in part, to dietary differences and to
physiological differences between the immature and mature intestine (EPA 1986a).
LEAD 200
2. HEALTH EFFECTS
Lead absorption in children is affected by nutritional iron status. Children who are iron deficient have
higher blood lead concentrations than similarly exposed children who are iron replete, which would suggest
that iron deficiency may result in higher absorption of lead or, possibly, other changes in lead biokinetics
that would contribute to lower blood lead concentrations (Mahaffey and Annest 1986; Marcus and Schwartz
1987). Evidence for the effect for iron deficiency on lead absorption has been provided from animal
studies. In rats, iron deficiency increases the gastrointestinal absorption of lead, possibly by enhancing
binding of lead to iron binding proteins in the intestine (Barton et al. 1978; Morrison and Quatermann
1987).
Dietary calcium intake appears to affect lead absorption. An inverse relationship has been observed
between dietary calcium intake and blood lead concentration in children, suggesting that children who are
calcium deficient may absorb more lead than calcium replete children (Mahaffey et al. 1986; Ziegler et al.
1978). An effect of calcium on lead absorption is also evident in adults. In experimental studies of adults,
absorption of a single dose of lead (100-300 ug lead chloride) was lower when the lead was ingested
together with calcium carbonate (0.2-1 g calcium carbonate) than when the lead was ingested without
additional calcium (Blake and Mann 1983; Heard and Chamberlain 1982). A similar effect of calcium
occurs in rats (Barton et al. 1978). In other experimental animal models, absorption of lead from the
gastrointestinal tract has been shown to be enhanced by dietary calcium depletion or administration of
vitamin D (Mykkanen and Wasserman 1981, 1982).
Absorption of lead may increase during pregnancy. An increase in lead absorption may contribute, along
with other mechanisms (e.g., increased mobilization of bone lead), to the increase in PbB concentration that
has been observed during the later half of pregnancy (Gulson et al. 1997; Lagerkvist et al. 1996;
Schuhmacher et al. 1996).
Lead absorption in humans may be a capacity limited process, in which case, the percentage of ingested lead
that is absorbed may decrease with increasing rate of lead intake. Studies, to date, do not provide a firm
basis for discerning if the gastrointestinal absorption of lead is grossly linear or non-linear. Numerous
observations of non-linear relationships between PbB concentration and lead intake in humans provide
further support for the existence of a saturable absorption mechanism or some other capacity limited process
in the distribution of lead in humans (Pocock et al. 1983; Sherlock et al. 1984, 1986). However, in
immature swine that received oral doses of lead in soil, lead dose-blood lead relationships were non-linear;
whereas, dose-tissue lead relationships for bone, kidney and liver were linear. The same pattern
LEAD 201
2. HEALTH EFFECTS
(nonlinearity for PbB and linearity for tissues) was observed in swine administered lead acetate
intravenously (Casteel et al. 1997). These results suggest that the non-linearity in the lead dose-PbB
relationship may derive from an effect of lead dose on some aspect of the biokinetics of lead other than
absorption. Evidence from mechanistic studies for capacity-limited processes at the level of the intestinal
epithelium is compelling, which would suggest that the intake-uptake relationship for lead is likely to be
non-linear; these studies are discussed in greater detail in Section 2.4.1.
The absorption of lead in soil is less than that of dissolved lead, but is similarly depressed by meals. Adult
subjects who ingested soil (particle size less than 250 urn) from the Bunker Hill NPL site absorbed 26% of
the resulting 250 ug/70 kg body weight lead dose when the soil was ingested in the fasted state and 2.5%
when the same soil lead dose was ingested with a meal (Maddaloni et al. 1998). There are no reported
measurements of the absorption of soil-borne lead in infants or children. Additional evidence for a lower
absorption of soil-borne lead compared to dissolved lead is provided from studies in laboratory animal
models. In immature swine that received oral doses of soil from one of four NPL sites (75 or 225 ug Pb/kg
body weight), bioavailability of soil-borne lead ranged from 50% to 82% of that of a similar dose of highly
water soluble lead acetate (Table 2-5) (Casteel et al. 1997; EPA 1996a, 1996b, 1996c). If the relative
bioavailability of soil-borne lead (soil/acetate) in immature swine is indicative of the relative bioavailability
in human children, and if the absolute bioavailability of water soluble lead in humans children is 50%, as
the Alexander et al. (1974) and Ziegler et al. (1978) studies would suggest, then the absolute bioavailability
of soil-borne lead in human children predicted from the swine studies would range from 25 to 41%. In
fasted rats, absorption was estimated at 42 and 2% following single oral administration of 1 and 100 mg
lead/kg, respectively, as lead acetate (Aungst et al. 1981). Fed rats were administered lead in soil from mine
waste over a 30-day period, and relative bioavailability compared to that of lead acetate was estimated from
measurements of blood lead concentration (Freeman et al. 1992). For one test soil, relative bioavailability
estimates for samples having lead concentrations of 1.62 and 4.05 ppm were 18.1 and 12.1% in males and
25.7 and 13.8% in females for average lead dosages of 1.13 and 3.23 mg Pb/kg/day in males, and 1.82 and
4.28 mg Pb/kg/day in females (1.62 and 4.05 ppm Pb), respectively. For a second test soil, relative
bioavailability estimates for samples having lead concentrations of 78.2 and 19.5 ppm were 19.6 and 21.5%
in males and 26.8 and 22.1% in females for average lead dosages of 5.13 and 12.1 mg Pb/kg/day in males
and 7.39 and 23.2 mg Pb/kg/day in females, respectively. In a subsequent follow-up study, absolute
bioavailability of ingested lead acetate in rats was estimated to be 15% based on measurements of blood
lead concentrations after oral or intravenous administration of lead acetate (Freeman et al. 1994). Based on
this estimate, the absolute bioavailability of lead in the soils from the
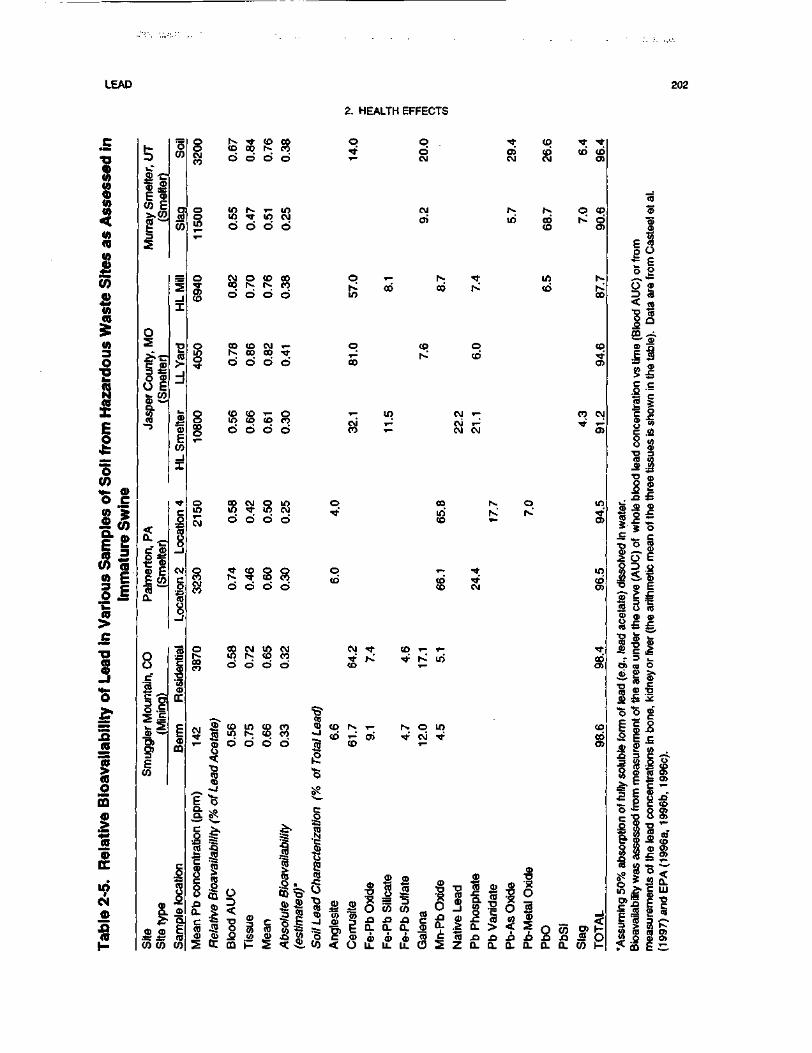
LEAD 202
2. HEALTH EFFECTS
C
1V)Q)(0
(0TO10JB+*
V)Q)ton5(0
o•g
XE0*^
"50)<*- 0>o c
lillif™flj>£
•o
n-o^*
!5ra
1(0om>JS
•
tN0)A(D
L<D yC <p
co E
§
s
0CO
M
OS
g *gO E«- COr
isi
•2(0
_i-1
1CD
ECO
I
.-gO ±i
cu EE co
°-
1
§
CM
1toQ
8.c
1.1
I*CO
|CD
DC
CDffi
jl B.
.•e i; (DCO CO CO
SCMCO
O
S^
o
S
1
g§
SCM
CMCO
O
COCO
2
^_^
0.
Mea
n P
b c
once
ntra
tion
I85cb-J"o
^
Rel
ativ
e B
ioav
aila
bilit
y \
fed
inind
Sd
Sd
coind
Sd
d
Sd
COind
O
Eo
CO
00d
TC
d
o
d
CO00d
CDCOd
d
5?d
d
12d
0)
i=
CO
d
10d
ISd
d
tod
Sd
gd
Sd
gd
c
8 5d »-
Sd
CO ^D
d m
T- q
d co
d co
m q
d
9 qCO too
CM CM •*n. •* KO CD
S"CO
co i> CD r- i-m. ^1 <D 0)o g co
,o1—
S?
_o
Abs
olut
e B
ioav
aila
bilit
y(e
stim
ated
)'
Soi
l Lea
d C
hara
ctei
izat
iA
ngle
site
Cer
rusi
te
Fe-P
b O
xide
q ^- co »t ;d o> co co coCM CM CM O)
CM r-; r- o cqcri in cb r d
co o>
T^ N ; in r^co co r^< co ^
CO
co q coh- CD 'f
o>
in CM »- eo CMT^ CM T^ tf T-^T- CM CM O)
co iv. q inin rv is.' 'CD i- O)
*": ! "?CO ^ COco CM cn
CO T- T- <Cf
•* N^ in co
r. o in co•* c\i TT co
r- O)
fiilfillllggff^£ l x O S Z Q . a . Q . a . ( L Q . C O ) -
e
§3
^o
CD0)
§g.X
ncen
tra
8TJ
Ji
oQ
fi1°J: o^O ~ja <.
S oCO ^~
'O (5
S "J2r 3
O> CO
E CO
~*O O
bte
form
iur
emen
t
1 oc
J-^
c ?
"Ass
umin
g 50
% a
bsor
ptio
Bio
avai
labi
lity w
as a
sses
se
cti
0a
OE
1(3SQ
_^"ST
1CD
.C
£2
O
a$3
1
8;
1iE
E
1(fi
£k_
o>.cS
CO
1.C0 .
i $is O>
g".c g>o o>
mea
sure
men
ts o
f the
lead
(199
7) a
nd E
PA
(19
96a,
1
LEAD 203
2. HEALTH EFFECTS
Freeman et al. (1992) study was estimated to be 2.7% (Freeman et al. 1994). In rats that received diets
containing 17-127 mg lead/kg for 44 days in the form of lead acetate, lead sulfide, or lead-contaminated
soil, bone and tissue lead levels increased in a dose-dependent manner (Freeman et al. 1996). Estimated
bioavailability of lead sulfide was approximately 10% that of lead acetate. Bioavailability of lead in soil
from the California Gulch NPL site (Freeman et al. 1996), a former mining site, decreased with increasing
soil lead concentration in the diet and ranged from 7 to 28% of that of lead acetate. The predominant forms
of lead in the NPL site soil were identified as: iron-lead oxide (40%), manganese-lead oxide (16%), lead
phosphate (13%), "slag" (12%) and iron-lead sulfate (10%). The addition of "uncontaminated soil" (having
a lead concentration of 54±3 mg lead/kg soil) to diets containing lead acetate decreased the bioavailability
of lead acetate by approximately 76%. In adult mice, absorption was 14% in fasted mice versus 7.5% in fed
mice 4 hours after an oral gavage dose of 0.003 mg lead/kg as lead acetate (Garber and Wei 1974).
However, no difference in absorption (4-5%) was observed in fasted and nonfasted mice receiving 2 mg
lead/kg.
Particle size also influences the degree of gastrointestinal absorption (EPA 1986a; Grobler et al. 1988). An
inverse relationship was found between diets containing metallic lead of particle sizes • 250 u.m and
absorption in rats (Barltrop and Meek 1979). There was a 2.3-fold increase in tissue lead concentration
when animals ingested an acute dose of 37.5 mg/kg with a particle size of <38 urn (diameter) compared to a
particle diameter of 150-250 urn (Barltrop and Meek 1979). Dissolution kinetics experiments with lead-
bearing mine waste soil suggest that surface area effects control dissolution rates for particles sizes of
<90 urn diameter; however, dissolution of 90-250 u.m particle size fractions appeared to be controlled more
by surface morphology (Davis et al. 1994). Similarly, Healy et al. (1982) found that the solubility of lead
sulfide in gastric acid in vitro was much greater for particles of 30 u.m diameter than particles of 100 urn
diameter.
2.3.1.3 Dermal Exposure
Inorganic Lead. Limited information is available regarding absorption after dermal exposure in
humans. Dermal absorption of inorganic lead compounds is reported to be much less significant than
absorption by inhalation or oral routes of exposure, because of the greatly reduced dermal absorption rate
(EPA I986a). Following skin application of 203Pb-labeIed lead acetate in cosmetic preparations (O.I mL of a
lotion containing 6 mmol lead acetate/L or O.I g of a cream containing 9 mmol lead acetate/kg) to 8 male
volunteers for 12 hours, absorption was • 0.3%, but expected to be 0.06% during normal use of such
LEAD 204
2. HEALTH EFFECTS
preparations (Moore et al. 1980). Most of the absorption took place by 12 hours of exposure. A study
suggests that lead, applied to the skin as lead acetate or lead nitrate, was rapidly absorbed through the skin
and was detected in sweat, blood, and urine within 6 hours of application (Stauber et al. 1994). In this
study, 4.4 mg of lead equivalent was applied to the skin under a covered wax/plastic patch on the forearms
of human subjects; of the applied dose, 1.3 mg of lead was not recovered from skin washings. The amount
that actually remained in (or on) the skin and the mass balance of the fate of this lead was not determined; it
may have been absorbed or eliminated from the skin by exfoliation of epidermal cells. Thus, while this
study provides evidence for dermal absorption of lead, it did not quantity the fraction of applied dose that
was absorbed. The quantitative significance of the dermal absorption pathway as a contributor to lead body
burden remains an uncertainty. The wax/plastic patch provided a means by which the lead compounds
could permeate or adhere to the skin. The effect of concentration in aqueous solution may cause skin
abrasion through enhanced acidity since the lead ion is acidic. Abraded skin is known to promote
subsequent higher lead penetration.
Limited information was located regarding dermal absorption of inorganic lead in animals. An early study
reported that lead acetate was absorbed from the clipped skin of rats, as determined by an increase in the
concentration of lead in the kidneys relative to controls (Laug and Kunze 1948). It was further shown in
that study that mechanical injury to the skin significantly increased the penetration of lead and that the
penetration of lead from lead arsenate was significantly less than from lead acetate.
Organic Lead. Tetraalkyl lead compounds have been shown to be rapidly and extensively absorbed
through the skin of rabbits and rats (Kehoe and Thamann 1931; Laug and Kunze 1948). A 0.75-mL amount
of tetraethyl lead, which was allowed to spread uniformly over an area of 25 cm2 on the abdominal skin of
rabbits, resulted in 10.6 mg of lead in the carcass at 0.5 hours and 4.41 mg at 6 hours (Kehoe and Thamann
1931). Tetraethyl lead was reported to be absorbed by the skin of rats to a much greater extent than lead
acetate, lead oleate, and lead arsenate (Laug and Kunze 1948). The rank order of absorption rates through
excised skin from humans and guinea pigs was as follows: tetrabutyl lead >lead nuolate > lead naphthalene
> lead acetate > lead oxide (nondetectable) (Bress and Bidanset 1991).
LEAD 205
2. HEALTH EFFECTS
2.3.2 Distribution
2.3.2.1 Blood and Other Soft Tissues
Inorganic Lead. Once absorbed, inorganic lead appears to be distributed in essentially the same manner
regardless of the route of absorption (Kehoe 1987). This implies that a common lead transport system is
involved. Therefore, the distribution and body burden of absorbed lead for all routes is discussed in one
section. The body burden of a particular chemical is the total amount of that chemical found in the body.
The distribution of lead in the body is initially dependent on the rate of delivery by the bloodstream to
various organs and tissues. A subsequent redistribution may then occur, based on the relative affinity of
tissues for the element and its toxicodynamics there (EPA 1986a). With consistent exposure for an
extended period, a steady state of intercompartmental distribution is achieved; however, fluctuation can
occur when short-term exposure is superimposed on the long-term uptake pattern (EPA 1986a).
The distribution of lead in humans has been well characterized. In general, the distribution of lead appears
to be similar in children and adults, although a larger fraction of the lead body burden of adults resides in
bone (See Section 2.3.3 for further discussion). Lead in blood is primarily in the red blood cells (99%)
rather than the plasma (DeSilva 1981; EPA 1986a; Everson and Patterson 1980; Hursh and Suomela 1968).
Most of the lead found in red blood cells is found bound within the cell rather than the erythrocyte
membrane. Within the cell, 50% of lead is bound to hemoglobin A2 (EPA 1986a). Another 5% is bound to
a 10,000-dalton molecular-weight fraction, approximately 20% to a much heavier molecule, and about 25%
is considered "free" or bound to lower weight molecules (EPA 1986a; Raghavan and Gonick 1977). Fetal
hemoglobin appears to have a higher affinity for lead than adult hemoglobin (Ong and Lee 1980c).
Absorbed lead is distributed in various tissue compartments. Several models of lead pharmacokinetics have
been proposed to characterize such parameters as intercompartmental lead exchange rates, retention of lead
in various pools, and relative rates of distribution among the tissue groups. See Section 2.3.5 for a
discussion of the classical compartmental models and physiologically based pharmacokinetic models
(PBPK) developed for lead risk assessments.
In adult volunteers exposed to 0.0032-0.011 mg lead/m3 (species of lead not specified) continuously for
18 weeks, blood lead levels increased for about 12 weeks then leveled off between 27 and 37 ug/dL (Griffin
et al. 1975b). Lead content in blood declined after cessation of exposure, returning to pre-exposure levels
LEAD 206
2. HEALTH EFFECTS
by 5 months. The half-life of lead in adult human blood has been measured as 36 days by Rabinowitz et al.
(1976) and 28 days by Griffin et al. (1975b). Under steady-state conditions, 96-99% of blood lead is
associated with the erythrocytes in wVo(Boudene et al. 1977; Castellino and Aloj 1964; DeSilva 1981;
Everson and Patterson 1980; Kehoe 1987; Lloyd et al. 1975; Morgan et al. 1977). Within 1 hour following
the inhalation of tetramethyl lead, 61% and 39% of the inhaled dose was detected in the red blood cells and
plasma, respectively (Heard et al. 1979). Over 50% of this erythrocyte lead pool is bound to hemoglobin,
with lesser amounts bound to other proteins (Bruenger et al. 1973; Simons 1986). However, the ratio of
plasma lead to red blood cell lead was strongly correlated among 75 mother-newborn pairs, suggesting that
the partitioning of lead between plasma and red blood cells may not differ greatly between adults and
children (Cavalleri et al. 1978).
The relationship between the fractions of lead distributed in human erythrocytes and plasma has been
described by Manton and Cook (1984) in patients with neurological disease and in control subjects
including cases of plumbism. At blood lead levels • 40 ug/dL, blood lead and serum lead levels increase
linearly in a positive fashion; at higher blood lead levels, they assume a curvilinear relationship
(Figure 2-3). The ratio of lead in plasma to that in whole blood increases dramatically at blood lead levels
>40 ug/dL. In vitro data of the partitioning of PbB between erythrocytes and plasma show a positive linear
correlation at PbB levels • 100 ug/dL and deviation from linearity above that value (Clarkson and Kench
1958). The departure from linearity of this relationship in v/Voat PbB levels >40 ug/dL may be caused by
altered cell morphology at high blood lead levels, resulting in a reduced availability or stability of lead
binding sites in the erythrocytes (EPA 1986a; Gonick et al. 1985; Raghavan et al. 1980). The low
concentrations of lead in plasma, relative to red blood cells, has made it extremely difficult to accurately
measure plasma lead concentrations in humans, particularly at low PbB concentrations (i.e., less than
20 ug/dL). More recent measurements have been achieved with inductively coupled mass spectrometry
(1CP-MS), which has a higher analytical sensitivity than earlier atomic absorption spectrometry methods.
Using this analytical technique, a curvilinear relationship between plasma and blood lead concentrations has
been demonstrated in adults (118 active lead industry workers and 25 retired workers) whose PbB concen-
trations were 1-93 ug/dL: log plasma (|ig/L)= 0.00225 x blood (u.g/L) - 0.58; this relationship describes a
plasma/blood lead concentration ratio of approximately 0.4 at PbB concentrations between 10 and
30 ug/dL, and ratios increasing to 3.5% at PbB concentrations between 30 and 90 ug/dL (Berdahl et al.
1997; Berdahl and Skerfving 1997). Similar ratios have been reported for serum and blood; serum lead
concentrations were estimated to be 1-2% of PbB concentration in adults (49 lead industry workers) whose
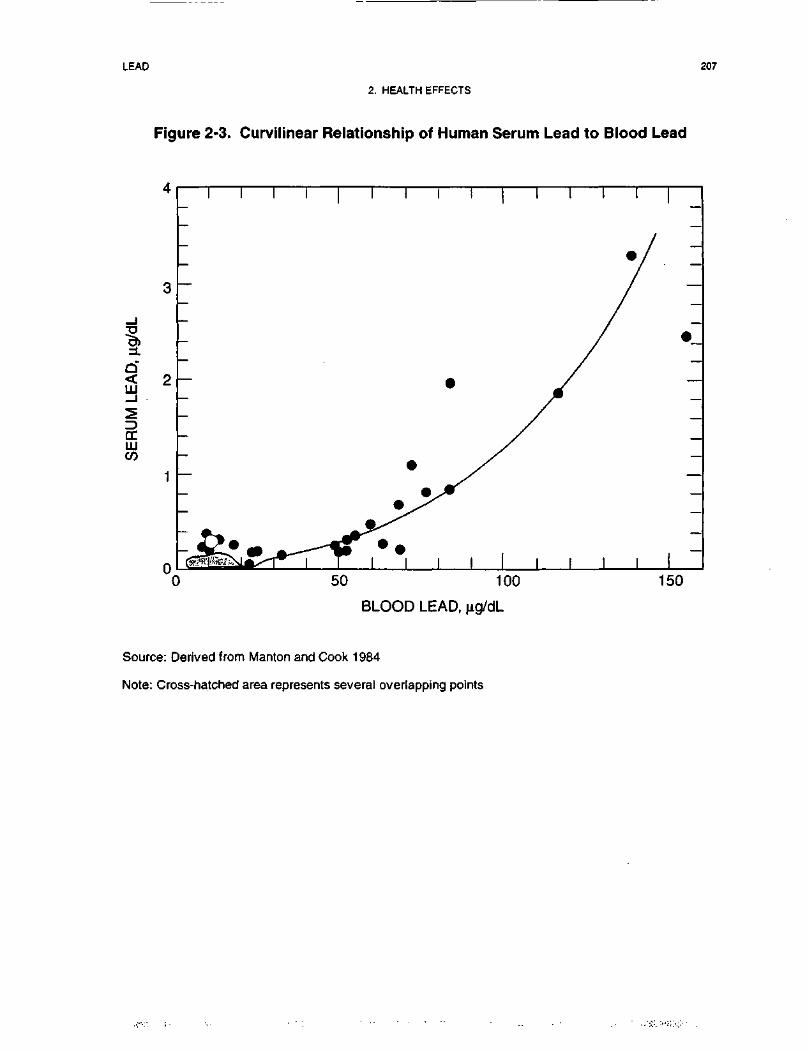
LEAD 207
2. HEALTH EFFECTS
Figure 2-3. Curvilinear Relationship of Human Serum Lead to Blood Lead
1Q< 2LLJ
DCLUCO
0
I I I I
0 50 100
BLOOD LEAD,
150
Source: Derived from Manton and Cook 1984
Note: Cross-hatched area represents several overlapping points
LEAD 208
2. HEALTH EFFECTS
blood lead concentrations were 16-55 ng/dL: plasma (ug/L) = 0.0206 x blood (ug/L) - 1.58 (Cake et al.
1996).
PbB concentrations have been observed to decrease in the early stages of pregnancy and increase during the
latter stages of pregnancy. The mechanism for these changes are not understood; however, increased
mobilization of bone lead during pregnancy may contribute to part of the increase (Gulson et al. 1997;
Lagerkvist et al. 1996; Schuhmacher et al. 1996). Increased blood volume and hemodilution may contribute
to the decrease observed the first half of pregnancy, whereas, increased absorption of lead during pregnancy
or decreased elimination may also occur, although evidence for this is limited (Gulson et al. 1997; Franklin
etal. 1997).
Autopsies of occupational workers showed that the lead content in lungs and liver was elevated compared to
control levels (Gerhardsson et al. 1986a). Gerhardsson et al. (1995b) showed that in 32 deceased smelter
workers with known lead exposure history, the major soft tissue organs of lead accumulation were, in
decreasing order: liver > kidney > lungs > brain. Autopsies of nonoccupational subjects revealed that
males had higher lead content in tissues compared to females; however, sex differences in lead levels were
not observed in tissues of children (Barry 1975; Treble and Thompson 1997). Autopsies of 41 men ages
18-80 years showed no relationship between blood lead concentrations and lead concentrations in
reproductive organs (Oldereid et al. 1993). In most soft tissues (including brain), lead does not appear to
accumulate as a function of age in humans over 20 years old (Barry 1975, 1981; Gross et al. 1975; Treble
and Thompson 1997), but these data are based on limited sample size. Selective accumulation of lead has
been observed in the hippocampus in both children and adults (EPA 1986a). However, this selective
concentration of lead in hippocampus may be an artifact of the use of dry rather than wet weights in the
analyses (Widzowski and Cory-Slechta 1991).
In animals, lead is widely distributed to soft tissues ini t ial ly then redistributes and accumulates in bones. In
general, the liver, lungs, and kidneys of rats showed the highest tissue lead concentrations immediately after
acute exposure by inhalation (Boudene et al. 1977; Morgan and Holmes 1978), oral (Aungst et al. 1981),
dermal (Kehoe and Thamann 1931; Laug and Kunze 1948), and intravenous routes (Castellino and Aloj
1964). The lead content in the bones gradually increased while levels in soft tissues began to decline and
stabilize (Kehoe and Thamann 1931; Keller and Doherty 1980b). In a 12-month continuous inhalation
exposure to 0.0215 mg leaoVm3 (species of lead not specified) in rats, lead content in kidney, liver, and lungs
were increased at 6 and 12 months (Griffin et al. 1975b). The bone had the highest concentrations of lead.
LEAD 209
2. HEALTH EFFECTS
Lead concentration in the lung increased the least. Following the end of exposure, tissue levels declined
except in the bone. A similar distribution pattern was observed in mice following intermediate exposure to
lead nitrate (Kozlowski and Wojcik 1987). In rats exposed to 5 or 50 ppm lead acetate via drinking water
(approximately 1.7 or 17 mg lead/kg/day) for 90 days the distribution of lead in the high-dose group was in
descending order: kidney > brain > spleen > prostate > heart > testis and liver (Areola et al. 1999). In the
low-dose group, significant lead accumulation was seen only in the brain and kidney. In most organs, the
lead concentration was highest 2 weeks after dosing began and subsequently declined. In the brain, lead
increased gradually over the 90-day dosing period. PbB in the low-dose group was similar to untreated
controls over the duration of the experiment (1-2 ug/dL), whereas in the high-dose group it rose gradually
to a maximum of about 16 (ig/dL at the termination of the study.
The effects of aging on the tissue distribution of lead acetate were studied in male Fischer 344 rats; the
compound was administered in drinking water to juvenile (21-day-old), adult (8-month-oId), and old
(16-month-old) rats (Cory-Slechta 1990b; Cory-Slechta et al. 1989). Animals received 0, 1.27, and
6.37 mg lead/kg/day for 9.5 months (Cory-Slechta 1990b) or 0 and 4.5 mg lead/kg/day for 11 months
(Cory-Slechta et al. 1989). Although the tissue lead distribution pattern (femur > kidneys > liver > brain)
was similar for the three groups of animals, age-related increases in distribution were found in the brain and
kidneys and a decline in lead content was found in the bones (femur). These age-related changes in tissue
concentration may be the result of bone demineralization and redistribution of released lead (Cory-Slechta
1990b). Retention was greater in suckling rats than adults following intraperitoneal exposure; brain levels
were higher and kidney levels were lower in the pups (Kostial et al. 1978). One day after administration of
the first dose of 50 mg lead/kg as lead acetate by gavage to neonatal rats, lead had accumulated in the liver,
kidney, intestine, and intestinal contents (Miller et al. 1983). No lead was found in the blood, bone, or
brain. Fifteen days after the first dose, and after the 50-mg/kg dose had been repeated for a total of five
administrations, the highest concentration of lead was found in the femur. Brain lead levels had also
increased. No accumulation of lead was observed in the lungs, heart, stomach, or spleen over the dosing
period. Rat pups (4-8 weeks old) had a 2-3-fold increase in brain lead concentration when oral doses
increased by 10-fold from 0.1 to 1 mg lead/kg (Collins et al. 1982). The highest brain lead level in these
pups was in the hippocampus.
Transplacental transfer of lead in humans has been demonstrated in a number of studies, and lead has been
identified in umbilical cord blood. In the work of Bellinger et al. (1987a), the mean lead concentration in
umbilical cord blood from a sample size of • i 1,000 women was 6.6±3.2 ug/dL. In a study of 236 pregnant
LEAD 210
2.. HEALTH EFFECTS
women in Glasgow, Scotland, the geometric mean PbB levels were 14 ug/dL for the mothers and 12 ug/dL
in the umbilical cord at birth (Moore et al. 1982). The fetal/maternal PbB concentration ratio based on
maternal and umbilical cord blood lead concentrations at delivery, is approximately 0.9 (Abdulla et al.
1997b; Goyer 1990; Graziano et al. 1990; Schuhmacher et al. 1996). Diffusion, associated with fetal blood
flow rate, has been proposed as the primary mechanism for transplacental lead transport (Goyer 1990).
A portion of the maternal-to-fetal transfer of lead appears to be related to the mobilization of lead from the
maternal skeleton. Analysis for kinetics of changes in the stable isotope signatures of blood lead in
pregnant women as they come into equilibrium with a novel environmental lead isotope signature indicate
that 9-65% of the lead in blood may derive from the mobilization of bone lead stores (Gulson et al. 1997).
Additional evidence for increased mobilization of bone lead into blood during pregnancy is provided from
studies in non-human primates and rats (Franklin et al. 1997; Maldonado-Vega et al. 1996). Lead may
enhance processes of bone demineralization (and excretion of bone lead to mother's milk) by inhibiting
activation of vitamin D, decreasing calcium absorption, and interfering with hormonal regulation of mineral
metabolism and bone cell function (Silbergeld 1991). Direct evidence for transfer of maternal bone lead to
the fetus has been provided from stable lead isotope studies in cynomolgus monkeys (Macaca fascicularis);
approximately 7-39% of the maternal lead burden that is transferred to the fetus in this species appears to
derive from the maternal skeleton (Franklin et al. 1997). Maternal-to-fetal transfer of lead also has been
shown to occur in other animal models, including pigs and rats (Donald et al. 1986b; Jing et al. 1997).
Transfer of maternal lead to offspring can also occur during nursing, as indicated from studies in mice and
rats (Keller and Doherty 1980a; Palminger Hallen et al. 1995, 1996a, 1996b).
Studies in animal models have shown that maternal lead is distributed to breast milk and can be transferred
to offspring during breast feeding. Lead is transferred through breast milk to suckling mouse litters (Keller
and Doherty 1980a) and suckling rat litters (Palminger Hallen et al. 1995, 1996a, 1996b) if the mothers are
exposed prior to or during lactation. Approximately 25% of the maternal dose was transferred to suckling
mice via milk (Keller and Doherty 1980a), and 33% was transferred to suckling rats (Palminger Hallen et al.
I996a, 1996b), suggesting that excretion of lead into mi lk may represent a significant change in lead
pharmacokinetics in humans (both lactating mothers and nursed infants).
Organic Lead. The highest lead levels were reported to be in liver, kidney, spleen, and lungs from
autopsies (Gross et al. 1975). In a man and woman who accidentally inhaled a solvent containing 31%
LEAD . 211
2. HEALTH EFFECTS
tetraethyl lead (17.6% lead weight to weight [w/w]) (Bolanowska et al. 1967), lead concentrations in the
tissues, from highest to lowest, were liver, kidney, brain, pancreas, muscle, and heart. In another incident, a
man ingested a chemical containing 59% tetraethyl lead (38% lead w/w); lead concentration was highest in
the liver followed by kidney, pancreas, brain, and heart (Bolanowska et al. 1967).
2.3.2.2 Bone
In human adults, approximately 94% of the total body burden of lead is found in the bones. In contrast,
bone lead accounts for 73% of the body burden in children (Barry 1975). This large pool of lead in adults
can serve to maintain blood lead levels long after exposure has ended (Flemming et al. 1997; Inskip et al.
1996; Kehoe 1987; O'Flaherty et al. 1982; Smith et al. 1996). It can also serve as a source of lead transfer
to the fetus when the maternal skeleton is catabolized for the production of the fetal skeleton (Franklin et al.
1997;Gulsonetal. 1997).
Lead is not distributed uniformly in bone. Lead will accumulate in those regions of bone undergoing the
most active calcification at the time of exposure. During infancy and childhood, bone calcification is most
active in trabecular bone, whereas in adulthood, calcification occurs at sites of remodeling in cortical and
trabecular bone. This would suggest that lead accumulation will occur predominantly in trabecular bone
during childhood, and in both cortical and trabecular bone in adulthood (Auferheide and Wittmets 1992).
Two physiological compartments appear to exist for lead in cortical and trabecular bone, to varying degrees.
In one compartment, bone lead is essentially inert, having a half-life of several decades. A labile
compartment exists as well that allows for maintenance of an equilibrium of lead between bone and soft
tissue or blood (Rabinowitz et al. 1976, 1977). The presence of labile lead may be a more accurate
predictor of recent exposure or imminent toxicity-than total body or whole blood burdens (EPA 1986a).
Although a high bone formation rate in early childhood results in the rapid uptake of circulating lead into
mineralizing bone, bone lead is also recycled to other tissue compartments or excreted in accordance with a
high bone resorption rate (O'Flaherty 1995a). Thus, most of the lead acquired early in life is not
permanently fixed in the bone (O'Flaherty 1995a). In general, bone turnover rates decrease as a function of
age, resulting in slowly increasing bone lead levels among adults. An X-ray fluorescence study of tibial
lead concentrations in individuals older than 10 years showed a gradual increase in bone lead after age 20
(Kosnett et al. 1994). In 60-70-year-old men, the total bone lead burden may be • 200 mg, while children
less than 16 years old have been shown to have a total bone lead burden of 8 mg (Barry 1975). However, in
some bones (i.e., mid femur and pelvic bone) the increase in lead content plateaus at middle age and then
LEAD 212
2. HEALTH EFFECTS
decreases at higher ages (Drasch et al. 1987). This decrease is most pronounced in females and may be due
to osteoporosis. Bone lead burdens in adults are slowly lost by diffusion (heteroionic exchange) as well as
by resorption (O'Flaherty 1995a, 1995b).
Evidence for the exchange of bone lead and soft tissue lead stores comes from analyses of stable lead
isotope signatures of lead in bone and blood. A comparison of blood and bone lead stable isotope
signatures in five adults indicated that bone lead stores contributed to approximately 40-70% of the lead in
blood (Smith et al. 1996). During pregnancy, the mobilization of bone lead increases, apparently as the
bone is catabolized to produce the fetal skeleton. Analysis for kinetics of changes in the stable isotope
signatures of blood lead in pregnant women as they come into equilibrium with a novel environmental lead
isotope signature indicate that 9-65% of the lead in blood may derive from the mobilization of bone lead
stores (Gulson et al. 1997). The mobilization of bone lead during pregnancy may contribute, along with
other mechanisms (e.g., increased absorption), to the increase in PbB concentration that has been observed
during the later stages of pregnancy (Gulson et al. 1997; Lagerkvist et al. 1996; Schuhmacher et al. 1996).
Additional evidence for increased mobilization of bone lead into blood during pregnancy is provided from
studies in non-human primates and rats (Franklin et al. 1997; Maldonado-Vega et al. 1996). Direct evidence
for transfer of maternal bone lead to the fetus has been provided from stable lead isotope studies in
cynomolgus monkeys (Macaca fascicularis) that were dosed with lead having a different stable isotope ratio
than the lead to which the monkeys were exposed at an earlier age; approximately 7-39% of the maternal
lead burden that is transferred to the fetus in this species appears to derive from the maternal skeleton
(Franklin et al. 1997).
2.3.3 Metabolism
Inorganic Lead. Inorganic lead ion in the body is not known to be metabolized or biotransformed
(Phase I processes); it does form complexes with a variety of protein and non-protein ligands (see
Section 2.4.1). Primarily, it is absorbed, distributed, and then excreted, often in complexed form (EPA
1986a).
Organic Lead. Alkyl lead compounds are actively metabolized in the liver by oxidative dealkylation
catalyzed by cytochrome P-450.
LEAD 213
2. HEALTH EFFECTS
Relatively few human studies that address the metabolism of alkyl lead compounds were found in the
available literature. The dealkylation, mediated by cytochrome P-450, of alkyl lead compounds is thought
to occur in the rat, mouse, and rabbit. This step converts tetraethyl and tetramethyl lead to the triethyl and
trimethyl metabolites, respectively, and inorganic lead (Bolanowska 1968; EPA 1986a; Kehoe and
Thamann 1931). Further biotransformation of these intermediate metabolites is highly species-specific.
Diethyl metabolite was not detected in rats receiving tetraethyl lead (Bolanowska 1968). Trialkyl lead
metabolites were found in the liver, kidney, and brain following exposure to the tetraalkyl compounds in
workers; these metabolites have also been detected in brain tissue of nonoccupational subjects (Bolanowska
et al. 1967; Nielsen et al. 1978). In volunteers exposed by inhalation to 0.64 and 0.78 mg lead/m3 of203Pb-labeled tetraethyl and tetramethyl lead, respectively, lead was cleared from the blood within 10 hours,
followed by a reappearance of radioactivity back into the blood after approximately 20 hours (Heard et al.
1979). The high level of radioactivity init ially in the plasma indicates the presence of tetraalkyl/trialkyl
lead. The subsequent rise in blood radioactivity, however, probably represents water-soluble inorganic lead
and trialkyl and dialkyl leads that were formed from the metabolic conversion of the volatile parent
compounds (Heard et al. 1979).
2.3.4 Excretion
Inorganic Lead. Excretion of lead for all routes of exposure is discussed without subdividing data
according to the route of exposure. In humans or animals, any dietary lead not absorbed by the gastro-
intestinal tract is eliminated in the feces (EPA 1986a). However, the feces also include an enterohepatic
component. Airborne lead that has been swallowed and not absorbed is eliminated in a similar fashion.
The lead that is not retained is either excreted by the kidney or excreted through biliary clearance, some in
the form of glutathione conjugates, into the gastrointestinal tract (EPA 1986a). For example, ingestion of
0.3-3.0 mg lead as lead acetate in drinking water per day for 16-208 weeks by adult volunteers resulted in
excretion of greater than 85% of the ingested lead, of which over 90% was found in the feces (Kehoe 1987).
Negligible amounts were eliminated in perspiration.
Urinary excretion of lead was observed at H .0 mg lead per day after ingesting lead in the drinking water as
lead acetate (Kehoe 1987). The urinary lead excretion in men after 3 months of continuous inhalation
exposure to 0.011 mg lead/m3 was approximately 85 (ag lead/g urinary solids, which was nearly double the
pre-exposure baseline level of urinary excretion (Griffin et al. 1975b). Lead content in feces did not reveal
any differences between the exposed and control groups (Griffin et al. 1975b). However, this may have
LEAD 214
2. HEALTH EFFECTS
been due to the relatively low concentration of lead used and the presence of lead in the diet. Moderately
exposed workers were shown to have mean levels of lead in urine of 0.05-0.2 mg/L (Robinson 1974). The
data suggest that 50-60% of the absorbed fraction of lead in adults in a steady-state condition with regard to
lead intake/output was excreted on a short-term basis (Chamberlain et al. 1978; Rabinowitz et al. 1976).
The half-life of this short-term fraction was found to be 19 days (Chamberlain et al. 1978). Comparison of
data on lead kinetics for children and adults, shows that infants may have a lower total excretion rate for
lead (Rabinowitz et al. 1977; Ziegler et al. 1978). Infants from birth to 2 years of age have been shown to
retain 31.7% of the total amount of lead absorbed (Ziegler et al. 1978), whereas adults retained only 1% of
an absorbed dose of lead (Rabinowitz et al. 1977).
In general, there is a greater excretion of lead in feces than in urine of animals following acute, intermediate,
and chronic exposure. Species differences exist in the rate and extent of total lead excretion. Rats excreted
43% of the dose after 5 days (Morgan et al. 1977) and 66% after 8 days (Momcilovic and Kostial 1974).
Six days after inhalation of 0.01 mg/m3 lead for 30-45 minutes in Wistar rats, 40% and 15% of the dose was
eliminated in the feces and urine, respectively (Boudene et al. 1977). After rats received an intravenous
dose of lead, 45.3% of the administered dose was excreted 6 days postexposure (Castellino and Aloj 1964).
Total excretion of lead was 7.29% and 18.3% of a single oral exposure to 6.37 mg/kg as lead acetate in
young and adult rhesus monkeys, respectively (Pounds et al. 1978). Three weeks following intravenous
administration of lead, Beagle dogs excreted approximately 50% of the dose; 75% of the excreted dose was
detected in the feces (Lloyd et al. 1975). Adult mice excreted 62% of injected lead by 50 days; cumulative
lead in feces was 25-50% (Keller and Doherty 1980a; Kostial and Momcilovic 1974). Fecal excretion was
relatively constant (6% of the dose per day) during the 30-day recovery period in mice fed wheat grain
containing 3.38, 83.2, or 171.1 mg lead/kg as lead nitrate for up to 40 days (Kozlowski and Wojcik 1987).
However, urinary excretion was not measured. With chronic lead exposure, the average fecal and urinary
lead concentrations in rats and rhesus monkeys exposed to 0.0215 mg leaoVm3, 22 hours per day, for a year,
were higher than controls, with lead content greater in the feces than in the urine; however, there were high
individual variations in the excretion rate (Griffin et al. 1975b).
Lead is also eliminated in the bile (Klaassen and Shoeman 1974). In the rat, excretion occurs in the urine,
with greater excretion in the feces following intravenous administration (Castellino and Aloj 1964; Klaassen
and Shoeman 1974; Morgan et al. 1977). As the dose increases, the proportion of the lead excreted into the
gut via bile increases, then plateaus at 3 and 10 mg/kg (Klaassen and Shoeman 1974). Biliary excretion of
LEAD 215
2. HEALTH EFFECTS
lead is suggested to be a saturable process (Gregus and Klaassen 1986). Excretion of lead in the bile by
dogs amounted to approximately 2% of that by rats, and biliary excretion of lead by rabbits amounted to
approximately 40% of that by rats (Klaassen and Shoeman 1974).
In rats, excretion of lead was biphasic following intravenous administration, with half-lives of 21 hours for
the fast phase and 280 hours for the slow phase (Morgan et al. 1977). Dogs excreted lead in three phases,
with half-lives of 12, 184, and 4,951 days (Lloyd et al. 1975). The half-life of the terminal phase of a
biphasic elimination curve for mice was 110 days (Keller and Doherty 1980a).
Lead acetate administered at 100 ug lead/g in the drinking water of fasting rats for 3 days resulted in a
2-fold increase in the total mass of lead excreted in feces and urine compared with the same dose rate for fed
rats (Hayashi et al. 1993). In addition, the total mass of lead in feces of control animals that were fasted for
3 days resulted in an increase in the mass of lead excreted, suggesting that excretion of lead from other
tissues is enhanced during short periods of fasting.
Organic Lead. Urinary lead levels were elevated for 4 days in a man accidentally exposed to an
unknown quantity of tetramethyl lead (Gething 1975). Exhalation of the tetraalkyl lead compounds
following inhalation exposure is a major route of elimination in humans. At 48 hours postexposure, 40%
and 20% of the initially inhaled tetramethyl and tetraethyl lead doses, respectively, were exhaled with low
urinary excretion (Heard et al. 1979).
2.3.5 Physiologically Based Pharmacokinetic (PBPK)/Pharmacodynamic (PD) Models
Physiologically based pharmacokinetic (PBPK) models use mathematical descriptions of the uptake and
disposition of chemical substances to quantitatively describe the relationships among critical biological
processes (Krishnan et al. 1994). PBPK models are also called biologically based tissue dosimetry models.
PBPK models are increasingly used in risk assessments, primarily to predict the concentration of potentially
toxic moieties of a chemical that will be delivered to any given target tissue following various combinations
of route, dose level, and test species (Clewell and Andersen 1985). Physiologically based pharmaco-
dynamic (PBPD) models use mathematical descriptions of the dose-response function to quantitatively
describe the relationship between target tissue dose and toxic end points.
LEAD 216
2. HEALTH EFFECTS
PBPK/PD models refine our understanding of complex quantitative dose behaviors by helping to delineate
and characterize the relationships between: (I) the external/exposure concentration and target tissue dose of
the toxic moiety, and (2) the target tissue dose and observed responses (Andersen and Krishnan 1994;
Andersen et al. 1987). These models are biologically and mechanistically based and can be used to
extrapolate the pharmacokinetic behavior of chemical substances from high to low dose, from route to route,
between species, and between subpopulations within a species. The biological basis of PBPK models
results in more meaningful extrapolations than those generated with the more conventional use of
uncertainty factors.
The PBPK model for a chemical substance is developed in four interconnected steps: (1) model
representation, (2) model parameterization, (3) model simulation, and (4) model validation (Krishnan and
Andersen 1994). In the early 1990s, validated PBPK models were developed for a number of
toxicologically important chemical substances, both volatile and nonvolatile (Krishnan and Andersen 1994;
Leung 1993). PBPK models for a particular substance require estimates of the chemical substance-specific
physicochemical parameters, and species-specific physiological and biological parameters. The numerical
estimates of these model parameters are incorporated within a set of differential and algebraic equations that
describe the pharmacokinetic processes. Solving these differential and algebraic equations provides the
predictions of tissue dose. Computers then provide process simulations based on these solutions.
The structure and mathematical expressions used in PBPK models significantly simplify the true
complexities of biological systems. If the uptake and disposition of the chemical substance(s) is adequately
described, however, this simplification is desirable because data are often unavailable for many biological
processes. A simplified scheme reduces the magnitude of cumulative uncertainty. The adequacy of the
model is, therefore, of great importance, and model validation is essential to the use of PBPK models in risk
assessment.
PBPK models improve the pharmacokinetic extrapolations used in risk assessments that identify the
maximal (i.e., the safe) levels for human exposure to chemical substances (Andersen and Krishnan 1994).
PBPK models provide a scientifically-sound means to predict the target tissue dose of chemicals in humans
who are exposed to environmental levels (for example, levels that might occur at hazardous waste sites)
based on the results of studies where doses were higher or were administered in different species.
Figure 2-4 shows a conceptualized representation of a PBPK model.
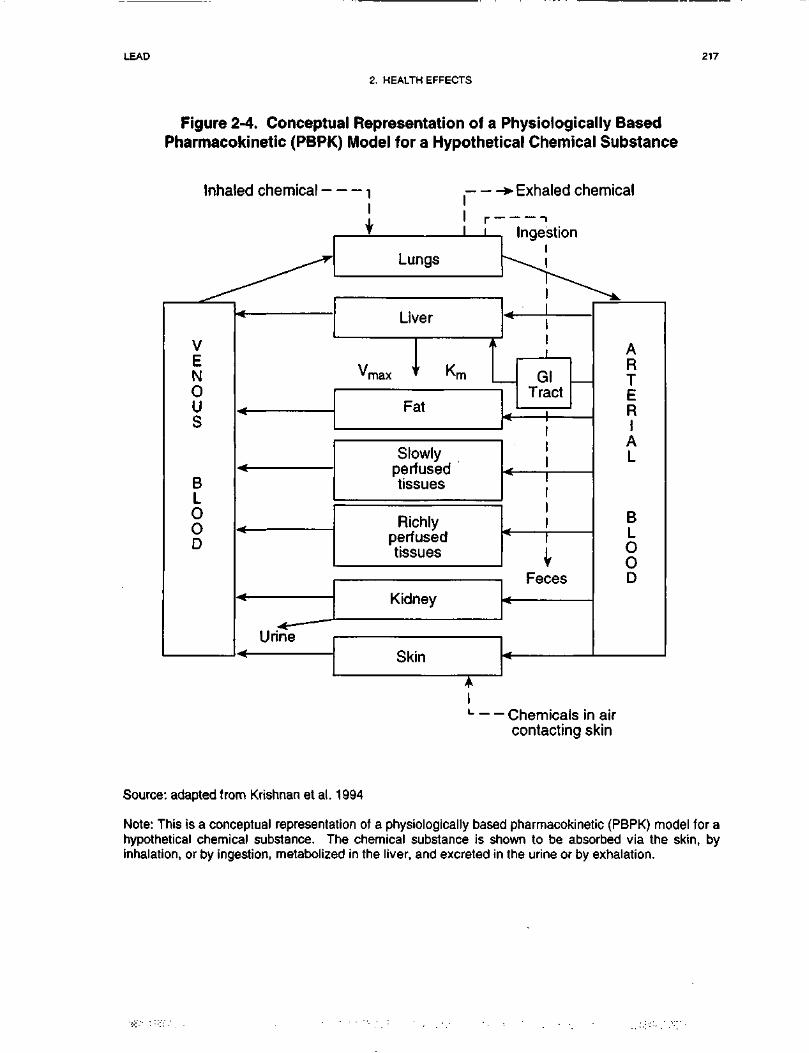
LEAD 217
2. HEALTH EFFECTS
Figure 2-4. Conceptual Representation of a Physiologically BasedPharmacokinetic (PBPK) Model for a Hypothetical Chemical Substance
Inhaled chemical --- , > Exhaled chemical
^^
V
N
US
BLOoD
^^---
-« —1 Irino
i
i ! r-Lungs
Liver
1vmax * Km
Fat
Slowlynorfi iQpH
tissues
Richlyperfusedtissues
_rxiuney
c±\*\**okin
A1i
Ingestion
\^---
GlTract
r '
1
111
* 1
VFeces
*
• r^hamir*alo in
\k.
ART
Ep|
L
B
OoD
air
contacting skin
Source: adapted from Krishnan et al. 1994
Note: This is a conceptual representation of a physiologically based pharmacokinetic (PBPK) model for ahypothetical chemical substance. The chemical substance is shown to be absorbed via the skin, byinhalation, or by ingestion, metabolized in the liver, and excreted in the urine or by exhalation.
LEAD 218
2. HEALTH EFFECTS
For PBPK models for lead, the overall results and individual models are discussed in this section in terms of
their use in risk assessment, tissue dosimetry, dose, route, and species extrapolations.
The fundamental basis for physiological pharmacokinetics is given by Pick's First Law, which states that
the rate of diffusion of a solute down a concentration gradient is proportional to the magnitude of the
gradient (O'Flaherty 1987). In the general case of modeling the rate of change in the amount of a chemical
in blood or tissue, Pick's First Law can be expressed as blood flow rate times the concentration difference
according to the following equation:
dM, dC,L . .u ~ L
dt ' dl
where M, is the mass of a chemical in blood, V, is the volume of blood, C, - C2 is the concentration
difference among blood and tissue fluids, and k, is the blood flow rate to the tissue (O'Flaherty 1987). Both
physiologically based pharmacokinetic models and classical pharmacokinetic models employ first-order
mass balance equations of this form with rate constants that have dimensions of flow rate. However, the
fundamental distinction between PBPK and classical models is that in PBPK models, the rate constant is a
physiologically based parameter (e.g., blood flow in the above equation), whereas in classical pharma-
cokinetics, precise physiological correlates to model parameters may not exist. In addition to using
physiologically based parameters of the test species, mass balance equations for each compartment in a
PBPK model also include physicochemical parameters (i.e., partition coefficients and biochemical
constants) for each chemical (Gerlowski and Jain 1983). The solution set of mass balance differential
equations yields chemical concentrations as a function of time in each compartment/tissue.
PBPK and classical pharmacokinetic models both have valid applications in lead risk assessment. Both
approaches can incorporate capacity-limited or nonlinear kinetic behavior in parameter estimates. An
advantage of classical pharmacokinetic models is that, because the kinetic characteristics of the
compartments of which they are composed are not constrained, a best possible fit to empirical data can be
arrived at by varying the values of the parameters (O'Flaherty 1987). However, such models are not readily
extrapolated to other species because the parameters do not have precise physiological correlates.
Compartmental models developed to date also do not simulate changes in bone metabolism, tissue volumes,
blood flow rates, and enzyme activities associated with pregnancy, adverse nutritional states, aging, or
LEAD 219
2. HEALTH EFFECTS
osteoporotic diseases. Therefore, extrapolation of classical compartmental model simulations outside the
age and exposure ranges for which they have been calibrated is assumed to be less reliable than for PBPK.
model simulations (O'Flaherty 1995a).
2.3.5.1 Summary of Physiologically Based and Classical Pharmacokinetic Models.
Early lead modeling applications relied on classical pharmacokinetics. Compartments representing
individual organs or groups of organs that share a common characteristic were defined as fluid volumes, or
pools, that are kinetically homogeneous. For example, the body could be represented by a central
compartment (e.g., blood plasma), and one or two peripheral compartments which may be "shallow" or
"deep" (i.e., they may exchange relatively rapidly or relatively slowly with blood plasma) (O'Flaherty
1987). A three-compartment model for lead proposed by Rabinowitz et al. (1976), based on tracer and
balance data from five healthy men, identifies the relative proportioning of lead among the bone, blood, and
soft-tissue pools (Figure 2-5). The figure shows the lead content and mean half-life of each pool and the
rates of lead movement between pools (X). The blood compartment shows the shortest half-life (36 days),
followed by the soft-tissue compartment (40 days), and then by the bone compartment (I04 days or
approximately 27 years). Bone contains most of the total body burden of lead, as discussed in Sections
2.3.2 (Distribution) and 2.4.1 (Pharmacokinetic Mechanisms). Thus, although sequestration by binding to
specific metal-binding proteins in liver, kidney, and red blood cells is an important mechanism by which
metals are distributed to various soft tissue compartments, physiologically based models for bone-seeking
elements such as lead require that bone turnover and metabolism be incorporated into modeling efforts
(O'Flaherty 1993).
The generation of more recent data on lead pharmacokinetics has allowed for a refinement of this three-
compartment model. The proposed multicompartment kinetic model for lead presented in Figure 2-6
addresses the diffusion of lead into bone and such principles as plasma-erythrocyte lead interactions
(Marcus 1985a, I985b, 1985c). For the bone diffusion model, Marcus (1985a) used the lead kinetic
parameters generated for the dog. This model, which accounts for the exchange of lead between blood in
bone canaliculi and the crystalline bone of the osteon, enables one to predict the effect of a number of
parameters (such as diffusion and surface area) on the kinetics of lead in bone. A similar multicompartment
model was developed by Marcus (1985c) to describe the kinetics of lead in plasma and erythrocytes. Based
on the data collected by DeSilva (1981), Marcus (1985c) incorporated four blood lead compartments into
this model: diffusible lead in plasma, protein-bound lead in plasma, a "shallow" erythrocyte pool, and a
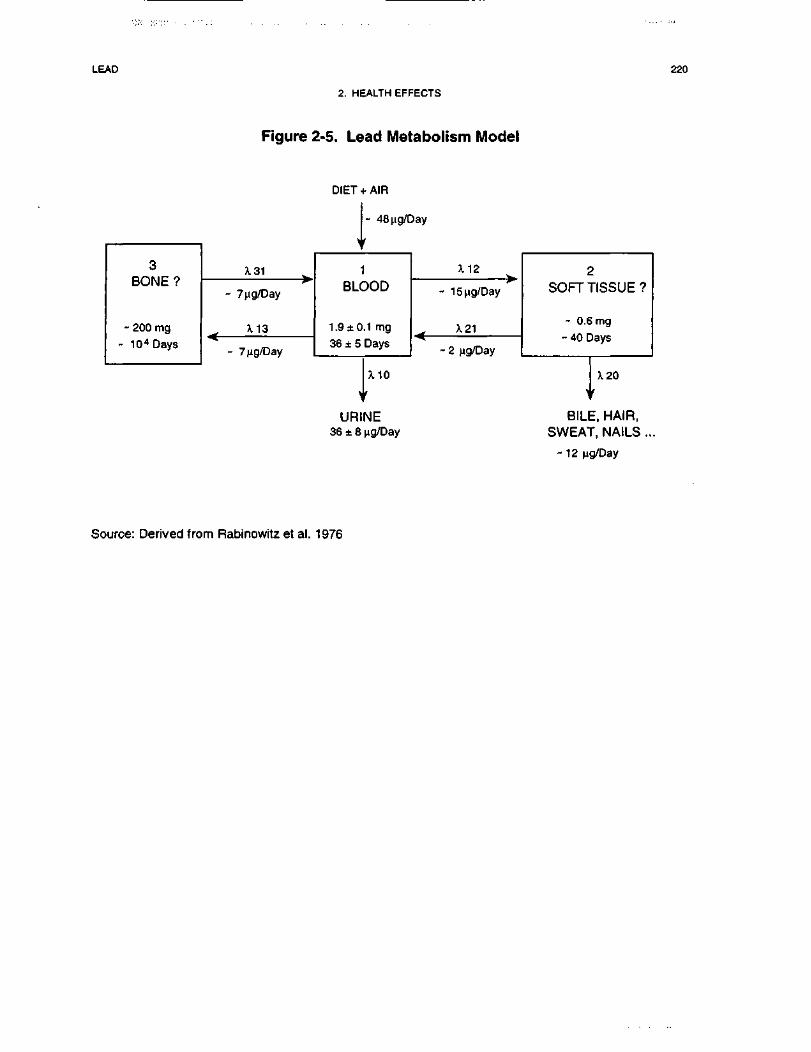
LEAD 220
2. HEALTH EFFECTS
Figure 2-5. Lead Metabolism Model
3BONE?
- 200 mg
- 104 Days
X31 ^
- 7|ig/Day
X13^
- 7ng/Day
DIET
>
fAIR
- 48ng/Day
r
1BLOOD
1.9 ±0.1 mg
36 ± 5 Days
)
URI36 ±8
X10
'NEng/Day
X12 w
- 15ng/Day
^ A. 21
- 2 ng/Day
2SOFT TISSUE?
- 0.6 mg
- 40 Days
J120
BILE, HAIR,SWEAT, NAILS ..
- 12 ng/Day
Source: Derived from Rabinowitz et al. 1976
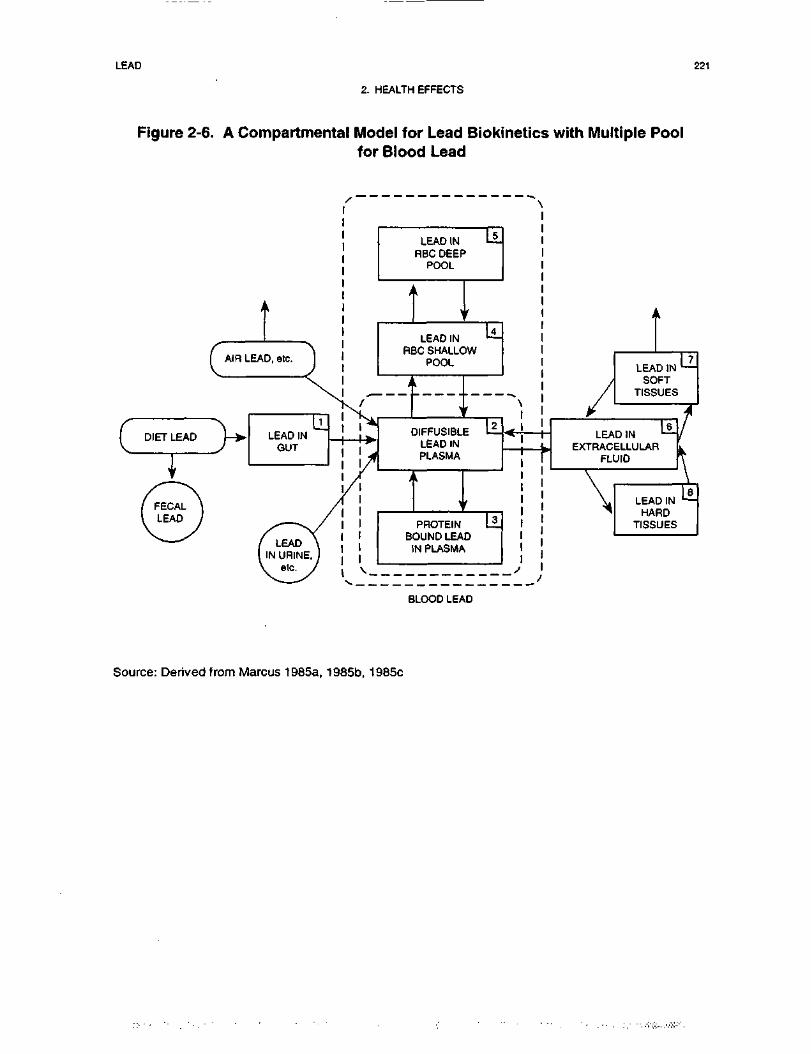
LEAD 221
2. HEALTH EFFECTS
Figure 2-6. A Compartmental Model for Lead Biokinetics with Multiple Poolfor Blood Lead
cAIR LEAD
C DIET LEAD ]->•
Tf *,
.iCA_I LEAD I
LEAD INRBC DEEP
POOL
LEAD INRBC SHALLOW
POOL
2DIFFUSIBLE Li
LEAD INPLASMA
PROTEINBOUND LEAD
IN PLASMA
BLOOD LEAD
Source: Derived from Marcus 1985a, 1985b, 1985c
LEAD 222
2. HEALTH EFFECTS
"deep" erythrocyte pool (see Figure 2-6). When this model is applied to the data of DeSilva (1981), a
curvilinear relationship results between plasma and blood lead levels.
Additional information on lead biokinetics and lead exposures has led to further refinements and expansions
of these earlier modeling efforts. Three pharmacokinetic models, in particular, are currently being
considered for broad application in lead risk assessment: (1) the O'Flaherty Model, a PBPK model for
children and adults (O'Flaherty 1993, 1995a); (2) the Integrated Exposure Uptake BioKinetic (IEUBK)
Model for Lead in Children developed by EPA (1994a, 1994b); and (3) the Leggett Model for children and
adults (Leggett 1993). Of the three approaches, only the O'Flaherty Model uses physiologically based
parameters to describe the volume, composition, and metabolic activity of blood and tissues that determine
the disposition of lead in the human body. Both the IEUBK Model and the Leggett Model are classic
multicompartmental models; the values of the age-specific transfer rate constants are based on kinetic data
from studies in animals and humans, and may not have precise physiological correlates. Thus, the structure
and parameterization of the O'Flaherty Model is distinct from both the IEUBK Model and Leggett Model.
The models represent the rate of uptake of lead (i.e., amount of lead absorbed per day) as relatively simple
functions of lead intake (e.g., uptake = intake x A, or uptake = intake x f[intake]). The values assigned to A
or other variables in ffintake] are, in general, age-specific and, in some models, environmental medium-
specific. However, the models do not modify the representation of uptake as functions of the many other
physiologic variables that may affect lead absorption (e.g., nutritional status). While one can view this
approach as a limitation of the models, it also represents a limitation of the data available to support more
complex representations of lead absorption.
The IEUBK Model is used to simulate multimedia exposures, uptake, and kinetics of lead in children ages
0 to 7 years; the model is not intended for use in predicting lead pharmacokinetics in adults. The O'Flaherty
and Leggett models are lifetime models, whose parameter values are based on experimental information
about the uptake and kinetics of lead during infancy, childhood, adolescence, and adulthood. Detailed
information describing exposure (e.g., residence-specific environmental lead concentrations, childhood
activity patterns) is not readily described by current versions of these models. By contrast, the IEUBK
model incorporates detailed exposure and uptake modules to estimate average daily uptake of lead (jag/day)
among populations of children potentially exposed via soil and dust ingestion, air inhalation, lead-based
paint chip ingestion, tap water ingestion, and diet.
LEAD 223
2. HEALTH EFFECTS
All three models have been calibrated, to varying degrees, against empirical physiological data on animals
and humans, and data on blood lead concentrations in individuals and/or populations (EPA 1994a, 1994c;
Leggett 1993; O'Flaherty 1993). However, applications in risk assessment require that the models
accurately predict blood lead distributions in real populations, in particular the "upper tails"(e.g., 95th
percentile), when input to the models consists of data that describe site-specific exposure conditions (e.g.,
environmental lead concentrations, physicochemical properties of soil and dust). In evaluating models for
use in risk assessment, exposure data collected at hazardous waste sites are used to drive model simulations.
The exposure module in the IEUBK model enables this type of evaluation to be made. Efforts described by
EPA (1994c) are currently in progress to fully assess the degree to which the IEUBK model accurately
simulates PbB distributions in populations of children who are exposed to lead at hazardous waste sites.
2.3.5.2 Lead PBPK Model Comparison and Discussion
Several pharmacokinetic models have been developed to predict blood and tissue lead concentrations as a
function of multimedia lead exposures. Although the principal adverse health effects of lead have been
related to concentrations of lead in blood (see Section 2.2.1), current PbB concentrations may not always be
predictive of lead-related behavioral dysfunction and need not be the only measure of adverse health effects
of lead. Nevertheless, the empirical basis for a relationship between low levels of lead exposure and
behavioral dysfunction largely consists of prospective epidemiological studies relating various indices of
dysfunction with PbB concentration. Thus, in this context, PbB concentration has been related to health
effects of lead, and this is the main reason that the focus of interest in the models has been on estimating
PbB concentrations. Also, the best data with which to calibrate and validate the models has been data
relating exposure and/or lead intake to PbB concentration. Thus, there is greater confidence in the validity
of the models for estimating PbB concentrations, rather than lead levels in other physiologic compartments.
While these models simulate the transfer of lead between many of the same physiological compartments,
they use different methodologies to quantify lead exposure as well as the kinetics of lead transfer among the
compartments. As described earlier, in contrast to PBPK models, classical pharmacokinetic models are
calibrated to experimental data using transfer coefficients that may not have any physiological correlates.
Examples of lead models that use PBPK and classical pharmacokinetic approaches are discussed in the
following section, with a focus on the basis for model parameters, including age-specific blood flow rates
and volumes for multiple body compartments, kinetic rate constants, tissue dosimetry, and species
LEAD 224
2. HEALTH EFFECTS
extrapolations. The following three pharmacokinetic models for lead are discussed below: (1) the
O'Flaherty Model (O'Flaherty 1993, 1995a); (2) the IEUBK Model for Lead in Children (EPA 1994a,
1994b); and (3) the Leggett Model (Leggett 1993).
The O'Flaherty Model.
The O'Flaherty Model is a physiologically based pharmacokinetic (PBPK) model of lead uptake and
disposition in children and adults (O'Flaherty 1993, 1995a). Figure 2-7 shows a conceptualized represent-
ation of the O'Flaherty Model, including the movement of lead from exposure media (i.e., intake via
inhalation or ingestion) to the lungs and gastrointestinal tract, followed by the subsequent exchanges
between blood plasma, liver, kidney, richly-perfused tissues, poorly-perfused tissues, bone compartments,
and excretion from liver and/or kidney. A detailed exposure module is not linked to the O'Flaherty Model;
rather, lead exposure estimates are incorporated into the model as age-specific point estimates of average
daily intake (ug/day) from inhalation, or total ingestion via diet, dust, lead-based paint, soil, and water. The
model also simulates both age- and media-specific absorption. Because many of the pharmacokinetic
functions are based on body weight and age, the model can be used to estimate PbB concentrations across a
broad age range, including infants, children, adolescents, and adults. The model uses physiologically based
parameters to describe the volume, composition, and metabolic activity of blood, soft tissues, and bone that
determine the disposition of lead in the human body.
Description of the model. The O'Flaherty Model simulates lead absorption and disposition as a
function of age-specific anatomical and physiological variables. A central feature of the model is the
growth curve, a logistic expression relating body weight to age. The full expression relating weight to age
has five parameters (constants), so that it can readily be adapted to fit a range of standardized growth curves
for men and women. The values of the five parameters were calibrated (but not optimized) based on
comparisons with model predictions and concentrations measurements in empirical studies (O'Flaherty
199la). Physiologic functions are linked to body weight, to age, or to both, as appropriate.
Bone formation rate is also a critical feature of the model. The model includes three mechanisms of
interaction of lead with bone. One is the rapid exchange of lead at all surfaces of the bone in contact with
blood, one is incorporation into forming bone and return to the blood with resorbing bone, and the third is a
heteroionic exchange process that can be modeled as diffusion throughout the entire bone volume
(O'Flaherty 1995b). All three processes are linked to body weight, or the rate of change of weight with age.
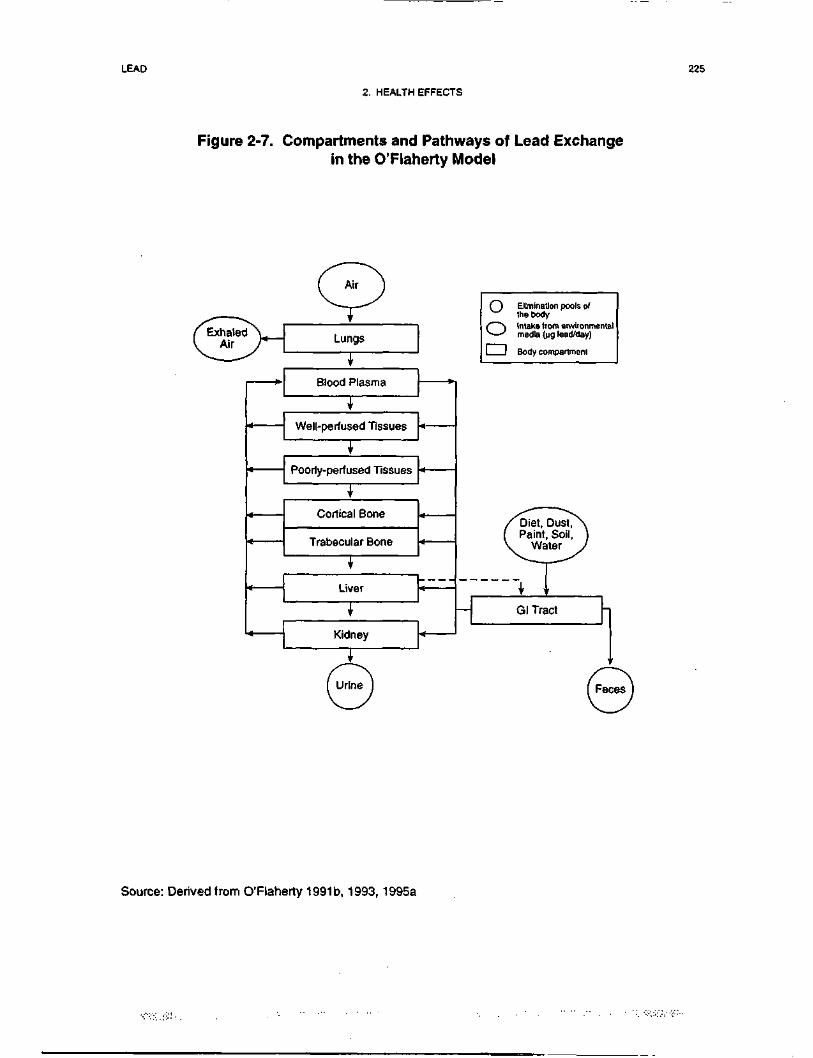
LEAD 225
2. HEALTH EFFECTS
Figure 2-7. Compartments and Pathways of Lead Exchangein the 0'Flaherty Model
Lungs
C~) Elimination pools of^ the body
O Intake from environmentalmedia (pg lead/day)
I I Body compartment
1
1
1
iT
.
1Kidney
^/Diet, Dust/\( Paint, Soil, )V Water )
^****^_ ^^^^^
1T
— Gl Tract
Source: Derived from O'Flaherty 1991t>, 1993, 1995a
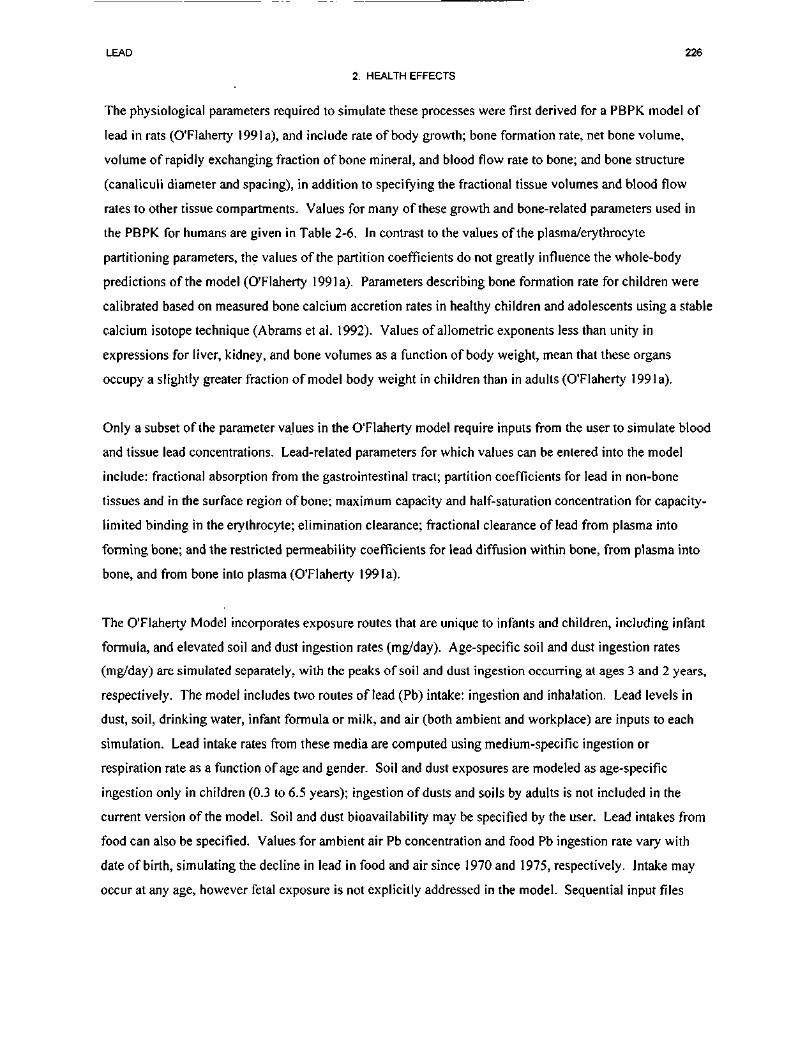
LEAD 226
2. HEALTH EFFECTS
The physiological parameters required to simulate these processes were first derived for a PBPK model of
lead in rats (O'Flaherty 1991a), and include rate of body growth; bone formation rate, net bone volume,
volume of rapidly exchanging fraction of bone mineral, and blood flow rate to bone; and bone structure
(canaliculi diameter and spacing), in addition to specifying the fractional tissue volumes and blood flow
rates to other tissue compartments. Values for many of these growth and bone-related parameters used in
the PBPK for humans are given in Table 2-6. In contrast to the values of the plasma/erythrocyte
partitioning parameters, the values of the partition coefficients do not greatly influence the whole-body
predictions of the model (O'Flaherty 1991a). Parameters describing bone formation rate for children were
calibrated based on measured bone calcium accretion rates in healthy children and adolescents using a stable
calcium isotope technique (Abrams et al. 1992). Values of allometric exponents less than unity in
expressions for liver, kidney, and bone volumes as a function of body weight, mean that these organs
occupy a slightly greater fraction of model body weight in children than in adults (O'Flaherty 199 la).
Only a subset of the parameter values in the O'Flaherty model require inputs from the user to simulate blood
and tissue lead concentrations. Lead-related parameters for which values can be entered into the model
include: fractional absorption from the gastrointestinal tract; partition coefficients for lead in non-bone
tissues and in the surface region of bone; maximum capacity and half-saturation concentration for capacity-
limited binding in the erythrocyte; elimination clearance; fractional clearance of lead from plasma into
forming bone; and the restricted permeability coefficients for lead diffusion within bone, from plasma into
bone, and from bone into plasma (O'Flaherty 199la).
The O'Flaherty Model incorporates exposure routes that are unique to infants and children, including infant
formula, and elevated soil and dust ingestion rates (mg/day). Age-specific soil and dust ingestion rates
(mg/day) are simulated separately, with the peaks of soil and dust ingestion occurring at ages 3 and 2 years,
respectively. The model includes two routes of lead (Pb) intake: ingestion and inhalation. Lead levels in
dust, soil, drinking water, infant formula or milk, and air (both ambient and workplace) are inputs to each
simulation. Lead intake rates from these media are computed using medium-specific ingestion or
respiration rate as a function of age and gender. Soil and dust exposures are modeled as age-specific
ingestion only in children (0.3 to 6.5 years); ingestion of dusts and soils by adults is not included in the
current version of the model. Soil and dust bioavailability may be specified by the user. Lead intakes from
food can also be specified. Values for ambient air Pb concentration and food Pb ingestion rate vary with
date of birth, simulating the decline in lead in food and air since 1970 and 1975, respectively. Intake may
occur at any age, however fetal exposure is not explicitly addressed in the model. Sequential input files
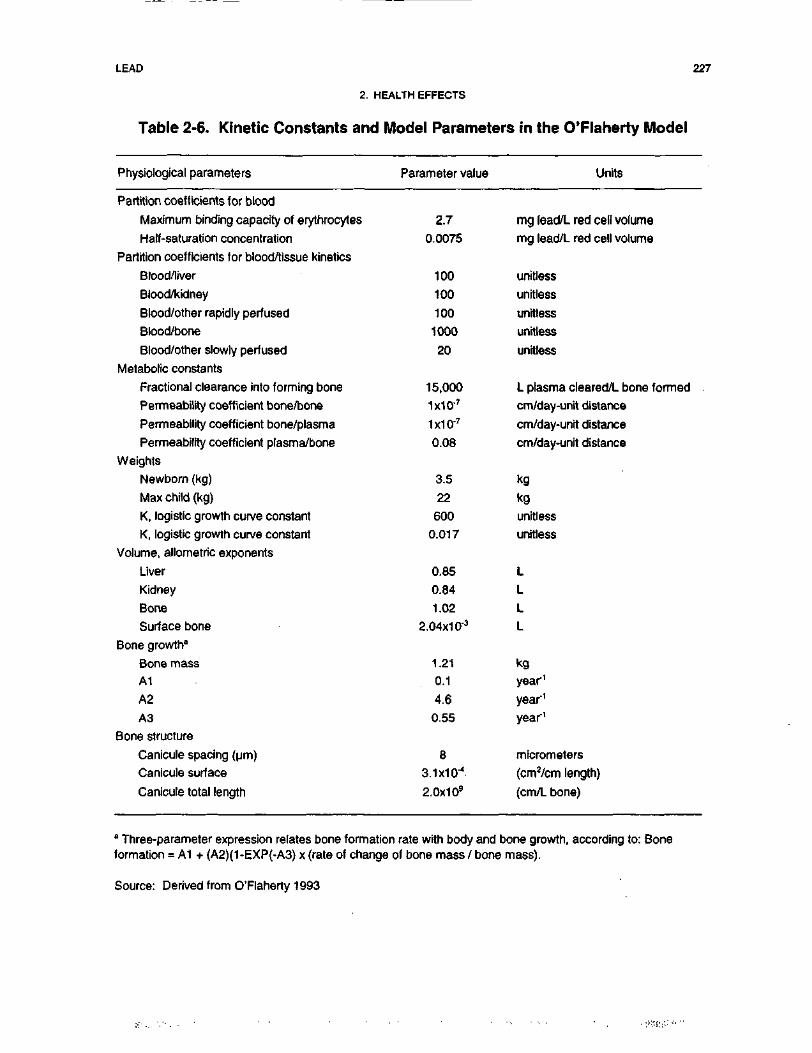
LEAD 227
2. HEALTH EFFECTS
Table 2-6. Kinetic Constants and Model Parameters in the 0'Flaherty Model
Physiological parameters Parameter value Units
Partition coefficients for blood
Maximum binding capacity of erythrocytes
Half-saturation concentration
Partition coefficients tor blood/tissue kinetics
Blood/liver
Blood/kidney
Blood/other rapidly perfused
Blood/bone
Blood/other slowly perfused
Metabolic constants
Fractional clearance into forming bone
Permeability coefficient bone/bone
Permeability coefficient bone/plasma
Permeability coefficient plasma/bone
Weights
Newborn (kg)
Max child (kg)
K, logistic growth curve constant
K, logistic growth curve constant
Volume, allometric exponents
Liver
Kidney
Bone
Surface bone
Bone growth0
Bone massA1
A2
A3
Bone structure
Canicule spacing (urn)
Canicule surface
Canicule total length
2.70.0075
100
100
100
1000
20
15,000
1x10'7
1x10'7
0.08
3.5
22
600
0.017
0.85
0.84
1.02
2.04x1 0'3
1.210.1
4.6
0.55
8
3.1X10'4
2.0x1 09
mg lead/L red cell volumemg lead/L red cell volume
unitless
unitless
unitless
unitless
unitless
L plasma cleared/L bone formed
cm/day-unit distance
cm/day-unit distance
cm/day-unit distance
kgkgunitless
unitless
LLLL
kgyear1
year'1
year1
micrometers
(cm2/cm length)
(cm/L bone)
" Three-parameter expression relates bone formation rate with body and bone growth, according to: Boneformation = A1 + (A2)(1-EXP(-A3) x (rate of change of bone mass / bone mass).
Source: Derived from O'Flaherty 1993
LEAD 228
2. HEALTH EFFECTS
may be specified to simulate changes in lead levels and intake rates over time. Both chronic and acute
exposures may be modeled. Fractional lead absorption from the gastrointestinal tract was modeled as a
first-order process.
The O'Flaherty Model simulates the age-dependence of lead kinetics on such factors as absorption
efficiency, excretion efficiency, uptake into bone and loss from bone, and partitioning between plasma and
red blood cells. The model does not incorporate age, dose rate, or time dependence of lead accumulation in
every organ (e.g., kidney) because the complex patterns of lead accumulation in certain tissues are not
known (O'Flaherty 199la) (see Section 2.4.1). However, the basic model structure allows for additional
modules to be incorporated, depending on its intended use in risk assessment. For example, additional
modules that are currently being developed are a pregnancy model and a model of net bone loss in older
women and men.
Risk assessment. The O'Flaherty Model has several potential applications to risk assessments at
hazardous waste sites. The model can be used to predict the PbB concentrations in a broad age range,
including infants, children, and adults. The model may be modified to simulate the pharmacokinetics of
lead in potential sensitive subpopulations, including pregnant women and fetuses, as well as older adults.
The model does not contain a detailed exposure module; however, model simulations have been run holding
physiological variables fixed and allowing soil and dust lead concentrations to vary in order to estimate the
range of environmental lead concentrations that would be expected to yield close correspondence between
predicted and observed PbB concentrations (O'Flaherty 1993, 1995a).
The O'Flaherty Model utilizes point estimates for parameter values and yields point estimates as output. It
does not contain a probabilistic modeling component that simulates variability; therefore, it is not used to
predict PbB probability distributions in exposed populations. Accordingly, the current version will not
predict the probability that children exposed to lead in environmental media will have PbB concentrations
exceeding a health-based level of concern (e.g., 10 ug/dL). Efforts are currently underway to explore
applications of stochastic modeling methodologies to investigate variability in both exposure and biokinetic
variables that will yield estimates of distributions of lead concentrations in blood, bone, and other tissues.
Validation of the model. The O'Flaherty Model was initially calibrated to predict blood, bone, and
tissue lead concentrations in rats (O'Flaherty 199la), and subsequently modified to reflect anatomical and
physiological characteristics in children (O'Flaherty 1995a), adults (O'Flaherty 1993) and Cynomolgus

LEAD 229
2. HEALTH EFFECTS
monkeys (Macaca fasicularis) (O'Flaherty et al. 1998). Model parameters were modified to correspond
with available information on species- and age-specific anatomy and physiological processes described
above. In general, the model has been shown to reproduce blood lead observations in children and adults
well, except in instances where lead is ingested at very high concentrations (O'Flaherty 1993, 1995a).
Target tissues. Output from the O'Flaherty Model is an estimate of age-specific blood lead
concentrations. The O'Flaherty Model has also been used to predict lead concentrations in bone and other
tissue compartments (O'Flaherty 1995a), in order to evaluate correspondence between predicted tissue
concentrations and observed concentrations in different populations of children and adults.
Species extrapolation. Data on both animals and humans (children and adults) describing the
absorption, distribution, metabolism, and excretion of lead provide the biological basis of the biokinetic
model and parameter values used in the O'Flaherty Model. The model is calibrated to predict
compartmental lead masses for human children and adults. The model for humans was derived from a
model for rats (O'Flaherty 199la), and O'Flaherty suggests that certain parameter values describing bone
physiology and metabolism are independent of species. For example, volume fractions of cortical bone and
trabecular bone appear to be similar across species (i.e., 80% cortical, 20% trabecular) (Gong et al. 1964).
In addition, surface-to-volume ratios (cm2/cm3) and blood flows to cortical and trabecular bone are
proportional to bone formation rates. However, while the potential for bone resorptiqn and accretion of new
bone is present in all species, the magnitude and age dependence of these processes are variable with species
(O'Flaherty 1995a). The mathematical structure of the O'Flaherty Model for humans is designed to accept
parameter values that reflect the physiology and metabolism of different species (O'Flaherty 1993).
Interroute extrapolation. The values for pharmacokinetic variables in the O'Flaherty Model are
independent of the route of exposure. However, the model does incorporate media-specific estimates of
absorption from the gastrointestinal tract. Different exposure scenarios have been evaluated with the
O'Flaherty Model for children and adults (O'Flaherty 1993, 1995a).
The IEUBK Model.
The Integrated Exposure Uptake and BioKinetic (IEUBK) Model for Lead in Children is a classical
multicompartmental pharmacokinetic model linked to an exposure and probabilistic model of PbB
distributions in populations of children ages 0-7 years (EPA 1994a, 1994b; White et al. 1998). Figure 2-8
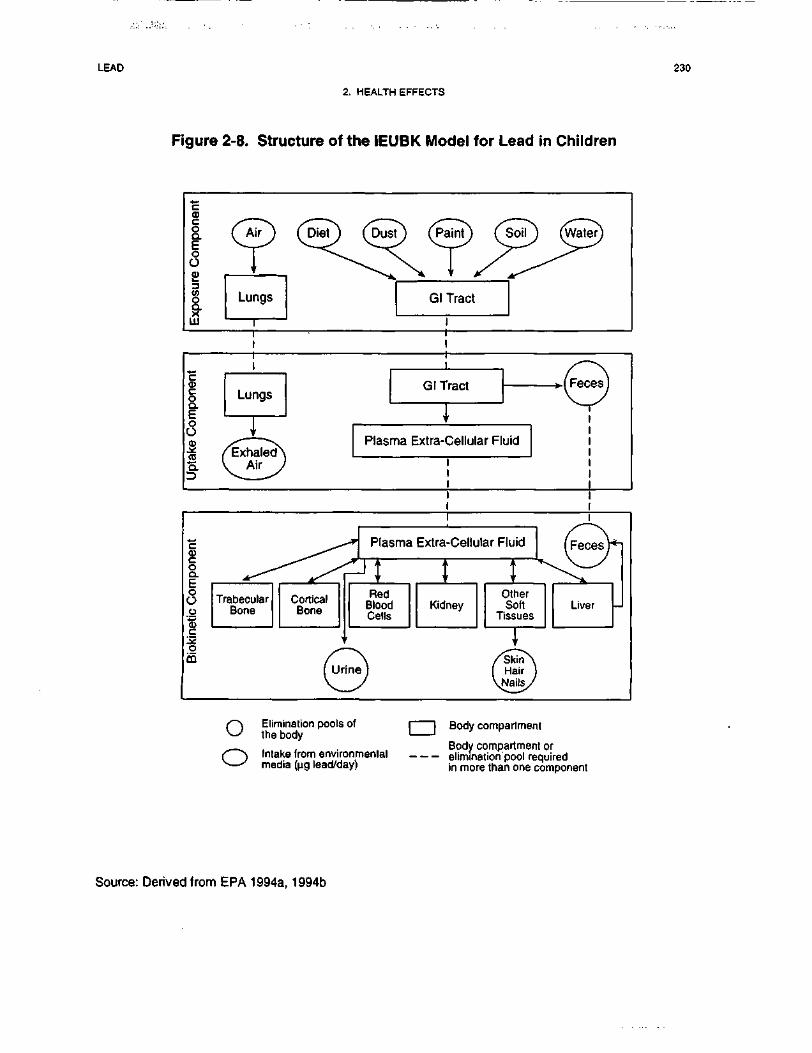
LEAD 230
2. HEALTH EFFECTS
Figure 2-8. Structure of the IEUBK Model for Lead in Children
Plasma Extra-Cellular Fluid
Plasma Extra-Cellular Fluid
oo
Elimination pools ofthe body
Intake from environmentalmedia (ng lead/day)
| [ Body compartment
Body compartment orelimination pool requiredin more than one component
Source: Derived from EPA 1994a, 1994b
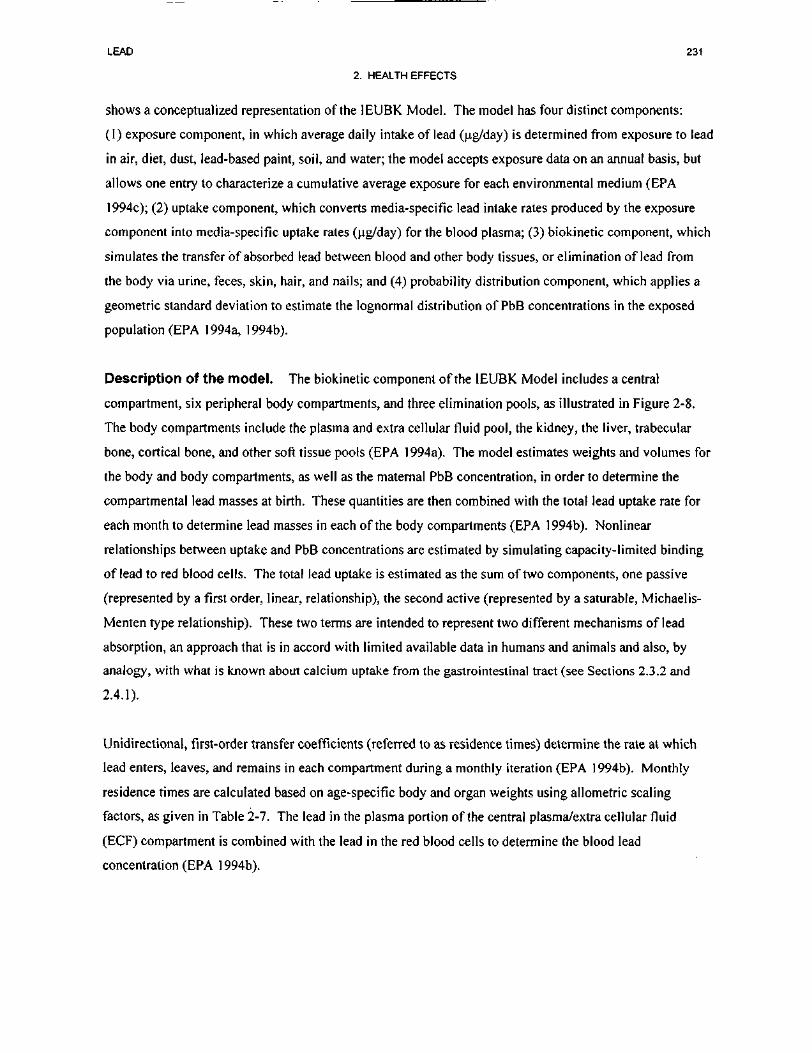
LEAD 231
2. HEALTH EFFECTS
shows a conceptualized representation of the IEUBK Model. The model has four distinct components:
(I) exposure component, in which average daily intake of lead (ug/day) is determined from exposure to lead
in air, diet, dust, lead-based paint, soil, and water; the model accepts exposure data on an annual basis, but
allows one entry to characterize a cumulative average exposure for each environmental medium (EPA
1994c); (2) uptake component, which converts media-specific lead intake rates produced by the exposure
component into media-specific uptake rates (ug/day) for the blood plasma; (3) biokinetic component, which
simulates the transfer of absorbed lead between blood and other body tissues, or elimination of lead from
the body via urine, feces, skin, hair, and nails; and (4) probability distribution component, which applies a
geometric standard deviation to estimate the lognormal distribution of PbB concentrations in the exposed
population (EPA I994a, 1994b).
Description of the model. The biokinetic component of the IEUBK Model includes a central
compartment, six peripheral body compartments, and three elimination pools, as illustrated in Figure 2-8.
The body compartments include the plasma and extra cellular fluid pool, the kidney, the liver, trabecular
bone, cortical bone, and other soft tissue pools (EPA 1994a). The model estimates weights and volumes for
the body and body compartments, as well as the maternal PbB concentration, in order to determine the
compartmental lead masses at birth. These quantities are then combined with the total lead uptake rate for
each month to determine lead masses in each of the body compartments (EPA 1994b). Nonlinear
relationships between uptake and PbB concentrations are estimated by simulating capacity-limited binding
of lead to red blood cells. The total lead uptake is estimated as the sum of two components, one passive
(represented by a first order, linear, relationship), the second active (represented by a saturable, Michaelis-
Menten type relationship). These two terms are intended to represent two different mechanisms of lead
absorption, an approach that is in accord with limited available data in humans and animals and also, by
analogy, with what is known about calcium uptake from the gastrointestinal tract (see Sections 2.3.2 and
2.4.1).
Unidirectional, first-order transfer coefficients (referred to as residence times) determine the rate at which
lead enters, leaves, and remains in each compartment during a monthly iteration (EPA 1994b). Monthly
residence times are calculated based on age-specific body and organ weights using allometric scaling
factors, as given in Table 2-7. The lead in the plasma portion of the central plasma/extra cellular f luid
(ECF) compartment is combined with the lead in the red blood cells to determine the blood lead
concentration (EPA 1994b).
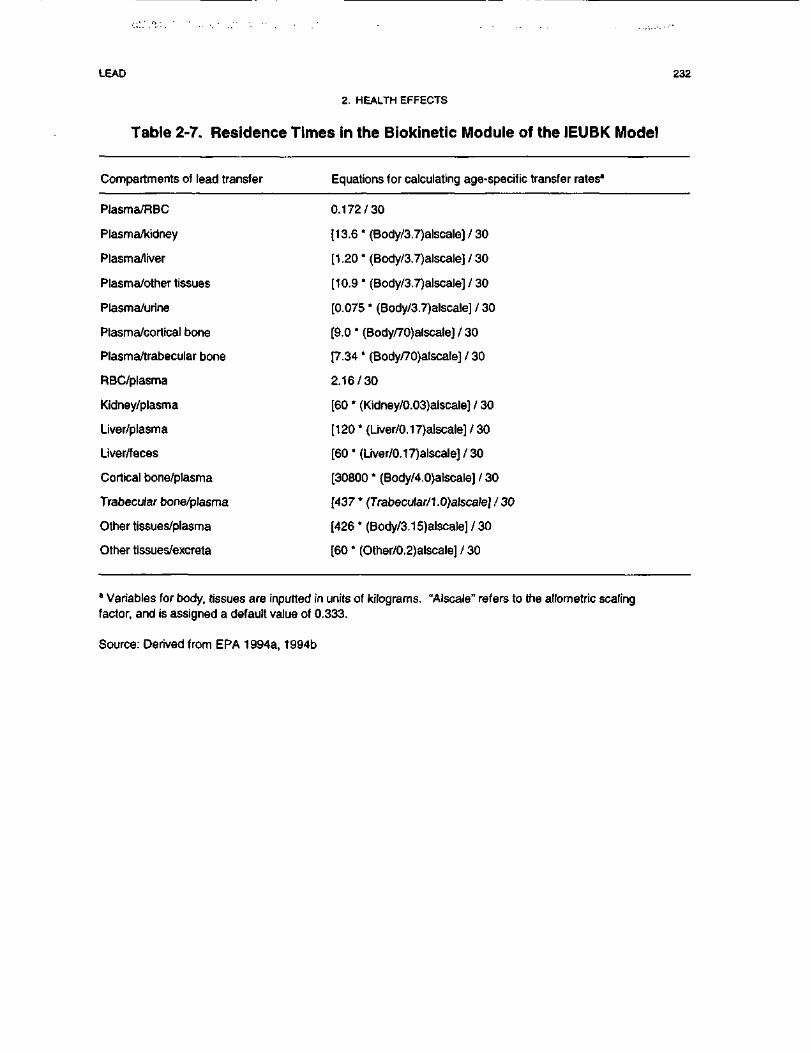
LEAD 232
2. HEALTH EFFECTS
Table 2-7. Residence Times in the Biokinetic Module of the IEUBK Model
Compartments of lead transfer Equations for calculating age-specific transfer rates"
Plasma/RBC 0.172/30
Plasma/kidney [13.6 * (Body/3.7)alscale] / 30
Plasma/liver [1.20 * (Body/3.7)alscale] / 30
Plasma/other tissues [10.9 * (Body/3.7)alscale] / 30
Plasma/urine [0.075 * (Body/3.7)alscale] / 30
Plasma/cortical bone [9.0 * (Body/70)alscale] / 30
Plasma/trabecular bone [7.34 * (Body/70)alscale] / 30
RBC/plasma 2.16/30
Kidney/plasma [60 * (Kidney/0.03)alscale] / 30
Liver/plasma [120 * (Liver/0.17)alscale] / 30
Liver/feces [60 * (Liver/0.17)alscale] / 30
Cortical bone/plasma [30800 * (Body/4.0)alscale] / 30
Trabecu/ar bone/plasma [437 * (Trabecu/ar/1.0)alscale] / 30
Other tissues/plasma [426 * (Body/3.15)alscale] / 30
Other tissues/excreta [60 * (Other/0.2)alscale] / 30
0 Variables for body, tissues are inputted in units of kilograms. "Alscale" refers to the allometric scalingfactor, and is assigned a default value of 0.333.
Source: Derived from EPA 1994a, 1994b
LEAD 233
2. HEALTH EFFECTS
Inputs to the IEUBK model are point estimates that are intended to yield age-specific estimates of the
geometric mean blood lead concentration among an exposed population (EPA 1994a, 1994b). The
distribution of metals in tissues of relatively homogeneous human populations closely follows a lognormal
distribution (EPA 1986a). Therefore, in order to estimate a plausible distribution of PbB concentrations for
the exposed population, a geometric standard deviation (GSD PbB) is applied to the age-specific geometric
mean blood lead estimate. The GSD PbB reflects variability associated with repeat sampling, and inter-
individual and biological variability, as determined from community blood lead studies of children's
residential settings (EPA 1994c).
Risk assessment. The IEUBK Model was developed to predict the probability of elevated blood lead
concentrations in children. The model addresses three components of human health risk assessment: (1) the
multimedia nature of exposures to lead; (2) lead pharmacokinetics; and (3) significant variability in
exposure and risk (EPA 1994c). Thus, the IEUBK Model can be used to predict the probability that
children ages 6 months to 7 years exposed to lead in multiple environmental media will have Pb
concentrations exceeding a health-based level of concern (e.g., 10 ug/dL). These risk estimates can be
useful in assessing the possible consequences of alternative lead exposure scenarios following intervention,
abatement, or other remedial actions. The current version of the IEUBK Model (version 0.99D) was not
developed to assess lead risks for age groups older than 7 years.
Validation of the model. An evaluation of the IEUBK model has been conducted in which model
predictions of blood lead concentrations in children were compared to observations from epidemiologic
studies of hazardous waste sites (Hogan et al. 1998). Data characterizing residential lead exposures and
blood lead concentrations in children living at four Superfund NPL sites were collected in a study designed
by ATSDR and EPA. The residential exposure data were used as input to the IEUBK model and the
resulting predicted blood lead concentration distributions were compared to the observed distributions in
children living at the same residences. IEUBK model predictions agreed reasonably well with observations
for children whose exposures were predominantly from their residence (e.g., who spent no more than
10 hours per week away from home). The predicted geometric mean blood lead concentrations were within
0.7 ug/dL of the observed geometric means at each site. The prediction of the percentage of children
expected to have blood lead concentrations exceeding 10 ug/dL were within 4% of the observed percentage
at each site. This evaluation provides support for the validity of the IEUBK model for estimating blood
lead concentrations in children at sites where their residential exposures can be adequately characterized. In
addition to the above empirical comparisons, the computer code used to implement the IEUBK model

LEAD 234
2. HEALTH EFFECTS
(IEUBK versus 0.99d) has undergone an independent validation and verification and has been shown to
accurately implement the conceptual IEUBK model (Zaragoza and Hogan 1998).
Target tissues. The output from the IEUBK Model is an estimate of age-specific blood lead
concentrations. The current version of the IEUBK Model does not save as output the interim parameter
values determined for lead in other tissues or tissue compartments.
Species extrapolation. Data in both animals and humans (children and adults) describing the
absorption, distribution, metabolism, and excretion of lead provide the biological basis of the biokinetic
model and parameter values used in the IEUBK Model. The model is calibrated to predict compartmental
lead masses for human children ages 6 months to 7 years, and is not intended to be applied to other species
or age groups.
Interroute extrapolation. The IEUBK Model includes an exposure module that simulates age-specific
lead exposures via inhalation, and ingestion of lead in diet, dust, lead-based paint, soil, and water. The total
exposure from each route is defined as the total lead uptake (ug/day) over a 1-month period. Other routes of
exposure may be simulated by the IEUBK Model pending available information from which to characterize
both the exposure and media-specific absorption variables. Values for variables in the biokinetic
component of the IEUBK Model are independent of the route of exposure.
The Leggett Model.
The Leggett Model is a classical multicompartmental pharmacokinetic model of lead uptake and disposition
in children and adults (Leggett 1993). Figure 2-9 shows a conceptualized representation of the model,
including the movement of lead from exposure media (i.e., intake via inhalation or ingestion) to the lungs
and gastrointestinal tract, followed by the subsequent exchanges between diffusible blood plasma, soft
tissues, bone compartments, and excretion from liver, kidneys, and sweat. As a classical compartmental
model, tissue compartments, kinetic constants, and model parameters may not all have physiological
correlates. A detailed exposure module is not linked to the Leggett Model; rather, lead exposure estimates
are incorporated into the model as age-specific point estimates of average daily intake (ug/day) from
inhalation and ingestion. A detailed description of the model and its potential application to risk
assessment are provided below.
Description of the model. The Leggett Model includes a central compartment, 15 peripheral body
compartments, and 3 elimination pools, as illustrated in Figure 2-9. Transport of lead between
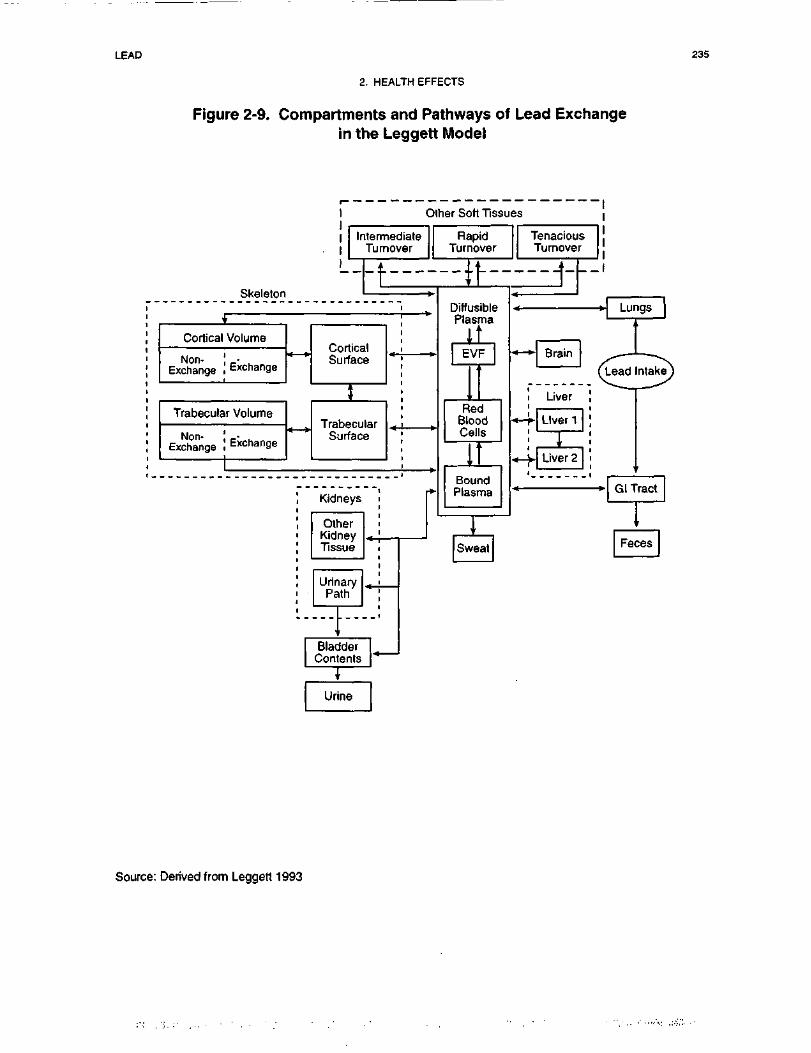
LEAD 235
2. HEALTH EFFECTS
Figure 2-9. Compartments and Pathways of Lead Exchangein the Leggett Model
Other Soft Tissues
Skeleton
i .1 Intermediate1 Turnover1
RapidTurnover
i
I'
Volume
Exchange
r Volume
Exchange
K — >
4 »•
CorticalSurface
J
TrabecularSurface
Kidneys p
TenaciousTurnover
.
DiffusiblePlasma
ItEVF
RedBloodCells
^
BoundPlasma
•*-*• Brain
Liver
•*-+• Liver 1|
«-y Liver 2
Source: Derived from Leggett 1993

LEAD 236
2. HEALTH EFFECTS
compartments is assumed to follow first-order kinetics provided the concentration in red blood cells stays
below a nonlinear threshold concentration (assumed to be 60 ug/dL) (Leggert 1993). Nonlinear
relationships between uptake and PbB concentrations are estimated by simulating capacity-limited binding
of lead to red blood cells.
Unidirectional, first-order transfer rates (day"1) between compartments were developed for 6 age groups, and
intermediate age-specific values are obtained by linear interpolation. The range of age-specific transfer rate
values are given in Table 2-8. The total transfer rate from diffusible plasma to all destinations combined is
assumed to be 2,000 day"', based on isotope tracer studies in humans receiving lead via injection or
inhalation. Values for transfer rates in various tissues and tissue compartments are based on measured
deposition fractions, or instantaneous fractional outflows of lead between tissue compartments (Leggett
1993).
The Leggett Model was developed from a biokinetic model originally developed for the International
Commission on Radiological Protection (ICRP) for calculating radiation doses from environmentally
important radionuclides, including radioisotopes of lead (Leggett 1993). The Leggett Model simulates age-
specific bone physiology using a model structure developed for application to the alkaline earth elements,
but parameterized using data specific to lead where possible. Cortical and trabecular bone are viewed as
consisting of exchangeable and nonexchangeable pools in order to model both rapid exchange of lead with
plasma and slow loss by bone resorption. Assumptions in the bone module include: (1) bone lead is rapidly
exchangeable if, and only if, it resides on bone surfaces; (2) bone volume is in exchange with bone surfaces
and not plasma; and (3) all lead reaching bone volume is initially available for exchange (Leggett 1993).
The Leggett Model simulates lead biokinetics in liver with two compartments: the first simulates rapid
uptake of lead from plasma and a relatively short removal half-life (days) for transfers to plasma and to the
small intestine by biliary secretion; a second compartment simulates a more gradual transfer to plasma of
approximately 10% of lead uptake in liver. Different transfer rates associated with each compartment are
calibrated to reproduce patterns of uptake and retention of lead observed in humans, baboons, and beagles
following intravenous injection, as well as blood-to-liver concentration ratios from data on chronically
exposed humans. Similarly, the Leggett Model simulates lead biokinetics in three compartments of soft
tissues, representing rapid, intermediate, and slow turnover rates (without specific physiologic correlates).
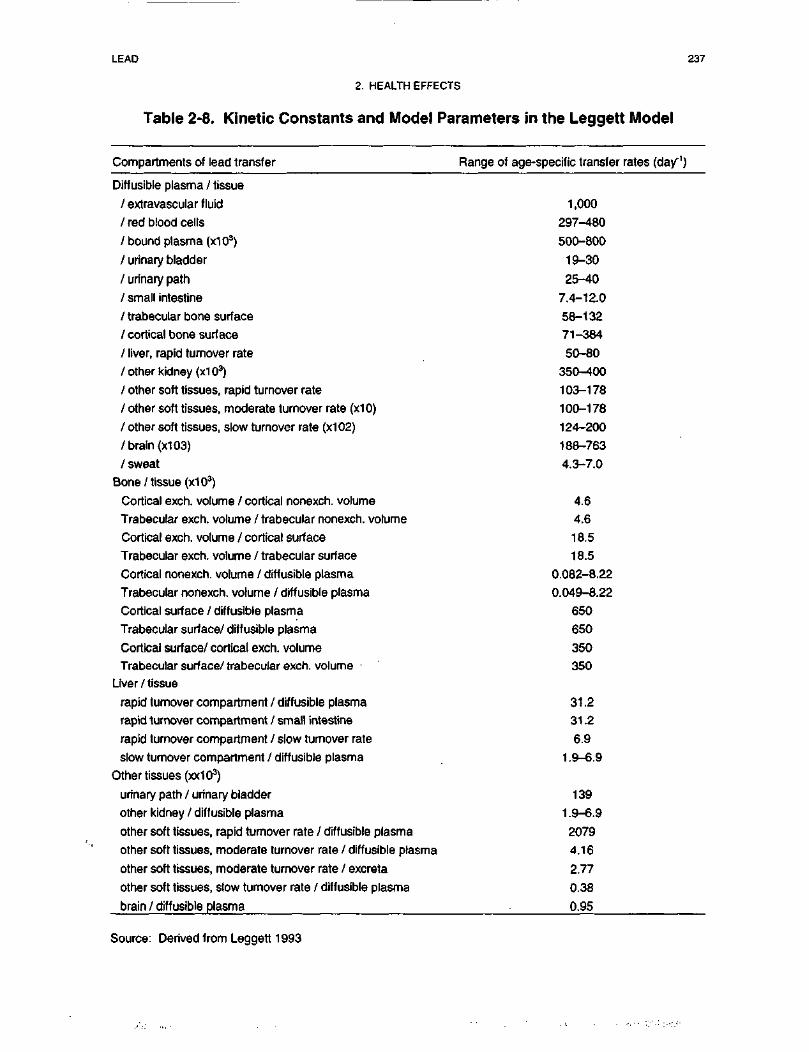
LEAD 237
2. HEALTH EFFECTS
Table 2-8. Kinetic Constants and Model Parameters in the Leggett Model
Compartments of lead transfer Range of age-specific transfer rates (day"1)
Diffusible plasma / tissue
/ extravascular fluid
/ red blood cells
/bound plasma (x103)
/ urinary bladder
/ urinary path
/ small intestine
/ trabecular bone surface
/ cortical bone surface
/ liver, rapid turnover rate
/ other kidney (x103)
/ other soft tissues, rapid turnover rate
/ other soft tissues, moderate turnover rate (x10)
/ other soft tissues, slow turnover rate (x102)
/ brain (x103)
/ sweat
Bone/tissue (x103)
Cortical exch. volume / cortical nonexch. volume
Trabecular exch. volume / trabecular nonexch. volume
Cortical exch. volume / cortical surface
Trabecular exch. volume / trabecular surface
Cortical nonexch. volume / diffusible plasma
Trabecular nonexch. volume / diffusible plasma
Cortical surface / diffusible plasma
Trabecular surface/ diffusible plasma
Cortical surface/ cortical exch. volumeTrabecular surface/ trabecular exch. volume •
Liver / tissue
rapid turnover compartment / diffusible plasma
rapid turnover compartment / small intestine
rapid turnover compartment / slow turnover rate
slow turnover compartment / diffusible plasma
Other tissues (xx103)
urinary path / urinary bladder
other kidney / diffusible plasma
other soft tissues, rapid turnover rate / diffusible plasma
other soft tissues, moderate turnover rate / diffusible plasma
other soft tissues, moderate turnover rate / excreta
other soft tissues, slow turnover rate / diffusible plasma
brain / diffusible plasma
1,000297-480500-800
19-3025-40
7.4-12.0
58-13271-384
50-80
350-400
103-178100-178
124-200
188-7634.3-7.0
4.64.618.518.5
0.082-8.22
0.049-8.22650650350350
31.231.2
6.91.9-6.9
1391.9-6.9
20794.16
2.770.38
0.95
Source: Derived from Leggett 1993

LEAD 238
2. HEALTH EFFECTS
The Leggett Model simulates the age-dependence of lead kinetics on such factors as bone turnover rates,
partitioning between soft tissues and excreta, removal half-times in liver, kidneys, and red blood cells, and
the deposition fraction in brain. The model structure represents a compromise between biological realism
and practical considerations regarding the quantity and quality of information available to determine
parameter values (Leggett 1993).
Risk assessment. The Leggett Model has several potential applications to risk assessment at hazardous
waste sites. The model can be used to predict blood lead concentrations in both children and adults. The
model allows the simulation of lifetime exposures, including assumptions of blood lead concentrations at
birth (from which levels in other tissue in the first time step after birth would are calculated). Thus,
exposures and absorption of lead prior to any given period of time during the lifetime can be simulated with
the Leggett model. The model parameters may be calibrated to fit kinetic data from radiolabeled lead tracer
studies that are ongoing. The model does not contain a detailed exposure module and, therefore, requires
assumptions regarding total lead intake from multiple exposure media. In addition, it does not contain a
probabilistic modeling component and, therefore, is not used to predict blood lead distributions in exposed
populations.
Validation of the model. Output from the Leggett Model has been compared with data in children and
adult subjects exposed to lead in order to calibrate model parameters. The model appears to predict blood
lead concentrations in adults exposed to relatively low levels of lead; however, no information could be
found describing efforts to compare predicted blood lead concentrations with observations in children.
Target tissues. The output from the Leggett Model is an estimate of age-specific PbB concentrations.
The current version of the Leggett Model does not save as output the interim parameter values determined
for lead in other tissues or tissue compartments.
Species extrapolation. Data on both animals and humans (children and adults) describing the
absorption, distribution, metabolism, and excretion of lead provide the biological basis of the biokinetic
model and parameter values used in the Leggett Model. The model is calibrated to predict compartmental
lead masses only for humans, both children and adults.
Interroute extrapolation. The values for pharmacokinetic variables in the Leggett Model are
independent of the route of exposure. Based on the description of the inputs to the model provided by
LEAD 239
2. HEALTH EFFECTS
Leggett (1993), lead intake from different exposure routes is defined as a total lead intake from all routes of
exposure.
2.4 MECHANISMS OF ACTION
2.4.1 Pharmacokinetic Mechanisms
Absorption. Gastrointestinal absorption of lead occurs primarily in the duodenum (Mushak 1991). The
exact mechanisms of absorption are unknown and may involve active transport and/or diffusion through
intestinal epithelial cells (transcellular) or between cells (paracellular), and may involve ionized lead (Pb+2)
and/or inorganic or organic complexes of lead. Saturable mechanisms have been inferred from
measurements of net flux kinetics of lead in the in situ perfused mouse intestine, the //75/Vuligated chicken
intestine, and in in vitro isolated segments of rat intestine (Aungst and Fung 1981; Barton 1984; Flanagan et
al. 1979; Mykkanen and Wasserman 1981). By analogy to other divalent cations, saturable transport
mechanisms for Pb+2 may exist within the mucosal and serosal membranes and within the intestinal
epithelial cell. For calcium, these are thought to represent membrane carriers (e.g., Ca2+-Mg2+-ATPase,
Ca2VNa+ exchange) or facilitated diffusion pathways (e.g., Ca2+ channel) and intracellular binding proteins
for Ca2+ (Bronner et al. 1986; Gross and Kumar 1990). Numerous observations of non-linear relationships
between PbB concentration and lead intake in humans suggest the existence of a saturable absorption
mechanism or some other capacity-limited process in the distribution of lead in humans (Pocock et al. 1983;
Sherlock and Quinn 1986; Sherlock et al. 1984). In immature swine that received oral doses of lead in soil,
lead dose-blood lead relationships were non-linear; however, dose-tissue lead relationships for bone,
kidney, and liver were linear. The same pattern (nonlinearity for PbB and linearity for tissues) was
observed in swine administered lead acetate intravenously (Casteel et al. 1997). These results raise the
question of whether there is an effect of dose on absorption or on some other aspect of the biokinetics of
lead.
Gastrointestinal absorption of lead is influenced by dietary and nutritional calcium and iron status. An
inverse relationship has been observed between dietary calcium intake and PbB concentration (Mahaffey et
al. 1986; Ziegler et al. 1978). Complexation with calcium (and phosphate) in the gastrointestinal tract and
competition for a common transport protein have been proposed as possible mechanisms for this interaction
(Barton et al. 1978a; Heard and Chamberlain 1982). Absorption of lead from the gastrointestinal tract is
enhanced by dietary calcium depletion or administration of cholecalciferol. This "cholecalciferol-
dependent" component of lead absorption appears to involve a stimulation of the serosal transfer of lead
LEAD 240
2. HEALTH EFFECTS
from the epithelium, not stimulation of mucosal uptake of lead (Mykkanen and Wasserman 1981, 1982).
This is similar to the effects of cholecalciferol on calcium absorption (Bronner et al. 1986; Fullmer and
Rosen 1990). Iron deficiency is associated with increased PbB concentration in children (Mahaffey and
Annest 1986; Marcus and Schwartz 1987). In rats, iron deficiency increases the gastrointestinal absorption
of lead, possibly by enhancing binding of lead to iron binding proteins in the intestine (Morrison and
Quatermann 1987). Iron (FeCl2) added to the mucosal fluid of the everted rat duodenal sac decreases
serosal transfer, but not mucosal uptake of lead (Barton 1984). Thus, interactions between iron and lead
also appear to involve either intracellular transfer or basolateral transfer mechanisms. The above
observations suggest that rate-limiting saturable mechanisms for lead absorption are associated with transfer
of lead from cell to blood rather than with mucosal transfer. Similar mechanisms may contribute to lead-
iron and lead-calcium absorption interactions in humans, and, possibly interactions between lead and other
divalent cations such as cadmium, copper, magnesium and zinc.
The bioavailability of ingested soluble lead in adults has been found to vary from less than 10% when
ingested with a meal to 60-80% when ingested after a fast (Blake and Mann 1983; Blake et al. 1983; Heard
and Chamberlain 1982; James et al. 1985; Rabinowitz et al. 1976, 1980). The general consensus is that
food in the gastrointestinal tract decreases absorption of ingested lead, although the exact mechanisms by
which this occurs are not entirely understood.
Inorganic lead in ambient air consists primarily of particulate aerosols which can be deposited in the
respiratory tract when the aerosols are inhaled. Amounts and patterns of deposition of particulate aerosols
in the respiratory tract are affected by the size of the inhaled particles, age-related factors that determine
breathing patterns (e.g., nose breathing vs mouth breathing), airway geometry, and airstream velocity within
the respiratory tract (EPA 1994a). In general, large particles (>2.5 urn) deposit in the nasopharyngeal tract
where high airstream velocities and airway geometry facilitate inertial impaction (Chamberlain et al. 1978;
Chan and Lippman 1980). In the tracheobronchial and alveolar regions, where airstream velocities are
lower, processes such as sedimentation and interception become important for deposition of smaller
particles (<2.4 urn). Breathing patterns, airflow velocity, and airway geometry change with age, giving rise
to age-related differences in particle deposition (James 1978; Phalen et al. 1985). Deposition in the various
regions of the respiratory tract in children may be higher or lower than in adults depending on particle size;
for submicron particles, fractional deposition in 2-year-old children has been estimated to be 1.5 times
greater than in adults (Xu and Yu 1986).
LEAD 241
2. HEALTH EFFECTS
Absorption of deposited lead is influenced by particle size and solubility as well as the pattern of regional
deposition within the respiratory tract. Larger particles (>2.5 urn) that are deposited in the ciliated airways
(nasopharyngeal and tracheobronchial regions) can be transferred by mucociliary transport into the
esophagus and swallowed. Particles deposited in the alveolar region can be absorbed after extracellular
dissolution or ingestion by phagocytic cells. The relative contributions of these two pathways to lead
absorption have not been quantified; however, data on cadmium suggests by analogy that their relative
importance may depend on the chemical form of the metal as well as particulate size (Oberdorster 1992).
Inhaled tetraethyl and tetramethyl lead vapors behave as gases in the respiratory tract and, as a result, their
pattern and extent of deposition and absorption differ from that of inhaled inorganic lead particles (EPA
1994a; Overton et al. 1987; Overton and Miller 1988). These differences result in a higher fractional
absorption of inhaled tetraethyl and tetramethyl lead (Heard et al. 1979).
Distribution. Lead in blood partitions between plasma and red blood cells, with the larger fraction
(90-99%) associated with red blood cells (Cake et al. 1996; DeSilva 1981; Everson and Patterson 1980;
Manton and Cook 1984; Ong and Lee 1980a). Lead in plasma binds to albumin and y-globulins (Ong and
Lee 1980a). The fraction that is not bound to protein exists largely as complexes with low molecular weight
sulfhydryl compounds; these may include cysteine, homocysteine, and cysteamine (Al-Modhefer et al.
1991). Approximately 75% was bound to protein when whole human blood was incubated with 50 ng/dL
lead (as lead chloride); approximately 90% of the bound lead was associated with albumin (Ong and Lee
1980a). However, the fraction of lead in plasma bound to protein would be expected to vary with the
plasma lead concentration.
Lead associated with red blood cells exists largely as complexes with hemoglobin, low molecular weight
intracellular compounds, and unidentified membrane proteins (Bruenger et al. 1973; Ong and Lee 1980b,
1980c; Raghavan et al. 1980). A 10 kD inducible lead binding protein in human red blood cells has been
reported, but not fully characterized (Lolin and O'Gorman 1988; Raghavan et al. 1980). Lead and calcium
appear to share a common binding site on the red cell membrane (Ong and Lee 1980b). Binding to
hemoglobin and other intracellular lead binding constituents of red blood cells is capacity limited and, as a
result, the fraction of lead in whole blood that is associated with plasma increases as the whole PbB
concentration increases (DeSilva 1981; Manton and Cook 1984). The capacity limitation has been
postulated and modeled as a saturable binding site in the red cell (Leggett 1993; Marcus 1985a; O'Flaherty
1993).
LEAD 242
2. HEALTH EFFECTS
As in red blood cells, lead in other soft tissues such as kidney, liver, and brain exists predominantly bound
to protein. High affinity cytosolic lead binding proteins (PbBP) have been identified in rat kidney and brain
(DuVal and Fowler 1989; Fowler 1989). The PbBP of rat is a cleavage product of a2[1-globulin, a member
of the protein superfamily known as retinol-binding proteins (Fowler and DuVal 1991). a2M-Globulin is
synthesized in the liver under androgen control and has been implicated in the mechanism of male rat
hyaline droplet nephropathy produced by certain hydrocarbons (EPA 1991c; Swenberg et al. 1989);
however, there is no evidence that lead induces male-specific nephropathy or hyaline droplet nephropathy.
The precise role for PbBP in the toxicokinetics and toxicity of lead has not been firmly established;
however, it has been proposed that PbBP may serve as a cytosolic lead "receptor" that, when transported
into the nucleus, binds to chromatin and modulates gene expression (Fowler and DuVal 1991; Mistry et al.
1985, 1986). Lead also binds to another prominent cytosolic metal binding protein, metallothionein.
Binding of lead to either metallothionein or PbBP attenuates lead-induced inhibition of the enzyme ALAD;
thus, these proteins may have a modulating effect on lead-induced inhibition of this and other cellular
enzymes (Goering and Fowler 1984, 1985, 1987; Goering et al. 1986). A characteristic histologic finding in
lead-induced nephropathy is the appearance of intranuclear inclusion bodies in renal proximal tubule cells
(Goyer and Rhyne 1973; Vicente-Ortega et al. 1996). The intranuclear inclusion bodies contain lead
complexed with acidic proteins which may include PbBP or similar proteins (Moore and Goyer 1974).
Storage. Approximately 95% of lead in adult tissues, and approximately 70% in children, resides in
mineralized tissues such as bone and teeth (Barry 1975, 1981). A portion of lead in bone readily exchanges
with the plasma lead pool and, as a result, bone lead is a reservoir for replenishment of lead eliminated from
blood by excretion (Alessio 1988; Chettle et al. 1991; Hryhirczuk et al. 1985; Nilsson et al. 1991;
Rabinowitz et al. 1976). Lead forms highly stable complexes with phosphate and can replace calcium in the
calcium-phosphate salt, hydroxyapatite, which comprises the primary crystalline matrix of bone (Lloyd et
al. 1975). As a result, lead deposits in bone during the normal mineralization process that occurs during
bone growth and remodeling and is released to the blood during the process of bone resorption (O'Flaherty
1991b, 1993). The distribution of lead in bone reflects these mechanisms; lead tends to be more highly
concentrated at bone surfaces where growth and remodeling are most active (Auferheide and Wirtmets
1992). The association of lead uptake and release from bone with the normal physiological processes of
bone formation and resorption renders lead biokinetics sensitive to these processes. Physiological states
(e.g., pregnancy, menopause, advanced age) or disease states (e.g., osteoporosis, prolonged immobilization)
that are associated with increased bone resorption wil l tend to promote the release of lead from bone which,

LEAD 243
2. HEALTH EFFECTS
in turn, may contribute to an increase in the concentration of lead in blood (Bonithon-Kopp et al. 1986c;
Markowitz and Weinburger 1990; Silbergeld et al. 1988; Thompson et al. 1985).
Metabolism. Metabolism of inorganic lead consists primarily of reversible ligand reactions, including
the formation of complexes with amino acids and non-protein thiols, and binding to various proteins
(DeSilva 1981; Everson and Patterson 1980; Goering and Fowler 1987; Goering et al. 1986; Ong and Lee
1980a, 1980b, 1980c; Raghavan and Gonick 1977).
Tetraethyl and tetramethyl lead under oxidative dealkylation metabolize to the highly neurotoxic
metabolites, triethyl and trimethyl lead, respectively. In the liver, the reaction is catalyzed by a cytochrome
P-450 dependent monoxygenase system (Kimmel et al. 1977). Complete oxidation of alkyl lead to
inorganic lead also occurs (Bolanowska 1968).
Excretion. The precise mechanisms of excretion of lead into the urine have not been determined. Such
studies have been hampered by the difficulties associated with measuring ultrafilterable lead in plasma and,
thereby, in measuring the rate of glomerular filtration of lead. Measurement of the renal clearance of
ultrafilterable lead in plasma indicates that, in dogs and humans, lead undergoes glomerular filtration and
net tubular reabsorption (Araki et al. 1986, 1990; Victery et al. 1979). Net tubular secretion of lead has
been demonstrated in dogs made alkalotic by infusions of bicarbonate (Victery et al. 1979). Renal clearance
of blood lead increases with increasing blood lead concentrations above 25 ng/dL (Chamberlain 1983). The
mechanism for this has not been elucidated and could involve a shift in the distribution of lead in blood
towards a fraction having a higher glomerular filtration rate (e.g., lower molecular weight complex), a
capacity-limited mechanism in the tubular reabsorption of lead, or the effects of lead-induced nephrotoxicity
on lead reabsorption.
Lead undergoes biliary excretion in the dog, rat, and rabbit; biliary excretion is presumed to contribute to
fecal excretion of lead in humans (EPA 1994b; Klaassen and Shoeman 1974; O'Flaherty 1993). The
mechanism of biliary excretion has not been elucidated.
Tetraethyl lead is excreted in the urine as diethyl lead, ethyl lead and inorganic lead in both humans
(Turlakiewicz and Chmielnicka 1985; Vural and Duydu 1995; Zhang et al. 1994) and rabbits (Aria and
Yamamura 1990; Kozarzewska and Chmielnicka 1987).

LEAD 244
2. HEALTH EFFECTS
Effect of Dose and Duration of Exposure on Toxicity. The principal adverse health effects of lead
can be related to concentrations of lead in blood (see Section 2.2.1). Correlation and regression analyses of
data on blood lead concentrations and various health effects define a spectrum of effects that become
apparent in human populations having a range of PbB levels approaching 10-15 ug/dL. These include
effects on heme metabolism, erythrocyte pyrimidine nucleotide metabolism, serum vitamin D levels, mental
and physical development, and blood pressure. As PbB concentrations increase above the range of
10-15 ug/dL, more pronounced effects on all of the above end points occur. At levels exceeding 30 u.g/dL,
anemia, nephrotoxicity and more overt neurological impairment can occur. PbB concentration can be
related to these diverse effects, presumably because it is related to plasma lead, which exchanges with lead
in critical target tissues such as the brain, bone, erythroblasts, and kidney.
In using blood lead concentration as an internal dose metric to predict target tissue lead levels, it must be
kept in mind that there are several potential sources of non-linearity in the relationship between PbB and
target tissue lead: (1) absorption of lead from the gastrointestinal tract may be capacity limited (Aungst and
Fung 1981; Barton 1984; Flanagan et al. 1979; Mykkanen and Wasserman 1981) and may contribute to a
non-linear relationship between lead intake and PbB concentration that has been observed in human
populations (Pocock et al. 1983; Sherlock and Quinn 1986; Sherlock et al. 1984); (2) red blood cells have a
limited capacity to accumulate lead and, as a result, the relationship between plasma and PbB concentrations
is non-linear (DeSilva 1981; Manton and Cook 1984), which may explain the observations that, in human
populations, bone lead levels correlate more strongly with serum lead than with whole PbB levels (Cake et
al. 1996), and that, in immature swine administered oral doses of lead in soil, the relationship between lead
intake and PbB concentration is non-linear, while the relationship between lead intake and lead in bone,
kidney, and liver is linear (Casteel et al. 1997); (3) elimination of lead from blood is much more rapid than
from bone (Leggett 1993; Marcus 1985b; O'Flaherty 1993; Rabinowitz et al. 1976), and therefore, PbB
concentrations will change more rapidly than bone lead levels when exposure changes, which would be
expected to give rise to transient changes in the blood/bone lead ratio; and (4) renal clearance of blood lead
increases with increasing PbB concentrations above 25 u,g/dL (Chamberlain 1983), which would give rise to
non-linearities in the relationship between lead intake and whole PbB concentration.
Route Dependent Toxicity. The toxicity of lead does not appear to be dependent on the route of
exposure, but the time course may be affected.

LEAD 245
2. HEALTH EFFECTS
2.4.2 Mechanisms of Toxicity
Target Organ Toxicity. This section focuses on mechanisms for sensitive health effects of major
concern for lead—cardiovascular effects, hematological effects, and neurological effects, particularly in
children. Bone is a major sink for lead, and there is some limited information regarding the effects of lead
on bone and potential mechanisms of action. Renal effects occur at relatively high blood lead levels and
evidence of renal carcinogenicity has been demonstrated only in animals; mechanisms for these effects will
be discussed briefly.
Because lead affects virtually every organ or system in the body, it is not surprising that the proposed
mechanisms of lead toxicity involve fundamental biochemical processes. These proposed mechanisms
include lead's ability to inhibit or mimic the action of calcium and to interact with proteins (Bressler and
Goldstein 1991; Fowler 1992; Goering 1993; Goldstein 1993; Coyer 1993). In its interaction with proteins,
lead binds primarily with sulfhydryl, amine, phosphate and carboxyl groups, with sulfhydryl having the
highest affinity. The stability of lead complexes increases with increasing numbers of binding sites, and
with optimal spacing, such as with vicinal sulfhydryls. Lead's ability to mimic calcium in the activation of
calmodulin (discussed below under cardiovascular and neurological effects) involves binding to carboxyl
groups; lead's ability to mimic calcium in the activation of protein kinase C (discussed under
cardiovascular, neurological and carcinogenic effects) probably involves binding to sulfhydryl groups.
Hence, the calcium agonist and protein-binding mechanisms sometimes overlap (Goering 1993).
Cardiovascular Effects. Several mechanisms for lead's purported effects on blood pressure have been
proposed, based on experimental findings. These include effects on several hormonal and neural regulatory
systems, changes in vascular smooth muscle reactivity, cardiac muscle contractility, changes in cell
membrane cation transport systems, and possible effects on vascular endothelial cells (Victery 1988).
Limited evidence from studies of men exposed occupationally to lead suggested that the effect of lead on
blood pressure may be mediated in part through the renin-angiotensin system, as evidenced by lead-related
increases in plasma renin and angiotensin I levels (Campbell et al. 1985) and through the kallikrein-kinin
system, as indicated by a correlation between renin and kallikrein (Boscolo et al. 1981). Evidence from
patients with essential hypertension and renal impairment suggested that excessive lead absorption may be
involved in the development of both conditions (Batuman et al. 1983). A review of the data on lead's
hypertensive action in animals was presented in Section 2.2, and included effects on the renin-angiotensin
system at low levels of lead exposure. These effects, however, have not been established as the cause of
LEAD 246
2. HEALTH EFFECTS
hypertension. The changes observed in both humans and animals are variable, and dependent on the
exposure intensity and duration and on other stimuli of the renin-angiotensin system. Hypertension is more
likely to be due to changes in vascular reactivity and level of sympathetic tone, both of which may be
dependent on lead-related changes in intracellular calcium ion concentration. Although the effects of lead
on intracellular calcium may also affect renin release from the juxtaglomerular cells of the kidney, there are
a number of potential mechanisms by which lead could stimulate or inhibit calcium ion fluxes in these cells,
such that the net direction of effect is uncertain (EPA 1986a, 1990g).
Lead causes increased intracellular concentrations of calcium in brain capillaries, neurons, osteoclasts,
hepatocytes, and arteries. Increased intracellular calcium is the trigger for smooth muscle contraction;
therefore, increased intracellular calcium stores may result in increased vascular smooth muscle tone.
Furthermore, lead has been found to interfere with cellular calcium metabolism; it activates calmodulin in
its role of activating c-AMP phosphodiesterase, the enzyme that converts cAMP into AMP. cAMP is
involved in stimulating the calcium pump that removes calcium from the cytosol into the endoplasmic
reticulum. This would be expected to reduce reactivity and tone, and a lead effect on increasing the
conversion of cAMP into AMP would be expected to increase reactivity and tone (Schwartz 1988, 1991,
1992). Alternatively, it has been suggested that lead-induced hypertension may be partially mediated by
activation of the protein kinase C branch of the calcium messenger system, which would, in turn, result in
increased vascular reactivity (Chai and Webb 1988; Schwartz 1991, 1992). Both calmodulin and protein
kinase C have a higher affinity for lead than for calcium (Bressler and Goldstein 1991; Goering 1993).
Results of a more recent series of investigations suggest that lead may cause hypertension in rats by
increasing reactive oxygen species, which act as vasoconstrictors, and decreasing nitric oxide, a vasodilator
released by the endothelium. The reactive oxygen species may be the hydroxyl radical, and did not appear
to be the superoxide anion (Ding et al. 1998).
HematologicalEffects. The effects of lead on the hematopoietic system have been well documented. These
effects, which are seen in both humans and animals, include increased urinary porphyrins, coproporphyrins,
ALA, EP, FEP, ZPP, and anemia. The process of heme biosynthesis is outlined in Figure 2-10. Lead
interferes with heme biosynthesis by altering the activity of three enzymes: ALAS, ALAD, and
ferrochelatase. Lead indirectly stimulates the mitochondrial enzyme ALAS, which catalyzes the
condensation of glycine and succinyl-coenzyme A to form ALA. The activity of ALAS is the rate-limiting
step in heme biosynthesis; increase of ALAS activity occurs through feedback derepression. Lead
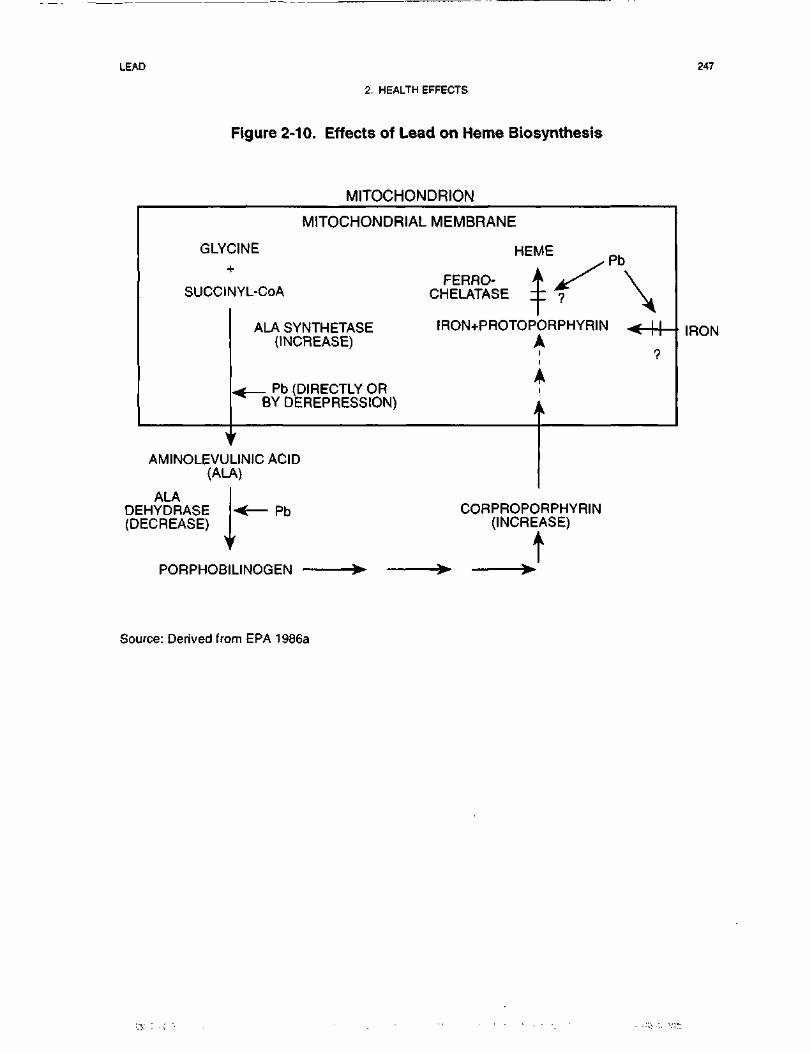
LEAD 247
2. HEALTH EFFECTS
Figure 2-10. Effects of Lead on Heme Biosynthesis
MITOCHONDRION
GLYC-
succir
>AMINOLEVU
(AL
MITOCHONDRIAL:INEh
MYL-CoA
ALA SYNTHETASE(INCREASE)
^ Pb (DIRECTLY OR^ BY DEREPRESSION)
1
LINICACID*)
MEMBRANE
HEME ,PbFERRO- A xX^ \
CHELATASE ± ? V
IRON+PROTOPORPHYRIN < | [
^^
I
A
A
ALADEHYDRASE(DECREASE)
Pb
IRON
CORPROPORPHYRIN(INCREASE)
t
Source: Derived from EPA 1986a
LEAD 248
2. HEALTH EFFECTS
inhibits the zinc-containing cytosolic enzyme ALAD, which catalyzes the condensation of two units of
ALA to form porphobilinogen. This inhibition is noncompetitive, and occurs through the binding of lead to
vicinal sulfhydryls at the active site of ALAD. Lead bridges the vicinal sulfhydryls, whereas Zn, which is
normally found at the active site, binds to only one of these sulfhydryls. Inhibition of ALAD and feedback
derepression of ALAS result in accumulation of ALA. Lead decreases in a non-competitively fashion the
activity of the zinc-containing mitochondrial enzyme ferrochelatase, which catalyzes the insertion of iron
(II) into the protoporphyrin ring to form heme. Inhibition of ferrochelatase (a mitochondrial enzyme) may
occur through binding of lead to the vicinal sulfhydryl groups of the active site. Another possible
mechanism is indirect, through impaired transport of iron in the mitochondrion, due to disruption of
mitochondrial structure. Some other enzymes of the heme synthesis pathway contain single sulfhydryl
groups at their active sites and are not as sensitive to inhibition by lead as are ALAD and ferrochelatase
(EPA 1986a;Goeringl993).
Lead inhibition of ferrochelatase results in an accumulation of protoporphyrin IX, which is present in the
circulating erythrocytes as ZPP, because of the placement of zinc, rather than iron, in the porphyrin moiety.
ZPP is bound in the heme pockets of hemoglobin and remains there throughout the life of the erythrocyte.
Assays used in studies of protoporphyrin accumulation measure ZPP or FEP, because ZPP is converted to
FEP during extraction. Because accumulation of ZPP occurs only in erythrocytes formed during the
presence of lead in erythropoietic tissue, this effect is detectable in circulating erythrocytes only after a lag
time reflecting maturation of erythrocytes and does not reach steady state until the entire population of
erythrocytes has turned over, in approximately 120 days (EPA 1986a).
A marked interference with heme synthesis results in a reduction of the hemoglobin concentration in blood.
Decreased hemoglobin production, coupled with an increase in erythrocyte destruction, results in a
hypochromic, normocytic anemia with associated reticulocytosis. Decreased hemoglobin and anemia have
been observed in lead workers and in children with prolonged exposure at higher PbB levels than those
noted as threshold levels for inhibition or stimulation of enzyme activities involved in heme synthesis (EPA
1986a).
The increase in erythrocyte destruction may be due in part to inhibition by lead of pyrimidine-5'-nuc!eo-
tidase, which results in an accumulation of pyrimidine nucleotides (cytidine and uridine phosphates) in the
erythrocyte or reticulocyte. This enzyme inhibition and nucleotide accumulation affect erythrocyte
membrane stability and survival by alteration of cellular energetic (Angle et al. 1982; EPA 1986a).
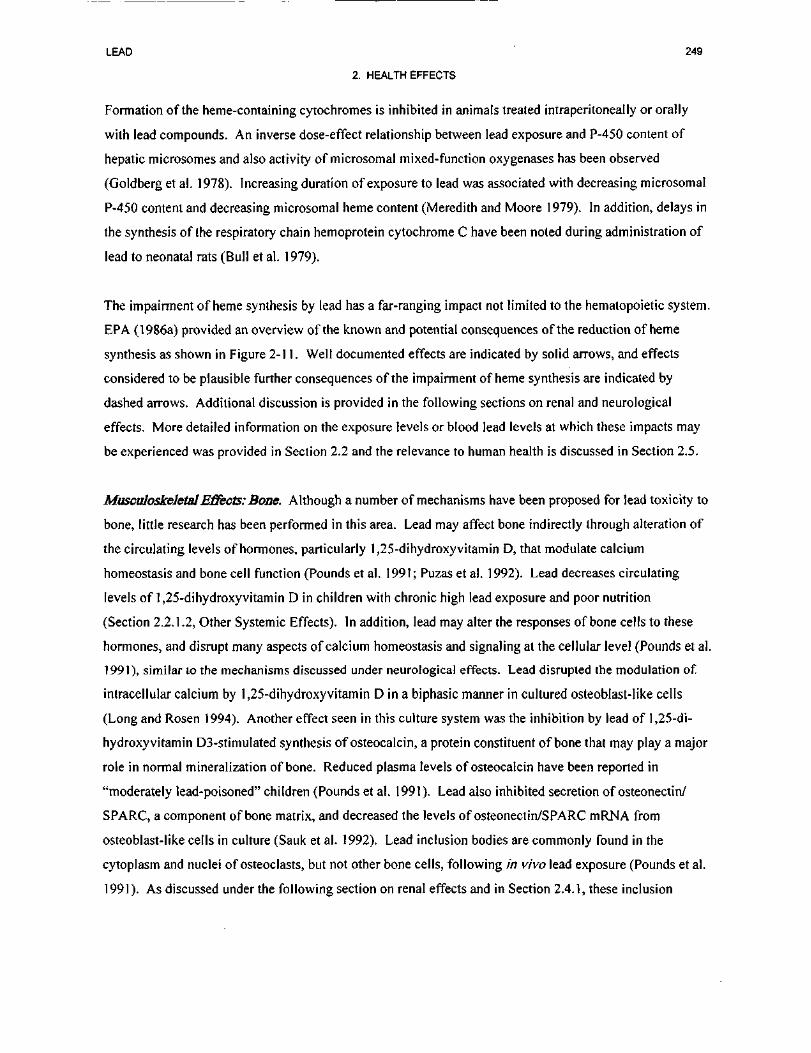
LEAD 249
2. HEALTH EFFECTS
Formation of the heme-containing cytochromes is inhibited in animals treated intraperitoneally or orally
with lead compounds. An inverse dose-effect relationship between lead exposure and P-450 content of
hepatic microsomes and also activity of microsomal mixed-function oxygenases has been observed
(Goldberg et al. 1978). Increasing duration of exposure to lead was associated with decreasing microsomal
P-450 content and decreasing microsomal heme content (Meredith and Moore 1979). In addition, delays in
the synthesis of the respiratory chain hemoprotein cytochrome C have been noted during administration of
lead to neonatal rats (Bull et al. 1979).
The impairment of heme synthesis by lead has a far-ranging impact not limited to the hematopoietic system.
EPA (1986a) provided an overview of the known and potential consequences of the reduction of heme
synthesis as shown in Figure 2-11. Well documented effects are indicated by solid arrows, and effects
considered to be plausible further consequences of the impairment of heme synthesis are indicated by
dashed arrows. Additional discussion is provided in the following sections on renal and neurological
effects. More detailed information on the exposure levels or blood lead levels at which these impacts may
be experienced was provided in Section 2.2 and the relevance to human health is discussed in Section 2.5.
MusculoskeletalEffects: Bone. Although a number of mechanisms have been proposed for lead toxicity to
bone, little research has been performed in this area. Lead may affect bone indirectly through alteration of
the circulating levels of hormones, particularly 1,25-dihydroxy vitamin D, that modulate calcium
homeostasis and bone cell function (Pounds et al. 1991; Puzas et al. 1992). Lead decreases circulating
levels of 1,25-dihydroxyvitamin D in children with chronic high lead exposure and poor nutrition
(Section 2.2.1.2, Other Systemic Effects). In addition, lead may alter the responses of bone cells to these
hormones, and disrupt many aspects of calcium homeostasis and signaling at the cellular level (Pounds et al.
1991), similar to the mechanisms discussed under neurological effects. Lead disrupted the modulation of
intracellular calcium by 1,25-dihydroxy vitamin D in a biphasic manner in cultured osteoblast-like cells
(Long and Rosen 1994). Another effect seen in this culture system was the inhibition by lead of 1,25-di-
hydroxyvitamin D3-stimulated synthesis of osteocalcin, a protein constituent of bone that may play a major
role in normal mineralization of bone. Reduced plasma levels of osteocalcin have been reported in
"moderately lead-poisoned" children (Pounds et al. 1991). Lead also inhibited secretion of osteonectin/
SPARC, a component of bone matrix, and decreased the levels of osteonectin/SPARC mRNA from
osteoblast-like cells in culture (Sauk et al. 1992). Lead inclusion bodies are commonly found in the
cytoplasm and nuclei of osteoclasts, but not other bone cells, following in vivo lead exposure (Pounds et al.
1991). As discussed under the following section on renal effects and in Section 2.4.1, these inclusion
LEAD 251
2. HEALTH EFFECTS
bodies may contain high-affinity binding proteins, and may sequester lead, but also may indicate a potential
for modulation of gene expression. Another observation from in vivo studies was increased bone resorption
activity, evident from increased osteoid coverage of trabecular surfaces and increased osteoclasts in the
trabecular lacunae (Gruber et al. 1997).
Renal Effects. High-affinity cytosolic lead-binding proteins have been identified in the kidneys (and brain).
These high-affinity zinc- and lead-binding proteins are thought to moderate the inhibition of ALAD by lead
through chelating lead and donating zinc, and to translocate lead to the nucleus, where it may influence gene
expression. In the rat kidney, the high-affinity lead-binding protein is an acidic carboxyl-rich protein,
which has been found in intranuclear inclusion bodies and associated with nuclear chromatin. It has been
further identified as the kidney-specific cleavage product of a2(J-globulin, a protein specific to male rats.
Similar lead-binding proteins have been demonstrated in human kidney, liver, and brain cytosol. In
addition, lead can bind to metallothionein, but does not appear to be a significant inducer of the protein in
comparison with the inducers cadmium and zinc. In vivo, only a small fraction of the lead in the kidney
was bound to metallothionein, and lead did not displace cadmium or zinc. Metallothionein also may
sequester lead (Fowler 1992; Goering 1993; Goyer 1993).
In some human studies where clinical chemistry measurements but no renal biopsies were performed, the
only parameter of renal function shown to be affected was an increase in the levels of NAG in the urine.
NAG is a lysosomal enzyme present in renal tubular cells that has been shown to be a sensitive indicator of
early subclinical renal tubular disease. The mechanism by which lead affects the release of NAG from renal
tubular cells is not known, but it is suggested that lead could attach to kidney cell membranes and alter
membrane permeability (Chia et al. 1994).
Lead may affect renin release from the kidney by affecting calcium ion fluxes in the juxtaglomerular cells,
as discussed previously under Cardiovascular Effects.
Lead has been shown to decrease circulating levels of the active form of vitamin D (1,25-dihydroxy-
vitamin D) in children. The conversion of vitamin D to this active hormonal form takes place via hydroxy-
lation to 25-hydroxyvitamin D in the liver, followed by 1-hydroxylation in the mitochondria of the renal
tubule by a complex cytochrome P-450 (heme-containing) system (Mahaffey et al. 1982; Rosen and
Chesney 1983). Comparisons of the serum 1,25-dihydroxyvitamin D levels in children with blood lead
levels of* 33 ug/dL with those in children with severe renal insufficiency (Rosen et al. 1980) and in
LEAD 252
2. HEALTH EFFECTS
children with an inborn error of vitamin D metabolism in which the l-hydroxylase system or component
thereof is virtually absent (Rosen and Chesney 1983; Rosen et al. 1980) suggested that lead decreases the
production of 1,25-dihydroxyvitamin D by renal l-hydroxylase. This decrease may be mediated through
the inhibition of heme synthesis.
Neurological Effects. Lead may substitute for calcium as a second messenger in neurons. The data from
studies of nervous tissue in vitro following in vivo or in vitro lead exposure indicate that lead blocks the
voltage-regulated calcium channels, inhibiting the influx of calcium and release of neurotransmitter that
follows the depolarization of presynaptic nerve terminals, thus inhibiting synaptic transmission. Lead enters
the cell by the same channels, where it acts as a calcium agonist to increase the spontaneous release of
neurotransmitter, resulting in an increase in the frequency of miniature endplate potentials. These biphasic
effects on neurotransmitter release were seen in the cholinergic and GABAergic systems. With regard to
dopaminergic systems, lead inhibited depolarization-evoked neurotransmitter release and also inhibited
dopamine uptake, and either did not affect spontaneous release (Bressler and Goldstein 1991; Goldstein
1993; Pages and Deloncle 1997) or decreased it (Kala and Jadhav 1995b). Lead has also been shown to
decrease the activity of tyrosine hydroxylase in the brain, the rate-limiting enzyme in catecholamine
biosynthesis (Jadhav and Ramesh 1997). In glutamatergic systems, lead inhibited depolarization-evoked
glutamate release (Gilbert 1997). In addition, in the astroglia, lead inhibited high affinity glutamate uptake
and glutamine synthetase activity, which catalyzes the formation of glutamine from glutamate. The
glutamine synthesized by the astroglia is thought to be returned to the neurons for use in regenerating
glutamate, which is a major excitatory neurotransmitter in the brain (Cory-Slechta 1995a; Tiffany-
Castiglioni 1993; Tiffany-Castiglioni et al. 1996). The development of neural networks early in life involves
pruning of excess synapses, and is influenced by the pattern of neural activity occurring in response to
experiences of the infant. This process may be modulated by lead-induced increases in basal neurotrans-
mitter release or persistence in the synaptic cleft and decreases in depolarization-induced neurotransmitter
release. Whether or not there is an effect on the development of neural networks, adaptation to these
changes in neurotransmitter release may alter the efficiency of synaptic transmission and, thereby,
contribute to some of the neurobehavioral deficits in children at low-level lead exposure (Bressler and
Goldstein 1991; Goldstein 1993; Pages and Deloncle 1997). Additional discussion of this possibility will
be provided later in this section.
Additional studies in rats in vivo and in rat tissues or cells in vitro have focused on potential relationships
between the effects of lead on neurotransmitter systems and neurobehavioral function. Lead exposure
LEAD 253
2. HEALTH EFFECTS
decreased dopamine binding sites, suggesting excess dopamine availability. The decreased dopamine
binding was localized in the nucleus accumbens (mesolimbic dopamine system) but not the dorsal striatum
(nigrostriatal dopamine system). The nucleus accumbens has been shown to be critical to the mediation of
fixed-interval schedule controlled behavior, which is altered by lead. Additional evidence of the
involvement of dopaminergic system in fixed interval performance changes is that of a variety of agonists
tested, only the dopamine agonists caused differential effects on fixed-interval performance of control and
lead-exposed rats (Cory-Slechta 1997b; Cory-Slechta et al. 1996, 1997a; Pokora et al. 1996). A study in
which dopamine was microinjected into the nucleus accumbens provided further evidence of the
involvement of this neurotransmitter on fixed-interval performance (Cory-Slechta et al. 1998). The results
also indicated possible similarites and differences in the behavioral mechanisms by which dopamine and
lead induce alterations in fixed-interval performance, suggesting that additional mechanisms modulate the
specific behavioral processes underlying fixed-interval increases produced by lead exposure (Cory-Slechta
et al. 1998). Lead inhibition of the N-methyl-D-aspartate (NMDA) receptor complex activity, evidenced,
for example, by decreases in MK-801 binding throughout the brain, appeared to play a role in learning
deficits (Cory-Slechta 1995a; Cory-Slechta 1997; Cory-Slechta et al. 1997b, 1997c). MK-801 binding is a
use-dependent binding that requires glutamate and glycine activation of the NMDA receptor complex;
decreases in MK-801 binding suggest a hypoglutamatergic function. Some studies have suggested that lead
inhibits NMDA receptor binding through the zinc allosteric site, which modulates receptor binding (Cory-
Slechta 1995a; Guilarte 1997; Guilarte et al. 1995). The inhibitory effects of lead on the NMDA receptor
were age-dependent, with greater effects occurring during early neuronal development (Guilarte 1997). An
alternative explanation to the age-related differential susceptibility is that lead achieved a much greater
concentration in the immature rat brain than in the adult brain. The relationship between cholinergic system
dysfunction and lead-induced neurobehavioral impairments is not known, but evidence that lead decreases
the depolarization-evoked release and increases the spontaneous release of acetylcholine (summarized
previously), decreases choline acetyltransferase activity (which catalyzes acetylcholine synthesis), and
increases the sensitivity of muscarinic cholinergic receptors, is suggestive (Cory-Slechta 1995a).
Lead may act as a calcium substitute in the activation of protein kinase C, which is important in cell growth
and differentiation, including the differentiation of brain endothelial cells. The affinity of lead for protein
kinase C is higher, however, than that of calcium. The blood-brain barrier consists of the endothelial cells
of the brain microvessels, which are sealed together by continuous tight junctions, and the astroglia
(astrocytes), which initiate and maintain the expression of this phenotype, extending foot processes that
LEAD 254
2. HEALTH EFFECTS
almost completely sheathe the microvascular wall. In immature brain microvessels, most of the protein
kinase C is in the cytosol, whereas in mature brain microvessels, this enzyme is membrane-bound.
Activation of protein kinase C in other systems is known to result in a change in distribution from cytosol to
membrane, and has been observed with exposure of immature brain microvessels to lead. An inhibition of
microvascular formation has been observed with lead concentrations that are effective in activating protein
kinase C. Thus, it appears that premature activation of protein kinase C by lead may impair brain
microvascular formation and function, and at high levels of lead exposure, may account for gross defects in
the blood-brain barrier that contribute to acute lead encephalopathy. The blood-brain barrier normally
excludes plasma proteins and many organic molecules, and limits the passage of ions. With disruption of
this barrier, molecules such as albumin freely enter the brain and ions and water follow. Because the brain
lacks a well-developed lymphatic system, clearance of plasma constituents is slow, edema occurs, and
intracranial pressure rises. At lower levels of exposure, subtle dysfunction of the blood-brain barrier may
contribute to neurobehavioral deficits in children (Bressler and Goldstein 1991; Goldstein 1993). The
particular vulnerability of the fetus and infant to the neurotoxicity of lead may be due in part to immaturity
of the blood-brain barrier and to the lack of the high-affinity lead-binding protein in astroglia, which is
discussed later in this section. Results of measurements of transendothelial electrical resistance across the
blood-brain barrier from mice of various ages showed that lead potentiates cytokines-induced increase in
ion permeability of the blood-brain barrier (Dyatlov et al. 1998). The effect was greater in younger animals
which is consistent with age dependence of lead neurotoxicity.
In addition, the activation of protein kinase C is thought to contribute to long-term potentiation, which may
function in memory storage. Lead has been reported to inhibit (Gilbert 1997) or to stimulate the activation
of protein kinase C. Other processes involved in long-term potentiation that also are inhibited by lead are
depolarization-induced neurotransmitter release, NMDA receptor-mediated activity, and cholinergic
activity. Lead's effects on these processes and on protein kinase C would be expected to disrupt long-term
potentiation, resulting in learning deficits (Gilbert 1997). Data from a recent study in rats showed that lead
exposure during development influences protein kinase C distribution (membrane vs. cytoplasm) in
fractions of the hippocampus (Chen et al. 1998), and the authors suggested that these changes may be
involved in the subclinical neurotoxicity of chronic lead exposure in young children.
Lead also has been shown to substitute for calcium in the activation of calmodulin, but this requires higher
levels of lead than does the activation of protein kinase C. Nevertheless, the affinity of lead for calmodulin
is higher than that of calcium. Once activated, calmodulin regulates the activity of certain enzymes and
LEAD 255
2. HEALTH EFFECTS
transporters. For example, it activates c-AMP phosphodiesterase to hydrolyze and terminate the action of
cAMP, another second messenger (Bressler and Goldstein 1991; Goldstein 1993; Goering 1993).
Another mechanism by which lead may affect the nervous system is through its effect on neuronal cell
adhesion molecules (NCAMs), membrane-bound cell-recognition molecules that regulates cell-cell
interactions, including synapse formation. Chronic, low-level lead exposure impairs the desialylation of
NCAMs during postnatal periods that coincide with synapse formation. This interference with sialylation
pattern may perturb synapse selection, thus contributing to learning deficits. The exact mechanism of
interference with desialylation has not been determined, but stimulation by lead of the enzyme that
sialylates NCAMs has been reported (Regan 1993; Tiffany-Castiglioni 1993). Lead was found to increase
the particulate form and decrease the soluble form of the amyloid (3 precursor protein (ApPP) in
hippocampal cells in vitro (Davey and Breen 1998). The particulate form of A(3PP plays a role as a
mediator of cell-cell adhesion and cell interaction with components of the extracellular matrix and any
changes in the partitioning of A|3PP would be expected to produce major effects within the central nervous
system, particularly during the period of neural development.
It has been also suggested that lead may perturb glucocorticoid-mediated events in the central nervous
system hormonal target tissues (Tonner et al. 1997). Glucocorticoid receptors are widespread in neurons
and glial cells and are known to modulate glial cell functions such as synthesis of myelin phosphatide
precursors by glycerol phosphate dehydrogenase, amidation of the neurotransmitter glutamate, and
detoxification of ammonia by glutamine synthetase. Tonner et al. (1997) found that addition of lead acetate
to C6 glioma cells in vitro resulted in a significant reduction of the binding affinity of glucocorticoids for
cytosolic receptors. Lead altered glucocorticoid signal transduction in other non-neural cell types in vitro as
well (Heiman and Tonner 1995; Tonner and Heiman 1997).
As discussed previously under renal effects, high-affinity cytosolic lead-binding proteins have been
identified in the brain (and kidneys) of rats. These high-affinity zinc- and lead-binding proteins are thought
to moderate lead inhibition of ALAD through lead chelation and zinc donation, and to translocate lead to the
nucleus, where it may influence gene expression. Similar lead-binding proteins have been demonstrated in
human brain (and kidney and liver) cytosol. The rat brain lead-binding protein appears to be richly acidic,
is not the same as that found in the kidney, and is developmentally regulated. Only traces of this protein
were detectible in neonatal rats, increasing to adult levels within 2 weeks, with a concomitant increase in
resistance to lead-induced encephalopathy. The development of this resistance is thought to be related to
LEAD 256
2. HEALTH EFFECTS
the formation of lead-protein inclusion bodies in the astroglia, which sequester lead. Studies in astroglial
cultures provide supporting evidence that astroglia develop the ability to sequester lead as they mature. In
addition, lead can bind to metallothionein, which also is present in the astroglia (Fowler 1992; Goering
1993; Goyer 1990, 1993; Tiffany-Castiglioni 1993; Tiffany-Castiglioni etal. 1996).
The nervous system may be affected indirectly through lead's inhibition of heme synthesis (discussed
previously in this section). For example, inhibition of heme synthesis may result in decreases in
microsomal cytochrome P-450 (which metabolizes endogenous and exogenous chemicals), and
mitochondrial cytochromes (which conduct cellular respiration) in the nervous tissue. In addition,
tryptophan pyrrolase, a hepatic heme-requiring enzyme system, is inhibited via a reduction in the free
hepatic heme pool. This inhibition results in elevated plasma tryptophan and elevated brain levels of
tryptophan, serotonin (5-hydroxytryptamine), and 5-hydroxyindoleactic acid, which may increase aberrant
neurotransmission in serotonergic pathways. Infusion of heme into lead-treated rats reduced the elevated
levels of these compounds to normal levels; and intravenous administration of hematin, a heme-like
molecule, to a lead-exposed worker diminished subjective symptoms of neurotoxicity and urinary ALA,
providing some evidence of the potential clinical significance of decreased heme synthesis (EPA 1986a;
Goering 1993).
ALA itself may be neurotoxic by interfering with neurotransmission by the inhibitory neurotransmitter
GABA, which is similar in structure to ALA. Although ALA at very high levels may competitively inhibit
GABA binding to the postsynaptic receptor in vitro, negative-feedback inhibition of GABA release via
interaction of ALA with presynaptic GABA receptors is the more likely mechanism of action in wVo(EPA
1986a). In addition, it has been suggested that free radicals generated during the autoxidation of ALA and
the promotion of oxyhemoglobin oxidation by ALA may contribute to the observed toxicity of lead. Lead
itself may accelerate lipid peroxidation induced by ALA-generated oxygen radicals or by Fe2+ (Hermes-
Lima etal. 1991; Monteiro etal. 1991).
Carcinogenesis. Suggested mechanisms for the renal carcinogenesis of lead in rodents include: (1) an
alteration of genetic function by lead in association with the high-affinity lead-binding protein following
translocation to the nucleus (see previous discussion on mechanism of renal effects); (2) tumor promotion
by activation of protein kinase C, which, in addition to the functions noted above, phosphorylates growth
factor receptors and oncogenes; and (3) stimulation of cellular proliferation or cystic hyperplasia (which
may be secondary to other mechanisms) (Fowler 1992; Goyer 1992, 1993). Although the high-affinity

LEAD 257
2. HEALTH EFFECTS
lead-binding protein is a cleavage product of a2M-g!obulin, it does not appear to act through the mechanism
of male rat hyaline droplet nephropathy and associated tumorigenicity.
2.4.3 Animal-to-Human Extrapolations
Studies in rodents, dogs, and non-human primates have demonstrated all of the major types of health effects
of lead that have been observed in humans, including cardiovascular, hematological, neurodevelopmental,
and renal effects (EPA 1986a). These studies also provide support for the concept of blood lead
concentration as a metric of internal dose for use in dose-response assessments in humans.
The effects of low-level lead exposure on cognitive development and function in humans are difficult to
discern against the background of genetic, environmental, and socioeconomic factors that would be
expected to affect these end points in children. Experimental studies in animals have been helpful for
establishing the plausibility of the hypothesis that low-level exposures to lead can affect learning in
mammals and for providing insights into possible mechanisms for these effects. Studies in rats and non-
human primates have demonstrated deficits in learning associated with blood lead concentrations between
10 and 15 ug/dL, a range which is comparable to those reported in epidemiological studies which found
learning deficits in children (Cory-Slechta 1995a).
The lead-induced nephropathy observed in humans and rodents shows a comparable early pathology (Goyer
1993). However, in rodents, proximal tubular cell injury induced by lead can progress to adenocarcinomas
of the kidney (see Section 2.2.3.8). The observation of lead-induced kidney tumors in rats may not be
relevant to humans. Conclusive evidence for lead-induced renal cancers (or any other type of cancer) in
humans is lacking, even in populations in which chronic lead nephropathy is evident.
2.5 RELEVANCE TO PUBLIC HEALTH
People living near hazardous waste sites may be exposed to lead via ingestion of contaminated water or
soils or by inhalation of lead particles in the air. For people not living in the vicinity of hazardous waste
sites, the major route of exposure to lead is ingestion, particularly of lead-contaminated water, food, soil,
lead-based paint chips, or dusts (the latter two are particularly relevant to children in lower-income
urbanized populations). For occupationally exposed individuals, the predominant route of exposure is the
inhalation of lead particles with oral ingestion also important in many cases.
LEAD 258
2. HEALTH EFFECTS
Lead has been shown to affect virtually every organ and/or system in the body in both humans and animals
(see Figure 2-11). The most sensitive target organs of lead appear to be the nervous system (particularly in
children), the hematopoietic system, and the cardiovascular system. There is evidence in both humans and
animals to suggest that the kidneys and the immune and reproductive systems are also adversely affected by
lead. Lead has also been shown to be carcinogenic in animals. The adverse health effects noted in humans
are generally supported by observations in laboratory animals. No MRLs have been developed for lead.
The lack of a clear threshold for health effects and the need to consider multi-media routes of exposure
makes evaluating the risks from exposure to lead in the environment difficult. In addition, factors such as
absorption potential of the lead compound of interest, and age and nutritional status of the population
complicate the development of generic guidance. Despite these complexities, guidance is needed for the
assessment of risk to humans from exposure to lead at NPL sites. Such guidance must be adaptable to site-
specific information regarding exposure sources and demographic data; it must also provide default values
where data may not be available in order to generate quantitative estimates of risk (DeRosa et al. 1991).
Numerous studies have attempted to correlate environmental lead levels with blood lead levels (Table 2-9).
Slope factors have been calculated which attempt to predict increases in PbB (ug/dL) per unit lead
concentration in environmental media (EPA 1986a, 1989g). The relationship between media concentration
and PbB is curvilinear, such that the slopes decrease with increasing lead concentrations.
Air slope factors calculated from experimental and cross-sectional studies range from a 1- to at 2.7-ug/dL
increase in PbB per ug/m3 air lead concentration. A slope factor of 1,92±0.60 for children was calculated
by Angle et al. (1984) from a study conducted between 1971 and 1977 in three areas of Omaha, Nebraska
(Angle and Mclntyre 1979). This study provides some of the most useful and relevant information because
covariates (e.g., age, dust exposure, sex) were controlled. EPA analysis of two other reliable studies
provide comparable slope factors for children of 2.46±0.58 (Roels et al. 1980) and 1.53±0.064 (Yankel et al.
1977). A study of 44 workers in five major operations in a U.S. high volume, lead acid battery plant
calculated a slope factor of 1.14 (Hodgkins et al. 1992). This study, which also controlled for job category,
seniority, age, ethnicity, sex, and smoking habit, covered a 30-month period in which workers received
frequent measurements of lead in air and in blood. In both univariate and multivariate linear regressions,
longitudinal analyses averaging air lead concentrations over the 30-month study period predicted PbB
concentrations more accurately than cross-sectional analyses using only 6-month air lead averages.
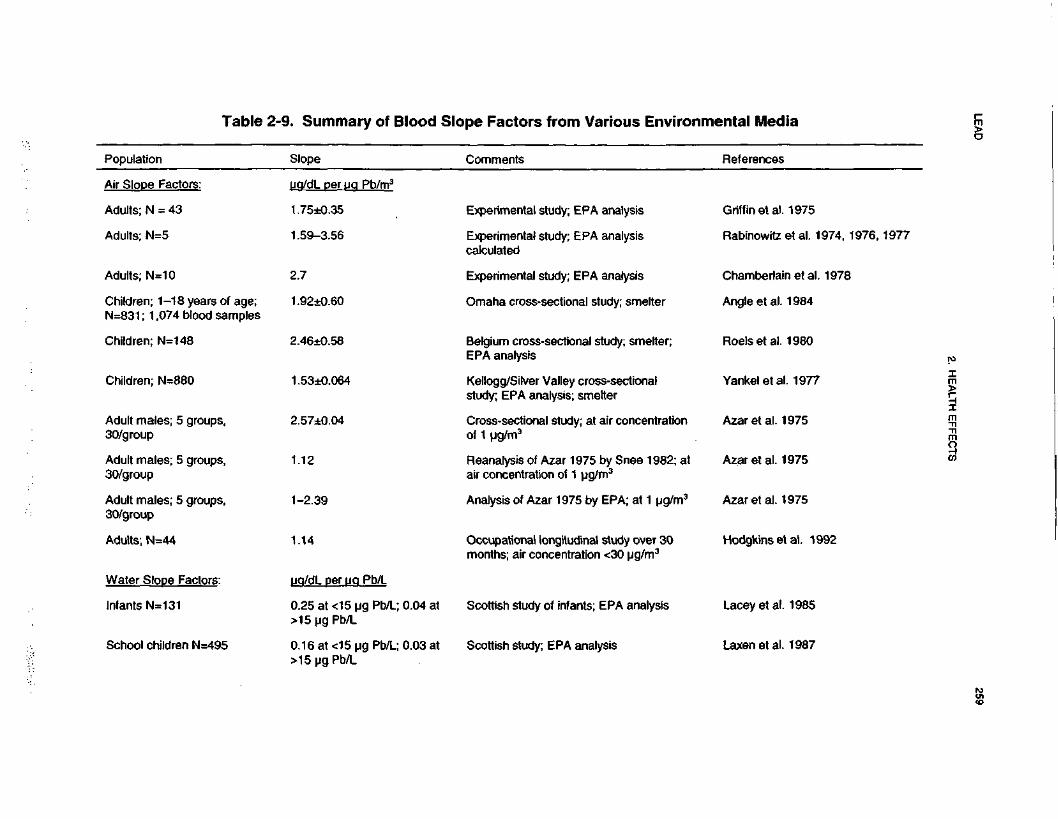
LEA
D259
2. HE
ALTH
EFFE
CTS
rental Med
References
0)Ec0t^cLUpe Factors from Various
Comments
O</>TJ0M»
m"o>ire2
Q)
w
§-•
CO
0)
<NJ>reH~
cPopulatio
LOGriffin et al.Experimental study; EPA analysis
Q.
OaCD CO
Q
Q
•O
in"d
>>
i»! 5
U-
II
S
2O
io
C/J 3
* 3
a>co"a>O
S"co75RabinowitzExperimental study; EPA analysiscalculated
COCOd.ini-iiniiJo"B
oo^1575cChamberlaiExperimental study; EPA analysis
t--C\j
ozJo"
1
11575ojOmaha cross-sectional study; srm
sCMO)
^_I
. . co
8,1
m
p**~
=O
TO(/)
w "
03 o
IfChildren;
N=831 ; 1
SosRoels et al.
SCD
1COCD& «
§ >
•E
S
3 C
O
"53 Q.m
in
sCOcJ1IFChildren;
O)
75c15Kellogg/Silver Valley cross-sectiorstudy; EPA analysis; smelter
i?;COm^oCOCOIIfcfk.
6
int.
OS75c.217:Cross-sectional study; at air conce
of 1 ug/m3
S3inCMco"Q.
3oOS
minCDAdult ma30/group
mt.OSto75ro75C\f
00
T-Reanalysis of Azar 1975 by Sneeair concentration of 1 ug/m3
5!•f—co"aQO
Sineo"CDco
a.
^2
^ O
S"0
0
< C
O
OSAzar et al. 1
PJE°J,_Analysis of Azar 1975 by EPA; at
CO^co"3O)
inco"CDco
a^ o
? 5
>5
i^
§s15Hodgkins e1
°r>
CD E
Occupational longitudinal study ovmonths; air concentration <30 ug/i
Q.OCDQ_l
T—
3jo
3
®*£
D
II O
Adults; N
Water Sli
ffl 00
OS
O)
r-
r-
75 75
O
X
CO
'§,15CO
<
w
UJ
£
J2 2
I J
1
^o
^
To to
s «
1 !
173 W
75 75
S
Sd
d
a. a.
OS
O
S3.
. 3.
^£
^75 ™
75
d 'A
din*yiiz
T- C
D
™
1
Z
o
1
8•2
"S£
(/3
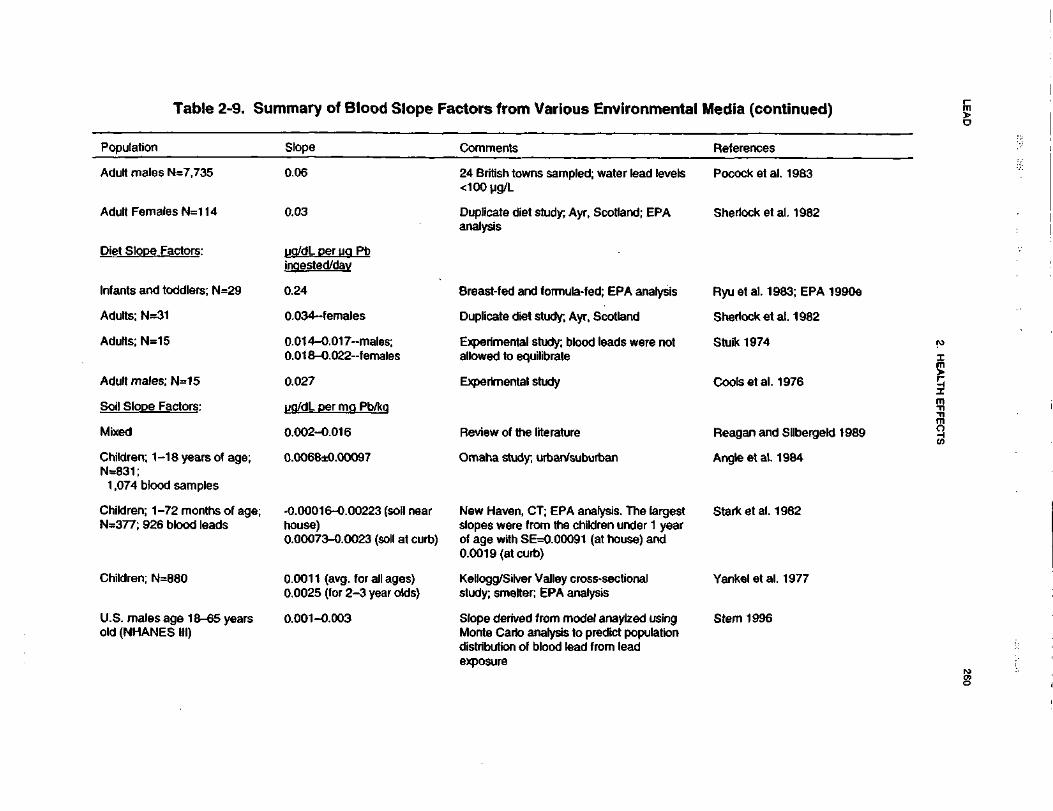
LEA
D260
2. HE
ALTH
EFFE
CTS
^^
•o0)5"£on'5S"5ous Environmeai(0i(0u.a055TOoo5•fto£1^
iE3
.
O)
CM
£™
(/)
§0)•zCLComments
a>a.
0CO§=s3&a.
o>15Q.
"53ipled; water lead leviSJS24 British towi<100ug/L
8dinK?II
CO
0)CO
x:
•a
o>"rao>Q>
COAyr, Scotland; EPA:£•oiDuplicate dietanalysis
£o<5Q_J
8 1
d
3
^ _ • •
u £2
2
S(A
U
1
"
1
S
* I
e
W
5
.2<
Q
O)
^UJ
iTo1DCCOula-fed; EPA analysi
|1isCO
31•o0)
tn0) •*
D
CM
-S
dMze*—1•«_CO
|5 £
"8 •*
15^^
^^ «^
O
O>
Q
)
-e ^
w
£
1
8to
co O
1Z_
<D
?
5S
</>1
«
w
5
* s.1 II 1
1 p
10)
a> 2
o
1 1^ 1
i y i
Q
HI
CO
U
J
M
*** T
5
^"r5
E
®
! T
n15
s. CM
gi
5S
f£
d d
*
^
^
CD
t^ —
In
»— *—
C
NJ
^o
o o
o
>d
d d
d
a. .
Jo T-
co LL
n n
.2 a
21
^Z
^3
D
^"
M
s
«
XJ
T3
TJ
'5<
<
<
CO
1•o0)tu .
=• s
sco
en S
•o ^
^§
15
15
I « |
1 f
8w
jg
III
J(fl 3 O
ll ill
1 1
^.fl
1 *.
°- 1 co |
1 * fill
IE
18
- "8
EC
O
Z
"w O
O
,
1
"=
c
"
1 5
f 8,
^" ^
?3
CD |
9 8
d |
^~
NCM
C
O
S
f O
do
9 E
d
ra
^
5
ow
O
« <2 "S
w
«
to
S
! E
IT
J>
. m
t
000
<" C
M -2
i- T
3
f- -°
1 Q
1
(OT
~
Q
T^
^^
• _*
^2
• - O
5
"O
^ co ^
-n P
;£
IE * r-"
S 1?
2
0 Z
O
Z
£*•15I
' cross-sectionalanalysis
|SII^"of -TO0)
-sg>2« S^9
?L
§>^f^•^T
~
C\J
§o0
d d
101
6
1iCOrr, C
model anaylzed usinis to predict populatiolead from lead
Ifl
Slope derivedMonte Carlo adistribution of
COd^_ood(Qs,u*)COLis1|*- z
wrT
D 0
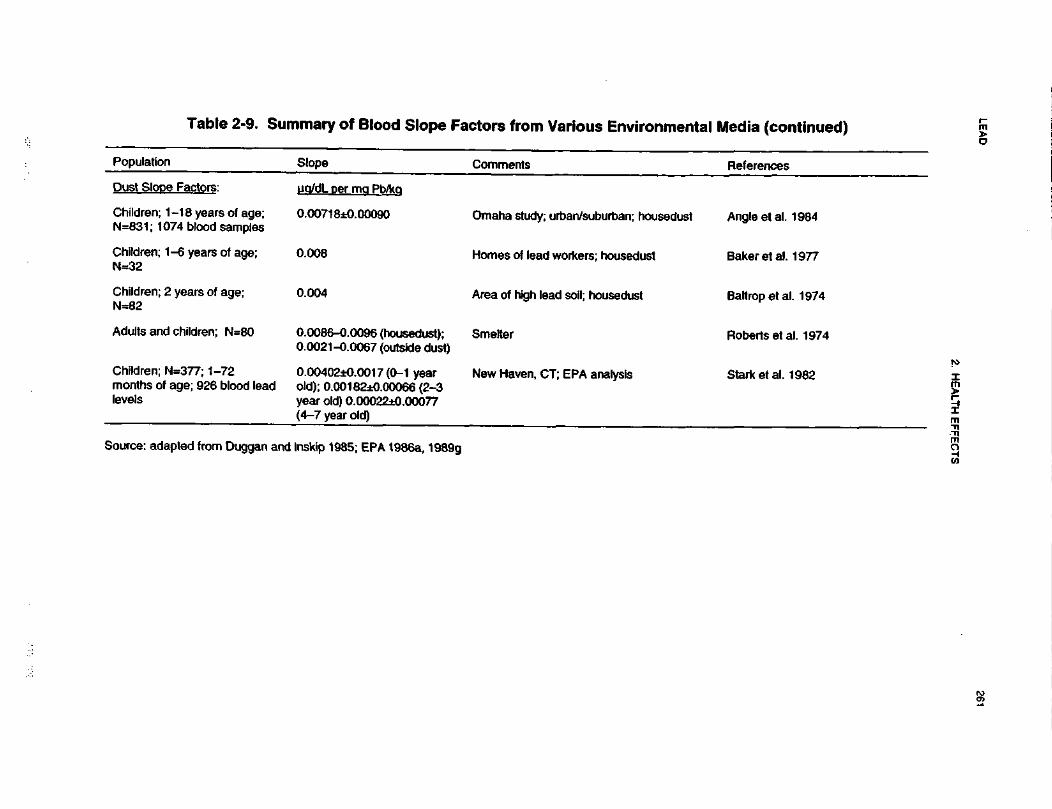
LEA
D261
2. HE
ALTH
EFFE
CTS
•o0>3'SI0
TJo20>EcocUJ(AO•c2H-
2o^j(0••(it2?
OCO•ooom•5nE
B
o>CM0)5.2
M£wCD"35CC<AVQOd)
8-toco"3Q.
OCL
C2o.UQ/dL oer ma>e Factors:
"otoInD
CO0>13a>COO)
In3T3
|J ""1VJ
1I•S5coEOS0
0.0071 8±0.00
CO m
OJ —
co Q
-
1-1 8 years of074 blood sam
{~S »-
1?
6 z
P:O)
15a>Jj-
<om31Sg•S1•5COa>5Id£A•5(05.
S^is£ no z
0)^15^»a.oCO
QD
_•D$11115g)<dS,m•s1CMC£•a CM
O Z
.fe15cocc1to• •. ^™*
1? D
§•0
•D a>
1 ^
- *2-CD
h-
0.0086-0.0090.0021-0.006
COn12offt
to
"5T3
CMAIB*-^CO•BJ" 1
SCO
a.UJ
H01CO0)z^
C
O .§
« ^. k
i H
*5K!'
. 1T— Q
o
0.00402±0.00old); 0.001 82dyear old) 0.00(4-7 year old)
ao>•g
-1
K.-W
C0) ^
OE
!
O)
o>coen«'ego>-
a.01D.
i§toB>0sT3£8-cti
io
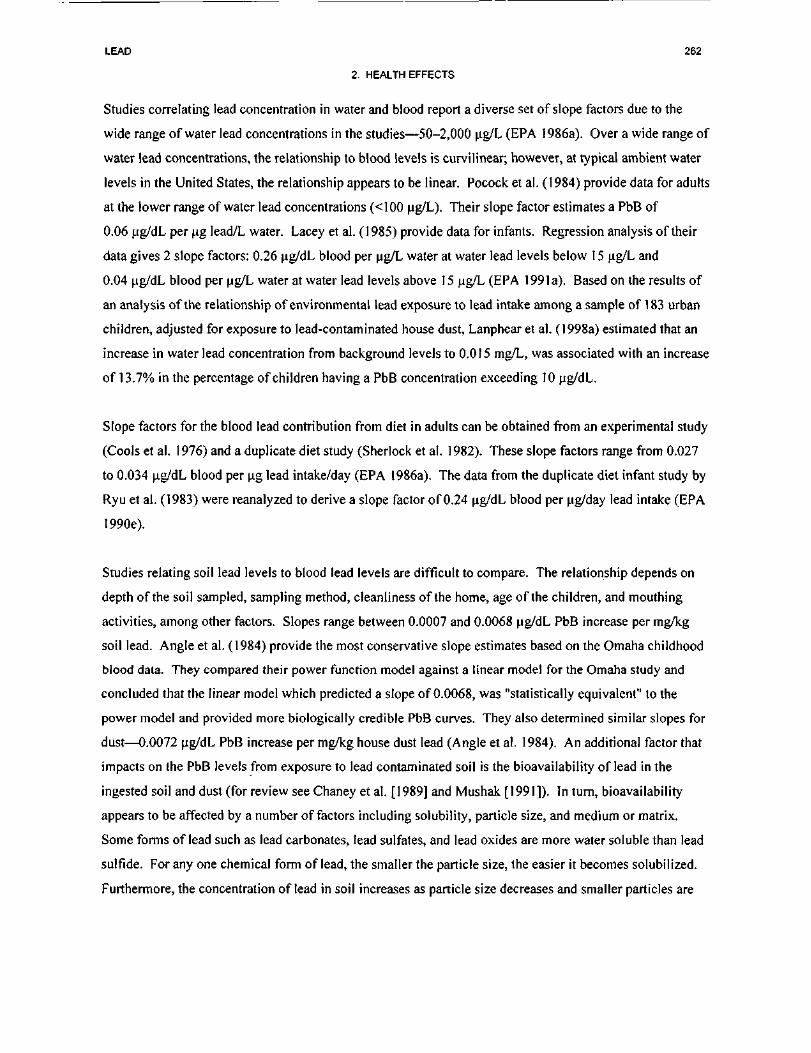
LEAD 262
2. HEALTH EFFECTS
Studies correlating lead concentration in water and blood report a diverse set of slope factors due to the
wide range of water lead concentrations in the studies—50-2,000 \ig/L (EPA 1986a). Over a wide range of
water lead concentrations, the relationship to blood levels is curvilinear; however, at typical ambient water
levels in the United States, the relationship appears to be linear. Pocock et al. (1984) provide data for adults
at the lower range of water lead concentrations (<100 ug/L). Their slope factor estimates a PbB of
0.06 ng/dL per (ig lead/L water. Lacey et al. (1985) provide data for infants. Regression analysis of their
data gives 2 slope factors: 0.26 ug/dL blood per ug/L water at water lead levels below 15 ng/L and
0.04 ug/dL blood per ug/L water at water lead levels above 15 ug/L (EPA 199la). Based on the results of
an analysis of the relationship of environmental lead exposure to lead intake among a sample of 183 urban
children, adjusted for exposure to lead-contaminated house dust, Lanphear et al. (1998a) estimated that an
increase in water lead concentration from background levels to 0.015 mg/L, was associated with an increase
of 13.7% in the percentage of children having a PbB concentration exceeding 10 ug/dL.
Slope factors for the blood lead contribution from diet in adults can be obtained from an experimental study
(Cools et al. 1976) and a duplicate diet study (Sherlock et al. 1982). These slope factors range from 0.027
to 0.034 )ig/dL blood per ug lead intake/day (EPA 1986a). The data from the duplicate diet infant study by
Ryu et al. (1983) were reanalyzed to derive a slope factor of 0.24 ^g/dL blood per ug/day lead intake (EPA
1990e).
Studies relating soil lead levels to blood lead levels are difficult to compare. The relationship depends on
depth of the soil sampled, sampling method, cleanliness of the home, age of the children, and mouthing
activities, among other factors. Slopes range between 0.0007 and 0.0068 ug/dL PbB increase per mg/kg
soil lead. Angle et al. (1984) provide the most conservative slope estimates based on the Omaha childhood
blood data. They compared their power function model against a linear model for the Omaha study and
concluded that the linear model which predicted a slope of 0.0068, was "statistically equivalent" to the
power model and provided more biologically credible PbB curves. They also determined similar slopes for
dust—0.0072 ug/dL PbB increase per mg/kg house dust lead (Angle et al. 1984). An additional factor that
impacts on the PbB levels from exposure to lead contaminated soil is the bioavailability of lead in the
ingested soil and dust (for review see Chaney et al. [1989] and Mushak [1991]). In turn, bioavailability
appears to be affected by a number of factors including solubility, particle size, and medium or matrix.
Some forms of lead such as lead carbonates, lead sulfates, and lead oxides are more water soluble than lead
sulfide. For any one chemical form of lead, the smaller the particle size, the easier it becomes solubilized.
Furthermore, the concentration of lead in soil increases as particle size decreases and smaller particles are
LEAD 263
2. HEALTH EFFECTS
more easily moved into the home to become lead-rich housedust and on to the hands of children who may
ingest soil particles via mouthing behavior. Danse et al. (1995) examined blood lead data and
environmental lead data of residents from 13 communities where mi l l tailings from prior activities were
present. The majority of the samples (2,995 PbB measurements) were from children. The results were
compared to 1,806 controls from nearby communities, national norms, and communities with active
smelters. The authors found that PbB values in residents exposed to tailings were usually comparable to
controls; however, at some smelter sites that generated fine soluble dusts, blood lead levels were found to be
increased in populations residing downwind from smelters and in dusty areas. In a recent study of urban
children, Lanphear et al. (1998a) estimated that increasing the concentration of soil lead from background to
400 ug/g produced an increase of 11.6% in the percentage of children estimated to have a PbB level
exceeding 10 ug/dL, and increasing dust load loading from background to 200 ug/feer2 was estimated to
produce an increase of 23.3% in the percentage of children having a PbB concentration exceeding 10 ug/dL.
The information summarized above suggests that provision of health-based guidance requires an approach
that uses site- and media-specific information. ATSDR has developed guidance with this approach which
can be used by employing media-specific slope factors to integrate exposures from various pathways
(Abadin et al. 1997a; see also Appendix D). For a given site, slope factors can be used with environmental
data to predict media-specific contributions to blood lead. Summation of the individual media contributions
will yield a total predicted PbB level. The uncertainties in predicting mean PbB can be estimated by using
the standard errors associated with the slope values to generate a range of predicted PbB. Proposed default
values can be used in lieu of missing environmental data.
By predicting PbB levels, a determination can be made about what health impacts may be occurring at a
given site. This will assist health assessment personnel in deciding whether further action is needed. A site-
specific evaluation must be made before reaching any conclusions (e.g., pica children, ground cover over
contaminated soil, nutritional status and age of the population, etc.). Issues relevant to children are
explicitly discussed in Sections 2.6, Children's Susceptibility, and 5.6, Exposures of Children.
Death. Death can be the end result in cases of severe lead encephalopathy in both adults and children.
The National Academy of Sciences (NAS 1972) analyzed unpublished data obtained from the patient
populations reported in Chisolm (1962, 1965) and Chisolm and Harrison (1956) and concluded that the
range of blood lead levels associated with death from lead encephalopathy in children was approximately
LEAD 264
2. HEALTH EFFECTS
125-750 ug/dL (mean, 327 ug/dL). A case report described a 70-year-old female nursing home resident
who drank lead ceramic glaze (Roberge et al. 1994). During the next 10 days her mental status progress-
ively deteriorated, and her abdomen became distended. On admission to the hospital her PbB level was
259 ug/dL. After several days of chelation therapy, her PbB decreased to 21 ug/dL. In spite of the
reduction in PbB, the patient's lethargy and confusion persisted and she developed renal failure and
associated anasarca, as well as brief apneic periods. She expired on the 16th day and the cause of death was
listed as lead intoxication; an autopsy was not performed.
The results of mortality studies conducted on occupationally exposed workers are discrepant, and all the
studies have design flaws that limit the validity of the conclusions that can be drawn from their results. One
study found a statistically significant increase in mortality due to malignant neoplasms, chronic renal
disease, and "ill-defined" causes in lead-exposed workers (Cooper 1988; Cooper et al. 1985). Another study
found a statistically significant increase in mortality due to cardiovascular disease in lead-exposed workers
(Fanning 1988), and another found a statistically significant increase in the incidence of deaths from
cerebrovascular disease in lead-exposed newspaper printers (Michaels et al. 1991). Two additional studies
found no statistically significant increase in mortality due to lead exposure (Gerhardsson et al. 1986b,
1995a). Slightly lower blood lead levels were recorded in the study by Gerhardsson et al. (1986b) than in
the study by Cooper et al. (1985). A follow-up evaluation of the cohort studied by Gerhardsson et al.
(1986b) provided evidence suggesting an increased mortality due to lung cancer among lead workers
(Lundstrom et al. 1997). Suggestive evidence of excess death from cardiovascular disease among adults
diagnosed with lead poisoning as children was presented by McDonald and Potter (1996). Weak evidence
of an association between increase mortality due to renal cancer and long-term lead exposure was presented
byCoccoetal.(1997).
High levels of lead have been suggested as a causative agent in Sudden Infant Death Syndrome (SIDS).
Investigators have found that babies who died of SIDS had a greater number of the highest lead levels in dry
blood (blood samples in which the water has been removed) as compared to control (alive or dead due to
traumatic causes) babies (Drasch et al. 1988). These results suggest that there may be an association
between high lead body burden and SIDS, but the mechanism behind this association cannot be determined
at this time. Possibilities include an effect of lead on prenatal and/or postnatal neurological development.
Oral LDLO values in a number of animal species are available for lead (see Table 2-3). Mortality data from
longer-term studies in animals are often inconclusive. However, based on the information available in
LEAD 265
2. HEALTH EFFECTS
humans, it is apparent that high body burdens of lead can result in death, which is most often secondary to
lead-induced encephalopathy.
Systemic Effects
Respiratory Effects. There are no conclusive data available to indicate that lead adversely affects the
respiratory system in humans. However, one inhalation study in animals indicates that continuous
prolonged (28-day) exposure to lead nitrate particles may be irritating to the lungs, as evidenced by the
pulmonary edema and hemorrhage seen in the lungs of the lead-exposed mice at necropsy (Hillam and
Ozkan 1986). These effects were not seen in animals continuously exposed for 14 days, suggesting that the
apparent adverse respiratory effects were dependent on the duration of exposure and are cumulative.
However, the irritative properties of inhaled lead depend partially on the solubility and pH of the species. In
this study, the animals were exposed to lead nitrate, which is acidic and, therefore, irritating. These results
are not sufficient to determine whether prolonged inhalation exposure of humans to high levels of lead
particles other than lead nitrate (such as may occur near hazardous waste sites) may result in pulmonary
irritation.
Cardiovascular Effects. The evidence from occupational, clinical, and general population studies suggests
that lead affects the cardiovascular system in humans, producing cardiac lesions and electrocardiographic
abnormalities at high levels of exposure. However, the association between PbB and blood pressure is still
a matter of controversy. The contribution of lead, compared with many other factors that affect blood
pressure, appears to be relatively small, usually not accounting for more than 1-2% of the variation when
compared with other significant factors (EPA 1986a). The evidence in humans, at this time, does not
support a conclusive positive association between increased PbB levels and blood pressure.
The animal data demonstrate that lead increases blood pressure, despite confounding experimental design
factors such as species tested, age of animals, route of administration, dose used (doses that are high enough
to induce nephrotoxicity may produce hypertension as a secondary effect), method of measuring blood
pressure, and use of anesthesia. In reviewing the database on the mechanism of lead's hypertensive action in
animals, EPA (1986a) concluded that although lead, even at very low levels, produces effects on the renin-
angiotensin system in animals, these changes are not established as the cause of hypertension. Rather,
hypertension is more likely to be due to changes in vascular reactivity and level of sympathetic tone,
LEAD 266
2. HEALTH EFFECTS
both of which may be dependent on lead-related changes in intracellular calcium ion concentration (EPA
1986a).
Interpretation of the blood lead-blood pressure data in epidemiological studies of the general population
remains an area of controversy. Factors that contribute to the controversy include the methodology used to
monitor blood lead and blood pressure, and statistical issues. The association between blood lead and blood
pressure was the subject of a 1987 Symposium on Lead-Blood Pressure Relationships (Environmental
Health Perspectives, Volume 78, June 1988) and of several population studies (Elwood et al. 1988;
Grandjean et al. 1989; Neri et al. 1988; Pocock et al. 1988; Staessen et al. 1990, 1991). In addition, data
from the NHANES II study were re-analyzed by Coate and Fowles (1989) and Gartside (1988). As
summarized by Victery et al. (1988), both S. J. Pocock and J. Schwartz, considered the evidence from
general population epidemiological studies and concluded that a doubling of PbB levels is associated with
an increase of approximately 1-2 mm Hg in systolic blood pressure. Pocock concluded that the overall
evidence from the human studies did not support a causal relationship between PbB and blood pressure.
Schwartz concluded that, although a causal inference could not readily be drawn from the epidemiological
data alone, such an inference was consistent with the animal data. Based on the data for both humans and
animals, Schwartz concluded that a causal relationship is likely. Staessen et al. (1994a) reviewed 21 animal
studies published since 1977 and concluded that most found a positive association between blood pressure
and lead exposure. However, in the articles in which all the lead doses had been higher than 1 ppm, the
association between blood pressure and exposure was found to be positive in 7, inconsistent in 3, absent in
4, and negative in one. Five out of 6 studies that employed doses not exceeding 1 ppm reported a small
pressor effect, and one of these 5 failed to show a dose-response relationship when exposure was increased
from 0.1 to 1 ppm. Staessen et al. (1994a) noted that publication bias may have inflated the number of
positive studies appearing in the literature. They suggested that the significance to human health of lead
doses between 0.1 pm and 1 ppm given to genetically heterogeneous rats, dogs, or pigeons still needs to be
elucidated.
The results from more recent studies have not clarified the issue. In a study of the general population in
Belgium in which 2 sets of data were collected at a 6-year interval, Staessen et al. (1996) found that blood
pressure was not correlated with PbB or ZPP concentrations in men or women. The study further found that
the risk of becoming hypertensive was not associated with PbB or ZPP concentrations measured at the first
data collection. Results from the evaluation of participants in the Normative Aging Study showed that an
increase in tibia bone lead of about 29 ug/g was associated with an increased odds ratio of hypertension of
LEAD 267
2. HEALTH EFFECTS
1.5 (Hu et al. 1996a). However, the authors acknowledged that the procedures used to estimate long-term
ethanol ingestion and smoking habits were rather crude. Hu et al. (1996a) further stated that given the
cross-sectional nature of the investigation and the fact that tibia lead is an indicator of long-term absorption
and stores in cortical bone, they could not specifically evaluate the temporality of the relationship, making
premature any inference on causality.
Schwartz (1995) used meta-analysis to examine the evidence for an association between PbB concentrations
and systolic blood pressure in males. The results of the analysis showed a highly significant and moderately
consistent association—a decrease in PbB from 10 ug/dL to 5 ug/dL was associated with a decrease of 1.25
mm Hg (95% 01=0.87-1.63 mm Hg). Hertz-Picciotto and Croft (1993) reviewed all the major studies
conducted since 1980 and concluded that an increase in blood pressure was associated with increases in
blood lead in most, but not all, of the population-based studies. Regarding occupational cohorts, the
reviewer's opinion was that the results are mixed, but that overall the studies suggested a small positive
association between PbB and blood pressure. Staessen et al. (1994b) conducted a meta-analysis of 23
studies that included 33,141 subjects from either the general population (13 surveys) or from occupational
groups (10 studies). Separate analyses (whenever possible) of data from men and women and white and
black subjects showed that the association between blood pressure and PbB was similar in both genders and
in each race. In all 23 studies combined, a doubling in the PbB concentration was associated with a
1 mm Hg rise in systolic pressure and with a 0.6 mm Hg increase in diastolic pressure. Staessen et al.
(1994b) noted that the association with systolic pressure strongly relied on the inclusion of one study in
which women had their blood pressure measured at the end of pregnancy (Rabinowitz et al. 1987). The
association with diastolic blood pressure was, to a large extent, due to the results of the NHANES II survey
(Harlan et al. 1985; Pirkle et al. 1985). IPCS (1995) also reviewed the literature and concluded that no
causal relationship has been demonstrated between body burden of lead and blood pressure.
Limited data on occupationally exposed men indicate that the effect of lead on blood pressure may be
mediated in part through the renin-angiotensin system, as evidenced by lead-related increases in plasma
renin and angiotensin I levels (Campbell et al. 1985) and the kallikrein-kinin system, as indicated by a
correlation between renin and kallikrein (Boscolo et al. 1981). Evidence from patients with essential
hypertension and renal impairment suggests that excessive lead absorption may be involved in the
development of both conditions (Batuman et al. 1983).
LEAD 268
2. HEALTH EFFECTS
Gastrointestinal Effects. Colic, which is characterized by a combination of abdominal pain, constipation,
cramps, nausea, vomiting, anorexia, and weight loss, is a consistent early symptom of lead poisoning in
occupationally exposed cases or in individuals acutely exposed to high levels of lead. Colic is also seen in
children with lead poisoning. Histopathological evidence of lead-induced gastrointestinal damage has not
been reported. Adverse gastrointestinal effects have not been noted in animal studies, but it is difficult to
study the symptoms of colic that are noted in humans in the laboratory situation.
HematologicalEffects. Lead has long been known to have profound effects on heme synthesis. The
impairment of heme synthesis has a far-ranging impact not limited to the hematopoietic system. EPA
(1986a) summarized the known and potential consequences of the reduction of heme synthesis as shown in
Figure 2-11. The mechanisms by which lead interferes with heme synthesis are discussed in Section 2.4.2.
Numerous studies of both occupationally-exposed subjects and the general population have tried to correlate
PbB levels with changes in hematological parameters. Of all the parameters examined, ALAD activity
appears to be the most sensitive indicator of lead exposure. For example, in studies of the general
population, ALAD activity was inversely correlated with PbB levels over the entire range of 3-34 ug/dL.
In contrast, the threshold for increase in urinary ALA in adults is a PbB concentration of approximately
40 ug/dL; for increases in blood EP or ZPP the threshold in adults is around 30 ug/dL; and the threshold for
increased ZPP in children is about 15 u£/dL in children. Threshold PbB levels for decreased hemoglobin
levels in adults and .children have been estimated at 50 ug/dL and 40 ug/dL, respectively. Although the
measurement of ALAD activity seems to be a very sensitive hematological marker of lead exposure, the
inhibition of the enzyme is so extensive at PbB levels • 30 ug/dL that the assay cannot distinguish between
moderate and severe exposure.
Although the effects on some steps in the heme synthesis pathway occur at very low exposure levels, there
is some controversy as to the toxicological significance of a depression in ALAD activity in the absence of a
detectable effect on hemoglobin levels. EPA (1986a) and ATSDR (1988) are concerned about effects on
the heme synthesis pathway, however, because of the emerging evidence of a constellation of effects (as
seen in Figure 2-11), including inhibition of ALAD and pyrimidine-5'-nucleotidase activities, elevations in
EP levels, reductions in serum 1,25-dihydroxyvitamin D levels, and also subtle neurobehavioral,
electrophysiological, growth and blood pressure effects at low PbB levels (10-15 ug/dL and possibly
lower). Of particular concern is the impact that this constellation of effects may cause in the developing
organism, since exposure to lead may occur through the placenta and via maternal milk. In addition, young
LEAD 269
2. HEALTH EFFECTS
children, particularly those growing in socioeconomically disadvantaged areas, have a greater potential for
exposure and absorption, as reflected by their higher blood lead levels reported by recent population surveys
(Brody et al. 1994; Pirkle et al. 1994).
Musculoskeletal Effects. Individuals who have had high exposures to lead, either occupationally or by the
consumption of alcohol from lead stills, have been reported to exhibit a bluish-tinged line in the gums (i.e.,
the "lead line"). In addition, case reports of high occupational exposure to lead have described the
occurrence of muscle weakness, cramps, and joint pain.
Limited data from intermediate-duration experimental rat studies suggest that oral lead exposure may impair
normal bone growth (Escribano et al. 1997; Gonzalez-Rialo et al. 1997; Hamilton and O'Flaherty 1994,
1995; Gruber et al. 1997). Epidemiological studies have found inverse relationships between lead exposure
(reflected by PbB concentration) and growth of children (see Section 2.2.1.2, Other Systemic Effects).
These observed relationships in humans have not been conclusively linked to either direct or indirect effects
of lead on bone metabolism such as those suggested from the rat studies.
Hepatic Effects. Limited evidence exists to suggest that lead affects hepatic mixed function oxygenases by
inhibiting the formation of the heme-containing protein, cytochrome P-450 (Alvares et al. 1975; Saenger et
al. 1984). Abnormal liver function in individuals exposed to high levels of lead could not be conclusively
linked to lead because prior medical histories were not known. Studies in animals provide limited evidence
that lead may affect the liver. Reported in the literature include effects on hepatic glycogen and DNA
content and the ability to incorporate amino acids into proteins (Barratt et al. 1989). This evidence is not
conclusive because these end points are relatively non-specific, and no histopathological evaluation or organ
function tests (i.e., serum enzymes) were performed. Based on the information available in humans and
animals, it is difficult to conclude that lead adversely affects the liver.
Renal Effects. Exposure to lead that results in PbB ranging from approximately 60 to >100 ug/dL has been
associated with nephropathy in some studies of lead-exposed workers (e.g., Chia et al. 1995a). The
characteristics of early or acute lead-induced nephropathy in humans include nuclear inclusion bodies,
mitochondria! changes, and cytomegaly of the proximal tubular epithelial cells; dysfunction of the proximal
tubules (Fanconi's syndrome) manifested as aminoaciduria, glucosuria, and phosphaturia with
hypophosphatemia; and increased sodium and decreased uric acid excretion. These effects appear to be
reversible. Characteristics of chronic lead nephropathy include progressive interstitial fibrosis, dilation of
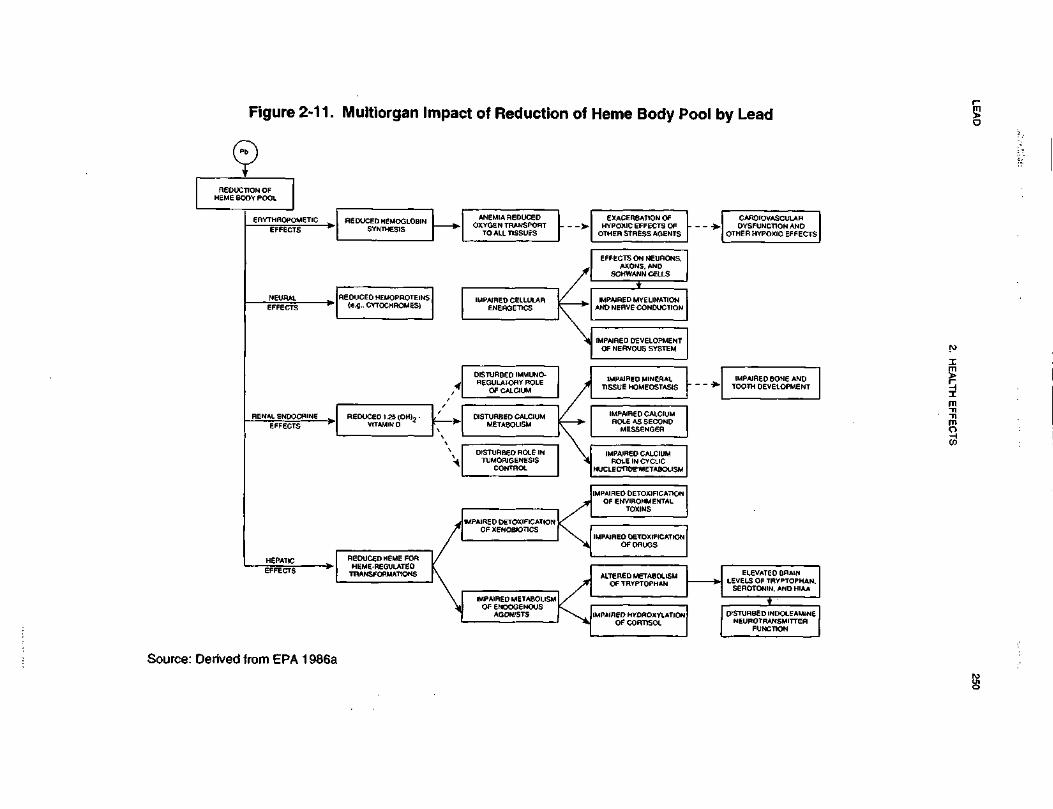
LEA
D250
2. H
EA
LTH
EF
FE
CT
S
oa>.•ooma>oo•o0)QCna.reD
)
CMIO)
EXACERBATION OFHYPOXIC EFFECTS O
OTHER STRESS AGEN
s>
AIRED MYELINATI ONNERVE CONDUCTION
ENM
DEVEOUS
IMPAIRED MINERALISSUE HOMEOSTASI
PAIRED CALCIUMOLE AS SECONDMESSENGER
1°
ALTERED METABOLISMOF TRYPTOPHAN
AIREDENERG
SO
SSS5
(i uj
Ms
33:38
°3!
m<
ocr =J u.g
g°
!2S
TURBEMETA
CEDI.25VITAMIN
COCO
UJE2*»-
•D0)O>O0)oCO
LEAD 270
2. HEALTH EFFECTS
tubules and atrophy or hyperplasia of the tubular epithelial cells, few or no nuclear inclusion bodies,
reduction in glomerular filtration rate, and azotemia. These effects are irreversible. The acute form is
reported in lead-intoxicated children, whose primary exposure is via the oral route, and sometimes in lead
workers. The chronic form is reported mainly in lead workers, whose primary exposure is via inhalation.
Animal studies provide evidence of nephropathy similar to that in humans, and particularly to the acute
form.
In human studies where no renal biopsies have been performed to prove conclusively the occurrence of
nephropathy, the results have not been consistent. This could partially be explained by the choice of the
renal function parameter studied. The only parameter of renal function shown to be affected in some studies
is an increase in the levels of N-acetyl-p-D-glucosaminidase (NAG). NAG is a lysosomal enzyme present
in renal tubular cells that has been shown to be a sensitive indicator of early subclinical renal tubular
disease. Increases in NAG in lead-exposed individuals have been seen at PbB levels of around • 62 ug/dL,
which suggests that lead may affect renal tubular function to a greater extent than glomerular function. The
marker is not specific and is also increased by exposure to cadmium. 1PCS (1995) reviewed the
epidemiological data and concluded that renal function impairment was not associated with PbB levels
below 62 ug/dL when measured by BUN and serum creatinine levels in workers exposed to lead. It should
be mentioned, however, that Kim et al. (1996a) found an association between PbB and serum creatinine in a
group of older men with PbB concentration lower than 62 ug/dL. IPCS (1995) stated that urinary NAG is a
more sensitive indicator since altered levels were found at PbB levels <62 ug/dL. This is consistent with
the results of a recent study that found a significant increase in urinary NAG in children with a mean PbB
concentration of 34.2 ug/dL (Verberk et al. 1996). In that study, NAG activity increased 14% per 10 ug/dL
PbB and was the only one out of 5 renal parameters evaluated that exhibited an association with PbB. Some
investigators have suggested that the elevation of urinary NAG activity may be a response to a sharp
increase in the renal lead burden rather than a response to the cumulative dose (Chia et al. 1994) and that a
preferable early indicator of renal toxicity is an increase in urinary a ] (1-globulin, which correlated well with
a time-integrated blood level index in lead exposed workers (Chia et al. 1995a, 1995b). The results from
Verberk et al. (1996) suggest that tubular function may be a more sensitive target for lead toxicity in
children than in adults, but the results need to be confirmed. A study of adults from the general population
provided suggestive evidence of impaired renal function in subjects with PbB • ¥0 ug/dL (Staessen et al.
1992).
LEAD 271
2. HEALTH EFFECTS
Kidney function has been evaluated not only in relation to PbB levels, but also in relation to bone lead
concentrations, which provide a better assessment of cumulative dose of lead to the kidneys than blood lead.
In a study of lead-exposed workers whose mean tibia lead was three times that of controls (66 versus
21 ^ig/g bone mineral) bone lead showed a modest but positive statistical association with both baseline and
peak creatinine clearance after a protein challenge (Roels et al. 1994). No association existed with PbB
(mean 43 ug/dL), urinary lead, or blood ZPP.
Excessive lead exposure has also been implicated as a causative agent in kidney disease associated with
gout and essential hypertension (Batuman et al. 1981, 1983). Gout patients with renal impairment, and
hypertensive patients with renal impairment, had significantly higher lead stores (as determined by the
3-day EDTA lead mobilization test) than gout patients or hypertensive patients without renal impairment,
respectively. Therefore, excessive lead absorption may be involved in the renal impairment seen in patients
with gout or essential hypertension.
Several studies conducted in children known to have lead toxicity, indicate that nephropathy occurs in
children only at PbB >80 ug/dL, and usually exceeding 120 u.g/dL (NAS 1972).
The possible mechanism kidney-induced hypertension is discussed in Section 2.4.2, Mechanisms of
Toxicity. Lead appears to affect vitamin D metabolism in renal tubule cells, such that circulating levels of
the vitamin D hormone, 1,25-dihydroxyvitamin D, are reduced. This effect is discussed later in this section
under Other Systemic Effects.
Endocrine Effects. Controversial data exist regarding thyroid function in workers occupationally exposed
to lead. A weak but statistically significant negative correlation was found between duration of exposure to
lead and thyroxin and free thyroxin levels in workers with PbB levels that were • '56 ug/dL and had over
10 years of exposure (Tuppurainen et al. 1988). According to the author, this finding could be explained by
a direct effect of lead on the thyroid gland; an effect on the hypothalamopituitary level; and an effect on the
peripheral turnover of thyroid hormones. A different study found no indication of altered thyroid function
in workers from a lead acid battery factory (Gennart et al. 1992a). However, in the latter study the PbB
levels were generally lower than in the workers examined by Tuppurainen et al. (1988), which would
indicate that thyroid changes are not good indicators of moderate lead exposure.

LEAD 272
2. HEALTH EFFECTS
Adverse effects on the thyroid have not been observed in children, however. In a study of inner-city
children, linear regression analysis revealed that there was no association between PbB levels and either
thyroxin or free thyroxin (Siegel et al. 1989). Similar findings were reported by Huseman et al. (1992) in a
group of 12 children from the Omaha Lead and Poison Prevention Program with PbB levels in the range of
41 to 72 ug/dL. Siegel et al. (1989) offered four possible explanations to account for this apparent lack of
effect of lead on thyroid function in children. First, children may be less susceptible than adults to the toxic
effects of lead on the thyroid gland. However, this is not consistent with the greater susceptibility of
children to the other toxic effects of lead (e.g., neurotoxicity). Second, the lead-exposed workers had higher
PbB levels than the children in this study (51.9 ug/dL versus 25 ug/dL). However, no effect on thyroxin
was seen even in children with PbB • 60 ug/dL. Third, the workers had a longer duration of exposure
(average exposure of 5.8 years versus 2.8 years in the children). Finally, thyroxin levels may not be a
sensitive enough indicator of thyroid function. In addition, the iodine content of the adult versus children's
diet should be compared because iodine intake affects thyroid function.
Ocular Effects. Visual problems have been noted in some human studies. These are mostly anecdotal in
nature and not well documented.
Long-term scotopic visual system deficits have been observed in laboratory animals following low-level
exposure during early postnatal development. A series of experiments were conducted in rats to determine
whether these effects are secondary to an effect on the central nervous system or are the result of a direct
effect on the eye following low-level exposure during early postnatal development. The results
demonstrated an adverse effect on the rods of the retina. This was evidenced by changes in single-flash
electroretinograms, selective degeneration of rod (but not cone) photoreceptor cells, accumulation of
glycogen particles in the retinas, decreased retinal sensitivity and rhodopsin content, and a decrease in rod
outer segment length with a selective loss of 20% of the rod cells (Fox and Chu 1988; Fox and Farber 1988;
Fox and Rubinstein 1989; Fox et al. 1997). These investigators also demonstrated that most of the effects
occur within the first 30 days of life, although the changes remain throughout the first year. A possible
mechanism of action for this selective adverse effect on the rods of the retina was proposed. This effect
could be due to a lead-induced alteration in cyclic nucleotide metabolism resulting in a change in the
activity of the sodium channels in the rods. To investigate this possibility, cyclic nucleotide content and the
activity of the enzymes associated with their metabolism were measured. A significant increase in cGMP
but not cAMP was found in the lead-treated rats. This increase in cGMP content was in turn found to be
associated with decrease cGMP-PDE activity (Fox and Farber 1988). Using cGPM-PDE isolated from
LEAD 273
2. HEALTH EFFECTS
frozen dark-adapted bovine rod outer segments, Fox and Srivastava (1995) showed that lead binds at the
magnesium site of the enzyme, but with 4-6 log units higher affinity. Effects of lead on the retina were also
reported in monkeys following lifetime exposure to lead (Kohler et al. 1997). In this study, the effects were
observed at a time when PbB levels were near control levels following a 3-year maintenance in a lead-free
diet.
Other Systemic Effects.
Effects on Vitamin D Metabolism. Lead appears to interfere with the conversion of vitamin D to its
hormonal form, 1,25-dihydroxy vitamin D. In children with PbB levels of 33-55 ug/dL, 1,25-dihydroxy-
vitamin D levels were reduced to levels comparable to those observed in children with severe renal
insufficiency (Rosen et al. 1980). In lead-exposed children with blood lead levels of 33-120 ug/dL,
1,25-dihydroxyvitamin D levels were depressed to levels (• 20 pg/mL) comparable to those found in vitamin
D-dependent rickets, type I—an inborn error of vitamin D metabolism in which the 1-hydroxylase system or
component thereof is virtually absent (Rosen and Chesney 1983; Rosen et al. 1980). These comparisons are
consistent with an effect of lead on the production of 1,25-dihydroxyvitamin D by renal 1-hydroxylase.
However, in children with low to moderate lead exposure (average lifetime PbB levels ranging from
4.8-23.6 ug/dL) and adequate dietary intake of calcium, phosphorus, and vitamin D, no effect was observed
on vitamin D metabolism, calcium and phosphorus homeostasis, or bone mineral content (Koo et al. 1991).
Based on these results, it appears that adverse effects on vitamin D metabolism may be manifested only at
chronically high lead exposures in children deficient in calcium, phosphorus, and vitamin D. After
reviewing the human data, IPCS (1995) also concluded that in the presence of adequate nutritional status,
PbB levels below 20 ug/dL appear to have no demonstrable effect on circulating concentrations of
1,25-dihydroxyvitamin D.
It is possible that lead's interference with heme synthesis may underlie the effects on vitamin D metabolism.
Evidence that lead affects heme synthesis in the kidney was presented in the section on hematological
effects. In addition, apparent thresholds for the effects of lead on renal vitamin D metabolism and for
erythrocyte protoporphyrin accumulation are similar.
Because the vitamin D-endocrine system is responsible in large part for the maintenance of extra- and
intracellular calcium homeostasis, it is reasonable to conclude that the interference of lead with renal
LEAD 274
2. HEALTH EFFECTS
1,25-dihydroxyvitamin D production will have an impact on fundamental processes throughout the body
(EPA 1986a). The potential impact is presented in Figure 2-11.
Lead was found to decrease tissue levels of vitamin C in a study in rats (Vij et al. 1998). Since vitamin C is
required for the synthesis of heme, the authors suggested that some hematological effects of lead (e.g.,
inhibition of ALAD) may be due at least partially to a lead-induced decrease in bioavailability or increased
demand of vitamin C. Supplementation with vitamin C almost completely restored ALAD activity in blood
and liver.
Effects on Growth. Some of the available evidence suggests a growth retardant effect of lead in children
(Angle and Kuntzelman 1989; Frisancho and Ryan 1991; Huseman et al. 1992; Lyngbye et al. 1987;
Schwartz et al. 1986; Shukla et al. 1989, 1991). These findings are supported by the results of independent
prospective studies of prenatal effects on human development discussed in Section 2.2.1.6 on
developmental toxicity and by numerous animal studies. However, several other studies have failed to
identify a significant association between PbB level and growth in children (Greene and Ernhart 1991; Kim
et al. 1995; Sachs and Moel 1989). The finding of a suppressed release of thyrotropin-stimulating hormone
(TSH) in response to thyrotropin-releasing hormone (TRH) in two young lead-intoxicated children suggests
pituitary involvement (Huseman et al. 1987). In vitro studies with rat pituitary cells showed that lead
inhibited the TRH-stimulated release of TSH in a dose-related manner (Huseman et al. 1987), supporting
the conclusions drawn from the human data. Alternatively, it is possible that nutritional deficits that retard
growth also increase lead absorption.
Immunological Effects. The effects on the immune system of young rats at PbB levels of 29
(Faith etal. 1979; Luster et al. 1978), of mice at PbB levels of 1 5-45 ng/dL (Hillam and Ozkan 1986), and
of rabbits at PbB of 1-2 |ig/dL (Zelikoff et al. 1993) raise the concern that low-level exposure of humans to
lead may also have adverse effects on the immune system. The best available human data, while not fully
adequate to address this issue, gave no indication of immune system effects in children with blood lead
levels of • 40 u.g/dL (Reigart and Graher 1976) and very inconsistent responses of both the cell and humoral
components of the immune system in lead workers with mean blood lead levels ranging from 19 to
80 u.g/dL (Alomran and Shleamoon 1988; Ewers et al. 1982; Fischbein et al. 1993; Pinkerton et al. 1998;
Sata et al. 1998; Ondeger et al. 1996). The inconsistent results may reflect differences in measures of
exposure (i.e., current PbB versus cumulative indices of exposure) and/or methodological differences in the
LEAD 275
2. HEALTH EFFECTS
evaluation of specific immunological endpoints. Overall, there has been no evidence of marked
immunotoxic effects of lead at the exposure levels studied.
Neurological Effects. The data on neurobehavioral toxicity of exposure to lead suggest that children
are more sensitive, as indicated by responses at lower PbB levels, than are adult humans, and that animals
are affected at roughly the same PbB levels as are humans.
In humans, encephalopathy can occur at PbB levels as low as 100-120 |ig/dL in some adults (Kehoe 196la,
1961b, 1961c; Smith etal. 1938) and at PbB levels as low as 80-100 u.g/dL in some children (EPA 1986a;
NAS 1972). This condition can result in death or in permanent cognitive impairment, particularly in
children. Furthermore, children with high PbB levels (>80-100 u.g/dL) and symptoms of lead poisoning, but
no symptoms of acute encephalopathy, also have an increased incidence of lasting neurological and
behavioral impairment (EPA 1986a).
Adults may have overt neurological signs and symptoms and impairment on neurobehavioral tests at blood
lead levels as low as 40-60 ug/dL (Baker et al. 1979, 1983; Campara et al. 1984; Haenninen et al. 1979;
Maizlish et al. 1995; Williamson and Teo 1986; Zimmerman-Tanselia et al. 1983). These blood lead levels
are comparable to those at which other symptoms of lead poisoning, such as gastrointestinal symptoms,
occur. Common limitations of studies examining neurobehavioral effects of lead in adults include
inadequate estimation of cumulative exposure and inadequate control for age and intellectual ability before
exposure. The importance of evaluating several measures of exposure (present, past, and cumulative) is
illustrated, for example, by Lindgren et al. (1996), who found no association between current, and relatively
low (27.5 ug/dL) PbB levels and neuropsychological variables in lead workers. The lack of association at
these PbB levels was not inconsistent with what others had found, but a significant association became
apparent when performance was measured against a cumulative dose estimate. Ehle and McKee (1990)
reviewed several studies published between 1978 and 1986 and concluded that "the issue of psychological
and neuropsychological effects of low-level lead in adults remains to be resolved in the studies reviewed.
The methodologies were so varied and the cultures in which the studies were conducted so diverse that it is
impossible to generalize across findings." Similar conclusions were drawn by Balbus-Kornfeld et al. (1995)
after evaluation of 21 studies, mostly cross-sectional studies. Two recent studies presented evidence of an
association between decreased neurobehavioral performance and PbB in aging subjects with mean PbB
concentrations around 5 u.g/dL (Muldoon et al. 1996; Payton et al. 1998).
LEAD 276
2. HEALTH EFFECTS
The overall results from evaluations of peripheral nerve function, specifically conduction velocity, suggest
that an inverse relationship exists between blood lead and speed of conduction. The role of lead was
apparent in a study by Araki et al. (1980) who found significant improvement in motor nerve conduction
velocity in workers following reduction of PbB by chelation therapy. The inconsistencies among studies
may reflect differences in the nerves evaluated, methodologies, characterization of lead exposure, and
control for confounding. Davis and Svendsgaard (1990) conducted a meta-analysis of 32 studies and found
that the median motor nerve shows more reliable effects of lead than other nerves. The LOAEL for
decreased nerve conduction velocity observed in adults appeared to be a PbB concentration of 30 ug/dL
(Seppalainen et al. 1983). It is possible that decreased peripheral conduction velocity may have affected
performance on some of the behavioral tests such as reaction time, grip strength, and eye-hand coordination.
In children with no symptoms of lead intoxication, the results have been inconsistent, but the overall
evidence suggests a negative association between lead exposure and cognitive development in children.
Neurobehavioral impairment, including IQ deficits of approximately 5 points, has been associated with
mean PbB levels of approximately 50-70 ug/dL (de la Burde and Choate 1972; Rummo 1974; Rummo et al.
1979). IQ deficits of approximately 4 points have been associated with PbB levels of 30-50 ug/dL
(estimated from dentin lead values and other data by the EPA [1986a]) (Needleman et al. 1979). The highly
significant inverse linear relationship between IQ and PbB levels over the range of 6 to 46 ug/dL found by
Hawk et al. (1986) and Schroeder and Hawk (1987) in black children of low socioeconomic status indicates
that IQ decrements may occur without an evident threshold down to very low PbB levels. A study of
children of higher and less uniform socioeconomic status in Edinburgh, Scotland, also reported a significant
inverse dose-effect relationship between PbB level and cognitive ability, with no threshold evident from the
mean PbB of 22.1 ug/dL in the highest lead group down to the mean PbB level of 5.6 ug/dL in the lowest
lead group (Fulton et al. 1987). Hence, the lack of threshold in the inverse relationship between PbB level
and cognitive function pertains not only to a particular socioeconomic status, but to the general population
of children. The data of Fulton et al. (1987) provide evidence of IQ deficits in children with lead exposure
at PbB levels <25 ug/dL (ATSDR 1988).
Several prospective studies have reported an inverse relationship between indices of lead exposure and
persistent neurobehavioral deficits in children (see also Section 2.2.1.6, Developmental Toxicity). The most
recent assessments are summarized below. In the Kosovo cohort (Yugoslavia) PbB, measured every
6 months from birth to age 4, was significantly associated with a decrease in GCl at each age point
LEAD 277
2. HEALTH EFFECTS
(Wasserman et al. 1994). The 4-year GCI scores declined by an estimated 4 points, while PbB, measured
between 24 and 48 months, increased from 10 to 25 ug/dL. A subsequent evaluation at age 7 found that a
change in lifetime PbB from 10 ug/dL to 30 ug/dL was associated with an estimated decrease of
approximately 4 IQ points (Wassermann et al. 1997). In the Port Pirie cohort (Australia), children's scores
on neurobehavioral tests were significantly and inversely correlated with log PbB levels at 6, 24, and
36 months, and with the integrated average for birth to 4 years (McMichael et al. 1988). The estimated
decrease in GCI score was approximately 7.2 points for an increase in integrated average PbB from 10 to
30 ug/dL. At 7 years of age, the IQ was reduced by 4.4-5.3 points for an increase in PbB level of 10 to
30 ug/dL (Baghurst et al. 1992). Also at this age, a deficits in visual motor performance were significantly
associated with increases in lifetime average PbB, suggesting that this parameter may be a more sensitive
index than IQ (Baghurst et al. 1995). There was also an inverse relationship between tooth lead
concentration and intellectual development when the children were tested in their eighth year (McMichael et
al. 1994). Neurobehavioral deficits persisted in this cohort at the age of 11-13 years (Tong et al. 1996).
Evaluation of the Boston cohort showed similar results. At 5 years of age, deficits in GCI scores correlated
significantly with PbB levels at 24 months of age (mean 7 ug/dL), but not with prenatal PbB levels
(Bellinger et al. 1991). Reevaluation at age 10 revealed that the decline in Full Scale IQ corresponded to
5.8 points per 10 ug/dL increase in 24-month PbB (Bellinger et al. 1992). In this cohort, tooth lead
concentration at age 8 was significantly associated with total problem behavior scores in school (Bellinger
et al. 1994); the association, however, was considered modest (<1% of the variance). Evaluation of the
Cincinnati cohort when the children were approximately 6.5 years old showed that almost every index of
postnatal exposure was associated with Wechsler Performance IQ, including PbB at 66 and 72 months of
age (Dietrich et al. 1993a). The analysis also showed that average lifetime PbB concentrations in excess of
20 ug/dL were associated with deficits in Performance IQ on the order of about 7 points compared with
children with mean PbB concentrations -to ug/dL. In addition, at the age of 6 years, children from this
cohort having an average mean lifetime PbB of approximately • 9 ug/dL appeared to have a deficit on both
the Bilateral Coordination subset and Fine Motor Composite relative to children in the lowest PbB quartile
(Dietrich et al. 1993b).
Several studies have reported no association between neurobehavioral impairment and low levels of lead
exposure. Cooney et al. (1989a) reported that PbB levels of approximately 10 ug/dL had little or no effect
on neurobehavioral development at age 4. Harvey et al. (1988) concluded that the effects of lead (mean
PbB, 13 ug/dL) were small and generally not significant. Likewise, Emhart et al. (1988), Lansdown et al.
(1986), and Pocock et al. (1989) found no effect of lead on intelligence.

LEAD 278
2. HEALTH EFFECTS
The seemingly inconsistent nature of the database on lead-induced neurobehavioral effects in children has
been the subject of many reviews (i.e., Bellinger 1995; Gatsonis and Needleman 1992; Mushak 1993;
Needleman and Gatsonis 1990; Pocock et al. 1994; Schwartz 1994; Winneke et al. 1990, 1996; IPCS 1995).
According to Bellinger (1995), the "lack of consistency in findings could be due to differences among study
cohorts in exposure/toxicokinetic factors (e.g., dose, timing), differences in the environmental
characteristics (e.g., co-exposures, co-morbidity, developmental supports, assessment setting), or differences
in the distribution of genetic characteristics that affect lead metabolism." Gatsonis and Needleman (1992)
identified a different set of statistical and methodological issues that have contributed to the inconsistencies:
(1) selection of adequate markers of exposure or internal dose, (2) measuring outcome with instruments of
adequate sensitivity, (3) identifying, measuring and controlling for factors which might confound the lead
effect, (4) recruiting and testing a sample large enough to provide adequate statistical power to detect a
small effect, (5) designing a study which avoids biases in sample selection and (6) assessing the effect of
measurement error. Despite the problems encountered, the overall conclusion is that there appears to be a
modest association between indices of lead burden, usually PbB, and global indices of development or
neuropsychological functioning, usually IQ. Support for this is provided by the results of several meta-
analyses and other analyses of cross-sectional and/or prospective studies (Needleman and Gatsonis 1990;
Pocock et al. 1994; Schwartz 1994; IPCS 1995). These analyses, briefly summarized below, concluded that
a doubling of PbB from 10 to 20 (ig/dL is associated with an average IQ loss of 1-3 points.
Needleman and Gatsonis (1990) conducted a meta-analysis of 12 studies 7 of which used blood lead as
measure of exposure and 5 used tooth lead. Covariates examined by the studies were socioeconomic status
(SES); parental factors (i.e., parent health score); parent IQ; parental rearing measures; perinatal factors
(i.e.,birth weight, length of hospital stay after birth); physical factors (i.e., age, weight, medical history), and
gender. The t-value of the regression coefficient for lead was negative in all but one study, and ranged from
-0.36 to 0.48 in the PbB group and from -3 to -.03 in the tooth lead group. Their analysis also showed that
no single study appeared to be responsible for the significance of the final finding.
Pocock et al. (1994) analyzed 5 prospective studies, 14 cross-sectional studies of blood lead, and 7 cross-
sectional studies of tooth lead separately and all together. Only studies published since 1979 were included
in the analysis. Analyses of the prospective studies showed no association of cord blood lead or antenatal
maternal blood lead with subsequent IQ. PbB at around age 2 had a small and significant inverse
association with IQ which was greater than that for mean PbB over the preschool years; the estimated mean
LEAD 279
2. HEALTH EFFECTS
change was -1.85 IQ points for a change in PbB from 10 to 20 ng/dL. For the cross-sectional studies of
PbB, the combined estimate for mean change in IQ for a change in PbB from 10 to 20 ug/dL was -2.53 IQ
points. For the cross-sectional studies of tooth lead, the mean change in IQ for a change in tooth lead from
5 to 10 ug/g was -1.03 IQ points. Comparison of the association with and without adjustment for covariates
showed that, with few exceptions, adjusting reduced the association by less than 1.5 points. Analysis of the
26 studies simultaneously indicated that a doubling of PbB from 10 to 20 ug/dL or of tooth lead from 5 to
10 ug/g is associated with a mean deficit in Full Scale IQ of around 1-2 IQ points. A threshold below
which there is negligible influence of lead could not be determined.
The analysis carried out by Schwartz (1994) included a total of eight studies, three longitudinal and five
cross-sectional, relating blood lead to Full Scale IQ in school age children. To evaluate potential
confounding, the baseline meta-analysis was followed by sensitivity analyses in order to contrast results
across studies that differ on key factors that are potential confounders. The analyses showed an estimated
decrease of 2.57 IQ points for an increase in PbB from 10 to 20 ug/dL. Analyses that excluded individual
studies showed that no single study appeared to dominate the results. For longitudinal studies, the loss was
2.96 IQ points and for cross-sectional, 2.69 IQ points. For studies in disadvantaged populations, the
estimated IQ loss was 1.85 IQ points versus 2.89 IQ points in nondisadvantaged populations. Also of
interest in Schwartz's analysis was the fact that a trend towards a higher.slope at lower blood lead levels
was seen. Direct analysis of the Boston prospective study (Bellinger et al. 1992), which had the lowest
mean PbB concentration (6.5 ug/dL) showed no evidence of a threshold for the effects of lead on IQ.
The European Multicenter Study (Winneke et al. 1990) combined eight individual cross-sectional studies
from eight European countries which shared a common protocol with inherent quality assurance elements.
A total of 1,879 children, age 6-11 years, were studied. PbB concentration was used as a measure of
exposure and the range was 5-60 ug/dL. The overall statistical analysis was done using a uniform
predetermined regression model with age, gender, occupational status of the father, and maternal education
as confounders or covariates. The results of the analyses showed an inverse association between PbB and
IQ of only borderline significance (p<0.1), and a decrease of 3 IQ points was estimated for a PbB increase
from 5 to 20 ug/dL. Much higher and significant associations were found for tests of visual-motor
integration and in serial choice reaction performance. Yet, the outcome variance explained by lead never
exceeded 0.8% of the total variance. No obvious threshold could be located on the dose-effect curves.

LEAD 280
2. HEALTH EFFECTS
A Task Group on Environmental Health Criteria for Inorganic Lead conducted separate meta-analyses on
four prospective studies and four cross-sectional studies (IPCS 1995). The European Multicenter Study was
one of the cross-sectional studies included in the analyses. The outcome measured was Full Scale IQ at age
6-10 years old, and the measure of exposure was concentration of lead in blood. In the analyses of
prospective studies, when cumulative exposure rather than lead at a specific time was used as measure of
exposure, the association between changes in PbB and changes in IQ did not reach statistical significance
(p>0.05). However, weighing studies according to the inverse of their variance produced a weighed mean
decrease in Full Scale IQ of 2 points for a 10 u.g/dL increase in PbB level. When blood lead levels at
specific times were considered, the inverse association varied from significant and very strong to less strong
and of borderline significance, depending on the specific time chosen. Analyses of cross-sectional studies
showed a significant inverse association between increase in blood lead an decrease in IQ in only 2 out 10
studies, however, there was no evidence of statistical heterogeneity. The meta-analysis estimated that Full
Scale IQ was reduced by 2.15 IQ points for an increase on PbB from 10 to 20 ug/dL. FPCS (1995) also
confirmed that the positive association between lead measures and indicators of social disadvantage. When
social and other confounding factors are controlled, the effect in most cases was to reduce the strength of the
association between lead measures and IQ without, however, changing the direction.
It should be noted that the effects of blood lead on IQ and other neurobehavioral scores are very small
compared with the effects of other factors such as parent's IQ or vocabulary (Fulton et al. 1987; Pocock et
al. 1987; Winneke et al. 1985a). Lead neurotoxicity, however, may have major implications for public
health when exposure is considered in terms of large populations and its preventable nature (Davis and
Svendsgaard 1987; Grant and Davis 1989).
Hearing thresholds in children may be affected adversely by lead exposure at low blood lead levels
(Robinson et al. 1985; Schwartz and Otto 1987, 1991). Robinson et al. (1985) reported that hearing
thresholds increased linearly with maximum historical PbB levels of 6.2-56.0 ug/dL. In the analyses by
Schwartz and Otto (1987, 1991), the probability of lead levels studied (NHANES 11 and HHANES data,
respectively), from <4 to >50 u.g/dL, with no apparent threshold. There is also some evidence suggesting
that lead exposure may cause postural disequilibrium in children (Bhattacharya et al. 1993). The children
evaluated in that study had a geometric mean PbB for the first 5 years of life of 11.9 ug/dL, the range was
5.1 to 28.2 ug/dL.
LEAD 281
2. HEALTH EFFECTS
Evidence of electrophysiological changes (altered slow-wave voltage during conditioning, changes in
evoked potential measures and peripheral nerve conduction velocities) has been observed in children at low
PbB levels (15-30 ug/dL and possibly lower) (EPA 1986a; Holdstein et al. 1986; Landrigan et al. 1976;
Otto et al. 1981, 1982, 1985; Robinson et al. 1987; Rothenberg et al. 1994; Winneke et al. 1984). Results
from recent studies have also suggested that lead may affect visual evoked potentials in children who had a
geometric PbB concentration of 4.3 ug/dL (range, 1.4-17.4 ug/dL) (Altmann et al. 1998; Winneke et al.
1994).
Delays in reflex development have been reported in rats during early postnatal life at PbB levels • 59 ug/dL
(Kishi et al. 1983), and alterations in visual evoked responses and decreased visual acuity in young rats
occurred at mean PbB levels of 65 ug/dL (Cooper etal. 1980; Fox et al. 1977, 1982; Impelman et al. 1982;
Winneke 1980). Decreased visual acuity persisted through 90 days of age even though exposure was
terminated at 21 days of age.
Neurobehavioral effects, measured in various discrimination reversal and operant learning tests, were
observed in lead exposed rats. PbB levels in rats as low as 15-20 ug/dL were associated with slower .
learning and higher rates of inappropriate responses (Cory-Slechta et al. 1985; Jadhav and Areola 1997).
Neurobehavioral alterations were also reported in young rats that had been exposed to lead via maternal
milk, but that at the time of testing had PbB levels below the detection limit (Cory-Slechta et al. 1992).
Similar experiments in monkeys support the findings in rats, with even lower PbB levels associated with
adverse effects, levels that were comparable to those at which subtle effects are seen in human children.
Monkeys given a soluble lead compound at 0.05 mg lead/kg/day orally from birth until neurobehavioral
testing at 3-4, 6-7, and 9-10 years of age had peak and steady-state PbB levels of 15.4 and 10.9 ug/dL and
performed significantly less well in learning discrimination reversal and delayed alternation tasks than did
controls (Gilbert and Rice 1987; Rice 1985a, 1985b). In addition, monkeys orally exposed to lead for the
first year with average blood lead levels of 32 ug/dL had neurobehavioral effects that persisted from
termination of exposure at 1 year through 49-55 months of age, at which time PbB levels had decreased to
5 ug/dL, virtually the same as control values (Bushnell and Bowman 1979b, 1979c). Lilienthal and
Winneke (1996) reported long lasting altered brain stem auditory evoked potentials in monkeys 18 months
after termination of chronic lead exposure, at which time PbB concentration had returned to nearly normal
values. Persistent neurobehavioral alterations (open field behavior) were reported also by Ferguson and
Bowman (1990) in monkeys tested 3 years after cessation of exposure; however, no such effects were
observed when the monkeys were tested at 7 years of age (Ferguson et al. 1996).

LEAD 282
2. HEALTH EFFECTS
The overall evidence from studies in animals supports the observations of lead neurobehavioral effects in
humans. As pointed out by Cory-Slechta (1995), studies in animals "have provided a direct measurement of
the behavioral process per se, and have done so in the absence of the covariates (e.g., socioeconomic status,
parental 1Q) known to affect IQ scores in human studies." It is also worth noting that animal studies, in
which the experimental design is carefully controlled, have shown that the t iming of exposure is crucial, that
different neurobehavioral outcomes are affected differently (different thresholds), and that some behavioral
alterations last longer than others.
Reproductive Effects. There is sufficient qualitative evidence to support the conclusion that at high
occupational exposure levels lead has significant adverse effects on human reproduction, including
increased incidences of spontaneous abortion, miscarriages, and stillbirths. The mechanisms responsible for
these effects are unknown at this time, but many factors may contribute to these results. These factors
include indirect effects of lead on maternal nutrition or hormonal status before and during pregnancy to
more direct gametogenic effects that could affect parental fertility in either sex. The available data do not
permit any estimate of effect levels in women, although two studies found no effect on the rate of
spontaneous abortions at PbB levels of 10 u.g/dL. Regarding male reproductive function, evidence is
accumulating from the more recent studies (Alexander et al. 1996; Gennart et al. 1992b; Lerda 1992; Lin et
al. 1996) that adverse effects such as lowered sperm counts, and increases in the numbers of abnormal
sperm may be associated with PbB concentrations below the currently accepted worker protection criteria of
40 ug/dL. Studies that did not find decreased fertility among lead-exposed male workers are not necessarily
in contradiction with those that did find such an effect. As discussed for example by Bonde and Kolstad
(1997) in their study of Danish workers, reduced fecundity does not necessarily translate into reduced
fertility in populations such as the Danish one where most couples plan the size of their family and have
easy access to contraception. Impairment of fecundity may go on unnoticed because couples continue to try
until they become pregnant.
Studies in animals have, in general, been supportive of the reproductive findings of studies in humans.
Studies in male monkeys exposed for lifetime and using exposure protocols to evaluate different
developmental ages have reported structural alterations in the testis at PbB levels relevant to the human
population (Foster et al. 1996, 1998). Moreover, exposure only during infancy resulted in noticeable
alterations at the age of 10 years (Foster et al. 1998). Studies in a rat "lifetime" model showed that
continuous lead exposure produces a developmental delay in sexual maturity (Ronis et al. 1998b, 1998c) by
suppressing the normal sex steroid surges observed at birth and during puberty.

LEAD 283
2. HEALTH EFFECTS
Developmental Effects. Evidence from human studies on congenital anomalies as an end point
(Ernhart et al. 1985, 1986; McMichael et al. 1986; Needleman et al. 1984) indicate no association between
prenatal exposure to low levels of lead and the occurrence of major congenital anomalies. This conclusion
is further supported by developmental toxicity studies conducted in rats and mice; these studies provide no
evidence that lead compounds (acetate or nitrate) are teratogenic when exposure is by natural routes (i.e.,
inhalation, oral, dermal). Intravenous or intraperitoneal injection of lead compounds (acetate, chloride, or
nitrate) into pregnant rats, mice, or hamsters, however, has produced malformations in several studies
reviewed by EPA (1986a).
The effects of low levels of lead on birth weight and gestational age are controversial. The earlier evidence
for such effects was not reproduced in more studies by Factor-Litvak et al. (1991) and Greene and Ernhart
(1991). A significant inverse association between prenatal maternal blood lead levels and birth weight was
reported in the Cincinnati study (Bornschein et al. 1989; Dietrich et al. 1986, 1987a). An earlier study
showed that the percentage of small-for-gestational-age infants increased with increasing cord blood lead,
although the trend was not quite statistically significant (Bellinger et al. 1984). Significant direct
associations between maternal and cord PbB levels and birth weight were reported by McMichael et al.
(1986). On the other hand, no association has been observed between maternal or cord PbB levels and birth
weight in several other studies (Ernhart et al. 1985, 1986; Factor-Litvak et al. 1991; Greene and Ernhart
1991; Moore et al. 1982; Needleman et al. 1984).
Evidence from some of the above studies also indicates that gestational age may be reduced as prenatal lead
exposure increases, even at blood lead levels below 15 ug/dL (EPA 1986a). Significant negative
correlations between maternal or cord PbB levels and gestational age were reported by Dietrich et al. (1986,
I987a), McMichael et al. (1986), and Moore et al. (1982). Based on parameter estimates of Dietrich et al.
(1986), the reduction in gestational age was 0.6 week per natural log unit of PbB increase (EPA 1986a).
Based on risk estimates of McMichael et al. (1986), the risk of preterm delivery increases by at least
fourfold as either cord PbB or maternal PbB level at delivery increases from • 8 to >14 ug/dL. However,
other investigators did not find a significant relationship between maternal or cord PbB level and gestational
age (Bellinger et al. 1984; Factor-Litvak et al. 1991; Needleman et al. 1984).
As mentioned in the section on Neurological Effects, studies that examined the neurodevelopmental effects
of low level lead exposure in children have not been totally consistent. Part of the difference can be
attributed to different experimental designs (Bellinger 1995). Several indices of exposure have been used

LEAD 284
2. HEALTH EFFECTS
including prenatal (maternal) PbB, neonatal (cord lead) blood lead, postnatal PbB at various ages, and
dentin lead. In addition, studies used different neurobehavioral tests. In spite of this, it appears that some
neurodevelopmental deficits observed around 2 years of age and thereafter are much better correlated with
postnatal indices of lead exposure than with prenatal or cord PbB levels. In some studies, neurodevelop-
mental impairment (at age 5) has been correlated at 24 months of age with mean PbB levels as low as
7 ug/dL (Bellinger et al. 1991). In general, the degree of neurodevelopmental impairment is considered
modest. However, although a 2-8-point decline in Mental Developmental Index (MDI) score for an
individual child may not be clinically significant, a 4-point downward shift in a normal distribution of MDI
scores of a population of children would result in 50% more children scoring below 80, a consequence of
great concern to public health (Davis and Svendsgaard 1987; Grant and Davis 1989). Furthermore, even
small decrements in performance, when they occur at a critical or important time such as the early years of
school when children learn the most fundamental skills, can have detrimental effects for long periods
thereafter. Additional evidence of an association between relatively low PbB levels and neurobehavioral
effects in children is reported in Section 2.2.1.4.
Some studies demonstrating neurobehavioral and developmental effects discussed in this section on
developmental toxicity as well as in the previous section on neurobehavioral toxicity have been criticized
for methodological flaws, including handling of cofactors (EPA 1986a; Ernhart 1988). ATSDR (1988) and
EPA (1986a) have taken such criticisms into account, and have concluded that the findings associating
relatively low blood lead levels with neurobehavioral and developmental effects in children are nonetheless
cause for concern. It should be noted that some of the studies that demonstrated no such association, have
also been criticized for methodological flaws and bias towards Type II (false negative) errors (Needleman
1987b; Needleman and Bellinger 1987). Although no single study associating low blood lead levels with
reduced cognitive performance in children is definitive, the results of several meta-analyses of both
prospective and cross-sectional studies suggest a small inverse association between measures of lead
exposure and neurodevelopmental indices (IPCS 1995; Needleman and Gatsonis 1990; Pocock et al. 1994;
Schwartz 1994).
In summary, on the basis of IQ measurements, which provide a better degree of comparability between the
studies than various sensorimotor paradigms, it appears that a highly significant IQ decrement of 1-3 points
is associated with a change of PbB from 10 to 20 ug/dL. This relationship is supported by prospective and
cross-sectional studies (see IPCS 1995; Needleman and Gatsonis 1990; Pocock et al. 1994; Schwartz 1994
for individual studies included in the meta-analyses).

LEAD 285
2. HEALTH EFFECTS
Children appear to be much more sensitive to lead-related neurobehavioral alterations than adults.
Neurobehavioral dysfunction has not been demonstrated in lead-exposed workers at PbB concentrations
below 40 ug/dL, whereas cognitive and sensorimotor deficits have been shown in children to be associated
with PbB concentrations as low as 10 to 15 ug/dL. To put these findings in perspective, a 1-3 point
IQ decrement corresponds to 1/5 or less of a standard deviation of the typical 1Q distribution. While this
qualifies as a small population-effect, the normal variability of individual susceptibility means that there
may be a larger IQ deficit in particularly vulnerable individuals.
Animal studies support he human evidence of neurobehavioral toxicity from prenatal exposure to low levels
of lead. In an extensive review of the literature, Davis et al. (1990) discussed similarities between human
effects and those in animals. The authors concluded that qualitatively ". .. the greatest similarities between
human and animal effects involve cognitive and relatively complex behavioral processes such as learning."
They further reported that quantitative relationships for PbB levels across species that cause developmental
neurobehavioral effects are 10-15 ug/dL in children, <15 ug/dL in primates, and <20 ug/dL in rodents.
Jn contrast to the animal studies for prenatal exposure, animal studies for postnatal exposure report effects at
blood lead levels similar to those associated with effects in humans.
Genotoxic Effects. Evaluation of the genotoxicity of lead in humans has focused on evaluations of
lymphocytes from occupationally or environmentally exposed persons (Table 2-10) and in vitro studies of
structural chromosomal aberrations and sister chromatid exchange in cultures of lymphocytes taken from
healthy individuals (Table 2-11). Results of studies with human lymphocyte cultures exposed in vitro to
lead acetate were nearly equally divided between positive (Beek and Obe 1974; Niebuhr and Wulf 1984)
and negative (Beek and Obe 1975; Deknudt and Deminatti 1978; Gasiorek and Bauchinger 1981; Schmid et
al. 1972).
Maternal and fetal chromosomal aberrations were observed in mice following prenatal exposure to
subembryotoxic doses of lead nitrate (Nayak et al. 1989a). Pregnant Swiss Webster mice were given
intravenous doses of lead nitrate at levels of 12.5, 25, 50, and 75 mg/kg body weight on the 9th day of
gestation. On day 18, the animals were killed, and maternal bone marrow cells and fetal liver cells were
examined for chromosomal aberrations. Low levels of constitutive changes mostly in the form of deletions
were seen at all doses administered in both maternal and fetal cells indicating that prenatal exposure to lead
may induce genotoxic changes in the fetus.
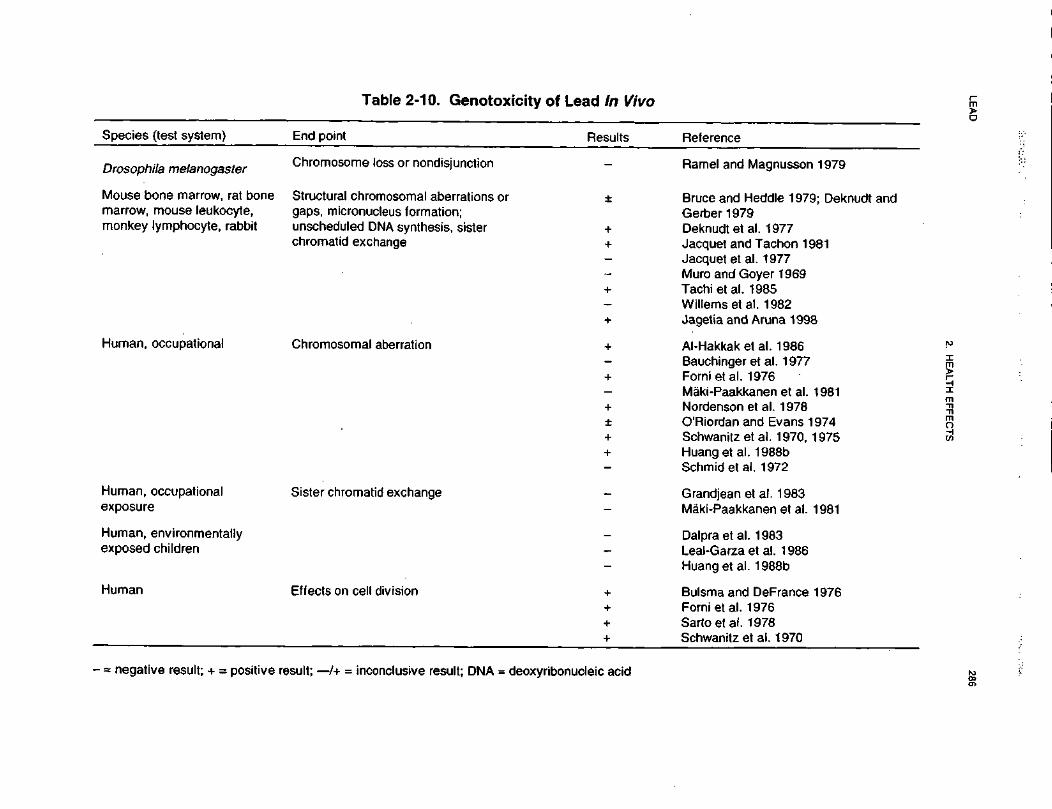
LEA
D286
2. H
EA
LTH E
FF
EC
TS
Os•a10s-J^^o>»,0'xoo0)
Oo10)
SI<a
Reference
£"5to0)DCc:'oQ
.•DU
J«tototoCD8Q.
CO
o>O5^-Ramel and Magnussoricgoc'•&oo82CDE%oE2.c0
Ql
!CD0)E£1Q
•acCOcCDQ
,-00
03 o>
CDK
'
-C
D
22
03
c
§
?*""
£"* o I s*- O
) c\j
Q)
r*» _
c
f**» ^
CO
(0T
I ^ ^
O5 '
lO O
) C
Ti
l" u~ ^
^™
05 0
0 ^~
^
-a
cn
'S^
^^
-s
'Sc
8 "ill
11 11
•H
+
+
1
1
+
I +
^_OCOc
*—O
CD
^'Is
•—i_
j_- W
CU O
to"
«| 8
« |
£8 w
^ Si
§ w $ ci
2 So
o
•5 .0 ~B
;a_3
E
CD |j
t5 uj- -5 §
~
CO
C
£
C/5 O
3 3
O
0)cSC
D-S
•*-• -^
Q
llit:
CD
><
>- —
O
«
CD
0
E
co -c
g | E
o E
>.
3 t C
o co o
2
E E
,_ ^
C3> £:
o>
co h- •
"to *
w
°"
rri O
) C
O
CO
O
Jis
•»— •
•*— •
Q)
llsfii^
lSs
« o
•£ ~
-g
.2 5
cE
+
1 +
1
+
* +
+
I
cot^15EoE2.cO"coOfflQ.
OCO3
Grandjeanet al. 1983i0)O)
CO.coX0)T
Q00E2_c~0sCO"reofoQ
.
8oc"CO3I
,_0)Maki-Paakkanen et al.i9?exposu
CO
CO
2*
co oo
CO
—
j 00
cO CO
cO
co (
O)
^" "(0
^
CO fl)
^r^
j T*
I I
I
^CDE c
C
CD
o >-*~
lO
fc T3
co to
Eo
_, Q
.i S
cos
Bulsma and DeFrance+co[to'>"55ocQUJ
oUJHuman
gO5
CO
C
O
]T
05 03 «
-
»-
"53
"co ra ^
a> ®
a
151
O
CO
Ou. co co
+ + +
•D8o'CDT3co.QXO0)^IID1CD
'co"oCII
f10)^'tooQ.
II"5to£CDraCDI
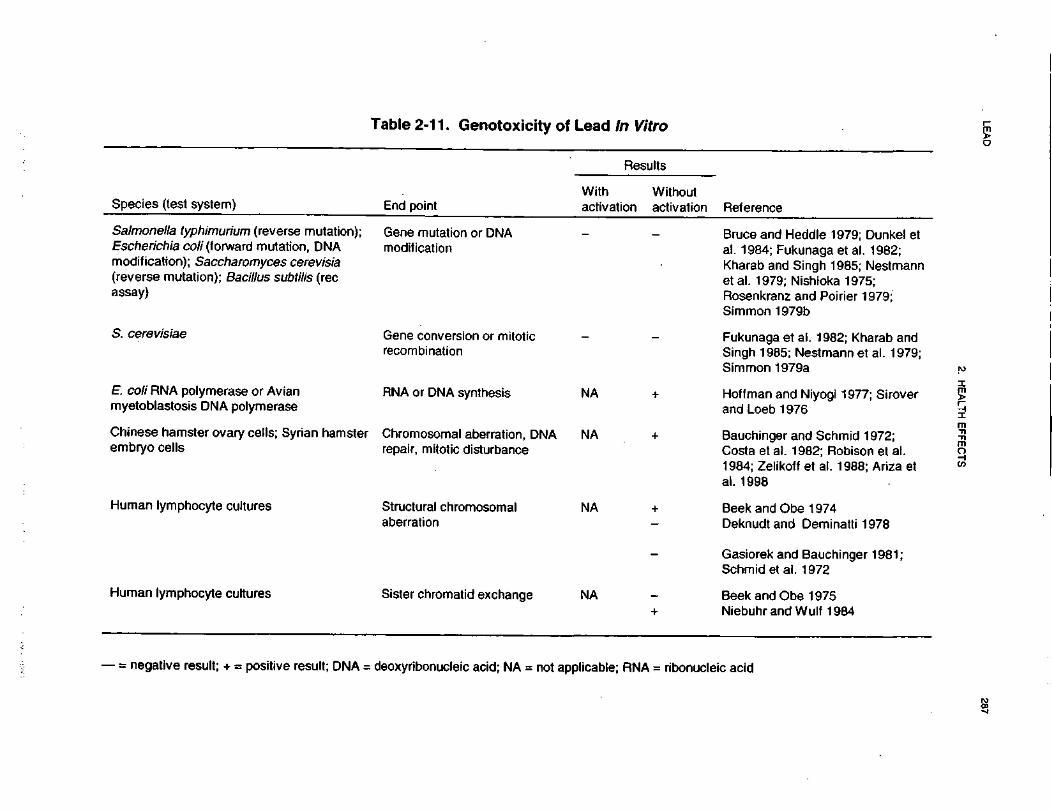
LE
AD
287
2. H
EA
LTH
EF
FE
CT
S
Q.{5S "^~"
5""••T
3n0)•J
^^o>,
"5Genotoxi
CNJ0)J3(DH
-
Reference
c—
.2
o ^5
£ •-
J2 >
^
"5COQ)
cC
L g15
.c >
« *
-*5
re'cT3
LU
"ESiQ)
CO0)'o0)Q
.CO
cCD
C_
C
O
c co
t/3
6>"3
O
3
QJ
(N»
Q ••-
in
" 0
5
Bruce and Heddle 1979; Ial. 1984; Fukunaga et al.Kharab and Singh 1985; Ietal. 1979; Nishioka 197!Rosenkranz and Poirier 1Simmon 1979b
iizQOcoCO o
IsE o
"c"gS
Z
w
Q>
3 D
'S i^
E
- c ^
Salmonella typhimurium (reverseEscherichia co// (forward mutatioimodification); Saccharomyces ce(reverse mutation); Bacillus subtiassay)
-a oi
c r--re a>^5
'"
£? -=
M
CO
CO
.
Fukunaga et al. 1982; KhSingh 1985; Nestmann et
iio010o'co c
Gene conveirecombinatic
S. cerevisiae
Simmon 1979a
*—<D§h.
w. _f*^f"»»
T—
"5)
oiZ C
D
CO "*"
I!li+z
, synthesis
<Q0ocE. co// RNA polymerase or Avianmyetoblastosis DNA polymerase
. . re
CM
*-r^
cu05
c
Bauchinger and Schmid 1Costa et al. 1982; Robiso
+zzQ
al aberration,c disturbance
Chromosomirepair, mitoti
u.
CDwCOcCOChinese hamster ovary cells; Syrembryo cells
*_>0)sN^co~COo>"re"531(D
00
O>
Beek and Obe 1 974Deknudt and Deminatti 1
+ i
^z
romosomalStructural chaberration
Human lymphocyte cultures
^_"coT~Gasiorek and BauchingerSchmid etal. 1972
i
Beek and Obe 1975Niebuhr and Wulf 1984
i +
^zCDD)
COOXCD•g"re0oCD
.«Human lymphocyte cultures
i'«•c.f'H44•'"'''i:<cT<4t
Ci!c4'iI4ic\(1
LEAD 288
2. HEALTH EFFECTS
A single intracardiac dose of 40 ug/g body weight lead acetate induced a 25-fold increase in mitosis of
mouse liver cells 5 hours after injection (Choie and Richter 1978). Results were mixed for various
manifestations of genotoxicity or cell cycle disruptions in several experiments with lead acetate in mammals
(Bruce and Meddle 1979; Deknudt and Gerber 1979; Deknudt et al. 1977; Jacquet and Tachon 1981; Jacquet
etal. 1977; Muro and Coyer 1969; Tachietal. 1985; Willems et al. 1982).
Acute intraperitoneal exposure to 25 mg lead/kg as acetate resulted in no increase in the number of
micronuclei in bone marrow polychromatic erythrocytes in mice examined 6 hours after dosing (Jacquet et
al. 1977). In contrast, a significant increase in the frequency of micronuclei was observed in bone marrow
from mice treated intraperitoneally with single doses of 0.4 to 50 mg lead/kg as lead nitrate; increases were
observed 12 to 36 hours after dosing (Jagetia and Aruna 1998). The response was not dose-related. With
few exceptions, the frequency of micronuclei was significantly higher in male mice than in females at all
doses and at all post-treatment periods. Lead acetate administered intraperitoneally to Sprague-Dawley rats
caused an increase in the percentage of aberrant bone marrow cells in female, but not male rats. The
aberrations were primarily chromatid gaps, although there was no dose dependency across the four dose
points used (Tachi et al. 1985).
Several genotoxic end points were assayed in male rabbits after subcutaneous injection of doses of 0, 0.25,
and 0.50 mg lead acetate/kg body weight 3 times a week for 14 weeks. No treatment-related effects were
seen in sperm count, morphologic abnormalities of sperm, histopathology of the testes, or on the number of
sister chromatid exchanges in lymphocytes or the relative number of micronuclei in bone marrow
erythrocytes (Willems et al. 1982). Tests for gene mutations, DNA modification, and recombinations in
various microorganisms (See Table 2-11) using lead acetate (Bruce and Heddle 1979; Dunkel et al. 1984;
Nishioka 1975; Rosenkranz and Poirier 1979; Simmon 1979a, 1979b; Simmon et al. 1979), lead nitrate
(Kharab and Singh 1985), and lead chloride (Fukunaga et al. 1982; Nishioka 1975) were consistently
negative with or without metabolic activation. Lead chloride was shown to be mutagenic in Salmonella
typhimurium strain TA102 without S9 activation; it was nonmutagenic in three other strains with and
without activation (Wong 1988). A positive response was observed by Nestmann et al. (1979) for lead
chromate, but further testing clarified that the positive response was associated with the chromate rather
than the lead moiety. Lead chloride has been shown to inhibit both RNA (Hoffman and Niyogi 1977) and
DNA (Siroverand Loeb 1976) synthesis.
LEAD 289
2. HEALTH EFFECTS
In mammalian test systems in vitro (Syrian or Chinese hamster cells), lead acetate gave conflicting results
for structural chromosomal aberrations (Bauchinger and Schmid 1972; Robison et al. 1984). Lead acetate
increased the frequency of DNA repair (Robison et al. 1984), and the frequency of achromatic lesions and
gaps (Bauchinger and Schmid 1972); both lead acetate (Bauchinger and Schmid 1972) and lead sulfate
(Costa et al. 1982) interfered with normal mitotic division. Both lead sulfide and lead nitrate were
mutagenic at the hypoxanthine guanine phosphoribosyl transferase (HPRT) locus in Chinese hamster V79
cells (Zelikoff et al. 1988). Because these investigators failed to demonstrate either sister chromatid
exchange induction or DNA single-strand breaks following treatment with either lead compound, they
propose an indirect mechanism of genotoxicity probably involving DNA repair enzymes. A series of
experiments with lead acetate alone and lead acetate in conjunction with ultraviolet radiation indicate that
the mechanism of genotoxicity of lead ions may indeed be an indirect one (Hartwig et al. 1990). Lead
acetate alone did not induce DNA-strand breaks in HeLa cells or mutations at the HPRT locus, nor did it
increase sister chromatid exchange frequency in V79 Chinese hamster cells. However, for all end points
tested, lead ions interfered with the processing of UV-induced DNA damage, thus increasing the frequency
of the end points measured. These authors suggested the possibility of interference with repair enzymes
such as polymerase or ligase, or else interaction with calcium-regulated processes. An interaction with
calcium-regulated processes, such as those modified by calmodulin, would be consistent with other
observed interactions with calcium levels (Deknudt et al. 1977). Lead is also known to form complexes
•with amine and carboxyl groups of proteins, which in turn can lead to enzyme inactivation (Bota et al.
1982). A recent study using Chinese hamster ovary cells suggested that the mutagenicity of lead may be
due to lead-induced formation of reactive oxygen intermediates such as hydrogen peroxide (Ariza et al.
1998).
Cancer. The information available on the carcinogenicity of lead in occupationally exposed humans is
limited in its usefulness because the lead compound(s), the route(s) of exposure, and the levels of exposure
were not always reported. Furthermore, concurrent exposure to other chemical (including arsenic,
particularly in lead smelters) and confounding variables, such as smoking, were often not evaluated.
Therefore, the data currently available do not support an assessment of the potential carcinogenic risk of
lead in humans.
Fu and Boffetta (1995) conducted a meta-analysis of case-control and cohort epidemiology studies focusing
on overall cancer, stomach cancer, lung cancer, kidney cancer, and bladder cancer. They found a significant
excess risk of overall cancer, lung cancer, and bladder cancer. The corresponding relative risk ratios (RR)
LEAD 290
2. HEALTH EFFECTS
and 95% CI were 1 . 1 1 (1.05-1.17), 1.29 (1.10-1.50), and 1.41 (1.16-1.71). The RR for kidney cancer was
also high, but did not achieve statistical significance. When meta-analysis was restricted to studies that
were conducted in battery or smelter industries where exposure to lead was heavy, slightly higher RRs for
cancers of the stomach (1.50) and lung (1.42) were found. A serious limitation of this analysis is that no
corrections for confounders could be made because there were no data available in most reports. Some of
these confounders included cumulative exposure to lead, smoking and dietary habits, and exposure to other
chemicals.
According to EPA (IRIS 1999), the available human epidemiological studies lack quantitative exposure data
for lead and for possible confounding exposures (e.g., arsenic, smoking). Cancer excesses in the lung and
stomach of lead-exposed workers that are reported are relatively small, dose-response relationships are not
demonstrated neither is there consistency in the site of cancers reported. EPA (IRIS 1999) concluded that
the human data are inadequate to refute or demonstrate the potential carcinogenicity of lead exposure.
The available data on the carcinogenicity of lead following ingestion by laboratory animals indicate that
lead is carcinogenic, and that the most common tumors to develop are renal tumors (Azar et al. 1973; Koller
et al. 1985; Van Esch and Kroes 1969). Administration of lead compounds by the parenteral route produced
similar results. Lead subacetate was positive at high dosages in the strain A mouse lung adenoma bioassay
(Poirier et al. 1984; Stoner et al. 1976), but the positive response was blocked by simultaneous
administration of calcium or magnesium acetate (Poirier et al. 1984). Subcutaneous administration of lead
phosphate to rats was associated with high incidence of renal tumors (Balo et al. 1965; Zollinger 1953).
Lead acetate was positive in Syrian hamster embryo cell transformation tests (Dunkel et al. 1981; Pienta et
al. 1977), in MLV-infected rat embryo cell transformation test (Dunkel et al. 1981), and in enhanced simian
adenovirus (SA-7) transformation of Syrian hamster embryo cells (Casto et al. 1979). Lead oxide also
enhanced SA-7 transformation of Syrian hamster embryo cells (Casto et al. 1979).
The extremely high cumulative doses of lead used in these studies are difficult to extrapolate to low-level
exposure in humans, and thus do not provide a sufficient basis for quantitative risk assessment (see
discussion below). In addition, it is possible that the high doses required to induce renal tumors may have
produced a carcinogenic effect that resulted from nonspecific tissue damage and was independent of any
direct effect of lead. Furthermore, the relevance of chemically-induced male rat kidney tumors to potential
carcinogenicity in humans has been questioned (EPA 1991c). I PCS (1995) reviewed the literature on
cancer and lead and concluded that "renal tumors can occur in rats and mice administered high doses of

LEAD 291
2. HEALTH EFFECTS
lead. However, the evidence for the carcinogenicity of lead and inorganic lead compounds in humans is
inadequate."
Nonetheless, EPA (1988b) concludes that the animal data are sufficient to demonstrate that lead and
(inorganic lead) compounds, particularly soluble lead salts, are carcinogenic to animals. Although dose-
response data are available from animal studies, EPA (1988b) recommends that a numerical estimate of
cancer potency or risk based on such data should not be used because of the uncertainties involved in such
an extrapolation, some of which may be unique to lead. Current knowledge of the pharmacokinetics of lead
indicates that an estimate derived by standard methods would not adequately delineate the potential risk
(IRJS 1999). EPA (IRIS 1999) has assigned lead and (inorganic) lead compounds a classification of B2,
probable human carcinogen.
The International Agency for Research on Cancer (IARC 1987) concluded that the evidence for carcinogen-
icity of lead and inorganic lead compounds was inadequate in humans and sufficient in animals. IARC
(1987) classified lead and inorganic lead compounds in IARC Group 2B, possible human carcinogen. The
Department of Health and Human Services (DHHS) has determined that lead acetate and phosphate may
reasonably be anticipated to be carcinogens based on sufficient evidence from animal studies, but
inadequate evidence from human studies (NTP 1994).
The association of colorectal cancer with exposure to tetraethyl lead manufacturing is currently being
investigated (Fayerweather et al. 1997).
2.6 CHILDREN'S SUSCEPTIBILITY
This section discusses potential health effects from exposures during the period from conception to maturity
at 18 years of age in humans, when all biological systems will have fully developed. Potential effects on
offspring resulting from exposures of parental germ cells are considered, as well as any indirect effects on
the fetus and neonate due to maternal exposure during gestation and lactation. Relevant animal and in vitro
models are also discussed.
Children are not small adults. They differ from adults in their exposures and may differ in their
susceptibility to hazardous chemicals. Children's unique physiology and behavior can influence the extent
of their exposure. Exposures of children are discussed in Section 5.6, Exposures of Children.
LEAD 292
2. HEALTH EFFECTS
Children sometimes differ from adults in their susceptibility to hazardous chemicals, but whether there is a
difference depends on the chemical (Guzelian et al. 1992; NRC 1993). Children may be more or less
susceptible than adults to health effects, and the relationship may change with developmental age (Guzelian
et al. 1992; NRC 1993). Vulnerability often depends on developmental stage. There are critical periods of
structural and functional development during both pre-natal and post-natal life and a particular structure or
function will be most sensitive to disruption during its critical period(s). Damage may not be evident until a
later stage of development. There are often differences in pharmacokinetics and metabolism between
children and adults. For example, absorption may be different in neonates because of the immaturity of
their gastrointestinal tract and their larger skin surface area in proportion to body weight (Morselli et al.
1980; NRC 1993); the gastrointestinal absorption of lead is greatest in infants and young children (Ziegler
et al. 1978). Distribution of xenobiotics may be different; for example, infants have a larger proportion of
their bodies as extracellular water and their brains and livers are proportionately larger (Altman and Dittmer
1974; Fomon 1966; Fomon etal. 1982; Owen and Brozek 1966; Widdowson and Dickerson 1964). The
infant also has an immature blood-brain barrier (Adinolfi 1985; Johanson 1980) and probably an immature
blood-testis barrier (Setchell and Waites 1975). Many xenobiotic metabolizing enzymes have distinctive
developmental patterns and at various stages of growth and development, levels of particular enzymes may
be higher or lower than those of adults and sometimes unique enzymes may exist at particular
developmental stages (Komori 1990; Leederand Kearns 1997; NRC 1993; Vieira etal. 1996). Whether
differences in xenobiotic metabolism make the child more or less susceptible also depends on whether the
relevant enzymes are involved in activation of the parent compound to its toxic form or in detoxification.
There may also be differences in excretion, particularly in the newborn who has a low glomerular filtration
rate and has not developed efficient tubular secretion and resorption capacities (Altman and Dittmer 1974;
NRC 1993; West et al. 1948). Children and adults may differ in their capacity to repair damage from
chemical insults. Children also have a longer lifetime in which to express damage from chemicals; this
potential is particularly relevant to cancer.
Certain characteristics of the developing human may increase exposure or susceptibility while others may
decrease susceptibility to the same chemical. For example, the fact that infants breathe more air per
kilogram of body weight than adults may be somewhat counterbalanced by their alveoli being less
developed, so there is a disproportionately smaller surface area for absorption (NRC 1993).
Health effects that have been associated with lead exposures during infancy or childhood include, anemia
(Schwartz et al. 1990) (and related disorders of heme synthesis), neurological impairment (e.g.,

LEAD 293
2. HEALTH EFFECTS
encephalopathy), renal alterations, and colic (Chisolm 1962, 1965; Chisolm and Harrison 1956), and
impaired metabolism of vitamin D (Mahaffey et al. 1982; Rosen and Chesney 1983). Death from
encephalopathy may occur with PbB levels • 4 25 ug/dL. In addition to the above effects, the following
health effects have been associated with lead exposures either in utero, during infancy or during childhood:
delays or impairment of neurological development, neurobehavioral deficits including IQ deficits, growth
retardation, low birth weight, and low gestational age (Bellinger et al. 1987a; Dietrich et al. 1987a, 1987b;
McMichael et al. 1986; et al. 1989a). These effects, which are discussed in Section 2.2.1, are consistent
with findings in animals exposed to lead. Effects of lead observed at relatively high exposures such as
anemia, colic and encephalopathy, also occur in adults. There is no evidence that exposure to lead causes
structural birth defects in humans or in animals. Exposure to lead during childhood may result in
neurobehavioral effects that persist into adulthood (e.g., Stokes et al. 1998).
Children are more susceptible to lead toxicity than adults. This higher susceptibility derives from numerous
factors. Children exhibit more severe toxicity at lower exposures than adults, as indicated by lower PbB
concentrations and time-integrated PbB concentrations that are associated with toxicity in children (See
Sections 2.2.1.4 and 2.2.1.6 for more detailed discussion). This suggests that children are more vulnerable to
absorbed lead than adults. The mechanism for this increased vulnerability is not understood. .Children also
absorb a larger fraction of ingested lead than do adults; thus, children will experience a higher internal lead
dose per unit of body mass than adults at similar exposure concentrations (Alexander et al. 1974; Blake et
al. 1983; James et al. 1985; Rabinowitzet al. 1980Ziegleret al. 1978). Absorption of lead appears to be
higher in children who have low dietary iron or calcium intakes; thus, dietary insufficiencies, which are not
uncommon in lower socioeconomic children, may contribute to their lead absorption (Mahaffey and Annest
1986; Mahaffey et al. 1986; Marcus and Schwartz 1987; Ziegler et al. 1978) (see Section 2.3.1.2 for more
detailed discussion of lead absorption in children). Insufficient dietary zinc, also not uncommon in children,
may contribute to their increased susceptibility to lead, since lead impairs the activity of zinc-requiring
enzymes in the heme biosynthesis pathway (see Section 2.4.2). Infants are born with a lead body burden
that reflects the burden of the mother (Abdulla et al. 1997b; Coyer 1990; Graziano et al. 1990;
Schuhmacher et al. 1996). During gestation, lead from the maternal skeleton is transferred across the
placenta to the fetus (Gulson et al. 1997). Additional lead exposure may occur during breast feeding (Keller
and Doherty 1980a; Palminger Hallen et al. 1995, 1996a, 1996b) (see Section 2.3.3 for more detailed
discussion). This means that lead stored in the mother's body from exposure prior to conception can result
in exposure to the fetus or nursing neonate. Behavioral patterns of children can result in higher rates of
ingestion of soil and dust, both of which are often important environmental depots for lead (Barnes 1990;
LEAD 294
2. HEALTH EFFECTS
Binder etal. 1986; Calabrese et al. 1989, 1997; Clausing etal. 1987). Examples of activities that tend to
promote soil and dust ingestion preferentially in children include playing and crawling on the ground and
floor, hand-to-mouth activity, mouthing of objects, and indiscriminate eating of food items dropped or
found on the ground or floor (see Section 5.6 for more detailed discussion). Some children engage in pica,
or the ingestion of non-food items (e.g., soil). This behavior can lead to excess exposure if a child
consumes soil contaminated with lead.
The toxicokinetics of lead in children appears to be similar to that in adults, with the exception of the higher
absorption of ingested lead in children. Most of the lead body burden in both children and adults is in bone;
a slightly large fraction of the body burden in adults resides in bone (Barry 1975). The difference may
reflect the larger amount of trabecular bone and bone turnover during growth; trabecular bone has a shorter
retention halftime for lead than does cortical bone (See Section 2.3.3 for details). Limited information
suggests that organic lead compounds undergo enzymatic (cytochrome P-450) biotransformation and that
inorganic lead is complexed (non-enzymatically) with proteins and non-protein ligands. However, the
information available is insufficient to determine whether the metabolism of lead in children is similar to
adults. Several models of lead pharmacokinetics in children have been developed (EPA 1994a, 1994b;
Leggett 1993; O'Flaherty 1993, 1995a); these are described in Section 2.3.5.
The important biomarkers of exposure that have been explored in children include PbB concentration (CDC
1991), bone lead levels (as measured from non-invasive with XRF measurements of phalanx, patella, tibia
or ulna), and lead levels in deciduous teeth (Hu et al. 1998). Lead in blood has a much shorter retention
half-time than lead in bone (days compared to years); therefore, PbB concentration provides a marker for
more recent exposure, while lead in bone appears to reflect longer-term cumulative exposures (Borjesson et
al. 1997; Nilsson et al. 1991; Schutz et al. 1987). Lead in tooth enamel is thought to reflect exposures
in uteroand during early infancy, during which development of tooth enamel and coronal dentine is
completed. Lead appears to accumulate in dentin after formation of the dentin is complete; therefore, lead
in dentin is thought to reflect exposures that occur up to the time the tooth is shed (Gulson 1994, 1996;
Rabinowitz 1995; Rabinowitz et al. 1993). A more detailed discussion of the above biomarkers of
exposure, as well as other less important biomarkers, is presented in Section 2.7.1. The most sensitive
biomarkers of effects of lead in children relate to the effects of lead on heme metabolism, they include 5-
amino levulinic acid dehydratase (ALAD) activity, erythrocyte protoporphyrin (EP), free erythrocyte
protoporphyrin (FEP), and zinc protoporphyrin (ZPP); however, these are not specific for lead (Bernard and
Becker 1988; CDC 1991; Hernberg et al. 1970). EP has been used as a screening test. However, it is not

LEAD 295
2. HEALTH EFFECTS
sensitive below a PbB of about 25 ug/dL. These and other biomarkers of effects of lead are discussed in
Section 2.7.2.
Methods for preventing or decreasing the absorption of lead following acute exposures to potentially toxic
levels of lead include, removal of the child from the exposure source, removal of lead-containing dirt and
dust from the skin and, if the lead has been ingested, standard treatments to induce vomiting. Ensuring a
diet that is nutritionally adequate in calcium and iron may decrease the absorbed dose of lead associated
with a given exposure level, because lead absorption appears to be higher in children who have low levels
of iron or calcium in their diets (Mahaffey and Annest 1986; Mahaffey et al. 1986; Marcus and Schwartz
1987; Ziegler et al. 1978). Diets that are nutritionally adequate in zinc also may be helpful for reducing the
risks of lead toxicity because zinc may protect against lead-induced inhibition of zinc-dependent enzymes,
such as ALAD (Chisolm 1981; Johnson and Tenuta 1979; Markowitz and Rosen 1981). Methods for
reducing the toxicity of absorbed lead include the injection or oral administration of chelating or
complexing agents (e.g., EDTA, penicillamine, DMSA) (CDC 1991). These agents form complexes with
lead that are more rapidly excreted and, thereby, decrease the body burden of lead. These methods for
reducing the toxic effects of lead are described in greater detail in Section 2.10.
2.7 BIOMARKERS OF EXPOSURE AND EFFECT
Biomarkers are broadly defined as indicators signaling events in biologic systems or samples. They have
been classified as markers of exposure, markers of effect, and markers of susceptibility (NAS/NRC 1989).
A biomarker of exposure is a xenobiotic substance or its metabolite(s) or the product of an interaction
between a xenobiotic agent and some target molecules or cells that is measured within a compartment of an
organism (NAS/NRC 1989). The preferred biomarkers of exposure are generally the substance itself or
substance-specific metabolites in readily obtainable body fluids or excreta. However, several factors can
confound the use and interpretation of biomarkers of exposure. The body burden of a substance may be the
result of exposures from more than one source. The substance being measured may be a metabolite of
another xenobiotic substance (e.g., high urinary levels of phenol can result from exposure to several
different aromatic compounds). Depending on the properties of the substance (e.g., biologic half-life) and
environmental conditions (e.g., duration and route of exposure), the substance and all of its metabolites may
have left the body by the time biologic samples can be taken. It may be difficult to identify individuals
exposed to hazardous substances that are commonly found in body tissues and fluids (e.g., essential mineral
LEAD 296
2. HEALTH EFFECTS
nutrients such as copper, zinc, and selenium). Biomarkers of exposure to lead are discussed in
Section 2.7.1.
Biomarkers of effect are defined as any measurable biochemical, physiologic, or other alteration within an
organism that, depending on magnitude, can be recognized as an established or potential health impairment
or disease (NAS/NRC 1989). This definition encompasses biochemical or cellular signals of tissue
dysfunction (e.g., increased liver enzyme activity or pathologic changes in female genital epithelial cells), as
well as physiologic signs of dysfunction such as increased blood pressure or decreased lung capacity. Note
that these markers are often not substance specific. They also may not be directly adverse, but can indicate
potential health impairment (e.g., DNA adducts). Biomarkers of effects caused by lead are discussed in
Section 2.7.2.
A biomarker of susceptibility is an indicator of an inherent or acquired limitation of an organism's ability to
respond to the challenge of exposure to a specific xenobiotic substance. It can be an intrinsic genetic or
other characteristic or a preexisting disease that results in an increase in absorbed dose, biologically effec-
tive dose, or target tissue response. If biomarkers of susceptibility exist, they are discussed in Section 2.9,
Populations That Are Unusually Susceptible.
2.7.1 Biomarkers Used to Identify or Quantify Exposure to Lead
2.7.1.1 Lead in Soft Tissues
Biomarkers of exposure for inorganic and organic forms of lead are usually the measurement of total lead
levels in tissues or fluids. Total lead measurements of biological media includes all metabolites and
endogenous lead sources as well as any original lead-containing exposure agent. Tetraalkyl lead
compounds may also be measured in the breath.
Measurement of PbB concentration is the most widely used biomarker of lead exposure. A PbB level
greater than 10 ug/dL indicates that excessive lead exposure may be occurring (CDC 1991). The half-life of
lead in human blood is 28-36 days (Griffin et al. 1975b; Rabinowitz et al. 1976); thus, levels in blood
reflect relatively recent exposure (Graziano 1994; Lyngbye et al. 1990b). Nevertheless, because lead cycles
between the blood and bone, a single blood lead determination cannot distinguish between low-level
intermediate or chronic exposure and high-level acute exposure. Both types of exposure could result in the
LEAD 297
2. HEALTH EFFECTS
same blood level because of recycling from bone. Therefore, PbB levels cannot serve as exact measures of
lead exposure or the total body lead burden because of the intervening processes of transfer, mobilization,
and storage among the different body compartments. Furthermore, the relationship between blood lead and
lead exposure and uptake for both inhalation and gastrointestinal exposure is nonlinear, such that the
increase in PbB concentration is less at high exposure levels than at low exposure levels (EPA 1986a;
Manton and Cook 1984). This behavior may be attributed to changes in tissue lead kinetics, reduced lead
absorption, or increased excretion, such that blood lead may be an imperfect measure of tissue lead burdens
and of changes in tissue levels in relation to changes in external exposure (EPA 1986a). In addition, there
are nonlinear relationships between different metabolic and toxic effects on one hand, and PbB on the other;
this is most likely due to saturation of the erythrocytes. Despite the limitations of PbB levels in indexing
tissue burden and exposure changes (Skerfving et al. 1993), this parameter still remains the one readily
accessible measure that can demonstrate in a relative way the relationship of various effects to increases in
exposure. The biological exposure index (BEI) for lead in blood of exposed workers is 30 ug/dL (ACG1H
1996). This PbB level represents the threshold for effects seen in at least some adults; therefore, because of
individual variations in sensitivity, many people may not experience the stated effect until much higher PbB
levels are reached and conversely, effects can be seen below the stated blood levels. Furthermore,
instability of PbB levels have been reported to occur in infants in which the average increase in blood lead
from birth to 2 years of age was 5 ug/dL while levels for older children were found to be more stable
(Rabinowitz et al. 1984). The influence of age, sex, and smoking may also be potential confounders for the
interpretation of PbB measurements (Rabinowitz et al. 1976; Somashekaraiah et al. 1990; Watanabe et al.
1987).
The low concentrations of lead in plasma, relative to red blood cells, has made it extremely difficult to
accurately measure plasma lead concentrations in humans, particularly at low PbB concentrations (i.e., less
than 20 ug/dL). However, more recent measurements have been achieved with inductively coupled mass
spectrometry (1CP-MS), which has a higher analytical sensitivity than earlier atomic absorption
spectrometry methods. Using this analytical technique, recent studies have shown that plasma lead
concentrations may correlate more strongly with bone lead levels than do PbB concentrations (Cake et al.
1996; Hernandez-A vila et al. 1998). The above studies were conducted in adults, similar studies of children
have not been reported.
Urinary lead levels have also been used to measure current exposure (Robinson 1974) but they are of
questionable value as biomarkers of exposure because of the relatively low and fluctuating lead levels that
LEAD 298
2. HEALTH EFFECTS
are excreted in the urine (ACGIH 1986; Ibels and Pollock 1986; Jensen 1984). In contrast, the
determination of urinary lead following a single injection of the chelating agent, calcium disodium EDTA,
which mobilizes extracellular lead and produces increased urinary excretion of lead, is presumed to be
indicative of an elevated body burden of lead (Cory-SIechta et al. 1987; Ibels and Pollock 1986; Janin et al.
1985). Children whose PbB levels are • 45 ug/dL should not receive a provocative chelation test; they
should be immediately referred for appropriate chelation therapy (CDC 1991). Furthermore, work by
Cory-SIechta et al. (1987) indicates that diagnostic calcium disodium EDTA chelation may increase the
levels of lead in the liver and brain, raising serious concern about continued use of calcium disodium EDTA
as a diagnostic tool in children. Other disadvantages of this test are the unknown physiological source of
the lead mobilized into urine, and the requirement of parenteral drug administration and nursing care.
However, there is some experimental evidence that supports the use of the EDTA chelation test to assess
bone lead at least in adults who are not currently exposed to excessive lead burdens (Wedeen 1992).
Urinary diethyl lead has been proposed as a qualitative marker of exposure to tetraethyl lead (Turlakiewicz
and Chmielnicka 1985; Vural and Duydu 1995; Zhang et al. 1994).
Another indicator of current exposure to lead is hair, which offers the advantage of being a noninvasive
stable medium. Hair has been used as an indicator for intermediate exposure (2 months) in children
(Wilhelm et al. 1989). However, artificial hair treatment (i.e., dyeing, bleaching, permanents) can invalidate
metal analysis of hair (Wilhelm et al. 1989), and external surface contamination make it difficult to
differentiate between externally and internally deposited lead (EPA 1986a). Drasch et al. (1997) found lead
hair levels to be a poor predictor of PbB concentrations in a group of unexposed subjects with relatively low
PbB levels (<12 ug/dL). For example, they estimated that with a statistical probability of 95%, hair with a
concentration of 770 ng lead/g may be associated with PbB levels from <0.9 to 12.8 ug/dL. Nevertheless,
levels of lead in hair were positively correlated with children's classroom attention deficit behavior in a
study (Tuthill 1996) (see Section 2.2.1). Lead in hair was correlated with liver and kidney lead in a study of
deceased smelter workers (Gerhardsson et al. 1995b). Nail lead has also been utilized as a marker
(Gerhardsson et al. 1995b).
Another method for studying not only lead exposure, but also the source of exposure, is the measurement of
stable lead isotopes. Lead has four stable nonradioactive isotopes 204Pb, 206Pb, 207Pb, and 208Pb; the last three
are continually being produced by radioactive decay. By measuring the ratio 206Pb/207Pb, which varies
greatly according to the geological age of the lead deposit, one can identify the source of the lead in any
matrix providing that there is a predominant source. For example, Graziano et al. (1996) observed that the
LEAD 299
2. HEALTH EFFECTS
206Pb/201Pb ratios for subjects from New York City were 1.195 or higher, subjects from Brisbane (Australia)
had ratios ranging from 1.095 to 1.145, and Scottish subjects from Glasgow had ratios between 1.105 and
1.115. By using the isotope dilution method, Graziano et al. (1996) estimated in six volunteers that, on the
average, 70% of lead ingested from drinking wine stored in a lead-crystal decanter was absorbed, indicating
high bioavailability. This method has also been used to determine the source of lead exposure by measuring
206pb/2Wpb ratios jn teethj b]ood) an(j nome environments (Gulson and Wilson 1994; Gulson et al. 1996).
Physiological changes that are associated with lead exposure may be used as biomarkers of exposure.
Generally, blood lead levels are determined concurrently with these physiological biomarkers. Interference
with heme synthesis following lead exposure can lead to a reduction of hemoglobin concentration in blood
(Bernard and Becker 1988) and an increase in urinary coproporphyrin (EPA 1986a). Measurement of
specific enzymes or intermediates in the heme synthesis pathway can suggest that lead exposure has
occurred. ALAD activity measured in erythrocytes may be associated with recent exposure to lead because,
as with PbB levels, there is not a large time lag between exposure and decreased activity of this enzyme in
workers occupationally exposed to lead for the first time (Tola et al. 1973). A negative correlation between
ALAD activity and PbB levels of 5-95 ug/dL was observed by Hernberg et al. (1970). ALAD was found to
be a more sensitive biomarker than urinary ALA and ZPP at PbB concentrations between 21 and 30 ug/dL
(Schuhmacher et al. 1997). Consistent with this, PbB, but not ALAD, could be used to discriminate
between controls (PbB, 11.3 ng/dL) and workers (PbB, 15.7 ug/dL) exposed to lead for <2 hours/day
(Schuhmacher et al. 1997). A limitation of ALAD activity measurement, as a biomarker of exposure, is that
the inhibition of the enzyme is so extensive at PbB levels • 30 ug/dL that the assay cannot distinguish
between moderate and severe exposure (Graziano 1994). A marked increase in urinary excretion of ALA,
the intermediate that accumulates from decreased ALAD, can be detected when PbB levels exceed 35 ug/dL
in adults and 25-75 ug/dL in children (NAS 1972; Roels and Lauwerys 1987; Schuhmacher et al. 1997);
thus, ALA in urine is not considered as sensitive a measure of current lead exposure as ALAD activity
(Hernberg et al. 1970).
ALA in plasma was as good a discriminator of lead exposure as ALAD activity in workers at PbB levels
between 10 and 40 (ig/dL and continued to discriminate up to PbB levels approaching 100 ug/dL (Sakai and
Morita 1996). The same group of investigators recently showed that the activity of adenine dinucleotide
synthetase (NADS) in erythrocytes is a better predictor of PbB levels >40 ug/dL than ALAD (Morita et al.
LEAD 300
2. HEALTH EFFECTS
1997). The decrease in NADS activity between PbB concentration of 5 and 80 ug/dL was linear with a
correlation coefficient of-0.87.
Inhibition of ferrochelatase in the heme pathway causes accumulation of protoporphyrin in erythrocytes
(CDC 1985). Most protoporphyrin in erythrocytes (about 90%) exists as zinc protoporphyrin (ZnPP). This
fraction is preferentially measured by hematofluorometers. Extraction methods measure all the
protoporphyrin present, but strip the zinc from the ZnPP during the extraction process. For this reason,
extraction results are sometimes referred to as [zinc] free erythrocyte protoporphyrin (FEP). Although the
chemical forms measured by the two methods differ slightly, on a weight basis they are roughly equivalent;
thus, results reported as EP, ZnPP, or FEP all reflect essentially the same analyte. The concentration of EP
rises above background at blood lead levels of 25-30 ug/dL (CDC 1985); there is a positive correlation
between PbB levels and EP (CDC 1985; Hernberg et al. 1970; Tola et al. 1973). Determination of EP in
blood is an indicator of past exposure since elevated EP reflects average PbB levels for the past 4 months
(ACG1H 1986; Janin et al. 1985). Therefore, EP is better for population investigations than for routine
occupational exposure (Haeger-Aronsen et al. 1971). However, other diseases or conditions such as
porphyria, liver cirrhosis, iron deficiency, age, and alcoholism may also produce similar effects on heme
synthesis (Somashekaraiah et al. 1990). In addition, EP is not sensitive enough to identify children with
PbB levels below 25 (ig/dL (CDC 1991). Therefore, PbB concentration is a better biomarker of exposure.
Reduction in the serum 1,25-dihydroxy vitamin D concentration has been reported as an indicator of
increased lead absorption or lead levels in the blood (Rosen et al. 1980). Lead inhibits the formation of this
active metabolite of vitamin D, which occurs in bone mineral metabolism (EPA 1986a; Landrigan 1989).
Children with PbB concentrations of 12-120 (ig/dL lead showed decreased serum 1,25-dihydroxy vitamin D
concentrations comparable to those found in patients with hypoparathyroidism, uremia, and metabolic bone
disease (Mahaffey et al. 1982; Rosen et al. 1980). This biomarker is clearly not specific for lead exposure
and several diseases can influence this measurement.
In summary, several indices in blood and body tissues are available to serve as biomarkers for lead
exposure. Blood lead levels are the easiest and most widely used index of lead exposure. Currently, PbB
measurement is the screening test of choice to identify children with elevated PbB levels below about
25 ug/dL (CDC 1991). Venous sampling of blood is preferable to finger prick sampling, which has a
considerable risk of surface lead contamination from the finger if proper finger cleaning is not carried out.
In children, PbB levels between 10 and 14 ug/dL should trigger community-wide childhood lead poisoning
LEAD 301
2. HEALTH EFFECTS
prevention activities (CDC 1991). Since the half-life of lead in blood is 28-36 days, PbB levels generally
reflect relatively recent exposure. However, because of continuous mobilization and recycling of lead from
soft tissue and bone, blood lead levels cannot be used to distinguish between low-level intermediate or
chronic exposure and high-level acute exposure. Recently, the CDC issued new guidance on screening
children for lead poisoning that recommends a systematic approach to the development of appropriate lead
screening in states and communities (CDC 1997c). The objective of the new guidelines is maximum
screening of high-risk children and reduced screening of low-risk children, as contrasted with previous
guidelines (CDC 1991), which recommended universal screening. A PbB level of 50 ug/dL has been
determined to be an approximate threshold for the expression of lead toxicity in exposed workers.
Urinary lead is generally not a useful biomarker to estimate general population (i.e., low-level) exposure to
lead. However, elevated urinary lead-chelate complexes resulting from the EDTA mobilization test provide
a good means to assess increased lead body burden. Lead in hair and nails are useful confirmatory markers
and their significances are not understood. Lead in both hair and nails showed good correlation with liver
and kidney lead at autopsy in one study (Gerhardsson et al. 1995b).
ALAD in blood is a sensitive indicator of recent exposure to lead. Urinary ALA becomes elevated at PbB
levels • 50 ug/dL, and is not as sensitive an indicator as ALAD. EP becomes elevated at PbB levels of
25-30 ug/dL and is a good indicator of past exposure to lead. It should be noted, however, that ALAD,
ALA, and EP are not specific biomarkers for lead.
With any of these biomarkers of exposure, it is not possible to predict how long they remain elevated after
exposure has ceased. Refer to Section 2.3 for additional information on potential biomarkers of lead
exposure.
2.7.1.2 Lead in Bones and Teeth
The development of noninvasive X-ray fluorescence (XRF) techniques for measuring lead concentrations in
bone has enabled the exploration of bone lead as a biomarker of lead exposure in children and in adults
(Batuman et al. !989;Huetal . 1989, 1990, 1991, 1995; Rosen et al. 1993; Wedeen 1988, 1990, 1992).
Lead in bone is considered as a biomarker of cumulative exposure to lead because lead accumulates in bone
over the lifetime and most of the lead body burden resides in bone. Lead is not distributed uniformly in
bone. Lead will accumulate in those regions of bone undergoing the most active calcification at the time of
LEAD 302
2. HEALTH EFFECTS
exposure. During infancy and childhood, bone calcification is most active in trabecular bone, whereas in
adulthood, calcification occurs at sites of remodeling in cortical and trabecular bone. This would suggest
that lead accumulation will occur predominantly in trabecular bone during childhood, and in both cortical
and trabecular bone in adulthood (Auferheide and Wittmets 1992). Patella, calcaneus and sternum XRF
measurements primarily reflect lead in trabecular bone, whereas XRF measurements of mid-tibia, phalanx;
or ulna reflect primarily lead in cortical bone. Lead levels in cortical bone may be a better indicator of long-
term cumulative exposure than lead in trabecular bone, possibly because lead in trabecular bone may
exchange more actively with lead in blood than does cortical bone. This is consistent with estimates of a
longer elimination half-time of lead in cortical bone, compared to trabecular bone (Borjesson et al. 1997;
Nilssonetal. 1991; Schutzet al. 1987). Evidence that cortical bone lead measurements may provide a
better reflection of long-term exposure than do measurements of trabecular bone comes from studies in
which cortical and trabecular bone lead measurements have been compared to concentrations of lead in
blood. Lead levels in trabecular bone (in adults) correlate more highly with contemporary PbB
concentrations than do levels of lead in cortical bone (Erkkila et al. 1992; Hernandez-Avila et al. 1996; Hu
et al. 1996b, 1998; Watanabe et al. 1994). Cortical bone lead measurements correlate well with time-
integrated PbB measurements, which would be expected to be a better reflection of cumulative exposure
than contemporary blood lead measurements (Borjesson et al. 1997; Roels et al. 1994). Bone lead levels
tend to increase with age (Hu et al. 1996b; Kosnett et al. 1994; Roy et al. 1997), although the relationship
between age and bone lead may be stronger after adolescence (Hoppin et al. 1997). These observations are
consistent with cortical bone reflecting cumulative exposures over the lifetime.
Relationships between bone lead levels and health outcomes have been studied in several cross-sectional
epidemiology studies, however, not as extensively as have other biomarkers of exposure such as PbB
concentration (Hu 1998a, 1998b). These studies suggest that bone lead levels may be better predictors of
certain health outcomes in adults than are contemporary PbB concentrations; these include declines in
hematocrit and blood hemoglobin, hypertension and decreased birthweight (Gonzalez-Cossio et al. 1997;
H u e t a l . 1994, 1996b).
Tooth lead has been considered a potential biomarker for measuring long-term exposure to lead (e.g., years)
because lead that accumulates in tooth dentin and enamel appears to be retained until the tooth is shed or
extracted (Rabinowitz et al. 1989; Steenhout and Pourtois 1987). Formation of enamel and coronal dentin
of deciduous teeth is complete prior to the time children begin to crawl, however, lead in shed deciduous
teeth is not uniformly distributed. Differences in lead levels and stable isotope signatures of the enamel and

LEAD 303
2. HEALTH EFFECTS
dentin suggest that lead uptake occurs differentially in enamel and dentin after eruption of the tooth (Gulson
and Wilson 1994, 1996). Lead in enamel is thought to reflect primarily lead exposure that occurs in utero
and early infancy, prior to tooth eruption. Dentin appears to continue to accumulate lead after eruption of
the tooth, therefore, dentin lead is thought to reflect exposure that occurs up to the time the teeth are shed or
extracted (Gulson 1994, 1996; Rabinowitz 1995; Rabinowitz et al. 1993). Accumulation of lead in dentin
of permanent teeth may continue for the life of the tooth (Steenhout 1982; Steenhout and Pourtois 1981).
Because it is in direct contact with the external environment, enamel lead levels may be more influenced
than dentin lead by external lead levels and tooth wear (Purchase and Ferguson 1986).
An analysis of eight cross-sectional and/or prospective studies which reported tooth lead and PbB levels of
the same children found considerable consistency among the studies (Rabinowitz 1995). The mean tooth
lead levels ranged from under 3 to over 12 ug/g. In a study of 63 subjects, dentin lead was found to be
predictive of concentrations of lead in the tibia, patella, and mean bone lead 13 years after tooth lead
assessment in half of them (Kim et al. 1996b). The authors estimated that a 10 ug/g increase in dentin lead
levels in childhood was predictive of a 1 ug/g increase in tibia lead levels, a 5 ug/g in patella lead levels and
a 3 ug/g increase in mean bone lead among the young adults.
2.7.2 Biomarkers Used to Characterize Effects Caused by Lead
One of the most sensitive effects of lead exposure is the inhibition of the heme biosynthesis pathway, which
is necessary for the production of red blood cells. Hematologic tests such as hemoglobin concentration may
suggest toxicity, but this is very nonspecific (Bernard and Becker 1988). Measurements of FEP and ZPP,
the form of EP in red blood cells, reflect essentially the same compound and can both be used as biomarkers
of effect (CDC 1985). An elevated EP level is one of the earliest and most reliable indicators of impairment
of heme biosynthesis and reflects average lead levels at the site of erythropoiesis over the previous 4 months
(Janin et al. 1985). Lead toxicity is generally considered to be present when a PbB of • 40 ug/dL is
associated with an EP level of- 35 ug/dL (CDC 1991; Somashekaraiah et al. 1990). This effect is
detectable in circulating erythrocytes only after a lag time reflecting maturation in which the entire
population of red blood cells has turned over (i.e., 120 days) (EPA 1986a; Moore and Goldberg 1985).
Likewise, elevated erythrocyte protoporphyrin can reflect iron deficiency, sickle cell anemia, and hyperbili-
rubinemia (jaundice). Therefore, reliance on EP levels alone for initial screening could result in an
appreciable number of false positive cases (CDC 1985; Mahaffey and Annest 1986; Marcus and Schwartz
1987). On the other hand, some have estimated that relying only on ZPP screening to predict future lead
LEAD 304
2. HEALTH EFFECTS
toxicity would miss about 3 cases with toxic blood lead concentrations in every 200 workers at risk (Froom
et al. 1998). A limitation of measuring porphyrin accumulation is that porphyrin is labile because of
photochemical decomposition; thus, assay samples must be protected from light. A dose-response curve for
EP as a function of blood lead level is depicted in Figure 2-12.
ALAD, an enzyme occurring early in the heme pathway, is also considered a sensitive indicator of lead
effect (Hernberg et al. 1970; Morris et al. 1988; Somashekaraiah et al. 1990; Tola et al. 1973). Because
there is no well-defined blood lead threshold at which inhibition of ALAD does not occur, it allows
measurement of the effect on the general population at environmental lead levels and does not require high
exposure levels as with occupational workers (Hernberg et al. 1970). However, ALAD activity may also be
decreased with other diseases or conditions such as porphyria, liver cirrhosis, and alcoholism
(Somashekaraiah et al. 1990).
Another potential biomarker for hematologic effects of lead is the observation of basophilic stippling and
premature erythrocyte hemolysis (Paglia et al. 1975, 1977). Lead can impair the activity of pyrimidine
5'-nucleotidase, resulting in a corresponding increase in pyrimidine nucleotides in red blood cells, which
leads to a deficiency in maturing erythroid elements and thus, decreased red blood cells. However, this
effect is nonspecific; it is encountered with benzene and arsenic poisoning (Smith et al. 1938) and in a
genetically-induced enzyme-deficiency syndrome (Paglia et al. 1975, 1977). Furthermore, since basophilic
stippling is not universally found in chronic lead poisoning, it is relatively insensitive to lesser degrees of
lead toxicity (CDC 1985).
A multisite study of populations living near four NPL sites was conducted to assess the relationship between
exposure (PbB and area of residence) and biomarkers of four organ systems: immune function disorders,
kidney dysfunction, liver dysfunction, and hematopoietic dysfunction (ATSDR 1995). The geometric mean
PbB concentration in those living in the target areas was 4.26 ng/dL (n=1,645) compared with 3.45 ug/dL
for a group living in comparison areas (n=493). In children <6 years old. the corresponding means were
5.37 versus 3.96 (ig/dL. In subjects 15 years old or older, the target and comparison values were 3.06 ug/dL
and 3.63 ug/dL, respectively. Ninety percent of target and 93% of comparison area participants had PbB
levels <10 (ig/dL. Lead in soil and in water was found to be higher in comparison areas than in the target
areas, but lead in house dust and in interior paint was higher in the target areas. PbB correlated with lead in
soil and dust, but not with lead in paint and water. Multivariate regression analyses showed that of all the
biomarkers analyzed, PbB was significantly associated with and
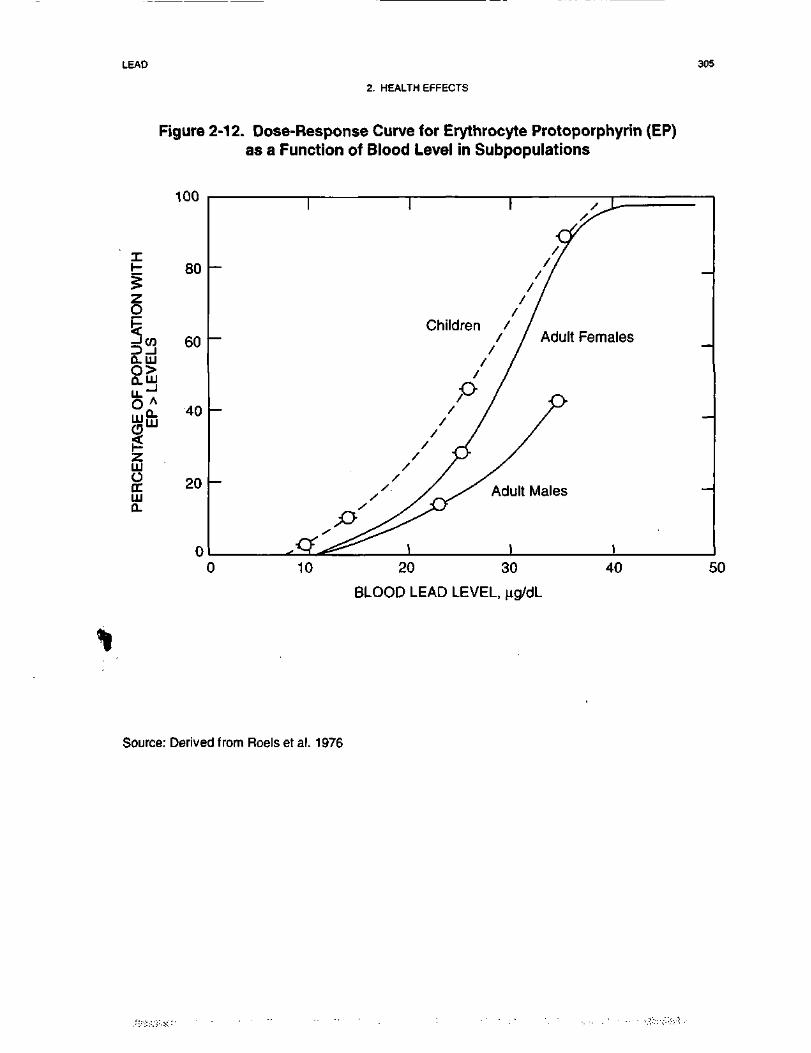
LEAD 305
2. HEALTH EFFECTS
Figure 2-12. Dose-Response Curve for Erythrocyte Protoporphyrin (EP)as a Function of Blood Level in Subpopulations
§3Q-LUO>O.UJ
100
80
60
LU
ILUOITLU0-
Q_ 40LU
20
0
Children / ,/ / Adult Females
Adult Males
10 20 30
BLOOD LEAD LEVEL, iig/dL
40 50
Source: Derived from Roels et al. 1976
LEAD 306
2. HEALTH EFFECTS
predictive of hematocrit in adults 15 years of age or older and with increased mean serum IgA in children
6-71 months of age. The biological significance of these associations is unclear since both hematocrit and
IgA levels were well within normal ranges and were hardly different than levels in subjects from the
comparison areas.
One of the most sensitive systems affected by lead exposure is the nervous system. Encephalopathy is
characterized by symptoms such as coma, seizures, ataxia, apathy, bizarre behavior, and incoordination
(CDC 1985). Children are more sensitive to neurological changes. In children, encephalopathy has been
associated with PbB levels as low as 70 u.g/dL (CDC 1985). The most sensitive peripheral index of
neurotoxicity of lead is reported to be slowed conduction in small motor fibers of the ulnar nerve in workers
with 30-40 u.g/dL lead in blood (Landrigan 1989). Other potential biomarkers of lead suggested for
neurotoxicity in workers are neurological and behavioral tests, as well as cognitive and visual sensory
function tests (Williamson and Teo 1986). However, these tests are not specific to elevated lead exposure.
The kidneys are affected by high-level, chronic exposure to lead (Landrigan 1989). Increases in BUN or
serum creatinine are clinical manifestations of kidney damage (Landrigan 1989), but they do not reflect
early loss of renal function and are nonspecific (Bernard and Becker 1988). Intranuclear inclusion bodies in
the lining cells of the proximal tubules are reported to be the most characteristic feature of early
nephropathy (Bernard and Becker 1988). These lead inclusion bodies disappear with appropriate chelation
and shed into the urine. Thus, EDTA lead mobilization test may be the best test for diagnosing persons at
risk of chronic lead nephropathy. Results from some occupational studies suggested that elevation of
urinary NAG might be an early marker of nephrotoxiciry (Ong et al. 1987; Verschoor et al. 1987).
However, there is evidence suggesting that the increase in NAG activity may be a response to a sharp
increase in the renal lead burden rather than to the cumulative dose (Chia et al. 1994). A study compared
the relationship of several exposure indices and various early markers of tubular and glomerular dysfunction
in 128 occupationally exposed subjects (Chia et al. 1995b). The markers examined were urinary and serum
p2(J-globulin, urinary a,M-globulin, urinary retinol binding protein (RNP-U), and urinary albumin. The result
showed that a time-integrated PbB level index (ug lead/[dL x years of exposure]) rather than current PbB
level (mean 32.6 |ig/dL) was the most important exposure variable in describing the variability in urinary
<x,M-globulin, p2M-globulin, and RNP. Moreover, urinary a,M-globulin was the only marker that was
significantly higher in the exposed workers, showing a good dose-response and dose-effect relationship with
the time-integrated PbB level. Chia et al. (1995b) suggested that the relatively high sensitivity of the
LEAD 307
2. HEALTH EFFECTS
urinary a,M-globulin marker may be due to its higher molecular weight, and hence the lower efficiency in its
tubular reabsorption.
2.8 INTERACTIONS WITH OTHER CHEMICALS
The toxicokinetic and lexicological behavior of lead can be affected by interactions with essential elements
and nutrients (for a review see Mushak and Crocetti 1996). In humans, the interactive behavior of lead and
various nutritional factors is particularly significant for children, since this age group is not only sensitive to
the effects of lead, but also experiences the greatest changes in relative nutrient status. Nutritional
deficiencies are especially pronounced in children of lower socioeconomic status; however, children of all
socioeconomic strata can be affected.
Available data from a number of reports document the association of lead absorption with suboptimal
nutritional status. In infants and children 1-6 years of age, lead retention (as measured by PbB content) was
inversely correlated with calcium intake, expressed either as a percentage of total or on a weight basis
(Johnson and Tenuta 1979; Mahaffey et al. 1986; Sorrell et al. 1977; Ziegler et al. 1978). Dietary intakes of
calcium and vitamin D were significantly (pO.OOl) lower in children with PbB levels >60 ug/dL (Johnson
and Tenuta 1979). The gastrointestinal uptake of 203Pb was monitored in eight adult subjects as a function
of dietary calcium and phosphorus intakes (Heard and Chamberlain 1982). The label absorption rate was
63% without supplementation of these minerals in fasting subjects, compared with 10% in subjects
supplemented with 200 mg calcium plus 140 mg phosphorus, the amounts present in an average meal.
Calcium and phosphorus alone reduced lead uptake by a factor of 1.3 and 1.2, respectively; both together
yielded a reduction factor of 6. Copper, iron, and zinc have also been postulated to affect lead absorption
(Klauder and Peterini 1975).
Children with elevated PbB (12-120 ug/dL) were found to have significantly lower serum concentrations of
the vitamin D metabolite 1,25-dihydroxyvitamin D compared with age-matched controls (pO.OOl), and
showed a negative correlation of serum 1,25-dihydroxyvitamin D with lead over the range of blood lead
levels measured (Mahaffey et al. 1982; Rosen et al. 1980).
Zinc is in the active site of ALAD and can play a protective role in lead intoxication by reversing the
enzyme-inhibiting effects of lead. Children with high PbB levels (50-67 ug/dL) were reported to consume
less zinc than children with lower PbB (12-29 ug/dL) (Johnson and Tenuta 1979). In a group of
LEAD 308
2. HEALTH EFFECTS
13 children, Markowitz and Rosen (1981) reported that the mean serum zinc levels in children with
plumbism were significantly below the values seen in normal children; chelation therapy reduced the mean
level even further. An inverse relationship between ALA in urine and the amount of chelatable or
systemically active zinc was reported in 66 children challenged with EDTA and having PbB levels ranging
from 45-60 ug/dL (Chisolm 1981). Zinc sulfate administration to a lead-intoxicated man following calcium
disodium EDTA therapy restored the erythrocyte ALAD activity that was inhibited by lead (Thomasino et
al. 1977).
Forty-three children with elevated PbB (>30 ug/dL) and EP (>35 ug/dL) had an increased prevalence of
iron deficiency (Yip et al. 1981). An inverse relationship between chelatable iron and chelatable body lead
levels as indexed by urinary ALA levels has been demonstrated in 66 children with elevated blood lead
(Chisolm 1981). Another study reported that the lead absorption rate was 2 to 3 times greater in iron-
deficient adults compared to subjects who were iron replete (Watson et al. 1980). Daily nutritional intake of
dietary fiber, iron, and thiamine were negatively correlated with blood lead levels in male workers
occupationally exposed to lead in a steel factory (Ito et al. 1987). Results from the NHANES II national
survey showed that in children low iron status increases the lead hematotoxic dose response curves (Marcus
and Schwartz 1987) and that iron deficiency plus elevated blood lead levels produce a greater degree of
hematotoxiciry compared with either factor alone (Mahaffey and Annest 1986). A study of 299 children
from 9 months to 5 years old from an urban area found a significant negative association between PbB and
dietary iron intake (Hammad et al. 1996). Graziano et al. (1990) studied a population of pregnant women in
Kosovo, Yugoslavia. They found that serum ferritin concentrations were associated with lower PbB levels,
suggesting that dietary iron may inhibit lead absorption.
Results from a recent study showed a marginally significant association of Parkinson's disease with more
than 20 years of occupational exposure to lead (Gorell et al. 1997); when the analysis included more than
20 years of combined exposure to lead and iron, the association greatly increased, with the odds ratios
exceeding that for exposure to one of the metals alone.
An in vitro study demonstrated that cadmium and zinc have an antagonistic effect on the inhibitory effects
of lead on human ALAD activity (Davis and Avram 1978). Cadmium was 40-100 times more potent than
zinc in activating ALAD. Furthermore, the combined effects of cadmium and lead in tissue resulted in an
additively increased risk of mortality related to cardiac failure in humans with significant relation to age in
80% of the cases (Voors et al. 1982).
LEAD 309
2. HEALTH EFFECTS
The relationship between nutritional factors, other than those mentioned above, and PbB levels of preschool
children was examined by Lucas et al. (1996). The objective of the study was to determine whether total
caloric intake, dietary fat, dietary protein, and carbohydrates are associated with PbB while simultaneously
controlling for other nutrient and environmental exposures. The cohort comprised 296 children aged
9-72 months, predominantly black (82%), from an urban area. The mean PbB concentration was
11.4 ug/dL (range, 1-55 ug/dL). After adjusting for confounders, the study found significant positive
associations for total caloric intake and dietary fat with PbB. Lucas et al. (1996) speculated that bile
secreted into the gastrointestinal to aid in the digestion and absorption of fat may increase lead absorption,
as shown in rats (Cikrt and Tichy 1975). The influence of total caloric intake may just reflect increased
intake of lead through contaminated food.
Reports of lead-nutrient interactions in experimental animals have generally described such relationships in
terms of a single nutrient, using relative absorption or tissue retention in the animal to index the effect.
Most of the data are concerned with the impact of dietary levels of calcium, iron, phosphorus, and
vitamin D. These interaction studies are summarized in Table 2-12.
Lead has also been found to interact with a number of other metals in the bodies of animals with resultant
synergistic, additive, or antagonistic effects.
Animals on low-calcium diets exhibit increased susceptibility to lead as a consequence of increased lead
retention associated with decreased renal excretion of lead (Barton et al. 1978a; Goyer 1986). For example,
rat systolic blood pressures during the third trimester of gestation were significantly higher in rats exposed
to lead and fed a low calcium diet than in rats exposed to lead alone (Bogden et al. 1995). A low-calcium
diet has been shown to promote genetic damage by lead (Deknudt and Gerber 1979). Lead administered to
mice in combination with a low-calcium diet produced an excess of chromosomal aberrations compared
with low-calcium controls fed no lead or with mice administered lead on a normal-calcium diet. In addition,
a significantly increased frequency of severe chromosomal abnormalities (dicentrics, rings, translations,
and exchanges) was found in monkeys given lead in conjunction with a low-calcium diet compared with a
group given as much lead but on a normal diet (Deknudt et al. 1977). Calcium and magnesium prevented an
increase in lung adenoma formation in mice administered lead subacetate (Poirier et al. 1984). It has been
postulated that calcium and lead compete for similar binding sites on intestinal mucosal proteins, which are
important in the absorptive process (Barton et al. 1978a). A high calcium diet was also shown to influence
the toxicity of lead. Dam and pup hemoglobin
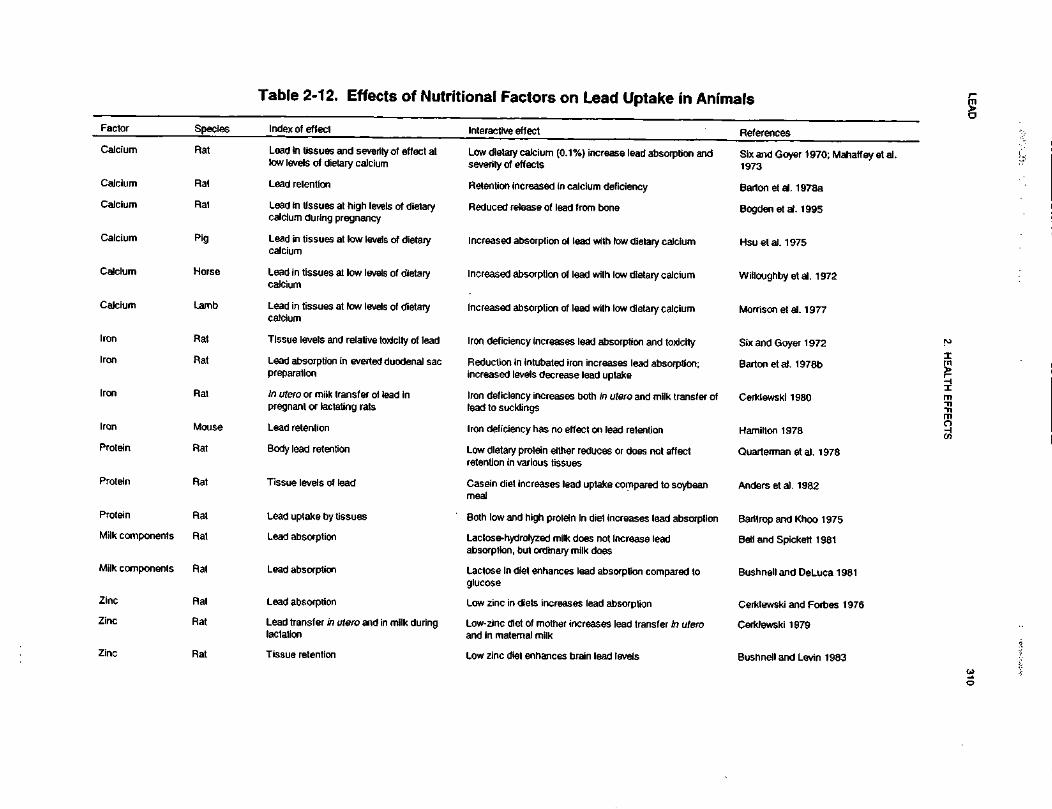
LEA
D310
2. H
EA
LTH
EF
FE
CT
S
JO"SE<jc0).*aQ
.3•anj«Jc0woUs.75.0J51t|_0<A4*
U«£sHIoir-CXJjO
)A£
•ences
i?DCSiU.1i533iBX1sIC/3o•yro<0s.
73tsfr*:CO
* SgO)
^1OIs.£ <J)
w ;2
I1U)
•a13sCD18CD8*-25o^E3 </)
f"o1
CQ O
=5 ~
—1
u
73SiB||
Q)
TOt/>
u
tissues andIs of dietary
51
51
73CCE3'o73O
SS£73Tij
•cCOffl§"'C1•D1U1.Csocg1a:g15•D!75CCE3'o73U
inS787581
fflocEo*:8•5CDCD
•DCDufCC&•
CO
S
i levels of dincy
ragtissues at hiduring preg
51
i y
75CCED'313O
3W£1f
CMf-
a>7375O)
§
g>a.aU
oIIO
fcO)
73IBE'o73u•5ge-
~ I - I s I
ml ra
S ?
|Q
) (Q
Q
) C
J 0)
CO
EO
S
£2
S^
01
I 2U.5
S
co m
sIf-o
00S;78o
*<0O
COr-cnI s
S
3i
O
p
>,
£S
c
.9J c
.FJ g
~•
CDO
Q.
w
2
1
=^
CO
.c
1 1
.1 II
I II
ll
o To
1•5V)
O)
_c3T3
•ai1g
.s
III
i S'73
coCC
COCC
COC
C
S §
§ e
^
D.
75CCai75o.
SO)
73a
CO CO
CC CC
75CC75
73cc
cc
<uISa>3tn«73cc
sN
N
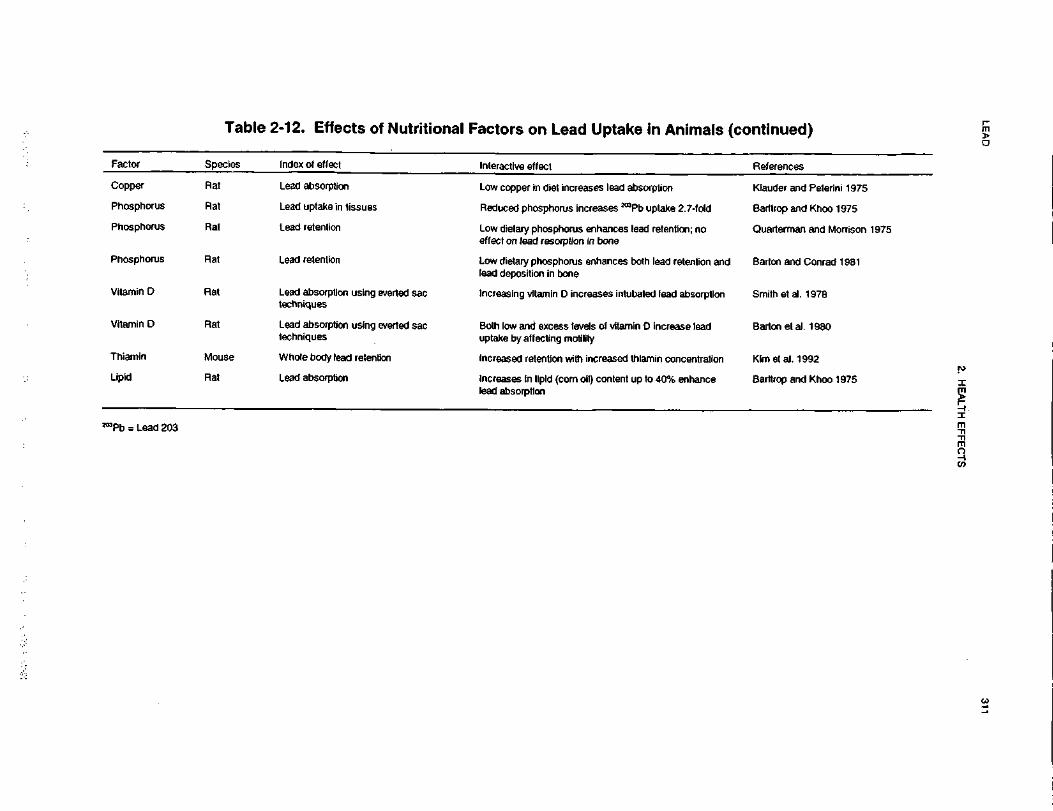
LEA
D311
2. HE
ALT
H E
FF
EC
TS
ntinued]0O^"^V)75E'£<c.0)ra4>rf
Q.
•acaco(A0o(QU.C03Z
•
•5w4->Ua>9=UJ
egT"1
egosito\-
References•active effect
££
of effect
cV)
'5Q.
0
inO)
~•c0)
CLKlauder andg•=O.
11
copper In diet increases IE5_iabsorptionto_j
ToCC1oo
in25£
Barttrop and2.7-fold
<5'5.JDQ
.Q§u.cc/>
fQ.
"gDCSwuptake in ti:
315ccy)2D-
ICL
inO)
co'EoSQuarterman ioc1"cO
J
mTJID0 ®
dietary phosphorus enhan:t on lead resorption in bon
^ y=—
J 0>
retention
1atrtn2Q.
IQ.
000>2§OSreCD•Dretentionrasc.
Iu
dietary phosphorus enhandeposition in bone
§1
3° retention
115CCto5CL
CL
COr*.O)Smith et al. 1
|815)11o_cODl
U_Cg1cDl
*OJ
Dabsorptioniques
11"53CCD
Vitamin
Barton et al.
1<u(J
Q1•5(A§i1•§i115CCQc
ke by affecting motility
B3tn0)Dcr'c1
egKImetal. 19!§incentrati
8CC£E(/i;ased retention with increa
ucgI15e body lead0101Vi§sc!c
ino>g5
Barltrop andQ)
O1gTt
OD.
3"ca
sases In lipld (com oil) conabsorption
o ^
11rarrI
8C\J
I3Q.
g
LEAD 312
2. HEALTH EFFECTS
concentrations and hematocrits were reduced in rats exposed perinatally to lead and a high calcium diet
relative to rats treated with lead and a normal calcium diet (Bogden et al. 1995). Also, body weight and
length of day-old pups were decreased in the group fed the high calcium diet. These results were consistent
with a reduced iron absorption caused by the increased dietary calcium.
It has also been demonstrated in animals that lead blocks the intestinal responses to vitamin D and its
metabolites (Smith et al. 1981). Dietary concentrations of lead in combination with a low phosphorus or a
low calcium diet administered to rats suppressed plasma levels of the vitamin D metabolite, 1,25-dihydroxy-
cholecaliferol, while dietary intakes rich in calcium and phosphorus protected against this effect (Smith et
al. 1981). Thus, animals fed a diet high in calcium or phosphorus appear to be less susceptible to the effects
of lead, because of hindered tissue accumulation of lead.
Cadmium also affects the toxicity of lead. A synergistic effect of these metals was found on prostatic
cytology and testicular damage in male rats following intraperitoneal injection (Fahim and Khare 1980).
Rats fed lead and cadmium or zinc had a marked reduction of reticulocytosis compared with rats fed lead
alone (Thawley et al. 1977). Mice exposed simultaneously to lead and cadmium for 10 weeks had higher
mortality rates than mice exposed to either metal alone (Exon et al. 1979). In addition, interactions between
cadmium and lead have been reported at the behavioral effects level (Nation et al. 1990).
Several interactions of lead and iron have been documented in animals. Low dietary iron tends to increase
the susceptibility to lead intoxication because of enhanced gastrointestinal absorption, suggesting a common
absorption pathway for these two elements (Six and Goyer 1972). There is a synergistic action between
lead intoxication and iron deficiency on impairment of hematopoiesis, specifically on hemoglobin level and
red blood cell size (Hashmi et al. 1989a; Waxman and Rabinowitz 1966). In addition, iron and lead appear
to be antagonistic with respect to A LAD activity; iron deficiency enhances blood ALAD activity while lead
exposure suppresses ALAD activity (Hashmi et al. 1989a). Iron appeared to reduce the effects of orally or
subcutaneously administered lead on blood enzyme and liver catalase activity (Bota et al. 1982). Treatment
of pregnant hamsters with iron- or calcium-deficient diets in conjunction with orally administered lead
resulted in embryonic or fetal mortality and abnormalities (runting, edema) in the litters, while treatment
with complete diets and lead did not (Carpenter 1982). Inadequate levels of iron in association with
increased body burdens of lead enhanced biochemical changes associated with lead intoxication (Waxman
and Rabinowitz 1966). Ferrous iron was reported to protect against the inhibition of hemoglobin synthesis
and cell metabolism by lead; it has been speculated that iron competes with lead uptake by the cell
LEAD 313
2. HEALTH EFFECTS
(Waxman and Rabinowitz 1966). In addition, the incorporation of iron into heme in the mouse embryonic
liver was greatly decreased in lead-treated mice, resulting in retarded embryo growth due to impaired heme
synthesis (Gerber and Maes 1978). Another study demonstrated that both the decrease in plasma iron and
the increased total iron binding capacity observed in iron deficient rats, or in rats exposed to lead, were
more marked in animals exposed simultaneously to lead and fed an iron deficient diet (Hashmi et al. 1989b).
The same study showed that plasma ceruloplasmin, a copper binding protein, was significantly reduced by
iron deficiency or lead exposure, and a synergistic effect was seen in rats exposed to lead and fed an iron
deficient diet.
Dietary copper also appears to be antagonistic to the adverse effects of lead on the hematopoietic system,
growth depression, and tissue hypertrophy (Klauder and Peterini 1975). The reduction in uptake of lead and
decrease of lead-induced ALAD inhibition upon administration of copper may be achieved through a
competition between the two metals for binding to proteins (Underwood 1977).
Zinc can have a protective effect against lead toxicity. Zinc added in the diet has been found to protect
horses grazing on lead-contaminated pastures from clinical signs of lead toxicity (Goyer 1986). Zinc almost
entirely eliminated the inhibition of ALAD by lead in rabbits (Haeger-Aronsen et al. 1976) and was shown
to protect rats against the effects of orally administered lead (Brewer et al. 1985; Cerklewski and Forbes
1976), even during gestation and lactation (Cerklewski 1979) and intraperitoneally administered lead (Satija
and Vij 1995). A protective effect of zinc against lead toxicity in the chick embryo has also been shown
(Srivastava and Tandon 1984). In addition, lead exposure and zinc deficiency exerted additive effects on
decreased body weights of rats (Bushnell and Levin 1983). The protective action of zinc on lead toxicity is
thought to be mediated by an inhibition of gastrointestinal absorption via an intestinal metallothionein
mechanism, which binds lead (Brewer et al. 1985; Cerklewski and Forbes 1976). Also, excess zinc protects
zinc-containing enzymes like ALAS, ferrochelatase, and ALAD. In vivo, aqueous solution containing zinc
administered to rats significantly reduced the genotoxic effects induced by lead (Kowalska-Wochna et al.
1988). It was postulated that zinc's protective action may be related to its functioning in DNA and RNA
polymerases and consequent enhancement of cell repair processes.
Evidence suggests that lead exacerbates the toxic effects of mercury. In the rat, the administration of lead
nitrate increased kidney and liver glutathione content and resulted in increased mercury deposition in the
kidney, along with increased lethality in rats (Congiu et al. 1979).
LEAD 314
2. HEALTH EFFECTS
Chandra et al. (1981) studied the effects of simultaneous daily exposure to lead and manganese in rats.
Manganese was administered via drinking water and lead was administered intraperitoneally for 14 days.
Simultaneous dosing with lead and manganese reduced motor activity, impaired learning, and increased
aggressive behavior to a much greater degree than did lead alone. Also, while lead alone increases the
content of norepinephrine in the brain, the manganese-lead combination produced a decrease in norepin-
ephrine. Furthermore, manganese significantly increased the accumulation of lead in the brain compared to
administration of lead alone. In a subsequent study, Chandra et al. (1983) reported that simultaneous
administration of lead and manganese to rats during gestation and lactation induced a significant and greater
decrease in body weight and brain weight in the offspring than lead alone. The metal combination also
decreased the content of DNA and RNA in the brain to a greater extent than did lead alone. As seen in their
earlier report, treatment with the metal combination resulted in a much greater accumulation of lead in the
brain of 21-day-old pups than that observed after only lead. These results suggest that manganese in some
way facilitates the absorption of lead, but the mechanism by which this may happen is unknown.
In summary, lead appears to interact with all elements that can form divalent cations.
The interaction of lead and ethanol has been studied by Flora and Tandon (1987), who suggested that rats
exposed to lead and ethanol are more susceptible to the neurological and hepatotoxic effects of lead. In this
study, the simultaneous exposure of rats to lead and ethanol resulted in a significantly higher concentration
of lead in blood, brain, and liver tissues compared with rats treated with lead alone. Lead given with
ethanol resulted in more pronounced inhibition of the activities of hepatic glutamic oxaloacetic transaminase
(GOT, AST) and glutamic pyruvic transaminase (GPT, ALT) than did treatment with lead by itself. In
addition, exposure to lead plus ethanol resulted in a greater depression of dopamine and 5-hydroxy-
tryptamine levels in the rat brain than did lead treatment alone. A subsequent study conducted by the same
investigators, found that rats co-exposed to lead and ethanol (20% in drinking water) experienced more
marked inhibition of blood ALAD activity, elevation of blood ZPP, urinary elimination of lead and ALA,
and increased blood, liver, kidney, and brain lead levels than rats exposed to lead alone (Dhawan et al.
1989).
Another study investigated the interactive effects of lead and alcohol during pregnancy on fetal
development and offspring learning (Zajac and Abel 1990). No differences were found in maternal weight
gain, percent resorptions, litter size, or fetal weight in rats treated simultaneously with lead and alcohol,
LEAD 315
2. HEALTH EFFECTS
compared with alcohol-treated rats; however, these parameters were significantly different for lead-plus-
alcohol-dosed rats compared with lead-treated rats. In addition, no potentiation of activity, passive
avoidance, or active avoidance learning was observed compared to animals treated with alcohol or lead
alone. The authors concluded that neither lead nor alcohol attenuate or potentiate each other's effects on
reproduction or learning behavior.
Gelman et al. (1978) found that the interaction between lead and phenylhydrazine produced an additive
effect in the acute hemolytic phase of anemia and a probable synergistic effect during the compensatory
phase of anemia in rabbits. The mechanism postulated for anemic interaction appears to be primarily
related to depressed bone marrow production of erythrocytes rather than to increased hemolysis.
2.9 POPULATIONS THAT ARE UNUSUALLY SUSCEPTIBLE
A susceptible population exhibits different or enhanced response to lead than do most persons exposed to
the same level of lead in the environment. Reasons include genetic make-up, developmental stage, health
and nutritional status, and chemical exposure history. These parameters result in decreased function of the
detoxification and excretory processes (mainly hepatic and renal) or the pre-existing compromised function
of target organs. For these reasons we expect the elderly with declining organ function and the youngest of
the population with immature and developing organs generally to be more vulnerable to toxic substances
than healthy adults. Populations who are at greater risk due to their unusually high exposure are discussed
in Section 5.7, Populations With Potentially High Exposure.
Certain subgroups of the population may be more susceptible to the toxic effects of lead exposure. These
include crawling and house-bound children (<6 years old), pregnant women (and the fetus), the elderly,
smokers, alcoholics, and people with genetic diseases affecting heme synthesis, nutritional deficiencies, and
neurological or kidney dysfunction. This is not an exhaustive list and reflects only current data available,
further research may identify additional susceptible subgroups.
Children. Children are at the greatest risk for experiencing lead-induced health effects, particularly in the
urbanized, low-income segments of this pediatric population. Young children (<5 years old) have been
documented to absorb lead via the gastrointestinal tract more efficiently (50% relative absorption) than
adults (15% relative absorption) (Chamberlain et al. 1978). The use of leaded seams in cans used for
canned food is not nearly as prevalent as it once was, so this is no longer as important a source of dietary
exposure to lead. Behavior such as thumb sucking and pica result in an elevated transfer of lead-
LEAD 316
2. HEALTH EFFECTS
contaminated dust and dirt to the gastrointestinal tract (Schroeder and Hawk 1987). Also, children
frequently have a greater prevalence of nutrient deficiency (Yip et al. 1981; Ziegler et al. 1978). For
example, the diets of young children are commonly deficient in zinc, a condition that exacerbates some of
the toxic effects of lead. Children have also been documented to have lower blood thresholds for the
hematological and neurological effects induced by lead exposure. In addition, the resultant encephalopathy,
central nervous system deficits, and neurologic sequelae tend to be much more severe in children than adults
(Bellinger et al. 1988; Bradley et al. 1956; Wang et al. 1989). Breast-fed infants of lead-exposed mothers
are also a susceptible group since lead is also secreted in the breast mi lk (Dabeka et al. 1988).
Susceptibility to lead toxicity is influenced by dietary levels of calcium, iron, phosphorus, vitamins A and
D, dietary protein, and alcohol (Calabrese 1978). Low dietary ingestion of calcium or iron increased the
predisposition to lead toxicity in animals (Barton et al. 1978a; Carpenter 1982; Hashmi et al. 1989a; Six and
Goyer 1972; Waxman and Rabinowitz 1966). Iron deficiency combined with lead exposure acts
synergistically to impair heme synthesis and cell metabolism (Waxman and Rabinowitz 1966). Nutritional
surveys indicate that children of low-income groups consume less than recommended dietary allowances of
calcium and iron. Dietary deficiencies of these two minerals have been shown to potentiate the toxicity of
lead (Johnson and Tenuta 1979; Yip et al. 1981; Ziegler et al. 1978). Thus, nutrient deficiencies in
conjunction with a developmental predisposition to absorb lead makes this subset of children at a
substantially elevated risk. More information on children's susceptibility to lead is presented in Section 2.6.
Embryo/Fetus. The embryo/fetus are at increased risk because of transplacental transfer of maternal
lead (Bellinger et al. 1987a; Moore et al. 1982). Thompson et al. (1985) reported the case of a woman
whose PbB level increased to 74 ug/dL over the course of pregnancy resulting in the baby's PbB level of
55 (ig/dL and showing clinical signs of intoxication. No evidence of increased exposure to external lead
source during this period was apparent, but it was found that the mother had excessive exposure to lead
30 years prior to the pregnancy. Lead has been demonstrated in animal studies to increase the incidence of
fetal resorptions (McClain and Becker 1972) and to induce adverse neurobehavioral effects in offspring
exposed in ufero(Draski et al. 1989).
Women. Studies of women suggest that conditions of pregnancy, lactation, and osteoporosis may
intensify bone demineralization, thus mobilizing bone lead into the blood resulting in increased body
burdens of lead (Silbergeld et al. 1988). For example, women show an increased rate of bone lead loss with
LEAD 317
2. HEALTH EFFECTS
age relative to men (Drasch et al. 1987). Women with postmenopausal osteoporosis may be at an increased
risk since lead inhibits activation of vitamin D, uptake of calcium, and several aspects of bone cell function
to aggravate the course of osteoporosis. Using data collected from 2,981 women in the NHANES II study, a
significant increase in PbB levels was observed after menopause (Silbergeld et al. 1988). However, the
actual prevalence of osteoporosis was not reported in this study, so it is not possible to conclude that
increased mobilization of lead from bone in postmenopausal women is directly related to an increased
incidence of osteoporosis based on these data. Furthermore, in a study of 3,098 55-66 year-old women, it
was found that PbB levels were not elevated to toxic levels as a result of lead mobilization from bone during
conditions of bone demineralization, such as osteoporosis (Ewers et al. 1990). The highest PbB levels
measured in this study ranged from 15 to 30 ug/dL. Long-term effects of lead exposure were also reported
by Hu (1991) who found that pregnant women who had experienced childhood plumbism had a higher rate
of spontaneous abortion or stillbirth than matched controls, and their offspring were more likely to
experience learning disabilities.
Elders. The aged population may be at an increased risk for toxic effects of lead as suggested by two
recent studies that found an association between decreased neurobehavioral performance and PbB in aging
subjects with PbB around 5 ug/dL (Muldoon et al. 1996; Payton et al. 1998). In addition to the
mobilization of bone lead and increased lead body burden due to osteoporosis, animal data suggest that aged
animals may be more susceptible to the effects of lead than adult or young animals (Cory-SIechta 1990b).
For example, increases in ZPP and urinary ALA were observed in aged rats sooner than in young or adult
rats with comparable PbB levels. Also, aged rats exposed to lead had a higher mortality rate than
nonexposed aged rats. Aged rats also had higher brain lead levels than did young or adult rats.
People with Inheritable Genetic Diseases. The toxic effects of lead exposure become exacerbated
in individuals with inherited genetic diseases, such as thalassemia, which is characterized by an abnormality
in the rate of hemoglobin synthesis (Calabrese 1978). Individuals with glucose-6-phosphate dehydrogenase
(G6PD) deficiency are also unusually susceptible and may exhibit hemolytic anemia following lead
exposure (Calabrese 1978). In a study of 148 subjects, Cocco et al. (1991) found that chronic lead
poisoning tended to decrease total cholesterol and LDL in both G6PD-deficient and G6PD-nondeficient
populations, but positive slopes were seen for cholesterol esters in G6PD deficient subjects and for HDL in
G6DP normal subjects. Another study from the same group found that mortality from all causes and cancer
mortality were lower among lead smelter workers with the glucose-6-phosphate dehydrogenase deficient
phenotype compared to coworkers with the wild phenotype; the study comprised 867 workers with the wild
LEAD 318
2. HEALTH EFFECTS
phenotype and 213 with the deficient phenotype (Cocco et al. 1996). Because of the relatively small
number of subjects with the deficient phenotype, the study may have lacked statistical power to examine
deaths among this group. It has also been postulated that children with sickle cell disease have an increased
risk of developing neuropathy with exposure to lead (Erenberg et al. 1974). People with metabolic
disorders associated with the synthesis of porphyrins (important intermediates in the synthesis of
hemoglobin, cytochromes, and vitamin B12), collectively known as porphyrias, are especially susceptible to
lead exposure since lead inhibits two critical enzymes, ALAD and ferrochelatase, concerned with heme
synthesis in erythrocytes (Hubermont et al. 1976; Silbergeld et al. 1982). The presence of genetic disorders
that induce excessive ALA synthetase activity in addition to lead exposure produce higher than normal
levels of ALA, resulting in excessive ALA excretion, accumulation, and lack of negative feedback on the
ALA synthetase activity from heme (Calabrese 1978).
Human ALAD is a polymorphic enzyme with two common alleles, ALAD1 and ALAD2 (Petrucci et al.
1982). This results in an enzyme system with three distinct isozyme phenotypes, designated ALAD 1-1,
ALAD 1-2, and ALAD 2-2. Several white populations express the alleles ALAD1 and ALAD2 with gene
frequencies of 0.9 and 0.1, respectively (Astrin et al. 1987; Battistuzzi et al. 1981; Benkmann et al. 1983;
Petrucci et al. 1982). The existence of this common polymorphism in a gene whose product was implicated
in the pathogenesis of lead toxicity suggested that differential susceptibility to lead may be genetically
determined. Wetmur (1994) summarized the results of an analysis of ALAD isozyme types in blood and
blood lead from two populations. One group consisted of 202 lead workers in a factory in Germany. The
other group was composed of 1,278 children subjected to low-level environmental lead exposure in New
York City. The results showed that in the 40-60 percentile group for PbB in each phenotype group, PbB
levels in individuals with the ALAD2 allele (phenotypes ALAD 1-2 and ALAD 2-2) were approximately
10 ug/dL higher than in similarly exposed individuals homozygous for the ALAD1 allele (phenotype ALAD
1-1). These results strongly suggested that a relationship exists between the ALAD2 allele and the
accumulation of lead in blood. It was hypothesized that the increased susceptibility of those with the
ALAD2 allele is due to the ALAD2 subunit binding lead more tightly than the ALAD1 subunit (Astrin et al.
1987).
Smith et al. (1995) examined the association between ALAD polymorphism and lead concentration in blood
and bone in a group of 122 subjects with relatively modest overall lead exposure. Mean PbB in ALAD2
carriers was 7.78 ug/dL compared with 7.73 for ALAD1 ug/dL allele indicating that the ALAD2 phenotype
was not a significant determinant of blood lead concentrations among individuals exposed at relatively low
LEAD 319
2. HEALTH EFFECTS
levels. When the age-adjusted difference patellar-minus-tibial lead was compared between ALAD2 and
ALAD1 subjects it was found that the latter showed a greater difference (3.4 vs 8.6 ug Pb/g bone mineral),
and this suggested that ALAD status may modify the way in which lead partitions between these two
storage sites. According to Smith et al. (1995), this differential partitioning could provide a sensitive
indicator of genotype-related differences in the overall pharmacokinetics of lead. Schwartz et al. (1997)
found that lead battery manufacturing workers with the ALAD 1-2 phenotype excreted on average 24 ug
less lead after oral administration of the chelating agent DMSA than did workers with the ALAD 1-1
phenotype. Schwartz et al. (1997) stated that if urinary excretion of lead after DMSA is a surrogate for
bioavailable lead stores, their findings implicated that subjects with ALAD 1-2 had lower bioavailable lead
stores. According to the authors, this provided evidence that ALAD genotype modifies the toxicokinetics of
lead by, for example, differential binding of current lead stores or by differences in long term retention and
disposition of lead.
Alcoholics and Smokers. Alcoholics, and people who consume excess amounts of alcohol, may be at
increased risk of hematological, neurological, and hepatotoxic effects. In animal studies, lead and alcohol
synergistically inhibited blood ALAD activity and hepatic glutamic oxaloacetic transaminase (GOT, AST)
and glutamic pyruvic transaminase (GPT, ALT) activity, depressed dopamine and 5-hydroxytryptamine
levels in rat brain, increased lead burdens in tissue organs, and elevated blood ZPP (Dhawan et al. 1989;
Flora and Tandon 1987). Smokers are also at elevated risks of lead intoxication since cigarette smoke
contains lead and other heavy metals such as cadmium and mercury (Calabrese 1978), which have been
shown to be synergistic in experimental animals (Congiu et al. 1979; Exon et al. 1979; Fahim and Khare
1980).
People with Neurologic Dysfunction or Kidney Disease. This population is unusually
susceptible to lead exposure. The neurologic and renal systems are the primary target organs of lead
intoxication, which may become overburdened at much lower threshold concentrations to elicit
manifestations of lead intoxication (Benetou-Marantidou et al. 1988; Chisolm 1962, 1968; Lilis et al. 1968;
Pollock and Ibels 1986).
2.10 METHODS FOR REDUCING TOXIC EFFECTS
This section will describe clinical practice and research concerning methods for reducing toxic effects of
exposure to lead. However, because some of the treatments discussed may be experimental and unproven,
LEAD 320
2. HEALTH EFFECTS
this section should not be used as a guide for treatment of exposures to lead. When specific exposures have
occurred, poison control centers and medical lexicologists should be consulted for medical advice.
2.10.1 Reducing Peak Absorption Following Exposure
Individuals potentially exposed to lead can prevent inhalation exposure to particles by wearing the
appropriate respirator. The mechanism and rate of lead absorption from the gastrointestinal tract is not
completely understood, but it is believed that absorption occurs in the small intestine by both active and
passive transport following solubilization of lead salts by gastric acid (see Section 2.4.1). Lead is poorly
absorbed from the gastrointestinal tract; however, toxic effects can result from the relatively small amount
of lead that is absorbed. It has been estimated that approximately 10% of an administered dose is absorbed
by adults and 4-50% of ingested lead is absorbed by children (Chamberlain et al. 1978). Lead absorption
from the gut appears to be blocked by calcium, iron, and zinc. Although no treatment modalities to reduce
lead absorption have yet been developed that make use of these observations; it is recommended that a
child's diet contain ample amounts of iron and calcium to reduce the likelihood of increased absorption of
lead (CDC 1991). General recommendations to reduce absorption following acute exposure to lead, include
removing the individual from the source of exposure and decontaminating exposed areas of the body.
Contaminated skin is washed with soap and water, and eyes exposed to lead are thoroughly flushed with
water or saline (Stutz and Janusz 1988). Once lead is ingested, it is suggested that syrup of ipecac be
administered to induce emesis. Administration of activated charcoal following emesis has not been proven
to reduce absorption of any lead remaining in the gastrointestinal system, but is frequently recommended
(Stutz and Janusz 1988). Gastric lavage has been used to remove ingested lead compounds. Whole gut
lavage with an osmotically neutral (polyethylene glycol electrolyte solution [GO-Lytely®, Co-lyte®]) has
successfully removed ingested lead-containing pottery glazes according to anecdotal case reports.
However, this procedure is not universally accepted. Patients who ingest lead foreign objects should be
observed for the possible, although rare, development of signs or symptoms of lead poisoning until the
ingested object has been proven to have passed through the gut. Surgical excision has been recommended
when lead bullets or shrapnel are lodged near joint capsules (reaction with synovial fluid leads to systemic
uptake of lead in some cases). The blood lead level can be monitored and used as an indication for surgical
removal of the projectile.

LEAD 321
2. HEALTH EFFECTS
2.10.2 Reducing Body Burden
Lead is initially distributed throughout the body and then redistributed to soft tissues and bone. In human
adults and children, approximately 94% and 73% of the total body burden of lead is found in bones,
respectively. Lead may be stored in bone for long periods of time, but may be mobilized, thus achieving a
steady state of intercompartmental distribution (see Section 2.3.2).
All of the currently available methods to obviate the toxic effects of lead are based on their ability to reduce
the body burden of lead by chelation. All of the chelating agents bind inorganic lead, enhance its excretion,
and facilitate the transfer of lead from soft tissues to the circulation where it can be excreted. Since the
success of chelation therapy depends on excretion of chelated lead via the kidney, caution should be used
when treating a patient with renal failure. The standard chelating agents currently in use are dimercaprol
(British Anti-Lewisite, or BAL) and CaNa2-EDTA (or EDTA). Both of these agents are administered
parenterally. Penicillamine has been used as an oral chelating agent. It increases urinary excretion of lead
by an unknown mechanism but is not as effective as EDTA and is not yet approved for use by the FDA for
lead poisoning (Ellenhorn and Barceloux 1988; Goldfrank et al. 1994). The preferred chelating agent and
the treatment regimen depend on the nature of the intoxication (i.e., the symptomology present and the
extent of lead exposure as determined by blood lead level). BAL chelates both intracellular and
extracellular stores. BAL-lead chelates are excreted primarily in the bile, with some excretion in the urine.
Thus, in individuals with kidney impairment, BAL is the chelating agent of choice. EDTA mobilizes lead
from bone and soft tissue stores, and thus may aggravate acute toxic symptoms by increasing PbB if not
given in conjunction with BAL. Therefore, for adults that are symptomatic or have PbB levels >70 ug/dL
and for children (symptomatic or asymptomatic) with PbB levels >70 ug/dL, therapy with BAL followed by
EDTA is used (CDC 1991; Ellenhorn and Barceloux 1988; Goldfrank et al. 1994). For asymptomatic
children with PbB levels of 45-69 ug/dL, a course of EDTA chelation therapy is used (CDC 1991;
Ellenhorn and Barceloux 1988; Goldfrank et al. 1994). 2,3-Dimercaptosuccinic acid (DSMA; Succimer®) is
an orally administered chelating agent approved by the FDA for treating children with PbB levels
>45 ug/dL, for which indication it is the treatment of choice. Although not yet FDA labeled for this
indication, DSMA is also being used to treat lead poisoning in adults. The effectiveness of chelation
therapy for treating children with PbB levels ranging from 25 to 44 ug/dL is still being debated (Angle
1993; Graziano 1994), and treatment of children in this range varies. At a minimum, it is recommended
that exposure to lead be minimized, sufficient calcium and iron intake be ensured, and regular blood lead
level testing be conducted in children who fall into this range (CDC 1991). Children with PbB levels of
LEAD 322
2. HEALTH EFFECTS
20-24 ug/dL are generally not chelated. Management of these children includes reducing sources of lead
exposure, ensuring proper nutritional status, and routine blood lead testing (CDC 1991).
2.10.3 Interfering with the Mechanism of Action for Toxic Effects
One of the mechanisms underlying the diffuse effects of lead is thought to be the result of its ability to
combine with ligand groups (predominantly sulfhydryl groups) on proteins, thereby affecting many enzyme
systems and cellular processes throughout the body (e.g., the enzymes involved in heme synthesis, see
Sections 2.2.1.2, 2.4, and 2.5). Therefore, interfering with the binding of lead to these macromolecules
would reduce the toxicity of lead. For example, the efficacy of treatment with a sulfhydryl donor for lead to
bind to, such as acetylcysteine, could be investigated. The chelating agents discussed in Section 2.10.2 bind
to lead and, therefore, prevent its binding to proteins. All chelating agents have more or less significant
potential adverse effects, and some are contraindicated or must be used with extreme caution in some
situations or in some patients (e.g., patients with renal impairment). It is advisable to consult with a medical
toxicologist or other physician familiar with those medications before commencing treatment. CDC (1991)
summarized information on the pharmacology of chelating agents. For example, some clinicians
recommend that for patients with glucose-6-phosphate dehydrogenase, BAL be used only in life-
threatening situations, since the drug may induce hemolysis. Also, medicinal iron should never be
administered during BAL therapy because the combination of iron and BAL has been implicated in serious
reactions. BAL should not be used for children allergic to peanuts or peanuts products. Na2-EDTA should
never be used for treating children with lead poisoning because it will induce tetany and possibly fatal
hypocalcemia; only CaNa2-EDTA can be used for treating children with lead poisoning. D-penicillamine
should not be administered to patients with known penicillin allergy. Succimer is chemically similar to
BAL but it is more water soluble, has a high therapeutic index, and is absorbed from the gastrointestinal
tract. Toxicity due to succimer appears to be minimal, but clinical experience with succimer is limited.
In cases of lead encephalopathy with cerebral edema, edema can be treated with mannitol, corticosteroids,
and hypothermia. Convulsions can be treated with diazepam, phenytoin, and/or phenobarbital (Garrettson
1990).

LEAD 323
2. HEALTH EFFECTS
2.11 ADEQUACY OF THE DATABASE
Section I04(i)(5) of CERCLA directs the Administrator of ATSDR (in consultation with the Administrator
of EPA and agencies and programs of the Public Health Service) to assess whether adequate information on
the health effects of lead is available. Where adequate information is not available, ATSDR, in conjunction
with the National Toxicology Program (NTP), is required to assure the initiation of a program of research
designed to determine the health effects (and techniques for developing methods to determine such health
effects) of lead.
The following categories of possible .data needs have been identified by a joint team of scientists from
ATSDR, NTP, and EPA. They are defined as substance-specific informational needs that if met would
reduce or eliminate the uncertainties of human health assessment. This definition should not be interpreted
to mean that all data needs discussed in this section must be filled. In the future, the identified data needs
will be evaluated and prioritized, and a substance-specific research agenda will be proposed.
2.11.1 Existing Information on Health Effects of Lead
The existing data on health effects of inhalation, oral, and dermal exposure of humans and animals to lead
are summarized in Figure 2-13. The purpose of this figure is to illustrate the existing information
concerning the health effects of lead. Each dot in the figure indicates that one or more studies provide
information associated with that particular effect. The dot does not necessarily imply anything about the
quality of the study or studies, nor should missing information in this figure be interpreted as a "data need."
A data need, as defined in ATSDR's Decision Guide for Identifying Substance-Specific Data Needs Related
to ToxicologicalProfiles (ATSDR 1989), is substance-specific information necessary to conduct
comprehensive public health assessments. Generally, ATSDR defines a data gap more broadly as any
substance-specific information missing from the scientific literature.
2.11.2 Identification of Data Needs
Acute-Duration Exposure. There are few data available for acute exposures in humans. This may be
a function of the time required for the expression of effects (decreased heme synthesis, neurobehavioral
changes, increased blood pressure, and interference with vitamin D metabolism) and the usual modes of
exposure in humans, which are repeated ingestion of lead-containing dirt or lead-based paint chips in
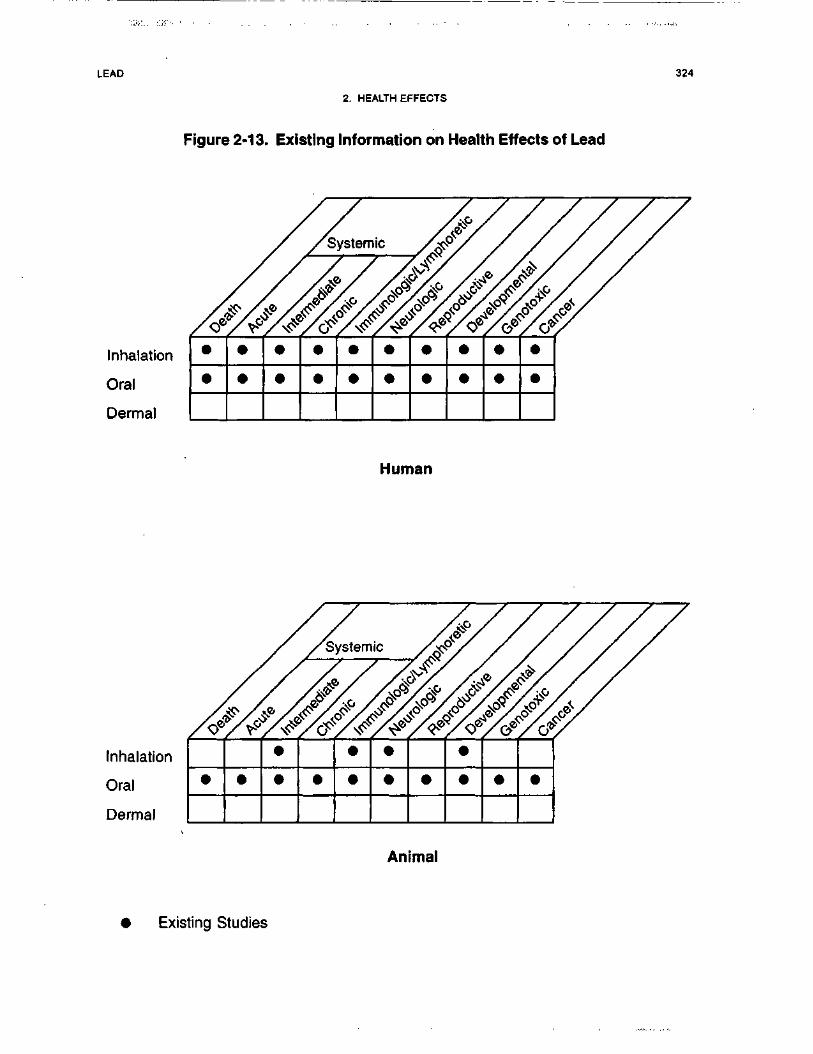
LEAD
2. HEALTH EFFECTS
Figure 2-13. Existing Information on Health Effects of Lead
324
Inhalation
Oral
Dermal
• • • • • • • • • •
Human
Inhalation
Oral
Dermal
• •
•
• •
•
•
•
• •
•
• • •
Animal
• Existing Studies
LEAD 325
2. HEALTH EFFECTS
children and continuous occupational inhalation exposures for adults. Both of these modes of exposure
occur simultaneously with exposure to other metals so that the effect of lead may be modulated by the
presence of other metals. More data need to be generated in studies that include multi-elemental analyses.
One case report reviewed described a patient that presented with headache, fatigue, nausea, abdominal
cramps, and arthralgias with a PbB level of 90 ug/dL following a 12-hour exposure to lead from sand-
blasting old lead-based paint, indicating that lead toxicity can occur in humans after acute-duration
exposures (Schneitzer et al. 1990). A 70-year-old woman who was a nursing home resident died of lead
intoxication 16 days after drinking lead ceramic glaze (Roberge et al. 1994). On admission to the hospital
her PbB level was 259 ug/dL, but decreased to 21 ug/dL after chelation therapy. In spite of this, the
patient's lethargy and confusion persisted and she developed renal failure and associated anasarca, as well
as a brief apneic period before dying. Some data exist that show death occurred in children who had severe
lead-induced encephalopathy (Chisolm 1962; Chisolm and Harrison 1956). The duration of exposure
associated with this effect is not clear; it may have been a few weeks or more and, in some cases, may have
been acute. There are data that show human ingestion of lead acetate producing a decrease in erythrocyte
ALAD within 3 days (Stuik 1974). There are no data available on acute inhalation exposures in animals.
A 7-day oral study in rats fed lead acetate (Smith et al. 1981) reported a depression of 1,25-dihydroxy-
vitamin D plasma levels providing support for the evidence seen in humans that vitamin D metabolism may
be a target for lead toxicity. Additional data relating environmental measurements of exposure, blood lead
levels, and toxic effects from acute inhalation and oral exposures would be useful for assessment of the
public health concern with acute exposure to lead. Further data that provided dose-response information
would be useful for determining if there is a threshold for lead toxicity in animals and, if so, the thresholds
for lead toxicity for both oral and inhalation exposures. There are no pharmacokinetic data that specifically
address whether or not the route of exposure alters the health effects caused by lead, but the available
information indicates that the toxic effects of lead are the same regardless of route of exposure. Dermal
exposures are not considered to be significant in humans because the dermal absorption rate of lead is so
low for inorganic compounds. Significant dermal absorption occurs for organolead compounds, but
because the potential exposure levels are very low, additional studies do not seem warranted at this time.
Intermediate-Duration Exposure. Intermediate and chronic exposures in humans should be
considered together, because the length of exposure is not usually known. The database for lead is unusual
in that it contains a great deal of data concerning dose-effect relationships in humans. However, the dose
data for humans are usually expressed in terms of blood lead levels rather than as environmental exposure
LEAD 326
2. HEALTH EFFECTS
levels. Dose-effect data in terms of environmental levels (mg/kg/day or mg/m3) by a single route of
exposure are not generally available for humans.
The dose-effect relationship between blood lead and ALAD has been reported to extend through the lowest
blood lead levels detectable (Chisolm et al. 1985; Hernberg and Nikkanen 1970; Lauwerys et al. 1978;
Roels and Lauwerys 1987; Sakai and Morita 1996; Secchi et al. 1974). Inhibition of enzyme activity results
in reduced heme synthesis, which affects not only the oxygen-carrying potential of erythrocytes but also
decreases formation of cytochrome P-450. This effect can influence many metabolic energy-transfer
processes. Formation of heme-containing cytochromes is also inhibited in animals treated intraperitoneally
or orally with lead compounds (Azar et al. 1973; Goldberg et al. 1978; Krasovskii et al. 1979; Overmann
1977; Walsh and Ryden 1984). Additional data from 90-day animal studies would be useful for correlating
environmental exposure measurements with both blood lead levels and health effects. Further data that
provided dose-response information would be useful for determining if there is a threshold for lead toxicity
for both oral and inhalation exposures. There are no pharmacokinetic data that specifically address whether
or not the route of exposure alters the health effects caused by lead, but the available information indicates
that the toxic effects of lead are the same regardless of route of exposure. Dermal exposures are not
considered to be significant in humans because the dermal absorption rate of inorganic lead is so low.
Significant dermal absorption occurs for organolead compounds, but because the potential exposure levels
are very low, additional studies do not seem warranted at this time.
Chronic-Duration Exposure and Cancer. As stated in the preceding section, intermediate and
chronic exposures in humans should be considered together, because the length of exposure is usually not
known. Effects on heme synthesis and erythropoiesis (Adebonojo 1974; Alessio et al. 1976; Awad et al.
1986; Baker et al. 1979; Betts et al. 1973; Chisolm et al. 1985; Grandjean 1979; Hernberg and Nikkanen
1970; Lauwerys et al. 1974, 1978; Lilis et al. 1978; Meredith et al. 1978; Pollock and Ibels 1986; Roels and
Lauwerys 1987; Roels etal. 1975, 1976, 1979; Rosen et al. 1974; Schwartz et al. 1990; Secchi et al. 1974;
Selander and Cramer 1970; Solliway et al. 1996), neurobehavioral toxicity (Arnvig et al. 1980; Awad et al.
1986; Baker etal. 1979; Baloh et al. 1979; Campara et al. 1984; de la Burde and Choate 1972, 1975;
Ernhart et al. 1981; Glickman et al. 1984; Haenninen et al. 1979; Hogstedt et al. 1983; Holness and
Nethercott 1988; Khera et al. 1980b; Kotok 1972; Kotok et al. 1977; Lindgren et al. 1996; Maizlish et al.
1995; Mantere et al. 1982; Marino et al. 1989; Matte et al. 1989; Pagliuca et al. 1990; Parkinson et al. 1986;
Pasternak et al. 1989; Pollock and Ibels 1986; Rummoeta l . 1979; Schneitzer et al. 1990; Stollery et al.
1989, 1991; Zimmerman-Tanselia et al. 1983), cardiovascular toxicity (de Kort et al. 1987; Kirkby and
LEAD 327
2. HEALTH EFFECTS
Gyntelberg 1985; Kline 1960; Kosmiderand Petelenz 1962; Pocock et al. 1984, 1985, 1988; Pollock and
Ibels 1986; Marino et al. 1989; Silver and Rodriguez-Torres 1968; Weiss et al. 1986, 1988), renal toxicity
(Batuman et al. 1981, 1983; Biagini et al. 1977; Chisolm 1962; Cramer et al. 1974; Kim et al. 1996a;Lilis
etal. 1968;Maranelliand Apostoli 1987; Ong et al. 1987; Pollock and Ibels 1986; Pueschel et al. 1972;
Staessen et al. 1992; Verschoor et al. 1987; Wedeen et al. 1979), and vitamin D metabolism (Mahaffey et al.
1982; Rosen et al. 1980) have been noted. Additional data providing dose-response information would be
useful for determining if there is a threshold for lead toxicity for both oral and inhalation exposures. There
are no pharmacokinetic data that specifically address whether or not the route of exposure alters the health
effects caused by lead, but the available information indicates that the toxic effects of lead are the same
regardless of route of exposure, but the time course differs. Dermal exposures are not considered to be
significant in humans because the dermal absorption rate of lead is so low. This is not so for organolead
compounds (Stauber et al. 1994).
No acute, intermediate, or chronic MRLs have been derived for any route of exposure because of the lack of
a clear threshold for the most sensitive effects in humans. However, ATSDR has developed a framework to
provide health guidance at lead sites (see appendix D).
Several epidemiological studies of occupationally exposed persons have examined the potential carcino-
genicity of lead (Anttila et al. 1995, 1996; Cocco et al. 1997; Cooper 1976; Cooper and Gaffey 1975;
Fayerweather et al. 1991; Kang etal. 1980; Lundstrom et al. 1997; Selevan etal. 1985; Steenland et al.
1992). These studies all exhibit some methodological limitations, which include no identification of the
actual lead compounds, no specification of the route of exposure, no adjustment for concomitant exposure to
other chemicals, and no adjustment for other confounders such as cigarette smoking. Increased incidences
of total malignant neoplasms were reported in some studies; statistical significance was reached in some
categories, but not others. Three studies reported a non-significant increase in renal cancer, which is
supportive of animal studies that associate lead exposure with kidney cancer (Cocco et al. 1997; Selevan et
al. 1985; Steenland et al. 1992). Two additional case reports of renal cancer in occupationally exposed men
also provide anecdotal support for this effect (Baker et al. 1980; Lilis 1981). These case reports are the only
occupational cancer reports to include blood lead levels. There are no data regarding the carcinogenicity of
lead in humans exposed solely by the oral route. The association of exposure to tetraethyl lead with
colon/rectal cancer was published in 1997 (Fayerweather et al. 1997) and needs to be confirmed.
LEAD 328
2. HEALTH EFFECTS
Several animal studies associate oral exposure to several lead compounds with renal rumors in various
species (Azar et al. 1973; Koller et al. 1985; Van Esch and Kroes 1969). Most studies used one or two
doses; good dose-effect data are not available. One 2-year study in rats used six doses as well as a control
group (Azar et al. 1973). This study measured both exposure levels and blood levels, and correlated these
with increased tumor incidence, as well as reduced heme synthesis. There are no animal data on the
carcinogenicity of lead by inhalation exposure. Additional long-term studies of other species are needed to
evaluate the potential carcinogenic effects of lead in humans. Information on inhalation exposures would be
particularly useful because most long-term human exposures are thought to be occupational and primarily
by inhalation. There are recognized species differences in the pharmacokinetics of lead that may have a
bearing on the carcinogenic potential for this compound across species (see "Comparative Toxicokinetics").
Genotoxicity. Data are available on the genotoxicity of lead both from in vitro and in vivo studies.
Human lymphocytes have been examined from both occupationally or environmentally exposed persons
and from healthy controls as well (Beek and Obe 1974; Deknudt and Deminatti 1978; Gasiorek and
Bauchinger 1981; Niebuhr and Wulf 1984; Schmid et al. 1972). The results of these studies are mixed. The
positive data indicate that lead is a clastogen. The results of in vivo tests are also contradictory, but there is
some evidence that lead has an effect on chromosomes. Increased sister chromatid exchange occurred in
some lead-exposed workers (Huang et al. 1988b), but not in others (Maki-Paakkanen et al. 1981). A
positive correlation between increased frequency of sister chromatid exchange and duration of occupational
exposure independent of blood level (Grandjean et al. 1983), or between chromosomal aberrations and
blood levels (Huang et al. 1988b) has been reported. In mammalian test systems in vitro, there are
conflicting results for lead acetate-induced structural chromosomal aberrations (Bauchinger and Schmid
1972;Robisonetal. 1984).
Tests for gene mutations, DNA modifications, and recombinations in various microorganisms using lead
acetate, lead nitrate, and lead chloride gave equivocal results (Bruce and Heddle 1979; Dunkel et al. 1984;
Fukunaga et al. 1982; Hoffman and Niyogi 1977; Kharab and Singh 1985; Nestmann et al. 1979; Nishioka
1975; Rosenkranz and Poirier 1979; Simmon 1979a, 1979b; Sirover and Loeb 1976). As summarized by
Winder and Bonin (1993), some reasons for the equivocal results may be related to solubility differences
among the lead compounds in biological fluids, chemical interferences, nonspecificity of the assays used,
the delivery of toxic doses to specific genetic processes, or the mediation of genotoxicity through indirect
mechanisms. There are some data to indicate that the status of calcium availability may be important in the
LEAD 329
2. HEALTH EFFECTS
expression of lead-induced clastogenicity in both in vitro anA in vivo tests (Deknudt et al. 1977; Hartwig et
al. 1990). Studies in monkeys indicated that calcium deficiency may enhance the genotoxicity of lead as it
does for other manifestations of lead toxicity (Deknudt et al. 1977). In a study in mice, males were found to
be more susceptible to the clastogenic effects of lead than females (Jagetia and Aruna 1998). Additional
studies are needed to clarify the clastogenic potential of lead and its compounds and to assess the possible
implications for carcinogenic potential. Specific aberrations, if identified, would offer insight into a
mechanism for carcinogenesis.
Reproductive Toxicity. Human data on reproductive toxicity come from observations in occupational
cohorts (Alexander et al. 1996; Assennato et al. 1987; Baghurst et al. 1987; Bonde and Kolstad 1997;
Braunsteinetal. 1978; Chowdhury et al. 1986; Cullen et al. 1984; Gennart et al. 1992b; Hu et al. 1991;
Lancranjan et al. 1975; Lerda 1992; Lin et al. 1996; McMichael et al. 1986; Murphy et al. 1990; Ng et al.
1991; Nordstrom etal. 1979; Rodamilans et al. 1988; Sallmen et al. 1995; Wibberley et al. 1977; Wildtet
al. 1983). Although no dose-effect data were presented, occupational exposure to inorganic lead has been
associated with a higher likelihood of spontaneous abortion (Baghurst et al. 1987; Hu et al. 1991;
McMichael et al. 1986; Nordstrom et al. 1979; Wibberley et al. 1977). Studies of increased frequency of
spontaneous abortion in women living close to a lead smelter or working in highly contaminated areas of
the smelter were confounded by the presence of other toxic agents and by the lack of matching for
socioeconomic status. There are data that indicate that reproductive effects occur in men exposed to lead
manifested as asthenospermia, hypospermia, teratospermia, and reduced fertility and that these effects are
related to blood lead levels (Alexander et al. 1996; Assennato et al. 1987; Braunstein et al. 1978;
Chowdhury et al. 1986; Cullen etal. 1984; Lancranjan et al. 1975; Lerda 1992; Lin et al. 1996; Rodamilans
etal. 1988; Wildtet al. 1983).
Animal studies support the evidence of lead-induced reproductive toxicity in humans. Rats dosed with oral
lead acetate show irregular estrous cycles in females and testicular damage in males (Hilderbrand et al.
1973). Recent lifetime exposure studies in male monkeys, using exposure protocols to evaluate different
developmental ages, have reported structural alterations in the testis at PbB levels relevant to the human
population (Foster et al. 1996, 1998). Studies in rats have suggested that continuous lead exposure delays
sexual maturation by suppressing normal sex steroid surges at birth and during puberty (Ronis et al. 1998b,
1998c). There are no data on the reproductive toxicity of inhaled lead in animals.

LEAD 330
2. HEALTH EFFECTS
There are enough data to provide qualitative evidence in support of the association with high levels of lead
and reproductive effects in humans and animals. However, the data cannot be used to estimate effect levels
in women and can be used only with caution to describe effects on sperm or testes from specific blood
levels of lead. Additional dose-effect data on inhalation exposures (the most common occupational
exposure in adults) in humans are needed to determine the potential for reproductive effects. Ninety-day
inhalation animal studies that quantify lead-induced reproductive toxicity are needed to confirm the
qualitative data in humans.
Developmental Toxicity. Three human studies that described congenital malformations as an end
point allow no definitive conclusion to be drawn regarding an association between prenatal lead exposure,
and the occurrence of congenital anomalies (Ernhart et al. 1985, 1986; McMichael et al. 1986; Needleman
et al. 1984). The limitations of these studies include possible bias introduced by use of hospital records and
a restricted range of maternal and cord blood lead levels. The sizes of the groups studied were not sufficient
for the detection of differences in low frequencies of anomalies.
The data are mixed regarding reduced birth weight and prenatal lead exposure in humans. Studies
evaluating exposure to low levels of lead and its influence upon birth weight and gestational age are more
controversial. The earlier evidence for such effects has not been reproduced in the studies by Factor-Litvak
et al. (1991) and Greene and Ernhart (1991). A significant inverse association between prenatal maternal
blood lead levels and birth weight was reported in the Cincinnati study (Bornschein et al. 1989; Dietrich et
al. 1986, 1987a). An earlier study showed that the percentage of small-for-gestational-age infants increased
with increasing cord blood lead, although the trend was not quite statistically significant (Bellinger et al.
1984). Significant direct associations between maternal and cord PbB levels and birth weight were reported
by McMichael et al. (1986). On the other hand, no association has been observed between maternal or cord
blood levels and birth weight in several other studies (Ernhart et al. 1985, 1986; Factor-Litvak et al. 1991;
Greene and Ernhart 1991; Moore et al. 1982; Needleman et al. 1984).
Evidence from some of the above studies also indicates that gestational age may be reduced as prenatal lead
exposure increases, even at PbB levels below 15 ug/dL (EPA 1986a). Significant negative correlations
between maternal or cord blood lead levels and gestational age were reported by Dietrich et al. (1986,
1987a, 1987b), McMichael etal. (1986); and Moore et al. (1982). Based on parameter estimates of Dietrich
et al. (1986), the reduction in gestational age was 0.6 week per natural log unit of blood lead increase (EPA
1986a). Based on risk estimates of McMichael et al. (1986), the risk of preterm delivery increases by at
LEAD 331
2. HEALTH EFFECTS
least fourfold as either cord blood or maternal PbB level at delivery increases from • 8 to >14 ug/dL.
However, other investigators did not find a significant relationship between maternal or cord PbB level and
gestational age (Bellinger et al. 1984; Factor-Litvak et al. 1991; Needleman et al. 1984). These studies also
indicate that adverse neurobehavioral affects can occur because of prenatal lead exposure (see the discussion
on "Neurotoxicity" below). The intellectual development of children exposed prenatally to lead has been
followed in several prospective studies. Some of these include the Yugoslavia cohort (Wasserman et al.
1994, 1997, 1998), the Port Pirie cohort (Baghurst et al. 1992, 1995; McMichae! et al. 1994; Tong et al.
1996), the Boston cohort (Bellinger et al. 1989a, 1989b, 1992, 1994) and the Cincinnati cohort (Dietrich et
al. 1989, 1991, 1992, 1993a, 1993b). These studies found that a typical doubling of PbB from 10 to
20 ug/dL is associated with an average 1Q loss of 1-3 IQ points. The continued evaluation of these groups
is expected to provide information as to the persistency of some of the neurodevelopmental effects. The
research should focus on neurobehavioral outcome measures while controlling for socio-hereditary factors.
Additional studies on the mobilization of lead from bone during gestation and lactation would provide
valuable information on the potential toxic consequences on both the mother and the neonate. Also, further
research on the relationship between paternal lead exposure and fetal/infant development should be
considered. As most adult exposures associated with hazardous waste sites are via the inhalation or oral
routes, studies examining these routes of exposure would be particularly useful.
Inhalation and oral teratogenicity studies in rats and mice provide no evidence that lead acetate or lead
nitrate are teratogenic after oral or inhalation exposure (Draski et al. 1989; Grant et al. 1980; Kimmel et al.
1980; Miller et al. 1982; Prigge and Greve 1977; Rabe et al. 1985). Intravenous and intraperitoneal injec-
tions of lead acetate, chloride, or nitrate into pregnant rats, mice, or hamsters have produced malformations
in several studies (Gale 1978; McClain and Becker 1972; Snowden 1973). Based on these results, it would
appear that parenteral administration of lead leads to greater target tissue doses than oral or inhalation
exposure. Additional data on dose-effect relationships for these exposure routes would be useful because
these data, along with pharmacokinetic data, could be used to assess the apparent difference in blood lead
effects between injected lead compounds and more conventional route of exposure (i.e., inhalation or oral).
Immunotoxicity. The data in humans are limited to a few studies of immune function in lead workers
and a study of firearm instructors. In both type of studies, inhalation is assumed to be the primary route of
exposure. One study reported significant suppression of IgA levels (Ewers et al. 1982). Another study

LEAD 332
2. HEALTH EFFECTS
indicated that serum immunoglobulin levels were not significantly altered (Alomran and Shleamoon 1988).
Another large study examined several parameters of immune function (serum immunoglobulins, PHA
response, and natural killer cell activity) and found no differences in exposed workers and controls (Kimber
et al. 1986b). The study of firearm instructors found functional impairment of cell-mediated immunity in
subjects with PbB levels >25 ug/dL (Fischbein et al. 1993). A recent study that evaluated a comprehensive
panel of immunologic parameters among lead workers found minor differences in some specific parameters
between exposed and nonexposed controls, but there was no evidence of marked immunotoxic effects of
lead (Pinkerton et al. 1998). The information available in children show no difference in several measures
of immune response between children with PbB • 40 ug/dL and children without elevated PbB (Reigart and
Graher 1976).
The best human data available on immune response involve small numbers of subjects and lack of adequate
controls. Additional studies on immune function parameters in both children and adults are needed to verify
or refute the lack of immunotoxicity seen in humans to date. These studies should include a well defined set
of immunologic assays in order to facilitate comparisons between studies.
One inhalation study in animals showed no effect on phagocytosis of bacteria in mice exposed to lead
(Hillam and Ozkan 1986). No PbB data were available. An inhalation study in rabbits showed that in vitro
lung macrophage function can be altered by exposure to lead even though blood lead levels remained at
control levels (Zelikoff et al. 1993). An intermediate-duration study in mice indicated that several
components of the immune system were depressed following both inhalation and oral exposure, and that the
immunosuppressive effect is most pronounced when the antigen is introduced by the same route as the
pollutant (Hillam and Ozkan 1986). Dose-effect data for immune system effects at low blood levels and
external lead exposure levels are available from rat studies (Faith et al. 1979; Kimber et al. 1986a; Luster et
al. 1978). Prenatal and postnatal exposure of rats to lead acetate at 25 ppm in drinking water resulted in
marked depression of antibody responses to sheep red blood cells, decreased serum IgG, decreased
lymphocyte responsiveness to mitogens, impaired delayed hypersensitivity reactions, and decreased thymus
weights as compared with controls (Faith et al. 1979; Luster et al. 1978). One study in mice suggests that
lead-induced immunosuppression may be greater following inhalation exposure; inhalation exposures can
be significant for human adults. The available rat data are both quantitative and broad in scope. These
positive data are suggestive of an effect on the immune system that may or may not be species specific.
Additional data are needed from 90-day inhalation studies in species other than rats to provide good dose-
effect information on a variety of immune system parameters.

LEAD 333
2. HEALTH EFFECTS
Neurotoxicity. There is a very large database on the neurotoxic effects of lead. The most severe
neurobehavioral effect of lead toxicity in adults is lead encephalopathy (Kehoe 196la; Kumar et al. 1987;
Smith et al. 1978). Early symptoms, which may develop within weeks of initial exposure, include dullness,
irritability, poor attention span, headache, muscular tremor, loss of memory, and hallucinations. These
symptoms worsen, sometimes abruptly, to delirium, convulsions, paralysis, coma, and death. Other nervous
system effects seen in adults at lower exposure levels include extensor muscle weakness, loss of appetite,
paresthesias in lower limbs, weakness of upper limbs, poor performance on cognitive and visual-motor
coordination tasks, and impaired verbal reasoning ability (Arnvig et al. 1980; Awad et al. 1986; Baker et al.
1979; Baloh et al. 1979; Campara et al. 1984; Glickman et al. 1984; Haenninen et al. 1979; Hogstedt et al.
1983; Holness and Nethercott 1988; Khera et al. 1980b; Lindgren et al. 1996; Maizlish et al. 1995; Mantere
et al. 1982; Marino et al. 1989; Matte et al. 1989; Pagliuca et al. 1990; Parkinson et al. 1986; Pasternak et al.
1989; Pollock and Ibels 1986; Schneitzer et al. 1990; Stollery et al. 1989, 1991; Stollery 1996; Zimmerman-
Tanselia et al. 1983). Taken together, the results of these studies on adults (primarily occupational and
therefore predominantly inhalation exposures) indicate that the PbB levels at which neurological signs occur
in adults are in the range of 40-60 ug/dL and that neurological effects occur at roughJy the same blood lead
levels as other symptoms of lead poisoning, such as gastrointestinal complaints.
In children, most exposures are oral, but the neurotoxic effects are similar to those seen in adults (Bradley
and Baumgartner 1958; Bradley et al. 1956; Chisolm 1962, 1965; Chisolm and Harrison 1956; de la Burde
andChoate 1972, 1975; Ernhart et al. 1981;Gant 1938;Kotok 1972; Kotok et al. 1977; Rummo et al. 1979;
Smith et al. 1983). There are data available that indicate children with symptomatic lead poisoning without
encephalopathy have an increased incidence of lasting neurological and behavioral impairments. While no
adverse neurological effects have been clearly documented at low blood lead levels, an inverse relationship
between lead burden and IQ is well documented and some studies indicate that PbB levels as low as 7 u.g/dL
may also decrease IQ (Bellinger and Needleman 1983; Bergomi et al. 1989; Fulton et al. 1987; Hansen et al.
1989; Hawk et al. 1986; Needleman et al. 1979, 1985, 1990; Schroeder and Hawk 1987; Schroeder et al.
1985) and meta-analyses of the epidemiological data have provided no evidence of a threshold (IPCS 1995;
Needleman and Gatsonis 1990, Pocock et al. 1994; Schwartz 1994). These data suggest that children are
more sensitive to lead-induced neurotoxicity than adults, as indicated by responses at lower PbB.
Pharmacokinetic data indicate that young children are more susceptible to the effects of lead because of the
greater absorption and retention rates in children, a greater prevalence of nutrient deficiency, which can
affect gastrointestinal absorption, differences in the efficiency of lead sequestration in bone, and incomplete

LEAD 334
2. HEALTH EFFECTS
development of the blood-brain barrier (Barry 1975; Chamberlain et al. 1978). Virtually all neurotoxic
effects are reported as related to blood lead level. More information on the relationship of health effects to
environmental exposure levels would be useful for quantifying the potential risk to environmentally
exposed human populations. Additional data on the relationships between blood lead levels and environ-
mental levels are needed to quantify these risks. Additional information is needed on the pharmacokinetic
differences between human adults and children to improve risk estimates for the more susceptible groups.
Further information on the effects of lead during advanced age and/or its relationship to aging processes to
determine the extent to which aging populations are vulnerable to lead and the extent to which lead may
contribute to age-related dysfunction, particularly the neurological disturbances and neurodegeneration is
needed. Two recent studies provided preliminary evidence of an association between PbB and impaired
neurobehavioral performance in aging populations with relatively low blood lead levels (Muldoon et al.
1996; Payton et al. 1998). Tests designed to directly compare behavioral data from humans and animals
would provide valuable information that could be used to study in animals the underlying biological
mechanisms responsible for well defined behavioral changes.
There are no animal inhalation studies but many oral ones that describe adverse neurological effects
(Bushnell and Bowman 1979a, 1979b; Bushnell and Levin 1983; Cory-Slechta et al. 1983, 1985; Ferguson
and Bowman 1990; Gilbert and Rice 1987; Hopper et al. 1986; Krasovskii et al. 1979; Levin et al. 1988;
Massaro and Massaro 1987; Overmann 1977; Rice 1985a). It appears that animals are affected at roughly
the same blood lead levels as humans. Measured neurotoxic effects in animals include significantly delayed
motor function and reflexes, decreased performance on learning tasks, and impaired spatial discrimination.
Additional animal studies are needed to investigate the neurotoxic effects of subchronic inhalation
exposures to establish external dose-effect relationships.
Epidemiological and Human Dosimetry Studies. There are dozens of epidemiological studies in
both adults and children that investigate the health effects of lead. However, epidemiological studies on
environmental chemicals are faced with the task of identifying relevant confounders and dealing with them
effectively in order to arrive at valid conclusions within the risk assessment process. The general population
is exposed to lead in ambient air, in many foods, in drinking water, and in dust. Segments of the general
population at highest risk from lead exposure are preschool-age children (especially those in lower-income,
inner city housing where there is old lead-based paint), pregnant women and their fetuses, and white males
between 40 and 59 years of age. Within these groups, strong relationships have been established between
lead exposure (as measured by PbB levels) and adverse health effects. Because the effects generally appear
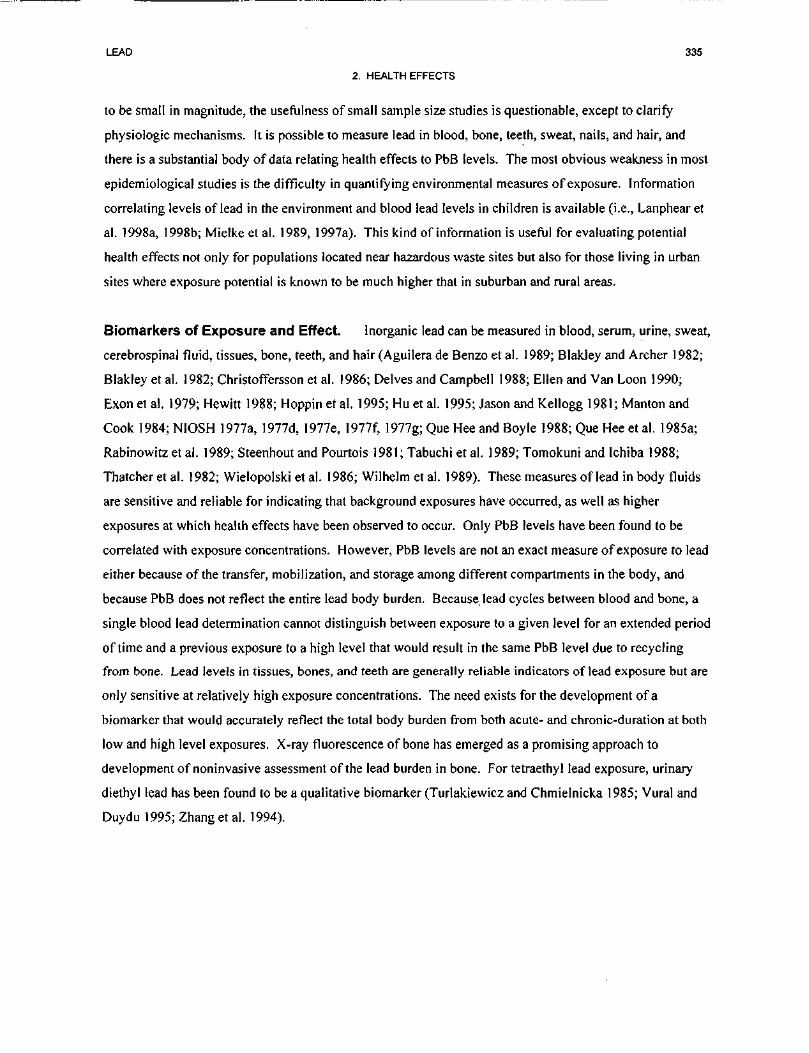
LEAD 335
2. HEALTH EFFECTS
to be small in magnitude, the usefulness of small sample size studies is questionable, except to clarify
physiologic mechanisms. It is possible to measure lead in blood, bone, teeth, sweat, nails, and hair, and
there is a substantial body of data relating health effects to PbB levels. The most obvious weakness in most
epidemiological studies is the difficulty in quantifying environmental measures of exposure. Information
correlating levels of lead in the environment and blood lead levels in children is available (i.e., Lanphear et
al. 1998a, 1998b; Mielke et al. 1989, 1997a). This kind of information is useful for evaluating potential
health effects not only for populations located near hazardous waste sites but also for those living in urban
sites where exposure potential is known to be much higher that in suburban and rural areas.
Biomarkers of Exposure and Effect. Inorganic lead can be measured in blood, serum, urine, sweat,
cerebrospinal fluid, tissues, bone, teeth, and hair (Aguilera de Benzo et al. 1989; Blakley and Archer 1982;
Blakley et al. 1982; Christoffersson et al. 1986; Delves and Campbell 1988; Ellen and Van Loon 1990;
Exon et al. 1979; Hewitt 1988; Hoppin et al. 1995; Hu et al. 1995; Jason and Kellogg 1981; Manton and
Cook 1984;NIOSH 1977a, 1977d, 1977e, 1977f, 1977g; Que Hee and Boyle 1988; Que Hee et al. 1985a;
Rabinowitzetal. 1989; Steenhout and Pourtois 1981; Tabuchi etal. 1989; Tomokuni and Ichiba 1988;
Thatcher et al. 1982; Wielopolski et al. 1986; Wilhelm et al. 1989). These measures of lead in body fluids
are sensitive and reliable for indicating that background exposures have occurred, as well as higher
exposures at which health effects have been observed to occur. Only PbB levels have been found to be
correlated with exposure concentrations. However, PbB levels are not an exact measure of exposure to lead
either because of the transfer, mobilization, and storage among different compartments in the body, and
because PbB does not reflect the entire lead body burden. Because lead cycles between blood and bone, a
single blood lead determination cannot distinguish between exposure to a given level for an extended period
of time and a previous exposure to a high level that would result in the same PbB level due to recycling
from bone. Lead levels in tissues, bones, and teeth are generally reliable indicators of lead exposure but are
only sensitive at relatively high exposure concentrations. The need exists for the development of a
biomarker that would accurately reflect the total body burden from both acute- and chronic-duration at both
low and high level exposures. X-ray fluorescence of bone has emerged as a promising approach to
development of noninvasive assessment of the lead burden in bone. For tetraethyl lead exposure, urinary
diethyl lead has been found to be a qualitative biomarker (Turlakiewicz and Chmielnicka 1985; Vural and
Duydu 1995; Zhang etal. 1994).

LEAD 336
2. HEALTH EFFECTS
There is no clinical disease state that is pathognomonic for lead exposure. The neurotoxic effects and
hematopoietic effects of lead are well recognized. The primary biomarkers of effect for lead are EP, ALAD,
basophilic stippling and premature erythrocyte hemolysis, and presence of intranuclear lead inclusion
bodies in the kidneys. Of these, activity of ALAD is a sensitive indicator of lead exposure (Hernberg et al.
1970; Morris et al. 1988; Somashekaraiah et al. 1990; Tola et al. 1973), but the assay can not distinguish
between moderate and severe exposure (Graziano 1994). Sensitive, reliable, well-established methods exist
to monitor for these biomarkers; however, they are not specific for lead exposure. Therefore, there is a need
to develop more specific biomarkers of effect for lead. Recent data suggest that the concentration of
d|M-globulin in urine may be a early marker of nephrotoxicity, although this is still nonspecific (Chia et al.
1995b).
Absorption, Distribution, Metabolism, and Excretion. Studies of absorption of inhaled lead in
adult humans indicate that following deposition of between 30 and 50% of inhaled airborne lead in the
respiratory tract, lead is almost completely absorbed (EPA 1986a; Morrow et al. 1980). About 70% of
inhaled lead is absorbed within 10 hours. There are no data on the deposition and absorption of inhaled lead
in children. However, models of age-related changes in airway geometry and physiology predict that,
particle deposition in the various regions of the respiratory tract in children may be higher or lower than in
adults depending on particle size; for submicron particles, fractional deposition in 2-year-old children has
been estimated to be 1.5 times greater than in adults (Xu and Yu 1986).
Oral intake of lead in humans can result from consuming lead-containing food, drinking water and
beverages, from ingesting lead-containing dusts, and from swallowing lead deposited in the upper
respiratory tract after inhalation exposure. Children can ingest lead-containing dusts, lead-based paint, and
other non-food materials through their normal mouthing activity and pica (abnormal ingestion of non-food
items). Fractional absorption of ingested lead appears to vary in magnitude with age, being as much as 5 to
10 times greater in infants and young children than in adults (Alexander et al. 1974; Chamberlain et al.
1978; James et al. 1985; Ziegler et al. 1978). However, there are no data on the absorption of lead in older
children and adolescents; thus, it is uncertain whether lead absorption in this population is more similar to
that of adults or to that of infants and young children. Ingested soil lead is less readily absorbed than
ingested water soluble lead acetate (Casteel et al. 1997; EPA 1996a, 1996b, 1996c; Freeman et al. 1996).
This difference may reflect a lower solubility of soil lead because of its chemical or physical form; for
example, there is an inverse relationship between lead particle size and gastrointestinal absorption (Barltrop
and Meek 1979). There is one published study that assessed the bioavailability of lead in adults who
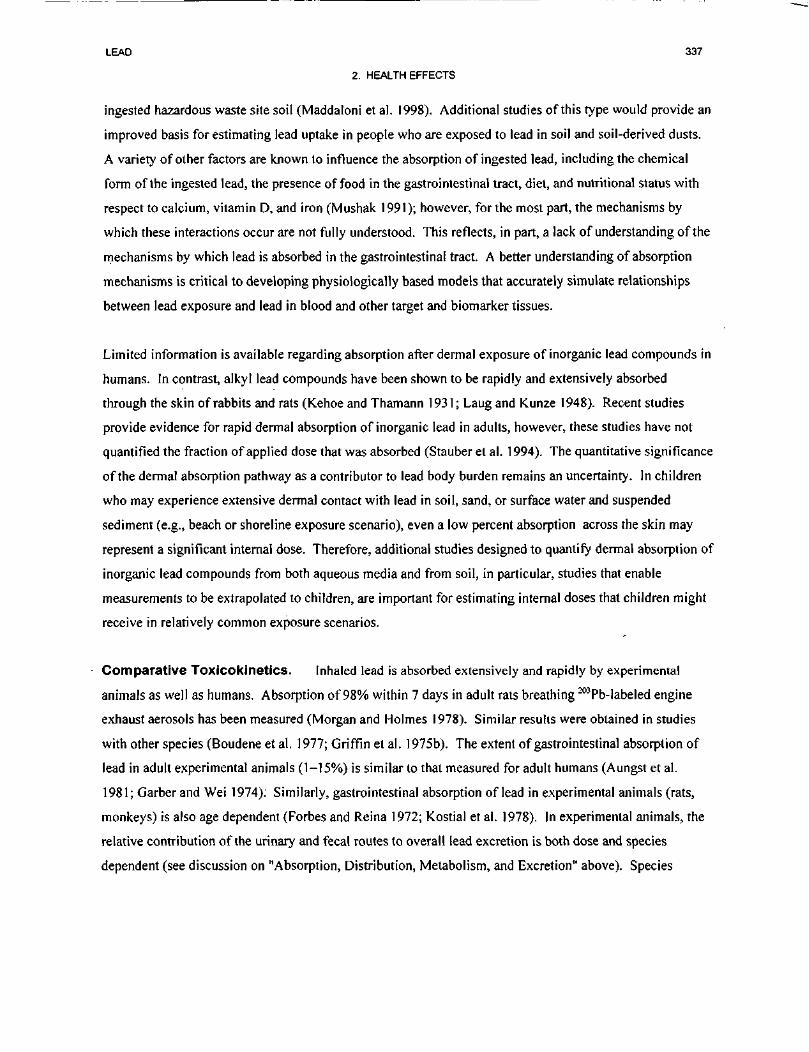
LEAD 337
2. HEALTH EFFECTS
ingested hazardous waste site soil (Maddaloni et al. 1998). Additional studies of this type would provide an
improved basis for estimating lead uptake in people who are exposed to lead in soil and soil-derived dusts.
A variety of other factors are known to influence the absorption of ingested lead, including the chemical
form of the ingested lead, the presence of food in the gastrointestinal tract, diet, and nutritional status with
respect to calcium, vitamin D, and iron (Mushak 1991); however, for the most part, the mechanisms by
which these interactions occur are not fully understood. This reflects, in part, a lack of understanding of the
mechanisms by which lead is absorbed in the gastrointestinal tract. A better understanding of absorption
mechanisms is critical to developing physiologically based models that accurately simulate relationships
between lead exposure and lead in blood and other target and biomarker tissues.
Limited information is available regarding absorption after dermal exposure of inorganic lead compounds in
humans. In contrast, alkyl lead compounds have been shown to be rapidly and extensively absorbed
through the skin of rabbits and rats (Kehoe and Thamann 1931; Laug and Kunze 1948). Recent studies
provide evidence for rapid dermal absorption of inorganic lead in adults, however, these studies have not
quantified the fraction of applied dose that was absorbed (Stauber et al. 1994). The quantitative significance
of the dermal absorption pathway as a contributor to lead body burden remains an uncertainty. In children
who may experience extensive dermal contact with lead in soil, sand, or surface water and suspended
sediment (e.g., beach or shoreline exposure scenario), even a low percent absorption across the skin may
represent a significant internal dose. Therefore, additional studies designed to quantify dermal absorption of
inorganic lead compounds from both aqueous media and from soil, in particular, studies that enable
measurements to be extrapolated to children, are important for estimating internal doses that children might
receive in relatively common exposure scenarios.
Comparative Toxicokinetics. Inhaled lead is absorbed extensively and rapidly by experimental
animals as well as humans. Absorption of 98% within 7 days in adult rats breathing 203Pb-labeled engine
exhaust aerosols has been measured (Morgan and Holmes 1978). Similar results were obtained in studies
with other species (Boudene et al. 1977; Griffin et al. 1975b). The extent of gastrointestinal absorption of
lead in adult experimental animals (1-15%) is similar to that measured for adult humans (Aungst et al.
1981; Garber and Wei 1974). Similarly, gastrointestinal absorption of lead in experimental animals (rats,
monkeys) is also age dependent (Forbes and Reina 1972; Kostial et al. 1978). In experimental animals, the
relative contribution of the urinary and fecal routes to overall lead excretion is both dose and species
dependent (see discussion on "Absorption, Distribution, Metabolism, and Excretion" above). Species

LEAD 338
2. HEALTH EFFECTS
differences also exist in the rate and extent of total lead excretion. Rats, mice, dogs, and monkeys have
been shown to excrete lead at different rates (Boudene et al. 1977; Castellino and Aloj 1964; Keller and
Doherty 1980a; Kostial and Momcilovic 1974; Kozlowski and Wojcik 1987; Lloyd et al. 1975; Momcilovic
and Kostial 1974; Morgan et al. 1977; Pounds et al. 1978). These studies represent oral, parenteral, and
injection exposures; therefore, the apparent species differences may be confounded by exposure route
differences. Additional data from directly comparable studies would be useful for clarifying this issue.
The metabolism of alkyl lead compounds appears to begin with dealkylation mediated by cytochrome P-450
in the rat, mouse, and rabbit. This step creates triethyl and trimethyl metabolites from tetraethyl and
tetramethyl lead. Further biotransformation of these metabolites is highly species specific (Bolanowska
1968; EPA 1986a; Kehoe and Thamann 1931).
Rats are not known to convert triethyl lead to the diethyl form (Bolanowska 1968), but rabbits excrete large
amounts of diethyl lead following exposure to alkyl lead (Klaassen and Shoeman 1974). Final conversion
to inorganic lead may take place, although trialkyl lead compounds are usually stable in biological tissues.
Methods for Reducing Toxic Effects. The extent of lead absorption in the gastrointestinal tract
depends on numerous factors including nutritional factors and the presence or absence of other metals which
interact with lead. Thus, further studies that could identify additional factors that affect lead absorption
would be valuable. These factors may be nutritional factors or specific pathologic conditions. Chelators
have been used in the management of lead poisoning, particularly in children. However, further research
should address questions such as what blood lead levels warrant chelation therapy and whether chelation
therapy may redistribute lead from bone to other tissues. Moreover, the effectiveness of chelation therapy
in reducing neuropsychologic impairment in children with clinically inapparent lead poisoning is unknown.
Clinical studies of oral chelation should not only monitor PbB concentrations, but also the possibility of
ongoing lead exposure, the child's age, sources of lead exposure, length of exposure, and general health
status. Lead inhibits heme synthesis by inhibit ing the enzyme ALAD, and this results in a diffuse effect that
involves many organs. Even if ALAD inhibition could be prevented, because of the ability of lead to inhibit
and/or substitute for calcium in many cellular processes (such as neurotransmitter exocytosis) it appears that
the question of how to interfere with the mechanism of toxic action of lead will not be easily solved.
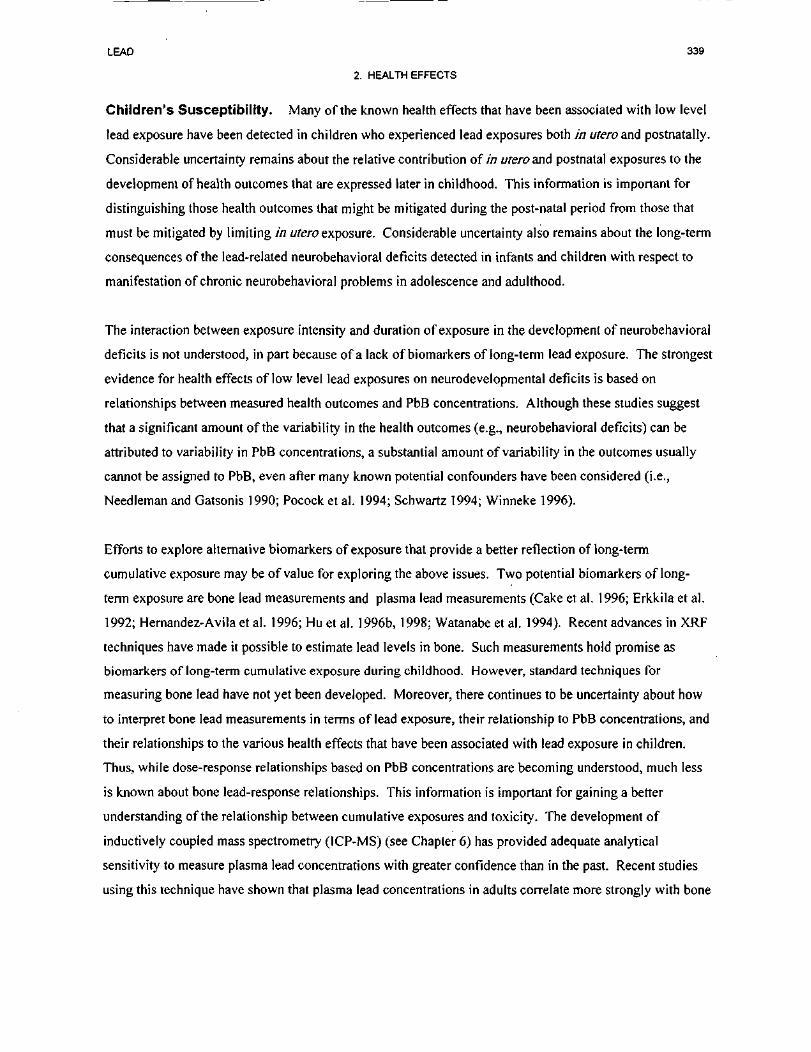
LEAD 339
2. HEALTH EFFECTS
Children's Susceptibility. Many of the known health effects that have been associated with low level
lead exposure have been detected in children who experienced lead exposures both in utero and postnatally.
Considerable uncertainty remains about the relative contribution of in utero and postnatal exposures to the
development of health outcomes that are expressed later in childhood. This information is important for
distinguishing those health outcomes that might be mitigated during the post-natal period from those that
must be mitigated by limiting in utero exposure. Considerable uncertainty also remains about the long-term
consequences of the lead-related neurobehavioral deficits detected in infants and children with respect to
manifestation of chronic neurobehavioral problems in adolescence and adulthood.
The interaction between exposure intensity and duration of exposure in the development of neurobehavioral
deficits is not understood, in part because of a lack of biomarkers of long-term lead exposure. The strongest
evidence for health effects of low level lead exposures on neurodevelopmental deficits is based on
relationships between measured health outcomes and PbB concentrations. Although these studies suggest
that a significant amount of the variability in the health outcomes (e.g., neurobehavioral deficits) can be
attributed to variability in PbB concentrations, a substantial amount of variability in the outcomes usually
cannot be assigned to PbB, even after many known potential confounders have been considered (i.e.,
Needleman and Gatsonis 1990; Pocock et al. 1994; Schwartz 1994; Winneke 1996).
Efforts to explore alternative biomarkers of exposure that provide a better reflection of long-term
cumulative exposure may be of value for exploring the above issues. Two potential biomarkers of long-
term exposure are bone lead measurements and plasma lead measurements (Cake et al. 1996; Erkkila et al.
1992; Hernandez-Avilaetal. 1996;Huetal . 1996b, 1998; Watanabe et al. 1994). Recent advances in XRF
techniques have made it possible to estimate lead levels in bone. Such measurements hold promise as
biomarkers of long-term cumulative exposure during childhood. However, standard techniques for
measuring bone lead have not yet been developed. Moreover, there continues to be uncertainty about how
to interpret bone lead measurements in terms of lead exposure, their relationship to PbB concentrations, and
their relationships to the various health effects that have been associated with lead exposure in children.
Thus, while dose-response relationships based on PbB concentrations are becoming understood, much less
is known about bone lead-response relationships. This information is important for gaining a better
understanding of the relationship between cumulative exposures and toxicity. The development of
inductively coupled mass spectrometry (1CP-MS) (see Chapter 6) has provided adequate analytical
sensitivity to measure plasma lead concentrations with greater confidence than in the past. Recent studies
using this technique have shown that plasma lead concentrations in adults correlate more strongly with bone

LEAD 340
2. HEALTH EFFECTS
lead levels than do blood lead concentrations (Cake et al. 1996; Hemandez-Avila et al. 1998). Since most
of the body lead burden resides in bone, measurements of plasma lead concentration may turn out to be a
better predictor of lead body burden than are measurements of PbB concentration. This observation has not
been explored in children, and few studies have attempted to explore relationships between plasma lead
concentration and health outcomes in children.
Studies in animals have provided abundant support for the plausibility of the neurodevelopmental effects of
lead that have been associated with lead exposure in children, and researchers have begun to identify
potential mechanisms (i.e., Cory-Slechta 1995a). However, mechanistic connections between behavioral
deficits, or changes observed in animals, and those that have been associated with lead exposure in children
have not been completely elucidated. Understanding of such connections would be valuable for developing
better and more relevant animal models of lead toxicity.
Studies of the effects of lead on bone metabolism indicate that, in addition to being a reservoir for the lead
body burden, bone may also be atoxicological target (Hamilton and O'Flaherty 1994, 1995). Studies in rats
have shown effects of lead on bone mineralization and bone growth. The effects observed in rats may be
relevant to our understanding of the mechanisms for the growth deficits that have been associated with low-
level in uteroand childhood lead exposures. Additional studies of the effects of lead on bone metabolism in
humans and in animal models would improve our understanding of the toxicological significance of lead in
bone.
Further research on the relationship between paternal lead exposure and fetal/infant development should be
conducted. Additional information on relationships between nutritional deficits and vulnerability of the
fetus and child to lead would be valuable.
Absorption of ingested lead is higher in infants and young children than in adults; however, available data
on lead absorption during the ages between childhood and adulthood are very limited (Alexander et al.
1974; Ziegler et al. 1978). The higher absorption of lead in childhood contributes to the greater
susceptibility of children to lead; therefore, it is important to know at what age the higher absorption status
of the child changes to the lower absorption status observed in adults. Limited data suggest that this
conversion may occur early in adolescence. This information is particularly important for accurately
simulating biokinetics of lead in older children and adolescents. Additional information on interactions

LEAD 341
2. HEALTH EFFECTS
between nutritional deficiencies and lead absorption and other aspects of lead biokinetics would be
valuable.
Recent studies provide evidence for rapid dermal absorption of inorganic lead in adults; however, these
studies have not quantified the fraction of applied dose that was absorbed (Stauber et al. 1994). The
quantitative significance of the dermal absorption pathway as a contributor to lead body burden remains an
uncertainty. In children who experience extensive dermal contact with lead in soil, sand, or surface water
and suspended sediment (e.g., beach or shoreline exposure scenario), even a low percent absorption across
the skin may represent a significant internal dose. Therefore, additional studies designed to quantify dermal
absorption of inorganic lead compounds from both aqueous media and soil, in particular, studies that enable
measurements to be extrapolated to children, are important for estimating internal doses that children might
receive in relatively common exposure scenarios.
The kinetics of bone formation and remodeling are important factors in the overall biokinetics of lead. Most
of the body burden of lead resides in bone; a portion of the maternal bone lead stores is transferred to the
fetus during gestation and incorporated into fetal bone during the development of the fetal skeleton. Thus,
changes in maternal bone metabolism (e.g., formation and remodeling) is likely to have a significant impact
on in utero exposure of the fetus. However, very little is known about the kinetics of the mobilization of
maternal bone lead, or its incorporation into the fetal skeleton. This information is critical for developing
models that accurately simulate in utero exposures and maternal lead biokinetics during pregnancy and for
understanding how changes in maternal bone metabolism might affect the susceptibility of the fetus to lead
toxicity. Bone formation undergoes rapid changes during infancy, childhood, and adolescence. These
changes may give rise to periods of greater or lower susceptibility to environmental lead; however, little is
known about the potential consequences of these changes on the biokinetics of lead in children.
Child health data needs relating to exposure are discussed in Section 5.8.1, Data Needs: Exposures of
Children.

LEAD 342
2. HEALTH EFFECTS
2.11.3 Ongoing Studies
Ongoing studies regarding the health effects of lead were reported in the Federal Research in Progress File
(FEDRIP 1998) database. Table 2-13 presents a summary of these studies.

LEAD 343
2. HEALTH EFFECTS
Table 2-13. Ongoing Studies on Lead
Investigator Affiliation Research description Sponsor
Albuquerque EX
Angle CR
Audesirk GJ
Beitzel PM
Bellinger DC
Benjamin SA
Bergman SM
Berkowttz G
Berkowitz G
Bhattacharya A
Billings RE
University of Maryland,Baltimore, MD
Univ of Nebraska MedicalCenter,Omaha, NE
University of Colorado,Denver, CO
NCI, NIH, Division ofCancer Treatment
Children's Hospital,Boston, MA
Colorado StateUniversity, Fort Collins,CO
University of Alabama,Birmingham, AL
Mount Sinai School ofMedicine,New York, NY
Mount Sinai School ofMedicine,New York, NY
University of Cincinnati,Cincinnati, OH
Colorado StateUniversity, Fort Collins,CO
Understand the mechanisms by whichlead (Pb2+) exerts neurotoxic effects inthe central nervous system particularlyin the developing brain
Endogenous and exogenous sourcesof blood lead from pregnancy through2 years of age
The mechanisms of developmentalneurotoxicity (rat)
Develop bifunctional ligands whichhave a high affinity for Pb(ll) and Bi(lll);systematic exploration of incorporatingthiol donor groups into chelatingagents
Environmental lead and children'spsychologic function
Drinking water and varioussubmixtures of the full seven-chemicalmixture as a promoter in thecarcinogenic process (arsenic,benzene, chloroform, chromium, lead,trichloroethylene, and phenol) (rats)
Evaluate the influence of body storesot lead and chronic low dose exposureto lead from the environment
The mobilization of lead duringpregnancy and lactation (humans)
The mobilization of lead from boneduring menopause and associatedneuropsychologteal dysfunction
Understand developmental benefits ofchelation therapy and other measuresto reduce lead in the range ofexposures
Interactions among metals andorganics in the induction of stressresponse proteins (rat)
National Institute ofEnvironmental HealthSciences
National Institute ofEnvironmental HealthSciences
National Institute ofEnvironmental HealthSciences
NCI, NIH
National Institute of ChildHealth and HumanDevelopment
National Institute ofEnvironmental HealthSciences
Nat Inst of Diabetes AndDigestive And KidneyDiseases
National Institute ofEnvironmental HealthSciences
National Institute ofEnvironmental HealthSciences
National Institute ofEnvironmental HealthSciences
National Institute ofEnvironmental HealthSciences

LEAD 344
2. HEALTH EFFECTS
Table 2-13. Ongoing Studies on Lead (continued)
Investigator Affiliation Research description Sponsor
Bogden JD
Bornschein R
Bowen WH
Bressler JP
Bressler JP
Brocket BJ
Burchiel SW
Campbell JR
Clements WH
Cory-Slechta DA
Cory-Slechta DA
UMDNJ-New JerseyMedical School,Newark, NJ
University of Cincinnati,Cincinnati, OH
University of Rochester,Rochester, NY
Kennedy/KriegerResearch Institute,Baltimore, MD
Kennedy ResearchInstitute,Baltimore, MD
University of RochesterSchool of Medical/Dental,Rochester, NY
Univ of New Mexico,Albuquerque, NM
Rochester GeneralHospital,Rochester, NY
Colorado StateUniversity, Fort Collins,CO
University of Rochester,Rochester, NY
University of Rochester,Rochester, NY
Investigate relationships duringpregnancy among five factors: bloodpressure, temporal changes in bloodlead, dietary calcium intake, currentlead ingestion, and bone leadmobilization (rats)
The long-range adverse neurologicaleffects of lead exposure, from birththrough the early school years
The influence of prenatal leadexposure on susceptibility to dentalcaries and on salivary glanddevelopment and function (rat)
Toxicokinetic model to predict riskfactors for lead toxicity
Mechanism for lead toxicity andchildren
Attentional basis of Pb-associatedcognitive changes (rats)
Examine the effects of variousenvironmental agents on humanperipheral blood leukocytes (hPbl)following in vitro exposures; to developbiomarkers for immunotoxicity usingflow cytometry
Derive preliminary data regarding theassociation between lead exposureand caries in children
Influence of previous heavy metalsexposure on responses to subsequentstress (macroinvertebrate populations)
Behavioral toxicity of lead; role of theNMDA receptor
Pb levels that can be linked todeleterious behavioral effects
National Heart, Lung, andBlood Institute
National Institute ofEnvironmental HealthSciences
National Institute ofDental Research
National Institute ofEnvironmental HealthSciences
National Institute ofEnvironmental HealthSciences
National Institute ofEnvironmental HealthSciences
National Center ForResearch Resources
National Institute ofEnvironmental HealthSciences
National Institute ofEnvironmental HealthSciences
National Institute ofEnvironmental HealthSciences
National Institute ofEnvironmental HealthSciences
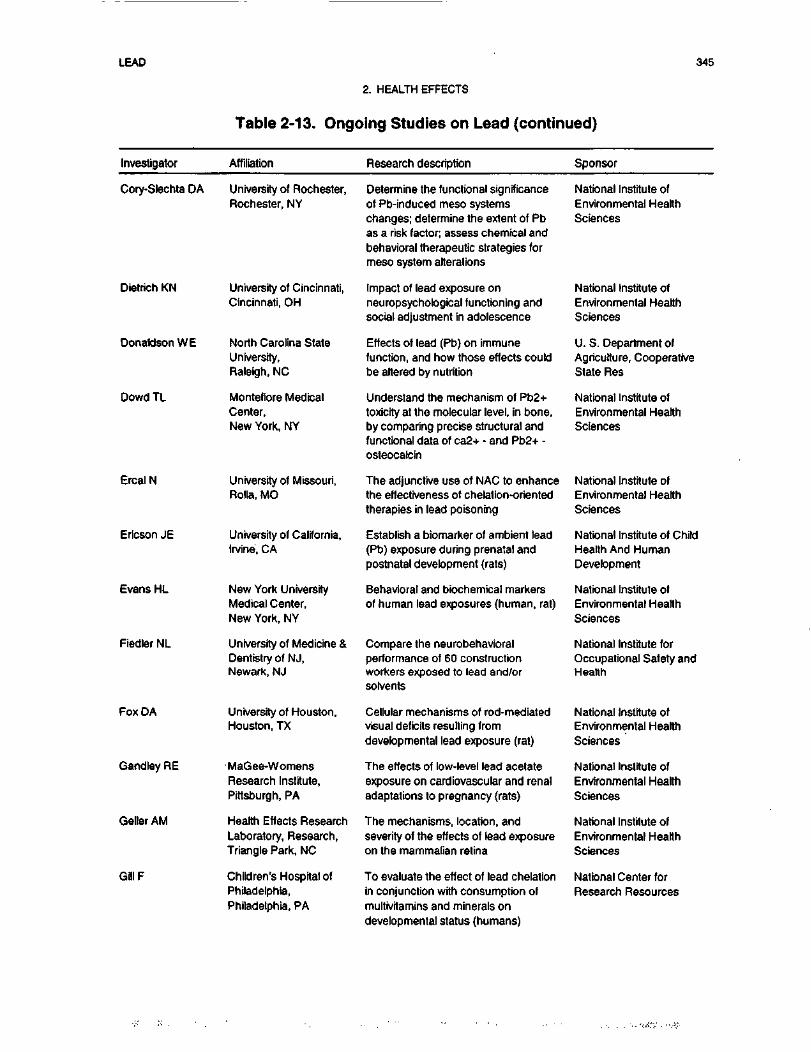
LEAD 345
2. HEALTH EFFECTS
Table 2-13. Ongoing Studies on Lead (continued)
Investigator Affiliation Research description Sponsor
Cory-Slechta DA University of Rochester,Rochester, NY
Dietrich KN
Donaldson WE
Dowd TL
Ercal N
Ericson JE
Evans HL
Fiedler NL
Fox DA
Gandley RE
Geller AM
GilIF
University of Cincinnati,Cincinnati, OH
North Carolina StateUniversity,Raleigh, NC
Montefiore MedicalCenter,New York, NY
University of Missouri,Rolla, MO
University of California,Irvine, CA
New York UniversityMedical Center,New York, NY
University of Medicine &Dentistry of NJ,Newark, NJ
University of Houston,Houston, TX
MaGee-WomensResearch Institute,Pittsburgh, PA
Health Effects ResearchLaboratory, Research,Triangle Park, NC
Children's Hospital ofPhiladelphia,Philadelphia, PA
Determine the functional significanceof Pb-induced meso systemschanges; determine the extent of Pbas a risk factor; assess chemical andbehavioral therapeutic strategies formeso system alterations
Impact of lead exposure onneuropsychological functioning andsocial adjustment in adolescence
Effects of lead (Pb) on immunefunction, and how those effects couldbe altered by nutrition
Understand the mechanism of Pb2+toxicity at the molecular level, in bone,by comparing precise structural andfunctional data of ca2+ - and Pb2+ -osteocalcin
The adjunctive use of NAC to enhancethe effectiveness of chelation-orientedtherapies in lead poisoning
Establish a biomarker of ambient lead(Pb) exposure during prenatal andpostnatal development (rats)
Behavioral and biochemical markersof human lead exposures (human, rat)
Compare the neurobehavioralperformance of 60 constructionworkers exposed to lead and/orsolvents
Cellular mechanisms of rod-mediatedvisual deficits resulting fromdevelopmental lead exposure (rat)
The effects of low-level lead acetateexposure on cardiovascular and renaladaptations to pregnancy (rats)
The mechanisms, location, andseverity of the effects of lead exposureon the mammalian retina
To evaluate the effect of lead chelationin conjunction with consumption ofmultivitamins and minerals ondevelopmental status (humans)
National Institute ofEnvironmental HealthSciences
National Institute ofEnvironmental HealthSciences
U. S. Department ofAgriculture, CooperativeState Res
National Institute ofEnvironmental HealthSciences
National Institute ofEnvironmental HealthSciences
National Institute of ChildHealth And HumanDevelopment
National Institute ofEnvironmental HealthSciences
National Institute forOccupational Safety andHealth
National Institute ofEnvironmental HealthSciences
National Institute ofEnvironmental HealthSciences
National Institute ofEnvironmental HealthSciences
National Center forResearch Resources

LEAD 346
2. HEALTH EFFECTS
Table 2-13. Ongoing Studies on Lead (continued)
Investigator Affiliation Research description Sponsor
Gillett JW Cornell University,Ithaca, NY
Biological responses associated withexposure, biodegradation andchemodynamics of lead
National Institute ofEnvironmental HealthSciences
Gray LC
Graziano JH
Graziano JH
Graziano JH
Guilarte TR
Hall DB
Hammock BD
Hammond PB
Hanbauer I
Harry GJ
Hassett JJ
University of TexasHealth Science Center,Houston, TX
Columbia UniversityHealth Sciences,New York, NY.
Columbia UniversityHealth Sciences,New York, NY
Columbia UniversityHealth Sciences,New York, NY
Johns HopkinsUniversity, Baltimore, MD
Michigan State University,Chicago, IL
University of CaliforniaDavis,Davis, CA
University of Cincinnati,Cincinnati, OH
NHLBI, NIH
National Institute ofEnvironmental HealthSciences
University of Illinois,Urbana, IL
The effects of lead and carbondisulfide on the measurement ofcognitive and sensory function (chickmodel)
Precisely determine the bioavailabilityof Pb in soils representative of theU.S., which contain negligibleamounts
Neurotoxicity and treatment of leadexposure
Aim to elucidate the pathophysfologicmechanism(s) whereby Pb exposureinduces anemia
Study the mechanism(s) underlyingthe relationship between leadexposure during development andneurological and behavioraldysfunction (rat)
After describing the properties of theyoung spiral ganglion cells within themammalian auditory system theninvestigate the neurotoxic effects oflead on the sodium current
Develop assays to assess humanexposure and effect; to probe themechanistic basis of toxicity
Mechanisms underlying lead-induceddepression of growth (rat)
To understand the neurotoxic effect oflead (Pb)
The effects of environmental lead onthe level of specific nervous systemgenes and cell types
Continued studies on bioavailability oflead (Pb) in soil (rats)
National Institute ofEnvironmental HealthSciences
National Center ForResearch Resources
National Institute ofEnvironmental HealthSciences
National Institute ofEnvironmental HealthSciences
National Institute ofEnvironmental HealthSciences
National Institute onDeafness & OtherCommunicationDisorders
National Institute ofEnvironmental HealthSciences
National Institute ofEnvironmental HealthSciences
National Heart, Lung, AndBlood Institute
National Institute ofEnvironmental HealthSciences
U. S. Department ofAgriculture, CooperativeState Res
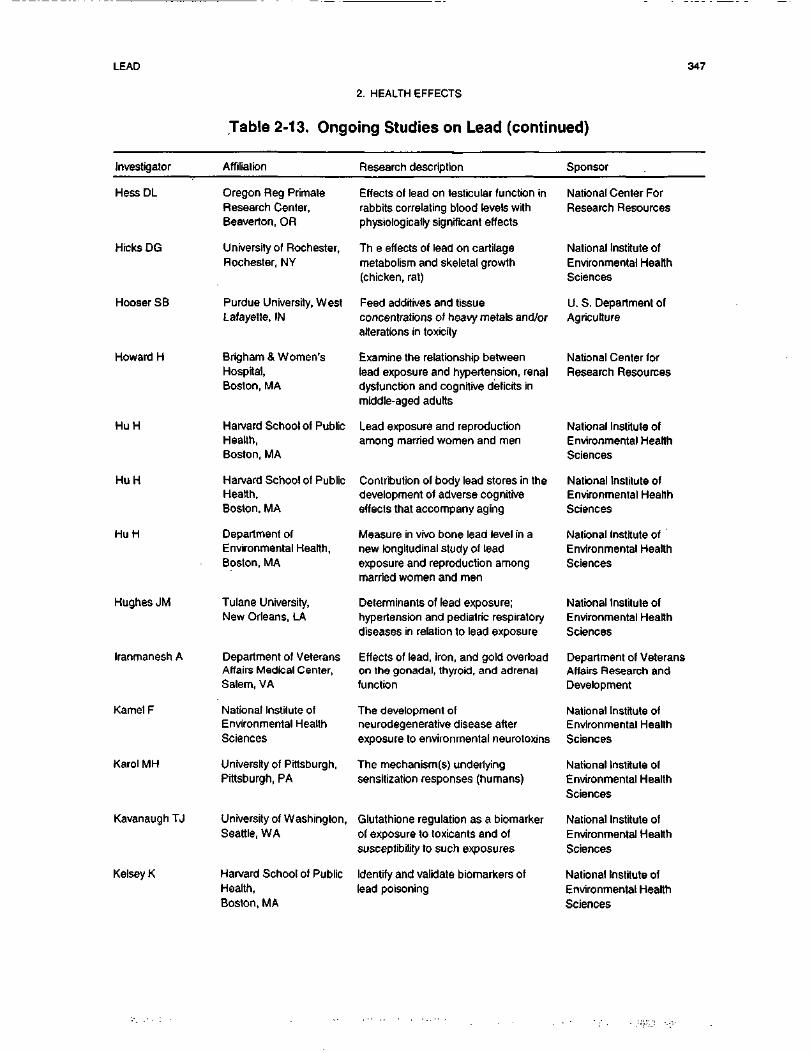
LEAD 347
2. HEALTH EFFECTS
Table 2-13. Ongoing Studies on Lead (continued)
Investigator Affiliation Research description Sponsor
Hess DL
Hicks DG
Hooser SB
Howard H
HuH
HuH
HuH
Hughes JM
Iranmanesh A
Kamet F
Karol MH
Kavanaugh TJ
Kelsey K
Oregon Reg PrimateResearch Center,Beaverton, OR
University of Rochester,Rochester, NY
Purdue University, WestLafayette, IN
Brigham & Women'sHospital,Boston, MA
Harvard School of PublicHealth,Boston, MA
Harvard School of PublicHealth,Boston, MA
Department ofEnvironmental Health,Boston, MA
Tulane University,New Orleans, LA
Department of VeteransAffairs Medical Center,Salem, VA
National Institute ofEnvironmental HealthSciences
University of Pittsburgh,Pittsburgh, PA
University of Washington,Seattle, WA
Harvard School of PublicHealth,Boston, MA
Effects of lead on testicular function inrabbits correlating blood levels withphysiologically significant effects
Th e effects of lead on cartilagemetabolism and skeletal growth(chicken, rat)
Feed additives and tissueconcentrations of heavy metals and/oralterations in toxicity
Examine the relationship betweenlead exposure and hypertension, renaldysfunction and cognitive deficits inmiddle-aged adults
Lead exposure and reproductionamong married women and men
Contribution of body lead stores in thedevelopment of adverse cognitiveeffects that accompany aging
Measure in vivo bone lead level in anew longitudinal study of leadexposure and reproduction amongmarried women and men
Determinants of lead exposure;hypertension and pediatric respiratorydiseases in relation to lead exposure
Effects of lead, iron, and gold overloadon the gonadal, thyroid, and adrenalfunction
The development ofneurodegenerative disease afterexposure to environmental neurotoxins
The mechanism(s) underlyingsensitization responses (humans)
Glutathione regulation as a biomarkerof exposure to toxicants and ofsusceptibility to such exposures
Identify and validate biomarkers oflead poisoning
National Center ForResearch Resources
National Institute ofEnvironmental HealthSciences
U. S. Department ofAgriculture
National Center forResearch Resources
National Institute ofEnvironmental HealthSciences
National Institute ofEnvironmental HealthSciences
National Institute ofEnvironmental HealthSciences
National Institute ofEnvironmental HealthSciences
Department of VeteransAffairs Research andDevelopment
National Institute ofEnvironmental HealthSciences
National Institute ofEnvironmental HealthSciences
National Institute ofEnvironmental HealthSciences
National Institute ofEnvironmental HealthSciences

LEAD 348
2. HEALTH EFFECTS
Table 2-13. Ongoing Studies on Lead (continued)
Investigator Affiliation Research description Sponsor
Keogh JP
Kerper LE
Klein RF
Kohler PF
Korrish S
Kosnett M
Landrigan PJ
Lanphear BP
Lasley SM
University of Maryland atBaltimore,Baltimore, MD
University of Rochester,Rochester, NY
Department of VeteransAffairs, Medical Center,Portland, OR
Tulane University Schoolof Medicine,New Orleans, LA
Harvard School of PublicHealth,Boston, MA
University of California,San Francisco, CA
Mount Sinai School ofMedicine of CUNY,New York, NY
Laughlin NK
University of Rochester,Rochester, NY
University of Illinois,Peoria, IL
Harlow PrimateLaboratory, Madison, Wl
Validation of new bbmarkers aspredictors of long term health effectsafter lead intoxication
Intracellular lead-calcium interactions(bovine brain endothelial cells)
Chronic lead exposure impairsosteoblast function in vivo; gain insightinto the consequences of leadintoxication on the skeleton
To determine lead poisoning process;to evaluate the use of the oral chelatorof lead, Succimer, in the diagnosisand treatment of lead poisoning inadults
Associations of in utero environmentalexposures with newborn and infanthearth outcomes
Determine the mechanism forlead-associated increases in bloodpressure
Lead and organochbrines in New YorkCity: study the current urban sources,environmental distribution and toxiceffects on human health of lead andpersistent chlorinatedhydrocarbons-in particular PCBs andDDT
Confirm that lead exposure appears todisrupt cognitive functions known toinvolve mesofrontal dopaminergicsystems
Pb-induced alterations of theglutamate-mediated regulation ofintracellular Ca+2 concentrations andsynaptic plasticity in hippocampalneurons (rats)
Effect of succimer therapy on lead-induced neurobehavioral and organsystem toxicity (rhesus monkey)
National Institute ofEnvironmental HealthSciences
National Institute ofEnvironmental HealthSciences
Department of VeteransAffairs, Research andDevelopment
National Center forResearch Resourcesl
National Institute ofEnvironmental HealthSciences
National Center forResearch Resources
National Institute ofEnvironmental HealthSciences
National Institute ofEnvironmental HealthSciences
National Institute ofEnvironmental HealthSciences
National Institute ofEnvironmental HealthSciences
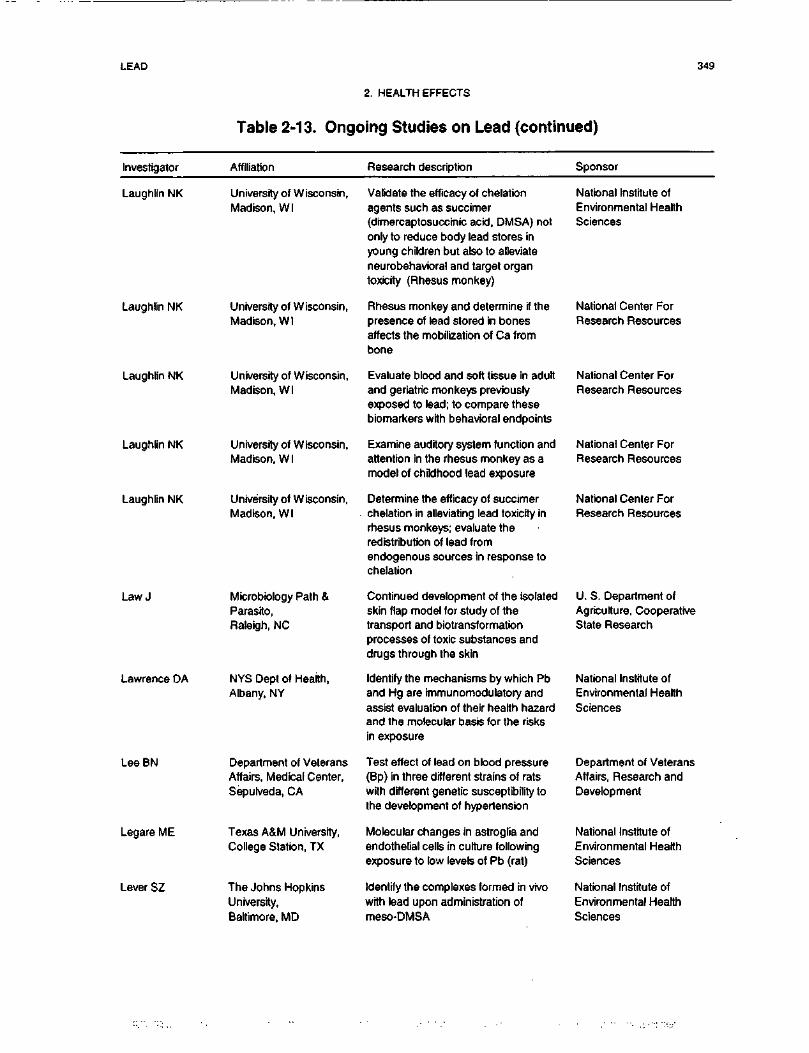
LEAD 349
2. HEALTH EFFECTS
Table 2-13. Ongoing Studies on Lead (continued)
Investigator Affiliation Research description Sponsor
Laughlin NK
Laughlin NK
Laughlin NK
Laughlin NK
Laughlin NK
Law J
Lawrence DA
LeeBN
Legare ME
Lever SZ
University of Wisconsin,Madison, Wl
University of Wisconsin,Madison, Wl
University of Wisconsin,Madison, WI
University of Wisconsin,Madison, Wl
University of Wisconsin,Madison, Wl
Microbiology Path &Parasito,Raleigh, NC
NYS Dept of Health,Albany, NY
Department of VeteransAffairs, Medical Center,Sepulveda, CA
Texas A&M University,College Station, TX
The Johns HopkinsUniversity,Baltimore, MD
Validate the efficacy of chelationagents such as succimer(dimercaptosuccinic acid, DMSA) notonly to reduce body lead stores inyoung children but also to alleviateneurobehavioral and target organtoxicity (Rhesus monkey)
Rhesus monkey and determine if thepresence of lead stored in bonesaffects the mobilization of Ca frombone
Evaluate blood and soft tissue in adultand geriatric monkeys previouslyexposed to lead; to compare thesebiomarkers with behavioral endpoints
Examine auditory system function andattention in the rhesus monkey as amodel of childhood lead exposure
Determine the efficacy of succimerchelation in alleviating lead toxicity inrhesus monkeys; evaluate theredistribution of lead fromendogenous sources in response tochelation
Continued development of the isolatedskin flap model for study of thetransport and biotransformationprocesses of toxic substances anddrugs through the skin
Identify the mechanisms by which Pband Hg are immunomodulatory andassist evaluation of their health hazardand the molecular basis for the risksin exposure
Test effect of lead on blood pressure(Bp) in three different strains of ratswith different genetic susceptibility tothe development of hypertension
Molecular changes in astroglia andendothelial cells in culture followingexposure to low levels of Pb (rat)
Identify the complexes formed in vivowith lead upon administration ofmeso-DMSA
National Institute ofEnvironmental HealthSciences
National Center ForResearch Resources
National Center ForResearch Resources
National Center ForResearch Resources
National Center ForResearch Resources
U. S. Department ofAgriculture, CooperativeState Research
National Institute ofEnvironmental HealthSciences
Department of VeteransAffairs, Research andDevelopment
National Institute ofEnvironmental HealthSciences
National Institute ofEnvironmental HealthSciences

LEAD 350
2. HEALTH EFFECTS
Table 2-13. Ongoing Studies on Lead (continued)
Investigator Affiliation Research description Sponsor
Liebelt E
Liebelt E
Markowrtz ME
Markowrtz ME
Me Cabe MJ Jr.
Me Michael AJ
Milder FL
Moline J
Monson RR
Yale University,New Haven, CT
Yale University,New Haven, CT
Montefiore MedicalCenter, New York, NY
Montefiore MedicalCenter, New York, NY
Metropolitan Center forHigher Technology,Detroit, Ml
University of Adelaide,Adelaide, Australia
Applied BiomedicalCorp., Danvers, MA
Mt Sinai School ofMedicine,New York, NY
Harvard School of PublicHealth,Boston, MA
Efficacy of three forms of inpatientchelation that are being utilized in thetreatment of children with elevatedblood lead levels
Investigate whether children with leadpoisoning have lower erythropoietinproduction compared to childrenwithout lead poisoning; determine ifthere is a threshold for diminishederythropoietin production in childrenwith lead poisoning
Examine the interaction betweenelevated lead and low iron levels onthe response to clinical intervention inyoung children between 18 and 30months of age
Define the role of Ca supplementationas a treatment for children with mild tomoderate Pb poisoning
Mechanisms and consequences of Pbmodulation of cell-mediated andhumoral immunity (in vitro culturesystem; mice in vivo)
Investigate the relative contribution tothe infant in utero of mother's currentenvironmental lead compared withmobilization of lead from maternalstores, especially bone lead
Use x-ray fluorescence in atransmission geometry to measure thetotal body-burden of lead, in vivo,noninvasively
Effects of mobilization of skeletal leadduring pregnancy
Assessment of human health risksfrom toxic substances in theenvironment
National Center ForResearch Resources
National Center ForResearch Resources
National Institute of ChildHealth And HumanDevelopment
National Institute ofEnvironmental HealthSciences
National Institute ofEnvironmental HealthSciences
National Institute ofEnvironmental HealthSciences
HHS
National Center forResearch Resources
National Institute ofEnvironmental HealthSciences
Muldoon SB
Narahashi T
University of Florida,Gainesville, FL
Northwestern UniversityMedical School,Chicago, IL
Association of menopausal bone losswith blood lead levels in women
The effects of therapeutic drugs andtoxins on neuronal ion channels
National Institute ofEnvironmental HealthSciences
National Institute ofNeurological Disordersand Stroke

LEAD 351
2. HEALTH EFFECTS
Table 2-13. Ongoing Studies on Lead (continued)
Investigator Affiliation Research description Sponsor
Nation JR
Neary JT
Needleman HL
Nelson LM
Osterloh JD
Paglia DE
Pattillo RA
Pepper L
Texas A&M UniversityHealth Science Center,College Station, TX
Department of VeteransAffairs, Medical Center,Miami, FL
University of Pittsburgh atPittsburgh,Pittsburgh, PA
Stanford University,Stanford, CA
San Francisco GeneralHospital,San Francisco, CA
Unrv of California Schoolof Medicine,Los Angeles, CA
Morehouse School ofMedicine, Atlanta, GA
Boston University,Boston, MA
Heavy metals and cocaineinteractions: possible link betweenxenobiotic contamination and theresponse to a.prominently abusedpsychoactrve drug
Effects of lead on nerve growthfactor-induced neurrte outgrowth andbranching due to an interaction of leadwith signal transduction mechanismsimportant for neuronal differentiation
Lead exposure is related to delinquentbehavior; understand one of thecausal factors of delinquent andaggressive behavior, and plan effectivepreventive strategies
Investigate the role of environmentaltoxicants and genetic susceptibilityfactors in the etiology of ALS
Alterations in storage of environmentalPb burdens in bone
The use of nucleotidase isozymes assensitive and reliable indices of lowlead overburden in humans
Neurobehavioral effects of low-levelexposure in human newborns
Determine why high blood levels oflead continue to occur in bridgeconstruction workers despitegovernment regulations and industryrecommendations
National Institute on DrugAbuse
Department of VeteransAflairs, Research andDevelopment
National Institute ofEnvironmental HealthSciences
National Institute ofEnvironmental HealthSciences
National Institute ofEnvironmental HealthSciences
National Institute ofEnvironmental HealthSciences
ATSDR
National Institute forOccupational Safety andHealth
Pollitt E
Poretz RD
Univ of California,Administration,Davis, CA
Rutgers UniversityBiochemistry &Microbiology,New Brunswick, NJ
The effects of lead and iron interactionon behavioral development; the effectsof iron treatment on iron status, bloodlead level, and behavioraldevelopment in children with elevatedlead levels and iron deficiency
To define a possible genetic factorwhich may cause certain individuals tobe hypersusceptible to lead-incudedneurobehavioral abnormality
U. S. Department ofAgriculture, CompetitiveResearch
U. S. Department ofAgriculture, CooperativeState Res

LEAD 352
2. HEALTH EFFECTS
Table 2-13. Ongoing Studies on Lead (continued)
Investigator Affiliation Research description Sponsor
Poretz RD
PoundsJG
Proctor SP
Puzas JE
Rajanna B
Raymond KN
Renner SW
RennerSW
Rogan WJ
Rutgers The State Univ,New Brunswick, NJ
Wayne State UniversityDetroit, Ml
Boston UniversityMedical Center,Boston, MA
University of Rochester,Rochester, NY
Alcorn State University,Lorman, MS
University of California,Berkeley, CA
Department of VeteransAffairs, Medical Center,West Los Angeles, CA
Department of VeteransAffairs, Medical Center,West Los Angeles, CA
National Institute ofEnvironmental HealthSciences
Lead-induced neurotoxicity; define agenetic factor which may cause certainindividuals to be hypersusceptible tolead-induced neurobehavioralabnormalities
Lead toxicity is mediated viaperturbation of the signal transductionprocesses; further our understandingof the skeleton as a target of leadtoxicity, skeletal metabolism of lead,and the physiological factors whichmobilize skeletal lead
Epidemiologic study ofneurobehavioral effects due toneurotoxicant exposure
An in vitro cell model resembles theremodeling process of osteoclasticbone resorption followed byosteoblastic bone formation;investigate the influence of lead on thecommunication between these cells;determine if lead in the medium (i.e.extracellular fluid) or in the matrix (i.e.in the bone) has different effects onosteoclasts and osteoblasts
Developmental exposure to Pb or Mmaffect signal transduction process,possibly related to the modulation ofnitric oxide as well as alterations inreceptor-mediated phosphoinositidehydrolysis and protein kinase C (rats)
Develop new chelating agents for leaddecorporation
Assess the value and feasibility ofusing nucleotidase isozymes assensitive and reliable indices of lowlead overburden in humans
Establish the validity of using twospecific erythrocyte enzymemeasurements as sensitive indicatorsof very low body burdens of lead andother heavy metals
Use of succimer in the prevention ofdevelopmental delay, slowed growth,and behavior disorders in toddlers
National Institute ofEnvironmental HealthSciences
National Institute ofEnvironmental HealthSciences
National Institute forOccupational Safety andHealth
National Institute ofEnvironmental HealthSciences
National Institute ofGeneral Medical Sciences
National Institute ofEnvironmental HealthSciences
Department of VeteransAffairs, Research andDevelopment
Department of VeteransAffairs, Research andDevelopment
National Institute ofEnvironmental HealthSciences

LEAD 353
2. HEALTH EFFECTS
Table 2-13. Ongoing Studies on Lead (continued)
Investigator Affiliation Research description Sponsor
Ronis MJ
Rosen HAN
Rosen JF
Rossman TG
Rothenberg SJ
Rothenberg SJ
Rude CS
Schell LM
Scholl TO
Schonfeld D
Schramm W
University of Arkansas,Little Rock, AR
Beth Israel HospitalBoston, MA
Montefiore MedicalCenter, Bronx, NY
New York UniversityMedical Center,New York, NY
Charles R. DrewUniversity of Medicine &Science,Los Angeles, CA
Charles R. DrewUniversity of Medicineand Science, LosAngeles, CA
University of Vermont,Burlington, VT
State University of NewYork at Albany,Albany, NY
Univ of Medical/DentalNJ-School of OsteopathicMedicine,Stratford, NJ
Yale University,New Haven, CT
Bioquant Inc.,Ann Arbor, Ml
The molecular mechanismsunderlying the lead-induceddevelopmental impairment of theendocrine systems of reproductionand growth (rats)
The relationship between leadintoxication or increased lead levelsand bone mineral content in humans
Treatment outcomes in moderatelylead toxic children (human)
The main goal of this project is todelineate cellular mechanisms of leadresistance (rat)
The role of prepregnancy maternalbone lead and prenatal maternalbbod lead upon alterations in infantsaccadic and smooth pursuit eyemovements
Correlation between blood lead levelsand blood pressure during pregnancy
Determine the prevalence of leadpoisoning among children less thansix years of age; determine thepredictive ability of a prescreening leadquestionnaire
To identify the maternal characteristicswhich determine fetal exposure to leadand to identify the effects of pre- andpostnatal lead exposure on earlyhuman development
This prospective study will allow theinvestigators to examine leadmobilization from bone turnover in still-growing, adolescent and maturemothers
The efficacy of various forms ofinpatient chelation in the treatment ofchildren with elevated blood leadlevels are being studied
The potential use of saliva as abiological medium for the screening ofelevated lead levels in humans
National Institute ofEnvironmental HealthSciences
National Center forResearch Resources
National Institute ofEnvironmental HealthSciences
National Institute ofEnvironmental HealthSciences
National Institute ofGeneral Medical Sciences
ATDSR
National Center forResearch Resources
National Institute ofEnvironmental HealthSciences
National Institute ofEnvironmental HealthSciences
National Center forResearch Resources
HHS

LEAD 354
2. HEALTH EFFECTS
Table 2-13. Ongoing Studies on Lead (continued)
Investigator Affiliation Research description Sponsor
Schwartz BS
Schwarz D
Sens DA
Shuster TA
Sinclair JA
Sokol RZ
Soliman KFA
Smith D
Stewart WF
Strupp BJ
Suszkiw JB
John Hopkins UniversitySchool of Hygiene &Public Health,Baltimore, MD
Joseph Stokes JrResearch InstituteChildren's HospitalPhiladelphia, PA
West Virginia University,North Morgantown, WV
California StateUniversity, Long Beach,CA
Dartmouth College,Hanover, NH
Health ResearchAssociation, Inc.,Los Angeles, CA
Florida A&M University,Tallahassee, FL
University of California,Santa Cruz, CA
Johns HopkinsUniversity, Baltimore, MD
Cornell University,Ithaca, NY
University of Cincinnati,Cincinnati, OH
Study of the relations among BLLS,DMSA-chelatable lead, bone lead, andhealth effects (heme synthesis, renalearly biologic effects and function,blood pressure, and CNS and PNSfunction) in lead workers in SouthKorea
Effects of Chelation With Succimer onGrowth and Development of Childrenwith Low Levels of Blood Lead
Validation of cultured human proximaltubule cells as a model for the study ofhuman metal-induced nephropathies
The roles of nucleotides and divalentcations in normal and degeneratingrod outer segments (rd mouse)
The effects of heavy metals on thesynthesis and degradation of hemeand hemoproteins in the P450super-family (cell culture; rat, chick andrabbit)
Pb exposure in utero may induce aninherited change in DNA methylationpatterns in Pb exposed pups, themechanism by which Pb exposureduring the critical time of sexualdifferentiation induces reproductiveaxis abnormalities in adulthood
The effects of lead exposure onhypothalamus, pituitary and adrenalgland function (rats)
Factors contributing to increased leadexposures in postmenopausalfemales, and the effects of lead on theaged skeleton
Change in cognitive function in currentand former lead exposed workers
The efficacy of dimercaptosuccinic acid(DMSA) in alleviating Pb-inducedcognitive dysfunction
The mechanism and functionalconsequences of lead's effects oncholinergic cells (rats)
National Institute ofEnvironmental HealthSciences
National Center ForResearch Resources
National Institute ofEnvironmental HealthSciences
National Institute ofGeneral Medical Sciences
National Institute ofEnvironmental HealthSciences
National Institute ofEnvironmental HealthSciences
National Institute ofGeneral Medical Sciences
National Institute ofEnvironmental HealthSciences
National Institute onAging
National Institute ofEnvironmental HealthSciences
National Institute ofEnvironmental HealthSciences

LEAD 355
2. HEALTH EFFECTS
Table 2-13. Ongoing Studies on Lead (continued)
Investigator Affiliation Research description Sponsor
Terrian DM East Carolina University,Greenville, NC
Thomas PM University of TexasAustin, Austin, TX
Tiffany-Castiglinoi E Texas A&M University,College Station, TX
Tiffany-Castiglioni E Texas A&M University,College Station, TX
Todd AC
WaalkesMP
WedeenRP
Wedeen RP
Wetmur JG
Williams JC
Ml. Sinai School ofMedicine,New York, NY
National Cancer Institute,NIH,Division of CancerEtiology
Veterans AdministrationMedical Center,East Orange, NJ
Department of VeteransAffairs Medical Center,East Orange, NJ
Mount Sinai School ofMedicine,New York, NY
Memphis StateUniversity, Memphis, TN
How low levels of lead exposure maypromote the use-independent releaseof glutamate, a physiologicallyinappropriate activity that can beexpected to have a devastating effecton the establishment of synapticconnections early in development
That lead and Aroctor 1254 alter GTHsecretion by disrupting differentcomponents of the 5-HT-GNRH-GTHstimulatory neuroendocrine pathwaycontrolling reproduction
The intracellular mechanisms of leadtoxicity
Molecular-and cellular uptake andtolerance to Pb and associatedbehavioral deficits (rat)
Relationship between relativelylow-level environmental exposure tolead in adults and chronic neurotoxicity
The mechanism of action of metals inhuman and rodent carcinogenesis(mouse, rat)
In vivo tibial XRF measurement ofbone lead
Renal-hypertensive and cardiovasculareffects of environmental lead, zinc, andcadmium exposure
Biochemical basis tor the differentialgenetic susceptibility of individuals tolead exposure (transgenic mice,humans)
Develop and improve quantitativemethods for the determination of bothmetal and nonmetal elements inbiological samples
National Institute ofEnvironmental HealthSciences
National Institute ofEnvironmental HealthSciences
U. S. Department ofAgriculture
National Institute ofEnvironmental HealthSciences
National Institute ofEnvironmental HealthSciences
NCI, NIH
Veterans Administration
Department of VeteransAffairs Research andDevelopment
National Institute ofEnvironmental HealthSciences
National Institute ofGeneral Medical Sciences

LEAD 356
2. HEALTH EFFECTS
Table 2-13. Ongoing Studies on Lead (continued)
Investigator Affiliation Research description Sponsor
Wolff MS
Woolley DE
Worobey J
XuX
Zawia NH
Zheng W
Zidenberg-Cherr S
Not specified
Not specified
Mount Sinai School ofMedicine of CUNY,New York, NY
University of California,Davis, CA
Rutgers UniversityNutritional Sciences,New Brunswick, NJ
Harvard School of PublicHealth,Boston, MA
Meharry Medical College,Nashville, Tn
Columbia University,New York, NY
University of California,Davis, CA
University of Cincinnatiand Gradient Corporation
Imperial College ofScience, Technology andMedicine
Analytical support for comprehensiveassessment of lead exposures; bodyburden measures will include bloodlead, plasma lead, ZPP, bone lead,representing multiple compartmentsfor deposition of lead and widelyvariable rates of elimination; measure-ment of total lead in soil extracts tovalidate quantitative measures
To determine immediate andlong-term effects of exposure toenvironmental toxicants, especiallyinsecticides and heavy metals (rat)
Measure the cognitive status of leadburdened children via developmentalassessments before and after anintervention and examine the influenceof lead-nutrient interactions ondevelopment via an analysis of dietarystatus before and after the intervention
The effects of lead exposure onendocrine dysfunction and adversereproductive outcomes in China
Understanding the mechanism of leadneurotoxicity with models andexperiments
The effects of DMSA on blood leadconcentrations and urinary Pbexcretion
The relationship between nutritionalstatus and lead toxiciry in children
Develop a sophisticated, flexiblemodel to be used in a site- andapplication-specific way to predictimpact of lead in various media ongeneral population blood lead levels
Lead and male reproductive function,evaluate impact of changes inindicators of semen quality andreproductive hormones as function ofoccupational lead exposure
National Institute ofEnvironmental HealthSciences
U. S. Department ofAgriculture
U. S. Department ofAgriculture, CooperativeState Res
National Institute ofEnvironmental HealthSciences
Natbnal Institute ofEnvironmental HealthSciences
Natbnal Institute ofEnvironmental HealthSciences
U. S. Department ofAgriculture
ILZRO
ILZRO
Source: FEDRIP 1998
ALAD = delta-aminolevulinic acid dehydratase; DMSA = dimercaptosuccinic acid; NMDA = N-methyl- D-aspartate;PCBs = polychlorinated biphenyls; XRF = X-ray fluorescence