Atomic force microscopy differentiates discrete size distributions between membrane protein...
8
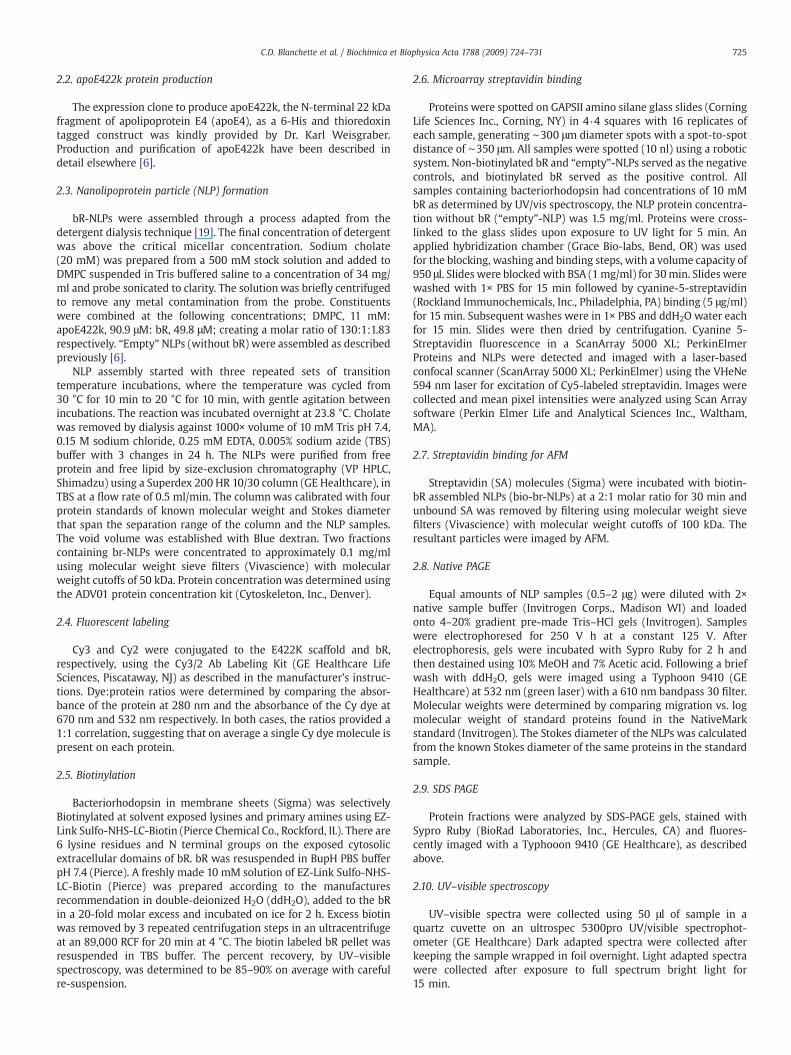
Atomic force microscopy differentiates discrete size distributions between membrane protein containing and empty nanolipoprotein particles Craig D. Blanchette a , Jenny A. Cappuccio a , Edward A. Kuhn a , Brent W. Segelke a , W. Henry Benner a , Brett A. Chromy a , Matthew A. Coleman a , Graham Bench a , Paul D. Hoeprich a, ⁎, Todd A. Sulchek b, ⁎ a Physical Life Sciences, Lawrence Livermore National Laboratory, Livermore, CA 94551, USA b School of Mechanical Engineering, Georgia Institute of Technology, Atlanta, GA 30332, USA abstract article info Article history: Received 3 October 2008 Received in revised form 11 November 2008 Accepted 14 November 2008 Available online 8 December 2008 Keywords: Apolipoprotein Nanolipoprotein particle Nanodisc Atomic force microscopy Membrane protein Bacteriorhodopsin NLP To better understand the incorporation of membrane proteins into discoidal nanolipoprotein particles (NLPs) we have used atomic force microscopy (AFM) to image and analyze NLPs assembled in the presence of bacteriorhodopsin (bR), lipoprotein E4 n-terminal 22k fragment scaffold and DMPC lipid. The self-assembly process produced two distinct NLP populations: those containing inserted bR (bR-NLPs) and those that did not (empty-NLPs). The bR-NLPs were distinguishable from empty-NLPs by an average increase in height of 1.0 nm as measured by AFM. Streptavidin binding to biotinylated bR confirmed that the original 1.0 nm height increase corresponds to br-NLP incorporation. AFM and ion mobility spectrometry (IMS) measurements suggest that NLP size did not vary around a single mean but instead there were several subpopulations, which were separated by discrete diameters. Interestingly, when bR was present during assembly the diameter distribution was shifted to larger particles and the larger particles had a greater likelihood of containing bR than smaller particles, suggesting that membrane proteins alter the mechanism of NLP assembly. © 2008 Elsevier B.V. All rights reserved. 1. Introduction Approximately one third of all eukaryotic proteins are membrane associated. These membrane proteins are involved in numerous vital biological processes including signal transduction, transport, adhesion, and cell–cell communication, and are the primary targets of many therapeutic drugs [1,2]. Despite the recognized importance of membrane proteins, few robust and versatile methods exist for the isolation and solubilization of these biological molecules in their properly folded and functional state. Self-assembling nanolipoprotein particles (NLPs) have been identified as a potential membrane mimetic for the solubilization of membrane proteins. Purified apolipoproteins and phospholipids are known to self-assemble in vitro to form nano-scale discoidal bilayer patches or NLPs, where the lipoproteins localize to the NLP perimeter [3– 6]. Recently, it has been shown that when membrane proteins are present during the NLP self-assembly process, the membrane protein will associate with NLP constructs producing soluble and functional integral membrane protein complexes [7–17]. The ability to incorporate membrane proteins into the bilayer environment contained within the NLP offers both scientific and technological promise. Although several groups have reported successful incorporation of membrane proteins into NLPs, their collective focus has been on characterization by PAGE analysis and functional assessment; quantifica- tion of overall yield and incorporation efficiency has largely been ignored. However, it will likely be important to understand and control membrane protein incorporation efficiencies and NLP heterogeneity in order to maximize the utility of NLPs for the study of membrane proteins. Biochemical techniques along with single particle analyses can offer powerful insights into NLP size polydispersity [18–21] that may play an important role in understanding membrane protein incorporation. For example, atomic force microscopy (AFM) imaging, in principle, can directly verify incorporation of membrane proteins into individual NLPs, since the particle height resolution is sufficient to distinguish the topographic height change resulting from a membrane protein extending above the face of the phospholipid bilayer. Here, we use AFM to study bacteriorhodopsin incorporation into NLPs assembled from the phospholipid 1,2-Dimyristoyl-sn-Glycero-3-Phosphocholine (DMPC) and a fragment from the human apolipoprotein E4 (apoE422K). 2. Materials and methods 2.1. Materials Phospholipid 1,2-Dimyristoyl-sn-Glycero-3-Phosphocholine (DMPC) was purchased from Avanti Polar Lipids, Inc. (Alabaster, AL). Bacteriorhodopsin was purchased from Sigma-Aldrich (St. Louis, MO). Biochimica et Biophysica Acta 1788 (2009) 724–731 ⁎ Corresponding authors. P. D. Hoeprich is to be contacted at Chemistry, Materials, Earth and Life Science, Lawrence Livermore National Laboratory, 7000 East Avenue, L-452, Livermore, CA 94550, USA. Tel.: +1 925 423 9298; fax: +1 925 422 2282. T.A. Sulchek, Georgia Institute of Technology, School of Mechanical Engineering, MRDC Building, 801 Ferst Drive, Atlanta, GA 30332, USA. E-mail addresses: [email protected] (P.D. Hoeprich), [email protected] (T.A. Sulchek). 0005-2736/$ – see front matter © 2008 Elsevier B.V. All rights reserved. doi:10.1016/j.bbamem.2008.11.019 Contents lists available at ScienceDirect Biochimica et Biophysica Acta journal homepage: www.elsevier.com/locate/bbamem
-
Upload
independent -
Category
Documents
-
view
0 -
download
0
Transcript of Atomic force microscopy differentiates discrete size distributions between membrane protein...
Biochimica et Biophysica Acta 1788 (2009) 724–731
Contents lists available at ScienceDirect
Biochimica et Biophysica Acta
j ourna l homepage: www.e lsev ie r.com/ locate /bbamem
Atomic force microscopy differentiates discrete size distributions between membraneprotein containing and empty nanolipoprotein particles
Craig D. Blanchette a, Jenny A. Cappuccio a, Edward A. Kuhn a, Brent W. Segelke a, W. Henry Benner a,Brett A. Chromy a, Matthew A. Coleman a, Graham Bench a, Paul D. Hoeprich a,⁎, Todd A. Sulchek b,⁎a Physical Life Sciences, Lawrence Livermore National Laboratory, Livermore, CA 94551, USAb School of Mechanical Engineering, Georgia Institute of Technology, Atlanta, GA 30332, USA
⁎ Corresponding authors. P. D. Hoeprich is to be conEarth and Life Science, Lawrence Livermore National LL-452, Livermore, CA 94550, USA. Tel.: +1 925 423 929Sulchek, Georgia Institute of Technology, School of MBuilding, 801 Ferst Drive, Atlanta, GA 30332, USA.
E-mail addresses: [email protected] (P.D. Hoeprich(T.A. Sulchek).
0005-2736/$ – see front matter © 2008 Elsevier B.V. Adoi:10.1016/j.bbamem.2008.11.019
a b s t r a c t
a r t i c l e i n f oArticle history:
To better understand the inc Received 3 October 2008Received in revised form 11 November 2008Accepted 14 November 2008Available online 8 December 2008Keywords:ApolipoproteinNanolipoprotein particleNanodiscAtomic force microscopyMembrane proteinBacteriorhodopsinNLP
orporation of membrane proteins into discoidal nanolipoprotein particles (NLPs)we have used atomic force microscopy (AFM) to image and analyze NLPs assembled in the presence ofbacteriorhodopsin (bR), lipoprotein E4 n-terminal 22k fragment scaffold and DMPC lipid. The self-assemblyprocess produced two distinct NLP populations: those containing inserted bR (bR-NLPs) and those that did not(empty-NLPs). The bR-NLPs were distinguishable from empty-NLPs by an average increase in height of 1.0 nmasmeasured byAFM. Streptavidin binding to biotinylated bR confirmed that the original 1.0 nmheight increasecorresponds to br-NLP incorporation. AFM and ion mobility spectrometry (IMS) measurements suggest thatNLP size did not vary around a single mean but instead there were several subpopulations, which wereseparated bydiscrete diameters. Interestingly, when bRwas present during assembly the diameter distributionwas shifted to larger particles and the larger particles had a greater likelihood of containing bR than smallerparticles, suggesting that membrane proteins alter the mechanism of NLP assembly.
© 2008 Elsevier B.V. All rights reserved.
1. Introduction
Approximately one third of all eukaryotic proteins are membraneassociated. These membrane proteins are involved in numerous vitalbiological processes including signal transduction, transport, adhesion,and cell–cell communication, and are the primary targets of manytherapeutic drugs [1,2]. Despite the recognized importanceofmembraneproteins, few robust and versatile methods exist for the isolation andsolubilization of these biological molecules in their properly folded andfunctional state. Self-assembling nanolipoprotein particles (NLPs) havebeen identified asa potentialmembranemimetic for the solubilization ofmembrane proteins. Purified apolipoproteins and phospholipids areknown to self-assemble in vitro to form nano-scale discoidal bilayerpatches orNLPs,where the lipoproteins localize to theNLPperimeter [3–6]. Recently, it has been shown that when membrane proteins arepresent during the NLP self-assembly process, the membrane proteinwill associate with NLP constructs producing soluble and functionalintegral membrane protein complexes [7–17]. The ability to incorporatemembrane proteins into the bilayer environment contained within theNLP offers both scientific and technological promise.
tacted at Chemistry, Materials,aboratory, 7000 East Avenue,8; fax: +1 925 422 2282. T.A.echanical Engineering, MRDC
ll rights reserved.
Although several groups have reported successful incorporation ofmembrane proteins into NLPs, their collective focus has been oncharacterization by PAGE analysis and functional assessment; quantifica-tion of overall yield and incorporation efficiency has largely been ignored.However, it will likely be important to understand and controlmembraneprotein incorporation efficiencies and NLP heterogeneity in order tomaximize the utility of NLPs for the study of membrane proteins.
Biochemical techniques alongwith single particle analyses can offerpowerful insights into NLP size polydispersity [18–21] that may play animportant role in understanding membrane protein incorporation. Forexample, atomic force microscopy (AFM) imaging, in principle, candirectly verify incorporation of membrane proteins into individualNLPs, since the particle height resolution is sufficient to distinguish thetopographic height change resulting from a membrane proteinextending above the face of the phospholipid bilayer. Here, we useAFM to study bacteriorhodopsin incorporation into NLPs assembledfrom the phospholipid 1,2-Dimyristoyl-sn-Glycero-3-Phosphocholine(DMPC) and a fragment from the human apolipoprotein E4 (apoE422K).
2. Materials and methods
2.1. Materials
Phospholipid 1,2-Dimyristoyl-sn-Glycero-3-Phosphocholine(DMPC) was purchased from Avanti Polar Lipids, Inc. (Alabaster, AL).Bacteriorhodopsin was purchased from Sigma-Aldrich (St. Louis, MO).
725C.D. Blanchette et al. / Biochimica et Biophysica Acta 1788 (2009) 724–731
2.2. apoE422k protein production
The expression clone to produce apoE422k, the N-terminal 22 kDafragment of apolipoprotein E4 (apoE4), as a 6-His and thioredoxintagged construct was kindly provided by Dr. Karl Weisgraber.Production and purification of apoE422k have been described indetail elsewhere [6].
2.3. Nanolipoprotein particle (NLP) formation
bR-NLPs were assembled through a process adapted from thedetergent dialysis technique [19]. The final concentration of detergentwas above the critical micellar concentration. Sodium cholate(20 mM) was prepared from a 500 mM stock solution and added toDMPC suspended in Tris buffered saline to a concentration of 34 mg/ml and probe sonicated to clarity. The solutionwas briefly centrifugedto remove any metal contamination from the probe. Constituentswere combined at the following concentrations; DMPC, 11 mM:apoE422k, 90.9 μM: bR, 49.8 μM; creating a molar ratio of 130:1:1.83respectively. “Empty” NLPs (without bR) were assembled as describedpreviously [6].
NLP assembly started with three repeated sets of transitiontemperature incubations, where the temperature was cycled from30 °C for 10 min to 20 °C for 10 min, with gentle agitation betweenincubations. The reaction was incubated overnight at 23.8 °C. Cholatewas removed by dialysis against 1000× volume of 10 mM Tris pH 7.4,0.15 M sodium chloride, 0.25 mM EDTA, 0.005% sodium azide (TBS)buffer with 3 changes in 24 h. The NLPs were purified from freeprotein and free lipid by size-exclusion chromatography (VP HPLC,Shimadzu) using a Superdex 200 HR 10/30 column (GE Healthcare), inTBS at a flow rate of 0.5 ml/min. The column was calibrated with fourprotein standards of known molecular weight and Stokes diameterthat span the separation range of the column and the NLP samples.The void volume was established with Blue dextran. Two fractionscontaining br-NLPs were concentrated to approximately 0.1 mg/mlusing molecular weight sieve filters (Vivascience) with molecularweight cutoffs of 50 kDa. Protein concentrationwas determined usingthe ADV01 protein concentration kit (Cytoskeleton, Inc., Denver).
2.4. Fluorescent labeling
Cy3 and Cy2 were conjugated to the E422K scaffold and bR,respectively, using the Cy3/2 Ab Labeling Kit (GE Healthcare LifeSciences, Piscataway, NJ) as described in the manufacturer's instruc-tions. Dye:protein ratios were determined by comparing the absor-bance of the protein at 280 nm and the absorbance of the Cy dye at670 nm and 532 nm respectively. In both cases, the ratios provided a1:1 correlation, suggesting that on average a single Cy dye molecule ispresent on each protein.
2.5. Biotinylation
Bacteriorhodopsin in membrane sheets (Sigma) was selectivelyBiotinylated at solvent exposed lysines and primary amines using EZ-Link Sulfo-NHS-LC-Biotin (Pierce Chemical Co., Rockford, IL). There are6 lysine residues and N terminal groups on the exposed cytosolicextracellular domains of bR. bR was resuspended in BupH PBS bufferpH 7.4 (Pierce). A freshly made 10 mM solution of EZ-Link Sulfo-NHS-LC-Biotin (Pierce) was prepared according to the manufacturesrecommendation in double-deionized H2O (ddH2O), added to the bRin a 20-fold molar excess and incubated on ice for 2 h. Excess biotinwas removed by 3 repeated centrifugation steps in an ultracentrifugeat an 89,000 RCF for 20 min at 4 °C. The biotin labeled bR pellet wasresuspended in TBS buffer. The percent recovery, by UV–visiblespectroscopy, was determined to be 85–90% on average with carefulre-suspension.
2.6. Microarray streptavidin binding
Proteins were spotted on GAPSII amino silane glass slides (CorningLife Sciences Inc., Corning, NY) in 4 ·4 squares with 16 replicates ofeach sample, generating ∼300 μm diameter spots with a spot-to-spotdistance of ∼350 μm. All samples were spotted (10 nl) using a roboticsystem. Non-biotinylated bR and “empty”-NLPs served as the negativecontrols, and biotinylated bR served as the positive control. Allsamples containing bacteriorhodopsin had concentrations of 10 mMbR as determined by UV/vis spectroscopy, the NLP protein concentra-tion without bR (“empty”-NLP) was 1.5 mg/ml. Proteins were cross-linked to the glass slides upon exposure to UV light for 5 min. Anapplied hybridization chamber (Grace Bio-labs, Bend, OR) was usedfor the blocking, washing and binding steps, with a volume capacity of950 μl. Slides were blocked with BSA (1mg/ml) for 30min. Slides werewashed with 1× PBS for 15 min followed by cyanine-5-streptavidin(Rockland Immunochemicals, Inc., Philadelphia, PA) binding (5 μg/ml)for 15 min. Subsequent washes were in 1× PBS and ddH2O water eachfor 15 min. Slides were then dried by centrifugation. Cyanine 5-Streptavidin fluorescence in a ScanArray 5000 XL; PerkinElmerProteins and NLPs were detected and imaged with a laser-basedconfocal scanner (ScanArray 5000 XL; PerkinElmer) using the VHeNe594 nm laser for excitation of Cy5-labeled streptavidin. Images werecollected and mean pixel intensities were analyzed using Scan Arraysoftware (Perkin Elmer Life and Analytical Sciences Inc., Waltham,MA).
2.7. Streptavidin binding for AFM
Streptavidin (SA) molecules (Sigma) were incubated with biotin-bR assembled NLPs (bio-br-NLPs) at a 2:1 molar ratio for 30 min andunbound SA was removed by filtering using molecular weight sievefilters (Vivascience) with molecular weight cutoffs of 100 kDa. Theresultant particles were imaged by AFM.
2.8. Native PAGE
Equal amounts of NLP samples (0.5–2 μg) were diluted with 2×native sample buffer (Invitrogen Corps., Madison WI) and loadedonto 4–20% gradient pre-made Tris–HCl gels (Invitrogen). Sampleswere electrophoresed for 250 V h at a constant 125 V. Afterelectrophoresis, gels were incubated with Sypro Ruby for 2 h andthen destained using 10% MeOH and 7% Acetic acid. Following a briefwash with ddH2O, gels were imaged using a Typhoon 9410 (GEHealthcare) at 532 nm (green laser) with a 610 nm bandpass 30 filter.Molecular weights were determined by comparing migration vs. logmolecular weight of standard proteins found in the NativeMarkstandard (Invitrogen). The Stokes diameter of the NLPs was calculatedfrom the known Stokes diameter of the same proteins in the standardsample.
2.9. SDS PAGE
Protein fractions were analyzed by SDS-PAGE gels, stained withSypro Ruby (BioRad Laboratories, Inc., Hercules, CA) and fluores-cently imaged with a Typhooon 9410 (GE Healthcare), as describedabove.
2.10. UV–visible spectroscopy
UV–visible spectra were collected using 50 μl of sample in aquartz cuvette on an ultrospec 5300pro UV/visible spectrophot-ometer (GE Healthcare) Dark adapted spectra were collected afterkeeping the sample wrapped in foil overnight. Light adapted spectrawere collected after exposure to full spectrum bright light for15 min.

726 C.D. Blanchette et al. / Biochimica et Biophysica Acta 1788 (2009) 724–731
2.11. AFM imaging
Atomically flat Muscovite mica disks were glued to metalsubstrates to secure them to the scanner of a stand-alone MFP-3DAFM (Asylum Research, Santa Barbara, CA). 2 μl of the NLP solution at a100 ng/ml concentration was incubated for 2 min on the mica surfacein imaging buffer (10 mM MgCl2, 10 mM Tris–HCL, and 0.1 M NaCl,adjusted to pH 8.0) then lightly rinsed. The AFM has a closed loop inthe x, y, and z axes, which improved imaging fidelity. Thetopographical images were obtained with oxide sharpened siliconnitride levers (MSCT, Veeco, Santa Barbara, CA) with a spring constantof 0.1 N/m. Images were taken in alternate contact (AC) mode, alsoknown as tappingmode, in an aqueous environment, with amplitudesbelow 20 nm and an amplitude setpoint at 65% of the tappingamplitude, scan rates were below 1.5 Hz. Height, amplitude, and phaseimages were recorded. High resolution 600 nm by 600 nm imageswere acquired at 512 by 512 pixel resolution, such that each NLP onaverage contained 600 pixels. The density of particles on the micasubstrate was kept low, on average 90 particles per 1 μm2, to facilitateindividual particle identification and sizing. Experiments were carriedout in a temperature controlled room at 23±1 °C, with acoustic hoodisolation and active vibration damping.
2.12. AFM image analysis
The height of features in the images were examined by histogramanalysis using IgorPro Wavemetrics software routines, where con-tiguous particles were defined by a threshold height above thebackground and the height arbitrarily defined as the maximum heightcontained by 10 or more pixels within the particle. Particle diameterwas determined by the full width half maximum (FWHM) analysis ofcontiguous particles in the slow scan direction (vertical), using IgorProWavemetrics software routines. In addition, to limit instrumentbroadening during lateral particle sizing, only tips revealing sharpimaging were used for diameter analysis. We have previouslydetermined, based on NLP size and MD simulations, that the averagetip broadening effect was ∼2–3 nm [21]. To determine the
Fig. 1. (A) bR-NLP assembly protocol. The reagents undergo a temperature transition and detNLP assembly monitored at absorbance of 280 nm. The SEC profile post NLP assembly contaNLP rich peak, apoE422k rich peak and bR rich peak.
reproducibility of the procedure used for measuring NLP diameters,randomly selected particles were repeatedly imaged to verifyconsistent diameter measurements. To remove image slopes andoffsets, raw AFM images were flattened with a planar fit using AsylumResearch data modification routines. To avoid coupling the NLP intothe flattening procedure, surface features higher than 1 nm weremasked followed by a second round of flattening. This procedureproduced a flat mica surface while not altering the NLP height.
2.13. Ion mobility spectrometry
IMS determines the mean aerodynamic diameter populationdistribution of particles in a volatile buffer. NLP samples wereexchanged via dialysis into a 25 mM ammonium acetate buffer andthe aerodynamic diameter of NLPs were determined with a MacroionMobility Spectrometer (Model 3890, TSI Inc., Shoreview, MN), aspreviously described [22,23]. NLP aerodynamic diameters weresubsequently converted to aerodynamic spherical volumes as pre-viously described [21].
3. Results
3.1. NLP assembly, SEC purification, native gel electrophoresis, SDS-PAGEanalysis and UV–visible spectroscopy
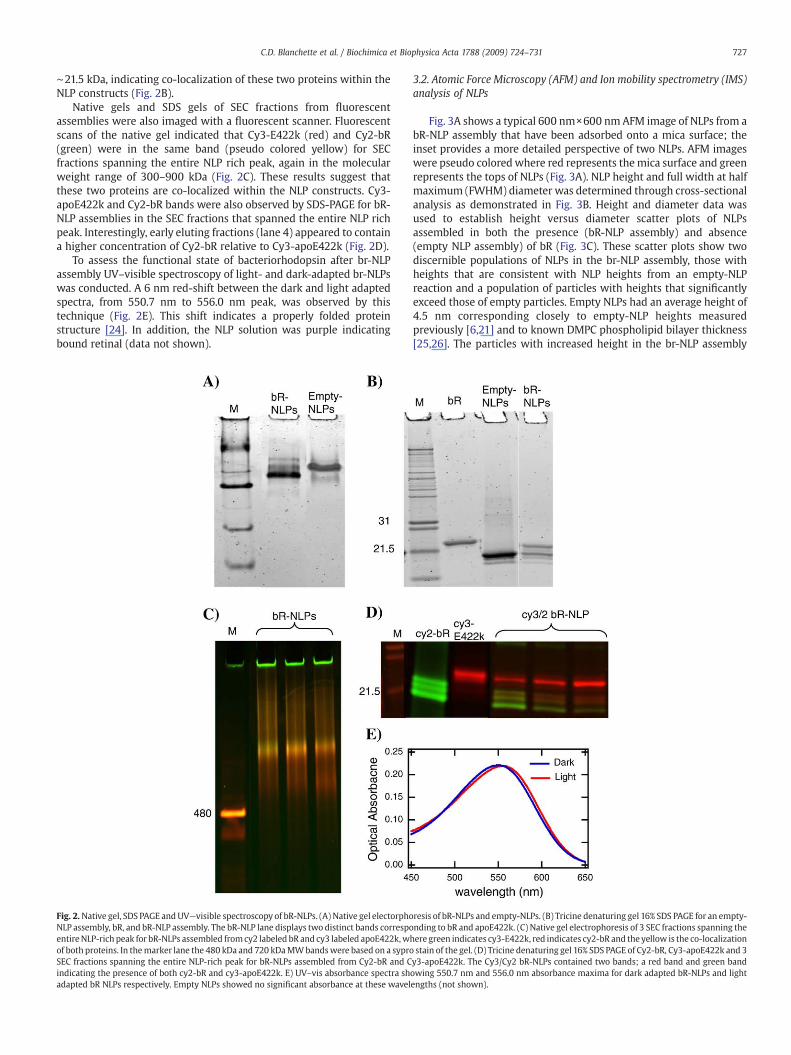
Following assembly (Fig. 1A), NLPs were separated from otherassembly components using SEC (Fig. 1B). The SEC profile containedfour dominant peaks, a lipid rich peak, an NLP rich peak, apoE422krich peak and bR rich peak (Fig. 1B). The NLPs from assemblies both inthe absence and presence of bR were subjected to native-PAGE andSDS-PAGE electrophoresis (Fig. 2A and B). Bands on the native gel fromthe bR containing assemblies spanned the molecular weight range of300–950 kDa, indicating the sample was highly heterogeneous. Singlebands at ∼22 kDa and ∼21.5 kDa were observed by SDS-PAGE forempty NLP assemblies (lanes 2) and bR alone (lane 3), respectively(Fig. 2B). In contrast, NLPs assembled in the presence of bR (bR-NLPassembly—lane 4) contained two bands by SDS-PAGE at ∼22 kDa and
ergent dialysis to self assemble the NLPs. (B) SEC chromatography purification after bR-ined four dominant peaks corresponding to (from left to right) a free lipid rich peak, an
727C.D. Blanchette et al. / Biochimica et Biophysica Acta 1788 (2009) 724–731
∼21.5 kDa, indicating co-localization of these two proteins within theNLP constructs (Fig. 2B).
Native gels and SDS gels of SEC fractions from fluorescentassemblies were also imaged with a fluorescent scanner. Fluorescentscans of the native gel indicated that Cy3-E422k (red) and Cy2-bR(green) were in the same band (pseudo colored yellow) for SECfractions spanning the entire NLP rich peak, again in the molecularweight range of 300–900 kDa (Fig. 2C). These results suggest thatthese two proteins are co-localized within the NLP constructs. Cy3-apoE422k and Cy2-bR bands were also observed by SDS-PAGE for bR-NLP assemblies in the SEC fractions that spanned the entire NLP richpeak. Interestingly, early eluting fractions (lane 4) appeared to containa higher concentration of Cy2-bR relative to Cy3-apoE422k (Fig. 2D).
To assess the functional state of bacteriorhodopsin after br-NLPassembly UV–visible spectroscopy of light- and dark-adapted br-NLPswas conducted. A 6 nm red-shift between the dark and light adaptedspectra, from 550.7 nm to 556.0 nm peak, was observed by thistechnique (Fig. 2E). This shift indicates a properly folded proteinstructure [24]. In addition, the NLP solution was purple indicatingbound retinal (data not shown).
Fig. 2.Native gel, SDS PAGE and UV—visible spectroscopy of bR-NLPs. (A) Native gel electorphoNLP assembly, bR, and bR-NLP assembly. The bR-NLP lane displays two distinct bands correspoentireNLP-rich peak for bR-NLPs assembled fromcy2 labeled bR and cy3 labeled apoE422k,wof both proteins. In themarker lane the 480 kDa and 720 kDaMWbandswere based on a syproSEC fractions spanning the entire NLP-rich peak for bR-NLPs assembled from Cy2-bR and Cindicating the presence of both cy2-bR and cy3-apoE422k. E) UV–vis absorbance spectra shadapted bR NLPs respectively. Empty NLPs showed no significant absorbance at these wavel
3.2. Atomic Force Microscopy (AFM) and Ion mobility spectrometry (IMS)analysis of NLPs
Fig. 3A shows a typical 600 nm×600 nm AFM image of NLPs from abR-NLP assembly that have been adsorbed onto a mica surface; theinset provides a more detailed perspective of two NLPs. AFM imageswere pseudo colored where red represents themica surface and greenrepresents the tops of NLPs (Fig. 3A). NLP height and full width at halfmaximum (FWHM) diameter was determined through cross-sectionalanalysis as demonstrated in Fig. 3B. Height and diameter data wasused to establish height versus diameter scatter plots of NLPsassembled in both the presence (bR-NLP assembly) and absence(empty NLP assembly) of bR (Fig. 3C). These scatter plots show twodiscernible populations of NLPs in the br-NLP assembly, those withheights that are consistent with NLP heights from an empty-NLPreaction and a population of particles with heights that significantlyexceed those of empty particles. Empty NLPs had an average height of4.5 nm corresponding closely to empty-NLP heights measuredpreviously [6,21] and to known DMPC phospholipid bilayer thickness[25,26]. The particles with increased height in the br-NLP assembly
resis of bR-NLPs and empty-NLPs. (B) Tricine denaturing gel 16% SDS PAGE for an empty-nding to bR and apoE422k. (C) Native gel electrophoresis of 3 SEC fractions spanning thehere green indicates cy3-E422k, red indicates cy2-bR and the yellow is the co-localizationstain of the gel. (D) Tricine denaturing gel 16% SDS PAGE of Cy2-bR, Cy3-apoE422k and 3y3-apoE422k. The Cy3/Cy2 bR-NLPs contained two bands; a red band and green bandowing 550.7 nm and 556.0 nm absorbance maxima for dark adapted bR-NLPs and lightengths (not shown).
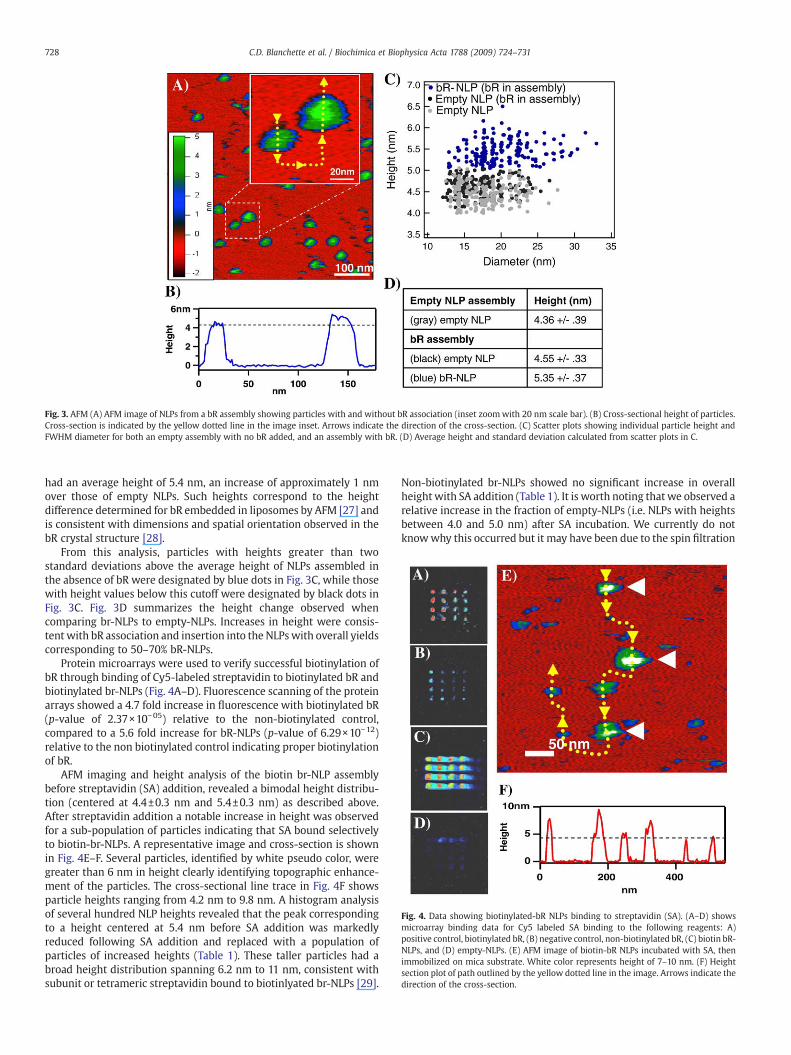
Fig. 3. AFM (A) AFM image of NLPs from a bR assembly showing particles with and without bR association (inset zoomwith 20 nm scale bar). (B) Cross-sectional height of particles.Cross-section is indicated by the yellow dotted line in the image inset. Arrows indicate the direction of the cross-section. (C) Scatter plots showing individual particle height andFWHM diameter for both an empty assembly with no bR added, and an assembly with bR. (D) Average height and standard deviation calculated from scatter plots in C.
Fig. 4. Data showing biotinylated-bR NLPs binding to streptavidin (SA). (A–D) showsmicroarray binding data for Cy5 labeled SA binding to the following reagents: A)positive control, biotinylated bR, (B) negative control, non-biotinylated bR, (C) biotin bR-NLPs, and (D) empty-NLPs. (E) AFM image of biotin-bR NLPs incubated with SA, thenimmobilized on mica substrate. White color represents height of 7–10 nm. (F) Heightsection plot of path outlined by the yellow dotted line in the image. Arrows indicate thedirection of the cross-section.
728 C.D. Blanchette et al. / Biochimica et Biophysica Acta 1788 (2009) 724–731
had an average height of 5.4 nm, an increase of approximately 1 nmover those of empty NLPs. Such heights correspond to the heightdifference determined for bR embedded in liposomes by AFM [27] andis consistent with dimensions and spatial orientation observed in thebR crystal structure [28].
From this analysis, particles with heights greater than twostandard deviations above the average height of NLPs assembled inthe absence of bR were designated by blue dots in Fig. 3C, while thosewith height values below this cutoff were designated by black dots inFig. 3C. Fig. 3D summarizes the height change observed whencomparing br-NLPs to empty-NLPs. Increases in height were consis-tent with bR association and insertion into the NLPswith overall yieldscorresponding to 50–70% bR-NLPs.
Protein microarrays were used to verify successful biotinylation ofbR through binding of Cy5-labeled streptavidin to biotinylated bR andbiotinylated br-NLPs (Fig. 4A–D). Fluorescence scanning of the proteinarrays showed a 4.7 fold increase in fluorescence with biotinylated bR(p-value of 2.37×10−05) relative to the non-biotinylated control,compared to a 5.6 fold increase for bR-NLPs (p-value of 6.29×10⁻¹²)relative to the non biotinylated control indicating proper biotinylationof bR.
AFM imaging and height analysis of the biotin br-NLP assemblybefore streptavidin (SA) addition, revealed a bimodal height distribu-tion (centered at 4.4±0.3 nm and 5.4±0.3 nm) as described above.After streptavidin addition a notable increase in height was observedfor a sub-population of particles indicating that SA bound selectivelyto biotin-br-NLPs. A representative image and cross-section is shownin Fig. 4E–F. Several particles, identified by white pseudo color, weregreater than 6 nm in height clearly identifying topographic enhance-ment of the particles. The cross-sectional line trace in Fig. 4F showsparticle heights ranging from 4.2 nm to 9.8 nm. A histogram analysisof several hundred NLP heights revealed that the peak correspondingto a height centered at 5.4 nm before SA addition was markedlyreduced following SA addition and replaced with a population ofparticles of increased heights (Table 1). These taller particles had abroad height distribution spanning 6.2 nm to 11 nm, consistent withsubunit or tetrameric streptavidin bound to biotinlyated br-NLPs [29].
Non-biotinylated br-NLPs showed no significant increase in overallheight with SA addition (Table 1). It is worth noting that we observed arelative increase in the fraction of empty-NLPs (i.e. NLPs with heightsbetween 4.0 and 5.0 nm) after SA incubation. We currently do notknowwhy this occurred but it may have been due to the spin filtration

Table 1Particle height data for biotin-bR NLPs and bR-NLPs before and after the incubation ofSA
Condition 4.0–5.0 nm 5.0–6.0 nm N6.0 nm
Biotin bR-NLP/ −SA 0.46 0.54 0Biotin bR-NLP/ +SA 0.61 0.05 0.34bR-NLP/ −SA 0.45 0.53 0.02bR-NLP/ +SA 0.61 0.39 0
729C.D. Blanchette et al. / Biochimica et Biophysica Acta 1788 (2009) 724–731
step that was done after the particles were incubated with SA toseparate NLPs from unbound SA. Therefore, it is possible that somematerial was lost during this process, which may account for therelative increase in the population of empty-NLPs. Despite thisdiscrepancy, after SA addition almost no NLPs displayed a heightbetween 5.0 and 6.0 nm, which support the notion that the NLPs with5.0–6.0 nm heights represented bR containing NLPs.
Diameters determined by AFM for NLPs assembled both in thepresence and absence of bR did not vary around a single mean butrather varied slightly around several discrete and stable means (Fig.5A). The existence of discrete NLP diameters is consistent with ourprevious report where NLP size distributions were quantified [21]. Thediameter histogram determined by AFM clearly indicates that thediameter distribution shifts to larger particle sizes for NLPs assembledin the presence of bR (Fig. 5A). To verify the observed shift in thediameter distribution for particles assembled in the presence of bR,particle sizes were also analyzed by ion mobility spectrometry (IMS).The IMS traces confirms that the diameter distribution is shifted tolarger particles for NLPs assembled in the presence of bR (black line)relative to empty NLP assemblies (gray line) (Inset, Fig. 5A). NLPs fromthe control assembly (not containing bR) (Fig. 5A— gray line) and NLPsfrom bR-NLP assemblies whose height was similar to that of NLPsassembled in the absence of bR (Fig. 5B— black line) were more likelyto have diameter values of 18 nm and smaller. However, NLPs from the
Fig. 5. (A) Histogram of NLP diameter determined through AFM for the bR assembly (blackdistribution for the bR assembly (black line) and empty control assembly (gray line). (B) Diam
bR-NLP assemblies whose height is 1 nm larger than that of NLPsassembled in the absence of bR are more likely to have diameters of18 nm and larger (Fig. 5B — blue line).
4. Discussion
AFM has previously been used to accurately discriminate twosubpopulations of particles [30–32]. In this study, AFM was used as asingle particle imaging technique and a significant increase in heightfor a relatively large fraction of NLPs assembled with bR was observed.Since empty NLPs rarely attain heights above 5 nm we hypothesizethat the larger height values in the bR assembly resulted from anincorporated bR. If we assume the height distribution of br-NLPs andempty-NLPs within the same sample are described by two Gaussiandistributions, we find the first is centered at 4.6 nm±0.3 nm and thesecond centered at 5.4 nm±0.4 nm. These two population peaks areseparated by 0.8 nm, which corresponds closely to the heightdifferential of a bR molecule [27] and the phospholipid bilayer [26].
To further verify identification of successful bR incorporation weassembled NLPs in the presence of biotinylated bR. Biotinylation of bRand the association of biotin-bR with NLPs were confirmed byvisualizing binding of Cyanine 5 (Cy5) labeled streptavidin in proteinmicroarrays. It was also shown that streptavidin did not significantlybind to empty-NLPs prepared in the absence of bR. Because ourmicroarray data could not distinguish between br-NLPs and empty-NLPs within the same sample, we utilized streptavidin binding as amolecular contrast agent to selectively identify individual br-NLPs.This is equivalent to improving image contrast in optical microscopyby adding a dye contrast agent. Similar approaches have been usedpreviously in AFM imaging [32]. By binding streptavidin, thetopographic height differential between br-NLPs and empty NLPswithin a given sample increased from less than 1 nm to over 2.5 nm.This method for identifying membrane proteins within NLPs is
line) and empty control assembly (gray line). Inset — IMS traces of particle diametereter distributions for bR-NLPs (blue line) and empty NLPs (black line) in the bR assembly.

Table 2The fraction of NLPs containing bR for a given NLP size
NLP diameter Fraction bR
14+/−2 0.2617+/−2 0.6222+/−2 0.728+/−2 0.7933+/−2 1
730 C.D. Blanchette et al. / Biochimica et Biophysica Acta 1788 (2009) 724–731
applicable to other membrane protein systems through biotinylationand binding of streptavidin or by using antibodies specific to themembrane protein. Through this combined approach we were able todetermine that approximately 60% of the NLPs contained bR underthese assembly conditions.
The ability to identify whether individual particles incorporate bRallowed us to correlate NLP diameter and bR incorporation. Theempty- and br-containing NLPs show diameters with discrete andstable diameters [21], with the caveat being that the br-NLP diameterdistributions were shifted to larger values relative to empty-NLPs (Fig.5A and B) The empty-NLP distribution in the samples assembled in thepresence and absence of bR was skewed toward the smallest diameterNLP (14 nm). In contrast, the proportion of the smallest diameterparticles in bR-NLPS significantly reduced and the proportion of largerparticles at 18 nm, 23 nm, and 28 nm greatly increased. Not only werebr-NLPs larger on average than the empty-NLPs, but the presence of bRduring self-assembly appears to drive the formation of larger diameterparticles (Fig. 5A). It is worth noting that molecular modeling andsimulations suggest that the discrete stable diameters observed hereare consistent with discrete numbers of apolipoprotein scaffoldingstabilizing the circumference of different particle sizes.
To quantify this effect, the fraction of bR containing NLPs wascalculated for each discrete size. This value was calculated as the ratioof br-NLPs to the sum of NLPs within a diameter range determinedfrom the peaks of Fig. 5B. These values as a function of particlediameter are listed in Table 2. The incorporation probability correlatedclosely with particle diameter; it was lowest for the smallest particlesfrom peak 1 (less than 26%) and increased to 100% for particles largerthan 30 nm.
It is not clear why the presence of bR results in the formation oflarger particles. The likely form of incorporated bR was a monomer(22 kDa) or trimer (66 kDa) depending upon the lipid:bR stoichio-metry [16]. Spectral results from the light/dark adaptation showabsorption maxima (550.7 nm/556.0 nm) that are in between that ofdetergent solubilized monomeric (546 nm/553 nm) and trimeric(560 nm/568 nm) bR, respectively [24]. The larger trimer withassociated archaeal lipid has a crossectional area of 3380 A2 in theplane of the lipid bilayer [33] and has a diameter that is less than 8 nm[34] and thus should readily fit into 14 nm particles. That this rarelyoccurs can perhaps be explained by the fact that physiological lipidssurrounding the bR may be carried through the purification andassembly process by tight binding [28] or that the some amount ofDMPC lipid is utilized in the self assembly. Alternatively, bR-NLPs maycontain bR oligomers that are larger than a trimer.
Our results show that the membrane protein bR was notincorporated into every NLP. However, the incorporation probabilitymay be improved by assembling the NLP under conditions that favorthe formation of larger particles. Previous investigations havemeasured bR-NLPs with a truncated apoA scaffold to be 9.2 nm indiameter as determined by calibrated size exclusion chromatography[17]. However, this method measures an average of all species in amixture; thus it is not suitable for observing multiple particle sizes. Infact, heterogeneous particles were observed by TEM imaging,however the authors of this study did not focus on NLP sizedistribution [17]. Furthermore, the efficiency of bR incorporationwas not quantified so it is possible that the majority of particlesdisplaying bR activity were larger than the reported 9.2 nm. In fact by
using larger scaffold proteins and smaller lipid to bR ratios, Bayburt etal. recently showed that larger particles contain a higher fraction oftrimer versus monomer bR species [16], which may also reflect higherefficiencies of bR incorporation. It is also worth noting that NLPs wereassembled with DMPC, which is not a typical lipid found in cellularmembranes. Therefore, it is plausible that the use of native lipids forNLP assembly may increase the membrane protein incorporationefficiency, since the native lipid–membrane protein interactions maybe more favorable than DMPC–membrane protein interactions. Basedon this notion, it would be valuable to examine the effects of the lipidcomponent on membrane protein incorporation efficiencies, particu-larly when this technology is utilized for the solubilization of a widerrange of membrane proteins.
We have demonstrated methods to quantify NLP membraneprotein incorporation efficiencies and have shown that the levels ofincorporation varywith NLP size. Themost significant and novel resultwas that larger particles had a greater likelihood of containing bR thansmaller particles. These results may prove valuable for futurestrategies in designing protocols for membrane protein incorporation.It has been shown that the size of empty NLPs can be controlled by theuse of different sized scaffolds or by changing the ratios of protein tolipid [18,35]. Therefore, future strategies may involve engineeringscaffold proteins to form larger particles in combinationwith utilizingprotein to lipid ratios that drive the NLP assembly process to largerparticles.
Acknowledgments
This work was performed under the auspices of the U.S.Department of Energy by Lawrence Livermore National Laboratoryunder Contract DE-AC52-07NA27344 with support from LawrenceLivermore National Laboratory (LDRD 06-SI-003 awarded to PDH).UCRL-JRNL-235806.
References
[1] J. Drews, Drug discovery: a historical perspective, Science 287 (2000) 1960–1964.[2] E. Wallin, G. von Heijne, Genome-wide analysis of integral membrane proteins
from eubacterial, archaean, and eukaryotic organisms, Protein Sci. 7 (1998)1029–1038.
[3] A. Jonas, S.M. Drengler, B.W. Patterson, 2 types of complexes formed by theInteraction of apolipoprotein a-I with vesicles of L-alpha-dimyristoylphosphati-dylcholine, J. Biol. Chem. 255 (1980) 2183–2189.
[4] B. Lu, J.A. Morrow, K.H. Weisgraber, Conformational reorganization of the four-helix bundle of human apolipoprotein E in binding to phospholipid, J. Biol. Chem.275 (2000) 20775–20781.
[5] M. Wientzek, C.M. Kay, K. Oikawa, R.O. Ryan, Binding of insect apolipophorin-Iii todimyristoylphosphatidylcholine vesicles — evidence for a conformational change,J. Biol. Chem. 269 (1994) 4605–4612.
[6] B.A. Chromy, E. Arroyo, C.D. Blanchette, G. Bench, H. Benner, J.A. Cappuccio, M.A.Coleman, P.T. Henderson, A.K. Hinz, E.A. Kuhn, J.B. Pesavento, B.W. Segelke, T.A.Sulchek, T. Tarasow, V.L. Walsworth, P.D. Hoeprich, Different apolipoproteinsimpact nanolipoprotein particle formation, J. Am. Chem. Soc. 129 (2007)14348–14354.
[7] T.H. Bayburt, J.W. Carlson, S.G. Sligar, Reconstitution and imaging of a membraneprotein in a nanometer-size phospholipid bilayer, J. Struct. Biol. 123 (1998) 37–44.
[8] T.H. Bayburt, A.J. Leitz, G. Xie, D.D. Oprian, S.G. Sligar, Transducin activation bynanoscale lipid bilayers containing one and two rhodopsins, J. Biol. Chem. 282(2007) 14875–14881.
[9] T.H. Bayburt, S.G. Sligar, Single-molecule height measurements on microsomalcytochrome P450 in nanometer-scale phospholipid bilayer disks, Proc. Natl. Acad.Sci. U. S. A. 99 (2002) 6725–6730.
[10] T. Boldog, S. Grimme, M.S. Li, S.G. Sligar, G.L. Hazelbauer, Nanodiscs separatechemoreceptor oligomeric states and reveal their signaling properties, Proc. Natl.Acad. Sci. U. S. A. 103 (2006) 11509–11514.
[11] T. Boldog, M. Li, G.L. Hazelbauer, Using nanodiscs to create water-solubletransmembrane chemoreceptors inserted in lipid bilayers, Methods Enzymol.423 (2007) 317–335.
[12] F. Cruz, D.E. Edmondson, Kinetic properties of recombinant MAO-A on incorpora-tion into phospholipid nanodisks, J. Neural Transm. 114 (2007) 699–702.
[13] A.J. Leitz, T.H. Bayburt, A.N. Barnakov, B.A. Springer, S.G. Sligar, Functionalreconstitution of Beta2-adrenergic receptors utilizing self-assembling Nanodisctechnology, Biotechniques 40 (2006) 601–602, 604, 606.
[14] M.R. Whorton, M.P. Bokoch, S.G.F. Rasmussen, B. Huang, R.N. Zare, B. Kobilka, R.K.Sunahara, A monomeric G protein-coupled receptor isolated in a high-density

731C.D. Blanchette et al. / Biochimica et Biophysica Acta 1788 (2009) 724–731
lipoprotein particle efficiently activates its G protein, Proc. Natl. Acad. Sci. U. S. A.104 (2007) 7682–7687.
[15] M.R. Whorton, B. Jastrzebska, P.S. Park, D. Fotiadis, A. Engel, K. Palczewski, R.K.Sunahara, Efficient coupling of transducin to monomeric rhodopsin in aphospholipid bilayer, J. Biol. Chem. 283 (2008) 4387–4394.
[16] T.H. Bayburt, Y.V. Grinkova, S.G. Sligar, Assembly of single bacteriorhodopsintrimers in bilayer nanodiscs, Arch. Biochem. Biophys. 450 (2006) 215–222.
[17] T.H. Bayburt, S.G. Sligar, Self-assembly of single integral membrane proteins intosoluble nanoscale phospholipid bilayers, Protein Sci. 12 (2003) 2476–2481.
[18] A. Jonas, Reconstitution of high-density lipoproteins, Methods Enzymol. 128(1986) 553–582.
[19] A. Jonas, K.E. Kezdy, J.H. Wald, Defined apolipoprotein A–I conformations inreconstituted high density lipoprotein discs, J. Biol. Chem. 264 (1989) 4818–4824.
[20] C.D. Mitchell, W.C. King, K.R. Applegate, T. Forte, J.A. Glomset, K.R. Norum, E. Gjone,Characterization of apolipoprotein E-rich high-density lipoproteins in familiallecithin–cholesterol acyltransferase deficiency, J. Lipid Res. 21 (1980) 625–634.
[21] C.D. Blanchette, L. Richard, W.H. Benner, J.B. Pesavento, J.A. Cappuccio, V.L.Walsworth, E.A. Kuhn, M. Corzett, B.A. Chromy, B.W. Segelke, M.A. Coleman, G.Bench, P.D. Hoeprich Jr., T.A. Sulchek, Quantifying size distributions of nanolipo-protein particles (NLPs) with single particle analysis and molecular dynamic (MD)simulations, J. Lipid Res. 49 (2008) 1420–1430.
[22] G. Bacher, R. Korner, A. Atrih, S.J. Foster, P. Roepstorff, G. Allmaier, Negative andpositive ion matrix-assisted laser desorption/ionization time-of-flight massspectrometry and positive ion nano-electrospray ionization quadrupole ion trapmass spectrometry of peptidoglycan fragments isolated from various bacillusspecies, J. Mass Spectrom. 36 (2001) 124–139.
[23] J.A. Loo, B. Berhane, C.S. Kaddis, K.M. Wooding, Y. Xie, S.L. Kaufman, I.V.Chernushevich, Electrospray ionization mass spectrometry and ion mobilityanalysis of the 20S proteasome complex, J. Am. Soc. Mass Spectrom. 16 (2005)998–1008.
[24] J. Wang, S. Link, C.D. Heyes, M.A. El-Sayed, Comparison of the dynamics of theprimary events of bacteriorhodopsin in its trimeric and monomeric states,Biophys. J. 83 (2002) 1557–1566.
[25] A.F. Xie, R. Yamada, A.A. Gewirth, S. Granick, Materials science of the gel to fluidphase transition in a supported phospholipid bilayer, Phys. Rev. Lett. 89 (2002).
[26] S.J. Johnson, T.M. Bayerl, D.C. McDermott, G.W. Adam, A.R. Rennie, R.K. Thomas, E.Sackmann, Structure of an adsorbed dimyristoylphosphatidylcholine bilayermeasured with specular reflection of neutrons, Biophys. J. 59 (1991) 289–294.
[27] D.J. Muller, M. Kessler, F. Oesterhelt, C. Moller, D. Oesterhelt, H. Gaub, Stability ofbacteriorhodopsin alpha-helices and loops analyzed by single-molecule forcespectroscopy, Biophys. J. 83 (2002) 3578–3588.
[28] H. Luecke, B. Schobert, H.T. Richter, J.P. Cartailler, J.K. Lanyi, Structure ofbacteriorhodopsin at 1.55 angstrom resolution, J. Mol. Biol. 291 (1999) 899–911.
[29] J.M. Cooper, J. Shen, F.M. Young, P. Connolly, J.R. Barker, G. Moores, The imaging ofstreptavidin and avidin using scanning tunnelling microscopy, J. Mater. Sci., Mater.Electron. 5 (1993) 106–110.
[30] J.A. Cappuccio, C.D. Blanchette, T.A. Sulchek, E.S. Arroyo, J.M. Kralj, A.K. Hinz, E.A.Kuhn, B.A. Chromy, B.W. Segelke, K.J. Rothschild, J. Fletcher, F. Katzen, T.C.Peterson, W.A. Kudlicki, G. Bench, P.D. Hoeprich, M.A. Coleman, Cell-free co-expression of functional membrane proteins and apolipoprotein forming solublenanolipoprotein particles, Mol. Cell Proteomics (2008).
[31] F. Katzen, J.E. Fletcher, J.P. Yang, D. Kang, T.C. Peterson, J.A. Cappuccio, C.D.Blanchette, T. Sulchek, B.A. Chromy, P.D. Hoeprich, M.A. Coleman, W. Kudlicki,Insertion of membrane proteins into discoidal membranes using a cell-freeprotein expression approach, J. Proteome Res. 7 (2008) 3535–3542.
[32] W. Suhara, M. Kobayashi, H. Sagara, K. Hamada, T. Goto, I. Fujimoto, K. Torimitsu, K.Mikoshiba, Visualization of inositol 1,4,5-trisphosphate receptor by atomic forcemicroscopy, Neurosci. Lett. 391 (2006) 102–107.
[33] R. Henderson, J.M. Baldwin, T.A. Ceska, F. Zemlin, E. Beckmann, K.H. Downing,Model for the structure of bacteriorhodopsin based on high-resolution electroncryomicroscopy, J. Mol. Biol. 213 (1990) 899–929.
[34] D.J. Muller, A. Engel, Atomic force microscopy and spectroscopy of nativemembrane proteins, Nat. Protocols 2 (2007) 2191–2197.
[35] I.G. Denisov, Y.V. Grinkova, A.A. Lazarides, S.G. Sligar, Directed self-assembly ofmonodisperse phospholipid bilayer nanodiscs with controlled size, J. Am. Chem.Soc. 126 (2004) 3477–3487.