Association of Quarterly Average Achieved Hematocrit With Mortality in Dialysis Patients: A...
10
Association of Quarterly Average Achieved Hematocrit With Mortality in Dialysis Patients: A Time-Dependent Comorbidity-Adjusted Model Joseph M. Messana, MD, 1 Chien-Chia Chuang, MAE, 2 Marc Turenne, PhD, 2 John Wheeler, PhD, 2 Jason Turner, MAE, 3 Kathryn Sleeman, MS, 2 Philip Tedeschi, PhD, 2 and Richard Hirth, PhD 2 Background: Recent publications suggest that increased mortality is associated with high hematocrit targets in erythropoietin-stimulating agent–treated patients with chronic kidney disease. We aim to further inform the debate about optimal hematocrit targets, advancing the hypothesis that the current hematocrit target may not optimize the survival of patients with end-stage renal disease. Study Design: Cross-sectional observational study. Setting & Participants: Medicare dialysis patients from 2002 to 2004 (n 393,967). Factors: Quarterly average hematocrit and erythropoietin alfa (EPO) dose. Outcomes: Mortality hazard ratios from time-dependent Cox proportional hazard models, adjusting for comorbidities. Results: N 2,712,197 patient-facility quarters. During the study, 100,086 deaths were identified. Percentages of patient quarters within each hematocrit category: hematocrit less than 27% (2.0%), 27% to 28.49% (1.7%), 28.5% to 29.9% (2.9%), 30% to 31.49% (5.2%), 31.5% to 32.99% (9.0%), 33% to 34.49% (14.9%), 34.5% to 35.99% (19.2%), 36% to 37.49% (18.0%), 37.5% to 38.99% (12.0%), 39% to 40.49% (6.4%), 40.5% to 41.99% (3.0%), and 42% or greater (3.1%). Mortality hazard ratios from the fully adjusted model: hematocrit less than 27% (3.11), 27% to 28.49% (2.60), 28.5% to 29.9% (2.14), 30% to 31.49% (1.80), 31.5% to 32.99% (1.44), 33% to 34.49% (1.17), 34.5% to 35.99% (reference), 36% to 37.49% (0.98), 37.5% to 38.99% (1.01), 39% to 40.49% (1.13), 40.5% to 41.99% (1.32), and 42% or greater (1.57). Limitations: First, potential confounding by indication related to associations between underlying illness and mortality, anemia, and EPO responsiveness. Second, Medicare claims data reflect a range of conditions and degrees of severity not easily translated into the clinical context. Third, for Medicare claims, EPO reporting is not required if EPO is not billed. Greater than 95% of “missing hematocrit” quarters are “EPO 0” patient quarters. Interpretation of results for the missing hematocrit and EPO 0 use categories is complicated by data source limitations. Conclusions: We show an association between mortality and low hematocrit in dialysis patients, in part reflecting the presence of comorbidities. We also show an association between increased mortality and high hematocrit. Additional interventional trials should be undertaken to better define the optimal target for anemia management in patients with end-stage renal disease, with careful prospective identification of underlying comorbidities and clinical factors contributing to high erythropoietin- stimulating agent requirement. Am J Kidney Dis 53:503-512. © 2009 by the National Kidney Foundation, Inc. INDEX WORDS: Hematocrit; erythropoietin-stimulating agent (ESA); mortality; hemodialysis. T he introduction of erythropoietin alfa (EPO) in 1989 as a treatment for anemia in pa- tients with end-stage renal disease (ESRD) re- sulted in profound changes in clinical ESRD care. Initial clinical trials reported few adverse clinical events, and early observational studies showed associations between higher hematocrit or hemoglobin level and improved survival in long-term dialysis patients. 1,2 These observa- tions and other factors resulted in progressively higher targeted and achieved hematocrits in the nearly 2 decades since EPO became available. 3-5 A recent study using data from one large dialysis organization showed an association be- tween hemoglobin level of 13.5 g/dL or greater and increased mortality in long-term dialysis From the 1 Division of Nephrology, University of Michi- gan Health System; 2 Kidney Epidemiology and Cost Center, University of Michigan, Ann Arbor, MI; and 3 Department of Health Management and Policy, School of Public Health, St Louis University, St Louis, MO. Received May 30, 2008. Accepted in revised form October 24, 2008. Originally published online as doi: 10.1053/j.ajkd.2008.10.047 on February 2, 2009. Address correspondence to Joseph M. Messana, MD, 3914 Taubman Center, Box 5364, Division of Nephrology, University of Michigan Health System, Ann Arbor, MI 48109- 5364. E-mail: [email protected] © 2009 by the National Kidney Foundation, Inc. 0272-6386/09/5303-0018$36.00/0 doi:10.1053/j.ajkd.2008.10.047 American Journal of Kidney Diseases, Vol 53, No 3 (March), 2009: pp 503-512 503
Transcript of Association of Quarterly Average Achieved Hematocrit With Mortality in Dialysis Patients: A...

Ttsccso
gUHL
21
A
Association of Quarterly Average Achieved Hematocrit With Mortality inDialysis Patients: A Time-Dependent Comorbidity-Adjusted Model
Joseph M. Messana, MD,1 Chien-Chia Chuang, MAE,2 Marc Turenne, PhD,2
John Wheeler, PhD,2 Jason Turner, MAE,3 Kathryn Sleeman, MS,2 Philip Tedeschi, PhD,2
and Richard Hirth, PhD2
Background: Recent publications suggest that increased mortality is associated with high hematocrittargets in erythropoietin-stimulating agent–treated patients with chronic kidney disease. We aim tofurther inform the debate about optimal hematocrit targets, advancing the hypothesis that the currenthematocrit target may not optimize the survival of patients with end-stage renal disease.
Study Design: Cross-sectional observational study.Setting & Participants: Medicare dialysis patients from 2002 to 2004 (n � 393,967).Factors: Quarterly average hematocrit and erythropoietin alfa (EPO) dose.Outcomes: Mortality hazard ratios from time-dependent Cox proportional hazard models, adjusting
for comorbidities.Results: N � 2,712,197 patient-facility quarters. During the study, 100,086 deaths were identified.
Percentages of patient quarters within each hematocrit category: hematocrit less than 27% (2.0%), 27%to 28.49% (1.7%), 28.5% to 29.9% (2.9%), 30% to 31.49% (5.2%), 31.5% to 32.99% (9.0%), 33% to34.49% (14.9%), 34.5% to 35.99% (19.2%), 36% to 37.49% (18.0%), 37.5% to 38.99% (12.0%), 39% to40.49% (6.4%), 40.5% to 41.99% (3.0%), and 42% or greater (3.1%). Mortality hazard ratios from thefully adjusted model: hematocrit less than 27% (3.11), 27% to 28.49% (2.60), 28.5% to 29.9% (2.14),30% to 31.49% (1.80), 31.5% to 32.99% (1.44), 33% to 34.49% (1.17), 34.5% to 35.99% (reference),36% to 37.49% (0.98), 37.5% to 38.99% (1.01), 39% to 40.49% (1.13), 40.5% to 41.99% (1.32), and42% or greater (1.57).
Limitations: First, potential confounding by indication related to associations between underlyingillness and mortality, anemia, and EPO responsiveness. Second, Medicare claims data reflect a rangeof conditions and degrees of severity not easily translated into the clinical context. Third, for Medicareclaims, EPO reporting is not required if EPO is not billed. Greater than 95% of “missing hematocrit”quarters are “EPO � 0” patient quarters. Interpretation of results for the missing hematocrit and EPO �0 use categories is complicated by data source limitations.
Conclusions: We show an association between mortality and low hematocrit in dialysis patients, inpart reflecting the presence of comorbidities. We also show an association between increased mortalityand high hematocrit. Additional interventional trials should be undertaken to better define the optimaltarget for anemia management in patients with end-stage renal disease, with careful prospectiveidentification of underlying comorbidities and clinical factors contributing to high erythropoietin-stimulating agent requirement.Am J Kidney Dis 53:503-512. © 2009 by the National Kidney Foundation, Inc.
INDEX WORDS: Hematocrit; erythropoietin-stimulating agent (ESA); mortality; hemodialysis.
lthn
dta
he introduction of erythropoietin alfa (EPO)in 1989 as a treatment for anemia in pa-
ients with end-stage renal disease (ESRD) re-ulted in profound changes in clinical ESRDare. Initial clinical trials reported few adverselinical events, and early observational studieshowed associations between higher hematocritr hemoglobin level and improved survival in
From the 1Division of Nephrology, University of Michi-an Health System; 2Kidney Epidemiology and Cost Center,niversity of Michigan, Ann Arbor, MI; and 3Department ofealth Management and Policy, School of Public Health, Stouis University, St Louis, MO.Received May 30, 2008. Accepted in revised form October
4, 2008. Originally published online as doi:
0.1053/j.ajkd.2008.10.047 on February 2, 2009.merican Journal of Kidney Diseases, Vol 53, No 3 (March), 2009
ong-term dialysis patients.1,2 These observa-ions and other factors resulted in progressivelyigher targeted and achieved hematocrits in theearly 2 decades since EPO became available.3-5
A recent study using data from one largeialysis organization showed an association be-ween hemoglobin level of 13.5 g/dL or greaternd increased mortality in long-term dialysis
Address correspondence to Joseph M. Messana, MD,914 Taubman Center, Box 5364, Division of Nephrology,niversity of Michigan Health System, Ann Arbor, MI 48109-364. E-mail: [email protected]© 2009 by the National Kidney Foundation, Inc.0272-6386/09/5303-0018$36.00/0
3U5
doi:10.1053/j.ajkd.2008.10.047
: pp 503-512 503

perurnvcrsw
teiEtptpmahamt
D
MaiDmuiogfdD
S
EDaats
D
awpf
C
pm13(3t4
ium
I
ecar�biaf
I
a3abP3
S
atqicMiacmaMi
Messana et al504
atients.6 We extend the observations of Regidort al6 in 2 important ways. First, we analyze theelationship between hematocrit and mortalitysing Medicare data from 2002 to 2004. Our dataepresent the majority of patients with ESRDationally as opposed to one large dialysis pro-ider. Second, we adjust for an extensive set ofomorbidities. Regidor et al6 relied on laboratoryesults as surrogates for systemic inflammatorytate because only incident comorbidity dataere available for use as adjusters in their model.Recently, the US Food and Drug Administra-
ion reinforced the package inserts for erythropoi-tin-stimulating agents (ESAs) to reflect grow-ng concern about aggressive hematocrit targets inSA-treated patients in the context of recent in-
erventional trials showing greater mortality inatients with greater hemoglobin levels.7 In addi-ion, the National Kidney Foundation recentlyublished revised guidelines for anemia manage-ent in this uncertain environment. This report
ims to further inform the debate about optimalematocrit targets and ESA dosing, specificallydvancing the hypothesis that the current recom-ended target may not optimize survival in pa-
ients with ESRD.
METHODS
ata Sources
Medicare claims for all hemodialysis patients for whomedicare was the primary payer between January 1, 2002,
nd December 31, 2004, were used to identify the use of keynjectable medications (EPO, darbepoetin, iron, and vitamin
injectables) and dialysis treatment results reported ononthly dialysis claims (hematocrit or [3 · hemoglobin] and
rea reduction ratio). Hematocrit reporting is not mandatoryn months in which the patient did not receive ESAs (6.4%f patient months; 3.0% of patient quarters). Patient demo-raphics and comorbidities were obtained from the Centersor Medicare & Medicaid Services (CMS) Medical Evi-ence Form (CMS Form 2728) and/or Medicare claims.etails for these data sources are available elsewhere.8
tudy Sample
The study population included Medicare patients withSRD receiving hemodialysis between January 1, 2002, andecember 31, 2004. Observations with a missing value for
ny of the case-mix measures, such as body size measuresnd comorbidities from the 2728 Form, were excluded fromhe analysis (4.0% of patient quarters). The final analysis
ample included 2,712,197 patient quarters. mependentVariable
All-cause mortality was the outcome variable in thisnalysis, measured by using a binary indicator of mortalityithin a given quarter. We calculated follow-up days foratients in a given quarter to allow modeling time to eventor proportional hazards models.
ase-MixMeasures
All repeated and time-varying case-mix measures for eachatient were averaged over each quarter to obtain a quarterlyean value. Consequently, each patient may have had up to
2 repeated and quarterly-varying measurements during the-year study period. We divided hematocrit into 13 groups�27%, 27% to 28.49%, 28.5% to 29.99%, 30% to 31.49%,1.5% to 32.99%, 33% to 34.49%, 34.5% to 35.99%, 36%o 37.49%, 37.5% to 38.99%, 39% to 40.49%, 40.5% to1.99%, �42%, and missing).Patient characteristics identified as case-mix adjusters
ncluded age, sex, race, duration of renal replacement therapy,rea reduction ratio, body mass index, and comorbidityeasures, as previously described.9,10
njectables forAnemiaManagement
Average EPO dose and utilization measures for darbepo-tin, iron, and vitamin D injectables derived from Medicarelaims were included in one case-mix–adjusted model asdditional time-varying covariates. Five EPO dose catego-ies (0, 1 to 5,999, 6,000 to 11,999, 12,000 to 17,999, and18,000 U/wk) were created to explore the association
etween EPO dose status and mortality. Use of darbepoetin,ron, and vitamin D injectables, based on Medicare Allow-ble Payments, was also averaged over each calendar quarteror each patient.
nteraction Terms
Thirty interaction terms among the 5 EPO dose groupsnd quarterly average achieved hematocrit groups (�30%,0% to 32.9%, 33% to 35.9%, 36% to 38.9%, 39% to 41.9%,nd �42%) were created to explore the interaction effectsetween EPO dose and hematocrit on mortality hazard.atients with 6,000 � EPO dose (units/week) � 12,000 and6% � hematocrit � 38.9% served as the reference group.
tatistical Analysis
Time-dependent Cox proportional hazards models withdjustment for facility effects were estimated to investigatehe association between average hematocrit per calendaruarter and mortality, controlling for an extensive comorbid-ty list. The base model (model 1) included average hemato-rit in the quarter with entry quarter categories as covariates.odel 2 added adjustment for patient demographics and 13
ncident comorbidities from Medicare Form 2728. Model 3dded adjustment for patient demographics and 38 acute andhronic comorbidities from Medicare claims on top ofodel 1. The fully adjusted model (model 4) included
dditional adjustment for average EPO dose and averageedicare payments for darbepoetin, iron, and vitamin D
njectables per calendar quarter on top of model 3. Similar
odels, excluding patient quarters with missing hematocrit
oqaewa
atbsgc2dt
wMpicedrqFppls
s
M
R
WM
C
Anemia and Survival in ESRD 505
r patient quarters in which the patient survived the entireuarter, but in which only one hematocrit value was avail-ble, were developed to evaluate the sensitivity of the modelstimates to their exclusion. An additional mortality modelas developed to explore interaction effects between
chieved hematocrit and EPO dose.
RESULTS
This study reports on the association betweenverage achieved hematocrit per calendar quar-er and observed mortality in the same quarter foroth incident and prevalent Medicare hemodialy-is patients in 2002 to 2004. Table 1 lists demo-raphic statistics for this population and frequen-ies of comorbidities reported on Medicare Form728 or abstracted from Medicare claims. Theistribution of demographic measures reflectshe majority of the Medicare ESRD population.
Table 1. Baseline Descriptive Statistics for 393,
ean age (y)�18 (%)18-44 (%)45-59 (%)60-69 (%)70-79 (%)�80 (%)ace (%)Native AmericanAsianBlackWhiteOther/unknownomen (%)ean body mass index (kg/m2)
omorbiditiesDiabetes mellitus (%)Ischemic heart disease (%)Congestive heart failure (%)Pericarditis (%)Cardiac arrhythmia (%)Cardiac arrest (%)Cerebrovascular disease (%)Peripheral vascular disease (%)Chronic obstructive pulmonary disease (%)Malignant neoplasm (%)Septicemia/septic shock (%)Pneumonia (%)Gastrointestinal bleed within 3 mo (%)Gastrointestinal/no hemorrhage within 6 mo (%)Sickle cell anemia (%)
*Primary or contributing.
†On insulin.For most comorbidities listed in Table 1 forhich comparison between those derived fromedicare Form 2728 and Medicare claims is
ossible, comorbidity frequencies are greater us-ng the claims-derived definition. For conditionsommonly associated with chronic kidney dis-ase (eg, congestive heart failure, ischemic heartisease, arrhythmia, and cerebrovascular and pe-ipheral vascular disease), claims-defined fre-uencies were 2- to 5-fold greater than Medicareorm 2728–defined frequencies. Such underre-orting on Form 2728 has been previously re-orted.11-15 In addition, the Medicare claimsikely identify conditions diagnosed after thetart of renal replacement therapy.
Several claims-derived comorbidities often as-ociated with acute illness and hospitalization
dicare Patients With End-Stage Renal Disease
For First Calendar Quarter
64.30.2
12.222.423.627.214.4
1.42.1
32.659.44.4
46.727.6
m Medicare Form 2728 From Medicare Claims44.0*; 22.3† 61.4
24.0 56.531.0 61.70.7 2.35.8 41.70.6 2.08.9 33.3
13.7 49.37.1 36.05.3 21.5
18.54.02.41.10.3
967 Me
Value
Fro

(oeitnmdwcsiiPrpb
caoot3
A
Cdhdnamt
t2(aMip
thSchaaplabmo
tththedigdtmsrhesfCrcrcLafrc(
a
Messana et al506
time-limited comorbidities) were included inur models. They included several infection cat-gories (septicemia, pneumonia, opportunisticnfections, and other infections) and specific gas-rointestinal disease (bleeding or ulcer). The diag-osis of septicemia in the current or 3 previousonths was associated with 18.5% of patients
uring their first quarter in the study. Comparedith septicemia, remaining infectious disease
ategories were present less frequently, with theole exception of other infections, a categoryncluding more than 1,000 specific diagnoses,nitially developed for the Medicare Advantagerogram.16 Gastrointestinal bleeding in the cur-ent or previous 3 months was present in 2.4% ofatients, whereas gastrointestinal ulcer withoutleeding was present in 1.1% of patients.The frequency distribution of average hemato-
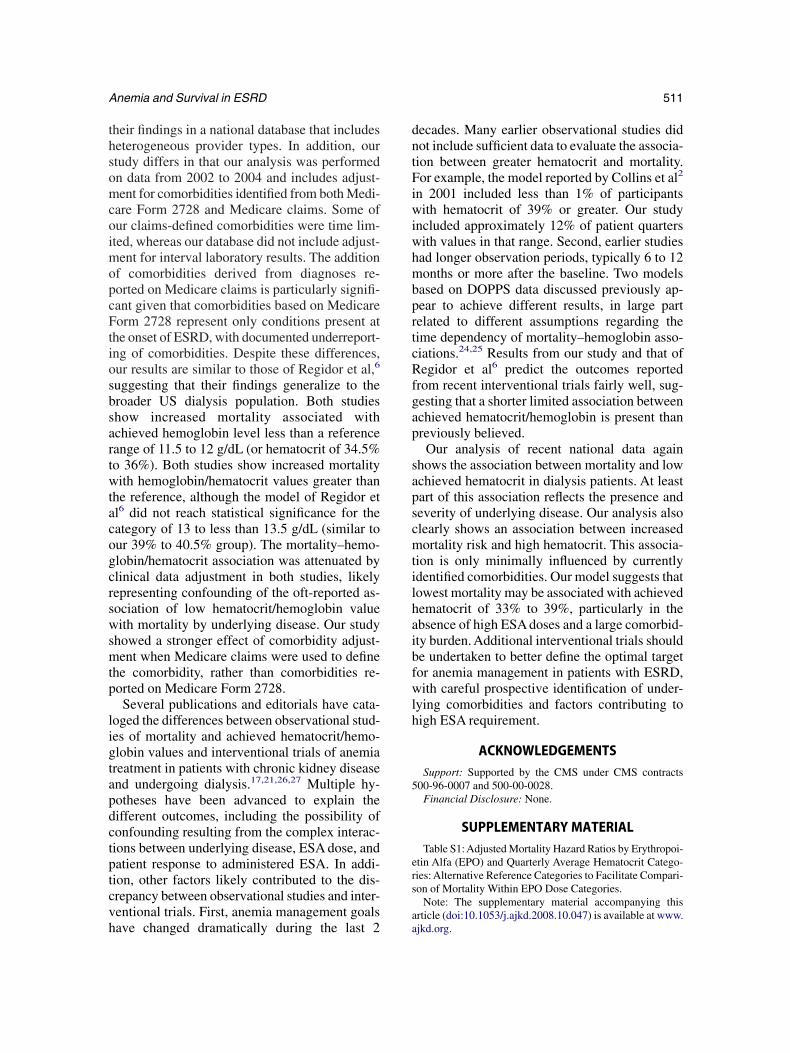
rit per patient-quarter is shown in Fig 1. Aver-ge hematocrit was less than 30% in only 6.6%f patient quarters and 39% or greater in 12.5%f patient quarters. Nearly 64% of patient quar-ers were associated with a hematocrit between3% and 39%.
chievedHematocrit–MortalityAssociation
Table 2 lists results from our time-dependentox proportional hazards models. These resultsefine the association between quarterly averageematocrit and mortality within the same calen-ar quarter. The base model (model 1) includeseither comorbidity nor injectable medicationdjustment. Additional models include adjust-ent for demographics, anthropometric charac-
eristics, and comorbidities, either derived from
Figure 1. Distribution of quarterly average hematocrit
EHct) values from Medicare claims. Results are expresseds total patient quarters.
hose reported on Medicare Form 2728 (model) or abstracted from Medicare claims datamodel 3). Model 4 is adjusted for demographic,nthropometric, and Medicare claims data as inodel 3, but also includes adjustment for EPO,
ron, and vitamin D analogues administered asart of dialysis.The lowest mortality hazard is present in pa-
ient quarters in which the average achievedematocrit is 36% or greater, but less than 39%.ignificantly increased mortality hazard is asso-iated with patient quarters in which averageematocrit is 39% or greater. Quarters in whichverage hematocrit is less than 34.5% are associ-ted with increased mortality hazard ratios, withrogressively greater mortality associated withower hematocrit. The addition of comorbiditynd parenteral medication adjustments to thease model results in changes in the relativeagnitude of mortality hazard ratio within hemat-
crit categories.Comparing results from models 1 and 2 shows
hat adjustment for demographic and comorbidi-ies reported at the initiation of dialysis therapyas little impact on mortality hazard ratios. Mor-ality hazard ratios change by less than 10% in allematocrit categories and less than 5% in allxcept 2 categories. After adjustment for inci-ent comorbidities, the mortality hazard rationcreased slightly for most hematocrit categoriesreater than the reference (34.5% to 36%) andecreased for all hematocrit categories less thanhe reference. The addition of comorbidity adjust-
ent from Medicare claims data resulted in aimilar pattern of change in mortality hazardatio, but of greater magnitude, particularly forematocrit categories less than the reference cat-gory (model 3 versus model 1). Similarly, re-ults from model 4, which includes adjustmentor parenteral medication use from Medicarelaims data, have even lower mortality hazard
atios than model 3 for the lowest hematocritategories, but nearly identical mortality hazardatios compared with models 1 to 3 for hemato-rit categories greater than the reference group.ower average EPO use within a quarter gener-lly was associated with lower mortality, exceptor EPO � 0. Interpretation of mortality hazardatios for this group is confounded by a strongorrelation between missing hematocrit and
PO � 0. Model results were insensitive to the
Table 2. Results From Cox Proportional Hazards Models Using 2002-2004 Data
Variable
Outcome Model 1: UnadjustedModel 2: Demographics and
Medicare 2728 FormModel 3: Demographics and
Medicare Claims Data
Model 4: Demographics,Medicare Claims, EPO, Other
Injectable Medications
PatientQuarters
No. ofDeaths
MortalityRate
HazardRatio 95% CI P
HazardRatio 95% CI P
HazardRatio 95% CI P
HazardRatio 95% CI P
Hct � 27% 48,125 5,899 0.123 5.17 5.02-5.33 �0.001 5.11 4.95-5.27 �0.001 3.54 3.44-3.65 �0.001 3.11 3.01-3.20 �0.00127% � Hct � 28.5% 40,567 4,479 0.110 4.54 4.39-4.69 �0.001 4.33 4.18-4.48 �0.001 2.99 2.89-3.09 �0.001 2.60 2.51-2.69 �0.00128.5% � Hct � 30% 70,636 6,434 0.091 3.56 3.46-3.67 �0.001 3.36 3.26-3.46 �0.001 2.44 2.37-2.51 �0.001 2.14 2.08-2.21 �0.00130% � Hct � 31.5% 125,438 8,982 0.072 2.67 2.60-2.74 �0.001 2.53 2.46-2.60 �0.001 1.99 1.94-2.05 �0.001 1.80 1.75-1.85 �0.00131.5% � Hct � 33% 217,689 11,218 0.052 1.84 1.80-1.89 �0.001 1.78 1.74-1.83 �0.001 1.55 1.51-1.59 �0.001 1.44 1.41-1.48 �0.00133% � Hct � 34.5% 360,818 13,360 0.037 1.29 1.26-1.32 �0.001 1.27 1.24-1.30 �0.001 1.21 1.18-1.24 �0.001 1.17 1.14-1.20 �0.00134.5% � Hct � 36% 466,469 13,554 0.029 Ref Ref Ref Ref Ref Ref Ref Ref Ref Ref Ref Ref36% � Hct � 37.5% 437,218 11,945 0.027 0.93 0.91-0.96 �0.001 0.94 0.92-0.96 �0.001 0.96 0.93-0.98 �0.001 0.98 0.95-1.00 0.0437.5% � Hct � 39% 290,159 8,152 0.028 0.95 0.93-0.99 �0.001 0.96 0.93-0.98 0.002 0.98 0.95-1.01 0.2 1.01 0.98-1.03 0.739% � Hct � 40.5% 154,377 4,933 0.032 1.09 1.05-1.12 �0.001 1.09 1.06-1.13 �0.001 1.10 1.07-1.14 �0.001 1.13 1.09-1.17 �0.00140.5% � Hct � 42% 73,050 2,796 0.038 1.30 1.25-1.36 �0.001 1.31 1.26-1.36 �0.001 1.29 1.24-1.34 �0.001 1.32 1.26-1.37 �0.001Hct � 42% 76,371 3,612 0.047 1.60 1.55-1.66 �0.001 1.57 1.51-1.63 �0.001 1.54 1.49-1.60 �.001 1.57 1.51-1.63 �0.001Hct missing 67,067 4,722 0.070 2.27 2.20-2.34 �0.001 2.05 1.98-2.11 �0.001 2.10 2.03-2.17 �0.001 1.77 1.64-1.90 �0.001EPO dose (U/wk)
EPO � 0 0.89 0.83-0.95 0.0010 � EPO � 6,000 0.59 0.57-0.60 �0.0016,000 � EPO �12,000
0.62 0.61-0.63 �0.001
12,000 � EPO �18,000
0.75 (0.73-0.76) �0.001
EPO � 18,000 Ref Ref Ref
Note: N � 2,712,197 patient-facility-quarters with clustering adjustment.Abbreviations: CI, confidence interval; EPO, erythropoietin alfa; Hct, hematocrit; Ref, reference.
Anem
iaand
Survivalin
ES
RD
507

esa
A
ihTtacrvwqmoEtaher
hWt3qaOEaesc
paohaigtoiwAtfdE
Esiauigutgmesac
tt
E061E
Messana et al508
xclusion of patient quarters in which the patienturvived, but only 1 hematocrit value was avail-ble.
chievedHematocrit–EPODose Interactions
Results of a model developed to assess fornteractions between quarterly average achievedematocrit and EPO dose are listed in Table 3.able 3 lists mortality hazard estimates from a
ime-dependent Cox proportional hazards modeldjusted for comorbidities derived from Medi-are claims (additional analysis with alternativeeference categories presented in Table S1, pro-ided as online supplementary material availableith this article at www.ajkd.org). For patientuarters in which EPO was used, decreasingortality hazard is observed through hematocrits
f 33% to 35.9% or 36% to 38.9%, dependent onPO dose category. For all EPO categories, quar-
erly average hematocrit of 39% or greater isssociated with significant increased mortalityazard. Within any hematocrit category, the great-st mortality hazard is observed for patientseceiving 18,000 U/wk or greater of EPO.
Average EPO dose (units/week) for each EPO �ematocrit interaction term is listed in Table 4.ithin all EPO categories, the majority of pa-
ient quarters are within the hematocrit range of3% to 38.9%. Approximately 74% of patientuarters in the 0- to 5,999-U/wk EPO categorychieved an average hematocrit of 33% to 38.9%.nly 54% of patient quarters in the categoryPO dose of 18,000 U/wk or greater achieved anverage hematocrit of 33% to 38.9%. Withinach EPO dose category, little variation is ob-erved in mean EPO doses across hematocrit
Table 3. Adjusted Mortality Hazard Ratios
EPO Dose Category(U/wk) �30 30-32.9
PO � 0 2.84* (2.33-3.46) 1.68* (1.36-2.08) 1� EPO � 6,000 2.52* (2.34-2.73) 1.56* (1.47-1.64) 0,000 � EPO � 12,000 2.82* (2.68-2.98) 1.63* (1.56-1.70)2,000 � EPO � 18,000 3.32* (3.17-3.48) 1.85* (1.77-1.93) 1PO � 18,000 3.83* (3.71-3.96) 2.41* (2.33-2.48) 1
Note: The 95% confidence interval is in parentheses.Abbreviations: EPO, erythropoietin alfa; Hct, hematocrit.*P � 0.001 compared with reference group.
ategories. r
DISCUSSION
Our observational study of Medicare dialysisatients shows a complex association betweenchieved hematocrit and mortality during a shortbservation period of 3 months. Both lower andigher quarterly average hematocrits (�34.5%nd �39%, respectively) were associated withncreased mortality hazard relative to a referenceroup with 34.5% � hematocrit � 36%. In addi-ion, average EPO dose administered during thebservation period was associated with mortalityn our models. Lower EPO dose was associatedith lower mortality for a given hematocrit value.ssociations between hematocrit, EPO, and mor-
ality were significantly affected by adjustmentor comorbidities obtained from Medicare claimsata, particularly in patient groups with higherPO dose and/or lowest achieved hematocrit.Models that specified a range of hematocrit–
PO combinations showed differences in theensitivity of mortality hazard ratios to comorbid-ty adjustment. For patient groups identified aschieving a hematocrit of 30% or greater andsing less than 12,000 U/wk of EPO, the mortal-ty hazard ratio was minimally affected by demo-raphic and comorbidity adjustment. If residualnobserved factors have relative effects similaro observed factors on hazard ratios, using theseroups to define optimal target hematocrit forortality reduction may result in less biased
stimates of optimal hematocrit targets in dialy-is patients and the relative mortality risk associ-ted with failure to achieve these targets inlinical practice.
Our study contains several potential limita-ions, including those common to all observa-ional studies. The relationships presented in this
O and Quarterly Average Hct Categories
Average Hct (%)
5.9 36-38.9 39-41.9 �42
2-1.36) 1.32 (1.08-1.62) 1.67 (1.28-2.18) 1.96* (1.46-2.64)9-0.96) 0.87* (0.84-0.91) 1.23* (1.17-1.30) 1.70* (1.59-1.83)
ence 0.91* (0.87-0.94) 1.12* (1.06-1.18) 1.55* (1.44-1.66)0-1.29) 1.13* (1.09-1.18) 1.32* (1.25-1.40) 1.77* (1.63-1.92)3-1.84) 1.71* (1.65-1.77) 1.92* (1.83-2.01) 2.52* (2.37-2.68)
by EP
33-3
.12 (0.9.92* (0.8
Refer.24* (1.2.79* (1.7
eport are solely associations. Causal inference

srmptetdrtmTaiacmy
MFdsiamtTMiattvr
EEEEEE000000666666111111EEEEEE(
Anemia and Survival in ESRD 509
hould be made with caution. In addition, theecent controversy about the definition of opti-al target values for anemia management in
atients with chronic kidney disease and long-erm dialysis patients has highlighted the inher-nt difficulty using observational data to definehe target.17 Potential confounding issues are wellescribed, including “confounding by indication”elated to the previously reported associations be-ween acute illness (including inflammation) and
ortality, anemia, and EPO responsiveness.18-20
hese limitations, in part related to uncertaintybout unmeasured factors with the potential tonfluence the magnitude or direction of observedssociations, have led some to recommend betterontrol for baseline comorbidities and assess-ent of effect modification in observational anal-
Table 4. EPO Dose for Each E
EPO Dose Category (U/wk) Achieved Hematocrit (%)
PO � 0 �30PO � 0 30-32.9PO � 0 33-35.9PO � 0 36-38.9PO � 0 39-41.9PO � 0 �42� EPO � 6,000 �30� EPO � 6,000 30-32.9� EPO � 6,000 33-35.9� EPO � 6,000 36-38.9� EPO � 6,000 39-41.9� EPO � 6,000 �42,000 � EPO � 12,000 �30,000 � EPO � 12,000 30-32.9,000 � EPO � 12,000 33-35.9,000 � EPO � 12,000 36-38.9,000 � EPO � 12,000 39-41.9,000 � EPO � 12,000 �422,000 � EPO � 18,000 �302,000 � EPO � 18,000 30-32.92,000 � EPO � 18,000 33-35.92,000 � EPO � 18,000 36-38.92,000 � EPO � 18,000 39-41.92,000 � EPO � 18,000 �42PO � 18,000 �30PO � 18,000 30-32.9PO � 18,000 33-35.9PO � 18,000 36-38.9PO � 18,000 39-41.9PO � 18,000 �42
Various) Missing
Abbreviation: EPO, erythropoietin alfa.
ses.21 a
The data used in our analyses, derived fromedicare claims, have 2 important limitations.
irst, diagnostic categories derived from claimsata reflect a range of conditions and degrees ofeverity, resulting in potential difficulty translat-ng results of analyses to clinical contexts. Inddition, patients requiring more frequent orore intense medical treatment (eg, hospitaliza-
ion) may be more likely to have claims present.hus, the presence of diagnoses reported onedicare claims could reflect global severity of
llness in addition to or instead of reflecting thessociation between specific conditions and mor-ality. A second limitation of our data set relateso the use of Medicare claims for hematocritalues. In 2002 to 2004, Medicare regulationsequired submission of current hematocrit with
Hematocrit Interaction Term
Patient Quarters %Mean Weekly EPO
Dose � SD
1,489 0.06 0 � 01,863 0.08 0 � 03,489 0.15 0 � 02,875 0.12 0 � 01,434 0.06 0 � 0
955 0.04 0 � 010,601 0.45 3,664 � 1,57045,513 1.93 3,831 � 1,467
204,886 8.68 3,655 � 1,508220,608 9.34 3,456 � 1,60268,007 2.88 3,228 � 1,70021,817 0.92 3,037 � 1,77621,753 0.92 9,097 � 1,69079,320 3.36 8,968 � 1,704
245,940 10.42 8,795 � 1,704225,453 9.55 8,758 � 1,70267,786 2.87 8,798 � 1,70521,565 0.91 8,826 � 1,70825,393 1.08 14,816 � 1,76566,205 2.80 14,771 � 1,735
150,511 6.38 14,661 � 1,726125,536 5.32 14,639 � 1,72440,995 1.74 14,690 � 1,72014,377 0.61 14,699 � 1,716
100,092 4.24 37,898 � 18,378150,226 6.36 33,483 � 15,669222,461 9.42 30,862 � 13,886152,905 6.48 29,332 � 12,53649,205 2.08 28,848 � 11,86117,657 0.75 28,908 � 12,05867,067 2.84 1,021 � 4,833
PO �
ll EPO billing for Medicare dialysis patients.

Cpptcoatucq
pwihMlaalMicntavhuatwblMcddwamwtc
hzshg
Pehmtgpoibc2b6bagtsecll
dtittqhctrarb1hssabirwa
t
Messana et al510
onsequently, our analysis included very fewatient quarters in which hematocrit values wereresent and no EPO was used. These observa-ions may be subject to some unobserved biasompared with patients who did not have hemat-crit values included on their claims (and presum-bly were not receiving EPO during the observa-ion period). This potential source of bias isnlikely to have significantly altered our out-omes given the very small fraction of patientuarters involved.Our results can be compared with several
reviously published studies, many of whichere included in a recent review.21 Several stud-
es reported on the association between achievedematocrit/hemoglobin level and mortality usingedicare data. Ma et al1 and subsequently Col-
ins et al2 reported on mortality hazard ratios bychieved hematocrit by using a proportional haz-rds model adjusted for demographics and aimited number of comorbidities derived from
edicare claims. They showed increased mortal-ty associated with low hematocrits, but no in-reased mortality associated with the limitedumber of participants with hematocrits greaterhan the reference group. The data used in thesenalyses were from 1993 to 1999, a time whenery few Medicare dialysis patients achieved aematocrit greater than 36% and average EPOse was much less than in 2003 and 2004.5 Inddition, the mortality observation period was upo 12 months, after a 6-month baseline periodhen average hematocrit, EPO use, and comor-idity burden were defined. Cotter et al22 ana-yzed relative mortality risk in 1998 incident
edicare dialysis patients by achieved hemato-rit categories and EPO dose quartiles by usingesign parameters similar to those in the studiesescribed previously. The overall trend was to-ard lower mortality in categories with greater
chieved hematocrit (including � 39%) and lowerortality was associated with lower EPO useithin most hematocrit categories. The investiga-
ors report 7.5% of participants in the hematocritategory of 39% or greater.
Associations between mortality and achievedemoglobin level from one large dialysis organi-ation were reported by Ofsthun et al.23 In theirtudy, increased mortality was observed only inemoglobin categories less than the reference
roup (11 � hemoglobin � 12). dPisoni et al24 used the Dialysis Outcomes andractice Patterns Study (DOPPS) I database tovaluate the association between mortality andemoglobin level by using proportional hazardsodeling adjusted for demographics, comorbidi-
ies, and facility clustering.24,25 Average hemo-lobin concentration during a 180-day baselineeriod was used, with a longer than 1.5-yearbservation period. In their models, lower mortal-ty was associated with greater baseline hemoglo-in level. Robinson et al25 subsequently used aohort from the American arm of DOPPS I (n �,790 participants) to model all-cause mortalityy baseline hemoglobin category in 1-, 3-, and-month lagged models. The reference hemoglo-in category was 11 to less than 12 g/dL, andnalyses included a category for baseline hemo-lobin of 13 g/dL or greater. Although the statis-ical power of the analyses was limited by studyize, mortality hazard ratios for hemoglobin cat-gory of 13 g/dL or greater was higher than theategories of 11 to less than 12 g/dL and 12 toess than 13 g/dL in both the 1- and 3-monthagged models, but not the 6-month lagged model.
Regidor et al6 used data from one nationalialysis chain between July 2001 and June 2003o evaluate the mortality-hemoglobin associationn maintenance dialysis patients. The investiga-ors used a time-limited proportional hazardsechnique to model mortality within a calendaruarter associated with the average achievedematocrit in the same quarter. The model in-luded adjustment for demographics, comorbidi-ies (obtained from Medicare Form 2728), labo-atory measures, and medications administereds part of in-center dialysis treatment. Theiresults show increased mortality in all hemoglo-in categories less than the reference (11.5 to �2 g/dL) and increased mortality for groups withemoglobin levels of 13.5 g/dL or greater. Ob-erved mortality hazard ratios decreased progres-ively from unadjusted models with case-mixnd laboratory adjustment within each hemoglo-in category less than the reference group andncreased slightly for most hemoglobin catego-ies greater than the reference hemoglobin groupith the addition of case-mix and laboratory
djustment.Our analysis of mortality-hematocrit associa-
ion is modeled after that of Regidor et al,6
escribed previously, with the goal of evaluating
thsomcoimopcFtiosbsartwtacogcrswsmtp
ligtapdctptcvh
dntFiwiwhmbprtcRfgap
sapscmtilhaibfwlh
5
ers
a
Anemia and Survival in ESRD 511
heir findings in a national database that includeseterogeneous provider types. In addition, ourtudy differs in that our analysis was performedn data from 2002 to 2004 and includes adjust-ent for comorbidities identified from both Medi-
are Form 2728 and Medicare claims. Some ofur claims-defined comorbidities were time lim-ted, whereas our database did not include adjust-ent for interval laboratory results. The addition
f comorbidities derived from diagnoses re-orted on Medicare claims is particularly signifi-ant given that comorbidities based on Medicareorm 2728 represent only conditions present at
he onset of ESRD, with documented underreport-ng of comorbidities. Despite these differences,ur results are similar to those of Regidor et al,6
uggesting that their findings generalize to theroader US dialysis population. Both studieshow increased mortality associated withchieved hemoglobin level less than a referenceange of 11.5 to 12 g/dL (or hematocrit of 34.5%o 36%). Both studies show increased mortalityith hemoglobin/hematocrit values greater than
he reference, although the model of Regidor etl6 did not reach statistical significance for theategory of 13 to less than 13.5 g/dL (similar tour 39% to 40.5% group). The mortality–hemo-lobin/hematocrit association was attenuated bylinical data adjustment in both studies, likelyepresenting confounding of the oft-reported as-ociation of low hematocrit/hemoglobin valueith mortality by underlying disease. Our study
howed a stronger effect of comorbidity adjust-ent when Medicare claims were used to define
he comorbidity, rather than comorbidities re-orted on Medicare Form 2728.Several publications and editorials have cata-
oged the differences between observational stud-es of mortality and achieved hematocrit/hemo-lobin values and interventional trials of anemiareatment in patients with chronic kidney diseasend undergoing dialysis.17,21,26,27 Multiple hy-otheses have been advanced to explain theifferent outcomes, including the possibility ofonfounding resulting from the complex interac-ions between underlying disease, ESA dose, andatient response to administered ESA. In addi-ion, other factors likely contributed to the dis-repancy between observational studies and inter-entional trials. First, anemia management goals
ave changed dramatically during the last 2 aecades. Many earlier observational studies didot include sufficient data to evaluate the associa-ion between greater hematocrit and mortality.or example, the model reported by Collins et al2
n 2001 included less than 1% of participantsith hematocrit of 39% or greater. Our study
ncluded approximately 12% of patient quartersith values in that range. Second, earlier studiesad longer observation periods, typically 6 to 12onths or more after the baseline. Two models
ased on DOPPS data discussed previously ap-ear to achieve different results, in large partelated to different assumptions regarding theime dependency of mortality–hemoglobin asso-iations.24,25 Results from our study and that ofegidor et al6 predict the outcomes reported
rom recent interventional trials fairly well, sug-esting that a shorter limited association betweenchieved hematocrit/hemoglobin is present thanreviously believed.Our analysis of recent national data again
hows the association between mortality and lowchieved hematocrit in dialysis patients. At leastart of this association reflects the presence andeverity of underlying disease. Our analysis alsolearly shows an association between increasedortality risk and high hematocrit. This associa-
ion is only minimally influenced by currentlydentified comorbidities. Our model suggests thatowest mortality may be associated with achievedematocrit of 33% to 39%, particularly in thebsence of high ESA doses and a large comorbid-ty burden. Additional interventional trials shoulde undertaken to better define the optimal targetor anemia management in patients with ESRD,ith careful prospective identification of under-
ying comorbidities and factors contributing toigh ESA requirement.
ACKNOWLEDGEMENTSSupport: Supported by the CMS under CMS contracts
00-96-0007 and 500-00-0028.Financial Disclosure: None.
SUPPLEMENTARY MATERIALTable S1: Adjusted Mortality Hazard Ratios by Erythropoi-
tin Alfa (EPO) and Quarterly Average Hematocrit Catego-ies: Alternative Reference Categories to Facilitate Compari-on of Mortality Within EPO Dose Categories.
Note: The supplementary material accompanying thisrticle (doi:10.1053/j.ajkd.2008.10.047) is available at www.
jkd.org.
aN
tsN
Tp
sD
RS
tes
aJ
RCouEA
aC
ms
oJ
Mi1
tA(
Jm
FtCf
RCouE
J
pa3
Ntm7
Dp
lm2
ssd
Ja6
ADA
Fpu
i
m
Messana et al512
REFERENCES1. Ma JZ, Ebben J, Hong X, Collins AJ: Hematocrit level
nd associated mortality in hemodialysis patients. J Am Socephrol 10:610-619, 19992. Collins AJ, Li S, St Peter W, et al: Death, hospitaliza-
ion, and economic associations among incident hemodialy-is patients with hematocrit values of 36 to 39%. J Am Socephrol 12:2465-2473, 20013. Coladonato JA, Frankenfield DL, Reddan DN, et al:
rends in anemia management among US hemodialysisatients. J Am Soc Nephrol 13:1288-1295, 20024. Wish JB: Can evidence drive the development of a
ound national EPO reimbursement policy? Am J Kidneyis 41:254-258, 20035. US Renal Data System: USRDS 2006 Annual Data
eport. Available at: http://www.usrds.org/adr.htm. Accessedeptember 6, 20066. Regidor DL, Kopple JD, Kovesdy CP, et al: Associa-
ions between changes in hemoglobin and administeredrythropoiesis-stimulating agent and survival in hemodialy-is patients. J Am Soc Nephrol 17:1181-1191, 2006
7. Singh AK, Szczech L, Tang KL, et al: Correction ofnemia with epoetin alfa in chronic kidney disease. N EnglMed 355:2085-2098, 20068. Hirth RA, Wheeler J, Messana J, et al: End Stage
enal Disease Payment System: Results of Research onase-Mix Adjustment for an Expanded Bundle. Universityf Michigan, February 2008. Available at: http://www.sph.mich.edu/kecc/assets/documents/UM-KECC_Expanded_SRD_Bundle.pdf. Appendix A, Data Sources Appendix.ccessed September 18, 20089. Hirth RA, Wolfe RA, Wheeler JRC, et al: Is casemix
djustment necessary for an expanded dialysis bundle? Healthare Finance Rev 24:77-88, 200310. Hirth RA, Turenne MN, Wheeler JRC, et al: Case-ix adjustment for an expanded renal prospective payment
ystem. J Am Soc Nephrol 8:2565-2574, 200711. Ashby VB, Wolfe RA, Loos ME, Port FK: The effect
f comorbidities on facility standardized mortality ratios.Am Soc Nephrol 9:197A, 1998 (abstr)12. Roys EC, Port FK, Agodoa LYC, et al: Validation ofedical Evidence Form with DMMS data showing relative
mportance as predictor of mortality. J Am Soc Nephrol0:255A, 1999 (abstr)13. Wolfe RA, Port FK, Webb RL, et al: Introduction to
he excerpts from the United States Renal Data System 1999nnual Data Report. Am J Kidney Dis 34:S1-S3, 1999
suppl 1)14. Wolfe RA, Ashby VB, Daugirdas JT, Agodoa LY,
ones CA, Port FK: Body size, dose of hemodialysis, and
ortality. Am J Kidney Dis 35:80-88, 2000 g15. Longnecker JC, Klag MJ, Levey AS, Martin AA,ink NE, Powe NR: Validation of comorbid conditions on
he end-stage renal disease medical evidence report: TheHOICE Study. Choices for Healthy Outcomes in Caring
or ESRD. J Am Soc Nephrol 11:520-529, 200016. Hirth RA, Wheeler J, Messana J, et al: End Stage
enal Disease Payment System: Results of Research onase-Mix Adjustment for an Expanded Bundle. Universityf Michigan, February 2008. Available at: http://www.sph.mich.edu/kecc/assets/documents/UM-KECC_Expanded_SRD_Bundle.pdf. Accessed May 30, 200817. Coyne DW. Use of epoetin in chronic renal failure.
AMA 297:1713-1716, 200718. Gunnell J, Yeun JY, Depner TA, Kaysen GA: Acute-
hase response predicts erythropoietin resistance in hemodi-lysis and peritoneal dialysis patients. Am J Kidney Dis3:63-72, 199919. Kalantar-Zadeh K, McAllister CJ, Lehn RS, Lee GH,
issenson AR, Kopple JD: Effect of malnutrition-inflamma-ion complex syndrome on EPO hyporesponsiveness inaintenance hemodialysis patients. Am J Kidney Dis 42:761-
73, 200320. Zhang Y, Thamer M, Stefanik K, Kaufman J, Cotter
J: Epoetin requirements predict mortality in hemodialysisatients. Am J Kidney Dis 44:866-876, 200421. Volkova N, Arab L: Evidence-based systematic
iterature review of hemoglobin/hematocrit and all-causeortality in dialysis patients. Am J Kidney Dis 47:24-36,
00622. Cotter DJ, Stefanik K, Zhang Y, Thamer M, Scharf-
tein D, Kaufman J: Hematocrit was not validated as aurrogate end point for survival among epoetin-treated hemo-ialysis patients. J Clin Epidemiol 57:1086-1095, 200423. Ofsthun N, LaBrecque J, Lacson E, Keen M, Lazarus
M: The effects of higher hemoglobin levels on mortalitynd hospitalization in hemodialysis patients. Kidney Int3:1908-1914, 200324. Pisoni RL, Bragg-Gresham JL, Young EW, et al:
nemia management and outcomes from 12 countries in theialysis Outcomes and Practice Patterns Study (DOPPS).m J Kidney Dis 44:94-111, 200425. Robinson BM, Joffe MM, Berns JS, Pisoni RL, Port
K, Feldman HI: Anemia and mortality in hemodialysisatients: Accounting for morbidity and treatment variablespdated over time. Kidney Int 68:2323-2330, 200526. Parfrey PS: Target hemoglobin level for EPO therapy
n CKD. Am J Kidney Dis 47:171-173, 200627. Fishbane S, Besarab A: Mechanism of increasedortality risk with erythropoietin treatment to higher hemo-
lobin targets. Clin J Am Soc Nephrol 2:1274-1282, 2007