Asset deterioration and discolouration in water distribution systems
12
Asset deterioration and discolouration in water distribution systems P.S. Husband*, J.B. Boxall Pennine Water Group, Department of Civil and Structural Engineering, University of Sheffield, Mappin street, Sheffield S1 3JD, United Kingdom article info Article history: Received 18 June 2010 Received in revised form 4 August 2010 Accepted 10 August 2010 Available online 17 August 2010 Keywords: Hydraulics Shear stress Cohesive material Regeneration Asset deterioration abstract Water Distribution Systems function to supply treated water safe for human consumption and complying with increasingly stringent quality regulations. Considered primarily an aesthetic issue, discolouration is the largest cause of customer dissatisfaction associated with distribution system water quality. Pro-active measures to prevent discolouration are sought yet network processes remain insufficiently understood to fully justify and optimise capital or operational strategies to manage discolouration risk. Results are presented from a comprehensive fieldwork programme in UK water distribu- tion networks that have determined asset deterioration with respect to discolouration. This is achieved by quantification of material accumulating as cohesive layers on pipe surfaces that when mobilised are acknowledged as the primary cause of discolouration. It is shown that these material layers develop ubiquitously with defined layer strength characteristics and at a consistent and repeatable rate dependant on water quality. For UK networks iron concentration in the bulk water is shown as a potential indicator of dete- rioration rate. With material layer development rates determined, management decisions that balance discolouration risk and expenditure to maintain water quality integrity can be justified. In particular the balance between capital investment such as improving water treatment output or pipe renewal and operational expenditure such as the frequency of network maintenance through flushing may be judged. While the rate of development is shown to be a function of water quality, the magnitude (peak or average turbidity) of discolouration incidents is shown to be dominated by hydraulic conditions. From this it can be proposed that network hydraulic management, such as regular periodic ‘stressing’, is a potential strategy in reducing discolouration risk. The ultimate application of this is the hydraulic design of self-cleaning networks to maintain discolouration risk below accept- able levels. ª 2010 Elsevier Ltd. All rights reserved. 1. Introduction Discolouration remains the single largest water quality issue facing water companies worldwide. Of the 154,985 customer complaints about drinking water quality in 2007 for England and Wales, 124,671 (80%) were about discoloured water. Yet with a 99.96% compliance with the European Drinking Water Directive, the overall result for England and Wales is compa- rable with the best reported in Europe. In 2007, 33% of all incidents investigated by the UK Drinking Water Inspectorate * Corresponding author. Tel.: þ44 114 2225416; fax: þ44 114 2225700. E-mail addresses: s.husband@sheffield.ac.uk (P.S. Husband), j.b.Boxall@sheffield.ac.uk (J.B. Boxall). Available at www.sciencedirect.com journal homepage: www.elsevier.com/locate/watres water research 45 (2011) 113 e124 0043-1354/$ e see front matter ª 2010 Elsevier Ltd. All rights reserved. doi:10.1016/j.watres.2010.08.021
Transcript of Asset deterioration and discolouration in water distribution systems

wat e r r e s e a r c h 4 5 ( 2 0 1 1 ) 1 1 3e1 2 4
Avai lab le a t www.sc iencedi rec t .com
journa l homepage : www.e lsev ie r . com/ loca te /wat res
Asset deterioration and discolouration in waterdistribution systems
P.S. Husband*, J.B. Boxall
Pennine Water Group, Department of Civil and Structural Engineering, University of Sheffield, Mappin street, Sheffield S1 3JD,
United Kingdom
a r t i c l e i n f o
Article history:
Received 18 June 2010
Received in revised form
4 August 2010
Accepted 10 August 2010
Available online 17 August 2010
Keywords:
Hydraulics
Shear stress
Cohesive material
Regeneration
Asset deterioration
* Corresponding author. Tel.: þ44 114 222541E-mail addresses: [email protected]
0043-1354/$ e see front matter ª 2010 Elsevdoi:10.1016/j.watres.2010.08.021
a b s t r a c t
Water Distribution Systems function to supply treated water safe for human consumption
and complying with increasingly stringent quality regulations. Considered primarily an
aesthetic issue, discolouration is the largest cause of customer dissatisfaction associated
with distribution system water quality. Pro-active measures to prevent discolouration are
sought yet network processes remain insufficiently understood to fully justify and optimise
capital or operational strategies to manage discolouration risk.
Results are presented from a comprehensive fieldwork programme in UK water distribu-
tion networks that have determined asset deterioration with respect to discolouration.
This is achieved by quantification of material accumulating as cohesive layers on pipe
surfaces that when mobilised are acknowledged as the primary cause of discolouration. It
is shown that these material layers develop ubiquitously with defined layer strength
characteristics and at a consistent and repeatable rate dependant on water quality. For UK
networks iron concentration in the bulk water is shown as a potential indicator of dete-
rioration rate. With material layer development rates determined, management decisions
that balance discolouration risk and expenditure to maintain water quality integrity can be
justified. In particular the balance between capital investment such as improving water
treatment output or pipe renewal and operational expenditure such as the frequency of
network maintenance through flushing may be judged. While the rate of development is
shown to be a function of water quality, the magnitude (peak or average turbidity) of
discolouration incidents is shown to be dominated by hydraulic conditions. From this it
can be proposed that network hydraulic management, such as regular periodic ‘stressing’,
is a potential strategy in reducing discolouration risk. The ultimate application of this is the
hydraulic design of self-cleaning networks to maintain discolouration risk below accept-
able levels.
ª 2010 Elsevier Ltd. All rights reserved.
1. Introduction and Wales, 124,671 (80%) were about discoloured water. Yet
Discolouration remains the single largest water quality issue
facing water companies worldwide. Of the 154,985 customer
complaints about drinking water quality in 2007 for England
6; fax: þ44 114 2225700..uk (P.S. Husband), j.b.Boier Ltd. All rights reserved
with a 99.96% compliance with the European Drinking Water
Directive, the overall result for England and Wales is compa-
rable with the best reported in Europe. In 2007, 33% of all
incidents investigated by the UK Drinking Water Inspectorate
[email protected] (J.B. Boxall)..

wat e r r e s e a r c h 4 5 ( 2 0 1 1 ) 1 1 3e1 2 4114
(DWI) were due to discolouration, Fig. 1a. Of significance it was
found that 48% of these incidents were a result of ‘planned
work’, Fig. 1b (DWI, 2007; DWI, 2008; DWI, 2009). This is a clear
indictment that current operational and management strat-
egies are insufficiently informed and that there is inadequate
understanding of the processes and mechanisms that lead to
discolouration events. In addition the DWI questioned the UK
industry’s reactive, failure driven attitude towards the main-
tenance of assets, which it had aimed to improve through
instigating Distribution Operation and Maintenance Strate-
gies, DOMS (DWI 2002). To justify efficient implementation of
DOMS, water companies need to balance justifiable capital
expenditure against the long term operational costs of main-
tenance interventions with respect to maintaining water
quality. From 2010 UK water supplier’s statutory duties to
manage assets will also include discolouration complaints as
a quantitativemeasure reflecting consumers’ expectations set
in a framework of maintaining serviceability (OFWAT, 2008).
Furthermore implementation of Water Safety Plans (WSP),
regarded as the most effective way to ensure a water supply
safe for human consumption, require comprehensive risk
assessment and risk management of the network (WHO,
2005). To achieve these statutory obligations within the
distribution network it is evident that understanding of the
processes governing discolouration is essential.
2. Background
For a discolouration event to occur a three-phase processmay
be conceptualised consisting of a material supply to the
network, a period during which material accumulates and
ultimately the mobilisation of material into the bulk flow
(Boxall and Saul, 2005). Material sources linked with dis-
colouration include oxidation of iron mains, metal precipita-
tion, biological activity and poor system maintenance or
treatment practices (McCoy and Olsen, 1986; Gauthier et al.,
2001; Slaats et al., 2002; Sarin et al., 2004). Trials in a plastic
only network with particle-free water produced by 0.1 mm
ultra-filtration demonstrated that particles responsible for
discolouration can originate solely from the supplied water
(Vreeburg et al., 2008). Most likely it was proposed through
intrinsic processes such as precipitation and biological
Fig. 1 e DWI incidents in En
activity. With the inevitable presence of material within
a distribution system, it could be assumed that localised
settling and the subsequent mobilisation of loose deposits
may account for discolouration incidents (Barbeau et al.,
2005). Research analysing material entrained during flushing
operations has however repeatedly demonstrated that it is
particulate in nature, with a size predominately around 10 mm
and a specific gravity in the range 1e1.3 (Boxall et al., 2001;
Gauthier et al., 2001; Seth et al., 2004; Verberk et al., 2006;
Vreeburg and Boxall, 2007). Sedimentation of these particles
is restricted to quiescent conditions; therefore in general they
remain as a permanent wash load or solute within distribu-
tion systems (Smith et al., 1999; Boxall et al., 2001; Hossain
et al., 2003; Ryan and Jayaratne, 2003). Based on such obser-
vations, Boxall et al. (2001) proposed and subsequently vali-
dated for field data (Boxall and Saul, 2005; Husband and Boxall,
2010) that it is the generation of cohesive-like material layers
that are responsible for discolouration. In their empirical
model, Predicting Discolouration in Distribution Systems
(PODDS), Boxall et al. (2001) suggest that these material layers
behave in a similar way to cohesive estuarine muds and
cohesive-like sewer sediments (Parchure and Mehta, 1985;
Mehta and Lee, 1994; Skipworth et al., 1999). In the PODDS
model however the concept of cohesive layers was specifically
applied with the assumption that the layers are conditioned
by system hydraulics. The erosion of material layers with
distinct shear stress characteristics and their subsequent
regeneration has since been demonstrated under laboratory
conditions in a full scale pipe loop (Husband et al., 2008).
The practically recognised trigger for discolouration event
initiation is an increase in hydraulic conditions, for example
a rise in flow (Twort et al., 2000; Ackers et al., 2001; Marshall,
2001; Slaats et al., 2002; Ryan and Jayaratne, 2003). It was
recognised by Boxall et al. (2001) in the PODDS model that
increasing the flow raises the force acting tangentially to the
pipe surface, the boundary wall shear stress. If this exceeds
the conditioned shear strength of the cohesive layers then
mobilisation of discolouration material would occur. An
appreciation of the non-linear relationship between shear
stress and velocity can explainwhy some valve operations, re-
zoning or other network interventions may have resulted in
discolouration incidents when planning indicated only
marginal increases in flow velocity. By analysing for boundary
gland and Wales, 2006.

wat e r r e s e a r c h 4 5 ( 2 0 1 1 ) 1 1 3e1 2 4 115
shear stress, hydraulically simulating ‘planned works’ as part
of a pro-active management strategy, it is likely that such
events may be anticipated.
In the Netherlands a 0.4 m/s flow velocity has been iden-
tified as a design criterion for self-cleaning networks (Slaats
et al., 2002). The value of 0.4 m/s is a pragmatic one
proposed to prohibit the accumulation of material within
Dutch water distribution systems.
With progressively more stringent regulations, increasing
customer expectations and acceptance that discolouration is
a widespread international issue, it is essential that water
suppliers have the ability to assess, quantify and proactively
manage this risk of water quality failure. The concept of
cohesive material layers with a relationship linking shear
stress and discolouration potential can accurately describe
the mobilisation process and has been verified through
modelling of distribution network discolouration events.
What is not known however is the rate these layers regenerate
following disturbance or the controlling variables, although
laboratory and associated field studies suggest that it is
a continuous, repeatable and linear accumulation process
(Cook, 2007; Husband and Boxall, 2008; Husband et al., 2008).
Turbidity profiles from such fieldwork have shown distinct
responses from unlined cast iron and plastic pipes and
interpretation has indicated internal pipe condition in moni-
tored sections (Husband and Boxall, 2010). However, the
significance of upstream pipes, in particular unlined cast iron,
and the impact of this on bulk water quality and hence
material accumulation and discolouration risk in downstream
sections has not been investigated. If the rate at which
material layers regenerate was known and the influential
factors understood it would be possible to make strategic
management decisions that justify cost benefits from capital
or operational expenditure. In addition the knowledge gained
of system behaviour may be used to support risk assessment
methodologies such as WSP and aid prediction of dis-
colouration response from planned works or changes in
network operation. The aim of this work is therefore to
quantify material layer regeneration and assess the signifi-
cance of potential influencing factors such as source water
type, coagulation treatment processes and pipe material. The
work is based on the results of repeated field operations in the
UK, spanning a number of years, where turbidity data has
been collected from hydraulically induced discolouration
events. From this data, regeneration values have been deter-
mined and correlation of these with site information has been
used to assess influencing factors.
3. Fieldwork
Collection of field data during uni-directional flushing oper-
ations was planned in partnership with nine collaborating
water companies who serve over 75% of the registered
consumers in England and Wales (40 million customers).
Fieldwork objectives involved the implementation and
monitoring of incremental hydraulic flushing operations to
obtain the temporal and spatial turbidity response of pipes
within live distribution systems. The incremental approach
of stepped flow increases above typical peak flows has been
successfully applied to demonstrate the cohesive nature and
variable shear strength properties of material layers shown
to cause discolouration and how these layers are conditioned
by the hydraulic regime (Husband and Boxall, 2010). The
results presented here are for repeated visits to sites such
that the amount of material accumulated over time can be
investigated and correlated with other system information.
The knowledge gained by investigating material quantities
and shear strength characteristics of developing layers will
help inform management strategies to mitigate discoloura-
tion risk.
Selection of test sites was planned to facilitate coverage of
a range of factors hypothesised as potentially influential in
discolouration processes and the development of material
layers. Factors included:
� pipe material, significant as the surface on which the
material layers develop,
� pipe diameter and roughness that determine boundary
shear stress identified to condition material layers under
hydraulic loading,
� factors known to influence bulk water quality such as
B water source,
B water treatment processes and
B presence of upstream unlined cast iron pipes, known to
contribute to corrosion products to the bulk water.
To establish a comparable dataset between sites required
a consistent baseline, technically difficult to achieve due to
the inherent variables in distribution networks. Ideally the
initial flushing operation would mobilise fully developed
material layers that represent a maximum discolouration
potential. With hydraulics known to condition the material
layers, priority was therefore given to sites for which histor-
ical records spanning back 5 years or more indicating no
hydraulic events in excess of typical demands. Operation
dates were typically set by company maintenance pro-
grammes yet seasonal variations are an unknown factor in
layer development, although work indicated minimal impact
for one specific groundwater site (Boxall et al., 2003). To
mitigate for possible seasonal effects repeat flushing opera-
tions were planned to allow a full year layer development
period. For the year between the first and repeat operations,
collaborating water companies were requested not to sanc-
tion non-critical interventions within the monitored site that
may compromise the development of discolourationmaterial.
The two operations (initial visit and repeat) were planned to
be completed under identical conditions (same time of day,
flushing flow rates and duration) but a year apart, thereby
producing two sets of comparable turbidity data. From this an
annual regeneration of erodable discolouration material, irre-
spective of operational date or location, could be determined.
Subsequent site specific details could then be correlated to
identify influencing factors.
To capture the required data at the wash out hydrant
a specially adapted standpipe was used. This incorporated
a valve at the discharge point to control the flow; using the
hydrant valve results in a rapid pressure drop in water pres-
sure entering the standpipe causing the dissolution of air into
bubbles that critically disrupts turbidity measurements. Prior

Fig. 2 e Regeneration fieldwork sites.
wat e r r e s e a r c h 4 5 ( 2 0 1 1 ) 1 1 3e1 2 4116
to the valve a tapping point directedwater through a sampling
cell housing the turbidity probe, a CENSAR CT�, whilst
a second probe was placed directly in the standpipe riser. In
addition to the two turbidity probes logging at 10 s, manual
samples were collected for laboratory water quality analysis
and by a HACH Pocket Turbidimeter�. This replication of the
recorded turbidity data ensured a high degree of confidence
with the results. In addition to the turbidity probes the
standpipewas also fittedwith a Burkert Easyflow� flowmeter,
pressure tapping and pressure gauge to monitor the hydraulic
conditions, essential for hydraulic model and pipe roughness
calibration (critical in calculating the hydraulic gradient and
therefore pipe wall shear stress). In all examples shown
upstream pipe sections were flushed to ensure a clean supply
and an inlet hydrant with attached sampling standpipe and
turbidity monitoring were connected to confirm that material
mobilised at thewash out could be solely attributed to the pipe
length under investigation.
Fig. 3 e Pipe diagram and h
The study utilised 15 locations from across the UK with 67
monitored pipe sections. Site locations are shown in Fig. 2
with the following water supply details:
� 5 Groundwater supply e no coagulation treatment
� 2 Groundwater/surface water blended supply e iron coag-
ulation treatment
� 8 Surface water supply e 5 iron and 3 aluminium coagula-
tion treatment
Pipe sections monitored were primarily of typical distri-
bution pipe diameters around 100 mm but did range from
53 mm to 306 mm with the following split in pipe materials:
� 23 Cast Iron (CI, unlined)
� 17 PE (or polyethylene derivative)
� 15 uPVC
� 12 Asbestos Cement (AC) or cement lined CI
The results reported here generally refer to the annual
regeneration and are therefore not directly an indication of the
risk or potential magnitude of a discolouration event. The
annual regeneration is a percentage value relating material
mobilised from the repeat operation to that measured during
the initial operation. In addition to an annual regeneration, an
average turbidity value is calculated for each flushing opera-
tion. As flushing duration and hydraulic steps were variable
between pipe lengths, this value is not directly comparable
but it may be considered to indicate the possible discoloura-
tion potential should a shear force similar to those imposed by
the flushing and in excess of typical conditioning hydraulics
occur for that pipe length.
4. Site results
Results from three fieldwork sites are presented that illustrate
the turbidity features typical to all flushing studies conducted.
Individual field results also demonstrate how pipe length
specific characteristics need to be considered when analysing
ydrant locations, Site 1.

Fig. 4 e Site 1 initial and 12 month return turbidity results with flushing flow rate.
wat e r r e s e a r c h 4 5 ( 2 0 1 1 ) 1 1 3e1 2 4 117
the flushing turbidity response. Following the examples,
overall trends governing the regeneration of discolouration
material in distribution systems are explored based on anal-
ysis of site characteristics.
In order to determine a useful regeneration index, three
methods were trialled to establish if there is an optimum for
future studies. These calculations have been undertaken for
all pipe lengths, but are only presented here for the six
example pipe lengths across the three sites. The first method
uses the peak turbidity, which is a subjective measure based
on manually selecting a turbidity feature that can be clearly
identified from both initial and repeat operations (not neces-
sarily the highest single value although typically a dominant
turbidity peak). This peak value does however convey
a potential risk rating as it is possible that a consumer may be
subjected to water with this turbidity as a ‘worst case’. The
secondmeasure is the average turbidity, simply themean of all
data within the measured time frame. The third measure is
based on integration of the timeeturbidity plots: effectively
a step in calculating an amount of material (Gauthier et al.,
2001; Boxall et al., 2003). However the material mobilised
from sites is not consistent due to differences in water quality
Table 1 e Site 1 regeneration flushing results.
Flush Ø mm L m Pipe Peak NTU
1 2 %
A 89 380 PE 22.5 6.1 27
B 72 282 PE 25.6 7.8 30
so multiplication by a common conversion factor to sus-
pended solids, a mass of material, is not undertaken. Should
site specific conversion factors be determined however, mass
of material mobilised would probably be the optimal and
operationally pertinent comparison. With the appropriate
score determined for each operation, a percentage regenera-
tion value, indicating the rate material returns to a fully
developed and maximum discolouration risk, is calculated by
dividing the repeat by the initial results (flush 2/flush 1).
4.1. Example site 1
The first site is shown in Fig. 3 and comprises two sections of
polyethylene (PE) pipe of different internal diameters (72 and
89 mm) that form a looped section of an urban District
Metered Area (DMA e a term used to denote a management
sub-zone of a distribution network in the UK). The site is
supplied aluminium coagulation treated river water and has
asset records indicating no upstream unlined iron pipe
sections.
This operation used the planned approach of stepped
increases in flushing flow rate to investigate discolouration
Average NTU Amount NTU.s
1 2 % 1 2 %
10.5 3.7 35 28038 9988 36
17.1 5.3 31 33857 10650 31

Fig. 5 e Pipe diagram and hydrant locations, Site 2.
wat e r r e s e a r c h 4 5 ( 2 0 1 1 ) 1 1 3e1 2 4118
material shear strength properties, in particular the regen-
erated material mobilised during the repeat flushing opera-
tion. Fig. 3 shows the network location of the two monitored
sections A and B. Fig. 4 shows the temporal turbidity response
(primary y-axis) and the flushing flow (secondary y-axis). Each
plot shows two turbidity datasets; the initial field visit flush 1
and the repeat operation 1 year (12 months) later, flush 2.
For both plots in Fig. 4 measured turbidity increases are
evident in response to the flushing showing discolouration
material is eroded and propagates to the wash out. This
mobilisation of material is universal to every flushing opera-
tion undertaken during the course of these studies and high-
lights the ubiquitous nature of discolouration. Crucially at
every increase in applied shear stress there is a further release
of discolourationmaterial, an expected phenomenonwith the
cohesive layer concept. The same response characteristics to
the stepped increases in flow are observed during the initial
and repeat operations. This demonstrates that within a year
cohesive layers accumulate with a range of shear strengths,
not solely weakly or strongly adhered material. The mobi-
lisation of the regenerated material can be seen to produce
a scaled version of the initial data, indicating distinct accu-
mulation patterns and a reproducible process. Due to the
hydraulic and temporally equivalent consecutive operations
the rate at which this material has regenerated can be derived
by comparing the two datasets.
The percentage regeneration results are shown in Table 1
and demonstrate a consistency between the three calcula-
tion methods for these two pipe lengths. A combined average
of 30% represents a potential maximum discolouration risk,
assuming linear development, in less than 4 years for these
plastic pipes. Examination from UK industry standard
hydraulic model EPANET software using 24 h extended period
simulation with top down demand allocation (pattern derived
fromDMAflowmeter data and distributed according to billing
data) of the network shows a peak daily velocity of 0.1 m/s in
both pipes with the turbidity observed showing no evidence of
self-cleaning, as expected based on the Dutch value of 0.4m/s.
During the flushing the shear stress at each of the three steps
is approximately double for the smaller 72mmpipe at 1/2/8 N/
m2 compared to 0.6/1.3/3.6 N/m2 for the 89 mm pipe (flow
velocities 0.6/0.9/1.9m/s and 0.5/0.7/1.2m/s respectively). This
difference in shear stress (and not velocity) is reflected in
more discolouration material mobilised during the initial trial
from the smaller diameter and 100 m shorter section of pipe
(so less material might have been expected).
4.2. Example site 2
The second site presented here is supplied with blended
ground/surface water having undergone iron coagulation
based treatment. Results are from stepped flushing of two
parallel pipe lengths of 79 mm PE that form a loop within
a further looped residential DMA, Fig. 5. The turbidity/flow
results are shown in Fig. 6.
Flush C produced trends of similar magnitude to those
from Site 1, Fig. 4 at about 30 NTU, with the exception of a 200
NTU spike on start-up not seen during the repeat operation.
Flush D, the second and shorter pipe section however
produced turbidity of over 900 NTU (instrument limit), well in
excess of values seen elsewhere in plastic pipes. Although
most turbidity was mobilised during the first flow step, the
two further increases in flow produced turbidity peaks of 80
NTU and 10 NTU respectively. This demonstrates material
attachment with low cohesive shear strength and therefore
presents a significant discolouration risk. It was suggested
that an additional intrusion of material may have been
responsible yet the flush a year later produced a scaled replica
of the turbidity trend, peaking this time at 300 NTU. This
indicates that the accumulation is most likely a chronic
process due to a continual material source and favourable
hydraulics. No source of material to generate this level of
turbidity was identified, but investigations to examine the
accountability of the blended ground/surface iron coagulated
supply water in Site 2 have been proposed.
FromTable 2 it can be seen that although the peak turbidity
is high for Flush D, all three scores show regeneration of
material to be around 30%, indicating over 3 years required for
a return to maximum risk assuming linear regeneration. This
is akin to the plastic pipes in Site 1. Due to the non-replicated
turbidity feature on start-up during the first visit of Flush C
having an adverse effect on the material regenerated calcu-
lations, the results are non-conclusive. This second trial in
a looped network however indicates that the presence of
potential tidal points where two flow paths converge (not
confirmed due to sensitivity of hydraulic solutions in such low
flow situations) may induce unusually high material accu-
mulation, speculatively with a low shear strength and there-
fore high discolouration risk.
4.3. Example site 3
The third example site is a groundwater supplied rural DMA
with no coagulation treatment; Fig. 7. Operational constraints
limited flushing to a single step from the two predominately
cast iron (CI) pipe length operations, Flushes E and F. The
majority of Flush E (2 km in total), with the exception of the
final 594mdead-end section, and thewhole of Flush F (1.5 km)
from the supply to a village a further 1.5 kmdownstream. Peak
daily flows exceed 0.4 m/s, the proposed self-cleaning velocity
(Slaats et al., 2002). The turbidity results are shown in Fig. 8.
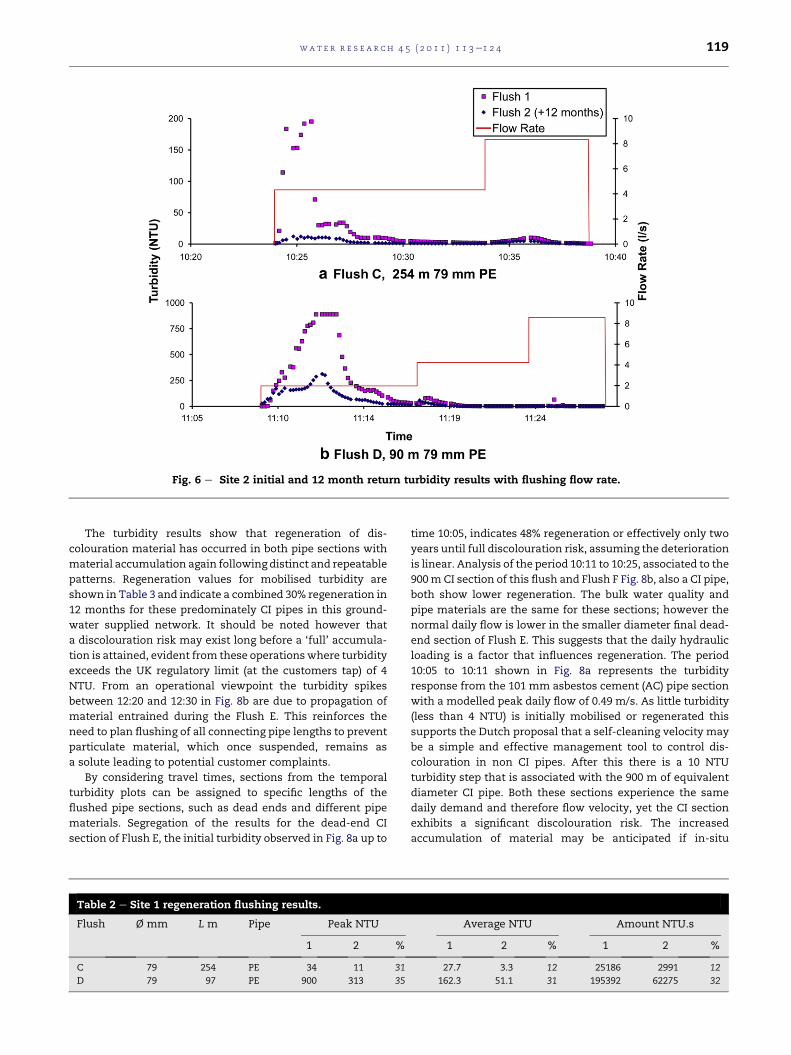
Fig. 6 e Site 2 initial and 12 month return turbidity results with flushing flow rate.
wat e r r e s e a r c h 4 5 ( 2 0 1 1 ) 1 1 3e1 2 4 119
The turbidity results show that regeneration of dis-
colouration material has occurred in both pipe sections with
material accumulation again following distinct and repeatable
patterns. Regeneration values for mobilised turbidity are
shown in Table 3 and indicate a combined 30% regeneration in
12 months for these predominately CI pipes in this ground-
water supplied network. It should be noted however that
a discolouration risk may exist long before a ‘full’ accumula-
tion is attained, evident from these operationswhere turbidity
exceeds the UK regulatory limit (at the customers tap) of 4
NTU. From an operational viewpoint the turbidity spikes
between 12:20 and 12:30 in Fig. 8b are due to propagation of
material entrained during the Flush E. This reinforces the
need to plan flushing of all connecting pipe lengths to prevent
particulate material, which once suspended, remains as
a solute leading to potential customer complaints.
By considering travel times, sections from the temporal
turbidity plots can be assigned to specific lengths of the
flushed pipe sections, such as dead ends and different pipe
materials. Segregation of the results for the dead-end CI
section of Flush E, the initial turbidity observed in Fig. 8a up to
Table 2 e Site 1 regeneration flushing results.
Flush Ø mm L m Pipe Peak NTU
1 2 %
C 79 254 PE 34 11 31
D 79 97 PE 900 313 35
time 10:05, indicates 48% regeneration or effectively only two
years until full discolouration risk, assuming the deterioration
is linear. Analysis of the period 10:11 to 10:25, associated to the
900m CI section of this flush and Flush F Fig. 8b, also a CI pipe,
both show lower regeneration. The bulk water quality and
pipe materials are the same for these sections; however the
normal daily flow is lower in the smaller diameter final dead-
end section of Flush E. This suggests that the daily hydraulic
loading is a factor that influences regeneration. The period
10:05 to 10:11 shown in Fig. 8a represents the turbidity
response from the 101 mm asbestos cement (AC) pipe section
with a modelled peak daily flow of 0.49 m/s. As little turbidity
(less than 4 NTU) is initially mobilised or regenerated this
supports the Dutch proposal that a self-cleaning velocity may
be a simple and effective management tool to control dis-
colouration in non CI pipes. After this there is a 10 NTU
turbidity step that is associated with the 900 m of equivalent
diameter CI pipe. Both these sections experience the same
daily demand and therefore flow velocity, yet the CI section
exhibits a significant discolouration risk. The increased
accumulation of material may be anticipated if in-situ
Average NTU Amount NTU.s
1 2 % 1 2 %
27.7 3.3 12 25186 2991 12
162.3 51.1 31 195392 62275 32

Fig. 7 e Pipe diagram and hydrant locations, Site 3.
wat e r r e s e a r c h 4 5 ( 2 0 1 1 ) 1 1 3e1 2 4120
corrosion processes are considered contributory but the
results also reveal CI pipes, typically rougher than plastic or
AC pipes and therefore undergoing greater changes in shear
stress, are not self-cleaning at this velocity. Epanet (Rossman,
2000) hydraulic model calibration, determined through the
collection of flow and pressure data during the flushing
operations, set the DarcyeWeisbach pipe roughness at
0.1 mm and 1 mm in the AC and CI pipes respectively.
The majority of sites reported here only underwent one
repeat visit. However Husband and Boxall (2008) presented
results fromasitewithmultiple repeat visits thatdemonstrated
linear asset deterioration. Combined with the repeatable, and
therefore predictable, turbidity trends observed during these
trials and a consistent accumulation rate at each site, this
indicates a regular, yet site specific, supply of discolouration
material. Of the three site examples the lowest average regen-
erated turbidity came from the groundwater site, even
accounting for CI pipes and the likely presence of corrosion by-
Fig. 8 e Site 3 initial and 12 month return t
products. All this evidence implicates water quality as the key
factor governing regeneration. It is therefore proposed that
discolouration material accumulation can be simplified as two
processes;primarilyanindirectprocesswithmaterialadsorbing
to the boundary surfaces from the bulk water and secondly
a direct precipitation process due to corrosion of iron assets.
5. Site fieldwork summary
By collating the data from all sites it is possible to explore the
relative influence of the factors identified as possibly influ-
encingassetdeterioration, in the formofmaterial accumulation
leading to potential discolouration. Key factors acknowledged
as influencing thewater quality include the sourcewater origin,
type of coagulation process during treatment and presence of
unlined upstream cast iron pipes. In addition the interaction at
the boundary of bulk water and the pipe wall is intrinsically
important for any study of accumulation processes and hence
pipematerial isdeemedafactor.Due to thenumberandrangeof
interactions possible in live networks scatter is expected when
summarising the data from all the sites. To investigate the
statistical significance of this variance the coefficient of varia-
tion (Cv), a dimensionless number has been determined where;
Cv ¼ s
m(1)
with s the standard deviation and m the mean of the sample
groups. Cv values of less than one are low-variance, whereas
values greater than one are considered high-variance.
From Table 1 to Table 3 it can be seen that the average and
integration method for calculating regeneration percentages
returns comparable results while the peak method, subject to
manual interpretation, is more variable. As the average
urbidity results with flushing flow rate.

Table 3 e Site 3 regeneration flushing results.
Flush Ø mm L m Pipe Peak NTU Average NTU NTU/s
1 2 % 1 2 % 1 2 %
E 101 900 CI 17.2 3.1 18 10.9 2.0 18 9300 1550 17
101 440 AC No feature 4 0.9 23 1079 255 24
74 594 CI 31.4 14.3 46 14.3 6.8 48 6832 3298 48
Combined Not applicable 10.4 2.8 27 21880 6020 28
F 101 1617 CI 13.7 4.1 30 8.0 2.4 30 24585 7660 31
wat e r r e s e a r c h 4 5 ( 2 0 1 1 ) 1 1 3e1 2 4 121
method is simpler and returns turbidity values likely to be
indicative of that which may be observed by a consumer
should a discolouration event occur, this has been used as the
basis to compare factors between sites. The annual
percentage and magnitude of regeneration results for all sites
tested across the UK are shown in Table 4. An overall appraisal
indicates that water quality factors are statistically significant
in determining the annual percentage of material regen-
erated, with an average variance of only 0.5 and no single
result greater than 1. Conversely with an average variance of
1.2 this analysis suggests that water quality does not influence
the potential discolouration magnitude.
From Table 4 information of practical benefit to water
suppliers can be derived. For example it indicates CI pipes have
the greatest deterioration, presenting a maximum discoloura-
tion risk after only 2 years from flushing (52% regeneration).
With an average of over 20 NTU mobilised within a year these
pipes also pose the greatest potential turbidity risk to
customers. Combinedwith the knowledge that no self-cleaning
effect has been identified and the detrimental effect on water
quality (and subsequent layer development downstream) due
to the release of corrosion by-products, effective management
of these pipes is essential. If CI pipes are split between surface
water and groundwater supplied sites the regeneration is 66%
and 31% respectively, with crucially the former generating
significantly higher average turbidities. Non ferrous, or
‘smooth’ pipes with no corrosion by-products, present an
average regeneration percentage of 28%, suggesting 4 years
after cleaning for full regeneration. After a year the average
Table 4 e Coefficient of variation determination of annual regfactors influencing water quality.
Factor Regeneration per annum, %
m s
CI pipe (all sites) 52 30.7
Non-ferrous 28 15.7
CI/surface water 66 32.0
CI/groundwater 31 11.4
Surface water 55 32.5
Blended water 24 14.2
Groundwater 32 10.5
Iron coagulation 49 33.2
Aluminium coagulation 40 29.2
No coagulation 32 10.5
Upstream unlined CI pipes 54 30.1
No unlined CI pipes 27 14.2
Average Cv
turbidity during flushing in these pipes is 5 NTU, just exceeding
UK regulatory limits. The results show surface water sites
regenerate discolouration material quicker than other water
sources, although some blended water sites with looped
connections have produced very high turbidity, Fig. 6b. Typi-
cally surfacewaters are regardedashavingpoorerqualitywater
so this result fits with the understanding that regeneration is
governed by water quality. Examination of correlation with
treatment processes suggest that sites supplied with iron
coagulatedwater have a greatermaterial layer regeneration yet
of lower magnitude than aluminium coagulated waters.
However treatment processes are linked to source water char-
acteristics, so thismeasure inparticularmay be capturingmore
than simply treatment process effects. The presence of
upstreamunlined cast ironasapotential independent source of
material was also examined. Not surprisingly sites with this
feature present a higher rate of material regeneration, on
average 50% or full risk in two years, twice the rate or half the
time of sites with no upstream unlined CI pipes. This may
explain the anomaly demonstrated between the lower regen-
eration recorded from the blended water sites compared to the
expected higher quality groundwater sites. In these trials the
latter siteshad significant lengthsofupstreamCIpipeswhereas
the blended sites are plastic only networks. This complex
interaction of variables is intrinsic when dealing with opera-
tional networks and indicates the need for ongoing assessment
and a requirement for laboratory trials to study isolated factors.
In the UK it is acknowledged that iron is a dominant
constituent of discolouration material and it is common for
eneration and average regenerated turbidity for identified
Average regenerated turbidity, NTU
Cv m s Cv
0.6 24 47.4 2.0
0.6 5 3.6 0.8
0.5 36 58 1.6
0.4 4 2.0 0.5
0.6 20 41.8 2.1
0.6 13 16.6 1.29
0.3 3 2.1 0.6
0.7 13 12.6 1
0.7 27 61.5 2.2
0.3 3 2.1 0.6
0.6 9 7.8 0.6
0.5 9 13.2 1.4
0.5 1.2

Fig. 9 e Bulk water iron concentration against a) annual material regeneration and b) mean annual regenerated turbidity.
Fig. 10 e Factors regulating pipe discolouration potential
(asset deterioration).
wat e r r e s e a r c h 4 5 ( 2 0 1 1 ) 1 1 3e1 2 4122
water suppliers to receive red water complaints due to precipi-
tated ferric oxides. It is therefore proposed that bulk water iron
concentrations could potentially be a singlemeasure capturing
the dominant influence of the water quality factors such as
source water, coagulation treatment processes and presence of
unlined upstream iron assets. To investigate this, bulk water
iron concentrations (not the concentrations exiting treatment
works) for each pipe length have been determined using data
from regulatory sampling at the DMAs studied. These are
plotted against the annual percentage regeneration, Fig. 9a, and
the average regenerated turbidity, Fig. 9b.
Although not conclusive with a proportional variance R2 of
0.57, Fig. 9a indicates a potential relationship exists between
bulk water iron concentration and material regeneration. The
general trend is for regeneration to increase with iron levels,
whilst of operational benefit it appears a greater discoloura-
tion risk is likelywhen concentrations rise above 25e40 mgFe/l.
This reinforces the findings that water quality is a key factor
governing cohesive layer development and suggests that for
the UK bulk water monitoring of iron may be used to justify
capital investments such as improvements to treatment to
lower iron concentrations versus the necessity of operational
interventions such as flushing. Although only statistically
indicative, linear regression implies that for every microgram
per litre increase in iron concentration the annual regenera-
tion increases by just over 1%. It also suggests that even with
negligible iron concentration levels, annual regeneration
remains at about 15% or effectively 6 years for material layers
to reach their maximum discolouration risk. This indicates
that although iron may be a primary source of discolouration,
there are other contributory factors requiring investigation,
such as the prevalence of other metals or microbiological
interactions and biofilm development. If the linear regression
is forced through the origin of the graph (with a resulting
R2 ¼ 0.44), effectively considering iron as a vital component of
discolouration material, an increase of just 1 mgFe/l leads to
a 1.5% increase in annual regeneration rate. Compared to the
regeneration water quality relationship in Fig. 9a,b indicates
no relationship between bulk water iron concentrations and
quantity of material mobilised from the pipe wall, R2 ¼ 0.01,
matching the result from Table 4 and indicating water quality
does not influence the discolouration magnitude.
6. Discussion
This research demonstrates that discolouration, or the accu-
mulation of cohesive layers that can lead to discolouration
upon mobilisation, is an unavoidable and continuous process
that occurs throughout UK water distribution systems. The
magnitude or severity of a potential discolouration event
however may be controlled throughmaintenance or as a result
of network design and operation. Fortunately in some cases the
operational hydraulics under the daily demand patterns may
already be sufficient to limit the discolouration risk to accept-
able levels and this may have led to the general complacency
surrounding discolouration. In time water companies who
wish to demonstrate pro-activewater qualitymanagementwill
effectively need to assign a risk rating for every pipe and this
will necessitate an understanding of the controlling factors.
Throughwork such as this these elementsmay be defined such
that each network and its unique characteristics may be taken
into account and suitable management strategies imposed.

wat e r r e s e a r c h 4 5 ( 2 0 1 1 ) 1 1 3e1 2 4 123
Primarily thisworkdemonstrates thatwaterqualitydefines
the rate at which discolouration causing layers regenerate.
From the sites tested it has been possible to propose deterio-
rationpercentagesandevensuggest target ironconcentrations
to limit material accumulation. With this type of data it now
becomes a possibility forwater companies to optimise costs by
balancing capital expenditure to improve water quality justi-
fiedonaquantified risk and reduction in customer complaints.
Not surprisingly, due to the particulate nature of discoloura-
tion, it is shown that surface waters with the addition of
coagulation treatment processes, supply water that leads to
the quickest deterioration. Groundwaters however, generally
accepted to be of a higher quality, see a reduced rate of dete-
rioration. The presence of additionalmaterial sources, such as
unlined cast iron pipes has a negative impact on deterioration.
Cast iron pipes, most likely due to the direct corrosion
processes are shown to deteriorate quicker than other pipes
only subjected to the indirect, bulk water, material source.
Results show that water quality does not influence the
magnitude of a potential discolouration incident. Therefore if
a pipe is known to pose a risk, no improvements to water
qualitywill ameliorate thishazard completely, although itmay
extend the interval prior to an event occurrence. It is therefore
proposed that systemhydraulics are crucial indetermining the
magnitude of mobilised turbidity. A basic understanding then
would be that a reduction in the discolouration potential may
be achieved by increasing the peak daily flow, and hence shear
stresson thepipewalls.Networkmanagersmayfind itpossible
to change demand and/or flow patterns such that regular peak
boundary shear stress is increased to limit the ultimate accu-
mulation of material and the associated risk to customers.
These twooverarchingfindings relating toaccumulationand
ultimate volumeofmaterial are encompassed in the conceptual
model shown in Fig. 10. In this model water quality is shown to
govern the gradient of deterioration while hydraulic conditions
define the ultimate state achieved in a particular pipe.
The real significance ofhydraulic patterns, the conditioning
shear stress regimes, and how they affect the accumulation of
discolouration material has yet to be thoroughly investigated.
It is possible to make assumptions based on examining
hydraulic records, yet the number of variables involved, even
within the samenetwork,will always be an issue in comparing
results. To enable progress in the understanding of the role of
hydraulics in discolouration it is suggested that researchneeds
to be conducted within a controlled environment whereby
specific, individual factors may be adjusted and the influence
evaluated. It may then be possible to extrapolate results to live
systems which could see an improvement in management
strategies; reducing the risk of water quality failure and
subsequent customer complaints, extending maintenance
intervals and reducing operational costs.
7. Conclusions
Fundamentals:
� Water quality influences the rate of discolouration material
regeneration within water distribution systems but shows
no significant correlation to magnitude of potential
discolouration
� Bulk water iron concentrations may effectively be used as
an indicator of water quality influencing discolouration
regeneration/deterioration
� System hydraulics are significant in determining the
magnitude of potential discolouration
Network components:
� On average CI pipes would present a fully regenerated dis-
colouration risk after 2 years
B Surface water sourced CI pipes present a fully regen-
erated discolouration risk after 1½ years
B Groundwater sourced CI pipes present a fully regenerated
discolouration risk after 3 years
� On average plastic pipes present a fully regenerated dis-
colouration risk after 4 years
Operational:
� Lower bulk water iron concentration reduced the rate of
asset deterioration, with an apparent lower limit of 25 mg/l
after which that data becomes scattered as other factors
also become significant
� Higher normally or routinely experienced pipe wall shear
stress reduces the magnitude of potential discolouration
� Looped networks in some instances may create hydraulic
flow patterns that favour the development of material layers
leading to an increased discolouration risk
� Network flow patterns may be managed to reduce dis-
colouration risk
� The hydraulic design of networks to maintain discoloura-
tion risk below acceptable thresholds (self-cleaning) is
feasible
Issues:
� The relative significance of peak and variable daily
hydraulics are not clear
� The influence of other system variables are not determined,
e.g. hardness, chlorine residuals, organic components,
microbiological interactions, seasonal variations, pH,
temperature, etc.
r e f e r e n c e s
Ackers, J., Brandt, M., Powell, J., 2001. Hydraulic Characterisationof Deposits and Review of Sediment Modelling. DrinkingWater Quality and Health e Distribution Systems e DW/03.UKWIR, pp. 109.
Barbeau, B., Julienne, K., Carriere, A., Gauthier, V., 2005.Dead-end flushing of a distribution system: short and long-term effects on water quality. Journal Water SRT e Aqua 54,371e383.
Boxall, J.B., Saul, A.J., Skipworth, P.J., 2001. A novel approach tomodelling sediment movement in distribution mains basedon particle characteristics. In: Ulanicki, B., Coulbeck, B.,Rance, J.P. (Eds.), Water Software Systems: V. 1: Theory andApplications (Water Engineering & Management), vol. 1.Research Studies Press, Hertfordshire, UK, pp. 263e273.
Boxall, J.B., Saul, A.J., Gunstead, J.D., Dewis, N., 2003. Regenerationof Discolouration in Distribution Systems. ASCE/EWRI/WorldWater and Environmental Resources Conference,Philadelphia.

wat e r r e s e a r c h 4 5 ( 2 0 1 1 ) 1 1 3e1 2 4124
Boxall, J.B., Saul, A.J., 2005. Modelling discolouration in potablewater distribution systems. Journal of EnvironmentalEngineering ASCE 131 (5), 716e725.
Cook, D.M., 2007. Field Investigation of Discolouration MaterialAccumulation Rates in Live Drinking Water DistributionSystems. Civil and Structural Engineering. Sheffield,Sheffield. Ph.D.
DWI Information Letter 15/02 DWI, 2002. In: Rouse, M. (Ed.),Distribution Operation and Maintenance Strategies (DOMS) eDWI Requirements and Expectations. DWI.
DWI, 2007. Drinking Water 2006; Drinking Water in England andWales 2006. A report by the Chief Inspector Drinking WaterInspectorate. Drinking Water Inspectorate, London, pp. 89.
DWI, 2008. Drinking Water 2007; Drinking Water in England andWales 2007. A report by the Chief Inspector Drinking WaterInspectorate. Drinking Water Inspectorate, London, pp. 83.
DWI, 2009. Drinking Water 2008; Drinking Water in England andWales 2008. A report by the Chief Inspector, Drinking WaterInspectorate. Drinking Water Inspectorate, London.
Gauthier, V., Barbeau, B., Millette, R., Block, J.-C., Prevost, M., 2001.Suspended particles in the drinking water of two distributionsystems. Water Science and Technology: Water Supply 1 (4),237e245.
Hossain, A., Naser, J., McMannus, K., Ryan, G., 2003. CFDinvestigation of particle deposition and dispersion ina horizontal pipe. In: Third International Conference on CFDin the Minerals and Process Industries, Melbourne, Australia.
Husband, P.S., Boxall, J.B., 2008. Water Distribution System AssetDeterioration and Impact on Water Quality e A Case Study.World Environmental and Water Resources Congress, May2008. ASCE, Ahupua’a, Hawaii.
Husband, P.S., Boxall, J.B., Saul, A.J., 2008. Laboratory studiesinvestigating the processes leading to discolouration in waterdistribution networks. Water Research 42 (16), 4309e4318.
Husband, P.S., Boxall, J.B., 2010. Field studies of discolouration inwater distribution systems: model verification and practicalimplications. Journal of Environmental Engineering 136 (1),86e94.
Marshall, G.P., 2001. Understanding and Preventing DiscolouredWater. Drinking Water Quality and Health e DistributionSystems DW-03. UKWIR/Thames Water Utilities Limited.pp. 75.
McCoy, W.F., Olsen, B.H., 1986. Relationship among turbidity,particle counts and bacteriological quality within waterdistribution lines. Water Research 20 (8), 1023e1029.
Mehta, A.J., Lee, S.-C., 1994. Problems in linking the thresholdcondition for the transport of cohesionless and cohesivesediment grain. Journal of Coastal Research 10 (1), 170e177.
OFWAT, 2008. In: Dunn, A. (Ed.), PR09/09 OFWAT’S Review of theOPA and Regulation of Service to Consumers. OFWAT PR09.
Parchure, T.M., Mehta, A.J., 1985. Erosion of soft cohesivesediment deposits. Journal of Hydraulic Engineering 111 (10),1308e1326.
Rossman, L.A., 2000. In: U.S.E.P. Agency (Ed.), EPANET 2 UsersManual. EPA, Cincinnati.
Ryan, G., Jayaratne, A., 2003. Particles in distribution systems andassessment of discoloured water. In: Maintenance andAssessment of Distribution Sstems to Improve Water Quality.C.G. Workshop. Sydney.
Sarin, P., Snoeyink, V.L., Bebee, J., Jim, K.K., Beckett, M.A.,Kriven, W.M., Clement, J.A., 2004. Iron release from corrodediron pipes in drinking water distribution systems: effect ofdissolved oxygen. Water Research 38, 1259e1269.
Seth, A., Bachmann, R., Boxall, J., Saul, A.J., Edyvean, R., 2004.Characterisation of materials causing discolouration inpotable water systems. Water Science and Technology 49 (2),27e32.
Skipworth, P.J., Tait, S.J., Saul, A.J., 1999. Erosion of sediment bedsin sewers: model development. Journal of EnvironmentalEngineering 125 (6), 566e573.
Slaats, N., Rosenthal, L.P.M., Siegers, W.G., Boomen, M.v. d.,Beuken, R.H.S., Vreeburg, J.H.G., 2002. Processes Involved in theGeneration of Discolored Water. KOA 02.058. Kiwa. AmericanWater Works Association/Kiwa, The Netherlands, pp. 116.
Smith, S.E., Holt, D.M., Delanoue, A., Colbourne, J.S.,Chamberlain, A.H.L., Lloyd, B.J., 1999. A pipeline testing facilityfor the examination of pipe wall deposits and red-waterevents in drinking water. Journal of Chartered Institution ofWater and Environmental Management 13, 7e15.
Twort, A.C., Ratnayaka, D.D., Brandt, M.J., 2000. Water Supply.Arnold, London.
Verberk, J.Q.J.C., Hamilton, L.A., O’Halloran, K.J., Van DerHorst, W., Vreeburg, J., 2006. Analysis of particle numbers, sizeand composition in drinking water transportation pipelines:results of online measurements. Water Science & Technology:Water Supply 6 (4), 35e43.
Vreeburg, J.H.G., Schippers, D., Verberk, J.Q.J.C., van Dijk, J.C.,2008. Impact of particles on sediment accumulation ina drinking water distribution system. Water Research 42 (16),4233e4242.
Vreeburg, J.H.G., Boxall, J.B., 2007. Discolouration in potable waterdistribution systems: a review. Water Research 41, 519e529.
WHO, 2005. In: Davison, A., Howard, G., Stevens, M., et al., (Eds.),Water Safety Plans Managing Drinking-water Quality fromCatchment to Consumer. World Health Organization, Geneva,p. 244.