Assessment of the thermal performance and energy conservation opportunities of a cement industry in...
16
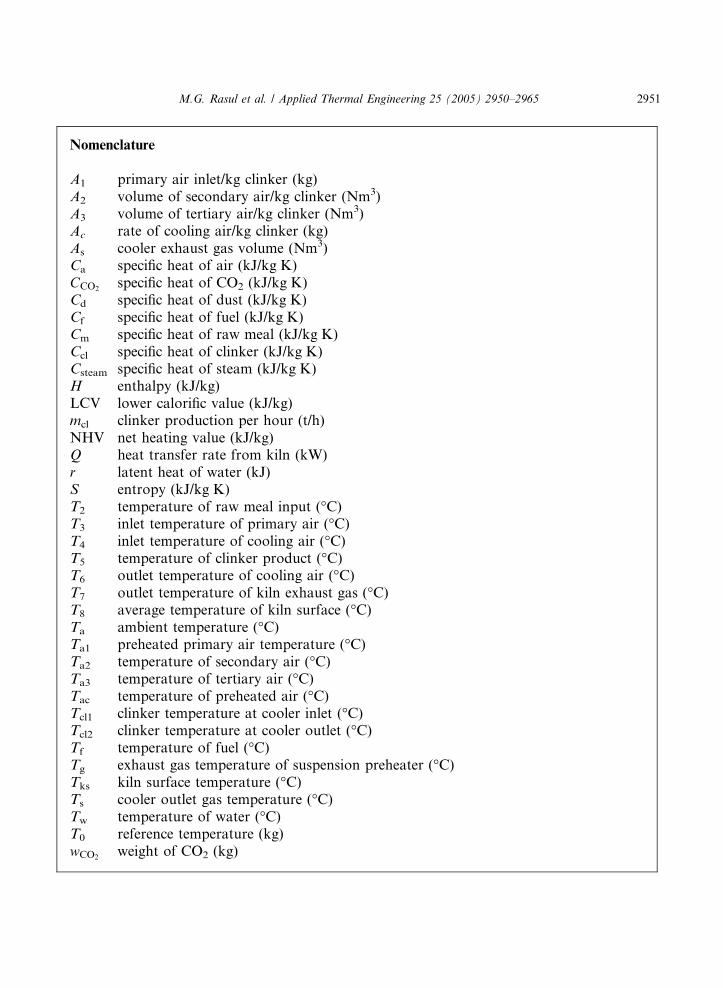
Assessment of the thermal performance and energy conservation opportunities of a cement industry in Indonesia M.G. Rasul a, * , W. Widianto b , B. Mohanty b a School of Advanced Technologies and Processes, Faculty of Engineering and Physical Systems, Central Queensland University, Queensland 4702, Australia b School of Energy, Asian Institute of Technology, Bangkok 12120, Thailand Received 27 October 2004; accepted 3 March 2005 Available online 21 April 2005 Abstract A simple model is presented to assess the thermal performance of a cement industry with an integrated view to improve the productivity of the plant. The model is developed on the basis of mass, energy and exergy balance and is applied to an existing Portland cement industry in Indonesia. The data obtained from industry show that the burning efficiency and the second law efficiency of the kiln system are 52.07% and 57.07% respectively. Cooler efficiency and heat recovery efficiency are 47.75% and 51.2% respectively. The unaccounted loss at kiln system was found to be 1.85% and that of cooler system was 19%. The high loss at cooler was mainly due to the convection and radiation losses from the uninsulated cooler. Irreversibility of the system was found to be about 20%, which is due to the conversion from chemical to thermal energy. The thermal energy conservation opportunities are identified. This study show that by replacing industrial diesel oil (IDO) with waste heat recovery from kiln and cooler exhaust for drying of raw meal and fuel, and preheating of combustion air, a cement industry in Indonesia can save about 1.264 · 10 5 US dollars per year. Ó 2005 Elsevier Ltd. All rights reserved. Keywords: Thermal performance; Kiln and cooler systems; Burning and second law efficiencies; Cooler and recovery efficiencies; Energy conservation opportunities 1359-4311/$ - see front matter Ó 2005 Elsevier Ltd. All rights reserved. doi:10.1016/j.applthermaleng.2005.03.003 * Corresponding author. Tel.: +61 7 4930 9676; fax: +61 7 4930 9382. E-mail address: [email protected] (M.G. Rasul). www.elsevier.com/locate/apthermeng Applied Thermal Engineering 25 (2005) 2950–2965
-
Upload
independent -
Category
Documents
-
view
2 -
download
0
Transcript of Assessment of the thermal performance and energy conservation opportunities of a cement industry in...
www.elsevier.com/locate/apthermeng
Applied Thermal Engineering 25 (2005) 2950–2965
Assessment of the thermal performance and energyconservation opportunities of a cement industry in Indonesia
M.G. Rasul a,*, W. Widianto b, B. Mohanty b
a School of Advanced Technologies and Processes, Faculty of Engineering and Physical Systems,
Central Queensland University, Queensland 4702, Australiab School of Energy, Asian Institute of Technology, Bangkok 12120, Thailand
Received 27 October 2004; accepted 3 March 2005
Available online 21 April 2005
Abstract
A simple model is presented to assess the thermal performance of a cement industry with an integrated
view to improve the productivity of the plant. The model is developed on the basis of mass, energy and
exergy balance and is applied to an existing Portland cement industry in Indonesia. The data obtained from
industry show that the burning efficiency and the second law efficiency of the kiln system are 52.07% and
57.07% respectively. Cooler efficiency and heat recovery efficiency are 47.75% and 51.2% respectively. The
unaccounted loss at kiln system was found to be 1.85% and that of cooler system was 19%. The high loss at
cooler was mainly due to the convection and radiation losses from the uninsulated cooler. Irreversibility ofthe system was found to be about 20%, which is due to the conversion from chemical to thermal energy.
The thermal energy conservation opportunities are identified. This study show that by replacing industrial
diesel oil (IDO) with waste heat recovery from kiln and cooler exhaust for drying of raw meal and fuel, and
preheating of combustion air, a cement industry in Indonesia can save about 1.264 · 105 US dollars per
year.
� 2005 Elsevier Ltd. All rights reserved.
Keywords: Thermal performance; Kiln and cooler systems; Burning and second law efficiencies; Cooler and recovery
efficiencies; Energy conservation opportunities
1359-4311/$ - see front matter � 2005 Elsevier Ltd. All rights reserved.
doi:10.1016/j.applthermaleng.2005.03.003
* Corresponding author. Tel.: +61 7 4930 9676; fax: +61 7 4930 9382.
E-mail address: [email protected] (M.G. Rasul).
Nomenclature
A1 primary air inlet/kg clinker (kg)A2 volume of secondary air/kg clinker (Nm3)A3 volume of tertiary air/kg clinker (Nm3)Ac rate of cooling air/kg clinker (kg)As cooler exhaust gas volume (Nm3)Ca specific heat of air (kJ/kg K)CCO2
specific heat of CO2 (kJ/kg K)Cd specific heat of dust (kJ/kg K)Cf specific heat of fuel (kJ/kg K)Cm specific heat of raw meal (kJ/kg K)Ccl specific heat of clinker (kJ/kg K)Csteam specific heat of steam (kJ/kg K)H enthalpy (kJ/kg)LCV lower calorific value (kJ/kg)mcl clinker production per hour (t/h)NHV net heating value (kJ/kg)Q heat transfer rate from kiln (kW)r latent heat of water (kJ)S entropy (kJ/kg K)T2 temperature of raw meal input (�C)T3 inlet temperature of primary air (�C)T4 inlet temperature of cooling air (�C)T5 temperature of clinker product (�C)T6 outlet temperature of cooling air (�C)T7 outlet temperature of kiln exhaust gas (�C)T8 average temperature of kiln surface (�C)Ta ambient temperature (�C)Ta1 preheated primary air temperature (�C)Ta2 temperature of secondary air (�C)Ta3 temperature of tertiary air (�C)Tac temperature of preheated air (�C)Tcl1 clinker temperature at cooler inlet (�C)Tcl2 clinker temperature at cooler outlet (�C)Tf temperature of fuel (�C)Tg exhaust gas temperature of suspension preheater (�C)Tks kiln surface temperature (�C)Ts cooler outlet gas temperature (�C)Tw temperature of water (�C)T0 reference temperature (kg)wCO2
weight of CO2 (kg)
M.G. Rasul et al. / Applied Thermal Engineering 25 (2005) 2950–2965 2951
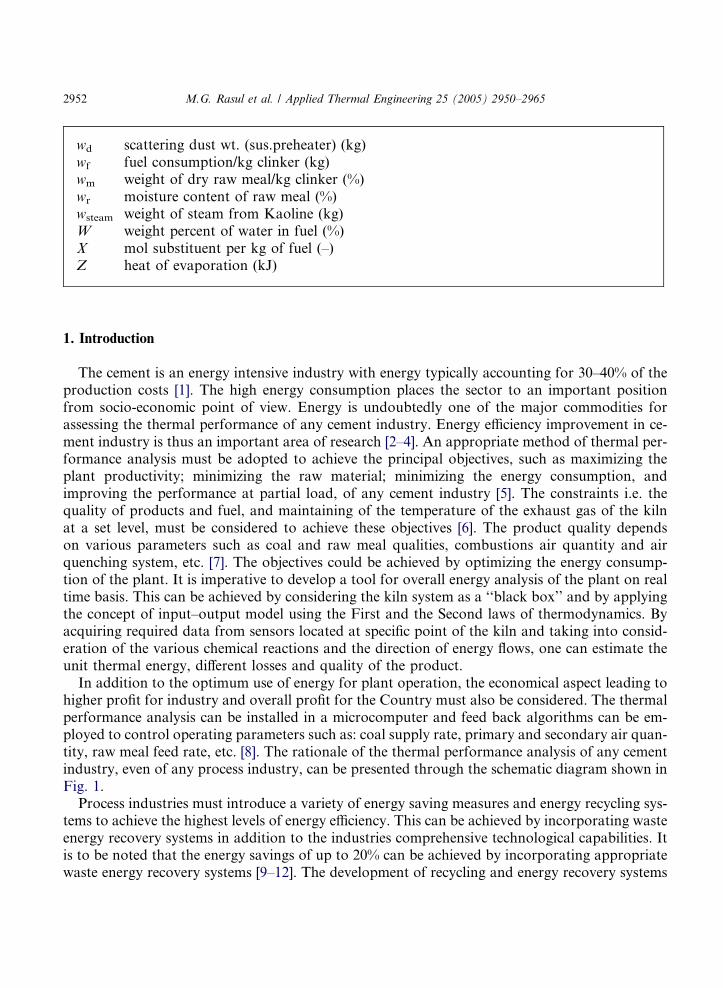
wd scattering dust wt. (sus.preheater) (kg)wf fuel consumption/kg clinker (kg)wm weight of dry raw meal/kg clinker (%)wr moisture content of raw meal (%)wsteam weight of steam from Kaoline (kg)W weight percent of water in fuel (%)X mol substituent per kg of fuel (–)Z heat of evaporation (kJ)
2952 M.G. Rasul et al. / Applied Thermal Engineering 25 (2005) 2950–2965
1. Introduction
The cement is an energy intensive industry with energy typically accounting for 30–40% of theproduction costs [1]. The high energy consumption places the sector to an important positionfrom socio-economic point of view. Energy is undoubtedly one of the major commodities forassessing the thermal performance of any cement industry. Energy efficiency improvement in ce-ment industry is thus an important area of research [2–4]. An appropriate method of thermal per-formance analysis must be adopted to achieve the principal objectives, such as maximizing theplant productivity; minimizing the raw material; minimizing the energy consumption, andimproving the performance at partial load, of any cement industry [5]. The constraints i.e. thequality of products and fuel, and maintaining of the temperature of the exhaust gas of the kilnat a set level, must be considered to achieve these objectives [6]. The product quality dependson various parameters such as coal and raw meal qualities, combustions air quantity and airquenching system, etc. [7]. The objectives could be achieved by optimizing the energy consump-tion of the plant. It is imperative to develop a tool for overall energy analysis of the plant on realtime basis. This can be achieved by considering the kiln system as a ‘‘black box’’ and by applyingthe concept of input–output model using the First and the Second laws of thermodynamics. Byacquiring required data from sensors located at specific point of the kiln and taking into consid-eration of the various chemical reactions and the direction of energy flows, one can estimate theunit thermal energy, different losses and quality of the product.
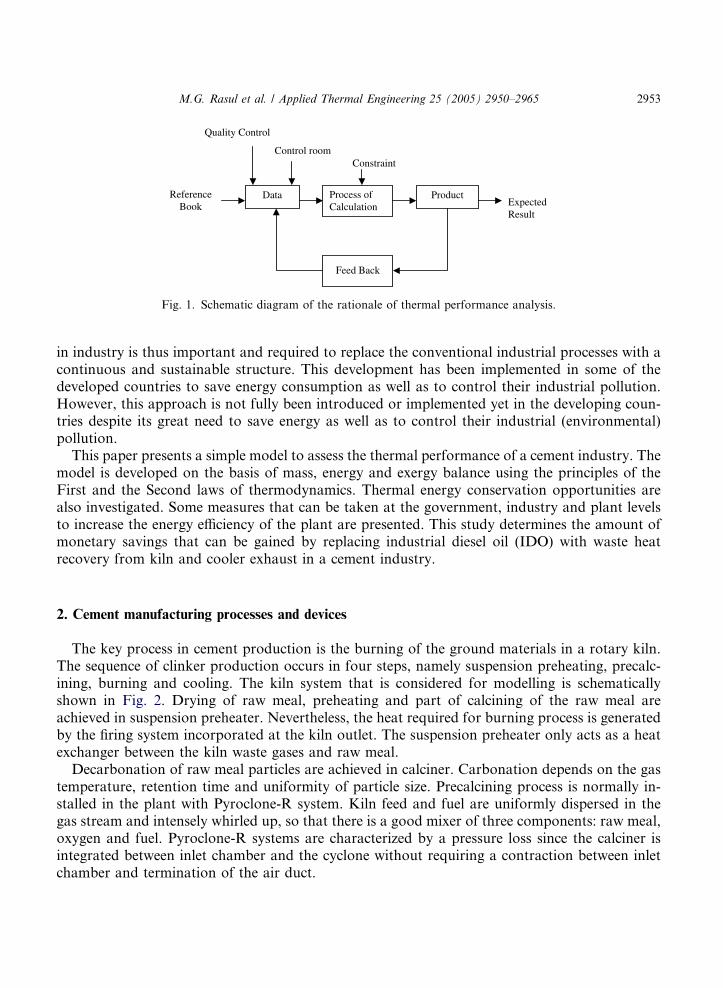
In addition to the optimum use of energy for plant operation, the economical aspect leading tohigher profit for industry and overall profit for the Country must also be considered. The thermalperformance analysis can be installed in a microcomputer and feed back algorithms can be em-ployed to control operating parameters such as: coal supply rate, primary and secondary air quan-tity, raw meal feed rate, etc. [8]. The rationale of the thermal performance analysis of any cementindustry, even of any process industry, can be presented through the schematic diagram shown inFig. 1.
Process industries must introduce a variety of energy saving measures and energy recycling sys-tems to achieve the highest levels of energy efficiency. This can be achieved by incorporating wasteenergy recovery systems in addition to the industries comprehensive technological capabilities. Itis to be noted that the energy savings of up to 20% can be achieved by incorporating appropriatewaste energy recovery systems [9–12]. The development of recycling and energy recovery systems
Data Process of Calculation Expected
Result
Product
Feed Back
ConstraintControl room
Quality Control
ReferenceBook
Fig. 1. Schematic diagram of the rationale of thermal performance analysis.
M.G. Rasul et al. / Applied Thermal Engineering 25 (2005) 2950–2965 2953
in industry is thus important and required to replace the conventional industrial processes with acontinuous and sustainable structure. This development has been implemented in some of thedeveloped countries to save energy consumption as well as to control their industrial pollution.However, this approach is not fully been introduced or implemented yet in the developing coun-tries despite its great need to save energy as well as to control their industrial (environmental)pollution.
This paper presents a simple model to assess the thermal performance of a cement industry. Themodel is developed on the basis of mass, energy and exergy balance using the principles of theFirst and the Second laws of thermodynamics. Thermal energy conservation opportunities arealso investigated. Some measures that can be taken at the government, industry and plant levelsto increase the energy efficiency of the plant are presented. This study determines the amount ofmonetary savings that can be gained by replacing industrial diesel oil (IDO) with waste heatrecovery from kiln and cooler exhaust in a cement industry.
2. Cement manufacturing processes and devices
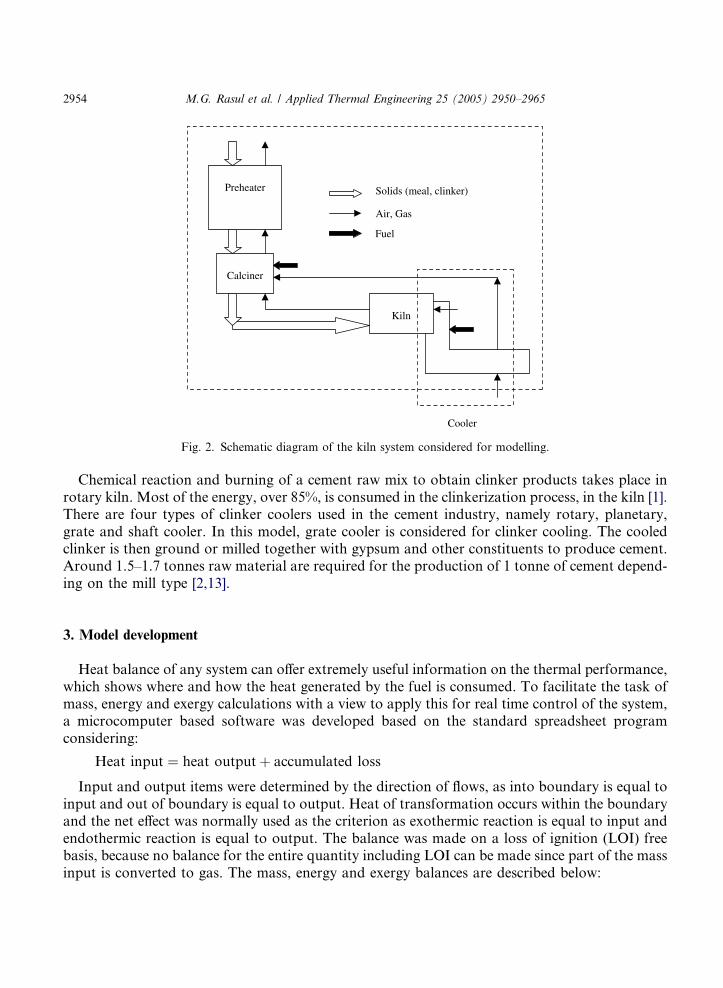
The key process in cement production is the burning of the ground materials in a rotary kiln.The sequence of clinker production occurs in four steps, namely suspension preheating, precalc-ining, burning and cooling. The kiln system that is considered for modelling is schematicallyshown in Fig. 2. Drying of raw meal, preheating and part of calcining of the raw meal areachieved in suspension preheater. Nevertheless, the heat required for burning process is generatedby the firing system incorporated at the kiln outlet. The suspension preheater only acts as a heatexchanger between the kiln waste gases and raw meal.
Decarbonation of raw meal particles are achieved in calciner. Carbonation depends on the gastemperature, retention time and uniformity of particle size. Precalcining process is normally in-stalled in the plant with Pyroclone-R system. Kiln feed and fuel are uniformly dispersed in thegas stream and intensely whirled up, so that there is a good mixer of three components: raw meal,oxygen and fuel. Pyroclone-R systems are characterized by a pressure loss since the calciner isintegrated between inlet chamber and the cyclone without requiring a contraction between inletchamber and termination of the air duct.
Calciner
Kiln
Preheater
Air, Gas
Solids (meal, clinker)
Fuel
Cooler
Fig. 2. Schematic diagram of the kiln system considered for modelling.
2954 M.G. Rasul et al. / Applied Thermal Engineering 25 (2005) 2950–2965
Chemical reaction and burning of a cement raw mix to obtain clinker products takes place inrotary kiln. Most of the energy, over 85%, is consumed in the clinkerization process, in the kiln [1].There are four types of clinker coolers used in the cement industry, namely rotary, planetary,grate and shaft cooler. In this model, grate cooler is considered for clinker cooling. The cooledclinker is then ground or milled together with gypsum and other constituents to produce cement.Around 1.5–1.7 tonnes raw material are required for the production of 1 tonne of cement depend-ing on the mill type [2,13].
3. Model development
Heat balance of any system can offer extremely useful information on the thermal performance,which shows where and how the heat generated by the fuel is consumed. To facilitate the task ofmass, energy and exergy calculations with a view to apply this for real time control of the system,a microcomputer based software was developed based on the standard spreadsheet programconsidering:
Heat input ¼ heat outputþ accumulated loss
Input and output items were determined by the direction of flows, as into boundary is equal toinput and out of boundary is equal to output. Heat of transformation occurs within the boundaryand the net effect was normally used as the criterion as exothermic reaction is equal to input andendothermic reaction is equal to output. The balance was made on a loss of ignition (LOI) freebasis, because no balance for the entire quantity including LOI can be made since part of the massinput is converted to gas. The mass, energy and exergy balances are described below:
M.G. Rasul et al. / Applied Thermal Engineering 25 (2005) 2950–2965 2955
3.1. Mass balance
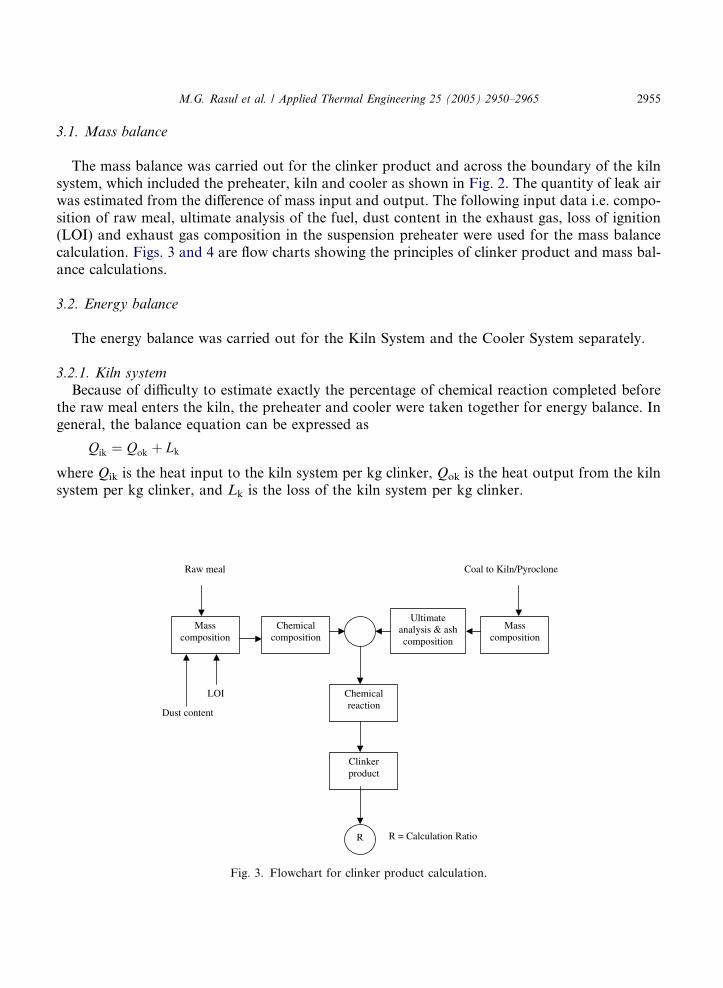
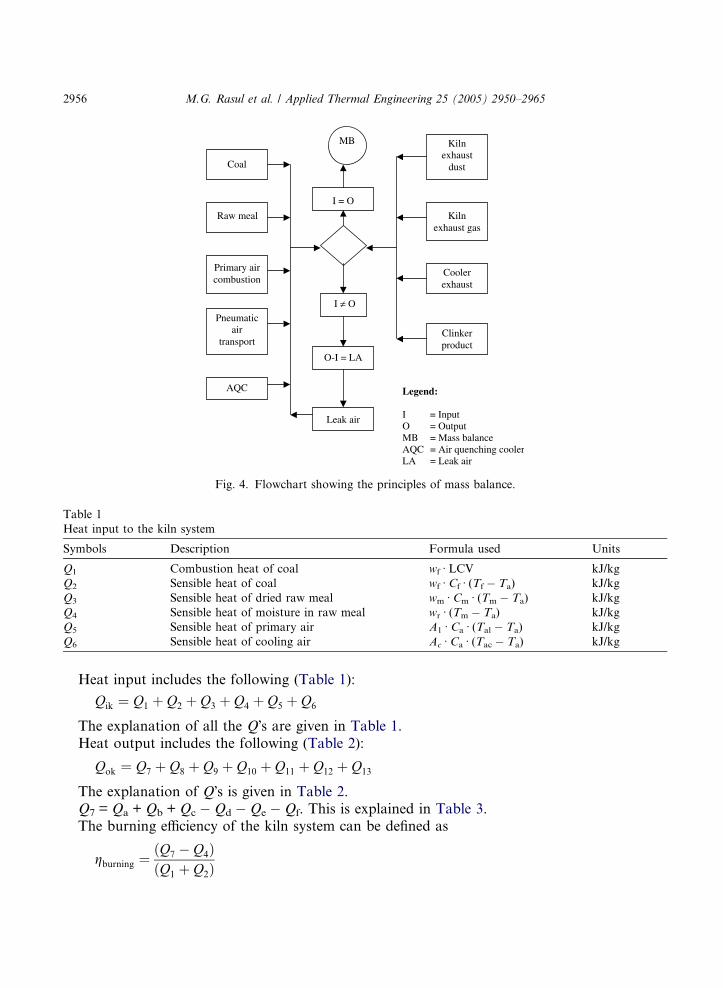
The mass balance was carried out for the clinker product and across the boundary of the kilnsystem, which included the preheater, kiln and cooler as shown in Fig. 2. The quantity of leak airwas estimated from the difference of mass input and output. The following input data i.e. compo-sition of raw meal, ultimate analysis of the fuel, dust content in the exhaust gas, loss of ignition(LOI) and exhaust gas composition in the suspension preheater were used for the mass balancecalculation. Figs. 3 and 4 are flow charts showing the principles of clinker product and mass bal-ance calculations.
3.2. Energy balance
The energy balance was carried out for the Kiln System and the Cooler System separately.
3.2.1. Kiln systemBecause of difficulty to estimate exactly the percentage of chemical reaction completed before
the raw meal enters the kiln, the preheater and cooler were taken together for energy balance. Ingeneral, the balance equation can be expressed as
Qik ¼ Qok þ Lk
where Qik is the heat input to the kiln system per kg clinker, Qok is the heat output from the kilnsystem per kg clinker, and Lk is the loss of the kiln system per kg clinker.
Masscomposition
Chemicalcomposition
Ultimateanalysis & ashcomposition
Masscomposition
R R = Calculation Ratio
Chemicalreaction
LOI
Dust content
Raw meal
Clinkerproduct
Coal to Kiln/Pyroclone
Fig. 3. Flowchart for clinker product calculation.
Coal
AQC
Pneumaticair
transport
Raw meal
Primary aircombustion
O-I = LA
I ≠ O
Leak air
I = O
Clinkerproduct
Coolerexhaust
Kilnexhaust gas
Kilnexhaust
dust
Legend:
IO = OutputMB = Mass balanceAQC = Air quenching coolerLA = Leak air
MB
= Input
Fig. 4. Flowchart showing the principles of mass balance.
Table 1
Heat input to the kiln system
Symbols Description Formula used Units
Q1 Combustion heat of coal wf Æ LCV kJ/kg
Q2 Sensible heat of coal wf Æ Cf Æ (Tf � Ta) kJ/kg
Q3 Sensible heat of dried raw meal wm Æ Cm Æ (Tm � Ta) kJ/kg
Q4 Sensible heat of moisture in raw meal wr Æ (Tm � Ta) kJ/kg
Q5 Sensible heat of primary air A1 Æ Ca Æ (Tal � Ta) kJ/kg
Q6 Sensible heat of cooling air Ac Æ Ca Æ (Tac � Ta) kJ/kg
2956 M.G. Rasul et al. / Applied Thermal Engineering 25 (2005) 2950–2965
Heat input includes the following (Table 1):
Qik ¼ Q1 þ Q2 þ Q3 þ Q4 þ Q5 þ Q6
The explanation of all the Q�s are given in Table 1.Heat output includes the following (Table 2):
Qok ¼ Q7 þ Q8 þ Q9 þ Q10 þ Q11 þ Q12 þ Q13
The explanation of Q�s is given in Table 2.Q7 = Qa + Qb + Qc � Qd � Qe � Qf. This is explained in Table 3.The burning efficiency of the kiln system can be defined as
gburning ¼ðQ7 � Q4ÞðQ1 þ Q2Þ
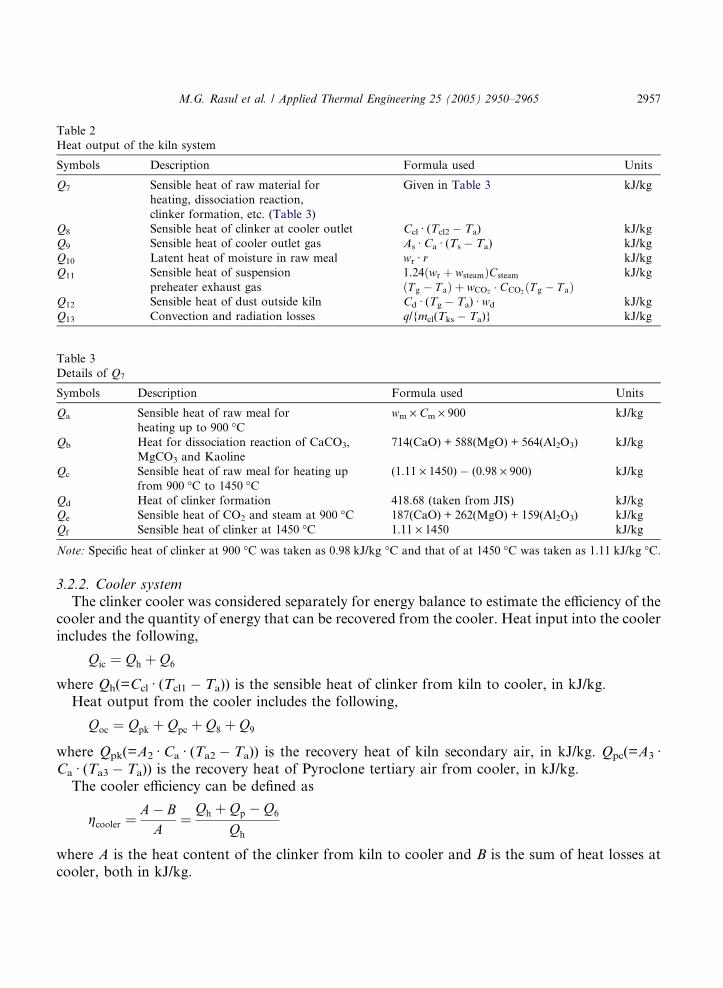
Table 3
Details of Q7
Symbols Description Formula used Units
Qa Sensible heat of raw meal for
heating up to 900 �Cwm · Cm · 900 kJ/kg
Qb Heat for dissociation reaction of CaCO3,
MgCO3 and Kaoline
714(CaO) + 588(MgO) + 564(Al2O3) kJ/kg
Qc Sensible heat of raw meal for heating up
from 900 �C to 1450 �C(1.11 · 1450) � (0.98 · 900) kJ/kg
Qd Heat of clinker formation 418.68 (taken from JIS) kJ/kg
Qe Sensible heat of CO2 and steam at 900 �C 187(CaO) + 262(MgO) + 159(Al2O3) kJ/kg
Qf Sensible heat of clinker at 1450 �C 1.11 · 1450 kJ/kg
Note: Specific heat of clinker at 900 �C was taken as 0.98 kJ/kg �C and that of at 1450 �C was taken as 1.11 kJ/kg �C.
Table 2
Heat output of the kiln system
Symbols Description Formula used Units
Q7 Sensible heat of raw material for
heating, dissociation reaction,
clinker formation, etc. (Table 3)
Given in Table 3 kJ/kg
Q8 Sensible heat of clinker at cooler outlet Ccl Æ (Tcl2 � Ta) kJ/kg
Q9 Sensible heat of cooler outlet gas As Æ Ca Æ (Ts � Ta) kJ/kg
Q10 Latent heat of moisture in raw meal wr Æ r kJ/kg
Q11 Sensible heat of suspension
preheater exhaust gas
1.24ðwr þ wsteamÞCsteam
ðT g � T aÞ þ wCO2� CCO2
ðT g � T aÞkJ/kg
Q12 Sensible heat of dust outside kiln Cd Æ (Tg � Ta) Æ wd kJ/kg
Q13 Convection and radiation losses q/{mcl(Tks � Ta)} kJ/kg
M.G. Rasul et al. / Applied Thermal Engineering 25 (2005) 2950–2965 2957
3.2.2. Cooler system
The clinker cooler was considered separately for energy balance to estimate the efficiency of thecooler and the quantity of energy that can be recovered from the cooler. Heat input into the coolerincludes the following,
Qic ¼ Qh þ Q6
where Qh(=Ccl Æ (Tcl1 � Ta)) is the sensible heat of clinker from kiln to cooler, in kJ/kg.Heat output from the cooler includes the following,
Qoc ¼ Qpk þ Qpc þ Q8 þ Q9
where Qpk(=A2 Æ Ca Æ (Ta2 � Ta)) is the recovery heat of kiln secondary air, in kJ/kg. Qpc(=A3 ÆCa Æ (Ta3 � Ta)) is the recovery heat of Pyroclone tertiary air from cooler, in kJ/kg.
The cooler efficiency can be defined as
gcooler ¼A� BA
¼Qh þ Qp � Q6
Qh
where A is the heat content of the clinker from kiln to cooler and B is the sum of heat losses atcooler, both in kJ/kg.
2958 M.G. Rasul et al. / Applied Thermal Engineering 25 (2005) 2950–2965
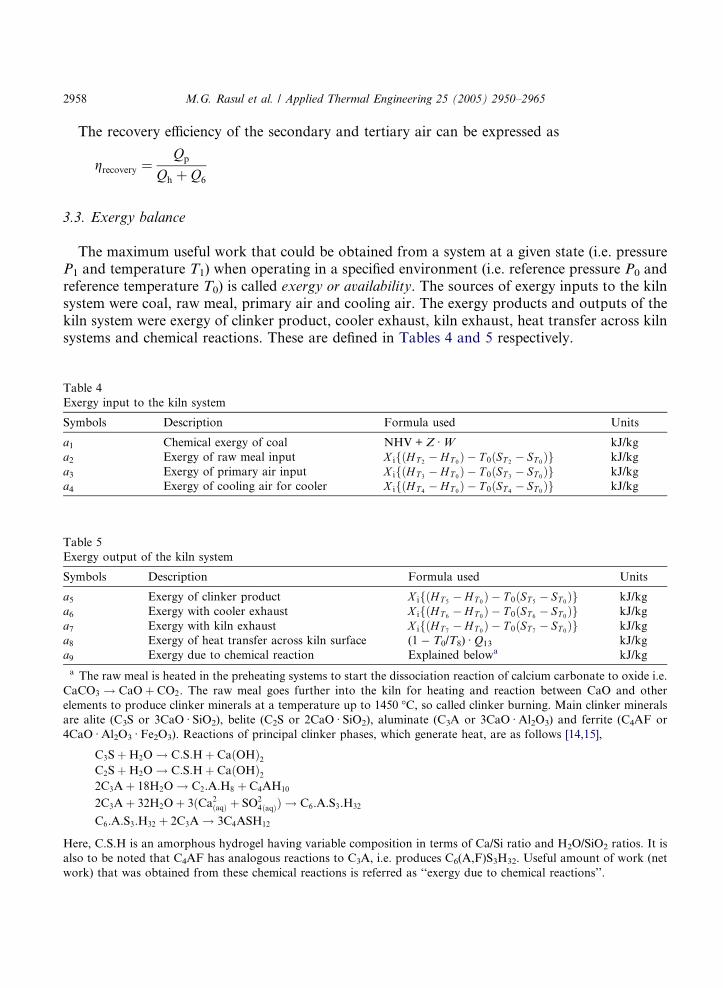
The recovery efficiency of the secondary and tertiary air can be expressed as
Table
Exerg
Symb
a1a2a3a4
Table
Exerg
Symb
a5a6a7a8a9a Th
CaCO
eleme
are al
4CaO
Here,
also t
work)
grecovery ¼Qp
Qh þ Q6
3.3. Exergy balance
The maximum useful work that could be obtained from a system at a given state (i.e. pressureP1 and temperature T1) when operating in a specified environment (i.e. reference pressure P0 andreference temperature T0) is called exergy or availability. The sources of exergy inputs to the kilnsystem were coal, raw meal, primary air and cooling air. The exergy products and outputs of thekiln system were exergy of clinker product, cooler exhaust, kiln exhaust, heat transfer across kilnsystems and chemical reactions. These are defined in Tables 4 and 5 respectively.
4
y input to the kiln system
ols Description Formula used Units
Chemical exergy of coal NHV + Z ÆW kJ/kg
Exergy of raw meal input X ifðHT 2� HT 0
Þ � T 0ðST 2� ST 0
Þg kJ/kg
Exergy of primary air input X ifðHT 3� HT 0
Þ � T 0ðST 3� ST 0
Þg kJ/kg
Exergy of cooling air for cooler X ifðHT 4� HT 0
Þ � T 0ðST 4� ST 0
Þg kJ/kg
5
y output of the kiln system
ols Description Formula used Units
Exergy of clinker product X ifðHT 5� HT 0
Þ � T 0ðST 5� ST 0
Þg kJ/kg
Exergy with cooler exhaust X ifðHT 6� HT 0
Þ � T 0ðST 6� ST 0
Þg kJ/kg
Exergy with kiln exhaust X ifðHT 7� HT 0
Þ � T 0ðST 7� ST 0
Þg kJ/kg
Exergy of heat transfer across kiln surface (1 � T0/T8) Æ Q13 kJ/kg
Exergy due to chemical reaction Explained belowa kJ/kg
e raw meal is heated in the preheating systems to start the dissociation reaction of calcium carbonate to oxide i.e.
3 ! CaOþ CO2. The raw meal goes further into the kiln for heating and reaction between CaO and other
nts to produce clinker minerals at a temperature up to 1450 �C, so called clinker burning. Main clinker minerals
ite (C3S or 3CaO Æ SiO2), belite (C2S or 2CaO Æ SiO2), aluminate (C3A or 3CaO Æ Al2O3) and ferrite (C4AF or
Æ Al2O3 Æ Fe2O3). Reactions of principal clinker phases, which generate heat, are as follows [14,15],
C3SþH2O ! C:S:Hþ CaðOHÞ2C2SþH2O ! C:S:Hþ CaðOHÞ22C3Aþ 18H2O ! C2.A.H8 þ C4AH10
2C3Aþ 32H2Oþ 3ðCa2ðaqÞ þ SO24ðaqÞÞ ! C6.A.S3.H32
C6.A.S3.H32 þ 2C3A ! 3C4ASH12
C.S.H is an amorphous hydrogel having variable composition in terms of Ca/Si ratio and H2O/SiO2 ratios. It is
o be noted that C4AF has analogous reactions to C3A, i.e. produces C6(A,F)S3H32. Useful amount of work (net
that was obtained from these chemical reactions is referred as ‘‘exergy due to chemical reactions’’.
M.G. Rasul et al. / Applied Thermal Engineering 25 (2005) 2950–2965 2959
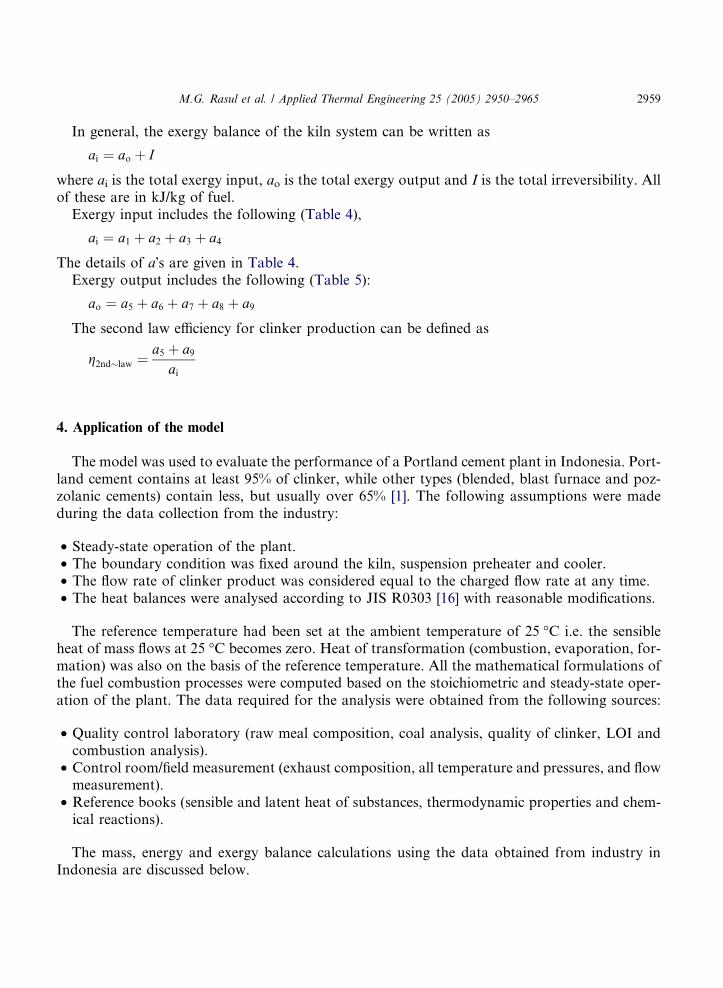
In general, the exergy balance of the kiln system can be written as
ai ¼ ao þ I
where ai is the total exergy input, ao is the total exergy output and I is the total irreversibility. Allof these are in kJ/kg of fuel.
Exergy input includes the following (Table 4),
ai ¼ a1 þ a2 þ a3 þ a4
The details of a�s are given in Table 4.Exergy output includes the following (Table 5):
ao ¼ a5 þ a6 þ a7 þ a8 þ a9
The second law efficiency for clinker production can be defined as
g2nd�law ¼ a5 þ a9ai
4. Application of the model
The model was used to evaluate the performance of a Portland cement plant in Indonesia. Port-land cement contains at least 95% of clinker, while other types (blended, blast furnace and poz-zolanic cements) contain less, but usually over 65% [1]. The following assumptions were madeduring the data collection from the industry:
• Steady-state operation of the plant.• The boundary condition was fixed around the kiln, suspension preheater and cooler.• The flow rate of clinker product was considered equal to the charged flow rate at any time.• The heat balances were analysed according to JIS R0303 [16] with reasonable modifications.
The reference temperature had been set at the ambient temperature of 25 �C i.e. the sensibleheat of mass flows at 25 �C becomes zero. Heat of transformation (combustion, evaporation, for-mation) was also on the basis of the reference temperature. All the mathematical formulations ofthe fuel combustion processes were computed based on the stoichiometric and steady-state oper-ation of the plant. The data required for the analysis were obtained from the following sources:
• Quality control laboratory (raw meal composition, coal analysis, quality of clinker, LOI andcombustion analysis).
• Control room/field measurement (exhaust composition, all temperature and pressures, and flowmeasurement).
• Reference books (sensible and latent heat of substances, thermodynamic properties and chem-ical reactions).
The mass, energy and exergy balance calculations using the data obtained from industry inIndonesia are discussed below.
2960 M.G. Rasul et al. / Applied Thermal Engineering 25 (2005) 2950–2965
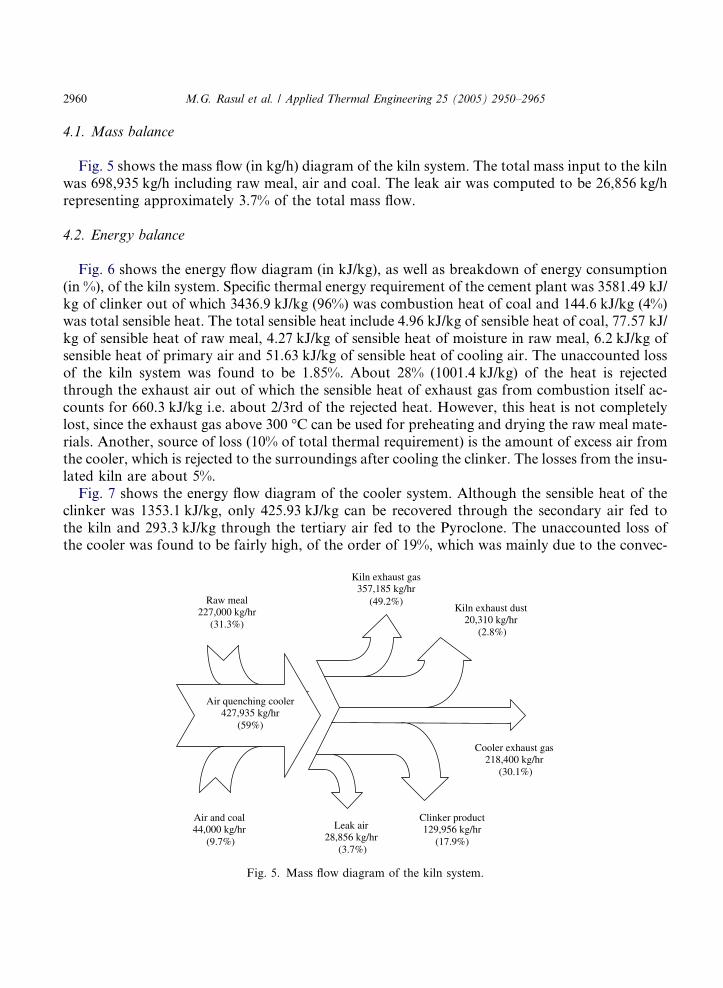
4.1. Mass balance
Fig. 5 shows the mass flow (in kg/h) diagram of the kiln system. The total mass input to the kilnwas 698,935 kg/h including raw meal, air and coal. The leak air was computed to be 26,856 kg/hrepresenting approximately 3.7% of the total mass flow.
4.2. Energy balance
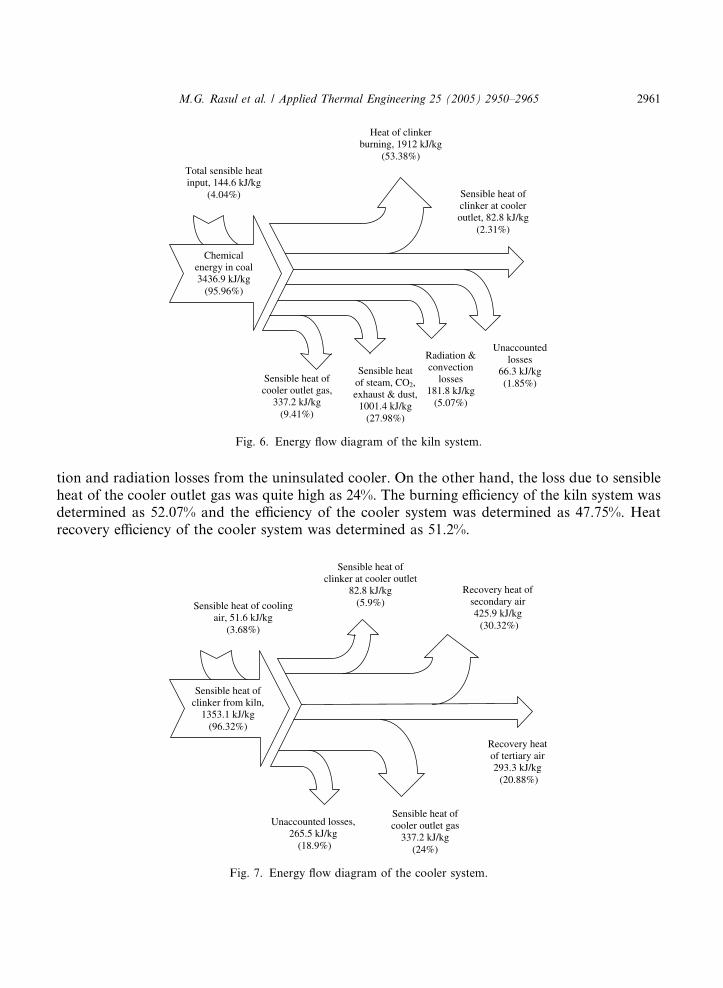
Fig. 6 shows the energy flow diagram (in kJ/kg), as well as breakdown of energy consumption(in %), of the kiln system. Specific thermal energy requirement of the cement plant was 3581.49 kJ/kg of clinker out of which 3436.9 kJ/kg (96%) was combustion heat of coal and 144.6 kJ/kg (4%)was total sensible heat. The total sensible heat include 4.96 kJ/kg of sensible heat of coal, 77.57 kJ/kg of sensible heat of raw meal, 4.27 kJ/kg of sensible heat of moisture in raw meal, 6.2 kJ/kg ofsensible heat of primary air and 51.63 kJ/kg of sensible heat of cooling air. The unaccounted lossof the kiln system was found to be 1.85%. About 28% (1001.4 kJ/kg) of the heat is rejectedthrough the exhaust air out of which the sensible heat of exhaust gas from combustion itself ac-counts for 660.3 kJ/kg i.e. about 2/3rd of the rejected heat. However, this heat is not completelylost, since the exhaust gas above 300 �C can be used for preheating and drying the raw meal mate-rials. Another, source of loss (10% of total thermal requirement) is the amount of excess air fromthe cooler, which is rejected to the surroundings after cooling the clinker. The losses from the insu-lated kiln are about 5%.
Fig. 7 shows the energy flow diagram of the cooler system. Although the sensible heat of theclinker was 1353.1 kJ/kg, only 425.93 kJ/kg can be recovered through the secondary air fed tothe kiln and 293.3 kJ/kg through the tertiary air fed to the Pyroclone. The unaccounted loss ofthe cooler was found to be fairly high, of the order of 19%, which was mainly due to the convec-
Kiln exhaust gas 357,185 kg/hr
(49.2%)Raw meal227,000 kg/hr
(31.3%)
Kiln exhaust dust20,310 kg/hr
(2.8%)
Air quenching cooler427,935 kg/hr
(59%)
Cooler exhaust gas218,400 kg/hr
(30.1%)
Air and coal44,000 kg/hr
(9.7%)
Clinker product 129,956 kg/hr
(17.9%)
Leak air28,856 kg/hr
(3.7%)
Fig. 5. Mass flow diagram of the kiln system.
Heat of clinkerburning, 1912 kJ/kg
(53.38%)
Total sensible heatinput, 144.6 kJ/kg
(4.04%) Sensible heat of clinker at cooleroutlet, 82.8 kJ/kg
(2.31%)
Chemicalenergy in coal3436.9 kJ/kg
(95.96%)
Unaccountedlosses
66.3 kJ/kg(1.85%)
Radiation &convection
losses181.8 kJ/kg
(5.07%)
Sensible heatof steam, CO2,exhaust & dust,
1001.4 kJ/kg(27.98%)
Sensible heat of cooler outlet gas,
337.2 kJ/kg(9.41%)
Fig. 6. Energy flow diagram of the kiln system.
M.G. Rasul et al. / Applied Thermal Engineering 25 (2005) 2950–2965 2961
tion and radiation losses from the uninsulated cooler. On the other hand, the loss due to sensibleheat of the cooler outlet gas was quite high as 24%. The burning efficiency of the kiln system wasdetermined as 52.07% and the efficiency of the cooler system was determined as 47.75%. Heatrecovery efficiency of the cooler system was determined as 51.2%.
Sensible heat of clinker at cooler outlet
82.8 kJ/kg(5.9%)
Recovery heat of secondary air 425.9 kJ/kg (30.32%)
Sensible heat of coolingair, 51.6 kJ/kg
(3.68%)
Sensible heat of clinker from kiln,
1353.1 kJ/kg(96.32%)
Recovery heatof tertiary air293.3 kJ/kg (20.88%)
Sensible heat ofcooler outlet gas
337.2 kJ/kg(24%)
Unaccounted losses, 265.5 kJ/kg
(18.9%)
Fig. 7. Energy flow diagram of the cooler system.
Exergy withcooler exhaust3241.1 kJ/kg
(10.36%)
Exergy withkiln exhaust3374.9 kJ/kg
(10.79%)
Exergy due to heat transferacross kiln647.8 kJ/kg
(2.07%)
Exergy with rawmeal & total air
3061.8 kJ/kg(9.79%)
Chemicalexergy of coal28214.8 kJ/kg
(90.21%)
Exergy withclinker product
360.5 kJ/kg(1.15%)
Exergy due to chemical reaction
17490.2 kJ/kg(55.92%)
Irreversibility6162.1 kJ/kg
(19.7%)
Fig. 8. Exergy flow diagram of the kiln system.
2962 M.G. Rasul et al. / Applied Thermal Engineering 25 (2005) 2950–2965
4.3. Exergy balance
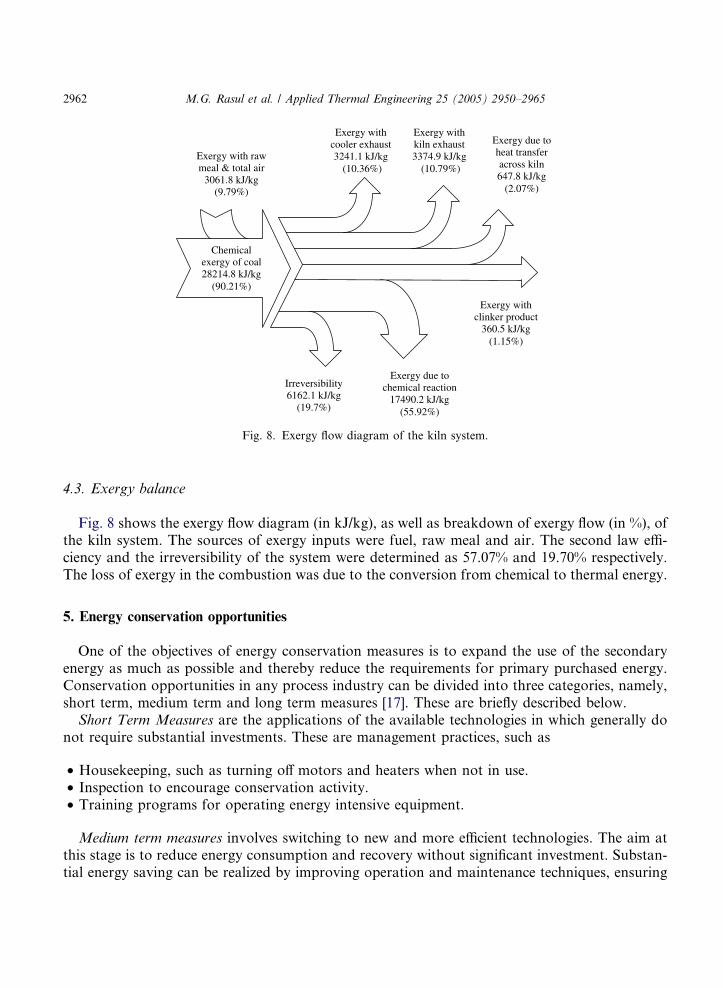
Fig. 8 shows the exergy flow diagram (in kJ/kg), as well as breakdown of exergy flow (in %), ofthe kiln system. The sources of exergy inputs were fuel, raw meal and air. The second law effi-ciency and the irreversibility of the system were determined as 57.07% and 19.70% respectively.The loss of exergy in the combustion was due to the conversion from chemical to thermal energy.
5. Energy conservation opportunities
One of the objectives of energy conservation measures is to expand the use of the secondaryenergy as much as possible and thereby reduce the requirements for primary purchased energy.Conservation opportunities in any process industry can be divided into three categories, namely,short term, medium term and long term measures [17]. These are briefly described below.
Short Term Measures are the applications of the available technologies in which generally donot require substantial investments. These are management practices, such as
• Housekeeping, such as turning off motors and heaters when not in use.• Inspection to encourage conservation activity.• Training programs for operating energy intensive equipment.
Medium term measures involves switching to new and more efficient technologies. The aim atthis stage is to reduce energy consumption and recovery without significant investment. Substan-tial energy saving can be realized by improving operation and maintenance techniques, ensuring
M.G. Rasul et al. / Applied Thermal Engineering 25 (2005) 2950–2965 2963
the continuity of the processes, and improving inter process delivery conditions. Finally, improve-ments in production yields can add another substantial contribution to energy saving.
Long term measures requires large investment and new innovations. This involves capital invest-ment of the interconnection of the processes. This can be a combination of various measures asdescribed below.
• Management and association of two energy sources, the best example of which is the cogene-ration of heat and power [18–22].
• Optimization of linking between equipment that helps in best utilization of intermediate prod-ucts and energies (e.g. thermal cascading in fertilizer plants).
• Completely interconnected, centralized automation of the whole plant based on the earlierdiagnostics of the actual operations of various equipments and an optimization algorithmdeveloped.
• Modification or redesign of the processes. Older technologies are replaced by new, advancedtechnologies, which are the major contributing factor for lower specific energy consumption.
In this study, only thermal energy conservation measures are presented. Basically all outputflows from kiln system could have potential for waste heat recovery. The main sources of energyconservation can be sensible heat of exhaust gas from kiln and cooler, latent heat of exhaust gases,and radiation heat of kiln and cooler. The recovered waste heat can be used for drying of rawmaterial and coal, and preheating of combustion air as secondary air for kiln and tertiary airfor Pyroclone. These are discussed below.
5.1. Heat recovery from kiln exhaust
The calculation of energy and monetary savings through waste heat recovery of kiln exhaust fordrying of raw materials used in the clay dryer and drum dryer is given in Table 6. The plant useclay material of approximately 148,586 tonnes (dried) and raw mix of approximately1,221,857 tonnes (dried) per annum. Therefore, the total amount of heat used, yearly, to evapo-rate water in clay dryer and drum dryer is equal to 1.934 · 1011 kJ.
Prior to use waste heat from the kiln, the plant used Industrial Diesel Oil (IDO) as the dryingmedium. The specifications of IDO were: NHV = 3.977 · 104 kJ/kg, specific gravity=0.98 kg/l. So,NHV of IDO = 3.898 · 104 kJ/l. Therefore, the quantity of IDO used in the dryerwas = 1.934 · 1011 kJ/3.898 · 104 kJ/l = 4,961,519 l. The cost of IDO in Indonesia is Rupiah 200per litre. Therefore, the monetary savings could be about Rupiah 9.923 · 108 which is equivalentto US dollars of 118,342 per year at the current conversion rate of Rupiah 8385 = 1 USD.
5.2. Heat recovery from cooler exhaust
Considerable amount of heat is lost in the excess cooler exhaust, which can be used to preheatprimary air to the kiln system. The input data were as follows:
• Primary air input to the kiln = 165 m3/min at 40 �C, and• Primary air input to the Pyroclone = 84 m3/min at 40 �C.

Table 6
Energy and monetary savings through waste heat utilization from kiln and cooler exhaust
Description Clay dryer Drum dryer
Inlet moisture content 12.5% (max value) 12.5%
Outlet moisture content 7% 7 �CInlet temperature 20 �C 20 �COutlet temperature 80 �C 80 �CWater evaporated 148,586 (12.7 � 7) = 8175 tonnes 67,200 tonnes
Sensible heat of water 8175 · 103 kg · 4.1868 kJ/kg �C · (80 � 20)�C = 2.054 · 109 kJ 1.688 · 1010 kJ
Heat of evaporation 2315.3 kJ/kg water 2315.3 kJ/kg water
Latent heat of water 8175 · 103 kg · 2315.3 kJ/kg = 1.893 · 1010 kJ 1.553 · 1011 kJ
2964 M.G. Rasul et al. / Applied Thermal Engineering 25 (2005) 2950–2965
The sensible heat of air without preheating:
Heat capacity of air = 1.0 kJ/kgSpecific gravity of air at 40 �C = 1.112 kg/m3
Inlet temperature = 25 �COutlet temperature = 40 �C
Therefore, the sensible heat of air = (165+84) m3/min · 60 · 24 · 330 · 1.112 kg/m3 · 1.0 ·(40 � 25) = 1.983 · 109 kJ. If preheated air is used, sensible heat will increase as follows:
Cooler exhaust gas temperature = 220 �CHeat capacity of air = 1.0 kJ/kgSpecific gravity of air at 220 �C = 0.73 kg/m3
Inlet temperature = 25 �COutlet temperature = 40 �CNo of operating days = 330 per year
Therefore, the sensible heat of air = (165 + 84) m3/min · 60 · 24 · 330 · 0.73 kg/m3 · 1.0 ·(40 � 25) = 7.034 · 1010 kJ. The difference in sensible heat input is = 6.836 · 1010 kJ. If this sensi-ble heat is produced by coal, assuming the NHV of coal is 2.554 · 105 kJ/kg and its price was US$30/tonne, the monetary savings by reducing the coal consumption per year could be = US$ 8,030.
6. Conclusions
A thermal performance analysis is presented on the basis of mass, energy and exergy balance ofthe kiln and cooler systems. The First law and the Second law efficiencies of the kiln systems werefound to be 52.07% and 57.07% respectively. Cooler efficiency and heat recovery efficiency weredetermined as 47.75% and 51.2% respectively. The irreversibility of the system was found to beabout 20%. The main cause of irreversibility in the process was due to the conversion of the chem-ical energy of the fuel (coal) to thermal energy. Thermal performance analysis is important andcan be used as a precursor to achieve and how to achieve the objectives i.e. maximizing the plantproductivity, minimizing the raw materials and energy consumption, etc. of any cement, even ofany process, industry.
M.G. Rasul et al. / Applied Thermal Engineering 25 (2005) 2950–2965 2965
Implementation of energy conservation measures in an existing plant are obvious, particularlyfor the developing countries, for: (i) optimum use of energy in industry, (ii) reduction of energycost per unit of product output, and (iii) reduction of environmental pollution generated fromindustries. Waste energy recovery systems must also be incorporated in the design of new indus-tries to minimize energy consumption, manufacturing costs and to improve the product quality.This study show that only by replacing industrial diesel oil (IDO) for drying of raw materials andcoal, and preheating of combustion air with waste heat recovery from kiln and cooler exhausts, acement industry in Indonesia can save about 1.264 · 105 US dollars per year.
References
[1] L. Szabo, I. Hidalgo, J.C. Ciscar, A. Soria, P. Russ, Energy consumption and CO2 emissions from the world
cement industry, European Commission Joint Research Centre, Report EUR 20769 EN, June 2003.
[2] International Energy Agency, The reduction of greenhouse gas emission from the cement industry, IEA
Greenhouse Gas R&D Programme, 1999.
[3] E. Worell, N. Martin, L. Pryce, Potentials for energy efficiency improvements in the US cement industry, Energy
25 (2000) 1189–1214.
[4] F. Liu, M. Ross, S. Wang, Energy efficiency of China�s cement industry, Energy 20 (7) (1995) 669–689.
[5] L. Ben-dor, Thermal methods, Advances in cement technology by SN Ghosh, Department of Inorganic and
Analytical Chemistry, The Hebrew University of Jerusalem, Israel, 1981.
[6] K. Yoshida, Thermodynamic analysis of energy flows and its applications to cement industry, Energy
Conservation of Cement Industries, University of Tokyo, Japan, 1982.
[7] O. Labahn, Cement Engineers Handbook, fourth ed., Bauveriag GMNH, 1983.
[8] D.W. Haspel, High Level Kiln Control, Process Technology of Cement Manufacturing, VDZ, Greenhithe, 1985.
[9] Japan Iron and Steel Federation, 2003. Available from: <http://www.jisf.or.jp/energy>.
[10] EETD, Energy Efficiency Technical Department Newsletter, Summer 1999.
[11] A. Shirazi, Potential for implementation of energy saving measures in selected cement factories in Iran, M.Sc.
Thesis, University of Flenburg, Germany, March 2002.
[12] Cement industry handy manual prepared by UNIDO (United Nations Industrial Development Organization)
1994. Available from: <http://www.unido.org/userfiles/puffk/cement>.
[13] C.A. Hendriks, E. Worell, D. Jager, K. Blok, P. Reimer, Emission reduction of greenhouse gases from the cement
industry, Greenhouse Gas Control Technologies Conference Paper 2000. Available from: <http://
www.ieagreen.org>.
[14] W. Widianto, Thermal performance modelling of cement industries: a case study in Indonesia, AIT Thesis No. ET-
89-16, Bangkok, Thailand, 1989.
[15] Chemistry of cement. Available from: <http://www.abdn.ac.uk/chemistry/research/dem/cemhon.doc>.
[16] Japanese standard JIS R0303, Heat Balancing Method for Cement Industry, 1979.
[17] B. Mohanty, J.C. Mora, An overview of rational use of energy in industry, in: Proceedings 6th Asian School on
Energy, Asian Institute of Technology, Bangkok, Thailand, 1988.
[18] A.B. Herrera, Techno-economic evaluation of co-generation potential in two manufacturing plants in Philippines,
Masters Thesis, Energy Technology Division, Asian Institute of Technology, Bangkok, Thailand, 1989.
[19] Powergen, A power generation company throughout the world, ‘‘Plant start-up and engineering support to the
power industry, 2003. Available from: <http://www.pwrgen.com/pwrgen.html>.
[20] SEDA, Sustainable energy development authority, New South Wales, Australia, ‘‘Renewable energy and co-
generation, 2003. Available from: <http://www.seda.nsw.gov.au/ren_cogeneration_body.asp>.
[21] T.D. Baker, Co-generation for resort hotel, ASHRAE Transaction (Part B1) 92 (1986) 318–329.
[22] D.C. Pedreyra, A micro-computer version of a large mainframe program for use in co-generation analysis,
ASHRAE Transaction 94 (1988) 1617–1625.