
Assessment of the canopy urban heat island of a coastal arid tropical city: The case of Muscat, Oman
13
Assessment of the canopy urban heat island of a coastal arid tropical city: The case of Muscat, Oman Yassine Charabi ⁎, Abdelhamid Bakhit Department of Geography, Sultan Qaboos University, Sultanate of Oman article info abstract Article history: Received 12 January 2010 Received in revised form 9 January 2011 Accepted 17 February 2011 The spatio-temporal variability of the canopy-level urban heat island (UHI) of Muscat is examined on the basis of meteorological observations and mobile measurements during a span of 1 year. The results indicate that the peak UHI magnitude occurs from 6 to 7 hours after sunset and it is well developed in the summer season. The warm core of the UHI is located in the Highland zone of Muscat, along a narrow valley characterized by low ventilation, high business activities, multi-storied buildings and heavy road traffic. Topographically, this valley is surrounded by mountains formed of dark-colored rocks such Ophiolites that can absorb short wave radiation and contribute, herewith, to the emergence of this warm urban core. In addition, this mountainous terrain tends to isolate this location from the cooling effect of the land–sea breeze circulation during the day time. In this warm valley the hottest temperature is encountered in the compact districts of old Muscat. In comparison, the urban thermal pattern in Lowland zone of Muscat is fragmented and the urban–rural thermal difference is reduced because of the lower urban density of the residential quarters. In addition, the flat alluvial terrain on which these residential quarters are located is consistently exposed to the land breeze circulation. Also, the study illuminates and emphasizes the importance giving due consideration to the nature of the rural baseline when assessing the urban effect on an area's climate. For Muscat City, irrespective of the rural baseline used, a significant difference in the value of the urban heat island is registered. © 2011 Elsevier B.V. All rights reserved. Keywords: Arid tropical climate Canopy urban heat island Coastal city Muscat 1. Introduction The Arab Gulf countries lying on the West Coast of the Arabian Gulf share several geographical characteristics and have many traits in common. The emergence of oil-wealth in the Arab Gulf countries in the last three decades has transformed the region into one of the world's primary centers of business. Oil has become, in nearly two decades, the main contributor to the region's seemingly overnight transformation from desert and simple fishing communities to modern, industrialized nation states (Babikir, 1986). Oil wealth has been accompanied by a huge influx of foreign workers and new ways of life (El-Arifi, 1986). During the last decade, liberal economic policies have encouraged fierce competition among Gulf States and fueled efforts to attract human and financial capital. This has resulted in an urgent need for infrastructure and rapid expansion of the urban landscape. This unprecedented form of urbanization which has taken place in tropical desert regions hastens the need for detailed studies of their effects on local climate change. Sustaining an acceptable quality of life for this growing population in arid cities may depend, to a critical extent, on our understanding of the climatic modifications induced by urbanization (Pearlmutter et al., 2007). The desert urban areas of the Arab Gulf states constitute an ideal living laboratory to examine the double risk of urban population to urban heat island and global climate change factors that are increasing and intensifying as they interact (Guyot, 2008). They are heavily populated, hot and arid—like many places around the world experiencing rapid urbanization and limited water Atmospheric Research 101 (2011) 215–227 ⁎ Corresponding author. Tel.: +968 24142954; fax: +968 24141851. E-mail address: [email protected] (Y. Charabi). 0169-8095/$ – see front matter © 2011 Elsevier B.V. All rights reserved. doi:10.1016/j.atmosres.2011.02.010 Contents lists available at ScienceDirect Atmospheric Research journal homepage: www.elsevier.com/locate/atmos
Transcript of Assessment of the canopy urban heat island of a coastal arid tropical city: The case of Muscat, Oman

Atmospheric Research 101 (2011) 215–227
Contents lists available at ScienceDirect
Atmospheric Research
j ourna l homepage: www.e lsev ie r.com/ locate /atmos
Assessment of the canopy urban heat island of a coastal arid tropical city:The case of Muscat, Oman
Yassine Charabi ⁎, Abdelhamid BakhitDepartment of Geography, Sultan Qaboos University, Sultanate of Oman
a r t i c l e i n f o
⁎ Corresponding author. Tel.: +968 24142954; fax:E-mail address: [email protected] (Y. Charabi).
0169-8095/$ – see front matter © 2011 Elsevier B.V.doi:10.1016/j.atmosres.2011.02.010
a b s t r a c t
Article history:Received 12 January 2010Received in revised form 9 January 2011Accepted 17 February 2011
The spatio-temporal variability of the canopy-level urban heat island (UHI) of Muscat isexamined on the basis of meteorological observations andmobile measurements during a spanof 1 year. The results indicate that the peak UHImagnitude occurs from 6 to 7 hours after sunsetand it is well developed in the summer season. The warm core of the UHI is located in theHighland zone of Muscat, along a narrow valley characterized by low ventilation, high businessactivities, multi-storied buildings and heavy road traffic. Topographically, this valley issurrounded by mountains formed of dark-colored rocks such Ophiolites that can absorb shortwave radiation and contribute, herewith, to the emergence of this warm urban core. Inaddition, this mountainous terrain tends to isolate this location from the cooling effect of theland–sea breeze circulation during the day time. In this warm valley the hottest temperature isencountered in the compact districts of old Muscat. In comparison, the urban thermal patternin Lowland zone of Muscat is fragmented and the urban–rural thermal difference is reducedbecause of the lower urban density of the residential quarters. In addition, the flat alluvialterrain on which these residential quarters are located is consistently exposed to the landbreeze circulation. Also, the study illuminates and emphasizes the importance giving dueconsideration to the nature of the rural baseline when assessing the urban effect on an area'sclimate. For Muscat City, irrespective of the rural baseline used, a significant difference in thevalue of the urban heat island is registered.
© 2011 Elsevier B.V. All rights reserved.
Keywords:Arid tropical climateCanopy urban heat islandCoastal cityMuscat
1. Introduction
The Arab Gulf countries lying on the West Coast of theArabian Gulf share several geographical characteristics andhave many traits in common. The emergence of oil-wealth inthe Arab Gulf countries in the last three decades hastransformed the region into one of the world's primary centersof business. Oil has become, in nearly two decades, the maincontributor to the region's seemingly overnight transformationfrom desert and simple fishing communities to modern,industrialized nation states (Babikir, 1986). Oil wealth hasbeen accompanied by a huge influx of foreignworkers and newways of life (El-Arifi, 1986). During the last decade, liberal
+968 24141851.
All rights reserved.
economic policies have encouraged fierce competition amongGulf States and fueled efforts to attract human and financialcapital. This has resulted in an urgent need for infrastructureand rapid expansion of the urban landscape.
This unprecedented form of urbanization which has takenplace in tropical desert regions hastens the need for detailedstudies of their effects on local climate change. Sustaining anacceptable quality of life for this growing population in aridcities may depend, to a critical extent, on our understandingof the climatic modifications induced by urbanization(Pearlmutter et al., 2007). The desert urban areas of theArab Gulf states constitute an ideal living laboratory toexamine the double risk of urban population to urban heatisland and global climate change factors that are increasingand intensifying as they interact (Guyot, 2008). They areheavily populated, hot and arid—like many places around theworld experiencing rapid urbanization and limited water

216 Y. Charabi, A. Bakhit / Atmospheric Research 101 (2011) 215–227
supplies. No doubt, that the environmental consequences ofthe actual urban sprawl are not restricted to the physical limitof the city, but may indeed arise at regional and global levels.Cities create their own micro- and local climate but areconnected to regional and global climates through thechemistry of the atmospheric effects on radiation balanceand greenhouse gas emissions (Roth, 2007).
The urban heat island (UHI) is the most intensively studiedclimatic feature of cities (Montávez et al., 2000; Souch andGrimmond., 2006). Universally themodified thermal climate incities is usually warmer than the surrounding areas and, hence,leads to a set of distinct micro-and mesoscale climates (Rothet al., 1989; Gluch et al., 2006). Comprehensive assessment ofdistinctive UHIs has been provided by many UHI researchers(Jauregui, 1973; Landsberg, 1981; Oke, 1973, 1981, 1982, 1986,1987; Atkinson, 2003). Several factors have been postulated toexplain the extra warmth of cities. They are (1) increasedabsorption of short-wave radiation, (2) increased storage ofsensible heat, (3) anthropogenic heat production, (4) reducedlong-wave radiation losses, (5) lower evapotranspiration rates,and (6) lower sensible heat loss due to reduced turbulencein urban canyons (Oke, 1987). Other factors, such as synopticweather conditions (e.g., wind speed, cloud amount andheight) (Oke, 1998), topography (Goldreich, 1984), citymorphology, and size (Oke, 1973) modify the magnitude ofUHI intensity, which is defined as the temperature differencebetween the urban area (Tu) and its rural (Tr) surroundings(ΔTu−r=Tu−Tr) (Chow and Roth, 2006).
Over the past 50 years, most of our knowledge abouturban climate is derived from research conducted inNorthwest Europe and North America and, to some extent,from tropical and subtropical areas (Arnfield, 2003). Roth(2007) has reviewed from available literature the nature andthe intensity of the UHI in tropical and subtropical cities. Thereviewed studies cover a large portion of subtropical climatetypes and encompass a wide range of cities ranging from theextreme dry areas (e.g., Lima in Peru) to the continuously wetareas (e.g., Kuala Lumpur in Malaysia). These reviews havepaved the way for comparisons with data from temperatelatitudes. The preliminary conclusion reached from thesecomparisons points to a seasonal variation of monthlynocturnal UHI with lower intensities during the wet seasonand higher intensities during the dry season. The registeredlower nocturnal maximum UHI intensities are comparable tothose of temperate cities with comparable population.Besides, the review study shows the existence of a relation-ship between population in subtropical cities and nocturnalmaximum UHI intensities. However, the available data areinsufficient to confirm logarithmic relationship or systematicdifferences between different climate types. Moreover,differences in urban morphology, variations in the nature ofthe rural reference and differences in methods and time ofobservation prevent from reaching robust conclusions.
Literature and scientific knowledge pertaining to heatisland in arid environments are very restricted and limited tofew cities; Phoenix and Tucson, Arizona (Hsu, 1984; Ballingand Brazel, 1986, 1987; Tarleton and Katz, 1995), Kuwait city(Nasrallah et al., 1990); Pune (Deosthali, 2000); Cairo (Rooba,2003), Ouagadougou (Linden, 2004); Eilat city (Sofer andPotchter, 2006) and Negev Desert, (Pearlmutter et al., 2007).The Arizona investigations demonstrate that UHI intensity is
higher during summer nights, and that it increases in time,due to rapid urbanization growth. The UHI of Kuwait City ispoorly developed (Nasrallah et al., 1990). In Eilat City, theresults prove the development of a moderate UHI locatedaround the most intensive area of human activity. The UHI ismore pronounced at midday during the summer season,while early morning inversions in winter have a weakeningeffect on the UHI intensity (Sofer and Potchter, 2006).
Arid urban environments offer to climatologists a specificdomain of investigation with circumstances that can bequalitatively and quantitatively different from those encoun-tered in temperate areas. These distinctions are most clearlypronounced in the following points; the daytime levels ofrelative humidity in an arid region may be considerably lowerthan what is experienced in surrounding non-arid areas.Atmospheric conditions in arid areas are characterized byclear skies and intense radiative exchanges. The high amountsof solar energy gained during daytime are balanced bynocturnal long-wave losses, resulting in a pattern of thermalextremes over the daily and seasonal cycles. A scarcity ofmoisture is most often reflected in sparse vegetation, whichsignificantly changes the characteristics of the natural terrainsurrounding desert cities. High albedo, strong winds, unstableor encrusted soils, and frequent sand or dust storms typify arid-region landscapes. But, while such places are distinguished byharsh thermal extremes, they also present unique opportuni-ties for microclimatic enhancement (Pearlmutter et al., 2007).
A multidisciplinary research project examining accuratelythe urban climate and air pollution in Muscat city wasinitiated in Sultan Qaboos University (Oman). This projectseeks to observe, measure, model and analyze how the rapidgrowth of Muscat city since 1970s has impacted the regionclimate and air quality. This paper presents the results of thepreliminary research that was conducted in Muscat city,located in an extreme hot and tropical arid area and in acomplex topography on the coast of the Sea of Oman. Theprimary aim of this paper is to explore the combined effects oftopography, mesoscale circulation, urban form and landscapevariability on air temperature at 2 m above the ground. Tocapture the expected spatio-temporal variability of airtemperature at meso- andmicro-scale variousmeteorologicalparameters were recorded using mobile traverses during1 year. Data were also obtained for the same period fromtemporary meteorological station installed in rural area andfrom suburb and urban weather stations of the DirectorateGeneral of Meteorology and Air Navigation (DGMAN). Thispaper focuses on the analysis of differences in air temperatureamong the sites, and discusses them in the context of anassessment of the canopy UHI.
2. The study area
Muscat, the capital of the Sultanate of Oman (23°25′N and57°00 E), extends from Seeb in the North to the Quariyat inthe South along a coastline that runs around 200 km along theSea of Oman (Fig. 1). By virtue of its location astride the Tropicof Cancer, Muscat city exhibits a typically arid environmentalsetup: day time temperatures are high, rainfall is scanty andhighly variable and evaporation rate is high. The averageyearly precipitation over a 30-year period is approximately100 mm and occurs mainly between November and March

Fig. 1. Localization and hills shade of Muscat.
217Y. Charabi, A. Bakhit / Atmospheric Research 101 (2011) 215–227
(Charabi and Al-Hatrushi, 2010). Having a coastal location,the city is exposed daily to sea breeze circulation during daytime and weak land breeze turning sometimes to calm con-ditions at night. Only during the winter season (November–February), the Northeast wintermonsoon prevailsmost of thetime. The duration of daily bright sunshine varies betweenabout 11 hours in December [altitude of sun at noon 43.3°]and 14 hours in June [ altitude of sun at noon 89.9°].
Muscat is situated in a very complex topographical setting(Fig. 1) that can be divided in general in two contrastedzones: Highland Muscat and Lowland Muscat. HighlandMuscat extends eastward and southwards from Ras Al-Hamra. Eastwards from Ras Al-Hamra extends an irregularcoast with numerous rock heads that protrude into the sealeading, hereby, to the formation of very rugged and steep seacliffs which are separatedwith small and narrow coastal bays.This mountainous terrain is composed of the outcrops ofdifferent rocks. The most prominent of all is Ophiolite whichdistinguishes itself through its dark color (Fig. 2). Thismountainous terrain is the dominant feature in, for example,Matrah,Mina Al-Fahal, Sidab, Al-Bustan, Gantab and Quariyat.A number of big and small wadis have carved, on their way tothe sea, distinct V shaped valleys which divide the area intonumerous peaks and steep ridges. These wadis, in addition tofew other basin-shaped pockets, formed in fact the mostsuitable locations of residential settlement and economicactivities. The most important of these locations in thisdifficult terrain is Ruwi basin and its extension Al-Wadi Al-Kabir which currently form the most crowded area in Muscat(Fig. 3).
Westwards from Ras Al-Hamra, this mountainous trainstarts to retreat away from the sea in a broad curve givingway to the development of a narrow accumulation plain, of 6–20 km width in average, which is built mainly by thenumerous wadis that drain the surrounding slopes in apredominantly SW–NE direction. For a long time before thegrowth of Muscat to an expanding metropolis this alluvialplain has been extensively used for agricultural purposes.Under the effect of urban sprawl, the agricultural plots havebeen gradually transformed into urban functions andarrangements. Evidence of this is Medinat Qaboos, Bawshar,Al-Resail and Al-Khoudh which form now basic quarters inthe settlement mosaic in Muscat.
Muscat city witnessed a spectacular socioeconomic de-velopment since 1970, stimulated by oil exploration andproduction. The primacy given to the capital triggered anunprecedented demographic pull. The population size rosefrom 56,000 to 236,000 in one decade (1970–1980) with anenormous annual growth rate of 12.3%. This sustained growthraised the population of Muscat to more than 549,000 in 1993and to 796,000 in 2007 constituting, thus, 27% of the totalpopulation in Oman. Currently, the population of Muscatgrows at an annual rate of 7.6% as compared to a nationaldemographic growth rate of 4%.
An analysis of the history of land use showed that Muscatexperienced three phases of urban expansion (Fig. 4): (i) in theperiod 1960–1970 the expansion was very limited and tookplace only between the two old towns of Matrah and Muscat,(ii) between 1970 and 1980 the expansion extended from thecoast line towards thewest suburbs and (iii) between 1980 and

±
59°0'0"E
59°0'0"E
58°0'0"E
58°0'0"E
23°0'0"N23°0'0"N
0 5 10 20 Kilometers
Upper extrusives
Ophiolite
Slope and basin facies
Shelf, fore-reef and slope facies
Shelf facies
Sheeted dyke complex
Sabkhah deposits
Piedmont facies
Khabra deposits
Intrusives - Peridotite, gabbro
Fore-reef and slope facies
Cumulate and High level gabbro
Coastal deposits
Basin, slope and shelf facies
Amphibolite and metasedimentary rocks
Alluvial and aeolian deposits
Fig. 2. Simplified geological map of Muscat.
218 Y. Charabi, A. Bakhit / Atmospheric Research 101 (2011) 215–227
2003 the urban expansion started filling the spaces and gapsbetween the previously built-up areas. In addition, this urbansprawl has been associatedwith significant changes in the landuse categories. A summary of these changes is given in Fig. 5which shows the total areas under each class for each year.Fig. 4 and Fig. 5 clearly reflect that the major increase in urbangrowthhas takenplace in the decade 1970 to1980. This growthamounts to more than 3.5 times the increase in the previousdecade. It can also be inferred that during this decade asignificant increase in residential land has taken place. It isworth tonote that public building categoryhas the largest shareof the built up area especially in 1980 period and late. It formedabout 29.8% in 1980 and rose to 30.2% in 2003. This is attributedmainly to the large portion of land allocated to schools,hospitals, government buildings, mosques, public companies,military and security uses (Al-Awadhi, 2008).
The physical aspects of the site of Muscat have logicallyinfluenced the direction of the urban expansion giving thecity its linear plan of 60 km length and of 1 to 12 km wide.Throughout, this topographically varied coastal band, theurban space seems paradoxically to have the profile of acontinuous area and the structure of a fragmented body. Thisleapfrog pattern of urban development leads to a very lowdensity of buildings. In the low land of Muscat city, theresidential batches are likewise dispersed and individualhousing plots show a patchy urban landscape. In 2007, thebuilding permits issued in Muscat city point out that thestandard size of the plots is about 649 m2 and it represent74.3% of issued permission. These facts mean that the number
of buildings per hectare is less than 13 units which is one ofthe lowest among the worldwide urbanized areas. Actually,the city continued to extend towards the south-west andnorth-west directions (low land). The built-up area of about200 km² looks currently as a ribbon meandering throughoutthe narrow coastal prone areas as well as across hill slopesand wadis (Mokhtar, 2010).
In terms of microclimate, most of Muscat built-up area ischaracterized by a high sky-view factor (SVF), except for theCDB area of Ruwi, where some of the buildings are over tenfloors high. Street structure in the old cities of Muscat andMatrah is extremely compact with very low SVF (Fig. 6). Thebuildings are usually not more than three stories high. Thestreets are narrow and form deep canyons throughout the oldcity. No transport by car is possible except on few distributorroads. Because of this narrow and irregular street network,mutual shading by buildings is very pronounced. The shadingat street level is further enhanced by the protruding upperfloors which in some places bridge the alleyways.
3. Observations and methodology
The aforementioned physical and human characteristicscombined have influenced to a large extent the overallthermal behavior in the city. The interactions betweendifferent natural and artificial elements in the lower urbanboundary layer produce patterns of varying local climateconditions very sensitive to structural changes. The hetero-geneity of the local surface temperatures over the urban area,
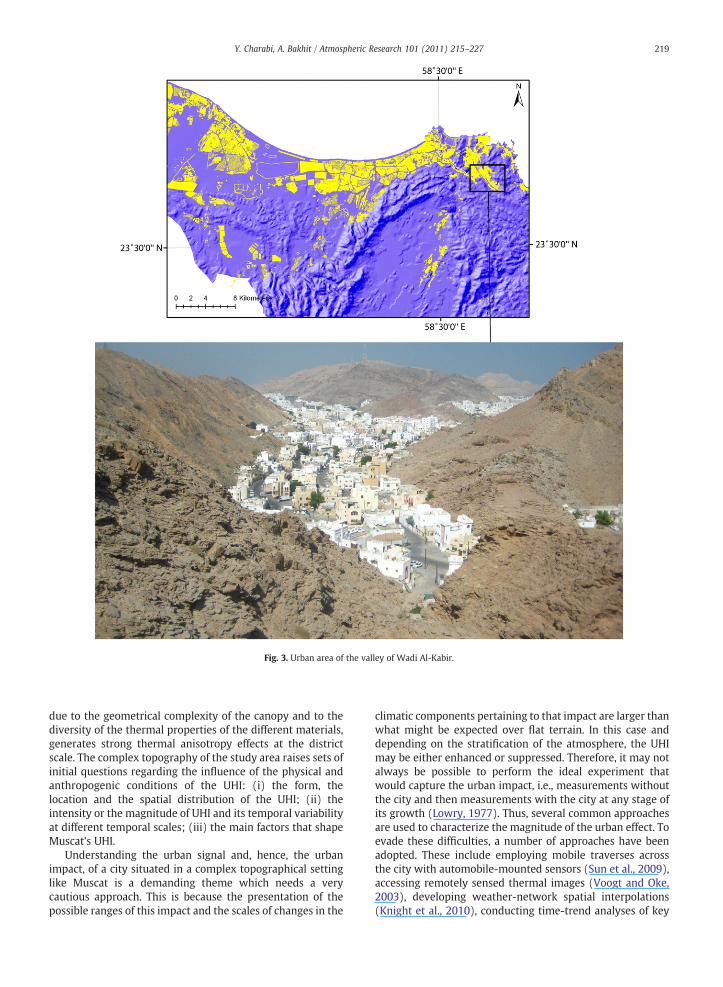
Fig. 3. Urban area of the valley of Wadi Al-Kabir.
219Y. Charabi, A. Bakhit / Atmospheric Research 101 (2011) 215–227
due to the geometrical complexity of the canopy and to thediversity of the thermal properties of the different materials,generates strong thermal anisotropy effects at the districtscale. The complex topography of the study area raises sets ofinitial questions regarding the influence of the physical andanthropogenic conditions of the UHI: (i) the form, thelocation and the spatial distribution of the UHI; (ii) theintensity or the magnitude of UHI and its temporal variabilityat different temporal scales; (iii) the main factors that shapeMuscat's UHI.
Understanding the urban signal and, hence, the urbanimpact, of a city situated in a complex topographical settinglike Muscat is a demanding theme which needs a verycautious approach. This is because the presentation of thepossible ranges of this impact and the scales of changes in the
climatic components pertaining to that impact are larger thanwhat might be expected over flat terrain. In this case anddepending on the stratification of the atmosphere, the UHImay be either enhanced or suppressed. Therefore, it may notalways be possible to perform the ideal experiment thatwould capture the urban impact, i.e., measurements withoutthe city and then measurements with the city at any stage ofits growth (Lowry, 1977). Thus, several common approachesare used to characterize the magnitude of the urban effect. Toevade these difficulties, a number of approaches have beenadopted. These include employing mobile traverses acrossthe city with automobile-mounted sensors (Sun et al., 2009),accessing remotely sensed thermal images (Voogt and Oke,2003), developing weather-network spatial interpolations(Knight et al., 2010), conducting time-trend analyses of key

Fig. 4. Evolution of land use cover in Muscat city between 1960 and 2003 (Al-Awadhi, 2008).
Fig. 5. Dynamic of Land use categories between 1960 and 2003 (Al-Awadhi, 2008).
220 Y. Charabi, A. Bakhit / Atmospheric Research 101 (2011) 215–227

Fig. 6. Sky view in the old districts of Muscat.
221Y. Charabi, A. Bakhit / Atmospheric Research 101 (2011) 215–227
sites (Fujibe, 2009), calculating energy balances (Masson,2006) and calculating urban and rural site differences(Hawkins et al., 2004).
The urban heat island discussed in this paper is a canopylayer heat island (Oke, 1987)measured at street level. Despitethe limitations of budget and manpower, several attempts

222 Y. Charabi, A. Bakhit / Atmospheric Research 101 (2011) 215–227
were undertaken to collect data of high spatial and temporalresolution about the urban impact. The conventional meteoro-logical network of the DGMAN in Muscat city is composed oftwo coastal stations situated in two different urban environ-ments: the first in Muscat International Airport (elevation8.40 m, sea distance 3000 m)which is situated in the suburbanarea of Al-Seeb in the West and the second is Mina SultanQaboos Station (elevation 4.08 m, sea distance 100 m) locatedin the core of the urban area. In order to compensate for theabsenceofmeteorological stations in the environs,whichmightotherwise have facilitated comparison, an automatic meteoro-logical station was installed and left working for 2 years (2007to 2008) in the rural suburb of Al-Amerat (Fig. 7).
In order to enhance the spatio-temporal density of themeteorological data in the study area, the technique of mobilemeasurements was largely used. As a start, this technique wasused to measure two meteorological parameters, namely airtemperature and relative humidity. The mobile instrumentswere installed on vehicles moving simultaneously alongpredetermined routes. In eachmobile traverse, air temperatureand relativehumidityweremeasured at a height of 2 mand at afrequency of once per second. Allmeasurementswere capturedusing a TG-502 coupled with GPS for georeferencing andestimation of altitude. The TG-502 probe is designed forindoor air quality with accurate sensors for air pollutants, airtemperature and relative humidity. These first operations ofmobile measurements revealed the problems inherent in thescale of data analysis. One of these is the complex topographyofthe study area in which usually poses short distance abruptchanges in the urban landscape. For example, at a speed of40 km/hour the vehicle can run a distance of 333.33 m in30 seconds and reveals a problem in the spatial attribution ofthe recorded measurements.
Fig. 7. Localization of the fixed meteorological stati
In order to optimize the accuracy of mobile measurementsand allow the sensors the necessary time to restore stability, aseries of itinerant measurements based on a predeterminednetwork of points were carried out in advance. In addition,meteorological and air pollution sensors were used tomeasure the principal parameters which include air temper-ature, relative humidity, wind direction, wind speed, CO, NO,O3 and VOC concentrations. Also, itinerant measurementswere taken from several transects that cover the urban area inorder to capture impacts of the varying topography, thedisparities in the built-up density, and the distribution of landuse categories. For comparison purposes, the measurementswere extended to outside Muscat. The sites of measurementswere selected according to the ability of each site to representthe local climate and, especially, the geometry of spacearound the points of measurements. This information wasextracted from a GIS data base obtained from NationalAuthority of Survey in the Sultanate of Oman. Nine para-meters were extracted from this data base: two parameters todescribe the geometry of buildings around measurementspoints (i.e., distance to the nearest wall and width of thestreet) and six parameters obtained from the fraction ofdifferent urban surfaces (i.e., built-up, green areas, woodedareas, water surfaces, roads and open areas) based on the fourvalues of 50, 100, 200 and 500 m.
The two parameters extracted from the GIS data base todescribe thebuildinggeometry around the site ofmeasurementwere restricted to the horizontal plan. In urban environments,narrow streets and high buildings generate horizontal andvertical roughness in the surface which ultimately leads to thecreation of deep microclimatic canyons. This 3D geometricalconfiguration plays a crucial role in regulating long-waveradiative heat losses restricting to a large extent, hereby, the
ons and the mobile measurements network.

223Y. Charabi, A. Bakhit / Atmospheric Research 101 (2011) 215–227
outgoing long-wave radiation losses. Thus, urban geometry is acrucial contributing factor in intra-urban temperature varia-tionsbelow roof level (e.g., Oke, 1981; Eliasson, 1996). Added toall that,measurements of SVFwere carried out. A digital camerawith fish-eye lens coupled with Rayman software was used todetermine the SVF ratio.
In total, 10 transects were run throughMuscat city coveringa network of 83 points of measurements, whereby along eachtransect 14–20 points were located (Fig. 7). Themeasurementswere carried out by three teams, each moving simultaneouslyover one transect, covering, hereby, an average of 45 points.Measurements were taken at four local time intervals: 19–20 hours, 04–05 hours, 07–08 hours and 15–16 hours. Themaximum measurement duration of each transects is 45 min.In order to cater for the significant natural fluctuation of airtemperature during sunset and sunrise, corrections wereintroduced in cases where the temperature difference fromstarting point to final point was more than ±0.3 °C measuredaccording to the readings at the official meteorological station.
The measurement operations were carried out on twodifferent seasons. Measurements during the winters of 2007and 2008 were run in December to mid-January, which is aperiod characterized by stable synoptic conditions with aclear skies. This was augmented by further measurementsduring February andMarchwhere the synoptic conditions arelargely influenced by the winter monsoon and the incursionsometimes of the east mobile trough that brings rainfall to theNorthern parts of Oman. In the summers of 2008 and 2009,measurements were carried out during the period June to Julywherein the synoptic condition are usually favorable for theenhancement of the local wind circulation, especially seabreeze, in the study area. For plotting the thermal surface ofthe Muscat city at a height of 2 m, the difference between thecore of the urban heat island and the other points of thenetwork is calculated.
4. Results and discussion
4.1. Structure of the urban heat island
An idealized spatial pattern of an urban heat island featuresusually outward temperature decreases from a city center innearly concentric isotherms. A typical example of this proto-type was encountered in previous studies in Lille Metropolitanarea in northern France and Sfax city in southern Tunisia(Charabi et al., 2002; Charabi and Melki, 2006). However,because the two areas are characterized by different regionalclimates, it is most probable that this similarity of their urbanheat island pattern may be attributed to the location of both inflat topography. The urban heat island in Muscat city deviatesconsiderably from this prototype; in comparison, its portraysdistinct multiple forms. This is mainly because of the variedtopography of the city in addition to the maritime influences itentertains and the location of the main commercial quarters init. Temporal and spatial mapping of the identified temperaturedistribution displays the following general traits:
Fig. 8 shows that by night time, the relatively warmregions are located mainly in the Highland zone in the East,while the relatively cold regions are located in the Low Landzone in the West. However, within this general picture thecoastal fringe entertains a special setting where temperature
is, as would be expected, relatively warm due mainly to theinfluence of the thermal transfer of the air coming from thesea and the urbanized coastal shore. Besides, along theurbanized coastal line the velocity of the nocturnal landbreeze is significantly reduced, which contribute to thewarming of the shore line of the study area. In addition,several warmest quarters are observed in the Highland zone.Particularly, warmest temperature occurs along the narrowvalley of Wadi Al-Kabir and in Ruwi, Matrah, Bait Al-Falaj andDarsit (marked by the red and black points in Fig. 8). Beingthemost favored business center inMuscat is one reasonwhythese warm air temperatures are generated in these locationsin particular. High-story buildings have combined to keepfree air ventilation to the minimum. The heating effect isfurther accentuated by the presence of the dark-colored rockssuch as Ophiolite which crop at the immediate vicinity andcontribute to the emergence of this warm urban core (Fig. 8).So, in reality, the mountainous terrain which surrounds thispart of Muscat tends to isolate it from the effects of the land–sea breeze circulation and, hence, contributes, herewith, tothe emergence of these warm urban cores and to theirmaintenance all day long.
Within this warm urban valley the highest temperaturevaluesare encountered in theoldparts (calledHila) of RuwiandMatrah which are particularly distinguished by compact urbanforms and narrow streets that lead to the development of deepcanyonswith a raise of temperature of about 0.7 °C (marked bythe black points in Fig. 8). The lower SVF generated by thisdensely built-up urban fabric prohibits the emission of long-wave radiation and, hence, leads to the trapping of heat whicheventually results into higher temperatures especially at latenight hours. The same scenario is repeated in an isolatedwarmquarter in old Muscat north-east of this warm valley in whichhigh urban density is confined within a narrow valley withsurrounded by steep slopes.
However, westwards from this warm valley, especially inthe residential areas of Al-Qurum, Medinat As Sultan Qaboosand Al-Khuwair A-Janubiyah (Khuwair South), the temper-ature anomaly decreases mainly because of higher elevationand less urban density. The sites of these residential areasbenefit from the natural ventilation caused by the enhancedland–sea breeze circulation which contributes effectively tothe cooling of air temperature.
In comparison, the behavior of the heat island in the urbanarea situated in Lowland of Muscat is devoid of the complica-tions inherent in HighlandMuscat. Asmentioned before, in thisarea open flat terrain dominates the landscape and the built-uparea is fragmented. Accordingly, the effect of the anthropogenicheat release on air temperature is highly reduced and the rural–urban thermalheterogeneity is abridged. So, LowlandofMuscatis strongly affected by land breeze that contributes significantlyto the homogenization of air temperature.
The mobile traverses of the winter season (not shown)reveal that the spatial configuration of the UHI is static andexactly comparable to the summer pattern. The noticeablechanges are observed in the intensity of the UHI. The winterseason in the study area is mainly characterized by thedecrease of the duration and the intensity of solar radiation,which reduce considerably the absorption and retention ofthe solar energy by urban surfaces. The emitted radiation isreduced and affects the development of the UHI.

Fig. 8. Thermal difference between the core of the UHI (black points) and the other points of the network. Strong UHI between 02h30 and 3h30, on 6 June 2008
224 Y. Charabi, A. Bakhit / Atmospheric Research 101 (2011) 215–227
4.2. Urban heat island intensity
For the purpose of investigating the temporal character-istics of the urban heat island intensity in Muscat, twometeorological stations are selected: (1) Mina Sultan Qaboosmeteorological station, to represent the Highland zone.Despite its isolation from the direct influence of the heatflux generated by the traffic road, it is the only fixed stationnear the urban core. (2) As Seeb meteorological stationlocated in Muscat International Airport, to represent Lowlandof Muscat and suburban conditions. In addition, a temporary
-1
-0.5
0
0.5
1
1.5
2
2.5
3
3.5
4
4.5
7 8 9 10 11 12 13 14 15 16 17 18 19 20 21 22 23 0 1 2 3 4 5 6
ΔT (
urb
an -
ru
ral)
Time
Summer
Winter
Fig. 9. ΔT between the urban station of Mina Sultan Qaboos and the rural station of Al-Amerat during one year.
.
meteorological station was installed in Al-Amerat to repre-sent the rural site. It is envisaged that comparisons of thereadings of these stations during a period of 1 year (February2008 to January 2009) can yield reliable indicators of the dailydevelopment of thermal differences between rural and urbanareas and the disturbances that affect wind velocity under thecombined impact of urbanization and topography.
The difference between the temperature at Mina SultanQaboos (urban) and Al-Amerat can be regarded as the max-imum intensity of the urban heat island in Muscat (Fig. 9). Theaverage maximum urban heat island intensity over the 1-year

225Y. Charabi, A. Bakhit / Atmospheric Research 101 (2011) 215–227
period is 2.4 °C. However, evaluation of readings of urban heatisland intensity discloses clear cycles. Diurnally, it is strongduring nighttime (2100–0400 hours) than during daytime(800–1700 hours). In average, maximum urban heat islandintensity is the strongest at 0300 hours (3.2 °C) and is theweakest at 1300 hours (0 °C). Seasonally, the analysis indicatesthat urbanheat intensity tends tobe strong in summerandweakin winter (Fig. 9). During the summer season, the UHI intensitycan reach a maximum of 4.3 °C in nighttime and 2.3 °C indaytime. In the short winter season, especially during idealsynoptic conditionsof clear andcalmweather, thenocturnalUHIintensity decreases to 2.4 °C. However, during the winter NEmonsoon this nocturnal UHI intensity can reach its minimumvalues. The seasonal variation of the urban heat island seems tobe related to the seasonal variations in the incoming solarradiation. The monthly mean of the total solar radiation inMuscat exceeded 8000Wh/m2/day in June and 4407Wh/m2/day in January. These large values of the total solar radiation andits seasonal variations directly affect the amount and seasonalvariations of the heat trapped by urban surfaces.
For the estimation of the urban heat island over the wholecity, the data collected during field campaigns of mobilemeasurements were used. Identification of the urban heatisland intensity is based on the calculation of the differencebetween the average of temperatures registered over theurban areas that exhibit the highest values and the lowesttemperature registered on the selected rural site. Anensemble of hot quarters forming the core of the urban heatisland emerges in the old central part of urban area, in theimmediate proximity of the dense traffic roads. Among thesewarm quarters, four have developed along the canyon streetof old Muscat. For the rural signal, two rural sites wereselected; Al-Amerat, situated in a small alluvial enclavesouth-west of the Highland zone of Muscat city to representthe Highland zone, and Al-Mabela (point TG 1 in Fig. 7),situated in large alluvial flat, to represent the Lowland zone.
The results derived from comparison between the fixedmeteorological stations confirm the diurnal and seasonalcycles of the urban heat intensity. However, the ΔT(u-r) valuesderived from mobile measurements are much more pro-nounced. The evaluation of the intensity of urban heat islandwas calculated for each rural site. Depending on which ruralsite was used to calculate the heat island, the average heatisland over the study period ranged from to 3.7 C° to 5.2 C°.The maximum heat island ranged from 4.3 C° to 6.2 C°. Forboth the average andmaximum heat island, the smallest heatisland value using rural location of the Highland and thelarger heat island occurred using rural site of the Lowland.The maximum heat island for each rural site occurred insummer season, after sunset and when urban heat islandevolution is expected to peak during the cooling phase (Oke,1987).
On the basis of the results obtained, several factors can bepostulated to explain variability in the magnitude of theurban heat island of Muscat city. Given that the urban and therural signals are influenced mainly by the conditionssurrounding the site of measurements, intra urban variabilityin the computed values reflects to a large extent the impact oftopography, urban density and the anthropogenic heatproduced by road traffic as well as that from air conditioning.The selected sites of the mobile measurements of the warm
city center are situated in a topographically narrow valley.Given that it is the major business district in Muscat, thisvalley possesses a high urban density and is exposed tointensive road traffic. Hence, it can be ascertained that thelow ventilation triggered by the topography of the site, theanthropogenic heat flux generated by the combustion offossils fuel and heat emissions from air conditioning are mostprobably the agents responsible for this extra warmth.However, there is a need for a more thorough effort for theprovision of a more accurate estimation of the anthropogenicheat flux inMuscat and to quantitatively relate the spatial andtemporal distributions of anthropogenic heat flux to theurban heat island.
However, for the sake of comparing the magnitude of heatisland in rural areas with that in urban areas, it should beborne in mind that, in addition to topography, morphologyand anthropogenic heat changes, land cover specifics shouldbe taken into account. Rural arid sites are usually scattered,buildings are not so dense and exhibit bare surfaces on whichonly sparse herbage biomass can be found. Furthermore, thesurfaces of the surveyed sites are composed of differentmaterials; in some, it is a mixture of sedimentary coarse greygravel with sizes ranging from boulders to silt and in others itis mainly lava rocks such as Ophiolite and dark Gabbro. Theresponse of this surface cover to heat absorption andradiation is very variable and, hence, plays a significantinfluence on the budget regime of surface energy. This mayexplain why the assessment of the magnitude of UHI in theserural areas is variable. Assessment of the rural sites aroundMuscat has revealed the existence of a thermal contrastbetween sedimentary alluvial soil cover and dark Gabbro andOphiolite cover that reaches a value of 2–3 °C. Further, thesource of this variability may be partly related to localtopography of each site: the rural site of the Lowland Zone issituated in a large flat alluvial fan and, hence, is much moreexposed to the cooling effect of land breeze.
5. Summary and conclusions
The main features of the spatio-temporal evolution of theUHI in Muscat have been analyzed using hourly data fromtwo urban stations and one rural station. The data recordedover a period of 1 year and complemented with mobilemeasurements along selected transects reveal that thewarmest core of the UHI is located in the Highland zone ofMuscat, along the narrow valley of Wadi Al-Kabir, Ruwi,Matrah, Bait Al-Falaj and Darsit. In this valley, the hottest airtemperature is encountered in the old compactly builtdistricts. The main factors responsible for the retention thereleased thermal energy in the lower atmosphere in thislocation are the local topography (low ventilation), the landcover (black lava rocks), urban geometry (high urbandensity) and the anthropogenic heat from road traffic andair conditioning. In Lowland of Muscat, the urban thermalpattern is fragmented and the urban–rural thermal differenceis reduced. Reasons for this are the flat alluvial terrain, the lowurban density of the subsequently established residentialquarters and the recurrent exposition of this Lowland zone toland breeze circulation.
The UHI exhibits a diurnal and seasonal cycle. The UHIreaches a maximum approximately 7 hours after sunset. In

226 Y. Charabi, A. Bakhit / Atmospheric Research 101 (2011) 215–227
addition, the UHI is well developed in the warm months ofthe year, i.e., mainly in summer. This seasonal variability canbe attributed to the variability of sun radiation. It is noticedthat during the rare winter rainfall spells and the occasionalwinter monsoon the UHI intensity usually decreases. Thesefindings correlate well with the empirical generalizationsidentified by Oke (1982).
The assessment of the UHI intensity in the probed rurallocations reveals strong variability among them. The varia-tions arise mainly from differences in the configuration oftheir local topography which influences the local airflow. Inaddition, land breeze, which usually moves fast, exercises atangible cooling of air in the rural sites of the Lowland. Thestudy point out that a cautious approach should be adoptedwhen assessing the effect of the built environment, to takeinto account the characteristics of the rural area. The UHI ofMuscat depends on the specificity of the rural site used todetermine the magnitude. This result corroborate with thefinding of Hawkins et al. (2004) about Phoenix, Arizona, inwhich they demonstrate that the variations in land coverscharacteristics in the rural area exert significant control onthe magnitude of UHI.
The preliminary investigation shows the complex nature ofassessing the impact of urbanization in arid tropical coastalenvironment. The results illustrate the meso- and micro-levelvariability of temperature due to several competing factors inthis region—topography,mesoscale circulation, urban formandlandscape variability. However, attempts to isolate the effect ofthose parameters or to give a quantitative assessment for eachfactor and its respective contribution in the genesis of the UHIare well beyond the scope of this study. The number ofobservations used in this investigation is small and limits thepossibility of proposing decisive conclusions. Therefore, inorder to adequately address the potential degree of variabilityintroduced by topography, recourse to the regional and local airflow and temperature simulation models using digital topo-graphic and remotely sensed biogeophysical data can throwmore light on this issue. However, the findings of this studycontribute to the corpus of knowledge about UHI in arid zones.
Acknowledgments
This research was funded by His Majesty Annual TrustFund (Sultan Qaboos University). The authors are grateful tothe students of the Department of Geography (class of 2007and 2008) for their efforts in carrying out the mobile mea-surements. Thanks also to the anonymous referees for theircomments.
References
Al-Awadhi, T., 2008. Analysis, assessment and modeling of the urban growthin Grater Muscat, Sultanate of Oman, using geographical informationsystems & remote sensing. The Egyptian Journal of Remote Sensing andSpace Sciences 11, 3–22.
Arnfield, A.J., 2003. Two decades of urban climate research: a review ofturbulence, exchanges of energy and water, and the urban heat island.International Journal Of Climatology 23, 1–26.
Atkinson, B.W., 2003. Numerical modelling of urban heat-island intensity.Boundary-Layer Meteorology 109, 285–310.
Babikir, A., 1986. Some aspects of climate and economic activities in the ArabGulf states. GeoJournal 13 (3), 211–222.
Balling, R.C., Brazel, S.W., 1986. New weather in Phoenix? Myths andrealities. Weatherwise 39 (2), 86–90.
Balling, R.C., Brazel, S.W., 1987. Temporal variations in Tucson, Arizonasummertime atmospheric moisture, temperature and weather stresslevels. Journal of Climate and Applied Meteorology 26, 995–999.
Charabi, Y., Al-hatrushi, S., 2010. Synoptic aspects of winter rainfallvariability in Oman. Atmospheric Research 95, 470–486.
Charabi, Y., Melki, T., 2006. Eléments de Climatologie Urbaine: cas de la villede Sfax. Centre de Publication Universitaire, Tunisie, p. 183.
Charabi, Y., Kergomard, C., Bigot, S., 2002. Le Climat urbain de l'agglomera-tion lilloise: configuration spatiale et variations temporelles de l'ilot dechaleur urbain. Hommes et Terres du Nord, Université Lille 1, Sciences etTechnologies, pp. 15–25.
Chow, W.T., Roth, M., 2006. Temporal dynamics of the urban heat island ofSingapore. International Journal of Climatology 26, 2243–2260.
Deosthali, V., 2000. Impact of rapid urban growth on heat and moisture islandsin Pune city, India. Atmospheric Environment 34 (17), 2745–2754.
El-Arifi, S., 1986. The nature of urbanization in the gulf countries. GeoJournal13 (3), 223–235.
Eliasson, I., 1996. Intra-urban nocturnal temperature differences: a multi-variate approach. Climate Research 7, 21–30.
Fujibe, F., 2009. Detection of urban warming in recent temperature trends inJapan. International Journal of Climatology 29 (12), 1811–1822.
Gluch, R., Quattrochi, D.A., Luvall, J.C., 2006. A multi-scale approach to urbanthermal analysis. Remote Sensing of Environment 104, 123–132.
Goldreich, Y., 1984. Urban topoclimatology. Progress in Physical Geography8 (3), 336–364.
Guyot, J., 2008. Project examines urban dwellers' vulnerability to heat in faceof climate changes. http://www.eurekalert.org/pub_releases/2008-10/asu-peu102408.php. Website visited on November 2008.
Hawkins, T.W., Brazel, W.L., Bigler, W., Saffell, E.M., 2004. The role of ruralvariability in urban heat island determination for Phoenix, Arizona. Journalof Applied Meteorology 43, 476–486.
Hsu, S.I., 1984. Variation of an urban heat island in Phoenix. The ProfessionalGeographer 36, 196–200.
Jauregui, E., 1973. The urban climate of Mexico City. Erdkunde 27, 298–306.Knight, S., Smith, C., Roberts, M., 2010. Mapping Manchester's urban heat
island. Weather 65 (7), 188–193.Landsberg, H.E., 1981. The Urban Climate. Academic Press, New York.Linden, J., 2004. Intra urban temperature differences in Ouagadougou,
Burkina Faso. MSC thesis, Earth Sciences Center, Goteborg University,Sweden, ISSN 1400-3821, 54.
Lowry, W.P., 1977. Empirical estimation of urban effects on urban climate: aproblem analysis. Journal of Applied Meteorology 16, 129–135.
Masson, V., 2006. Urban surface modeling and the meso-scale impact ofcities. Theoretical and Applied Climatology 84 (1–3), 35–45.
Mokhtar, B., 2010. Urban sprawl and city vulnerability: where does Muscatstand? Indian Ocean Tropical Cyclones and climate change. Springer,pp. 231–242.
Montávez, J.P., Rodríguez, A., Jiménez, J.I., 2000. A study of the urban heatisland of Granada. International Journal of Climatology 20, 899–911.
Nasrallah, H.A., Brazel, A.J., Balling, R.C., 1990. Analysis of the Kuwait-Cityurban heat island. Int J Climatol 10, 401–405.
Oke, T.R., 1973. City size and theurbanheat island. Atmospheric Environment 7,769–779.
Oke, T.R., 1981. Canyon geometry and the nocturnal urban heat island:comparison of scale model and field observations. Journal of Climatology1, 237–254.
Oke, T.R., 1982. The energetic basis of the urban heat island. Quarterly Journalof the Royal Meteorological Society 108, 1–24.
Oke, T.R., 1986. Urban climatology and the tropical city. Urban Climatologyand its Applications with Special Regard to Tropical Areas, World ClimateProgramme, WMO Publication No. 652. World Meteorological Organi-sation, Geneva, pp. 1–25.
Oke, T.R., 1987. Boundary Layer Climates, 2nd edition. London, Methuen.Oke, T.R., 1998. An algorithmic scheme to estimate hourly heat island
magnitude. Proceedings from the 2nd Urban Environment Symposium.American Meteorological Society, A Albuquerque, NM, Boston, MA,pp. 80–83.
Pearlmutter, D., Berliner, P., Shaviv, E., 2007. Urban climatology in arid regions:current research in the Negev desert. International Journal of Climatology27, 1875–1885.
Rooba, S.M., 2003. Urban–suburban/rural differences over Greater Cairo,Egypt. Atmosfera 16, 157–171.
Roth, M., 2007. Review of urban climate research in (sub) tropical regions.Int. J. Climatol. 27, 1859–1873.
Roth, M., Oke, T.R., Emery, W.J., 1989. Satellite-derived urban heat islandsfrom three coastal cities and the utilization of such data in urbanclimatology. International Journal of Remote Sensing 10, 1699–1720.
Sofer, M., Potchter, O., 2006. The urban heat island of a city in an aridzone: the case of Eilat, Israel. Theoretical and Applied Climatology85, 81–88.

227Y. Charabi, A. Bakhit / Atmospheric Research 101 (2011) 215–227
Souch, C., Grimmond, S., 2006. Applied climatology: urban climate. Progressin Physical Geography 30 (2), 270–279.
Sun, C.Y., Brazel, A.J., Chow, W.T.L., Hedquist, B.C., Prashad, L., 2009. Desertheat island study in winter by mobile transect and remote sensingtechniques. Theoretical and Applied Climatology 98 (3–4), 323–335.
Tarleton, L.F., Katz, R.W., 1995. Statistical explanation for trends in extremesummer temperatures at Phoenix, Arizona. J. Climate 8, 1704–1708.
Voogt, J.A., Oke, T.R., 2003. Thermal remote sensing of urban climates. RemoteSensing of Environment 86, 370–384.