Assessment of the 18 September 2011 Mw 6.9 Sikkim ...
39
Assessment of the 18 September 2011 M w 6.9 Sikkim earthquake using very high resolution satellite data Geosciences Division RS&GIS Applications Area National Remote Sensing Centre Indian Space Research Organisation Department of Space, Govt. of India Balanagar, Hyderabad - 500 625 Disaster Management Support Programme
-
Upload
khangminh22 -
Category
Documents
-
view
1 -
download
0
Transcript of Assessment of the 18 September 2011 Mw 6.9 Sikkim ...
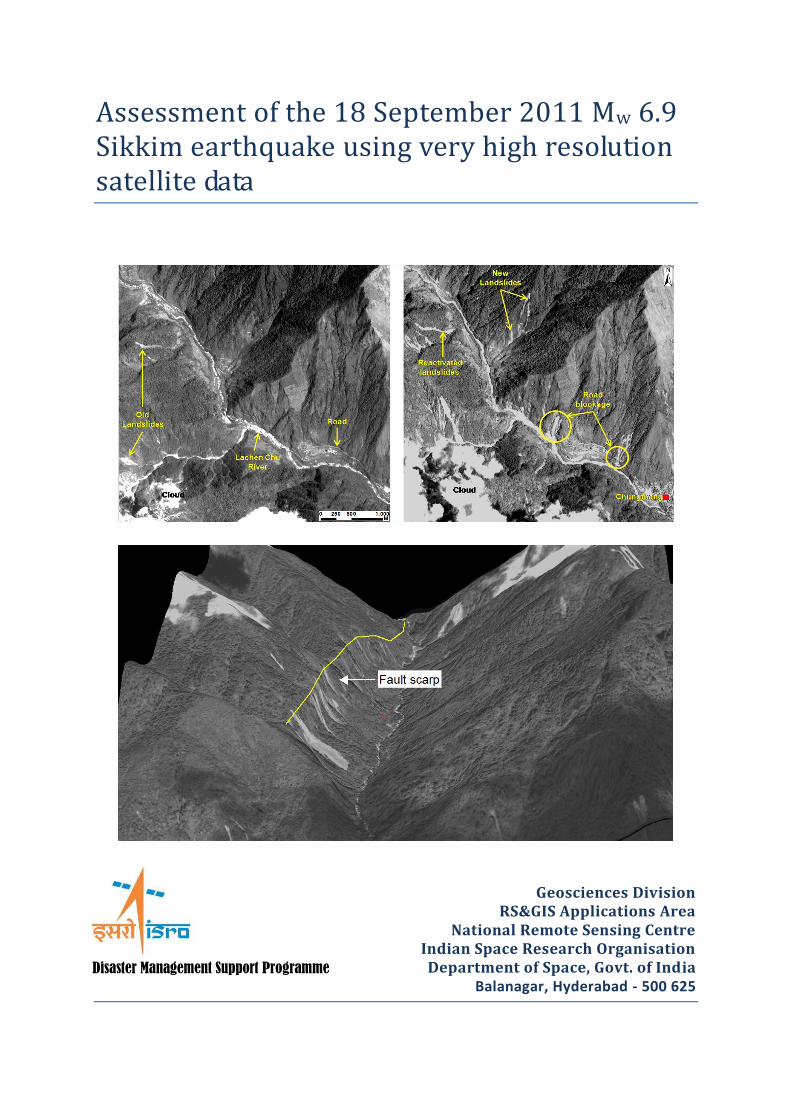
Assessment of the 18 September 2011 Mw 6.9 Sikkim earthquake using very high resolution satellite data
Geosciences Division
RS&GIS Applications Area National Remote Sensing Centre
Indian Space Research Organisation Department of Space, Govt. of India
Balanagar, Hyderabad - 500 625 Disaster Management Support Programme
NATIONAL REMOTE SENSING CENTRE
REPORT / DOCUMENT CONTROL SHEET
1 Security Classification Unrestricted
2 Distribution ISRO and collaborating organisations
3 Report / Document version (a) Issue no. 01 (b) Revision & Date 18.10.2011
4 Report / Document Type Project report
5 Document Control Number NRSC-RS&GISAA-ERG-GD-DEC11-TR338
6 Title Assessment of the 18 September 2011 Mw 6.9 Sikkim earthquake
using very high resolution satellite data
7 Particulars of collation
Pages
34
Figures
11
Tables
1
References
22
8 Author(s) Dr. K. Vinod Kumar, Dr. Tapas Ranjan Martha and Shri K. Babu
Govindharaj
9 Affiliation of authors Geosciences Division, RS&GIS-AA, NRSC
10 Scrutiny mechanism
Compiled by Reviewed by Approved/Controlled by
Dr. T. R. Martha Head, Geosciences DD (RS&GIS-AA)
11 Originating unit NRSC
12 Sponsor(s)/ Name and
Address ISRO
13 Date of Initiation 18 - September - 2011
14 Date of Publication 18 - October - 2011
15
Abstract (with Keywords): In this report, we studied the Mw 6.9 earthquake in Sikkim, India
occurred on 18 September 2011 using Cartosat-1 & 2, GeoEye-1, QuickBird-2 and WorldView-2
data, which were acquired by ISRO and USGS under the initiative of International Charter Space and
Major Disasters. Total 123 image scenes from eight satellites covering an area of 4105 km2 were
analysed, 1196 new landslides were mapped, blocked roads were identified and affected villages
were located. Geological assessment of the earthquake highlighted linear disposition of landslides
along existing faults suggesting their reactivation.
Keywords: International Charter, Damage, Landslide, Fault, VHR, Disaster
i
Summary
Satellite data are known for their capability to provide firsthand information for a large area
after disasters. Availability of very high resolution (VHR) satellite data immediately after a
disaster has enhanced the role of remote sensing in damage assessment. In this report, we
studied the Mw 6.9 earthquake in Sikkim, India occurred on 18 September 2011 using
Cartosat-1&2, GeoEye-1, QuickBird-2 and WorldView-2 data, which were acquired by ISRO
and USGS under the initiative of International Charter Space and Major Disasters. The
earthquake affected area being in inaccessible Himalayan mountainous terrain, VHR data
from these satellites provided an opportunity to quickly view the terrain both spatially and
temporally. Using visual change analysis technique through comparison of pre- and post-
earthquake images, we assessed the damage caused by the event. A total of 123 image scenes
from eight satellites covering an area of 4105 km2
were analysed, 1196 new landslides were
mapped, blocked roads were identified and affected villages were located. Geological
assessment of the earthquake highlighted linear disposition of landslides along existing faults
suggesting their reactivation. The landslide inventory map prepared from VHR images also
showed a good match with the earthquake shake map of USGS. Results showed several parts
of north Sikkim, particularly Mangan and Chungthang, close to the epicentre, were severely
affected by the earthquake.
ii
Acknowledgements
This work was carried out under the Decision Support Centre (DSC) activities of NRSC. The
guidance by Dr. V. K. Dadhwal, Director, NRSC, Dr. P.G. Diwakar, Director, EOS and Shri
G. Behera, Deputy Director, RS&GIS-AA, NRSC is duly acknowledged. We thank
International Charter on Space and Major Disasters for providing very high resolution
satellite data for assessment of the earthquake affected area against the Charter call 372
(Earthquake in northeast India). We also thank Rynn M. Lamb, disaster response coordinator,
USGS and Dr. N. Aparna, NRSC and Dr. R Nagaraja, Head, NDC for quick dissemination of
satellite data for analysis purpose.
Table of Contents
Page No.
Summary i
Acknowledgements ii
1. Introduction 1
2. Study area 2
2.1. Geological setting 2
3. Data sources 4
4. Methodology 5
4.1. Data processing 5
4.2. Data analysis 6
5. Results and Discussion 6
5.1. Post-earthquake landslide inventory 6
5.2. Infrastructure damage 10
5.3. Building damage 10
5.4. Agricultural damage 14
5.5. Geological assessment 15
6. Conclusion 18
7. References 18
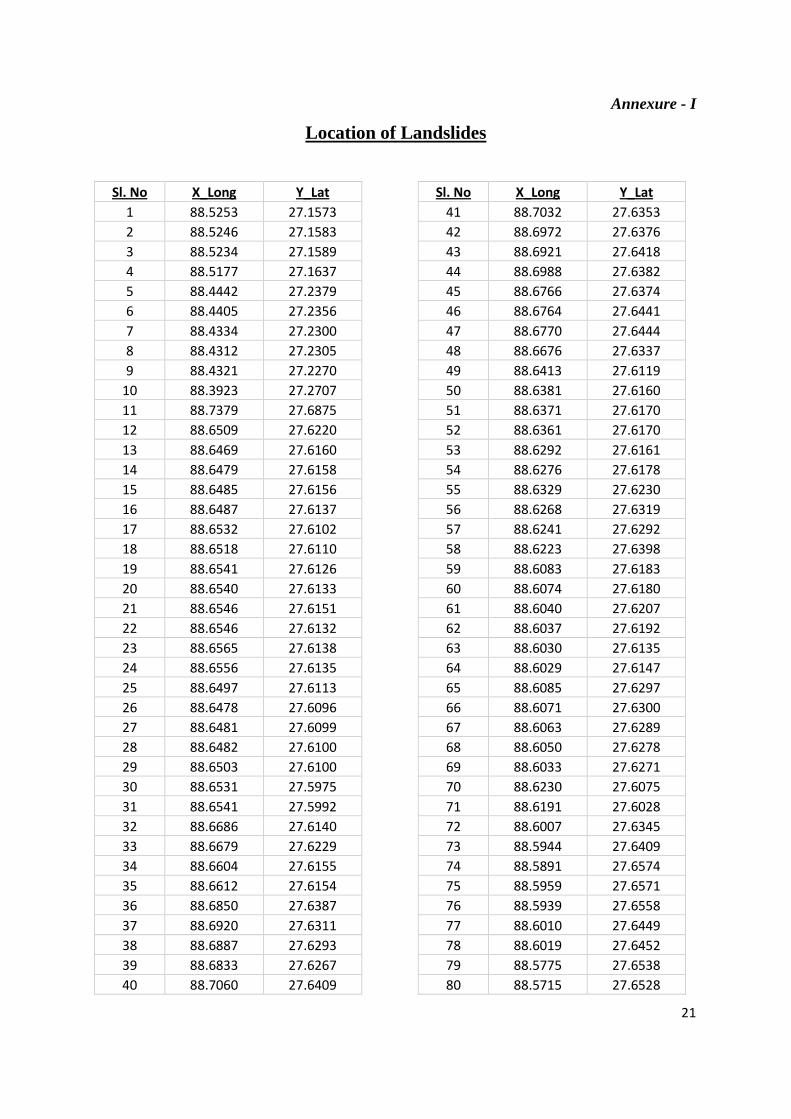
Annexure - I 21
1
1. Introduction
The Himalayas is known for active seismicity due to its tectonic setting. Regions around the
Himalayas are always in the danger of earthquakes. Recently an earthquake of Mw 6.9 struck
India-Nepal border on 18 September 2011 at 06:10:48 PM (IST) with its epicentre at
27.723°N and 88.064°E, and focus at 19.7 km depth (Source: USGS). The energy released by
this shallow focus earthquake shook far away regions lying in the plain areas as tremors were
felt in many parts of Sikkim, West Bengal, Bihar, Jharkhand, Uttar Pradesh, Delhi in India.
Adjoining areas in Nepal and China also felt the tremor due to this event. As per the news
reports several houses were damaged, 116 people were killed and many important roads were
blocked due to landslides in Sikkim.
In recent times, disaster support activities, especially in post-disaster situations, are
becoming dependent on the results derived from satellite data analysis (Tralli et al., 2005;
Voigt et al., 2007). This is primarily due to the availability of large number Earth
Observation satellites, and better coordination among space faring nations to share data in
emergency scenarios. ISRO as a part of its disaster management support activities has
programmed its satellites to acquire data over Sikkim area immediately after the earthquake.
At the same time International Charter on Space and Major Disasters (ICSMD) was activated
(Charter call 372) to acquire data from other satellites over the earthquake affected region.
Use of high resolution satellite data for rapid earthquake damage assessment has been
shown comprehensively for three recent major earthquakes i.e. Bam, Iran; Kashmir, India and
Pakistan; and Wenchuan, China (Arciniegas et al., 2007; Dunning et al., 2007; Gamba et al.,
2007; Ray et al., 2009; Vinod Kumar et al., 2006; Wang et al., 2009). Vinod Kumar et al.
(2006) have shown how stereoscopic Cartosat-1 data were useful for damage assessment in
the 2005 Kashmir earthquake. Voigt et al. (2007) stressed that since time is a constraint and
fast extraction of damage maps are desirable after a disaster situation, sophisticated image
processing techniques such as atmospheric corrections should only be used if it is absolutely
necessary. However, damage maps should have high planimetric accuracy for which
orthorectification of satellite images should be attempted.
Apart from damage to houses, properties and infrastructures, earthquakes also trigger
landslides (Di et al., 2010; Jibson et al., 2006). Several studies have shown the effectiveness
2
of satellite data to identify landslides triggered by earthquake (Gorum et al., 2011;
Metternicht et al., 2005; Stumpf and Kerle, 2011; Wang et al., 2009). Earthquake induced
landslides are more dangerous in comparison to rainfall triggered landslides since the former
creates mostly large deep-seated landslides capable of severe destruction. Large landslides
are also capable of creating temporary dams, which may create a situation potential for flash
floods (Dunning et al., 2007).
The main objective of this study is to carry out a rapid assessment of the earthquake
affected Sikkim area using VHR data so that maps can be disseminated rapidly to support
disaster management activities. The assessment was mainly focussed on identifying damage
to roads, infrastructures, and demarcating landslides triggered after the earthquake. A
geological assessment of the event was also made to find out any possible reactivation of
faults in this tectonically active area.
2. Study area
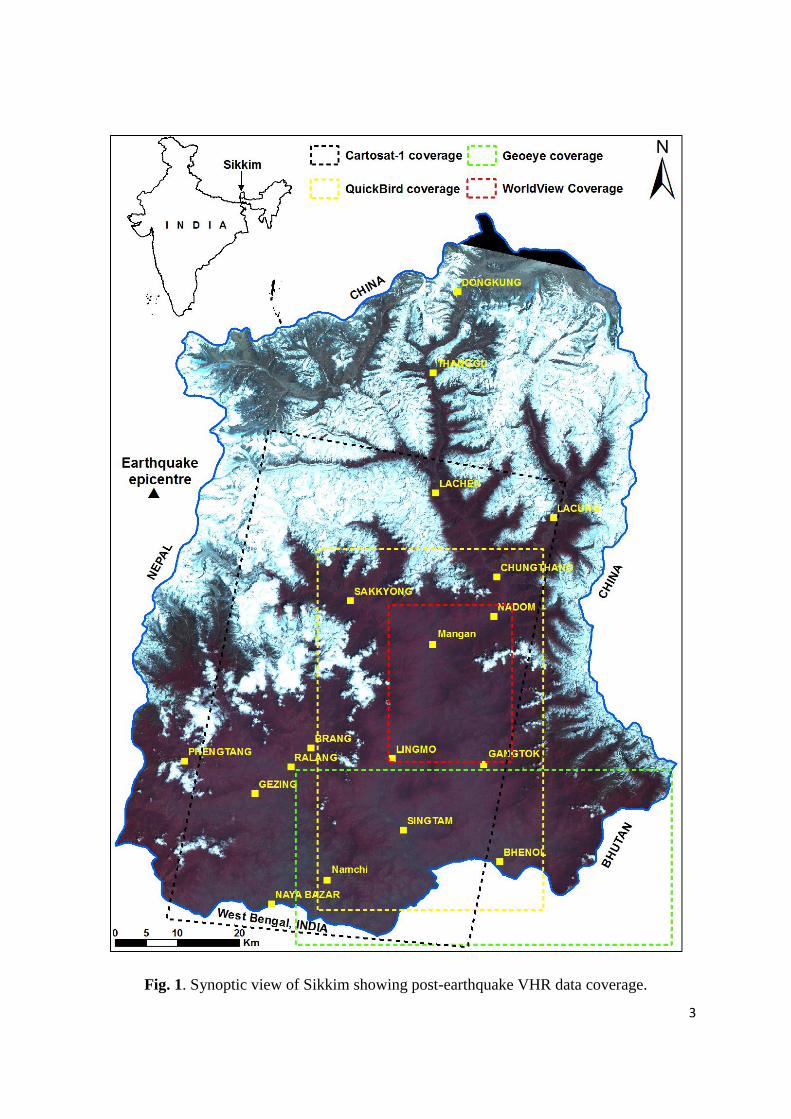
Parts of Sikkim, India covering an area of 4105 km2
were analysed for damage assessment
(Fig.1). This area is in the high Himalayan terrain, where occurrence of earthquakes and
landslides are frequent (Ghosh et al., 2010; Kayal, 2001). Gangtok, the capital of Sikkim
state, is a major city in this area. Kanchenjunga (8586 m), the third highest mountain peak of
the world is located in the study area. Major parts of the north Sikkim are covered by snow
and glaciers, which are the sources to many perennial rivers in the Indo-Gangetic plain. Tista
is the major river in this area and is a tributary to the Brahmaputra river.
2.1. Geological setting
Geologically, Sikkim Himalayas is a seismically active area as the Indian plate is subducting
under the Eurasian plate at approximately 50 mm/yr. The zones of subduction are represented
on the surface in the form of main boundary thrust (MBT) and main central thrust (MCT).
While MBT separates low grade lesser Himalayan rocks in the north from Siwalik group of
rocks in the south, MCT separates high grade central crystalline rocks in the north from low
grade lesser Himalayan rocks in the south. MCT and MBT are the two major tectonic features
in the Sikkim Himalayas around which most of the earthquake epicentres were located. Last
time this area experienced a major earthquake (Mw 5.3) was on 14 February 2006 (Raju et al.,
2007).
3
Fig. 1. Synoptic view of Sikkim showing post-earthquake VHR data coverage.
4
3. Data sources
To assess damage caused by the earthquake, ISRO has programmed its satellites to acquire
VHR and microwave images of Sikkim immediately after the event. Subsequently, on 19
September 2011, data were received from Cartosat-2 and Resourcesat-2. But, due to high
cloud cover, these datasets could not be interpreted. To avoid cloud problem, microwave data
from Indian microwave satellite (RISAT-2) were acquired. Similarly, through an initiative of
ICSMD, Radarsat-2 and TerraSAR-X data were provided by Canadian Space Agency and
German Aerospace Centre, respectively. However, these microwave datasets could not be
interpreted for damage assessment in this area due to: i) unavailability of pre-earthquake
microwave data with acquisition parameters similar to the post-earthquake data, and ii) high
geometric distortion due to foreshortening and layover effects, which is typical in steep
terrains such as the Himalayas.
ISRO and other agencies of ICSMD continued their watch over Sikkim, and first
cloud free VHR data for this area were available on 27 September 2011 from WorldView-2.
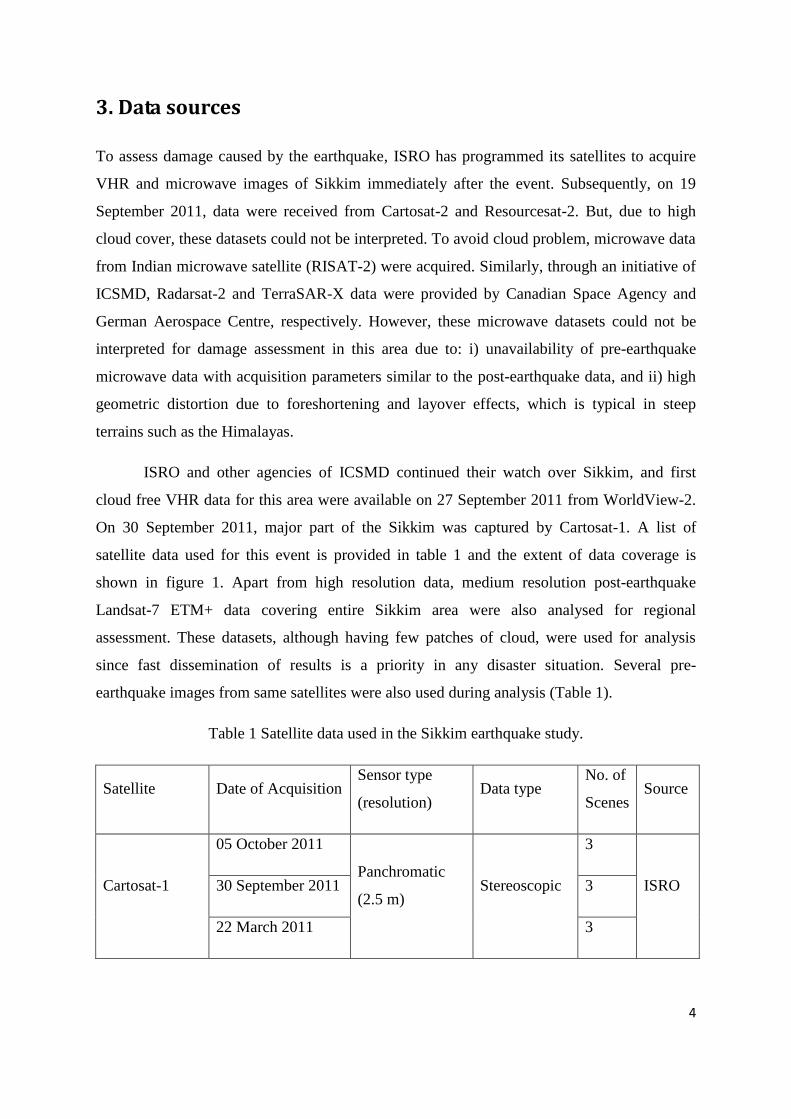
On 30 September 2011, major part of the Sikkim was captured by Cartosat-1. A list of
satellite data used for this event is provided in table 1 and the extent of data coverage is
shown in figure 1. Apart from high resolution data, medium resolution post-earthquake
Landsat-7 ETM+ data covering entire Sikkim area were also analysed for regional
assessment. These datasets, although having few patches of cloud, were used for analysis
since fast dissemination of results is a priority in any disaster situation. Several pre-
earthquake images from same satellites were also used during analysis (Table 1).
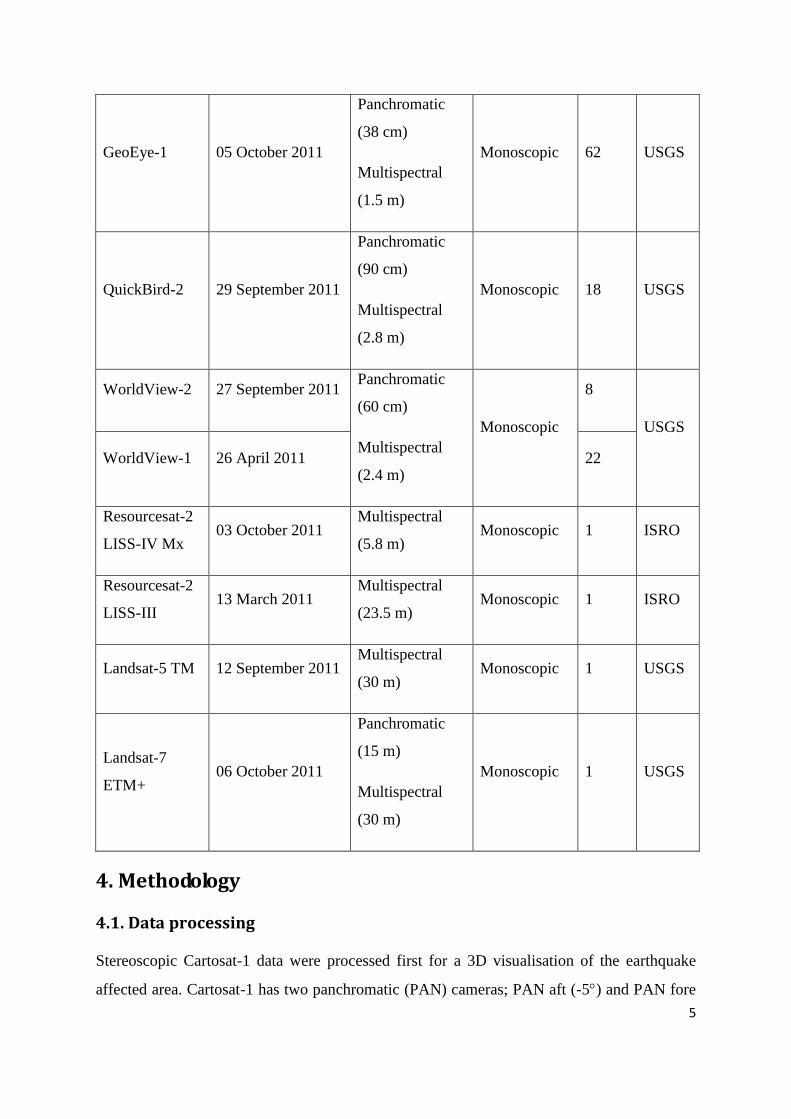
Table 1 Satellite data used in the Sikkim earthquake study.
Satellite Date of Acquisition Sensor type
(resolution) Data type
No. of
Scenes Source
Cartosat-1
05 October 2011
Panchromatic
(2.5 m) Stereoscopic
3
ISRO 30 September 2011 3
22 March 2011 3
5
GeoEye-1 05 October 2011
Panchromatic
(38 cm)
Multispectral
(1.5 m)
Monoscopic 62 USGS
QuickBird-2 29 September 2011
Panchromatic
(90 cm)
Multispectral
(2.8 m)
Monoscopic 18 USGS
WorldView-2 27 September 2011 Panchromatic
(60 cm)
Multispectral
(2.4 m)
Monoscopic
8
USGS
WorldView-1 26 April 2011 22
Resourcesat-2
LISS-IV Mx 03 October 2011
Multispectral
(5.8 m) Monoscopic 1 ISRO
Resourcesat-2
LISS-III 13 March 2011
Multispectral
(23.5 m) Monoscopic 1 ISRO
Landsat-5 TM 12 September 2011 Multispectral
(30 m) Monoscopic 1 USGS
Landsat-7
ETM+ 06 October 2011
Panchromatic
(15 m)
Multispectral
(30 m)
Monoscopic 1 USGS
4. Methodology
4.1. Data processing
Stereoscopic Cartosat-1 data were processed first for a 3D visualisation of the earthquake
affected area. Cartosat-1 has two panchromatic (PAN) cameras; PAN aft (-5) and PAN fore
6
(+26), and are provided with rational polynomial coefficients (RPCs), which can be used for
photogrammetric processing and subsequent generation of digital elevation models (DEMs)
and orthorectified images. High planimetric accuracy is desirable for products derived from
satellite data for disaster support purposes (Voigt et al., 2007). In order to improve the
planimetric accuracy of Cartosat-1 data, we used existing ground control points collected
from a differential GPS (DGPS) survey (Baltsavias et al., 2008; Martha et al., 2010). The
stereo pairs were processed and block triangulation was performed using Leica
Photogrammetric Suite (LPS) software. Subsequently, a 10 m DEM and Cartosat-1
orthorectified images were generated.
Pan-sharpening and contrast enhancement were the other data processing techniques
attempted in this study. For example, pan-sharpening of the GeoEye-1 panchromatic image
(38 cm) with its multispectral image (1.5 m) resulted in a 38 cm (resolution) post-disaster
colour image that provided information about the damages those were intuitive and detailed.
4.2. Data analysis
A combination of panchromatic, multispectral, monoscopic and stereoscopic data were used
for image interpretation. Visual change analysis by comparing post-earthquake images with
the pre-earthquake images was mainly used to find earthquake induced changes in the terrain.
3D visual interpretation of Cartosat-1 images was carried out using the feature extraction tool
of ERDAS software. While Cartosat-1 was helpful for damage assessment due to the 3D
visualisation of the terrain; GeoEye-1, WorldView-2 and QuickBird-2 data were able to
provide details of the changes on the ground after the earthquake. The focus of the image
interpretation was to find out the damage to infrastructures (roads, bridges and dam sites),
buildings, terrain in the form of landslides and any other economic losses.
5. Results and discussion
5.1. Post-earthquake landslide inventory
The Sikkim Himalayas is susceptible landslide occurrences (Mehrotra et al., 1996).
Landslides cause exposure of fresh rocks and soils, and removal of vegetations. These effects
can be seen clearly in the post-earthquake image in the form of high image brightness. Some
other features such as barren land, roads and river sands also provide similar tone and can
7
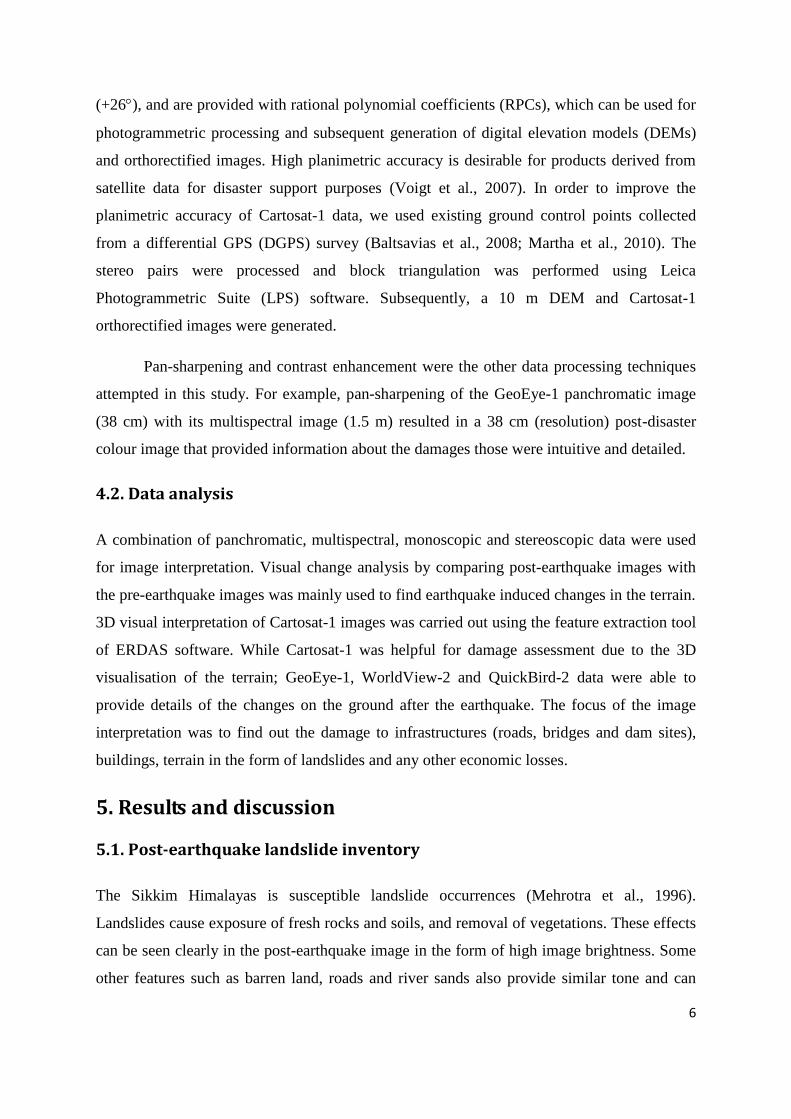
incorrectly be interpreted as landslides. Due to several developmental activities in this area,
road cuttings can be falsely interpreted as post-earthquake landslides since they also give
high brightness as landslides (Fig. 2). However, a careful analysis of the image tone in
association with texture, shape and pattern can help accurate identification of landslides.
Fig. 2. New landslides mapped from Cartosat-1 image in an area east of Mangan (bottom)
and near Chungthang (top). Pre- and post-earthquake images are shown in left and right,
respectively. Road cuttings can be seen in both images.
Demarcation of landslides as polygons, through ideal, was avoided in this study since
it was time consuming (Voigt et al., 2007). Therefore, landslide locations were marked as
points. The points were placed in the zones of initiation of the landslides by using similar
8
method applied by Gorum et al. (2011) for the 2008 Wenchuan earthquake. Most of the
landslides were of shallow transalational nature, which can be interpreted from its size and
elongated shape. However, large rock falls and rock slides were also observed in this area.
Occurrence of rock falls and rock slides are typical after an earthquake (Jibson et al., 2006).
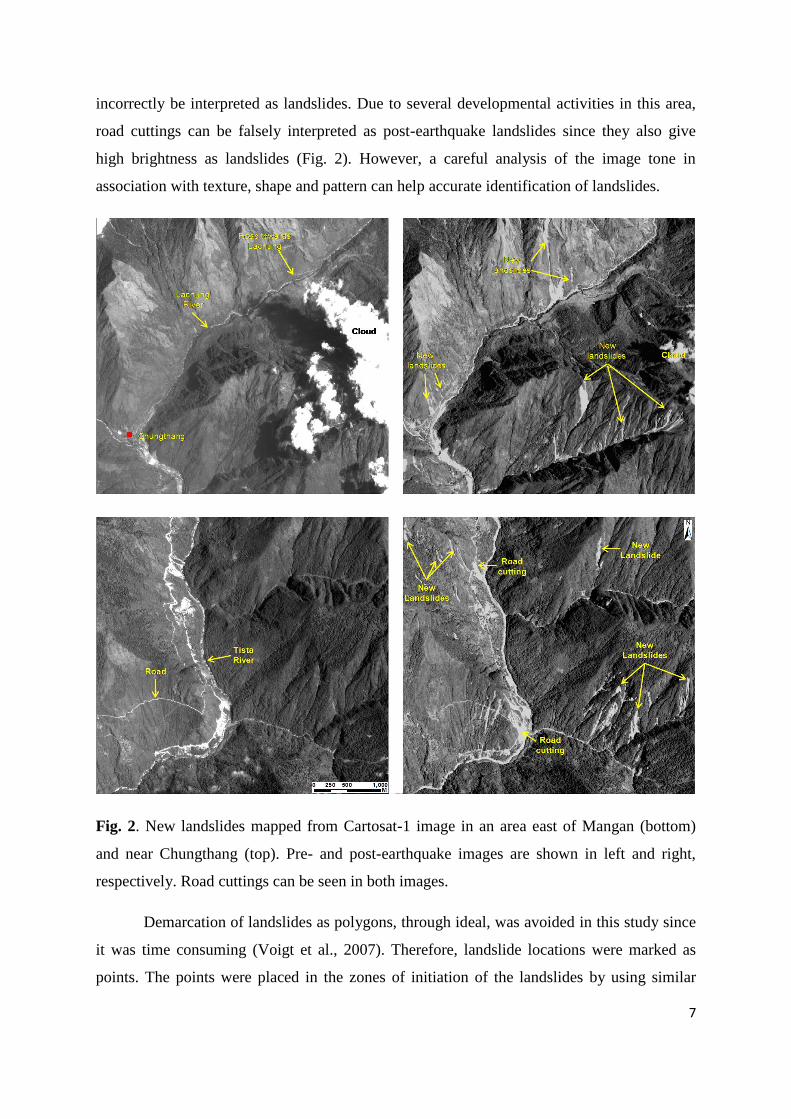
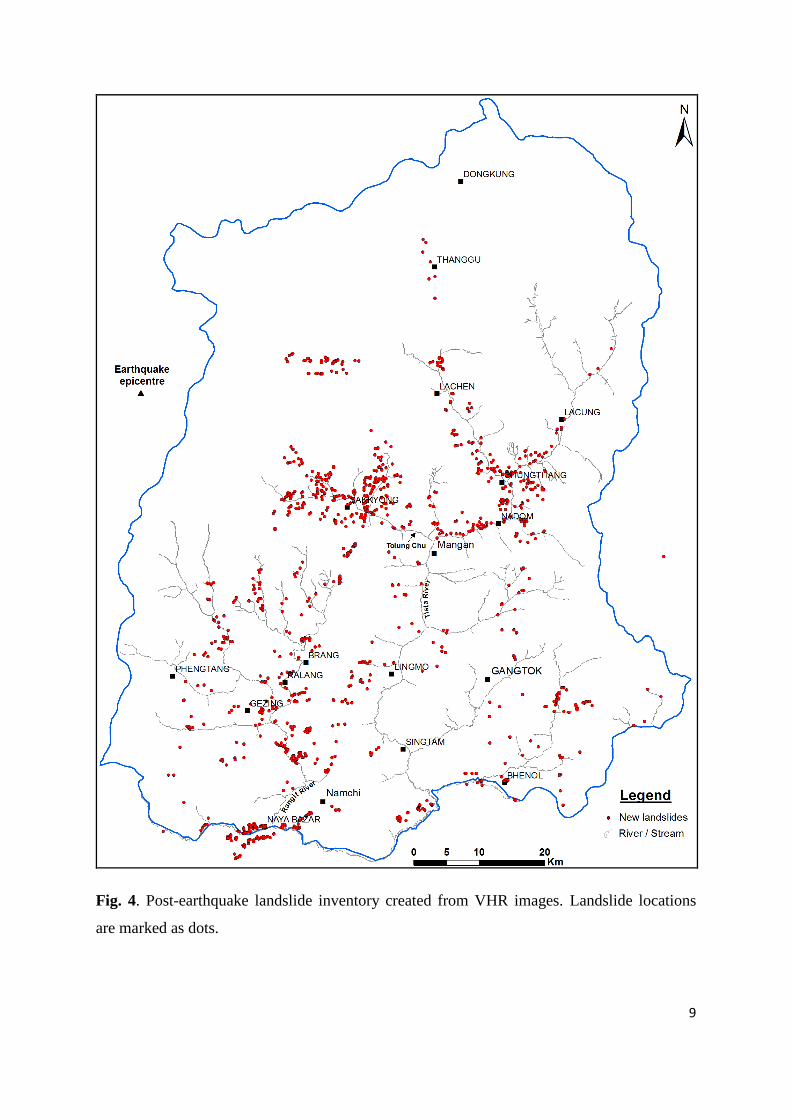
Old landslides, reactivated due to the earthquake, were identified and mapped as new
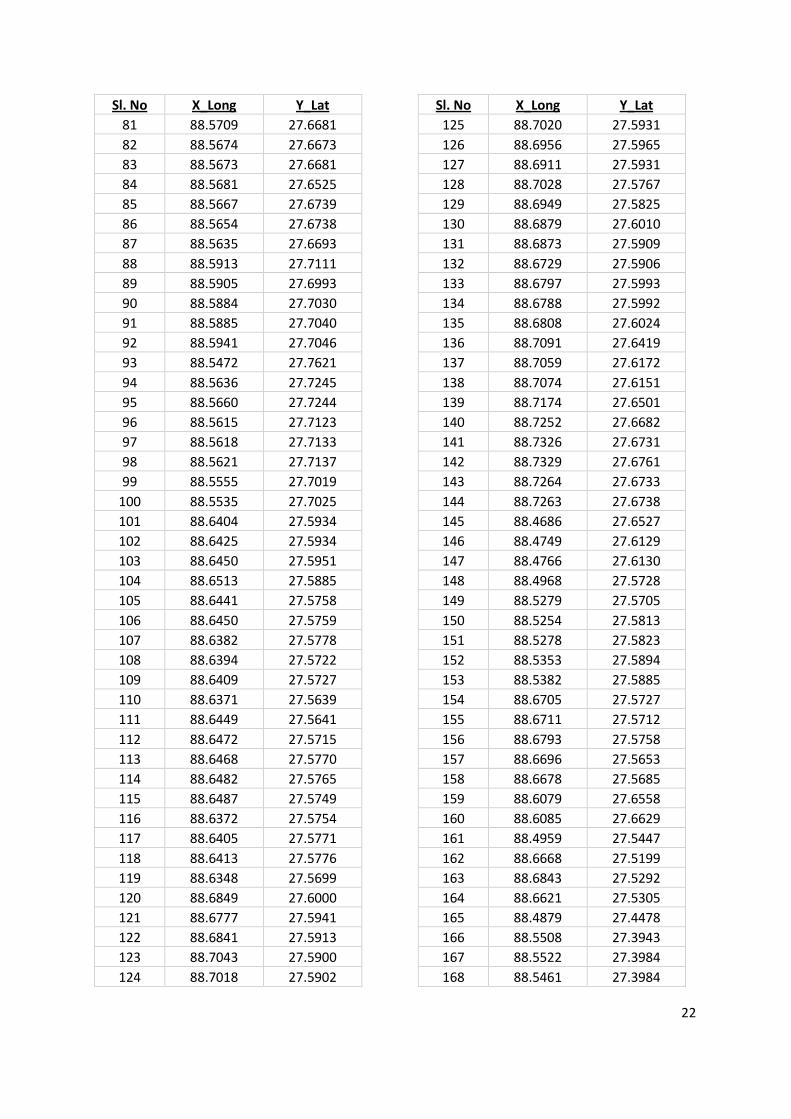
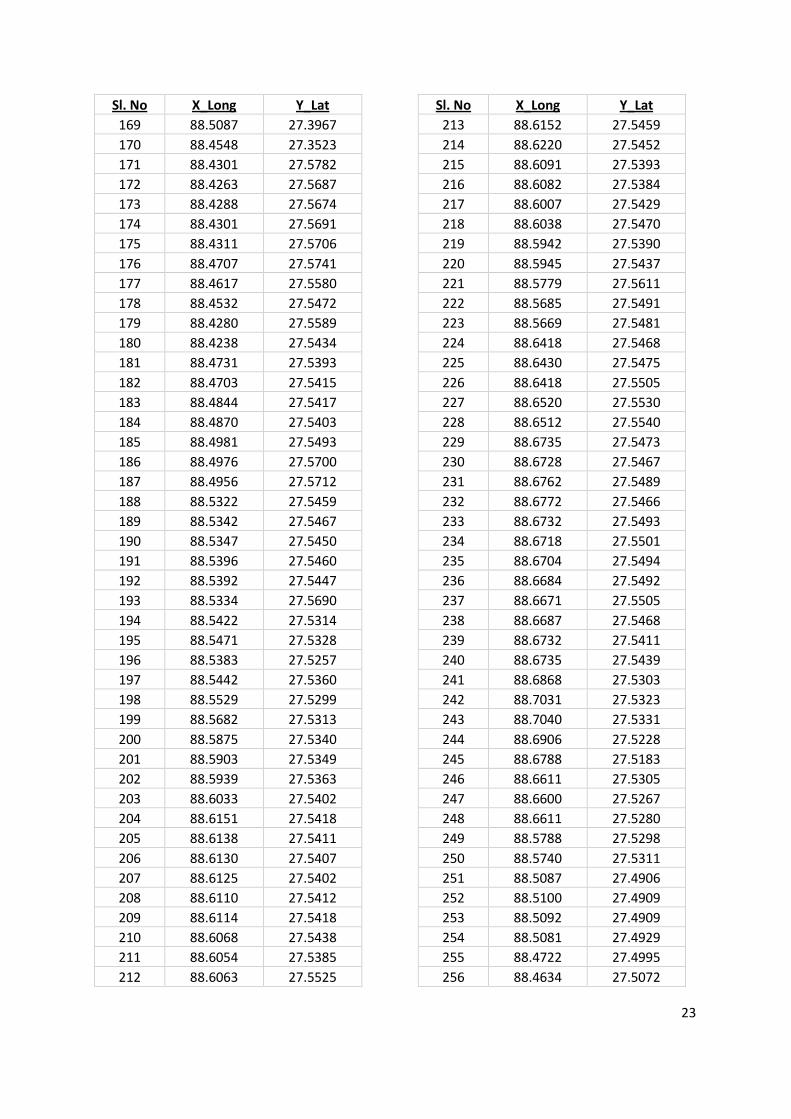
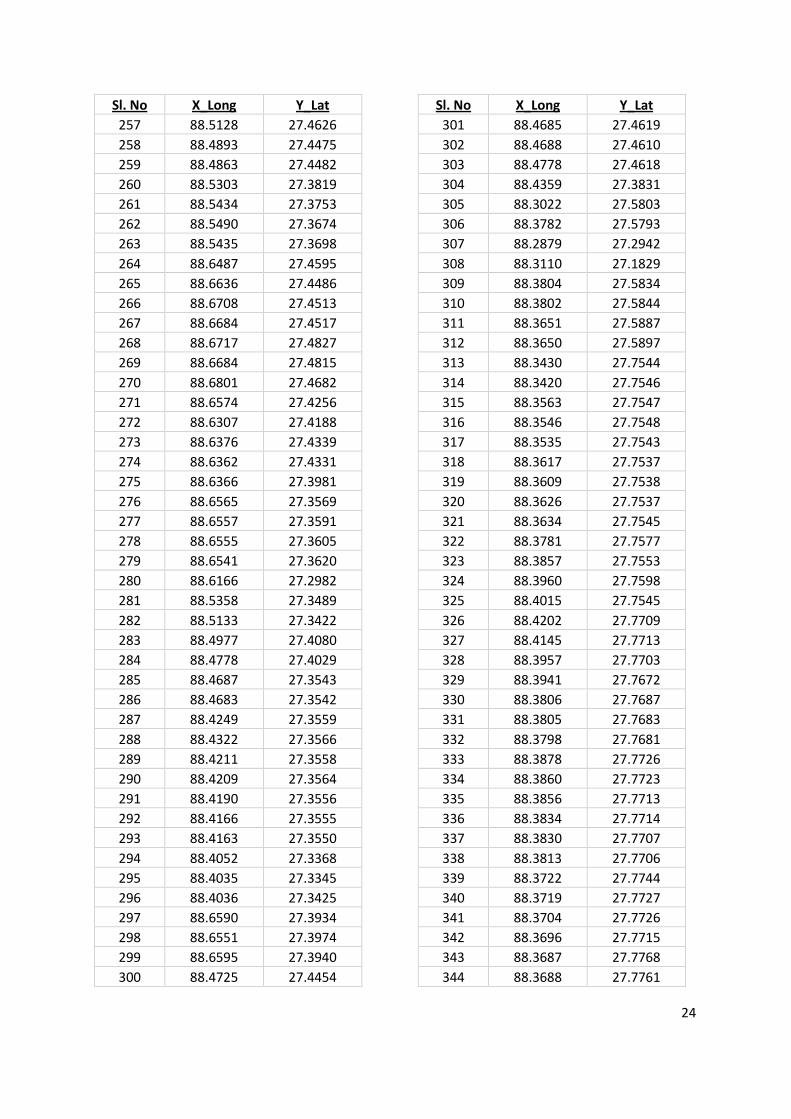
landslides (Fig. 3). Total 1196 new landslides were mapped using post-earthquake satellite
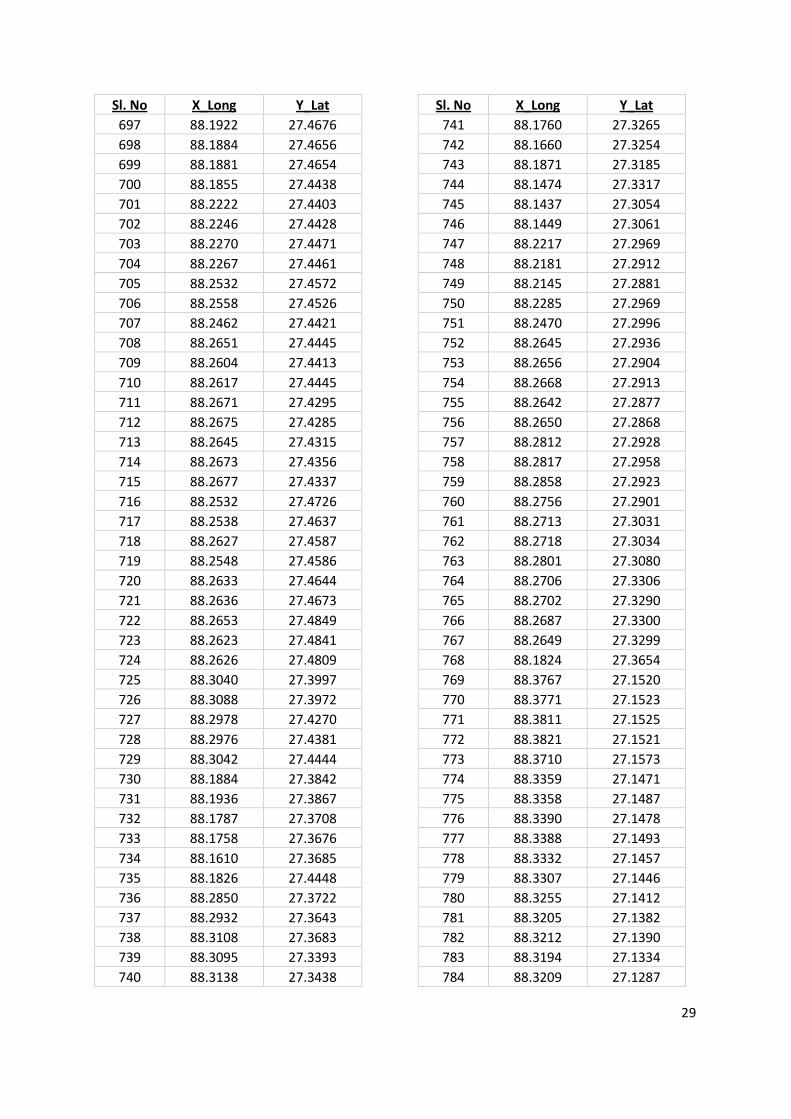
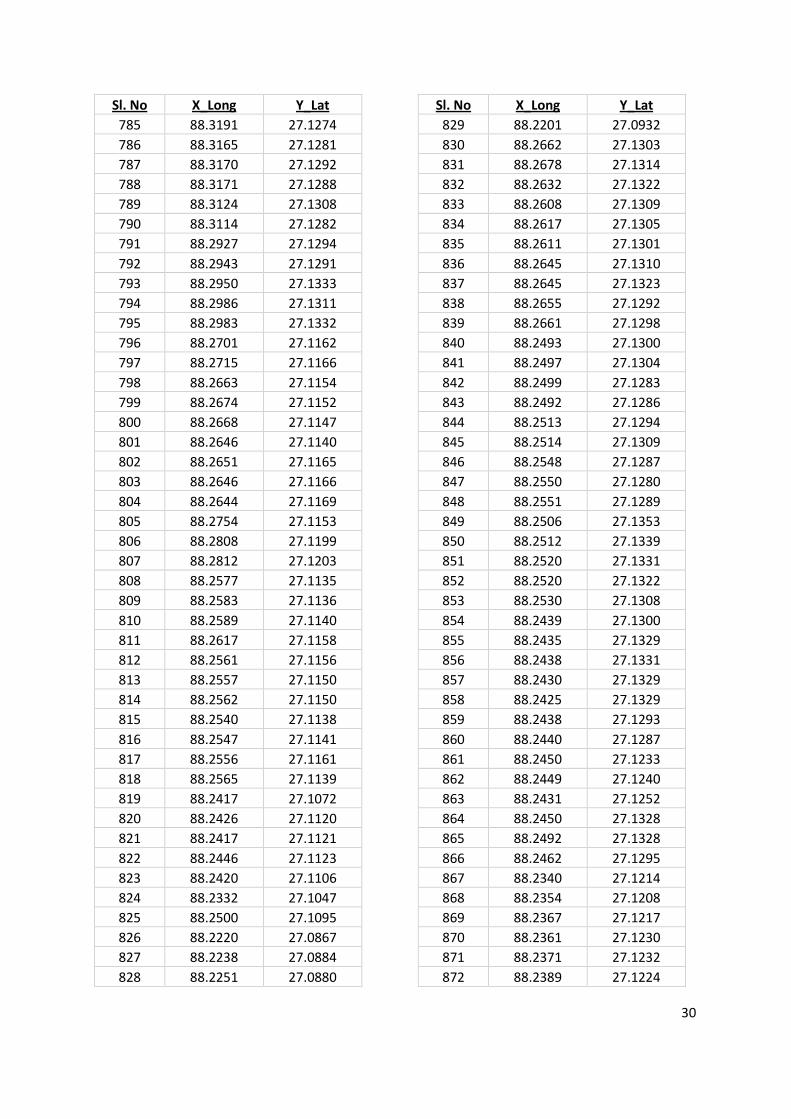
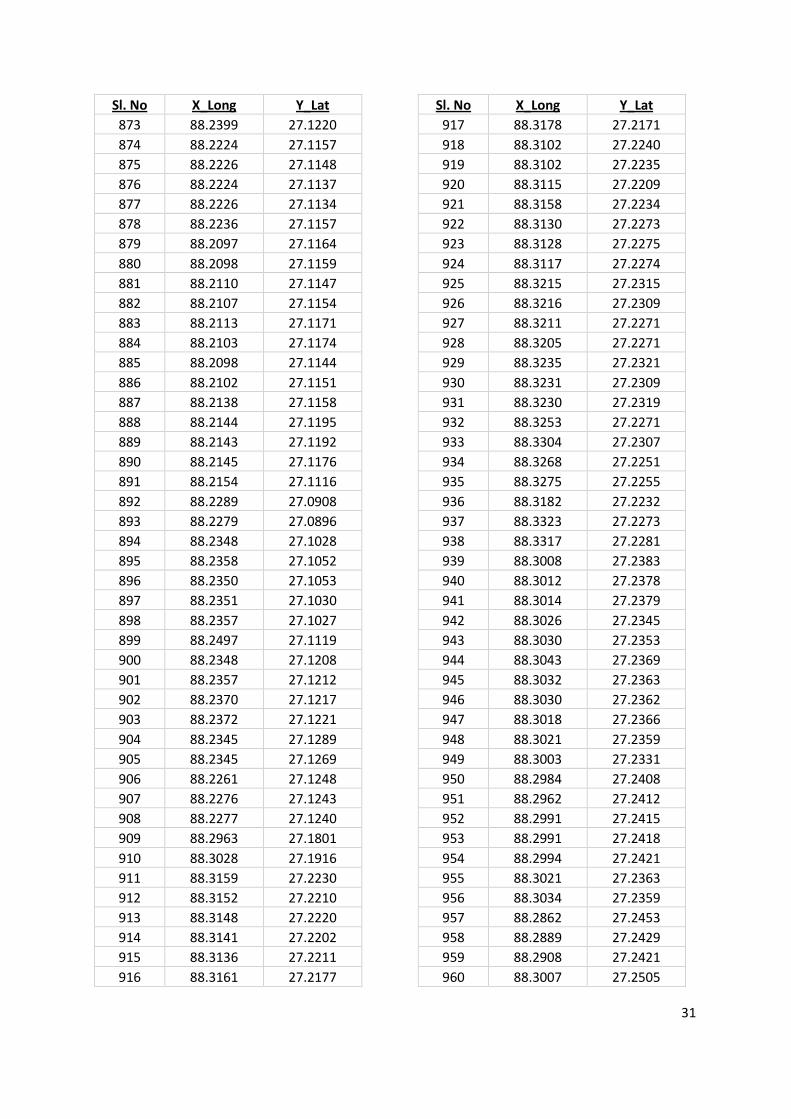
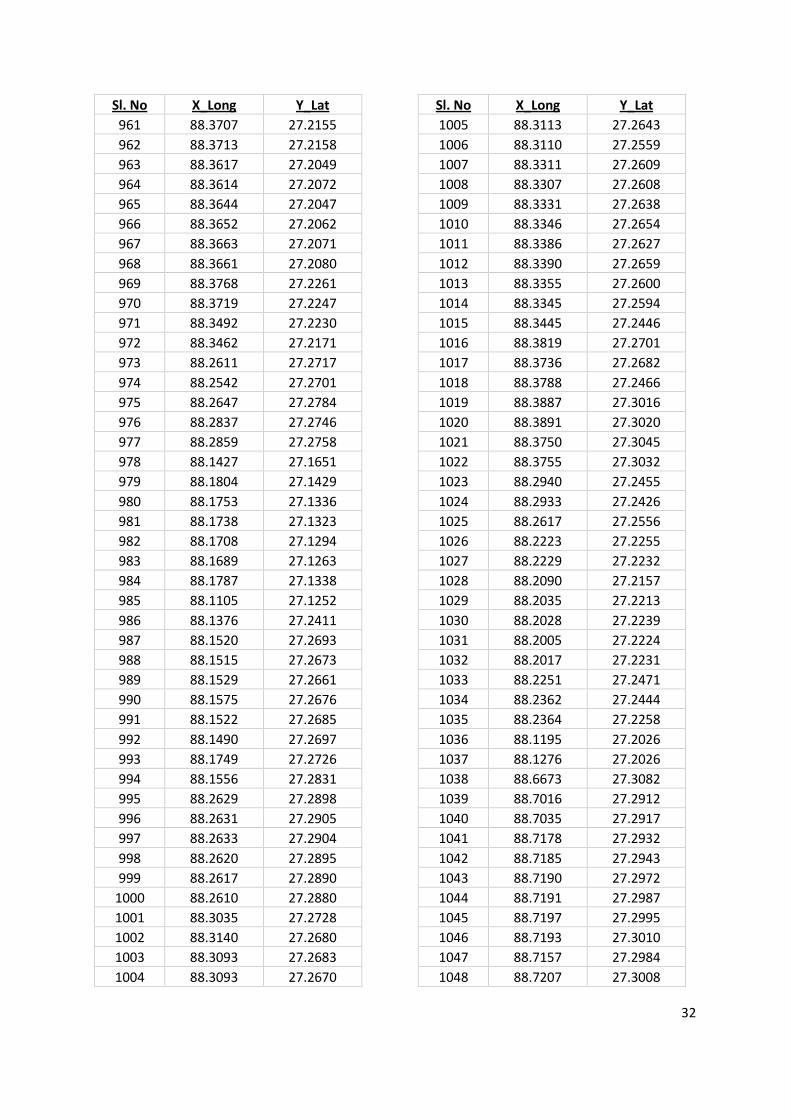
images (Fig. 4). The geographic location of all landslides is given in Annexure-I.
Fig. 3. Different types of landslides. a. Post-earthquake WorldView-2 false colour composite
of a large rock slide, b. Pre-earthquake Cartosat-1 image. Rectangle inside shows the location
of WorldView-2 image, c. Old landslides (shown with yellow arrows) as seen in the pre-
earthquake WorldView-1 image, and d. Reactivation of old landslides seen from post-
earthquake GeoEye-1 image.
9
Fig. 4. Post-earthquake landslide inventory created from VHR images. Landslide locations
are marked as dots.
10
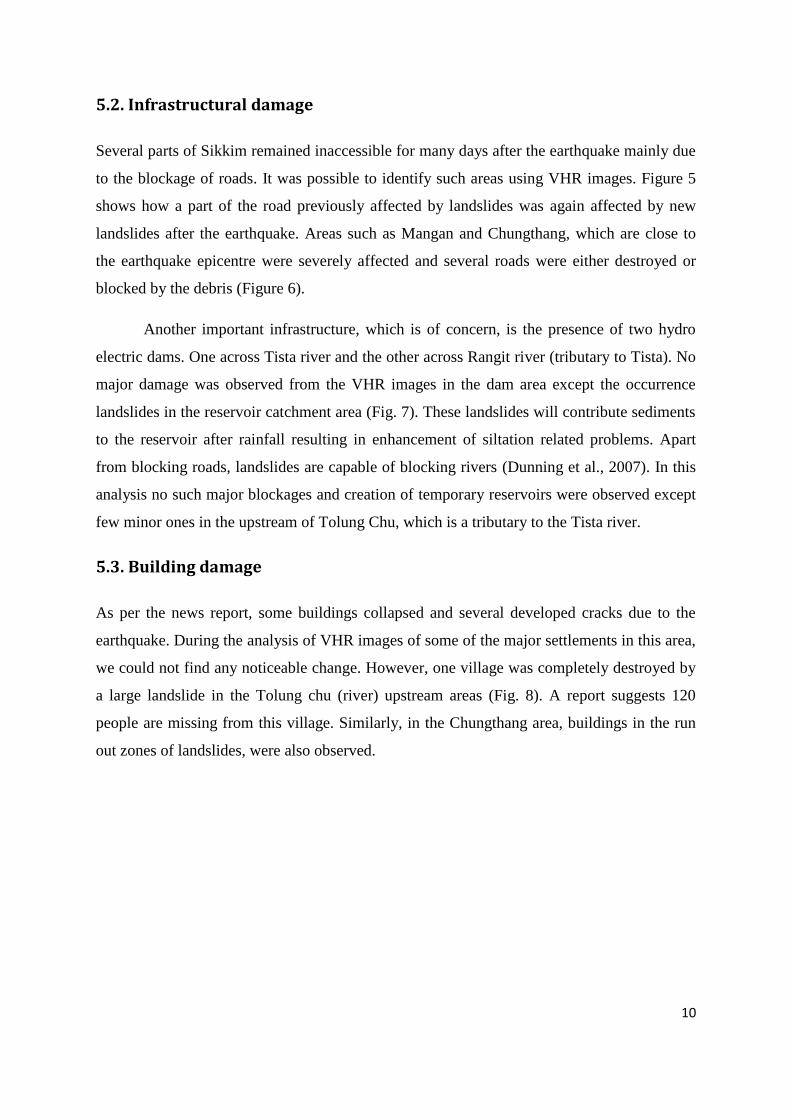
5.2. Infrastructural damage
Several parts of Sikkim remained inaccessible for many days after the earthquake mainly due
to the blockage of roads. It was possible to identify such areas using VHR images. Figure 5
shows how a part of the road previously affected by landslides was again affected by new
landslides after the earthquake. Areas such as Mangan and Chungthang, which are close to
the earthquake epicentre were severely affected and several roads were either destroyed or
blocked by the debris (Figure 6).
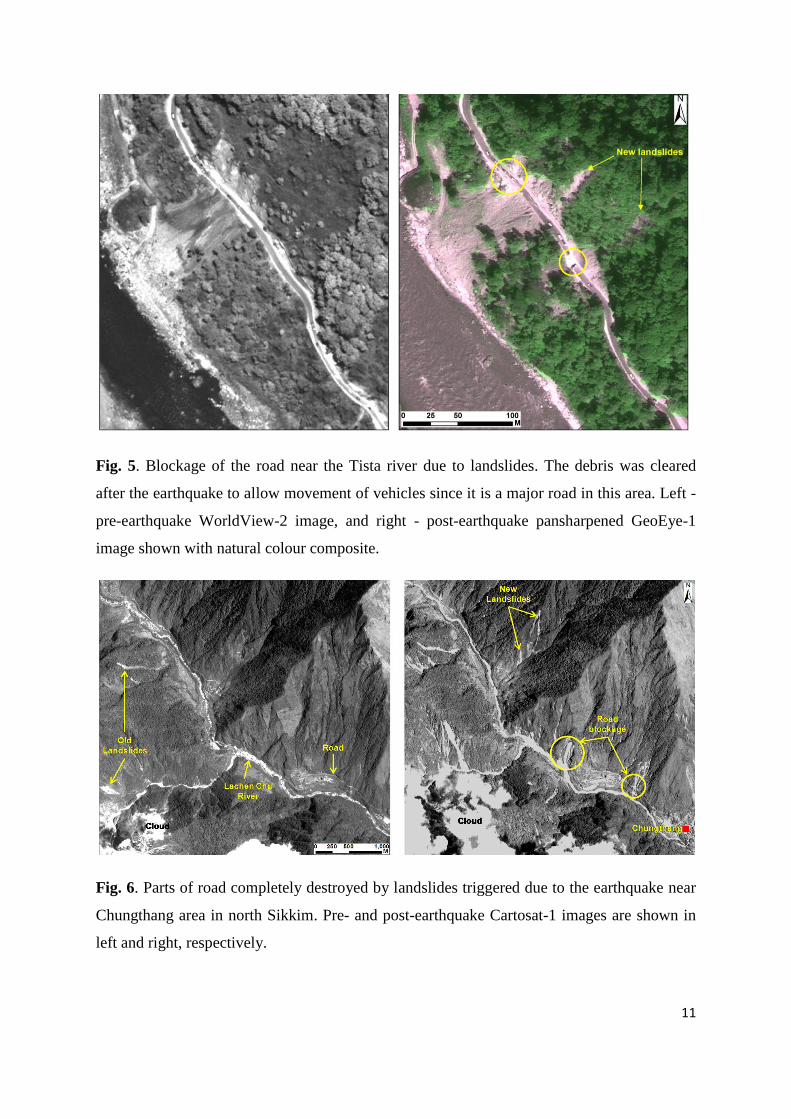
Another important infrastructure, which is of concern, is the presence of two hydro
electric dams. One across Tista river and the other across Rangit river (tributary to Tista). No
major damage was observed from the VHR images in the dam area except the occurrence
landslides in the reservoir catchment area (Fig. 7). These landslides will contribute sediments
to the reservoir after rainfall resulting in enhancement of siltation related problems. Apart
from blocking roads, landslides are capable of blocking rivers (Dunning et al., 2007). In this
analysis no such major blockages and creation of temporary reservoirs were observed except
few minor ones in the upstream of Tolung Chu, which is a tributary to the Tista river.
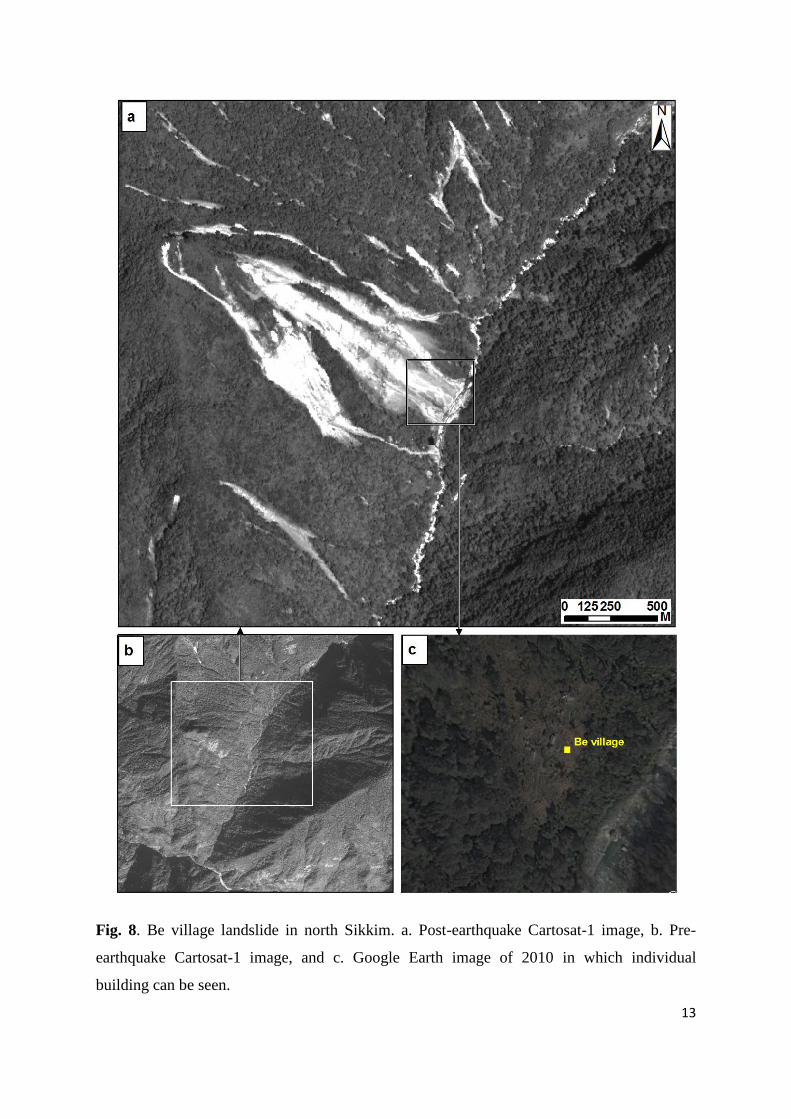
5.3. Building damage
As per the news report, some buildings collapsed and several developed cracks due to the
earthquake. During the analysis of VHR images of some of the major settlements in this area,
we could not find any noticeable change. However, one village was completely destroyed by
a large landslide in the Tolung chu (river) upstream areas (Fig. 8). A report suggests 120
people are missing from this village. Similarly, in the Chungthang area, buildings in the run
out zones of landslides, were also observed.
11
Fig. 5. Blockage of the road near the Tista river due to landslides. The debris was cleared
after the earthquake to allow movement of vehicles since it is a major road in this area. Left -
pre-earthquake WorldView-2 image, and right - post-earthquake pansharpened GeoEye-1
image shown with natural colour composite.
Fig. 6. Parts of road completely destroyed by landslides triggered due to the earthquake near
Chungthang area in north Sikkim. Pre- and post-earthquake Cartosat-1 images are shown in
left and right, respectively.
12
Fig. 7. False colour composite of post-earthquake QuickBird-2 multispectral image in the
bottom showing landslides in the reservoir area of a dam across Tista river. Pre-earthquake
panchromatic WorldView-1 is shown in the top. High reflectance of water in the reservoir in
the post-earthquake image is due to its sediment richness. New landslides triggered after the
earthquake are shown with yellow dots.
13
Fig. 8. Be village landslide in north Sikkim. a. Post-earthquake Cartosat-1 image, b. Pre-
earthquake Cartosat-1 image, and c. Google Earth image of 2010 in which individual
building can be seen.
14
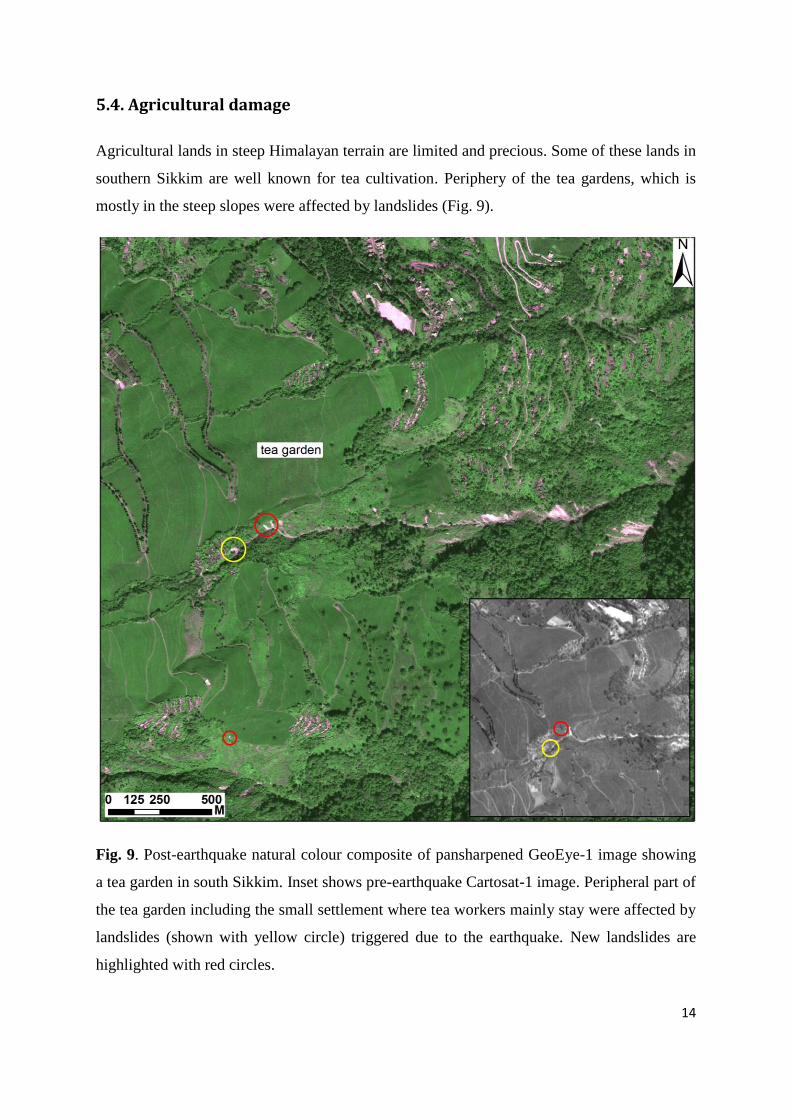
5.4. Agricultural damage
Agricultural lands in steep Himalayan terrain are limited and precious. Some of these lands in
southern Sikkim are well known for tea cultivation. Periphery of the tea gardens, which is
mostly in the steep slopes were affected by landslides (Fig. 9).
Fig. 9. Post-earthquake natural colour composite of pansharpened GeoEye-1 image showing
a tea garden in south Sikkim. Inset shows pre-earthquake Cartosat-1 image. Peripheral part of
the tea garden including the small settlement where tea workers mainly stay were affected by
landslides (shown with yellow circle) triggered due to the earthquake. New landslides are
highlighted with red circles.
15
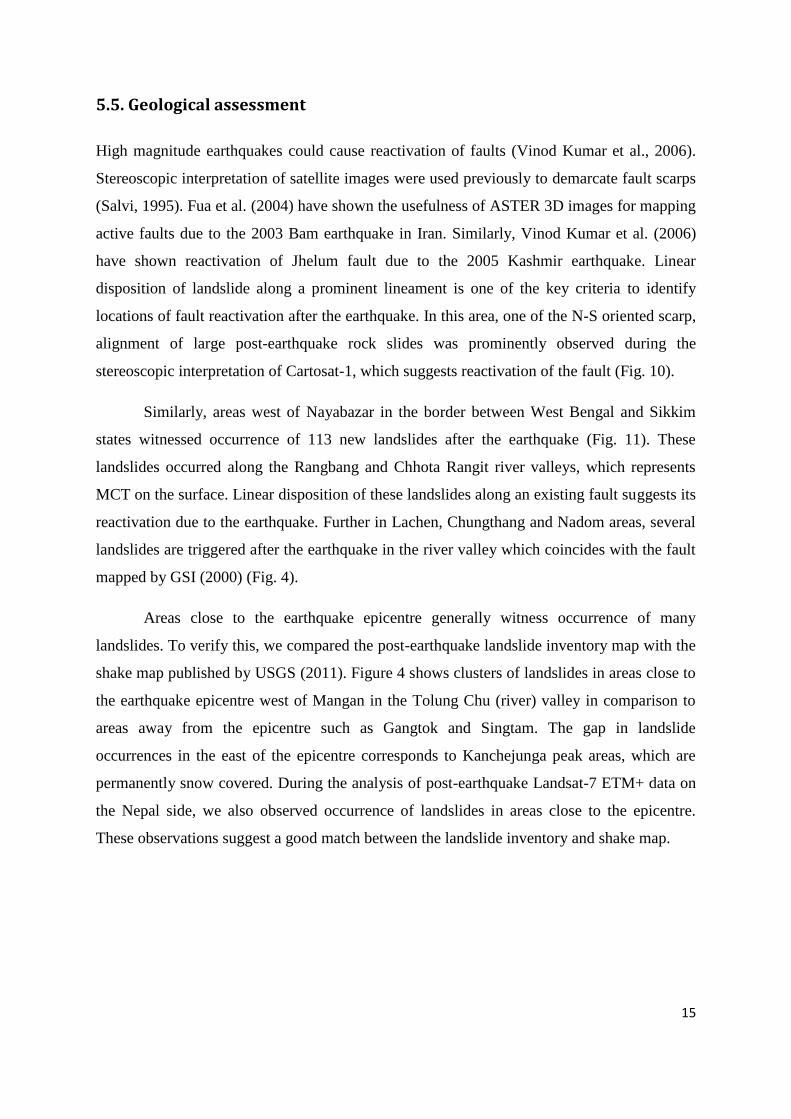
5.5. Geological assessment
High magnitude earthquakes could cause reactivation of faults (Vinod Kumar et al., 2006).
Stereoscopic interpretation of satellite images were used previously to demarcate fault scarps
(Salvi, 1995). Fua et al. (2004) have shown the usefulness of ASTER 3D images for mapping
active faults due to the 2003 Bam earthquake in Iran. Similarly, Vinod Kumar et al. (2006)
have shown reactivation of Jhelum fault due to the 2005 Kashmir earthquake. Linear
disposition of landslide along a prominent lineament is one of the key criteria to identify
locations of fault reactivation after the earthquake. In this area, one of the N-S oriented scarp,
alignment of large post-earthquake rock slides was prominently observed during the
stereoscopic interpretation of Cartosat-1, which suggests reactivation of the fault (Fig. 10).
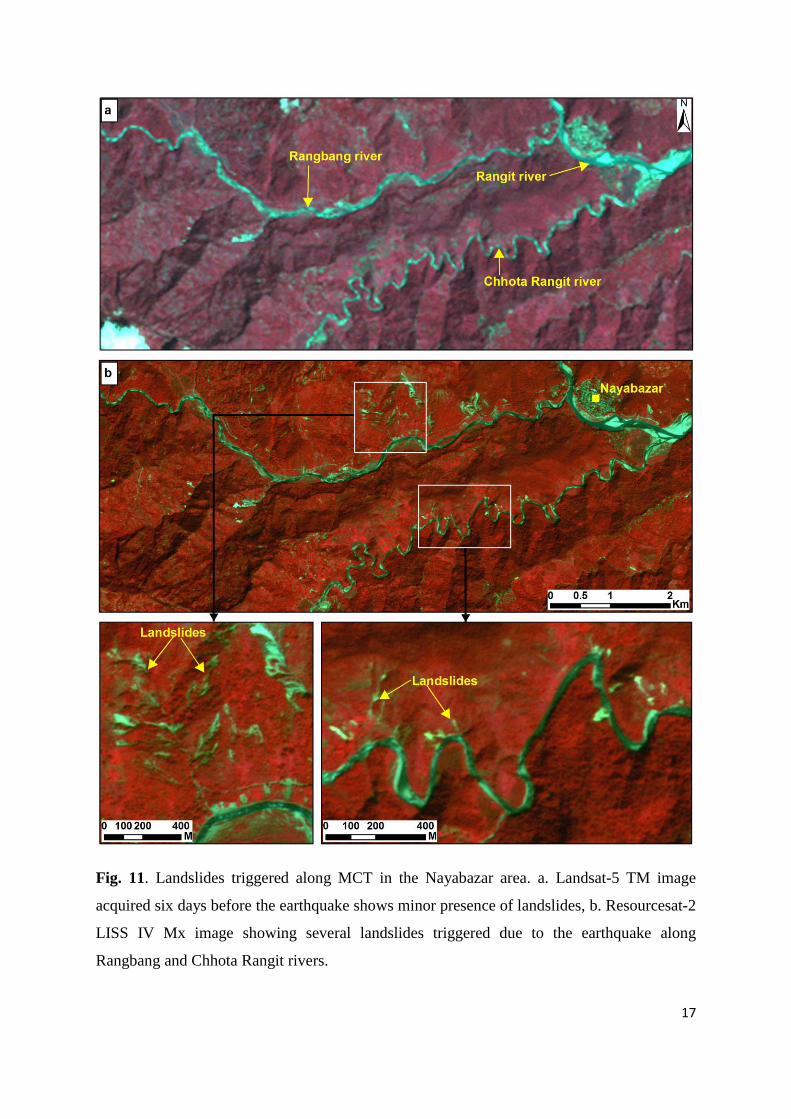
Similarly, areas west of Nayabazar in the border between West Bengal and Sikkim
states witnessed occurrence of 113 new landslides after the earthquake (Fig. 11). These
landslides occurred along the Rangbang and Chhota Rangit river valleys, which represents
MCT on the surface. Linear disposition of these landslides along an existing fault suggests its
reactivation due to the earthquake. Further in Lachen, Chungthang and Nadom areas, several
landslides are triggered after the earthquake in the river valley which coincides with the fault
mapped by GSI (2000) (Fig. 4).
Areas close to the earthquake epicentre generally witness occurrence of many
landslides. To verify this, we compared the post-earthquake landslide inventory map with the
shake map published by USGS (2011). Figure 4 shows clusters of landslides in areas close to
the earthquake epicentre west of Mangan in the Tolung Chu (river) valley in comparison to
areas away from the epicentre such as Gangtok and Singtam. The gap in landslide
occurrences in the east of the epicentre corresponds to Kanchejunga peak areas, which are
permanently snow covered. During the analysis of post-earthquake Landsat-7 ETM+ data on
the Nepal side, we also observed occurrence of landslides in areas close to the epicentre.
These observations suggest a good match between the landslide inventory and shake map.
16
Fig. 10. Post-earthquake panchromatic image of GeoEye-1. Inset (upper) shows a large rock
fall. Source area of the rock fall as well as the debris could be seen clearly in the VHR image.
Inset (lower) shows 3D perspective of the fault scarp with the yellow line marked on a
prominent break-in-slope. Linear disposition of large rock falls along the scarp suggests
reactivation of the fault.
17
Fig. 11. Landslides triggered along MCT in the Nayabazar area. a. Landsat-5 TM image
acquired six days before the earthquake shows minor presence of landslides, b. Resourcesat-2
LISS IV Mx image showing several landslides triggered due to the earthquake along
Rangbang and Chhota Rangit rivers.
18
6. Conclusions
This report highlights the importance of VHR images in a disaster situation. The main
contribution of the report is rapid assessment of an area (4105 km2) in Sikkim using 123
scenes of images from eight satellites. Acquisition of satellite images under the coordinated
effort under ICSMD was very helpful since the data for the affected area was made available
in short time, which helped in rapid assessment and quick dissemination of results.
Preliminary results highlighting the affected areas were hosted on 04 October 2011 in the
NRSC website (www.nrsc.gov.in) for information to general public.
A total of 1196 new landslides (including reactivated landslides) were mapped in the
Sikkim area. Mangan and Chungthang areas in north Sikkim were found to be severely
affected by landslides. Be village, west of Mangan was completely destroyed by a large rock
slide. Many roads along Tista river and its tributaries, were either blocked or completely
dislodged by landslides. Landslides were also mapped in the reservoir catchment areas which
may cause siltation related problems in future.
3D visualisation coupled with detail information of the terrain provided by VHR
images were helpful to identify locations of rock fall along an escarpment suggesting
activation of faults due to the earthquake. Linear disposition of landslides along existing
faults showed their reactivation due to the earthquake. The landslide inventory map prepared
from VHR images matched well with the earthquake shake map of USGS.
Although results from the rapid assessment of Sikkim earthquake were presented in
this report, availability of cloud free data nine days after the earthquake caused the delay in
carrying out the damage assessment. Microwave data, although, available immediately after
the earthquake could not be interpreted due to foreshortening and layover effects, which are
inherent problems in rugged terrains. Nevertheless, the report presented a rapid and detail
assessment of vastly inaccessible areas in Sikkim which otherwise would have been difficult.
7. References
Arciniegas, G.A., Bijker, W., Kerle, N., & Tolpekin, V.A. (2007). Coherence- and
Amplitude-Based Analysis of Seismogenic Damage in Bam, Iran, Using ENVISAT
ASAR Data. IEEE Transactions on Geoscience and Remote Sensing, 45, 1571-1581
19
Baltsavias, E., Kocaman, S., & Wolff, K. (2008). Analysis of Cartosat-1 images regarding
image quality, 3D point measurement and DSM generation. The Photogrammetric
Record, 23, 305-322
Di, B., Zeng, H., Zhang, M., Ustin, S.L., Tang, Y., Wang, Z., Chen, N., & Zhang, B. (2010).
Quantifying the spatial distribution of soil mass wasting processes after the 2008
earthquake in Wenchuan, China A case study of the Longmenshan area. Remote
Sensing of Environment, 114, 761-771
Dunning, S.A., Mitchell, W.A., Rosser, N.J., & Petley, D.N. (2007). The Hattian Bala rock
avalanche and associated landslides triggered by the Kashmir Earthquake of 8
October 2005. Engineering Geology, 93, 130-144
Fua, B., Ninomiyab, Y., Leib, X., Todaa, S., & Awata, Y. (2004). Mapping active fault
associated with the 2003 Mw 6.6 Bam (SE Iran) earthquake with ASTER 3D
images. Remote Sensing of Environment, 94, 153-157
Gamba, P., Dell'Acqua, F., & Trianni, G. (2007). Rapid Damage Detection in the Bam Area
Using Multitemporal SAR and Exploiting Ancillary Data. IEEE Transactions on
Geoscience and Remote Sensing, 45, 1582-1589
Ghosh, S., Gunther, A., Carranza, E.J.M., van Westen, C.J., & Jetten, V.G. (2010). Rock
slope instability assessment using spatially distributed structural orientation data in
Darjeeling Himalaya (India). Earth Surf. Process. Landforms, 35, 1773-1792
Gorum, T., Fan, X., van Westen, C.J., Huang, R.Q., Xu, Q., Tang, C., & Wang, G. (2011).
Distribution Pattern of Earthquake-induced Landslides Triggered by the 12 May
2008 Wenchuan Earthquake. Geomorphology, 133, 152-167
GSI (2000). Seismotectonic atlas of India and its environs. Calcutta, India: Geological
Survey of India
Jibson, R.W., Harp, E.L., Schulz, W., & Keefer, D.K. (2006). Large rock avalanches
triggered by the M 7.9 Denali Fault, Alaska, earthquake of 3 November 2002.
Engineering Geology, 83, 144-160
Kayal, J.R. (2001). Microearthquake activity in some parts of the Himalayas and the tectonic
model. Tectonophysics, 339, 331-351
Martha, T.R., Kerle, N., van Westen, C.J., Jetten, V., & Vinod Kumar, K. (2010). Effect of
sun elevation angle on DSMs derived from Cartosat-1 data. Photogrammetric
Engineering and Remote Sensing, 76, 429-438
20
Mehrotra, G.S., Sarkar, S., Kanungo, D.P., & Mahadevaiah, K. (1996). Terrain analysis and
spatial assessment of landslide hazards in parts of Sikkim Himalaya. Journal of the
Geological Society of India, 47, 491-498
Metternicht, G., Hurni, L., & Gogu, R. (2005). Remote sensing of landslides: An analysis of the
potential contribution to geo-spatial systems for hazard assessment in mountainous
environments. Remote Sensing of Environment, 98, 284-303
Raju, P.S., Rao, N.P., Singh, A., & Ravi Kumar, A. (2007). The 14 February 2006 Sikkim earthquake
of magnitude 5.3. Current Science, 93, 848-850
Ray, P.K.C., Parvaiz, I., Jayangondaperumal, R., Thakur, V.C., Dadhwal, V.K., & Bhat, F.A. (2009).
Analysis of seismicity-induced landslides due to the 8 October 2005 earthquake in Kashmir
Himalaya. Current Science, 97, 1742-1755
Salvi, S. (1995). Analysis and interpretation of Landsat synthetic stereo pair for the detection of active
fault zones in the Abruzzi region (Central Italy). Remote Sensing of Environment, 53, 165-
163
Stumpf, A., & Kerle, N. (2011). Object-oriented mapping of landslides using random forests. Remote
Sensing of Environment, DOI:10.1016/j.rse.2011.05.013
Tralli, D.M., Blom, R.G., Zlotnicki, V., Donnellan, A., & Evans, D.L. (2005). Satellite remote sensing
of earthquake, volcano, flood, landslide and coastal inundation hazards. ISPRS Journal of
Photogrammetry and Remote Sensing, 59, 185-198
USGS (2011). Shake map: India-Nepal border region. Available online at:
http://earthquake.usgs.gov/earthquakes/shakemap/global/shape/c0005wg6/#Instrumental_Int
ensity.
Vinod Kumar, K., Martha, T.R., & Roy, P.S. (2006). Mapping damage in the Jammu and Kashmir
caused by 8 October 2005 Mw 7.3 earthquake from the Cartosat–1 and Resourcesat–1
imagery. International Journal of Remote Sensing, 27, 4449-4459
Voigt, S., Kemper, T., Riedlinger, T., Kiefl, R., Scholte, K., & Mehl, H. (2007). Satellite Image
Analysis for Disaster and Crisis-Management Support. IEEE Transactions on Geoscience
and Remote Sensing, 45, 1520-1528
Wang, F., Cheng, Q., Highland, L., Miyajima, M., Wang, H., & Yan, C. (2009). Preliminary
investigation of some large landslides triggered by the 2008 Wenchuan earthquake, Sichuan
Province, China. Landslides, 6, 47-54
21
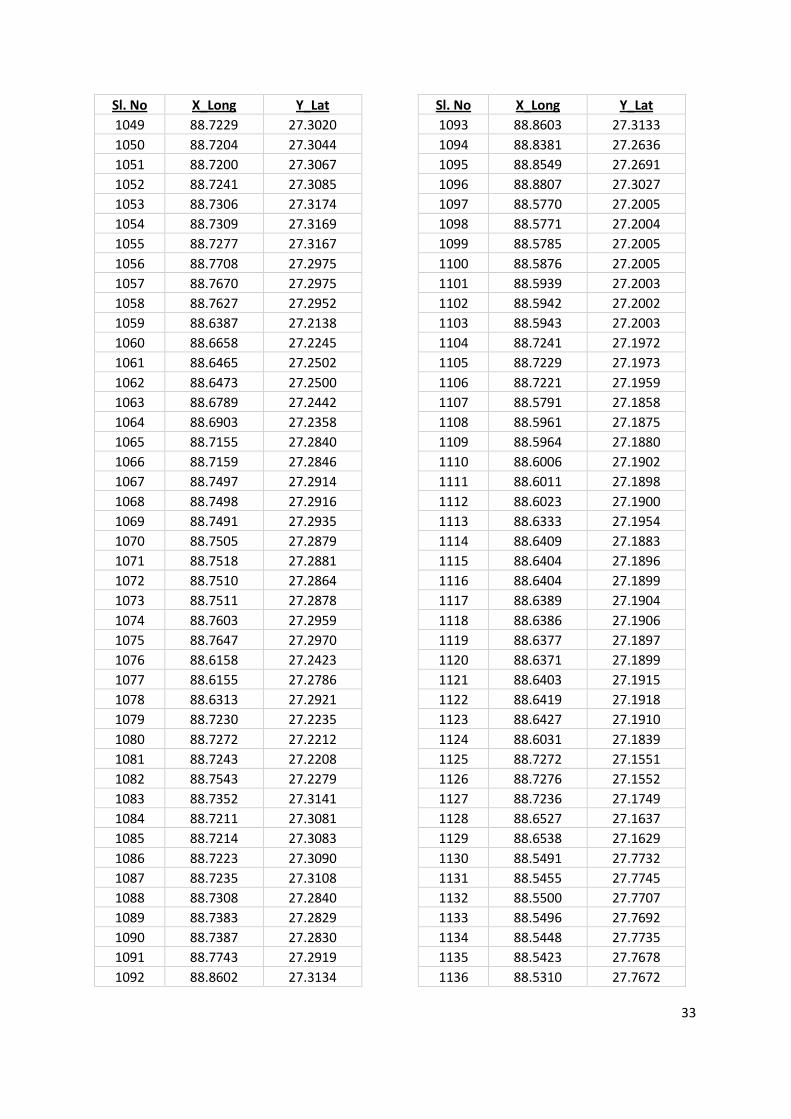
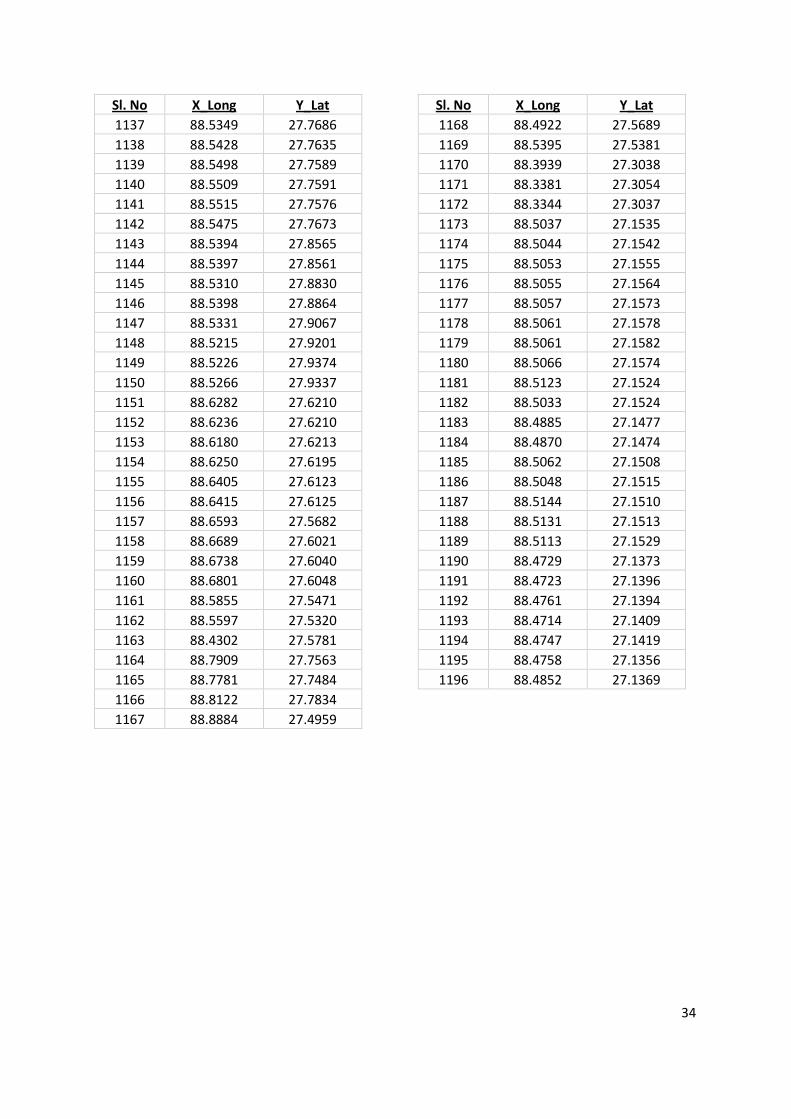
Annexure - I
Location of Landslides
Sl. No X_Long Y_Lat
1 88.5253 27.1573
2 88.5246 27.1583
3 88.5234 27.1589
4 88.5177 27.1637
5 88.4442 27.2379
6 88.4405 27.2356
7 88.4334 27.2300
8 88.4312 27.2305
9 88.4321 27.2270
10 88.3923 27.2707
11 88.7379 27.6875
12 88.6509 27.6220
13 88.6469 27.6160
14 88.6479 27.6158
15 88.6485 27.6156
16 88.6487 27.6137
17 88.6532 27.6102
18 88.6518 27.6110
19 88.6541 27.6126
20 88.6540 27.6133
21 88.6546 27.6151
22 88.6546 27.6132
23 88.6565 27.6138
24 88.6556 27.6135
25 88.6497 27.6113
26 88.6478 27.6096
27 88.6481 27.6099
28 88.6482 27.6100
29 88.6503 27.6100
30 88.6531 27.5975
31 88.6541 27.5992
32 88.6686 27.6140
33 88.6679 27.6229
34 88.6604 27.6155
35 88.6612 27.6154
36 88.6850 27.6387
37 88.6920 27.6311
38 88.6887 27.6293
39 88.6833 27.6267
40 88.7060 27.6409
Sl. No X_Long Y_Lat
41 88.7032 27.6353
42 88.6972 27.6376
43 88.6921 27.6418
44 88.6988 27.6382
45 88.6766 27.6374
46 88.6764 27.6441
47 88.6770 27.6444
48 88.6676 27.6337
49 88.6413 27.6119
50 88.6381 27.6160
51 88.6371 27.6170
52 88.6361 27.6170
53 88.6292 27.6161
54 88.6276 27.6178
55 88.6329 27.6230
56 88.6268 27.6319
57 88.6241 27.6292
58 88.6223 27.6398
59 88.6083 27.6183
60 88.6074 27.6180
61 88.6040 27.6207
62 88.6037 27.6192
63 88.6030 27.6135
64 88.6029 27.6147
65 88.6085 27.6297
66 88.6071 27.6300
67 88.6063 27.6289
68 88.6050 27.6278
69 88.6033 27.6271
70 88.6230 27.6075
71 88.6191 27.6028
72 88.6007 27.6345
73 88.5944 27.6409
74 88.5891 27.6574
75 88.5959 27.6571
76 88.5939 27.6558
77 88.6010 27.6449
78 88.6019 27.6452
79 88.5775 27.6538
80 88.5715 27.6528
22
Sl. No X_Long Y_Lat
81 88.5709 27.6681
82 88.5674 27.6673
83 88.5673 27.6681
84 88.5681 27.6525
85 88.5667 27.6739
86 88.5654 27.6738
87 88.5635 27.6693
88 88.5913 27.7111
89 88.5905 27.6993
90 88.5884 27.7030
91 88.5885 27.7040
92 88.5941 27.7046
93 88.5472 27.7621
94 88.5636 27.7245
95 88.5660 27.7244
96 88.5615 27.7123
97 88.5618 27.7133
98 88.5621 27.7137
99 88.5555 27.7019
100 88.5535 27.7025
101 88.6404 27.5934
102 88.6425 27.5934
103 88.6450 27.5951
104 88.6513 27.5885
105 88.6441 27.5758
106 88.6450 27.5759
107 88.6382 27.5778
108 88.6394 27.5722
109 88.6409 27.5727
110 88.6371 27.5639
111 88.6449 27.5641
112 88.6472 27.5715
113 88.6468 27.5770
114 88.6482 27.5765
115 88.6487 27.5749
116 88.6372 27.5754
117 88.6405 27.5771
118 88.6413 27.5776
119 88.6348 27.5699
120 88.6849 27.6000
121 88.6777 27.5941
122 88.6841 27.5913
123 88.7043 27.5900
124 88.7018 27.5902
Sl. No X_Long Y_Lat
125 88.7020 27.5931
126 88.6956 27.5965
127 88.6911 27.5931
128 88.7028 27.5767
129 88.6949 27.5825
130 88.6879 27.6010
131 88.6873 27.5909
132 88.6729 27.5906
133 88.6797 27.5993
134 88.6788 27.5992
135 88.6808 27.6024
136 88.7091 27.6419
137 88.7059 27.6172
138 88.7074 27.6151
139 88.7174 27.6501
140 88.7252 27.6682
141 88.7326 27.6731
142 88.7329 27.6761
143 88.7264 27.6733
144 88.7263 27.6738
145 88.4686 27.6527
146 88.4749 27.6129
147 88.4766 27.6130
148 88.4968 27.5728
149 88.5279 27.5705
150 88.5254 27.5813
151 88.5278 27.5823
152 88.5353 27.5894
153 88.5382 27.5885
154 88.6705 27.5727
155 88.6711 27.5712
156 88.6793 27.5758
157 88.6696 27.5653
158 88.6678 27.5685
159 88.6079 27.6558
160 88.6085 27.6629
161 88.4959 27.5447
162 88.6668 27.5199
163 88.6843 27.5292
164 88.6621 27.5305
165 88.4879 27.4478
166 88.5508 27.3943
167 88.5522 27.3984
168 88.5461 27.3984
23
Sl. No X_Long Y_Lat
169 88.5087 27.3967
170 88.4548 27.3523
171 88.4301 27.5782
172 88.4263 27.5687
173 88.4288 27.5674
174 88.4301 27.5691
175 88.4311 27.5706
176 88.4707 27.5741
177 88.4617 27.5580
178 88.4532 27.5472
179 88.4280 27.5589
180 88.4238 27.5434
181 88.4731 27.5393
182 88.4703 27.5415
183 88.4844 27.5417
184 88.4870 27.5403
185 88.4981 27.5493
186 88.4976 27.5700
187 88.4956 27.5712
188 88.5322 27.5459
189 88.5342 27.5467
190 88.5347 27.5450
191 88.5396 27.5460
192 88.5392 27.5447
193 88.5334 27.5690
194 88.5422 27.5314
195 88.5471 27.5328
196 88.5383 27.5257
197 88.5442 27.5360
198 88.5529 27.5299
199 88.5682 27.5313
200 88.5875 27.5340
201 88.5903 27.5349
202 88.5939 27.5363
203 88.6033 27.5402
204 88.6151 27.5418
205 88.6138 27.5411
206 88.6130 27.5407
207 88.6125 27.5402
208 88.6110 27.5412
209 88.6114 27.5418
210 88.6068 27.5438
211 88.6054 27.5385
212 88.6063 27.5525
Sl. No X_Long Y_Lat
213 88.6152 27.5459
214 88.6220 27.5452
215 88.6091 27.5393
216 88.6082 27.5384
217 88.6007 27.5429
218 88.6038 27.5470
219 88.5942 27.5390
220 88.5945 27.5437
221 88.5779 27.5611
222 88.5685 27.5491
223 88.5669 27.5481
224 88.6418 27.5468
225 88.6430 27.5475
226 88.6418 27.5505
227 88.6520 27.5530
228 88.6512 27.5540
229 88.6735 27.5473
230 88.6728 27.5467
231 88.6762 27.5489
232 88.6772 27.5466
233 88.6732 27.5493
234 88.6718 27.5501
235 88.6704 27.5494
236 88.6684 27.5492
237 88.6671 27.5505
238 88.6687 27.5468
239 88.6732 27.5411
240 88.6735 27.5439
241 88.6868 27.5303
242 88.7031 27.5323
243 88.7040 27.5331
244 88.6906 27.5228
245 88.6788 27.5183
246 88.6611 27.5305
247 88.6600 27.5267
248 88.6611 27.5280
249 88.5788 27.5298
250 88.5740 27.5311
251 88.5087 27.4906
252 88.5100 27.4909
253 88.5092 27.4909
254 88.5081 27.4929
255 88.4722 27.4995
256 88.4634 27.5072
24
Sl. No X_Long Y_Lat
257 88.5128 27.4626
258 88.4893 27.4475
259 88.4863 27.4482
260 88.5303 27.3819
261 88.5434 27.3753
262 88.5490 27.3674
263 88.5435 27.3698
264 88.6487 27.4595
265 88.6636 27.4486
266 88.6708 27.4513
267 88.6684 27.4517
268 88.6717 27.4827
269 88.6684 27.4815
270 88.6801 27.4682
271 88.6574 27.4256
272 88.6307 27.4188
273 88.6376 27.4339
274 88.6362 27.4331
275 88.6366 27.3981
276 88.6565 27.3569
277 88.6557 27.3591
278 88.6555 27.3605
279 88.6541 27.3620
280 88.6166 27.2982
281 88.5358 27.3489
282 88.5133 27.3422
283 88.4977 27.4080
284 88.4778 27.4029
285 88.4687 27.3543
286 88.4683 27.3542
287 88.4249 27.3559
288 88.4322 27.3566
289 88.4211 27.3558
290 88.4209 27.3564
291 88.4190 27.3556
292 88.4166 27.3555
293 88.4163 27.3550
294 88.4052 27.3368
295 88.4035 27.3345
296 88.4036 27.3425
297 88.6590 27.3934
298 88.6551 27.3974
299 88.6595 27.3940
300 88.4725 27.4454
Sl. No X_Long Y_Lat
301 88.4685 27.4619
302 88.4688 27.4610
303 88.4778 27.4618
304 88.4359 27.3831
305 88.3022 27.5803
306 88.3782 27.5793
307 88.2879 27.2942
308 88.3110 27.1829
309 88.3804 27.5834
310 88.3802 27.5844
311 88.3651 27.5887
312 88.3650 27.5897
313 88.3430 27.7544
314 88.3420 27.7546
315 88.3563 27.7547
316 88.3546 27.7548
317 88.3535 27.7543
318 88.3617 27.7537
319 88.3609 27.7538
320 88.3626 27.7537
321 88.3634 27.7545
322 88.3781 27.7577
323 88.3857 27.7553
324 88.3960 27.7598
325 88.4015 27.7545
326 88.4202 27.7709
327 88.4145 27.7713
328 88.3957 27.7703
329 88.3941 27.7672
330 88.3806 27.7687
331 88.3805 27.7683
332 88.3798 27.7681
333 88.3878 27.7726
334 88.3860 27.7723
335 88.3856 27.7713
336 88.3834 27.7714
337 88.3830 27.7707
338 88.3813 27.7706
339 88.3722 27.7744
340 88.3719 27.7727
341 88.3704 27.7726
342 88.3696 27.7715
343 88.3687 27.7768
344 88.3688 27.7761
25
Sl. No X_Long Y_Lat
345 88.3623 27.7723
346 88.3626 27.7701
347 88.3627 27.7693
348 88.3459 27.7722
349 88.3446 27.7712
350 88.3427 27.7750
351 88.3416 27.7757
352 88.3357 27.7723
353 88.3378 27.7726
354 88.3184 27.7825
355 88.3159 27.7806
356 88.3129 27.7799
357 88.3077 27.7753
358 88.3100 27.7713
359 88.3047 27.5843
360 88.3080 27.5861
361 88.3068 27.5858
362 88.3083 27.5883
363 88.3081 27.5900
364 88.3095 27.5903
365 88.3114 27.5890
366 88.3106 27.5871
367 88.2988 27.5812
368 88.3096 27.5701
369 88.3118 27.5712
370 88.3129 27.5720
371 88.3098 27.5652
372 88.3081 27.5597
373 88.3103 27.5630
374 88.3233 27.5754
375 88.3206 27.5688
376 88.3250 27.5682
377 88.3254 27.5690
378 88.3310 27.5699
379 88.3308 27.5733
380 88.3326 27.5763
381 88.3337 27.5751
382 88.3311 27.5913
383 88.3310 27.5852
384 88.3297 27.5900
385 88.3193 27.5925
386 88.3163 27.5892
387 88.3132 27.5869
388 88.3121 27.5825
Sl. No X_Long Y_Lat
389 88.3132 27.5849
390 88.3449 27.6074
391 88.3537 27.5918
392 88.3545 27.5904
393 88.3541 27.5893
394 88.3597 27.5935
395 88.3616 27.5924
396 88.3606 27.5922
397 88.3668 27.6139
398 88.3617 27.6084
399 88.3663 27.6080
400 88.3687 27.6082
401 88.3682 27.6067
402 88.3605 27.6017
403 88.3629 27.5980
404 88.3591 27.6113
405 88.3557 27.6165
406 88.3531 27.6120
407 88.3722 27.6112
408 88.3749 27.6153
409 88.3777 27.5937
410 88.3764 27.5953
411 88.3814 27.5928
412 88.3842 27.5851
413 88.3845 27.5843
414 88.3880 27.5857
415 88.3806 27.5798
416 88.4021 27.5848
417 88.4057 27.5832
418 88.3999 27.5728
419 88.4045 27.5749
420 88.4050 27.5752
421 88.4097 27.5915
422 88.4119 27.5899
423 88.4099 27.5893
424 88.4101 27.5893
425 88.4108 27.5878
426 88.4112 27.5928
427 88.4091 27.5814
428 88.4100 27.5766
429 88.3961 27.5841
430 88.3941 27.5826
431 88.3964 27.5823
432 88.4267 27.5752
26
Sl. No X_Long Y_Lat
433 88.4252 27.5741
434 88.4288 27.5765
435 88.4276 27.5665
436 88.4289 27.5638
437 88.4305 27.5635
438 88.4308 27.5647
439 88.4309 27.5635
440 88.4311 27.5640
441 88.4260 27.5552
442 88.4264 27.5559
443 88.4279 27.5570
444 88.4269 27.5539
445 88.4252 27.5537
446 88.4255 27.5526
447 88.4260 27.5493
448 88.4212 27.5570
449 88.4218 27.5598
450 88.4206 27.5555
451 88.4147 27.5611
452 88.4074 27.5591
453 88.4059 27.5572
454 88.4097 27.5490
455 88.3972 27.5431
456 88.3966 27.5535
457 88.3909 27.5492
458 88.3798 27.5522
459 88.3799 27.5511
460 88.3816 27.5506
461 88.3819 27.5510
462 88.3858 27.5597
463 88.3818 27.5478
464 88.3646 27.5569
465 88.3583 27.5534
466 88.3431 27.5625
467 88.3408 27.5607
468 88.3607 27.5844
469 88.3612 27.5803
470 88.3523 27.5832
471 88.3476 27.5874
472 88.3507 27.5869
473 88.2878 27.5398
474 88.2880 27.5404
475 88.2877 27.5418
476 88.2879 27.5414
Sl. No X_Long Y_Lat
477 88.2877 27.5653
478 88.2856 27.5620
479 88.3036 27.6389
480 88.3139 27.6536
481 88.3165 27.6500
482 88.3173 27.6500
483 88.3215 27.6460
484 88.3180 27.6336
485 88.3089 27.6317
486 88.3115 27.6321
487 88.3120 27.6320
488 88.3121 27.6324
489 88.3250 27.6373
490 88.3311 27.6310
491 88.3302 27.6325
492 88.3292 27.6354
493 88.3267 27.6283
494 88.3379 27.6135
495 88.3465 27.6196
496 88.3797 27.6246
497 88.3798 27.6259
498 88.3739 27.6172
499 88.3713 27.6157
500 88.3562 27.6120
501 88.3540 27.5956
502 88.3520 27.6015
503 88.3557 27.6056
504 88.3532 27.6060
505 88.3679 27.5951
506 88.3680 27.5661
507 88.3617 27.5612
508 88.3695 27.5696
509 88.3930 27.5859
510 88.4304 27.5856
511 88.4264 27.5851
512 88.4316 27.5834
513 88.4356 27.5878
514 88.4376 27.5902
515 88.4389 27.5932
516 88.4400 27.5953
517 88.4353 27.6002
518 88.4351 27.5989
519 88.4267 27.6030
520 88.4296 27.6000
27
Sl. No X_Long Y_Lat
521 88.4263 27.5960
522 88.4259 27.5930
523 88.4290 27.6099
524 88.4318 27.6107
525 88.4367 27.6111
526 88.4355 27.6088
527 88.4274 27.6069
528 88.4495 27.6078
529 88.4483 27.6049
530 88.4562 27.6106
531 88.4604 27.6082
532 88.4539 27.6206
533 88.4534 27.6203
534 88.4486 27.6241
535 88.4505 27.6250
536 88.4513 27.6246
537 88.4424 27.6202
538 88.4439 27.6083
539 88.4450 27.6096
540 88.4437 27.6050
541 88.4422 27.6036
542 88.4419 27.5974
543 88.4402 27.5975
544 88.4453 27.6030
545 88.4460 27.6192
546 88.4558 27.6276
547 88.4608 27.6235
548 88.4529 27.6339
549 88.4541 27.6385
550 88.4433 27.6411
551 88.4477 27.6498
552 88.4486 27.6508
553 88.4381 27.6748
554 88.4607 27.6588
555 88.4705 27.6287
556 88.4444 27.6497
557 88.4490 27.6378
558 88.4560 27.6093
559 88.4530 27.6082
560 88.4571 27.6047
561 88.4571 27.6056
562 88.4573 27.5958
563 88.4632 27.5984
564 88.4633 27.6001
Sl. No X_Long Y_Lat
565 88.4623 27.5985
566 88.4619 27.5840
567 88.4538 27.5829
568 88.4523 27.5824
569 88.4532 27.5819
570 88.4601 27.5852
571 88.4521 27.5942
572 88.4428 27.5645
573 88.4453 27.5658
574 88.4363 27.5624
575 88.4371 27.5621
576 88.4392 27.5599
577 88.4408 27.5596
578 88.4392 27.5588
579 88.4530 27.5701
580 88.4568 27.5740
581 88.4599 27.5736
582 88.4672 27.5752
583 88.4597 27.5675
584 88.4115 27.5192
585 88.4739 27.6127
586 88.4755 27.6127
587 88.4771 27.6129
588 88.4776 27.6134
589 88.4819 27.6029
590 88.4831 27.6108
591 88.4080 27.5149
592 88.4104 27.5168
593 88.4096 27.5156
594 88.4107 27.5161
595 88.4112 27.5167
596 88.4108 27.5184
597 88.4120 27.5169
598 88.4042 27.5080
599 88.4046 27.5092
600 88.3992 27.5057
601 88.4003 27.5069
602 88.3991 27.5022
603 88.4005 27.5037
604 88.3943 27.5027
605 88.3932 27.5125
606 88.3876 27.4745
607 88.3861 27.4689
608 88.3865 27.4714
28
Sl. No X_Long Y_Lat
609 88.3885 27.4707
610 88.3865 27.4646
611 88.3878 27.4664
612 88.3777 27.4672
613 88.3642 27.4638
614 88.3498 27.4505
615 88.3301 27.4948
616 88.3260 27.4863
617 88.3213 27.4801
618 88.3181 27.4745
619 88.3171 27.4779
620 88.3272 27.4221
621 88.3405 27.4339
622 88.3367 27.4406
623 88.3395 27.4450
624 88.3299 27.3858
625 88.3268 27.3866
626 88.3269 27.3883
627 88.3319 27.3900
628 88.3344 27.3895
629 88.3392 27.3867
630 88.3399 27.3891
631 88.3395 27.3902
632 88.3305 27.3893
633 88.3273 27.3884
634 88.3430 27.3722
635 88.3480 27.3774
636 88.3486 27.3772
637 88.3546 27.3787
638 88.3224 27.3630
639 88.3216 27.3613
640 88.3136 27.3111
641 88.3158 27.3126
642 88.3146 27.3128
643 88.3141 27.3118
644 88.3107 27.3110
645 88.3064 27.3038
646 88.3146 27.3022
647 88.3159 27.3035
648 88.3191 27.3022
649 88.3229 27.3129
650 88.3215 27.3125
651 88.3269 27.3150
652 88.3311 27.3148
Sl. No X_Long Y_Lat
653 88.3306 27.3150
654 88.3330 27.3204
655 88.4326 27.3381
656 88.4308 27.3297
657 88.4206 27.3278
658 88.4179 27.3313
659 88.4167 27.3297
660 88.4286 27.3541
661 88.3993 27.3231
662 88.4021 27.3240
663 88.4277 27.3188
664 88.3938 27.3040
665 88.3970 27.2993
666 88.4036 27.2999
667 88.3029 27.3209
668 88.3008 27.3214
669 88.2939 27.3271
670 88.2918 27.3358
671 88.2958 27.3410
672 88.3046 27.3431
673 88.3087 27.3420
674 88.2745 27.3354
675 88.2626 27.3384
676 88.2170 27.3859
677 88.2201 27.3857
678 88.2119 27.3898
679 88.2105 27.3913
680 88.2128 27.3914
681 88.2067 27.3932
682 88.2086 27.3899
683 88.2044 27.3843
684 88.2070 27.3846
685 88.1989 27.3764
686 88.2026 27.3757
687 88.2136 27.4018
688 88.1911 27.4162
689 88.1924 27.4152
690 88.1929 27.4147
691 88.1965 27.4202
692 88.2075 27.4217
693 88.1994 27.4130
694 88.1996 27.4063
695 88.1822 27.4671
696 88.1847 27.4667
29
Sl. No X_Long Y_Lat
697 88.1922 27.4676
698 88.1884 27.4656
699 88.1881 27.4654
700 88.1855 27.4438
701 88.2222 27.4403
702 88.2246 27.4428
703 88.2270 27.4471
704 88.2267 27.4461
705 88.2532 27.4572
706 88.2558 27.4526
707 88.2462 27.4421
708 88.2651 27.4445
709 88.2604 27.4413
710 88.2617 27.4445
711 88.2671 27.4295
712 88.2675 27.4285
713 88.2645 27.4315
714 88.2673 27.4356
715 88.2677 27.4337
716 88.2532 27.4726
717 88.2538 27.4637
718 88.2627 27.4587
719 88.2548 27.4586
720 88.2633 27.4644
721 88.2636 27.4673
722 88.2653 27.4849
723 88.2623 27.4841
724 88.2626 27.4809
725 88.3040 27.3997
726 88.3088 27.3972
727 88.2978 27.4270
728 88.2976 27.4381
729 88.3042 27.4444
730 88.1884 27.3842
731 88.1936 27.3867
732 88.1787 27.3708
733 88.1758 27.3676
734 88.1610 27.3685
735 88.1826 27.4448
736 88.2850 27.3722
737 88.2932 27.3643
738 88.3108 27.3683
739 88.3095 27.3393
740 88.3138 27.3438
Sl. No X_Long Y_Lat
741 88.1760 27.3265
742 88.1660 27.3254
743 88.1871 27.3185
744 88.1474 27.3317
745 88.1437 27.3054
746 88.1449 27.3061
747 88.2217 27.2969
748 88.2181 27.2912
749 88.2145 27.2881
750 88.2285 27.2969
751 88.2470 27.2996
752 88.2645 27.2936
753 88.2656 27.2904
754 88.2668 27.2913
755 88.2642 27.2877
756 88.2650 27.2868
757 88.2812 27.2928
758 88.2817 27.2958
759 88.2858 27.2923
760 88.2756 27.2901
761 88.2713 27.3031
762 88.2718 27.3034
763 88.2801 27.3080
764 88.2706 27.3306
765 88.2702 27.3290
766 88.2687 27.3300
767 88.2649 27.3299
768 88.1824 27.3654
769 88.3767 27.1520
770 88.3771 27.1523
771 88.3811 27.1525
772 88.3821 27.1521
773 88.3710 27.1573
774 88.3359 27.1471
775 88.3358 27.1487
776 88.3390 27.1478
777 88.3388 27.1493
778 88.3332 27.1457
779 88.3307 27.1446
780 88.3255 27.1412
781 88.3205 27.1382
782 88.3212 27.1390
783 88.3194 27.1334
784 88.3209 27.1287
30
Sl. No X_Long Y_Lat
785 88.3191 27.1274
786 88.3165 27.1281
787 88.3170 27.1292
788 88.3171 27.1288
789 88.3124 27.1308
790 88.3114 27.1282
791 88.2927 27.1294
792 88.2943 27.1291
793 88.2950 27.1333
794 88.2986 27.1311
795 88.2983 27.1332
796 88.2701 27.1162
797 88.2715 27.1166
798 88.2663 27.1154
799 88.2674 27.1152
800 88.2668 27.1147
801 88.2646 27.1140
802 88.2651 27.1165
803 88.2646 27.1166
804 88.2644 27.1169
805 88.2754 27.1153
806 88.2808 27.1199
807 88.2812 27.1203
808 88.2577 27.1135
809 88.2583 27.1136
810 88.2589 27.1140
811 88.2617 27.1158
812 88.2561 27.1156
813 88.2557 27.1150
814 88.2562 27.1150
815 88.2540 27.1138
816 88.2547 27.1141
817 88.2556 27.1161
818 88.2565 27.1139
819 88.2417 27.1072
820 88.2426 27.1120
821 88.2417 27.1121
822 88.2446 27.1123
823 88.2420 27.1106
824 88.2332 27.1047
825 88.2500 27.1095
826 88.2220 27.0867
827 88.2238 27.0884
828 88.2251 27.0880
Sl. No X_Long Y_Lat
829 88.2201 27.0932
830 88.2662 27.1303
831 88.2678 27.1314
832 88.2632 27.1322
833 88.2608 27.1309
834 88.2617 27.1305
835 88.2611 27.1301
836 88.2645 27.1310
837 88.2645 27.1323
838 88.2655 27.1292
839 88.2661 27.1298
840 88.2493 27.1300
841 88.2497 27.1304
842 88.2499 27.1283
843 88.2492 27.1286
844 88.2513 27.1294
845 88.2514 27.1309
846 88.2548 27.1287
847 88.2550 27.1280
848 88.2551 27.1289
849 88.2506 27.1353
850 88.2512 27.1339
851 88.2520 27.1331
852 88.2520 27.1322
853 88.2530 27.1308
854 88.2439 27.1300
855 88.2435 27.1329
856 88.2438 27.1331
857 88.2430 27.1329
858 88.2425 27.1329
859 88.2438 27.1293
860 88.2440 27.1287
861 88.2450 27.1233
862 88.2449 27.1240
863 88.2431 27.1252
864 88.2450 27.1328
865 88.2492 27.1328
866 88.2462 27.1295
867 88.2340 27.1214
868 88.2354 27.1208
869 88.2367 27.1217
870 88.2361 27.1230
871 88.2371 27.1232
872 88.2389 27.1224
31
Sl. No X_Long Y_Lat
873 88.2399 27.1220
874 88.2224 27.1157
875 88.2226 27.1148
876 88.2224 27.1137
877 88.2226 27.1134
878 88.2236 27.1157
879 88.2097 27.1164
880 88.2098 27.1159
881 88.2110 27.1147
882 88.2107 27.1154
883 88.2113 27.1171
884 88.2103 27.1174
885 88.2098 27.1144
886 88.2102 27.1151
887 88.2138 27.1158
888 88.2144 27.1195
889 88.2143 27.1192
890 88.2145 27.1176
891 88.2154 27.1116
892 88.2289 27.0908
893 88.2279 27.0896
894 88.2348 27.1028
895 88.2358 27.1052
896 88.2350 27.1053
897 88.2351 27.1030
898 88.2357 27.1027
899 88.2497 27.1119
900 88.2348 27.1208
901 88.2357 27.1212
902 88.2370 27.1217
903 88.2372 27.1221
904 88.2345 27.1289
905 88.2345 27.1269
906 88.2261 27.1248
907 88.2276 27.1243
908 88.2277 27.1240
909 88.2963 27.1801
910 88.3028 27.1916
911 88.3159 27.2230
912 88.3152 27.2210
913 88.3148 27.2220
914 88.3141 27.2202
915 88.3136 27.2211
916 88.3161 27.2177
Sl. No X_Long Y_Lat
917 88.3178 27.2171
918 88.3102 27.2240
919 88.3102 27.2235
920 88.3115 27.2209
921 88.3158 27.2234
922 88.3130 27.2273
923 88.3128 27.2275
924 88.3117 27.2274
925 88.3215 27.2315
926 88.3216 27.2309
927 88.3211 27.2271
928 88.3205 27.2271
929 88.3235 27.2321
930 88.3231 27.2309
931 88.3230 27.2319
932 88.3253 27.2271
933 88.3304 27.2307
934 88.3268 27.2251
935 88.3275 27.2255
936 88.3182 27.2232
937 88.3323 27.2273
938 88.3317 27.2281
939 88.3008 27.2383
940 88.3012 27.2378
941 88.3014 27.2379
942 88.3026 27.2345
943 88.3030 27.2353
944 88.3043 27.2369
945 88.3032 27.2363
946 88.3030 27.2362
947 88.3018 27.2366
948 88.3021 27.2359
949 88.3003 27.2331
950 88.2984 27.2408
951 88.2962 27.2412
952 88.2991 27.2415
953 88.2991 27.2418
954 88.2994 27.2421
955 88.3021 27.2363
956 88.3034 27.2359
957 88.2862 27.2453
958 88.2889 27.2429
959 88.2908 27.2421
960 88.3007 27.2505
32
Sl. No X_Long Y_Lat
961 88.3707 27.2155
962 88.3713 27.2158
963 88.3617 27.2049
964 88.3614 27.2072
965 88.3644 27.2047
966 88.3652 27.2062
967 88.3663 27.2071
968 88.3661 27.2080
969 88.3768 27.2261
970 88.3719 27.2247
971 88.3492 27.2230
972 88.3462 27.2171
973 88.2611 27.2717
974 88.2542 27.2701
975 88.2647 27.2784
976 88.2837 27.2746
977 88.2859 27.2758
978 88.1427 27.1651
979 88.1804 27.1429
980 88.1753 27.1336
981 88.1738 27.1323
982 88.1708 27.1294
983 88.1689 27.1263
984 88.1787 27.1338
985 88.1105 27.1252
986 88.1376 27.2411
987 88.1520 27.2693
988 88.1515 27.2673
989 88.1529 27.2661
990 88.1575 27.2676
991 88.1522 27.2685
992 88.1490 27.2697
993 88.1749 27.2726
994 88.1556 27.2831
995 88.2629 27.2898
996 88.2631 27.2905
997 88.2633 27.2904
998 88.2620 27.2895
999 88.2617 27.2890
1000 88.2610 27.2880
1001 88.3035 27.2728
1002 88.3140 27.2680
1003 88.3093 27.2683
1004 88.3093 27.2670
Sl. No X_Long Y_Lat
1005 88.3113 27.2643
1006 88.3110 27.2559
1007 88.3311 27.2609
1008 88.3307 27.2608
1009 88.3331 27.2638
1010 88.3346 27.2654
1011 88.3386 27.2627
1012 88.3390 27.2659
1013 88.3355 27.2600
1014 88.3345 27.2594
1015 88.3445 27.2446
1016 88.3819 27.2701
1017 88.3736 27.2682
1018 88.3788 27.2466
1019 88.3887 27.3016
1020 88.3891 27.3020
1021 88.3750 27.3045
1022 88.3755 27.3032
1023 88.2940 27.2455
1024 88.2933 27.2426
1025 88.2617 27.2556
1026 88.2223 27.2255
1027 88.2229 27.2232
1028 88.2090 27.2157
1029 88.2035 27.2213
1030 88.2028 27.2239
1031 88.2005 27.2224
1032 88.2017 27.2231
1033 88.2251 27.2471
1034 88.2362 27.2444
1035 88.2364 27.2258
1036 88.1195 27.2026
1037 88.1276 27.2026
1038 88.6673 27.3082
1039 88.7016 27.2912
1040 88.7035 27.2917
1041 88.7178 27.2932
1042 88.7185 27.2943
1043 88.7190 27.2972
1044 88.7191 27.2987
1045 88.7197 27.2995
1046 88.7193 27.3010
1047 88.7157 27.2984
1048 88.7207 27.3008
33
Sl. No X_Long Y_Lat
1049 88.7229 27.3020
1050 88.7204 27.3044
1051 88.7200 27.3067
1052 88.7241 27.3085
1053 88.7306 27.3174
1054 88.7309 27.3169
1055 88.7277 27.3167
1056 88.7708 27.2975
1057 88.7670 27.2975
1058 88.7627 27.2952
1059 88.6387 27.2138
1060 88.6658 27.2245
1061 88.6465 27.2502
1062 88.6473 27.2500
1063 88.6789 27.2442
1064 88.6903 27.2358
1065 88.7155 27.2840
1066 88.7159 27.2846
1067 88.7497 27.2914
1068 88.7498 27.2916
1069 88.7491 27.2935
1070 88.7505 27.2879
1071 88.7518 27.2881
1072 88.7510 27.2864
1073 88.7511 27.2878
1074 88.7603 27.2959
1075 88.7647 27.2970
1076 88.6158 27.2423
1077 88.6155 27.2786
1078 88.6313 27.2921
1079 88.7230 27.2235
1080 88.7272 27.2212
1081 88.7243 27.2208
1082 88.7543 27.2279
1083 88.7352 27.3141
1084 88.7211 27.3081
1085 88.7214 27.3083
1086 88.7223 27.3090
1087 88.7235 27.3108
1088 88.7308 27.2840
1089 88.7383 27.2829
1090 88.7387 27.2830
1091 88.7743 27.2919
1092 88.8602 27.3134
Sl. No X_Long Y_Lat
1093 88.8603 27.3133
1094 88.8381 27.2636
1095 88.8549 27.2691
1096 88.8807 27.3027
1097 88.5770 27.2005
1098 88.5771 27.2004
1099 88.5785 27.2005
1100 88.5876 27.2005
1101 88.5939 27.2003
1102 88.5942 27.2002
1103 88.5943 27.2003
1104 88.7241 27.1972
1105 88.7229 27.1973
1106 88.7221 27.1959
1107 88.5791 27.1858
1108 88.5961 27.1875
1109 88.5964 27.1880
1110 88.6006 27.1902
1111 88.6011 27.1898
1112 88.6023 27.1900
1113 88.6333 27.1954
1114 88.6409 27.1883
1115 88.6404 27.1896
1116 88.6404 27.1899
1117 88.6389 27.1904
1118 88.6386 27.1906
1119 88.6377 27.1897
1120 88.6371 27.1899
1121 88.6403 27.1915
1122 88.6419 27.1918
1123 88.6427 27.1910
1124 88.6031 27.1839
1125 88.7272 27.1551
1126 88.7276 27.1552
1127 88.7236 27.1749
1128 88.6527 27.1637
1129 88.6538 27.1629
1130 88.5491 27.7732
1131 88.5455 27.7745
1132 88.5500 27.7707
1133 88.5496 27.7692
1134 88.5448 27.7735
1135 88.5423 27.7678
1136 88.5310 27.7672
34
Sl. No X_Long Y_Lat
1137 88.5349 27.7686
1138 88.5428 27.7635
1139 88.5498 27.7589
1140 88.5509 27.7591
1141 88.5515 27.7576
1142 88.5475 27.7673
1143 88.5394 27.8565
1144 88.5397 27.8561
1145 88.5310 27.8830
1146 88.5398 27.8864
1147 88.5331 27.9067
1148 88.5215 27.9201
1149 88.5226 27.9374
1150 88.5266 27.9337
1151 88.6282 27.6210
1152 88.6236 27.6210
1153 88.6180 27.6213
1154 88.6250 27.6195
1155 88.6405 27.6123
1156 88.6415 27.6125
1157 88.6593 27.5682
1158 88.6689 27.6021
1159 88.6738 27.6040
1160 88.6801 27.6048
1161 88.5855 27.5471
1162 88.5597 27.5320
1163 88.4302 27.5781
1164 88.7909 27.7563
1165 88.7781 27.7484
1166 88.8122 27.7834
1167 88.8884 27.4959
Sl. No X_Long Y_Lat
1168 88.4922 27.5689
1169 88.5395 27.5381
1170 88.3939 27.3038
1171 88.3381 27.3054
1172 88.3344 27.3037
1173 88.5037 27.1535
1174 88.5044 27.1542
1175 88.5053 27.1555
1176 88.5055 27.1564
1177 88.5057 27.1573
1178 88.5061 27.1578
1179 88.5061 27.1582
1180 88.5066 27.1574
1181 88.5123 27.1524
1182 88.5033 27.1524
1183 88.4885 27.1477
1184 88.4870 27.1474
1185 88.5062 27.1508
1186 88.5048 27.1515
1187 88.5144 27.1510
1188 88.5131 27.1513
1189 88.5113 27.1529
1190 88.4729 27.1373
1191 88.4723 27.1396
1192 88.4761 27.1394
1193 88.4714 27.1409
1194 88.4747 27.1419
1195 88.4758 27.1356
1196 88.4852 27.1369